Intel Iris Xe MAX Graphics vs NVIDIA T550 Laptop GPU
Intel Iris Xe MAX Graphics ► remove from comparison
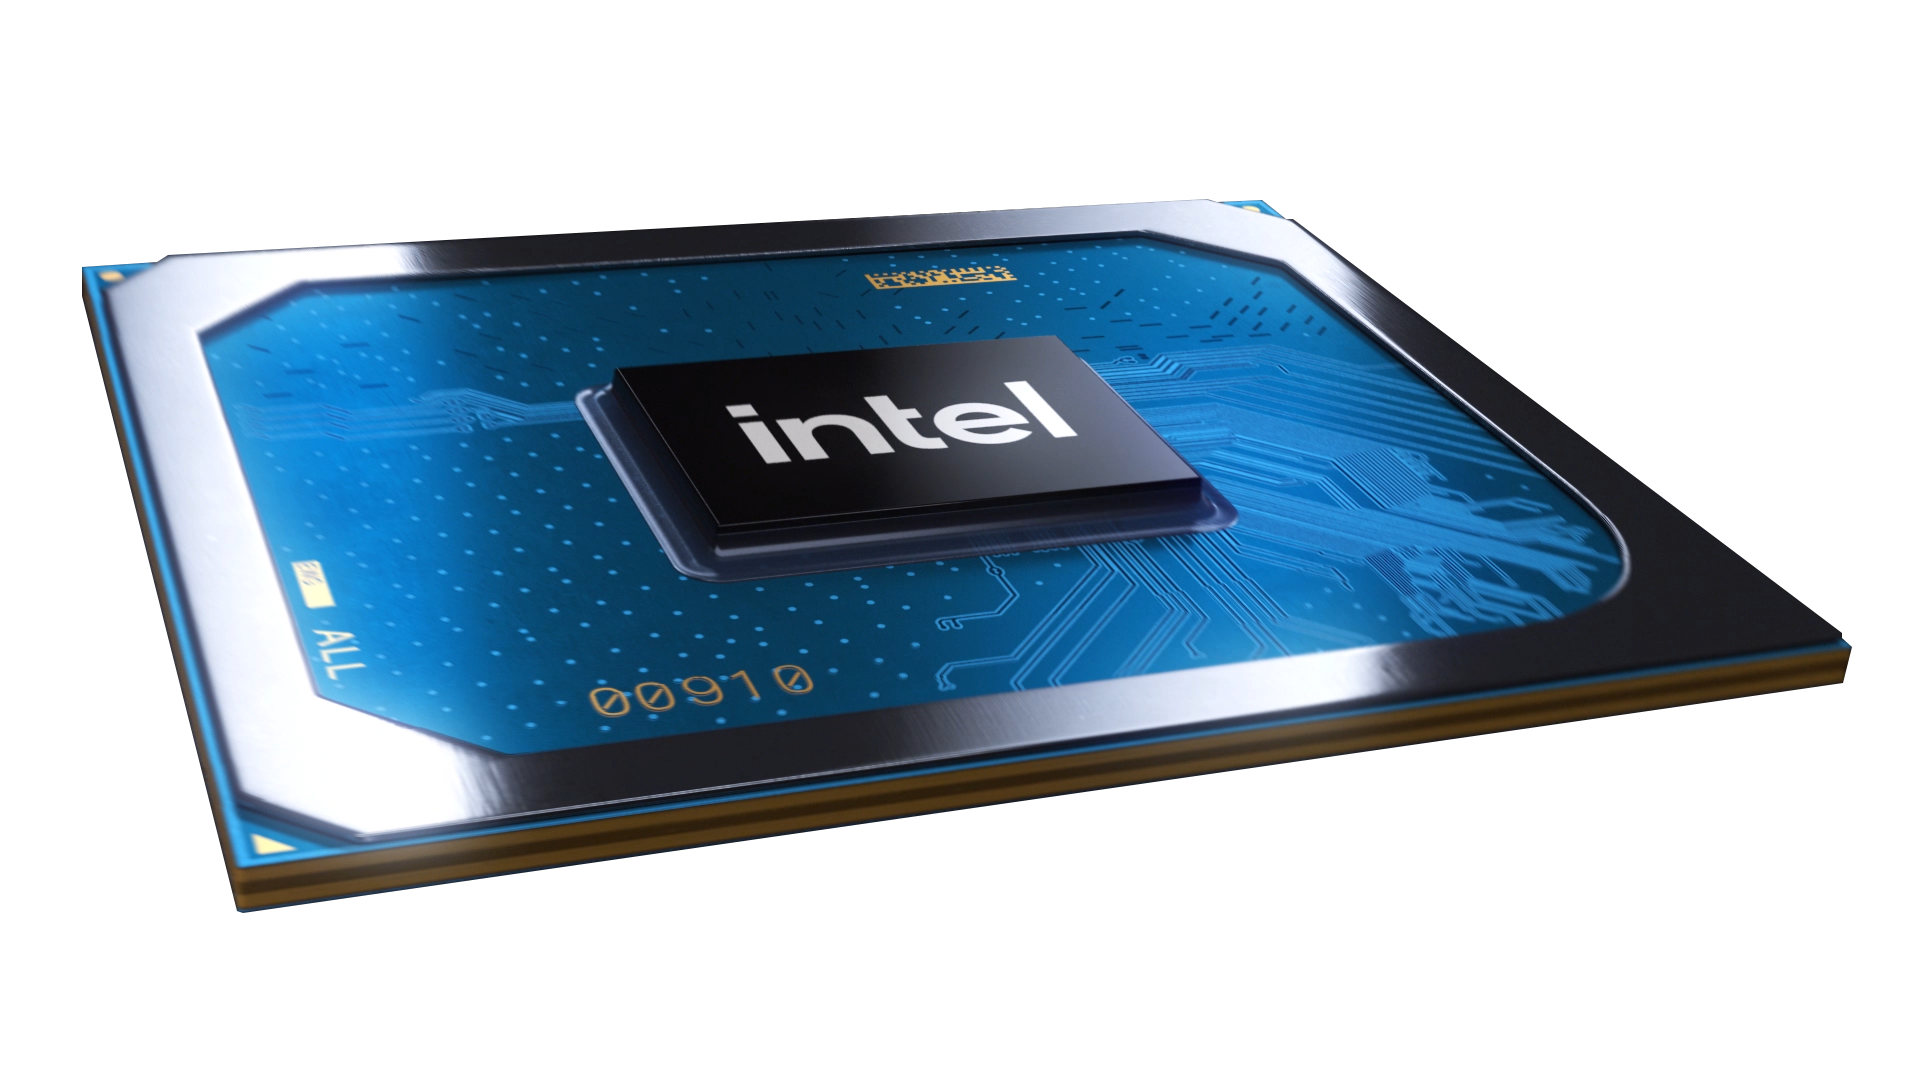
The Intel Iris Xe MAX (DG1 Low Power - LP or iDG1LPDEV) is a dedicated PCIe 4.0 mobile entry-level graphics card with 96 execution units (EUs) based on the Gen 12 architecture. Compared to the integrated Intel Iris Xe in the Tiger Lake CPUs , the Xe MAX offers 4 GB dedicated LPDDR4x graphics memory (68 GB/s versus 56 GB/s for the MX350) and higher clock speeds of 1.65 GHz (vs. 1.35 GHz). Both support DP4A DLBoost instructions to speed up AI tasks and two media engines (including AV1 decoding in hardware). Currently the GPU is only available for Tiger Lake based laptops and offers some possibilities to use the iGPU and dGPU together (using the Deep Link software framework). The GPU uses hybrid graphics to turn off the Xe MAX when not in used (display ports are routed through the iGPU, but the Xe MAX features four dedicated display ports in comparison to the Nvidia GeForce MX350 ).
Furthermore, Intel supports to shift TDP between the two chips for better CPU performance or balancing graphics workloads.
The gaming performance is on average slightly better than a fast Intel Iris Xe iGPU with plenty of TDP and cooling headroom. There are even some games where the iGPU is faster thanks to Deep Link sharing power and cooling. Intel targets 1080p gaming with low to medium settings with the GPU and provided examples where the MAX is on par or better than a dedicated Nvidia GeForce MX350 .
According to Intel, the GPU is mostly aimed at content creators that can make use of the additional compute units, AI (DP4a) acceleration or media encoders.
As the Iris Xe Graphics, the Xe MAX supports Variable Rate Shading, Adaptive Sync, Async Compute, DirectX 12.1, OpenGL 4.6 and OpenCL 2.
As the Tiger Lake CPUs, the Iris Xe MAX dGPU is manufactured in the modern 10nm SuperFin process at Intel. Intel aims the Max-GPU for laptops with a combined power budget of 35 Watt and up. The power consumption of the GPU alone is specified similar to the 25W of the GeForce MX350 (we guess including the graphics memory).
NVIDIA T550 Laptop GPU ► remove from comparison
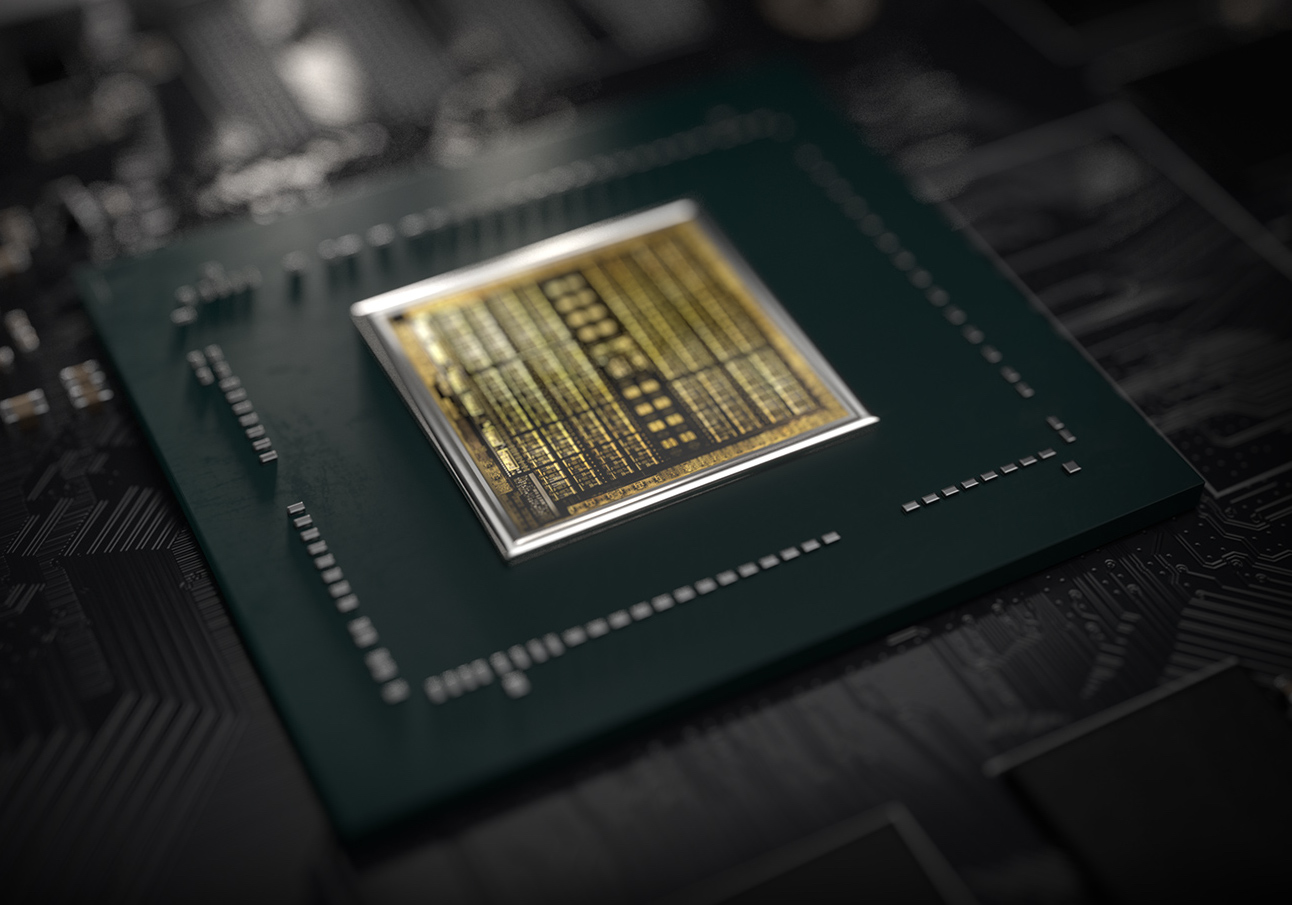
The Nvidia T550 Laptop GPU (formerly known as Quadro T550 Mobile) for laptops is a professional mobile graphics card that is based on the Turing architecture (TU117 chip). It is based on the consumer GeForce MX550 and features the same 1024 cores and a 64 Bit memory bus. The card offers 4 GB GDDR6 with a maximum bandwidth of 112 GB/s and no dedicated display outputs (iGPU display outputs used via Optimus). The chip is manufactured in 12nm FinFET at TSMC.
The professional GPUs offer certified drivers , which are optimized for stability and performance in professional applications (CAD, DCC, medical, prospection, and visualizing applications). The performance in these areas is therefore much better compared to corresponding consumer GPUs.
The Turing generation did not only introduce raytracing for the RTX cards, but also optimized the architecture of the cores and caches. According to Nvidia the CUDA cores offer now a concurrent execution of floating point and integer operations for increased performance in compute-heavy workloads of modern games. Furthermore, the caches were reworked (new unified memory architecture with twice the cache compared to Pascal). This leads to up to 50% more instructions per clock and a 40% more power efficient usage compared to Pascal. In contrary to the faster Quadro RTX cards, the T550 does not feature raytracing and Tensor cores.
Intel Iris Xe MAX Graphics NVIDIA T550 Laptop GPU Codename iDG1LPDEV TU117 Architecture Gen. 12 Xe Turing Pipelines 96 - unified 1024 - unified TMUs 16 ROPs 8 Core Speed 1650 (Boost) MHz 1065 - 1665 (Boost) MHz Memory Speed 4266 MHz 12000 effective = 1500 MHz Memory Bus Width 128 Bit 64 Bit Memory Type LPDDR4x GDDR5, GDDR6 Max. Amount of Memory 4 GB 4 GB Shared Memory no no Memory Bandwidth 68.3 GB/s 112 GB/s API DirectX 12.1, OpenGL 4.6 DirectX 12_1, Shader 6.7, OpenGL 4.6 Power Consumption 25 Watt 25 Watt (20 - 60 Watt TGP) technology 10 nm 12 nm PCIe 4.0 Date of Announcement 31.10.2020 27.05.2022 Quadro Turing Series Theoretical Performance 7.2 TFLOPS FP16, 3.7 TFLOPS FP32 Notebook Size medium sized Information Optimus only Link to Manufacturer Page nvdam.widen.net
Benchmarks Performance Rating - 3DMark 11 + Fire Strike + Time Spy - Xe MAX
2.9 pt (9%)
...
Intel Iris Xe MAX Graphics
...
max:
3DMark - 3DMark Time Spy Score
min: 1825 avg: 1879 median: 1876 (5%) max: 1939 Points
GPU TDP ? TDP 10 W 100% 98%
min: 2031 avg: 2187 median: 2066 (6%) max: 2465 Points
GPU TDP ? TDP 10 W TDP 20 W TDP 30 W 77% 75% 83% 100%
3DMark - 3DMark Time Spy Graphics
min: 1697 avg: 1735 median: 1743 (5%) max: 1766 Points
GPU TDP ? TDP 10 W 100% 97%
min: 1882 avg: 2021 median: 1928 (5%) max: 2252 Points
GPU TDP ? TDP 10 W TDP 20 W TDP 30 W 78% 75% 85% 100%
3DMark - 3DMark Ice Storm Unlimited Graphics
min: 82964 avg: 177443 median: 177442 (20%) max: 271921 Points
GPU TDP ? TDP 10 W 100% 31%
3DMark - 3DMark Ice Storm Extreme Graphics
64040 Points (8%)
3DMark - 3DMark Cloud Gate Score
min: 19254 avg: 20527 median: 20526.5 (22%) max: 21799 Points
GPU TDP ? TDP 10 W 100% 88%
min: 17399 avg: 17614 median: 17614 (19%) max: 17829 Points
GPU TDP ? TDP 10 W TDP 20 W 100% 88% 81%
3DMark - 3DMark Cloud Gate Graphics
min: 34947 avg: 37147 median: 36993 (10%) max: 39502 Points
GPU TDP ? TDP 10 W 100% 91%
min: 32743 avg: 33219 median: 33218.5 (9%) max: 33694 Points
GPU TDP ? TDP 10 W TDP 20 W 100% 91% 87%
3DMark - 3DMark Fire Strike Standard Score
min: 5412 avg: 5835 median: 5658 (10%) max: 6610 Points
GPU TDP ? TDP 10 W 100% 91%
min: 4559 avg: 4786 median: 4581 (8%) max: 5218 Points
GPU TDP ? TDP 10 W TDP 20 W TDP 30 W 100% 91% 76% 87%
3DMark - 3DMark Fire Strike Standard Graphics
min: 6111 avg: 6297 median: 6333 (7%) max: 6447 Points
GPU TDP ? TDP 10 W 100% 96%
min: 4816 avg: 5100 median: 4890 (6%) max: 5593 Points
GPU TDP ? TDP 10 W TDP 20 W TDP 30 W 100% 96% 76% 88%
3DMark - 3DMark Ice Storm Graphics
115123 Points (14%)
3DMark - 3DMark Wild Life Unlimited
13344 Points (7%)
3DMark - 3DMark Wild Life Extreme Unlimited
min: 3530 avg: 3590 median: 3589.5 (4%) max: 3649 Points
3DMark - 3DMark Night Raid
min: 16047 avg: 16486 median: 16486 (16%) max: 16925 Points
3DMark - 3DMark Night Raid Graphics Score
min: 20539 avg: 20650 median: 20649.5 (8%) max: 20760 Points
3DMark 11 - 3DM11 Performance Score
min: 7720 avg: 8113 median: 8024 (11%) max: 8594 Points
GPU TDP ? TDP 10 W 100% 93%
min: 7405 avg: 8160 median: 8160 (11%) max: 8915 Points
GPU TDP ? TDP 10 W TDP 20 W TDP 30 W 93% 87% 83% 100%
3DMark 11 - 3DM11 Performance GPU
min: 7804 avg: 8133 median: 8214 (7%) max: 8380 Points
GPU TDP ? TDP 10 W 100% 94%
min: 7432 avg: 8067 median: 8066.5 (7%) max: 8701 Points
GPU TDP ? TDP 10 W TDP 20 W TDP 30 W 95% 90% 85% 100%
3DMark Vantage + NVIDIA T550 Laptop GPU 3DMark Vantage - 3DM Vant. Perf. total
25155 Points (7%)
3DM Vant. Perf. GPU no PhysX + NVIDIA T550 Laptop GPU 3DMark Vantage - 3DM Vant. Perf. GPU no PhysX
24697 Points (14%)
3DMark 06 3DMark 06 - Standard 1280x1024 + Intel Iris Xe MAX Graphics
22466 Points (29%)
3DMark 06 - Standard 1280x1024 + NVIDIA T550 Laptop GPU
31003 Points (41%)
GPU TDP 10 W TDP 20 W 72% 100%
Unigine Valley 1.0 - Unigine Valley 1.0 DX
18.8 fps (6%)
Blender - Blender 3.3 Classroom CUDA *
min: 278 avg: 282 median: 283 (42%) max: 285 Seconds
GPU TDP 20 W TDP 30 W 100% 102%
Blender - Blender 3.3 Classroom OPTIX *
min: 256 avg: 263.3 median: 265 (99%) max: 269 Seconds
GPU TDP 20 W TDP 30 W 100% 650%
SPECviewperf 12 + Intel Iris Xe MAX Graphics SPECviewperf 12 - specvp12 sw-03
23.1 fps (6%)
specvp12 snx-02 + Intel Iris Xe MAX Graphics SPECviewperf 12 - specvp12 snx-02
1 fps (0%)
specvp12 showcase-01 + Intel Iris Xe MAX Graphics SPECviewperf 12 - specvp12 showcase-01
22.3 fps (5%)
specvp12 mediacal-01 + Intel Iris Xe MAX Graphics SPECviewperf 12 - specvp12 mediacal-01
11.8 fps (3%)
specvp12 maya-04 + Intel Iris Xe MAX Graphics SPECviewperf 12 - specvp12 maya-04
39.6 fps (11%)
specvp12 energy-01 + Intel Iris Xe MAX Graphics SPECviewperf 12 - specvp12 energy-01
0.5 fps (0%)
specvp12 creo-01 + Intel Iris Xe MAX Graphics SPECviewperf 12 - specvp12 creo-01
10.3 fps (4%)
specvp12 catia-04 + Intel Iris Xe MAX Graphics SPECviewperf 12 - specvp12 catia-04
43.4 fps (7%)
SPECviewperf 13 specvp13 sw-04 + Intel Iris Xe MAX Graphics SPECviewperf 13 - specvp13 sw-04
31.3 fps (8%)
specvp13 sw-04 + NVIDIA T550 Laptop GPU
min: 95 avg: 98.8 median: 95.8 (26%) max: 105.68 fps
GPU TDP 10 W TDP 20 W TDP 30 W 30% 90% 100%
specvp13 snx-03 + Intel Iris Xe MAX Graphics SPECviewperf 13 - specvp13 snx-03
1.8 fps (0%)
specvp13 snx-03 + NVIDIA T550 Laptop GPU
min: 95.8 avg: 101.7 median: 99.7 (11%) max: 109.67 fps
GPU TDP 10 W TDP 20 W TDP 30 W 2% 89% 100%
specvp13 showcase-02 + Intel Iris Xe MAX Graphics SPECviewperf 13 - specvp13 showcase-02
22.4 fps (5%)
specvp13 showcase-02 + NVIDIA T550 Laptop GPU
min: 24.8 avg: 26.1 median: 25.3 (6%) max: 28.06 fps
GPU TDP 10 W TDP 20 W TDP 30 W 80% 89% 100%
specvp13 medical-02 + Intel Iris Xe MAX Graphics SPECviewperf 13 - specvp13 medical-02
15.3 fps (3%)
specvp13 medical-02 + NVIDIA T550 Laptop GPU
min: 34.5 avg: 37.2 median: 36.2 (8%) max: 40.74 fps
GPU TDP 10 W TDP 20 W TDP 30 W 38% 87% 100%
specvp13 maya-05 + Intel Iris Xe MAX Graphics SPECviewperf 13 - specvp13 maya-05
46 fps (5%)
specvp13 maya-05 + NVIDIA T550 Laptop GPU
min: 77.5 avg: 82 median: 80.9 (9%) max: 87.57 fps
GPU TDP 10 W TDP 20 W TDP 30 W 53% 90% 100%
specvp13 energy-02 + Intel Iris Xe MAX Graphics SPECviewperf 13 - specvp13 energy-02
6.4 fps (2%)
specvp13 energy-02 + NVIDIA T550 Laptop GPU
min: 11.7 avg: 12.4 median: 12 (4%) max: 13.37 fps
GPU TDP 10 W TDP 20 W TDP 30 W 48% 89% 100%
specvp13 creo-02 + Intel Iris Xe MAX Graphics SPECviewperf 13 - specvp13 creo-02
11.9 fps (2%)
specvp13 creo-02 + NVIDIA T550 Laptop GPU
min: 82.4 avg: 86.2 median: 85.5 (13%) max: 90.66 fps
GPU TDP 10 W TDP 20 W TDP 30 W 13% 93% 100%
specvp13 catia-05 + Intel Iris Xe MAX Graphics SPECviewperf 13 - specvp13 catia-05
66.4 fps (7%)
specvp13 catia-05 + NVIDIA T550 Laptop GPU
min: 104 avg: 110.4 median: 109 (12%) max: 118.22 fps
GPU TDP 10 W TDP 20 W TDP 30 W 56% 90% 100%
specvp13 3dsmax-06 + Intel Iris Xe MAX Graphics SPECviewperf 13 - specvp13 3dsmax-06
42.6 fps (7%)
specvp13 3dsmax-06 + NVIDIA T550 Laptop GPU
min: 61.6 avg: 63.7 median: 63 (11%) max: 66.38 fps
GPU TDP 10 W TDP 20 W TDP 30 W 64% 94% 100%
SPECviewperf 2020 specvp2020 solidworks-05 1080p + NVIDIA T550 Laptop GPU SPECviewperf 2020 - specvp2020 solidworks-05 1080p
min: 46.3 avg: 54 median: 54.3 (11%) max: 61.38 fps
GPU TDP 20 W TDP 30 W 82% 100%
specvp2020 snx-04 1080p + NVIDIA T550 Laptop GPU SPECviewperf 2020 - specvp2020 snx-04 1080p
min: 84 avg: 99.4 median: 99.3 (16%) max: 114.82 fps
GPU TDP 20 W TDP 30 W 80% 100%
specvp2020 medical-03 1080p + NVIDIA T550 Laptop GPU SPECviewperf 2020 - specvp2020 medical-03 1080p
min: 13.5 avg: 15.6 median: 15.4 (11%) max: 17.87 fps
GPU TDP 20 W TDP 30 W 81% 100%
specvp2020 maya-06 1080p + NVIDIA T550 Laptop GPU SPECviewperf 2020 - specvp2020 maya-06 1080p
min: 86.9 avg: 98.2 median: 98.1 (14%) max: 109.68 fps
GPU TDP 20 W TDP 30 W 84% 100%
specvp2020 energy-03 1080p + NVIDIA T550 Laptop GPU SPECviewperf 2020 - specvp2020 energy-03 1080p
min: 10.6 avg: 12.1 median: 12 (10%) max: 13.56 fps
GPU TDP 20 W TDP 30 W 83% 100%
specvp2020 creo-03 1080p + NVIDIA T550 Laptop GPU SPECviewperf 2020 - specvp2020 creo-03 1080p
min: 44.5 avg: 46.2 median: 45.7 (23%) max: 48.5 fps
GPU TDP 20 W TDP 30 W 100% 98%
specvp2020 catia-06 1080p + NVIDIA T550 Laptop GPU SPECviewperf 2020 - specvp2020 catia-06 1080p
min: 22.4 avg: 25.6 median: 24.9 (16%) max: 29.58 fps
GPU TDP 20 W TDP 30 W 80% 100%
specvp2020 3dsmax-07 1080p + NVIDIA T550 Laptop GPU SPECviewperf 2020 - specvp2020 3dsmax-07 1080p
min: 28.3 avg: 30 median: 29.6 (13%) max: 32.03 fps
GPU TDP 20 W TDP 30 W 90% 100%
Cinebench R10 Cinebench R10 Shading (32bit) + Intel Iris Xe MAX Graphics Cinebench R10 - Cinebench R10 Shading (32bit)
11787 Points (8%)
Cinebench R11.5 Cinebench R11.5 OpenGL 64 Bit + Intel Iris Xe MAX Graphics Cinebench R11.5 - Cinebench R11.5 OpenGL 64 Bit
64.3 fps (22%)
Cinebench R15 + Intel Iris Xe MAX Graphics Cinebench R15 - Cinebench R15 OpenGL 64 Bit
min: 92.1 avg: 103 median: 105 (6%) max: 112 fps
GPU TDP ? TDP 10 W 100% 85%
Cinebench R15 OpenGL 64 Bit + NVIDIA T550 Laptop GPU
min: 184.9 avg: 193 median: 189.2 (11%) max: 205 fps
GPU TDP ? TDP 10 W TDP 20 W TDP 30 W 53% 45% 91% 100%
Cinebench R15 OpenGL Ref. Match 64 Bit + Intel Iris Xe MAX Graphics Cinebench R15 - Cinebench R15 OpenGL Ref. Match 64 Bit
97.8 % (98%)
GPU TDP ? TDP 10 W 100% 100%
Cinebench R15 OpenGL Ref. Match 64 Bit + NVIDIA T550 Laptop GPU
99.6 % (100%)
GPU TDP ? TDP 10 W TDP 20 W TDP 30 W 98% 98% 100% 100%
GFXBench - GFXBench 5.0 Aztec Ruins High Tier Offscreen
19 fps (3%)
GFXBench - GFXBench 5.0 Aztec Ruins Normal Tier Offscreen
43.5 fps (3%)
GFXBench - GFXBench Car Chase Offscreen
118.3 fps (13%)
GFXBench 3.1 - GFXBench Manhattan ES 3.1 Offscreen
172.6 fps (4%)
GFXBench 3.0 - GFXBench 3.0 Manhattan Offscreen
229.9 fps (13%)
GFXBench (DX / GLBenchmark) 2.7 + NVIDIA T550 Laptop GPU GFXBench (DX / GLBenchmark) 2.7 - GFXBench T-Rex HD Offscreen C24Z16
449.9 fps (4%)
LuxMark v2.0 64Bit - LuxMark v2.0 Room GPU
1161 Samples/s (5%)
LuxMark v2.0 64Bit - LuxMark v2.0 Sala GPU
3073 Samples/s (5%)
ComputeMark v2.1 - ComputeMark v2.1 Result
3898 Points (4%)
5190 Points (6%)
GPU TDP 10 W TDP 20 W 75% 100%
Power Consumption - Furmark Stress Test Power Consumption - external Monitor *
min: 42.9 avg: 46.2 median: 46.2 (7%) max: 49.4 Watt
GPU TDP ? TDP 10 W 100% 101%
min: 34.2 avg: 34.7 median: 34.7 (5%) max: 35.1 Watt
GPU TDP ? TDP 10 W TDP 20 W 100% 101% 102%
Power Consumption - The Witcher 3 Power Consumption - external Monitor *
min: 46.3 avg: 49.6 median: 49.6 (7%) max: 52.8 Watt
GPU TDP ? TDP 10 W 100% 101%
min: 41.2 avg: 41.3 median: 41.3 (6%) max: 41.4 Watt
GPU TDP ? TDP 10 W TDP 20 W 100% 101% 102%
Power Consumption - Witcher 3 Power Consumption *
min: 45.9 avg: 50.7 median: 52.2 (11%) max: 54.1 Watt
GPU TDP ? TDP 10 W 101% 100%
min: 42.9 avg: 44.1 median: 44.1 (10%) max: 45.3 Watt
GPU TDP ? TDP 10 W TDP 20 W 101% 100% 102%
Power Consumption - Witcher 3 ultra Power Efficiency
min: 0.3391 avg: 0.4 median: 0.3 (34%) max: 0.3747 fps per Watt
GPU TDP ? TDP 10 W 100% 95%
min: 0.4393 avg: 0.4 median: 0.4 (44%) max: 0.4569 fps per Watt
GPU TDP ? TDP 10 W TDP 20 W 80% 76% 100%
Power Consumption - Witcher 3 ultra Power Efficiency - external Monitor
min: 0.3504 avg: 0.4 median: 0.4 (30%) max: 0.3823 fps per Watt
GPU TDP ? TDP 10 W 92% 100%
min: 0.4734 avg: 0.5 median: 0.5 (40%) max: 0.483 fps per Watt
GPU TDP ? TDP 10 W TDP 20 W 73% 80% 100%
Emissions Witcher 3 Fan Noise + Intel Iris Xe MAX Graphics Emissions - Witcher 3 Fan Noise
min: 42.3 avg: 44.9 median: 44.9 (72%) max: 47.4 dB(A)
GPU TDP ? TDP 10 W 89% 100%
Witcher 3 Fan Noise + NVIDIA T550 Laptop GPU
min: 38.2 avg: 40.4 median: 40.5 (65%) max: 42.5 dB(A)
GPU TDP ? TDP 10 W TDP 20 W TDP 30 W 89% 100% 83% 90%
Clock Speed - GPU Clock Speed Furmark
1200 MHz (48%)
Average Benchmarks Intel Iris Xe MAX Graphics → 100% n=21 Average Benchmarks NVIDIA T550 Laptop GPU → 430% n=21
- Range of benchmark values for this graphics card
- Average benchmark values for this graphics card
* Smaller numbers mean a higher performance
1 This benchmark is not used for the average calculation
Game Benchmarks The following benchmarks stem from our benchmarks of review laptops. The performance depends on the used graphics memory, clock rate, processor, system settings, drivers, and operating systems. So the results don't have to be representative for all laptops with this GPU. For detailed information on the benchmark results, click on the fps number.
100%
Xe MAX:
32 (!) [X] Asus VivoBook Flip 14 TP470EZ Intel Core i5-1135G7 2.4GHz
Xe MAX
min:
10 fps, P0.1:
10 fps, P1:
11 fps, max:
95 fps
fps
100%
Xe MAX:
19 (!) [X] Asus VivoBook Flip 14 TP470EZ Intel Core i5-1135G7 2.4GHz
Xe MAX
min:
5 fps, P0.1:
5 fps, P1:
7 fps, max:
84 fps
fps
100%
Xe MAX:
6 (!) [X] Asus VivoBook Flip 14 TP470EZ Intel Core i5-1135G7 2.4GHz
Xe MAX
min:
1 fps, P0.1:
0.1 fps, P1:
1 fps, max:
34 fps
fps
130%
T550 Laptop GPU:
47.7 51 56 ~ 52 fps
127%
T550 Laptop GPU:
38.7 42 44 ~ 42 fps
124%
T550 Laptop GPU:
33.2 36 38 ~ 36 fps
197%
T550 Laptop GPU:
75 fps
158%
T550 Laptop GPU:
41 fps
152%
T550 Laptop GPU:
38 fps
146%
T550 Laptop GPU:
35 fps
142%
T550 Laptop GPU:
73 75 78 ~ 75 fps
121%
T550 Laptop GPU:
39 40 43 ~ 41 fps
Average Gaming Intel Iris Xe MAX Graphics → 100% Average Gaming 30-70 fps → 100%
Average Gaming NVIDIA T550 Laptop GPU → 162% Average Gaming 30-70 fps → 152%
NVIDIA T550 Laptop GPU low med. high ultra QHD 4K F1 22 69 62 43 31 F1 2021 153 74 59 37 Strange Brigade 131 52 42 36 Far Cry 5 75 41 38 35 X-Plane 11.11 70 63 57 Final Fantasy XV Benchmark 62 31 22 Dota 2 Reborn 117 105 95 88 The Witcher 3 128 75 41 21 GTA V 116 114 62 29 < 30 fps < 60 fps < 120 fps ≥ 120 fps 6 3 3 6 1 6 2 2 4 1
For more games that might be playable and a list of all games and graphics cards visit our Gaming List
v1.26
log 20. 06:00:49
#0 checking url part for id 9956 +0s ... 0s
#1 checking url part for id 11429 +0s ... 0s
#2 not redirecting to Ajax server +0s ... 0s
#3 did not recreate cache, as it is less than 5 days old! Created at Sun, 19 May 2024 05:37:06 +0200 +0.001s ... 0.001s
#4 composed specs +0.099s ... 0.1s
#5 did output specs +0s ... 0.1s
#6 start showIntegratedCPUs +0s ... 0.1s
#7 getting avg benchmarks for device 9956 +0.047s ... 0.147s
#8 got single benchmarks 9956 +0.015s ... 0.162s
#9 getting avg benchmarks for device 11429 +0.002s ... 0.163s
#10 got single benchmarks 11429 +0.021s ... 0.185s
#11 got avg benchmarks for devices +0s ... 0.185s
#12 min, max, avg, median took s +0.37s ... 0.554s
#13 before gaming benchmark output +0s ... 0.554s
#14 Got 280 rows for game benchmarks. +0.067s ... 0.621s
#15 composed SQL query for gamebenchmarks +0s ... 0.621s
#16 got data and put it in $dataArray +0.036s ... 0.657s
#17 benchmarks composed for output. +0.103s ... 0.76s
#18 calculated avg scores. +0s ... 0.76s
#19 return log +0.053s ... 0.813s
Please share our article, every link counts!
Redaktion, 2017-09- 8 (Update: 2023-07- 1)
 Deutsch
 English
 Español
 Français
 Italiano
 Nederlands
 Polski
 Português
 Русский
 Türkçe
 Svenska
 Chinese
 Magyar