Notebookcheck Logo

Intel Iris Plus Graphics 650 vs NVIDIA GeForce GTX 1070 Ti (Desktop) vs Intel HD Graphics P630

Intel Iris Plus Graphics 650

► remove from comparison Intel Iris Plus Graphics 650

The Intel Iris Plus Graphics 650 (GT3e) is a processor graphics card for Kaby Lake models announced in January 2017. As the successor to the Intel Iris Graphics 550 (Skylake), the Iris Plus Graphics 650 is used for 28-Watt models and is equipped with 64 MB eDRAM cache. There should not be any big changes compared to the Iris Graphics 550.

The so called GT3e version of the Kaby Lake GPU probably still has 48 Execution Units (EUs), which can reach up to 1100 MHz depending on the model. Besides eDRAM cache, the Iris 650 can also access the system memory (2x 64 Bit DDR3L-1600/DDR4-2400) via processor interface.

Compared to the Iris Plus 640 from the 15-Watt models, the Iris 650 only has a slightly higher maximum clock as well as almost twice the TDP, which allows a better utilization of the Turbo Boost potential.

Performance

The exact performance of the Iris Plus Graphics 650 depends on the CPU model, because maximum clock as well as the size of the L3 cache can differ a bit. The system memory (DDR3/DDR4) will influence the performance as well.

The fastest chips are high-clocked Core i7 models like the Core i7-7567U. Depending on the game, the Iris Plus 650 will probably be on par with a dedicated GeForce 930M and can handle smooth gameplay in modern titles in low up to medium settings.

Features

The reworked video engine now fully supports hardware decoding of H.265/HEVC videos. Contrary to Skylake, however, Kaby Lake can now also decode H.265/HEVC Main 10 with a 10-bit color depth as well as Google's VP9 codec. The video output is possible via DP 1.2/eDP 1.3 (up to 3840 x 2160 @60 Hz), whereas HDMI is also supported in the older 1.4a standard. An HDMI 2.0 output can be added via converter from DisplayPort. The GPU can drive up to three displays simultaneously.

Power Consumption

The Iris Plus Graphics 650 is used for 28-Watt processor and therefore medium-sized notebooks.

NVIDIA GeForce GTX 1070 Ti (Desktop)

► remove from comparison NVIDIA GeForce GTX 1070 Ti (Desktop)

The Nvidia GeForce GTX 1070 Ti is the second fastest Pascal based graphics card in November 2017. It is a high-end desktop graphics card based on a cut down GP104 chip as the GTX 1080 and manufactured in 16 nm FinFET at TSMC. Compared to the GTX 1080, it uses the more available GDDR5 graphics memory, and compared to the GTX 1070 it offers more shaders (2432 versus 1920). More details on the Pascal architecture including all features and comparisons to Maxwell, can be found here.

The performance of the GTX 1070 Ti was in our tests right between the GTX 1070 and GTX 1080. However, the powerefficiency was worse than the GTX 1070 and near the GTX 1080. Nvidia also specifies the 1070 Ti and 1080 at 180W.

Intel HD Graphics P630

► remove from comparison Intel HD Graphics P630

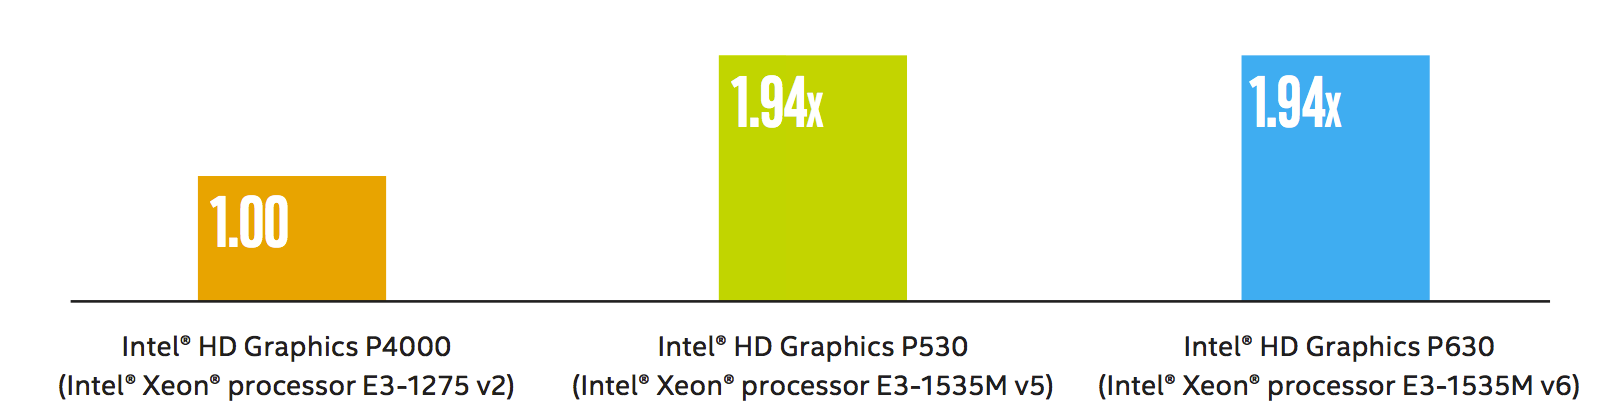
The Intel HD Graphics P630 (GT2) is an integrated graphics unit, which can be found in various Xeon workstation processors of the Kaby Lake generation. The "GT2" version of the Skylake GPU offers 24 Execution Units (EUs) clocked at up to 1050 MHz (depending on the CPU model). Due to its lack of dedicated graphics memory or eDRAM cache, the P630 has to access the main memory (2x 64bit DDR3L-1600 / DDR4-2133). It uses the same silicon as the consumer HD Graphics 630 in Kaby-Lake-H processors but features optimized drivers for workstaion and CAD software. According to Intel it is certified for 15 applications (see list).

Performance

According to Intel, the performance of the P630 is identical to the Intel HD Graphis P530 (Skylake predecessor) processor graphics card and 1.94x faster than the old Intel HD Graphics P4000. Compared to consumer cards, the gaming performance should be on a similar level to the dedicated GeForce 920M and will handle old games (as of 2015) in low or medium settings.

Features

The revised video engine in the Kaby Lake chips now supports H.265/HEVC Main10 profile at 10-bit color depth and also the VP9 codec in hardware. Furthermore, HDCP 2.2 is also supported in all chips, which allows Netflix 4K videos, for instance.

Power Consumption

The HD Graphics P630 can be found in mobile quad-core Xeon processors with 45 W TDP and also desktop processors of the Xeon range with higher TDPs.

Sourcehttp://www.intel.com/content/dam/www/public/us/en/documents/guides/hd-graphics-performance-guide.pdf

Intel Iris Plus Graphics 650NVIDIA GeForce GTX 1070 Ti (Desktop)Intel HD Graphics P630
Gen. 9.5 Series
Iris Plus Graphics 655 48 @ 0.3 - 1.2 GHz
Iris Plus Graphics 650 48 @ 0.3 - 1.1 GHz64/128 Bit
Iris Plus Graphics 645 48 @ 0.3 - 1.15 GHz
Iris Plus Graphics 640 48 @ 0.3 - 1.05 GHz64/128 Bit
UHD Graphics 630 24 @ 0.3 - 1.15 GHz64/128 Bit
UHD Graphics P630 24 @ 0.3 - 1.2 GHz64/128 Bit
HD Graphics 630 24 @ 0.3 - 1.15 GHz64/128 Bit
HD Graphics P630 24 64/128 Bit
UHD Graphics 620 24 @ 0.3 - 1.15 GHz
HD Graphics 620 24 @ 0.3 - 1.05 GHz64/128 Bit
UHD Graphics 617 24 @ 0.3 - 1.15 GHz64/128 Bit
UHD Graphics 615 24 @ 0.3 - 1 GHz64/128 Bit
HD Graphics 615 24 @ 0.3 - 1.05 GHz64/128 Bit
GeForce GTX 1080 Ti 3584 @ 1.48 - 1.6 GHz352 Bit @ 11000 MHz
GeForce GTX 1080 SLI (Laptop) 5120 @ 1.56 - 1.73 GHz256 Bit @ 10000 MHz
GeForce GTX 1070 SLI (Desktop) 3840 @ 1.51 - 1.68 GHz256 Bit @ 8000 MHz
GeForce GTX 1070 SLI (Laptop) 4096 @ 1.44 - 1.65 GHz256 Bit @ 8000 MHz
GeForce GTX 1080 (Desktop) 2560 @ 1.61 - 1.73 GHz256 Bit @ 10000 MHz
GeForce GTX 1080 Mobile 2560 @ 1.57 - 1.73 GHz256 Bit @ 10000 MHz
GeForce GTX 1070 Ti (Desktop) 2432 @ 1.61 - 1.68 GHz256 Bit @ 8000 MHz
GeForce GTX 1070 (Desktop) 1920 @ 1.51 - 1.68 GHz256 Bit @ 8000 MHz
GeForce GTX 1080 Max-Q 2560 @ 1.1 - 1.28 GHz256 Bit @ 10000 MHz
GeForce GTX 1070 Mobile 2048 @ 1.44 - 1.65 GHz256 Bit @ 8000 MHz
GeForce GTX 1070 Max-Q 2048 @ 1.1 - 1.27 GHz256 Bit @ 8000 MHz
GeForce GTX 1060 (Desktop) 1280 @ 1.51 - 1.71 GHz192 Bit @ 8000 MHz
GeForce GTX 1060 Mobile 1280 @ 1.4 - 1.67 GHz192 Bit @ 8000 MHz
GeForce GTX 1060 Max-Q 1280 @ 1.06 - 1.34 GHz192 Bit @ 8000 MHz
GeForce GTX 1050 Ti Mobile 768 @ 1.49 - 1.62 GHz128 Bit @ 7000 MHz
GeForce GTX 1050 Ti (Desktop) 768 @ 1.29 - 1.39 GHz128 Bit @ 7008 MHz
GeForce GTX 1050 Ti Max-Q 768 @ 1.15 - 1.29 GHz128 Bit @ 7000 MHz
GeForce GTX 1050 (Desktop) 640 @ 1.35 - 1.46 GHz128 Bit @ 7008 MHz
GeForce GTX 1050 Mobile 640 @ 1.35 - 1.49 GHz128 Bit @ 7000 MHz
GeForce GTX 1050 Max-Q 640 @ 1 - 1.14 GHz128 Bit @ 7000 MHz
GeForce GT 1030 (Desktop) 384 @ 1.23 - 1.67 GHz64 Bit @ 6000 MHz
Iris Plus Graphics 655 48 @ 0.3 - 1.2 GHz
Iris Plus Graphics 650 48 @ 0.3 - 1.1 GHz64/128 Bit
Iris Plus Graphics 645 48 @ 0.3 - 1.15 GHz
Iris Plus Graphics 640 48 @ 0.3 - 1.05 GHz64/128 Bit
UHD Graphics 630 24 @ 0.3 - 1.15 GHz64/128 Bit
UHD Graphics P630 24 @ 0.3 - 1.2 GHz64/128 Bit
HD Graphics 630 24 @ 0.3 - 1.15 GHz64/128 Bit
HD Graphics P630 24 64/128 Bit
UHD Graphics 620 24 @ 0.3 - 1.15 GHz
HD Graphics 620 24 @ 0.3 - 1.05 GHz64/128 Bit
UHD Graphics 617 24 @ 0.3 - 1.15 GHz64/128 Bit
UHD Graphics 615 24 @ 0.3 - 1 GHz64/128 Bit
HD Graphics 615 24 @ 0.3 - 1.05 GHz64/128 Bit
CodenameKaby Lake GT3ePascal GP104Kaby-Lake-H-GT2
ArchitectureGen. 9.5 Kaby LakePascalGen. 9.5 Kaby Lake
Pipelines48 - unified2432 - unified24 - unified
Core Speed300 - 1100 (Boost) MHz1607 - 1683 (Boost) MHz
Memory Bus Width64/128 Bit256 Bit64/128 Bit
Memory TypeDDR4GDDR5
Shared Memoryyesnoyes
APIDirectX 12_1, OpenGL 4.4DirectX 12_1, OpenGL 4.5DirectX 12_1, OpenGL 4.4
technology14 nm16 nm14 nm
FeaturesQuickSyncMulti-Projection, VR Ready, G-SYNC, Vulkan, Multi MonitorQuickSync
Date of Announcement03.01.2017 02.11.2017 05.08.2015
Memory Speed8000 MHz
Max. Amount of Memory8 GB
Power Consumption180 Watt
Transistors7.2 Billion
Link to Manufacturer Pagewww.nvidia.at
CPU in Iris Plus Graphics 650GPU Base SpeedGPU Boost / Turbo
Intel Core i7-7567U2 x 3500 MHz, 28 W300 MHz1100 MHz
Intel Core i5-7287U2 x 3300 MHz, 28 W300 MHz1100 MHz
Intel Core i5-7267U2 x 3100 MHz, 28 W300 MHz1050 MHz
Intel Core i3-7167U2 x 2800 MHz, 28 W300 MHz1000 MHz
min. - max.300 MHz1000 - 1100 MHz
CPU in HD Graphics P630GPU Base SpeedGPU Boost / Turbo
Intel Xeon E3-1535M v64 x 3100 MHz, 45 W300 MHz1150 MHz
Intel Xeon E3-1505M v64 x 3000 MHz, 45 W300 MHz1150 MHz
min. - max.300 MHz1000 - 1150 MHz

Benchmarks

3DMark - 3DMark Time Spy Score
623 Points (2%)
6177 Points (18%)
400 Points (1%)
3DMark - 3DMark Time Spy Graphics
555 Points (1%)
6531 Points (17%)
3DMark - 3DMark Ice Storm Unlimited Graphics
161538 Points (18%)
442105 Points (50%)
3DMark - 3DMark Cloud Gate Score
min: 8403     avg: 9150     median: 9149.5 (10%)     max: 9896 Points
29364 Points (31%)
8280 Points (9%)
3DMark - 3DMark Cloud Gate Graphics
13153 Points (3%)
88161 Points (23%)
3DMark - 3DMark Fire Strike Standard Score
min: 1586     avg: 1655     median: 1655 (3%)     max: 1724 Points
15061 Points (27%)
1040 Points (2%)
3DMark - 3DMark Fire Strike Standard Graphics
1698 Points (2%)
18405 Points (21%)
3DMark 11 - 3DM11 Performance Score
2924 Points (4%)
20106 Points (28%)
3DMark 11 - 3DM11 Performance GPU
2762 Points (2%)
27503 Points (24%)
3DMark 06 3DMark 06 - Standard 1280x1024 + Intel Iris Plus Graphics 650
3DMark 06
15175 Points (20%)
3DMark 06 - Standard 1280x1024 + NVIDIA GeForce GTX 1070 Ti (Desktop)
36475 Points (48%)
Cinebench R10 Cinebench R10 Shading (32bit) + Intel Iris Plus Graphics 650
Cinebench R10 - Cinebench R10 Shading (32bit)
8773 Points (6%)
Cinebench R11.5 Cinebench R11.5 OpenGL 64 Bit + Intel Iris Plus Graphics 650
Cinebench R11.5 - Cinebench R11.5 OpenGL 64 Bit
45.2 fps (16%)
Cinebench R15
Cinebench R15 OpenGL 64 Bit + Intel Iris Plus Graphics 650
Cinebench R15 - Cinebench R15 OpenGL 64 Bit
min: 41.21     avg: 59.1     median: 59.1 (3%)     max: 77 fps
Cinebench R15 OpenGL Ref. Match 64 Bit + Intel Iris Plus Graphics 650
Cinebench R15 - Cinebench R15 OpenGL Ref. Match 64 Bit
99.3 % (99%)
LuxMark v2.0 64Bit - LuxMark v2.0 Room GPU
336 Samples/s (2%)
2542 Samples/s (11%)
LuxMark v2.0 64Bit - LuxMark v2.0 Sala GPU
813 Samples/s (1%)
5159 Samples/s (9%)
ComputeMark v2.1 - ComputeMark v2.1 Result
1730 Points (2%)
15488 Points (17%)
Power Consumption - Furmark Stress Test Power Consumption - external Monitor *
51.4 Watt (7%)
291 Watt (41%)
Power Consumption - The Witcher 3 Power Consumption - external Monitor *
51.4 Watt (7%)
290 Watt (41%)
Power Consumption - Witcher 3 ultra Power Efficiency - external Monitor
0.2 fps per Watt (21%)
Emissions Witcher 3 Fan Noise + Intel Iris Plus Graphics 650
Emissions - Witcher 3 Fan Noise
39.1 dB(A) (63%)
Clock Speed - GPU Clock Witcher 3 ultra
998 MHz (39%)
1810 MHz (71%)
Clock Speed - GPU Clock Speed Furmark
848 MHz (34%)
1677 MHz (66%)

Average Benchmarks Intel Iris Plus Graphics 650 → 100% n=3

Average Benchmarks NVIDIA GeForce GTX 1070 Ti (Desktop) → 741% n=3

Average Benchmarks Intel HD Graphics P630 → 73% n=3

- Range of benchmark values for this graphics card
- Average benchmark values for this graphics card
* Smaller numbers mean a higher performance
1 This benchmark is not used for the average calculation

Game Benchmarks

The following benchmarks stem from our benchmarks of review laptops. The performance depends on the used graphics memory, clock rate, processor, system settings, drivers, and operating systems. So the results don't have to be representative for all laptops with this GPU. For detailed information on the benchmark results, click on the fps number.

Control

Control

2019
low 1280x720
GeForce GTX 1070 Ti (Desktop):
200  fps
med. 1920x1080
GeForce GTX 1070 Ti (Desktop):
78  fps
high 1920x1080
GeForce GTX 1070 Ti (Desktop):
58.5  fps
QHD 2560x1440
GeForce GTX 1070 Ti (Desktop):
37.1  fps
4K 3840x2160
GeForce GTX 1070 Ti (Desktop):
17.9  fps
F1 2019

F1 2019

2019
low 1280x720
GeForce GTX 1070 Ti (Desktop):
244  fps
med. 1920x1080
GeForce GTX 1070 Ti (Desktop):
183  fps
high 1920x1080
GeForce GTX 1070 Ti (Desktop):
164  fps
ultra 1920x1080
GeForce GTX 1070 Ti (Desktop):
120  fps
QHD 2560x1440
GeForce GTX 1070 Ti (Desktop):
94  fps
4K 3840x2160
GeForce GTX 1070 Ti (Desktop):
57  fps
low 1280x720
GeForce GTX 1070 Ti (Desktop):
271  fps
med. 1920x1080
GeForce GTX 1070 Ti (Desktop):
249  fps
high 1920x1080
GeForce GTX 1070 Ti (Desktop):
241  fps
ultra 1920x1080
GeForce GTX 1070 Ti (Desktop):
219  fps
QHD 2560x1440
GeForce GTX 1070 Ti (Desktop):
222  fps
4K 3840x2160
GeForce GTX 1070 Ti (Desktop):
221  fps
high 1920x1080
GeForce GTX 1070 Ti (Desktop):
86.6  fps
ultra 1920x1080
GeForce GTX 1070 Ti (Desktop):
63.4  fps
QHD 2560x1440
GeForce GTX 1070 Ti (Desktop):
41.2  fps
4K 3840x2160
GeForce GTX 1070 Ti (Desktop):
20.3  fps
Anno 1800

Anno 1800

2019
ultra 1920x1080
GeForce GTX 1070 Ti (Desktop):
46  fps
QHD 2560x1440
GeForce GTX 1070 Ti (Desktop):
40.4  fps
4K 3840x2160
GeForce GTX 1070 Ti (Desktop):
24.1  fps
low 1280x720
GeForce GTX 1070 Ti (Desktop):
121  fps
med. 1920x1080
GeForce GTX 1070 Ti (Desktop):
107  fps
high 1920x1080
GeForce GTX 1070 Ti (Desktop):
103  fps
ultra 1920x1080
GeForce GTX 1070 Ti (Desktop):
93  fps
QHD 2560x1440
GeForce GTX 1070 Ti (Desktop):
76  fps
4K 3840x2160
GeForce GTX 1070 Ti (Desktop):
42  fps
low 1280x720
GeForce GTX 1070 Ti (Desktop):
147  fps
med. 1920x1080
GeForce GTX 1070 Ti (Desktop):
83  fps
high 1920x1080
GeForce GTX 1070 Ti (Desktop):
63  fps
ultra 1920x1080
GeForce GTX 1070 Ti (Desktop):
52.3  fps
QHD 2560x1440
GeForce GTX 1070 Ti (Desktop):
40.2  fps
4K 3840x2160
GeForce GTX 1070 Ti (Desktop):
24.6  fps
low 1280x720
GeForce GTX 1070 Ti (Desktop):
144  fps
med. 1920x1080
GeForce GTX 1070 Ti (Desktop):
138  fps
high 1920x1080
GeForce GTX 1070 Ti (Desktop):
123  fps
ultra 1920x1080
GeForce GTX 1070 Ti (Desktop):
121  fps
QHD 2560x1440
GeForce GTX 1070 Ti (Desktop):
81  fps
4K 3840x2160
GeForce GTX 1070 Ti (Desktop):
42.4  fps
ultra 1920x1080
GeForce GTX 1070 Ti (Desktop):
88  fps
QHD 2560x1440
GeForce GTX 1070 Ti (Desktop):
64  fps
4K 3840x2160
GeForce GTX 1070 Ti (Desktop):
35.3  fps
ultra 1920x1080
GeForce GTX 1070 Ti (Desktop):
110  fps
QHD 2560x1440
GeForce GTX 1070 Ti (Desktop):
74  fps
4K 3840x2160
GeForce GTX 1070 Ti (Desktop):
35.4  fps
ultra 1920x1080
GeForce GTX 1070 Ti (Desktop):
111  fps
QHD 2560x1440
GeForce GTX 1070 Ti (Desktop):
83  fps
4K 3840x2160
GeForce GTX 1070 Ti (Desktop):
47.1  fps
ultra 1920x1080
GeForce GTX 1070 Ti (Desktop):
120  fps
QHD 2560x1440
GeForce GTX 1070 Ti (Desktop):
80  fps
4K 3840x2160
GeForce GTX 1070 Ti (Desktop):
40.1  fps
ultra 1920x1080
GeForce GTX 1070 Ti (Desktop):
63  fps
QHD 2560x1440
GeForce GTX 1070 Ti (Desktop):
48  fps
4K 3840x2160
GeForce GTX 1070 Ti (Desktop):
27  fps
ultra 1920x1080
GeForce GTX 1070 Ti (Desktop):
100  fps
QHD 2560x1440
GeForce GTX 1070 Ti (Desktop):
81  fps
4K 3840x2160
GeForce GTX 1070 Ti (Desktop):
55  fps
FIFA 19

FIFA 19

2018
ultra 1920x1080
GeForce GTX 1070 Ti (Desktop):
267  fps
4K 3840x2160
GeForce GTX 1070 Ti (Desktop):
141  fps
ultra 1920x1080
GeForce GTX 1070 Ti (Desktop):
84  fps
QHD 2560x1440
GeForce GTX 1070 Ti (Desktop):
51  fps
4K 3840x2160
GeForce GTX 1070 Ti (Desktop):
28  fps
F1 2018

F1 2018

2018
ultra 1920x1080
GeForce GTX 1070 Ti (Desktop):
97  fps
QHD 2560x1440
GeForce GTX 1070 Ti (Desktop):
78  fps
4K 3840x2160
GeForce GTX 1070 Ti (Desktop):
49  fps
ultra 1920x1080
GeForce GTX 1070 Ti (Desktop):
78  fps
QHD 2560x1440
GeForce GTX 1070 Ti (Desktop):
48.5  fps
4K 3840x2160
GeForce GTX 1070 Ti (Desktop):
23.8  fps
Far Cry 5

Far Cry 5

2018
low 1280x720
GeForce GTX 1070 Ti (Desktop):
135  fps
med. 1920x1080
GeForce GTX 1070 Ti (Desktop):
114  fps
high 1920x1080
GeForce GTX 1070 Ti (Desktop):
108  fps
ultra 1920x1080
GeForce GTX 1070 Ti (Desktop):
102  fps
QHD 2560x1440
GeForce GTX 1070 Ti (Desktop):
75  fps
4K 3840x2160
GeForce GTX 1070 Ti (Desktop):
39  fps
low 1280x720
GeForce GTX 1070 Ti (Desktop):
101  fps
med. 1920x1080
GeForce GTX 1070 Ti (Desktop):
89  fps
high 1920x1080
GeForce GTX 1070 Ti (Desktop):
74.5  fps
4K 3840x2160
GeForce GTX 1070 Ti (Desktop):
66.7  fps
low 1280x720
GeForce GTX 1070 Ti (Desktop):
154  fps
med. 1920x1080
GeForce GTX 1070 Ti (Desktop):
100  fps
high 1920x1080
GeForce GTX 1070 Ti (Desktop):
82  fps
ultra 1920x1080
GeForce GTX 1070 Ti (Desktop):
59.1  fps
QHD 2560x1440
GeForce GTX 1070 Ti (Desktop):
42.4  fps
4K 3840x2160
GeForce GTX 1070 Ti (Desktop):
22.7  fps
low 1280x720
GeForce GTX 1070 Ti (Desktop):
146  fps
med. 1920x1080
GeForce GTX 1070 Ti (Desktop):
87  fps
high 1920x1080
GeForce GTX 1070 Ti (Desktop):
63  fps
4K 3840x2160
GeForce GTX 1070 Ti (Desktop):
27.7  fps
Fortnite

Fortnite

2018
ultra 1920x1080
GeForce GTX 1070 Ti (Desktop):
109  fps
QHD 2560x1440
GeForce GTX 1070 Ti (Desktop):
72  fps
4K 3840x2160
GeForce GTX 1070 Ti (Desktop):
36  fps
ultra 1920x1080
GeForce GTX 1070 Ti (Desktop):
117  fps
QHD 2560x1440
GeForce GTX 1070 Ti (Desktop):
77  fps
4K 3840x2160
GeForce GTX 1070 Ti (Desktop):
38  fps
ultra 1920x1080
GeForce GTX 1070 Ti (Desktop):
122  fps
QHD 2560x1440
GeForce GTX 1070 Ti (Desktop):
85  fps
4K 3840x2160
GeForce GTX 1070 Ti (Desktop):
45  fps
low 1280x720
GeForce GTX 1070 Ti (Desktop):
103  fps
med. 1920x1080
GeForce GTX 1070 Ti (Desktop):
92  fps
high 1920x1080
GeForce GTX 1070 Ti (Desktop):
88  fps
ultra 1920x1080
GeForce GTX 1070 Ti (Desktop):
75  fps
QHD 2560x1440
GeForce GTX 1070 Ti (Desktop):
58  fps
4K 3840x2160
GeForce GTX 1070 Ti (Desktop):
34  fps
low 1280x720
GeForce GTX 1070 Ti (Desktop):
165  fps
med. 1920x1080
GeForce GTX 1070 Ti (Desktop):
136  fps
high 1920x1080
GeForce GTX 1070 Ti (Desktop):
109  fps
ultra 1920x1080
GeForce GTX 1070 Ti (Desktop):
85  fps
4K 3840x2160
GeForce GTX 1070 Ti (Desktop):
34  fps
ultra 1920x1080
GeForce GTX 1070 Ti (Desktop):
47.1  fps
4K 3840x2160
GeForce GTX 1070 Ti (Desktop):
17.3  fps
F1 2017

F1 2017

2017
ultra 1920x1080
GeForce GTX 1070 Ti (Desktop):
106  fps
4K 3840x2160
GeForce GTX 1070 Ti (Desktop):
52  fps
4K 3820x2160
GeForce GTX 1070 Ti (Desktop):
152  fps
Dirt 4

Dirt 4

2017
low 1280x720
100%
Iris Plus Graphics 650:
64  fps
med. 1920x1080
100%
Iris Plus Graphics 650:
21.3  fps
high 1920x1080
100%
Iris Plus Graphics 650:
14.2  fps
4K 3840x2160
GeForce GTX 1070 Ti (Desktop):
57.9  fps
low 1280x720
100%
Iris Plus Graphics 650:
113  fps
med. 1920x1080
100%
Iris Plus Graphics 650:
56.8  fps
high 1920x1080
100%
Iris Plus Graphics 650:
38.9  fps
573%
GeForce GTX 1070 Ti (Desktop):
223  fps
4K 3840x2160
GeForce GTX 1070 Ti (Desktop):
92  fps
Prey

Prey

2017
low 1280x720
100%
Iris Plus Graphics 650:
51.4  fps
med. 1920x1080
100%
Iris Plus Graphics 650:
20.2  fps
low 1280x720
100%
Iris Plus Graphics 650:
25.8  fps
med. 1920x1080
100%
Iris Plus Graphics 650:
10.5  fps
low 1280x720
100%
Iris Plus Graphics 650:
17.6  fps
ultra 1920x1080
GeForce GTX 1070 Ti (Desktop):
54.2  fps
4K 3840x2160
GeForce GTX 1070 Ti (Desktop):
35.8  fps
For Honor

For Honor

2017
low 1280x720
100%
Iris Plus Graphics 650:
39.7  fps
med. 1920x1080
100%
Iris Plus Graphics 650:
15.2  fps
high 1920x1080
GeForce GTX 1070 Ti (Desktop):
156  fps
ultra 1920x1080
GeForce GTX 1070 Ti (Desktop):
122  fps
4K 3840x2160
GeForce GTX 1070 Ti (Desktop):
47.9  fps
low 1280x720
100%
Iris Plus Graphics 650:
15  fps
low 1280x720
100%
Iris Plus Graphics 650:
32.4  fps
4K 3840x2160
GeForce GTX 1070 Ti (Desktop):
67.8  fps
low 1280x720
100%
Iris Plus Graphics 650:
54.1  fps
med. 1366x768
100%
Iris Plus Graphics 650:
37.9  fps
high 1920x1080
100%
Iris Plus Graphics 650:
36.8  fps
ultra 1920x1080
100%
Iris Plus Graphics 650:
19.9  fps
4K 3840x2160
GeForce GTX 1070 Ti (Desktop):
80  fps
low 1280x720
100%
Iris Plus Graphics 650:
46.1  fps
med. 1366x768
100%
Iris Plus Graphics 650:
29.5  fps
low 1024x768
100%
Iris Plus Graphics 650:
42.2  fps
med. 1366x768
100%
Iris Plus Graphics 650:
20.2  fps
ultra 1920x1080
GeForce GTX 1070 Ti (Desktop):
108  fps
4K 3840x2160
GeForce GTX 1070 Ti (Desktop):
91  fps
low 1280x720
100%
Iris Plus Graphics 650:
19.2  fps
med. 1366x768
100%
Iris Plus Graphics 650:
14.6  fps
high 1920x1080
100%
Iris Plus Graphics 650:
8.2  fps
ultra 1920x1080
GeForce GTX 1070 Ti (Desktop):
67.9  fps
4K 3840x2160
GeForce GTX 1070 Ti (Desktop):
31.9  fps
Overwatch

Overwatch

2016
low 1280x720
100%
Iris Plus Graphics 650:
79.2  fps
med. 1366x768
100%
Iris Plus Graphics 650:
57.4  fps
high 1920x1080
100%
Iris Plus Graphics 650:
25.6  fps
ultra 1920x1080
100%
Iris Plus Graphics 650:
21.4  fps
850%
GeForce GTX 1070 Ti (Desktop):
182  fps
4K 3840x2160
GeForce GTX 1070 Ti (Desktop):
88.7  fps
low 1280x720
100%
Iris Plus Graphics 650:
30  fps
ultra 1920x1080
GeForce GTX 1070 Ti (Desktop):
94.6  fps
4K 3840x2160
GeForce GTX 1070 Ti (Desktop):
45.6  fps
low 1280x720
100%
Iris Plus Graphics 650:
32  fps
med. 1920x1080
100%
Iris Plus Graphics 650:
15  fps
ultra 1920x1080
GeForce GTX 1070 Ti (Desktop):
98  fps
4K 3840x2160
GeForce GTX 1070 Ti (Desktop):
41  fps
low 1024x768
100%
Iris Plus Graphics 650:
25.9  fps
med. 1366x768
100%
Iris Plus Graphics 650:
18.3  fps
ultra 1920x1080
GeForce GTX 1070 Ti (Desktop):
111  fps
4K 3840x2160
GeForce GTX 1070 Ti (Desktop):
46.5  fps
low 1024x768
100%
Iris Plus Graphics 650:
54.2  fps
med. 1366x768
100%
Iris Plus Graphics 650:
35.6  fps
high 1920x1080
100%
Iris Plus Graphics 650:
20.8  fps
ultra 1920x1080
GeForce GTX 1070 Ti (Desktop):
177  fps
4K 3840x2160
GeForce GTX 1070 Ti (Desktop):
77  fps
low 1280x720
100%
Iris Plus Graphics 650:
95  fps
150%
GeForce GTX 1070 Ti (Desktop):
142.7  fps
med. 1366x768
100%
Iris Plus Graphics 650:
64  fps
210%
GeForce GTX 1070 Ti (Desktop):
134.2  fps
high 1920x1080
100%
Iris Plus Graphics 650:
29.7  fps
426%
GeForce GTX 1070 Ti (Desktop):
126.6  fps
ultra 1920x1080
100%
Iris Plus Graphics 650:
25  fps
485%
GeForce GTX 1070 Ti (Desktop):
121.2  fps
4K 3840x2160
GeForce GTX 1070 Ti (Desktop):
105  fps
low 1024x768
100%
Iris Plus Graphics 650:
21.4  fps
1369%
GeForce GTX 1070 Ti (Desktop):
293  fps
ultra 1920x1080
GeForce GTX 1070 Ti (Desktop):
71.8  fps
4K 3840x2160
GeForce GTX 1070 Ti (Desktop):
47.1  fps
GTA V

GTA V

2015
low 1024x768
100%
Iris Plus Graphics 650:
56.5  fps
med. 1366x768
100%
Iris Plus Graphics 650:
49.9  fps
high 1920x1080
100%
Iris Plus Graphics 650:
11.6  fps
ultra 1920x1080
100%
Iris Plus Graphics 650:
5  fps
4K 3840x2160
GeForce GTX 1070 Ti (Desktop):
67  fps
low 1280x720
100%
Iris Plus Graphics 650:
84  fps
med. 1366x768
100%
Iris Plus Graphics 650:
54.4  fps
high 1366x768
100%
Iris Plus Graphics 650:
46.5  fps
ultra 1920x1080
100%
Iris Plus Graphics 650:
13.3  fps
992%
GeForce GTX 1070 Ti (Desktop):
132  fps

Average Gaming Intel Iris Plus Graphics 650 → 100%

Average Gaming 30-70 fps → 100%

Average Gaming NVIDIA GeForce GTX 1070 Ti (Desktop) → 632%

NVIDIA GeForce GTX 1070 Ti (Desktop)lowmed.highultraQHD4K
Control2007858.537.117.9
F1 20192441831641209457
League of Legends271249241219222221
Total War: Three Kingdoms86.663.441.220.3
Anno 18004640.424.1
Far Cry New Dawn121107103937642
Metro Exodus147836352.340.224.6
Apex Legends1441381231218142.4
Just Cause 4886435.3
Darksiders III1107435.4
Battlefield V1118347.1
Call of Duty Black Ops 41208040.1
Assassin´s Creed Odyssey634827
Forza Horizon 41008155
FIFA 19267141
Shadow of the Tomb Raider845128
F1 2018977849
Monster Hunter World7848.523.8
Far Cry 51351141081027539
X-Plane 11.111018974.566.7
Kingdom Come: Deliverance1541008259.142.422.7
Final Fantasy XV Benchmark146876327.7
Fortnite1097236
Star Wars Battlefront 21177738
Need for Speed Payback1228545
Assassin´s Creed Origins1039288755834
Middle-earth: Shadow of War1651361098534
Ark Survival Evolved47.117.3
F1 201710652
Team Fortress 2152
Dirt 457.9
Rocket League22392
Ghost Recon Wildlands54.235.8
For Honor15612247.9
Call of Duty Infinite Warfare67.8
Farming Simulator 1780
Civilization VI10891
Deus Ex Mankind Divided67.931.9
Overwatch18288.7
The Division94.645.6
Far Cry Primal9841
Rise of the Tomb Raider11146.5
Rainbow Six Siege17777
Dota 2 Reborn142.7134.2126.6121.2105
The Witcher 329371.847.1
GTA V67
BioShock Infinite132
< 30 fps
< 60 fps
< 120 fps
≥ 120 fps


2
12


8
5

1
9
6

5
22
11

9
13
1
10
24
9
3
Intel Iris Plus Graphics 650lowmed.highultraQHD4K
Dirt 46421.314.2
Rocket League11356.838.9
Prey51.420.2
Mass Effect Andromeda25.810.5
Ghost Recon Wildlands17.6
For Honor39.715.2
Dishonored 215
Call of Duty Infinite Warfare32.4
Titanfall 254.137.9
Farming Simulator 1736.819.9
Battlefield 146.129.5
Civilization VI42.220.2
Deus Ex Mankind Divided19.214.68.2
Overwatch79.257.425.621.4
The Division30
Far Cry Primal3215
Rise of the Tomb Raider25.918.3
Rainbow Six Siege54.235.620.8
Dota 2 Reborn956429.725
The Witcher 321.4
GTA V56.549.911.65
BioShock Infinite8454.446.513.3
< 30 fps
< 60 fps
< 120 fps
≥ 120 fps
6
10
5
9
6
1
6
3

5


For more games that might be playable and a list of all games and graphics cards visit our Gaming List

v1.26
log 10. 07:49:13

#0 checking url part for id 7655 +0s ... 0s

#1 checking url part for id 8258 +0s ... 0s

#2 checking url part for id 7657 +0s ... 0s

#3 not redirecting to Ajax server +0s ... 0s

#4 did not recreate cache, as it is less than 5 days old! Created at Fri, 10 May 2024 05:38:50 +0200 +0.001s ... 0.001s

#5 composed specs +0.146s ... 0.147s

#6 did output specs +0s ... 0.147s

#7 start showIntegratedCPUs +0s ... 0.147s

#8 getting avg benchmarks for device 7655 +0.038s ... 0.185s

#9 got single benchmarks 7655 +0.009s ... 0.193s

#10 getting avg benchmarks for device 8258 +0.002s ... 0.195s

#11 got single benchmarks 8258 +0.008s ... 0.203s

#12 getting avg benchmarks for device 7657 +0.002s ... 0.204s

#13 got single benchmarks 7657 +0.005s ... 0.21s

#14 got avg benchmarks for devices +0s ... 0.21s

#15 min, max, avg, median took s +0.218s ... 0.427s

#16 before gaming benchmark output +0s ... 0.427s

#17 Got 201 rows for game benchmarks. +0.014s ... 0.441s

#18 composed SQL query for gamebenchmarks +0s ... 0.441s

#19 got data and put it in $dataArray +0.038s ... 0.478s

#20 benchmarks composed for output. +0.119s ... 0.597s

#21 calculated avg scores. +0s ... 0.597s

#22 return log +0.002s ... 0.6s

Please share our article, every link counts!
> Expert Reviews and News on Laptops, Smartphones and Tech Innovations > Benchmarks / Tech > Graphics Card Comparison - Head 2 Head
Redaktion, 2017-09- 8 (Update: 2023-07- 1)