Notebookcheck Logo
Teaser

HP OmniBook Ultra 16 Spark review: Choose your RAM configuration carefully

$3200 for 32 GB of RAM.

The hardware is unquestionably impressive from a performance-per-watt and chassis design perspective. The software surrounding it, however, could still use a bit of work and buyers should definitely choose their configurations carefully.
Allen Ngo 👁 Published
RTX Spark Laptop Nvidia ARM Gaming

Verdict — A New Challenger Approaches

One of the most impressive aspects of Nvidia Spark is its high performance-per-watt considering the tight 140 W USB-C power envelope. All Spark laptops, including the HP OmniBook Ultra 16, pack a ton of power and memory in very thin packages. Users or creators who can exploit both the portable form factor and ARM environment will benefit the most from the specialized Spark platform.

Price is arguably the biggest hurdle. While Spark supports up to 128 GB of unified memory, the entry-level option starts at a whopping $3200 for just 32 GB of non-upgradeable RAM split between the operating system, user tasks, and any local AI models you wish to run. Use cases are therefore harshly limited until you move up to the $4000+ range where 64 GB options become available. By bottlenecking RAM to 32 GB, you're essentially taking away one of the key strengths of Spark.

It's important to note that the OmniBook Ultra 16 (and by extension other Spark laptops) are not designed primarily for gaming. We experienced crashes and more noticeable stutters on our launch drivers when running modern titles like Forza Horizon 6 and Assassin's Creed Resynced, respectively. Performance is akin to midrange gaming laptops powered by the non-Ti GeForce RTX 5070 at best assuming no compatibility issues of which there will almost certainly be several. Support will improve over time, of course, but this is nonetheless the experience for early adopters.

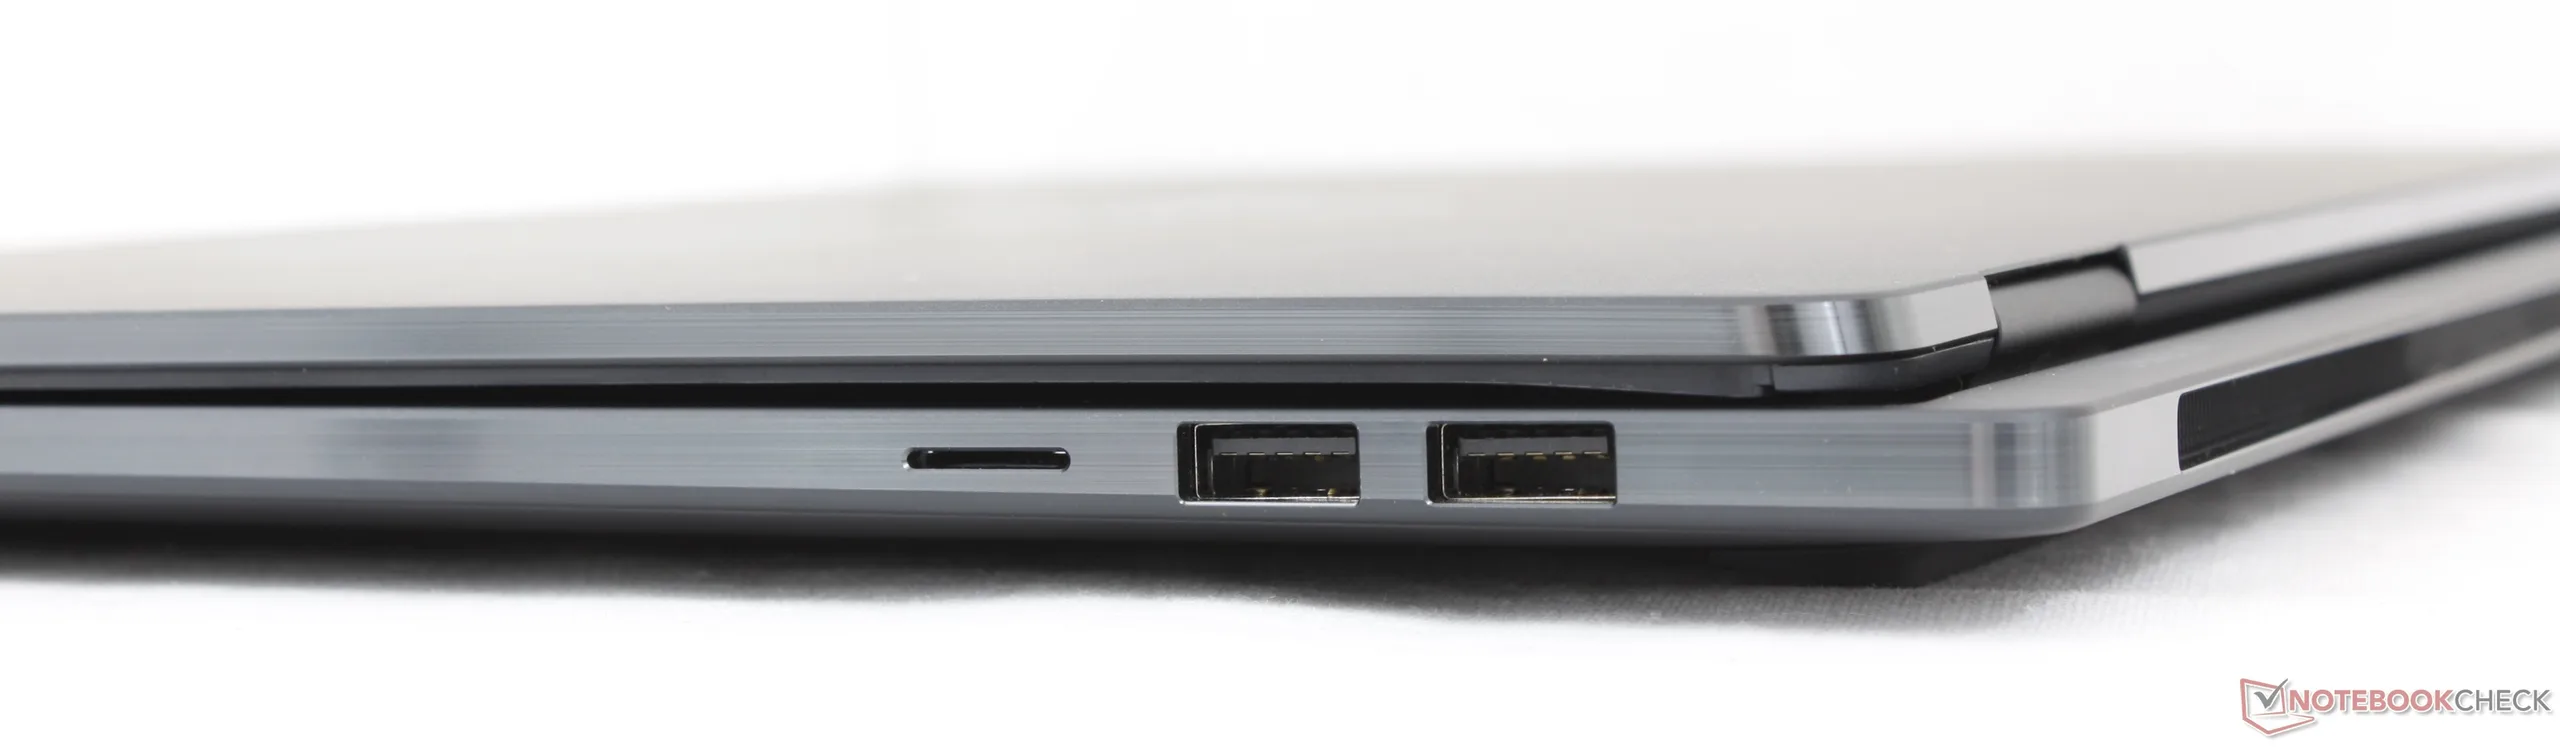
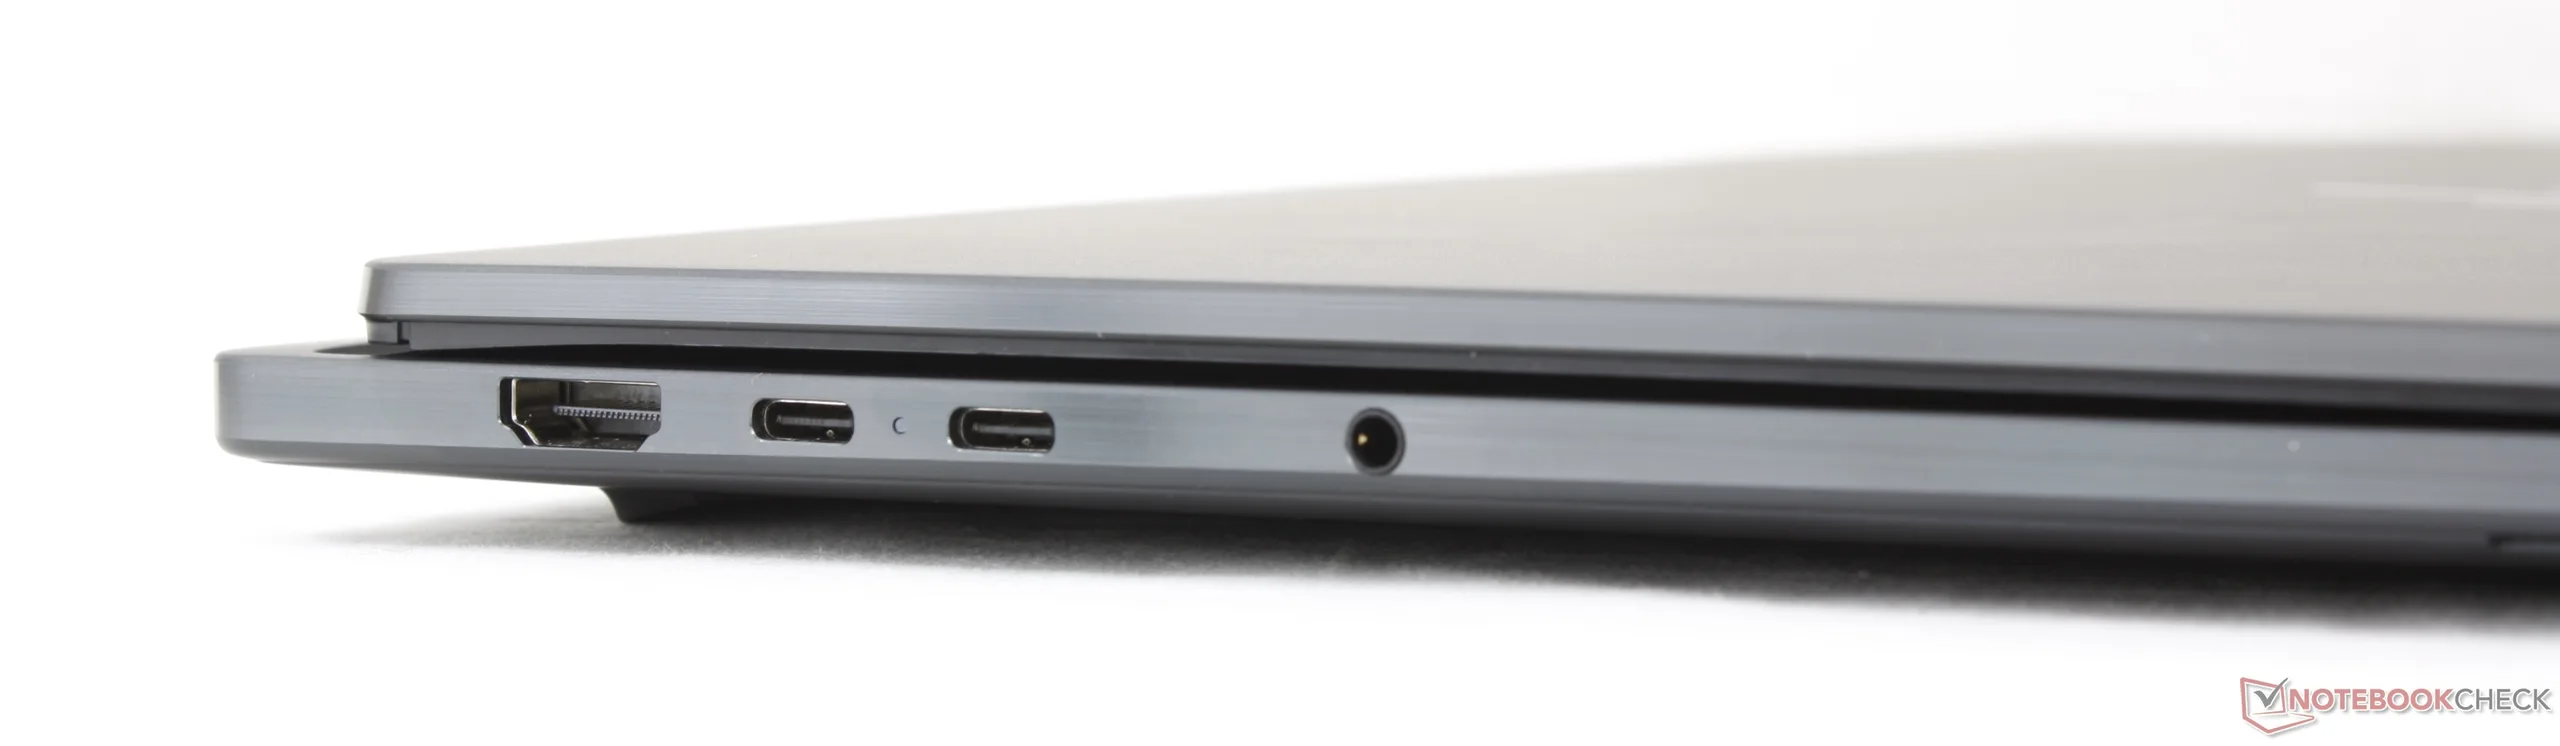
Integrated ports could have been better. The Asus ProArt P16, for example, features USB-C ports on both sides as well as a full-size SD reader whereas the HP features USB-C ports only along the left edge and a slower MicroSD reader. These would normally be minor annoyances on most other laptops, but as a system designed specifically for content creators and demanding multimedia, port options and positioning play a bigger role than usual and so the differences are worth pointing out.

Users who aren't enamored by the sleek chassis designs or AI priorities of Spark will find significantly more powerful traditional x64 laptops for the same price. The HP Omen Max 16, for example, currently retails for $3000 with 32 GB of upgradeable RAM, 16 GB of VRAM, and a GeForce RTX 5080 with more raw power than a 32 GB Spark SKU. Even the ultrathin MSI Stealth 16 features more total RAM and storage and a GeForce RTX 5080 GPU for the same price of a 32 GB OmniBook Ultra 16 Spark. Thus, much of the price premium for Spark involves the portable design and novel silicon itself.

Our full impressions and experience with Spark can be found on our article here.

Pros

+ compact 140 W USB-C AC adapter
+ high performance-per-weight
+ high quality metal chassis
+ long battery life
+ loud speakers

Cons

- software and gaming compatibility will vary
- 4K60 video playback tends to stutter
- no full-size SD reader; MicroSD only
- pricey even for entry-level option
- hinges could be stronger

Price and Availability

HP is currently shipping its base 32 GB configuration for $3200 up to $5300 for the 128 GB configuration.

Amazon Logo
  • $919.99
    HP Omnibook X Flip 16" 2-in-1 Next Gen AI Laptop | 2K Touchscreen | AI Boost Core Ultra 7 256V | 16GB DDR5 RAM | 256GB PCIe SSD + 500GB w/WOWPC External SSD | Backlit Keyboard | Wi-Fi 6E | Windows 11
  • $619.99
    HP OmniBook 3 16 AI Touchscreen Laptop, 16" 2K WUXGA IPS Display, Intel Core Ultra 5 225U, 8GB RAM, 512GB PCIe SSD, Wi-Fi 7, FHD Webcam, Numeric Keypad, Dual USB-C, Windows 11 Home
  • $699.99
    HP Omnibook 3 16’’ 2K Touchscreen Laptop, Intel 12-Core Ultra 5 225U, 12 Tops NPU, 16GB DDR5 RAM 512GB SSD, Long Battery Life, WiFi 7, Business & Student Laptop with Lifetime MS Office, Win 11 Pro

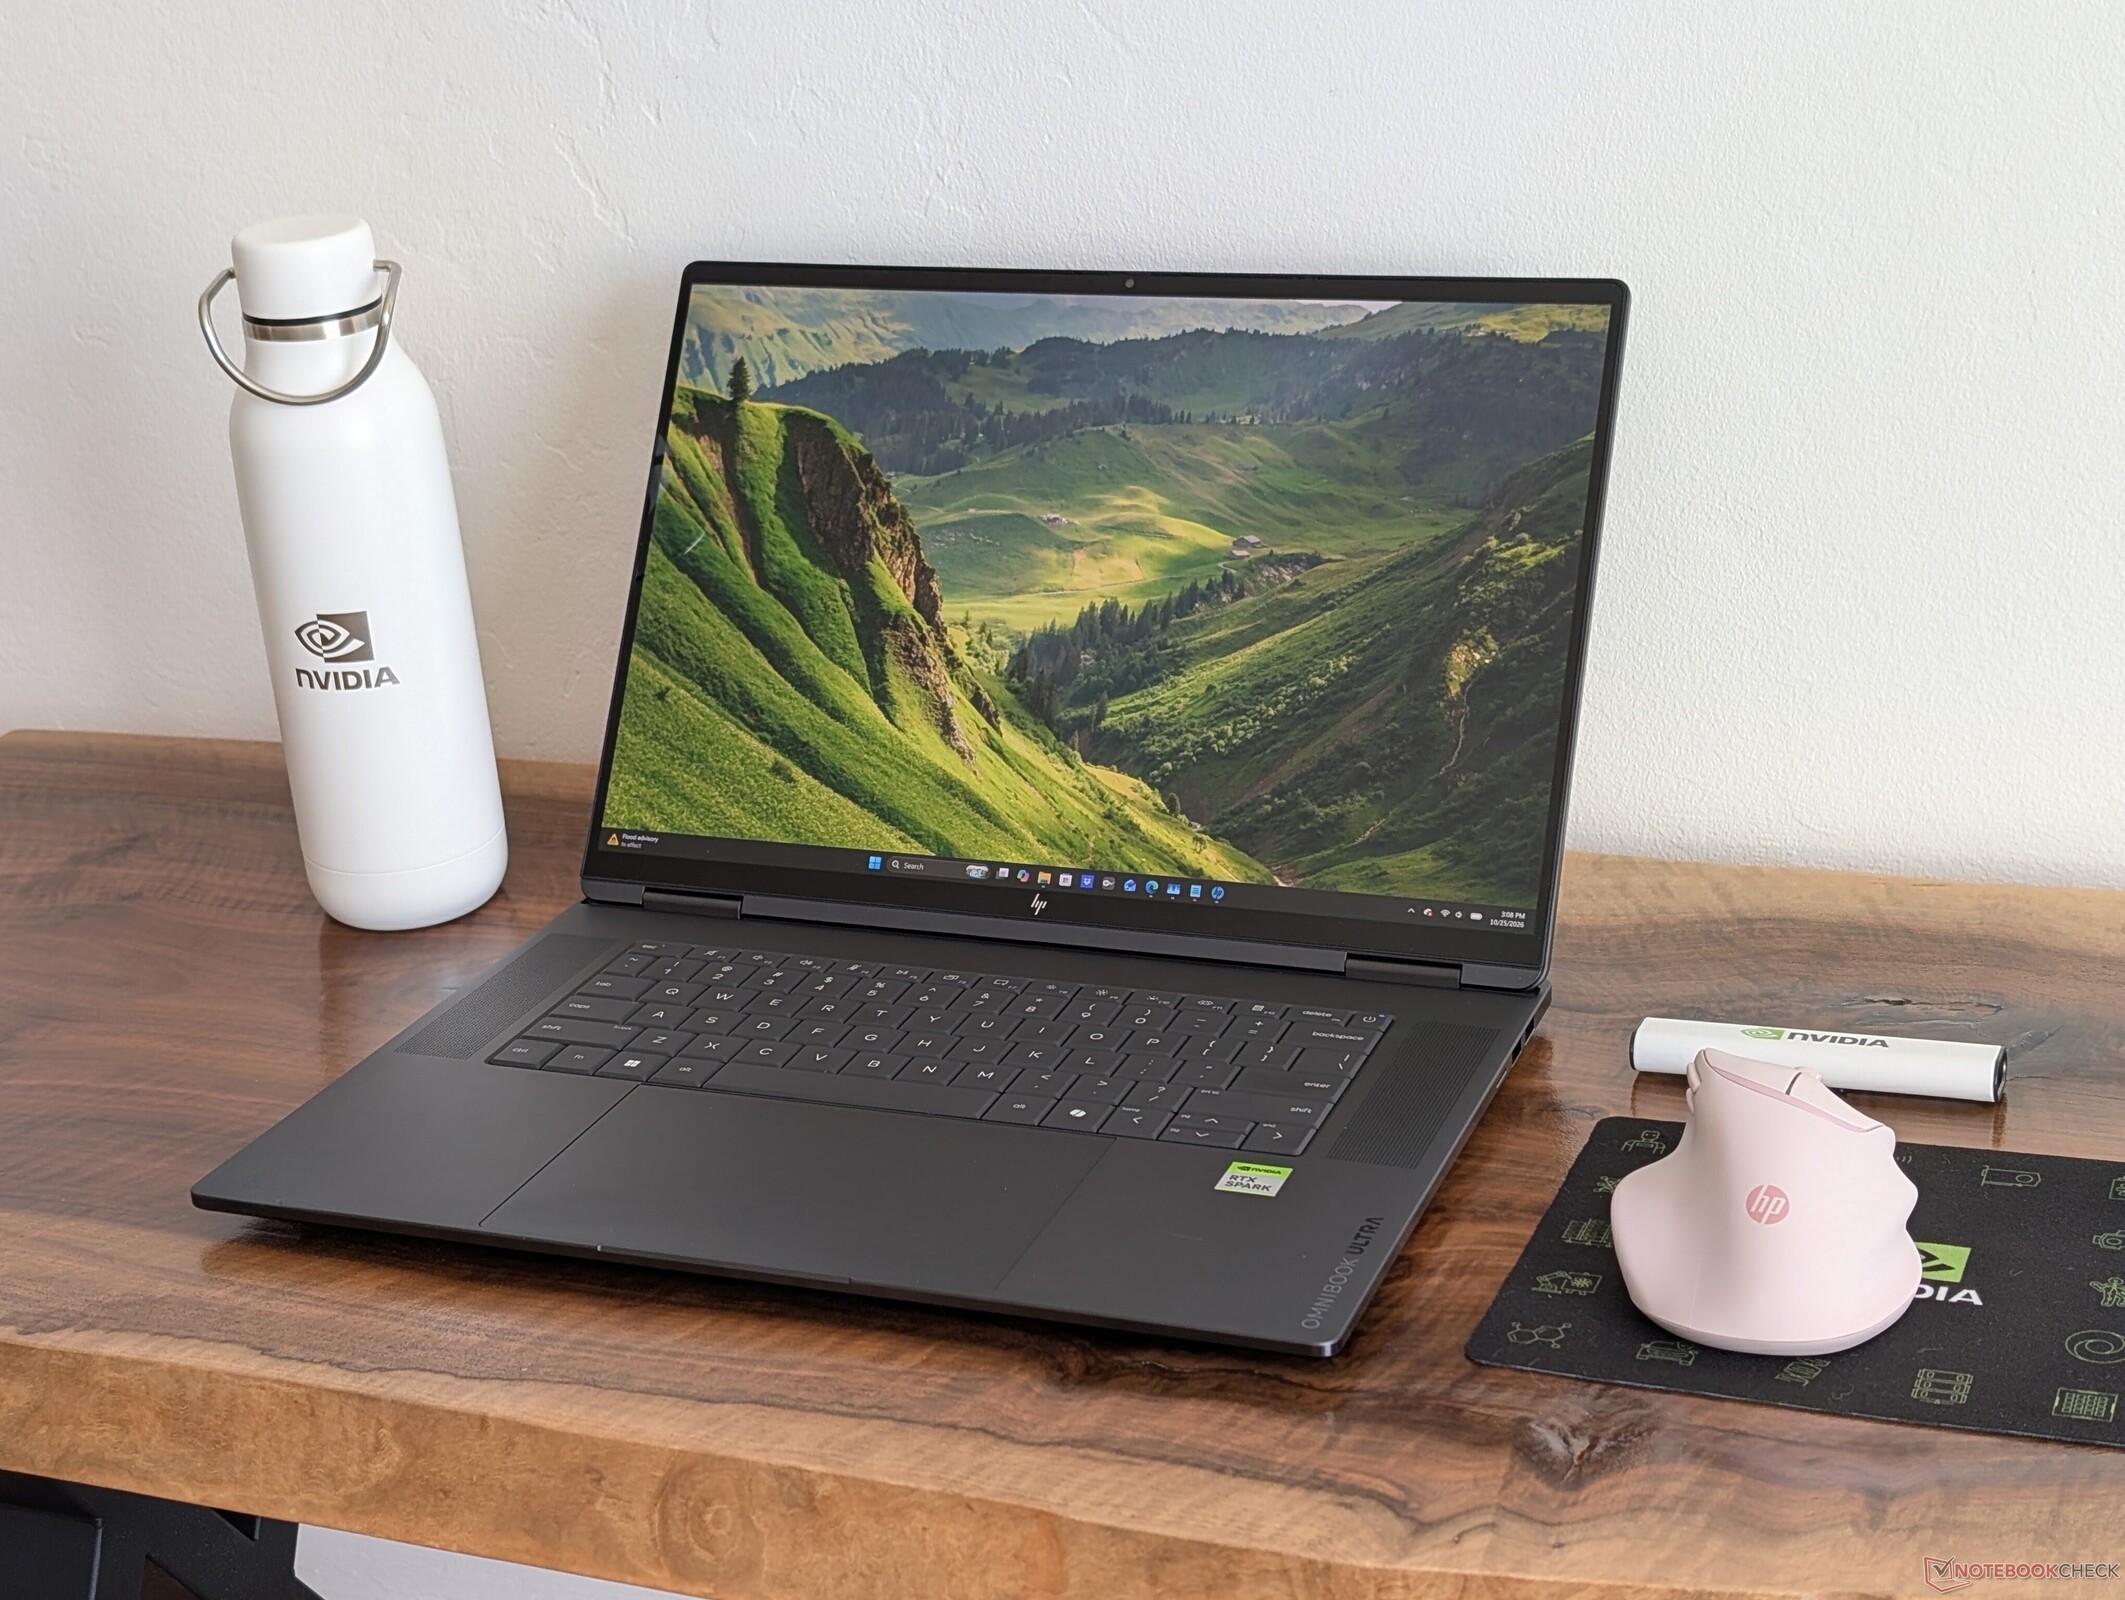
The HP OmniBook Ultra 16 was one of the first Nvidia Spark laptops to become available. Unlike some of its rivals, however, it forgoes a 2-in-1 form factor for a more traditional clamshell design.

Our test unit is a lower configuration with 32 GB of RAM and RTX Spark 20-core for $3600. Other SKUs may come with the RTX Spark 18-core instead or up to 128 GB of RAM for over $5300, but the 1800p OLED touchscreen remains constant.

Alternatives in this new Spark space include the Asus ProArt P16, Lenovo Yoga 9n 2-in-1, Dell XPS 16 Creator Edition or the Microsoft Surface Laptop Ultra.

More HP reviews:

Specifications

HP OmniBook Ultra 16-bk0013dx (OmniBook Ultra 2026 Series)
Processor
Nvidia RTX Spark N1X 20-Core 20c/20t, 10 x 4.0 GHz ARM Cortex-X925, 10 x 2.8 GHz ARM Cortex-A725, Spark
Memory
32 GB 
, LPDDR5x, 9400 MT/s, Soldered
Display
16.00 inch 16:10, 2880 x 1800 pixel 212 PPI, 10-point capacitive, Samsung SDC4257, OLED, glossy: yes, HDR, 120 Hz
Connections
2 USB 3.1 Gen2, 2 USB4 40 Gbps, USB-C Power Delivery (PD), 1 HDMI, 2 DisplayPort, Audio Connections: 3.5 mm combo, Card Reader: MicroSD
Networking
Mediatek MT7925B14L (a/b/g/n = Wi-Fi 4/ac = Wi-Fi 5/ax = Wi-Fi 6/ Wi-Fi 6E 6 GHz be = Wi-Fi 7), Bluetooth 6.0
Size
height x width x depth (in mm): 15.8 x 355.9 x 256.5 ( = 0.62 x 14.01 x 10.1 in)
Battery
99 Wh Lithium-Polymer
Operating System
Microsoft Windows 11 Home
Camera
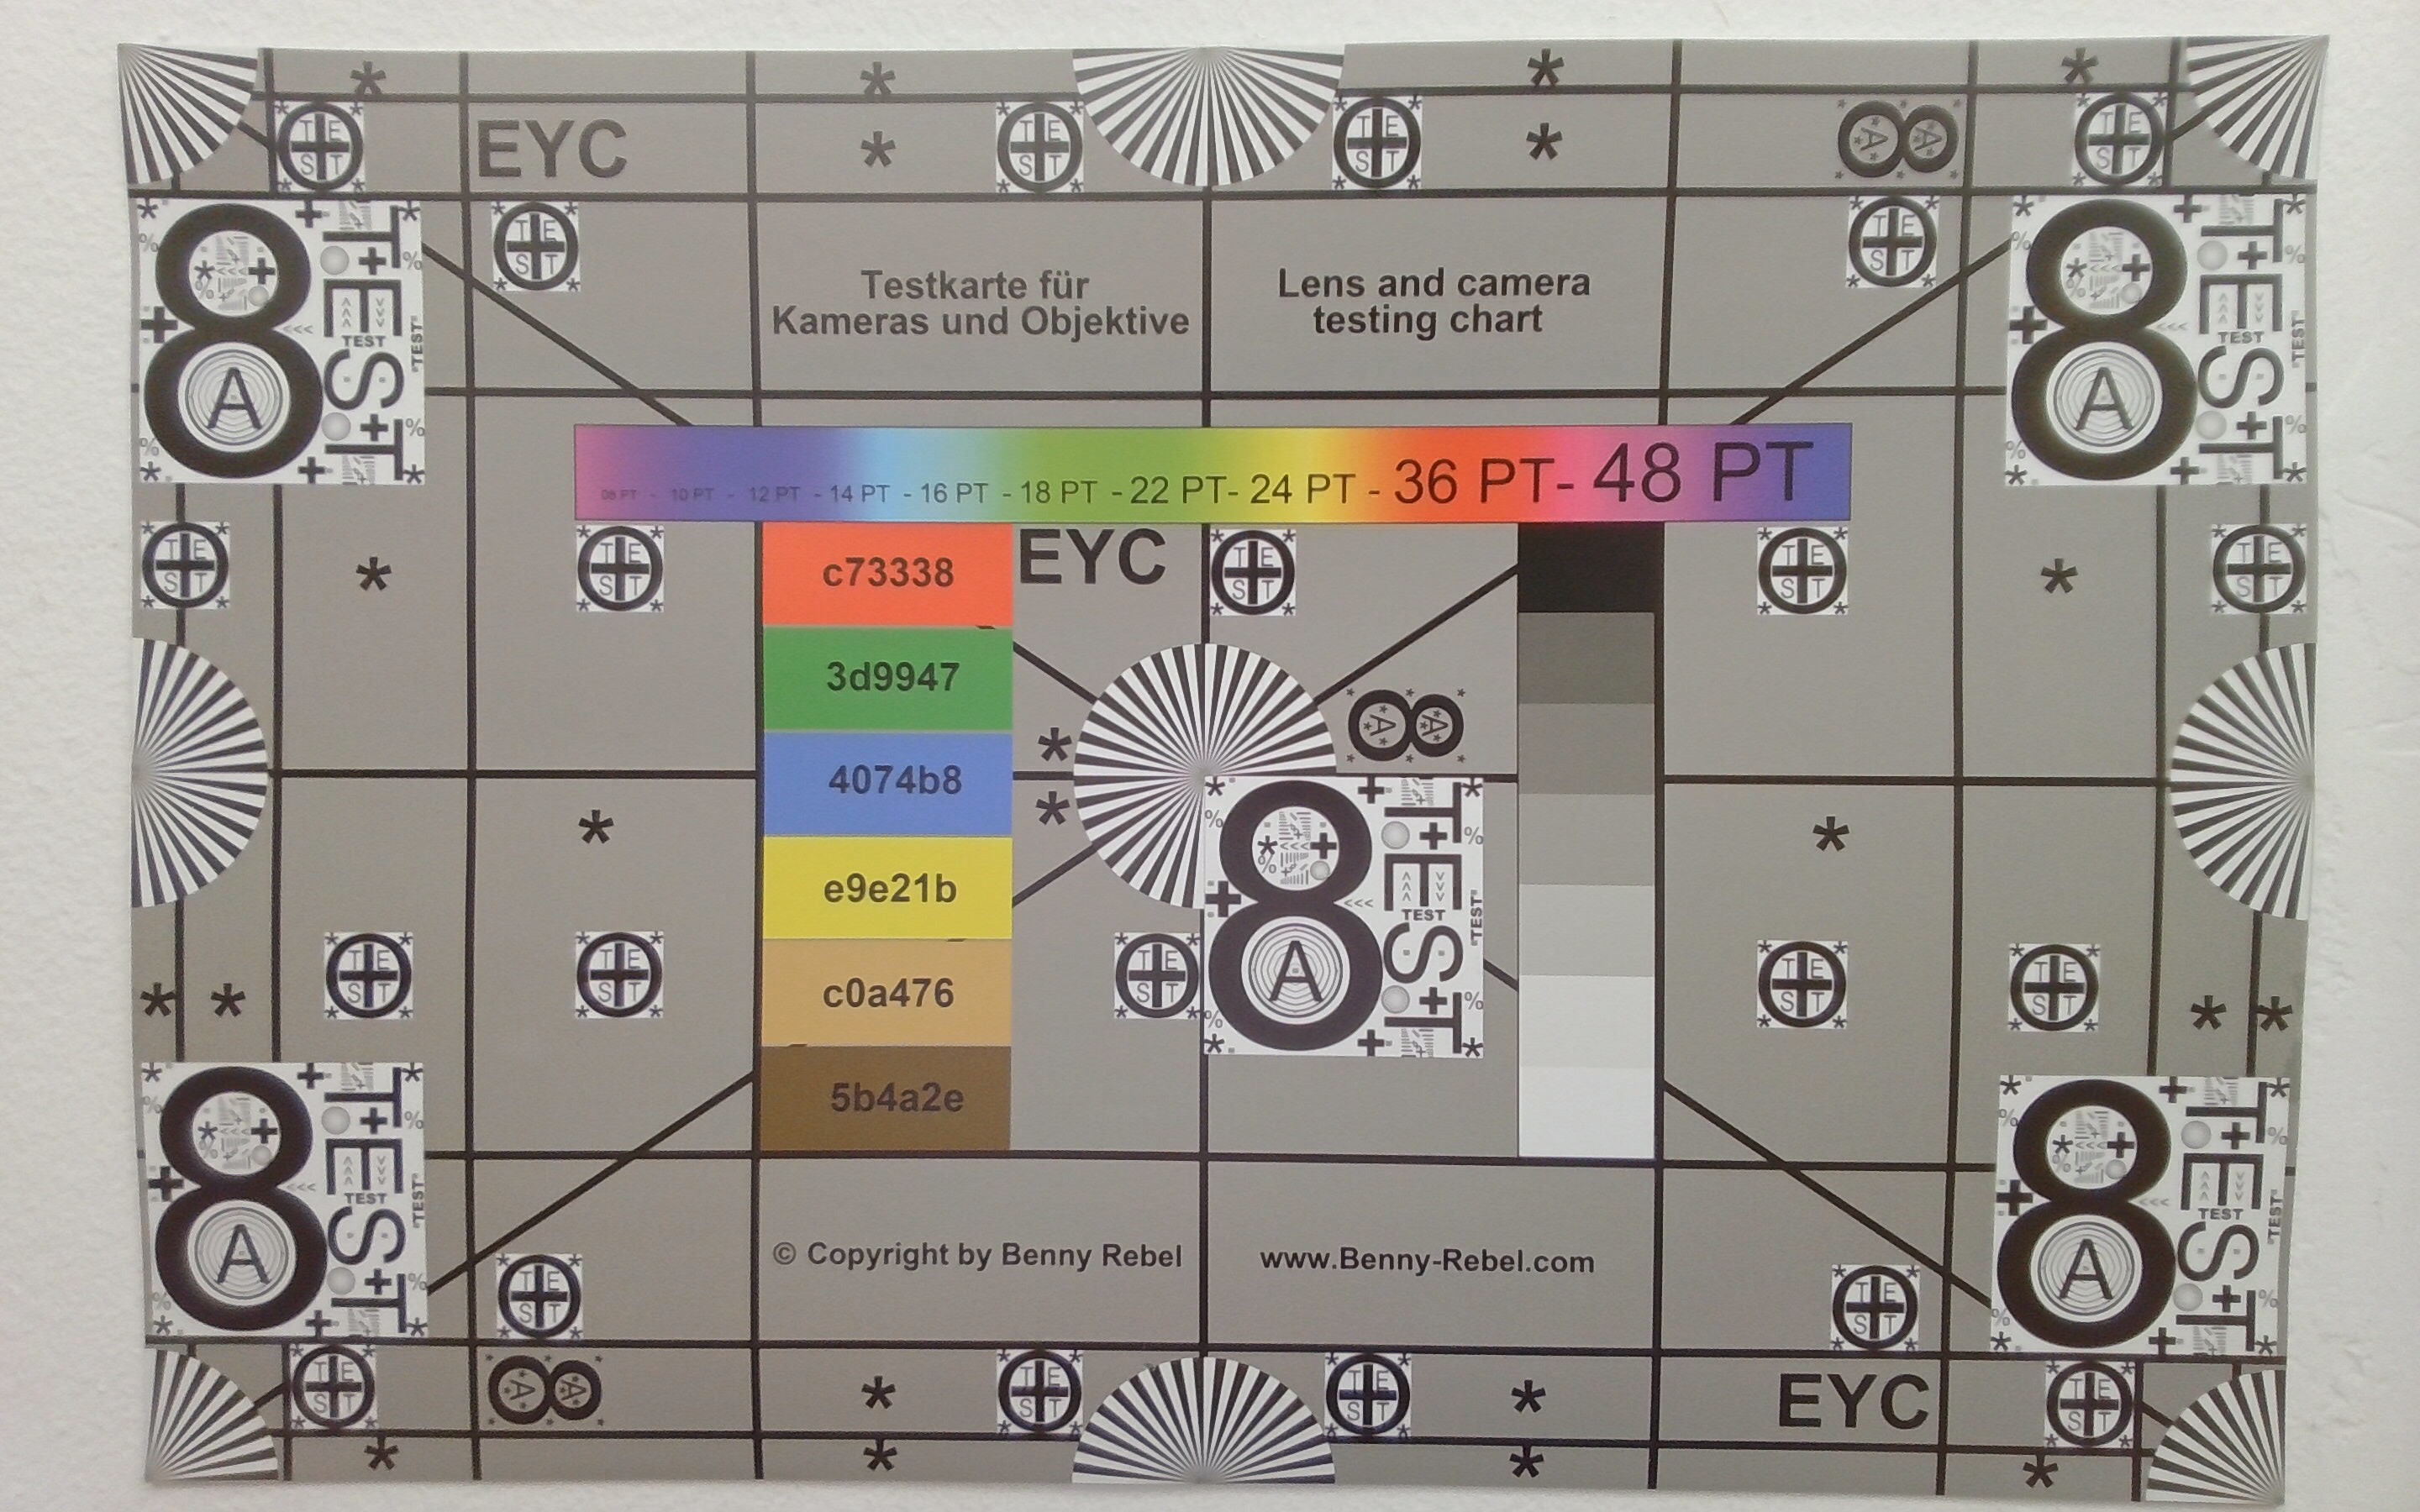
Webcam: 1440p30
Primary Camera: 5.2 MPix
Additional features
Speakers: Quad, Keyboard: Lattice-less, Keyboard Light: yes, HP TV+, 12 Months Warranty
Weight
2.209 kg ( = 77.92 oz / 4.87 pounds), Power Supply: 336 g ( = 11.85 oz / 0.74 pounds)
Price
3200 USD
Note: The manufacturer may use components from different suppliers including display panels, drives or memory sticks with similar specifications.


Case

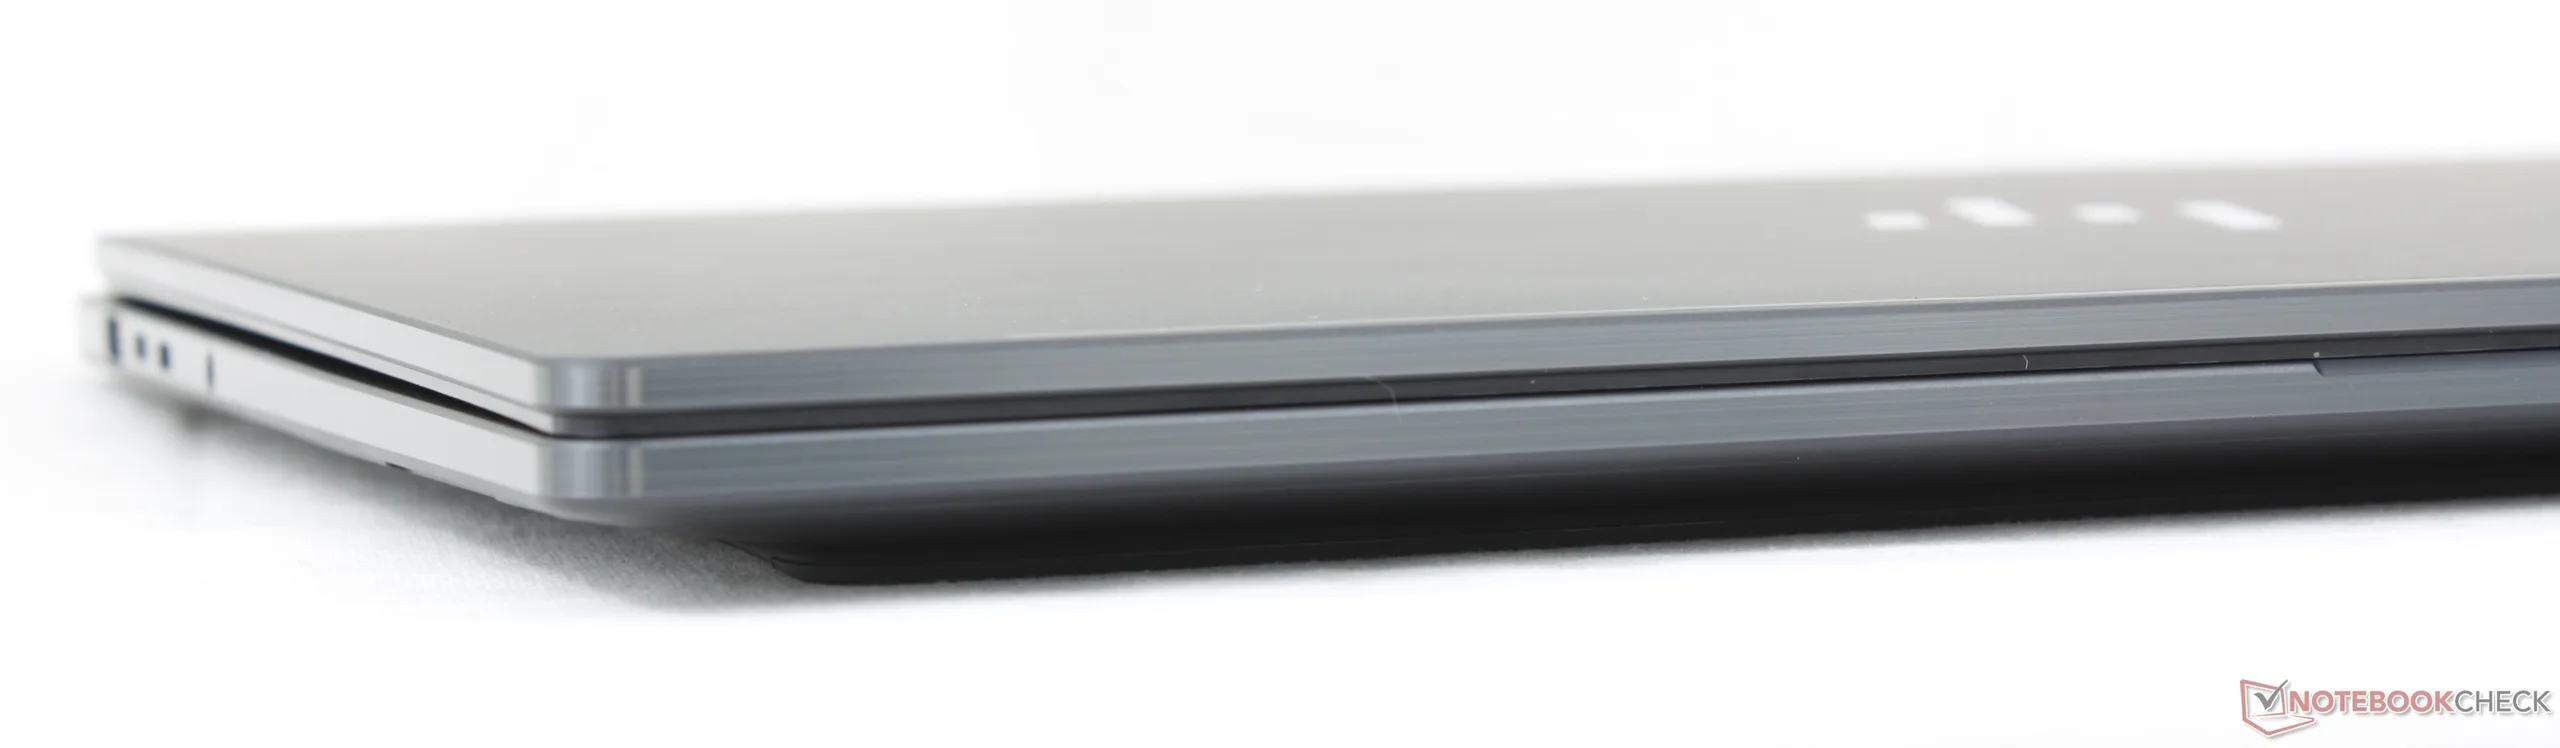
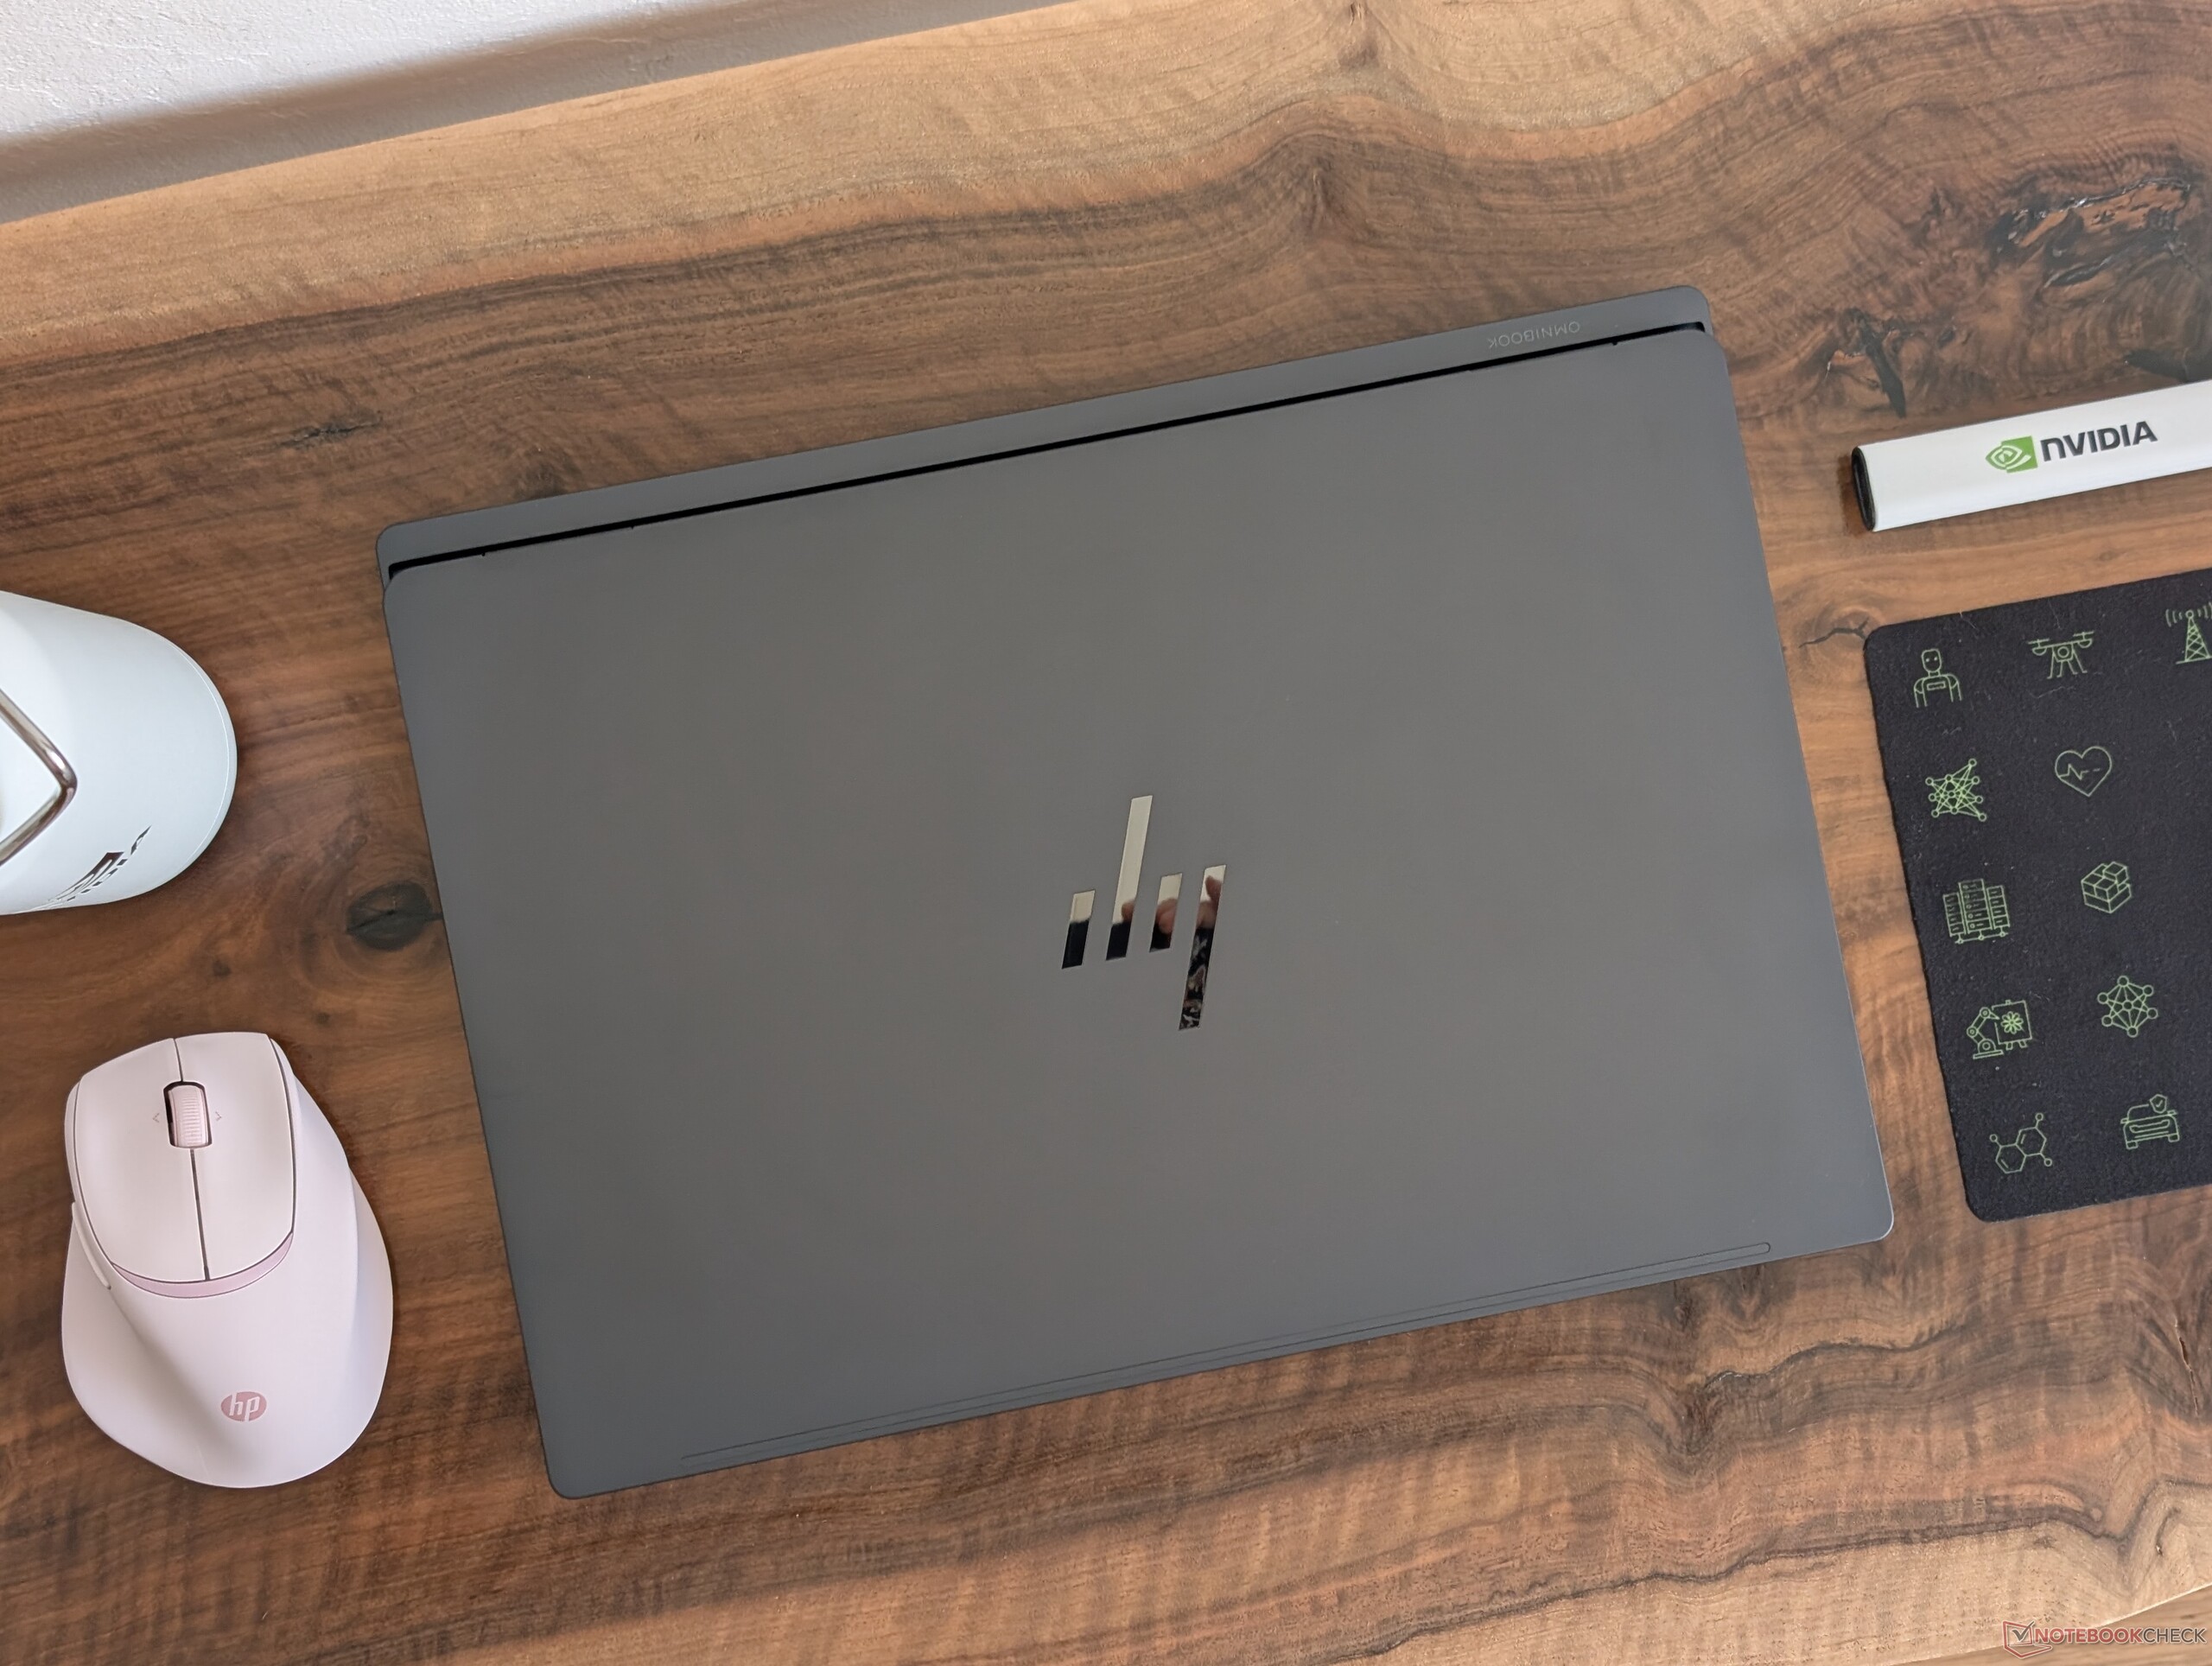
Chassis exhibits the same high quality impressions of recent OmniBook prosumer models like the OmniBook X or OmniBook Ultra.
Size Comparison

❌
364 mm / 14.3 in 266 mm / 10.5 in 30.23 mm / 1.19 in 3 kg6.63 lbs354 mm / 13.9 in 246 mm / 9.69 in 19.99 mm / 0.787 in 2 kg4.48 lbs355 mm / 14 in 250.5 mm / 9.86 in 17.4 mm / 0.685 in 2.1 kg4.68 lbs355.9 mm / 14 in 256.5 mm / 10.1 in 15.8 mm / 0.622 in 2.2 kg4.87 lbs352.58 mm / 13.9 in 237.47 mm / 9.35 in 14.62 mm / 0.576 in 1.7 kg3.79 lbs354.1 mm / 13.9 in 243 mm / 9.57 in 13 mm / 0.512 in 1.8 kg3.95 lbs297 mm / 11.7 in 210 mm / 8.27 in 1 mm / 0.03937 in 5.7 g0.01257 lbs

Connectivity

Front: No ports
Front: No ports
Right: MicroSD reader, 2x USB-A 3.2 Gen. 2 (10 Gbps)
Rear: No ports
Rear: No ports
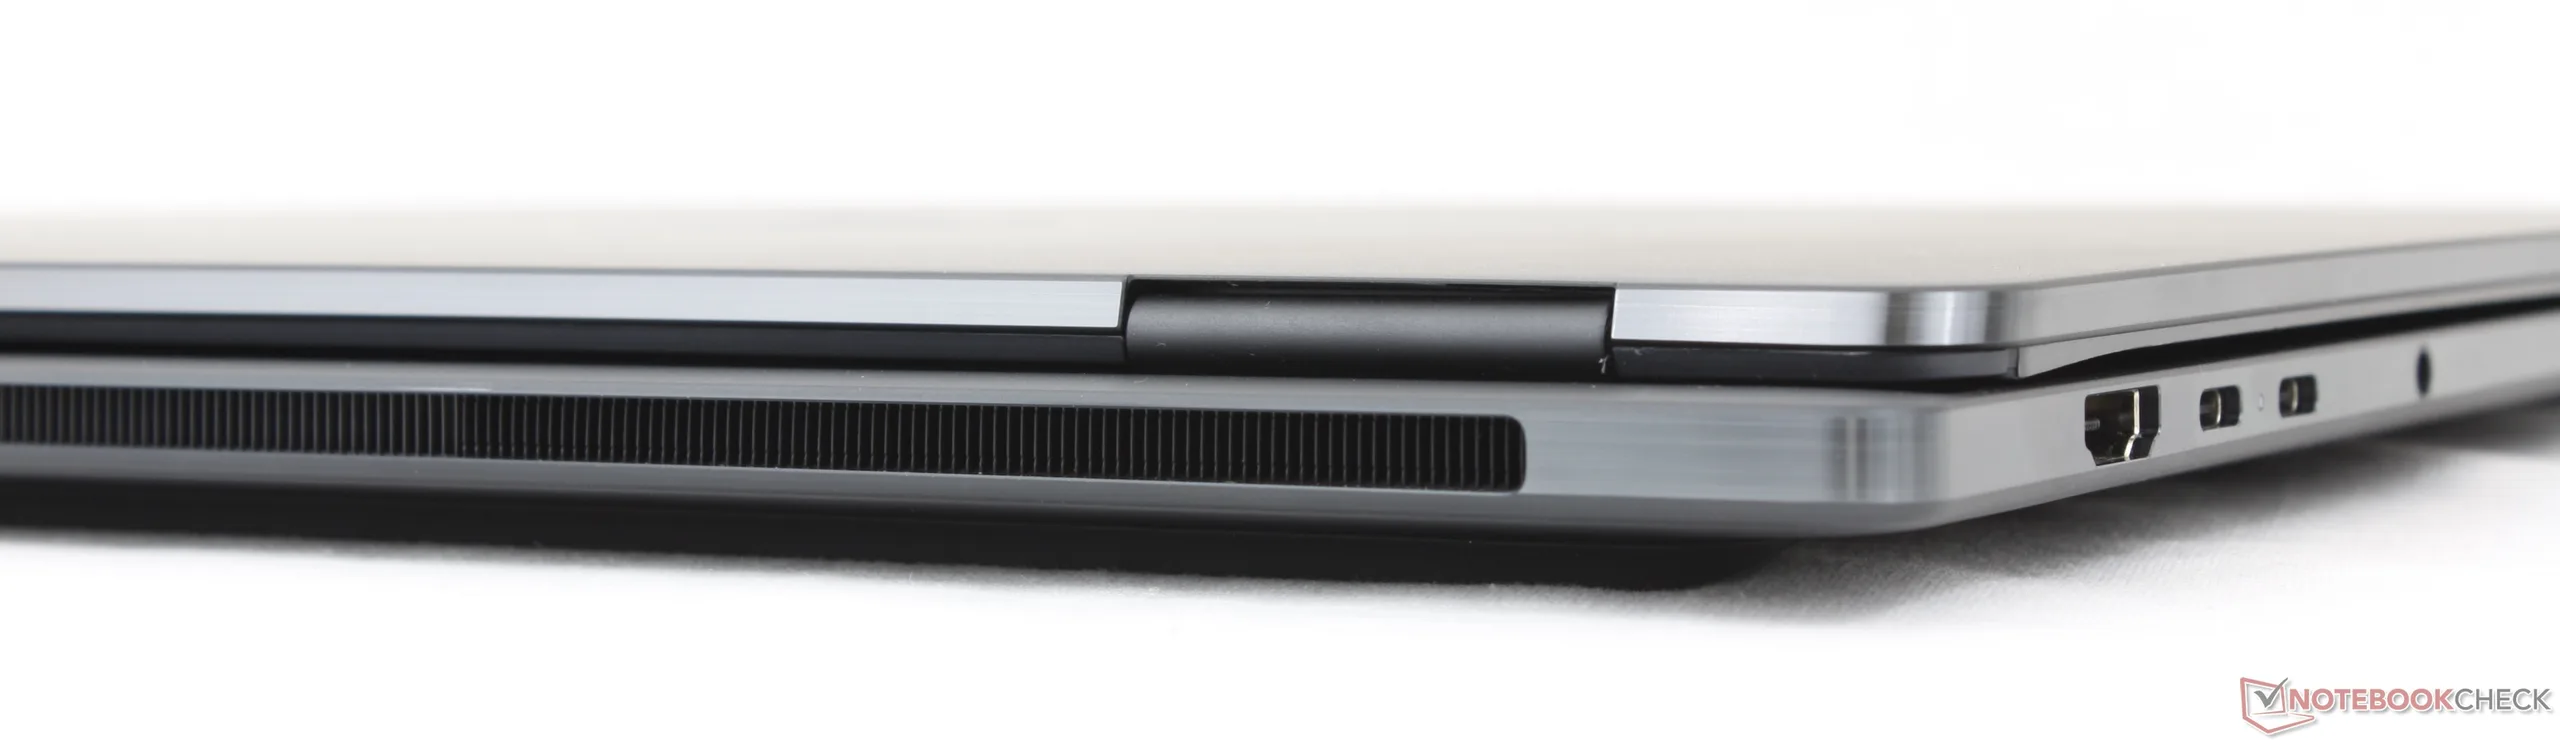
Left: HDMI 2.1, 2x USB-C 4.0 (40 Gbps) w/ DisplayPort 2.1 + Power Delivery 3.2, 3.5 mm headset

SD Card Reader

SD Card Reader
average JPG Copy Test (av. of 3 runs)
Asus ProArt P16 H7607
Nvidia RTX Spark N1X 20-Core (A-DATA SD-Express 8.0 512 GB)
474 MB/s +1231%
Razer Blade 16 Core Ultra 9 386H
Intel Core Ultra 9 386H (Toshiba Exceria Pro SDXC 64 GB UHS-II)
151.3 MB/s +325%
Lenovo ThinkPad P16 G2 21FA000FGE
Intel Core i7-13700HX
54.8 MB/s +54%
HP OmniBook Ultra 16-bk0013dx
Nvidia RTX Spark N1X 20-Core (Angelbird AV Pro V60)
35.6 MB/s
maximum AS SSD Seq Read Test (1GB)
Asus ProArt P16 H7607
Nvidia RTX Spark N1X 20-Core (A-DATA SD-Express 8.0 512 GB)
714 MB/s +255%
Razer Blade 16 Core Ultra 9 386H
Intel Core Ultra 9 386H (Toshiba Exceria Pro SDXC 64 GB UHS-II)
228.9 MB/s +14%
HP OmniBook Ultra 16-bk0013dx
Nvidia RTX Spark N1X 20-Core (Angelbird AV Pro V60)
201.4 MB/s
Lenovo ThinkPad P16 G2 21FA000FGE
Intel Core i7-13700HX
85.1 MB/s -58%

Communication

Networking
iperf3 transmit Wi-Fi6/7 RT-BE96U
Asus ProArt P16 H7607
Mediatek Wi-Fi 7 MT7925 Wireless LAN Card
2236 (2142min - 2289max) MBit/s +27%
MSI Stealth 16 AI B3WH
Intel Wi-Fi 7 BE213 160MHz
2147 (1998min - 2242max) MBit/s +22%
HP OmniBook Ultra 16-bk0013dx
Mediatek MT7925B14L
1765 (979min - 2101max) MBit/s
iperf3 receive Wi-Fi6/7 RT-BE96U
HP OmniBook Ultra 16-bk0013dx
Mediatek MT7925B14L
2087 (1837min - 2171max) MBit/s
Asus ProArt P16 H7607
Mediatek Wi-Fi 7 MT7925 Wireless LAN Card
2021 (1874min - 2075max) MBit/s -3%
MSI Stealth 16 AI B3WH
Intel Wi-Fi 7 BE213 160MHz
1980 (1639min - 2107max) MBit/s -5%
iperf3 receive AXE11000 6GHz
Razer Blade 16 Core Ultra 9 386H
Intel Wi-Fi 7 BE213 160MHz
1736 (1708min - 1755max) MBit/s
Dell XPS 16 Core Ultra X7 358H
Intel Wi-Fi 7 BE211 320MHz
1735 (1715min - 1747max) MBit/s
Lenovo ThinkPad P16 G2 21FA000FGE
Intel Wi-Fi 6E AX211
1696 (1632min - 1734max) MBit/s
iperf3 transmit AXE11000 6GHz
Dell XPS 16 Core Ultra X7 358H
Intel Wi-Fi 7 BE211 320MHz
1619 (1525min - 1692max) MBit/s
Razer Blade 16 Core Ultra 9 386H
Intel Wi-Fi 7 BE213 160MHz
1597 (1410min - 1661max) MBit/s
Lenovo ThinkPad P16 G2 21FA000FGE
Intel Wi-Fi 6E AX211
632 (556min - 717max) MBit/s
0100200300400500600700800900100011001200130014001500160017001800190020002100Tooltip
HP OmniBook Ultra 16-bk0013dx; iperf3 transmit Wi-Fi6/7 RT-BE96U; iperf 3.1.3: Ø1765 (979-2101) MBit/s
HP OmniBook Ultra 16-bk0013dx; iperf3 receive Wi-Fi6/7 RT-BE96U; iperf 3.1.3: Ø2086 (1837-2171) MBit/s

Webcam

ColorChecker
19.9 ∆E
12.6 ∆E
15.3 ∆E
19.6 ∆E
15.5 ∆E
12 ∆E
13.1 ∆E
22 ∆E
18.3 ∆E
20 ∆E
11.5 ∆E
11.9 ∆E
22.4 ∆E
18 ∆E
25.9 ∆E
14.2 ∆E
20.3 ∆E
20.9 ∆E
1.2 ∆E
8.3 ∆E
15.9 ∆E
19.6 ∆E
22.2 ∆E
15.4 ∆E
ColorChecker HP OmniBook Ultra 16-bk0013dx: 16.5 ∆E min: 1.2 - max: 25.88 ∆E

Maintenance

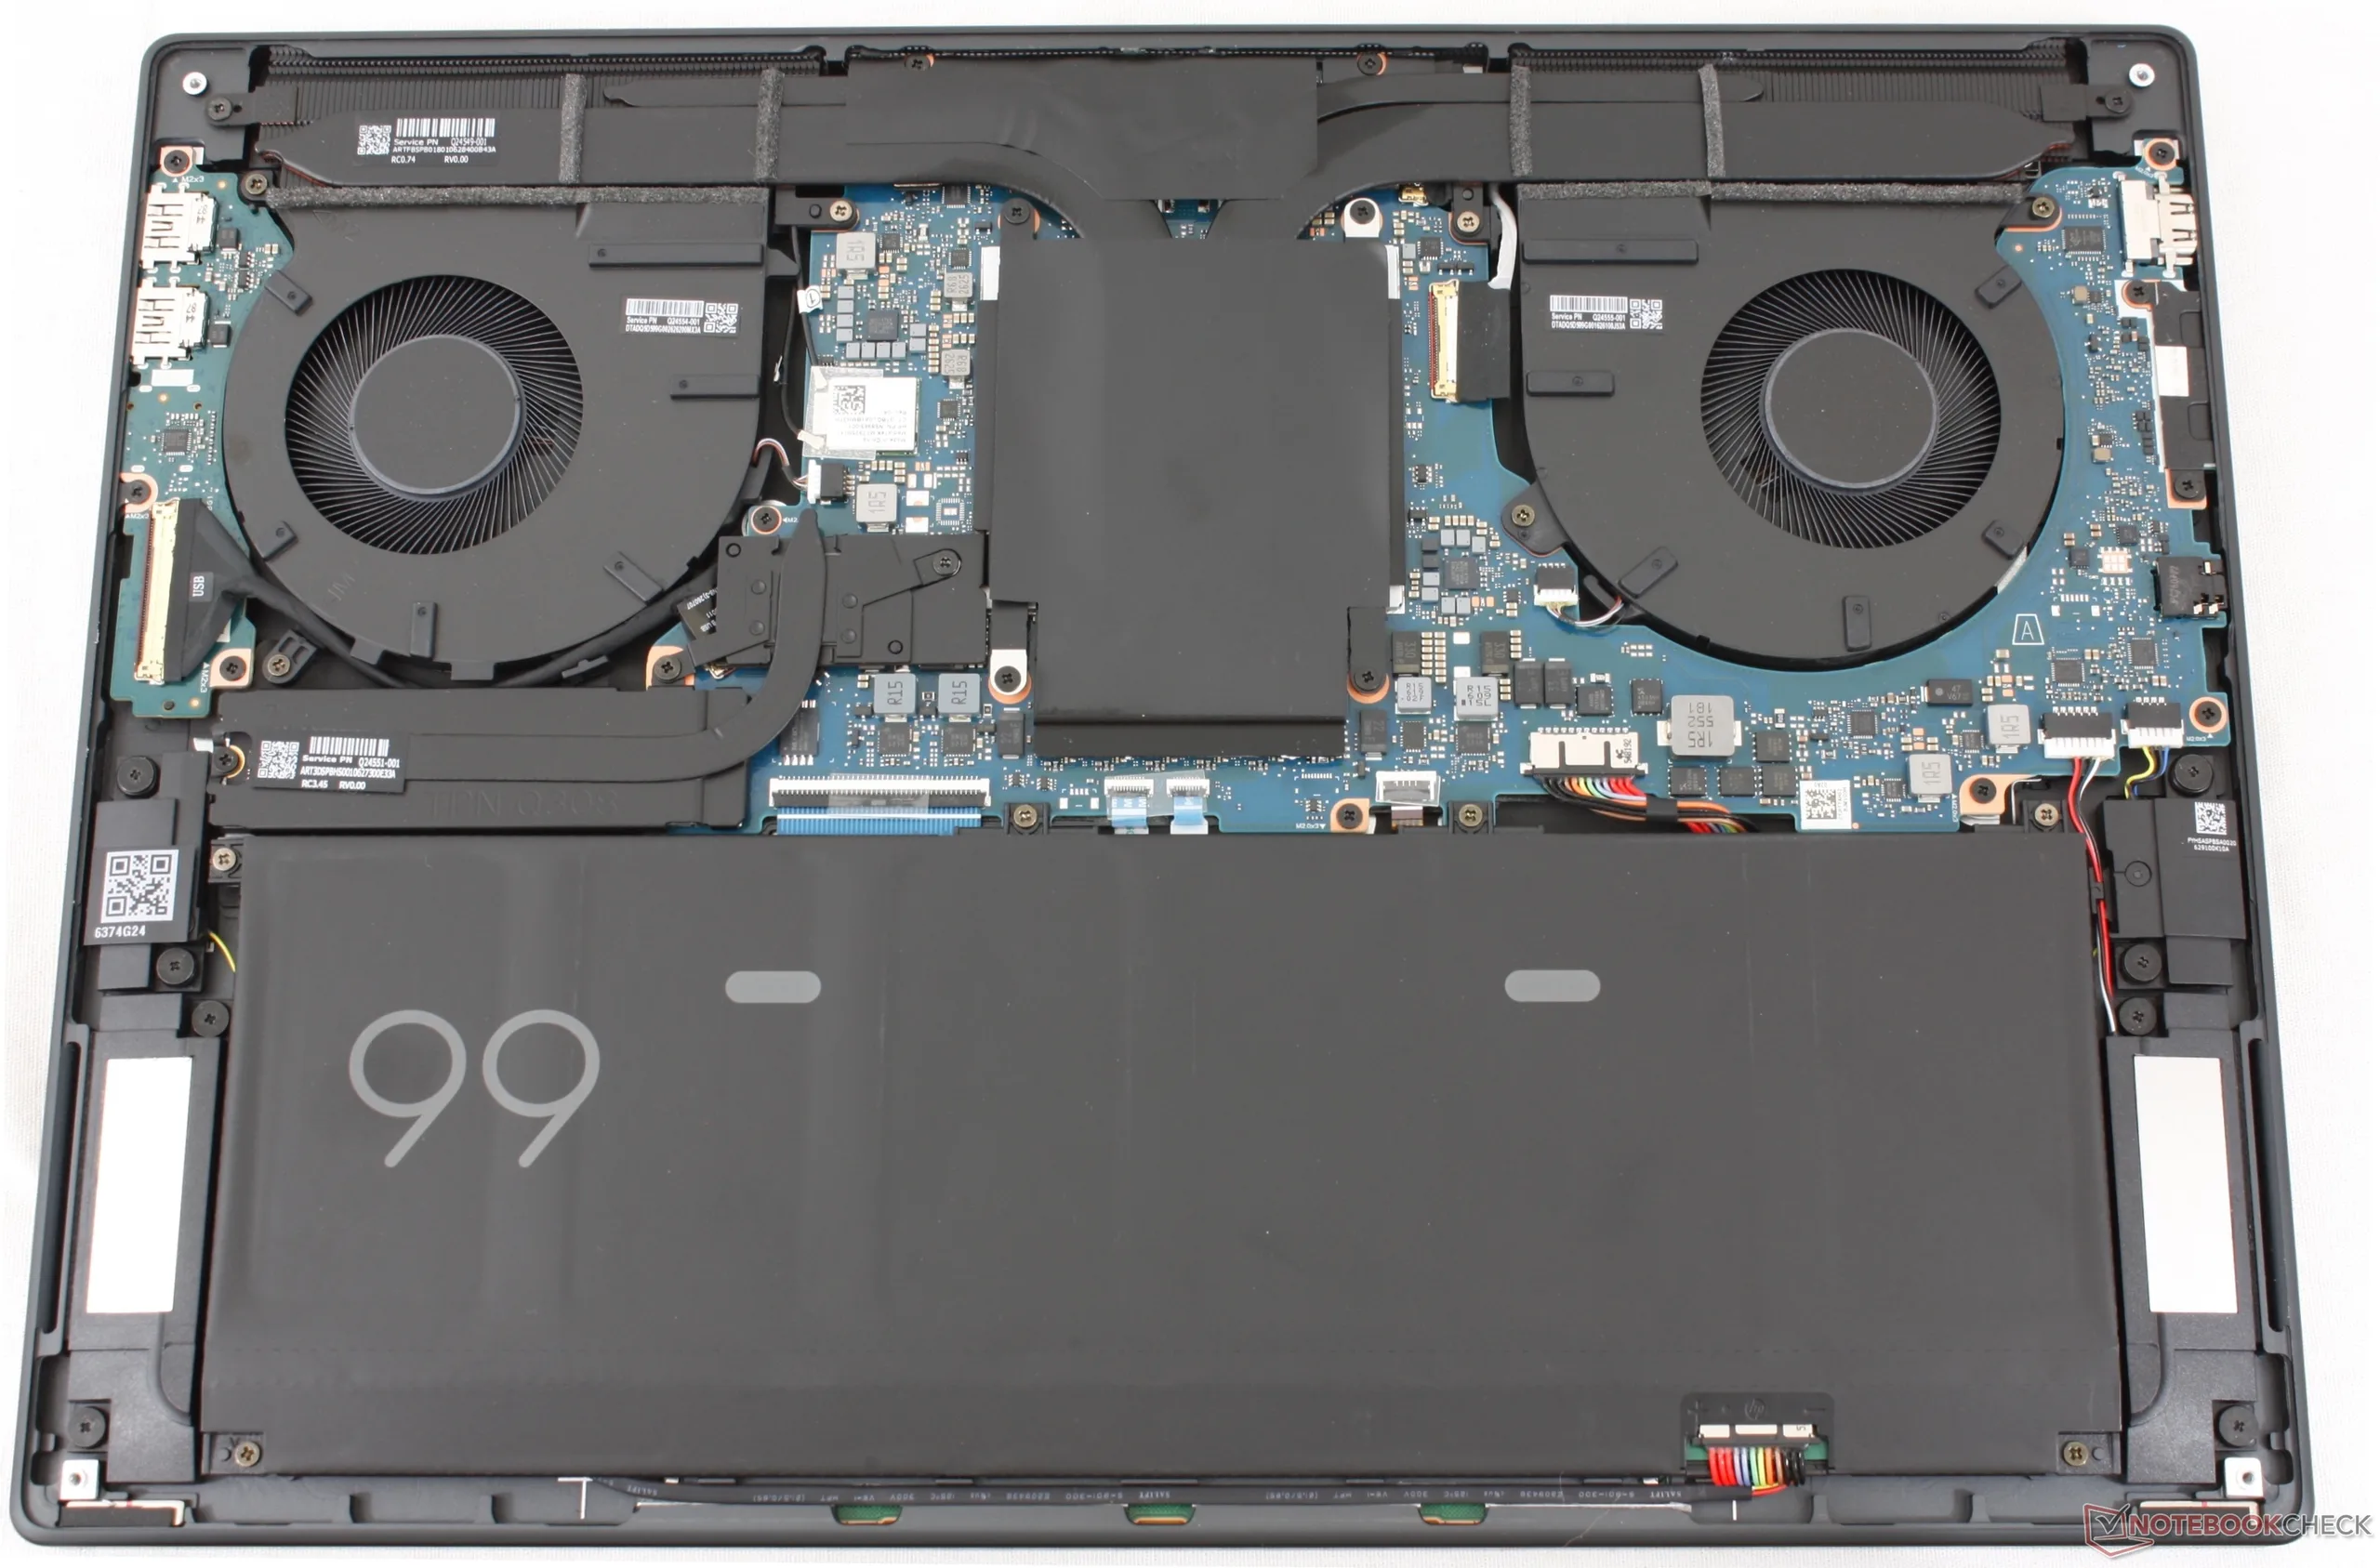
M.2 PCIe5 SSD gets its own copper heat sink. Battery is easy to replace if needed

Sustainability

The chassis and keyboard consist of up to 50 percent recycled metals and 85 percent post-consumer recycled plastics, respectively. The packaging is fully recyclable and free of plastics.

Input Devices
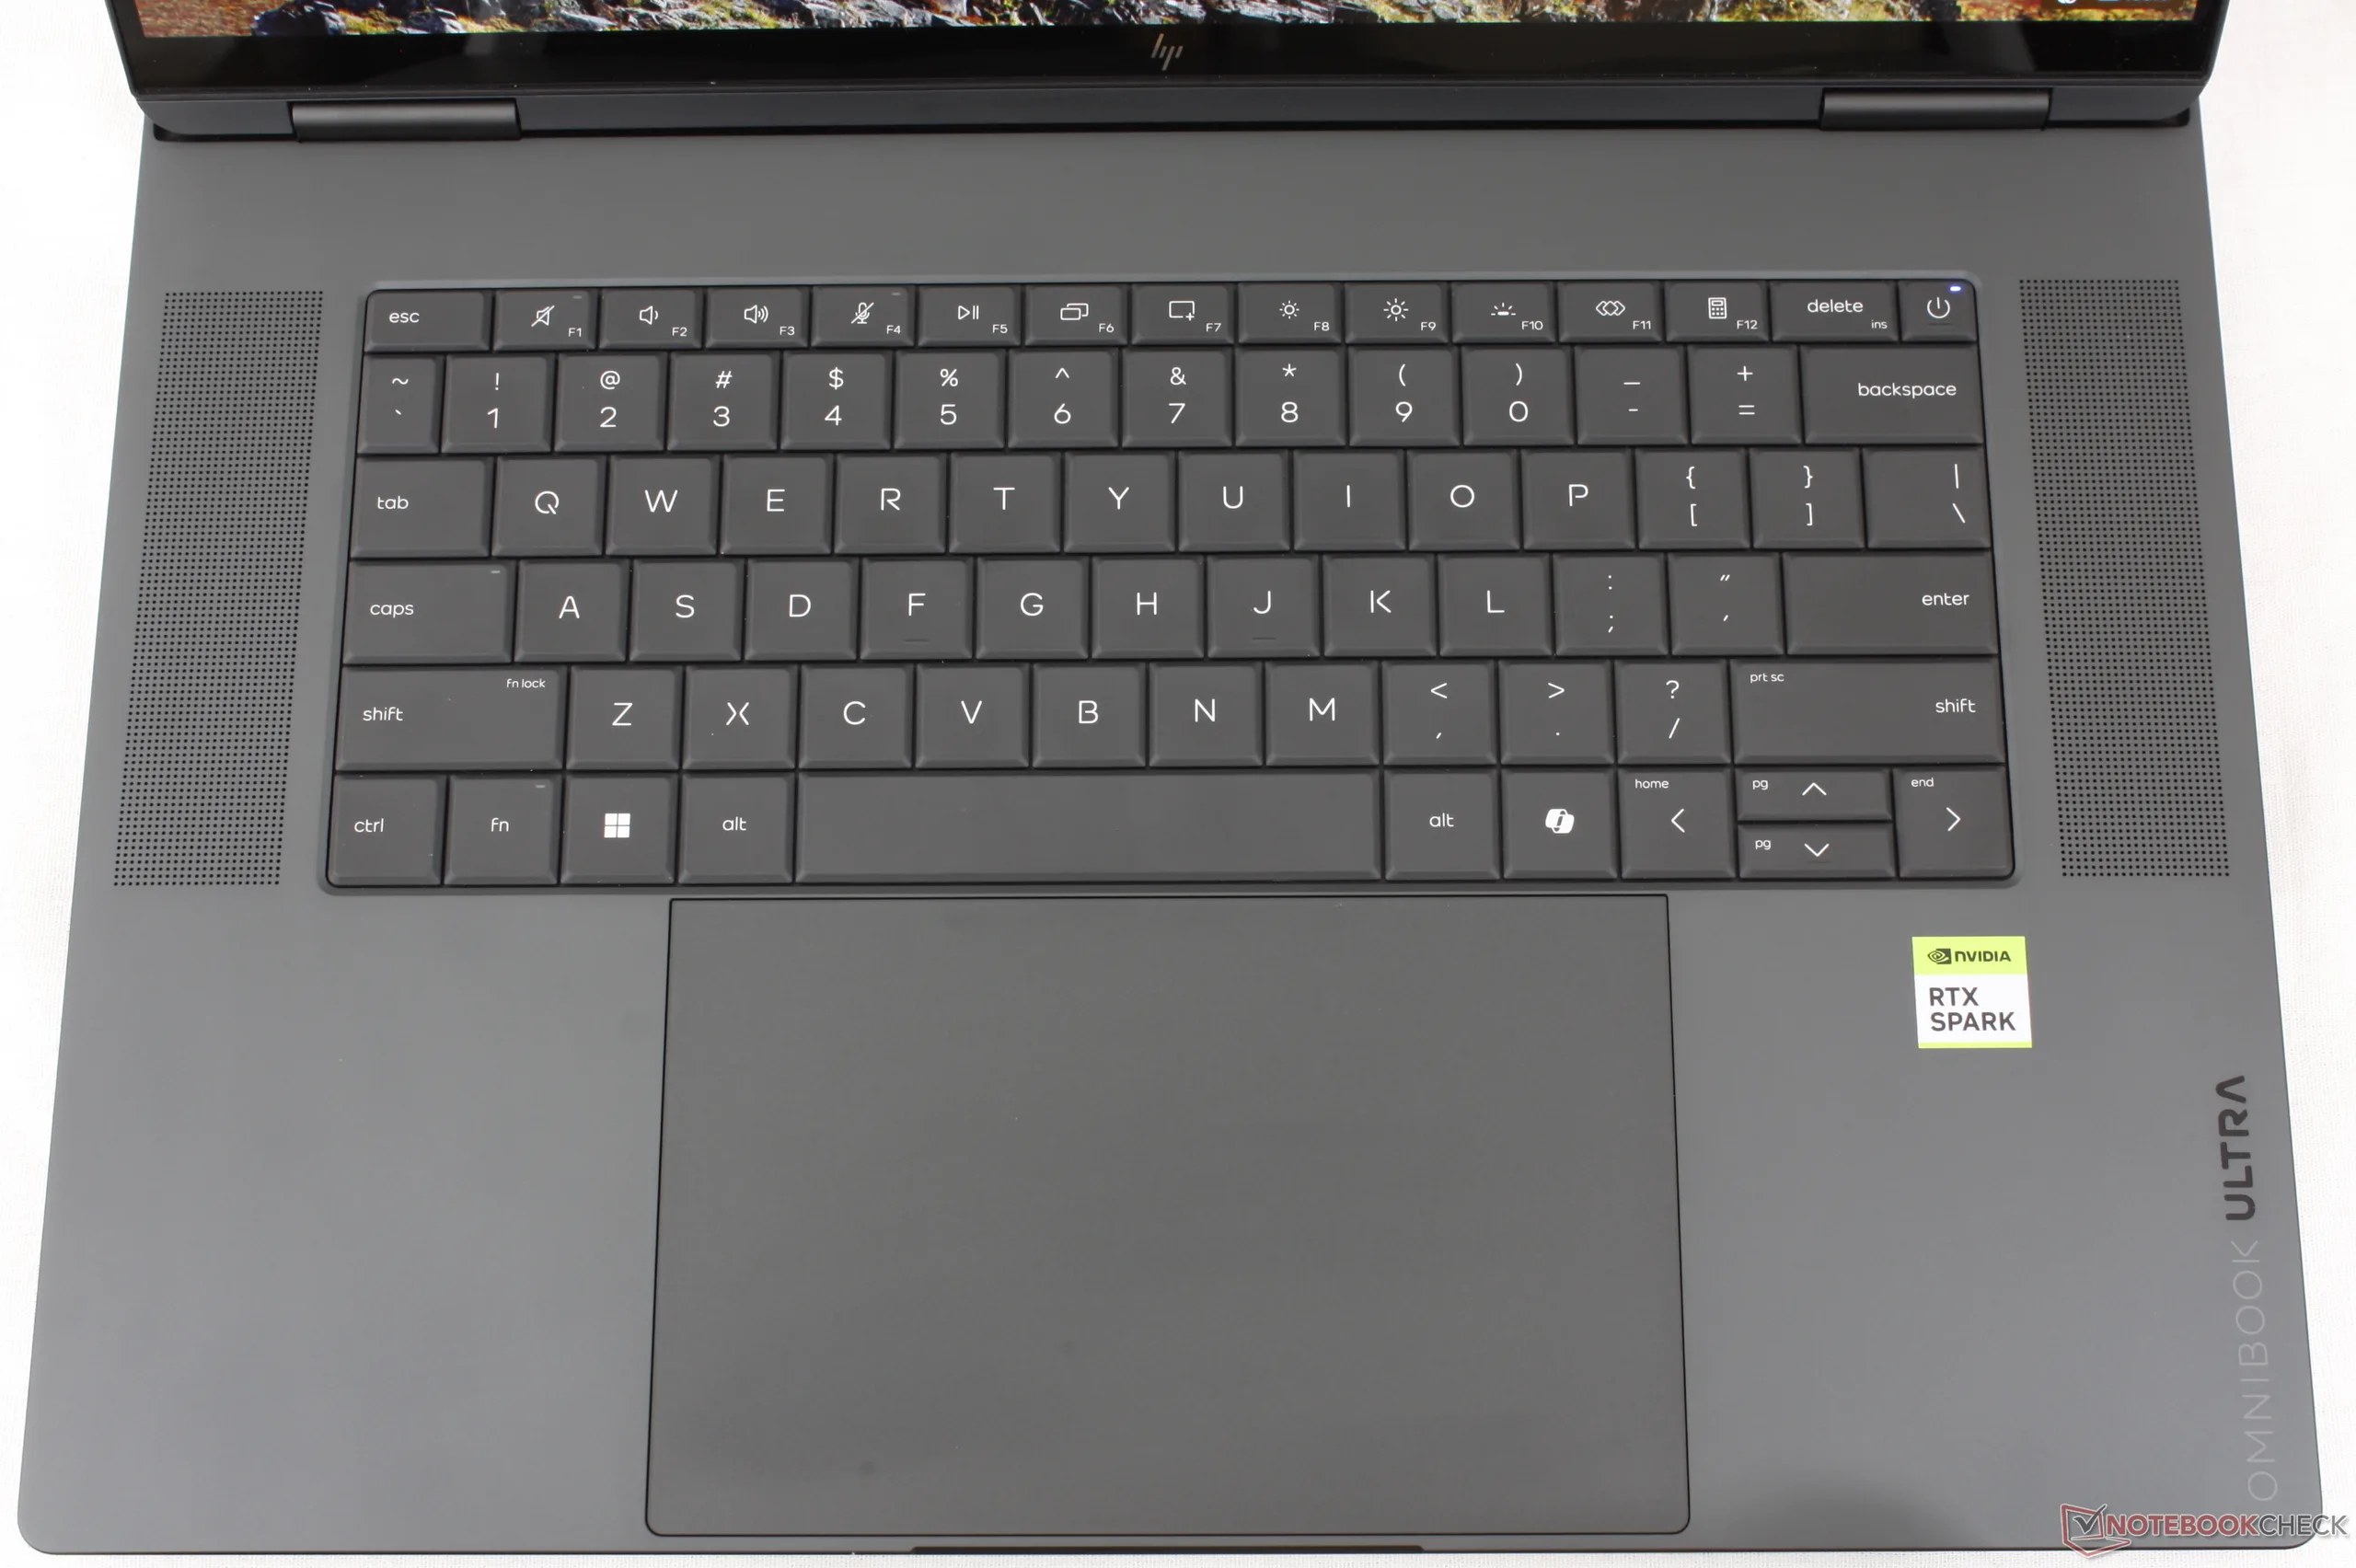
Zero-lattice keyboard feels tight in contrast to the spacious (~16 x 10 cm) clickpad

Display

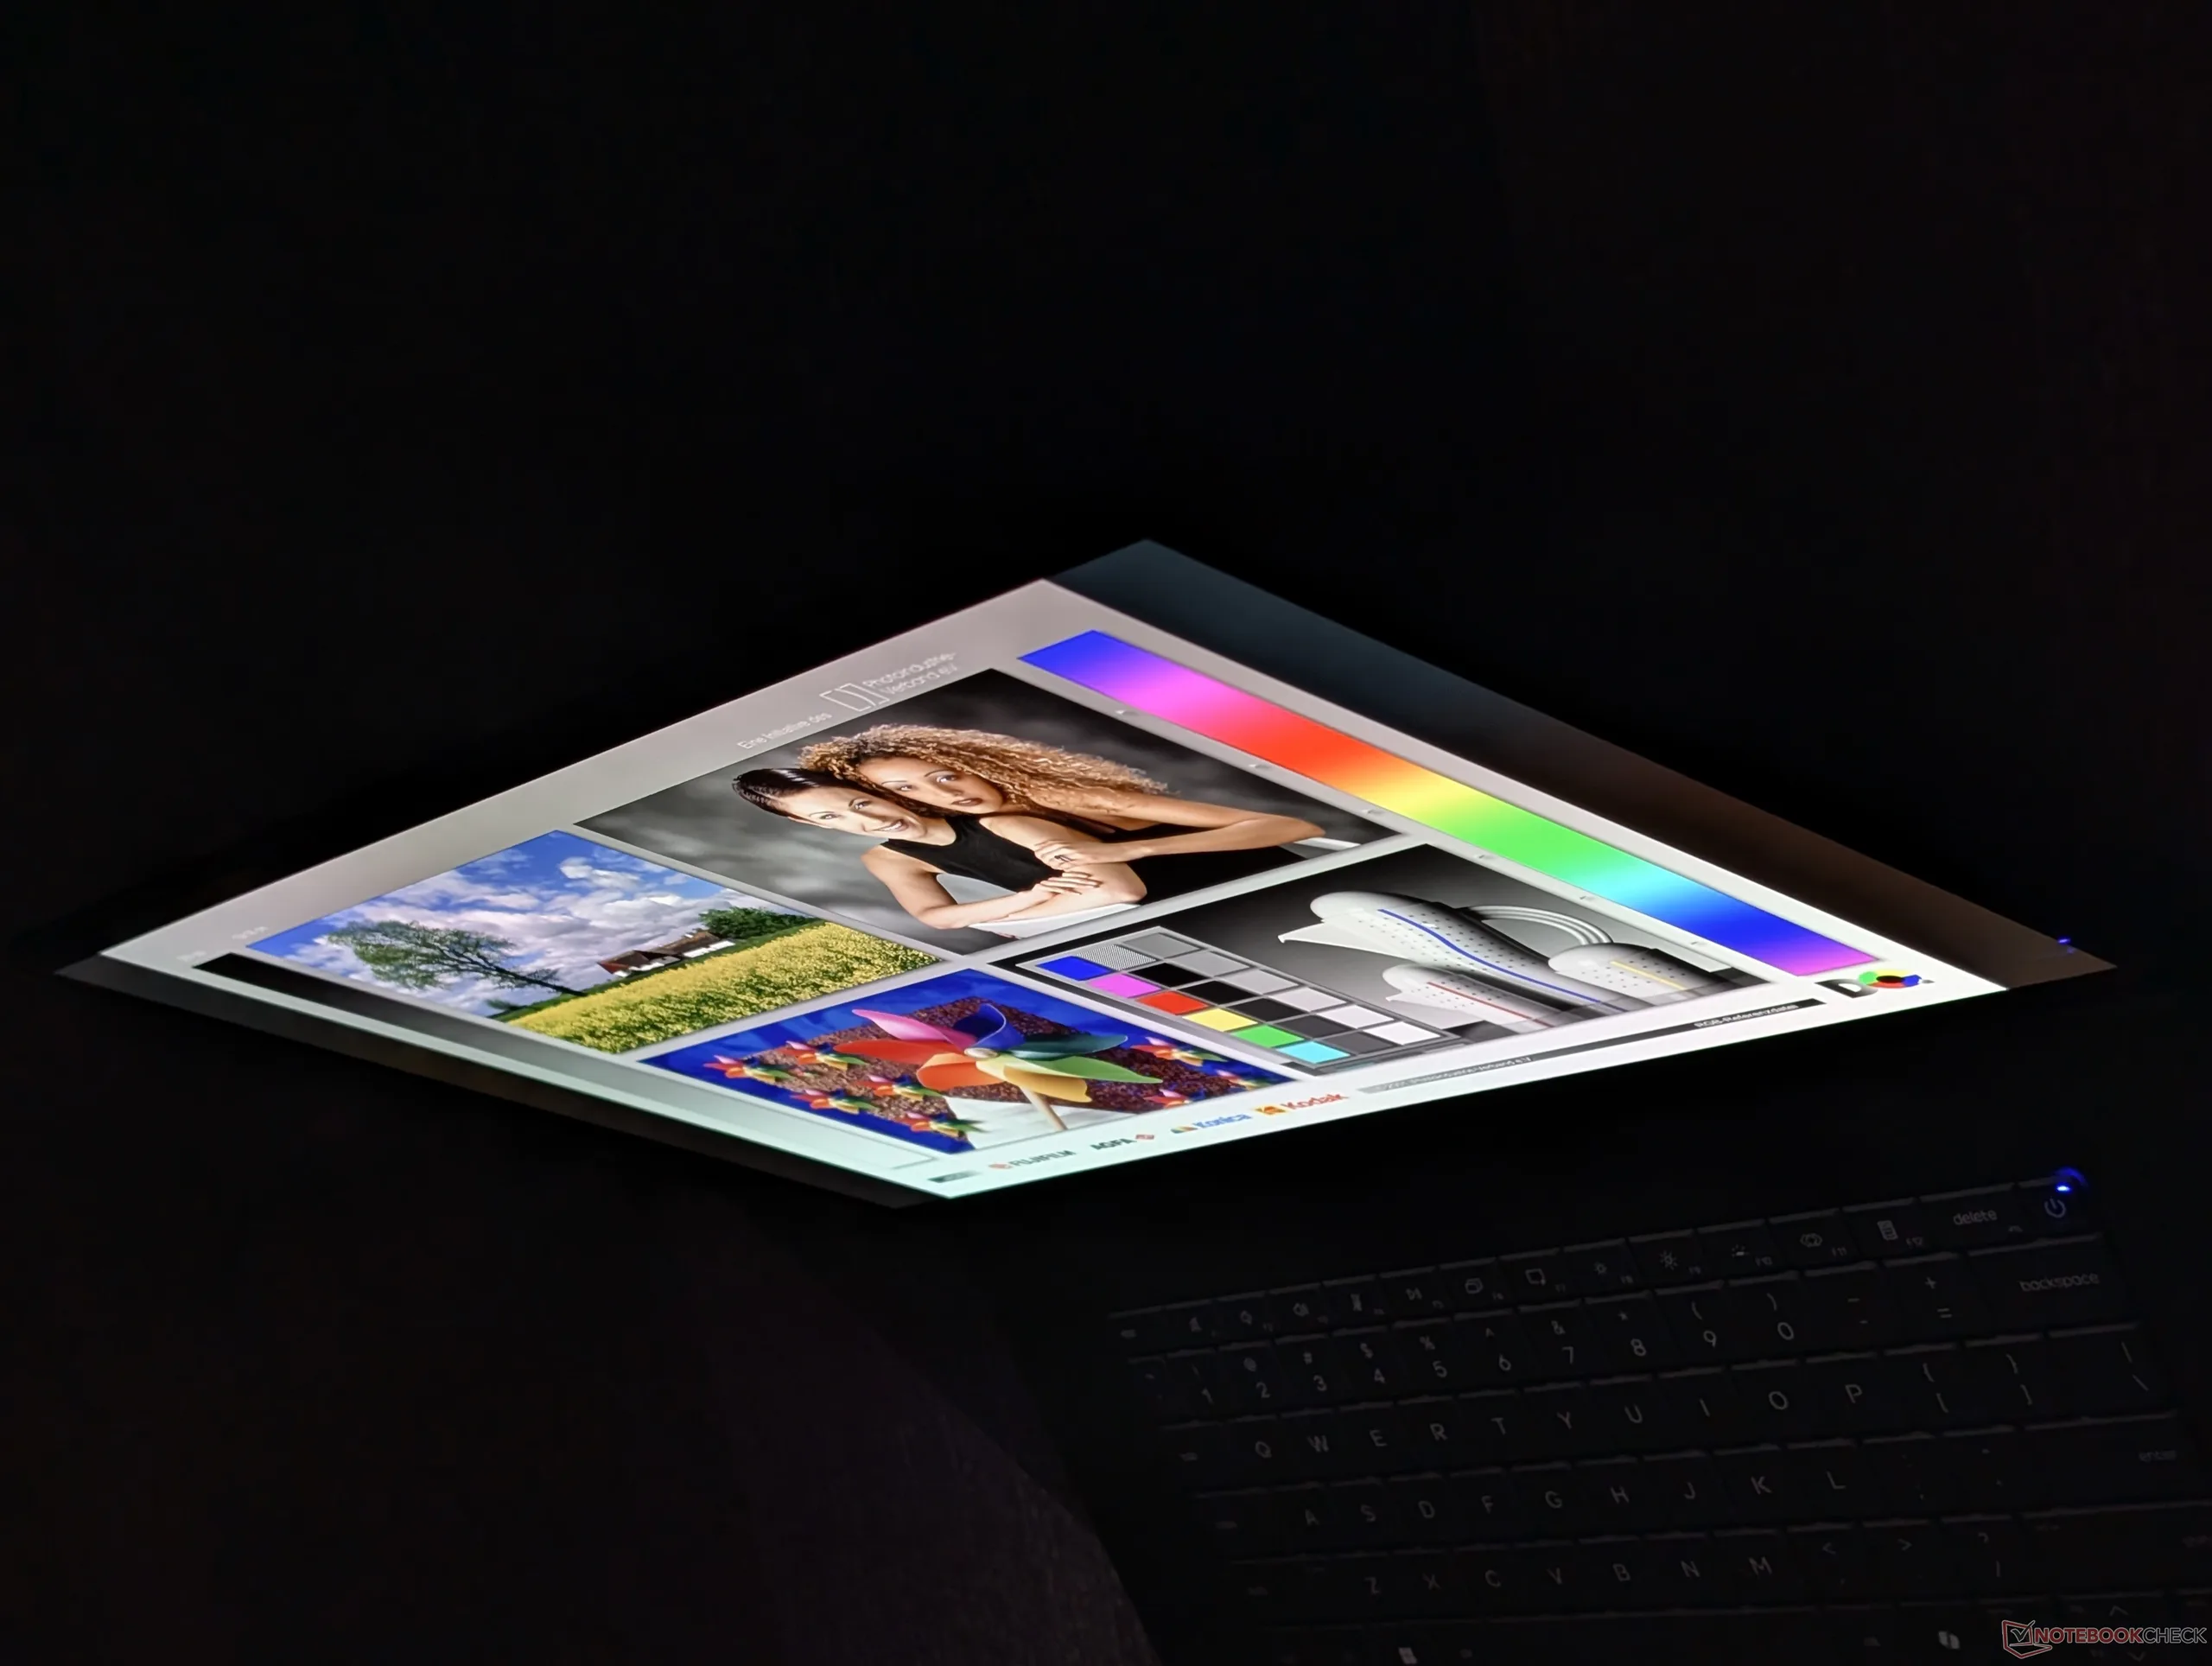
Sharp RGB subpixels from the glossy overlay

Whereas the Asus ProArt P16 would ship with a 4K display supporting a maximum HDR brightness of over 1500 nits, the HP model ships with a 3K display supporting a maximum HDR brightness of 1000 nits. The dimmer backlight makes the screen more reflective in most scenarios.

444
cd/m²
437.1
cd/m²
432
cd/m²
434.8
cd/m²
434.3
cd/m²
433.1
cd/m²
429.9
cd/m²
430.5
cd/m²
436.7
cd/m²
Distribution of brightness
Samsung SDC4257 tested with X-Rite i1Pro 3
Maximum: 444 cd/m² (Nits) Average: 434.7 cd/m² Minimum: 3.36 cd/m²
Brightness Distribution: 97 %
Center on Battery: 434.3 cd/m²
Contrast: ∞:1 (Black: 0 cd/m²)
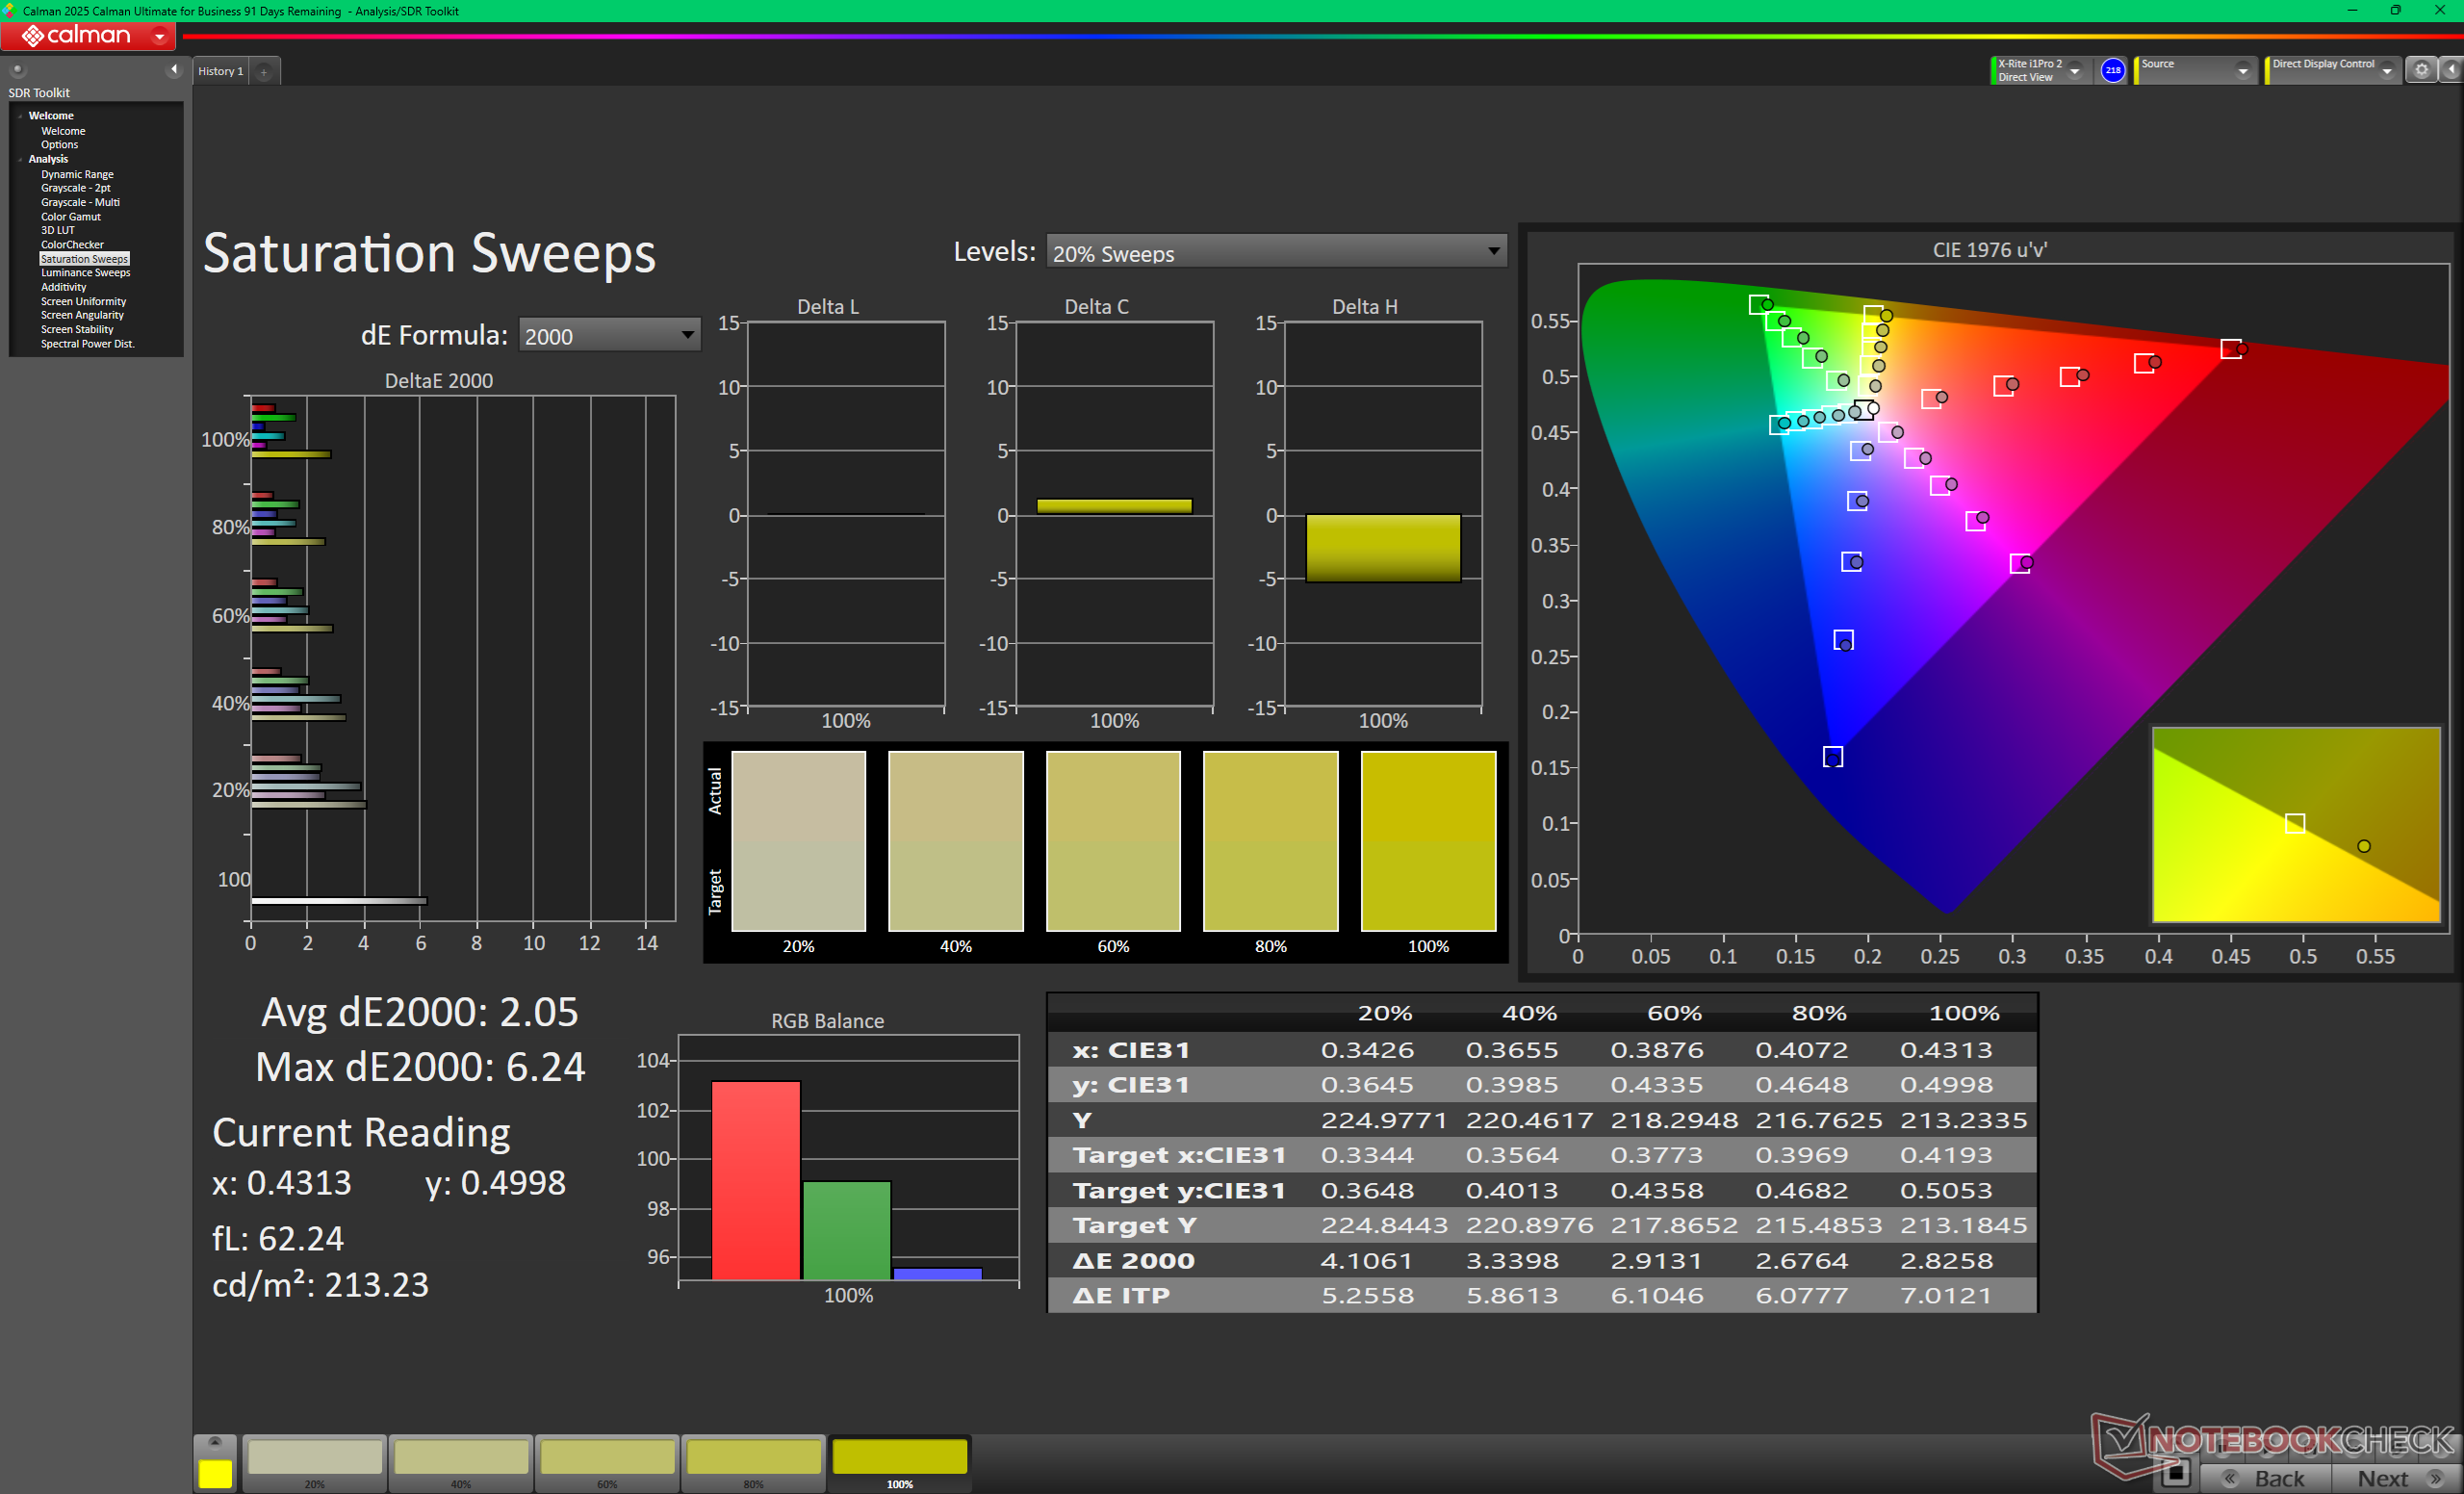
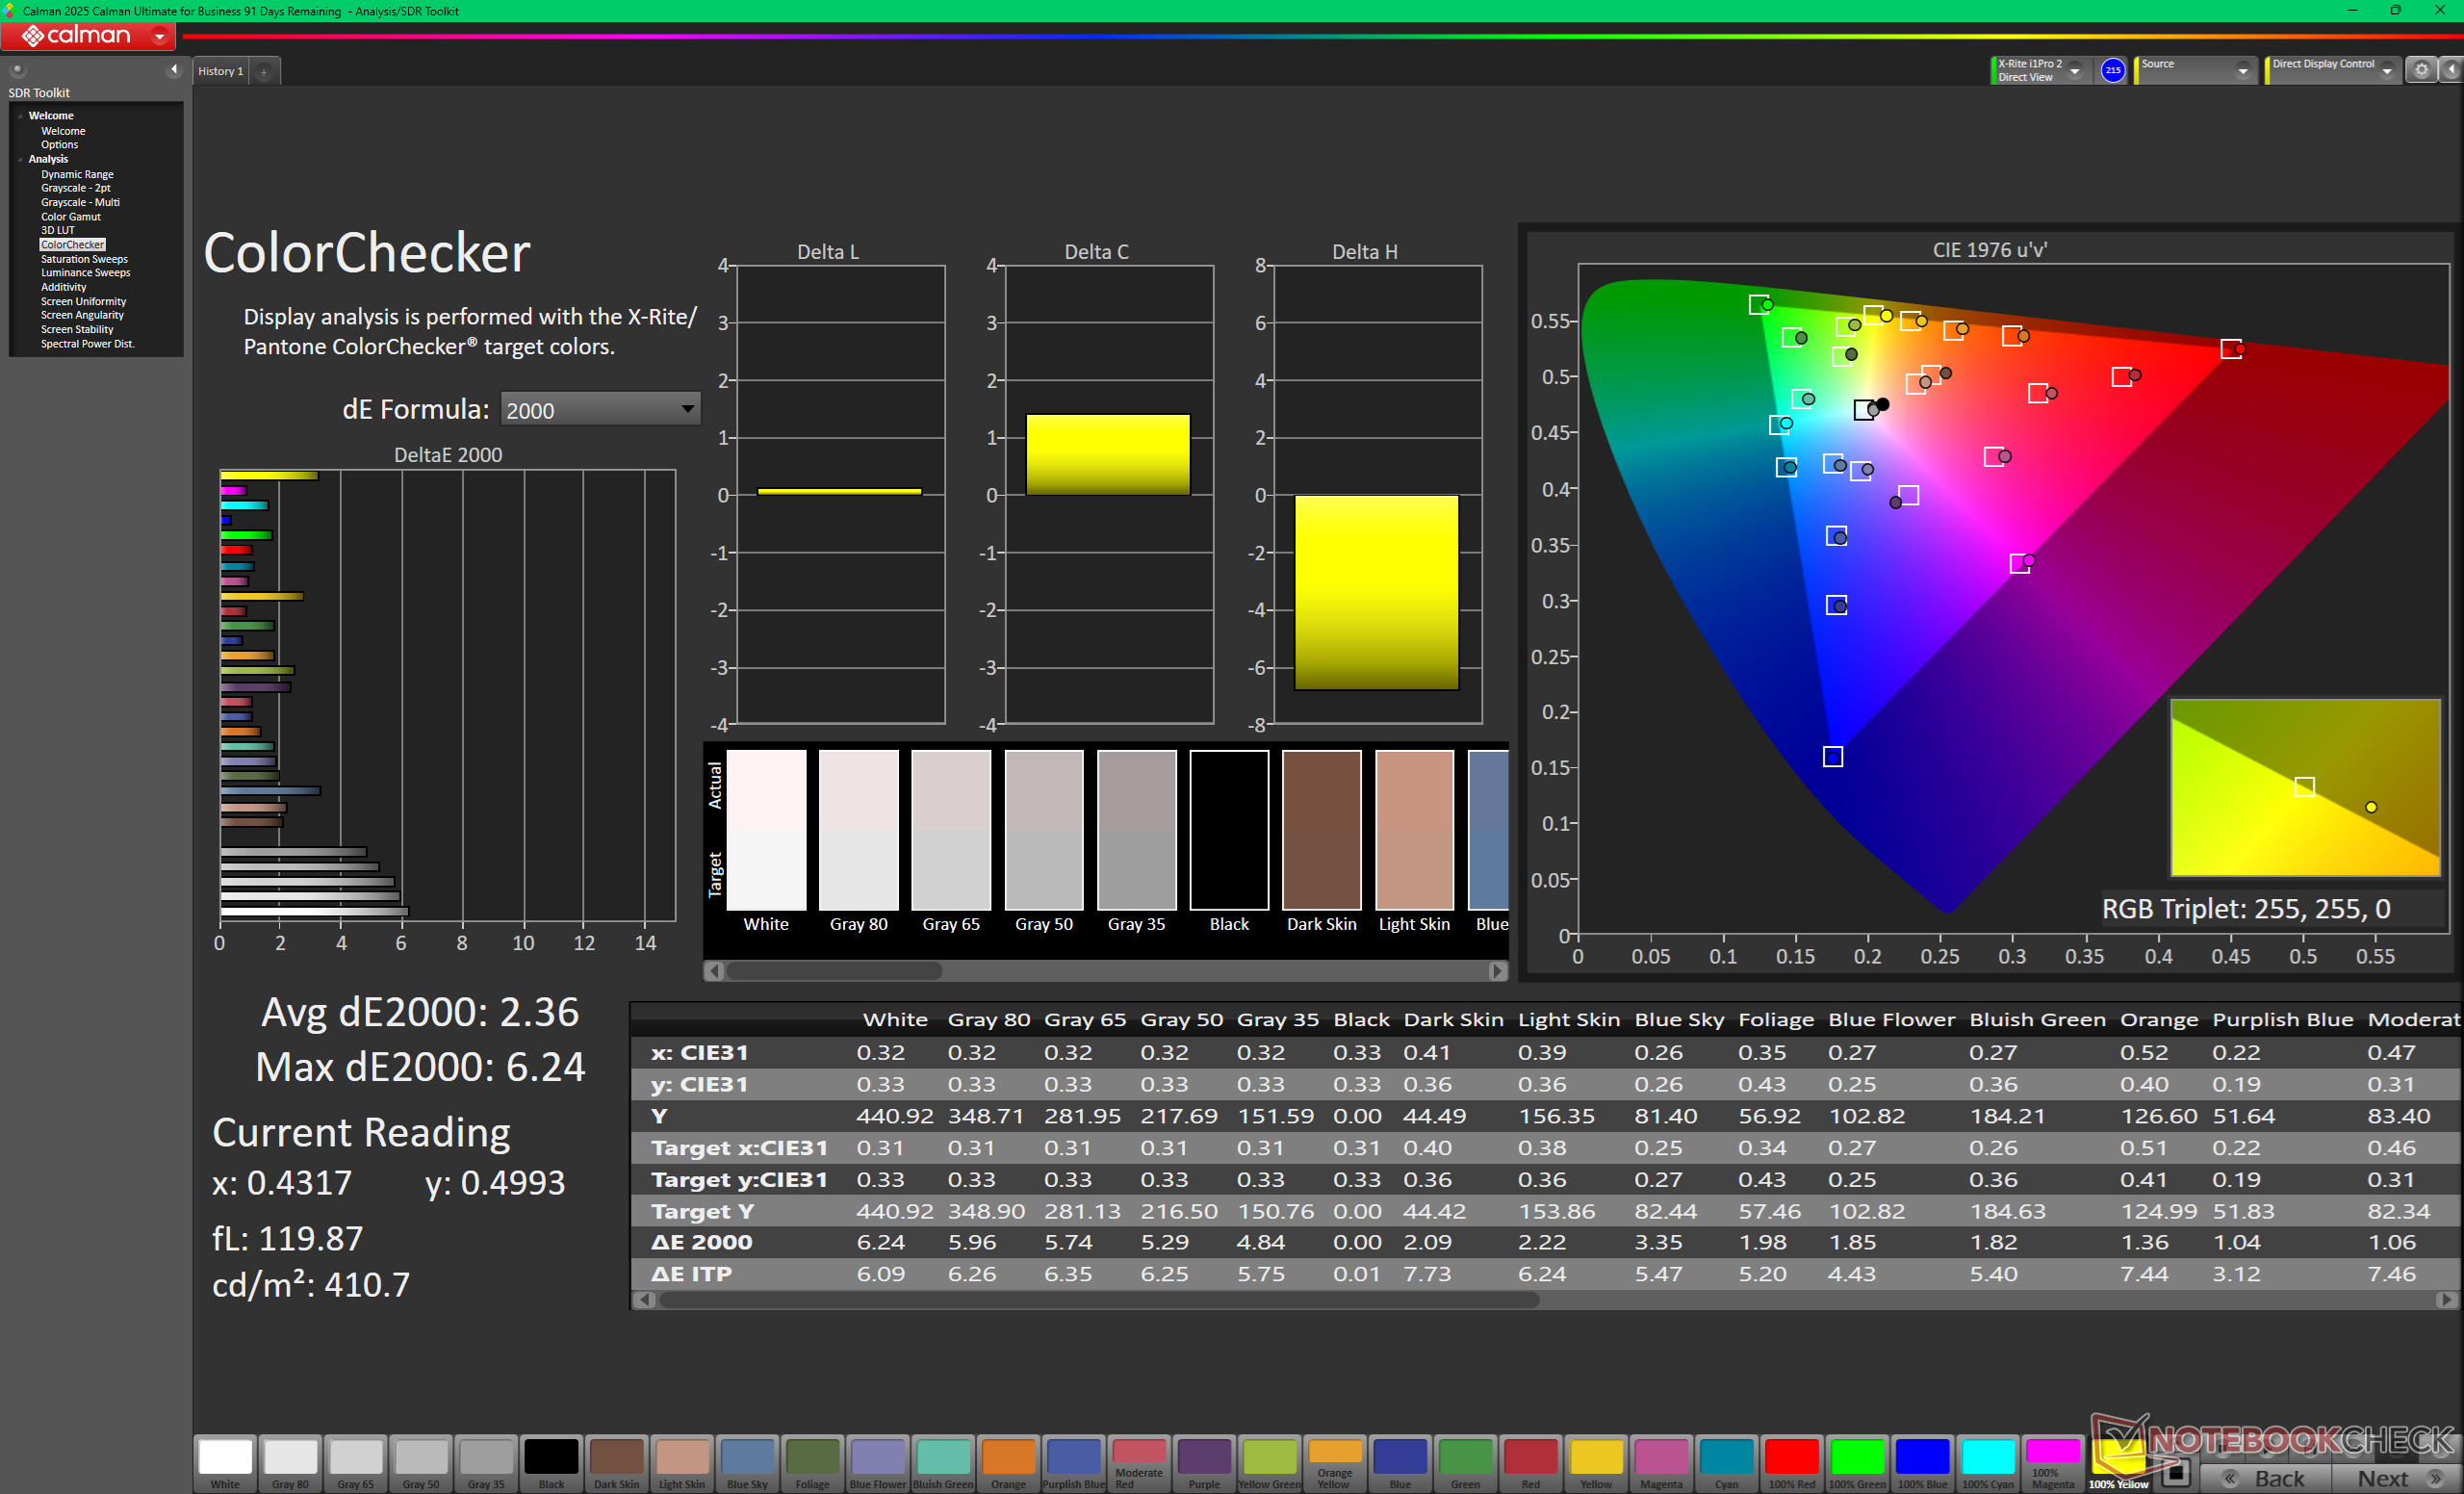
ΔE ColorChecker Calman: 2.36 | ∀{0.5-29.43 Ø4.68}
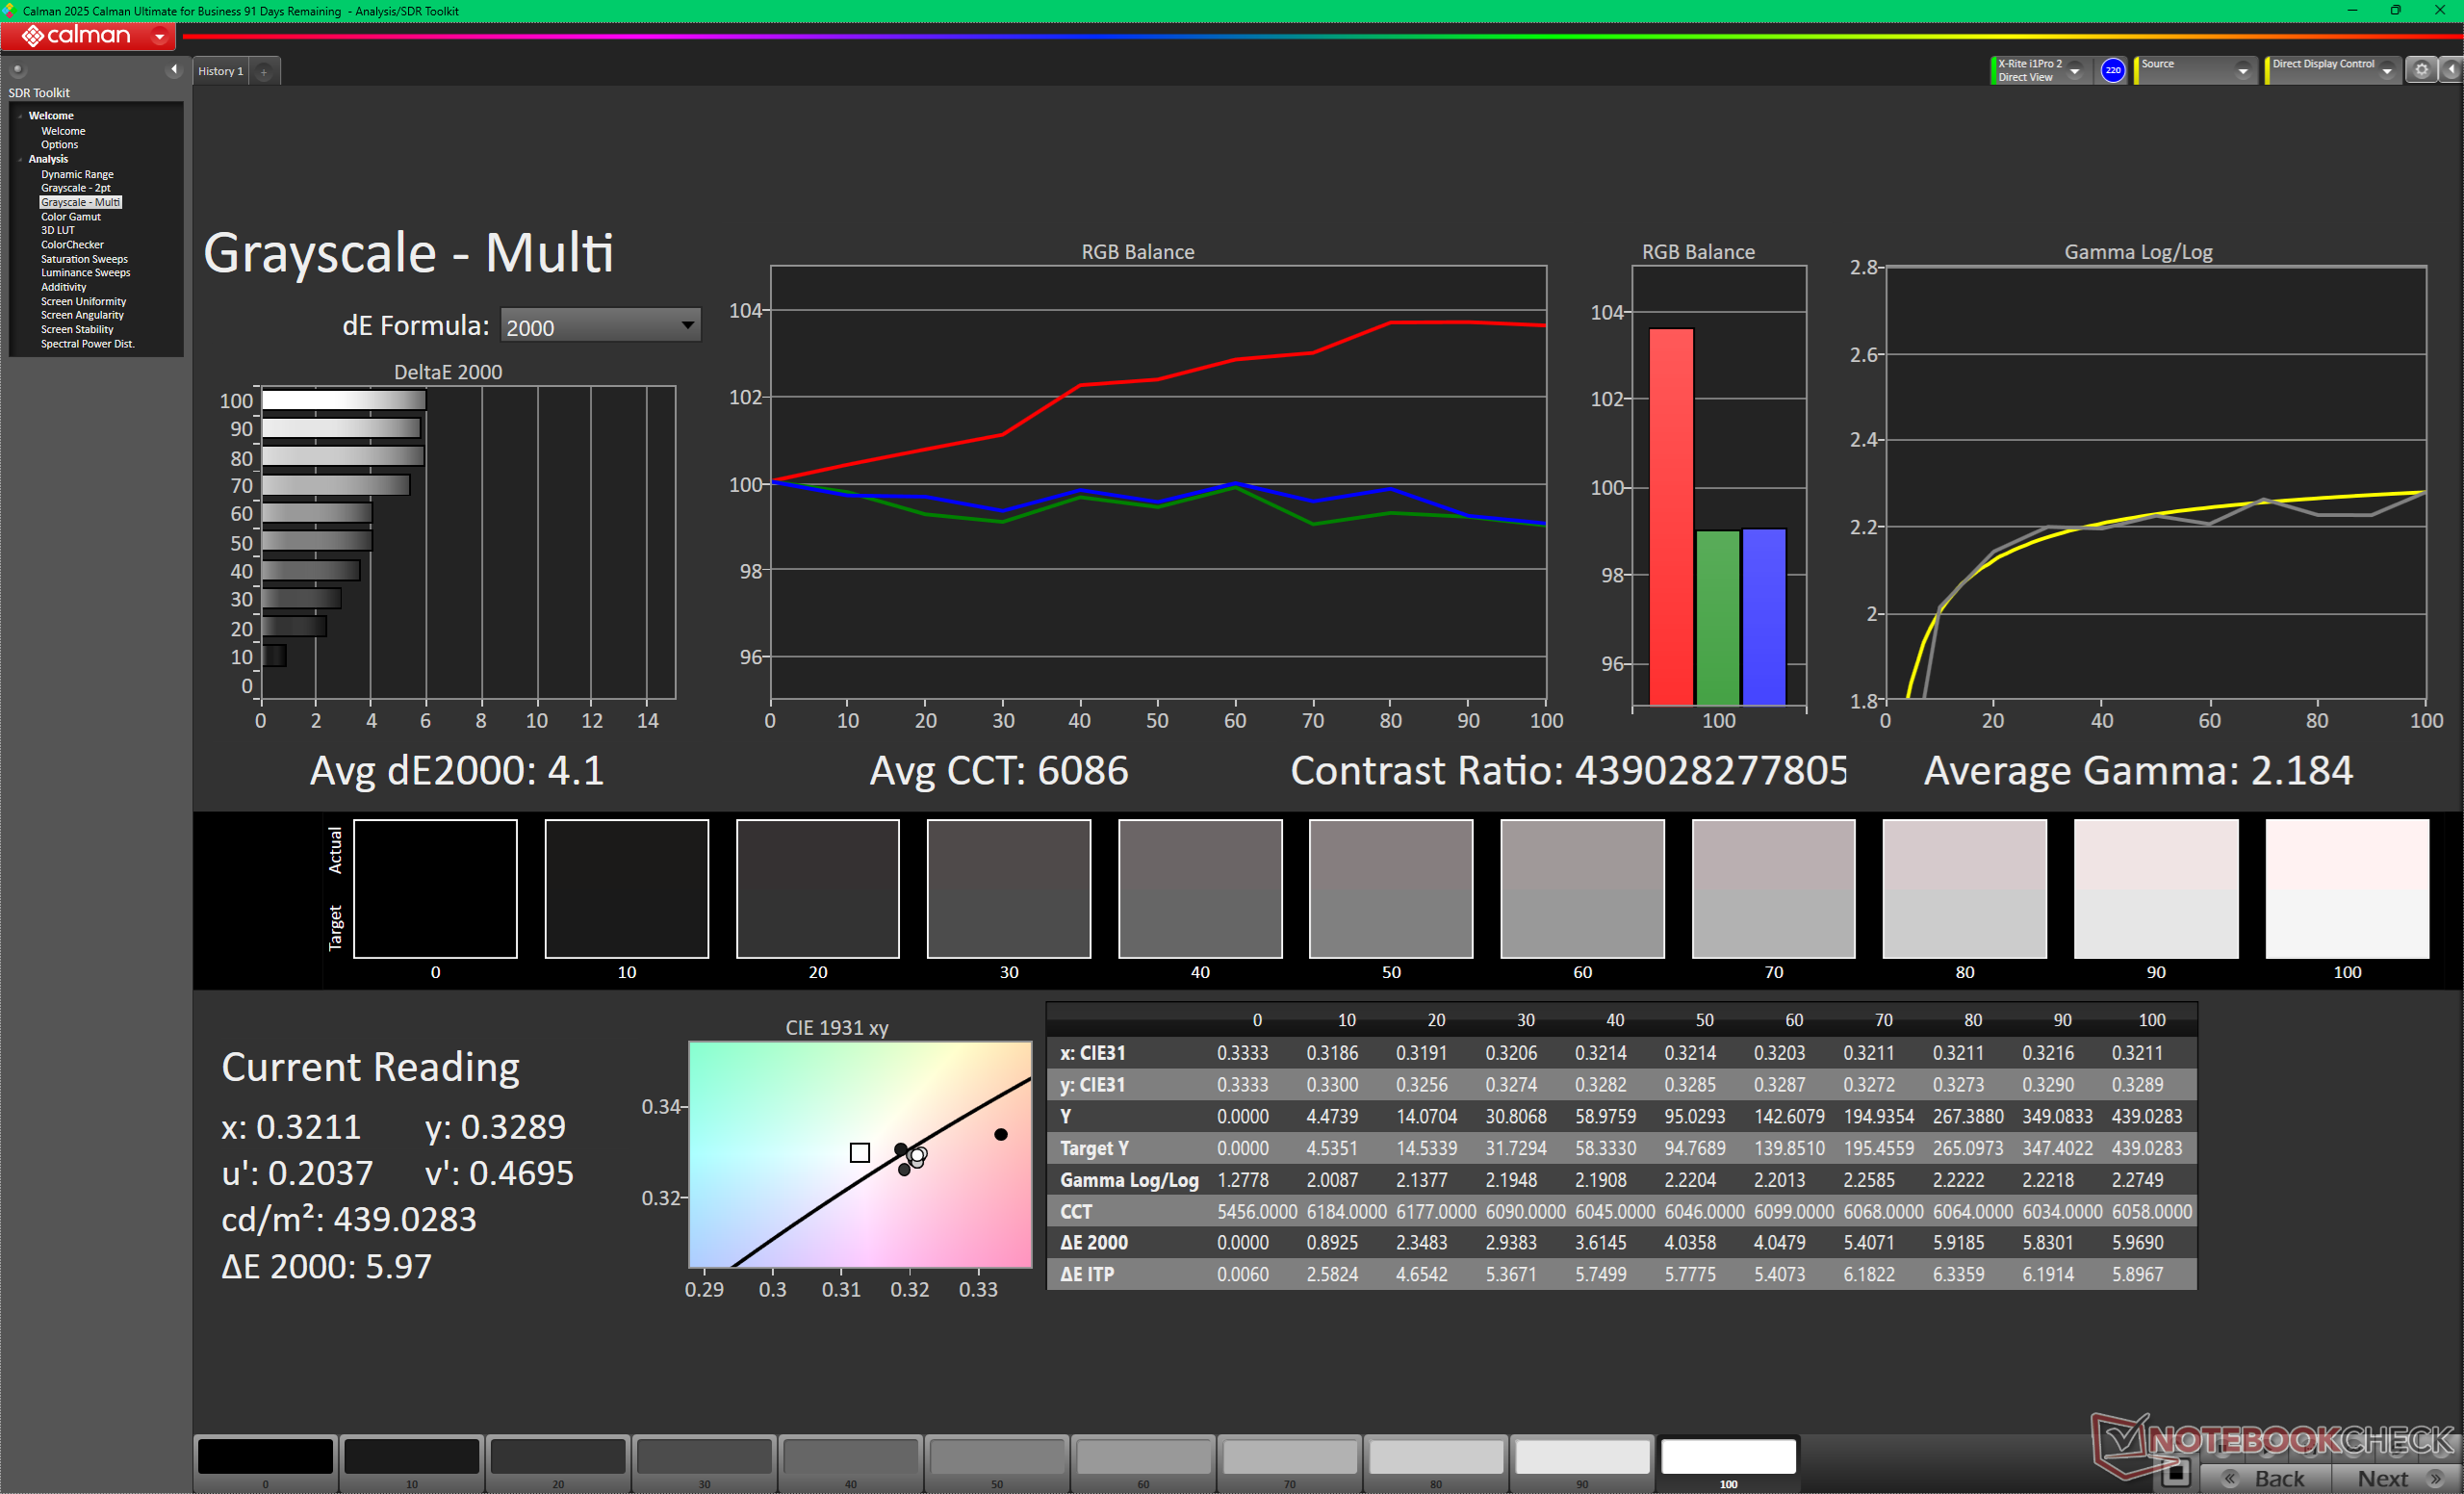
ΔE Greyscale Calman: 4.1 | ∀{0.09-98 Ø4.93}
Gamma: 2.18
CCT: 6086 K
HP OmniBook Ultra 16-bk0013dx
Samsung SDC4257, OLED, 2880x1800, 16", 120 Hz
Asus ProArt P16 H7607
ATNA60HC05-0, OLED, 3840x2400, 16", 120 Hz
MSI Stealth 16 AI B3WH
Samsung ATNA60DL07-0, OLED, 2560x1600, 16", 240 Hz
Razer Blade 16 Core Ultra 9 386H
Samsung ATNA60HU06-0, OLED, 2560x1600, 16", 240 Hz
Dell XPS 16 Core Ultra X7 358H
LG Philips 160WV1, OLED, 3200x2000, 16", 120 Hz
Lenovo ThinkPad P16 G2 21FA000FGE
MNG007DA1-9, IPS LED, 2560x1600, 16", 165 Hz
Display
60%
-49%
HDR Peak Brightness (cd/m²)
1025
1644
60%
518
-49%
Display P3 Coverage (%)
99
99.5
99.7
99.5
71
sRGB Coverage (%)
98.9
100
100
100
99.2
AdobeRGB 1998 Coverage (%)
89
97.8
93.5
96.5
73.2
Response Times
-97%
28%
28%
-13%
-1724%
Response Time Grey 50% / Grey 80% * (ms)
0.53 ?(0.26, 0.27)
2.23 ?(1.9, 0.93)
-321%
0.29 ?(0.15, 0.14)
45%
0.28 ?(0.15, 0.13)
47%
0.65 ?(0.36, 0.29)
-23%
12.8 ?(61, 6.8)
-2315%
Response Time Black / White * (ms)
0.82 ?(0.4, 0.42)
0.43 ?(0.24, 0.19)
48%
0.46 ?(0.22, 0.24)
44%
0.4 ?(0.2, 0.2)
51%
0.87 ?(0.43, 0.44)
-6%
10.1 ?(5.8, 4.3)
-1132%
PWM Frequency (Hz)
963
960 ?(79)
960.2
1441
240.2 ?(100)
PWM Amplitude * (%)
28
33
-18%
29
-4%
32
-14%
31
-11%
Screen
35%
30%
13%
-8%
8%
Brightness middle (cd/m²)
434.3
717
65%
384.8
-11%
462.2
6%
395.4
-9%
510
17%
Brightness (cd/m²)
435
722
66%
389
-11%
465
7%
392
-10%
517
19%
Brightness Distribution (%)
97
98
1%
98
1%
97
0%
95
-2%
89
-8%
Black Level * (cd/m²)
0.03
0.37
Colorchecker dE 2000 *
2.36
1.6
32%
0.7
70%
3.03
-28%
3.69
-56%
2.6
-10%
Colorchecker dE 2000 max. *
6.24
4.8
23%
2.95
53%
5.84
6%
7.94
-27%
5.2
17%
Greyscale dE 2000 *
4.1
3.3
20%
1
76%
0.6
85%
1.9
54%
3.6
12%
Gamma
2.18 101%
2.19 100%
2.2 100%
2.2 100%
2.28 96%
2.26 97%
CCT
6086 107%
6547 99%
6573 99%
6452 101%
6274 104%
5969 109%
Contrast (:1)
23900
1378
Colorchecker dE 2000 calibrated *
0.44
0.6
0.68
2.3
Total Average (Program / Settings)
-1% / -2%
29% / 29%
21% / 18%
-23% / -14%
-858% / -425%

* ... smaller is better

Grayscale
Grayscale
Saturation Sweeps
Saturation Sweeps
ColorChecker
ColorChecker

Display Response Times

ℹ
Display response times show how fast the screen is able to change from one color to the next. Slow response times can lead to afterimages and can cause moving objects to appear blurry (ghosting). Gamers of fast-paced 3D titles should pay special attention to fast response times.
   ↔    Response Time Black to White
0.82 ms ... rise ↗ and fall ↘ combined↗ 0.4 ms rise
↘ 0.42 ms fall
The screen shows very fast response rates in our tests and should be very well suited for fast-paced gaming.
In comparison, all tested devices range from 0.1 (minimum) to 240 (maximum) ms. » 3 % of all devices are better.
This means that the measured response time is better than the average of all tested devices (19.6 ms).
   ↔    Response Time 50% Grey to 80% Grey
0.53 ms ... rise ↗ and fall ↘ combined↗ 0.26 ms rise
↘ 0.27 ms fall
The screen shows very fast response rates in our tests and should be very well suited for fast-paced gaming.
In comparison, all tested devices range from 0.13 (minimum) to 636 (maximum) ms. » 1 % of all devices are better.
This means that the measured response time is better than the average of all tested devices (30.7 ms).

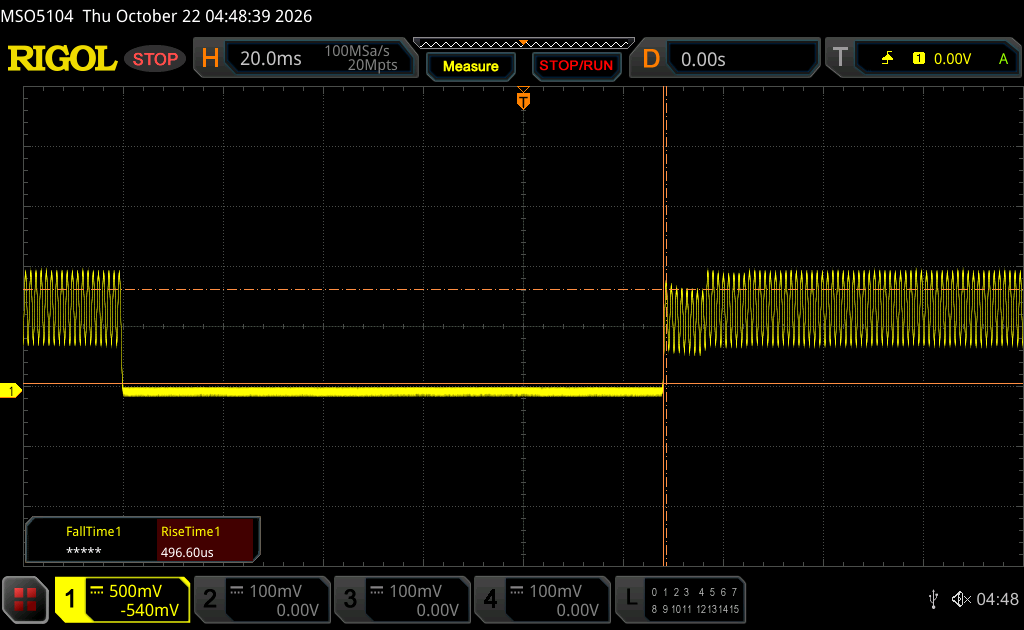
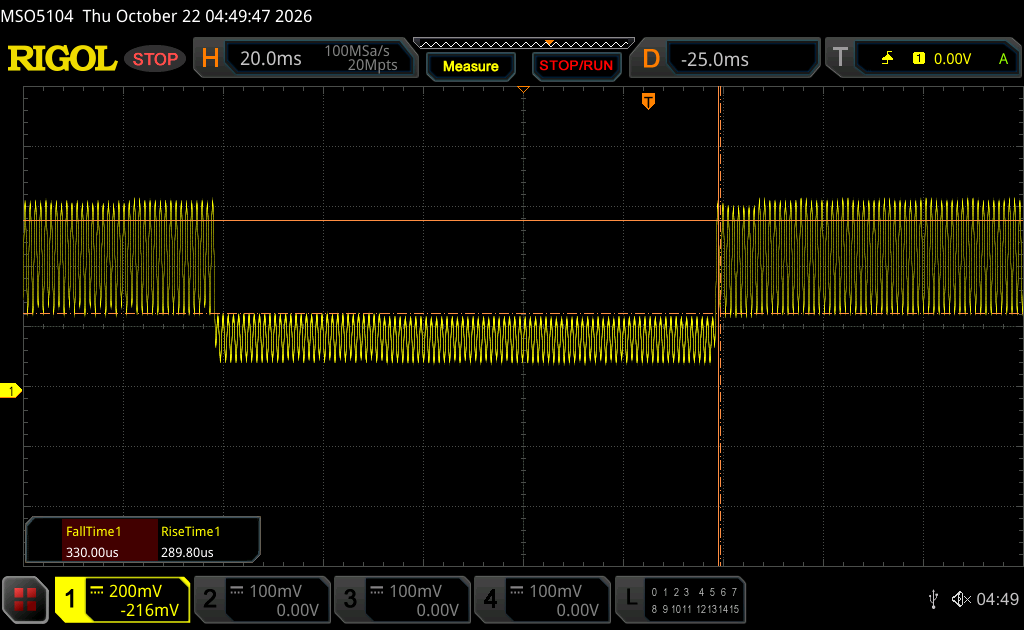
Screen Flickering / PWM (Pulse-Width Modulation)

ℹ
To dim the screen, some notebooks will simply cycle the backlight on and off in rapid succession - a method called Pulse Width Modulation (PWM) . This cycling frequency should ideally be undetectable to the human eye. If said frequency is too low, users with sensitive eyes may experience strain or headaches or even notice the flickering altogether.
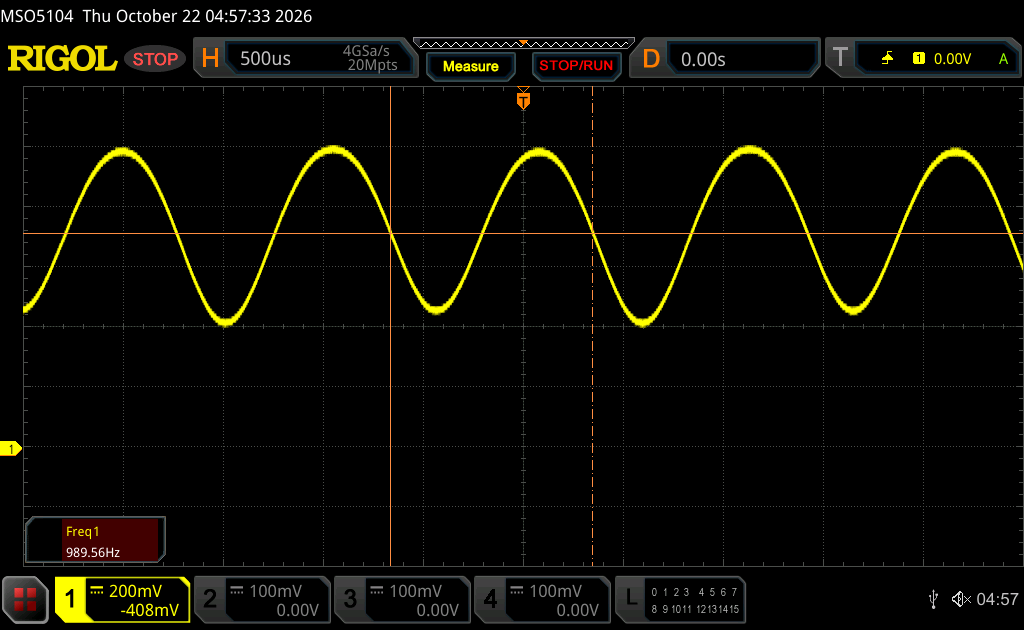
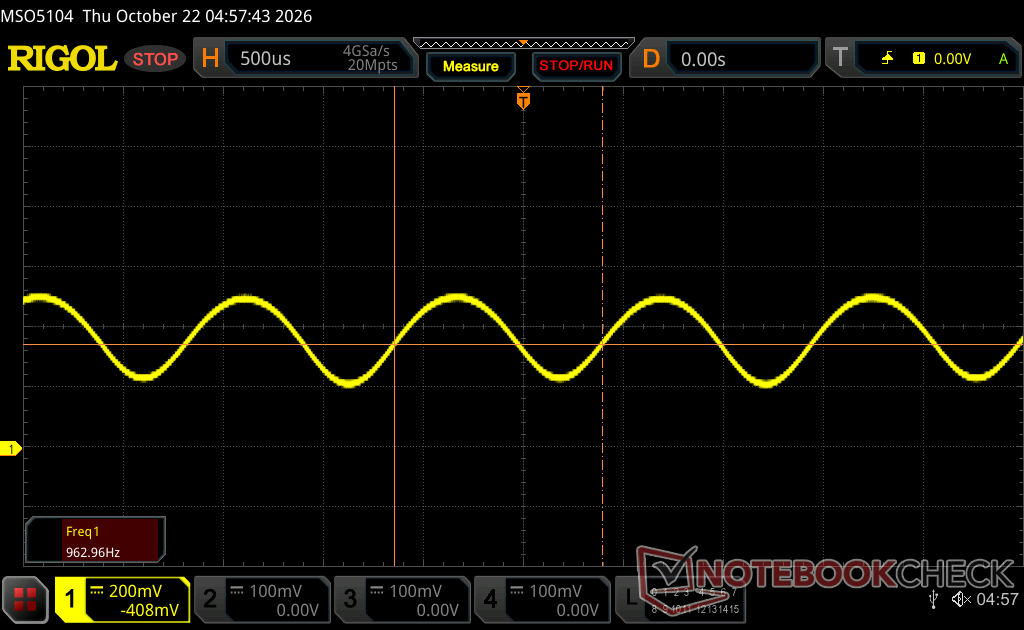
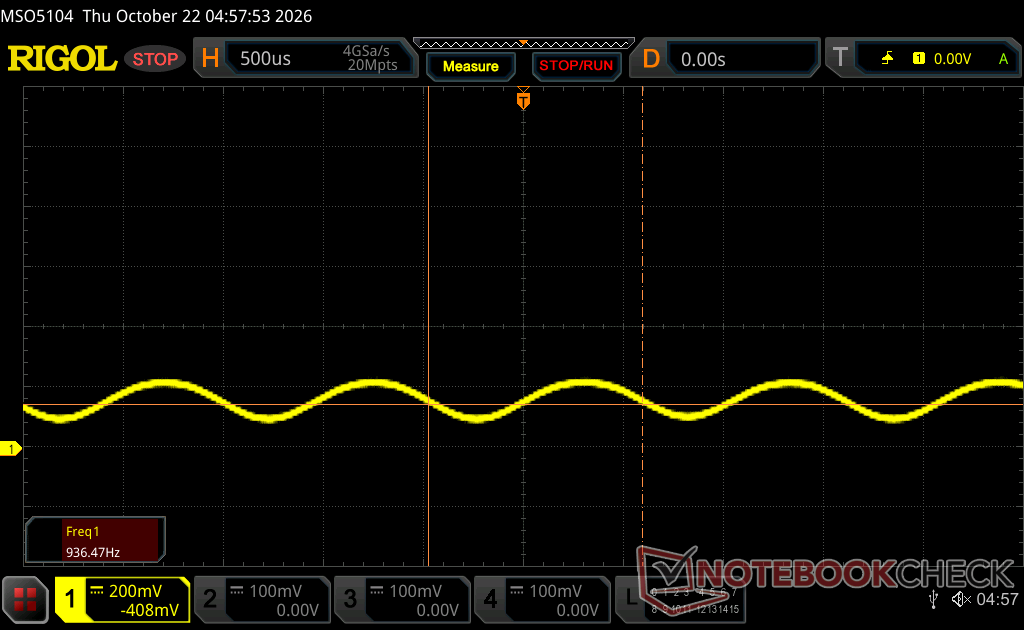
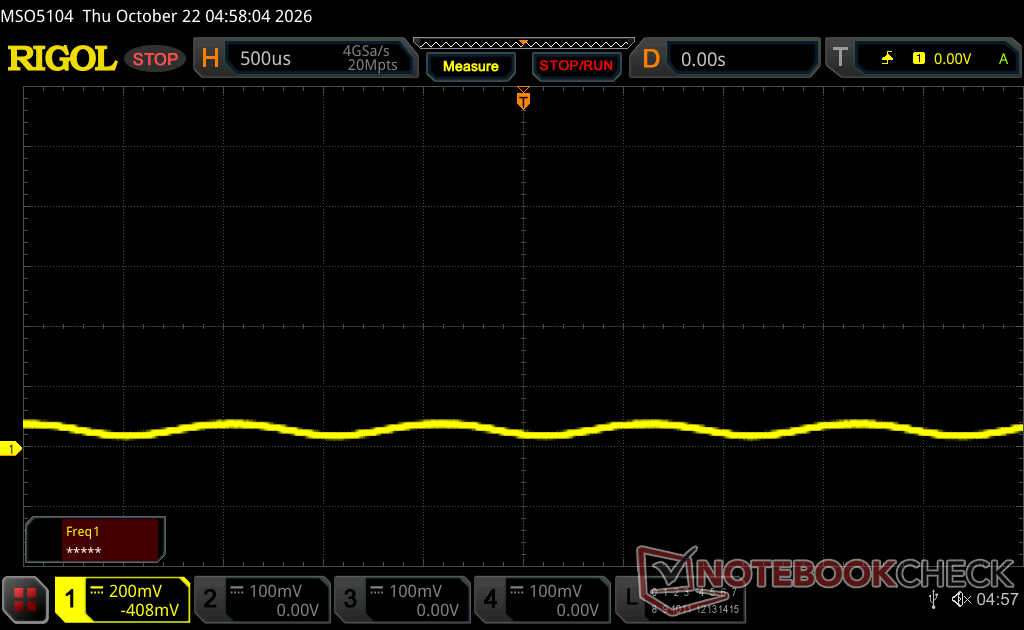
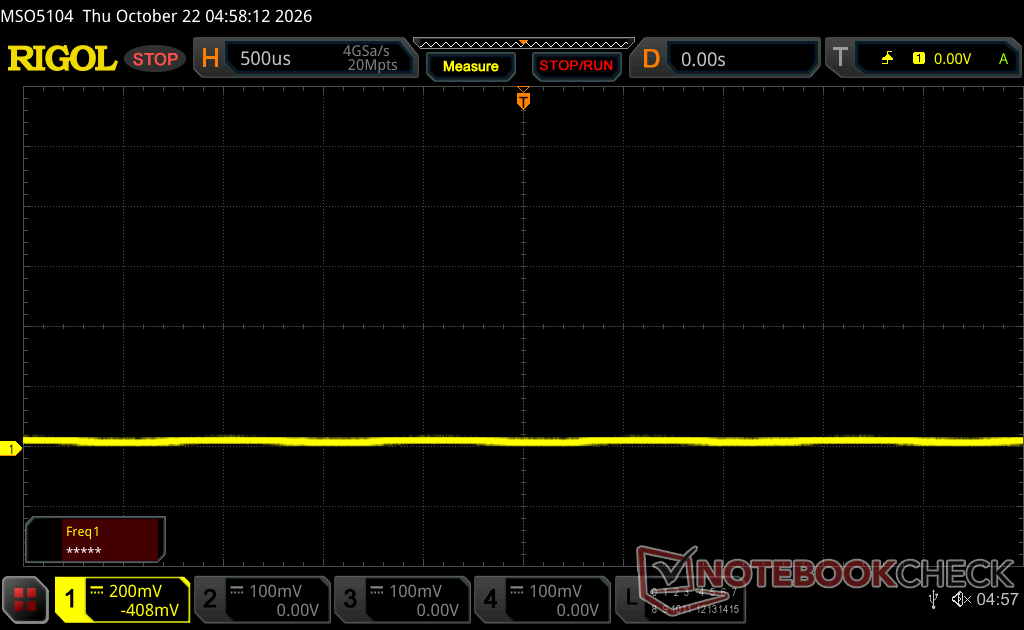
Screen flickering / PWM detected 963 Hz
Amplitude: 28 %

The display backlight flickers at 963 Hz (worst case, e.g., utilizing PWM) .

The frequency of 963 Hz is quite high, so most users sensitive to PWM should not notice any flickering.

In comparison: 52 % of all tested devices do not use PWM to dim the display. If PWM was detected, an average of 7572 (minimum: 5 - maximum: 343500) Hz was measured.

100 percent brightness
75 percent brightness
50 percent brightness
25 percent brightness
0 percent brightness
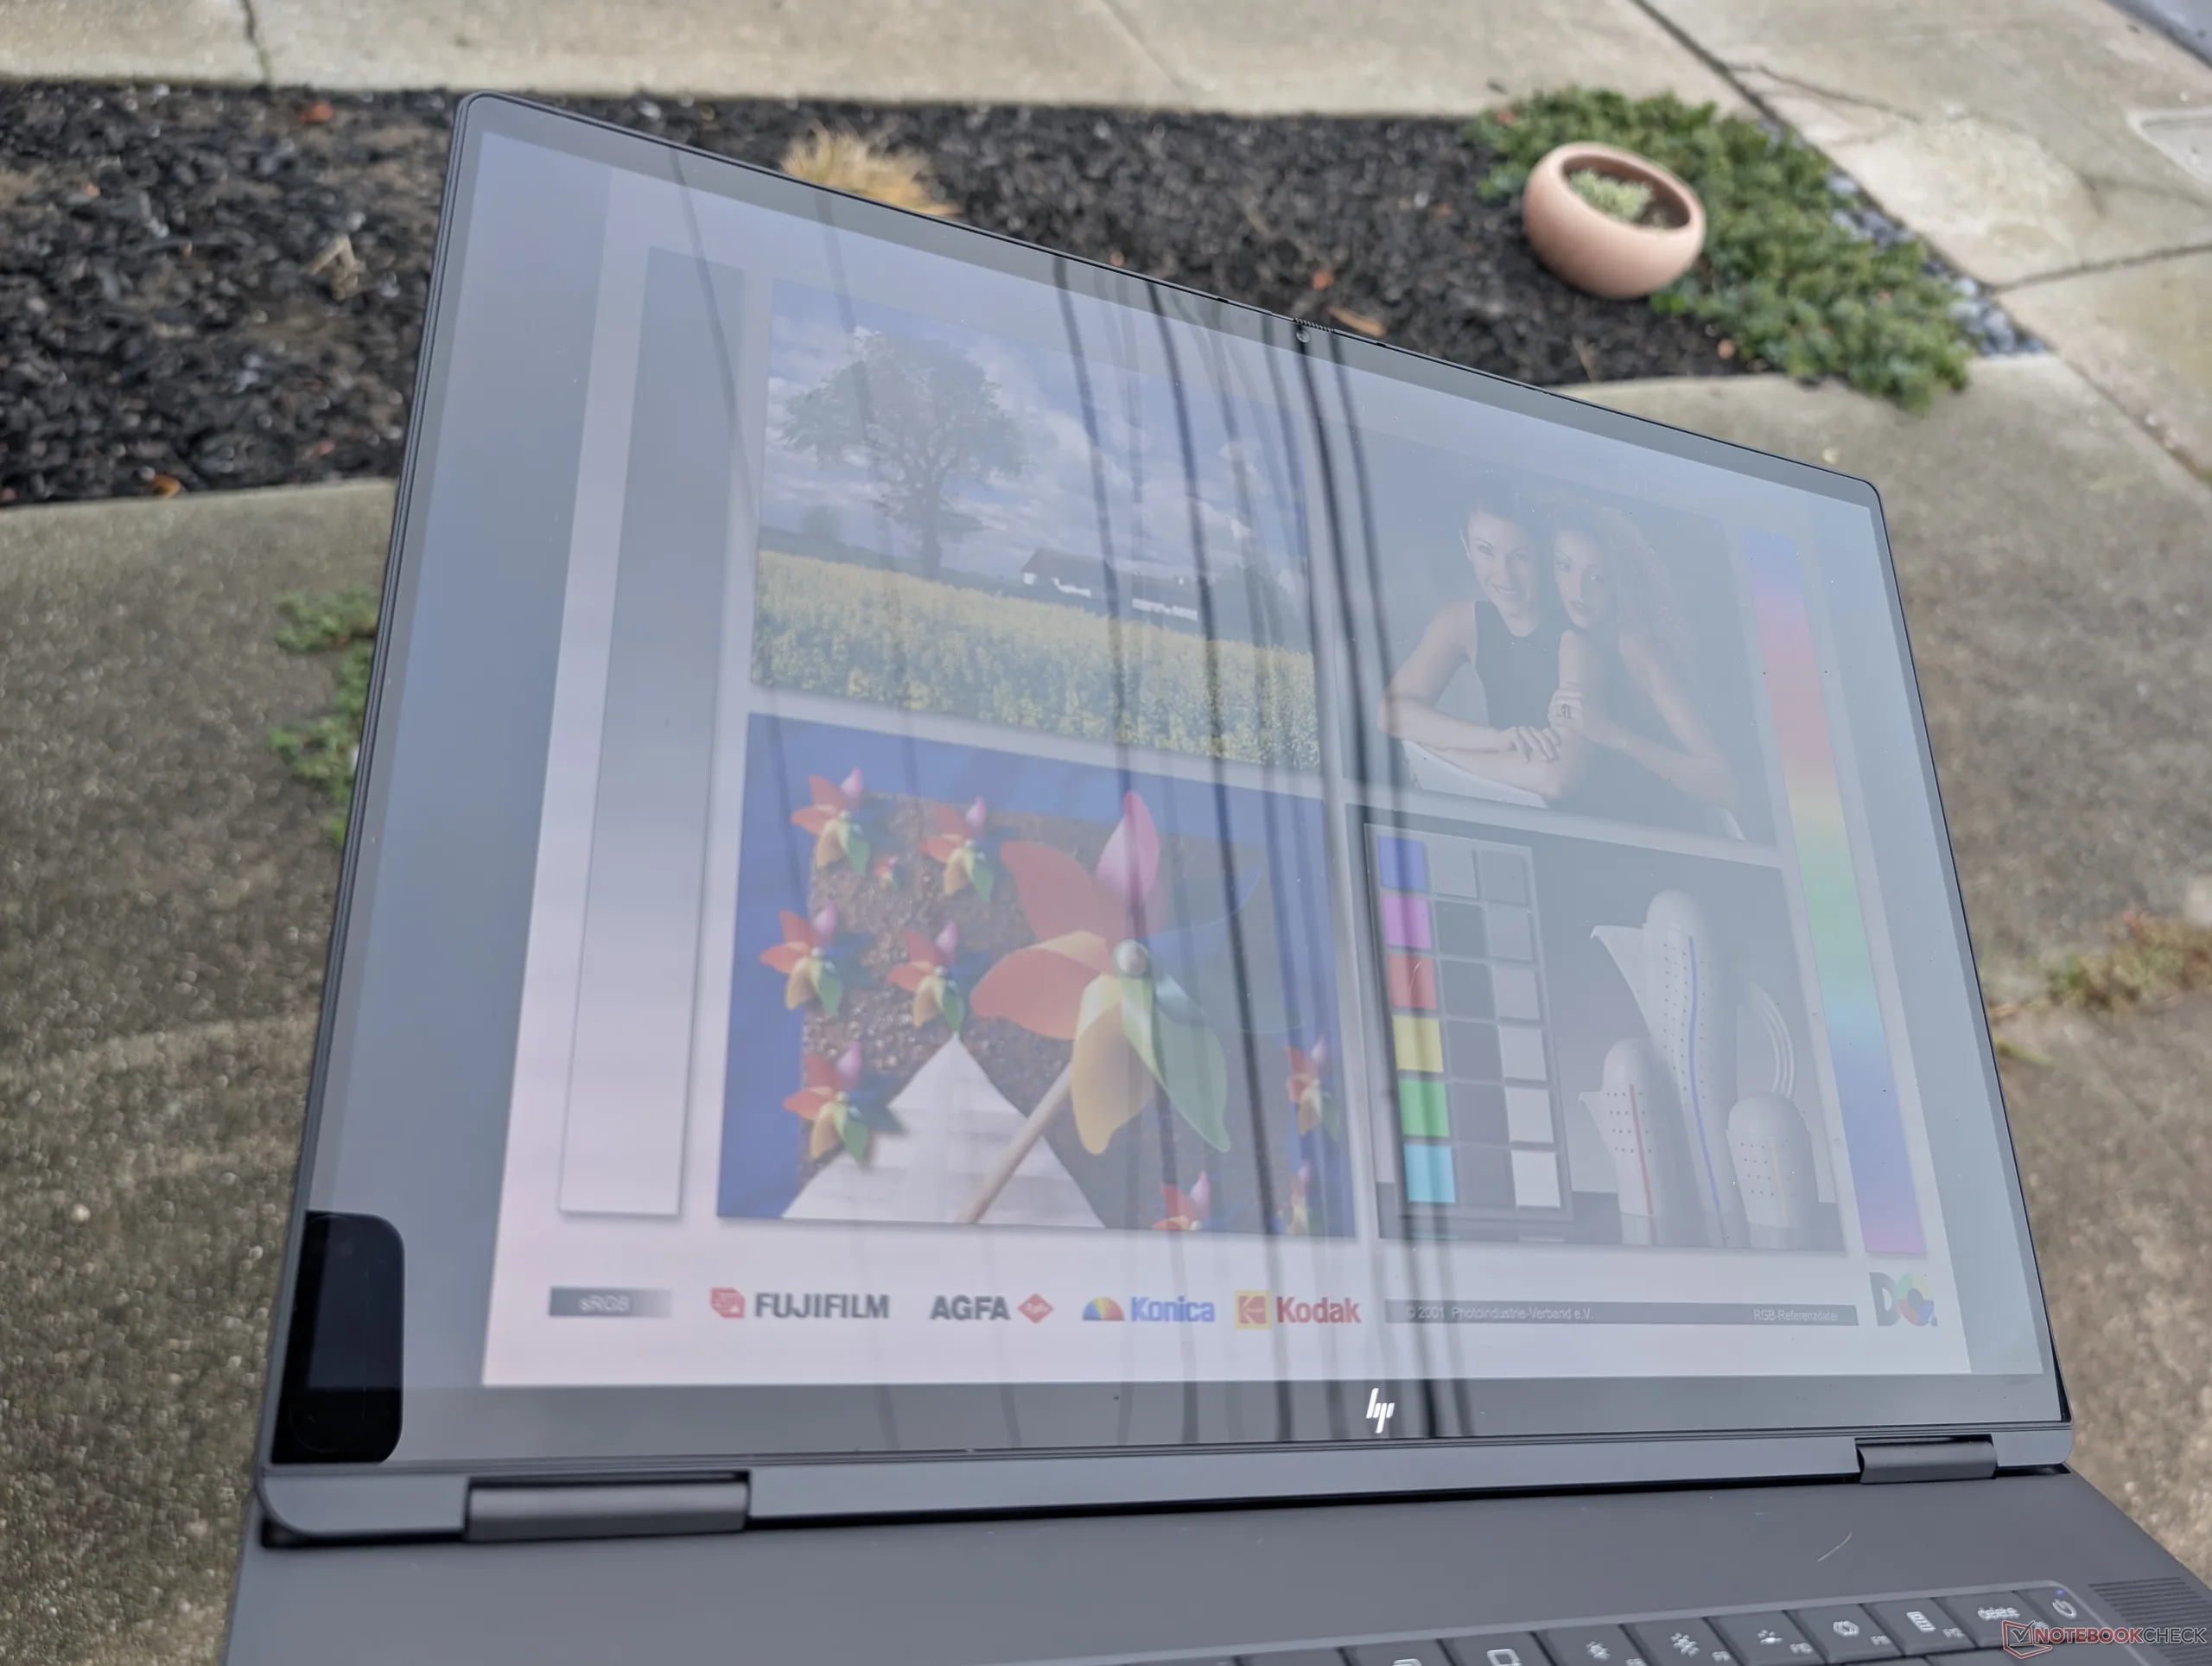
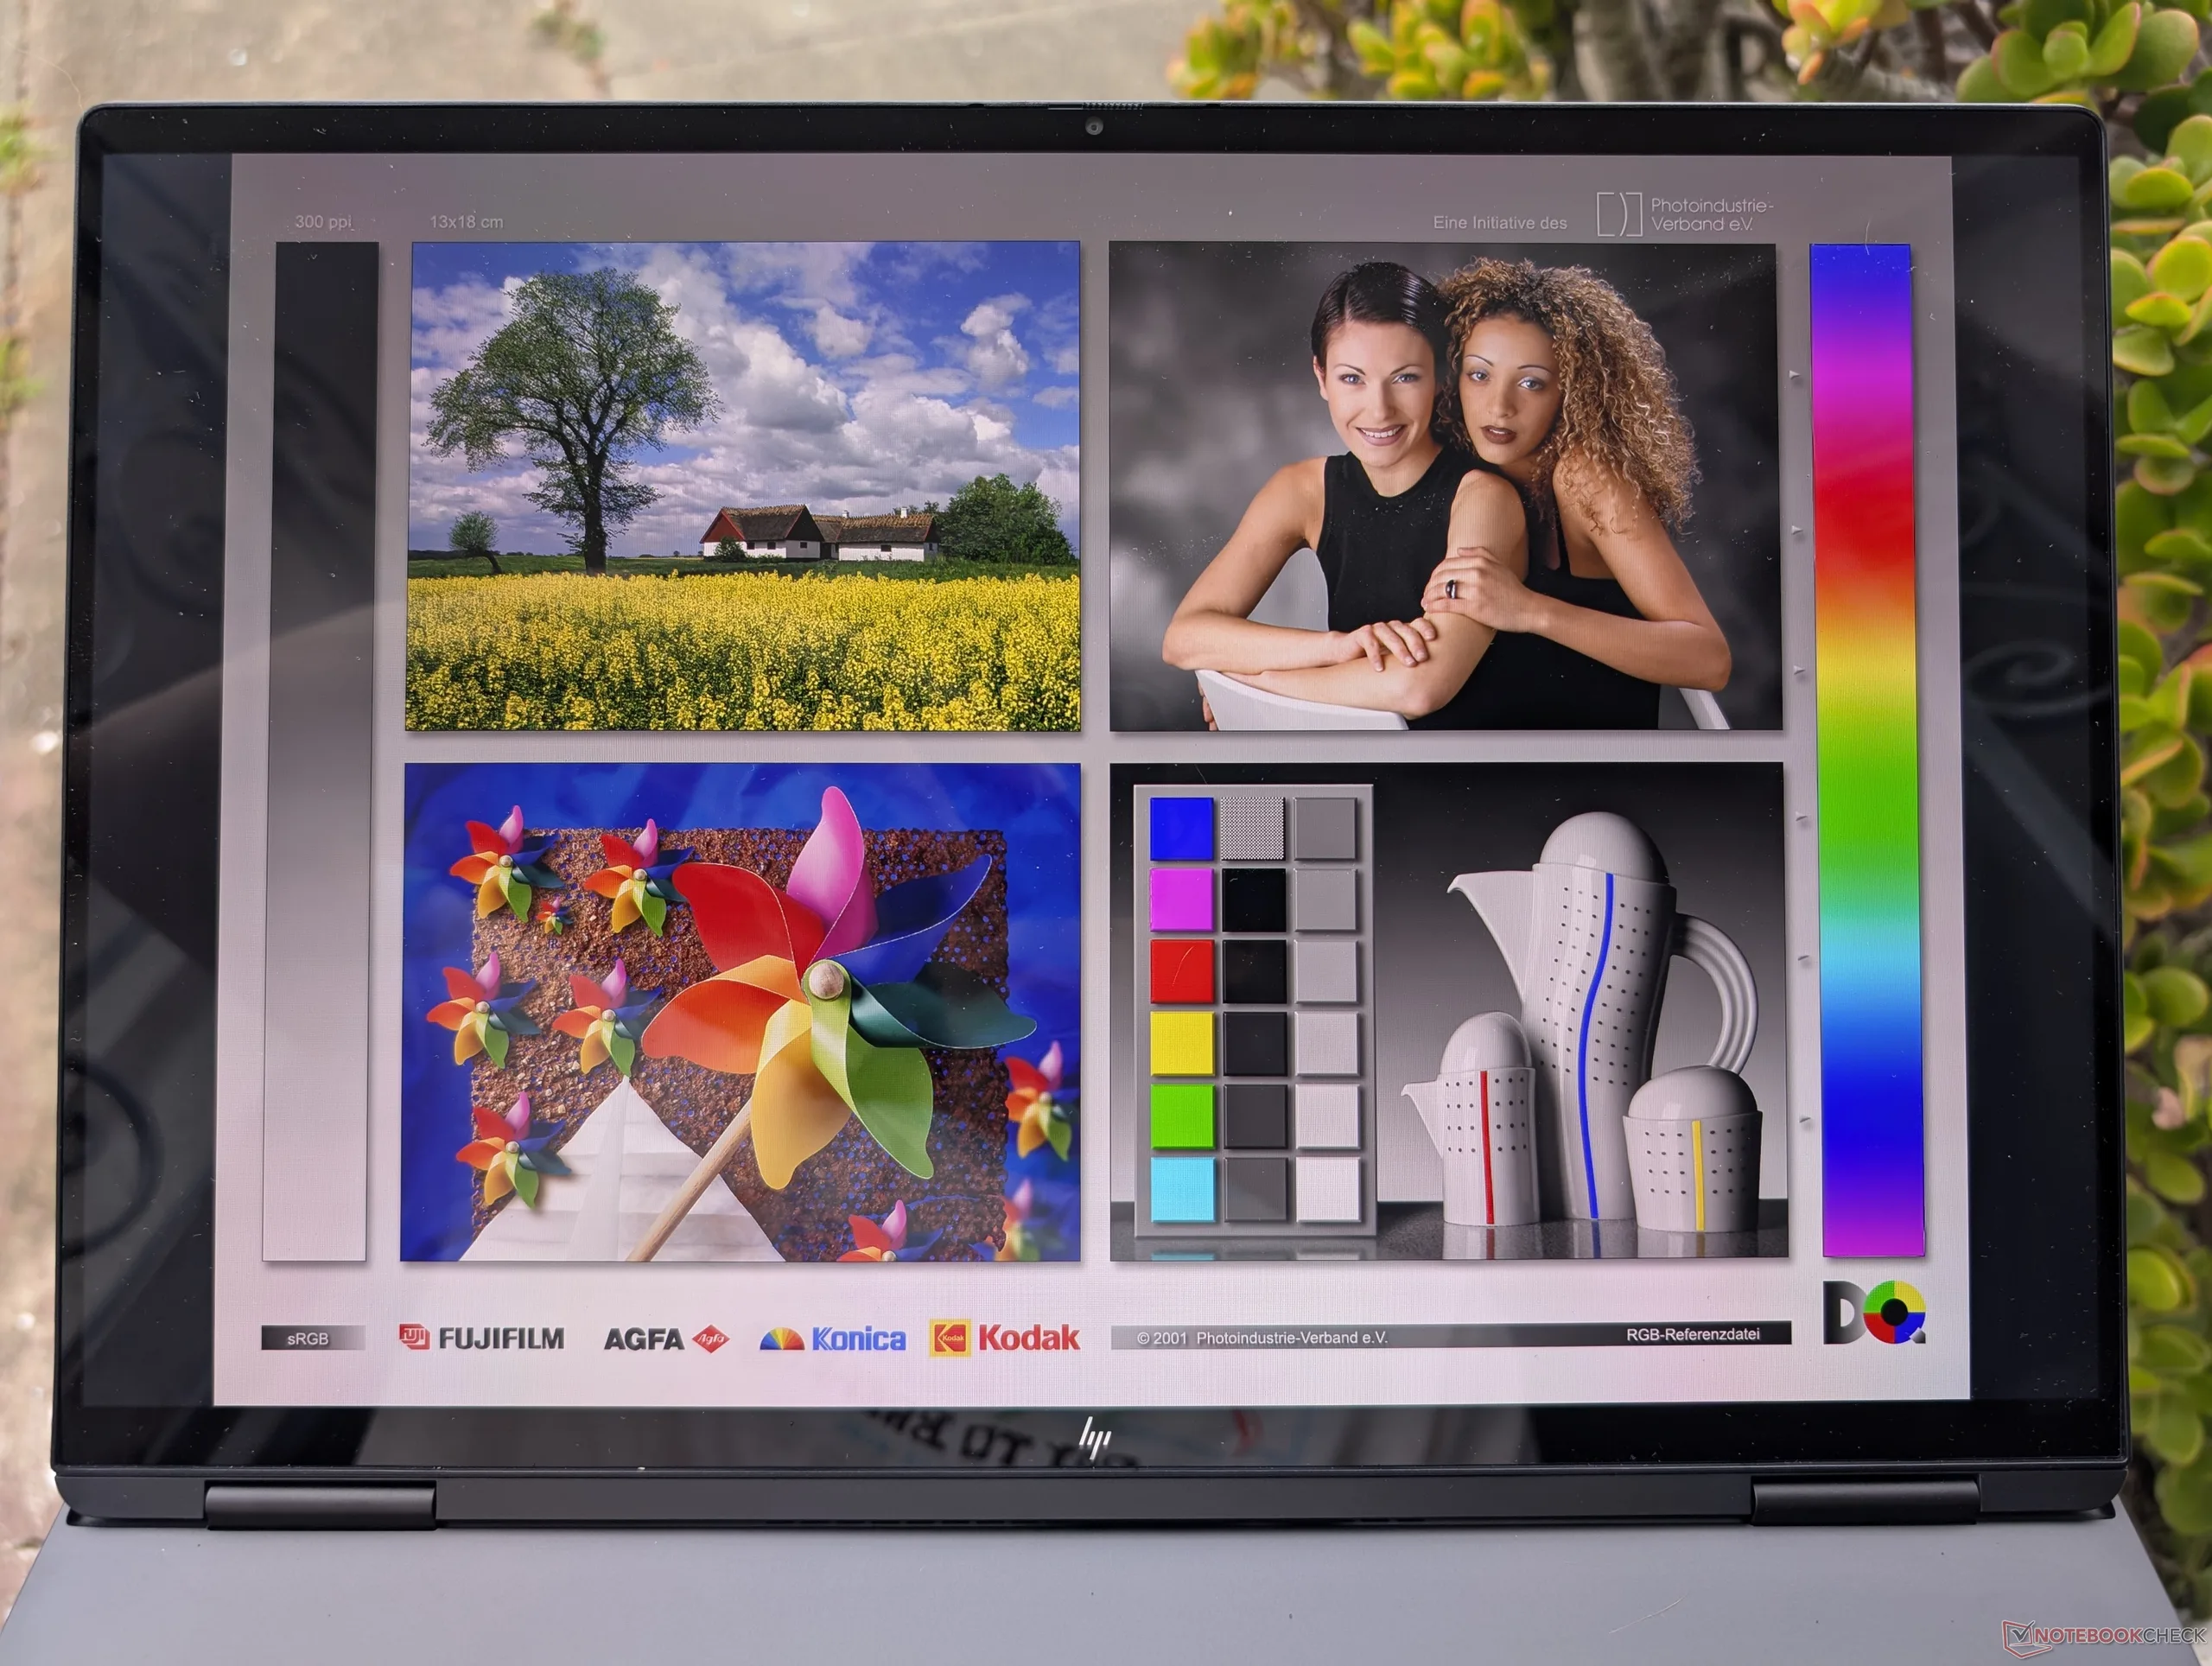
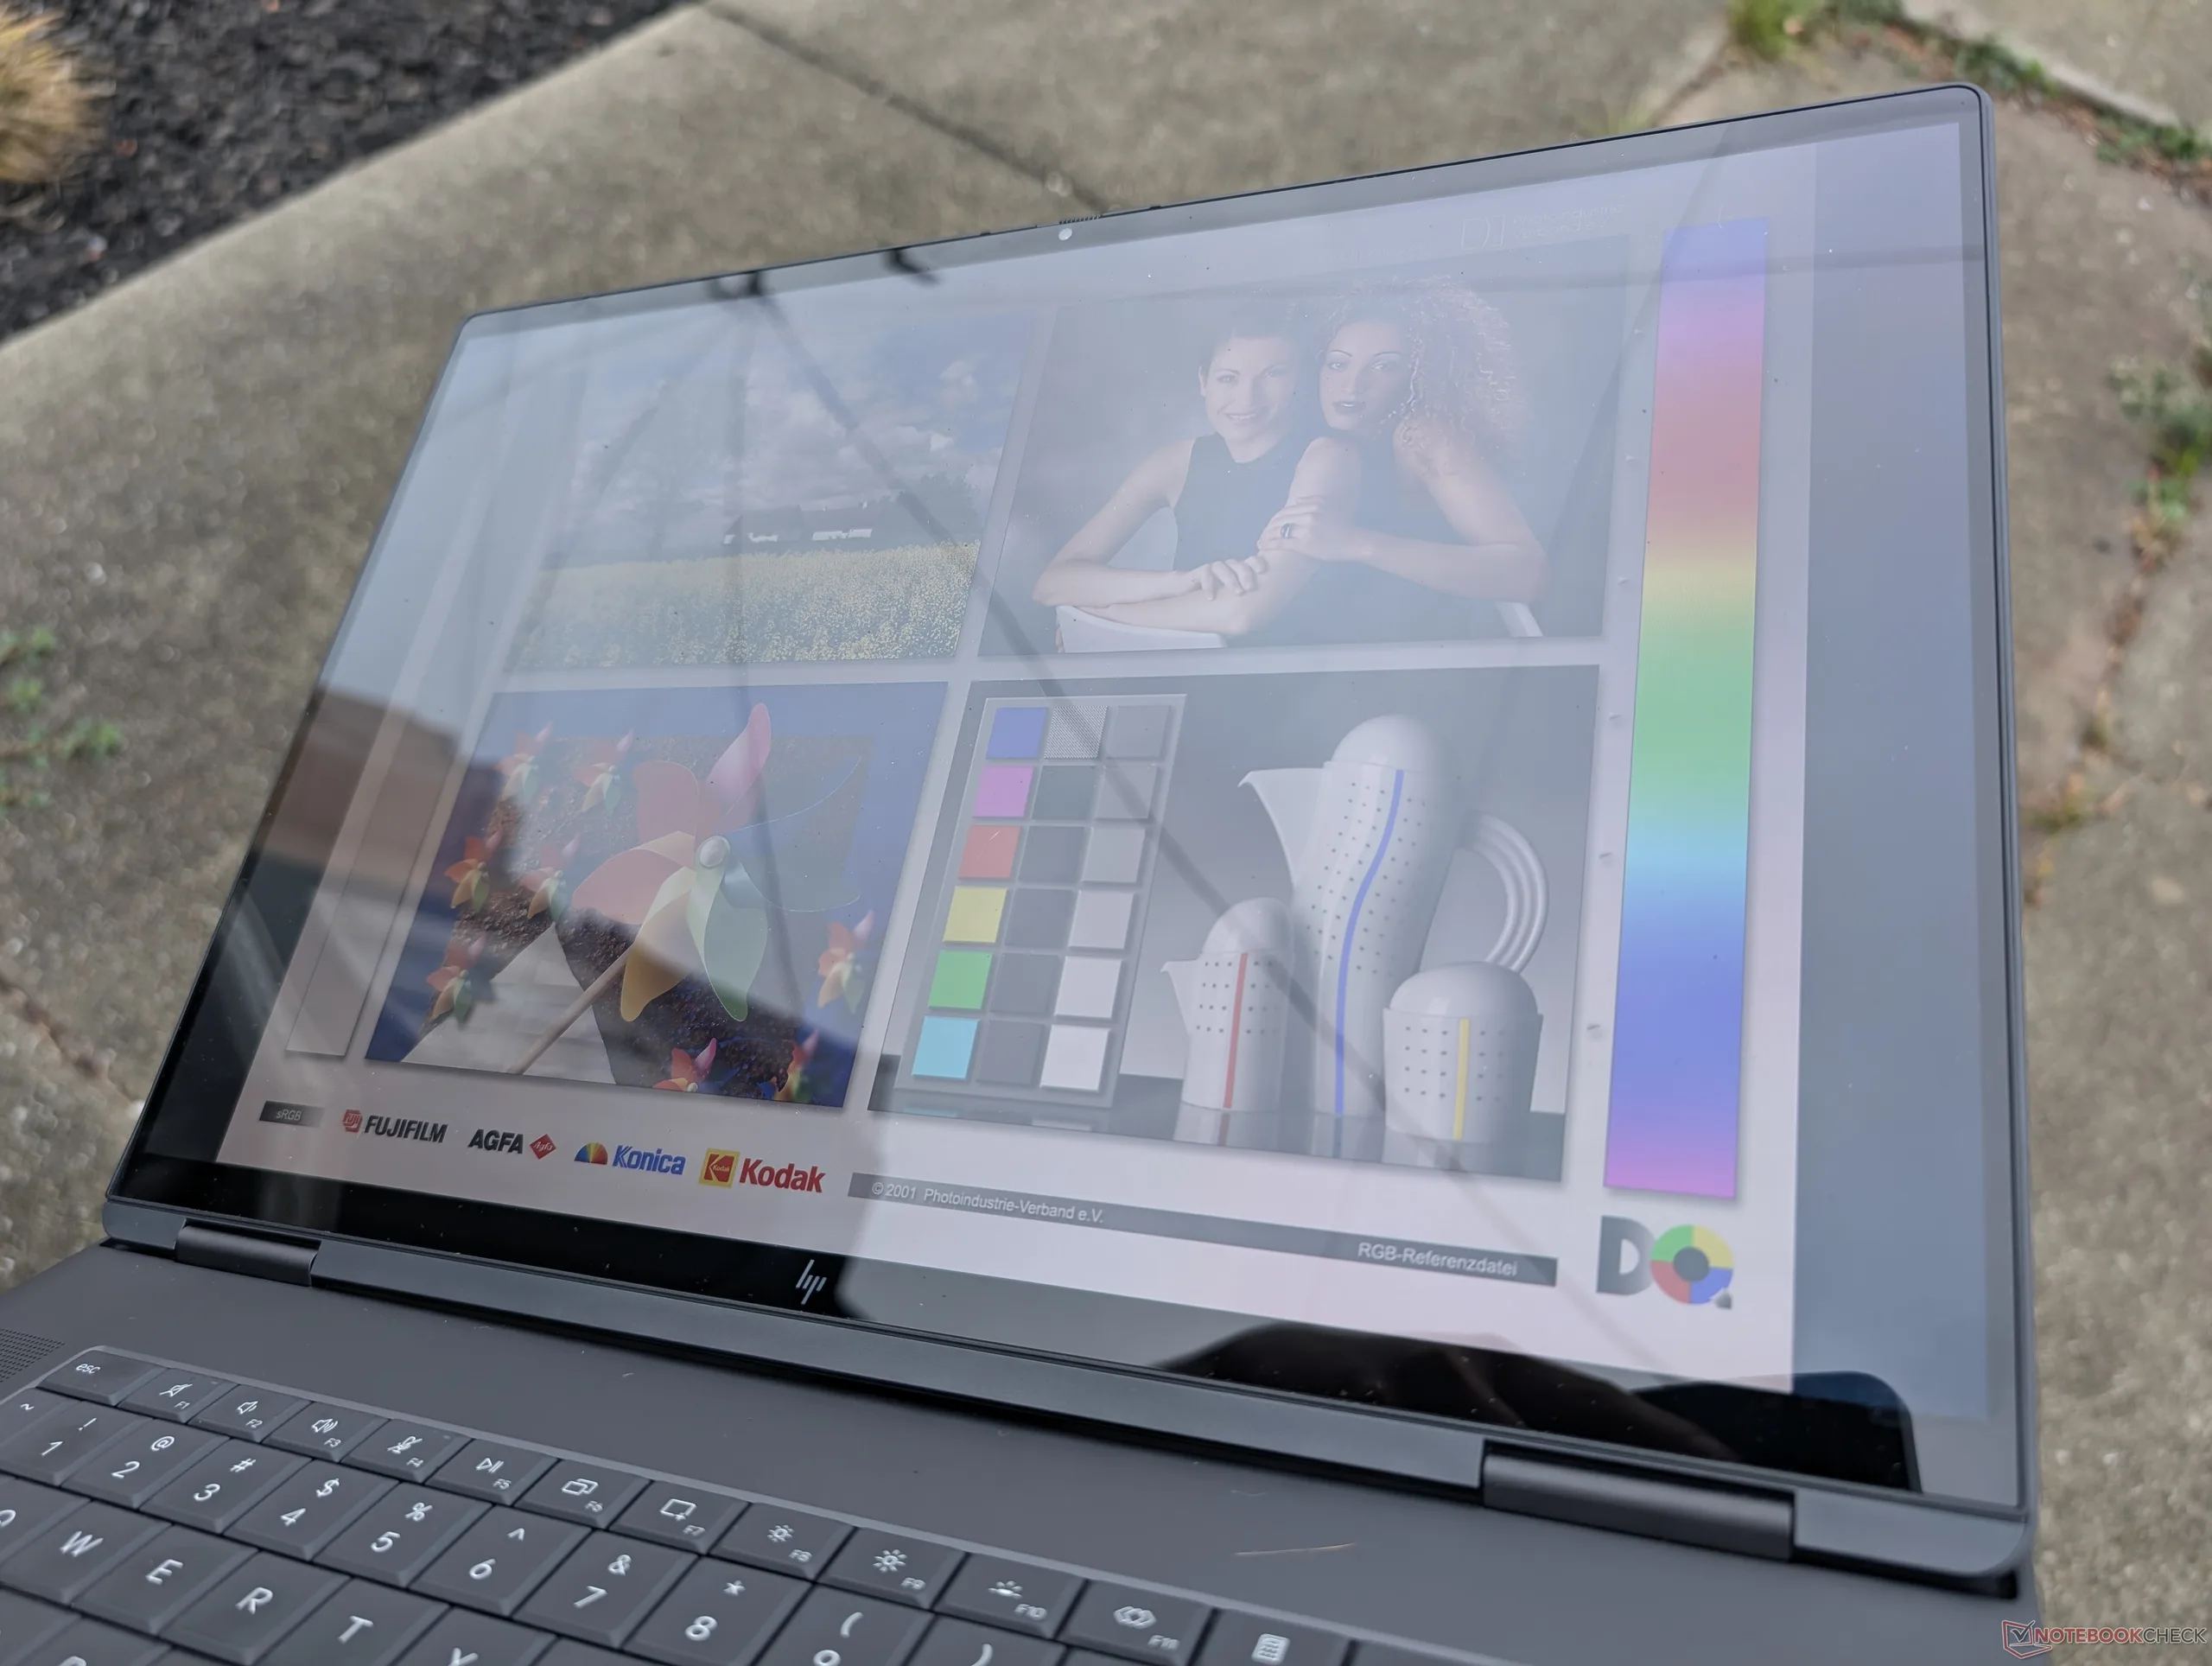
Outdoors under bright overcast
Outdoors under shade
Outdoors under bright overcast
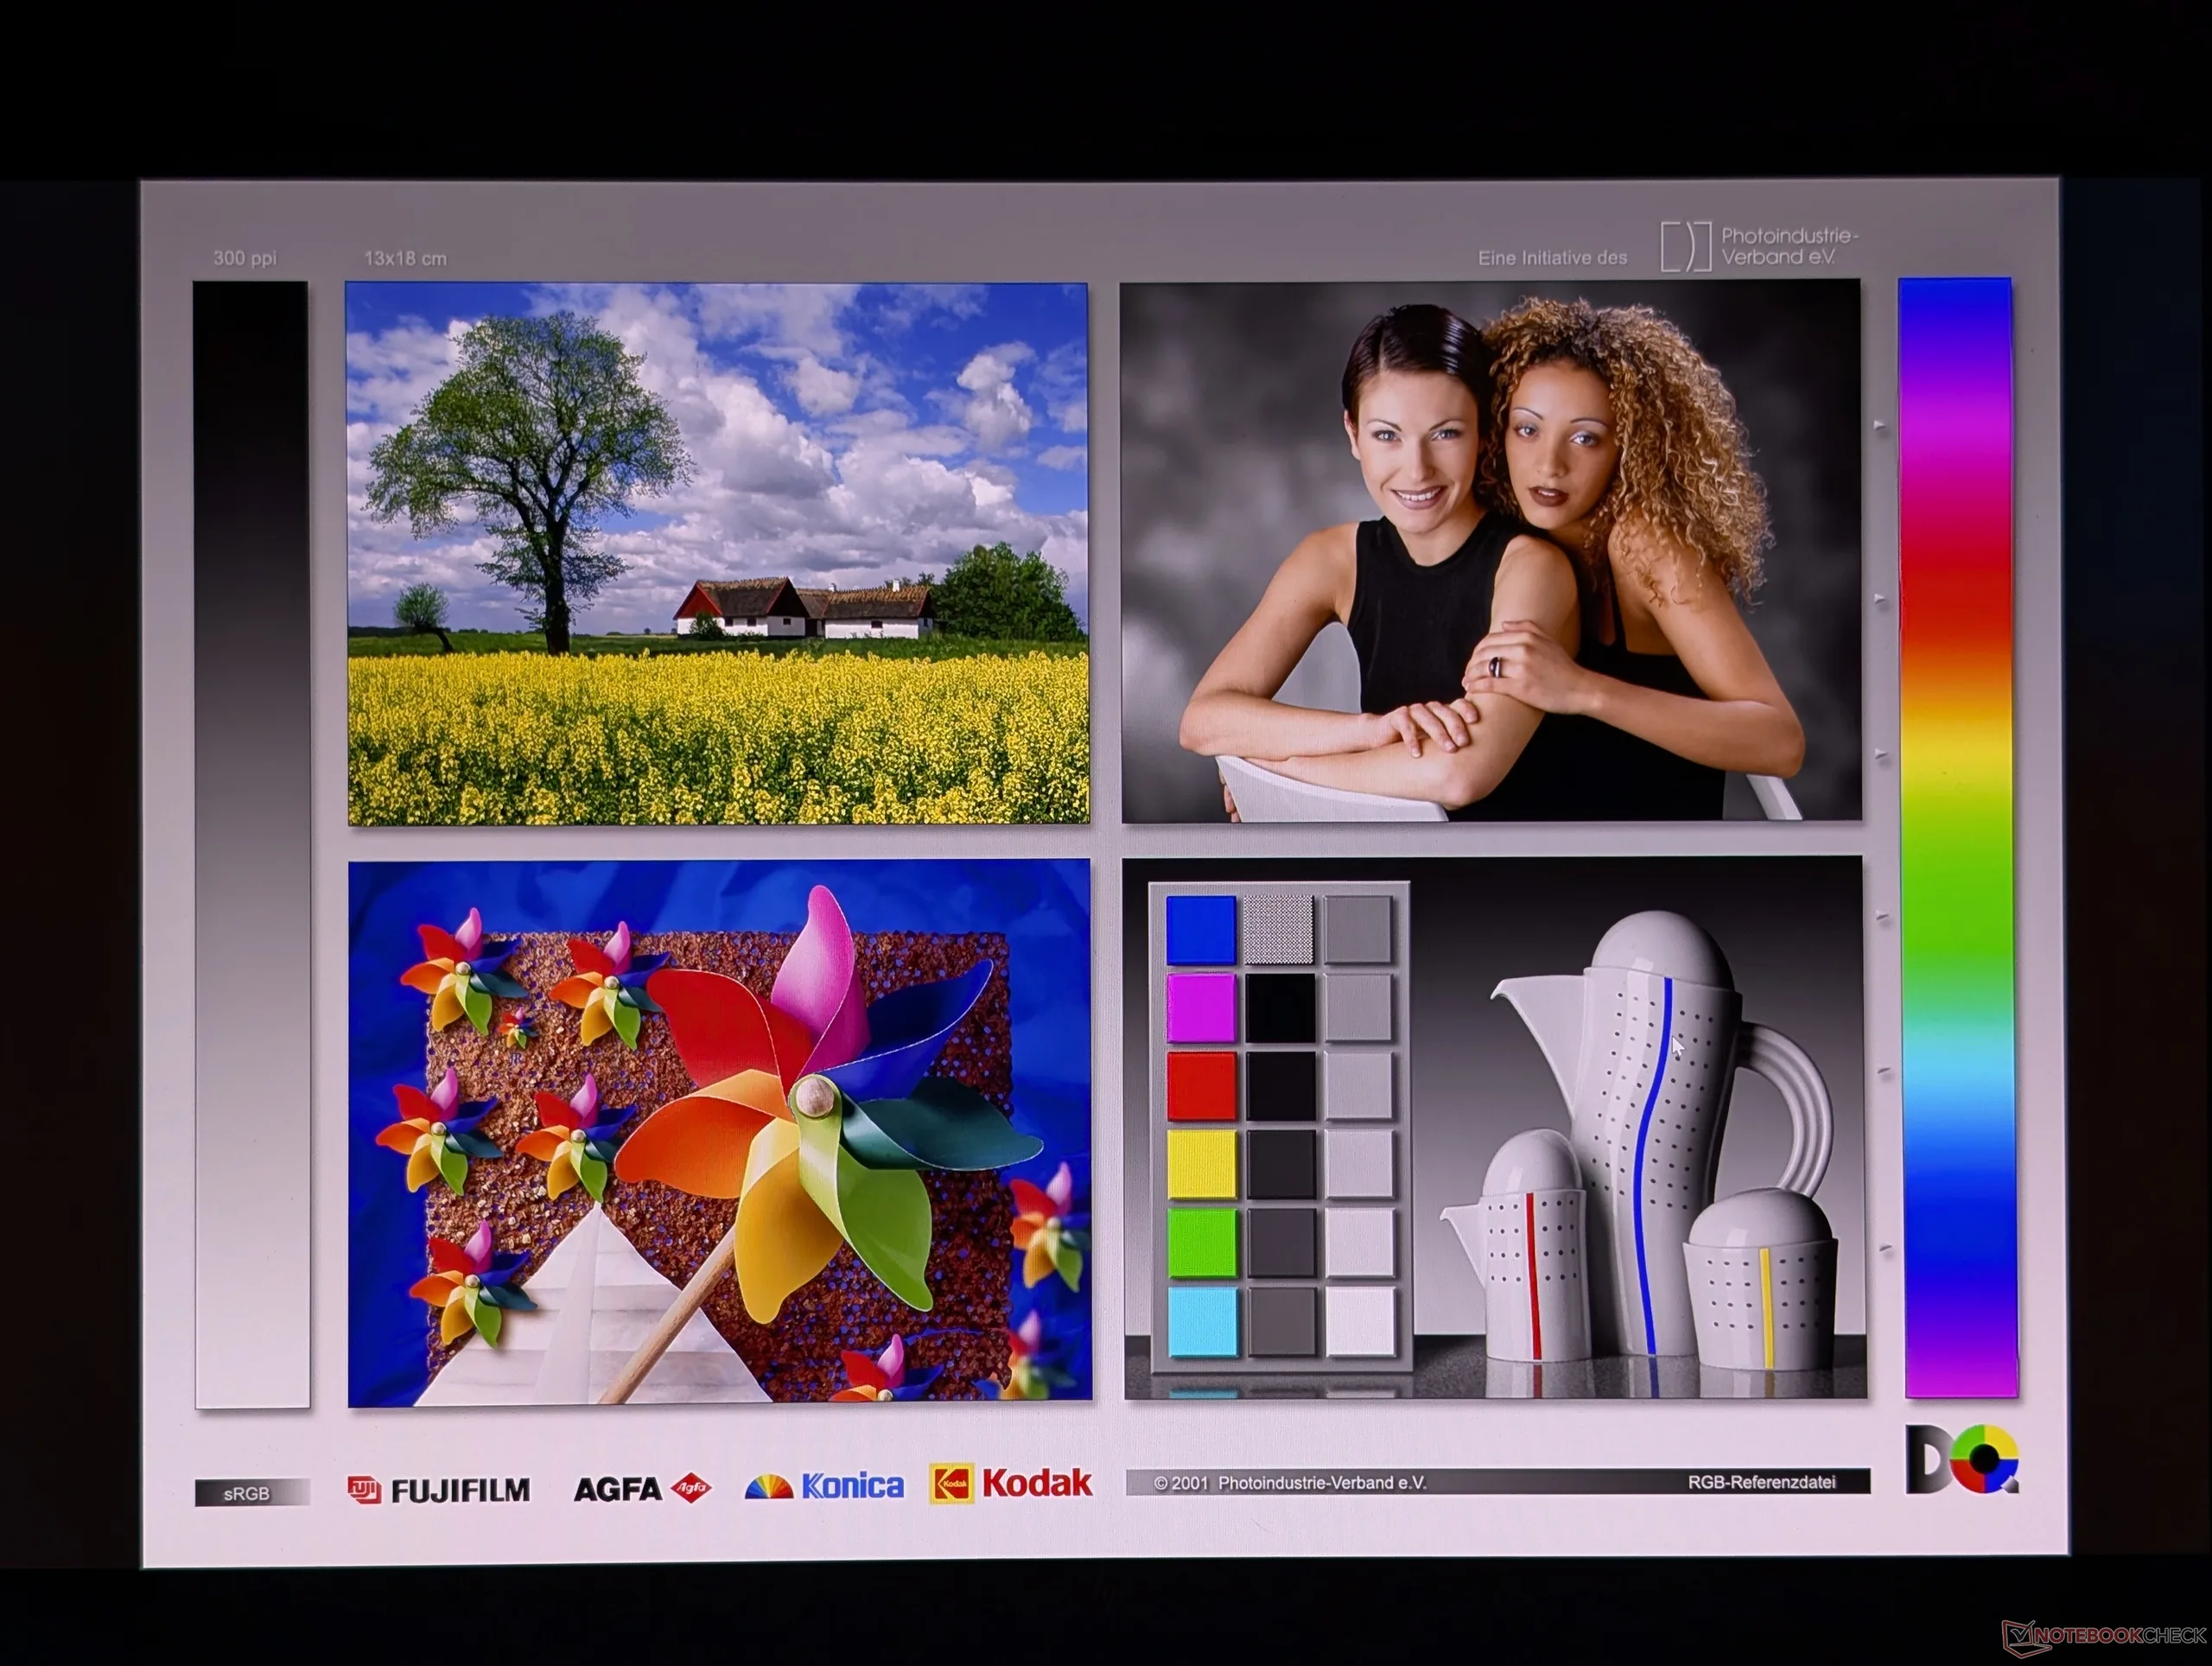
Wide OLED viewing angles

Performance

Testing Conditions

We set Windows to Performance mode prior to running the benchmarks below. Dedicated GPU VRAM sits at 12 GB by default and is adjustable via the Nvidia App.

Processor Performance

Raw CPU multi-thread performance rivals the Core Ultra 7 255HX when running ARM-native applications. Otherwise, the Spark N1X 20-Core performs similarly to the Core Ultra X7 358H if running via emulation.

Cinebench R15 Multi Loop

075150225300375450525600675750825900975105011251200127513501425150015751650172518001875195020252100217522502325240024752550262527002775285029253000307531503225330033753450352536003675Tooltip
HP OmniBook Ultra 16-bk0013dx Nvidia RTX Spark N1X 20-Core: Ø3441 (3343.64-3479.17) Points
Asus ProArt P16 H7607 Nvidia RTX Spark N1X 20-Core: Ø3627 (3288.12-3676.81) Points
MSI Stealth 16 AI B3WH Intel Core Ultra 9 386H: Ø3222 (3176.62-3317.02) Points
Razer Blade 16 Core Ultra 9 386H Intel Core Ultra 9 386H: Ø2941 (2806.23-3172.09) Points
Dell XPS 16 Core Ultra X7 358H Intel Core Ultra X7 358H: Ø2543 (2491.75-2985.52) Points
Lenovo ThinkPad P16 G2 21FA000FGE Intel Core i7-13700HX: Ø2785 (2533.57-3082.38) Points
CPU Performance rating: Percent
Cinebench 2024: CPU Single Core | CPU Multi Core
Cinebench 2026: CPU Multi | CPU Single Thread
Cinebench R23: Multi Core | Single Core
Cinebench R20: CPU (Multi Core) | CPU (Single Core)
Cinebench R15: CPU Multi 64Bit | CPU Single 64Bit
Blender: v2.79 BMW27 CPU
7-Zip 18.03: 7z b 4 | 7z b 4 -mmt1
Geekbench 6.7: Multi-Core | Single-Core
Geekbench 5.5: Multi-Core | Single-Core
HWBOT x265 Benchmark v2.2: 4k Preset
LibreOffice : 20 Documents To PDF
R Benchmark 2.5: Overall mean
CPU Performance rating
HP Omen Max 16-ah1932nr
Intel Core Ultra 9 290HX Plus
89.2 pt
HP HyperX Omen 16 16-ap1931nr
AMD Ryzen 9 9955HX3D
88.7 pt
Lenovo ThinkBook 16p G6 21R00013GE -2!
Intel Core Ultra 7 255HX
82.5 pt
HP ZBook Ultra G1a 14
AMD Ryzen AI Max+ PRO 395
75.7 pt
Razer Blade 16 Core Ultra 9 386H
Intel Core Ultra 9 386H
69.8 pt
MSI Stealth 16 AI B3WH -2!
Intel Core Ultra 9 386H
68 pt
Dell Pro 5 16 P516265
AMD Ryzen AI 9 HX PRO 470
66.6 pt
Dell XPS 16 Core Ultra X7 358H
Intel Core Ultra X7 358H
65.8 pt
Asus ProArt P16 H7607 -2!
Nvidia RTX Spark N1X 20-Core
62.5 pt
Average Nvidia RTX Spark N1X 20-Core -2!
 
61.9 pt
Lenovo ThinkPad P16 G2 21FA000FGE -6!
Intel Core i7-13700HX
61 pt
HP OmniBook Ultra 16-bk0013dx -4!
Nvidia RTX Spark N1X 20-Core
57.4 pt
Acer Swift 16 AI SF16-51T-932H, Ultra 9 288V -4!
Intel Core Ultra 9 288V
49 pt
Cinebench 2024 / CPU Single Core
HP Omen Max 16-ah1932nr
Intel Core Ultra 9 290HX Plus
137.5 Points +3%
HP OmniBook Ultra 16-bk0013dx
Nvidia RTX Spark N1X 20-Core
133 Points
Average Nvidia RTX Spark N1X 20-Core
  (130 - 133, n=3)
131.3 Points -1%
Lenovo ThinkBook 16p G6 21R00013GE
Intel Core Ultra 7 255HX
131.1 Points -1%
Asus ProArt P16 H7607
Nvidia RTX Spark N1X 20-Core
130 Points -2%
HP HyperX Omen 16 16-ap1931nr
AMD Ryzen 9 9955HX3D
128.2 Points -4%
Razer Blade 16 Core Ultra 9 386H
Intel Core Ultra 9 386H
126.8 Points -5%
Dell XPS 16 Core Ultra X7 358H
Intel Core Ultra X7 358H
123.7 Points -7%
MSI Stealth 16 AI B3WH
Intel Core Ultra 9 386H
122.8 Points -8%
Dell Pro 5 16 P516265
AMD Ryzen AI 9 HX PRO 470
120.2 Points -10%
HP ZBook Ultra G1a 14
AMD Ryzen AI Max+ PRO 395
112.2 Points -16%
Cinebench 2024 / CPU Multi Core
HP Omen Max 16-ah1932nr
Intel Core Ultra 9 290HX Plus
2096 Points +28%
HP HyperX Omen 16 16-ap1931nr
AMD Ryzen 9 9955HX3D
2015 Points +23%
Lenovo ThinkBook 16p G6 21R00013GE
Intel Core Ultra 7 255HX
1758 Points +8%
Asus ProArt P16 H7607
Nvidia RTX Spark N1X 20-Core
1726 Points +6%
Average Nvidia RTX Spark N1X 20-Core
  (1635 - 1726, n=3)
1681 Points +3%
HP ZBook Ultra G1a 14
AMD Ryzen AI Max+ PRO 395
1643 Points 0%
HP OmniBook Ultra 16-bk0013dx
Nvidia RTX Spark N1X 20-Core
1635 Points
MSI Stealth 16 AI B3WH
Intel Core Ultra 9 386H
1233 Points -25%
Razer Blade 16 Core Ultra 9 386H
Intel Core Ultra 9 386H
1172 Points -28%
Dell Pro 5 16 P516265
AMD Ryzen AI 9 HX PRO 470
1070 Points -35%
Dell XPS 16 Core Ultra X7 358H
Intel Core Ultra X7 358H
1004 Points -39%
Cinebench 2026 / CPU Multi
HP Omen Max 16-ah1932nr
Intel Core Ultra 9 290HX Plus
8490 Points +24%
HP HyperX Omen 16 16-ap1931nr
AMD Ryzen 9 9955HX3D
8296 Points +21%
Asus ProArt P16 H7607
Nvidia RTX Spark N1X 20-Core
7187 Points +5%
HP OmniBook Ultra 16-bk0013dx
Nvidia RTX Spark N1X 20-Core
6833 Points
Average Nvidia RTX Spark N1X 20-Core
  (5771 - 7187, n=4)
6667 Points -2%
HP ZBook Ultra G1a 14
AMD Ryzen AI Max+ PRO 395
5859 Points -14%
MSI Stealth 16 AI B3WH
Intel Core Ultra 9 386H
4951 Points -28%
Razer Blade 16 Core Ultra 9 386H
Intel Core Ultra 9 386H
4730 Points -31%
Dell Pro 5 16 P516265
AMD Ryzen AI 9 HX PRO 470
4448 Points -35%
Dell XPS 16 Core Ultra X7 358H
Intel Core Ultra X7 358H
4087 Points -40%
Cinebench 2026 / CPU Single Thread
HP Omen Max 16-ah1932nr
Intel Core Ultra 9 290HX Plus
556 Points +1%
HP OmniBook Ultra 16-bk0013dx
Nvidia RTX Spark N1X 20-Core
552 Points
Asus ProArt P16 H7607
Nvidia RTX Spark N1X 20-Core
551 Points 0%
Average Nvidia RTX Spark N1X 20-Core
  (540 - 552, n=4)
548 Points -1%
HP HyperX Omen 16 16-ap1931nr
AMD Ryzen 9 9955HX3D
522 Points -5%
Razer Blade 16 Core Ultra 9 386H
Intel Core Ultra 9 386H
519 Points -6%
Dell XPS 16 Core Ultra X7 358H
Intel Core Ultra X7 358H
508 Points -8%
MSI Stealth 16 AI B3WH
Intel Core Ultra 9 386H
507 Points -8%
Dell Pro 5 16 P516265
AMD Ryzen AI 9 HX PRO 470
488 Points -12%
HP ZBook Ultra G1a 14
AMD Ryzen AI Max+ PRO 395
429 Points -22%
Cinebench R23 / Multi Core
HP Omen Max 16-ah1932nr
Intel Core Ultra 9 290HX Plus
38242 (36217.9min - 38242.1max) Points +119%
HP HyperX Omen 16 16-ap1931nr
AMD Ryzen 9 9955HX3D
36580 (35337.4min - 36580.1max) Points +110%
Lenovo ThinkBook 16p G6 21R00013GE
Intel Core Ultra 7 255HX
33362 Points +91%
HP ZBook Ultra G1a 14
AMD Ryzen AI Max+ PRO 395
30706 (29203.2min - 30705.8max) Points +76%
MSI Stealth 16 AI B3WH
Intel Core Ultra 9 386H
22084 (21312.9min - 22083.8max) Points +27%
Razer Blade 16 Core Ultra 9 386H
Intel Core Ultra 9 386H
20750 (18849.5min - 20749.6max) Points +19%
Lenovo ThinkPad P16 G2 21FA000FGE
Intel Core i7-13700HX
20479 Points +17%
Dell Pro 5 16 P516265
AMD Ryzen AI 9 HX PRO 470
19095 (17945.6min - 19094.8max) Points +9%
Asus ProArt P16 H7607
Nvidia RTX Spark N1X 20-Core
17944 Points +3%
Dell XPS 16 Core Ultra X7 358H
Intel Core Ultra X7 358H
17884 (15984.6min - 17883.7max) Points +3%
HP OmniBook Ultra 16-bk0013dx
Nvidia RTX Spark N1X 20-Core
17439 (17029.9min - 17439.3max) Points
Average Nvidia RTX Spark N1X 20-Core
  (16591 - 17944, n=3)
17325 Points -1%
Acer Swift 16 AI SF16-51T-932H, Ultra 9 288V
Intel Core Ultra 9 288V
10484 Points -40%
Cinebench R23 / Single Core
HP Omen Max 16-ah1932nr
Intel Core Ultra 9 290HX Plus
2231 Points +71%
Lenovo ThinkBook 16p G6 21R00013GE
Intel Core Ultra 7 255HX
2171 Points +66%
HP HyperX Omen 16 16-ap1931nr
AMD Ryzen 9 9955HX3D
2154 Points +65%
MSI Stealth 16 AI B3WH
Intel Core Ultra 9 386H
2111 Points +61%
Dell XPS 16 Core Ultra X7 358H
Intel Core Ultra X7 358H
2087 Points +60%
Razer Blade 16 Core Ultra 9 386H
Intel Core Ultra 9 386H
2087 Points +60%
Dell Pro 5 16 P516265
AMD Ryzen AI 9 HX PRO 470
2063 Points +58%
HP ZBook Ultra G1a 14
AMD Ryzen AI Max+ PRO 395
2003 Points +53%
Acer Swift 16 AI SF16-51T-932H, Ultra 9 288V
Intel Core Ultra 9 288V
1940 Points +48%
Lenovo ThinkPad P16 G2 21FA000FGE
Intel Core i7-13700HX
1889 Points +44%
Asus ProArt P16 H7607
Nvidia RTX Spark N1X 20-Core
1314 Points 0%
Average Nvidia RTX Spark N1X 20-Core
  (1308 - 1317, n=3)
1313 Points 0%
HP OmniBook Ultra 16-bk0013dx
Nvidia RTX Spark N1X 20-Core
1308 Points
Cinebench R20 / CPU (Multi Core)
HP Omen Max 16-ah1932nr
Intel Core Ultra 9 290HX Plus
14722 Points +125%
HP HyperX Omen 16 16-ap1931nr
AMD Ryzen 9 9955HX3D
14209 Points +117%
Lenovo ThinkBook 16p G6 21R00013GE
Intel Core Ultra 7 255HX
12912 Points +97%
HP ZBook Ultra G1a 14
AMD Ryzen AI Max+ PRO 395
11816 Points +81%
MSI Stealth 16 AI B3WH
Intel Core Ultra 9 386H
8447 Points +29%
Razer Blade 16 Core Ultra 9 386H
Intel Core Ultra 9 386H
8162 Points +25%
Lenovo ThinkPad P16 G2 21FA000FGE
Intel Core i7-13700HX
7870 Points +20%
Dell Pro 5 16 P516265
AMD Ryzen AI 9 HX PRO 470
7433 Points +14%
Dell XPS 16 Core Ultra X7 358H
Intel Core Ultra X7 358H
7195 Points +10%
Asus ProArt P16 H7607
Nvidia RTX Spark N1X 20-Core
6679 Points +2%
HP OmniBook Ultra 16-bk0013dx
Nvidia RTX Spark N1X 20-Core
6546 Points
Average Nvidia RTX Spark N1X 20-Core
  (6184 - 6679, n=3)
6470 Points -1%
Acer Swift 16 AI SF16-51T-932H, Ultra 9 288V
Intel Core Ultra 9 288V
4091 Points -38%
Cinebench R20 / CPU (Single Core)
HP HyperX Omen 16 16-ap1931nr
AMD Ryzen 9 9955HX3D
845 Points +74%
HP Omen Max 16-ah1932nr
Intel Core Ultra 9 290HX Plus
840 Points +73%
Lenovo ThinkBook 16p G6 21R00013GE
Intel Core Ultra 7 255HX
833 Points +72%
Dell Pro 5 16 P516265
AMD Ryzen AI 9 HX PRO 470
810 Points +67%
MSI Stealth 16 AI B3WH
Intel Core Ultra 9 386H
806 Points +66%
Razer Blade 16 Core Ultra 9 386H
Intel Core Ultra 9 386H
795 Points +64%
HP ZBook Ultra G1a 14
AMD Ryzen AI Max+ PRO 395
783 Points +61%
Dell XPS 16 Core Ultra X7 358H
Intel Core Ultra X7 358H
780 Points +61%
Acer Swift 16 AI SF16-51T-932H, Ultra 9 288V
Intel Core Ultra 9 288V
748 Points +54%
Lenovo ThinkPad P16 G2 21FA000FGE
Intel Core i7-13700HX
727 Points +50%
Asus ProArt P16 H7607
Nvidia RTX Spark N1X 20-Core
488 Points +1%
Average Nvidia RTX Spark N1X 20-Core
  (485 - 488, n=3)
486 Points 0%
HP OmniBook Ultra 16-bk0013dx
Nvidia RTX Spark N1X 20-Core
485 Points
Cinebench R15 / CPU Multi 64Bit
HP HyperX Omen 16 16-ap1931nr
AMD Ryzen 9 9955HX3D
5839 (5471.21min - 5839.42max) Points +68%
HP Omen Max 16-ah1932nr
Intel Core Ultra 9 290HX Plus
5628 (5175.31min - 5628.25max) Points +62%
Lenovo ThinkBook 16p G6 21R00013GE
Intel Core Ultra 7 255HX
5019 (4604.05min - 5018.82max) Points +44%
HP ZBook Ultra G1a 14
AMD Ryzen AI Max+ PRO 395
4784 (4586.1min - 4783.54max) Points +38%
Asus ProArt P16 H7607
Nvidia RTX Spark N1X 20-Core
3677 (3288.12min - 3676.81max) Points +6%
Average Nvidia RTX Spark N1X 20-Core
  (3479 - 3677, n=3)
3577 Points +3%
HP OmniBook Ultra 16-bk0013dx
Nvidia RTX Spark N1X 20-Core
3479 (3343.64min - 3479.17max) Points
MSI Stealth 16 AI B3WH
Intel Core Ultra 9 386H
3317 (3176.62min - 3317.02max) Points -5%
Razer Blade 16 Core Ultra 9 386H
Intel Core Ultra 9 386H
3172 (2806.23min - 3172.09max) Points -9%
Lenovo ThinkPad P16 G2 21FA000FGE
Intel Core i7-13700HX
3082 (2533.57min - 3082.38max) Points -11%
Dell XPS 16 Core Ultra X7 358H
Intel Core Ultra X7 358H
2986 (2491.75min - 2985.52max) Points -14%
Dell Pro 5 16 P516265
AMD Ryzen AI 9 HX PRO 470
2983 (2832.46min - 2983.29max) Points -14%
Acer Swift 16 AI SF16-51T-932H, Ultra 9 288V
Intel Core Ultra 9 288V
1583 (1473.84min - 1582.72max) Points -54%
Cinebench R15 / CPU Single 64Bit
HP HyperX Omen 16 16-ap1931nr
AMD Ryzen 9 9955HX3D
335 Points +31%
Lenovo ThinkBook 16p G6 21R00013GE
Intel Core Ultra 7 255HX
326 Points +27%
MSI Stealth 16 AI B3WH
Intel Core Ultra 9 386H
319 Points +25%
Dell Pro 5 16 P516265
AMD Ryzen AI 9 HX PRO 470
316 Points +23%
Razer Blade 16 Core Ultra 9 386H
Intel Core Ultra 9 386H
313 Points +22%
HP ZBook Ultra G1a 14
AMD Ryzen AI Max+ PRO 395
307 Points +20%
Dell XPS 16 Core Ultra X7 358H
Intel Core Ultra X7 358H
304 Points +19%
HP Omen Max 16-ah1932nr
Intel Core Ultra 9 290HX Plus
303 Points +18%
Acer Swift 16 AI SF16-51T-932H, Ultra 9 288V
Intel Core Ultra 9 288V
294 Points +15%
Lenovo ThinkPad P16 G2 21FA000FGE
Intel Core i7-13700HX
279 Points +9%
HP OmniBook Ultra 16-bk0013dx
Nvidia RTX Spark N1X 20-Core
256 Points
Average Nvidia RTX Spark N1X 20-Core
  (255 - 257, n=3)
256 Points 0%
Asus ProArt P16 H7607
Nvidia RTX Spark N1X 20-Core
255 Points 0%
Blender / v2.79 BMW27 CPU
Acer Swift 16 AI SF16-51T-932H, Ultra 9 288V
Intel Core Ultra 9 288V
330 Seconds * -68%
HP OmniBook Ultra 16-bk0013dx
Nvidia RTX Spark N1X 20-Core
197 Seconds *
Dell XPS 16 Core Ultra X7 358H
Intel Core Ultra X7 358H
196 Seconds * +1%
Average Nvidia RTX Spark N1X 20-Core
  (192 - 197, n=3)
194.7 Seconds * +1%
Asus ProArt P16 H7607
Nvidia RTX Spark N1X 20-Core
192 Seconds * +3%
Razer Blade 16 Core Ultra 9 386H
Intel Core Ultra 9 386H
171 Seconds * +13%
Dell Pro 5 16 P516265
AMD Ryzen AI 9 HX PRO 470
168 Seconds * +15%
Lenovo ThinkPad P16 G2 21FA000FGE
Intel Core i7-13700HX
161 Seconds * +18%
MSI Stealth 16 AI B3WH
Intel Core Ultra 9 386H
158 Seconds * +20%
Lenovo ThinkBook 16p G6 21R00013GE
Intel Core Ultra 7 255HX
106 Seconds * +46%
HP ZBook Ultra G1a 14
AMD Ryzen AI Max+ PRO 395
102 Seconds * +48%
HP Omen Max 16-ah1932nr
Intel Core Ultra 9 290HX Plus
92 Seconds * +53%
HP HyperX Omen 16 16-ap1931nr
AMD Ryzen 9 9955HX3D
91 Seconds * +54%
7-Zip 18.03 / 7z b 4
HP HyperX Omen 16 16-ap1931nr
AMD Ryzen 9 9955HX3D
130158 MIPS +62%
HP ZBook Ultra G1a 14
AMD Ryzen AI Max+ PRO 395
109760 MIPS +36%
Lenovo ThinkBook 16p G6 21R00013GE
Intel Core Ultra 7 255HX
103536 MIPS +29%
HP Omen Max 16-ah1932nr
Intel Core Ultra 9 290HX Plus
103072 MIPS +28%
Asus ProArt P16 H7607
Nvidia RTX Spark N1X 20-Core
82683 MIPS +3%
Average Nvidia RTX Spark N1X 20-Core
  (80534 - 82683, n=3)
81504 MIPS +1%
HP OmniBook Ultra 16-bk0013dx
Nvidia RTX Spark N1X 20-Core
80534 MIPS
Lenovo ThinkPad P16 G2 21FA000FGE
Intel Core i7-13700HX
78900 MIPS -2%
Dell Pro 5 16 P516265
AMD Ryzen AI 9 HX PRO 470
74523 MIPS -7%
Razer Blade 16 Core Ultra 9 386H
Intel Core Ultra 9 386H
71655 MIPS -11%
MSI Stealth 16 AI B3WH
Intel Core Ultra 9 386H
68649 MIPS -15%
Dell XPS 16 Core Ultra X7 358H
Intel Core Ultra X7 358H
64852 MIPS -19%
Acer Swift 16 AI SF16-51T-932H, Ultra 9 288V
Intel Core Ultra 9 288V
35851 MIPS -55%
7-Zip 18.03 / 7z b 4 -mmt1
HP HyperX Omen 16 16-ap1931nr
AMD Ryzen 9 9955HX3D
6960 MIPS +23%
HP Omen Max 16-ah1932nr
Intel Core Ultra 9 290HX Plus
6802 MIPS +20%
Lenovo ThinkBook 16p G6 21R00013GE
Intel Core Ultra 7 255HX
6533 MIPS +15%
Dell XPS 16 Core Ultra X7 358H
Intel Core Ultra X7 358H
6441 MIPS +14%
Razer Blade 16 Core Ultra 9 386H
Intel Core Ultra 9 386H
6367 MIPS +13%
Lenovo ThinkPad P16 G2 21FA000FGE
Intel Core i7-13700HX
6355 MIPS +12%
Dell Pro 5 16 P516265
AMD Ryzen AI 9 HX PRO 470
6353 MIPS +12%
MSI Stealth 16 AI B3WH
Intel Core Ultra 9 386H
6114 MIPS +8%
Acer Swift 16 AI SF16-51T-932H, Ultra 9 288V
Intel Core Ultra 9 288V
5734 MIPS +1%
Asus ProArt P16 H7607
Nvidia RTX Spark N1X 20-Core
5677 MIPS 0%
Average Nvidia RTX Spark N1X 20-Core
  (5658 - 5677, n=3)
5668 MIPS 0%
HP OmniBook Ultra 16-bk0013dx
Nvidia RTX Spark N1X 20-Core
5658 MIPS
HP ZBook Ultra G1a 14
AMD Ryzen AI Max+ PRO 395
5613 MIPS -1%
Geekbench 6.7 / Multi-Core
HP Omen Max 16-ah1932nr
Intel Core Ultra 9 290HX Plus
20585 Points
Asus ProArt P16 H7607
Nvidia RTX Spark N1X 20-Core
20296 Points
Average Nvidia RTX Spark N1X 20-Core
  (20031 - 20296, n=2)
20164 Points
HP HyperX Omen 16 16-ap1931nr
AMD Ryzen 9 9955HX3D
19418 Points
Lenovo ThinkBook 16p G6 21R00013GE
Intel Core Ultra 7 255HX
18521 Points
Dell XPS 16 Core Ultra X7 358H
Intel Core Ultra X7 358H
16943 Points
Razer Blade 16 Core Ultra 9 386H
Intel Core Ultra 9 386H
16903 Points
HP ZBook Ultra G1a 14
AMD Ryzen AI Max+ PRO 395
16855 Points
Dell Pro 5 16 P516265
AMD Ryzen AI 9 HX PRO 470
15079 Points
Acer Swift 16 AI SF16-51T-932H, Ultra 9 288V
Intel Core Ultra 9 288V
10972 Points
Geekbench 6.7 / Single-Core
HP HyperX Omen 16 16-ap1931nr
AMD Ryzen 9 9955HX3D
3159 Points
HP Omen Max 16-ah1932nr
Intel Core Ultra 9 290HX Plus
3100 Points
Average Nvidia RTX Spark N1X 20-Core
  (3092 - 3096, n=2)
3094 Points
Asus ProArt P16 H7607
Nvidia RTX Spark N1X 20-Core
3092 Points
Dell Pro 5 16 P516265
AMD Ryzen AI 9 HX PRO 470
2988 Points
Lenovo ThinkBook 16p G6 21R00013GE
Intel Core Ultra 7 255HX
2967 Points
Dell XPS 16 Core Ultra X7 358H
Intel Core Ultra X7 358H
2903 Points
Razer Blade 16 Core Ultra 9 386H
Intel Core Ultra 9 386H
2886 Points
Acer Swift 16 AI SF16-51T-932H, Ultra 9 288V
Intel Core Ultra 9 288V
2797 Points
HP ZBook Ultra G1a 14
AMD Ryzen AI Max+ PRO 395
2756 Points
Geekbench 5.5 / Multi-Core
HP Omen Max 16-ah1932nr
Intel Core Ultra 9 290HX Plus
24695 Points
HP HyperX Omen 16 16-ap1931nr
AMD Ryzen 9 9955HX3D
21223 Points
Lenovo ThinkBook 16p G6 21R00013GE
Intel Core Ultra 7 255HX
19643 Points
HP ZBook Ultra G1a 14
AMD Ryzen AI Max+ PRO 395
18251 Points
Razer Blade 16 Core Ultra 9 386H
Intel Core Ultra 9 386H
17017 Points
Dell XPS 16 Core Ultra X7 358H
Intel Core Ultra X7 358H
16763 Points
MSI Stealth 16 AI B3WH
Intel Core Ultra 9 386H
15541 Points
Dell Pro 5 16 P516265
AMD Ryzen AI 9 HX PRO 470
14571 Points
Lenovo ThinkPad P16 G2 21FA000FGE
Intel Core i7-13700HX
14422 Points
Acer Swift 16 AI SF16-51T-932H, Ultra 9 288V
Intel Core Ultra 9 288V
9631 Points
Geekbench 5.5 / Single-Core
HP HyperX Omen 16 16-ap1931nr
AMD Ryzen 9 9955HX3D
2326 Points
HP Omen Max 16-ah1932nr
Intel Core Ultra 9 290HX Plus
2251 Points
Dell Pro 5 16 P516265
AMD Ryzen AI 9 HX PRO 470
2175 Points
Lenovo ThinkBook 16p G6 21R00013GE
Intel Core Ultra 7 255HX
2169 Points
Dell XPS 16 Core Ultra X7 358H
Intel Core Ultra X7 358H
2119 Points
Razer Blade 16 Core Ultra 9 386H
Intel Core Ultra 9 386H
2109 Points
HP ZBook Ultra G1a 14
AMD Ryzen AI Max+ PRO 395
2071 Points
MSI Stealth 16 AI B3WH
Intel Core Ultra 9 386H
2070 Points
Acer Swift 16 AI SF16-51T-932H, Ultra 9 288V
Intel Core Ultra 9 288V
2024 Points
Lenovo ThinkPad P16 G2 21FA000FGE
Intel Core i7-13700HX
1873 Points
HWBOT x265 Benchmark v2.2 / 4k Preset
HP HyperX Omen 16 16-ap1931nr
AMD Ryzen 9 9955HX3D
39 fps +210%
Lenovo ThinkBook 16p G6 21R00013GE
Intel Core Ultra 7 255HX
36.1 fps +187%
HP ZBook Ultra G1a 14
AMD Ryzen AI Max+ PRO 395
33 fps +162%
HP Omen Max 16-ah1932nr
Intel Core Ultra 9 290HX Plus
32.6 fps +159%
MSI Stealth 16 AI B3WH
Intel Core Ultra 9 386H
24.6 fps +95%
Razer Blade 16 Core Ultra 9 386H
Intel Core Ultra 9 386H
24.5 fps +94%
Dell Pro 5 16 P516265
AMD Ryzen AI 9 HX PRO 470
23.2 fps +84%
Lenovo ThinkPad P16 G2 21FA000FGE
Intel Core i7-13700HX
22.2 fps +76%
Dell XPS 16 Core Ultra X7 358H
Intel Core Ultra X7 358H
21 fps +67%
Acer Swift 16 AI SF16-51T-932H, Ultra 9 288V
Intel Core Ultra 9 288V
13.1 fps +4%
Asus ProArt P16 H7607
Nvidia RTX Spark N1X 20-Core
12.6 fps 0%
HP OmniBook Ultra 16-bk0013dx
Nvidia RTX Spark N1X 20-Core
12.6 fps
Average Nvidia RTX Spark N1X 20-Core
  (12.5 - 12.6, n=3)
12.6 fps 0%
LibreOffice / 20 Documents To PDF
Asus ProArt P16 H7607
Nvidia RTX Spark N1X 20-Core
64.2 s * -6%
Average Nvidia RTX Spark N1X 20-Core
  (59.5 - 64.2, n=3)
61.4 s * -1%
HP OmniBook Ultra 16-bk0013dx
Nvidia RTX Spark N1X 20-Core
60.5 s *
Acer Swift 16 AI SF16-51T-932H, Ultra 9 288V
Intel Core Ultra 9 288V
56.9 s * +6%
Dell Pro 5 16 P516265
AMD Ryzen AI 9 HX PRO 470
54.7 s * +10%
HP ZBook Ultra G1a 14
AMD Ryzen AI Max+ PRO 395
53.4 s * +12%
HP HyperX Omen 16 16-ap1931nr
AMD Ryzen 9 9955HX3D
51.9 s * +14%
HP HyperX Omen 16 16-ap1931nr
AMD Ryzen 9 9955HX3D
51.9 s * +14%
Dell XPS 16 Core Ultra X7 358H
Intel Core Ultra X7 358H
49.5 s * +18%
Lenovo ThinkPad P16 G2 21FA000FGE
Intel Core i7-13700HX
49 s * +19%
MSI Stealth 16 AI B3WH
Intel Core Ultra 9 386H
39.6 s * +35%
Lenovo ThinkBook 16p G6 21R00013GE
Intel Core Ultra 7 255HX
39.2 s * +35%
Razer Blade 16 Core Ultra 9 386H
Intel Core Ultra 9 386H
38.5 s * +36%
HP Omen Max 16-ah1932nr
Intel Core Ultra 9 290HX Plus
37 s * +39%
R Benchmark 2.5 / Overall mean
Asus ProArt P16 H7607
Nvidia RTX Spark N1X 20-Core
0.538 sec * -1%
HP OmniBook Ultra 16-bk0013dx
Nvidia RTX Spark N1X 20-Core
0.535 sec *
Average Nvidia RTX Spark N1X 20-Core
  (0.52 - 0.538, n=3)
0.531 sec * +1%
Acer Swift 16 AI SF16-51T-932H, Ultra 9 288V
Intel Core Ultra 9 288V
0.4503 sec * +16%
Lenovo ThinkPad P16 G2 21FA000FGE
Intel Core i7-13700HX
0.4407 sec * +18%
Dell XPS 16 Core Ultra X7 358H
Intel Core Ultra X7 358H
0.4216 sec * +21%
Lenovo ThinkBook 16p G6 21R00013GE
Intel Core Ultra 7 255HX
0.4209 sec * +21%
MSI Stealth 16 AI B3WH
Intel Core Ultra 9 386H
0.4148 sec * +22%
HP ZBook Ultra G1a 14
AMD Ryzen AI Max+ PRO 395
0.4127 sec * +23%
Razer Blade 16 Core Ultra 9 386H
Intel Core Ultra 9 386H
0.4096 sec * +23%
Dell Pro 5 16 P516265
AMD Ryzen AI 9 HX PRO 470
0.393 sec * +27%
HP Omen Max 16-ah1932nr
Intel Core Ultra 9 290HX Plus
0.3899 sec * +27%
HP HyperX Omen 16 16-ap1931nr
AMD Ryzen 9 9955HX3D
0.3611 sec * +33%
CPU Performance rating: Percent
Cinebench 2024: CPU Single Core | CPU Multi Core
Cinebench 2026: CPU Multi | CPU Single Thread
Cinebench R23: Multi Core | Single Core
Cinebench R20: CPU (Multi Core) | CPU (Single Core)
Cinebench R15: CPU Multi 64Bit | CPU Single 64Bit
Blender: v2.79 BMW27 CPU
7-Zip 18.03: 7z b 4 | 7z b 4 -mmt1
Geekbench 6.7: Multi-Core | Single-Core
Geekbench 5.5: Multi-Core | Single-Core
HWBOT x265 Benchmark v2.2: 4k Preset
LibreOffice : 20 Documents To PDF
R Benchmark 2.5: Overall mean

* ... smaller is better

Cinebench R15 Ref. Match 64Bit
97.6 %
Cinebench R15 CPU Single 64Bit
256 Points
Cinebench R15 CPU Multi 64Bit
3479 Points
Cinebench R15 OpenGL 64Bit
196.2 fps
Cinebench R20 CPU (Multi Core)
6546 Points
Cinebench R20 CPU (Single Core)
485 Points
Cinebench R23 Multi Core
17439 Points
Cinebench R23 Single Core
1308 Points
Cinebench 2024 CPU Multi Core
1635 Points
Cinebench 2024 CPU Single Core
133 Points
Cinebench 2026 CPU Single Thread
552 Points
Cinebench 2026 CPU Multi
6833 Points
Help
Performance rating
Razer Blade 16 Core Ultra 9 386H -1!
Intel Core Ultra 9 386H, GeForce RTX 5090 Laptop
89.2 pt
MSI Stealth 16 AI B3WH -1!
Intel Core Ultra 9 386H, GeForce RTX 5070 Ti Laptop
86.5 pt
Lenovo ThinkPad P16 G2 21FA000FGE -1!
Intel Core i7-13700HX, RTX 2000 Ada Generation Laptop
80.6 pt
Dell XPS 16 Core Ultra X7 358H -1!
Intel Core Ultra X7 358H, Arc B390 Panther Lake iGPU
73.9 pt
Asus ProArt P16 H7607 -1!
Nvidia RTX Spark N1X 20-Core, RTX Spark N1X 6144-Core Blackwell GPU
62.6 pt
Average Nvidia RTX Spark N1X 20-Core -1!
 
60.9 pt
HP OmniBook Ultra 16-bk0013dx -1!
Nvidia RTX Spark N1X 20-Core, RTX Spark N1X 6144-Core Blackwell GPU
59.7 pt
AIDA64 / FP32 Ray-Trace
MSI Stealth 16 AI B3WH
Intel Core Ultra 9 386H, GeForce RTX 5070 Ti Laptop (v8.20.8100)
21481 KRay/s +92%
Razer Blade 16 Core Ultra 9 386H
Intel Core Ultra 9 386H, GeForce RTX 5090 Laptop (v8.20.8100)
20588 KRay/s +84%
Lenovo ThinkPad P16 G2 21FA000FGE
Intel Core i7-13700HX, RTX 2000 Ada Generation Laptop (v6.75.6100)
18420 KRay/s +64%
Dell XPS 16 Core Ultra X7 358H
Intel Core Ultra X7 358H, Arc B390 Panther Lake iGPU (v8.20.8100)
15681 KRay/s +40%
Asus ProArt P16 H7607
Nvidia RTX Spark N1X 20-Core, RTX Spark N1X 6144-Core Blackwell GPU (v8.20.8100)
11989 KRay/s +7%
Average Nvidia RTX Spark N1X 20-Core
  (11198 - 11989, n=3)
11587 KRay/s +3%
HP OmniBook Ultra 16-bk0013dx
Nvidia RTX Spark N1X 20-Core, RTX Spark N1X 6144-Core Blackwell GPU (v8.20.8100)
11198 KRay/s
AIDA64 / FPU Julia
Razer Blade 16 Core Ultra 9 386H
Intel Core Ultra 9 386H, GeForce RTX 5090 Laptop (v8.20.8100)
110173 Points +154%
MSI Stealth 16 AI B3WH
Intel Core Ultra 9 386H, GeForce RTX 5070 Ti Laptop (v8.20.8100)
109571 Points +153%
Lenovo ThinkPad P16 G2 21FA000FGE
Intel Core i7-13700HX, RTX 2000 Ada Generation Laptop (v6.75.6100)
94499 Points +118%
Dell XPS 16 Core Ultra X7 358H
Intel Core Ultra X7 358H, Arc B390 Panther Lake iGPU (v8.20.8100)
83114 Points +92%
Asus ProArt P16 H7607
Nvidia RTX Spark N1X 20-Core, RTX Spark N1X 6144-Core Blackwell GPU (v8.20.8100)
45056 Points +4%
Average Nvidia RTX Spark N1X 20-Core
  (43306 - 45056, n=3)
43960 Points +2%
HP OmniBook Ultra 16-bk0013dx
Nvidia RTX Spark N1X 20-Core, RTX Spark N1X 6144-Core Blackwell GPU (v8.20.8100)
43306 Points
AIDA64 / CPU SHA3
Razer Blade 16 Core Ultra 9 386H
Intel Core Ultra 9 386H, GeForce RTX 5090 Laptop (v8.20.8100)
5516 MB/s +30%
MSI Stealth 16 AI B3WH
Intel Core Ultra 9 386H, GeForce RTX 5070 Ti Laptop (v8.20.8100)
5407 MB/s +27%
Asus ProArt P16 H7607
Nvidia RTX Spark N1X 20-Core, RTX Spark N1X 6144-Core Blackwell GPU (v8.20.8100)
4431 MB/s +4%
Average Nvidia RTX Spark N1X 20-Core
  (4247 - 4431, n=3)
4332 MB/s +2%
Lenovo ThinkPad P16 G2 21FA000FGE
Intel Core i7-13700HX, RTX 2000 Ada Generation Laptop (v6.75.6100)
4265 MB/s 0%
HP OmniBook Ultra 16-bk0013dx
Nvidia RTX Spark N1X 20-Core, RTX Spark N1X 6144-Core Blackwell GPU (v8.20.8100)
4247 MB/s
Dell XPS 16 Core Ultra X7 358H
Intel Core Ultra X7 358H, Arc B390 Panther Lake iGPU (v8.20.8100)
4200 MB/s -1%
AIDA64 / CPU Queen
Lenovo ThinkPad P16 G2 21FA000FGE
Intel Core i7-13700HX, RTX 2000 Ada Generation Laptop (v6.75.6100)
109246 Points
AIDA64 / FPU SinJulia
Lenovo ThinkPad P16 G2 21FA000FGE
Intel Core i7-13700HX, RTX 2000 Ada Generation Laptop (v6.75.6100)
12013 Points +197%
MSI Stealth 16 AI B3WH
Intel Core Ultra 9 386H, GeForce RTX 5070 Ti Laptop (v8.20.8100)
7322 Points +81%
Razer Blade 16 Core Ultra 9 386H
Intel Core Ultra 9 386H, GeForce RTX 5090 Laptop (v8.20.8100)
7267 Points +80%
Dell XPS 16 Core Ultra X7 358H
Intel Core Ultra X7 358H, Arc B390 Panther Lake iGPU (v8.20.8100)
6892 Points +70%
Asus ProArt P16 H7607
Nvidia RTX Spark N1X 20-Core, RTX Spark N1X 6144-Core Blackwell GPU (v8.20.8100)
4077 Points +1%
HP OmniBook Ultra 16-bk0013dx
Nvidia RTX Spark N1X 20-Core, RTX Spark N1X 6144-Core Blackwell GPU (v8.20.8100)
4047 Points
Average Nvidia RTX Spark N1X 20-Core
  (3995 - 4077, n=3)
4040 Points 0%
AIDA64 / FPU Mandel
MSI Stealth 16 AI B3WH
Intel Core Ultra 9 386H, GeForce RTX 5070 Ti Laptop (v8.20.8100)
58598 Points +136%
Razer Blade 16 Core Ultra 9 386H
Intel Core Ultra 9 386H, GeForce RTX 5090 Laptop (v8.20.8100)
58275 Points +134%
Lenovo ThinkPad P16 G2 21FA000FGE
Intel Core i7-13700HX, RTX 2000 Ada Generation Laptop (v6.75.6100)
45667 Points +84%
Dell XPS 16 Core Ultra X7 358H
Intel Core Ultra X7 358H, Arc B390 Panther Lake iGPU (v8.20.8100)
44733 Points +80%
Asus ProArt P16 H7607
Nvidia RTX Spark N1X 20-Core, RTX Spark N1X 6144-Core Blackwell GPU (v8.20.8100)
26051 Points +5%
Average Nvidia RTX Spark N1X 20-Core
  (24870 - 26051, n=3)
25292 Points +2%
HP OmniBook Ultra 16-bk0013dx
Nvidia RTX Spark N1X 20-Core, RTX Spark N1X 6144-Core Blackwell GPU (v8.20.8100)
24870 Points
AIDA64 / CPU AES
Asus ProArt P16 H7607
Nvidia RTX Spark N1X 20-Core, RTX Spark N1X 6144-Core Blackwell GPU (v8.20.8100)
116546 MB/s +8%
Average Nvidia RTX Spark N1X 20-Core
  (107456 - 116546, n=3)
111188 MB/s +3%
HP OmniBook Ultra 16-bk0013dx
Nvidia RTX Spark N1X 20-Core, RTX Spark N1X 6144-Core Blackwell GPU (v8.20.8100)
107456 MB/s
Lenovo ThinkPad P16 G2 21FA000FGE
Intel Core i7-13700HX, RTX 2000 Ada Generation Laptop (v6.75.6100)
88115 MB/s -18%
Razer Blade 16 Core Ultra 9 386H
Intel Core Ultra 9 386H, GeForce RTX 5090 Laptop (v8.20.8100)
70408 MB/s -34%
MSI Stealth 16 AI B3WH
Intel Core Ultra 9 386H, GeForce RTX 5070 Ti Laptop (v8.20.8100)
70307 MB/s -35%
Dell XPS 16 Core Ultra X7 358H
Intel Core Ultra X7 358H, Arc B390 Panther Lake iGPU (v8.20.8100)
61102 MB/s -43%
AIDA64 / CPU ZLib
Asus ProArt P16 H7607
Nvidia RTX Spark N1X 20-Core, RTX Spark N1X 6144-Core Blackwell GPU (v8.20.8100)
1445 MB/s +6%
Average Nvidia RTX Spark N1X 20-Core
  (1365 - 1445, n=3)
1393 MB/s +2%
HP OmniBook Ultra 16-bk0013dx
Nvidia RTX Spark N1X 20-Core, RTX Spark N1X 6144-Core Blackwell GPU (v8.20.8100)
1369 MB/s
MSI Stealth 16 AI B3WH
Intel Core Ultra 9 386H, GeForce RTX 5070 Ti Laptop (v8.20.8100)
1273 MB/s -7%
Razer Blade 16 Core Ultra 9 386H
Intel Core Ultra 9 386H, GeForce RTX 5090 Laptop (v8.20.8100)
1271 MB/s -7%
Lenovo ThinkPad P16 G2 21FA000FGE
Intel Core i7-13700HX, RTX 2000 Ada Generation Laptop (v6.75.6100)
1126 MB/s -18%
Dell XPS 16 Core Ultra X7 358H
Intel Core Ultra X7 358H, Arc B390 Panther Lake iGPU (v8.20.8100)
991 MB/s -28%
AIDA64 / FP64 Ray-Trace
MSI Stealth 16 AI B3WH
Intel Core Ultra 9 386H, GeForce RTX 5070 Ti Laptop (v8.20.8100)
11432 KRay/s +83%
Razer Blade 16 Core Ultra 9 386H
Intel Core Ultra 9 386H, GeForce RTX 5090 Laptop (v8.20.8100)
10023 KRay/s +61%
Lenovo ThinkPad P16 G2 21FA000FGE
Intel Core i7-13700HX, RTX 2000 Ada Generation Laptop (v6.75.6100)
9876 KRay/s +58%
Dell XPS 16 Core Ultra X7 358H
Intel Core Ultra X7 358H, Arc B390 Panther Lake iGPU (v8.20.8100)
8285 KRay/s +33%
Asus ProArt P16 H7607
Nvidia RTX Spark N1X 20-Core, RTX Spark N1X 6144-Core Blackwell GPU (v8.20.8100)
6472 KRay/s +4%
Average Nvidia RTX Spark N1X 20-Core
  (6235 - 6472, n=3)
6322 KRay/s +1%
HP OmniBook Ultra 16-bk0013dx
Nvidia RTX Spark N1X 20-Core, RTX Spark N1X 6144-Core Blackwell GPU (v8.20.8100)
6235 KRay/s
AIDA64 / CPU PhotoWorxx
Razer Blade 16 Core Ultra 9 386H
Intel Core Ultra 9 386H, GeForce RTX 5090 Laptop (v8.20.8100)
89891 MPixel/s +17%
Dell XPS 16 Core Ultra X7 358H
Intel Core Ultra X7 358H, Arc B390 Panther Lake iGPU (v8.20.8100)
88154 MPixel/s +15%
Asus ProArt P16 H7607
Nvidia RTX Spark N1X 20-Core, RTX Spark N1X 6144-Core Blackwell GPU (v8.20.8100)
77724 MPixel/s +2%
Average Nvidia RTX Spark N1X 20-Core
  (76537 - 77724, n=3)
77211 MPixel/s +1%
HP OmniBook Ultra 16-bk0013dx
Nvidia RTX Spark N1X 20-Core, RTX Spark N1X 6144-Core Blackwell GPU (v8.20.8100)
76537 MPixel/s
MSI Stealth 16 AI B3WH
Intel Core Ultra 9 386H, GeForce RTX 5070 Ti Laptop (v8.20.8100)
54493 MPixel/s -29%
Lenovo ThinkPad P16 G2 21FA000FGE
Intel Core i7-13700HX, RTX 2000 Ada Generation Laptop (v6.75.6100)
35176 MPixel/s -54%
AIDA64 / CPU CheckMate
Razer Blade 16 Core Ultra 9 386H
Intel Core Ultra 9 386H, GeForce RTX 5090 Laptop (v8.20.8100)
4811 MP/s +282%
MSI Stealth 16 AI B3WH
Intel Core Ultra 9 386H, GeForce RTX 5070 Ti Laptop (v8.20.8100)
4708 MP/s +274%
Dell XPS 16 Core Ultra X7 358H
Intel Core Ultra X7 358H, Arc B390 Panther Lake iGPU (v8.20.8100)
4269 MP/s +239%
Asus ProArt P16 H7607
Nvidia RTX Spark N1X 20-Core, RTX Spark N1X 6144-Core Blackwell GPU (v8.20.8100)
1342 MP/s +7%
Average Nvidia RTX Spark N1X 20-Core
  (1260 - 1342, n=3)
1294 MP/s +3%
HP OmniBook Ultra 16-bk0013dx
Nvidia RTX Spark N1X 20-Core, RTX Spark N1X 6144-Core Blackwell GPU (v8.20.8100)
1260 MP/s

System Performance

4K video playback at 60 FPS is currently broken at the time of writing with noticeable frame skips on YouTube even after multiple retries.
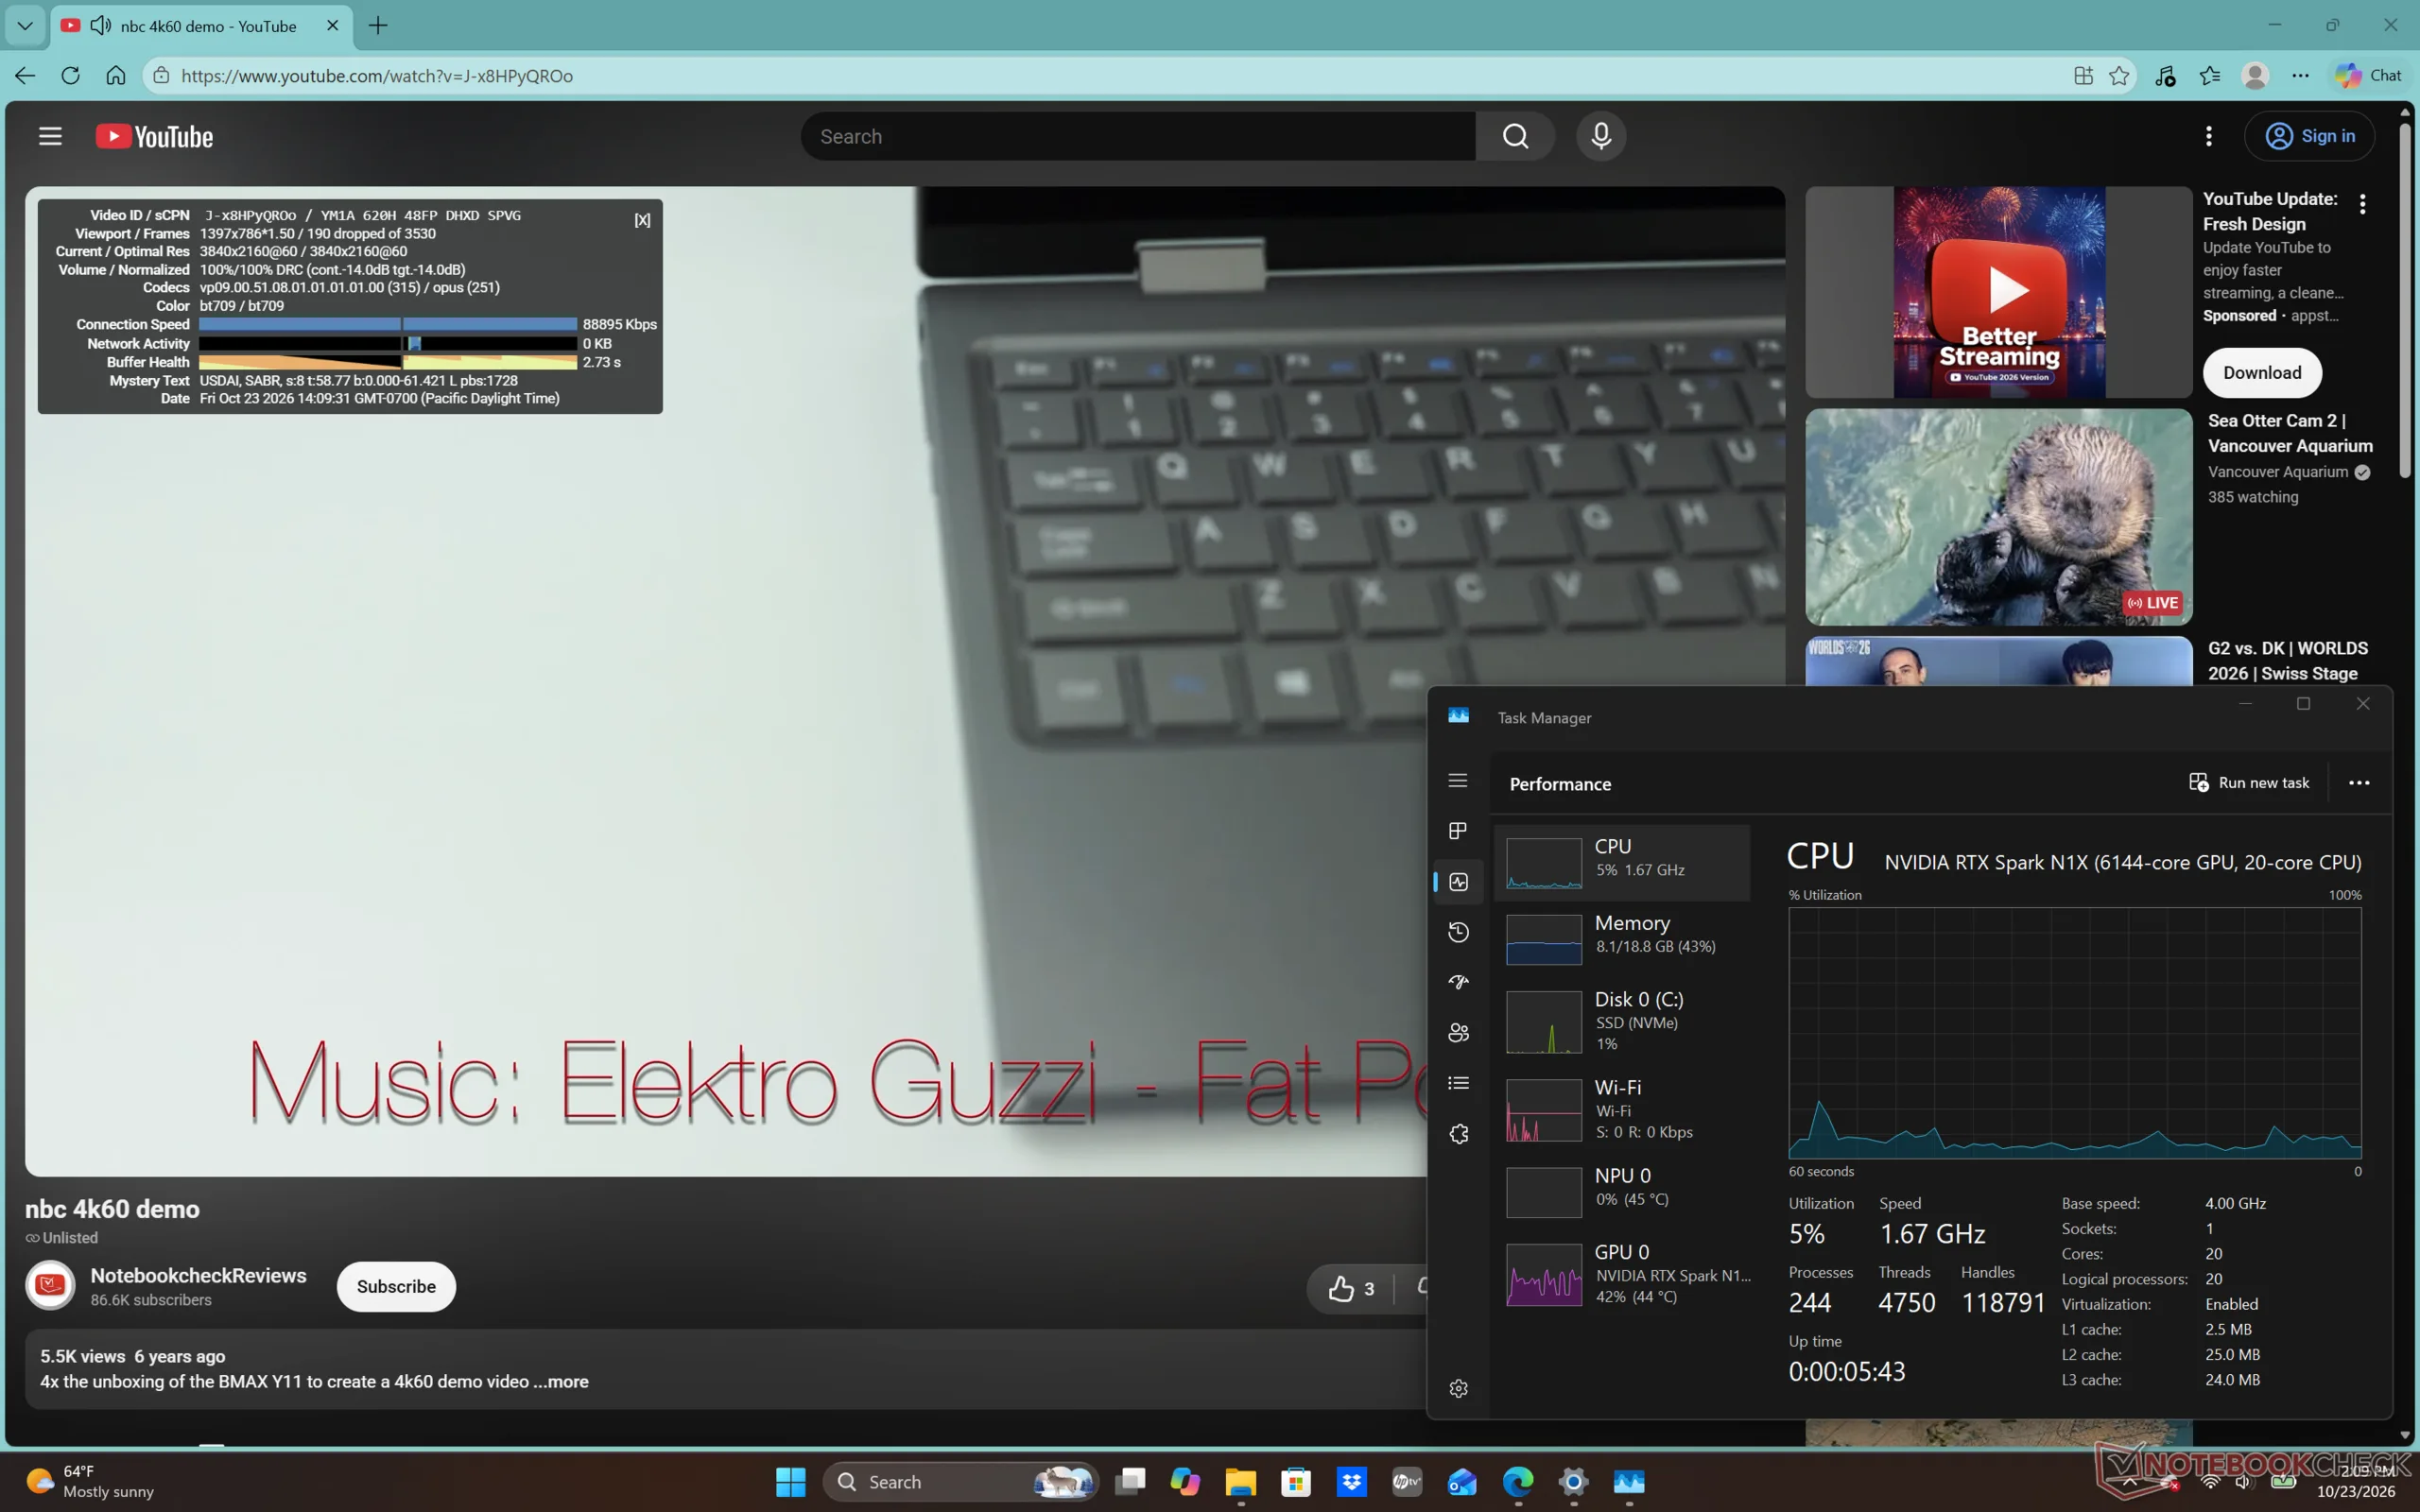
We recorded almost 200 dropped frames within a 60-second window when playing 4K60 video
Performance rating
Razer Blade 16 Core Ultra 9 386H -8!
GeForce RTX 5090 Laptop, Ultra 9 386H, Lexar NM790 2TB
81.9 pt
HP HyperX Omen 16 16-ap1931nr -8!
GeForce RTX 5070 Laptop, R9 9955HX3D
79.6 pt
MSI Stealth 16 AI B3WH -8!
GeForce RTX 5070 Ti Laptop, Ultra 9 386H, Samsung PM9C1b MZVL81T0HFLB-00BTW
79.4 pt
Lenovo ThinkBook 16p G6 21R00013GE -8!
GeForce RTX 5060 Laptop, Ultra 7 255HX, SK hynix PVC10 HFS001TEM4X182N
79.2 pt
Dell XPS 16 Core Ultra X7 358H -8!
Arc B390 Panther Lake iGPU, Ultra X7 358H
78.9 pt
Dell Pro 5 16 P516265 -8!
Radeon 890M, Ryzen AI 9 HX PRO 470, SanDisk PC SN5100S
75.4 pt
Lenovo ThinkPad P16 G2 21FA000FGE -9!
RTX 2000 Ada Generation Laptop, i7-13700HX, SK hynix PC801 HFS001TEJ9X162N
70.8 pt
Acer Swift 16 AI SF16-51T-932H, Ultra 9 288V -8!
Arc 140V, Core Ultra 9 288V, Western Digital PC SN5000S SDEQNSJ-1T00
67 pt
Average Nvidia RTX Spark N1X 20-Core, NVIDIA RTX Spark N1X 6144-Core Blackwell GPU -1!
 
47.4 pt
Asus ProArt P16 H7607 -1!
RTX Spark N1X 6144-Core Blackwell GPU, Spark RTX N1X 20-Core, SanDisk PC SN5100S 2TB
46.1 pt
HP OmniBook Ultra 16-bk0013dx -3!
RTX Spark N1X 6144-Core Blackwell GPU, Spark RTX N1X 20-Core
44.8 pt
CrossMark / Overall
Razer Blade 16 Core Ultra 9 386H
GeForce RTX 5090 Laptop, Ultra 9 386H, Lexar NM790 2TB
2185 Points +25%
Dell XPS 16 Core Ultra X7 358H
Arc B390 Panther Lake iGPU, Ultra X7 358H
2114 Points +21%
Lenovo ThinkBook 16p G6 21R00013GE
GeForce RTX 5060 Laptop, Ultra 7 255HX, SK hynix PVC10 HFS001TEM4X182N
2066 Points +18%
MSI Stealth 16 AI B3WH
GeForce RTX 5070 Ti Laptop, Ultra 9 386H, Samsung PM9C1b MZVL81T0HFLB-00BTW
2061 Points +18%
HP HyperX Omen 16 16-ap1931nr
GeForce RTX 5070 Laptop, R9 9955HX3D
1990 Points +14%
Dell Pro 5 16 P516265
Radeon 890M, Ryzen AI 9 HX PRO 470, SanDisk PC SN5100S
1903 Points +9%
Lenovo ThinkPad P16 G2 21FA000FGE
RTX 2000 Ada Generation Laptop, i7-13700HX, SK hynix PC801 HFS001TEJ9X162N
1831 Points +5%
HP OmniBook Ultra 16-bk0013dx
RTX Spark N1X 6144-Core Blackwell GPU, Spark RTX N1X 20-Core
1748 Points
Acer Swift 16 AI SF16-51T-932H, Ultra 9 288V
Arc 140V, Core Ultra 9 288V, Western Digital PC SN5000S SDEQNSJ-1T00
1725 Points -1%
Average Nvidia RTX Spark N1X 20-Core, NVIDIA RTX Spark N1X 6144-Core Blackwell GPU
  (1579 - 1750, n=3)
1692 Points -3%
Asus ProArt P16 H7607
RTX Spark N1X 6144-Core Blackwell GPU, Spark RTX N1X 20-Core, SanDisk PC SN5100S 2TB
1579 Points -10%
CrossMark / Productivity
Razer Blade 16 Core Ultra 9 386H
GeForce RTX 5090 Laptop, Ultra 9 386H, Lexar NM790 2TB
1972 Points +31%
Lenovo ThinkBook 16p G6 21R00013GE
GeForce RTX 5060 Laptop, Ultra 7 255HX, SK hynix PVC10 HFS001TEM4X182N
1943 Points +29%
MSI Stealth 16 AI B3WH
GeForce RTX 5070 Ti Laptop, Ultra 9 386H, Samsung PM9C1b MZVL81T0HFLB-00BTW
1926 Points +28%
Dell XPS 16 Core Ultra X7 358H
Arc B390 Panther Lake iGPU, Ultra X7 358H
1898 Points +26%
HP HyperX Omen 16 16-ap1931nr
GeForce RTX 5070 Laptop, R9 9955HX3D
1843 Points +22%
Dell Pro 5 16 P516265
Radeon 890M, Ryzen AI 9 HX PRO 470, SanDisk PC SN5100S
1729 Points +15%
Lenovo ThinkPad P16 G2 21FA000FGE
RTX 2000 Ada Generation Laptop, i7-13700HX, SK hynix PC801 HFS001TEJ9X162N
1704 Points +13%
Acer Swift 16 AI SF16-51T-932H, Ultra 9 288V
Arc 140V, Core Ultra 9 288V, Western Digital PC SN5000S SDEQNSJ-1T00
1663 Points +10%
HP OmniBook Ultra 16-bk0013dx
RTX Spark N1X 6144-Core Blackwell GPU, Spark RTX N1X 20-Core
1510 Points
Average Nvidia RTX Spark N1X 20-Core, NVIDIA RTX Spark N1X 6144-Core Blackwell GPU
  (1386 - 1510, n=3)
1461 Points -3%
Asus ProArt P16 H7607
RTX Spark N1X 6144-Core Blackwell GPU, Spark RTX N1X 20-Core, SanDisk PC SN5100S 2TB
1386 Points -8%
CrossMark / Creativity
Razer Blade 16 Core Ultra 9 386H
GeForce RTX 5090 Laptop, Ultra 9 386H, Lexar NM790 2TB
2558 Points +24%
Dell XPS 16 Core Ultra X7 358H
Arc B390 Panther Lake iGPU, Ultra X7 358H
2529 Points +23%
Lenovo ThinkBook 16p G6 21R00013GE
GeForce RTX 5060 Laptop, Ultra 7 255HX, SK hynix PVC10 HFS001TEM4X182N
2384 Points +16%
MSI Stealth 16 AI B3WH
GeForce RTX 5070 Ti Laptop, Ultra 9 386H, Samsung PM9C1b MZVL81T0HFLB-00BTW
2300 Points +12%
HP HyperX Omen 16 16-ap1931nr
GeForce RTX 5070 Laptop, R9 9955HX3D
2267 Points +10%
Dell Pro 5 16 P516265
Radeon 890M, Ryzen AI 9 HX PRO 470, SanDisk PC SN5100S
2254 Points +10%
Lenovo ThinkPad P16 G2 21FA000FGE
RTX 2000 Ada Generation Laptop, i7-13700HX, SK hynix PC801 HFS001TEJ9X162N
2123 Points +3%
HP OmniBook Ultra 16-bk0013dx
RTX Spark N1X 6144-Core Blackwell GPU, Spark RTX N1X 20-Core
2056 Points
Average Nvidia RTX Spark N1X 20-Core, NVIDIA RTX Spark N1X 6144-Core Blackwell GPU
  (1838 - 2102, n=3)
1999 Points -3%
Acer Swift 16 AI SF16-51T-932H, Ultra 9 288V
Arc 140V, Core Ultra 9 288V, Western Digital PC SN5000S SDEQNSJ-1T00
1966 Points -4%
Asus ProArt P16 H7607
RTX Spark N1X 6144-Core Blackwell GPU, Spark RTX N1X 20-Core, SanDisk PC SN5100S 2TB
1838 Points -11%
CrossMark / Responsiveness
Razer Blade 16 Core Ultra 9 386H
GeForce RTX 5090 Laptop, Ultra 9 386H, Lexar NM790 2TB
1854 Points +11%
MSI Stealth 16 AI B3WH
GeForce RTX 5070 Ti Laptop, Ultra 9 386H, Samsung PM9C1b MZVL81T0HFLB-00BTW
1818 Points +9%
Dell XPS 16 Core Ultra X7 358H
Arc B390 Panther Lake iGPU, Ultra X7 358H
1706 Points +2%
HP HyperX Omen 16 16-ap1931nr
GeForce RTX 5070 Laptop, R9 9955HX3D
1691 Points +1%
HP OmniBook Ultra 16-bk0013dx
RTX Spark N1X 6144-Core Blackwell GPU, Spark RTX N1X 20-Core
1667 Points
Lenovo ThinkBook 16p G6 21R00013GE
GeForce RTX 5060 Laptop, Ultra 7 255HX, SK hynix PVC10 HFS001TEM4X182N
1617 Points -3%
Average Nvidia RTX Spark N1X 20-Core, NVIDIA RTX Spark N1X 6144-Core Blackwell GPU
  (1481 - 1667, n=3)
1596 Points -4%
Dell Pro 5 16 P516265
Radeon 890M, Ryzen AI 9 HX PRO 470, SanDisk PC SN5100S
1526 Points -8%
Asus ProArt P16 H7607
RTX Spark N1X 6144-Core Blackwell GPU, Spark RTX N1X 20-Core, SanDisk PC SN5100S 2TB
1481 Points -11%
Lenovo ThinkPad P16 G2 21FA000FGE
RTX 2000 Ada Generation Laptop, i7-13700HX, SK hynix PC801 HFS001TEJ9X162N
1457 Points -13%
Acer Swift 16 AI SF16-51T-932H, Ultra 9 288V
Arc 140V, Core Ultra 9 288V, Western Digital PC SN5000S SDEQNSJ-1T00
1301 Points -22%
WebXPRT 3 / Overall
Dell Pro 5 16 P516265
Radeon 890M, Ryzen AI 9 HX PRO 470, SanDisk PC SN5100S
349 Points
HP HyperX Omen 16 16-ap1931nr
GeForce RTX 5070 Laptop, R9 9955HX3D
339 Points
MSI Stealth 16 AI B3WH
GeForce RTX 5070 Ti Laptop, Ultra 9 386H, Samsung PM9C1b MZVL81T0HFLB-00BTW
327 Points
Razer Blade 16 Core Ultra 9 386H
GeForce RTX 5090 Laptop, Ultra 9 386H, Lexar NM790 2TB
325 Points
Lenovo ThinkPad P16 G2 21FA000FGE
RTX 2000 Ada Generation Laptop, i7-13700HX, SK hynix PC801 HFS001TEJ9X162N
324 Points
Lenovo ThinkBook 16p G6 21R00013GE
GeForce RTX 5060 Laptop, Ultra 7 255HX, SK hynix PVC10 HFS001TEM4X182N
317 Points
Dell XPS 16 Core Ultra X7 358H
Arc B390 Panther Lake iGPU, Ultra X7 358H
304 Points
Acer Swift 16 AI SF16-51T-932H, Ultra 9 288V
Arc 140V, Core Ultra 9 288V, Western Digital PC SN5000S SDEQNSJ-1T00
297 Points
WebXPRT 4 / Overall
Asus ProArt P16 H7607
RTX Spark N1X 6144-Core Blackwell GPU, Spark RTX N1X 20-Core, SanDisk PC SN5100S 2TB
408 Points
Average Nvidia RTX Spark N1X 20-Core, NVIDIA RTX Spark N1X 6144-Core Blackwell GPU
  (393 - 408, n=2)
401 Points
HP HyperX Omen 16 16-ap1931nr
GeForce RTX 5070 Laptop, R9 9955HX3D
318 Points
Lenovo ThinkBook 16p G6 21R00013GE
GeForce RTX 5060 Laptop, Ultra 7 255HX, SK hynix PVC10 HFS001TEM4X182N
313 Points
MSI Stealth 16 AI B3WH
GeForce RTX 5070 Ti Laptop, Ultra 9 386H, Samsung PM9C1b MZVL81T0HFLB-00BTW
304 Points
Razer Blade 16 Core Ultra 9 386H
GeForce RTX 5090 Laptop, Ultra 9 386H, Lexar NM790 2TB
301 Points
Dell XPS 16 Core Ultra X7 358H
Arc B390 Panther Lake iGPU, Ultra X7 358H
300 Points
Dell Pro 5 16 P516265
Radeon 890M, Ryzen AI 9 HX PRO 470, SanDisk PC SN5100S
284 Points
Acer Swift 16 AI SF16-51T-932H, Ultra 9 288V
Arc 140V, Core Ultra 9 288V, Western Digital PC SN5000S SDEQNSJ-1T00
282 Points
Mozilla Kraken 1.1 / Total
Lenovo ThinkPad P16 G2 21FA000FGE
RTX 2000 Ada Generation Laptop, i7-13700HX, SK hynix PC801 HFS001TEJ9X162N
489 ms *
Acer Swift 16 AI SF16-51T-932H, Ultra 9 288V
Arc 140V, Core Ultra 9 288V, Western Digital PC SN5000S SDEQNSJ-1T00
466 ms *
Razer Blade 16 Core Ultra 9 386H
GeForce RTX 5090 Laptop, Ultra 9 386H, Lexar NM790 2TB
456 ms *
Dell XPS 16 Core Ultra X7 358H
Arc B390 Panther Lake iGPU, Ultra X7 358H
450 ms *
MSI Stealth 16 AI B3WH
GeForce RTX 5070 Ti Laptop, Ultra 9 386H, Samsung PM9C1b MZVL81T0HFLB-00BTW
450 ms *
Dell Pro 5 16 P516265
Radeon 890M, Ryzen AI 9 HX PRO 470, SanDisk PC SN5100S
426 ms *
Lenovo ThinkBook 16p G6 21R00013GE
GeForce RTX 5060 Laptop, Ultra 7 255HX, SK hynix PVC10 HFS001TEM4X182N
423 ms *
HP HyperX Omen 16 16-ap1931nr
GeForce RTX 5070 Laptop, R9 9955HX3D
402 ms *
Asus ProArt P16 H7607
RTX Spark N1X 6144-Core Blackwell GPU, Spark RTX N1X 20-Core, SanDisk PC SN5100S 2TB
293.3 ms *
Average Nvidia RTX Spark N1X 20-Core, NVIDIA RTX Spark N1X 6144-Core Blackwell GPU
  (290 - 293, n=2)
292 ms *
MLPerf Client 2.0 / GPU Qwen 3 8B LLM TTFT
HP OmniBook Ultra 16-bk0013dx
RTX Spark N1X 6144-Core Blackwell GPU, Spark RTX N1X 20-Core
0.28 s *
Average Nvidia RTX Spark N1X 20-Core, NVIDIA RTX Spark N1X 6144-Core Blackwell GPU
  (0.27 - 0.29, n=3)
0.28 s * -0%
Asus ProArt P16 H7607
RTX Spark N1X 6144-Core Blackwell GPU, Spark RTX N1X 20-Core, SanDisk PC SN5100S 2TB
0.27 s * +4%
MLPerf Client 2.0 / GPU Qwen 3 8B LLM Tokens/s
HP OmniBook Ultra 16-bk0013dx
RTX Spark N1X 6144-Core Blackwell GPU, Spark RTX N1X 20-Core
54.8 TPS
Average Nvidia RTX Spark N1X 20-Core, NVIDIA RTX Spark N1X 6144-Core Blackwell GPU
  (53.8 - 54.8, n=3)
54.5 TPS -1%
Asus ProArt P16 H7607
RTX Spark N1X 6144-Core Blackwell GPU, Spark RTX N1X 20-Core, SanDisk PC SN5100S 2TB
53.8 TPS -2%
MLPerf Client 2.0 / GPU Qwen 3 8B SWE Agent Avg Expected Duration
Asus ProArt P16 H7607
RTX Spark N1X 6144-Core Blackwell GPU, Spark RTX N1X 20-Core, SanDisk PC SN5100S 2TB
46.115 s * -0%
HP OmniBook Ultra 16-bk0013dx
RTX Spark N1X 6144-Core Blackwell GPU, Spark RTX N1X 20-Core
46.015 s *
Average Nvidia RTX Spark N1X 20-Core, NVIDIA RTX Spark N1X 6144-Core Blackwell GPU
  (45.6 - 46.1, n=3)
45.9 s * -0%
MLPerf Client 2.0 / GPU Qwen 3 8B SWE Agent Avg Tools Duration
Asus ProArt P16 H7607
RTX Spark N1X 6144-Core Blackwell GPU, Spark RTX N1X 20-Core, SanDisk PC SN5100S 2TB
6.556 s * -1%
HP OmniBook Ultra 16-bk0013dx
RTX Spark N1X 6144-Core Blackwell GPU, Spark RTX N1X 20-Core
6.474 s *
Average Nvidia RTX Spark N1X 20-Core, NVIDIA RTX Spark N1X 6144-Core Blackwell GPU
  (6.3 - 6.56, n=3)
6.44 s * +1%
MLPerf Client 2.0 / GPU Llama 3.1 8B LLM Tokens/s
Asus ProArt P16 H7607
RTX Spark N1X 6144-Core Blackwell GPU, Spark RTX N1X 20-Core, SanDisk PC SN5100S 2TB
55.8 TPS +1%
Average Nvidia RTX Spark N1X 20-Core, NVIDIA RTX Spark N1X 6144-Core Blackwell GPU
  (55.4 - 55.9, n=3)
55.7 TPS +1%
HP OmniBook Ultra 16-bk0013dx
RTX Spark N1X 6144-Core Blackwell GPU, Spark RTX N1X 20-Core
55.4 TPS
MLPerf Client 2.0 / GPU Llama 3.1 8B LLM TTFT
Asus ProArt P16 H7607
RTX Spark N1X 6144-Core Blackwell GPU, Spark RTX N1X 20-Core, SanDisk PC SN5100S 2TB
0.3 s * -11%
Average Nvidia RTX Spark N1X 20-Core, NVIDIA RTX Spark N1X 6144-Core Blackwell GPU
  (0.27 - 0.3, n=3)
0.2867 s * -6%
HP OmniBook Ultra 16-bk0013dx
RTX Spark N1X 6144-Core Blackwell GPU, Spark RTX N1X 20-Core
0.27 s *
MLPerf Client 2.0 / GPU Llama 3.1 8B SWE Agent Avg Tools Duration
HP OmniBook Ultra 16-bk0013dx
RTX Spark N1X 6144-Core Blackwell GPU, Spark RTX N1X 20-Core
7.027 s *
Average Nvidia RTX Spark N1X 20-Core, NVIDIA RTX Spark N1X 6144-Core Blackwell GPU
  (6.41 - 7.03, n=3)
6.8 s * +3%
Asus ProArt P16 H7607
RTX Spark N1X 6144-Core Blackwell GPU, Spark RTX N1X 20-Core, SanDisk PC SN5100S 2TB
6.414 s * +9%
MLPerf Client 2.0 / GPU Llama 3.1 8B SWE Agent Avg Expected Duration
Average Nvidia RTX Spark N1X 20-Core, NVIDIA RTX Spark N1X 6144-Core Blackwell GPU
  (46.2 - 46.6, n=3)
46.4 s * -0%
HP OmniBook Ultra 16-bk0013dx
RTX Spark N1X 6144-Core Blackwell GPU, Spark RTX N1X 20-Core
46.248 s *
Asus ProArt P16 H7607
RTX Spark N1X 6144-Core Blackwell GPU, Spark RTX N1X 20-Core, SanDisk PC SN5100S 2TB
46.234 s * -0%

* ... smaller is better

AIDA64 / Memory Copy
Average Nvidia RTX Spark N1X 20-Core
  (153516 - 157183, n=3)
154881 MB/s +1%
HP OmniBook Ultra 16-bk0013dx
Nvidia RTX Spark N1X 20-Core, RTX Spark N1X 6144-Core Blackwell GPU
153945 MB/s
Asus ProArt P16 H7607
Nvidia RTX Spark N1X 20-Core, RTX Spark N1X 6144-Core Blackwell GPU
153516 MB/s 0%
Dell XPS 16 Core Ultra X7 358H
Intel Core Ultra X7 358H, Arc B390 Panther Lake iGPU
132135 MB/s -14%
Razer Blade 16 Core Ultra 9 386H
Intel Core Ultra 9 386H, GeForce RTX 5090 Laptop
129946 MB/s -16%
MSI Stealth 16 AI B3WH
Intel Core Ultra 9 386H, GeForce RTX 5070 Ti Laptop
81326 MB/s -47%
Lenovo ThinkPad P16 G2 21FA000FGE
Intel Core i7-13700HX, RTX 2000 Ada Generation Laptop
56335 MB/s -63%
AIDA64 / Memory Read
HP OmniBook Ultra 16-bk0013dx
Nvidia RTX Spark N1X 20-Core, RTX Spark N1X 6144-Core Blackwell GPU
133877 MB/s
Average Nvidia RTX Spark N1X 20-Core
  (133601 - 134029, n=3)
133836 MB/s 0%
Asus ProArt P16 H7607
Nvidia RTX Spark N1X 20-Core, RTX Spark N1X 6144-Core Blackwell GPU
133601 MB/s 0%
Dell XPS 16 Core Ultra X7 358H
Intel Core Ultra X7 358H, Arc B390 Panther Lake iGPU
118888 MB/s -11%
Razer Blade 16 Core Ultra 9 386H
Intel Core Ultra 9 386H, GeForce RTX 5090 Laptop
118858 MB/s -11%
MSI Stealth 16 AI B3WH
Intel Core Ultra 9 386H, GeForce RTX 5070 Ti Laptop
83346 MB/s -38%
Lenovo ThinkPad P16 G2 21FA000FGE
Intel Core i7-13700HX, RTX 2000 Ada Generation Laptop
57623 MB/s -57%
AIDA64 / Memory Write
Average Nvidia RTX Spark N1X 20-Core
  (225242 - 225987, n=3)
225598 MB/s 0%
HP OmniBook Ultra 16-bk0013dx
Nvidia RTX Spark N1X 20-Core, RTX Spark N1X 6144-Core Blackwell GPU
225564 MB/s
Asus ProArt P16 H7607
Nvidia RTX Spark N1X 20-Core, RTX Spark N1X 6144-Core Blackwell GPU
225242 MB/s 0%
Razer Blade 16 Core Ultra 9 386H
Intel Core Ultra 9 386H, GeForce RTX 5090 Laptop
135096 MB/s -40%
Dell XPS 16 Core Ultra X7 358H
Intel Core Ultra X7 358H, Arc B390 Panther Lake iGPU
134998 MB/s -40%
MSI Stealth 16 AI B3WH
Intel Core Ultra 9 386H, GeForce RTX 5070 Ti Laptop
78270 MB/s -65%
Lenovo ThinkPad P16 G2 21FA000FGE
Intel Core i7-13700HX, RTX 2000 Ada Generation Laptop
57477 MB/s -75%
AIDA64 / Memory Latency
MSI Stealth 16 AI B3WH
Intel Core Ultra 9 386H, GeForce RTX 5070 Ti Laptop
118.6 ns * -766%
Lenovo ThinkPad P16 G2 21FA000FGE
Intel Core i7-13700HX, RTX 2000 Ada Generation Laptop
97.9 ns * -615%
Razer Blade 16 Core Ultra 9 386H
Intel Core Ultra 9 386H, GeForce RTX 5090 Laptop
87.2 ns * -536%
Dell XPS 16 Core Ultra X7 358H
Intel Core Ultra X7 358H, Arc B390 Panther Lake iGPU
84.6 ns * -518%
HP OmniBook Ultra 16-bk0013dx
Nvidia RTX Spark N1X 20-Core, RTX Spark N1X 6144-Core Blackwell GPU
13.7 ns *
Average Nvidia RTX Spark N1X 20-Core
  (n=1)
13.7 ns * -0%

* ... smaller is better

Storage Devices
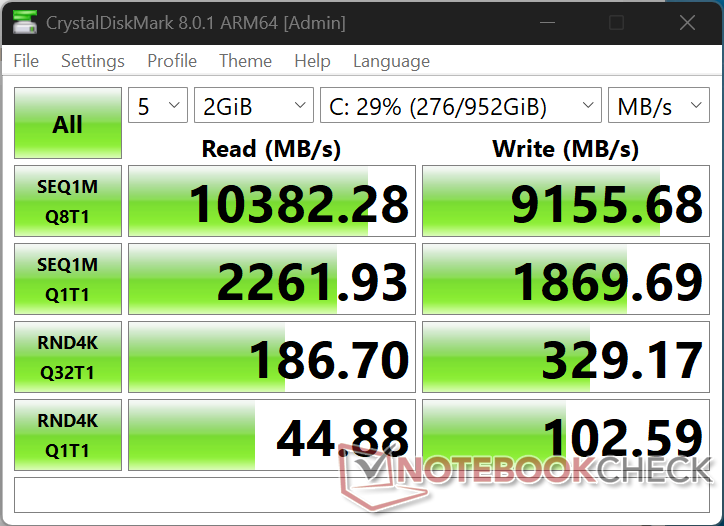
CDM 8
CDM 8
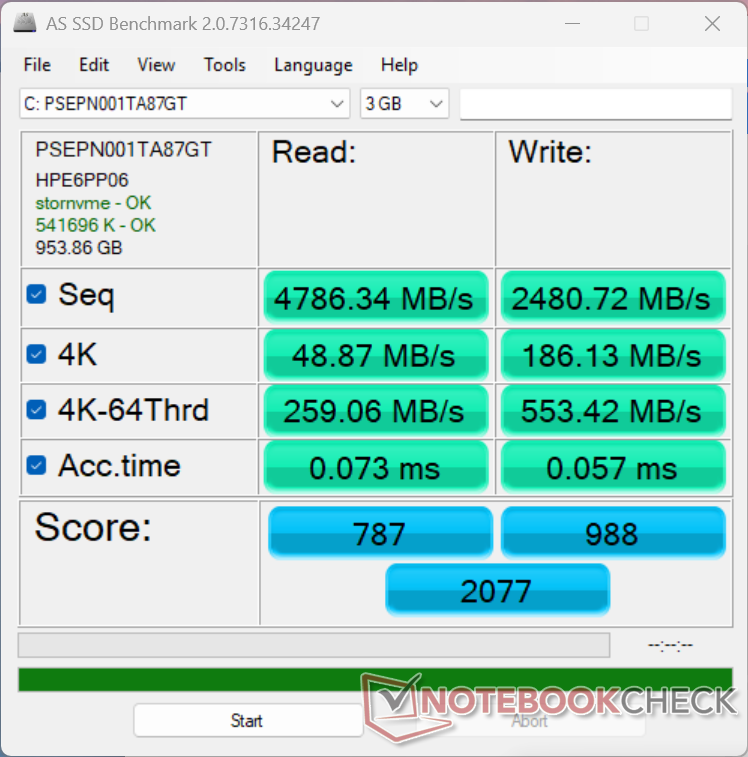
AS SSD
AS SSD
CDM 5/6 Read Seq Q32T1: 4767 MB/s
CDM 5/6 Write Seq Q32T1: 7562 MB/s
CDM 5/6 Read 4K Q32T1: 159.1 MB/s
CDM 5/6 Write 4K Q32T1: 299.7 MB/s
CDM 5 Read Seq: 2109 MB/s
CDM 5 Write Seq: 1820 MB/s
CDM 5/6 Read 4K: 35.45 MB/s
CDM 5/6 Write 4K: 73.67 MB/s
Drive Performance rating - Percent
MSI Stealth 16 AI B3WH
Samsung PM9C1b MZVL81T0HFLB-00BTW
75.8 pt
Lenovo ThinkPad P16 G2 21FA000FGE
SK hynix PC801 HFS001TEJ9X162N
70.8 pt
Dell XPS 16 Core Ultra X7 358H
 
66.7 pt
HP OmniBook Ultra 16-bk0013dx
 
63.8 pt
Razer Blade 16 Core Ultra 9 386H
Lexar NM790 2TB
61.8 pt
Asus ProArt P16 H7607
SanDisk PC SN5100S 2TB
60.2 pt
DiskSpd
seq read
Lenovo ThinkPad P16 G2 21FA000FGE
SK hynix PC801 HFS001TEJ9X162N
4658 (4604.53min - 4657.77max) MB/s +27%
HP OmniBook Ultra 16-bk0013dx
 
3678 (3620.52min - 3678.4max) MB/s
Dell XPS 16 Core Ultra X7 358H
 
3600 (3100.64min - 3600.18max) MB/s -2%
Razer Blade 16 Core Ultra 9 386H
Lexar NM790 2TB
2184 (2156.5min - 2184.39max) MB/s -41%
Asus ProArt P16 H7607
SanDisk PC SN5100S 2TB
2156 (2048.92min - 2156.08max) MB/s -41%
MSI Stealth 16 AI B3WH
Samsung PM9C1b MZVL81T0HFLB-00BTW
2145 (1598.45min - 2144.66max) MB/s -42%
seq write
Lenovo ThinkPad P16 G2 21FA000FGE
SK hynix PC801 HFS001TEJ9X162N
3564 (3288.75min - 3564.11max) MB/s +12%
Razer Blade 16 Core Ultra 9 386H
Lexar NM790 2TB
3302 (1890.37min - 3302.39max) MB/s +4%
HP OmniBook Ultra 16-bk0013dx
 
3190 (2608.67min - 3189.68max) MB/s
Dell XPS 16 Core Ultra X7 358H
 
2599 (796.92min - 2599.25max) MB/s -19%
Asus ProArt P16 H7607
SanDisk PC SN5100S 2TB
2231 (2151.15min - 2230.95max) MB/s -30%
MSI Stealth 16 AI B3WH
Samsung PM9C1b MZVL81T0HFLB-00BTW
1943 (1502.96min - 1942.59max) MB/s -39%
seq q8 t1 read
HP OmniBook Ultra 16-bk0013dx
 
10368 (9384.96min - 10368.3max) MB/s
Asus ProArt P16 H7607
SanDisk PC SN5100S 2TB
7278 (6146.54min - 7278.38max) MB/s -30%
Lenovo ThinkPad P16 G2 21FA000FGE
SK hynix PC801 HFS001TEJ9X162N
7157 (6238.19min - 7156.53max) MB/s -31%
MSI Stealth 16 AI B3WH
Samsung PM9C1b MZVL81T0HFLB-00BTW
7078 (5389.68min - 7077.89max) MB/s -32%
Dell XPS 16 Core Ultra X7 358H
 
7039 (5536.1min - 7039.48max) MB/s -32%
Razer Blade 16 Core Ultra 9 386H
Lexar NM790 2TB
6991 (6203.59min - 6991.49max) MB/s -33%
seq q8 t1 write
HP OmniBook Ultra 16-bk0013dx
 
9022 (8920.66min - 9022.36max) MB/s
Asus ProArt P16 H7607
SanDisk PC SN5100S 2TB
6544 (6131.13min - 6543.87max) MB/s -27%
Razer Blade 16 Core Ultra 9 386H
Lexar NM790 2TB
6384 (2633.81min - 6383.97max) MB/s -29%
Lenovo ThinkPad P16 G2 21FA000FGE
SK hynix PC801 HFS001TEJ9X162N
6125 (6104.39min - 6125.07max) MB/s -32%
Dell XPS 16 Core Ultra X7 358H
 
6101 (5938.22min - 6101.03max) MB/s -32%
MSI Stealth 16 AI B3WH
Samsung PM9C1b MZVL81T0HFLB-00BTW
5692 (1799.95min - 5692.24max) MB/s -37%
4k q1 t1 read
MSI Stealth 16 AI B3WH
Samsung PM9C1b MZVL81T0HFLB-00BTW
73.2 (72.71min - 73.2max) MB/s +33%
Asus ProArt P16 H7607
SanDisk PC SN5100S 2TB
61.1 (58.15min - 61.11max) MB/s +11%
Razer Blade 16 Core Ultra 9 386H
Lexar NM790 2TB
60.5 (59.31min - 60.47max) MB/s +10%
Dell XPS 16 Core Ultra X7 358H
 
59.1 (53.74min - 59.08max) MB/s +7%
Lenovo ThinkPad P16 G2 21FA000FGE
SK hynix PC801 HFS001TEJ9X162N
55.2 (54.95min - 55.23max) MB/s 0%
HP OmniBook Ultra 16-bk0013dx
 
55 (53.58min - 54.99max) MB/s
4k q1 t1 write
HP OmniBook Ultra 16-bk0013dx
 
266 (264.64min - 266.44max) MB/s
Asus ProArt P16 H7607
SanDisk PC SN5100S 2TB
217 (213.69min - 216.93max) MB/s -18%
MSI Stealth 16 AI B3WH
Samsung PM9C1b MZVL81T0HFLB-00BTW
207 (157.18min - 206.55max) MB/s -22%
Razer Blade 16 Core Ultra 9 386H
Lexar NM790 2TB
192.1 (191.3min - 192.14max) MB/s -28%
Dell XPS 16 Core Ultra X7 358H
 
145.5 (139.46min - 145.49max) MB/s -45%
Lenovo ThinkPad P16 G2 21FA000FGE
SK hynix PC801 HFS001TEJ9X162N
122.2 (121.67min - 122.17max) MB/s -54%
4k q32 t16 read
MSI Stealth 16 AI B3WH
Samsung PM9C1b MZVL81T0HFLB-00BTW
2851 (2824.97min - 2851.18max) MB/s +129%
Asus ProArt P16 H7607
SanDisk PC SN5100S 2TB
2366 (1748.88min - 2366.34max) MB/s +90%
HP OmniBook Ultra 16-bk0013dx
 
1245 (1209.68min - 1244.74max) MB/s
Lenovo ThinkPad P16 G2 21FA000FGE
SK hynix PC801 HFS001TEJ9X162N
909 (877.94min - 908.91max) MB/s -27%
Razer Blade 16 Core Ultra 9 386H
Lexar NM790 2TB
886 (853.99min - 885.71max) MB/s -29%
Dell XPS 16 Core Ultra X7 358H
 
652 (602.16min - 651.54max) MB/s -48%
4k q32 t16 write
MSI Stealth 16 AI B3WH
Samsung PM9C1b MZVL81T0HFLB-00BTW
2238 (2173.54min - 2237.9max) MB/s +129%
Asus ProArt P16 H7607
SanDisk PC SN5100S 2TB
1124 (1099.32min - 1123.83max) MB/s +15%
HP OmniBook Ultra 16-bk0013dx
 
976 (960.91min - 976.42max) MB/s
Razer Blade 16 Core Ultra 9 386H
Lexar NM790 2TB
504 (484.83min - 503.6max) MB/s -48%
Lenovo ThinkPad P16 G2 21FA000FGE
SK hynix PC801 HFS001TEJ9X162N
457 (451.72min - 456.57max) MB/s -53%
Dell XPS 16 Core Ultra X7 358H
 
447 (308.53min - 447.08max) MB/s -54%
AS SSD
Score Total
Lenovo ThinkPad P16 G2 21FA000FGE
SK hynix PC801 HFS001TEJ9X162N
5943 Points +186%
MSI Stealth 16 AI B3WH
Samsung PM9C1b MZVL81T0HFLB-00BTW
5733 Points +176%
Dell XPS 16 Core Ultra X7 358H
 
5309 Points +156%
Razer Blade 16 Core Ultra 9 386H
Lexar NM790 2TB
4107 Points +98%
HP OmniBook Ultra 16-bk0013dx
 
2077 Points
Asus ProArt P16 H7607
SanDisk PC SN5100S 2TB
1661 Points -20%
Score Read
MSI Stealth 16 AI B3WH
Samsung PM9C1b MZVL81T0HFLB-00BTW
2360 Points +200%
Lenovo ThinkPad P16 G2 21FA000FGE
SK hynix PC801 HFS001TEJ9X162N
1490 Points +89%
Dell XPS 16 Core Ultra X7 358H
 
1423 Points +81%
Razer Blade 16 Core Ultra 9 386H
Lexar NM790 2TB
1379 Points +75%
HP OmniBook Ultra 16-bk0013dx
 
787 Points
Asus ProArt P16 H7607
SanDisk PC SN5100S 2TB
689 Points -12%
Score Write
Lenovo ThinkPad P16 G2 21FA000FGE
SK hynix PC801 HFS001TEJ9X162N
3831 Points +288%
Dell XPS 16 Core Ultra X7 358H
 
3277 Points +232%
MSI Stealth 16 AI B3WH
Samsung PM9C1b MZVL81T0HFLB-00BTW
2309 Points +134%
Razer Blade 16 Core Ultra 9 386H
Lexar NM790 2TB
2100 Points +113%
HP OmniBook Ultra 16-bk0013dx
 
988 Points
Asus ProArt P16 H7607
SanDisk PC SN5100S 2TB
686 Points -31%
Seq Read
Dell XPS 16 Core Ultra X7 358H
 
5083.41 MB/s +6%
Razer Blade 16 Core Ultra 9 386H
Lexar NM790 2TB
4970.9 MB/s +4%
Lenovo ThinkPad P16 G2 21FA000FGE
SK hynix PC801 HFS001TEJ9X162N
4939 MB/s +3%
Asus ProArt P16 H7607
SanDisk PC SN5100S 2TB
4893 MB/s +2%
HP OmniBook Ultra 16-bk0013dx
 
4786.34 MB/s
MSI Stealth 16 AI B3WH
Samsung PM9C1b MZVL81T0HFLB-00BTW
4700.07 MB/s -2%
Seq Write
Asus ProArt P16 H7607
SanDisk PC SN5100S 2TB
3191 MB/s +29%
Razer Blade 16 Core Ultra 9 386H
Lexar NM790 2TB
3179.74 MB/s +28%
Dell XPS 16 Core Ultra X7 358H
 
2509.02 MB/s +1%
HP OmniBook Ultra 16-bk0013dx
 
2480.72 MB/s
Lenovo ThinkPad P16 G2 21FA000FGE
SK hynix PC801 HFS001TEJ9X162N
2028 MB/s -18%
MSI Stealth 16 AI B3WH
Samsung PM9C1b MZVL81T0HFLB-00BTW
1720.1 MB/s -31%
4K Read
MSI Stealth 16 AI B3WH
Samsung PM9C1b MZVL81T0HFLB-00BTW
65.86 MB/s +35%
Razer Blade 16 Core Ultra 9 386H
Lexar NM790 2TB
56.96 MB/s +17%
Asus ProArt P16 H7607
SanDisk PC SN5100S 2TB
53 MB/s +8%
Dell XPS 16 Core Ultra X7 358H
 
52.53 MB/s +7%
HP OmniBook Ultra 16-bk0013dx
 
48.87 MB/s
Lenovo ThinkPad P16 G2 21FA000FGE
SK hynix PC801 HFS001TEJ9X162N
46.6 MB/s -5%
4K Write
HP OmniBook Ultra 16-bk0013dx
 
186.13 MB/s
MSI Stealth 16 AI B3WH
Samsung PM9C1b MZVL81T0HFLB-00BTW
176.01 MB/s -5%
Asus ProArt P16 H7607
SanDisk PC SN5100S 2TB
163 MB/s -12%
Razer Blade 16 Core Ultra 9 386H
Lexar NM790 2TB
155.96 MB/s -16%
Dell XPS 16 Core Ultra X7 358H
 
125.58 MB/s -33%
Lenovo ThinkPad P16 G2 21FA000FGE
SK hynix PC801 HFS001TEJ9X162N
113.7 MB/s -39%
4K-64 Read
MSI Stealth 16 AI B3WH
Samsung PM9C1b MZVL81T0HFLB-00BTW
1824.38 MB/s +604%
Lenovo ThinkPad P16 G2 21FA000FGE
SK hynix PC801 HFS001TEJ9X162N
949 MB/s +266%
Dell XPS 16 Core Ultra X7 358H
 
862.49 MB/s +233%
Razer Blade 16 Core Ultra 9 386H
Lexar NM790 2TB
824.7 MB/s +218%
HP OmniBook Ultra 16-bk0013dx
 
259.06 MB/s
Asus ProArt P16 H7607
SanDisk PC SN5100S 2TB
146.4 MB/s -43%
4K-64 Write
Lenovo ThinkPad P16 G2 21FA000FGE
SK hynix PC801 HFS001TEJ9X162N
3514 MB/s +535%
Dell XPS 16 Core Ultra X7 358H
 
2900.39 MB/s +424%
MSI Stealth 16 AI B3WH
Samsung PM9C1b MZVL81T0HFLB-00BTW
1960.79 MB/s +254%
Razer Blade 16 Core Ultra 9 386H
Lexar NM790 2TB
1625.98 MB/s +194%
HP OmniBook Ultra 16-bk0013dx
 
553.42 MB/s
Asus ProArt P16 H7607
SanDisk PC SN5100S 2TB
204 MB/s -63%
Access Time Read
MSI Stealth 16 AI B3WH
Samsung PM9C1b MZVL81T0HFLB-00BTW
0.114 ms * -56%
HP OmniBook Ultra 16-bk0013dx
 
0.073 ms *
Lenovo ThinkPad P16 G2 21FA000FGE
SK hynix PC801 HFS001TEJ9X162N
0.067 ms * +8%
Razer Blade 16 Core Ultra 9 386H
Lexar NM790 2TB
0.062 ms * +15%
Dell XPS 16 Core Ultra X7 358H
 
0.059 ms * +19%
Asus ProArt P16 H7607
SanDisk PC SN5100S 2TB
0.056 ms * +23%
Access Time Write
Razer Blade 16 Core Ultra 9 386H
Lexar NM790 2TB
0.231 ms * -305%
Dell XPS 16 Core Ultra X7 358H
 
0.082 ms * -44%
HP OmniBook Ultra 16-bk0013dx
 
0.057 ms *
MSI Stealth 16 AI B3WH
Samsung PM9C1b MZVL81T0HFLB-00BTW
0.053 ms * +7%
Lenovo ThinkPad P16 G2 21FA000FGE
SK hynix PC801 HFS001TEJ9X162N
0.034 ms * +40%
Asus ProArt P16 H7607
SanDisk PC SN5100S 2TB
0.023 ms * +60%

* ... smaller is better

Disk Throttling: DiskSpd Read Loop, Queue Depth 8

021042063084010501260147016801890210023102520273029403150336035703780399042004410462048305040525054605670588060906300651067206930714073507560777079808190840086108820903092409450966098701008010290Tooltip
HP OmniBook Ultra 16-bk0013dx  ; diskspd 2.0.17 f: Ø9953 (9121.56-10368.74) MB/s
Asus ProArt P16 H7607 SanDisk PC SN5100S 2TB; diskspd 2.0.17 f: Ø7227 (5702.16-7258.87) MB/s

GPU Performance

Power ProfileGraphics ScorePhysics ScoreCombined Score
Performance Mode129121403213068
Balanced Mode12695 (-2%)12262 (-13%)12628 (-3%)
Battery Power12372 (-4%)14577 (+4%)12659 (-3%)
Time Spy
Time Spy
Speed Way
Speed Way
Port Royal
Port Royal
Steel Nomad
Steel Nomad
3DMark Performance rating - Percent
KFA2 GeForce RTX 5070 Ti HoF Gaming
NVIDIA GeForce RTX 5070 Ti, AMD Ryzen 7 9800X3D
99.5 pt
Razer Blade 16 Core Ultra 9 386H -1!
NVIDIA GeForce RTX 5090 Laptop, Intel Core Ultra 9 386H
70.4 pt
MSI Stealth 16 AI B3WH
NVIDIA GeForce RTX 5070 Ti Laptop, Intel Core Ultra 9 386H
58.5 pt
HP HyperX Omen 16 16-ap1931nr -1!
NVIDIA GeForce RTX 5070 Laptop, AMD Ryzen 9 9955HX3D
50.2 pt
HP OmniBook Ultra 16-bk0013dx
NVIDIA RTX Spark N1X 6144-Core Blackwell GPU, Nvidia RTX Spark N1X 20-Core
44.3 pt
Average NVIDIA RTX Spark N1X 6144-Core Blackwell GPU
 
43.9 pt
Lenovo ThinkBook 16p G6 21R00013GE -2!
NVIDIA GeForce RTX 5060 Laptop, Intel Core Ultra 7 255HX
43.7 pt
Asus ProArt P16 H7607
NVIDIA RTX Spark N1X 6144-Core Blackwell GPU, Nvidia RTX Spark N1X 20-Core
43.6 pt
Lenovo ThinkPad P16 G2 21FA000FGE -3!
NVIDIA RTX 2000 Ada Generation Laptop, Intel Core i7-13700HX
35.7 pt
Dell XPS 16 Core Ultra X7 358H -3!
Intel Arc B390 12 Xe3 Panther Lake iGPU, Intel Core Ultra X7 358H
23.7 pt
Acer Swift 16 AI SF16-51T-932H, Ultra 9 288V -3!
Intel Arc Graphics 140V, Intel Core Ultra 9 288V
14.4 pt
Dell Pro 5 16 P516265 -2!
AMD Radeon 890M, AMD Ryzen AI 9 HX PRO 470
10.7 pt
3DMark 11 - 1280x720 Performance GPU
KFA2 GeForce RTX 5070 Ti HoF Gaming
NVIDIA GeForce RTX 5070 Ti, AMD Ryzen 7 9800X3D
84914 Points +97%
MSI Stealth 16 AI B3WH
NVIDIA GeForce RTX 5070 Ti Laptop, Intel Core Ultra 9 386H
55888 Points +29%
HP HyperX Omen 16 16-ap1931nr
NVIDIA GeForce RTX 5070 Laptop, AMD Ryzen 9 9955HX3D
47922 Points +11%
HP OmniBook Ultra 16-bk0013dx
NVIDIA RTX Spark N1X 6144-Core Blackwell GPU, Nvidia RTX Spark N1X 20-Core
43182 Points
Average NVIDIA RTX Spark N1X 6144-Core Blackwell GPU
  (39804 - 43182, n=3)
41617 Points -4%
Lenovo ThinkBook 16p G6 21R00013GE
NVIDIA GeForce RTX 5060 Laptop, Intel Core Ultra 7 255HX
40295 Points -7%
Asus ProArt P16 H7607
NVIDIA RTX Spark N1X 6144-Core Blackwell GPU, Nvidia RTX Spark N1X 20-Core
39804 Points -8%
Lenovo ThinkPad P16 G2 21FA000FGE
NVIDIA RTX 2000 Ada Generation Laptop, Intel Core i7-13700HX
33001 Points -24%
Razer Blade 16 Core Ultra 9 386H
NVIDIA GeForce RTX 5090 Laptop, Intel Core Ultra 9 386H
26378 Points -39%
Dell XPS 16 Core Ultra X7 358H
Intel Arc B390 12 Xe3 Panther Lake iGPU, Intel Core Ultra X7 358H
18308 Points -58%
Dell Pro 5 16 P516265
AMD Radeon 890M, AMD Ryzen AI 9 HX PRO 470
14292 Points -67%
Acer Swift 16 AI SF16-51T-932H, Ultra 9 288V
Intel Arc Graphics 140V, Intel Core Ultra 9 288V
11396 Points -74%
3DMark
1920x1080 Fire Strike Graphics
KFA2 GeForce RTX 5070 Ti HoF Gaming
NVIDIA GeForce RTX 5070 Ti, AMD Ryzen 7 9800X3D
70373 Points +144%
Razer Blade 16 Core Ultra 9 386H
NVIDIA GeForce RTX 5090 Laptop, Intel Core Ultra 9 386H
52405 Points +82%
MSI Stealth 16 AI B3WH
NVIDIA GeForce RTX 5070 Ti Laptop, Intel Core Ultra 9 386H
43346 Points +50%
HP HyperX Omen 16 16-ap1931nr
NVIDIA GeForce RTX 5070 Laptop, AMD Ryzen 9 9955HX3D
38864 Points +35%
Lenovo ThinkBook 16p G6 21R00013GE
NVIDIA GeForce RTX 5060 Laptop, Intel Core Ultra 7 255HX
32868 Points +14%
Asus ProArt P16 H7607
NVIDIA RTX Spark N1X 6144-Core Blackwell GPU, Nvidia RTX Spark N1X 20-Core
29045 Points +1%
HP OmniBook Ultra 16-bk0013dx
NVIDIA RTX Spark N1X 6144-Core Blackwell GPU, Nvidia RTX Spark N1X 20-Core
28818 Points
Average NVIDIA RTX Spark N1X 6144-Core Blackwell GPU
  (28207 - 29045, n=3)
28690 Points 0%
Lenovo ThinkPad P16 G2 21FA000FGE
NVIDIA RTX 2000 Ada Generation Laptop, Intel Core i7-13700HX
24596 Points -15%
Dell XPS 16 Core Ultra X7 358H
Intel Arc B390 12 Xe3 Panther Lake iGPU, Intel Core Ultra X7 358H
17018 Points -41%
Acer Swift 16 AI SF16-51T-932H, Ultra 9 288V
Intel Arc Graphics 140V, Intel Core Ultra 9 288V
10131 Points -65%
Dell Pro 5 16 P516265
AMD Radeon 890M, AMD Ryzen AI 9 HX PRO 470
8227 Points -71%
2560x1440 Time Spy Graphics
KFA2 GeForce RTX 5070 Ti HoF Gaming
NVIDIA GeForce RTX 5070 Ti, AMD Ryzen 7 9800X3D
27607 Points +114%
Razer Blade 16 Core Ultra 9 386H
NVIDIA GeForce RTX 5090 Laptop, Intel Core Ultra 9 386H
23470 Points +82%
MSI Stealth 16 AI B3WH
NVIDIA GeForce RTX 5070 Ti Laptop, Intel Core Ultra 9 386H
16726 Points +30%
HP HyperX Omen 16 16-ap1931nr
NVIDIA GeForce RTX 5070 Laptop, AMD Ryzen 9 9955HX3D
13909 Points +8%
HP OmniBook Ultra 16-bk0013dx
NVIDIA RTX Spark N1X 6144-Core Blackwell GPU, Nvidia RTX Spark N1X 20-Core
12912 Points
Average NVIDIA RTX Spark N1X 6144-Core Blackwell GPU
  (12456 - 12912, n=3)
12667 Points -2%
Asus ProArt P16 H7607
NVIDIA RTX Spark N1X 6144-Core Blackwell GPU, Nvidia RTX Spark N1X 20-Core
12634 Points -2%
Lenovo ThinkBook 16p G6 21R00013GE
NVIDIA GeForce RTX 5060 Laptop, Intel Core Ultra 7 255HX
12316 Points -5%
Lenovo ThinkPad P16 G2 21FA000FGE
NVIDIA RTX 2000 Ada Generation Laptop, Intel Core i7-13700HX
9158 Points -29%
Dell XPS 16 Core Ultra X7 358H
Intel Arc B390 12 Xe3 Panther Lake iGPU, Intel Core Ultra X7 358H
6972 Points -46%
Acer Swift 16 AI SF16-51T-932H, Ultra 9 288V
Intel Arc Graphics 140V, Intel Core Ultra 9 288V
4211 Points -67%
Dell Pro 5 16 P516265
AMD Radeon 890M, AMD Ryzen AI 9 HX PRO 470
3000 Points -77%
2560x1440 Speed Way Score
KFA2 GeForce RTX 5070 Ti HoF Gaming
NVIDIA GeForce RTX 5070 Ti, AMD Ryzen 7 9800X3D
7772 Points +155%
Razer Blade 16 Core Ultra 9 386H
NVIDIA GeForce RTX 5090 Laptop, Intel Core Ultra 9 386H
6189 Points +103%
MSI Stealth 16 AI B3WH
NVIDIA GeForce RTX 5070 Ti Laptop, Intel Core Ultra 9 386H
4212 Points +38%
HP HyperX Omen 16 16-ap1931nr
NVIDIA GeForce RTX 5070 Laptop, AMD Ryzen 9 9955HX3D
3653 Points +20%
HP OmniBook Ultra 16-bk0013dx
NVIDIA RTX Spark N1X 6144-Core Blackwell GPU, Nvidia RTX Spark N1X 20-Core
3051 Points
Average NVIDIA RTX Spark N1X 6144-Core Blackwell GPU
  (2987 - 3051, n=3)
3009 Points -1%
Asus ProArt P16 H7607
NVIDIA RTX Spark N1X 6144-Core Blackwell GPU, Nvidia RTX Spark N1X 20-Core
2990 Points -2%
Dell Pro 5 16 P516265
AMD Radeon 890M, AMD Ryzen AI 9 HX PRO 470
254 Points -92%
Steel Nomad Score
KFA2 GeForce RTX 5070 Ti HoF Gaming
NVIDIA GeForce RTX 5070 Ti, AMD Ryzen 7 9800X3D
7249 Points +143%
KFA2 GeForce RTX 5070 Ti HoF Gaming
NVIDIA GeForce RTX 5070 Ti, AMD Ryzen 7 9800X3D
6825 Points +128%
Razer Blade 16 Core Ultra 9 386H
NVIDIA GeForce RTX 5090 Laptop, Intel Core Ultra 9 386H
5915 Points +98%
MSI Stealth 16 AI B3WH
NVIDIA GeForce RTX 5070 Ti Laptop, Intel Core Ultra 9 386H
3781 Points +27%
Asus ProArt P16 H7607
NVIDIA RTX Spark N1X 6144-Core Blackwell GPU, Nvidia RTX Spark N1X 20-Core
3134 Points +5%
Average NVIDIA RTX Spark N1X 6144-Core Blackwell GPU
  (2988 - 3134, n=3)
3085 Points +3%
HP HyperX Omen 16 16-ap1931nr
NVIDIA GeForce RTX 5070 Laptop, AMD Ryzen 9 9955HX3D
3049 Points +2%
HP OmniBook Ultra 16-bk0013dx
NVIDIA RTX Spark N1X 6144-Core Blackwell GPU, Nvidia RTX Spark N1X 20-Core
2988 Points
Lenovo ThinkBook 16p G6 21R00013GE
NVIDIA GeForce RTX 5060 Laptop, Intel Core Ultra 7 255HX
2603 Points -13%
2560x1440 Port Royal Graphics
KFA2 GeForce RTX 5070 Ti HoF Gaming
NVIDIA GeForce RTX 5070 Ti, AMD Ryzen 7 9800X3D
19507 Points +113%
MSI Stealth 16 AI B3WH
NVIDIA GeForce RTX 5070 Ti Laptop, Intel Core Ultra 9 386H
11058 Points +21%
HP OmniBook Ultra 16-bk0013dx
NVIDIA RTX Spark N1X 6144-Core Blackwell GPU, Nvidia RTX Spark N1X 20-Core
9161 Points
Average NVIDIA RTX Spark N1X 6144-Core Blackwell GPU
  (8856 - 9161, n=3)
9008 Points -2%
Asus ProArt P16 H7607
NVIDIA RTX Spark N1X 6144-Core Blackwell GPU, Nvidia RTX Spark N1X 20-Core
9007 Points -2%
3DMark 11 Performance
27145 points
3DMark Cloud Gate Standard Score
38707 points
3DMark Fire Strike Score
22562 points
3DMark Time Spy Score
13068 points
3DMark Steel Nomad Score
2988 points
Help
Blender
v3.3 Classroom OPTIX/RTX
Lenovo ThinkPad P16 G2 21FA000FGE
NVIDIA RTX 2000 Ada Generation Laptop, Intel Core i7-13700HX
25 Seconds * -19%
Lenovo ThinkBook 16p G6 21R00013GE
NVIDIA GeForce RTX 5060 Laptop, Intel Core Ultra 7 255HX
21 Seconds * -0%
HP OmniBook Ultra 16-bk0013dx
NVIDIA RTX Spark N1X 6144-Core Blackwell GPU, Nvidia RTX Spark N1X 20-Core
21 Seconds *
Average NVIDIA RTX Spark N1X 6144-Core Blackwell GPU
  (20 - 21, n=2)
20.5 Seconds * +2%
Asus ProArt P16 H7607
NVIDIA RTX Spark N1X 6144-Core Blackwell GPU, Nvidia RTX Spark N1X 20-Core
20 Seconds * +5%
HP HyperX Omen 16 16-ap1931nr
NVIDIA GeForce RTX 5070 Laptop, AMD Ryzen 9 9955HX3D
17 Seconds * +19%
MSI Stealth 16 AI B3WH
NVIDIA GeForce RTX 5070 Ti Laptop, Intel Core Ultra 9 386H
14 Seconds * +33%
KFA2 GeForce RTX 5070 Ti HoF Gaming
NVIDIA GeForce RTX 5070 Ti, AMD Ryzen 7 9800X3D
11 Seconds * +48%
Razer Blade 16 Core Ultra 9 386H
NVIDIA GeForce RTX 5090 Laptop, Intel Core Ultra 9 386H
10 Seconds * +52%
v3.3 Classroom CUDA
Lenovo ThinkBook 16p G6 21R00013GE
NVIDIA GeForce RTX 5060 Laptop, Intel Core Ultra 7 255HX
186 Seconds * -464%
Lenovo ThinkBook 16p G6 21R00013GE
NVIDIA GeForce RTX 5060 Laptop, Intel Core Ultra 7 255HX
40 Seconds * -21%
Lenovo ThinkPad P16 G2 21FA000FGE
NVIDIA RTX 2000 Ada Generation Laptop, Intel Core i7-13700HX
155 Seconds * -370%
HP OmniBook Ultra 16-bk0013dx
NVIDIA RTX Spark N1X 6144-Core Blackwell GPU, Nvidia RTX Spark N1X 20-Core
33 Seconds *
Average NVIDIA RTX Spark N1X 6144-Core Blackwell GPU
  (32 - 33, n=2)
32.5 Seconds * +2%
Asus ProArt P16 H7607
NVIDIA RTX Spark N1X 6144-Core Blackwell GPU, Nvidia RTX Spark N1X 20-Core
32 Seconds * +3%
HP HyperX Omen 16 16-ap1931nr
NVIDIA GeForce RTX 5070 Laptop, AMD Ryzen 9 9955HX3D
30 Seconds * +9%
MSI Stealth 16 AI B3WH
NVIDIA GeForce RTX 5070 Ti Laptop, Intel Core Ultra 9 386H
25 Seconds * +24%
KFA2 GeForce RTX 5070 Ti HoF Gaming
NVIDIA GeForce RTX 5070 Ti, AMD Ryzen 7 9800X3D
17 Seconds * +48%
Razer Blade 16 Core Ultra 9 386H
NVIDIA GeForce RTX 5090 Laptop, Intel Core Ultra 9 386H
17 Seconds * +48%
v3.3 Classroom CPU
Acer Swift 16 AI SF16-51T-932H, Ultra 9 288V
Intel Arc Graphics 140V, Intel Core Ultra 9 288V
541 Seconds * -50%
HP OmniBook Ultra 16-bk0013dx
NVIDIA RTX Spark N1X 6144-Core Blackwell GPU, Nvidia RTX Spark N1X 20-Core
360 Seconds *
Average NVIDIA RTX Spark N1X 6144-Core Blackwell GPU
  (337 - 360, n=3)
349 Seconds * +3%
Asus ProArt P16 H7607
NVIDIA RTX Spark N1X 6144-Core Blackwell GPU, Nvidia RTX Spark N1X 20-Core
337 Seconds * +6%
Dell XPS 16 Core Ultra X7 358H
Intel Arc B390 12 Xe3 Panther Lake iGPU, Intel Core Ultra X7 358H
328 Seconds * +9%
Lenovo ThinkPad P16 G2 21FA000FGE
NVIDIA RTX 2000 Ada Generation Laptop, Intel Core i7-13700HX
291 Seconds * +19%
Razer Blade 16 Core Ultra 9 386H
NVIDIA GeForce RTX 5090 Laptop, Intel Core Ultra 9 386H
282 Seconds * +22%
Dell Pro 5 16 P516265
AMD Radeon 890M, AMD Ryzen AI 9 HX PRO 470
261 Seconds * +27%
MSI Stealth 16 AI B3WH
NVIDIA GeForce RTX 5070 Ti Laptop, Intel Core Ultra 9 386H
252 Seconds * +30%
Lenovo ThinkBook 16p G6 21R00013GE
NVIDIA GeForce RTX 5060 Laptop, Intel Core Ultra 7 255HX
173 Seconds * +52%
HP HyperX Omen 16 16-ap1931nr
NVIDIA GeForce RTX 5070 Laptop, AMD Ryzen 9 9955HX3D
138 Seconds * +62%
v3.3 Classroom oneAPI/Intel
Acer Swift 16 AI SF16-51T-932H, Ultra 9 288V
Intel Arc Graphics 140V, Intel Core Ultra 9 288V
405 Seconds *
Dell XPS 16 Core Ultra X7 358H
Intel Arc B390 12 Xe3 Panther Lake iGPU, Intel Core Ultra X7 358H
105 Seconds *
v4.3 Barbershop CPU
HP OmniBook Ultra 16-bk0013dx
NVIDIA RTX Spark N1X 6144-Core Blackwell GPU, Nvidia RTX Spark N1X 20-Core
1969 Seconds *
Average NVIDIA RTX Spark N1X 6144-Core Blackwell GPU
  (1867 - 1969, n=3)
1918 Seconds * +3%
Asus ProArt P16 H7607
NVIDIA RTX Spark N1X 6144-Core Blackwell GPU, Nvidia RTX Spark N1X 20-Core
1867 Seconds * +5%
Dell XPS 16 Core Ultra X7 358H
Intel Arc B390 12 Xe3 Panther Lake iGPU, Intel Core Ultra X7 358H
1662 Seconds * +16%
Razer Blade 16 Core Ultra 9 386H
NVIDIA GeForce RTX 5090 Laptop, Intel Core Ultra 9 386H
1400 Seconds * +29%
Dell Pro 5 16 P516265
AMD Radeon 890M, AMD Ryzen AI 9 HX PRO 470
1336 Seconds * +32%
MSI Stealth 16 AI B3WH
NVIDIA GeForce RTX 5070 Ti Laptop, Intel Core Ultra 9 386H
1269 Seconds * +36%
HP HyperX Omen 16 16-ap1931nr
NVIDIA GeForce RTX 5070 Laptop, AMD Ryzen 9 9955HX3D
694 Seconds * +65%
v4.3 Barbershop OPTIX
Asus ProArt P16 H7607
NVIDIA RTX Spark N1X 6144-Core Blackwell GPU, Nvidia RTX Spark N1X 20-Core
102 Seconds * -3%
Average NVIDIA RTX Spark N1X 6144-Core Blackwell GPU
  (98 - 102, n=3)
99.7 Seconds * -1%
HP OmniBook Ultra 16-bk0013dx
NVIDIA RTX Spark N1X 6144-Core Blackwell GPU, Nvidia RTX Spark N1X 20-Core
99 Seconds *
HP HyperX Omen 16 16-ap1931nr
NVIDIA GeForce RTX 5070 Laptop, AMD Ryzen 9 9955HX3D
85 Seconds * +14%
MSI Stealth 16 AI B3WH
NVIDIA GeForce RTX 5070 Ti Laptop, Intel Core Ultra 9 386H
73 Seconds * +26%
KFA2 GeForce RTX 5070 Ti HoF Gaming
NVIDIA GeForce RTX 5070 Ti, AMD Ryzen 7 9800X3D
49 Seconds * +51%
Razer Blade 16 Core Ultra 9 386H
NVIDIA GeForce RTX 5090 Laptop, Intel Core Ultra 9 386H
49 Seconds * +51%

* ... smaller is better

Gaming Performance

The Spark performs most similarly to the mobile GeForce RTX 5070 when gaming. However, we experienced more stutters, crashes, and DLSS issues while a handful of games are not yet compatible at all including those that rely on anti-cheat software (Valorant, Marvel Rivals, etc.). Support for the latter is expected to come with a future update.

Performance rating - Percent
Razer Blade 16 Core Ultra 9 386H
Intel Core Ultra 9 386H, NVIDIA GeForce RTX 5090 Laptop
96.2 pt
MSI Stealth 16 AI B3WH
Intel Core Ultra 9 386H, NVIDIA GeForce RTX 5070 Ti Laptop
86.8 pt
Lenovo ThinkPad P16 G2 21FA000FGE -2!
Intel Core i7-13700HX, NVIDIA RTX 2000 Ada Generation Laptop
73.7 pt
HP OmniBook Ultra 16-bk0013dx -2!
Nvidia RTX Spark N1X 20-Core, NVIDIA RTX Spark N1X 6144-Core Blackwell GPU
58.4 pt
Asus ProArt P16 H7607
Nvidia RTX Spark N1X 20-Core, NVIDIA RTX Spark N1X 6144-Core Blackwell GPU
53.1 pt
Dell XPS 16 Core Ultra X7 358H
Intel Core Ultra X7 358H, Intel Arc B390 12 Xe3 Panther Lake iGPU
36.6 pt
Cyberpunk 2077 - 1920x1080 Ultra Preset (FSR off)
Razer Blade 16 Core Ultra 9 386H
Intel Core Ultra 9 386H, NVIDIA GeForce RTX 5090 Laptop
139.5 (100.7min, 89.2P1) fps
MSI Stealth 16 AI B3WH
Intel Core Ultra 9 386H, NVIDIA GeForce RTX 5070 Ti Laptop
118.7 (95.9min, 86P1) fps
Asus ProArt P16 H7607
Nvidia RTX Spark N1X 20-Core, NVIDIA RTX Spark N1X 6144-Core Blackwell GPU
76.6 (57.1min) fps
Dell XPS 16 Core Ultra X7 358H
Intel Core Ultra X7 358H, Intel Arc B390 12 Xe3 Panther Lake iGPU
48.7 (40min, 37.6P1) fps
Baldur's Gate 3 - 1920x1080 Ultra Preset AA:T
Razer Blade 16 Core Ultra 9 386H
Intel Core Ultra 9 386H, NVIDIA GeForce RTX 5090 Laptop
202 (12.2min, 112.6P0.1, 152.7P1) fps +89%
MSI Stealth 16 AI B3WH
Intel Core Ultra 9 386H, NVIDIA GeForce RTX 5070 Ti Laptop
154.5 (86.8min, 104.7P0.1, 124.9P1) fps +45%
HP OmniBook Ultra 16-bk0013dx
Nvidia RTX Spark N1X 20-Core, NVIDIA RTX Spark N1X 6144-Core Blackwell GPU
106.9 (57.9min, 71.1P0.1, 81.7P1) fps
Asus ProArt P16 H7607
Nvidia RTX Spark N1X 20-Core, NVIDIA RTX Spark N1X 6144-Core Blackwell GPU
93.4 (55min, 57.7P0.1, 67.4P1) fps -13%
Dell XPS 16 Core Ultra X7 358H
Intel Core Ultra X7 358H, Intel Arc B390 12 Xe3 Panther Lake iGPU
54.3 (48.6min, 49.6P0.1, 51P1) fps -49%
GTA V - 1920x1080 Highest AA:4xMSAA + FX AF:16x
MSI Stealth 16 AI B3WH
Intel Core Ultra 9 386H, NVIDIA GeForce RTX 5070 Ti Laptop
131.8 (5.08min, 90.9P1) fps
Razer Blade 16 Core Ultra 9 386H
Intel Core Ultra 9 386H, NVIDIA GeForce RTX 5090 Laptop
102.9 (8.02min, 55.6P1) fps
Lenovo ThinkPad P16 G2 21FA000FGE
Intel Core i7-13700HX, NVIDIA RTX 2000 Ada Generation Laptop
98 (18.5min, 66.7P1) fps
Asus ProArt P16 H7607
Nvidia RTX Spark N1X 20-Core, NVIDIA RTX Spark N1X 6144-Core Blackwell GPU
62.9 (9.92min, 45.5P1) fps
Dell XPS 16 Core Ultra X7 358H
Intel Core Ultra X7 358H, Intel Arc B390 12 Xe3 Panther Lake iGPU
45.2 (6.18min, 34.5P1) fps
Final Fantasy XV Benchmark - 1920x1080 High Quality
Razer Blade 16 Core Ultra 9 386H
Intel Core Ultra 9 386H, NVIDIA GeForce RTX 5090 Laptop
175.5 fps +72%
MSI Stealth 16 AI B3WH
Intel Core Ultra 9 386H, NVIDIA GeForce RTX 5070 Ti Laptop
150.3 fps +47%
HP OmniBook Ultra 16-bk0013dx
Nvidia RTX Spark N1X 20-Core, NVIDIA RTX Spark N1X 6144-Core Blackwell GPU
102.1 fps
Asus ProArt P16 H7607
Nvidia RTX Spark N1X 20-Core, NVIDIA RTX Spark N1X 6144-Core Blackwell GPU
99.9 fps -2%
Lenovo ThinkPad P16 G2 21FA000FGE
Intel Core i7-13700HX, NVIDIA RTX 2000 Ada Generation Laptop
84.2 fps -18%
Dell XPS 16 Core Ultra X7 358H
Intel Core Ultra X7 358H, Intel Arc B390 12 Xe3 Panther Lake iGPU
56.2 fps -45%
Strange Brigade - 1920x1080 ultra AA:ultra AF:16
Razer Blade 16 Core Ultra 9 386H
Intel Core Ultra 9 386H, NVIDIA GeForce RTX 5090 Laptop
326 (72.8min, 230P1) fps +64%
MSI Stealth 16 AI B3WH
Intel Core Ultra 9 386H, NVIDIA GeForce RTX 5070 Ti Laptop
284 (174.7min, 201P1) fps +43%
HP OmniBook Ultra 16-bk0013dx
Nvidia RTX Spark N1X 20-Core, NVIDIA RTX Spark N1X 6144-Core Blackwell GPU
198.7 (70.7min, 139.5P1) fps
Asus ProArt P16 H7607
Nvidia RTX Spark N1X 20-Core, NVIDIA RTX Spark N1X 6144-Core Blackwell GPU
180 fps -9%
Lenovo ThinkPad P16 G2 21FA000FGE
Intel Core i7-13700HX, NVIDIA RTX 2000 Ada Generation Laptop
158.4 (22.5min, 117.2P1) fps -20%
Dell XPS 16 Core Ultra X7 358H
Intel Core Ultra X7 358H, Intel Arc B390 12 Xe3 Panther Lake iGPU
90.6 (24.7min, 39.3P1) fps -54%
Dota 2 Reborn - 1920x1080 ultra (3/3) best looking
Razer Blade 16 Core Ultra 9 386H
Intel Core Ultra 9 386H, NVIDIA GeForce RTX 5090 Laptop
153.8 (132.8min) fps +61%
Lenovo ThinkPad P16 G2 21FA000FGE
Intel Core i7-13700HX, NVIDIA RTX 2000 Ada Generation Laptop
150.2 (130.8min) fps +57%
MSI Stealth 16 AI B3WH
Intel Core Ultra 9 386H, NVIDIA GeForce RTX 5070 Ti Laptop
140 (120.7min) fps +47%
Dell XPS 16 Core Ultra X7 358H
Intel Core Ultra X7 358H, Intel Arc B390 12 Xe3 Panther Lake iGPU
96.9 (57min) fps +2%
HP OmniBook Ultra 16-bk0013dx
Nvidia RTX Spark N1X 20-Core, NVIDIA RTX Spark N1X 6144-Core Blackwell GPU
95.4 (82.8min) fps
Asus ProArt P16 H7607
Nvidia RTX Spark N1X 20-Core, NVIDIA RTX Spark N1X 6144-Core Blackwell GPU
91.8 (78.5min) fps -4%
X-Plane 11.11 - 1920x1080 high (fps_test=3)
Lenovo ThinkPad P16 G2 21FA000FGE
Intel Core i7-13700HX, NVIDIA RTX 2000 Ada Generation Laptop
103.4 fps +72%
Razer Blade 16 Core Ultra 9 386H
Intel Core Ultra 9 386H, NVIDIA GeForce RTX 5090 Laptop
98.5 fps +64%
MSI Stealth 16 AI B3WH
Intel Core Ultra 9 386H, NVIDIA GeForce RTX 5070 Ti Laptop
84.9 fps +42%
HP OmniBook Ultra 16-bk0013dx
Nvidia RTX Spark N1X 20-Core, NVIDIA RTX Spark N1X 6144-Core Blackwell GPU
60 fps
Asus ProArt P16 H7607
Nvidia RTX Spark N1X 20-Core, NVIDIA RTX Spark N1X 6144-Core Blackwell GPU
52.8 fps -12%
Dell XPS 16 Core Ultra X7 358H
Intel Core Ultra X7 358H, Intel Arc B390 12 Xe3 Panther Lake iGPU
38.8 fps -35%
Forza Horizon 6
1920x1080 medium AA:T
HP OmniBook Ultra 16-bk0013dx
Nvidia RTX Spark N1X 20-Core, NVIDIA RTX Spark N1X 6144-Core Blackwell GPU
77 fps
Average NVIDIA RTX Spark N1X 6144-Core Blackwell GPU
  (76 - 77, n=2)
76.5 fps -1%
Asus ProArt P16 H7607
Nvidia RTX Spark N1X 20-Core, NVIDIA RTX Spark N1X 6144-Core Blackwell GPU
76 fps -1%
1920x1080 extreme AA:T
HP OmniBook Ultra 16-bk0013dx
Nvidia RTX Spark N1X 20-Core, NVIDIA RTX Spark N1X 6144-Core Blackwell GPU
67 fps
Average NVIDIA RTX Spark N1X 6144-Core Blackwell GPU
  (64 - 67, n=2)
65.5 fps -2%
Asus ProArt P16 H7607
Nvidia RTX Spark N1X 20-Core, NVIDIA RTX Spark N1X 6144-Core Blackwell GPU
64 fps -4%
1920x1080 extreme + RT AA:T
HP OmniBook Ultra 16-bk0013dx
Nvidia RTX Spark N1X 20-Core, NVIDIA RTX Spark N1X 6144-Core Blackwell GPU
43 fps
Average NVIDIA RTX Spark N1X 6144-Core Blackwell GPU
  (38 - 43, n=2)
40.5 fps -6%
Asus ProArt P16 H7607
Nvidia RTX Spark N1X 20-Core, NVIDIA RTX Spark N1X 6144-Core Blackwell GPU
38 fps -12%
2560x1440 extreme + RT AA:T
HP OmniBook Ultra 16-bk0013dx
Nvidia RTX Spark N1X 20-Core, NVIDIA RTX Spark N1X 6144-Core Blackwell GPU
31 fps
Average NVIDIA RTX Spark N1X 6144-Core Blackwell GPU
  (27 - 31, n=2)
29 fps -6%
Asus ProArt P16 H7607
Nvidia RTX Spark N1X 20-Core, NVIDIA RTX Spark N1X 6144-Core Blackwell GPU
27 fps -13%
2560x1440 extreme + RT + DLSS perf. AA:T
HP OmniBook Ultra 16-bk0013dx
Nvidia RTX Spark N1X 20-Core, NVIDIA RTX Spark N1X 6144-Core Blackwell GPU
42 fps
Average NVIDIA RTX Spark N1X 6144-Core Blackwell GPU
  (n=1)
42 fps 0%
Final Fantasy XV Benchmark
1920x1080 High Quality
KFA2 GeForce RTX 5070 Ti HoF Gaming
AMD Ryzen 7 9800X3D, NVIDIA GeForce RTX 5070 Ti
232 fps +127%
Razer Blade 16 Core Ultra 9 386H
Intel Core Ultra 9 386H, NVIDIA GeForce RTX 5090 Laptop
175.5 fps +72%
MSI Stealth 16 AI B3WH
Intel Core Ultra 9 386H, NVIDIA GeForce RTX 5070 Ti Laptop
150.3 fps +47%
HP HyperX Omen 16 16-ap1931nr
AMD Ryzen 9 9955HX3D, NVIDIA GeForce RTX 5070 Laptop
135.2 fps +32%
Lenovo ThinkBook 16p G6 21R00013GE
Intel Core Ultra 7 255HX, NVIDIA GeForce RTX 5060 Laptop
130.4 fps +28%
HP OmniBook Ultra 16-bk0013dx
Nvidia RTX Spark N1X 20-Core, NVIDIA RTX Spark N1X 6144-Core Blackwell GPU
102.1 fps
Asus ProArt P16 H7607
Nvidia RTX Spark N1X 20-Core, NVIDIA RTX Spark N1X 6144-Core Blackwell GPU
99.9 fps -2%
Average NVIDIA RTX Spark N1X 6144-Core Blackwell GPU
  (95.7 - 102.1, n=3)
99.2 fps -3%
Lenovo ThinkPad P16 G2 21FA000FGE
Intel Core i7-13700HX, NVIDIA RTX 2000 Ada Generation Laptop
84.2 fps -18%
Dell XPS 16 Core Ultra X7 358H
Intel Core Ultra X7 358H, Intel Arc B390 12 Xe3 Panther Lake iGPU
56.2 fps -45%
Acer Swift 16 AI SF16-51T-932H, Ultra 9 288V
Intel Core Ultra 9 288V, Intel Arc Graphics 140V
34.4 fps -66%
Dell Pro 5 16 P516265
AMD Ryzen AI 9 HX PRO 470, AMD Radeon 890M
29.4 fps -71%
2560x1440 High Quality
KFA2 GeForce RTX 5070 Ti HoF Gaming
AMD Ryzen 7 9800X3D, NVIDIA GeForce RTX 5070 Ti
193.1 fps +127%
Razer Blade 16 Core Ultra 9 386H
Intel Core Ultra 9 386H, NVIDIA GeForce RTX 5090 Laptop
154.1 fps +82%
MSI Stealth 16 AI B3WH
Intel Core Ultra 9 386H, NVIDIA GeForce RTX 5070 Ti Laptop
118.8 fps +40%
HP HyperX Omen 16 16-ap1931nr
AMD Ryzen 9 9955HX3D, NVIDIA GeForce RTX 5070 Laptop
100.2 fps +18%
Lenovo ThinkBook 16p G6 21R00013GE
Intel Core Ultra 7 255HX, NVIDIA GeForce RTX 5060 Laptop
94 fps +11%
HP OmniBook Ultra 16-bk0013dx
Nvidia RTX Spark N1X 20-Core, NVIDIA RTX Spark N1X 6144-Core Blackwell GPU
84.9 fps
Average NVIDIA RTX Spark N1X 6144-Core Blackwell GPU
  (83 - 84.9, n=3)
83.8 fps -1%
Asus ProArt P16 H7607
Nvidia RTX Spark N1X 20-Core, NVIDIA RTX Spark N1X 6144-Core Blackwell GPU
83 fps -2%
Lenovo ThinkPad P16 G2 21FA000FGE
Intel Core i7-13700HX, NVIDIA RTX 2000 Ada Generation Laptop
61.3 fps -28%
Strange Brigade
1920x1080 ultra AA:ultra AF:16
Razer Blade 16 Core Ultra 9 386H
Intel Core Ultra 9 386H, NVIDIA GeForce RTX 5090 Laptop
326 (72.8min, 230P1) fps +64%
MSI Stealth 16 AI B3WH
Intel Core Ultra 9 386H, NVIDIA GeForce RTX 5070 Ti Laptop
284 (174.7min, 201P1) fps +43%
HP HyperX Omen 16 16-ap1931nr
AMD Ryzen 9 9955HX3D, NVIDIA GeForce RTX 5070 Laptop
260 (56.4min, 196P1) fps +31%
Lenovo ThinkBook 16p G6 21R00013GE
Intel Core Ultra 7 255HX, NVIDIA GeForce RTX 5060 Laptop
240 (172.2min, 177.3P1) fps +21%
HP OmniBook Ultra 16-bk0013dx
Nvidia RTX Spark N1X 20-Core, NVIDIA RTX Spark N1X 6144-Core Blackwell GPU
198.7 (70.7min, 139.5P1) fps
Average NVIDIA RTX Spark N1X 6144-Core Blackwell GPU
  (180 - 198.7, n=3)
190.2 fps -4%
Asus ProArt P16 H7607
Nvidia RTX Spark N1X 20-Core, NVIDIA RTX Spark N1X 6144-Core Blackwell GPU
180 fps -9%
Lenovo ThinkPad P16 G2 21FA000FGE
Intel Core i7-13700HX, NVIDIA RTX 2000 Ada Generation Laptop
158.4 (22.5min, 117.2P1) fps -20%
Dell XPS 16 Core Ultra X7 358H
Intel Core Ultra X7 358H, Intel Arc B390 12 Xe3 Panther Lake iGPU
90.6 (24.7min, 39.3P1) fps -54%
Acer Swift 16 AI SF16-51T-932H, Ultra 9 288V
Intel Core Ultra 9 288V, Intel Arc Graphics 140V
58 (21.6min, 30.2P1) fps -71%
Dell Pro 5 16 P516265
AMD Ryzen AI 9 HX PRO 470, AMD Radeon 890M
47.9 (31.9min, 36.9P1) fps -76%
2560x1440 ultra AA:ultra AF:16
Razer Blade 16 Core Ultra 9 386H
Intel Core Ultra 9 386H, NVIDIA GeForce RTX 5090 Laptop
310 (68.5min, 220P1) fps +118%
MSI Stealth 16 AI B3WH
Intel Core Ultra 9 386H, NVIDIA GeForce RTX 5070 Ti Laptop
207 (141.1min, 158.8P1) fps +46%
HP HyperX Omen 16 16-ap1931nr
AMD Ryzen 9 9955HX3D, NVIDIA GeForce RTX 5070 Laptop
170.6 (115.5min, 139.3P1) fps +20%
Lenovo ThinkBook 16p G6 21R00013GE
Intel Core Ultra 7 255HX, NVIDIA GeForce RTX 5060 Laptop
164.3 (128.9min, 132.3P1) fps +16%
HP OmniBook Ultra 16-bk0013dx
Nvidia RTX Spark N1X 20-Core, NVIDIA RTX Spark N1X 6144-Core Blackwell GPU
142.1 (49.1min, 107.3P1) fps
Average NVIDIA RTX Spark N1X 6144-Core Blackwell GPU
  (133 - 142.1, n=3)
138.4 fps -3%
Asus ProArt P16 H7607
Nvidia RTX Spark N1X 20-Core, NVIDIA RTX Spark N1X 6144-Core Blackwell GPU
133 fps -6%
Lenovo ThinkPad P16 G2 21FA000FGE
Intel Core i7-13700HX, NVIDIA RTX 2000 Ada Generation Laptop
103.9 (32.8min, 84.8P1) fps -27%
Baldur's Gate 3
1920x1080 High Preset AA:T
KFA2 GeForce RTX 5070 Ti HoF Gaming
AMD Ryzen 7 9800X3D, NVIDIA GeForce RTX 5070 Ti
239 (110.8min, 195.6P0.1, 219P1) fps +120%
Razer Blade 16 Core Ultra 9 386H
Intel Core Ultra 9 386H, NVIDIA GeForce RTX 5090 Laptop
195.5 (98.4min, 116.8P0.1, 139P1) fps +80%
Lenovo ThinkBook 16p G6 21R00013GE
Intel Core Ultra 7 255HX, NVIDIA GeForce RTX 5060 Laptop
117 (16.1min, 71.4P0.1, 107.1P1) fps +8%
HP OmniBook Ultra 16-bk0013dx
Nvidia RTX Spark N1X 20-Core, NVIDIA RTX Spark N1X 6144-Core Blackwell GPU
108.8 (55.1min, 71.7P0.1, 79.8P1) fps
Average NVIDIA RTX Spark N1X 6144-Core Blackwell GPU
  (94.3 - 108.8, n=2)
101.6 fps -7%
Asus ProArt P16 H7607
Nvidia RTX Spark N1X 20-Core, NVIDIA RTX Spark N1X 6144-Core Blackwell GPU
94.3 (54.2min, 60.5P0.1, 68.2P1) fps -13%
Dell XPS 16 Core Ultra X7 358H
Intel Core Ultra X7 358H, Intel Arc B390 12 Xe3 Panther Lake iGPU
55.6 (49.5min, 50.1P0.1, 52.1P1) fps -49%
Dell Pro 5 16 P516265
AMD Ryzen AI 9 HX PRO 470, AMD Radeon 890M
31.6 (24.6min, 25.1P0.1, 28.8P1) fps -71%
1920x1080 Ultra Preset AA:T
KFA2 GeForce RTX 5070 Ti HoF Gaming
AMD Ryzen 7 9800X3D, NVIDIA GeForce RTX 5070 Ti
234 (199.9min, 205P0.1, 215P1) fps +119%
Razer Blade 16 Core Ultra 9 386H
Intel Core Ultra 9 386H, NVIDIA GeForce RTX 5090 Laptop
202 (12.2min, 112.6P0.1, 152.7P1) fps +89%
MSI Stealth 16 AI B3WH
Intel Core Ultra 9 386H, NVIDIA GeForce RTX 5070 Ti Laptop
154.5 (86.8min, 104.7P0.1, 124.9P1) fps +45%
HP HyperX Omen 16 16-ap1931nr
AMD Ryzen 9 9955HX3D, NVIDIA GeForce RTX 5070 Laptop
134.5 (79.5min, 79.7P0.1, 80P1) fps +26%
Lenovo ThinkBook 16p G6 21R00013GE
Intel Core Ultra 7 255HX, NVIDIA GeForce RTX 5060 Laptop
115.6 (97.5min, 98.1P0.1, 105.3P1) fps +8%
HP OmniBook Ultra 16-bk0013dx
Nvidia RTX Spark N1X 20-Core, NVIDIA RTX Spark N1X 6144-Core Blackwell GPU
106.9 (57.9min, 71.1P0.1, 81.7P1) fps
Average NVIDIA RTX Spark N1X 6144-Core Blackwell GPU
  (93.4 - 106.9, n=3)
99.2 fps -7%
Asus ProArt P16 H7607
Nvidia RTX Spark N1X 20-Core, NVIDIA RTX Spark N1X 6144-Core Blackwell GPU
93.4 (55min, 57.7P0.1, 67.4P1) fps -13%
Dell XPS 16 Core Ultra X7 358H
Intel Core Ultra X7 358H, Intel Arc B390 12 Xe3 Panther Lake iGPU
54.3 (48.6min, 49.6P0.1, 51P1) fps -49%
Dell Pro 5 16 P516265
AMD Ryzen AI 9 HX PRO 470, AMD Radeon 890M
31.1 (24.4min, 24.7P0.1, 28.8P1) fps -71%
2560x1440 Ultra Preset AA:T
KFA2 GeForce RTX 5070 Ti HoF Gaming
AMD Ryzen 7 9800X3D, NVIDIA GeForce RTX 5070 Ti
175.8 (153.6min, 156.7P0.1, 160.9P1) fps +114%
Razer Blade 16 Core Ultra 9 386H
Intel Core Ultra 9 386H, NVIDIA GeForce RTX 5090 Laptop
157.3 (113.3min, 121.2P0.1, 137.3P1) fps +91%
MSI Stealth 16 AI B3WH
Intel Core Ultra 9 386H, NVIDIA GeForce RTX 5070 Ti Laptop
103.8 (33.8min, 86.7P0.1, 88.5P1) fps +26%
HP HyperX Omen 16 16-ap1931nr
AMD Ryzen 9 9955HX3D, NVIDIA GeForce RTX 5070 Laptop
93.4 (60min, 72.2P0.1, 79.6P1) fps +14%
HP OmniBook Ultra 16-bk0013dx
Nvidia RTX Spark N1X 20-Core, NVIDIA RTX Spark N1X 6144-Core Blackwell GPU
82.2 (52min, 55.2P0.1, 67.1P1) fps
Asus ProArt P16 H7607
Nvidia RTX Spark N1X 20-Core, NVIDIA RTX Spark N1X 6144-Core Blackwell GPU
79.1 (54.2min, 59.8P0.1, 65.6P1) fps -4%
Average NVIDIA RTX Spark N1X 6144-Core Blackwell GPU
  (75.8 - 82.2, n=3)
79 fps -4%
Lenovo ThinkBook 16p G6 21R00013GE
Intel Core Ultra 7 255HX, NVIDIA GeForce RTX 5060 Laptop
78 (10.9min, 69.1P0.1, 71.4P1) fps -5%
2560x1440 Ultra Preset + Quality DLSS
KFA2 GeForce RTX 5070 Ti HoF Gaming
AMD Ryzen 7 9800X3D, NVIDIA GeForce RTX 5070 Ti
234 (172.7min, 204P0.1, 213P1) fps +122%
Razer Blade 16 Core Ultra 9 386H
Intel Core Ultra 9 386H, NVIDIA GeForce RTX 5090 Laptop
199.8 (14.6min, 122P0.1, 150.7P1) fps +89%
MSI Stealth 16 AI B3WH
Intel Core Ultra 9 386H, NVIDIA GeForce RTX 5070 Ti Laptop
151.9 (123.8min, 124.8P0.1, 130.1P1) fps +44%
HP HyperX Omen 16 16-ap1931nr
AMD Ryzen 9 9955HX3D, NVIDIA GeForce RTX 5070 Laptop
136.3 (79.7min, 79.8P0.1, 80P1) fps +29%
HP OmniBook Ultra 16-bk0013dx
Nvidia RTX Spark N1X 20-Core, NVIDIA RTX Spark N1X 6144-Core Blackwell GPU
105.6 (71.4min, 73.8P0.1, 81.8P1) fps
Average NVIDIA RTX Spark N1X 6144-Core Blackwell GPU
  (n=1)
105.6 fps 0%
GTA V
1920x1080 Highest AA:4xMSAA + FX AF:16x
HP HyperX Omen 16 16-ap1931nr
AMD Ryzen 9 9955HX3D, NVIDIA GeForce RTX 5070 Laptop
171.5 (1.578min, 111.1P1) fps
Lenovo ThinkBook 16p G6 21R00013GE
Intel Core Ultra 7 255HX, NVIDIA GeForce RTX 5060 Laptop
133.5 (4.86min, 100P1) fps
MSI Stealth 16 AI B3WH
Intel Core Ultra 9 386H, NVIDIA GeForce RTX 5070 Ti Laptop
131.8 (5.08min, 90.9P1) fps
Razer Blade 16 Core Ultra 9 386H
Intel Core Ultra 9 386H, NVIDIA GeForce RTX 5090 Laptop
102.9 (8.02min, 55.6P1) fps
Lenovo ThinkPad P16 G2 21FA000FGE
Intel Core i7-13700HX, NVIDIA RTX 2000 Ada Generation Laptop
98 (18.5min, 66.7P1) fps
Asus ProArt P16 H7607
Nvidia RTX Spark N1X 20-Core, NVIDIA RTX Spark N1X 6144-Core Blackwell GPU
62.9 (9.92min, 45.5P1) fps
Average NVIDIA RTX Spark N1X 6144-Core Blackwell GPU
  (n=1)
62.9 fps
Dell XPS 16 Core Ultra X7 358H
Intel Core Ultra X7 358H, Intel Arc B390 12 Xe3 Panther Lake iGPU
45.2 (6.18min, 34.5P1) fps
Dell Pro 5 16 P516265
AMD Ryzen AI 9 HX PRO 470, AMD Radeon 890M
30.1 (3.99min, 20.8P1) fps
Acer Swift 16 AI SF16-51T-932H, Ultra 9 288V
Intel Core Ultra 9 288V, Intel Arc Graphics 140V
28.9 (7.26min, 22.2P1) fps
2560x1440 Highest AA:4xMSAA + FX AF:16x
HP HyperX Omen 16 16-ap1931nr
AMD Ryzen 9 9955HX3D, NVIDIA GeForce RTX 5070 Laptop
133.2 (6.74min, 83.3P1) fps
MSI Stealth 16 AI B3WH
Intel Core Ultra 9 386H, NVIDIA GeForce RTX 5070 Ti Laptop
127.2 (4.93min, 90.9P1) fps
Lenovo ThinkBook 16p G6 21R00013GE
Intel Core Ultra 7 255HX, NVIDIA GeForce RTX 5060 Laptop
116 (5.62min, 71.4P1) fps
Lenovo ThinkPad P16 G2 21FA000FGE
Intel Core i7-13700HX, NVIDIA RTX 2000 Ada Generation Laptop
76.8 (12.6min, 47.6P1) fps
Lenovo ThinkPad P16 G2 21FA000FGE
Intel Core i7-13700HX, NVIDIA RTX 2000 Ada Generation Laptop
69 (19.2min, 43.5P1) fps
Razer Blade 16 Core Ultra 9 386H
Intel Core Ultra 9 386H, NVIDIA GeForce RTX 5090 Laptop
62.7 (2.84min, 50P1) fps
Asus ProArt P16 H7607
Nvidia RTX Spark N1X 20-Core, NVIDIA RTX Spark N1X 6144-Core Blackwell GPU
54.7 (10.8min, 40P1) fps
Average NVIDIA RTX Spark N1X 6144-Core Blackwell GPU
  (n=1)
54.7 fps
Cyberpunk 2077
1920x1080 High Preset (FSR off)
KFA2 GeForce RTX 5070 Ti HoF Gaming
AMD Ryzen 7 9800X3D, NVIDIA GeForce RTX 5070 Ti
224 (187min) fps +180%
Razer Blade 16 Core Ultra 9 386H
Intel Core Ultra 9 386H, NVIDIA GeForce RTX 5090 Laptop
149.4 (113.3min, 100.8P1) fps +87%
MSI Stealth 16 AI B3WH
Intel Core Ultra 9 386H, NVIDIA GeForce RTX 5070 Ti Laptop
131.4 (107.4min, 98.4P1) fps +64%
HP HyperX Omen 16 16-ap1931nr
AMD Ryzen 9 9955HX3D, NVIDIA GeForce RTX 5070 Laptop
123.7 (103.3min, 97.1P1) fps +55%
Lenovo ThinkBook 16p G6 21R00013GE
Intel Core Ultra 7 255HX, NVIDIA GeForce RTX 5060 Laptop
100.8 (84.4min) fps +26%
Asus ProArt P16 H7607
Nvidia RTX Spark N1X 20-Core, NVIDIA RTX Spark N1X 6144-Core Blackwell GPU
83 (67.2min) fps +4%
Average NVIDIA RTX Spark N1X 6144-Core Blackwell GPU
  (80 - 85.6, n=3)
82.9 fps +4%
HP OmniBook Ultra 16-bk0013dx
Nvidia RTX Spark N1X 20-Core, NVIDIA RTX Spark N1X 6144-Core Blackwell GPU
80 (60min, 53.7P1) fps
Dell XPS 16 Core Ultra X7 358H
Intel Core Ultra X7 358H, Intel Arc B390 12 Xe3 Panther Lake iGPU
56 (47.2min, 45.4P1) fps -30%
Acer Swift 16 AI SF16-51T-932H, Ultra 9 288V
Intel Core Ultra 9 288V, Intel Arc Graphics 140V
31.9 (26min, 23.3P1) fps -60%
Acer Swift 16 AI SF16-51T-932H, Ultra 9 288V
Intel Core Ultra 9 288V, Intel Arc Graphics 140V
31.9 (26min, 23.3P1) fps -60%
Dell Pro 5 16 P516265
AMD Ryzen AI 9 HX PRO 470, AMD Radeon 890M
29 (24.4min, 22.7P1) fps -64%
1920x1080 Ultra Preset (FSR off)
KFA2 GeForce RTX 5070 Ti HoF Gaming
AMD Ryzen 7 9800X3D, NVIDIA GeForce RTX 5070 Ti
202 (163.6min) fps
Razer Blade 16 Core Ultra 9 386H
Intel Core Ultra 9 386H, NVIDIA GeForce RTX 5090 Laptop
139.5 (100.7min, 89.2P1) fps
MSI Stealth 16 AI B3WH
Intel Core Ultra 9 386H, NVIDIA GeForce RTX 5070 Ti Laptop
118.7 (95.9min, 86P1) fps
HP HyperX Omen 16 16-ap1931nr
AMD Ryzen 9 9955HX3D, NVIDIA GeForce RTX 5070 Laptop
108.8 (88.3min, 83.2P1) fps
Lenovo ThinkBook 16p G6 21R00013GE
Intel Core Ultra 7 255HX, NVIDIA GeForce RTX 5060 Laptop
90 (74.4min) fps
Asus ProArt P16 H7607
Nvidia RTX Spark N1X 20-Core, NVIDIA RTX Spark N1X 6144-Core Blackwell GPU
76.6 (57.1min) fps
Average NVIDIA RTX Spark N1X 6144-Core Blackwell GPU
  (76.6 - 76.6, n=2)
76.6 fps
Dell XPS 16 Core Ultra X7 358H
Intel Core Ultra X7 358H, Intel Arc B390 12 Xe3 Panther Lake iGPU
48.7 (40min, 37.6P1) fps
Acer Swift 16 AI SF16-51T-932H, Ultra 9 288V
Intel Core Ultra 9 288V, Intel Arc Graphics 140V
26.9 (20.8min, 19.4P1) fps
Acer Swift 16 AI SF16-51T-932H, Ultra 9 288V
Intel Core Ultra 9 288V, Intel Arc Graphics 140V
26.9 (20.8min, 19.4P1) fps
Dell Pro 5 16 P516265
AMD Ryzen AI 9 HX PRO 470, AMD Radeon 890M
25.3 (20.9min, 18.5P1) fps
2560x1440 Ultra Preset DLSS4 quality no FG
KFA2 GeForce RTX 5070 Ti HoF Gaming
AMD Ryzen 7 9800X3D, NVIDIA GeForce RTX 5070 Ti
151.5 (130.4min) fps +139%
Razer Blade 16 Core Ultra 9 386H
Intel Core Ultra 9 386H, NVIDIA GeForce RTX 5090 Laptop
116.6 (94.5min, 85.9P1) fps +84%
MSI Stealth 16 AI B3WH
Intel Core Ultra 9 386H, NVIDIA GeForce RTX 5070 Ti Laptop
88.4 (74.8min, 71.1P1) fps +39%
HP HyperX Omen 16 16-ap1931nr
AMD Ryzen 9 9955HX3D, NVIDIA GeForce RTX 5070 Laptop
79.9 (69.7min, 66.3P1) fps +26%
Asus ProArt P16 H7607
Nvidia RTX Spark N1X 20-Core, NVIDIA RTX Spark N1X 6144-Core Blackwell GPU
63.6 (50.9min) fps 0%
Average NVIDIA RTX Spark N1X 6144-Core Blackwell GPU
  (63.4 - 63.6, n=2)
63.5 fps 0%
HP OmniBook Ultra 16-bk0013dx
Nvidia RTX Spark N1X 20-Core, NVIDIA RTX Spark N1X 6144-Core Blackwell GPU
63.4 (52.6min, 48.4P1) fps
2560x1440 Ultra Preset (FSR off)
KFA2 GeForce RTX 5070 Ti HoF Gaming
AMD Ryzen 7 9800X3D, NVIDIA GeForce RTX 5070 Ti
133.2 (110.7min) fps +139%
Razer Blade 16 Core Ultra 9 386H
Intel Core Ultra 9 386H, NVIDIA GeForce RTX 5090 Laptop
105.8 (84.1min, 74.9P1) fps +90%
MSI Stealth 16 AI B3WH
Intel Core Ultra 9 386H, NVIDIA GeForce RTX 5070 Ti Laptop
75 (63.2min, 61.3P1) fps +35%
HP HyperX Omen 16 16-ap1931nr
AMD Ryzen 9 9955HX3D, NVIDIA GeForce RTX 5070 Laptop
68.4 (58min, 55.5P1) fps +23%
Lenovo ThinkBook 16p G6 21R00013GE
Intel Core Ultra 7 255HX, NVIDIA GeForce RTX 5060 Laptop
57 (48.9min) fps +2%
Asus ProArt P16 H7607
Nvidia RTX Spark N1X 20-Core, NVIDIA RTX Spark N1X 6144-Core Blackwell GPU
56.8 (42.2min) fps +2%
HP OmniBook Ultra 16-bk0013dx
Nvidia RTX Spark N1X 20-Core, NVIDIA RTX Spark N1X 6144-Core Blackwell GPU
55.7 (44.5min, 40.5P1) fps
Average NVIDIA RTX Spark N1X 6144-Core Blackwell GPU
  (54.6 - 56.8, n=3)
55.7 fps 0%
1920x1080 Ray Tracing Ultra Preset (DLSS off)
Razer Blade 16 Core Ultra 9 386H
Intel Core Ultra 9 386H, NVIDIA GeForce RTX 5090 Laptop
72.5 (61.9min, 56.4P1) fps +70%
MSI Stealth 16 AI B3WH
Intel Core Ultra 9 386H, NVIDIA GeForce RTX 5070 Ti Laptop
55.1 (48.5min, 45.8P1) fps +29%
HP HyperX Omen 16 16-ap1931nr
AMD Ryzen 9 9955HX3D, NVIDIA GeForce RTX 5070 Laptop
48 (41.9min, 40P1) fps +12%
HP OmniBook Ultra 16-bk0013dx
Nvidia RTX Spark N1X 20-Core, NVIDIA RTX Spark N1X 6144-Core Blackwell GPU
42.7 (36.3min, 33.5P1) fps
Average NVIDIA RTX Spark N1X 6144-Core Blackwell GPU
  (n=1)
42.7 fps 0%
Assassin's Creed Black Flag Resynced
1920x1080 Ultra Low Preset AA:T
HP OmniBook Ultra 16-bk0013dx
Nvidia RTX Spark N1X 20-Core, NVIDIA RTX Spark N1X 6144-Core Blackwell GPU
58 fps
Average NVIDIA RTX Spark N1X 6144-Core Blackwell GPU
  (n=1)
58 fps 0%
1920x1080 Medium Preset AA:T
HP OmniBook Ultra 16-bk0013dx
Nvidia RTX Spark N1X 20-Core, NVIDIA RTX Spark N1X 6144-Core Blackwell GPU
34 fps
Average NVIDIA RTX Spark N1X 6144-Core Blackwell GPU
  (n=1)
34 fps 0%
1920x1080 High Preset AA:T
HP OmniBook Ultra 16-bk0013dx
Nvidia RTX Spark N1X 20-Core, NVIDIA RTX Spark N1X 6144-Core Blackwell GPU
33 fps
Average NVIDIA RTX Spark N1X 6144-Core Blackwell GPU
  (n=1)
33 fps 0%
1920x1080 Ultra High Preset + Extended Raytracing AA:T
HP OmniBook Ultra 16-bk0013dx
Nvidia RTX Spark N1X 20-Core, NVIDIA RTX Spark N1X 6144-Core Blackwell GPU
31 fps
Average NVIDIA RTX Spark N1X 6144-Core Blackwell GPU
  (n=1)
31 fps 0%
2560x1440 Ultra High Preset + Extended Raytracing AA:T
HP OmniBook Ultra 16-bk0013dx
Nvidia RTX Spark N1X 20-Core, NVIDIA RTX Spark N1X 6144-Core Blackwell GPU
28 fps
Average NVIDIA RTX Spark N1X 6144-Core Blackwell GPU
  (n=1)
28 fps 0%
2560x1440 Ultra High Preset + Extended Raytracing + DLSS Balanced AA:T
HP OmniBook Ultra 16-bk0013dx
Nvidia RTX Spark N1X 20-Core, NVIDIA RTX Spark N1X 6144-Core Blackwell GPU
32 fps
Average NVIDIA RTX Spark N1X 6144-Core Blackwell GPU
  (n=1)
32 fps 0%

Cyberpunk 2077 ultra FPS Chart

05101520253035404550556065707580Tooltip
HP OmniBook Ultra 16-bk0013dx Spark RTX N1X 20-Core, RTX Spark N1X 6144-Core Blackwell GPU: Ø79.3 (70.8-81.2) fps
Lenovo ThinkPad T1g Gen 8 21TD003GE Ultra 9 285H, GeForce RTX 5070 Laptop: Ø81.3 (75.6-82.6) fps
lowmed.highultraQHD DLSSQHD
Dota 2 Reborn (2015) 108.3 102.8 99.3 95.4
Final Fantasy XV Benchmark (2018) 144.5 125.3 102.1 84.9
X-Plane 11.11 (2018) 69.6 65.6 60
Strange Brigade (2018) 373 233 213 198.7 142.1
Baldur's Gate 3 (2023) 132.7 116.9 108.8 106.9 105.6 82.2
Cyberpunk 2077 (2023) 103.9 101.8 80 63.4 55.7
Forza Horizon 6 (2026) 95 77 67 43 42 31
Assassin's Creed Black Flag Resynced (2026) 58 34 33 31 32 28

Emissions

System Noise

The dual fans power down rather quickly when word processing or when workloads become undemanding. However, they also power up just as quickly and loudly when gaming or running local AI tasks. The system doesn't get quite as loud as dedicated gaming laptops or workstations, but it's noticeable nonetheless.
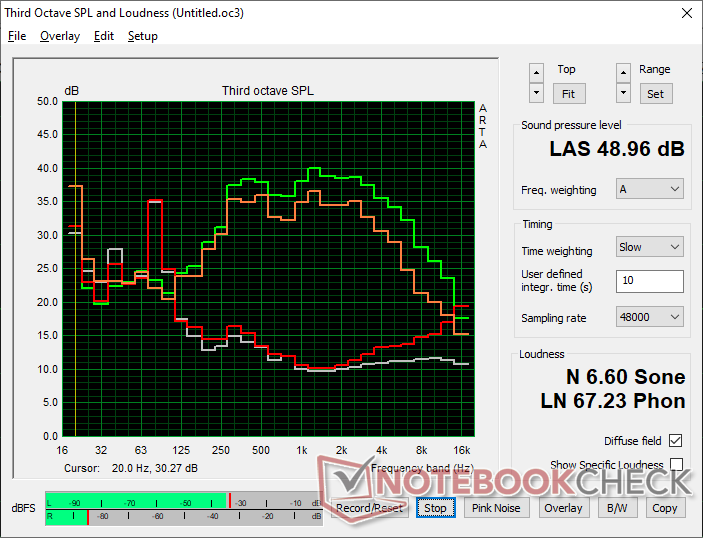
Fan noise profile (White: Background, Red: System idle, Orange: Cyberpunk 2077, Green: Prime95 stress)

Noise level

Idle
23.8 / 23.8 / 25.4 dB(A)
Load
/ 49 dB(A)
  red to green bar
 
 
30 dB
silent
40 dB(A)
audible
50 dB(A)
loud
 
min: dark, med: mid, max: light   Earthworks M23R, Arta (15 cm distance)   environment noise: 23.6 dB(A)
dB(A) 0102030405060708090Deep BassMiddle BassHigh BassLower RangeMidsHigher MidsLower HighsMid HighsUpper HighsSuper Highs2037.331.430.230.32526.42324.722.23123.220.12319.74023.125.727.922.35022.922.822.622.96324.523.523.924.78022.135.334.923.310020.424.924.521.312523.917.217.424.316023.816.31525.420027.914.512.82925030.214.513.431.231535.316.414.937.440034.915.41438.45003613.513.437.963032.712.211.33680032.311.91235.8100034.910.61038.1125036.510.29.840160034.510.29.638.8200034.510.71038.5250035.111.310.338.7315032.712.210.737.5400030.613.31135.5500028.913.411.334.1630024.713.811.332.2800021.314.711.528.21000019.915.311.726.112500181711.423.61600015.219.410.817.6SPL45.125.423.649N4.90.70.56.6median 30.6median 13.8median 11.4median 35.5Delta5.92.31.46.1hearing rangehide median Fan NoiseHP OmniBook Ultra 16-bk0013dx
HP OmniBook Ultra 16-bk0013dx
Spark RTX N1X 20-Core, RTX Spark N1X 6144-Core Blackwell GPU
Asus ProArt P16 H7607
Spark RTX N1X 20-Core, RTX Spark N1X 6144-Core Blackwell GPU
MSI Stealth 16 AI B3WH
Ultra 9 386H, GeForce RTX 5070 Ti Laptop
Razer Blade 16 Core Ultra 9 386H
Ultra 9 386H, GeForce RTX 5090 Laptop
Dell XPS 16 Core Ultra X7 358H
Ultra X7 358H, Arc B390 Panther Lake iGPU
Lenovo ThinkPad P16 G2 21FA000FGE
i7-13700HX, RTX 2000 Ada Generation Laptop
Noise
-7%
-6%
-8%
3%
-11%
off / environment * (dB)
23.6
24
-2%
23.4
1%
23.1
2%
23.3
1%
23.5
-0%
Idle Minimum * (dB)
23.8
24
-1%
23.4
2%
23.4
2%
23.4
2%
23.5
1%
Idle Average * (dB)
23.8
24
-1%
23.4
2%
25.4
-7%
23.4
2%
29.2
-23%
Idle Maximum * (dB)
25.4
30.1
-19%
27.4
-8%
29.3
-15%
25.8
-2%
29.5
-16%
Cyberpunk 2077 ultra * (dB)
45.1
51.1
-13%
52.3
-16%
53.6
-19%
38.1
16%
Load Maximum * (dB)
49
51.1
-4%
56.7
-16%
53.7
-10%
48.6
1%
56.6
-16%
Load Average * (dB)
38.7
37.8
42.6
38
32.7
Witcher 3 ultra * (dB)
50.6

* ... smaller is better

Temperature

Dual rear exhaust
Dual rear exhaust
AC adapter can be quite warm at over 57 C when running demanding loads
Max. Load
37.2 °C
99 F
42.8 °C
109 F
37 °C
99 F
38.6 °C
101 F
41.4 °C
107 F
36.8 °C
98 F
30.2 °C
86 F
29.8 °C
86 F
29.8 °C
86 F
Maximum: 42.8 °C = 109 F
Average: 36 °C = 97 F
39 °C
102 F
44.6 °C
112 F
39.6 °C
103 F
37.2 °C
99 F
45.6 °C
114 F
38.6 °C
101 F
32 °C
90 F
33.6 °C
92 F
31.4 °C
89 F
Maximum: 45.6 °C = 114 F
Average: 38 °C = 100 F
Power Supply (max.)  53 °C = 127 F | Room Temperature 20 °C = 68 F | Fluke 62 Mini IR Thermometer
(±) The average temperature for the upper side under maximal load is 36 °C / 97 F, compared to the average of 31.3 °C / 88 F for the devices in the class Multimedia.
(±) The maximum temperature on the upper side is 42.8 °C / 109 F, compared to the average of 36.8 °C / 98 F, ranging from 21 to 71 °C for the class Multimedia.
(-) The bottom heats up to a maximum of 45.6 °C / 114 F, compared to the average of 39.1 °C / 102 F
(+) In idle usage, the average temperature for the upper side is 25.2 °C / 77 F, compared to the device average of 31.3 °C / 88 F.
(+) The palmrests and touchpad are cooler than skin temperature with a maximum of 30.2 °C / 86.4 F and are therefore cool to the touch.
(±) The average temperature of the palmrest area of similar devices was 28.7 °C / 83.7 F (-1.5 °C / -2.7 F).
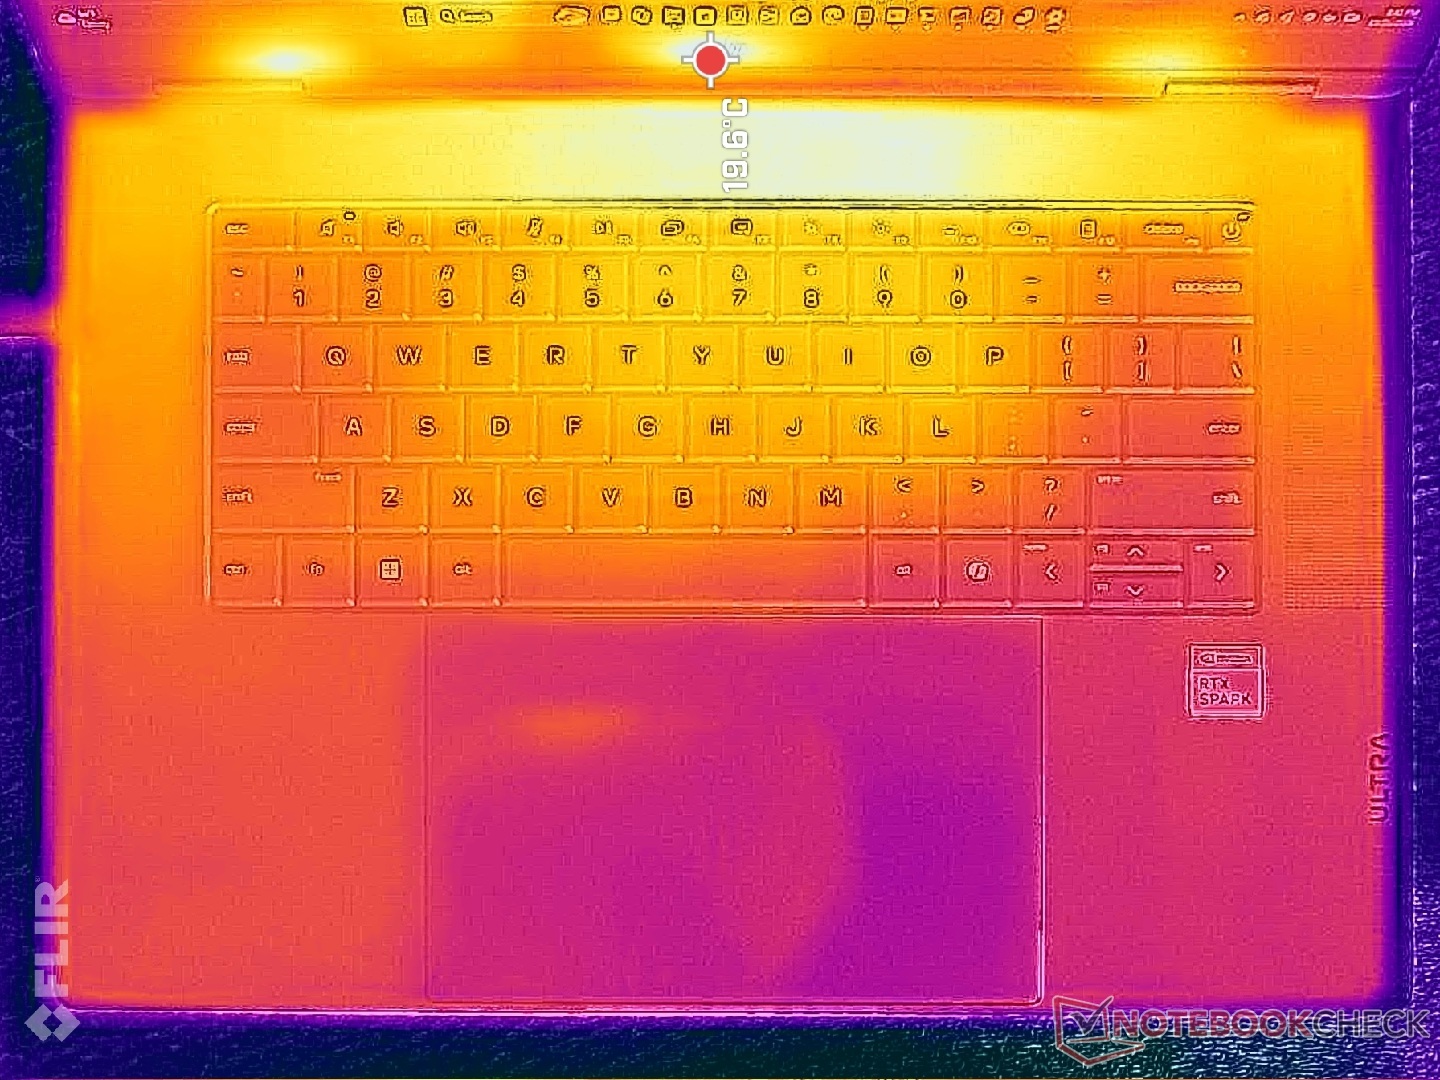
System idle (C cover)
System idle (D cover)
Prime95+FurMark stress (C cover)
Prime95+FurMark stress (D cover)
HP OmniBook Ultra 16-bk0013dx
Spark RTX N1X 20-Core, RTX Spark N1X 6144-Core Blackwell GPU
Asus ProArt P16 H7607
Spark RTX N1X 20-Core, RTX Spark N1X 6144-Core Blackwell GPU
MSI Stealth 16 AI B3WH
Ultra 9 386H, GeForce RTX 5070 Ti Laptop
Razer Blade 16 Core Ultra 9 386H
Ultra 9 386H, GeForce RTX 5090 Laptop
Dell XPS 16 Core Ultra X7 358H
Ultra X7 358H, Arc B390 Panther Lake iGPU
Lenovo ThinkPad P16 G2 21FA000FGE
i7-13700HX, RTX 2000 Ada Generation Laptop
Heat
-4%
-7%
-18%
12%
3%
Maximum Upper Side * (°C)
42.8
43
-0%
38.8
9%
45.6
-7%
40.6
5%
47.2
-10%
Maximum Bottom * (°C)
45.6
48.6
-7%
38.6
15%
47
-3%
39.8
13%
39.5
13%
Idle Upper Side * (°C)
27.2
28.2
-4%
32.6
-20%
35.2
-29%
23.2
15%
28.1
-3%
Idle Bottom * (°C)
28.2
29.3
-4%
36.6
-30%
37.6
-33%
23.8
16%
25.3
10%

* ... smaller is better

Stress Test

System idle
System idle

System metrics are limited due to the early launch and novelty of Spark. We can nonetheless see core temperatures averaging in the mid 70 C range when under load which is cooler than most gaming or performance laptops where 80 C or warmer is not uncommon.

CPU and GPU clock rates would dip when running on Balanced mode instead of Performance mode and so the latter profile is recommended under most conditions.
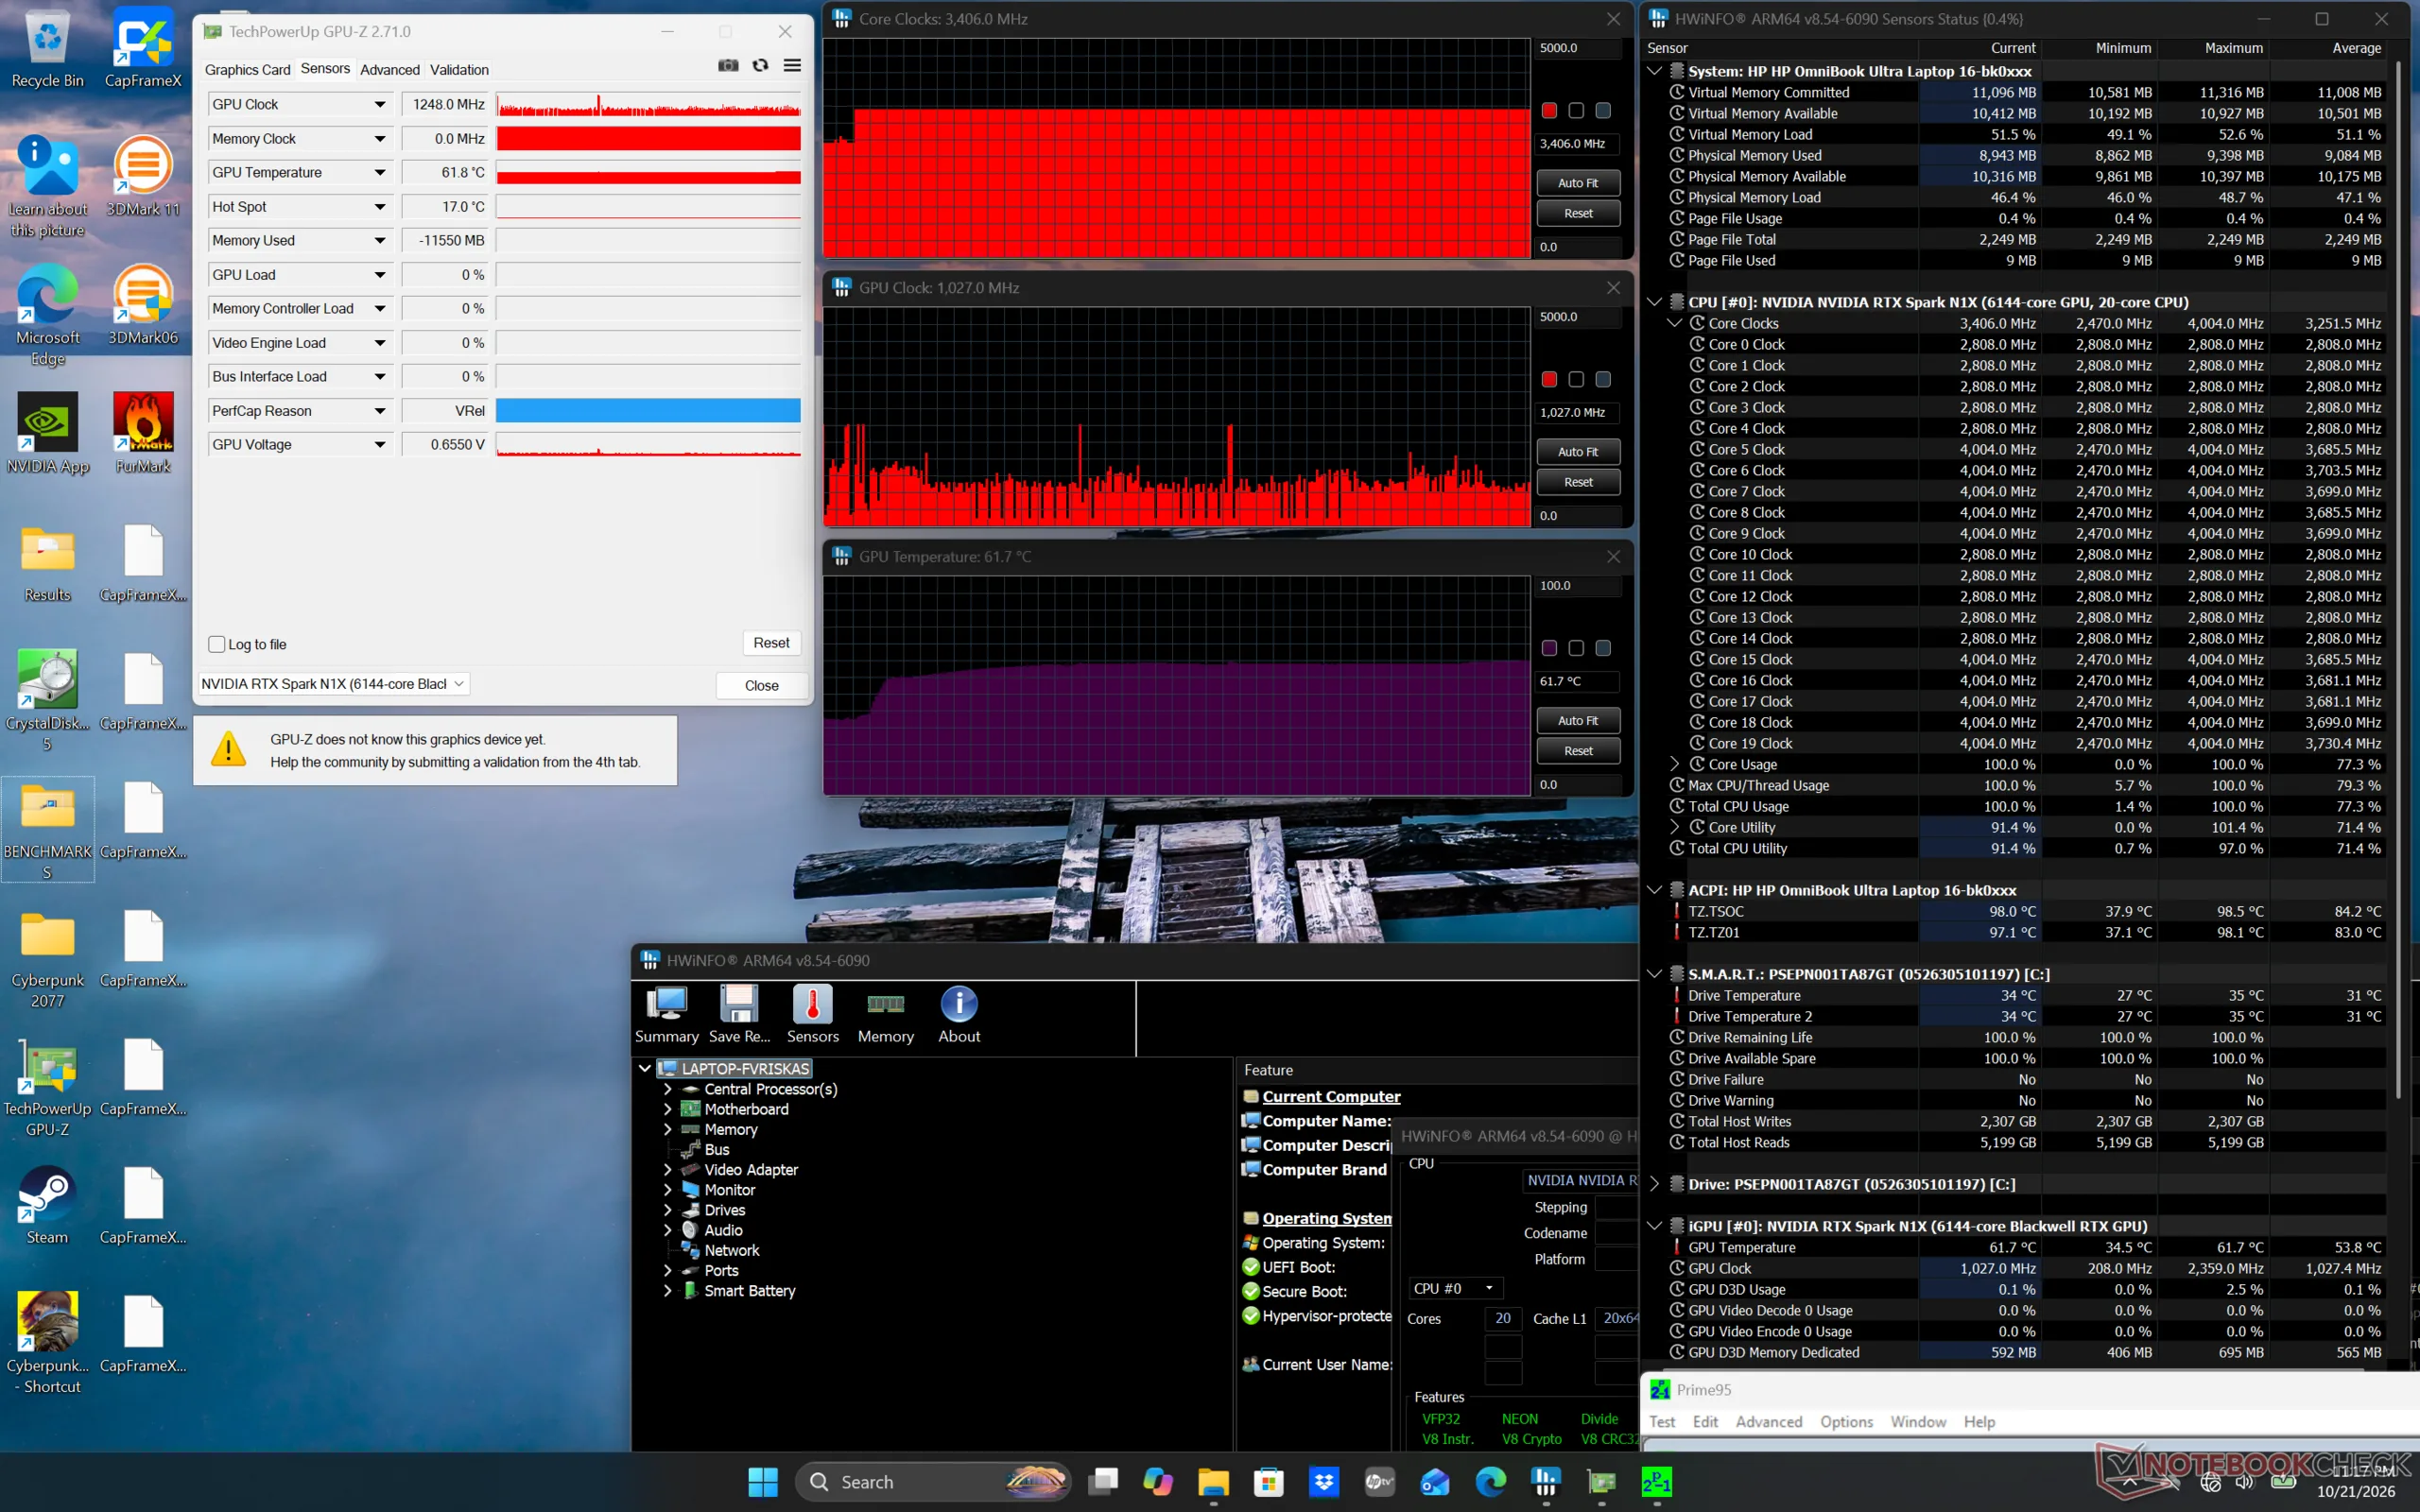
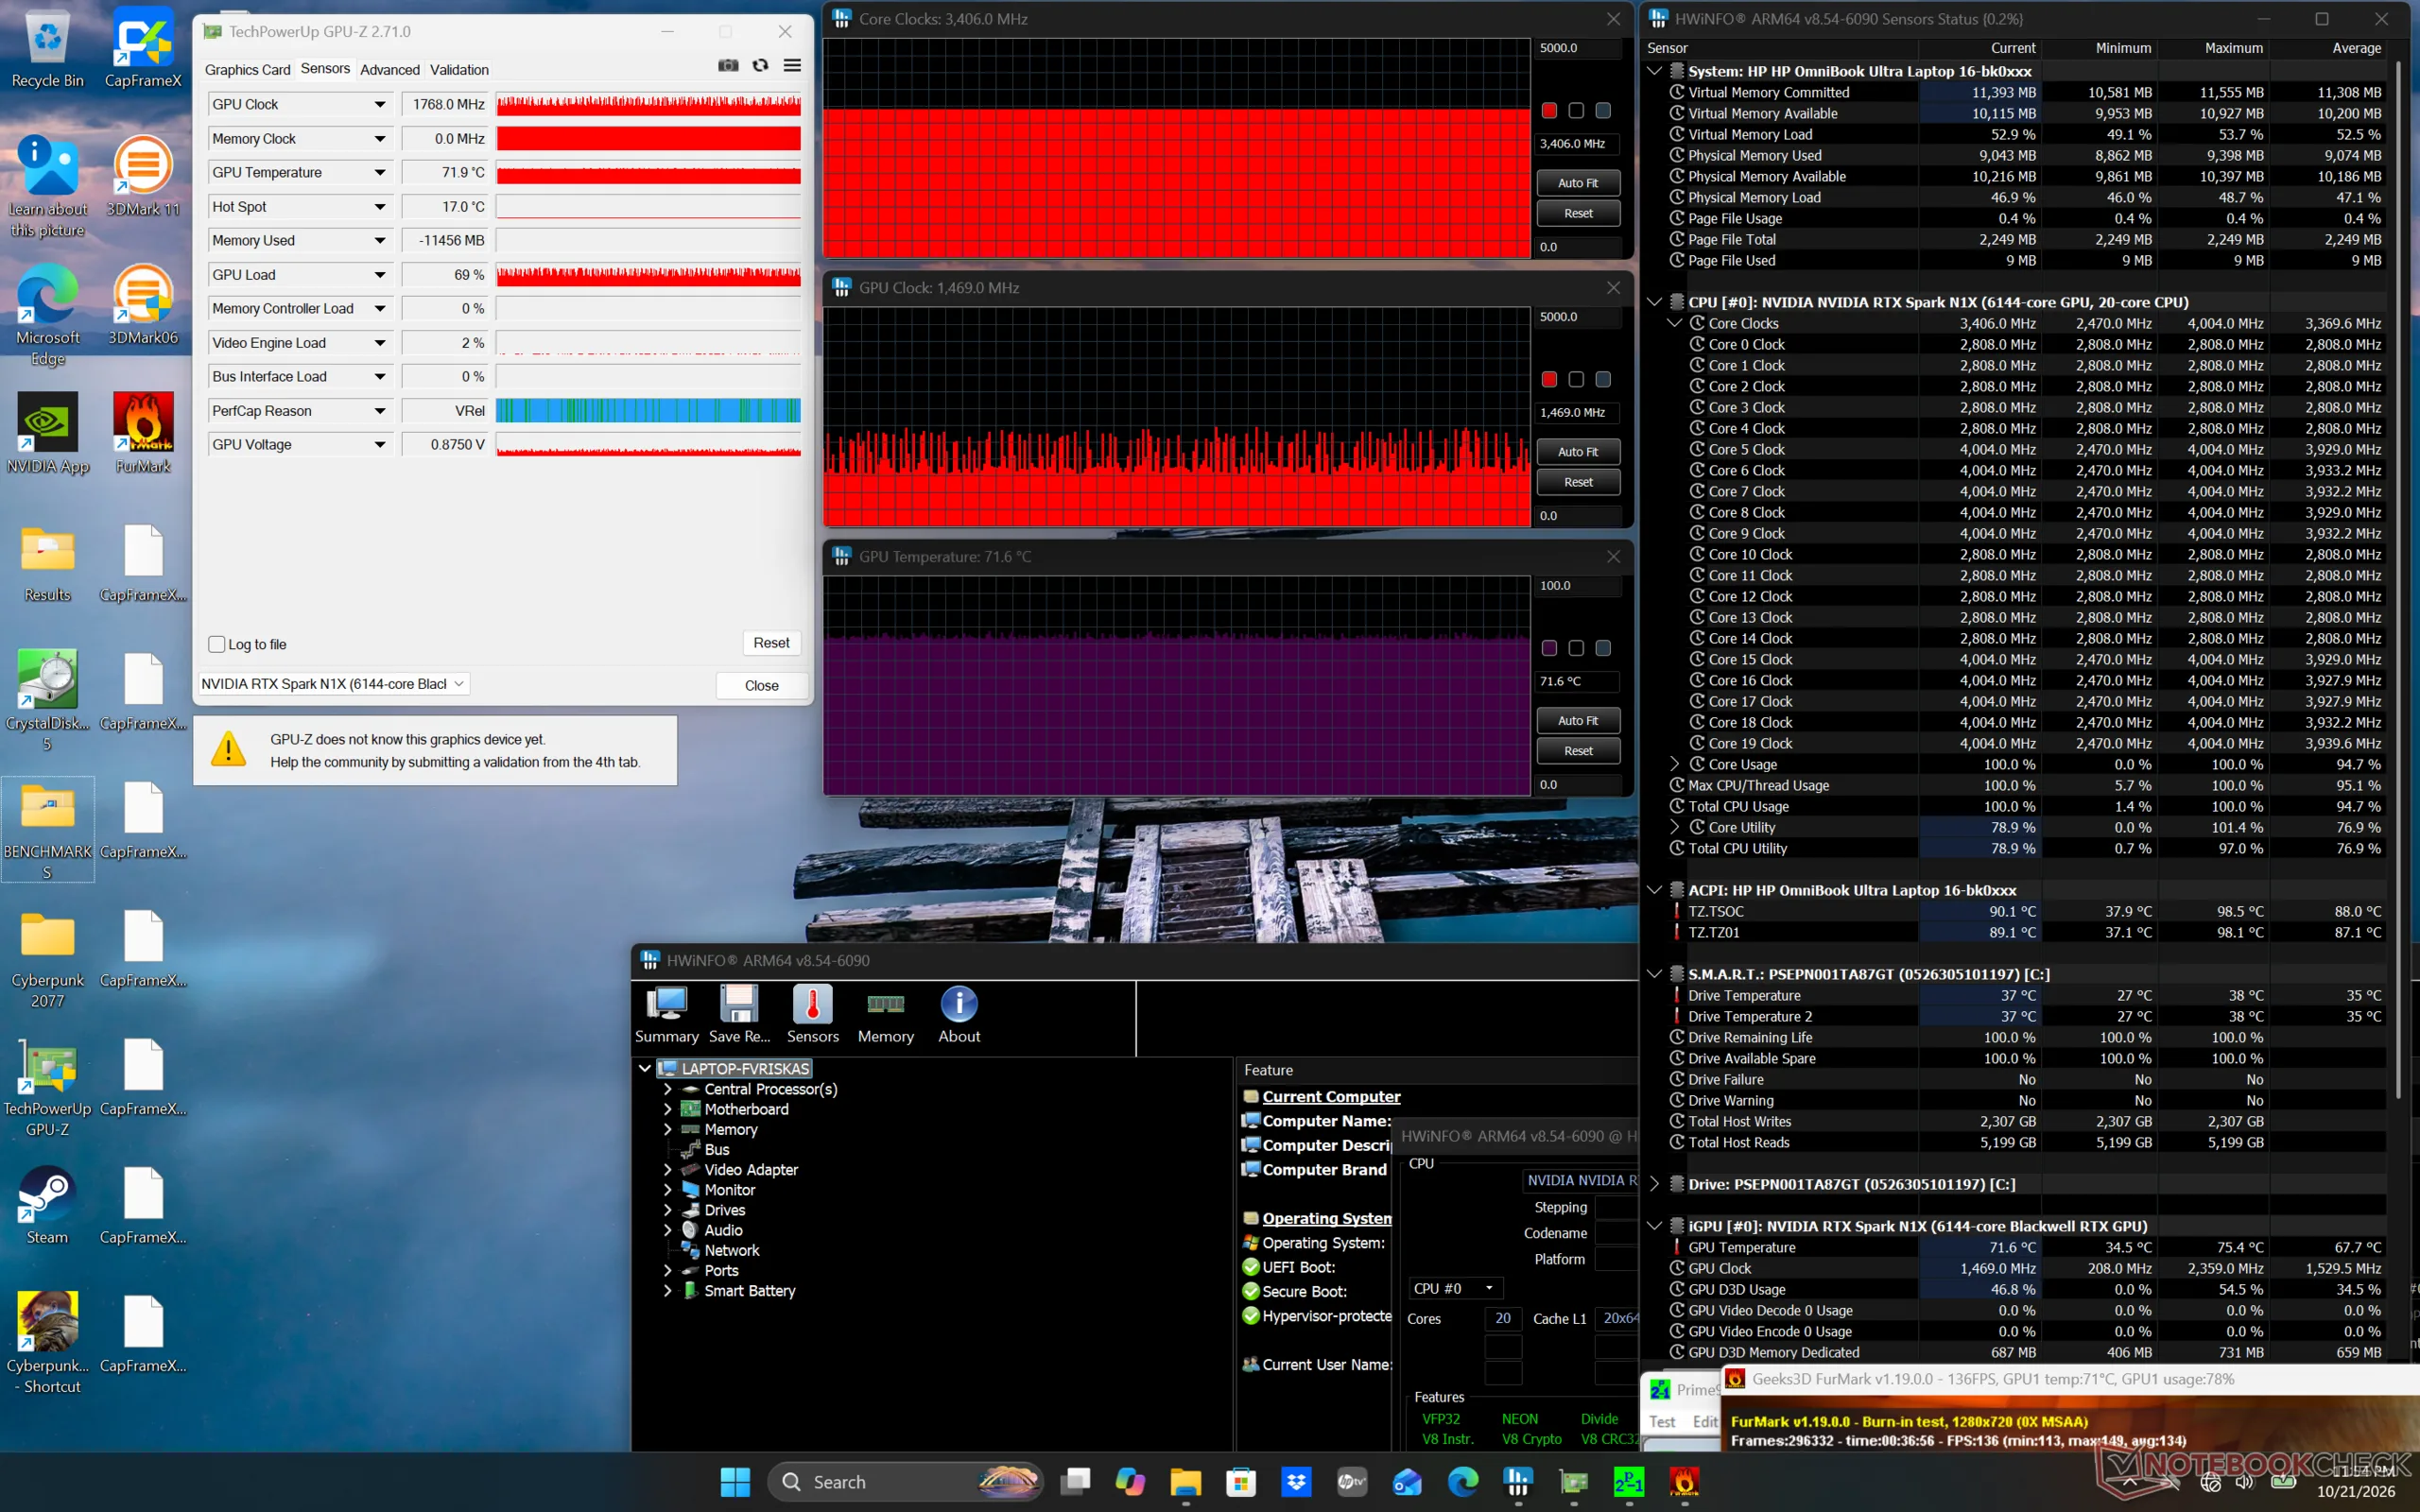
Prime95 stress
Prime95 stress
Prime95+FurMark stress
Cyberpunk 2077 (Balanced mode)
Cyberpunk 2077 (Performance mode)
CPU Clock (GHz) GPU Clock (MHz) Average CPU Temperature (°C)
System Idle -- ~344 35
Prime95 Stress 3.4 -- 62
Prime95 + FurMark Stress 3.4 ~1160 - 2308 72
Cyberpunk 2077 Stress (Balanced mode) ~2.8 ~1579 74
Cyberpunk 2077 Stress (Performance mode) ~3.3 1735 75

Speakers

Audio quality is reminiscent of a multimedia laptop than a weaker office laptop
dB(A) 0102030405060708090Deep BassMiddle BassHigh BassLower RangeMidsHigher MidsLower HighsMid HighsUpper HighsSuper Highs2031.431.9252321.83120.1214025.729.85022.834.76323.532.68035.345.510024.952.112517.255.216016.359.420014.563.325014.565.731516.468.540015.468.250013.570.463012.278.780011.981.8100010.677.8125010.276.4160010.273.1200010.771.4250011.370.2315012.270.2400013.370500013.467.6630013.869.4800014.773.21000015.372.9125001770.91600019.468.7SPL25.486.5N0.770.4median 13.8median 70.2Delta2.32.926.325.821.422.12624.925.127.622.532.523.448.72655.818.860.922.167.2267019.372.317.674.217.774.319.575.31571.711.871.311.27410.574.21072.710.17210.67210.97511.374.811.671.71269.71269.612.371.112.669.61270.111.269.824.784.70.666.6median 12median 71.73.42.2hearing rangehide median Pink NoiseHP OmniBook Ultra 16-bk0013dxApple MacBook Pro 16 2021 M1 Pro
Frequency diagram (checkboxes can be checked and unchecked to compare devices)
HP OmniBook Ultra 16-bk0013dx audio analysis

(+) | speakers can play relatively loud (86.5 dB)
Bass 100 - 315 Hz
(±) | reduced bass - on average 9.5% lower than median
(+) | bass is linear (6.8% delta to prev. frequency)
Mids 400 - 2000 Hz
(±) | higher mids - on average 5% higher than median
(+) | mids are linear (5.4% delta to prev. frequency)
Highs 2 - 16 kHz
(+) | balanced highs - only 1.4% away from median
(+) | highs are linear (2.5% delta to prev. frequency)
Overall 100 - 16.000 Hz
(+) | overall sound is linear (8.9% difference to median)
Compared to same class
» 11% of all tested devices in this class were better, 2% similar, 86% worse
» The best had a delta of 5%, average was 17%, worst was 45%
Compared to all devices tested
» 3% of all tested devices were better, 1% similar, 96% worse
» The best had a delta of 4%, average was 23%, worst was 136%

Apple MacBook Pro 16 2021 M1 Pro audio analysis

(+) | speakers can play relatively loud (84.7 dB)
Bass 100 - 315 Hz
(+) | good bass - only 3.8% away from median
(+) | bass is linear (5.2% delta to prev. frequency)
Mids 400 - 2000 Hz
(+) | balanced mids - only 1.3% away from median
(+) | mids are linear (2.1% delta to prev. frequency)
Highs 2 - 16 kHz
(+) | balanced highs - only 1.9% away from median
(+) | highs are linear (2.7% delta to prev. frequency)
Overall 100 - 16.000 Hz
(+) | overall sound is linear (4.6% difference to median)
Compared to same class
» 0% of all tested devices in this class were better, 0% similar, 100% worse
» The best had a delta of 5%, average was 17%, worst was 45%
Compared to all devices tested
» 0% of all tested devices were better, 0% similar, 100% worse
» The best had a delta of 4%, average was 23%, worst was 136%

Energy Management

Power Consumption

Average consumption is very similar to a traditional laptop running on GeForce RTX 5070 graphics such as the Lenovo ThinkPad T1g Gen 8. When under CPU or GPU load, the HP pushes its compact (~7 x 6.4 x 3.3 cm) 140 W USB-C AC adapter to its limits as consumption would frequently reach 140 W.
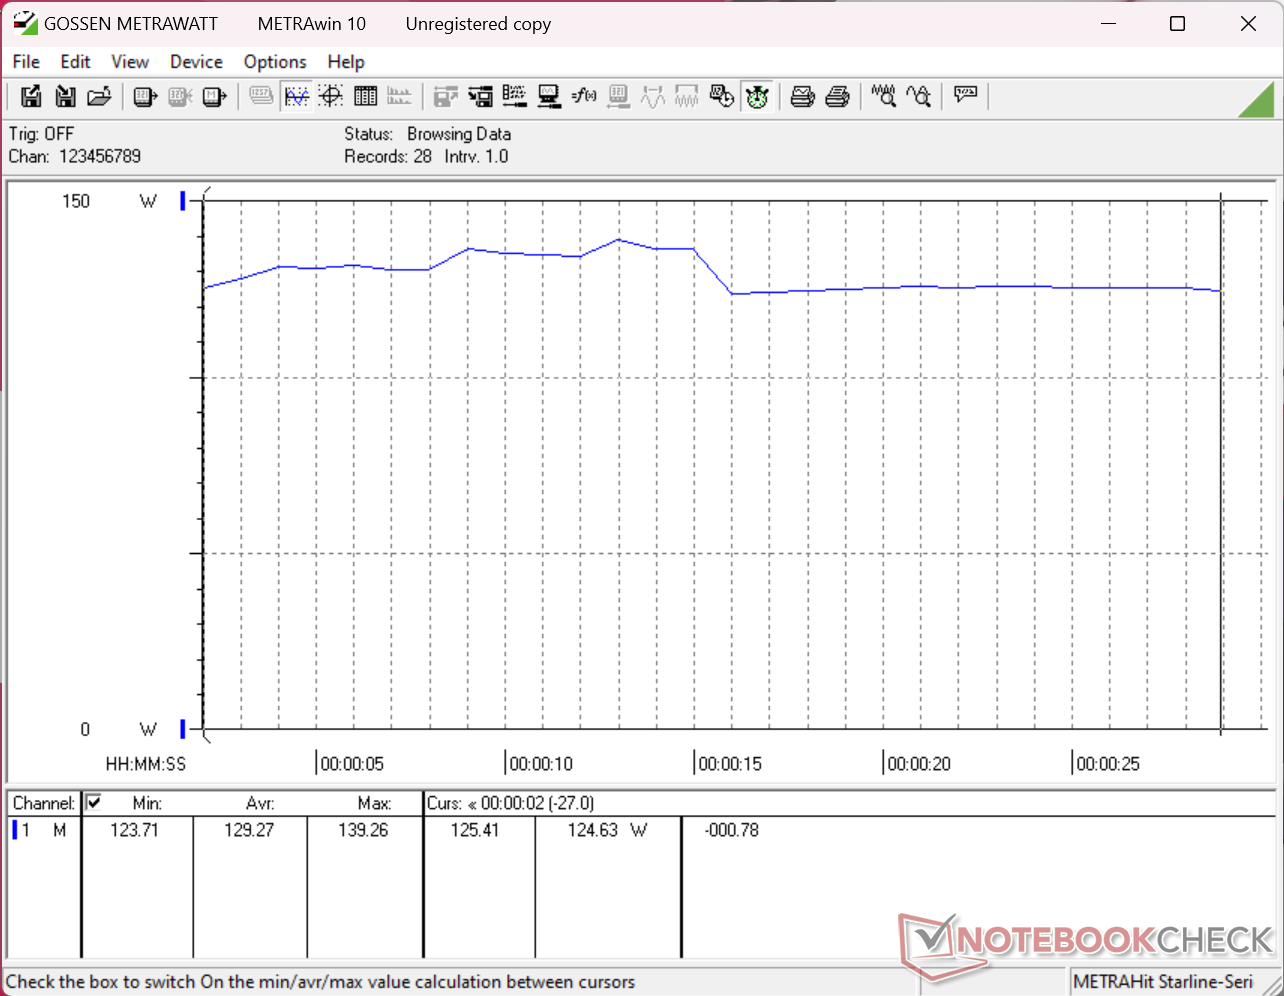
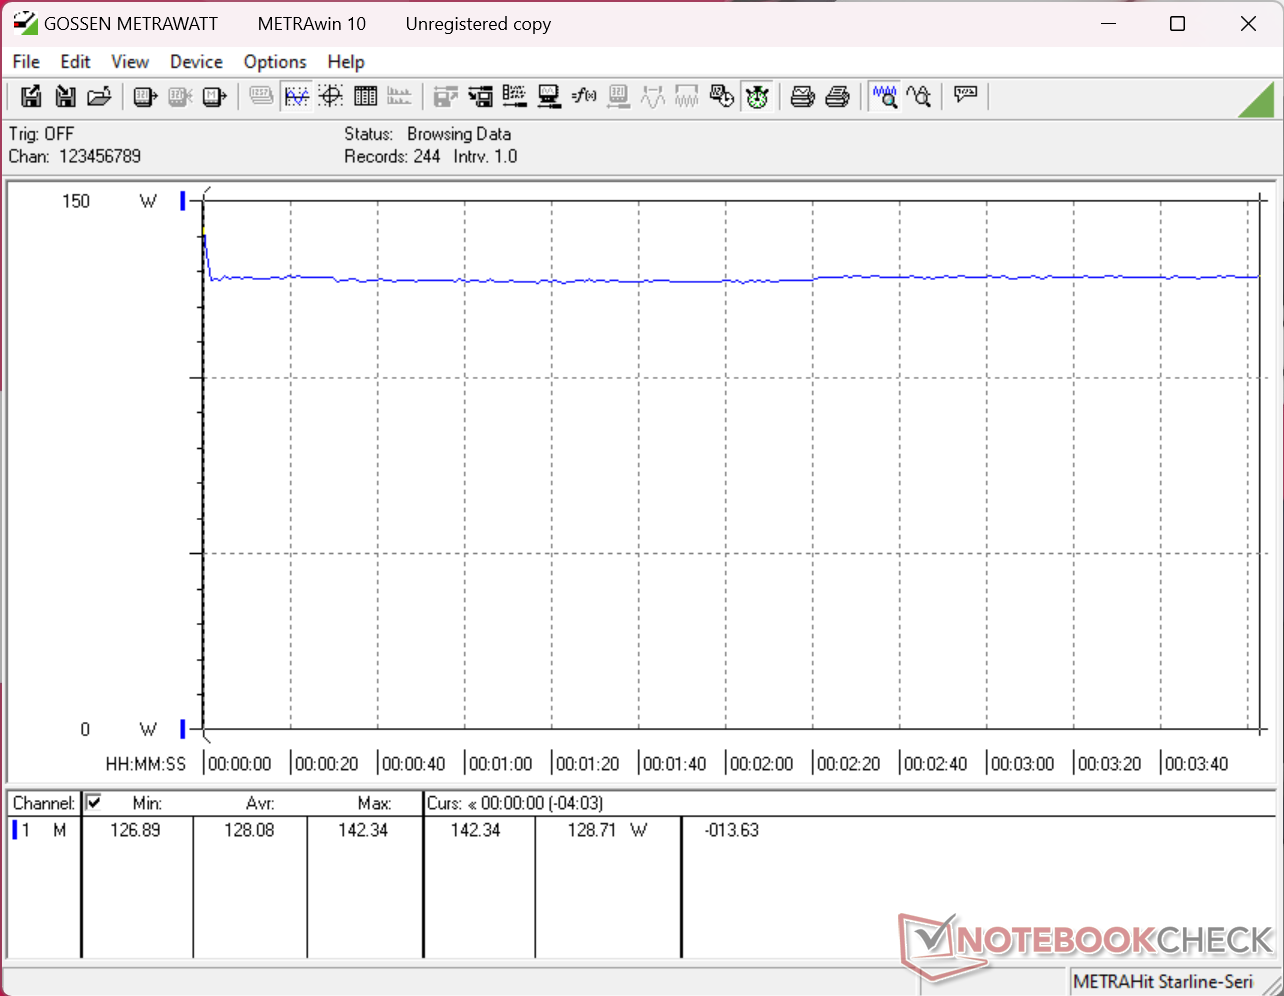
3DMark 11 consumption
Cyberpunk 2077 1080p Ultra consumption
Consumption would spike to 142 W when initiating Prime95 stress before steadily falling to 117 W after just a few seconds
Prime95+FurMark stress initiated at 10s mark. Consumption would cycle between ~115 W and ~143 W
Power Consumption
Off / Standbydarklight 0.27 / 0.83 Watt
Idledarkmidlight 6.4 / 8.8 / 18.7 Watt
Load midlight / 140.9 Watt
 color bar
Key: min: dark, med: mid, max: light        Metrahit Energy
HP OmniBook Ultra 16-bk0013dx
Spark RTX N1X 20-Core, RTX Spark N1X 6144-Core Blackwell GPU, , OLED, 2880x1800, 16"
Asus ProArt P16 H7607
Spark RTX N1X 20-Core, RTX Spark N1X 6144-Core Blackwell GPU, SanDisk PC SN5100S 2TB, OLED, 3840x2400, 16"
MSI Stealth 16 AI B3WH
Ultra 9 386H, GeForce RTX 5070 Ti Laptop, Samsung PM9C1b MZVL81T0HFLB-00BTW, OLED, 2560x1600, 16"
Razer Blade 16 Core Ultra 9 386H
Ultra 9 386H, GeForce RTX 5090 Laptop, Lexar NM790 2TB, OLED, 2560x1600, 16"
Dell XPS 16 Core Ultra X7 358H
Ultra X7 358H, Arc B390 Panther Lake iGPU, , OLED, 3200x2000, 16"
Lenovo ThinkPad P16 G2 21FA000FGE
i7-13700HX, RTX 2000 Ada Generation Laptop, SK hynix PC801 HFS001TEJ9X162N, IPS LED, 2560x1600, 16"
Power Consumption
-9%
-42%
-67%
45%
-29%
Idle Minimum * (Watt)
6.4
7.7
-20%
6.5
-2%
4.4
31%
4
37%
9.3
-45%
Idle Average * (Watt)
8.8
13.4
-52%
7.8
11%
22.3
-153%
4.4
50%
14.1
-60%
Idle Maximum * (Watt)
18.7
13.7
27%
24.5
-31%
30.4
-63%
10.2
45%
15.5
17%
Cyberpunk 2077 ultra external monitor * (Watt)
128.1
131.3
-2%
212
-65%
216
-69%
62.4
51%
Cyberpunk 2077 ultra * (Watt)
128.1
134.5
-5%
209
-63%
216
-69%
62.6
51%
Load Maximum * (Watt)
140.9
146.8
-4%
284.3
-102%
251.3
-78%
94.6
33%
179.6
-27%
Load Average * (Watt)
135.6
110.7
44.2
133.6
Witcher 3 ultra * (Watt)
144.9

* ... smaller is better

Power Consumption Cyberpunk / Stress Test

05101520253035404550556065707580859095100105110115120125130135140Tooltip
HP OmniBook Ultra 16-bk0013dx Spark RTX N1X 20-Core, RTX Spark N1X 6144-Core Blackwell GPU; 1280x720 Prime95 28.10 and Furmark 1.25: Ø126.1 (108.3-143.6) Watt
Lenovo ThinkPad T1g Gen 8 21TD003GE Ultra 9 285H, GeForce RTX 5070 Laptop; 1280x720 Prime95 28.10 and Furmark 1.25: Ø134.4 (130.7-143) Watt
HP OmniBook Ultra 16-bk0013dx Spark RTX N1X 20-Core, RTX Spark N1X 6144-Core Blackwell GPU; Idle 150cd/m2: Ø7.23 (6.78-10.5) Watt
Lenovo ThinkPad T1g Gen 8 21TD003GE Ultra 9 285H, GeForce RTX 5070 Laptop; Idle 150cd/m2: Ø10.1 (5.73-14) Watt
HP OmniBook Ultra 16-bk0013dx Spark RTX N1X 20-Core, RTX Spark N1X 6144-Core Blackwell GPU; Cyberpunk 2077 FHD ultra no FSR 150cd: Ø128.1 (126.9-142.3) Watt
Lenovo ThinkPad T1g Gen 8 21TD003GE Ultra 9 285H, GeForce RTX 5070 Laptop; Cyberpunk 2077 FHD ultra no FSR 150cd: Ø120.3 (118.3-122.9) Watt

Power Consumption external Monitor

05101520253035404550556065707580859095100105110115120125130135140Tooltip
HP OmniBook Ultra 16-bk0013dx Spark RTX N1X 20-Core, RTX Spark N1X 6144-Core Blackwell GPU; Prime95 V2810 Stress (external Monitor): Ø122.5 (91.2-141.8) Watt
Lenovo ThinkPad T1g Gen 8 21TD003GE Ultra 9 285H, GeForce RTX 5070 Laptop; Prime95 V2810 Stress (external Monitor): Ø112.2 (69.1-142.8) Watt
Lenovo ThinkPad T1g Gen 8 21TD003GE Ultra 9 285H, GeForce RTX 5070 Laptop; Cinebench R15 Multi (external Monitor): Ø142.7 (142.6-142.8) Watt
HP OmniBook Ultra 16-bk0013dx Spark RTX N1X 20-Core, RTX Spark N1X 6144-Core Blackwell GPU; Cinebench R23 Multi (external Monitor): Ø109.3 (104-127) Watt
Lenovo ThinkPad T1g Gen 8 21TD003GE Ultra 9 285H, GeForce RTX 5070 Laptop; Cinebench R23 Multi (external Monitor): Ø140.6 (118.7-143.4) Watt
HP OmniBook Ultra 16-bk0013dx Spark RTX N1X 20-Core, RTX Spark N1X 6144-Core Blackwell GPU; 1280x720 FurMark 1.19 GPU Stress Test (external Monitor): Ø122.7 (96.4-139.7) Watt
Lenovo ThinkPad T1g Gen 8 21TD003GE Ultra 9 285H, GeForce RTX 5070 Laptop; 1280x720 FurMark 1.19 GPU Stress Test (external Monitor): Ø111.7 (95.6-118.4) Watt
HP OmniBook Ultra 16-bk0013dx Spark RTX N1X 20-Core, RTX Spark N1X 6144-Core Blackwell GPU; Idle 1min (external Monitor): Ø6.45 (6.1-7.07) Watt
Lenovo ThinkPad T1g Gen 8 21TD003GE Ultra 9 285H, GeForce RTX 5070 Laptop; Idle 1min (external Monitor): Ø8.12 (4.02-13) Watt
HP OmniBook Ultra 16-bk0013dx Spark RTX N1X 20-Core, RTX Spark N1X 6144-Core Blackwell GPU; Cyberpunk 2077 FHD ultra no FSR (external Monitor): Ø128.1 (127.3-129.8) Watt
Lenovo ThinkPad T1g Gen 8 21TD003GE Ultra 9 285H, GeForce RTX 5070 Laptop; Cyberpunk 2077 FHD ultra no FSR (external Monitor): Ø118.1 (115.6-120.4) Watt

Battery Life

Battery Runtime
WiFi Websurfing
12h 02min
HP OmniBook Ultra 16-bk0013dx
Spark RTX N1X 20-Core, RTX Spark N1X 6144-Core Blackwell GPU, 99 Wh
Asus ProArt P16 H7607
Spark RTX N1X 20-Core, RTX Spark N1X 6144-Core Blackwell GPU, 99.9 Wh
MSI Stealth 16 AI B3WH
Ultra 9 386H, GeForce RTX 5070 Ti Laptop, 90 Wh
Razer Blade 16 Core Ultra 9 386H
Ultra 9 386H, GeForce RTX 5090 Laptop, 90 Wh
Dell XPS 16 Core Ultra X7 358H
Ultra X7 358H, Arc B390 Panther Lake iGPU, 70 Wh
Lenovo ThinkPad P16 G2 21FA000FGE
i7-13700HX, RTX 2000 Ada Generation Laptop, 94 Wh
Battery runtime
WiFi v1.3 (h)
12
9.5
-21%
9.3
-22%
11.7
-2%
10.3
-14%
8.6
-28%

Notebookcheck Rating

Strong performance considering the low weight and thin design, but performance-per-dollar is another story.

HP OmniBook Ultra 16-bk0013dx - 10/26/2026 v8
Allen Ngo

Chassis
85 / 98 → 87%
Keyboard
87%
Pointing Device
85%
Connectivity
69 / 80 → 87%
Weight
62 / 20-74 → 77%
Battery
89 / 95 → 94%
Display
86%
Games Performance
86 / 88 → 97%
Application Performance
81 / 92 → 88%
AI Performance
79%
Temperature
90%
Noise
82 / 95 → 86%
Audio
83%
Camera
37 / 75 → 49%
Average
69%
87%
Multimedia - Weighted Average
CO2 Emissions
No Data
Materials
50%
Packaging
100%
Power Use
82.2%
Repairability
50%
Software Updates
22.3%
Recycle Logo Total Sustainability Score: 50.8%

Potential Competitors in Comparison

Image
Model / Review
Price
Weight
Height
Display
1.
87.4%
HP OmniBook Ultra 16-bk0013dx
Nvidia RTX Spark N1X 20-Core ⎘
NVIDIA RTX Spark N1X 6144-Core Blackwell GPU ⎘
32 GB Memory
Amazon:
1. $919.99
HP Omnibook X Flip 16" 2-in-...
2. $699.99
HP Omnibook 3 16’’ 2K To...
3. $619.99
HP OmniBook 3 16 AI Touchscr...
List Price: 3200 USD
2.2 kg15.8 mm16.00"
2880x1800
212 PPI
OLED
2.
90.3%
Asus ProArt P16 H7607
Nvidia RTX Spark N1X 20-Core ⎘
NVIDIA RTX Spark N1X 6144-Core Blackwell GPU ⎘
128 GB Memory, 2048 GB SSD
Amazon:
1. $6,199.00
HIDevolution [2025] ASUS Pro...
2. $4,599.00
HIDevolution [2025] ASUS Pro...
3. $469.99
ASUS ProArt PA169CDV 15.6 In...
List Price: 6699€
1.8 kg13 mm16.00"
3840x2400
283 PPI
OLED
3.
87.7%
MSI Stealth 16 AI B3WH
Intel Core Ultra 9 386H ⎘
NVIDIA GeForce RTX 5070 Ti Laptop ⎘
32 GB Memory, 1000 GB SSD
List Price: 3100 USD2 kg19.99 mm16.00"
2560x1600
189 PPI
OLED
4.
87.7%
Razer Blade 16 Core Ultra 9 386H
Intel Core Ultra 9 386H ⎘
NVIDIA GeForce RTX 5090 Laptop ⎘
32 GB Memory, 2048 GB SSD
Amazon:
1. $5,599.99
Razer Blade 16 (2026) Thin G...
2. $3,499.99
Razer Blade 16 (2026) Thin G...
3. $4,323.99
Razer Blade 16 (2026) Thin G...
List Price: 4900 USD
2.1 kg17.4 mm16.00"
2560x1600
189 PPI
OLED
5.
87.2%
Dell XPS 16 Core Ultra X7 358H
Intel Core Ultra X7 358H ⎘
Intel Arc B390 12 Xe3 Panther Lake iGPU ⎘
32 GB Memory
Amazon:
1. $2,599.00
Dell Premium 16 (XPS 16 2025...
2. $2,599.00
Dell Premium 16 (XPS 16 2025...
3. $1,899.00
Dell Premium 16 (Previously ...
List Price: 2350 USD
1.7 kg14.62 mm16.00"
3200x2000
236 PPI
OLED
6.
90.2% v7 (old)
Lenovo ThinkPad P16 G2 21FA000FGE
Intel Core i7-13700HX ⎘
NVIDIA RTX 2000 Ada Generation Laptop ⎘
32 GB Memory, 1024 GB SSD
List Price: 2750 Euro3 kg30.23 mm16.00"
2560x1600
189 PPI
IPS LED

Transparency

The selection of devices to be reviewed is made by our editorial team. The test sample was provided to the author as a loan by the manufacturer or retailer for the purpose of this review. The lender had no influence on this review, nor did the manufacturer receive a copy of this review before publication. There was no obligation to publish this review. As an independent media company, Notebookcheck is not subjected to the authority of manufacturers, retailers or publishers.

This is how Notebookcheck is testing

Every year, Notebookcheck independently reviews hundreds of laptops and smartphones using standardized procedures to ensure that all results are comparable. We have continuously developed our test methods for around 20 years and set industry standards in the process. In our test labs, high-quality measuring equipment is utilized by experienced technicians and editors. These tests involve a multi-stage validation process. Our complex rating system is based on hundreds of well-founded measurements and benchmarks, which maintains objectivity. Further information on our test methods can be found here.

Google LogoAdd as a preferred source on Google
Mail Logo
static version load dynamic
Loading Comments
> Expert reviews and news on laptops, smartphones and tech innovations > Reviews > HP OmniBook Ultra 16 Spark review: Choose your RAM configuration carefully
Allen Ngo, 2026-10-26 (Update: 2026-10-26)