




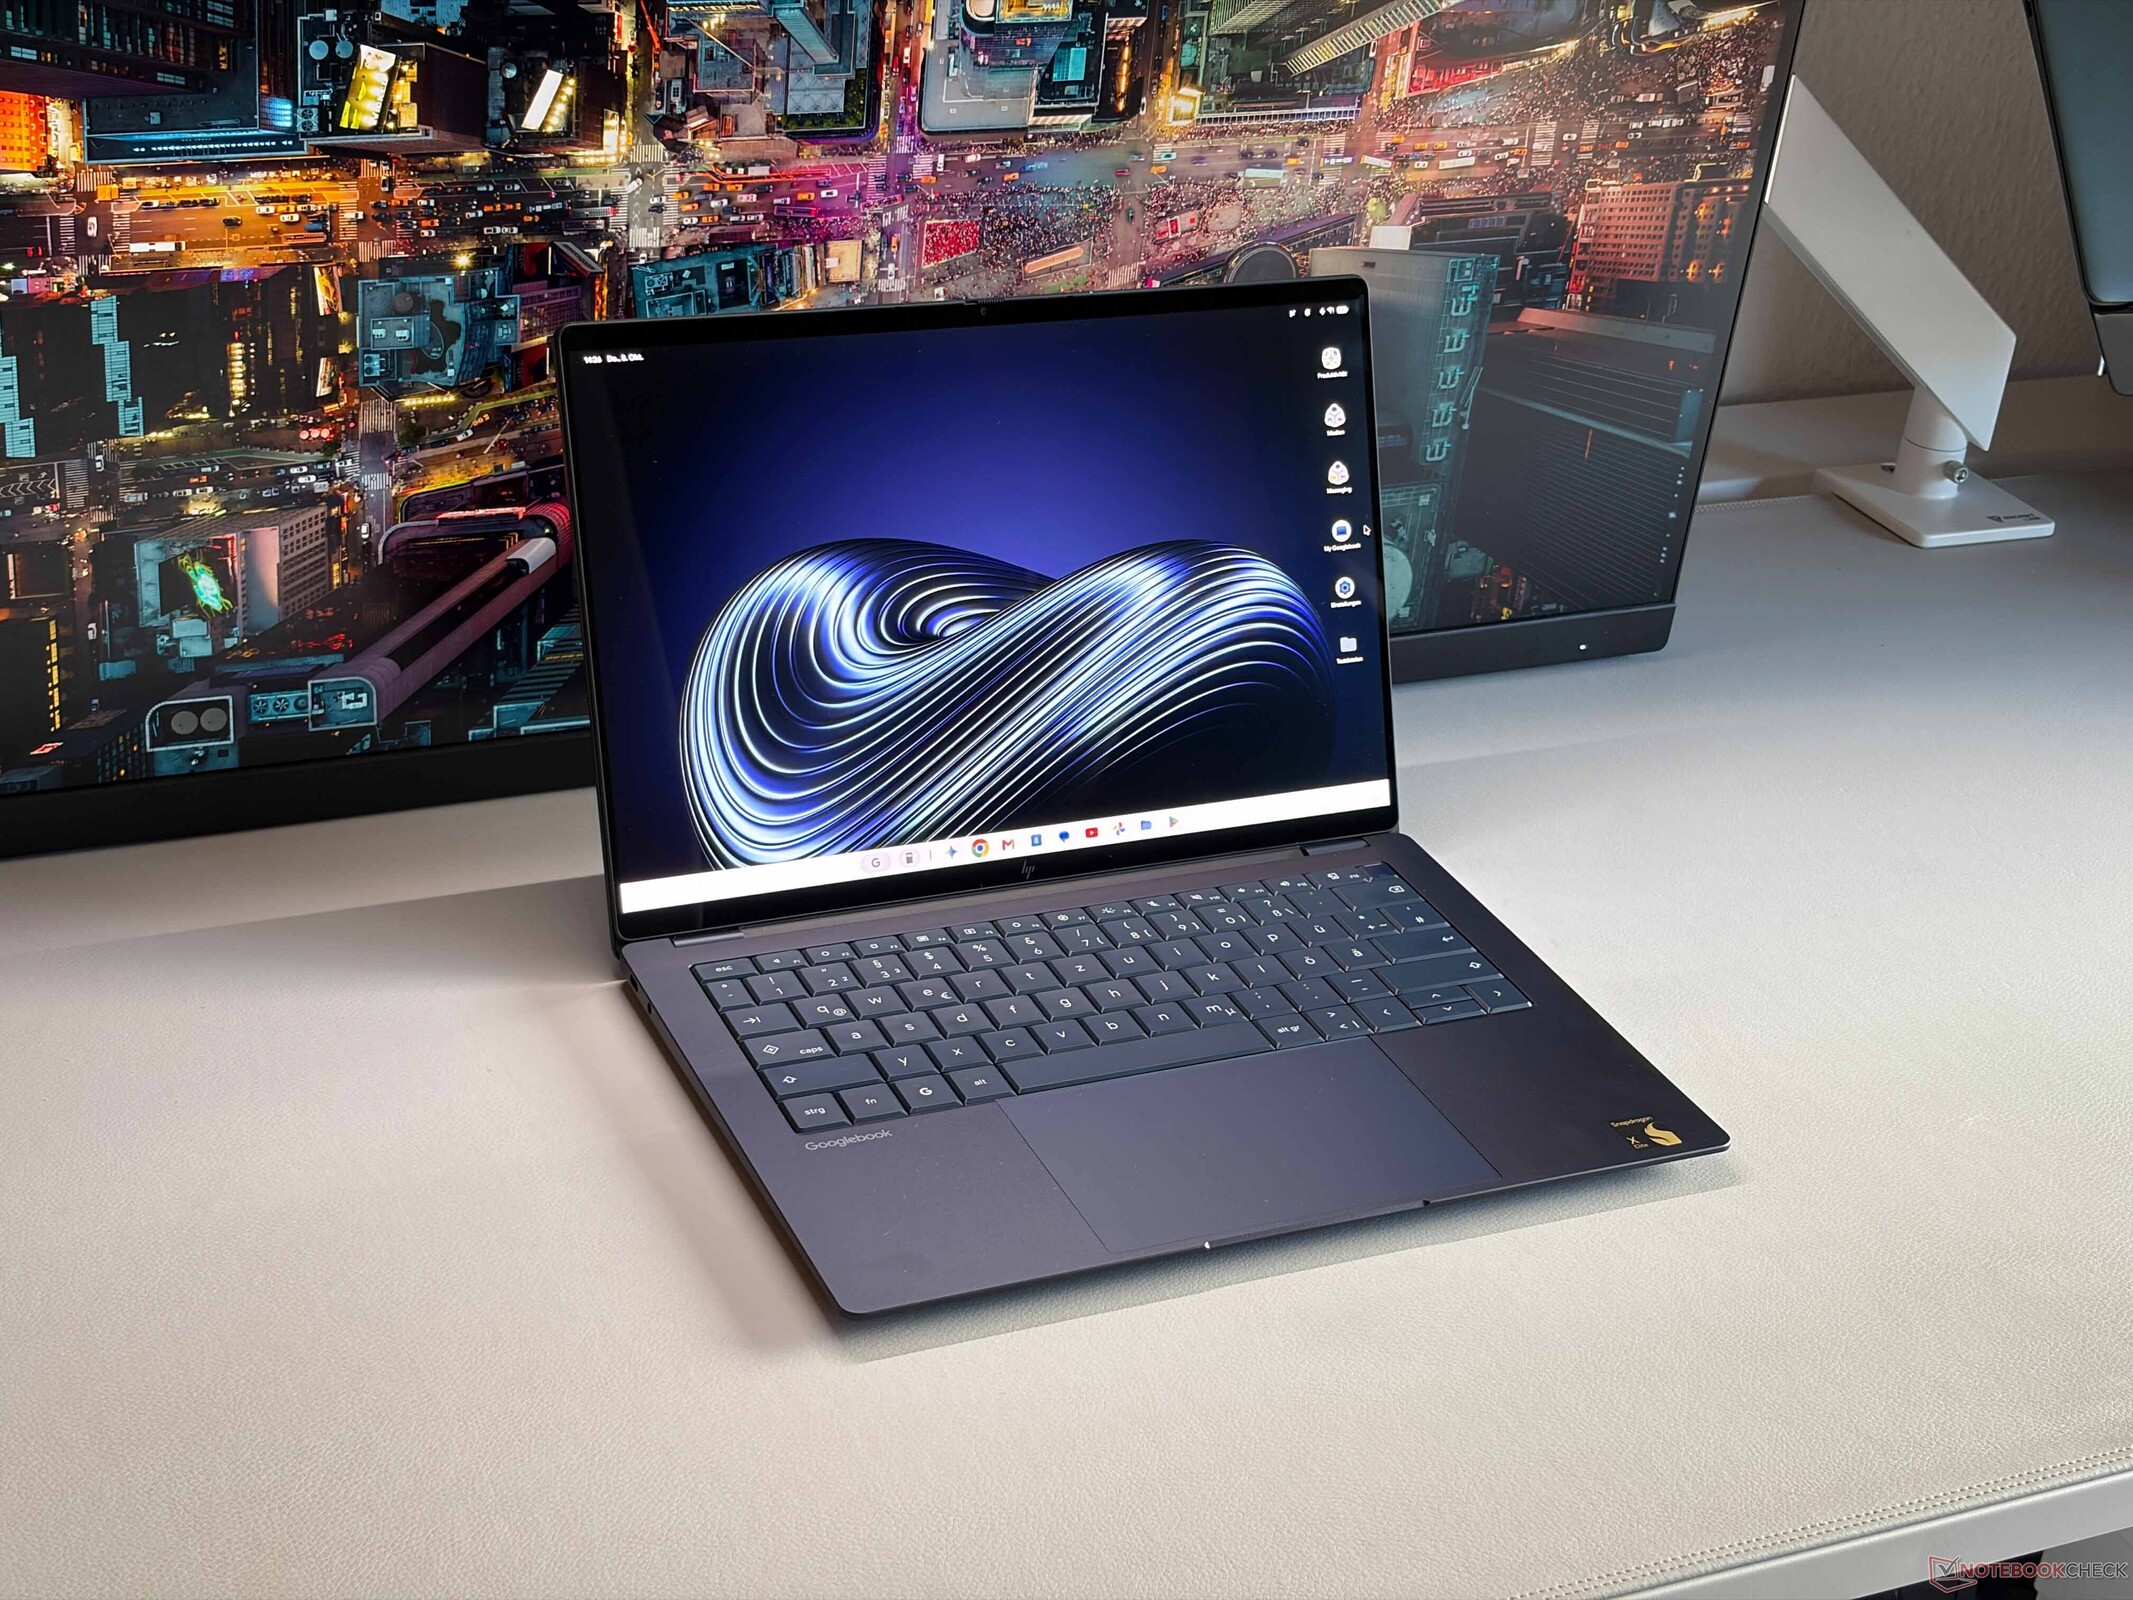
Verdict - Premium hardware, limited software
The new HP Googlebook 14c feels like a premium device - excellent build quality, high-resolution OLED touchscreen, good input devices and great speakers. You also get a Snapdragon X1 Extreme CPU, which almost seems a bit overkill considering you can only run Andoid apps. And this is the big problem, because the latest Googlebook OS still feels a lot like Chrome OS and it is basically still an online device that heavily relies on Google's services including Gemini AI, which require an Internet connection most of the time. It is therefore unfortunate that the Googlebook 14c does not offer built-in 5G connectivity. The connectivity of the HP Googlebook 14c in general is extremely limited with only two USB-C ports. Rivals like the Asus Googlebook (USB-C, USB-A, HDMI, card reader) are superior in this regard.
The other problem right now is that some Android apps simply do not work with Googlebook OS and we have no idea if there will be updates soon. This package is therefore a bit strange, because while the hardware feels premium, the software is simply very limited. HP's Googlebook also does not offer great battery runtimes. The results are not bad, but considering the large 70 Wh battery, we would have expected a bit more. The screen does not support HDR, either, which is not a limitation by Googlebook OS, because other models support HDR. We hope HP will fix this issue via software update soon.
All in all, the new HP Googlebook 14c leaves us a bit baffled. Sure, the chassis is nice and the screen looks great, but in addition to the hardware drawbacks, the biggest issue is simply Googlebook OS. For $1300, you have plenty of options in the Windows segment or Apple's excellent MacBook Air, so we are not really sure why you would want to pay this amount for such a limited operating system.
Pros
Cons
Specifications
Case, Connectivity and Input Devices
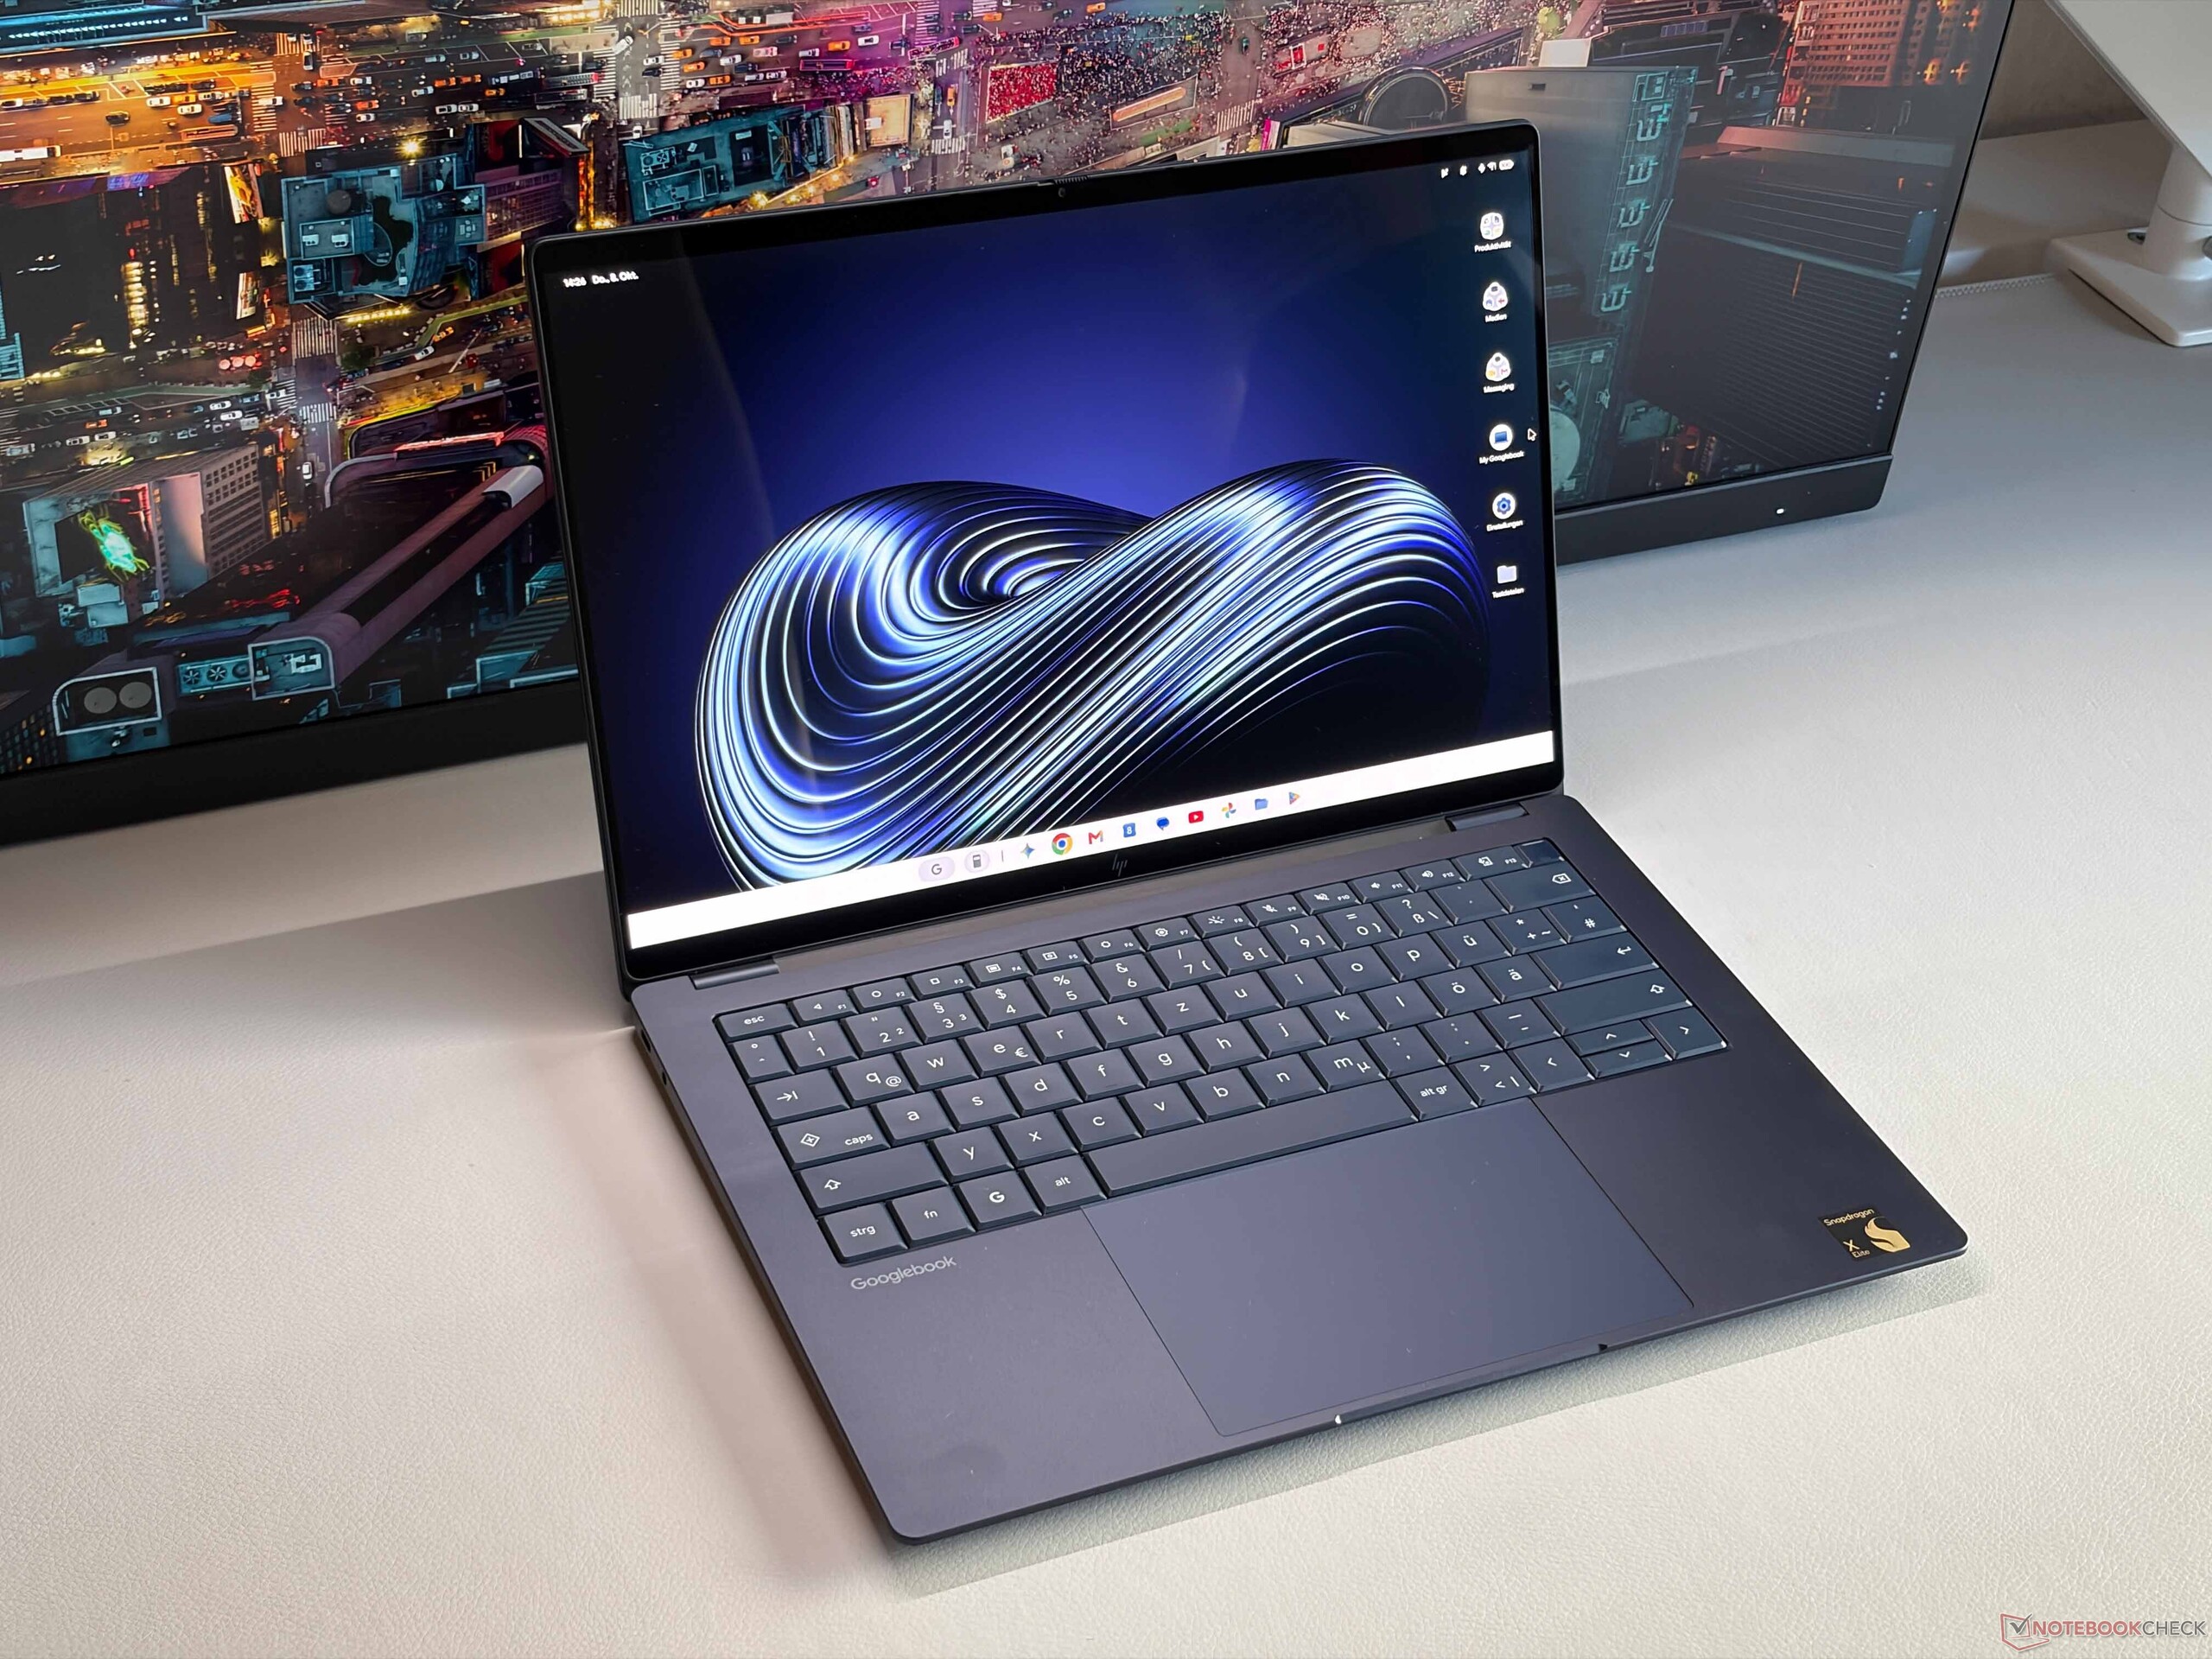
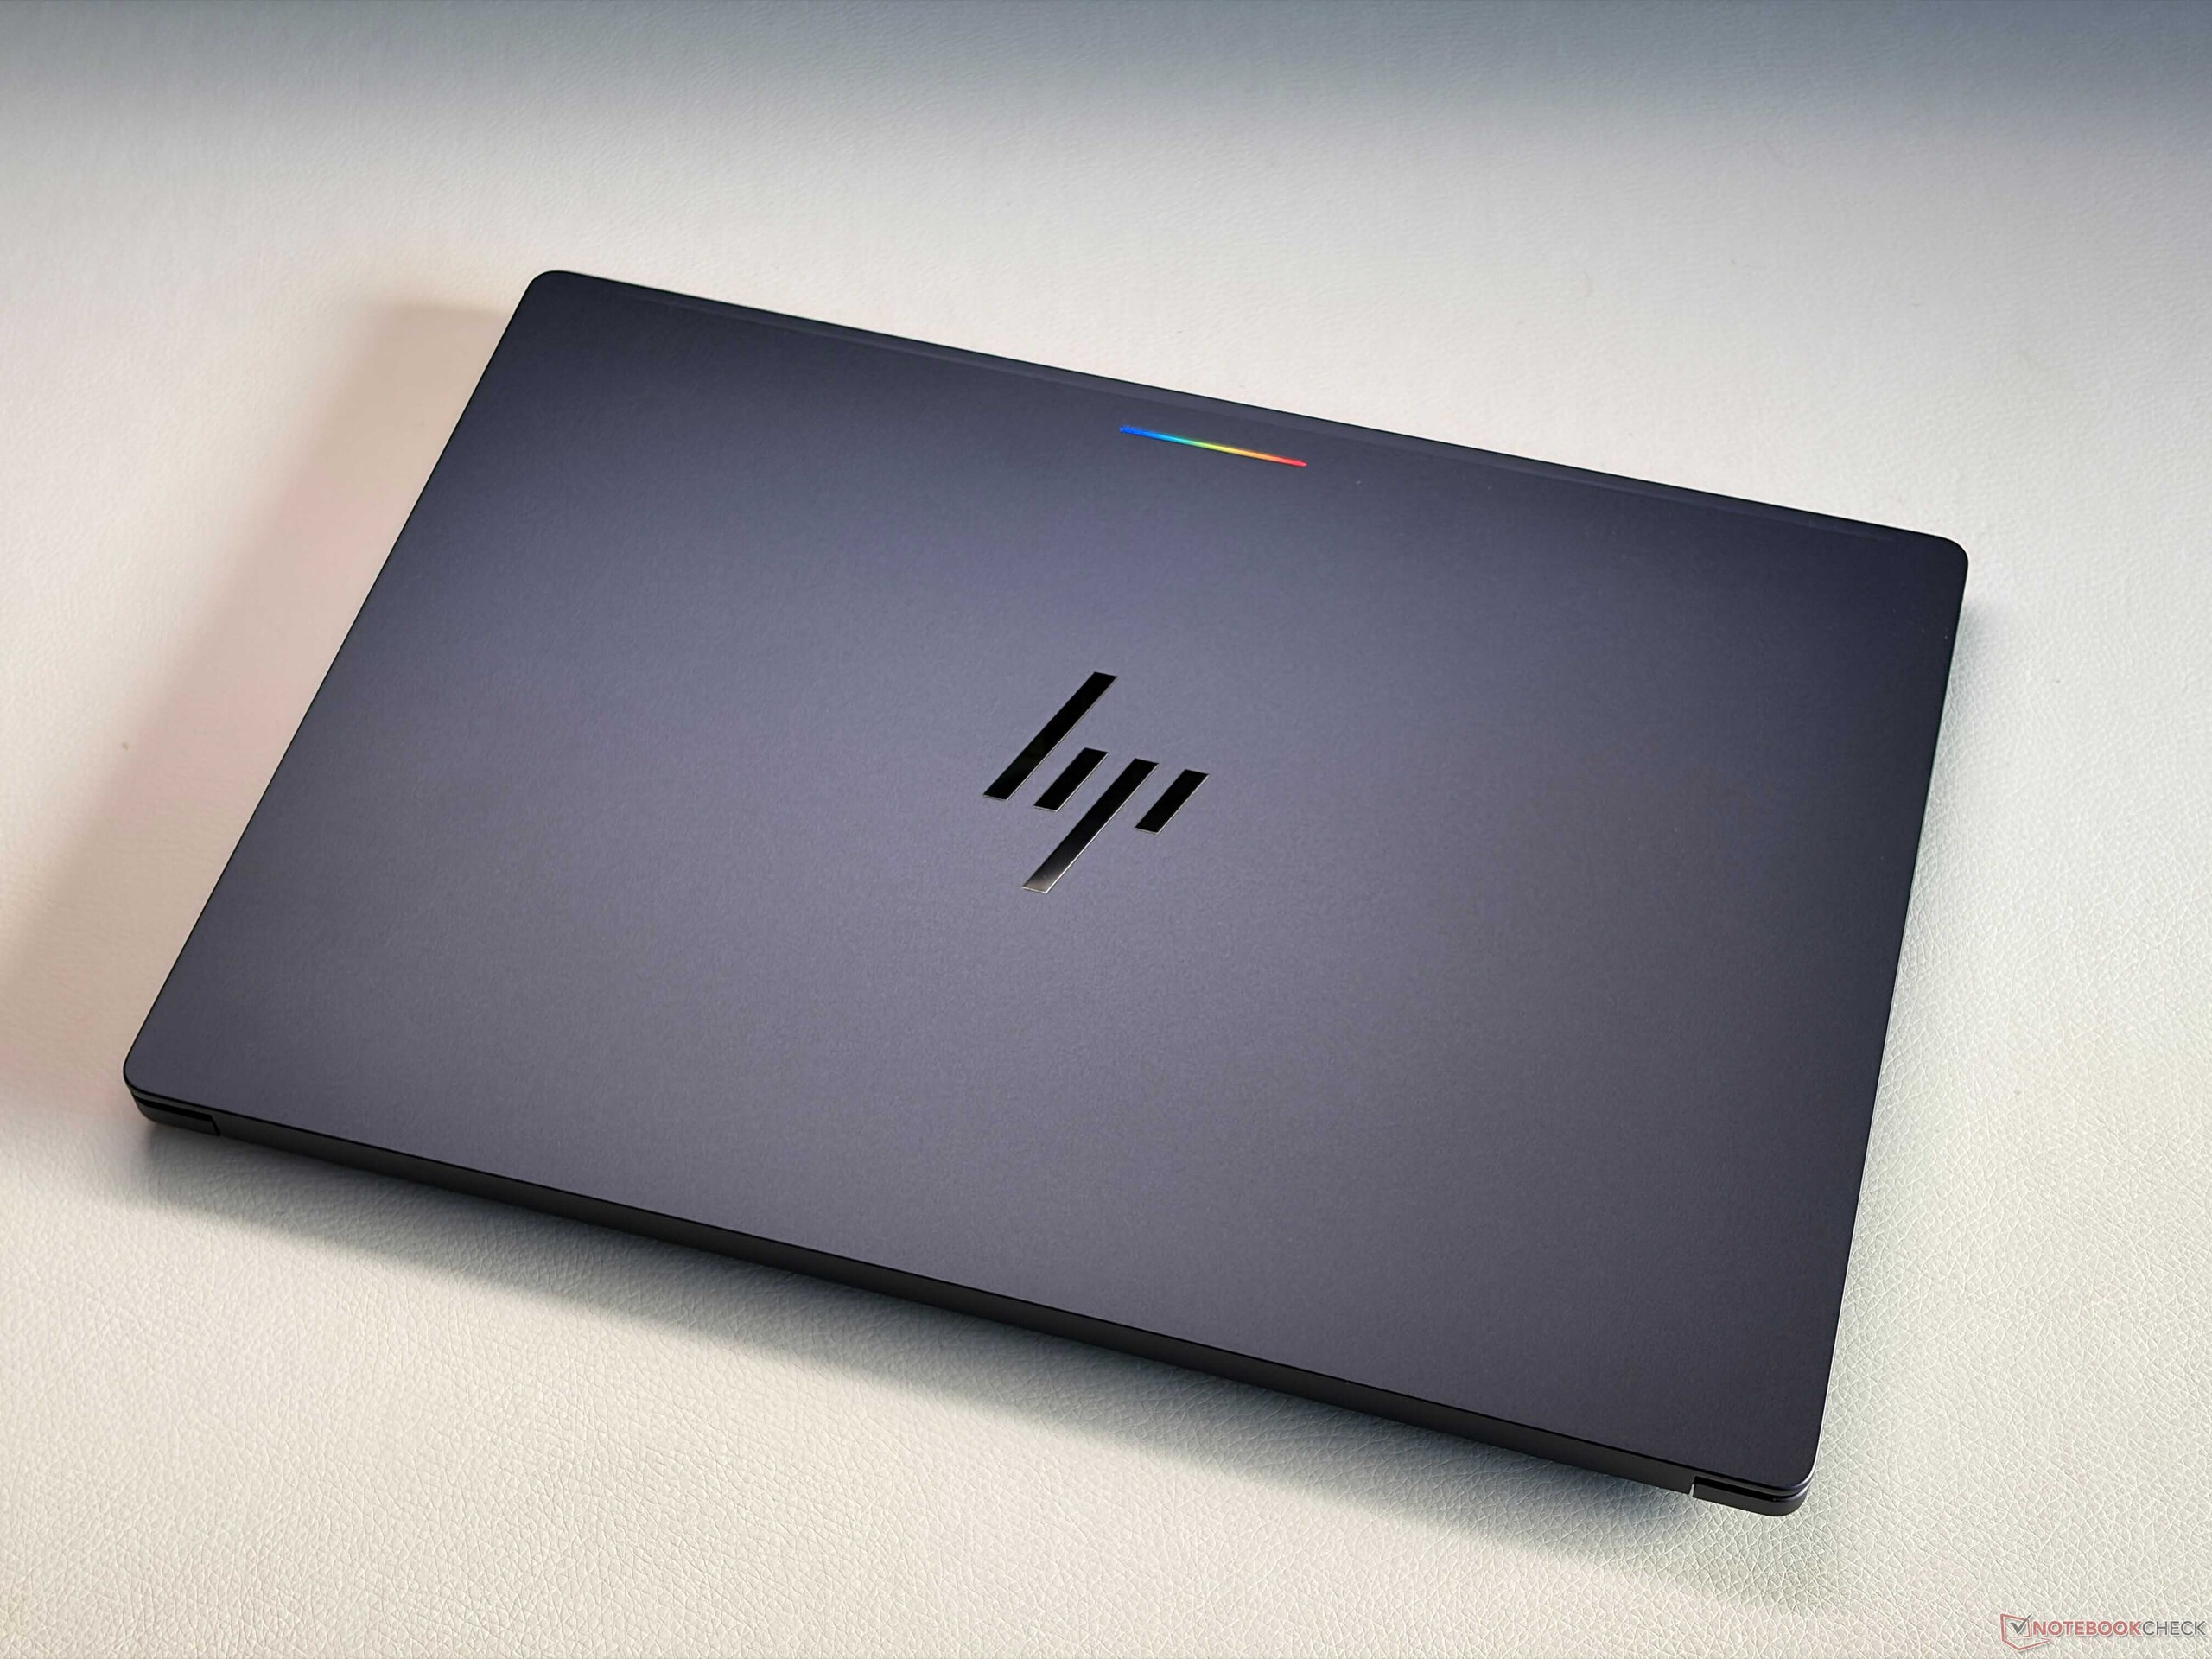
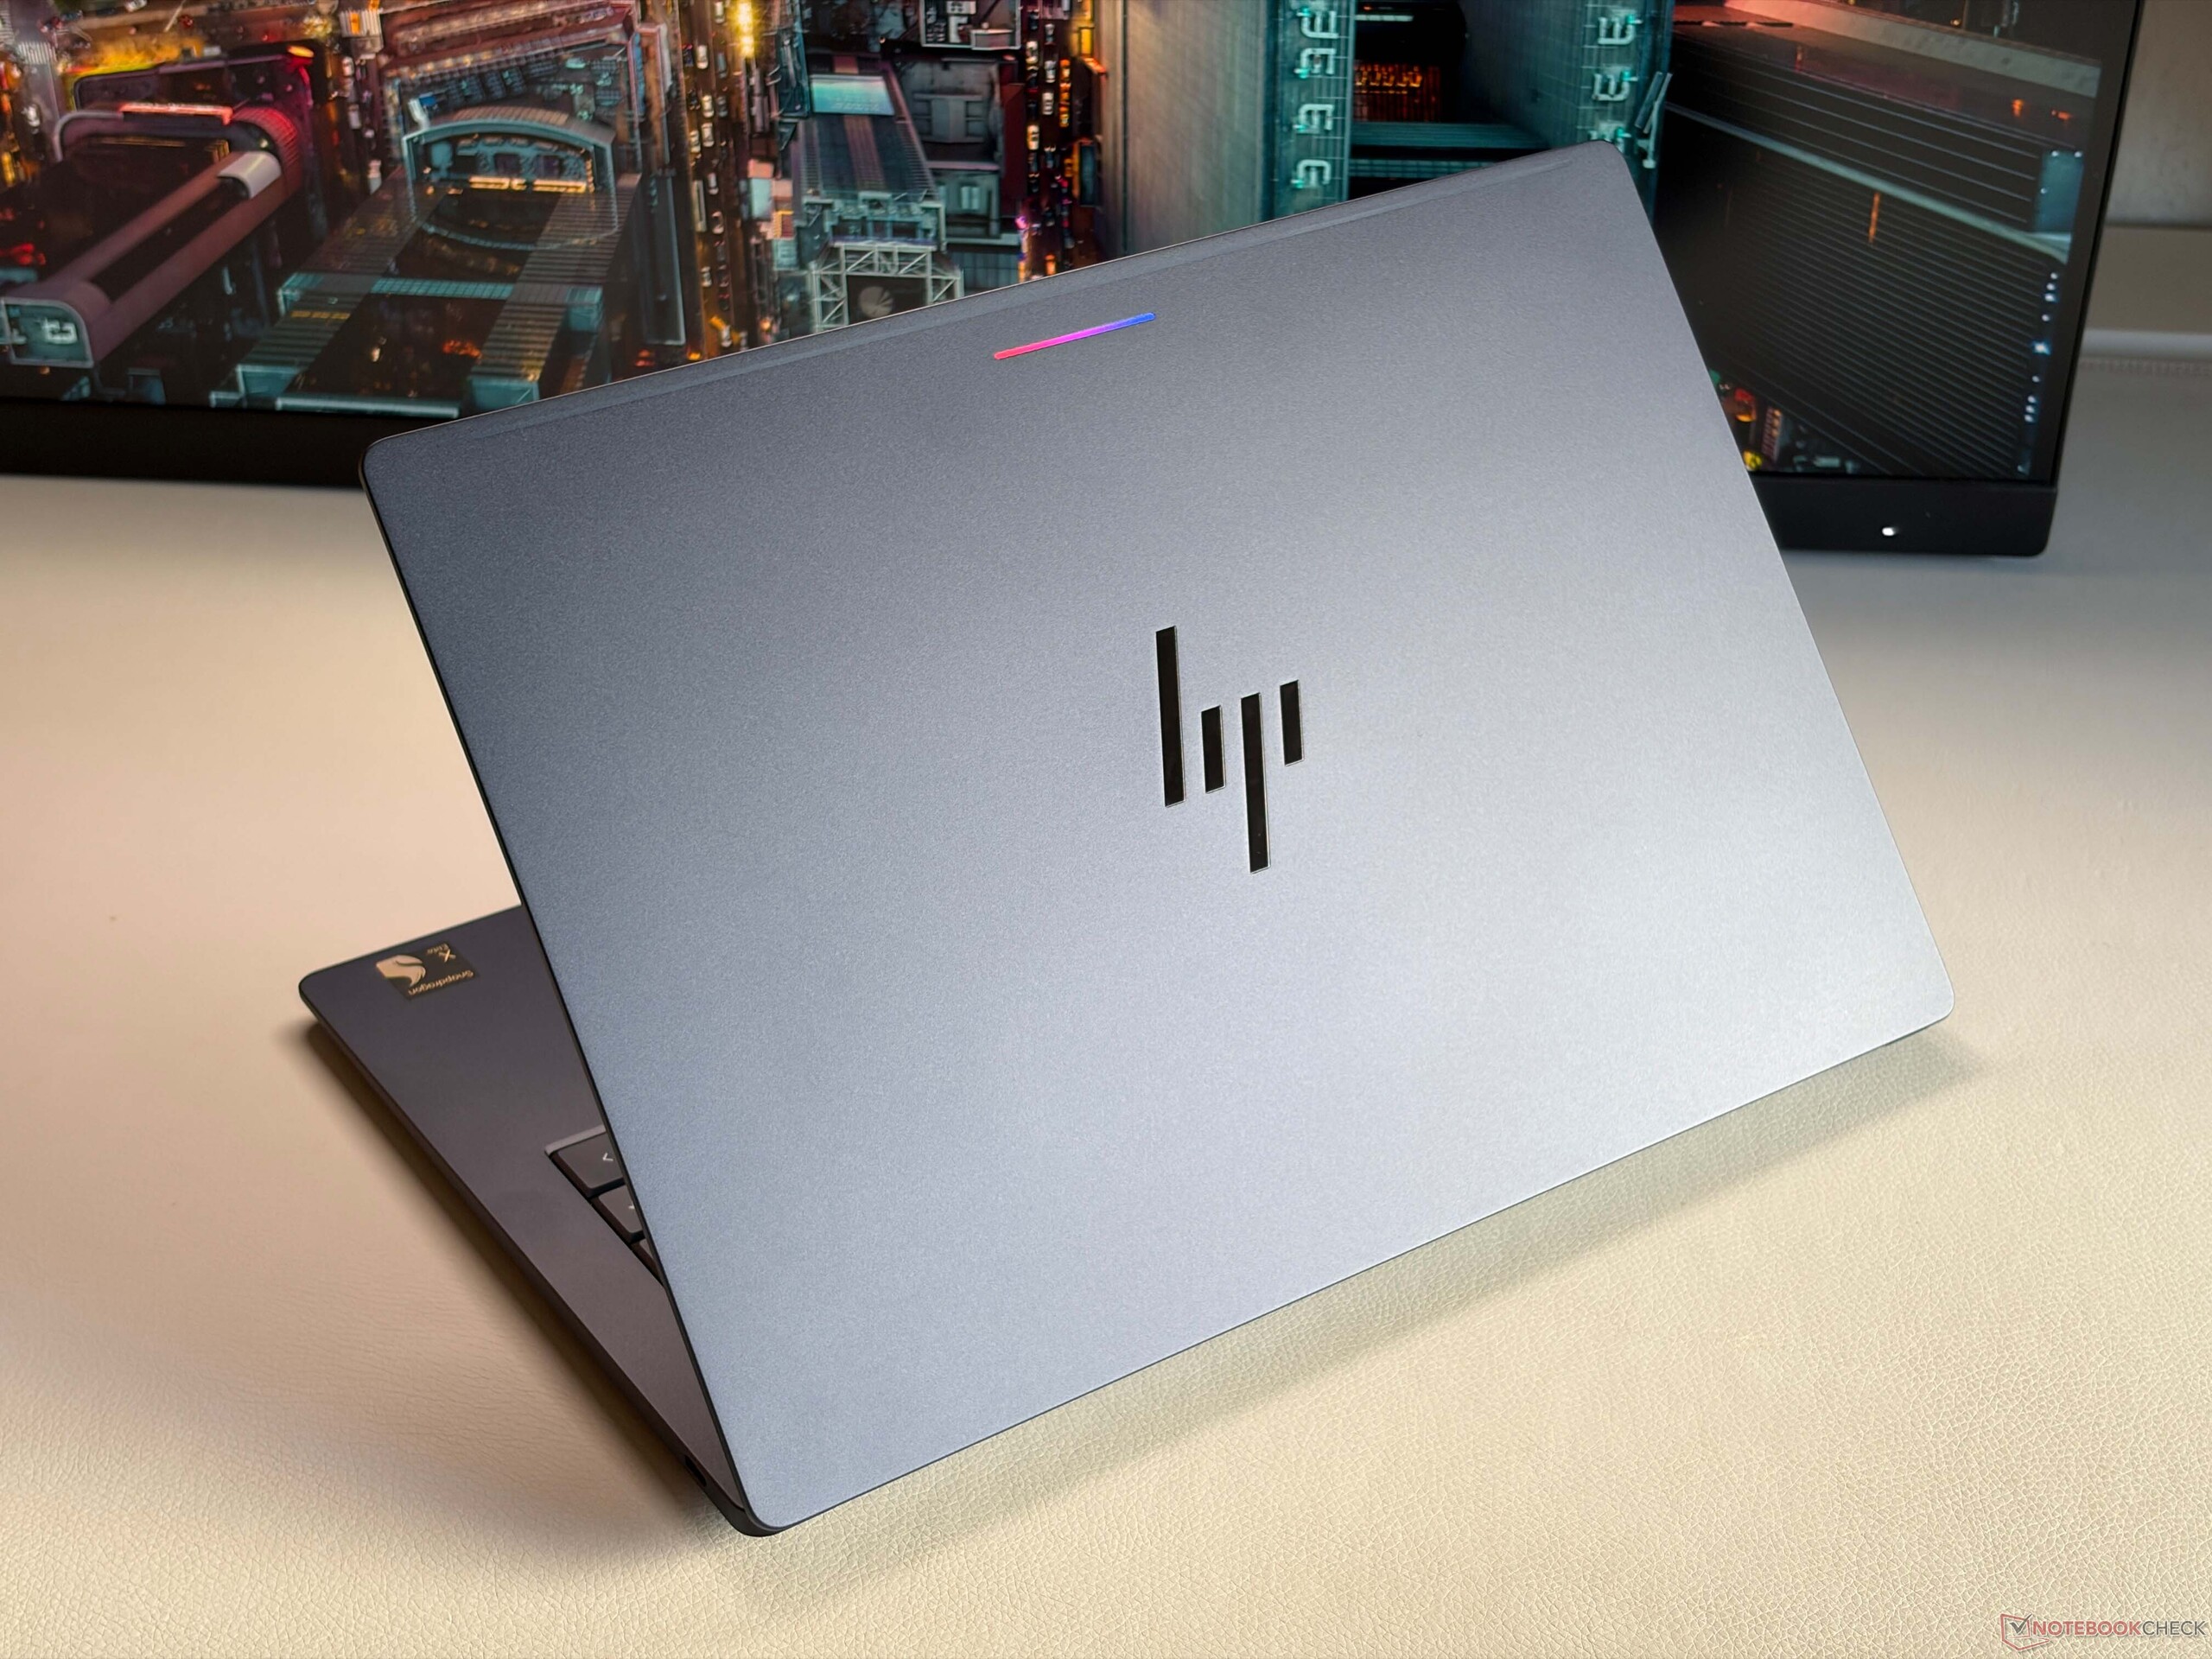
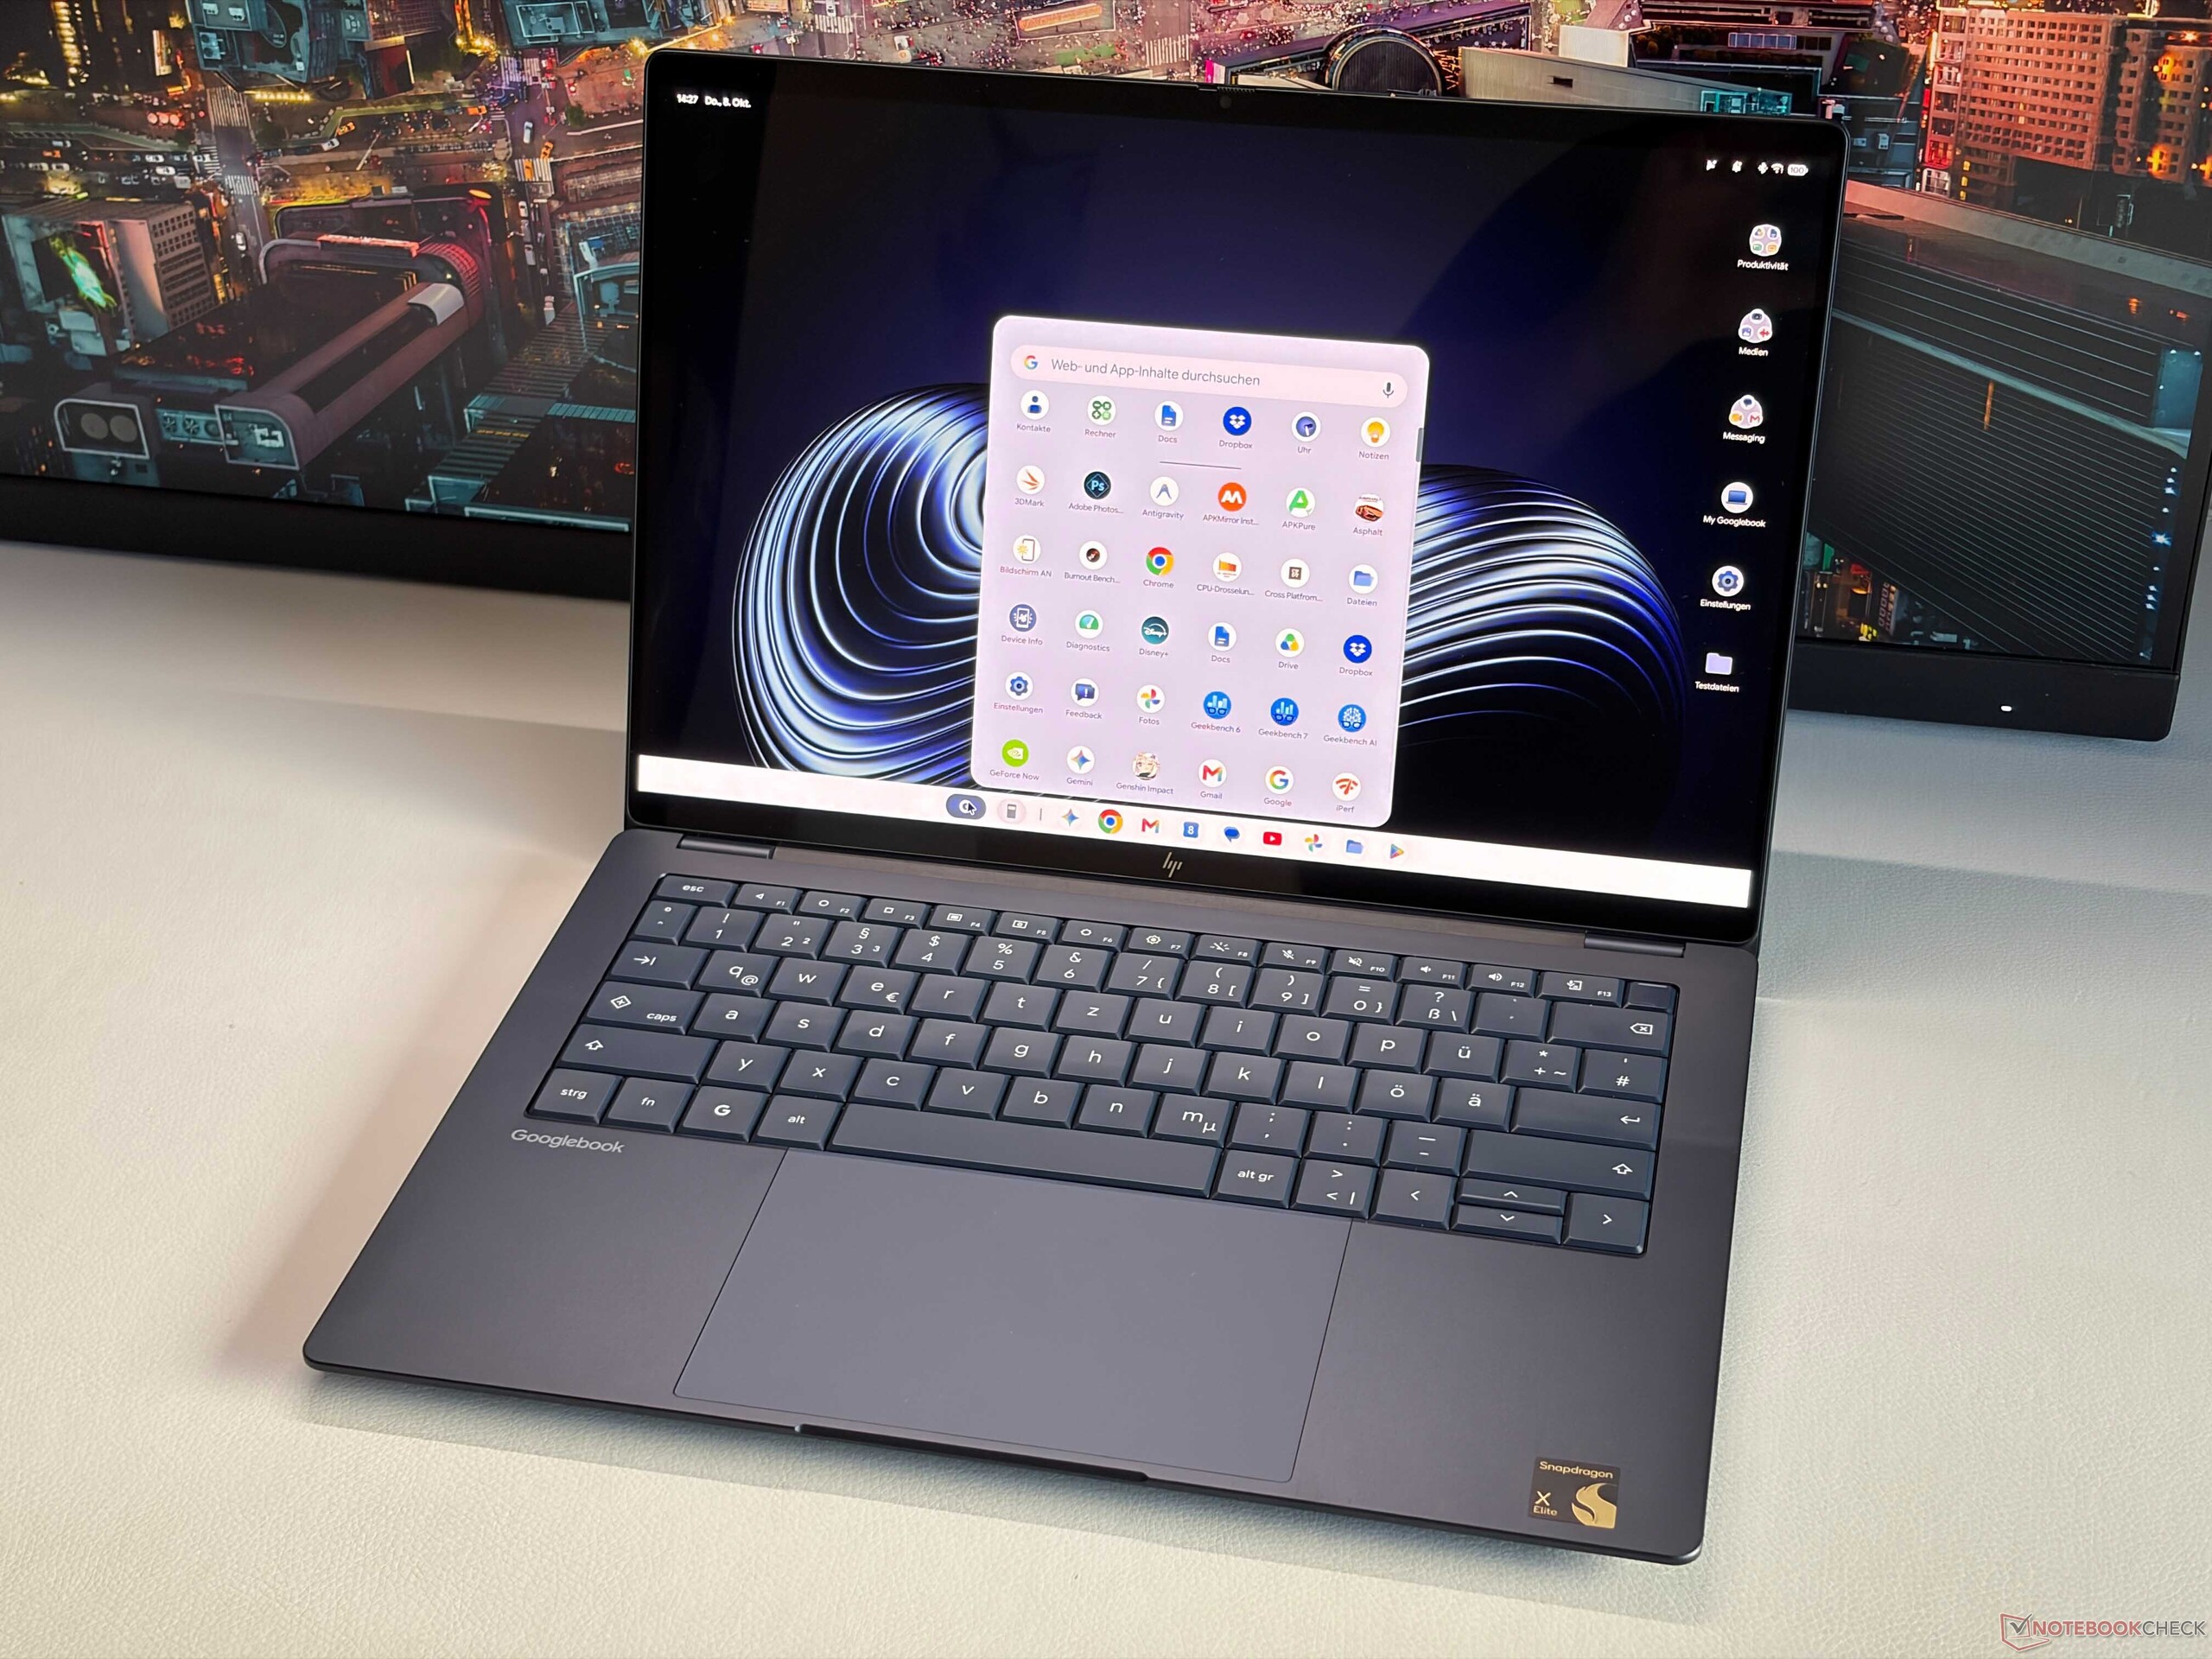
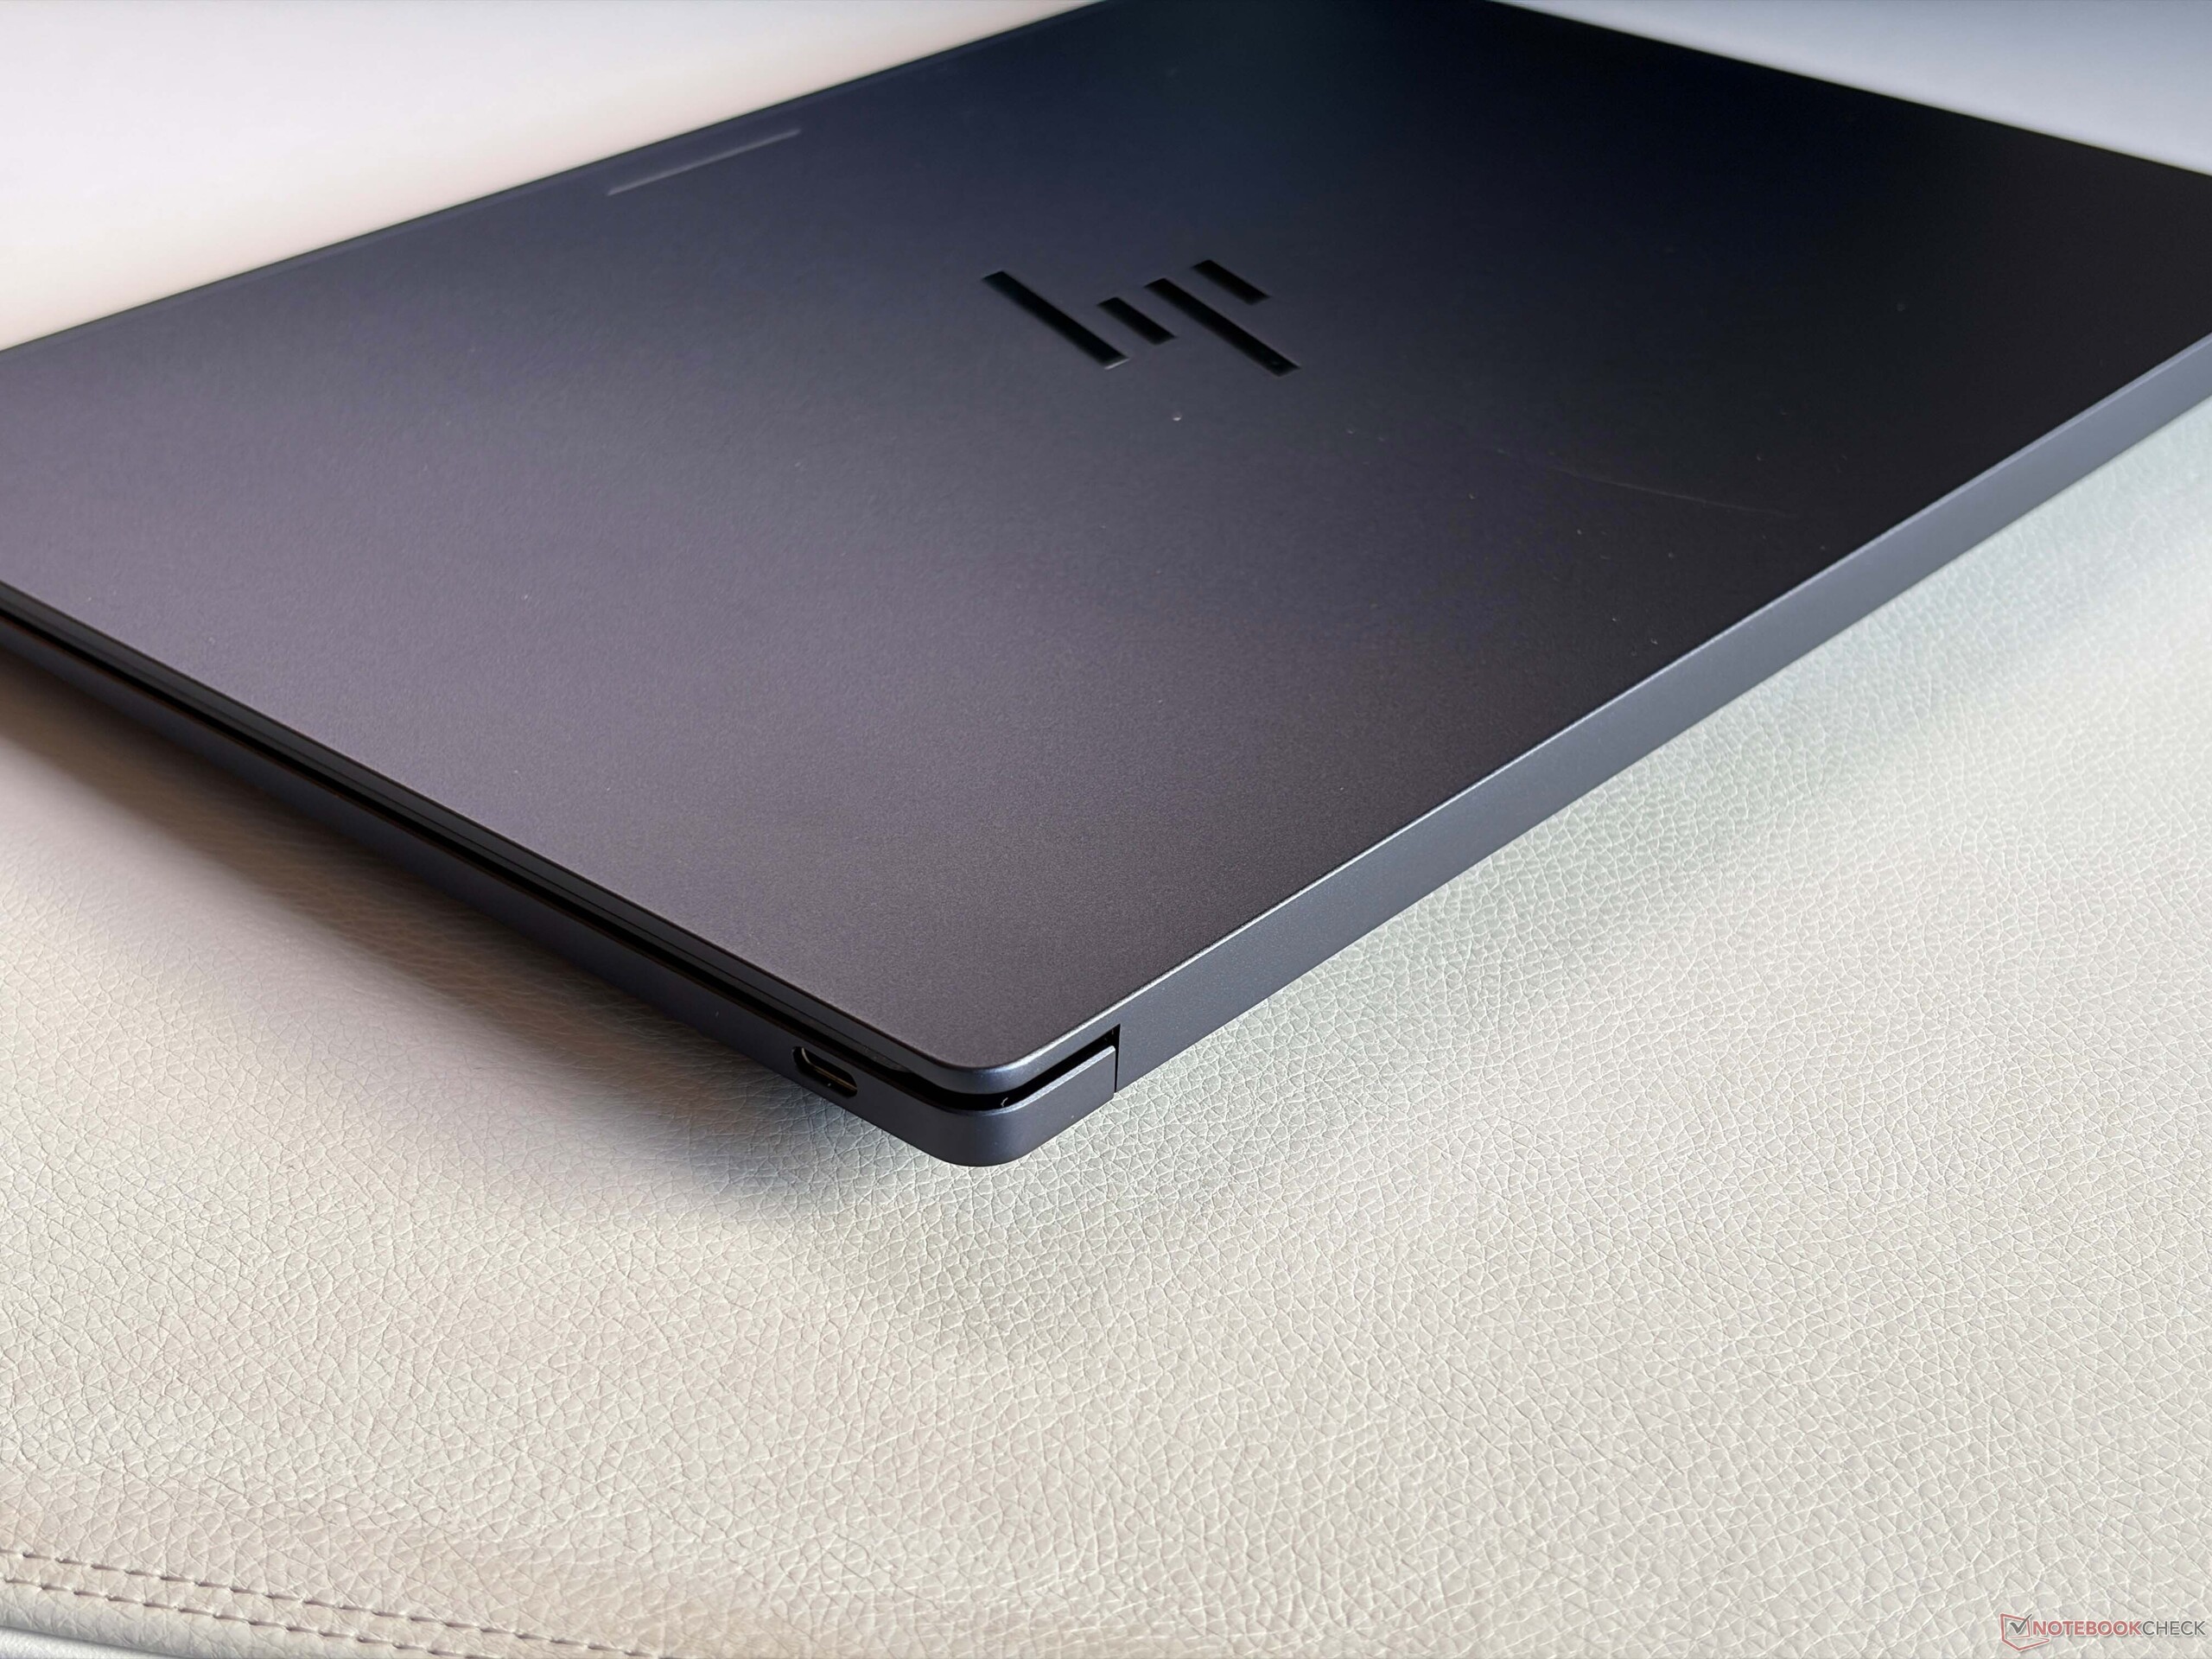
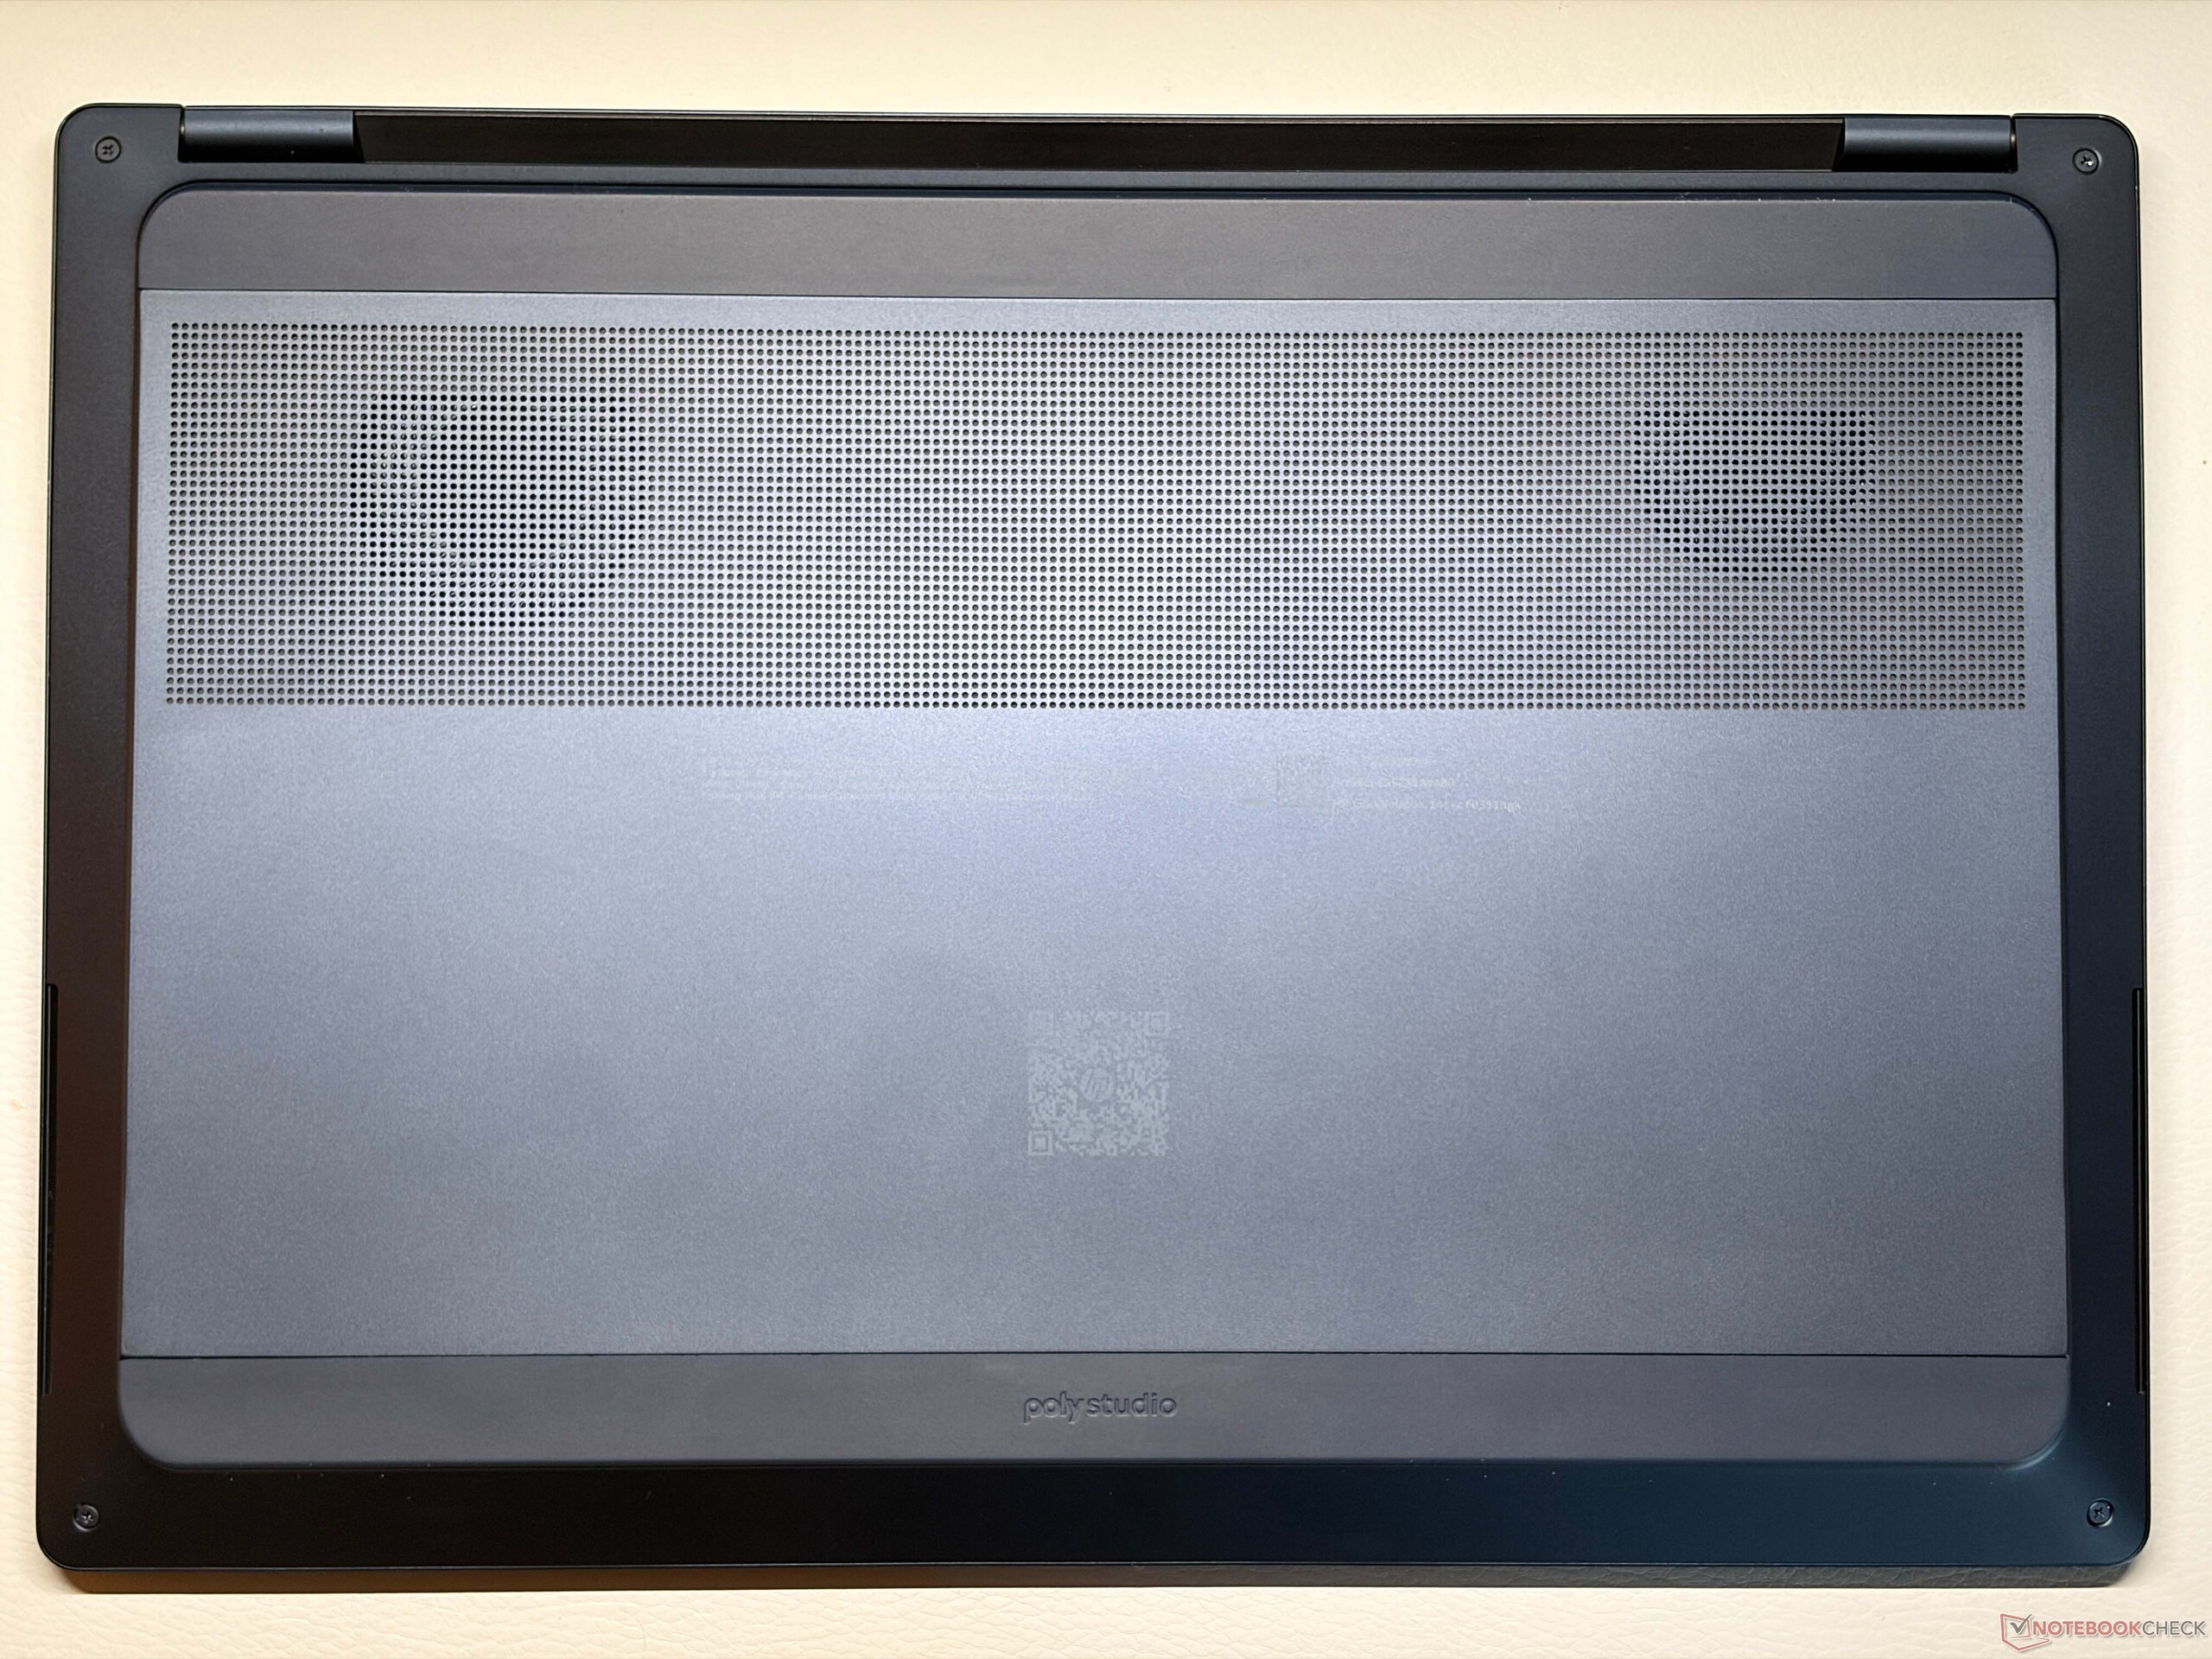
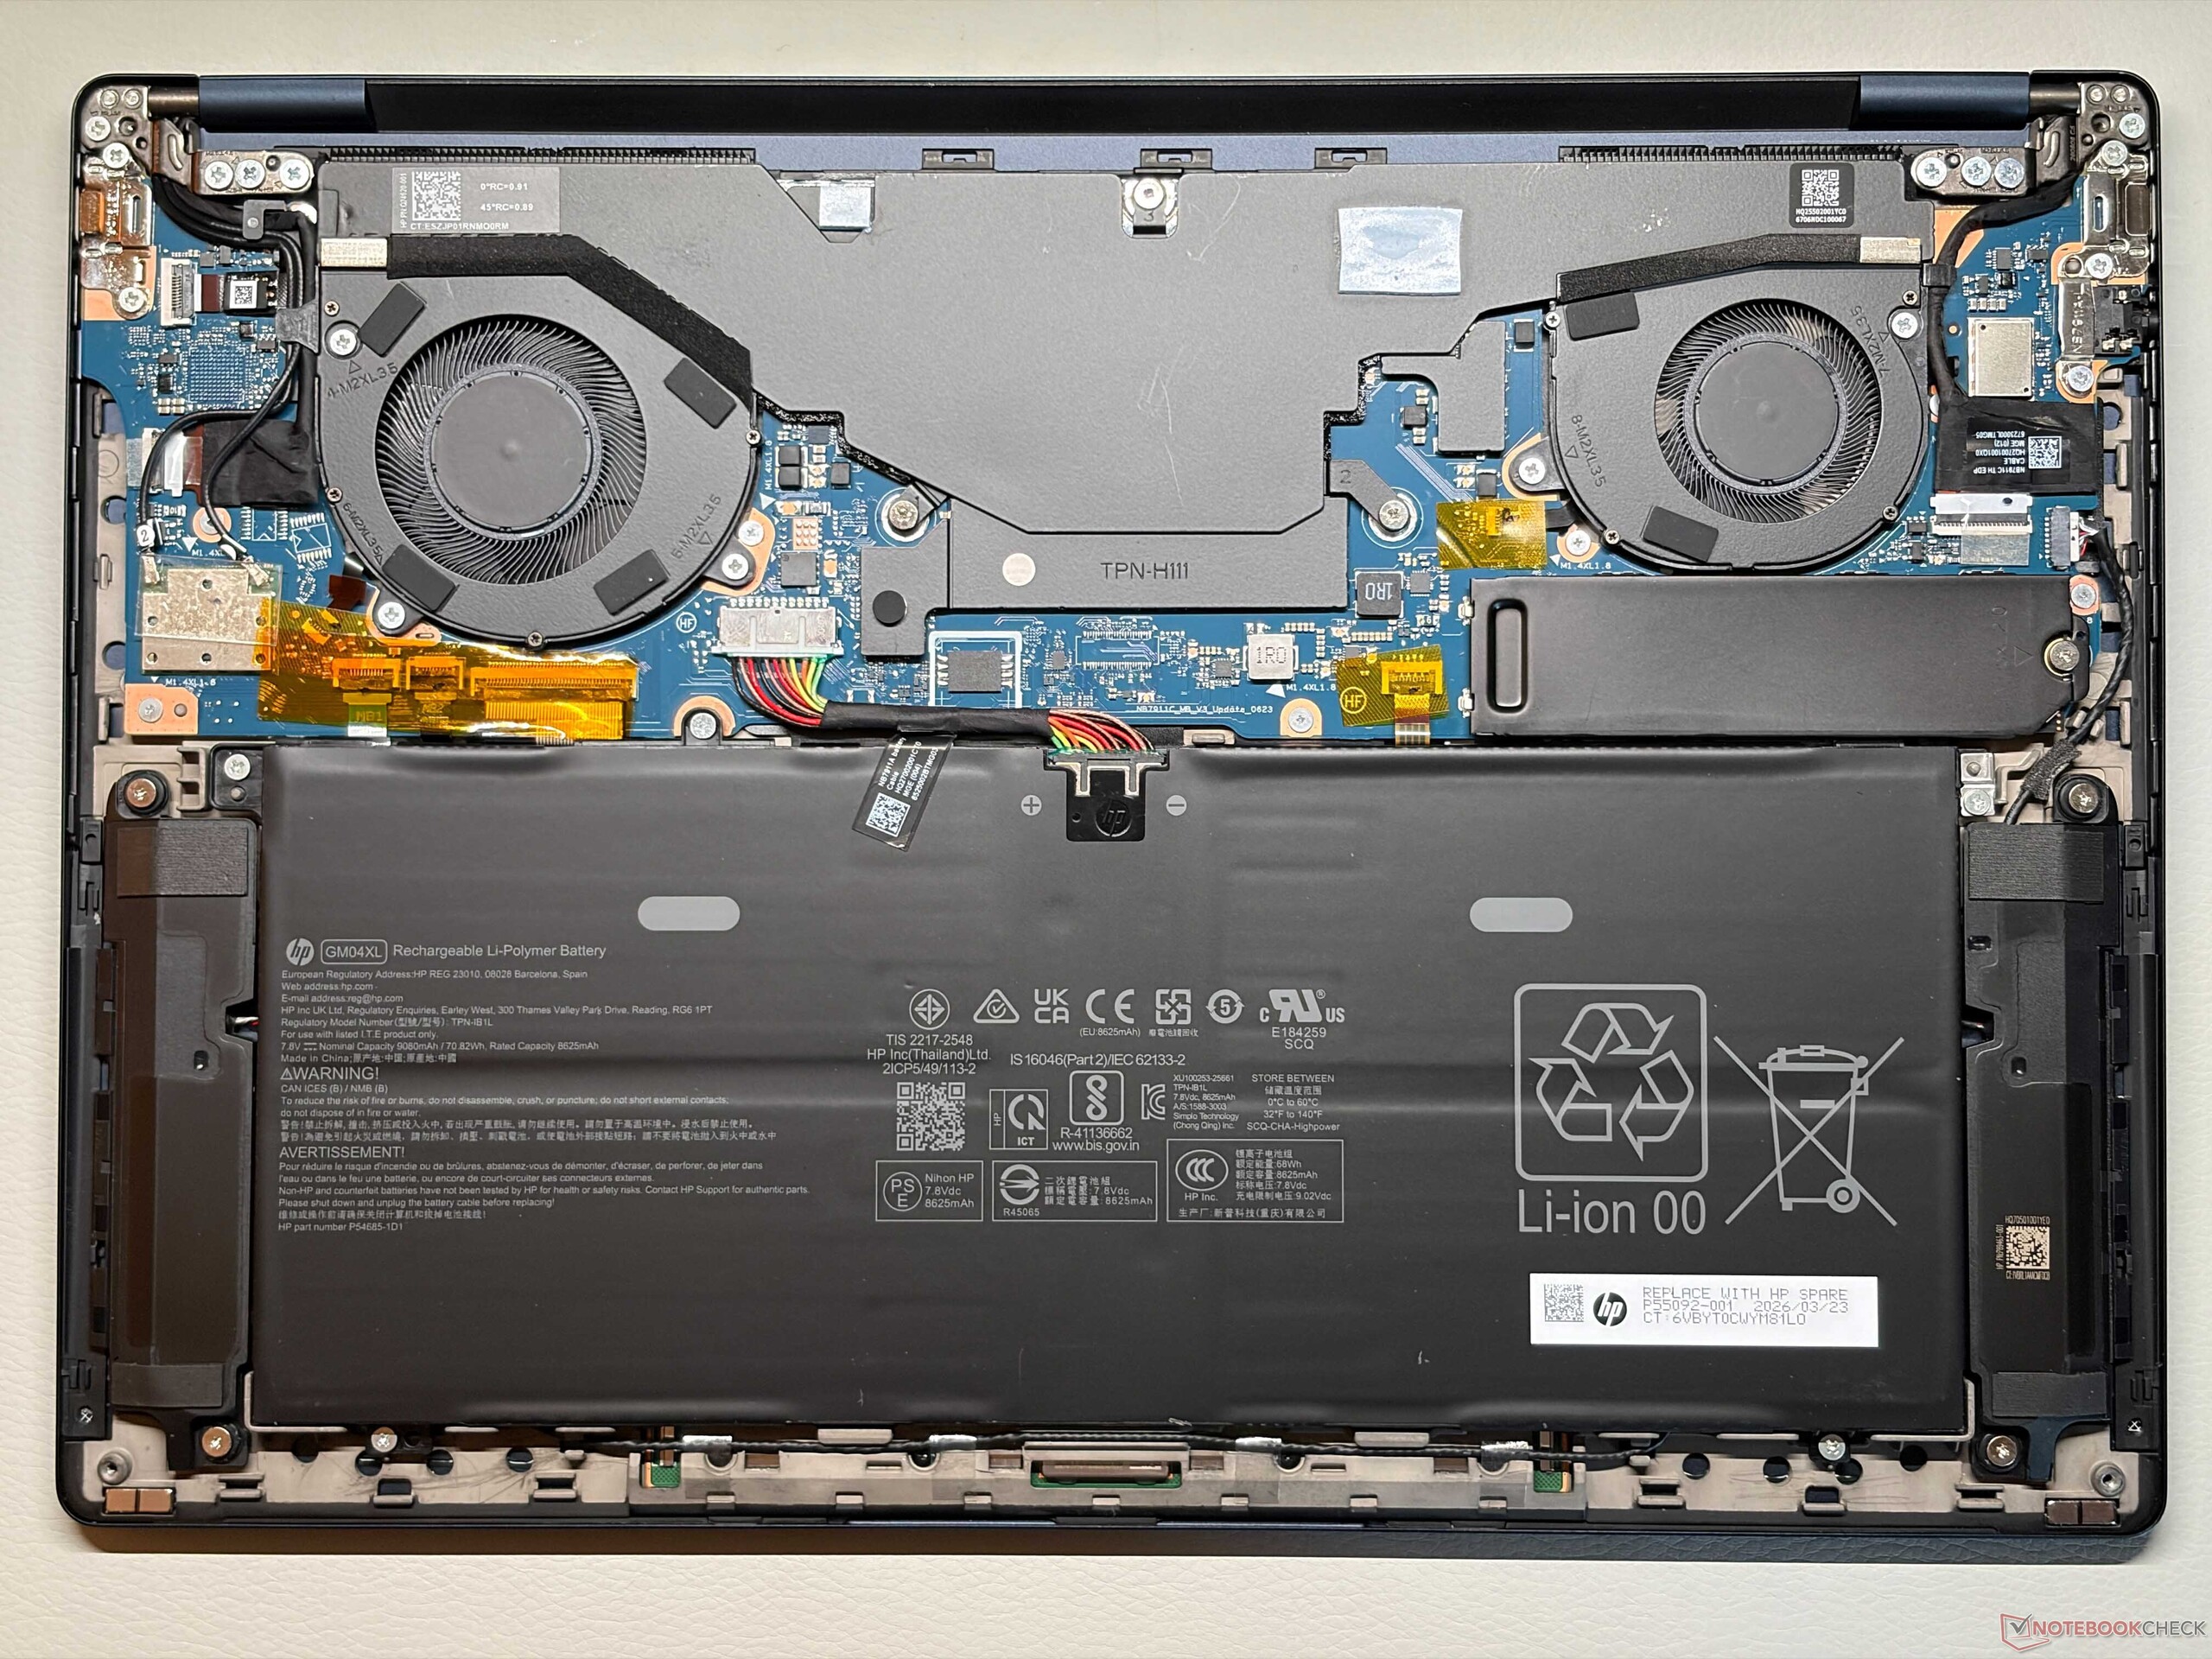
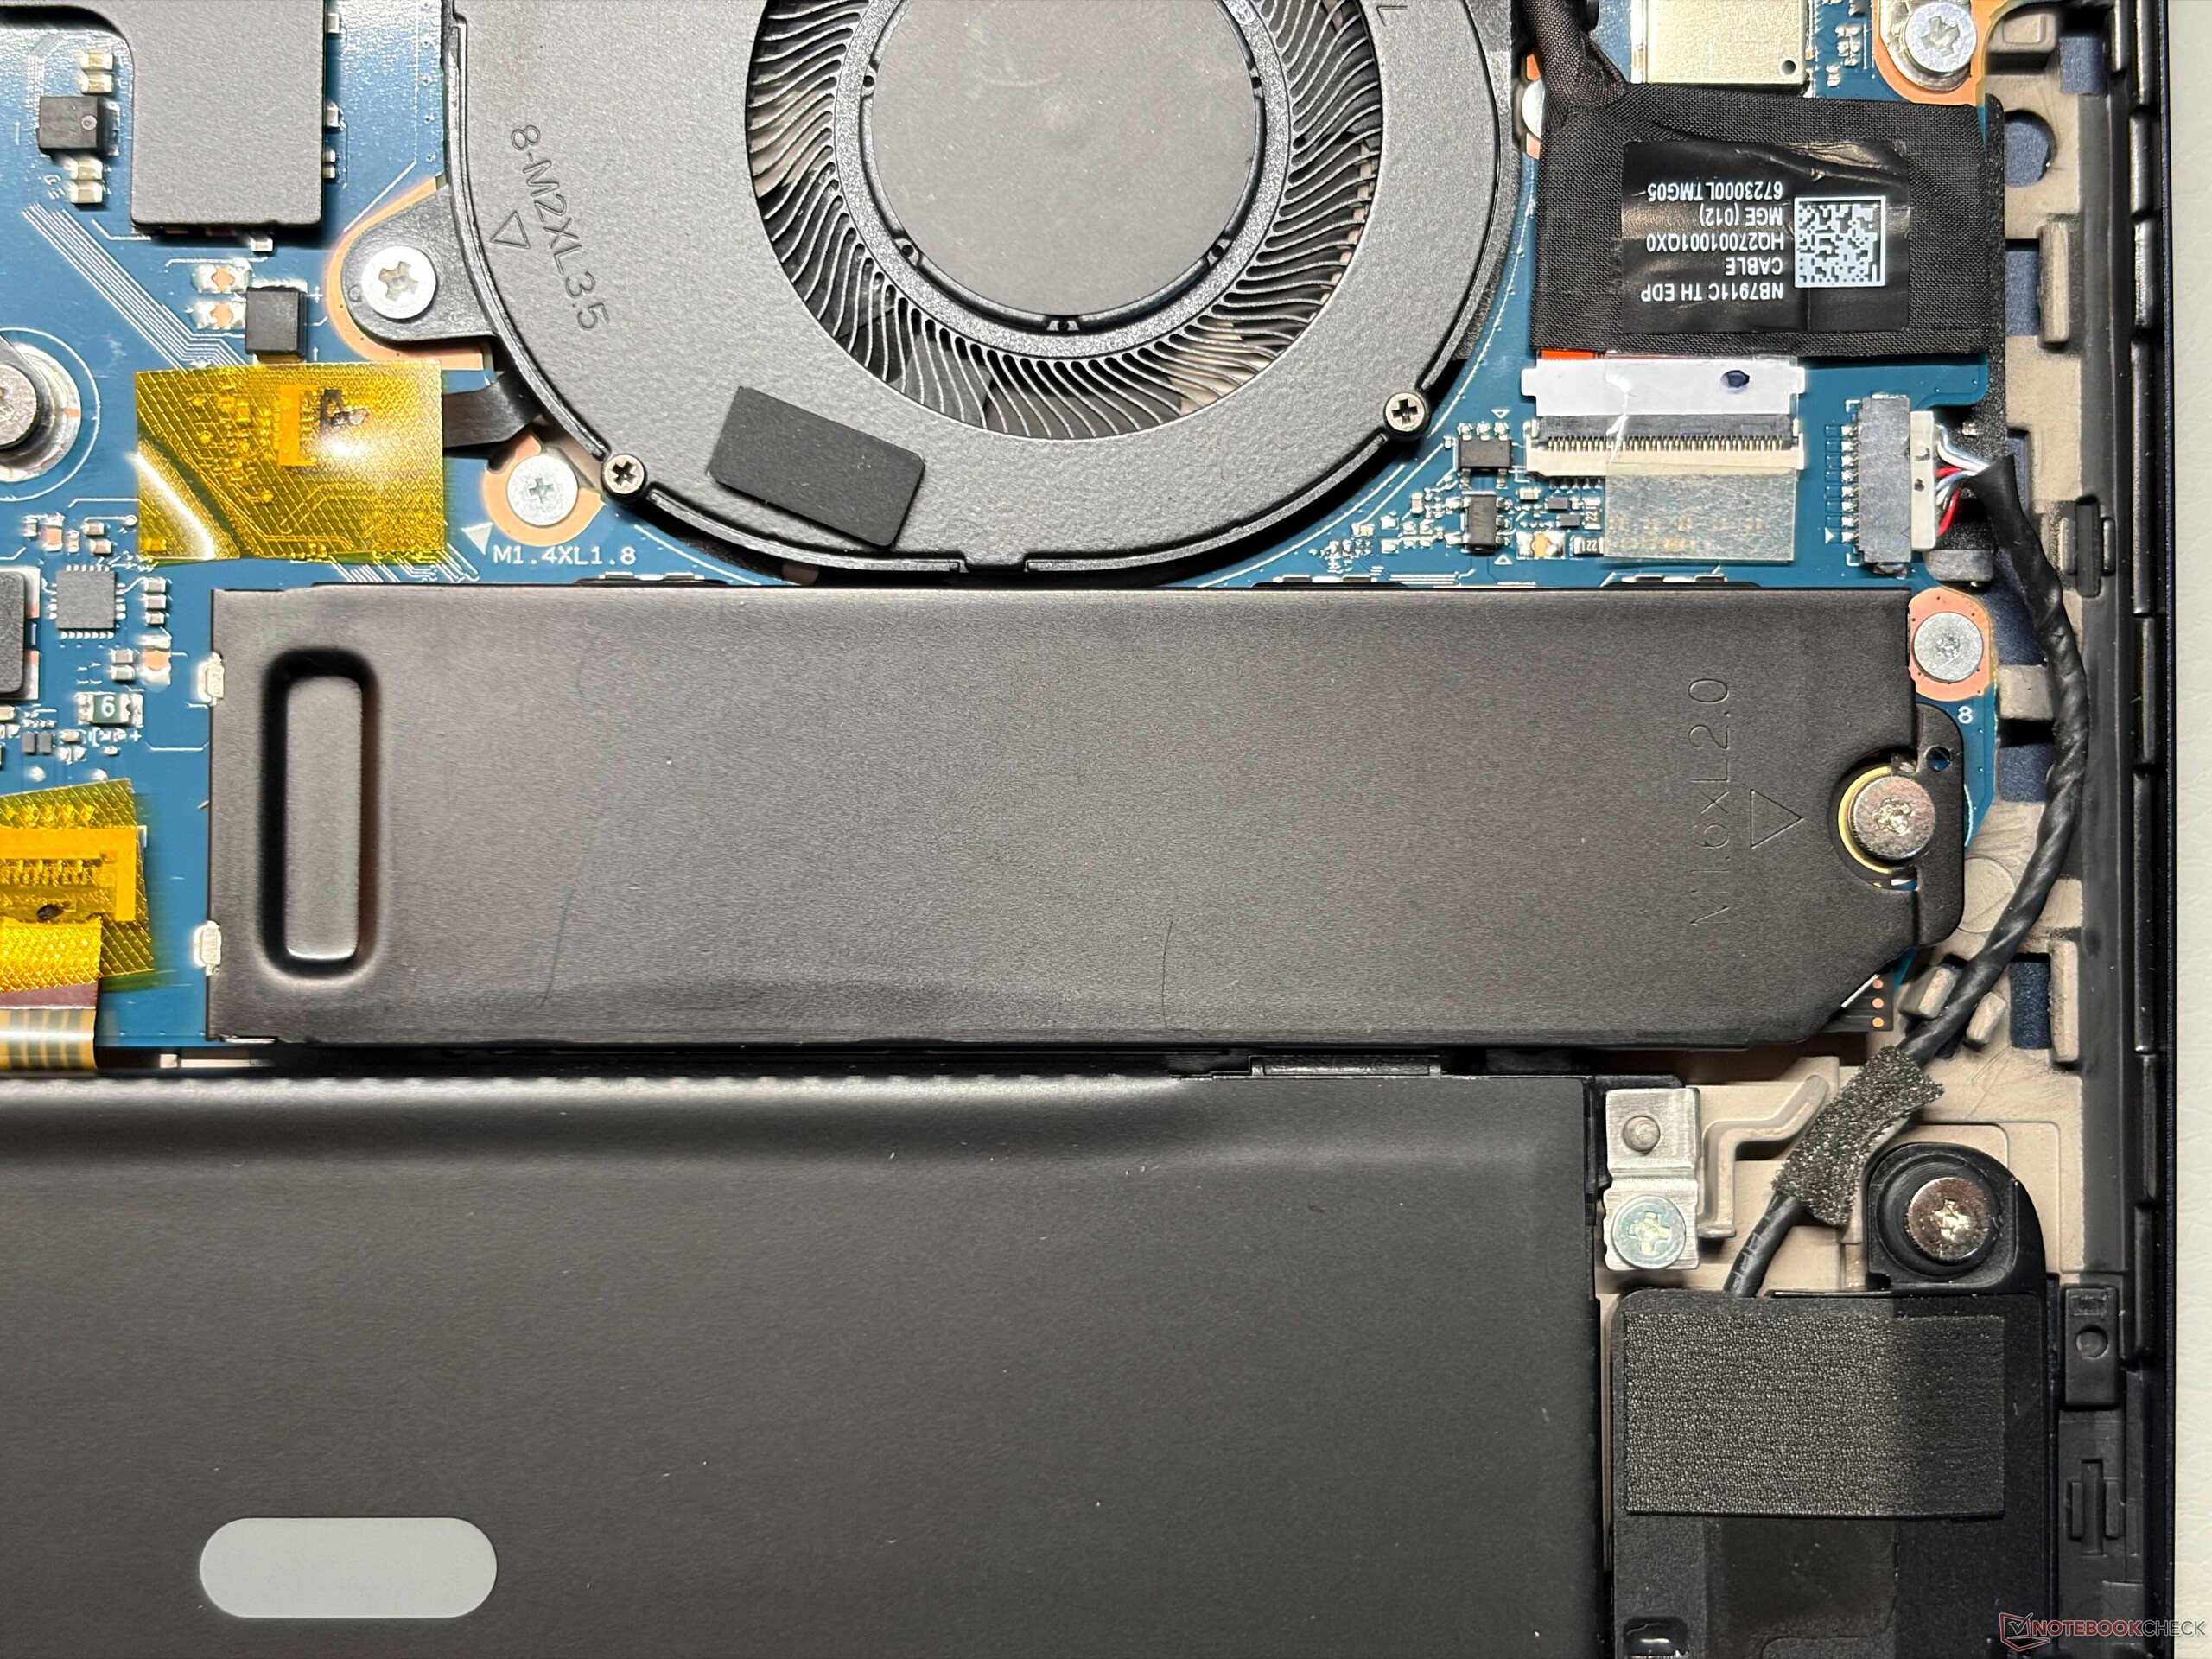
The new HP Googlebook 14c is without any doubt a premium product. The metal chassis in dark blue offers excellent build quality as well as stability and without the Googlebook logos, you would have a hard time to distinguish it from an expensive HP Spectre laptop. Fingerprints are not a big problem on the base unit despite the dark color, only the lid is a bit more susceptible. You also get a little RGB light bar on the lid that can indicate your charging status or react according to Gemini inputs, but it is more to show other users that you are using a Googlebook. The hinges are well-adjusted and there is only minor wobbling (max. angle ~135°). The bottom cover is only secured by four screws and you can clean both fans and replace the M.2-2280 SSD.
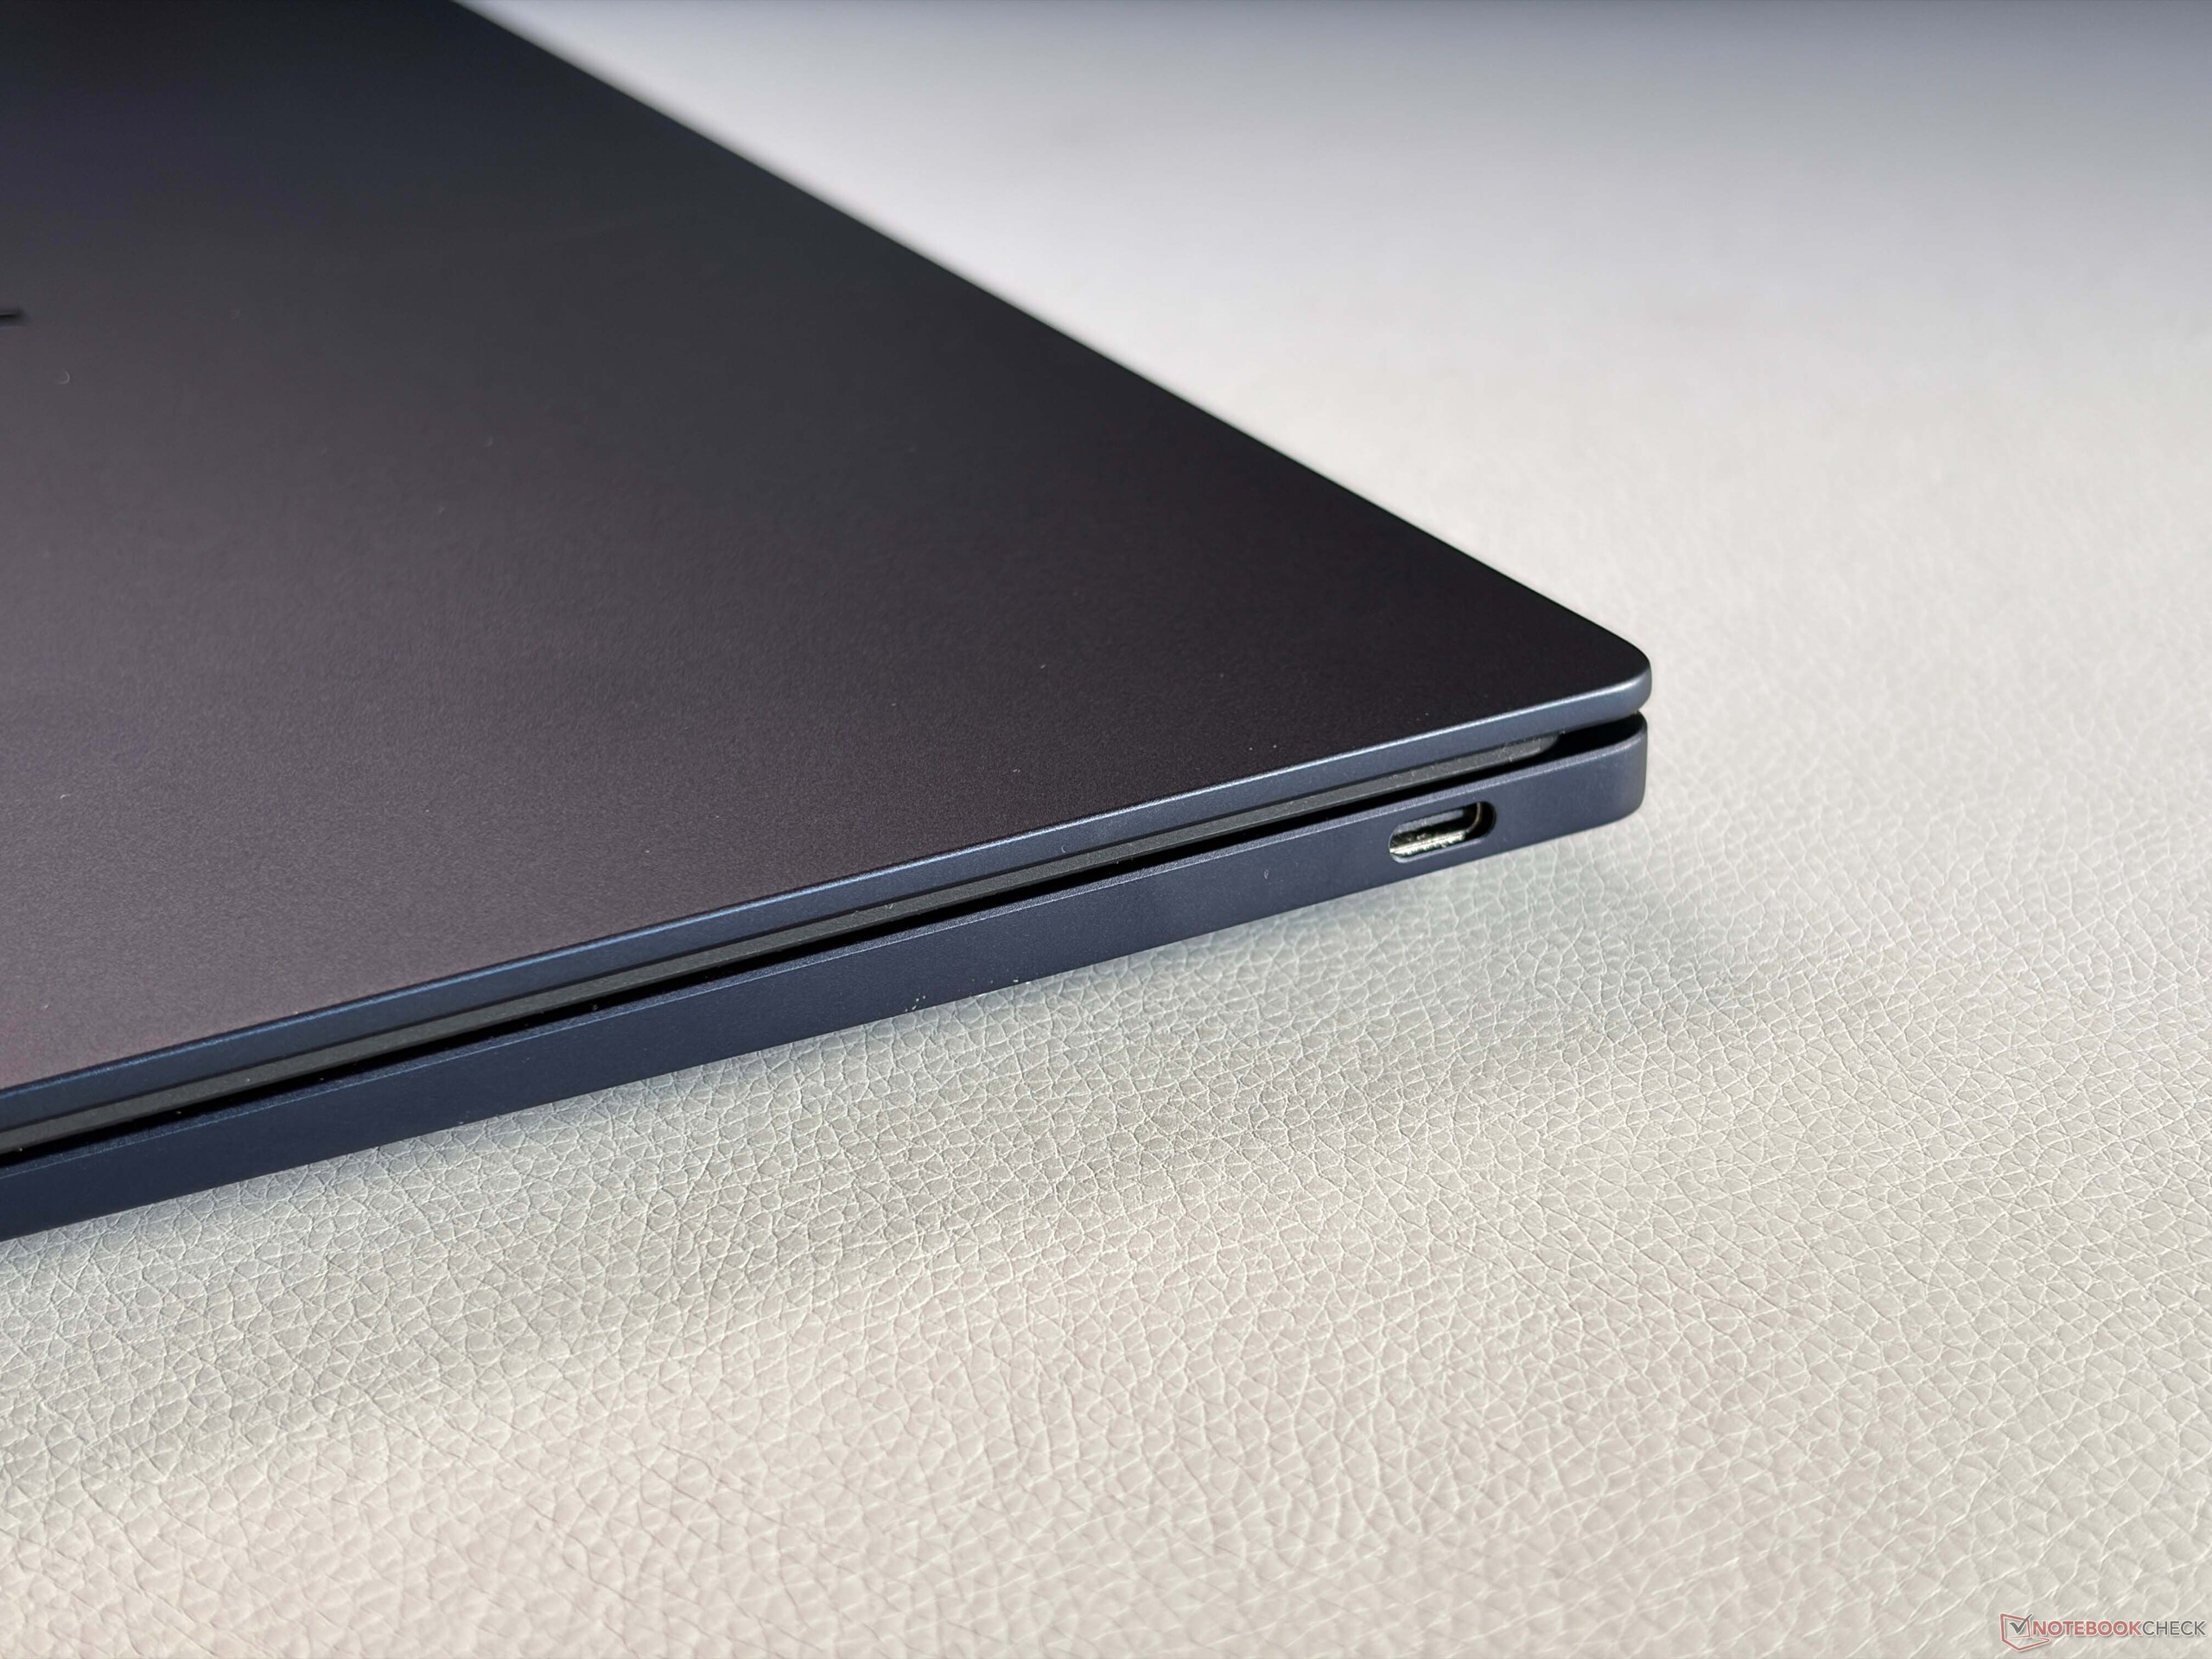
In terms of connectivity, you only get two USB-C ports without USB 4.0, which is not ideal, but probably not that important for the target group. You get a fast Wi-Fi 7 module as well as a decent 5 MP webcam with an IR sensor as well as a mechanical shutter. There is no 5G connectivity available.
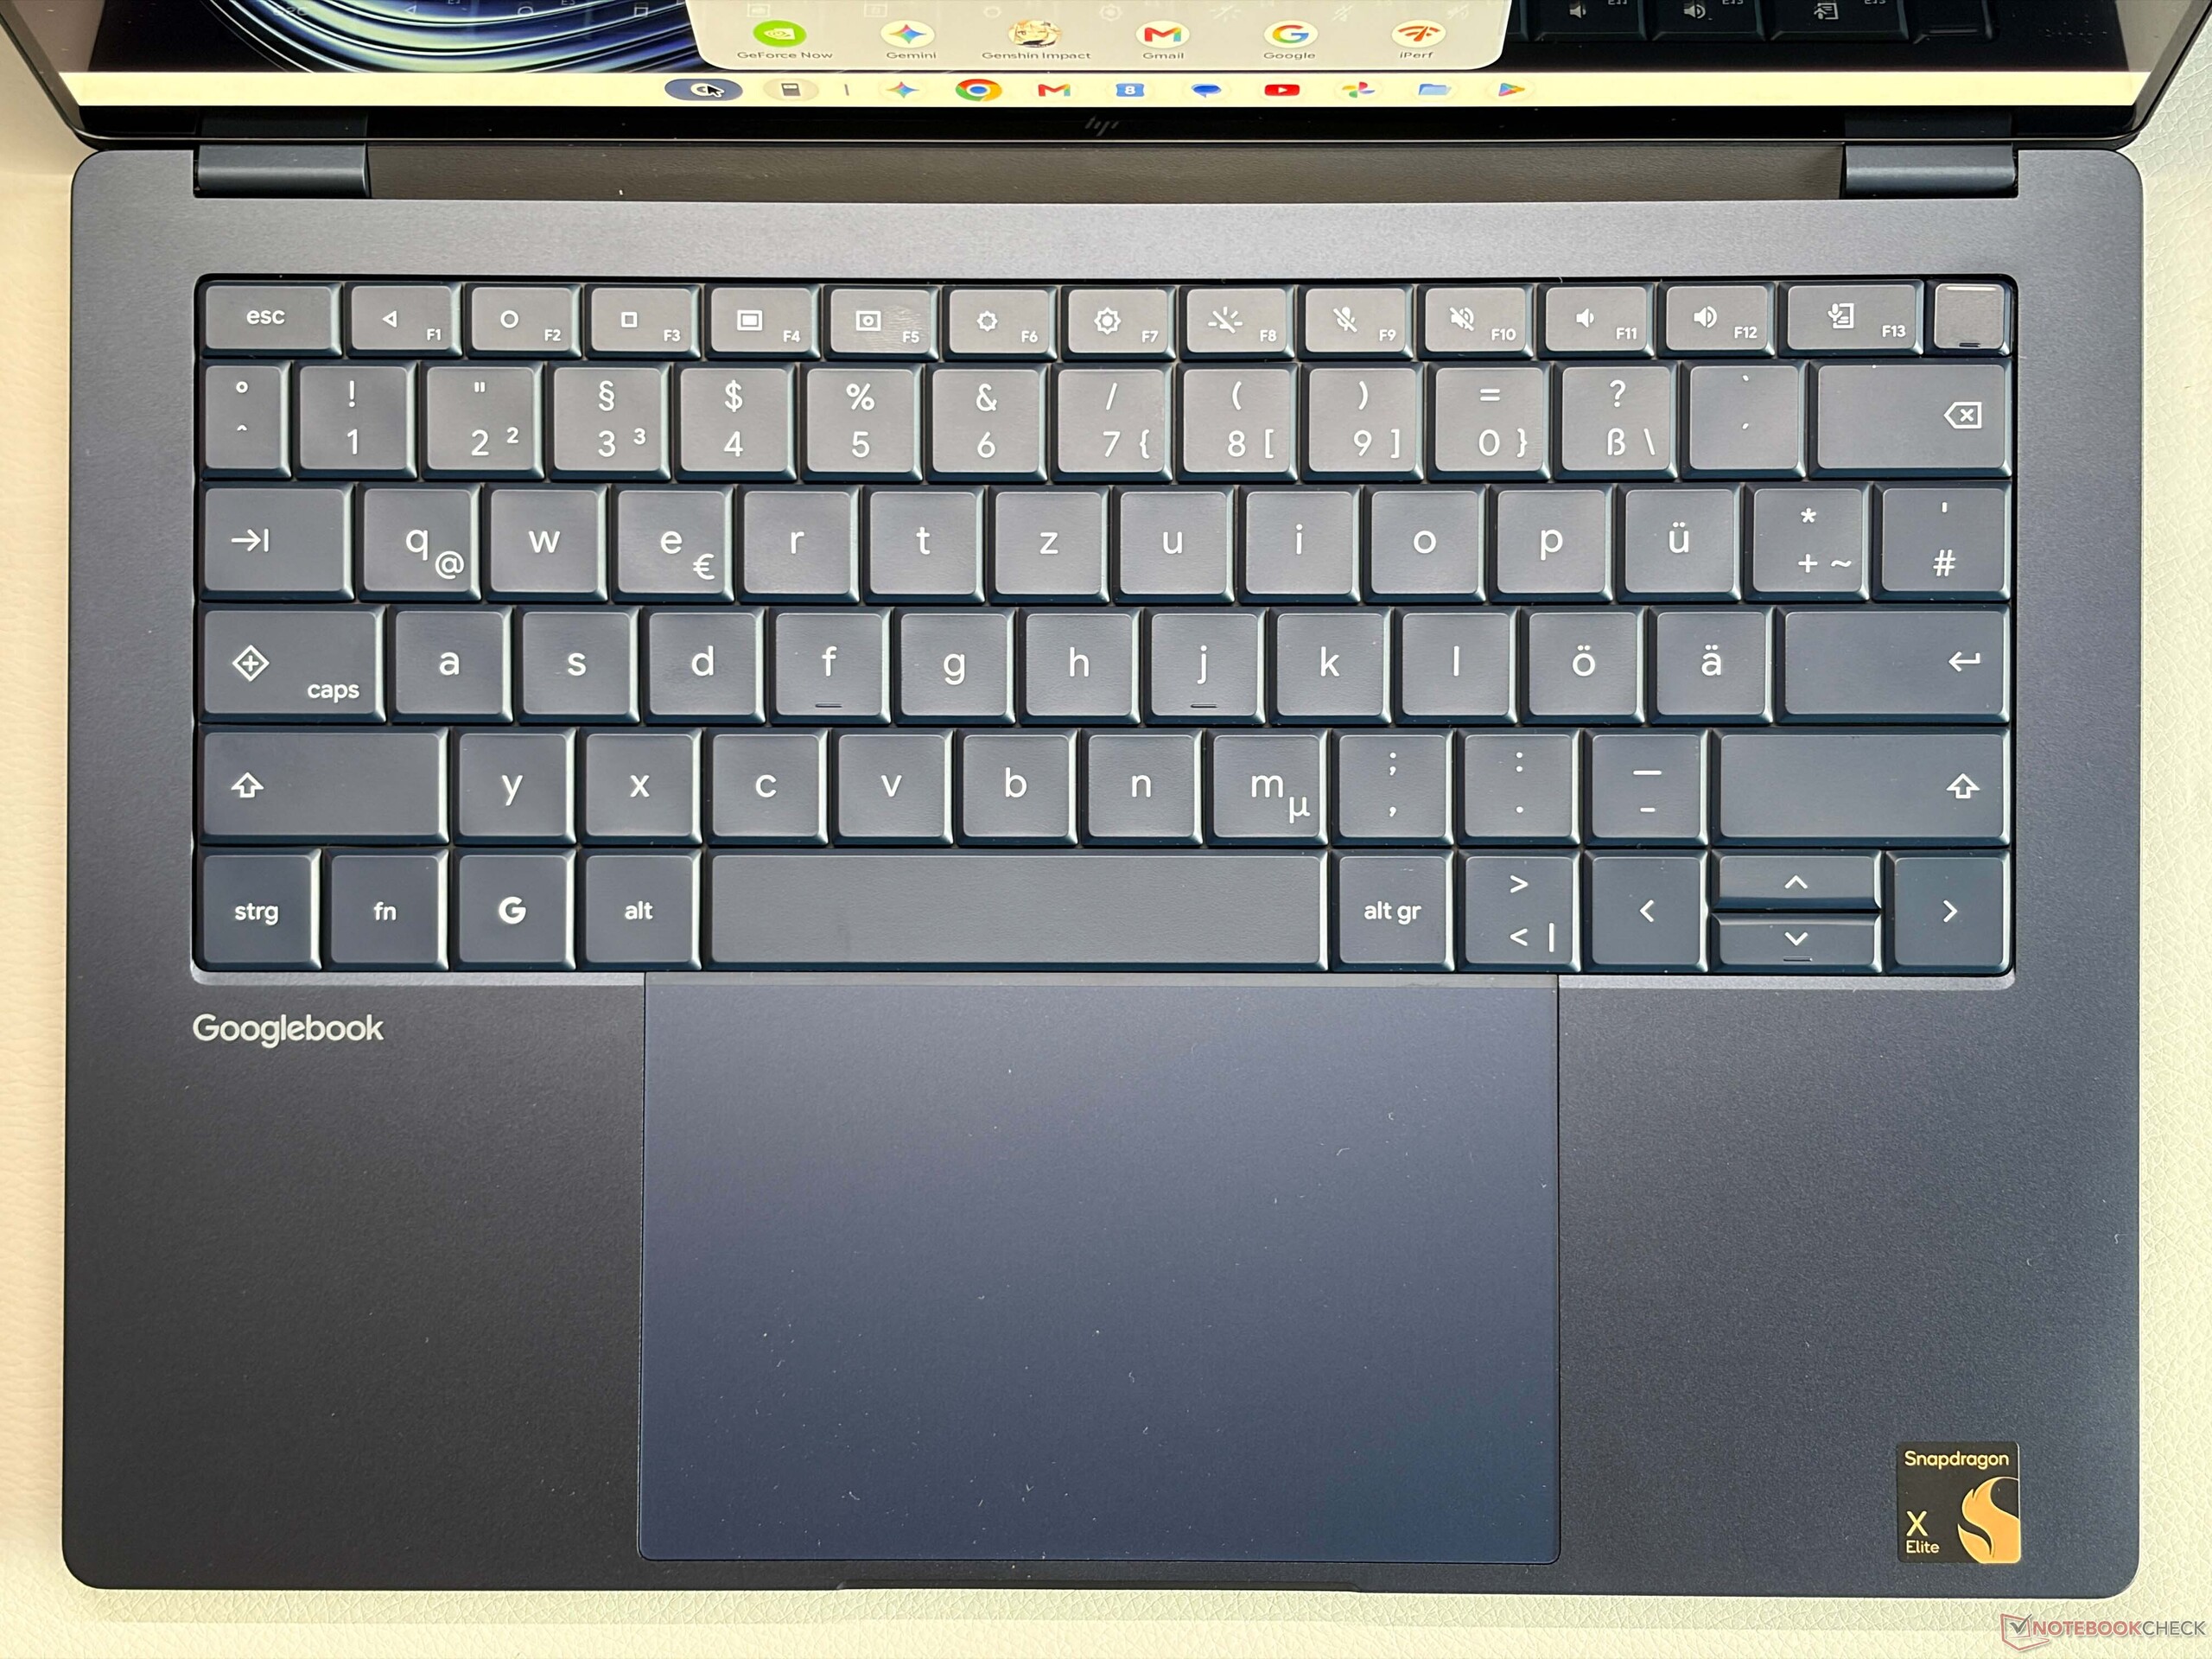
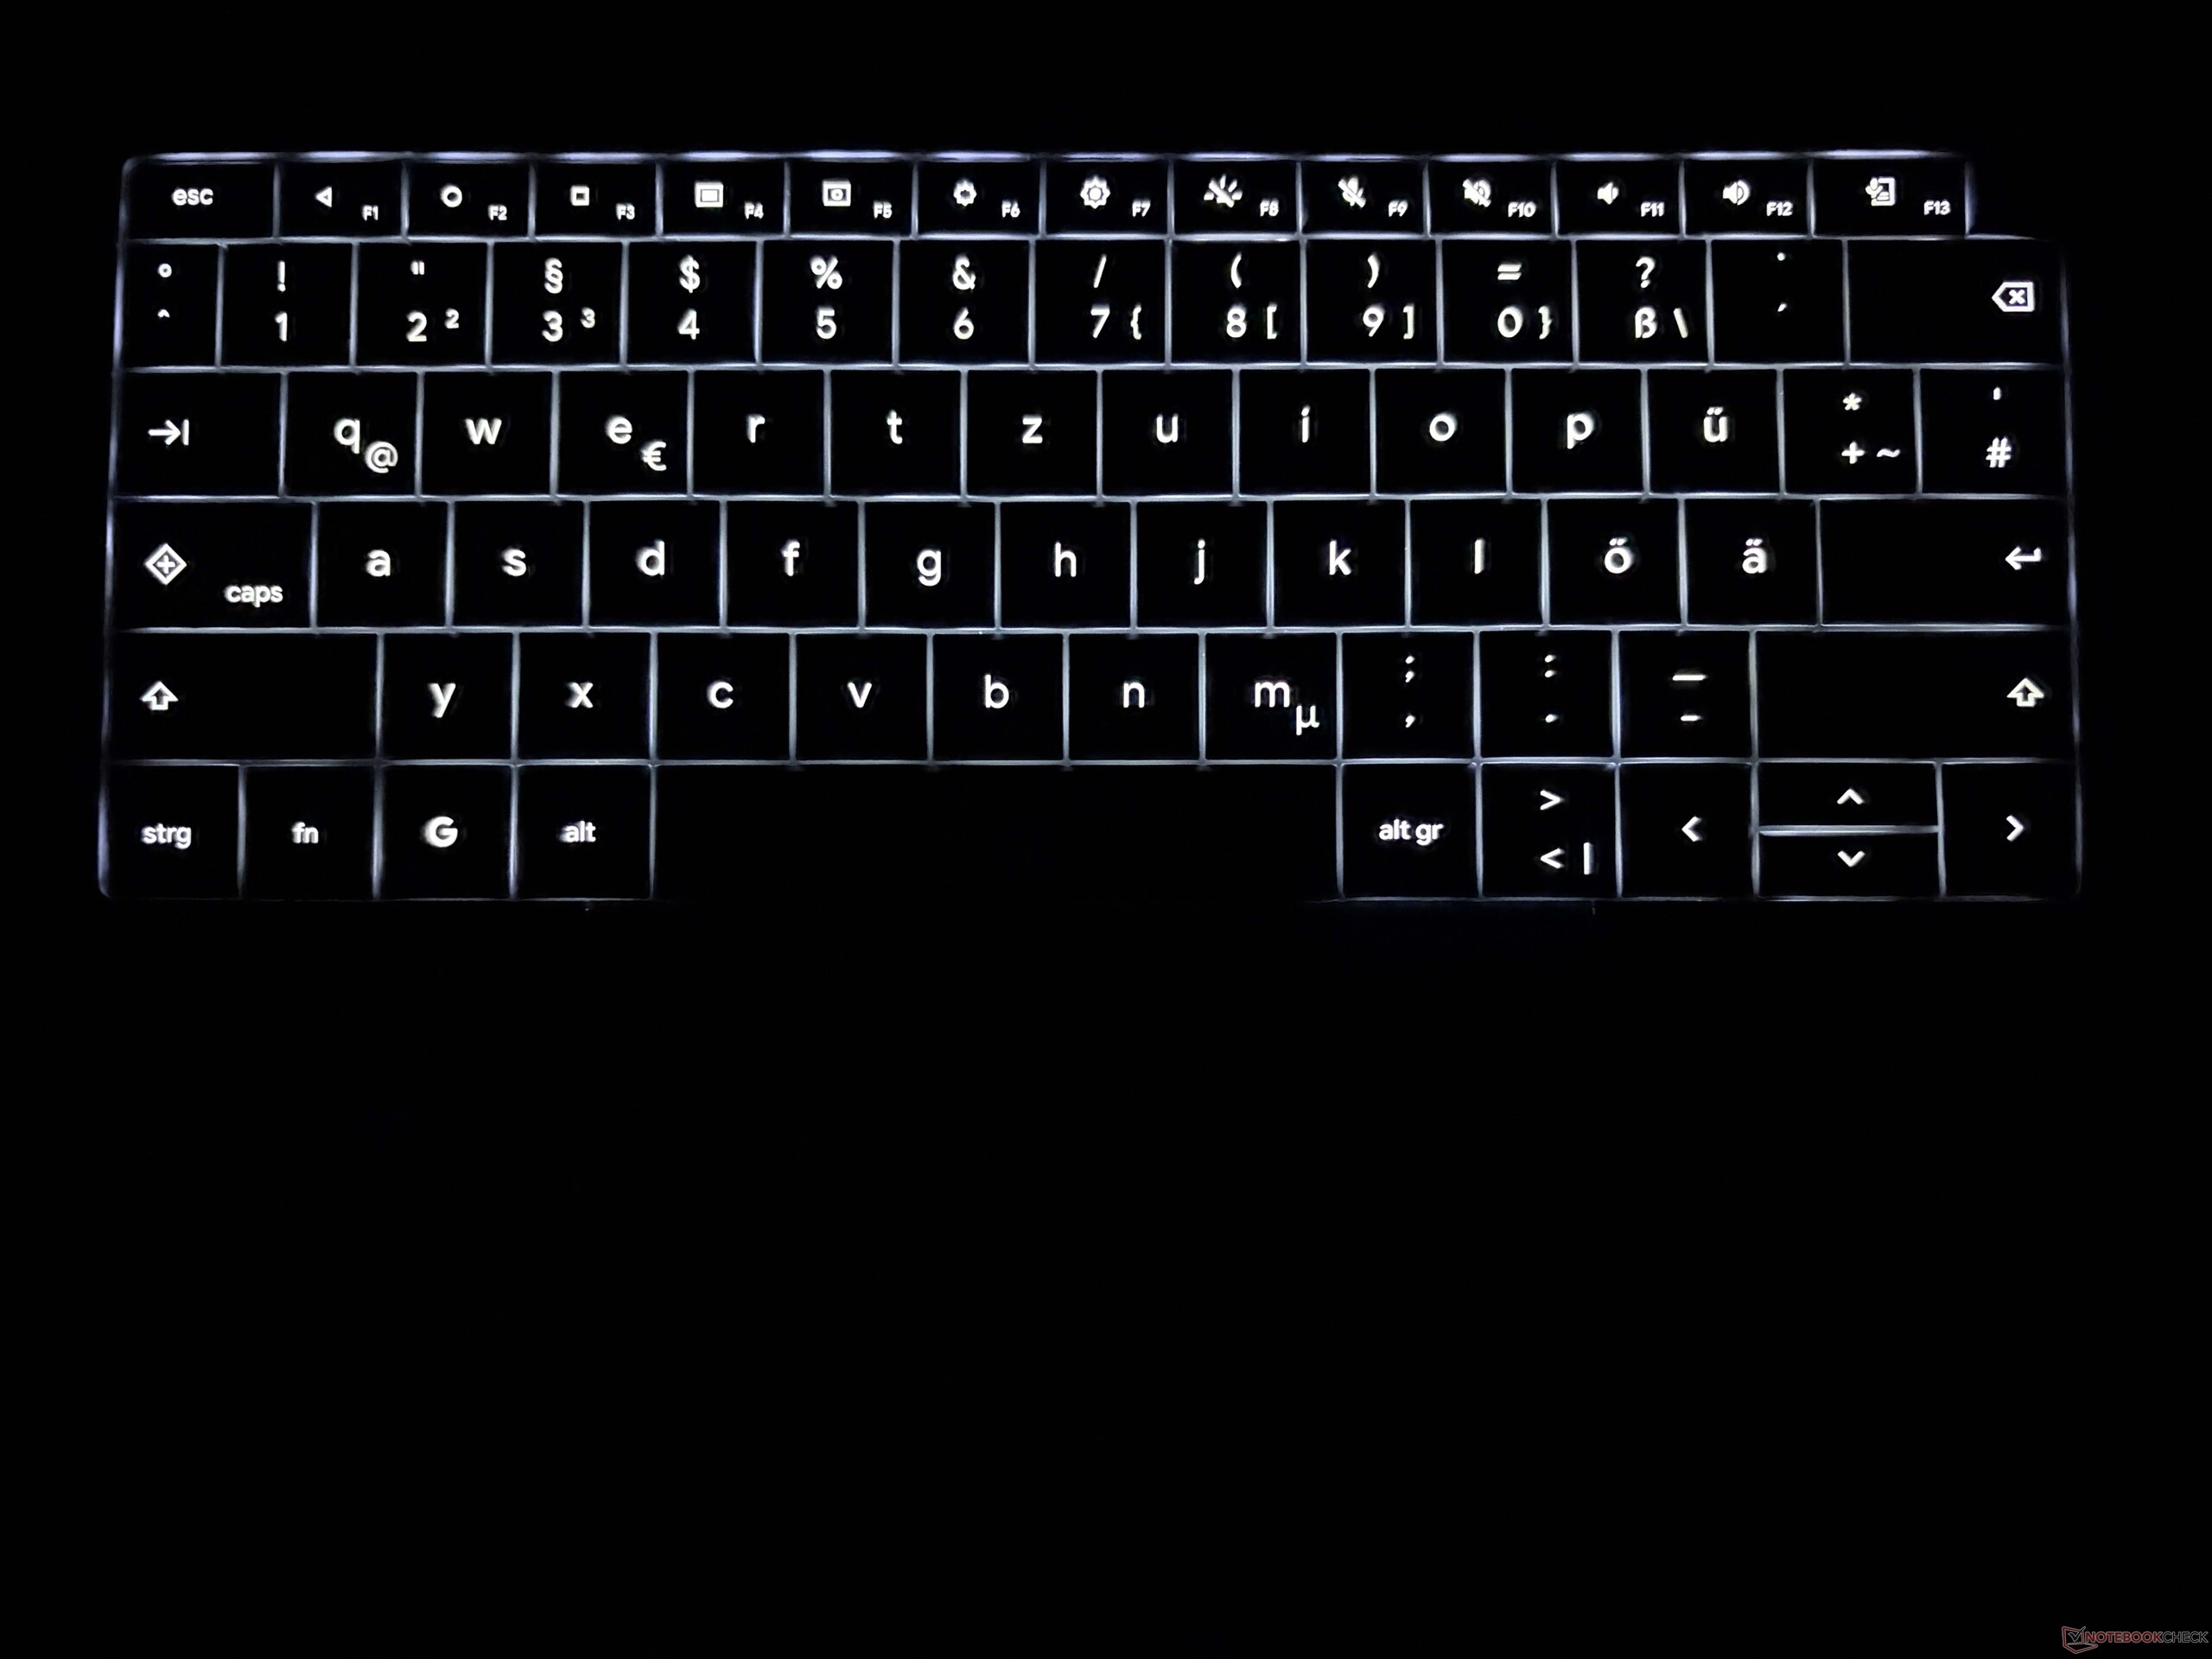
The backlit keyboard leaves mixed impressions. It is precise, but the keys are a bit stiff for our taste and it is a bit on the noisy side. Expensive EliteBooks definitely have an advantage in this respect. The haptic trackpad works well including gestures.





Display - 2.8K OLED touchscreen
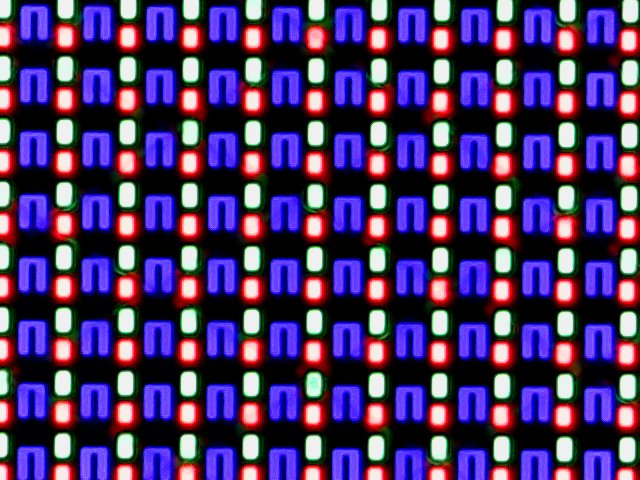
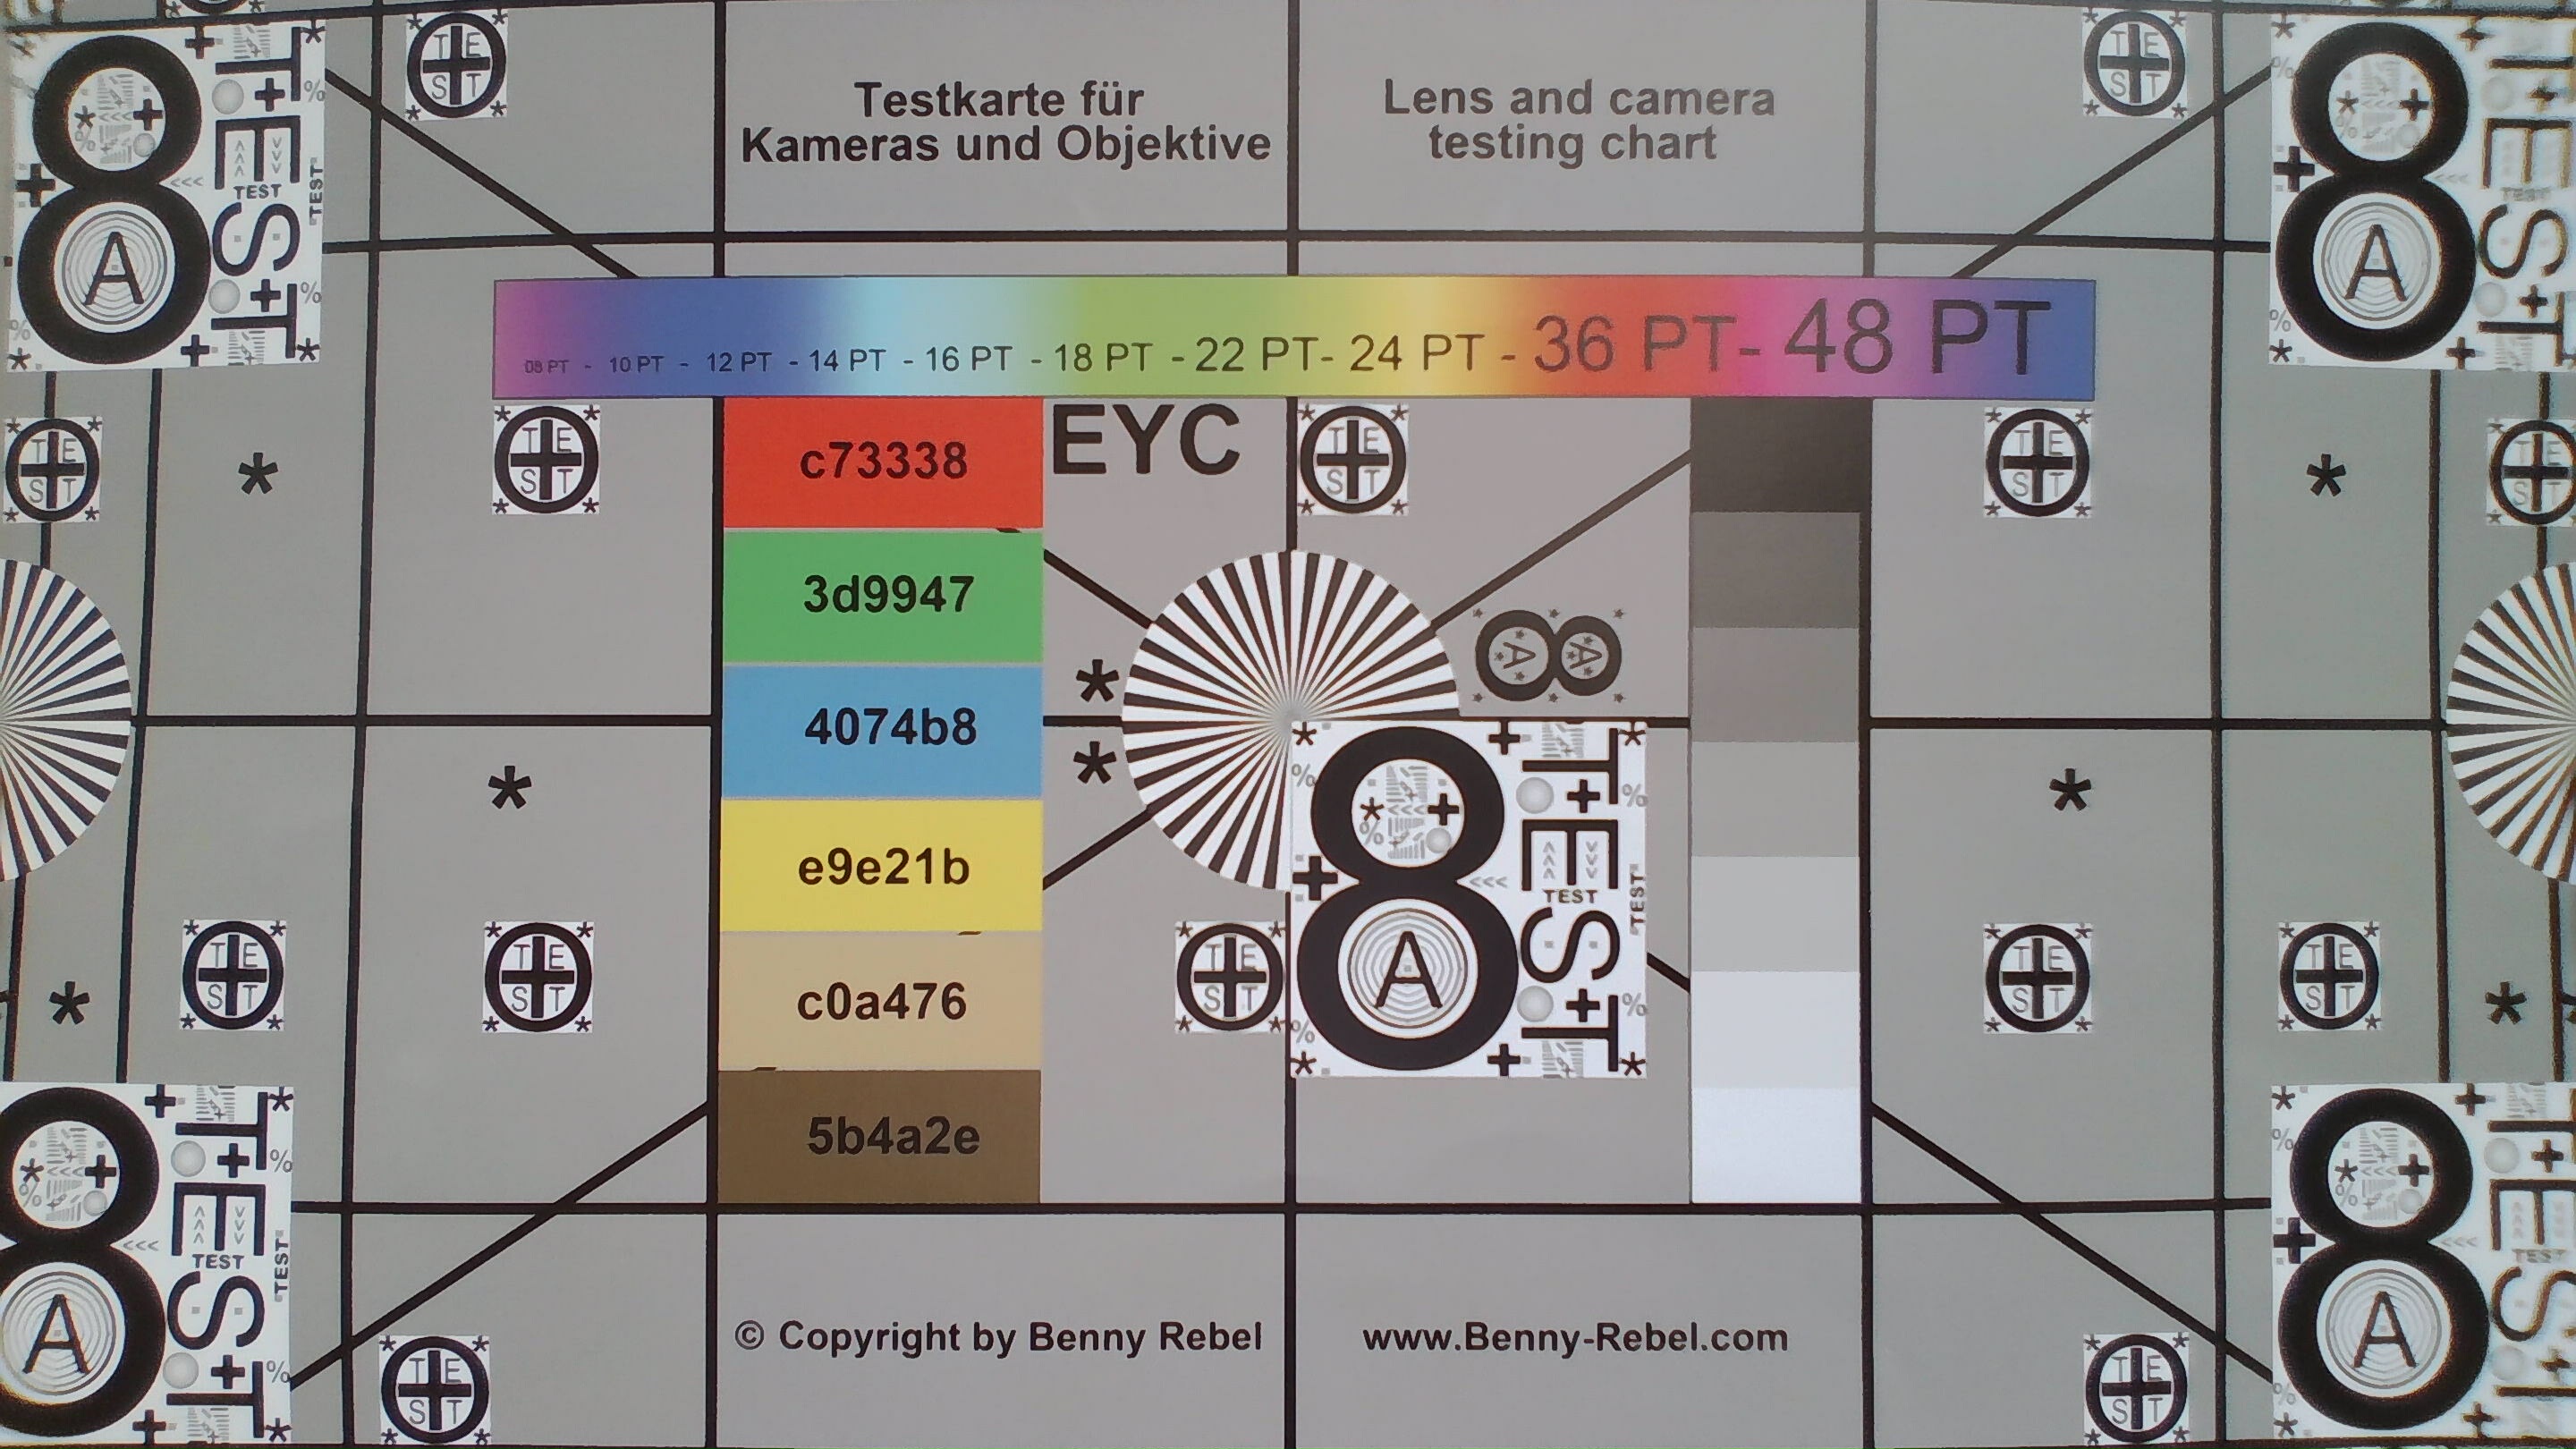
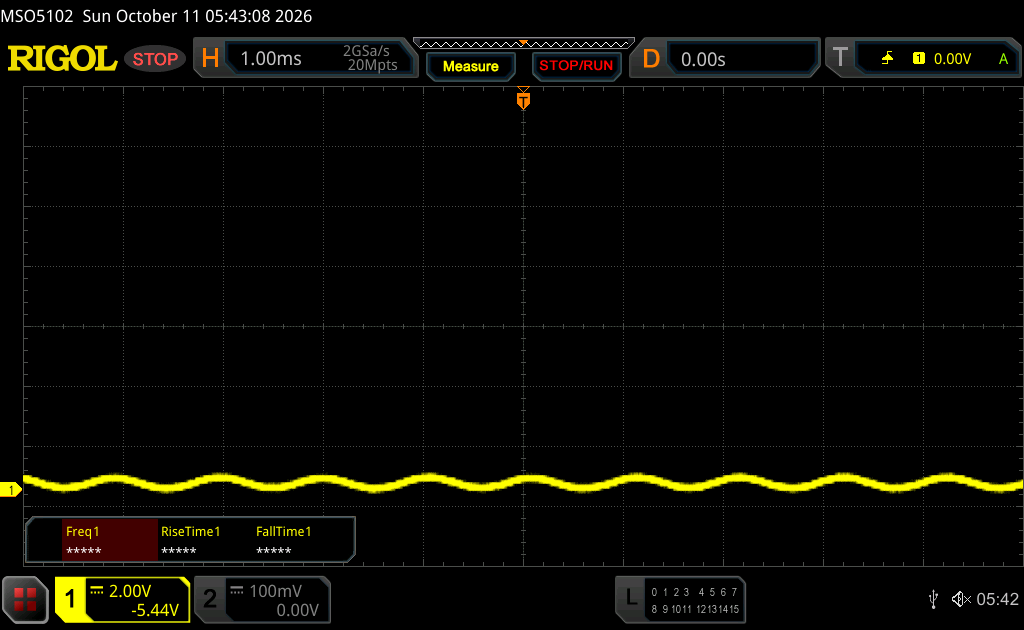
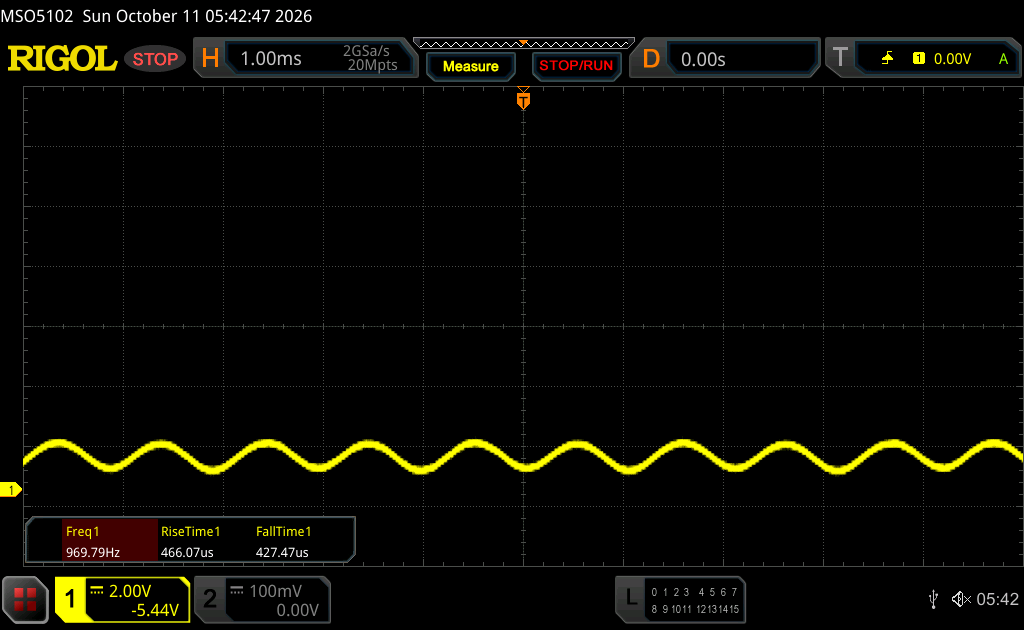
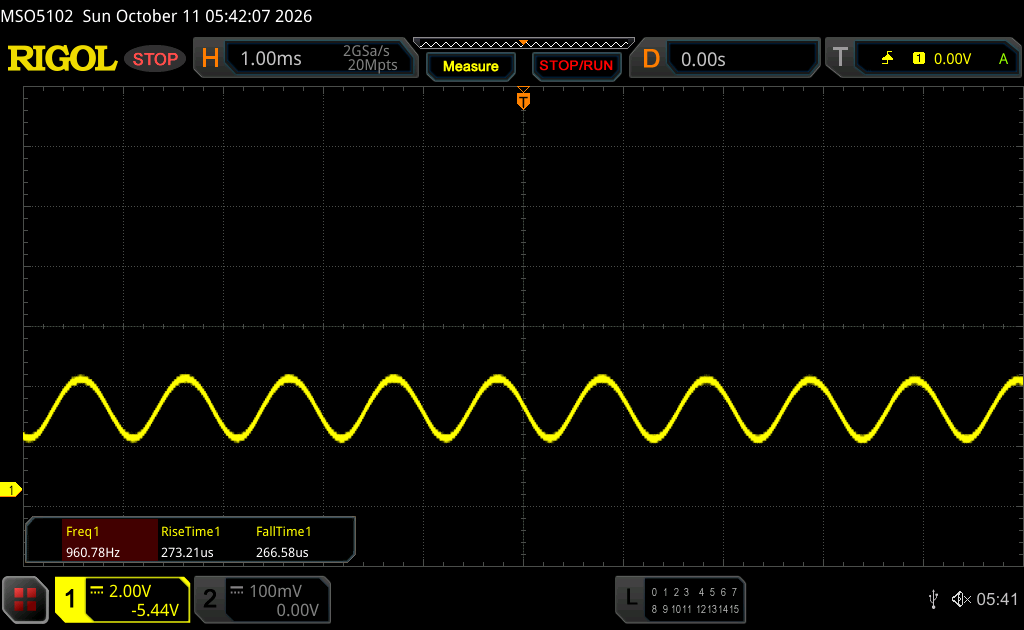
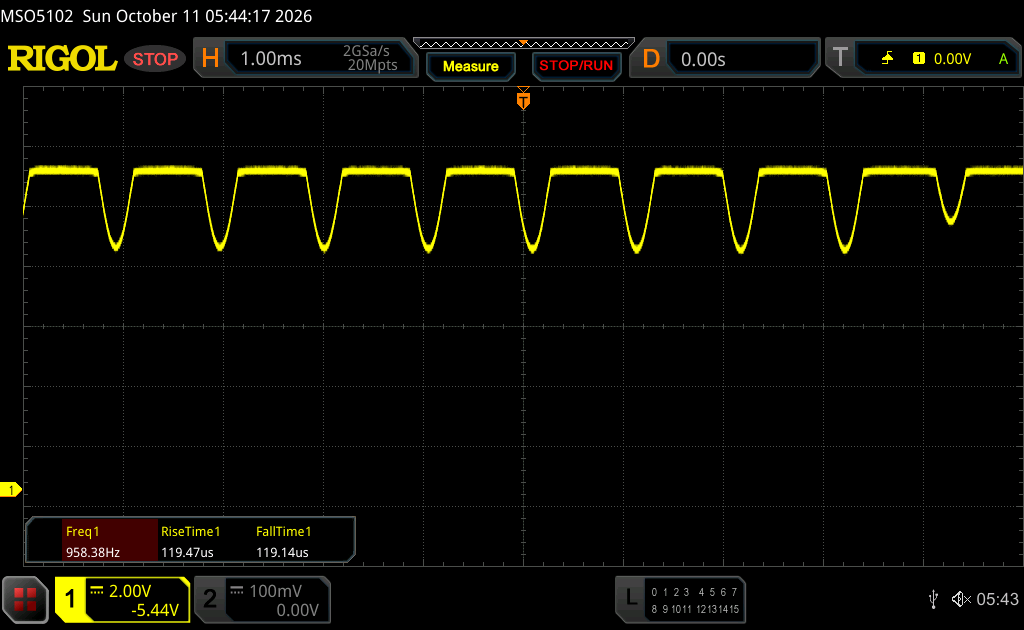
HP offers the Googlebook 14c with a Full-HD OLED or the 2.8K OLED (both touchscreen) of our review unit. The 2.8K version (2880 x 1800 pixels) supports 120 Hz refresh rate and the subjective image quality is very good, even though the touch layer affects the image slightly, which is only visible on brighter surfaces. It is also a very reflective screen, which is an issue outdoors. There is also PWM flickering, even though the frequency is pretty high at 960 Hz and should not be a huge issue for most users.
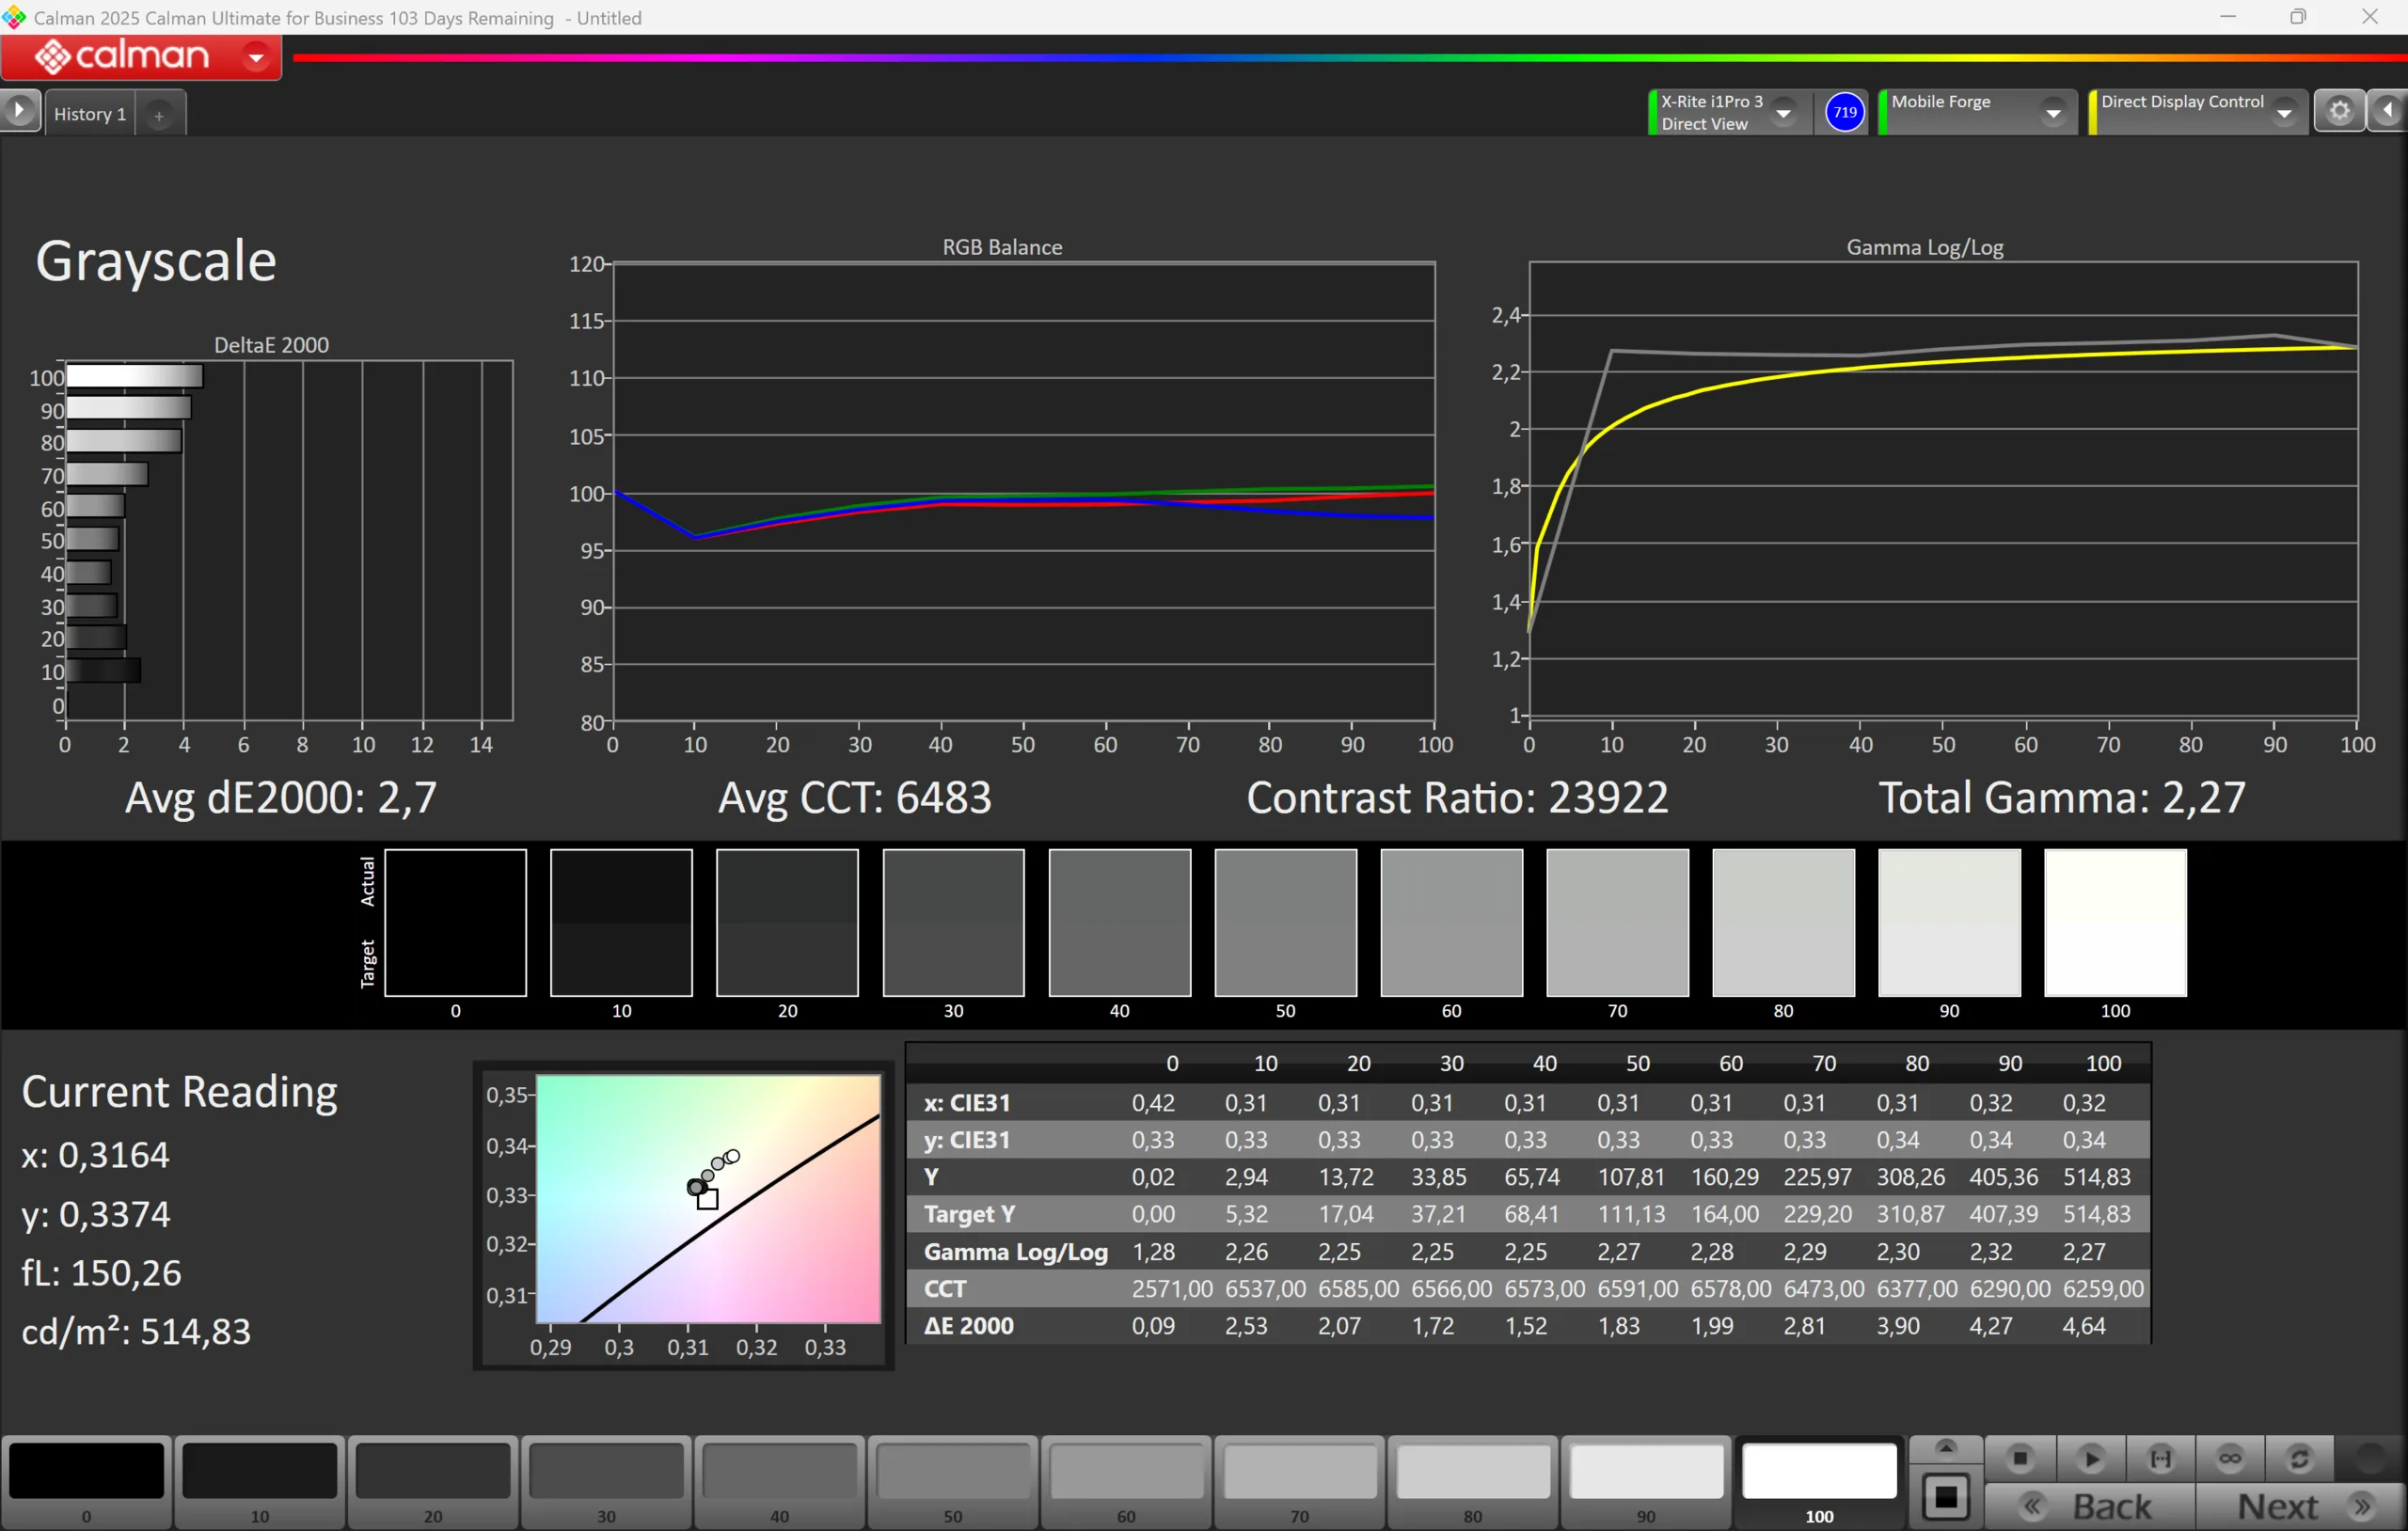
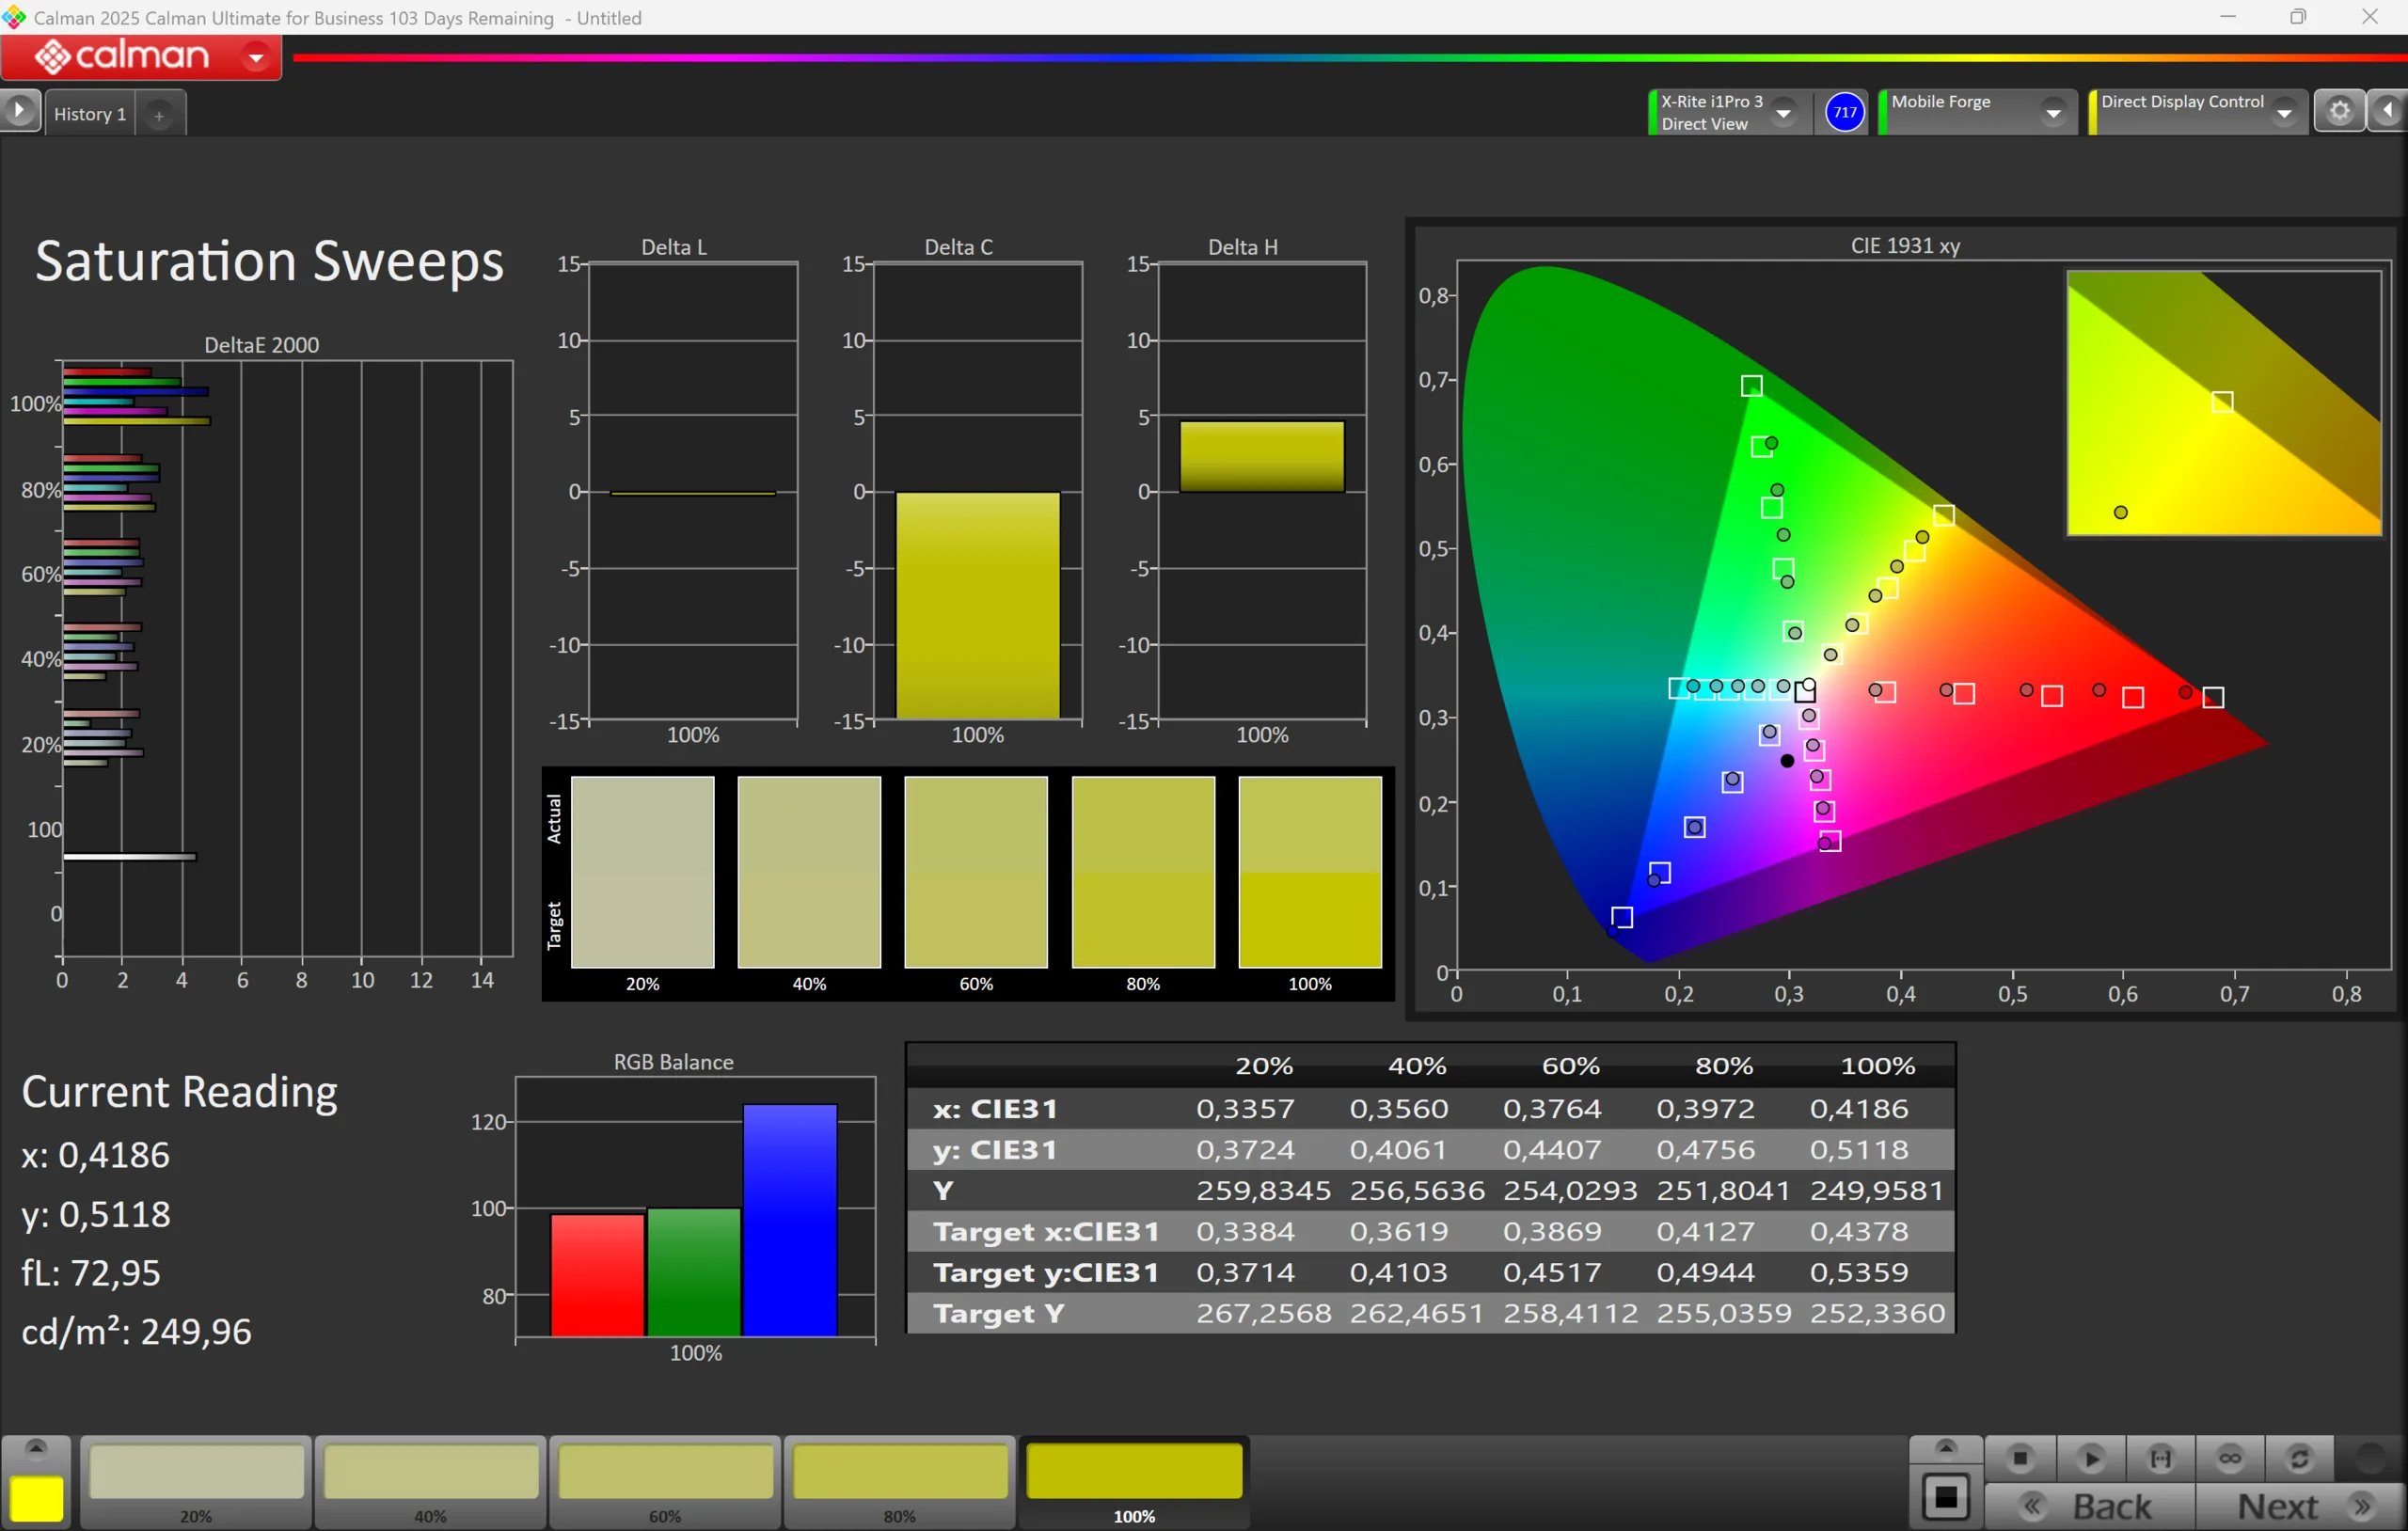
Our analysis with the professional CalMAN software reveals a brightness of more than 500 nits, but there is no support for HDR contents. This seems to be a software problem of the HP though, because other Googlebooks (like models from Acer or Asus) offer a setting for HDR brightness. The color accuracy is okay, but the P3 color gamut is only covered by 83 % and there is no option to switch to the sRGB gamut, so serious picture editing is not possible.
| |||||||||||||||||||||||||
Brightness Distribution: 98 %
Center on Battery: 515 cd/m²
Contrast: 25750:1 (Black: 0.02 cd/m²)
ΔE ColorChecker Calman: 2.9 | ∀{0.5-29.43 Ø4.69}
ΔE Greyscale Calman: 2.7 | ∀{0.09-98 Ø4.94}
80.6% AdobeRGB 1998 (Argyll 3D)
100% sRGB (Argyll 3D)
83.2% Display P3 (Argyll 3D)
Gamma: 2.27
CCT: 6483 K
| HP Googlebook 14c OLED, 2880x1800, 14", 120 Hz | Lenovo ThinkBook 14x, ILL, Ultra 5 226V TM140VDXY02, IPS, 1920x1200, 14", 120 Hz | Dell 14 Plus BOE NE14N42, IPS, 2560x1600, 14", 90 Hz | Asus Zenbook 14 UX3480QA ATNA40KW01-0, OLED, 1920x1200, 14", 60 Hz | Microsoft Surface Laptop 8 13.8 LQ138P1JX61, IPS, 2304x1536, 13.8", 120 Hz | Apple MacBook Air 13 M5 IPS, 2560x1664, 13.6", 60 Hz | |
|---|---|---|---|---|---|---|
| Display | -12% | -8% | 10% | 7% | 8% | |
| Display P3 Coverage (%) | 83.2 | 69.3 -17% | 71.7 -14% | 99.6 20% | 96.5 16% | 98.1 18% |
| sRGB Coverage (%) | 100 | 92.2 -8% | 99.9 0% | 98.9 -1% | 97.8 -2% | 98.6 -1% |
| AdobeRGB 1998 Coverage (%) | 80.6 | 72.9 -10% | 71.9 -11% | 88.7 10% | 86.5 7% | 86.8 8% |
| Response Times | -3045% | -3488% | -36% | -2700% | -1978% | |
| Response Time Grey 50% / Grey 80% * (ms) | 2 ? | 36.2 ? -1710% | 42.7 ? -2035% | 1.65 ? 17% | 38.8 ? -1840% | 24.3 ? -1115% |
| Response Time Black / White * (ms) | 0.5 ? | 22.4 ? -4380% | 25.2 ? -4940% | 1.41 ? -182% | 18.3 ? -3560% | 14.7 ? -2840% |
| PWM Frequency (Hz) | 960 ? | 480 ? | ||||
| PWM Amplitude * (%) | 52 | 22 58% | ||||
| Screen | -124% | -124% | -2% | -250% | -232% | |
| Brightness middle (cd/m²) | 515 | 349 -32% | 354 -31% | 302 -41% | 617 20% | 546 6% |
| Brightness (cd/m²) | 519 | 322 -38% | 333 -36% | 304 -41% | 623 20% | 519 0% |
| Brightness Distribution (%) | 98 | 82 -16% | 92 -6% | 98 0% | 91 -7% | 90 -8% |
| Black Level * (cd/m²) | 0.02 | 0.18 -800% | 0.21 -950% | 0.01 50% | 0.44 -2100% | 0.38 -1800% |
| Contrast (:1) | 25750 | 1939 -92% | 1686 -93% | 30200 17% | 1402 -95% | 1437 -94% |
| Colorchecker dE 2000 * | 2.9 | 2.62 10% | 1.94 33% | 2.1 28% | 0.9 69% | 2.1 28% |
| Colorchecker dE 2000 max. * | 6.2 | 5.56 10% | 3.28 47% | 6 3% | 2.2 65% | 4 35% |
| Greyscale dE 2000 * | 2.7 | 3.61 -34% | 1.4 48% | 3.6 -33% | 2 26% | 3.3 -22% |
| Gamma | 2.27 97% | 2.33 94% | 2.25 98% | 2.12 104% | 2.19 100% | 2.22 99% |
| CCT | 6483 100% | 7223 90% | 6453 101% | 6451 101% | 6810 95% | 7127 91% |
| Colorchecker dE 2000 calibrated * | 6.46 | 0.7 | 0.9 | |||
| Total Average (Program / Settings) | -1060% /
-547% | -1207% /
-614% | -9% /
-7% | -981% /
-568% | -734% /
-445% |
* ... smaller is better

Display Response Times
| ↔ Response Time Black to White | ||
|---|---|---|
| 0.5 ms ... rise ↗ and fall ↘ combined | ↗ 0.27 ms rise | 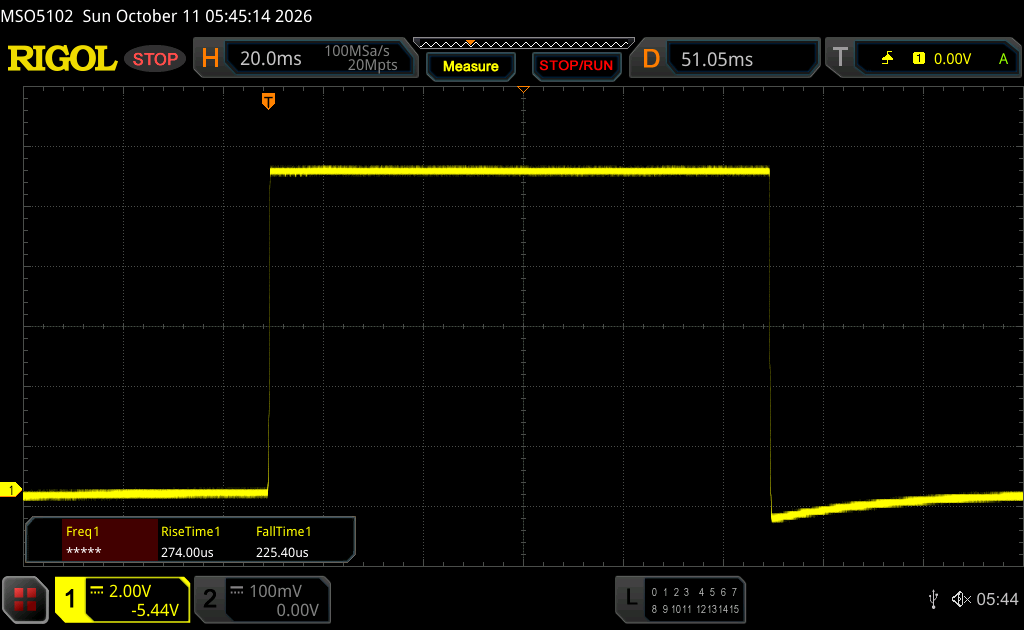 |
| ↘ 0.23 ms fall | ||
| The screen shows very fast response rates in our tests and should be very well suited for fast-paced gaming. In comparison, all tested devices range from 0.1 (minimum) to 240 (maximum) ms. » 1 % of all devices are better. This means that the measured response time is better than the average of all tested devices (19.6 ms). | ||
| ↔ Response Time 50% Grey to 80% Grey | ||
| 2 ms ... rise ↗ and fall ↘ combined | ↗ 1 ms rise | 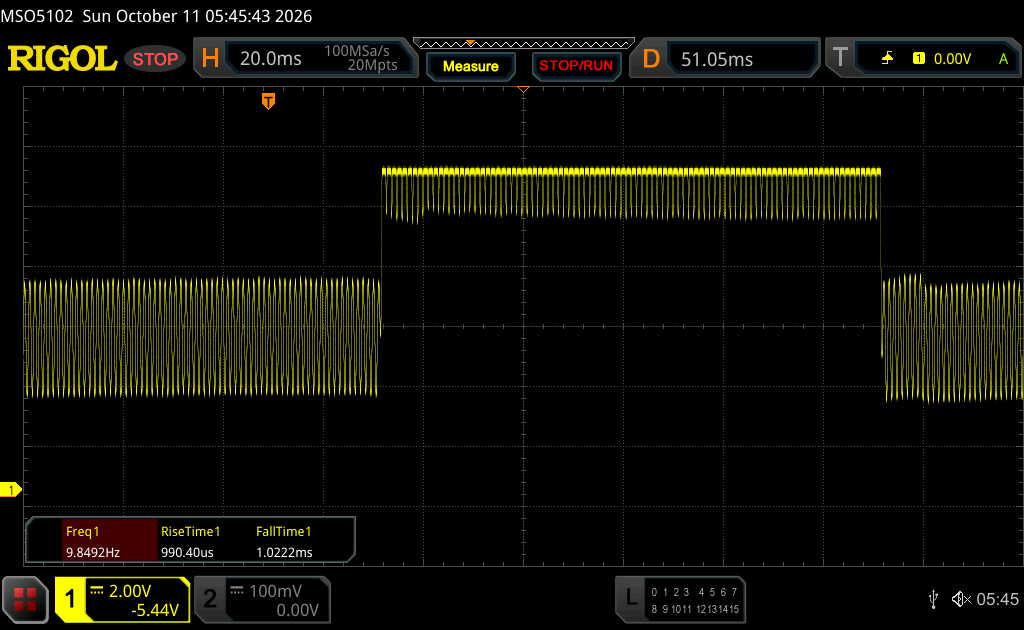 |
| ↘ 1 ms fall | ||
| The screen shows very fast response rates in our tests and should be very well suited for fast-paced gaming. In comparison, all tested devices range from 0.13 (minimum) to 636 (maximum) ms. » 10 % of all devices are better. This means that the measured response time is better than the average of all tested devices (30.7 ms). | ||
Screen Flickering / PWM (Pulse-Width Modulation)
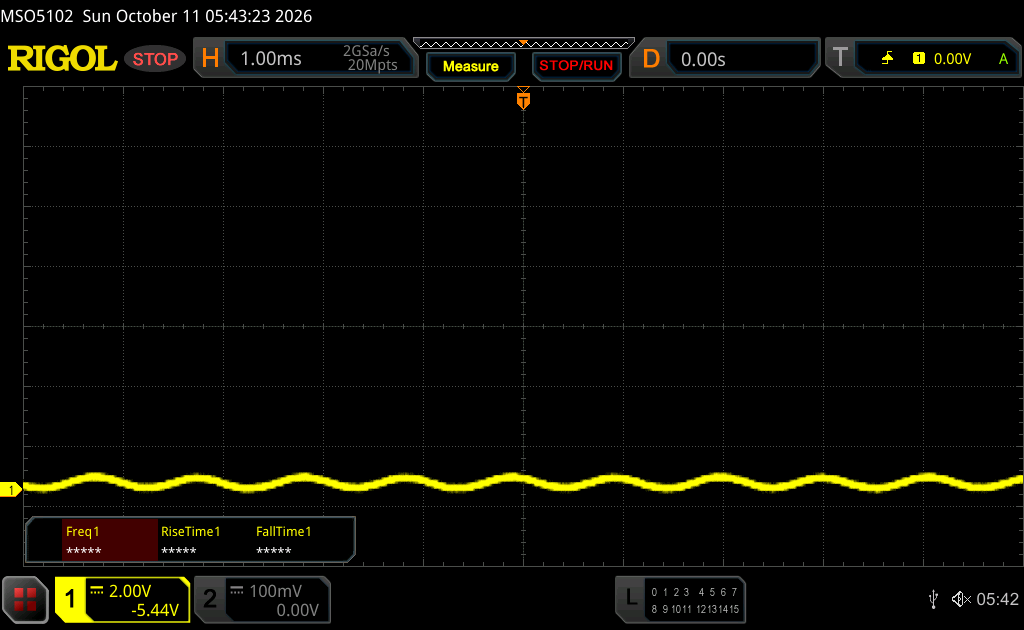
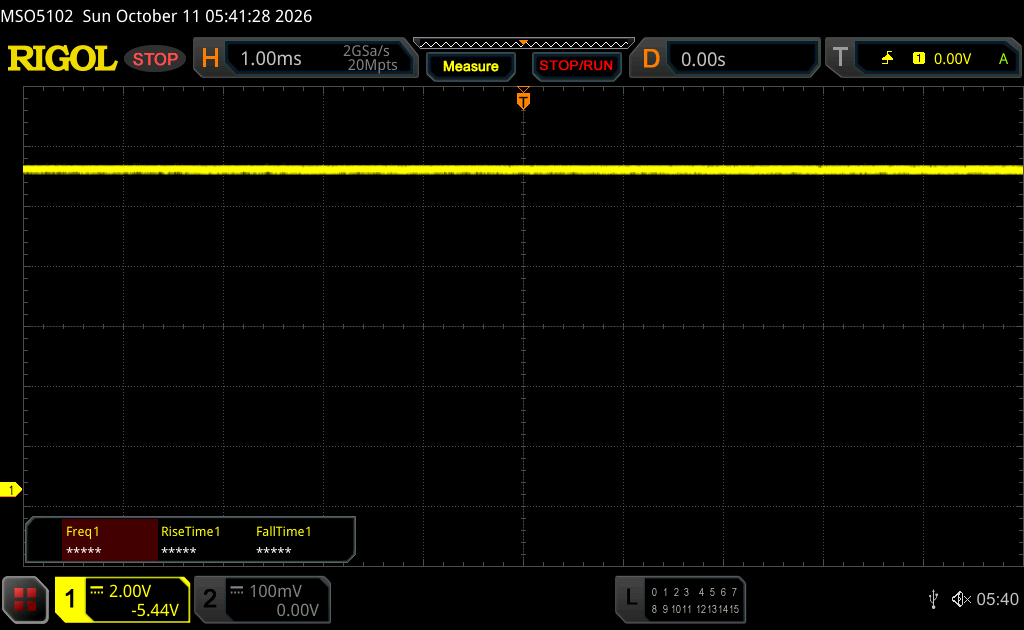
| Screen flickering / PWM detected | 960 Hz Amplitude: 52 % | ≤ 99 % brightness setting | 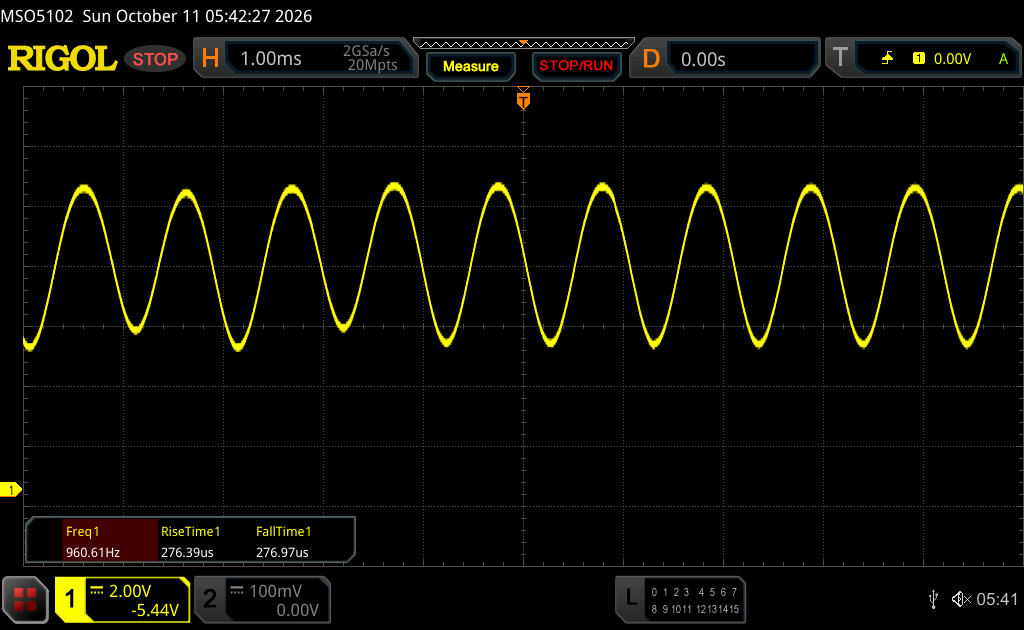 |
The display backlight flickers at 960 Hz (worst case, e.g., utilizing PWM) Flickering detected at a brightness setting of 99 % and below. There should be no flickering or PWM above this brightness setting. The frequency of 960 Hz is quite high, so most users sensitive to PWM should not notice any flickering. In comparison: 52 % of all tested devices do not use PWM to dim the display. If PWM was detected, an average of 7603 (minimum: 5 - maximum: 343500) Hz was measured. | |||


Performance - Snapdragon X1 Elite
Testing Conditions
There are no performance modes to choose from on the HP Googlebook 14c.
Processor Performance
HP uses the Snapdragon X1E-80-100, which is surprising. Firstly, it is obviously a first-gen Snapdragon chip, and secondly, it is a pretty beefy CPU with a Turbo of up to 4 GHz. Based on the power consumption, we estimate the maximum TDP to be around 45 Watts, so it packs quite a bit of punch. There are not many CPU benchmarks for Android, and we are pretty much limited to Geekbench as well as browser benchmarks here. The raw CPU performance (both single as well as multi core) is good, but falls short of the new Snapdragon X2 Plus in the Surface Laptop 13.8. The performance does not drop on battery power.
Geekbench 6.7: Multi-Core | Single-Core
WebXPRT 4: Overall
Jetstream 2: 2.2 Total
Speedometer 3: Score 3.0
Geekbench 7.0: Multi-Core | Single-Core
Geekbench AI: Single Precision CPU 1.7 | Half Precision CPU 1.7 | Quantized CPU 1.7
| CPU Performance rating | |
| Apple MacBook Air 13 M5 -3! | |
| HP Googlebook 14c | |
| Average Qualcomm Snapdragon X Elite X1E-80-100 | |
| Average of class Office | |
| Dell 14 Plus -7! | |
| Microsoft Surface Laptop 8 13.8 -4! | |
| Lenovo ThinkBook 14x, ILL, Ultra 5 226V -2! | |
| Asus Zenbook 14 UX3480QA -2! | |
| Geekbench 6.7 / Multi-Core | |
| Apple MacBook Air 13 M5 | |
| Microsoft Surface Laptop 8 13.8 | |
| HP Googlebook 14c | |
| Average Qualcomm Snapdragon X Elite X1E-80-100 (7596 - 14998, n=10) | |
| Dell 14 Plus | |
| Average of class Office (757 - 17846, n=84, last 2 years) | |
| Asus Zenbook 14 UX3480QA | |
| Lenovo ThinkBook 14x, ILL, Ultra 5 226V | |
| Geekbench 6.7 / Single-Core | |
| Apple MacBook Air 13 M5 | |
| Microsoft Surface Laptop 8 13.8 | |
| HP Googlebook 14c | |
| Dell 14 Plus | |
| Average Qualcomm Snapdragon X Elite X1E-80-100 (1896 - 2874, n=10) | |
| Lenovo ThinkBook 14x, ILL, Ultra 5 226V | |
| Average of class Office (462 - 2988, n=85, last 2 years) | |
| Asus Zenbook 14 UX3480QA | |
| WebXPRT 4 / Overall | |
| Apple MacBook Air 13 M5 | |
| Microsoft Surface Laptop 8 13.8 | |
| Average Qualcomm Snapdragon X Elite X1E-80-100 (279 - 324, n=8) | |
| Asus Zenbook 14 UX3480QA | |
| Dell 14 Plus | |
| HP Googlebook 14c | |
| Lenovo ThinkBook 14x, ILL, Ultra 5 226V | |
| Average of class Office (104.2 - 313, n=81, last 2 years) | |
| Jetstream 2 / 2.2 Total | |
| Apple MacBook Air 13 M5 | |
| Average Qualcomm Snapdragon X Elite X1E-80-100 (n=1) | |
| HP Googlebook 14c | |
| Average of class Office (187.4 - 485, n=20, last 2 years) | |
| Asus Zenbook 14 UX3480QA | |
| Speedometer 3 / Score 3.0 | |
| HP Googlebook 14c | |
| Asus Zenbook 14 UX3480QA | |
| Average of class Office (18.6 - 38.4, n=19, last 2 years) | |
| Average Qualcomm Snapdragon X Elite X1E-80-100 (23.8 - 37.3, n=6) | |
| Geekbench 7.0 / Multi-Core | |
| Average of class Office (10821 - 17682, n=5, last 2 years) | |
| HP Googlebook 14c | |
| Average Qualcomm Snapdragon X Elite X1E-80-100 (n=1) | |
| Lenovo ThinkBook 14x, ILL, Ultra 5 226V | |
| Geekbench 7.0 / Single-Core | |
| HP Googlebook 14c | |
| Average Qualcomm Snapdragon X Elite X1E-80-100 (n=1) | |
| Average of class Office (2433 - 2643, n=5, last 2 years) | |
| Lenovo ThinkBook 14x, ILL, Ultra 5 226V | |
| Geekbench AI / Single Precision CPU 1.7 | |
| HP Googlebook 14c | |
| Average Qualcomm Snapdragon X Elite X1E-80-100 (n=1) | |
| Apple MacBook Air 13 M5 | |
| Average of class Office (1515 - 5281, n=10, last 2 years) | |
| Lenovo ThinkBook 14x, ILL, Ultra 5 226V | |
| Microsoft Surface Laptop 8 13.8 | |
| Asus Zenbook 14 UX3480QA | |
| Geekbench AI / Half Precision CPU 1.7 | |
| Apple MacBook Air 13 M5 | |
| HP Googlebook 14c | |
| Average Qualcomm Snapdragon X Elite X1E-80-100 (n=1) | |
| Microsoft Surface Laptop 8 13.8 | |
| Asus Zenbook 14 UX3480QA | |
| Average of class Office (812 - 8079, n=10, last 2 years) | |
| Lenovo ThinkBook 14x, ILL, Ultra 5 226V | |
| Geekbench AI / Quantized CPU 1.7 | |
| HP Googlebook 14c | |
| Average Qualcomm Snapdragon X Elite X1E-80-100 (n=1) | |
| Microsoft Surface Laptop 8 13.8 | |
| Apple MacBook Air 13 M5 | |
| Average of class Office (3899 - 8706, n=10, last 2 years) | |
| Lenovo ThinkBook 14x, ILL, Ultra 5 226V | |
| Asus Zenbook 14 UX3480QA | |
System and Storage Devices
The Googlebook 14c is a snappy system and HP uses a PCIe 4.0 SSD, so there are no bottlenecks. However, Googlebook OS is not perfectly adjusted for trackpad use and gestures are pretty rudimentary. There is no gesture to switch between different desktops, for example, and you always have to use two gestures. We also had issues with some external SSDs, which did not work. The handoff with your smartphone also requires Android 17, so this is not an option for many users right now. We will take a closer look at the new functions of Googlebook OS in a separate article in a couple of days.
GPU and Gaming Performance
The iGPU is the Adreno X1-85 and the performance is more than sufficient for any Android apps. However, gaming is very limited because some popular Android titles like Fortnite or PUBG are not supported on the Googlebook. We are not sure whether there will be updates or when they will be available. As of right now, your best bet for gaming is a streaming service like GeForce Now. The GPU performance is stable, both under sustained workloads and on battery power.
| 3DMark Steel Nomad Light Score | 2119 points | |
Help | ||
Emissions & Power Consumption
System Noise
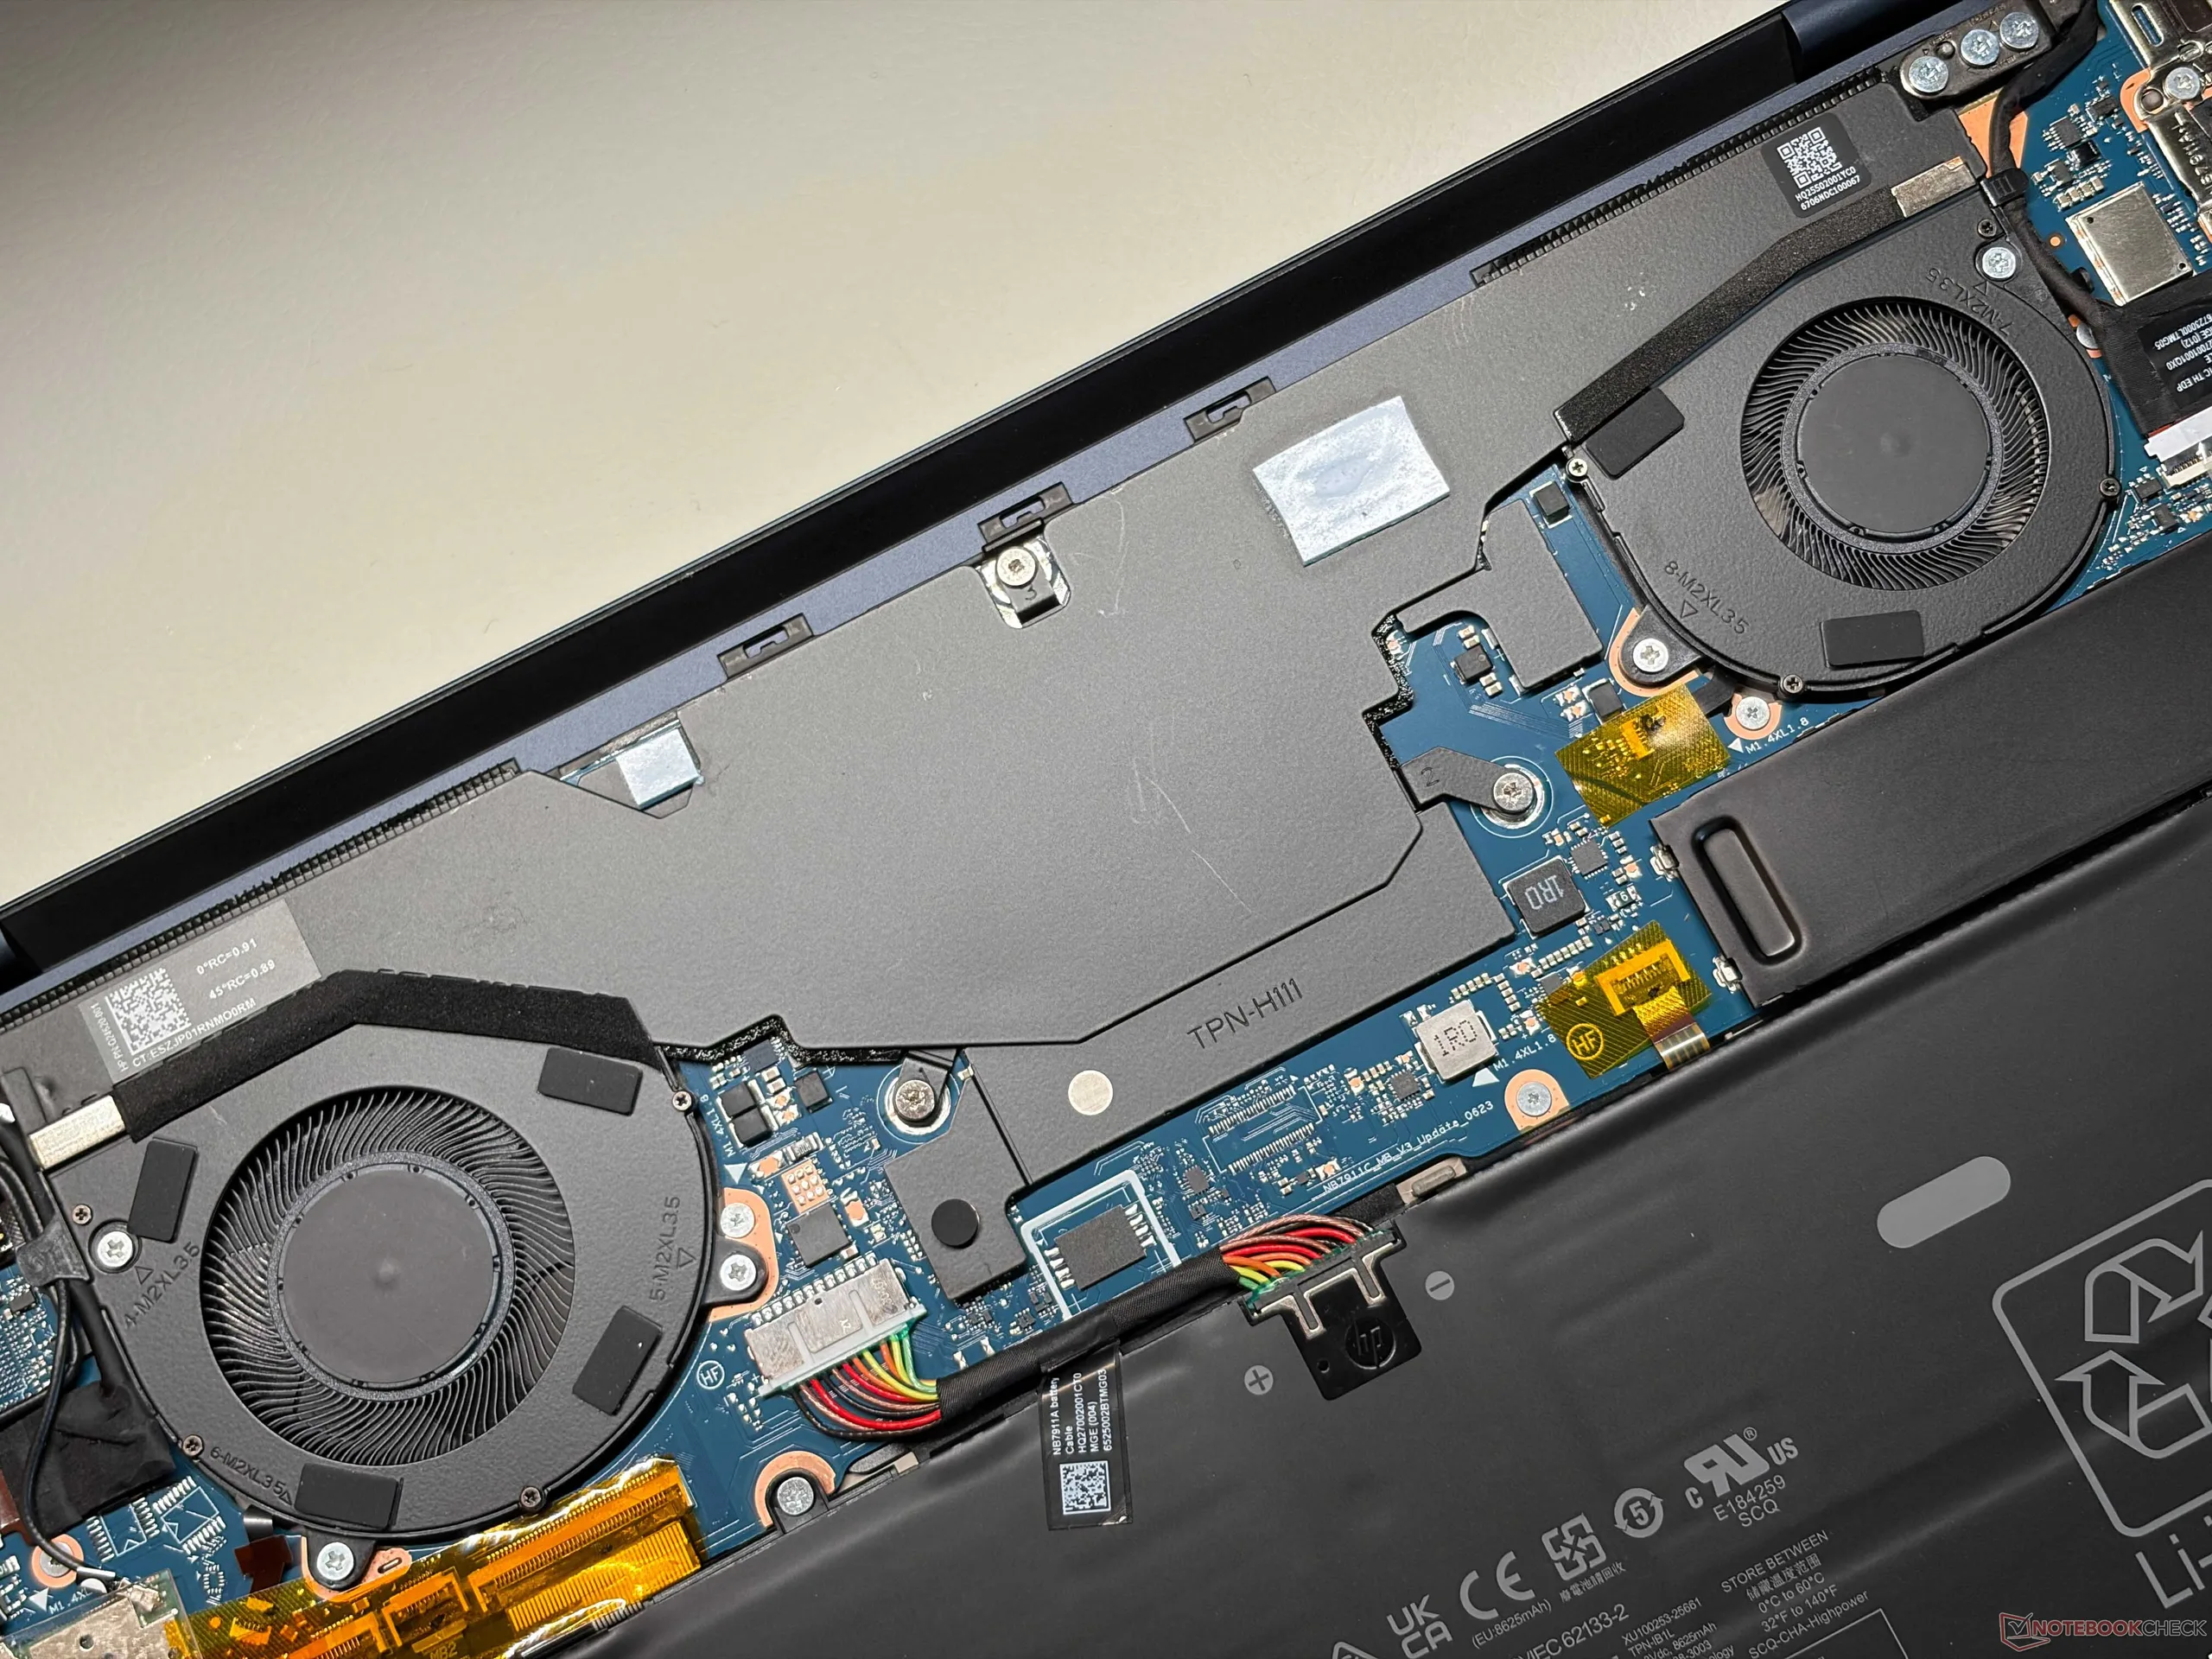
HP uses a cooling unit with two fans and the Googlebook 14c is usually a silent or very quiet device. During everyday tasks, we never really heard the fan, and only full CPU load will result in up to 37 dB(A), which is audible, but not really distracting at all. We did not notice any other electronic noises from our review unit, either.
Noise level
| Idle |
| 24.8 / 24.8 / 24.8 dB(A) |
| Load |
| 29.6 / 37.2 dB(A) |
 | ||
30 dB silent 40 dB(A) audible 50 dB(A) loud |
||
min:  , med: , med:  , max: , max:  Earthworks M23R, Arta (15 cm distance) environment noise: 24.8 dB(A) Earthworks M23R, Arta (15 cm distance) environment noise: 24.8 dB(A) | ||
| HP Googlebook 14c SD X Elite X1E-80-100, Adreno X1-85 3.8 TFLOPS | Lenovo ThinkBook 14x, ILL, Ultra 5 226V Core Ultra 5 226V, Arc 130V | Dell 14 Plus Core Ultra 7 256V, Arc 140V | Asus Zenbook 14 UX3480QA SD X1-26-100, Adreno X1-45 1.7 TFLOPS | Microsoft Surface Laptop 8 13.8 SD X2 Plus X2P-64-100, Adreno X2-45 | Apple MacBook Air 13 M5 M5 10-Core, M5 8-Core GPU | |
|---|---|---|---|---|---|---|
| Noise | -7% | -2% | -2% | -1% | ||
| off / environment * (dB) | 24.8 | 24.9 -0% | 23.8 4% | 24.6 1% | 25.1 -1% | |
| Idle Minimum * (dB) | 24.8 | 24.9 -0% | 23.8 4% | 24.6 1% | 25.1 -1% | |
| Idle Average * (dB) | 24.8 | 24.9 -0% | 23.8 4% | 24.6 1% | 25.1 -1% | |
| Idle Maximum * (dB) | 24.8 | 25 -1% | 23.8 4% | 24.6 1% | 25.1 -1% | |
| Load Average * (dB) | 29.6 | 35.4 -20% | 31.4 -6% | 26.1 12% | 25.1 15% | |
| Load Maximum * (dB) | 37.2 | 44.9 -21% | 45.2 -22% | 47.4 -27% | 42.4 -14% | |
| Witcher 3 ultra * (dB) | 35.2 | |||||
| Cyberpunk 2077 ultra * (dB) | 44.9 | 42 | 32.5 | 37.4 |
* ... smaller is better
Temperature
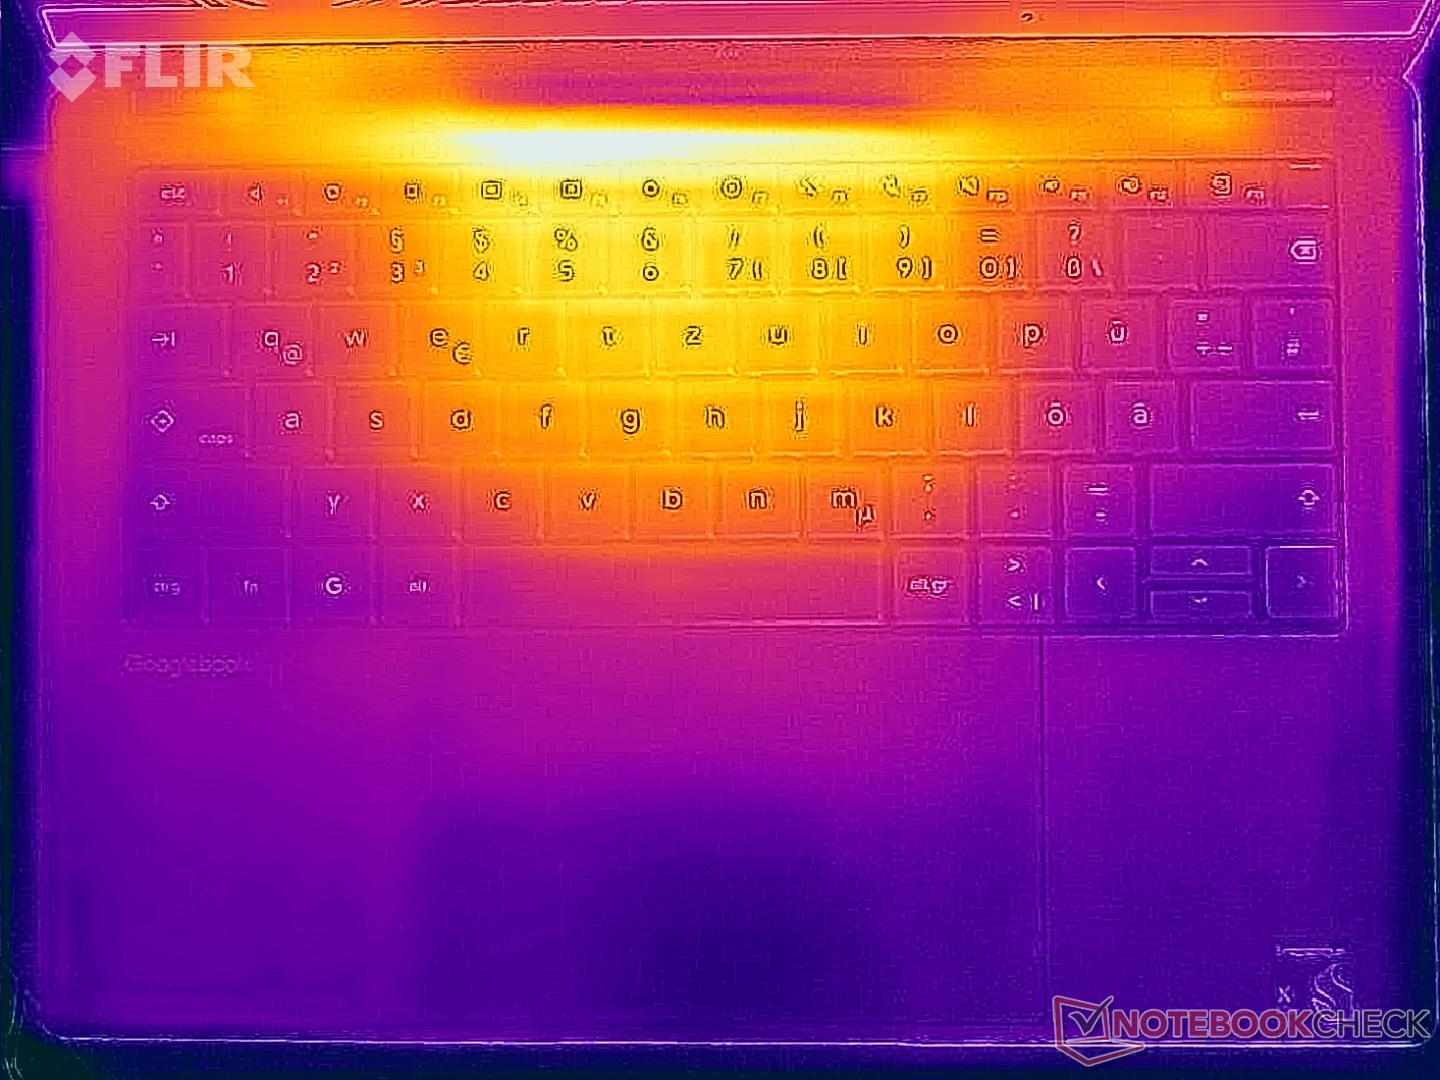
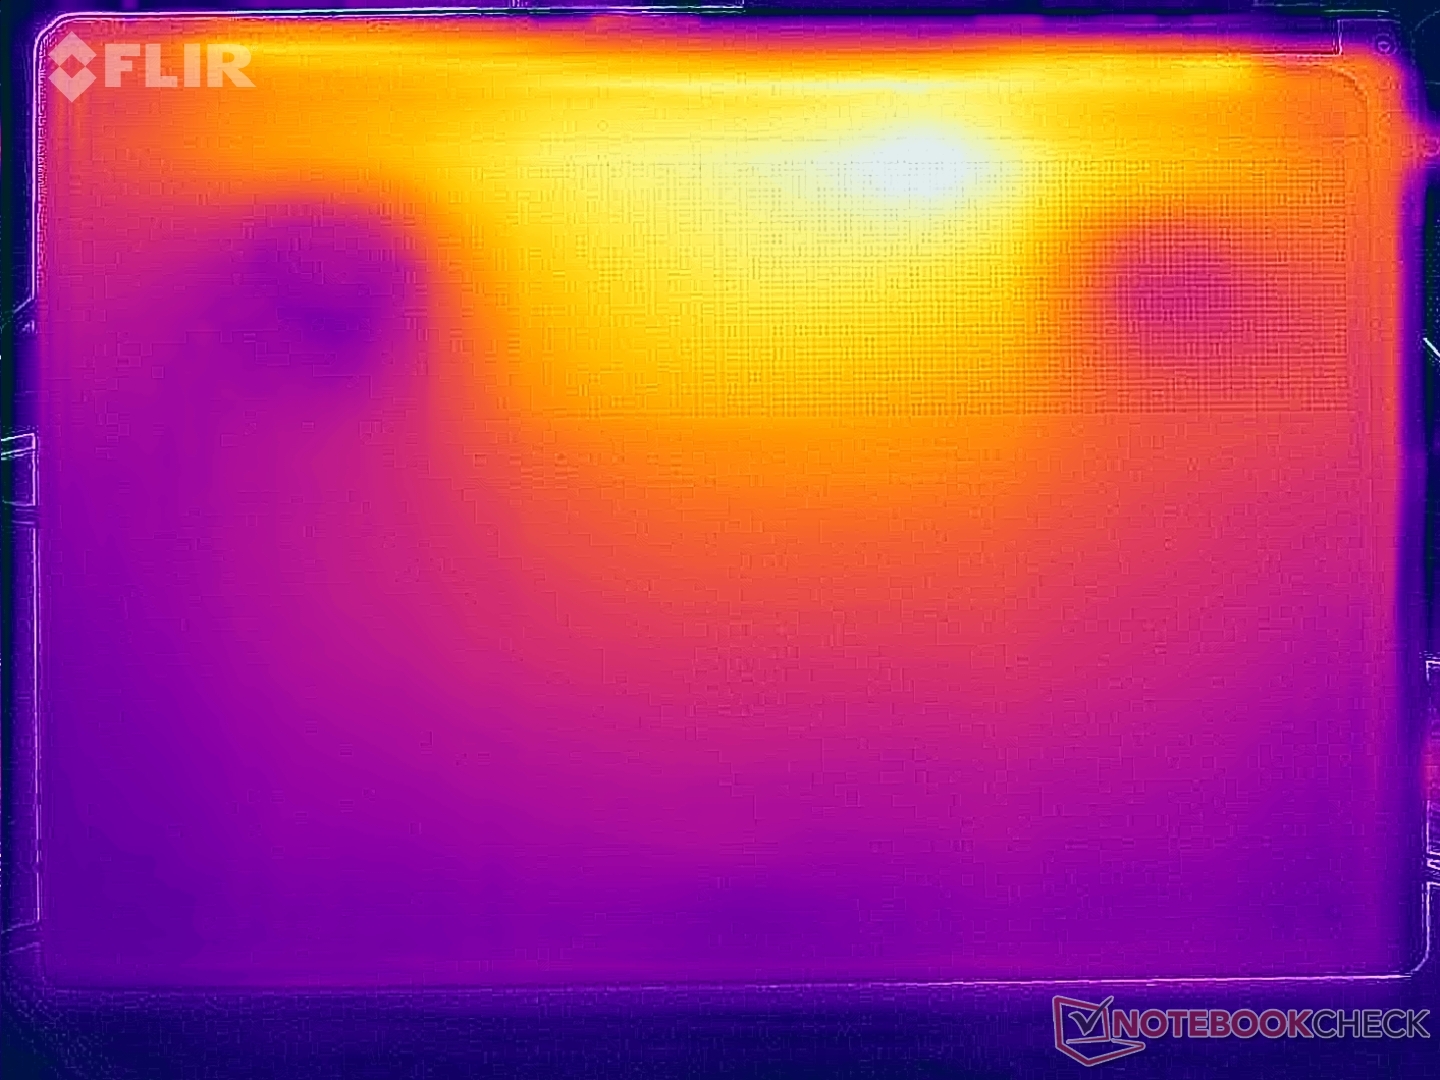
During light workloads, the Googlebook 14c is a very cool laptop, but if you really stress the CPU, the comparatively low fan noise will result in very warm temperatures. We measured more than 50 °C in the center top area of the keyboard, and also more than 50 °C at the bottom, so this is an issue for typing and putting it on your lap. While this is definitely not a common scenario for a Googlebook, it is still possible and simply a result of the high TDP configuration of the Snapdragon X1 Extreme CPU.
(-) The maximum temperature on the upper side is 50.8 °C / 123 F, compared to the average of 34.4 °C / 94 F, ranging from 21.2 to 62.5 °C for the class Office.
(-) The bottom heats up to a maximum of 51.6 °C / 125 F, compared to the average of 36.8 °C / 98 F
(+) In idle usage, the average temperature for the upper side is 25.7 °C / 78 F, compared to the device average of 29.5 °C / 85 F.
(+) The palmrests and touchpad are cooler than skin temperature with a maximum of 31.2 °C / 88.2 F and are therefore cool to the touch.
(-) The average temperature of the palmrest area of similar devices was 27.6 °C / 81.7 F (-3.6 °C / -6.5 F).
| HP Googlebook 14c SD X Elite X1E-80-100, Adreno X1-85 3.8 TFLOPS | Lenovo ThinkBook 14x, ILL, Ultra 5 226V Core Ultra 5 226V, Arc 130V | Dell 14 Plus Core Ultra 7 256V, Arc 140V | Asus Zenbook 14 UX3480QA SD X1-26-100, Adreno X1-45 1.7 TFLOPS | Microsoft Surface Laptop 8 13.8 SD X2 Plus X2P-64-100, Adreno X2-45 | Apple MacBook Air 13 M5 M5 10-Core, M5 8-Core GPU | |
|---|---|---|---|---|---|---|
| Heat | 0% | -1% | 7% | 9% | 13% | |
| Maximum Upper Side * (°C) | 50.8 | 39.4 22% | 43 15% | 41.6 18% | 44.4 13% | 44.1 13% |
| Maximum Bottom * (°C) | 51.6 | 39.1 24% | 42.6 17% | 43.8 15% | 42.5 18% | 42.4 18% |
| Idle Upper Side * (°C) | 26.4 | 32.3 -22% | 31.6 -20% | 27 -2% | 25.9 2% | 23.7 10% |
| Idle Bottom * (°C) | 26.6 | 32.8 -23% | 30.6 -15% | 27.1 -2% | 26 2% | 23.8 11% |
* ... smaller is better
Speakers
The sound system consists of four speakers. The sound quality is really good and it is better than Microsoft's Surface Laptop 8 or Apple's MacBook Air 13.
HP Googlebook 14c audio analysis
(+) | speakers can play relatively loud (82.2 dB)
Bass 100 - 315 Hz
(±) | reduced bass - on average 11.1% lower than median
(±) | linearity of bass is average (10.2% delta to prev. frequency)
Mids 400 - 2000 Hz
(+) | balanced mids - only 1.9% away from median
(+) | mids are linear (5.5% delta to prev. frequency)
Highs 2 - 16 kHz
(+) | balanced highs - only 3.3% away from median
(+) | highs are linear (5.6% delta to prev. frequency)
Overall 100 - 16.000 Hz
(+) | overall sound is linear (10.6% difference to median)
Compared to same class
» 2% of all tested devices in this class were better, 1% similar, 97% worse
» The best had a delta of 7%, average was 21%, worst was 53%
Compared to all devices tested
» 6% of all tested devices were better, 2% similar, 93% worse
» The best had a delta of 4%, average was 23%, worst was 136%
Lenovo ThinkBook 14x, ILL, Ultra 5 226V audio analysis
(±) | speaker loudness is average but good (78.9 dB)
Bass 100 - 315 Hz
(-) | nearly no bass - on average 17.2% lower than median
(±) | linearity of bass is average (10.4% delta to prev. frequency)
Mids 400 - 2000 Hz
(±) | higher mids - on average 7.4% higher than median
(+) | mids are linear (5% delta to prev. frequency)
Highs 2 - 16 kHz
(+) | balanced highs - only 4.2% away from median
(+) | highs are linear (4.3% delta to prev. frequency)
Overall 100 - 16.000 Hz
(±) | linearity of overall sound is average (20.9% difference to median)
Compared to same class
» 69% of all tested devices in this class were better, 7% similar, 24% worse
» The best had a delta of 5%, average was 18%, worst was 53%
Compared to all devices tested
» 57% of all tested devices were better, 8% similar, 35% worse
» The best had a delta of 4%, average was 23%, worst was 136%
Dell 14 Plus audio analysis
(+) | speakers can play relatively loud (82 dB)
Bass 100 - 315 Hz
(±) | reduced bass - on average 7.8% lower than median
(±) | linearity of bass is average (9.2% delta to prev. frequency)
Mids 400 - 2000 Hz
(±) | higher mids - on average 6.5% higher than median
(+) | mids are linear (3.6% delta to prev. frequency)
Highs 2 - 16 kHz
(+) | balanced highs - only 1.9% away from median
(+) | highs are linear (3.7% delta to prev. frequency)
Overall 100 - 16.000 Hz
(+) | overall sound is linear (12.4% difference to median)
Compared to same class
» 17% of all tested devices in this class were better, 4% similar, 78% worse
» The best had a delta of 5%, average was 18%, worst was 53%
Compared to all devices tested
» 11% of all tested devices were better, 2% similar, 86% worse
» The best had a delta of 4%, average was 23%, worst was 136%
Asus Zenbook 14 UX3480QA audio analysis
(±) | speaker loudness is average but good (79.2 dB)
Bass 100 - 315 Hz
(±) | reduced bass - on average 9% lower than median
(±) | linearity of bass is average (7.9% delta to prev. frequency)
Mids 400 - 2000 Hz
(+) | balanced mids - only 2.4% away from median
(+) | mids are linear (5.9% delta to prev. frequency)
Highs 2 - 16 kHz
(+) | balanced highs - only 4.8% away from median
(±) | linearity of highs is average (8% delta to prev. frequency)
Overall 100 - 16.000 Hz
(+) | overall sound is linear (11.7% difference to median)
Compared to same class
» 14% of all tested devices in this class were better, 3% similar, 83% worse
» The best had a delta of 5%, average was 18%, worst was 53%
Compared to all devices tested
» 8% of all tested devices were better, 3% similar, 89% worse
» The best had a delta of 4%, average was 23%, worst was 136%
Microsoft Surface Laptop 8 13.8 audio analysis
(+) | speakers can play relatively loud (83.3 dB)
Bass 100 - 315 Hz
(±) | reduced bass - on average 11.9% lower than median
(±) | linearity of bass is average (10.8% delta to prev. frequency)
Mids 400 - 2000 Hz
(+) | balanced mids - only 3.9% away from median
(+) | mids are linear (4.4% delta to prev. frequency)
Highs 2 - 16 kHz
(+) | balanced highs - only 2.5% away from median
(+) | highs are linear (3.1% delta to prev. frequency)
Overall 100 - 16.000 Hz
(+) | overall sound is linear (12% difference to median)
Compared to same class
» 15% of all tested devices in this class were better, 5% similar, 81% worse
» The best had a delta of 5%, average was 18%, worst was 53%
Compared to all devices tested
» 10% of all tested devices were better, 2% similar, 88% worse
» The best had a delta of 4%, average was 23%, worst was 136%
Apple MacBook Air 13 M5 audio analysis
(+) | speakers can play relatively loud (82.1 dB)
Bass 100 - 315 Hz
(±) | reduced bass - on average 10.5% lower than median
(±) | linearity of bass is average (10.2% delta to prev. frequency)
Mids 400 - 2000 Hz
(+) | balanced mids - only 2% away from median
(+) | mids are linear (2.7% delta to prev. frequency)
Highs 2 - 16 kHz
(±) | higher highs - on average 5.1% higher than median
(+) | highs are linear (3% delta to prev. frequency)
Overall 100 - 16.000 Hz
(+) | overall sound is linear (11.7% difference to median)
Compared to same class
» 14% of all tested devices in this class were better, 3% similar, 83% worse
» The best had a delta of 5%, average was 18%, worst was 53%
Compared to all devices tested
» 8% of all tested devices were better, 3% similar, 89% worse
» The best had a delta of 4%, average was 23%, worst was 136%
Power Consumption and Battery Life
The idle consumption results with the default dark background image are very low, but keep in mind that brighter images will increase the power consumption on OLED screens noticeably (we measured up to 8 Watts for idle max with a bright wallpaper, for example). Under maximum load, we measured up to 64 Watts, so a 65W adapter is recommended.
HP equips the Googlebook 14c with a 70 Wh battery, but the result in our default Wi-Fi test at 150 nits is a bit disappointing at just under 14 hours. The charging time with a 65W power adapter is 1:47 hours (50 % after 41 minutes; 80% after 1:06 hours). We will add more battery runtime tests soon.
| Off / Standby | 0.28 / 0.47 Watt |
| Idle | 2.3 / 3.6 / 3.7 Watt |
| Load |
22.5 / 64.2 Watt |
   
| |
Key:
min: ,
med: ,
max: Metrahit Energy | |
| HP Googlebook 14c SD X Elite X1E-80-100, Adreno X1-85 3.8 TFLOPS, Western Digital PC SN5000S SDEQNSJ-512G-1002, OLED, 2880x1800, 14" | Lenovo ThinkBook 14x, ILL, Ultra 5 226V Core Ultra 5 226V, Arc 130V, SAMSUNG MZAMX512HDLV-00BL2, IPS, 1920x1200, 14" | Dell 14 Plus Core Ultra 7 256V, Arc 140V, , IPS, 2560x1600, 14" | Asus Zenbook 14 UX3480QA SD X1-26-100, Adreno X1-45 1.7 TFLOPS, Samsung PM9C1b MZVL8512HFLU-00BLL, OLED, 1920x1200, 14" | Microsoft Surface Laptop 8 13.8 SD X2 Plus X2P-64-100, Adreno X2-45, SK hynix PVC10 HFS512GEM4X182N, IPS, 2304x1536, 13.8" | Apple MacBook Air 13 M5 M5 10-Core, M5 8-Core GPU, Apple SSD AP0512Z, IPS, 2560x1664, 13.6" | Average Qualcomm SD X Adreno X1-85 3.8 TFLOPS | Average of class Office | |
|---|---|---|---|---|---|---|---|---|
| Power Consumption | -82% | -62% | -19% | -37% | -54% | -54% | -78% | |
| Idle Minimum * (Watt) | 2.3 | 3.9 -70% | 3.6 -57% | 3 -30% | 1.7 26% | 1.8 22% | 3.53 ? -53% | 4 ? -74% |
| Idle Average * (Watt) | 3.6 | 6.4 -78% | 6.7 -86% | 5 -39% | 6.8 -89% | 9.3 -158% | 6.68 ? -86% | 7.04 ? -96% |
| Idle Maximum * (Watt) | 3.7 | 10.3 -178% | 6.9 -86% | 5.2 -41% | 7.5 -103% | 9.4 -154% | 7.59 ? -105% | 8.24 ? -123% |
| Load Average * (Watt) | 22.5 | 42.9 -91% | 41.2 -83% | 17.2 24% | 28 -24% | 29.4 -31% | 29.6 ? -32% | 44.2 ? -96% |
| Load Maximum * (Watt) | 64.2 | 59 8% | 62.6 2% | 70 -9% | 61.3 5% | 30.4 53% | 61.3 ? 5% | 65.1 ? -1% |
| Cyberpunk 2077 ultra * (Watt) | 42.9 | 36.6 | 19.4 | 37.9 | 18.9 | |||
| Cyberpunk 2077 ultra external monitor * (Watt) | 43 | 34.2 | 20.2 | 38.1 | 17.7 |
* ... smaller is better
| HP Googlebook 14c SD X Elite X1E-80-100, Adreno X1-85 3.8 TFLOPS, 70 Wh | Lenovo ThinkBook 14x, ILL, Ultra 5 226V Core Ultra 5 226V, Arc 130V, 65 Wh | Dell 14 Plus Core Ultra 7 256V, Arc 140V, 64 Wh | Asus Zenbook 14 UX3480QA SD X1-26-100, Adreno X1-45 1.7 TFLOPS, 50 Wh | Microsoft Surface Laptop 8 13.8 SD X2 Plus X2P-64-100, Adreno X2-45, 54 Wh | Apple MacBook Air 13 M5 M5 10-Core, M5 8-Core GPU, 53.8 Wh | Average of class Office | |
|---|---|---|---|---|---|---|---|
| Battery Runtime | |||||||
| WiFi Websurfing (h) | 13.8 | 16.9 22% | 14.3 4% | 20.2 46% | 18.9 37% | 16.2 17% | 13.9 ? 1% |
Notebookcheck Rating
HP Googlebook 14c
- 10/11/2026 v8
Andreas Osthoff
 Total Sustainability Score:
 Potential Competitors in Comparison
Image | Model / Review | Price | Weight | Height | Display |
|---|---|---|---|---|---|
1. 86.2% 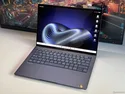 | HP Googlebook 14c Qualcomm Snapdragon X Elite X1E-80-100 ⎘ Qualcomm SD X Adreno X1-85 3.8 TFLOPS ⎘ 16 GB Memory, 512 GB SSD | List Price: 1199€ | 1.3 kg | 10.9 mm | 14.00" 2880x1800 243 PPI OLED |
2. 84.8%  | Lenovo ThinkBook 14x, ILL, Ultra 5 226V Intel Core Ultra 5 226V ⎘ Intel Arc Graphics 130V ⎘ 16 GB Memory, 512 GB SSD | List Price: 949€ | 1 kg | 15.6 mm | 14.00" 1920x1200 162 PPI IPS |
3. 83.4%  | Dell 14 Plus Intel Core Ultra 7 256V ⎘ Intel Arc Graphics 140V ⎘ 16 GB Memory | List Price: 1100 USD | 1.5 kg | 16.95 mm | 14.00" 2560x1600 216 PPI IPS |
4. 85.6%  | Asus Zenbook 14 UX3480QA Qualcomm Snapdragon X X1-26-100 ⎘ Qualcomm SD X Adreno X1-45 1.7 TFLOPS ⎘ 16 GB Memory, 512 GB SSD | Amazon: 1. $48.88 1pcs Cooler Fans for ASUS 14... 2. $1,199.99 ASUS Zenbook 14 OLED Touchsc... 3. $13.55 GinTai Bottom Cover Screws f... List Price: 999€ | 1.1 kg | 16.9 mm | 14.00" 1920x1200 162 PPI OLED |
5. 88.4%  | Microsoft Surface Laptop 8 13.8 Qualcomm Snapdragon X2 Plus X2P-64-100 ⎘ Qualcomm SD X2 Adreno X2-45 ⎘ 16 GB Memory, 512 GB SSD | List Price: 1699€ | 1.3 kg | 17.5 mm | 13.80" 2304x1536 201 PPI IPS |
6. 91.6%  | Apple MacBook Air 13 M5 Apple M5 10-Core ⎘ Apple M5 8-Core GPU ⎘ 16 GB Memory, 512 GB SSD | List Price: 1199€ | 1.2 kg | 11.3 mm | 13.60" 2560x1664 225 PPI IPS |
Transparency
The selection of devices to be reviewed is made by our editorial team. The test sample was provided to the author as a loan by the manufacturer or retailer for the purpose of this review. The lender had no influence on this review, nor did the manufacturer receive a copy of this review before publication. There was no obligation to publish this review. As an independent media company, Notebookcheck is not subjected to the authority of manufacturers, retailers or publishers.
This is how Notebookcheck is testing
Every year, Notebookcheck independently reviews hundreds of laptops and smartphones using standardized procedures to ensure that all results are comparable. We have continuously developed our test methods for around 20 years and set industry standards in the process. In our test labs, high-quality measuring equipment is utilized by experienced technicians and editors. These tests involve a multi-stage validation process. Our complex rating system is based on hundreds of well-founded measurements and benchmarks, which maintains objectivity. Further information on our test methods can be found here.
 Add as a preferred source on Google


