Notebookcheck Logo
Teaser

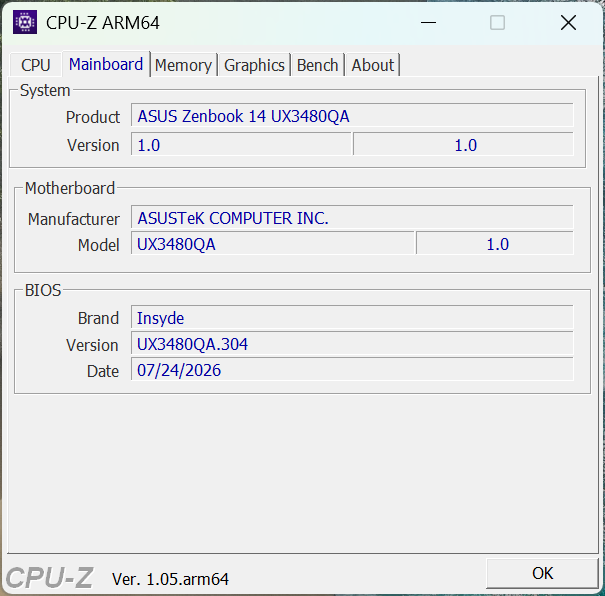
Great everyday OLED laptop starting at $799 - Asus Zenbook 14 UX3480 Review

Better than XPS 13 and MacBook Neo?

The new Zenbook 14 with a starting price of $799 is an affordable everyday laptop with an aluminum chassis, OLED panel and Snapdragon processor. Is this a better alternative to the Apple MacBook Neo and the Dell XPS 13 with Intel's Wildcat Lake processors?
Andreas Osthoff 👁 Published 🇳🇱 🇫🇷 ...
ARM Laptop Review Snippet Snapdragon X Series Windows

Verdict - Asus Zenbook 14 is a good all-rounder

The new Asus Zenbook 14 is an affordable 14-inch everyday laptop and leaves a good impression in our review. It offers a high-quality chassis, excellent input devices and longer battery runtimes than its rivals like the Dell XPS 13 or the Apple MacBook Neo. The Snapdragon X SoC offers sufficient performance for everyday usage scenarios and roughly on par with the Wildcat Lake CPU in the XPS 13. Apple's A18 Pro offers much higher single-core performance, but lower mutli-core performance. 

The OLED panel is a bit of a mixed bag. While the subjective image quality is very good with typical OLED strengths like deep black, rich colors and fast response times as well as accurate colors, it is limited to 60 Hz and the brightness is very low at just 300 nits. It also lacks HDR support.

Prices of $799 for the base model with 8/256 GB and $999 with 16/512 GB are fair in the current market situation and on par with the Dell XPS 13, but we would recommend the 16 GB model if possible. However, the bigger issue right now is the old Asus Zenbook A14 from last year, which is still available. You can, for example, get the SKU with the Snapdragon X1P-42-100, 16/512 GB and a brighter OLED screen with HDR support for $870 on Amazon, which offers a better price-performance ratio.

Pros

+ good chassis quality
+ excellent input devices
+ good image quality with accurate colors
+ excellent battery runtimes
+ usually very quiet
+ good speakers

Cons

- PWM flickering
- soldered RAM
- low brightness/no HDR support

Price and Availability

The SKU with 8 GB RAM and 256 GB SSD storage retails for $799, while our review unit with 16 GB RAM and 512 GB storage retails for $999.

Amazon Logo
  • $1,199.99
    ASUS Zenbook 14 OLED Touchscreen Laptop,14" FHD+, AMD Ryzen AI 9 465 (> Intel Ultra 9 288V), 16GB DDR5, IST Computer Customized 256GB/512GB/1TB/2TB SSD, Copilot+ PC, 1080p Webcam, Backlit, Win 11 Pro
  • $839.00
    ASUS Zenbook 14 UX3405CA 14" FHD Touchscreen Laptop, Intel Core Ultra 7 255H, 16GB RAM, 512GB SSD, Intel Arc Graphics, Windows 11 Home, Thin & Light Ultrabook Notebook
  • $48.88
    1pcs Cooler Fans for ASUS 14 Zenbook 14 AI UX3480GA UX3480AA UX3480QA

Specifications

Asus Zenbook 14 UX3480QA (ZenBook 14 Series)
Processor
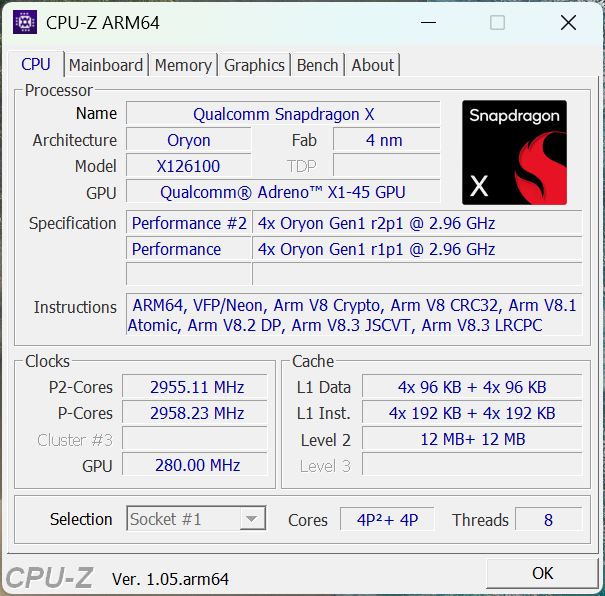
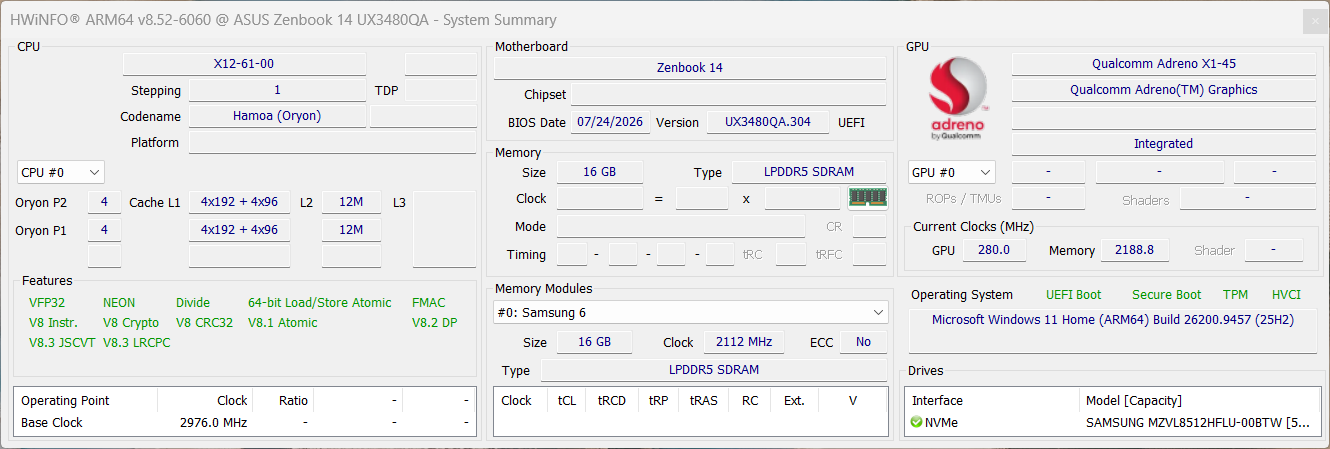
Qualcomm Snapdragon X X1-26-100 8c/8t, 8 x 3.0 GHz Qualcomm Oryon, Purwa SE / Oryon
Graphics adapter
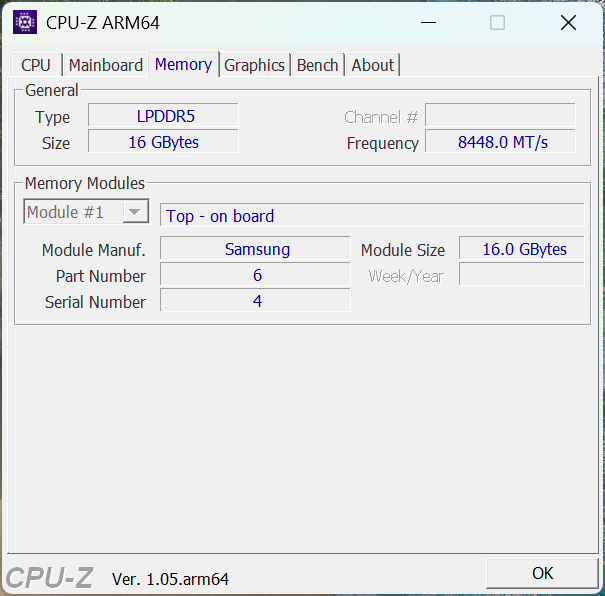
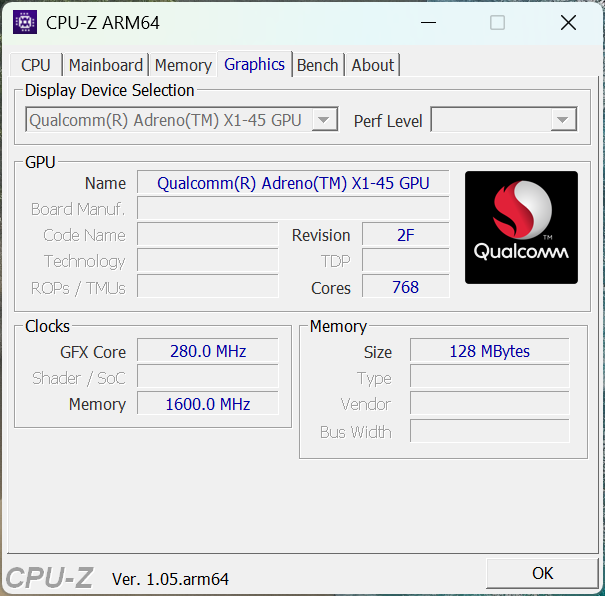
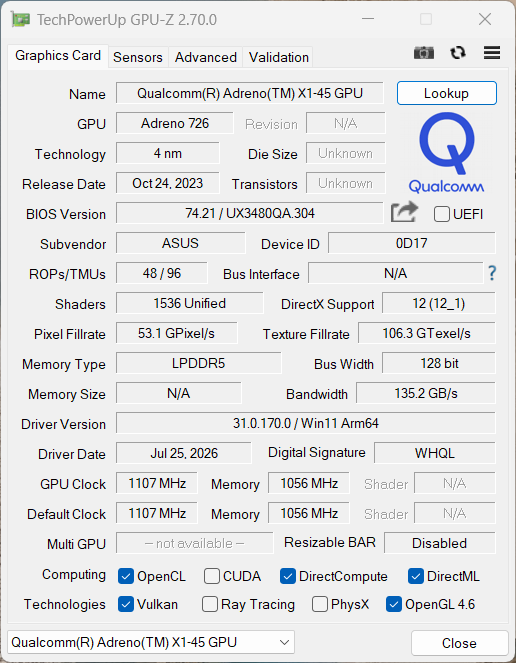
Qualcomm SD X Adreno X1-45 1.7 TFLOPS, Core: 1107 MHz, RAM: 1056 MHz, 31.0.170.0
Memory
16 GB 
, LPDDR5x-8448, Dual-Channel, onboard
Display
14.00 inch 16:10, 1920 x 1200 pixel 162 PPI, ATNA40KW01-0, OLED, glossy: yes, 60 Hz
Storage
Samsung PM9C1b MZVL8512HFLU-00BLL, 512 GB 
, 423 GB free
Connections
1 USB 3.0 / 3.1 Gen1, 2 USB 3.1 Gen2, USB-C Power Delivery (PD), 1 HDMI, 2 DisplayPort, 1 Docking Station Port, Audio Connections: 3.5 mm stereo
Networking
Qualcomm Fast Connect 6900 Wi-Fi 6E Dual Band Simultaneous (a/b/g/n = Wi-Fi 4/ac = Wi-Fi 5/ax = Wi-Fi 6/ Wi-Fi 6E 6 GHz), Bluetooth 5.4
Size
height x width x depth (in mm): 16.9 x 311.1 x 215.8 ( = 0.67 x 12.25 x 8.5 in)
Battery
50 Wh, 4454 mAh Lithium-Polymer
Operating System
Microsoft Windows 11 Home
Camera
Webcam: Full-HD + IR
Primary Camera: 2 MPix
Additional features
Speakers: Stereo, Keyboard: Chiclet, 36 Months Warranty
Weight
1.147 kg ( = 40.46 oz / 2.53 pounds)
Price
999 Euro
Note: The manufacturer may use components from different suppliers including display panels, drives or memory sticks with similar specifications.


Case, Connectivity and Input Devices

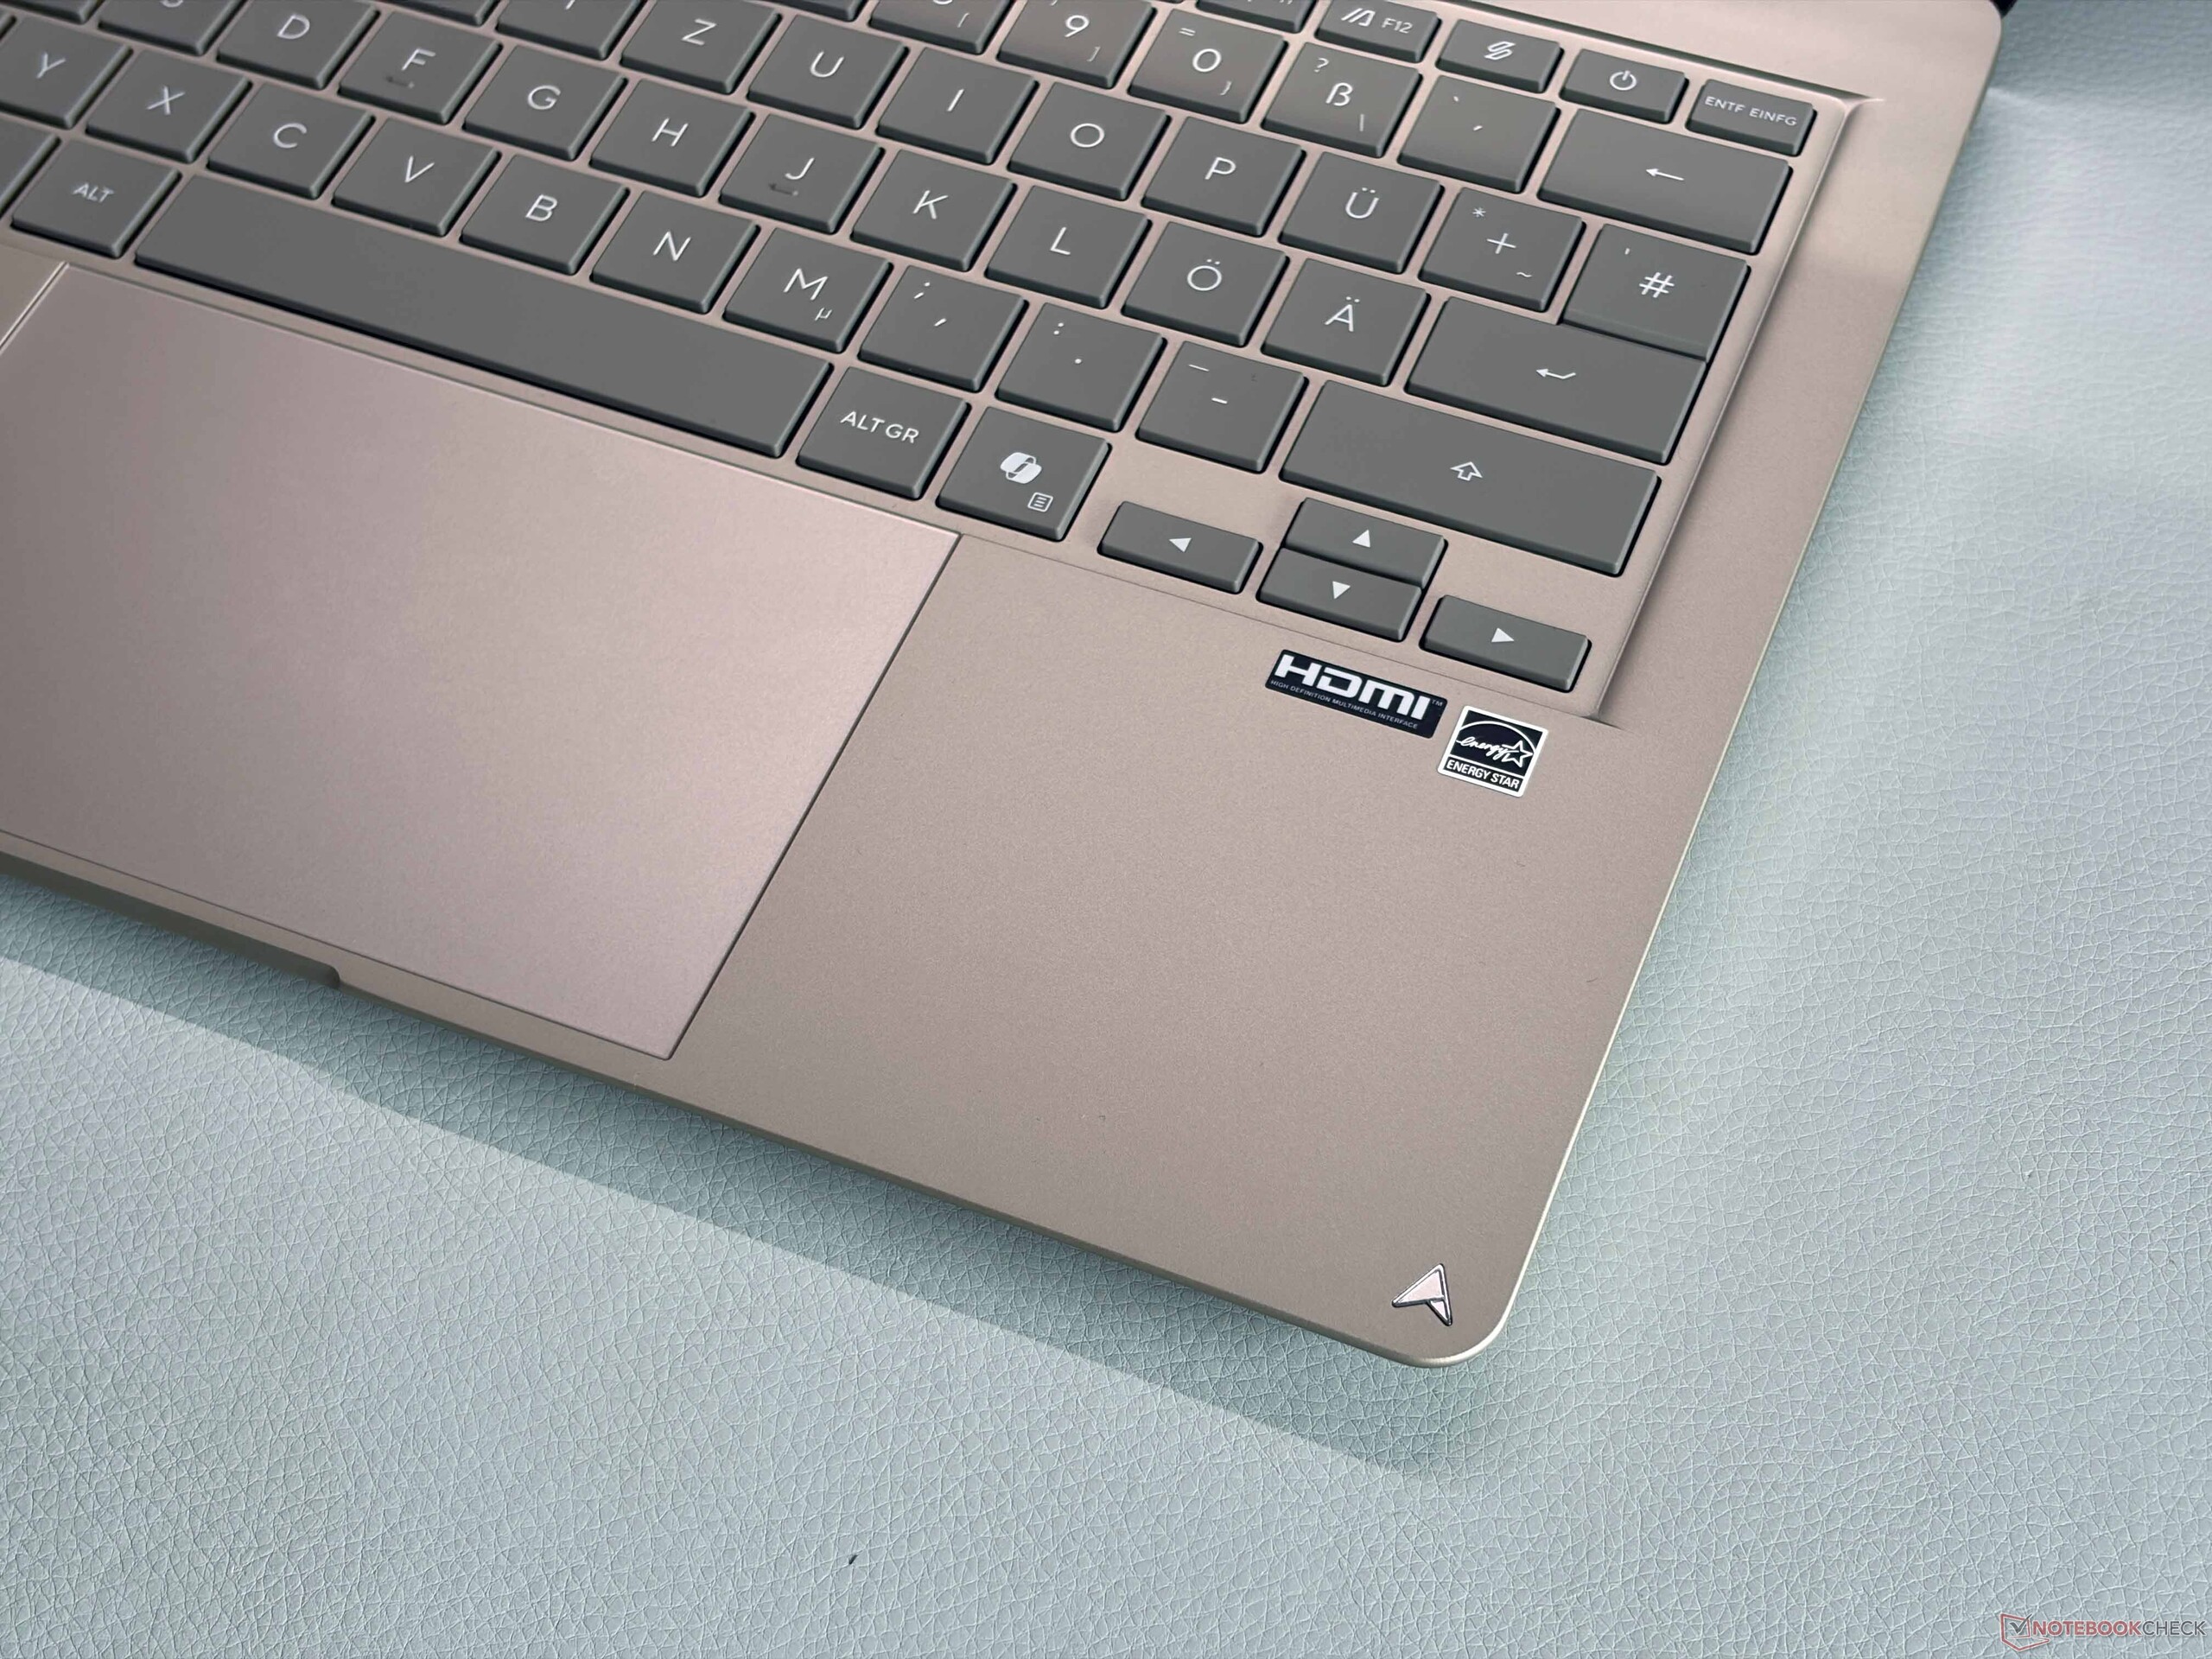
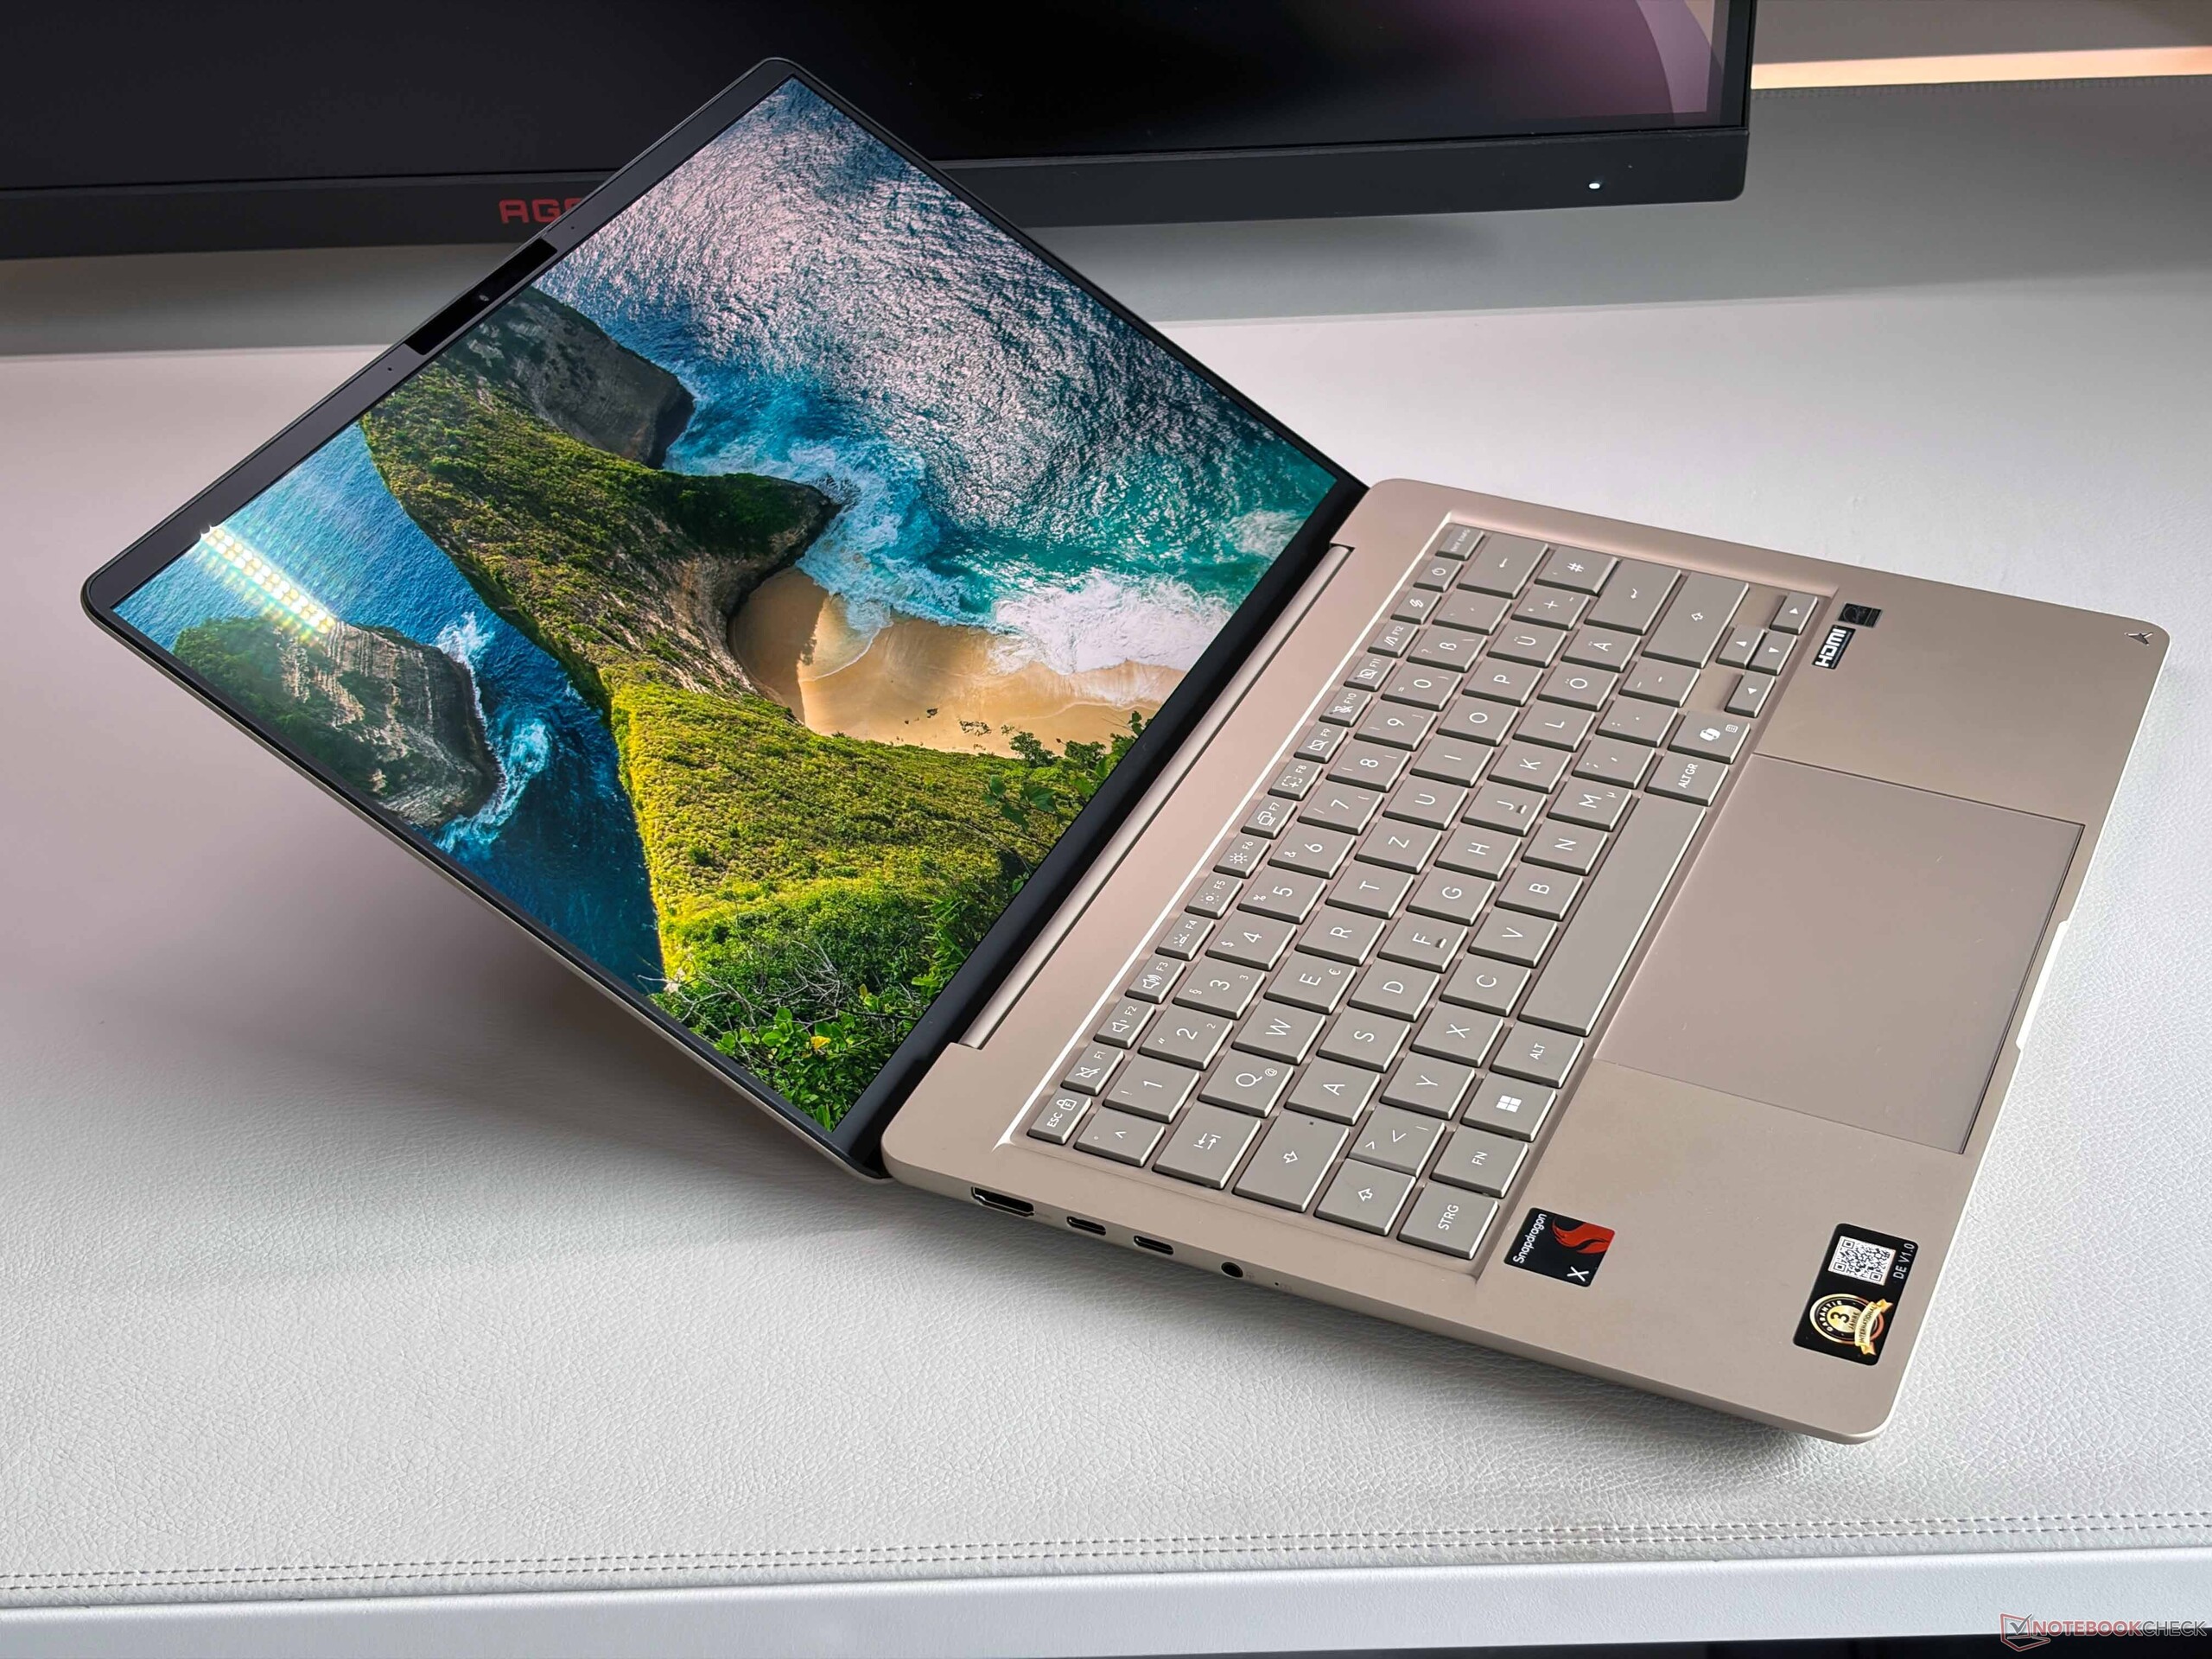
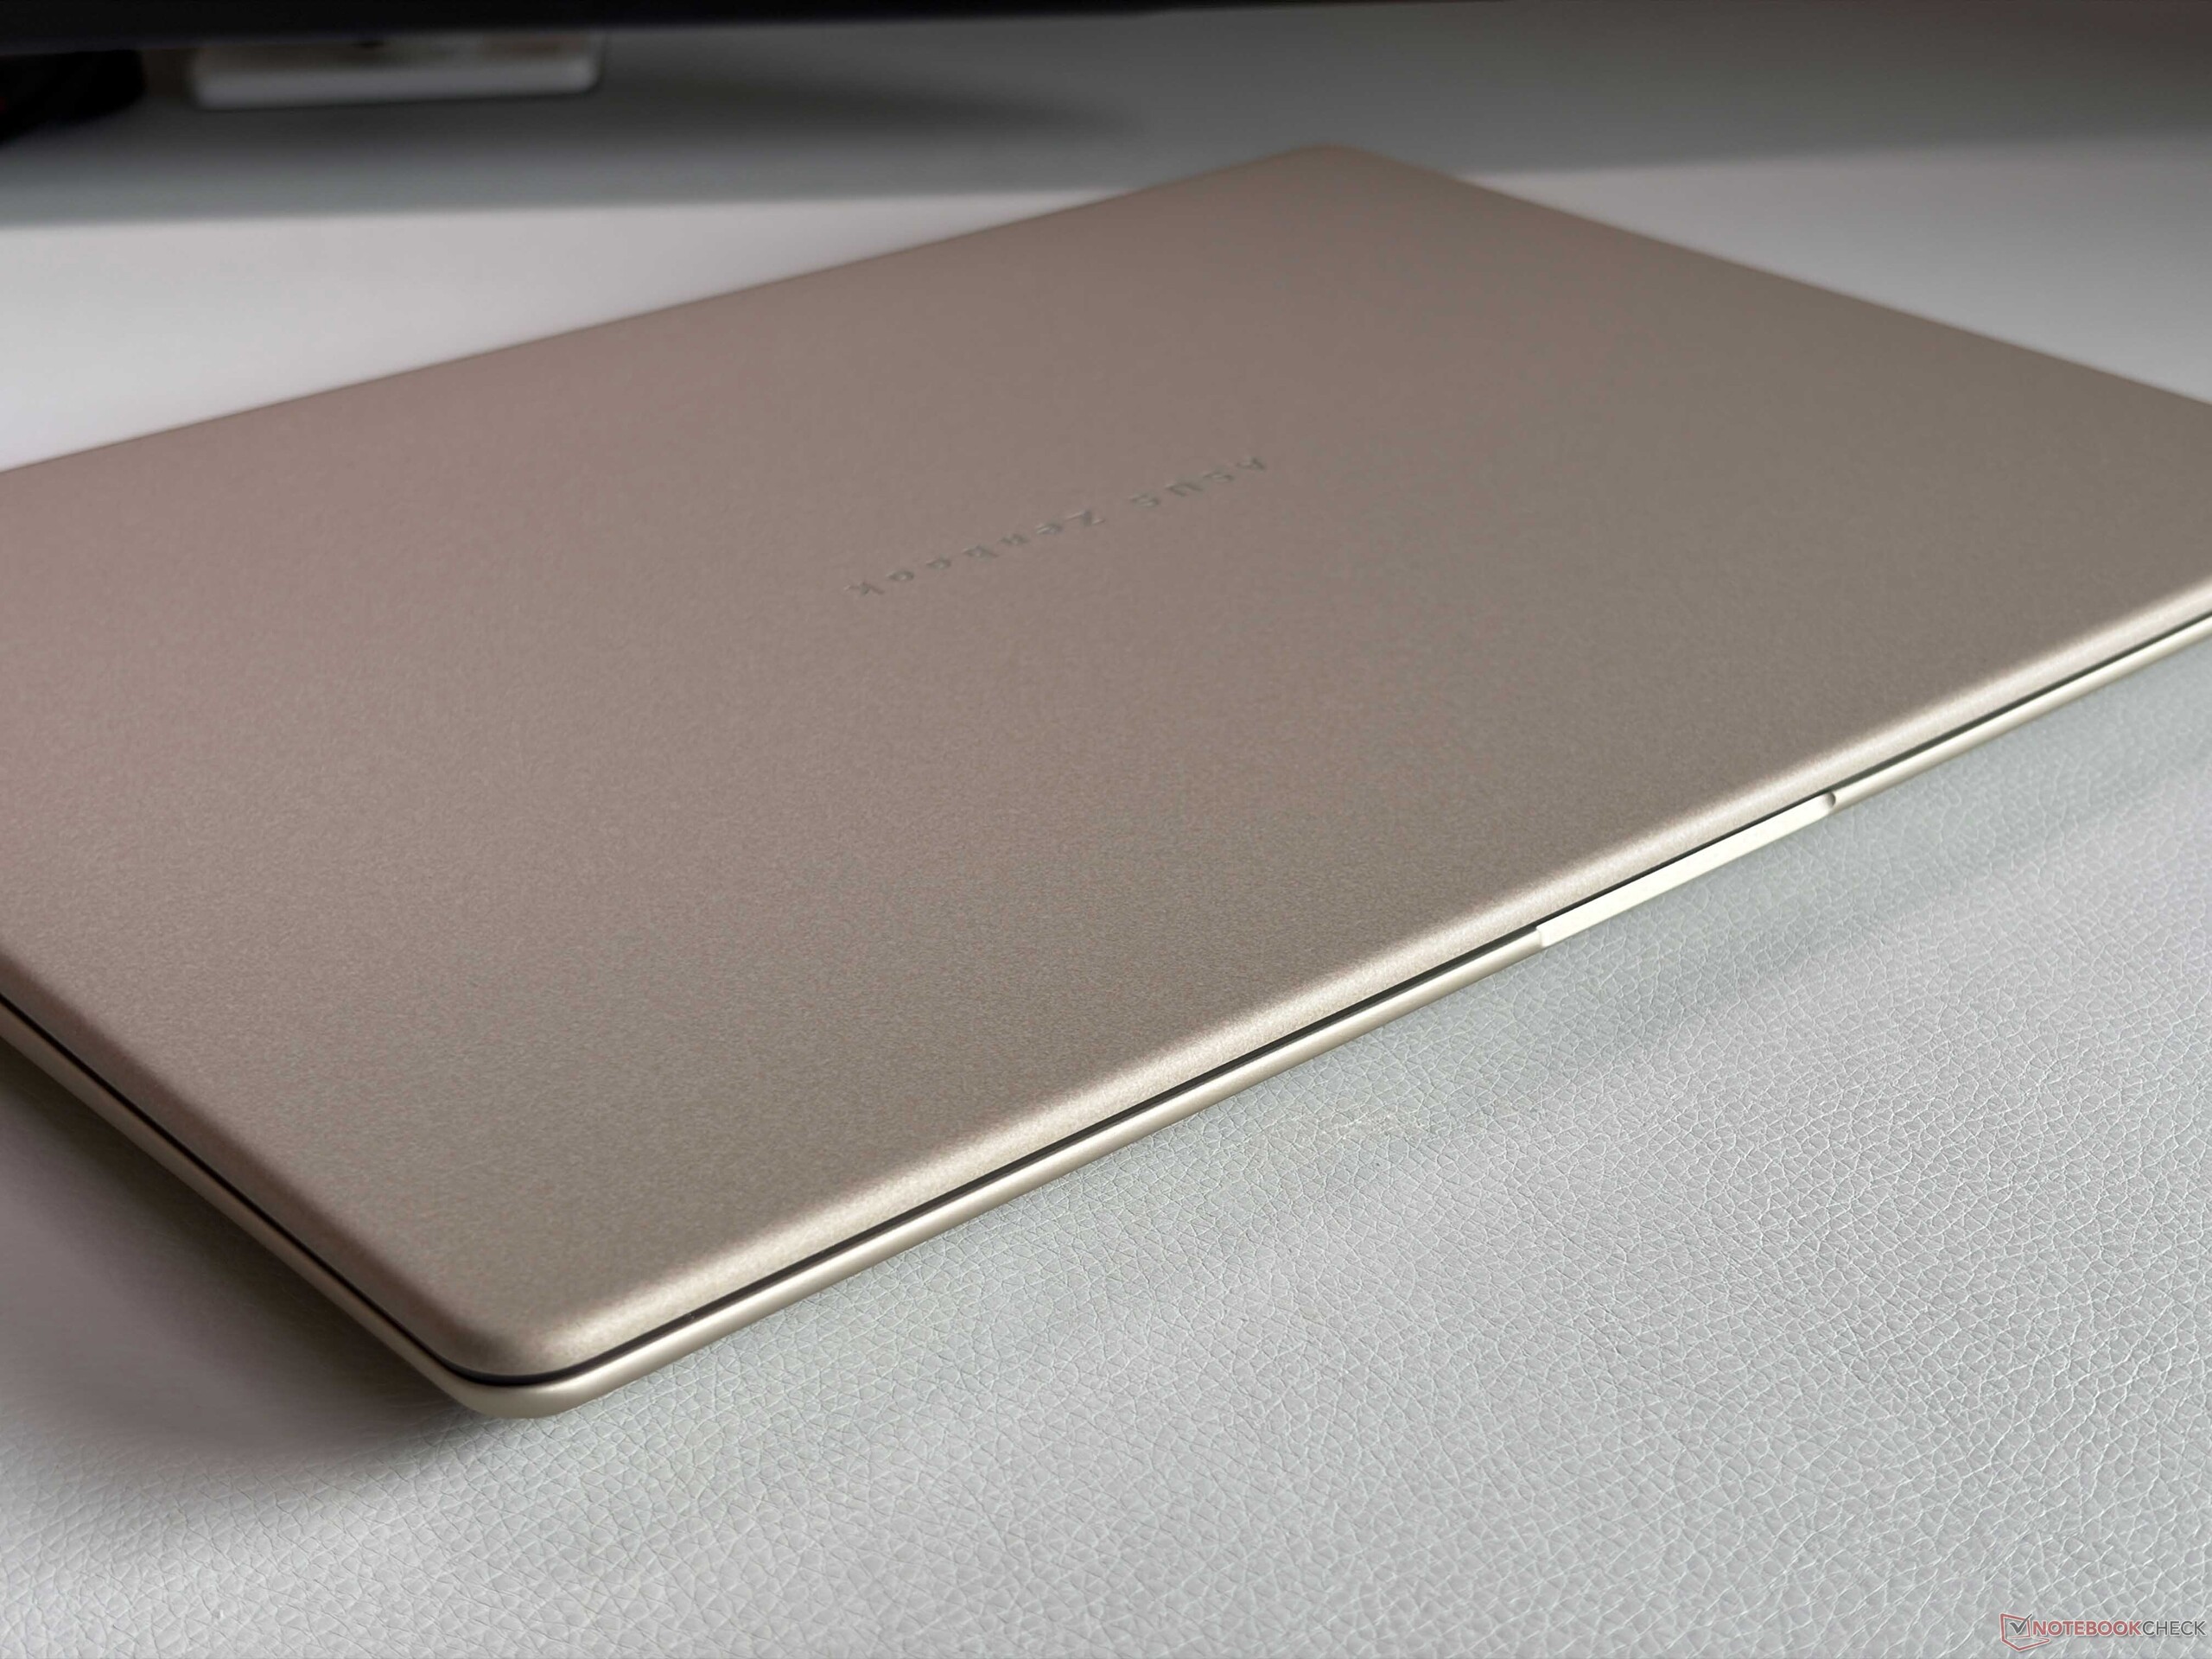
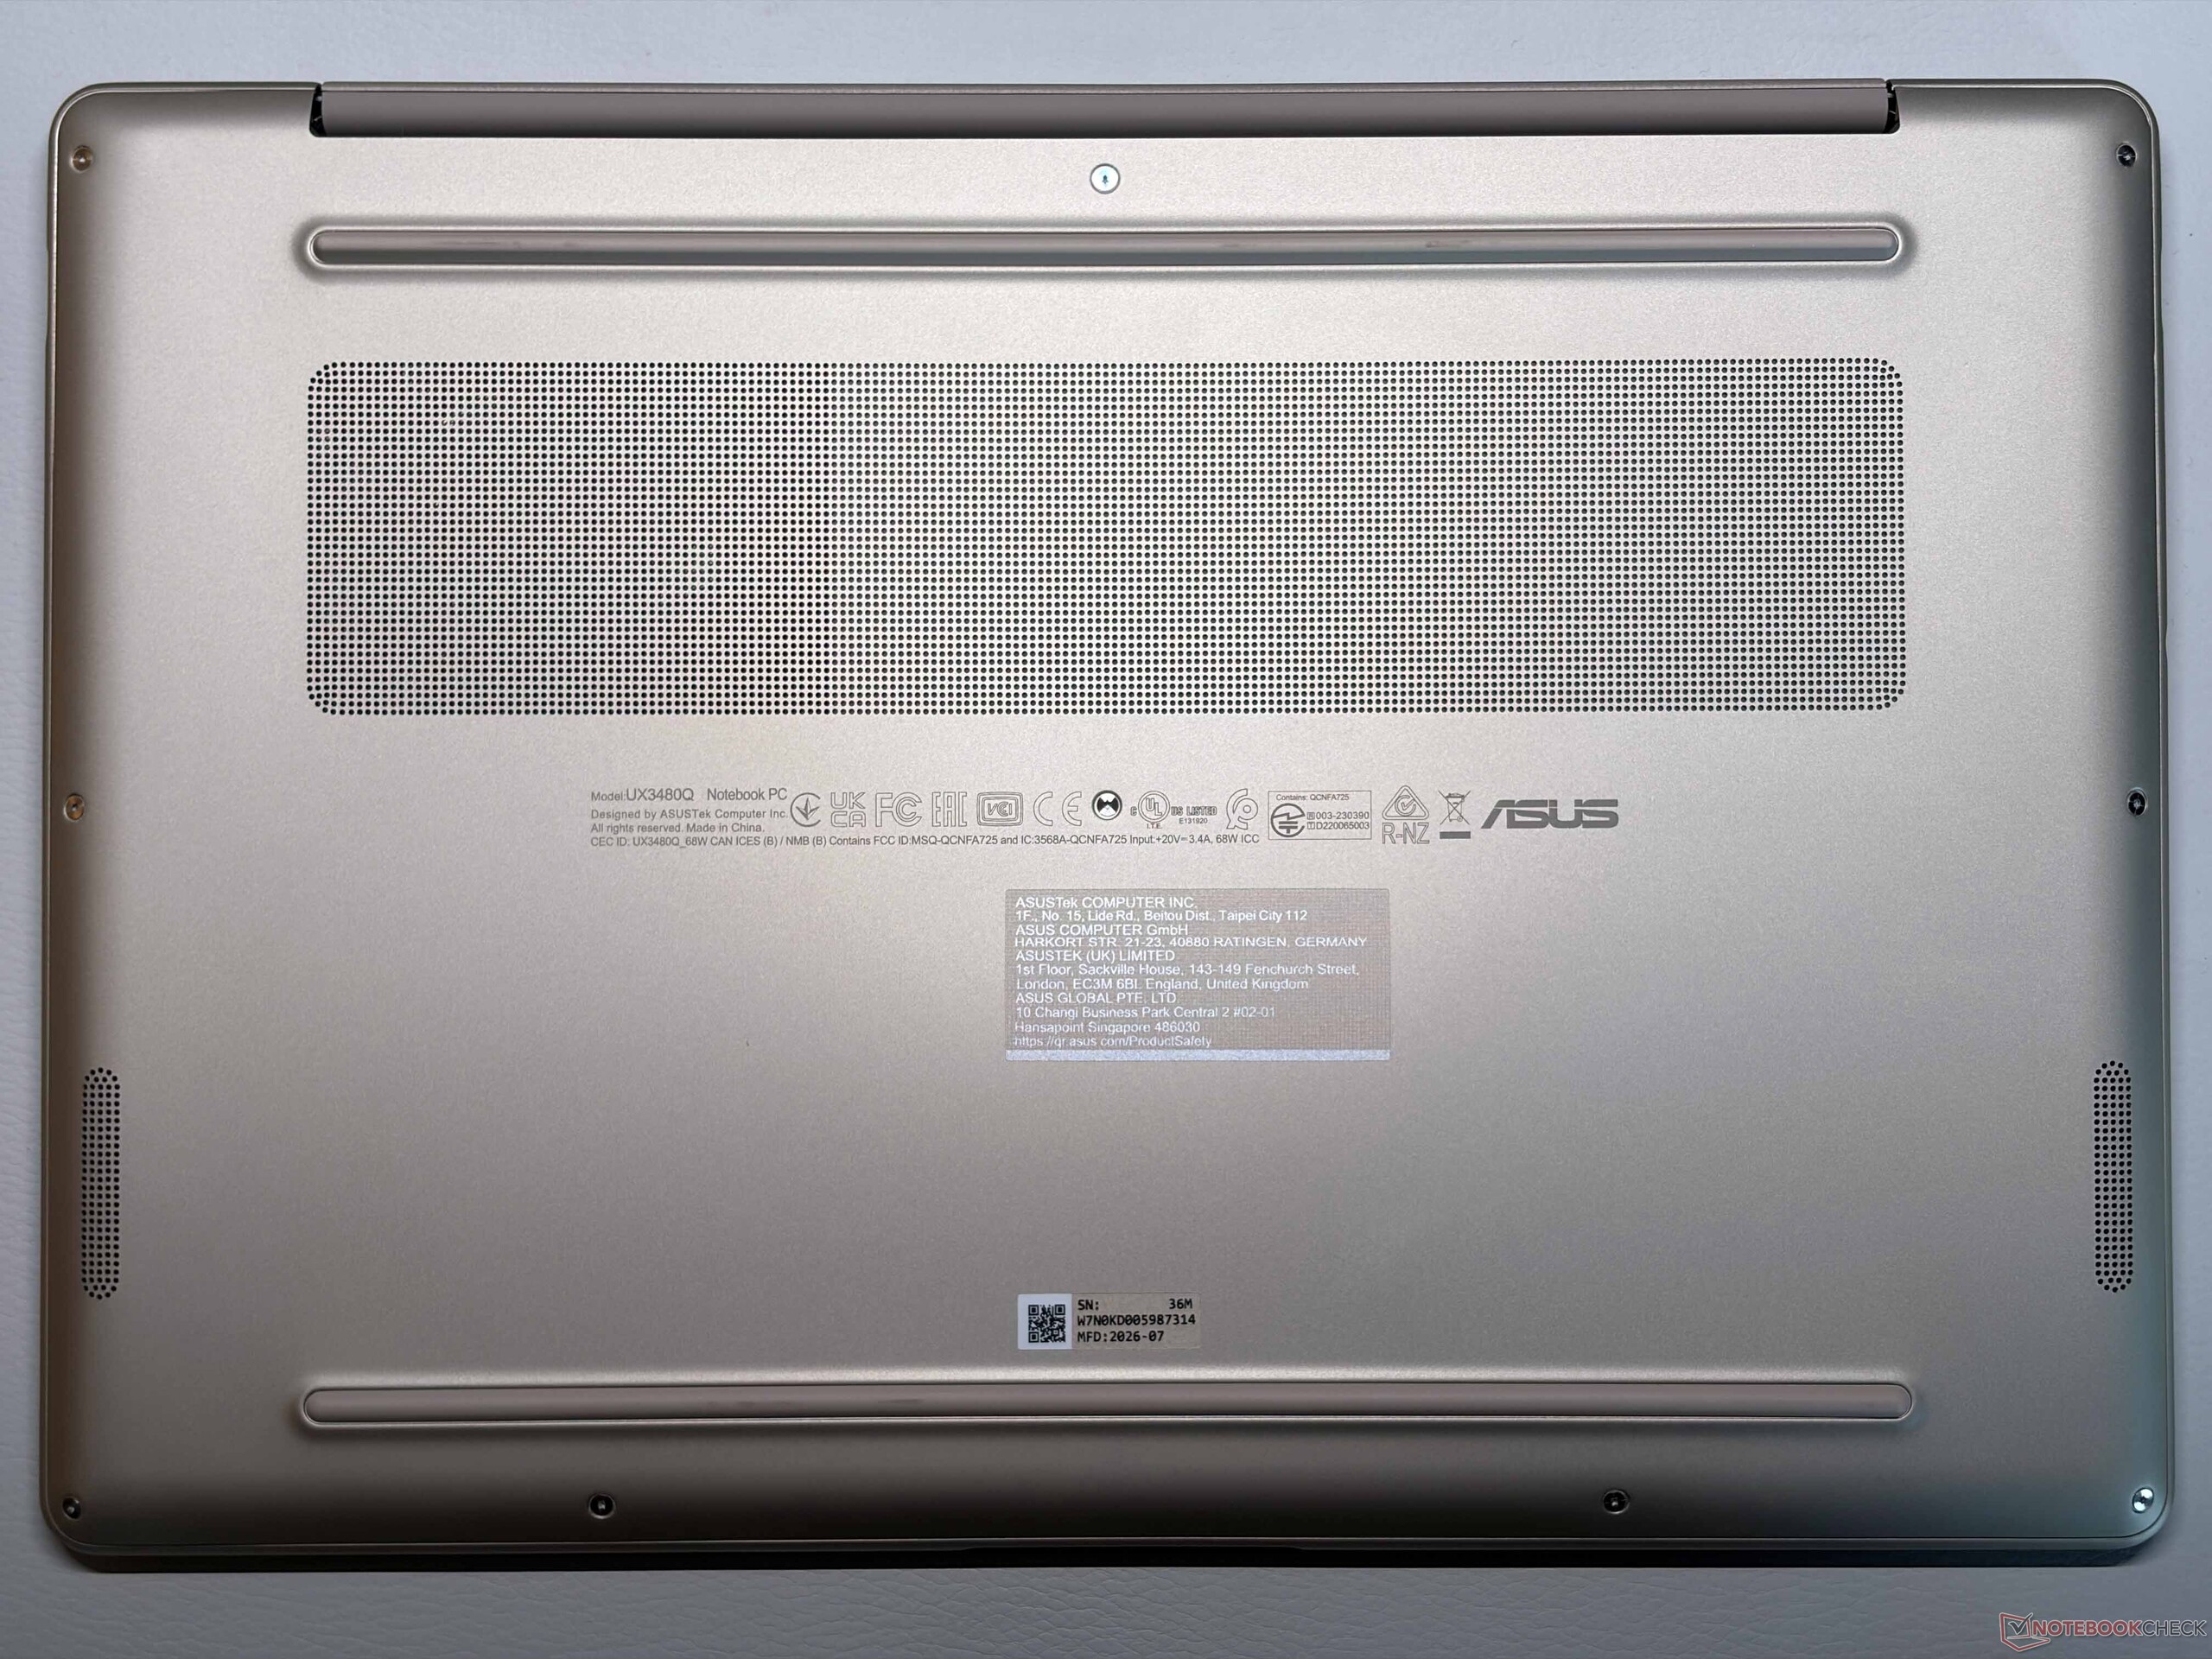
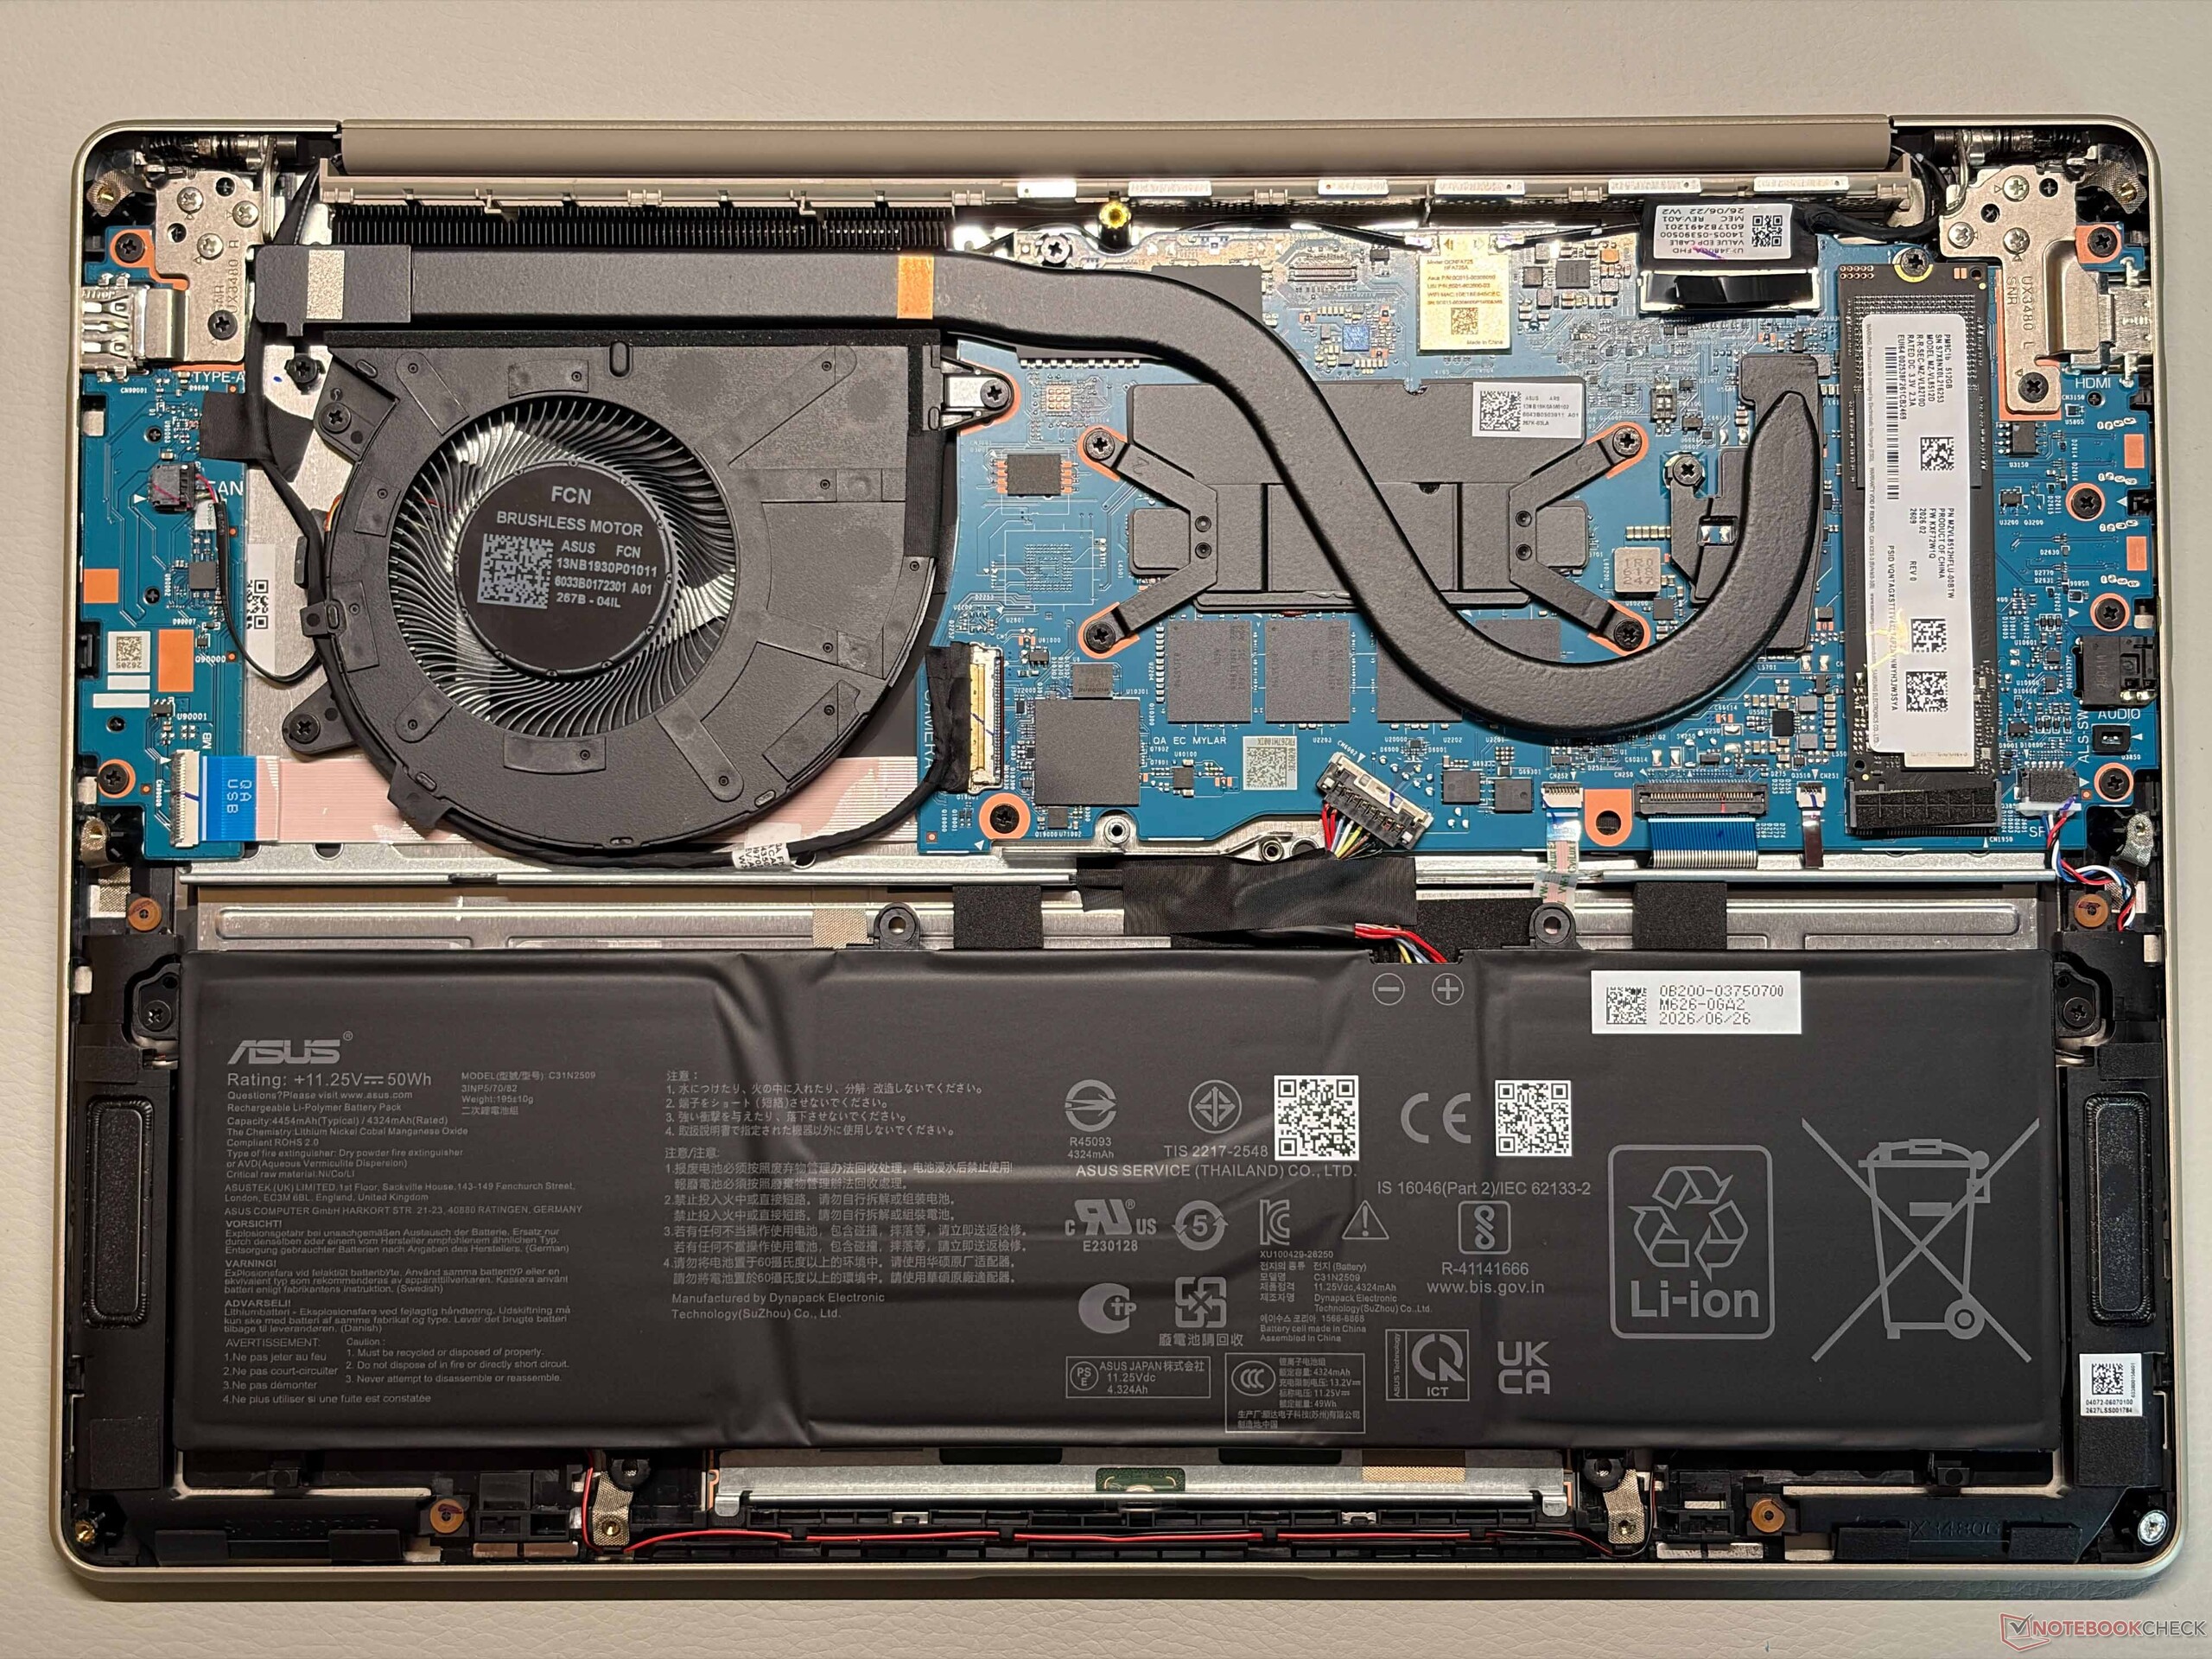
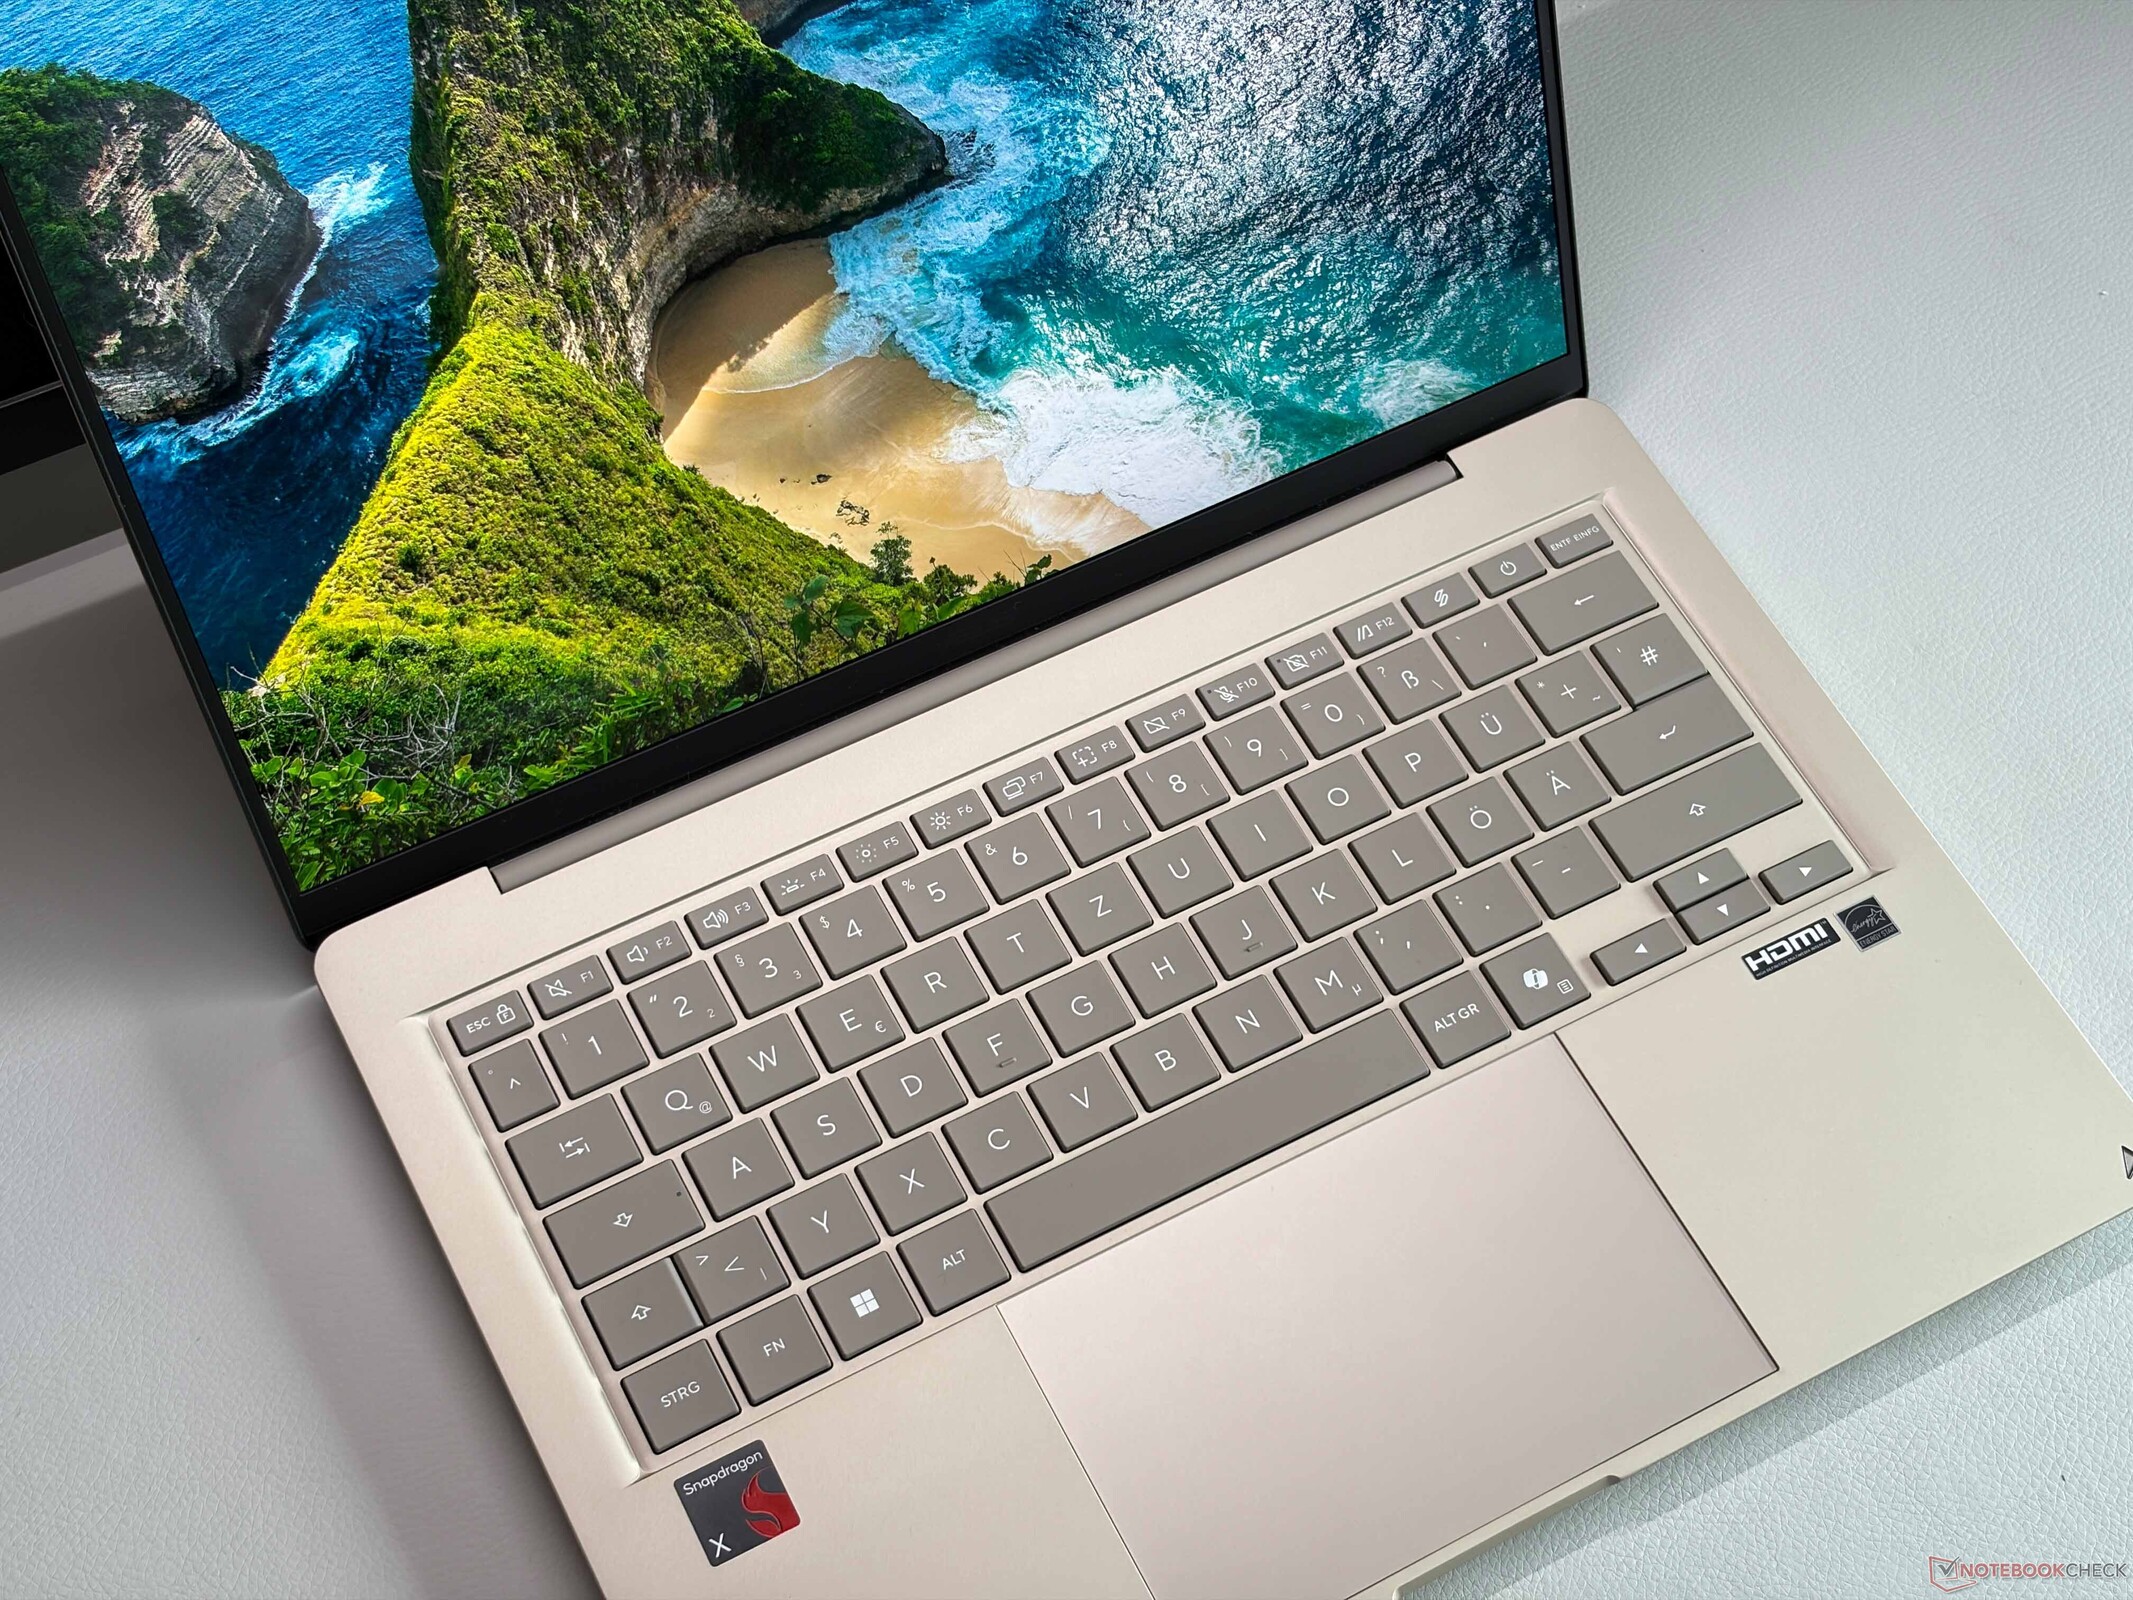
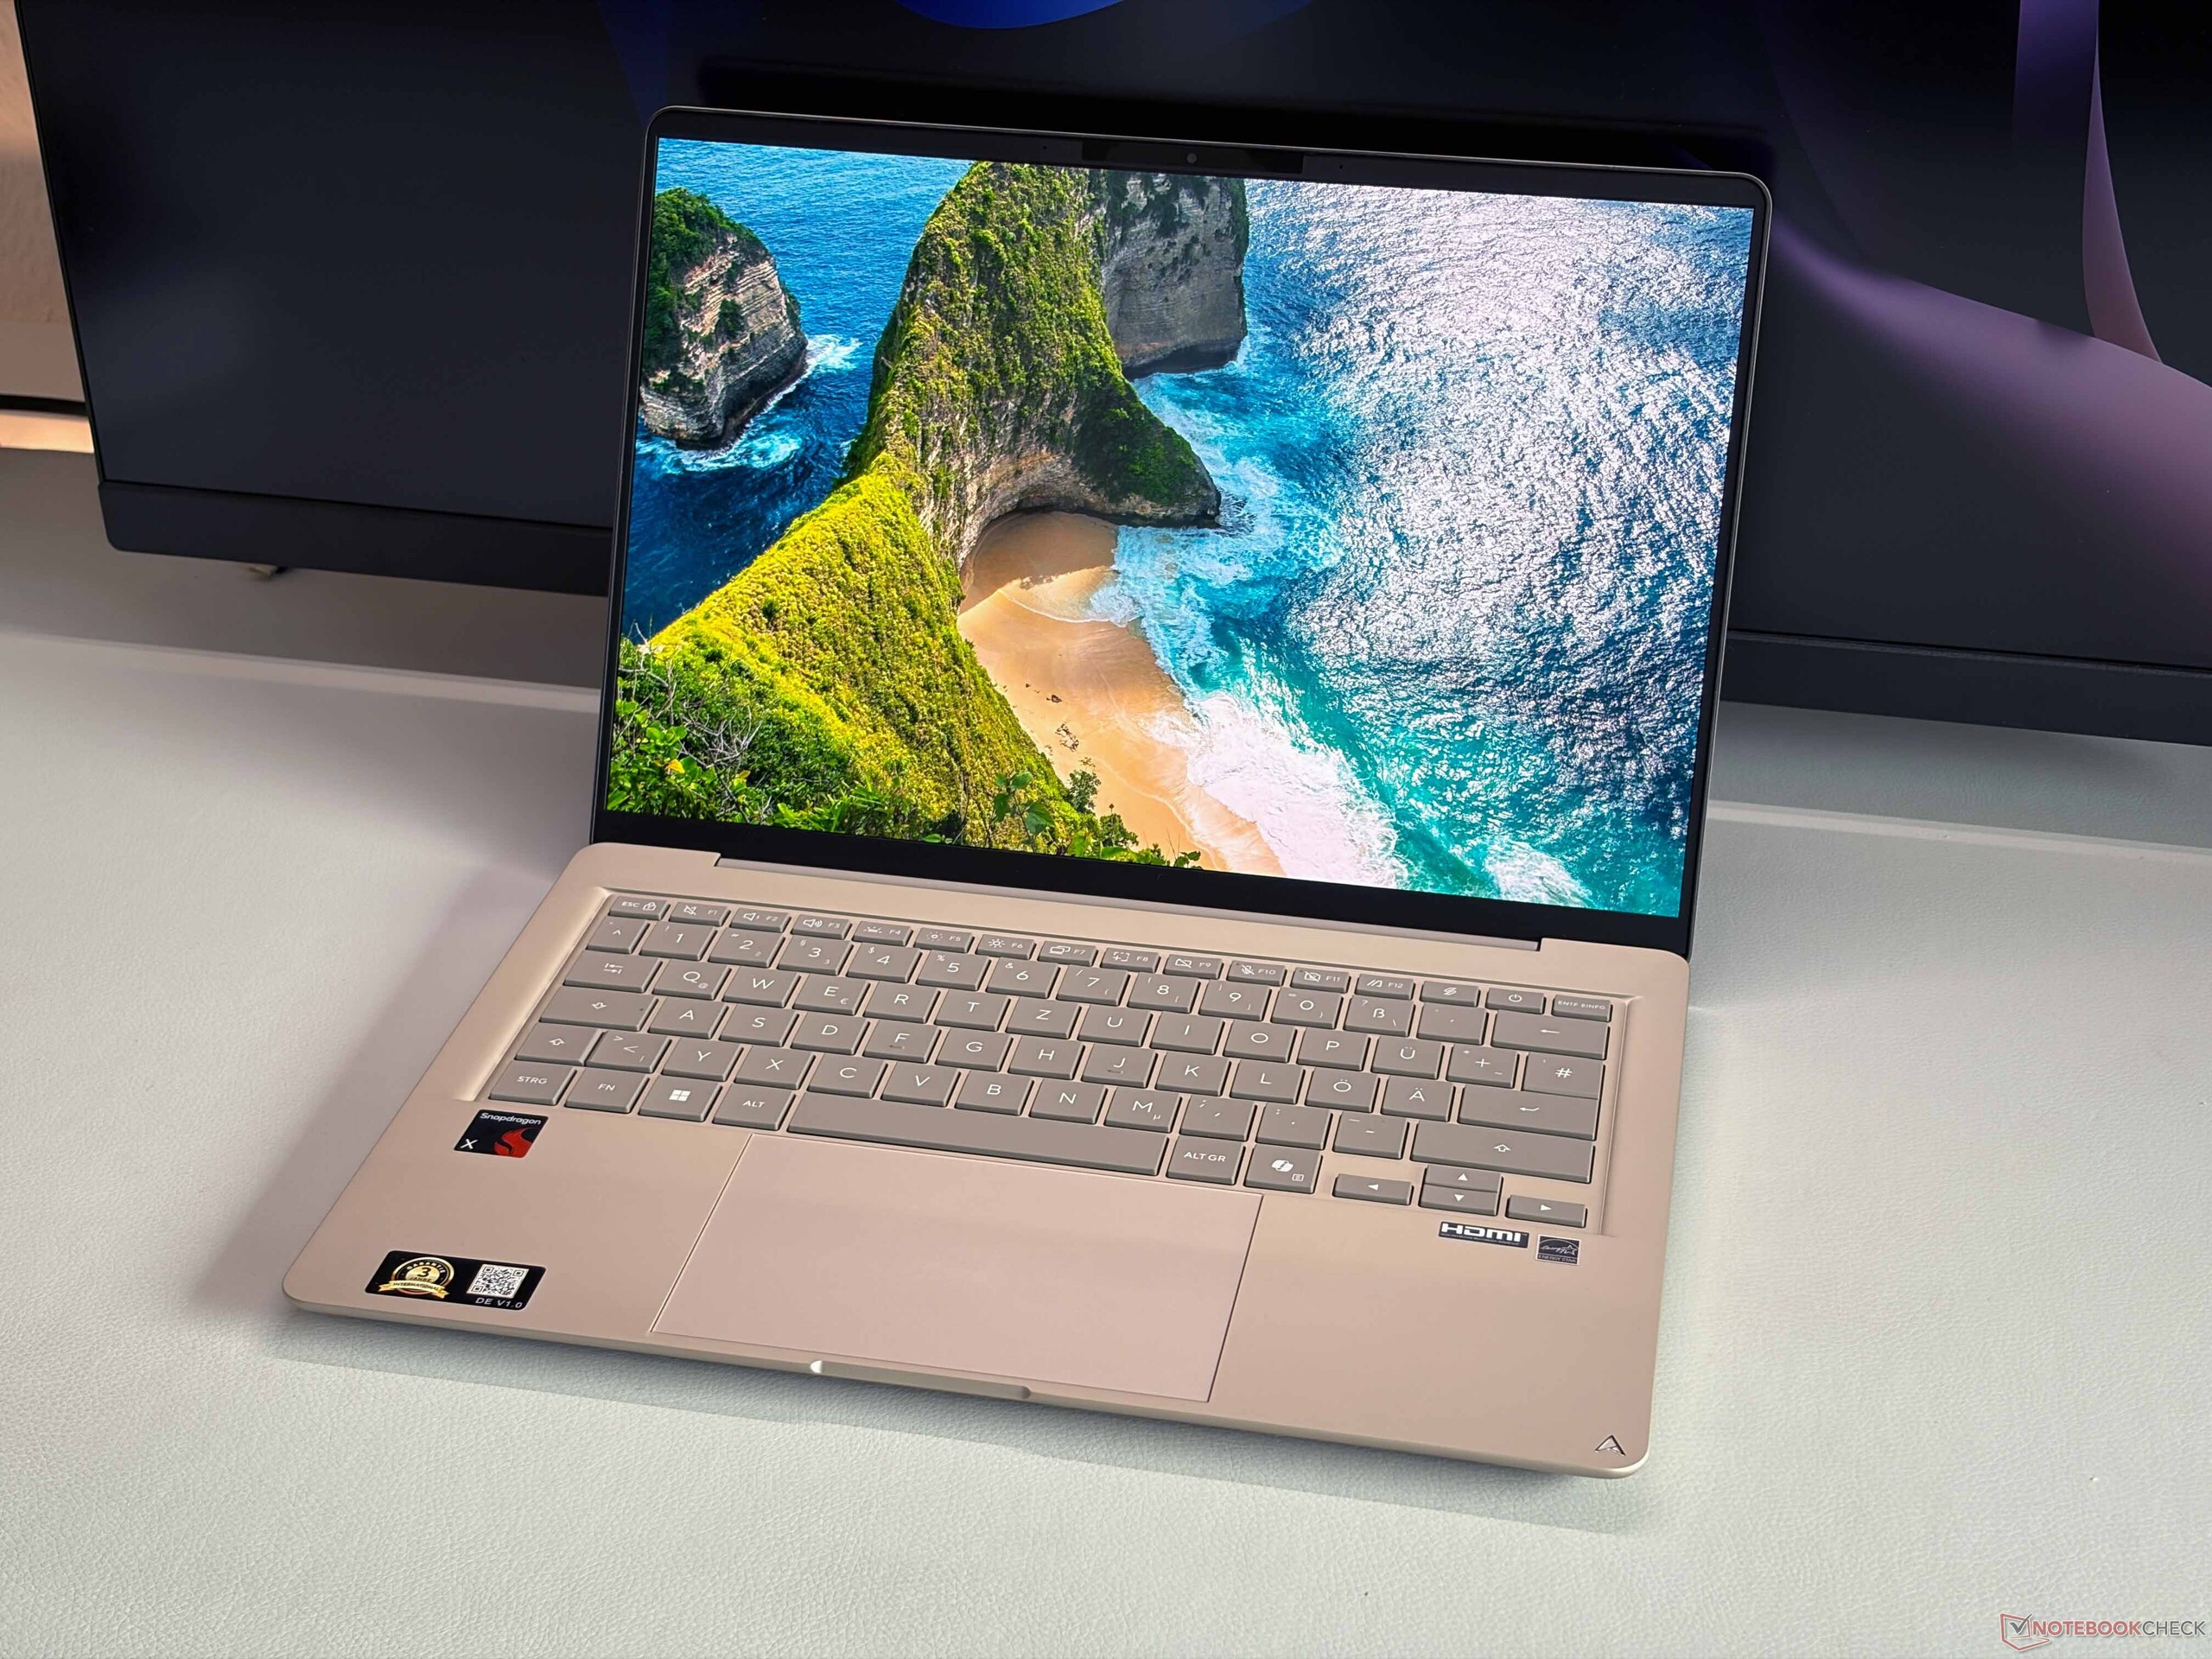
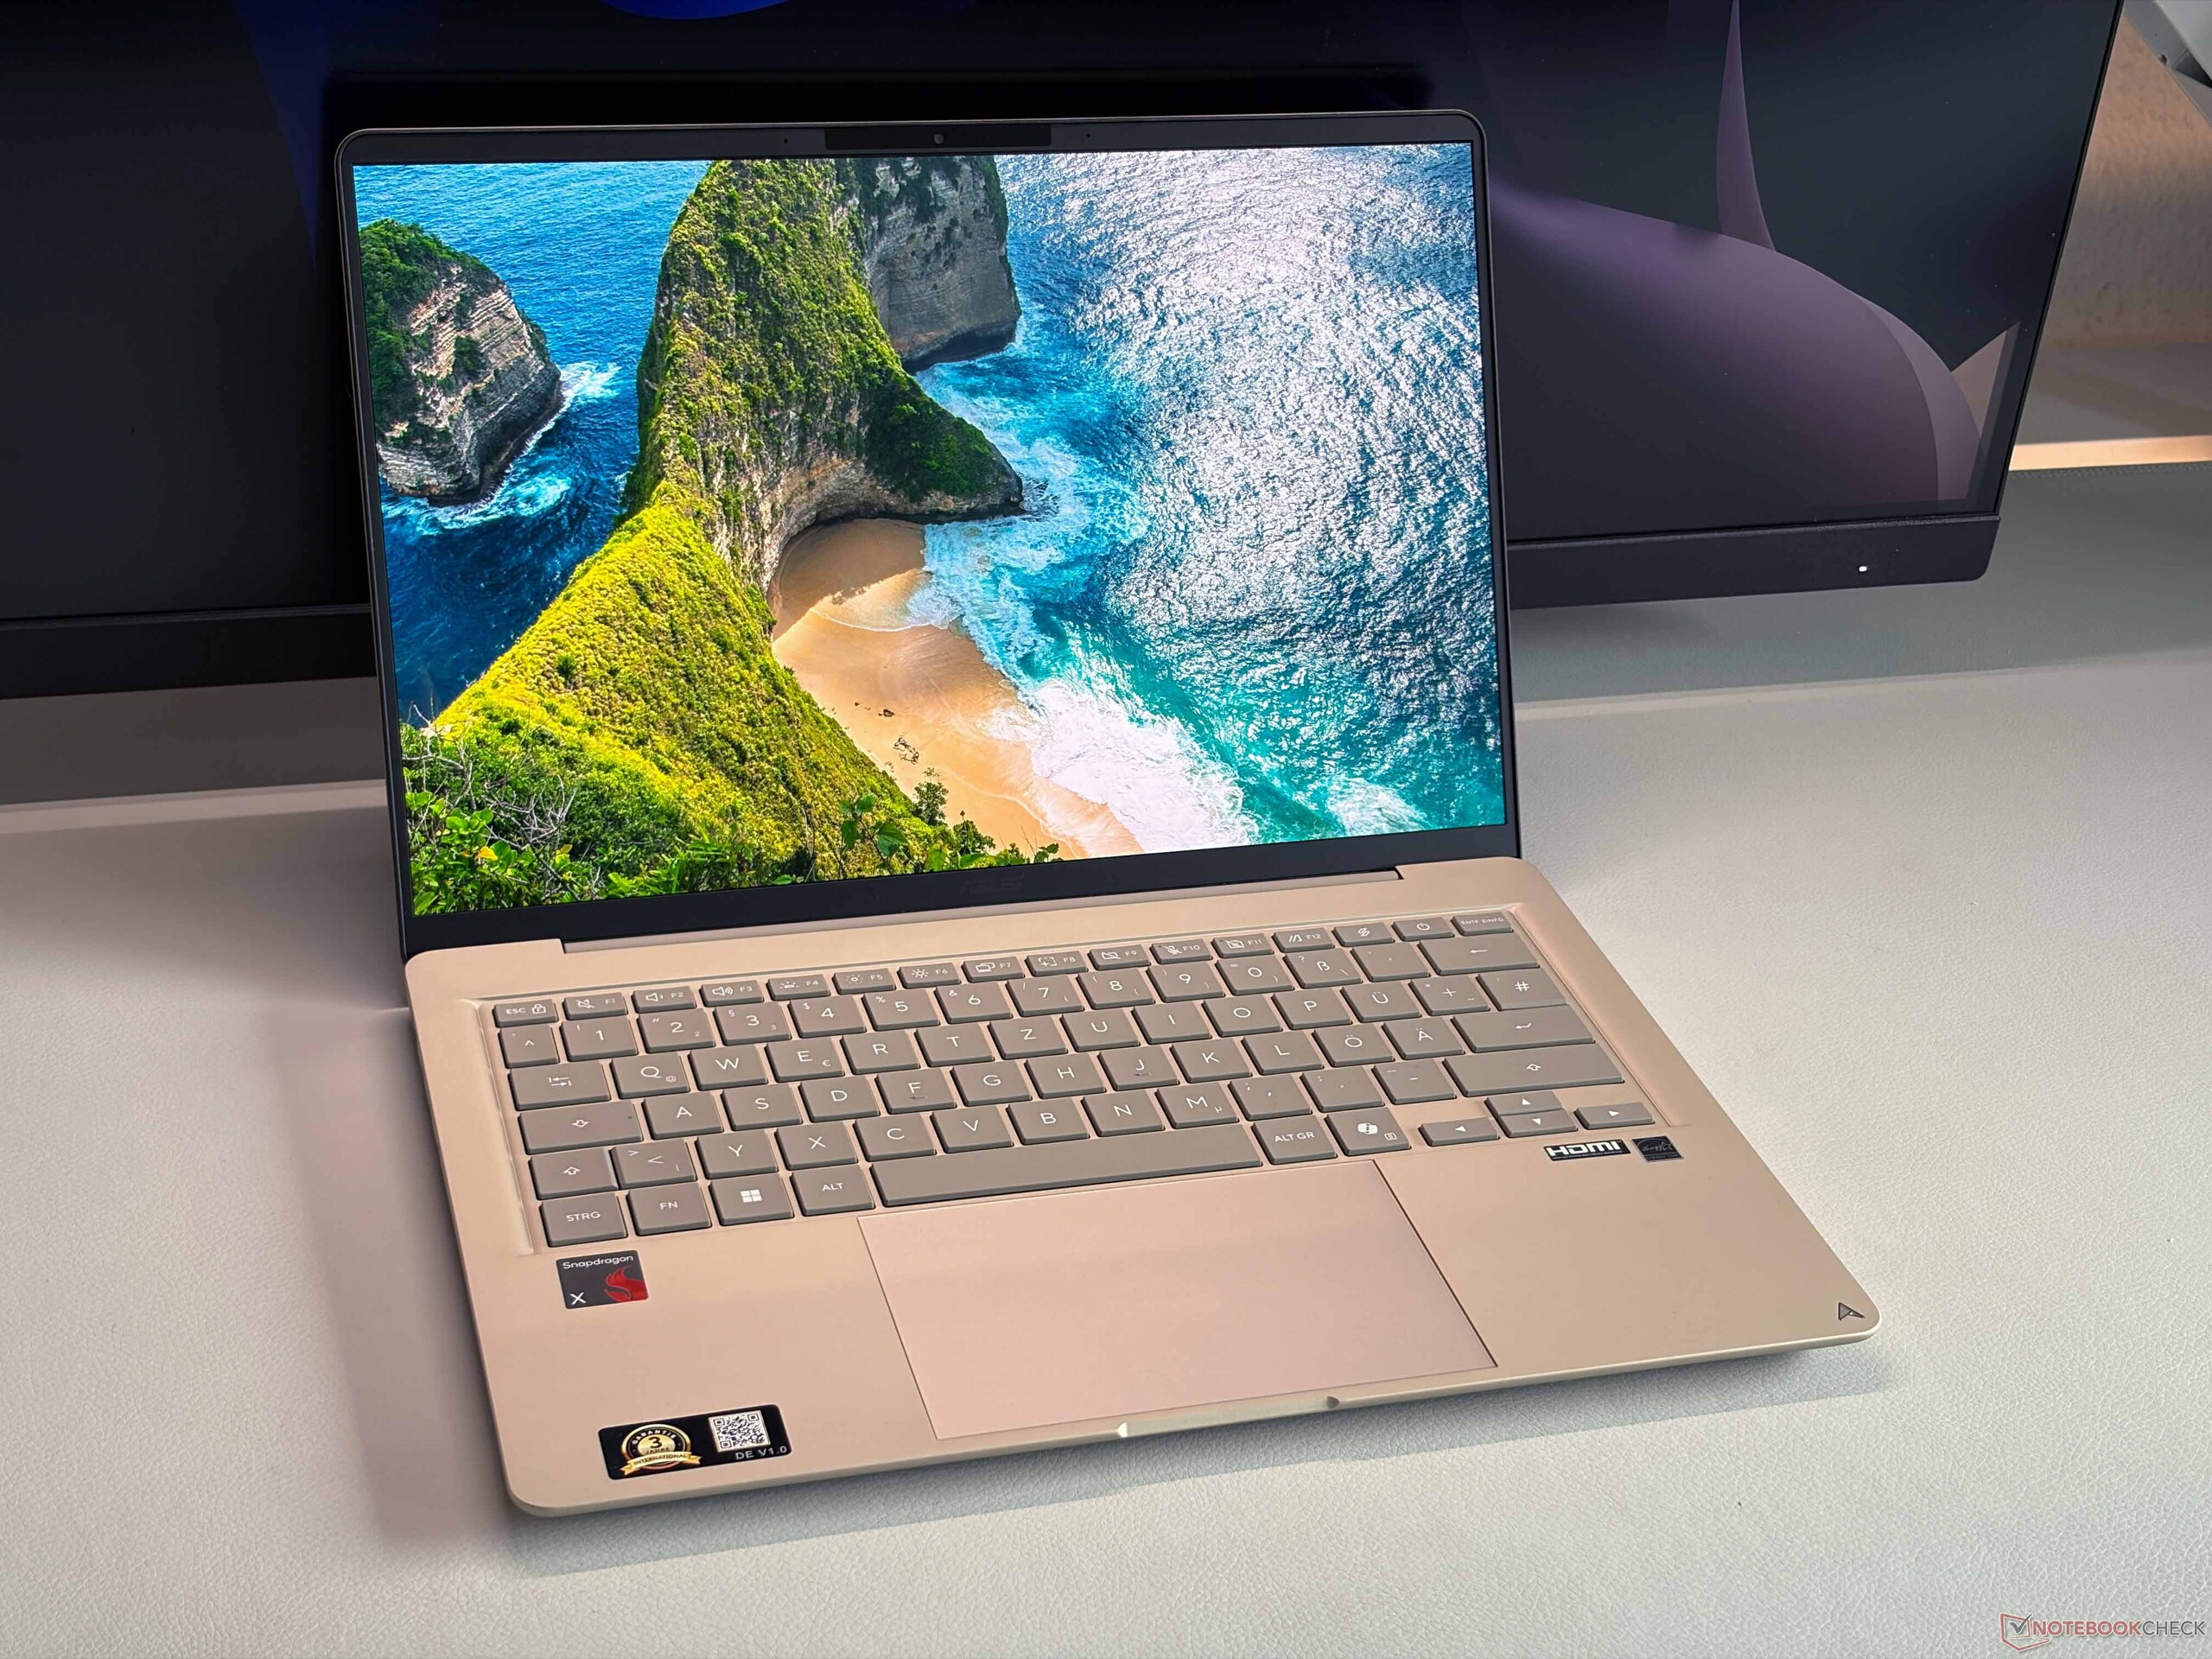
The Zenbook 14 is available in Zabriskie Beige, Arctic Blue as well as Komodo Coral and uses a ceraluminum chassis. Compared to the Zenbook A14 (under 1 kg), the new Zenbook 14 is slightly heavier at 1.1 kg, but the feeling is a bit more dense. The stability of the base unit is excellent and only the center of the keyboard can be pushed in with a lot of force, but this is no issue in practice. The lid is a bit weaker and there are also some creaking sounds, but the hinges are well adjusted. Maintenance options are limited to the M.2-2280 SSD and you can clean the fan. 

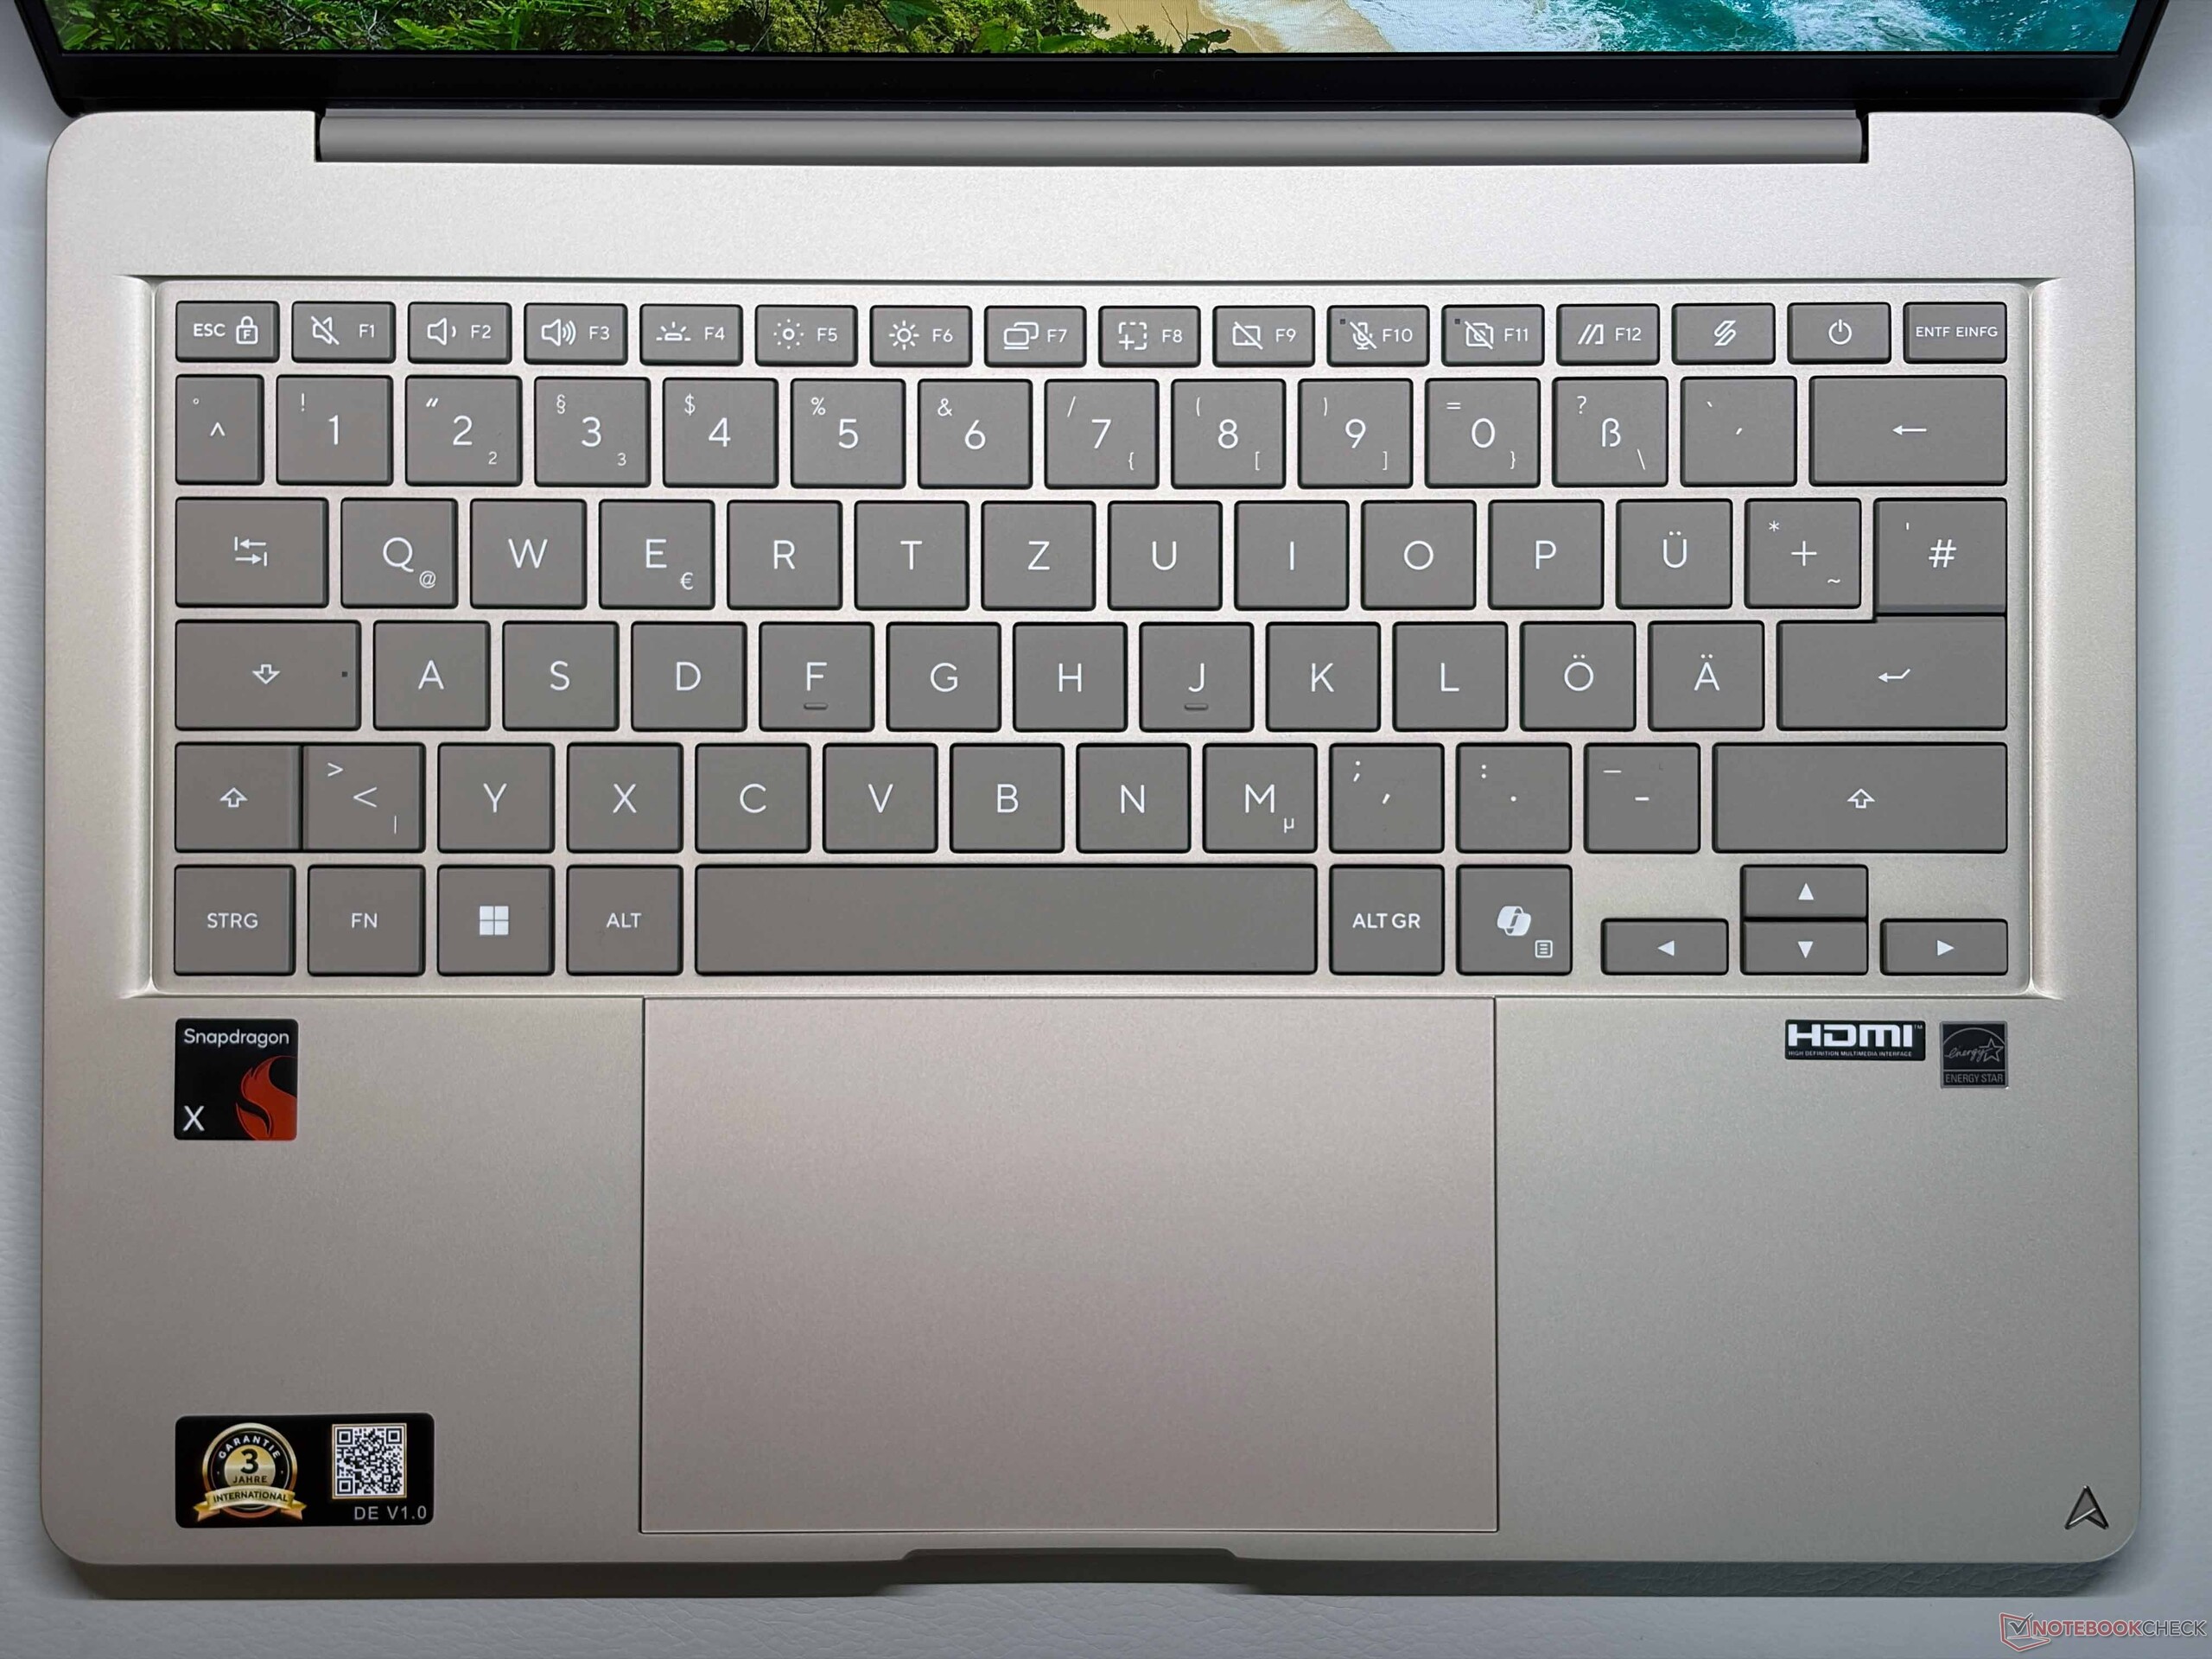
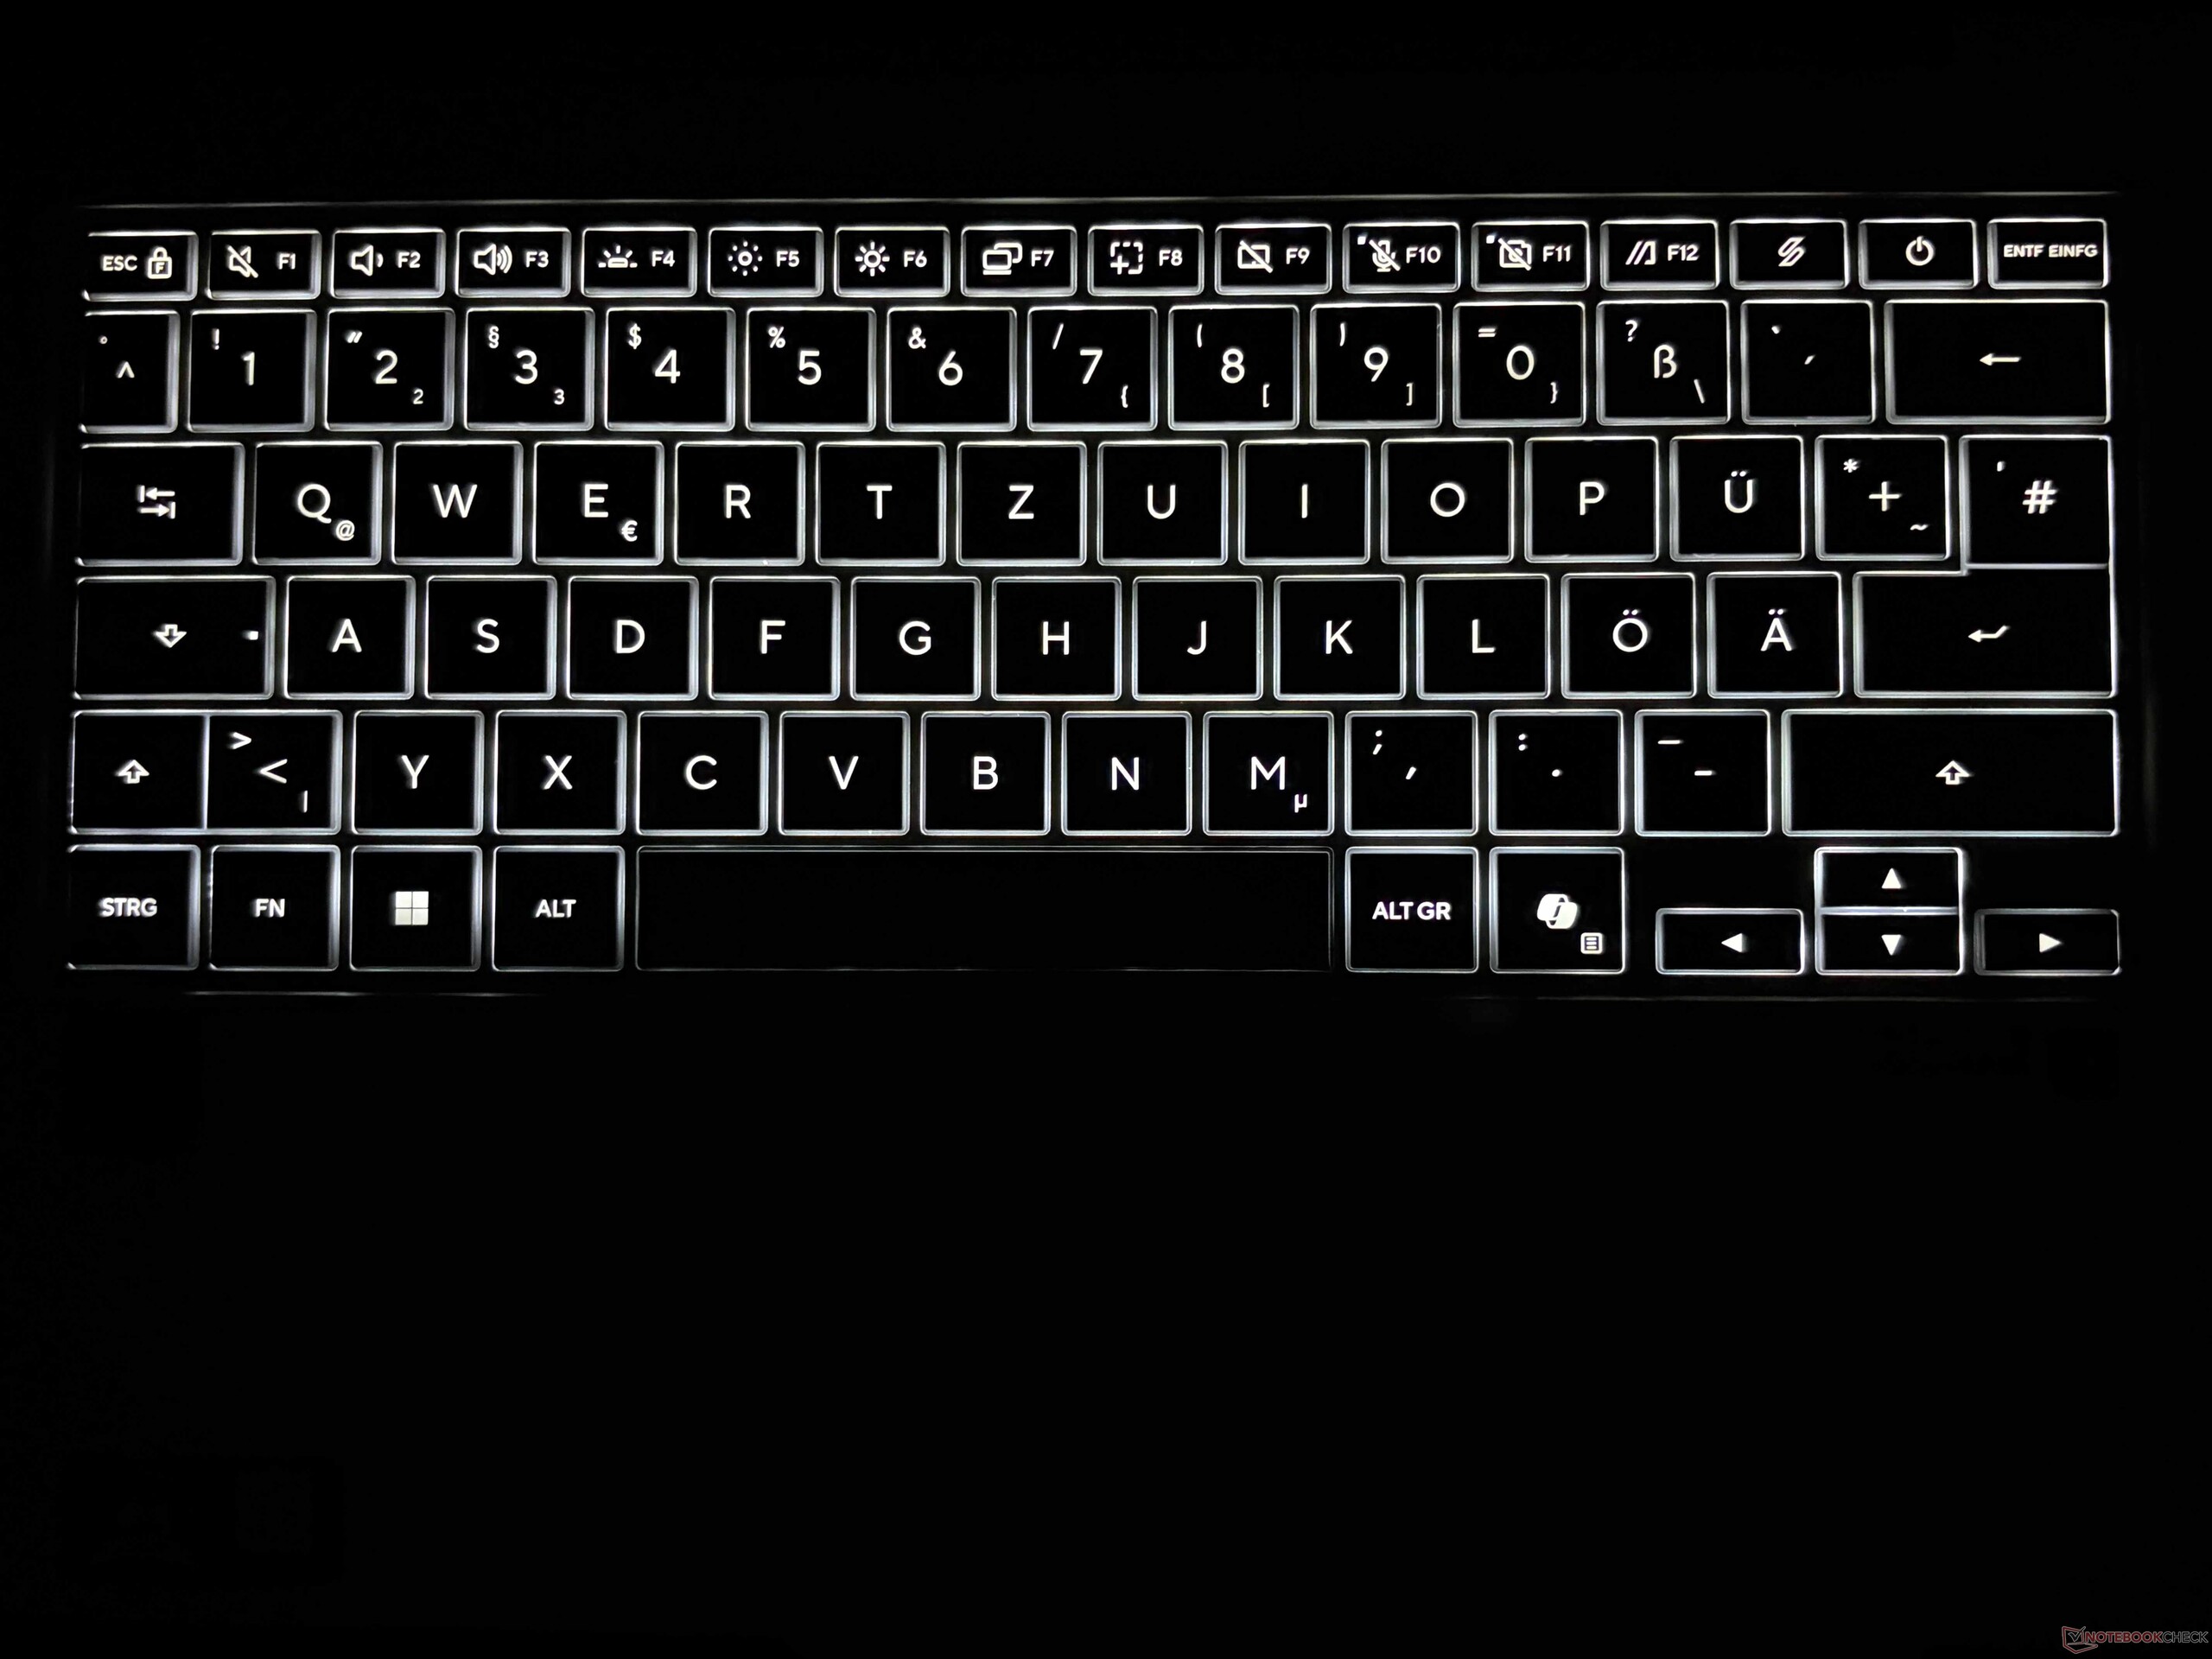
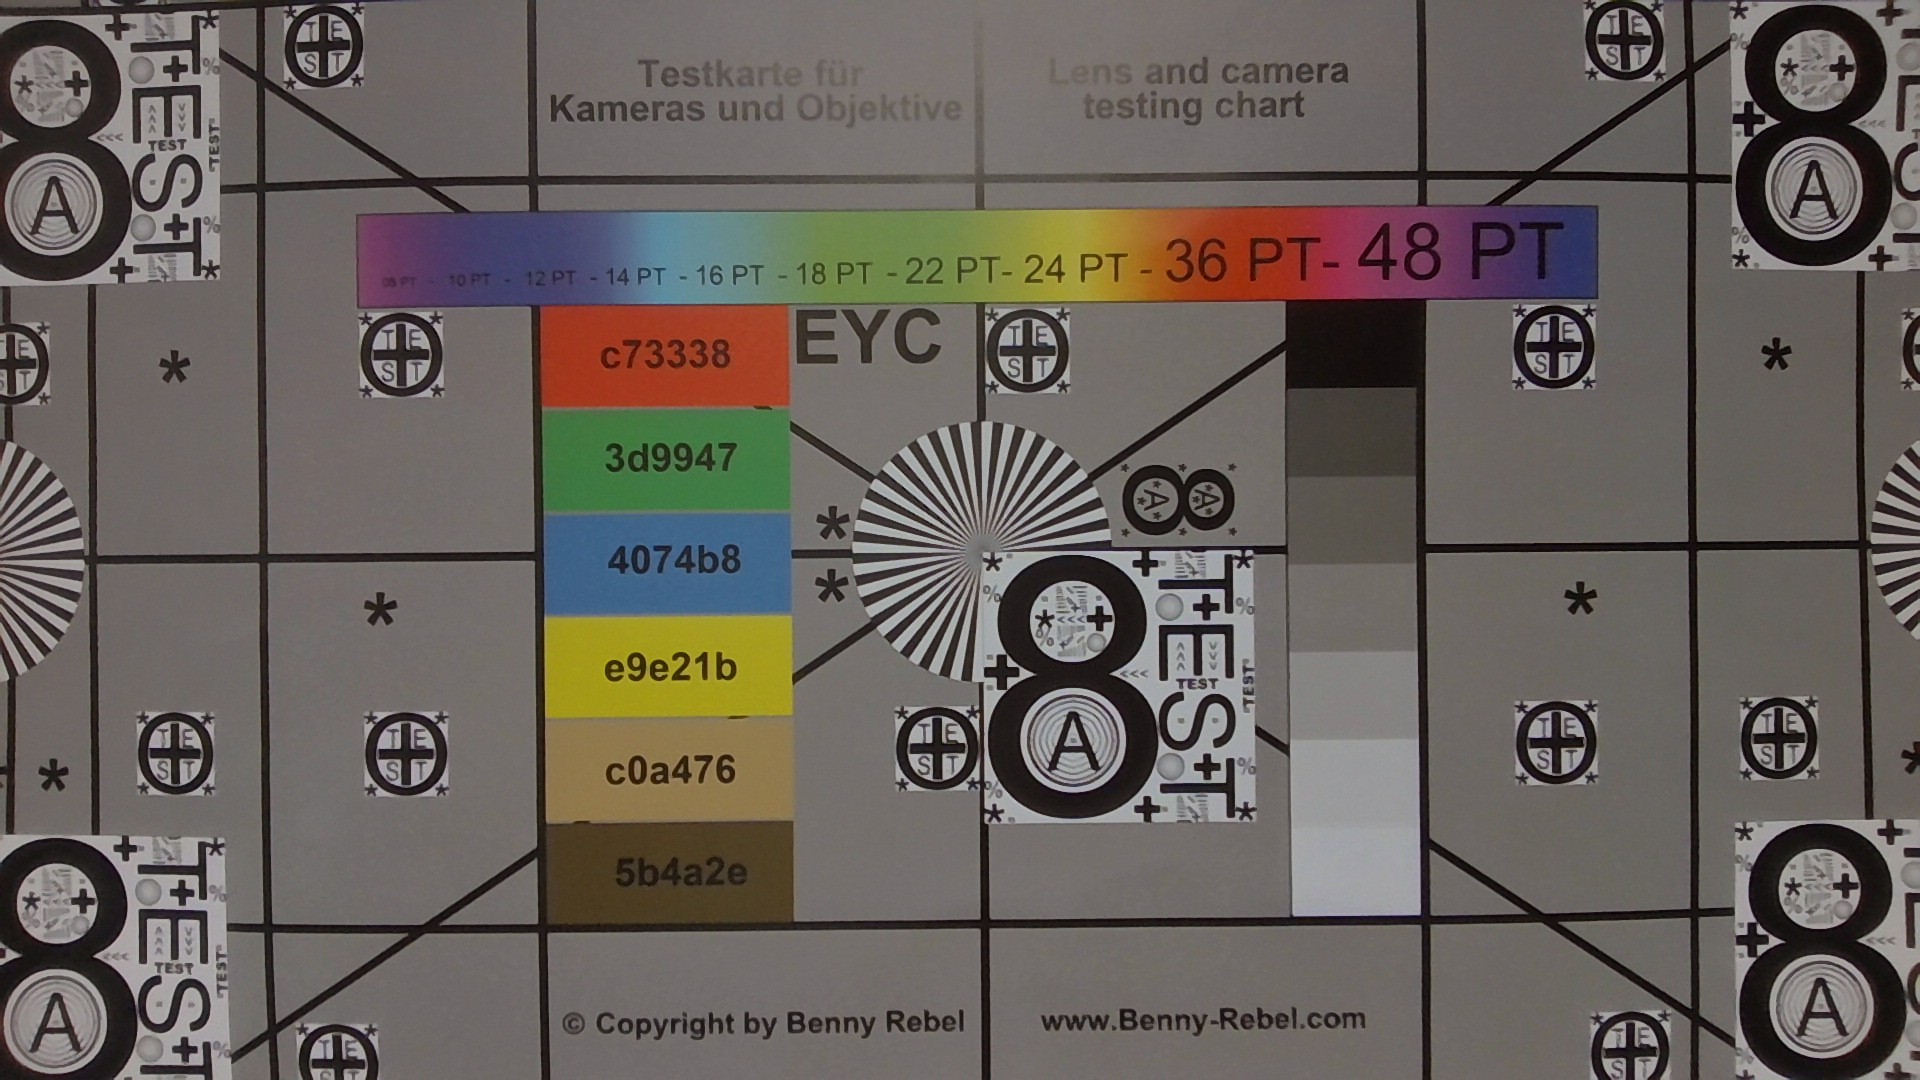
The port situation is sufficient with two USB-C ports, one USB-A as well as HDMI and you get a speedy Wi-Fi 6E module with stable transfer rates. The 1080p webcam takes decent images. The input devices are one of the highlights, because you get a a very precise backlit keyboard with 1.7 mm travel, which is a joy to type on. The clickpad also works extremely well and the mechanical clicks are not too loud.
Size Comparison

311.1 mm / 12.2 in 215.8 mm / 8.5 in 16.9 mm / 0.665 in 1.1 kg2.53 lbs312 mm / 12.3 in 222 mm / 8.74 in 15 mm / 0.591 in 1.1 kg2.38 lbs310.7 mm / 12.2 in 213.9 mm / 8.42 in 15.9 mm / 0.626 in 978 g2.16 lbs312 mm / 12.3 in 217.4 mm / 8.56 in 12.7 mm / 0.5 in 1.3 kg2.85 lbs297.5 mm / 11.7 in 206.4 mm / 8.13 in 12.7 mm / 0.5 in 1.2 kg2.72 lbs296.9 mm / 11.7 in 200.66 mm / 7.9 in 12.7 mm / 0.5 in 1.1 kg2.34 lbs297 mm / 11.7 in 210 mm / 8.27 in 1 mm / 0.03937 in 5.7 g0.01257 lbs
Left: HDMI 2.1 (TMDS), 2x USB-C 3.2 Gen.2 (10 Gbps, DisplayPort, Power Delivery), 3.5 mm stereo
Right: USB-A 3.2 Gen. 1 (5 Gbps)
Networking
Asus Zenbook 14 UX3480QA
Qualcomm Fast Connect 6900 Wi-Fi 6E Dual Band Simultaneous
iperf3 transmit Wi-Fi6/7 RT-BE96U
2025 (min: 1872) MBit/s ∼100%
iperf3 receive Wi-Fi6/7 RT-BE96U
1920 (min: 1902) MBit/s ∼100%
Dell XPS 13 DX13260
Intel Wi-Fi 7 BE213 160MHz
iperf3 receive AXE11000 6GHz
1498 (min: 1435) MBit/s ∼92%
iperf3 transmit AXE11000 6GHz
1500 (min: 1399) MBit/s ∼100%
iperf3 receive AXE11000
1376 (min: 1302) MBit/s ∼78%
iperf3 transmit AXE11000
1179 (min: 636) MBit/s ∼67%
Apple MacBook Neo 256 GB
Wi-Fi 6E
iperf3 receive AXE11000
1293 (min: 1243) MBit/s ∼73%
iperf3 transmit AXE11000
1118 (min: 876) MBit/s ∼64%
Ninkear S14, 16+1TB
RTL8851BE
iperf3 transmit Wi-Fi6/7 RT-BE96U
492 (min: 434) MBit/s ∼24%
iperf3 receive Wi-Fi6/7 RT-BE96U
500 (min: 474) MBit/s ∼26%
iperf3 receive AXE11000
504 (min: 481) MBit/s ∼29%
iperf3 transmit AXE11000
496 (min: 459) MBit/s ∼28%
HP Omnibook 5 14
Qualcomm Fast Connect 6900 Wi-Fi 6E Dual Band Simultaneous
iperf3 receive AXE11000 6GHz
1628 (min: 1583) MBit/s ∼100%
iperf3 transmit AXE11000 6GHz
524 (min: 496) MBit/s ∼35%
iperf3 receive AXE11000
1300 (min: 1008) MBit/s ∼74%
iperf3 transmit AXE11000
923 (min: 757) MBit/s ∼53%
Asus ZenBook A14 UX3407QA
Qualcomm Fast Connect 6900 Wi-Fi 6E Dual Band Simultaneous
iperf3 receive AXE11000
1762 (min: 1734) MBit/s ∼100%
iperf3 transmit AXE11000
1751 (min: 1703) MBit/s ∼100%
01002003004005006007008009001000110012001300140015001600170018001900200021002200Tooltip
Asus Zenbook 14 UX3480QA; iperf3 transmit Wi-Fi6/7 RT-BE96U; iperf 3.1.3: Ø2025 (1872-2243) MBit/s
Asus Zenbook 14 UX3480QA; iperf3 receive Wi-Fi6/7 RT-BE96U; iperf 3.1.3: Ø1919 (1902-1929) MBit/s
ColorChecker
7 ∆E
4.8 ∆E
11.1 ∆E
10.5 ∆E
8.4 ∆E
5.2 ∆E
8.2 ∆E
9.7 ∆E
12.6 ∆E
6.1 ∆E
4.9 ∆E
5 ∆E
4.7 ∆E
10.5 ∆E
14.4 ∆E
1.1 ∆E
7 ∆E
14 ∆E
5.9 ∆E
3.9 ∆E
6 ∆E
7.1 ∆E
1.3 ∆E
8.1 ∆E
ColorChecker Asus Zenbook 14 UX3480QA: 7.4 ∆E min: 1.12 - max: 14.38 ∆E

Display - OLED with 300 nits

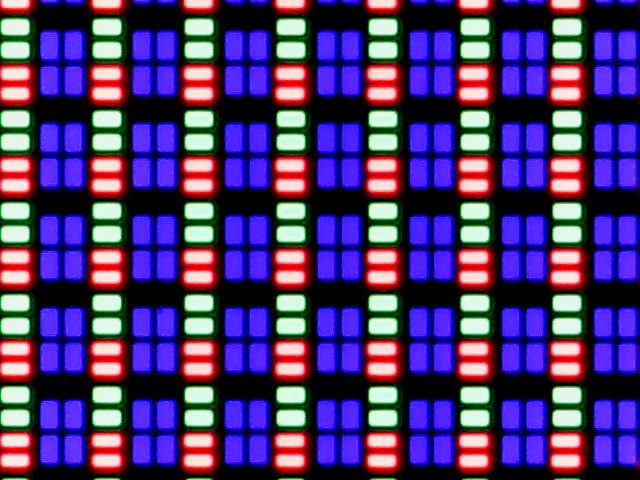
Subpixel array
Subpixel array

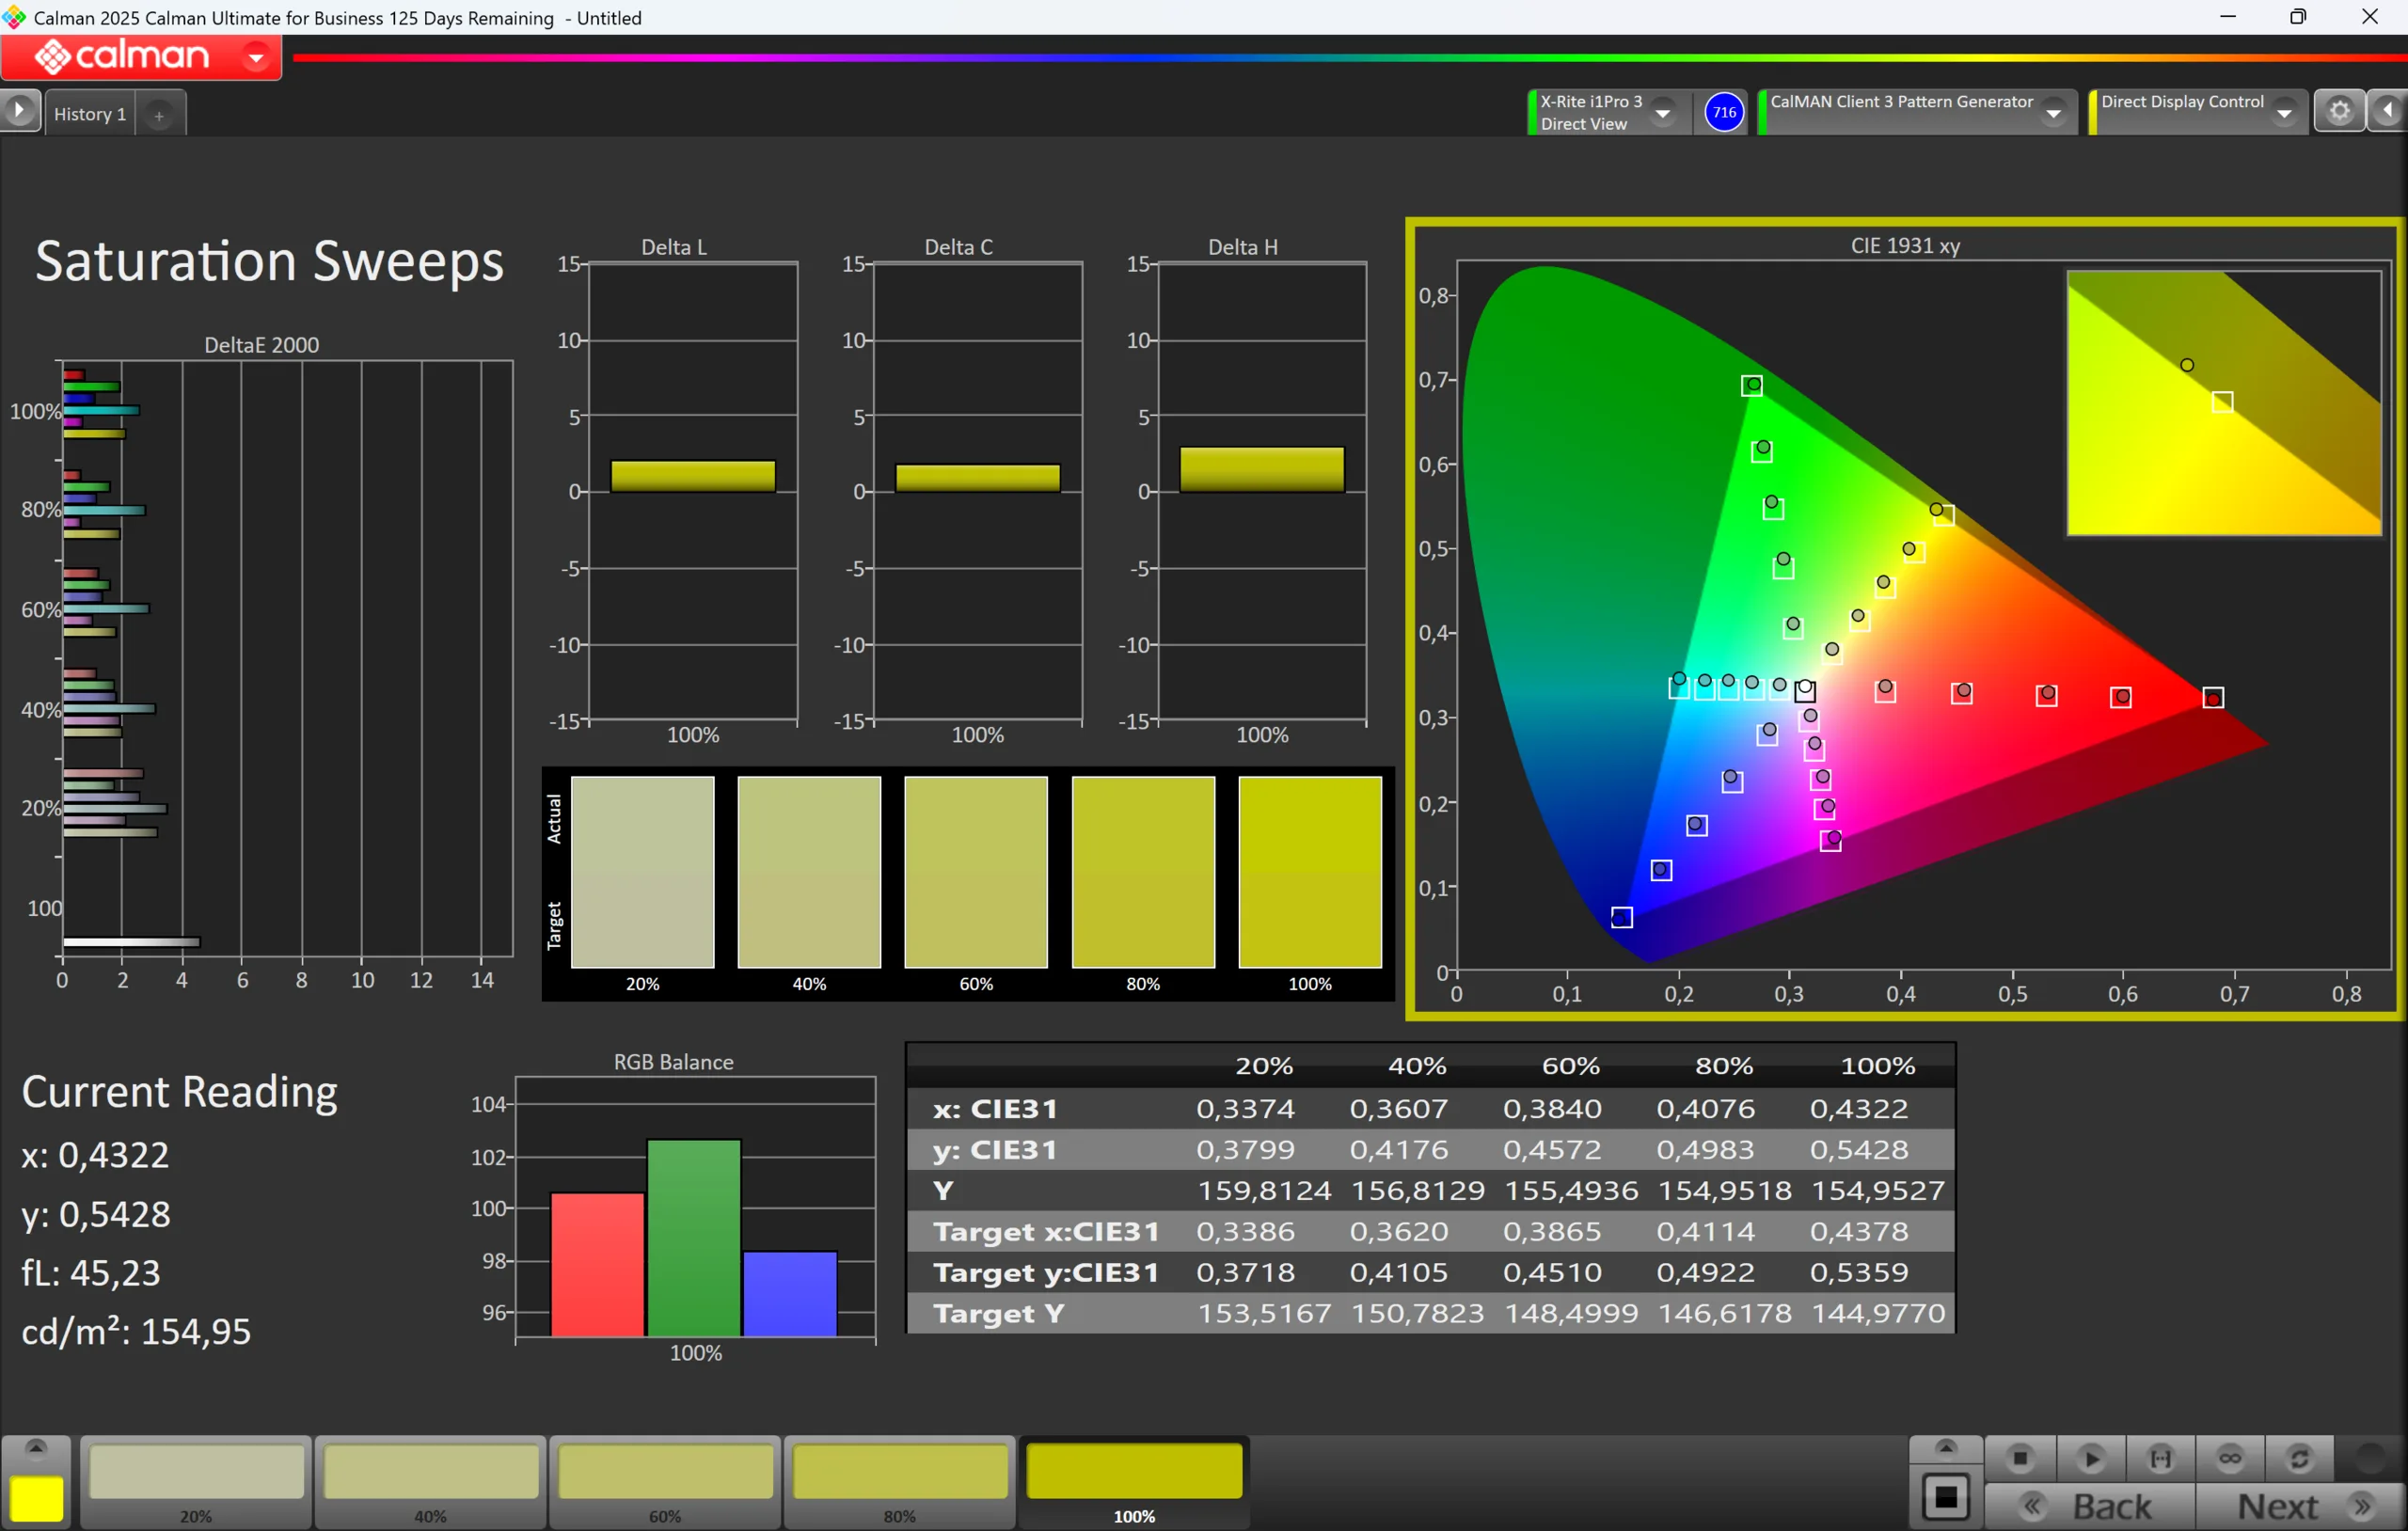
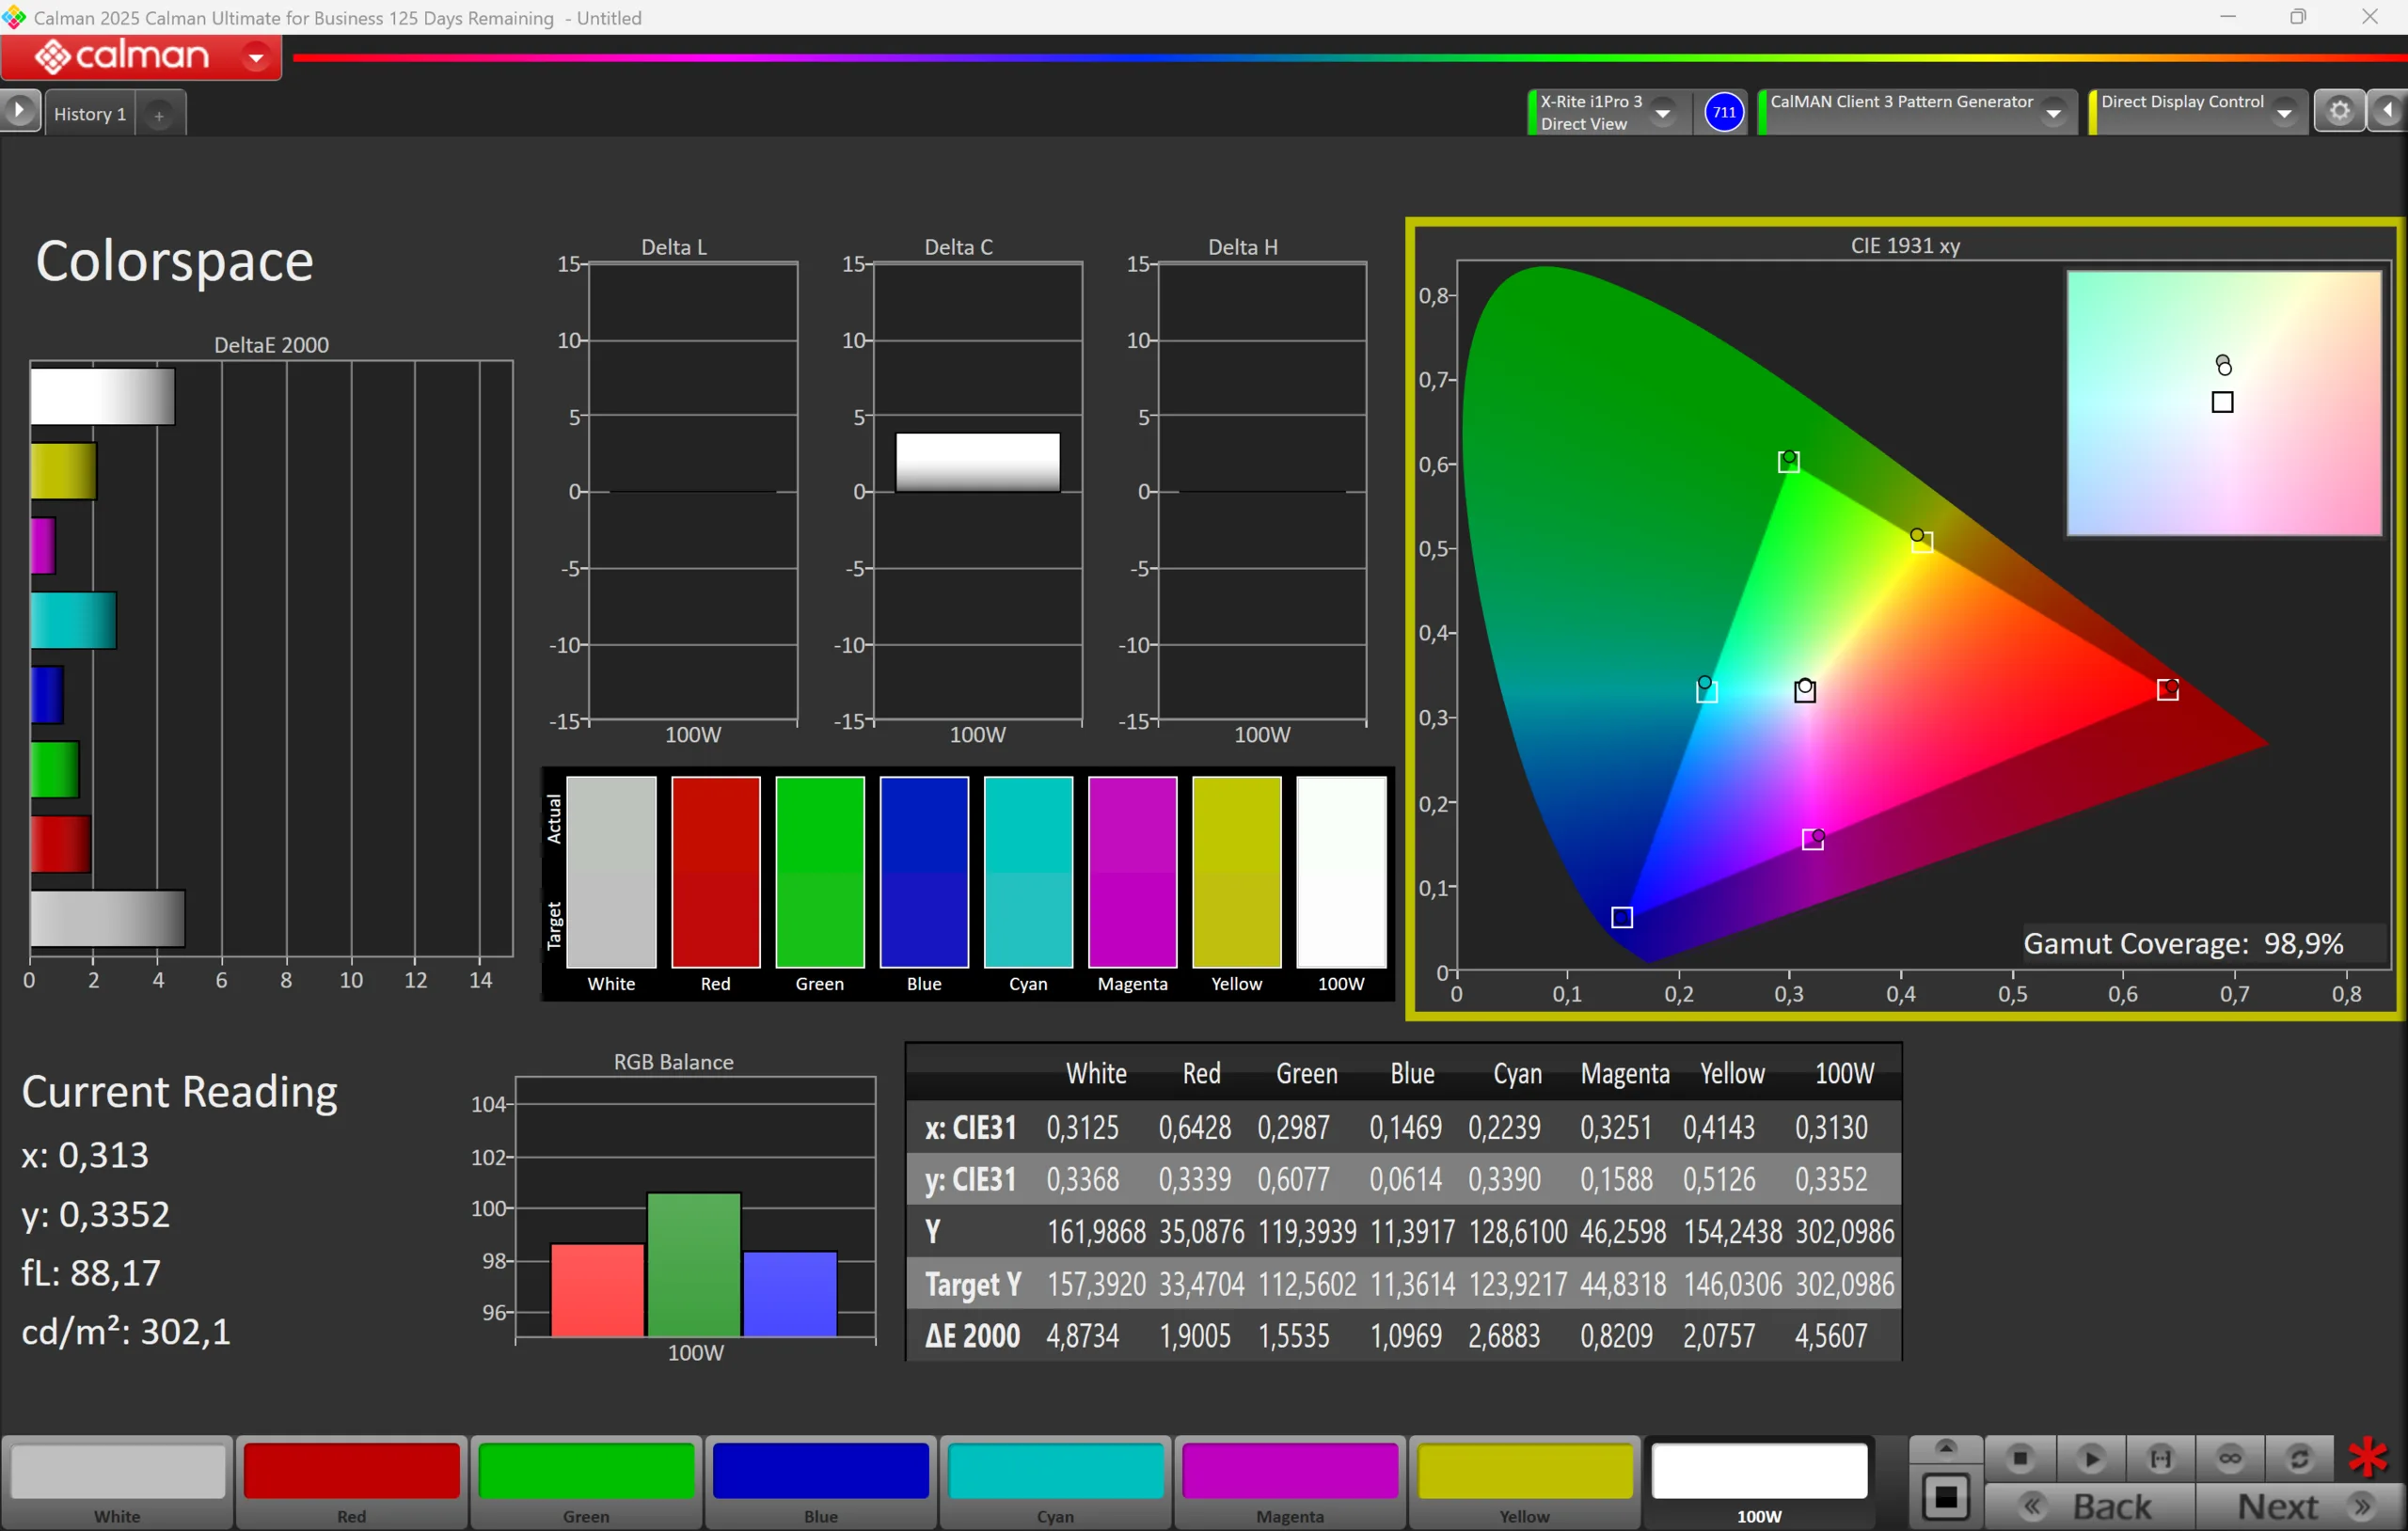
Asus uses an OLED panel (1920 x 1200 pixels, 16:10) and the subjective image quality is very good with rich colors (full P3 coverage), deep blacks and fast response times, but the problem is the brightness. The panel only manages around 300 nits and there is no HDR support. This is also an issue in combination with the glossy screen when you want to use it outdoors. The frequency is also limited to 60 Hz, but considering the price point, this is not a huge deal-breaker. The XPS 13 offers a 120 Hz IPS panel with a higher resolution and better brightness, but suffers from slow response times, while the MacBook Neo uses a brighter 60 Hz IPS panel. 

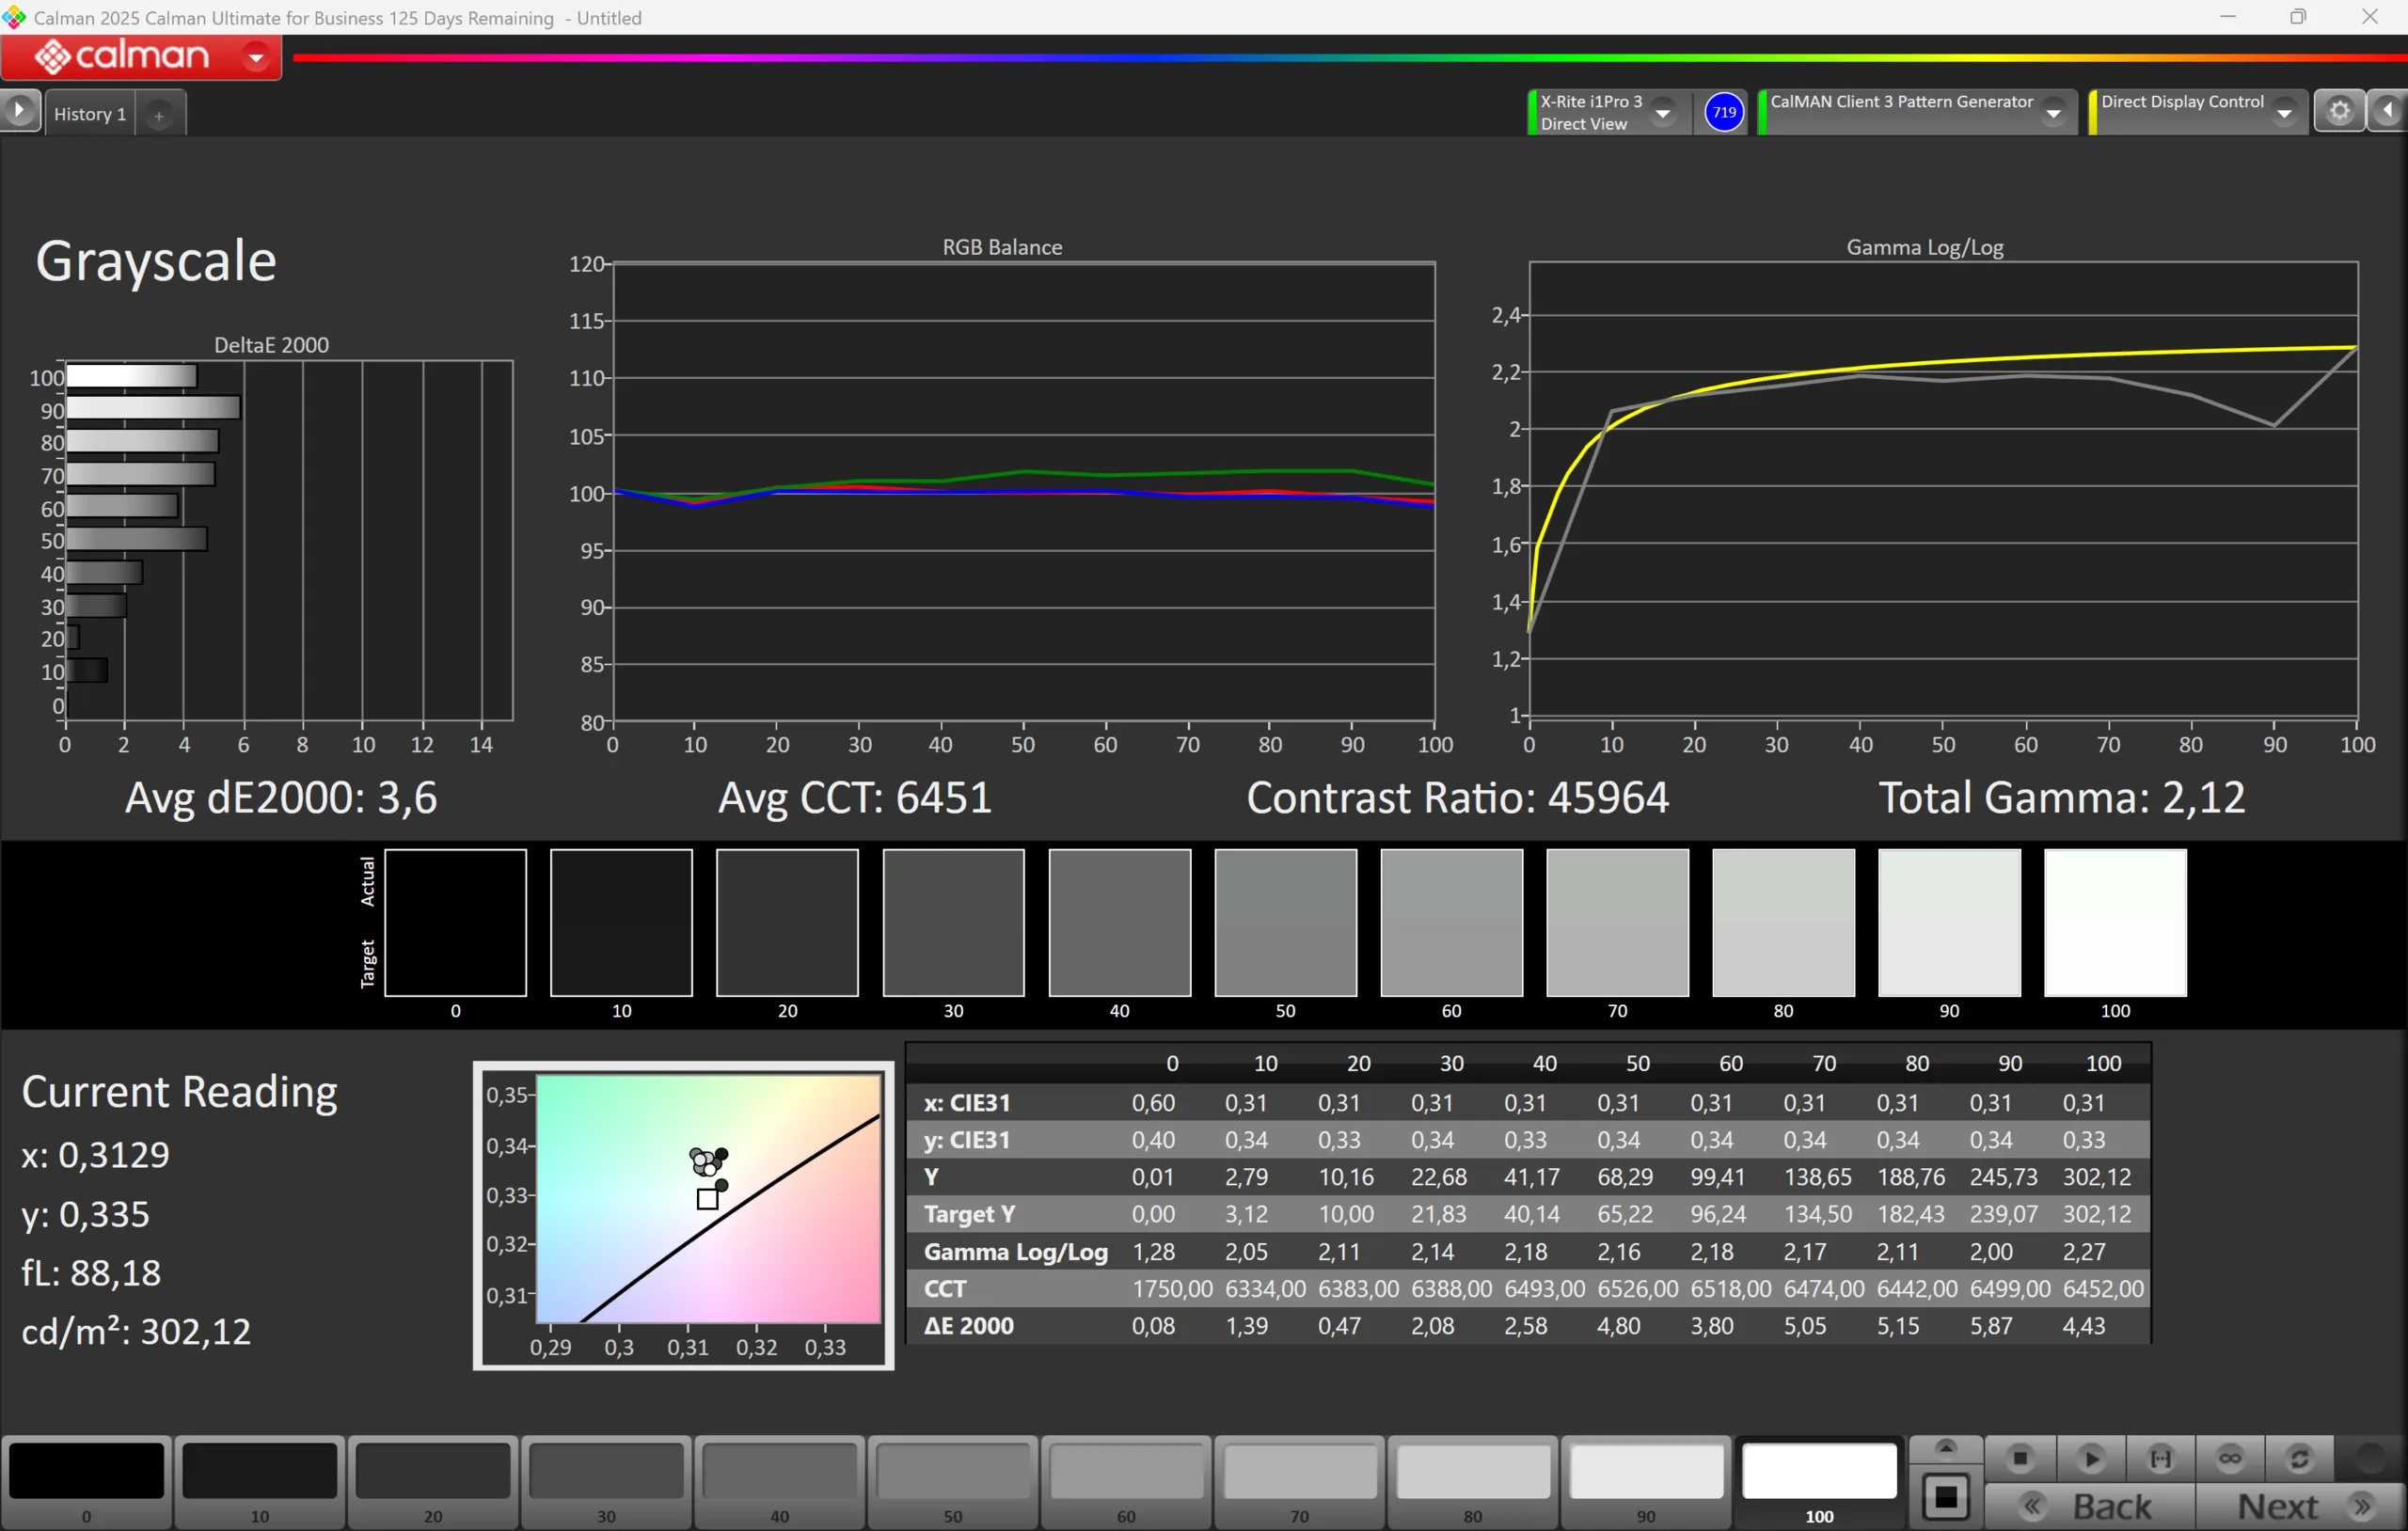
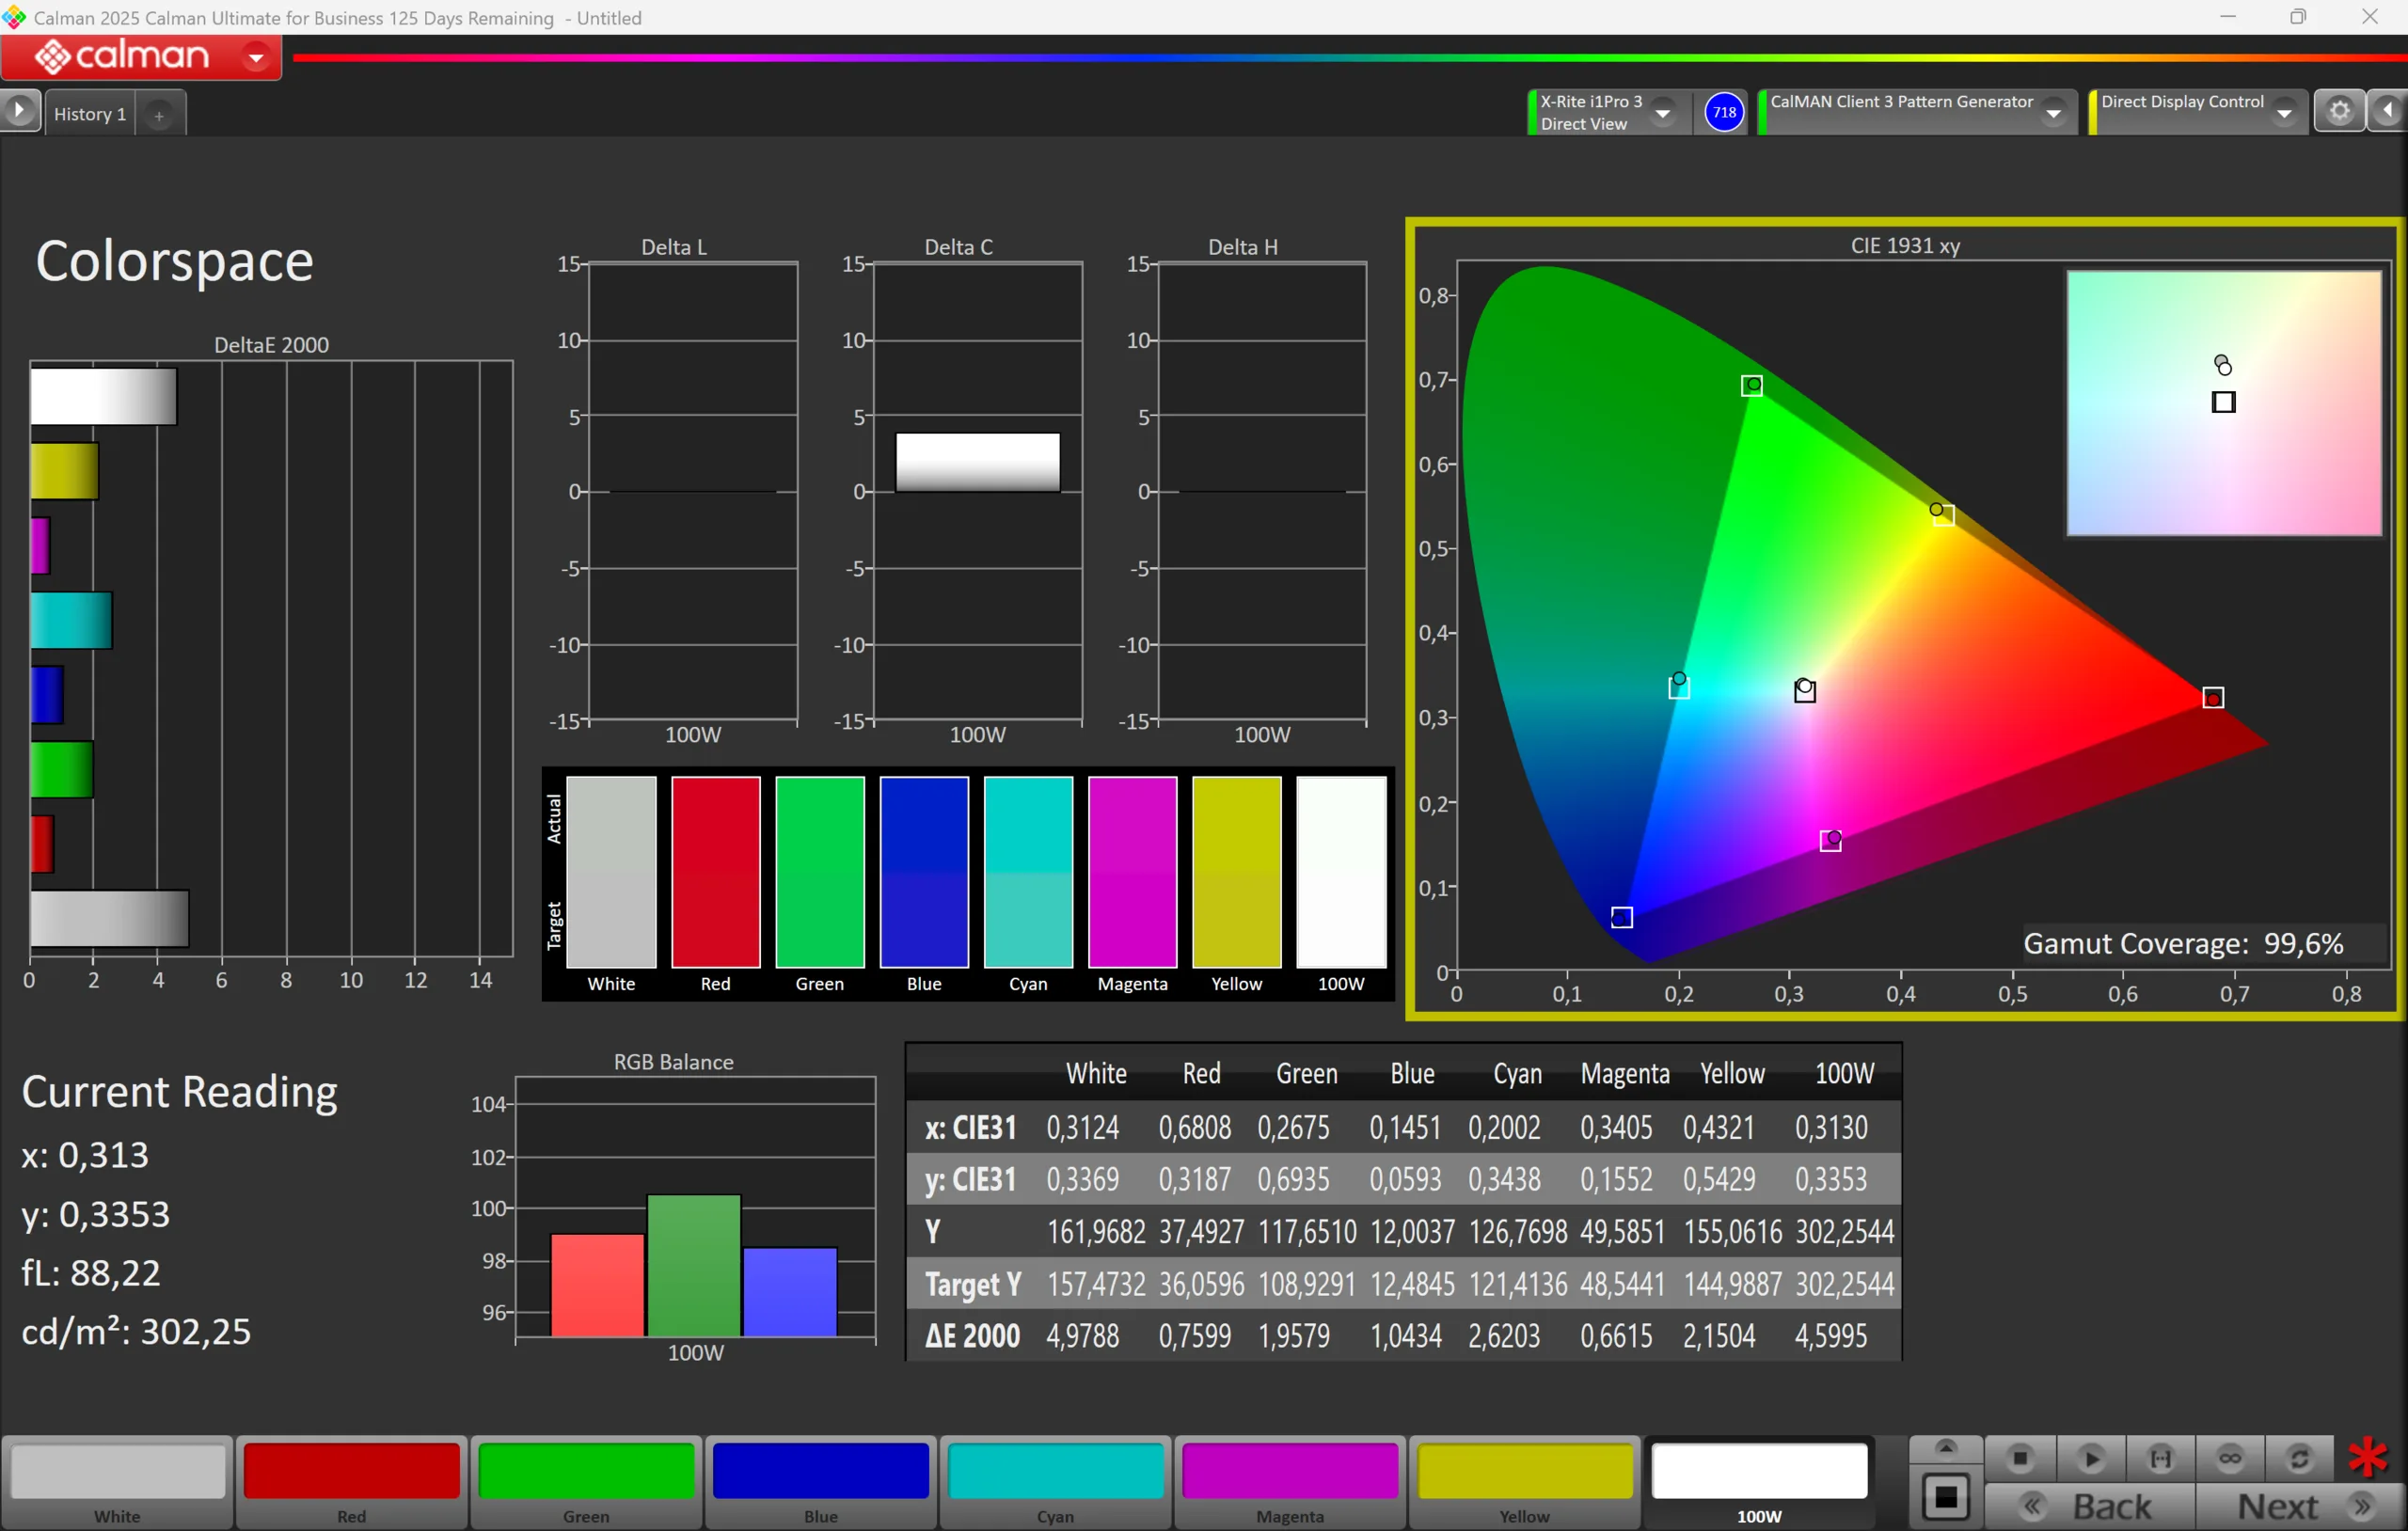
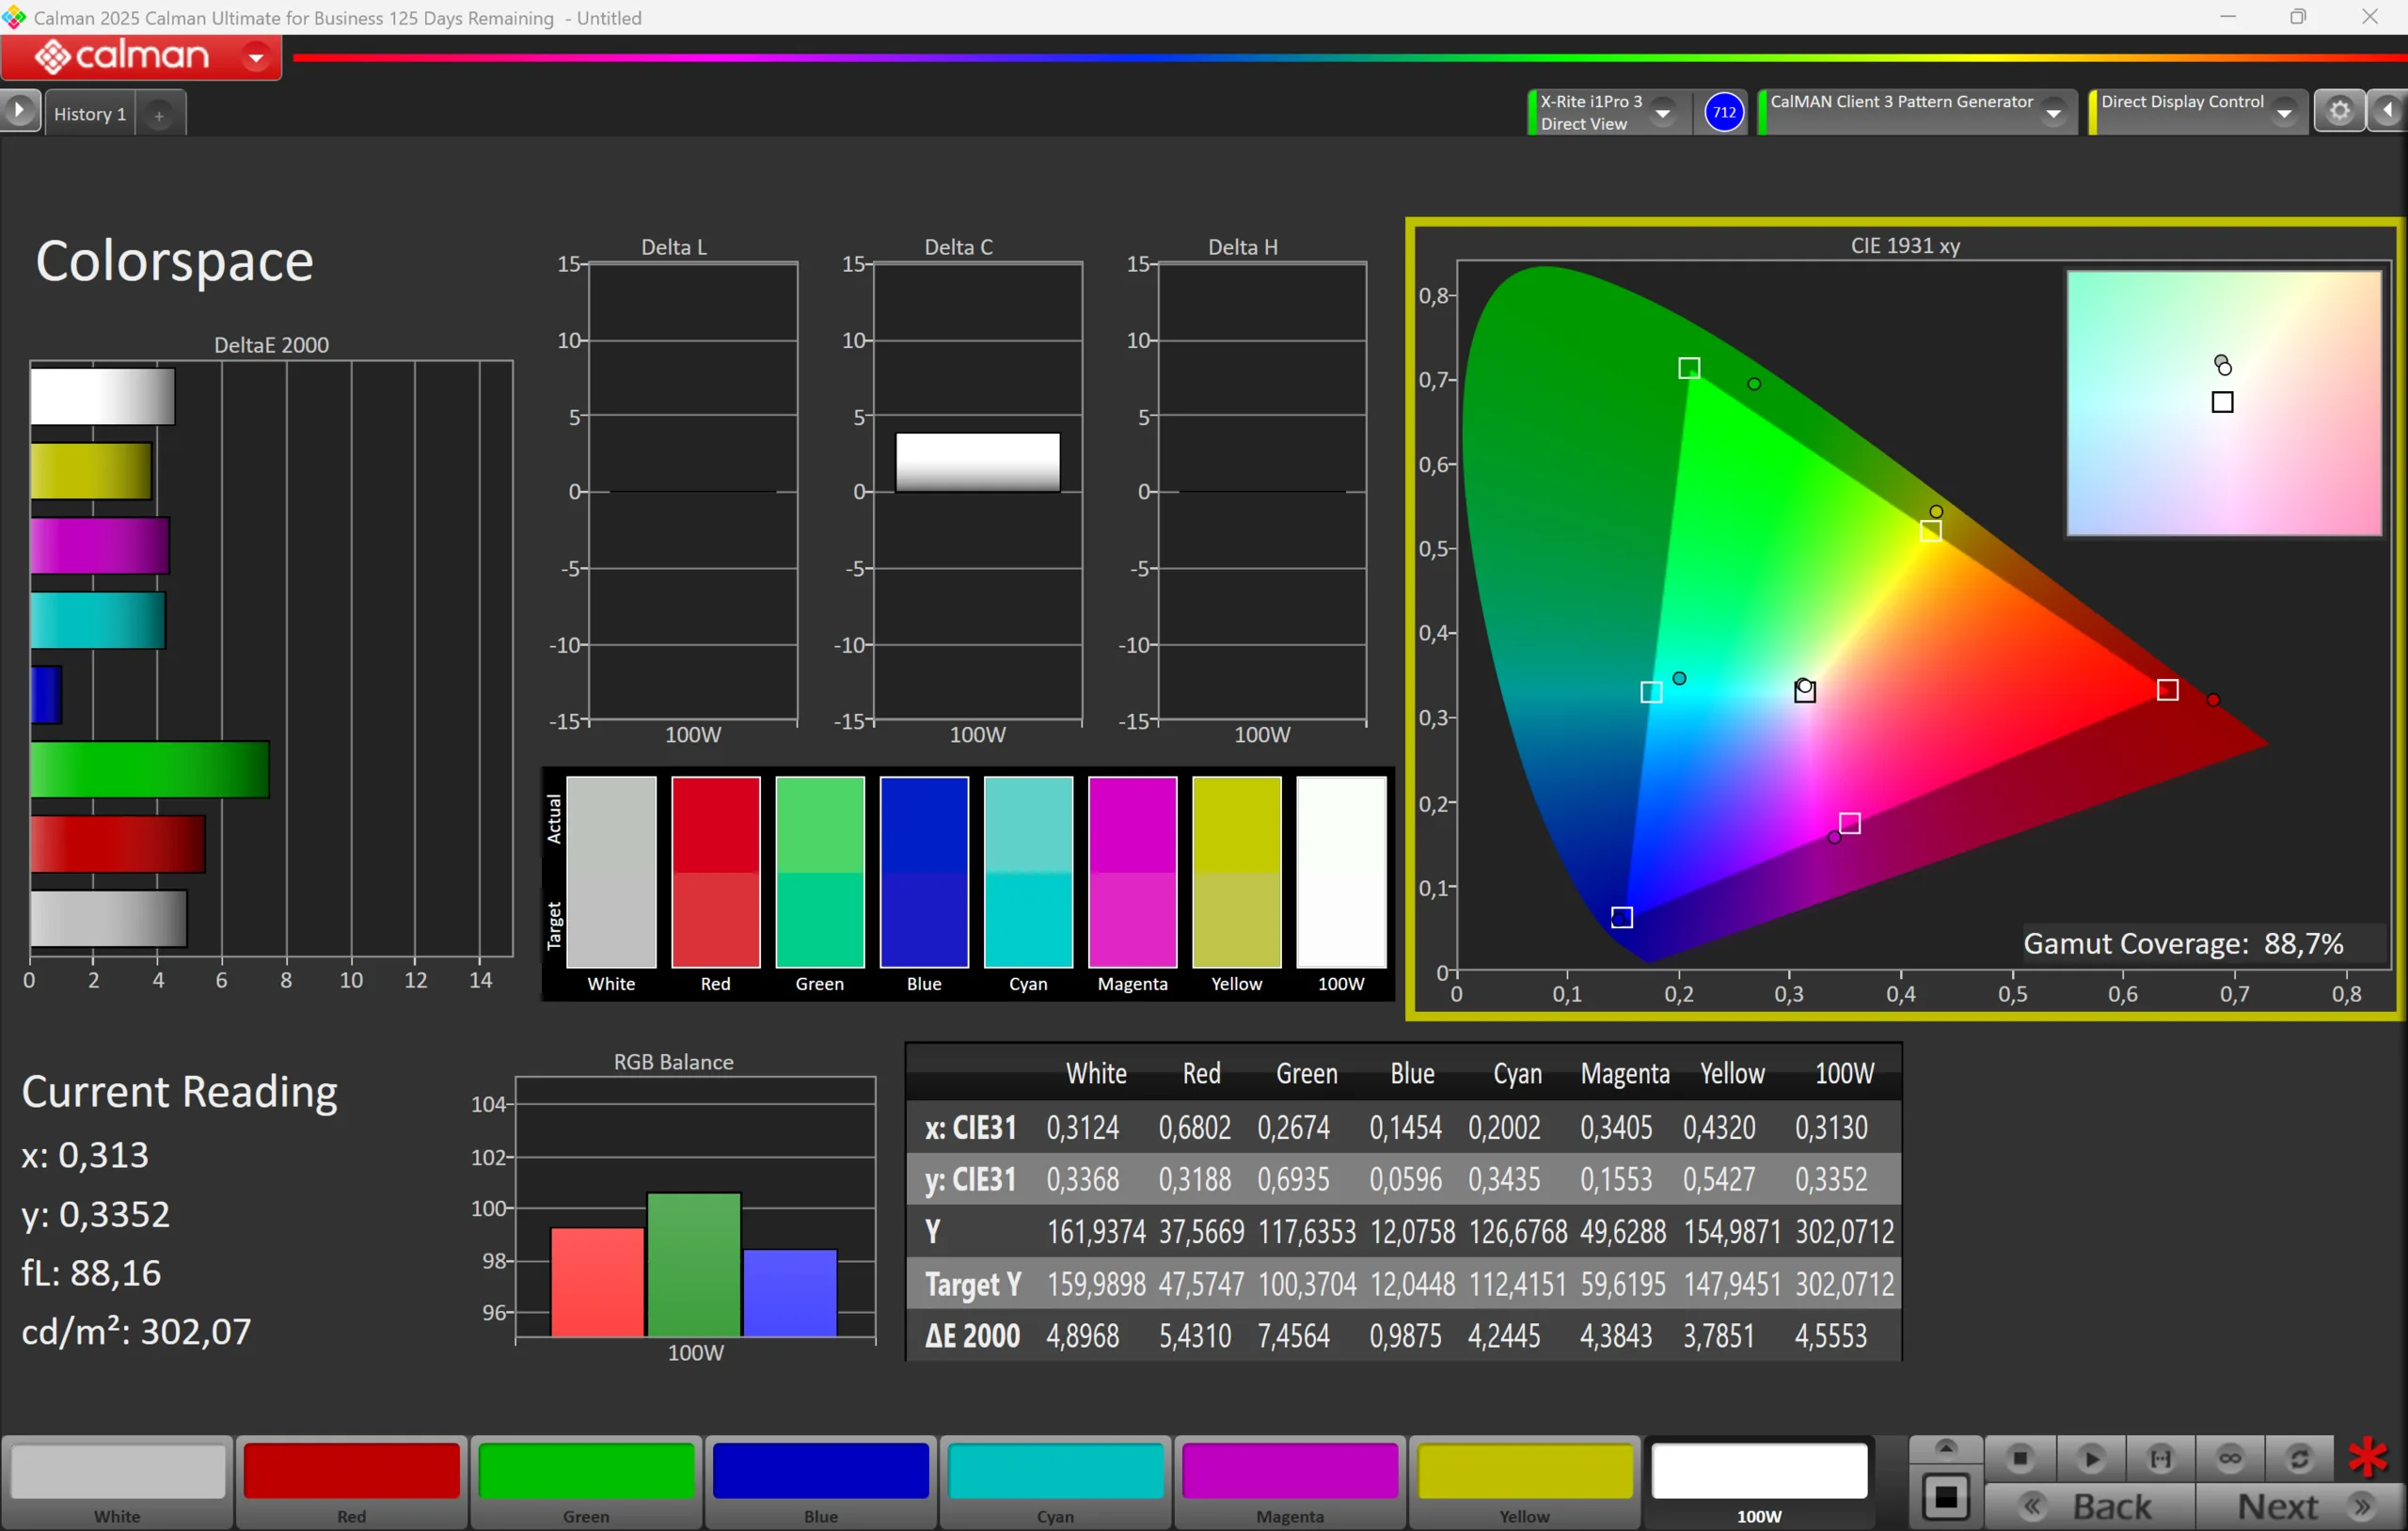
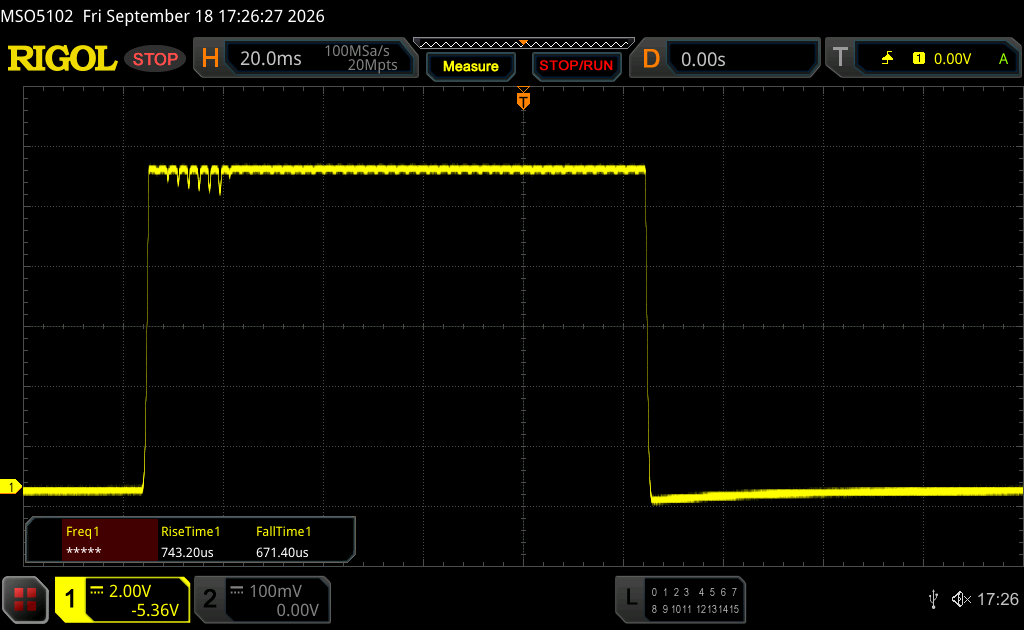
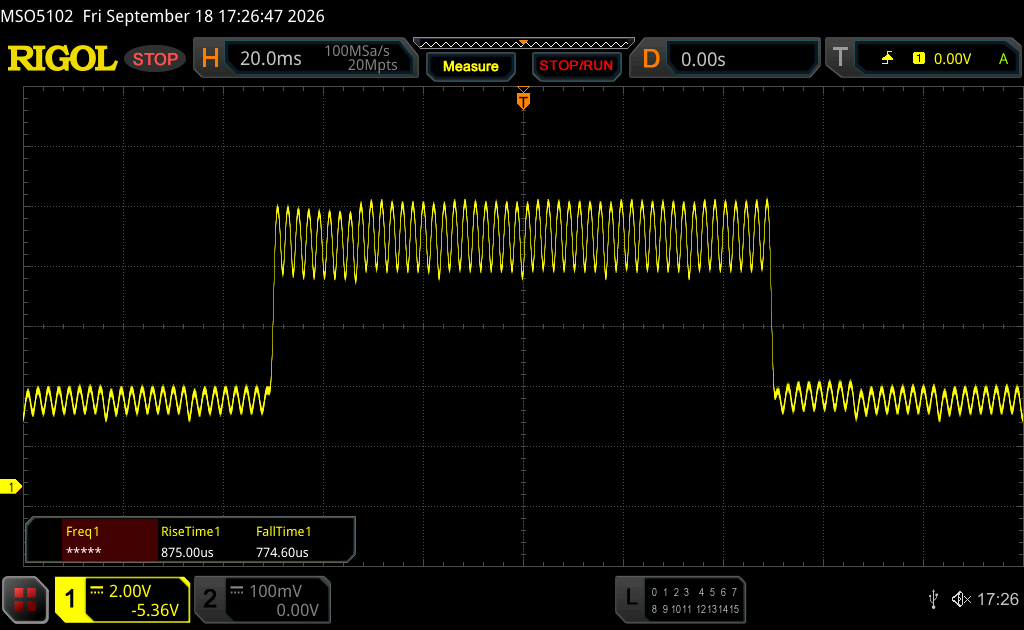
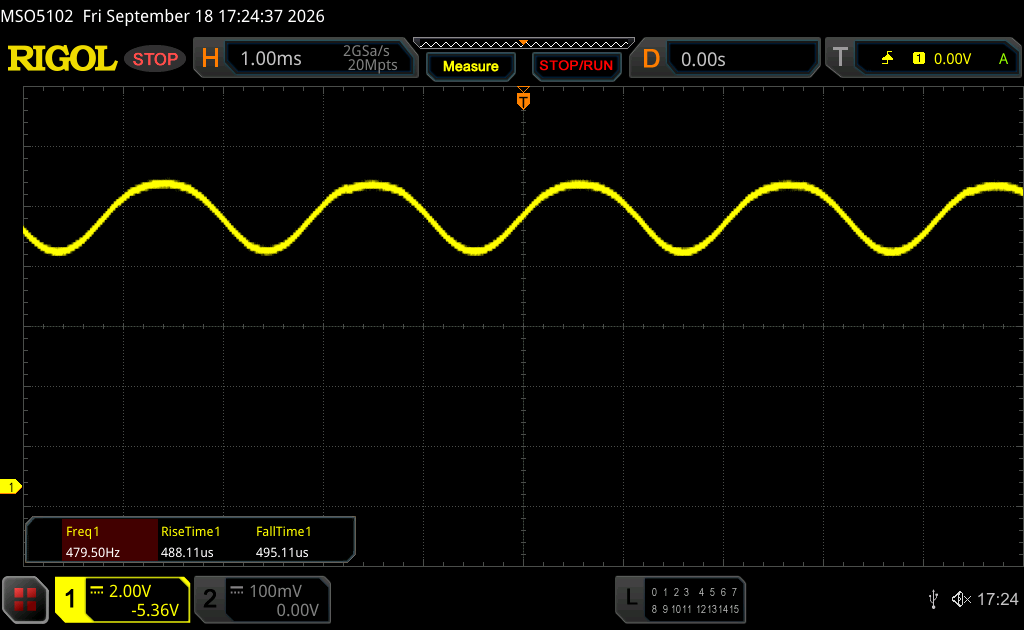
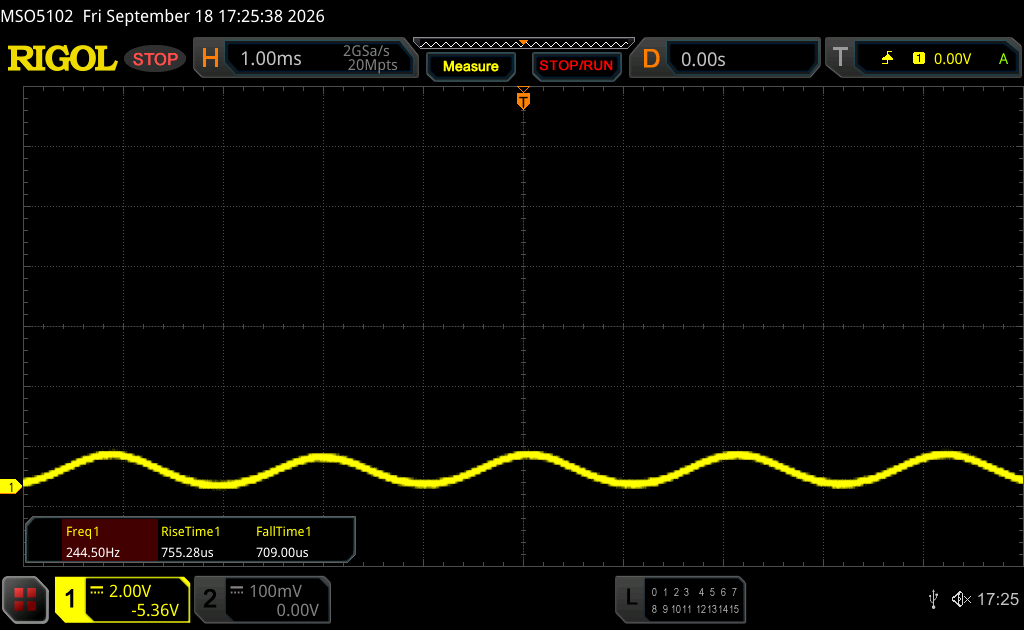
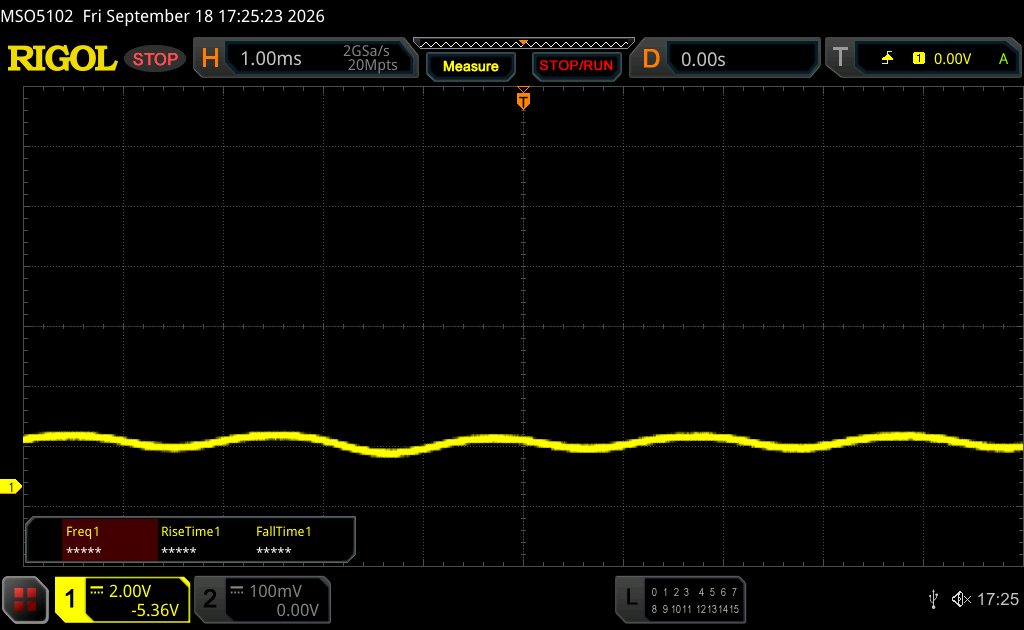
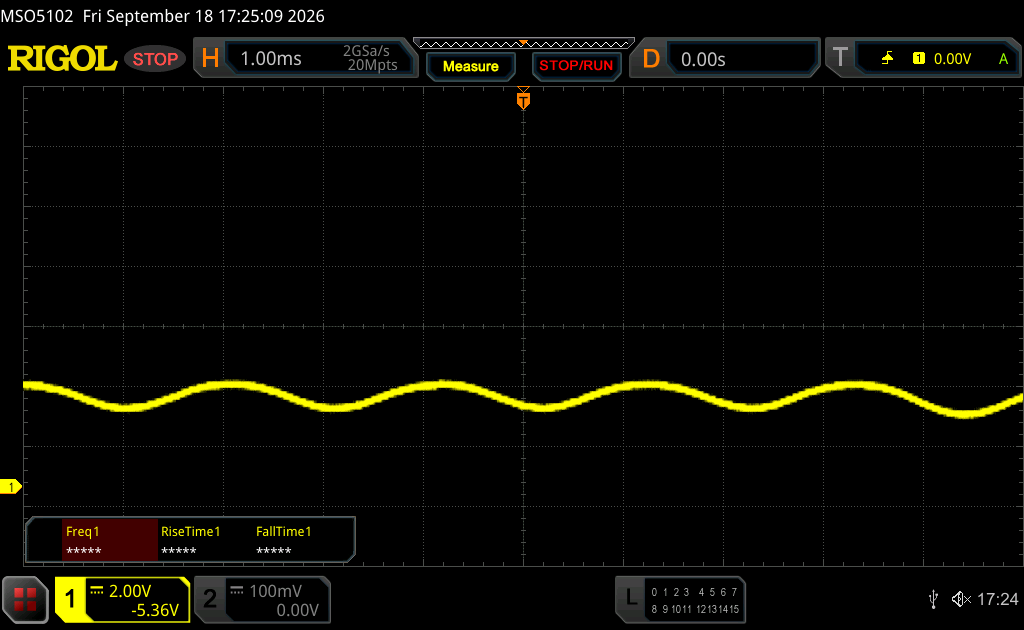
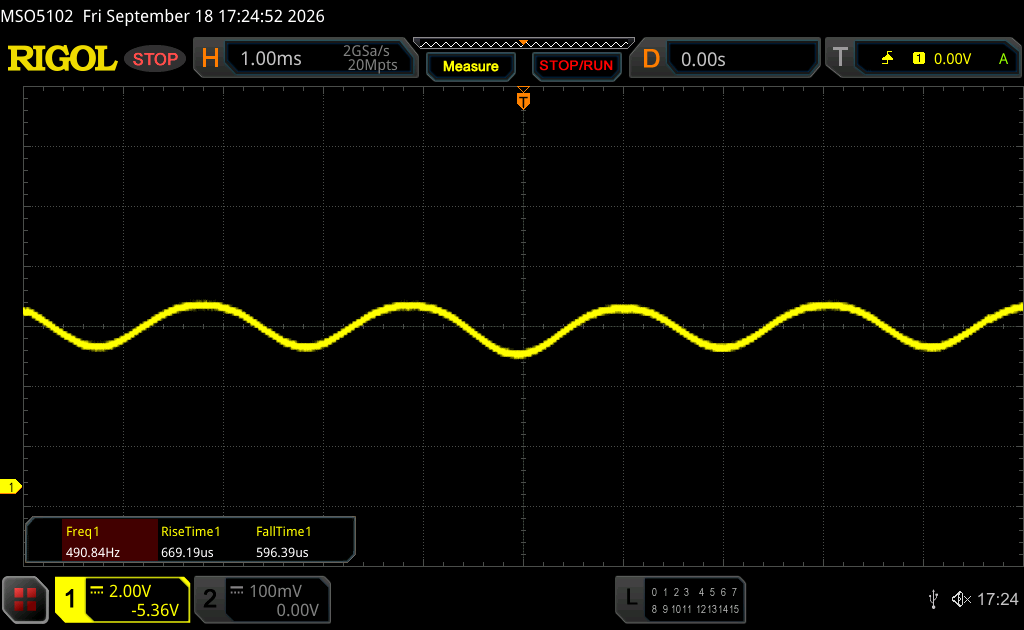
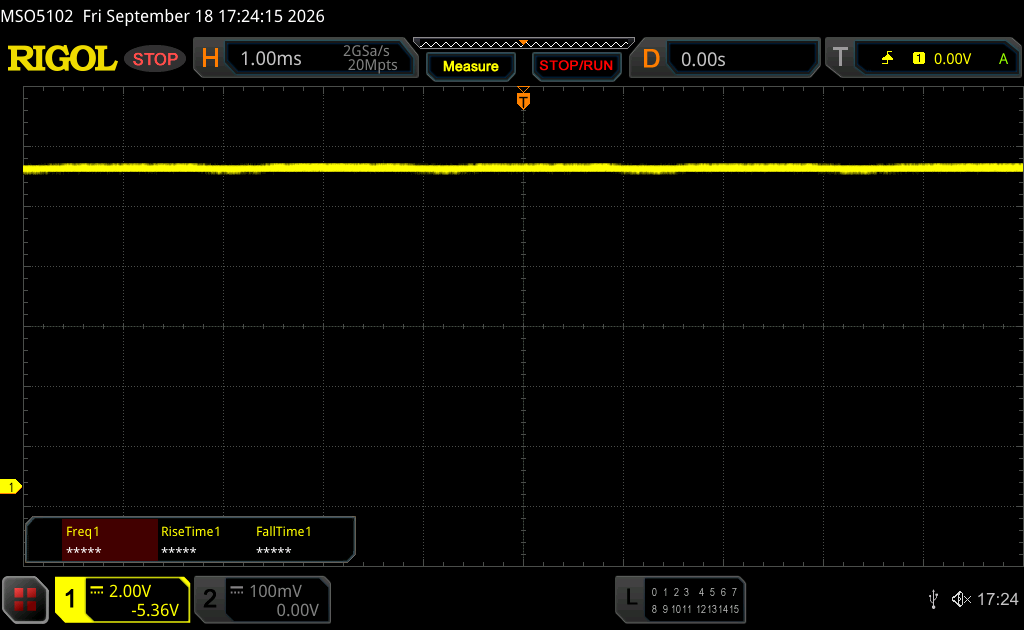
The Asus panel suffers from PWM flickering at 480 Hz, but the amplitude is low and Asus still offers its software solution for flicker-free dimming. The color accuracy is already very good out of the box and image editing is possible (Asus includes accurate profiles for P3 as well as sRGB). Our calibration software is not compatible with Windows on ARM, so we could not calibrate the panel.

305
cd/m²
302
cd/m²
308
cd/m²
304
cd/m²
302
cd/m²
308
cd/m²
303
cd/m²
301
cd/m²
305
cd/m²
Distribution of brightness
ATNA40KW01-0 tested with X-Rite i1Pro 3
Maximum: 308 cd/m² (Nits) Average: 304.2 cd/m² Minimum: 14.1 cd/m²
Brightness Distribution: 98 %
Center on Battery: 302 cd/m²
Contrast: 30200:1 (Black: 0.01 cd/m²)
ΔE ColorChecker Calman: 2.1 | ∀{0.5-29.43 Ø4.69}
ΔE Greyscale Calman: 3.6 | ∀{0.09-98 Ø4.94}
88.7% AdobeRGB 1998 (Argyll 3D)
98.9% sRGB (Argyll 3D)
99.6% Display P3 (Argyll 3D)
Gamma: 2.12
CCT: 6451 K
Asus Zenbook 14 UX3480QA
ATNA40KW01-0, OLED, 1920x1200, 14", 60 Hz
Dell XPS 13 DX13260
LG Philips LP134WQ, IPS, 2560x1600, 13.4", 120 Hz
Apple MacBook Neo 256 GB
IPS, 2408x1506, 13", 60 Hz
Ninkear S14, 16+1TB
BOE0D0A, , 2240x1400, 14", 60 Hz
HP Omnibook 5 14
Samsung SDC4213, OLED, 1920x1200, 14", 60 Hz
Asus ZenBook A14 UX3407QA
ATNA40CT06-0, OLED, 1920x1200, 14", 60 Hz
Display
-0%
-16%
-18%
-5%
1%
Display P3 Coverage (%)
99.6
98.2
-1%
72.2
-28%
67.4
-32%
95
-5%
100
0%
sRGB Coverage (%)
98.9
99.9
1%
97.9
-1%
97.3
-2%
100
1%
AdobeRGB 1998 Coverage (%)
88.7
87.6
-1%
72.6
-18%
69.7
-21%
89.6
1%
Response Times
-2643%
-1048%
-1634%
3%
17%
Response Time Grey 50% / Grey 80% * (ms)
1.65 ?(0.88, 0.77)
51.2 ?(23.6, 27.6)
-3003%
20.8 ?(9.2, 11.6)
-1161%
42 ?(20, 22)
-2445%
1.67 ?(0.91, 0.76)
-1%
1.08 ?(0.59, 0.49)
35%
Response Time Black / White * (ms)
1.41 ?(0.74, 0.67)
33.6 ?(14, 19.6)
-2283%
14.6 ?(4.3, 10.3)
-935%
13 ?(2, 11)
-822%
1.84 ?(0.87, 0.97)
-30%
1.17 ?(0.62, 0.55)
17%
PWM Frequency (Hz)
480 ?(100)
480
480 ?(86)
PWM Amplitude * (%)
22
13.5
39%
22
-0%
Screen
-277%
-566%
-275%
-4%
40%
Brightness middle (cd/m²)
302
539.3
79%
548
81%
381
26%
288.7
-4%
386
28%
Brightness (cd/m²)
304
503
65%
519
71%
362
19%
289
-5%
387
27%
Brightness Distribution (%)
98
89
-9%
91
-7%
82
-16%
98
0%
98
0%
Black Level * (cd/m²)
0.01
0.25
-2400%
0.48
-4700%
0.24
-2300%
Contrast (:1)
30200
2157
-93%
1142
-96%
1588
-95%
Colorchecker dE 2000 *
2.1
1.2
43%
1.4
33%
1.36
35%
3.43
-63%
0.9
57%
Colorchecker dE 2000 max. *
6
3.63
39%
3.1
48%
2.24
63%
7.04
-17%
1.7
72%
Greyscale dE 2000 *
3.6
1.4
61%
2.1
42%
1.09
70%
1.3
64%
1.5
58%
Gamma
2.12 104%
2.2 100%
2.24 98%
2.45 90%
2.2 100%
2.19 100%
CCT
6451 101%
6727 97%
6870 95%
6494 100%
6336 103%
6399 102%
Colorchecker dE 2000 calibrated *
0.92
0.4
1.2
Total Average (Program / Settings)
-973% / -577%
-543% / -513%
-642% / -425%
-2% / -2%
19% / 25%

* ... smaller is better

CalMAN Grayscale
CalMAN Grayscale
CalMAN Saturation
CalMAN Saturation
CalMAN ColorChecker
CalMAN ColorChecker
vs. sRGB
vs. sRGB
vs. P3
vs. P3
vs. AdobeRGB
vs. AdobeRGB

Display Response Times

Display response times show how fast the screen is able to change from one color to the next. Slow response times can lead to afterimages and can cause moving objects to appear blurry (ghosting). Gamers of fast-paced 3D titles should pay special attention to fast response times.
       Response Time Black to White
1.41 ms ... rise ↗ and fall ↘ combined↗ 0.74 ms rise
↘ 0.67 ms fall
The screen shows very fast response rates in our tests and should be very well suited for fast-paced gaming.
In comparison, all tested devices range from 0.1 (minimum) to 240 (maximum) ms. » 9 % of all devices are better.
This means that the measured response time is better than the average of all tested devices (19.7 ms).
       Response Time 50% Grey to 80% Grey
1.65 ms ... rise ↗ and fall ↘ combined↗ 0.88 ms rise
↘ 0.77 ms fall
The screen shows very fast response rates in our tests and should be very well suited for fast-paced gaming.
In comparison, all tested devices range from 0.13 (minimum) to 636 (maximum) ms. » 9 % of all devices are better.
This means that the measured response time is better than the average of all tested devices (30.7 ms).

Screen Flickering / PWM (Pulse-Width Modulation)

To dim the screen, some notebooks will simply cycle the backlight on and off in rapid succession - a method called Pulse Width Modulation (PWM) . This cycling frequency should ideally be undetectable to the human eye. If said frequency is too low, users with sensitive eyes may experience strain or headaches or even notice the flickering altogether.
Screen flickering / PWM detected 480 Hz
Amplitude: 22 %
≤ 100 % brightness setting

The display backlight flickers at 480 Hz (worst case, e.g., utilizing PWM) Flickering detected at a brightness setting of 100 % and below. There should be no flickering or PWM above this brightness setting.

The frequency of 480 Hz is relatively high, so most users sensitive to PWM should not notice any flickering. However, there are reports that some users are still sensitive to PWM at 500 Hz and above, so be aware.

In comparison: 52 % of all tested devices do not use PWM to dim the display. If PWM was detected, an average of 7625 (minimum: 5 - maximum: 343500) Hz was measured.

PWM flickering (0 % brightness)
PWM flickering (20 % brightness)
PWM flickering (40 % brightness)
PWM flickering (60 % brightness)
PWM flickering (80 % brightness)
PWM flickering (100 % brightness)
In the sun
In the sun
Outdoors (bright day, no direct sunlight)
Viewing angles
Viewing angles

Performance

Testing Conditions

We used the Performance mode for our tests. While HWiNFO shows consumption data for the Snapdragon X1 chips by now, they are incomplete and do not really match our consumption measurements, so we cannot give you exact numbers (it should be around 35 Watts). For everyday situations, we recommend the Standard mode, because the performance penalty is small and the fan stays much quieter even under maximum load.

Note: Right now, there is an SSD bug for the SKU with 512 GB storage, which increases the power consumption by around 3 Watts. Asus is aware of this issue and is working on a fix right now, so it should be available soon. We switched the Samsung SSD with a Samsung 990 Pro and used this drive for our power measurements and battery life tests. We also included the battery life tests with the higher consumption as well for comparison.

Processor Performance

The Snapdragon X1-26-100 is Qualcomm's slowest Snapdragon X CPU, but the overall CPU performance is definitely still sufficient for everyday tasks. The results are roughly on par with the Wildcat Lake CPU in the Dell XPS 13, while the A18 Pro in the Apple MacBook Neo is much faster in single-core scenarios, but falls behind when you stress all cores. While the CPU performance is no highlight, it is definitely sufficient for everyday tasks and also stable. The table below shows native CPU benchmarks, while the table underneath the CB R15 loop shows emulated CPU benchmarks. The multi-core performance drops by 8 % on battery power.

CPU Performance rating: Percent
Cinebench 2024: CPU Multi Core | CPU Single Core
Geekbench 6.7: Multi-Core | Single-Core
CPU Performance rating
Average of class Subnotebook
 
85.9 pt
HP Omnibook 5 14
Qualcomm Snapdragon X Plus X1P-42-100
84.9 pt
Apple MacBook Neo 256 GB
Apple A18 Pro
78.9 pt
Average Qualcomm Snapdragon X X1-26-100
 
72.4 pt
Asus Zenbook 14 UX3480QA
Qualcomm Snapdragon X X1-26-100
72 pt
Asus ZenBook A14 UX3407QA
Qualcomm Snapdragon X X1-26-100
69.9 pt
Dell XPS 13 DX13260 -2!
Intel Core 5 320
62.2 pt
Ninkear S14, 16+1TB
AMD Ryzen 5 7535HS
55.3 pt
Cinebench 2024 / CPU Multi Core
Average of class Subnotebook
  (416 - 1471, n=54, last 2 years)
761 Points +9%
Asus Zenbook 14 UX3480QA
Qualcomm Snapdragon X X1-26-100
701 Points
HP Omnibook 5 14
Qualcomm Snapdragon X Plus X1P-42-100
698 Points 0%
Average Qualcomm Snapdragon X X1-26-100
  (646 - 708, n=4)
688 Points -2%
Asus ZenBook A14 UX3407QA
Qualcomm Snapdragon X X1-26-100
646 Points -8%
Ninkear S14, 16+1TB
AMD Ryzen 5 7535HS
459 Points -35%
Apple MacBook Neo 256 GB
Apple A18 Pro
416 Points -41%
Cinebench 2024 / CPU Single Core
Apple MacBook Neo 256 GB
Apple A18 Pro
147 Points +53%
Average of class Subnotebook
  (83 - 200, n=52, last 2 years)
121.4 Points +26%
HP Omnibook 5 14
Qualcomm Snapdragon X Plus X1P-42-100
108 Points +13%
Asus ZenBook A14 UX3407QA
Qualcomm Snapdragon X X1-26-100
96 Points 0%
Asus Zenbook 14 UX3480QA
Qualcomm Snapdragon X X1-26-100
96 Points
Average Qualcomm Snapdragon X X1-26-100
  (96 - 96, n=4)
96 Points 0%
Ninkear S14, 16+1TB
AMD Ryzen 5 7535HS
83 Points -14%
Geekbench 6.7 / Multi-Core
HP Omnibook 5 14
Qualcomm Snapdragon X Plus X1P-42-100
14998 Points +41%
Average of class Subnotebook
  (5987 - 20325, n=62, last 2 years)
12443 Points +17%
Average Qualcomm Snapdragon X X1-26-100
  (10492 - 14998, n=6)
11353 Points +6%
Asus Zenbook 14 UX3480QA
Qualcomm Snapdragon X X1-26-100
10668 Points
Asus ZenBook A14 UX3407QA
Qualcomm Snapdragon X X1-26-100
10550 Points -1%
Apple MacBook Neo 256 GB
Apple A18 Pro
9140 Points -14%
Dell XPS 13 DX13260
Intel Core 5 320
7888 Points -26%
Ninkear S14, 16+1TB
AMD Ryzen 5 7535HS
7611 Points -29%
Geekbench 6.7 / Single-Core
Apple MacBook Neo 256 GB
Apple A18 Pro
3589 Points +68%
Average of class Subnotebook
  (1922 - 4195, n=61, last 2 years)
2802 Points +31%
HP Omnibook 5 14
Qualcomm Snapdragon X Plus X1P-42-100
2675 Points +25%
Dell XPS 13 DX13260
Intel Core 5 320
2575 Points +20%
Asus Zenbook 14 UX3480QA
Qualcomm Snapdragon X X1-26-100
2140 Points
Asus ZenBook A14 UX3407QA
Qualcomm Snapdragon X X1-26-100
2126 Points -1%
Average Qualcomm Snapdragon X X1-26-100
  (1421 - 2675, n=6)
2092 Points -2%
Ninkear S14, 16+1TB
AMD Ryzen 5 7535HS
1922 Points -10%

Cinebench R15 Multi Loop

03060901201501802102402703003303603904204504805105405706006306606907207507808108408709009309609901020105010801110114011701200123012601290132013501380141014401470Tooltip
Asus Zenbook 14 UX3480QA Qualcomm Snapdragon X X1-26-100: Ø1410 (1355.24-1421.97) Points
Dell XPS 13 DX13260 Intel Core 5 320: Ø940 (856.35-1053.52) Points
Ninkear S14, 16+1TB AMD Ryzen 5 7535HS: Ø1303 (1249.73-1404.1) Points
HP Omnibook 5 14 Qualcomm Snapdragon X Plus X1P-42-100: Ø1277 (1243.36-1480.66) Points
Asus ZenBook A14 UX3407QA Qualcomm Snapdragon X X1-26-100: Ø1254 (1229.33-1338.33) Points
CPU Performance rating: Percent
Cinebench R23: Multi Core | Single Core
Cinebench R20: CPU (Multi Core) | CPU (Single Core)
Cinebench R15: CPU Multi 64Bit | CPU Single 64Bit
7-Zip 18.03: 7z b 4 | 7z b 4 -mmt1
Geekbench 6.7: Multi-Core | Single-Core
HWBOT x265 Benchmark v2.2: 4k Preset
LibreOffice : 20 Documents To PDF
R Benchmark 2.5: Overall mean
CPU Performance rating
Average of class Subnotebook
 
86.2 pt
Apple MacBook Neo 256 GB -11!
Apple A18 Pro
80.5 pt
Dell XPS 13 DX13260
Intel Core 5 320
66.9 pt
Ninkear S14, 16+1TB
AMD Ryzen 5 7535HS
65.9 pt
HP Omnibook 5 14
Qualcomm Snapdragon X Plus X1P-42-100
61.4 pt
Asus Zenbook 14 UX3480QA
Qualcomm Snapdragon X X1-26-100
52.7 pt
Average Qualcomm Snapdragon X X1-26-100
 
51.2 pt
Asus ZenBook A14 UX3407QA
Qualcomm Snapdragon X X1-26-100
50.9 pt
Cinebench R23 / Multi Core
Average of class Subnotebook
  (5263 - 21812, n=58, last 2 years)
12325 Points +69%
Ninkear S14, 16+1TB
AMD Ryzen 5 7535HS
8540 Points +17%
HP Omnibook 5 14
Qualcomm Snapdragon X Plus X1P-42-100
7812 (5233.17min - 7812.38max) Points +7%
Asus Zenbook 14 UX3480QA
Qualcomm Snapdragon X X1-26-100
7300 Points
Average Qualcomm Snapdragon X X1-26-100
  (6897 - 7539, n=5)
7294 Points 0%
Asus ZenBook A14 UX3407QA
Qualcomm Snapdragon X X1-26-100
6897 Points -6%
Dell XPS 13 DX13260
Intel Core 5 320
6197 (6096.49min - 6196.88max) Points -15%
Cinebench R23 / Single Core
Dell XPS 13 DX13260
Intel Core 5 320
1926 Points +97%
Average of class Subnotebook
  (975 - 2213, n=59, last 2 years)
1797 Points +84%
Ninkear S14, 16+1TB
AMD Ryzen 5 7535HS
1435 Points +47%
HP Omnibook 5 14
Qualcomm Snapdragon X Plus X1P-42-100
1105 Points +13%
Asus Zenbook 14 UX3480QA
Qualcomm Snapdragon X X1-26-100
978 Points
Asus ZenBook A14 UX3407QA
Qualcomm Snapdragon X X1-26-100
975 Points 0%
Average Qualcomm Snapdragon X X1-26-100
  (956 - 978, n=5)
970 Points -1%
Cinebench R20 / CPU (Multi Core)
Average of class Subnotebook
  (2072 - 8541, n=55, last 2 years)
4786 Points +66%
Ninkear S14, 16+1TB
AMD Ryzen 5 7535HS
3280 Points +14%
Asus Zenbook 14 UX3480QA
Qualcomm Snapdragon X X1-26-100
2881 Points
HP Omnibook 5 14
Qualcomm Snapdragon X Plus X1P-42-100
2853 Points -1%
Average Qualcomm Snapdragon X X1-26-100
  (2639 - 2881, n=5)
2766 Points -4%
Asus ZenBook A14 UX3407QA
Qualcomm Snapdragon X X1-26-100
2644 Points -8%
Dell XPS 13 DX13260
Intel Core 5 320
2371 Points -18%
Cinebench R20 / CPU (Single Core)
Dell XPS 13 DX13260
Intel Core 5 320
717 Points +92%
Average of class Subnotebook
  (366 - 832, n=55, last 2 years)
685 Points +83%
Ninkear S14, 16+1TB
AMD Ryzen 5 7535HS
555 Points +48%
HP Omnibook 5 14
Qualcomm Snapdragon X Plus X1P-42-100
418 Points +12%
Asus Zenbook 14 UX3480QA
Qualcomm Snapdragon X X1-26-100
374 Points
Average Qualcomm Snapdragon X X1-26-100
  (359 - 374, n=5)
367 Points -2%
Asus ZenBook A14 UX3407QA
Qualcomm Snapdragon X X1-26-100
366 Points -2%
Cinebench R15 / CPU Multi 64Bit
Average of class Subnotebook
  (849 - 3334, n=55, last 2 years)
2003 Points +41%
HP Omnibook 5 14
Qualcomm Snapdragon X Plus X1P-42-100
1481 (1243.36min - 1480.66max) Points +4%
Asus Zenbook 14 UX3480QA
Qualcomm Snapdragon X X1-26-100
1422 (1355.24min - 1421.97max) Points
Average Qualcomm Snapdragon X X1-26-100
  (1338 - 1422, n=5)
1397 Points -2%
Ninkear S14, 16+1TB
AMD Ryzen 5 7535HS
1385 Points -3%
Asus ZenBook A14 UX3407QA
Qualcomm Snapdragon X X1-26-100
1338 (1229.33min - 1338.33max) Points -6%
Dell XPS 13 DX13260
Intel Core 5 320
1054 (856.35min - 1053.52max) Points -26%
Cinebench R15 / CPU Single 64Bit
Dell XPS 13 DX13260
Intel Core 5 320
276 Points +50%
Average of class Subnotebook
  (184 - 322, n=55, last 2 years)
271 Points +47%
Ninkear S14, 16+1TB
AMD Ryzen 5 7535HS
230 Points +25%
HP Omnibook 5 14
Qualcomm Snapdragon X Plus X1P-42-100
206 Points +12%
Asus ZenBook A14 UX3407QA
Qualcomm Snapdragon X X1-26-100
186 Points +1%
Asus Zenbook 14 UX3480QA
Qualcomm Snapdragon X X1-26-100
184 Points
Average Qualcomm Snapdragon X X1-26-100
  (181.2 - 186, n=5)
183.1 Points 0%
7-Zip 18.03 / 7z b 4
Average of class Subnotebook
  (16455 - 77867, n=55, last 2 years)
43880 MIPS +46%
Ninkear S14, 16+1TB
AMD Ryzen 5 7535HS
39949 MIPS +33%
HP Omnibook 5 14
Qualcomm Snapdragon X Plus X1P-42-100
32641 MIPS +9%
Asus Zenbook 14 UX3480QA
Qualcomm Snapdragon X X1-26-100
30075 MIPS
Asus ZenBook A14 UX3407QA
Qualcomm Snapdragon X X1-26-100
29907 MIPS -1%
Average Qualcomm Snapdragon X X1-26-100
  (29240 - 30075, n=5)
29592 MIPS -2%
Dell XPS 13 DX13260
Intel Core 5 320
23550 MIPS -22%
7-Zip 18.03 / 7z b 4 -mmt1
Average of class Subnotebook
  (4088 - 6699, n=57, last 2 years)
5647 MIPS +38%
Dell XPS 13 DX13260
Intel Core 5 320
5319 MIPS +30%
Ninkear S14, 16+1TB
AMD Ryzen 5 7535HS
5280 MIPS +29%
HP Omnibook 5 14
Qualcomm Snapdragon X Plus X1P-42-100
4667 MIPS +14%
Asus Zenbook 14 UX3480QA
Qualcomm Snapdragon X X1-26-100
4089 MIPS
Average Qualcomm Snapdragon X X1-26-100
  (4041 - 4127, n=5)
4089 MIPS 0%
Asus ZenBook A14 UX3407QA
Qualcomm Snapdragon X X1-26-100
4088 MIPS 0%
Geekbench 6.7 / Multi-Core
HP Omnibook 5 14
Qualcomm Snapdragon X Plus X1P-42-100
14998 Points +41%
Average of class Subnotebook
  (5987 - 20325, n=62, last 2 years)
12443 Points +17%
Average Qualcomm Snapdragon X X1-26-100
  (10492 - 14998, n=6)
11353 Points +6%
Asus Zenbook 14 UX3480QA
Qualcomm Snapdragon X X1-26-100
10668 Points
Asus ZenBook A14 UX3407QA
Qualcomm Snapdragon X X1-26-100
10550 Points -1%
Apple MacBook Neo 256 GB
Apple A18 Pro
9140 Points -14%
Dell XPS 13 DX13260
Intel Core 5 320
7888 Points -26%
Ninkear S14, 16+1TB
AMD Ryzen 5 7535HS
7611 Points -29%
Geekbench 6.7 / Single-Core
Apple MacBook Neo 256 GB
Apple A18 Pro
3589 Points +68%
Average of class Subnotebook
  (1922 - 4195, n=61, last 2 years)
2802 Points +31%
HP Omnibook 5 14
Qualcomm Snapdragon X Plus X1P-42-100
2675 Points +25%
Dell XPS 13 DX13260
Intel Core 5 320
2575 Points +20%
Asus Zenbook 14 UX3480QA
Qualcomm Snapdragon X X1-26-100
2140 Points
Asus ZenBook A14 UX3407QA
Qualcomm Snapdragon X X1-26-100
2126 Points -1%
Average Qualcomm Snapdragon X X1-26-100
  (1421 - 2675, n=6)
2092 Points -2%
Ninkear S14, 16+1TB
AMD Ryzen 5 7535HS
1922 Points -10%
HWBOT x265 Benchmark v2.2 / 4k Preset
Average of class Subnotebook
  (3.16 - 25.1, n=55, last 2 years)
13.7 fps +151%
Ninkear S14, 16+1TB
AMD Ryzen 5 7535HS
10.9 fps +100%
Dell XPS 13 DX13260
Intel Core 5 320
8.42 fps +54%
Asus Zenbook 14 UX3480QA
Qualcomm Snapdragon X X1-26-100
5.46 fps
HP Omnibook 5 14
Qualcomm Snapdragon X Plus X1P-42-100
5.34 fps -2%
Average Qualcomm Snapdragon X X1-26-100
  (4.44 - 5.52, n=5)
5.09 fps -7%
Asus ZenBook A14 UX3407QA
Qualcomm Snapdragon X X1-26-100
4.44 fps -19%
LibreOffice / 20 Documents To PDF
Average Qualcomm Snapdragon X X1-26-100
  (67.6 - 102.3, n=5)
77.4 s * -13%
Ninkear S14, 16+1TB
AMD Ryzen 5 7535HS
69.6 s * -2%
Asus Zenbook 14 UX3480QA
Qualcomm Snapdragon X X1-26-100
68.3 s *
Asus ZenBook A14 UX3407QA
Qualcomm Snapdragon X X1-26-100
67.6 s * +1%
HP Omnibook 5 14
Qualcomm Snapdragon X Plus X1P-42-100
57.1 s * +16%
Average of class Subnotebook
  (39.9 - 78.8, n=55, last 2 years)
53.8 s * +21%
Dell XPS 13 DX13260
Intel Core 5 320
47.7 s * +30%
R Benchmark 2.5 / Overall mean
Asus ZenBook A14 UX3407QA
Qualcomm Snapdragon X X1-26-100
0.861 sec * -2%
Average Qualcomm Snapdragon X X1-26-100
  (0.84 - 0.888, n=5)
0.861 sec * -2%
Asus Zenbook 14 UX3480QA
Qualcomm Snapdragon X X1-26-100
0.845 sec *
HP Omnibook 5 14
Qualcomm Snapdragon X Plus X1P-42-100
0.74 sec * +12%
Ninkear S14, 16+1TB
AMD Ryzen 5 7535HS
0.546 sec * +35%
Average of class Subnotebook
  (0.4024 - 0.861, n=56, last 2 years)
0.4941 sec * +42%
Dell XPS 13 DX13260
Intel Core 5 320
0.4748 sec * +44%

* ... smaller is better

Cinebench R15 CPU Multi 64Bit
1422 Points
Cinebench R15 Ref. Match 64Bit
72 %
Cinebench R15 CPU Single 64Bit
184 Points
Cinebench R20 CPU (Single Core)
374 Points
Cinebench R20 CPU (Multi Core)
2881 Points
Cinebench R23 Multi Core
7300 Points
Cinebench R23 Single Core
978 Points
Cinebench 2024 CPU Single Core
96 Points
Cinebench 2024 CPU Multi Core
701 Points
Cinebench 2026 CPU Multi
2994 Points
Cinebench 2026 CPU Single Thread
399 Points
Help
Performance rating
Average of class Subnotebook
 
95.7 pt
Ninkear S14, 16+1TB -1!
AMD Ryzen 5 7535HS, Radeon 660M
81 pt
Asus ZenBook A14 UX3407QA -1!
Qualcomm Snapdragon X X1-26-100, Adreno X1-45 1.7 TFLOPS
47 pt
Average Qualcomm Snapdragon X X1-26-100
 
45.8 pt
Dell XPS 13 DX13260 -1!
Intel Core 5 320, Intel Graphics 2 Xe3 WCL
18.7 pt
AIDA64 / FP32 Ray-Trace
Average of class Subnotebook
  (2069 - 32043, n=55, last 2 years)
13778 KRay/s
Ninkear S14, 16+1TB
AMD Ryzen 5 7535HS, Radeon 660M (v6.92.6600)
9714 KRay/s
Asus ZenBook A14 UX3407QA
Qualcomm Snapdragon X X1-26-100, Adreno X1-45 1.7 TFLOPS (v6.92.6600)
5647 KRay/s
Average Qualcomm Snapdragon X X1-26-100
  (5435 - 5647, n=4)
5564 KRay/s
Dell XPS 13 DX13260
Intel Core 5 320, Intel Graphics 2 Xe3 WCL (v8.20.8100)
2545 KRay/s
AIDA64 / FPU Julia
Average of class Subnotebook
  (11041 - 120045, n=55, last 2 years)
62868 Points
Ninkear S14, 16+1TB
AMD Ryzen 5 7535HS, Radeon 660M (v6.92.6600)
61244 Points
Average Qualcomm Snapdragon X X1-26-100
  (14133 - 16182, n=4)
15608 Points
Asus ZenBook A14 UX3407QA
Qualcomm Snapdragon X X1-26-100, Adreno X1-45 1.7 TFLOPS (v6.92.6600)
14133 Points
Dell XPS 13 DX13260
Intel Core 5 320, Intel Graphics 2 Xe3 WCL (v8.20.8100)
13325 Points
AIDA64 / CPU SHA3
Average of class Subnotebook
  (561 - 5169, n=55, last 2 years)
3097 MB/s
Average Qualcomm Snapdragon X X1-26-100
  (2093 - 2368, n=4)
2298 MB/s
Asus ZenBook A14 UX3407QA
Qualcomm Snapdragon X X1-26-100, Adreno X1-45 1.7 TFLOPS (v6.92.6600)
2093 MB/s
Ninkear S14, 16+1TB
AMD Ryzen 5 7535HS, Radeon 660M (v6.92.6600)
2075 MB/s
Dell XPS 13 DX13260
Intel Core 5 320, Intel Graphics 2 Xe3 WCL (v8.20.8100)
645 MB/s
AIDA64 / CPU Queen
Ninkear S14, 16+1TB
AMD Ryzen 5 7535HS, Radeon 660M (v6.92.6600)
73548 Points
Average of class Subnotebook
  (44593 - 95002, n=41, last 2 years)
60933 Points
Asus ZenBook A14 UX3407QA
Qualcomm Snapdragon X X1-26-100, Adreno X1-45 1.7 TFLOPS (v6.92.6600)
44593 Points
Average Qualcomm Snapdragon X X1-26-100
  (44150 - 44593, n=3)
44445 Points
AIDA64 / FPU SinJulia
Ninkear S14, 16+1TB
AMD Ryzen 5 7535HS, Radeon 660M (v6.92.6600)
8792 Points
Average of class Subnotebook
  (692 - 18164, n=55, last 2 years)
6391 Points
Average Qualcomm Snapdragon X X1-26-100
  (1357 - 1384, n=4)
1372 Points
Asus ZenBook A14 UX3407QA
Qualcomm Snapdragon X X1-26-100, Adreno X1-45 1.7 TFLOPS (v6.92.6600)
1370 Points
Dell XPS 13 DX13260
Intel Core 5 320, Intel Graphics 2 Xe3 WCL (v8.20.8100)
910 Points
AIDA64 / FPU Mandel
Ninkear S14, 16+1TB
AMD Ryzen 5 7535HS, Radeon 660M (v6.92.6600)
34121 Points
Average of class Subnotebook
  (5978 - 64271, n=55, last 2 years)
33141 Points
Average Qualcomm Snapdragon X X1-26-100
  (9024 - 9154, n=4)
9077 Points
Asus ZenBook A14 UX3407QA
Qualcomm Snapdragon X X1-26-100, Adreno X1-45 1.7 TFLOPS (v6.92.6600)
9051 Points
Dell XPS 13 DX13260
Intel Core 5 320, Intel Graphics 2 Xe3 WCL (v8.20.8100)
6944 Points
AIDA64 / CPU AES
Average of class Subnotebook
  (6815 - 96917, n=55, last 2 years)
51799 MB/s
Ninkear S14, 16+1TB
AMD Ryzen 5 7535HS, Radeon 660M (v6.92.6600)
41960 MB/s
Average Qualcomm Snapdragon X X1-26-100
  (35860 - 40691, n=4)
38906 MB/s
Asus ZenBook A14 UX3407QA
Qualcomm Snapdragon X X1-26-100, Adreno X1-45 1.7 TFLOPS (v6.92.6600)
35860 MB/s
Dell XPS 13 DX13260
Intel Core 5 320, Intel Graphics 2 Xe3 WCL (v8.20.8100)
8293 MB/s
AIDA64 / CPU ZLib
Average of class Subnotebook
  (127.2 - 1361, n=55, last 2 years)
743 MB/s
Ninkear S14, 16+1TB
AMD Ryzen 5 7535HS, Radeon 660M (v6.92.6600)
545 MB/s
Asus ZenBook A14 UX3407QA
Qualcomm Snapdragon X X1-26-100, Adreno X1-45 1.7 TFLOPS (v6.92.6600)
484 MB/s
Average Qualcomm Snapdragon X X1-26-100
  (447 - 490, n=4)
474 MB/s
Dell XPS 13 DX13260
Intel Core 5 320, Intel Graphics 2 Xe3 WCL (v8.20.8100)
135.3 MB/s
AIDA64 / FP64 Ray-Trace
Average of class Subnotebook
  (953 - 17362, n=55, last 2 years)
7319 KRay/s
Ninkear S14, 16+1TB
AMD Ryzen 5 7535HS, Radeon 660M (v6.92.6600)
5194 KRay/s
Average Qualcomm Snapdragon X X1-26-100
  (2699 - 3102, n=4)
2909 KRay/s
Asus ZenBook A14 UX3407QA
Qualcomm Snapdragon X X1-26-100, Adreno X1-45 1.7 TFLOPS (v6.92.6600)
2766 KRay/s
Dell XPS 13 DX13260
Intel Core 5 320, Intel Graphics 2 Xe3 WCL (v8.20.8100)
1297 KRay/s
AIDA64 / CPU PhotoWorxx
Average of class Subnotebook
  (10193 - 85600, n=55, last 2 years)
49538 MPixel/s
Asus ZenBook A14 UX3407QA
Qualcomm Snapdragon X X1-26-100, Adreno X1-45 1.7 TFLOPS (v6.92.6600)
31591 MPixel/s
Average Qualcomm Snapdragon X X1-26-100
  (30286 - 31591, n=4)
30937 MPixel/s
Ninkear S14, 16+1TB
AMD Ryzen 5 7535HS, Radeon 660M (v6.92.6600)
24728 MPixel/s
Dell XPS 13 DX13260
Intel Core 5 320, Intel Graphics 2 Xe3 WCL (v8.20.8100)
11144 MPixel/s
AIDA64 / CPU CheckMate
Average of class Subnotebook
  (471 - 5939, n=13, last 2 years)
2777 MP/s
Dell XPS 13 DX13260
Intel Core 5 320, Intel Graphics 2 Xe3 WCL (v8.20.8100)
590 MP/s
Average Qualcomm Snapdragon X X1-26-100
  (n=1)
567 MP/s

System and Storage Devices

The Zenbook 14 is a responsive system and does not feel slow in practice. We performed our usual benchmark suite without any hiccups and did not notice any stability issues. Some benchmarks and apps are still not working properly on ARM systems, so we recommend you check whether your desired app is compatible. The PCIe 4.0 SSD from Samsung offers a storage capacity of 512 GB (423 GB free) does not perform well in all benchmarks, but this might be related to the SSD bug we mentioned before. We will run the benchmarks again once Asus has fixed the issue.

Performance rating: Percent
CrossMark: Overall | Productivity | Creativity | Responsiveness
WebXPRT 3: Overall
WebXPRT 4: Overall
Mozilla Kraken 1.1: Total
Performance rating
Apple MacBook Neo 256 GB
A18 GPU, A18 Pro, Apple SSD AP0256Z
92 pt
Average of class Subnotebook
 
83.3 pt
Dell XPS 13 DX13260
Intel Graphics 2 Xe3 WCL, Core 5 320, Kioxia BG7 512 GB
74.1 pt
HP Omnibook 5 14
Adreno X1-45 1.7 TFLOPS, SD X Plus X1P-42-100, Samsung PM9C1 MZVL81T0HELB-00BTW
70.4 pt
Asus Zenbook 14 UX3480QA
Adreno X1-45 1.7 TFLOPS, SD X1-26-100, Samsung PM9C1b MZVL8512HFLU-00BLL
69.8 pt
Asus ZenBook A14 UX3407QA
Adreno X1-45 1.7 TFLOPS, SD X1-26-100, Micron 2500 1TB MTFDKBA1T0QGN
63.3 pt
Average Qualcomm Snapdragon X X1-26-100, Qualcomm SD X Adreno X1-45 1.7 TFLOPS
 
59.9 pt
Ninkear S14, 16+1TB
Radeon 660M, R5 7535HS, Faspeed P8-1TB-LB1
55.6 pt
CrossMark / Overall
Apple MacBook Neo 256 GB
A18 GPU, A18 Pro, Apple SSD AP0256Z
1715 Points +51%
Average of class Subnotebook
  (1061 - 2356, n=59, last 2 years)
1710 Points +51%
Dell XPS 13 DX13260
Intel Graphics 2 Xe3 WCL, Core 5 320, Kioxia BG7 512 GB
1511 Points +33%
Ninkear S14, 16+1TB
Radeon 660M, R5 7535HS, Faspeed P8-1TB-LB1
1275 Points +12%
HP Omnibook 5 14
Adreno X1-45 1.7 TFLOPS, SD X Plus X1P-42-100, Samsung PM9C1 MZVL81T0HELB-00BTW
1168 Points +3%
Asus Zenbook 14 UX3480QA
Adreno X1-45 1.7 TFLOPS, SD X1-26-100, Samsung PM9C1b MZVL8512HFLU-00BLL
1135 Points
Average Qualcomm Snapdragon X X1-26-100, Qualcomm SD X Adreno X1-45 1.7 TFLOPS
  (1093 - 1135, n=5)
1115 Points -2%
Asus ZenBook A14 UX3407QA
Adreno X1-45 1.7 TFLOPS, SD X1-26-100, Micron 2500 1TB MTFDKBA1T0QGN
1114 Points -2%
CrossMark / Productivity
Apple MacBook Neo 256 GB
A18 GPU, A18 Pro, Apple SSD AP0256Z
1808 Points +71%
Average of class Subnotebook
  (1022 - 2277, n=59, last 2 years)
1626 Points +54%
Dell XPS 13 DX13260
Intel Graphics 2 Xe3 WCL, Core 5 320, Kioxia BG7 512 GB
1570 Points +49%
Ninkear S14, 16+1TB
Radeon 660M, R5 7535HS, Faspeed P8-1TB-LB1
1311 Points +24%
HP Omnibook 5 14
Adreno X1-45 1.7 TFLOPS, SD X Plus X1P-42-100, Samsung PM9C1 MZVL81T0HELB-00BTW
1095 Points +4%
Asus Zenbook 14 UX3480QA
Adreno X1-45 1.7 TFLOPS, SD X1-26-100, Samsung PM9C1b MZVL8512HFLU-00BLL
1056 Points
Average Qualcomm Snapdragon X X1-26-100, Qualcomm SD X Adreno X1-45 1.7 TFLOPS
  (1001 - 1056, n=5)
1029 Points -3%
Asus ZenBook A14 UX3407QA
Adreno X1-45 1.7 TFLOPS, SD X1-26-100, Micron 2500 1TB MTFDKBA1T0QGN
1022 Points -3%
CrossMark / Creativity
Average of class Subnotebook
  (1070 - 2743, n=59, last 2 years)
1924 Points +60%
Apple MacBook Neo 256 GB
A18 GPU, A18 Pro, Apple SSD AP0256Z
1809 Points +50%
Dell XPS 13 DX13260
Intel Graphics 2 Xe3 WCL, Core 5 320, Kioxia BG7 512 GB
1505 Points +25%
Ninkear S14, 16+1TB
Radeon 660M, R5 7535HS, Faspeed P8-1TB-LB1
1301 Points +8%
HP Omnibook 5 14
Adreno X1-45 1.7 TFLOPS, SD X Plus X1P-42-100, Samsung PM9C1 MZVL81T0HELB-00BTW
1292 Points +7%
Asus ZenBook A14 UX3407QA
Adreno X1-45 1.7 TFLOPS, SD X1-26-100, Micron 2500 1TB MTFDKBA1T0QGN
1226 Points +2%
Average Qualcomm Snapdragon X X1-26-100, Qualcomm SD X Adreno X1-45 1.7 TFLOPS
  (1203 - 1246, n=5)
1219 Points +1%
Asus Zenbook 14 UX3480QA
Adreno X1-45 1.7 TFLOPS, SD X1-26-100, Samsung PM9C1b MZVL8512HFLU-00BLL
1206 Points
CrossMark / Responsiveness
Average of class Subnotebook
  (1010 - 1854, n=59, last 2 years)
1412 Points +20%
Dell XPS 13 DX13260
Intel Graphics 2 Xe3 WCL, Core 5 320, Kioxia BG7 512 GB
1363 Points +16%
Apple MacBook Neo 256 GB
A18 GPU, A18 Pro, Apple SSD AP0256Z
1248 Points +6%
Asus Zenbook 14 UX3480QA
Adreno X1-45 1.7 TFLOPS, SD X1-26-100, Samsung PM9C1b MZVL8512HFLU-00BLL
1176 Points
Ninkear S14, 16+1TB
Radeon 660M, R5 7535HS, Faspeed P8-1TB-LB1
1107 Points -6%
Average Qualcomm Snapdragon X X1-26-100, Qualcomm SD X Adreno X1-45 1.7 TFLOPS
  (1007 - 1176, n=5)
1089 Points -7%
Asus ZenBook A14 UX3407QA
Adreno X1-45 1.7 TFLOPS, SD X1-26-100, Micron 2500 1TB MTFDKBA1T0QGN
1081 Points -8%
HP Omnibook 5 14
Adreno X1-45 1.7 TFLOPS, SD X Plus X1P-42-100, Samsung PM9C1 MZVL81T0HELB-00BTW
1048 Points -11%
WebXPRT 3 / Overall
Apple MacBook Neo 256 GB
A18 GPU, A18 Pro, Apple SSD AP0256Z
450 Points +11%
HP Omnibook 5 14
Adreno X1-45 1.7 TFLOPS, SD X Plus X1P-42-100, Samsung PM9C1 MZVL81T0HELB-00BTW
414 Points +2%
Asus Zenbook 14 UX3480QA
Adreno X1-45 1.7 TFLOPS, SD X1-26-100, Samsung PM9C1b MZVL8512HFLU-00BLL
404 Points
Average Qualcomm Snapdragon X X1-26-100, Qualcomm SD X Adreno X1-45 1.7 TFLOPS
  (353 - 404, n=4)
372 Points -8%
Asus ZenBook A14 UX3407QA
Adreno X1-45 1.7 TFLOPS, SD X1-26-100, Micron 2500 1TB MTFDKBA1T0QGN
353 Points -13%
Average of class Subnotebook
  (203 - 530, n=55, last 2 years)
332 Points -18%
Dell XPS 13 DX13260
Intel Graphics 2 Xe3 WCL, Core 5 320, Kioxia BG7 512 GB
255 Points -37%
Ninkear S14, 16+1TB
Radeon 660M, R5 7535HS, Faspeed P8-1TB-LB1
203 Points -50%
WebXPRT 4 / Overall
Apple MacBook Neo 256 GB
A18 GPU, A18 Pro, Apple SSD AP0256Z
326 Points +14%
Asus Zenbook 14 UX3480QA
Adreno X1-45 1.7 TFLOPS, SD X1-26-100, Samsung PM9C1b MZVL8512HFLU-00BLL
286 Points
HP Omnibook 5 14
Adreno X1-45 1.7 TFLOPS, SD X Plus X1P-42-100, Samsung PM9C1 MZVL81T0HELB-00BTW
282 Points -1%
Average of class Subnotebook
  (167.3 - 378, n=59, last 2 years)
278 Points -3%
Dell XPS 13 DX13260
Intel Graphics 2 Xe3 WCL, Core 5 320, Kioxia BG7 512 GB
269 Points -6%
Asus ZenBook A14 UX3407QA
Adreno X1-45 1.7 TFLOPS, SD X1-26-100, Micron 2500 1TB MTFDKBA1T0QGN
248 Points -13%
Average Qualcomm Snapdragon X X1-26-100, Qualcomm SD X Adreno X1-45 1.7 TFLOPS
  (104.2 - 286, n=5)
200 Points -30%
Ninkear S14, 16+1TB
Radeon 660M, R5 7535HS, Faspeed P8-1TB-LB1
167.3 Points -42%
Mozilla Kraken 1.1 / Total
Ninkear S14, 16+1TB
Radeon 660M, R5 7535HS, Faspeed P8-1TB-LB1
709 ms * -69%
Average Qualcomm Snapdragon X X1-26-100, Qualcomm SD X Adreno X1-45 1.7 TFLOPS
  (420 - 1158, n=5)
619 ms * -47%
Asus ZenBook A14 UX3407QA
Adreno X1-45 1.7 TFLOPS, SD X1-26-100, Micron 2500 1TB MTFDKBA1T0QGN
520.6 ms * -24%
Dell XPS 13 DX13260
Intel Graphics 2 Xe3 WCL, Core 5 320, Kioxia BG7 512 GB
497 ms * -18%
Average of class Subnotebook
  (234 - 709, n=59, last 2 years)
465 ms * -11%
Asus Zenbook 14 UX3480QA
Adreno X1-45 1.7 TFLOPS, SD X1-26-100, Samsung PM9C1b MZVL8512HFLU-00BLL
419.9 ms *
HP Omnibook 5 14
Adreno X1-45 1.7 TFLOPS, SD X Plus X1P-42-100, Samsung PM9C1 MZVL81T0HELB-00BTW
396.1 ms * +6%
Apple MacBook Neo 256 GB
A18 GPU, A18 Pro, Apple SSD AP0256Z
273.4 ms * +35%

* ... smaller is better

» No benchmarks for this notebook found!

AIDA64 / Memory Copy
Average of class Subnotebook
  (15233 - 131023, n=55, last 2 years)
89427 MB/s
Asus ZenBook A14 UX3407QA
Qualcomm Snapdragon X X1-26-100, Adreno X1-45 1.7 TFLOPS
63432 MB/s
Average Qualcomm Snapdragon X X1-26-100
  (61578 - 63432, n=4)
62591 MB/s
Ninkear S14, 16+1TB
AMD Ryzen 5 7535HS, Radeon 660M
48040 MB/s
Dell XPS 13 DX13260
Intel Core 5 320, Intel Graphics 2 Xe3 WCL
16289 MB/s
AIDA64 / Memory Read
Average Qualcomm Snapdragon X X1-26-100
  (116332 - 127192, n=4)
122130 MB/s
Asus ZenBook A14 UX3407QA
Qualcomm Snapdragon X X1-26-100, Adreno X1-45 1.7 TFLOPS
116332 MB/s
Average of class Subnotebook
  (13982 - 127174, n=55, last 2 years)
83191 MB/s
Ninkear S14, 16+1TB
AMD Ryzen 5 7535HS, Radeon 660M
40044 MB/s
Dell XPS 13 DX13260
Intel Core 5 320, Intel Graphics 2 Xe3 WCL
16674 MB/s
AIDA64 / Memory Write
Average of class Subnotebook
  (17404 - 135141, n=55, last 2 years)
92535 MB/s
Ninkear S14, 16+1TB
AMD Ryzen 5 7535HS, Radeon 660M
48854 MB/s
Asus ZenBook A14 UX3407QA
Qualcomm Snapdragon X X1-26-100, Adreno X1-45 1.7 TFLOPS
48754 MB/s
Average Qualcomm Snapdragon X X1-26-100
  (46150 - 48754, n=4)
47192 MB/s
Dell XPS 13 DX13260
Intel Core 5 320, Intel Graphics 2 Xe3 WCL
18564 MB/s
AIDA64 / Memory Latency
Dell XPS 13 DX13260
Intel Core 5 320, Intel Graphics 2 Xe3 WCL
317 ns *
Ninkear S14, 16+1TB
AMD Ryzen 5 7535HS, Radeon 660M
110.3 ns *
Average of class Subnotebook
  (6.1 - 317, n=53, last 2 years)
103.8 ns *
Average Qualcomm Snapdragon X X1-26-100
  (7.2 - 17.2, n=2)
12.2 ns *
Asus ZenBook A14 UX3407QA
Qualcomm Snapdragon X X1-26-100, Adreno X1-45 1.7 TFLOPS
7.2 ns *

* ... smaller is better

Samsung PM9C1b MZVL8512HFLU-00BLL
CDM 5/6 Read Seq Q32T1: 5990 MB/s
CDM 5/6 Write Seq Q32T1: 5554 MB/s
CDM 5/6 Read 4K Q32T1: 311 MB/s
CDM 5/6 Write 4K Q32T1: 508 MB/s
CDM 5/6 Read 4K: 70.6 MB/s
CDM 5/6 Write 4K: 147.1 MB/s
CDM 6 Write 4K Q8T8: 612 MB/s
CDM 6 Read 4K Q8T8: 1210 MB/s
Drive Performance rating - Percent
Average Samsung PM9C1b MZVL8512HFLU-00BLL
 
84.1 pt
Average of class Subnotebook
 
82.6 pt
Asus ZenBook A14 UX3407QA
Micron 2500 1TB MTFDKBA1T0QGN
81.8 pt
Dell XPS 13 DX13260
Kioxia BG7 512 GB
69.4 pt
Ninkear S14, 16+1TB
Faspeed P8-1TB-LB1
67.7 pt
Asus Zenbook 14 UX3480QA
Samsung PM9C1b MZVL8512HFLU-00BLL
65.9 pt
HP Omnibook 5 14
Samsung PM9C1 MZVL81T0HELB-00BTW
63.5 pt
DiskSpd
seq read
Dell XPS 13 DX13260
Kioxia BG7 512 GB
3317 (3282.04min - 3316.51max) MB/s +100%
Asus ZenBook A14 UX3407QA
Micron 2500 1TB MTFDKBA1T0QGN
3153 (3138.19min - 3152.86max) MB/s +90%
Average of class Subnotebook
  (1451 - 4974, n=55, last 2 years)
3109 MB/s +88%
Average Samsung PM9C1b MZVL8512HFLU-00BLL
  (1658 - 3642, n=7)
2854 MB/s +72%
HP Omnibook 5 14
Samsung PM9C1 MZVL81T0HELB-00BTW
2217 (2196.56min - 2216.51max) MB/s +34%
Ninkear S14, 16+1TB
Faspeed P8-1TB-LB1
2198 (2085.83min - 2198.46max) MB/s +33%
Asus Zenbook 14 UX3480QA
Samsung PM9C1b MZVL8512HFLU-00BLL
1658 (1633.56min - 1658.22max) MB/s
seq write
Asus ZenBook A14 UX3407QA
Micron 2500 1TB MTFDKBA1T0QGN
3514 (3441.64min - 3513.57max) MB/s +432%
Dell XPS 13 DX13260
Kioxia BG7 512 GB
3272 (3191.03min - 3271.98max) MB/s +396%
Average of class Subnotebook
  (660 - 5392, n=55, last 2 years)
3121 MB/s +373%
Average Samsung PM9C1b MZVL8512HFLU-00BLL
  (660 - 5037, n=7)
2930 MB/s +344%
Ninkear S14, 16+1TB
Faspeed P8-1TB-LB1
2359 (1045.63min - 2358.67max) MB/s +257%
HP Omnibook 5 14
Samsung PM9C1 MZVL81T0HELB-00BTW
2326 (2180.41min - 2325.53max) MB/s +252%
Asus Zenbook 14 UX3480QA
Samsung PM9C1b MZVL8512HFLU-00BLL
660 (408.94min - 660.12max) MB/s
seq q8 t1 read
Asus ZenBook A14 UX3407QA
Micron 2500 1TB MTFDKBA1T0QGN
7004 (6317.04min - 7004.49max) MB/s +55%
Dell XPS 13 DX13260
Kioxia BG7 512 GB
6964 (5869.51min - 6964.43max) MB/s +54%
Average Samsung PM9C1b MZVL8512HFLU-00BLL
  (4522 - 6973, n=7)
6297 MB/s +39%
Average of class Subnotebook
  (2107 - 13544, n=55, last 2 years)
6215 MB/s +37%
HP Omnibook 5 14
Samsung PM9C1 MZVL81T0HELB-00BTW
4876 (3519.86min - 4876.3max) MB/s +8%
Asus Zenbook 14 UX3480QA
Samsung PM9C1b MZVL8512HFLU-00BLL
4522 (3778.42min - 4521.7max) MB/s
Ninkear S14, 16+1TB
Faspeed P8-1TB-LB1
3352 (2449.47min - 3352.3max) MB/s -26%
seq q8 t1 write
Asus ZenBook A14 UX3407QA
Micron 2500 1TB MTFDKBA1T0QGN
6028 (6002.47min - 6028.26max) MB/s +629%
Dell XPS 13 DX13260
Kioxia BG7 512 GB
5647 (5306.51min - 5646.79max) MB/s +583%
Average of class Subnotebook
  (827 - 9702, n=55, last 2 years)
4878 MB/s +490%
Average Samsung PM9C1b MZVL8512HFLU-00BLL
  (827 - 5948, n=7)
4600 MB/s +456%
Ninkear S14, 16+1TB
Faspeed P8-1TB-LB1
2708 (2681.3min - 2707.63max) MB/s +227%
HP Omnibook 5 14
Samsung PM9C1 MZVL81T0HELB-00BTW
2600 (2556.01min - 2600.01max) MB/s +214%
Asus Zenbook 14 UX3480QA
Samsung PM9C1b MZVL8512HFLU-00BLL
827 (500.64min - 827.35max) MB/s
4k q1 t1 read
Asus ZenBook A14 UX3407QA
Micron 2500 1TB MTFDKBA1T0QGN
72.1 (70.73min - 72.11max) MB/s +38%
Average Samsung PM9C1b MZVL8512HFLU-00BLL
  (52.4 - 74.6, n=7)
65.1 MB/s +24%
Dell XPS 13 DX13260
Kioxia BG7 512 GB
63.4 (62.65min - 63.44max) MB/s +21%
Average of class Subnotebook
  (28.9 - 95.2, n=55, last 2 years)
62.3 MB/s +19%
HP Omnibook 5 14
Samsung PM9C1 MZVL81T0HELB-00BTW
57.7 (55.68min - 57.68max) MB/s +10%
Asus Zenbook 14 UX3480QA
Samsung PM9C1b MZVL8512HFLU-00BLL
52.4 (51.36min - 52.41max) MB/s
Ninkear S14, 16+1TB
Faspeed P8-1TB-LB1
39.2 (20.66min - 39.21max) MB/s -25%
4k q1 t1 write
Asus ZenBook A14 UX3407QA
Micron 2500 1TB MTFDKBA1T0QGN
207 (202.13min - 207.4max) MB/s +20%
Asus Zenbook 14 UX3480QA
Samsung PM9C1b MZVL8512HFLU-00BLL
173.1 (140.94min - 173.11max) MB/s
Average of class Subnotebook
  (107 - 278, n=55, last 2 years)
158.2 MB/s -9%
Ninkear S14, 16+1TB
Faspeed P8-1TB-LB1
157.6 (30.98min - 157.61max) MB/s -9%
Dell XPS 13 DX13260
Kioxia BG7 512 GB
154.1 (152.71min - 154.07max) MB/s -11%
Average Samsung PM9C1b MZVL8512HFLU-00BLL
  (121.8 - 173.1, n=7)
153.1 MB/s -12%
HP Omnibook 5 14
Samsung PM9C1 MZVL81T0HELB-00BTW
124.5 (121.49min - 124.46max) MB/s -28%
4k q32 t16 read
Ninkear S14, 16+1TB
Faspeed P8-1TB-LB1
1483 (623.41min - 1482.59max) MB/s +8%
HP Omnibook 5 14
Samsung PM9C1 MZVL81T0HELB-00BTW
1435 (1369.5min - 1434.61max) MB/s +5%
Asus ZenBook A14 UX3407QA
Micron 2500 1TB MTFDKBA1T0QGN
1381 (1217.91min - 1380.8max) MB/s +1%
Asus Zenbook 14 UX3480QA
Samsung PM9C1b MZVL8512HFLU-00BLL
1368 (1242.59min - 1368.37max) MB/s
Average Samsung PM9C1b MZVL8512HFLU-00BLL
  (614 - 3510, n=7)
1188 MB/s -13%
Average of class Subnotebook
  (228 - 4203, n=55, last 2 years)
1128 MB/s -18%
Dell XPS 13 DX13260
Kioxia BG7 512 GB
554 (539.77min - 554.36max) MB/s -60%
4k q32 t16 write
Average Samsung PM9C1b MZVL8512HFLU-00BLL
  (375 - 3964, n=7)
962 MB/s +76%
Average of class Subnotebook
  (243 - 5007, n=55, last 2 years)
799 MB/s +46%
HP Omnibook 5 14
Samsung PM9C1 MZVL81T0HELB-00BTW
643 (639.25min - 643.18max) MB/s +18%
Asus ZenBook A14 UX3407QA
Micron 2500 1TB MTFDKBA1T0QGN
588 (585.07min - 587.63max) MB/s +7%
Asus Zenbook 14 UX3480QA
Samsung PM9C1b MZVL8512HFLU-00BLL
547 (264.8min - 546.96max) MB/s
Ninkear S14, 16+1TB
Faspeed P8-1TB-LB1
452 (244.84min - 451.81max) MB/s -17%
Dell XPS 13 DX13260
Kioxia BG7 512 GB
283 (279.07min - 282.59max) MB/s -48%
AS SSD
Score Total
Average Samsung PM9C1b MZVL8512HFLU-00BLL
  (3107 - 8479, n=7)
4479 Points +44%
Average of class Subnotebook
  (1439 - 9875, n=55, last 2 years)
4249 Points +37%
Ninkear S14, 16+1TB
Faspeed P8-1TB-LB1
4120 Points +33%
Asus ZenBook A14 UX3407QA
Micron 2500 1TB MTFDKBA1T0QGN
3292 Points +6%
Dell XPS 13 DX13260
Kioxia BG7 512 GB
3136 Points +1%
Asus Zenbook 14 UX3480QA
Samsung PM9C1b MZVL8512HFLU-00BLL
3107 Points
HP Omnibook 5 14
Samsung PM9C1 MZVL81T0HELB-00BTW
2693 Points -13%
Score Read
Ninkear S14, 16+1TB
Faspeed P8-1TB-LB1
1590 Points +75%
Average Samsung PM9C1b MZVL8512HFLU-00BLL
  (911 - 3047, n=7)
1416 Points +55%
Average of class Subnotebook
  (340 - 4048, n=55, last 2 years)
1406 Points +54%
Dell XPS 13 DX13260
Kioxia BG7 512 GB
1224 Points +34%
Asus ZenBook A14 UX3407QA
Micron 2500 1TB MTFDKBA1T0QGN
1049 Points +15%
Asus Zenbook 14 UX3480QA
Samsung PM9C1b MZVL8512HFLU-00BLL
911 Points
HP Omnibook 5 14
Samsung PM9C1 MZVL81T0HELB-00BTW
722 Points -21%
Score Write
Average Samsung PM9C1b MZVL8512HFLU-00BLL
  (1798 - 3910, n=7)
2397 Points +32%
Average of class Subnotebook
  (616 - 4148, n=55, last 2 years)
2193 Points +21%
Asus Zenbook 14 UX3480QA
Samsung PM9C1b MZVL8512HFLU-00BLL
1816 Points
Asus ZenBook A14 UX3407QA
Micron 2500 1TB MTFDKBA1T0QGN
1773 Points -2%
Ninkear S14, 16+1TB
Faspeed P8-1TB-LB1
1713 Points -6%
HP Omnibook 5 14
Samsung PM9C1 MZVL81T0HELB-00BTW
1624 Points -11%
Dell XPS 13 DX13260
Kioxia BG7 512 GB
1412 Points -22%
Seq Read
Dell XPS 13 DX13260
Kioxia BG7 512 GB
5210.55 MB/s +23%
Asus ZenBook A14 UX3407QA
Micron 2500 1TB MTFDKBA1T0QGN
4726 MB/s +12%
Average of class Subnotebook
  (2035 - 8075, n=55, last 2 years)
4681 MB/s +11%
Average Samsung PM9C1b MZVL8512HFLU-00BLL
  (3062 - 5182, n=7)
4481 MB/s +6%
Asus Zenbook 14 UX3480QA
Samsung PM9C1b MZVL8512HFLU-00BLL
4220 MB/s
Ninkear S14, 16+1TB
Faspeed P8-1TB-LB1
3008 MB/s -29%
HP Omnibook 5 14
Samsung PM9C1 MZVL81T0HELB-00BTW
2697 MB/s -36%
Seq Write
Average Samsung PM9C1b MZVL8512HFLU-00BLL
  (2066 - 4601, n=7)
3054 MB/s +48%
Average of class Subnotebook
  (817 - 5481, n=55, last 2 years)
3005 MB/s +45%
Asus ZenBook A14 UX3407QA
Micron 2500 1TB MTFDKBA1T0QGN
2994 MB/s +45%
Ninkear S14, 16+1TB
Faspeed P8-1TB-LB1
2801 MB/s +36%
Dell XPS 13 DX13260
Kioxia BG7 512 GB
2421.45 MB/s +17%
Asus Zenbook 14 UX3480QA
Samsung PM9C1b MZVL8512HFLU-00BLL
2066 MB/s
HP Omnibook 5 14
Samsung PM9C1 MZVL81T0HELB-00BTW
1899.04 MB/s -8%
4K Read
Asus Zenbook 14 UX3480QA
Samsung PM9C1b MZVL8512HFLU-00BLL
65.8 MB/s
Asus ZenBook A14 UX3407QA
Micron 2500 1TB MTFDKBA1T0QGN
65.4 MB/s -1%
Ninkear S14, 16+1TB
Faspeed P8-1TB-LB1
65 MB/s -1%
Average of class Subnotebook
  (34.3 - 96.3, n=55, last 2 years)
60.3 MB/s -8%
Average Samsung PM9C1b MZVL8512HFLU-00BLL
  (44.2 - 70, n=7)
59 MB/s -10%
Dell XPS 13 DX13260
Kioxia BG7 512 GB
53.66 MB/s -18%
HP Omnibook 5 14
Samsung PM9C1 MZVL81T0HELB-00BTW
52.58 MB/s -20%
4K Write
Asus ZenBook A14 UX3407QA
Micron 2500 1TB MTFDKBA1T0QGN
206 MB/s +11%
HP Omnibook 5 14
Samsung PM9C1 MZVL81T0HELB-00BTW
199.68 MB/s +8%
Asus Zenbook 14 UX3480QA
Samsung PM9C1b MZVL8512HFLU-00BLL
185.3 MB/s
Dell XPS 13 DX13260
Kioxia BG7 512 GB
175.33 MB/s -5%
Average of class Subnotebook
  (49 - 265, n=55, last 2 years)
165.5 MB/s -11%
Average Samsung PM9C1b MZVL8512HFLU-00BLL
  (94.9 - 188.8, n=7)
159.5 MB/s -14%
Ninkear S14, 16+1TB
Faspeed P8-1TB-LB1
139.8 MB/s -25%
4K-64 Read
Ninkear S14, 16+1TB
Faspeed P8-1TB-LB1
1224 MB/s +189%
Average Samsung PM9C1b MZVL8512HFLU-00BLL
  (423 - 2475, n=7)
909 MB/s +115%
Average of class Subnotebook
  (102.1 - 3417, n=55, last 2 years)
879 MB/s +108%
Dell XPS 13 DX13260
Kioxia BG7 512 GB
649.63 MB/s +54%
Asus ZenBook A14 UX3407QA
Micron 2500 1TB MTFDKBA1T0QGN
511 MB/s +21%
Asus Zenbook 14 UX3480QA
Samsung PM9C1b MZVL8512HFLU-00BLL
423 MB/s
HP Omnibook 5 14
Samsung PM9C1 MZVL81T0HELB-00BTW
399.43 MB/s -6%
4K-64 Write
Average Samsung PM9C1b MZVL8512HFLU-00BLL
  (1295 - 3355, n=7)
1932 MB/s +36%
Average of class Subnotebook
  (356 - 3386, n=55, last 2 years)
1727 MB/s +21%
Asus Zenbook 14 UX3480QA
Samsung PM9C1b MZVL8512HFLU-00BLL
1424 MB/s
Ninkear S14, 16+1TB
Faspeed P8-1TB-LB1
1293 MB/s -9%
Asus ZenBook A14 UX3407QA
Micron 2500 1TB MTFDKBA1T0QGN
1267 MB/s -11%
HP Omnibook 5 14
Samsung PM9C1 MZVL81T0HELB-00BTW
1234.43 MB/s -13%
Dell XPS 13 DX13260
Kioxia BG7 512 GB
994.65 MB/s -30%
Access Time Read
Dell XPS 13 DX13260
Kioxia BG7 512 GB
0.125 ms * -198%
Asus ZenBook A14 UX3407QA
Micron 2500 1TB MTFDKBA1T0QGN
0.111 ms * -164%
Average Samsung PM9C1b MZVL8512HFLU-00BLL
  (0.038 - 0.211, n=7)
0.09057 ms * -116%
Ninkear S14, 16+1TB
Faspeed P8-1TB-LB1
0.08 ms * -90%
HP Omnibook 5 14
Samsung PM9C1 MZVL81T0HELB-00BTW
0.073 ms * -74%
Average of class Subnotebook
  (0.024 - 0.172, n=55, last 2 years)
0.07136 ms * -70%
Asus Zenbook 14 UX3480QA
Samsung PM9C1b MZVL8512HFLU-00BLL
0.042 ms *
Access Time Write
Ninkear S14, 16+1TB
Faspeed P8-1TB-LB1
0.124 ms * -520%
Dell XPS 13 DX13260
Kioxia BG7 512 GB
0.065 ms * -225%
HP Omnibook 5 14
Samsung PM9C1 MZVL81T0HELB-00BTW
0.057 ms * -185%
Average of class Subnotebook
  (0.017 - 0.281, n=55, last 2 years)
0.05533 ms * -177%
Average Samsung PM9C1b MZVL8512HFLU-00BLL
  (0.02 - 0.064, n=7)
0.03143 ms * -57%
Asus Zenbook 14 UX3480QA
Samsung PM9C1b MZVL8512HFLU-00BLL
0.02 ms *
Asus ZenBook A14 UX3407QA
Micron 2500 1TB MTFDKBA1T0QGN
0.018 ms * +10%

* ... smaller is better

Disk Throttling: DiskSpd Read Loop, Queue Depth 8

0145290435580725870101511601305145015951740188520302175232024652610275529003045319033353480362537703915406042054350449546404785493050755220536555105655580059456090623563806525667068156960Tooltip
Asus Zenbook 14 UX3480QA Samsung PM9C1b MZVL8512HFLU-00BLL; diskspd 2.0.17 f: Ø4555 (1346.37-4615.2) MB/s
Dell XPS 13 DX13260 Kioxia BG7 512 GB; diskspd 2.0.17 f: Ø6973 (5927.07-7011.62) MB/s
Ninkear S14, 16+1TB Faspeed P8-1TB-LB1; diskspd 2.0.17 f: Ø3340 (2945.85-3382.5) MB/s
HP Omnibook 5 14 Samsung PM9C1 MZVL81T0HELB-00BTW; diskspd 2.0.17 f: Ø4339 (3603.04-4880.59) MB/s
Asus ZenBook A14 UX3407QA Micron 2500 1TB MTFDKBA1T0QGN; diskspd 2.0.17 f: Ø6638 (2998.38-7009.34) MB/s

GPU and Gaming Performance

The Adreno X1-45 iGPU is one of the slowest modern GPUs you can get and the graphics performance is very low overall, but it can still handle any daily tasks including the playback of high-resolution videos without any issues. Gaming is hardly possible at all and we recommend streaming services like Xbox Cloud Gaming.

3DMark Performance rating - Percent
Average of class Subnotebook
 
100 pt
Apple MacBook Neo 256 GB -3!
Apple A18 GPU, Apple A18 Pro
67.5 pt
Ninkear S14, 16+1TB -2!
AMD Radeon 660M, AMD Ryzen 5 7535HS
56.1 pt
Asus ZenBook A14 UX3407QA -1!
Qualcomm SD X Adreno X1-45 1.7 TFLOPS, Qualcomm Snapdragon X X1-26-100
46.8 pt
Asus Zenbook 14 UX3480QA
Qualcomm SD X Adreno X1-45 1.7 TFLOPS, Qualcomm Snapdragon X X1-26-100
43.5 pt
Average Qualcomm SD X Adreno X1-45 1.7 TFLOPS
 
43.1 pt
Dell XPS 13 DX13260 -2!
Intel Graphics 2 Xe3 Wildcat Lake iGPU, Intel Core 5 320
41.7 pt
HP Omnibook 5 14 -2!
Qualcomm SD X Adreno X1-45 1.7 TFLOPS, Qualcomm Snapdragon X Plus X1P-42-100
40.1 pt
3DMark 11 - 1280x720 Performance GPU
Average of class Subnotebook
  (2165 - 18489, n=53, last 2 years)
9495 Points +128%
Ninkear S14, 16+1TB
AMD Radeon 660M, AMD Ryzen 5 7535HS
5639 Points +36%
HP Omnibook 5 14
Qualcomm SD X Adreno X1-45 1.7 TFLOPS, Qualcomm Snapdragon X Plus X1P-42-100
4209 Points +1%
Asus Zenbook 14 UX3480QA
Qualcomm SD X Adreno X1-45 1.7 TFLOPS, Qualcomm Snapdragon X X1-26-100
4160 Points
Asus ZenBook A14 UX3407QA
Qualcomm SD X Adreno X1-45 1.7 TFLOPS, Qualcomm Snapdragon X X1-26-100
4131 Points -1%
Average Qualcomm SD X Adreno X1-45 1.7 TFLOPS
  (4031 - 4209, n=14)
4120 Points -1%
Dell XPS 13 DX13260
Intel Graphics 2 Xe3 Wildcat Lake iGPU, Intel Core 5 320
3822 Points -8%
3DMark
1920x1080 Fire Strike Graphics
Average of class Subnotebook
  (1998 - 32931, n=55, last 2 years)
8068 Points +115%
Ninkear S14, 16+1TB
AMD Radeon 660M, AMD Ryzen 5 7535HS
4929 Points +31%
HP Omnibook 5 14
Qualcomm SD X Adreno X1-45 1.7 TFLOPS, Qualcomm Snapdragon X Plus X1P-42-100
3756 Points 0%
Asus Zenbook 14 UX3480QA
Qualcomm SD X Adreno X1-45 1.7 TFLOPS, Qualcomm Snapdragon X X1-26-100
3755 Points
Average Qualcomm SD X Adreno X1-45 1.7 TFLOPS
  (3690 - 3852, n=14)
3738 Points 0%
Asus ZenBook A14 UX3407QA
Qualcomm SD X Adreno X1-45 1.7 TFLOPS, Qualcomm Snapdragon X X1-26-100
3690 Points -2%
Dell XPS 13 DX13260
Intel Graphics 2 Xe3 Wildcat Lake iGPU, Intel Core 5 320
3485 Points -7%
2560x1440 Time Spy Graphics
Average of class Subnotebook
  (753 - 14477, n=53, last 2 years)
3214 Points +248%
Ninkear S14, 16+1TB
AMD Radeon 660M, AMD Ryzen 5 7535HS
1535 Points +66%
Dell XPS 13 DX13260
Intel Graphics 2 Xe3 Wildcat Lake iGPU, Intel Core 5 320
1343 Points +45%
HP Omnibook 5 14
Qualcomm SD X Adreno X1-45 1.7 TFLOPS, Qualcomm Snapdragon X Plus X1P-42-100
941 Points +2%
Asus Zenbook 14 UX3480QA
Qualcomm SD X Adreno X1-45 1.7 TFLOPS, Qualcomm Snapdragon X X1-26-100
924 Points
Average Qualcomm SD X Adreno X1-45 1.7 TFLOPS
  (873 - 941, n=11)
918 Points -1%
Steel Nomad Light Score
Average of class Subnotebook
  (587 - 5084, n=25, last 2 years)
2626 Points +130%
Apple MacBook Neo 256 GB
Apple A18 GPU, Apple A18 Pro
1786 Points +57%
Asus ZenBook A14 UX3407QA
Qualcomm SD X Adreno X1-45 1.7 TFLOPS, Qualcomm Snapdragon X X1-26-100
1146 Points +1%
Asus Zenbook 14 UX3480QA
Qualcomm SD X Adreno X1-45 1.7 TFLOPS, Qualcomm Snapdragon X X1-26-100
1140 Points
Average Qualcomm SD X Adreno X1-45 1.7 TFLOPS
  (1080 - 1148, n=8)
1118 Points -2%
Wild Life Extreme
Average of class Subnotebook
  (1308 - 11498, n=31, last 2 years)
5966 Points +83%
Apple MacBook Neo 256 GB
Apple A18 GPU, Apple A18 Pro
3999 Points +22%
Asus Zenbook 14 UX3480QA
Qualcomm SD X Adreno X1-45 1.7 TFLOPS, Qualcomm Snapdragon X X1-26-100
3267 Points
Asus ZenBook A14 UX3407QA
Qualcomm SD X Adreno X1-45 1.7 TFLOPS, Qualcomm Snapdragon X X1-26-100
3252 Points 0%
Average Qualcomm SD X Adreno X1-45 1.7 TFLOPS
  (3221 - 3274, n=9)
3247 Points -1%
3DMark 11 Performance
4571 points
3DMark Fire Strike Score
3651 points
3DMark Time Spy Score
1056 points
3DMark Steel Nomad Light Score
1140 points
Help
Blender / v3.3 Classroom CPU
Average Qualcomm SD X Adreno X1-45 1.7 TFLOPS
  (711 - 1226, n=15)
853 Seconds * -6%
Asus ZenBook A14 UX3407QA
Qualcomm SD X Adreno X1-45 1.7 TFLOPS, Qualcomm Snapdragon X X1-26-100
851 Seconds * -6%
HP Omnibook 5 14
Qualcomm SD X Adreno X1-45 1.7 TFLOPS, Qualcomm Snapdragon X Plus X1P-42-100
828 Seconds * -3%
Apple MacBook Neo 256 GB
Apple A18 GPU, Apple A18 Pro
813 Seconds * -1%
Asus Zenbook 14 UX3480QA
Qualcomm SD X Adreno X1-45 1.7 TFLOPS, Qualcomm Snapdragon X X1-26-100
803 Seconds *
Dell XPS 13 DX13260
Intel Graphics 2 Xe3 Wildcat Lake iGPU, Intel Core 5 320
799 Seconds * -0%
Ninkear S14, 16+1TB
AMD Radeon 660M, AMD Ryzen 5 7535HS
643 Seconds * +20%
Average of class Subnotebook
  (241 - 1117, n=60, last 2 years)
531 Seconds * +34%
Blender / v3.3 Classroom METAL
Apple MacBook Neo 256 GB
Apple A18 GPU, Apple A18 Pro
227 Seconds *
Average of class Subnotebook
  (76.3 - 227, n=5, last 2 years)
121.9 Seconds *

* ... smaller is better

Performance rating - Percent
Average of class Subnotebook
 
100 pt
Ninkear S14, 16+1TB
AMD Ryzen 5 7535HS, AMD Radeon 660M
62 pt
HP Omnibook 5 14
Qualcomm Snapdragon X Plus X1P-42-100, Qualcomm SD X Adreno X1-45 1.7 TFLOPS
57.1 pt
Dell XPS 13 DX13260 -2!
Intel Core 5 320, Intel Graphics 2 Xe3 Wildcat Lake iGPU
54.8 pt
Asus Zenbook 14 UX3480QA
Qualcomm Snapdragon X X1-26-100, Qualcomm SD X Adreno X1-45 1.7 TFLOPS
53.7 pt
Asus ZenBook A14 UX3407QA -1!
Qualcomm Snapdragon X X1-26-100, Qualcomm SD X Adreno X1-45 1.7 TFLOPS
51.3 pt
Apple MacBook Neo 256 GB -5!
Apple A18 Pro, Apple A18 GPU
40.9 pt
Cyberpunk 2077 - 1920x1080 Ultra Preset (FSR off)
Average of class Subnotebook
  (5.6 - 78.6, n=58, last 2 years)
21.7 fps +160%
Ninkear S14, 16+1TB
AMD Ryzen 5 7535HS, AMD Radeon 660M
10.9 (9.28min, 8.76P1) fps +30%
Asus ZenBook A14 UX3407QA
Qualcomm Snapdragon X X1-26-100, Qualcomm SD X Adreno X1-45 1.7 TFLOPS
8.48 (6.99min) fps +1%
Asus Zenbook 14 UX3480QA
Qualcomm Snapdragon X X1-26-100, Qualcomm SD X Adreno X1-45 1.7 TFLOPS
8.36 (6.94min) fps
HP Omnibook 5 14
Qualcomm Snapdragon X Plus X1P-42-100, Qualcomm SD X Adreno X1-45 1.7 TFLOPS
8.3 fps -1%
Apple MacBook Neo 256 GB
Apple A18 Pro, Apple A18 GPU
5.6 fps -33%
Baldur's Gate 3 - 1920x1080 Medium Preset AA:T
Average of class Subnotebook
  (10.9 - 61.3, n=54, last 2 years)
27.7 fps +154%
Apple MacBook Neo 256 GB
Apple A18 Pro, Apple A18 GPU
15.5 fps +42%
Ninkear S14, 16+1TB
AMD Ryzen 5 7535HS, AMD Radeon 660M
14.1 (11.3min, 11.5P0.1, 12P1) fps +29%
Dell XPS 13 DX13260
Intel Core 5 320, Intel Graphics 2 Xe3 Wildcat Lake iGPU
12.6 (11.6min, 11.6P0.1, 11.8P1) fps +16%
HP Omnibook 5 14
Qualcomm Snapdragon X Plus X1P-42-100, Qualcomm SD X Adreno X1-45 1.7 TFLOPS
11.8 fps +8%
Asus ZenBook A14 UX3407QA
Qualcomm Snapdragon X X1-26-100, Qualcomm SD X Adreno X1-45 1.7 TFLOPS
11 fps +1%
Asus Zenbook 14 UX3480QA
Qualcomm Snapdragon X X1-26-100, Qualcomm SD X Adreno X1-45 1.7 TFLOPS
10.9 (9.55min, 9.58P0.1, 9.96P1) fps
GTA V - 1920x1080 Highest AA:4xMSAA + FX AF:16x
Average of class Subnotebook
  (4.73 - 43.7, n=52, last 2 years)
22.5 fps +49%
Ninkear S14, 16+1TB
AMD Ryzen 5 7535HS, AMD Radeon 660M
17.2 (1.233min, 11.4P1) fps +14%
HP Omnibook 5 14
Qualcomm Snapdragon X Plus X1P-42-100, Qualcomm SD X Adreno X1-45 1.7 TFLOPS
15.4 (3min, 10.5P1) fps +2%
Asus Zenbook 14 UX3480QA
Qualcomm Snapdragon X X1-26-100, Qualcomm SD X Adreno X1-45 1.7 TFLOPS
15.1 (3.35min, 10.5P1) fps
Asus ZenBook A14 UX3407QA
Qualcomm Snapdragon X X1-26-100, Qualcomm SD X Adreno X1-45 1.7 TFLOPS
14.5 (2.85min, 9.62P1) fps -4%
Dell XPS 13 DX13260
Intel Core 5 320, Intel Graphics 2 Xe3 Wildcat Lake iGPU
7.71 (1.599min, 5.99P1) fps -49%
Final Fantasy XV Benchmark - 1920x1080 High Quality
Average of class Subnotebook
  (8.37 - 54.5, n=50, last 2 years)
26.8 fps +125%
Dell XPS 13 DX13260
Intel Core 5 320, Intel Graphics 2 Xe3 Wildcat Lake iGPU
18.7 fps +57%
HP Omnibook 5 14
Qualcomm Snapdragon X Plus X1P-42-100, Qualcomm SD X Adreno X1-45 1.7 TFLOPS
15.3 fps +29%
Asus ZenBook A14 UX3407QA
Qualcomm Snapdragon X X1-26-100, Qualcomm SD X Adreno X1-45 1.7 TFLOPS
15.1 fps +27%
Asus Zenbook 14 UX3480QA
Qualcomm Snapdragon X X1-26-100, Qualcomm SD X Adreno X1-45 1.7 TFLOPS
11.9 fps
Ninkear S14, 16+1TB
AMD Ryzen 5 7535HS, AMD Radeon 660M
11.6 fps -3%
Strange Brigade - 1920x1080 ultra AA:ultra AF:16
Average of class Subnotebook
  (19 - 101.3, n=43, last 2 years)
48.6 fps +152%
Ninkear S14, 16+1TB
AMD Ryzen 5 7535HS, AMD Radeon 660M
27.8 (13.9min, 16.4P1) fps +44%
HP Omnibook 5 14
Qualcomm Snapdragon X Plus X1P-42-100, Qualcomm SD X Adreno X1-45 1.7 TFLOPS
19.7 (5min, 5.19P1) fps +2%
Asus Zenbook 14 UX3480QA
Qualcomm Snapdragon X X1-26-100, Qualcomm SD X Adreno X1-45 1.7 TFLOPS
19.3 (5min, 5P1) fps
Asus ZenBook A14 UX3407QA
Qualcomm Snapdragon X X1-26-100, Qualcomm SD X Adreno X1-45 1.7 TFLOPS
19 fps -2%
Dota 2 Reborn - 1920x1080 ultra (3/3) best looking
Average of class Subnotebook
  (29.9 - 97, n=55, last 2 years)
70.3 fps +39%
Ninkear S14, 16+1TB
AMD Ryzen 5 7535HS, AMD Radeon 660M
52.7 (46.7min) fps +4%
HP Omnibook 5 14
Qualcomm Snapdragon X Plus X1P-42-100, Qualcomm SD X Adreno X1-45 1.7 TFLOPS
51.8 (46min) fps +2%
Asus Zenbook 14 UX3480QA
Qualcomm Snapdragon X X1-26-100, Qualcomm SD X Adreno X1-45 1.7 TFLOPS
50.7 (44.6min) fps
Asus ZenBook A14 UX3407QA
Qualcomm Snapdragon X X1-26-100, Qualcomm SD X Adreno X1-45 1.7 TFLOPS
48.8 (39min) fps -4%
Dell XPS 13 DX13260
Intel Core 5 320, Intel Graphics 2 Xe3 Wildcat Lake iGPU
45.7 (22.3min) fps -10%
X-Plane 11.11 - 1920x1080 high (fps_test=3)
Average of class Subnotebook
  (16.2 - 50.5, n=51, last 2 years)
34.4 fps +34%
Ninkear S14, 16+1TB
AMD Ryzen 5 7535HS, AMD Radeon 660M
27.9 fps +9%
Ninkear S14, 16+1TB
AMD Ryzen 5 7535HS, AMD Radeon 660M
27.9 fps +9%
HP Omnibook 5 14
Qualcomm Snapdragon X Plus X1P-42-100, Qualcomm SD X Adreno X1-45 1.7 TFLOPS
27.3 fps +7%
Asus Zenbook 14 UX3480QA
Qualcomm Snapdragon X X1-26-100, Qualcomm SD X Adreno X1-45 1.7 TFLOPS
25.6 fps
Dell XPS 13 DX13260
Intel Core 5 320, Intel Graphics 2 Xe3 Wildcat Lake iGPU
20.4 fps -20%

Cyberpunk 2077 ultra FPS Chart

01234567Tooltip
Asus Zenbook 14 UX3480QA SD X1-26-100, Adreno X1-45 1.7 TFLOPS: Ø7.28 (6.94-7.44) fps
HP Omnibook 5 14 SD X Plus X1P-42-100, Adreno X1-45 1.7 TFLOPS: Ø7.61 (7.29-7.75) fps
Asus ZenBook A14 UX3407QA SD X1-26-100, Adreno X1-45 1.7 TFLOPS: Ø7.35 (5.71-7.62) fps
lowmed.highultra
GTA V (2015) 104.2 95 33.8 15.1
Dota 2 Reborn (2015) 87.3 71.7 59.5 50.7
Final Fantasy XV Benchmark (2018) 37.5 20 11.9
X-Plane 11.11 (2018) 39.3 29.9 25.6
Strange Brigade (2018) 86.9 30.1 22.2 19.3
Baldur's Gate 3 (2023) 13.4 10.9
Cyberpunk 2077 (2023) 14.9 11.4 9.75 8.36

Emissions & Power Consumption

System Noise

Cooling unit
Cooling unit

The Zenbook 14 is usually a silent or very quiet system. Unless you fully stress the CPU (which is quite hard in everyday situations), you will not hear the fan at all. In our stress test, we measure up to 47.1 dB(A) in Performance mode, 36.2 dB(A) in Standard mode and 27.7 dB(A) in Whisper mode. We did not hear any other electronic noises.

Noise level

Idle
24.6 / 24.6 / 24.6 dB(A)
Load
26.1 / 47.4 dB(A)
  red to green bar
 
 
30 dB
silent
40 dB(A)
audible
50 dB(A)
loud
 
min: dark, med: mid, max: light   Earthworks M23R, Arta (15 cm distance)   environment noise: 24.6 dB(A)
dB(A) 0102030405060708090Deep BassMiddle BassHigh BassLower RangeMidsHigher MidsLower HighsMid HighsUpper HighsSuper Highs2040.741.740.142.140.12533.8313432.932.93129.529.427.726.829.34030.330.129.63030.85038.236.131.631.133.76331.232.129.333.631.9802522.62325.926.410025.22322.422.424.612524.919.42118.319.916031.221.220.117.721.920026.927.420.719.220.525029.526.524.324.724.631531.119.818.317.819.240030.82016.515.617.45003219.315.313.817.263035.322.114.712.21880031.918.513.310.216.610003521.413.410.616.9125036.822.814.310.417.8160036.922.71310.317.8200038.424.312.710.716.2250037.121.312.511.114.3315036.818.712.410.912.9400036.416.912.811.312.6500033.914.912.811.612.7630033.214.11311.812.5800030.413.913.111.713.31000026.31312.911.713.1125002513131212.61600017.712.412.311.211.8SPL47.432.526.124.628N5.91.60.80.61median 31.9median 19.8median 13.3median 11.7median 16.9Delta4.73.82.23.33.740.439.840.240.138.228.62932.628.529.821.924.224.421.924.621.721.423.119.921.624.625.1222223.725.423.522.725.224.422.424.725.427.121.92223232221.817.718.918.217.221.815.415.414.916.118.515.414.414.518.221.513.913.614.119.823.11514.41520.624.112.512.113.220.32512.111.311.520.825.810.911.210.919.625.610.611.110.32126.310.410.910.621.726.110.1109.923.428.59.910.31025.229.910.210.310.125.530.610.410.610.326.331.410.811.310.726.731.711.311.311.124.73011.411.711.622.328.211.711.711.720.426.811.711.711.715.822.411.711.811.713.518.511.91211.912.415.710.911.111.111.312.423.323.523.335.640.70.50.50.52.13.4median 11.7median 11.7median 11.6median 20.6median 25.61.61.81.73.44.242.741.740.737.942.743.842.438.138.538.937.743.840.339.539.143.937.842.428.229.727.432.228.532.633.237.835.536.335.736.931.831.231.330.329.832.122.223.422.123.222.425.322.322.422.322.121.324.721.71918.617.516.623.32013.513.913.712.220.921.313.814.51412.821.825.311.712.111.710.825.326.312.312.312.711.525.127.310.810.910.29.226.828.99.29.68.98.628.427.99.29.49.28.828.3299.69.59.69.528.929.311.211.310.910.830.429.110.911.210.510.829.330.111.211.210.91130.434.71212.211.811.734.434.212.512.512.412.534.233.313.513.213.21333.435.213.913.813.914.134.937.814.414.214.314.43735.415.315.115.114.734.833.21515.114.914.832.73014.914.91514.929.526.71514.914.91526.122.714.314.214.214.522.545.325.225.225.124.9454.80.60.60.60.64.8median 29median 13.5median 13.2median 13.2median 12.5median 28.95.31.91.8224.334.232.628.932.433.326.42522.92526.826.224.227.824.328.123.625.222.821.925.830.630.427.131.331.72624.622.825.927.92826.623.12828.429.52826.72828.938.537.93737.438.219.718.617.518.721.21717.216.717.12017.417.618.218.422.517.81820.919.522.815.9171717.22215.114.71313.221.11616.513.313.622.713.813.810.710.322.215.514.910.31024.415.515.59.69.424.917.917.4109.926.819.819.410.510.627.918.717.911.41129.915.715.311.411.128.314.91511.511.32613.713.811.811.623.81414.912.311.721.612.412.711.911.81812.51312.411.914.912.613.612.211.813.411.412.211.51111.929.22925.825.837.81.21.20.80.82.7median 15.7median 15.5median 12.2median 11.8median 22.72.72.13.53.9342.236.53837.231.927.927.332.633.532.931.935.63635.141.135.835.131.230.931.129.427.929.629.225.222.823.22723.920.421.334.122.819.219.325.521.317.417.623.9231918.926.423.720.920.326.420.918.416.326.719.717.413.427.318.616.111.628.917.615.310.92816.214.211.127.617.514.611.131.616.21310.832.415.813.610.932.115.91411.532.916.91411.732.61613.312.231.21513.112.33014.913.212.730.415.313.51329.615.6141328.814.313.613.62414.614.113.120.314.313.912.316.928.726.424.742.71.20.80.64.2median 16.2median 14.1median 12.7median 28.82.91.72.53.2hearing rangehide median Fan NoiseAsus Zenbook 14 UX3480QADell XPS 13 DX13260Ninkear S14, 16+1TBHP Omnibook 5 14Asus ZenBook A14 UX3407QA
Asus Zenbook 14 UX3480QA
SD X1-26-100, Adreno X1-45 1.7 TFLOPS
Dell XPS 13 DX13260
Core 5 320, Intel Graphics 2 Xe3 WCL
Apple MacBook Neo 256 GB
A18 Pro, A18 GPU
Ninkear S14, 16+1TB
R5 7535HS, Radeon 660M
HP Omnibook 5 14
SD X Plus X1P-42-100, Adreno X1-45 1.7 TFLOPS
Asus ZenBook A14 UX3407QA
SD X1-26-100, Adreno X1-45 1.7 TFLOPS
Noise
3%
-16%
-0%
3%
off / environment * (dB)
24.6
23.3
5%
24.9
-1%
25.8
-5%
24.7
-0%
Idle Minimum * (dB)
24.6
23.3
5%
25.1
-2%
25.8
-5%
24.7
-0%
Idle Average * (dB)
24.6
23.3
5%
25.2
-2%
25.8
-5%
24.7
-0%
Idle Maximum * (dB)
24.6
23.3
5%
25.2
-2%
25.8
-5%
24.7
-0%
Load Average * (dB)
26.1
27.7
-6%
45.3
-74%
29
-11%
26.4
-1%
Cyberpunk 2077 ultra * (dB)
32.5
35.6
-10%
45.3
-39%
29.2
10%
28.7
12%
Load Maximum * (dB)
47.4
40.7
14%
45
5%
37.8
20%
42.7
10%
Witcher 3 ultra * (dB)
44.8

* ... smaller is better

Temperature

Surface temperatures are no problem in everyday situations. The base unit warms up noticeably on the left side under load, but up to 42-43 °C are not critical by any means.

Max. Load
41.6 °C
107 F
40.3 °C
105 F
31.1 °C
88 F
39.2 °C
103 F
38 °C
100 F
28.1 °C
83 F
32.8 °C
91 F
29.1 °C
84 F
27.3 °C
81 F
Maximum: 41.6 °C = 107 F
Average: 34.2 °C = 94 F
32 °C
90 F
41 °C
106 F
42.6 °C
109 F
28.6 °C
83 F
40.2 °C
104 F
43.8 °C
111 F
28.1 °C
83 F
32.9 °C
91 F
34.7 °C
94 F
Maximum: 43.8 °C = 111 F
Average: 36 °C = 97 F
Room Temperature 21.2 °C = 70 F | Fluke t3000FC (calibrated), Voltcraft IR-900
(±) The average temperature for the upper side under maximal load is 34.2 °C / 94 F, compared to the average of 30.8 °C / 87 F for the devices in the class Subnotebook.
(±) The maximum temperature on the upper side is 41.6 °C / 107 F, compared to the average of 35.9 °C / 97 F, ranging from 21.4 to 59 °C for the class Subnotebook.
(±) The bottom heats up to a maximum of 43.8 °C / 111 F, compared to the average of 39.2 °C / 103 F
(+) In idle usage, the average temperature for the upper side is 26.1 °C / 79 F, compared to the device average of 30.8 °C / 87 F.
(+) 3: The average temperature for the upper side is 29.7 °C / 85 F, compared to the average of 30.8 °C / 87 F for the class Subnotebook.
(+) The palmrests and touchpad are reaching skin temperature as a maximum (32.8 °C / 91 F) and are therefore not hot.
(-) The average temperature of the palmrest area of similar devices was 28.2 °C / 82.8 F (-4.6 °C / -8.2 F).
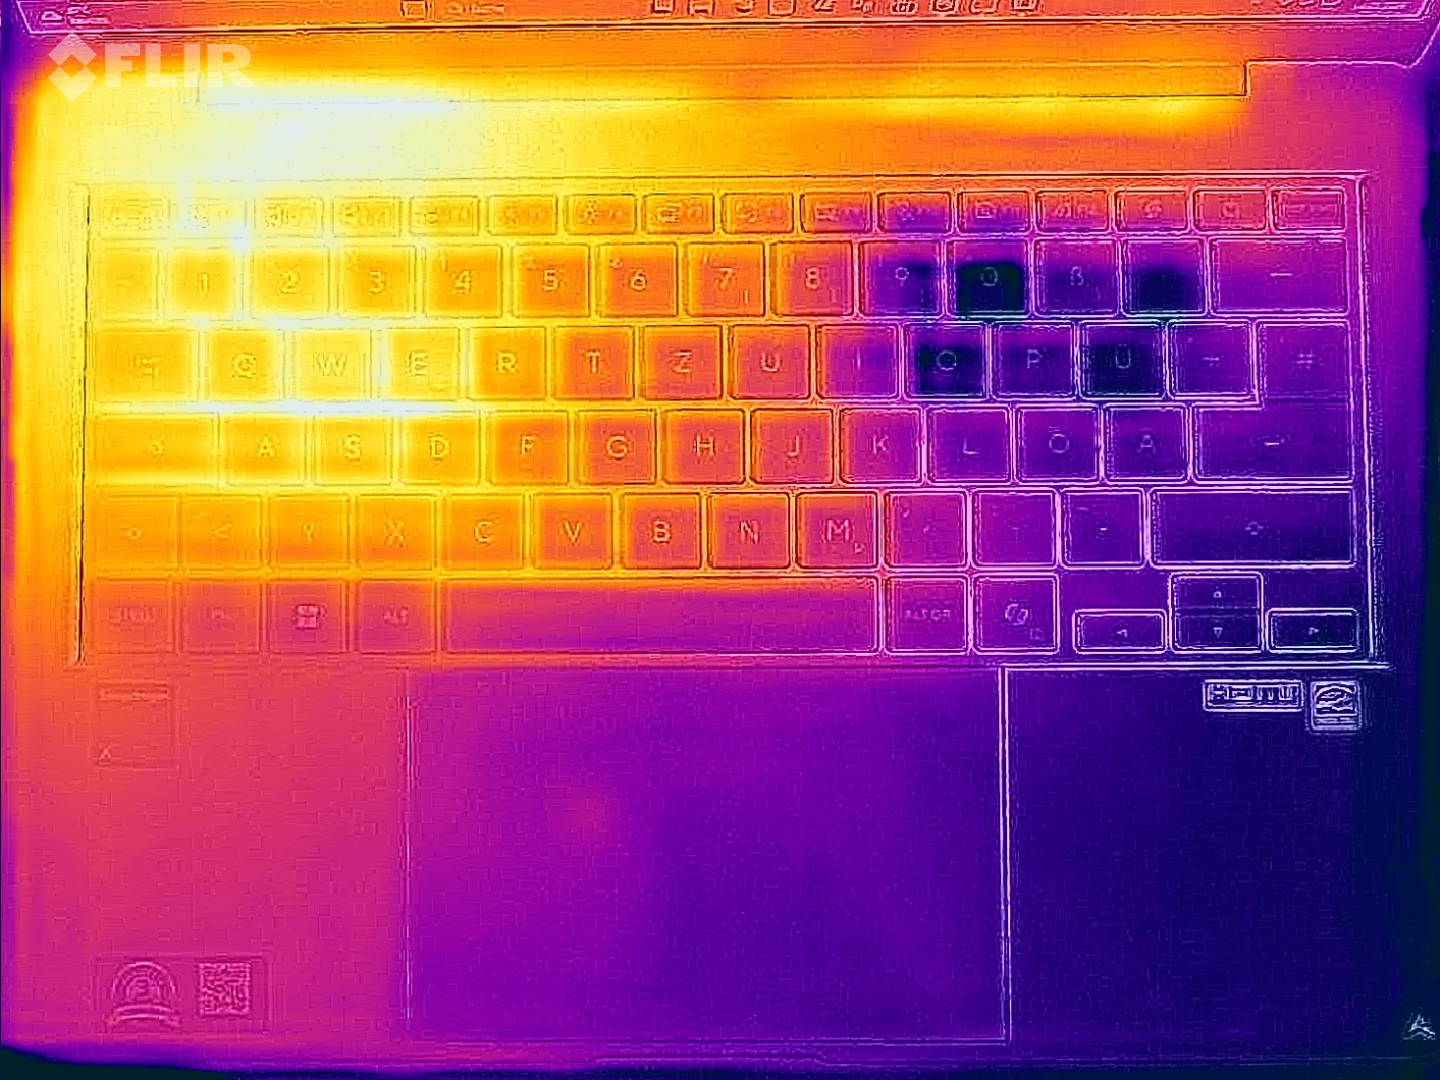
Heatmap stress test (top)
Heatmap stress test (bottom)
Asus Zenbook 14 UX3480QA
SD X1-26-100, Adreno X1-45 1.7 TFLOPS
Dell XPS 13 DX13260
Core 5 320, Intel Graphics 2 Xe3 WCL
Apple MacBook Neo 256 GB
A18 Pro, A18 GPU
Ninkear S14, 16+1TB
R5 7535HS, Radeon 660M
HP Omnibook 5 14
SD X Plus X1P-42-100, Adreno X1-45 1.7 TFLOPS
Asus ZenBook A14 UX3407QA
SD X1-26-100, Adreno X1-45 1.7 TFLOPS
Heat
7%
11%
-15%
4%
4%
Maximum Upper Side * (°C)
41.6
39
6%
40.8
2%
47
-13%
32.4
22%
40
4%
Maximum Bottom * (°C)
43.8
38.2
13%
38
13%
41.5
5%
33.6
23%
42.4
3%
Idle Upper Side * (°C)
27
26
4%
23.8
12%
33.9
-26%
30.2
-12%
25.7
5%
Idle Bottom * (°C)
27.1
26.2
3%
22.8
16%
33.9
-25%
32
-18%
26.5
2%

* ... smaller is better

Speakers

The stereo speakers offer good sound quality on par with the XPS 13, but not quite as good compared to the MacBook Neo.

dB(A) 0102030405060708090Deep BassMiddle BassHigh BassLower RangeMidsHigher MidsLower HighsMid HighsUpper HighsSuper Highs2042.140.82532.935.53126.832.1403032.35031.131.76333.630.48025.937.410022.444.612518.348.816017.750.820019.258.525024.760.131517.861.540015.662.550013.862.663012.263.180010.263.7100010.661.7125010.455.1160010.365.8200010.768.6250011.171.2315010.963.7400011.370.7500011.669.4630011.864.8800011.768.51000011.766.4125001266.31600011.257.2SPL24.679.2N0.645.3median 11.7median 63.1Delta3.34.439.839.22929.924.222.721.424.125.131.723.529.724.749.62354.918.955.115.458.314.462.513.666.214.470.712.177.611.380.411.276.511.17510.979.71076.910.373.710.368.810.673.111.370.311.367.311.767.411.765.811.766.111.866.51265.211.157.723.585.90.568.4median 11.7median 68.41.84.736.836.43036.129.732.625.932.62728.822.83121.943.520.152.119.656.91957.319.661.220.161.61766.614.96714.467.214.464.1136712.26711.964.912651270.411.873.311.77511.174.811.473.711.56711.365.211.267117310.363.924.7830.656.1median 12median 672.84.442.741.637.738.337.837.828.528.135.733.129.830.522.425.621.328.116.632.312.231.312.840.610.844.511.548.29.252.88.656.88.861.79.573.510.876.210.868.81163.211.766.712.566.61361.414.158.214.468.314.762.514.864.314.961.81556.414.554.524.980.10.642.8median 12.5median 61.429.641.228.941.241.522.941.544.127.844.14322.84343.327.143.347.822.847.847.923.147.948.826.748.850.93750.95817.55863.516.763.566.118.266.170.120.970.173.91773.975.91375.981.913.381.981.710.781.779.510.379.581.69.681.683.51083.580.410.580.479.711.479.780.911.480.983.411.583.479.811.879.878.812.378.878.611.978.678.412.478.469.112.269.162.211.562.292.725.892.7103.20.8103.2median 78.8median 12.2median 78.86.63.56.63841.527.335.931.937.441.142.730.938.129.635.923.231.521.331.219.344.217.650.518.955.620.359.916.363.913.462.311.663.610.969.411.170.711.167.810.870.310.96911.57311.773.912.269.712.370.812.768.11370.51373.813.672.513.17112.36924.782.90.657.3median 12.7median 692.55.7hearing rangehide median Pink NoiseAsus Zenbook 14 UX3480QADell XPS 13 DX13260Apple MacBook Neo 256 GBNinkear S14, 16+1TBHP Omnibook 5 14Asus ZenBook A14 UX3407QA
Frequency diagram (checkboxes can be checked and unchecked to compare devices)
Asus Zenbook 14 UX3480QA audio analysis

(±) | speaker loudness is average but good (79.2 dB)
Bass 100 - 315 Hz
(±) | reduced bass - on average 9% lower than median
(±) | linearity of bass is average (7.9% delta to prev. frequency)
Mids 400 - 2000 Hz
(+) | balanced mids - only 2.4% away from median
(+) | mids are linear (5.9% delta to prev. frequency)
Highs 2 - 16 kHz
(+) | balanced highs - only 4.8% away from median
(±) | linearity of highs is average (8% delta to prev. frequency)
Overall 100 - 16.000 Hz
(+) | overall sound is linear (11.7% difference to median)
Compared to same class
» 14% of all tested devices in this class were better, 3% similar, 83% worse
» The best had a delta of 5%, average was 18%, worst was 53%
Compared to all devices tested
» 8% of all tested devices were better, 3% similar, 89% worse
» The best had a delta of 4%, average was 23%, worst was 136%

Dell XPS 13 DX13260 audio analysis

(+) | speakers can play relatively loud (85.9 dB)
Bass 100 - 315 Hz
(±) | reduced bass - on average 7.9% lower than median
(+) | bass is linear (6.2% delta to prev. frequency)
Mids 400 - 2000 Hz
(±) | higher mids - on average 7.6% higher than median
(+) | mids are linear (6.8% delta to prev. frequency)
Highs 2 - 16 kHz
(+) | balanced highs - only 2.2% away from median
(+) | highs are linear (3.1% delta to prev. frequency)
Overall 100 - 16.000 Hz
(+) | overall sound is linear (11% difference to median)
Compared to same class
» 10% of all tested devices in this class were better, 4% similar, 86% worse
» The best had a delta of 5%, average was 18%, worst was 53%
Compared to all devices tested
» 6% of all tested devices were better, 2% similar, 92% worse
» The best had a delta of 4%, average was 23%, worst was 136%

Apple MacBook Neo 256 GB audio analysis

(+) | speakers can play relatively loud (83 dB)
Bass 100 - 315 Hz
(±) | reduced bass - on average 7.7% lower than median
(±) | linearity of bass is average (7% delta to prev. frequency)
Mids 400 - 2000 Hz
(+) | balanced mids - only 1.3% away from median
(+) | mids are linear (3.3% delta to prev. frequency)
Highs 2 - 16 kHz
(+) | balanced highs - only 4.4% away from median
(+) | highs are linear (4.3% delta to prev. frequency)
Overall 100 - 16.000 Hz
(+) | overall sound is linear (9% difference to median)
Compared to same class
» 4% of all tested devices in this class were better, 1% similar, 95% worse
» The best had a delta of 5%, average was 18%, worst was 53%
Compared to all devices tested
» 3% of all tested devices were better, 1% similar, 96% worse
» The best had a delta of 4%, average was 23%, worst was 136%

Ninkear S14, 16+1TB audio analysis

(±) | speaker loudness is average but good (80.1 dB)
Bass 100 - 315 Hz
(-) | nearly no bass - on average 23.9% lower than median
(±) | linearity of bass is average (8.3% delta to prev. frequency)
Mids 400 - 2000 Hz
(±) | higher mids - on average 6.9% higher than median
(±) | linearity of mids is average (11.4% delta to prev. frequency)
Highs 2 - 16 kHz
(+) | balanced highs - only 2.8% away from median
(±) | linearity of highs is average (8.4% delta to prev. frequency)
Overall 100 - 16.000 Hz
(±) | linearity of overall sound is average (21.9% difference to median)
Compared to same class
» 74% of all tested devices in this class were better, 6% similar, 20% worse
» The best had a delta of 5%, average was 18%, worst was 53%
Compared to all devices tested
» 63% of all tested devices were better, 7% similar, 30% worse
» The best had a delta of 4%, average was 23%, worst was 136%

HP Omnibook 5 14 audio analysis

(+) | speakers can play relatively loud (92.7 dB)
Bass 100 - 315 Hz
(-) | nearly no bass - on average 19.3% lower than median
(+) | bass is linear (5.5% delta to prev. frequency)
Mids 400 - 2000 Hz
(+) | balanced mids - only 3% away from median
(+) | mids are linear (4% delta to prev. frequency)
Highs 2 - 16 kHz
(+) | balanced highs - only 1.3% away from median
(+) | highs are linear (2% delta to prev. frequency)
Overall 100 - 16.000 Hz
(+) | overall sound is linear (12.8% difference to median)
Compared to same class
» 20% of all tested devices in this class were better, 4% similar, 76% worse
» The best had a delta of 5%, average was 18%, worst was 53%
Compared to all devices tested
» 12% of all tested devices were better, 3% similar, 85% worse
» The best had a delta of 4%, average was 23%, worst was 136%

Asus ZenBook A14 UX3407QA audio analysis

(+) | speakers can play relatively loud (82.9 dB)
Bass 100 - 315 Hz
(-) | nearly no bass - on average 18.2% lower than median
(±) | linearity of bass is average (9.8% delta to prev. frequency)
Mids 400 - 2000 Hz
(+) | balanced mids - only 2.6% away from median
(+) | mids are linear (4.5% delta to prev. frequency)
Highs 2 - 16 kHz
(+) | balanced highs - only 2.6% away from median
(+) | highs are linear (4.1% delta to prev. frequency)
Overall 100 - 16.000 Hz
(+) | overall sound is linear (12.4% difference to median)
Compared to same class
» 17% of all tested devices in this class were better, 4% similar, 78% worse
» The best had a delta of 5%, average was 18%, worst was 53%
Compared to all devices tested
» 11% of all tested devices were better, 2% similar, 87% worse
» The best had a delta of 4%, average was 23%, worst was 136%

Power Consumption and Battery Life

Battery information
Battery information

The Zenbook 14 is a very efficient system and we recommend a 65W power adapter (EU models are shipped without a PSU). The 50 Wh battery is comparatively small, but the resulting battery runtimes are excellent. in our Wi-Fi test at 150 nits lasts more than 20 hours and we record more than 11 hours at full panel brightness. The battery runtime with the SSD bug is significantly shorter at 9:20 hours (150 nits) and 6:54 hours (max. brightness), respectively.

Power Consumption
Off / Standbydarklight 0.35 / 0.51 Watt
Idledarkmidlight 3 / 5 / 5.2 Watt
Load midlight 17.2 / 70 Watt
 color bar
Key: min: dark, med: mid, max: light        Metrahit Energy
Asus Zenbook 14 UX3480QA
SD X1-26-100, Adreno X1-45 1.7 TFLOPS
Dell XPS 13 DX13260
Core 5 320, Intel Graphics 2 Xe3 WCL
Apple MacBook Neo 256 GB
A18 Pro, A18 GPU
Ninkear S14, 16+1TB
R5 7535HS, Radeon 660M
HP Omnibook 5 14
SD X Plus X1P-42-100, Adreno X1-45 1.7 TFLOPS
Asus ZenBook A14 UX3407QA
SD X1-26-100, Adreno X1-45 1.7 TFLOPS
Average Qualcomm SD X Adreno X1-45 1.7 TFLOPS
 
Average of class Subnotebook
 
Power Consumption
-14%
6%
-92%
4%
6%
-4%
-43%
Idle Minimum * (Watt)
3
1.9
37%
1.5
50%
5.3
-77%
1.9
37%
3.1
-3%
Idle Average * (Watt)
5
5.4
-8%
8.9
-78%
9.1
-82%
2.5
50%
5.2
-4%
5.23 ?(2.5 - 6.5, n=15)
-5%
Idle Maximum * (Watt)
5.2
5.8
-12%
9
-73%
12.5
-140%
8.1
-56%
5.4
-4%
6.86 ?(4.7 - 10.2, n=15)
-32%
Load Average * (Watt)
17.2
20.6
-20%
18.9
-10%
44.5
-159%
17.8
-3%
13.8
20%
Cyberpunk 2077 ultra external monitor * (Watt)
20.2
30.1
-49%
10.3
49%
38
-88%
19.1
5%
19.7
2%
Cyberpunk 2077 ultra * (Watt)
19.4
33.6
-73%
11.5
41%
40.7
-110%
19.9
-3%
19.6
-1%
Load Maximum * (Watt)
70
52
26%
26.3
62%
61.5
12%
70.3
-0%
46.8
33%

* ... smaller is better

Power Consumption Cyberpunk / Stress Test

0510152025303540455055606570Tooltip
Asus Zenbook 14 UX3480QA; 1280x720 Prime95 28.10 and Furmark 1.25: Ø55.2 (50.9-70.3) Watt
Asus Zenbook 14 UX3480QA; Idle 150cd/m2: Ø4.32 (4.12-6.32) Watt
Asus Zenbook 14 UX3480QA; Cyberpunk 2077 FHD ultra no FSR 150cd: Ø19.4 (17.6-23.9) Watt

Power Consumption external Monitor

0510152025303540455055606570Tooltip
Asus Zenbook 14 UX3480QA; Prime95 V2810 Stress (external Monitor): Ø54.6 (52.3-70.1) Watt
Asus Zenbook 14 UX3480QA; Cinebench R23 Single (external Monitor): Ø13.6 (13-20.8) Watt
Asus Zenbook 14 UX3480QA; Cinebench R23 Multi (external Monitor): Ø50.7 (47.3-52.5) Watt
Asus Zenbook 14 UX3480QA; 1280x720 FurMark 1.19 GPU Stress Test (external Monitor): Ø11.2 (7.94-12.1) Watt
Asus Zenbook 14 UX3480QA; Idle 1min (external Monitor): Ø4.97 (4.28-8.42) Watt
Asus Zenbook 14 UX3480QA; Cyberpunk 2077 FHD ultra no FSR (external Monitor): Ø20.2 (19.6-24.7) Watt
Battery Runtime
WiFi Websurfing
20h 13min
WiFi Websurfing max. Brightness
11h 18min
Battery Runtime
WiFi Websurfing
Asus Zenbook 14 UX3480QA
SD X1-26-100, Adreno X1-45 1.7 TFLOPS, 50 Wh
20.2 h
Dell XPS 13 DX13260
Core 5 320, Intel Graphics 2 Xe3 WCL, 52 Wh
18.4 h -9%
HP Omnibook 5 14
SD X Plus X1P-42-100, Adreno X1-45 1.7 TFLOPS, 60 Wh
16.9 h -16%
Asus ZenBook A14 UX3407QA
SD X1-26-100, Adreno X1-45 1.7 TFLOPS, 70 Wh
14.9 h -26%
Average of class Subnotebook
  (7.25 - 24, n=59, last 2 years)
14.3 h -29%
Apple MacBook Neo 256 GB
A18 Pro, A18 GPU, 36.5 Wh
12.9 h -36%
Ninkear S14, 16+1TB
R5 7535HS, Radeon 660M, 60 Wh
9.5 h -53%
WiFi Websurfing max. Brightness
Asus Zenbook 14 UX3480QA
SD X1-26-100, Adreno X1-45 1.7 TFLOPS, 50 Wh
11.3 h
Asus ZenBook A14 UX3407QA
SD X1-26-100, Adreno X1-45 1.7 TFLOPS, 70 Wh
10 h -12%
Average of class Subnotebook
  (4.82 - 15.8, n=32, last 2 years)
8.92 h -21%
Ninkear S14, 16+1TB
R5 7535HS, Radeon 660M, 60 Wh
8.1 h -28%
Apple MacBook Neo 256 GB
A18 Pro, A18 GPU, 36.5 Wh
4.8 h -58%

Notebookcheck Rating

Asus Zenbook 14 UX3480QA - 09/23/2026 v8
Andreas Osthoff

Chassis
84 / 98 → 86%
Keyboard
88%
Pointing Device
92%
Connectivity
62 / 74 → 84%
Weight
73 / 20-77 → 93%
Battery
91%
Display
79%
Games Performance
22 / 75 → 30%
Application Performance
78 / 92 → 84%
AI Performance
80%
Temperature
93%
Noise
89%
Audio
83 / 91 → 91%
Camera
37 / 75 → 49%
Average
67%
86%
Subnotebook - Weighted Average
CO2 Emissions
No Data
Materials
50%
Packaging
100%
Power Use
86.4%
Repairability
40%
Software Updates
22.3%
Recycle Logo Total Sustainability Score: 49.8%

Potential Competitors in Comparison

Image
Model / Review
Price
Weight
Height
Display
1.
85.6%
Asus Zenbook 14 UX3480QA
Qualcomm Snapdragon X X1-26-100 ⎘
Qualcomm SD X Adreno X1-45 1.7 TFLOPS ⎘
16 GB Memory, 512 GB SSD
Amazon:
1. $1,199.99
ASUS Zenbook 14 OLED Touchsc...
2. $839.00
ASUS Zenbook 14 UX3405CA 14"...
3. $48.88
1pcs Cooler Fans for ASUS 14...
List Price: 999€
1.1 kg16.9 mm14.00"
1920x1200
162 PPI
OLED
2.
85.7%
Dell XPS 13 DX13260
Dell XPS 13 DX13260
Intel Core 5 320 ⎘
Intel Graphics 2 Xe3 Wildcat Lake iGPU ⎘
8 GB Memory, 512 GB SSD
List Price: 700 USD1.1 kg12.7 mm13.40"
2560x1600
225 PPI
IPS
3.
86%
Apple MacBook Neo 256 GB
Apple A18 Pro ⎘
Apple A18 GPU ⎘
8 GB Memory, 256 GB SSD
List Price: 699€1.2 kg12.7 mm13.00"
2408x1506
218 PPI
IPS
4.
82.9%
Ninkear S14, 16+1TB
Ninkear S14, 16+1TB
AMD Ryzen 5 7535HS ⎘
AMD Radeon 660M ⎘
16 GB Memory, 1024 GB SSD
List Price: 629€1.1 kg15 mm14.00"
2240x1400
189 PPI
5.
85.5%
HP Omnibook 5 14
HP Omnibook 5 14
Qualcomm Snapdragon X Plus X1P-42-100 ⎘
Qualcomm SD X Adreno X1-45 1.7 TFLOPS ⎘
16 GB Memory, 1024 GB SSD
List Price: 550 USD1.3 kg12.7 mm14.00"
1920x1200
162 PPI
OLED
6.
86.3%
Asus ZenBook A14 UX3407QA
Qualcomm Snapdragon X X1-26-100 ⎘
Qualcomm SD X Adreno X1-45 1.7 TFLOPS ⎘
32 GB Memory, 1024 GB SSD
List Price: 1299€978 g15.9 mm14.00"
1920x1200
162 PPI
OLED

Transparency

The selection of devices to be reviewed is made by our editorial team. The test sample was provided to the author as a loan by the manufacturer or retailer for the purpose of this review. The lender had no influence on this review, nor did the manufacturer receive a copy of this review before publication. There was no obligation to publish this review. As an independent media company, Notebookcheck is not subjected to the authority of manufacturers, retailers or publishers.

This is how Notebookcheck is testing

Every year, Notebookcheck independently reviews hundreds of laptops and smartphones using standardized procedures to ensure that all results are comparable. We have continuously developed our test methods for around 20 years and set industry standards in the process. In our test labs, high-quality measuring equipment is utilized by experienced technicians and editors. These tests involve a multi-stage validation process. Our complex rating system is based on hundreds of well-founded measurements and benchmarks, which maintains objectivity. Further information on our test methods can be found here.

Google LogoAdd as a preferred source on Google
Mail Logo
static version load dynamic
Loading Comments
> Expert reviews and news on laptops, smartphones and tech innovations > Reviews > Great everyday OLED laptop starting at $799 - Asus Zenbook 14 UX3480 Review
Andreas Osthoff, 2026-09-23 (Update: 2026-09-23)