Qualcomm Adreno 680 vs ARM Mali-G71 MP20 vs Qualcomm Adreno 690
Qualcomm Adreno 680 ► remove from comparison
The Qualcomm Adreno 680 is an integrated graphics card in the Qualcomm Snapdragon 8cx SoC for Windows laptops. According to Qualcomm it is 2x faster than the previous Adreno 630 in the Snapdragon 850 for Windows PCs with a 60% improved efficiency (thanks to the 7nm process). The performance should be similar to a Intel UHD Graphics 620 (e.g. in a 8th gen Core i5) when running native ARM64 compiled Windows apps and games. Running emulated 32 bit games (64 bit games compiled for AMD/Intel are not supported), the performance is notably slower.
ARM Mali-G71 MP20 ► remove from comparison
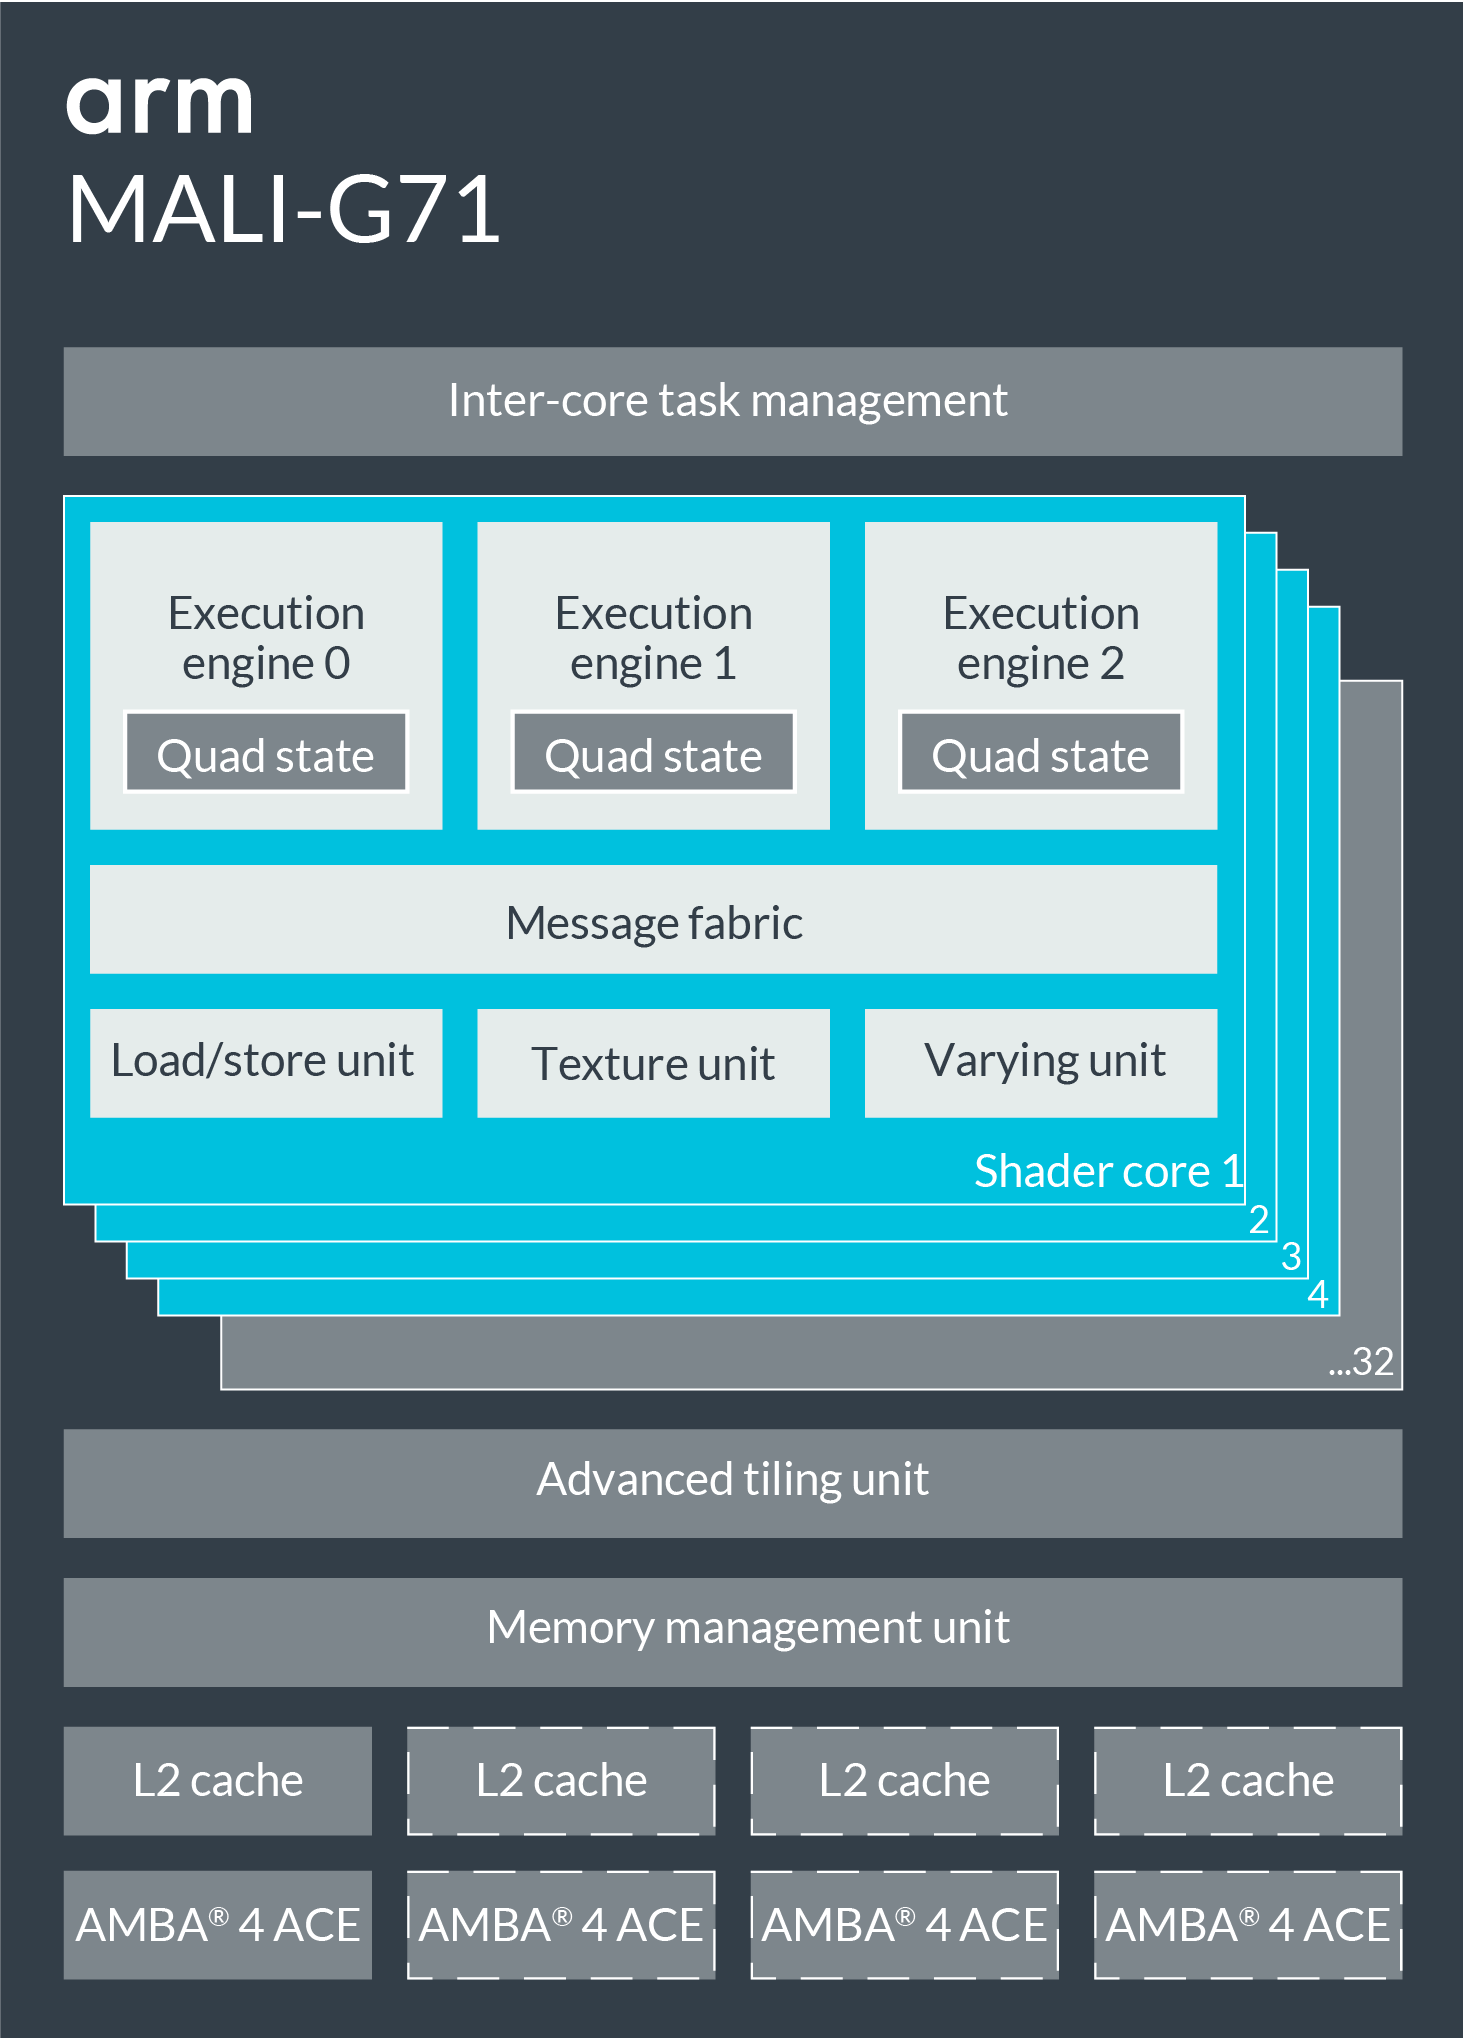
The ARM Mali-G71 MP20 is an integrated high-end graphics adapter for ARM SoCs, which was e.g. used in smartphone chip Samsung Exynos 9 8895 . It features 20 clusters and is manufactured in 10nm FinFET (in the Exynos 8895). The performance is in the high-end class and therefore all current Android games should run fluently on the chip.
Qualcomm Adreno 690 ► remove from comparison
The Qualcomm Adreno 690 is an integrated graphics card in the Qualcomm Snapdragon 8cx Gen 3 SoC for Windows laptops. According to Qualcomm, the 690 is up to 60% faster than the previous generation. In our tests with the Lenovo ThinkPad X13s, the Adreno 690 was only on par with a low en Intel UHD Graphics iGPU and not well suited for 3D games.
The chip is manufactured in 5nm at Samsung (5LPE) and suited for fanless laptops.
Qualcomm Adreno 680 ARM Mali-G71 MP20 Qualcomm Adreno 690 Adreno 600 Series Shared Memory yes no yes API DirectX 12 OpenGL ES 3.2 DirectX 12 Power Consumption 7 Watt 7 Watt technology 7 nm 16 nm 5 nm Date of Announcement 06.12.2018 29.03.2017 06.12.2018 Codename Mimir Architecture Bifrost Pipelines 8 - unified Core Speed 900 (Boost) MHz Link to Manufacturer Page www.arm.com
Benchmarks Performance Rating - 3DMark 11 + Fire Strike + Time Spy - Adreno 690
1.3 pt (4%)
...
...
max:
3DMark - 3DMark Time Spy Score
909 Points (3%)
3DMark - 3DMark Time Spy Graphics
811 Points (2%)
3DMark - 3DMark Ice Storm Unlimited Graphics
min: 33077 avg: 35410 median: 36347 (4%) max: 36807 Points
3DMark - 3DMark Cloud Gate Score
min: 8602 avg: 9818 median: 9818 (10%) max: 11034 Points
3DMark - 3DMark Cloud Gate Graphics
min: 13768 avg: 16708 median: 16707.5 (4%) max: 19647 Points
3DMark - 3DMark Fire Strike Standard Score
min: 2758 avg: 2835 median: 2834.5 (5%) max: 2911 Points
3DMark - 3DMark Fire Strike Standard Graphics
min: 2837 avg: 2933 median: 2932.5 (3%) max: 3028 Points
3DMark - 3DMark Ice Storm Graphics
14652 Points (2%)
3DMark - 3DMark Sling Shot (ES 3.0) Unlimited
min: 3222 avg: 3555 median: 3426 (15%) max: 4016 Points
3DMark - 3DMark Sling Shot (ES 3.0) Unlimited Graphics
min: 3896 avg: 4314 median: 4137 (9%) max: 4908 Points
3DMark - 3DMark Sling Shot Extreme (ES 3.1) Unlimited
min: 2648 avg: 3058 median: 3261 (16%) max: 3265 Points
3DMark - 3DMark Sling Shot Extreme (ES 3.1) Unlimited Graphics
min: 2723 avg: 3293 median: 3571 (11%) max: 3584 Points
3DMark - 3DMark Wild Life Extreme Unlimited
3067 Points (4%)
3DMark 11 - 3DM11 Performance Score
min: 1650 avg: 1847 median: 1847 (3%) max: 2044 Points
min: 3063 avg: 3085 median: 3077 (4%) max: 3115 Points
3DMark 11 - 3DM11 Performance GPU
min: 1593 avg: 1936 median: 1935.5 (2%) max: 2278 Points
min: 2898 avg: 2930 median: 2912 (3%) max: 2979 Points
Cinebench R10 Cinebench R10 Shading (32bit) + Qualcomm Adreno 680 Cinebench R10 - Cinebench R10 Shading (32bit)
353 Points (0%)
Cinebench R10 Shading (32bit) + Qualcomm Adreno 690 558 Points (0%)
Cinebench R15 + Qualcomm Adreno 690 Cinebench R15 - Cinebench R15 OpenGL 64 Bit
min: 13.4 avg: 13.7 median: 13.7 (1%) max: 14 fps
Cinebench R15 OpenGL Ref. Match 64 Bit + Qualcomm Adreno 690 Cinebench R15 - Cinebench R15 OpenGL Ref. Match 64 Bit
98 % (98%)
GFXBench - GFXBench Car Chase Offscreen
25 fps (3%)
GFXBench 3.1 - GFXBench Manhattan ES 3.1 Offscreen
min: 24 avg: 36 median: 42 (1%) max: 42 fps
GFXBench 3.0 - GFXBench 3.0 Manhattan Offscreen
min: 50 avg: 54.3 median: 51 (3%) max: 62 fps
GFXBench (DX / GLBenchmark) 2.7 + Qualcomm Adreno 680 GFXBench (DX / GLBenchmark) 2.7 - GFXBench T-Rex HD Offscreen C24Z16
140.2 fps (1%)
GFXBench T-Rex HD Offscreen C24Z16 + ARM Mali-G71 MP20
min: 104 avg: 110 median: 105 (1%) max: 121 fps
Basemark X 1.1 - Basemark X 1.1 High Quality
min: 41022 avg: 41847 median: 42183 (96%) max: 42335 Points
Basemark X 1.1 - Basemark X 1.1 Medium Quality
min: 41901 avg: 43072 median: 43464 (97%) max: 43852 Points
ComputeMark v2.1 - ComputeMark v2.1 Result
1890 Points (2%)
PassMark PerformanceTest Mobile V1 - PerformanceTest Mobile V1 2D Graphics Tests
7552 Points (8%)
PassMark PerformanceTest Mobile V1 - PerformanceTest Mobile V1 3D Graphics Tests
2573 Points (5%)
Power Consumption - Furmark Stress Test Power Consumption - external Monitor *
12.6 Watt (2%)
min: 17 avg: 19.7 median: 19.7 (3%) max: 22.3 Watt
Power Consumption - The Witcher 3 Power Consumption - external Monitor *
15.8 Watt (2%)
Power Consumption - Witcher 3 Power Consumption *
16.4 Watt (4%)
Average Benchmarks Qualcomm Adreno 680 → 0% n= Average Benchmarks ARM Mali-G71 MP20 → 0% n= Average Benchmarks Qualcomm Adreno 690 → 0% n=
- Range of benchmark values for this graphics card
- Average benchmark values for this graphics card
* Smaller numbers mean a higher performance
1 This benchmark is not used for the average calculation
Game Benchmarks The following benchmarks stem from our benchmarks of review laptops. The performance depends on the used graphics memory, clock rate, processor, system settings, drivers, and operating systems. So the results don't have to be representative for all laptops with this GPU. For detailed information on the benchmark results, click on the fps number.
Mali-G71 MP20:
30 30 30 ~ 30 fps
Mali-G71 MP20:
30 30 30 ~ 30 fps
Mali-G71 MP20:
29 30 30 ~ 30 fps
Qualcomm Adreno 690 low med. high ultra QHD 4K F1 22 26 22.5 17 12.6 X-Plane 11.11 14 12 11 Final Fantasy XV Benchmark 19 12.3 7.29 Dota 2 Reborn 58 55 44 37 The Witcher 3 25 16 10 4 GTA V 29.9 < 30 fps < 60 fps < 120 fps ≥ 120 fps 5 1 4 1 4 1 2 1
ARM Mali-G71 MP20 low med. high ultra QHD 4K Dead Trigger 2 30 Asphalt 8: Airborne 30 30 Temple Run 2 60 < 30 fps < 60 fps < 120 fps ≥ 120 fps 1 2 1
For more games that might be playable and a list of all games and graphics cards visit our Gaming List
v1.26
log 01. 09:31:29
#0 checking url part for id 9846 +0s ... 0s
#1 checking url part for id 7732 +0s ... 0s
#2 checking url part for id 11411 +0s ... 0s
#3 not redirecting to Ajax server +0s ... 0s
#4 did not recreate cache, as it is less than 5 days old! Created at Wed, 01 May 2024 05:36:19 +0200 +0.001s ... 0.001s
#5 composed specs +0.137s ... 0.138s
#6 did output specs +0s ... 0.138s
#7 start showIntegratedCPUs +0s ... 0.138s
#8 getting avg benchmarks for device 9846 +0.038s ... 0.177s
#9 got single benchmarks 9846 +0.014s ... 0.191s
#10 getting avg benchmarks for device 7732 +0.002s ... 0.192s
#11 got single benchmarks 7732 +0.01s ... 0.203s
#12 getting avg benchmarks for device 11411 +0.018s ... 0.22s
#13 got single benchmarks 11411 +0.01s ... 0.231s
#14 got avg benchmarks for devices +0s ... 0.231s
#15 min, max, avg, median took s +0.117s ... 0.348s
#16 before gaming benchmark output +0s ... 0.348s
#17 Got 50 rows for game benchmarks. +0.01s ... 0.358s
#18 composed SQL query for gamebenchmarks +0s ... 0.358s
#19 got data and put it in $dataArray +0.006s ... 0.364s
#20 benchmarks composed for output. +0.021s ... 0.385s
#21 calculated avg scores. +0s ... 0.385s
#22 return log +0.002s ... 0.387s
Please share our article, every link counts!
Redaktion, 2017-09- 8 (Update: 2023-07- 1)
 Deutsch
 English
 Español
 Français
 Italiano
 Nederlands
 Polski
 Português
 Русский
 Türkçe
 Svenska
 Chinese
 Magyar