




Samsung SSD 980 Pro 2TB MZ-V8P2T0 vs Micron 3400 1TB MTFDKBA1T0TFH
Samsung SSD 980 Pro 2TB MZ-V8P2T0
► remove from comparison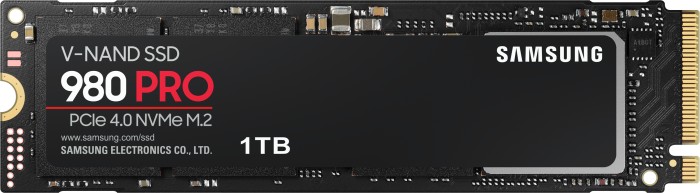
The Samsung SSD 980 PRO 2TB (MMZ-V8P2T0) is a very fast high end PCIe 4.0 x4 M.2 2280 SSD. It uses the Samsung Elpis controller with 8 channels, 1 GB LPDDR4 cache, SLC-Cache and 3D-NAND TLC memory modules from Samsung (V-NAND v6). Samsung specifies the drive with 7000 MB/s read and 5100 MB/s write (SLC cached, 2000 MB/s TLC). The power consumption is between 0.035W (idle) and 8.9 W (max.).
Micron 3400 1TB MTFDKBA1T0TFH
► remove from comparison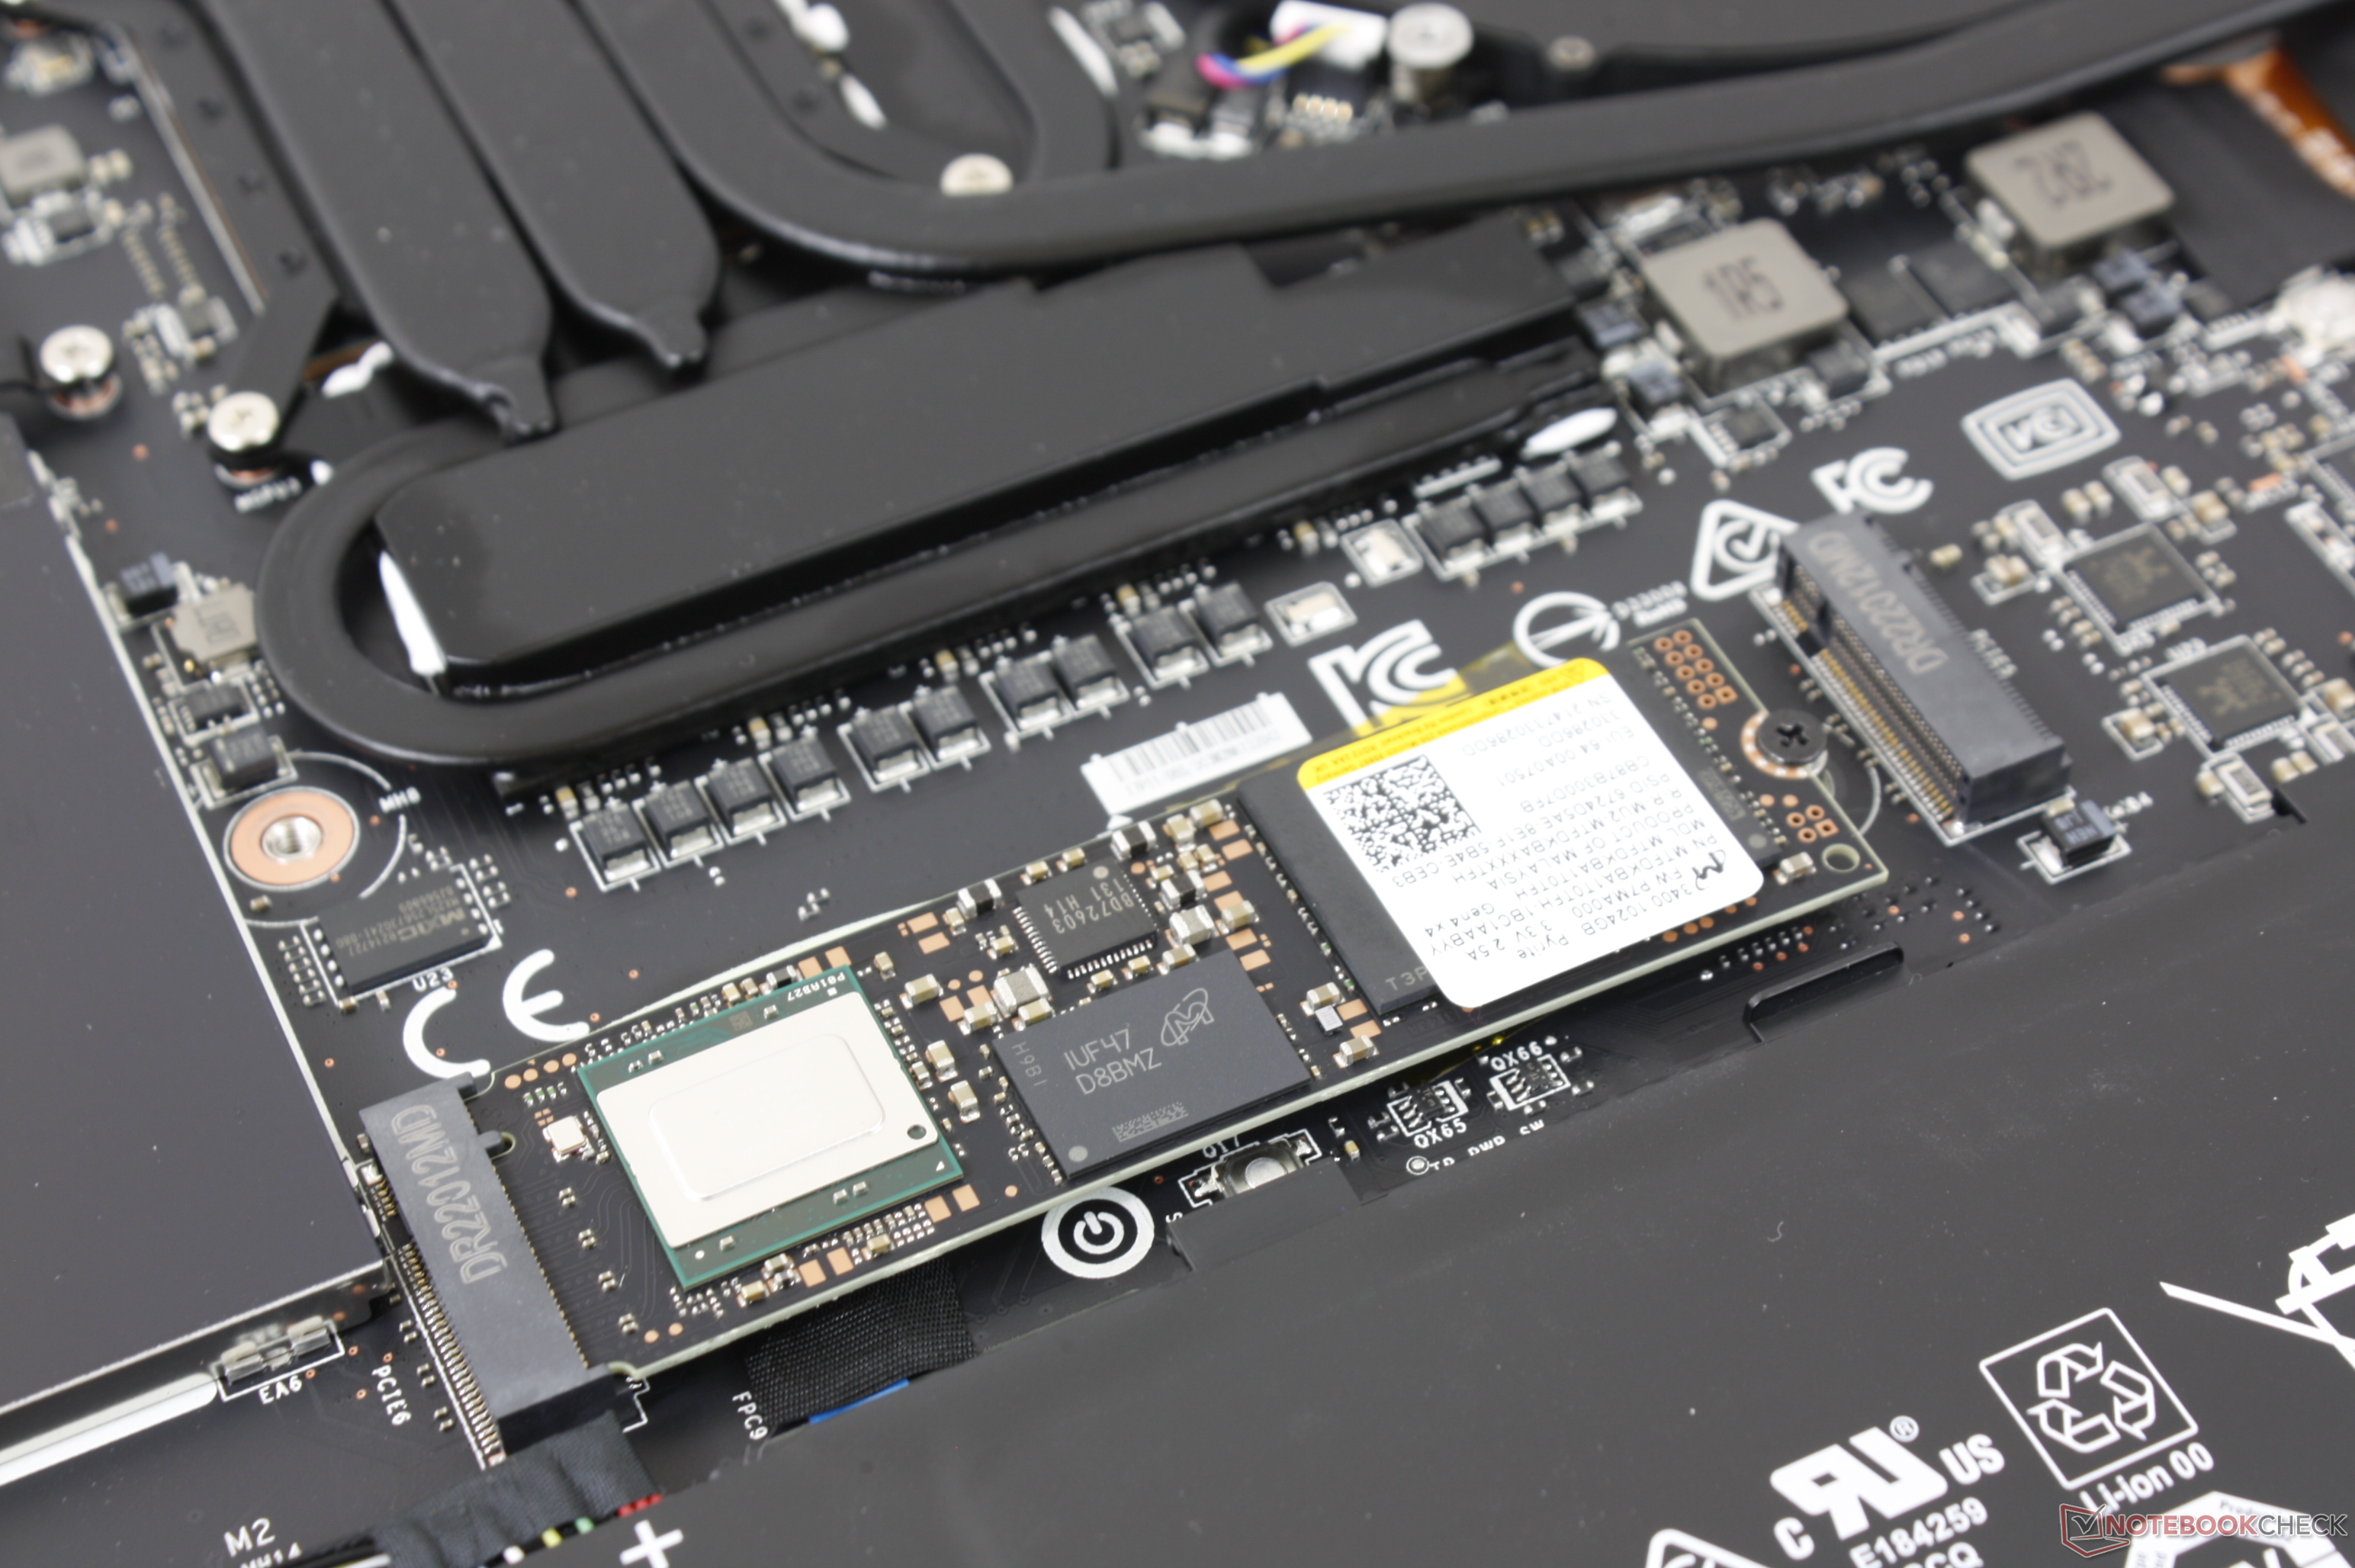
The Micron 3400 1TB (MTFDKBA1T0TFH Pyrite) is a fast M.2 2280 PCIe Gen4 SSD using the NVMe 1.4 protocol. It uses Micron's 176-layer triple-level cell (TLC) NAND and is specified at up to 6,600 MB/s sequential read and 5,000 MB/s write. The Endurance of the 1TB version is rated at 600TB and 2 million hours MTTF. The power consumption is specified at <5 mW in sleep, <450mW active idle and <7,5W in reading operations. It features hardware-based AES 256-bit encryption and power-loss protection.
| Samsung SSD 980 Pro 2TB MZ-V8P2T0 | Micron 3400 1TB MTFDKBA1T0TFH | |
| Type | SSD | SSD |
| Size | M.2 2280 | M.2 2280 |
| Capacity | 2048 GB | 1024 GB |
| Interface | NVMe | M.2 |
| Controller | Samsung Elpis S4LV003 | |
| Announced | 30.08.2020 | 24.02.2022 |
| Link | Micron 3400 1TB MTFDKBA1T0TFH |
Benchmarks
| Model | CPU | GPU | RAM | Value |
|---|---|---|---|---|
| Schenker XMG Ultra 17 Rocket Lake | i9-11900K 251 W / 130 W | GeForce RTX 3080 Laptop GPU 165 W 1710 / 1750 MHz 16 GB | 64 GB | 2365 |
| Tuxedo Pulse 14 Gen3 | R7 7840HS 65 W / 45 W | Radeon 780M 2055 / 800 MHz | 32 GB | 2485 |
| Schenker XMG SECTOR, i9 13900K, RTX 4090 | i9-13900K 253 W / 125 W | GeForce RTX 4090 450 W 2550 / 1313 MHz 24 GB | 32 GB | 2518.99 |
| Model | CPU | GPU | RAM | Value |
|---|---|---|---|---|
| Tuxedo Pulse 14 Gen3 | R7 7840HS 65 W / 45 W | Radeon 780M 2055 / 800 MHz | 32 GB | 929.61 |
| Schenker XMG Ultra 17 Rocket Lake | i9-11900K 251 W / 130 W | GeForce RTX 3080 Laptop GPU 165 W 1710 / 1750 MHz 16 GB | 64 GB | 1091 |
| Schenker XMG SECTOR, i9 13900K, RTX 4090 | i9-13900K 253 W / 125 W | GeForce RTX 4090 450 W 2550 / 1313 MHz 24 GB | 32 GB | 1309.25 |
| Model | CPU | GPU | RAM | Value |
|---|---|---|---|---|
| Schenker XMG SECTOR, i9 13900K, RTX 4090 | i9-13900K 253 W / 125 W | GeForce RTX 4090 450 W 2550 / 1313 MHz 24 GB | 32 GB | 3379.68 |
| Schenker XMG Ultra 17 Rocket Lake | i9-11900K 251 W / 130 W | GeForce RTX 3080 Laptop GPU 165 W 1710 / 1750 MHz 16 GB | 64 GB | 3424 |
| Tuxedo Pulse 14 Gen3 | R7 7840HS 65 W / 45 W | Radeon 780M 2055 / 800 MHz | 32 GB | 3770.68 |
| Model | CPU | GPU | RAM | Value |
|---|---|---|---|---|
| Schenker XMG SECTOR, i9 13900K, RTX 4090 2.0.7316.34247 | i9-13900K 253 W / 125 W | GeForce RTX 4090 450 W 2550 / 1313 MHz 24 GB | 32 GB | 8227 |
| Tuxedo Pulse 14 Gen3 2.0.7316.34247 | R7 7840HS 65 W / 45 W | Radeon 780M 2055 / 800 MHz | 32 GB | 8892 |
| Schenker XMG Ultra 17 Rocket Lake | i9-11900K 251 W / 130 W | GeForce RTX 3080 Laptop GPU 165 W 1710 / 1750 MHz 16 GB | 64 GB | 9134 |
| Model | CPU | GPU | RAM | Value |
|---|---|---|---|---|
| Schenker XMG SECTOR, i9 13900K, RTX 4090 2.0.7316.34247 | i9-13900K 253 W / 125 W | GeForce RTX 4090 450 W 2550 / 1313 MHz 24 GB | 32 GB | 3696 |
| Tuxedo Pulse 14 Gen3 2.0.7316.34247 | R7 7840HS 65 W / 45 W | Radeon 780M 2055 / 800 MHz | 32 GB | 3972 |
| Schenker XMG Ultra 17 Rocket Lake | i9-11900K 251 W / 130 W | GeForce RTX 3080 Laptop GPU 165 W 1710 / 1750 MHz 16 GB | 64 GB | 4414 |
| Model | CPU | GPU | RAM | Value |
|---|---|---|---|---|
| Schenker XMG SECTOR, i9 13900K, RTX 4090 2.0.7316.34247 | i9-13900K 253 W / 125 W | GeForce RTX 4090 450 W 2550 / 1313 MHz 24 GB | 32 GB | 3086 |
| Schenker XMG Ultra 17 Rocket Lake | i9-11900K 251 W / 130 W | GeForce RTX 3080 Laptop GPU 165 W 1710 / 1750 MHz 16 GB | 64 GB | 3164 |
| Tuxedo Pulse 14 Gen3 2.0.7316.34247 | R7 7840HS 65 W / 45 W | Radeon 780M 2055 / 800 MHz | 32 GB | 3307 |
| Model | CPU | GPU | RAM | Value |
|---|---|---|---|---|
| Schenker XMG SECTOR, i9 13900K, RTX 4090 2.0.7316.34247 | i9-13900K 253 W / 125 W | GeForce RTX 4090 450 W 2550 / 1313 MHz 24 GB | 32 GB | 0.018 |
| Tuxedo Pulse 14 Gen3 2.0.7316.34247 | R7 7840HS 65 W / 45 W | Radeon 780M 2055 / 800 MHz | 32 GB | 0.025 |
| Schenker XMG Ultra 17 Rocket Lake | i9-11900K 251 W / 130 W | GeForce RTX 3080 Laptop GPU 165 W 1710 / 1750 MHz 16 GB | 64 GB | 0.026 |
| Model | CPU | GPU | RAM | Value |
|---|---|---|---|---|
| Tuxedo Pulse 14 Gen3 2.0.7316.34247 | R7 7840HS 65 W / 45 W | Radeon 780M 2055 / 800 MHz | 32 GB | 0.024 |
| Schenker XMG SECTOR, i9 13900K, RTX 4090 2.0.7316.34247 | i9-13900K 253 W / 125 W | GeForce RTX 4090 450 W 2550 / 1313 MHz 24 GB | 32 GB | 0.066 |
| Schenker XMG Ultra 17 Rocket Lake | i9-11900K 251 W / 130 W | GeForce RTX 3080 Laptop GPU 165 W 1710 / 1750 MHz 16 GB | 64 GB | 0.072 |
| Model | CPU | GPU | RAM | Value |
|---|---|---|---|---|
| Schenker XMG SECTOR, i9 13900K, RTX 4090 2.0.7316.34247 | i9-13900K 253 W / 125 W | GeForce RTX 4090 450 W 2550 / 1313 MHz 24 GB | 32 GB | 3170 |
| Tuxedo Pulse 14 Gen3 2.0.7316.34247 | R7 7840HS 65 W / 45 W | Radeon 780M 2055 / 800 MHz | 32 GB | 3410 |
| Schenker XMG Ultra 17 Rocket Lake | i9-11900K 251 W / 130 W | GeForce RTX 3080 Laptop GPU 165 W 1710 / 1750 MHz 16 GB | 64 GB | 3859 |
| Model | CPU | GPU | RAM | Value |
|---|---|---|---|---|
| Schenker XMG SECTOR, i9 13900K, RTX 4090 2.0.7316.34247 | i9-13900K 253 W / 125 W | GeForce RTX 4090 450 W 2550 / 1313 MHz 24 GB | 32 GB | 2446 |
| Schenker XMG Ultra 17 Rocket Lake | i9-11900K 251 W / 130 W | GeForce RTX 3080 Laptop GPU 165 W 1710 / 1750 MHz 16 GB | 64 GB | 2611 |
| Tuxedo Pulse 14 Gen3 2.0.7316.34247 | R7 7840HS 65 W / 45 W | Radeon 780M 2055 / 800 MHz | 32 GB | 2682 |
| Model | CPU | GPU | RAM | Value |
|---|---|---|---|---|
| Schenker XMG Ultra 17 Rocket Lake | i9-11900K 251 W / 130 W | GeForce RTX 3080 Laptop GPU 165 W 1710 / 1750 MHz 16 GB | 64 GB | 156.8 |
| Tuxedo Pulse 14 Gen3 2.0.7316.34247 | R7 7840HS 65 W / 45 W | Radeon 780M 2055 / 800 MHz | 32 GB | 161 |
| Schenker XMG SECTOR, i9 13900K, RTX 4090 2.0.7316.34247 | i9-13900K 253 W / 125 W | GeForce RTX 4090 450 W 2550 / 1313 MHz 24 GB | 32 GB | 235 |
| Model | CPU | GPU | RAM | Value |
|---|---|---|---|---|
| Schenker XMG Ultra 17 Rocket Lake | i9-11900K 251 W / 130 W | GeForce RTX 3080 Laptop GPU 165 W 1710 / 1750 MHz 16 GB | 64 GB | 51.9 |
| Tuxedo Pulse 14 Gen3 2.0.7316.34247 | R7 7840HS 65 W / 45 W | Radeon 780M 2055 / 800 MHz | 32 GB | 72.3 |
| Schenker XMG SECTOR, i9 13900K, RTX 4090 2.0.7316.34247 | i9-13900K 253 W / 125 W | GeForce RTX 4090 450 W 2550 / 1313 MHz 24 GB | 32 GB | 76.5 |
| Model | CPU | GPU | RAM | Value |
|---|---|---|---|---|
| Schenker XMG SECTOR, i9 13900K, RTX 4090 2.0.7316.34247 | i9-13900K 253 W / 125 W | GeForce RTX 4090 450 W 2550 / 1313 MHz 24 GB | 32 GB | 2908 |
| Schenker XMG Ultra 17 Rocket Lake | i9-11900K 251 W / 130 W | GeForce RTX 3080 Laptop GPU 165 W 1710 / 1750 MHz 16 GB | 64 GB | 3974 |
| Tuxedo Pulse 14 Gen3 2.0.7316.34247 | R7 7840HS 65 W / 45 W | Radeon 780M 2055 / 800 MHz | 32 GB | 4004 |
| Model | CPU | GPU | RAM | Value |
|---|---|---|---|---|
| Schenker XMG Ultra 17 Rocket Lake | i9-11900K 251 W / 130 W | GeForce RTX 3080 Laptop GPU 165 W 1710 / 1750 MHz 16 GB | 64 GB | 5010 |
| Tuxedo Pulse 14 Gen3 2.0.7316.34247 | R7 7840HS 65 W / 45 W | Radeon 780M 2055 / 800 MHz | 32 GB | 5525 |
| Schenker XMG SECTOR, i9 13900K, RTX 4090 2.0.7316.34247 | i9-13900K 253 W / 125 W | GeForce RTX 4090 450 W 2550 / 1313 MHz 24 GB | 32 GB | 5630 |
| Model | CPU | GPU | RAM | Value |
|---|---|---|---|---|
| Schenker XMG SECTOR, i9 13900K, RTX 4090 | i9-13900K 253 W / 125 W | GeForce RTX 4090 450 W 2550 / 1313 MHz 24 GB | 32 GB | 601.1 |
| Model | CPU | GPU | RAM | Value |
|---|---|---|---|---|
| Acer Swift Edge SFE16-42-R1GM | R7 7735U 28 W / 20 W | Radeon 680M | 16 GB | 274.9 |
| Model | CPU | GPU | RAM | Value |
|---|---|---|---|---|
| Schenker XMG SECTOR, i9 13900K, RTX 4090 | i9-13900K 253 W / 125 W | GeForce RTX 4090 450 W 2550 / 1313 MHz 24 GB | 32 GB | 830.9 |
| Model | CPU | GPU | RAM | Value |
|---|---|---|---|---|
| Acer Swift Edge SFE16-42-R1GM | R7 7735U 28 W / 20 W | Radeon 680M | 16 GB | 351.4 |
| Model | CPU | GPU | RAM | Value |
|---|---|---|---|---|
| Schenker XMG SECTOR, i9 13900K, RTX 4090 | i9-13900K 253 W / 125 W | GeForce RTX 4090 450 W 2550 / 1313 MHz 24 GB | 32 GB | 265.1 |
| Model | CPU | GPU | RAM | Value |
|---|---|---|---|---|
| Acer Swift Edge SFE16-42-R1GM | R7 7735U 28 W / 20 W | Radeon 680M | 16 GB | 137.7 |
| Model | CPU | GPU | RAM | Value |
|---|---|---|---|---|
| Schenker XMG SECTOR, i9 13900K, RTX 4090 | i9-13900K 253 W / 125 W | GeForce RTX 4090 450 W 2550 / 1313 MHz 24 GB | 32 GB | 53.41 |
| Model | CPU | GPU | RAM | Value |
|---|---|---|---|---|
| Acer Swift Edge SFE16-42-R1GM | R7 7735U 28 W / 20 W | Radeon 680M | 16 GB | 41.84 |
| Model | CPU | GPU | RAM | Value |
|---|---|---|---|---|
| Schenker XMG SECTOR, i9 13900K, RTX 4090 | i9-13900K 253 W / 125 W | GeForce RTX 4090 450 W 2550 / 1313 MHz 24 GB | 32 GB | 2199 |
| Model | CPU | GPU | RAM | Value |
|---|---|---|---|---|
| Acer Swift Edge SFE16-42-R1GM | R7 7735U 28 W / 20 W | Radeon 680M | 16 GB | 1407 |
| Model | CPU | GPU | RAM | Value |
|---|---|---|---|---|
| Schenker XMG SECTOR, i9 13900K, RTX 4090 | i9-13900K 253 W / 125 W | GeForce RTX 4090 450 W 2550 / 1313 MHz 24 GB | 32 GB | 2530 |
| Model | CPU | GPU | RAM | Value |
|---|---|---|---|---|
| Acer Swift Edge SFE16-42-R1GM | R7 7735U 28 W / 20 W | Radeon 680M | 16 GB | 1021 |
| Model | CPU | GPU | RAM | Value |
|---|---|---|---|---|
| Schenker XMG SECTOR, i9 13900K, RTX 4090 | i9-13900K 253 W / 125 W | GeForce RTX 4090 450 W 2550 / 1313 MHz 24 GB | 32 GB | 2501 |
| Model | CPU | GPU | RAM | Value |
|---|---|---|---|---|
| Acer Swift Edge SFE16-42-R1GM | R7 7735U 28 W / 20 W | Radeon 680M | 16 GB | 3702 |
| Model | CPU | GPU | RAM | Value |
|---|---|---|---|---|
| Schenker XMG SECTOR, i9 13900K, RTX 4090 | i9-13900K 253 W / 125 W | GeForce RTX 4090 450 W 2550 / 1313 MHz 24 GB | 32 GB | 4168 |
| Model | CPU | GPU | RAM | Value |
|---|---|---|---|---|
| Acer Swift Edge SFE16-42-R1GM | R7 7735U 28 W / 20 W | Radeon 680M | 16 GB | 3536 |
| Model | CPU | GPU | RAM | Value |
|---|---|---|---|---|
| Tuxedo Pulse 14 Gen3 6.0.1 x64 1024 MiB [C: 5.1% (47.1/931.1 GiB)] (x5) [Interval=5 sec] | R7 7840HS 65 W / 45 W | Radeon 780M 2055 / 800 MHz | 32 GB | 126.4 |
| Schenker XMG Ultra 17 Rocket Lake | i9-11900K 251 W / 130 W | GeForce RTX 3080 Laptop GPU 165 W 1710 / 1750 MHz 16 GB | 64 GB | 240 |
| Schenker XMG SECTOR, i9 13900K, RTX 4090 | i9-13900K 253 W / 125 W | GeForce RTX 4090 450 W 2550 / 1313 MHz 24 GB | 32 GB | 256.5 |
| Model | CPU | GPU | RAM | Value |
|---|---|---|---|---|
| Acer Predator Triton 14 AI PT14-52 6.0.1 x64 1024 MiB [C: 10.3% (97.9/952.4 GiB)] (x5) [Interval=5 sec] | Core Ultra 9 288V 37 W / 37 W | GeForce RTX 5070 Laptop 110 W 2535 / 1481 MHz 8 GB | 32 GB | 119.5 |
| Lenovo ThinkBook 16p G3 ARH | R9 6900HX 65 W / 54 W | GeForce RTX 3060 Laptop GPU 90 W 1282 / 1500 MHz 6 GB | 32 GB | 134.1 |
| Acer Predator Triton 300 SE | i9-12900H 109 W / 69 W | GeForce RTX 3060 Laptop GPU 95 W 1282 / 1468 MHz 6 GB | 32 GB | 136.1 |
| Acer Swift Edge SFE16-42-R1GM | R7 7735U 28 W / 20 W | Radeon 680M | 16 GB | 144.5 |
| Lenovo ThinkPad X1 Extreme G5-21DE003RGE 6.0.1 x64 1024 MiB [C: 12.3% (117.4/951.6 GiB)] (x5) [Interval=5 sec] | i7-12700H 112 W / 80 W | GeForce RTX 3060 Laptop GPU 95 W 1425 / 1750 MHz 6 GB | 32 GB | 146.53 |
| HP ZBook Firefly 14 G9-6B8A2EA 6.0.1 x64 1024 MiB [C: 7.0% (66.4/952.7 GiB)] (x5) [Interval=5 sec] | i7-1265U 51 W / 12 W | T550 Laptop GPU 20 W 1665 / 1500 MHz 4 GB | 32 GB | 149.94 |
| HP ZBook Fury 16 G9 | i9-12950HX 96 W / 71 W | RTX A5500 Laptop GPU 1260 / 1750 MHz 16 GB | 64 GB | 150.1 |
| HP ZBook Studio 16 G9 62U04EA 6.0.1 x64 1024 MiB [C: 15.1% (143.5/952.7 GiB)] (x5) [Interval=5 sec] | i7-12800H 88 W / 70 W | RTX A2000 Laptop GPU 50 W 1335 / 1375 MHz 8 GB | 32 GB | 150.51 |
| HP Spectre x360 13.5 14t-ef000 | i7-1255U 44 W / 28 W | Iris Xe G7 96EUs 1250 / 2133 MHz | 16 GB | 151.1 |
| Acer Nitro 5 AN515-46-R1A1 | R7 6800H 80 W / 65 W | GeForce RTX 3070 Ti Laptop GPU 150 W 1410 / 1750 MHz 8 GB | 16 GB | 151.3 |
| HP Envy 16 h0112nr | i7-12700H 115 W / 55 W | GeForce RTX 3060 Laptop GPU 95 W 1425 / 1750 MHz 6 GB | 16 GB | 172.6 |
| HP ProBook 450 G10 | i7-1355U 55 W / 24 W | GeForce RTX 2050 Mobile 30 W 1155 / 1500 MHz 4 GB | 32 GB | 221.5 |
| MSI Creator Z17 A12UGST-054 6.0.0 x64 1024 MiB [C: 50.2% (468.6/933.3 GiB)] (x5) [Interval=5 sec] | i9-12900H 120 W / 65 W | GeForce RTX 3070 Ti Laptop GPU 90 W 8 GB | 32 GB | 224.14 |
| Lenovo Legion 7 16IAX7-82TD004SGE 6.0.1 x64 1024 MiB [C: 17.5% (166.8/951.6 GiB)] (x5) [Interval=5 sec] | i9-12900HX 165 W / 136 W | GeForce RTX 3080 Ti Laptop GPU 180 W 1590 / 2000 MHz 16 GB | 32 GB | 226.4 |
| MSI Pulse GL76 12UGK | i7-12700H 110 W / 85 W | GeForce RTX 3070 Laptop GPU 105 W 1290 / 1500 MHz 8 GB | 16 GB | 239.7 |
| Asus ROG Zephyrus M16 GU603Z 6.0.0 x64 1024 MiB [C: 42.8% (398.6/930.6 GiB)] (x5) [Interval=5 sec] | i9-12900H 90 W / 90 W | GeForce RTX 3070 Ti Laptop GPU 120 W | 32 GB | 247 |
| MSI Stealth GS77 12UHS-083US | i7-12700H 123 W / 71 W | GeForce RTX 3080 Ti Laptop GPU 105 W 1125 / 1750 MHz 16 GB | 32 GB | 256.4 |
| Model | CPU | GPU | RAM | Value |
|---|---|---|---|---|
| Schenker XMG SECTOR, i9 13900K, RTX 4090 | i9-13900K 253 W / 125 W | GeForce RTX 4090 450 W 2550 / 1313 MHz 24 GB | 32 GB | 55.01 |
| Tuxedo Pulse 14 Gen3 6.0.1 x64 1024 MiB [C: 5.1% (47.1/931.1 GiB)] (x5) [Interval=5 sec] | R7 7840HS 65 W / 45 W | Radeon 780M 2055 / 800 MHz | 32 GB | 67.7 |
| Schenker XMG Ultra 17 Rocket Lake | i9-11900K 251 W / 130 W | GeForce RTX 3080 Laptop GPU 165 W 1710 / 1750 MHz 16 GB | 64 GB | 87.8 |
| Model | CPU | GPU | RAM | Value |
|---|---|---|---|---|
| Acer Swift Edge SFE16-42-R1GM | R7 7735U 28 W / 20 W | Radeon 680M | 16 GB | 45.96 |
| Lenovo ThinkBook 16p G3 ARH | R9 6900HX 65 W / 54 W | GeForce RTX 3060 Laptop GPU 90 W 1282 / 1500 MHz 6 GB | 32 GB | 55.74 |
| Acer Predator Triton 14 AI PT14-52 6.0.1 x64 1024 MiB [C: 10.3% (97.9/952.4 GiB)] (x5) [Interval=5 sec] | Core Ultra 9 288V 37 W / 37 W | GeForce RTX 5070 Laptop 110 W 2535 / 1481 MHz 8 GB | 32 GB | 56.3 |
| Asus ROG Zephyrus M16 GU603Z 6.0.0 x64 1024 MiB [C: 42.8% (398.6/930.6 GiB)] (x5) [Interval=5 sec] | i9-12900H 90 W / 90 W | GeForce RTX 3070 Ti Laptop GPU 120 W | 32 GB | 60.3 |
| Acer Nitro 5 AN515-46-R1A1 | R7 6800H 80 W / 65 W | GeForce RTX 3070 Ti Laptop GPU 150 W 1410 / 1750 MHz 8 GB | 16 GB | 61.57 |
| Lenovo ThinkPad X1 Extreme G5-21DE003RGE 6.0.1 x64 1024 MiB [C: 12.3% (117.4/951.6 GiB)] (x5) [Interval=5 sec] | i7-12700H 112 W / 80 W | GeForce RTX 3060 Laptop GPU 95 W 1425 / 1750 MHz 6 GB | 32 GB | 62.62 |
| HP ZBook Fury 16 G9 | i9-12950HX 96 W / 71 W | RTX A5500 Laptop GPU 1260 / 1750 MHz 16 GB | 64 GB | 63.66 |
| HP ZBook Studio 16 G9 62U04EA 6.0.1 x64 1024 MiB [C: 15.1% (143.5/952.7 GiB)] (x5) [Interval=5 sec] | i7-12800H 88 W / 70 W | RTX A2000 Laptop GPU 50 W 1335 / 1375 MHz 8 GB | 32 GB | 63.83 |
| HP ZBook Firefly 14 G9-6B8A2EA 6.0.1 x64 1024 MiB [C: 7.0% (66.4/952.7 GiB)] (x5) [Interval=5 sec] | i7-1265U 51 W / 12 W | T550 Laptop GPU 20 W 1665 / 1500 MHz 4 GB | 32 GB | 63.88 |
| HP Spectre x360 13.5 14t-ef000 | i7-1255U 44 W / 28 W | Iris Xe G7 96EUs 1250 / 2133 MHz | 16 GB | 64.46 |
| HP Envy 16 h0112nr | i7-12700H 115 W / 55 W | GeForce RTX 3060 Laptop GPU 95 W 1425 / 1750 MHz 6 GB | 16 GB | 66.06 |
| MSI Stealth GS77 12UHS-083US | i7-12700H 123 W / 71 W | GeForce RTX 3080 Ti Laptop GPU 105 W 1125 / 1750 MHz 16 GB | 32 GB | 72 |
| MSI Creator Z17 A12UGST-054 6.0.0 x64 1024 MiB [C: 50.2% (468.6/933.3 GiB)] (x5) [Interval=5 sec] | i9-12900H 120 W / 65 W | GeForce RTX 3070 Ti Laptop GPU 90 W 8 GB | 32 GB | 73.02 |
| HP ProBook 450 G10 | i7-1355U 55 W / 24 W | GeForce RTX 2050 Mobile 30 W 1155 / 1500 MHz 4 GB | 32 GB | 73.32 |
| Lenovo Legion 7 16IAX7-82TD004SGE 6.0.1 x64 1024 MiB [C: 17.5% (166.8/951.6 GiB)] (x5) [Interval=5 sec] | i9-12900HX 165 W / 136 W | GeForce RTX 3080 Ti Laptop GPU 180 W 1590 / 2000 MHz 16 GB | 32 GB | 73.75 |
| Acer Predator Triton 300 SE | i9-12900H 109 W / 69 W | GeForce RTX 3060 Laptop GPU 95 W 1282 / 1468 MHz 6 GB | 32 GB | 73.95 |
| MSI Pulse GL76 12UGK | i7-12700H 110 W / 85 W | GeForce RTX 3070 Laptop GPU 105 W 1290 / 1500 MHz 8 GB | 16 GB | 73.97 |
| Model | CPU | GPU | RAM | Value |
|---|---|---|---|---|
| Schenker XMG Ultra 17 Rocket Lake | i9-11900K 251 W / 130 W | GeForce RTX 3080 Laptop GPU 165 W 1710 / 1750 MHz 16 GB | 64 GB | 4281 |
| Schenker XMG SECTOR, i9 13900K, RTX 4090 | i9-13900K 253 W / 125 W | GeForce RTX 4090 450 W 2550 / 1313 MHz 24 GB | 32 GB | 4399 |
| Model | CPU | GPU | RAM | Value |
|---|---|---|---|---|
| Schenker XMG SECTOR, i9 13900K, RTX 4090 | i9-13900K 253 W / 125 W | GeForce RTX 4090 450 W 2550 / 1313 MHz 24 GB | 32 GB | 3674 |
| Schenker XMG Ultra 17 Rocket Lake | i9-11900K 251 W / 130 W | GeForce RTX 3080 Laptop GPU 165 W 1710 / 1750 MHz 16 GB | 64 GB | 4228 |
| Model | CPU | GPU | RAM | Value |
|---|---|---|---|---|
| Tuxedo Pulse 14 Gen3 6.0.1 x64 1024 MiB [C: 5.1% (47.1/931.1 GiB)] (x5) [Interval=5 sec] | R7 7840HS 65 W / 45 W | Radeon 780M 2055 / 800 MHz | 32 GB | 563 |
| Schenker XMG SECTOR, i9 13900K, RTX 4090 | i9-13900K 253 W / 125 W | GeForce RTX 4090 450 W 2550 / 1313 MHz 24 GB | 32 GB | 591.5 |
| Schenker XMG Ultra 17 Rocket Lake | i9-11900K 251 W / 130 W | GeForce RTX 3080 Laptop GPU 165 W 1710 / 1750 MHz 16 GB | 64 GB | 696 |
| Model | CPU | GPU | RAM | Value |
|---|---|---|---|---|
| Acer Swift Edge SFE16-42-R1GM | R7 7735U 28 W / 20 W | Radeon 680M | 16 GB | 313.6 |
| Lenovo ThinkBook 16p G3 ARH | R9 6900HX 65 W / 54 W | GeForce RTX 3060 Laptop GPU 90 W 1282 / 1500 MHz 6 GB | 32 GB | 327.7 |
| HP ZBook Firefly 14 G9-6B8A2EA 6.0.1 x64 1024 MiB [C: 7.0% (66.4/952.7 GiB)] (x5) [Interval=5 sec] | i7-1265U 51 W / 12 W | T550 Laptop GPU 20 W 1665 / 1500 MHz 4 GB | 32 GB | 331.55 |
| Lenovo ThinkPad X1 Extreme G5-21DE003RGE 6.0.1 x64 1024 MiB [C: 12.3% (117.4/951.6 GiB)] (x5) [Interval=5 sec] | i7-12700H 112 W / 80 W | GeForce RTX 3060 Laptop GPU 95 W 1425 / 1750 MHz 6 GB | 32 GB | 353.92 |
| HP ZBook Studio 16 G9 62U04EA 6.0.1 x64 1024 MiB [C: 15.1% (143.5/952.7 GiB)] (x5) [Interval=5 sec] | i7-12800H 88 W / 70 W | RTX A2000 Laptop GPU 50 W 1335 / 1375 MHz 8 GB | 32 GB | 413.5 |
| Acer Nitro 5 AN515-46-R1A1 | R7 6800H 80 W / 65 W | GeForce RTX 3070 Ti Laptop GPU 150 W 1410 / 1750 MHz 8 GB | 16 GB | 421.9 |
| Acer Predator Triton 14 AI PT14-52 6.0.1 x64 1024 MiB [C: 10.3% (97.9/952.4 GiB)] (x5) [Interval=5 sec] | Core Ultra 9 288V 37 W / 37 W | GeForce RTX 5070 Laptop 110 W 2535 / 1481 MHz 8 GB | 32 GB | 422 |
| HP Spectre x360 13.5 14t-ef000 | i7-1255U 44 W / 28 W | Iris Xe G7 96EUs 1250 / 2133 MHz | 16 GB | 483.7 |
| HP ProBook 450 G10 | i7-1355U 55 W / 24 W | GeForce RTX 2050 Mobile 30 W 1155 / 1500 MHz 4 GB | 32 GB | 496.5 |
| Asus ROG Zephyrus M16 GU603Z 6.0.0 x64 1024 MiB [C: 42.8% (398.6/930.6 GiB)] (x5) [Interval=5 sec] | i9-12900H 90 W / 90 W | GeForce RTX 3070 Ti Laptop GPU 120 W | 32 GB | 579 |
| HP Envy 16 h0112nr | i7-12700H 115 W / 55 W | GeForce RTX 3060 Laptop GPU 95 W 1425 / 1750 MHz 6 GB | 16 GB | 580.9 |
| MSI Creator Z17 A12UGST-054 6.0.0 x64 1024 MiB [C: 50.2% (468.6/933.3 GiB)] (x5) [Interval=5 sec] | i9-12900H 120 W / 65 W | GeForce RTX 3070 Ti Laptop GPU 90 W 8 GB | 32 GB | 652.27 |
| MSI Pulse GL76 12UGK | i7-12700H 110 W / 85 W | GeForce RTX 3070 Laptop GPU 105 W 1290 / 1500 MHz 8 GB | 16 GB | 657.1 |
| MSI Stealth GS77 12UHS-083US | i7-12700H 123 W / 71 W | GeForce RTX 3080 Ti Laptop GPU 105 W 1125 / 1750 MHz 16 GB | 32 GB | 681 |
| Lenovo Legion 7 16IAX7-82TD004SGE 6.0.1 x64 1024 MiB [C: 17.5% (166.8/951.6 GiB)] (x5) [Interval=5 sec] | i9-12900HX 165 W / 136 W | GeForce RTX 3080 Ti Laptop GPU 180 W 1590 / 2000 MHz 16 GB | 32 GB | 714.7 |
| Acer Predator Triton 300 SE | i9-12900H 109 W / 69 W | GeForce RTX 3060 Laptop GPU 95 W 1282 / 1468 MHz 6 GB | 32 GB | 742.9 |
| HP ZBook Fury 16 G9 | i9-12950HX 96 W / 71 W | RTX A5500 Laptop GPU 1260 / 1750 MHz 16 GB | 64 GB | 760.8 |
| Model | CPU | GPU | RAM | Value |
|---|---|---|---|---|
| Tuxedo Pulse 14 Gen3 6.0.1 x64 1024 MiB [C: 5.1% (47.1/931.1 GiB)] (x5) [Interval=5 sec] | R7 7840HS 65 W / 45 W | Radeon 780M 2055 / 800 MHz | 32 GB | 713 |
| Schenker XMG Ultra 17 Rocket Lake | i9-11900K 251 W / 130 W | GeForce RTX 3080 Laptop GPU 165 W 1710 / 1750 MHz 16 GB | 64 GB | 778 |
| Schenker XMG SECTOR, i9 13900K, RTX 4090 | i9-13900K 253 W / 125 W | GeForce RTX 4090 450 W 2550 / 1313 MHz 24 GB | 32 GB | 803.4 |
| Model | CPU | GPU | RAM | Value |
|---|---|---|---|---|
| Acer Swift Edge SFE16-42-R1GM | R7 7735U 28 W / 20 W | Radeon 680M | 16 GB | 395.5 |
| Lenovo ThinkBook 16p G3 ARH | R9 6900HX 65 W / 54 W | GeForce RTX 3060 Laptop GPU 90 W 1282 / 1500 MHz 6 GB | 32 GB | 403.6 |
| HP ZBook Firefly 14 G9-6B8A2EA 6.0.1 x64 1024 MiB [C: 7.0% (66.4/952.7 GiB)] (x5) [Interval=5 sec] | i7-1265U 51 W / 12 W | T550 Laptop GPU 20 W 1665 / 1500 MHz 4 GB | 32 GB | 435.87 |
| Lenovo ThinkPad X1 Extreme G5-21DE003RGE 6.0.1 x64 1024 MiB [C: 12.3% (117.4/951.6 GiB)] (x5) [Interval=5 sec] | i7-12700H 112 W / 80 W | GeForce RTX 3060 Laptop GPU 95 W 1425 / 1750 MHz 6 GB | 32 GB | 455.83 |
| Acer Predator Triton 14 AI PT14-52 6.0.1 x64 1024 MiB [C: 10.3% (97.9/952.4 GiB)] (x5) [Interval=5 sec] | Core Ultra 9 288V 37 W / 37 W | GeForce RTX 5070 Laptop 110 W 2535 / 1481 MHz 8 GB | 32 GB | 463 |
| HP ZBook Studio 16 G9 62U04EA 6.0.1 x64 1024 MiB [C: 15.1% (143.5/952.7 GiB)] (x5) [Interval=5 sec] | i7-12800H 88 W / 70 W | RTX A2000 Laptop GPU 50 W 1335 / 1375 MHz 8 GB | 32 GB | 466.84 |
| HP ZBook Fury 16 G9 | i9-12950HX 96 W / 71 W | RTX A5500 Laptop GPU 1260 / 1750 MHz 16 GB | 64 GB | 502.9 |
| HP Spectre x360 13.5 14t-ef000 | i7-1255U 44 W / 28 W | Iris Xe G7 96EUs 1250 / 2133 MHz | 16 GB | 593 |
| HP Envy 16 h0112nr | i7-12700H 115 W / 55 W | GeForce RTX 3060 Laptop GPU 95 W 1425 / 1750 MHz 6 GB | 16 GB | 615.5 |
| Acer Nitro 5 AN515-46-R1A1 | R7 6800H 80 W / 65 W | GeForce RTX 3070 Ti Laptop GPU 150 W 1410 / 1750 MHz 8 GB | 16 GB | 618.2 |
| HP ProBook 450 G10 | i7-1355U 55 W / 24 W | GeForce RTX 2050 Mobile 30 W 1155 / 1500 MHz 4 GB | 32 GB | 721.9 |
| Asus ROG Zephyrus M16 GU603Z 6.0.0 x64 1024 MiB [C: 42.8% (398.6/930.6 GiB)] (x5) [Interval=5 sec] | i9-12900H 90 W / 90 W | GeForce RTX 3070 Ti Laptop GPU 120 W | 32 GB | 724 |
| MSI Pulse GL76 12UGK | i7-12700H 110 W / 85 W | GeForce RTX 3070 Laptop GPU 105 W 1290 / 1500 MHz 8 GB | 16 GB | 864.3 |
| MSI Stealth GS77 12UHS-083US | i7-12700H 123 W / 71 W | GeForce RTX 3080 Ti Laptop GPU 105 W 1125 / 1750 MHz 16 GB | 32 GB | 905 |
| MSI Creator Z17 A12UGST-054 6.0.0 x64 1024 MiB [C: 50.2% (468.6/933.3 GiB)] (x5) [Interval=5 sec] | i9-12900H 120 W / 65 W | GeForce RTX 3070 Ti Laptop GPU 90 W 8 GB | 32 GB | 906.01 |
| Acer Predator Triton 300 SE | i9-12900H 109 W / 69 W | GeForce RTX 3060 Laptop GPU 95 W 1282 / 1468 MHz 6 GB | 32 GB | 936.8 |
| Lenovo Legion 7 16IAX7-82TD004SGE 6.0.1 x64 1024 MiB [C: 17.5% (166.8/951.6 GiB)] (x5) [Interval=5 sec] | i9-12900HX 165 W / 136 W | GeForce RTX 3080 Ti Laptop GPU 180 W 1590 / 2000 MHz 16 GB | 32 GB | 960.83 |
| Model | CPU | GPU | RAM | Value |
|---|---|---|---|---|
| Schenker XMG Ultra 17 Rocket Lake | i9-11900K 251 W / 130 W | GeForce RTX 3080 Laptop GPU 165 W 1710 / 1750 MHz 16 GB | 64 GB | 5195 |
| Schenker XMG SECTOR, i9 13900K, RTX 4090 | i9-13900K 253 W / 125 W | GeForce RTX 4090 450 W 2550 / 1313 MHz 24 GB | 32 GB | 5222.1 |
| Tuxedo Pulse 14 Gen3 6.0.1 x64 1024 MiB [C: 5.1% (47.1/931.1 GiB)] (x5) [Interval=5 sec] | R7 7840HS 65 W / 45 W | Radeon 780M 2055 / 800 MHz | 32 GB | 5228 |
| Model | CPU | GPU | RAM | Value |
|---|---|---|---|---|
| HP ZBook Firefly 14 G9-6B8A2EA 6.0.1 x64 1024 MiB [C: 7.0% (66.4/952.7 GiB)] (x5) [Interval=5 sec] | i7-1265U 51 W / 12 W | T550 Laptop GPU 20 W 1665 / 1500 MHz 4 GB | 32 GB | 3897.6 |
| Lenovo ThinkPad X1 Extreme G5-21DE003RGE 6.0.1 x64 1024 MiB [C: 12.3% (117.4/951.6 GiB)] (x5) [Interval=5 sec] | i7-12700H 112 W / 80 W | GeForce RTX 3060 Laptop GPU 95 W 1425 / 1750 MHz 6 GB | 32 GB | 4141.4 |
| HP Spectre x360 13.5 14t-ef000 | i7-1255U 44 W / 28 W | Iris Xe G7 96EUs 1250 / 2133 MHz | 16 GB | 4233 |
| HP ProBook 450 G10 | i7-1355U 55 W / 24 W | GeForce RTX 2050 Mobile 30 W 1155 / 1500 MHz 4 GB | 32 GB | 4286 |
| Acer Swift Edge SFE16-42-R1GM | R7 7735U 28 W / 20 W | Radeon 680M | 16 GB | 4303.9 |
| Acer Nitro 5 AN515-46-R1A1 | R7 6800H 80 W / 65 W | GeForce RTX 3070 Ti Laptop GPU 150 W 1410 / 1750 MHz 8 GB | 16 GB | 4483 |
| MSI Creator Z17 A12UGST-054 6.0.0 x64 1024 MiB [C: 50.2% (468.6/933.3 GiB)] (x5) [Interval=5 sec] | i9-12900H 120 W / 65 W | GeForce RTX 3070 Ti Laptop GPU 90 W 8 GB | 32 GB | 4654.8 |
| Acer Predator Triton 14 AI PT14-52 6.0.1 x64 1024 MiB [C: 10.3% (97.9/952.4 GiB)] (x5) [Interval=5 sec] | Core Ultra 9 288V 37 W / 37 W | GeForce RTX 5070 Laptop 110 W 2535 / 1481 MHz 8 GB | 32 GB | 4796 |
| Acer Predator Triton 300 SE | i9-12900H 109 W / 69 W | GeForce RTX 3060 Laptop GPU 95 W 1282 / 1468 MHz 6 GB | 32 GB | 4884 |
| Asus ROG Zephyrus M16 GU603Z 6.0.0 x64 1024 MiB [C: 42.8% (398.6/930.6 GiB)] (x5) [Interval=5 sec] | i9-12900H 90 W / 90 W | GeForce RTX 3070 Ti Laptop GPU 120 W | 32 GB | 4887 |
| HP ZBook Fury 16 G9 | i9-12950HX 96 W / 71 W | RTX A5500 Laptop GPU 1260 / 1750 MHz 16 GB | 64 GB | 4892 |
| MSI Pulse GL76 12UGK | i7-12700H 110 W / 85 W | GeForce RTX 3070 Laptop GPU 105 W 1290 / 1500 MHz 8 GB | 16 GB | 4925 |
| HP ZBook Studio 16 G9 62U04EA 6.0.1 x64 1024 MiB [C: 15.1% (143.5/952.7 GiB)] (x5) [Interval=5 sec] | i7-12800H 88 W / 70 W | RTX A2000 Laptop GPU 50 W 1335 / 1375 MHz 8 GB | 32 GB | 4971.8 |
| Lenovo ThinkBook 16p G3 ARH | R9 6900HX 65 W / 54 W | GeForce RTX 3060 Laptop GPU 90 W 1282 / 1500 MHz 6 GB | 32 GB | 4978 |
| MSI Stealth GS77 12UHS-083US | i7-12700H 123 W / 71 W | GeForce RTX 3080 Ti Laptop GPU 105 W 1125 / 1750 MHz 16 GB | 32 GB | 4996 |
| HP Envy 16 h0112nr | i7-12700H 115 W / 55 W | GeForce RTX 3060 Laptop GPU 95 W 1425 / 1750 MHz 6 GB | 16 GB | 5001 |
| Lenovo Legion 7 16IAX7-82TD004SGE 6.0.1 x64 1024 MiB [C: 17.5% (166.8/951.6 GiB)] (x5) [Interval=5 sec] | i9-12900HX 165 W / 136 W | GeForce RTX 3080 Ti Laptop GPU 180 W 1590 / 2000 MHz 16 GB | 32 GB | 5006.2 |
| Model | CPU | GPU | RAM | Value |
|---|---|---|---|---|
| Schenker XMG SECTOR, i9 13900K, RTX 4090 | i9-13900K 253 W / 125 W | GeForce RTX 4090 450 W 2550 / 1313 MHz 24 GB | 32 GB | 6843.8 |
| Tuxedo Pulse 14 Gen3 6.0.1 x64 1024 MiB [C: 5.1% (47.1/931.1 GiB)] (x5) [Interval=5 sec] | R7 7840HS 65 W / 45 W | Radeon 780M 2055 / 800 MHz | 32 GB | 7014 |
| Schenker XMG Ultra 17 Rocket Lake | i9-11900K 251 W / 130 W | GeForce RTX 3080 Laptop GPU 165 W 1710 / 1750 MHz 16 GB | 64 GB | 7099 |
| Model | CPU | GPU | RAM | Value |
|---|---|---|---|---|
| HP ZBook Fury 16 G9 | i9-12950HX 96 W / 71 W | RTX A5500 Laptop GPU 1260 / 1750 MHz 16 GB | 64 GB | 6210 |
| HP ZBook Studio 16 G9 62U04EA 6.0.1 x64 1024 MiB [C: 15.1% (143.5/952.7 GiB)] (x5) [Interval=5 sec] | i7-12800H 88 W / 70 W | RTX A2000 Laptop GPU 50 W 1335 / 1375 MHz 8 GB | 32 GB | 6325.9 |
| Acer Nitro 5 AN515-46-R1A1 | R7 6800H 80 W / 65 W | GeForce RTX 3070 Ti Laptop GPU 150 W 1410 / 1750 MHz 8 GB | 16 GB | 6409 |
| Lenovo ThinkBook 16p G3 ARH | R9 6900HX 65 W / 54 W | GeForce RTX 3060 Laptop GPU 90 W 1282 / 1500 MHz 6 GB | 32 GB | 6495 |
| HP ProBook 450 G10 | i7-1355U 55 W / 24 W | GeForce RTX 2050 Mobile 30 W 1155 / 1500 MHz 4 GB | 32 GB | 6505 |
| Lenovo Legion 7 16IAX7-82TD004SGE 6.0.1 x64 1024 MiB [C: 17.5% (166.8/951.6 GiB)] (x5) [Interval=5 sec] | i9-12900HX 165 W / 136 W | GeForce RTX 3080 Ti Laptop GPU 180 W 1590 / 2000 MHz 16 GB | 32 GB | 6507.6 |
| Lenovo ThinkPad X1 Extreme G5-21DE003RGE 6.0.1 x64 1024 MiB [C: 12.3% (117.4/951.6 GiB)] (x5) [Interval=5 sec] | i7-12700H 112 W / 80 W | GeForce RTX 3060 Laptop GPU 95 W 1425 / 1750 MHz 6 GB | 32 GB | 6516.7 |
| HP Envy 16 h0112nr | i7-12700H 115 W / 55 W | GeForce RTX 3060 Laptop GPU 95 W 1425 / 1750 MHz 6 GB | 16 GB | 6541 |
| Acer Predator Triton 14 AI PT14-52 6.0.1 x64 1024 MiB [C: 10.3% (97.9/952.4 GiB)] (x5) [Interval=5 sec] | Core Ultra 9 288V 37 W / 37 W | GeForce RTX 5070 Laptop 110 W 2535 / 1481 MHz 8 GB | 32 GB | 6546 |
| Acer Swift Edge SFE16-42-R1GM | R7 7735U 28 W / 20 W | Radeon 680M | 16 GB | 6558.3 |
| MSI Stealth GS77 12UHS-083US | i7-12700H 123 W / 71 W | GeForce RTX 3080 Ti Laptop GPU 105 W 1125 / 1750 MHz 16 GB | 32 GB | 6565 |
| HP Spectre x360 13.5 14t-ef000 | i7-1255U 44 W / 28 W | Iris Xe G7 96EUs 1250 / 2133 MHz | 16 GB | 6566 |
| HP ZBook Firefly 14 G9-6B8A2EA 6.0.1 x64 1024 MiB [C: 7.0% (66.4/952.7 GiB)] (x5) [Interval=5 sec] | i7-1265U 51 W / 12 W | T550 Laptop GPU 20 W 1665 / 1500 MHz 4 GB | 32 GB | 6567.5 |
| Acer Predator Triton 300 SE | i9-12900H 109 W / 69 W | GeForce RTX 3060 Laptop GPU 95 W 1282 / 1468 MHz 6 GB | 32 GB | 6573 |
| MSI Pulse GL76 12UGK | i7-12700H 110 W / 85 W | GeForce RTX 3070 Laptop GPU 105 W 1290 / 1500 MHz 8 GB | 16 GB | 6575 |
| MSI Creator Z17 A12UGST-054 6.0.0 x64 1024 MiB [C: 50.2% (468.6/933.3 GiB)] (x5) [Interval=5 sec] | i9-12900H 120 W / 65 W | GeForce RTX 3070 Ti Laptop GPU 90 W 8 GB | 32 GB | 6578.6 |
| Asus ROG Zephyrus M16 GU603Z 6.0.0 x64 1024 MiB [C: 42.8% (398.6/930.6 GiB)] (x5) [Interval=5 sec] | i9-12900H 90 W / 90 W | GeForce RTX 3070 Ti Laptop GPU 120 W | 32 GB | 6585 |
| Model | CPU | GPU | RAM | Value |
|---|---|---|---|---|
| Schenker XMG SECTOR, i9 13900K, RTX 4090 | i9-13900K 253 W / 125 W | GeForce RTX 4090 450 W 2550 / 1313 MHz 24 GB | 32 GB | 2876.7 |
| Tuxedo Pulse 14 Gen3 6.0.1 x64 1024 MiB [C: 5.1% (47.1/931.1 GiB)] (x5) [Interval=5 sec] | R7 7840HS 65 W / 45 W | Radeon 780M 2055 / 800 MHz | 32 GB | 3003 |
| Model | CPU | GPU | RAM | Value |
|---|---|---|---|---|
| HP ZBook Firefly 14 G9-6B8A2EA 6.0.1 x64 1024 MiB [C: 7.0% (66.4/952.7 GiB)] (x5) [Interval=5 sec] | i7-1265U 51 W / 12 W | T550 Laptop GPU 20 W 1665 / 1500 MHz 4 GB | 32 GB | 283.81 |
| Lenovo ThinkPad X1 Extreme G5-21DE003RGE 6.0.1 x64 1024 MiB [C: 12.3% (117.4/951.6 GiB)] (x5) [Interval=5 sec] | i7-12700H 112 W / 80 W | GeForce RTX 3060 Laptop GPU 95 W 1425 / 1750 MHz 6 GB | 32 GB | 396.23 |
| Acer Predator Triton 14 AI PT14-52 6.0.1 x64 1024 MiB [C: 10.3% (97.9/952.4 GiB)] (x5) [Interval=5 sec] | Core Ultra 9 288V 37 W / 37 W | GeForce RTX 5070 Laptop 110 W 2535 / 1481 MHz 8 GB | 32 GB | 405 |
| HP ZBook Studio 16 G9 62U04EA 6.0.1 x64 1024 MiB [C: 15.1% (143.5/952.7 GiB)] (x5) [Interval=5 sec] | i7-12800H 88 W / 70 W | RTX A2000 Laptop GPU 50 W 1335 / 1375 MHz 8 GB | 32 GB | 438.39 |
| Acer Swift Edge SFE16-42-R1GM | R7 7735U 28 W / 20 W | Radeon 680M | 16 GB | 1550.4 |
| Asus ROG Zephyrus M16 GU603Z 6.0.0 x64 1024 MiB [C: 42.8% (398.6/930.6 GiB)] (x5) [Interval=5 sec] | i9-12900H 90 W / 90 W | GeForce RTX 3070 Ti Laptop GPU 120 W | 32 GB | 2360 |
| MSI Creator Z17 A12UGST-054 6.0.0 x64 1024 MiB [C: 50.2% (468.6/933.3 GiB)] (x5) [Interval=5 sec] | i9-12900H 120 W / 65 W | GeForce RTX 3070 Ti Laptop GPU 90 W 8 GB | 32 GB | 2760.8 |
| Lenovo Legion 7 16IAX7-82TD004SGE 6.0.1 x64 1024 MiB [C: 17.5% (166.8/951.6 GiB)] (x5) [Interval=5 sec] | i9-12900HX 165 W / 136 W | GeForce RTX 3080 Ti Laptop GPU 180 W 1590 / 2000 MHz 16 GB | 32 GB | 2964.54 |
| Model | CPU | GPU | RAM | Value |
|---|---|---|---|---|
| Schenker XMG SECTOR, i9 13900K, RTX 4090 | i9-13900K 253 W / 125 W | GeForce RTX 4090 450 W 2550 / 1313 MHz 24 GB | 32 GB | 2384.6 |
| Tuxedo Pulse 14 Gen3 6.0.1 x64 1024 MiB [C: 5.1% (47.1/931.1 GiB)] (x5) [Interval=5 sec] | R7 7840HS 65 W / 45 W | Radeon 780M 2055 / 800 MHz | 32 GB | 2912 |
| Model | CPU | GPU | RAM | Value |
|---|---|---|---|---|
| HP ZBook Firefly 14 G9-6B8A2EA 6.0.1 x64 1024 MiB [C: 7.0% (66.4/952.7 GiB)] (x5) [Interval=5 sec] | i7-1265U 51 W / 12 W | T550 Laptop GPU 20 W 1665 / 1500 MHz 4 GB | 32 GB | 509.54 |
| Acer Predator Triton 14 AI PT14-52 6.0.1 x64 1024 MiB [C: 10.3% (97.9/952.4 GiB)] (x5) [Interval=5 sec] | Core Ultra 9 288V 37 W / 37 W | GeForce RTX 5070 Laptop 110 W 2535 / 1481 MHz 8 GB | 32 GB | 683 |
| Lenovo ThinkPad X1 Extreme G5-21DE003RGE 6.0.1 x64 1024 MiB [C: 12.3% (117.4/951.6 GiB)] (x5) [Interval=5 sec] | i7-12700H 112 W / 80 W | GeForce RTX 3060 Laptop GPU 95 W 1425 / 1750 MHz 6 GB | 32 GB | 952.7 |
| HP ZBook Studio 16 G9 62U04EA 6.0.1 x64 1024 MiB [C: 15.1% (143.5/952.7 GiB)] (x5) [Interval=5 sec] | i7-12800H 88 W / 70 W | RTX A2000 Laptop GPU 50 W 1335 / 1375 MHz 8 GB | 32 GB | 1019.37 |
| Acer Swift Edge SFE16-42-R1GM | R7 7735U 28 W / 20 W | Radeon 680M | 16 GB | 1752.2 |
| Asus ROG Zephyrus M16 GU603Z 6.0.0 x64 1024 MiB [C: 42.8% (398.6/930.6 GiB)] (x5) [Interval=5 sec] | i9-12900H 90 W / 90 W | GeForce RTX 3070 Ti Laptop GPU 120 W | 32 GB | 2313 |
| MSI Creator Z17 A12UGST-054 6.0.0 x64 1024 MiB [C: 50.2% (468.6/933.3 GiB)] (x5) [Interval=5 sec] | i9-12900H 120 W / 65 W | GeForce RTX 3070 Ti Laptop GPU 90 W 8 GB | 32 GB | 2394.41 |
| Lenovo Legion 7 16IAX7-82TD004SGE 6.0.1 x64 1024 MiB [C: 17.5% (166.8/951.6 GiB)] (x5) [Interval=5 sec] | i9-12900HX 165 W / 136 W | GeForce RTX 3080 Ti Laptop GPU 180 W 1590 / 2000 MHz 16 GB | 32 GB | 2430.87 |
| Model | CPU | GPU | RAM | Value |
|---|---|---|---|---|
| Schenker XMG Ultra 17 Rocket Lake | i9-11900K 251 W / 130 W | GeForce RTX 3080 Laptop GPU 165 W 1710 / 1750 MHz 16 GB | 64 GB | 195 |
| Tuxedo Pulse 14 Gen3 diskspd 2.0.17 f | R7 7840HS 65 W / 45 W | Radeon 780M 2055 / 800 MHz | 32 GB | 205 |
| Schenker XMG SECTOR, i9 13900K, RTX 4090 | i9-13900K 253 W / 125 W | GeForce RTX 4090 450 W 2550 / 1313 MHz 24 GB | 32 GB | 271 |
| Model | CPU | GPU | RAM | Value |
|---|---|---|---|---|
| Schenker XMG Ultra 17 Rocket Lake | i9-11900K 251 W / 130 W | GeForce RTX 3080 Laptop GPU 165 W 1710 / 1750 MHz 16 GB | 64 GB | 58.5 |
| Tuxedo Pulse 14 Gen3 diskspd 2.0.17 f | R7 7840HS 65 W / 45 W | Radeon 780M 2055 / 800 MHz | 32 GB | 82.2 |
| Schenker XMG SECTOR, i9 13900K, RTX 4090 | i9-13900K 253 W / 125 W | GeForce RTX 4090 450 W 2550 / 1313 MHz 24 GB | 32 GB | 91.9 |
| Model | CPU | GPU | RAM | Value |
|---|---|---|---|---|
| Tuxedo Pulse 14 Gen3 diskspd 2.0.17 f | R7 7840HS 65 W / 45 W | Radeon 780M 2055 / 800 MHz | 32 GB | 4189 |
| Schenker XMG SECTOR, i9 13900K, RTX 4090 | i9-13900K 253 W / 125 W | GeForce RTX 4090 450 W 2550 / 1313 MHz 24 GB | 32 GB | 4245 |
| Schenker XMG Ultra 17 Rocket Lake | i9-11900K 251 W / 130 W | GeForce RTX 3080 Laptop GPU 165 W 1710 / 1750 MHz 16 GB | 64 GB | 4249 |
| Model | CPU | GPU | RAM | Value |
|---|---|---|---|---|
| Schenker XMG Ultra 17 Rocket Lake | i9-11900K 251 W / 130 W | GeForce RTX 3080 Laptop GPU 165 W 1710 / 1750 MHz 16 GB | 64 GB | 4079 |
| Tuxedo Pulse 14 Gen3 diskspd 2.0.17 f | R7 7840HS 65 W / 45 W | Radeon 780M 2055 / 800 MHz | 32 GB | 4286 |
| Schenker XMG SECTOR, i9 13900K, RTX 4090 | i9-13900K 253 W / 125 W | GeForce RTX 4090 450 W 2550 / 1313 MHz 24 GB | 32 GB | 4319 |
| Model | CPU | GPU | RAM | Value |
|---|---|---|---|---|
| Schenker XMG Ultra 17 Rocket Lake | i9-11900K 251 W / 130 W | GeForce RTX 3080 Laptop GPU 165 W 1710 / 1750 MHz 16 GB | 64 GB | 3385 |
| Tuxedo Pulse 14 Gen3 diskspd 2.0.17 f | R7 7840HS 65 W / 45 W | Radeon 780M 2055 / 800 MHz | 32 GB | 4317 |
| Schenker XMG SECTOR, i9 13900K, RTX 4090 | i9-13900K 253 W / 125 W | GeForce RTX 4090 450 W 2550 / 1313 MHz 24 GB | 32 GB | 4415 |
| Model | CPU | GPU | RAM | Value |
|---|---|---|---|---|
| Schenker XMG Ultra 17 Rocket Lake | i9-11900K 251 W / 130 W | GeForce RTX 3080 Laptop GPU 165 W 1710 / 1750 MHz 16 GB | 64 GB | 3339 |
| Tuxedo Pulse 14 Gen3 diskspd 2.0.17 f | R7 7840HS 65 W / 45 W | Radeon 780M 2055 / 800 MHz | 32 GB | 4057 |
| Schenker XMG SECTOR, i9 13900K, RTX 4090 | i9-13900K 253 W / 125 W | GeForce RTX 4090 450 W 2550 / 1313 MHz 24 GB | 32 GB | 4240 |
| Model | CPU | GPU | RAM | Value |
|---|---|---|---|---|
| Schenker XMG Ultra 17 Rocket Lake | i9-11900K 251 W / 130 W | GeForce RTX 3080 Laptop GPU 165 W 1710 / 1750 MHz 16 GB | 64 GB | 4847 |
| Tuxedo Pulse 14 Gen3 diskspd 2.0.17 f | R7 7840HS 65 W / 45 W | Radeon 780M 2055 / 800 MHz | 32 GB | 4955 |
| Schenker XMG SECTOR, i9 13900K, RTX 4090 | i9-13900K 253 W / 125 W | GeForce RTX 4090 450 W 2550 / 1313 MHz 24 GB | 32 GB | 5013 |
| Model | CPU | GPU | RAM | Value |
|---|---|---|---|---|
| Schenker XMG Ultra 17 Rocket Lake | i9-11900K 251 W / 130 W | GeForce RTX 3080 Laptop GPU 165 W 1710 / 1750 MHz 16 GB | 64 GB | 6149 |
| Tuxedo Pulse 14 Gen3 diskspd 2.0.17 f | R7 7840HS 65 W / 45 W | Radeon 780M 2055 / 800 MHz | 32 GB | 6844 |
| Schenker XMG SECTOR, i9 13900K, RTX 4090 | i9-13900K 253 W / 125 W | GeForce RTX 4090 450 W 2550 / 1313 MHz 24 GB | 32 GB | 6887 |
| Model | CPU | GPU | RAM | Value |
|---|---|---|---|---|
| Schenker XMG Ultra 17 Rocket Lake | i9-11900K 251 W / 130 W | GeForce RTX 3080 Laptop GPU 165 W 1710 / 1750 MHz 16 GB | 64 GB | 5752 |
| Tuxedo Pulse 14 Gen3 diskspd 2.0.17 f | R7 7840HS 65 W / 45 W | Radeon 780M 2055 / 800 MHz | 32 GB | 6835 |
| Schenker XMG SECTOR, i9 13900K, RTX 4090 | i9-13900K 253 W / 125 W | GeForce RTX 4090 450 W 2550 / 1313 MHz 24 GB | 32 GB | 6854 |
 - Average benchmark values for this graphics card
* Smaller numbers mean a higher performance
Average Benchmarks
Samsung SSD 980 Pro 2TB MZ-V8P2T0 → 100% n=41
Micron 3400 1TB MTFDKBA1T0TFH → 79% n=41

- $299.99Samsung 980 PRO SSD 2TB PCIe NVMe Gen 4 Gaming M.2 Internal Solid State Drive Memory Card, Maximum Speed, Thermal Control MZ-V8P2T0B/AM
- $319.99Samsung 980 PRO SSD with Heatsink 2TB PCIe Gen 4 NVMe M.2 Internal Solid State Drive, Heat Control, Max Speed, PS5 Compatible (MZ-V8P2T0CW)
- $319.99Samsung 980 PRO SSD with Heatsink 2TB PCIe Gen 4 NVMe M.2 Internal Solid State Hard Drive, Heat Control, Max Speed, PS5 Compatible, MZ-V8P2T0CW, Black
- $399.99SAMSUNG Samsung 990 PRO 2TB, 3-bit TLC V-NAND, M.2 (2280), NVMe 2.0, R/W(Max) 7,450MB/s/6,900MB/s, 1,400K/1,550K IOPS, 1200TBW, 5 Years Warranty
- $1,795.95Samsung MZ-V9P4T0B/AM 990 PRO PCIe 4.0 NVMe M.2 SSD 4TB 2 Pack
#0 ran 0s before starting gpusingle class +0s ... 0s
#1 checking url part for id 3651 +0s ... 0s
#2 checking url part for id 3830 +0s ... 0s
#3 redirected to Ajax server, took 1779729163s time from redirect:0 +0s ... 0s
#4 did not recreate cache, as it is less than 5 days old! Created at Fri, 22 May 2026 22:44:23 +0200 +0s ... 0s
#5 composed specs +0.002s ... 0.002s
#6 did output specs +0s ... 0.002s
#7 getting avg benchmarks for device 3651 +0.003s ... 0.005s
#8 got single benchmarks 3651 +0.004s ... 0.009s
#9 getting avg benchmarks for device 3830 +0.003s ... 0.012s
#10 got single benchmarks 3830 +0.026s ... 0.038s
#11 got avg benchmarks for devices +0s ... 0.038s
#12 min, max, avg, median took s +0.114s ... 0.152s
#13 return log +0.679s ... 0.831s
 Add as a preferred source on Google


