

MSI Katana 17 B13V laptop review: Nvidia GeForce RTX 4060 makes its debut

5499 dollars. That is how much potential buyers have to shell out for the MSI Titan GT77. On the one hand, you get the ultimate in power but not many people will be willing to spend that much on a laptop. With a few cut corners, the MSI Katana 17 B13VFK shows that cheaper can work too: With a Raptor Lake CPU and Nvidia GeForce RTX 4060, this gaming laptop (currently unavailable on Amazon and Best Buy) can be had in Germany for around 1999 euros. Still a lot of money but around two-thirds cheaper. In our extensive review, we reveal whether or not performance also takes a similar hit.
Possible competitors compared
Rating | Date | Model | Weight | Height | Size | Resolution | Price |
|---|---|---|---|---|---|---|---|
| 82.1 % v7 (old) | 02 / 2023 | MSI Katana 17 B13VFK i7-13620H, GeForce RTX 4060 Laptop GPU | 2.8 kg | 25.2 mm | 17.30" | 1920x1080 | |
| 89 % v7 (old) | 02 / 2023 | MSI Titan GT77 HX 13VI i9-13950HX, GeForce RTX 4090 Laptop GPU | 3.5 kg | 23 mm | 17.30" | 3840x2160 | |
| 83.2 % v7 (old) | 01 / 2023 | MSI Pulse GL76 12UGK i7-12700H, GeForce RTX 3070 Laptop GPU | 2.6 kg | 24.2 mm | 17.30" | 1920x1080 | |
| 83.3 % v7 (old) | 01 / 2023 | Gigabyte G7 KE i5-12500H, GeForce RTX 3060 Laptop GPU | 2.6 kg | 25 mm | 17.30" | 1920x1080 | |
| 86.9 % v7 (old) | 11 / 2022 | Asus ROG Strix Scar 17 SE G733CX-LL014W i9-12950HX, GeForce RTX 3080 Ti Laptop GPU | 2.9 kg | 28.3 mm | 17.30" | 2560x1440 | |
| 86.5 % v7 (old) | 11 / 2022 | Acer Predator Helios 300 (i7-12700H, RTX 3070 Ti) i7-12700H, GeForce RTX 3070 Ti Laptop GPU | 3 kg | 27.65 mm | 17.30" | 2560x1440 |
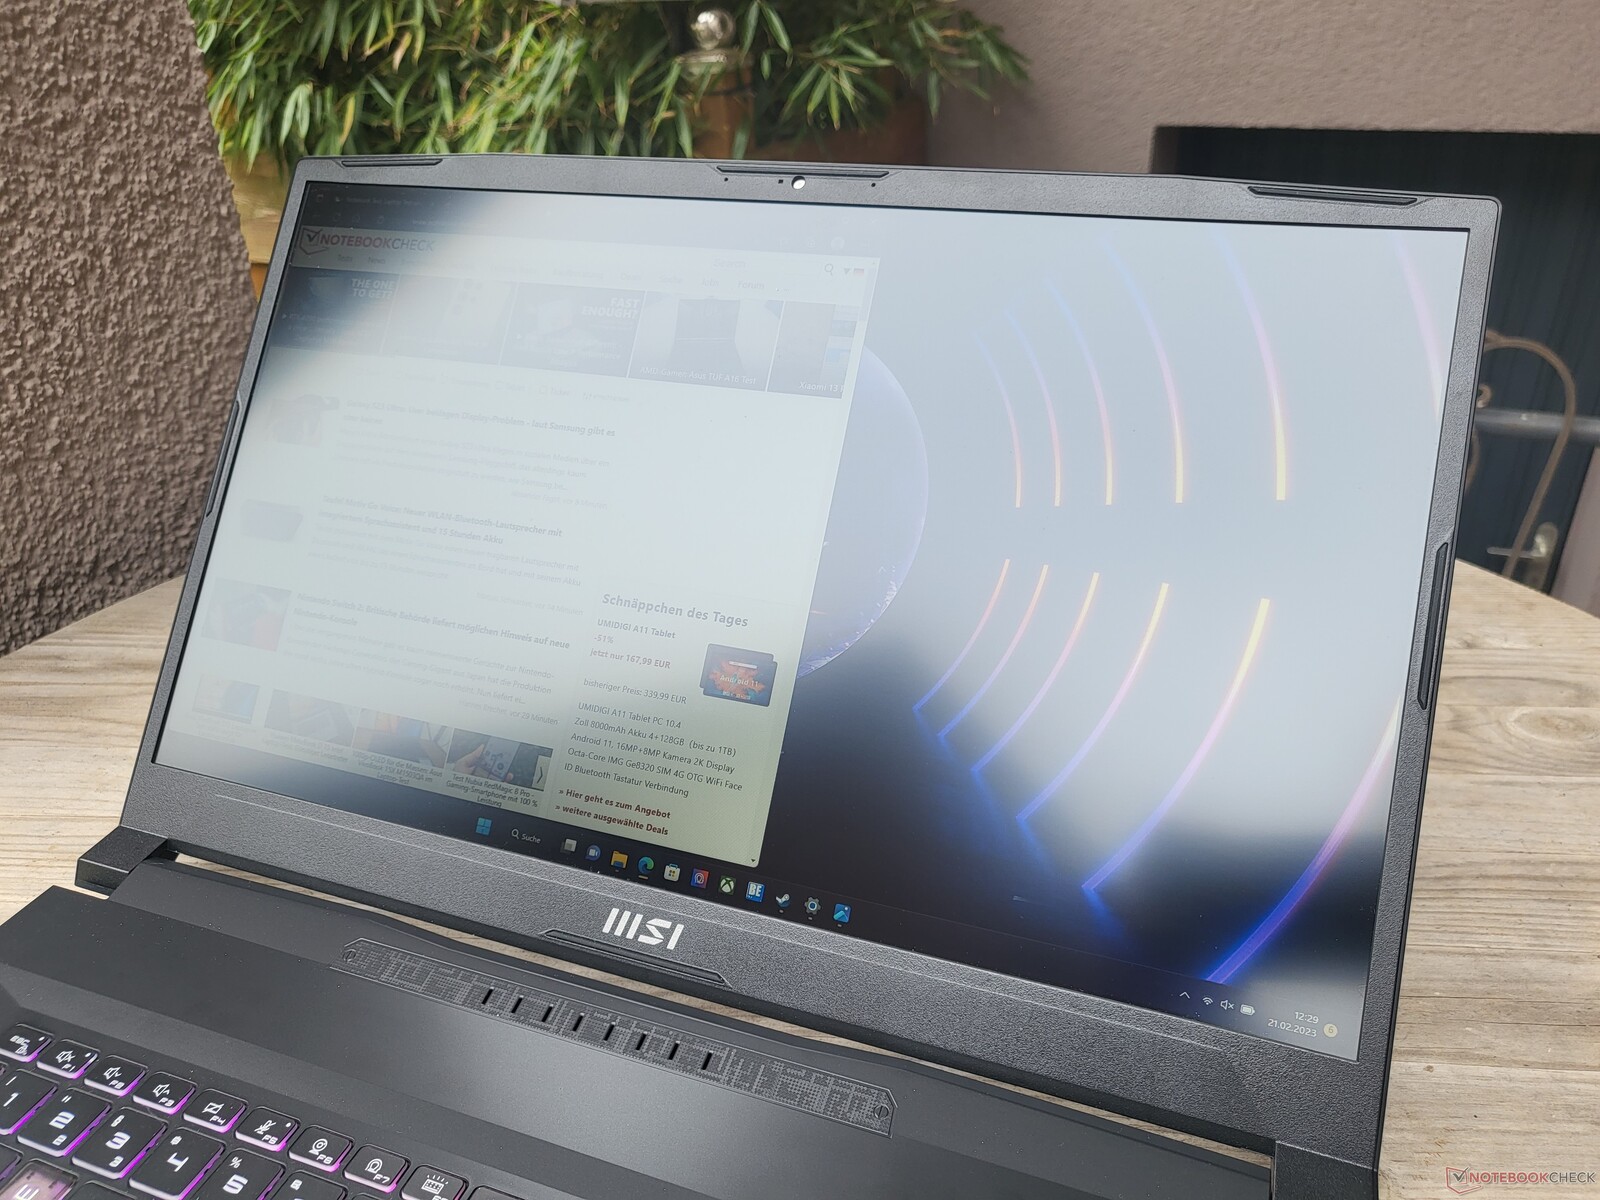
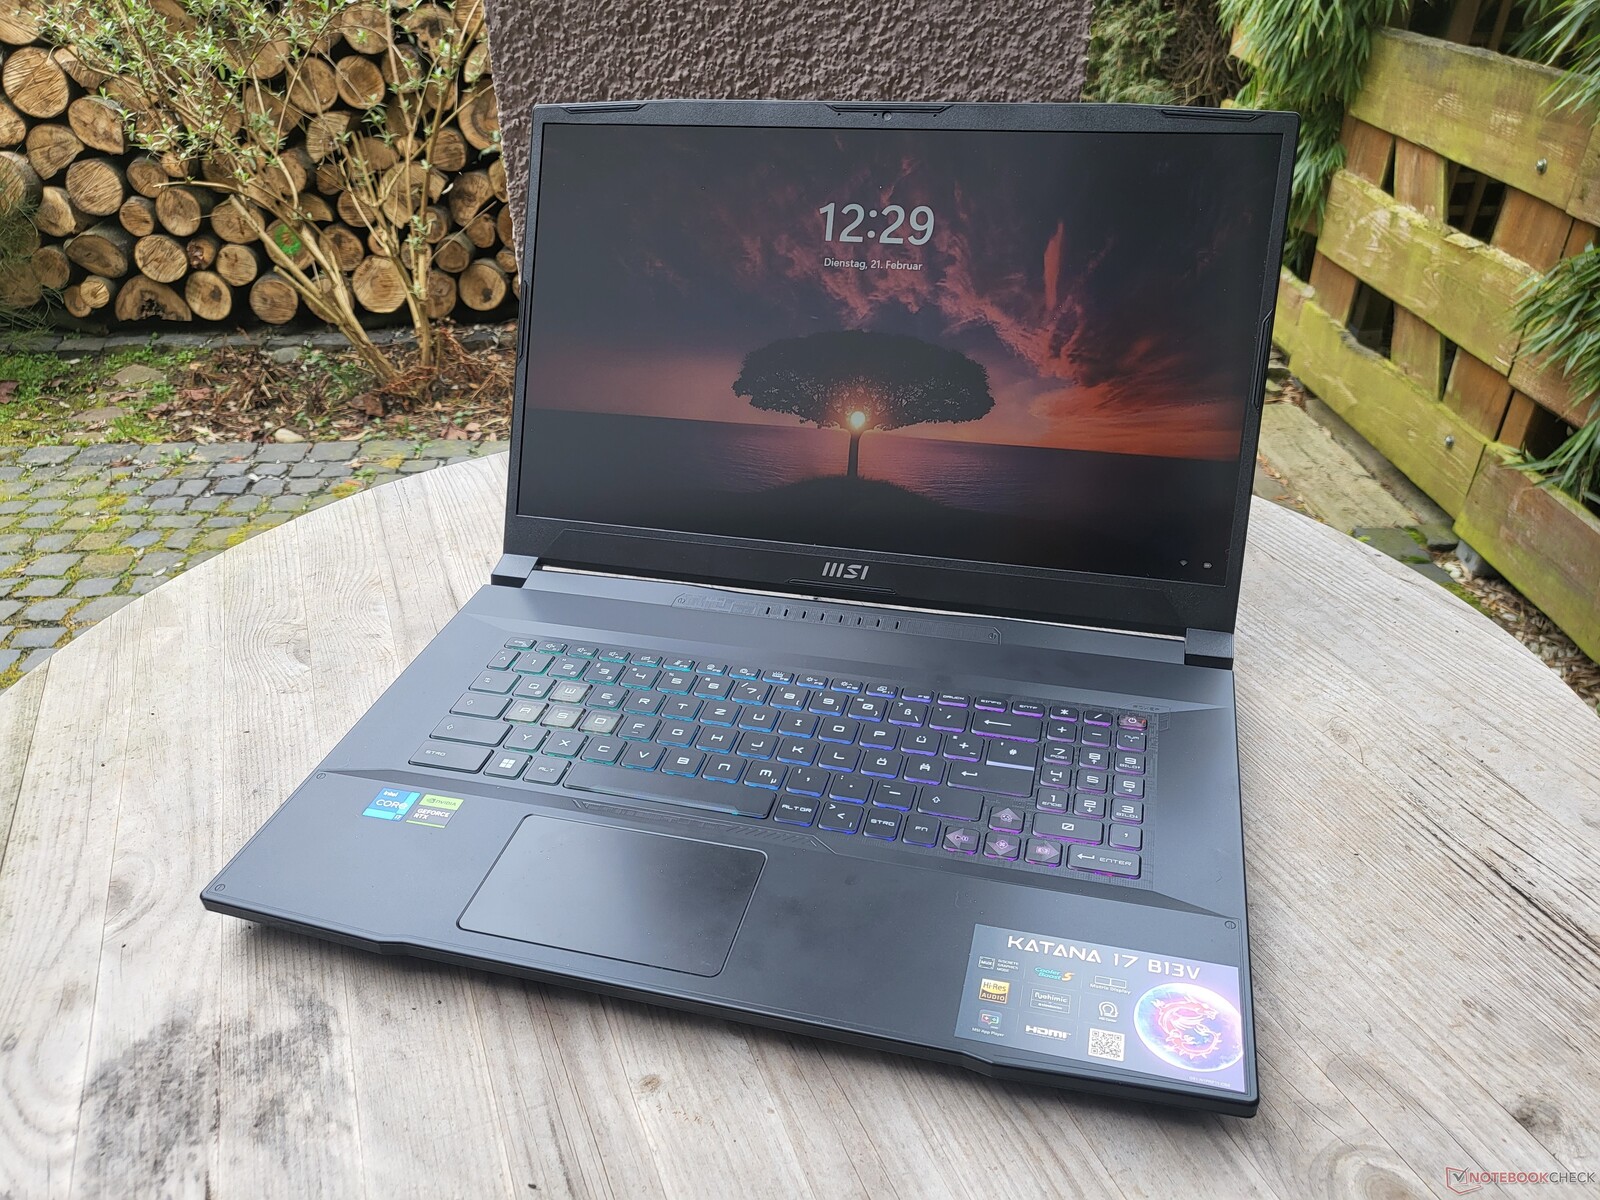
Case: A matte gray MSI rocket
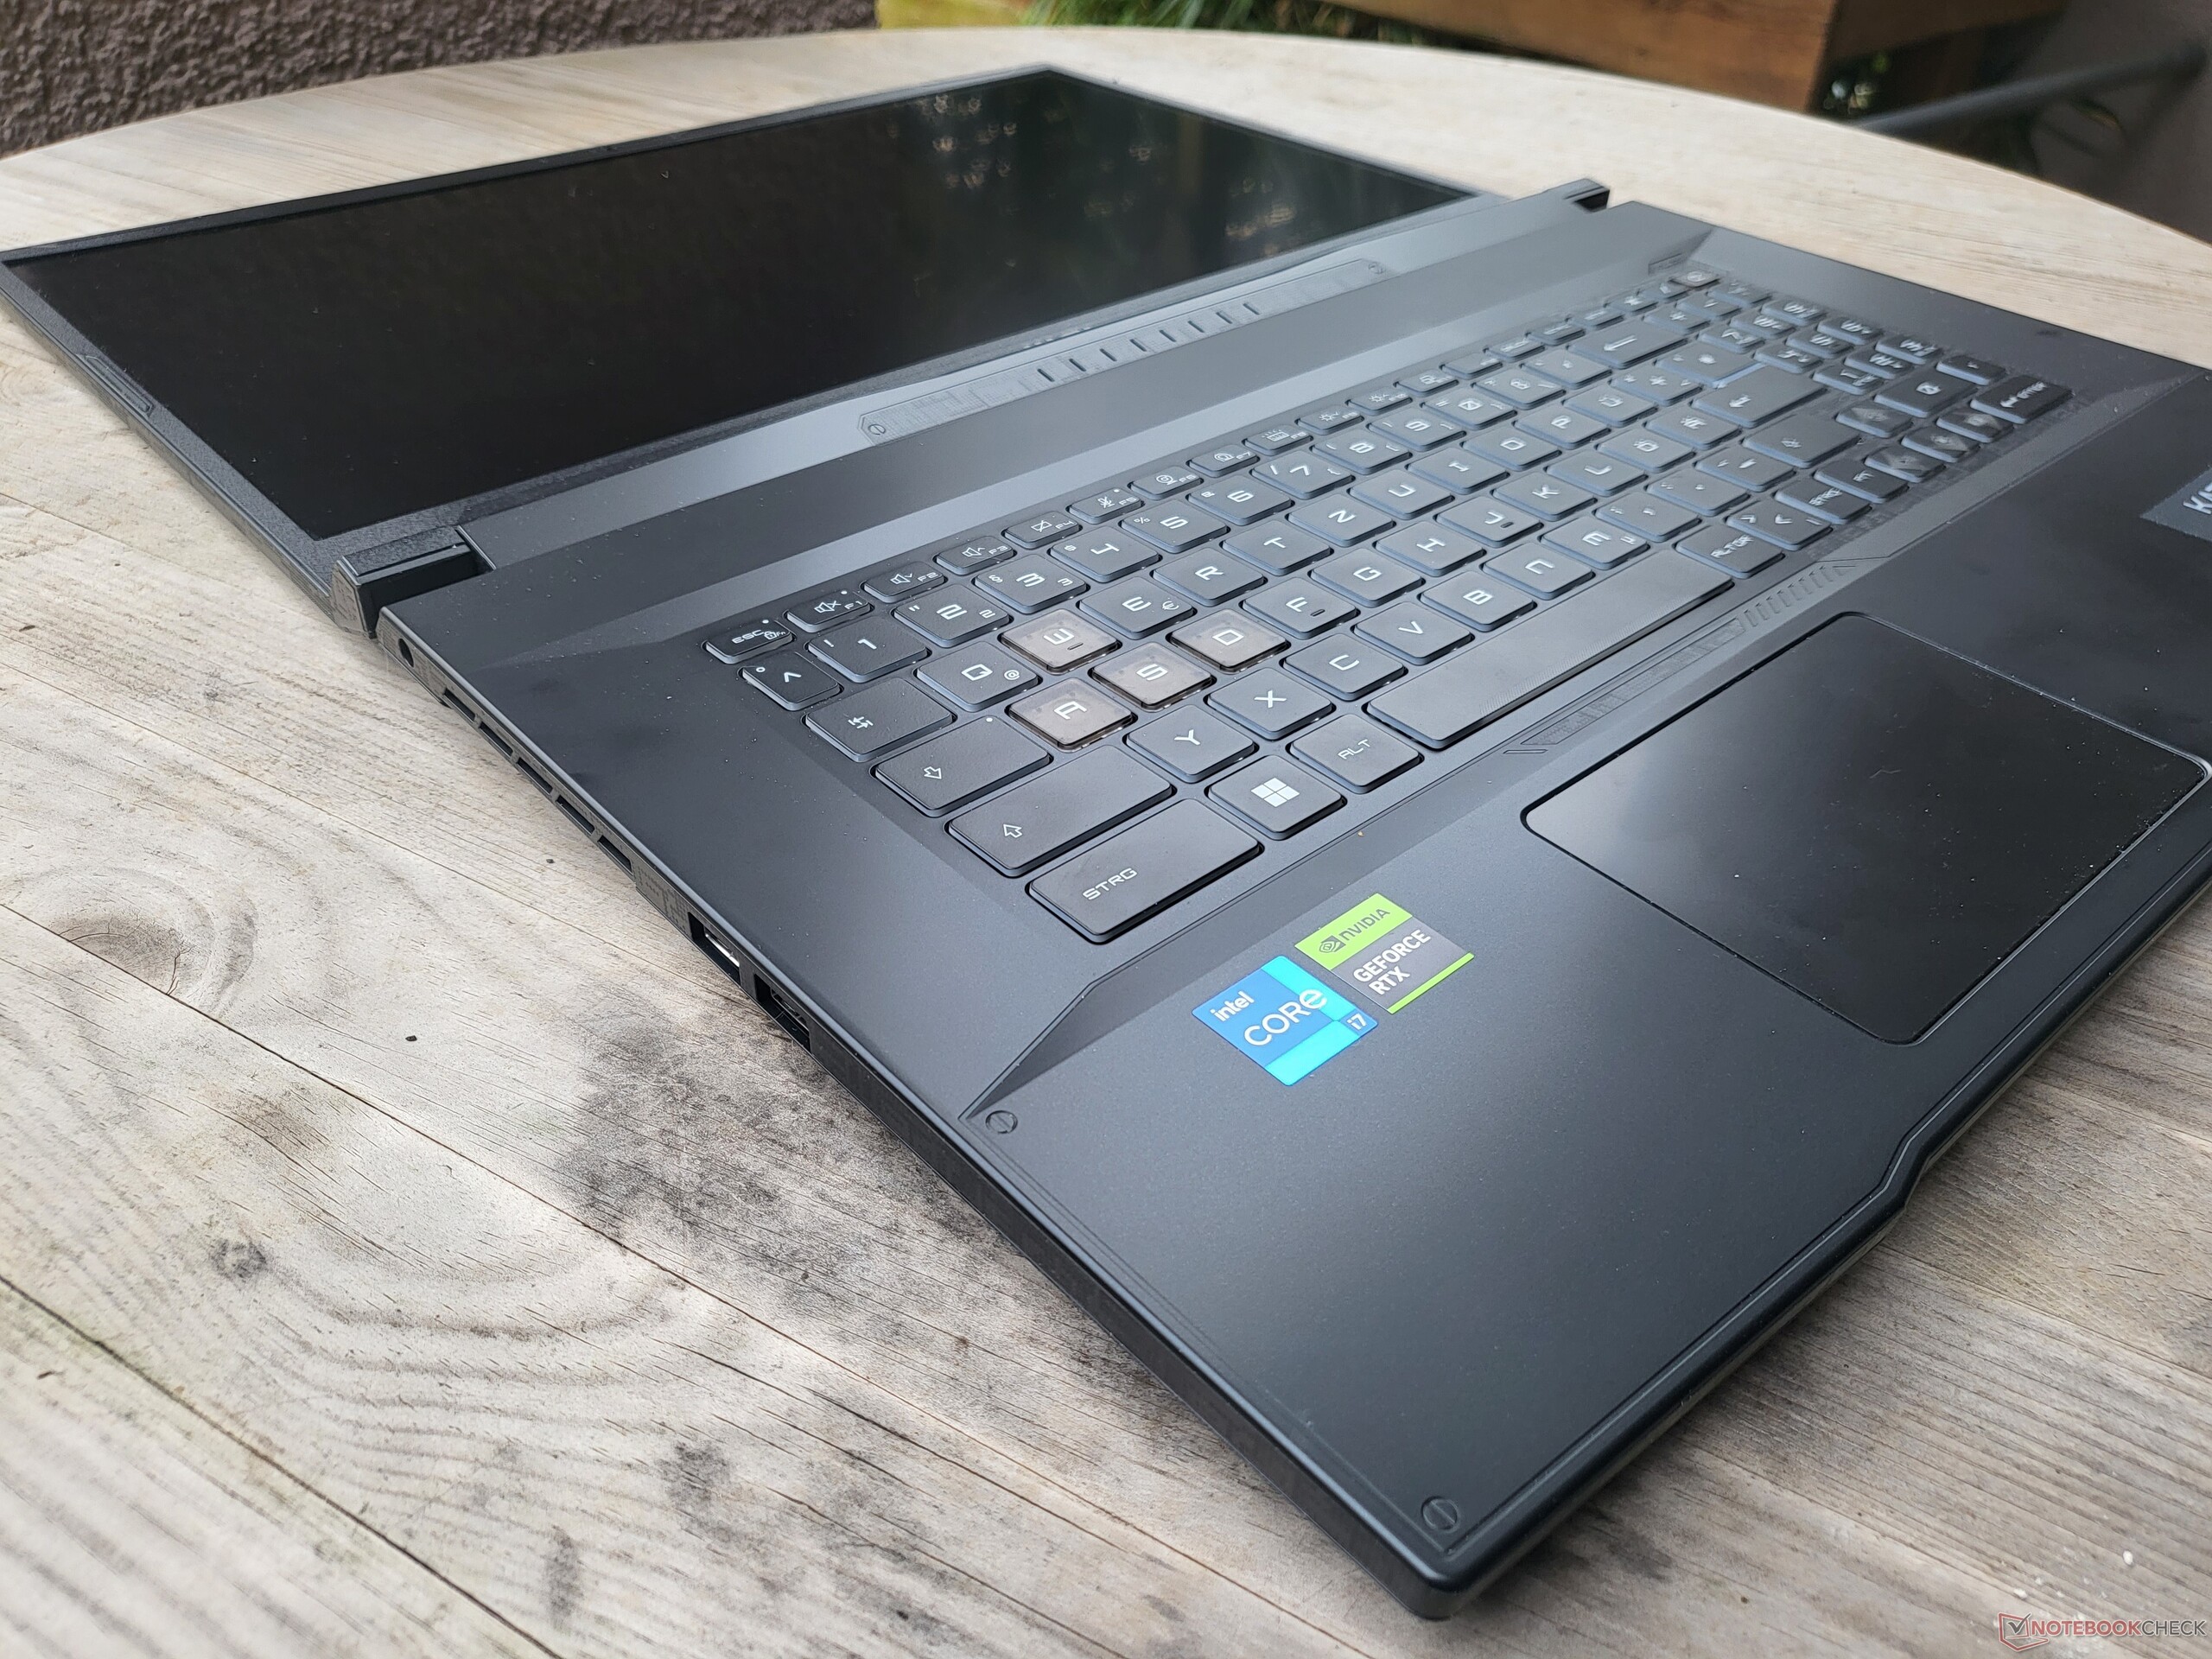
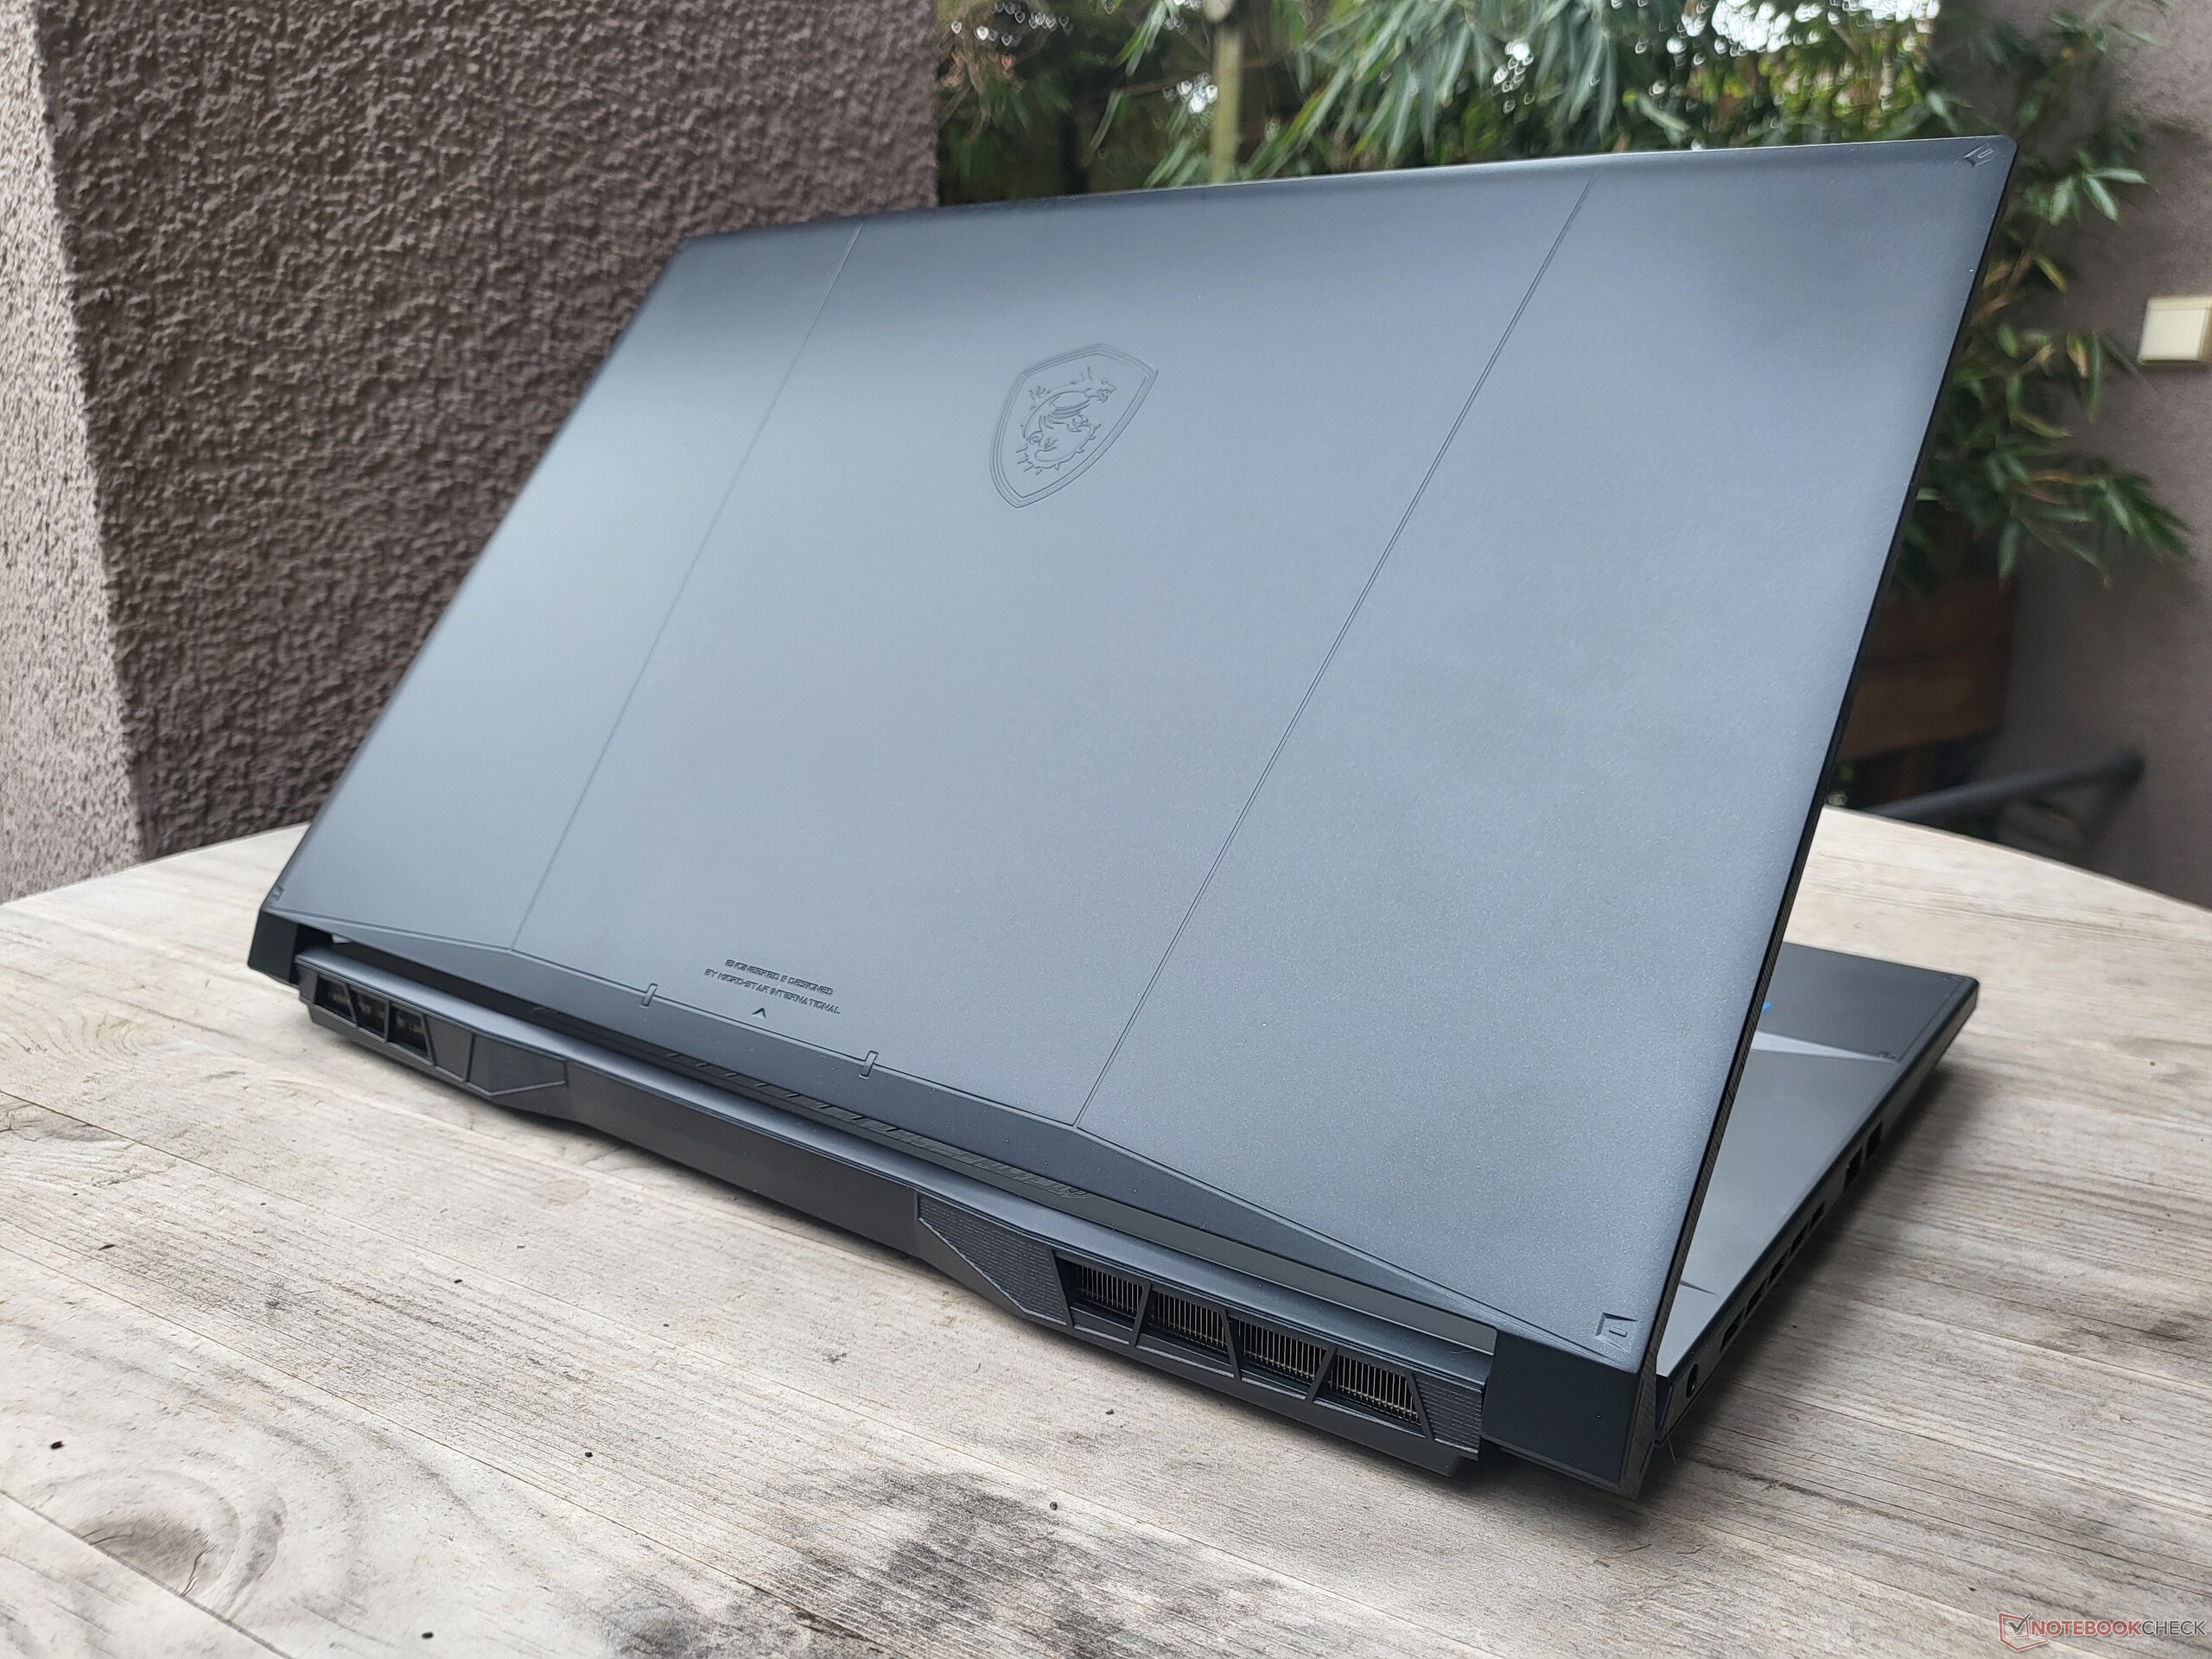
MSI has given the Katana 17 a typical gaming look. The design language can hardly be described as plain but that's something that doesn't apply to the laptop's color: The MSI is dark gray throughout. Although, that's only the case when the device is switched off. With the colourful, backlit keyboard activated, in terms of color, the MSI also looks like a gaming laptop.
Externally, at least, the laptop is made of plastic. The palm rest and lid feel smooth to the touch whereas the base of the unit is somewhat rougher. It's not necessarily the highest quality but it serves its purpose nevertheless. When light pressure is applied, the palm rest is firm but with additional pressure, it flexes a little in the middle. The display lid can be twisted slightly, unlike the base which cannot be twisted at all. For a laptop that should spend most of its time on a desk, this ought to be no problem.
The large hinges allow the device to be opened to an angle of 180 degrees and the display lid can be opened with one hand.
Weight-wise, the MSI Katana 17 sits in the middle of the pack when compared to its peers. In return, it boasts relatively compact dimensions.
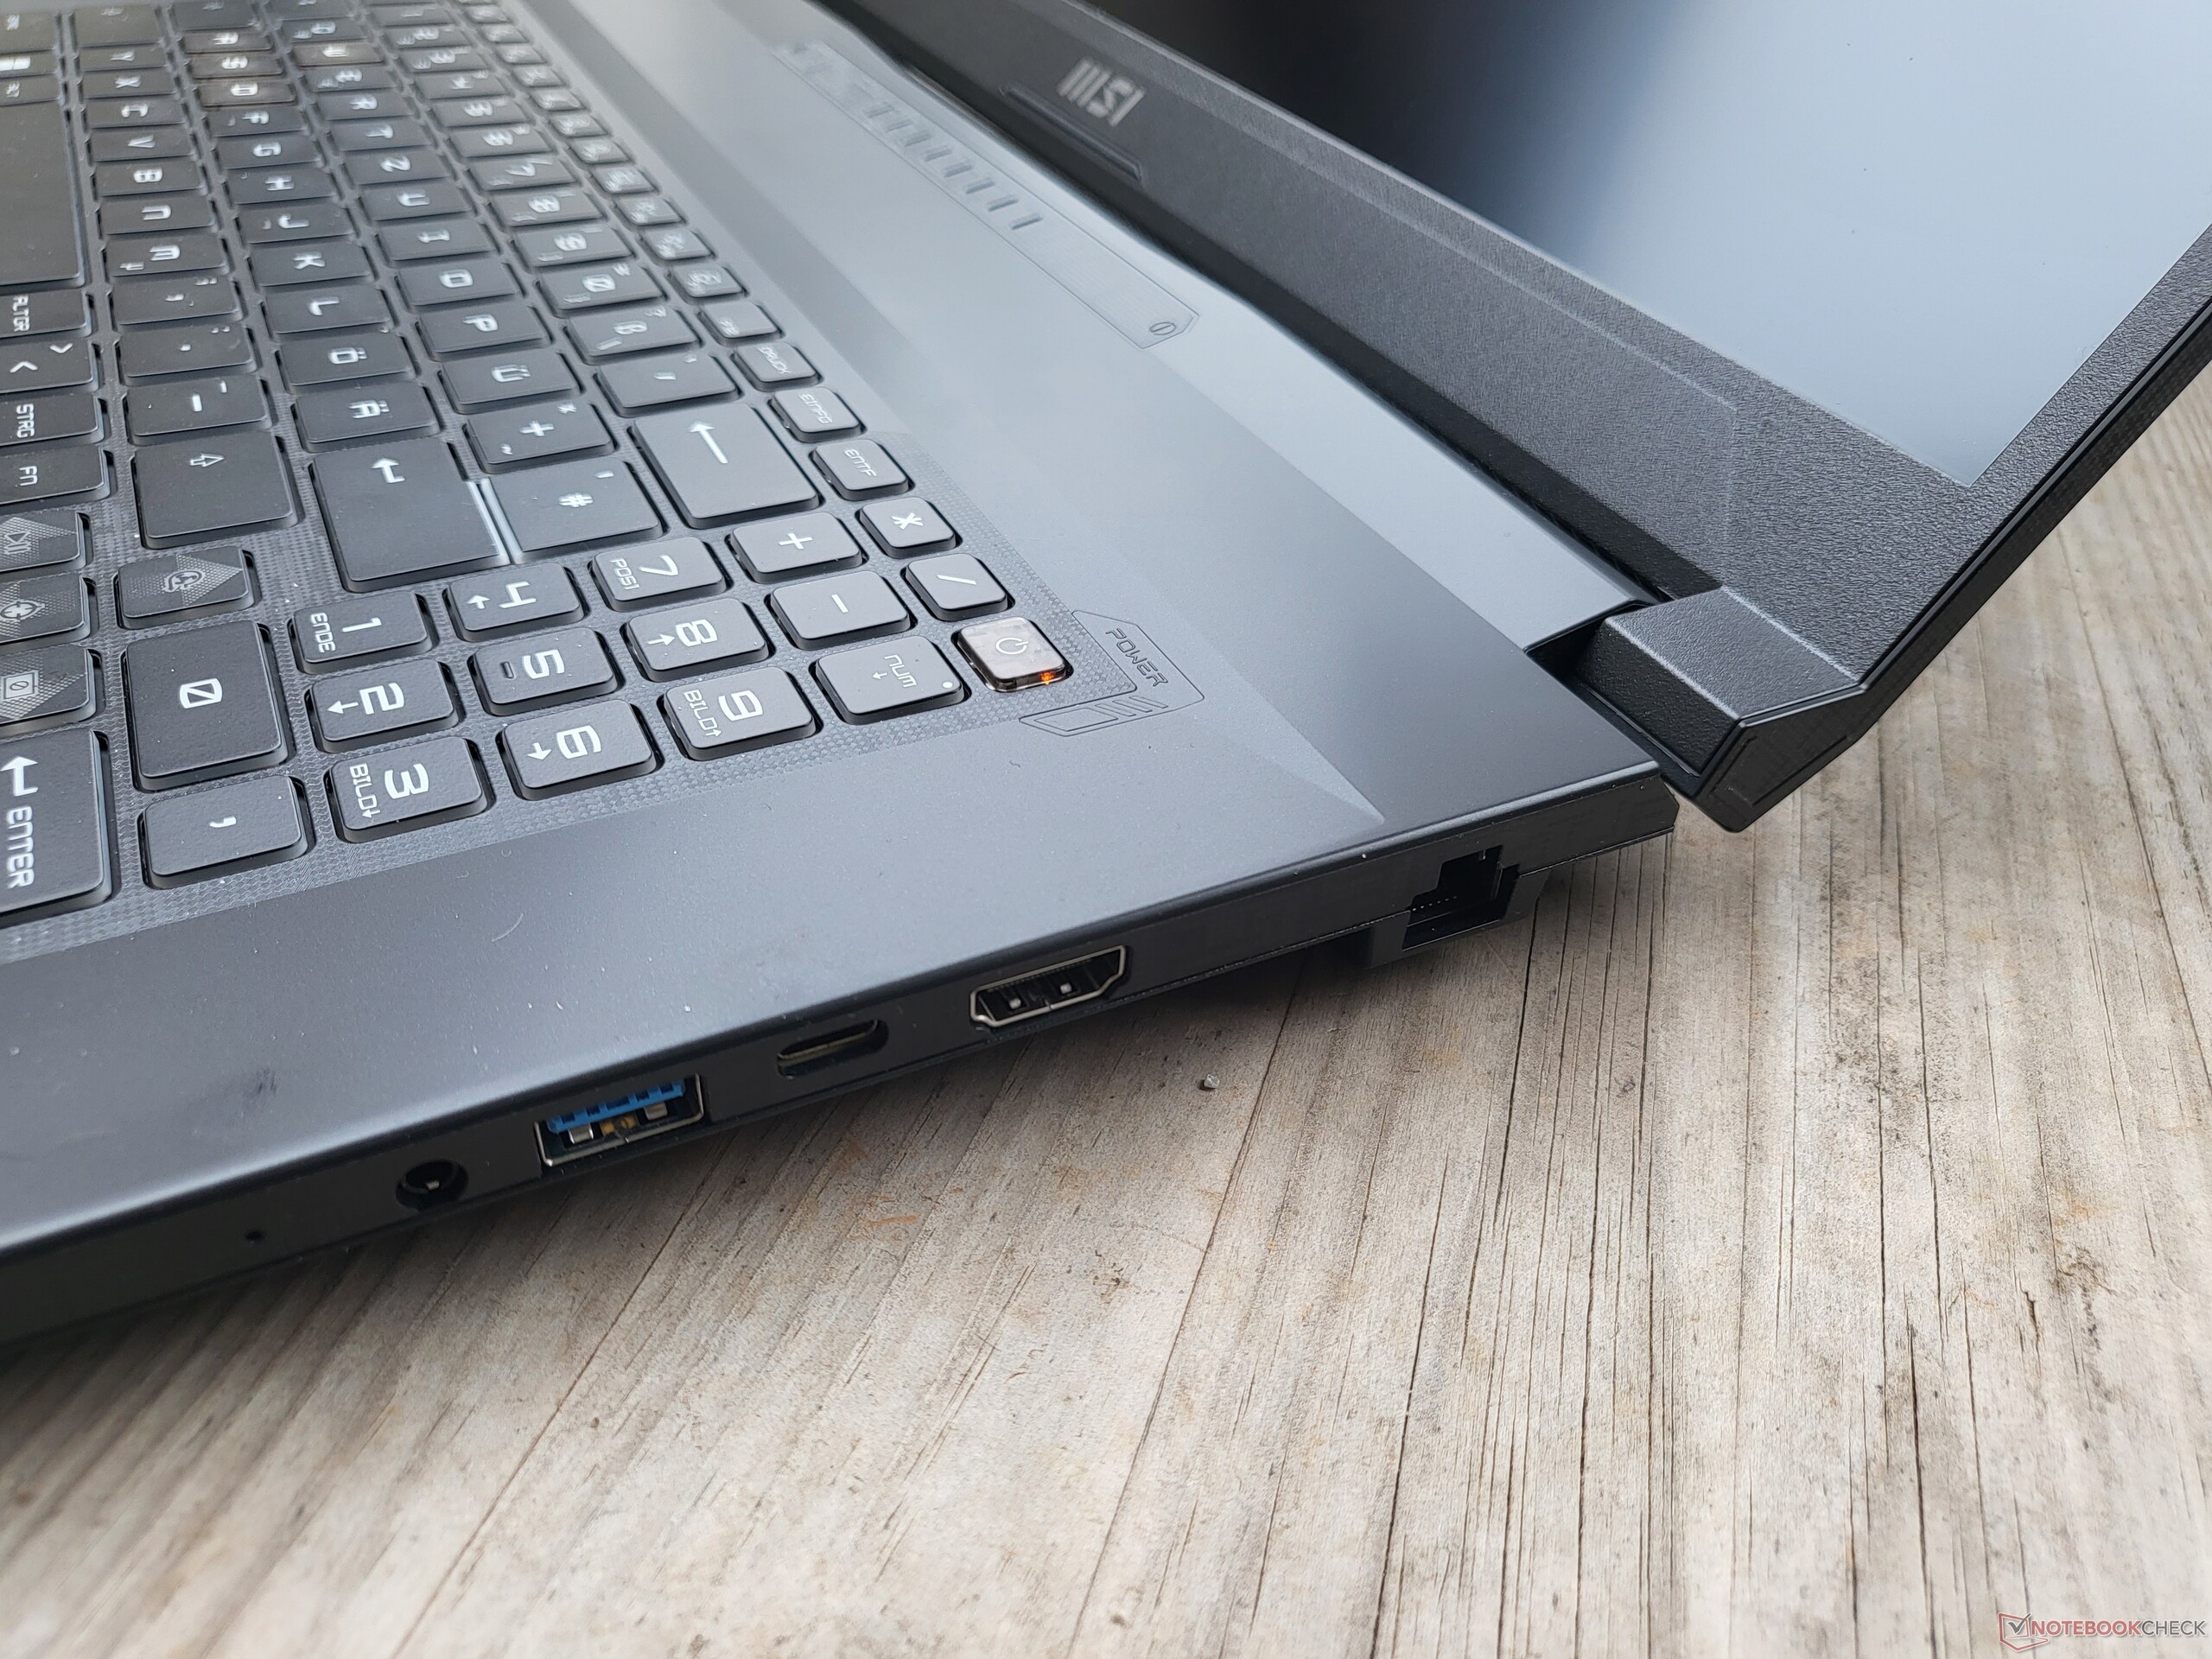
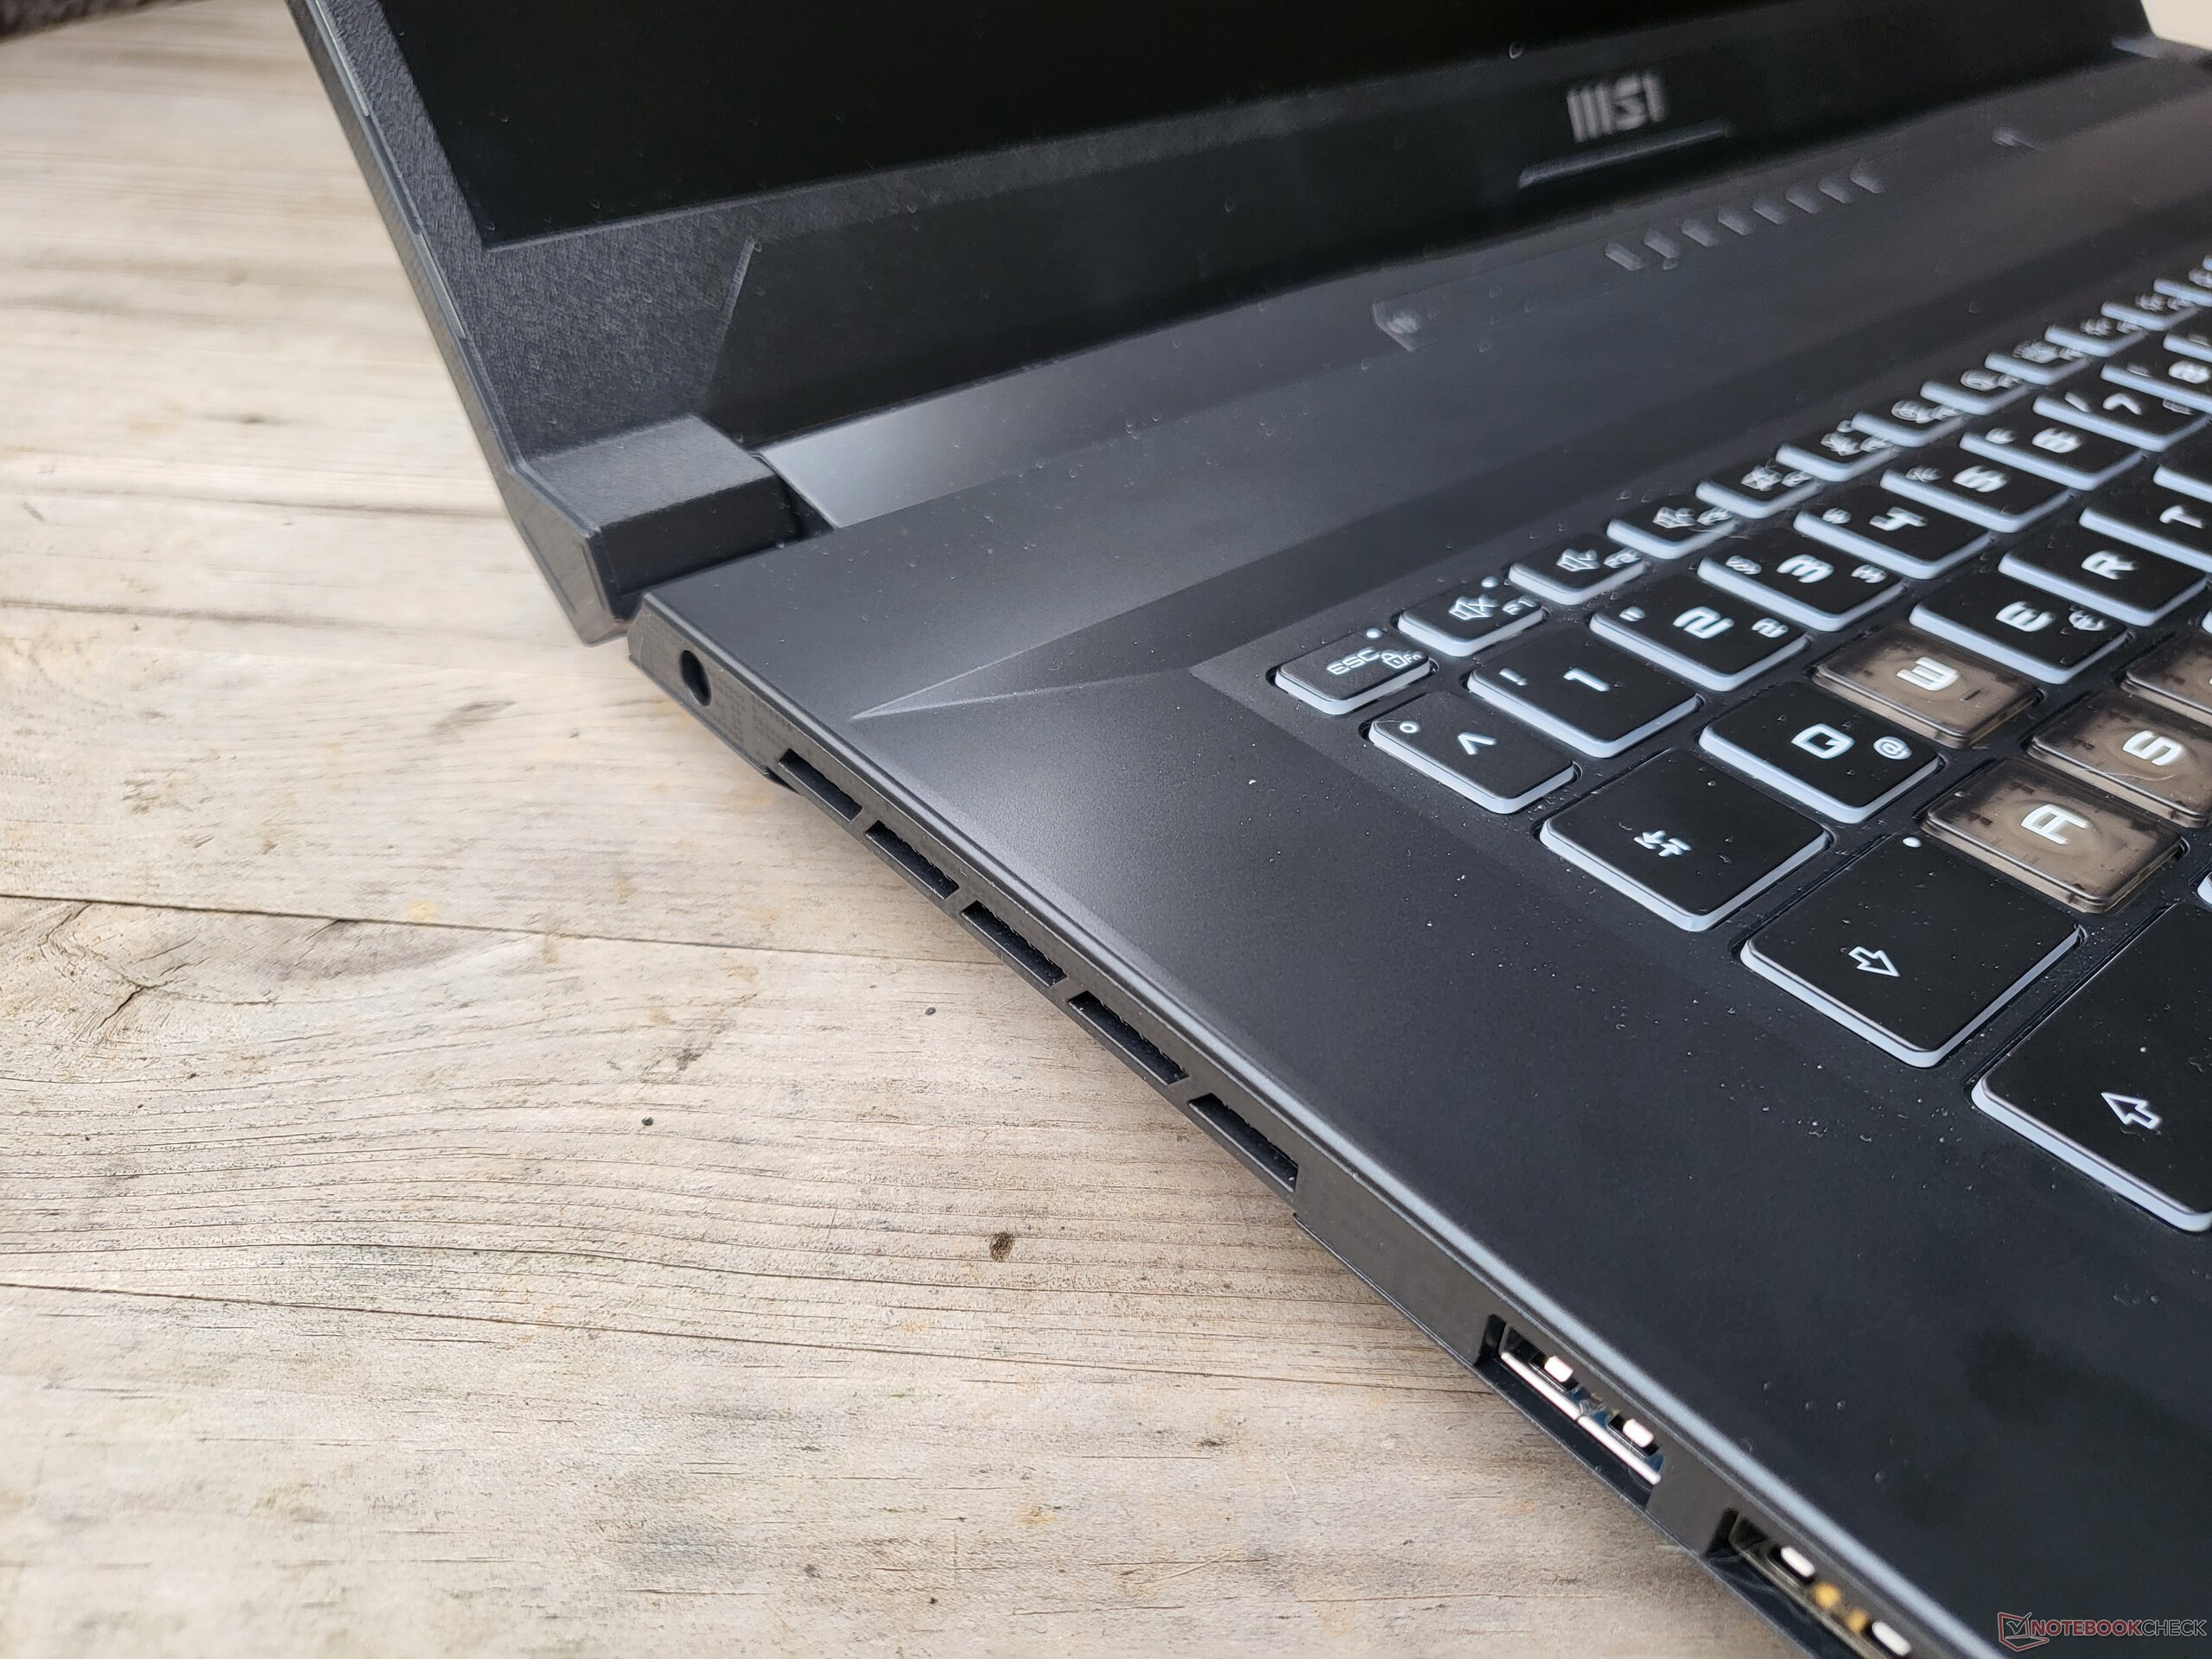
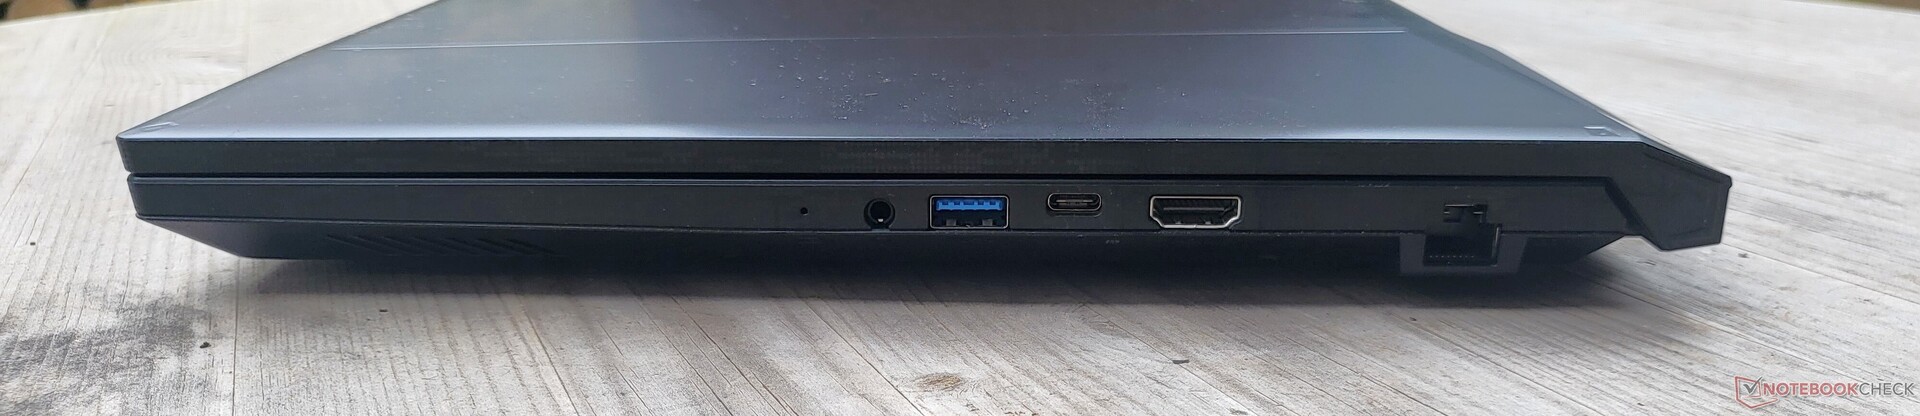
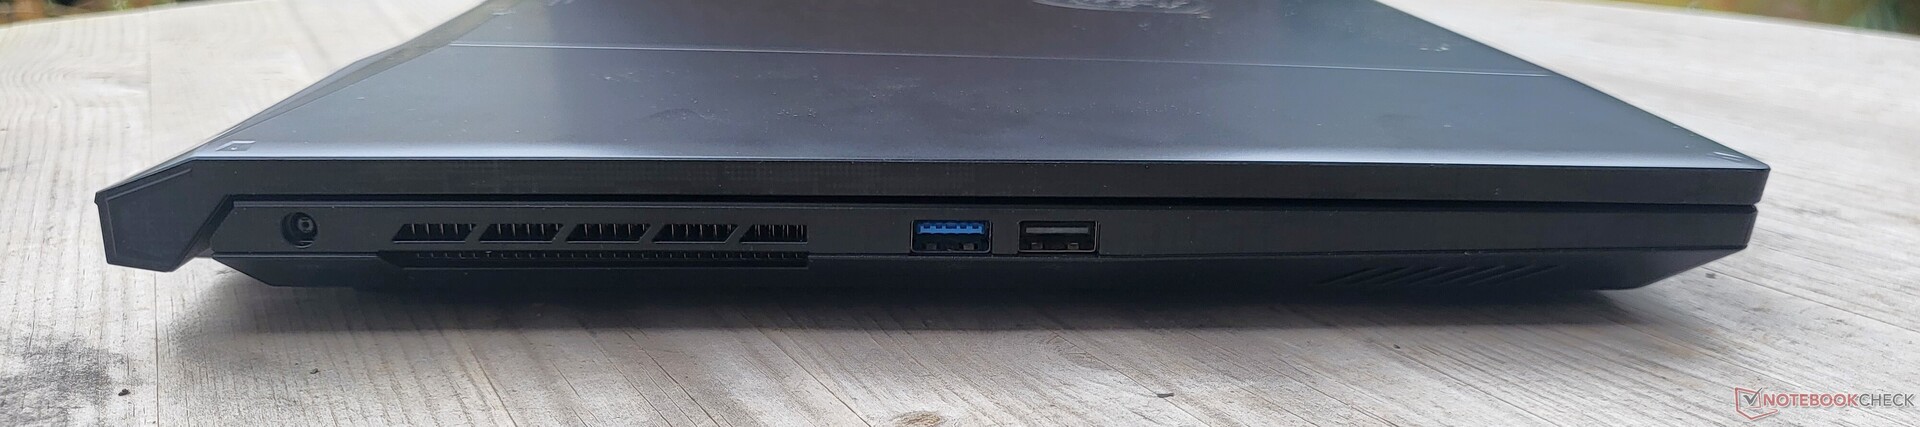
Features: USB 2.0 instead of Thunderbolt
The range of ports leaves a lot to be desired: USB 2.0 has no place in 2023 and Thunderbolt is also absent from the MSI Katana 17. Additionally, we miss not having an SD card reader but at least MSI hasn't skimped on the RJ45 port.
Communication
With the Katana 17 B13V, MSI has gone for a WiFi solution from Intel, albeit not one with the most up-to-date technology. The Intel AX201 delivers high, stable transfer rates although it has to do without the newer WiFI 6E standard.
Webcam
The 720p webcam delivers a picture typical for laptops: noisy, washed-out and lacking in sharpness.


Accessories
Out-of-the-box, the MSI Katana 17 B13V comes with a 240-watt power supply unit from Chicony that uses a proprietary connector.
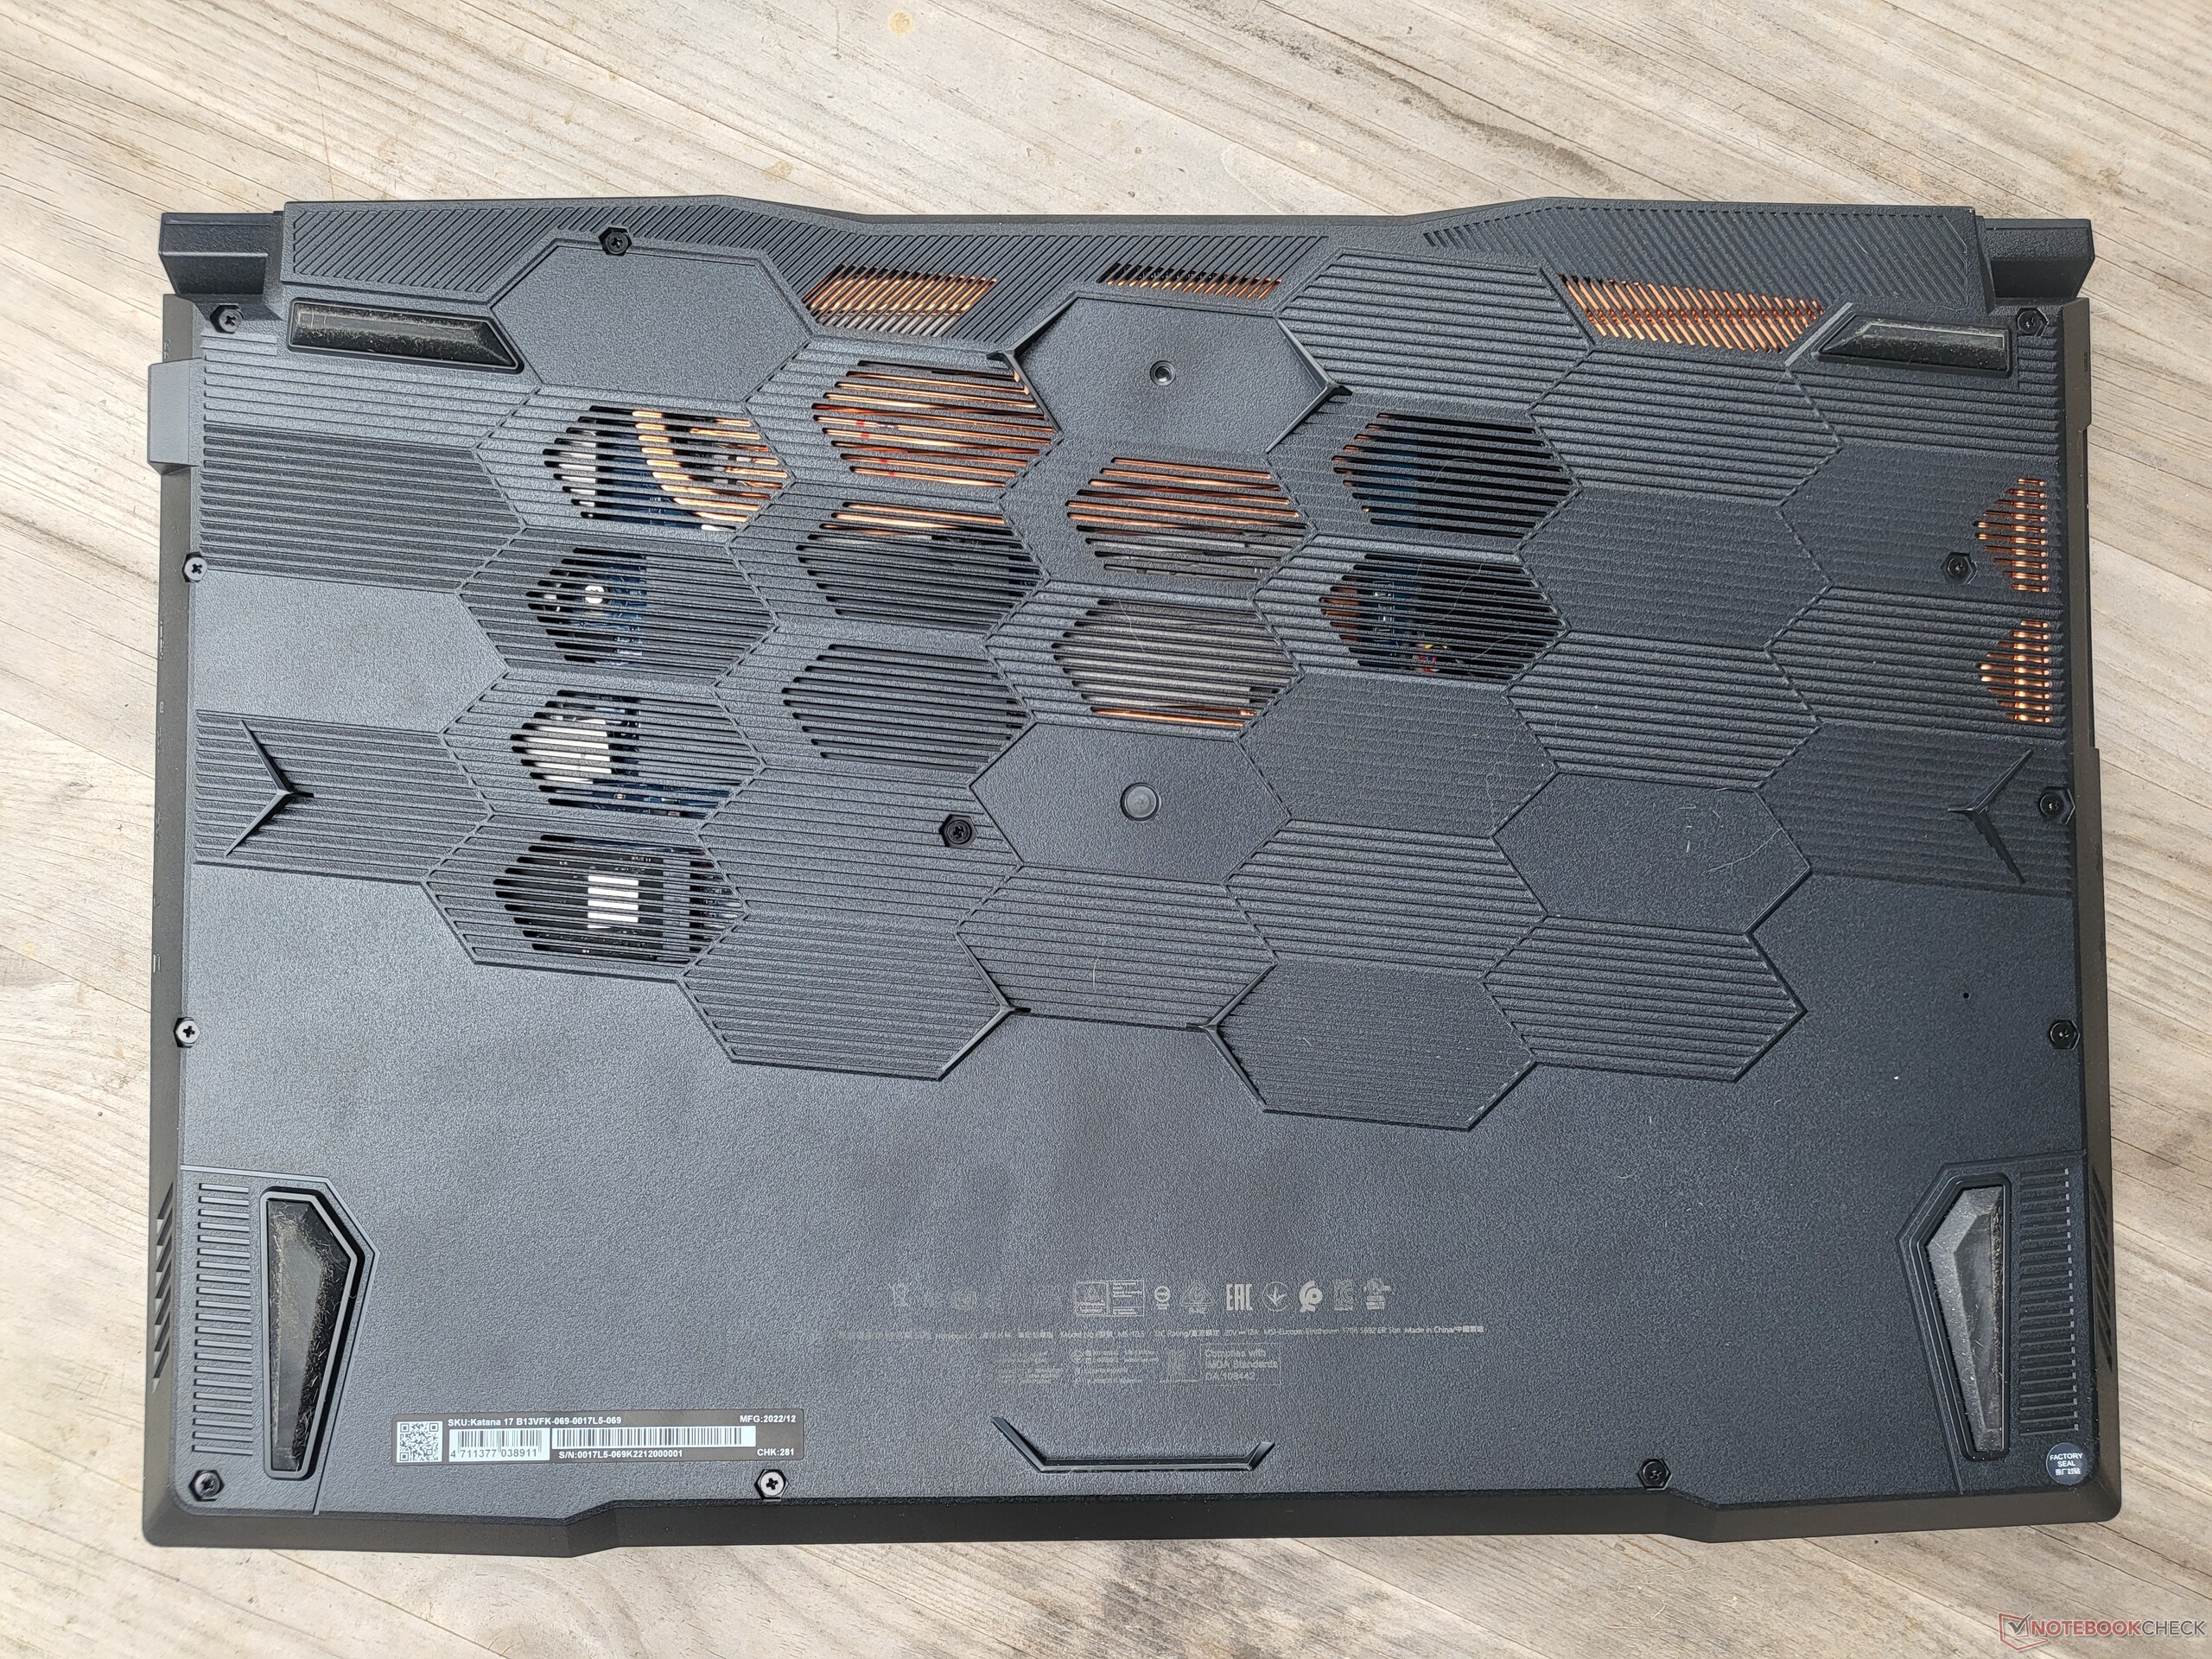
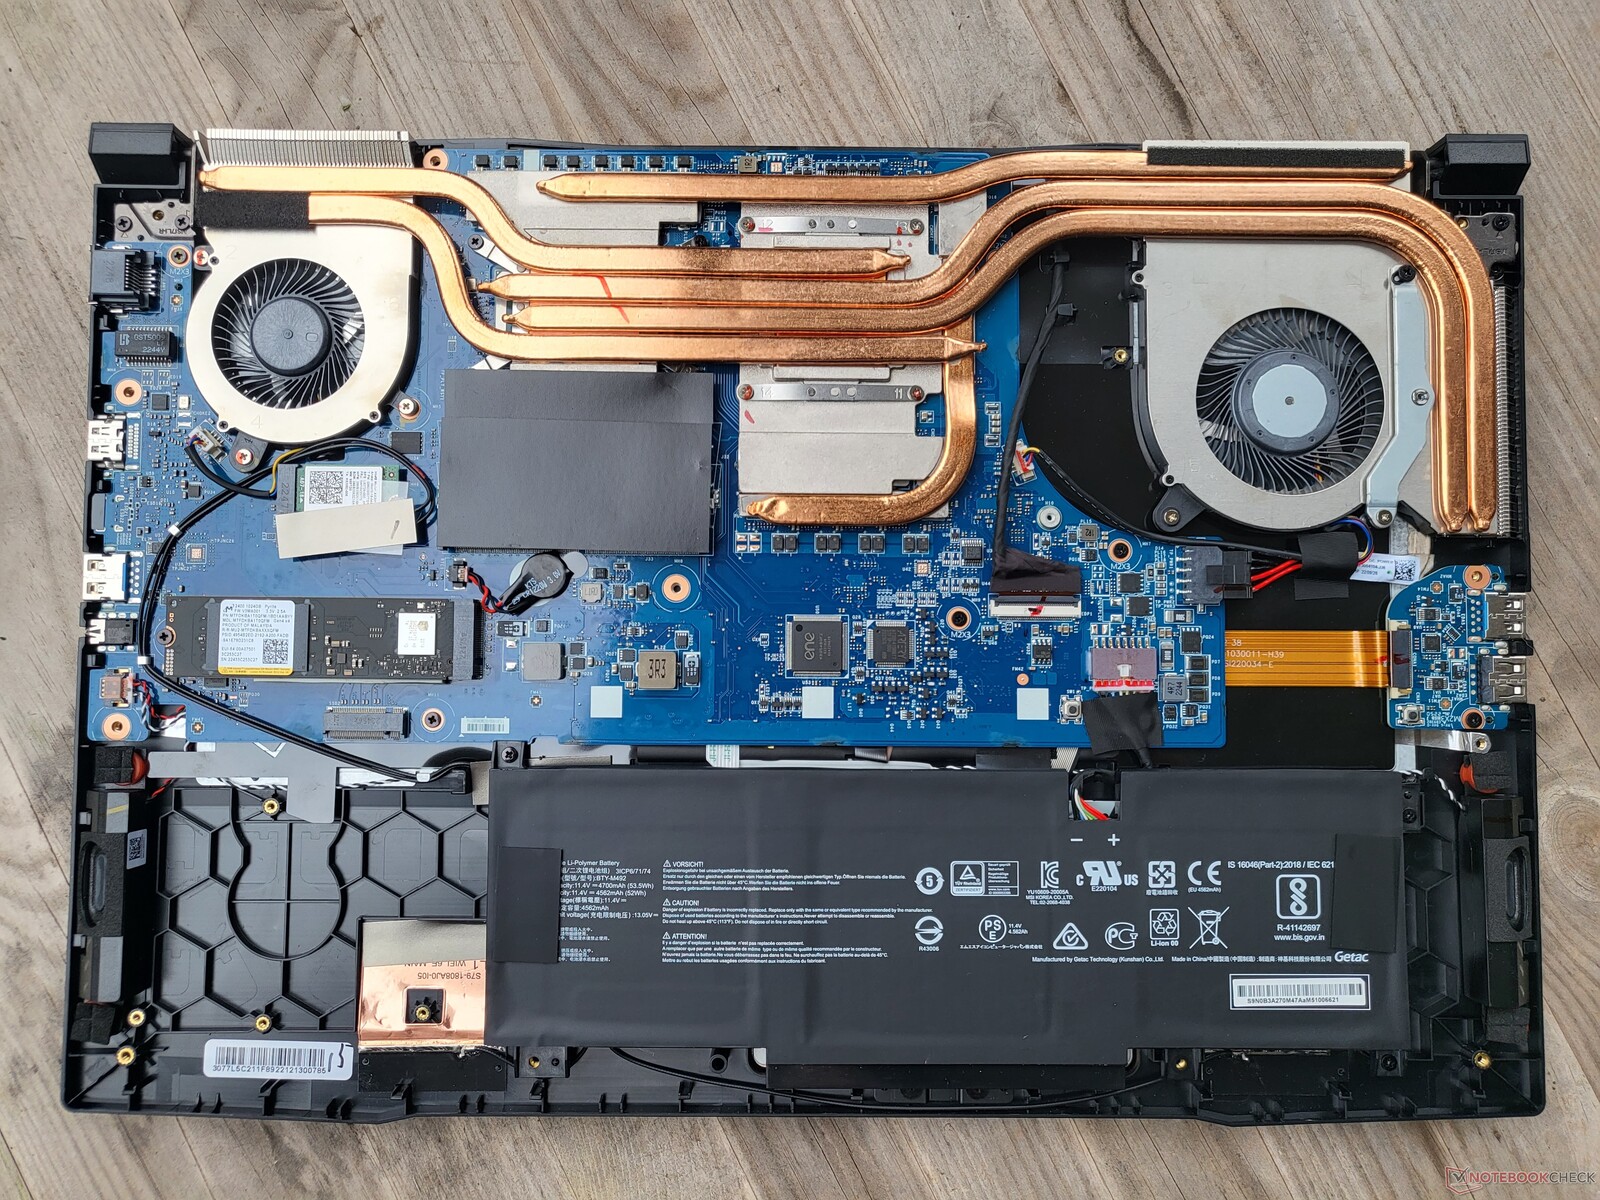
Maintenance
Thirteen screws and a few clips stand in the way of gaining access to the Katana's internals. The WiFi module, M.2 2280 SSD as well as both RAM modules can be upgraded. Additionally, you can access the large, two-fan cooling system and also the battery which is rather small for a device this size. The is a lot of free space next to the battery which shows a larger battery would have been possible. Interestingly, there is a weight on the base plate which makes the MSI laptop appear heavier - possibly due to the large, free space.
Warranty
The MSI laptop comes with a 2-year guarantee from the date of purchase which includes a Pick-Up & Return service. However, the manufacturer's guarantee only applies to Germany.
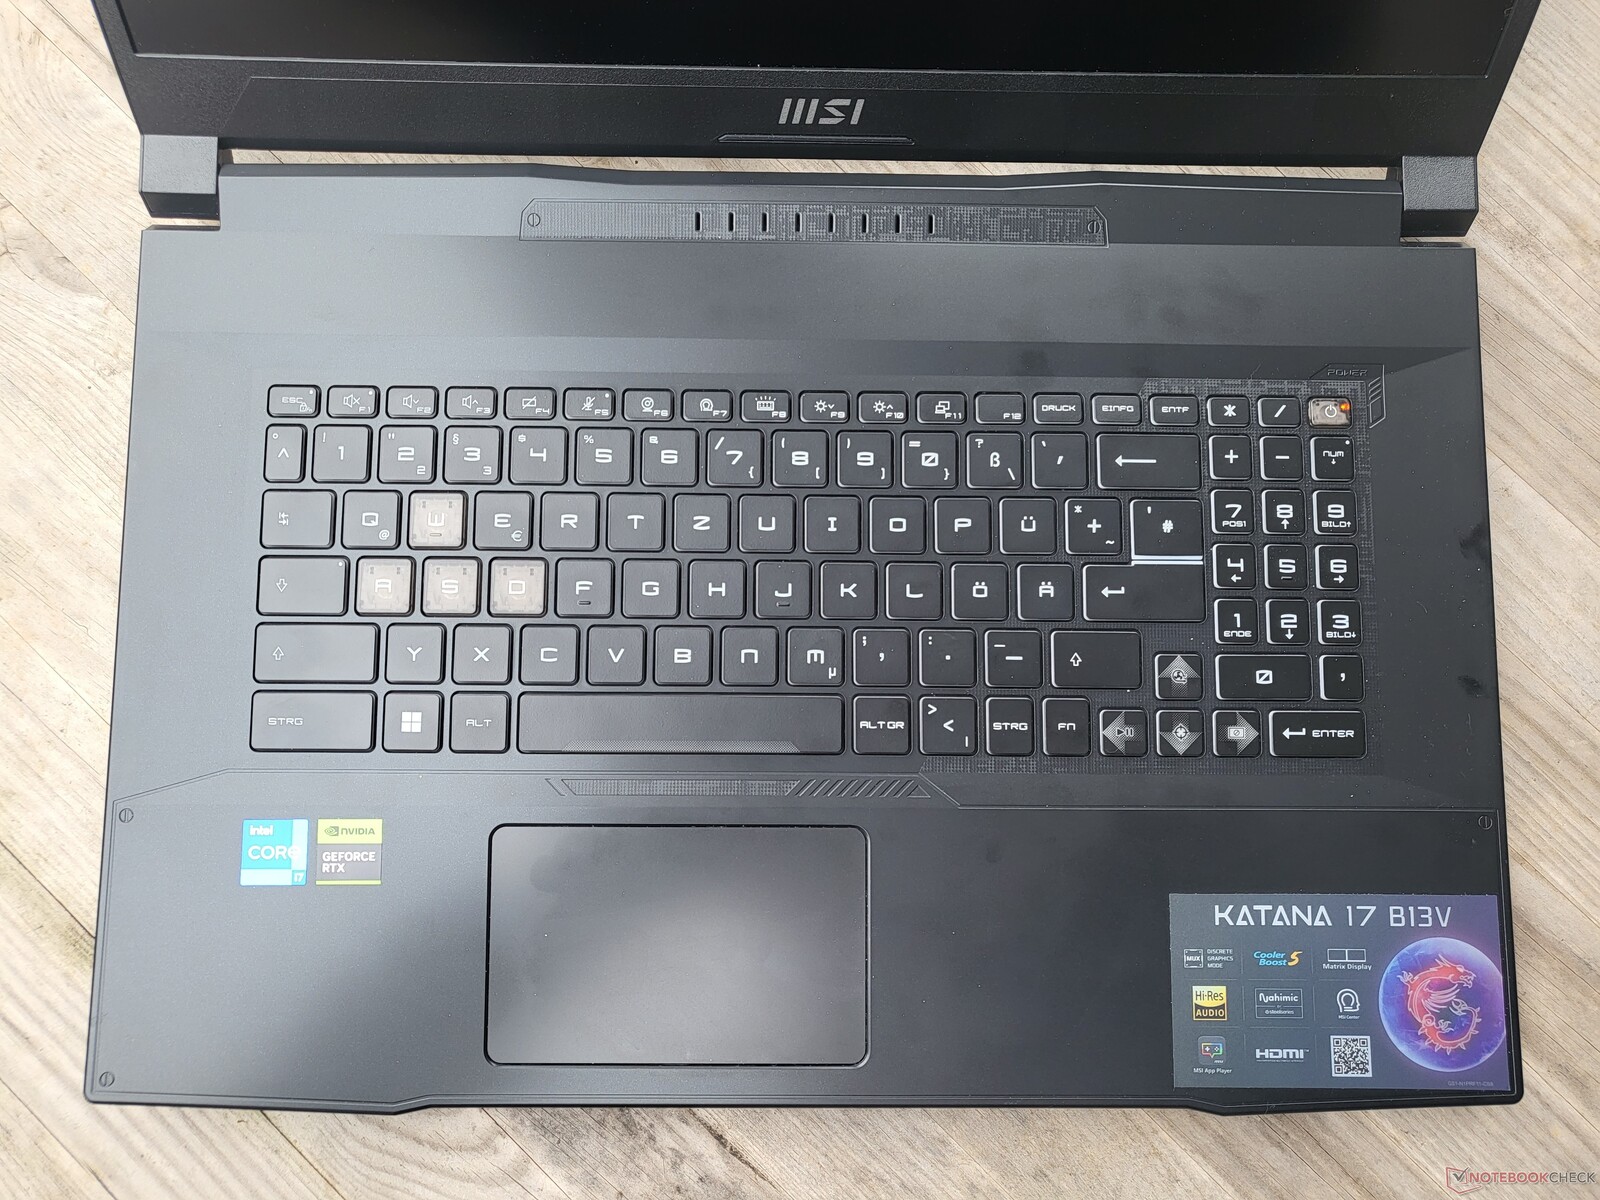
Input devices: Good keyboard, strange layout
Keyboard
Firstly the positives: The chiclet keyboard comes complete with multi-level RGB backlighting (four zones, configurable) and offers, by today's standards, very generous key travel of 1.7 mm. MSI has chosen a very good keyboard for the Katana 17 B13V. The typing experience is wonderful and the WASD key highlighting fits well with the gaming design - as do the relatively large arrow keys.
However, it is difficult to understand why MSI hasn't gone with a full-width keyboard. Some keys are clearer smaller than normal, and, in particular, the numeric keypad is tiny. In general, we are left dealing with a very unusual and awkward keyboard layout. The FN key is in an absurd position, the right shift key is considerably smaller, and, to top it all off, it's an ANSI layout with a narrow enter key meaning the # key is displaced. Not a problem for the worldwide market but very unusual here in Germany.
Touchpad
The MSI Katana 17's touchpad measures 10.5 x 6.5 cm - too small by today's standards and also in relation to the device's size. For our tastes, the plastic surface could be a little smoother and also doesn't feel very premium. At least this doesn't apply to the click mechanism: The click pad provides an even click and a high-quality feel. There is little to complain about in terms of software implementation, and, in this respect, it's the typical kind of touchpad found in modern Windows laptops.
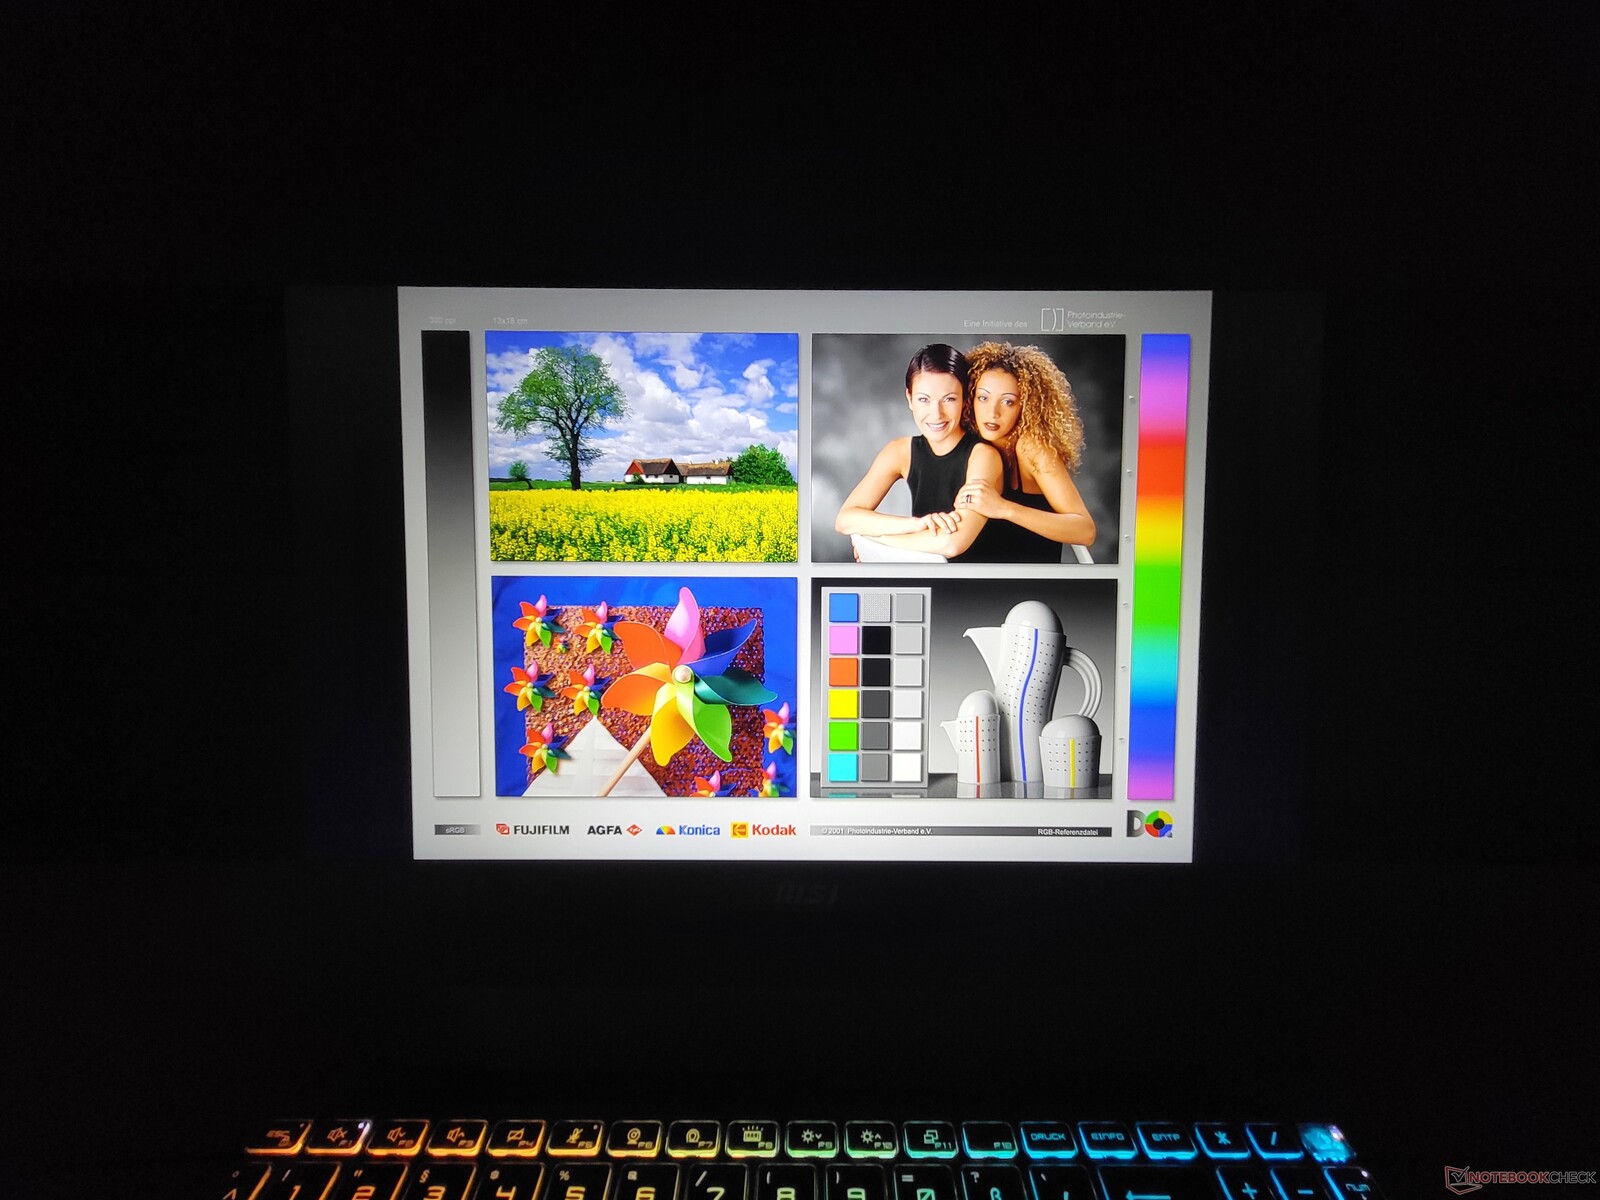
The MSI Katana 17's display is its weakest link
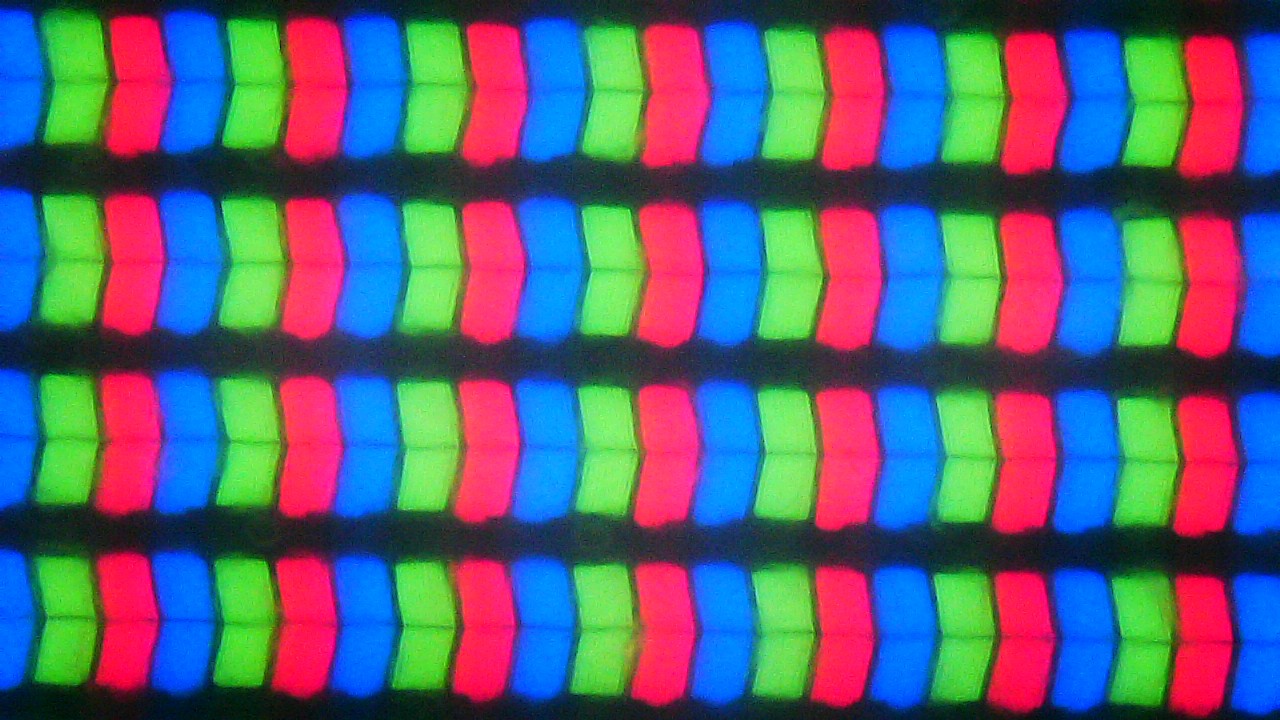
For the Katana 17 B13V, MSI only offers one display option and it's a 17.3-inch, matte, 16:9 format, IPS LCD. The only resolution available is 1920 x 1080, in other words, FullHD. That's a relatively low resolution for a monitor of this size - although at least it's a 144 Hz display.
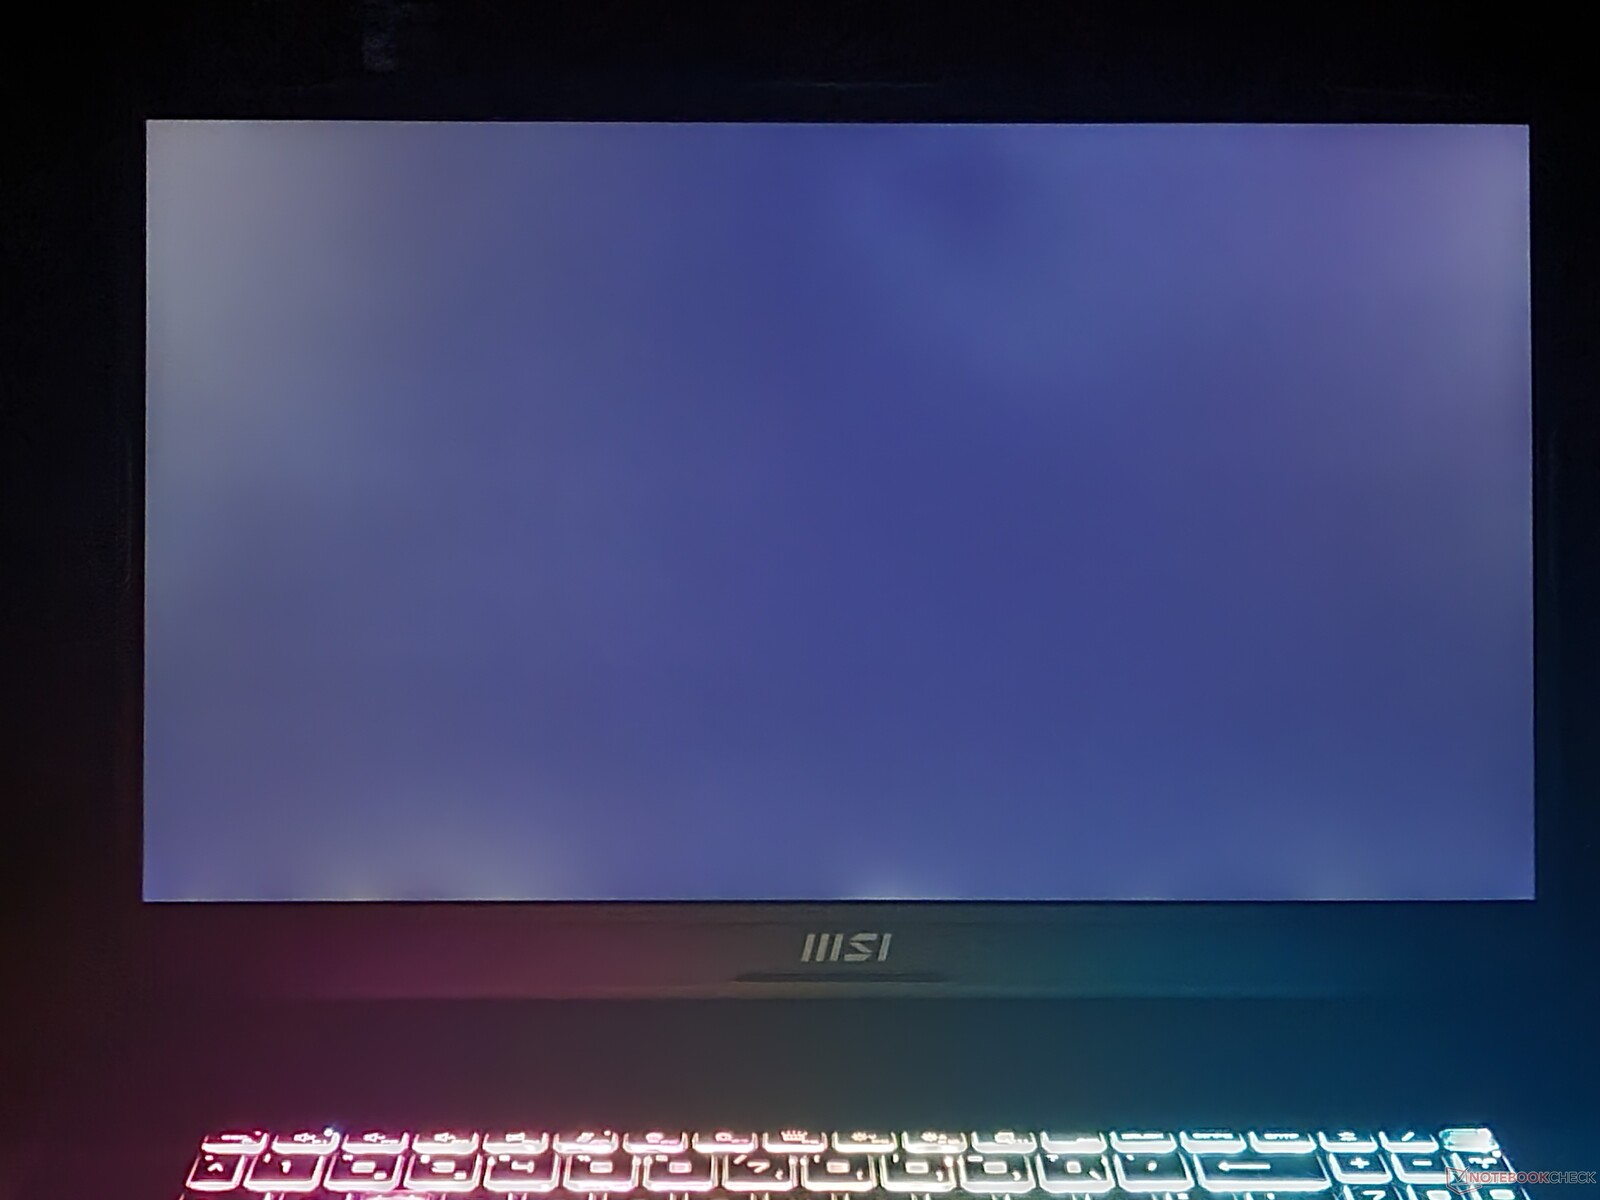
Unfortunately, the quality of AUO's panel leaves a lot to be desired. At around 256 cd/m², display brightness lags behind the competition. Response times are also poor for a gaming laptop.
| |||||||||||||||||||||||||
Brightness Distribution: 93 %
Center on Battery: 267 cd/m²
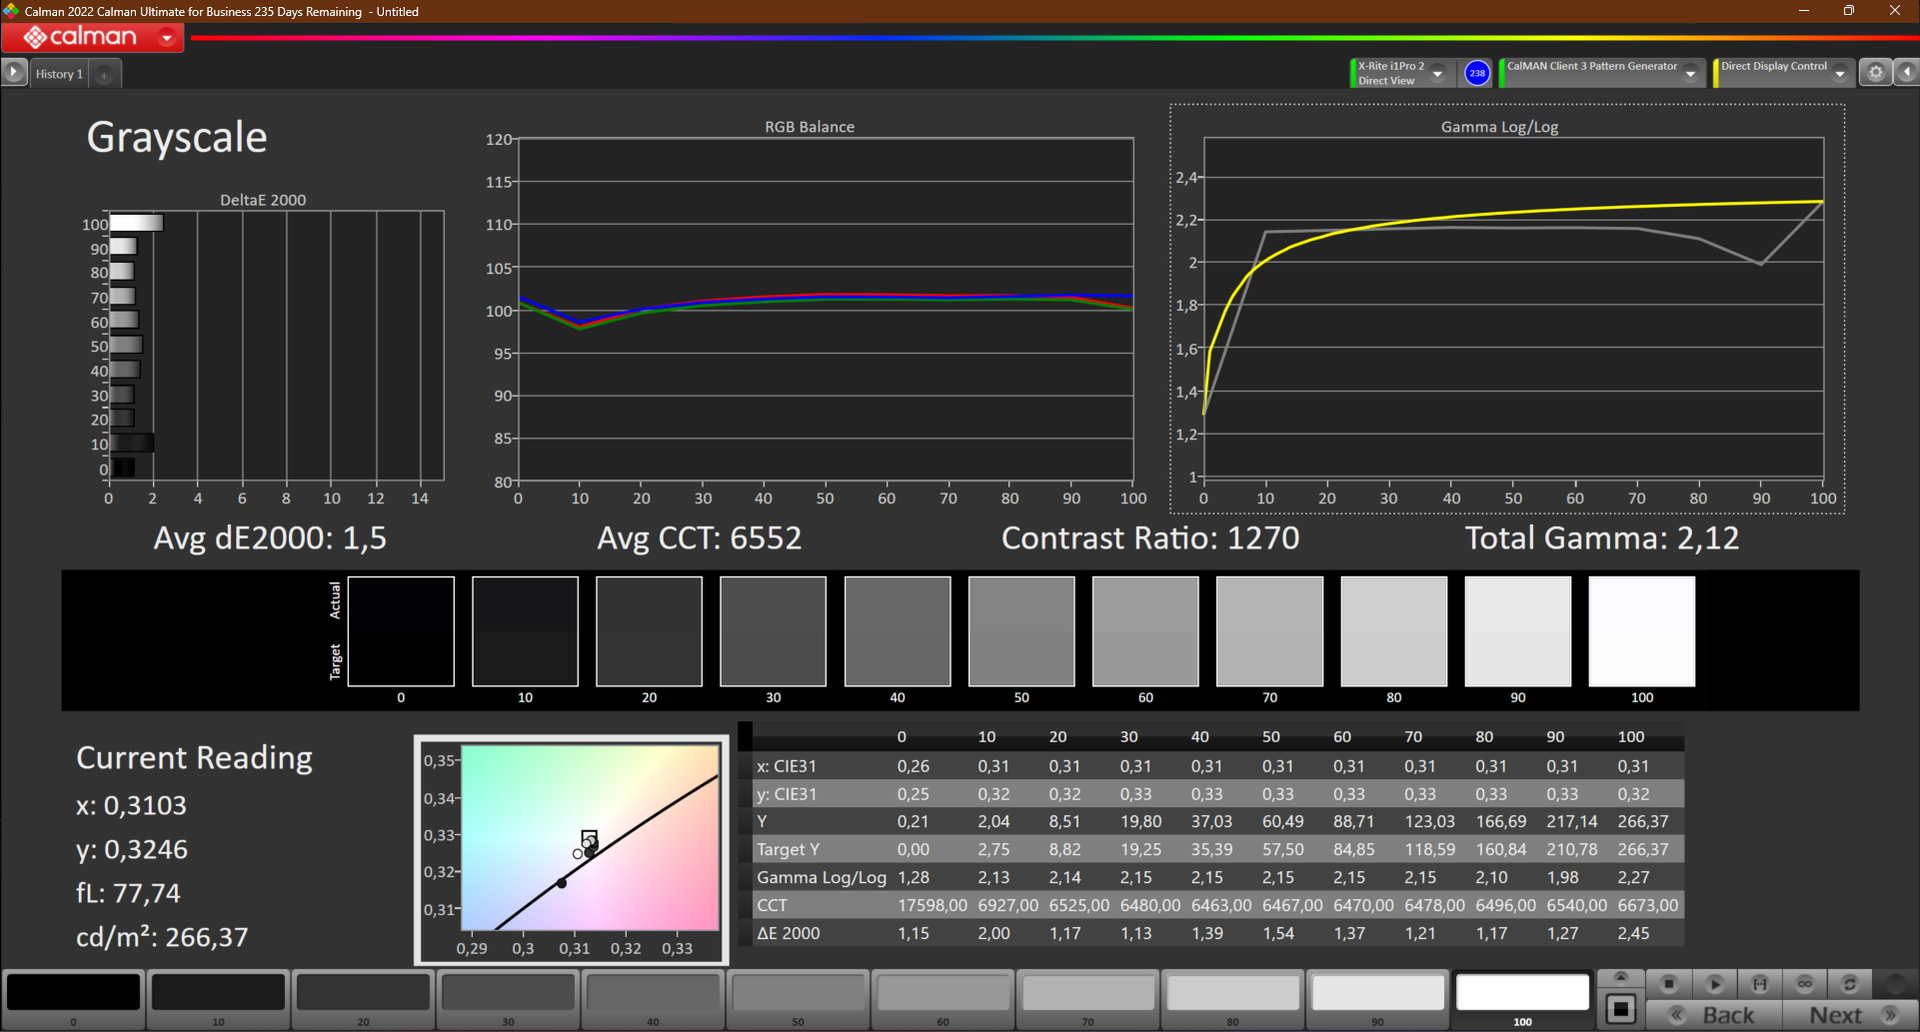
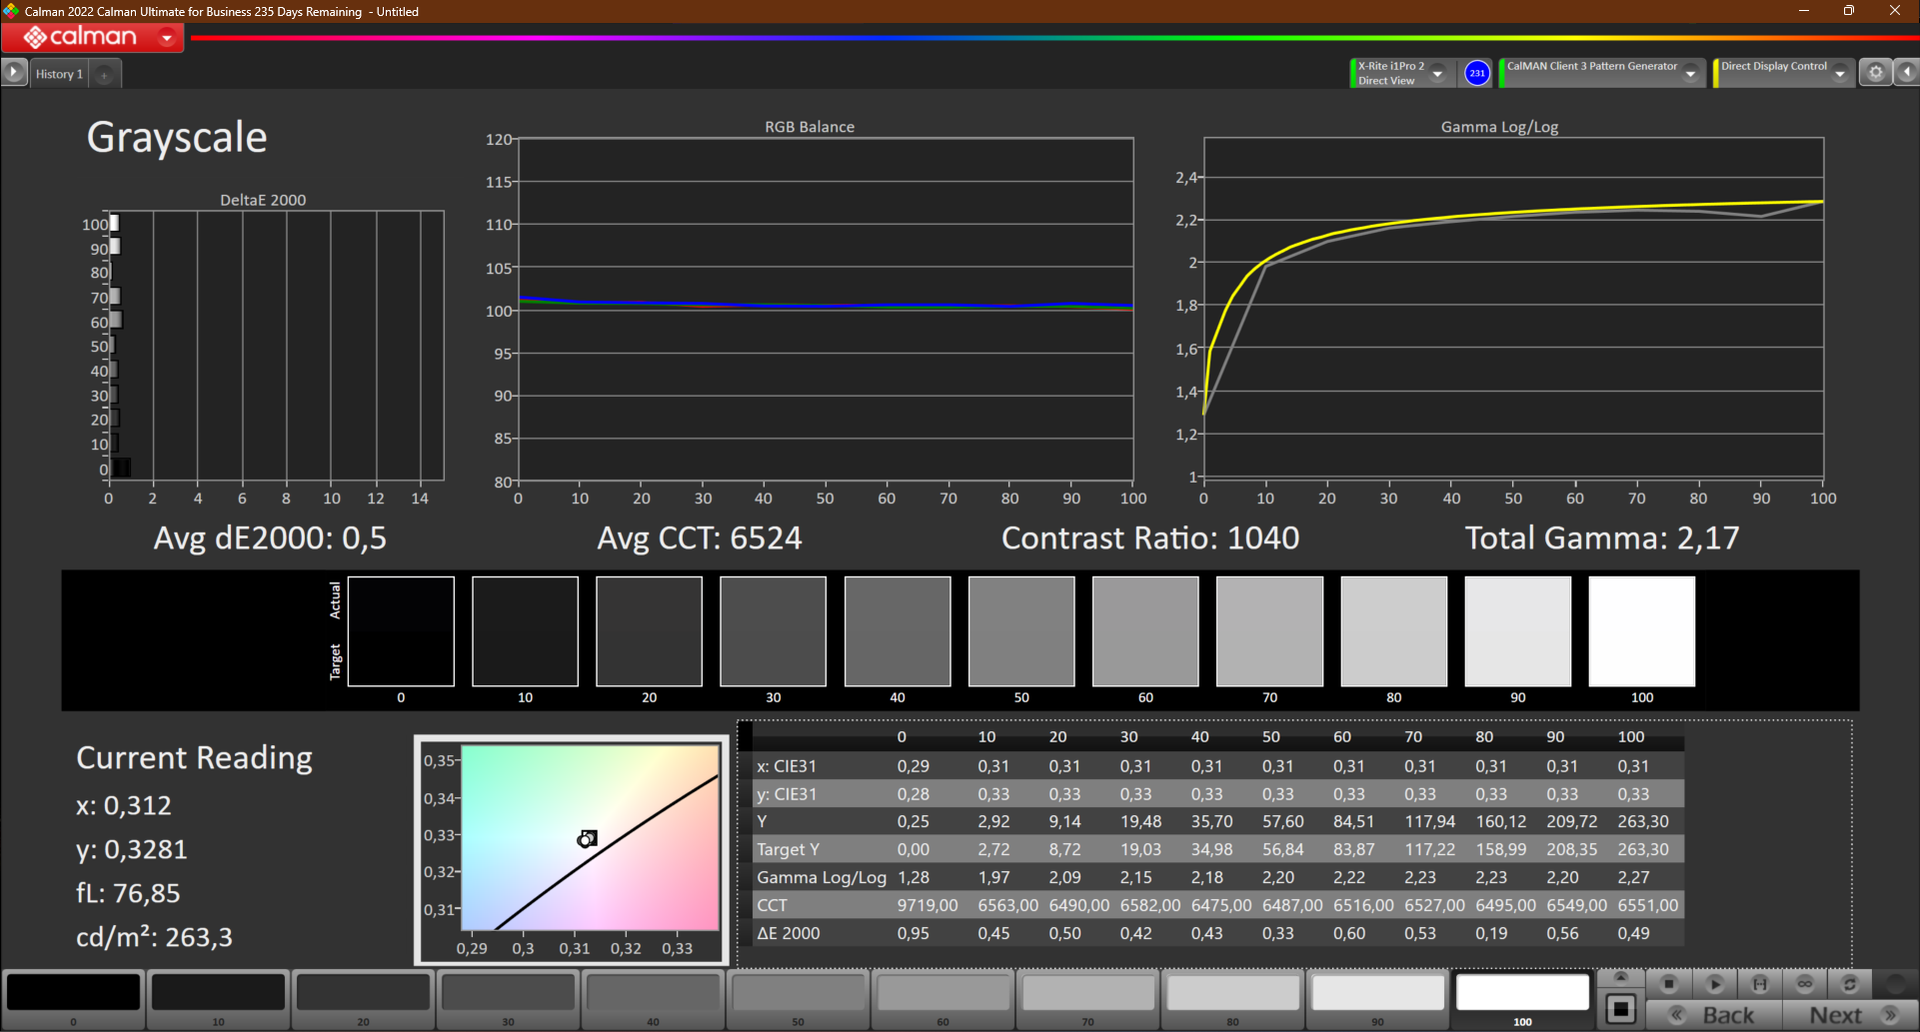
Contrast: 1271:1 (Black: 0.21 cd/m²)
ΔE ColorChecker Calman: 4.7 | ∀{0.5-29.43 Ø4.79}
calibrated: 4.5
ΔE Greyscale Calman: 1.5 | ∀{0.09-98 Ø5}
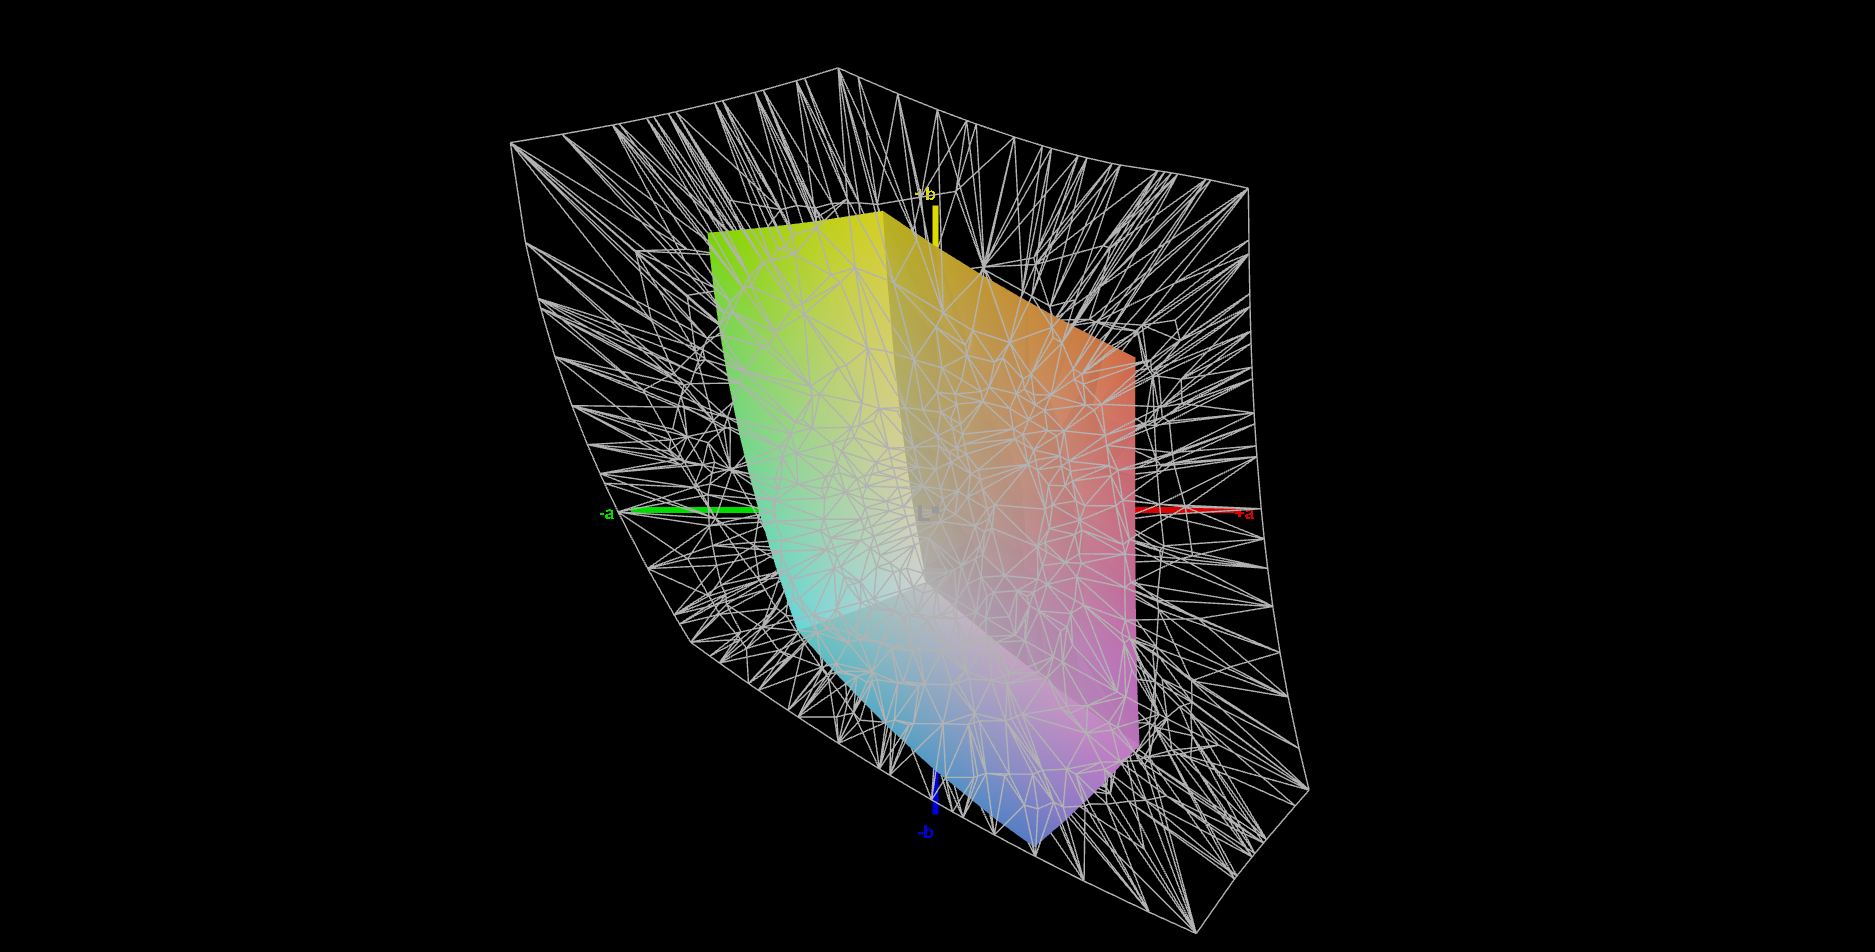
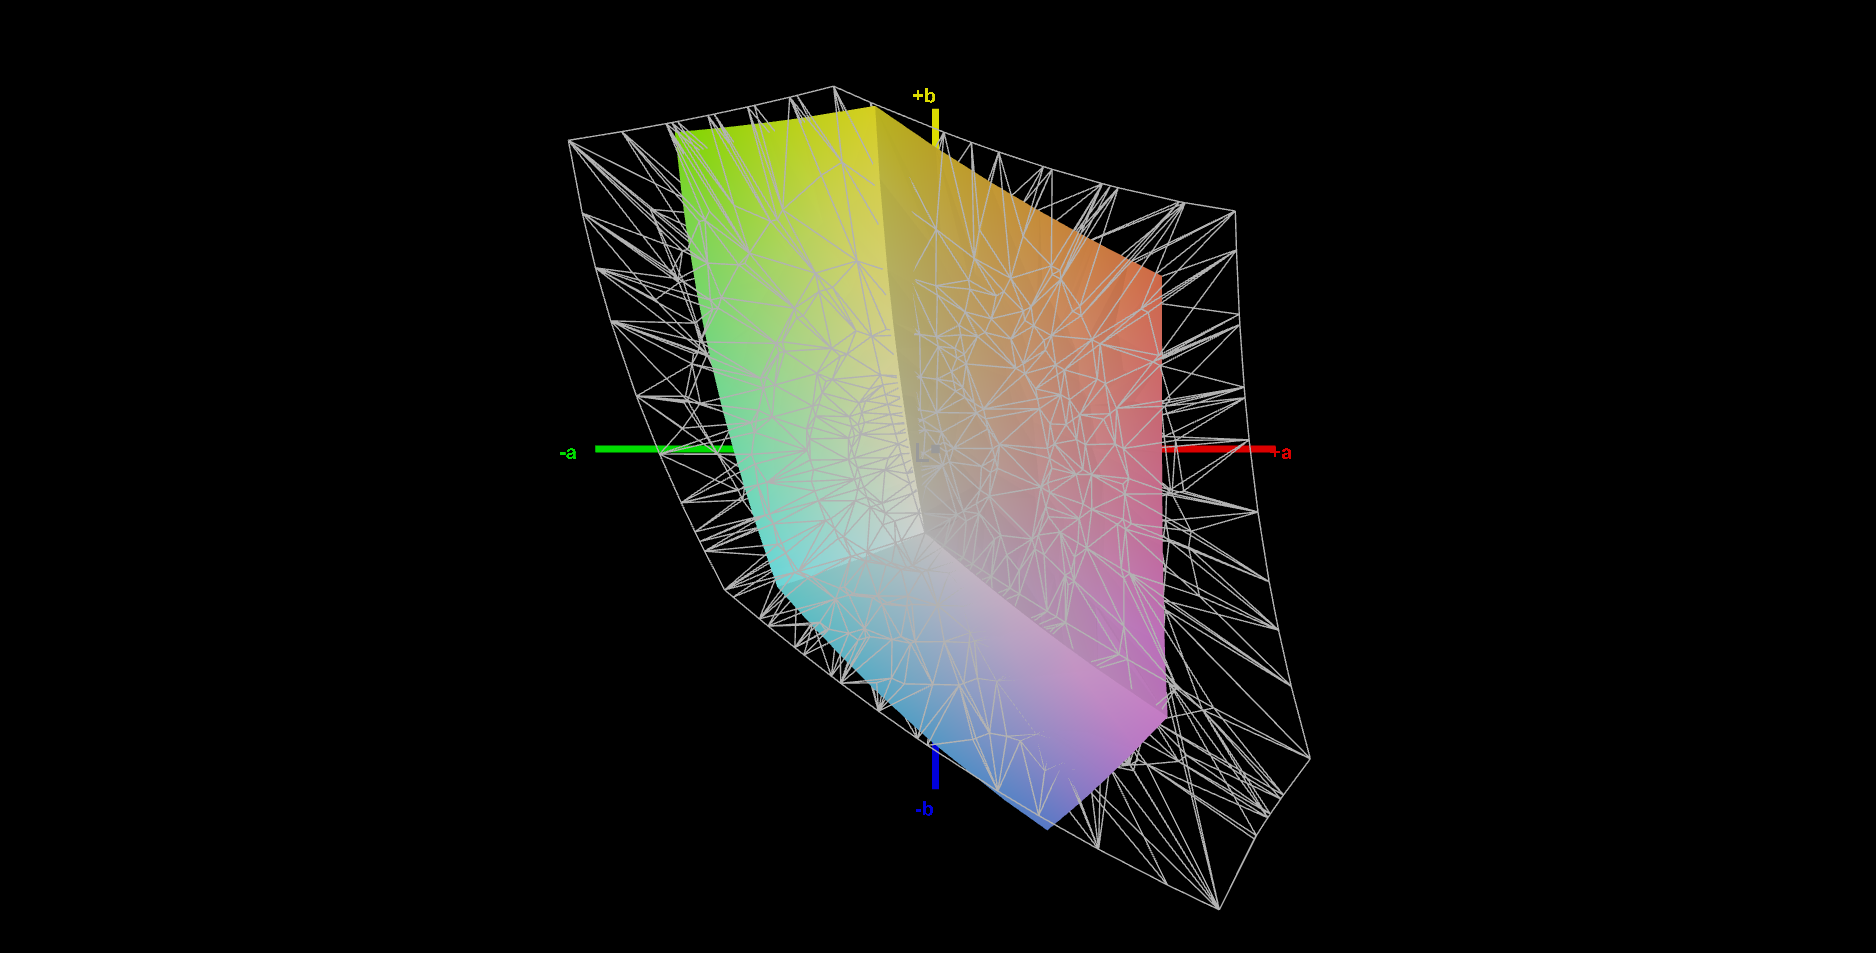
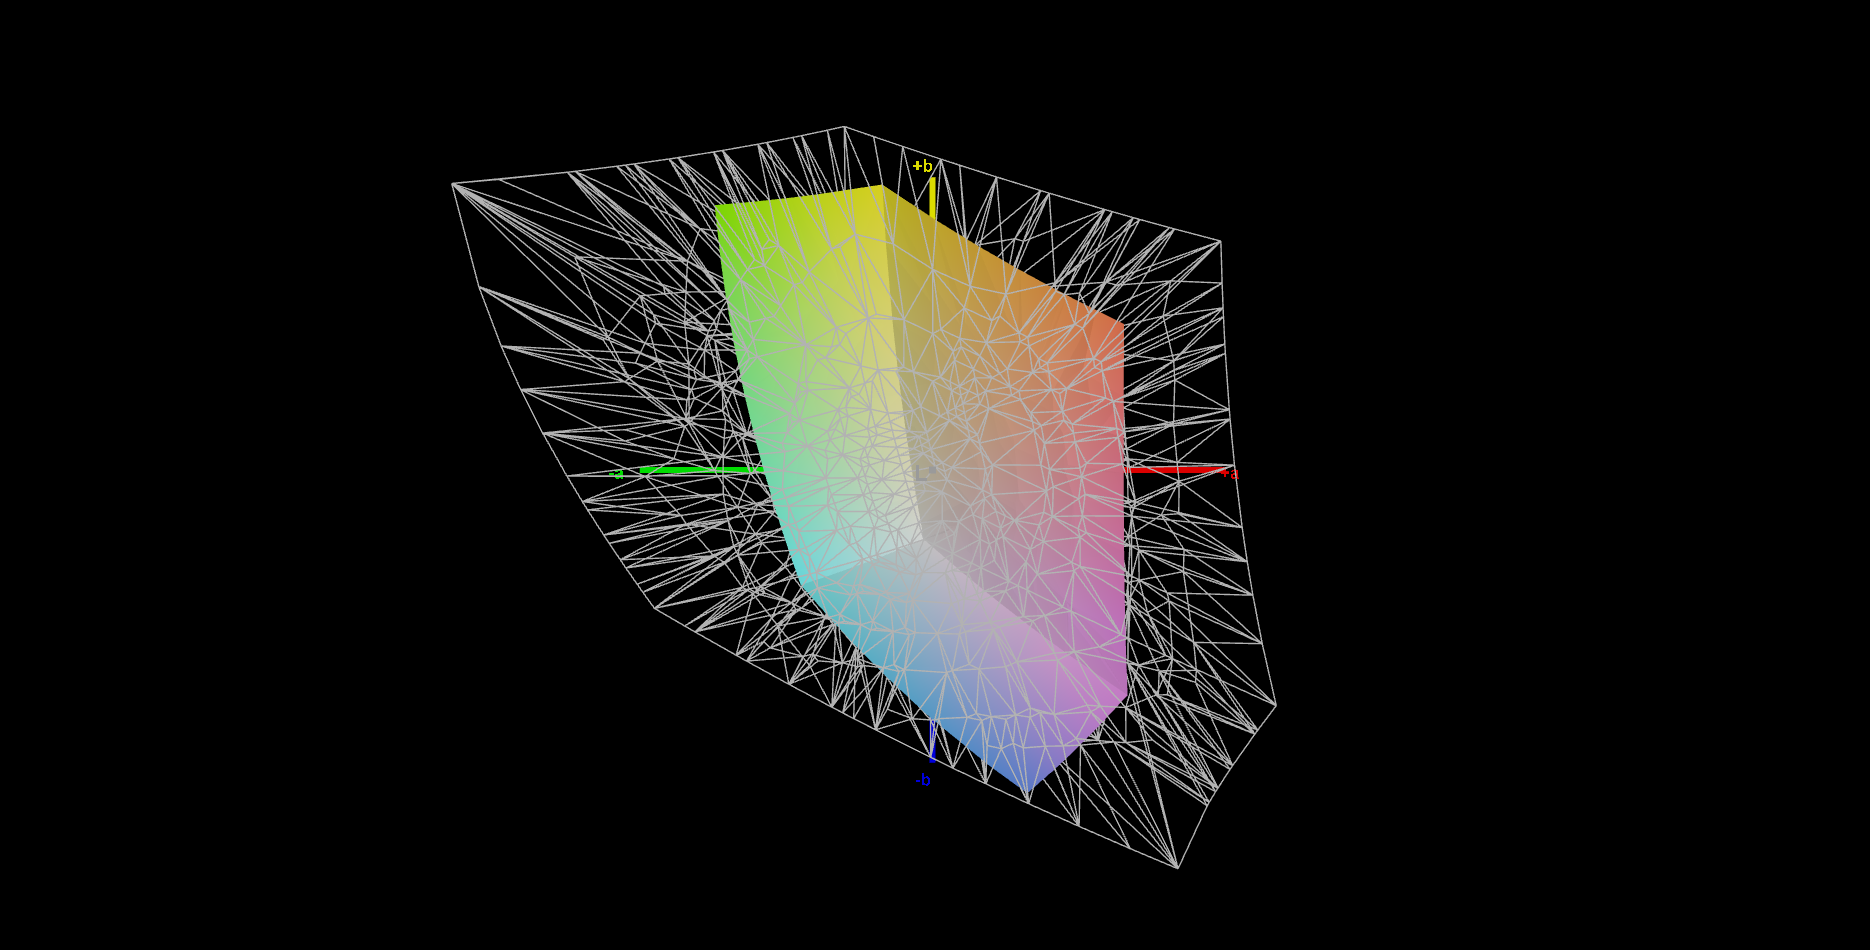
42.2% AdobeRGB 1998 (Argyll 3D)
61% sRGB (Argyll 3D)
40.8% Display P3 (Argyll 3D)
Gamma: 2.12
CCT: 6552 K
| MSI Katana 17 B13VFK B173HAN04.9, IPS LED, 1920x1080, 17.3" | MSI Titan GT77 HX 13VI B173ZAN06.C, Mini-LED, 3840x2160, 17.3" | MSI Pulse GL76 12UGK Sharp LQ173M1JW08, IPS, 1920x1080, 17.3" | Gigabyte G7 KE AU Optronics B173HAN05.1, IPS, 1920x1080, 17.3" | Asus ROG Strix Scar 17 SE G733CX-LL014W NE173QHM-NZ2, IPS, 2560x1440, 17.3" | Acer Predator Helios 300 (i7-12700H, RTX 3070 Ti) BOE0A1A, IPS, 2560x1440, 17.3" | |
|---|---|---|---|---|---|---|
| Display | 105% | 72% | 69% | 101% | 101% | |
| Display P3 Coverage (%) | 40.8 | 94.9 133% | 71.9 76% | 70.4 73% | 97.1 138% | 96.8 137% |
| sRGB Coverage (%) | 61 | 99.9 64% | 99.9 64% | 99.8 64% | 99.9 64% | 99.9 64% |
| AdobeRGB 1998 Coverage (%) | 42.2 | 92.4 119% | 73.7 75% | 71.7 70% | 84.8 101% | 84.8 101% |
| Response Times | -9% | 72% | 77% | 72% | 54% | |
| Response Time Grey 50% / Grey 80% * (ms) | 33 ? | 38.4 ? -16% | 4.6 ? 86% | 5 ? 85% | 5.7 ? 83% | 16.4 ? 50% |
| Response Time Black / White * (ms) | 26 ? | 26.6 ? -2% | 11.2 ? 57% | 8.3 ? 68% | 10.1 ? 61% | 11.2 ? 57% |
| PWM Frequency (Hz) | 2380 ? | |||||
| Screen | 52982% | -21% | 27% | 21% | 4% | |
| Brightness middle (cd/m²) | 267 | 606 127% | 337.7 26% | 307 15% | 320 20% | 366 37% |
| Brightness (cd/m²) | 256 | 602 135% | 331 29% | 301 18% | 303 18% | 340 33% |
| Brightness Distribution (%) | 93 | 93 0% | 82 -12% | 93 0% | 87 -6% | 85 -9% |
| Black Level * (cd/m²) | 0.21 | 0.0001 100% | 0.31 -48% | 0.2 5% | 0.3 -43% | 0.31 -48% |
| Contrast (:1) | 1271 | 6060000 476690% | 1089 -14% | 1535 21% | 1067 -16% | 1181 -7% |
| Colorchecker dE 2000 * | 4.7 | 4.8 -2% | 4.12 12% | 1.32 72% | 1.1 77% | 3.56 24% |
| Colorchecker dE 2000 max. * | 20.4 | 8.2 60% | 8.89 56% | 4.6 77% | 2.7 87% | 5.66 72% |
| Colorchecker dE 2000 calibrated * | 4.5 | 1.8 60% | 0.98 78% | 1.03 77% | 3.31 26% | |
| Greyscale dE 2000 * | 1.5 | 6.5 -333% | 6.3 -320% | 2.1 -40% | 1.1 27% | 2.84 -89% |
| Gamma | 2.12 104% | 2.63 84% | 2.48 89% | 2.247 98% | 2.13 103% | 2.29 96% |
| CCT | 6552 99% | 6596 99% | 6542 99% | 6815 95% | 6599 98% | 6835 95% |
| Total Average (Program / Settings) | 17693% /
34081% | 41% /
12% | 58% /
43% | 65% /
47% | 53% /
32% |
* ... smaller is better
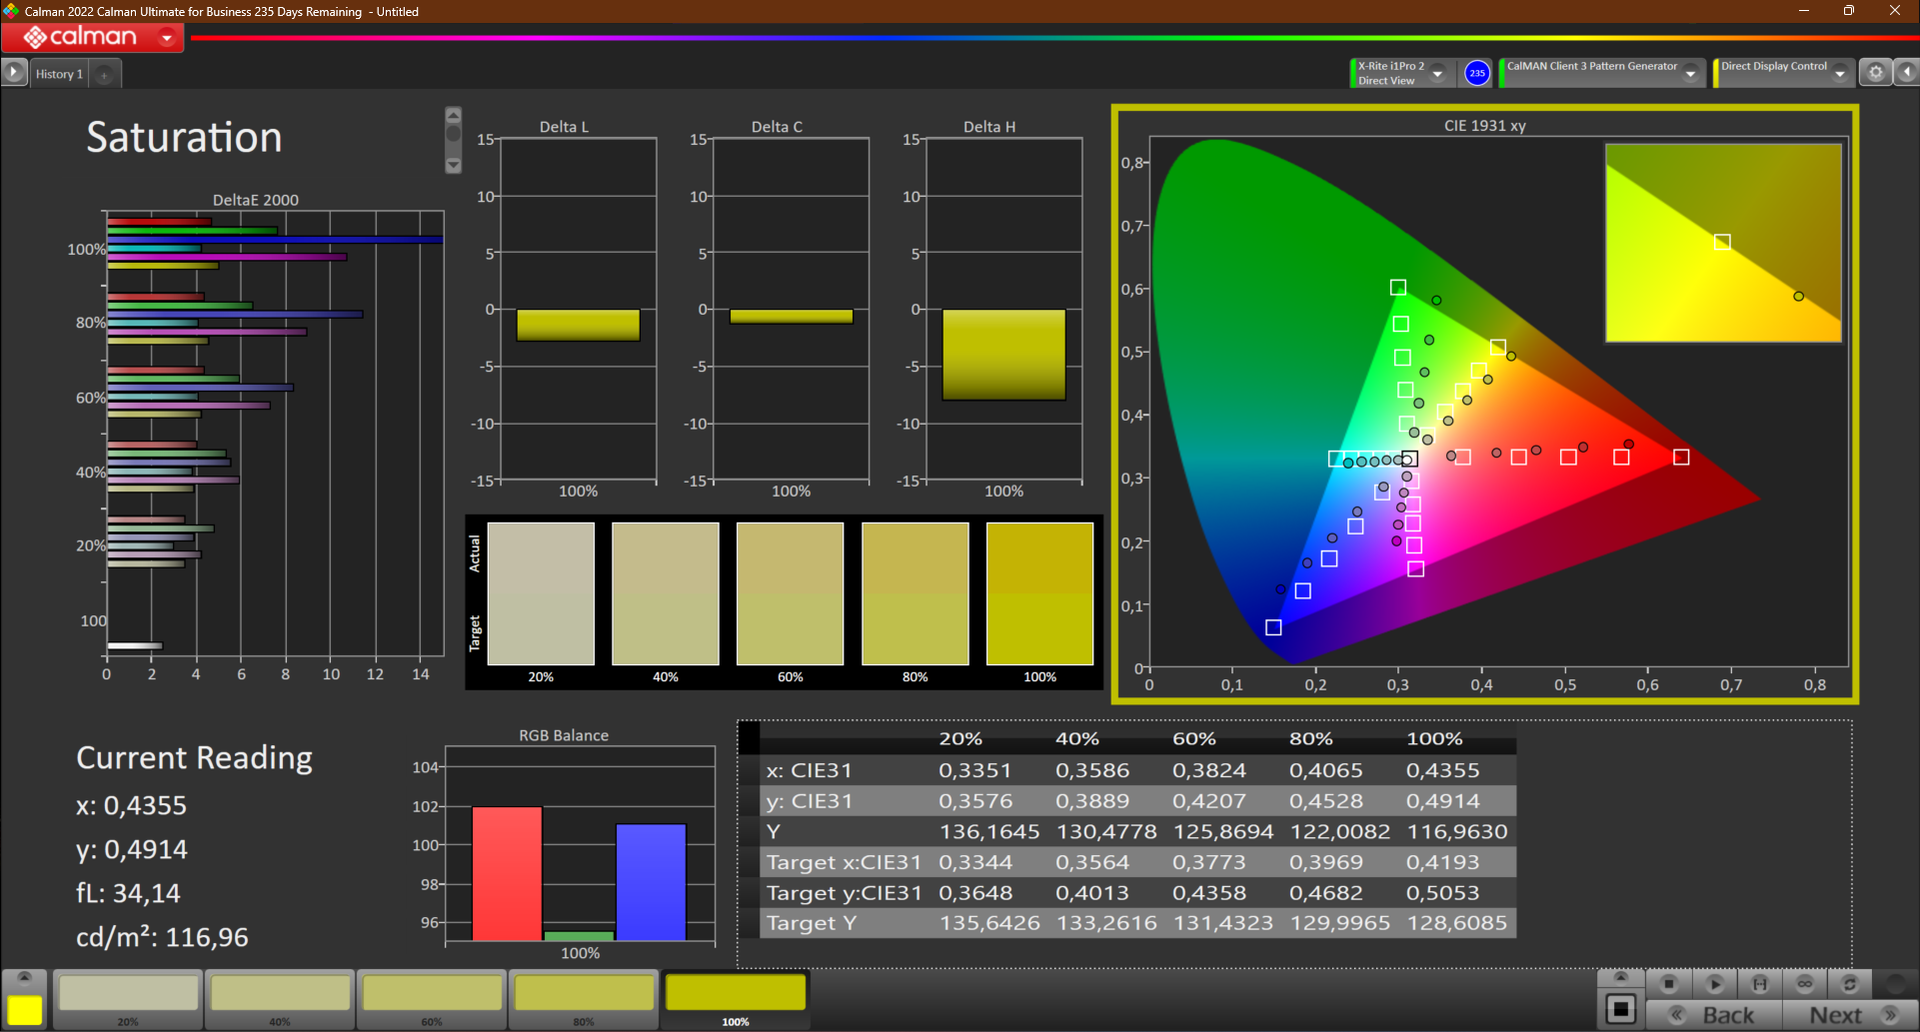
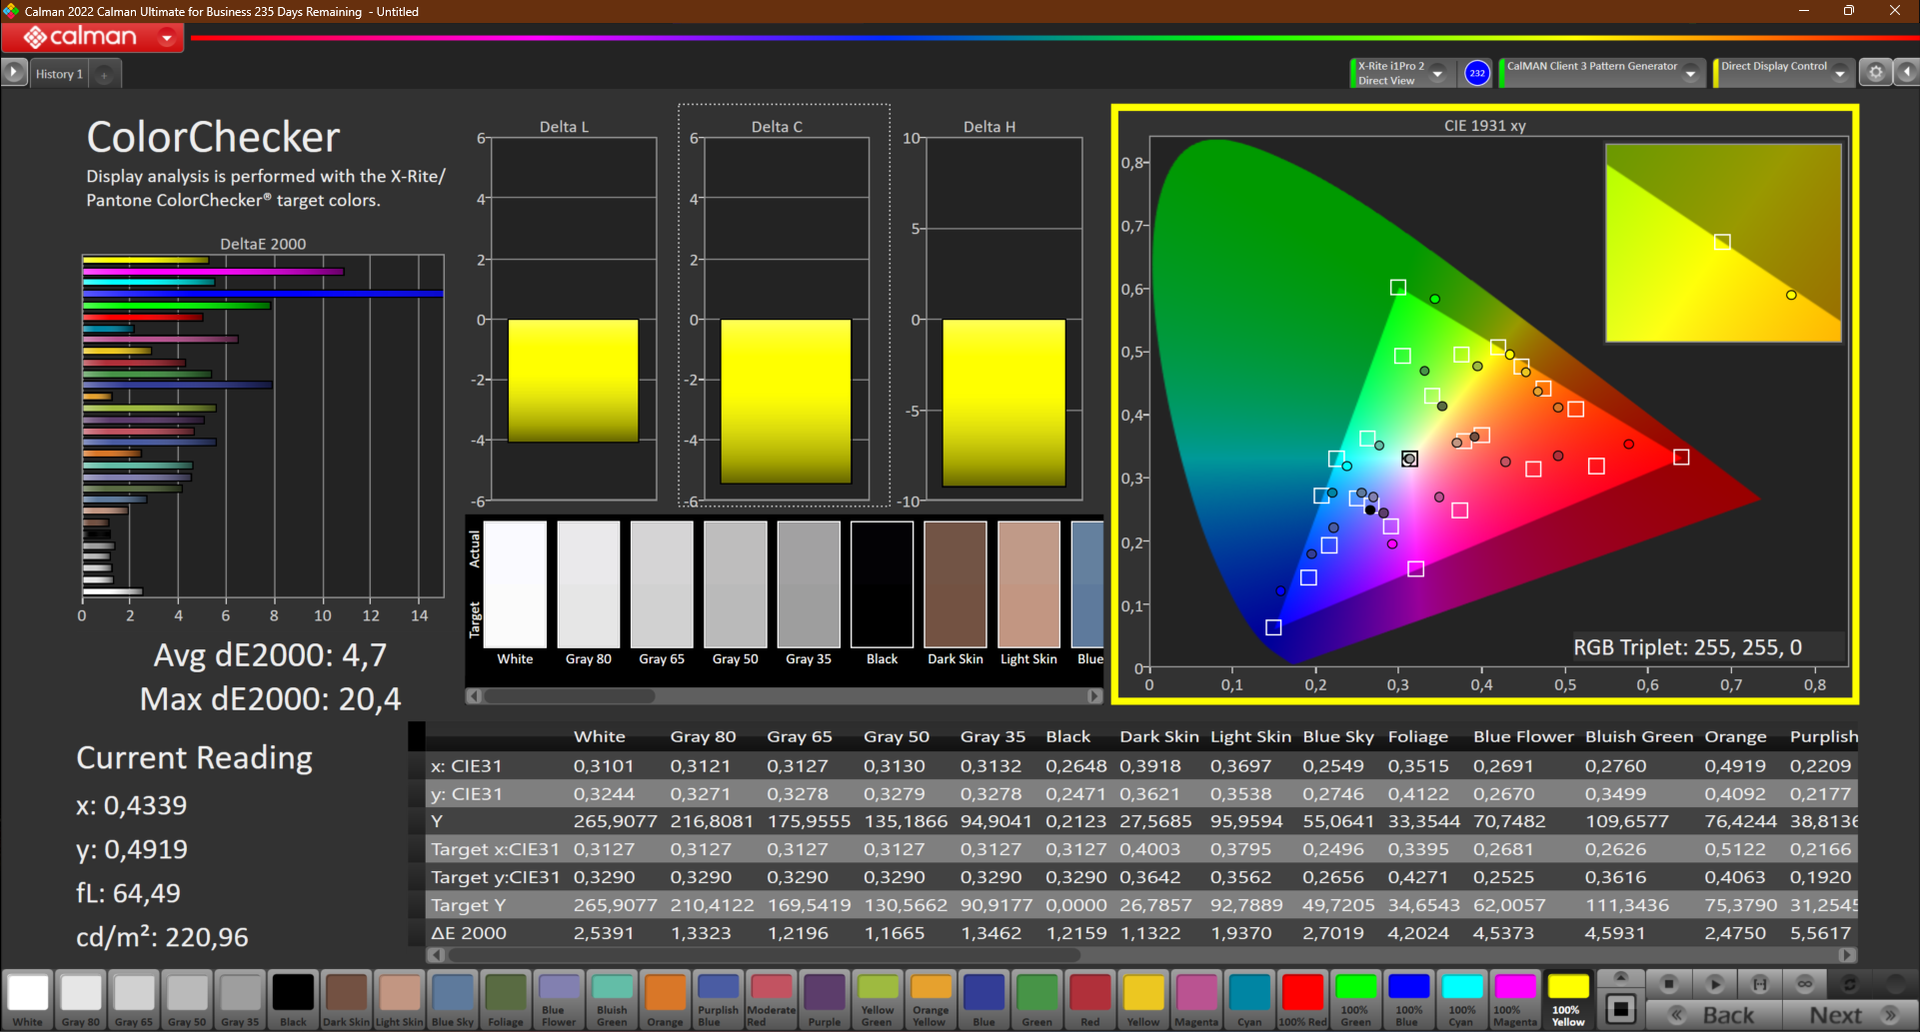
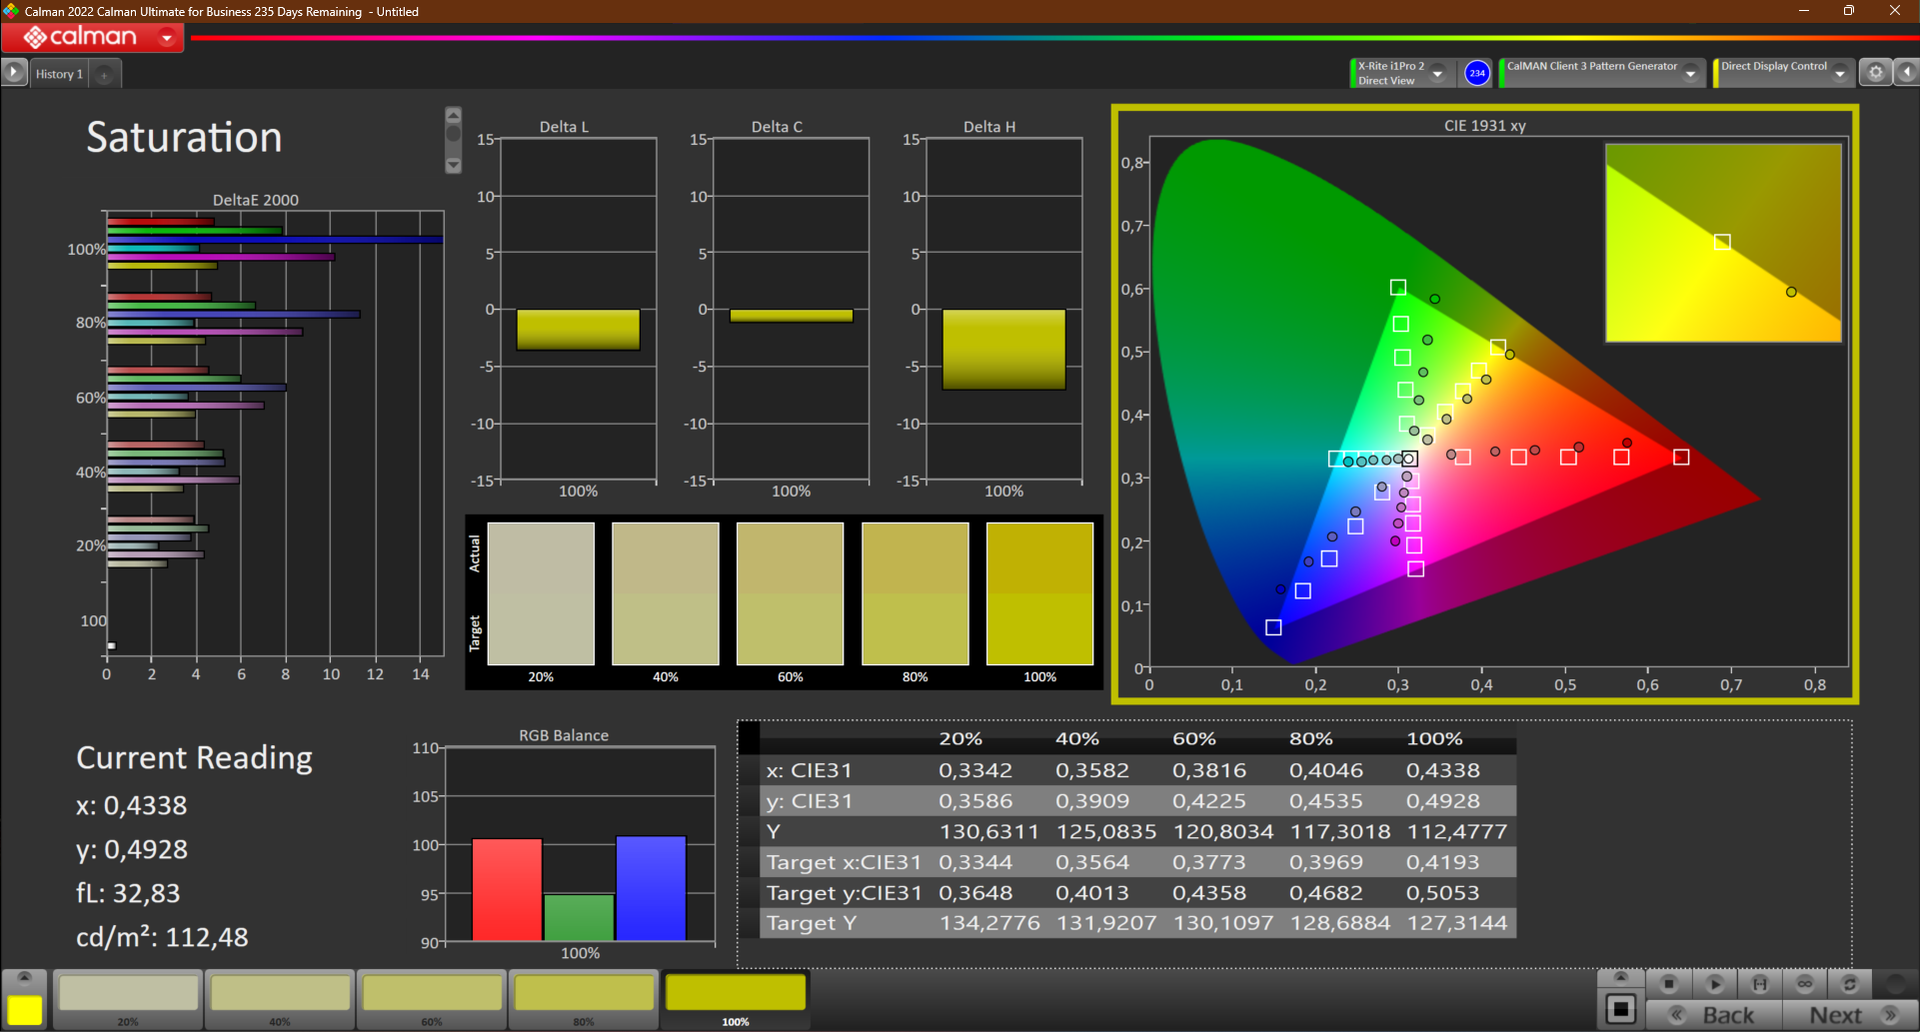
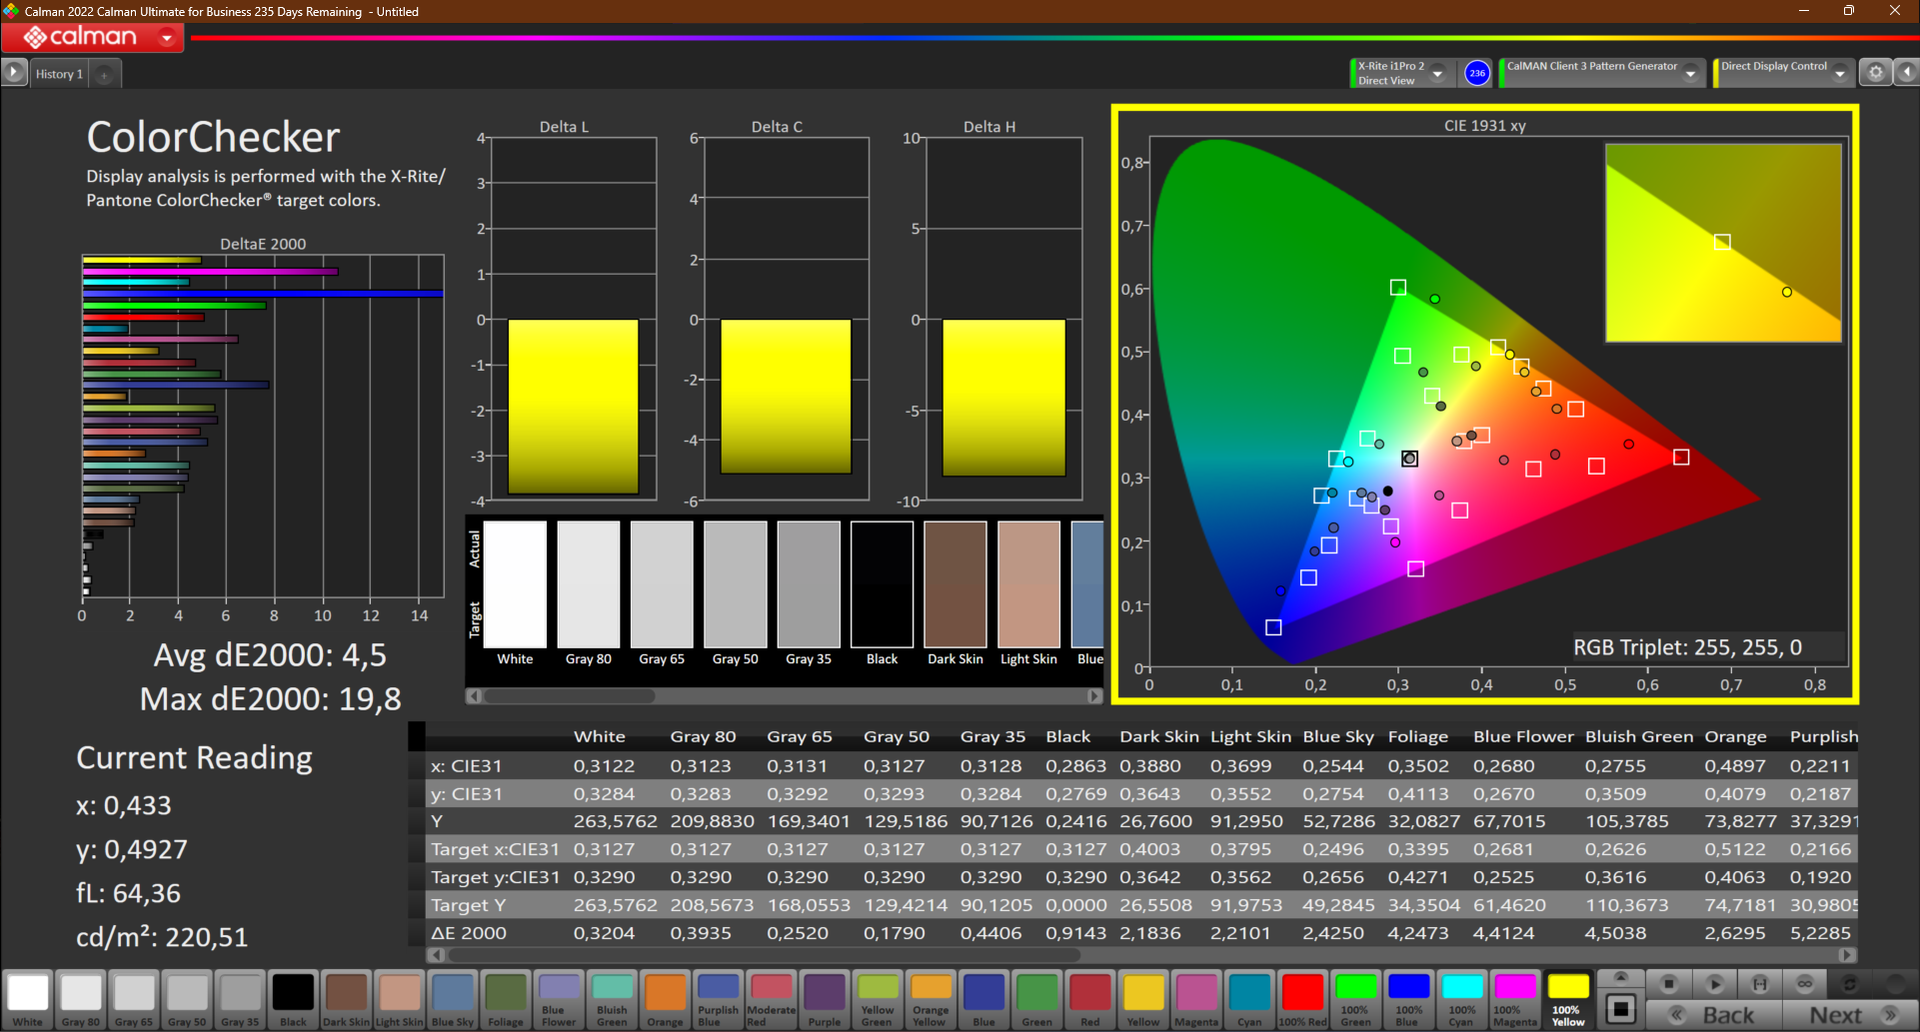
In the area of color representation, the display's less-than-positive impression continues. Even after calibration, the panel is a long away from displaying accurate colors. After calibrating it with i1Profiler and X-Rite i1Pro 2, the DeltaE-Wert dropped only minimally from 4.7 to 4.5.
The cause for this might be the lack of color space coverage. Nowadays, only 61 % of the sRGB color space is an unsatisfactory result – especially for a laptop geared towards media consumption.
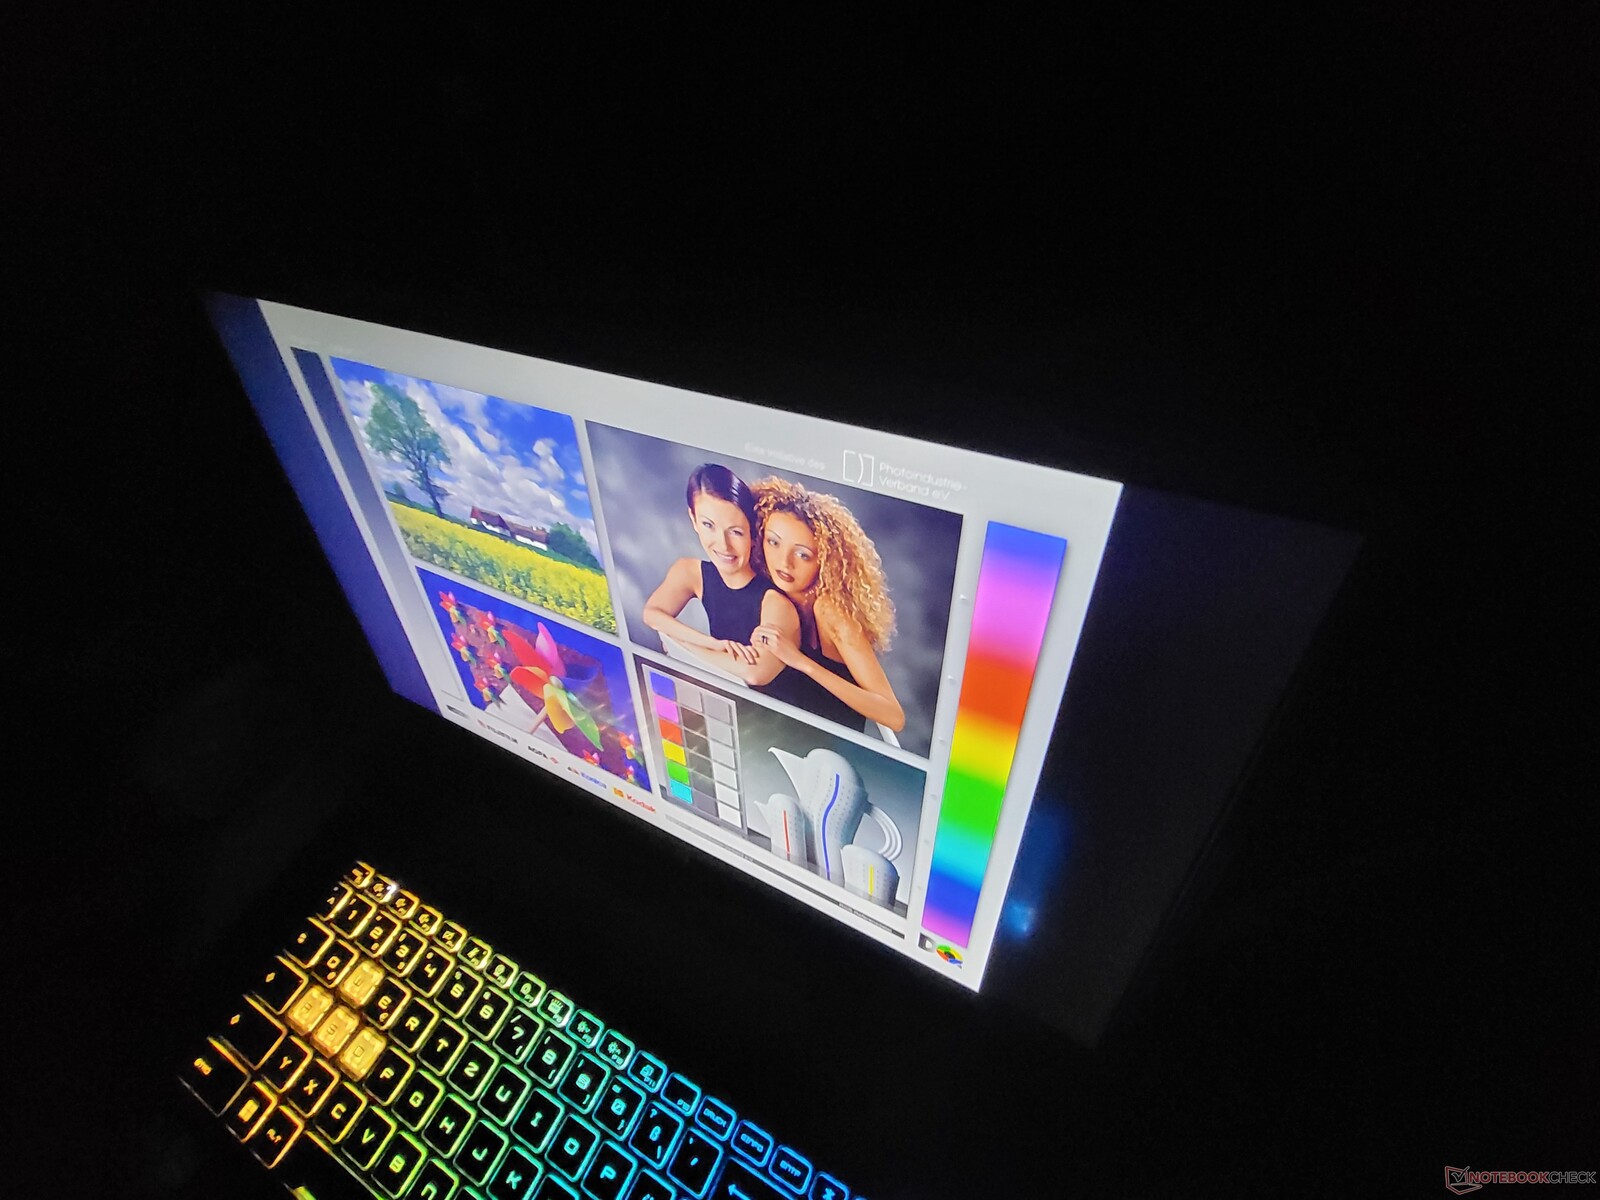
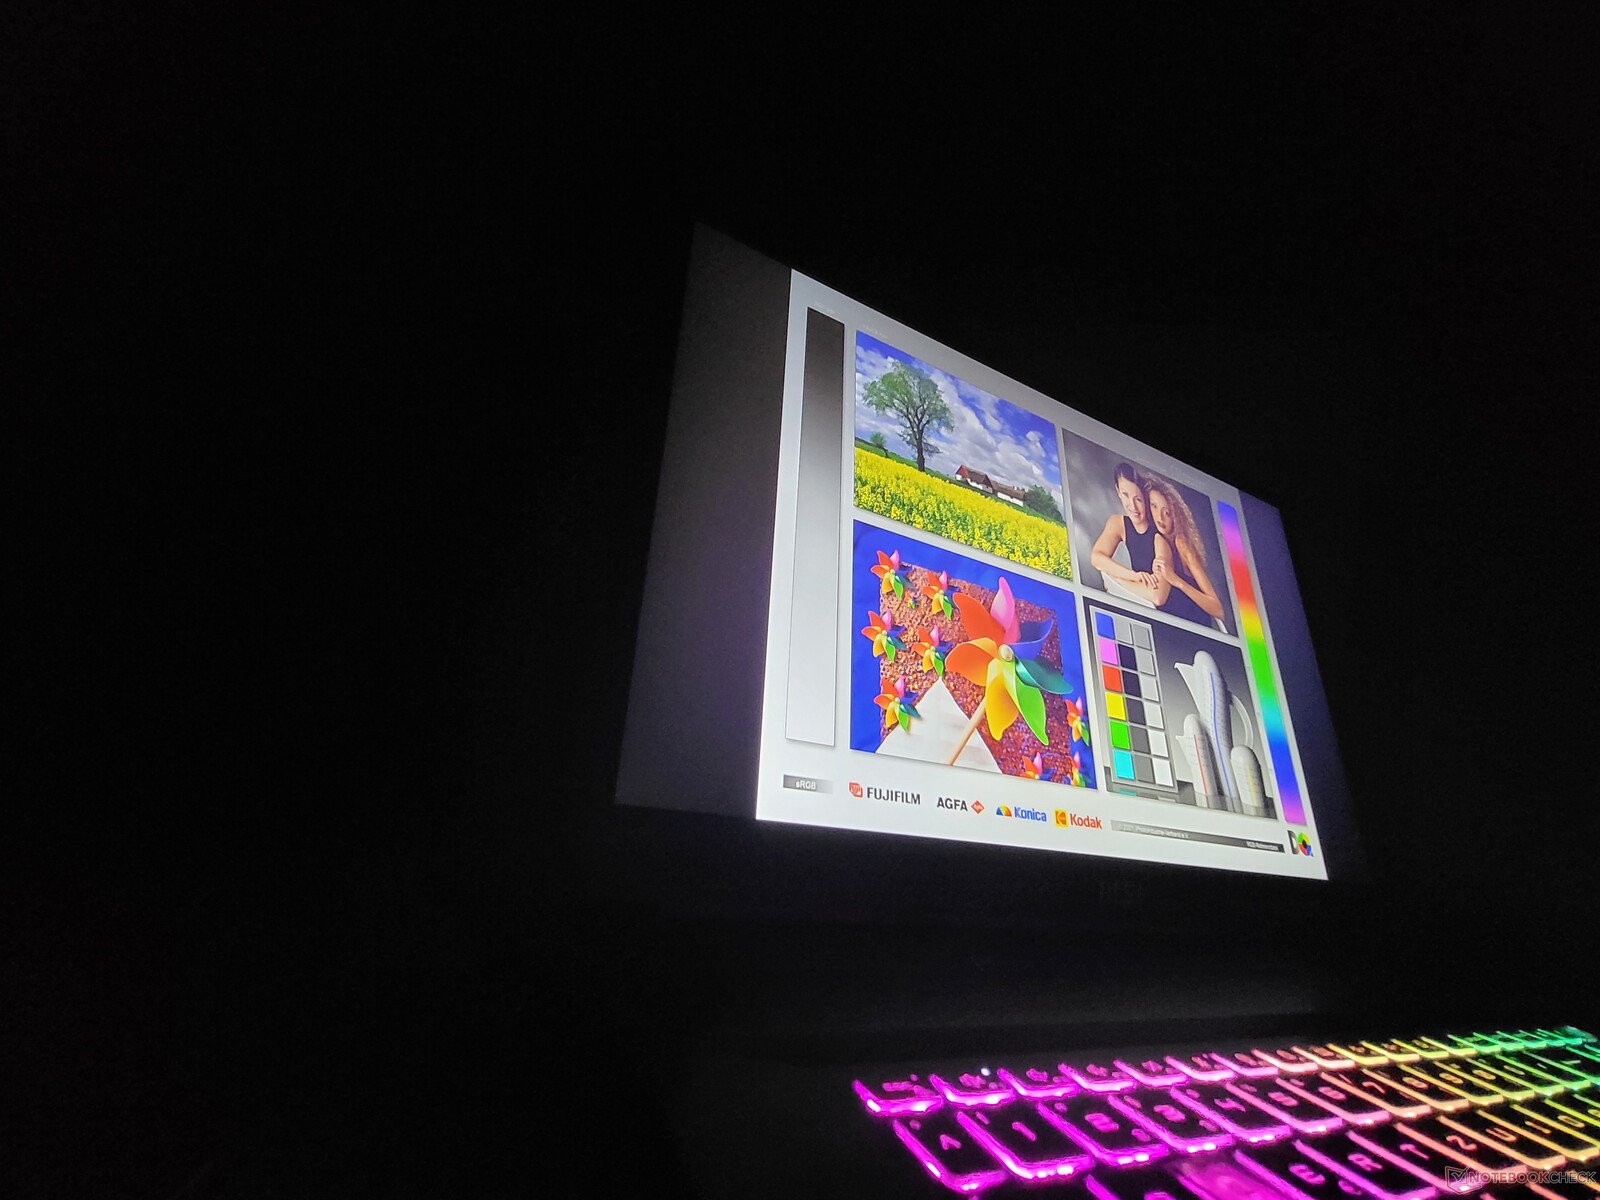
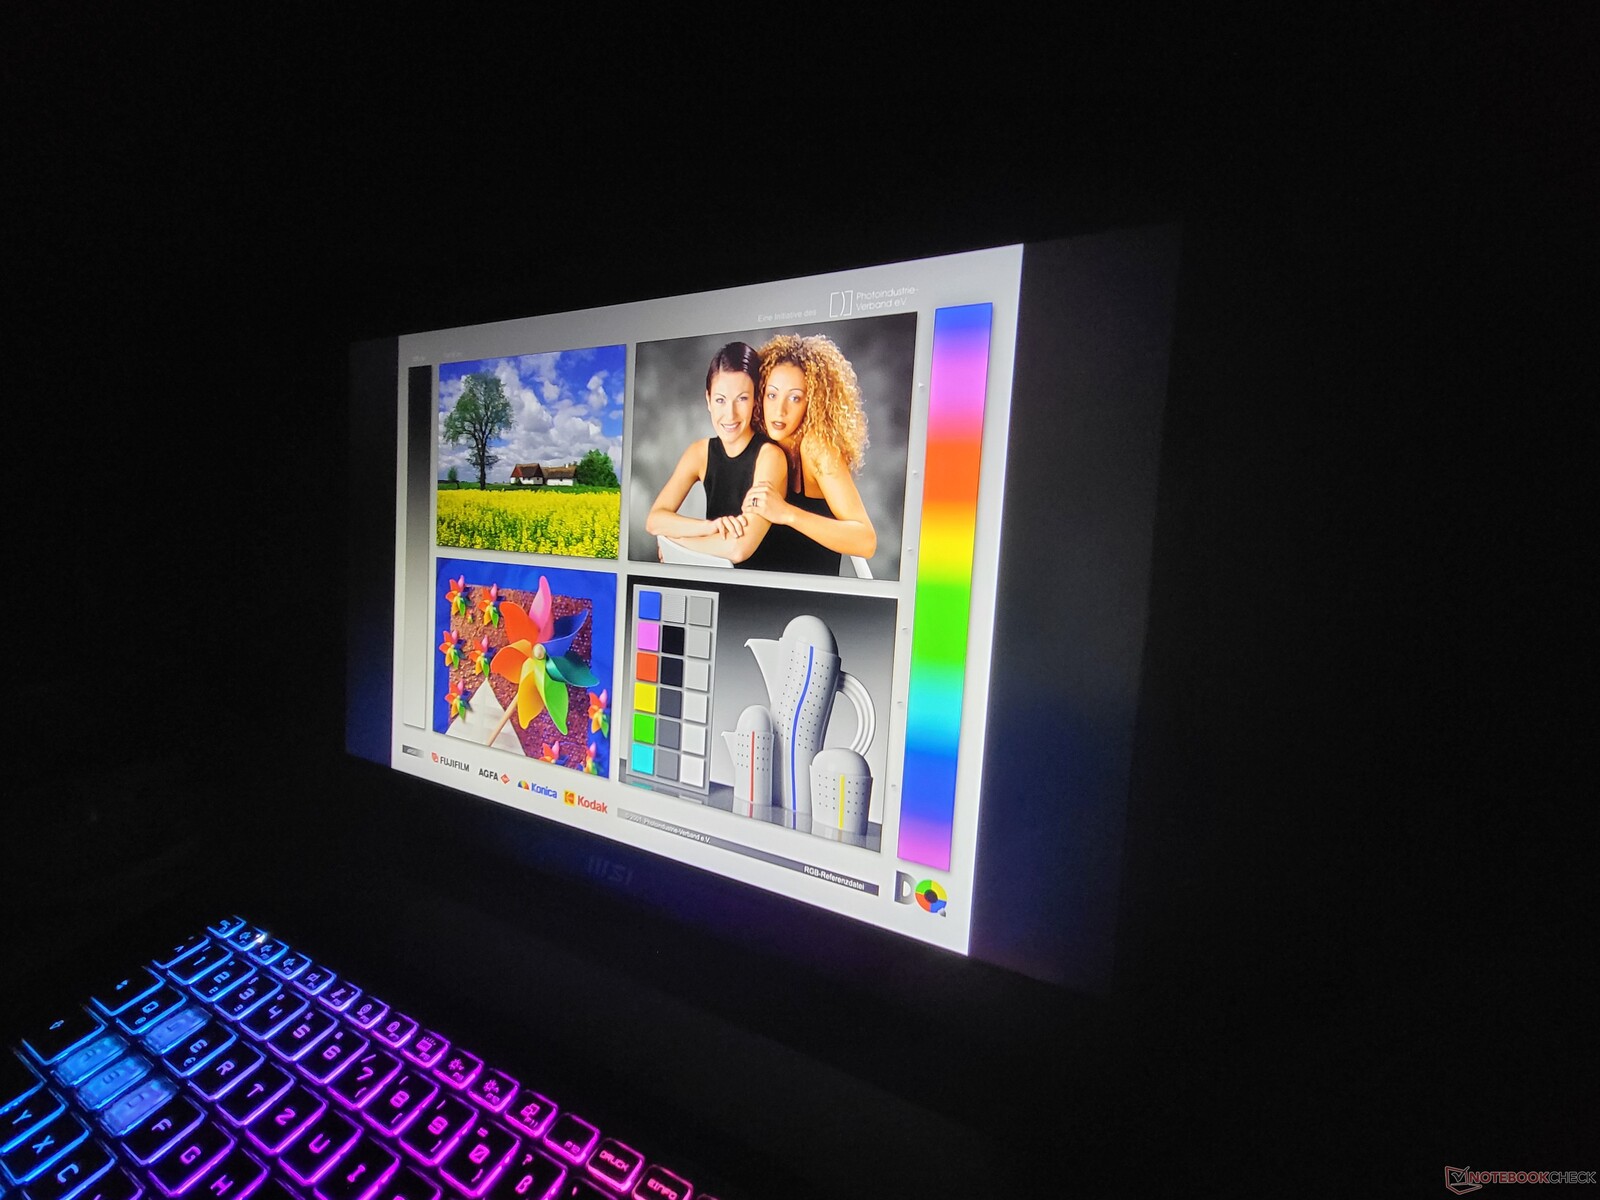
Outdoors, the MSI Katana 17 display is just about useable as long as the device is used in the shade.
Display Response Times
| ↔ Response Time Black to White | ||
|---|---|---|
| 26 ms ... rise ↗ and fall ↘ combined | ↗ 13 ms rise | 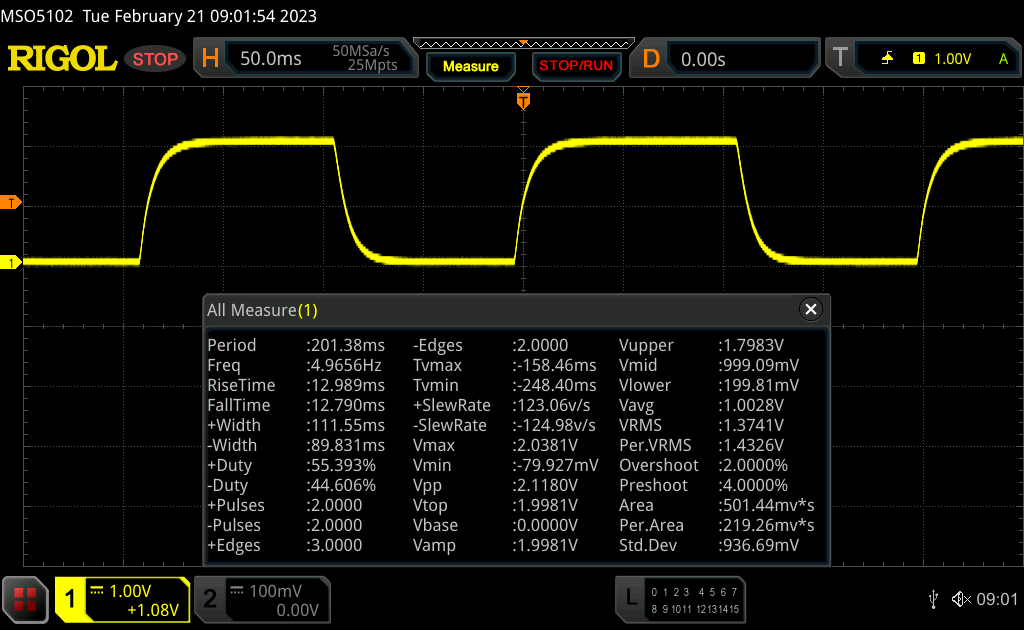 |
| ↘ 13 ms fall | ||
| The screen shows relatively slow response rates in our tests and may be too slow for gamers. In comparison, all tested devices range from 0.1 (minimum) to 240 (maximum) ms. » 61 % of all devices are better. This means that the measured response time is worse than the average of all tested devices (20.3 ms). | ||
| ↔ Response Time 50% Grey to 80% Grey | ||
| 33 ms ... rise ↗ and fall ↘ combined | ↗ 16 ms rise | 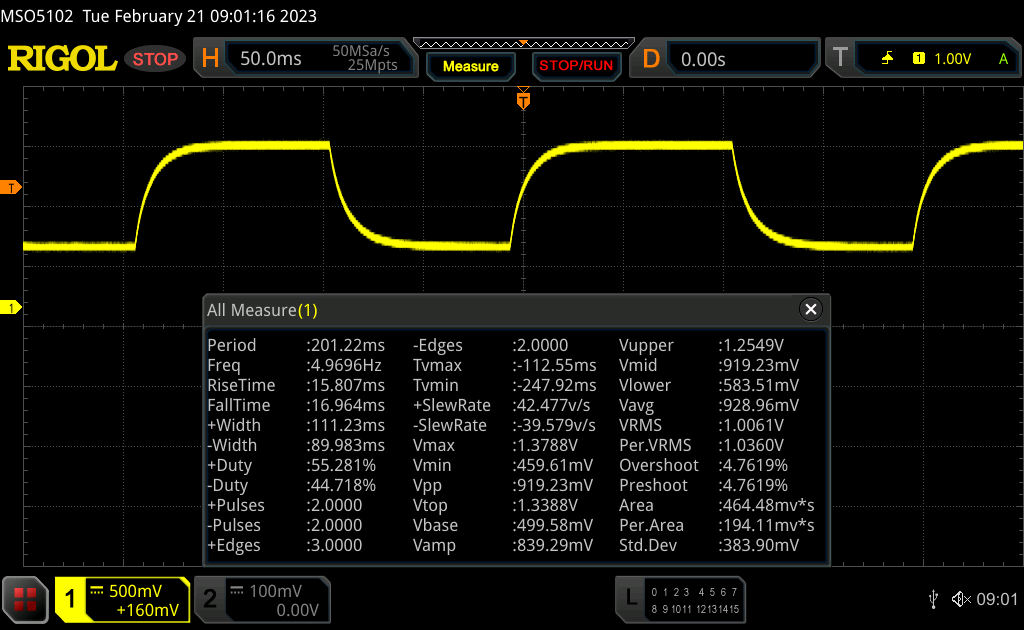 |
| ↘ 17 ms fall | ||
| The screen shows slow response rates in our tests and will be unsatisfactory for gamers. In comparison, all tested devices range from 0.165 (minimum) to 636 (maximum) ms. » 43 % of all devices are better. This means that the measured response time is similar to the average of all tested devices (31.7 ms). | ||
Screen Flickering / PWM (Pulse-Width Modulation)
| Screen flickering / PWM not detected | 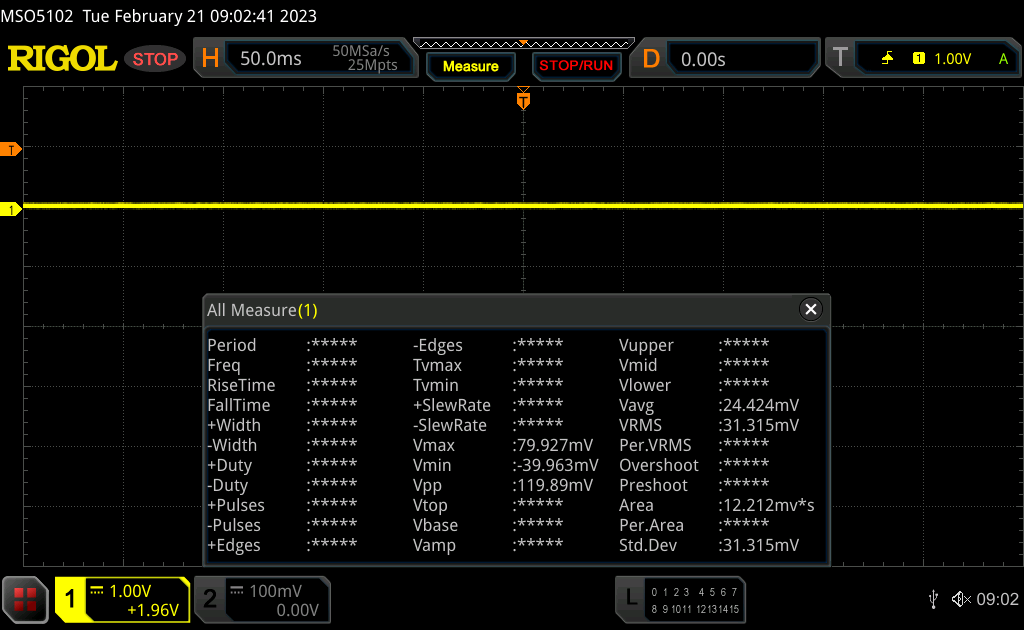 | ||
In comparison: 53 % of all tested devices do not use PWM to dim the display. If PWM was detected, an average of 8163 (minimum: 5 - maximum: 343500) Hz was measured. | |||
Performance: The Nvidia GeForce RTX 4060's debut
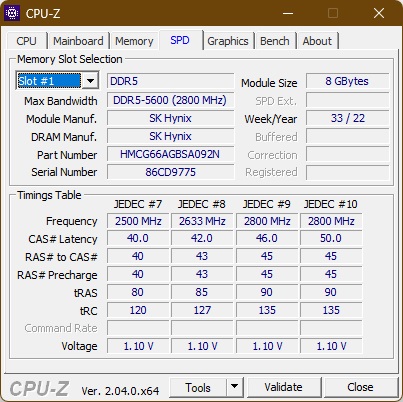
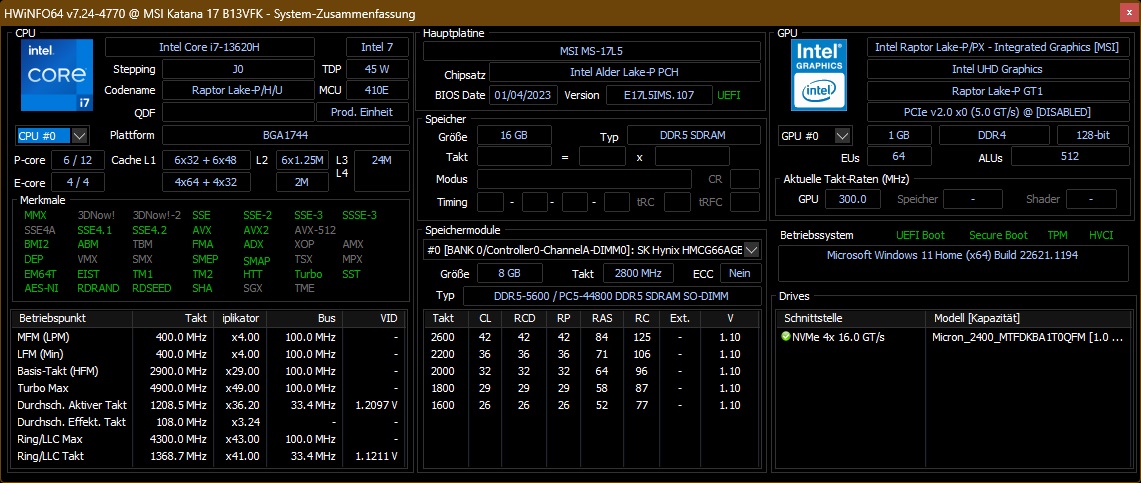
In Germany, MSI sells the Katana 17 B13V in two configurations. Both devices have Intel Core i7-13620H, Nvidia GeForce RTX 4060 as well as 16 GB of DDR5 5200 RAM in common. The only difference is: One model has a 512 GB SSD, and the other has an SSD capacity of 1 TB.
Test conditions
In MSI's software "MSI Center", there are four performance modes: Max Performance, Balanced, Silent modes as well as Super Battery. In addition, there is also an Auto mode. We ran all our tests using the Max Performance mode in which CPU consumption fluctuated between 70 and 80 watts. Performance reserves are similar in Balanced mode, which was used for the battery test. In Silent and Super Battery modes the CPU is limited to 30 and 15 watts, respectively.
Thanks to Optimus Advanced, it is possible to switch the graphics chip to purely Nvidia operation and deactivate the Intel GPU. We tested the device using the normal Optimus mode.
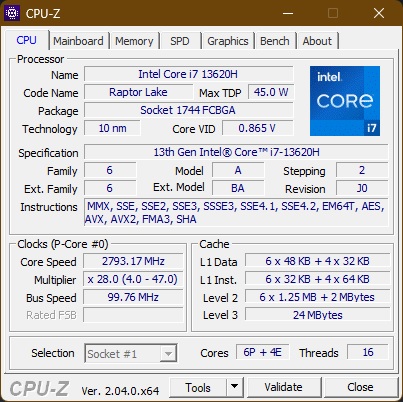
Processor
The Intel Core i7-13620H is the entry-level i7 model of the Raptor Lake H series. It has all of the six performance cores but only four of the smaller E cores. As an H CPU, it has a typical TDP of 45 watts, although this can differ greatly, depending on the laptop. All ten cores (16 threads) have a clock rate ranging from 1.8 to 4.9 GHz. You can find additional comparisons with other processors in our CPU list.
MSI has granted the processor a maximum of 80 watts. The resulting performance sits between the i7-12700H in the MSI Pulse GL76 and the i5-12500H found in the Gigabyte G7 KE. Given the specifications and small differences between Alder Lake and Raptor Lake anyway, these results were to be expected. With its eight P-cores and 16 E-cores, the Intel Core i9-13950HX is clearly ahead.
In battery mode, CPU performance is severely limited. With a total of 1399 points, the Cinebench R15 result was around 40 percent lower.
Cinebench R15 Multi Continuous Test
Cinebench R23: Multi Core | Single Core
Cinebench R20: CPU (Multi Core) | CPU (Single Core)
Cinebench R15: CPU Multi 64Bit | CPU Single 64Bit
Blender: v2.79 BMW27 CPU
7-Zip 18.03: 7z b 4 | 7z b 4 -mmt1
Geekbench 5.5: Multi-Core | Single-Core
HWBOT x265 Benchmark v2.2: 4k Preset
LibreOffice : 20 Documents To PDF
R Benchmark 2.5: Overall mean
| CPU Performance rating | |
| MSI Titan GT77 HX 13VI | |
| Average of class Gaming | |
| Asus ROG Strix Scar 17 SE G733CX-LL014W | |
| MSI Pulse GL76 12UGK | |
| MSI Katana 17 B13VFK | |
| Average Intel Core i7-13620H | |
| Acer Predator Helios 300 (i7-12700H, RTX 3070 Ti) | |
| Gigabyte G7 KE | |
| Cinebench R23 / Multi Core | |
| MSI Titan GT77 HX 13VI | |
| Average of class Gaming (5668 - 40970, n=146, last 2 years) | |
| Asus ROG Strix Scar 17 SE G733CX-LL014W | |
| Acer Predator Helios 300 (i7-12700H, RTX 3070 Ti) | |
| MSI Pulse GL76 12UGK | |
| MSI Katana 17 B13VFK | |
| Average Intel Core i7-13620H (10819 - 15496, n=6) | |
| Gigabyte G7 KE | |
| Cinebench R23 / Single Core | |
| MSI Titan GT77 HX 13VI | |
| Average of class Gaming (1136 - 2267, n=146, last 2 years) | |
| Asus ROG Strix Scar 17 SE G733CX-LL014W | |
| Average Intel Core i7-13620H (1805 - 1871, n=6) | |
| MSI Katana 17 B13VFK | |
| Acer Predator Helios 300 (i7-12700H, RTX 3070 Ti) | |
| MSI Pulse GL76 12UGK | |
| Gigabyte G7 KE | |
| Cinebench R20 / CPU (Multi Core) | |
| MSI Titan GT77 HX 13VI | |
| Average of class Gaming (2179 - 16108, n=145, last 2 years) | |
| Asus ROG Strix Scar 17 SE G733CX-LL014W | |
| MSI Pulse GL76 12UGK | |
| MSI Katana 17 B13VFK | |
| Acer Predator Helios 300 (i7-12700H, RTX 3070 Ti) | |
| Average Intel Core i7-13620H (4214 - 5905, n=6) | |
| Gigabyte G7 KE | |
| Cinebench R20 / CPU (Single Core) | |
| MSI Titan GT77 HX 13VI | |
| Average of class Gaming (439 - 870, n=145, last 2 years) | |
| Asus ROG Strix Scar 17 SE G733CX-LL014W | |
| Average Intel Core i7-13620H (693 - 719, n=6) | |
| Acer Predator Helios 300 (i7-12700H, RTX 3070 Ti) | |
| MSI Katana 17 B13VFK | |
| MSI Pulse GL76 12UGK | |
| Gigabyte G7 KE | |
| Cinebench R15 / CPU Multi 64Bit | |
| MSI Titan GT77 HX 13VI | |
| Average of class Gaming (1537 - 6271, n=145, last 2 years) | |
| Asus ROG Strix Scar 17 SE G733CX-LL014W | |
| Acer Predator Helios 300 (i7-12700H, RTX 3070 Ti) | |
| MSI Pulse GL76 12UGK | |
| MSI Katana 17 B13VFK | |
| Average Intel Core i7-13620H (1681 - 2492, n=6) | |
| Gigabyte G7 KE | |
| Cinebench R15 / CPU Single 64Bit | |
| MSI Titan GT77 HX 13VI | |
| Average of class Gaming (188.8 - 343, n=144, last 2 years) | |
| Asus ROG Strix Scar 17 SE G733CX-LL014W | |
| Average Intel Core i7-13620H (258 - 269, n=6) | |
| MSI Katana 17 B13VFK | |
| MSI Pulse GL76 12UGK | |
| Acer Predator Helios 300 (i7-12700H, RTX 3070 Ti) | |
| Gigabyte G7 KE | |
| Blender / v2.79 BMW27 CPU | |
| Average Intel Core i7-13620H (215 - 289, n=6) | |
| Gigabyte G7 KE | |
| MSI Katana 17 B13VFK | |
| Acer Predator Helios 300 (i7-12700H, RTX 3070 Ti) | |
| MSI Pulse GL76 12UGK | |
| Asus ROG Strix Scar 17 SE G733CX-LL014W | |
| Average of class Gaming (80 - 517, n=141, last 2 years) | |
| MSI Titan GT77 HX 13VI | |
| 7-Zip 18.03 / 7z b 4 | |
| MSI Titan GT77 HX 13VI | |
| Average of class Gaming (23795 - 148086, n=143, last 2 years) | |
| Asus ROG Strix Scar 17 SE G733CX-LL014W | |
| Acer Predator Helios 300 (i7-12700H, RTX 3070 Ti) | |
| MSI Pulse GL76 12UGK | |
| MSI Katana 17 B13VFK | |
| Average Intel Core i7-13620H (45983 - 62324, n=6) | |
| Gigabyte G7 KE | |
| 7-Zip 18.03 / 7z b 4 -mmt1 | |
| MSI Titan GT77 HX 13VI | |
| Average of class Gaming (4199 - 7508, n=143, last 2 years) | |
| Asus ROG Strix Scar 17 SE G733CX-LL014W | |
| Average Intel Core i7-13620H (5742 - 6326, n=6) | |
| Acer Predator Helios 300 (i7-12700H, RTX 3070 Ti) | |
| MSI Katana 17 B13VFK | |
| MSI Pulse GL76 12UGK | |
| Gigabyte G7 KE | |
| Geekbench 5.5 / Multi-Core | |
| MSI Titan GT77 HX 13VI | |
| Average of class Gaming (4557 - 27010, n=142, last 2 years) | |
| Asus ROG Strix Scar 17 SE G733CX-LL014W | |
| Acer Predator Helios 300 (i7-12700H, RTX 3070 Ti) | |
| MSI Pulse GL76 12UGK | |
| MSI Katana 17 B13VFK | |
| Average Intel Core i7-13620H (8357 - 12223, n=6) | |
| Gigabyte G7 KE | |
| Geekbench 5.5 / Single-Core | |
| MSI Titan GT77 HX 13VI | |
| Average of class Gaming (986 - 2423, n=142, last 2 years) | |
| Asus ROG Strix Scar 17 SE G733CX-LL014W | |
| Average Intel Core i7-13620H (1785 - 1865, n=6) | |
| MSI Katana 17 B13VFK | |
| Acer Predator Helios 300 (i7-12700H, RTX 3070 Ti) | |
| Gigabyte G7 KE | |
| MSI Pulse GL76 12UGK | |
| HWBOT x265 Benchmark v2.2 / 4k Preset | |
| MSI Titan GT77 HX 13VI | |
| Average of class Gaming (7.7 - 44.3, n=143, last 2 years) | |
| Asus ROG Strix Scar 17 SE G733CX-LL014W | |
| MSI Pulse GL76 12UGK | |
| MSI Katana 17 B13VFK | |
| Gigabyte G7 KE | |
| Acer Predator Helios 300 (i7-12700H, RTX 3070 Ti) | |
| Average Intel Core i7-13620H (12.9 - 17.7, n=6) | |
| LibreOffice / 20 Documents To PDF | |
| Acer Predator Helios 300 (i7-12700H, RTX 3070 Ti) | |
| MSI Katana 17 B13VFK | |
| Average Intel Core i7-13620H (41.5 - 56.8, n=6) | |
| Average of class Gaming (19 - 88.8, n=142, last 2 years) | |
| MSI Titan GT77 HX 13VI | |
| MSI Pulse GL76 12UGK | |
| Gigabyte G7 KE | |
| Asus ROG Strix Scar 17 SE G733CX-LL014W | |
| R Benchmark 2.5 / Overall mean | |
| Gigabyte G7 KE | |
| MSI Pulse GL76 12UGK | |
| Acer Predator Helios 300 (i7-12700H, RTX 3070 Ti) | |
| Average Intel Core i7-13620H (0.4438 - 0.4545, n=6) | |
| MSI Katana 17 B13VFK | |
| Average of class Gaming (0.3551 - 0.759, n=144, last 2 years) | |
| Asus ROG Strix Scar 17 SE G733CX-LL014W | |
| MSI Titan GT77 HX 13VI | |
* ... smaller is better
AIDA64: FP32 Ray-Trace | FPU Julia | CPU SHA3 | CPU Queen | FPU SinJulia | FPU Mandel | CPU AES | CPU ZLib | FP64 Ray-Trace | CPU PhotoWorxx
| Performance rating | |
| MSI Titan GT77 HX 13VI | |
| Average of class Gaming | |
| Asus ROG Strix Scar 17 SE G733CX-LL014W | |
| Acer Predator Helios 300 (i7-12700H, RTX 3070 Ti) | |
| MSI Pulse GL76 12UGK | |
| Gigabyte G7 KE | |
| MSI Katana 17 B13VFK | |
| Average Intel Core i7-13620H | |
| AIDA64 / FP32 Ray-Trace | |
| MSI Titan GT77 HX 13VI | |
| Average of class Gaming (7192 - 85542, n=141, last 2 years) | |
| Asus ROG Strix Scar 17 SE G733CX-LL014W | |
| Acer Predator Helios 300 (i7-12700H, RTX 3070 Ti) | |
| MSI Pulse GL76 12UGK | |
| MSI Katana 17 B13VFK | |
| Gigabyte G7 KE | |
| Average Intel Core i7-13620H (10779 - 13601, n=6) | |
| AIDA64 / FPU Julia | |
| MSI Titan GT77 HX 13VI | |
| Average of class Gaming (35040 - 252486, n=141, last 2 years) | |
| Acer Predator Helios 300 (i7-12700H, RTX 3070 Ti) | |
| Asus ROG Strix Scar 17 SE G733CX-LL014W | |
| MSI Pulse GL76 12UGK | |
| MSI Katana 17 B13VFK | |
| Gigabyte G7 KE | |
| Average Intel Core i7-13620H (54287 - 67187, n=6) | |
| AIDA64 / CPU SHA3 | |
| MSI Titan GT77 HX 13VI | |
| Average of class Gaming (1728 - 10389, n=141, last 2 years) | |
| Asus ROG Strix Scar 17 SE G733CX-LL014W | |
| Acer Predator Helios 300 (i7-12700H, RTX 3070 Ti) | |
| MSI Pulse GL76 12UGK | |
| Gigabyte G7 KE | |
| MSI Katana 17 B13VFK | |
| Average Intel Core i7-13620H (2357 - 2773, n=6) | |
| AIDA64 / CPU Queen | |
| MSI Titan GT77 HX 13VI | |
| Average of class Gaming (50699 - 200651, n=141, last 2 years) | |
| Asus ROG Strix Scar 17 SE G733CX-LL014W | |
| MSI Pulse GL76 12UGK | |
| Acer Predator Helios 300 (i7-12700H, RTX 3070 Ti) | |
| Gigabyte G7 KE | |
| MSI Katana 17 B13VFK | |
| Average Intel Core i7-13620H (66885 - 78867, n=6) | |
| AIDA64 / FPU SinJulia | |
| MSI Titan GT77 HX 13VI | |
| Average of class Gaming (5020 - 33636, n=141, last 2 years) | |
| Asus ROG Strix Scar 17 SE G733CX-LL014W | |
| Acer Predator Helios 300 (i7-12700H, RTX 3070 Ti) | |
| MSI Pulse GL76 12UGK | |
| MSI Katana 17 B13VFK | |
| Average Intel Core i7-13620H (6737 - 8421, n=6) | |
| Gigabyte G7 KE | |
| AIDA64 / FPU Mandel | |
| MSI Titan GT77 HX 13VI | |
| Average of class Gaming (17585 - 134044, n=141, last 2 years) | |
| Acer Predator Helios 300 (i7-12700H, RTX 3070 Ti) | |
| Asus ROG Strix Scar 17 SE G733CX-LL014W | |
| MSI Pulse GL76 12UGK | |
| MSI Katana 17 B13VFK | |
| Gigabyte G7 KE | |
| Average Intel Core i7-13620H (27242 - 32787, n=6) | |
| AIDA64 / CPU AES | |
| Asus ROG Strix Scar 17 SE G733CX-LL014W | |
| MSI Pulse GL76 12UGK | |
| MSI Titan GT77 HX 13VI | |
| Gigabyte G7 KE | |
| Average of class Gaming (19065 - 247074, n=141, last 2 years) | |
| Acer Predator Helios 300 (i7-12700H, RTX 3070 Ti) | |
| Average Intel Core i7-13620H (52697 - 85895, n=6) | |
| MSI Katana 17 B13VFK | |
| AIDA64 / CPU ZLib | |
| MSI Titan GT77 HX 13VI | |
| Average of class Gaming (373 - 2531, n=141, last 2 years) | |
| Asus ROG Strix Scar 17 SE G733CX-LL014W | |
| Acer Predator Helios 300 (i7-12700H, RTX 3070 Ti) | |
| MSI Pulse GL76 12UGK | |
| Gigabyte G7 KE | |
| MSI Katana 17 B13VFK | |
| Average Intel Core i7-13620H (697 - 835, n=6) | |
| AIDA64 / FP64 Ray-Trace | |
| MSI Titan GT77 HX 13VI | |
| Average of class Gaming (3856 - 45446, n=141, last 2 years) | |
| Acer Predator Helios 300 (i7-12700H, RTX 3070 Ti) | |
| Asus ROG Strix Scar 17 SE G733CX-LL014W | |
| MSI Pulse GL76 12UGK | |
| MSI Katana 17 B13VFK | |
| Gigabyte G7 KE | |
| Average Intel Core i7-13620H (6077 - 7364, n=6) | |
| AIDA64 / CPU PhotoWorxx | |
| Average of class Gaming (10805 - 62916, n=141, last 2 years) | |
| Asus ROG Strix Scar 17 SE G733CX-LL014W | |
| MSI Titan GT77 HX 13VI | |
| Acer Predator Helios 300 (i7-12700H, RTX 3070 Ti) | |
| MSI Katana 17 B13VFK | |
| Average Intel Core i7-13620H (19421 - 34544, n=6) | |
| Gigabyte G7 KE | |
| MSI Pulse GL76 12UGK | |
System performance
A fast SSD, paired with the Katana 17's powerful graphics chip, result in very good system performance which is, of course, somewhat behind the better-configured competition in synthetic benchmarks.
CrossMark: Overall | Productivity | Creativity | Responsiveness
| PCMark 10 / Score | |
| MSI Titan GT77 HX 13VI | |
| Average of class Gaming (5776 - 9852, n=120, last 2 years) | |
| Acer Predator Helios 300 (i7-12700H, RTX 3070 Ti) | |
| MSI Pulse GL76 12UGK | |
| Asus ROG Strix Scar 17 SE G733CX-LL014W | |
| MSI Katana 17 B13VFK | |
| Average Intel Core i7-13620H, NVIDIA GeForce RTX 4060 Laptop GPU (6678 - 7256, n=3) | |
| Gigabyte G7 KE | |
| PCMark 10 / Essentials | |
| MSI Titan GT77 HX 13VI | |
| MSI Pulse GL76 12UGK | |
| MSI Katana 17 B13VFK | |
| Average of class Gaming (8840 - 12600, n=124, last 2 years) | |
| Acer Predator Helios 300 (i7-12700H, RTX 3070 Ti) | |
| Average Intel Core i7-13620H, NVIDIA GeForce RTX 4060 Laptop GPU (9909 - 10809, n=3) | |
| Asus ROG Strix Scar 17 SE G733CX-LL014W | |
| Gigabyte G7 KE | |
| PCMark 10 / Productivity | |
| Acer Predator Helios 300 (i7-12700H, RTX 3070 Ti) | |
| MSI Pulse GL76 12UGK | |
| Asus ROG Strix Scar 17 SE G733CX-LL014W | |
| MSI Titan GT77 HX 13VI | |
| Average of class Gaming (6662 - 14612, n=120, last 2 years) | |
| MSI Katana 17 B13VFK | |
| Average Intel Core i7-13620H, NVIDIA GeForce RTX 4060 Laptop GPU (8642 - 9781, n=3) | |
| Gigabyte G7 KE | |
| PCMark 10 / Digital Content Creation | |
| MSI Titan GT77 HX 13VI | |
| Average of class Gaming (7440 - 19351, n=120, last 2 years) | |
| Acer Predator Helios 300 (i7-12700H, RTX 3070 Ti) | |
| MSI Pulse GL76 12UGK | |
| Asus ROG Strix Scar 17 SE G733CX-LL014W | |
| MSI Katana 17 B13VFK | |
| Average Intel Core i7-13620H, NVIDIA GeForce RTX 4060 Laptop GPU (9437 - 10204, n=3) | |
| Gigabyte G7 KE | |
| CrossMark / Overall | |
| MSI Titan GT77 HX 13VI | |
| Asus ROG Strix Scar 17 SE G733CX-LL014W | |
| Average of class Gaming (1247 - 2344, n=114, last 2 years) | |
| Average Intel Core i7-13620H, NVIDIA GeForce RTX 4060 Laptop GPU (1857 - 1986, n=3) | |
| Acer Predator Helios 300 (i7-12700H, RTX 3070 Ti) | |
| MSI Katana 17 B13VFK | |
| MSI Pulse GL76 12UGK | |
| Gigabyte G7 KE | |
| CrossMark / Productivity | |
| MSI Titan GT77 HX 13VI | |
| Asus ROG Strix Scar 17 SE G733CX-LL014W | |
| Average of class Gaming (1299 - 2211, n=114, last 2 years) | |
| Average Intel Core i7-13620H, NVIDIA GeForce RTX 4060 Laptop GPU (1765 - 1908, n=3) | |
| Gigabyte G7 KE | |
| MSI Pulse GL76 12UGK | |
| Acer Predator Helios 300 (i7-12700H, RTX 3070 Ti) | |
| MSI Katana 17 B13VFK | |
| CrossMark / Creativity | |
| MSI Titan GT77 HX 13VI | |
| Asus ROG Strix Scar 17 SE G733CX-LL014W | |
| Average of class Gaming (1275 - 2729, n=114, last 2 years) | |
| Acer Predator Helios 300 (i7-12700H, RTX 3070 Ti) | |
| Average Intel Core i7-13620H, NVIDIA GeForce RTX 4060 Laptop GPU (2013 - 2067, n=3) | |
| MSI Katana 17 B13VFK | |
| MSI Pulse GL76 12UGK | |
| Gigabyte G7 KE | |
| CrossMark / Responsiveness | |
| Gigabyte G7 KE | |
| Asus ROG Strix Scar 17 SE G733CX-LL014W | |
| Average Intel Core i7-13620H, NVIDIA GeForce RTX 4060 Laptop GPU (1734 - 1989, n=3) | |
| MSI Titan GT77 HX 13VI | |
| MSI Pulse GL76 12UGK | |
| Average of class Gaming (1030 - 2330, n=114, last 2 years) | |
| MSI Katana 17 B13VFK | |
| Acer Predator Helios 300 (i7-12700H, RTX 3070 Ti) | |
| PCMark 10 Score | 7160 points | |
Help | ||
| AIDA64 / Memory Copy | |
| Average of class Gaming (21750 - 104987, n=141, last 2 years) | |
| MSI Titan GT77 HX 13VI | |
| Asus ROG Strix Scar 17 SE G733CX-LL014W | |
| Acer Predator Helios 300 (i7-12700H, RTX 3070 Ti) | |
| MSI Katana 17 B13VFK | |
| Average Intel Core i7-13620H (31629 - 53927, n=6) | |
| MSI Pulse GL76 12UGK | |
| Gigabyte G7 KE | |
| AIDA64 / Memory Read | |
| Average of class Gaming (22956 - 104349, n=141, last 2 years) | |
| Asus ROG Strix Scar 17 SE G733CX-LL014W | |
| MSI Titan GT77 HX 13VI | |
| MSI Katana 17 B13VFK | |
| Acer Predator Helios 300 (i7-12700H, RTX 3070 Ti) | |
| Average Intel Core i7-13620H (35115 - 61853, n=6) | |
| MSI Pulse GL76 12UGK | |
| Gigabyte G7 KE | |
| AIDA64 / Memory Write | |
| Average of class Gaming (22297 - 133486, n=141, last 2 years) | |
| Asus ROG Strix Scar 17 SE G733CX-LL014W | |
| MSI Titan GT77 HX 13VI | |
| Acer Predator Helios 300 (i7-12700H, RTX 3070 Ti) | |
| MSI Katana 17 B13VFK | |
| Gigabyte G7 KE | |
| MSI Pulse GL76 12UGK | |
| Average Intel Core i7-13620H (30611 - 54111, n=6) | |
| AIDA64 / Memory Latency | |
| MSI Katana 17 B13VFK | |
| Average of class Gaming (59.5 - 259, n=141, last 2 years) | |
| Average Intel Core i7-13620H (75.9 - 108.2, n=6) | |
| MSI Pulse GL76 12UGK | |
| MSI Titan GT77 HX 13VI | |
| Acer Predator Helios 300 (i7-12700H, RTX 3070 Ti) | |
| Gigabyte G7 KE | |
| Asus ROG Strix Scar 17 SE G733CX-LL014W | |
* ... smaller is better
DPC latencies
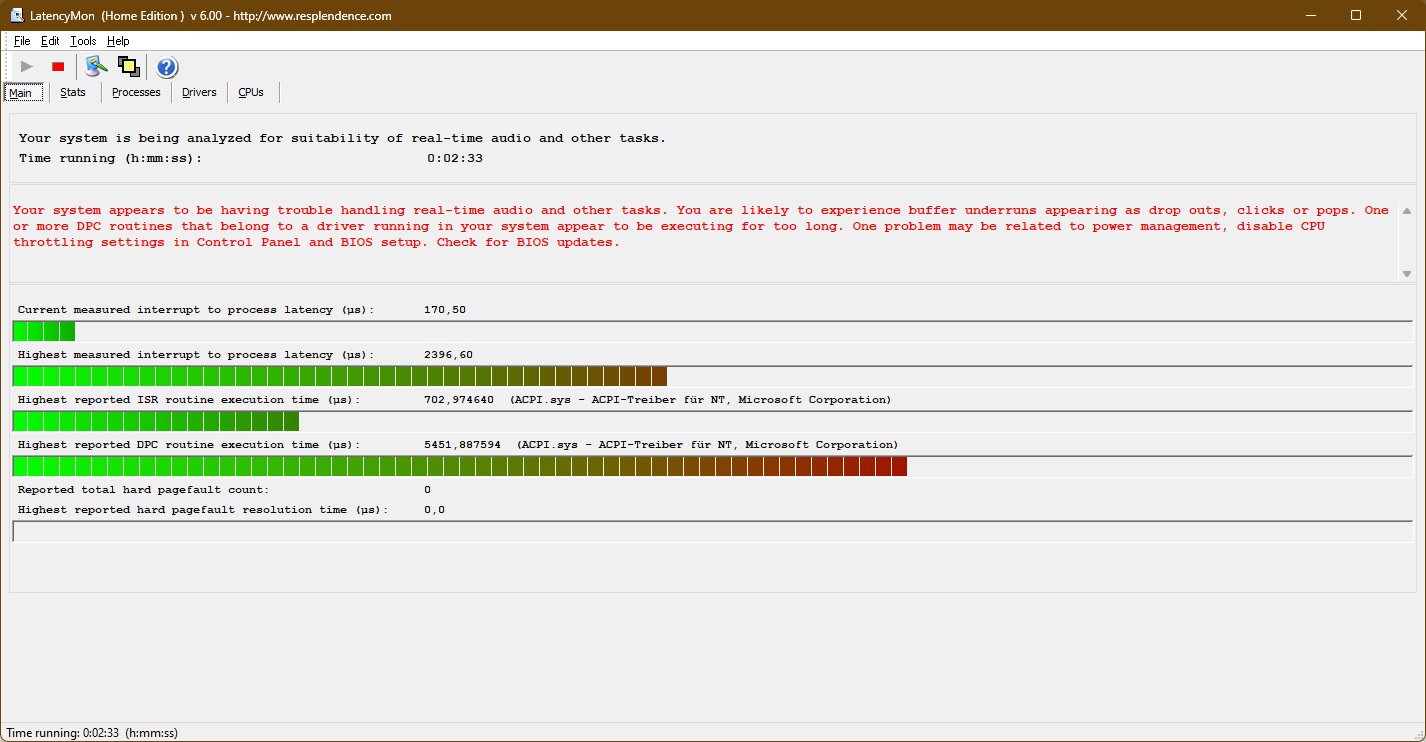
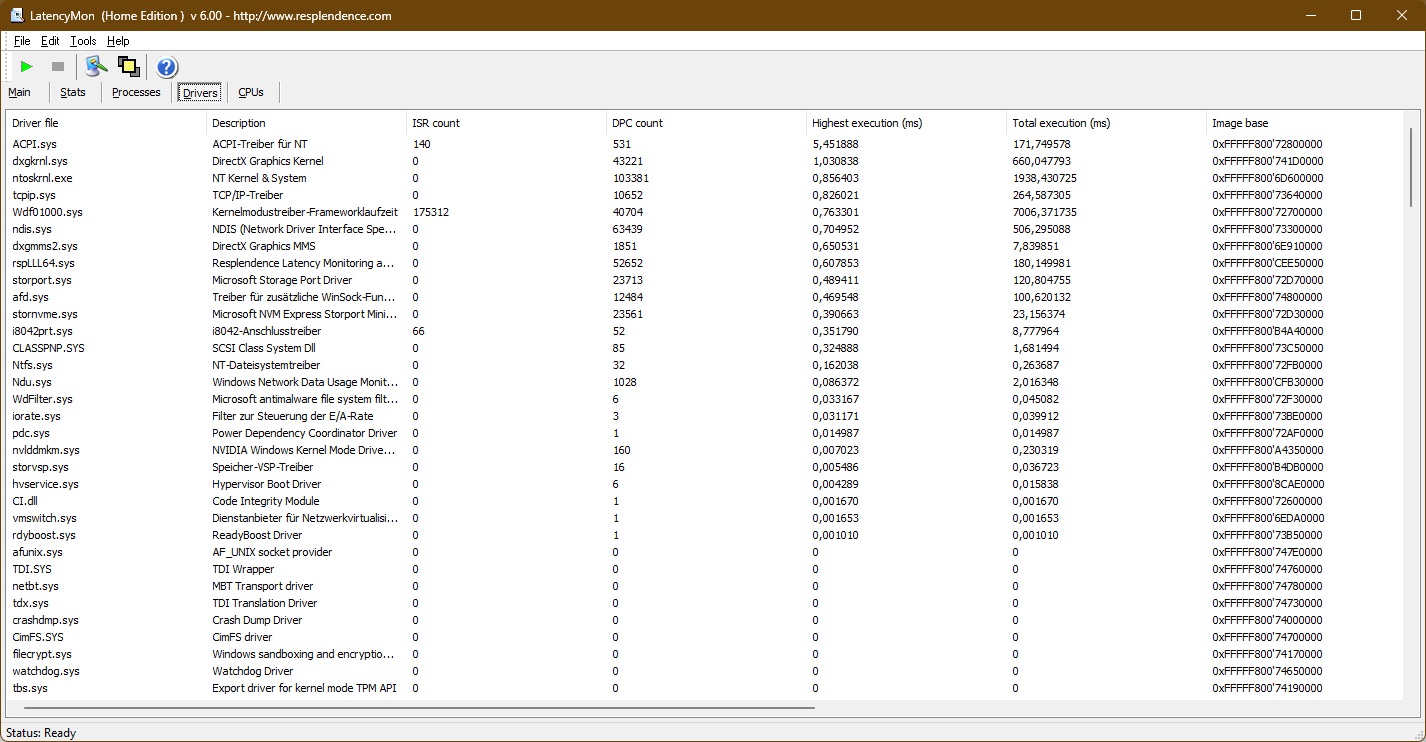
| DPC Latencies / LatencyMon - interrupt to process latency (max), Web, Youtube, Prime95 | |
| MSI Titan GT77 HX 13VI | |
| Asus ROG Strix Scar 17 SE G733CX-LL014W | |
| MSI Katana 17 B13VFK | |
| Gigabyte G7 KE | |
| Acer Predator Helios 300 (i7-12700H, RTX 3070 Ti) | |
| MSI Pulse GL76 12UGK | |
* ... smaller is better
Mass storage
With a capacity of one terabyte, the Micron 2400 is, in itself, a fast NVMe PCIe 4.0 SSD, performance-wise, it cannot keep up with the competition. However, this shouldn't really be noticeable in everday use.

* ... smaller is better
Continuous Performance Read: DiskSpd Read Loop, Queue Depth 8
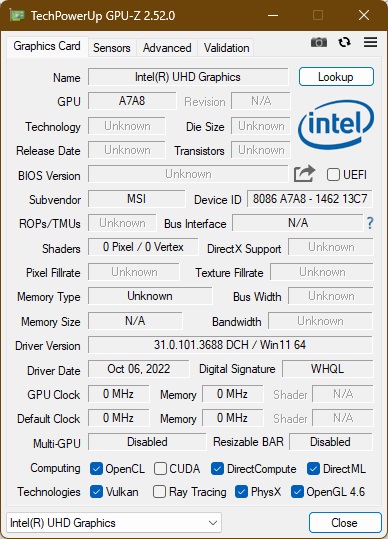
Graphics card
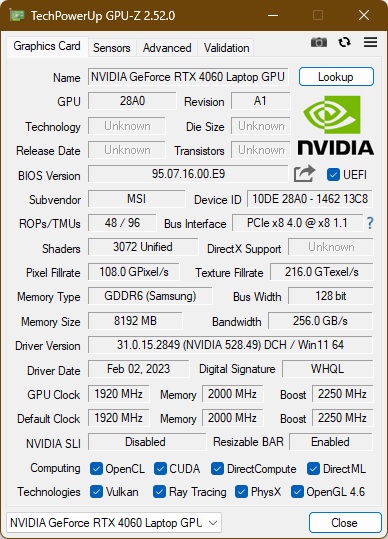
The Nvidia GeForce RTX 4060 is a mid-range GPU from Nvidia's "Ada Lovelace" generation. The 3072 shader units are clocked at a maximum of 2.25 GHz and the GPU installed here has eight gigabytes of GDDR6 RAM at its disposal. You can find additional comparisons with other graphics chips in our GPU benchmark list.
In 3DMark tests, the new GPU has its nose in front of last generation's Nvidia GeForce RTX 3070 - but only just. By contrast, the RTX 3070 Ti is marginally faster. Compared to the Nvidia GeForce RTX 3060, the RTX 4060 - which can consume its maximum 105 watts here - is around 23 % faster. At 115 watts, the Gigabyte G7 KE found in the 3060 consumed a little more than the 4060. The RTX 4060 is clearly outclassed by the GeForce RTX 4090 and was to be expected. In 3DMark benchmarks, the high-end chip runs twice as fast. The Blender benchmark results confirm the 3DMark test results.
As with the processor, the graphics card has a performance limit in battery mode. Without a power supply unit, only 50 % of GPU performance is available.
| 3DMark 06 Standard Score | 50607 points | |
| 3DMark Vantage P Result | 90275 points | |
| 3DMark 11 Performance | 30831 points | |
| 3DMark Ice Storm Standard Score | 185655 points | |
| 3DMark Cloud Gate Standard Score | 59494 points | |
| 3DMark Fire Strike Score | 22497 points | |
| 3DMark Time Spy Score | 10345 points | |
Help | ||
* ... smaller is better
Gaming Performance
In gaming tests, the Nvidia GeForce RTX 4060 does better than in synthetic benchmarks. In this respect, it marginally beats the GeForce RTX 3070 Ti. However, just like the RTX 4090, the RTX 3080 Ti remains unbeatable. Nevertheless, when it comes to gaming, the difference to the flagship isn't that big with the 4090 still being around 33 % faster.
The RTX 4060 can easily play older titles in 4K UHD. With new games, however, this is more difficult, at least without the implementation of DLSS. Either way, gaming in 2.5K is possible.
| The Witcher 3 - 1920x1080 Ultra Graphics & Postprocessing (HBAO+) | |
| MSI Titan GT77 HX 13VI | |
| Average of class Gaming (18.4 - 240, n=61, last 2 years) | |
| Acer Predator Helios 300 (i7-12700H, RTX 3070 Ti) | |
| Asus ROG Strix Scar 17 SE G733CX-LL014W | |
| MSI Katana 17 B13VFK | |
| MSI Pulse GL76 12UGK | |
| Gigabyte G7 KE | |
| GTA V - 1920x1080 Highest Settings possible AA:4xMSAA + FX AF:16x | |
| MSI Titan GT77 HX 13VI | |
| Asus ROG Strix Scar 17 SE G733CX-LL014W | |
| Average of class Gaming (12.1 - 186.9, n=130, last 2 years) | |
| Acer Predator Helios 300 (i7-12700H, RTX 3070 Ti) | |
| MSI Katana 17 B13VFK | |
| MSI Pulse GL76 12UGK | |
| Gigabyte G7 KE | |
| Final Fantasy XV Benchmark - 1920x1080 High Quality | |
| MSI Titan GT77 HX 13VI | |
| Average of class Gaming (19.2 - 215, n=141, last 2 years) | |
| Asus ROG Strix Scar 17 SE G733CX-LL014W | |
| Acer Predator Helios 300 (i7-12700H, RTX 3070 Ti) | |
| MSI Katana 17 B13VFK | |
| MSI Pulse GL76 12UGK | |
| Gigabyte G7 KE | |
Witcher 3 frame rate diagram
| low | med. | high | ultra | QHD | 4K DLSS | 4K | |
|---|---|---|---|---|---|---|---|
| GTA V (2015) | 186.1 | 184.7 | 180.2 | 112.1 | 83 | 82.1 | |
| The Witcher 3 (2015) | 435 | 322 | 206 | 104.7 | 62.6 | ||
| Dota 2 Reborn (2015) | 184.6 | 171 | 164.1 | 156.3 | 126 | ||
| Final Fantasy XV Benchmark (2018) | 204 | 135.1 | 96.1 | 70.1 | 40.2 | ||
| X-Plane 11.11 (2018) | 178.6 | 154.9 | 118.9 | 98.9 | |||
| Far Cry 5 (2018) | 134 | 99 | 51 | ||||
| Strange Brigade (2018) | 508 | 270 | 216 | 185.1 | 126.4 | 67.2 | |
| Shadow of the Tomb Raider (2018) | 155.6 | 120.7 | 67.2 | ||||
| Metro Exodus (2019) | 74.3 | 59 | 36.8 | ||||
| Control (2019) | 238 | 119 | 89 | ||||
| Borderlands 3 (2019) | 171.3 | 144.6 | 106.5 | 83.9 | |||
| Death Stranding (2020) | 200 | 158.9 | 150.3 | 146.7 | |||
| Horizon Zero Dawn (2020) | 108.3 | 85.9 | 46.5 | ||||
| Flight Simulator 2020 (2020) | 96.9 | 69.4 | 52.5 | ||||
| Crysis Remastered (2020) | 312 | 224 | 85.9 | 72.5 | |||
| Watch Dogs Legion (2020) | 65 | 44 | 25 | ||||
| Dirt 5 (2020) | 218 | 147.2 | 116.1 | 89.5 | |||
| Assassin´s Creed Valhalla (2020) | 135 | 111 | 96 | ||||
| Yakuza Like a Dragon (2020) | 131.7 | 123.2 | 117.4 | 109.6 | |||
| Hitman 3 (2021) | 267.5 | 197.7 | 172.7 | 163.5 | |||
| Days Gone (2021) | 148 | 131.4 | 100.2 | ||||
| F1 2021 (2021) | 389 | 312 | 244 | 128.9 | 93 | 50.2 | |
| Alan Wake Remastered (2021) | 149.8 | 144.9 | |||||
| Far Cry 6 (2021) | 97.2 | 32.6 | 3.38 | ||||
| Back 4 Blood (2021) | 245 | 197.5 | 188.2 | ||||
| Guardians of the Galaxy (2021) | 134 | 135 | 133 | ||||
| Riders Republic (2021) | 177 | 145 | 122 | 112 | |||
| Forza Horizon 5 (2021) | 137 | 125 | 84 | ||||
| Battlefield 2042 (2021) | 145.6 | 123 | 106.1 | ||||
| Halo Infinite (2021) | 144.9 | 123.6 | 114.2 | ||||
| God of War (2022) | 67.5 | 55.6 | 34.7 | ||||
| Rainbow Six Extraction (2022) | 149.1 | 106 | 52.4 | ||||
| Dying Light 2 (2022) | 64.7 | 43.8 | 23 | ||||
| GRID Legends (2022) | 126.4 | 102.2 | 63.9 | ||||
| Elden Ring (2022) | 59.5 | ||||||
| Cyberpunk 2077 1.6 (2022) | 73.81 | 45.9 | 21.1 | ||||
| Elex 2 (2022) | 115.4 | 115.4 | 113.5 | 96 | |||
| Ghostwire Tokyo (2022) | 68.6 | 65.9 | 36.8 | 29.6 | |||
| Tiny Tina's Wonderlands (2022) | 198.6 | 164.9 | 110 | 85.2 | |||
| Vampire Bloodhunt (2022) | 220 | 201 | 185.7 | ||||
| F1 22 (2022) | 247 | 240 | 179.2 | 65.4 | 41 | 19.7 | |
| The Quarry (2022) | 154.8 | 121.3 | 100.5 | 77.9 | |||
| A Plague Tale Requiem (2022) | 100.7 | 84.9 | 73 | 63.3 | |||
| Uncharted Legacy of Thieves Collection (2022) | 87.9 | 85.1 | 79.1 | 76.9 | |||
| Call of Duty Modern Warfare 2 2022 (2022) | 87 | 59 | 55 | 34 | |||
| Spider-Man Miles Morales (2022) | 77.3 | 59.7 | 35.3 | ||||
| The Callisto Protocol (2022) | 68.9 | 48.6 | 27 | ||||
| Need for Speed Unbound (2022) | 127.4 | 117.2 | 98.9 | 98.6 | |||
| High On Life (2023) | 220 | 165.8 | 125.6 | 99.9 | |||
| The Witcher 3 v4 (2023) | 66.3 | 40.5 | 21.4 | ||||
| Dead Space Remake (2023) | 67 | 43.4 | 20.6 | ||||
| Hogwarts Legacy (2023) | 150 | 126.7 | 107.7 | 91.6 | |||
| Returnal (2023) | |||||||
| Atomic Heart (2023) | 167.3 | 129.2 | 81.6 | 66.8 | |||
| Company of Heroes 3 (2023) | 202.7 | 182.1 | 133.3 | 131.3 | |||
| Sons of the Forest (2023) | 82 | 79.1 | 73.3 | 71.8 |
Emissions: Loud fans, cool case
Noise emissions
When performing undemanding tasks, the MSI Laptop Katana 17 runs mostly silent - but not always. When cooling is underway, at around 40 dB(A), the device runs comparatively loud. Under load, this rises to a maximum of 59 dB(A) which is very loud for sensitive ears but normal for gaming.
We didn't detect any coil whine.
Noise level
| Idle |
| 24.5 / 24.5 / 40 dB(A) |
| Load |
| 48.3 / 59.1 dB(A) |
 | ||
30 dB silent 40 dB(A) audible 50 dB(A) loud |
||
min: | ||
| MSI Katana 17 B13VFK GeForce RTX 4060 Laptop GPU, i7-13620H, Micron 2400 MTFDKBA1T0QFM | MSI Titan GT77 HX 13VI GeForce RTX 4090 Laptop GPU, i9-13950HX, Samsung PM9A1 MZVL22T0HBLB | MSI Pulse GL76 12UGK GeForce RTX 3070 Laptop GPU, i7-12700H, Micron 3400 1TB MTFDKBA1T0TFH | Gigabyte G7 KE GeForce RTX 3060 Laptop GPU, i5-12500H, Gigabyte AG470S1TB-SI B10 | Asus ROG Strix Scar 17 SE G733CX-LL014W GeForce RTX 3080 Ti Laptop GPU, i9-12950HX, Samsung PM9A1 MZVL22T0HBLB | Acer Predator Helios 300 (i7-12700H, RTX 3070 Ti) GeForce RTX 3070 Ti Laptop GPU, i7-12700H, Samsung PM9A1 MZVL21T0HCLR | |
|---|---|---|---|---|---|---|
| Noise | -2% | 6% | -9% | 16% | -0% | |
| off / environment * (dB) | 24.5 | 24.6 -0% | 24.1 2% | 27 -10% | 23.9 2% | 23 6% |
| Idle Minimum * (dB) | 24.5 | 29.2 -19% | 26.9 -10% | 27 -10% | 23.9 2% | 23 6% |
| Idle Average * (dB) | 24.5 | 29.2 -19% | 26.9 -10% | 35 -43% | 23.9 2% | 25.92 -6% |
| Idle Maximum * (dB) | 40 | 29.2 27% | 27 32% | 38 5% | 23.9 40% | 40.67 -2% |
| Load Average * (dB) | 48.3 | 50.7 -5% | 43.8 9% | 52 -8% | 34.3 29% | 42.7 12% |
| Witcher 3 ultra * (dB) | 56 | 53.3 5% | 44.7 20% | 56 -0% | 62.48 -12% | |
| Load Maximum * (dB) | 59.1 | 61 -3% | 58.3 1% | 59 -0% | 45.9 22% | 62.67 -6% |
* ... smaller is better
Temperature
Good news: You shouldn't worry about getting sweaty hands when using the Katana 17 as the palm rest area remains cool, even in stress tests. A maximum temperature of 45.5 degrees Celsius in the Witcher 3 test is also no cause for concern.
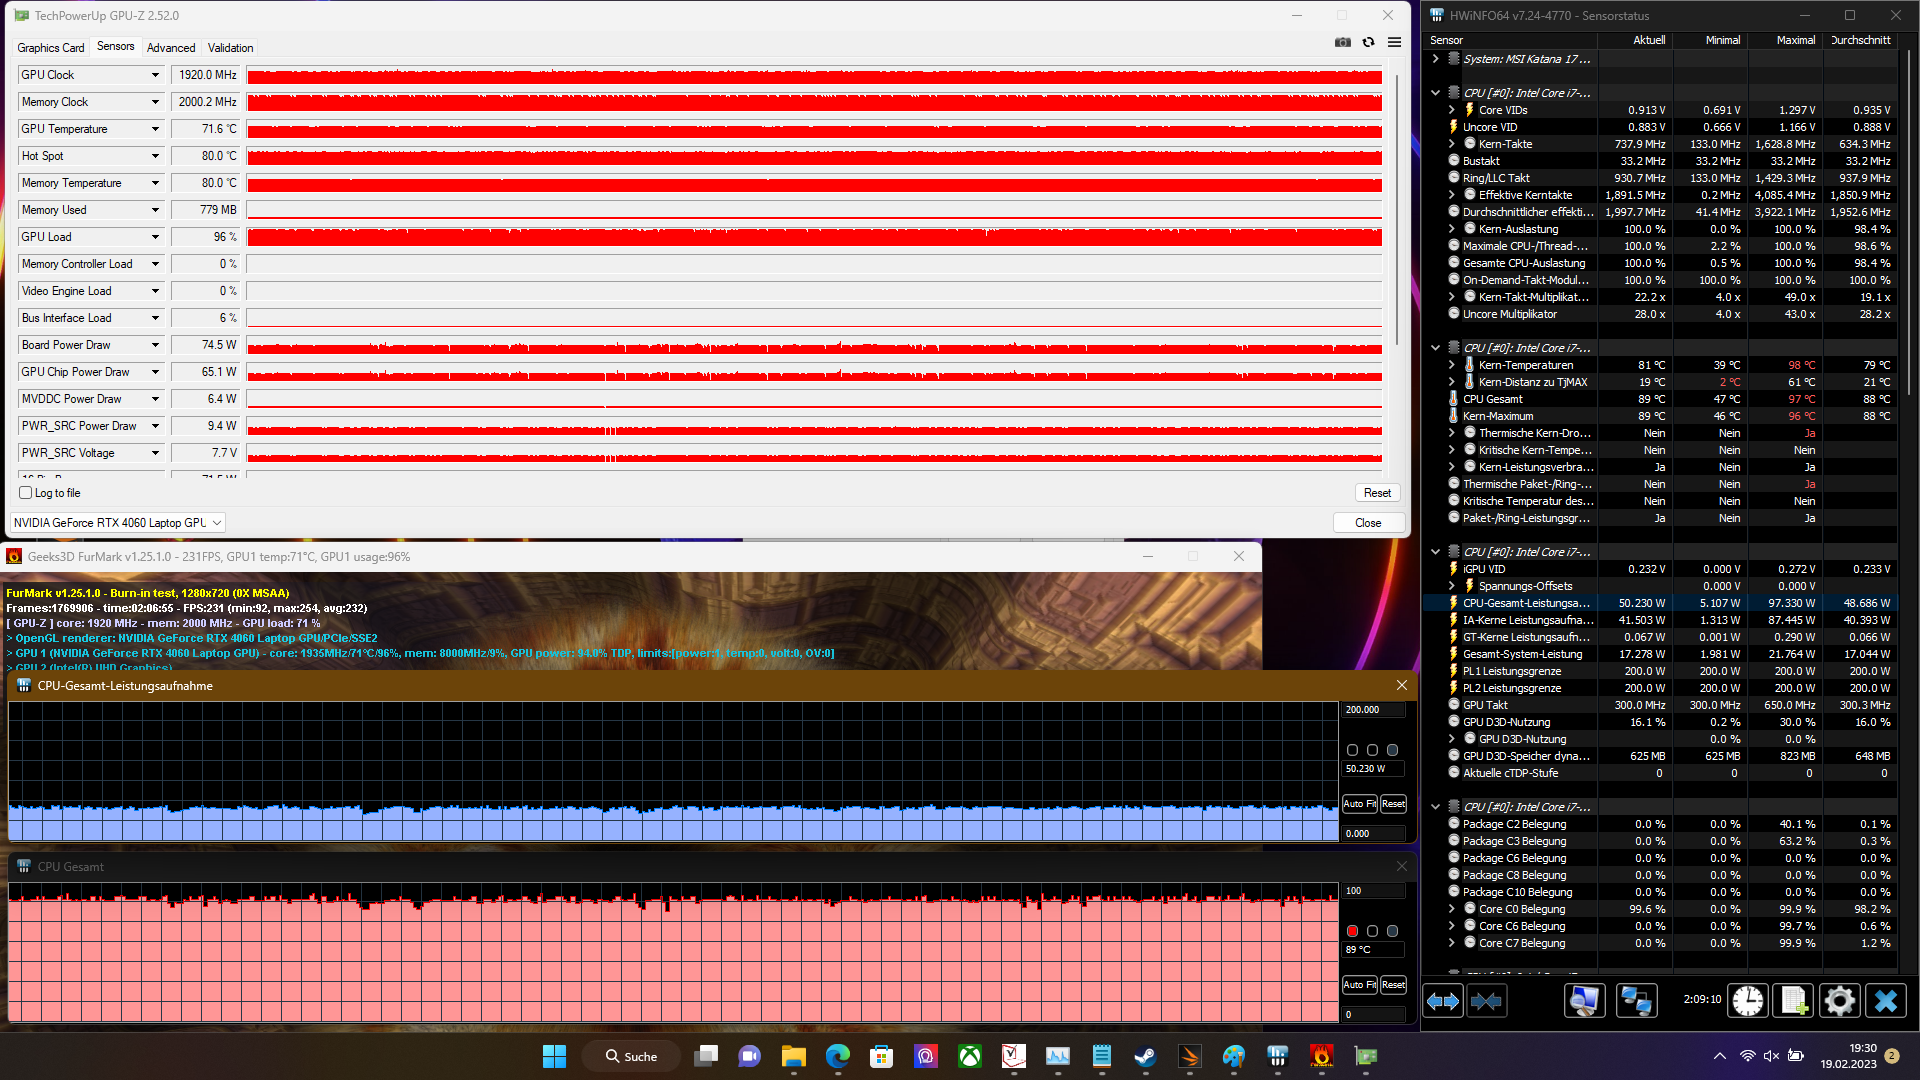
In the MSI Katana 17 B13V's stress tests, we didn't detect any throttling.
(±) The maximum temperature on the upper side is 41.6 °C / 107 F, compared to the average of 40.4 °C / 105 F, ranging from 21.2 to 68.8 °C for the class Gaming.
(±) The bottom heats up to a maximum of 43.1 °C / 110 F, compared to the average of 43.3 °C / 110 F
(+) In idle usage, the average temperature for the upper side is 27.8 °C / 82 F, compared to the device average of 33.9 °C / 93 F.
(+) Playing The Witcher 3, the average temperature for the upper side is 31.8 °C / 89 F, compared to the device average of 33.9 °C / 93 F.
(+) The palmrests and touchpad are cooler than skin temperature with a maximum of 24.2 °C / 75.6 F and are therefore cool to the touch.
(+) The average temperature of the palmrest area of similar devices was 28.9 °C / 84 F (+4.7 °C / 8.4 F).
| MSI Katana 17 B13VFK Intel Core i7-13620H, NVIDIA GeForce RTX 4060 Laptop GPU | MSI Titan GT77 HX 13VI Intel Core i9-13950HX, NVIDIA GeForce RTX 4090 Laptop GPU | MSI Pulse GL76 12UGK Intel Core i7-12700H, NVIDIA GeForce RTX 3070 Laptop GPU | Gigabyte G7 KE Intel Core i5-12500H, NVIDIA GeForce RTX 3060 Laptop GPU | Asus ROG Strix Scar 17 SE G733CX-LL014W Intel Core i9-12950HX, NVIDIA GeForce RTX 3080 Ti Laptop GPU | Acer Predator Helios 300 (i7-12700H, RTX 3070 Ti) Intel Core i7-12700H, NVIDIA GeForce RTX 3070 Ti Laptop GPU | |
|---|---|---|---|---|---|---|
| Heat | 10% | -5% | -7% | -7% | 2% | |
| Maximum Upper Side * (°C) | 41.6 | 40.6 2% | 44.2 -6% | 52 -25% | 48.8 -17% | 35 16% |
| Maximum Bottom * (°C) | 43.1 | 41.1 5% | 45.2 -5% | 54 -25% | 52.4 -22% | 53 -23% |
| Idle Upper Side * (°C) | 32 | 26.2 18% | 35.4 -11% | 28 12% | 30.4 5% | 29 9% |
| Idle Bottom * (°C) | 35.8 | 30.3 15% | 35 2% | 32 11% | 34.1 5% | 34 5% |
* ... smaller is better
Speakers
The MSI Katana 17's speakers are comparatively loud but lack bass. Instead, gamers should reach for a good headset, making fan noise inaudible.
MSI Katana 17 B13VFK audio analysis
(±) | speaker loudness is average but good (78.5 dB)
Bass 100 - 315 Hz
(-) | nearly no bass - on average 17.7% lower than median
(±) | linearity of bass is average (11.7% delta to prev. frequency)
Mids 400 - 2000 Hz
(±) | higher mids - on average 6.8% higher than median
(+) | mids are linear (6.7% delta to prev. frequency)
Highs 2 - 16 kHz
(+) | balanced highs - only 3.2% away from median
(±) | linearity of highs is average (7.2% delta to prev. frequency)
Overall 100 - 16.000 Hz
(±) | linearity of overall sound is average (19.4% difference to median)
Compared to same class
» 66% of all tested devices in this class were better, 7% similar, 27% worse
» The best had a delta of 6%, average was 18%, worst was 132%
Compared to all devices tested
» 46% of all tested devices were better, 7% similar, 46% worse
» The best had a delta of 4%, average was 24%, worst was 134%
Acer Predator Helios 300 (i7-12700H, RTX 3070 Ti) audio analysis
(±) | speaker loudness is average but good (73.83 dB)
Bass 100 - 315 Hz
(±) | reduced bass - on average 12.7% lower than median
(±) | linearity of bass is average (11.2% delta to prev. frequency)
Mids 400 - 2000 Hz
(±) | higher mids - on average 5.5% higher than median
(±) | linearity of mids is average (7.9% delta to prev. frequency)
Highs 2 - 16 kHz
(+) | balanced highs - only 2.1% away from median
(+) | highs are linear (3.5% delta to prev. frequency)
Overall 100 - 16.000 Hz
(±) | linearity of overall sound is average (15.8% difference to median)
Compared to same class
» 36% of all tested devices in this class were better, 7% similar, 56% worse
» The best had a delta of 6%, average was 18%, worst was 132%
Compared to all devices tested
» 23% of all tested devices were better, 5% similar, 72% worse
» The best had a delta of 4%, average was 24%, worst was 134%
Power management: MSI's power-hungry gaming machine
Power consumption
The minimal consumption of around 12.2 watts is relatively high but typical for a gaming system. However, compared to the competition, consumption is still relatively low.
The 240-watt power supply unit is sufficiently sized to cope with a maximum power consumption of 212 watts.
| Off / Standby | |
| Idle | |
| Load |
|
Key:
min: | |
| MSI Katana 17 B13VFK i7-13620H, GeForce RTX 4060 Laptop GPU, Micron 2400 MTFDKBA1T0QFM, IPS LED, 1920x1080, 17.3" | MSI Titan GT77 HX 13VI i9-13950HX, GeForce RTX 4090 Laptop GPU, Samsung PM9A1 MZVL22T0HBLB, Mini-LED, 3840x2160, 17.3" | MSI Pulse GL76 12UGK i7-12700H, GeForce RTX 3070 Laptop GPU, Micron 3400 1TB MTFDKBA1T0TFH, IPS, 1920x1080, 17.3" | Gigabyte G7 KE i5-12500H, GeForce RTX 3060 Laptop GPU, Gigabyte AG470S1TB-SI B10, IPS, 1920x1080, 17.3" | Asus ROG Strix Scar 17 SE G733CX-LL014W i9-12950HX, GeForce RTX 3080 Ti Laptop GPU, Samsung PM9A1 MZVL22T0HBLB, IPS, 2560x1440, 17.3" | Acer Predator Helios 300 (i7-12700H, RTX 3070 Ti) i7-12700H, GeForce RTX 3070 Ti Laptop GPU, Samsung PM9A1 MZVL21T0HCLR, IPS, 2560x1440, 17.3" | Average NVIDIA GeForce RTX 4060 Laptop GPU | Average of class Gaming | |
|---|---|---|---|---|---|---|---|---|
| Power Consumption | -55% | -14% | -22% | -61% | -41% | -7% | -34% | |
| Idle Minimum * (Watt) | 12.2 | 14 -15% | 12.4 -2% | 15 -23% | 19.3 -58% | 15 -23% | 11.5 ? 6% | 13.9 ? -14% |
| Idle Average * (Watt) | 14.9 | 21.6 -45% | 13.1 12% | 17 -14% | 26.5 -78% | 20 -34% | 16 ? -7% | 19.8 ? -33% |
| Idle Maximum * (Watt) | 15.8 | 24.8 -57% | 25.3 -60% | 24 -52% | 27.1 -72% | 22.3 -41% | 20.3 ? -28% | 26.9 ? -70% |
| Load Average * (Watt) | 85.22 | 122.5 -44% | 105.4 -24% | 111 -30% | 141 -65% | 133 -56% | 92.9 ? -9% | 110.7 ? -30% |
| Witcher 3 ultra * (Watt) | 151.1 | 265 -75% | 150 1% | 174.1 -15% | 225 -49% | 231 -53% | ||
| Load Maximum * (Watt) | 212.8 | 418 -96% | 240.5 -13% | 208 2% | 307.9 -45% | 290 -36% | 210 ? 1% | 260 ? -22% |
* ... smaller is better
Power consumption Witcher 3 / stress test
Power consumption with an external monitor
Battery life
The MSI Katana 17's small battery only has a capacity of 53.5 watt-hours. Therefore, one shouldn't expect good battery life when it comes to such a powerful system. The battery lasted a meagre three hours in WiFi tests, meaning the MSI laptop is not suitable for mobile use.
| MSI Katana 17 B13VFK i7-13620H, GeForce RTX 4060 Laptop GPU, 53.5 Wh | MSI Titan GT77 HX 13VI i9-13950HX, GeForce RTX 4090 Laptop GPU, 99.9 Wh | MSI Pulse GL76 12UGK i7-12700H, GeForce RTX 3070 Laptop GPU, 90 Wh | Gigabyte G7 KE i5-12500H, GeForce RTX 3060 Laptop GPU, 54 Wh | Asus ROG Strix Scar 17 SE G733CX-LL014W i9-12950HX, GeForce RTX 3080 Ti Laptop GPU, 90 Wh | Acer Predator Helios 300 (i7-12700H, RTX 3070 Ti) i7-12700H, GeForce RTX 3070 Ti Laptop GPU, 90 Wh | Average of class Gaming | |
|---|---|---|---|---|---|---|---|
| Battery runtime | 62% | 107% | 57% | 45% | 94% | 85% | |
| WiFi v1.3 (h) | 2.9 | 5.3 83% | 5.9 103% | 5.3 83% | 4.2 45% | 6 107% | 6.58 ? 127% |
| Load (h) | 1 | 1.4 40% | 2.1 110% | 1.3 30% | 1.8 80% | 1.42 ? 42% | |
| H.264 (h) | 6 | 2.2 | 5.9 | 7.74 ? | |||
| Reader / Idle (h) | 7.3 | 7.1 | 9.79 ? |
Pros
Cons
Verdict: The MSI Katana 17 B13V is a good gaming system
The MSI Katana 17 B13V laptop impressed us in its main area of competency - gaming. The Nvidia GeForce RTX 4060 ensures high-performance levels which can compete with the previous generation's RTX 3070 Ti. In addition to the speedy GPU, the MSI comes with a 144 Hz display as well as an RGB keyboard and provides a very good typing experience. Despite the power at hand, the laptop remains comparatively cool.
Above all else, the main point of criticism is the display: It is not very bright and has poor color space coverage as well as high response times. Also, a USB-2.0 port is something 2023 can really do without. On top of this, we also found the keyboard layout to be poorly executed as keys such as FN have been moved to rather unusual locations. Poor battery life is to be expected from a gaming laptop but is still worthy of criticism nonetheless.
The GeForce RTX 4060: The MSI 17 Katana B13V's attraction stands or falls with the GPU.
Overall, the MSI Katana 17 has earned a good rating and, with the RTX 4060, is definitely an interesting choice for gamers. However, in times of inflation, this also applies to the previous generation's devices such as the Gigabyte G7 KE with an RTX 3060. Price-conscious customers can save a lot of money on one of last-gen's models.
Price and availability
At the time of publishing this review, the MSI Katana 17 B14V is currently unavailable on Amazon and Best Buy. However, the previous generation model (3070Ti) can currently be had on Amazon for around 1499 dollars.
MSI Katana 17 B13VFK
- 02/21/2023 v7 (old)
Benjamin Herzig


Transparency
The selection of devices to be reviewed is made by our editorial team. The test sample was provided to the author as a loan by the manufacturer or retailer for the purpose of this review. The lender had no influence on this review, nor did the manufacturer receive a copy of this review before publication. There was no obligation to publish this review. As an independent media company, Notebookcheck is not subjected to the authority of manufacturers, retailers or publishers.
This is how Notebookcheck is testing
Every year, Notebookcheck independently reviews hundreds of laptops and smartphones using standardized procedures to ensure that all results are comparable. We have continuously developed our test methods for around 20 years and set industry standards in the process. In our test labs, high-quality measuring equipment is utilized by experienced technicians and editors. These tests involve a multi-stage validation process. Our complex rating system is based on hundreds of well-founded measurements and benchmarks, which maintains objectivity. Further information on our test methods can be found here.
Price comparison

