

MSI Pulse GL76 laptop review: 105 W TGP GeForce RTX 3070 graphics
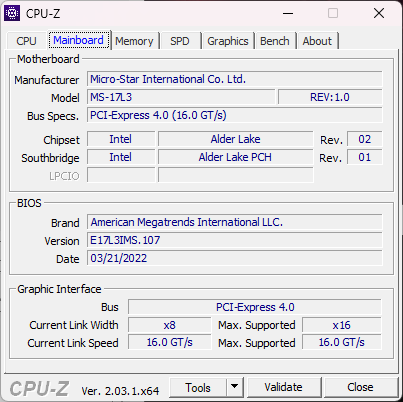
The Pulse GL76 is a midrange MSI gaming laptop in between the cheaper Katana or Sword series and more expensive GE Raider or GT Titan series. It is essentially the 17.3-inch version of the smaller 15.6-inch Pulse GL66. The 2021 and 2022 GL76 models sport identical chassis designs.
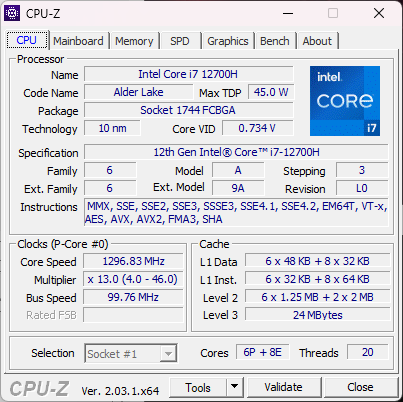
Our unit in review is a higher-end configuration with the 12th gen Core i7-12700H CPU, 105 W GeForce RTX 3070 GPU, and 360 Hz 1080p IPS display for approximately $1300 USD retail. Other SKUs are available with slower display refresh rates, GeForce RTX 3050/3050 Ti/3060 GPUs, or the Core i5-12500H CPU instead.
Competitors to the Pulse GL76 include other midrange 17.3-inch gaming laptops like the Acer Nitro 5, Asus TUF series, HP Victus series, or the Dell G series.
More MSI reviews:
Potential Competitors in Comparison
Rating | Date | Model | Weight | Height | Size | Resolution | Price |
|---|---|---|---|---|---|---|---|
| 83.2 % v7 (old) | 01 / 2023 | MSI Pulse GL76 12UGK i7-12700H, GeForce RTX 3070 Laptop GPU | 2.6 kg | 24.2 mm | 17.30" | 1920x1080 | |
| 86.1 % v7 (old) | 01 / 2023 | Alienware m17 R5 (R9 6900HX, RX 6850M XT) R9 6900HX, Radeon RX 6850M XT | 3.4 kg | 26.7 mm | 17.00" | 3840x2160 | |
| 86.9 % v7 (old) | 11 / 2022 | Asus ROG Strix Scar 17 SE G733CX-LL014W i9-12950HX, GeForce RTX 3080 Ti Laptop GPU | 2.9 kg | 28.3 mm | 17.30" | 2560x1440 | |
| 86.5 % v7 (old) | 11 / 2022 | Acer Predator Helios 300 (i7-12700H, RTX 3070 Ti) i7-12700H, GeForce RTX 3070 Ti Laptop GPU | 3 kg | 27.65 mm | 17.30" | 2560x1440 | |
| 89.9 % v7 (old) | 07 / 2022 | Razer Blade 17 Early 2022 i9-12900H, GeForce RTX 3080 Ti Laptop GPU | 2.8 kg | 19.9 mm | 17.30" | 3840x2160 | |
| 86.7 % v7 (old) | 05 / 2022 | MSI Vector GP76 12UGS-434 i7-12700H, GeForce RTX 3070 Ti Laptop GPU | 2.9 kg | 25.9 mm | 17.30" | 1920x1080 |
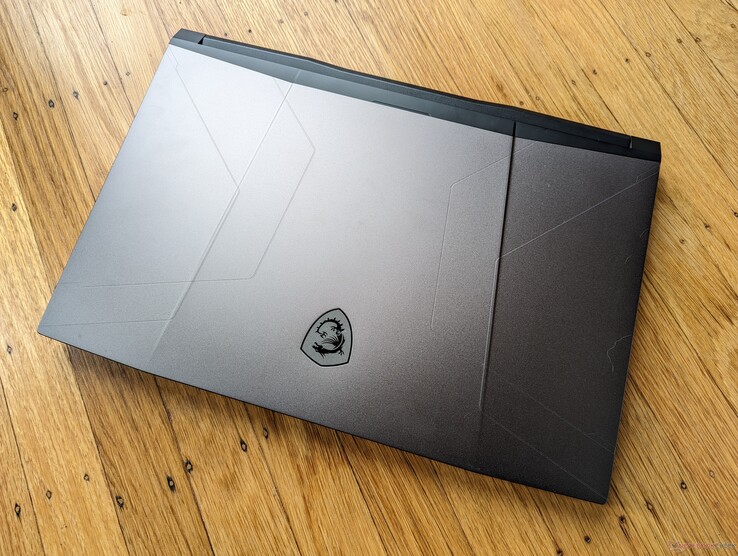
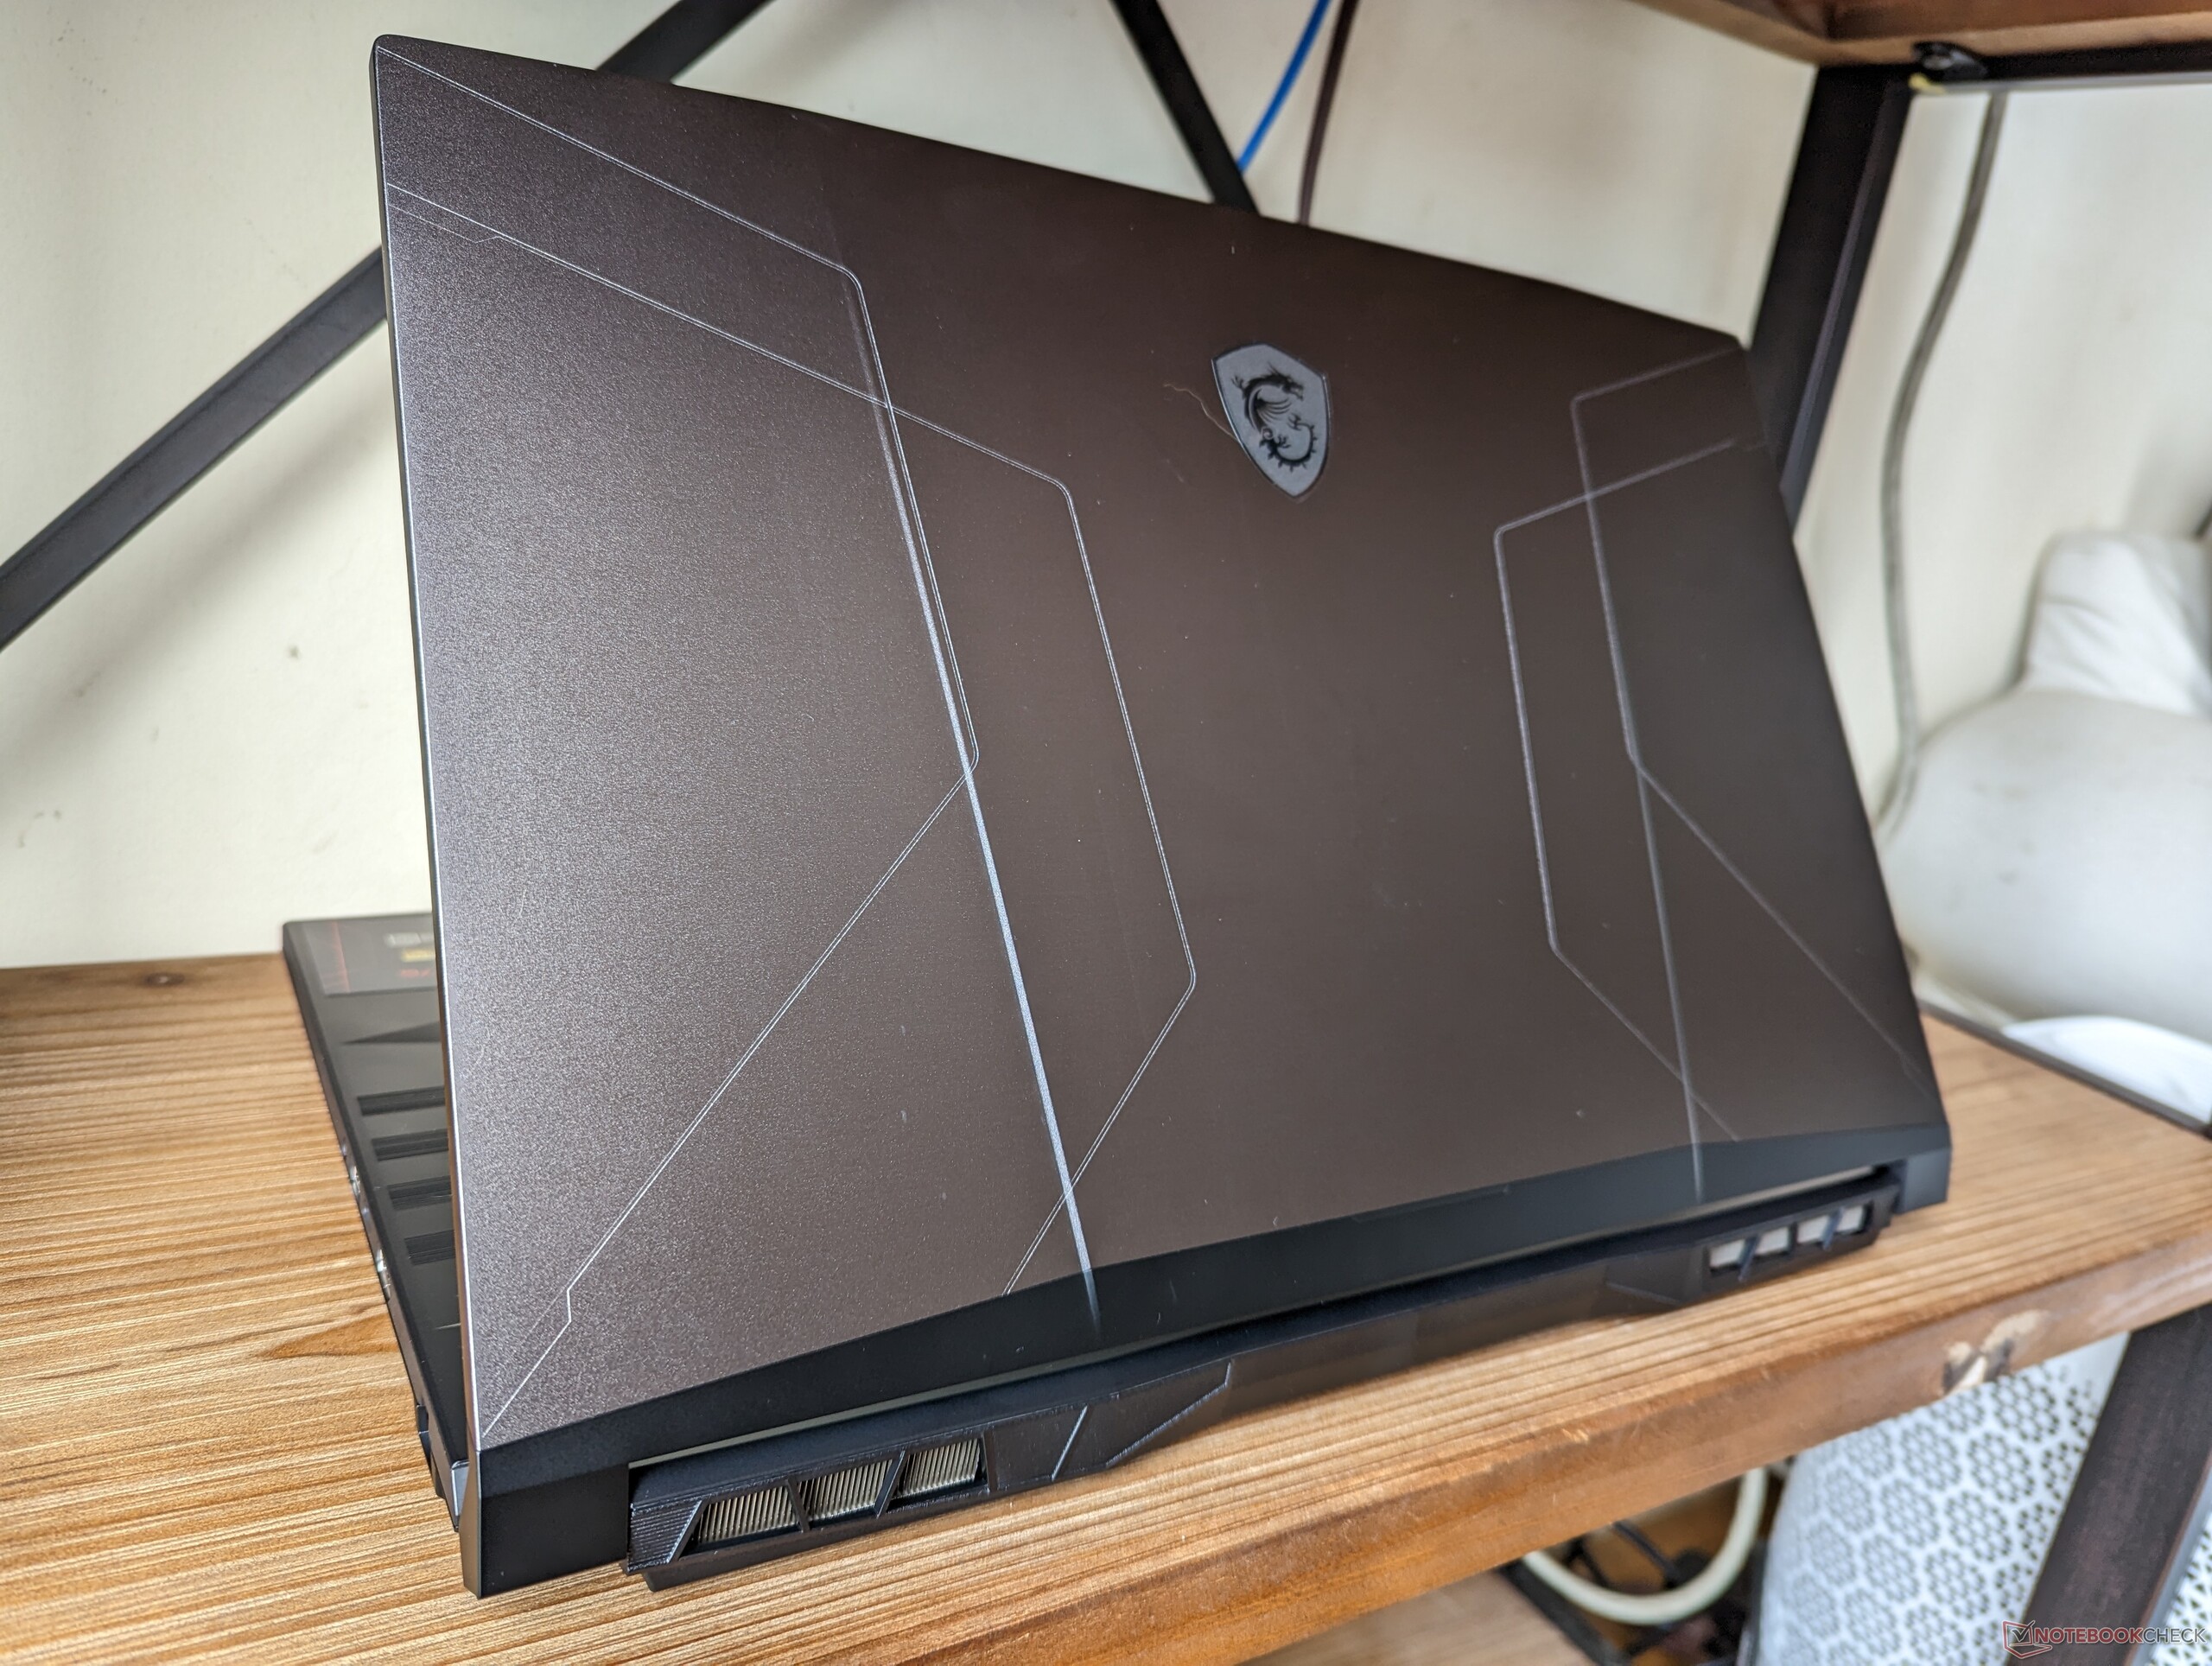
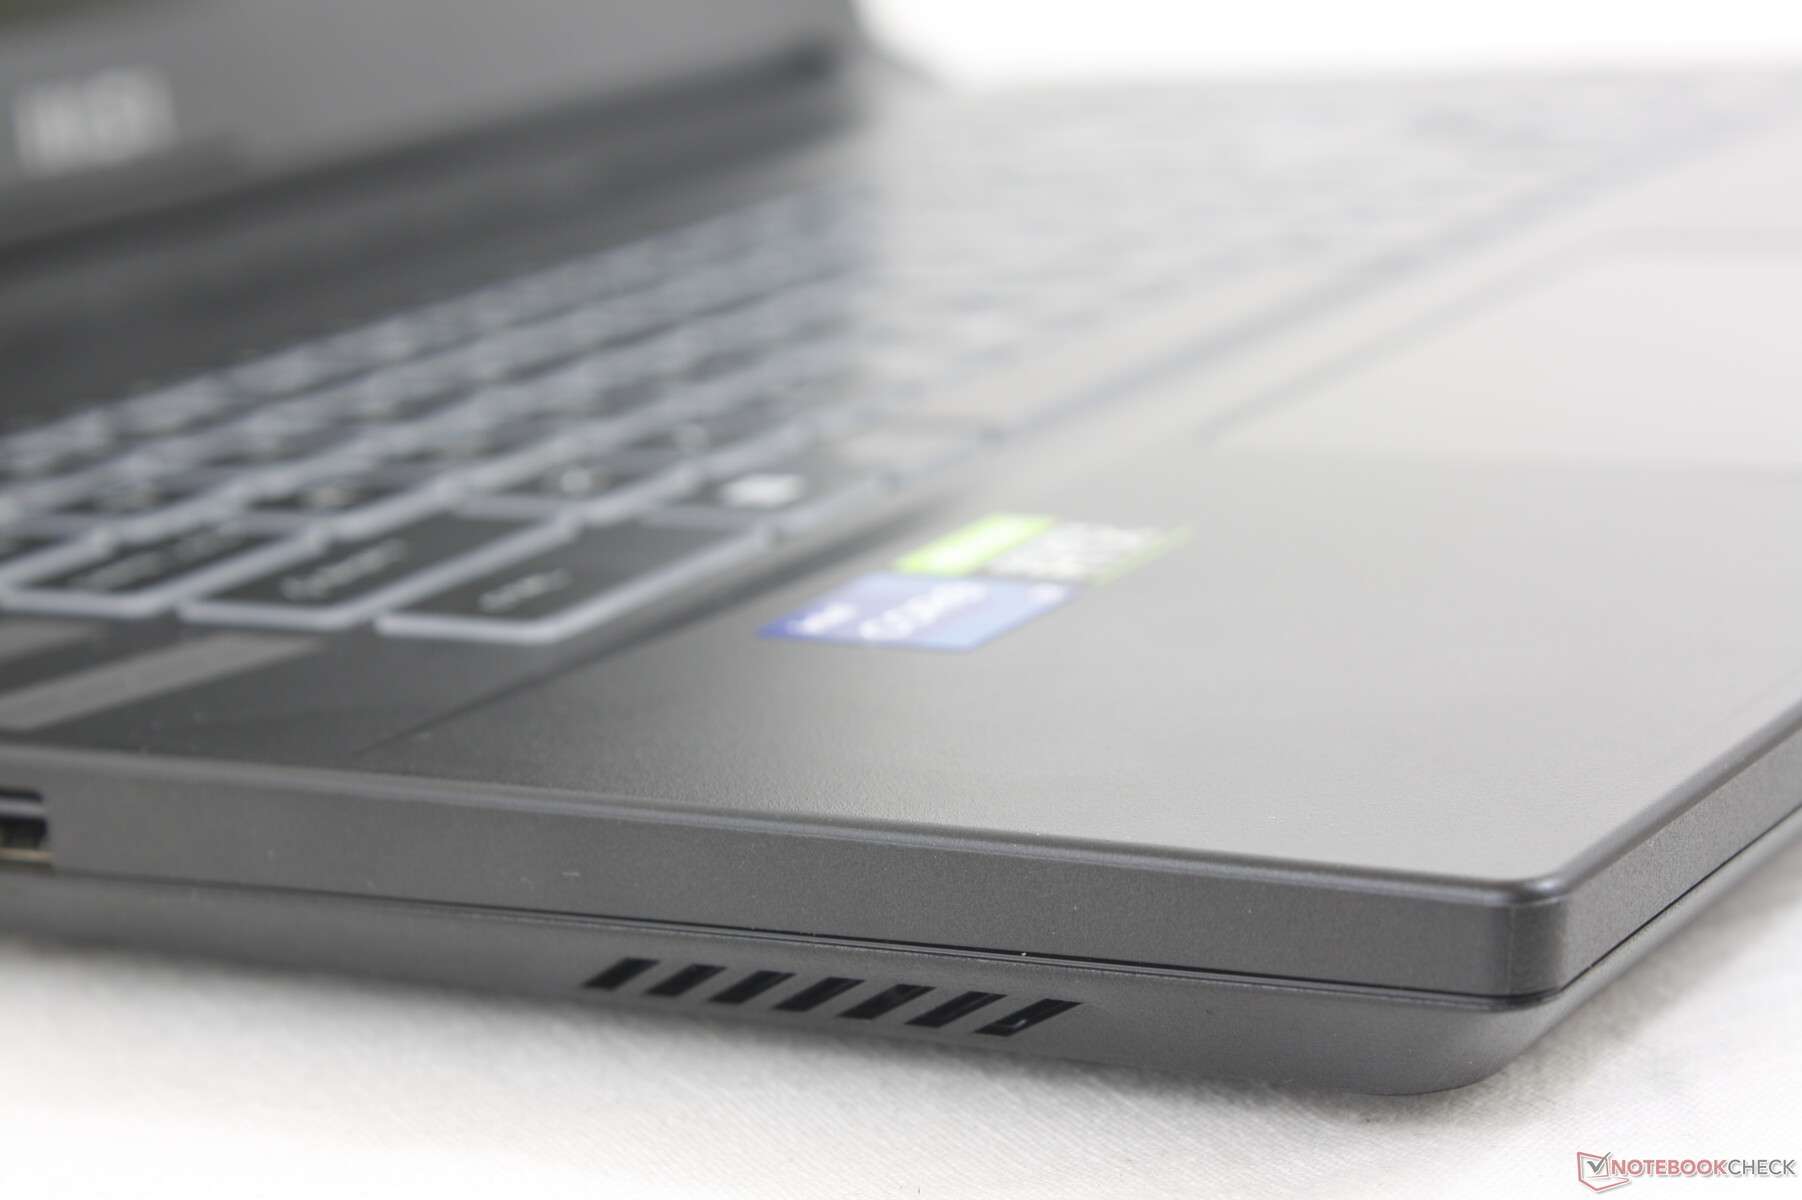
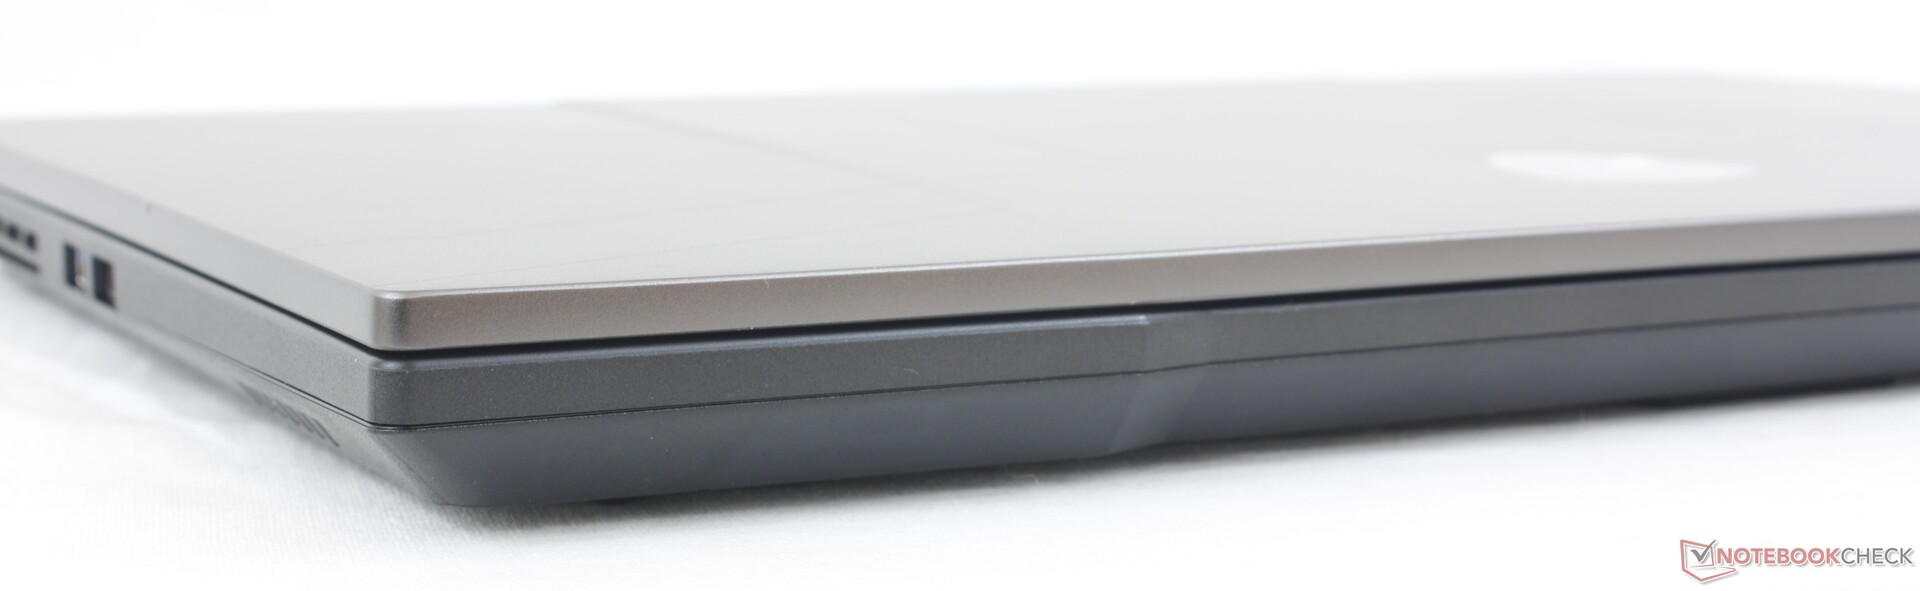
Case — No Fancy Colors or LEDs
The chassis is mostly plastic much like on all budget to midrange gaming laptops from MSI. It lacks the luxurious touches, flashy LEDs, and smoother feel of higher-end models like the MSI GE77 or Razer Blade 17 for a more bland impression. This shouldn't be surprising as appearance is one of the first things to get the axe when cutting costs on budget to midrange gaming models.
Chassis rigidity is thankfully not compromised. While the plastic surfaces feel cheaper to the touch than on a GE, GS, or GT model, they are nonetheless fairly sturdy and resistant to twists or depressions even down the keyboard center or outer lid. There are no major creaking issues, either. However, the hinges could have been stiffer at wider angles for a better sense of longevity.
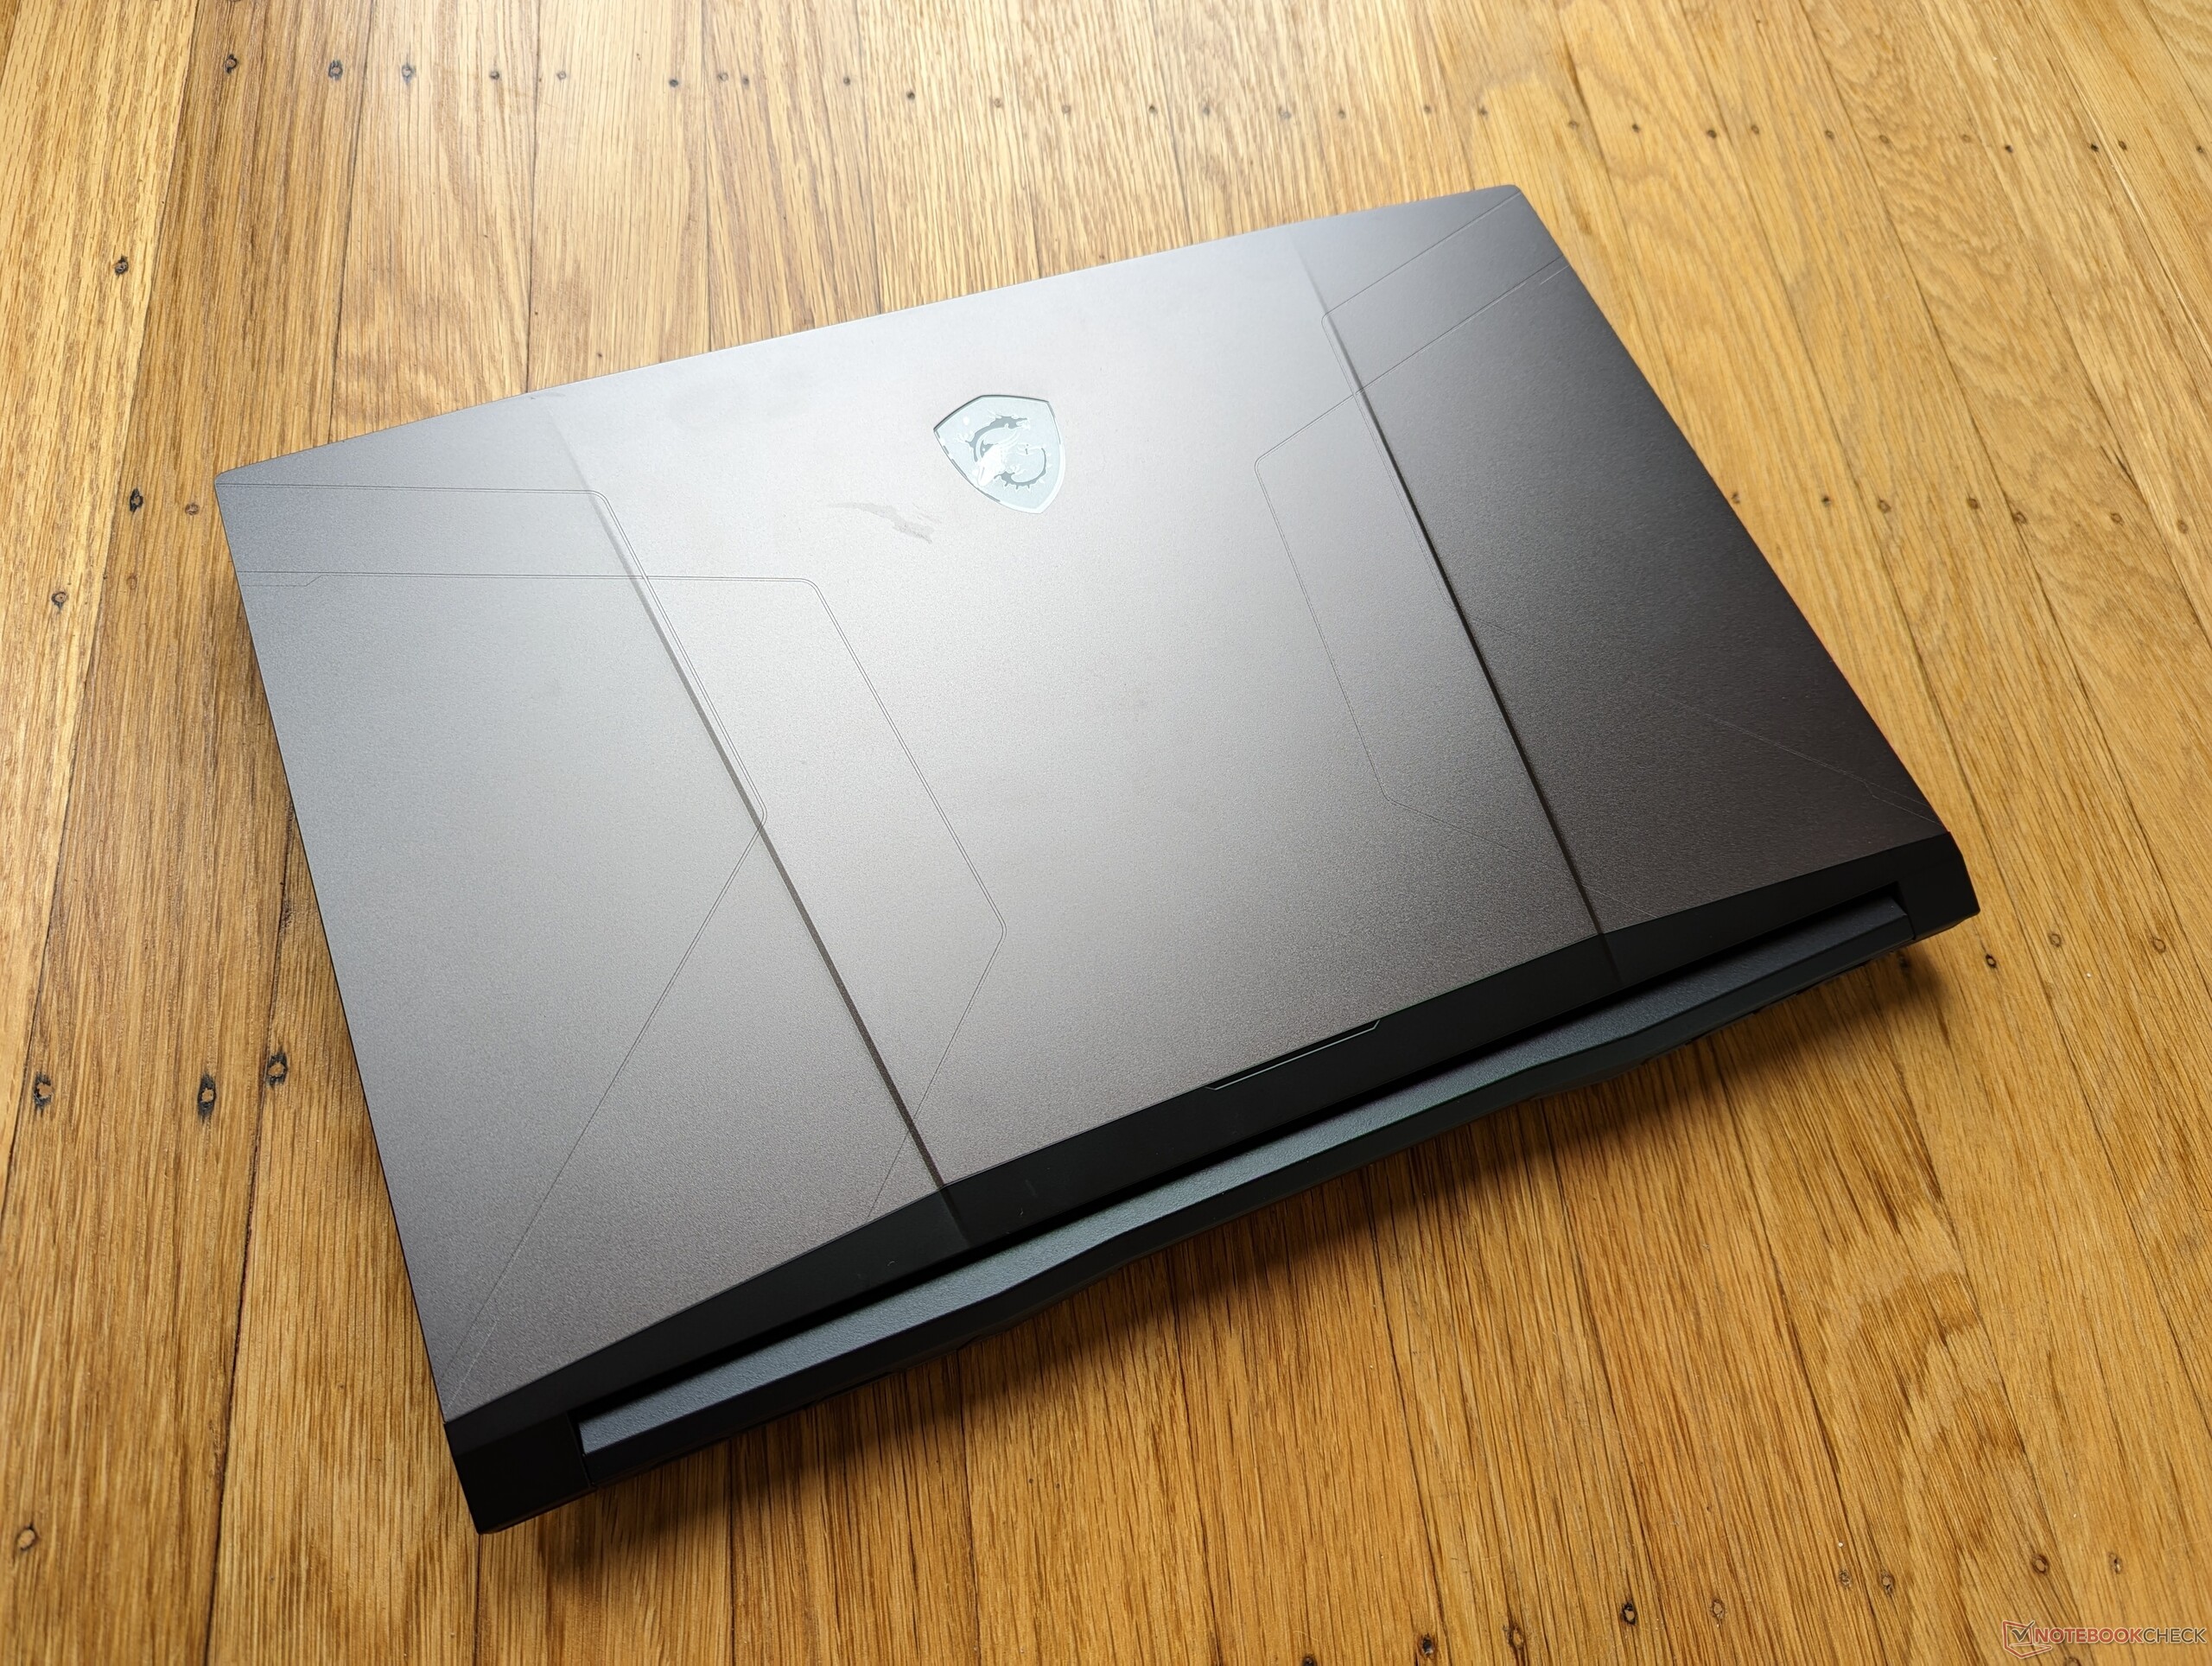
The system is lighter than expected especially for a 17.3-inch gaming laptop. At 2.6 kg, it is lighter than the Razer Blade 17, Asus ROG Strix Scar 17, and Acer Predator Helios 300 by a few hundred grams each. The weight advantage is likely due to the noticeably shorter length of the GL76 chassis design. It's a tad bit wide however, but the weight savings makes up for the slightly longer footprint.
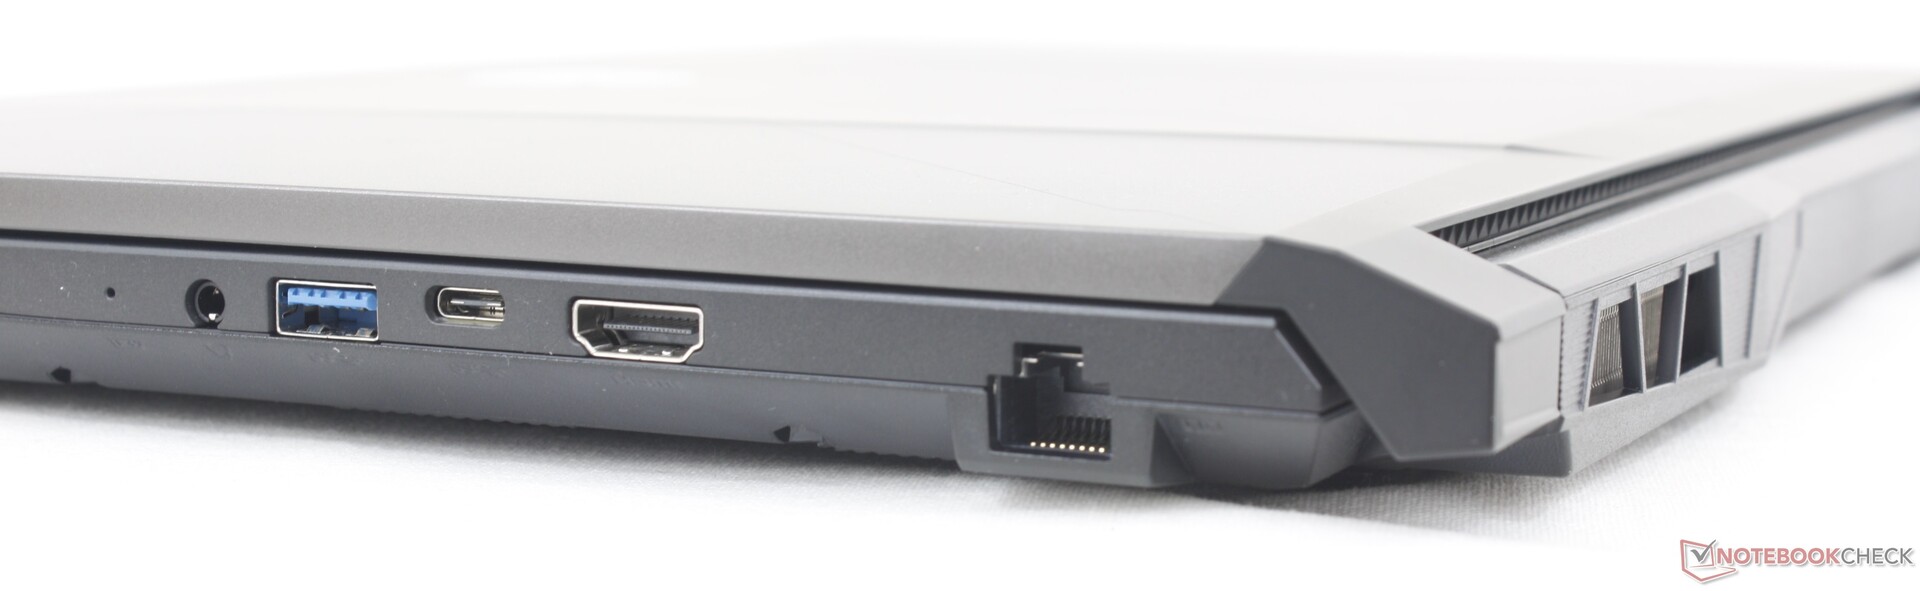
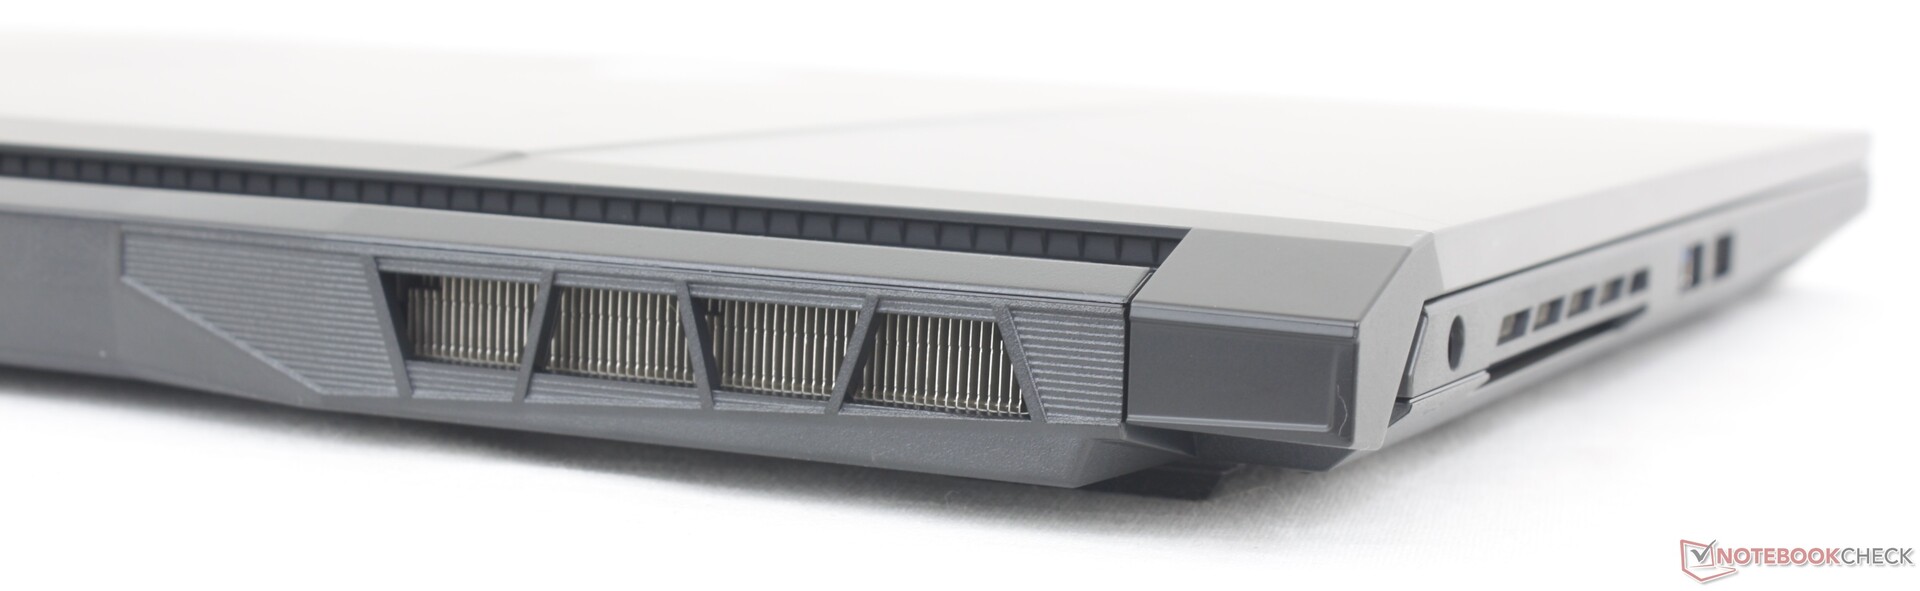
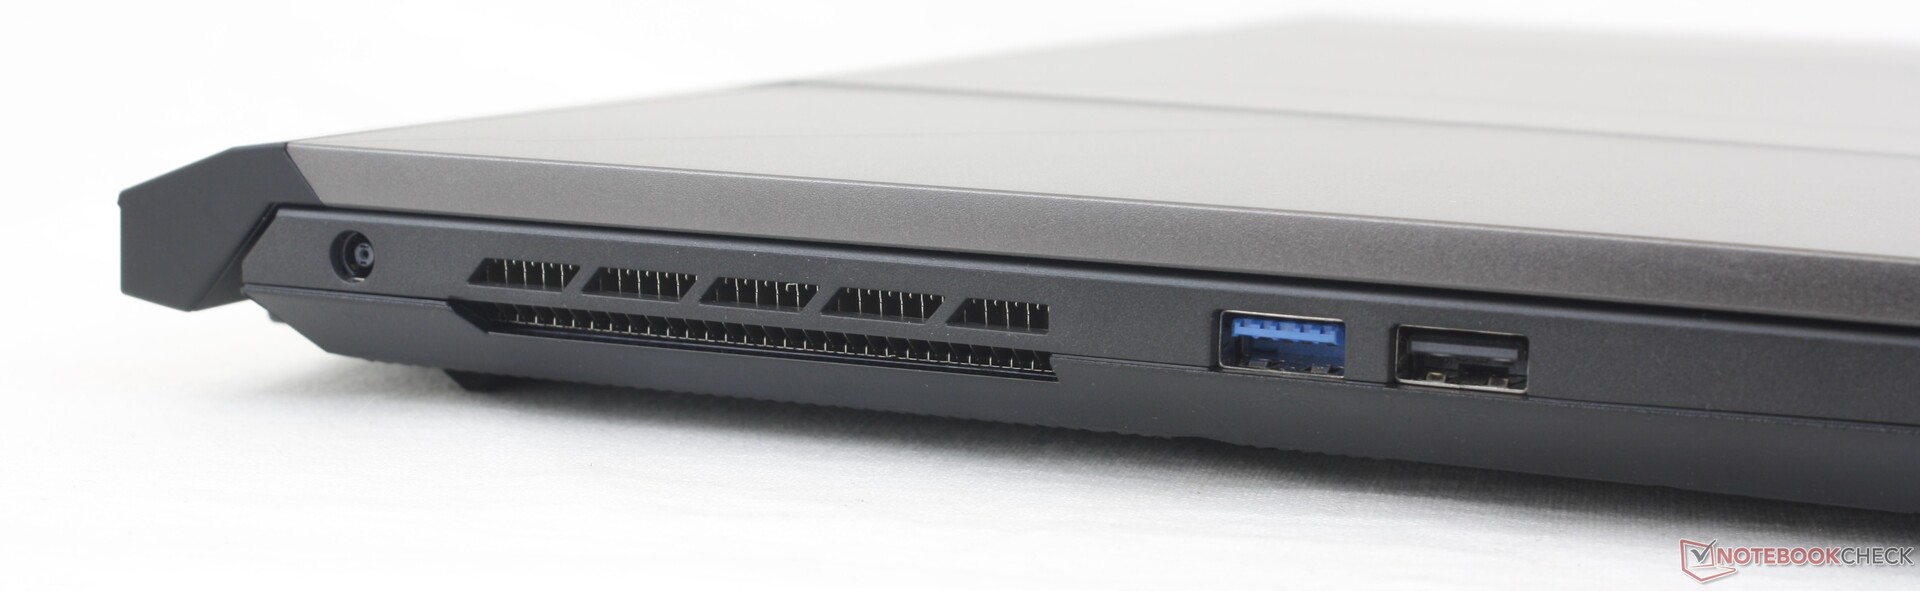
Connectivity — Limited For the Size
Port options are more limited when compared to other midrange gaming laptops like the Dell G16, Acer Nitro 5, or Asus TUF G17. The most important omission here is the lack of Thunderbolt support whereas all three aforementioned alternatives carry it. This is likely a conscious effort from MSI to encourage users to consider the higher-end GE, GS, or GT series instead.
DisplayPort-over-USB is not supported. Our test unit would not recognize any of our external monitors via USB-C.
Communication
An Intel AX201 comes standard for Wi-Fi 6 and Bluetooth 5.2 connectivity. Wi-Fi 6E is not included likely to save on costs, but an end-user upgrade is nonetheless straightforward. Performance is still steady with no notable issues when paired to our Asus AXE11000 router.
| Networking | |
| iperf3 transmit AX12 | |
| MSI Vector GP76 12UGS-434 | |
| iperf3 receive AX12 | |
| MSI Vector GP76 12UGS-434 | |
| iperf3 receive AXE11000 6GHz | |
| Asus ROG Strix Scar 17 SE G733CX-LL014W | |
| Acer Predator Helios 300 (i7-12700H, RTX 3070 Ti) | |
| iperf3 receive AXE11000 | |
| Razer Blade 17 Early 2022 | |
| MSI Pulse GL76 12UGK | |
| Alienware m17 R5 (R9 6900HX, RX 6850M XT) | |
| iperf3 transmit AXE11000 | |
| MSI Pulse GL76 12UGK | |
| Alienware m17 R5 (R9 6900HX, RX 6850M XT) | |
| iperf3 transmit AXE11000 6GHz | |
| Asus ROG Strix Scar 17 SE G733CX-LL014W | |
| Acer Predator Helios 300 (i7-12700H, RTX 3070 Ti) | |
Webcam
The integrated 720p webcam produces muddy pictures with poor colors. A non-gaming alternative like the HP Spectre is recommended if camera quality is important.
A digital camera kill switch is tied to the F7 key while Windows Hello is not supported.


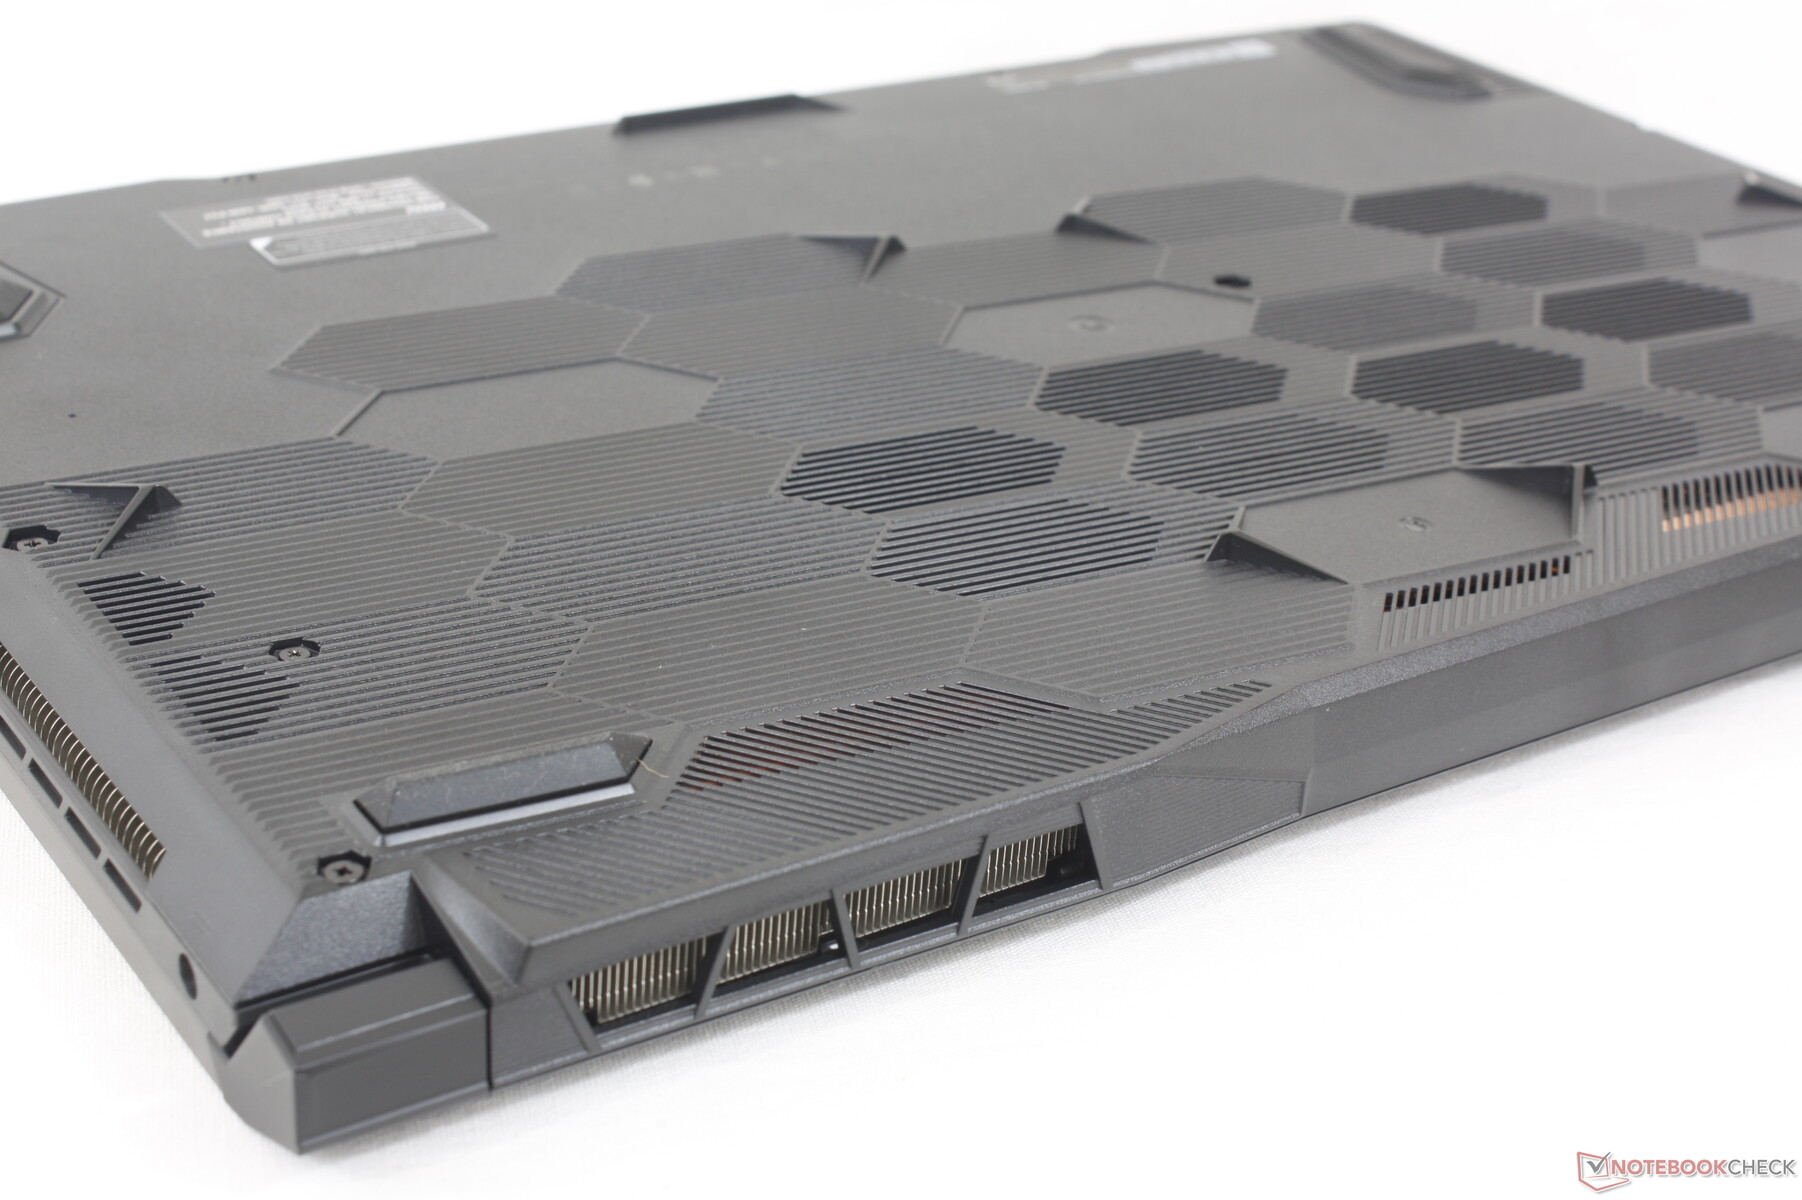
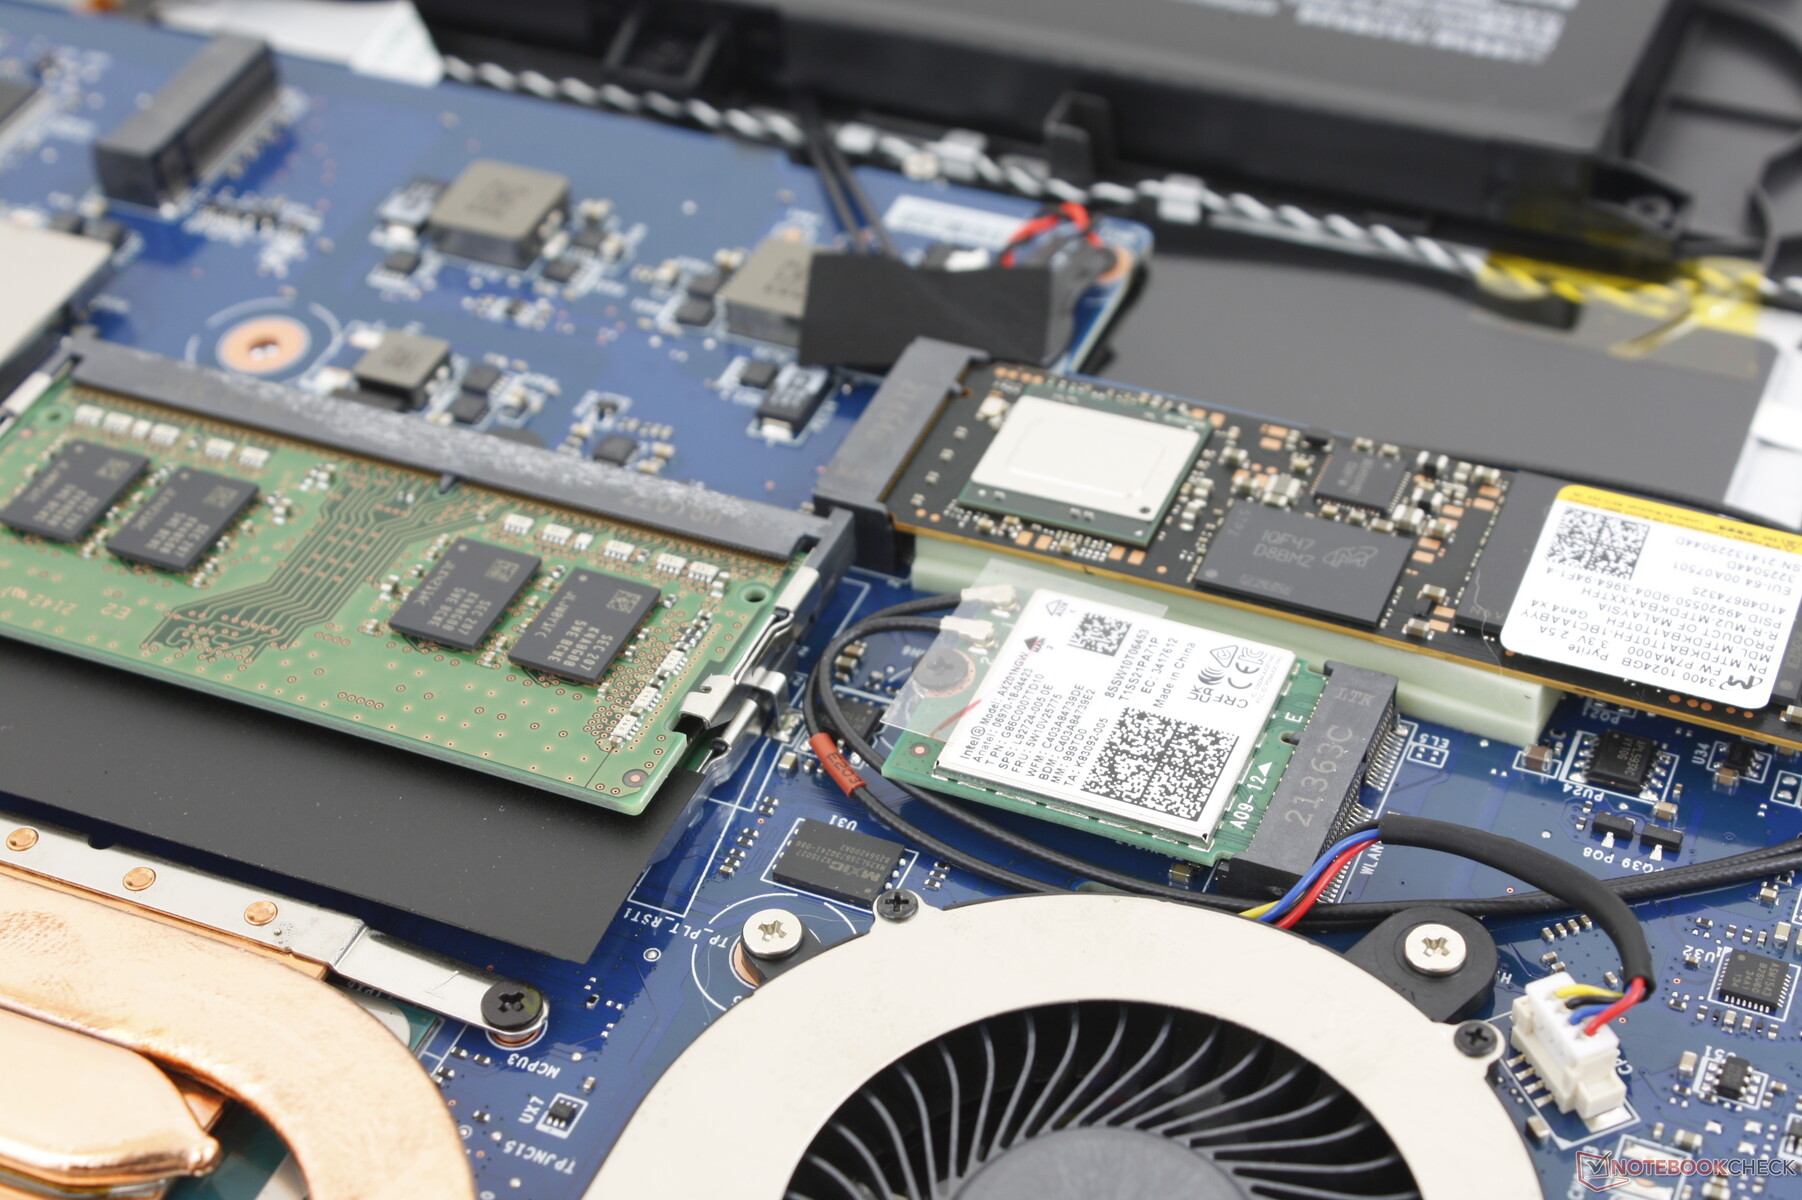
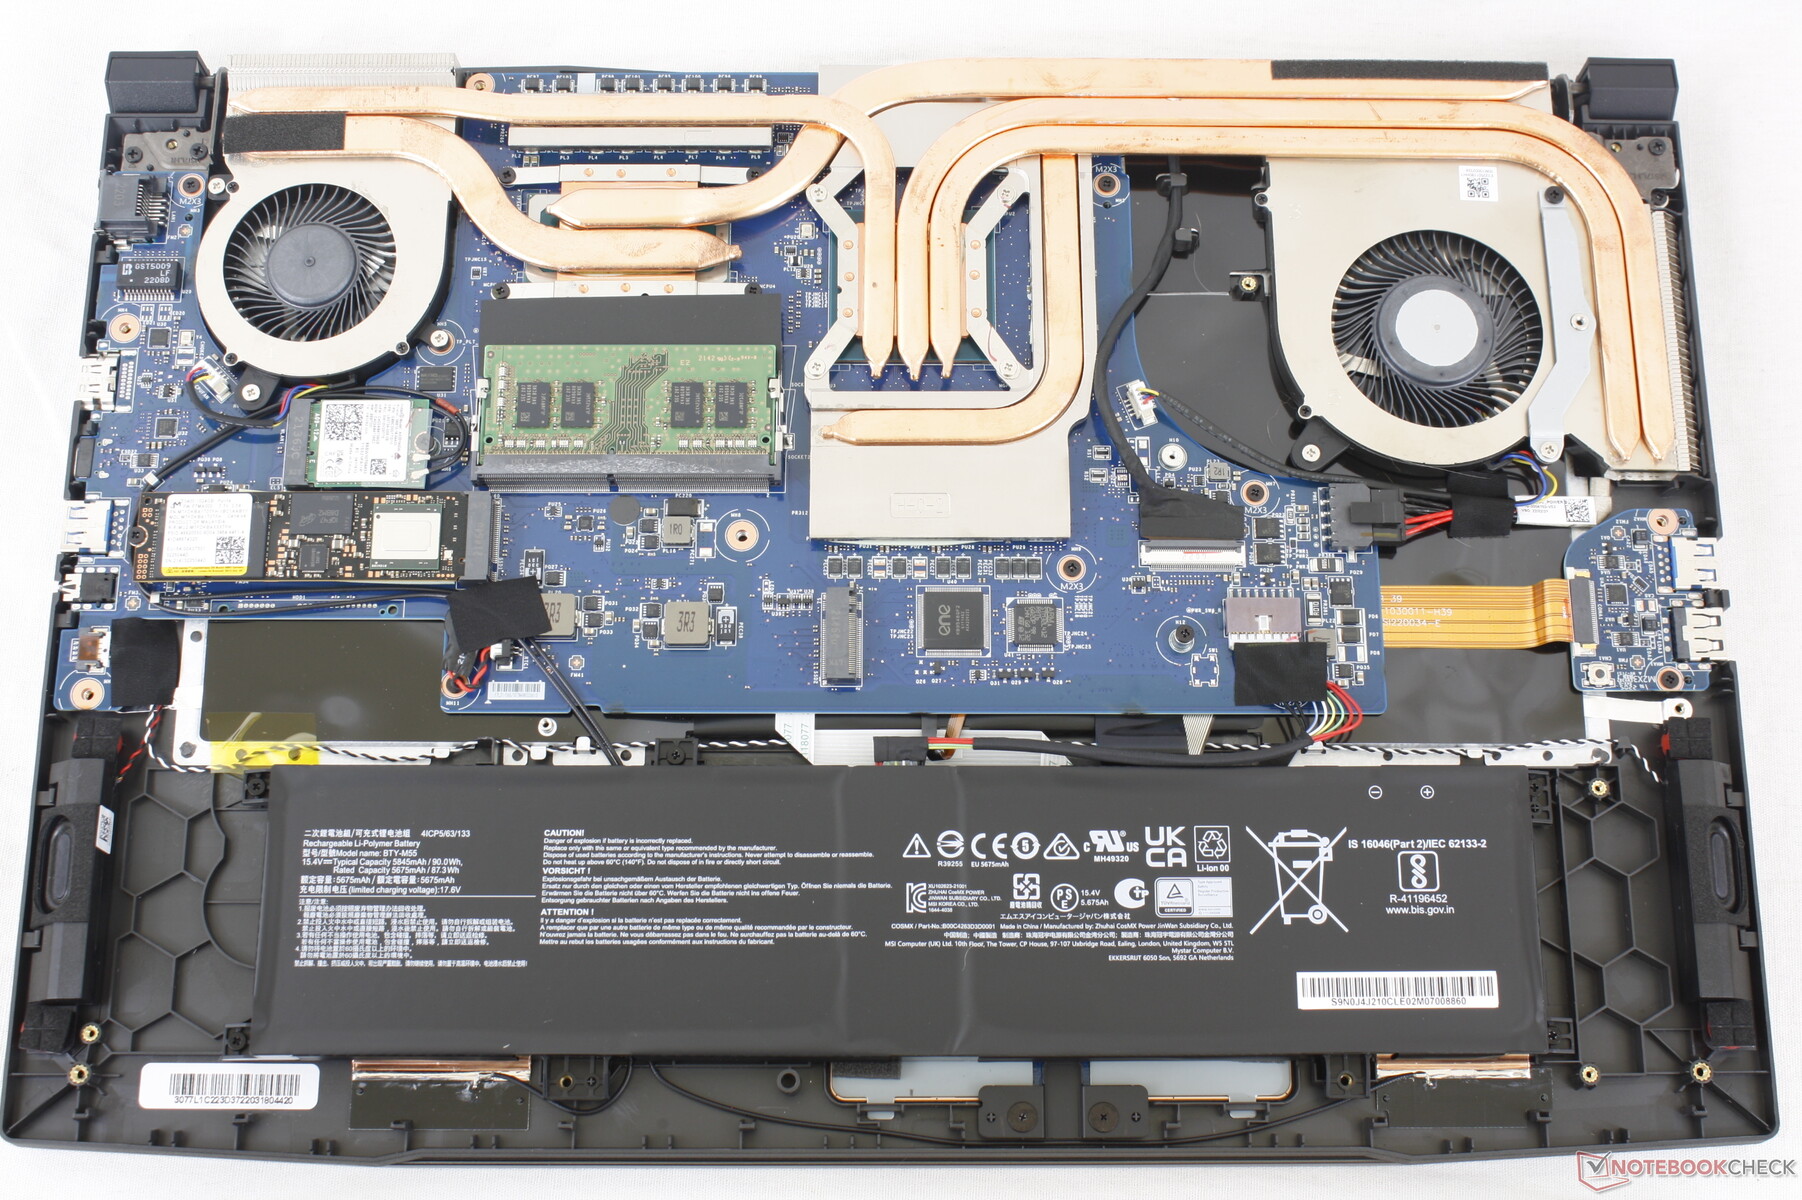
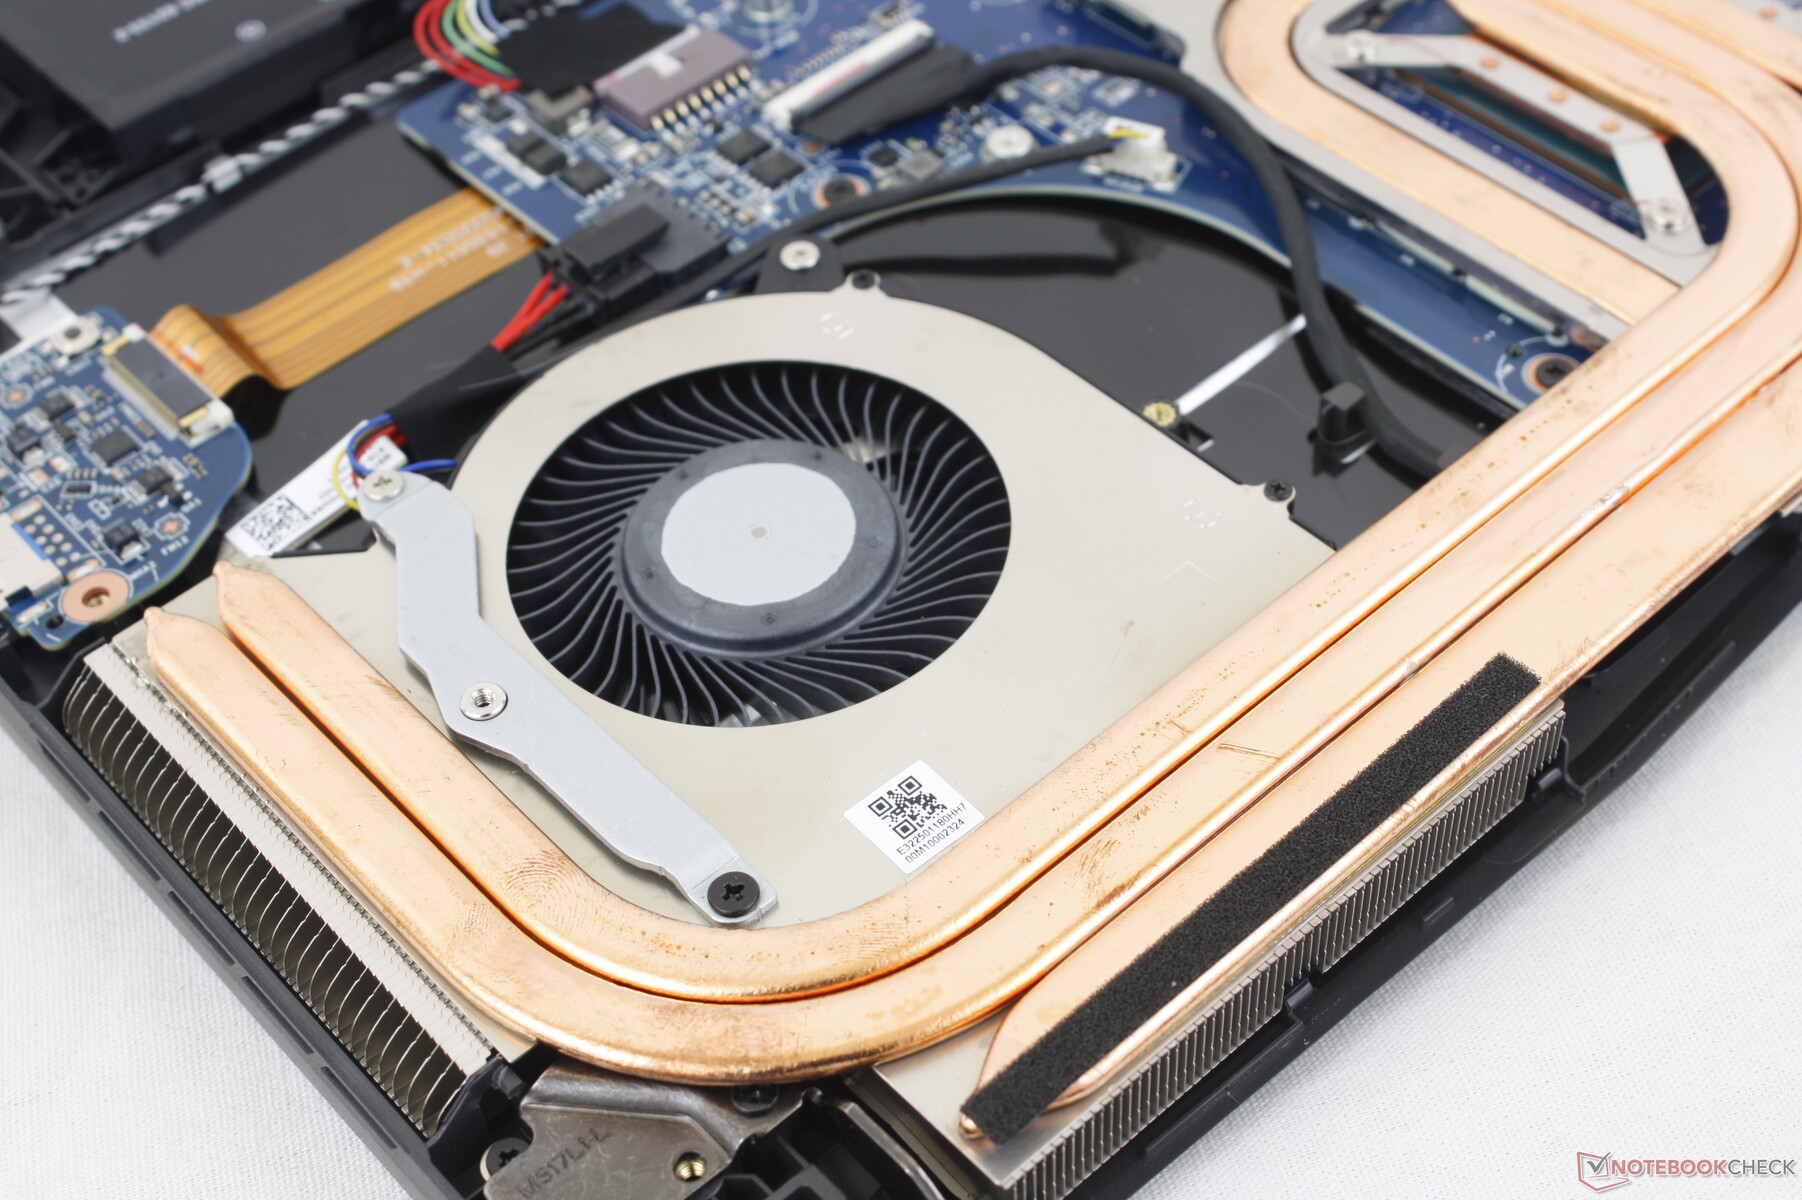
Maintenance
The bottom panel is secured by 13 easy-to-remove Philips screws. However, keep in mind that a factory seal sticker must be broken in order to do so. MSI continues to be one of the very few major manufacturers to have a factory seal sticker for even simple upgrades like RAM or storage.
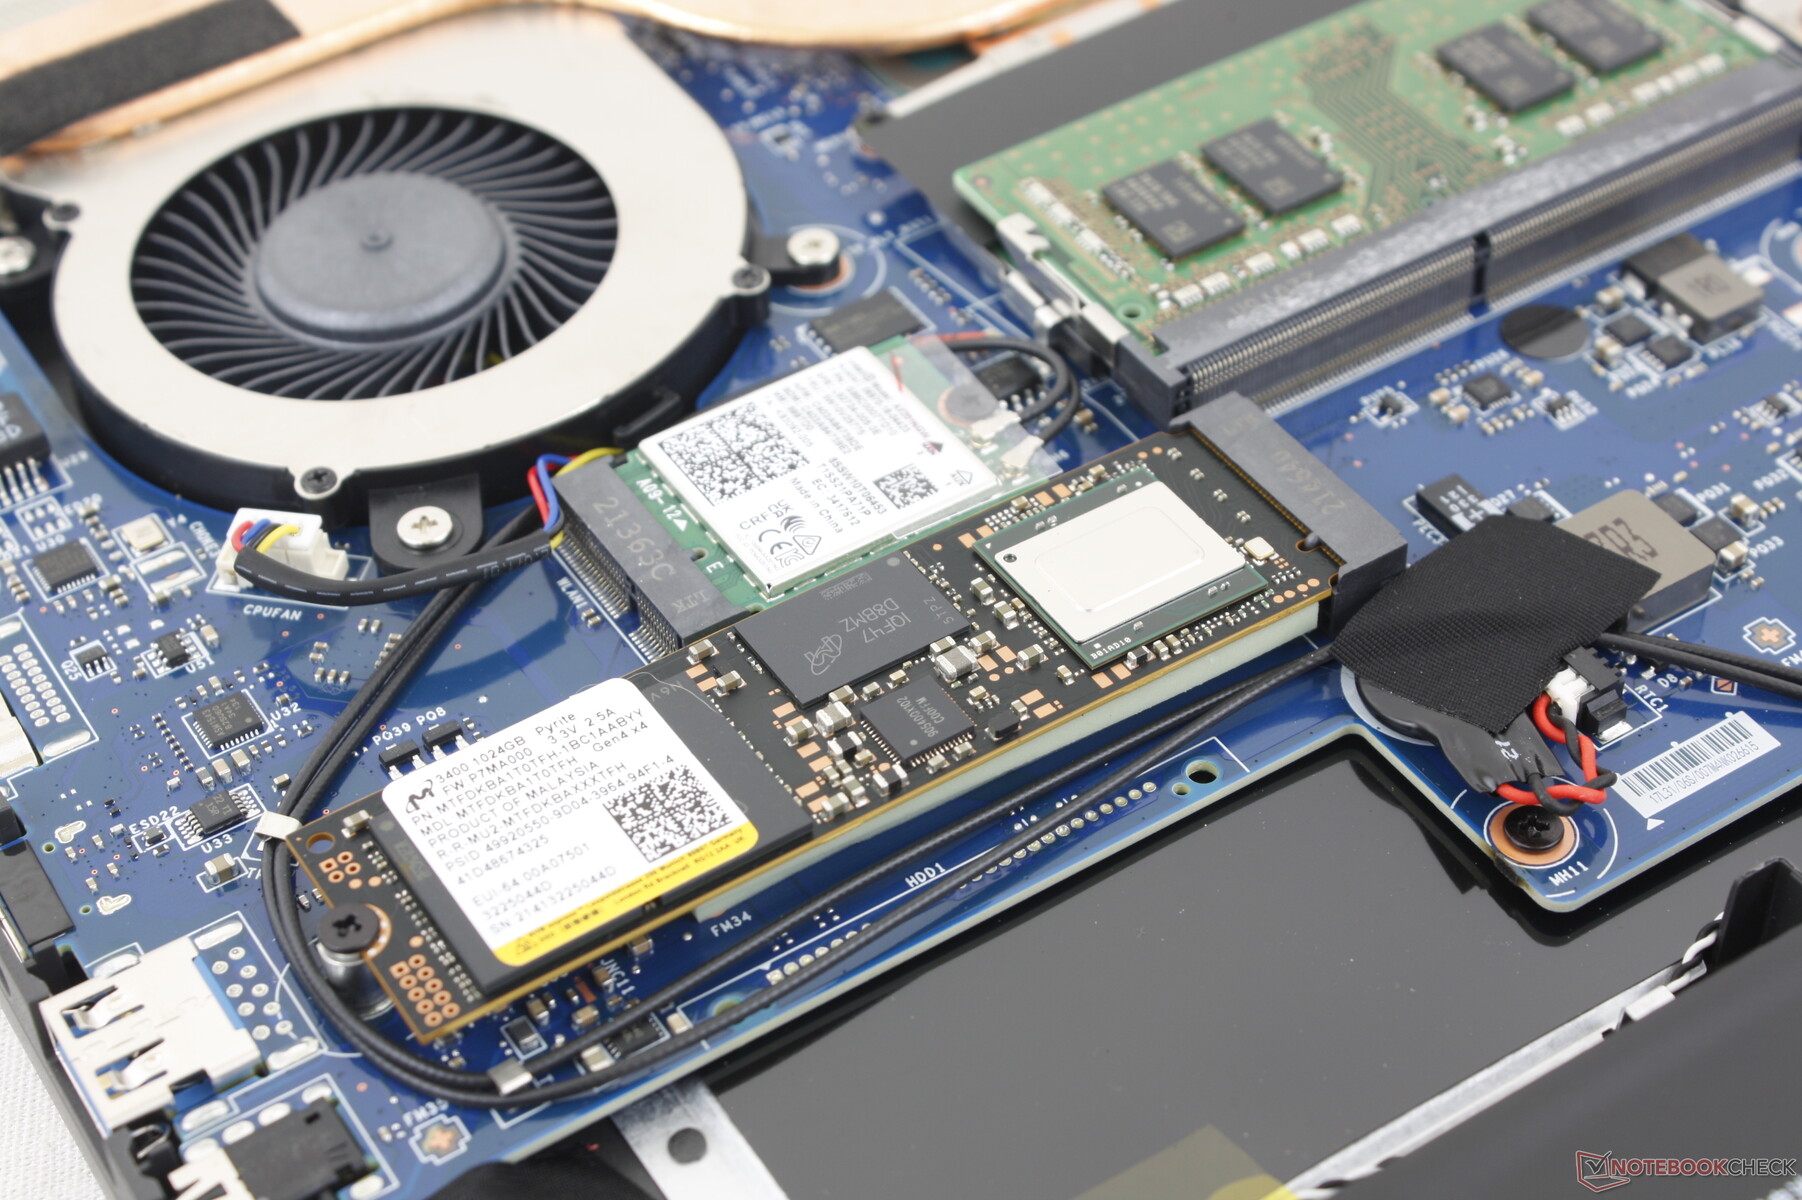
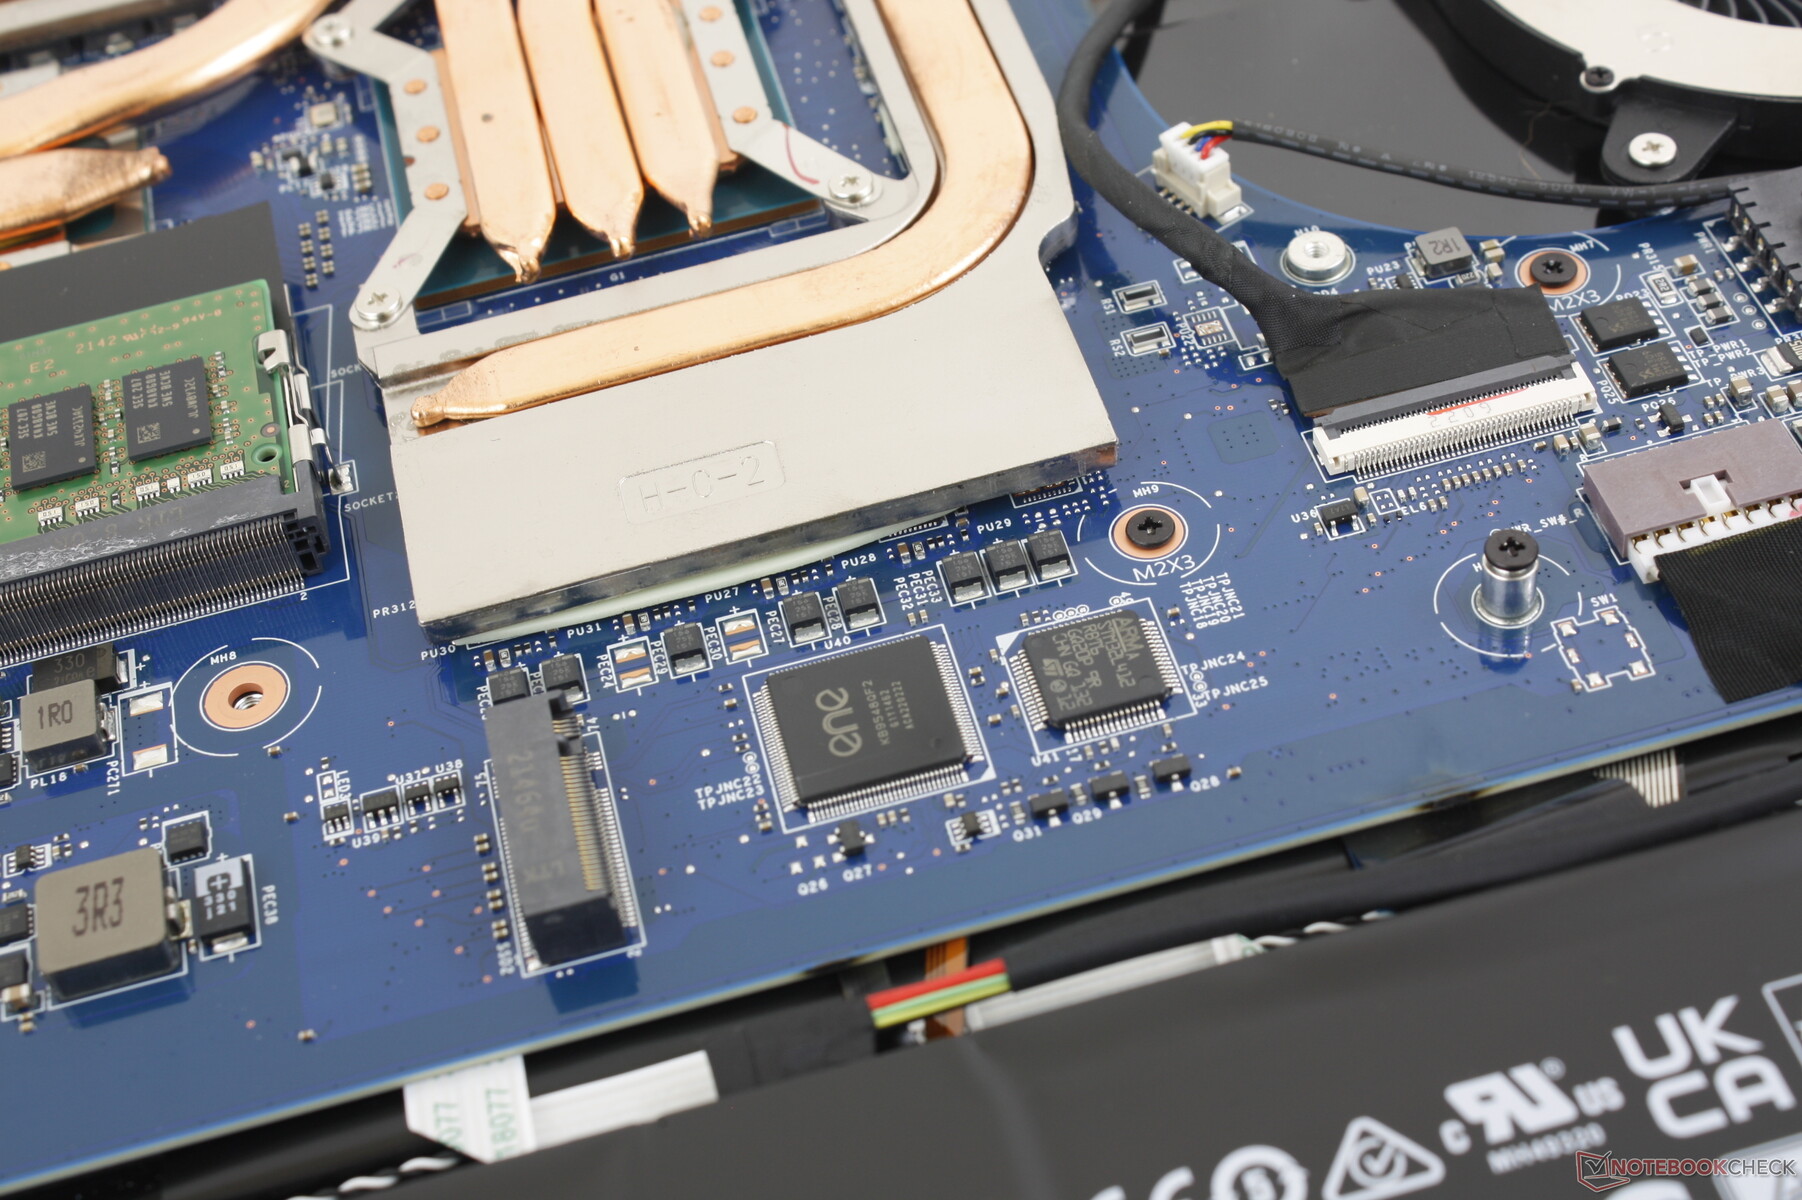
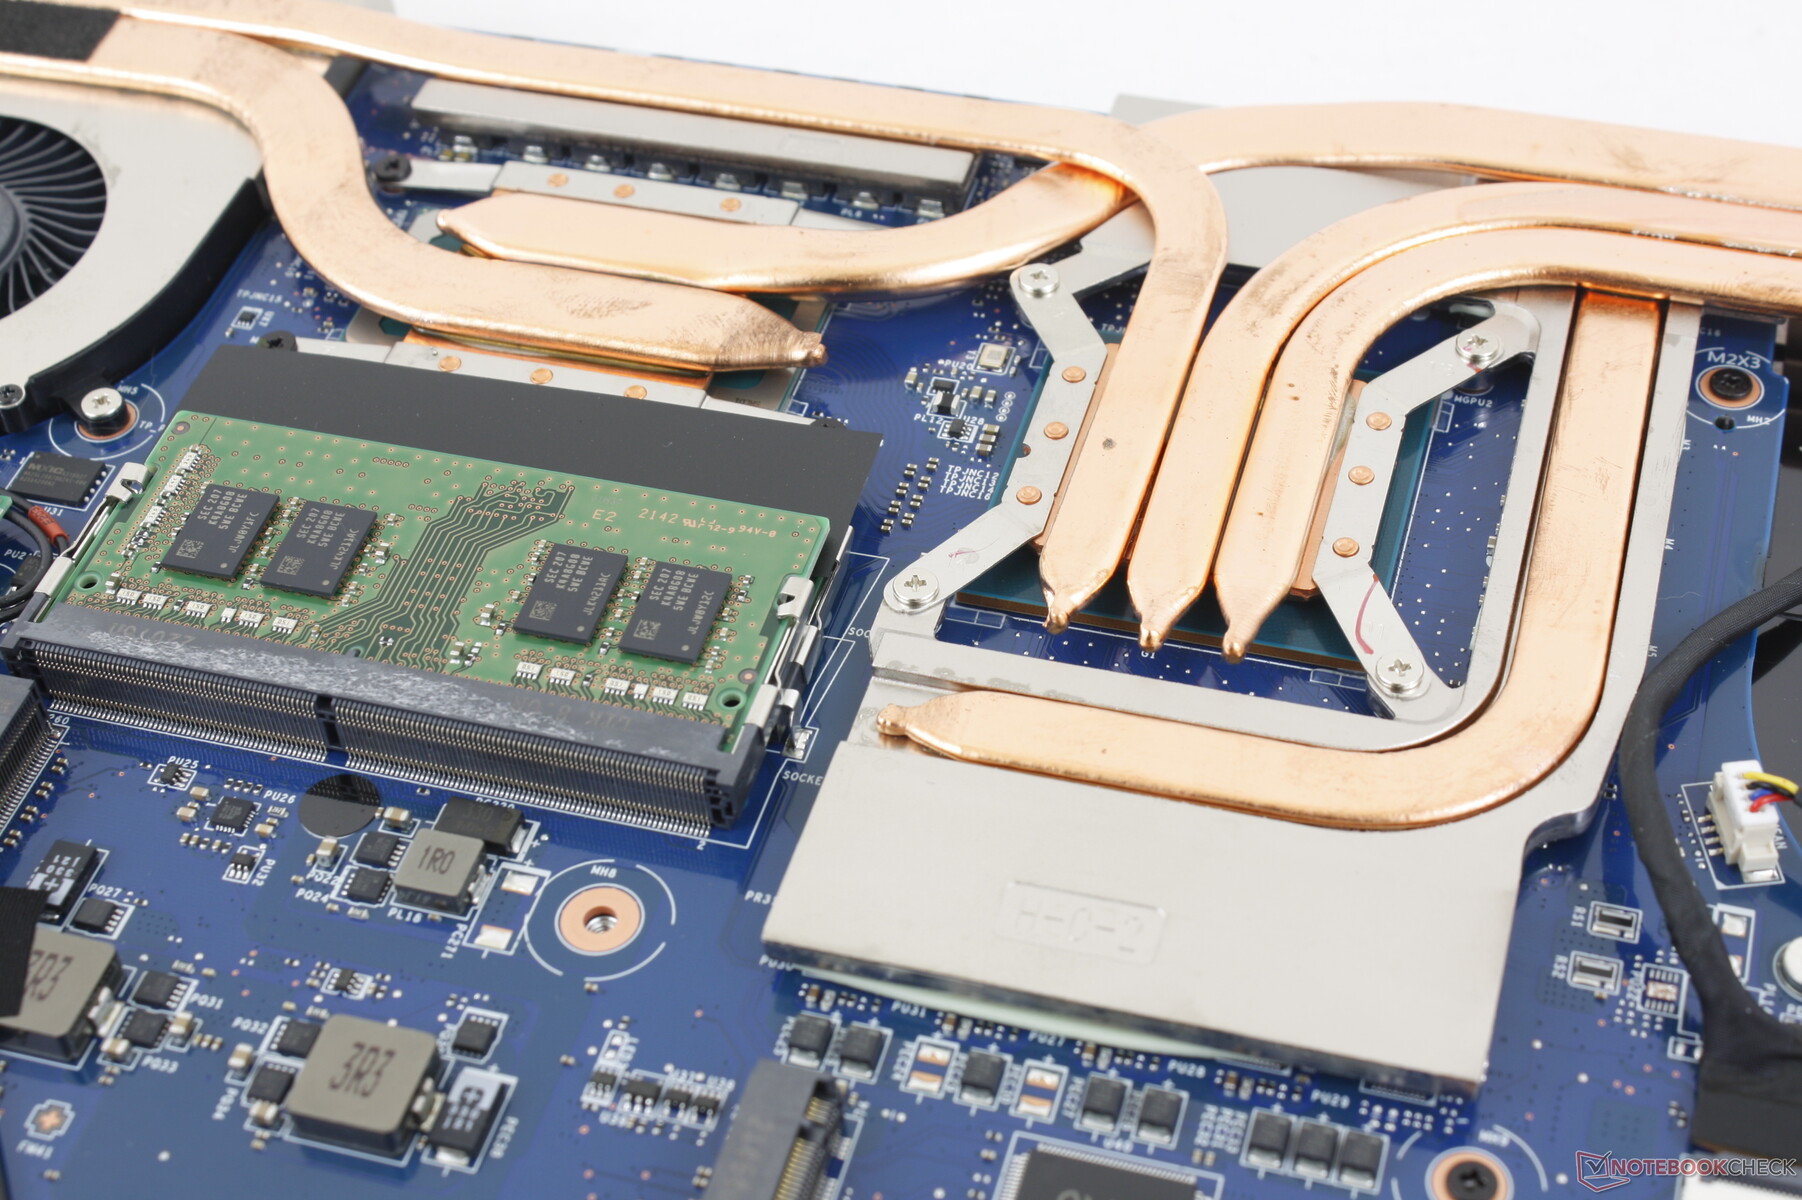
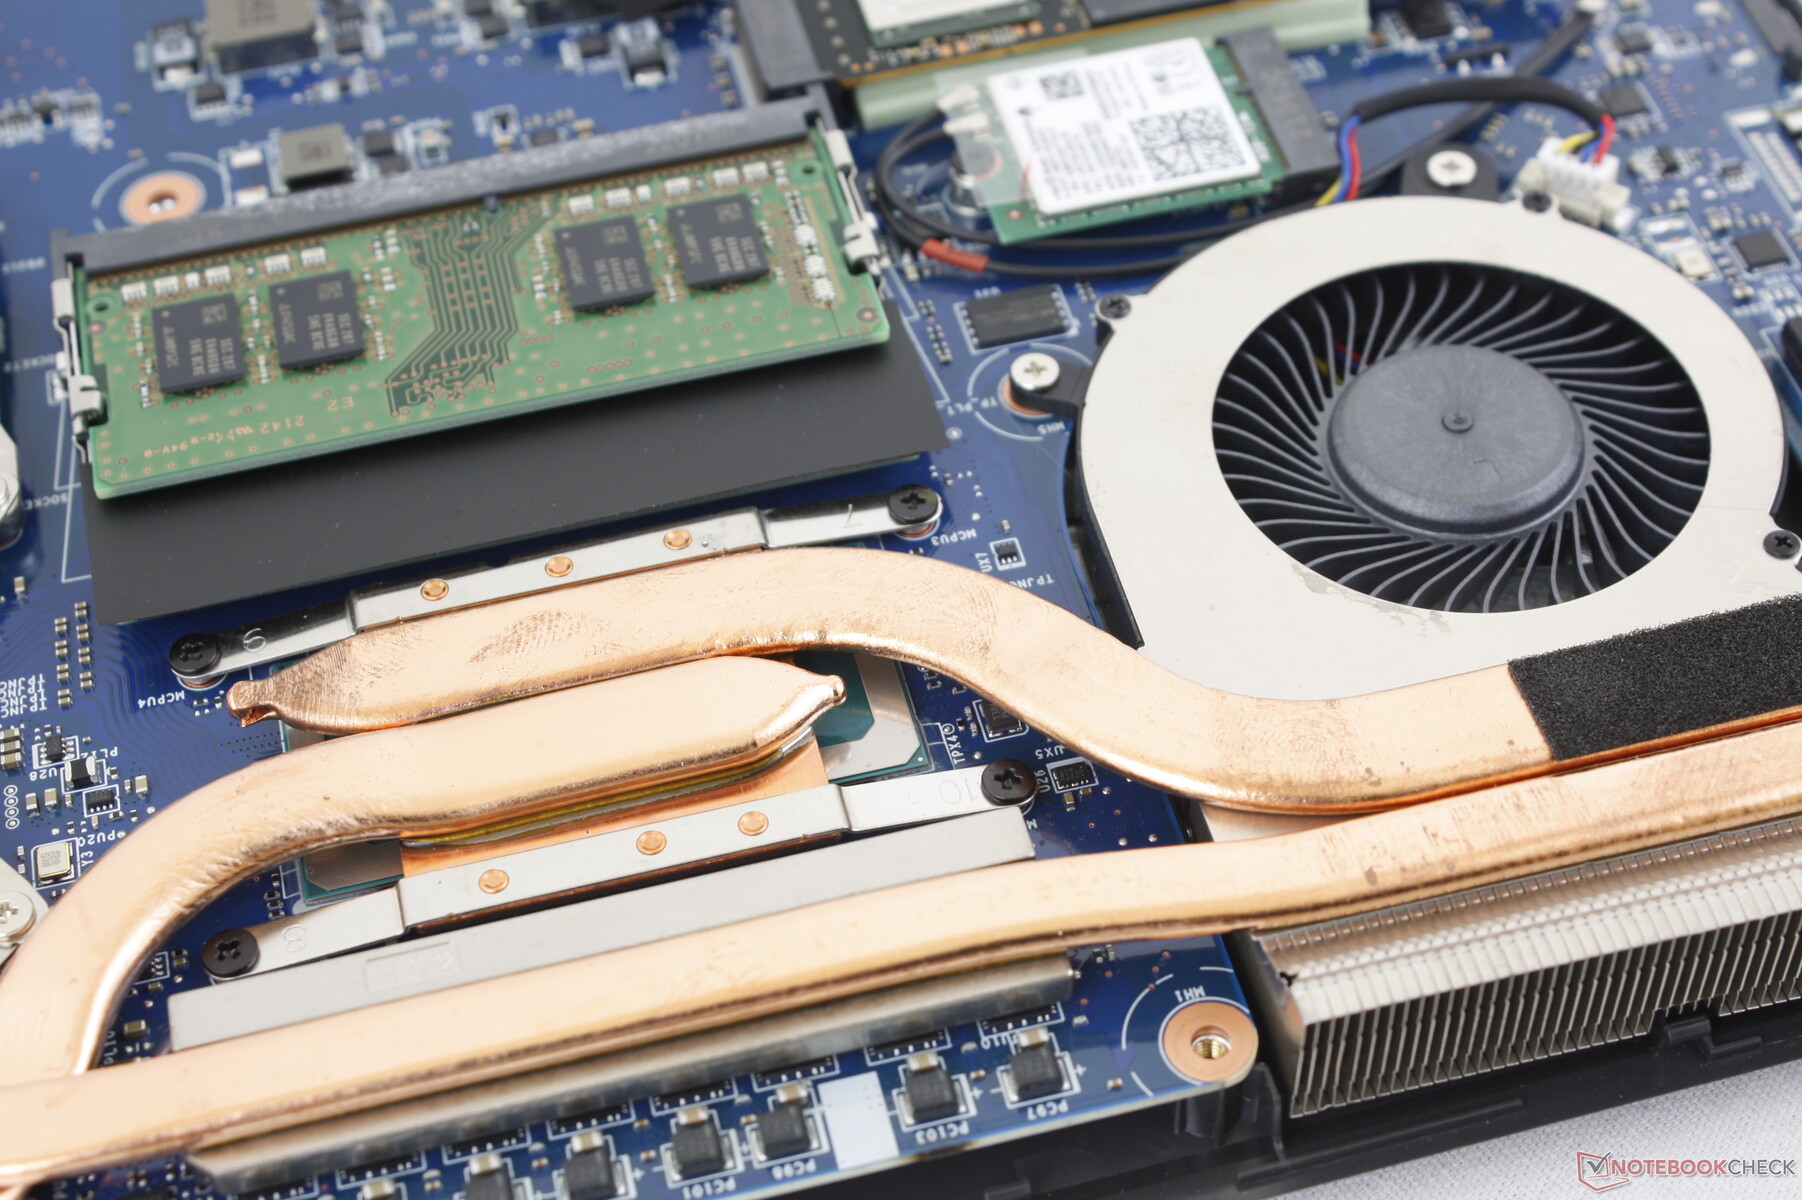
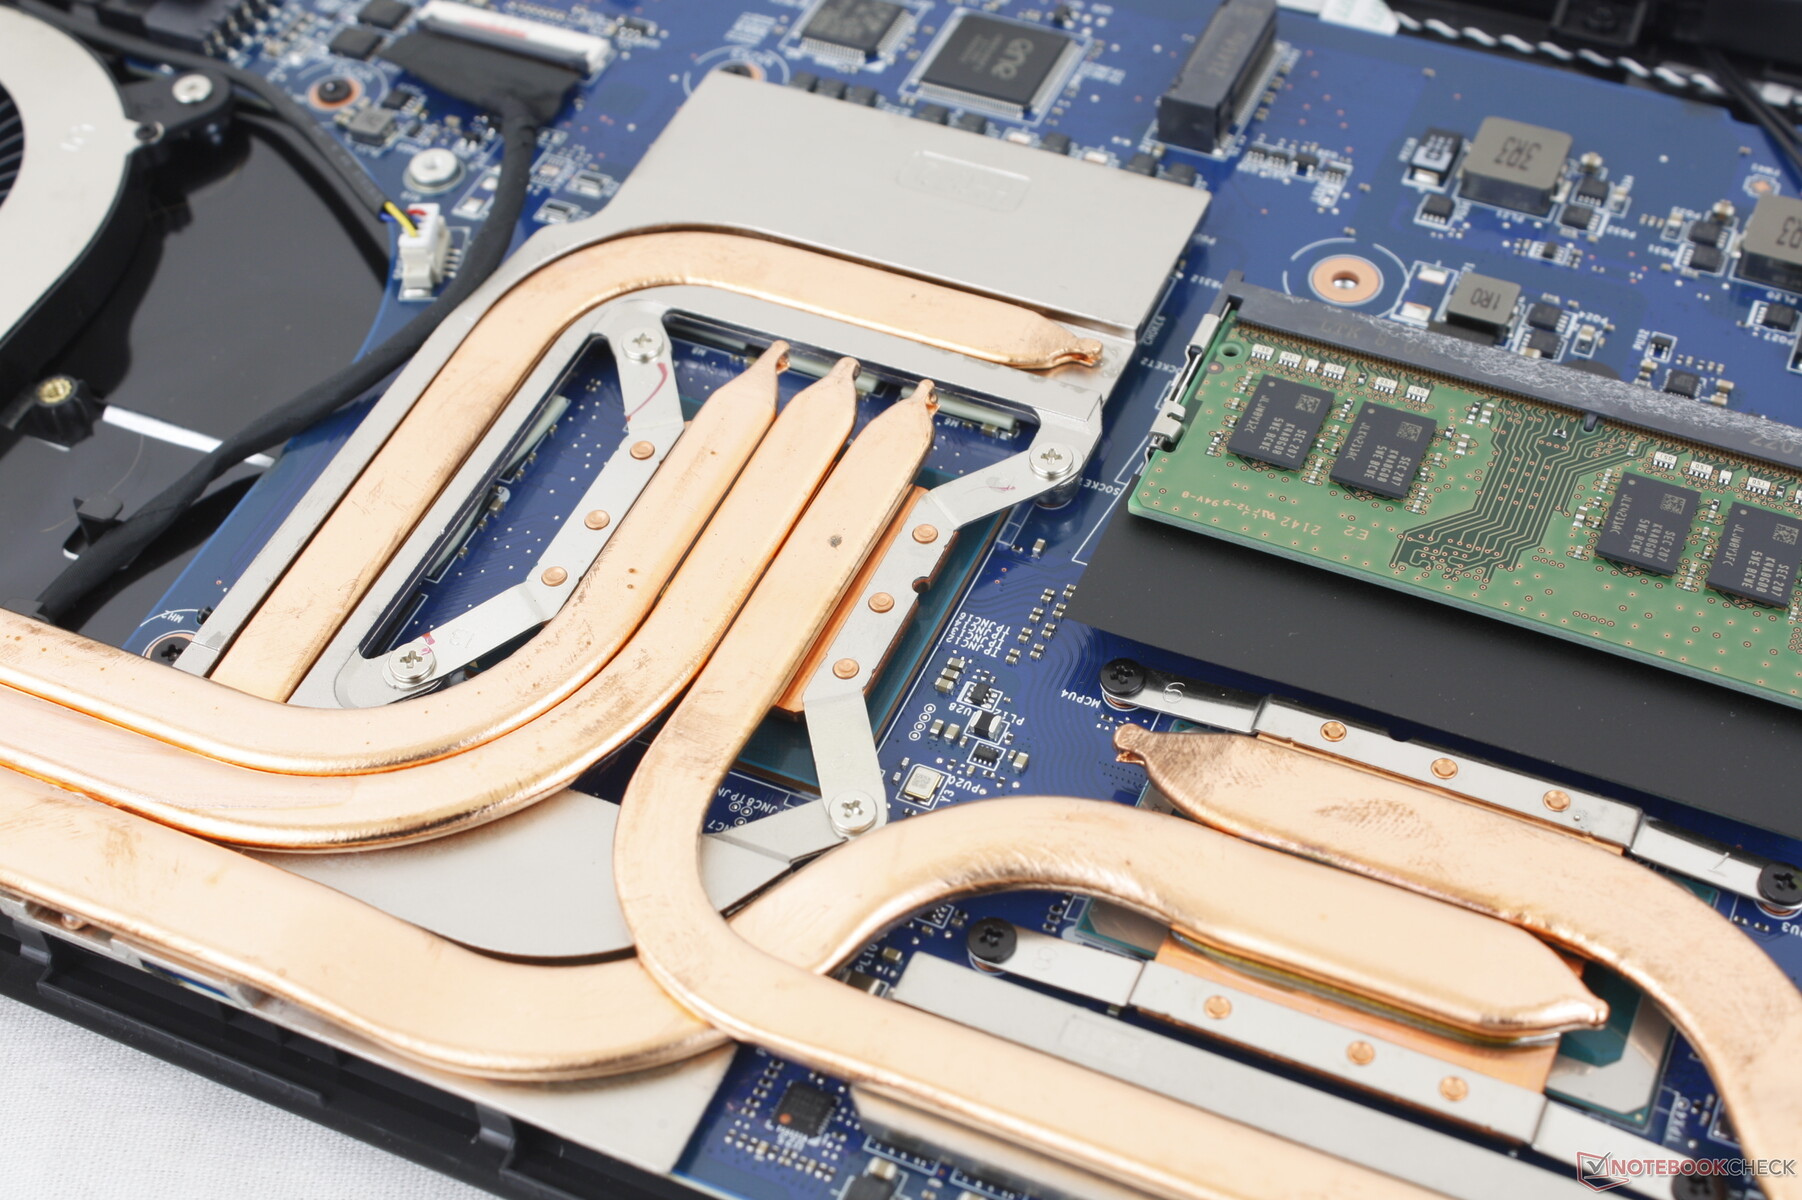
Once inside, users will have direct access to 2x PCIe4 SSD slots, 2x SODIMM slots, WLAN module, battery, and cooling solution.
Accessories and Warranty
There are no extras in the retail box beyond the AC adapter and paperwork. A standard one-year limited warranty applies if purchased in the US.
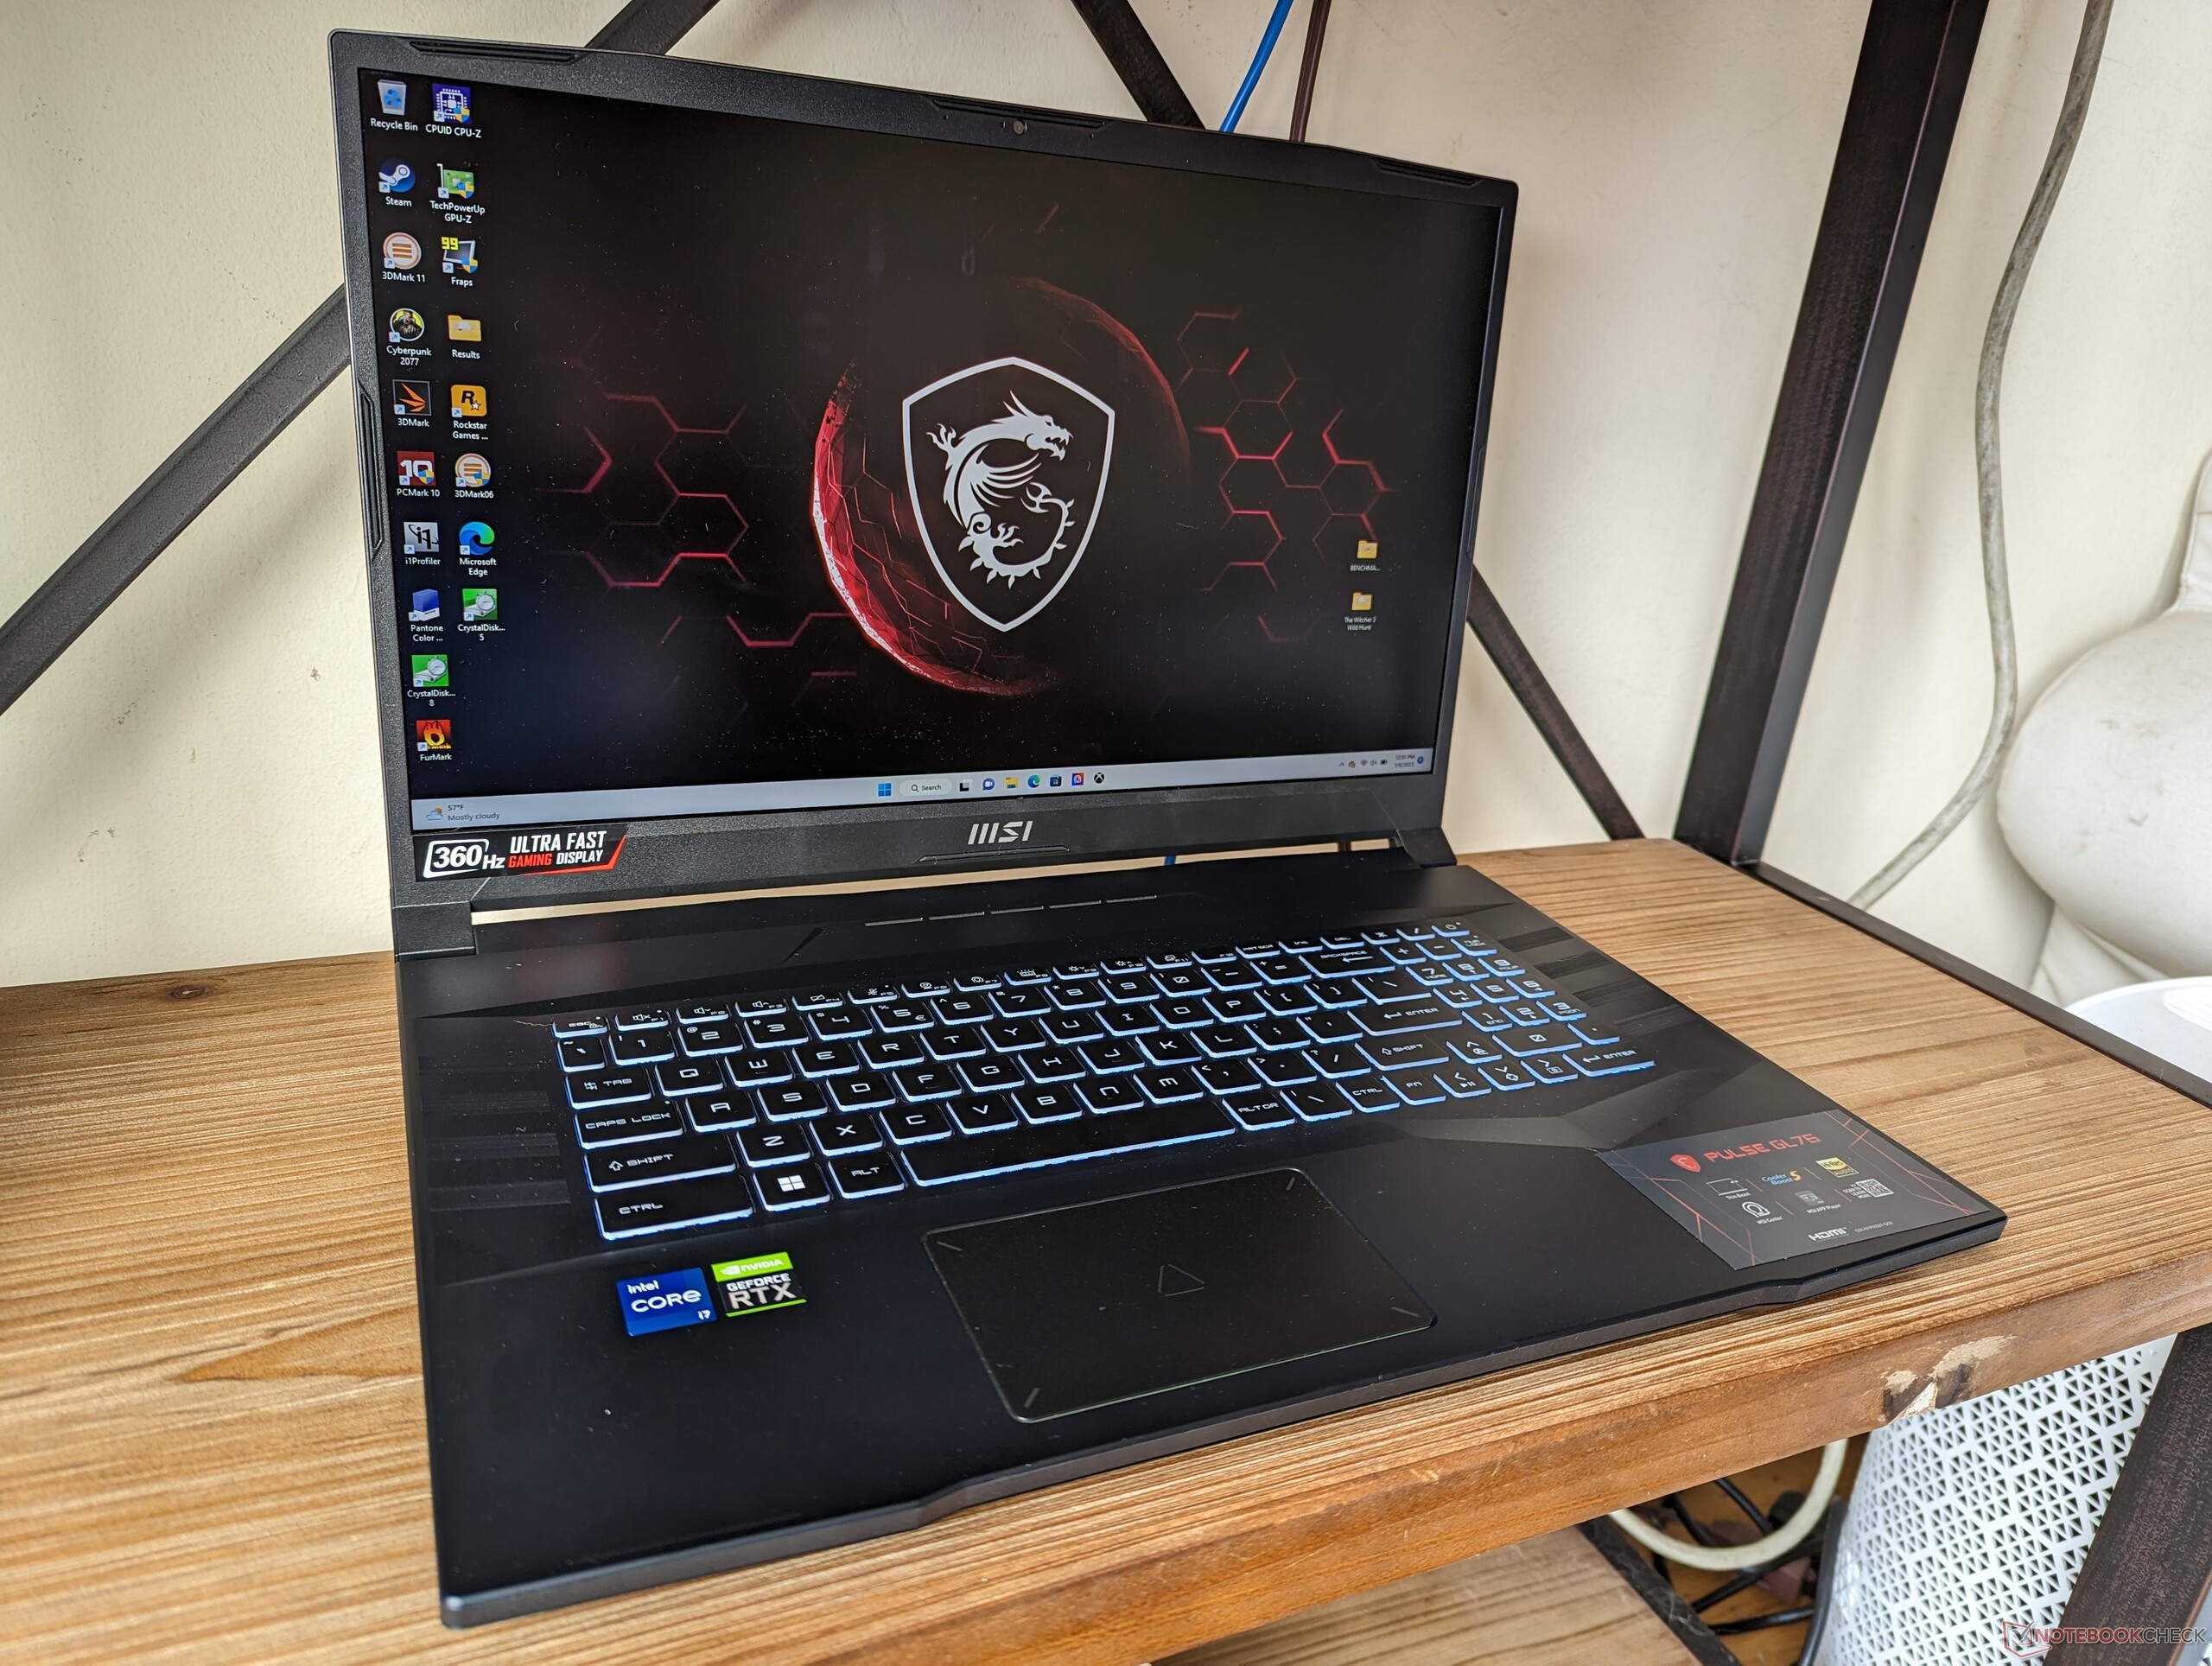
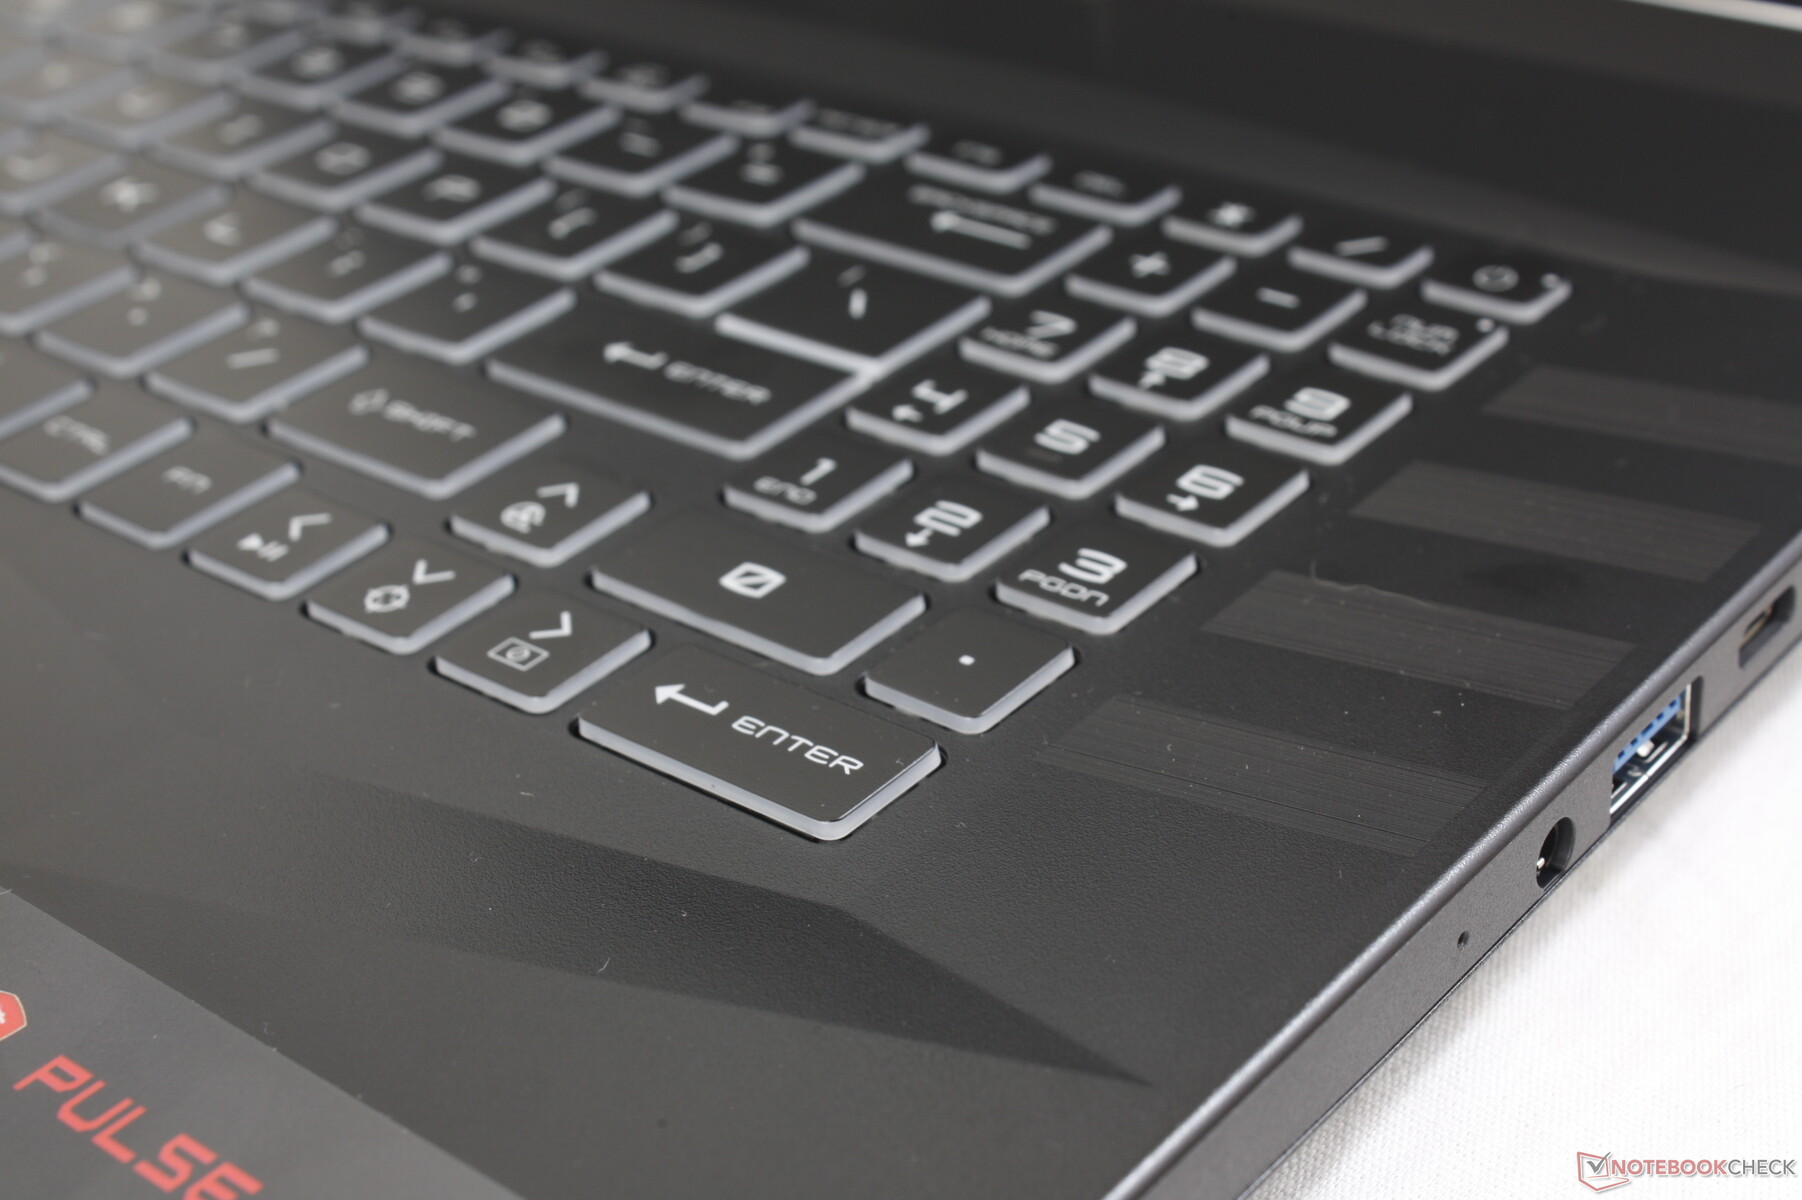
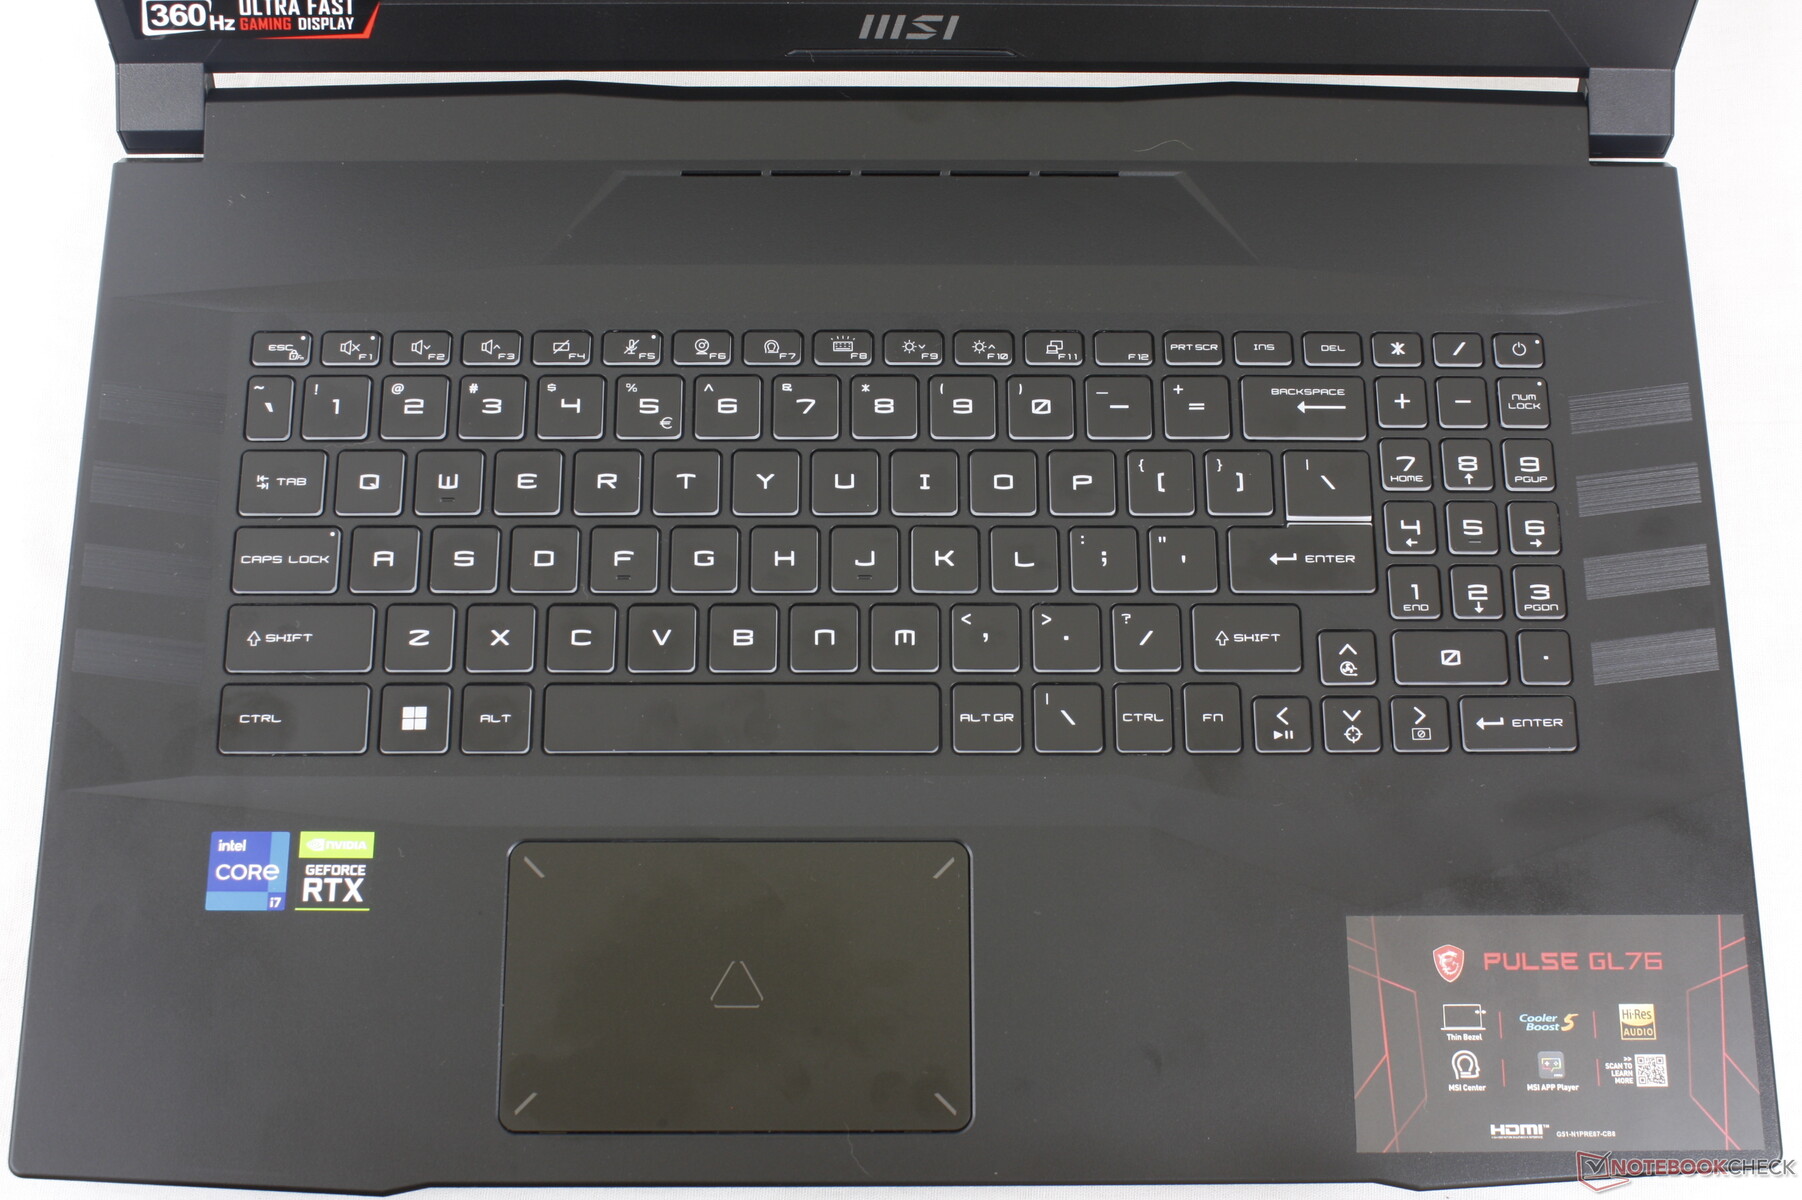
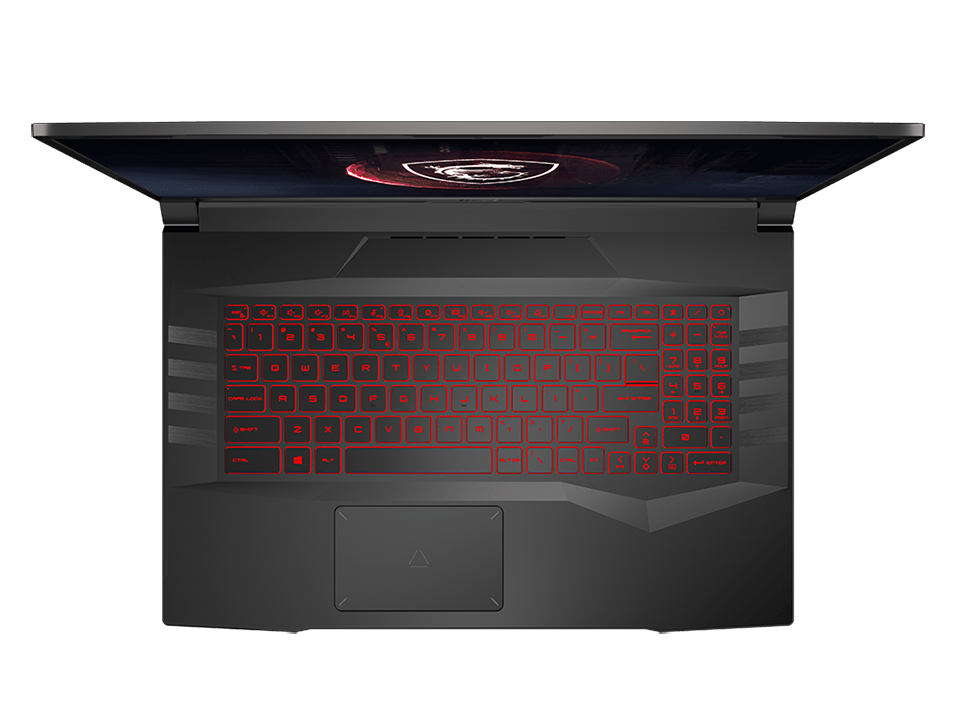
Input Devices — OK Keyboard, Spongy Clickpad
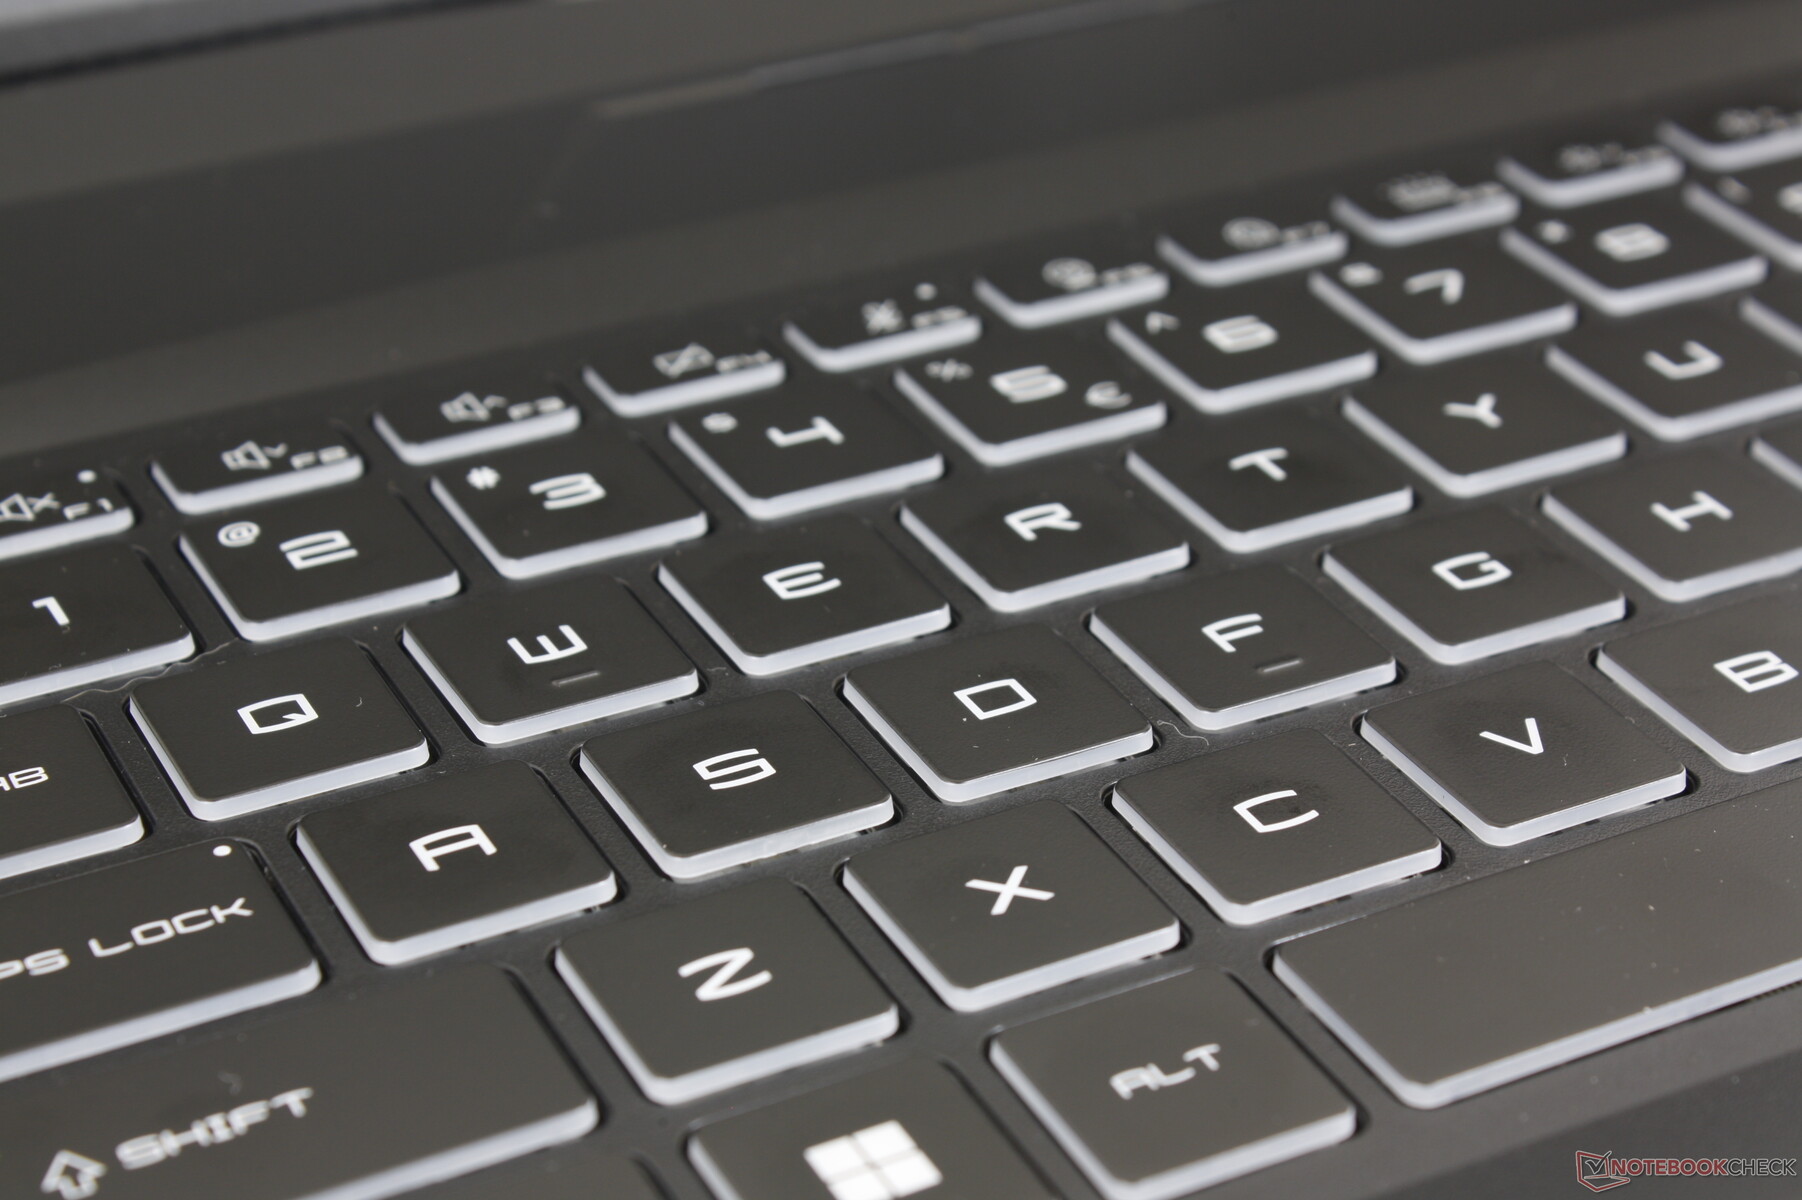
Keyboard
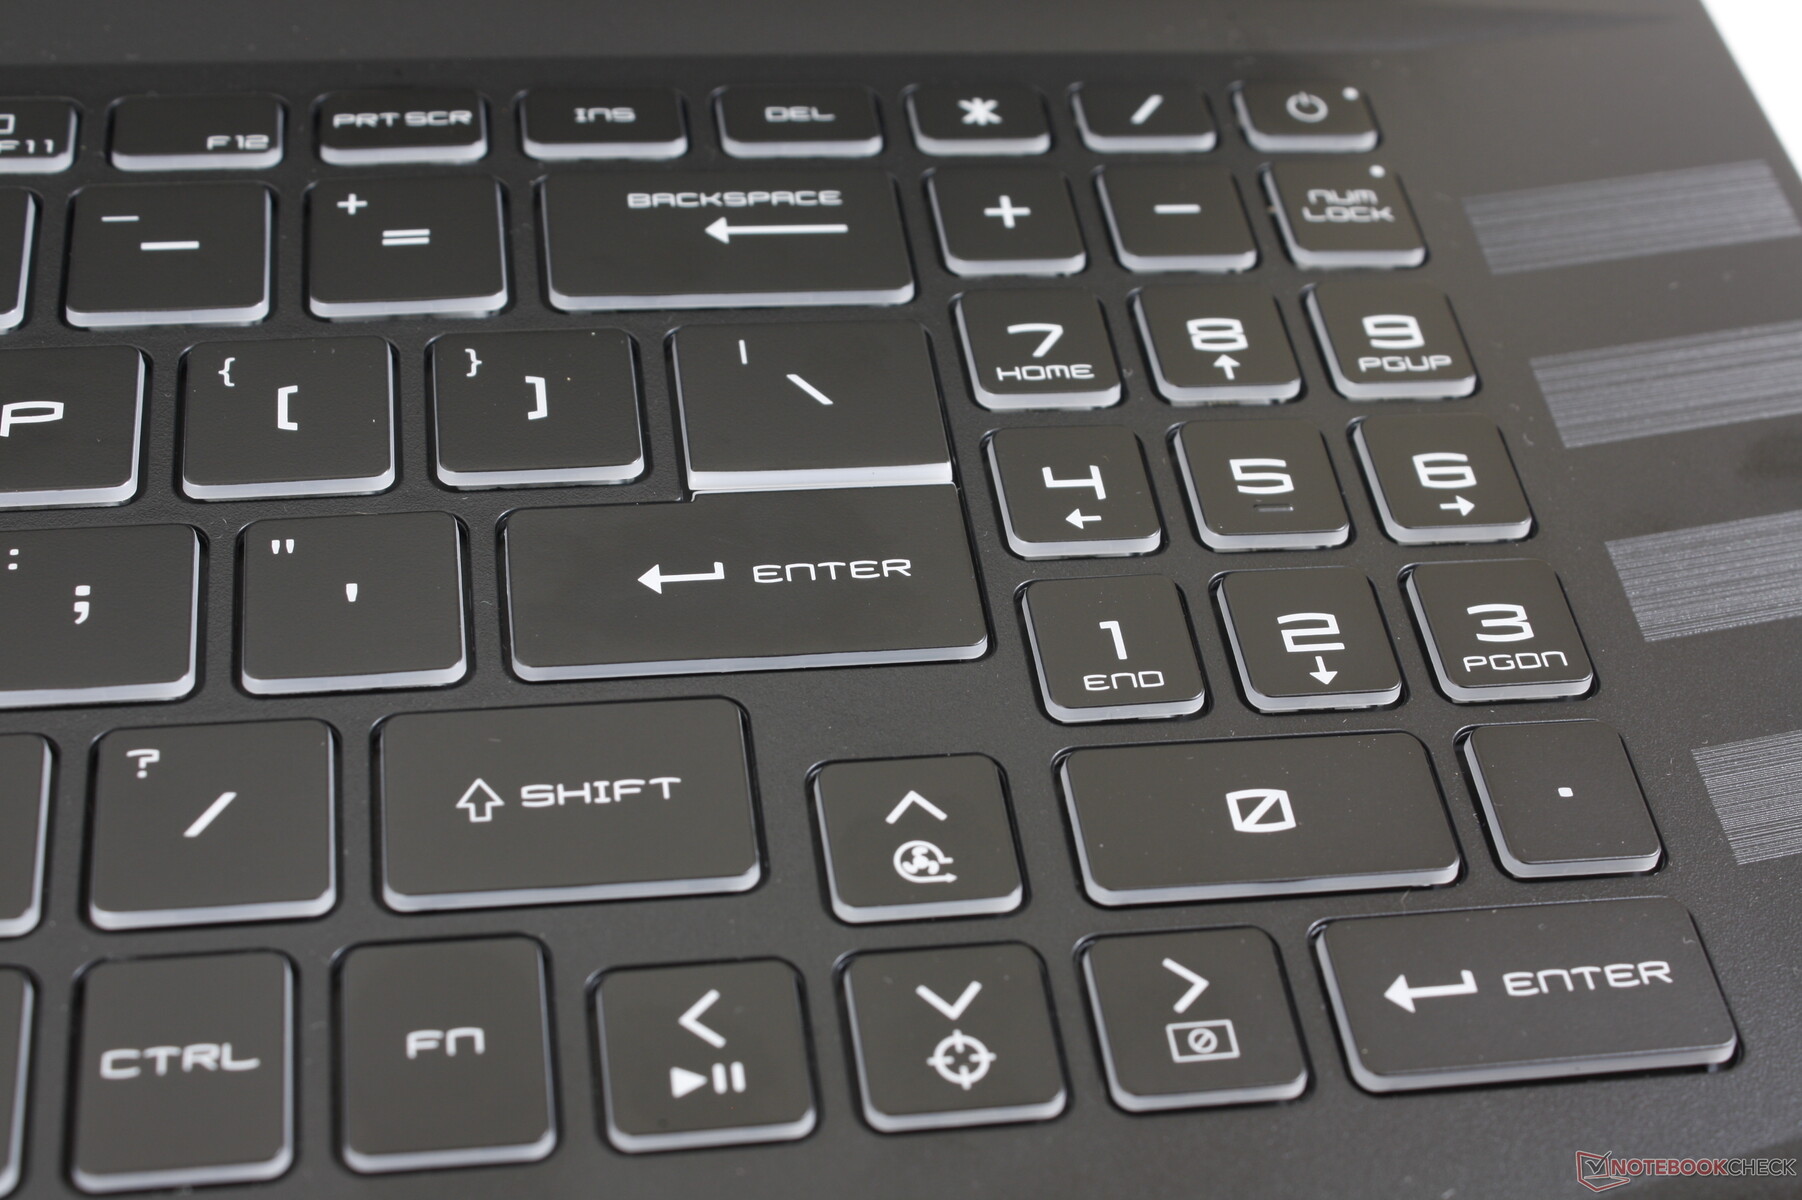
The GL76 shares the same keyboard and typing experience as on the GL66 despite their form factor differences. Thus, the short key travel and passable feedback on the GL66 apply here on the GL76 as well. It's unfortunate that MSI didn't better utilize the larger 17.3-inch form factor by increasing the size of the numpad and arrow keys as they are smaller, spongier, and more cramped when compared to the larger QWERTY keys. This trait is shared with the Asus TUF Gaming F17.
A single-zone RGB backlight comes standard with no per-key RGB options. All keys and symbols are illuminated.
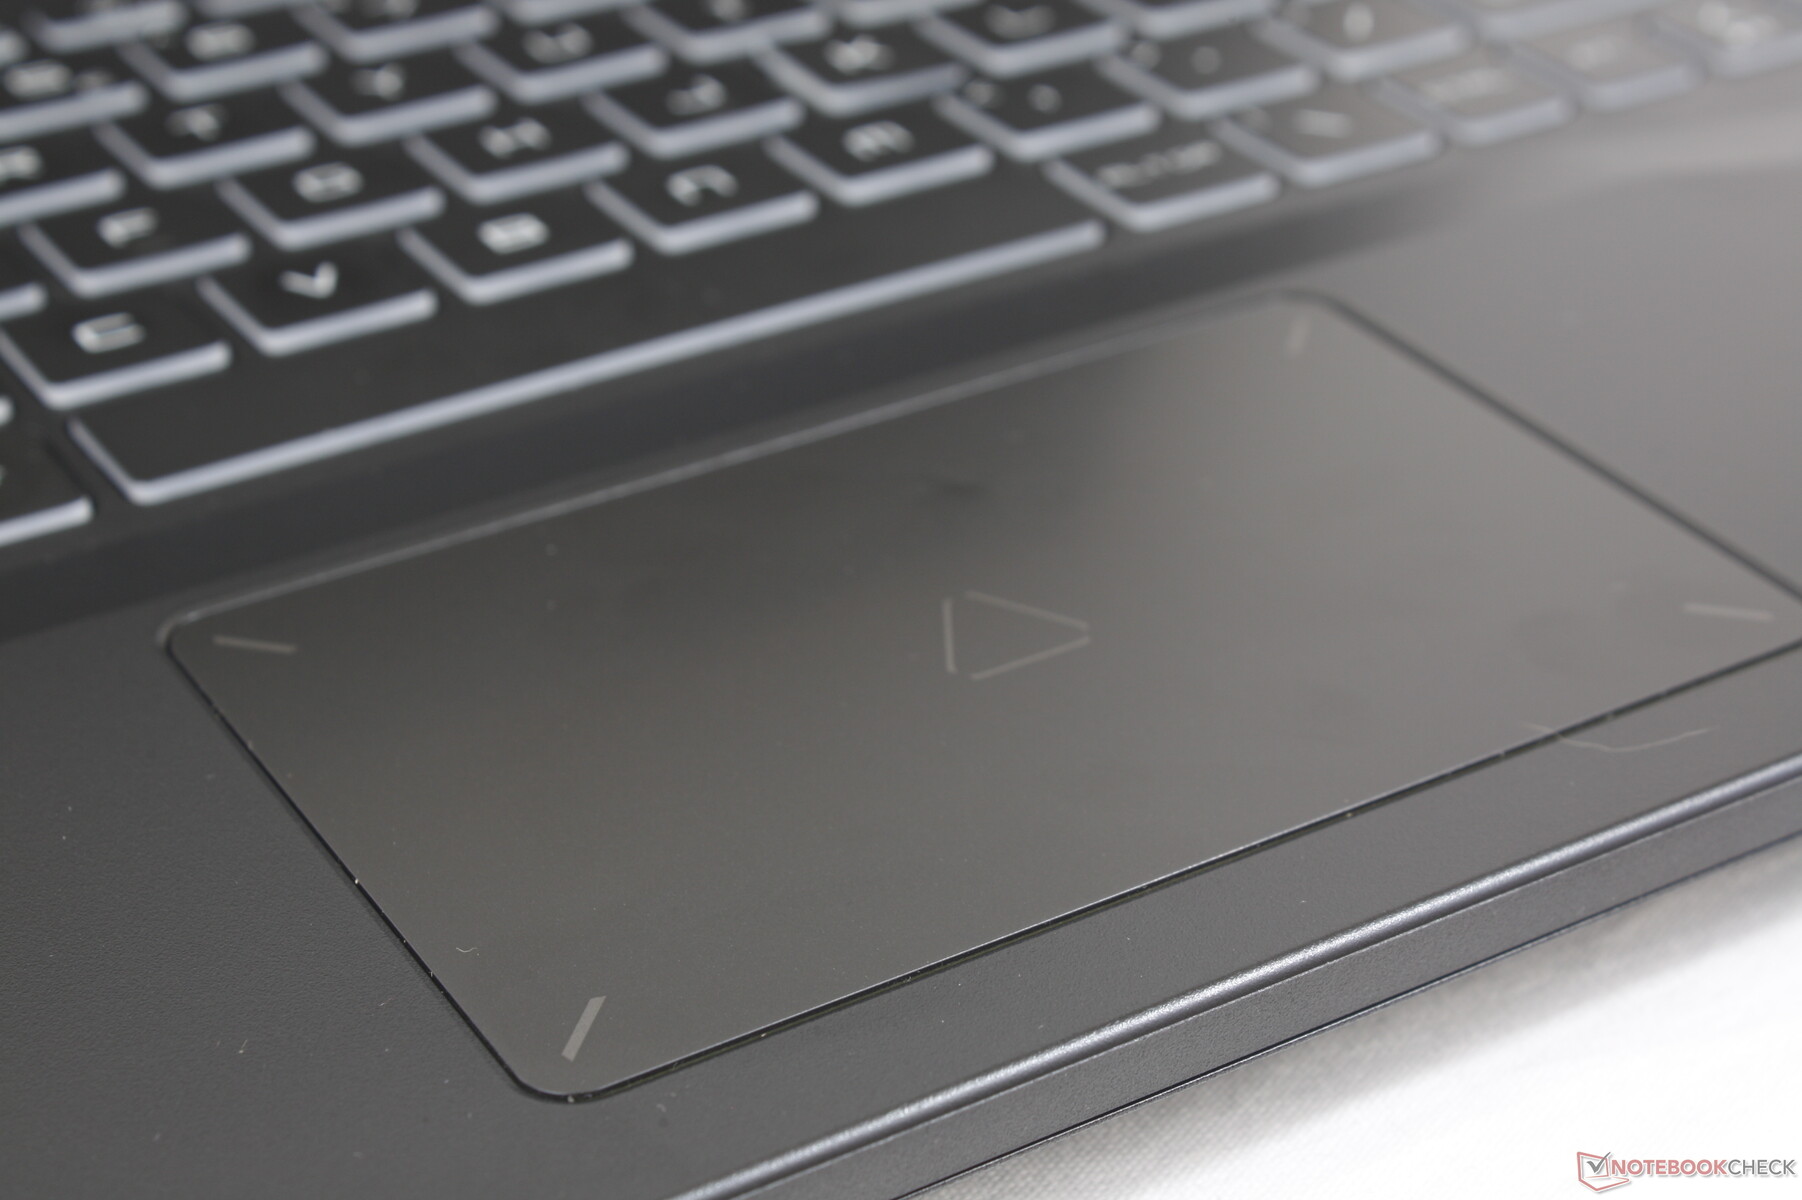
Touchpad
The clickpad is relatively small at 10.5 x 6.7 cm, but it is at least slightly larger than the 10.5 x 6 cm clickpad on the Dell G16. Its plastic surface tends to stick when gliding at medium or slower speeds which can make cursor control a bit bumpy at times. Furthermore, feedback when clicking on the surface is spongy for a very unsatisfying feel. You'll definitely want a proper external mouse handy whenever possible.
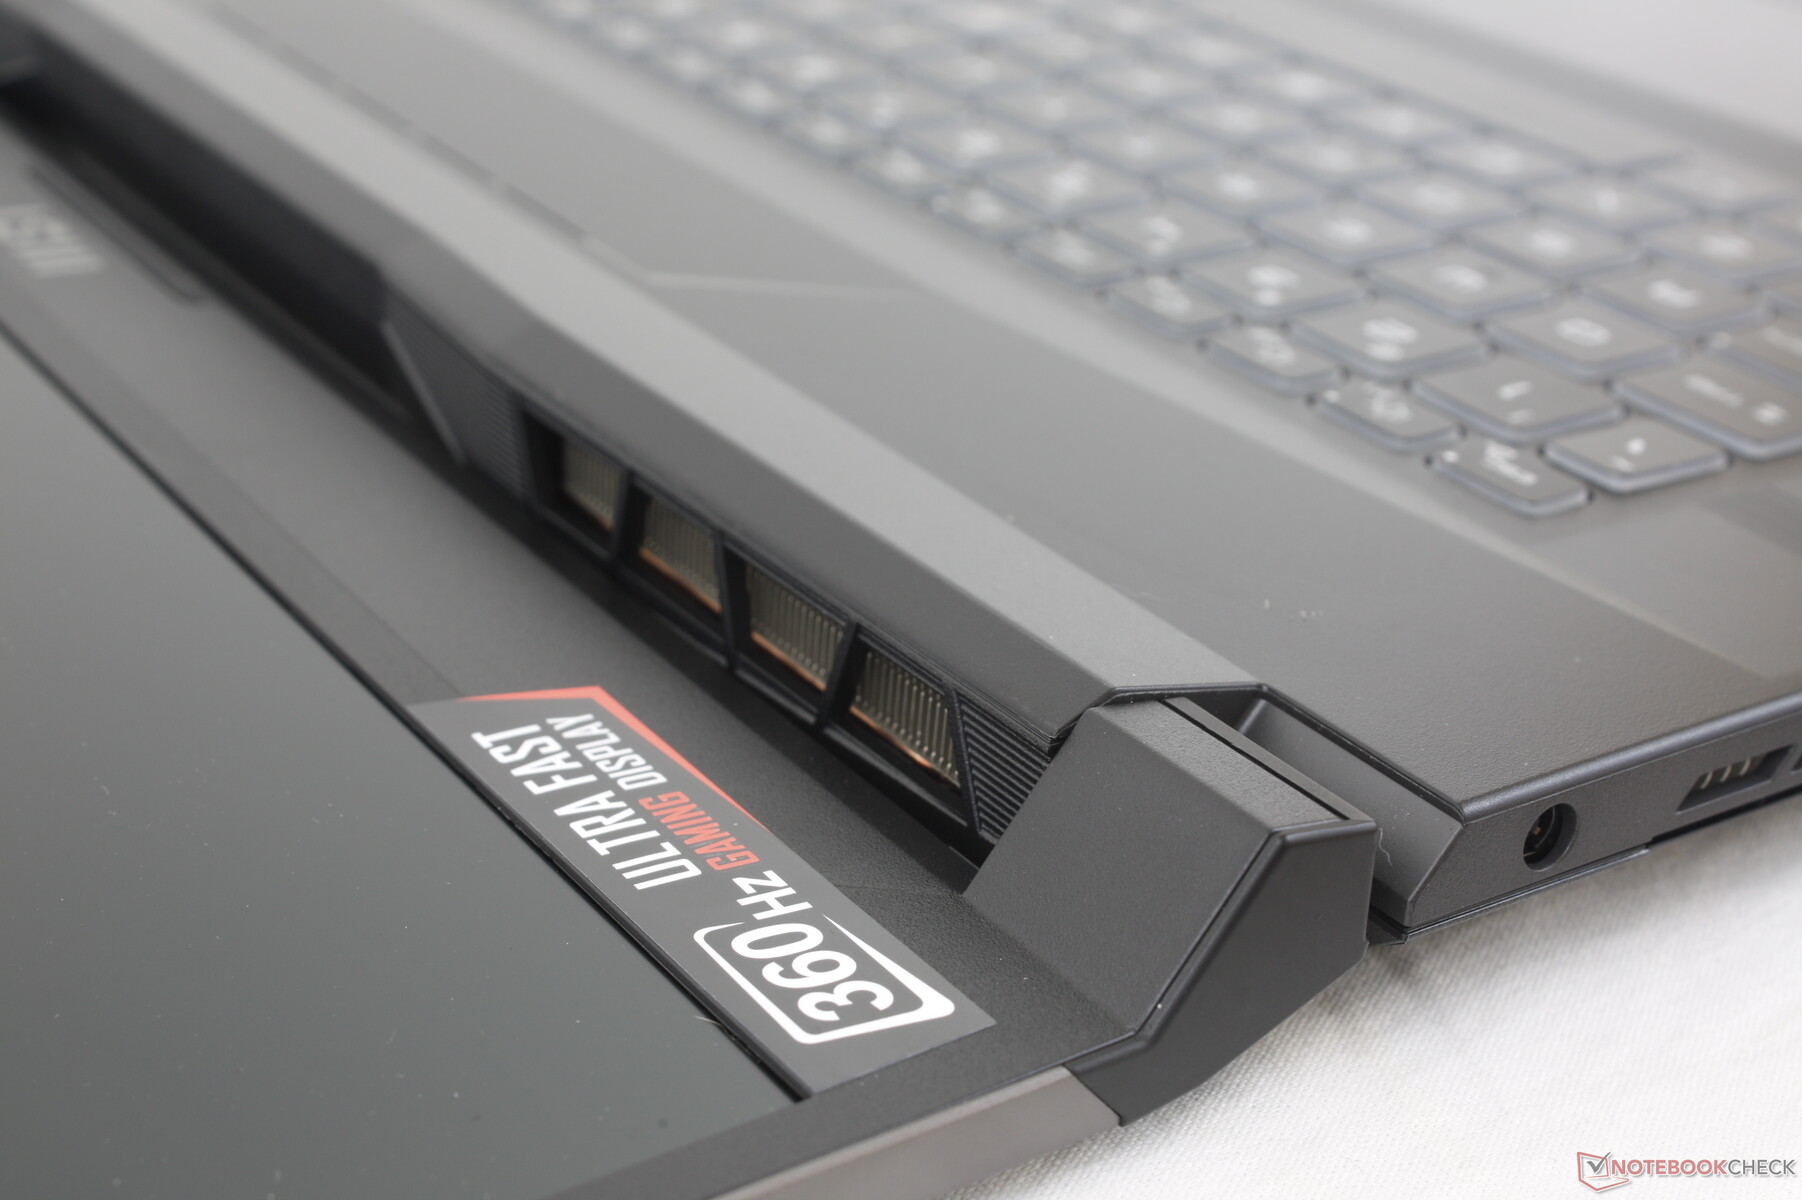
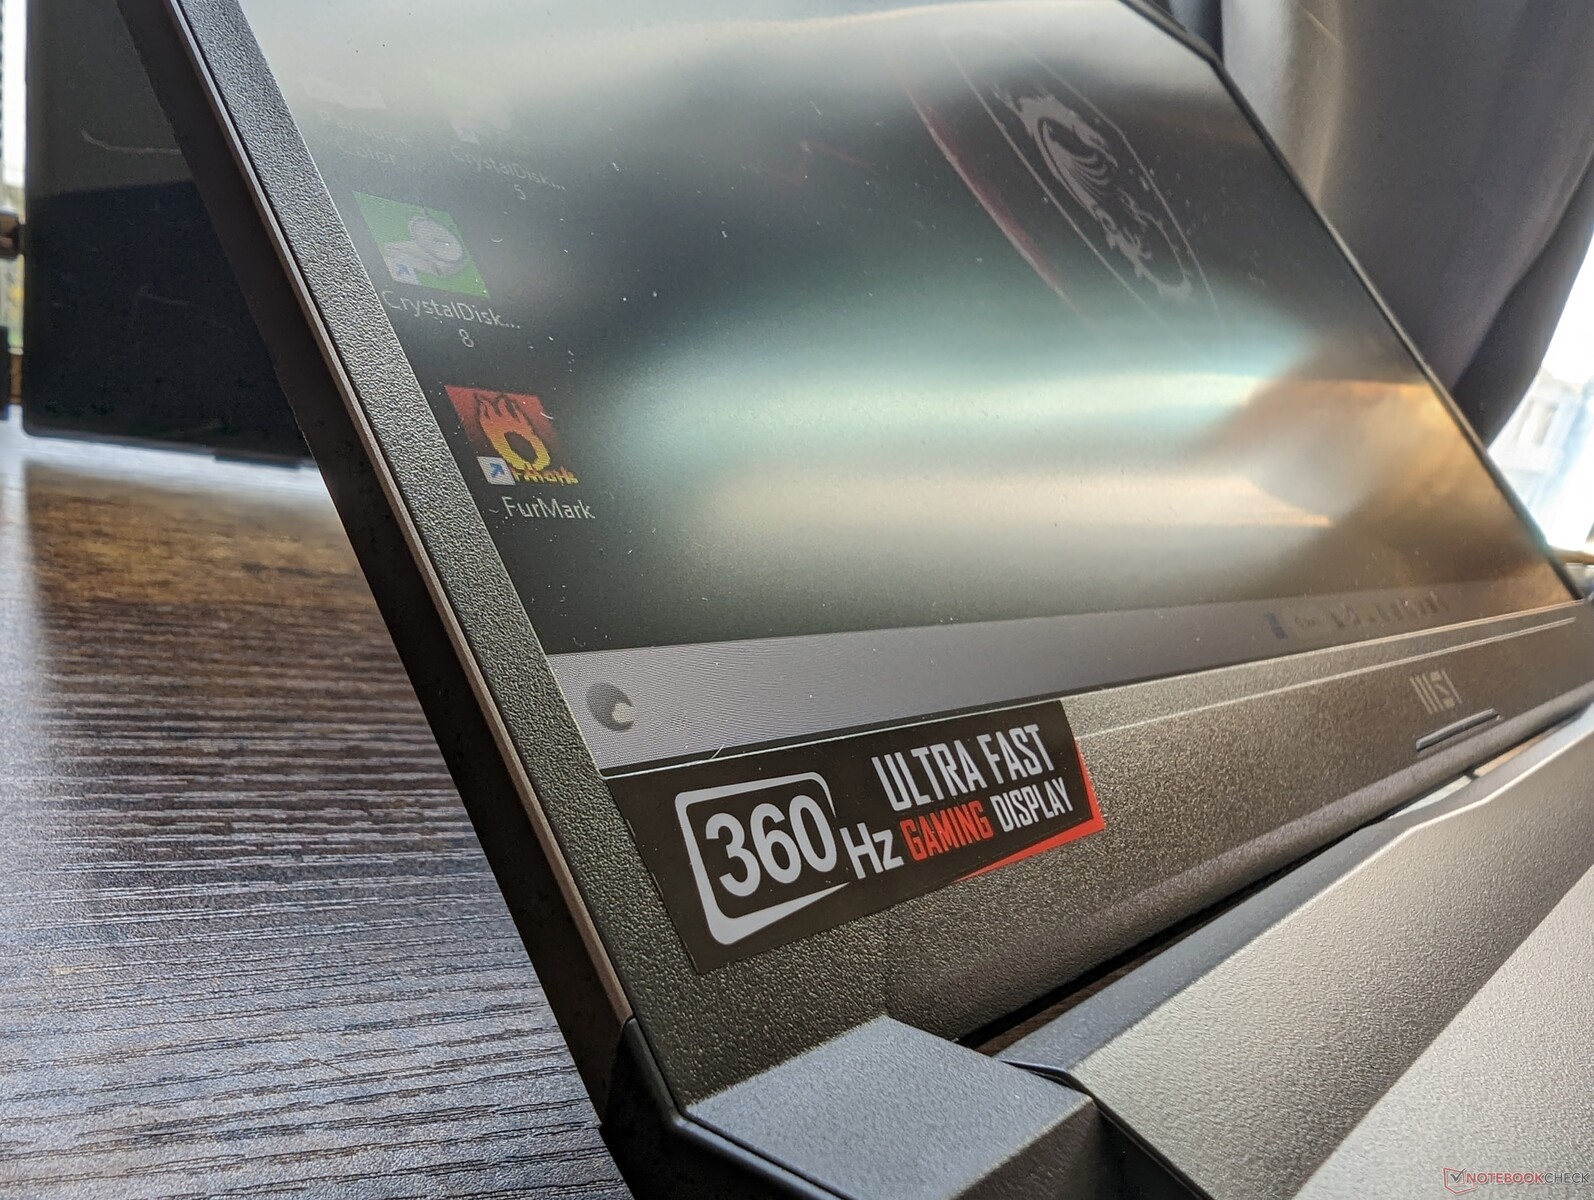
Display — 1080p Only
There are just two panel options for the 2022 GL76 as listed below. 1080p is the only resolution option for now whereas the 2021 model had a QHD SKU.
- 144 Hz, 1080p, 60% sRGB, IPS
- 360 Hz, 1080p, 100% sRGB, IPS
The 360 Hz panel has much faster black-white response times than the 144 Hz panel. It is also the same Sharp LQ173M1JW08 IPS panel that MSI also utilizes on its flagship Titan GT77. We recommend avoiding the 144 Hz option as its limited color space is a good indicator of a very cheap panel.
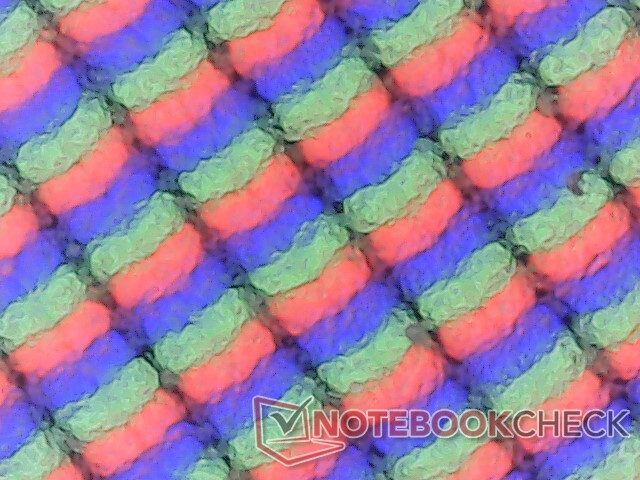
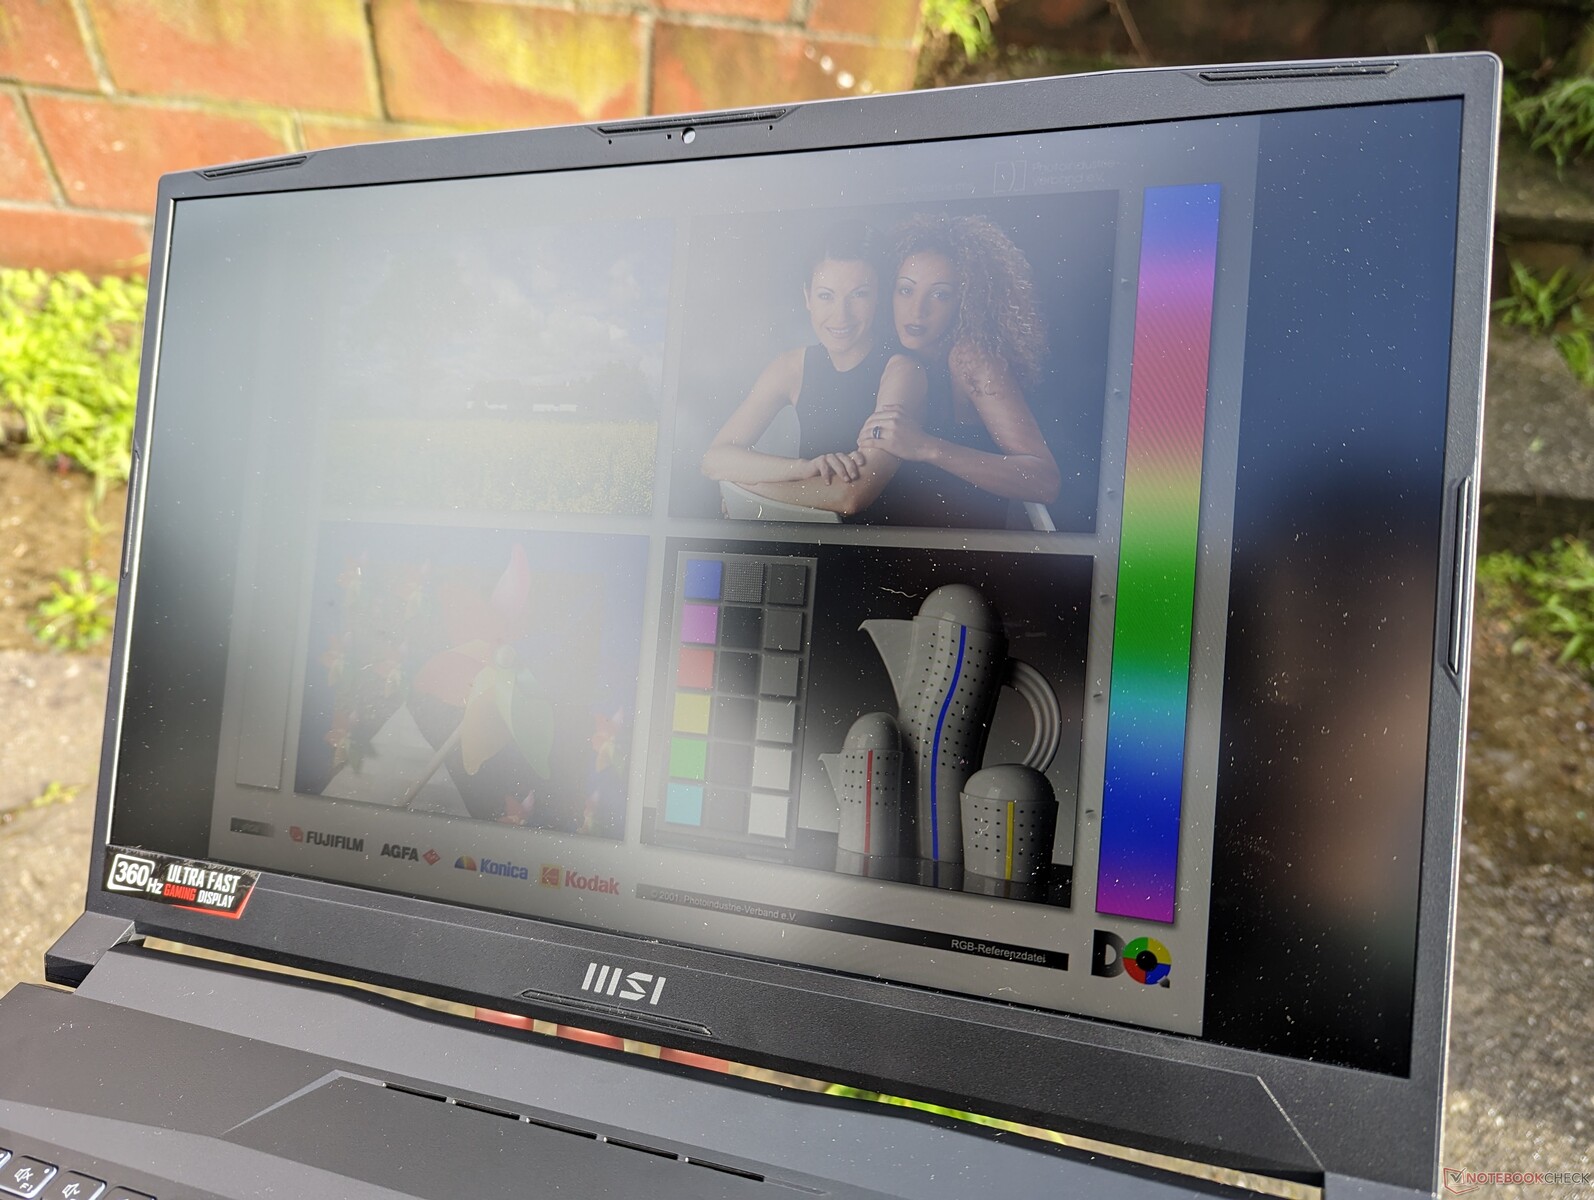
Image quality is excellent and buttery smooth because of the insanely fast refresh rate. Keep in mind that it's not as sharp as most Ultrabooks or smaller 15.6-inch gaming laptops due to the relatively low PPI. This particular panel prioritizes responsiveness and frame rates over resolution.

| |||||||||||||||||||||||||
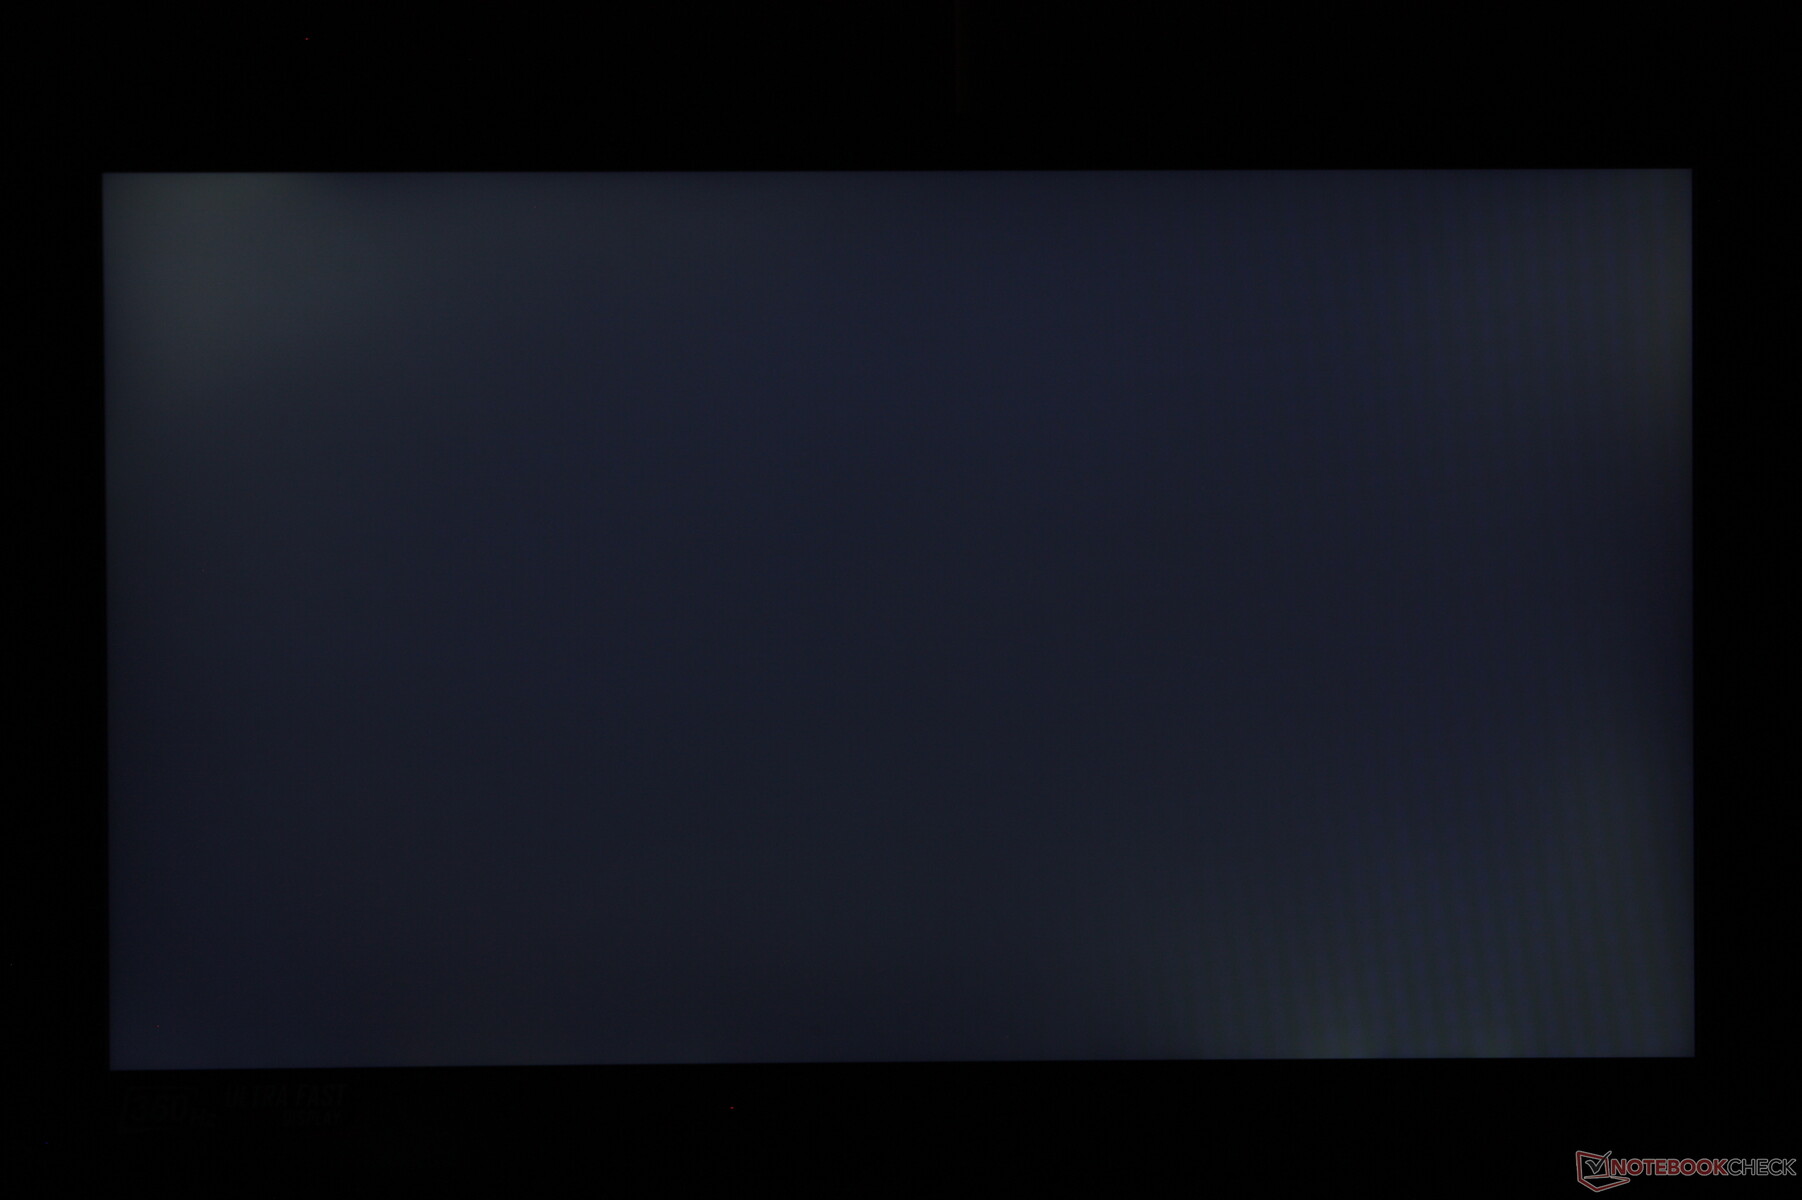
Brightness Distribution: 82 %
Center on Battery: 337.7 cd/m²
Contrast: 1089:1 (Black: 0.31 cd/m²)
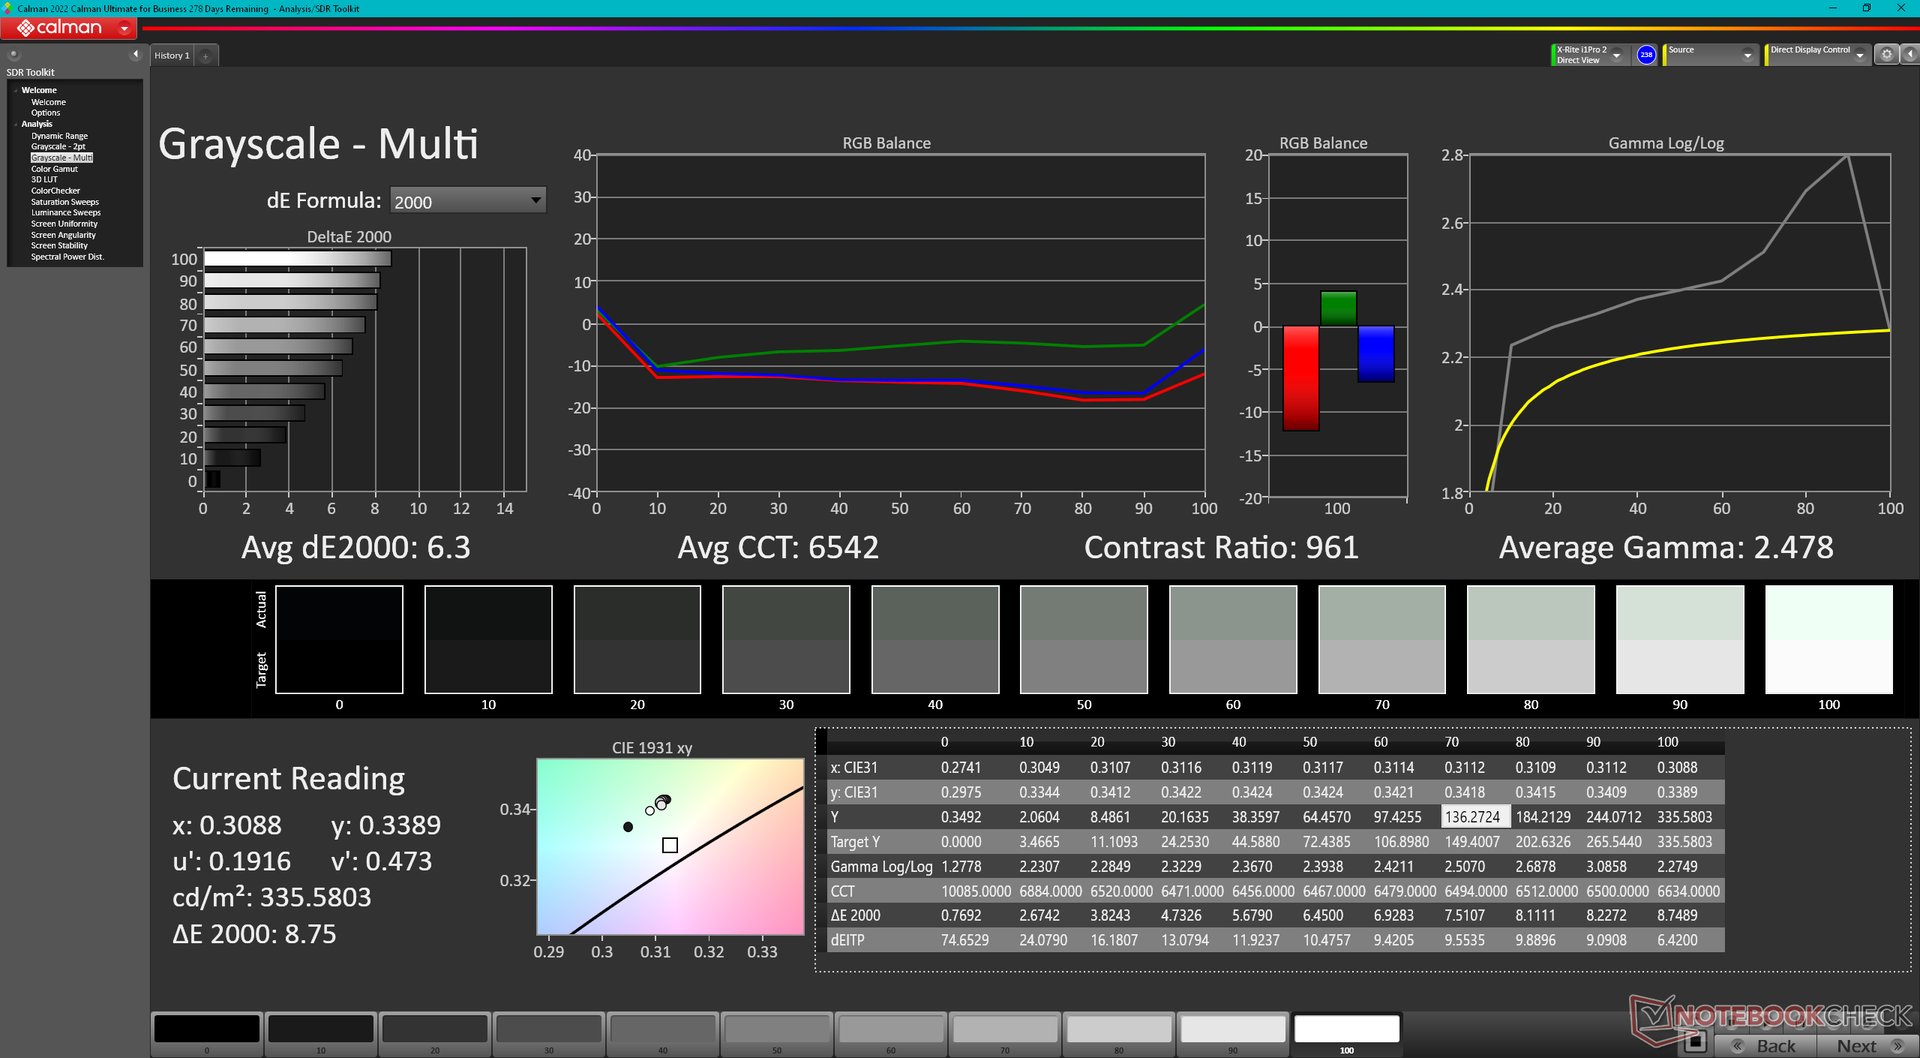
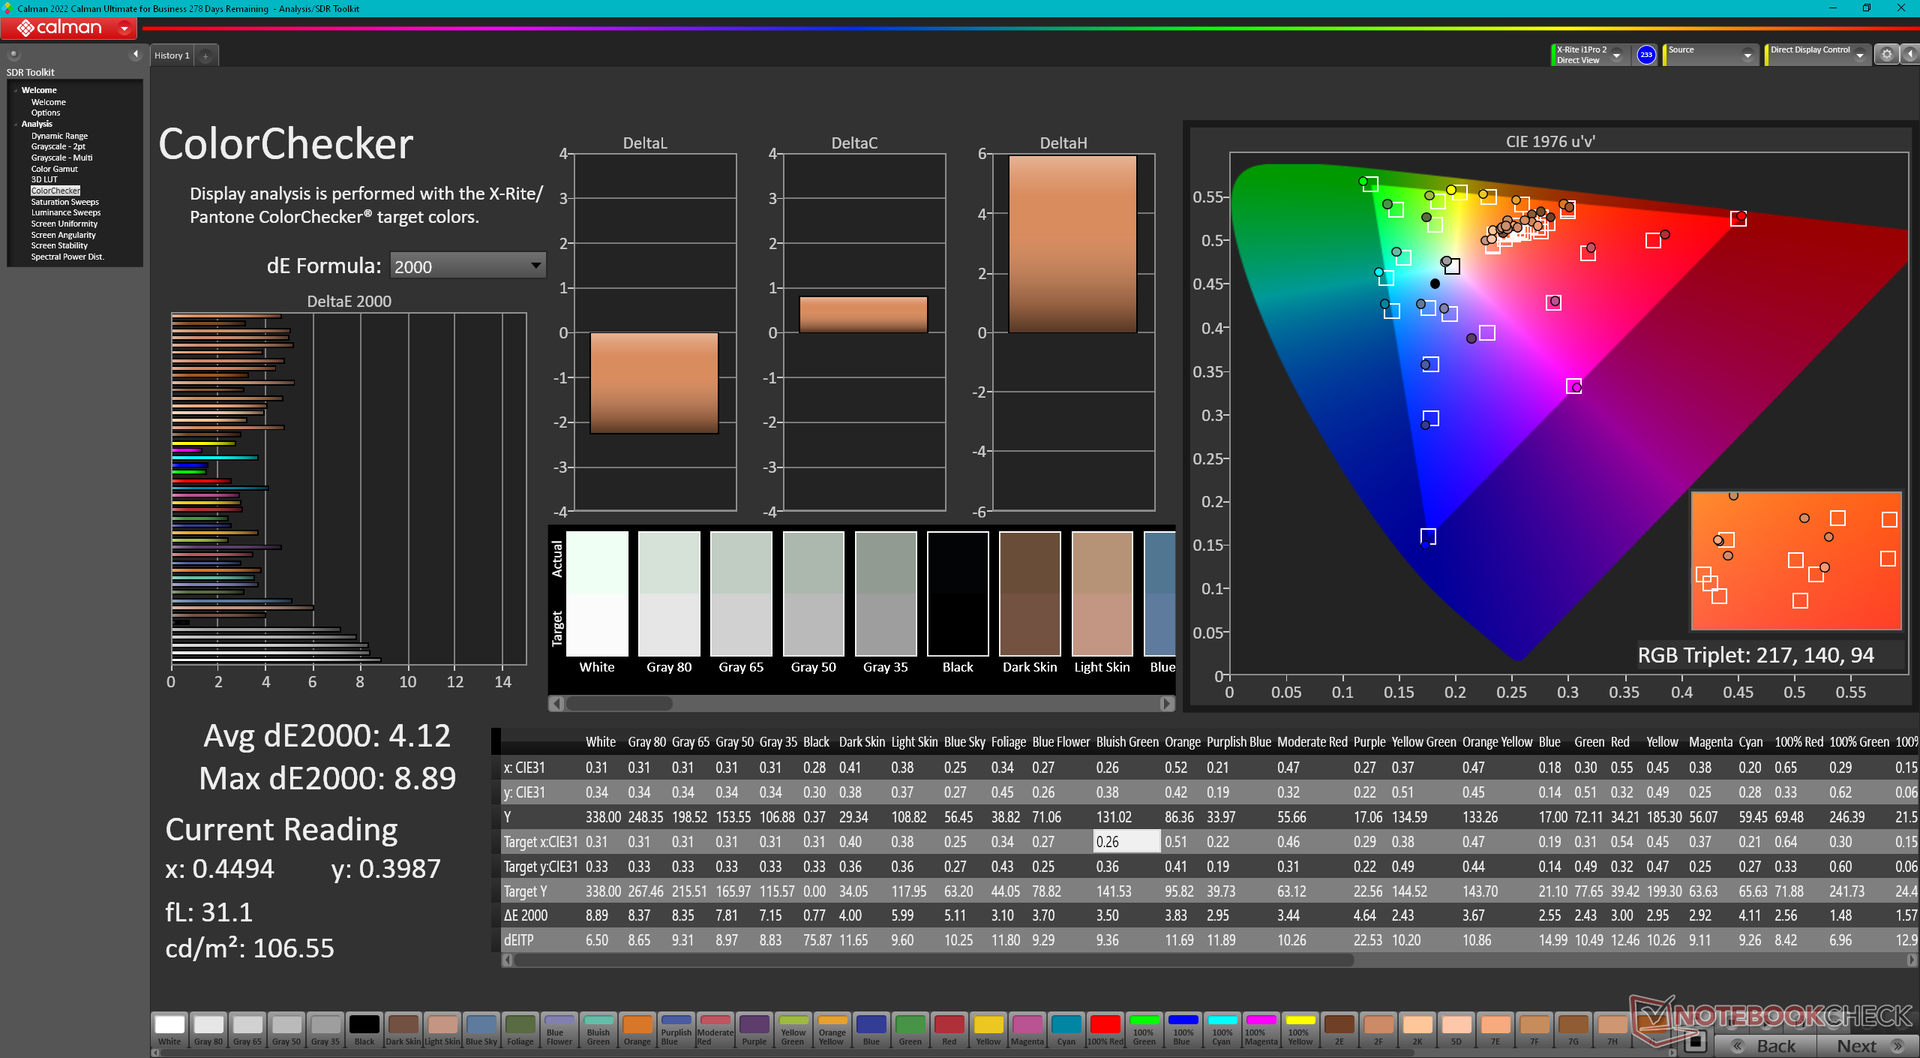
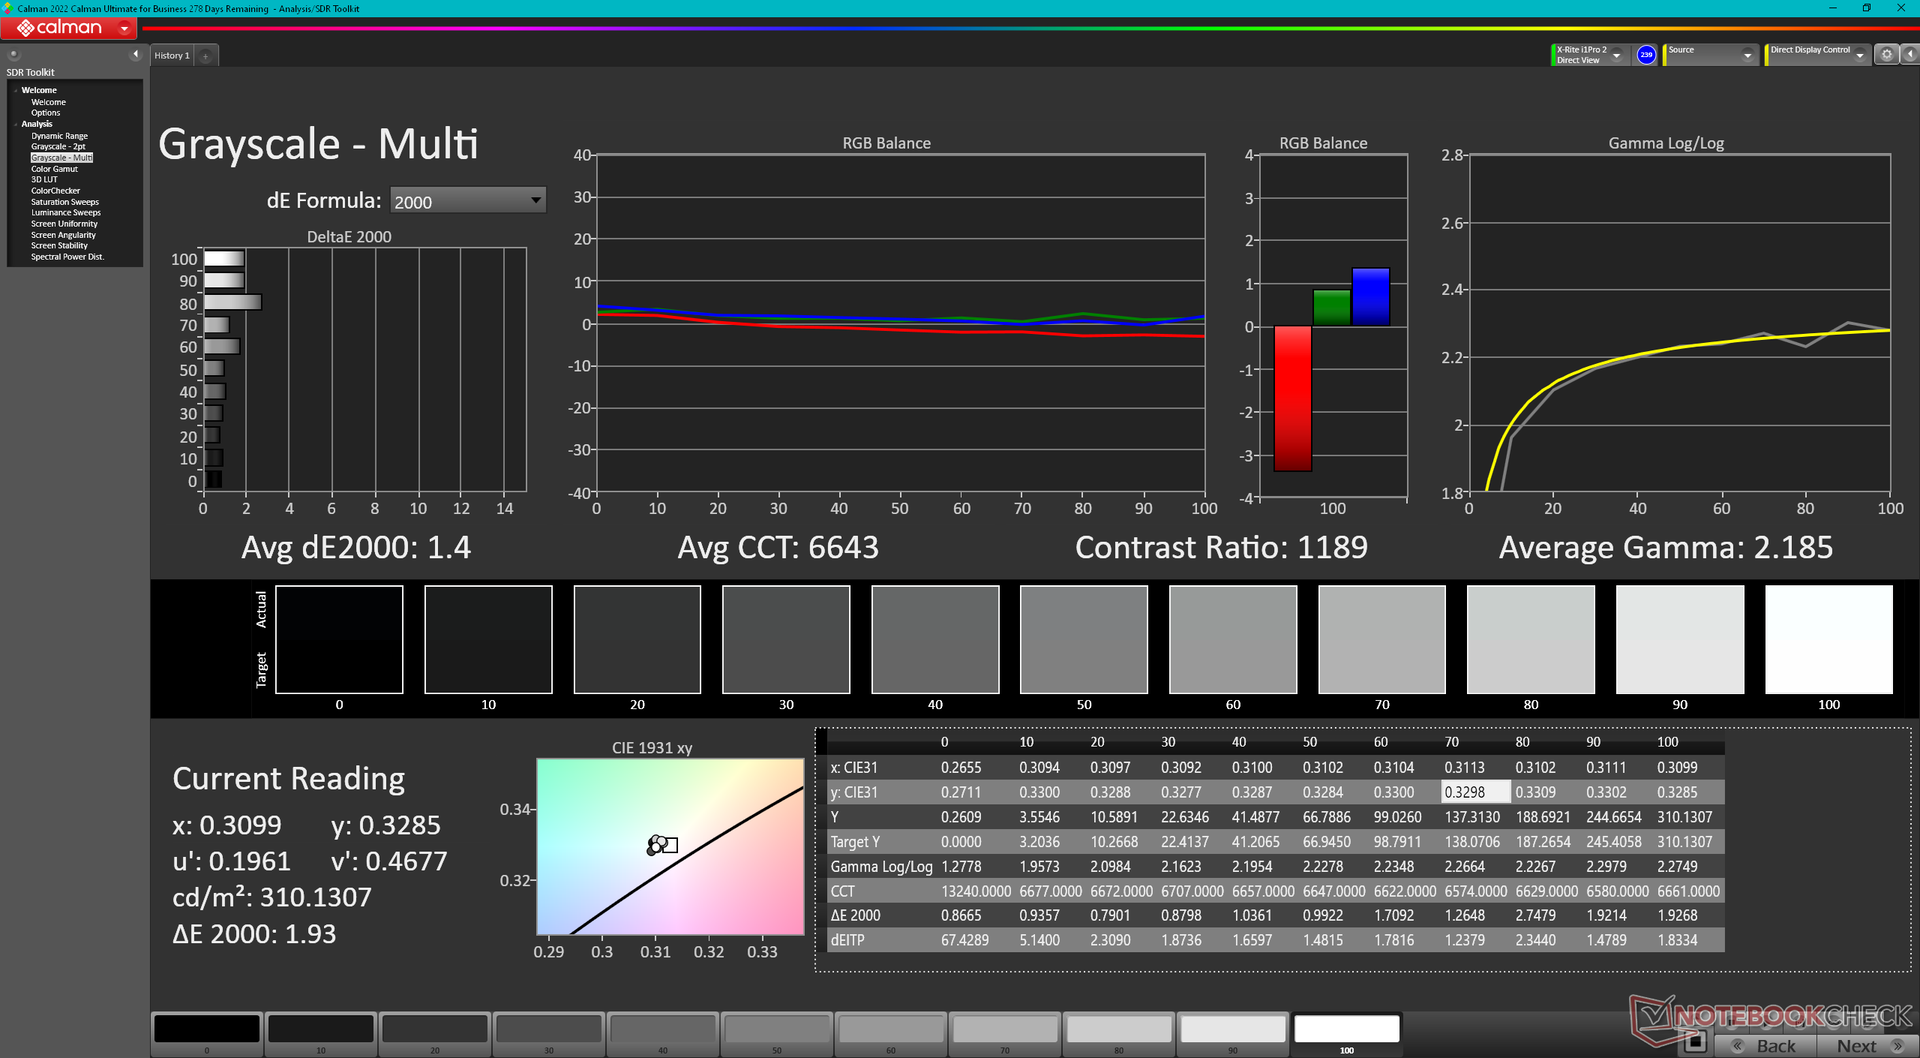
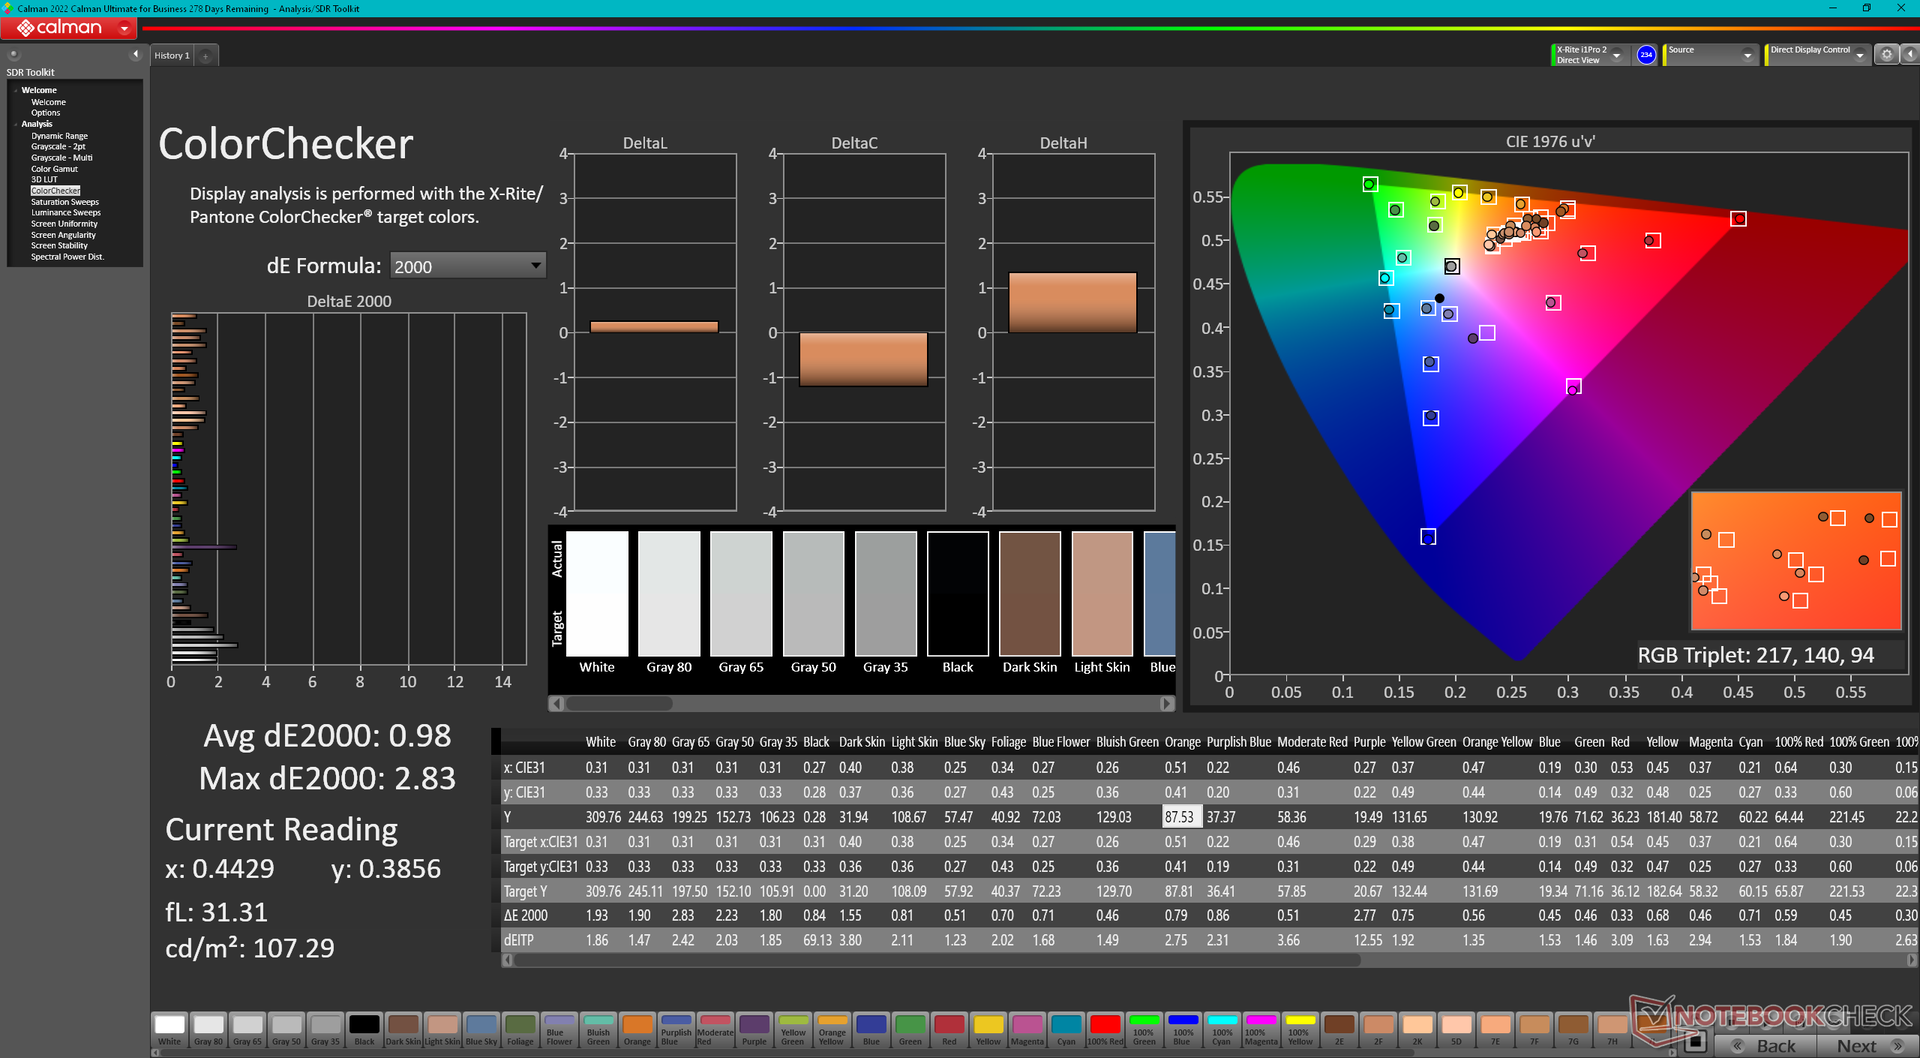
ΔE ColorChecker Calman: 4.12 | ∀{0.5-29.43 Ø4.83}
calibrated: 0.98
ΔE Greyscale Calman: 6.3 | ∀{0.09-98 Ø5.1}
73.7% AdobeRGB 1998 (Argyll 3D)
99.9% sRGB (Argyll 3D)
71.9% Display P3 (Argyll 3D)
Gamma: 2.48
CCT: 6542 K
| MSI Pulse GL76 12UGK Sharp LQ173M1JW08, IPS, 1920x1080, 17.3" | Alienware m17 R5 (R9 6900HX, RX 6850M XT) AU Optronics AUODBA3, IPS, 3840x2160, 17" | Asus ROG Strix Scar 17 SE G733CX-LL014W NE173QHM-NZ2, IPS, 2560x1440, 17.3" | Acer Predator Helios 300 (i7-12700H, RTX 3070 Ti) BOE0A1A, IPS, 2560x1440, 17.3" | Razer Blade 17 Early 2022 AU Optronics B173ZAN06.9, IPS, 3840x2160, 17.3" | MSI Vector GP76 12UGS-434 AUO B173HAN05.4, IPS, 1920x1080, 17.3" | |
|---|---|---|---|---|---|---|
| Display | 18% | 17% | 17% | 19% | -3% | |
| Display P3 Coverage | 71.9 | 97.2 35% | 97.1 35% | 96.8 35% | 99.4 38% | 70.09 -3% |
| sRGB Coverage | 99.9 | 99.6 0% | 99.9 0% | 99.9 0% | 100 0% | 98.98 -1% |
| AdobeRGB 1998 Coverage | 73.7 | 88.4 20% | 84.8 15% | 84.8 15% | 87.3 18% | 70.91 -4% |
| Response Times | -131% | -7% | -129% | -7% | 21% | |
| Response Time Grey 50% / Grey 80% * | 4.6 ? | 16.4 ? -257% | 5.7 ? -24% | 16.4 ? -257% | 7.5 ? -63% | 4 ? 13% |
| Response Time Black / White * | 11.2 ? | 11.6 ? -4% | 10.1 ? 10% | 11.2 ? -0% | 5.6 ? 50% | 8 ? 29% |
| PWM Frequency | ||||||
| Screen | -43% | 28% | -12% | 34% | 11% | |
| Brightness middle | 337.7 | 484 43% | 320 -5% | 366 8% | 503 49% | 274 -19% |
| Brightness | 331 | 449 36% | 303 -8% | 340 3% | 486 47% | 264 -20% |
| Brightness Distribution | 82 | 87 6% | 87 6% | 85 4% | 84 2% | 87 6% |
| Black Level * | 0.31 | 0.55 -77% | 0.3 3% | 0.31 -0% | 0.44 -42% | 0.25 19% |
| Contrast | 1089 | 880 -19% | 1067 -2% | 1181 8% | 1143 5% | 1096 1% |
| Colorchecker dE 2000 * | 4.12 | 4.8 -17% | 1.1 73% | 3.56 14% | 1.08 74% | 2.53 39% |
| Colorchecker dE 2000 max. * | 8.89 | 7.48 16% | 2.7 70% | 5.66 36% | 4.54 49% | 6.76 24% |
| Colorchecker dE 2000 calibrated * | 0.98 | 4.74 -384% | 3.31 -238% | 0.6 39% | 0.98 -0% | |
| Greyscale dE 2000 * | 6.3 | 5.5 13% | 1.1 83% | 2.84 55% | 1.3 79% | 3.49 45% |
| Gamma | 2.48 89% | 2.42 91% | 2.13 103% | 2.29 96% | 2.151 102% | 2.31 95% |
| CCT | 6542 99% | 6148 106% | 6599 98% | 6835 95% | 6541 99% | 6714 97% |
| Total Average (Program / Settings) | -52% /
-42% | 13% /
20% | -41% /
-23% | 15% /
25% | 10% /
9% |
* ... smaller is better
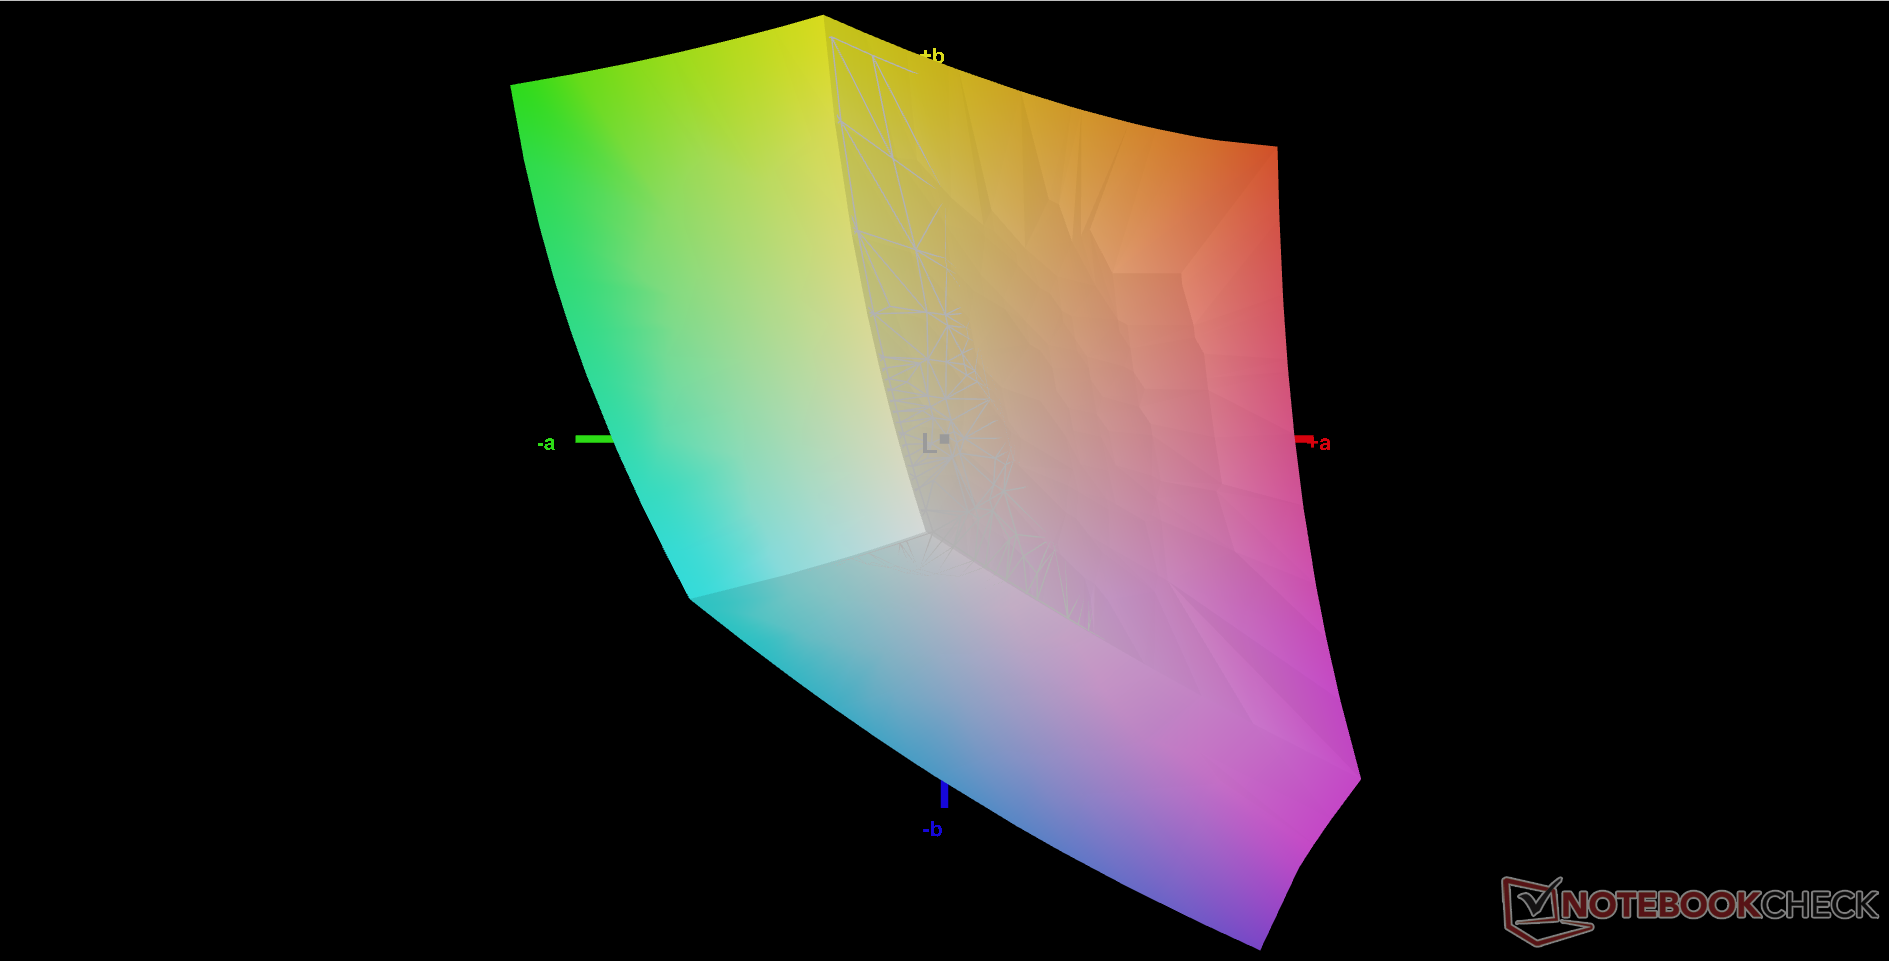
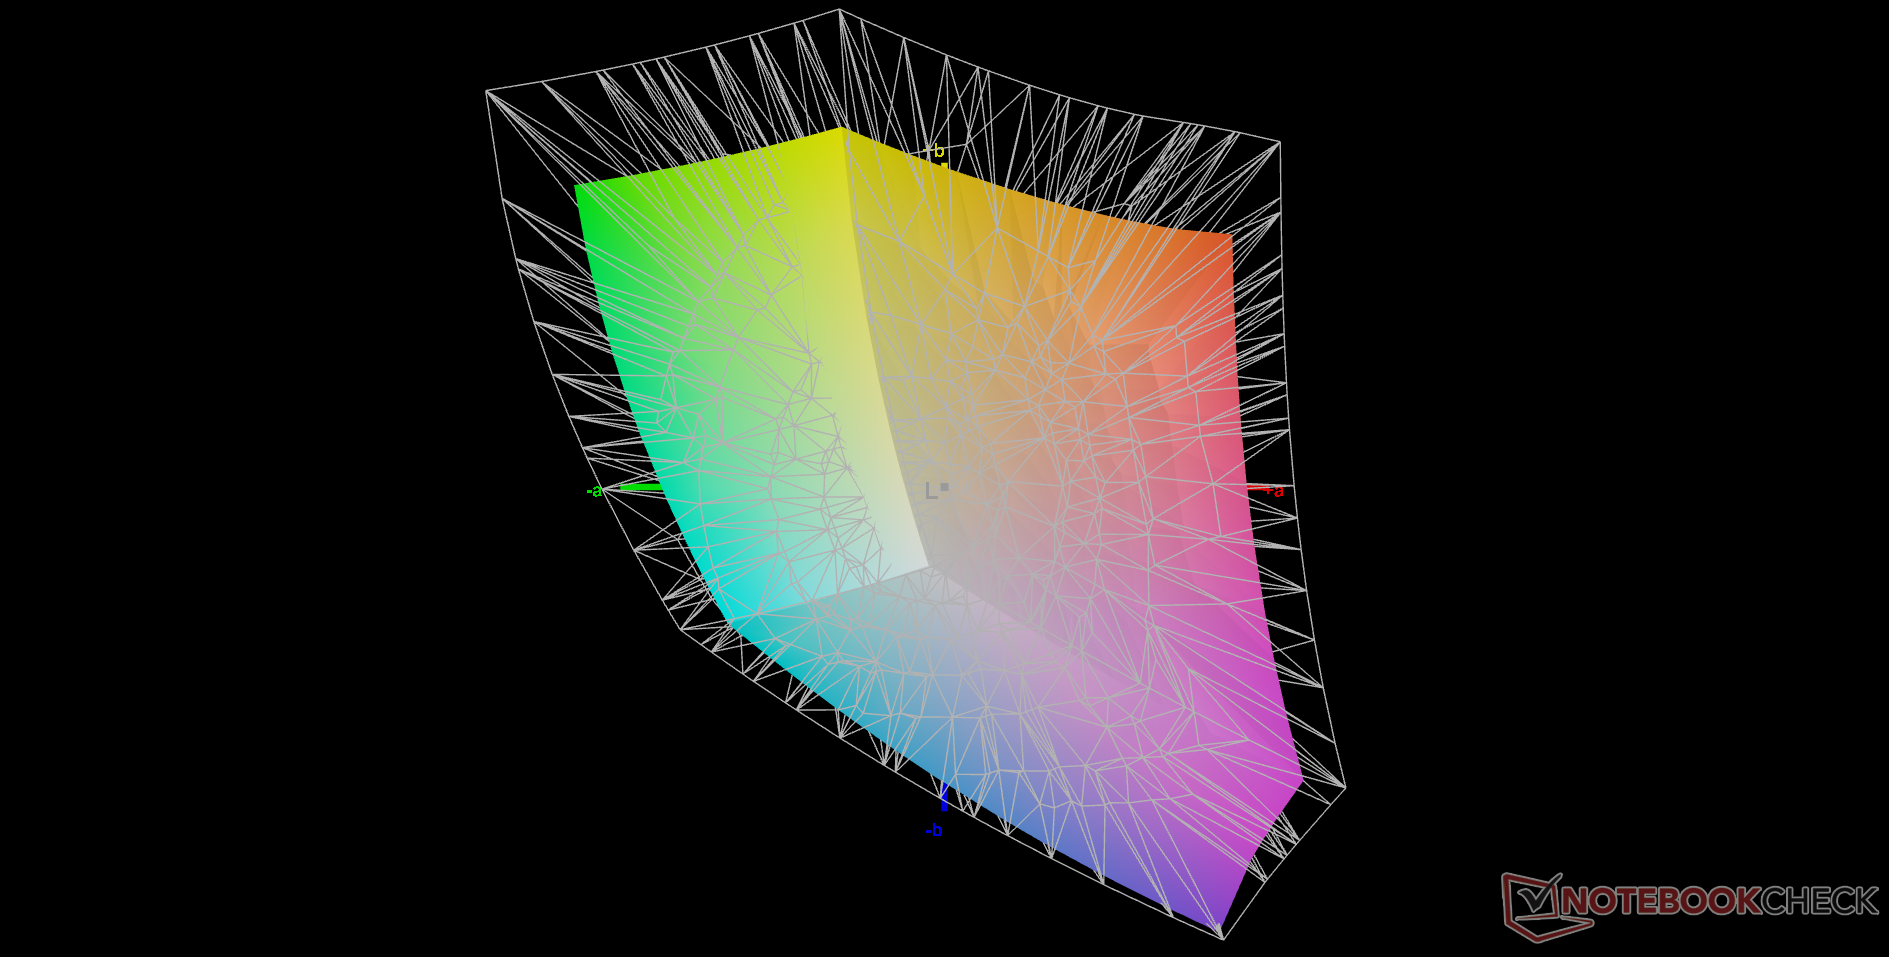
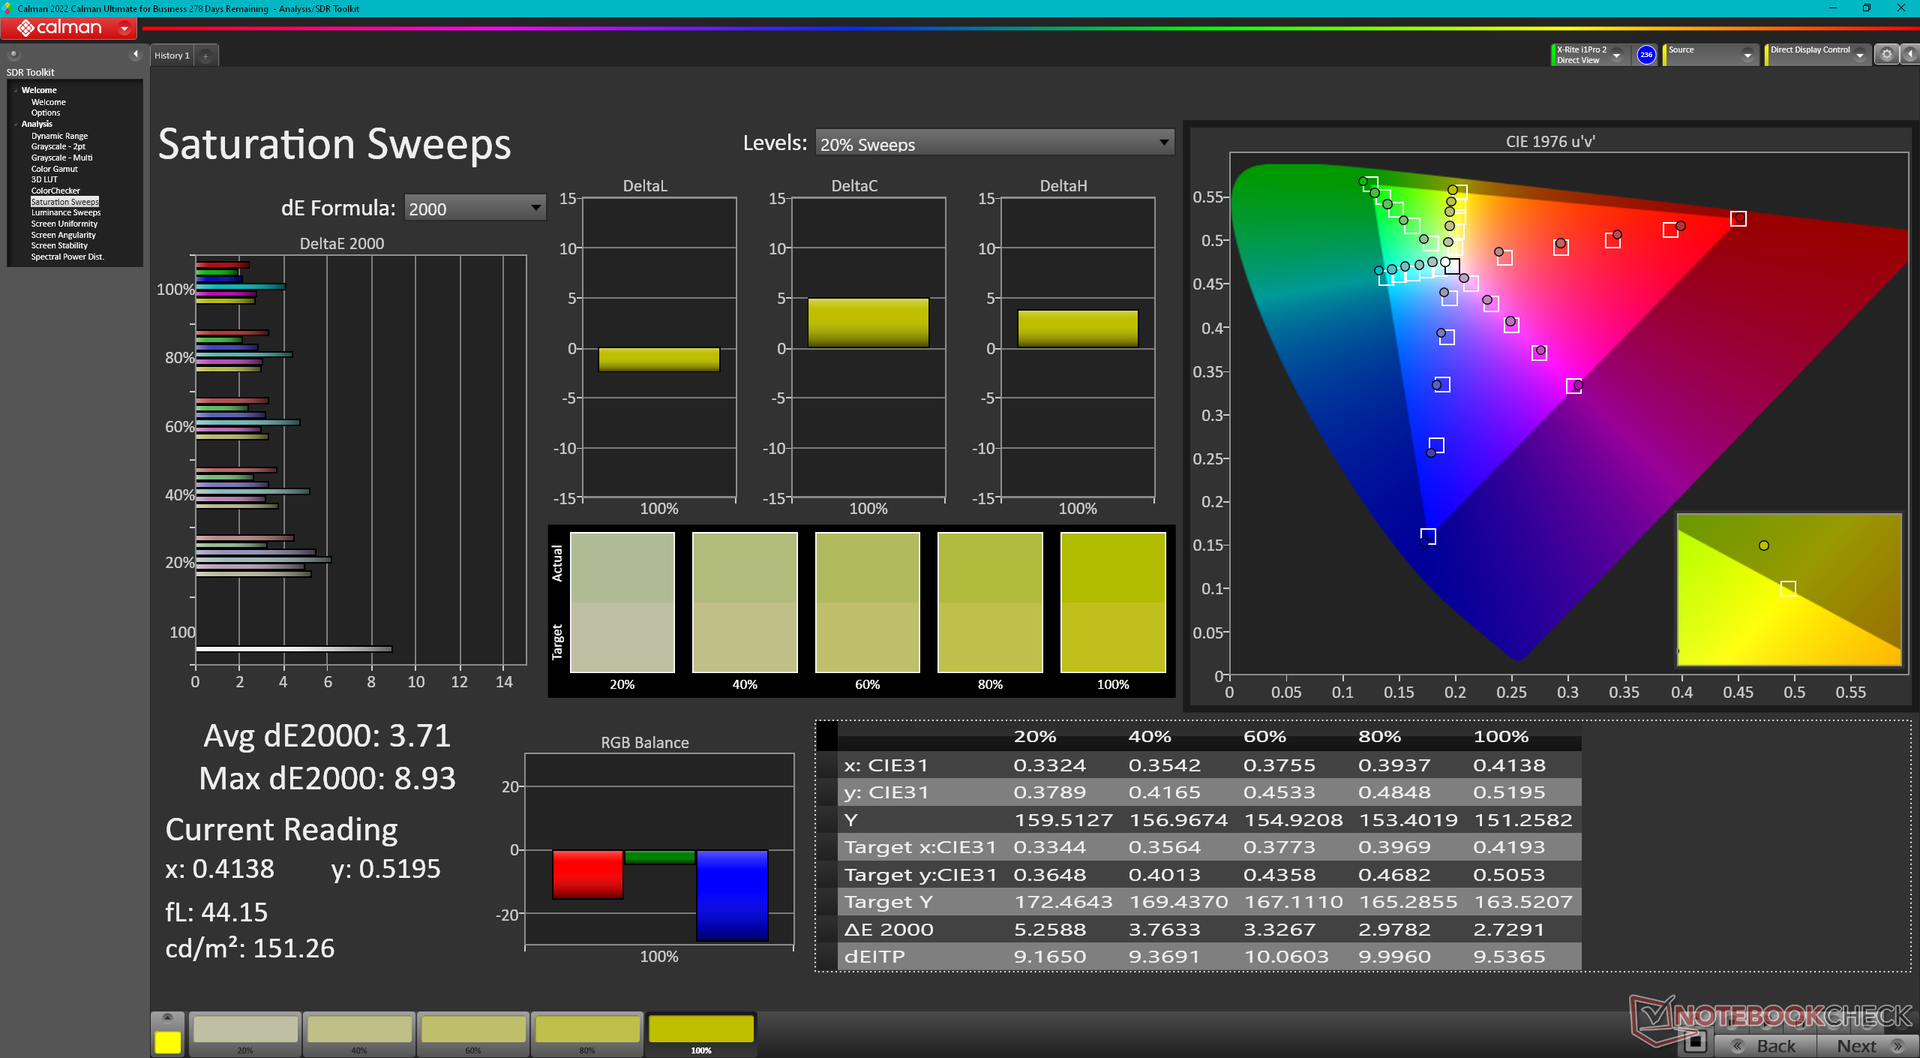
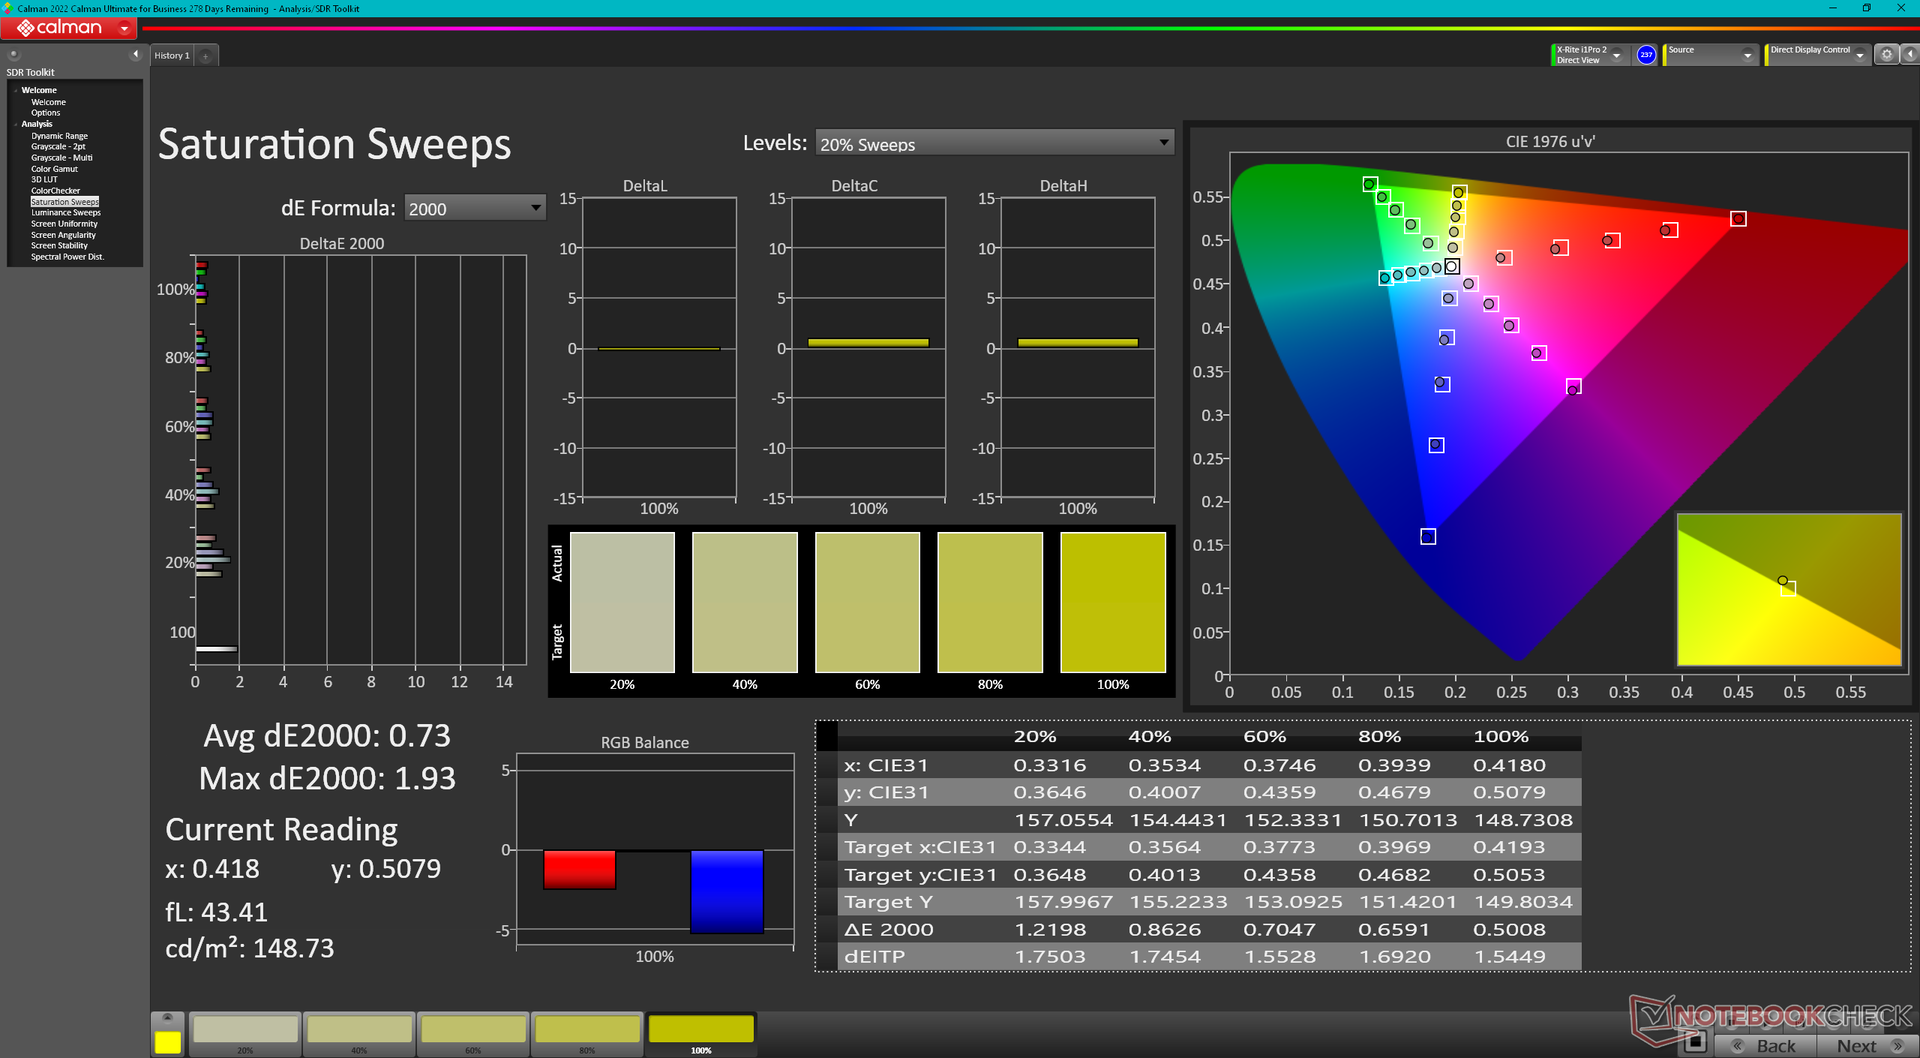
The display is not calibrated out of the box. Average grayscale and color DeltaE values would improve significantly from 6.3 and 4.12 to just 1.4 and 0.98, respectively, after a proper calibration with an X-Rite colorimeter. We recommend applying our ICM profile above to better exploit the full sRGB coverage of the panel.
Display Response Times
| ↔ Response Time Black to White | ||
|---|---|---|
| 11.2 ms ... rise ↗ and fall ↘ combined | ↗ 6.8 ms rise | 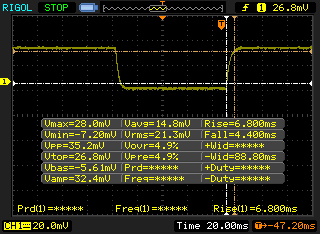 |
| ↘ 4.4 ms fall | ||
| The screen shows good response rates in our tests, but may be too slow for competitive gamers. In comparison, all tested devices range from 0.1 (minimum) to 240 (maximum) ms. » 28 % of all devices are better. This means that the measured response time is better than the average of all tested devices (20.5 ms). | ||
| ↔ Response Time 50% Grey to 80% Grey | ||
| 4.6 ms ... rise ↗ and fall ↘ combined | ↗ 2.2 ms rise | 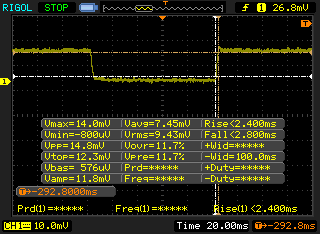 |
| ↘ 2.4 ms fall | ||
| The screen shows very fast response rates in our tests and should be very well suited for fast-paced gaming. In comparison, all tested devices range from 0.165 (minimum) to 636 (maximum) ms. » 14 % of all devices are better. This means that the measured response time is better than the average of all tested devices (32.1 ms). | ||
Screen Flickering / PWM (Pulse-Width Modulation)
| Screen flickering / PWM not detected | 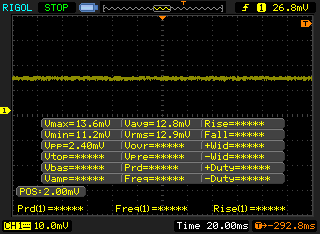 | ||
In comparison: 53 % of all tested devices do not use PWM to dim the display. If PWM was detected, an average of 8327 (minimum: 5 - maximum: 343500) Hz was measured. | |||
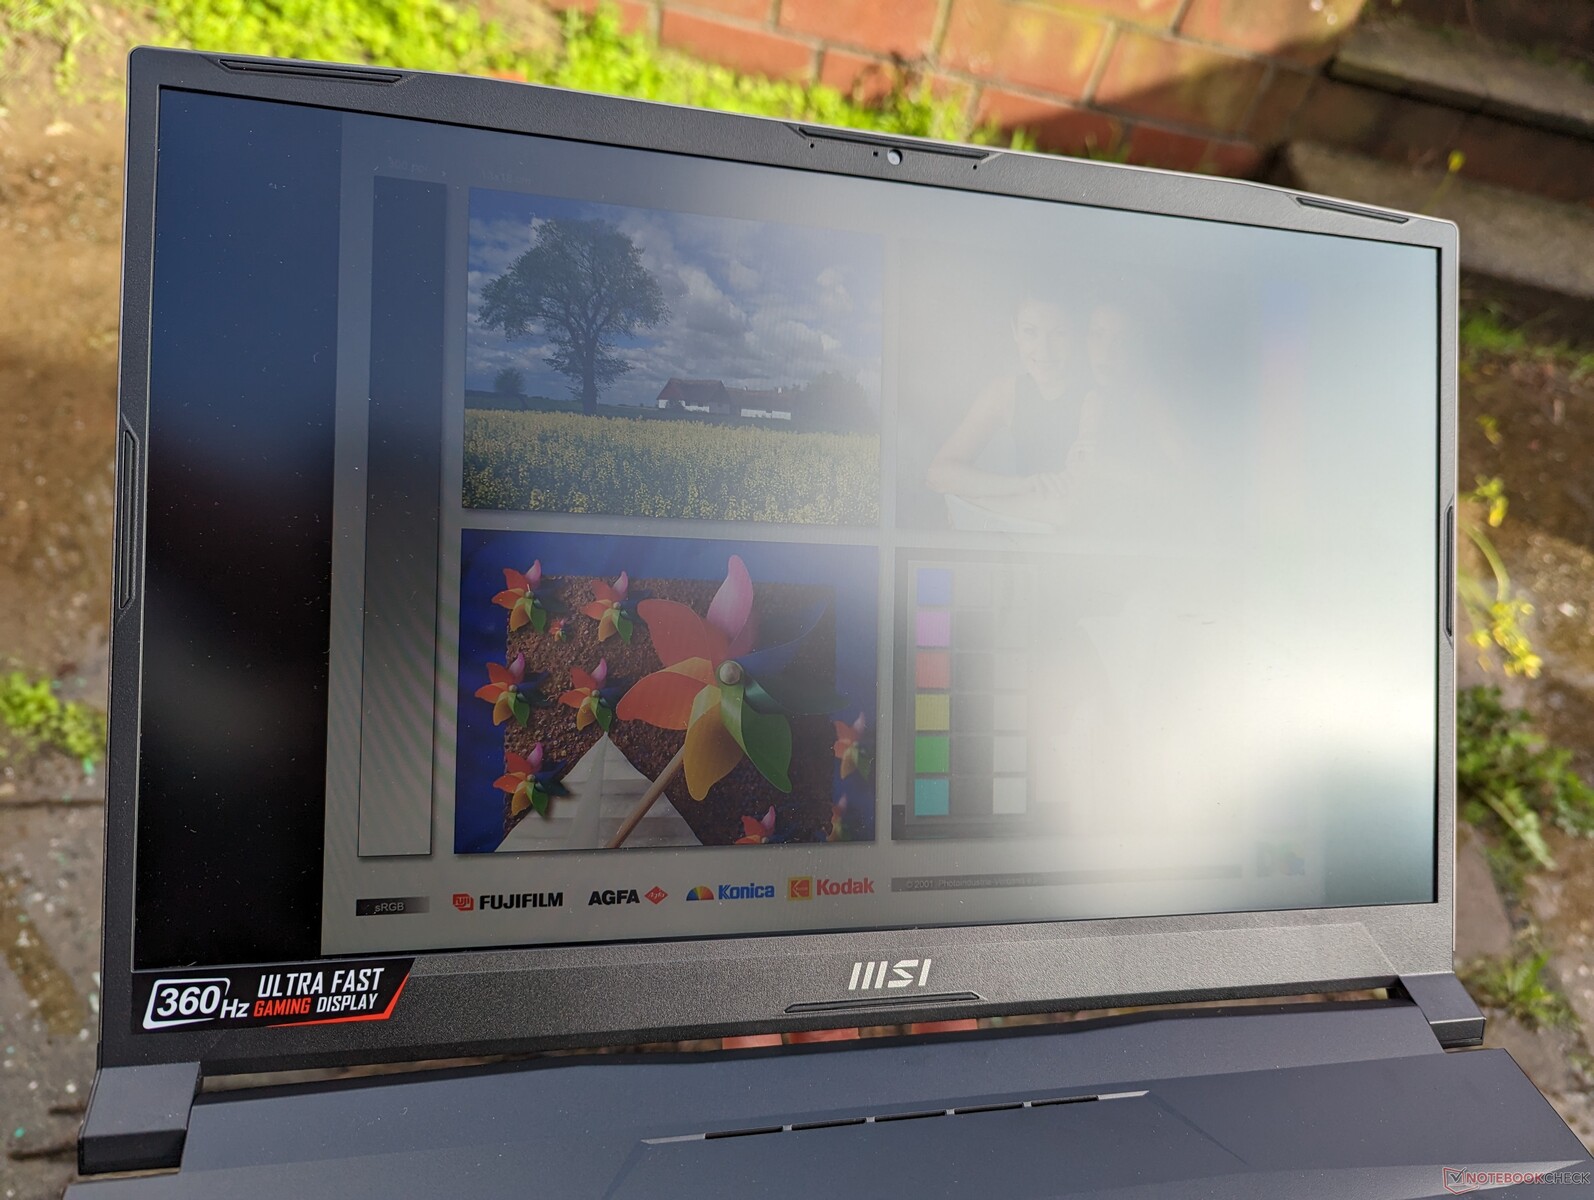
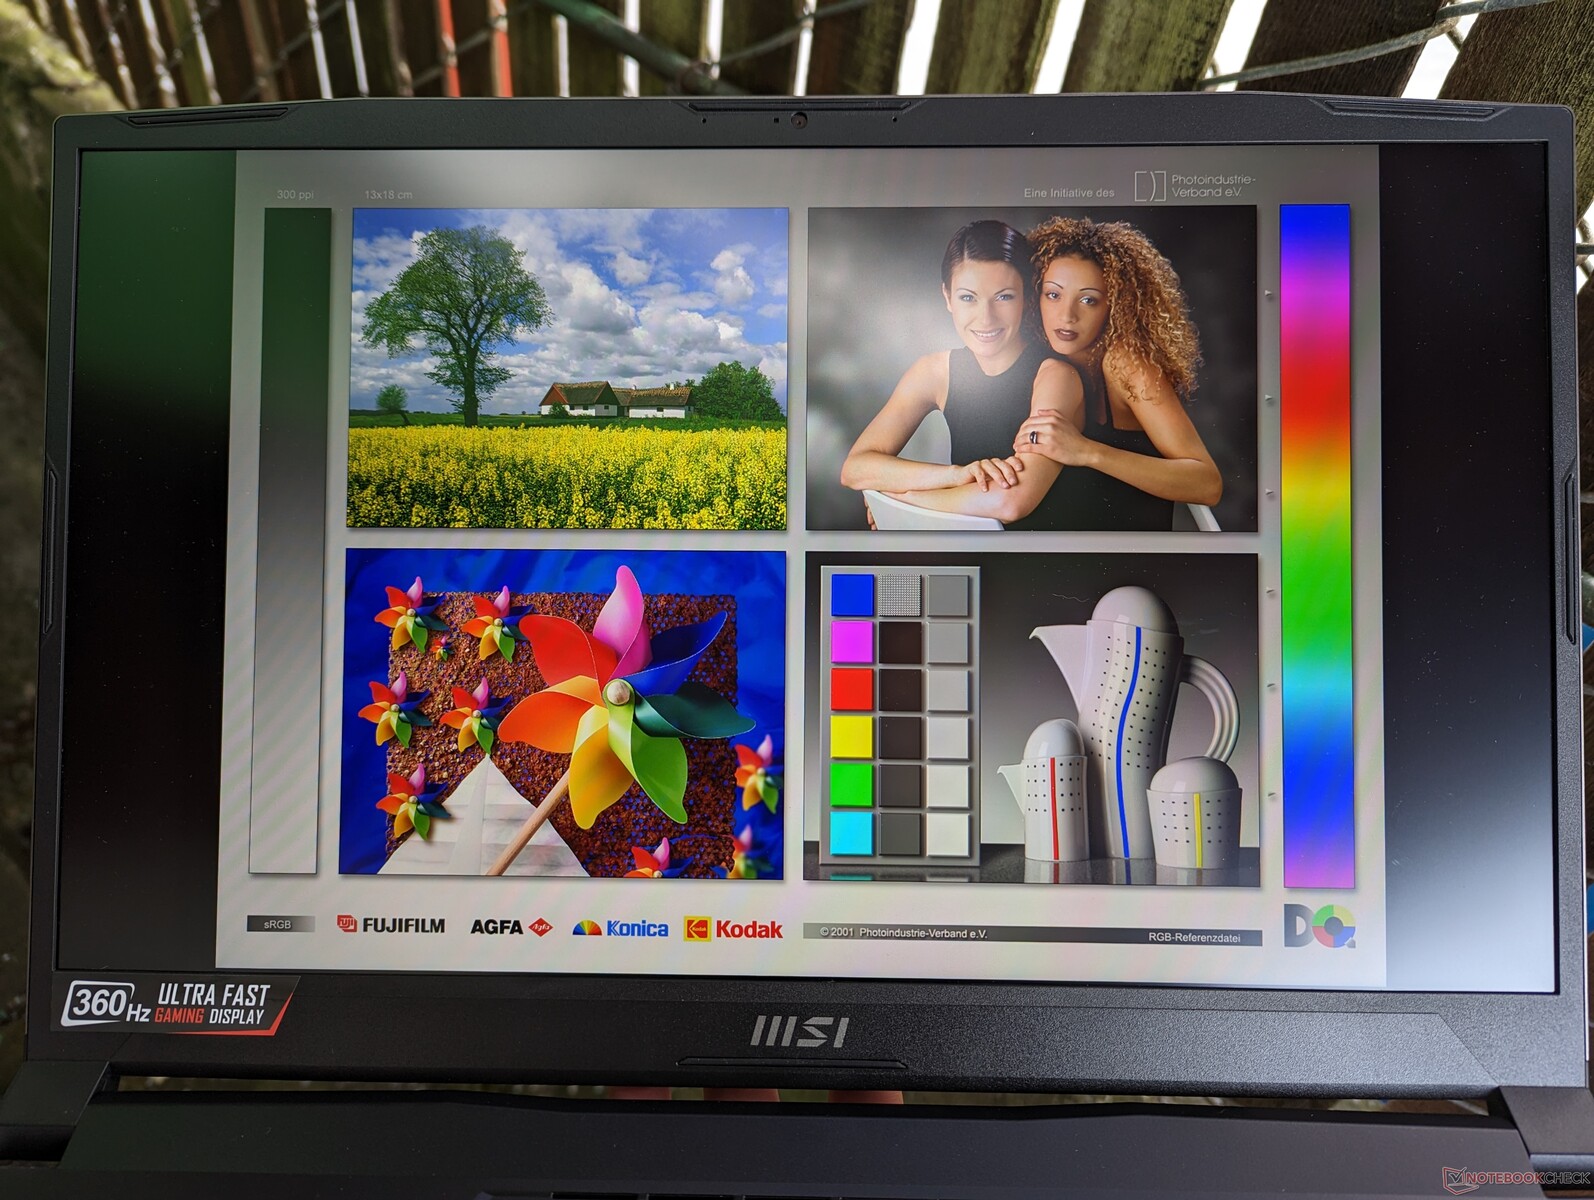
The matte display is bright enough for use under shade, but it is otherwise not designed for brighter outdoor conditions. A few gaming laptops, such as the Razer Blade 17 OLED, have brighter 500-nit displays for easier readability outdoors.
Performance — Intel 12th Gen Alder Lake-H
Testing Conditions
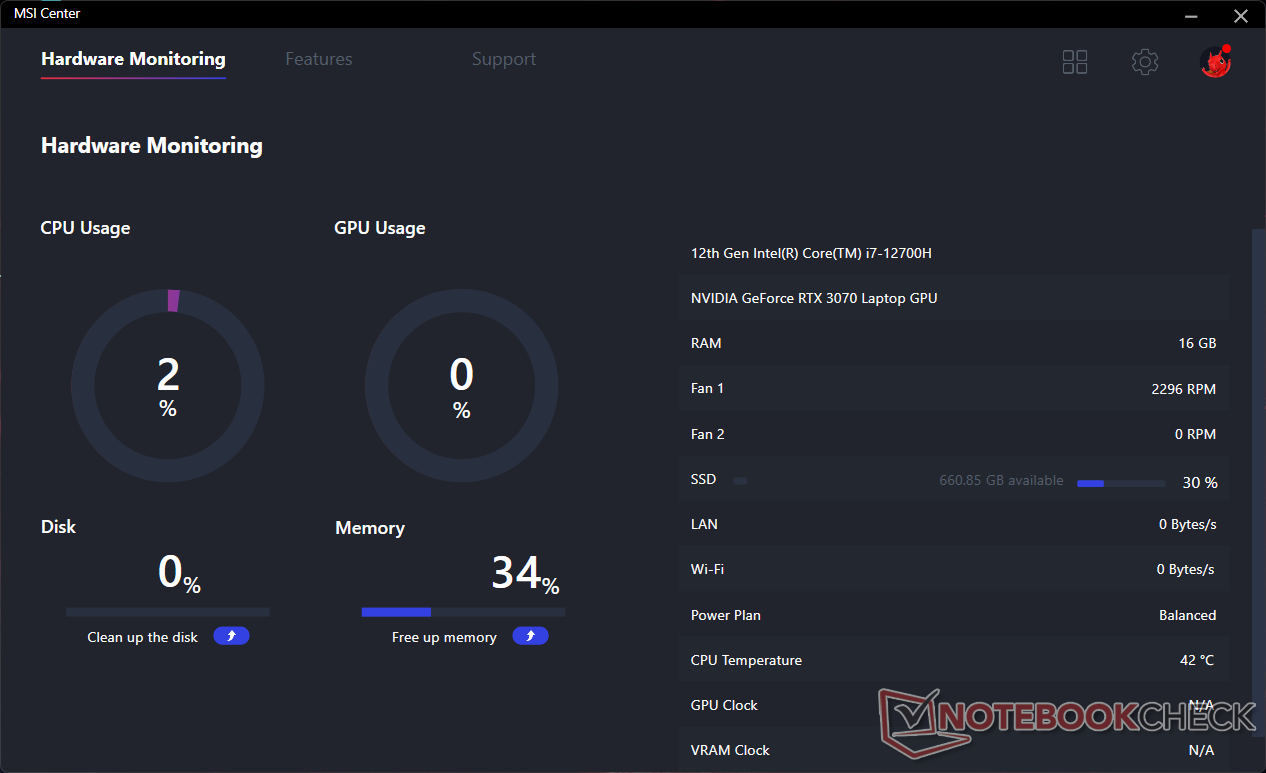
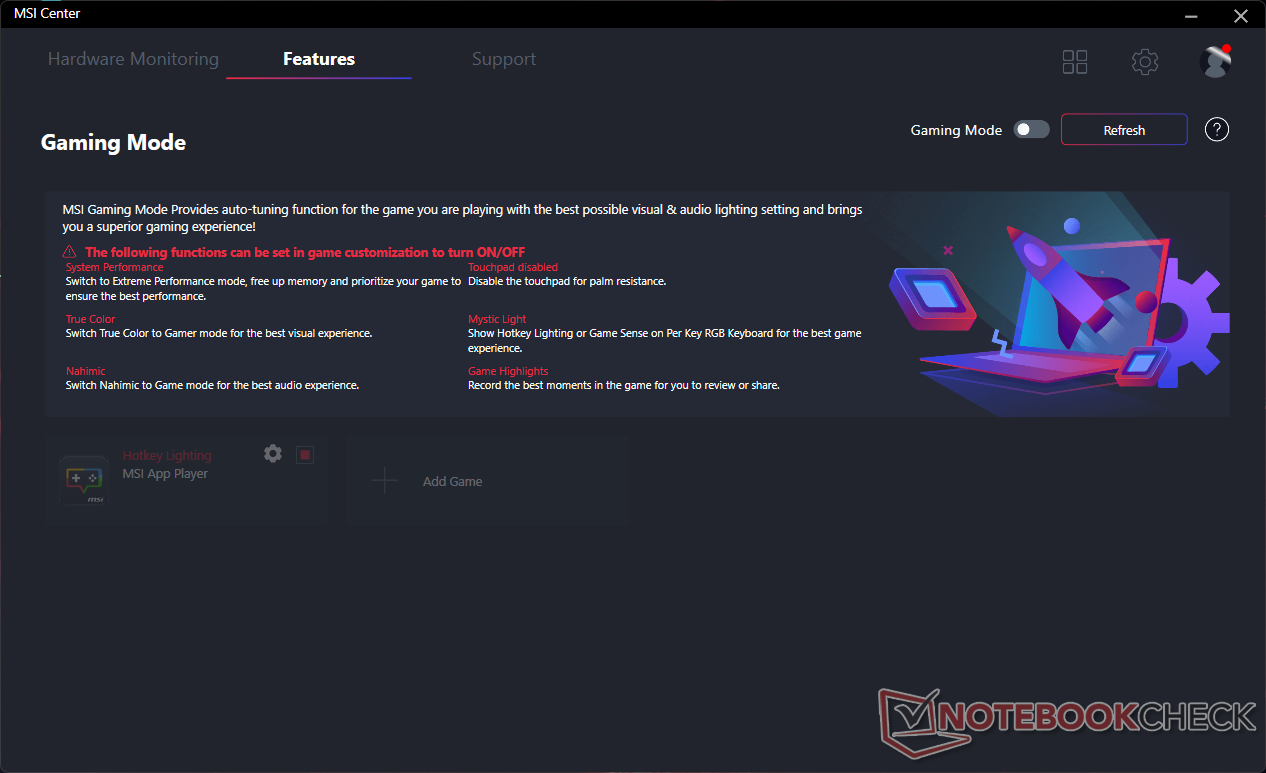
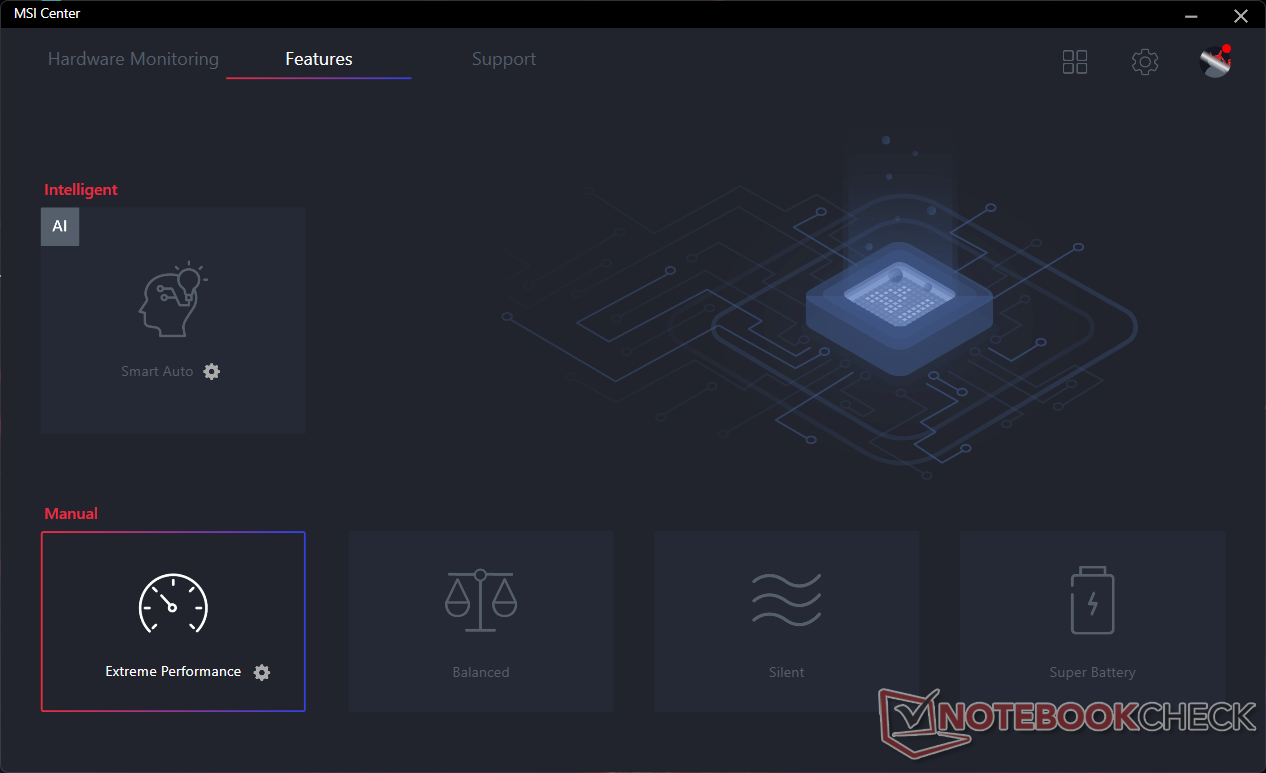
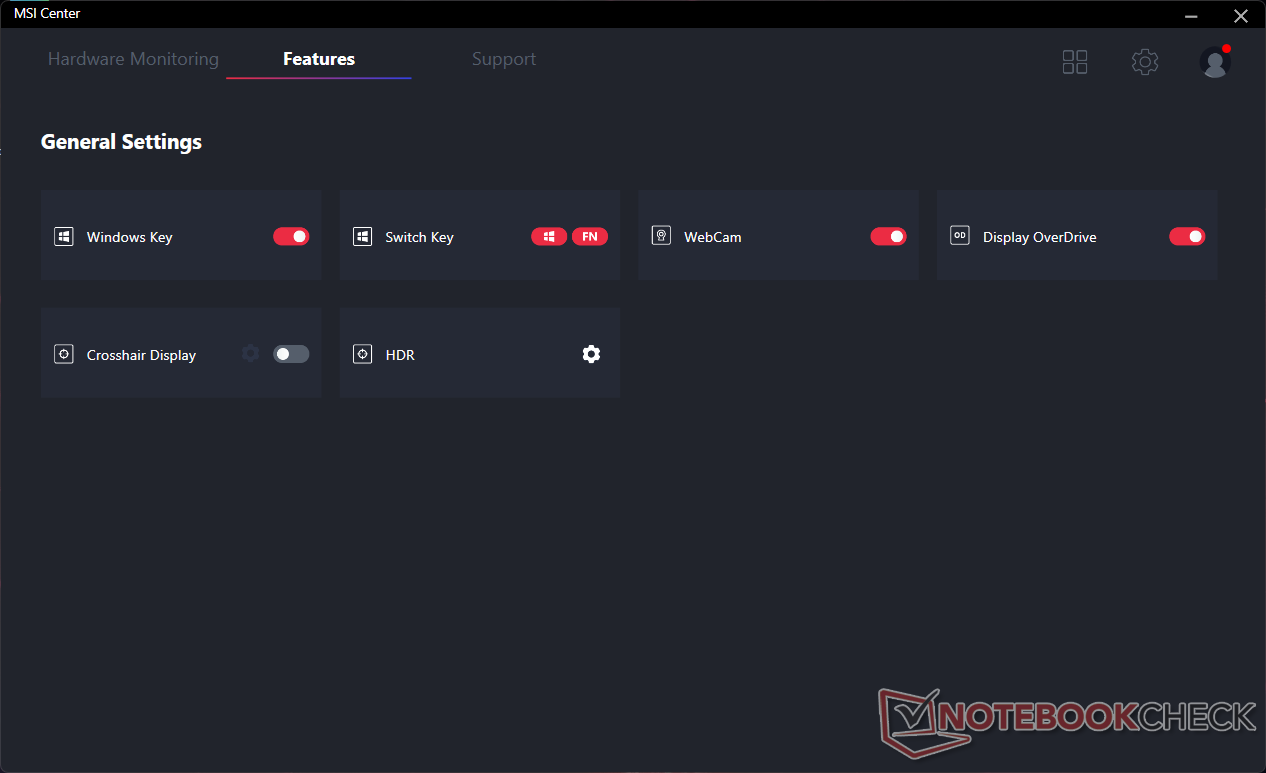
We set our unit to Performance mode via Windows and Extreme Performance mode via MSI Center with the dGPU active prior to running any performance benchmarks below. Fan mode was also set to Auto. Users should become familiar with MSI Center as it is the control hub for MSI-specific updates, performance profiles, hardware monitoring, and more as shown by the screenshots below.
There is no Advanced Optimus or MUX support on the GL76 series.
Processor
CPU performance is excellent with multi-thread results that are roughly 10 percent faster than the average laptop in our database equipped with the same Core i7-12700H CPU. It is overall within just a few percentage points of the Core i9-12900H in the much more expensive Alienware x15 R2.
Opting for the lower-end Core i5-12500H configuration instead of our Core i7 one would result in a multi-thread performance deficit of about 15 percent.
Cinebench R15 Multi Loop
Cinebench R20: CPU (Multi Core) | CPU (Single Core)
Cinebench R23: Multi Core | Single Core
Cinebench R15: CPU Multi 64Bit | CPU Single 64Bit
Blender: v2.79 BMW27 CPU
7-Zip 18.03: 7z b 4 | 7z b 4 -mmt1
Geekbench 5.5: Multi-Core | Single-Core
HWBOT x265 Benchmark v2.2: 4k Preset
LibreOffice : 20 Documents To PDF
R Benchmark 2.5: Overall mean
| HWBOT x265 Benchmark v2.2 / 4k Preset | |
| MSI GE67 HX 12UGS | |
| Asus ROG Strix Scar 17 SE G733CX-LL014W | |
| Alienware x15 R2 P111F | |
| MSI Pulse GL76 12UGK | |
| Razer Blade 15 2022 | |
| Alienware m17 R5 (R9 6900HX, RX 6850M XT) | |
| Average Intel Core i7-12700H (4.67 - 21.8, n=63) | |
| HP Omen 16-n0033dx | |
| Lenovo IdeaPad Gaming 3 15IAH7 | |
| MSI GE76 Raider 10UH | |
| SCHENKER XMG Apex 15 Max | |
* ... smaller is better
AIDA64: FP32 Ray-Trace | FPU Julia | CPU SHA3 | CPU Queen | FPU SinJulia | FPU Mandel | CPU AES | CPU ZLib | FP64 Ray-Trace | CPU PhotoWorxx
| AIDA64 / FP32 Ray-Trace | |
| Asus ROG Strix Scar 17 SE G733CX-LL014W | |
| Acer Predator Helios 300 (i7-12700H, RTX 3070 Ti) | |
| MSI Pulse GL76 12UGK | |
| Alienware m17 R5 (R9 6900HX, RX 6850M XT) | |
| Average Intel Core i7-12700H (2585 - 17957, n=62) | |
| MSI Vector GP76 12UGS-434 | |
| Razer Blade 17 Early 2022 | |
| AIDA64 / FP64 Ray-Trace | |
| Acer Predator Helios 300 (i7-12700H, RTX 3070 Ti) | |
| Asus ROG Strix Scar 17 SE G733CX-LL014W | |
| MSI Pulse GL76 12UGK | |
| Alienware m17 R5 (R9 6900HX, RX 6850M XT) | |
| Average Intel Core i7-12700H (1437 - 9692, n=62) | |
| MSI Vector GP76 12UGS-434 | |
| Razer Blade 17 Early 2022 | |
| AIDA64 / CPU PhotoWorxx | |
| Asus ROG Strix Scar 17 SE G733CX-LL014W | |
| Acer Predator Helios 300 (i7-12700H, RTX 3070 Ti) | |
| Razer Blade 17 Early 2022 | |
| Average Intel Core i7-12700H (12863 - 52207, n=62) | |
| Alienware m17 R5 (R9 6900HX, RX 6850M XT) | |
| MSI Pulse GL76 12UGK | |
| MSI Vector GP76 12UGS-434 | |
System Performance
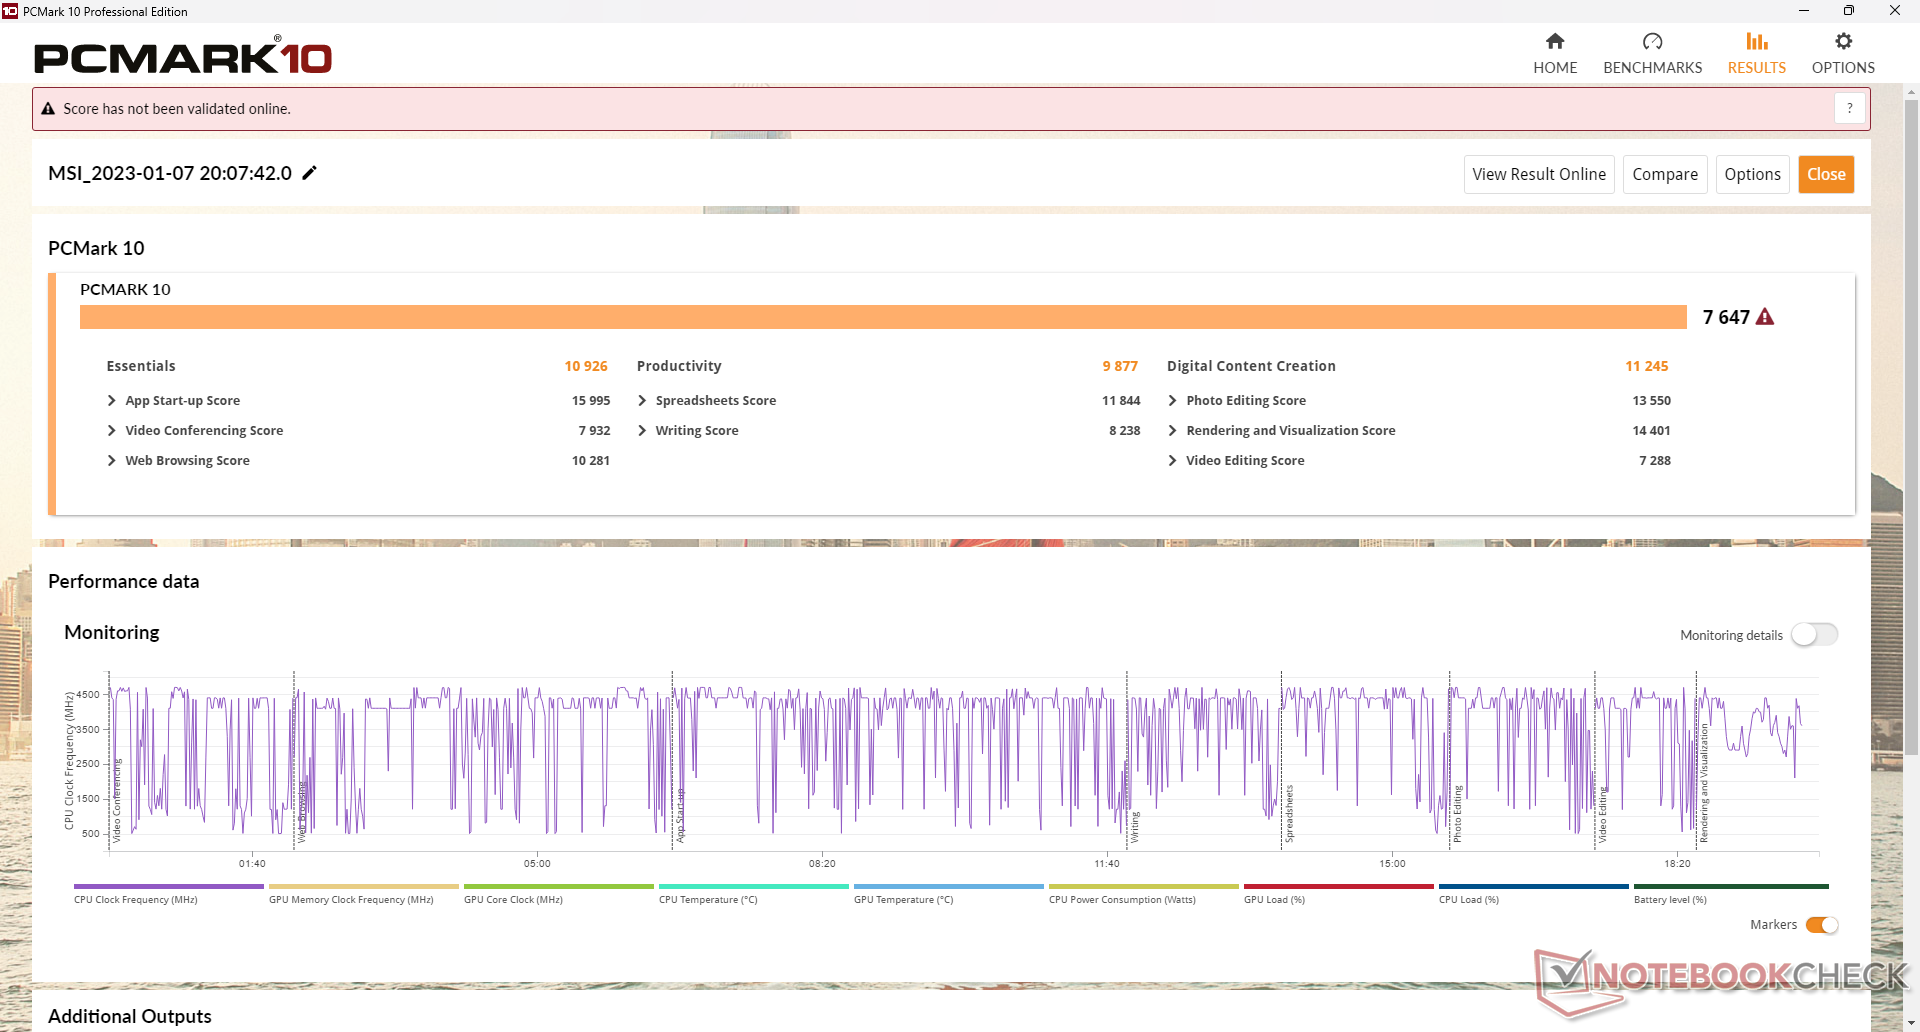
PCMark results are excellent and comparable to higher-end gaming laptops like the Asus ROG Strix Scar 17. In other words, the GL76 can offer almost the same performance as a flagship alternative but for much less money.
CrossMark: Overall | Productivity | Creativity | Responsiveness
| PCMark 10 / Score | |
| MSI Vector GP76 12UGS-434 | |
| Acer Predator Helios 300 (i7-12700H, RTX 3070 Ti) | |
| MSI Pulse GL76 12UGK | |
| Average Intel Core i7-12700H, NVIDIA GeForce RTX 3070 Laptop GPU (7082 - 7647, n=2) | |
| Alienware m17 R5 (R9 6900HX, RX 6850M XT) | |
| Asus ROG Strix Scar 17 SE G733CX-LL014W | |
| Razer Blade 17 Early 2022 | |
| PCMark 10 / Essentials | |
| MSI Pulse GL76 12UGK | |
| Acer Predator Helios 300 (i7-12700H, RTX 3070 Ti) | |
| MSI Vector GP76 12UGS-434 | |
| Average Intel Core i7-12700H, NVIDIA GeForce RTX 3070 Laptop GPU (10076 - 10926, n=2) | |
| Asus ROG Strix Scar 17 SE G733CX-LL014W | |
| Razer Blade 17 Early 2022 | |
| Alienware m17 R5 (R9 6900HX, RX 6850M XT) | |
| PCMark 10 / Productivity | |
| MSI Vector GP76 12UGS-434 | |
| Acer Predator Helios 300 (i7-12700H, RTX 3070 Ti) | |
| MSI Pulse GL76 12UGK | |
| Asus ROG Strix Scar 17 SE G733CX-LL014W | |
| Average Intel Core i7-12700H, NVIDIA GeForce RTX 3070 Laptop GPU (9460 - 9877, n=2) | |
| Razer Blade 17 Early 2022 | |
| Alienware m17 R5 (R9 6900HX, RX 6850M XT) | |
| PCMark 10 / Digital Content Creation | |
| Acer Predator Helios 300 (i7-12700H, RTX 3070 Ti) | |
| MSI Vector GP76 12UGS-434 | |
| Alienware m17 R5 (R9 6900HX, RX 6850M XT) | |
| MSI Pulse GL76 12UGK | |
| Average Intel Core i7-12700H, NVIDIA GeForce RTX 3070 Laptop GPU (10113 - 11245, n=2) | |
| Razer Blade 17 Early 2022 | |
| Asus ROG Strix Scar 17 SE G733CX-LL014W | |
| CrossMark / Overall | |
| Asus ROG Strix Scar 17 SE G733CX-LL014W | |
| MSI Vector GP76 12UGS-434 | |
| Average Intel Core i7-12700H, NVIDIA GeForce RTX 3070 Laptop GPU (1844 - 2003, n=2) | |
| Acer Predator Helios 300 (i7-12700H, RTX 3070 Ti) | |
| MSI Pulse GL76 12UGK | |
| Razer Blade 17 Early 2022 | |
| Alienware m17 R5 (R9 6900HX, RX 6850M XT) | |
| CrossMark / Productivity | |
| Asus ROG Strix Scar 17 SE G733CX-LL014W | |
| MSI Vector GP76 12UGS-434 | |
| Average Intel Core i7-12700H, NVIDIA GeForce RTX 3070 Laptop GPU (1785 - 1971, n=2) | |
| MSI Pulse GL76 12UGK | |
| Acer Predator Helios 300 (i7-12700H, RTX 3070 Ti) | |
| Razer Blade 17 Early 2022 | |
| Alienware m17 R5 (R9 6900HX, RX 6850M XT) | |
| CrossMark / Creativity | |
| Asus ROG Strix Scar 17 SE G733CX-LL014W | |
| Acer Predator Helios 300 (i7-12700H, RTX 3070 Ti) | |
| Average Intel Core i7-12700H, NVIDIA GeForce RTX 3070 Laptop GPU (1912 - 1979, n=2) | |
| MSI Vector GP76 12UGS-434 | |
| MSI Pulse GL76 12UGK | |
| Razer Blade 17 Early 2022 | |
| Alienware m17 R5 (R9 6900HX, RX 6850M XT) | |
| CrossMark / Responsiveness | |
| MSI Vector GP76 12UGS-434 | |
| Average Intel Core i7-12700H, NVIDIA GeForce RTX 3070 Laptop GPU (1824 - 2182, n=2) | |
| Asus ROG Strix Scar 17 SE G733CX-LL014W | |
| MSI Pulse GL76 12UGK | |
| Acer Predator Helios 300 (i7-12700H, RTX 3070 Ti) | |
| Razer Blade 17 Early 2022 | |
| Alienware m17 R5 (R9 6900HX, RX 6850M XT) | |
| PCMark 10 Score | 7647 points | |
Help | ||
| AIDA64 / Memory Latency | |
| Alienware m17 R5 (R9 6900HX, RX 6850M XT) | |
| MSI Pulse GL76 12UGK | |
| MSI Vector GP76 12UGS-434 | |
| Acer Predator Helios 300 (i7-12700H, RTX 3070 Ti) | |
| Asus ROG Strix Scar 17 SE G733CX-LL014W | |
| Average Intel Core i7-12700H (76.2 - 133.9, n=60) | |
* ... smaller is better
DPC Latency
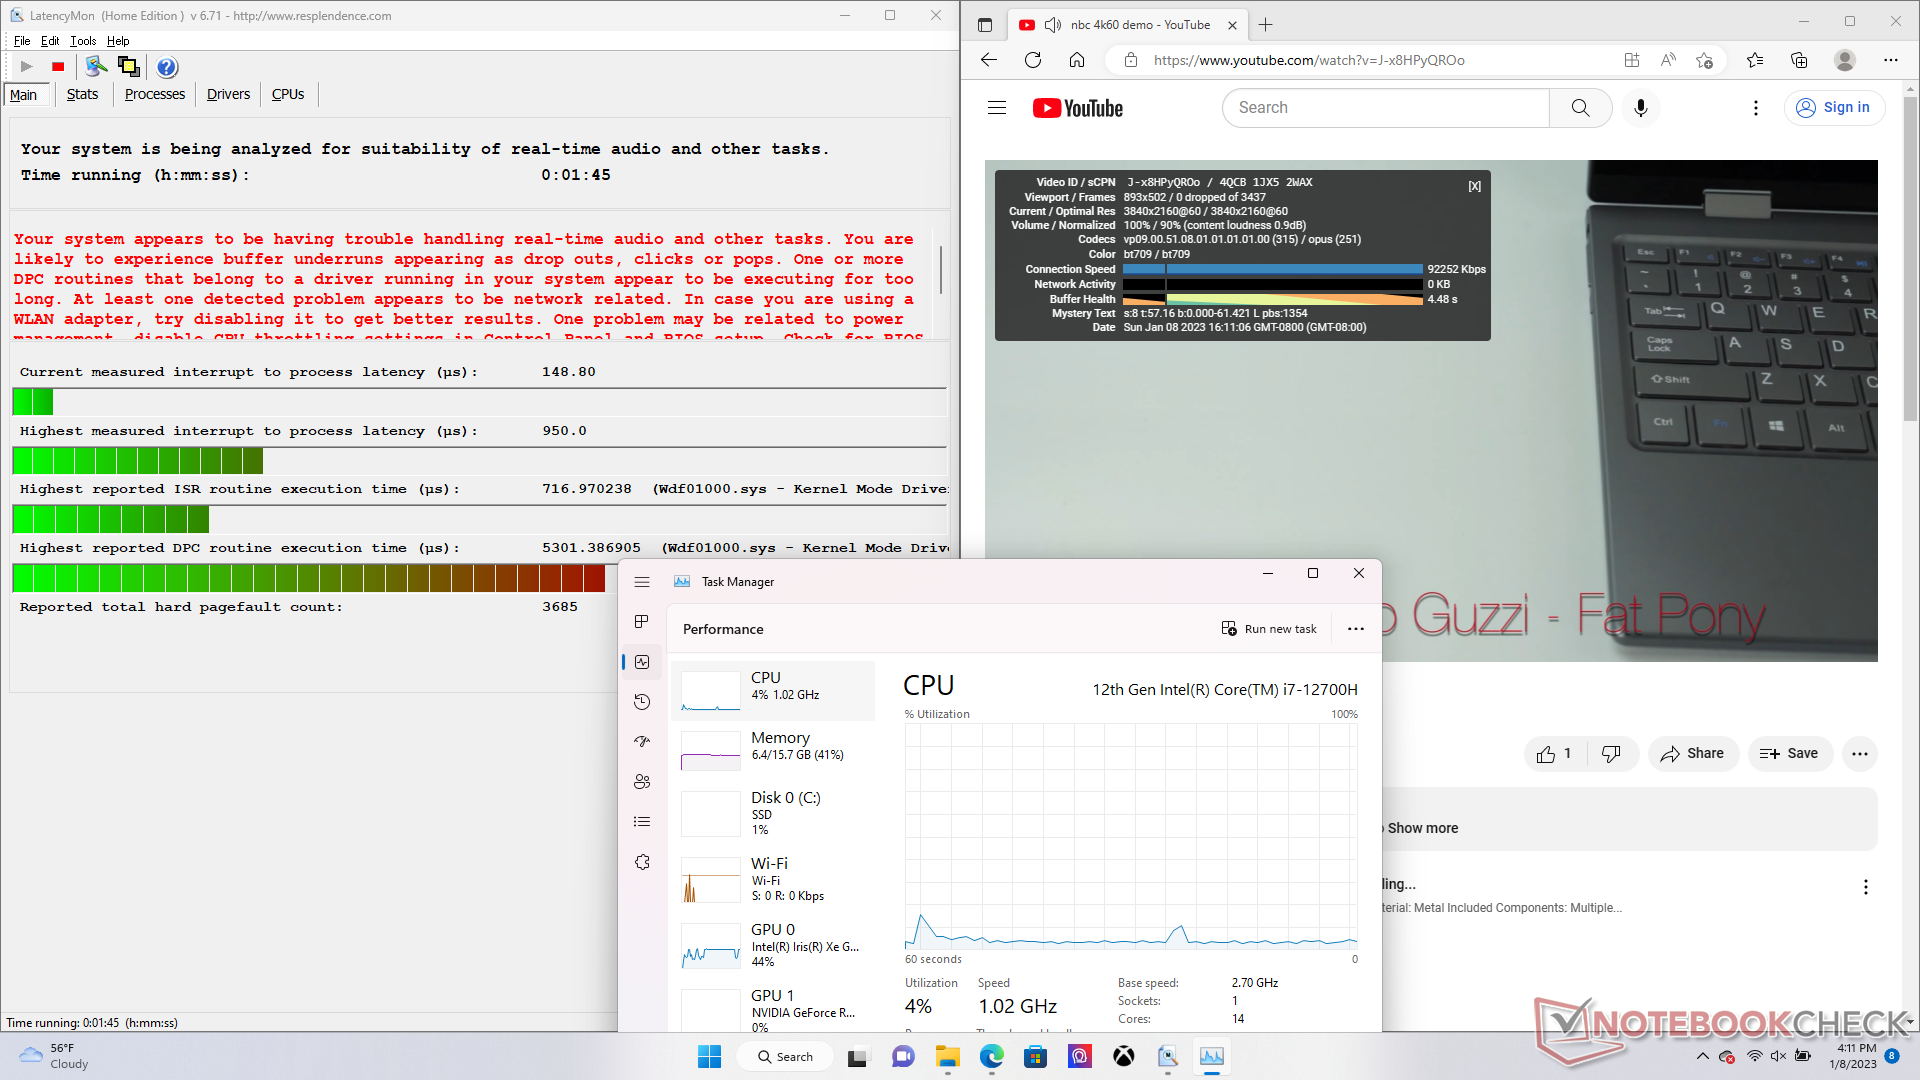
LatencyMon reveals no DPC issues when opening multiple browser tabs of our homepage. 4K video playback at 60 FPS is also flawless with no dropped frames.

| DPC Latencies / LatencyMon - interrupt to process latency (max), Web, Youtube, Prime95 | |
| Asus ROG Strix Scar 17 SE G733CX-LL014W | |
| MSI Vector GP76 12UGS-434 | |
| Acer Predator Helios 300 (i7-12700H, RTX 3070 Ti) | |
| Alienware m17 R5 (R9 6900HX, RX 6850M XT) | |
| MSI Pulse GL76 12UGK | |
| Razer Blade 17 Early 2022 | |
* ... smaller is better
Storage Devices — Up To Two NVMe SSDs
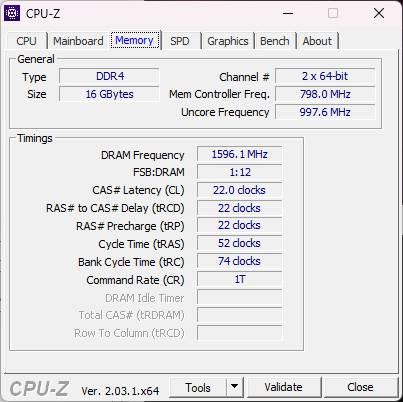
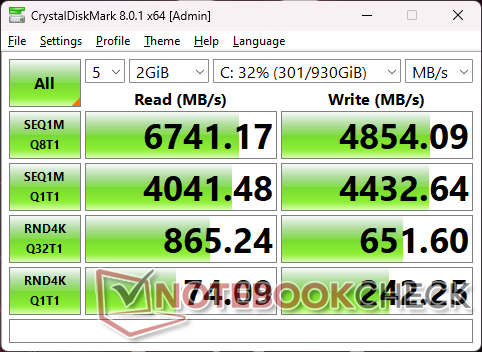
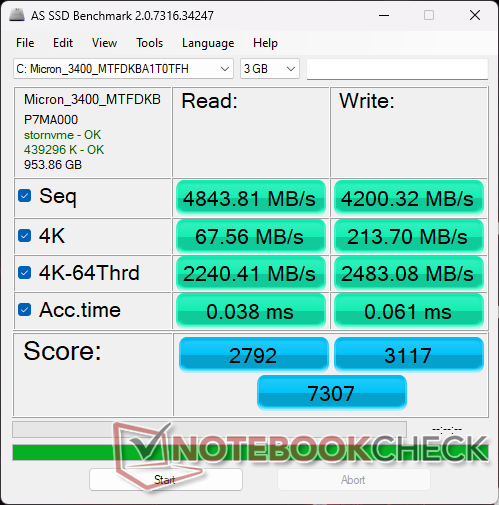
Our unit ships with a 1 TB Micron 3400 PCIe4 x4 NVMe SSD instead of the more common 1 TB Samsung PM9A1 likely to save on costs. Transfer rates are just ever-so-slightly slower by about 10 percent on average. We're more impressed by the drive's ability to maintain very high transfer rates of over 6400 MB/s for extended periods without a heat spreader.

* ... smaller is better
Disk Throttling: DiskSpd Read Loop, Queue Depth 8
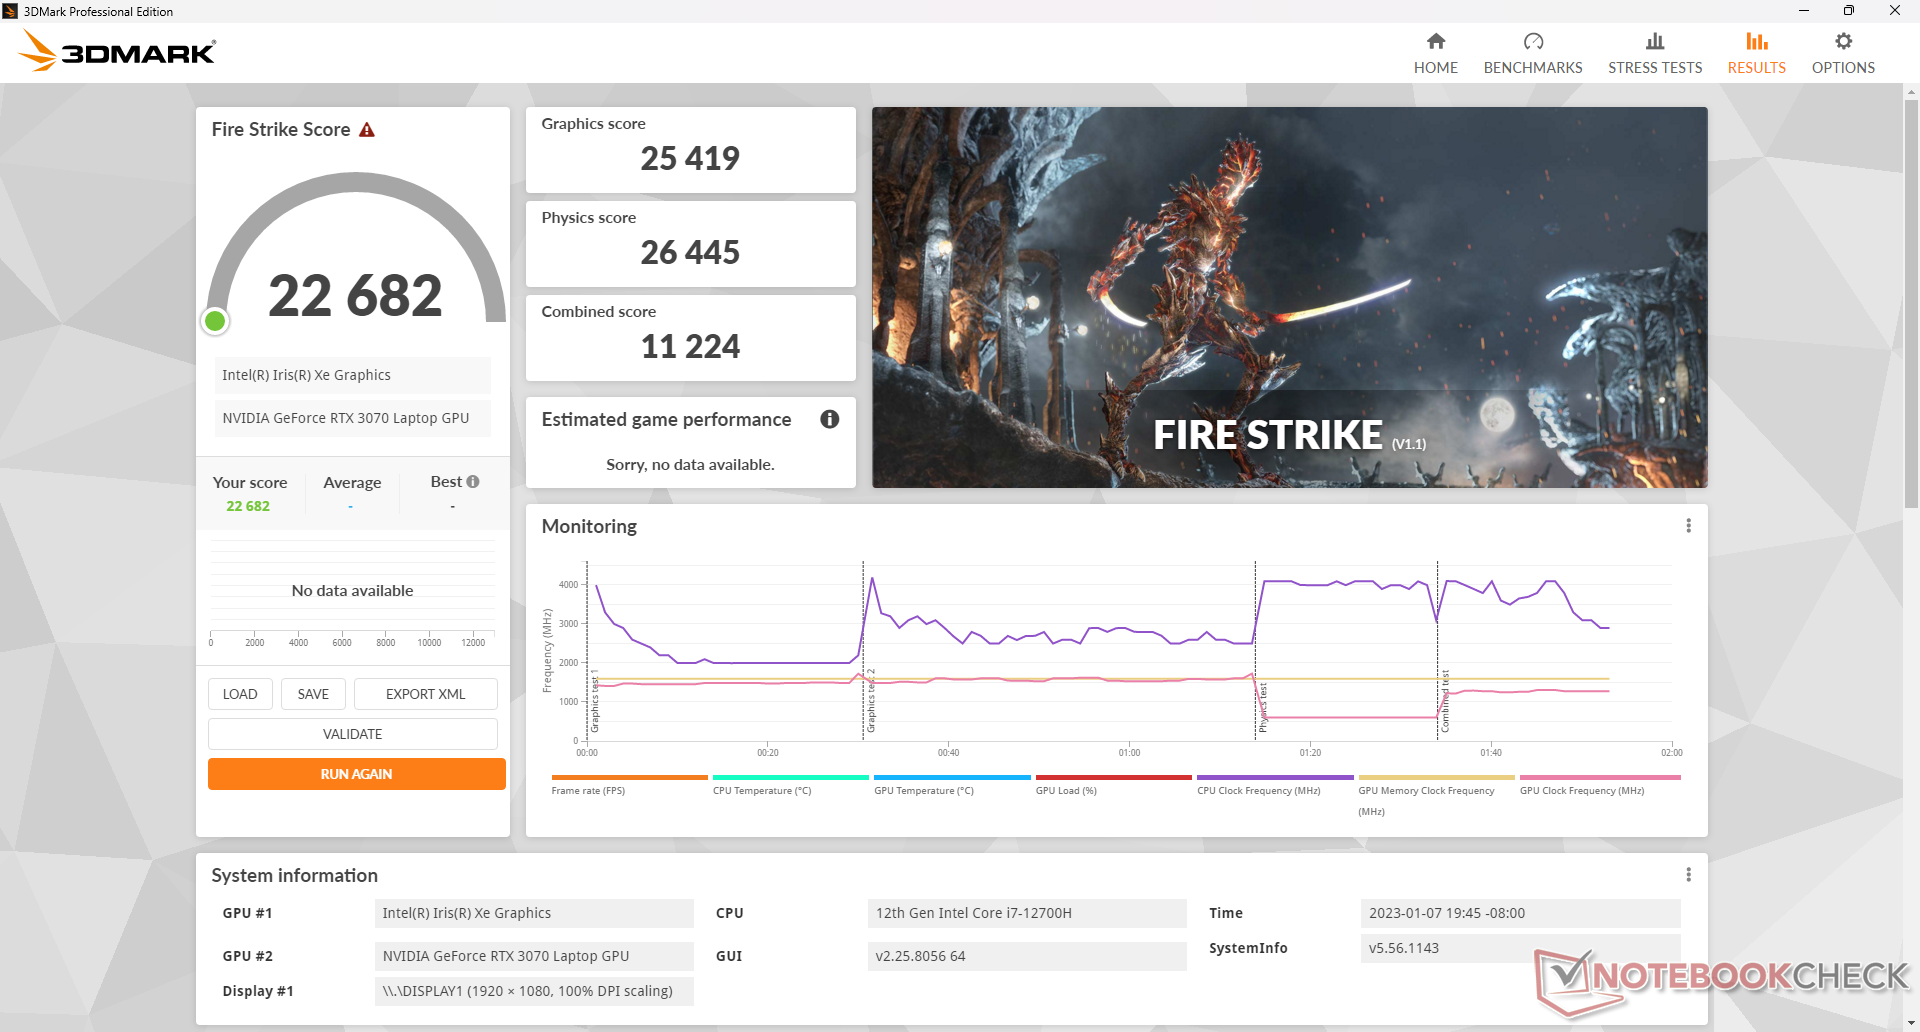
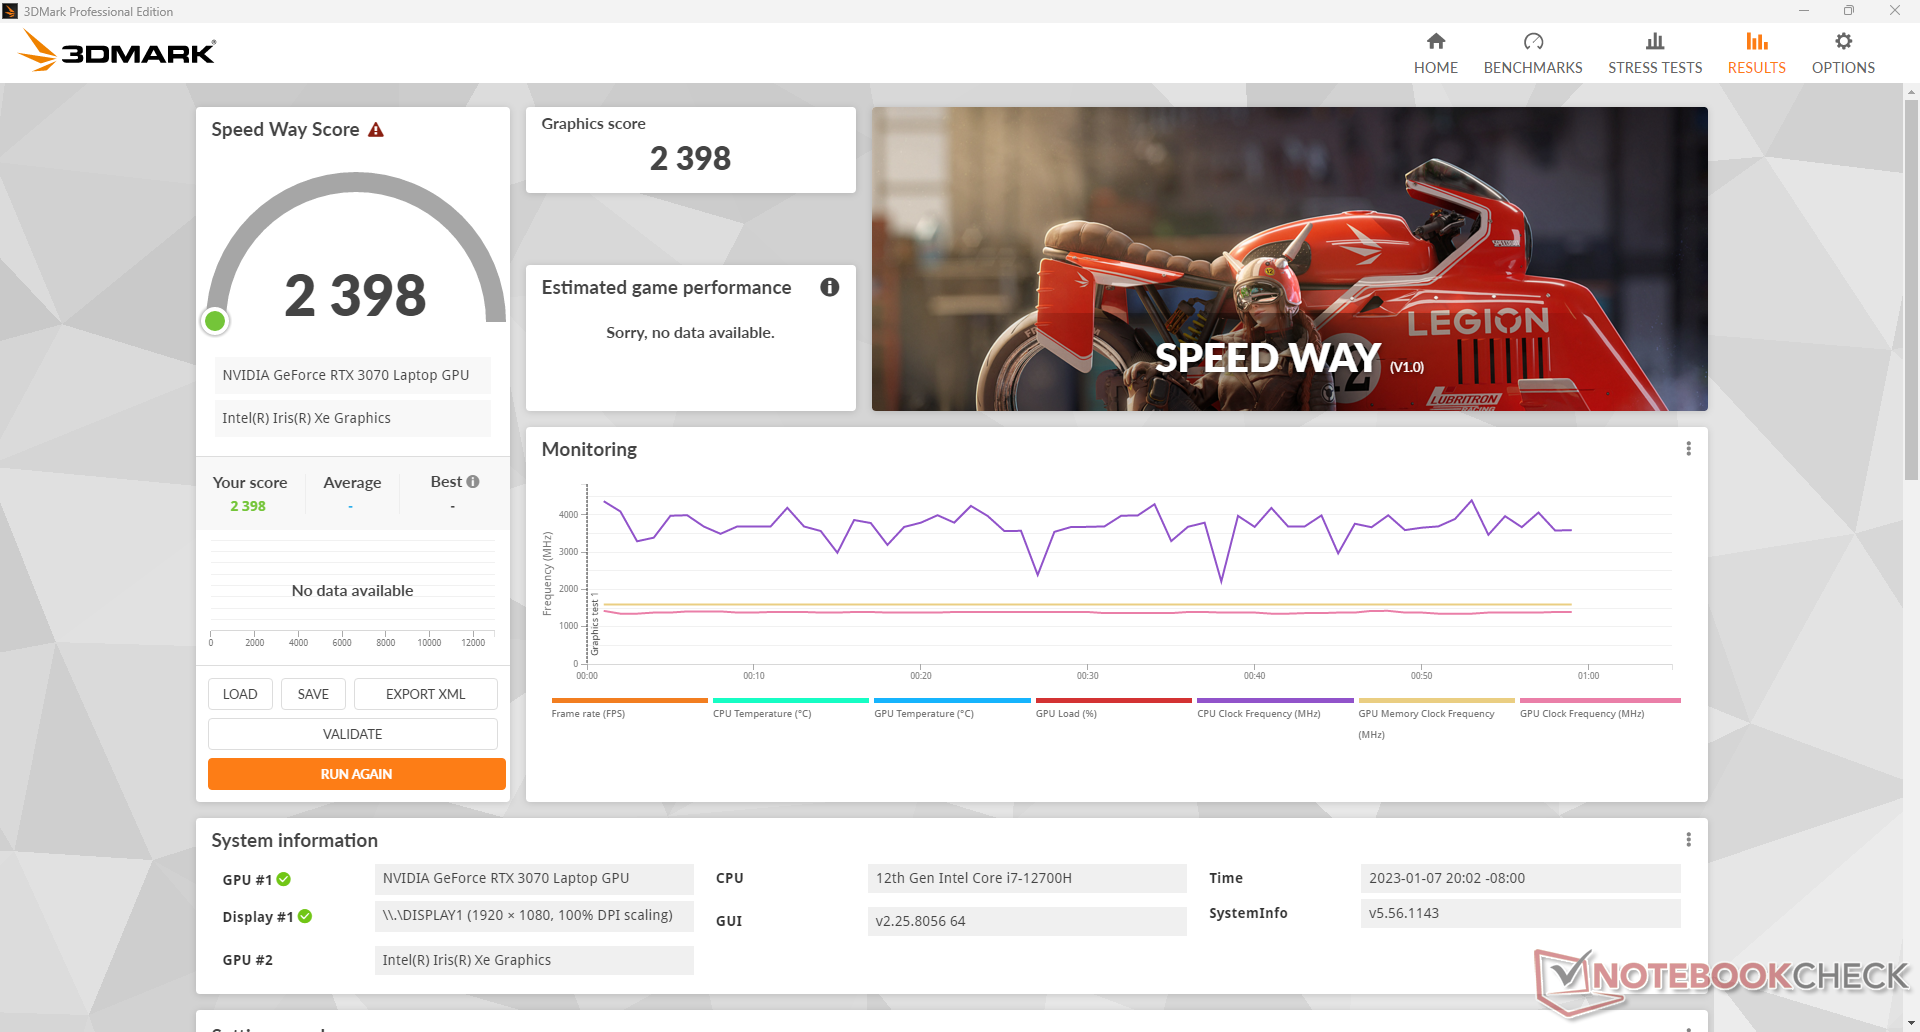
GPU Performance — 105 W TGP Graphics
Raw graphics performance is approximately 25 percent slower than our GeForce RTX 3070 desktop reference. When compared to the 115 W GeForce RTX 3070 in the Schenker XMG Apex 15, our 105 W version is only about 5 percent behind. Downgrading to the RTX 3060 or RTX 3050 will impact graphics performance by about 10 to 15 percent and 40 to 45 percent, respectively.
All current titles are playable at the native 1080p resolution with settings to maximum. To better exploit the fast 360 Hz native refresh rate, however, you may want to consider tuning down the settings to medium or lower especially on competitive games like CS:GO or Overwatch.
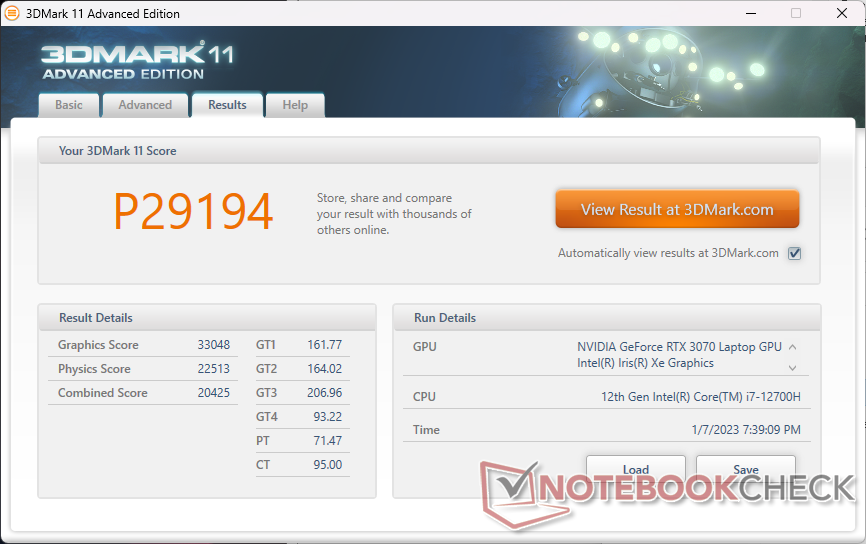
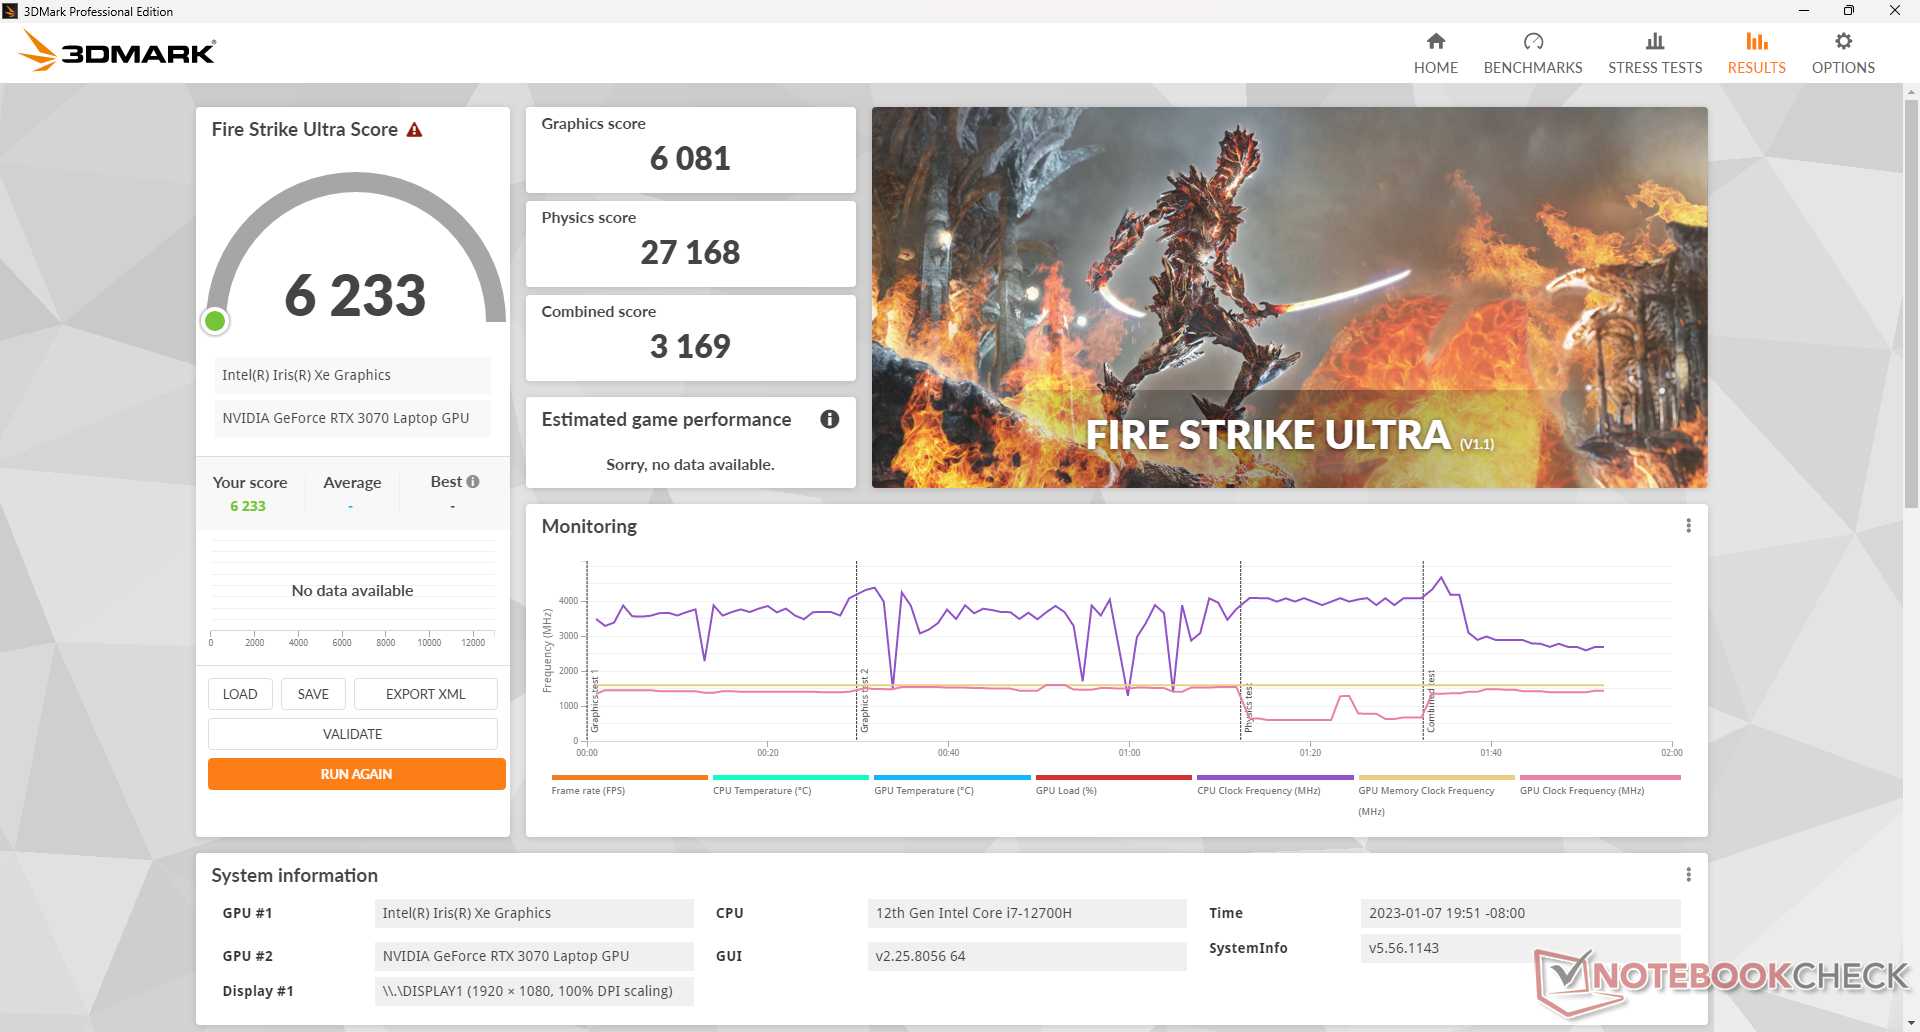
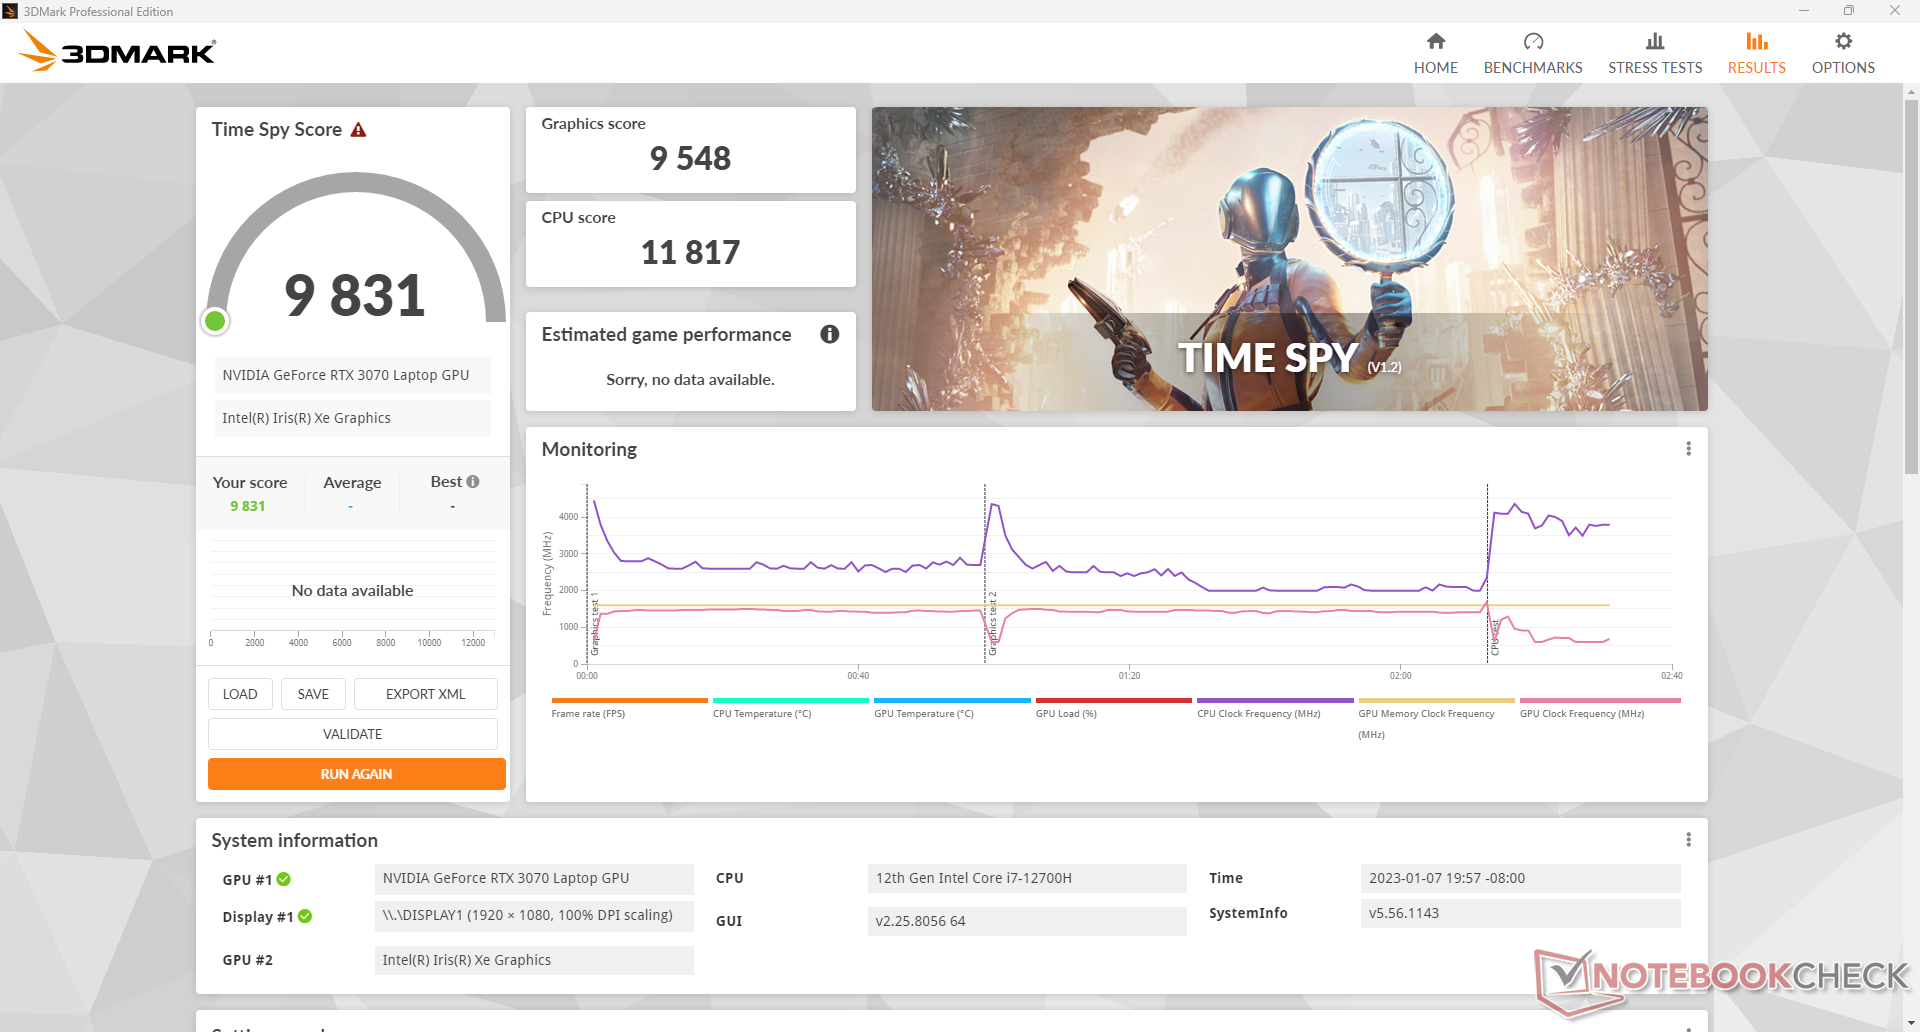
| 3DMark 11 Performance | 29194 points | |
| 3DMark Fire Strike Score | 22682 points | |
| 3DMark Time Spy Score | 9831 points | |
Help | ||
* ... smaller is better
Witcher 3 FPS Chart
| low | med. | high | ultra | |
|---|---|---|---|---|
| GTA V (2015) | 185.7 | 182.3 | 175.5 | 108.1 |
| The Witcher 3 (2015) | 377.1 | 252.8 | 170.5 | 92.8 |
| Dota 2 Reborn (2015) | 168.1 | 152.1 | 141.2 | 132.8 |
| Final Fantasy XV Benchmark (2018) | 186.3 | 118.5 | 89.7 | |
| X-Plane 11.11 (2018) | 139.9 | 122.9 | 97.7 | |
| Strange Brigade (2018) | 414 | 224 | 186.6 | 164.5 |
| Cyberpunk 2077 1.6 (2022) | 118.8 | 102.4 | 83.2 | 69.8 |
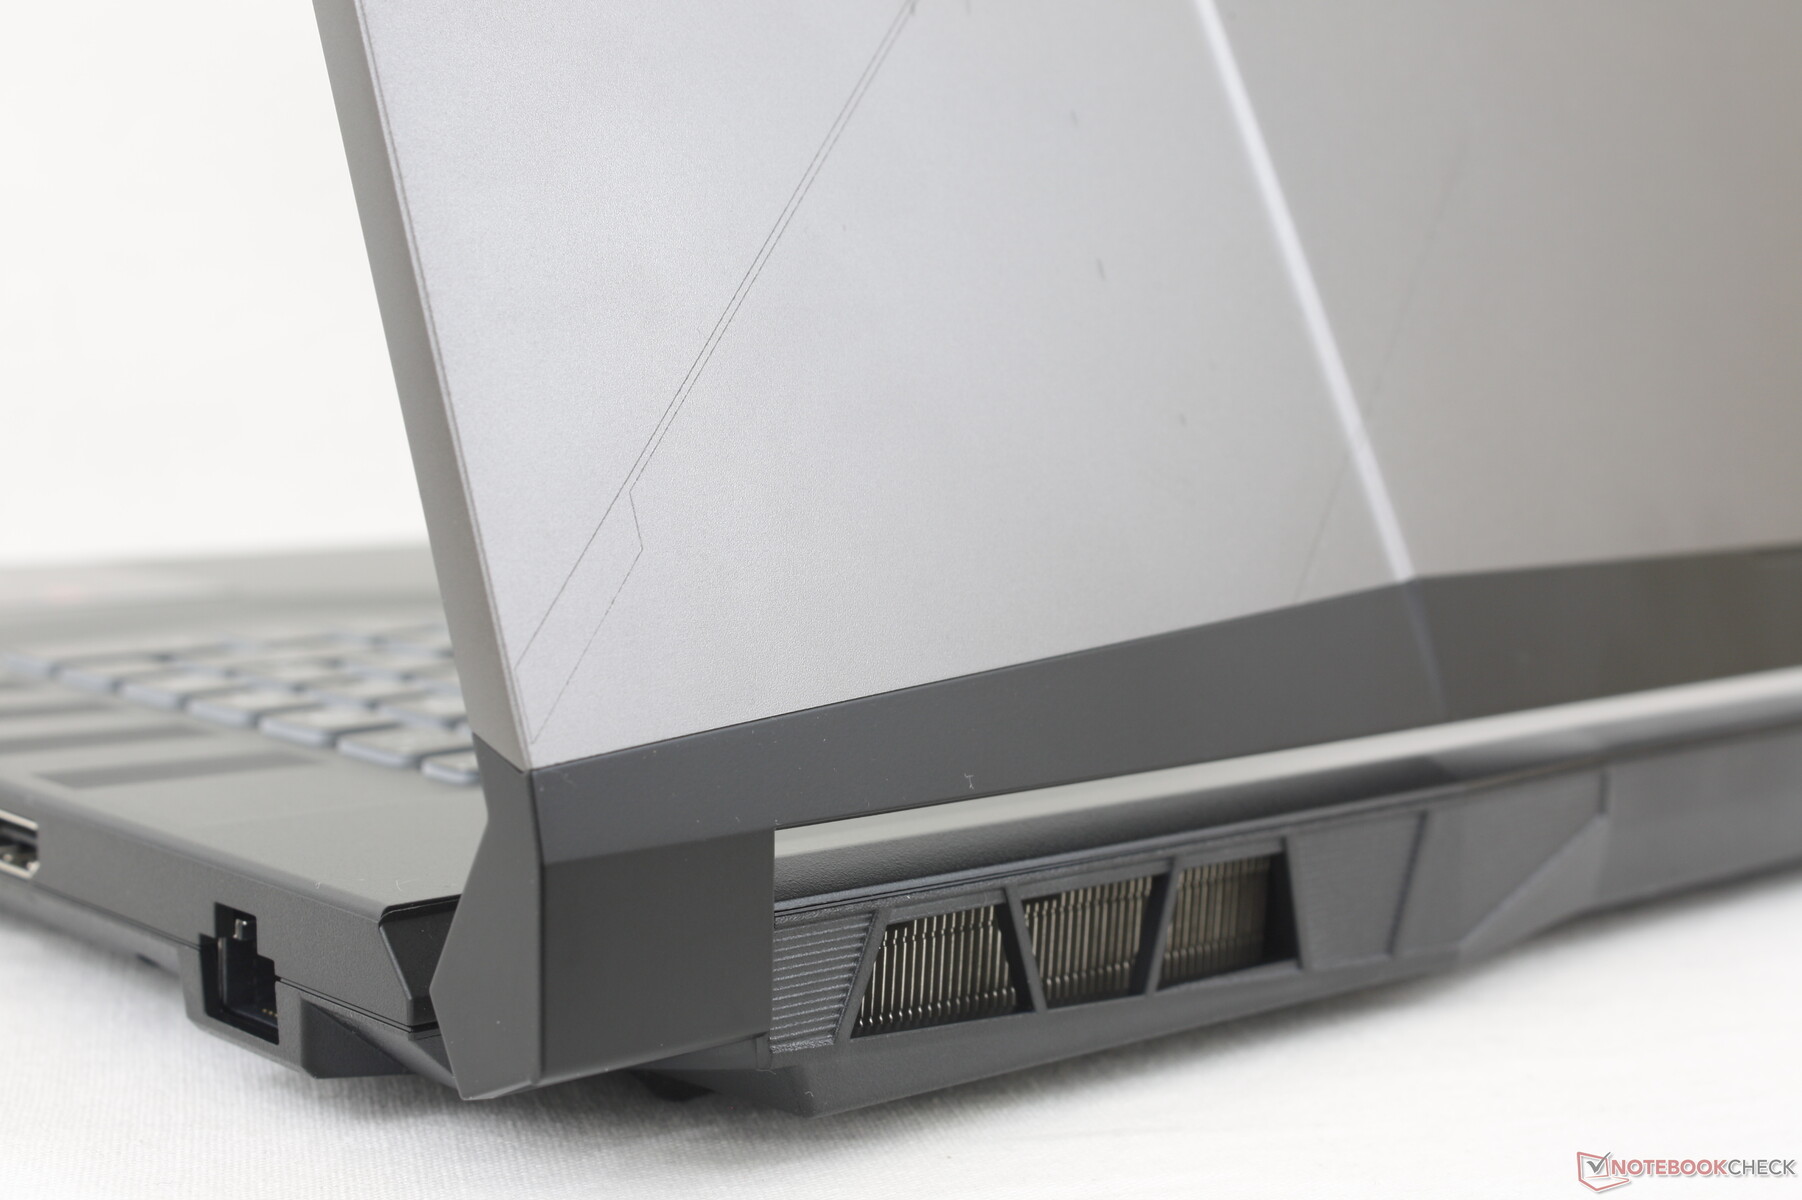
Emissions — Not Too Loud
System Noise
The fans never idle even when set to "Silent" mode. We're able to record a minimum of 26.9 dB(A) against a silent background of 24.1 dB(A) which is just barely audible in most scenarios. Instead, "Silent" mode is excellent at preventing the internal fans from pulsing in response to changing onscreen loads. When streaming videos or web browsing, for example, Silent mode is recommended over Balanced mode where the fans will frequently pulse between 27 and 43.8 dB(A).
Fan noise when running Witcher 3 stabilizes at just below 45 dB(A) to be quieter than many of its competitors as shown by the table below. If Cooler Boost (i.e., maximum fan mode) is enabled, fan noise would jump to as high as 58 dB(A). This mode is more for reducing temperatures rather than increasing performance and so it isn't necessary for most gaming scenarios.
Noise Level
| Idle |
| 26.9 / 26.9 / 27 dB(A) |
| Load |
| 43.8 / 58.3 dB(A) |
 | ||
30 dB silent 40 dB(A) audible 50 dB(A) loud |
||
min: | ||
| MSI Pulse GL76 12UGK GeForce RTX 3070 Laptop GPU, i7-12700H, Micron 3400 1TB MTFDKBA1T0TFH | Alienware m17 R5 (R9 6900HX, RX 6850M XT) Radeon RX 6850M XT, R9 6900HX, SSSTC CA6-8D1024 | Asus ROG Strix Scar 17 SE G733CX-LL014W GeForce RTX 3080 Ti Laptop GPU, i9-12950HX, Samsung PM9A1 MZVL22T0HBLB | Acer Predator Helios 300 (i7-12700H, RTX 3070 Ti) GeForce RTX 3070 Ti Laptop GPU, i7-12700H, Samsung PM9A1 MZVL21T0HCLR | Razer Blade 17 Early 2022 GeForce RTX 3080 Ti Laptop GPU, i9-12900H, Samsung PM9A1 MZVL21T0HCLR | MSI Vector GP76 12UGS-434 GeForce RTX 3070 Ti Laptop GPU, i7-12700H, Micron 2450 1TB MTFDKBA1T0TFK | |
|---|---|---|---|---|---|---|
| Noise | 6% | 13% | -10% | -6% | -6% | |
| off / environment * | 24.1 | 23 5% | 23.9 1% | 23 5% | 26 -8% | 25.6 -6% |
| Idle Minimum * | 26.9 | 23 14% | 23.9 11% | 23 14% | 26 3% | 27 -0% |
| Idle Average * | 26.9 | 28.11 -4% | 23.9 11% | 25.92 4% | 27 -0% | 27 -0% |
| Idle Maximum * | 27 | 28.11 -4% | 23.9 11% | 40.67 -51% | 32 -19% | 30.1 -11% |
| Load Average * | 43.8 | 30.62 30% | 34.3 22% | 42.7 3% | 50 -14% | 54.4 -24% |
| Witcher 3 ultra * | 44.7 | 49.75 -11% | 62.48 -40% | 51 -14% | ||
| Load Maximum * | 58.3 | 50.17 14% | 45.9 21% | 62.67 -7% | 51 13% | 56.2 4% |
* ... smaller is better
Temperature
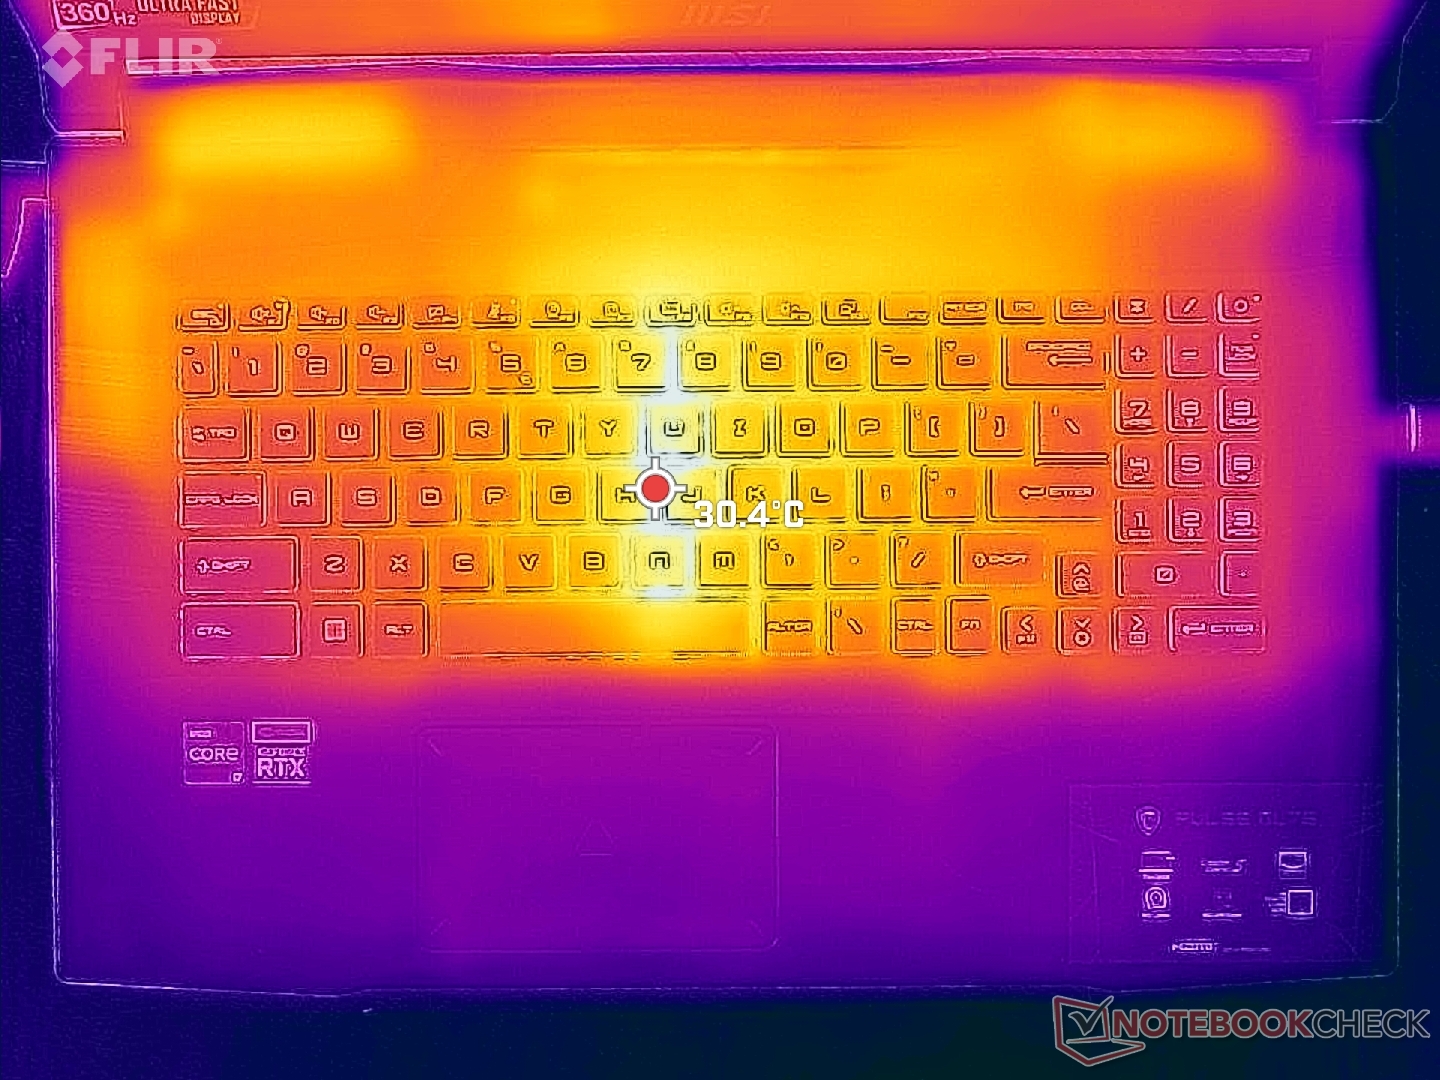
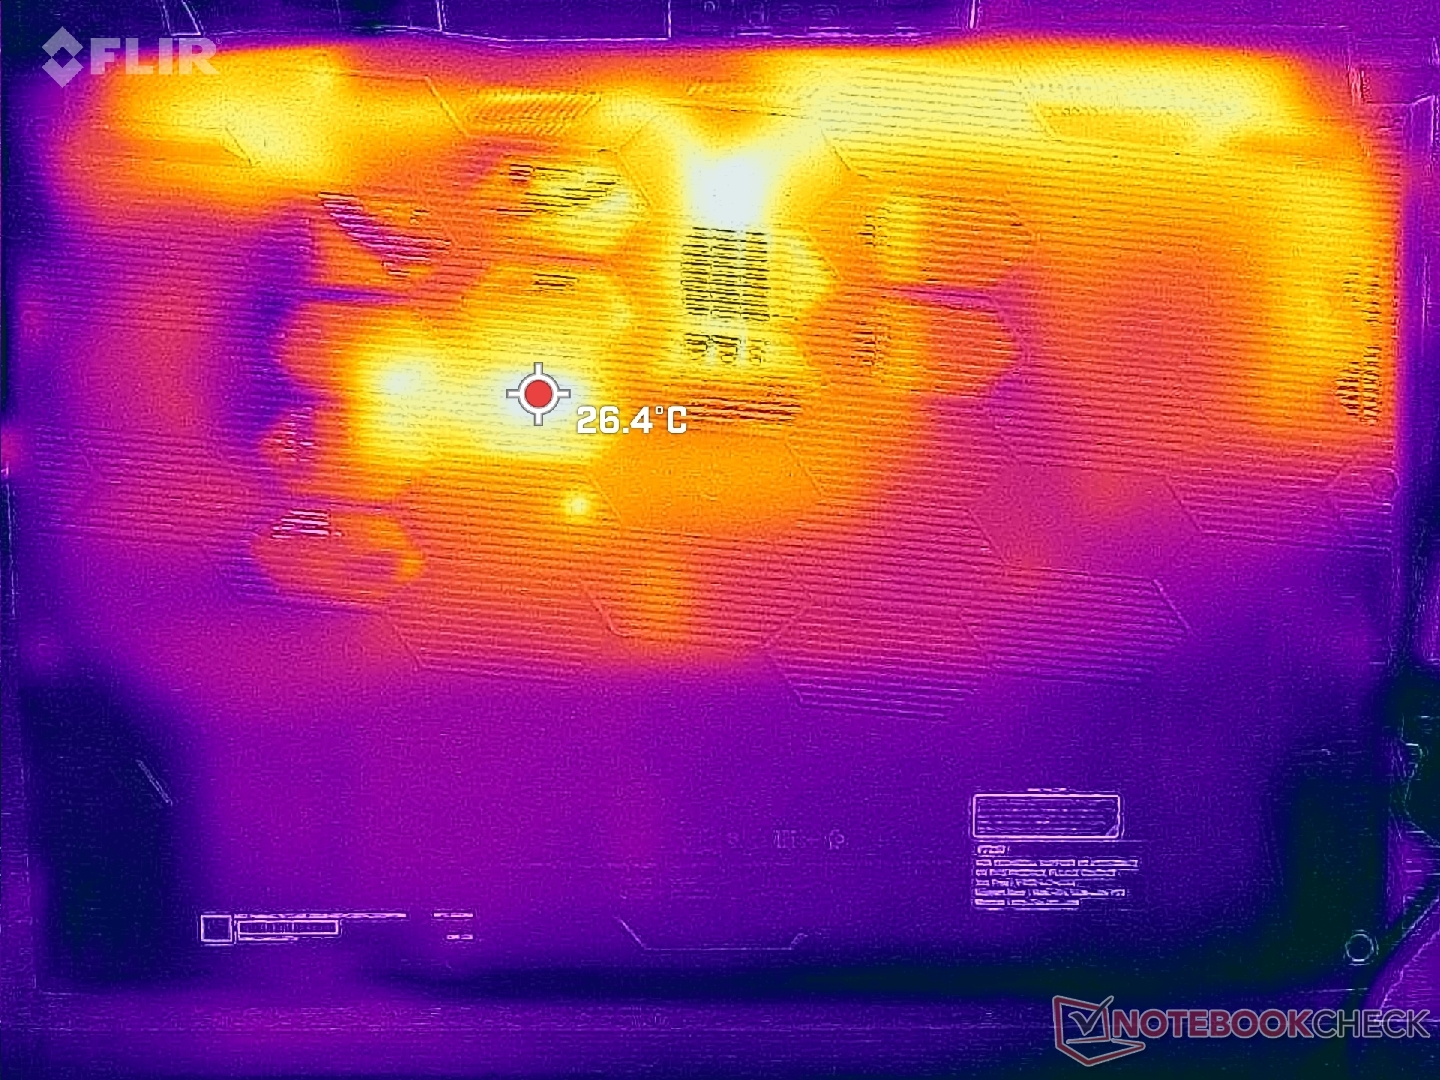
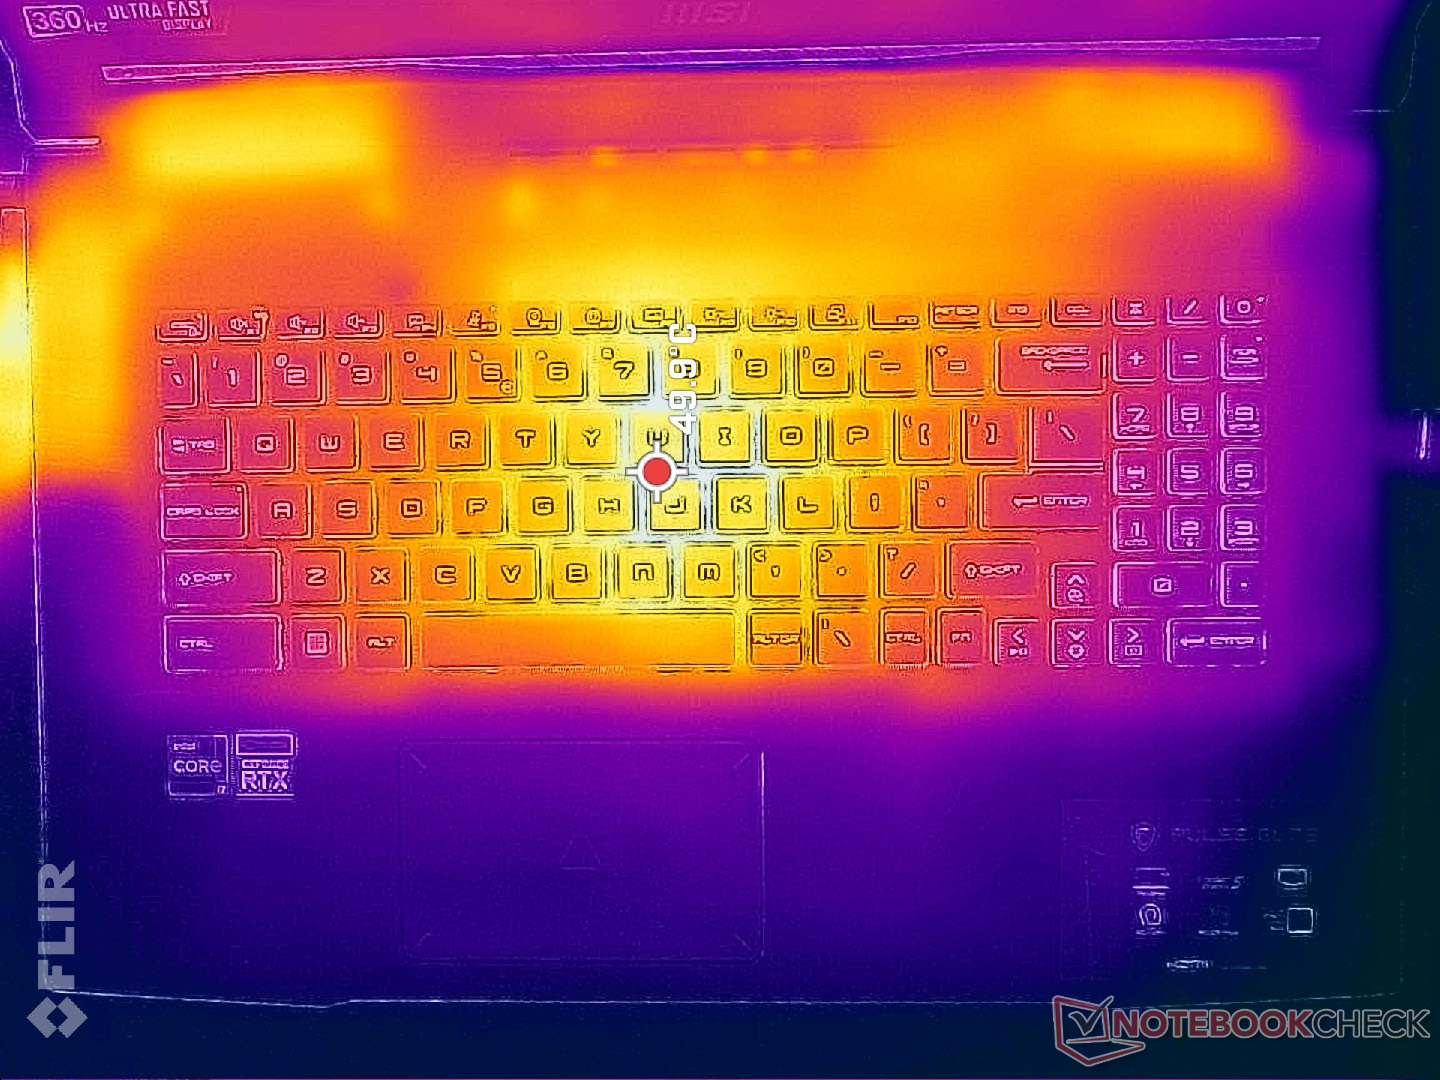
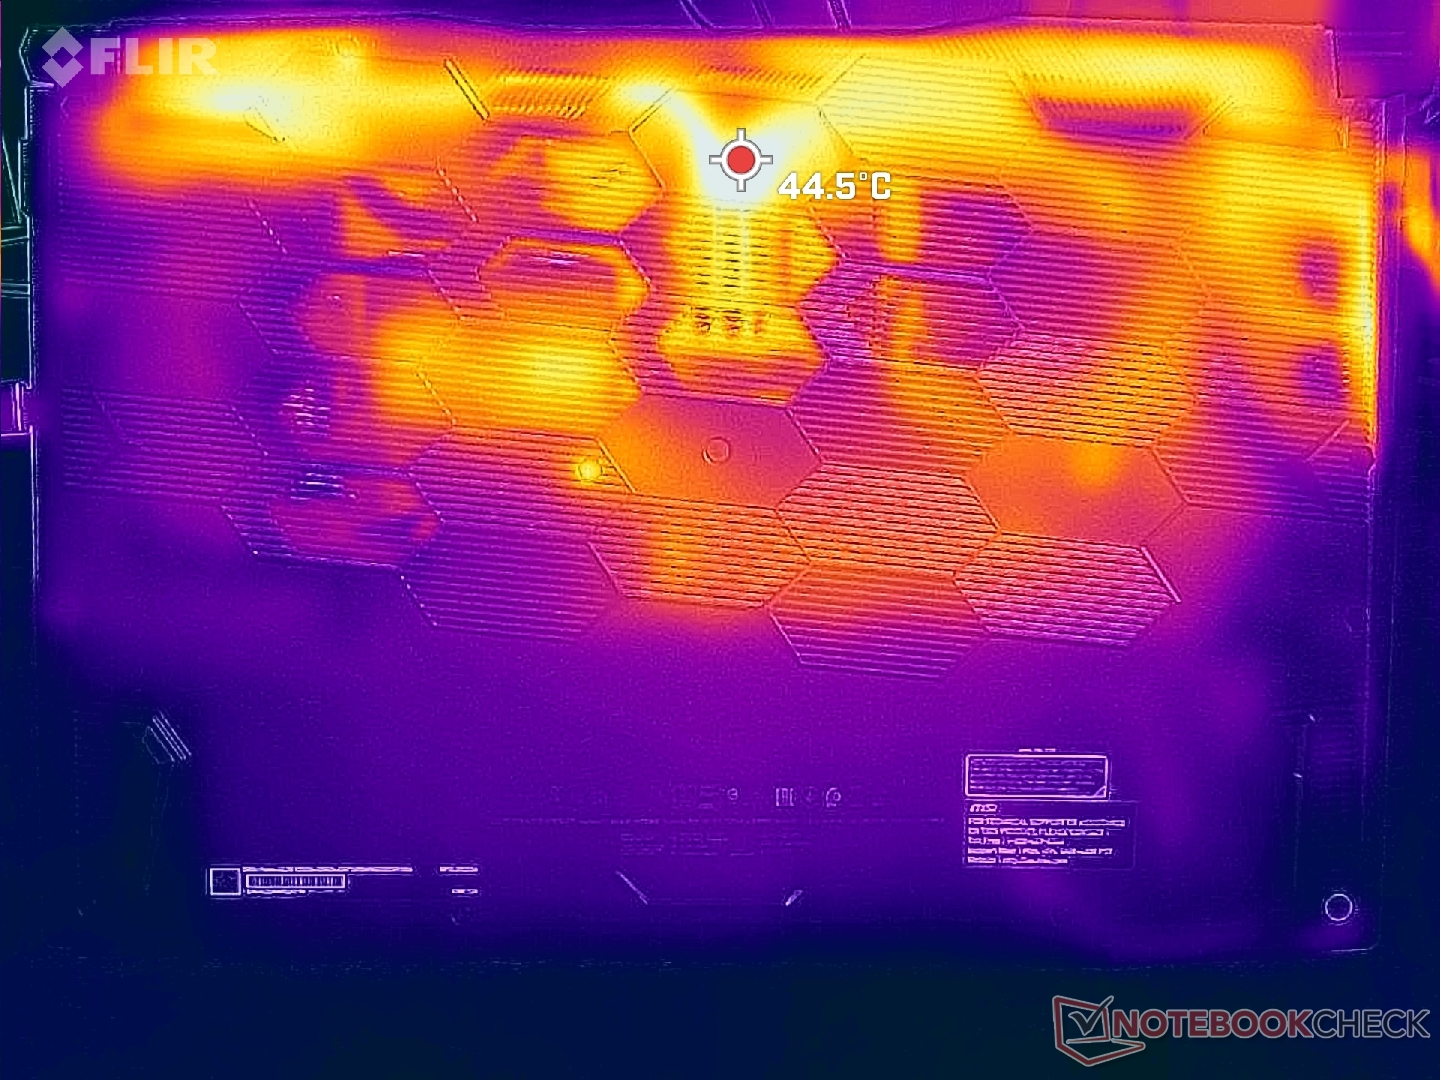
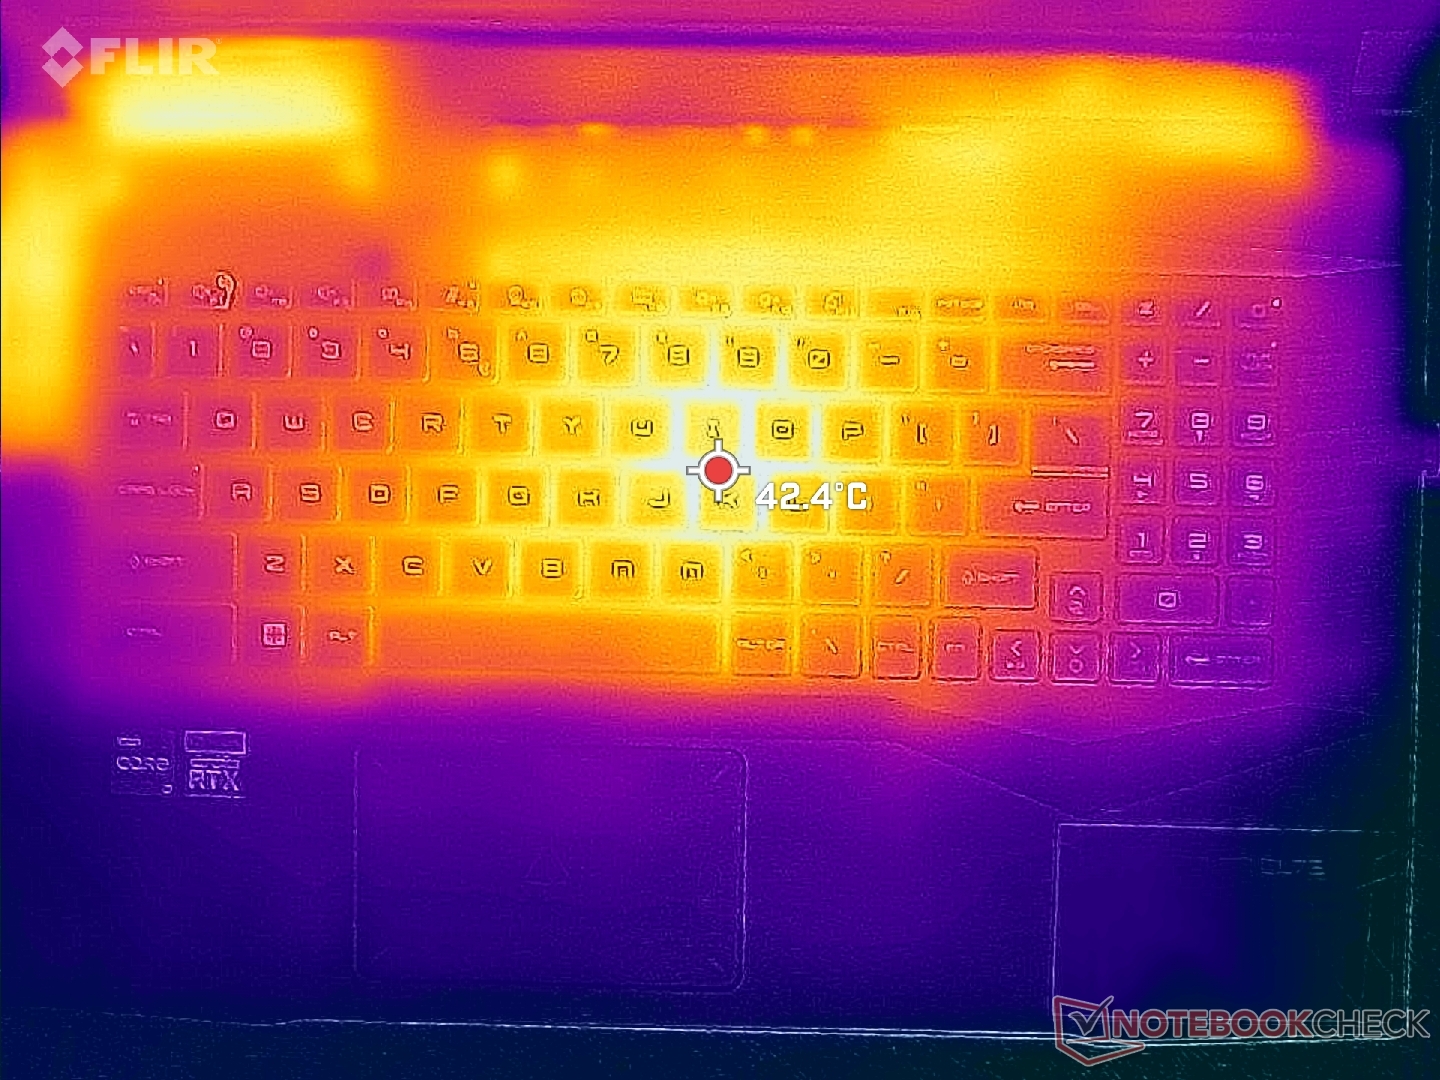
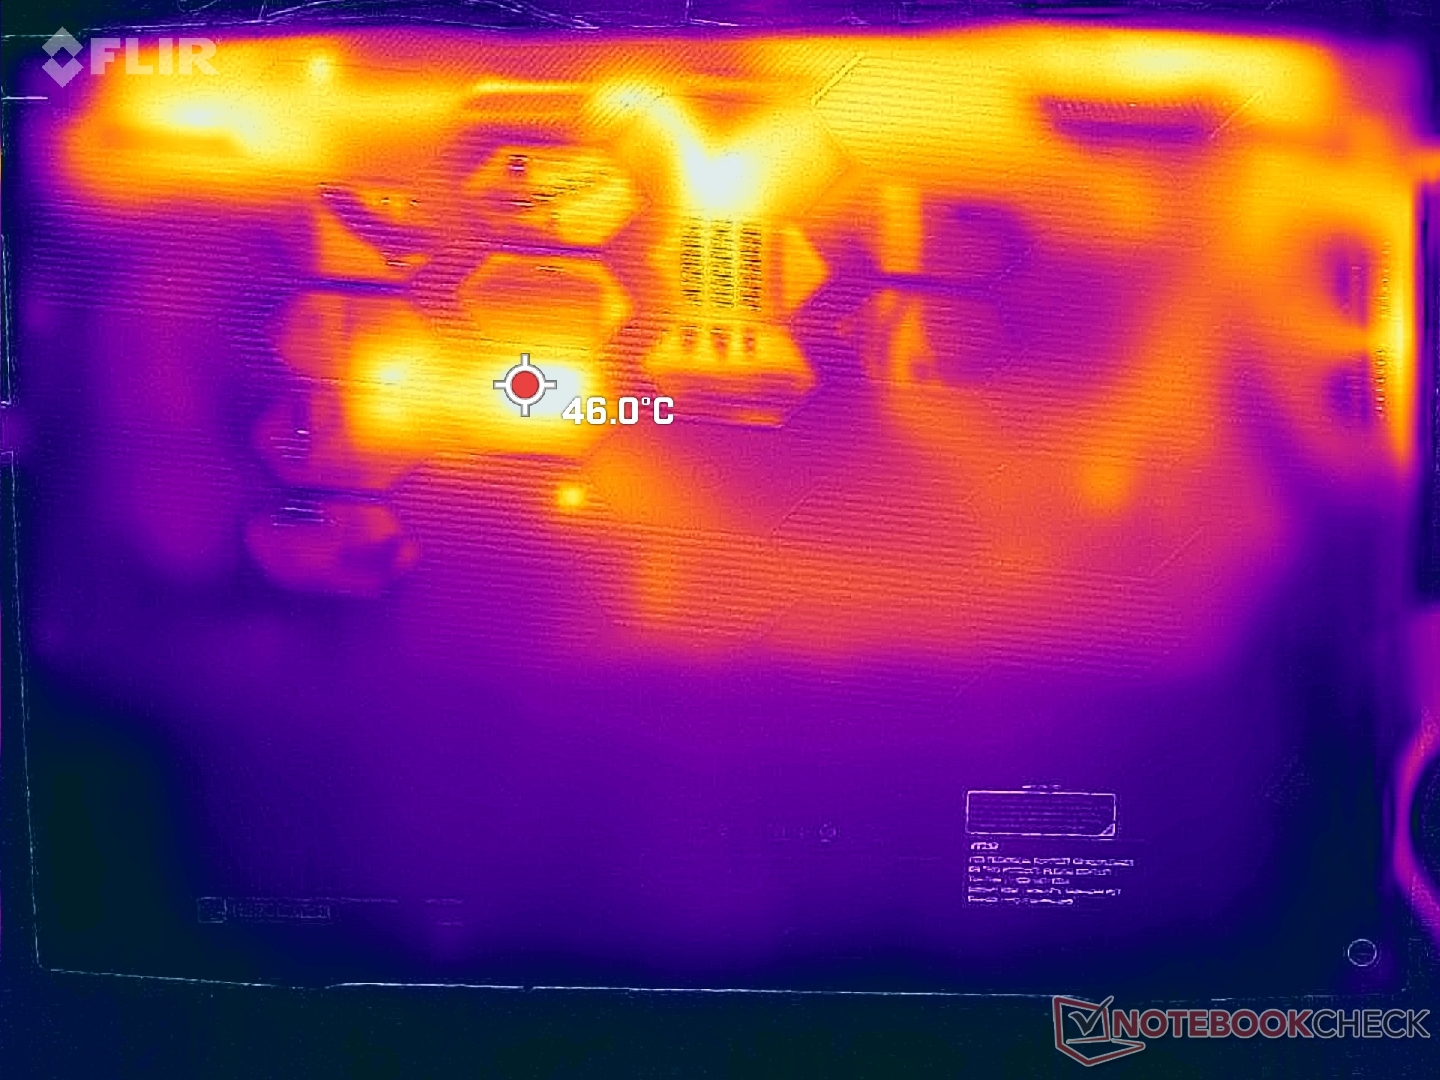
Average surface temperatures are not uncomfortably warm and any hot spots are very isolated due to the large 17.3-inch form factor and mostly plastic chassis. The keyboard center, for example, can reach almost 50 C when gaming while the palm rests and sides of the keyboard are much cooler in the mid 20 C and 30 C ranges, respectively. The hot spots on the top and bottom are rarely noticeable when gaming since skin contact is uncommon on these areas.
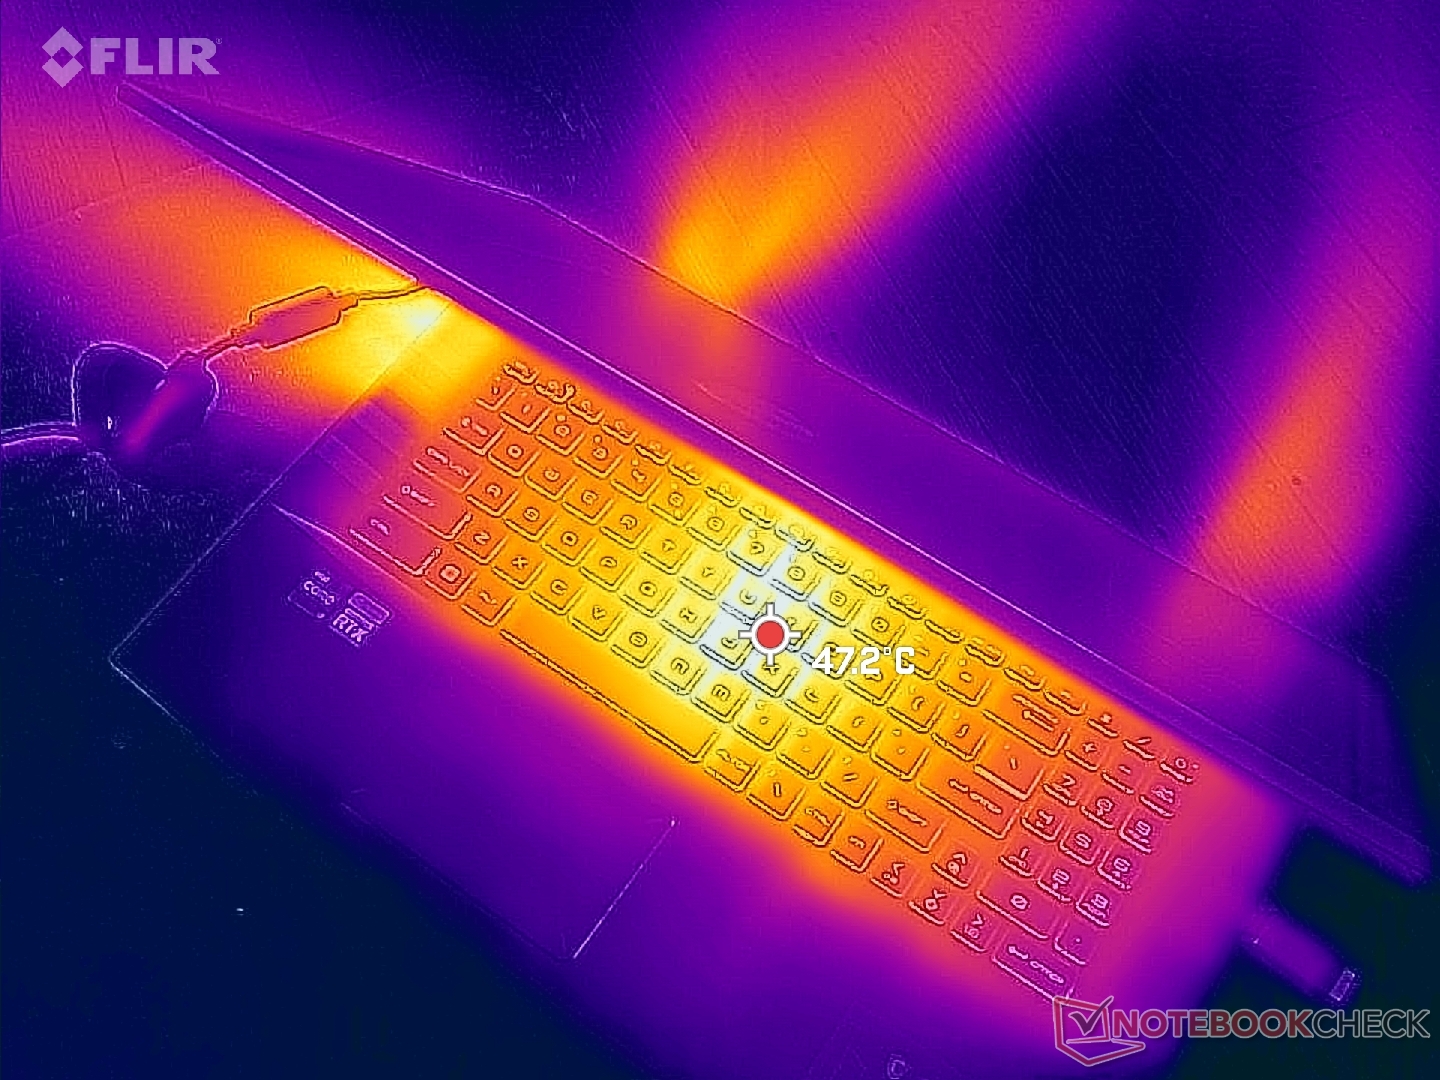
(±) The maximum temperature on the upper side is 44.2 °C / 112 F, compared to the average of 40.5 °C / 105 F, ranging from 21.2 to 68.8 °C for the class Gaming.
(-) The bottom heats up to a maximum of 45.2 °C / 113 F, compared to the average of 43.3 °C / 110 F
(+) In idle usage, the average temperature for the upper side is 27.7 °C / 82 F, compared to the device average of 33.9 °C / 93 F.
(±) Playing The Witcher 3, the average temperature for the upper side is 35.1 °C / 95 F, compared to the device average of 33.9 °C / 93 F.
(+) The palmrests and touchpad are cooler than skin temperature with a maximum of 25.4 °C / 77.7 F and are therefore cool to the touch.
(+) The average temperature of the palmrest area of similar devices was 28.9 °C / 84 F (+3.5 °C / 6.3 F).
| MSI Pulse GL76 12UGK Intel Core i7-12700H, NVIDIA GeForce RTX 3070 Laptop GPU | Alienware m17 R5 (R9 6900HX, RX 6850M XT) AMD Ryzen 9 6900HX, AMD Radeon RX 6850M XT | Asus ROG Strix Scar 17 SE G733CX-LL014W Intel Core i9-12950HX, NVIDIA GeForce RTX 3080 Ti Laptop GPU | Acer Predator Helios 300 (i7-12700H, RTX 3070 Ti) Intel Core i7-12700H, NVIDIA GeForce RTX 3070 Ti Laptop GPU | Razer Blade 17 Early 2022 Intel Core i9-12900H, NVIDIA GeForce RTX 3080 Ti Laptop GPU | MSI Vector GP76 12UGS-434 Intel Core i7-12700H, NVIDIA GeForce RTX 3070 Ti Laptop GPU | |
|---|---|---|---|---|---|---|
| Heat | -3% | -2% | 6% | -12% | -3% | |
| Maximum Upper Side * | 44.2 | 53 -20% | 48.8 -10% | 35 21% | 50 -13% | 46.3 -5% |
| Maximum Bottom * | 45.2 | 56 -24% | 52.4 -16% | 53 -17% | 56 -24% | 45 -0% |
| Idle Upper Side * | 35.4 | 30 15% | 30.4 14% | 29 18% | 36 -2% | 34.2 3% |
| Idle Bottom * | 35 | 29 17% | 34.1 3% | 34 3% | 38 -9% | 38.3 -9% |
* ... smaller is better
Stress Test
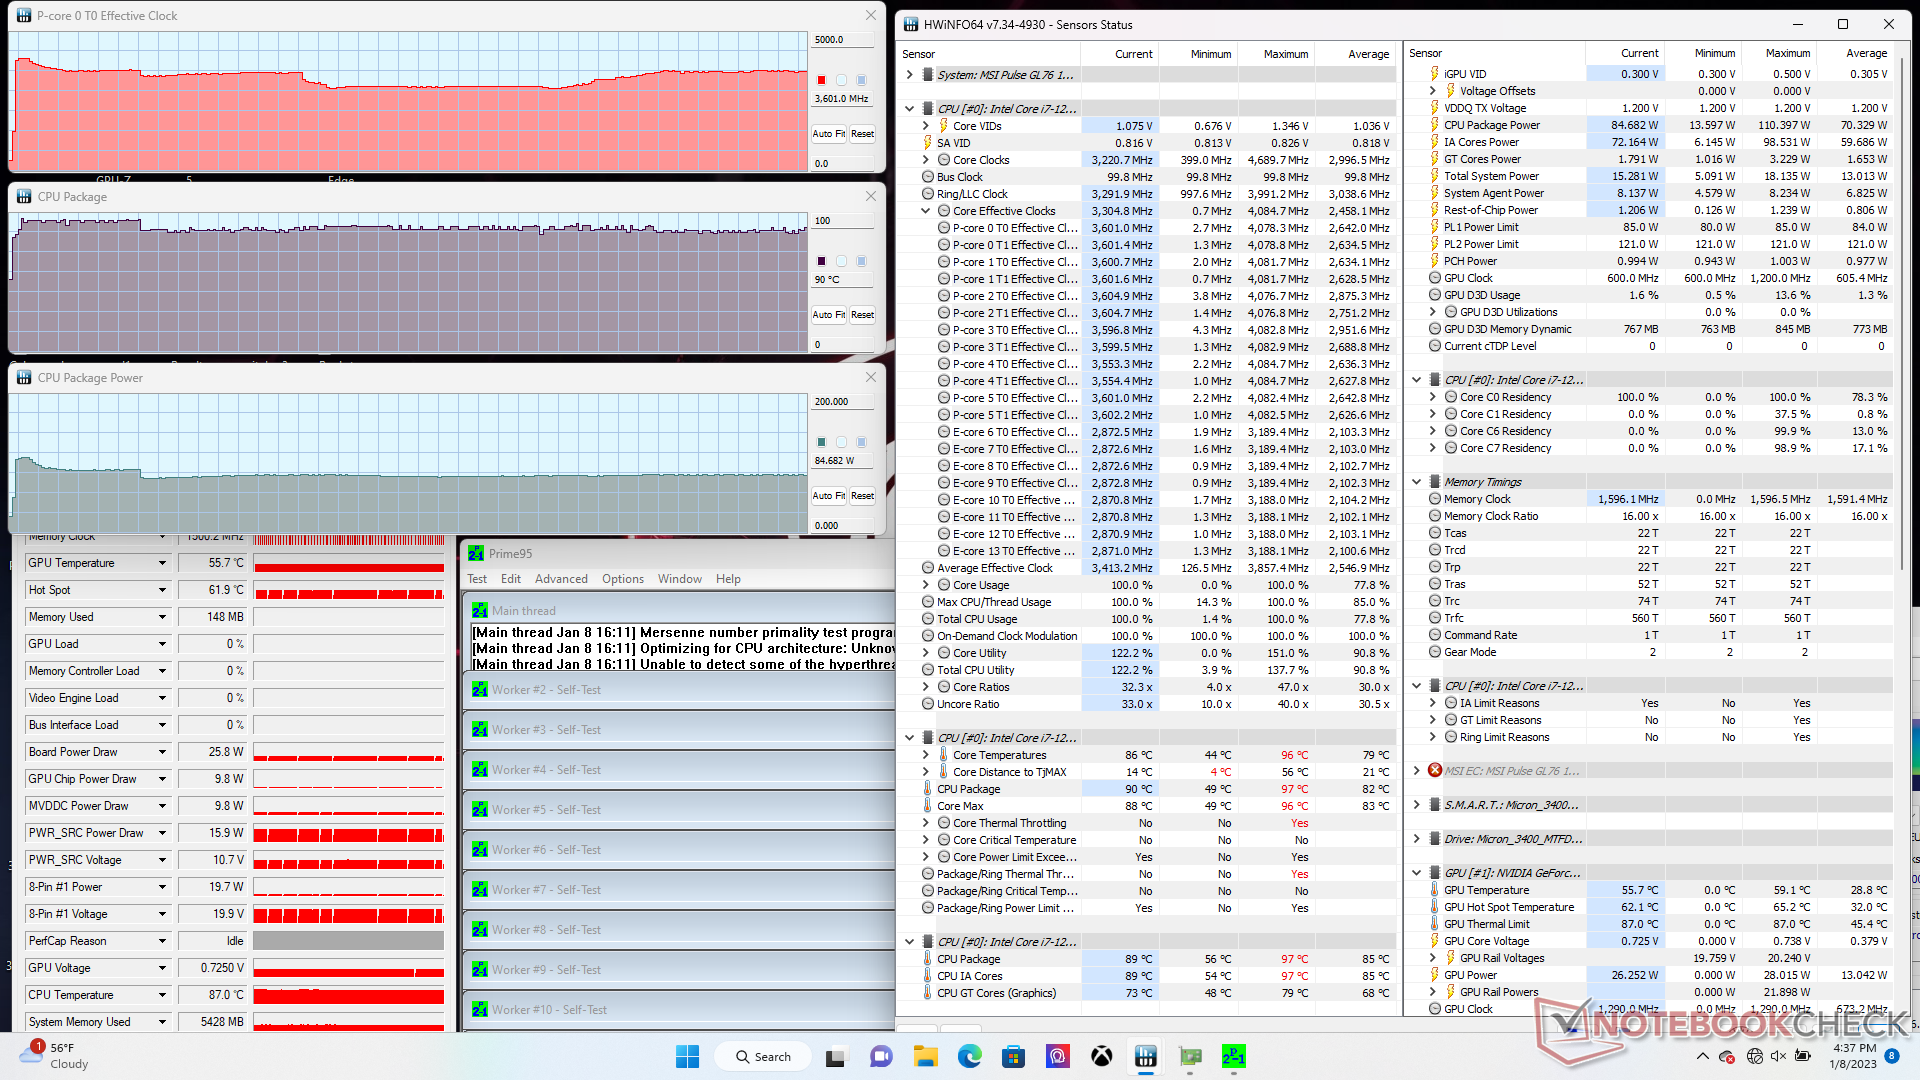
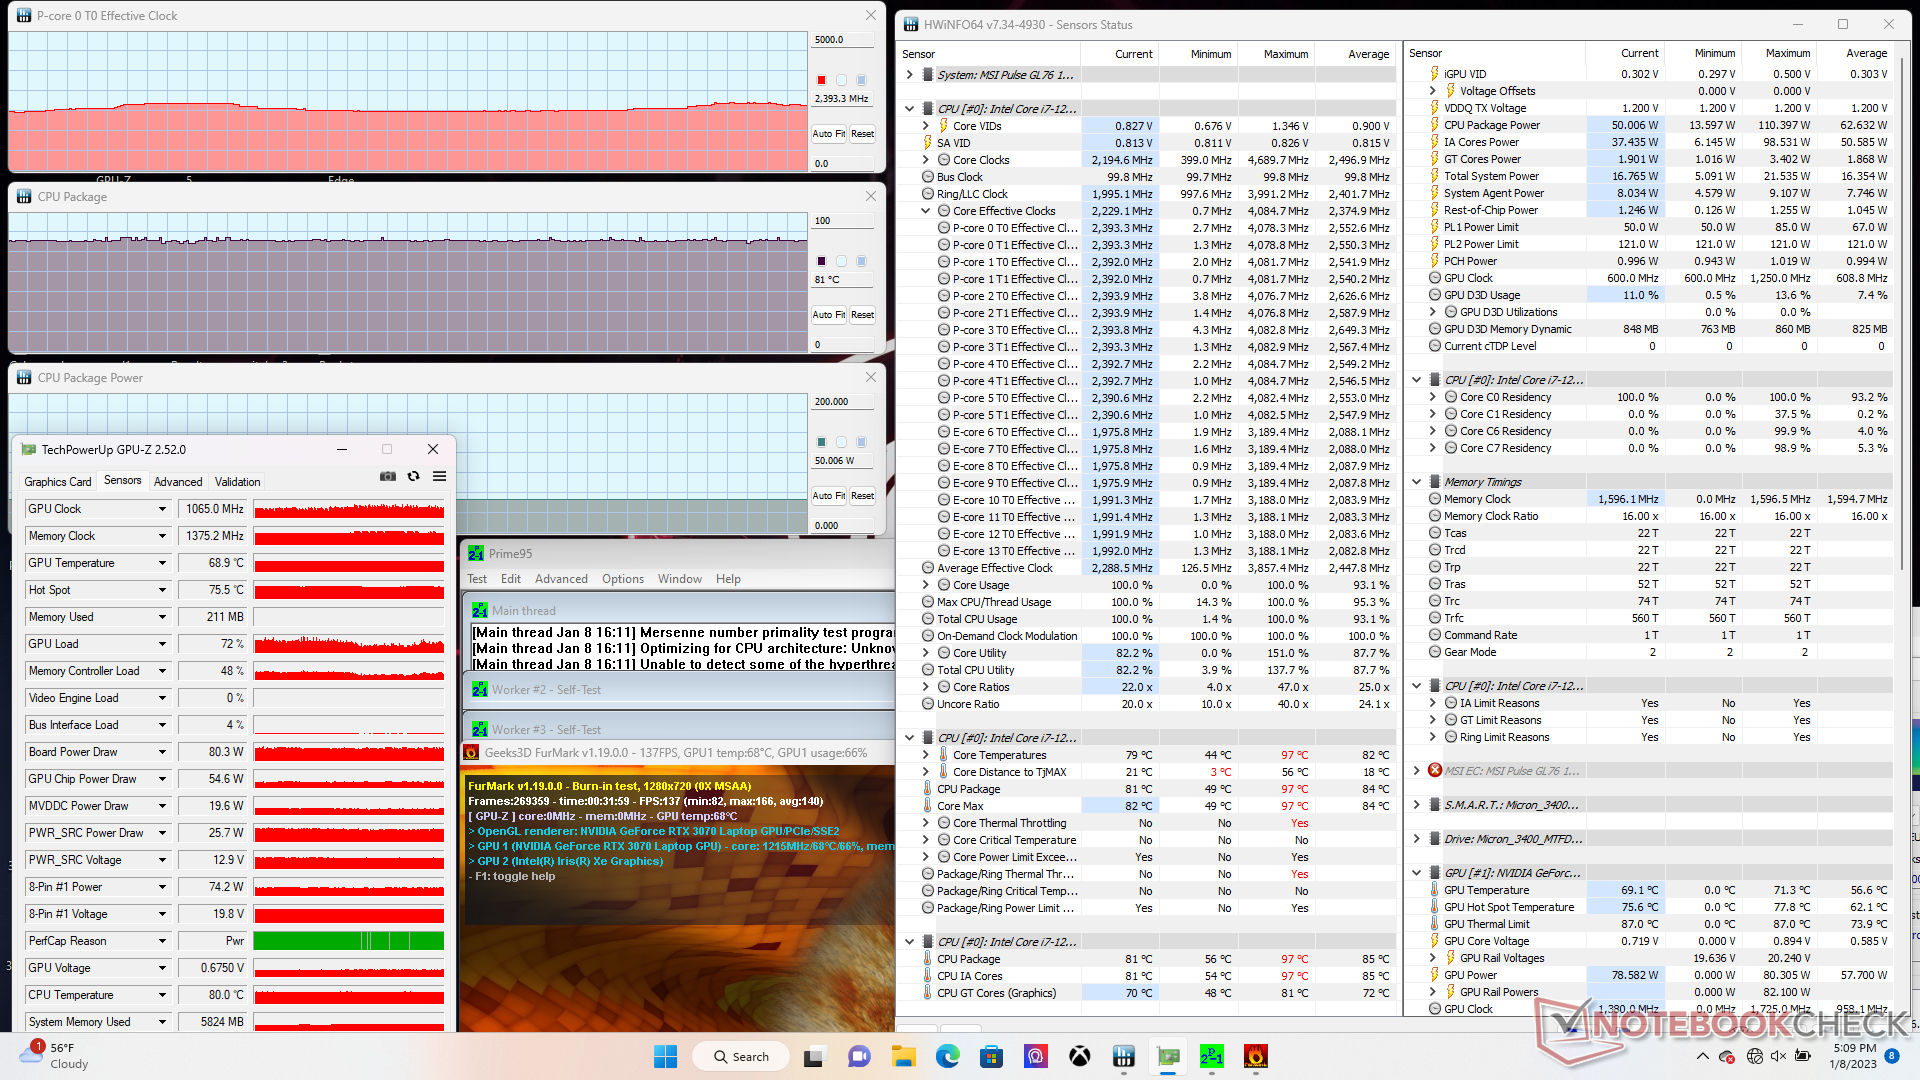
When running Prime95, CPU clock rates and board power draw would boost to 4.1 GHz and 110 W, respectively, lasting for just a few seconds or until core temperature reaches 95 C. Thereafter, clock rates and board power draw would drop to 3.6 GHz and 92 W before finally stabilizing at 3.1 to 3.6 GHz and 85 W, respectively. Core temperature would also stabilize at 90 C to indicate that the cooling solution is pretty much at its limit.
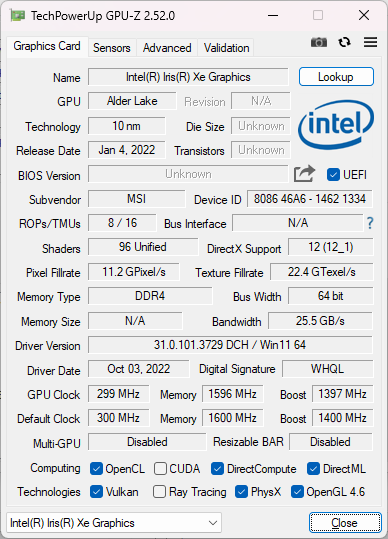
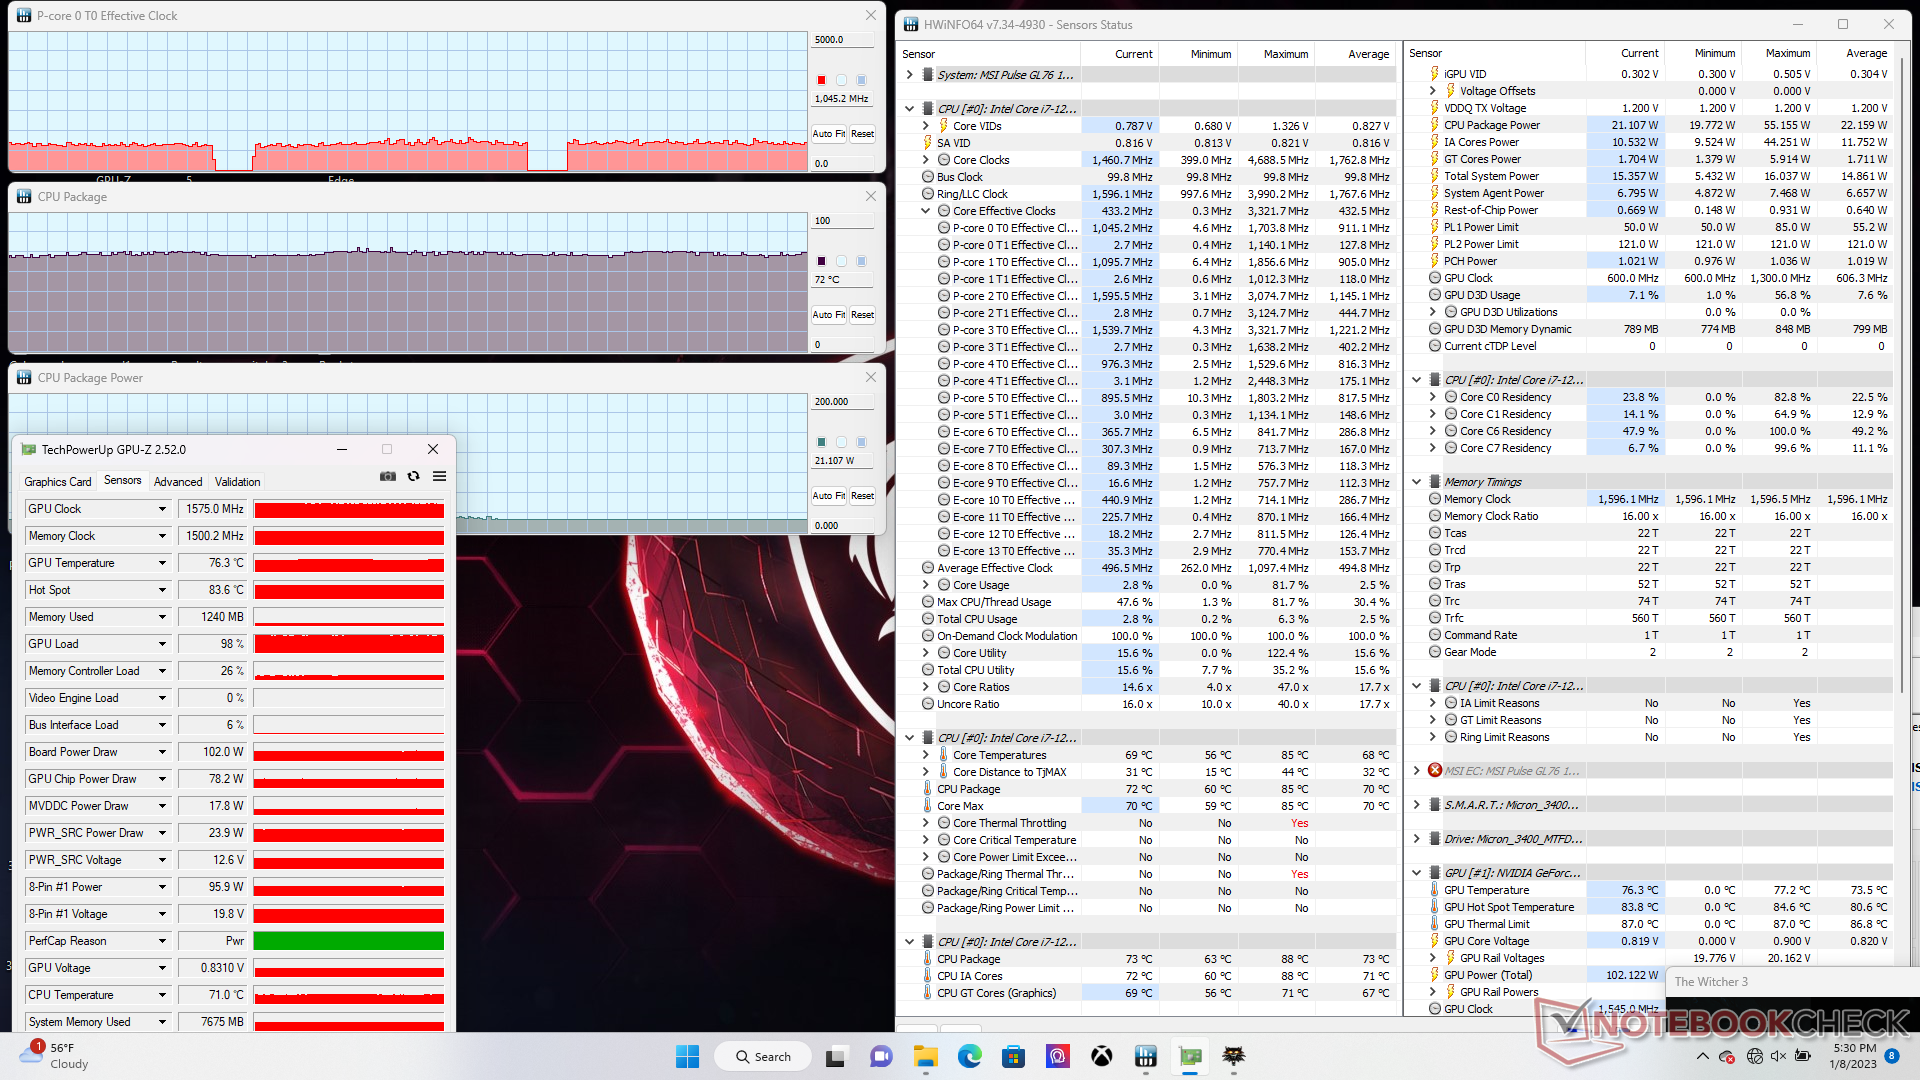
The Nvidia GPU would stabilize at 1575 MHz and 76 C when running Witcher 3 compared to 1725 MHz and 72 C on the Razer Blade 17 equipped with a higher 130 W TGP GeForce RTX 3070. GPU-Z on our MSI test unit would also indicate a GPU board power draw of 102 W to be very close to the advertised target of 105 W.
Running on battery power limits performance. A 3DMark 11 test on batteries would return Physics and Graphics scores of 9089 and 11291 points, respectively, compared to 22513 and 33048 points when on mains.
| CPU Clock (GHz) | GPU Clock (MHz) | Average CPU Temperature (°C) | Average GPU Temperature (°C) | |
| System Idle | -- | -- | 51 | 50 |
| Prime95 Stress | 3.4 - 3.6 | -- | 90 | 56 |
| Prime95 + FurMark Stress | 2.3 - 2.4 | 1065 | 81 | 69 |
| Witcher 3 Stress | ~1.1 | 1575 | 72 | 76 |
Speakers
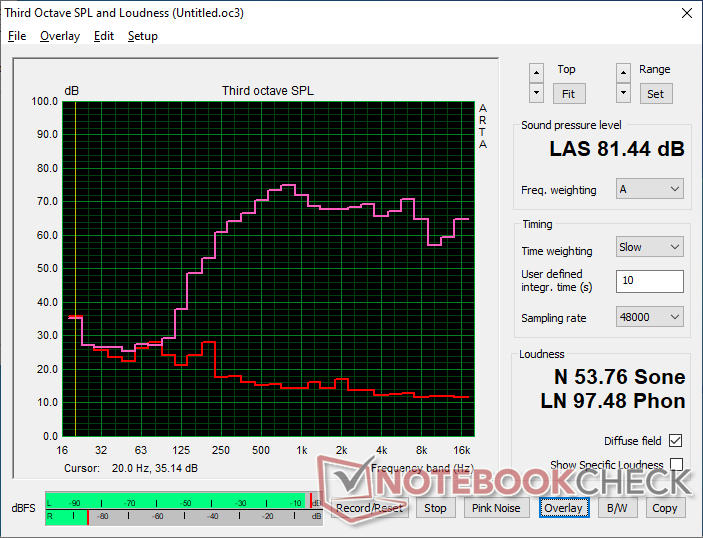
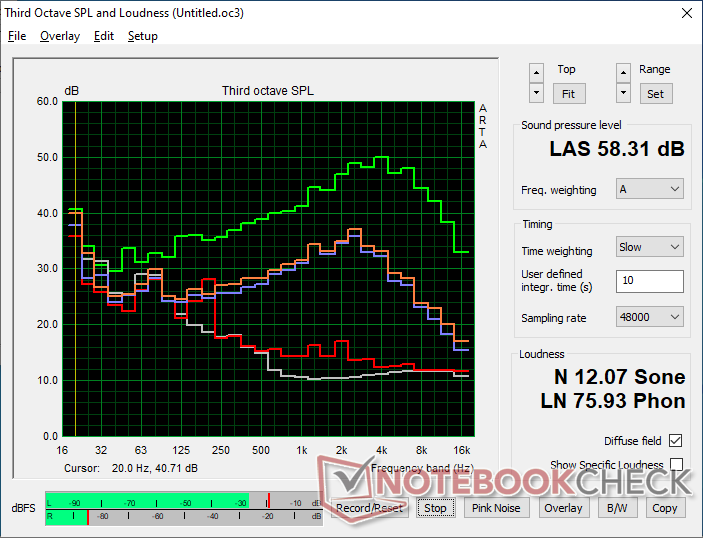
MSI Pulse GL76 12UGK audio analysis
(±) | speaker loudness is average but good (81.4 dB)
Bass 100 - 315 Hz
(-) | nearly no bass - on average 17.5% lower than median
(±) | linearity of bass is average (11.8% delta to prev. frequency)
Mids 400 - 2000 Hz
(+) | balanced mids - only 3.7% away from median
(+) | mids are linear (4.3% delta to prev. frequency)
Highs 2 - 16 kHz
(+) | balanced highs - only 3.1% away from median
(+) | highs are linear (6.6% delta to prev. frequency)
Overall 100 - 16.000 Hz
(+) | overall sound is linear (14.8% difference to median)
Compared to same class
» 29% of all tested devices in this class were better, 7% similar, 64% worse
» The best had a delta of 6%, average was 18%, worst was 132%
Compared to all devices tested
» 18% of all tested devices were better, 4% similar, 78% worse
» The best had a delta of 4%, average was 24%, worst was 134%
Apple MacBook Pro 16 2021 M1 Pro audio analysis
(+) | speakers can play relatively loud (84.7 dB)
Bass 100 - 315 Hz
(+) | good bass - only 3.8% away from median
(+) | bass is linear (5.2% delta to prev. frequency)
Mids 400 - 2000 Hz
(+) | balanced mids - only 1.3% away from median
(+) | mids are linear (2.1% delta to prev. frequency)
Highs 2 - 16 kHz
(+) | balanced highs - only 1.9% away from median
(+) | highs are linear (2.7% delta to prev. frequency)
Overall 100 - 16.000 Hz
(+) | overall sound is linear (4.6% difference to median)
Compared to same class
» 0% of all tested devices in this class were better, 0% similar, 100% worse
» The best had a delta of 5%, average was 18%, worst was 45%
Compared to all devices tested
» 0% of all tested devices were better, 0% similar, 100% worse
» The best had a delta of 4%, average was 24%, worst was 134%
Energy Management — More Power Efficient Than Expected
Power Consumption
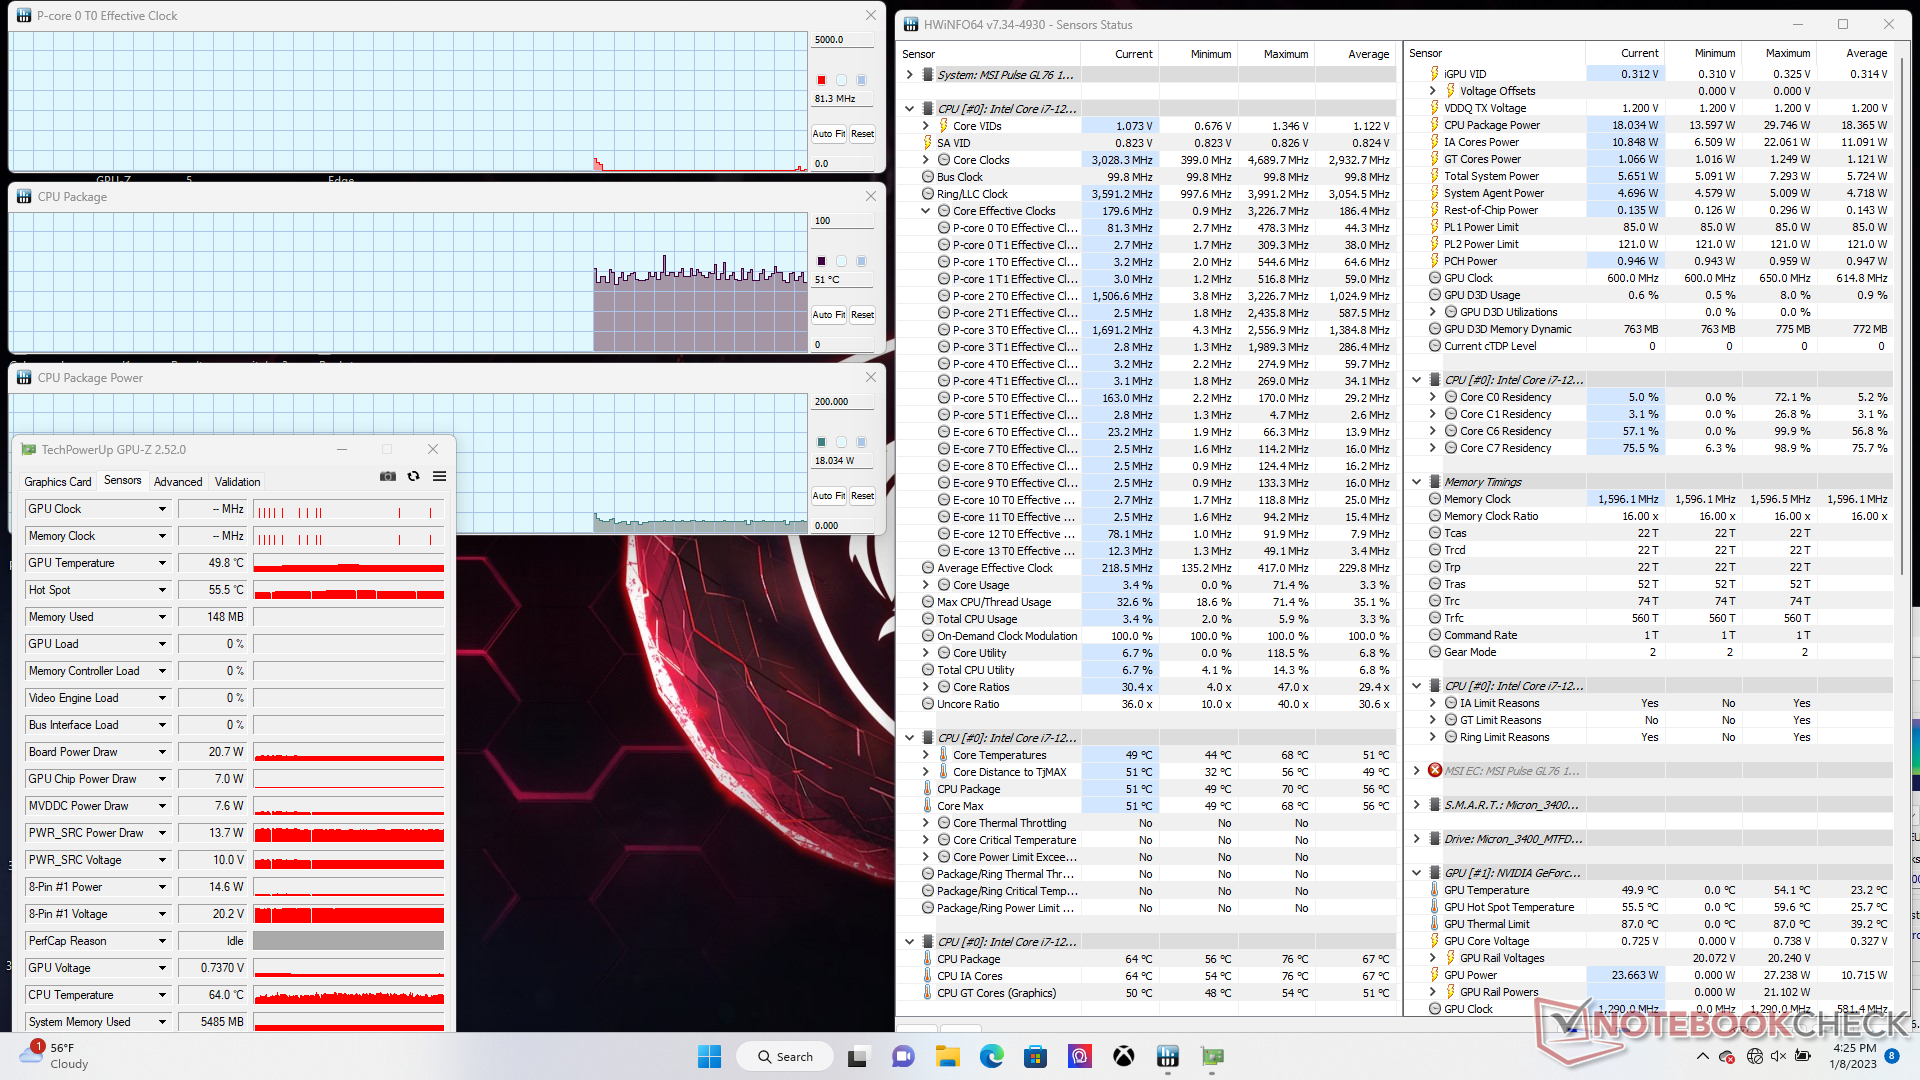
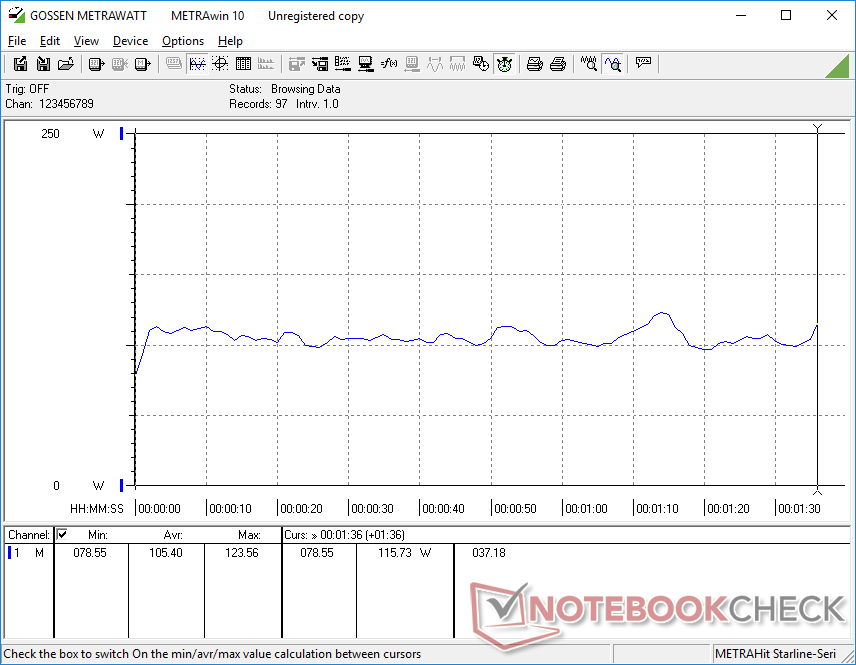
Idling on desktop consumes just 12 W when on the Power Saver profile with the iGPU active and the brightness set to minimum. Conversely, idling on desktop can consume just over 25 W when on Extreme Performance mode with the brightness set to maximum. Thus, switching between power modes is an important factor for prolonging battery life.
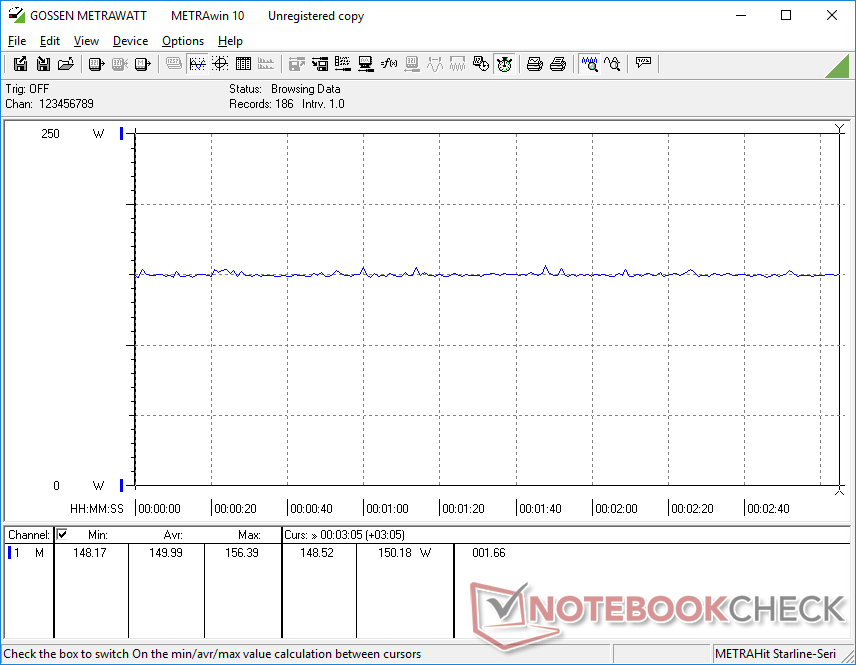
Overall power consumption is lower than on most other 17.3-inch gaming laptops. Running Witcher 3, for example, would consume just 150 W compared to 199 W and 231 W on the MSI Vector GP76 and Acer Predator Helios 300, respectively, each with the RTX 3070 Ti GPU. Consumption is also significantly lower than on the Radeon RX 6850M XT-powered Alienware m17 R5 while offering very nearly the same raw graphics performance.
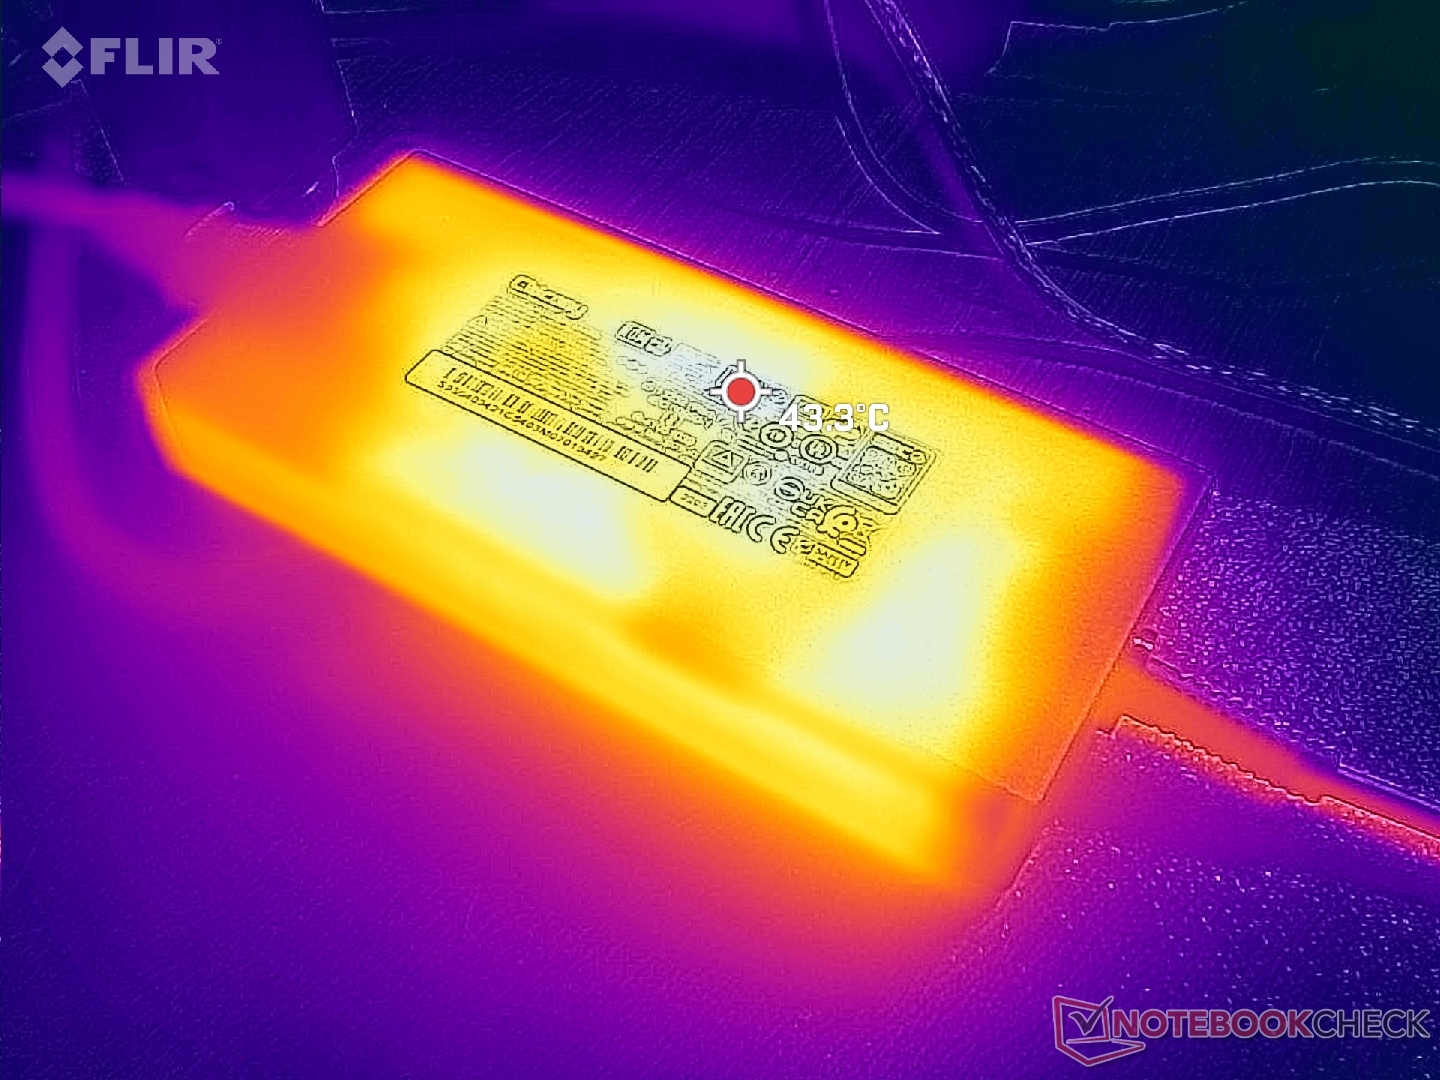
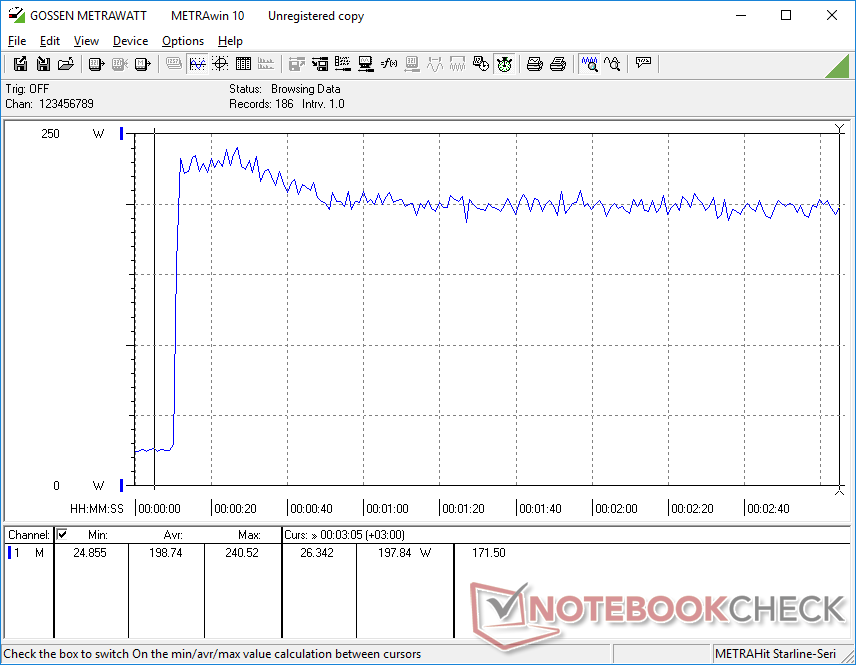
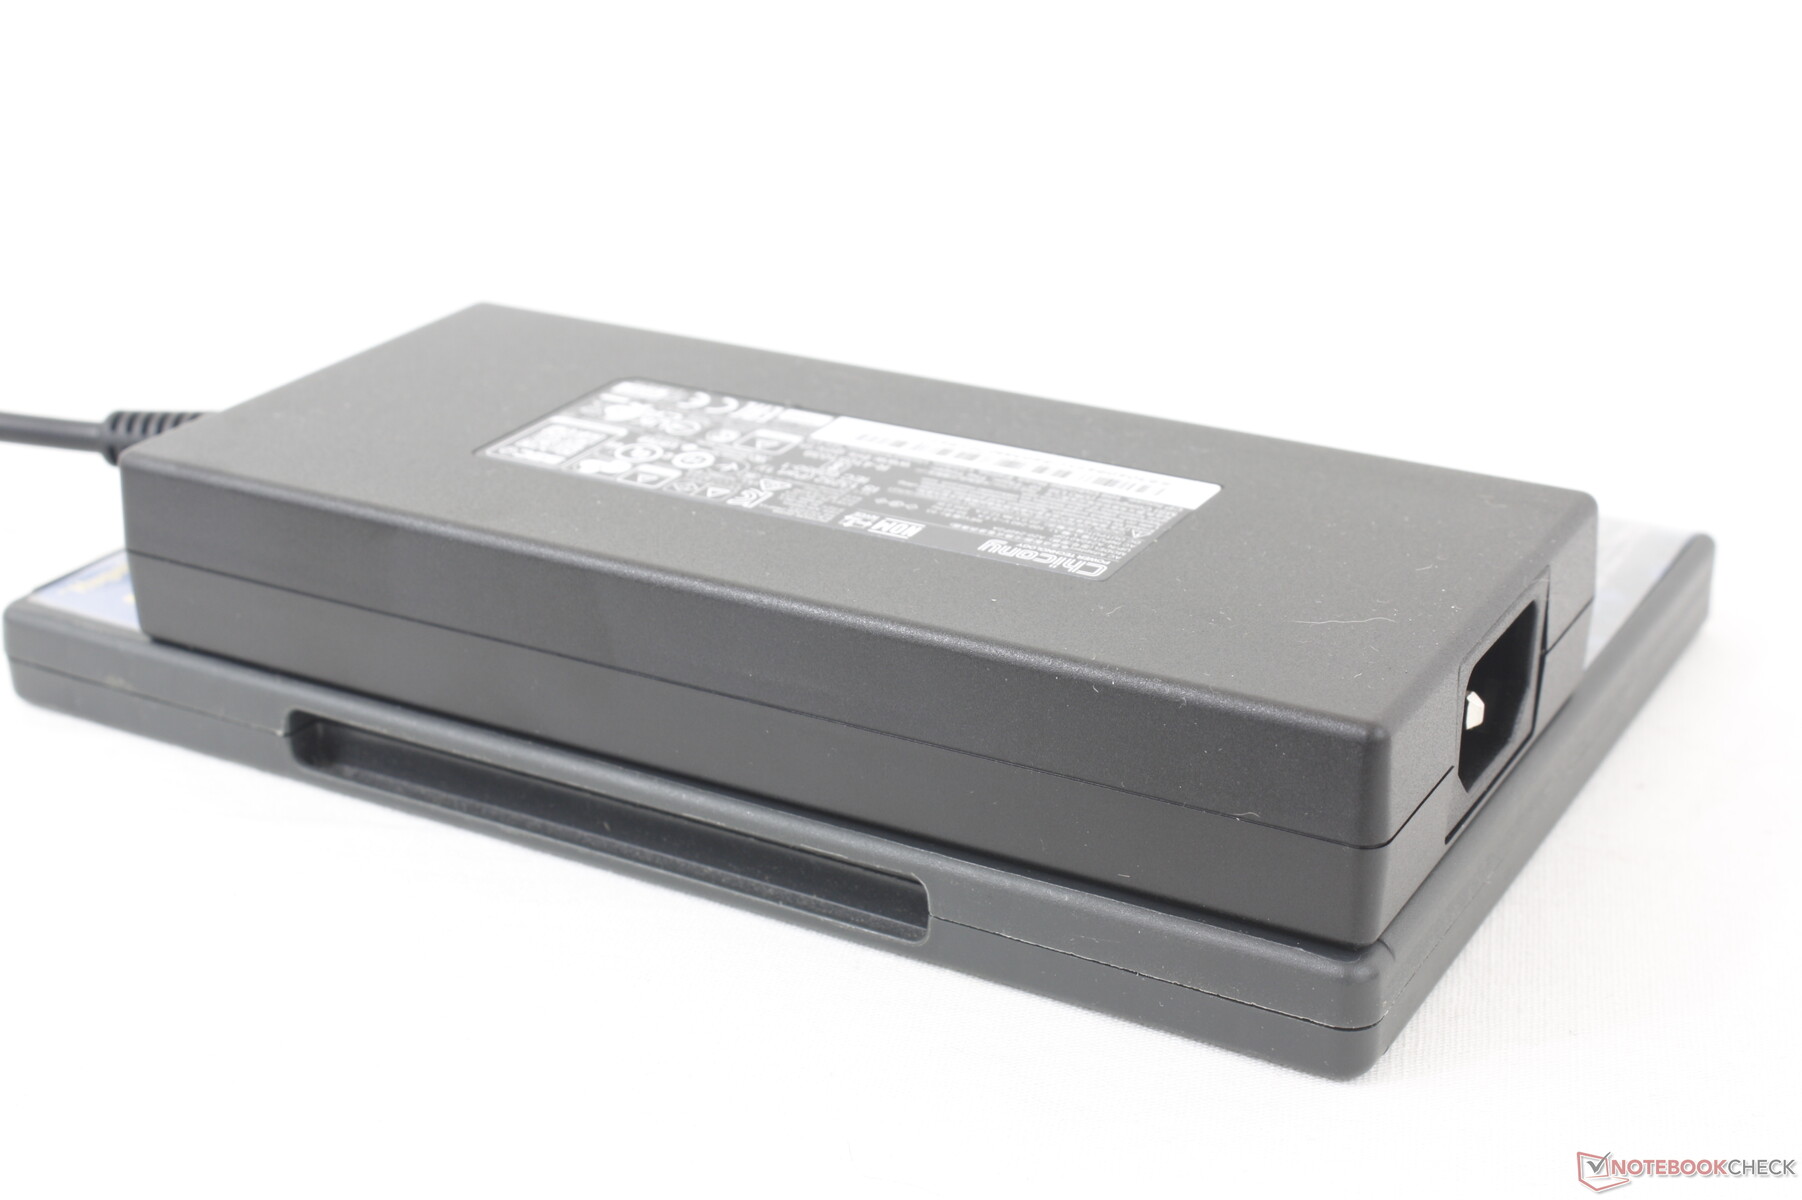
We're able to measure a maximum draw of 241 W from the medium-sized (~16.4 x 7.4 x 2.5 cm) 240 W AC adapter when the CPU and GPU are each at 100 percent utilization. This rate is only temporary as shown by the screenshots below due to the limited Turbo Boost potential of the CPU. The battery can still charge at a decent rate while running high loads like games.
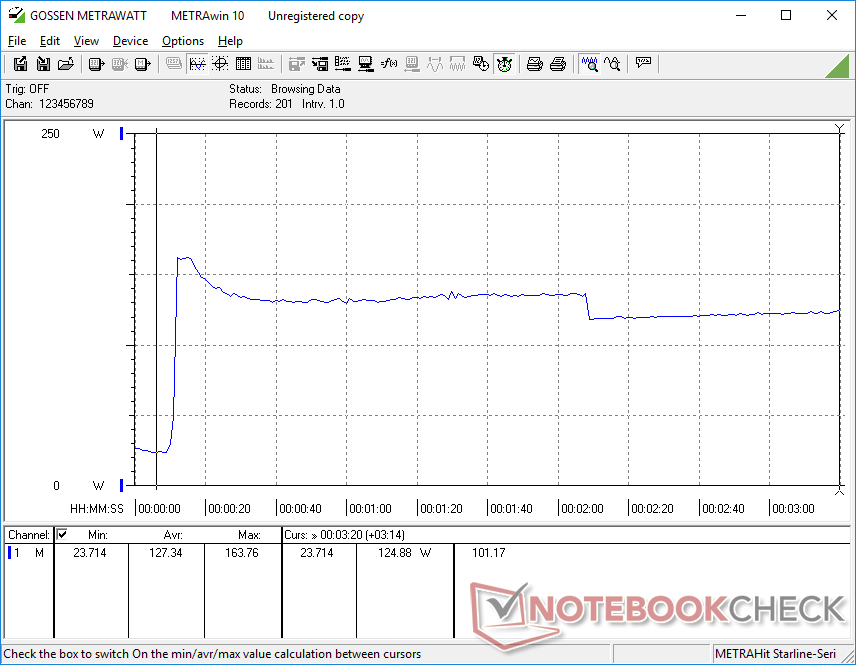
| Off / Standby | |
| Idle | |
| Load |
|
Key:
min: | |
| MSI Pulse GL76 12UGK i7-12700H, GeForce RTX 3070 Laptop GPU, Micron 3400 1TB MTFDKBA1T0TFH, IPS, 1920x1080, 17.3" | Alienware m17 R5 (R9 6900HX, RX 6850M XT) R9 6900HX, Radeon RX 6850M XT, SSSTC CA6-8D1024, IPS, 3840x2160, 17" | Asus ROG Strix Scar 17 SE G733CX-LL014W i9-12950HX, GeForce RTX 3080 Ti Laptop GPU, Samsung PM9A1 MZVL22T0HBLB, IPS, 2560x1440, 17.3" | Acer Predator Helios 300 (i7-12700H, RTX 3070 Ti) i7-12700H, GeForce RTX 3070 Ti Laptop GPU, Samsung PM9A1 MZVL21T0HCLR, IPS, 2560x1440, 17.3" | Razer Blade 17 Early 2022 i9-12900H, GeForce RTX 3080 Ti Laptop GPU, Samsung PM9A1 MZVL21T0HCLR, IPS, 3840x2160, 17.3" | MSI Vector GP76 12UGS-434 i7-12700H, GeForce RTX 3070 Ti Laptop GPU, Micron 2450 1TB MTFDKBA1T0TFK, IPS, 1920x1080, 17.3" | |
|---|---|---|---|---|---|---|
| Power Consumption | -8% | -46% | -27% | -36% | -27% | |
| Idle Minimum * | 12.4 | 13 -5% | 19.3 -56% | 15 -21% | 17 -37% | 13.5 -9% |
| Idle Average * | 13.1 | 16.5 -26% | 26.5 -102% | 20 -53% | 23 -76% | 15.6 -19% |
| Idle Maximum * | 25.3 | 17 33% | 27.1 -7% | 22.3 12% | 34 -34% | 20.6 19% |
| Load Average * | 105.4 | 93 12% | 141 -34% | 133 -26% | 120 -14% | 198 -88% |
| Witcher 3 ultra * | 150 | 239 -59% | 225 -50% | 231 -54% | 229 -53% | 199 -33% |
| Load Maximum * | 240.5 | 251 -4% | 307.9 -28% | 290 -21% | 243 -1% | 319 -33% |
* ... smaller is better
Power Consumption Witcher 3 / Stresstest
Power Consumption external Monitor
Battery Life — 99 Wh Li-Ion Pack
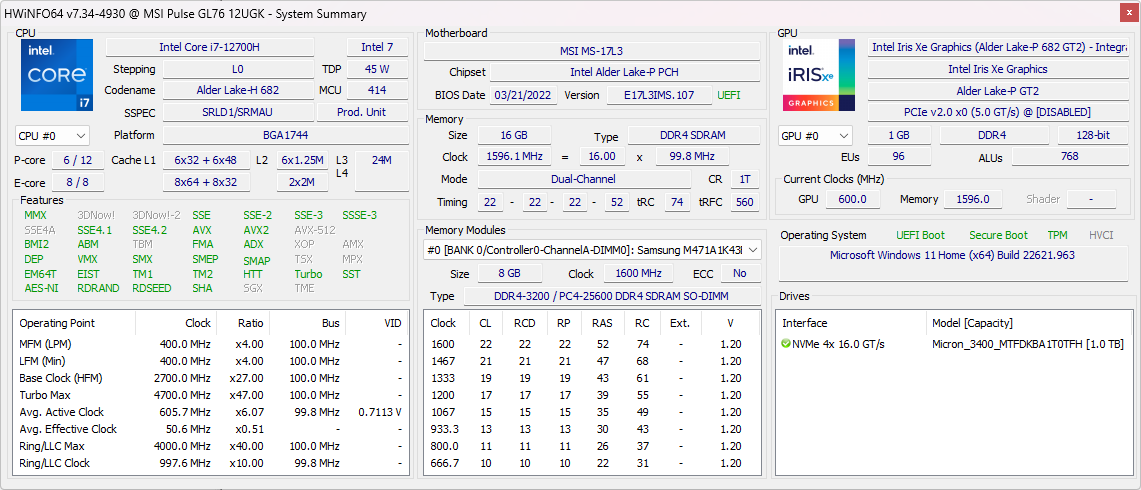
Interestingly, the official MSI specifications claim a 53 Wh battery pack for the GL76 while a closer look at HWiNFO and the physical battery pack of our test unit shows a capacity of 90 Wh. The discrepancy is likely a mistake on the manufacturer's part. Nonetheless, battery life is good for a gaming laptop. We're able to record a WLAN runtime of just under 6 hours which is roughly 2 hours longer than on the Razer Blade 17 or Asus ROG Strix Scar 17.
Charging from empty to full capacity takes just over 2 hours. USB-PD is not supported and so the system can only recharge with the included barrel-type AC adapter.
| MSI Pulse GL76 12UGK i7-12700H, GeForce RTX 3070 Laptop GPU, 90 Wh | Alienware m17 R5 (R9 6900HX, RX 6850M XT) R9 6900HX, Radeon RX 6850M XT, 97 Wh | Asus ROG Strix Scar 17 SE G733CX-LL014W i9-12950HX, GeForce RTX 3080 Ti Laptop GPU, 90 Wh | Acer Predator Helios 300 (i7-12700H, RTX 3070 Ti) i7-12700H, GeForce RTX 3070 Ti Laptop GPU, 90 Wh | Razer Blade 17 Early 2022 i9-12900H, GeForce RTX 3080 Ti Laptop GPU, 82 Wh | MSI Vector GP76 12UGS-434 i7-12700H, GeForce RTX 3070 Ti Laptop GPU, 65 Wh | |
|---|---|---|---|---|---|---|
| Battery Runtime | -16% | -29% | -6% | -18% | -11% | |
| Reader / Idle | 439 | 428 -3% | 440 0% | |||
| WiFi v1.3 | 353 | 290 -18% | 250 -29% | 362 3% | 229 -35% | 307 -13% |
| Load | 124 | 107 -14% | 105 -15% | 103 -17% | 99 -20% | |
| H.264 | 294 | 354 | 290 |
Pros
Cons
Verdict — Lots Of Raw Power But With Some Key Missing Features
The Pulse GL76 nails it when it comes to price, performance, and display. The Core i7-12700H pairs well with the GeForce RTX 3070 while the 360 Hz 1080p panel is the same panel that MSI uses for its much more expensive GT77 Titan. For $1400 USD or even $1200 if on sale, it would be tough to find another 17.3-inch gaming laptop with a better CPU, GPU, and display as our GL76.
Once you look beyond the processors and display, however, cut corners begin to show. The lack of G-Sync, MUX, Advanced Optimus, and Thunderbolt support in particular really puts a damper on an otherwise powerful system. Alternatives like the Asus TUF Gaming F17 or Acer Predator Helios 300 carry many of these missing features that advanced users or gamers might appreciate. We don't expect budget gaming laptops to have such modern features, but the GL76 is well over $1000 USD to be deserving of at least a few of them.
The MSI Pulse GL76 prioritizes raw Intel and Nvidia performance alongside a high quality 360 Hz IPS display. A few advanced features are missing likely to keep costs in check.
Other downsides like the spongy clickpad, muddy webcam, average hinges, mostly plastic design, and lack of per-key RGB lighting are mostly typical on midrange gaming laptops and not deal breakers. Gamers who want to maximize performance and display quality without breaking the bank should still consider the GL76.
Price and Availability
The Pulse GL76 as configured is currently available at Costco for $1200 to $1400 USD. The model is also available on Amazon for $1650 USD, Newegg for $1750 USD, or Best Buy for $1700 USD.
MSI Pulse GL76 12UGK
- 01/11/2023 v7 (old)
Allen Ngo


Price comparison
