 Deutsch
 English
 Español
 Français
 Italiano
 Nederlands
 Polski
 Português
 Русский
 Türkçe
 Svenska
 Chinese
 Magyar
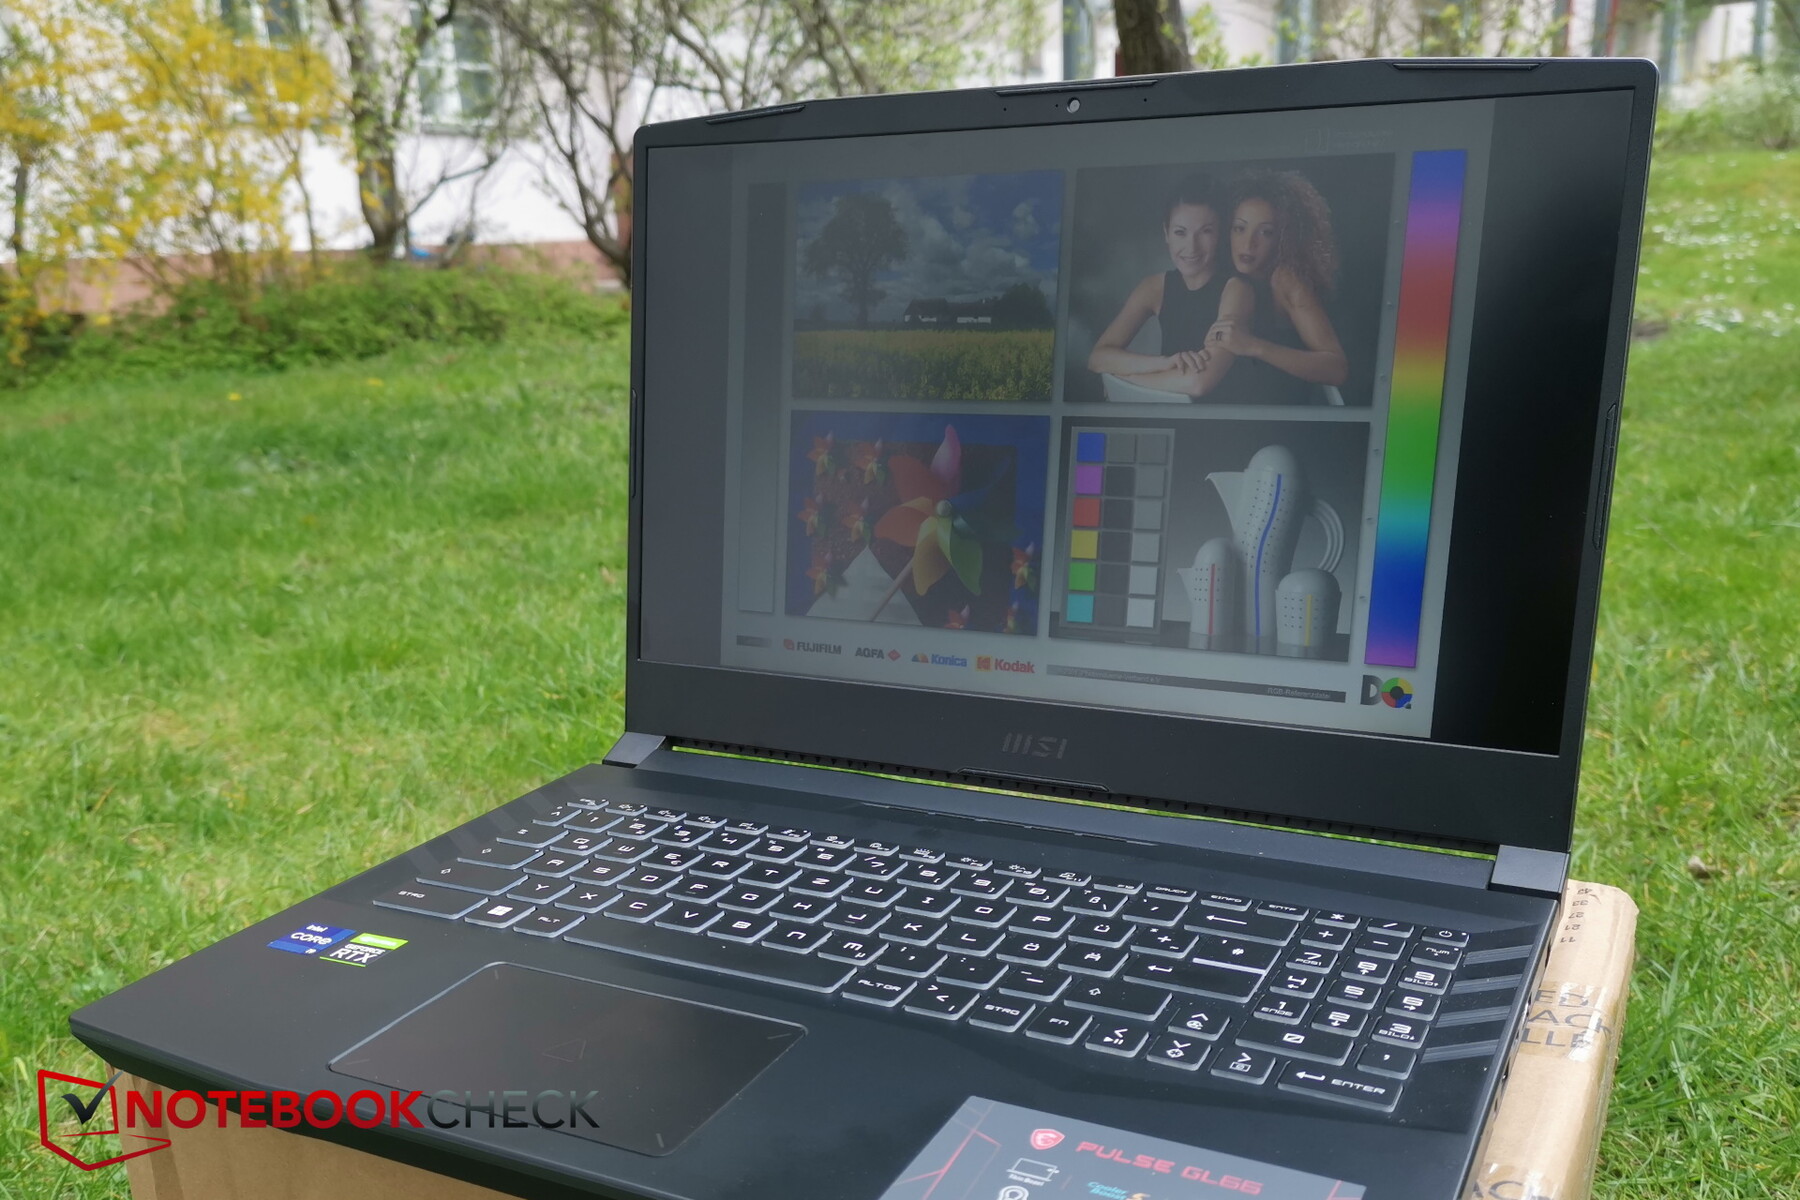
MSI Pulse GL66 review: Is the i9-12900H improving the RTX-3060 gaming laptop or only making it more expensive?
Last year, the Pulse gaming series was newly introduced with the two GL66 and GL76 models, and this year comes the update to Alder Lake. Since we did not test the devices last year, the test of this series is new for us. We review the 15-inch GL66 in its second iteration with an RTX 3060 and Core i9-12900H that is available for about 1,900 Euros (~$2057).
We already tested the combination of Alder Lake and RTX 3060 in the Alienware x14 (14 inch) and Asus TUF Gaming F15. As additional comparison devices, we use other 15-inch gaming laptops with the same GPU such as the Schenker XMG Apex 15, the Lenovo Legion S7, and the Alienware m15 R5.
Possible Competitors in Comparison
Rating | Date | Model | Weight | Height | Size | Resolution | Best Price |
|---|---|---|---|---|---|---|---|
| 80.7 % | 04/2022 | MSI Pulse GL66 12UEK i9-12900H, GeForce RTX 3060 Laptop GPU | 2.3 kg | 25 mm | 15.60" | 1920x1080 | |
| 87.2 % | 03/2022 | Asus TUF Gaming F15 FX507ZM i7-12700H, GeForce RTX 3060 Laptop GPU | 2.1 kg | 24.95 mm | 15.60" | 1920x1080 | |
| 86.7 % | 03/2022 | Alienware x14 i7 RTX 3060 i7-12700H, GeForce RTX 3060 Laptop GPU | 1.8 kg | 14.5 mm | 14.00" | 1920x1080 | |
| 84.4 % | 11/2021 | SCHENKER XMG Apex 15 NH57E PS R7 5800H, GeForce RTX 3060 Laptop GPU | 2.1 kg | 29 mm | 15.60" | 1920x1080 | |
| 87.9 % | 11/2021 | Lenovo Legion S7 15ACH6 82K80030GE R9 5900HX, GeForce RTX 3060 Laptop GPU | 2 kg | 18.9 mm | 15.60" | 3840x2160 | |
| 84.7 % | 06/2021 | Alienware m15 R5 Ryzen Edition R7 5800H, GeForce RTX 3060 Laptop GPU | 2.5 kg | 22.85 mm | 15.60" | 1920x1080 |
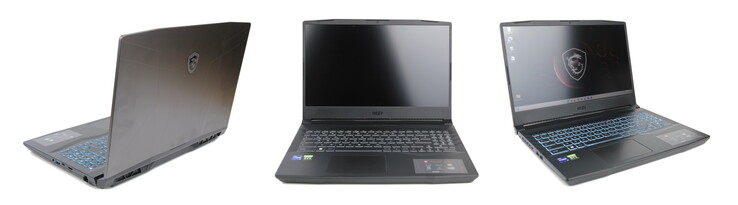
Case
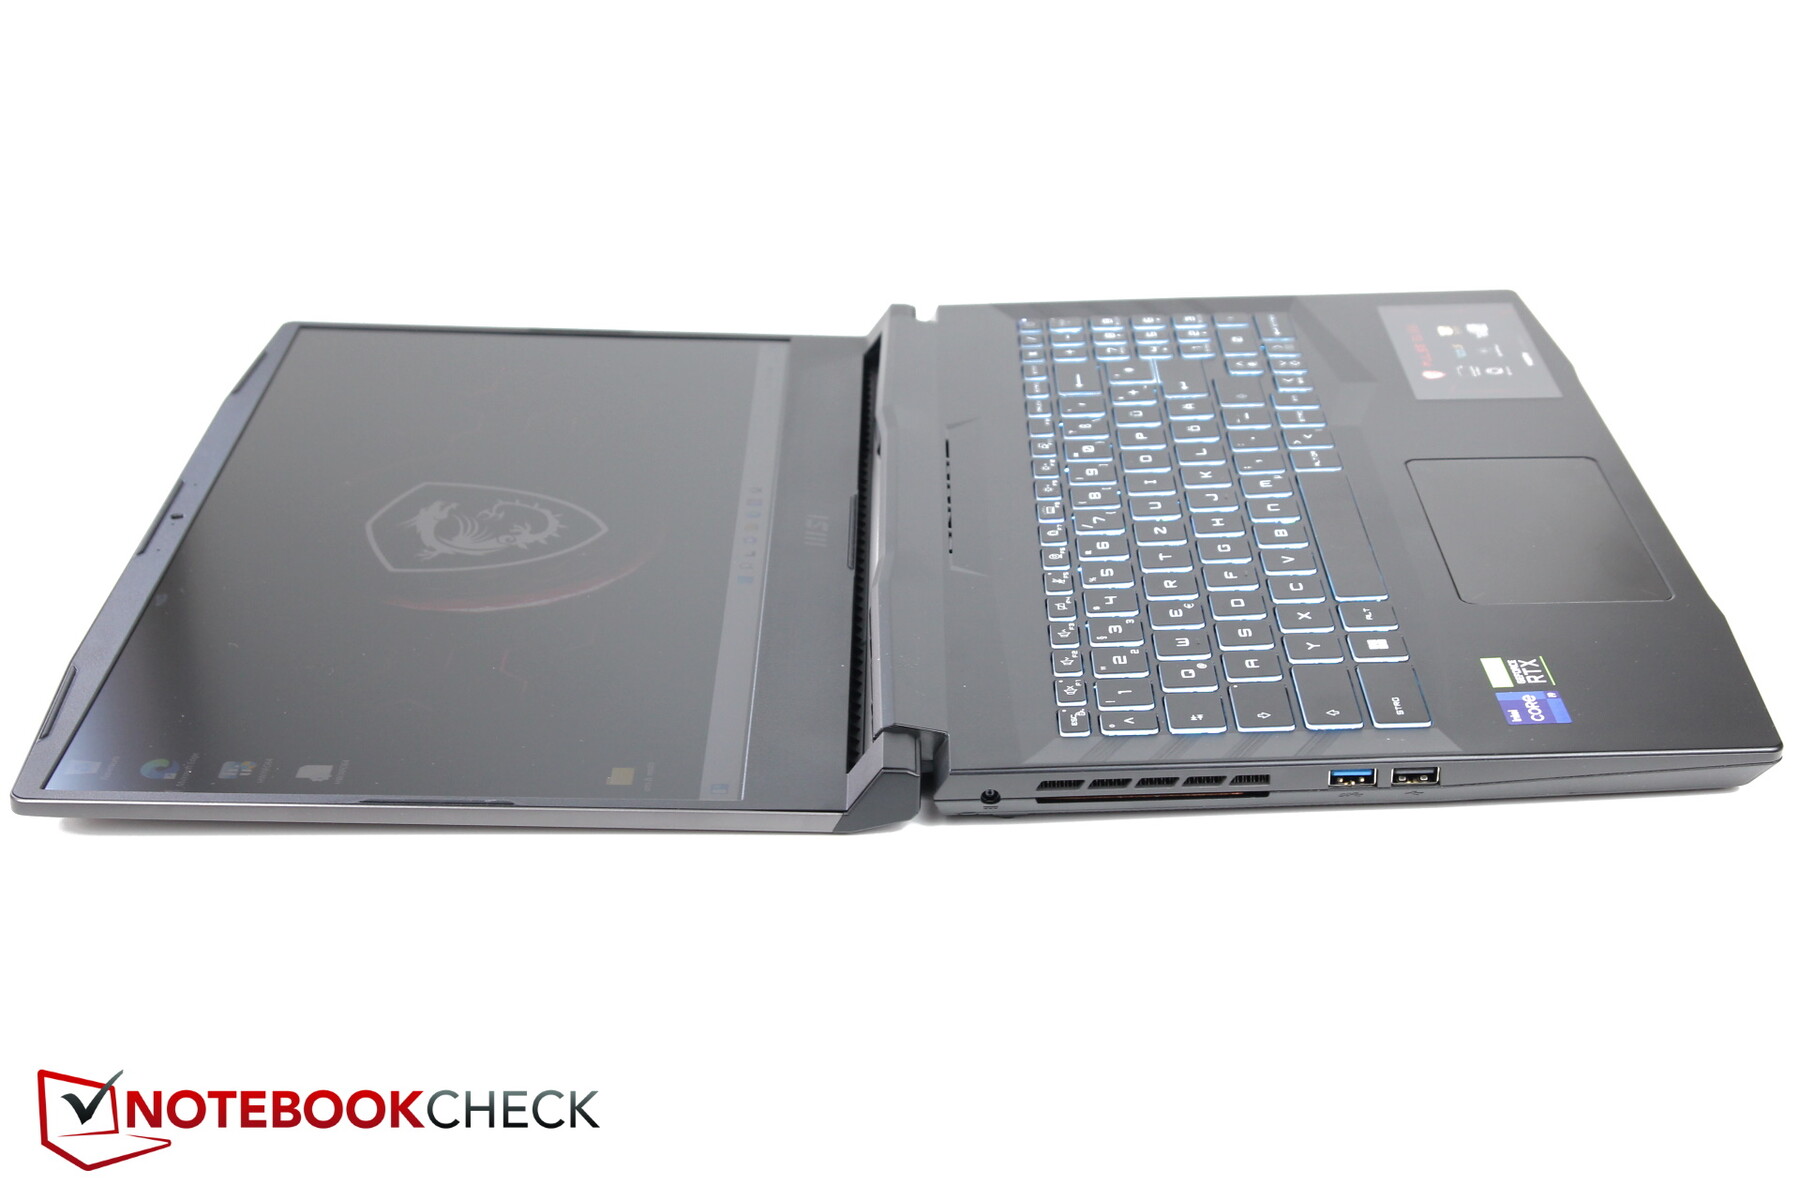
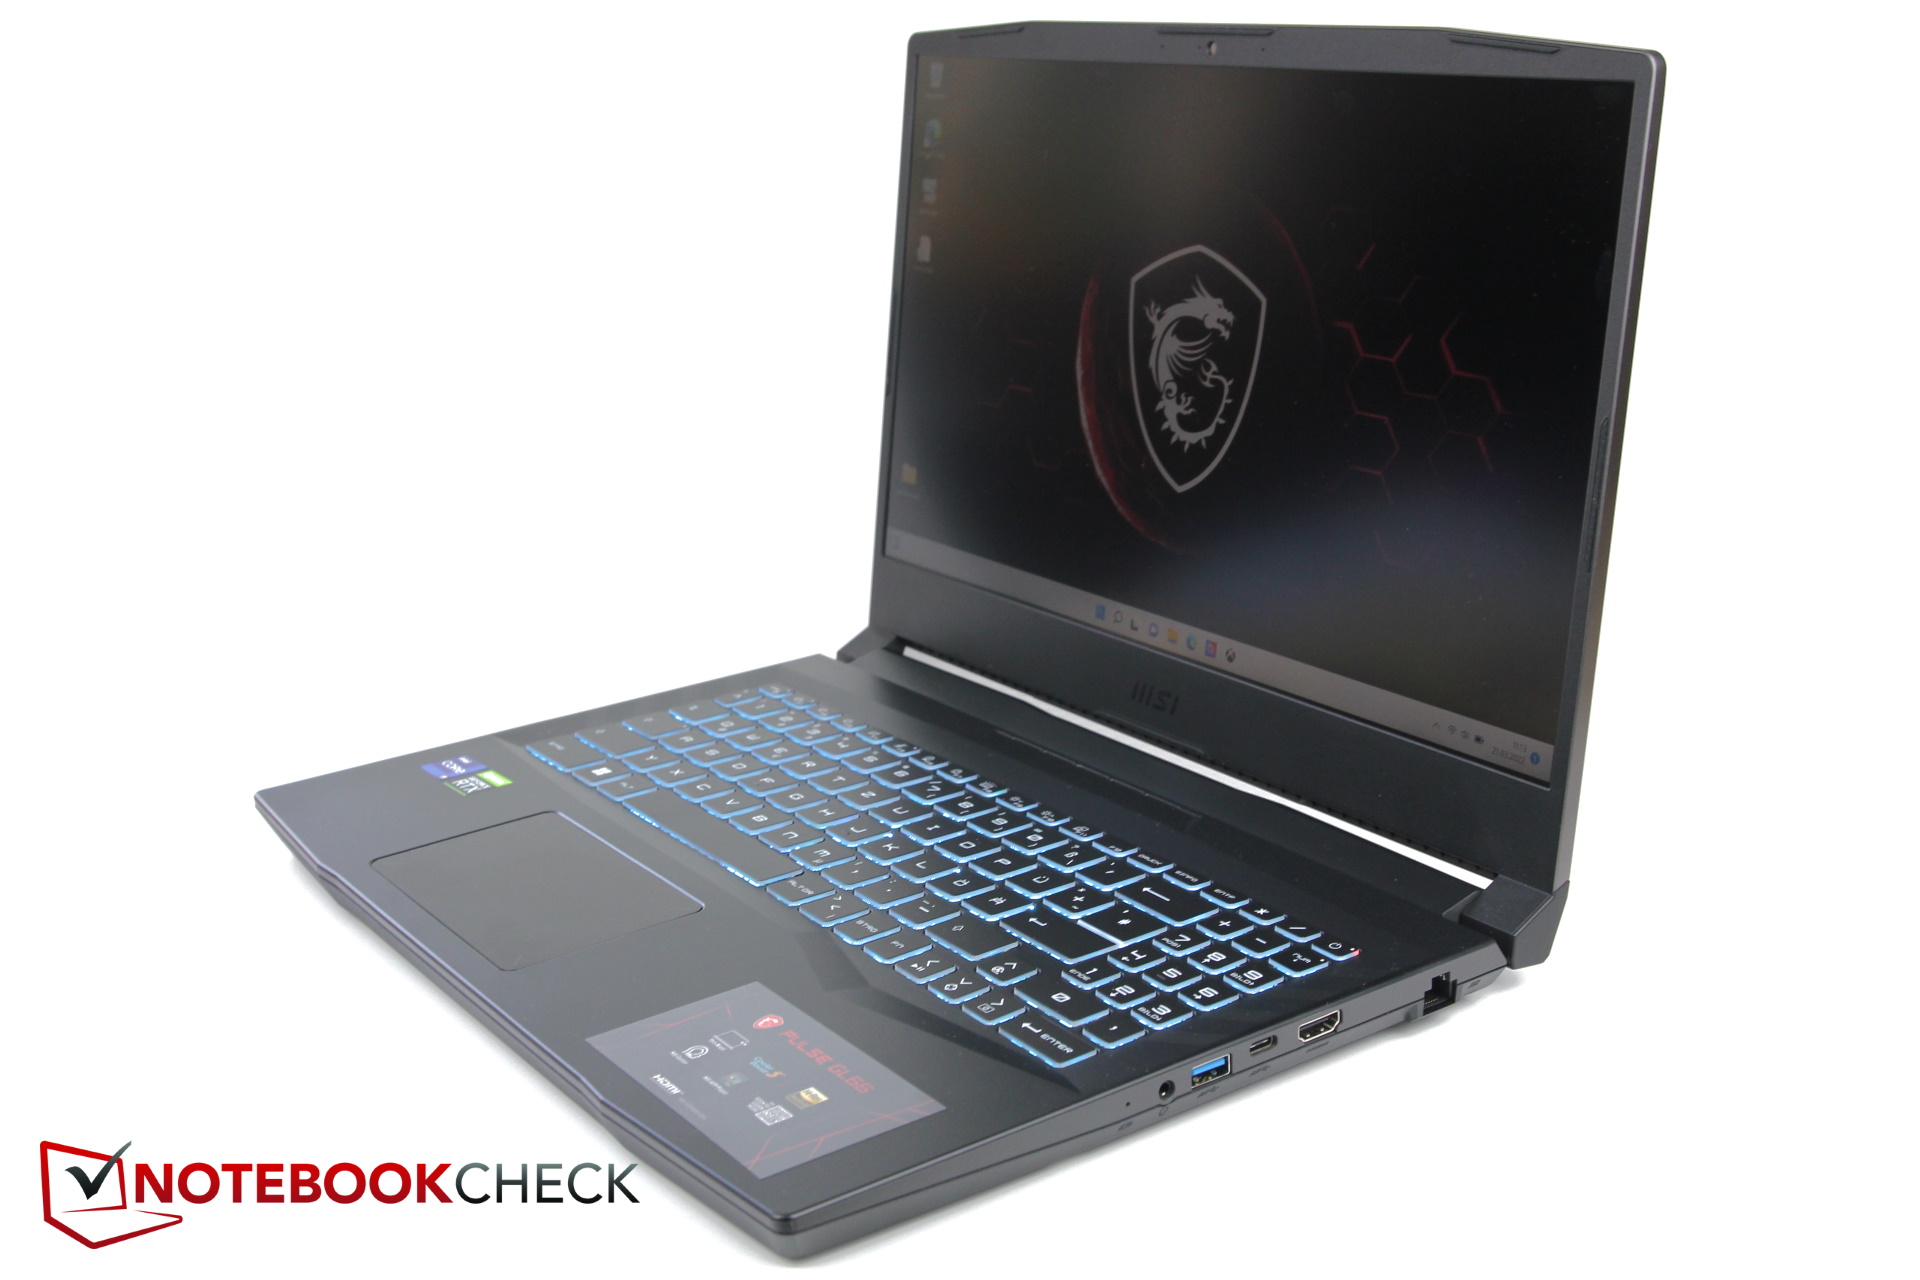
Only the display lid of the Pulse is made of metal and the rest of the laptop is made from plastic. This makes the lid fairly resistant to warping. Its maximum opening angle is almost 180 degrees. The two hinges on the sides do a good job, but since due to its metal construction the lid isn't particularly light, it can accidentally open up completely when you move the laptop, particularly if it is opened up more than two thirds of the way.
A notch in the base allows you to open the laptop easily with one hand. While the base is also fairly stable, attempts of warping it can also produce some creaking noises at times.
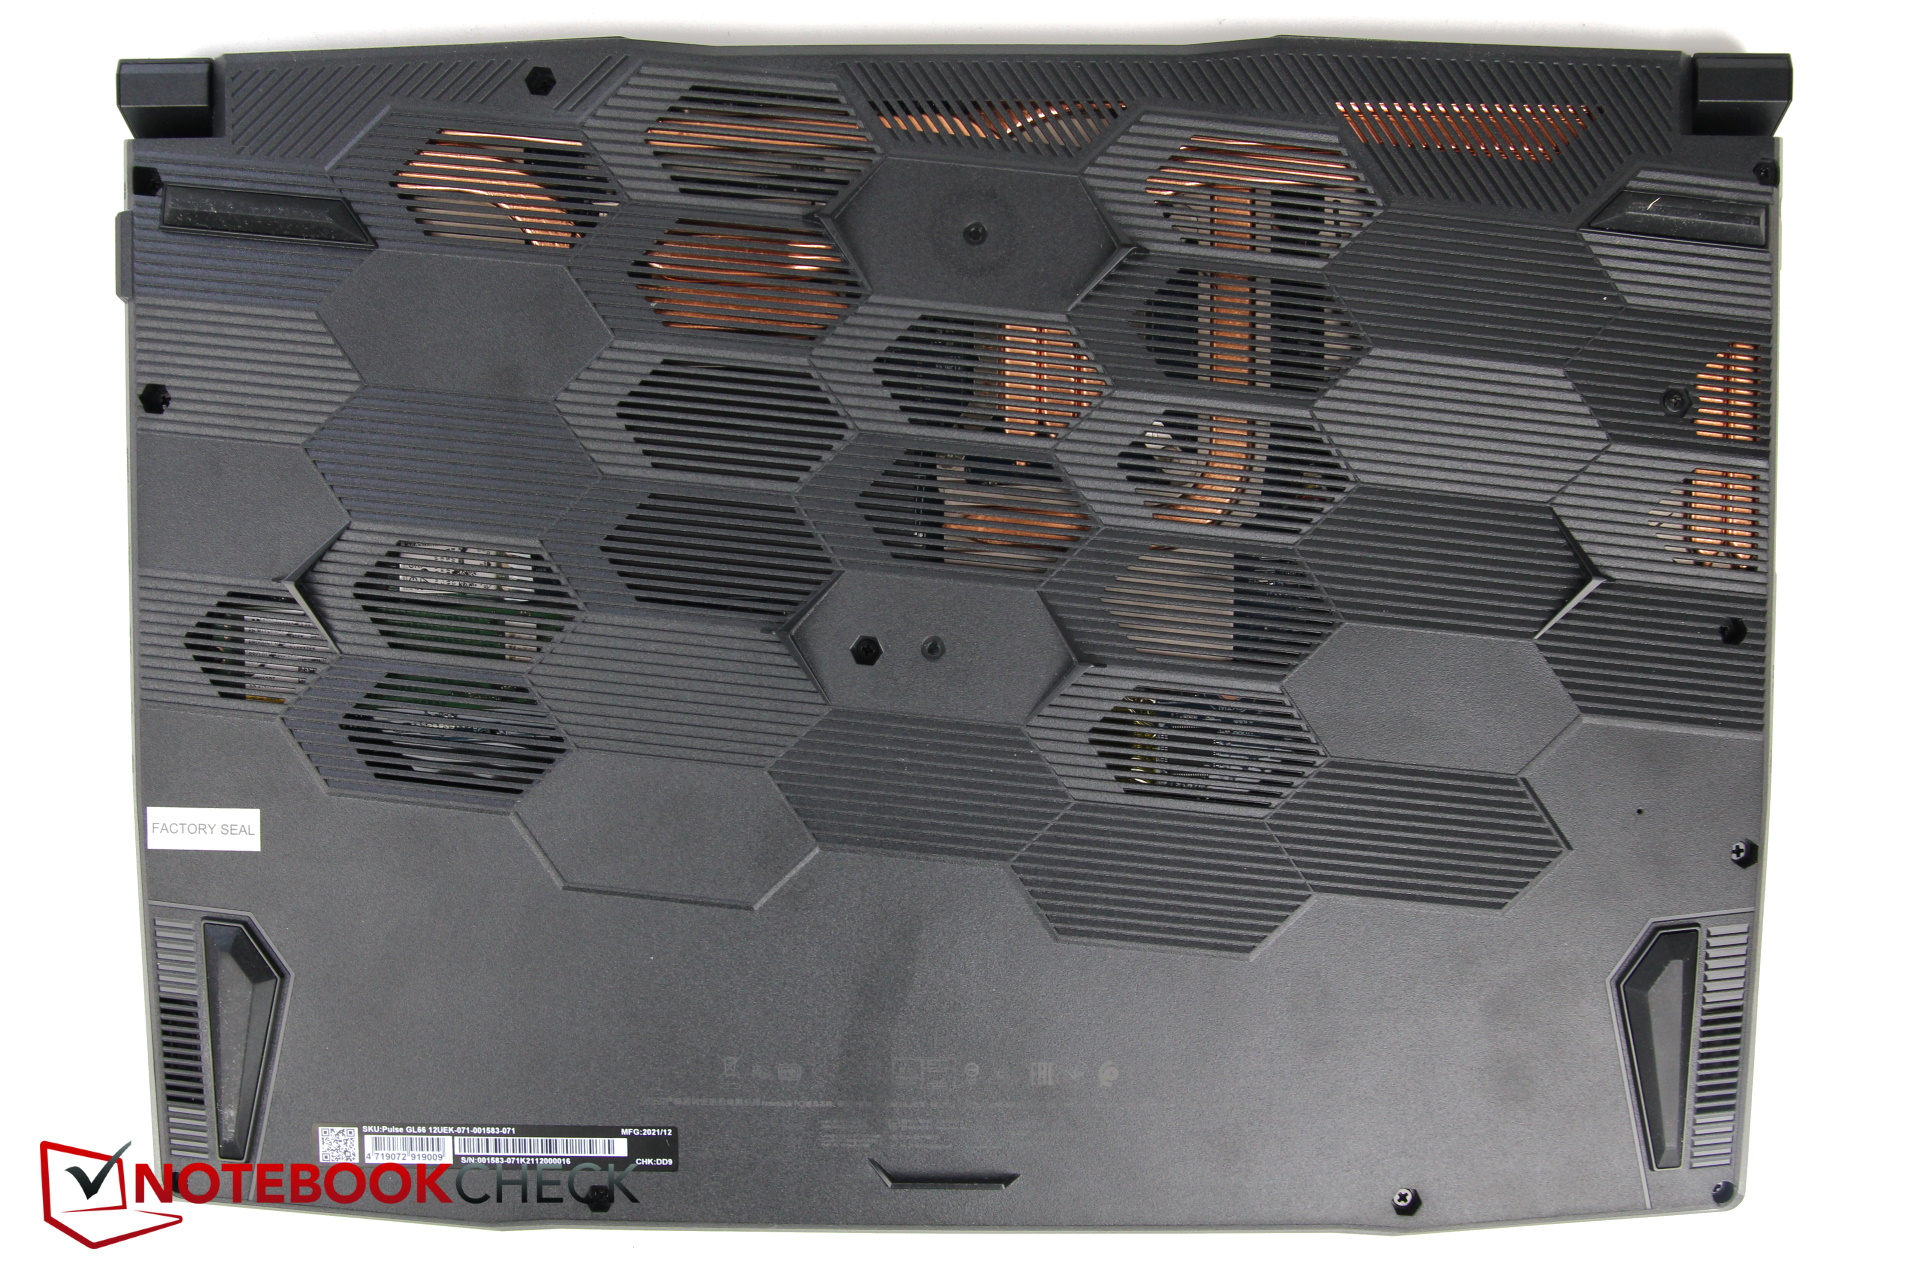
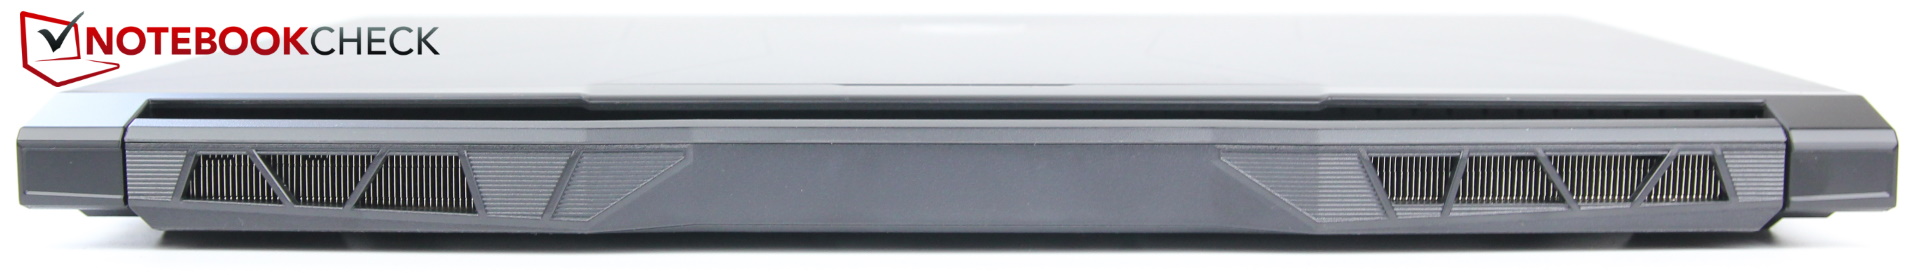
The keyboard is slightly recessed, so the palm rests are minimally elevated. The case bottom is made of thin plastic and covered by many large, honeycomb-like structures, some of which are fan vents. The exhaust air exits on the back and on the left side towards the back.
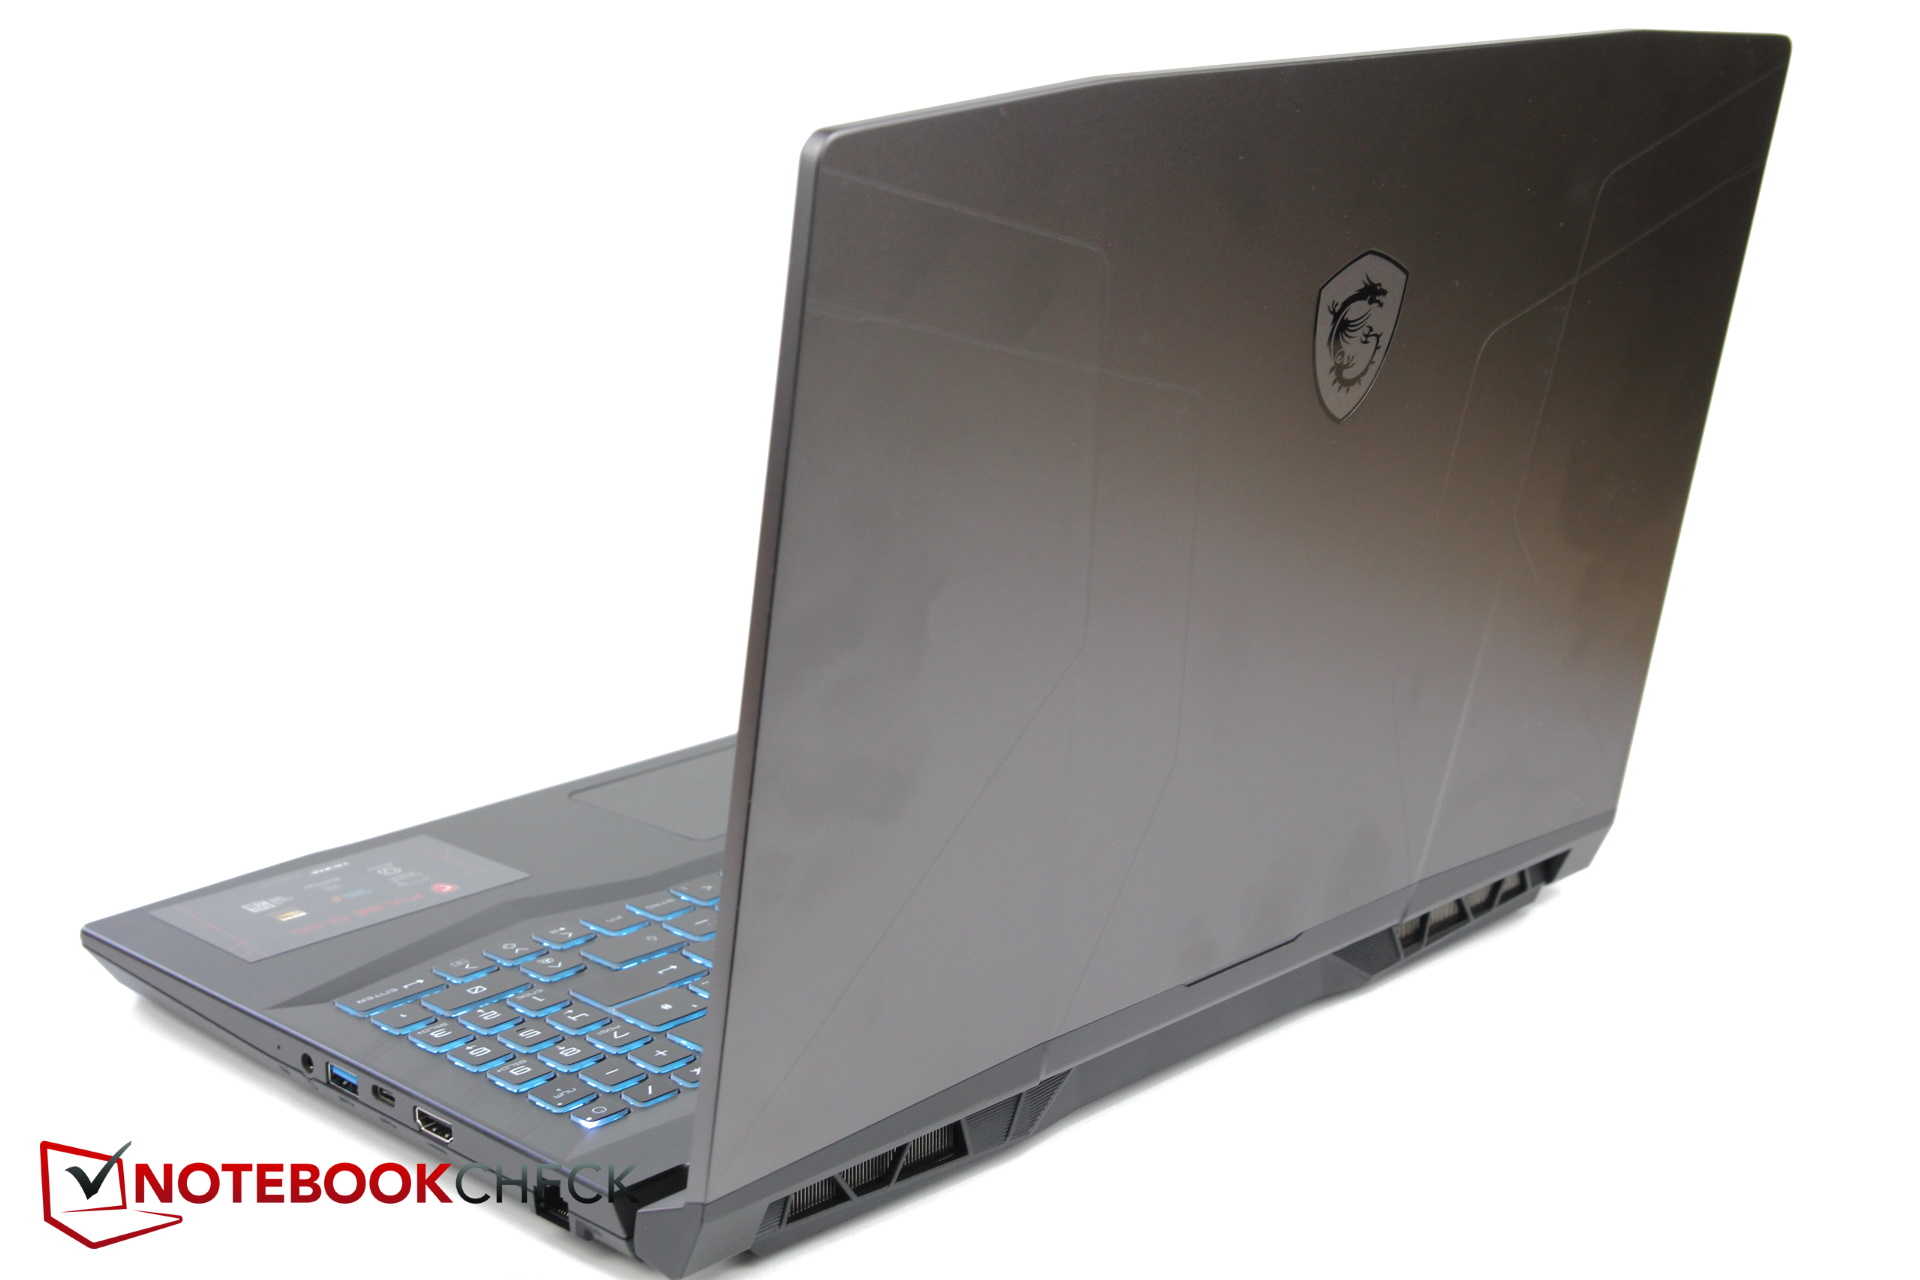
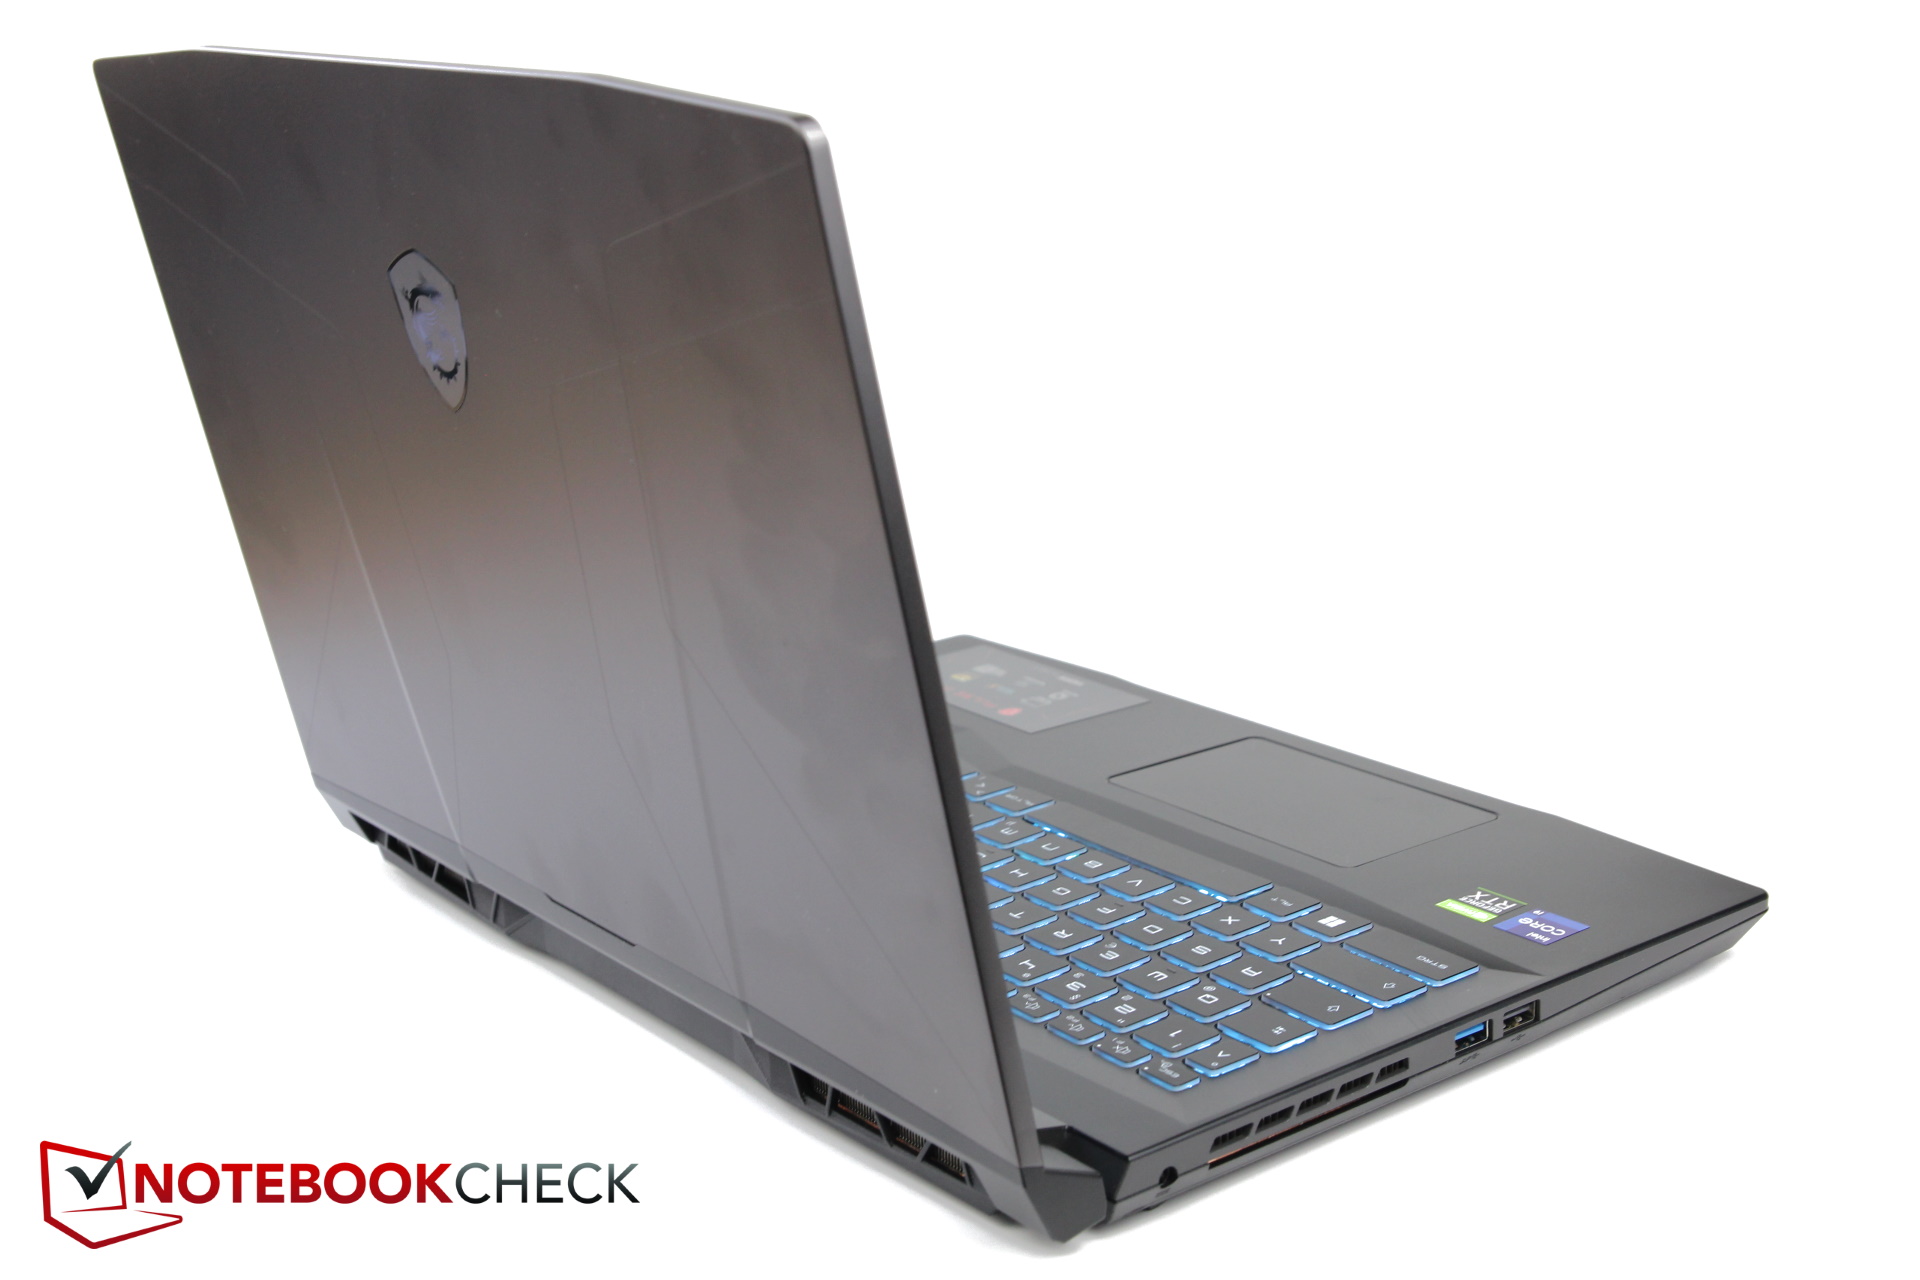
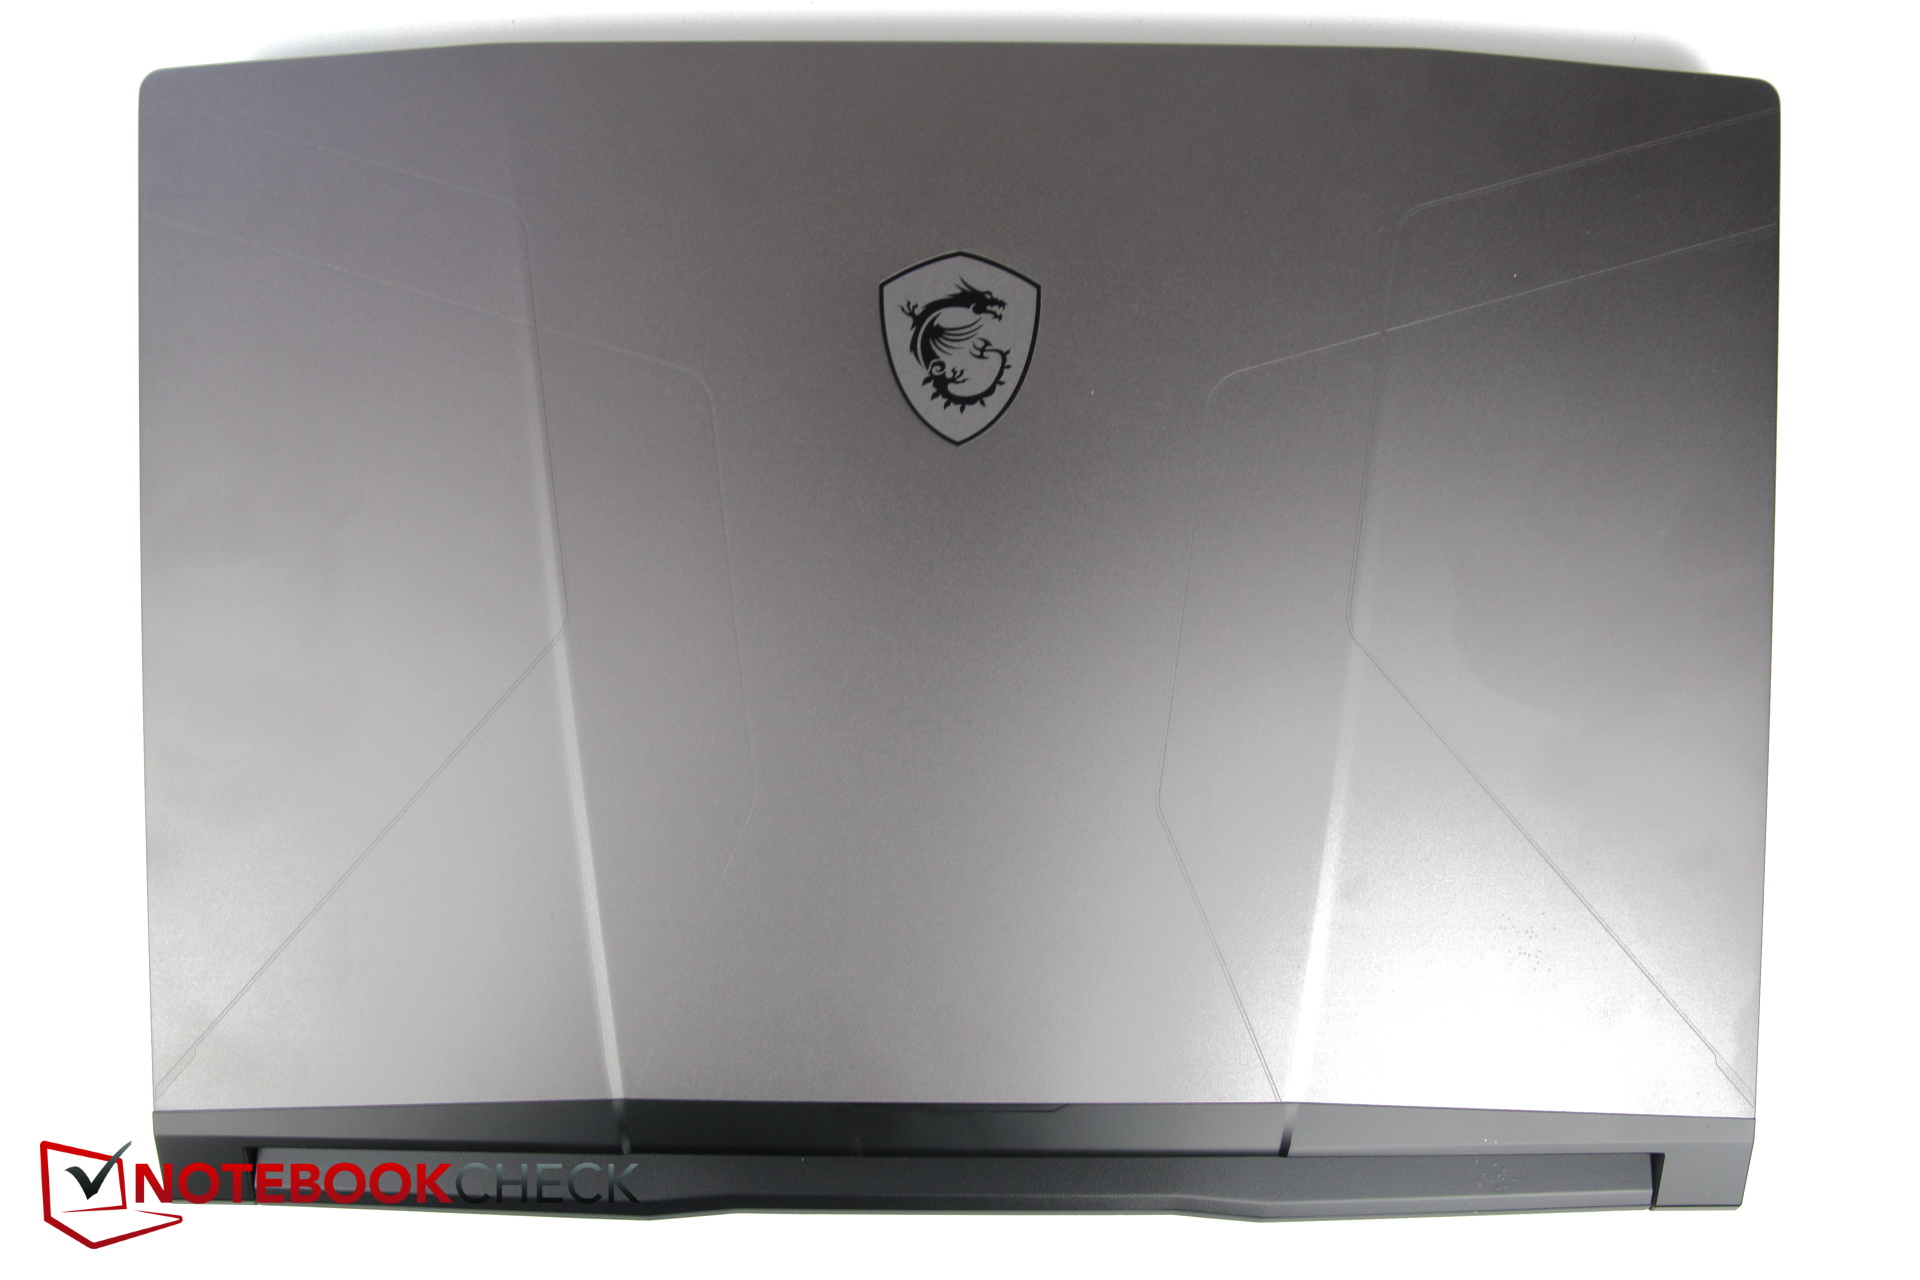
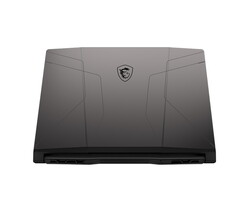
The design is targeted towards gamers without being overly ornamented. The silver-gray top prominently displays the Porsche-like shield logo with the dragon, and the base and bottom are kept in a dark black. The workmanship appears to be good, and we did not notice any uneven gaps.
Except for the larger Alienware m5, most of the laptops in our test field have about the same length and width. The thickness of the MSI places it in the middle of the field. However, MSI's specified thickness of 23.4 mm (~0.92 in) is more likely to refer to the thinnest place, and the laptop measures more like 25 mm (~0.98 in) towards the back.
The Legion S7 and Alienware x14 show that gaming laptops can also be slimmer, but both the XMG Apex and the TUG Gaming F15 are thicker. In terms of the weight, the MSI is one of the heavier models and only the Alienware m5 is even heavier.
Equipment
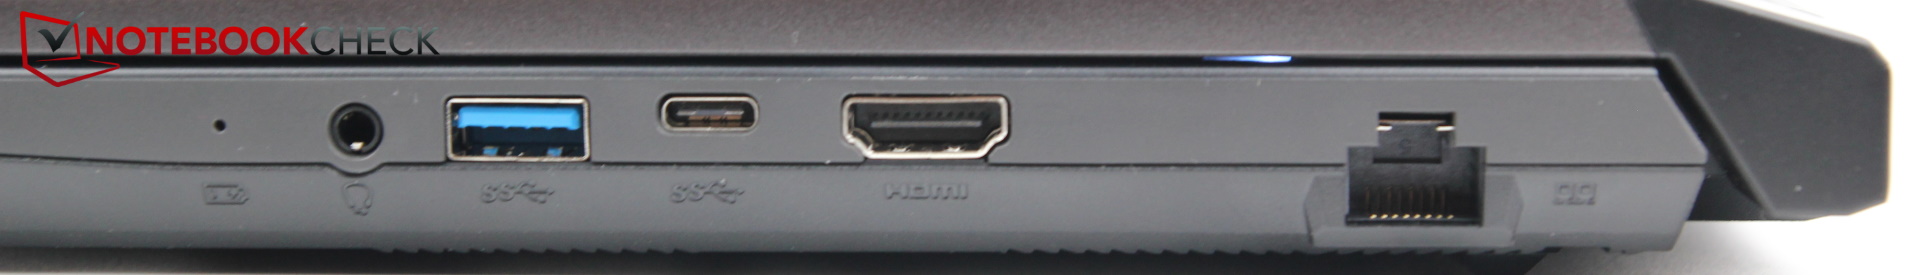
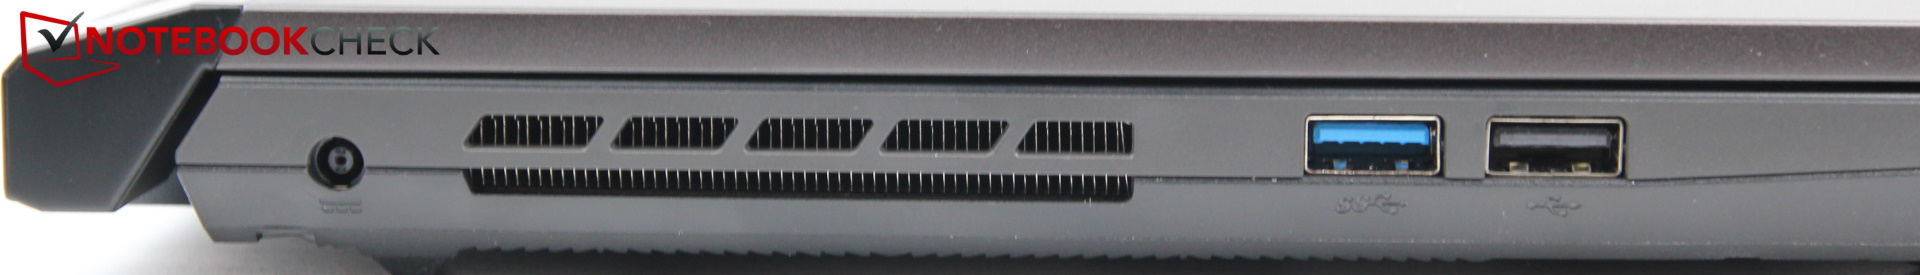
Only the most necessary connections are present but nothing more. There are four USB ports in total, with one of them in the USB-C format. Unfortunately, that is also only 3.2 Gen 1, which is almost the same as USB 3.0 (5Gb/s). Thunderbolt is lacking, just as an SD card reader. One of the three USB-A ports even only supports the 2.0 speed, which is not up to the current standards anymore.
But what is worse, is that the USB-C port did not work properly. Our external SSD in an M.2 case constantly re-announced itself in the USB-C port. While the light of the SSD remained turned on consistently, the OS continuously kept registering and deregistering it. A restart also didn't help, and we had to switch to using a USB-C-to-A adapter. After that, the problem didn't happen anymore. We encountered the same problem with the MSI Katana, but the Asus TUF Gaming F17 or ROG Strix Scar that we are also testing at the same time did not have the problem. Perhaps our USB-C plug cannot be inserted deep enough into the MSI ports.
The distribution of the ports is also less than optimal. Most of the ports are on the right side, including the HDMI port with its potentially large plugs and stiff cables. This is an annoyance for right-handed users. In addition, the ports are placed fairly close to each other, particularly the two USB-A ports on the left side, which is otherwise empty of connections.
We should also mention that the power plug doesn't fit very tightly. During our test, it happened several times that it slipped out half-way without us noticing.
Communication
The Pulse connects to the WLAN via an Intel AX201 module. Its potential isn't fully used, and the transfer rates are at the bottom end in our comparison.
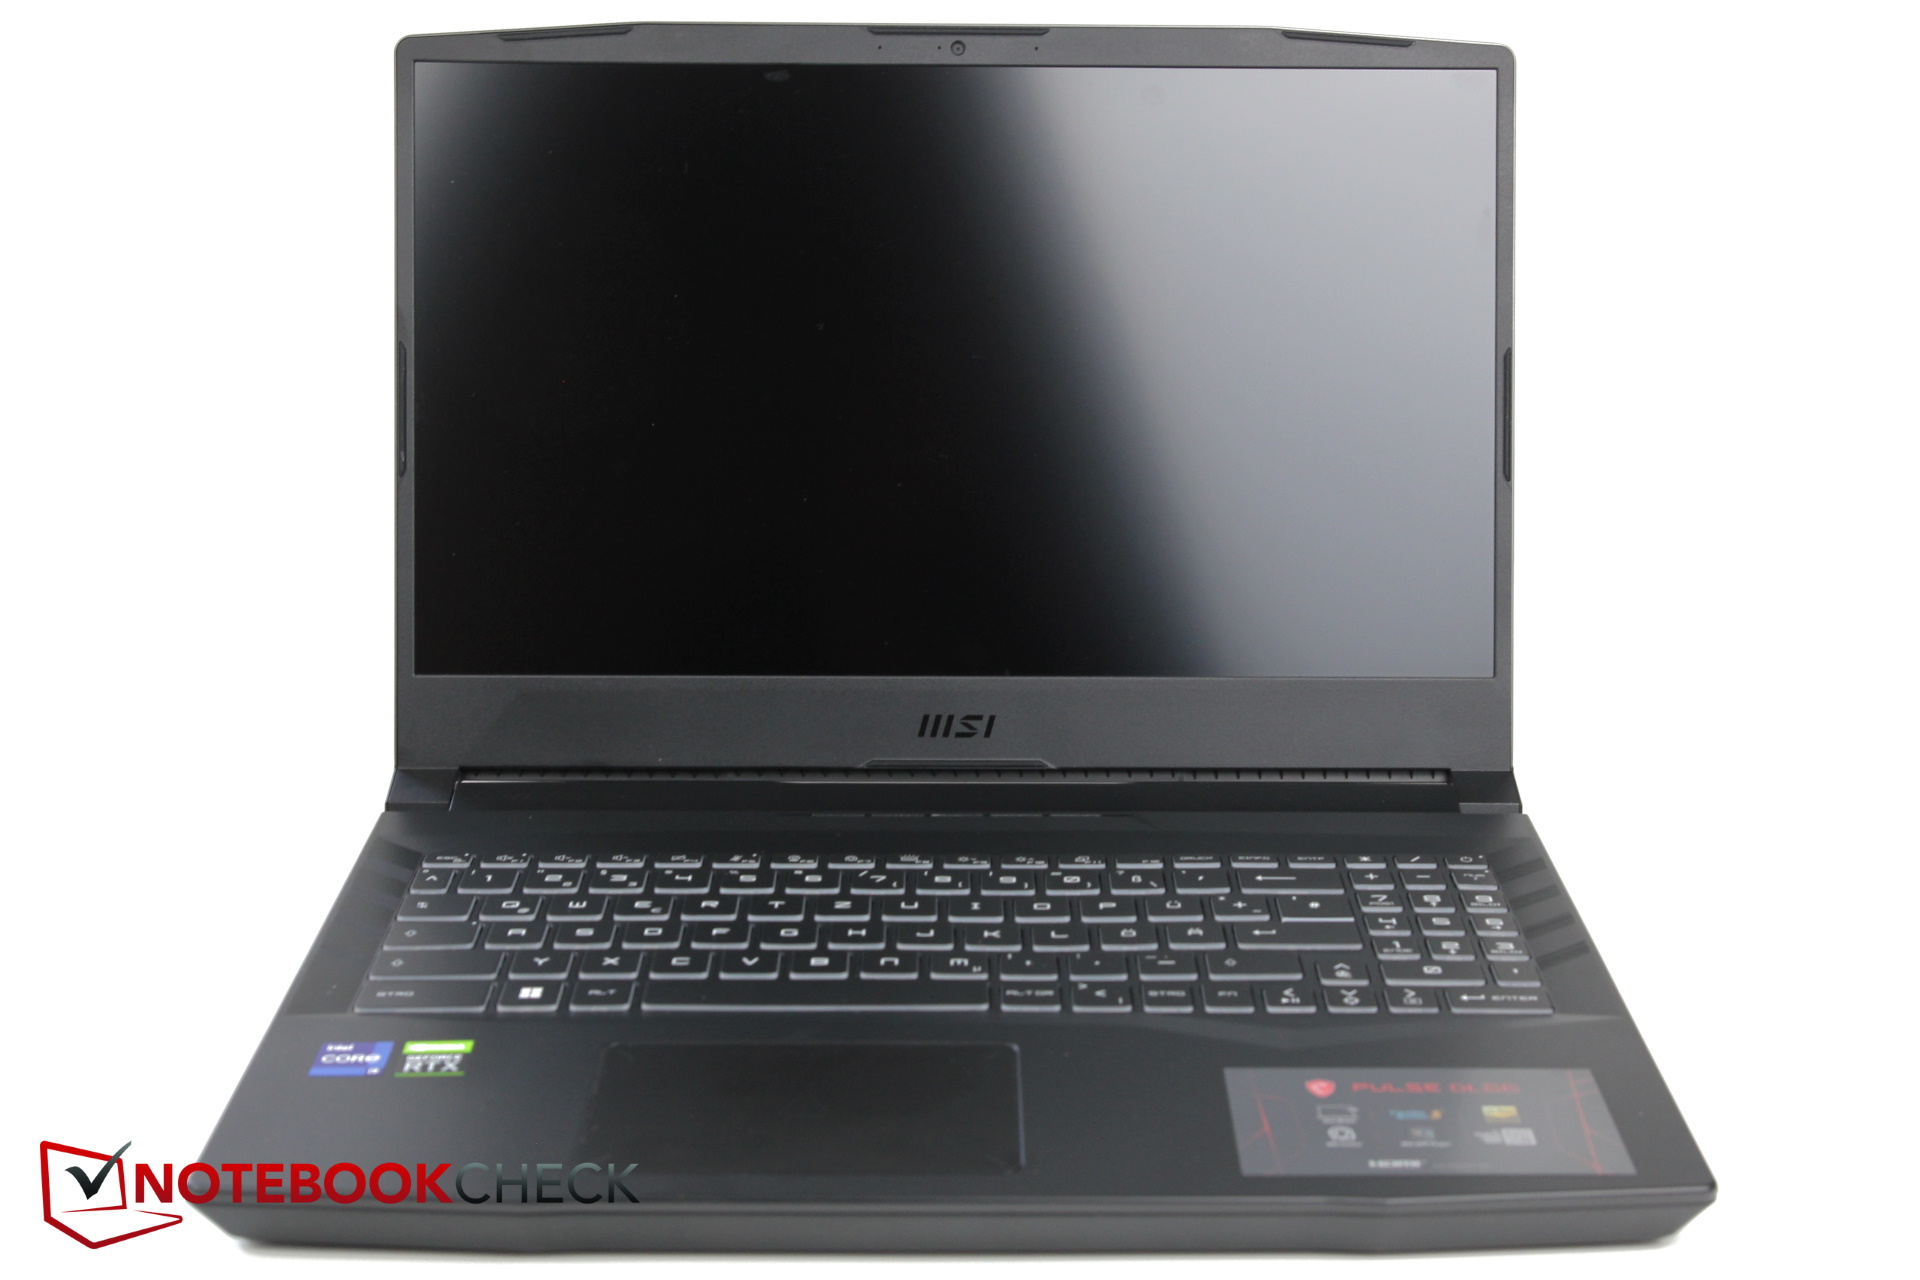
Webcam
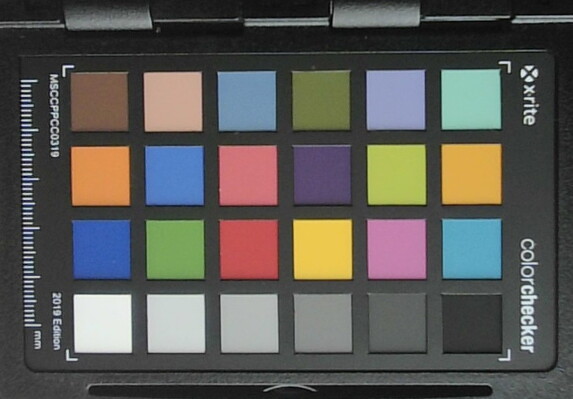
A standard 720p webcam is used. For years, there haven't really been any major upgrades in many laptops in this area, whether this is related to Corona shortages or not. But at least the color deviations remain within limits.


Security
The Pulse doesn't have much to offer for security purists, and there is neither a fingerprint sensor nor a Kensington connection. However, TPM 2.0 is of course included.
Accessories and Warranty
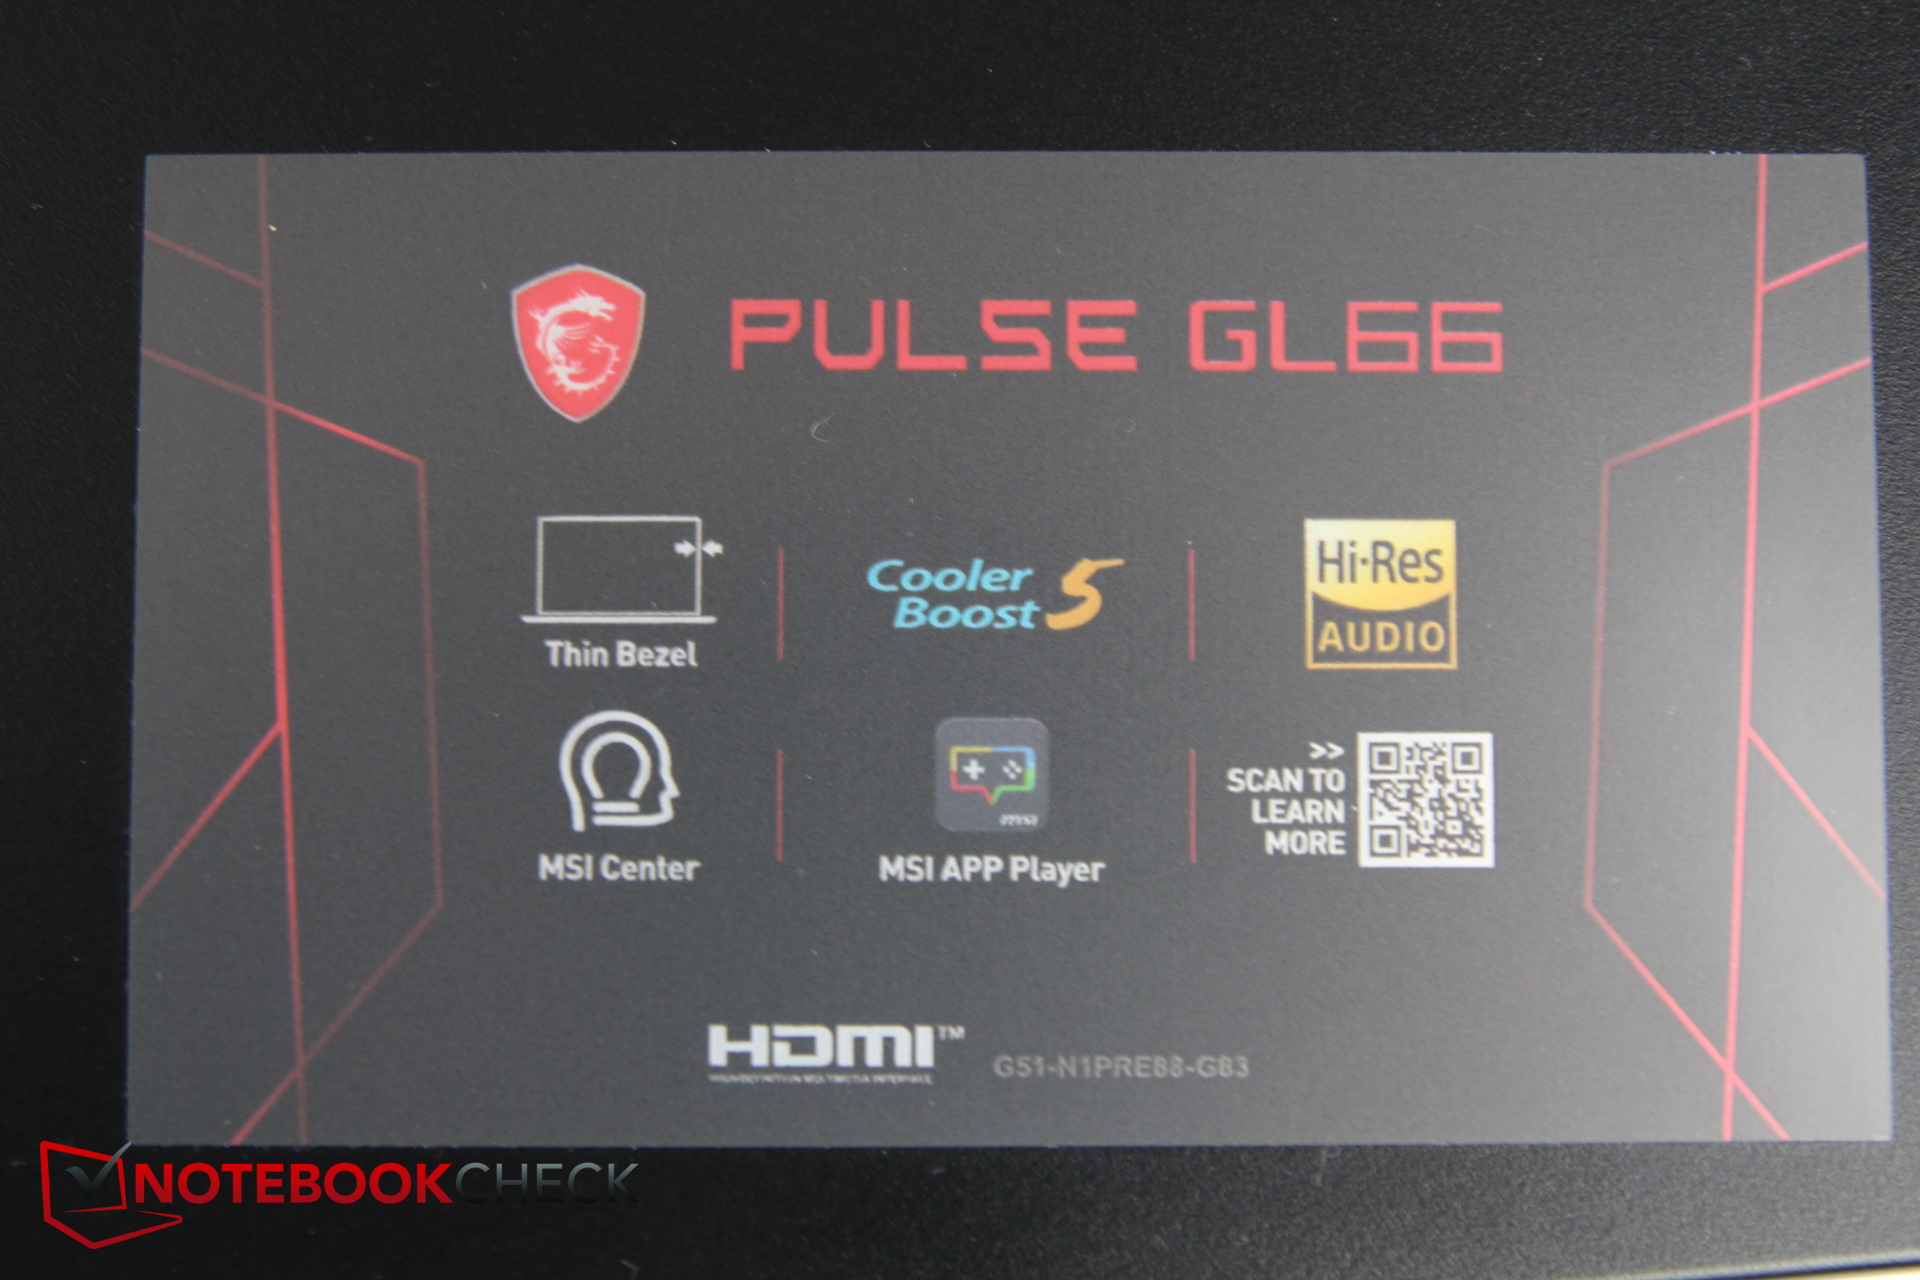
Other than a few "cool" stickers and the 240-Watt power supply, MSI doesn't include anything else worth mention with the laptop. The warranty covers 24 months of pick-up & return service.
Maintenance
MSI hides one of the screws behind a sticker. Our test unit is a loaner provided by the Cyberport shop, so we did not want to damage the sticker seal to open the device. However, according to MSI the device can also be opened by the customer for maintenance tasks. As long as this is done "professionally," the warranty of the device should not be affected.
Input Devices
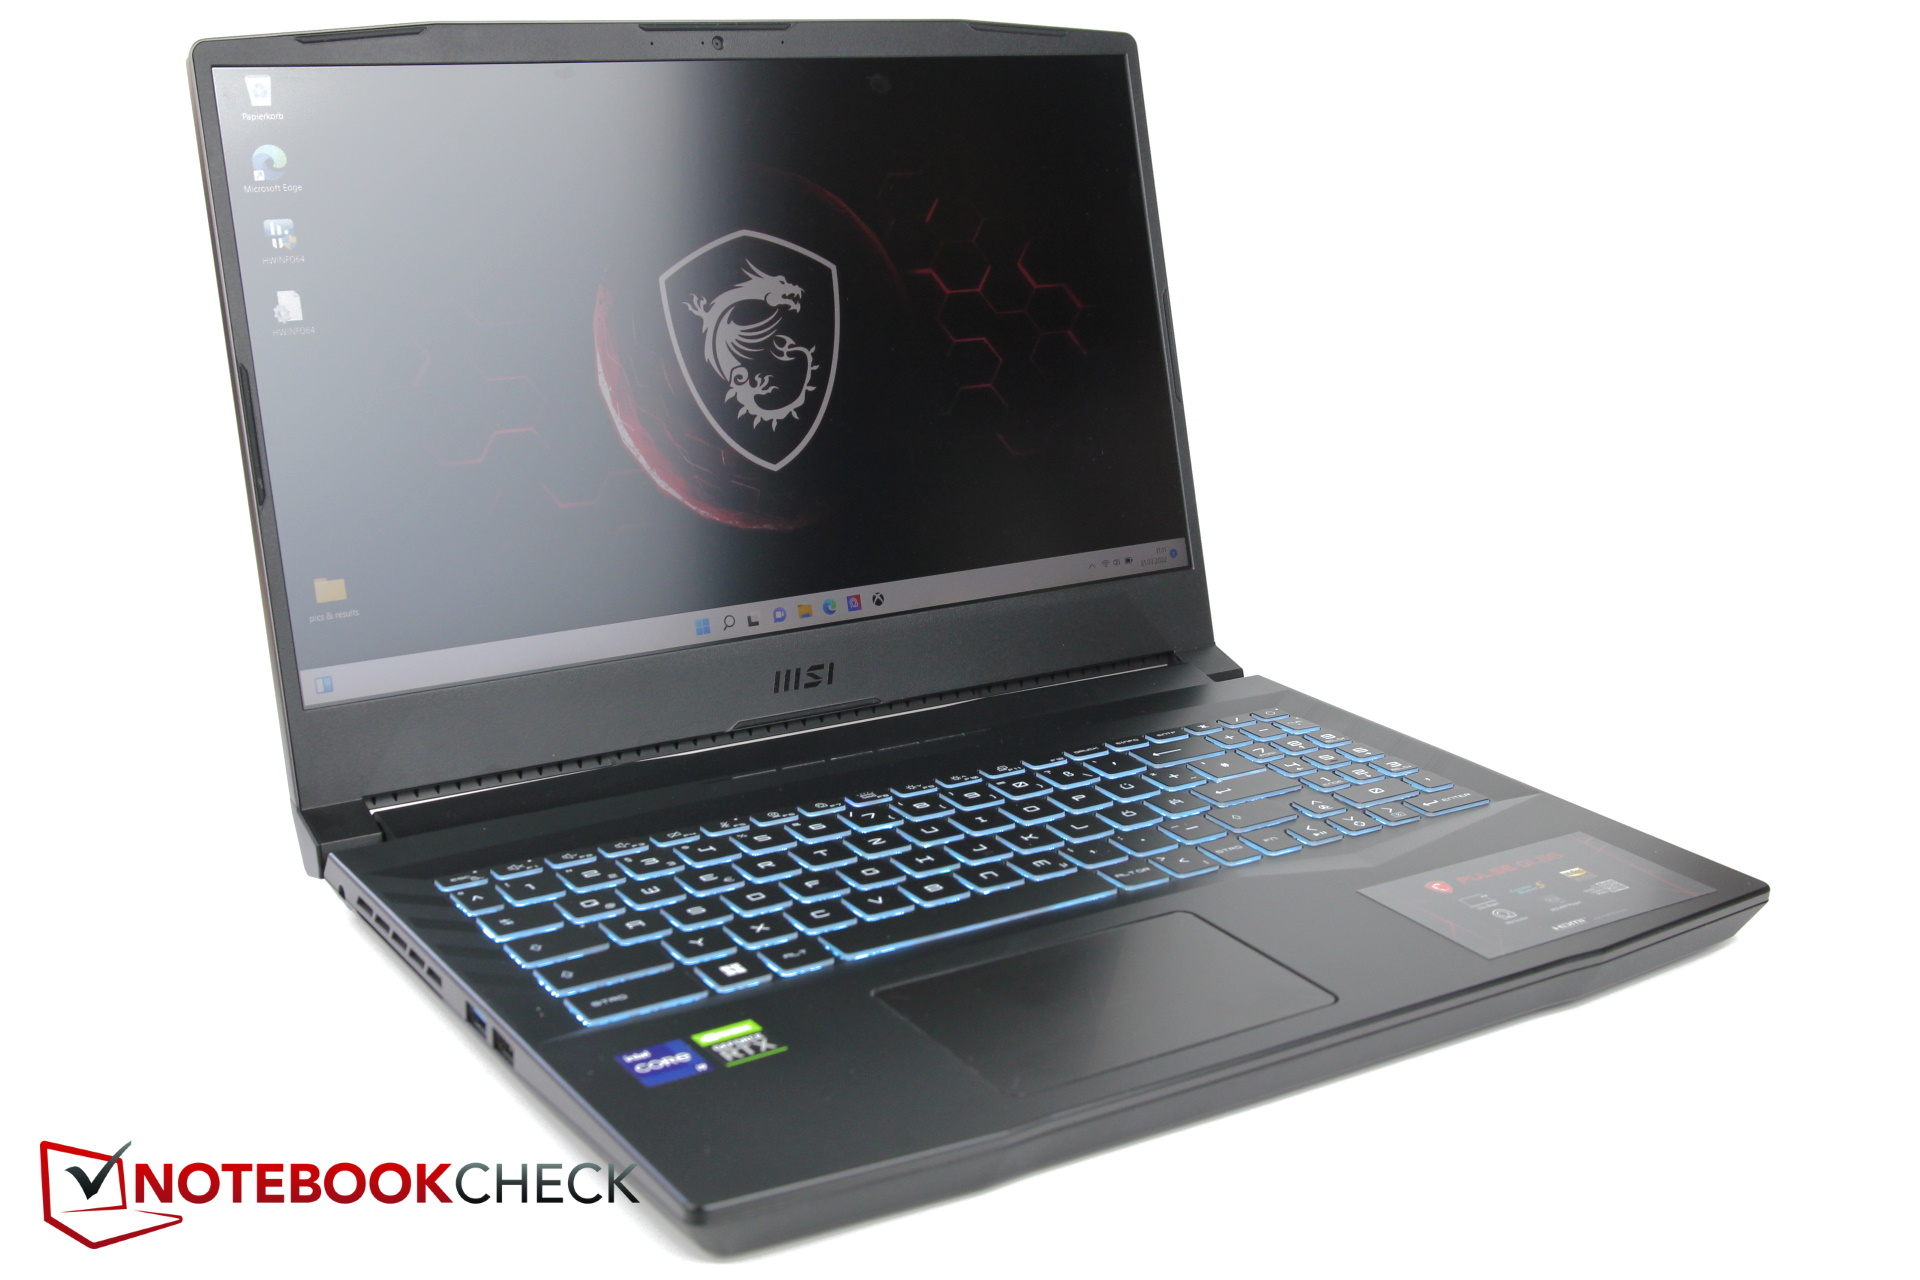
Keyboard
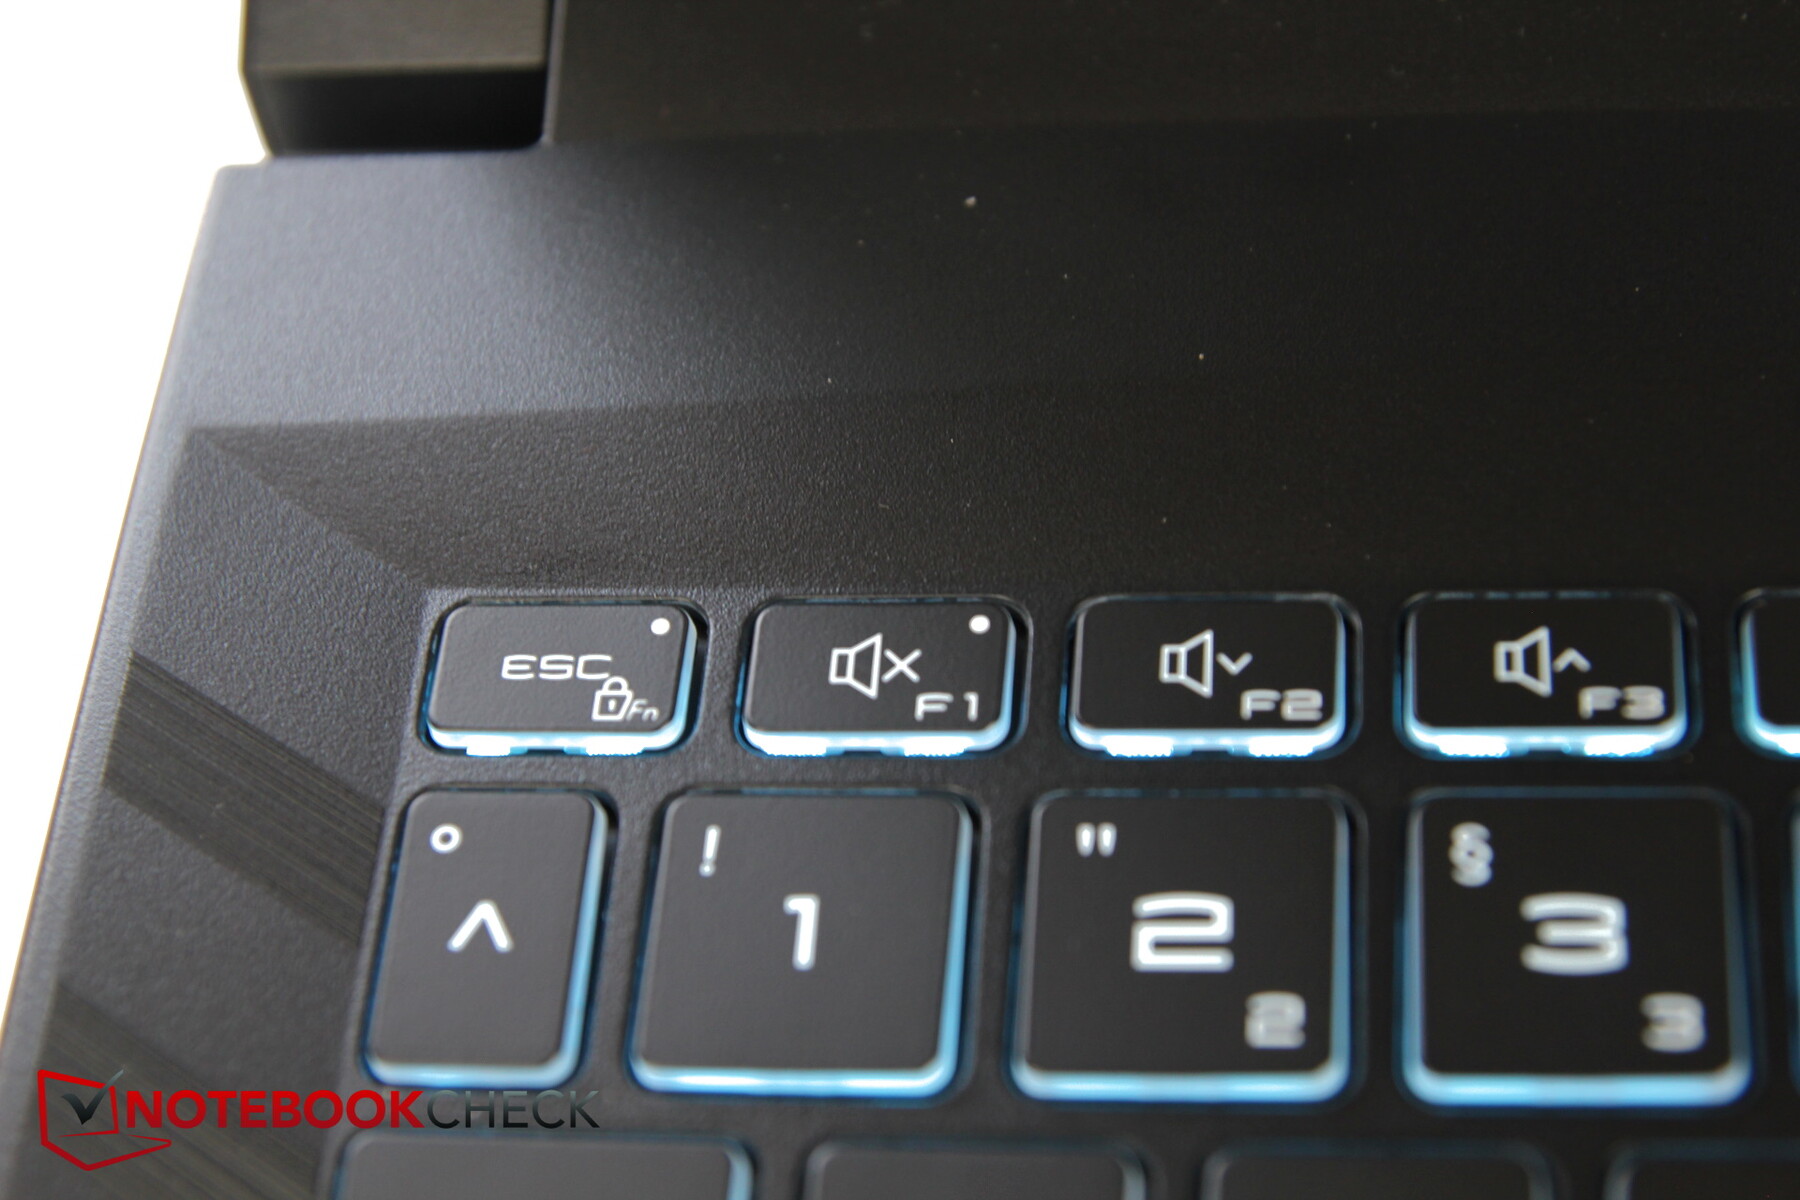
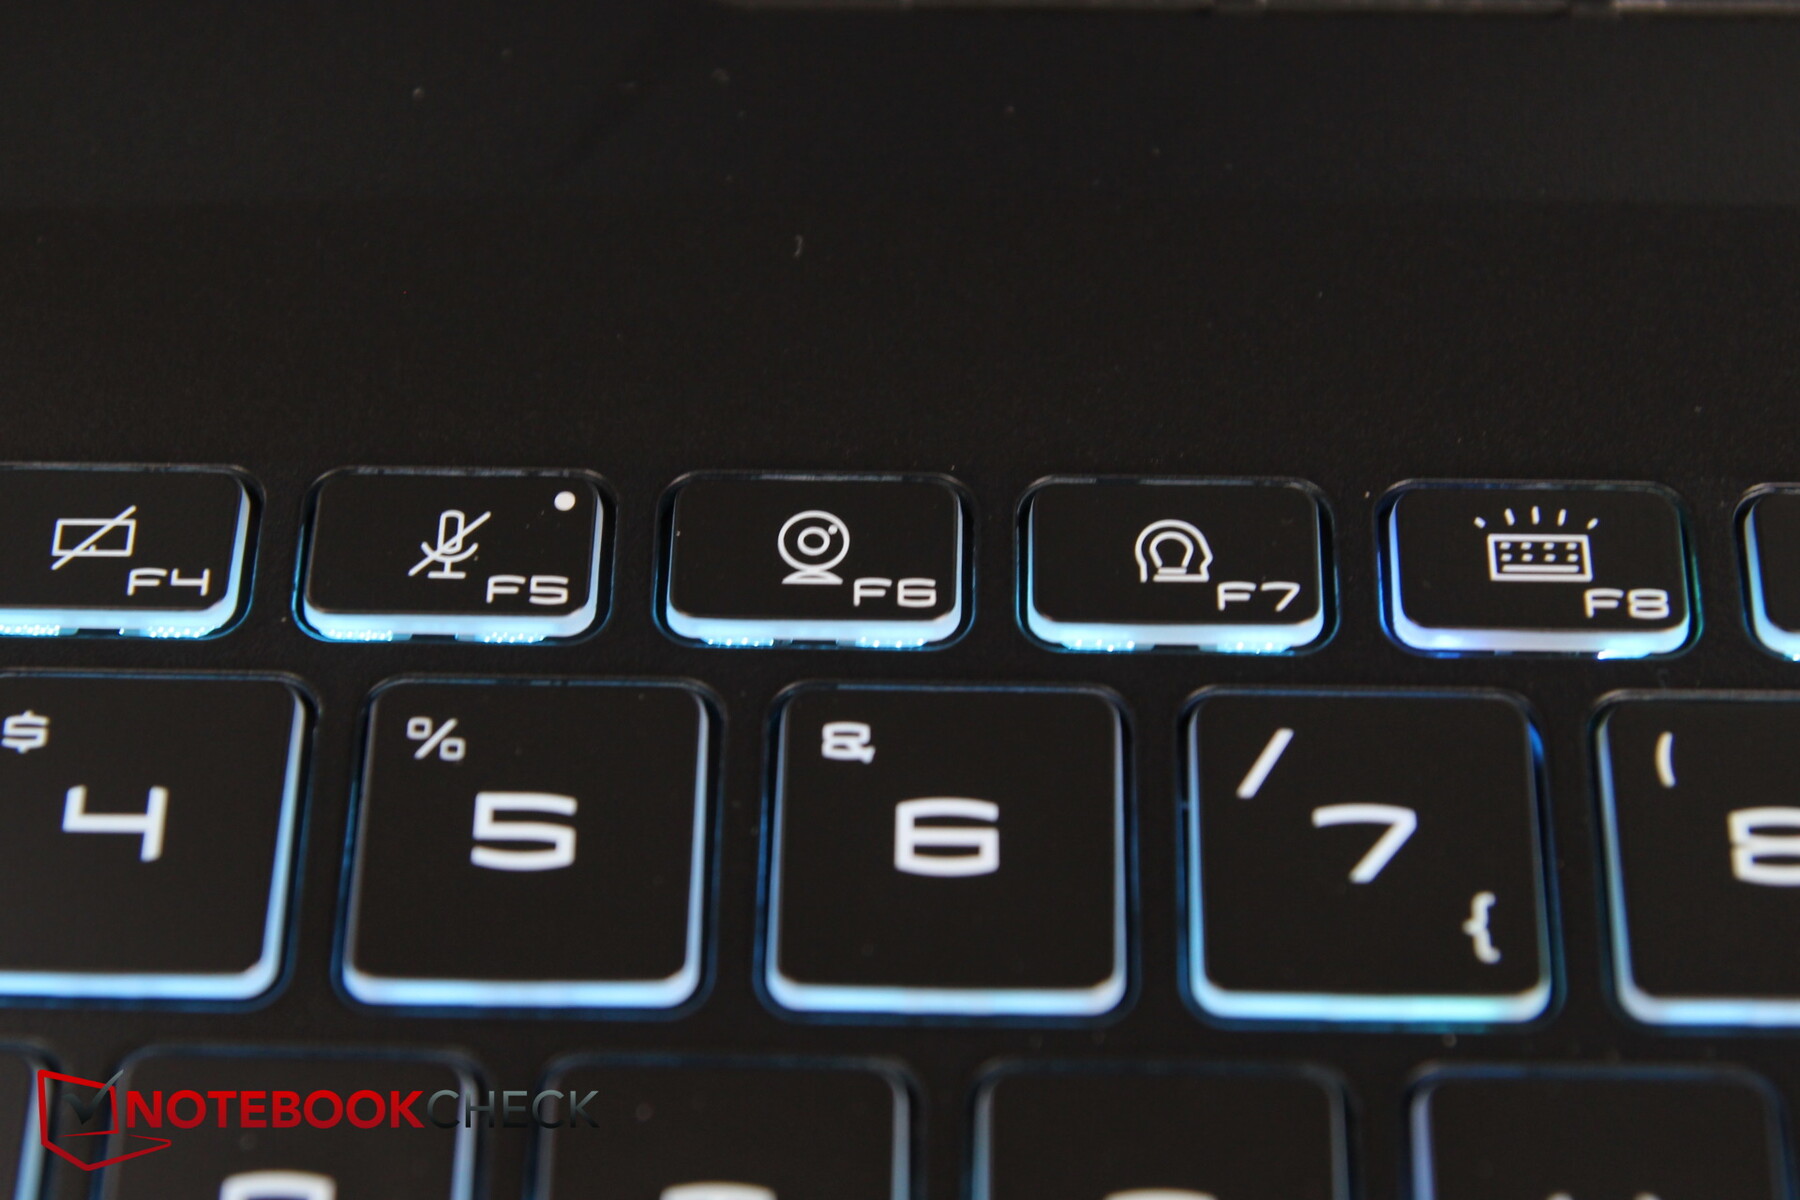
The keyboard shows a great similarity to other MSI laptops such as the Katana series. The layout appears well-arranged, but with its keys being close together and some of them also very small, it also looks a bit crammed. Particularly the F keys and even more the number pad that is squeezed in next to them turned out very small.
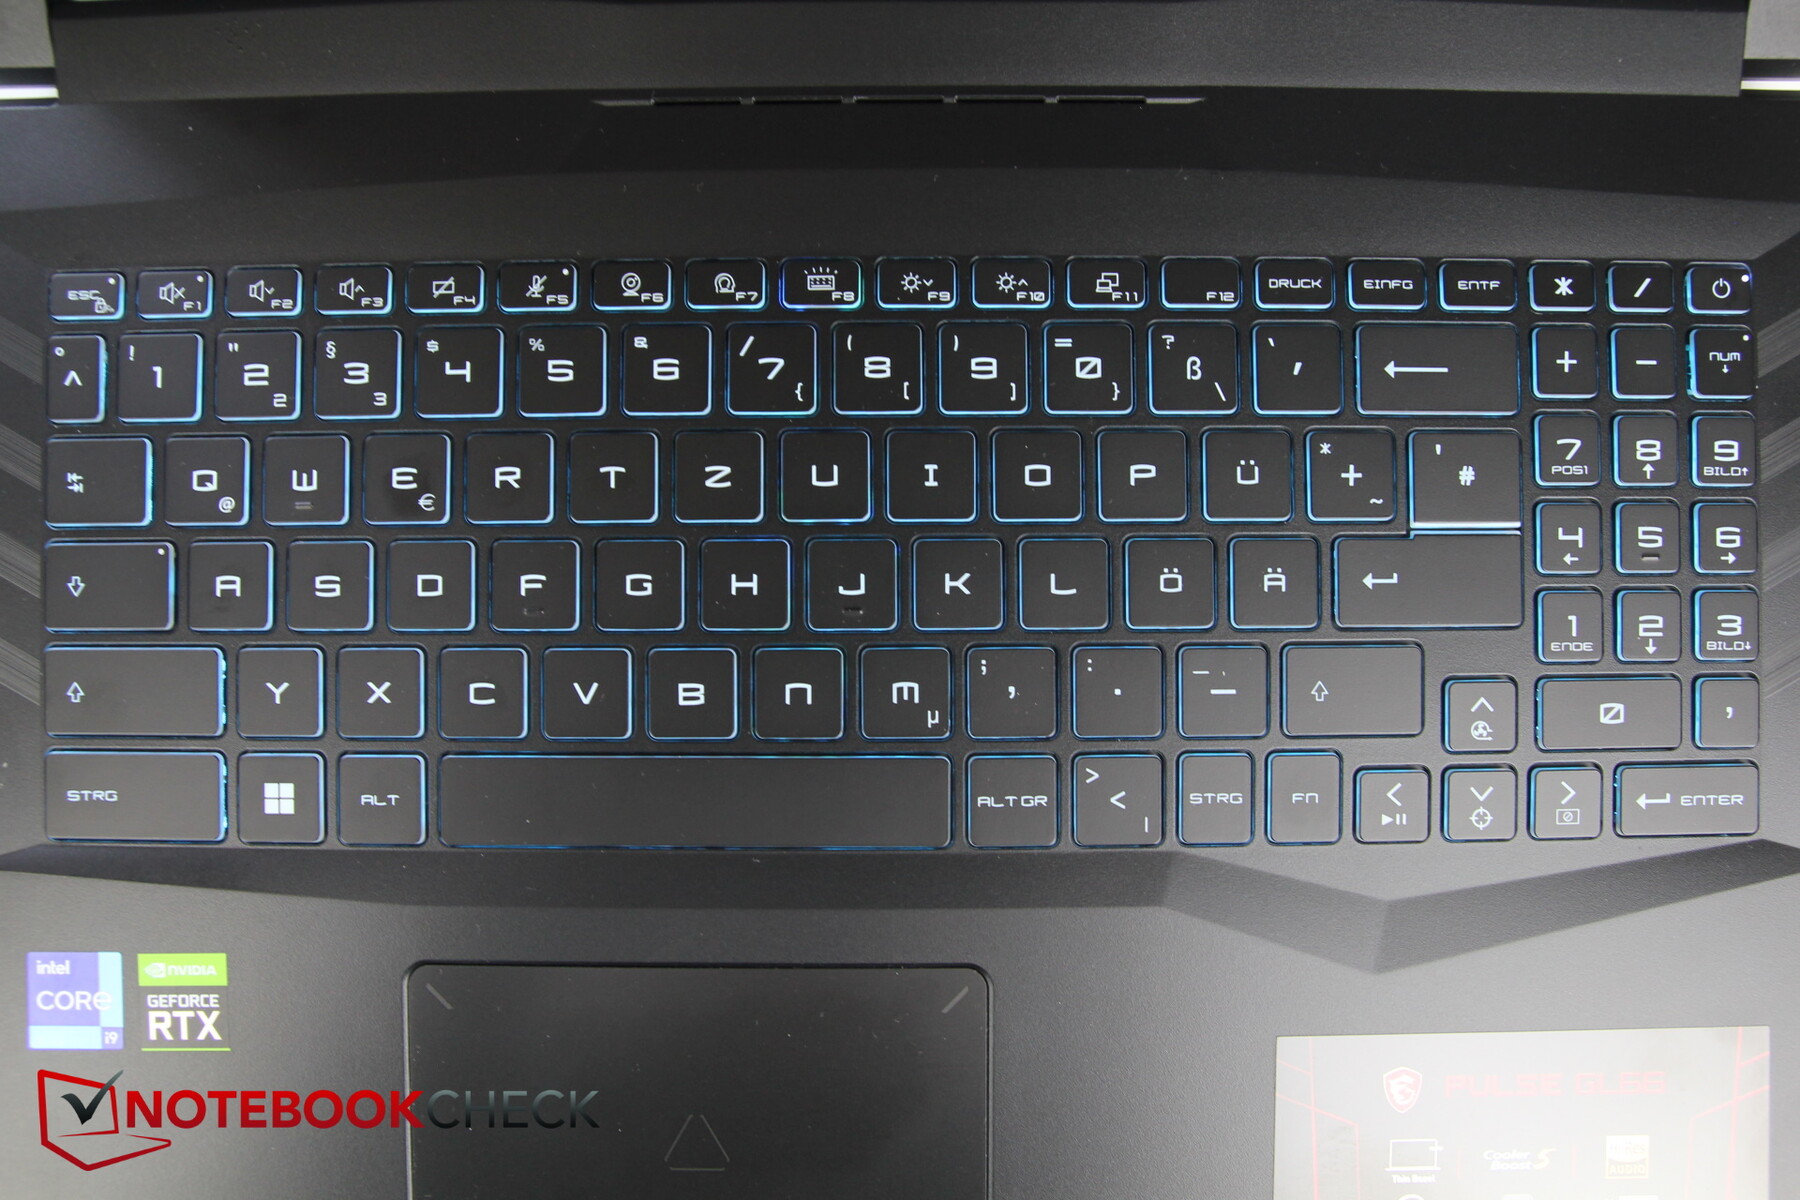
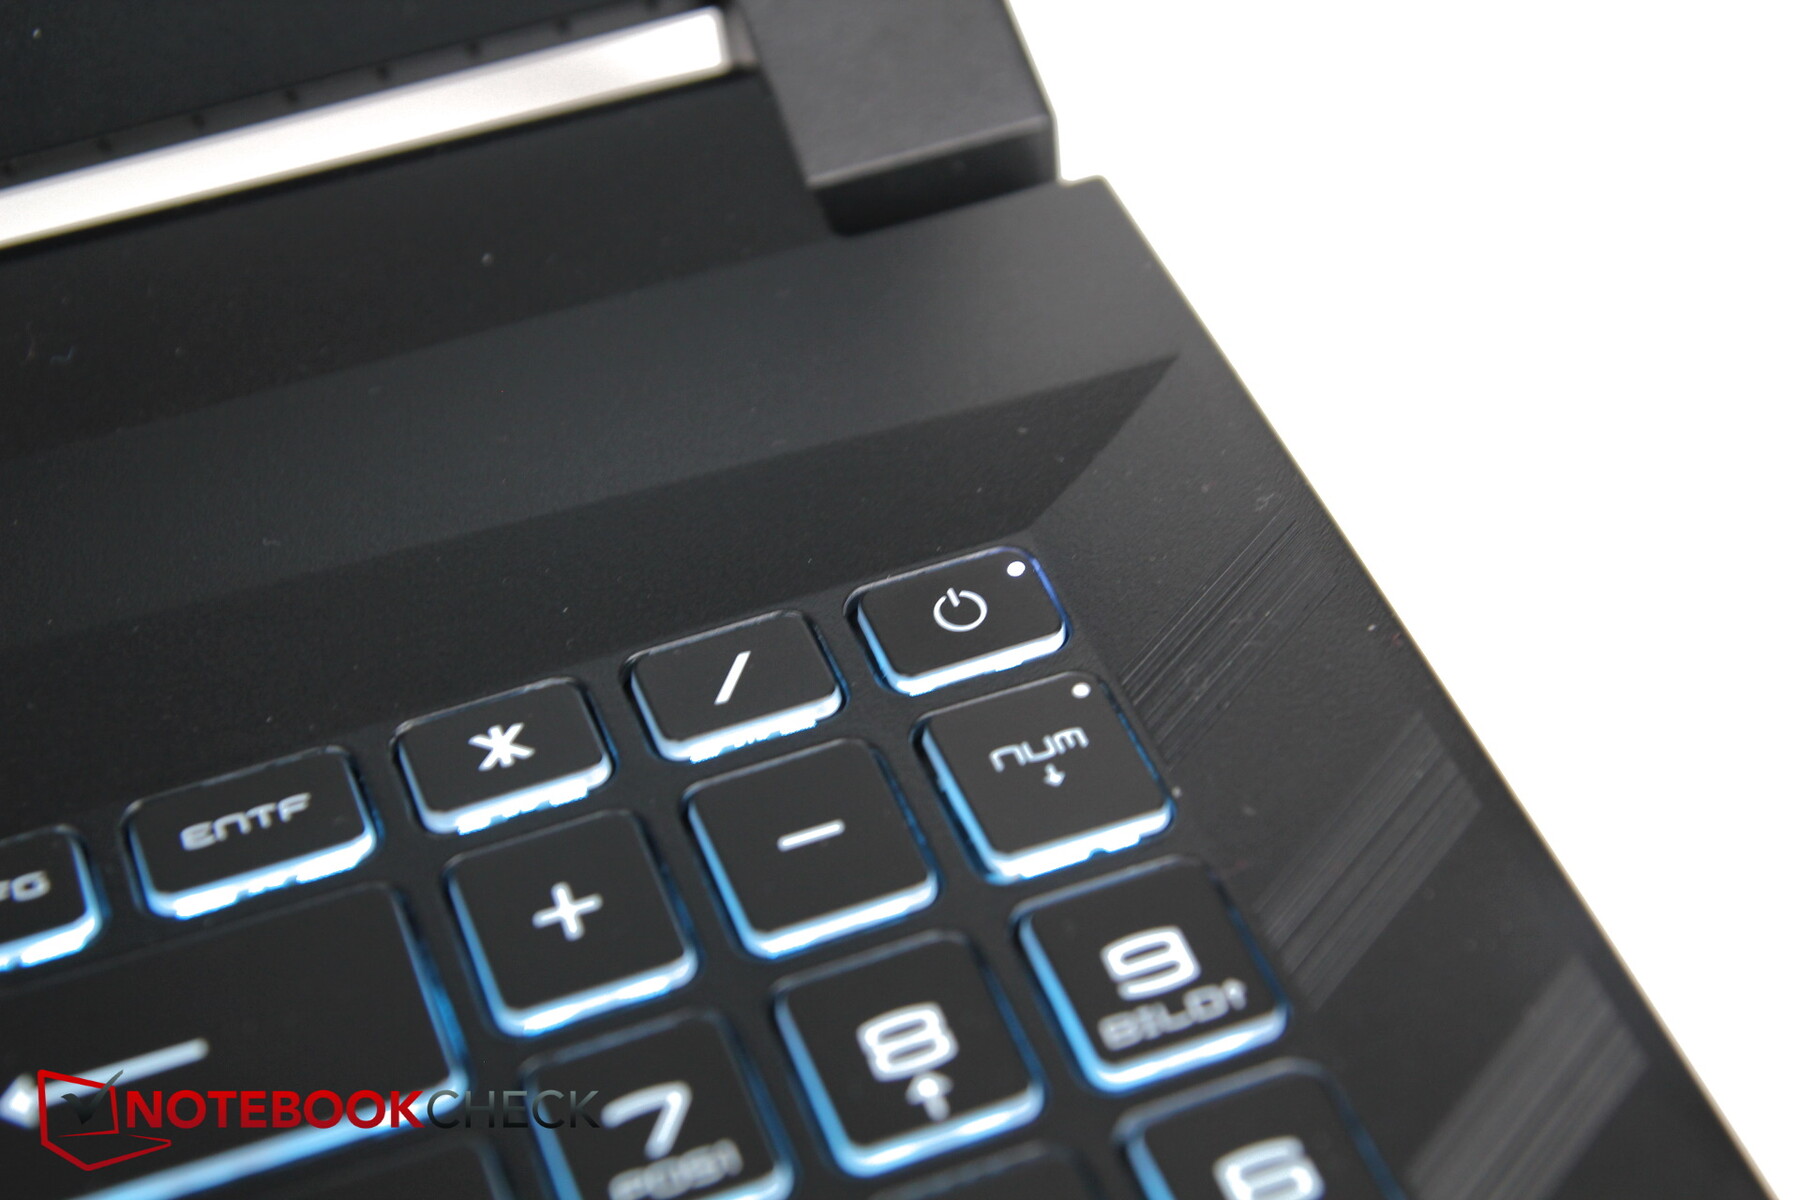
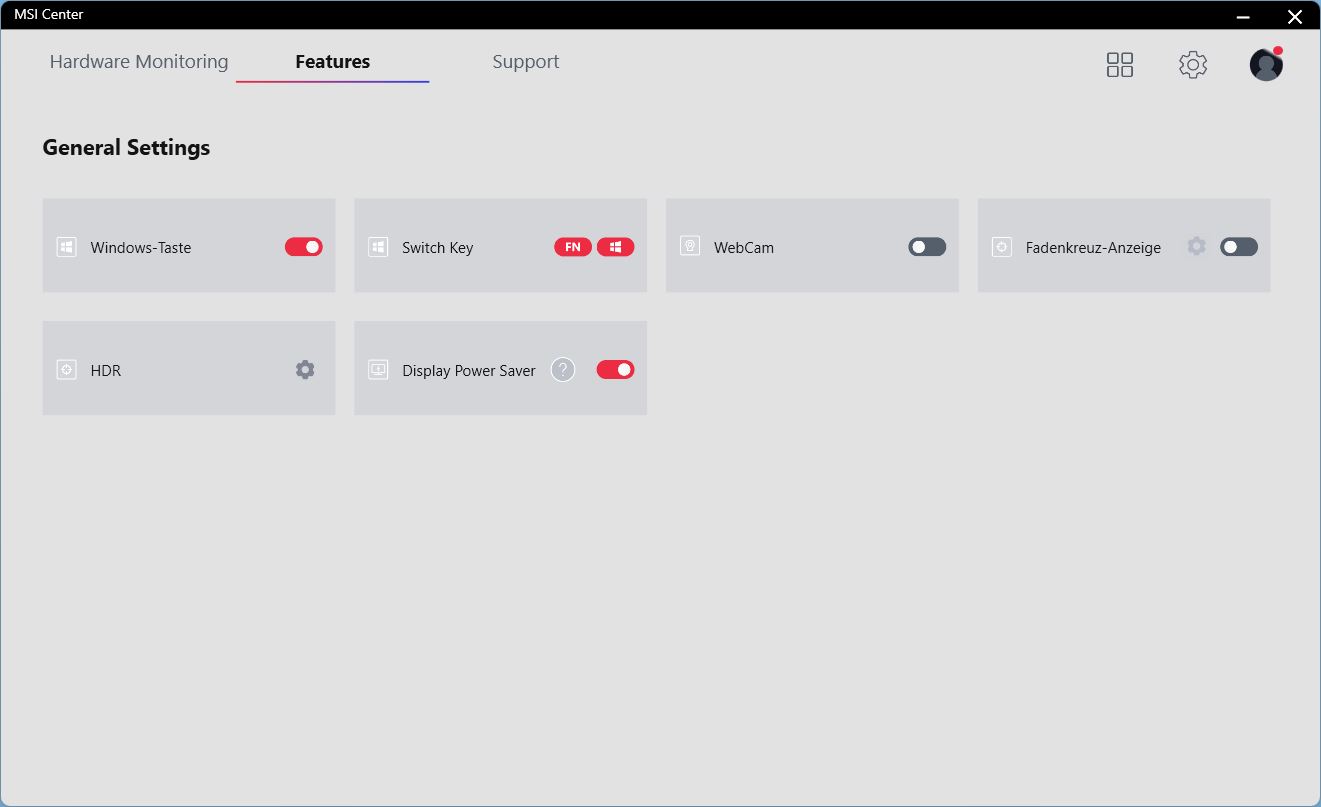
As typical for MSI, the Fn key is placed on the right instead of the left side, but it can switch functions with the Windows key on the left. The arrow keys also house special functions such as turning on the fan boost, turning off the display, or superimposing crosshairs.
The key labeling is easy to read and uses a futuristic font style that is probably supposed to attract gamers.
While there is a short stroke, the feedback is okay, allowing you to type easily and quickly. The keyboard doesn't bend annoyingly under pressure, and the typing noise is moderate.
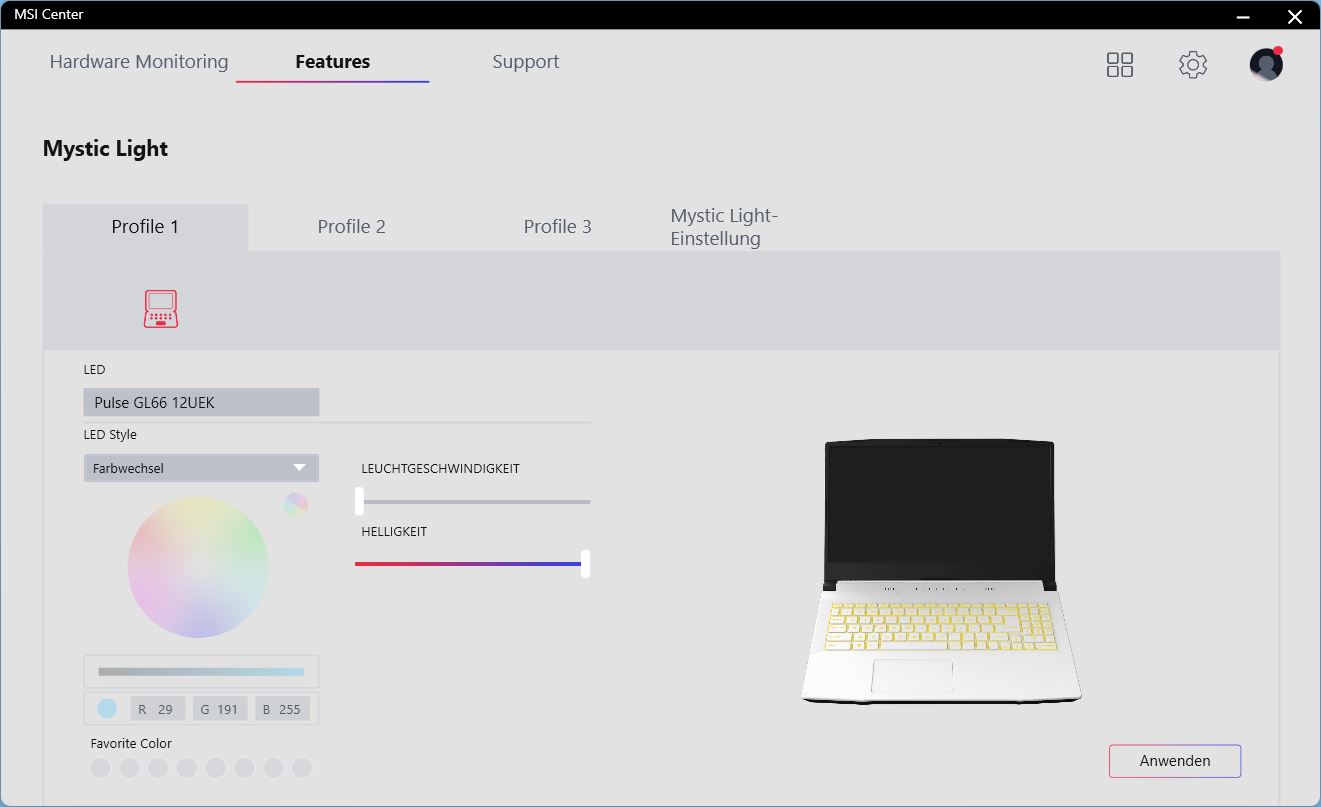
While there is a keyboard illumination, it only has a single zone. You can adjust the color and many other settings in the MSI Center.
Touchpad
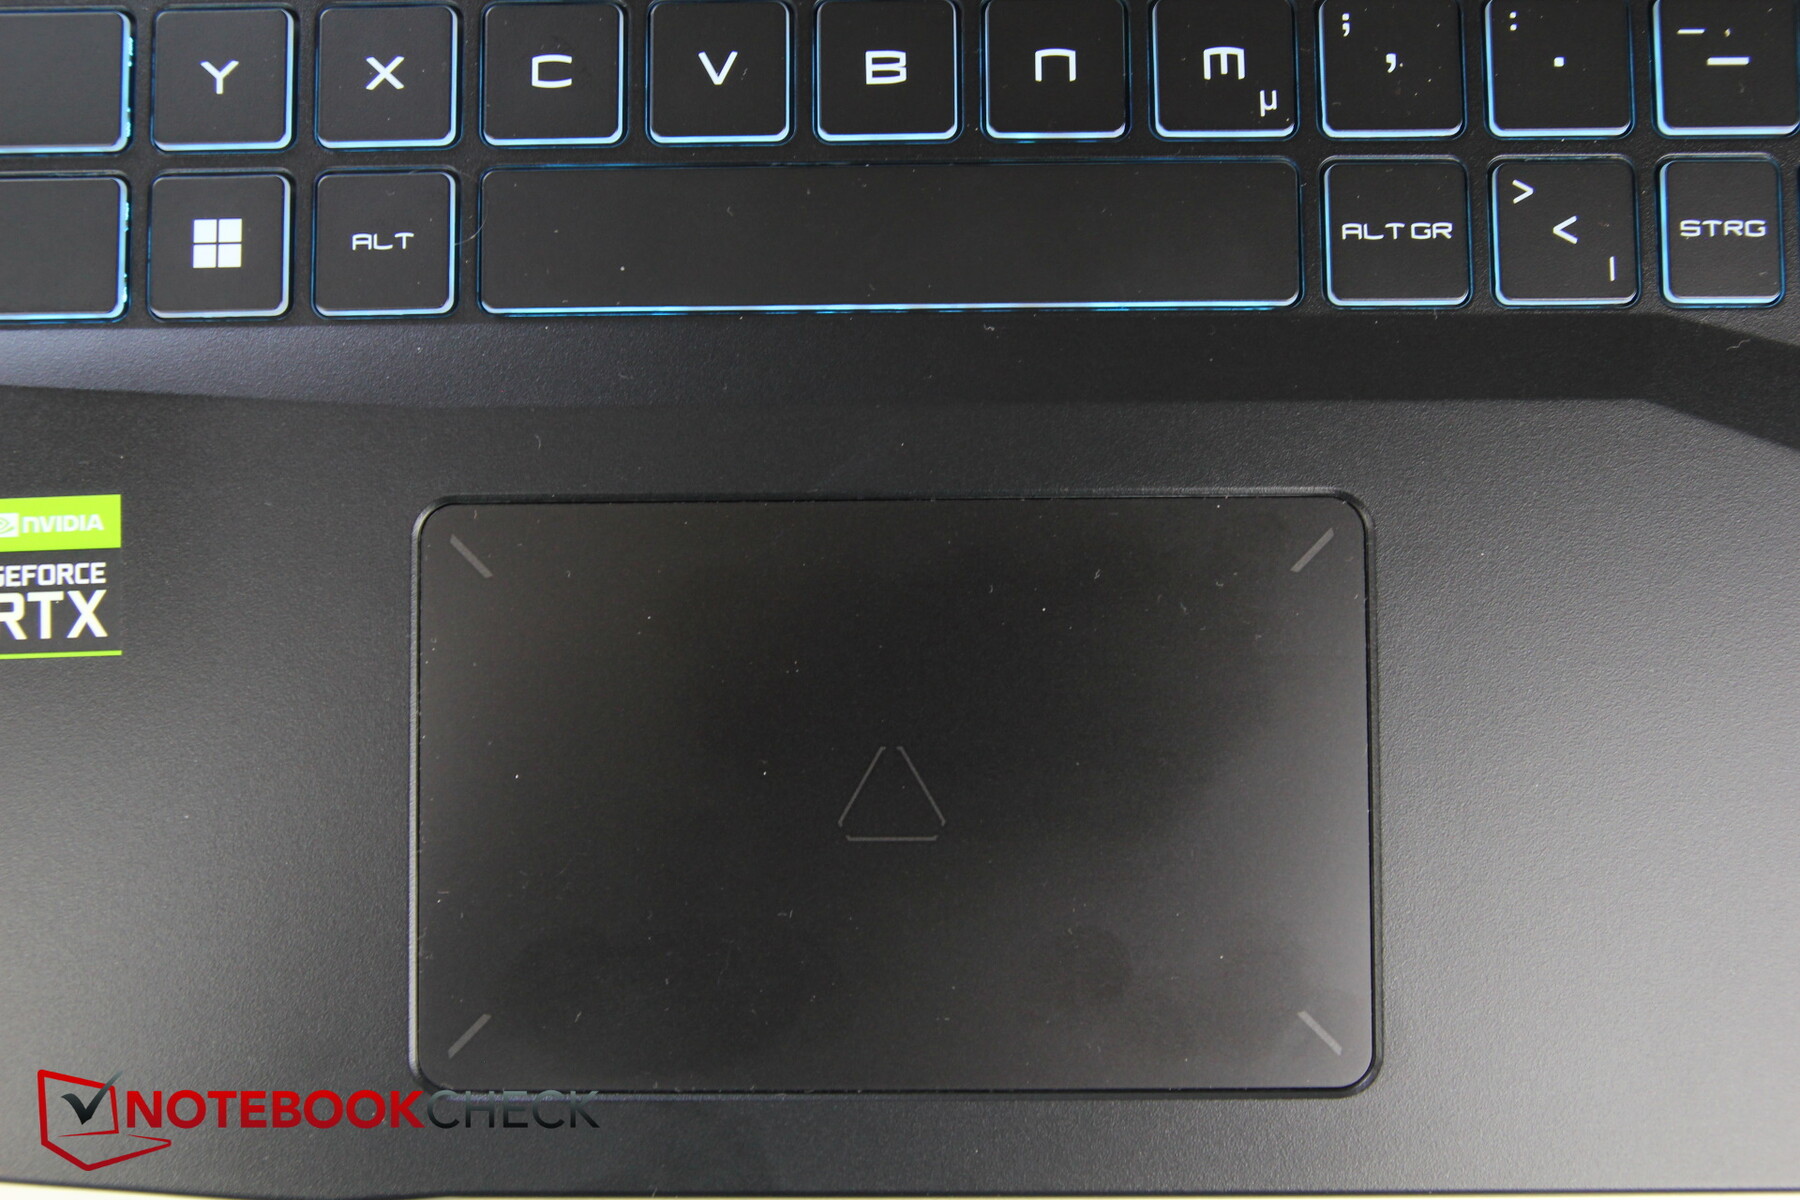
The touchpad doesn't look very large at about 10.5 x 6.5 cm (~4.1 x 2.6 in). While the surface is smooth, fingers can already stick a bit when they are only slightly wet. Multi-touch inputs still work very well.
The integrated mouse keys have a clear, very short, and crisp pressure point. They are slightly louder than the keyboard, but not to an extent that is particularly annoying.
Display

MSI uses a matte Full-HD IPS display with 144 Hz from AU Optronics. MSI already used this model last year, for example in the GF65 Thin. A large disadvantage of the panel is particularly its weak brightness of less than 250 nits. The brightness distribution is still within acceptable limits at 86%.
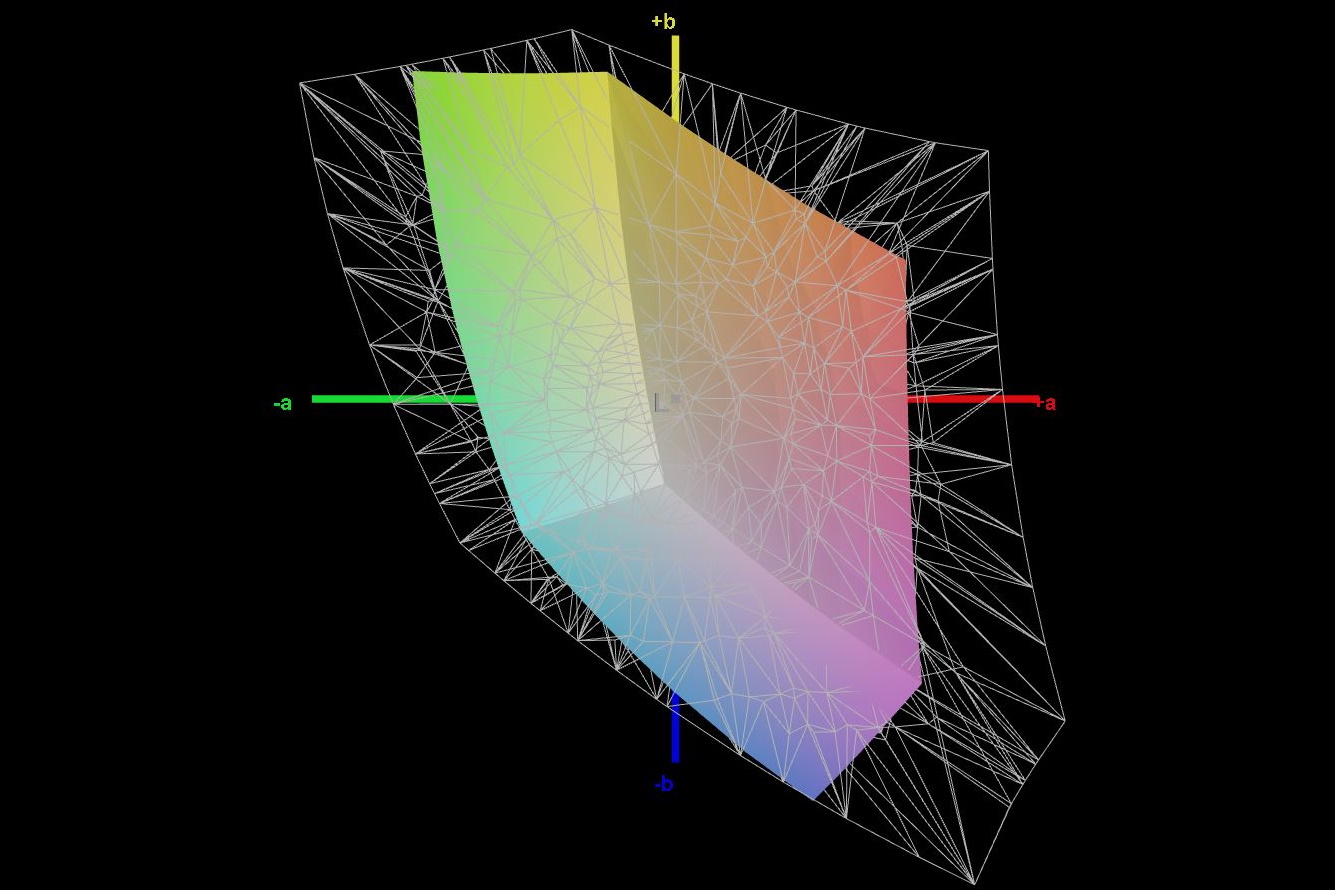
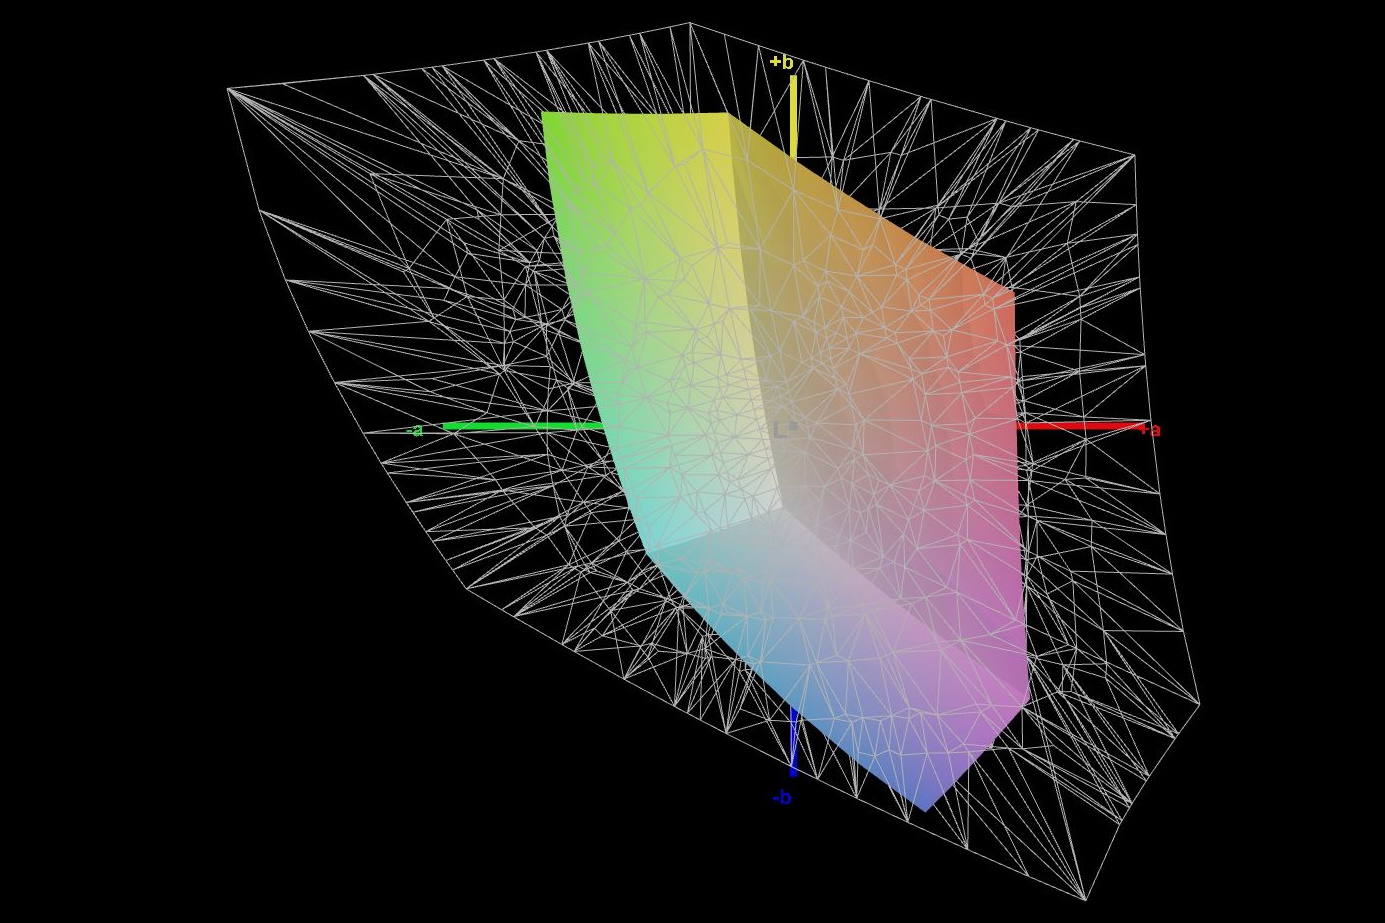
At least the black value is low and the contrast high, but at only 58% sRGB, the color space coverage turns out weak. The response times are also rather weak for a gaming laptop.
Unfortunately, it doesn't look like there are any other display options. At least the 17-inch Pulse offers a panel with 360 Hz, and hopefully that is also brighter.
While there is some screen bleeding at the top edge on the left, it is hardly noticeable.
| |||||||||||||||||||||||||
Brightness Distribution: 86 %
Center on Battery: 247 cd/m²
Contrast: 1908:1 (Black: 0.13 cd/m²)
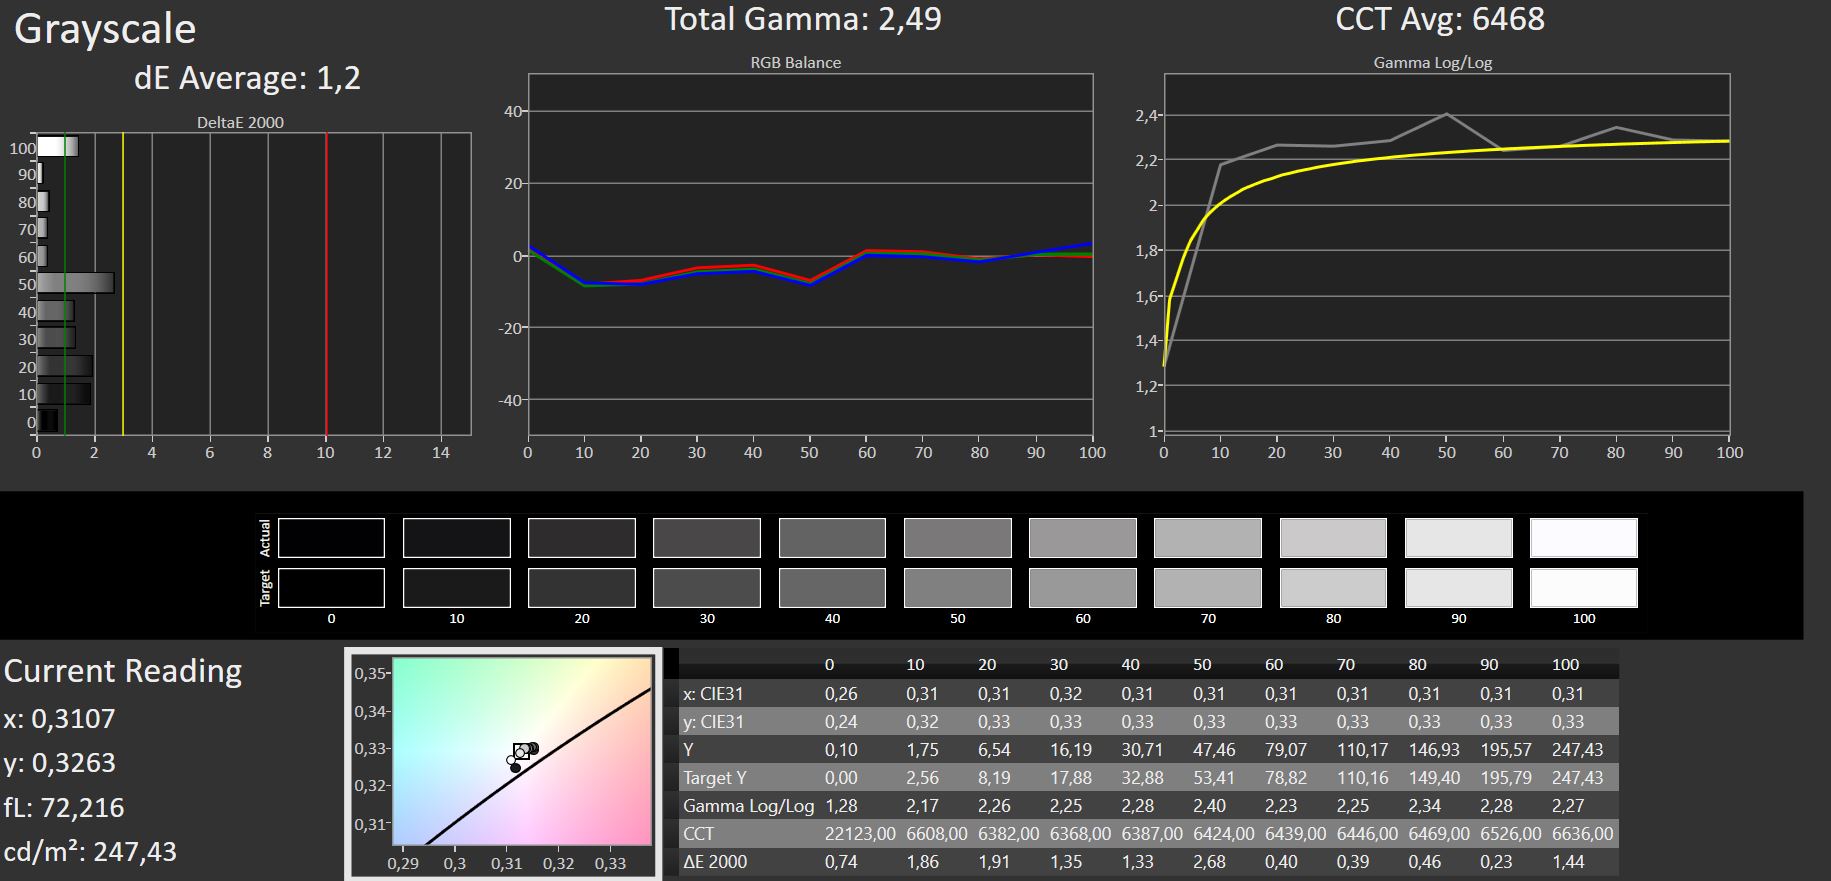
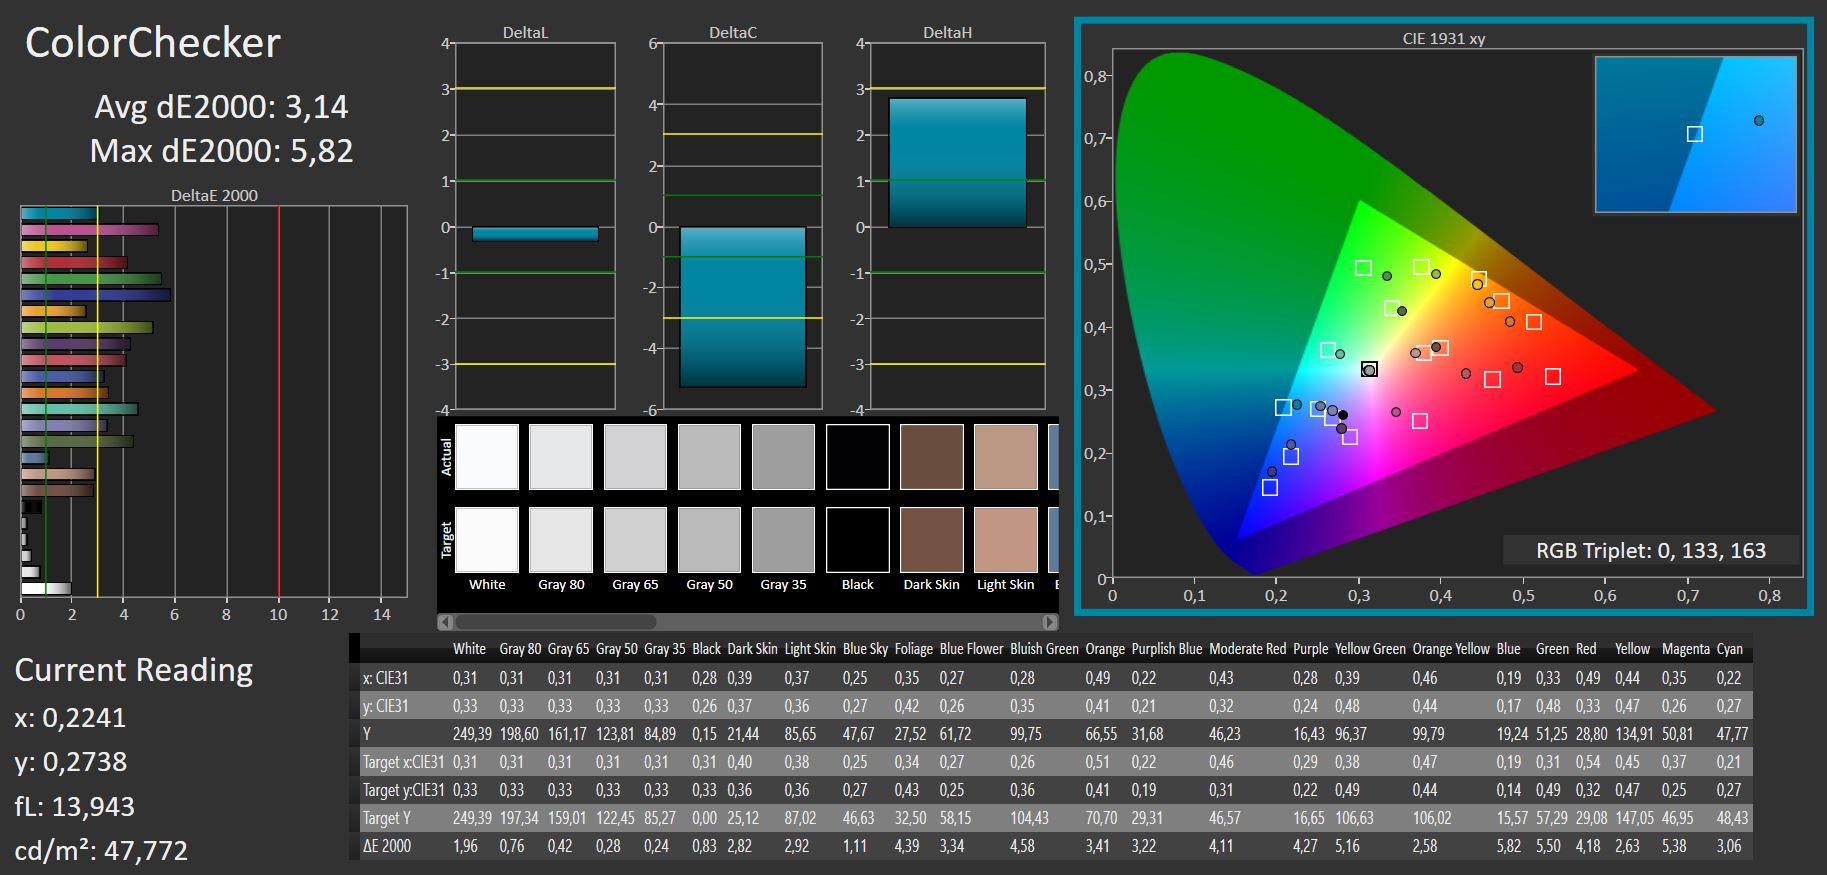
ΔE Color 3.14 | 0.5-29.43 Ø5, calibrated: 3.14
ΔE Greyscale 1.2 | 0.57-98 Ø5.3
40.3% AdobeRGB 1998 (Argyll 2.2.0 3D)
58.4% sRGB (Argyll 2.2.0 3D)
39% Display P3 (Argyll 2.2.0 3D)
Gamma: 2.49
| MSI Pulse GL66 12UEK AU Optronics B156HAN08.4 (AUOAF90), IPS, 1920x1080, 15.60 | Asus TUF Gaming F15 FX507ZM TL156VDXP0101, IPS, 1920x1080, 15.60 | Alienware x14 i7 RTX 3060 SHP154D, IPS, 1920x1080, 14.00 | SCHENKER XMG Apex 15 NH57E PS LG Philips LGD0625 (LP156WFG-SPB3), IPS, 1920x1080, 15.60 | Lenovo Legion S7 15ACH6 82K80030GE CSOT T3 MNF601EA1-6, IPS, 3840x2160, 15.60 | Alienware m15 R5 Ryzen Edition B156HAN, IPS, 1920x1080, 15.60 | |
|---|---|---|---|---|---|---|
| Display | 69% | 114% | 64% | 110% | ||
| Display P3 Coverage | 39 | 66.4 70% | 99.6 155% | 64.5 65% | 85.2 118% | |
| sRGB Coverage | 58.4 | 97 66% | 100 71% | 95.9 64% | 98.8 69% | |
| AdobeRGB 1998 Coverage | 40.3 | 68.5 70% | 87.6 117% | 65.8 63% | 98.2 144% | |
| Response Times | 70% | 74% | 60% | 31% | 80% | |
| Response Time Grey 50% / Grey 80% * | 38.8 ? | 5.6 ? 86% | 9.6 ? 75% | 15 61% | 31.6 ? 19% | 4 ? 90% |
| Response Time Black / White * | 28 ? | 12.8 ? 54% | 7.6 ? 73% | 11.6 59% | 16 ? 43% | 8.4 ? 70% |
| PWM Frequency | ||||||
| Screen | -3% | -24% | -40% | 30% | -12% | |
| Brightness middle | 248 | 353.7 43% | 434 75% | 393 58% | 607 145% | 329 33% |
| Brightness | 245 | 340 39% | 411 68% | 353 44% | 605 147% | 321 31% |
| Brightness Distribution | 86 | 89 3% | 89 3% | 83 -3% | 93 8% | 92 7% |
| Black Level * | 0.13 | 0.34 -162% | 0.25 -92% | 0.47 -262% | 0.41 -215% | 0.27 -108% |
| Contrast | 1908 | 1040 -45% | 1736 -9% | 836 -56% | 1480 -22% | 1219 -36% |
| Colorchecker dE 2000 * | 3.14 | 1.74 45% | 3 4% | 2.84 10% | 0.84 73% | 2.78 11% |
| Colorchecker dE 2000 max. * | 5.82 | 3.63 38% | 7.1 -22% | 7.15 -23% | 3.02 48% | 4.88 16% |
| Colorchecker dE 2000 calibrated * | 3.14 | 0.5 84% | 0.7 78% | 0.67 79% | 0.69 78% | 1.63 48% |
| Greyscale dE 2000 * | 1.2 | 2.1 -75% | 5.1 -325% | 3.73 -211% | 1.1 8% | 2.5 -108% |
| Gamma | 2.49 88% | 2.3 96% | 2.19 100% | 2.53 87% | 2.131 103% | 2.106 104% |
| CCT | 6468 100% | 6257 104% | 6204 105% | 7312 89% | 6648 98% | 6201 105% |
| Color Space (Percent of AdobeRGB 1998) | 76 | |||||
| Color Space (Percent of sRGB) | 99 | |||||
| Total Average (Program / Settings) | 45% /
23% | 55% /
19% | 28% /
-4% | 57% /
47% | 34% /
5% |
* ... smaller is better
At least the panel is already well calibrated in the state of delivery. The deviation in the grayscale is only 1.2. Accordingly, you can hardly get any improvements anymore by a manual calibration.
Display Response Times
| ↔ Response Time Black to White | ||
|---|---|---|
| 28 ms ... rise ↗ and fall ↘ combined | ↗ 14.6 ms rise | 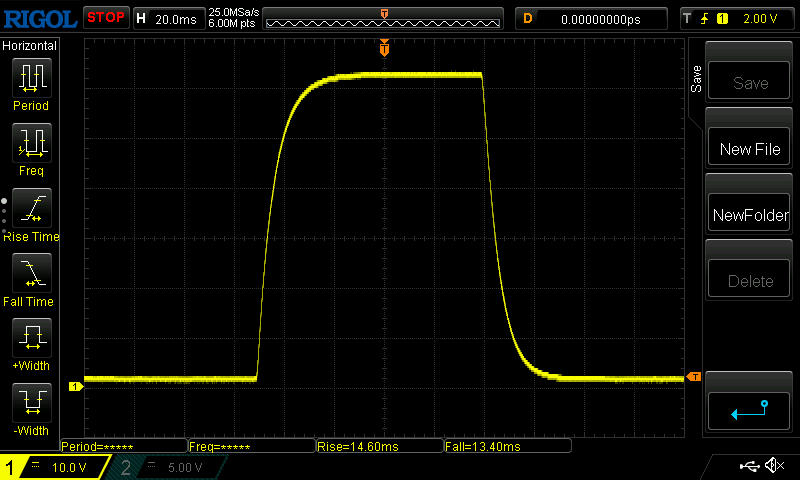 |
| ↘ 13.4 ms fall | ||
| The screen shows relatively slow response rates in our tests and may be too slow for gamers. In comparison, all tested devices range from 0.1 (minimum) to 240 (maximum) ms. » 67 % of all devices are better. This means that the measured response time is worse than the average of all tested devices (21.5 ms). | ||
| ↔ Response Time 50% Grey to 80% Grey | ||
| 38.8 ms ... rise ↗ and fall ↘ combined | ↗ 18.2 ms rise | 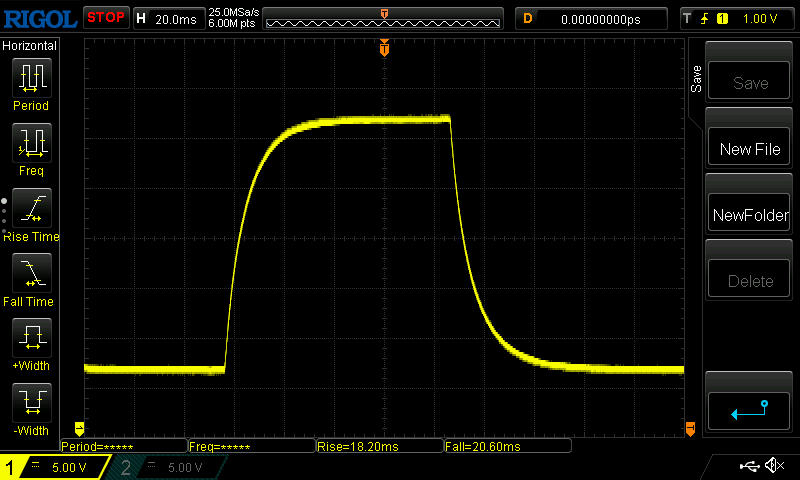 |
| ↘ 20.6 ms fall | ||
| The screen shows slow response rates in our tests and will be unsatisfactory for gamers. In comparison, all tested devices range from 0.2 (minimum) to 636 (maximum) ms. » 53 % of all devices are better. This means that the measured response time is worse than the average of all tested devices (33.7 ms). | ||
Screen Flickering / PWM (Pulse-Width Modulation)
| Screen flickering / PWM not detected | 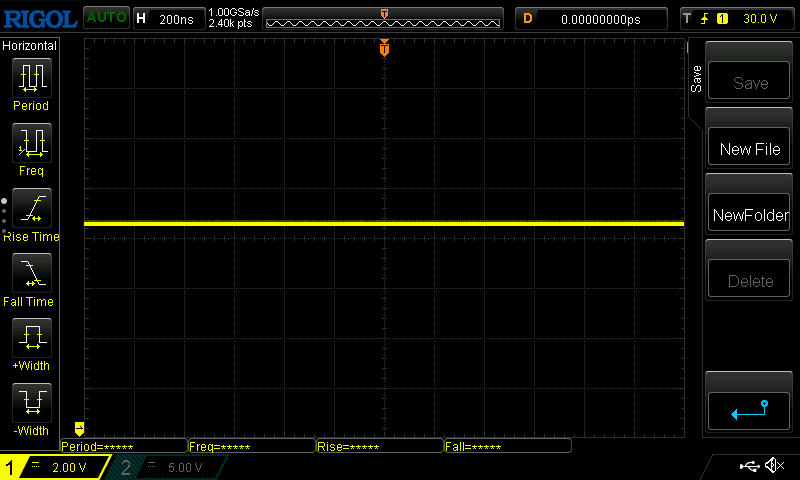 | ||
In comparison: 53 % of all tested devices do not use PWM to dim the display. If PWM was detected, an average of 17900 (minimum: 5 - maximum: 3846000) Hz was measured. | |||
Outdoors, particularly the low brightness will make things difficult, so seeking out less bright surroundings becomes therefore mandatory.
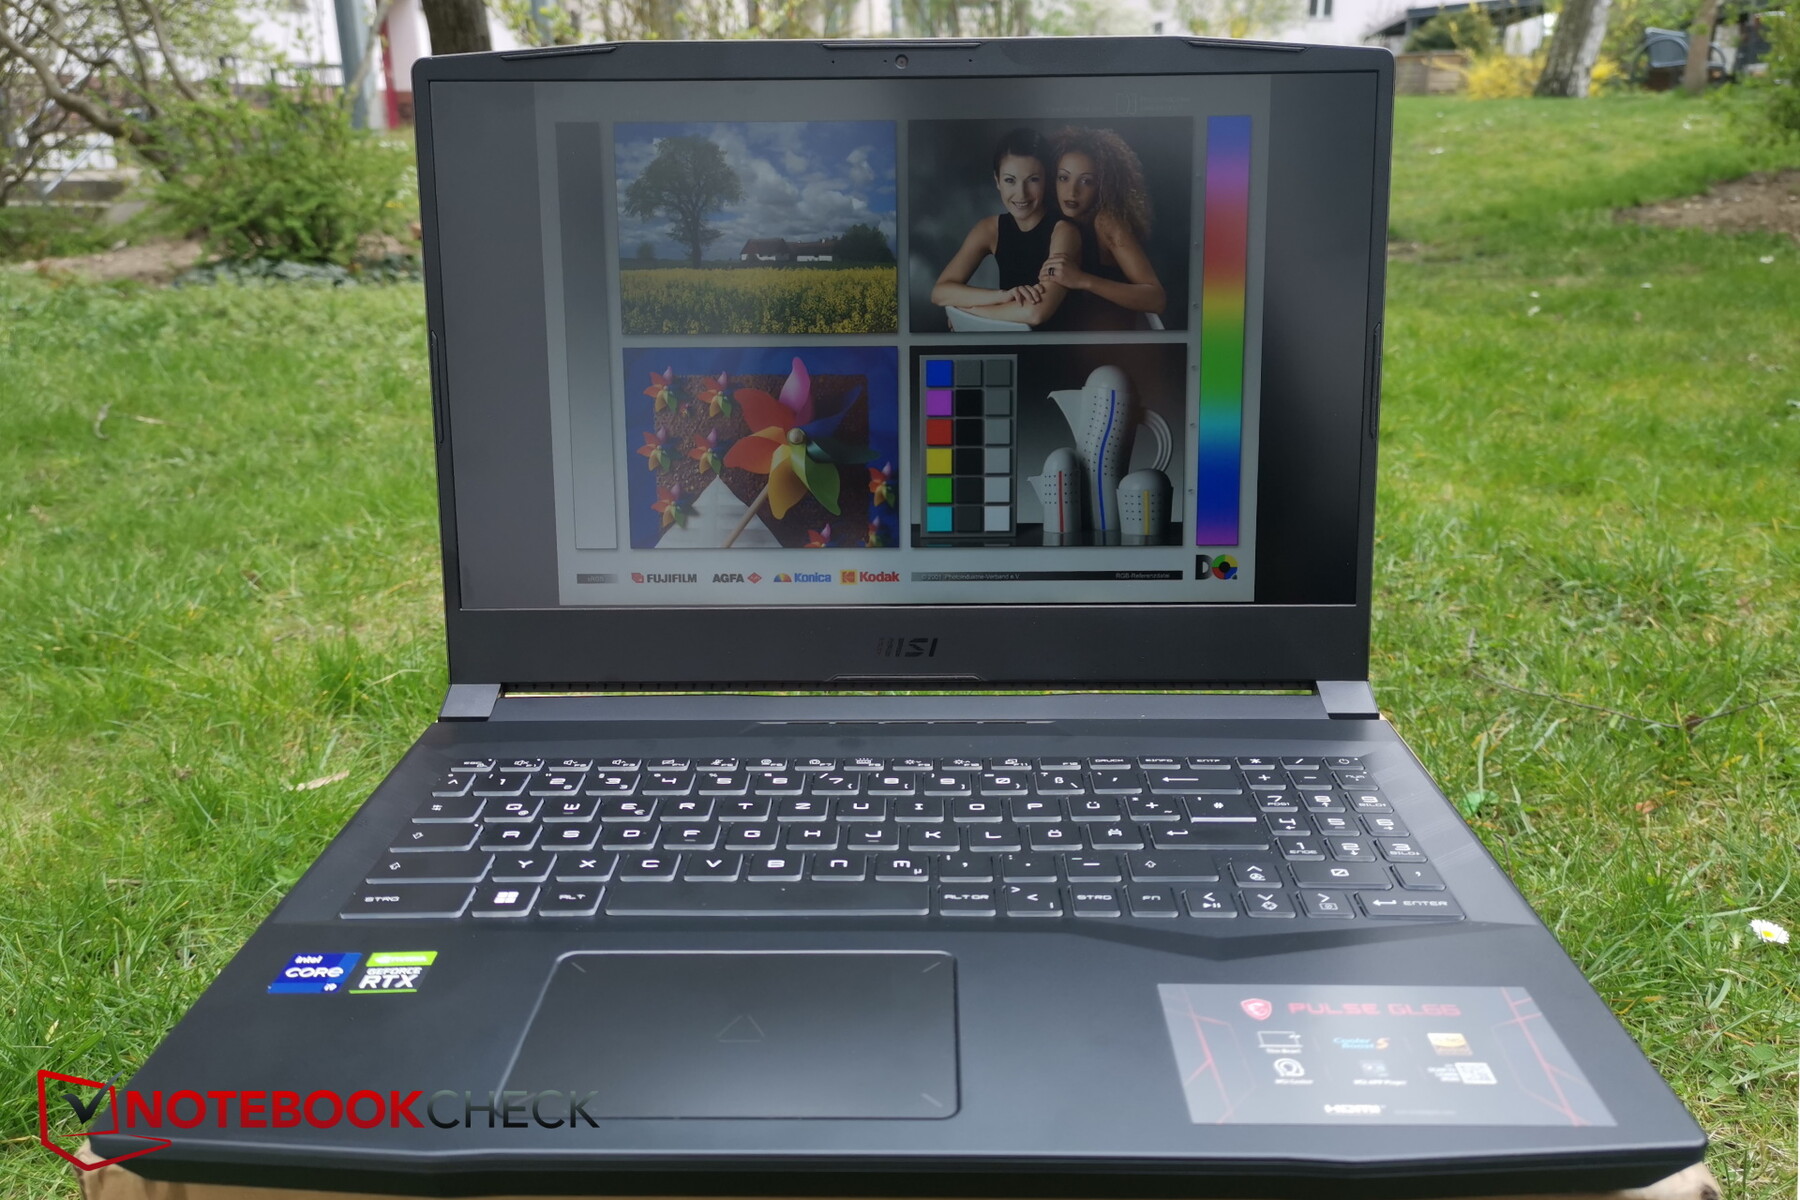
Even if IPS displays generally have fairly stable viewing angles, you can still notice a significant reduction in brightness when looking at our test unit from extreme viewing angles.

Performance
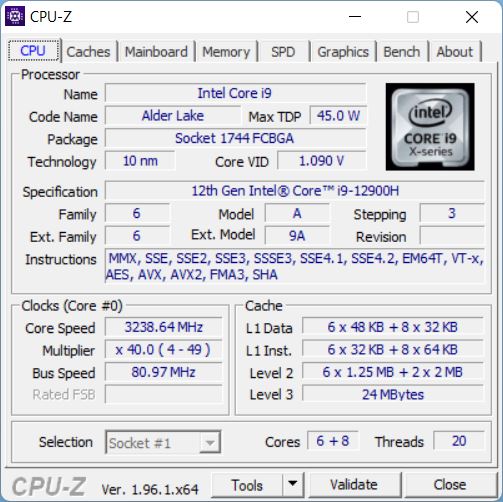
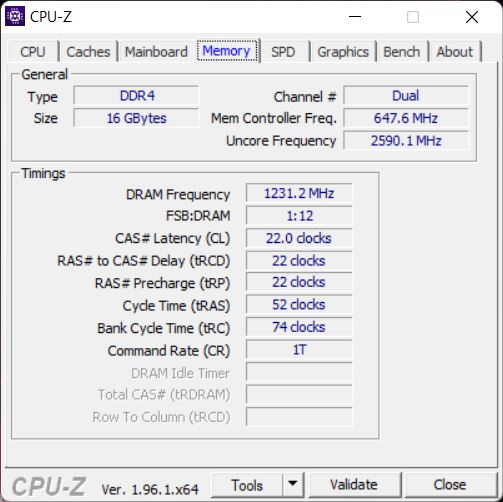
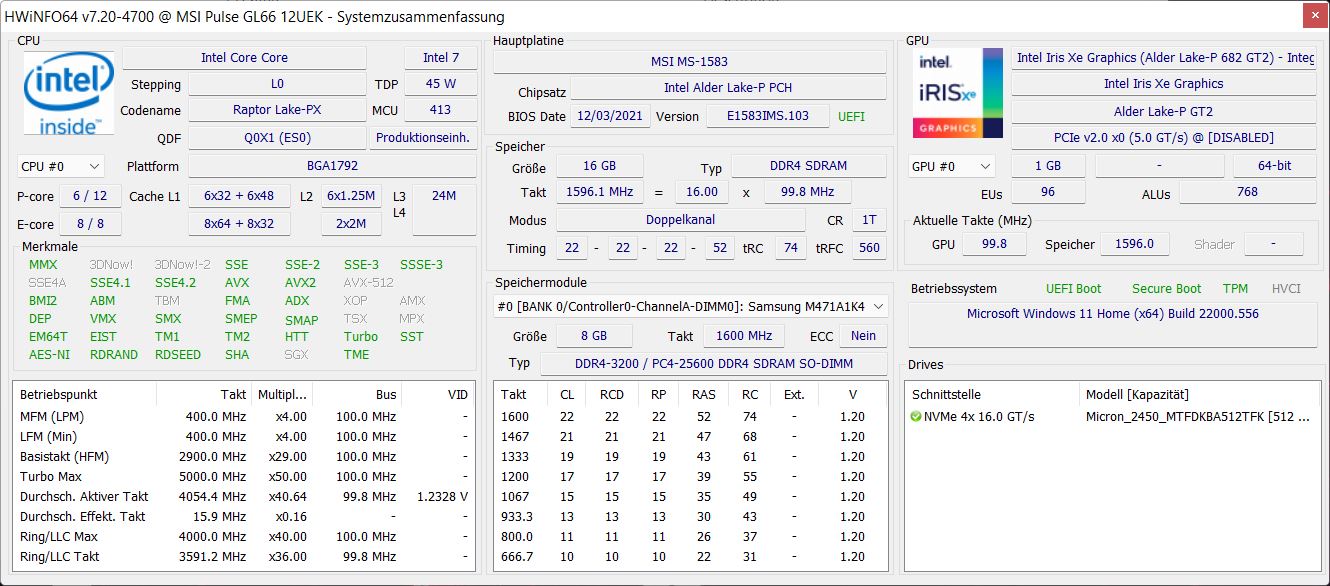
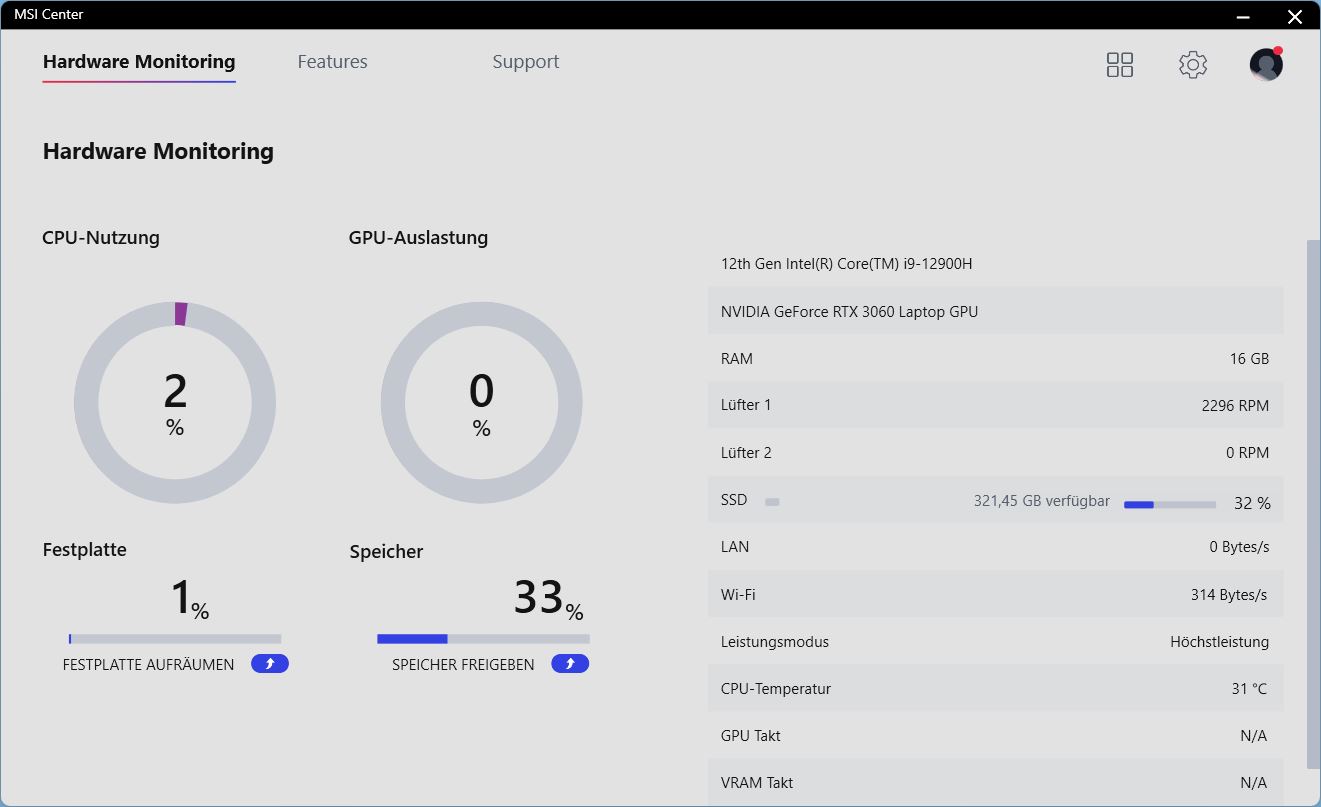
With its combination of an Intel Core i9-12900H and RTX 3060, the Pulse is clearly targeted for gamers. In addition, there are 16 GB of RAM, with MSI still using DDR4-RAM here. While costing about 1900 Euros (~$2057), the device still belongs to the lower midrange segment.
Test Conditions
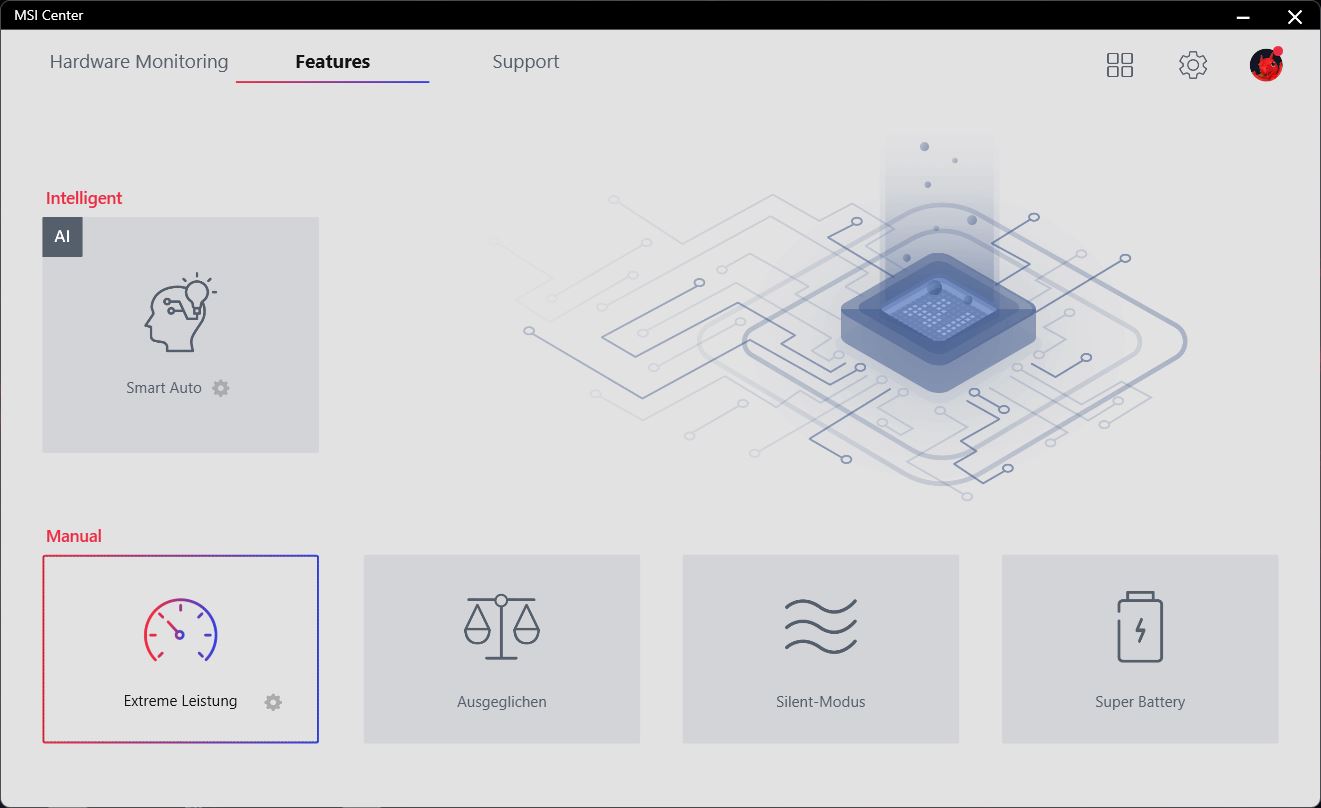
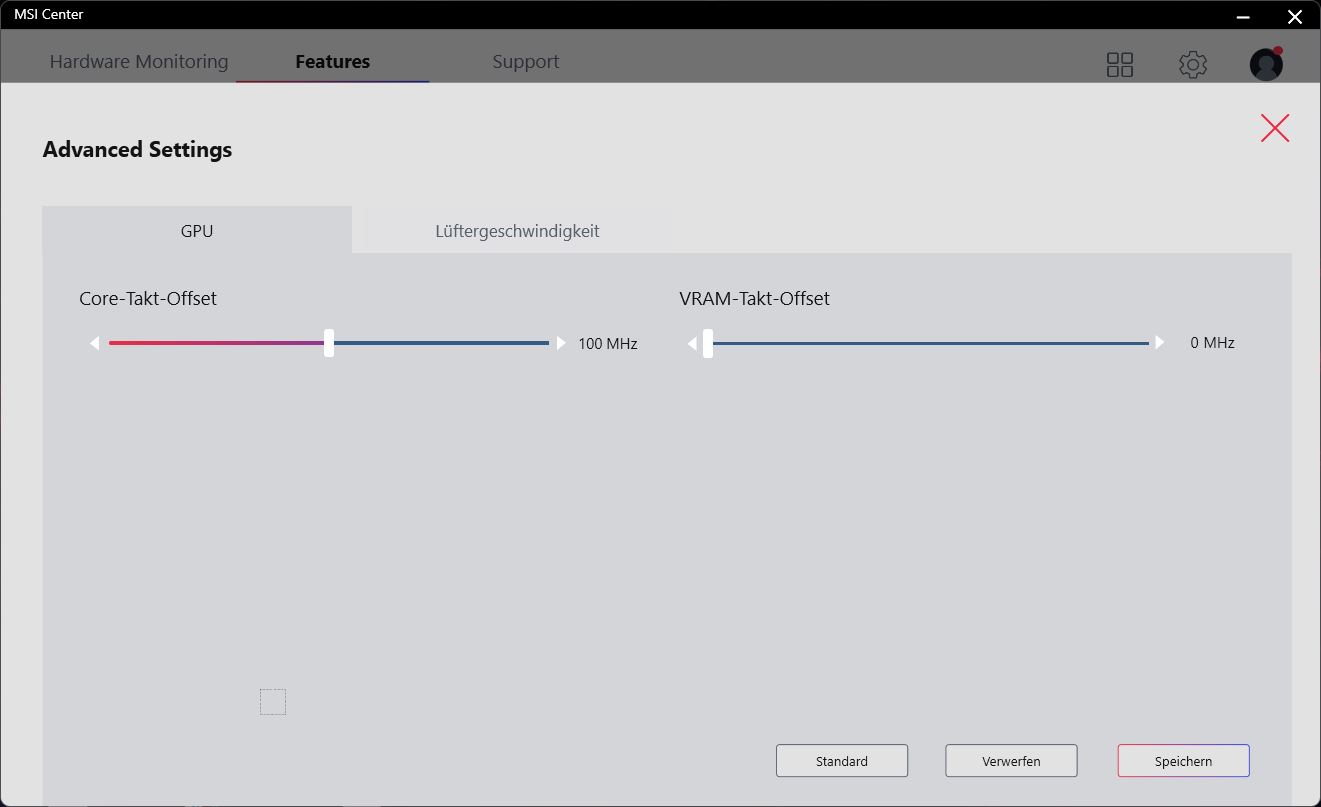
For the best benchmark results, we select the "Extreme Performance" mode in the MSI software. In the Advanced Settings, we use the Standard.
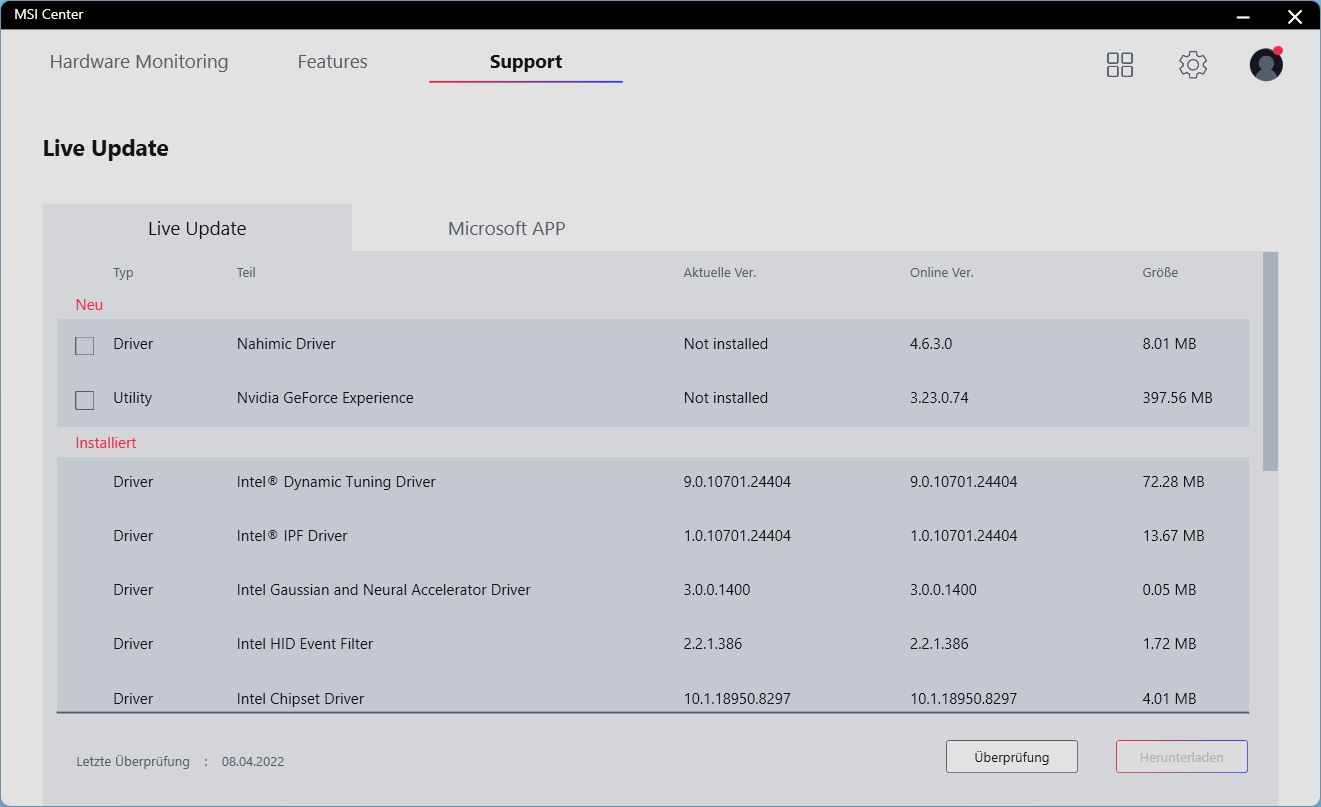
Users should get familiar with the MSI Center, since in addition to setting the fan profiles, you can also check the system for updates, configure the keyboard illumination, and adjust general settings and many more here. Of course, the manufacturer also gathers some user data here.
Processor
The Core i9-12900H is one of the top models of the current Alder Lake series from Intel, so it should fulfill all the demands from gamers. The CPU combines 6 performance and 8 efficiency cores and is able to operate on up to 20 threads simultaneously. The Turbo clock speed reaches up to 5 GHz.
The performance in the Cinebench loop is good, and the CPU is able to beat the predecessor generation with its AMD processors without any problems. However, the i9 in the Pulse is not significantly faster than the i7-12700H in some of the competing laptops. Particularly the Asus TUF F15 performs at least at eye level and in parts even slightly faster. MSI could have saved itself and its customers the additional premium for the significantly more expensive i9-12900H. On the other hand, the slim Alienware x14 with the i7-12700H is about 6 to 7 percent slower.
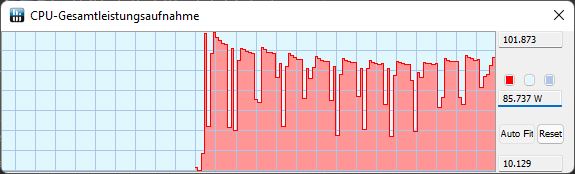
At the beginning of the first run, the TDP lies at around 100 watts, before its starts dropping and finally leveling out at 85 watts. However, it only rarely drops to the nominal 45 watts.
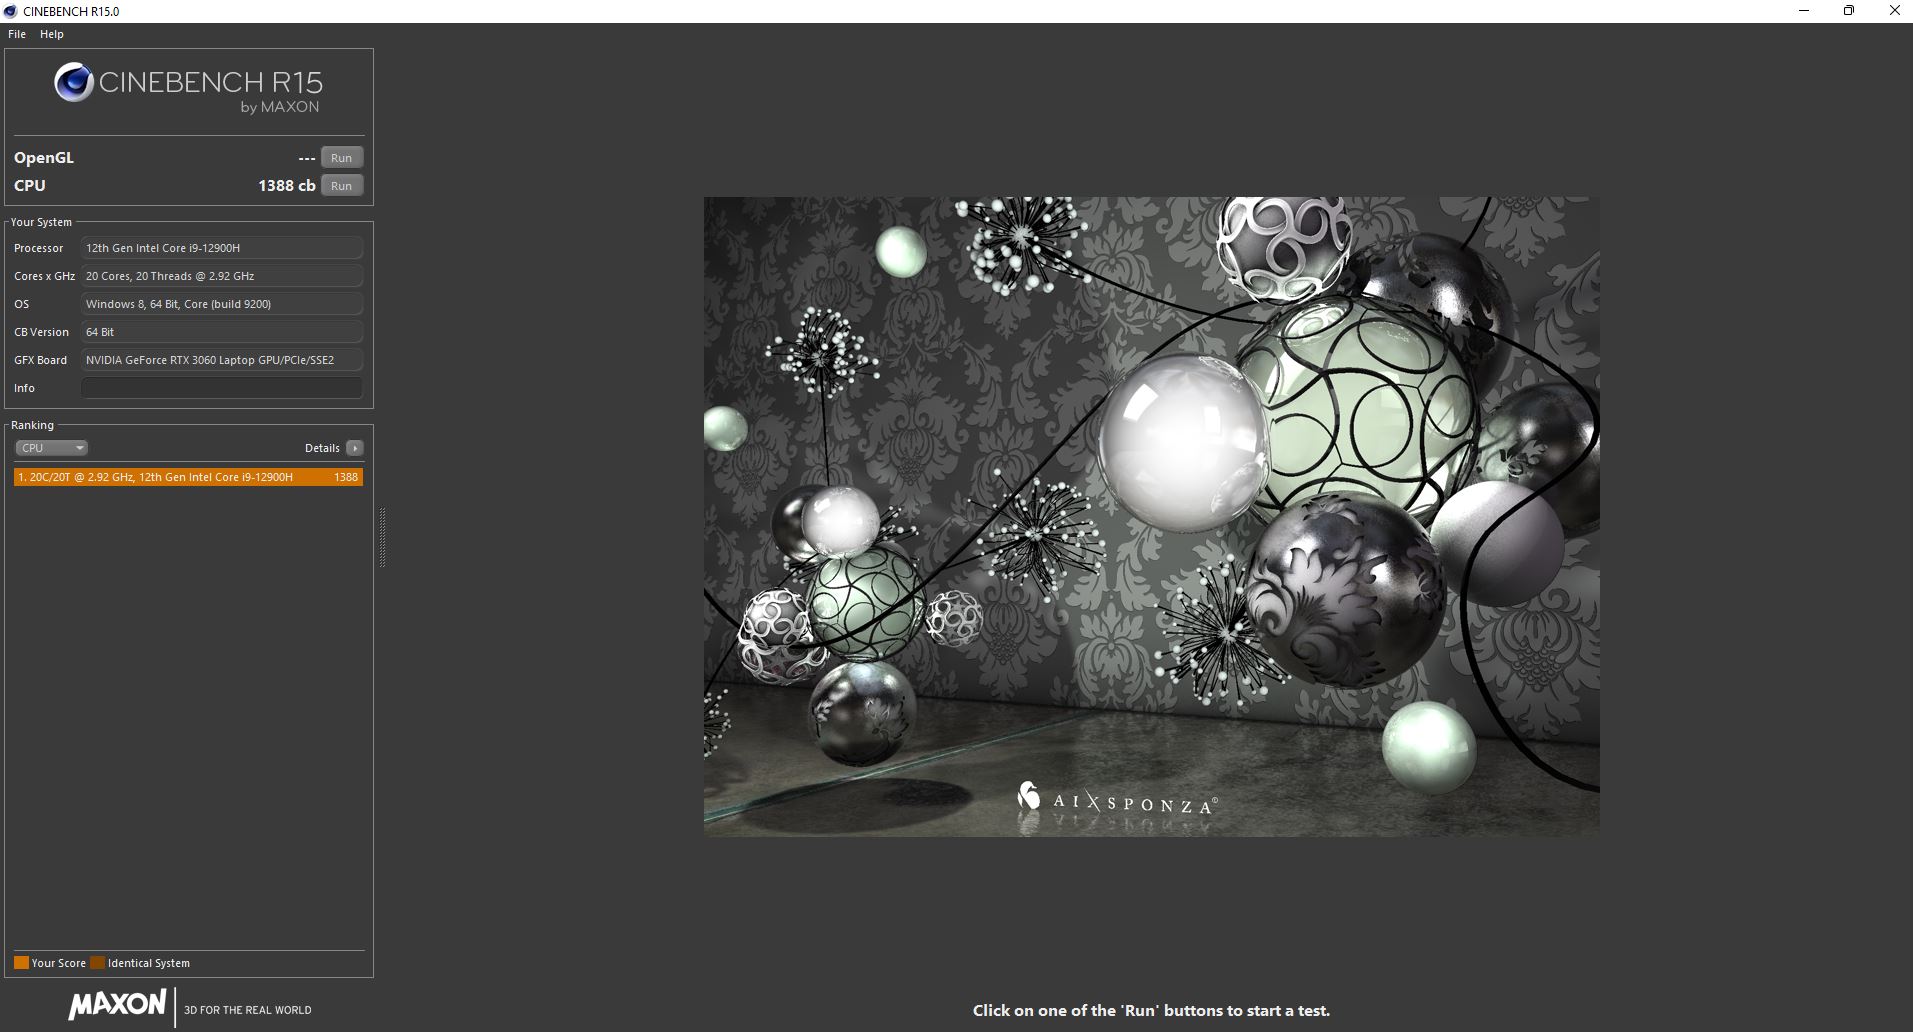
In battery operation, the Extreme Performance mode isn't available anymore and it changes to Balanced mode. In Cinebench, the performance drops by a whole 45% and only reaches 1388 points!
Cinebench R15 Multi Constant Load Test
Cinebench R23: Multi Core | Single Core
Cinebench R20: CPU (Multi Core) | CPU (Single Core)
Cinebench R15: CPU Multi 64Bit | CPU Single 64Bit
Blender: v2.79 BMW27 CPU
7-Zip 18.03: 7z b 4 | 7z b 4 -mmt1
Geekbench 5.5: Multi-Core | Single-Core
HWBOT x265 Benchmark v2.2: 4k Preset
LibreOffice : 20 Documents To PDF
R Benchmark 2.5: Overall mean
| CPU Performance Rating | |
| Average of class Gaming | |
| MSI Pulse GL66 12UEK | |
| Asus TUF Gaming F15 FX507ZM | |
| Alienware x14 i7 RTX 3060 | |
| Average Intel Core i9-12900H | |
| Lenovo Legion S7 15ACH6 82K80030GE | |
| SCHENKER XMG Apex 15 NH57E PS | |
| Alienware m15 R5 Ryzen Edition | |
| Cinebench R23 / Multi Core | |
| Average of class Gaming (2435 - 34613, n=232, last 2 years) | |
| Asus TUF Gaming F15 FX507ZM | |
| MSI Pulse GL66 12UEK | |
| Alienware x14 i7 RTX 3060 | |
| Average Intel Core i9-12900H (7359 - 19648, n=26) | |
| Lenovo Legion S7 15ACH6 82K80030GE | |
| SCHENKER XMG Apex 15 NH57E PS | |
| Alienware m15 R5 Ryzen Edition | |
| Cinebench R23 / Single Core | |
| MSI Pulse GL66 12UEK | |
| Average Intel Core i9-12900H (1634 - 1921, n=26) | |
| Average of class Gaming (527 - 2235, n=230, last 2 years) | |
| Asus TUF Gaming F15 FX507ZM | |
| Alienware x14 i7 RTX 3060 | |
| Lenovo Legion S7 15ACH6 82K80030GE | |
| Alienware m15 R5 Ryzen Edition | |
| SCHENKER XMG Apex 15 NH57E PS | |
| Cinebench R20 / CPU (Multi Core) | |
| Average of class Gaming (930 - 13769, n=230, last 2 years) | |
| Asus TUF Gaming F15 FX507ZM | |
| MSI Pulse GL66 12UEK | |
| Alienware x14 i7 RTX 3060 | |
| Average Intel Core i9-12900H (2681 - 7471, n=26) | |
| Lenovo Legion S7 15ACH6 82K80030GE | |
| SCHENKER XMG Apex 15 NH57E PS | |
| Alienware m15 R5 Ryzen Edition | |
| Cinebench R20 / CPU (Single Core) | |
| MSI Pulse GL66 12UEK | |
| Average Intel Core i9-12900H (624 - 738, n=26) | |
| Average of class Gaming (169 - 855, n=230, last 2 years) | |
| Alienware x14 i7 RTX 3060 | |
| Asus TUF Gaming F15 FX507ZM | |
| Lenovo Legion S7 15ACH6 82K80030GE | |
| Alienware m15 R5 Ryzen Edition | |
| SCHENKER XMG Apex 15 NH57E PS | |
| Cinebench R15 / CPU Multi 64Bit | |
| Average of class Gaming (400 - 5663, n=235, last 2 years) | |
| Asus TUF Gaming F15 FX507ZM | |
| MSI Pulse GL66 12UEK | |
| Alienware x14 i7 RTX 3060 | |
| Average Intel Core i9-12900H (1395 - 3077, n=26) | |
| Lenovo Legion S7 15ACH6 82K80030GE | |
| SCHENKER XMG Apex 15 NH57E PS | |
| Alienware m15 R5 Ryzen Edition | |
| Cinebench R15 / CPU Single 64Bit | |
| MSI Pulse GL66 12UEK | |
| Average of class Gaming (79.2 - 318, n=234, last 2 years) | |
| Average Intel Core i9-12900H (235 - 277, n=27) | |
| Asus TUF Gaming F15 FX507ZM | |
| Alienware x14 i7 RTX 3060 | |
| Lenovo Legion S7 15ACH6 82K80030GE | |
| Alienware m15 R5 Ryzen Edition | |
| SCHENKER XMG Apex 15 NH57E PS | |
| Blender / v2.79 BMW27 CPU | |
| Alienware m15 R5 Ryzen Edition | |
| SCHENKER XMG Apex 15 NH57E PS | |
| Average Intel Core i9-12900H (160 - 451, n=26) | |
| Lenovo Legion S7 15ACH6 82K80030GE | |
| Alienware x14 i7 RTX 3060 | |
| Average of class Gaming (87 - 1259, n=228, last 2 years) | |
| MSI Pulse GL66 12UEK | |
| Asus TUF Gaming F15 FX507ZM | |
| 7-Zip 18.03 / 7z b 4 | |
| Average of class Gaming (11386 - 140932, n=229, last 2 years) | |
| Asus TUF Gaming F15 FX507ZM | |
| Alienware x14 i7 RTX 3060 | |
| MSI Pulse GL66 12UEK | |
| Average Intel Core i9-12900H (34684 - 76677, n=26) | |
| Lenovo Legion S7 15ACH6 82K80030GE | |
| SCHENKER XMG Apex 15 NH57E PS | |
| Alienware m15 R5 Ryzen Edition | |
| 7-Zip 18.03 / 7z b 4 -mmt1 | |
| Average of class Gaming (2685 - 7581, n=229, last 2 years) | |
| MSI Pulse GL66 12UEK | |
| Average Intel Core i9-12900H (5302 - 6289, n=26) | |
| Lenovo Legion S7 15ACH6 82K80030GE | |
| Alienware x14 i7 RTX 3060 | |
| Alienware m15 R5 Ryzen Edition | |
| SCHENKER XMG Apex 15 NH57E PS | |
| Asus TUF Gaming F15 FX507ZM | |
| Geekbench 5.5 / Multi-Core | |
| Average of class Gaming (1946 - 22200, n=234, last 2 years) | |
| Alienware x14 i7 RTX 3060 | |
| Asus TUF Gaming F15 FX507ZM | |
| Average Intel Core i9-12900H (8519 - 14376, n=28) | |
| MSI Pulse GL66 12UEK | |
| Lenovo Legion S7 15ACH6 82K80030GE | |
| SCHENKER XMG Apex 15 NH57E PS | |
| Alienware m15 R5 Ryzen Edition | |
| Geekbench 5.5 / Single-Core | |
| MSI Pulse GL66 12UEK | |
| Average of class Gaming (158 - 2210, n=234, last 2 years) | |
| Alienware x14 i7 RTX 3060 | |
| Average Intel Core i9-12900H (1631 - 1892, n=28) | |
| Asus TUF Gaming F15 FX507ZM | |
| Lenovo Legion S7 15ACH6 82K80030GE | |
| SCHENKER XMG Apex 15 NH57E PS | |
| Alienware m15 R5 Ryzen Edition | |
| HWBOT x265 Benchmark v2.2 / 4k Preset | |
| Average of class Gaming (3 - 37.6, n=232, last 2 years) | |
| Asus TUF Gaming F15 FX507ZM | |
| MSI Pulse GL66 12UEK | |
| Alienware x14 i7 RTX 3060 | |
| Average Intel Core i9-12900H (8.05 - 22.5, n=26) | |
| Lenovo Legion S7 15ACH6 82K80030GE | |
| SCHENKER XMG Apex 15 NH57E PS | |
| Alienware m15 R5 Ryzen Edition | |
| LibreOffice / 20 Documents To PDF | |
| Lenovo Legion S7 15ACH6 82K80030GE | |
| Alienware m15 R5 Ryzen Edition | |
| SCHENKER XMG Apex 15 NH57E PS | |
| Asus TUF Gaming F15 FX507ZM | |
| Average of class Gaming (32.8 - 332, n=226, last 2 years) | |
| Average Intel Core i9-12900H (36.8 - 59.8, n=26) | |
| MSI Pulse GL66 12UEK | |
| Alienware x14 i7 RTX 3060 | |
| R Benchmark 2.5 / Overall mean | |
| Alienware m15 R5 Ryzen Edition | |
| SCHENKER XMG Apex 15 NH57E PS | |
| Lenovo Legion S7 15ACH6 82K80030GE | |
| Average of class Gaming (0.3609 - 4.47, n=229, last 2 years) | |
| Asus TUF Gaming F15 FX507ZM | |
| Alienware x14 i7 RTX 3060 | |
| Average Intel Core i9-12900H (0.4218 - 0.506, n=26) | |
| MSI Pulse GL66 12UEK | |
* ... smaller is better
AIDA64: FP32 Ray-Trace | FPU Julia | CPU SHA3 | CPU Queen | FPU SinJulia | FPU Mandel | CPU AES | CPU ZLib | FP64 Ray-Trace | CPU PhotoWorxx
| Performance Rating | |
| Average of class Gaming | |
| Lenovo Legion S7 15ACH6 82K80030GE | |
| SCHENKER XMG Apex 15 NH57E PS | |
| Alienware m15 R5 Ryzen Edition | |
| Average Intel Core i9-12900H | |
| Asus TUF Gaming F15 FX507ZM | |
| MSI Pulse GL66 12UEK | |
| Alienware x14 i7 RTX 3060 | |
| AIDA64 / FP32 Ray-Trace | |
| Average of class Gaming (3069 - 60169, n=225, last 2 years) | |
| Lenovo Legion S7 15ACH6 82K80030GE | |
| SCHENKER XMG Apex 15 NH57E PS | |
| Alienware m15 R5 Ryzen Edition | |
| Average Intel Core i9-12900H (4074 - 18289, n=26) | |
| Asus TUF Gaming F15 FX507ZM | |
| MSI Pulse GL66 12UEK | |
| Alienware x14 i7 RTX 3060 | |
| AIDA64 / FPU Julia | |
| Lenovo Legion S7 15ACH6 82K80030GE | |
| SCHENKER XMG Apex 15 NH57E PS | |
| Average of class Gaming (18567 - 252486, n=225, last 2 years) | |
| Alienware m15 R5 Ryzen Edition | |
| Average Intel Core i9-12900H (22307 - 93236, n=26) | |
| Asus TUF Gaming F15 FX507ZM | |
| MSI Pulse GL66 12UEK | |
| Alienware x14 i7 RTX 3060 | |
| AIDA64 / CPU SHA3 | |
| Average of class Gaming (629 - 10389, n=225, last 2 years) | |
| Lenovo Legion S7 15ACH6 82K80030GE | |
| Asus TUF Gaming F15 FX507ZM | |
| SCHENKER XMG Apex 15 NH57E PS | |
| MSI Pulse GL66 12UEK | |
| Alienware m15 R5 Ryzen Edition | |
| Average Intel Core i9-12900H (1378 - 4215, n=26) | |
| Alienware x14 i7 RTX 3060 | |
| AIDA64 / CPU Queen | |
| Average of class Gaming (15371 - 200651, n=225, last 2 years) | |
| MSI Pulse GL66 12UEK | |
| Lenovo Legion S7 15ACH6 82K80030GE | |
| Average Intel Core i9-12900H (78172 - 111241, n=26) | |
| Alienware x14 i7 RTX 3060 | |
| Asus TUF Gaming F15 FX507ZM | |
| SCHENKER XMG Apex 15 NH57E PS | |
| Alienware m15 R5 Ryzen Edition | |
| AIDA64 / FPU SinJulia | |
| Lenovo Legion S7 15ACH6 82K80030GE | |
| Average of class Gaming (2137 - 32988, n=225, last 2 years) | |
| SCHENKER XMG Apex 15 NH57E PS | |
| Alienware m15 R5 Ryzen Edition | |
| MSI Pulse GL66 12UEK | |
| Asus TUF Gaming F15 FX507ZM | |
| Alienware x14 i7 RTX 3060 | |
| Average Intel Core i9-12900H (5709 - 10410, n=26) | |
| AIDA64 / FPU Mandel | |
| Lenovo Legion S7 15ACH6 82K80030GE | |
| SCHENKER XMG Apex 15 NH57E PS | |
| Average of class Gaming (10291 - 134044, n=225, last 2 years) | |
| Alienware m15 R5 Ryzen Edition | |
| Average Intel Core i9-12900H (11257 - 45581, n=26) | |
| Asus TUF Gaming F15 FX507ZM | |
| MSI Pulse GL66 12UEK | |
| Alienware x14 i7 RTX 3060 | |
| AIDA64 / CPU AES | |
| Lenovo Legion S7 15ACH6 82K80030GE | |
| SCHENKER XMG Apex 15 NH57E PS | |
| Alienware m15 R5 Ryzen Edition | |
| Average of class Gaming (19065 - 328679, n=225, last 2 years) | |
| MSI Pulse GL66 12UEK | |
| Alienware x14 i7 RTX 3060 | |
| Average Intel Core i9-12900H (31935 - 151546, n=26) | |
| Asus TUF Gaming F15 FX507ZM | |
| AIDA64 / CPU ZLib | |
| Average of class Gaming (150.9 - 2409, n=225, last 2 years) | |
| Asus TUF Gaming F15 FX507ZM | |
| MSI Pulse GL66 12UEK | |
| Alienware x14 i7 RTX 3060 | |
| Average Intel Core i9-12900H (449 - 1193, n=26) | |
| Lenovo Legion S7 15ACH6 82K80030GE | |
| SCHENKER XMG Apex 15 NH57E PS | |
| Alienware m15 R5 Ryzen Edition | |
| AIDA64 / FP64 Ray-Trace | |
| Average of class Gaming (1518 - 31796, n=225, last 2 years) | |
| Lenovo Legion S7 15ACH6 82K80030GE | |
| SCHENKER XMG Apex 15 NH57E PS | |
| Alienware m15 R5 Ryzen Edition | |
| Average Intel Core i9-12900H (2235 - 10511, n=26) | |
| Asus TUF Gaming F15 FX507ZM | |
| MSI Pulse GL66 12UEK | |
| Alienware x14 i7 RTX 3060 | |
| AIDA64 / CPU PhotoWorxx | |
| Alienware x14 i7 RTX 3060 | |
| Average of class Gaming (10805 - 60161, n=226, last 2 years) | |
| Average Intel Core i9-12900H (20960 - 48269, n=27) | |
| Asus TUF Gaming F15 FX507ZM | |
| MSI Pulse GL66 12UEK | |
| SCHENKER XMG Apex 15 NH57E PS | |
| Lenovo Legion S7 15ACH6 82K80030GE | |
| Alienware m15 R5 Ryzen Edition | |
System Performance
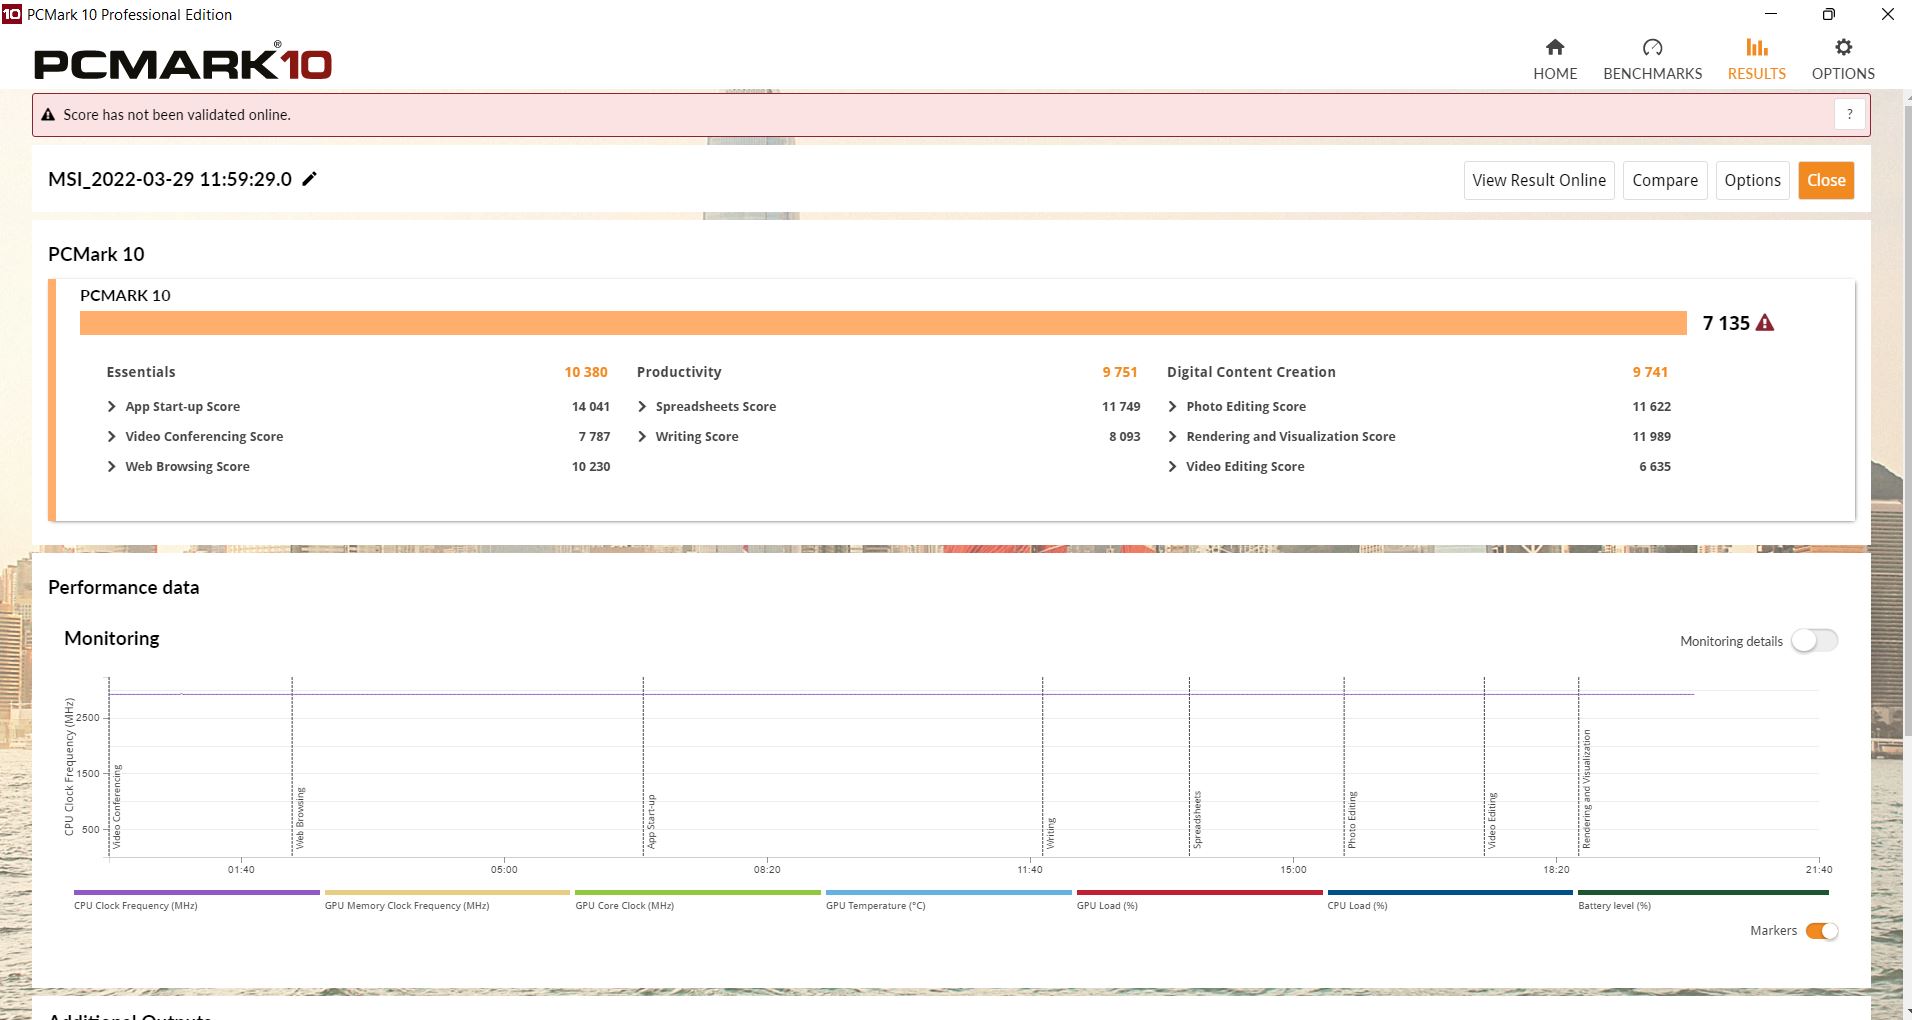
In the PCMark 10 Productivity benchmark, the Pulse places first, but in the other areas, it is slightly surpassed by the Asus TUF Gaming 15 and sometimes also the Alienware X14. On the other hand, in CrossMark our test unit also finishes ahead of the X14.
CrossMark: Overall | Productivity | Creativity | Responsiveness
| PCMark 10 / Score | |
| Average of class Gaming (5235 - 9852, n=200, last 2 years) | |
| Average Intel Core i9-12900H, NVIDIA GeForce RTX 3060 Laptop GPU (7135 - 7861, n=4) | |
| Asus TUF Gaming F15 FX507ZM | |
| Alienware x14 i7 RTX 3060 | |
| MSI Pulse GL66 12UEK | |
| SCHENKER XMG Apex 15 NH57E PS | |
| Lenovo Legion S7 15ACH6 82K80030GE | |
| Alienware m15 R5 Ryzen Edition | |
| PCMark 10 / Essentials | |
| Average Intel Core i9-12900H, NVIDIA GeForce RTX 3060 Laptop GPU (10380 - 11198, n=4) | |
| Average of class Gaming (8300 - 12334, n=199, last 2 years) | |
| Asus TUF Gaming F15 FX507ZM | |
| MSI Pulse GL66 12UEK | |
| Alienware x14 i7 RTX 3060 | |
| SCHENKER XMG Apex 15 NH57E PS | |
| Lenovo Legion S7 15ACH6 82K80030GE | |
| Alienware m15 R5 Ryzen Edition | |
| PCMark 10 / Productivity | |
| Average Intel Core i9-12900H, NVIDIA GeForce RTX 3060 Laptop GPU (9751 - 10486, n=4) | |
| MSI Pulse GL66 12UEK | |
| Average of class Gaming (6662 - 11833, n=199, last 2 years) | |
| Alienware x14 i7 RTX 3060 | |
| Asus TUF Gaming F15 FX507ZM | |
| Alienware m15 R5 Ryzen Edition | |
| Lenovo Legion S7 15ACH6 82K80030GE | |
| SCHENKER XMG Apex 15 NH57E PS | |
| PCMark 10 / Digital Content Creation | |
| Asus TUF Gaming F15 FX507ZM | |
| Average of class Gaming (6462 - 18475, n=199, last 2 years) | |
| Average Intel Core i9-12900H, NVIDIA GeForce RTX 3060 Laptop GPU (9741 - 11226, n=4) | |
| Alienware x14 i7 RTX 3060 | |
| MSI Pulse GL66 12UEK | |
| SCHENKER XMG Apex 15 NH57E PS | |
| Lenovo Legion S7 15ACH6 82K80030GE | |
| Alienware m15 R5 Ryzen Edition | |
| CrossMark / Overall | |
| MSI Pulse GL66 12UEK | |
| Average Intel Core i9-12900H, NVIDIA GeForce RTX 3060 Laptop GPU (1789 - 2096, n=4) | |
| Alienware x14 i7 RTX 3060 | |
| Average of class Gaming (1247 - 2334, n=170, last 2 years) | |
| CrossMark / Productivity | |
| MSI Pulse GL66 12UEK | |
| Average Intel Core i9-12900H, NVIDIA GeForce RTX 3060 Laptop GPU (1677 - 2062, n=4) | |
| Alienware x14 i7 RTX 3060 | |
| Average of class Gaming (1299 - 2204, n=170, last 2 years) | |
| CrossMark / Creativity | |
| Average Intel Core i9-12900H, NVIDIA GeForce RTX 3060 Laptop GPU (2032 - 2125, n=4) | |
| MSI Pulse GL66 12UEK | |
| Alienware x14 i7 RTX 3060 | |
| Average of class Gaming (1275 - 2514, n=170, last 2 years) | |
| CrossMark / Responsiveness | |
| MSI Pulse GL66 12UEK | |
| Average Intel Core i9-12900H, NVIDIA GeForce RTX 3060 Laptop GPU (1486 - 2230, n=4) | |
| Alienware x14 i7 RTX 3060 | |
| Average of class Gaming (1030 - 2330, n=170, last 2 years) | |
| PCMark 10 Score | 7135 points | |
Help | ||
| AIDA64 / Memory Copy | |
| Alienware x14 i7 RTX 3060 | |
| Average of class Gaming (21842 - 92565, n=225, last 2 years) | |
| Average Intel Core i9-12900H (34438 - 74264, n=26) | |
| Asus TUF Gaming F15 FX507ZM | |
| MSI Pulse GL66 12UEK | |
| SCHENKER XMG Apex 15 NH57E PS | |
| Lenovo Legion S7 15ACH6 82K80030GE | |
| Alienware m15 R5 Ryzen Edition | |
| AIDA64 / Memory Read | |
| Alienware x14 i7 RTX 3060 | |
| Average of class Gaming (24879 - 90647, n=225, last 2 years) | |
| Average Intel Core i9-12900H (36365 - 74642, n=26) | |
| Asus TUF Gaming F15 FX507ZM | |
| MSI Pulse GL66 12UEK | |
| SCHENKER XMG Apex 15 NH57E PS | |
| Lenovo Legion S7 15ACH6 82K80030GE | |
| Alienware m15 R5 Ryzen Edition | |
| AIDA64 / Memory Write | |
| Alienware x14 i7 RTX 3060 | |
| Average of class Gaming (21619 - 103259, n=225, last 2 years) | |
| Average Intel Core i9-12900H (32276 - 67858, n=26) | |
| Asus TUF Gaming F15 FX507ZM | |
| MSI Pulse GL66 12UEK | |
| SCHENKER XMG Apex 15 NH57E PS | |
| Lenovo Legion S7 15ACH6 82K80030GE | |
| Alienware m15 R5 Ryzen Edition | |
| AIDA64 / Memory Latency | |
| Alienware x14 i7 RTX 3060 | |
| MSI Pulse GL66 12UEK | |
| Average of class Gaming (59.5 - 152.5, n=222, last 2 years) | |
| Average Intel Core i9-12900H (74.7 - 118.1, n=25) | |
| Lenovo Legion S7 15ACH6 82K80030GE | |
| Alienware m15 R5 Ryzen Edition | |
| SCHENKER XMG Apex 15 NH57E PS | |
| Asus TUF Gaming F15 FX507ZM | |
* ... smaller is better
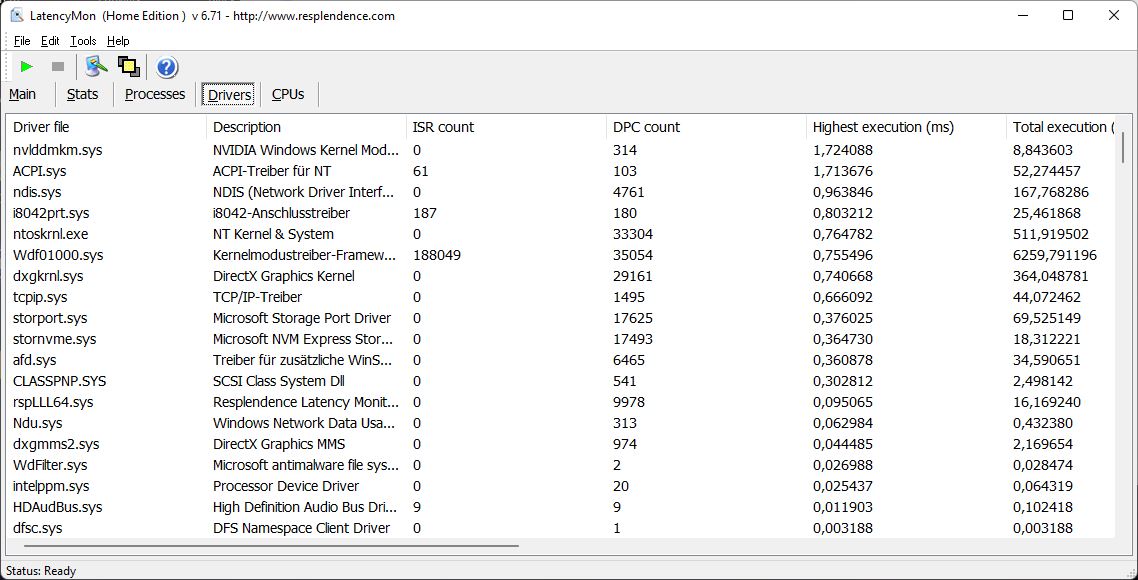
DPC Latencies
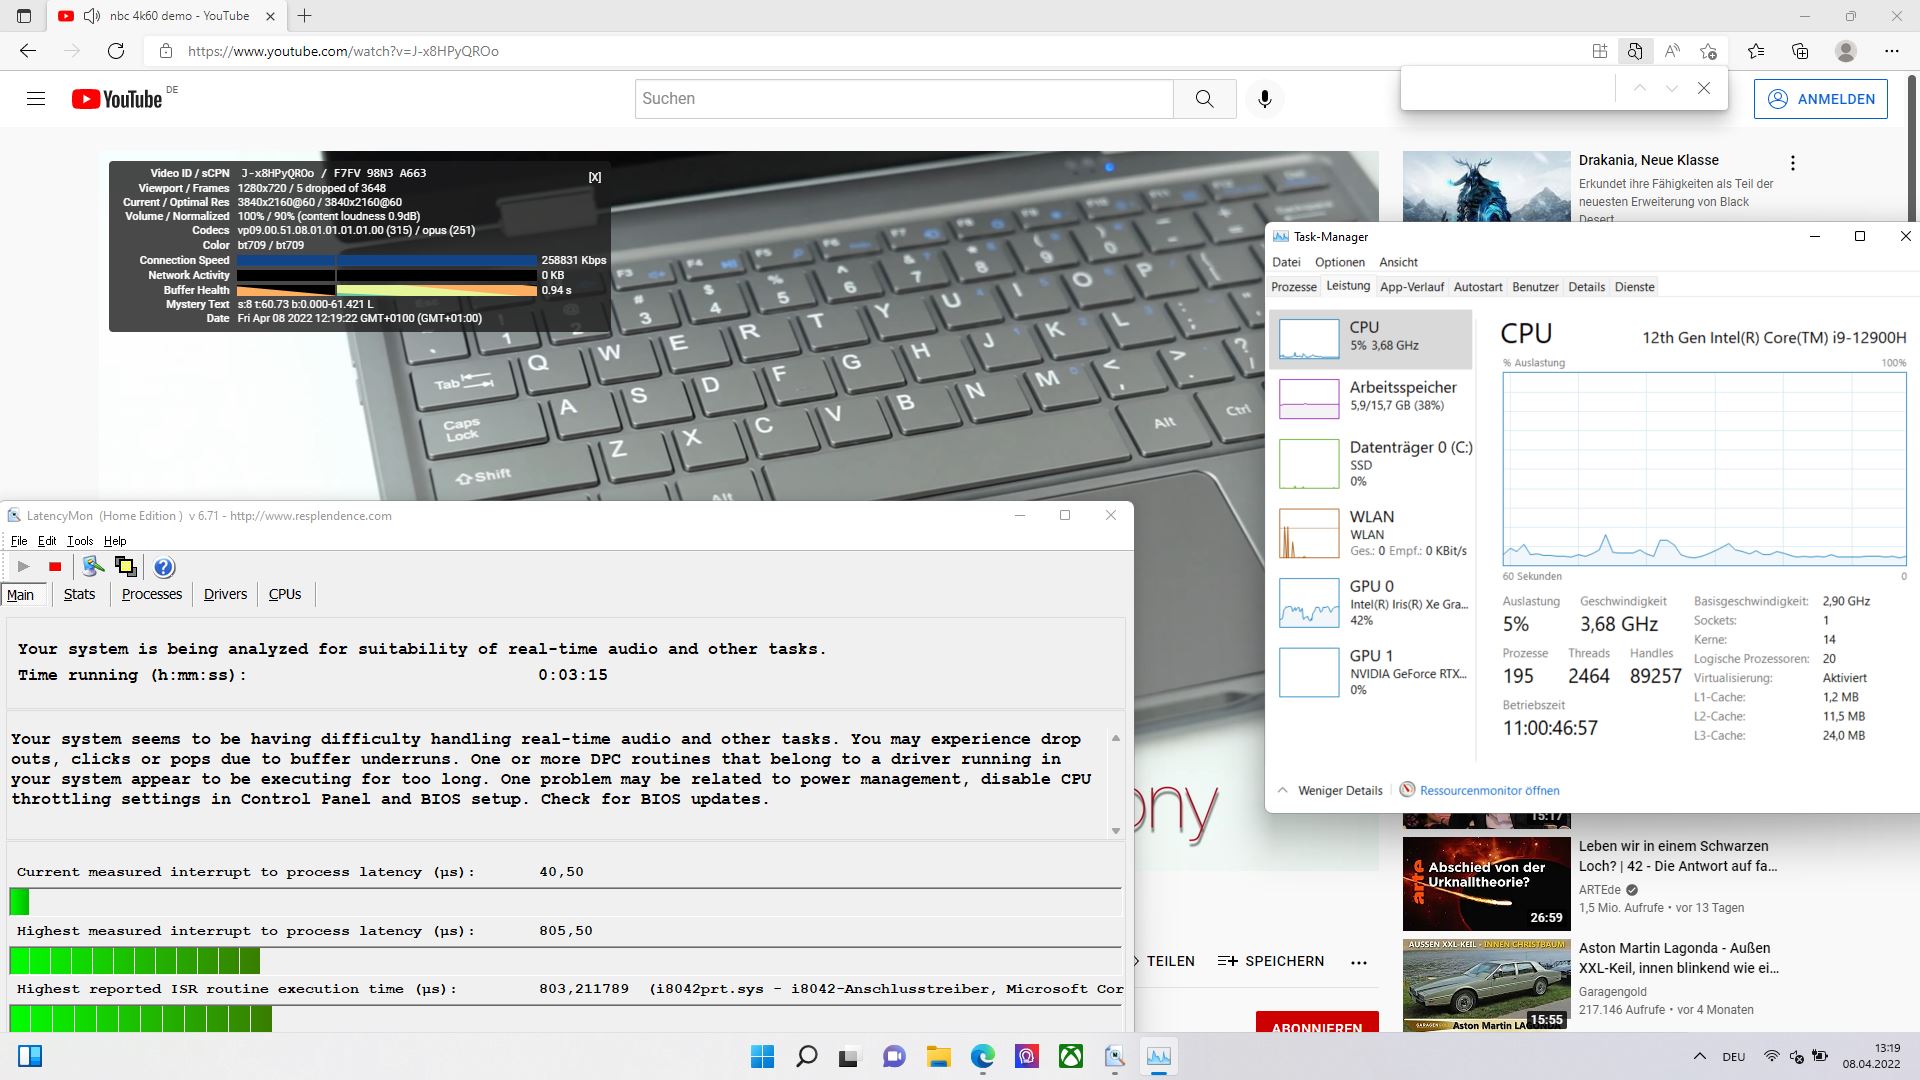
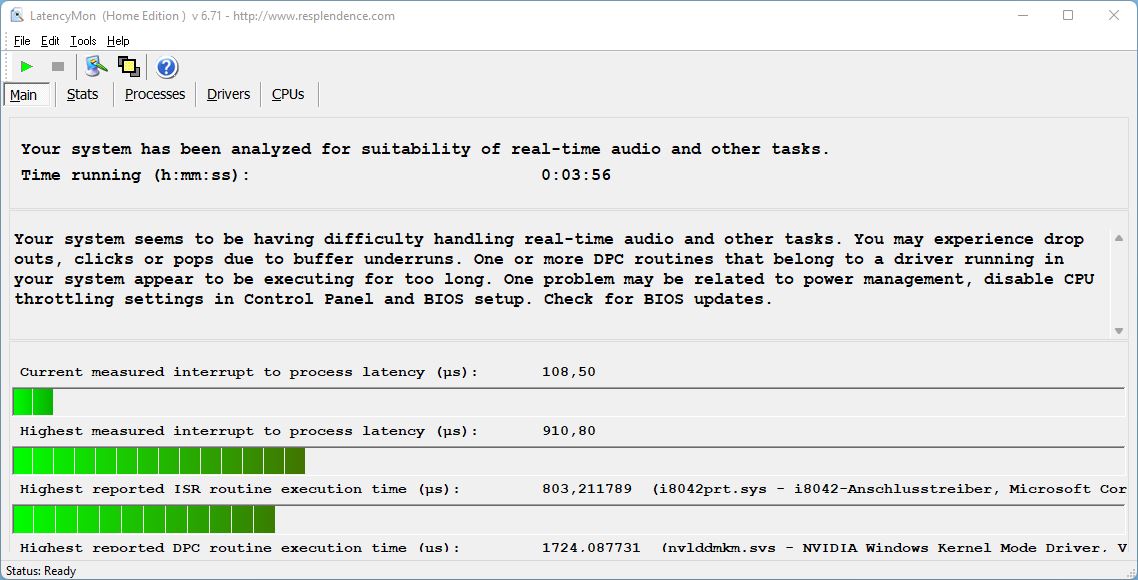
Unfortunately, LatencyMon already shows some minor problems when opening the browser. Opening several tabs doesn't show any further impact. There are five dropped frames when playing our 4K/60-fps YouTube video. A 10-second Prime95 right afterwards increases the latency value further.
| DPC Latencies / LatencyMon - interrupt to process latency (max), Web, Youtube, Prime95 | |
| SCHENKER XMG Apex 15 NH57E PS | |
| Alienware x14 i7 RTX 3060 | |
| MSI Pulse GL66 12UEK | |
| Asus TUF Gaming F15 FX507ZM | |
| Lenovo Legion S7 15ACH6 82K80030GE | |
| Alienware m15 R5 Ryzen Edition | |
* ... smaller is better
Storage Solution
MSI uses a 512-GB NVMe SSD from Micron. Its constant performance remains very even and it reaches around 3000 MB/s in sequential reading and writing, which is okay.

* ... smaller is better
Constant Performance Reading: DiskSpd Read Loop, Queue Depth 8
Graphics Performance
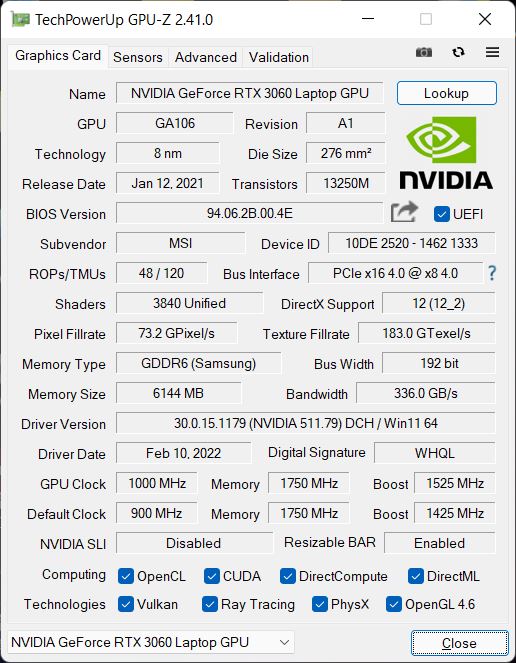
The Nvidia Geforce RTX 3060 with 6 GB of VRAM is used as GPU. However, instead of the possible maximum of 140 watts, it is only able to use up to 105 watts including Dynamic Boost. This might lead to some faster competitors in terms of pure 3D performance.
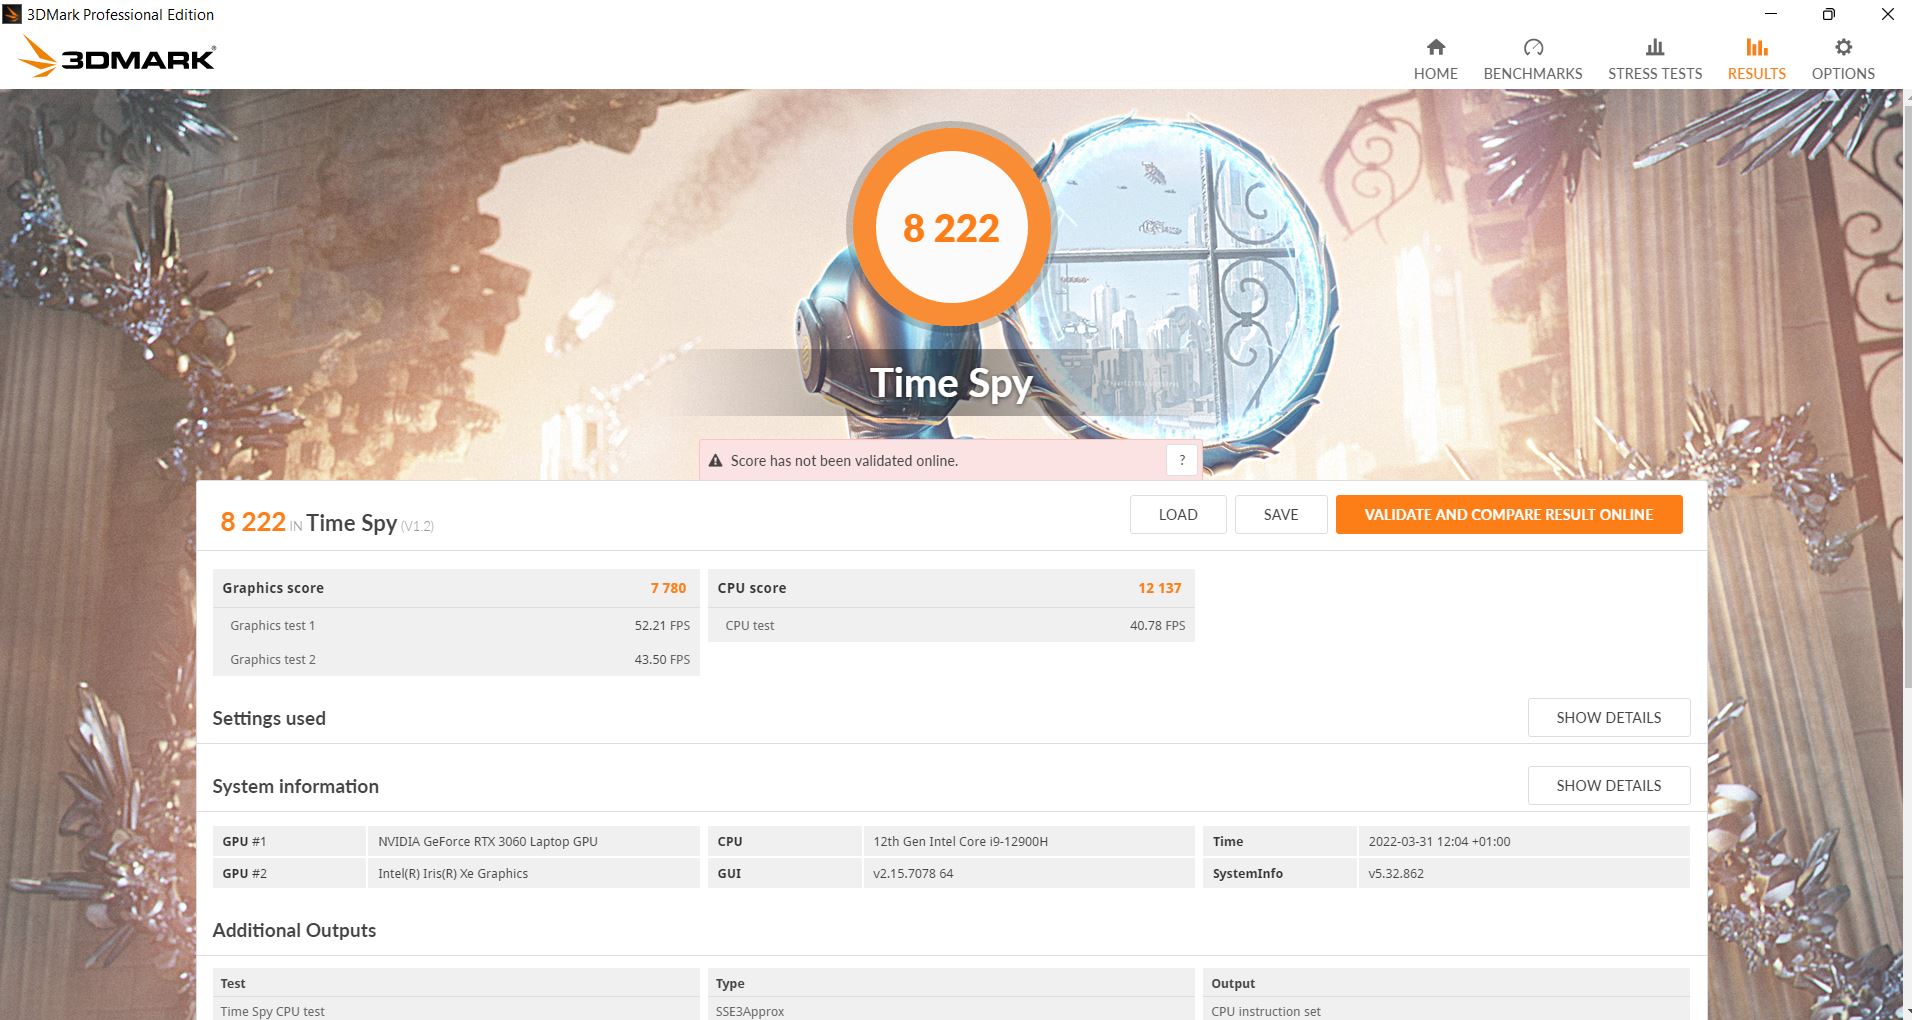
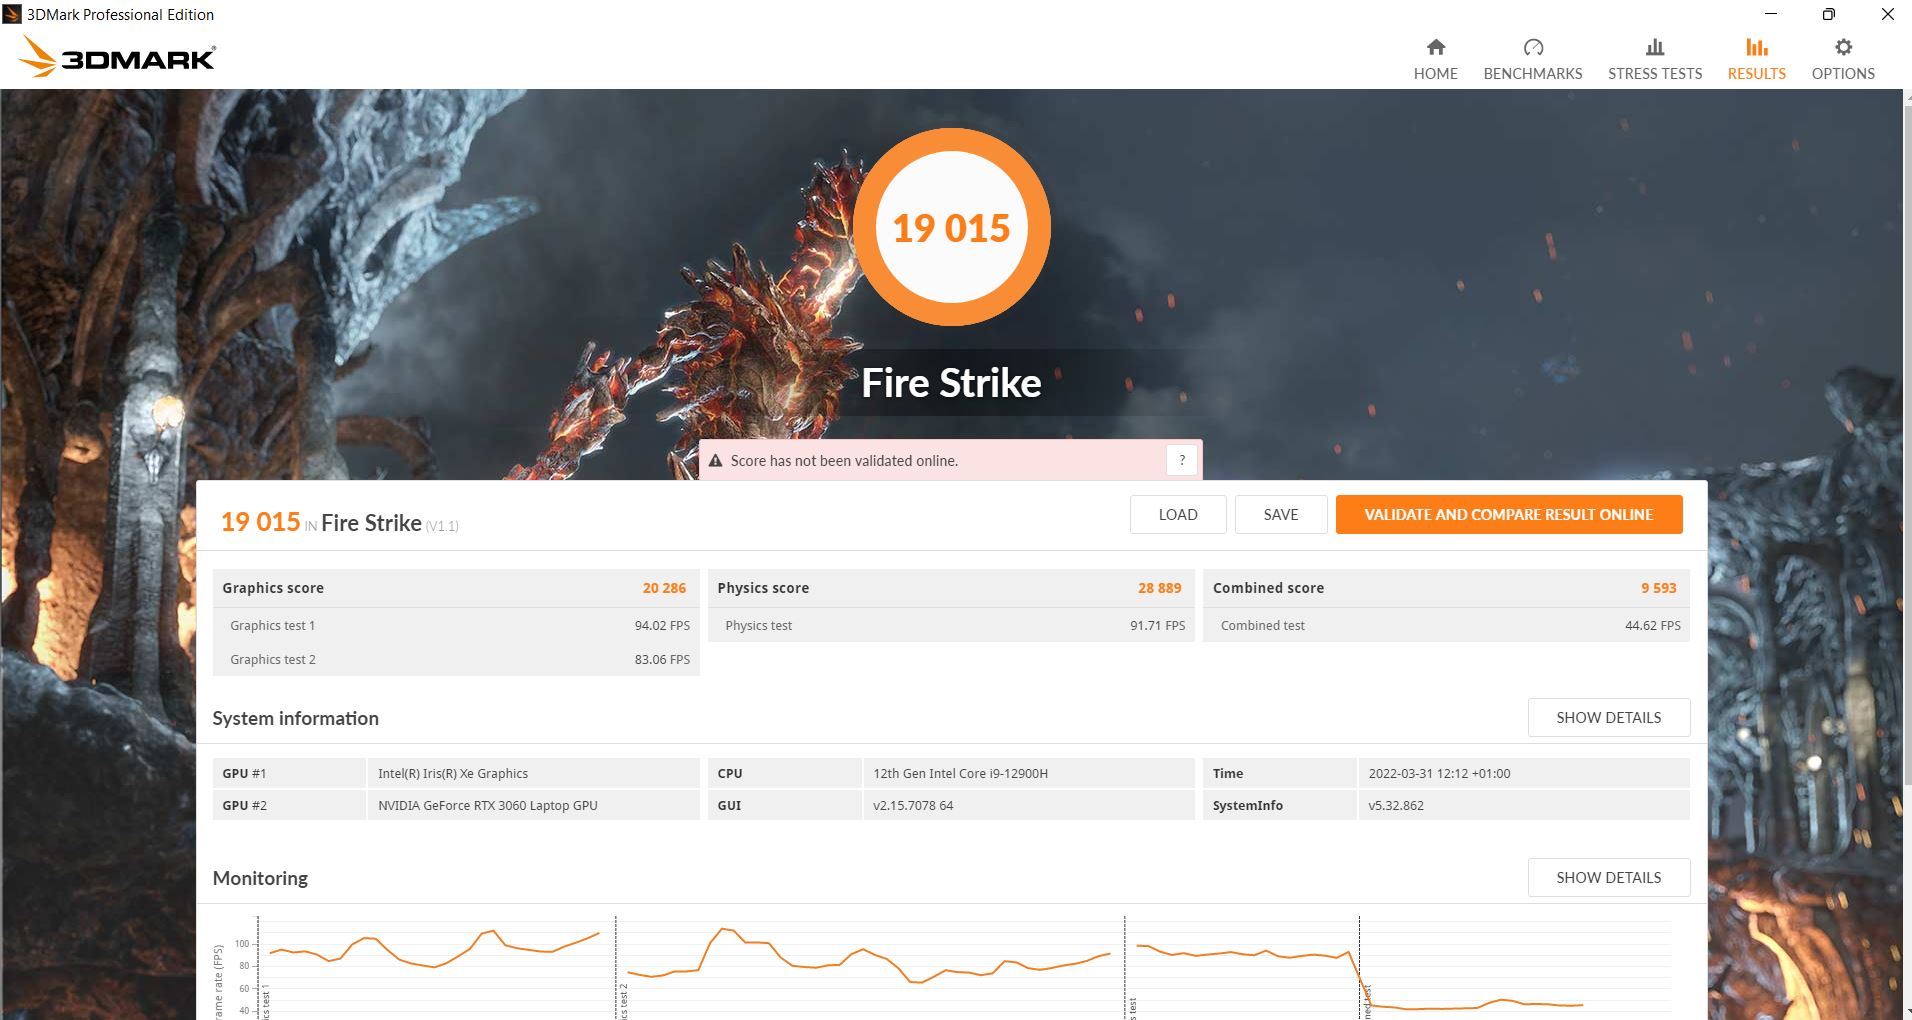
In the synthetic 3DMark tests, the Pulse is able to reach the levels expected for an average RTX 3060 in the Time Spy and Fire Strike tests. Several competitors are faster, including the Asus TUF Gaming F15, but some are also slightly slower, such as the Alienware X4. However, the distance to the top performers is larger than that to those at the bottom.
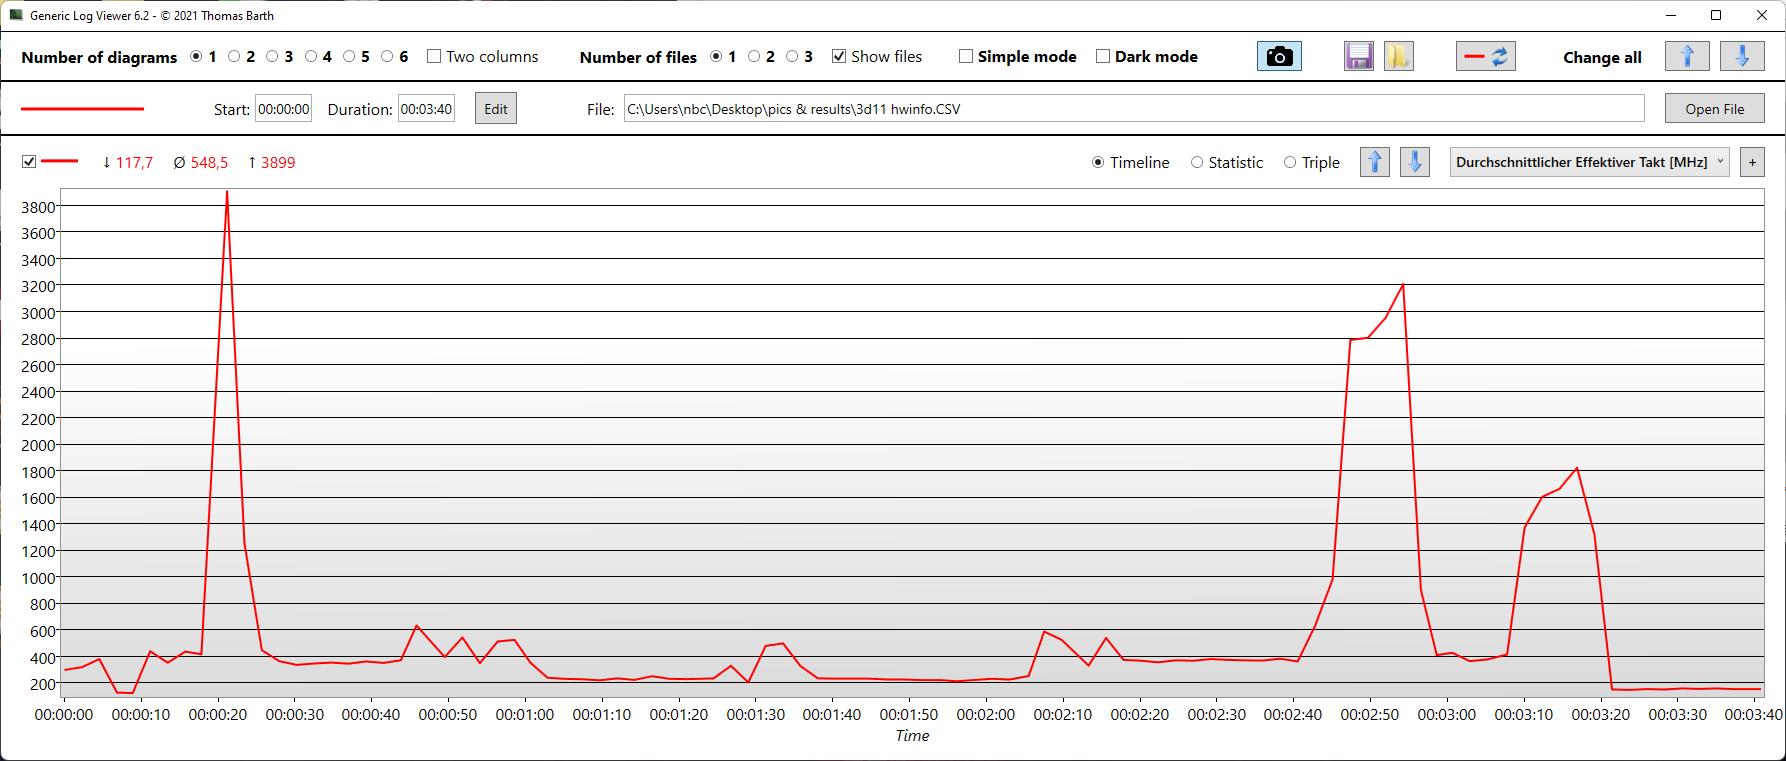
On the other hand, the laptop performance in the 3DMark 11 is very disappointing. Even after more than 4 runs including some reboots in between, the strange, bottom-level result was repeated. A log from HWinfo shows that the CPU clock speed is strangely low (see chart on the right). We observe a similar behavior in the Cloud-Gate benchmark.
In battery operation, the frame rate drops from 75 fps to a fairly constant 30 fps in "The Witcher 3." In addition, the cooling system only gets activated very late.
| 3DMark 11 Performance | 14164 points | |
| 3DMark Cloud Gate Standard Score | 28859 points | |
| 3DMark Fire Strike Score | 19015 points | |
| 3DMark Time Spy Score | 8222 points | |
Help | ||
Gaming Performance
"The Witcher 3" runs in native resolution and Ultra settings at around 75 fps. This corresponds to the expected level, but several competitors, headed by the Asus TUF, are still faster. In "Cyberpunk 2077 1.5," the system reaches only around 40 fps with the same settings. While this is still smoothly playable, it is insufficient for raytracing effects.
In "Far Cry 5" and in "X-Plane 11.11," the Pulse manages to even achieve second place behind the Asus TUF. Despite the relatively low TGP, you can otherwise play almost any game smoothly in native resolution and high detail levels.
| Cyberpunk 2077 1.6 | |
| 1920x1080 Medium Preset | |
| Average of class Gaming (9.7 - 178.6, n=78, last 2 years) | |
| Average NVIDIA GeForce RTX 3060 Laptop GPU (68 - 118, n=14) | |
| MSI Pulse GL66 12UEK | |
| Alienware x14 i7 RTX 3060 | |
| 1920x1080 High Preset | |
| Average of class Gaming (11.3 - 205, n=90, last 2 years) | |
| Average NVIDIA GeForce RTX 3060 Laptop GPU (42.2 - 87.7, n=14) | |
| Alienware x14 i7 RTX 3060 | |
| MSI Pulse GL66 12UEK | |
| 1920x1080 Ultra Preset | |
| Average of class Gaming (16.7 - 159.7, n=102, last 2 years) | |
| Alienware x14 i7 RTX 3060 | |
| Average NVIDIA GeForce RTX 3060 Laptop GPU (40 - 78.8, n=16) | |
| MSI Pulse GL66 12UEK | |
| 1920x1080 Ray Tracing Ultra Preset (DLSS off) | |
| Average of class Gaming (12.6 - 74, n=38, last 2 years) | |
| Average NVIDIA GeForce RTX 3060 Laptop GPU (12.6 - 28.9, n=7) | |
| MSI Pulse GL66 12UEK | |
The Pulse doesn't have advanced Optimus and there is also no MUX switch onboard. However, the frame rate of "The Witcher 3" still remains fairly constant over a period of one hour.
The Witcher 3 FPS Chart
| low | med. | high | ultra | |
| The Witcher 3 (2015) | 368.5 | 247.2 | 139.6 | 78 |
| Dota 2 Reborn (2015) | 179 | 161 | 151 | 144 |
| X-Plane 11.11 (2018) | 142 | 123 | 100 | |
| Far Cry 5 (2018) | 168 | 128 | 120 | 112 |
| Cyberpunk 2077 1.6 (2022) | 88.1 | 87.1 | 42.2 | 40.7 |
Emissions
Noise Emissions
While we ran most benchmarks in the Extreme Performance mode, MSI recommends the Balanced mode. In the Extreme mode, the fans even start briefly during idle operation, but in Balanced mode they even remain silent after 5 minutes of "The Witcher 3" during battery operation.
Even though the fans can also turn on during regular work tasks (such as writing up this review) in Balanced mode, they will then whirr along quietly and are hardly noticeable.
In Extreme mode, only the Schenker Core gets louder under load. The faster Asus TUF produces a similar noise level.
Noise Level
| Idle |
| 23 / 27 / 27 dB(A) |
| Load |
| 48.2 / 56.94 dB(A) |
 | ||
30 dB silent 40 dB(A) audible 50 dB(A) loud |
||
min: | ||
| MSI Pulse GL66 12UEK GeForce RTX 3060 Laptop GPU, i9-12900H, Micron 2450 512GB MTFDKBA512TFK | Asus TUF Gaming F15 FX507ZM GeForce RTX 3060 Laptop GPU, i7-12700H, SK Hynix HFM001TD3JX013N | Alienware x14 i7 RTX 3060 GeForce RTX 3060 Laptop GPU, i7-12700H, WDC PC SN810 1TB | SCHENKER XMG Apex 15 NH57E PS GeForce RTX 3060 Laptop GPU, R7 5800H, Samsung SSD 980 500GB (MZ-V8V500BW) | Lenovo Legion S7 15ACH6 82K80030GE GeForce RTX 3060 Laptop GPU, R9 5900HX, Samsung PM981a MZVLB1T0HBLR | Alienware m15 R5 Ryzen Edition GeForce RTX 3060 Laptop GPU, R7 5800H, Toshiba KBG40ZNS512G NVMe | |
|---|---|---|---|---|---|---|
| Noise | 6% | 2% | 6% | -5% | 1% | |
| off / environment * | 23 | 23.2 -1% | 24.7 -7% | 23 -0% | 25 -9% | 24 -4% |
| Idle Minimum * | 23 | 23.6 -3% | 24.7 -7% | 23 -0% | 25 -9% | 24 -4% |
| Idle Average * | 27 | 23.6 13% | 24.7 9% | 23 15% | 30 -11% | 25 7% |
| Idle Maximum * | 27 | 25.4 6% | 30.9 -14% | 26.4 2% | 36 -33% | 35 -30% |
| Load Average * | 48.2 | 38 21% | 40 17% | 34.25 29% | 42 13% | 44 9% |
| Witcher 3 ultra * | 56.9 | 54.1 5% | 51.5 9% | 58.4 -3% | 53 7% | 48 16% |
| Load Maximum * | 56.94 | 57.2 -0% | 51.5 10% | 58.42 -3% | 54 5% | 50 12% |
* ... smaller is better
Temperature
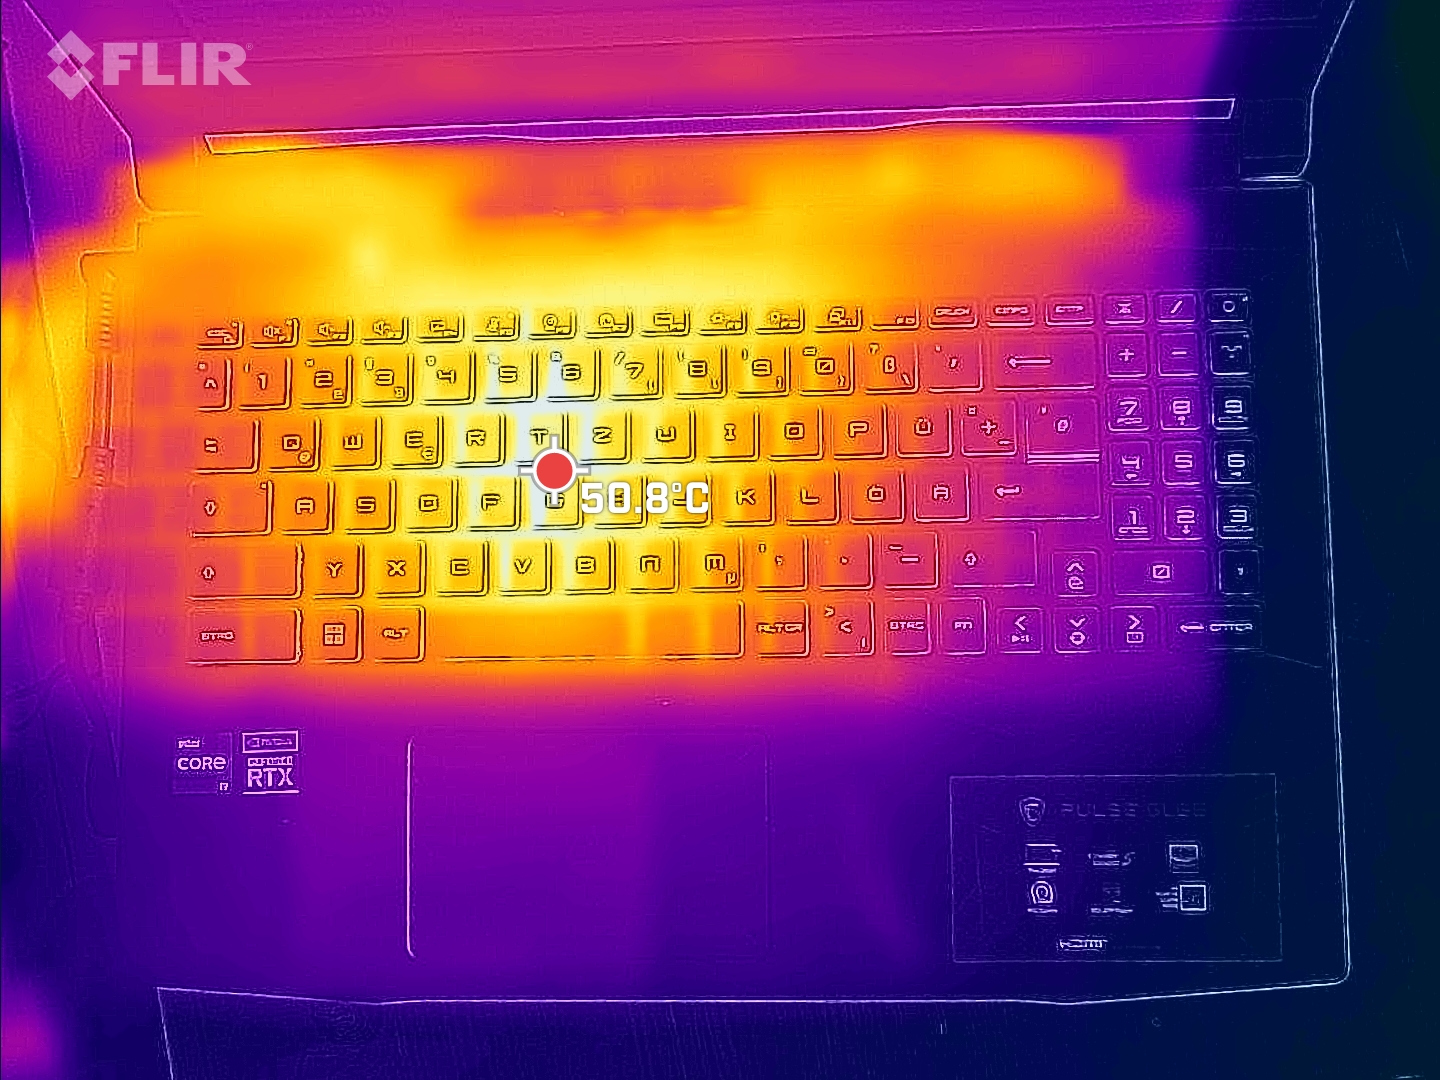
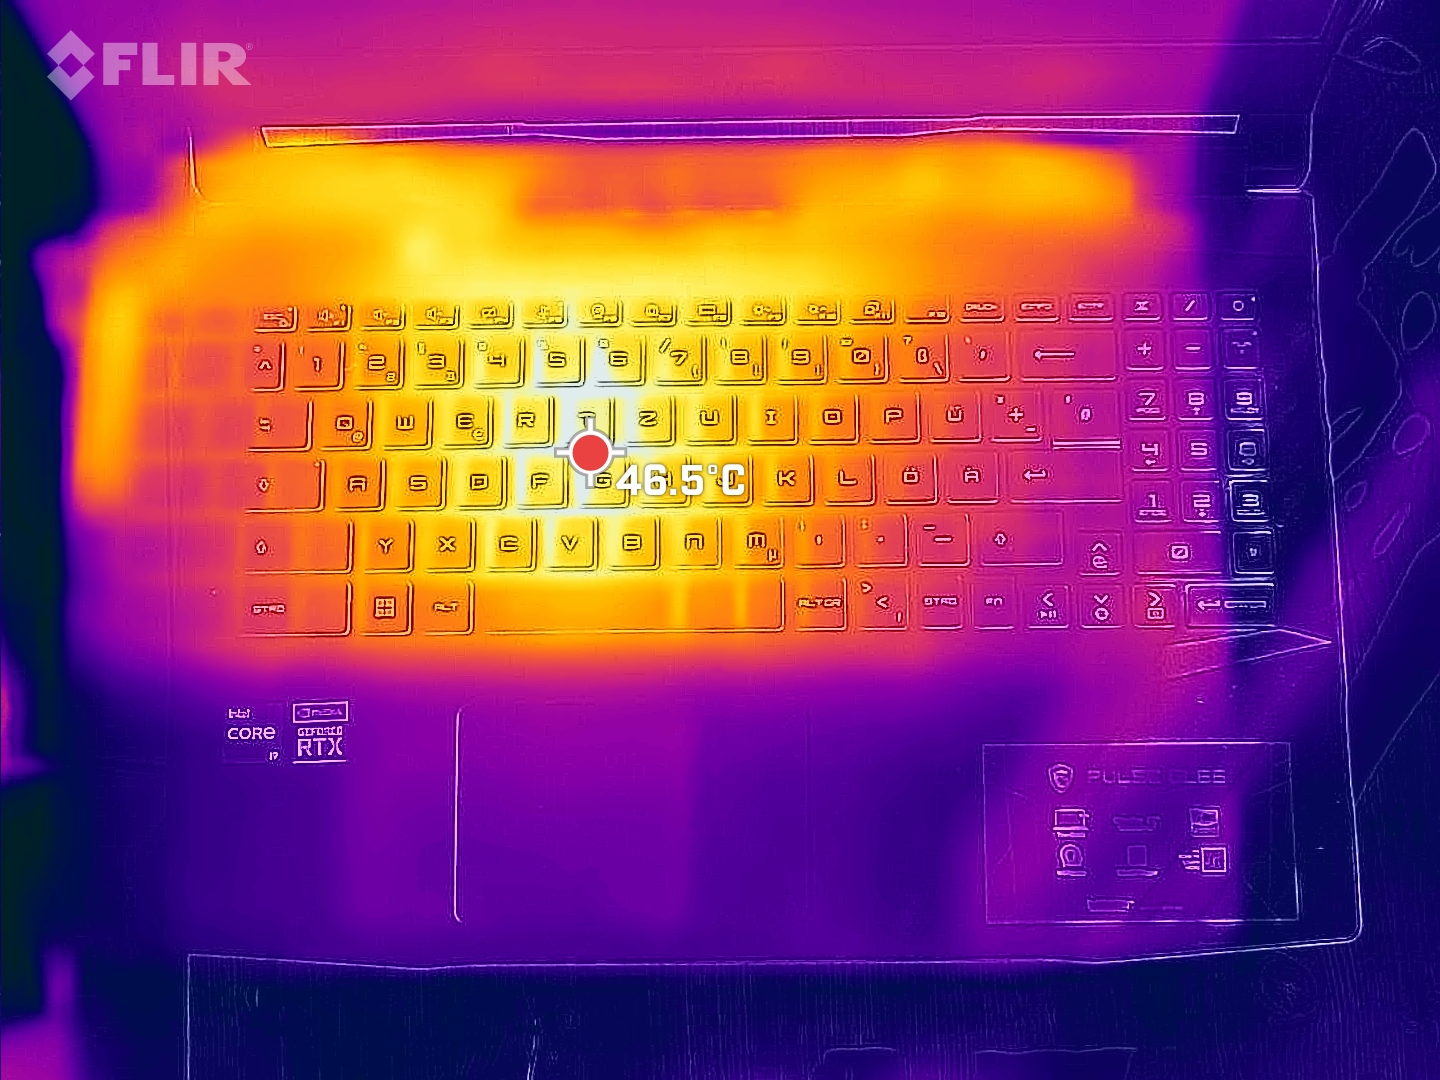
At about 37 °C (99 °F) during idle operation, the laptop gets slightly warmer than the competitors. Only the Asus TUF gets similarly warm here. Unter load, this continues up to 50 °C (122 °F), with several competitors reaching similar temperatures (Lenovo Legion S7) or getting even warmer (Alienware m5).
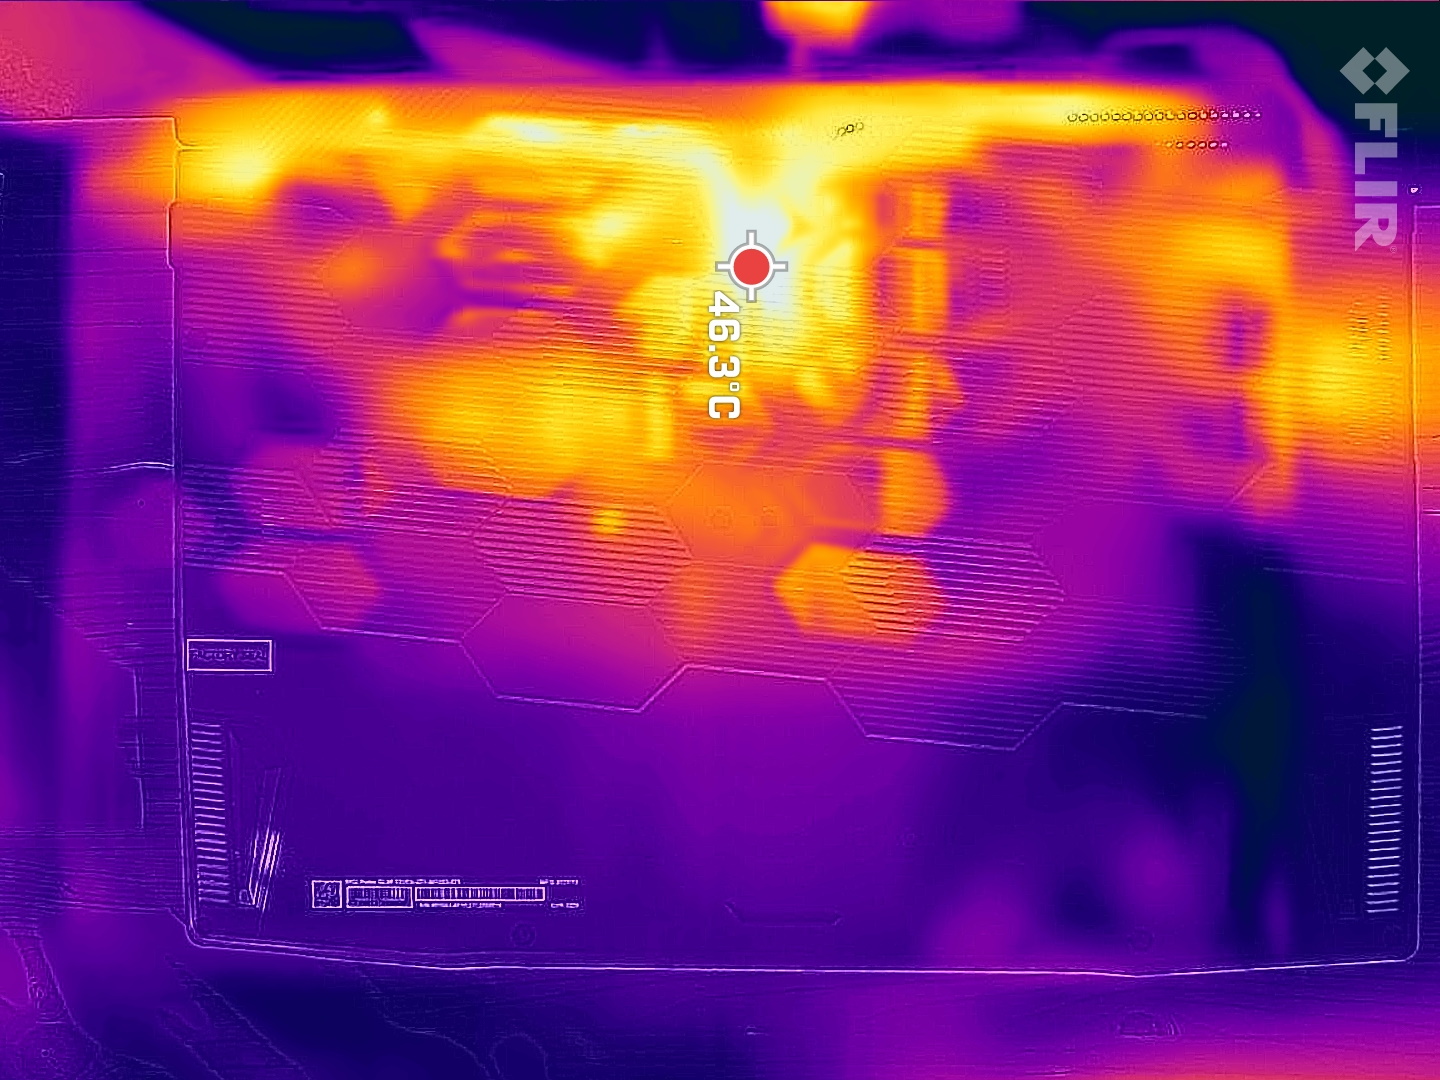
Fortunately, the palm rests always remain cool. The hotspots are in the center or closer to the display.
(-) The maximum temperature on the upper side is 50 °C / 122 F, compared to the average of 40.4 °C / 105 F, ranging from 21.2 to 68.8 °C for the class Gaming.
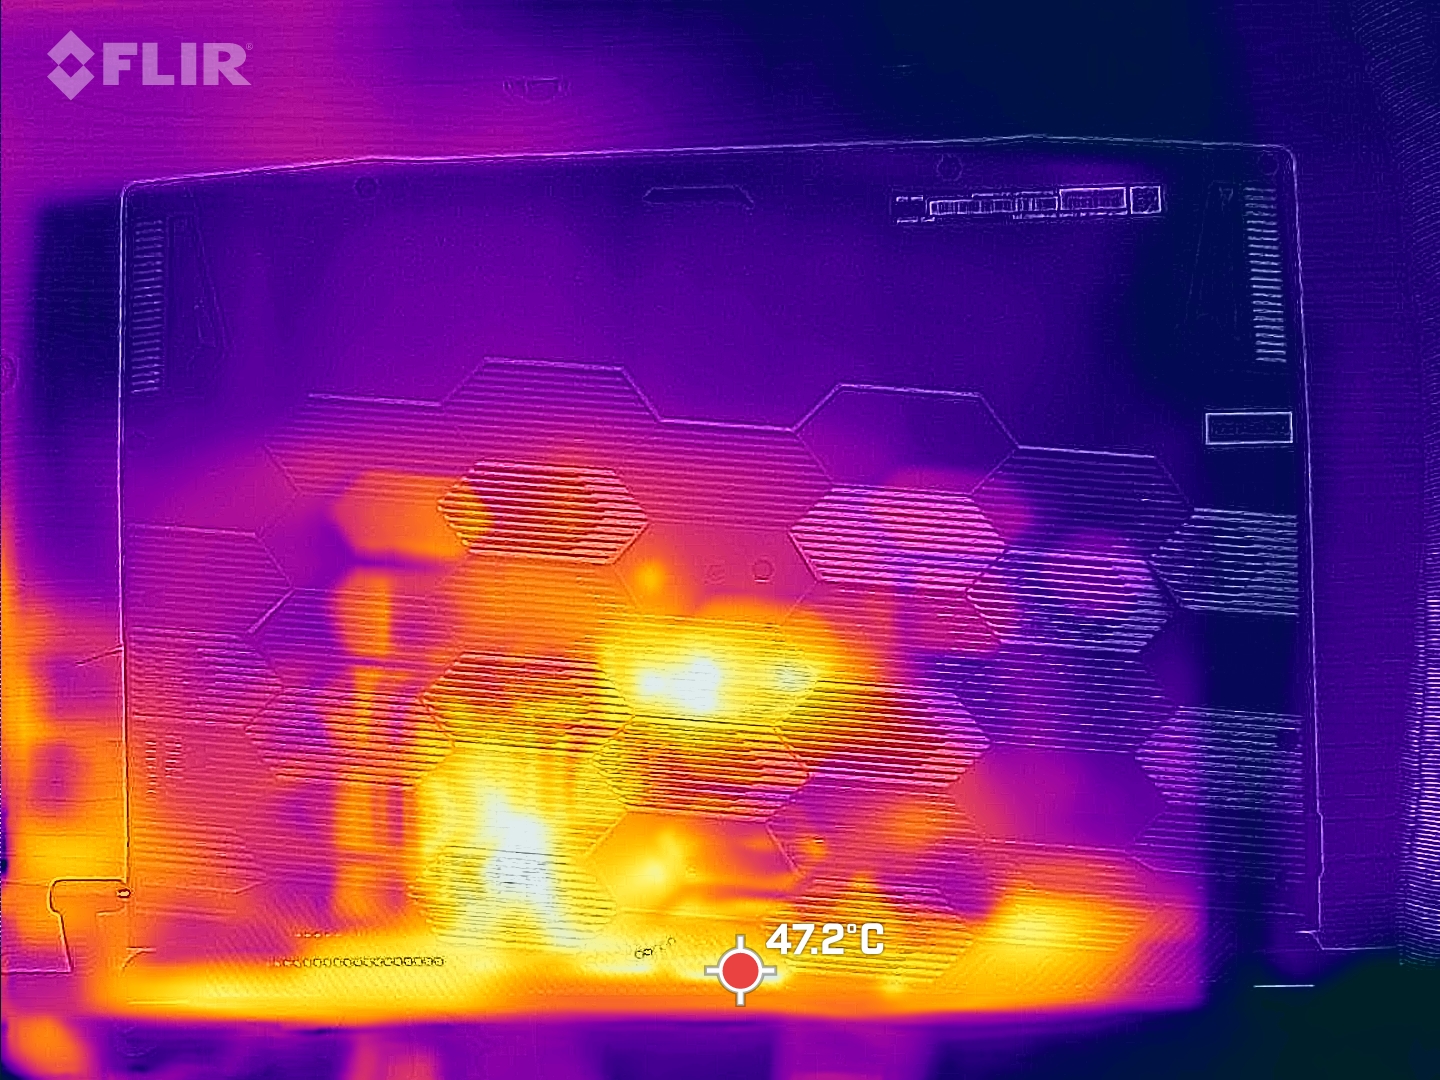
(-) The bottom heats up to a maximum of 47 °C / 117 F, compared to the average of 43.2 °C / 110 F
(+) In idle usage, the average temperature for the upper side is 30.8 °C / 87 F, compared to the device average of 33.8 °C / 93 F.
(-) Playing The Witcher 3, the average temperature for the upper side is 39.6 °C / 103 F, compared to the device average of 33.8 °C / 93 F.
(+) The palmrests and touchpad are cooler than skin temperature with a maximum of 26 °C / 78.8 F and are therefore cool to the touch.
(+) The average temperature of the palmrest area of similar devices was 28.9 °C / 84 F (+2.9 °C / 5.2 F).
| MSI Pulse GL66 12UEK Intel Core i9-12900H, NVIDIA GeForce RTX 3060 Laptop GPU | Asus TUF Gaming F15 FX507ZM Intel Core i7-12700H, NVIDIA GeForce RTX 3060 Laptop GPU | Alienware x14 i7 RTX 3060 Intel Core i7-12700H, NVIDIA GeForce RTX 3060 Laptop GPU | SCHENKER XMG Apex 15 NH57E PS AMD Ryzen 7 5800H, NVIDIA GeForce RTX 3060 Laptop GPU | Lenovo Legion S7 15ACH6 82K80030GE AMD Ryzen 9 5900HX, NVIDIA GeForce RTX 3060 Laptop GPU | Alienware m15 R5 Ryzen Edition AMD Ryzen 7 5800H, NVIDIA GeForce RTX 3060 Laptop GPU | |
|---|---|---|---|---|---|---|
| Heat | -1% | 14% | 19% | 9% | -10% | |
| Maximum Upper Side * | 50 | 44.4 11% | 51.3 -3% | 36 28% | 49 2% | 62 -24% |
| Maximum Bottom * | 47 | 48.8 -4% | 44.4 6% | 38 19% | 50 -6% | 61 -30% |
| Idle Upper Side * | 36 | 37.8 -5% | 27.2 24% | 31 14% | 29 19% | 36 -0% |
| Idle Bottom * | 38 | 39.6 -4% | 26.6 30% | 33 13% | 30 21% | 33 13% |
* ... smaller is better
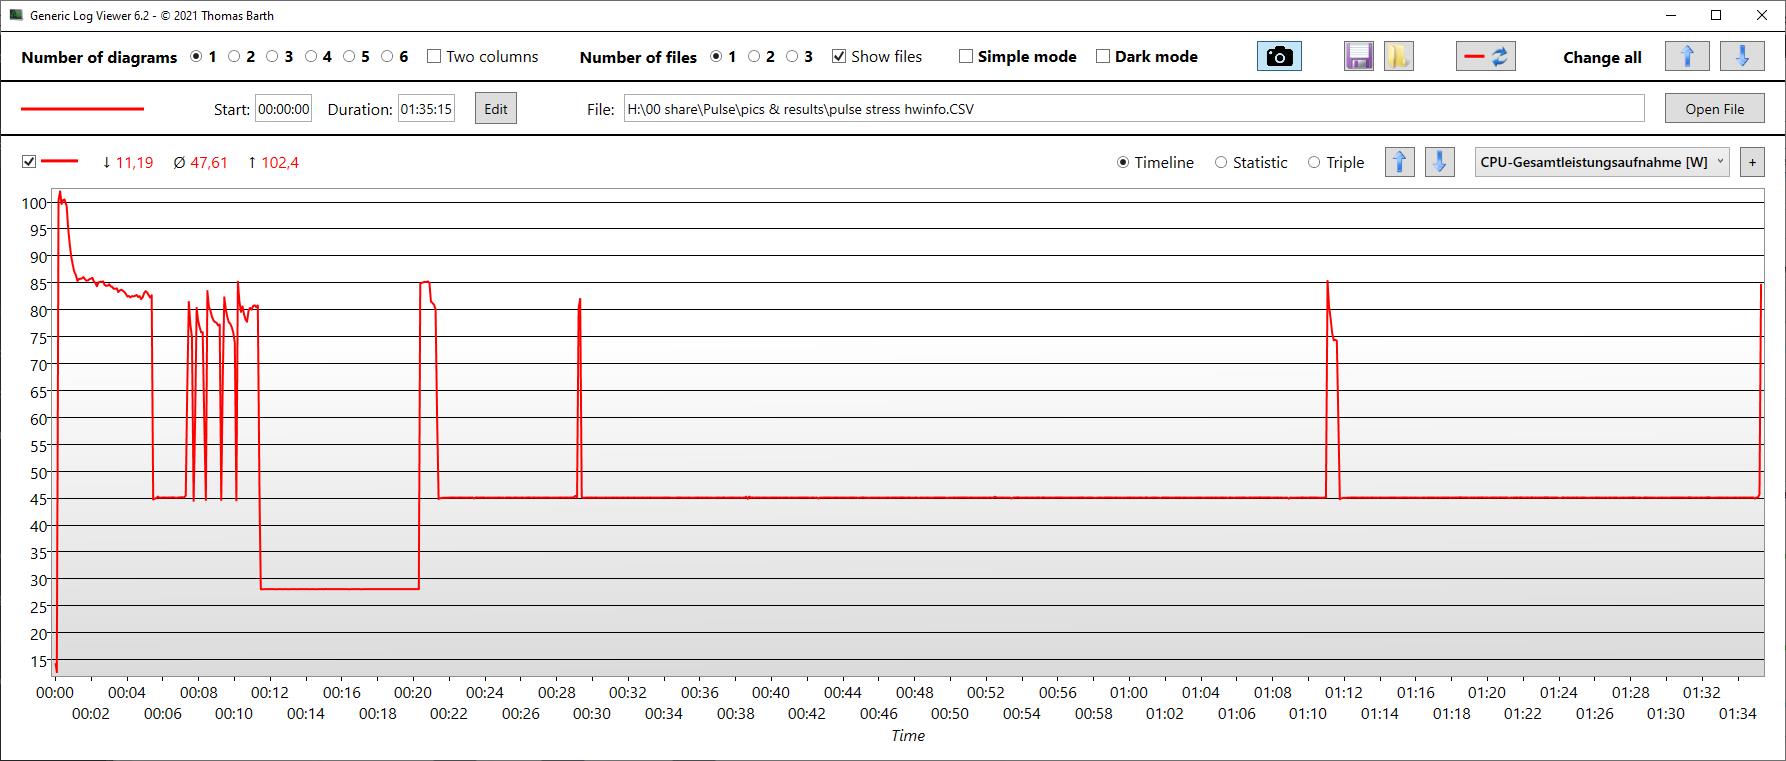
Stress Test
In the beginning of our stress test, the cores initially speed up to 3.6 GHz, which is far from the maximum of 5 GHz that is possible. After the initial minute, the clock speeds drop continuously. We measure only 2.9 GHz after 10 minutes and around 2.3 GHz after one hour. This means that despite the Extreme Performance mode, the CPU is throttled here. After one hour, the core temperatures are around 80 °C (176 °F). During the course of test, the maximum temperature went up to 97 °C (207 °F), which is the reason why the clock speed was throttled.
We saw a strange performance drop between minute 12 and 20, perhaps there were some other processes that interfered here.
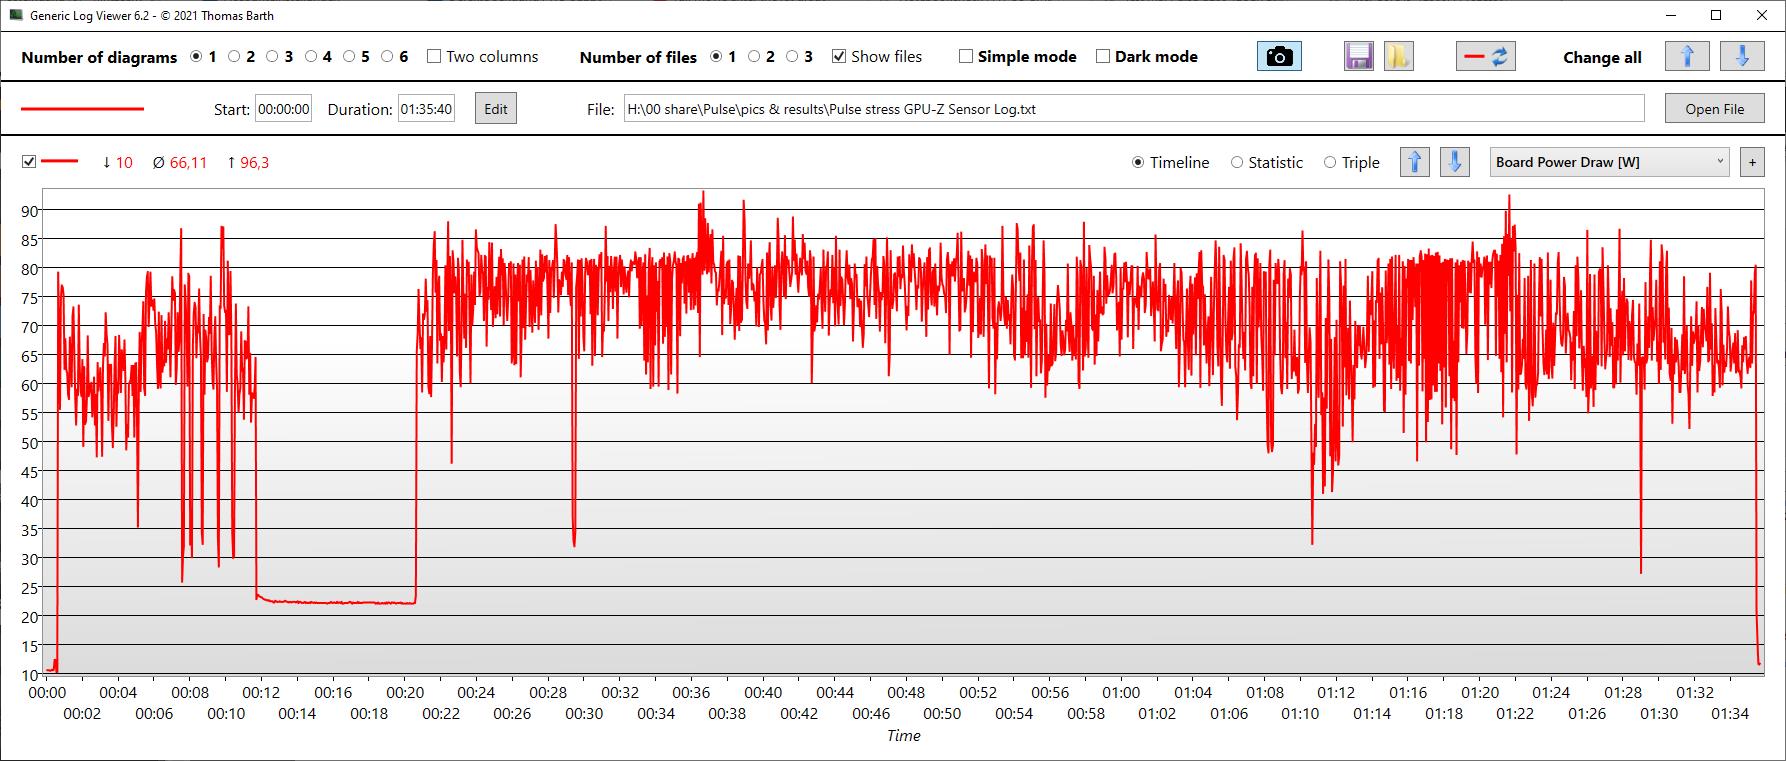
The GPU clock speed is very variable, ranging between about 1.6 and 1.2 GHz within one hour, and the temperatures are around 70 °C (158 °F). There are some larger performance drops in the GPU clock speeds and also in the storage speed. At least the latter should stay fairly constant, but according to the GPU-Z log, both values dropped down to 200 MHz during the course of the test.
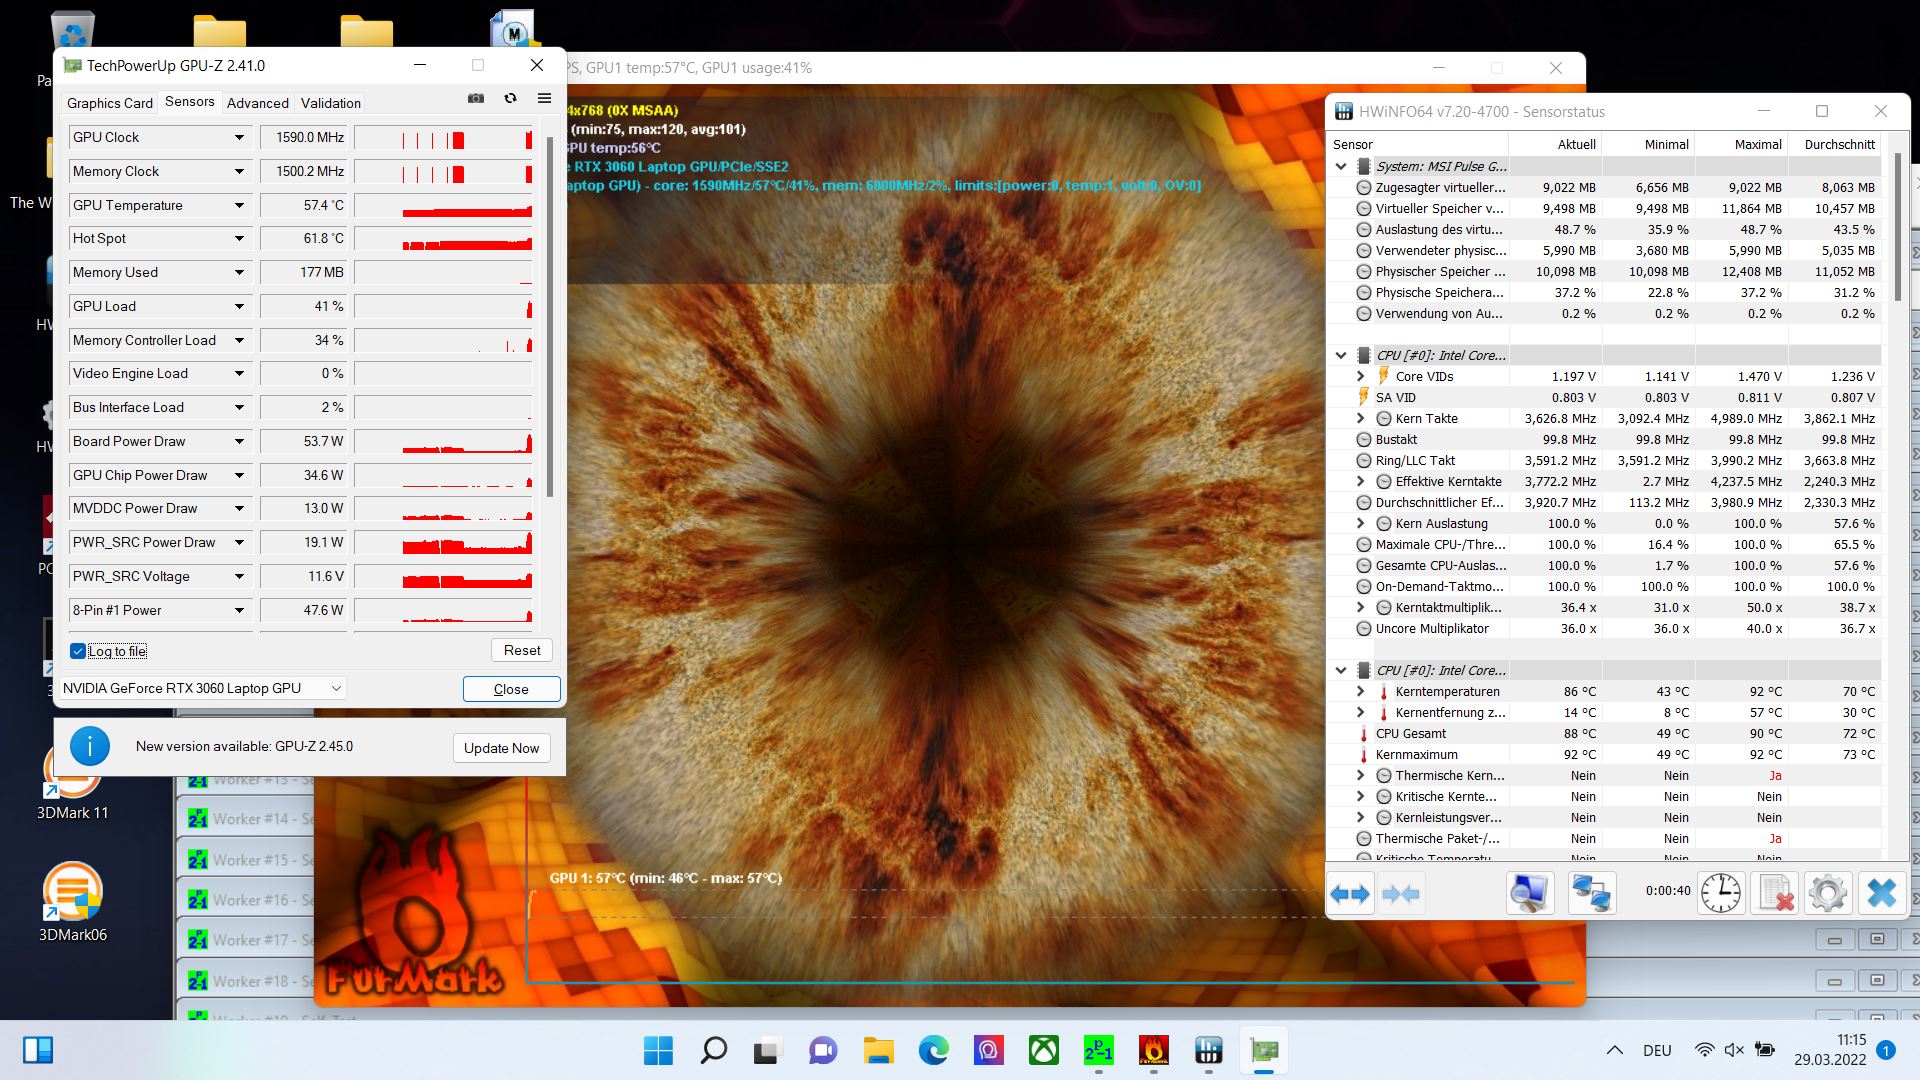
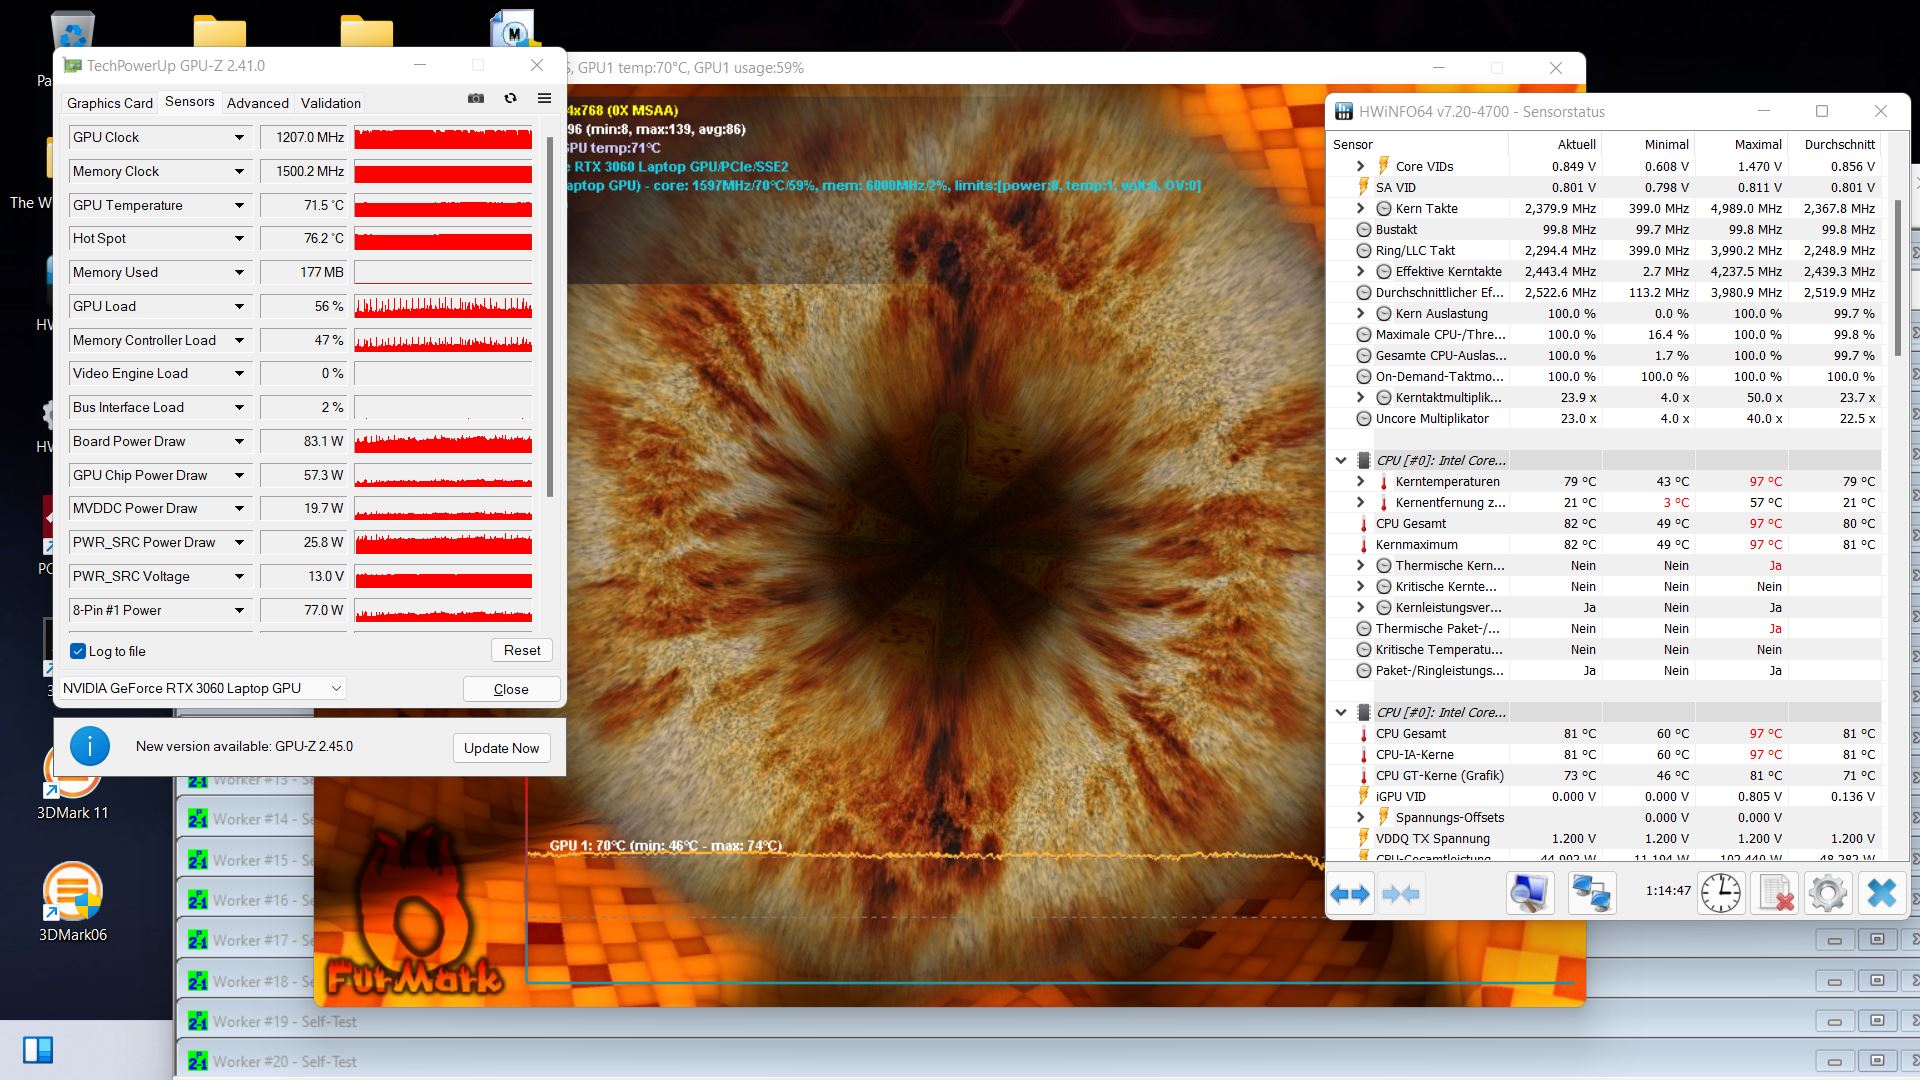
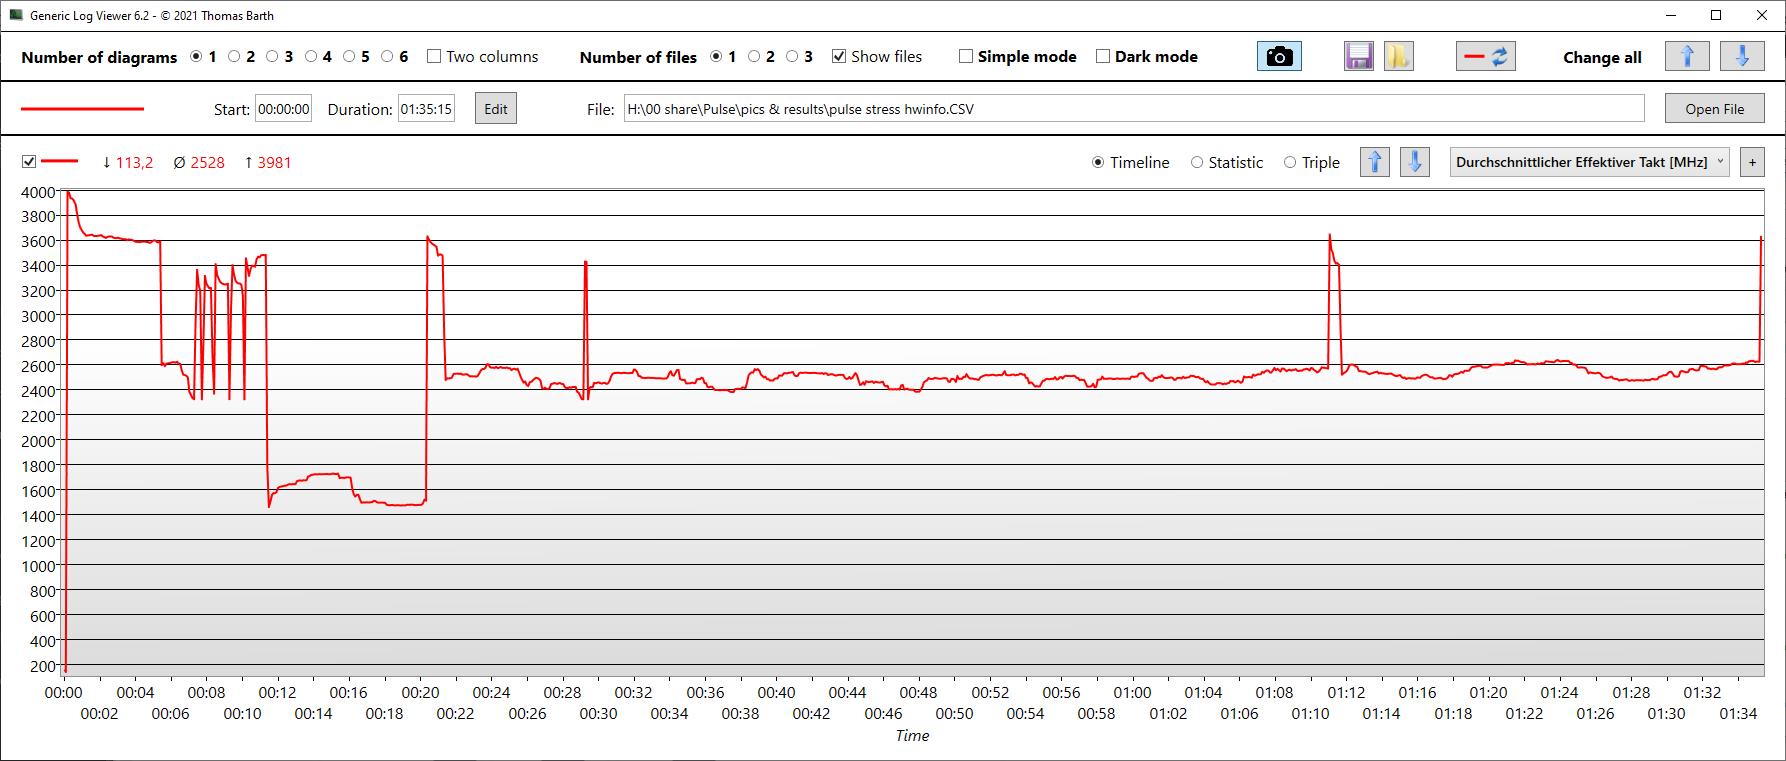
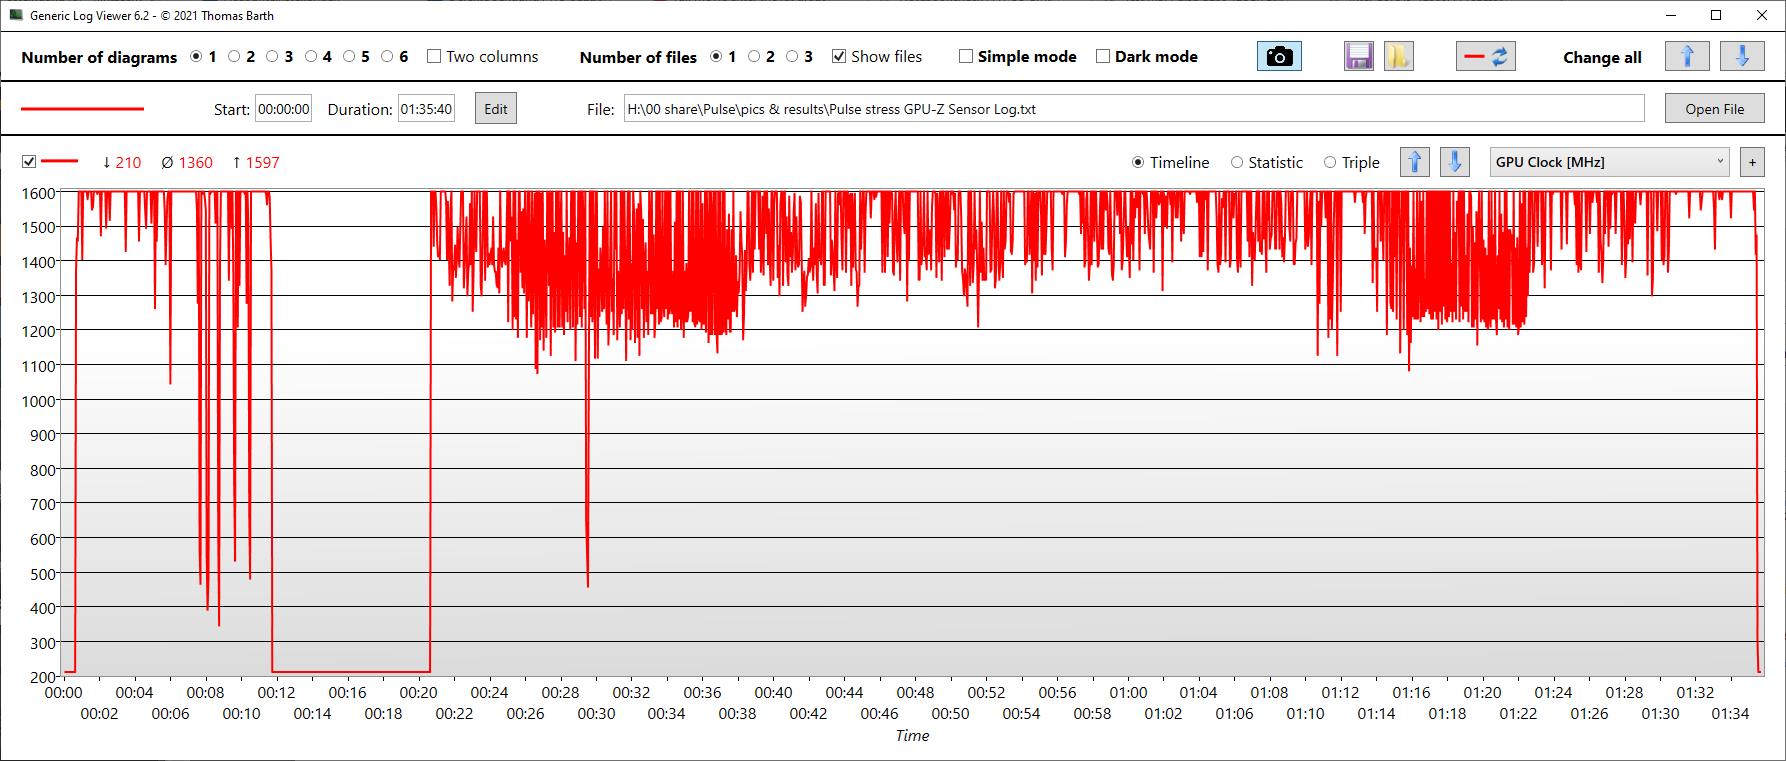
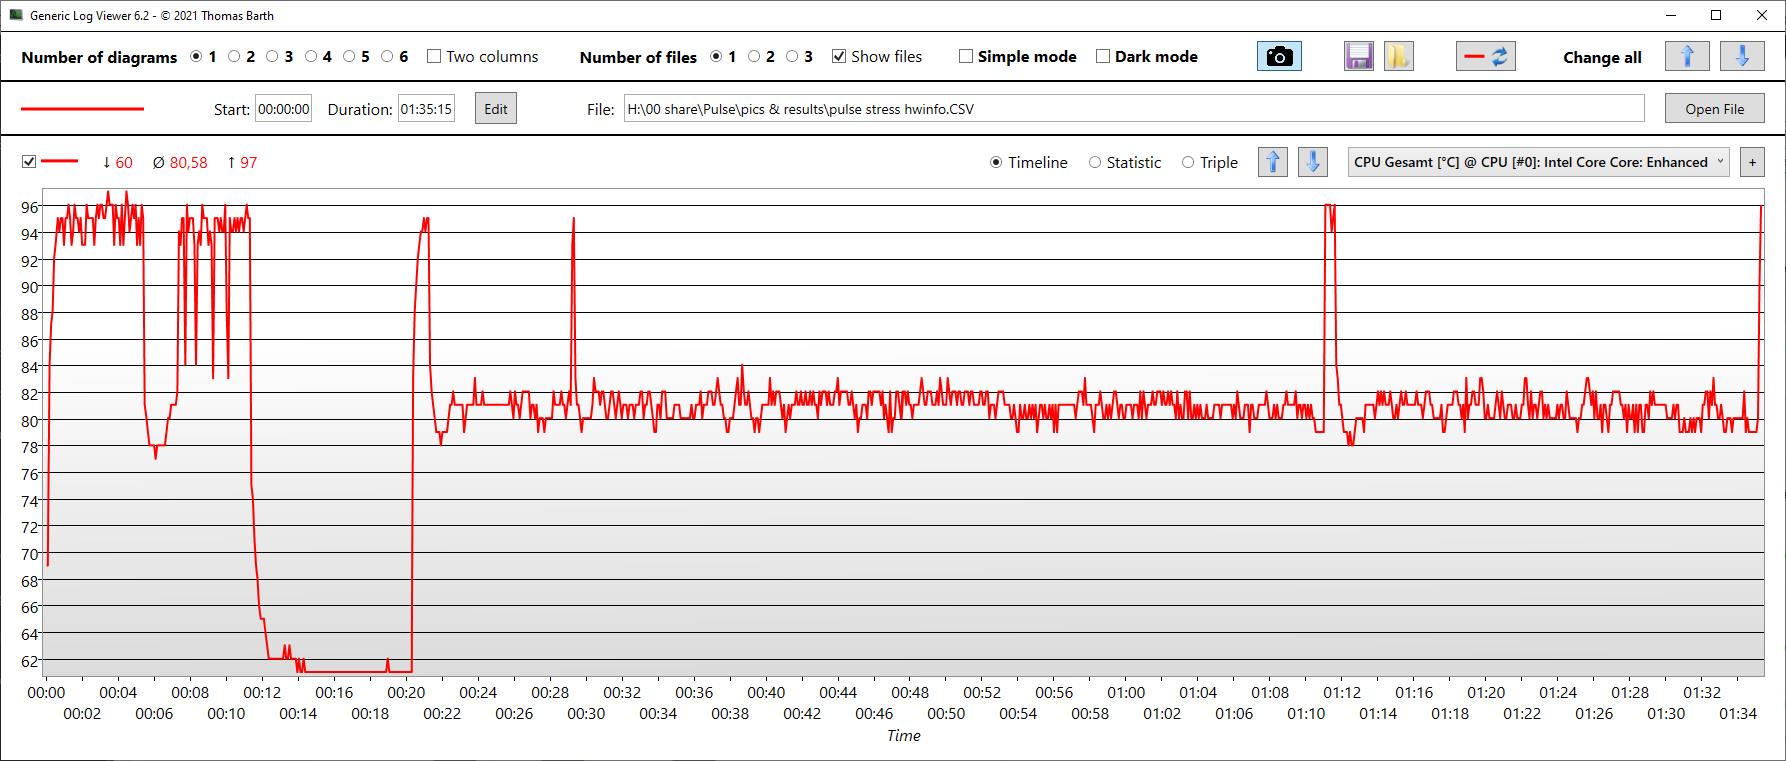
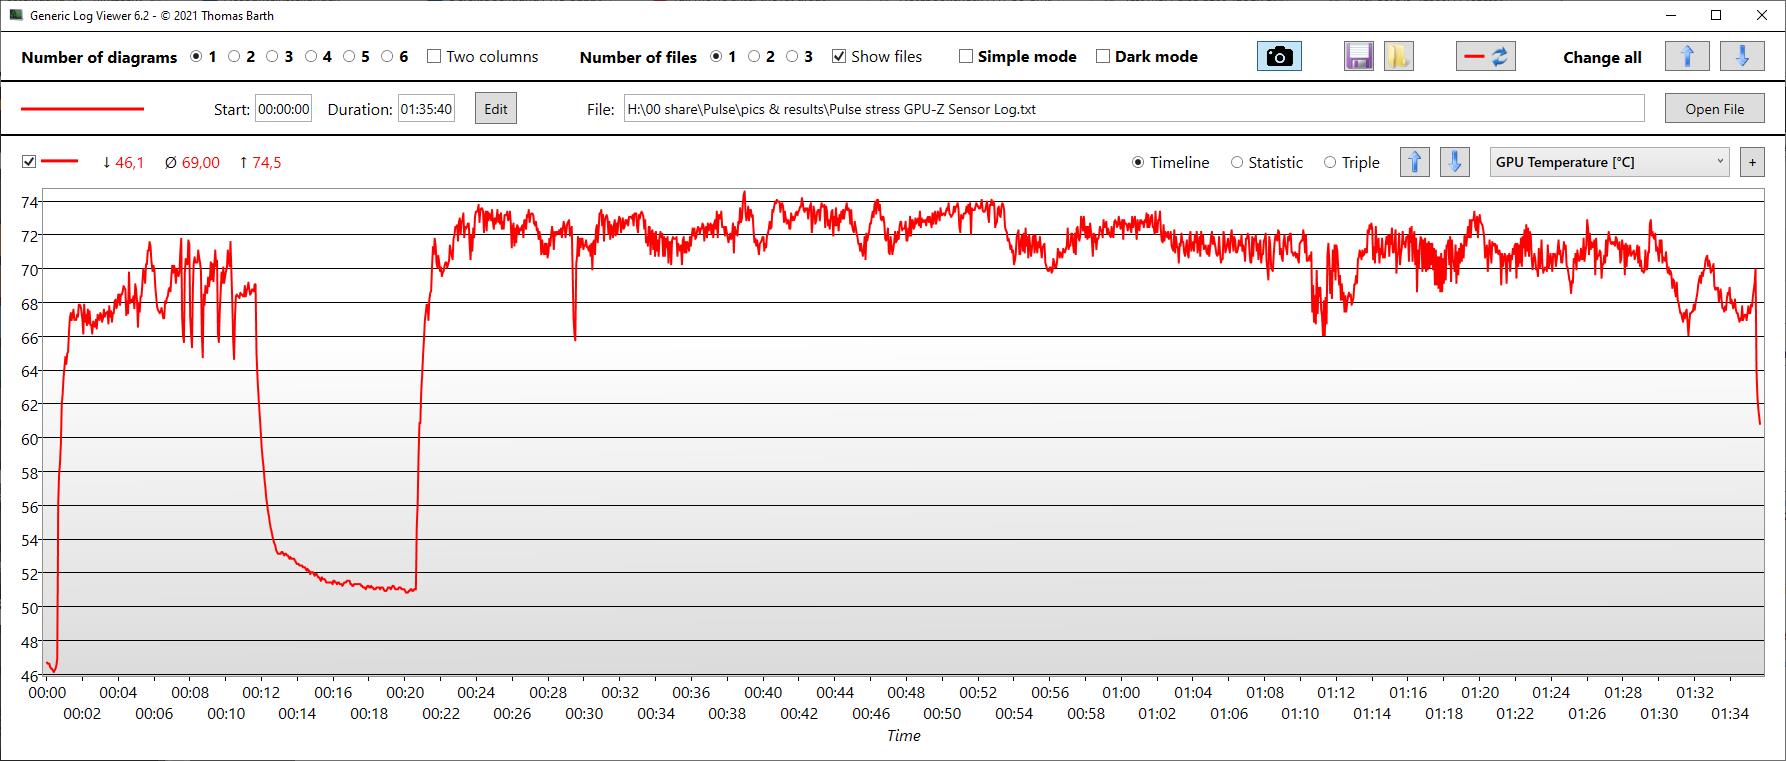
| CPU Clock (GHz) | GPU Clock (MHz) | Average CPU Temperature (°C) | Average GPU Temperature (°C) | |
| Prime95 + FurMark Stress | 2,5 | 1.360 | 81 | 69 |
Speakers
The speakers could be louder and clearly lack some bass. But at least the mids and highs are fairly balanced. There is a combined audio port to connect analog external audio devices.
MSI Pulse GL66 12UEK audio analysis
(±) | speaker loudness is average but good (79.8 dB)
Bass 100 - 315 Hz
(-) | nearly no bass - on average 16.2% lower than median
(±) | linearity of bass is average (10.4% delta to prev. frequency)
Mids 400 - 2000 Hz
(±) | higher mids - on average 7.6% higher than median
(+) | mids are linear (6.8% delta to prev. frequency)
Highs 2 - 16 kHz
(+) | balanced highs - only 4.1% away from median
(±) | linearity of highs is average (8.1% delta to prev. frequency)
Overall 100 - 16.000 Hz
(±) | linearity of overall sound is average (18.8% difference to median)
Compared to same class
» 59% of all tested devices in this class were better, 8% similar, 33% worse
» The best had a delta of 6%, average was 18%, worst was 132%
Compared to all devices tested
» 38% of all tested devices were better, 8% similar, 54% worse
» The best had a delta of 4%, average was 25%, worst was 134%
Asus TUF Gaming F15 FX507ZM audio analysis
(±) | speaker loudness is average but good (76.7 dB)
Bass 100 - 315 Hz
(±) | reduced bass - on average 13.7% lower than median
(±) | linearity of bass is average (10.1% delta to prev. frequency)
Mids 400 - 2000 Hz
(±) | higher mids - on average 5.2% higher than median
(+) | mids are linear (4.9% delta to prev. frequency)
Highs 2 - 16 kHz
(+) | balanced highs - only 4.1% away from median
(±) | linearity of highs is average (8.6% delta to prev. frequency)
Overall 100 - 16.000 Hz
(±) | linearity of overall sound is average (15.9% difference to median)
Compared to same class
» 35% of all tested devices in this class were better, 6% similar, 59% worse
» The best had a delta of 6%, average was 18%, worst was 132%
Compared to all devices tested
» 20% of all tested devices were better, 5% similar, 75% worse
» The best had a delta of 4%, average was 25%, worst was 134%
Power Management
Power Consumption
During idle operation and especially also under average loads (3DMark06), the power consumption is very low. While gaming, the consumption lies in the middle of the field, but at least it is then also one of the fastest devices. In our stress test, the consumption is the highest, reaching the same levels as the Asus TUF, which is really faster. However, the consumption is low or appropriate overall.
| Idle | |
| Load |
|
| MSI Pulse GL66 12UEK i9-12900H, GeForce RTX 3060 Laptop GPU, Micron 2450 512GB MTFDKBA512TFK, IPS, 1920x1080, 15.60 | Asus TUF Gaming F15 FX507ZM i7-12700H, GeForce RTX 3060 Laptop GPU, SK Hynix HFM001TD3JX013N, IPS, 1920x1080, 15.60 | Alienware x14 i7 RTX 3060 i7-12700H, GeForce RTX 3060 Laptop GPU, WDC PC SN810 1TB, IPS, 1920x1080, 14.00 | SCHENKER XMG Apex 15 NH57E PS R7 5800H, GeForce RTX 3060 Laptop GPU, Samsung SSD 980 500GB (MZ-V8V500BW), IPS, 1920x1080, 15.60 | Lenovo Legion S7 15ACH6 82K80030GE R9 5900HX, GeForce RTX 3060 Laptop GPU, Samsung PM981a MZVLB1T0HBLR, IPS, 3840x2160, 15.60 | Alienware m15 R5 Ryzen Edition R7 5800H, GeForce RTX 3060 Laptop GPU, Toshiba KBG40ZNS512G NVMe, IPS, 1920x1080, 15.60 | Average NVIDIA GeForce RTX 3060 Laptop GPU | Average of class Gaming | |
|---|---|---|---|---|---|---|---|---|
| Power Consumption | -33% | -7% | -36% | -43% | -52% | -45% | -75% | |
| Idle Minimum * | 7 | 6.3 10% | 7.9 -13% | 10.5 -50% | 13 -86% | 11 -57% | 10.4 ? -49% | 13.8 ? -97% |
| Idle Average * | 13 | 9.8 25% | 11.1 15% | 15 -15% | 16 -23% | 14 -8% | 14.5 ? -12% | 19.2 ? -48% |
| Idle Maximum * | 13.7 | 26.5 -93% | 11.8 14% | 17 -24% | 23 -68% | 25 -82% | 21.4 ? -56% | 27 ? -97% |
| Load Average * | 48.4 | 103.8 -114% | 107.4 -122% | 109 -125% | 95 -96% | 123 -154% | 109.3 ? -126% | 111.3 ? -130% |
| Witcher 3 ultra * | 148 | 189 -28% | 111 25% | 186 -26% | 156 -5% | 176 -19% | ||
| Load Maximum * | 244 | 241.9 1% | 140.4 42% | 186 24% | 191 22% | 226 7% | 206 ? 16% | 251 ? -3% |
* ... smaller is better
Power Consumption The Witcher 3 / Stress Test
Power Consumption With External Monitor
Battery Life
MSI uses a fairly small battery with only a 53-Wh capacity, and the battery life of the gaming laptop is correspondingly low. Only the Schenker has a similarly small battery, but all the other competitors have an 80 (Alienware) or even 90-Wh (Asus TUF) capacity.
This means that it is barely sufficient for 4 hours of watching videos or 4.5 hours of surfing at full (i.e., rather mediocre) brightness.
| MSI Pulse GL66 12UEK i9-12900H, GeForce RTX 3060 Laptop GPU, 53.5 Wh | Asus TUF Gaming F15 FX507ZM i7-12700H, GeForce RTX 3060 Laptop GPU, 90 Wh | Alienware x14 i7 RTX 3060 i7-12700H, GeForce RTX 3060 Laptop GPU, 80 Wh | SCHENKER XMG Apex 15 NH57E PS R7 5800H, GeForce RTX 3060 Laptop GPU, 49 Wh | Lenovo Legion S7 15ACH6 82K80030GE R9 5900HX, GeForce RTX 3060 Laptop GPU, 71 Wh | Alienware m15 R5 Ryzen Edition R7 5800H, GeForce RTX 3060 Laptop GPU, 86 Wh | Average of class Gaming | |
|---|---|---|---|---|---|---|---|
| Battery Runtime | -43% | 38% | -7% | 24% | 35% | 21% | |
| H.264 | 237 | 561 137% | 277 17% | 449 89% | 525 122% | 399 ? 68% | |
| Load | 116 | 66 -43% | 45 -61% | 81 -30% | 69 -41% | 55 -53% | 84.2 ? -27% |
| Reader / Idle | 947 | 841 | 881 | 544 ? | |||
| WiFi v1.3 | 285 | 535 | 389 | 421 | 306 | 368 ? | |
| Witcher 3 ultra | 45 | 96 | 80.6 ? |
Pros
Cons
Verdict - A lot of potential for improvement
Although the RTX 3060 is only able to use 105 watts, we still liked the gaming performance, particularly since this also makes the Pulse comfortably efficient but not slow by any means.
Neither the dark display with its lame response times, nor USB 2.0 or the lack of Thunderbolt will please real gamers. The use of a sticker factory seal, which is at least questionable, also won't inspire any enthusiasm.
It is obvious that the laptop is really designed for price-conscious gamers, even though the current price of about 1,900 Euros (~$2,057) doesn't really make it a steal. MSI could have lowered the price without any problems, if the manufacturer had used a i7-12700H or i7-12800H processor like most of the competitors, instead of the expensive i9-12900H. The performance difference isn't noticeable in the Pulse and doesn't justify the extra price premium.
With the Pulse GL66, MSI's fairly new gaming series still reveals some adjustment problems. The expensive CPU doesn't perform at its full level, and a more affordable model would have lowered the price of the system to a more appropriate level.
Looking at the performance, the Asus TUF Gaming F15 recommends itself as an alternative. It is faster, offers the better screen, and is even more affordable at about 1,600 Euros (~$1,732). Costing about the same as the Pulse, the Lenovo Legion S7 is also able to shine with a good display.
Price and Availability
In the US, various configurations of the Pulse GL66 12UEK with an i7-12700H are available from Amazon starting from $1549
MSI Pulse GL66 12UEK
-
04/11/2022 v7
Christian Hintze


Pricecompare

