Alienware m15 R5 Ryzen Edition Laptop Review - More performance for less money
Alienware now offers the gaming laptop m15 R5 as Ryzen Edition with a modern AMD processor. It is, however, not only a simple update of the familiar m15 R4, but you get a completely redesigned chassis and changes in terms of the port situation. Alienware combines the Ryzen CPUs with current Nvidia GPUs, starting with the GeForce RTX 3060 and even the RTX 3070 as an option. The Alienware m15 is not the flagship laptop anymore, this position is now occupied by the new Alienware x15, which uses Intel CPUs and starts at 2199 Euros.
The price of the new m15 R5 is a bit lower than the previous Intel model and it starts at 1750 Euros for the base model with the Ryzen 7 5800H, GeForce RTX 3060, 16 GB RAM, 512 GB SSD storage, and the fast 165 Hz FHD panel, which is exactly our review unit.
Alienware also introduced the new m15 R6 by now, which uses new Tiger Lake-H CPUs from Intel. It uses the same new design and also starts at 1750 Euros with the slower Core i5-11400H (6 cores). A spec with the more comparable Core i7-11800H is 100 Euros more expensive than our AMD model.
Possible competitors
Rating | Date | Model | Weight | Height | Size | Resolution | Price |
|---|---|---|---|---|---|---|---|
| 84.7 % v7 (old) | 06 / 2021 | Alienware m15 R5 Ryzen Edition R7 5800H, GeForce RTX 3060 Laptop GPU | 2.5 kg | 22.85 mm | 15.60" | 1920x1080 | |
| 85.4 % v7 (old) | 04 / 2021 | Alienware m15 R4 i9-10980HK, GeForce RTX 3070 Laptop GPU | 2.3 kg | 20 mm | 15.60" | 1920x1080 | |
| 85.9 % v7 (old) | 06 / 2021 | Asus TUF Gaming F15 FX506HM i7-11800H, GeForce RTX 3060 Laptop GPU | 2.3 kg | 24.9 mm | 15.60" | 1920x1080 | |
| 80.5 % v7 (old) | 05 / 2021 | Acer Aspire Nitro 5 AN515-55-57GF i5-10300H, GeForce RTX 3060 Laptop GPU | 2.3 kg | 23.9 mm | 15.60" | 1920x1080 | |
| 85.5 % v7 (old) | 03 / 2021 | Razer Blade 15 Base Edition 2021, i7-10750H RTX 3060 i7-10750H, GeForce RTX 3060 Laptop GPU | 2.1 kg | 19.9 mm | 15.60" | 1920x1080 |
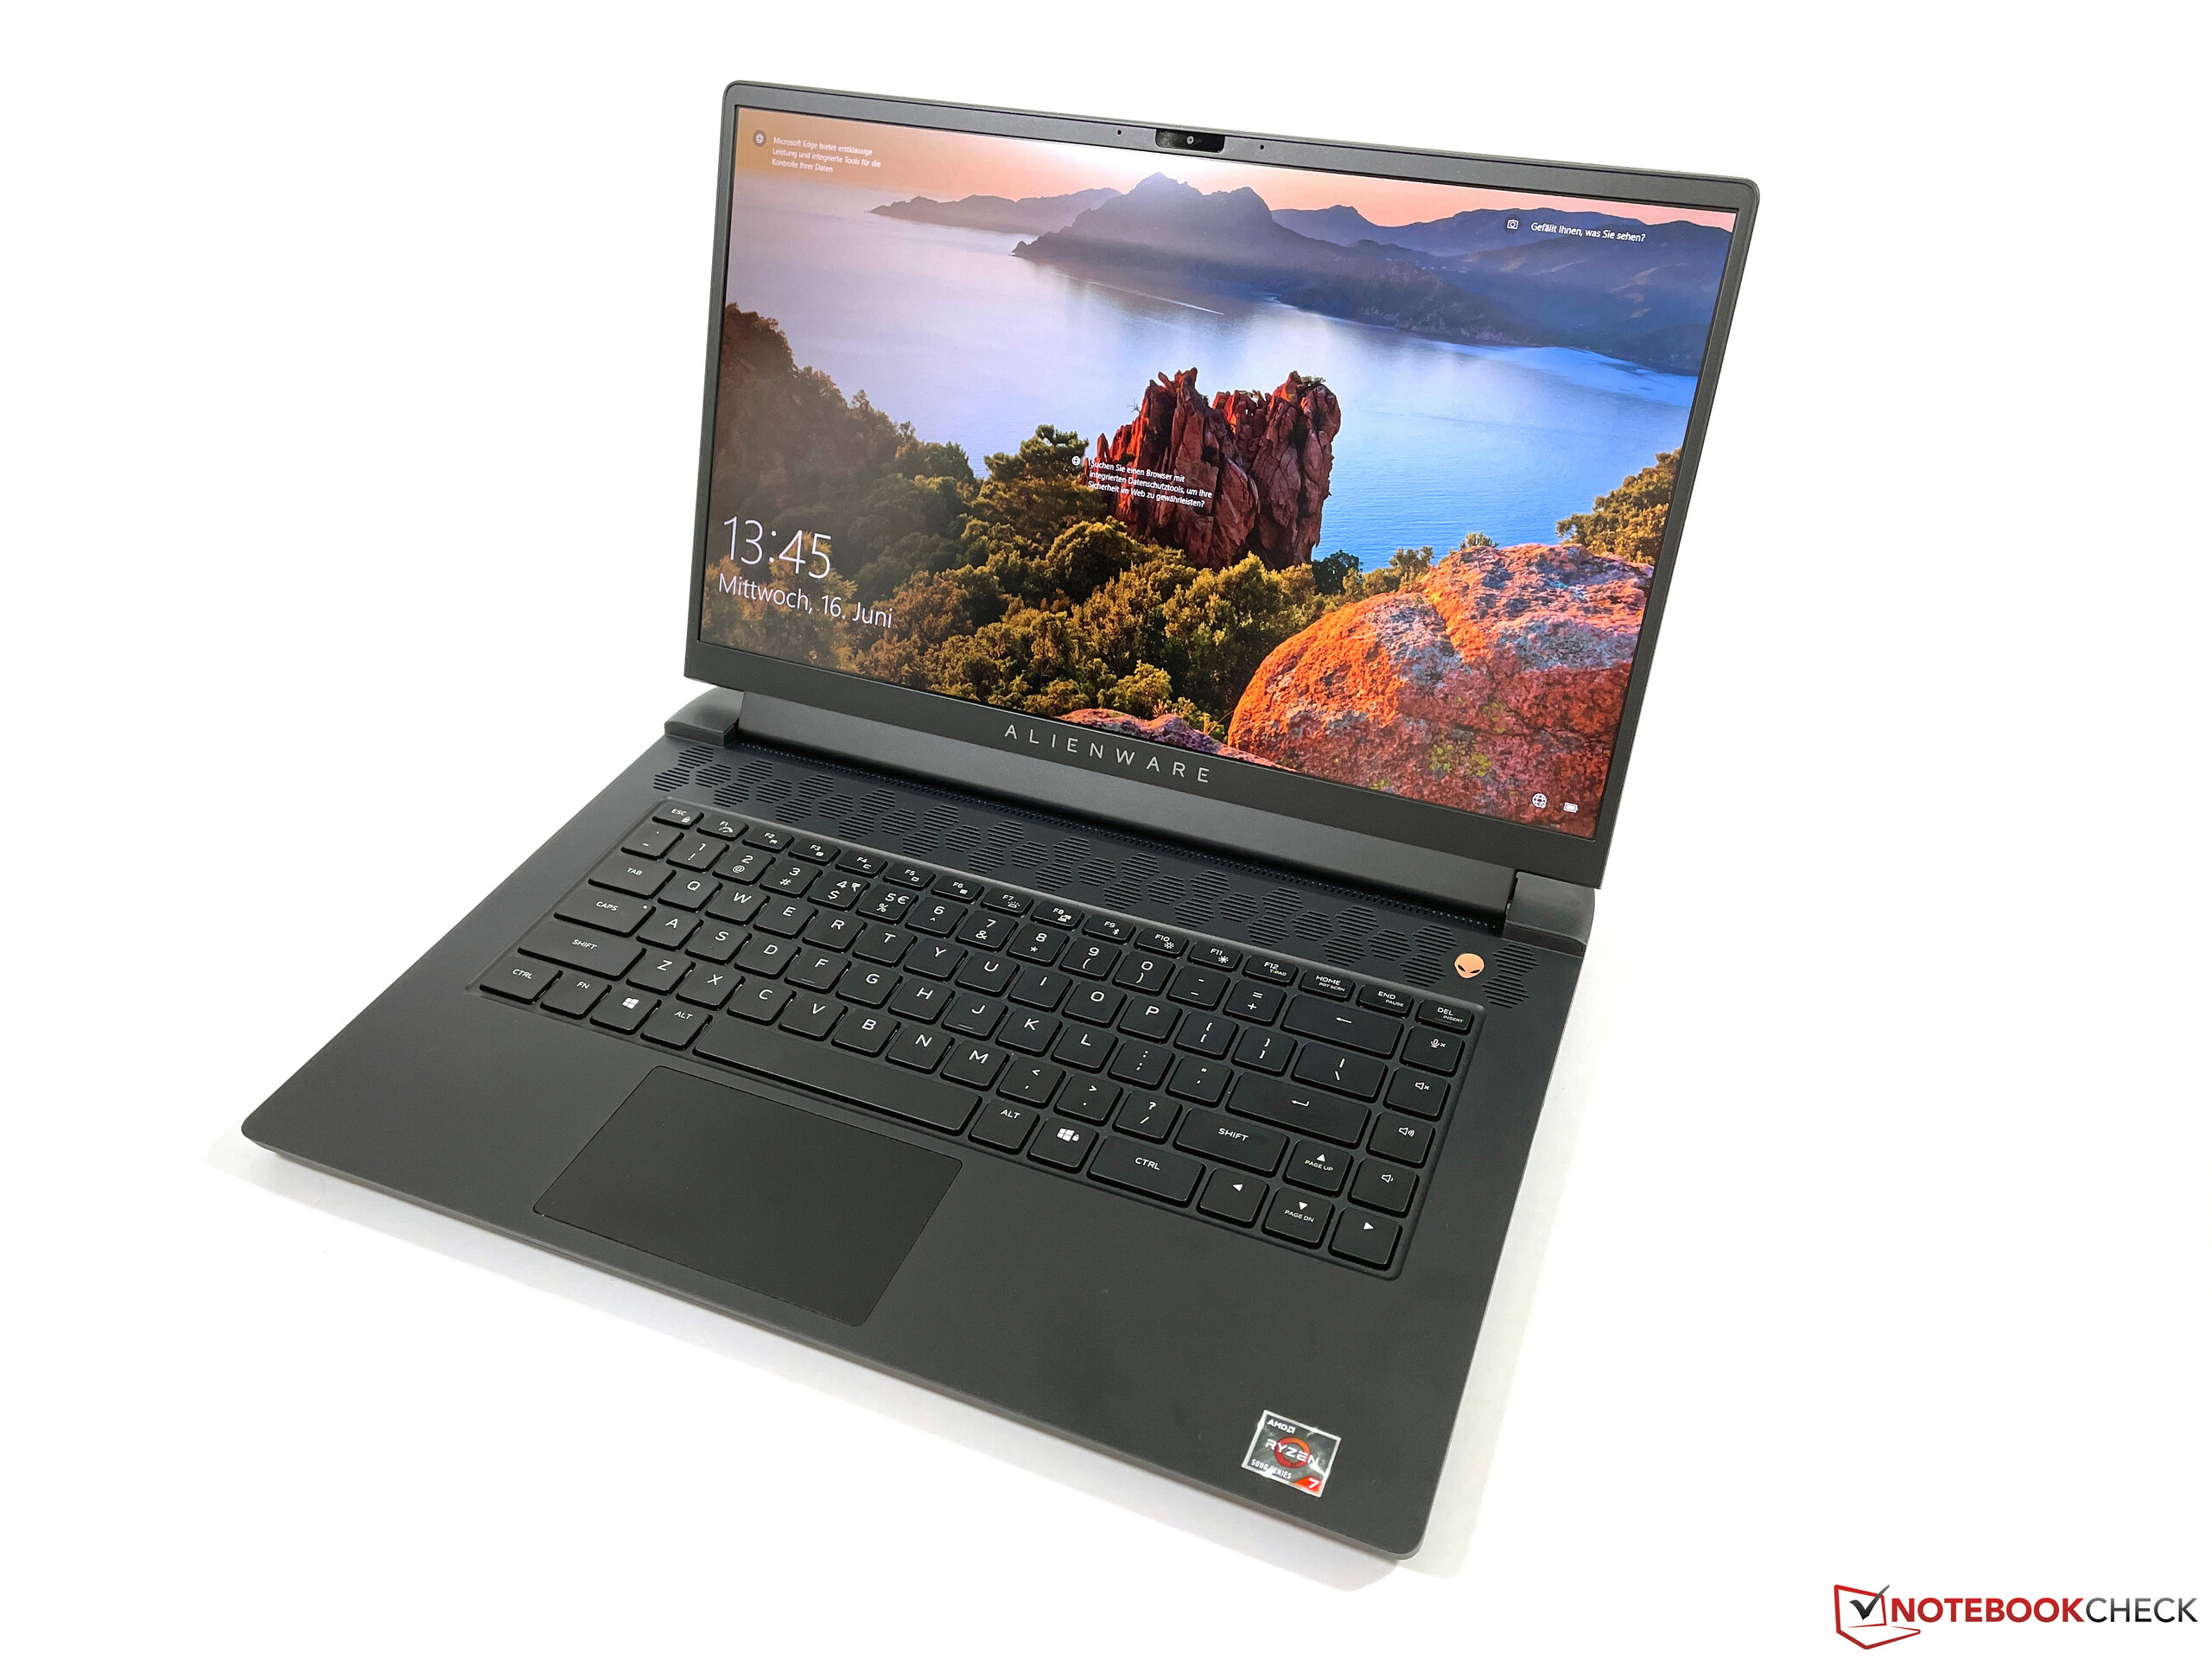
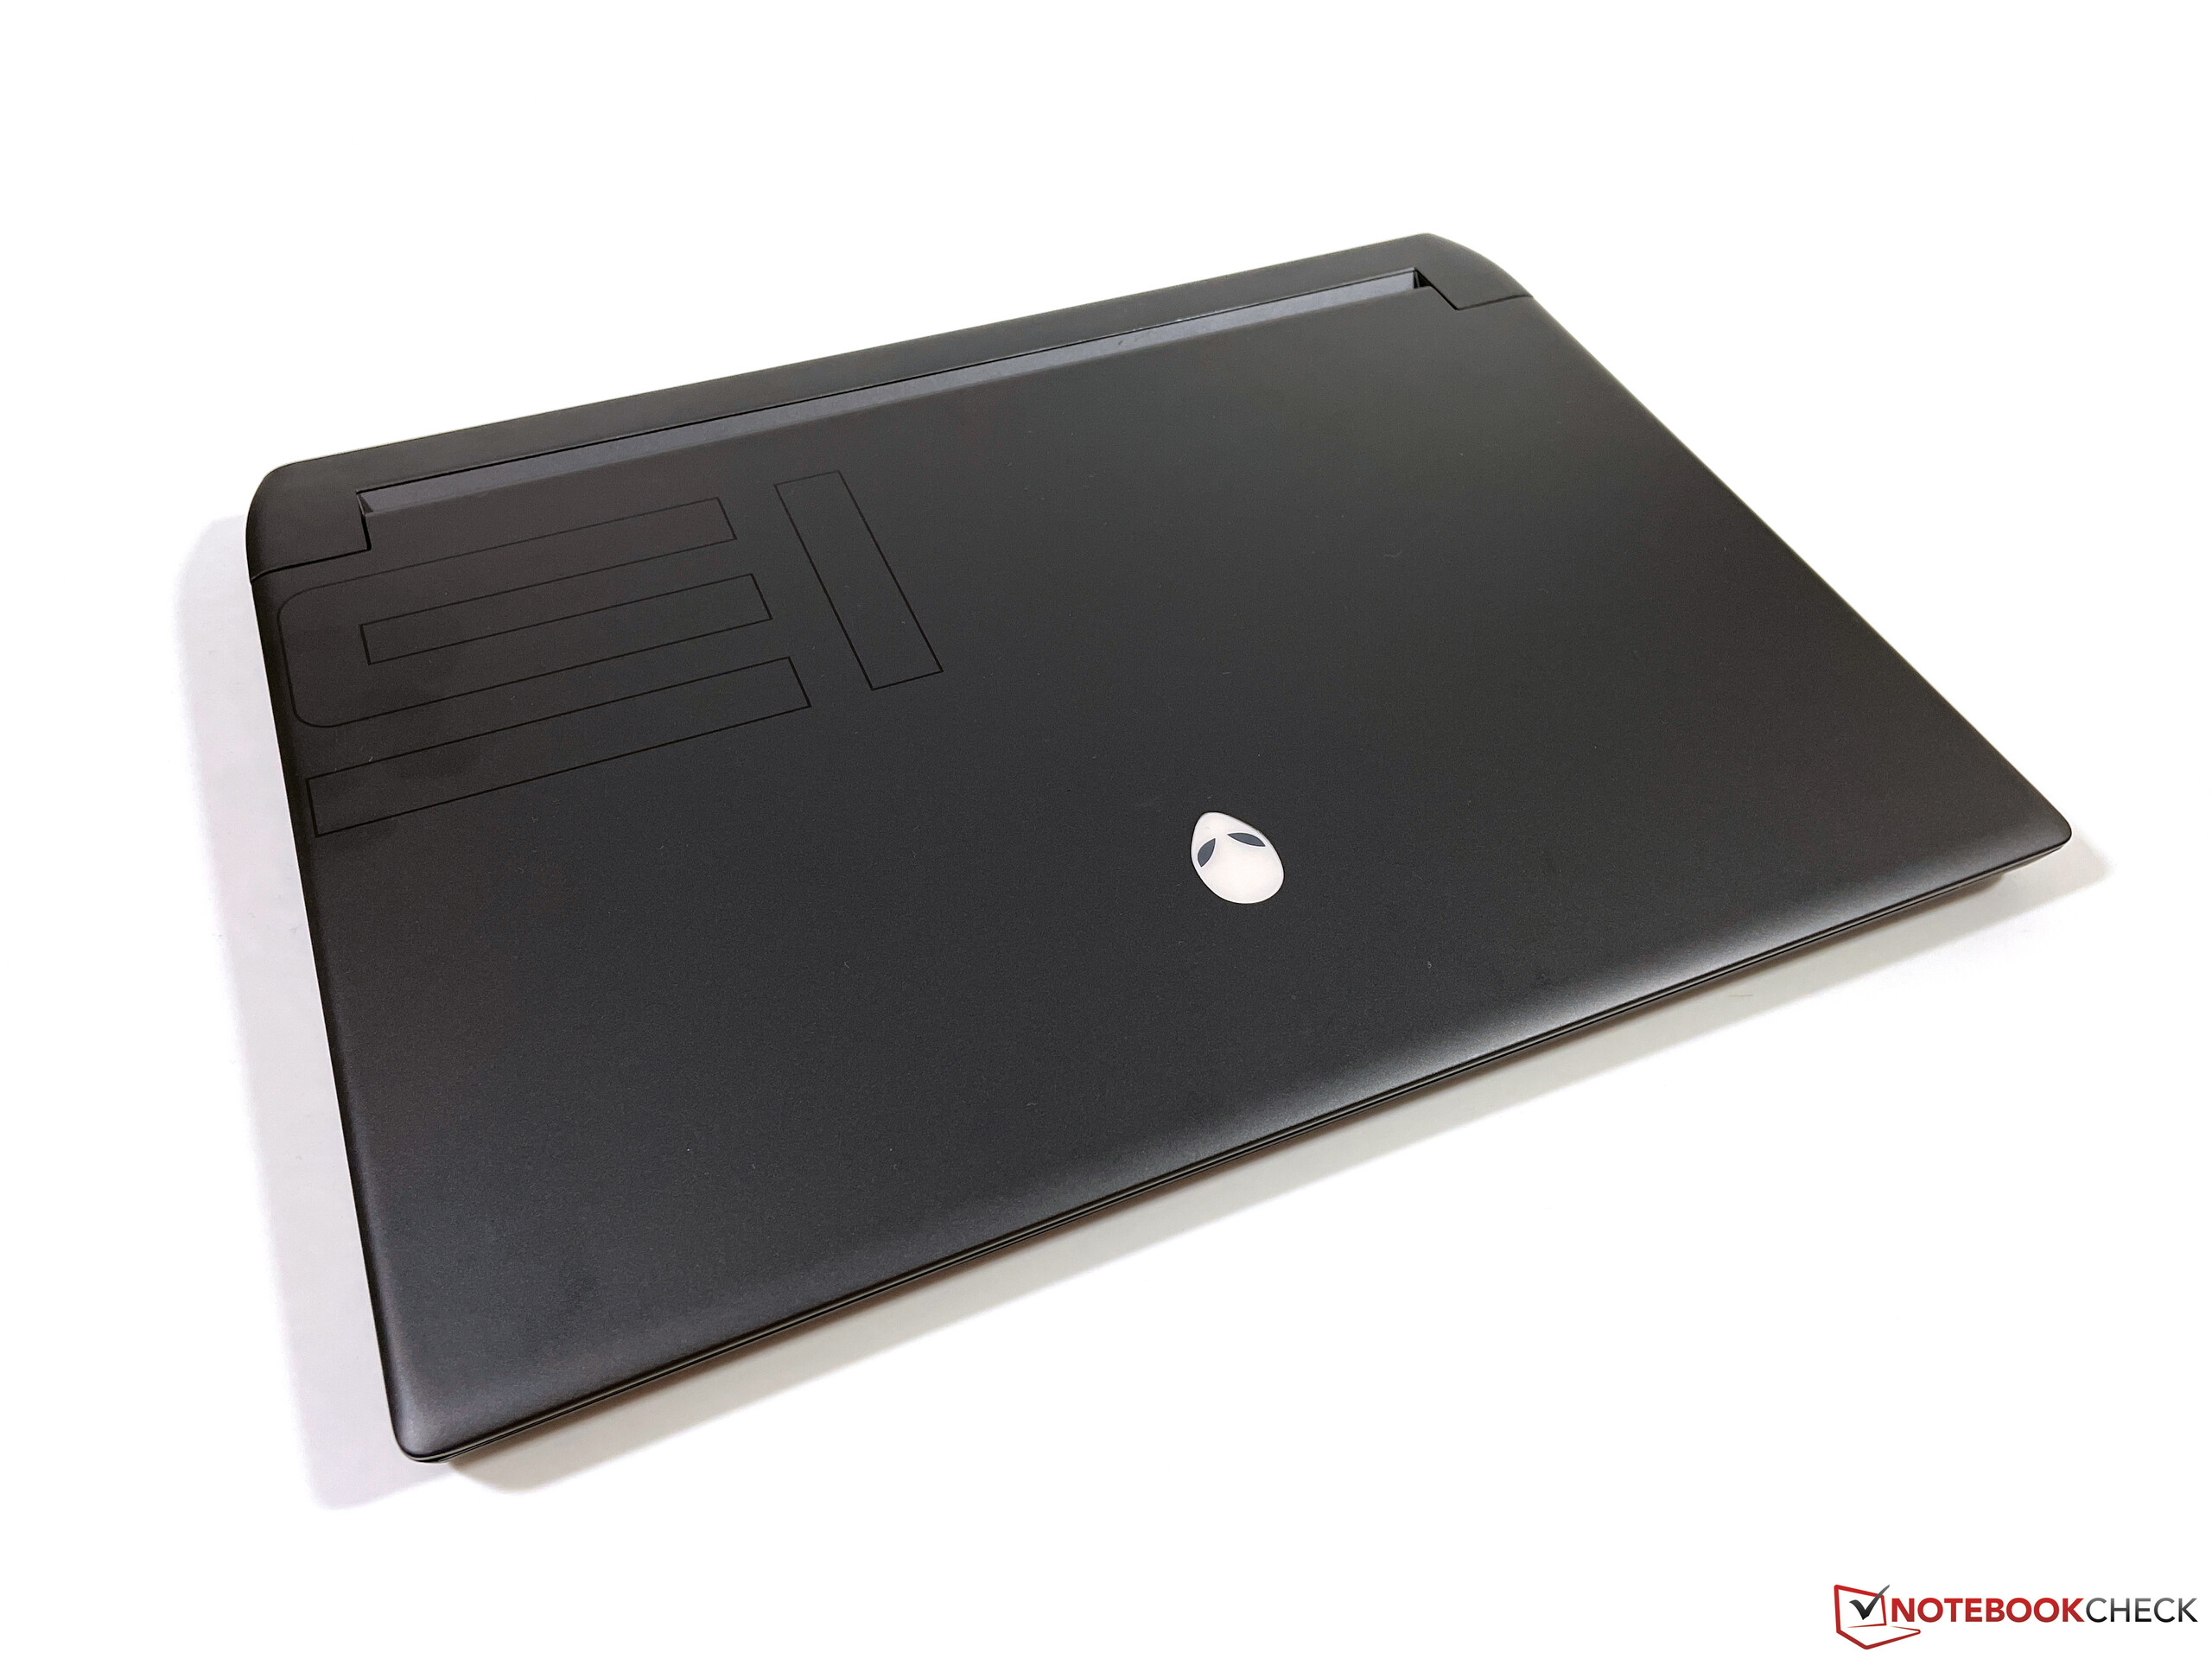
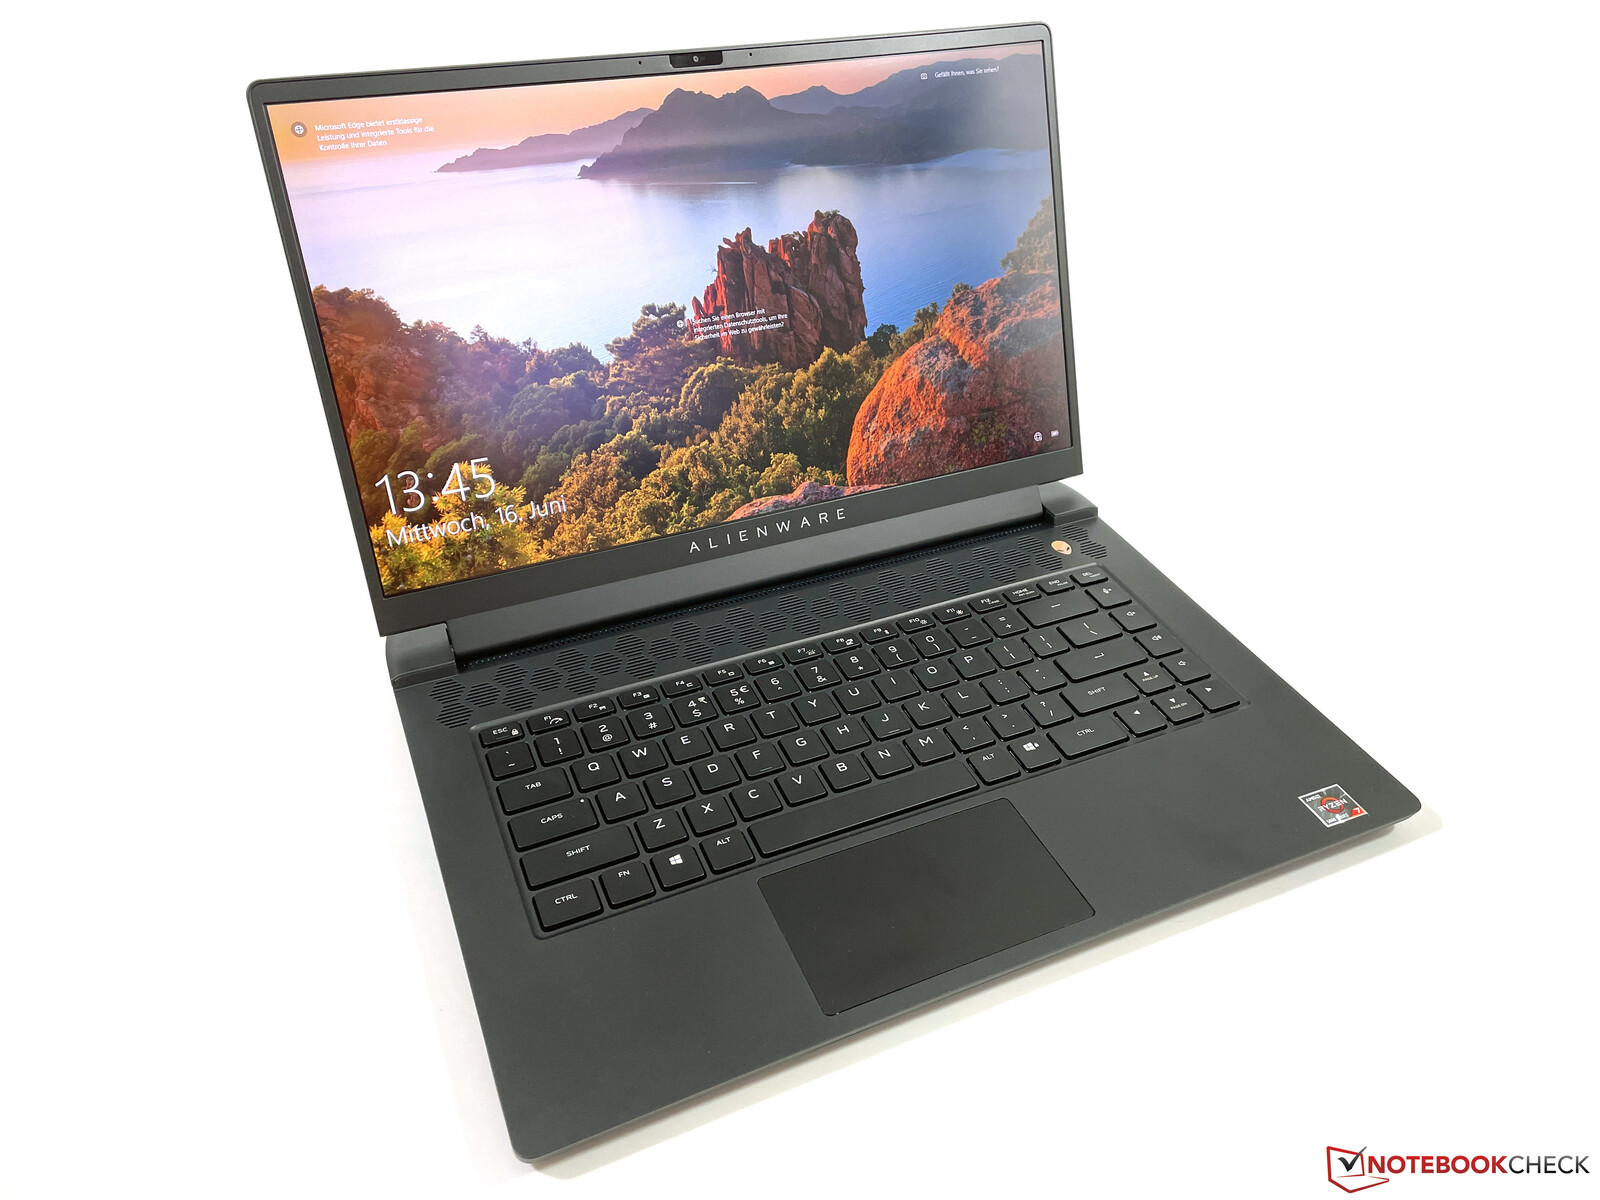
Case - m15 R5 uses familiar design
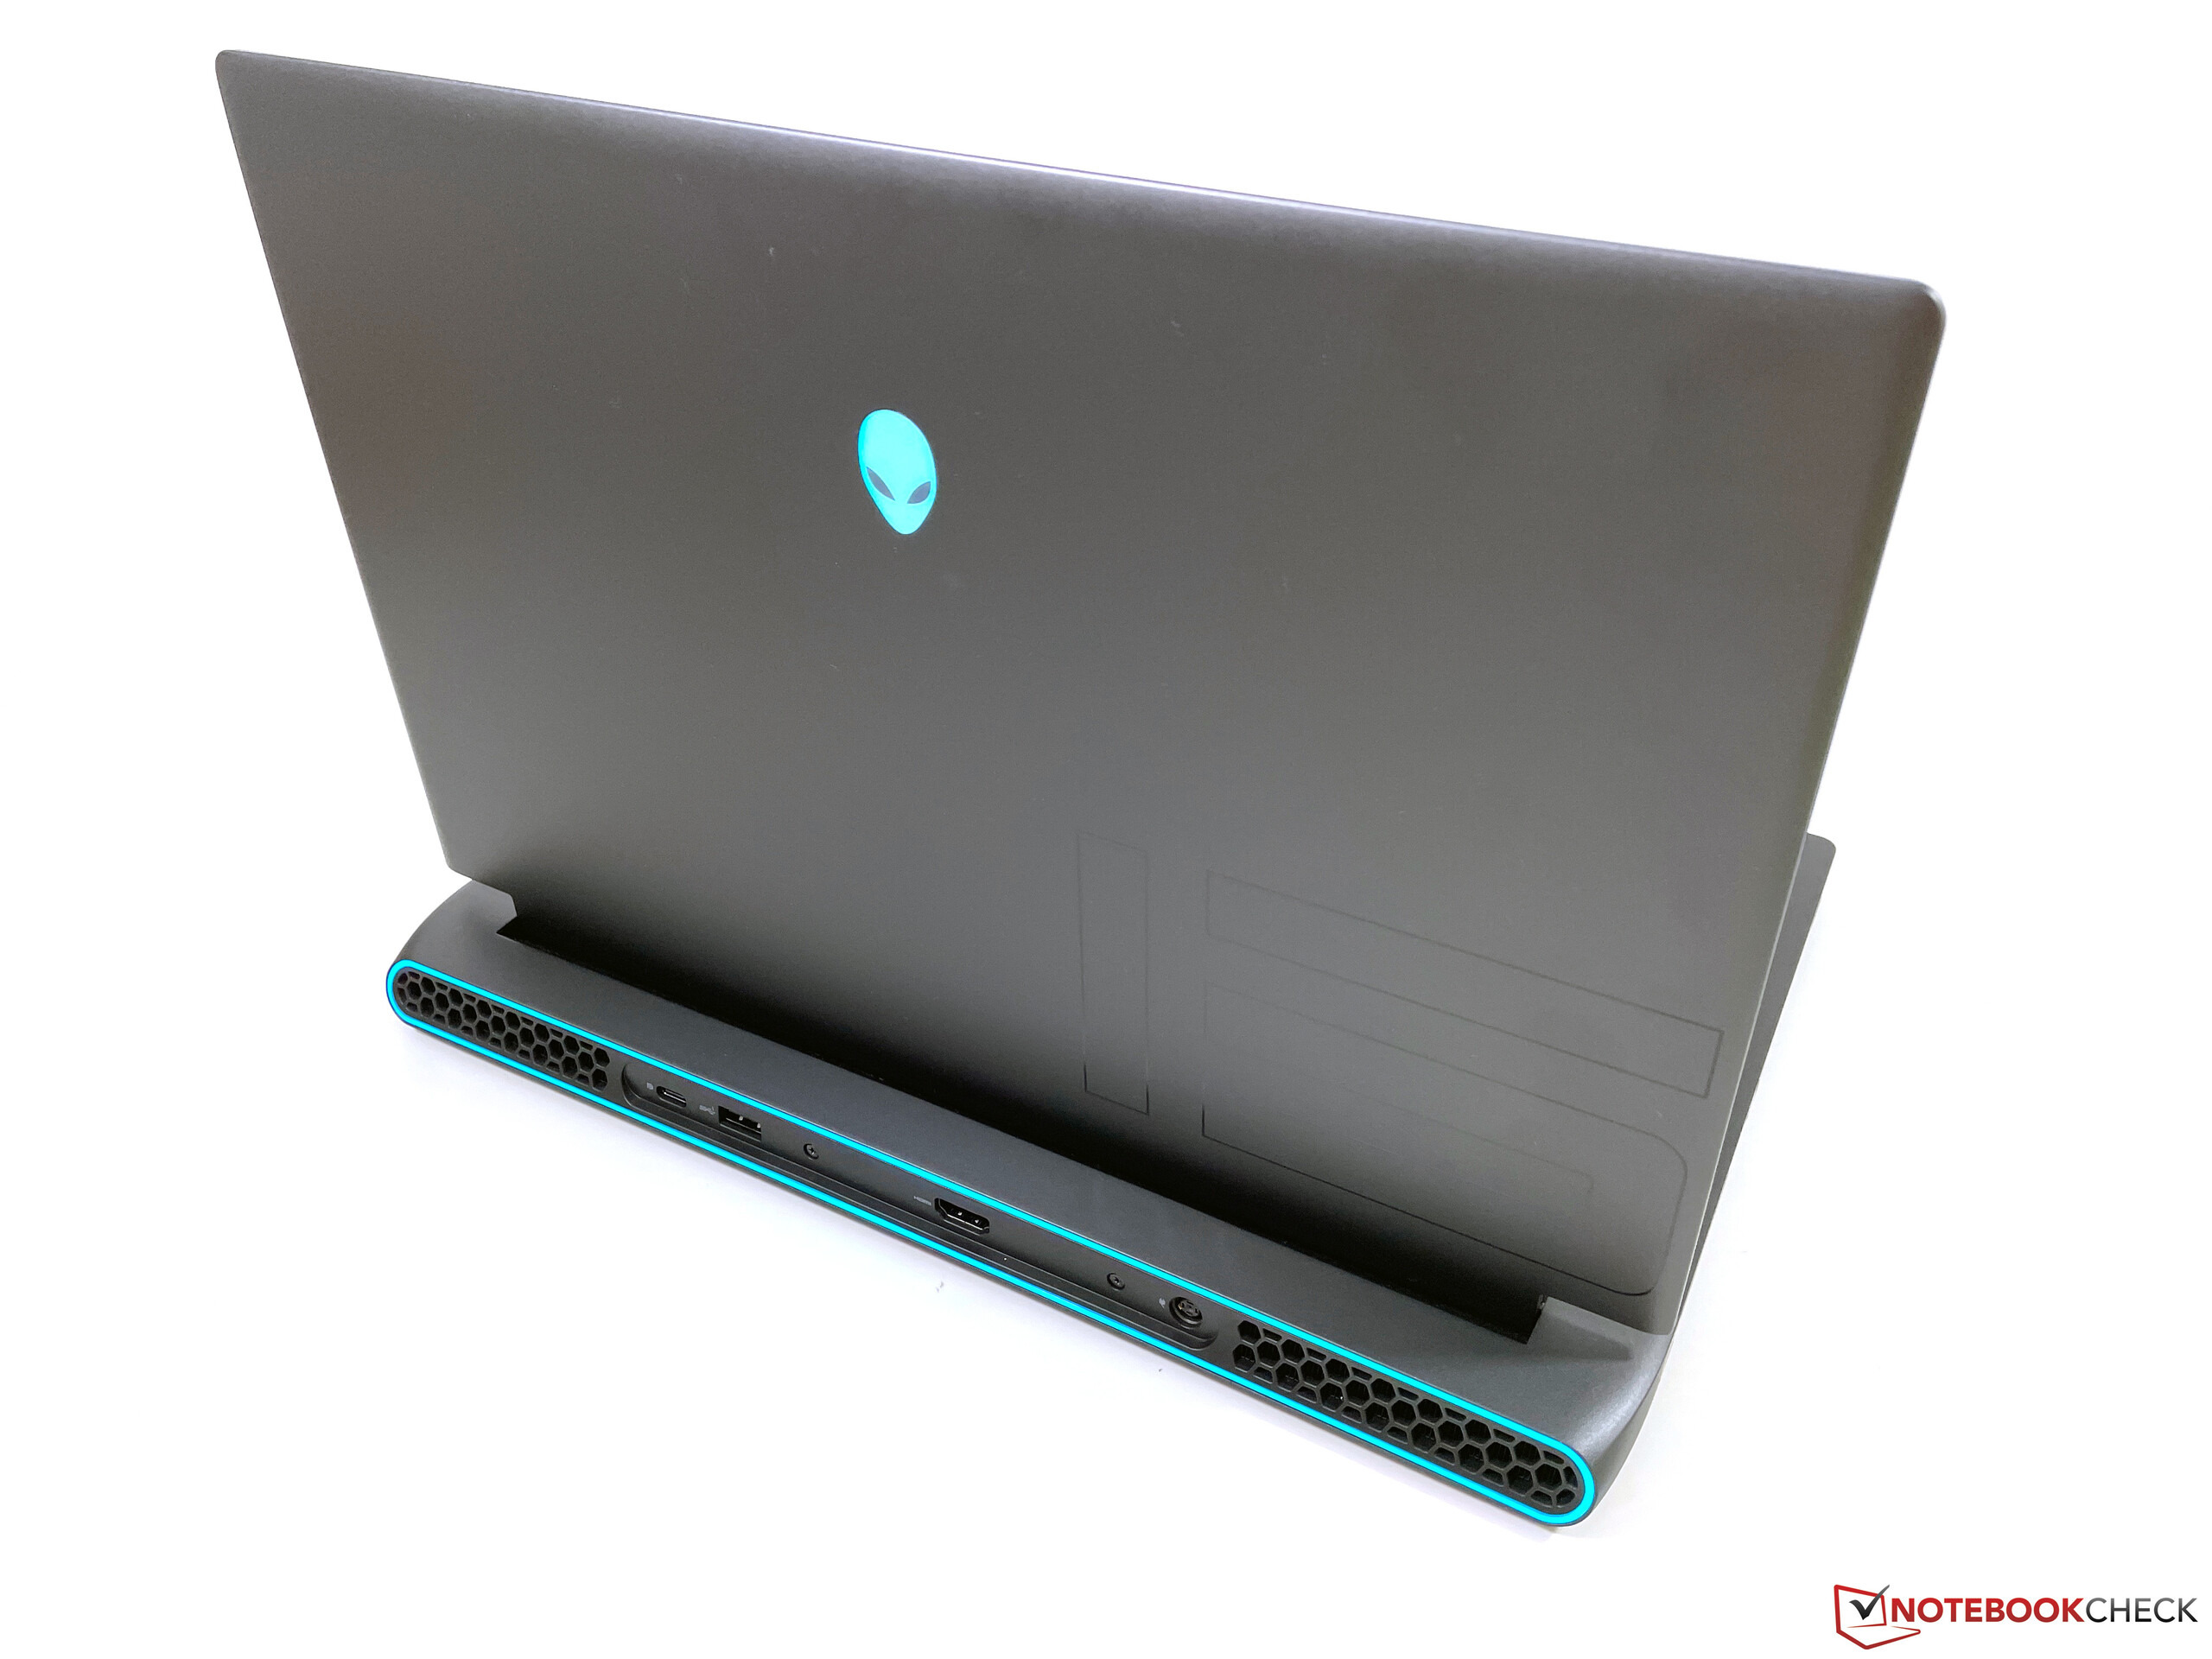
The chassis of the m15 R5 is completely new, but Alienware still keeps the familiar design language. The Ryzen Edition is only available in a dark gray color (Dark Side of the Moon) and you get the familiar lighting elements at the rear. There is a new darker strip at the front and the sides, which is supposed to make the design more appealing. All in all, the notebook now looks a bit more filigree than its predecessor. The semi-matt surfaces are nice to touch and fingerprints are not a huge problem.
The quality of the chassis does not quite meet our expectations. The build quality itself is very good and the base unit in particular is very sturdy, but you hear loud creaking noises when you open and close the lid. The lid itself is also more flexible and pressure on the back results in picture distortions, but this should not be a major issue in practice. The hinges are well-adjusted; you can open the lid with one hand and there is hardly any bouncing.
This new chassis is also used for the new Alienware m15 R6, which is equipped with modern Tiger Lake-H processors from Intel.
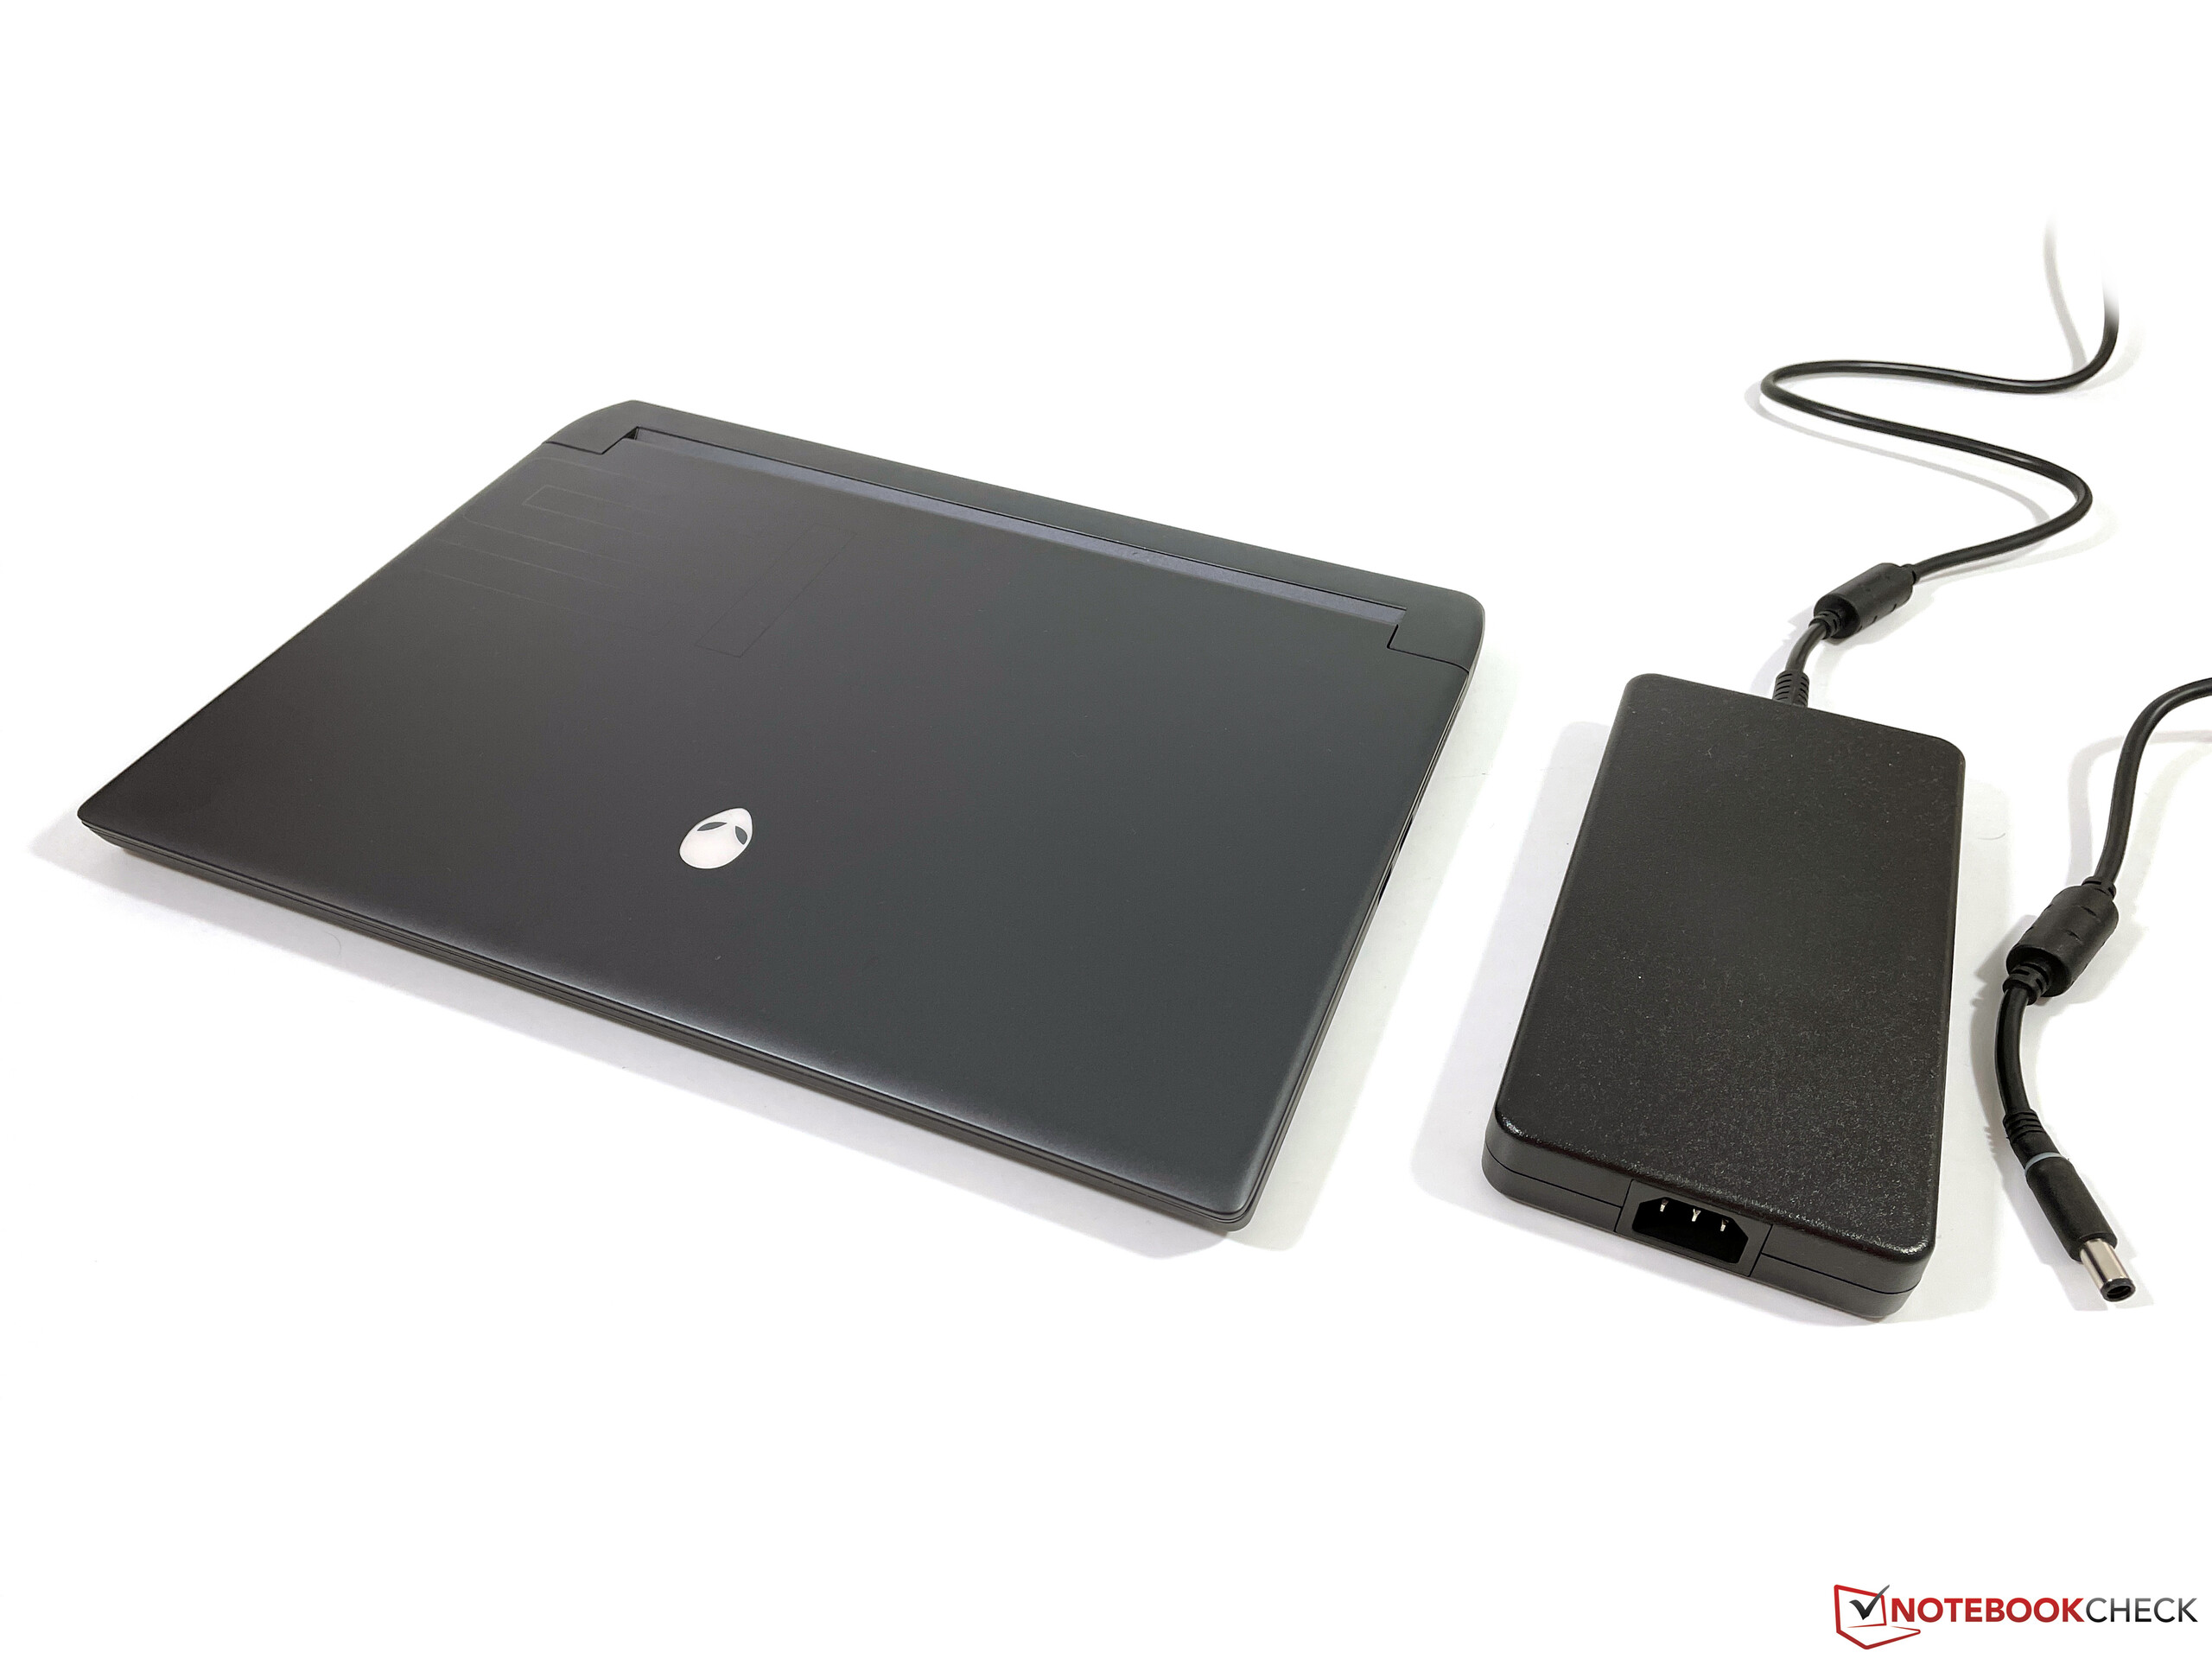
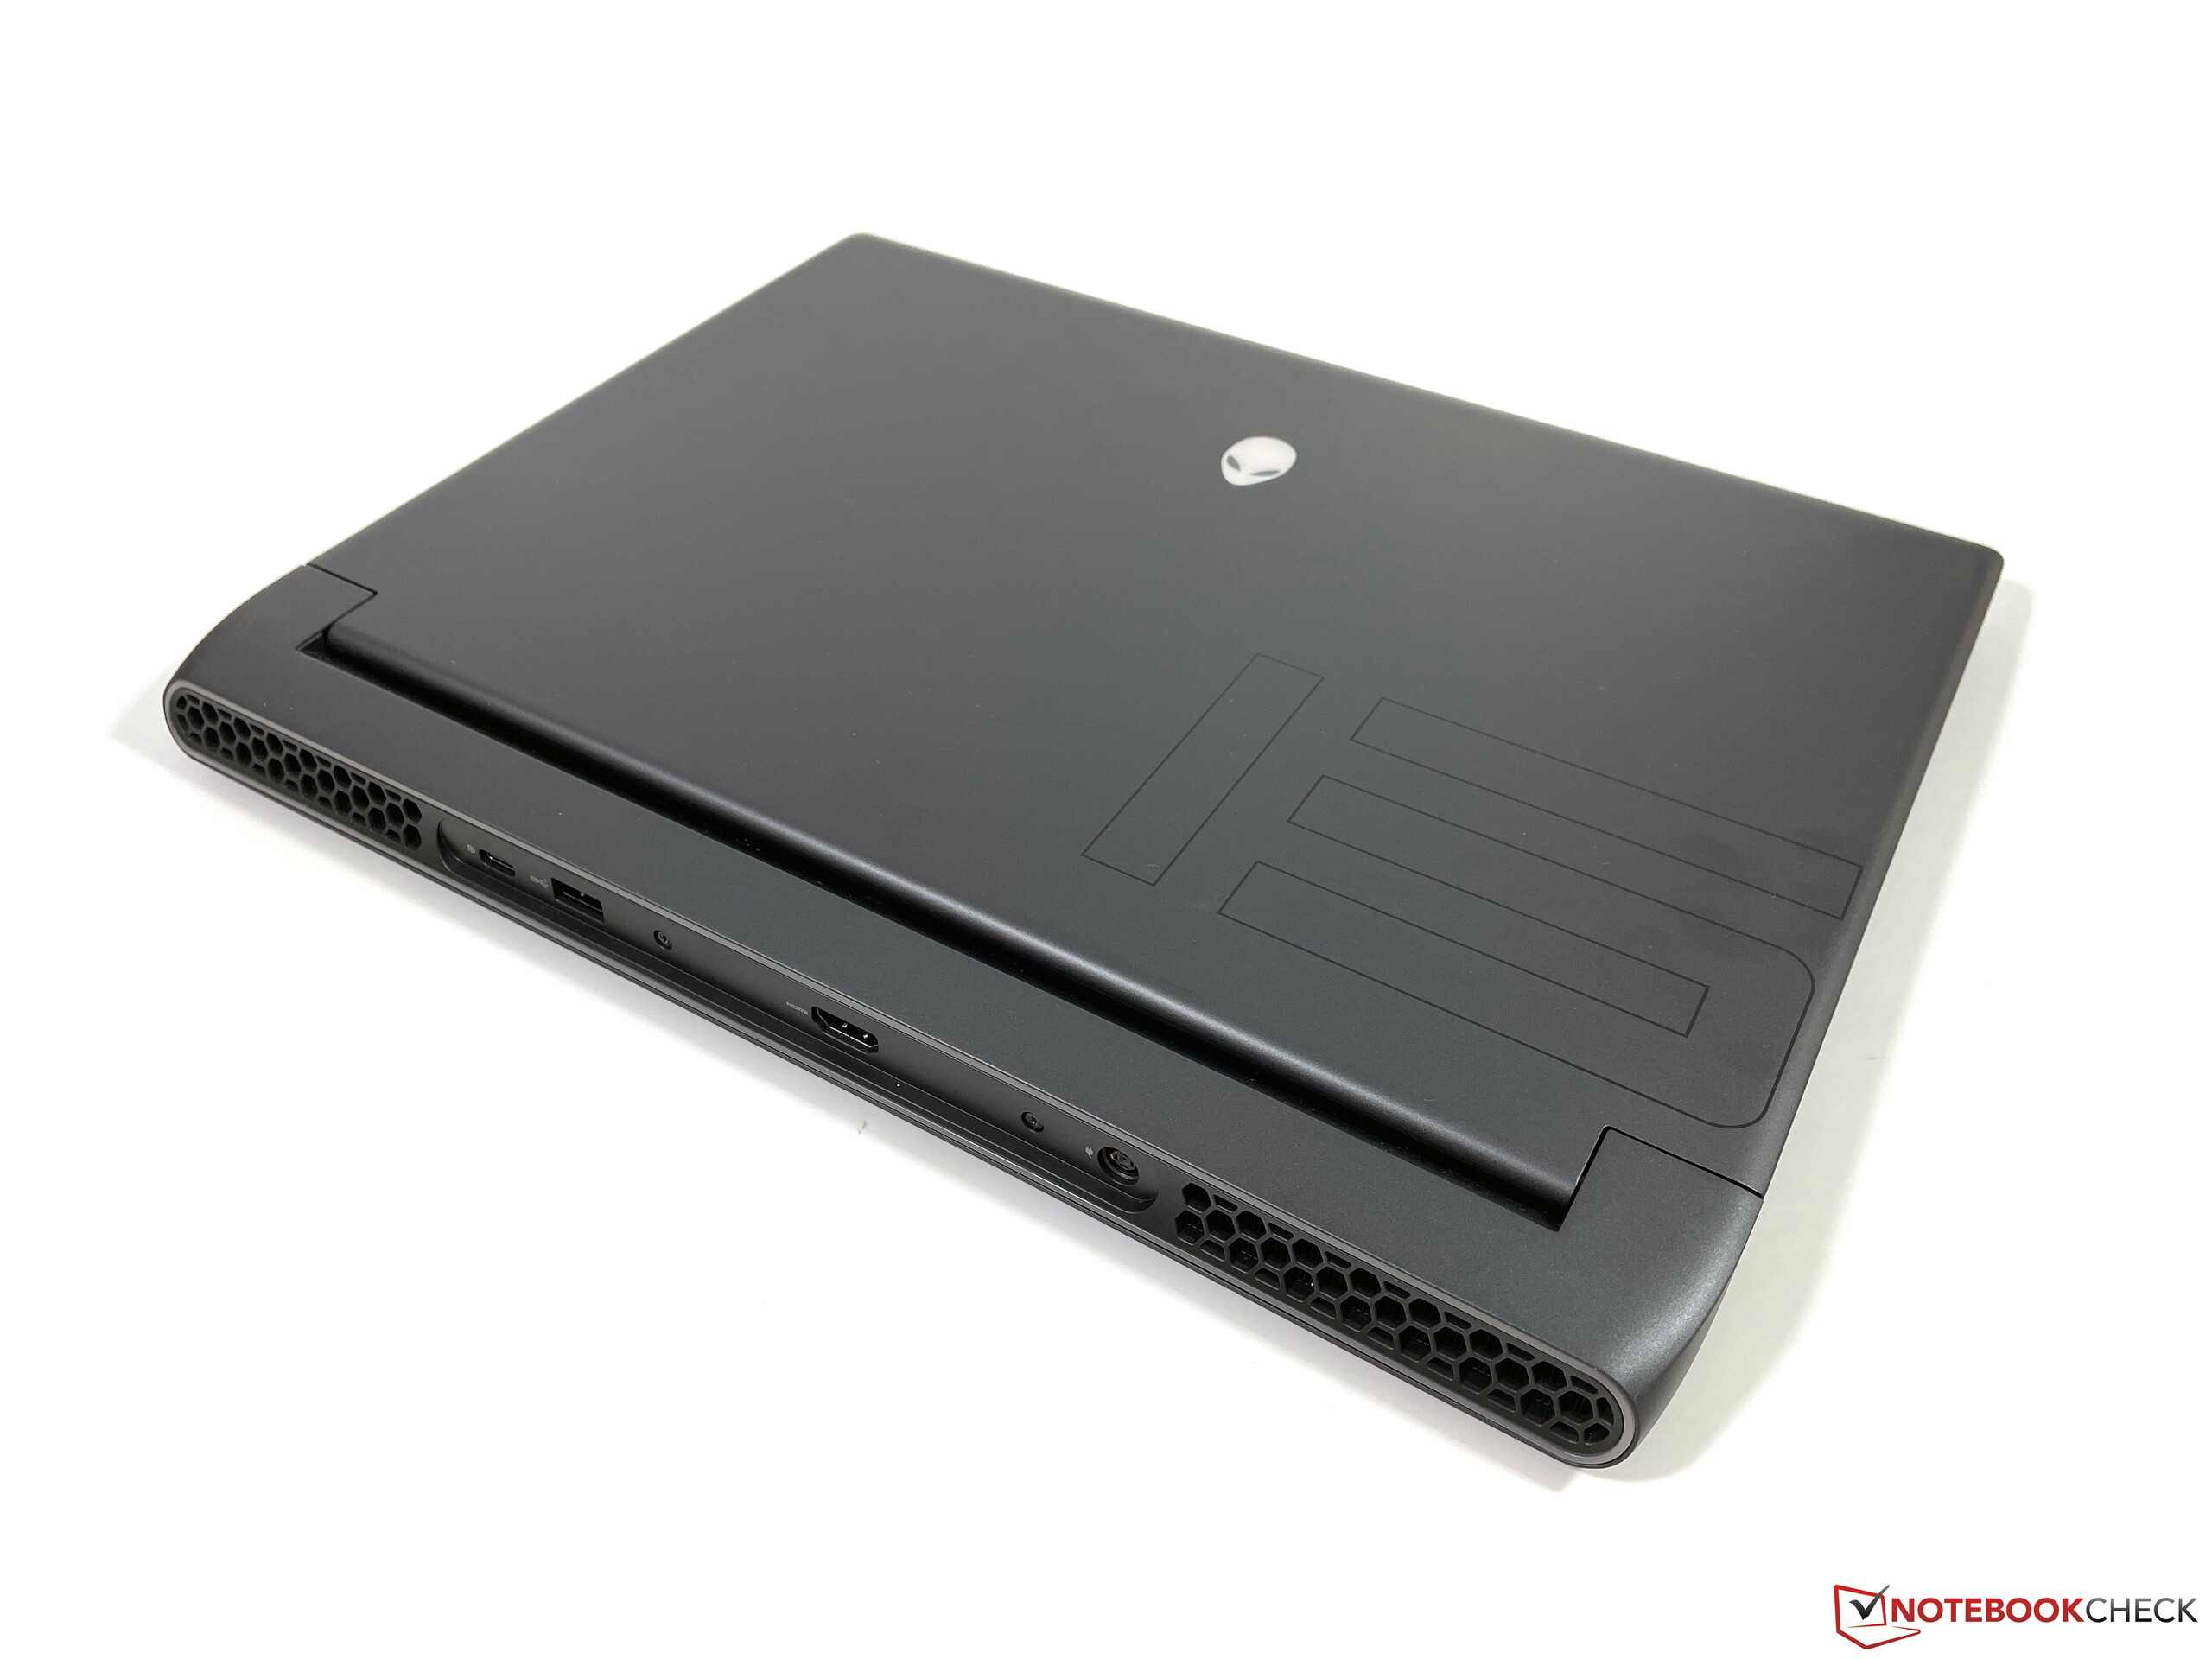
Thanks to the special hinge design, which is not located at the rear of the device, the Alienware m15 R5 is by far the deepest device in the comparison group. Width and height on the other hand are pretty comparable, but the m15 is also the heaviest device at almost 2.5 kg. You also have to consider 780 grams for the 240W power adapter when you travel.
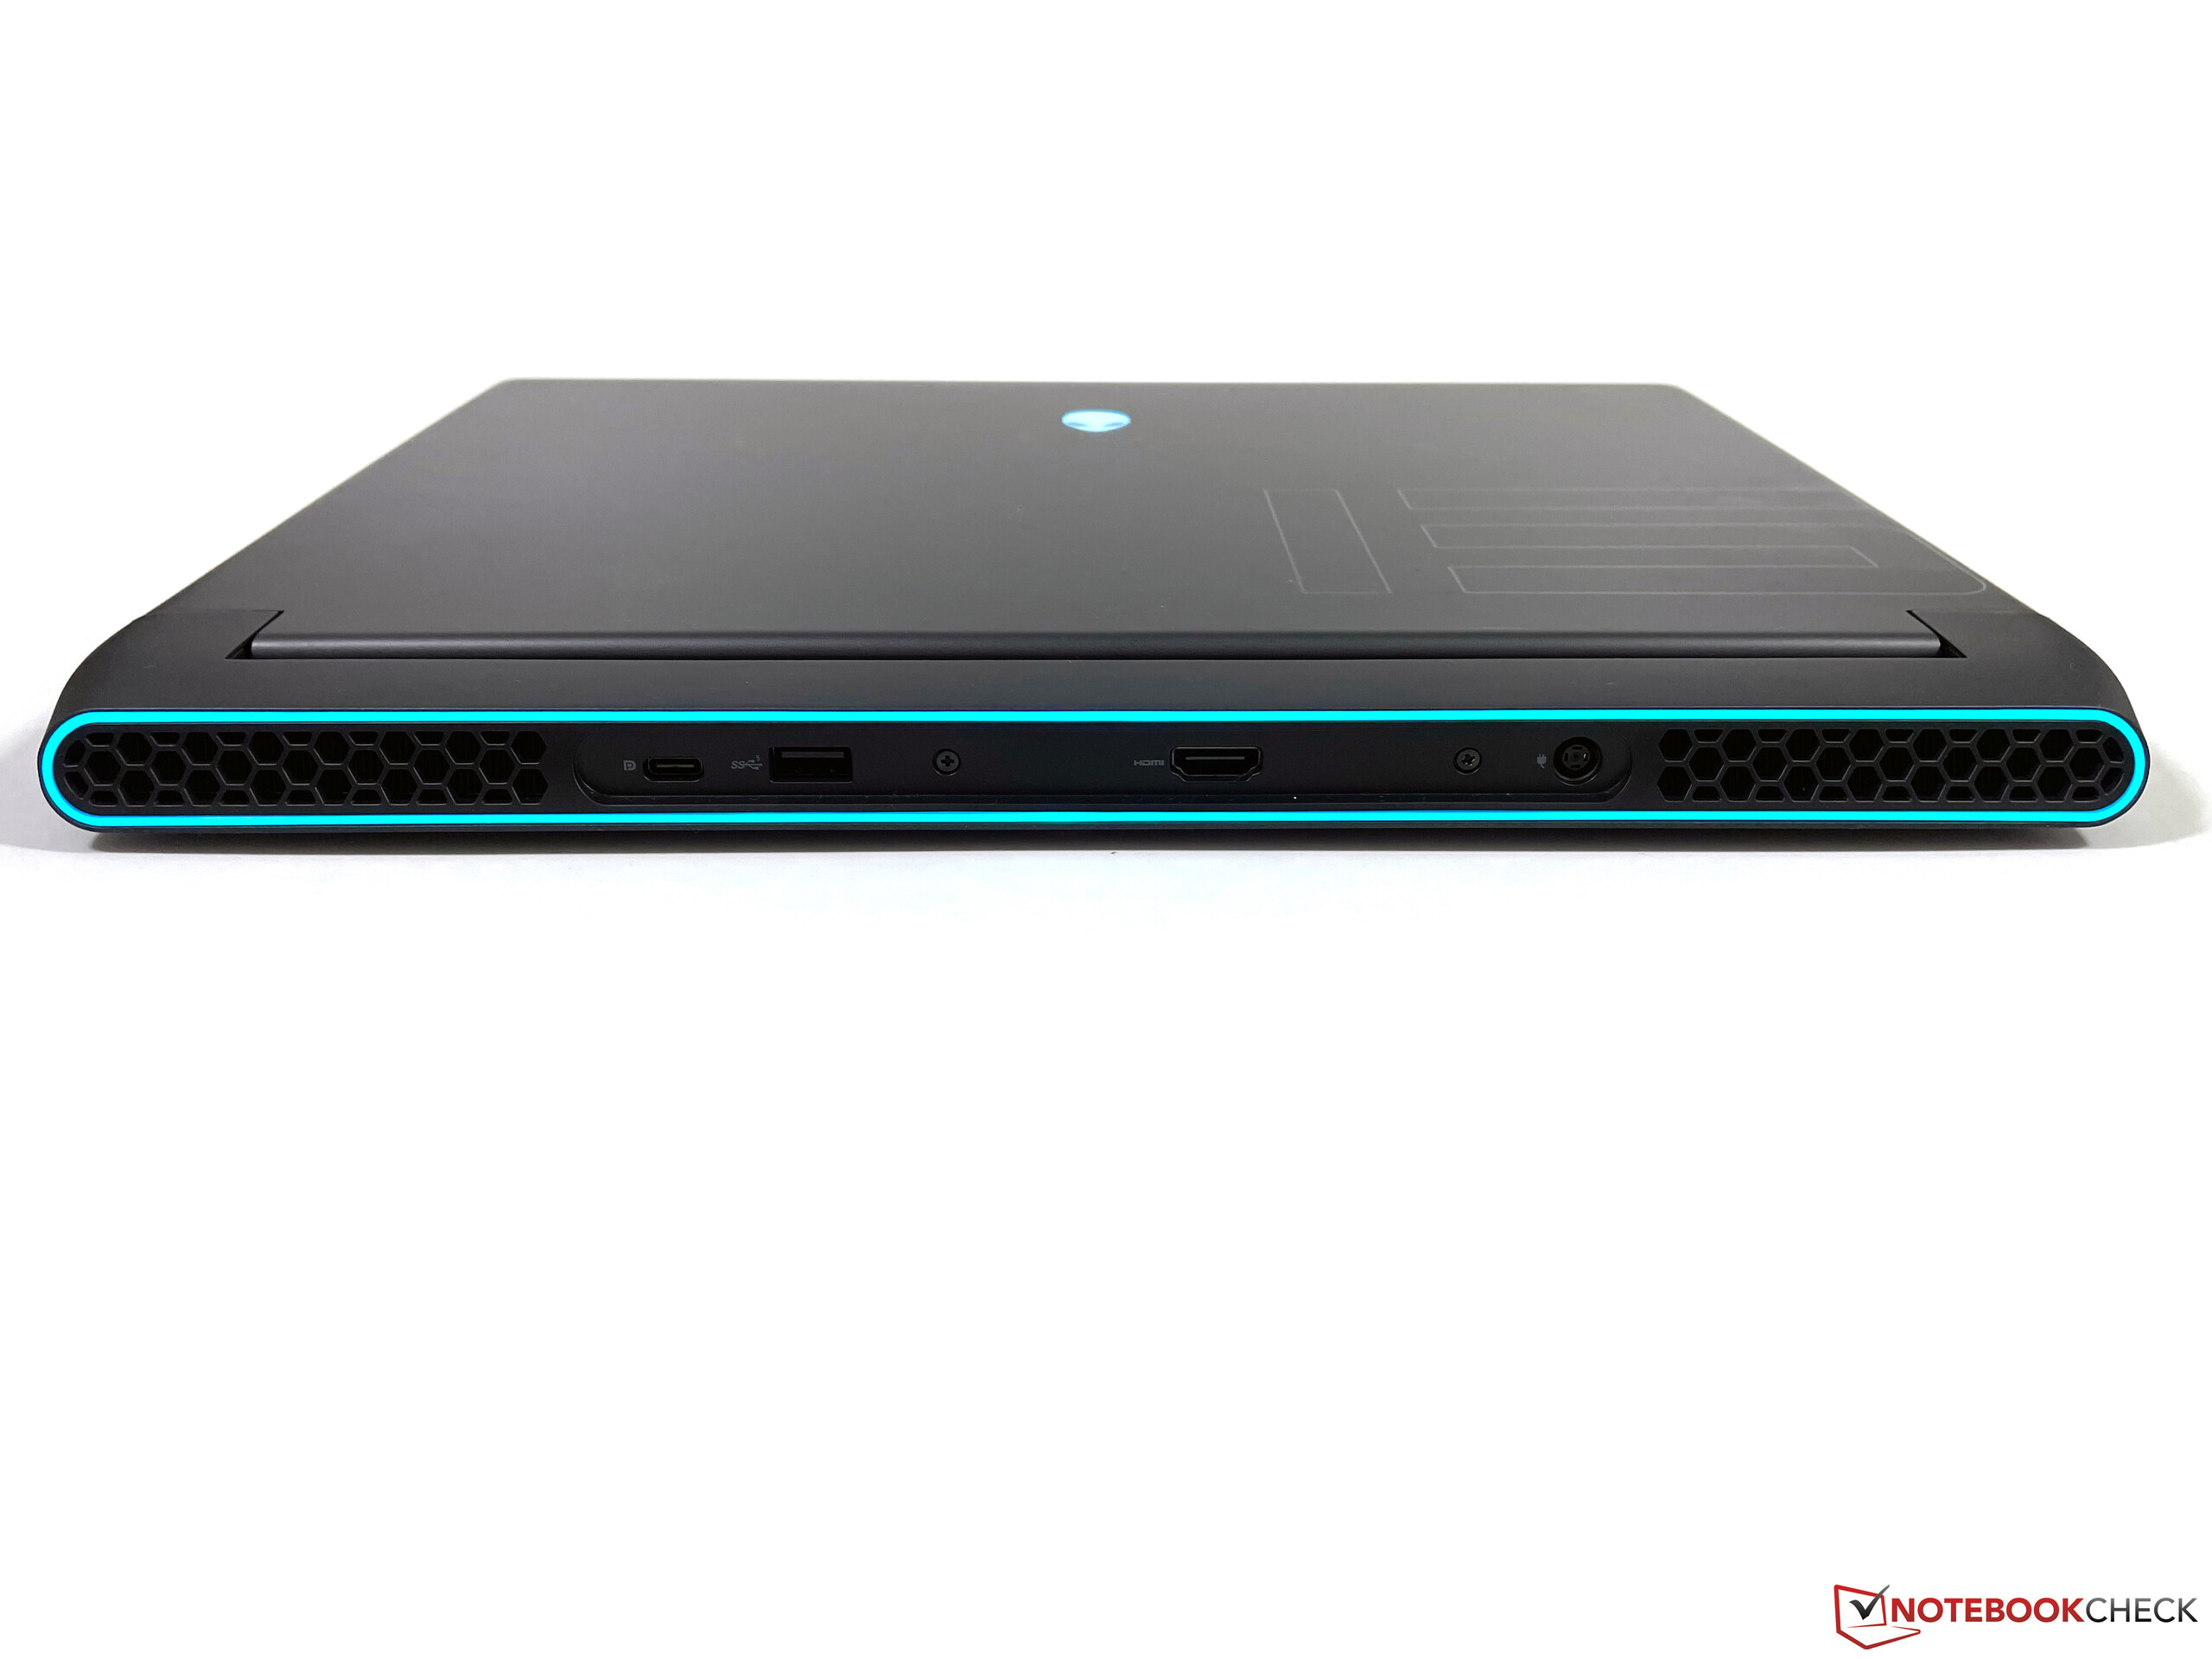
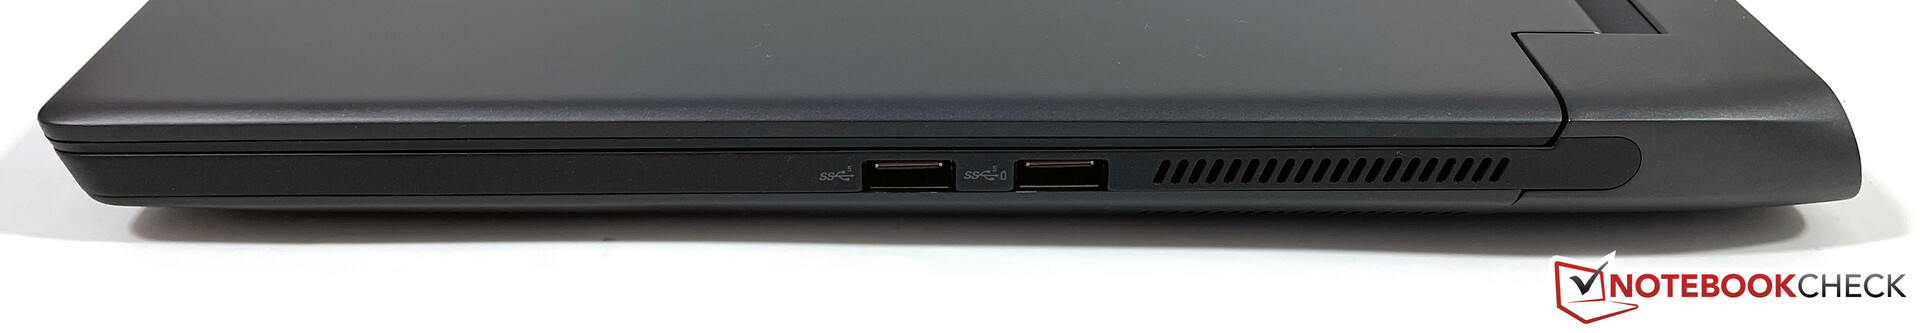
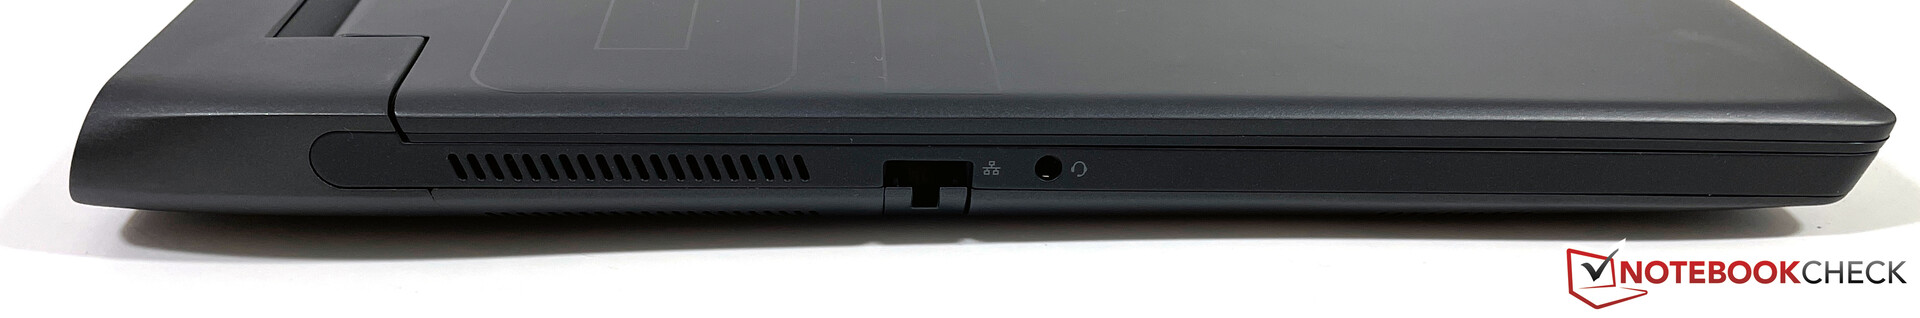
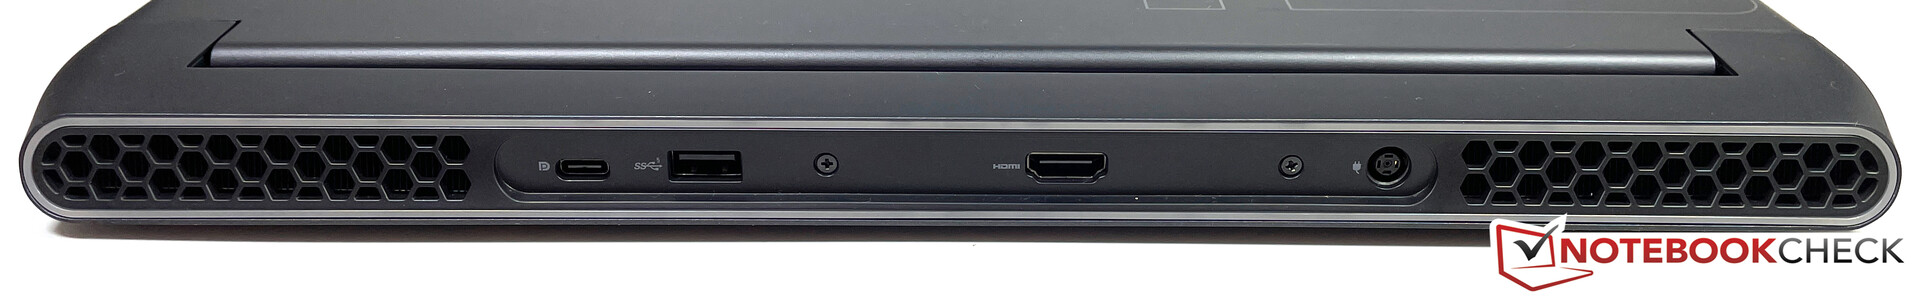
Connectivity - AMD Alienware without Thunderbolt
The port selection is worse compared to the old model. There are no more USB ports at the left side and both the microSD reader as well as the Graphics Amplifier port are gone. Gamers at least still get a fast Ethernet connector (2.5 Gbps). Thunderbolt is not supported; the USB-C port on the rear supports DisplayPort output but cannot be used to charge the device. The m15 R6 with Intel CPUs has Thunderbolt support, but the ports are otherwise identical.
Communication
The Wi-Fi module Killer AX1650x supports the fast Wi-Fi 6 standard and manages high transfer rates in our standardized Wi-Fi test with the router Netgear Nighthawk RAX120, even though the previous m15 R4 was even a bit faster. You can also use the fast Ethernet connection (2.5 Gbps) for more reliability when you play games.
Webcam
Alienware only implements a very simple 720p webcam, which does not have good picture quality.


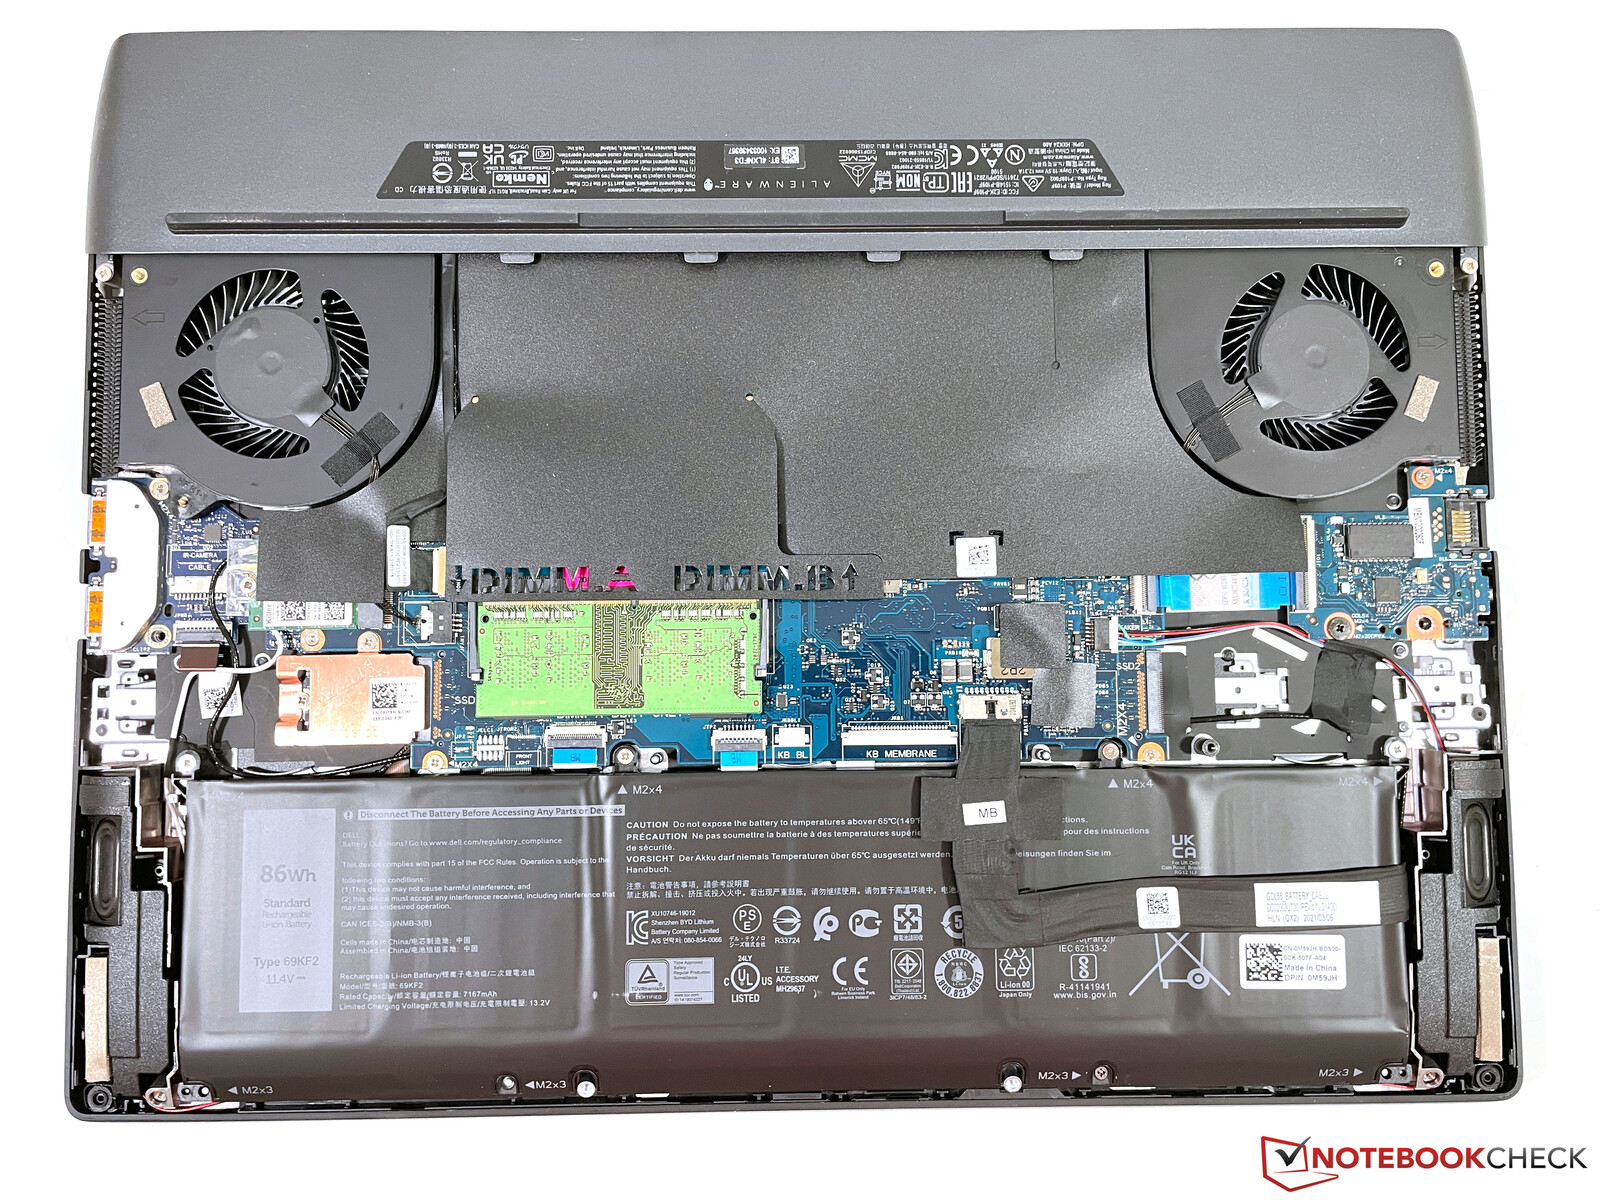
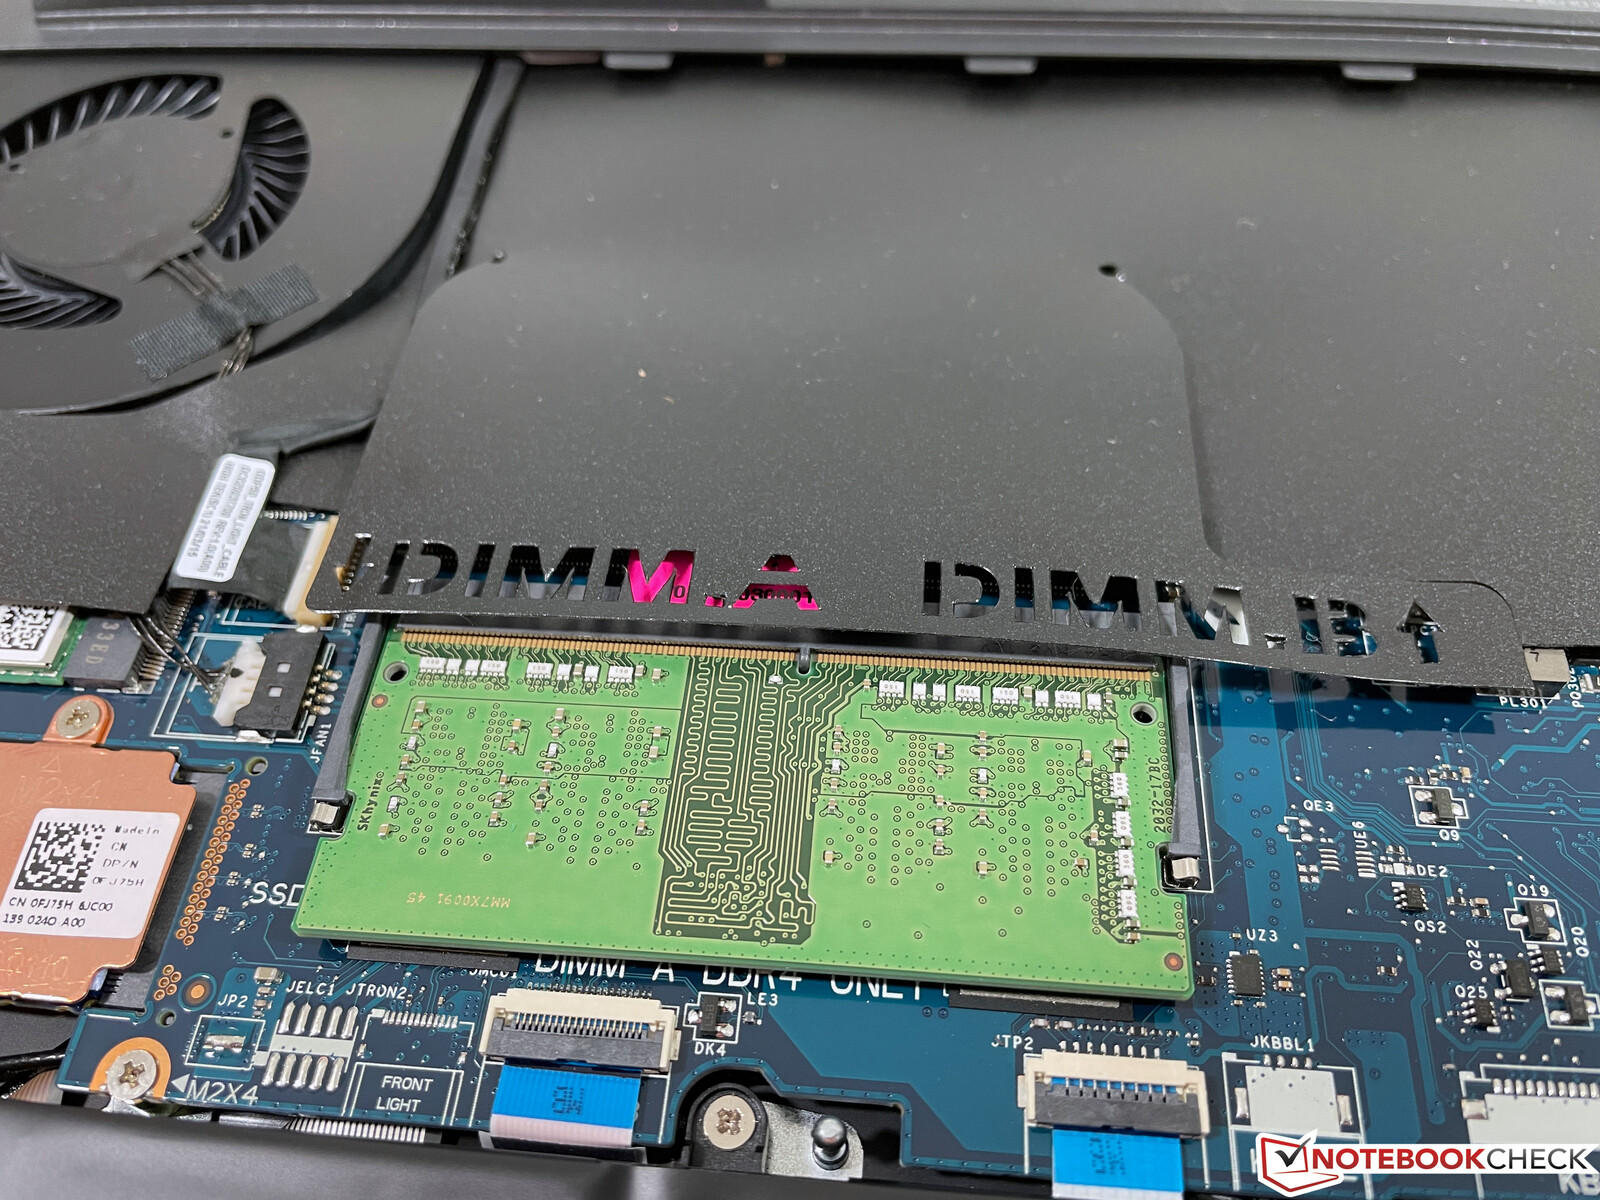
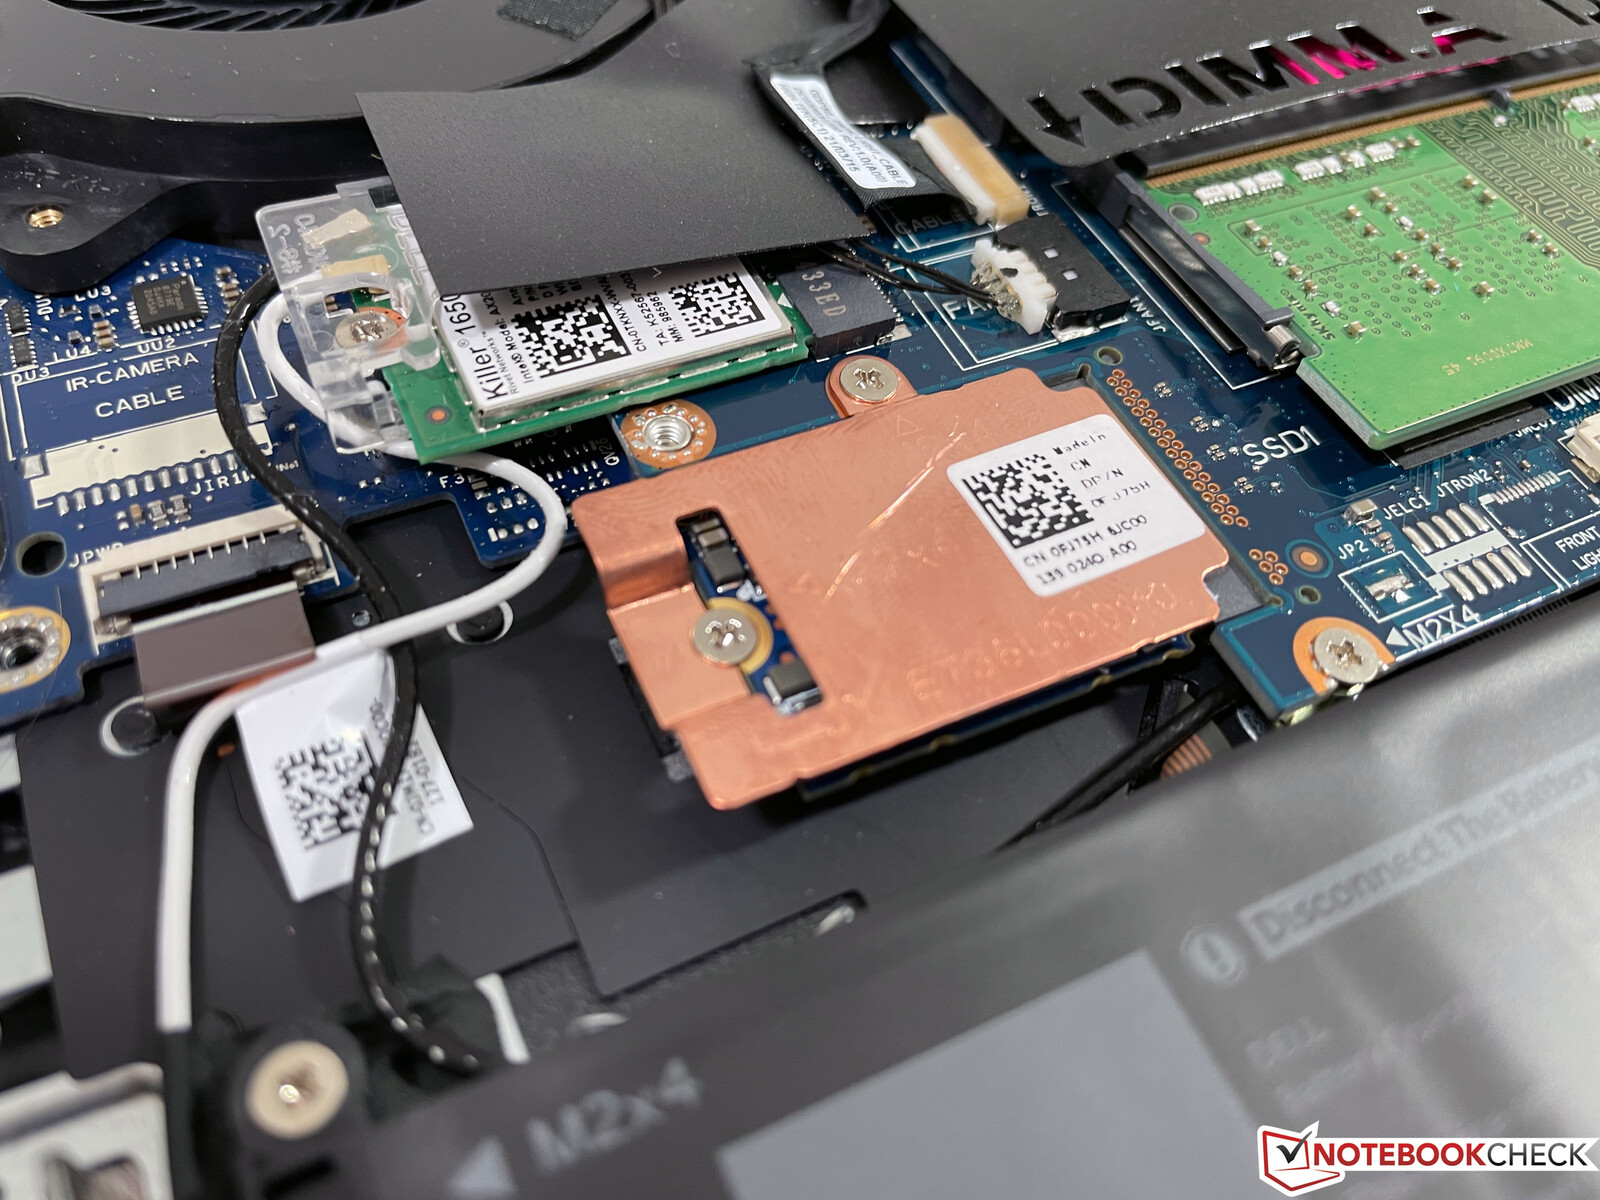
Maintenance
There is no dedicated maintenance, but the bottom panel is only secured with a couple of Philips screws and is easy to remove. You get access to both RAM slots as well as the two M.2 slots for SSDs. Contrary to the previous m15 R4, however, you can only use smaller M.2-2242 modules and the second tray was missing on our test unit. You can also replace the Wi-Fi module from Killer and clean the fans.
Warranty
The Alienware m15 R5 is only shipped with a one-year warranty by default, which also includes an on-site service. You can extend the duration all the way up to 4 years for an additional ~500 Euros.
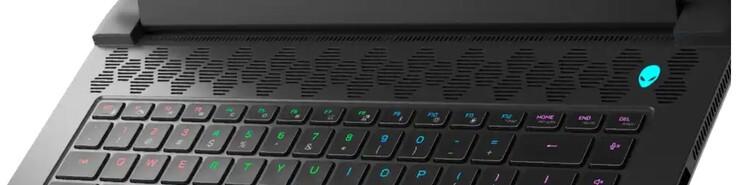
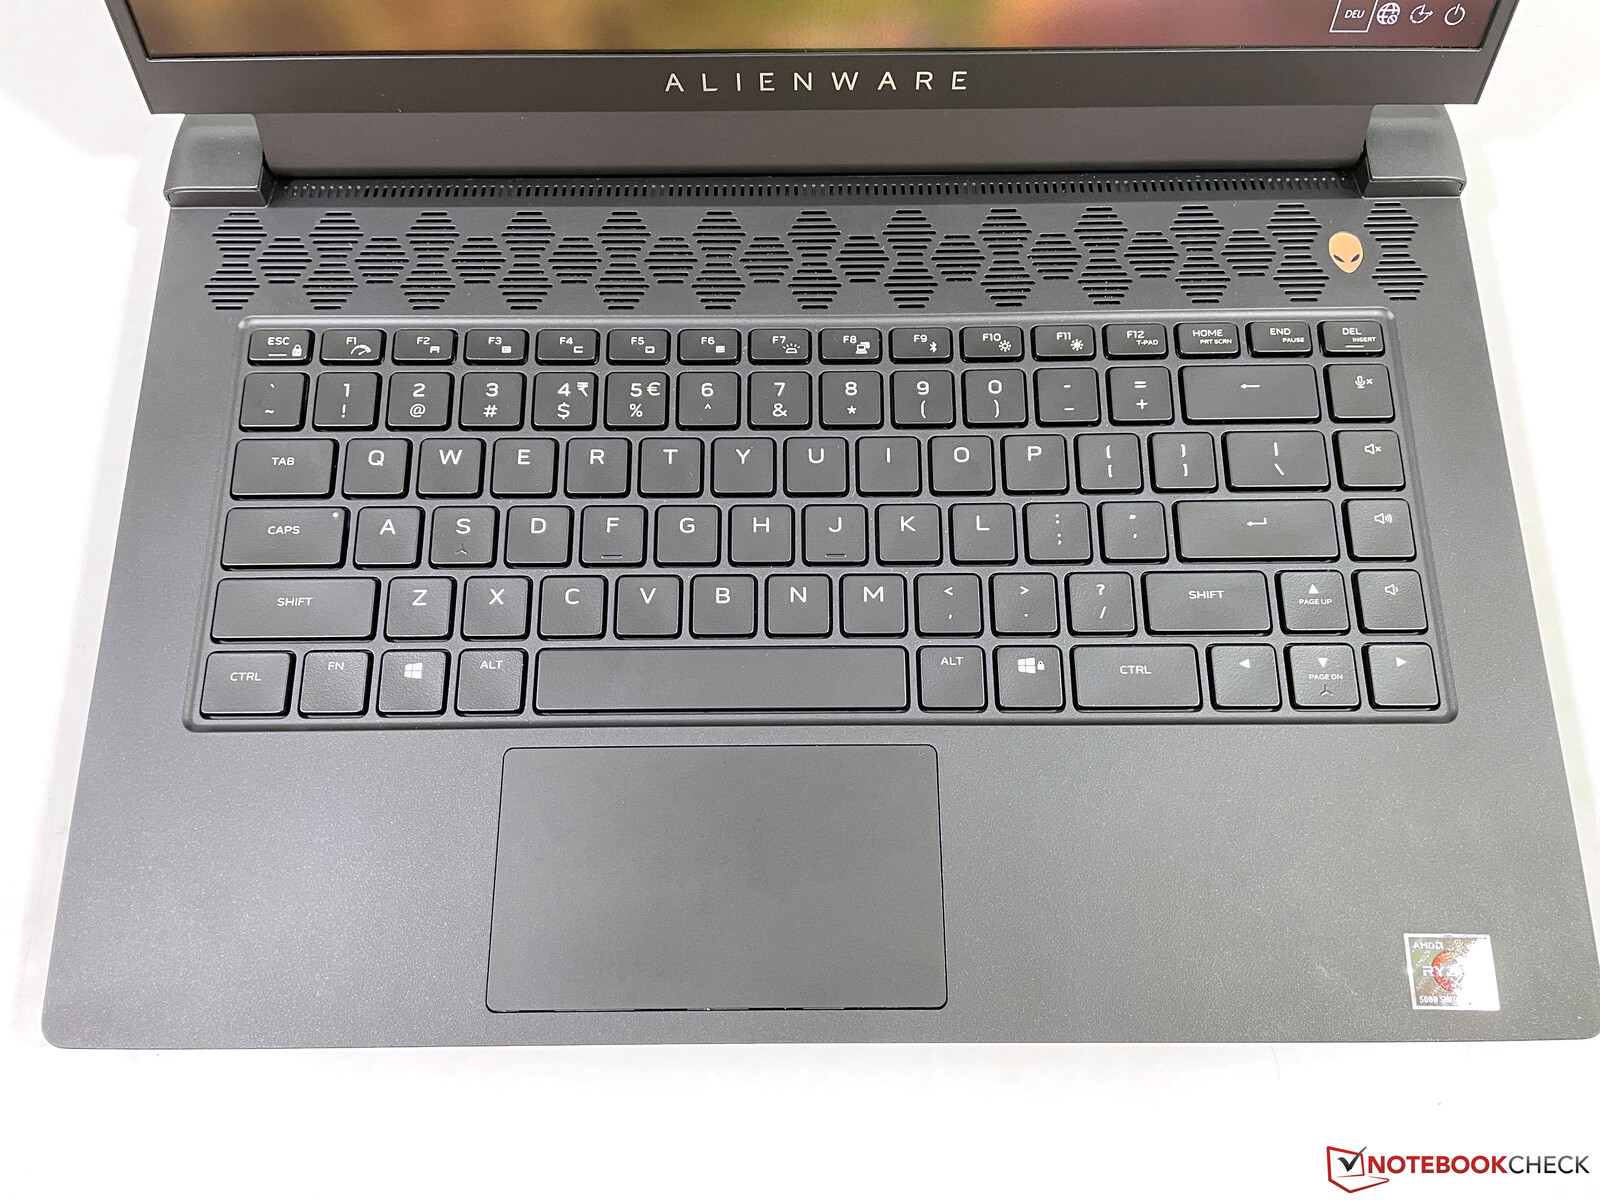
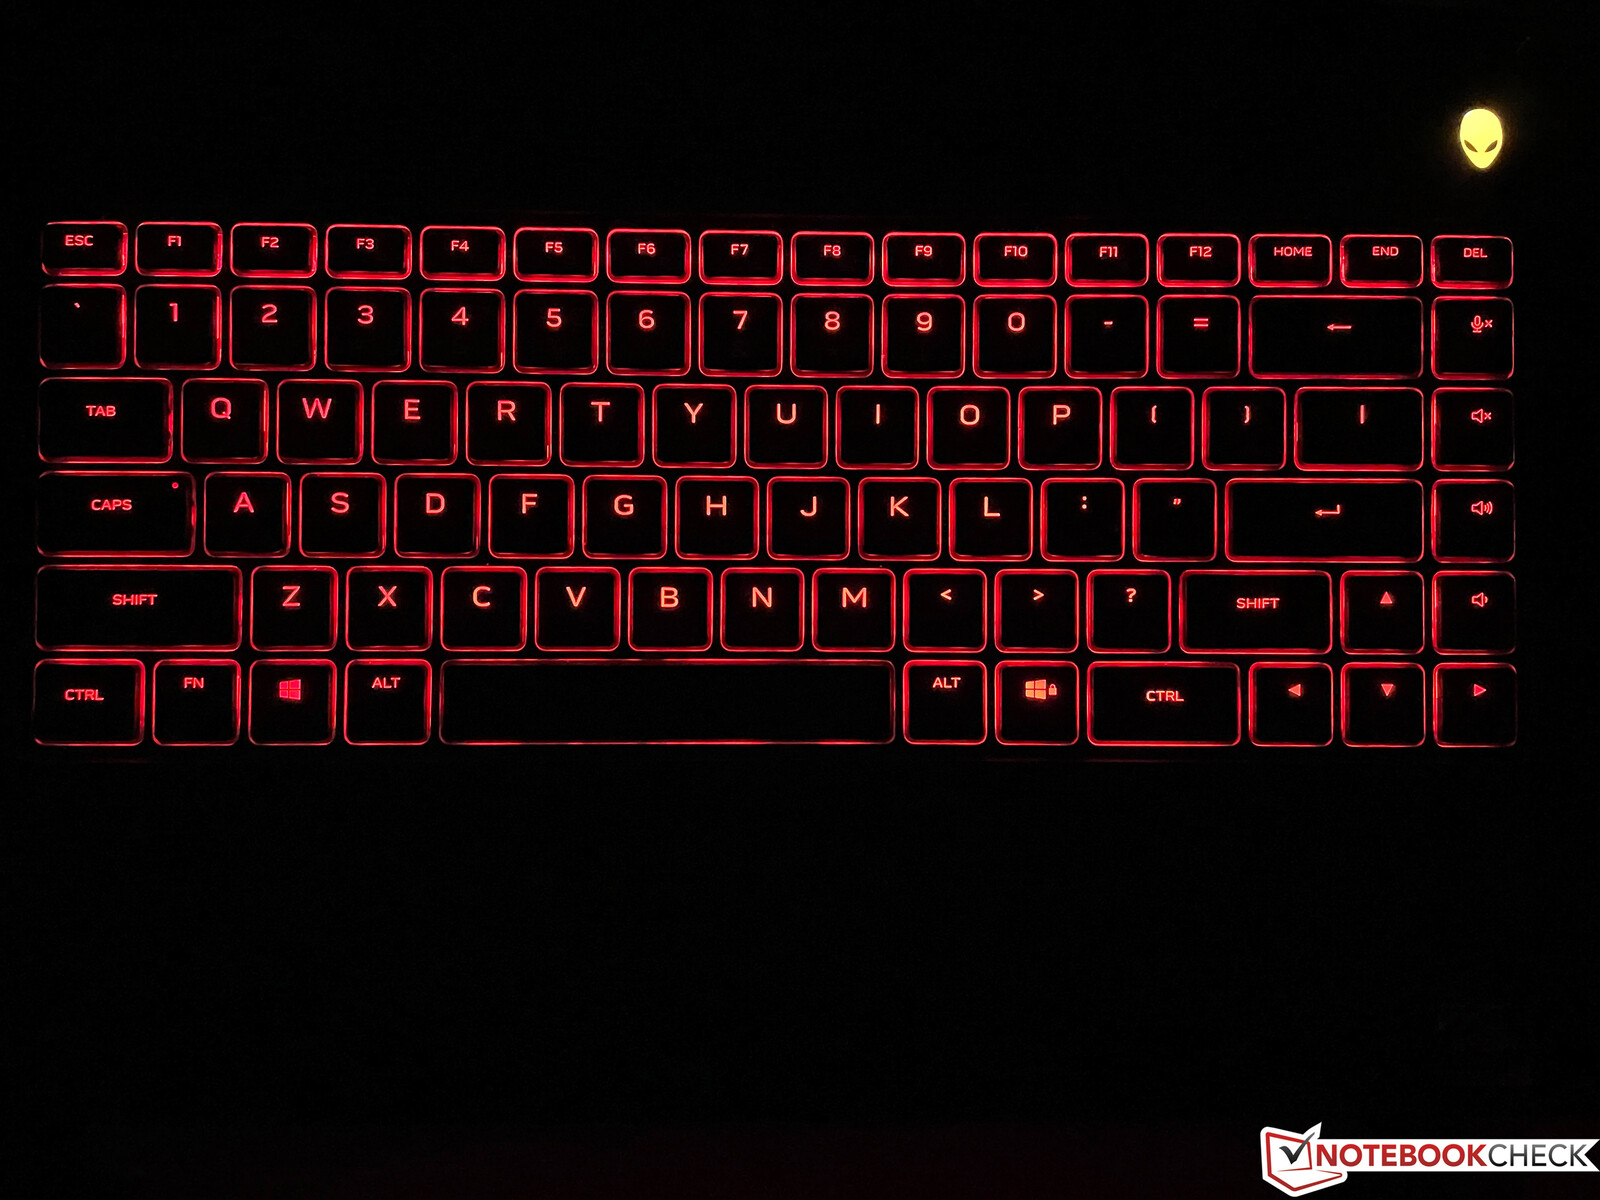
Input Devices - Mechanical keyboard is optional
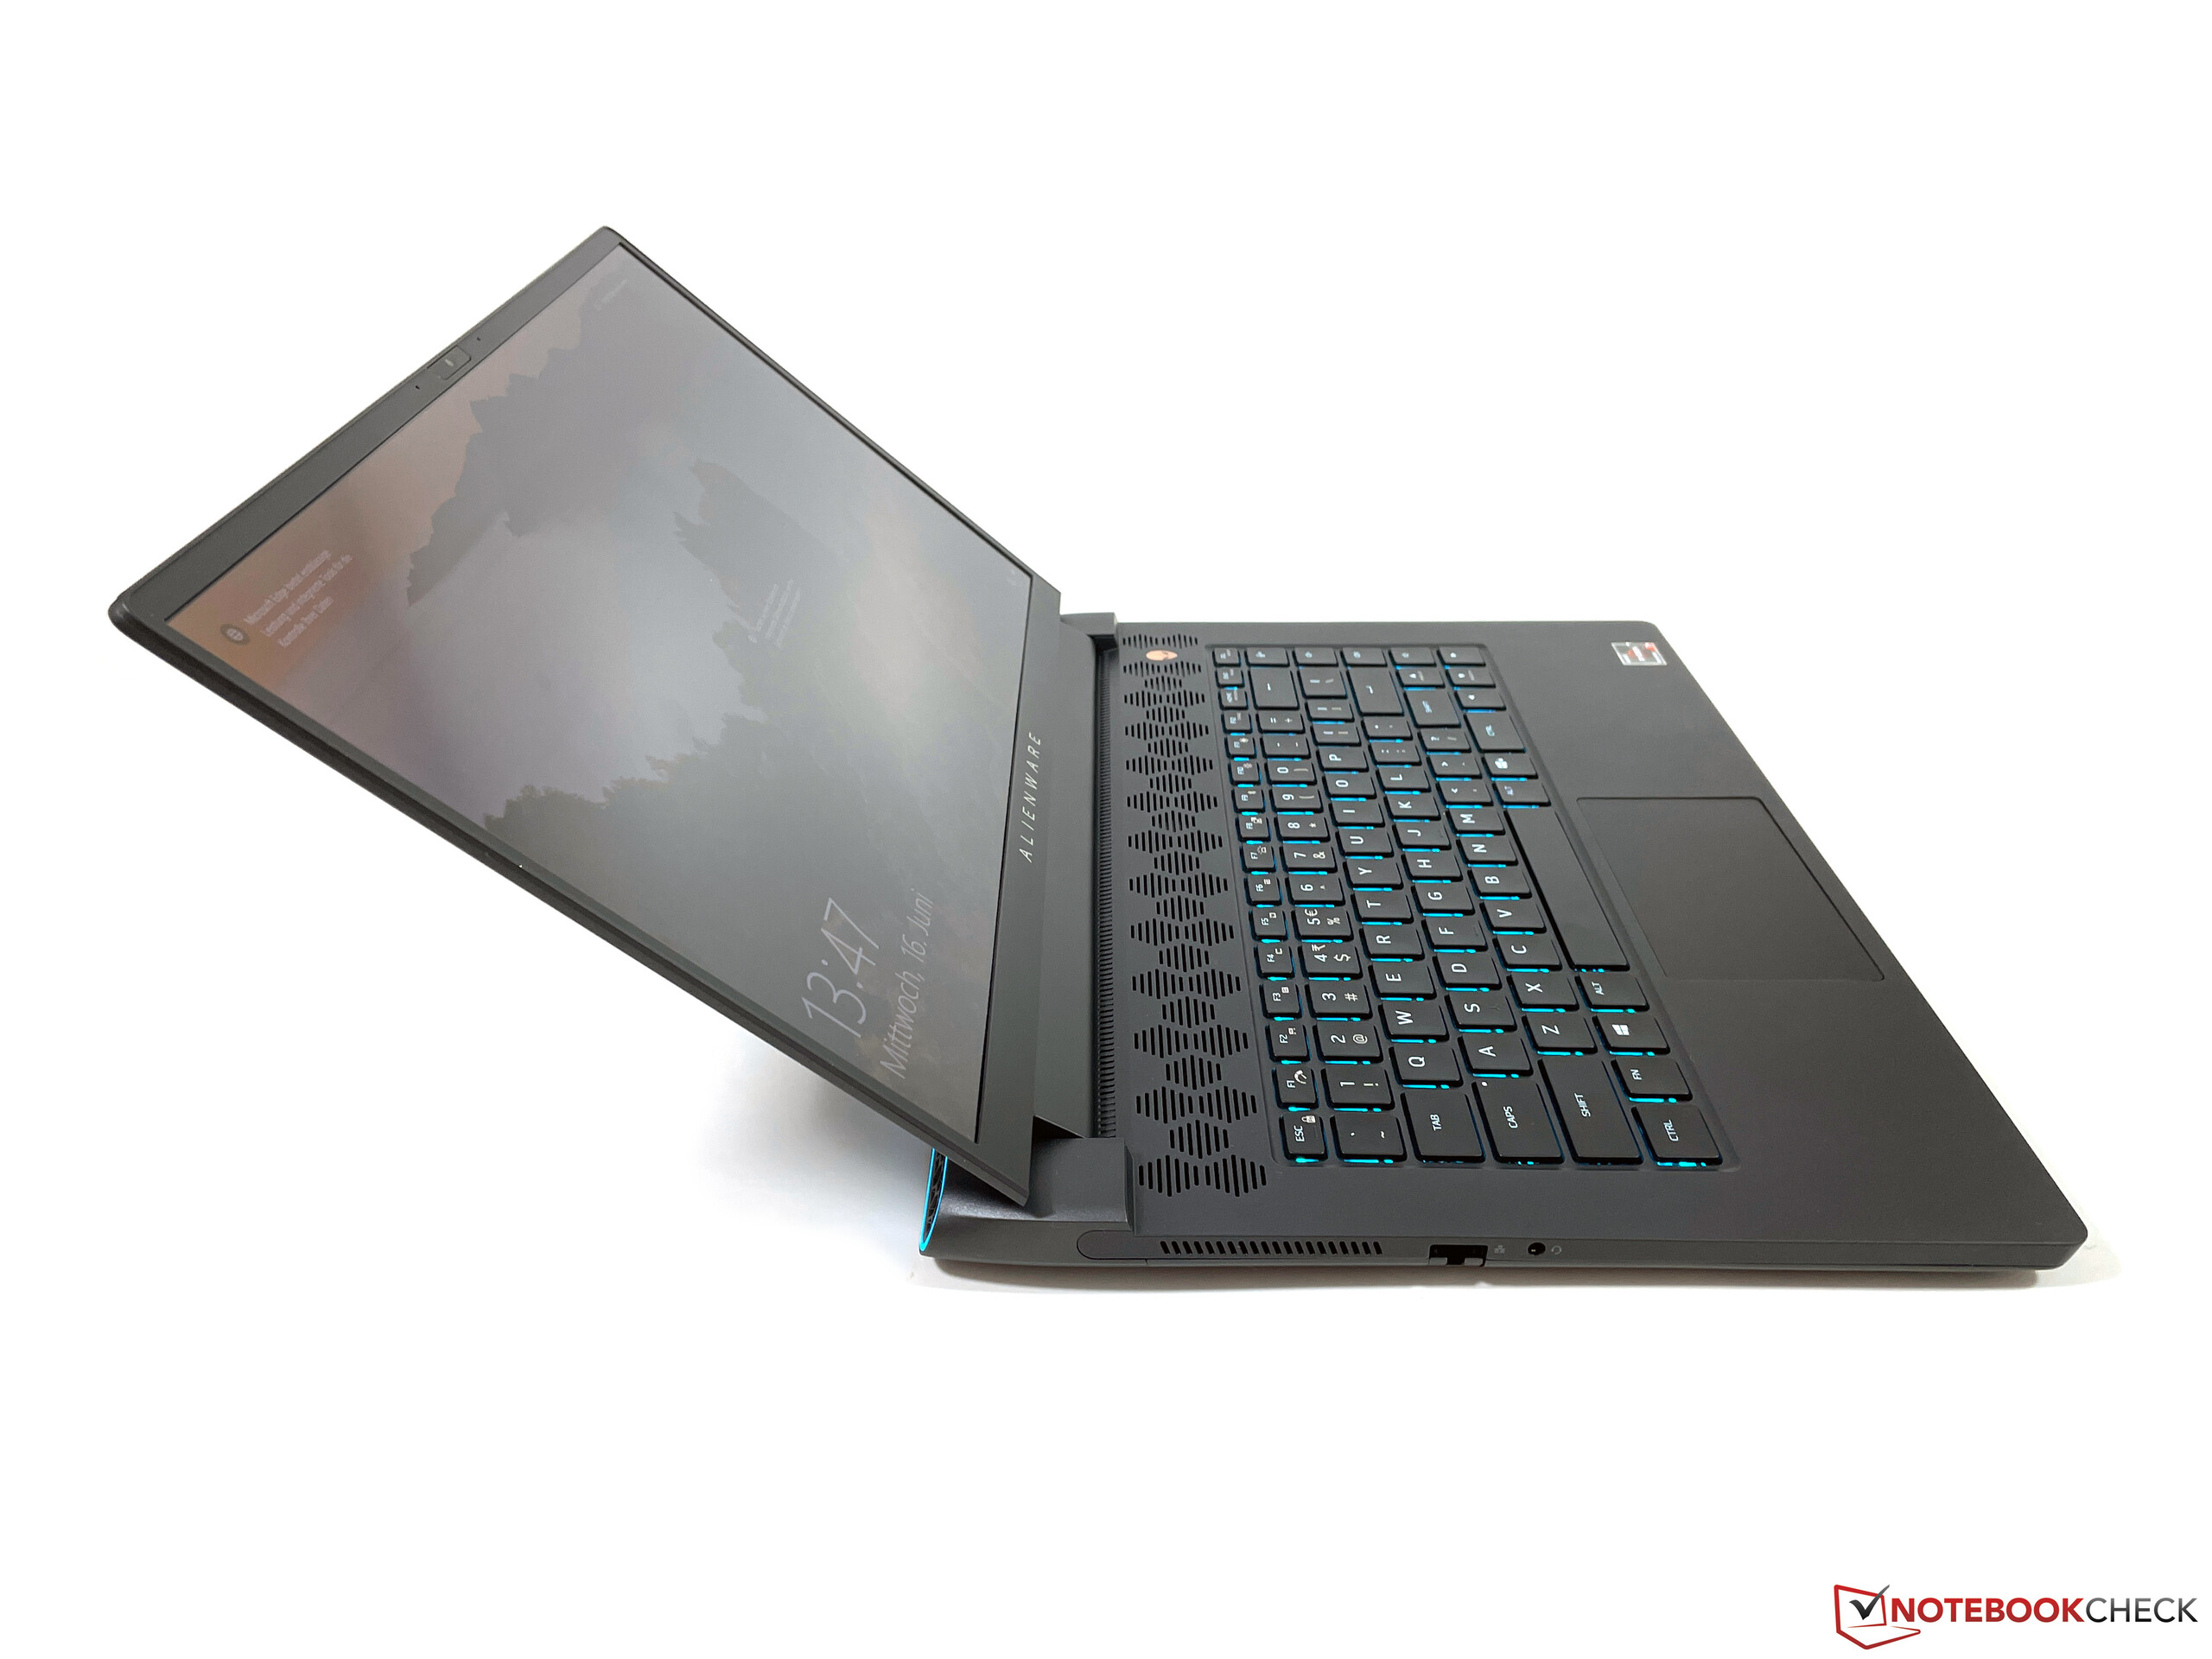
The input devices did not change, but this is no problem. The default chiclet keyboard with 1.7 mm key travel is very comfortable and pretty quiet. You can configure the 4-zone illumination quite extensively. There is also an option (100 Euros) for the mechanical keyboard we already reviewed on the m15 R4. It offers a much crisper feedback and per-key illumination, but it is also much louder.
The clickpad is not generously sized for modern standards at 10.5 x 6 cm, but cursor movements work very well, only the clicking sound is a bit loud. However, you will probably use an external mouse for your gaming sessions anyway, so this should not be a big issue.
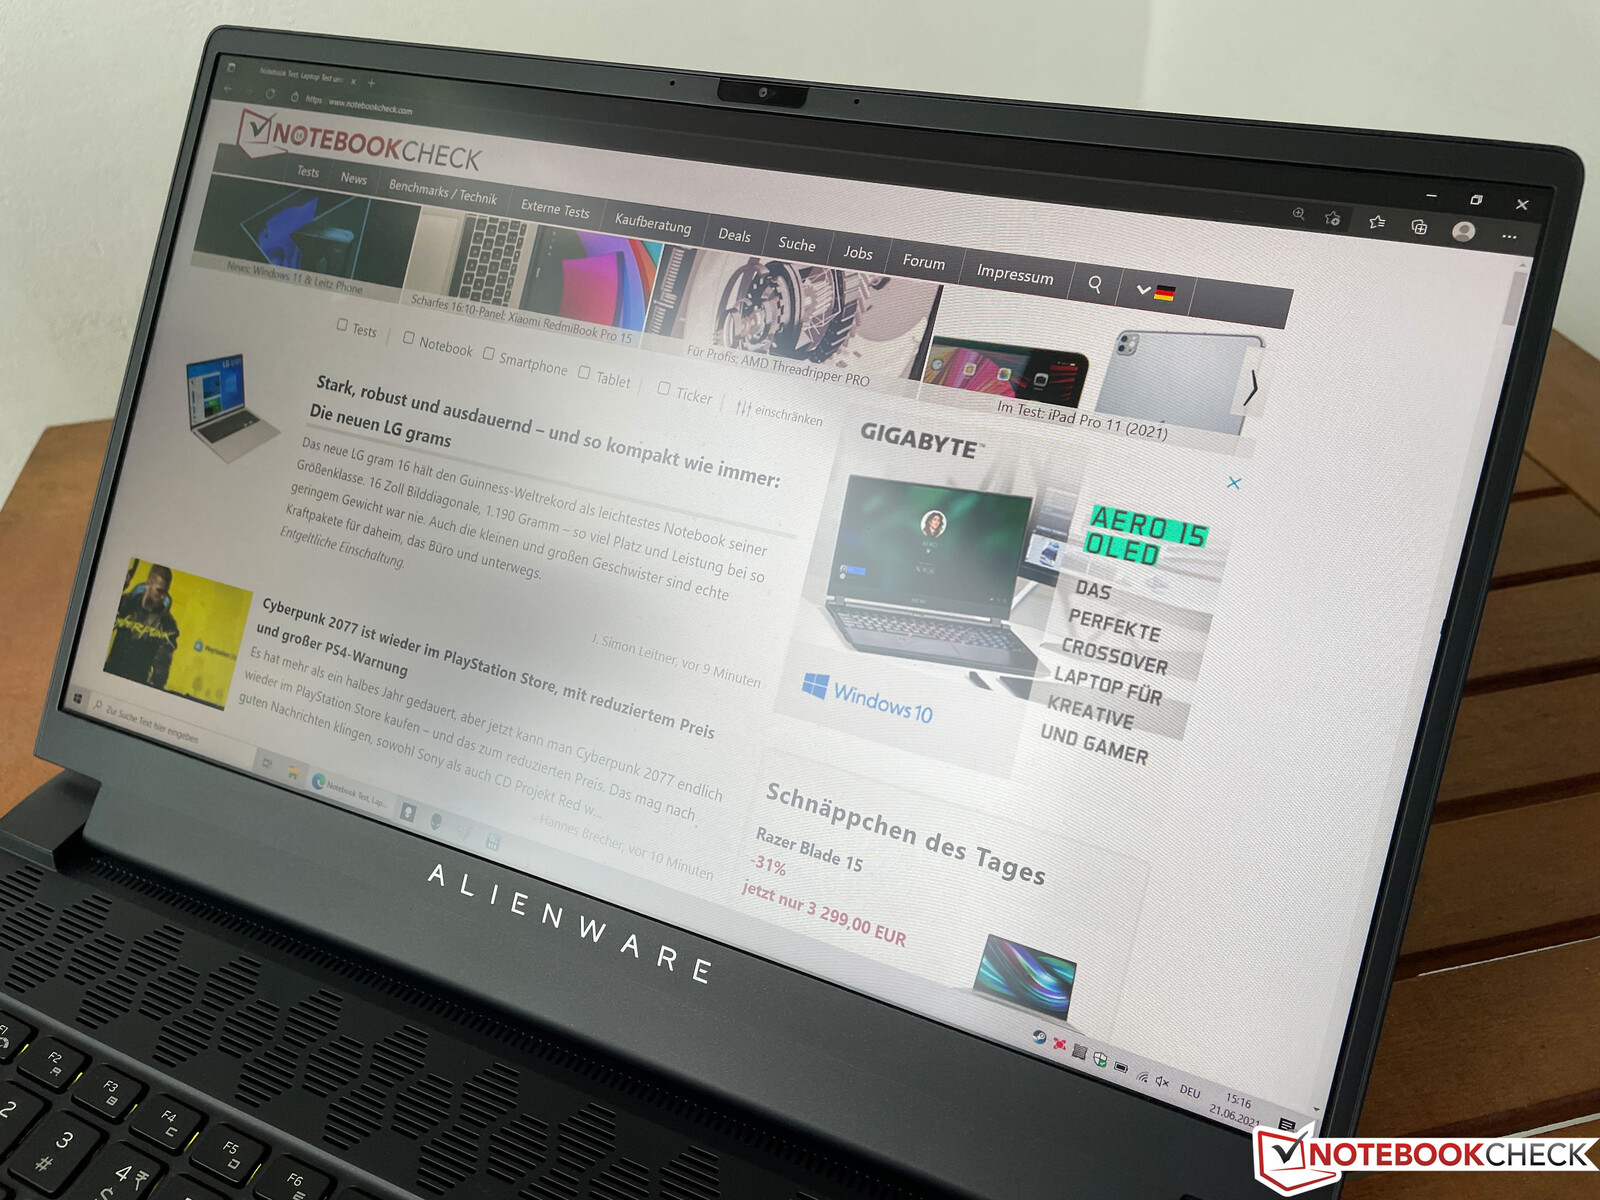
Display - m15 with 165 Hz panel
The display selection has changed a bit compared to the old m15 R4. You get a 1080p screen with fast response times and 165 Hz refresh rate by default, but you can also upgrade to a QHD panel with 240 Hz and G-Sync support. The Intel model m15 R6 even gets an option for a 1080p panel with 360 Hz.
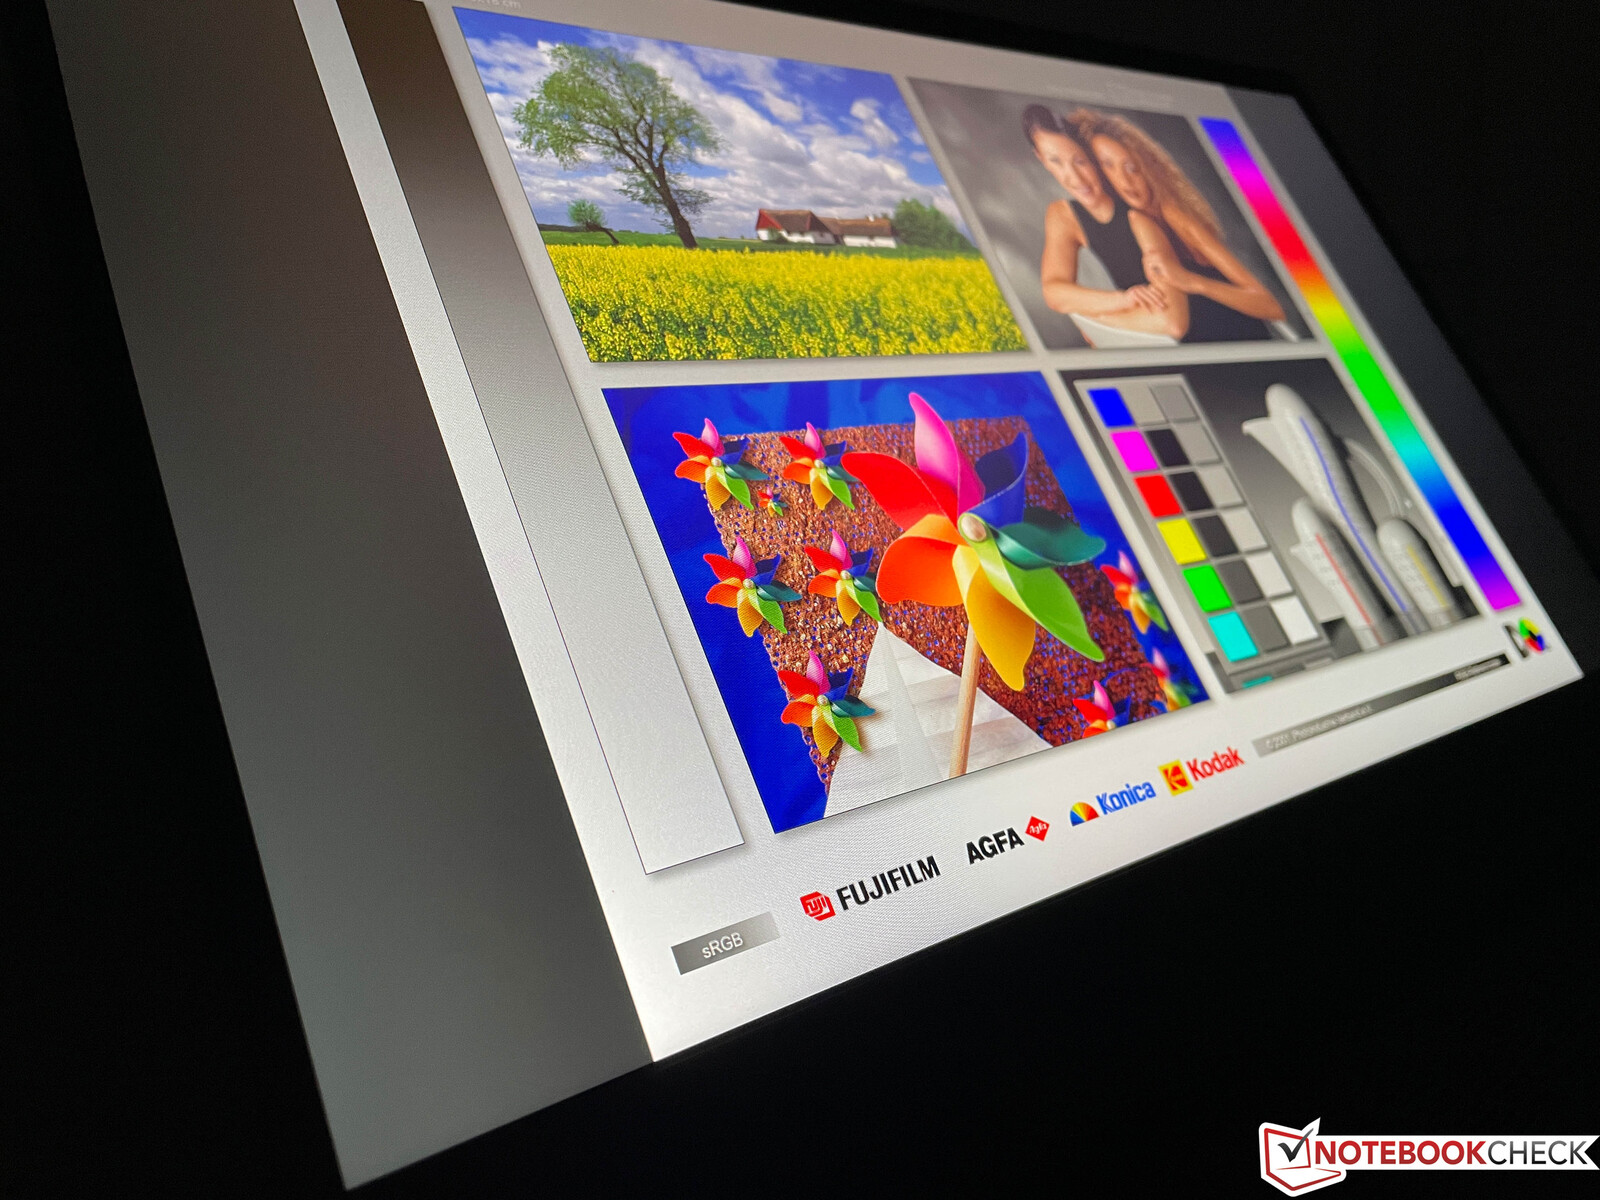
The panel in our review unit is provided by AU Optronics and manages decent results. It is not one of the brightest models, but the subjective picture quality of the matte screen is very good and it convinces with very fast response times and high refresh rates, which are very important for a gaming laptop. Very good: Our test unit did not suffer from any backlight bleeding.
| |||||||||||||||||||||||||
Brightness Distribution: 92 %
Center on Battery: 329 cd/m²
Contrast: 1219:1 (Black: 0.27 cd/m²)
ΔE ColorChecker Calman: 2.78 | ∀{0.5-29.43 Ø4.71}
calibrated: 1.63
ΔE Greyscale Calman: 2.5 | ∀{0.09-98 Ø4.96}
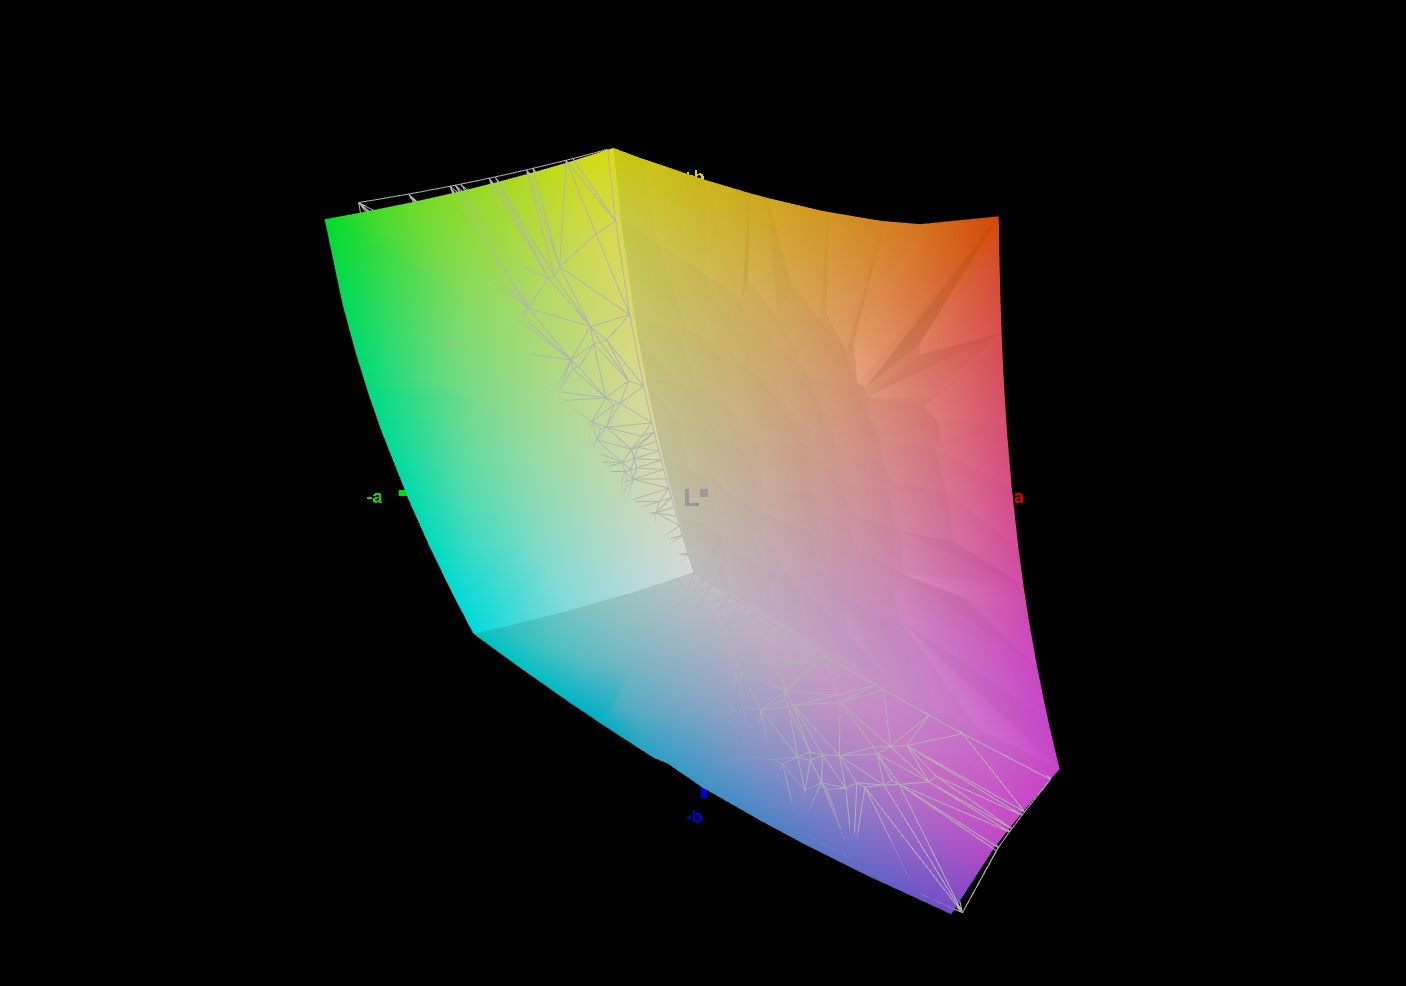
99% sRGB (Argyll 1.6.3 3D)
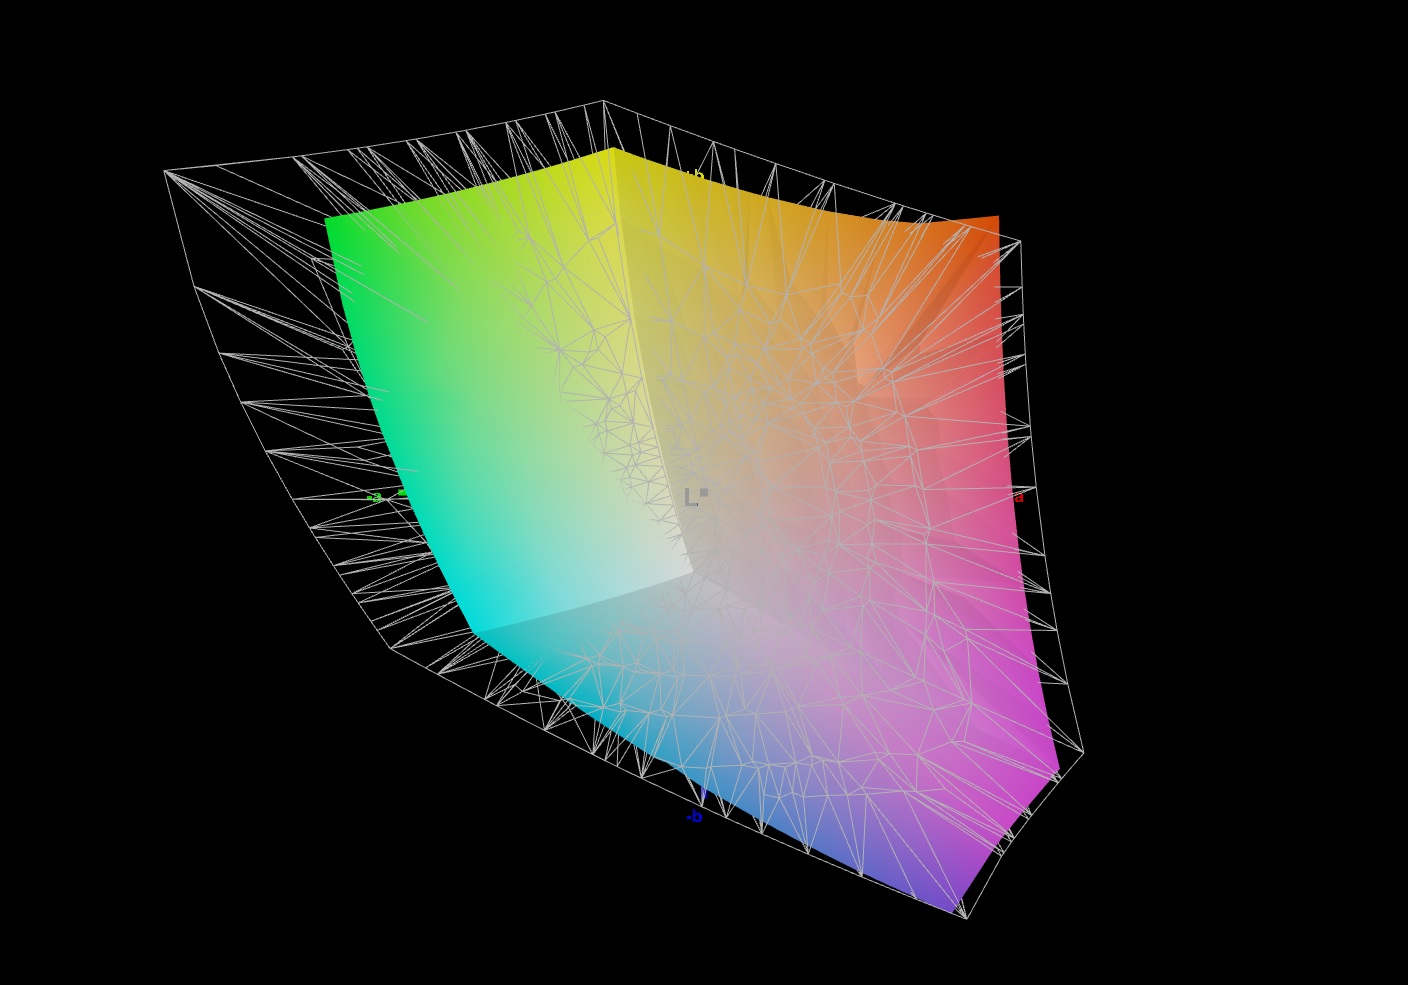
76% AdobeRGB 1998 (Argyll 1.6.3 3D)
Gamma: 2.106
CCT: 6201 K
| Alienware m15 R5 Ryzen Edition B156HAN, IPS, 1920x1080, 15.6" | Alienware m15 R4 LG Philips LGD066E, IPS, 1920x1080, 15.6" | Asus TUF Gaming F15 FX506HM Chi Mei N156HRA-EA1, IPS, 1920x1080, 15.6" | Acer Aspire Nitro 5 AN515-55-57GF Chi Mei CMN N156HRA-EA1, IPS, 1920x1080, 15.6" | Razer Blade 15 Base Edition 2021, i7-10750H RTX 3060 BOE NV156FHM-N4K, IPS, 1920x1080, 15.6" | |
|---|---|---|---|---|---|
| Display | |||||
| Display P3 Coverage (%) | 69.4 | 41.9 | 42.54 | 64.3 | |
| sRGB Coverage (%) | 99 | 62.9 | 63.5 | 91.8 | |
| AdobeRGB 1998 Coverage (%) | 70.5 | 43.3 | 44.02 | 65.5 | |
| Response Times | -52% | -384% | -461% | -70% | |
| Response Time Grey 50% / Grey 80% * (ms) | 4 ? | 7.4 ? -85% | 28.4 ? -610% | 33.8 ? -745% | 8.8 ? -120% |
| Response Time Black / White * (ms) | 8.4 ? | 10 ? -19% | 21.6 ? -157% | 23.2 ? -176% | 10 ? -19% |
| PWM Frequency (Hz) | 1000 ? | ||||
| Screen | 5% | -69% | -42% | -28% | |
| Brightness middle (cd/m²) | 329 | 333 1% | 268.3 -18% | 288 -12% | 317.2 -4% |
| Brightness (cd/m²) | 321 | 303 -6% | 257 -20% | 262 -18% | 306 -5% |
| Brightness Distribution (%) | 92 | 86 -7% | 84 -9% | 88 -4% | 89 -3% |
| Black Level * (cd/m²) | 0.27 | 0.29 -7% | 0.34 -26% | 0.21 22% | 0.31 -15% |
| Contrast (:1) | 1219 | 1148 -6% | 789 -35% | 1371 12% | 1023 -16% |
| Colorchecker dE 2000 * | 2.78 | 1.8 35% | 5.05 -82% | 3.61 -30% | 4.37 -57% |
| Colorchecker dE 2000 max. * | 4.88 | 4.49 8% | 15.43 -216% | 18.07 -270% | 6.62 -36% |
| Colorchecker dE 2000 calibrated * | 1.63 | 1.13 31% | 3.21 -97% | 3.12 -91% | 2.67 -64% |
| Greyscale dE 2000 * | 2.5 | 1.9 24% | 5.5 -120% | 2.4 4% | 4.5 -80% |
| Gamma | 2.106 104% | 2.265 97% | 2.35 94% | 2.216 99% | 2.4 92% |
| CCT | 6201 105% | 6840 95% | 7392 88% | 6675 97% | 7418 88% |
| Color Space (Percent of AdobeRGB 1998) (%) | 76 | 71 -7% | 44 -42% | 59.2 -22% | |
| Color Space (Percent of sRGB) (%) | 99 | 93 -6% | 62 -37% | 91.4 -8% | |
| Total Average (Program / Settings) | -24% /
-3% | -227% /
-126% | -252% /
-107% | -49% /
-35% |
* ... smaller is better
We determine an average brightness of 321 cd/m², so the new panel is slightly brighter than before. The black value is decent and results in a good contrast ratio of more than 1200:1.
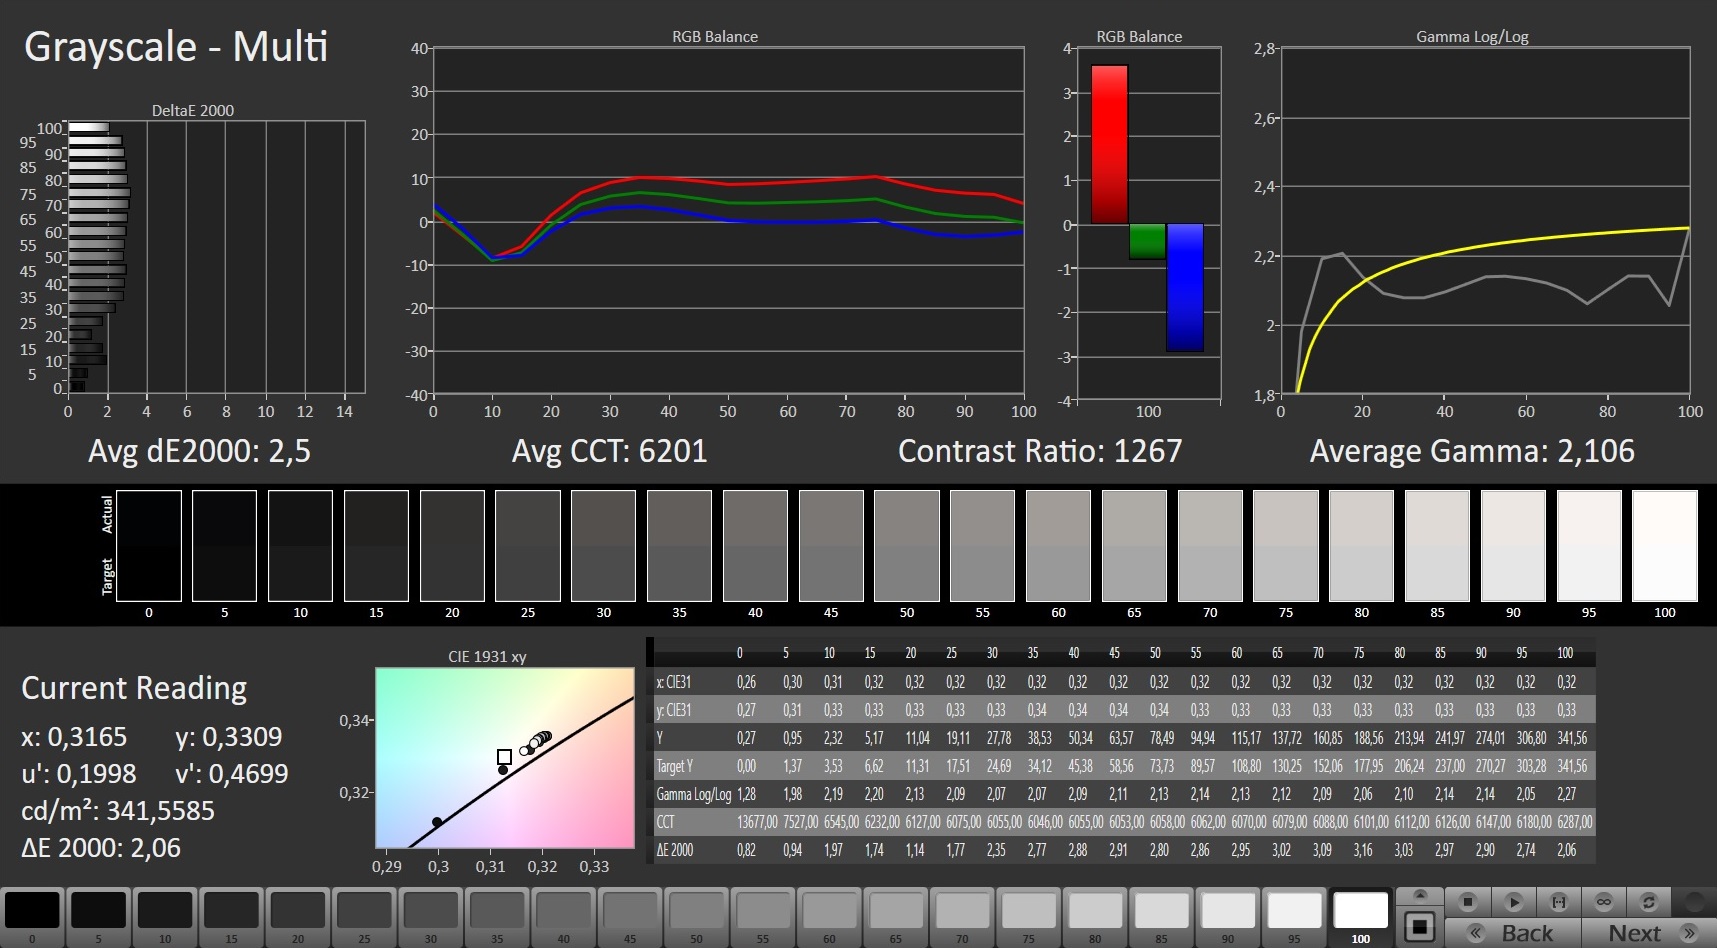
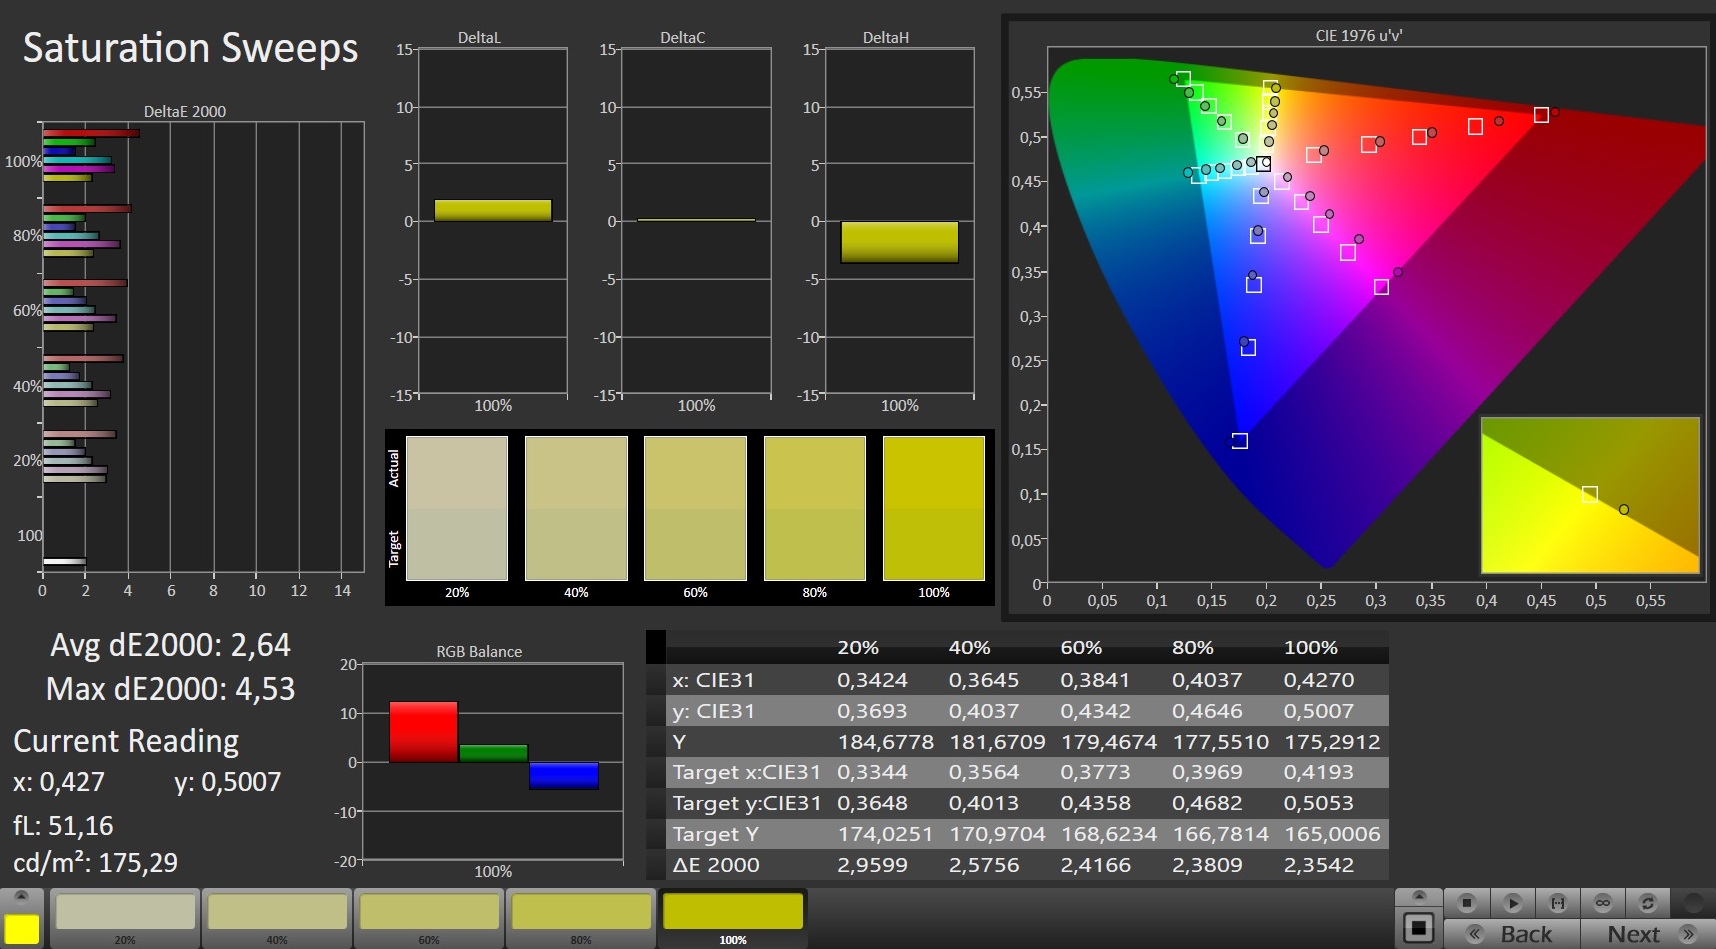
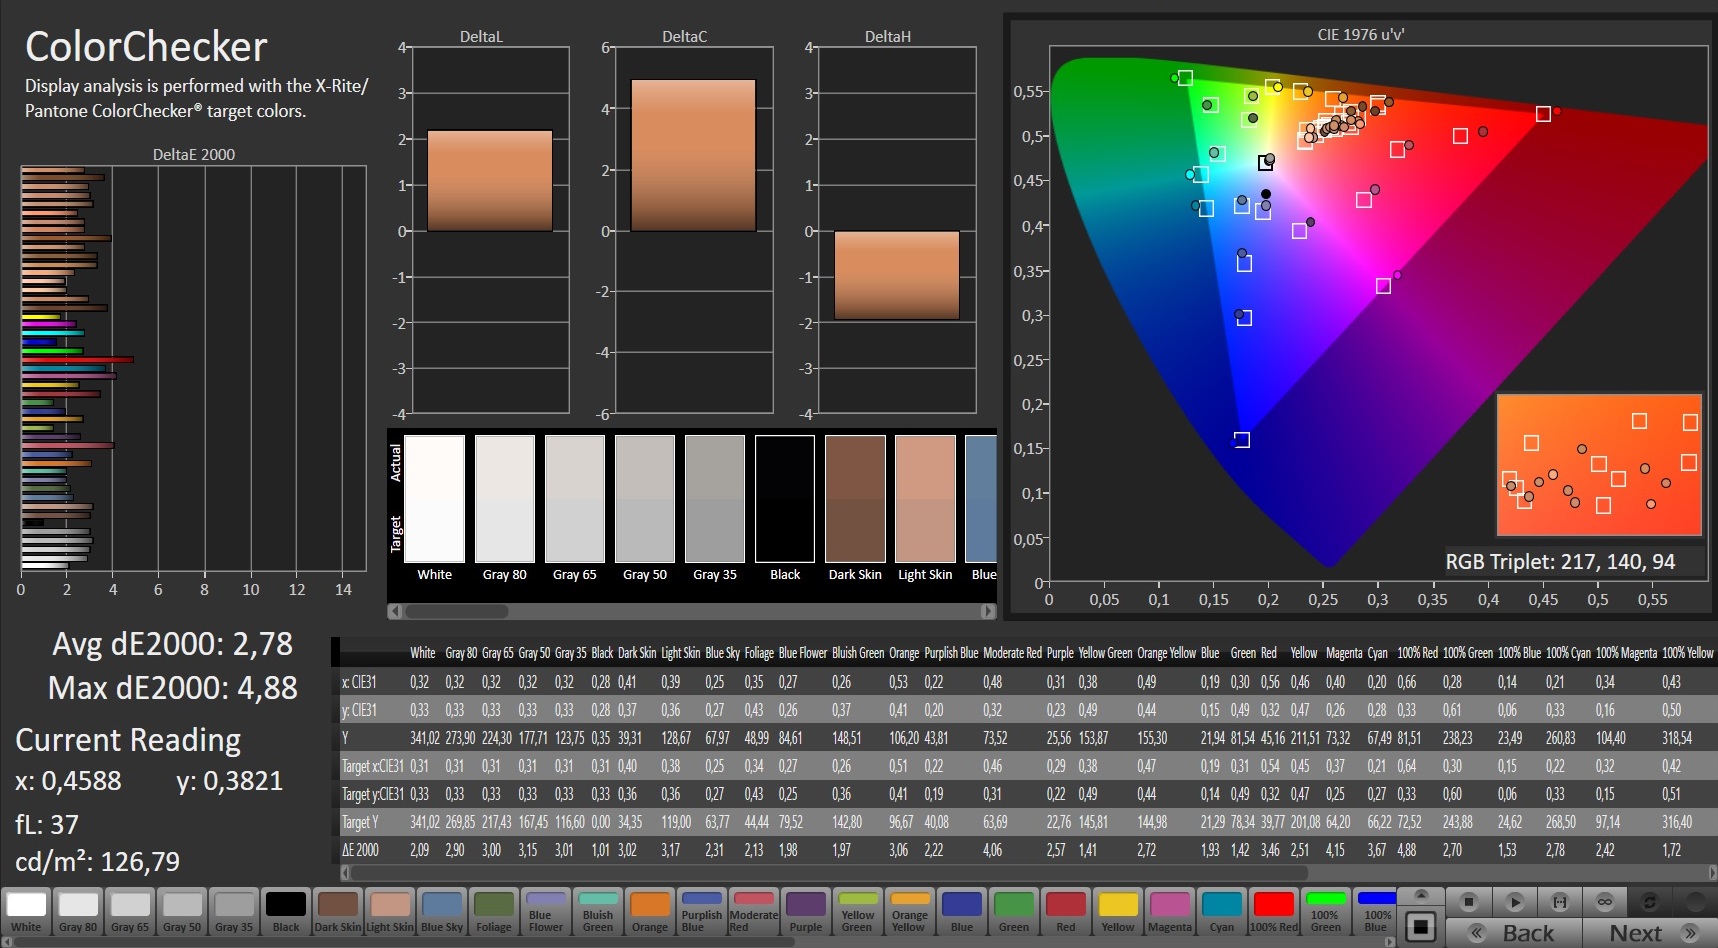
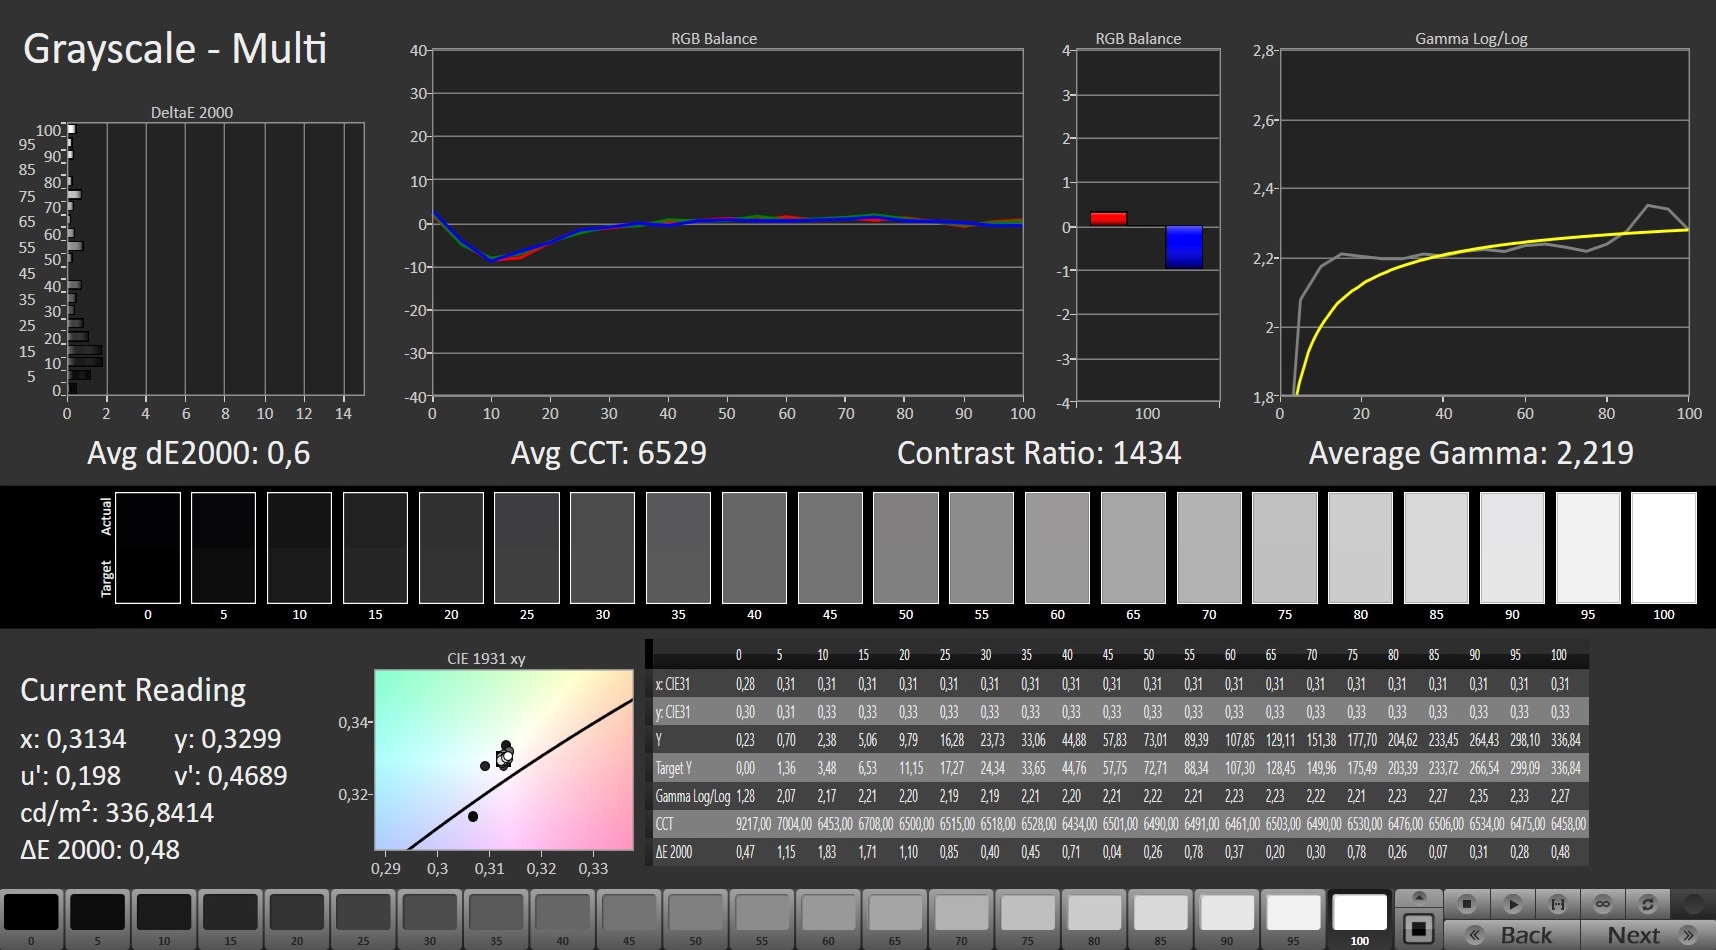
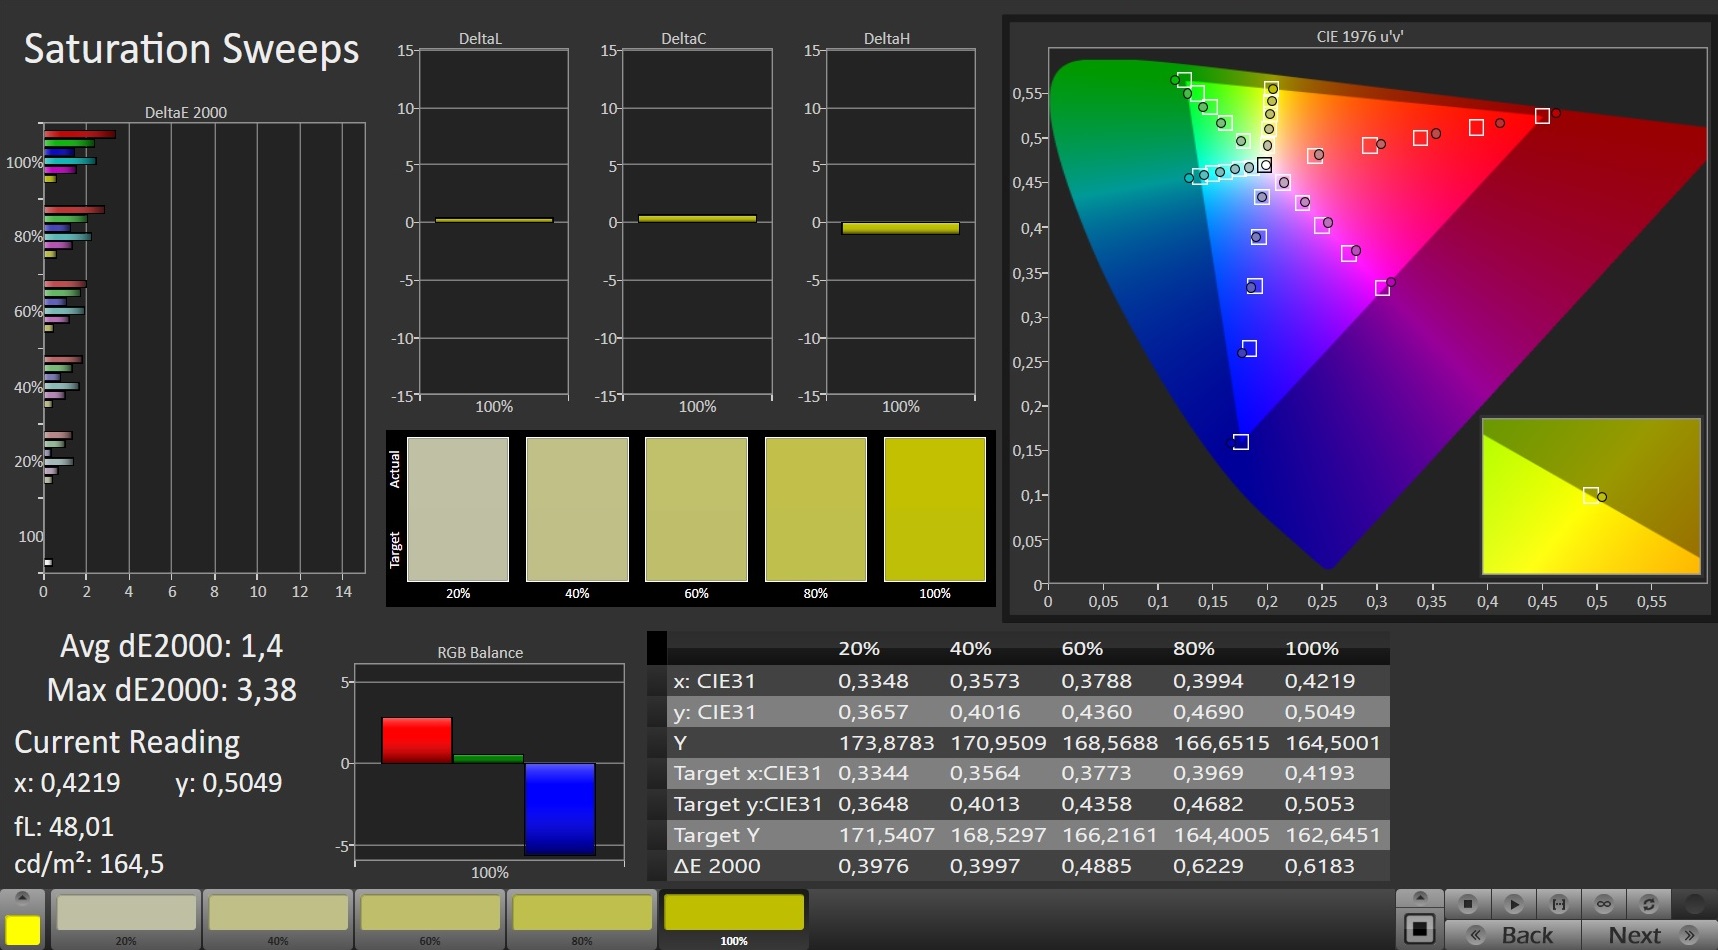
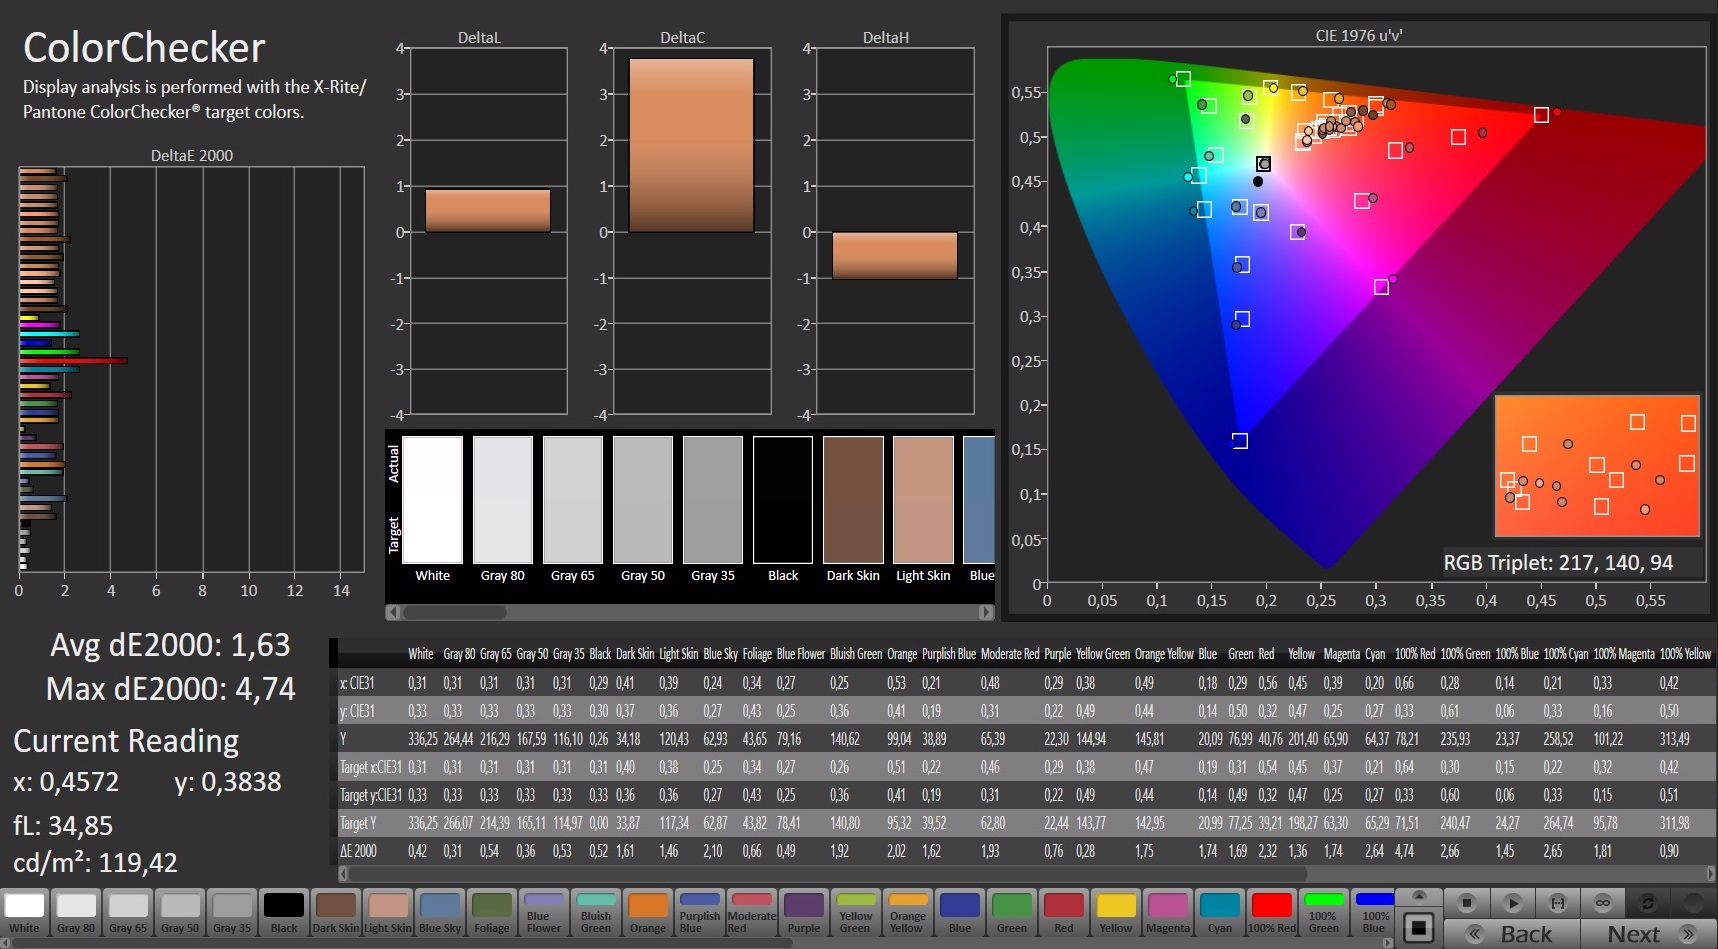
The calibration is already very good out of the box and there is no visible color cast. There are no major outliers in the color checker, either, and an additional calibration by the user is not really necessary. It will only improve the results slightly (our profile is available as a free download in the box above) and all colors (except for 100% red) show a DeltaE2000 deviation below 3. The sRGB gamut is covered completely, so you can edit pictures/videos with this panel.
Display Response Times
| ↔ Response Time Black to White | ||
|---|---|---|
| 8.4 ms ... rise ↗ and fall ↘ combined | ↗ 4.4 ms rise | 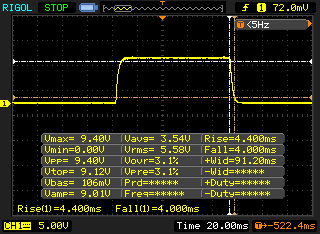 |
| ↘ 4 ms fall | ||
| The screen shows fast response rates in our tests and should be suited for gaming. In comparison, all tested devices range from 0.1 (minimum) to 240 (maximum) ms. » 24 % of all devices are better. This means that the measured response time is better than the average of all tested devices (19.8 ms). | ||
| ↔ Response Time 50% Grey to 80% Grey | ||
| 4 ms ... rise ↗ and fall ↘ combined | ↗ 1.2 ms rise | 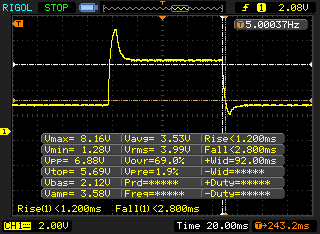 |
| ↘ 2.8 ms fall | ||
| The screen shows very fast response rates in our tests and should be very well suited for fast-paced gaming. In comparison, all tested devices range from 0.165 (minimum) to 636 (maximum) ms. » 15 % of all devices are better. This means that the measured response time is better than the average of all tested devices (31 ms). | ||
Screen Flickering / PWM (Pulse-Width Modulation)
| Screen flickering / PWM not detected | 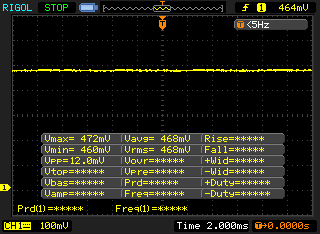 | ||
In comparison: 52 % of all tested devices do not use PWM to dim the display. If PWM was detected, an average of 7754 (minimum: 5 - maximum: 343500) Hz was measured. | |||
Thanks to the matte surface, you can use the laptop outdoors, but it is only really comfortable in the shade. The viewing angle stability of the IPS screen is very good.
Performance - AMD Ryzen & Nvidia GeForce
Alienware’s Command Center offer multiple settings for the performance, power consumption, and overclocking. We used the default settings (Overclocking: Off, Power: Balanced, Thermal: Balanced) for our measurements and benchmarks.
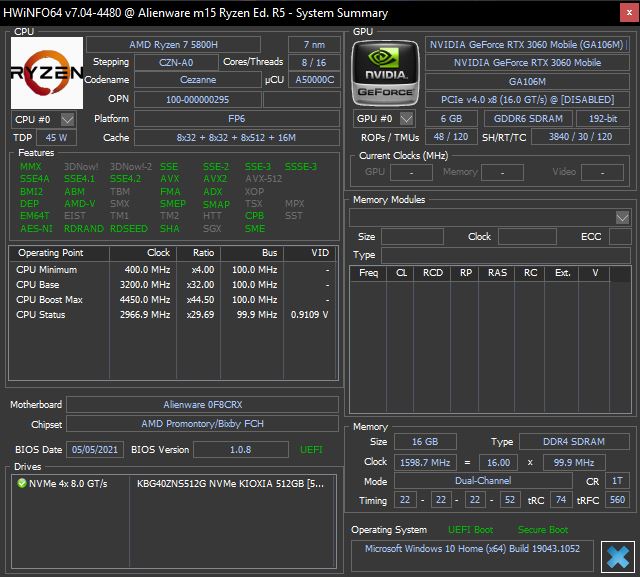
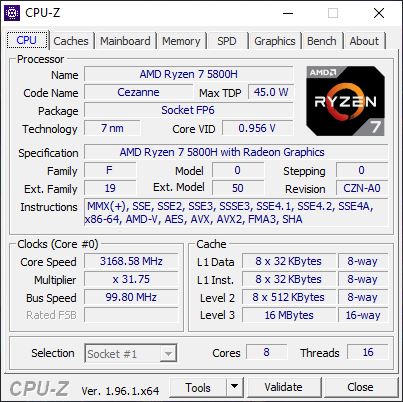
Processor - Ryzen 7 5800H
Our test unit is equipped with the modern Ryzen 7 5800H processor with 8 cores (16 threads) with a maximum clock of up to 4.4 GHz. More technical information about the processor is available here. The Alienware m15 R5 allows a consumption of 65W for a couple of seconds before it stabilizes at 54W, which results in 8x 3.6 GHz. The m15 R5 is also available with the Ryzen 9 5900HX (also 8 cores, up to 4.6 GHz) if you need a faster CPU.
The performance of the processor is very good and much better than the old Core i9-10980HK in the Alienware m15 R4 and it is pretty much identical to the brand-new Tiger Lake-H i7-11800H in the Asus TUF Gaming F15, even though it requires much more power (>70W) in this laptop. The performance is not reduced on battery power.
* ... smaller is better
System Performance
The system performance is excellent thanks to the powerful components, which is supported by our subjective performance impression as well as the good results in the synthetic benchmarks.
| PCMark 10 Score | 6465 points | |
Help | ||
DPC Latency
The Alienware laptop with the AMD processor does not show any problems in our standardized latency test (web browsing, YouTube 4K, CPU load) and manages excellent results.
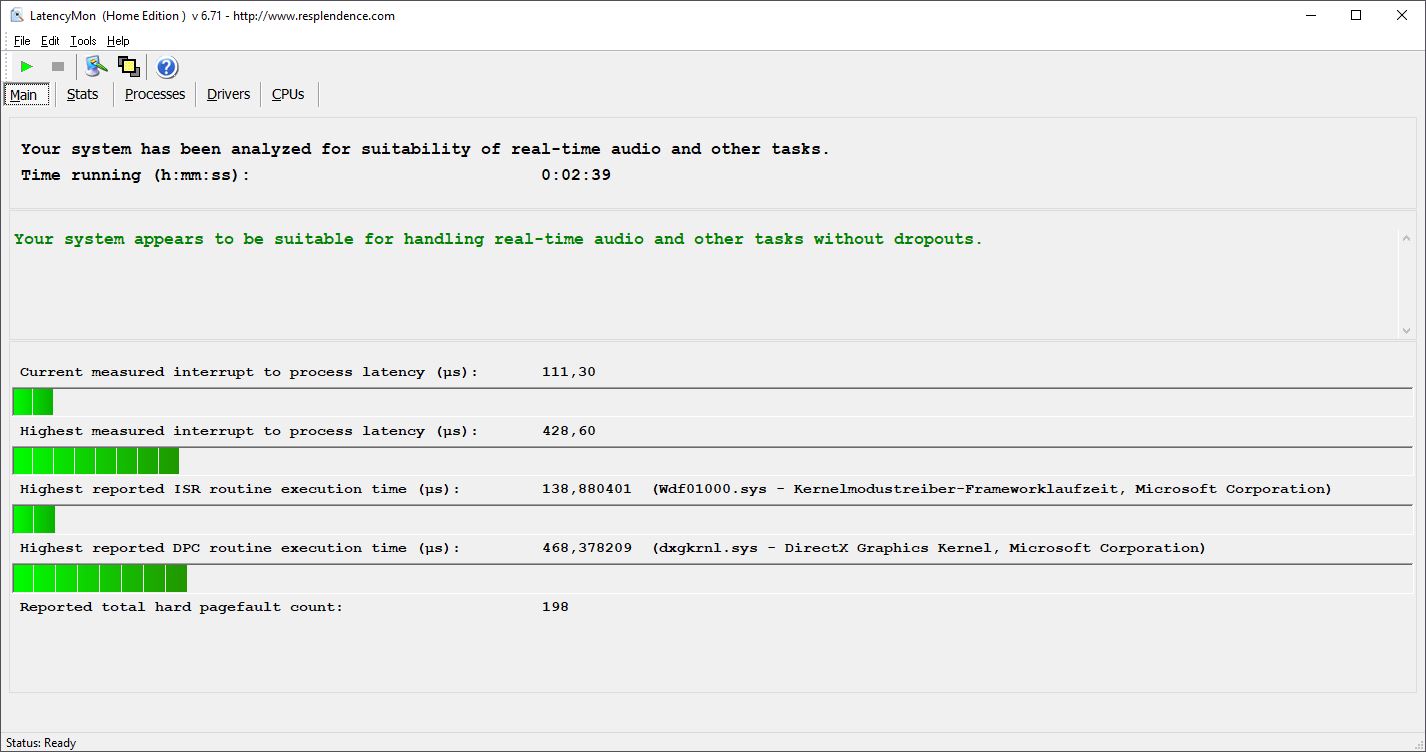
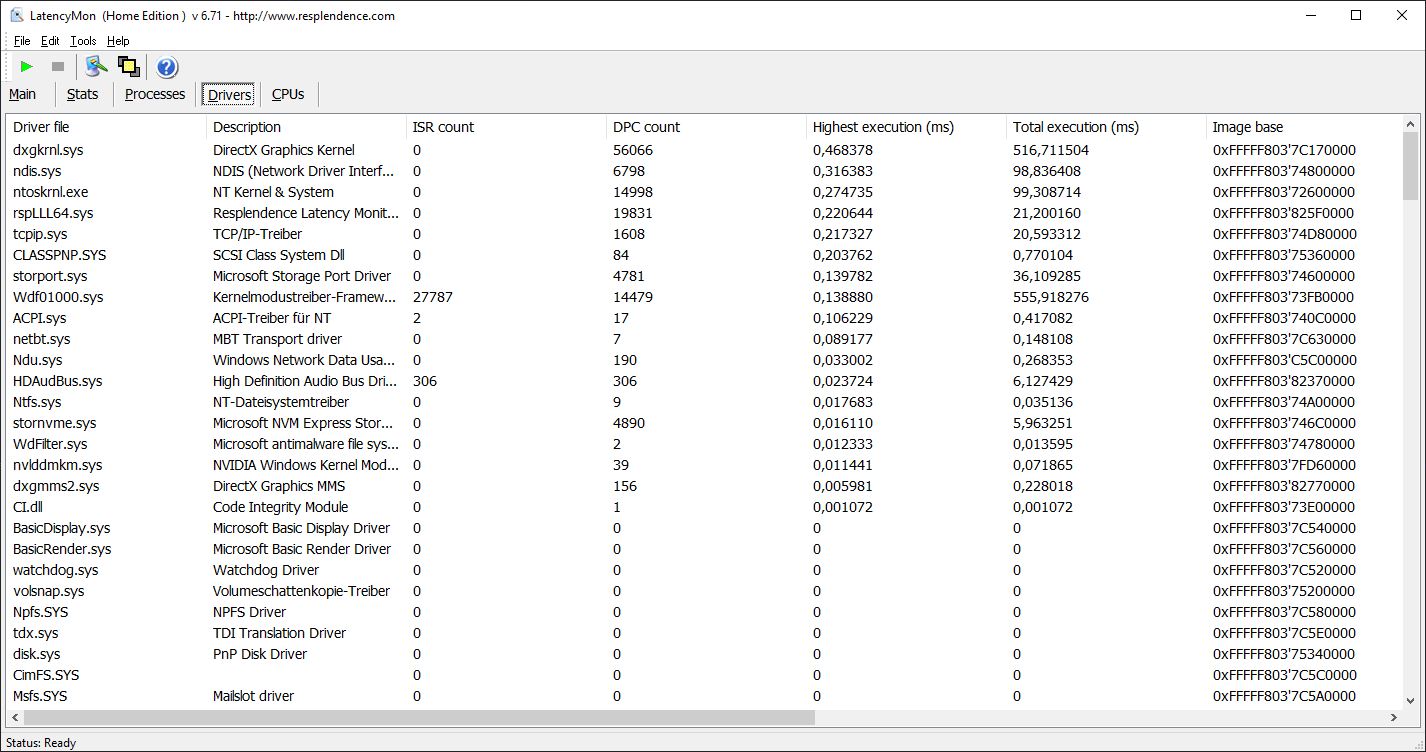
| DPC Latencies / LatencyMon - interrupt to process latency (max), Web, Youtube, Prime95 | |
| Alienware m15 R4 | |
| Asus TUF Gaming F15 FX506HM | |
| Razer Blade 15 Base Edition 2021, i7-10750H RTX 3060 | |
| Acer Aspire Nitro 5 AN515-55-57GF | |
| Alienware m15 R5 Ryzen Edition | |
* ... smaller is better
Storage Devices
The small M.2-2242 SSD in our review unit is provided by Toshiba and has a storage capacity of 512 GB. The NVMe-SSD is attached via PCIe 3.0-x4, but does not manage great results in the benchmarks. However, you will hardly notice the difference to a faster drive when you play games and PCIe 4.0 is not supported, either. More SSD benchmarks are available in our tech section.
| Alienware m15 R5 Ryzen Edition Toshiba KBG40ZNS512G NVMe | Alienware m15 R4 Micron 2300 1TB MTFDHBA1T0TDV | Asus TUF Gaming F15 FX506HM SK Hynix HFM001TD3JX013N | Acer Aspire Nitro 5 AN515-55-57GF WDC PC SN530 SDBPNPZ-512G | Razer Blade 15 Base Edition 2021, i7-10750H RTX 3060 Samsung SSD PM981a MZVLB512HBJQ | |
|---|---|---|---|---|---|
| CrystalDiskMark 5.2 / 6 | 38% | 38% | 3% | 28% | |
| Write 4K (MB/s) | 116.9 | 93.7 -20% | 168.1 44% | 118 1% | 123.8 6% |
| Read 4K (MB/s) | 44.56 | 48.1 8% | 65.1 46% | 48.5 9% | 45.53 2% |
| Write Seq (MB/s) | 1552 | 2785 79% | 2124 37% | 1828 18% | 2132 37% |
| Read Seq (MB/s) | 1682 | 2598 54% | 2204 31% | 1530 -9% | 2067 23% |
| Write 4K Q32T1 (MB/s) | 497.8 | 481.9 -3% | 455.3 -9% | 400 -20% | 462.9 -7% |
| Read 4K Q32T1 (MB/s) | 436.8 | 521 19% | 465.6 7% | 493 13% | 553 27% |
| Write Seq Q32T1 (MB/s) | 1461 | 3362 130% | 2911 99% | 1828 25% | 2955 102% |
| Read Seq Q32T1 (MB/s) | 2364 | 3200 35% | 3519 49% | 2128 -10% | 3246 37% |
| AS SSD | 50% | 58% | 12% | 55% | |
| Seq Read (MB/s) | 2082 | 2658 28% | 2873 38% | 1479 -29% | 2401 15% |
| Seq Write (MB/s) | 825 | 2769 236% | 1619 96% | 1715 108% | 2087 153% |
| 4K Read (MB/s) | 42.41 | 46.07 9% | 57.5 36% | 27.8 -34% | 49.58 17% |
| 4K Write (MB/s) | 98.3 | 87.2 -11% | 149.6 52% | 106 8% | 98.8 1% |
| 4K-64 Read (MB/s) | 1255 | 1372 9% | 1252 0% | 406 -68% | 1601 28% |
| 4K-64 Write (MB/s) | 738 | 1247 69% | 2196 198% | 1119 52% | 1862 152% |
| Access Time Read * (ms) | 0.109 | 0.052 52% | 0.04 63% | 0.128 -17% | 0.06 45% |
| Access Time Write * (ms) | 0.17 | 0.098 42% | 0.082 52% | 0.04 76% | 0.11 35% |
| Score Read (Points) | 1506 | 1684 12% | 1597 6% | 581 -61% | 1890 25% |
| Score Write (Points) | 918 | 1611 75% | 2508 173% | 1396 52% | 2170 136% |
| Score Total (Points) | 3136 | 4166 33% | 4869 55% | 2294 -27% | 5015 60% |
| Copy ISO MB/s (MB/s) | 1391 | 1583 14% | 1747 26% | 2206 59% | |
| Copy Program MB/s (MB/s) | 645 | 964 49% | 975 51% | 694 8% | |
| Copy Game MB/s (MB/s) | 1101 | 943 -14% | 1453 32% | 1555 41% | |
| Total Average (Program / Settings) | 44% /
45% | 48% /
51% | 8% /
9% | 42% /
46% |
* ... smaller is better

Disk throttling: DiskSpd Read Loop, Queue Depth 8
GPU Performance - GeForce RTX 3060 with 125 Watts
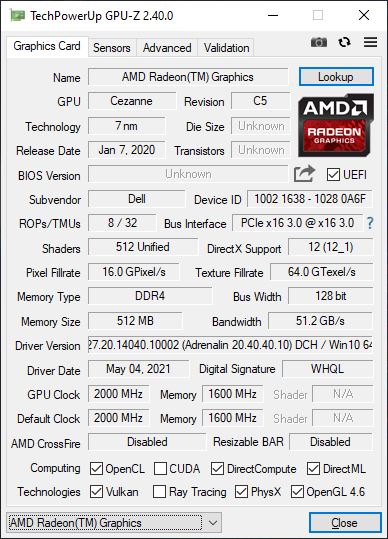
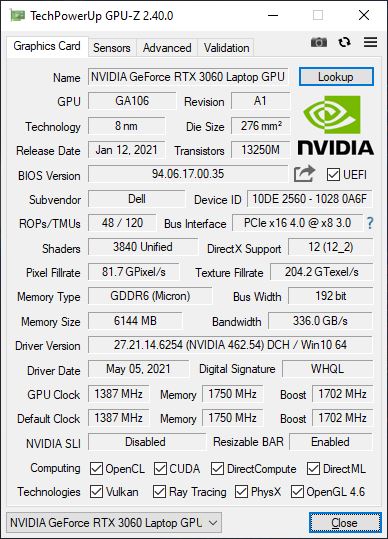
Simple workloads are handled by the integrated and efficient Radeon RX Vega 8 and the laptop will automatically switch to the dedicated GeForce RTX 3060 GPU via Nvidia Optimus. We reported that the m15 R5 was equipped with a slower RTX 3070, but there are no problems with the RTX 3060. It is one of the fastest implementations of the RTX 3060 with a TGP of 125 Watts and a maximum clock of 1875 MHz.
The GPU performance is very good and meets our expectations. It is about 30-40% slower than the RTX 3070 (140W) in the Alienware m15 R4 depending on the test, which is also available for the m15 R5. The performance is also stable and the 3DMark stress test (Time Spy) is easily passed. On battery power, however, the power consumption of the GPU is heavily throttled from 125W to just 30W, which means the GPU performance drops by 75%.
As we mentioned before, you can get the RTX 3070 for the AMD notebook, but it is mainly interesting in combination with the higher-resolution QHD panel. The Intel model m15 R6 on the other hand can be equipped with the RTX 3080, but only in combination with the fast 360 Hz display.
| 3DMark 11 Performance | 22348 points | |
| 3DMark Ice Storm Standard Score | 120393 points | |
| 3DMark Cloud Gate Standard Score | 45409 points | |
| 3DMark Fire Strike Score | 18898 points | |
| 3DMark Time Spy Score | 8306 points | |
Help | ||
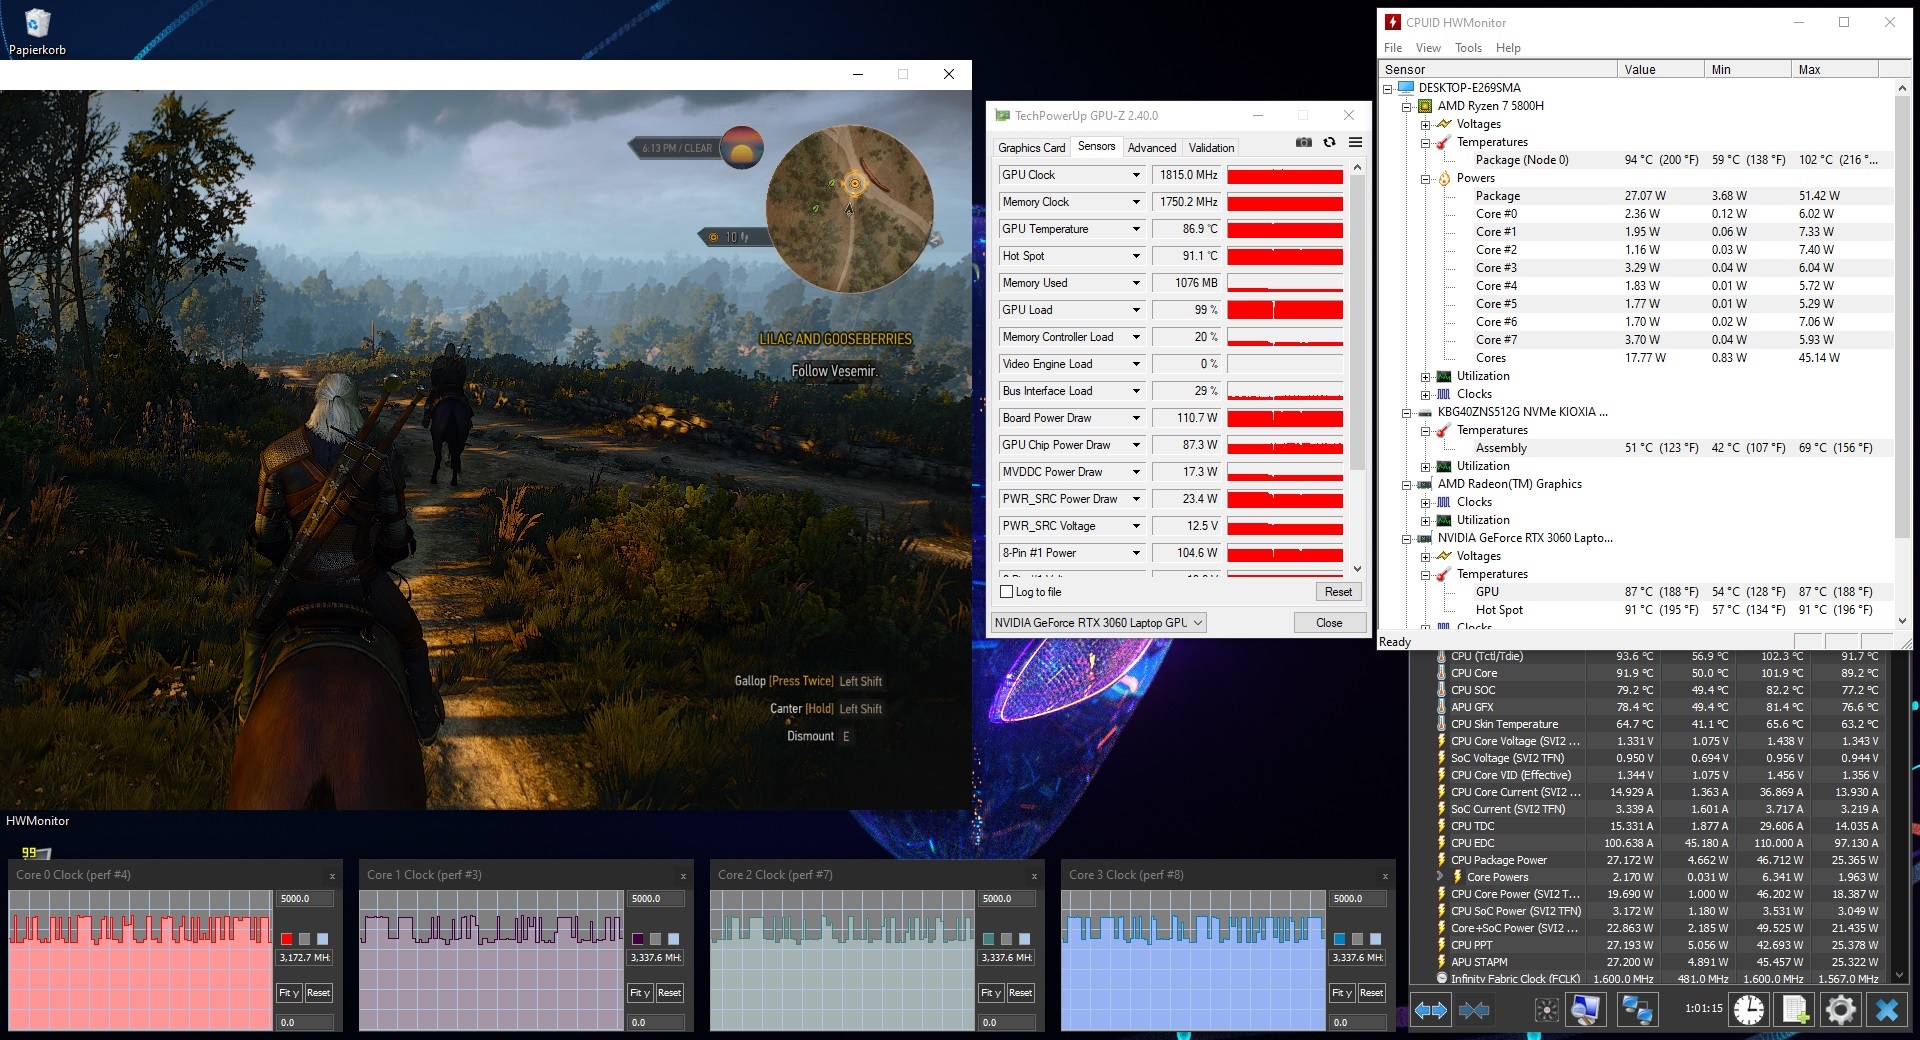
Gaming Performance
The GeForce RTX 3060 is a very good choice for the default FHD panel, and even demanding titles like Cyberpunk 2077 run smoothly at maximum details. The gaming performance of the Ryzen 7 5800H is pretty much on par with the new Tiger Lake-H Core i7-11800H and it is also stable in longer workloads, which is shown by the Witcher 3 loop. There is a significant performance drop on battery power; the fps in Witcher 3 (Ultra), for example, drops by more than 70% (76 vs. 22 fps). More gaming benchmarks with the GeForce RTX 3060 are available in our tech section.
| Cyberpunk 2077 1.0 | |
| 1920x1080 Ray Tracing Ultra Preset (DLSS off) | |
| Alienware m15 R4 | |
| Average NVIDIA GeForce RTX 3060 Laptop GPU (19.9 - 26.7, n=3) | |
| Acer Aspire Nitro 5 AN515-55-57GF | |
| 1920x1080 Ultra Preset | |
| Alienware m15 R4 | |
| Average NVIDIA GeForce RTX 3060 Laptop GPU (48.9 - 58, n=6) | |
| Alienware m15 R5 Ryzen Edition | |
| Acer Aspire Nitro 5 AN515-55-57GF | |
| 1920x1080 High Preset | |
| Average NVIDIA GeForce RTX 3060 Laptop GPU (57.9 - 68, n=6) | |
| Alienware m15 R5 Ryzen Edition | |
| Acer Aspire Nitro 5 AN515-55-57GF | |
| 1920x1080 Medium Preset | |
| Average NVIDIA GeForce RTX 3060 Laptop GPU (70.4 - 81, n=5) | |
| Alienware m15 R5 Ryzen Edition | |
| Acer Aspire Nitro 5 AN515-55-57GF | |
| 1920x1080 Low Preset | |
| Average NVIDIA GeForce RTX 3060 Laptop GPU (77.6 - 84.1, n=2) | |
| Acer Aspire Nitro 5 AN515-55-57GF | |
| 1280x720 Low Preset | |
| Acer Aspire Nitro 5 AN515-55-57GF | |
| Average NVIDIA GeForce RTX 3060 Laptop GPU (93.8 - 106.5, n=5) | |
| Alienware m15 R5 Ryzen Edition | |
Witcher 3 Ultra Loop
| low | med. | high | ultra | |
|---|---|---|---|---|
| GTA V (2015) | 172 | 133 | 81.5 | |
| The Witcher 3 (2015) | 280 | 142 | 75.6 | |
| Dota 2 Reborn (2015) | 137 | 130 | 115 | 109 |
| Final Fantasy XV Benchmark (2018) | 150 | 102 | 78.1 | |
| X-Plane 11.11 (2018) | 94.6 | 82.4 | 70 | |
| Far Cry 5 (2018) | 128 | 105 | 100 | 96 |
| Strange Brigade (2018) | 265 | 160 | 146 | 134 |
| F1 2020 (2020) | 215 | 163 | 151 | 120 |
| Cyberpunk 2077 1.0 (2020) | 99.6 | 74.9 | 63.3 | 54.9 |
Emissions
System Noise
Alienware still uses two fans and the noise levels are comparable to the previous model. They are often deactivated in light workloads and there are no annoying electronic sounds, either. As long as you do not use the dedicated graphics card, it also takes a while before the fans start spinning. With full CPU load, for example, it takes more than one minute before the fans kick in. You will definitely hear the fans when you play games, but subjectively, it is not annoying. We still recommend headphones for games with quiet sequences.
Noise level
| Idle |
| 24 / 25 / 35 dB(A) |
| Load |
| 44 / 50 dB(A) |
 | ||
30 dB silent 40 dB(A) audible 50 dB(A) loud |
||
min: | ||
| Alienware m15 R5 Ryzen Edition GeForce RTX 3060 Laptop GPU, R7 5800H, Toshiba KBG40ZNS512G NVMe | Alienware m15 R4 GeForce RTX 3070 Laptop GPU, i9-10980HK, Micron 2300 1TB MTFDHBA1T0TDV | Acer Aspire Nitro 5 AN515-55-57GF GeForce RTX 3060 Laptop GPU, i5-10300H, WDC PC SN530 SDBPNPZ-512G | Razer Blade 15 Base Edition 2021, i7-10750H RTX 3060 GeForce RTX 3060 Laptop GPU, i7-10750H, Samsung SSD PM981a MZVLB512HBJQ | |
|---|---|---|---|---|
| Noise | -3% | -4% | 4% | |
| off / environment * (dB) | 24 | 24 -0% | 25 -4% | 25.3 -5% |
| Idle Minimum * (dB) | 24 | 25 -4% | 25 -4% | 25.4 -6% |
| Idle Average * (dB) | 25 | 26 -4% | 30 -20% | 25.4 -2% |
| Idle Maximum * (dB) | 35 | 37 -6% | 33 6% | 25.4 27% |
| Load Average * (dB) | 44 | 48 -9% | 46 -5% | 42.5 3% |
| Witcher 3 ultra * (dB) | 48 | 47 2% | 47 2% | 42 12% |
| Load Maximum * (dB) | 50 | 49 2% | 50 -0% | 52.2 -4% |
* ... smaller is better
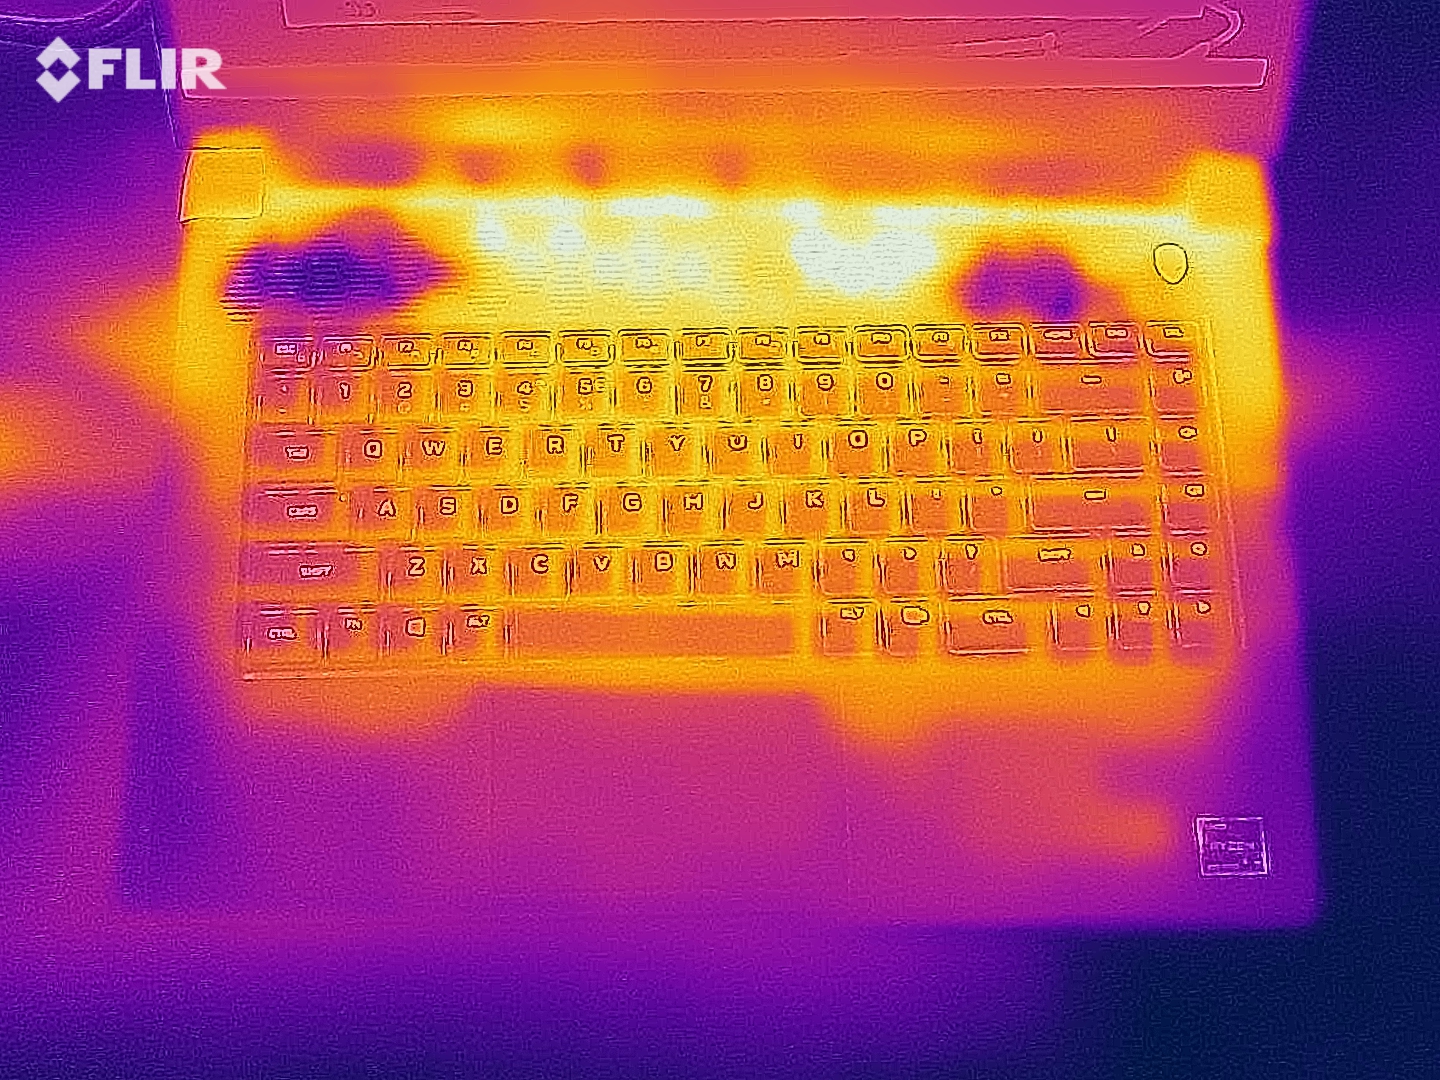
Temperature
The rear part of the laptop that accommodates the cooling solution gets very warm and you should definitely not put the device on your lap under load. This is a result of the high temperatures of more than 60 °C, but also the position of the fan and the air intakes at the bottom. The area above the keyboard also warms up to more than 60 °C, but you will probably not touch this area. The keyboard warms up as well, but there are no limitations and the palm rests stay comfortable even under load.
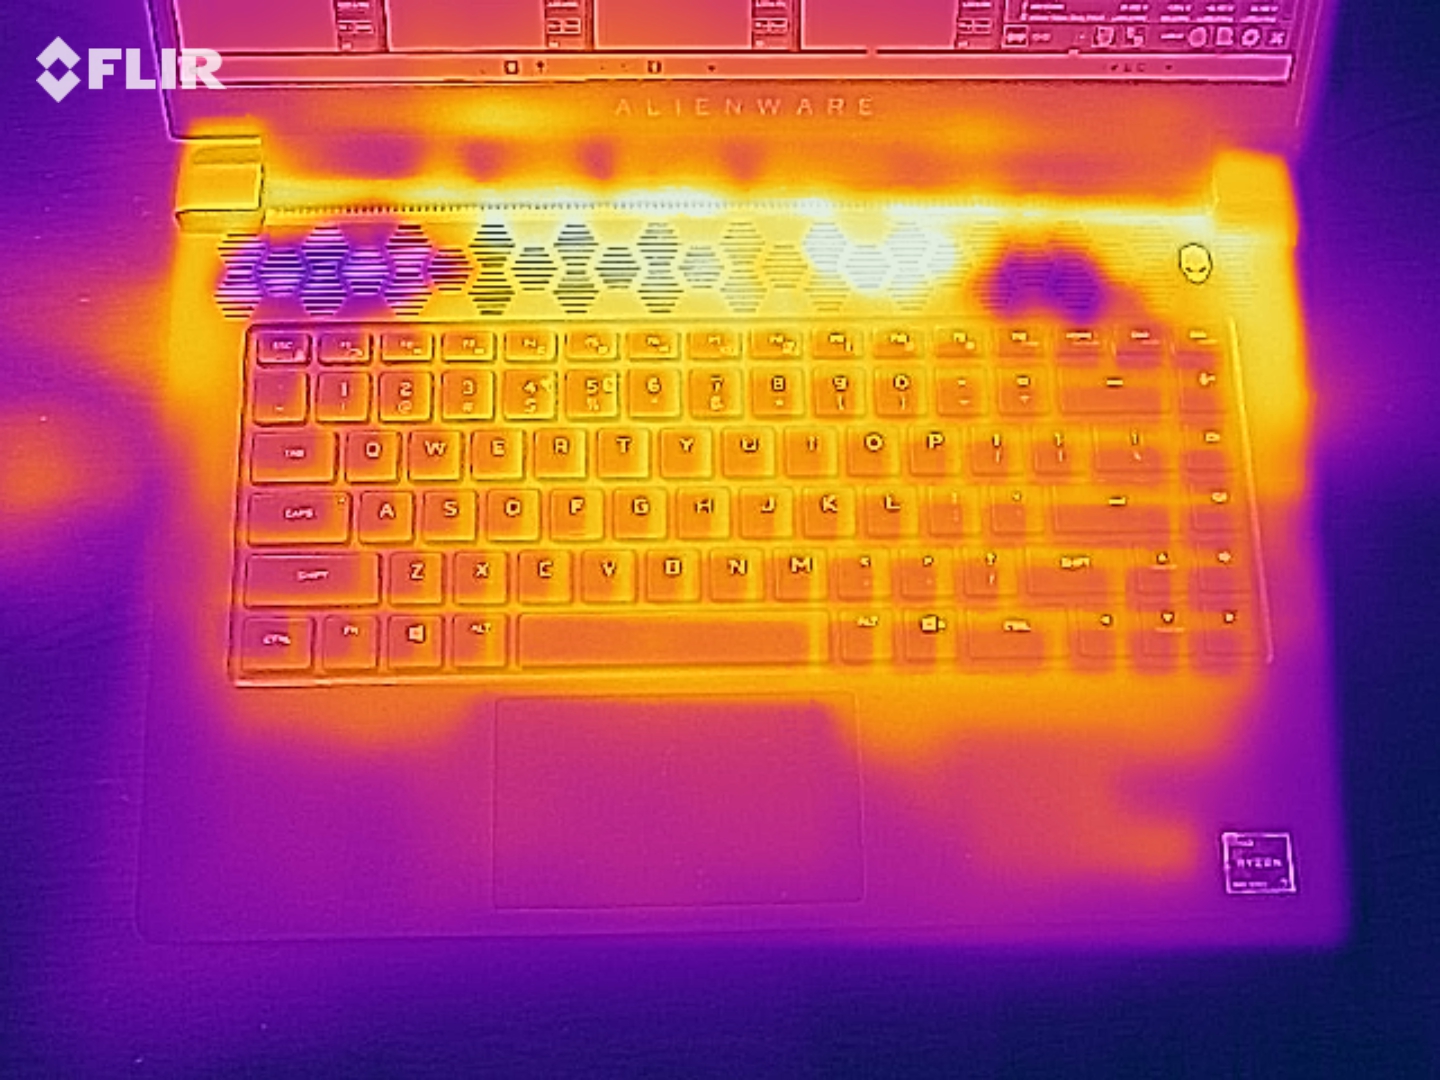
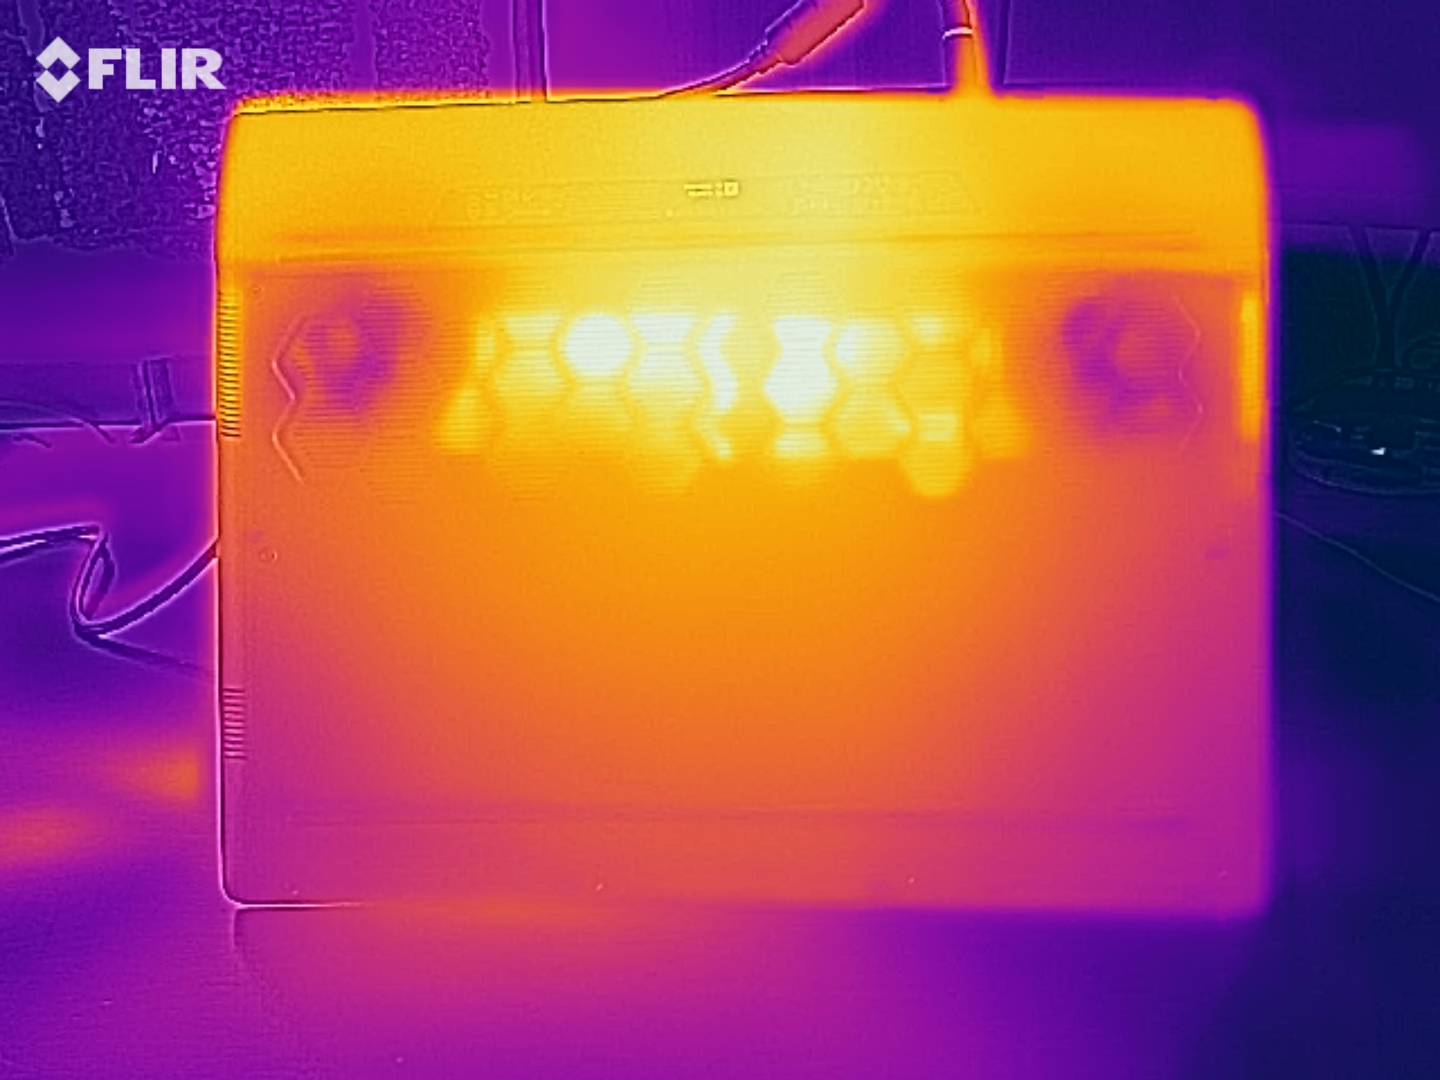
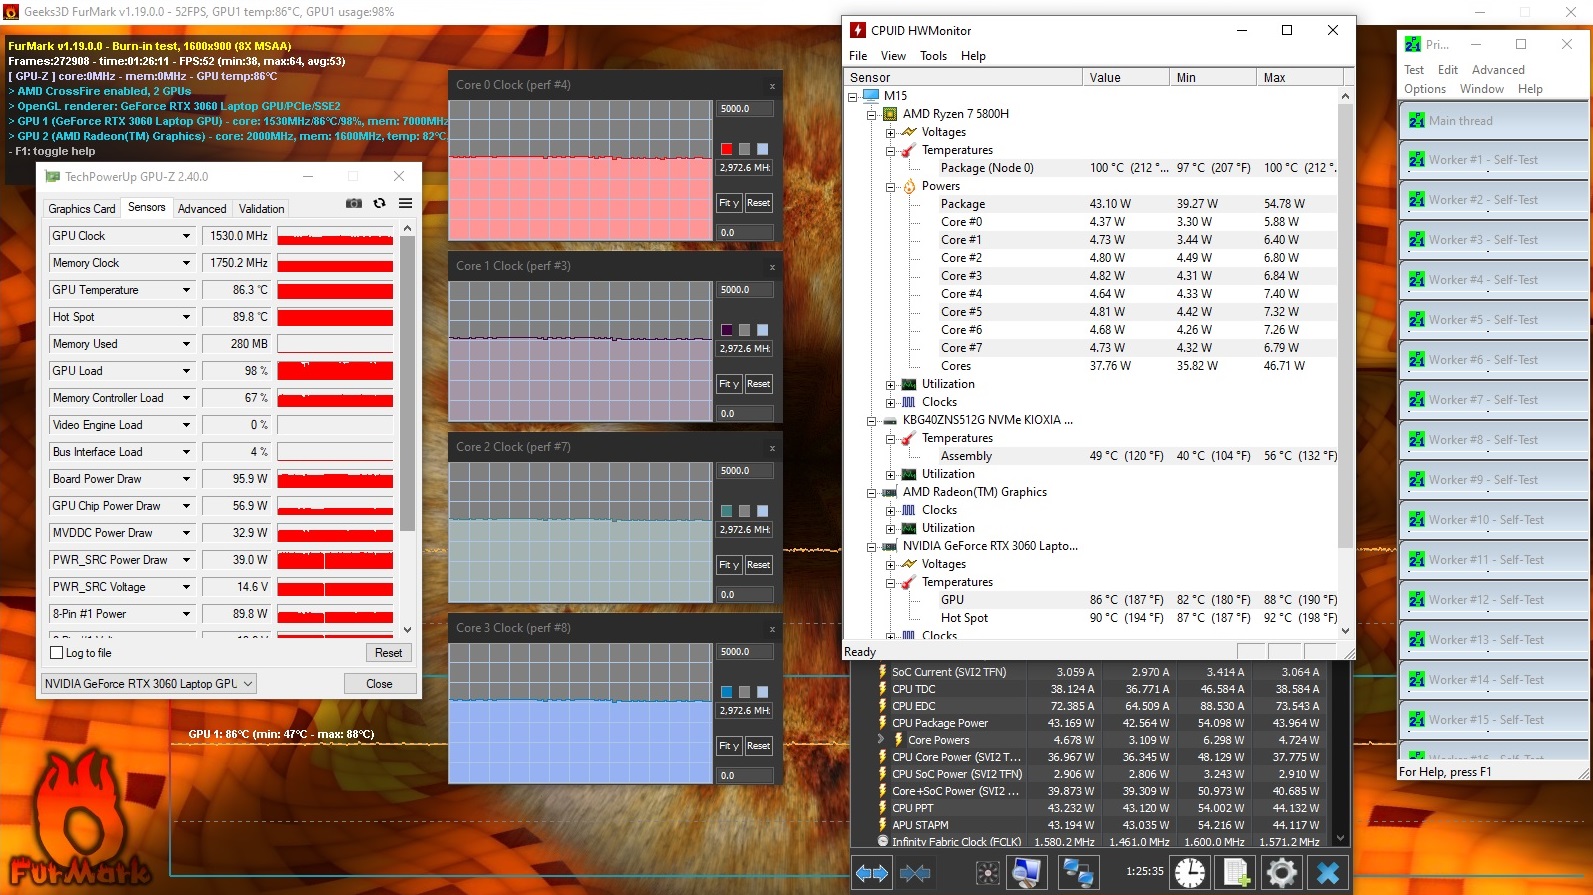
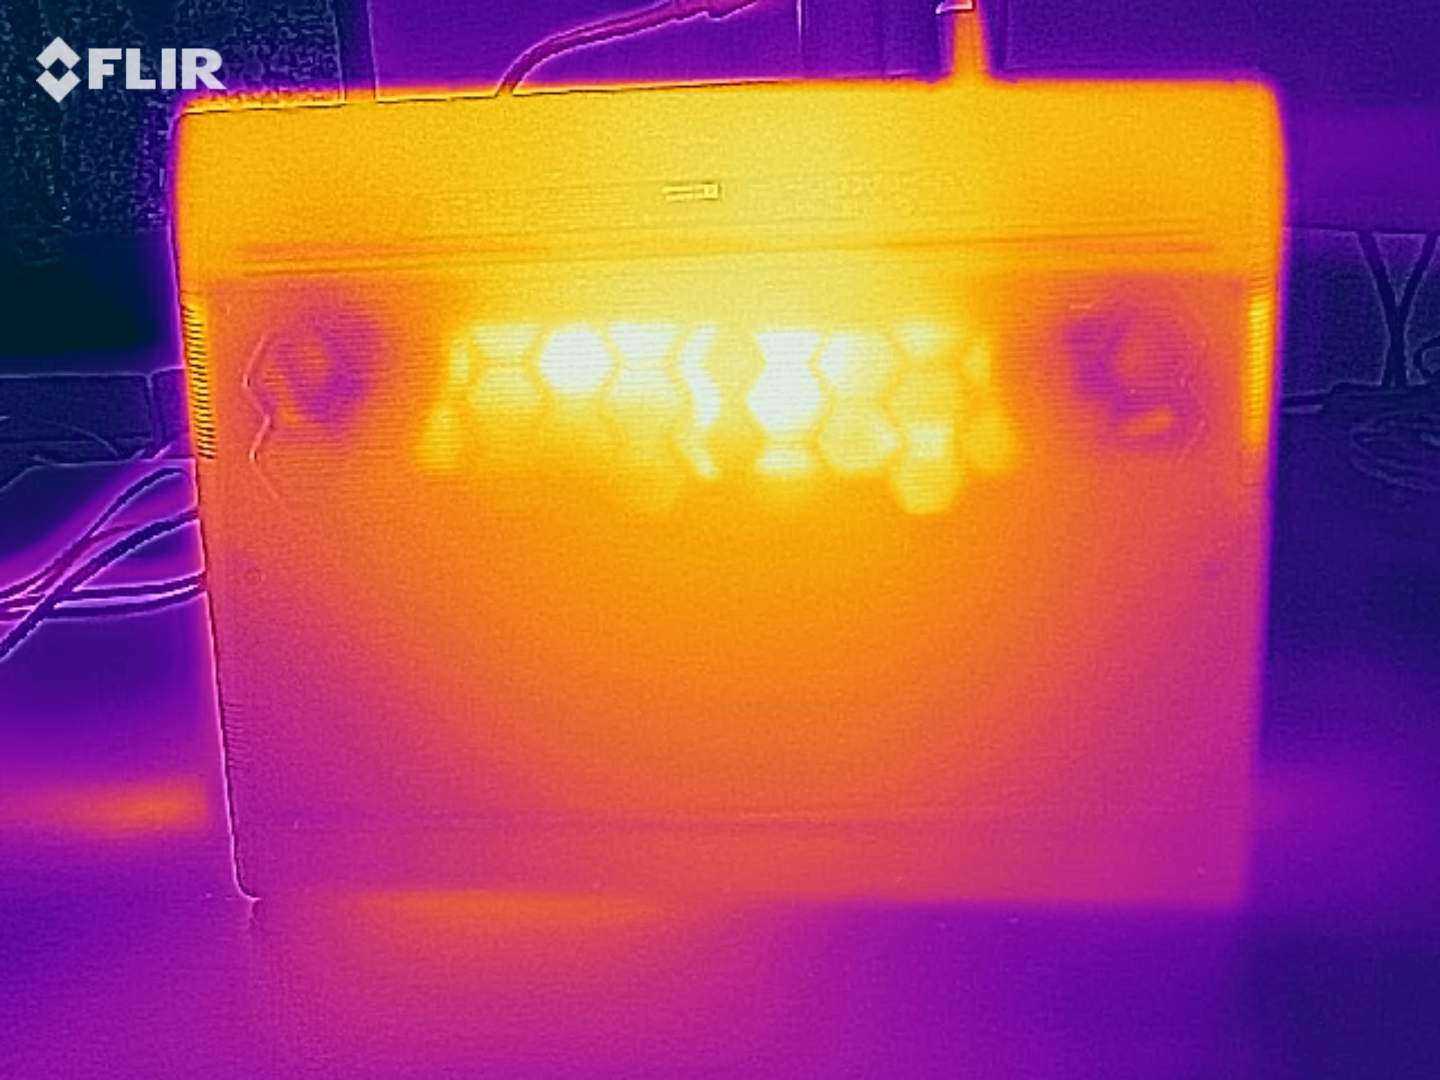
The components cannot utilize their full performance under combined workloads, but the reduction is moderate and the cryo tech cooling solution (Alienware’s name for vapor chamber) does a decent job. The processor still runs at 44W and the GPU at 96W during the stress test – very good results.
(-) The maximum temperature on the upper side is 62 °C / 144 F, compared to the average of 40.4 °C / 105 F, ranging from 21.2 to 68.8 °C for the class Gaming.
(-) The bottom heats up to a maximum of 61 °C / 142 F, compared to the average of 43.2 °C / 110 F
(±) In idle usage, the average temperature for the upper side is 33.8 °C / 93 F, compared to the device average of 33.9 °C / 93 F.
(-) Playing The Witcher 3, the average temperature for the upper side is 48.4 °C / 119 F, compared to the device average of 33.9 °C / 93 F.
(-) The palmrests and touchpad can get very hot to the touch with a maximum of 43 °C / 109.4 F.
(-) The average temperature of the palmrest area of similar devices was 28.8 °C / 83.8 F (-14.2 °C / -25.6 F).
Speakers
The two speakers are now located at the bottom of the base unit and the sound quality is a bit worse compared to the old Alienware m15 R4. The overall quality is just average, many multimedia laptops and even some compact Ultrabooks show that the sound performance could be much better.
Alienware m15 R5 Ryzen Edition audio analysis
(+) | speakers can play relatively loud (82 dB)
Bass 100 - 315 Hz
(-) | nearly no bass - on average 23.2% lower than median
(±) | linearity of bass is average (11.1% delta to prev. frequency)
Mids 400 - 2000 Hz
(±) | higher mids - on average 5.2% higher than median
(+) | mids are linear (4.2% delta to prev. frequency)
Highs 2 - 16 kHz
(+) | balanced highs - only 2.3% away from median
(+) | highs are linear (4.4% delta to prev. frequency)
Overall 100 - 16.000 Hz
(±) | linearity of overall sound is average (17.9% difference to median)
Compared to same class
» 55% of all tested devices in this class were better, 9% similar, 37% worse
» The best had a delta of 6%, average was 18%, worst was 132%
Compared to all devices tested
» 37% of all tested devices were better, 8% similar, 55% worse
» The best had a delta of 4%, average was 23%, worst was 134%
Acer Aspire Nitro 5 AN515-55-57GF audio analysis
(±) | speaker loudness is average but good (76 dB)
Bass 100 - 315 Hz
(-) | nearly no bass - on average 15.9% lower than median
(±) | linearity of bass is average (9% delta to prev. frequency)
Mids 400 - 2000 Hz
(±) | higher mids - on average 9.7% higher than median
(±) | linearity of mids is average (9% delta to prev. frequency)
Highs 2 - 16 kHz
(+) | balanced highs - only 2% away from median
(+) | highs are linear (4.5% delta to prev. frequency)
Overall 100 - 16.000 Hz
(±) | linearity of overall sound is average (22.8% difference to median)
Compared to same class
» 82% of all tested devices in this class were better, 5% similar, 13% worse
» The best had a delta of 6%, average was 18%, worst was 132%
Compared to all devices tested
» 68% of all tested devices were better, 5% similar, 27% worse
» The best had a delta of 4%, average was 23%, worst was 134%
Alienware m15 R4 audio analysis
(+) | speakers can play relatively loud (86 dB)
Bass 100 - 315 Hz
(-) | nearly no bass - on average 18.2% lower than median
(±) | linearity of bass is average (9.6% delta to prev. frequency)
Mids 400 - 2000 Hz
(±) | reduced mids - on average 6.4% lower than median
(±) | linearity of mids is average (8.1% delta to prev. frequency)
Highs 2 - 16 kHz
(+) | balanced highs - only 2.3% away from median
(+) | highs are linear (4% delta to prev. frequency)
Overall 100 - 16.000 Hz
(+) | overall sound is linear (13.4% difference to median)
Compared to same class
» 19% of all tested devices in this class were better, 7% similar, 74% worse
» The best had a delta of 6%, average was 18%, worst was 132%
Compared to all devices tested
» 14% of all tested devices were better, 4% similar, 82% worse
» The best had a delta of 4%, average was 23%, worst was 134%
Energy Management
Power Consumption
While the m15 R4 consumed a lot of power, especially while idling, the m15 R5 with the Ryzen processor is very comparable to the rivals. We measure up to 230W under maximum load and 180W while gaming, so the provided 240W power adapter is completely sufficient.
| Off / Standby | |
| Idle | |
| Load |
|
Key:
min: | |
| Alienware m15 R5 Ryzen Edition R7 5800H, GeForce RTX 3060 Laptop GPU, Toshiba KBG40ZNS512G NVMe | Alienware m15 R4 i9-10980HK, GeForce RTX 3070 Laptop GPU, Micron 2300 1TB MTFDHBA1T0TDV | Asus TUF Gaming F15 FX506HM i7-11800H, GeForce RTX 3060 Laptop GPU, SK Hynix HFM001TD3JX013N | Acer Aspire Nitro 5 AN515-55-57GF i5-10300H, GeForce RTX 3060 Laptop GPU, WDC PC SN530 SDBPNPZ-512G | Razer Blade 15 Base Edition 2021, i7-10750H RTX 3060 i7-10750H, GeForce RTX 3060 Laptop GPU, Samsung SSD PM981a MZVLB512HBJQ | Average of class Gaming | |
|---|---|---|---|---|---|---|
| Power Consumption | -87% | 15% | 36% | 3% | -11% | |
| Idle Minimum * (Watt) | 11 | 35 -218% | 9.5 14% | 5 55% | 11.7 -6% | 13 ? -18% |
| Idle Average * (Watt) | 14 | 39 -179% | 12.1 14% | 9 36% | 16 -14% | 19 ? -36% |
| Idle Maximum * (Watt) | 25 | 48 -92% | 22.5 10% | 13 48% | 29.3 -17% | 24.6 ? 2% |
| Load Average * (Watt) | 123 | 135 -10% | 99.5 19% | 84 32% | 95.6 22% | 110.7 ? 10% |
| Witcher 3 ultra * (Watt) | 176 | 194 -10% | 157 11% | 125 29% | 141.3 20% | |
| Load Maximum * (Watt) | 226 | 252 -12% | 173.5 23% | 190 16% | 197 13% | 259 ? -15% |
* ... smaller is better
Witcher 3 Ultra Power Consumption
Battery Runtime
The battery capacity of 86 Wh did not change, but thanks to the lower power consumption, the battery runtime is obviously longer. Our Wi-Fi test at 150 nits runs for around 5 hours, and you can expect around 8 hours of video playback. The improved video decoder of the Radeon iGPU definitely pays off here. Gaming on the go is possible for about 1.5 hours, but the performance is significantly lower as we have seen before.
| Alienware m15 R5 Ryzen Edition R7 5800H, GeForce RTX 3060 Laptop GPU, 86 Wh | Alienware m15 R4 i9-10980HK, GeForce RTX 3070 Laptop GPU, 86 Wh | Asus TUF Gaming F15 FX506HM i7-11800H, GeForce RTX 3060 Laptop GPU, 90 Wh | Acer Aspire Nitro 5 AN515-55-57GF i5-10300H, GeForce RTX 3060 Laptop GPU, 57.5 Wh | Razer Blade 15 Base Edition 2021, i7-10750H RTX 3060 i7-10750H, GeForce RTX 3060 Laptop GPU, 65 Wh | Average of class Gaming | |
|---|---|---|---|---|---|---|
| Battery runtime | -41% | 51% | 16% | 5% | 14% | |
| Reader / Idle (h) | 14.7 | 3.7 -75% | 11 -25% | 7.8 -47% | 8.27 ? -44% | |
| H.264 (h) | 8.8 | 6.2 -30% | 8.32 ? -5% | |||
| WiFi v1.3 (h) | 5.1 | 2.7 -47% | 7.9 55% | 5.7 12% | 4.8 -6% | 7.11 ? 39% |
| Witcher 3 ultra (h) | 1.6 | |||||
| Load (h) | 0.9 | 0.9 0% | 2 122% | 1.5 67% | 1.5 67% | 1.502 ? 67% |
Pros
Cons
Verdict - Alienware m15 with AMD is the better choice
The new Alienware m15 (both R5 with AMD CPUs as well as R6 with Intel CPUs) is a bit lower in Alienware’s portfolio. The entry-level price of 1750 Euros is much lower than before (2199 Euros) and the new flagship laptop is the Alienware x15 from now on, which also starts at 2199 Euros.
Alienware redesigned the chassis and the overall construction appears a bit more rounded, but we are not completely happy with the quality. The creaking lid in particular affects the quality impression and just does not suit the price tag. You also get fewer ports, the micro-SD reader is missing and Alienware's Graphics Amplifier port seems to be gone as well (not available on the new x15, either).
The new AMD processor puts up a convincing performance. It is not only less expensive (the comparable Intel model costs 100 Euros more), but it is also faster at the same power consumption. The combination with the GeForce RTX 3060 works very well and the default 1080p screen with fast response times and high refresh rate is very convincing.
The entry-level model of the new m15 R5 is already a very good gaming laptop. The 125W version of the GeForce RTX 3060 offers sufficient performance for the fast FHD panel with 165 Hz and the new AMD processor convinces in every regard. Thanks to the lower price, the AMD model is the better choice.
We are a little bit surprised by the reduced selection of GPUs and displays compared to the Intel model, because you can only get the RTX 3080 and the 360 Hz display with the Alienware m15 R6 with Intel chips, The AMD model of the m15 also lacks Thunderbolt, but this should not surprise anyone.
Price and Availability
Our test configuration of the Alienware m15 R5 Ryzen Edition is available for $1650 on alienware.com.
Alienware m15 R5 Ryzen Edition
- 06/23/2021 v7 (old)
Andreas Osthoff
Price comparison
