 Deutsch
 English
 Español
 Français
 Italiano
 Nederlands
 Polski
 Português
 Русский
 Türkçe
 Svenska
 Chinese
 Magyar
Alienware m15 R4 laptop in review: Now also with a mechanical keyboard
Yes, we already reviewed the Alienware m15 R4, but only with the RTX 3070 and a "normal" keyboard. This time, not only do we have the upgrade to a stronger RTX 3080, but Dell has also installed a mechanical keyboard. Since this is only a graphics card and keyboard upgrade, we'll skip various information regarding the case, maintenance, etc., which can be found in the review of the Alienware m15 R4 (RTX 3070) or its virtually identical predecessor, the m15 R3.
Among the competitors, we include other gaming laptops with the RTX 3080 such as the Razer Blade 15 Advanced Model, the Asus ROG Zephyrus G15, or the Schenker XMG Pro 15. In addition, we naturally make a comparison with the sibling configuration with the RTX 3070 (we'll just call it the sibling model) as well as with the direct predecessor, the m15 R3. Within this competition, the Alienware is one of the most expensive models, costing around 3,600 Euros (~$4,391) from Dell in our configuration.
Possible contenders in comparison
Rating | Date | Model | Weight | Height | Size | Resolution | Best Price |
|---|---|---|---|---|---|---|---|
| 86.1 % | 06/2021 | Alienware m15 R4 RTX 3080 i9-10980HK, GeForce RTX 3080 Laptop GPU | 2.4 kg | 20 mm | 15.60" | 1920x1080 | |
| 85.4 % | 04/2021 | Alienware m15 R4 i9-10980HK, GeForce RTX 3070 Laptop GPU | 2.3 kg | 20 mm | 15.60" | 1920x1080 | |
| 84.8 % | 07/2020 | Alienware m15 R3 P87F i7-10750H, GeForce RTX 2070 Mobile | 2.3 kg | 19.9 mm | 15.60" | 1920x1080 | |
| 87.5 % | 05/2021 | Razer Blade 15 Advanced Model Early 2021 i7-10875H, GeForce RTX 3080 Laptop GPU | 2 kg | 16.99 mm | 15.60" | 1920x1080 | |
| 83.8 % | 02/2021 | Asus ROG Zephyrus G15 GA503Q R9 5900HS, GeForce RTX 3080 Laptop GPU | 2 kg | 20 mm | 15.60" | 2560x1440 | |
| 86 % | 03/2021 | SCHENKER XMG Pro 15 (Early 2021, RTX 3080) i7-10870H, GeForce RTX 3080 Laptop GPU | 2 kg | 19.8 mm | 15.60" | 1920x1080 |
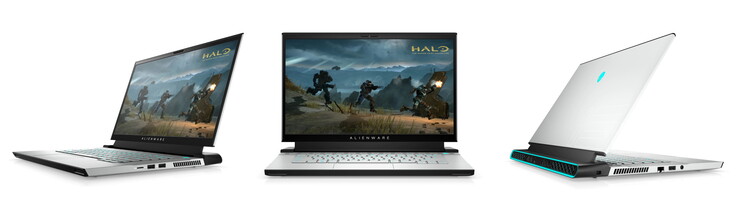
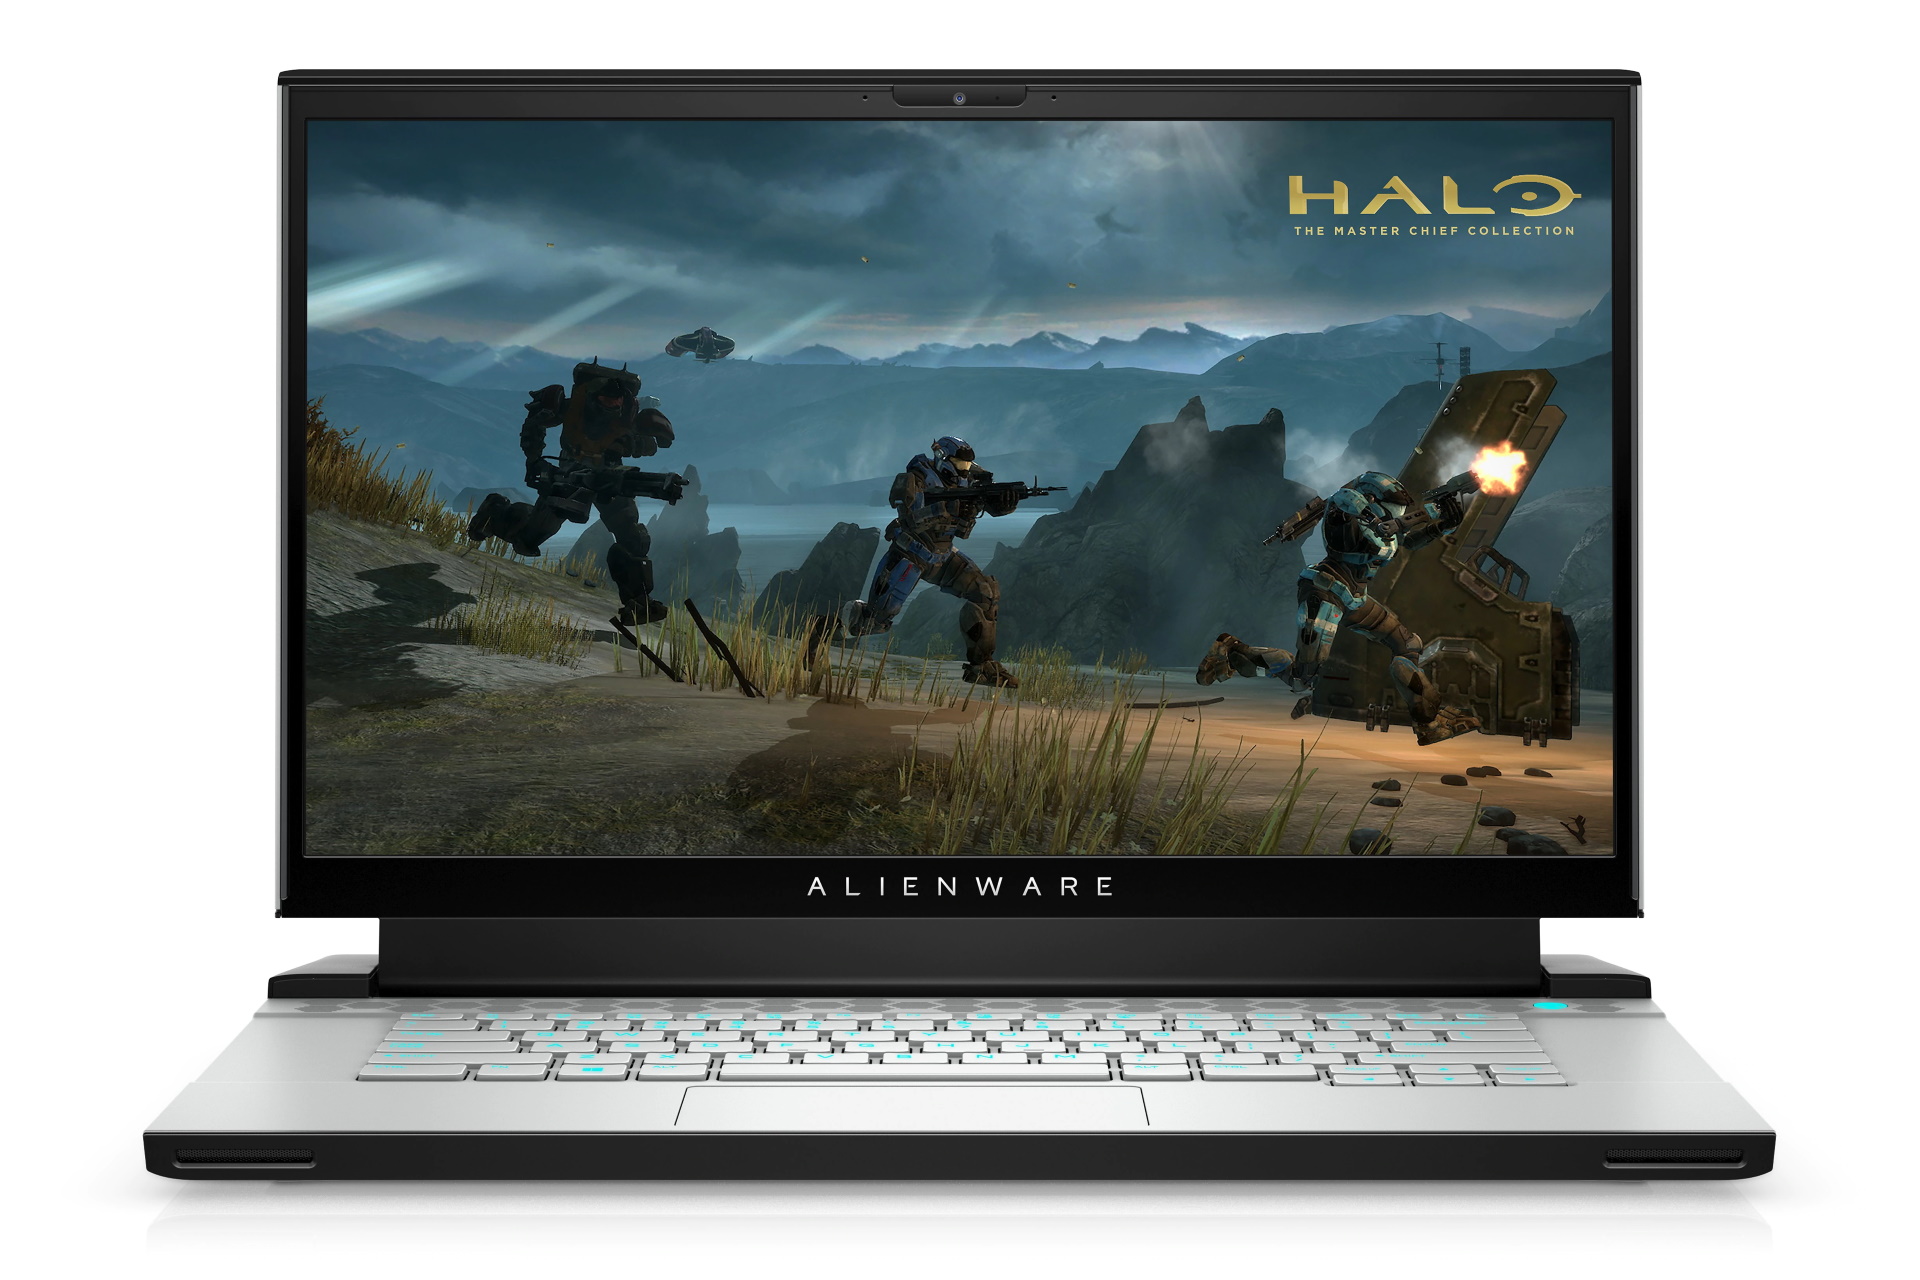
Case - Stylish Alienware design
The case has been adopted from the predecessor, which is why there is more information in the review of the Alienware m15 R3. Therefore, we'll only say this much: The case looks extremely stylish, and the designers have done a very good job.
Images source: Dell
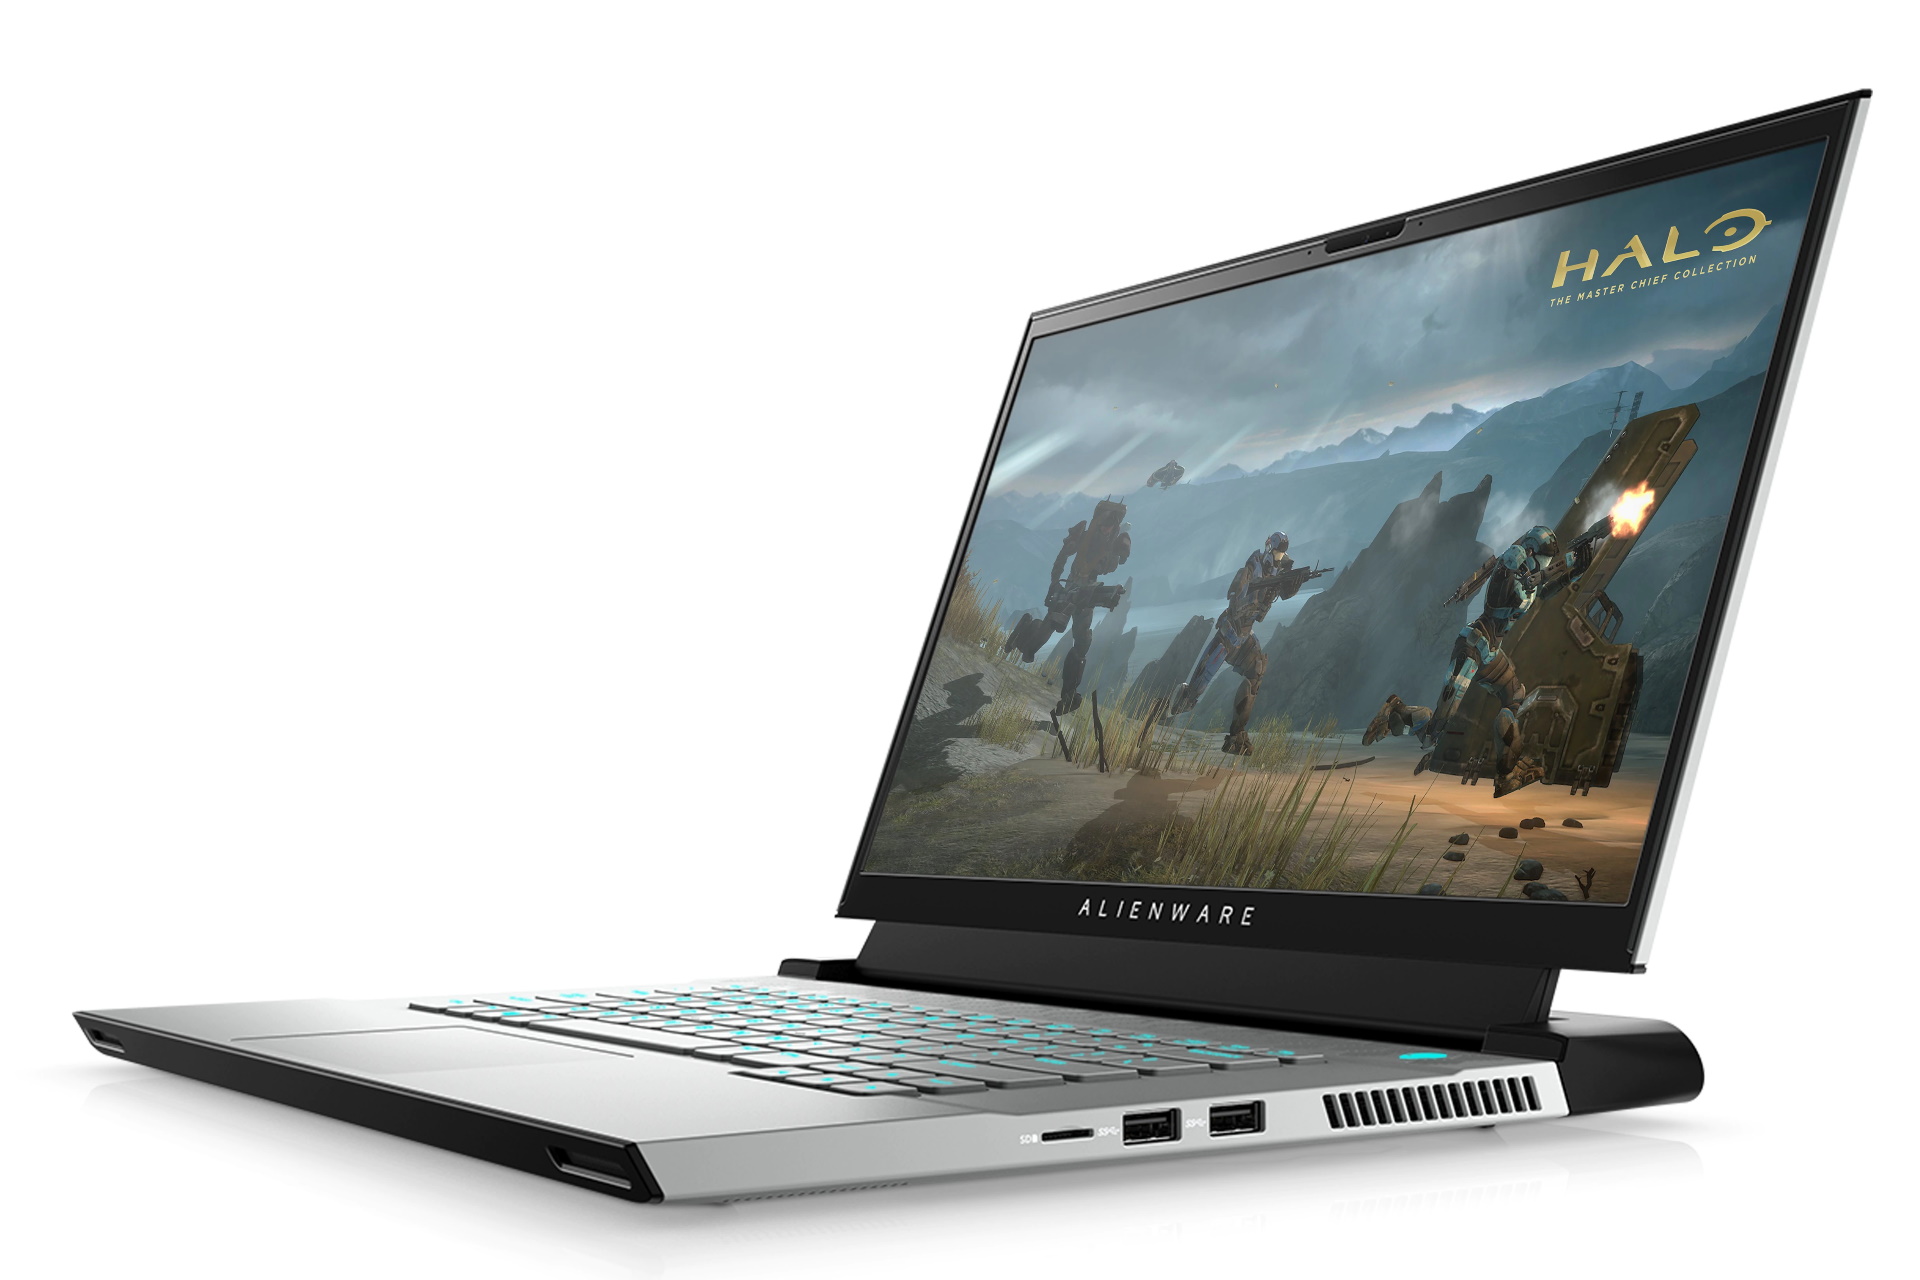
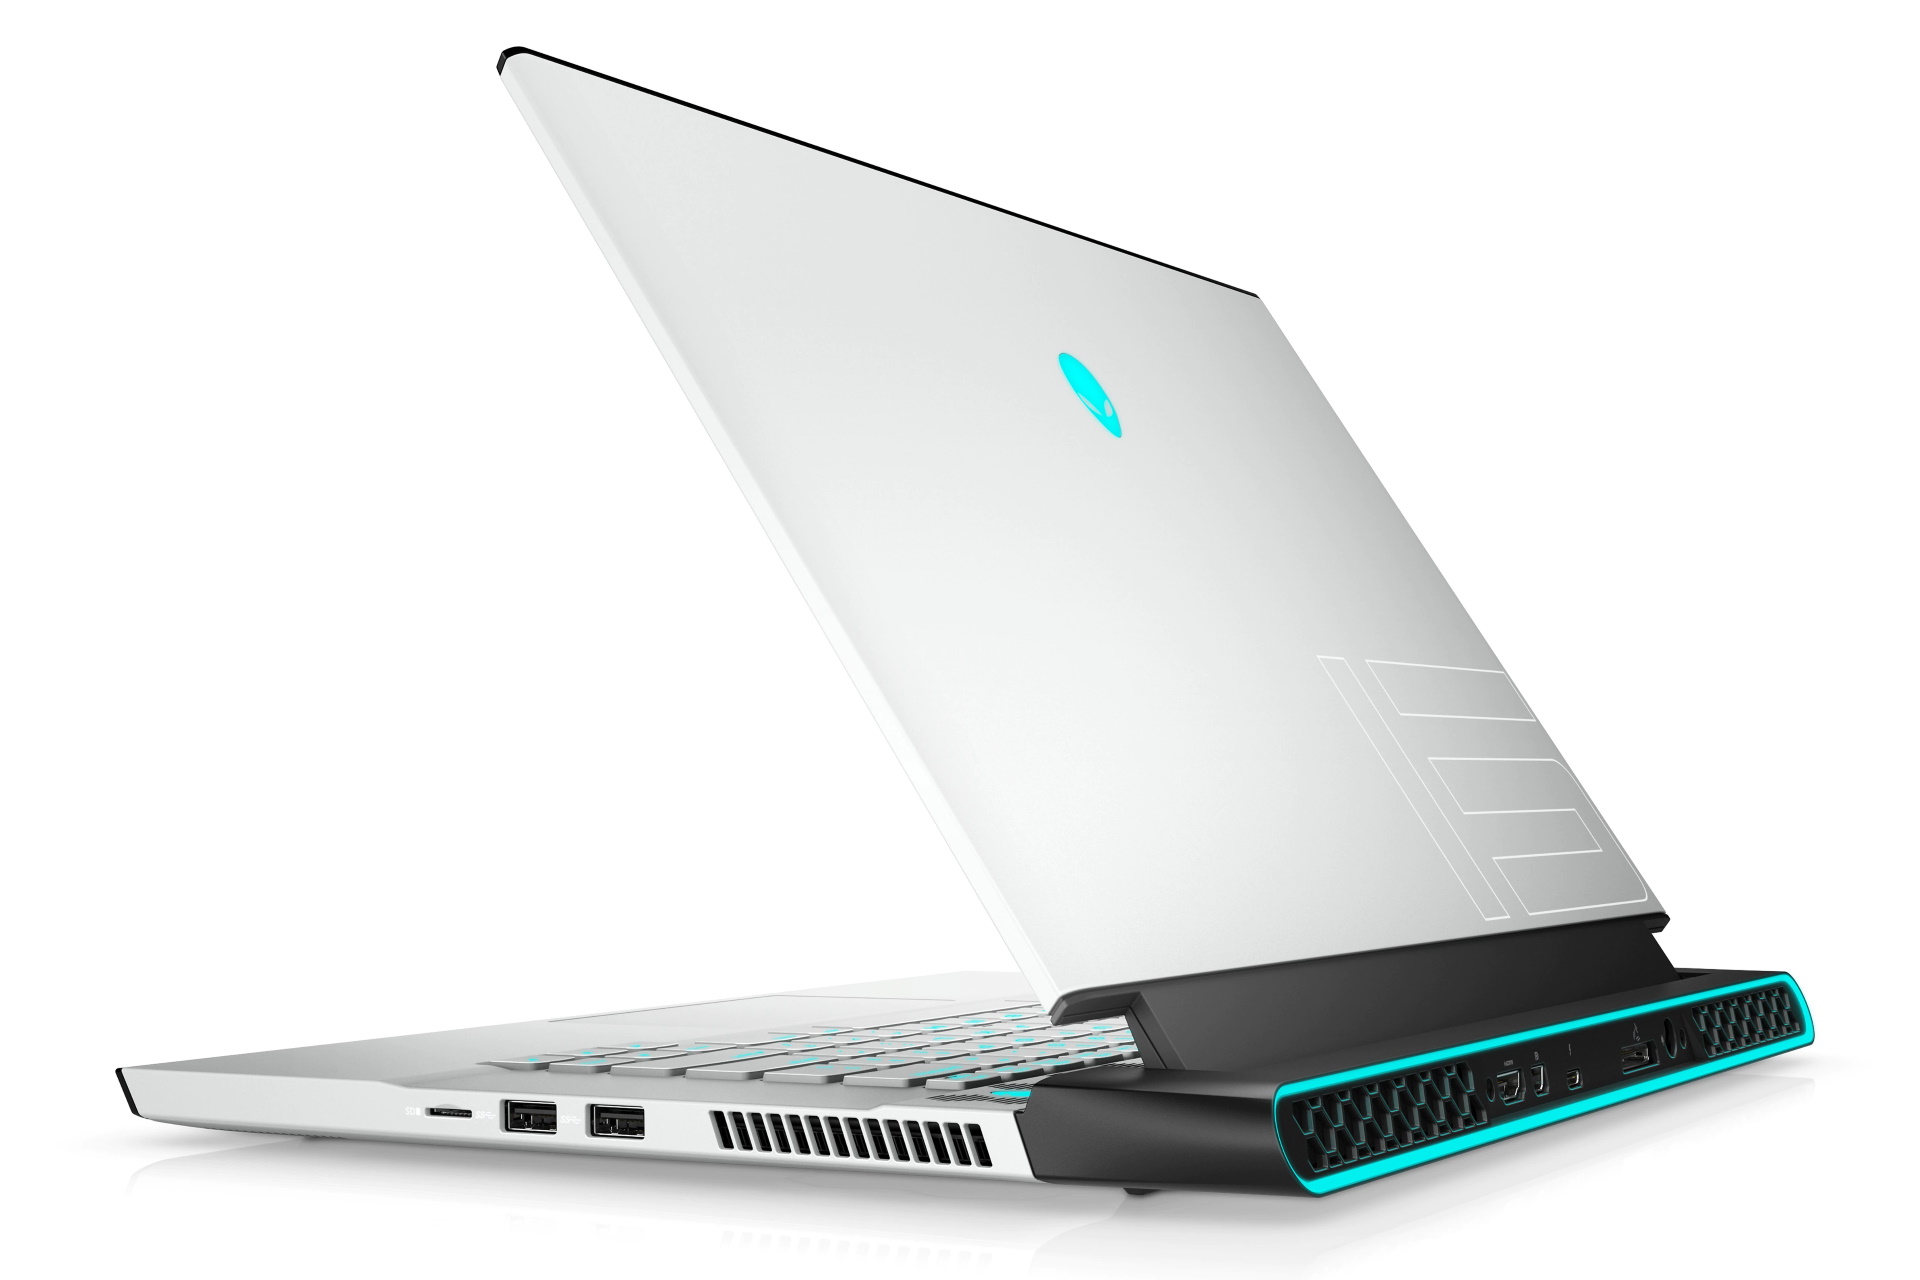
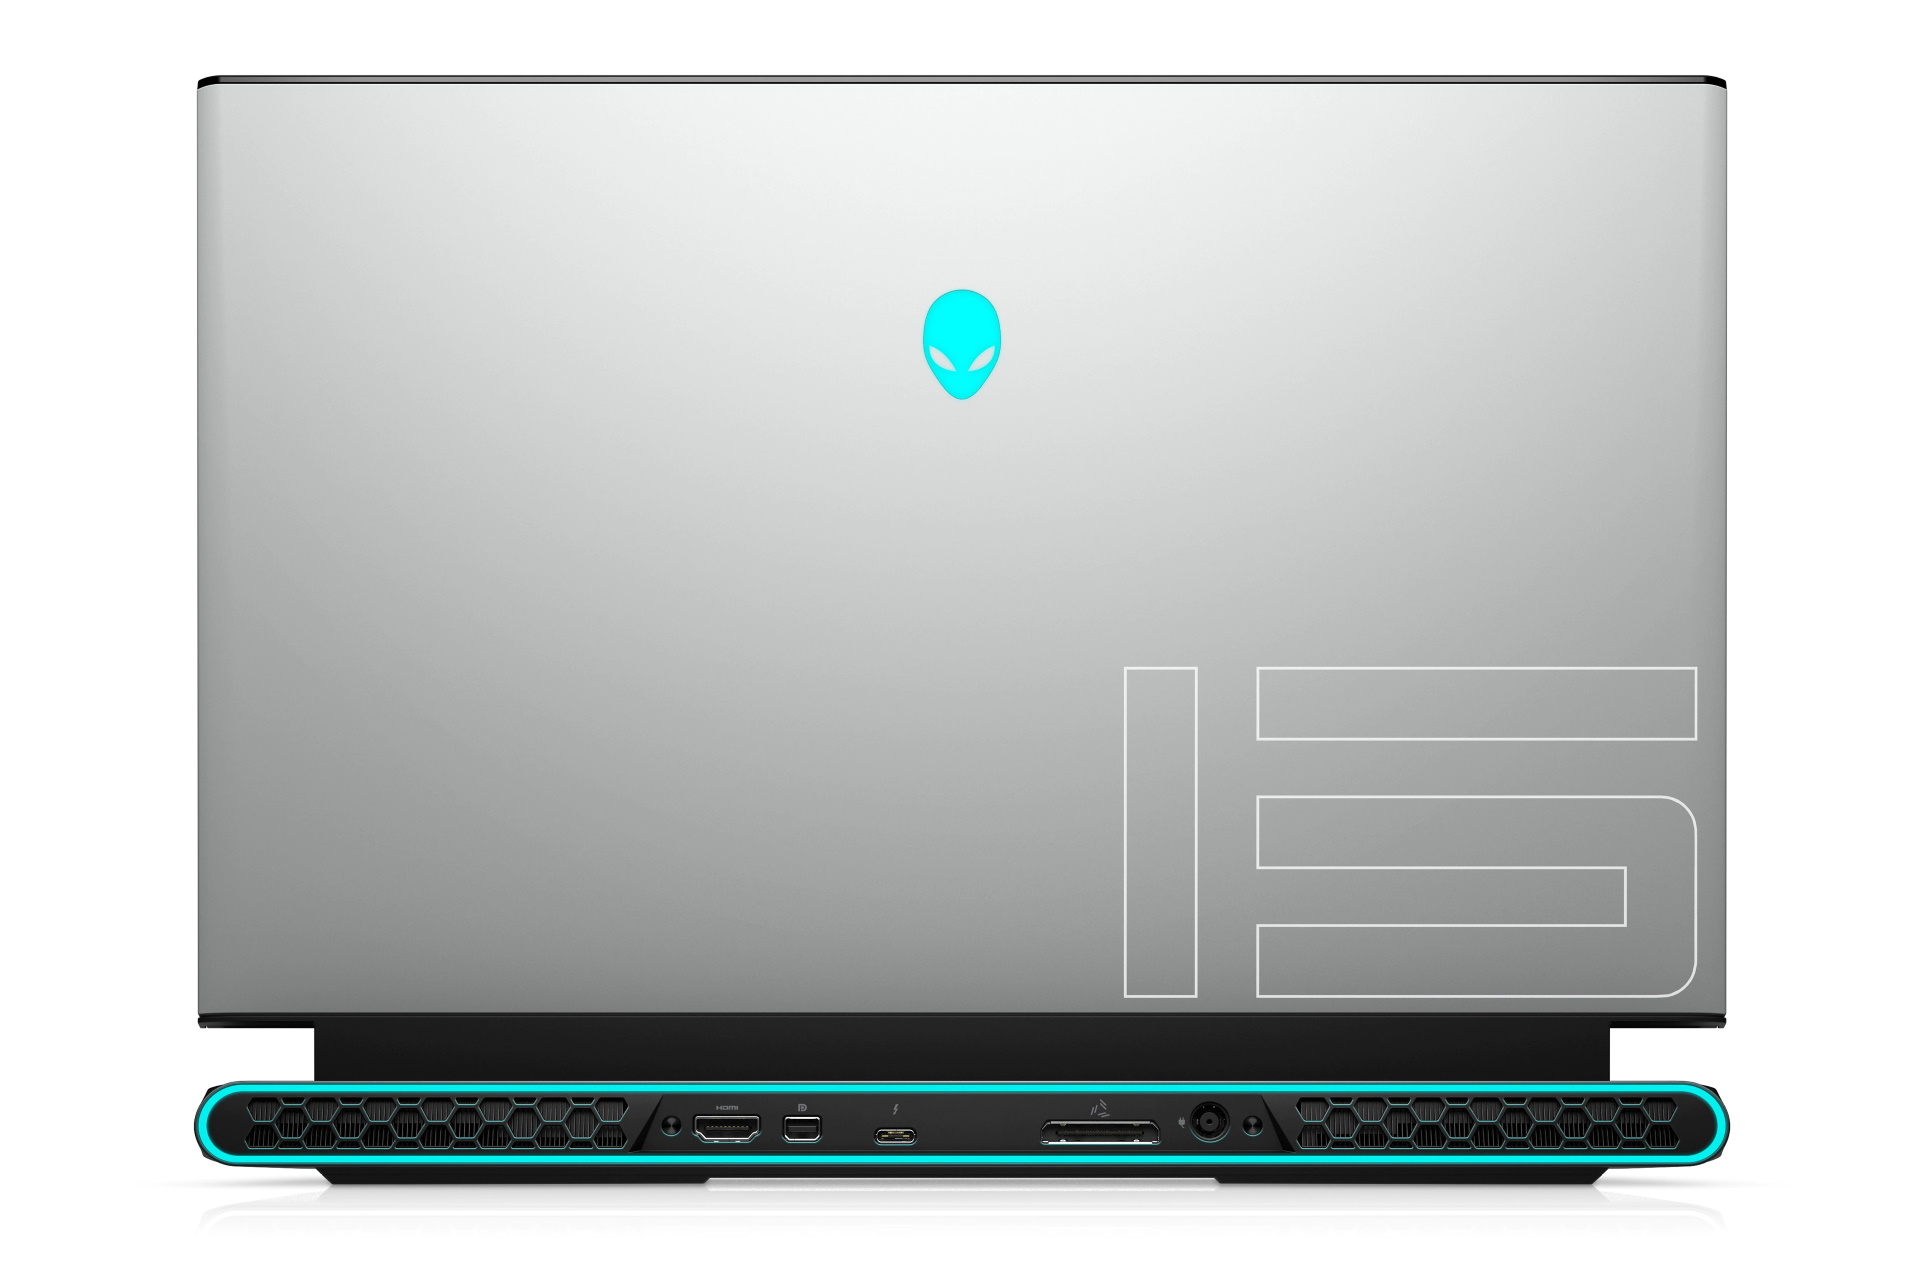
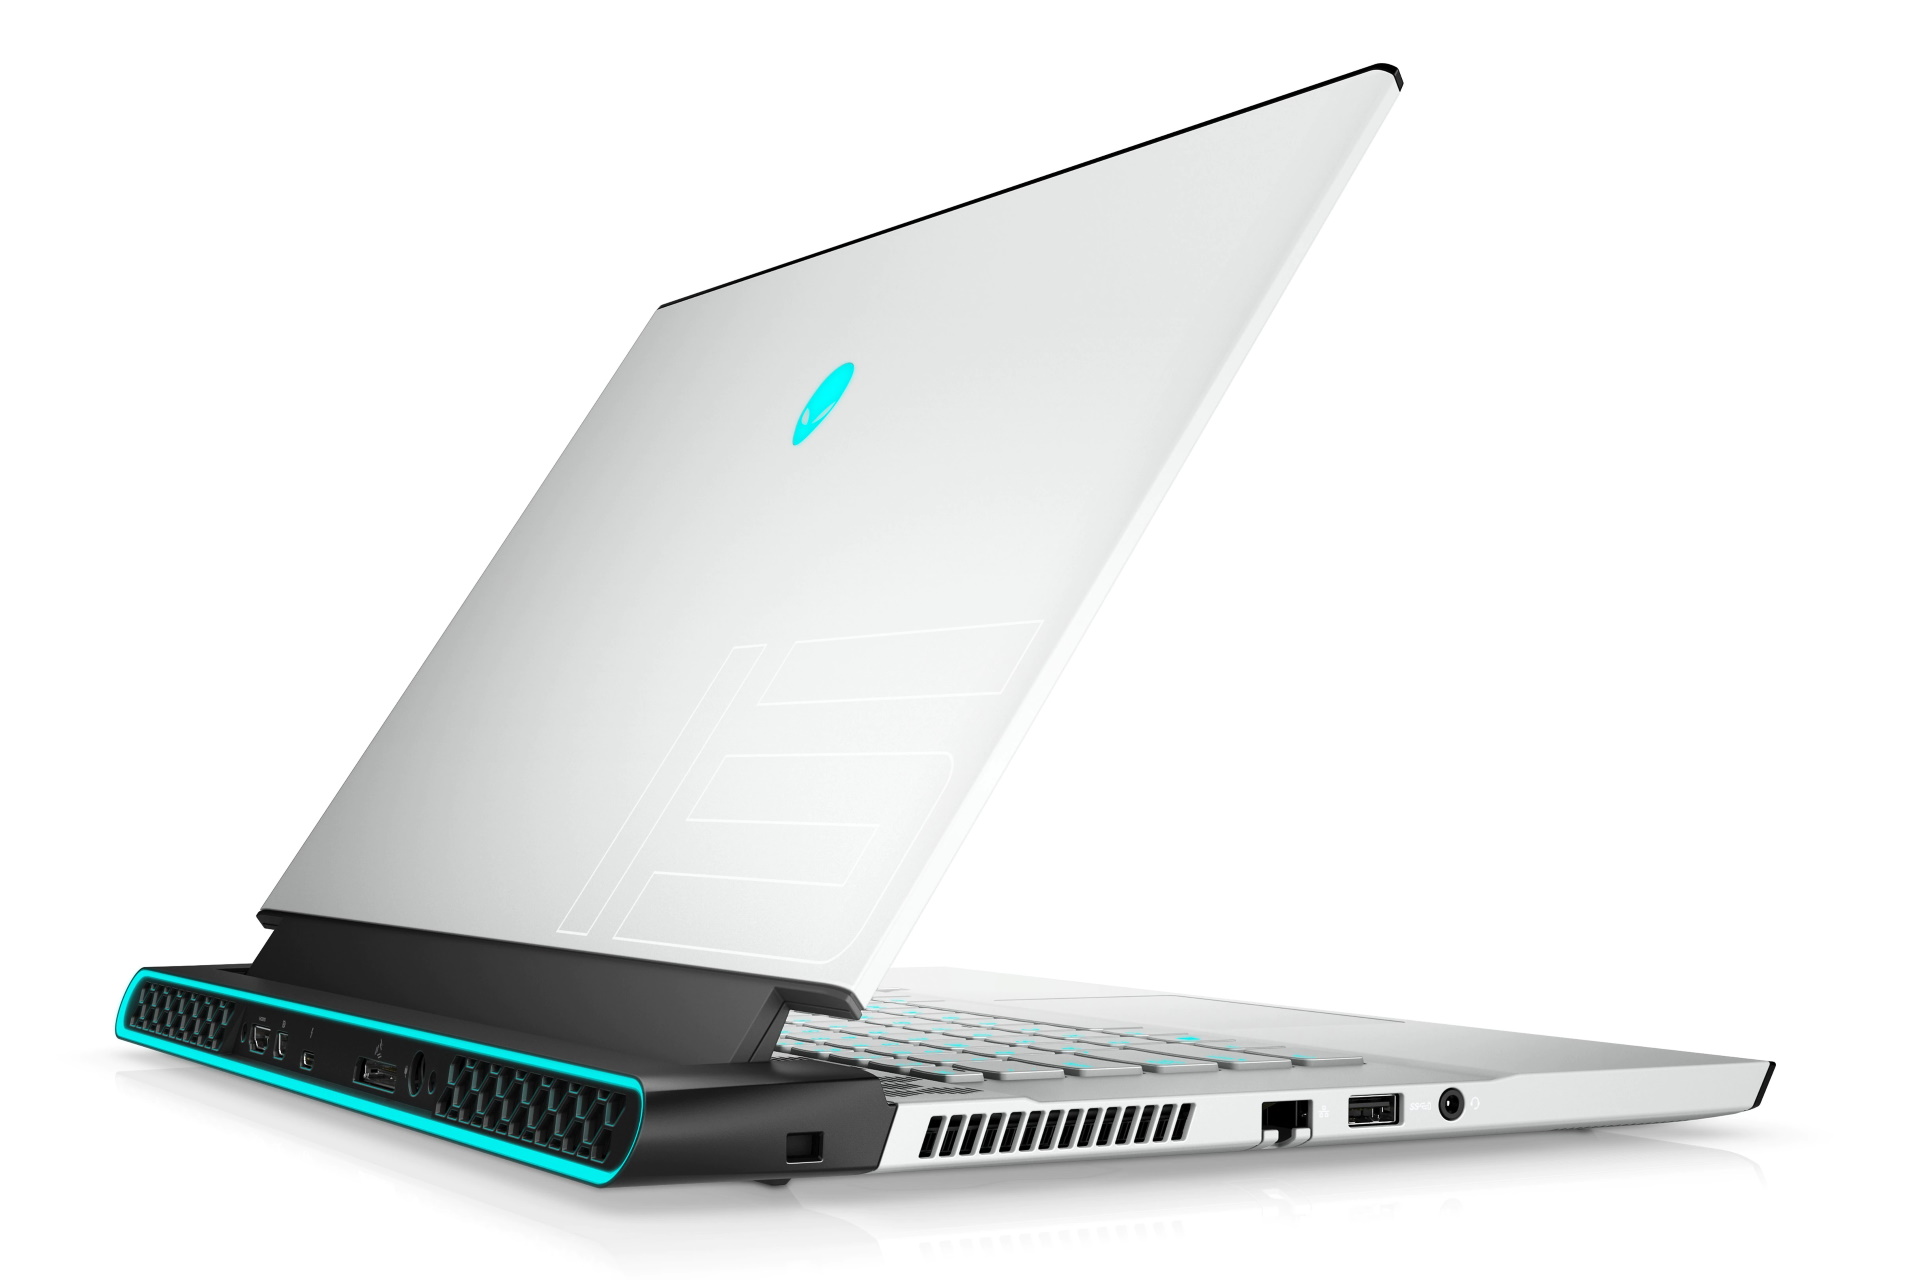
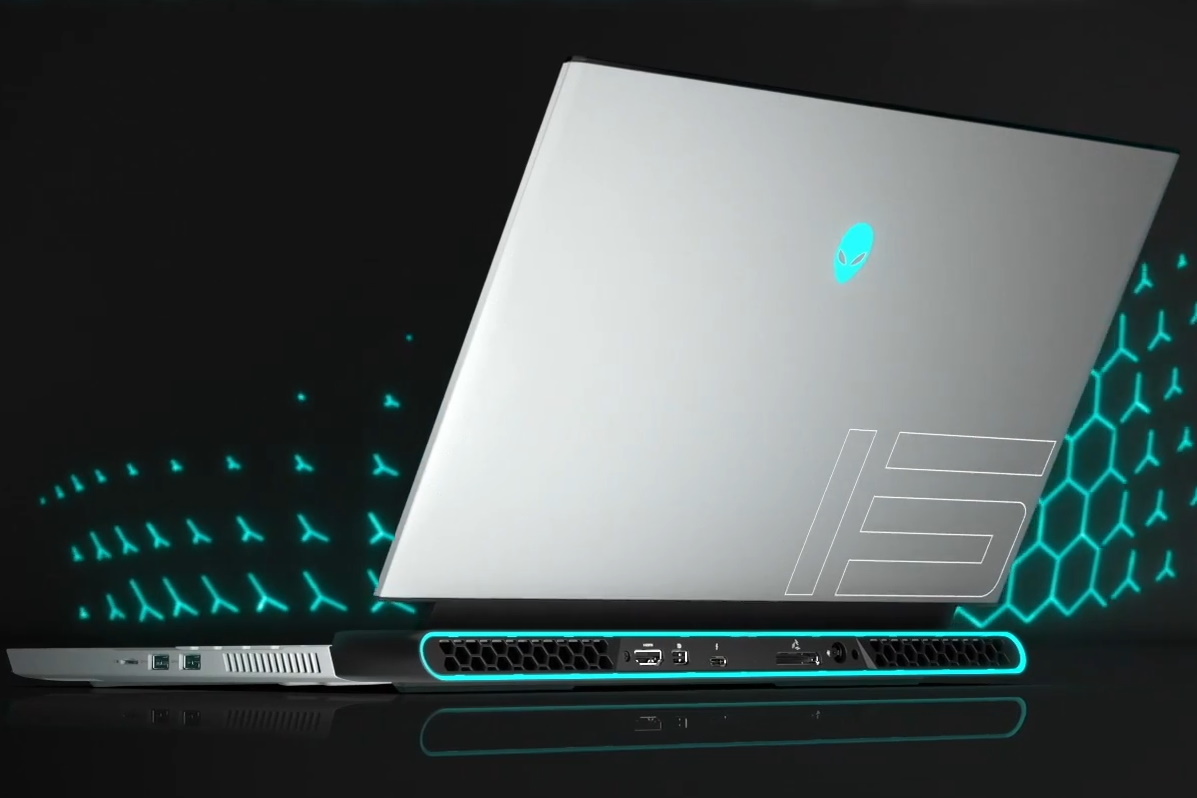
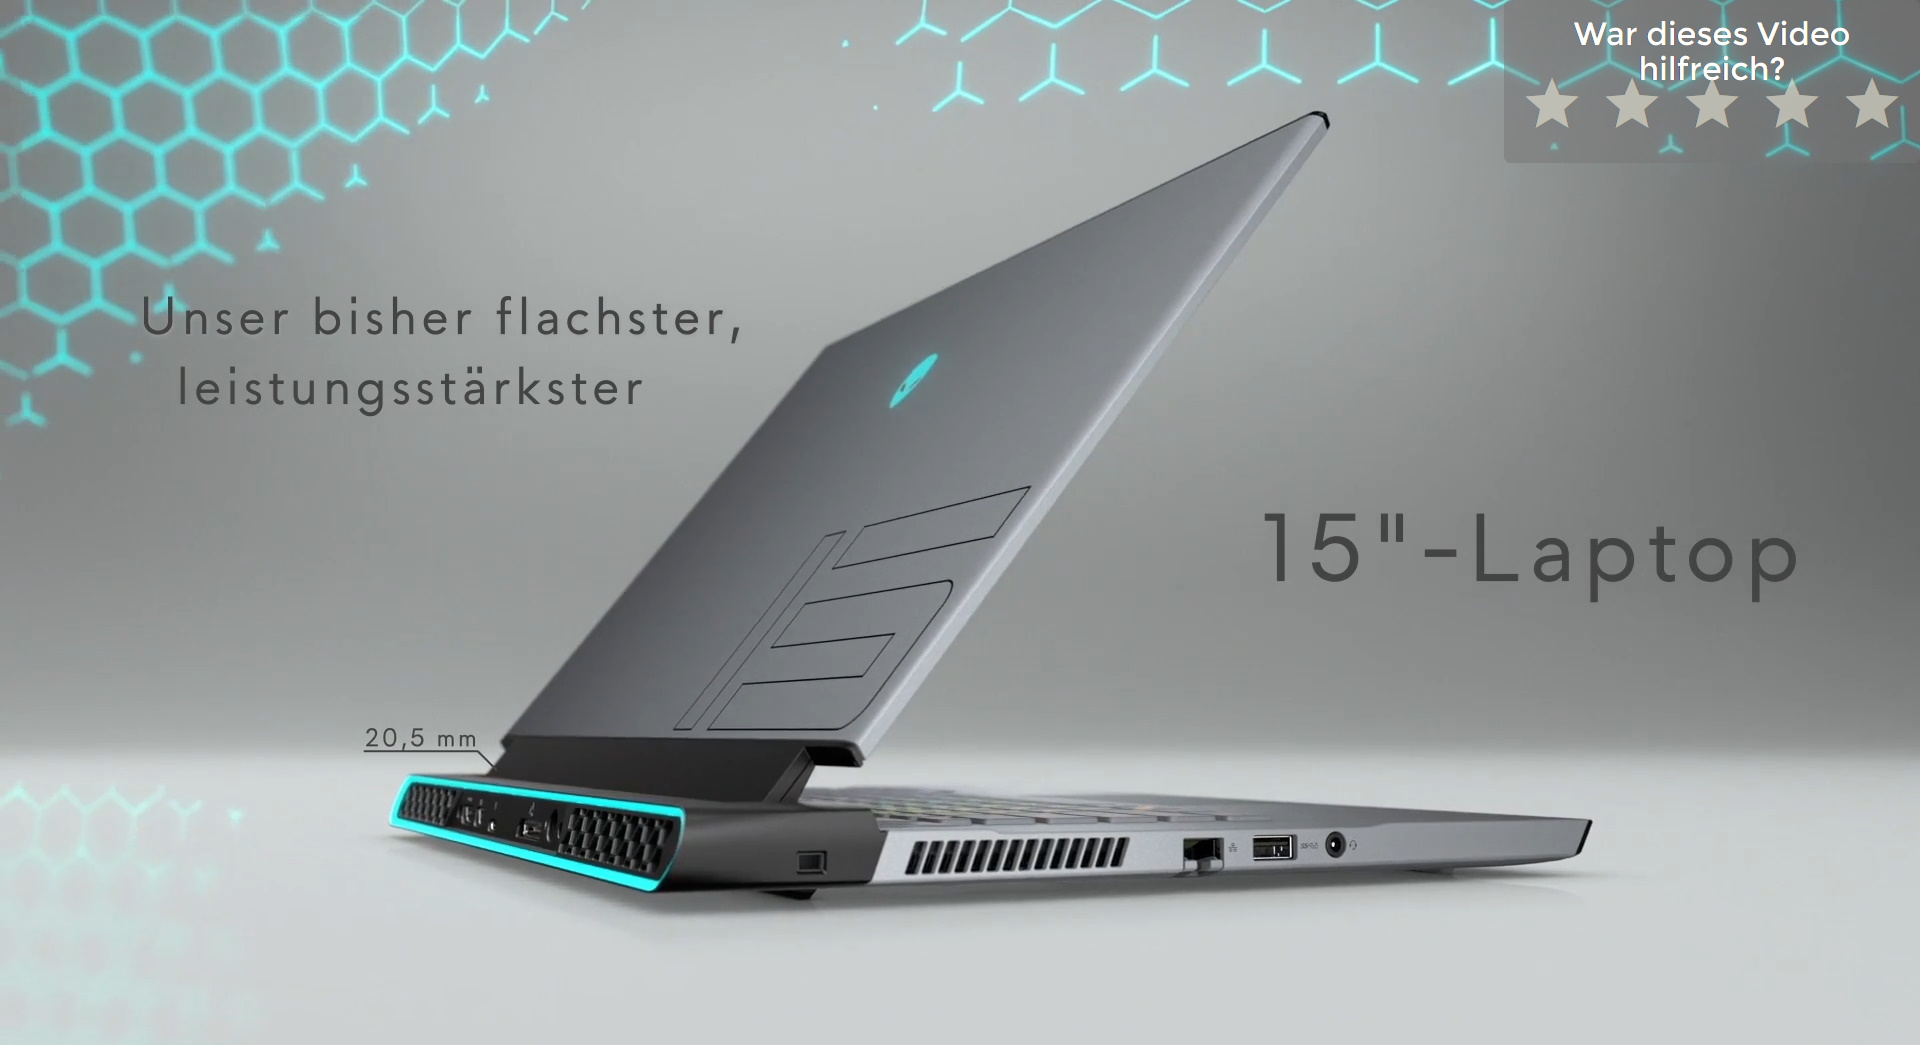
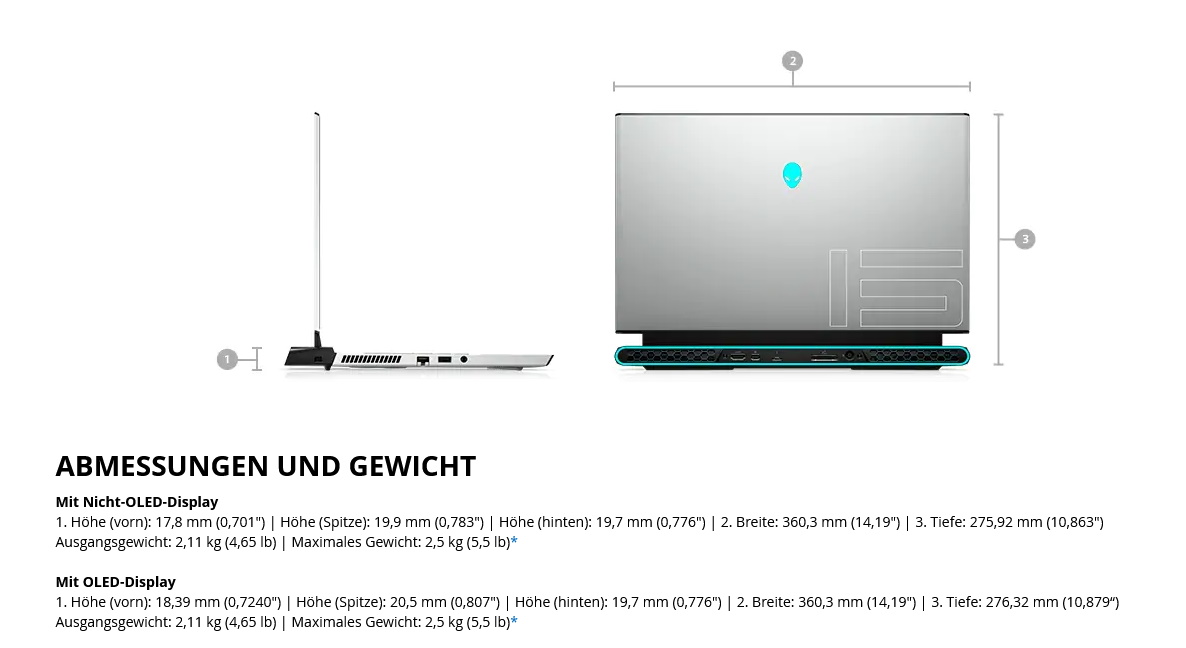
Due to its very special air vents, which protrude beyond the display at the rear end of the laptop, the device has significantly more depth than the competition, like most Alienware laptops. In terms of width and height, however, the m15 R4 is competitively small and thin.
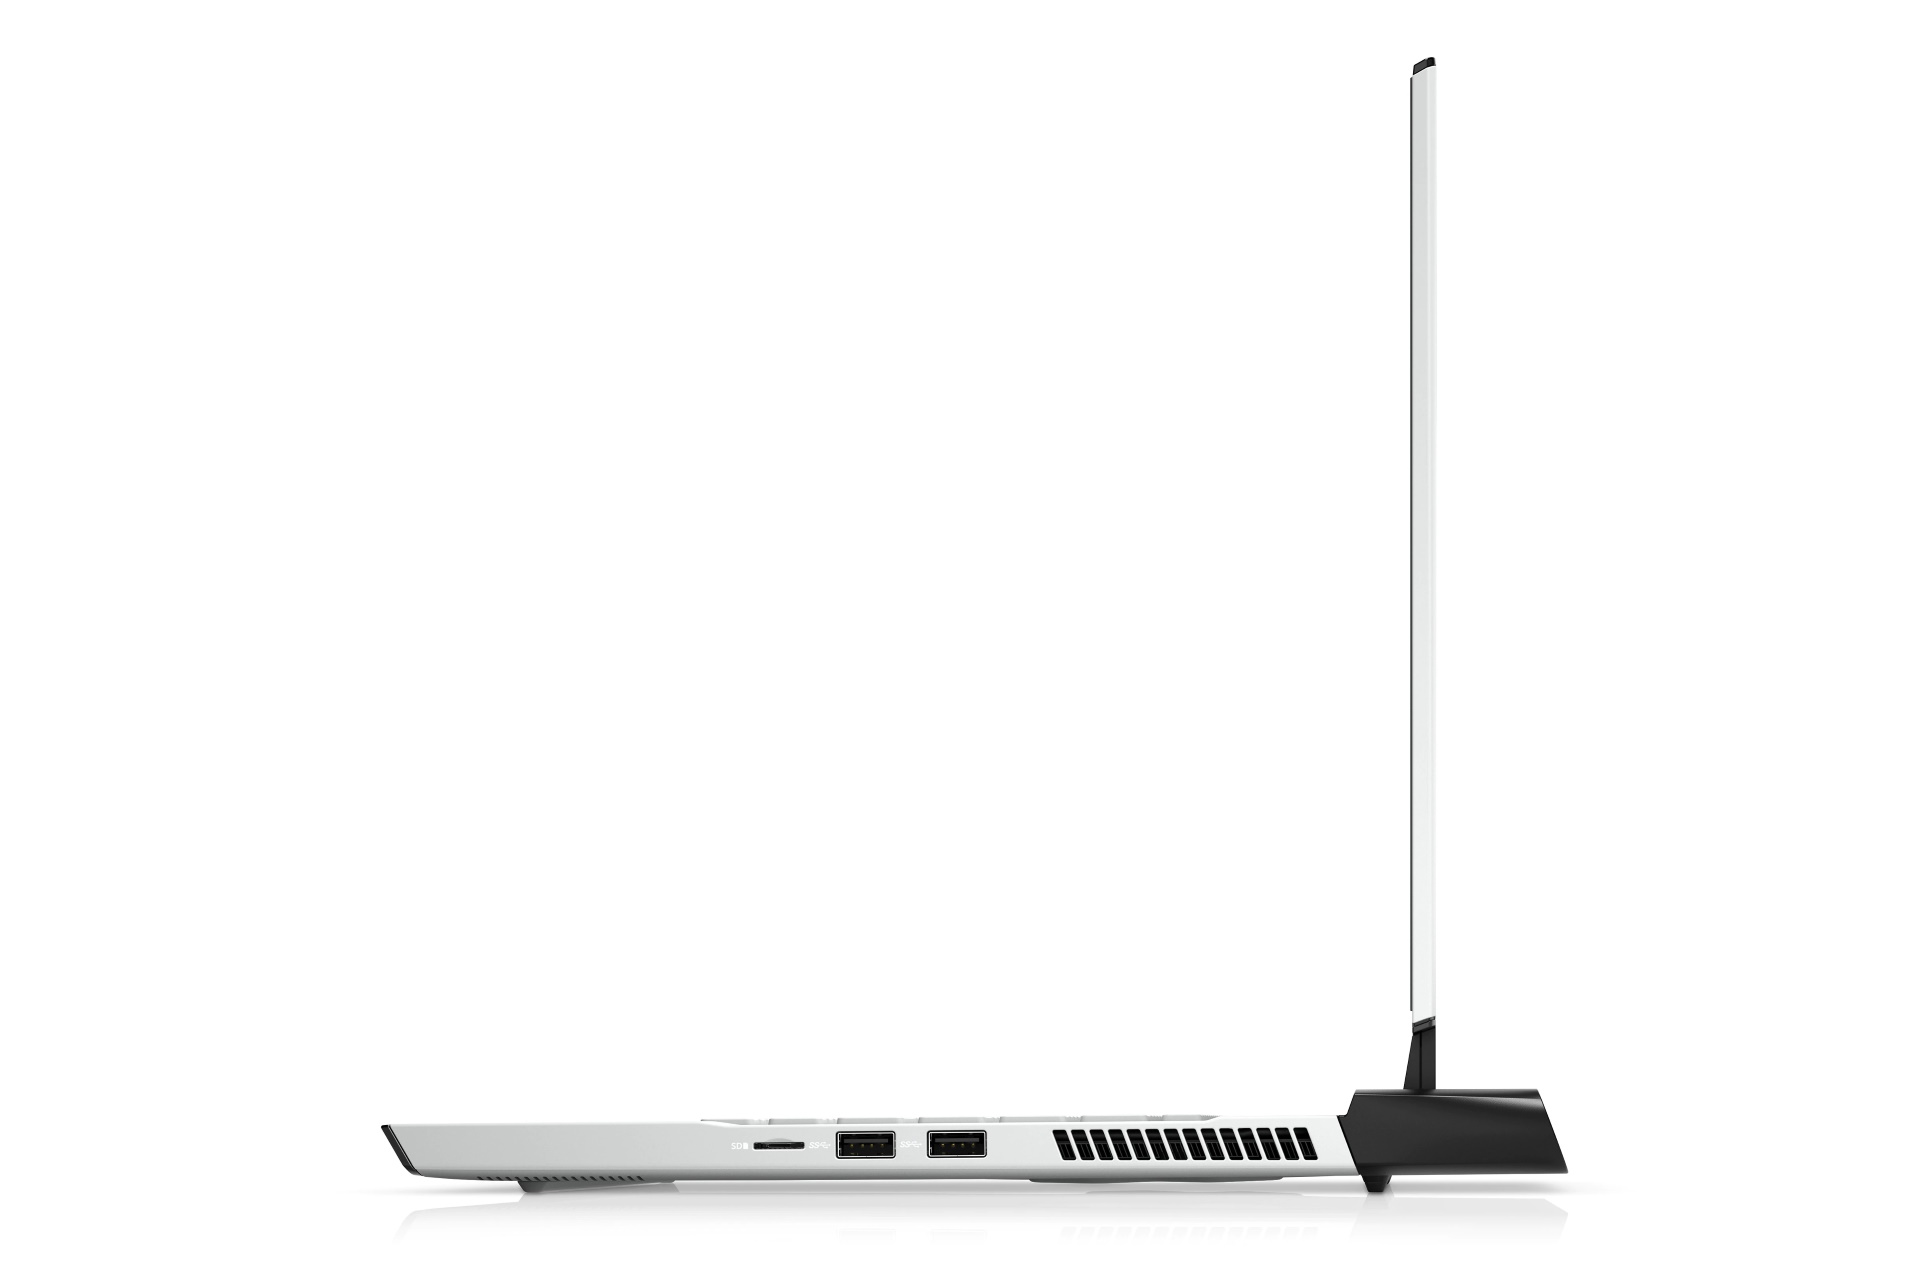
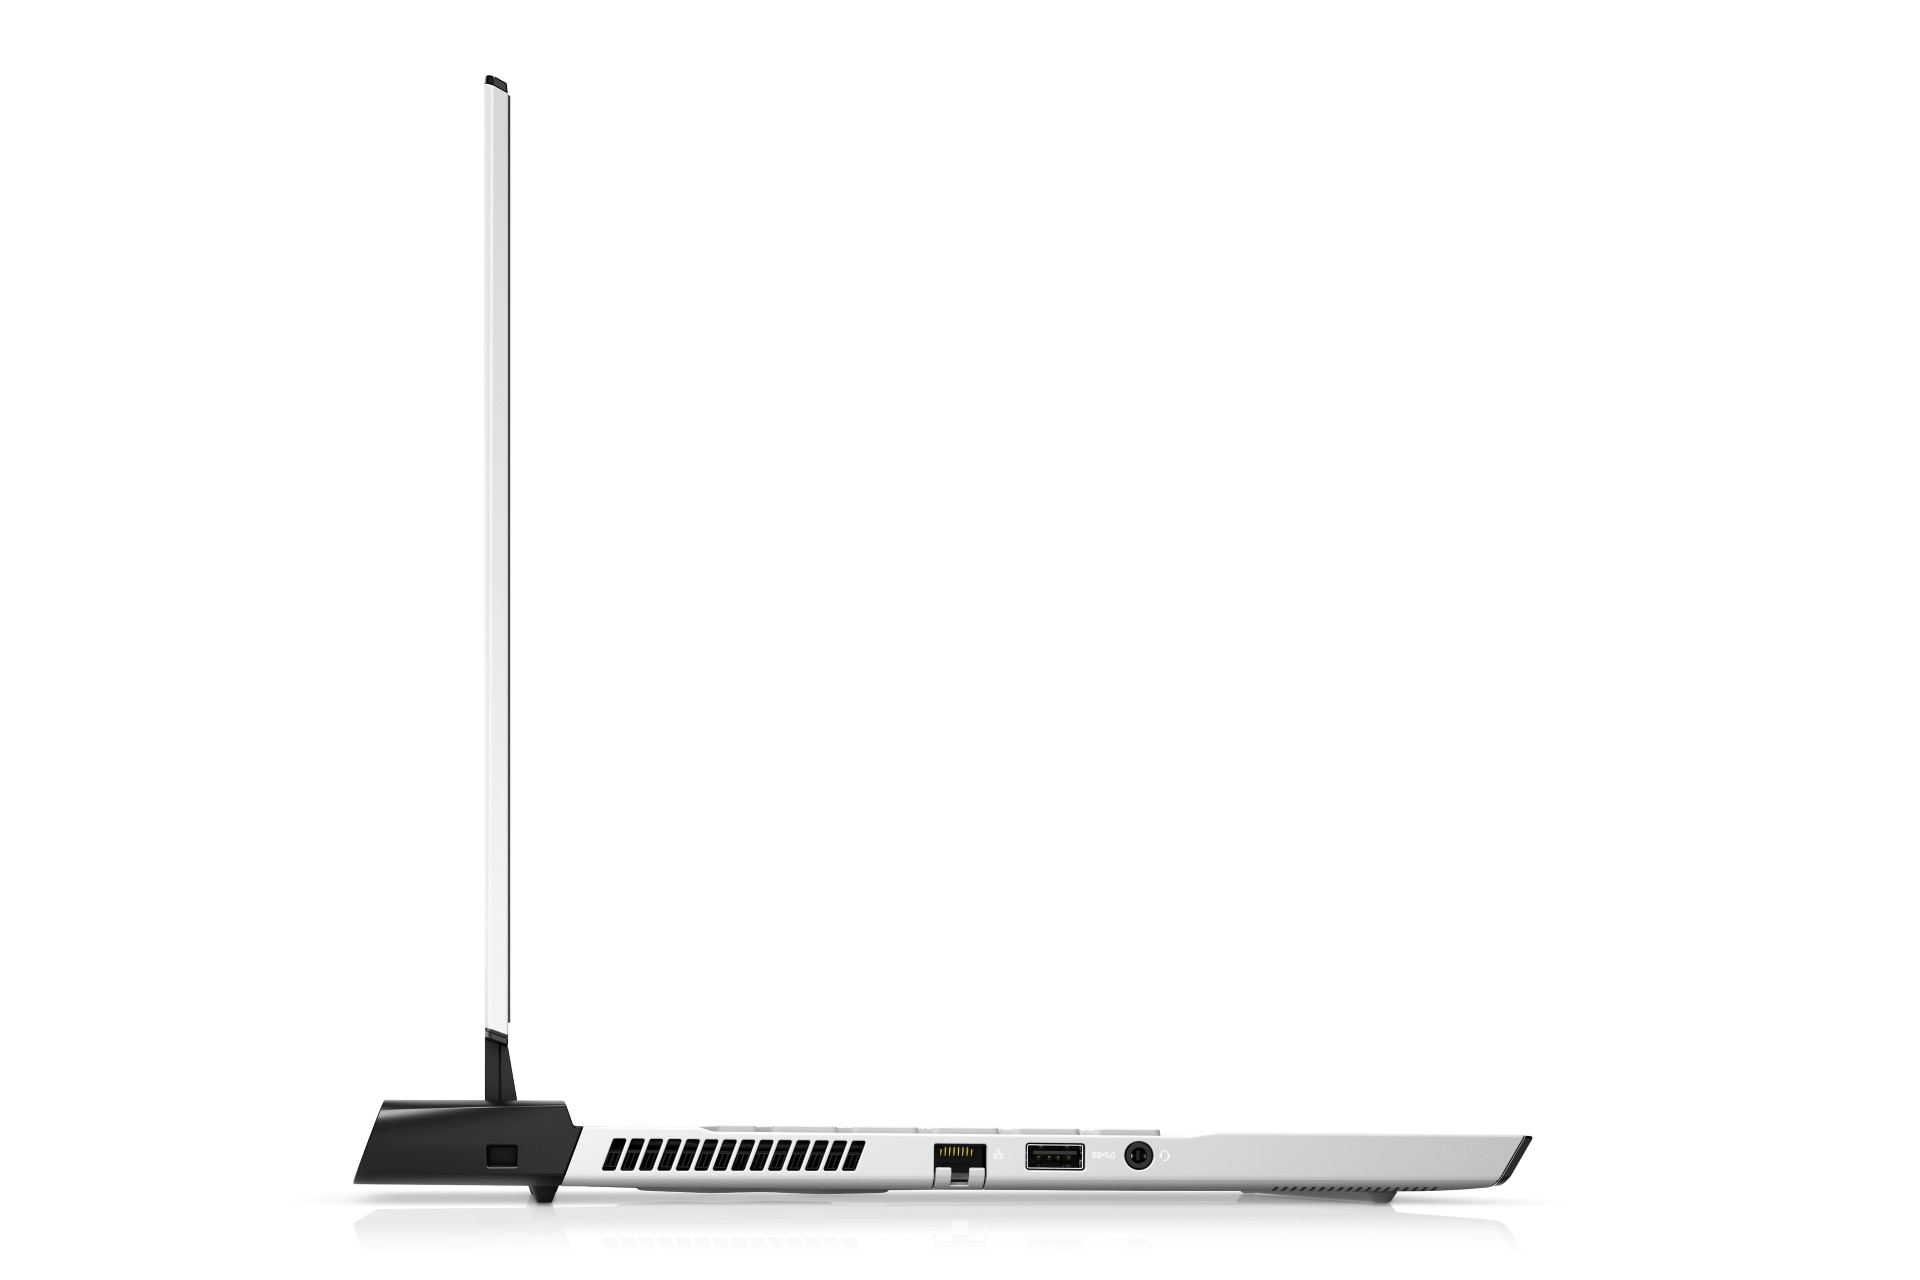
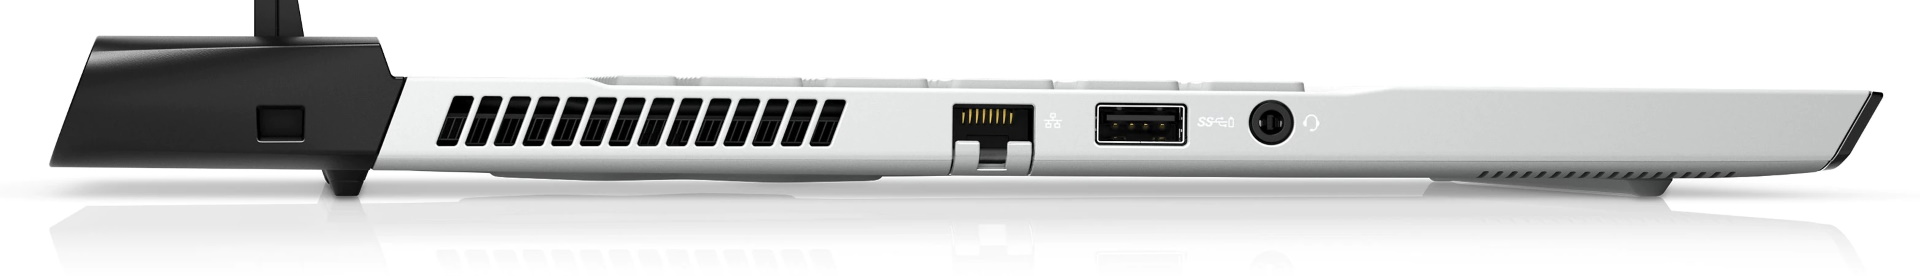
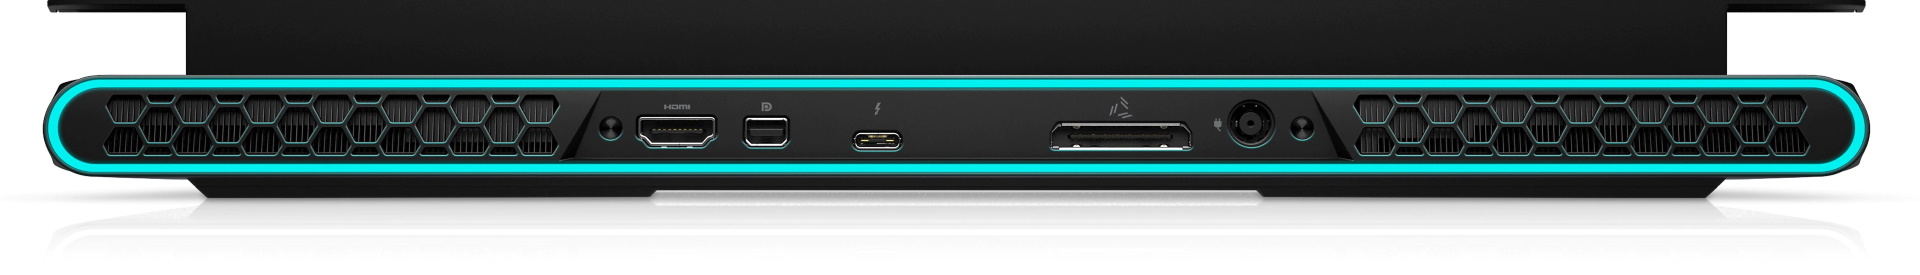
Connectivity - Thunderbolt 3 in the m15 R4
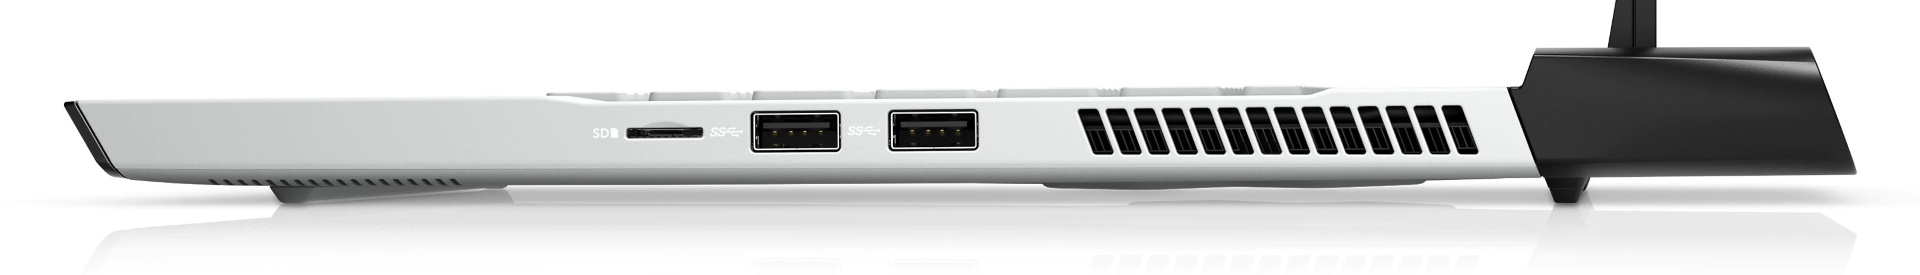
SD card reader
| SD Card Reader | |
| average JPG Copy Test (av. of 3 runs) | |
| Razer Blade 15 Advanced Model Early 2021 (AV PRO microSD 128 GB V60) | |
| Alienware m15 R4 (AV PRO microSD 128 GB V60) | |
| Alienware m15 R3 P87F (Toshiba Exceria Pro M501 UHS-II) | |
| Alienware m15 R4 RTX 3080 (AV PRO microSD 128 GB V60) | |
| Average of class Gaming (19 - 202, n=100, last 2 years) | |
| maximum AS SSD Seq Read Test (1GB) | |
| Alienware m15 R4 (AV PRO microSD 128 GB V60) | |
| Alienware m15 R3 P87F (Toshiba Exceria Pro M501 UHS-II) | |
| Alienware m15 R4 RTX 3080 (AV PRO microSD 128 GB V60) | |
| Razer Blade 15 Advanced Model Early 2021 (AV PRO microSD 128 GB V60) | |
| Average of class Gaming (25.8 - 269, n=94, last 2 years) | |
Communication
Webcam


")
")
Warranty
The manufacturer provides a 12-month warranty. Support extension is subject to additional costs; see below.
Input devices - The mechanical keyboard is able to convince
Keyboard
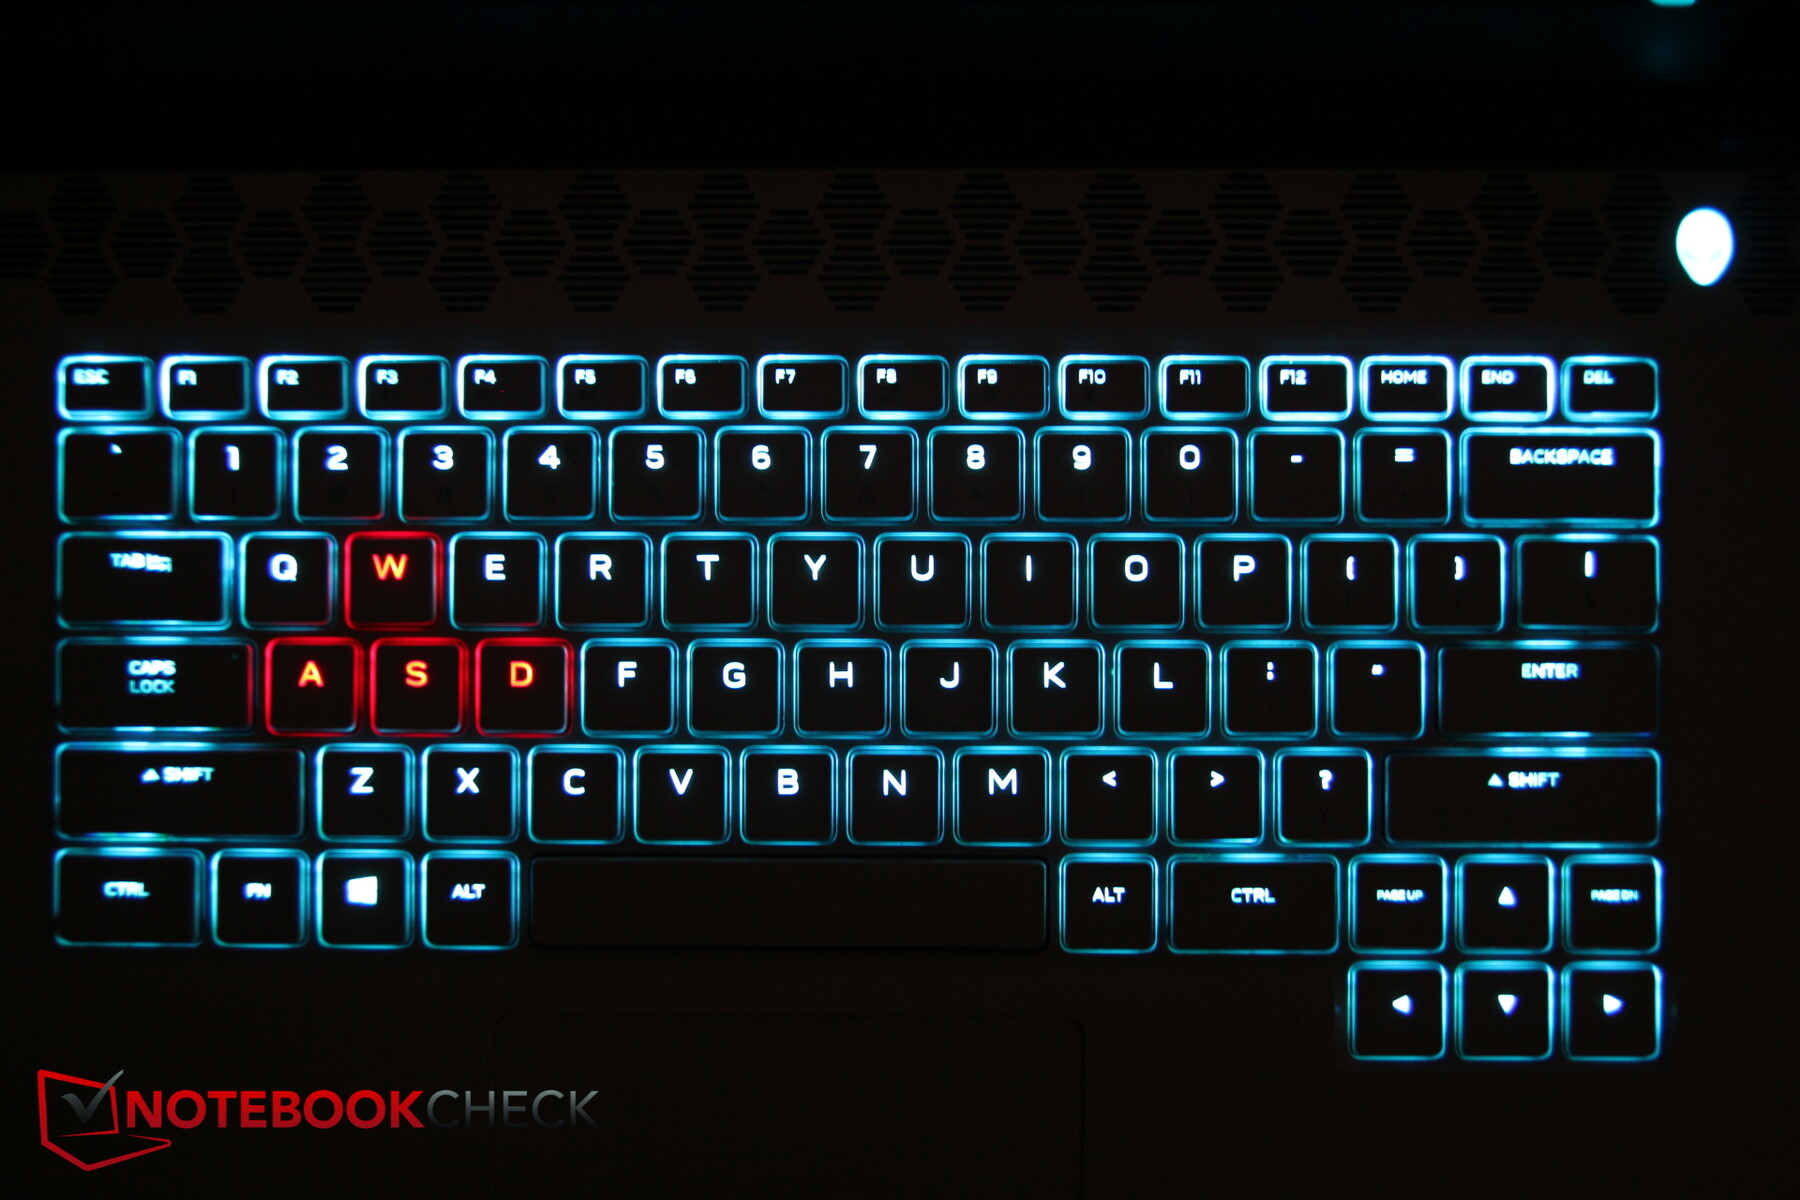
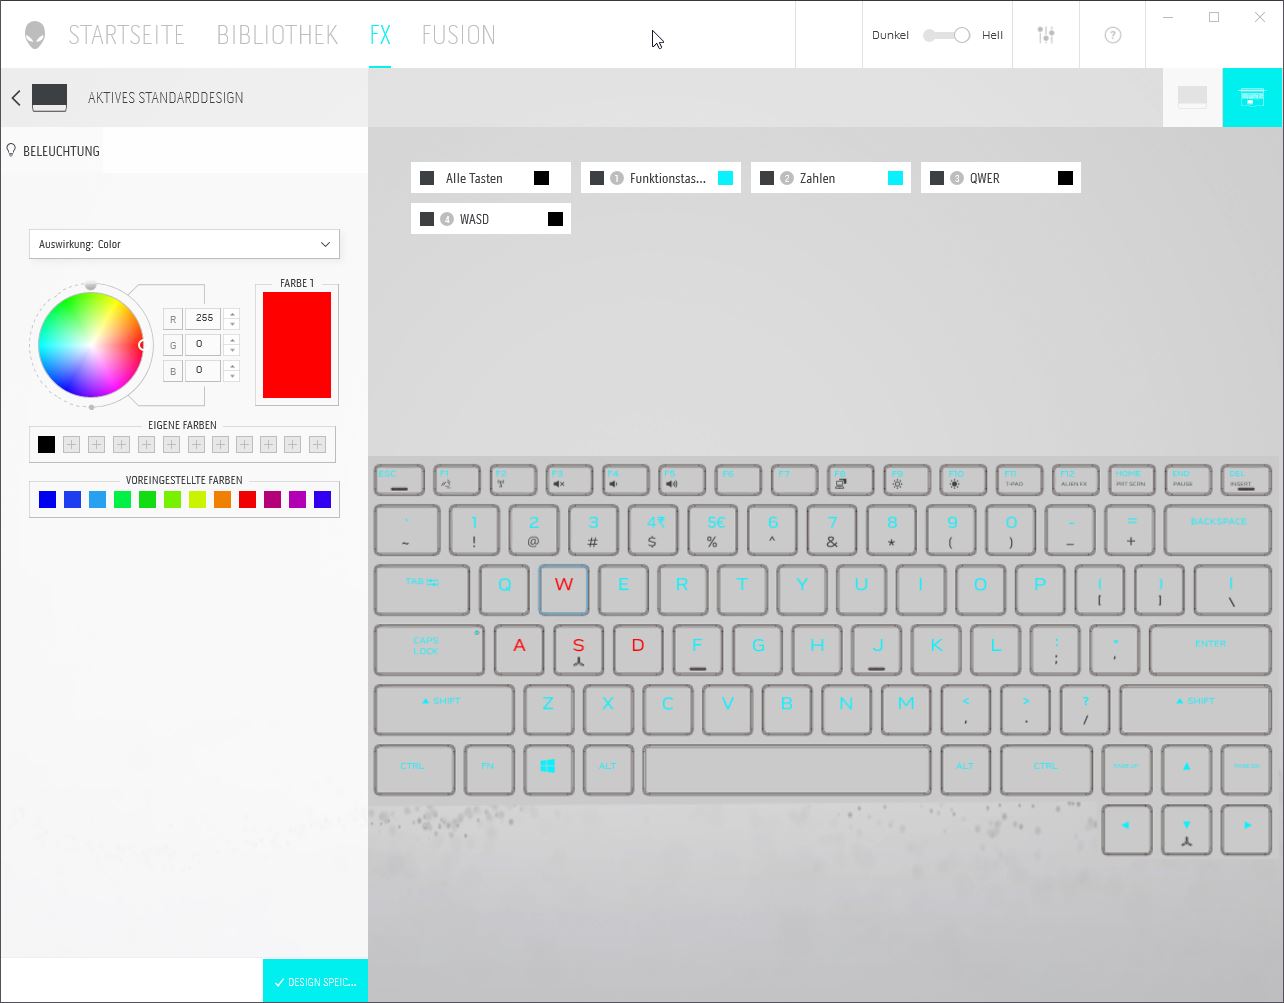
Unlike the sibling model with a "normal" chiclet keyboard, our test unit uses a mechanical keyboard, which is optionally available. However, it's not yet available on the German Alienware website, so we received a model with an English keyboard layout.
From a purely visual standpoint, however, you hardly notice a difference. The layout and design are completely unchanged compared to the normal keyboard, including the RGB lighting per key. It's only when typing that you notice significant differences. Feedback is considerably crisper than on the sibling model. The travel isn't particularly deep for a mechanical keyboard, but the typing experience is still very good, and it benefits from the pleasantly clear click feedback. However, it "clinks" and "clunks" when typing, so that entering text is considerably louder.
Furthermore, the upper row of keys, i.e. Esc, F keys, etc., doesn't seem to be mechanical; its keys feel much more muffled.

Touchpad
The touchpad isn't particularly large, but the mouse pointer can still be navigated well. The gliding capabilities of the pad's surface are also very good. It only gets a bit sluggish when it comes to extremely slow movements.
The integrated buttons are very hard, and you have to press them quite hard, but you get a good feedback after that. However, the click noise is also correspondingly quite loud.
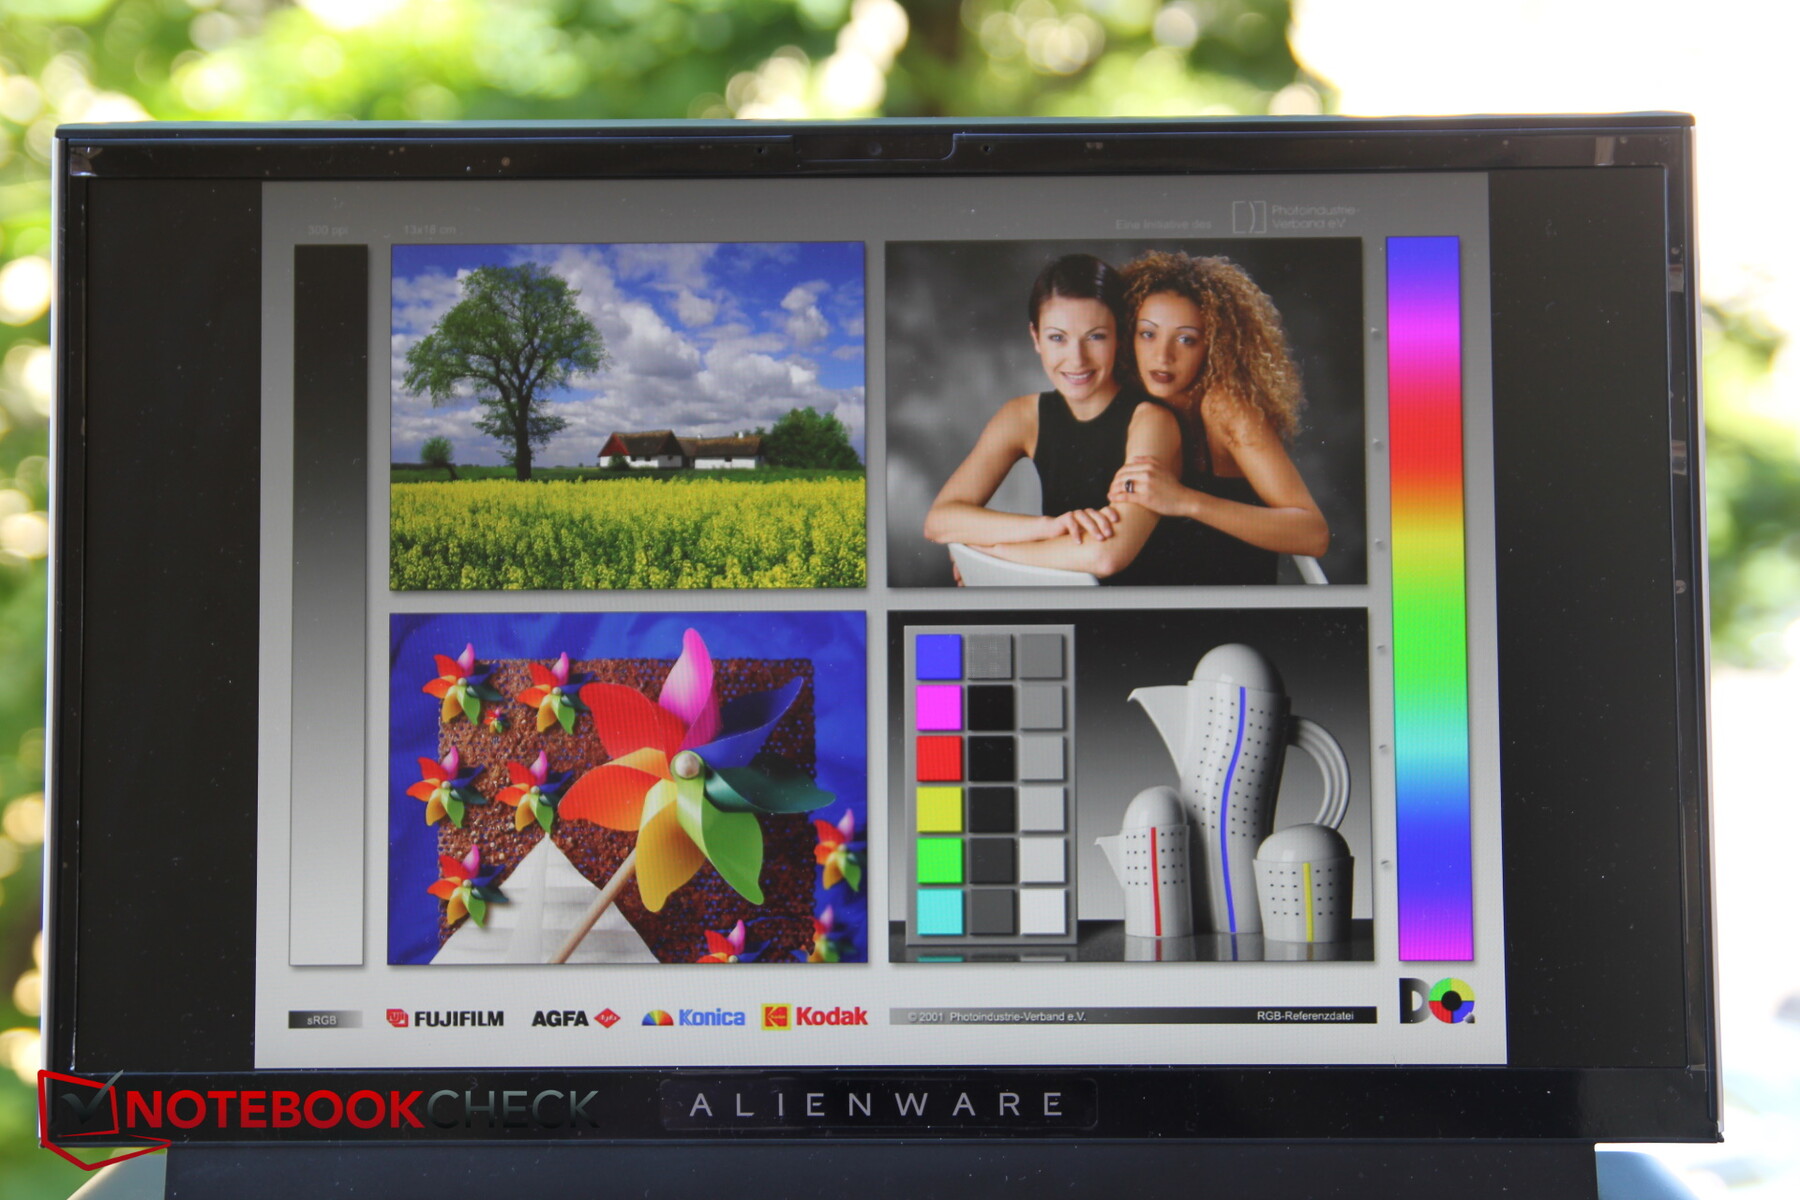
Display - 300 Hz and good values
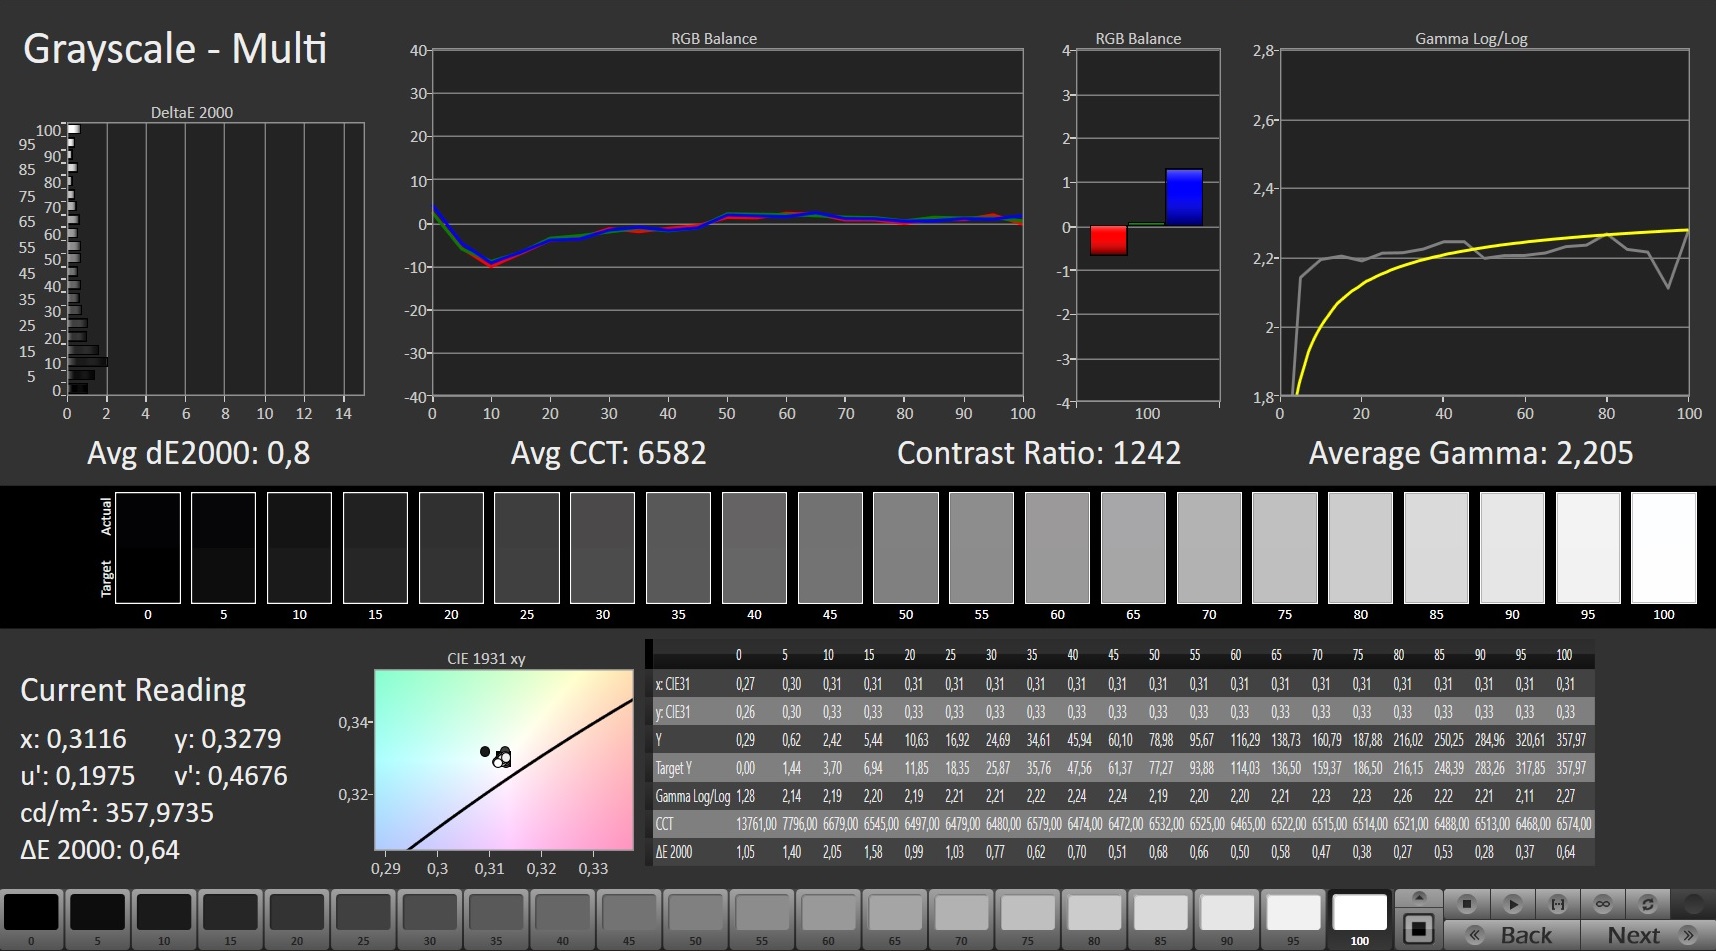
Unsurprisingly, the matte 15.6-inch Full HD IPS panel from LG Philips with a refresh rate of 300 Hz is exactly the same as the one in the sibling model that we already reviewed, so our measurements hardly differ. The brightness of just over 300 nits is on par with the competition, but its distribution could be a bit more uniform (86%).
Incidentally, Dell offers a total of three panels for the m15 R4. Besides this one, there is another Full HD IPS panel that "only" offers 144 Hz instead of 300 Hz and is supposed to be slightly slower (7 instead of 3 ms). The top choice is probably the more expensive 4K OLED version with higher color-space coverage, higher brightness (400 nits), and better contrasts. In return, however, you sacrifice the high refresh rate, which is 60 Hz in the 4K OLED panel. Furthermore, the IPS panel doesn't use PWM for brightness control.
Screen bleeding isn't particularly noticeable, but it's still minimally present, especially along the upper left edge.
| |||||||||||||||||||||||||
Brightness Distribution: 86 %
Center on Battery: 347 cd/m²
Contrast: 1119:1 (Black: 0.31 cd/m²)
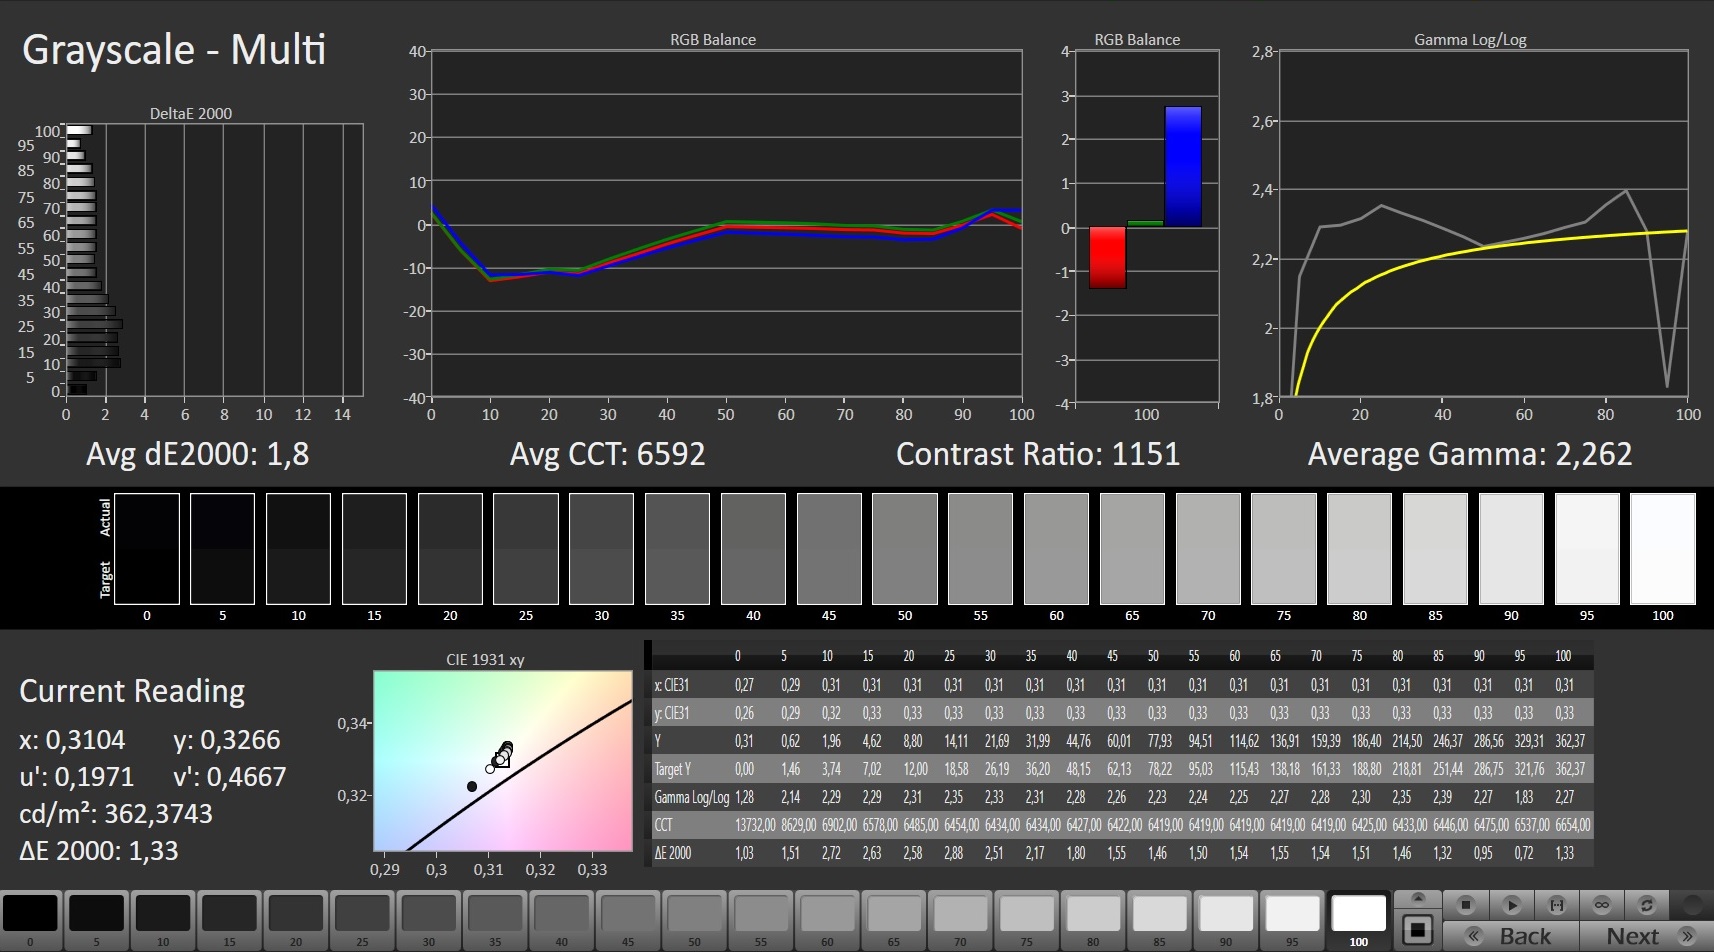
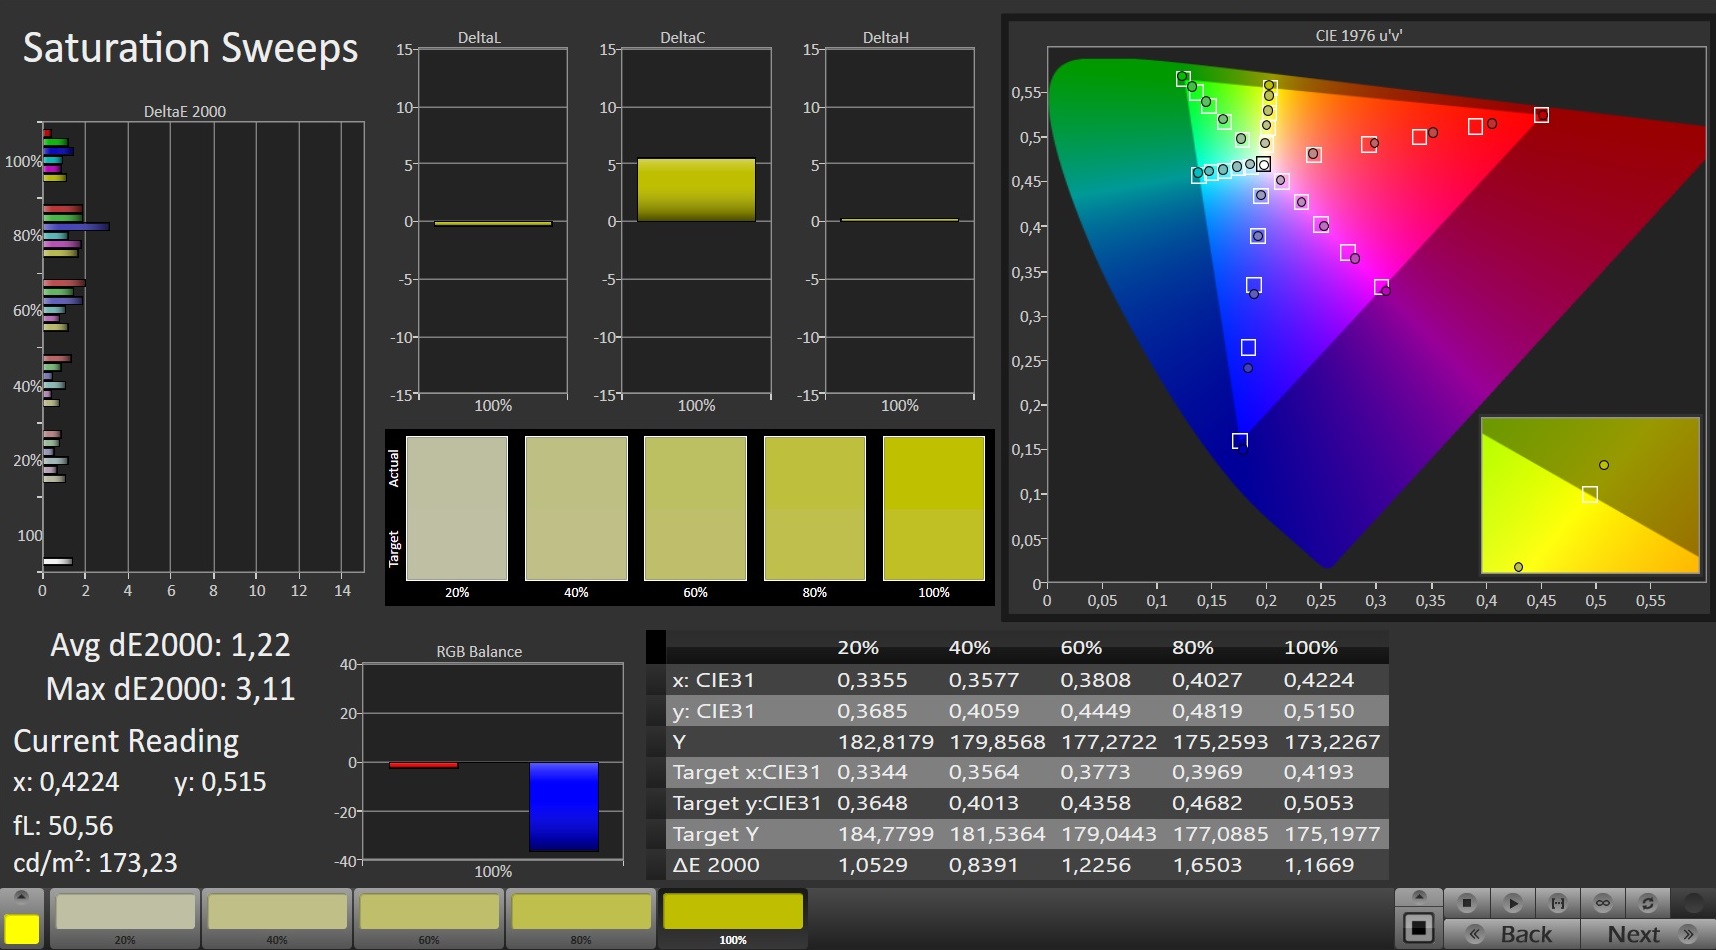
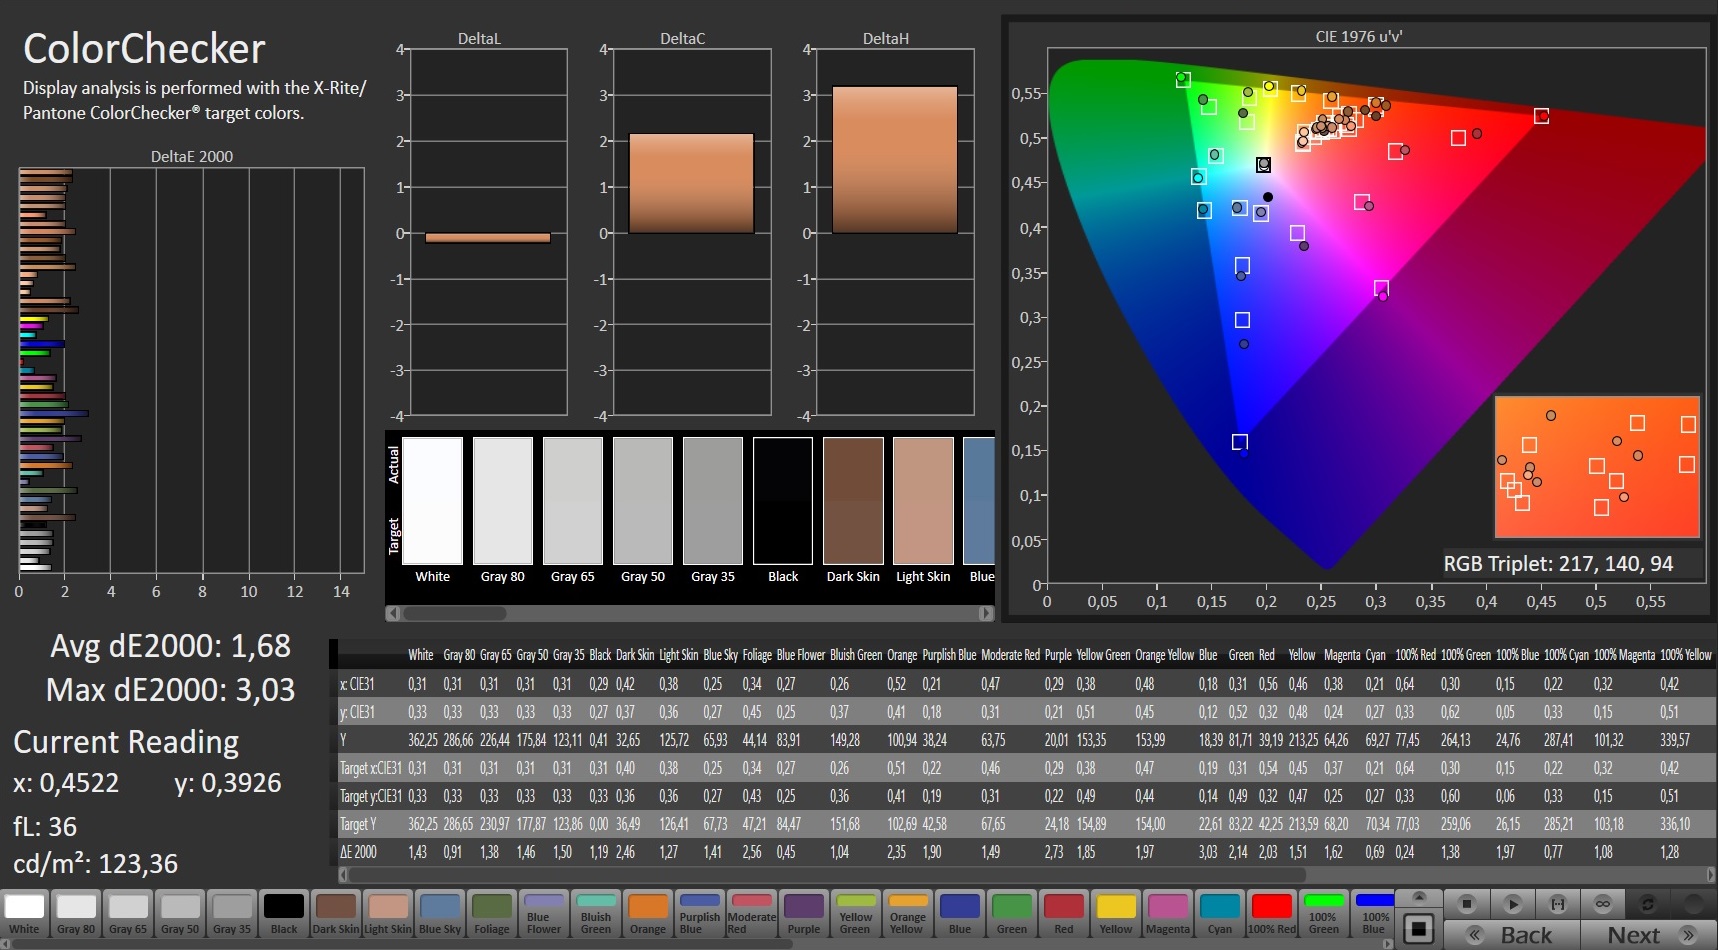
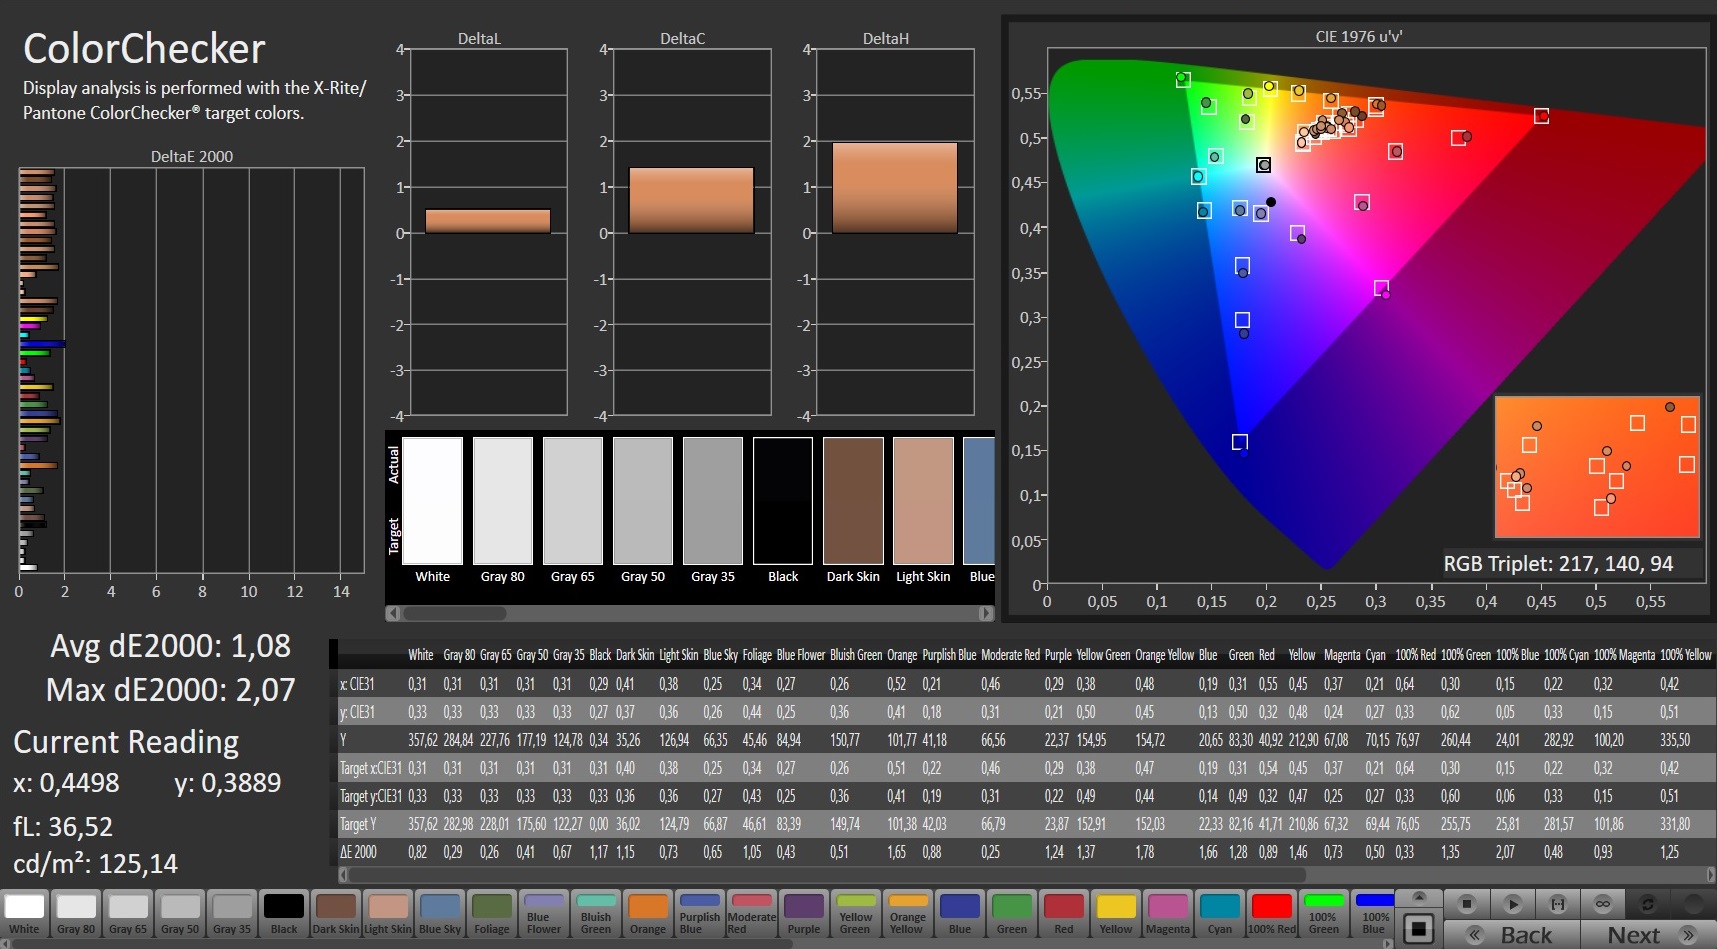
ΔE Color 1.68 | 0.5-29.43 Ø5, calibrated: 1.08
ΔE Greyscale 1.8 | 0.57-98 Ø5.3
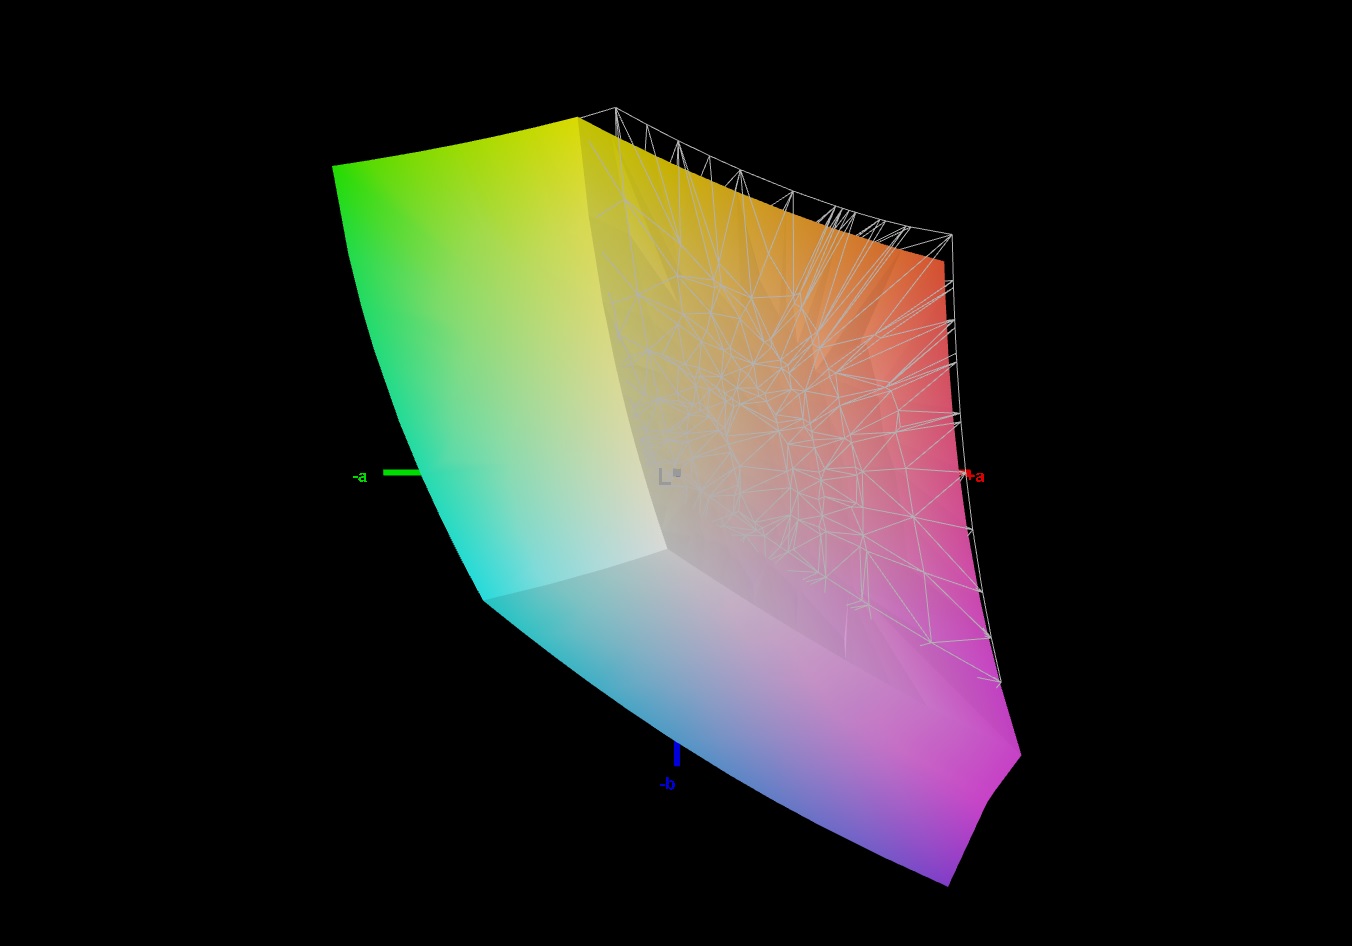
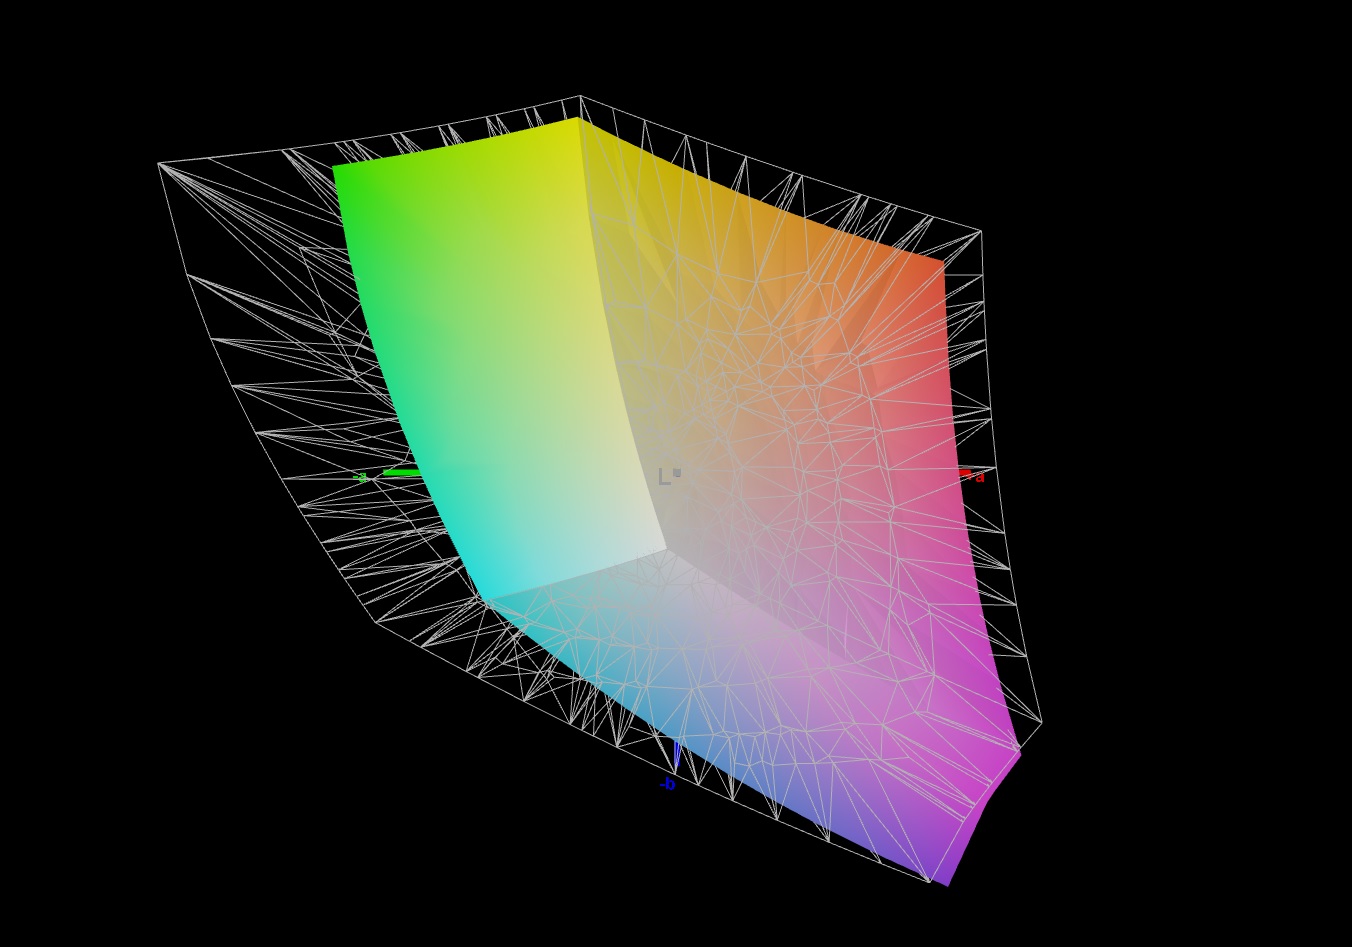
94% sRGB (Argyll 1.6.3 3D)
71% AdobeRGB 1998 (Argyll 1.6.3 3D)
71.5% AdobeRGB 1998 (Argyll 2.2.0 3D)
99.8% sRGB (Argyll 2.2.0 3D)
70.1% Display P3 (Argyll 2.2.0 3D)
Gamma: 2.262
| Alienware m15 R4 RTX 3080 LG Philips LGD066E (156WFG), IPS, 1920x1080, 15.60 | Alienware m15 R4 LG Philips LGD066E, IPS, 1920x1080, 15.60 | Alienware m15 R3 P87F AU Optronics B156HAN, IPS, 1920x1080, 15.60 | Razer Blade 15 Advanced Model Early 2021 TL156VDXP02-0, IPS, 1920x1080, 15.60 | Asus ROG Zephyrus G15 GA503Q CMN N156KME-GNA (CMN152A), IPS-Level, 2560x1440, 15.60 | SCHENKER XMG Pro 15 (Early 2021, RTX 3080) AU Optronics AUO7A8C (B156HAN12.0), IPS, 1920x1080, 15.60 | |
|---|---|---|---|---|---|---|
| Display | -1% | -2% | -5% | 20% | -1% | |
| Display P3 Coverage | 70.1 | 69.4 -1% | 68.6 -2% | 65.9 -6% | 97.3 39% | 69.2 -1% |
| sRGB Coverage | 99.8 | 99 -1% | 98.9 -1% | 96.4 -3% | 99.9 0% | 99.7 0% |
| AdobeRGB 1998 Coverage | 71.5 | 70.5 -1% | 69.8 -2% | 68 -5% | 86.2 21% | 70.8 -1% |
| Response Times | -1% | 17% | -60% | -17% | 25% | |
| Response Time Grey 50% / Grey 80% * | 7.6 ? | 7.4 ? 3% | 4 ? 47% | 16 ? -111% | 8.8 ? -16% | 3.6 ? 53% |
| Response Time Black / White * | 9.6 ? | 10 ? -4% | 10.8 ? -13% | 10.4 ? -8% | 11.2 ? -17% | 10 ? -4% |
| PWM Frequency | ||||||
| Screen | -6% | -26% | 7% | -53% | -4% | |
| Brightness middle | 347 | 333 -4% | 326.7 -6% | 338 -3% | 327 -6% | 327 -6% |
| Brightness | 318 | 303 -5% | 316 -1% | 334 5% | 309 -3% | 335 5% |
| Brightness Distribution | 86 | 86 0% | 87 1% | 94 9% | 89 3% | 89 3% |
| Black Level * | 0.31 | 0.29 6% | 0.33 -6% | 0.24 23% | 0.33 -6% | 0.22 29% |
| Contrast | 1119 | 1148 3% | 990 -12% | 1408 26% | 991 -11% | 1486 33% |
| Colorchecker dE 2000 * | 1.68 | 1.8 -7% | 2.4 -43% | 1.39 17% | 4.49 -167% | 2.18 -30% |
| Colorchecker dE 2000 max. * | 3.03 | 4.49 -48% | 6.06 -100% | 3.31 -9% | 8.42 -178% | 4.24 -40% |
| Colorchecker dE 2000 calibrated * | 1.08 | 1.13 -5% | 1.51 -40% | 0.97 10% | 2.27 -110% | 1 7% |
| Greyscale dE 2000 * | 1.8 | 1.9 -6% | 3.2 -78% | 1.6 11% | 4.2 -133% | 2.6 -44% |
| Gamma | 2.262 97% | 2.265 97% | 2.13 103% | 2.291 96% | 2.173 101% | 2.123 104% |
| CCT | 6592 99% | 6840 95% | 7129 91% | 6626 98% | 7014 93% | 6815 95% |
| Color Space (Percent of AdobeRGB 1998) | 71 | 71 0% | 63.7 -10% | 68 -4% | 86 21% | 71 0% |
| Color Space (Percent of sRGB) | 94 | 93 -1% | 99.2 6% | 89 -5% | 99 5% | 93 -1% |
| Total Average (Program / Settings) | -3% /
-4% | -4% /
-16% | -19% /
-3% | -17% /
-35% | 7% /
0% |
* ... smaller is better
The black level and contrast aren't spectacular, but they're acceptable. The color space displayed is also impressive: sRGB is almost completely covered, and AdobeRGB is still covered by 71%. The 4K OLED option provides an additional color-space boost for creators.
The display is already well calibrated out of the box, but a manual calibration will bring the color deviations down a bit. The corresponding ICC file can be downloaded above.

Display Response Times
| ↔ Response Time Black to White | ||
|---|---|---|
| 9.6 ms ... rise ↗ and fall ↘ combined | ↗ 3.6 ms rise | 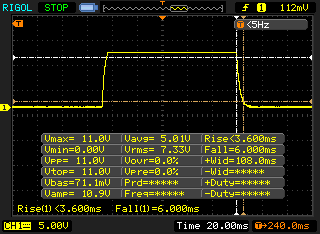 |
| ↘ 6 ms fall | ||
| The screen shows fast response rates in our tests and should be suited for gaming. In comparison, all tested devices range from 0.1 (minimum) to 240 (maximum) ms. » 21 % of all devices are better. This means that the measured response time is better than the average of all tested devices (21.5 ms). | ||
| ↔ Response Time 50% Grey to 80% Grey | ||
| 7.6 ms ... rise ↗ and fall ↘ combined | ↗ 2.4 ms rise | 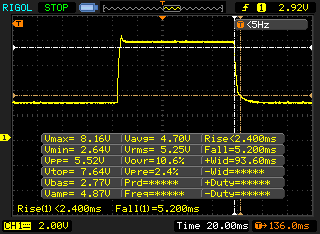 |
| ↘ 5.2 ms fall | ||
| The screen shows very fast response rates in our tests and should be very well suited for fast-paced gaming. In comparison, all tested devices range from 0.2 (minimum) to 636 (maximum) ms. » 15 % of all devices are better. This means that the measured response time is better than the average of all tested devices (33.7 ms). | ||
Screen Flickering / PWM (Pulse-Width Modulation)
| Screen flickering / PWM not detected | 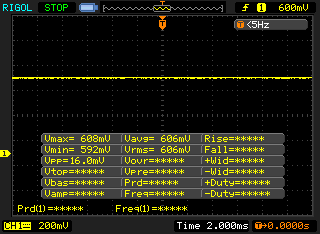 | ||
In comparison: 53 % of all tested devices do not use PWM to dim the display. If PWM was detected, an average of 17900 (minimum: 5 - maximum: 3846000) Hz was measured. | |||
Outdoor use is only possible to a limited extent due to the short runtimes (see the section on battery life), but the display doesn't pose an obstacle here. The matte surface eliminates most reflections, while brightness and contrast are sufficient to still be able to recognize the screen's content well, at least in places in the shade.
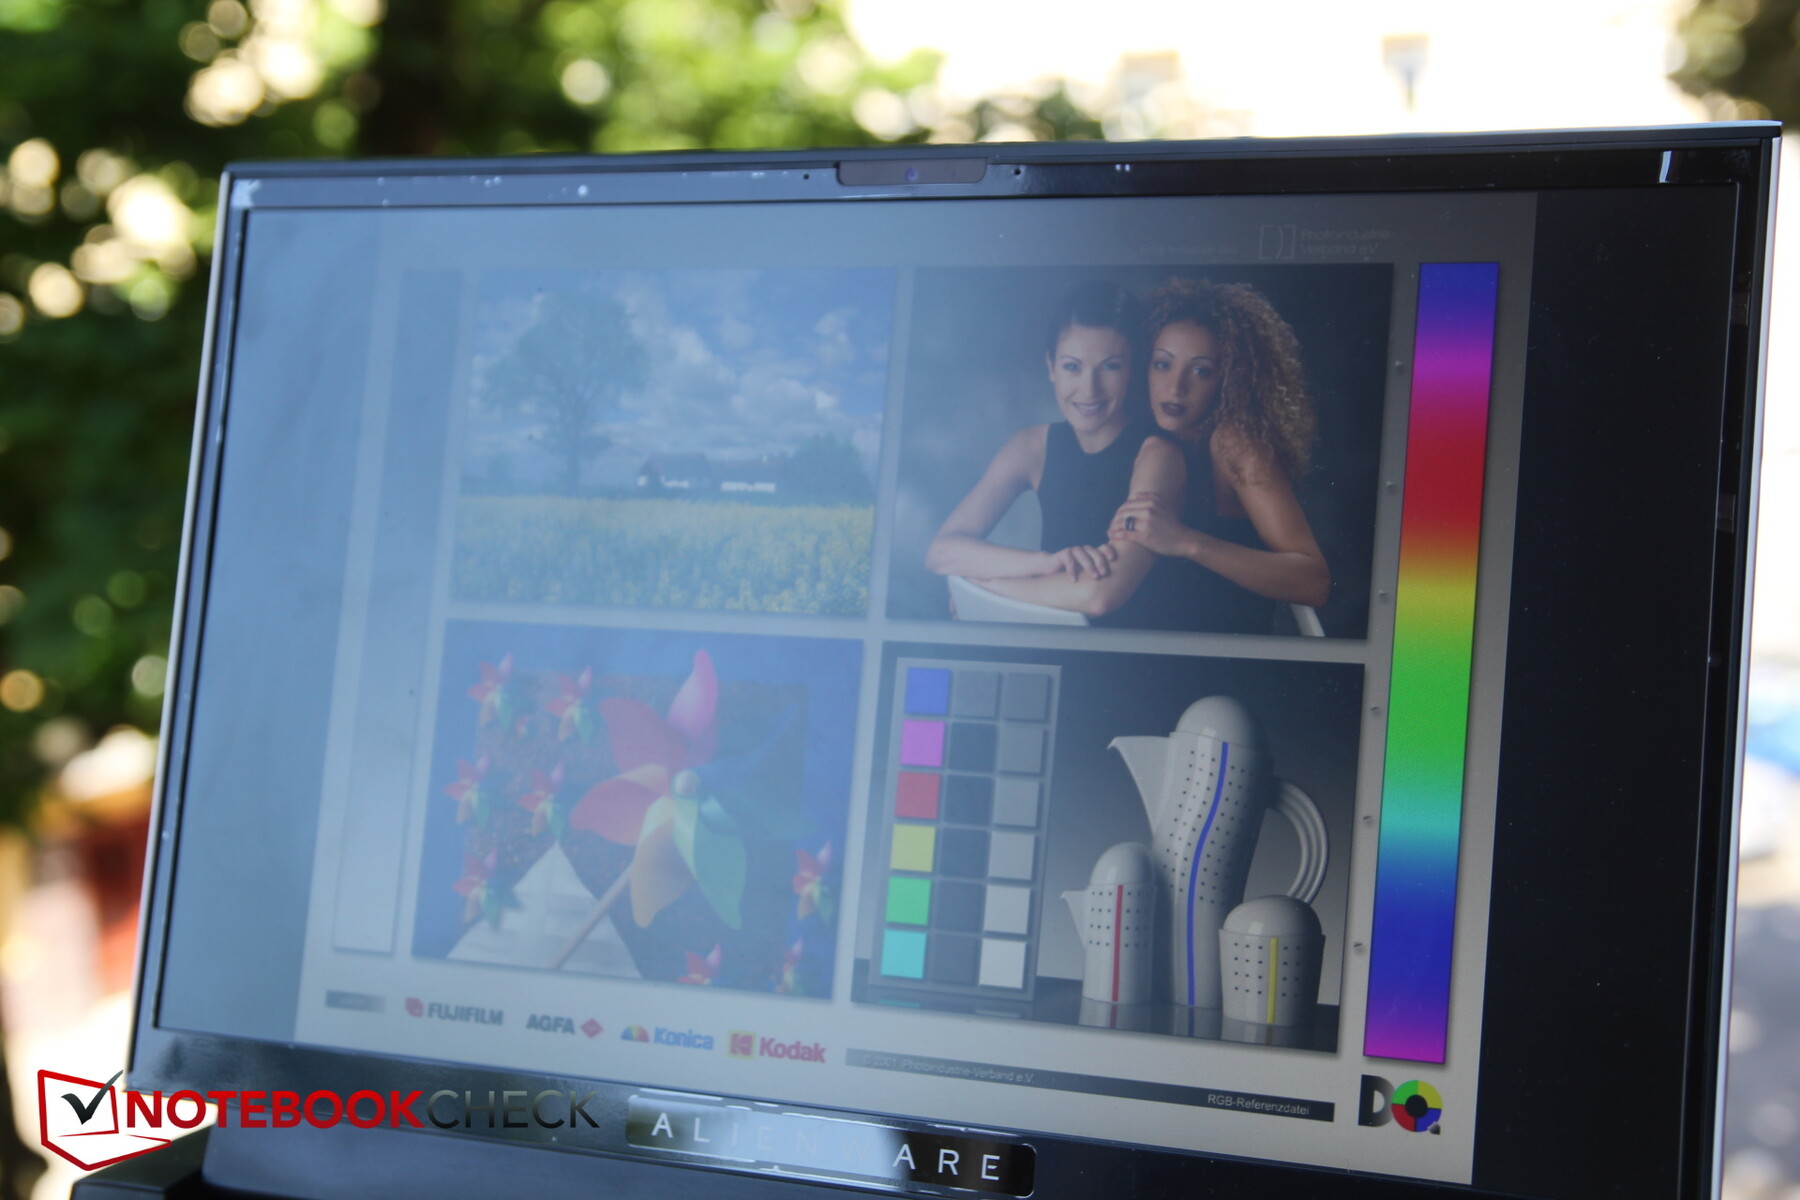
As is typical for IPS, the panel is quite viewing-angle stable. Extreme viewing angles are only accompanied by minor losses in image quality.

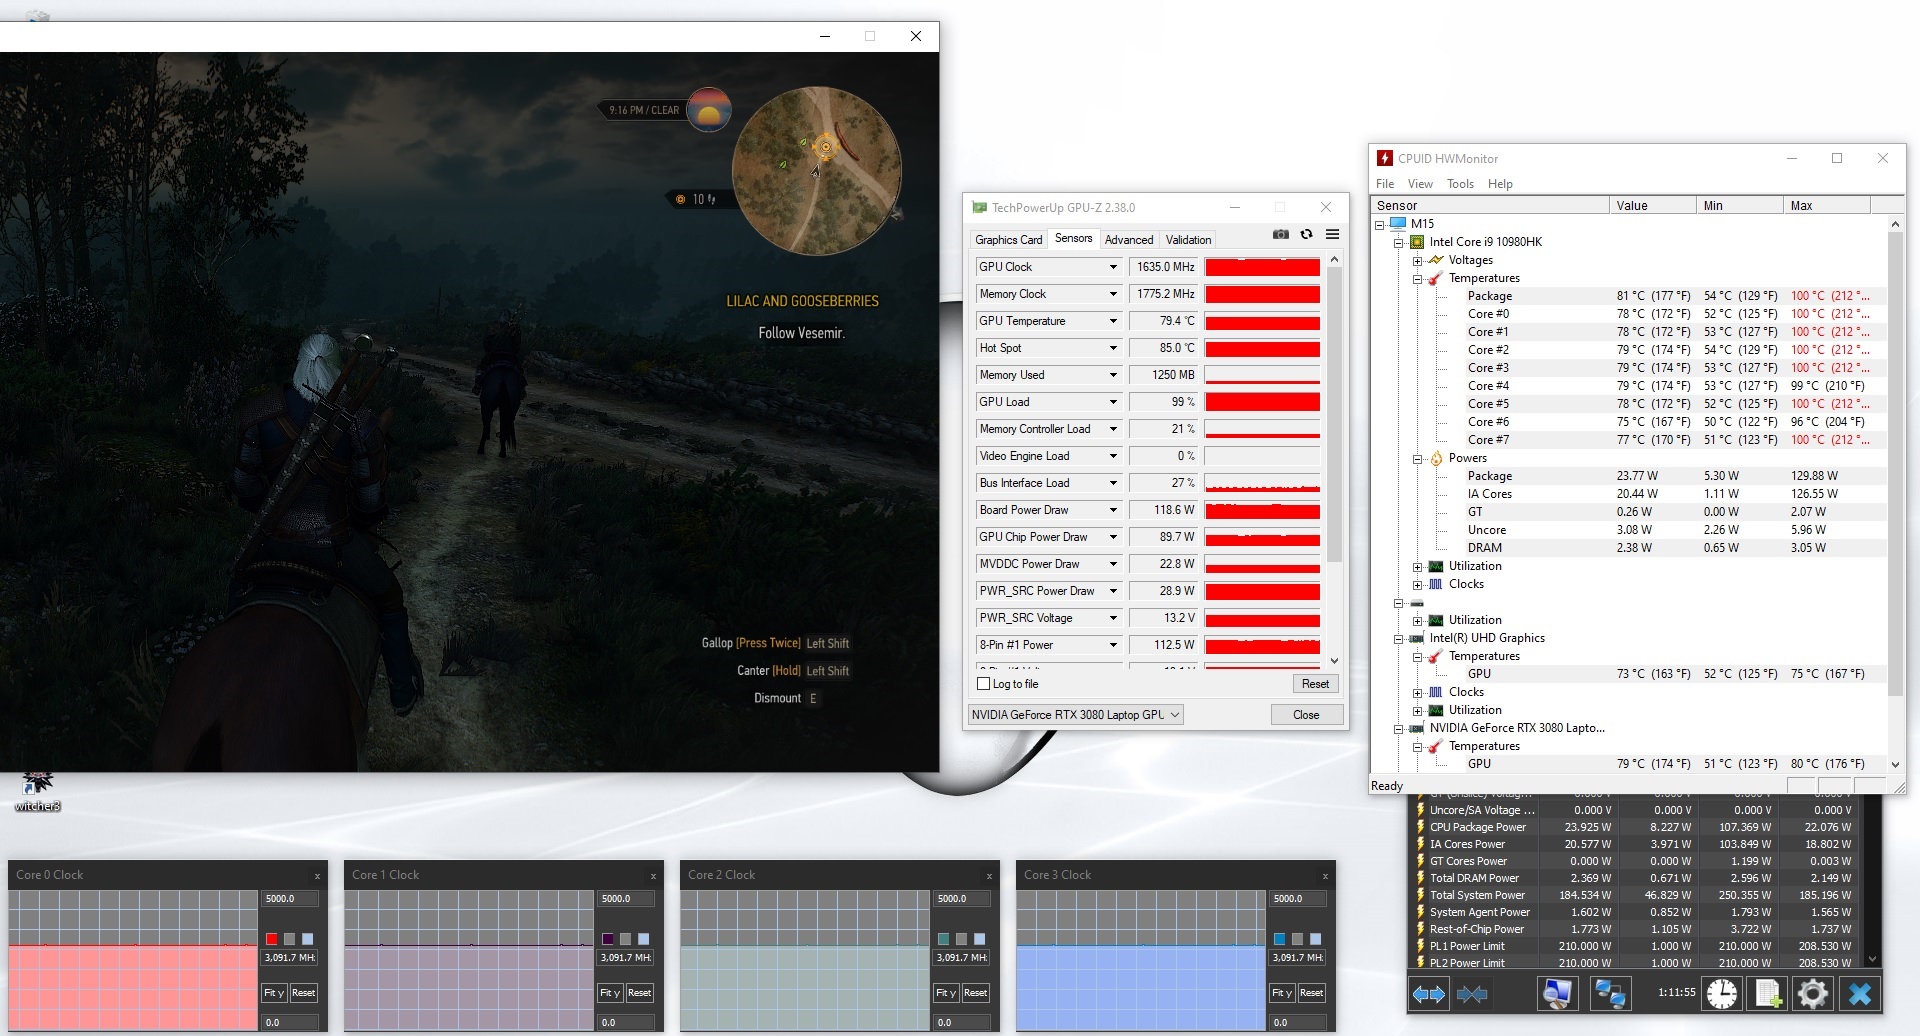
Performance - Strong Alienware m15
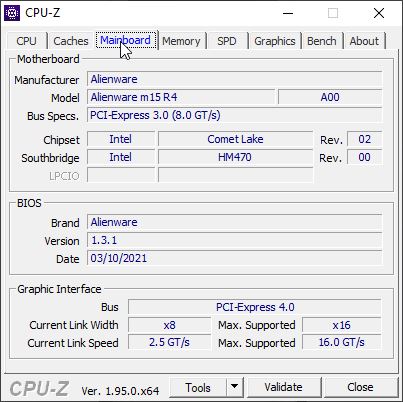
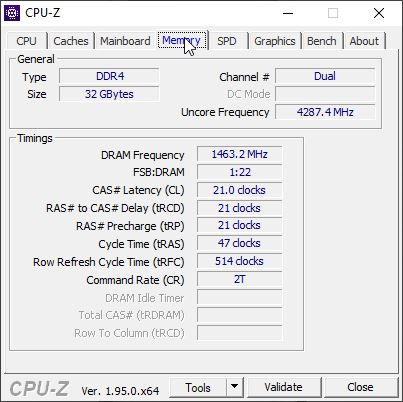
Our test model is equipped with a strong Intel CPU belonging to the Comet Lake series (Gen 10), an Nvidia GeForce RTX 3080, 32 GB of RAM, and a RAID 0 array consisting of two PCIe SSDs of 512 GB each. As a result, the Alienware's intended use is clearly focused on gaming, but it could also entice a creator or two - at least theoretically.
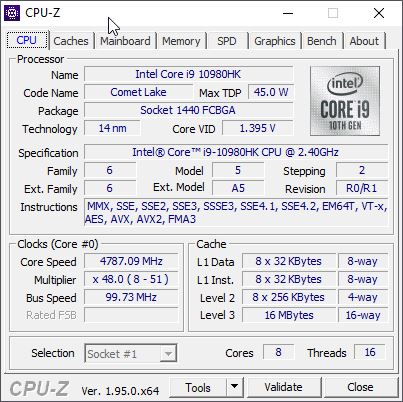
Processor
Two CPU options are offered for the m15 R4, both based on Intel's Comet Lake architecture. The Core i7-10870H and the Core i9-10980HK practically only differ by a few hundred MHz of clock rate. Moreover, the "K" in the i9 model indicates an open multiplier and consequently easier overclocking potential.
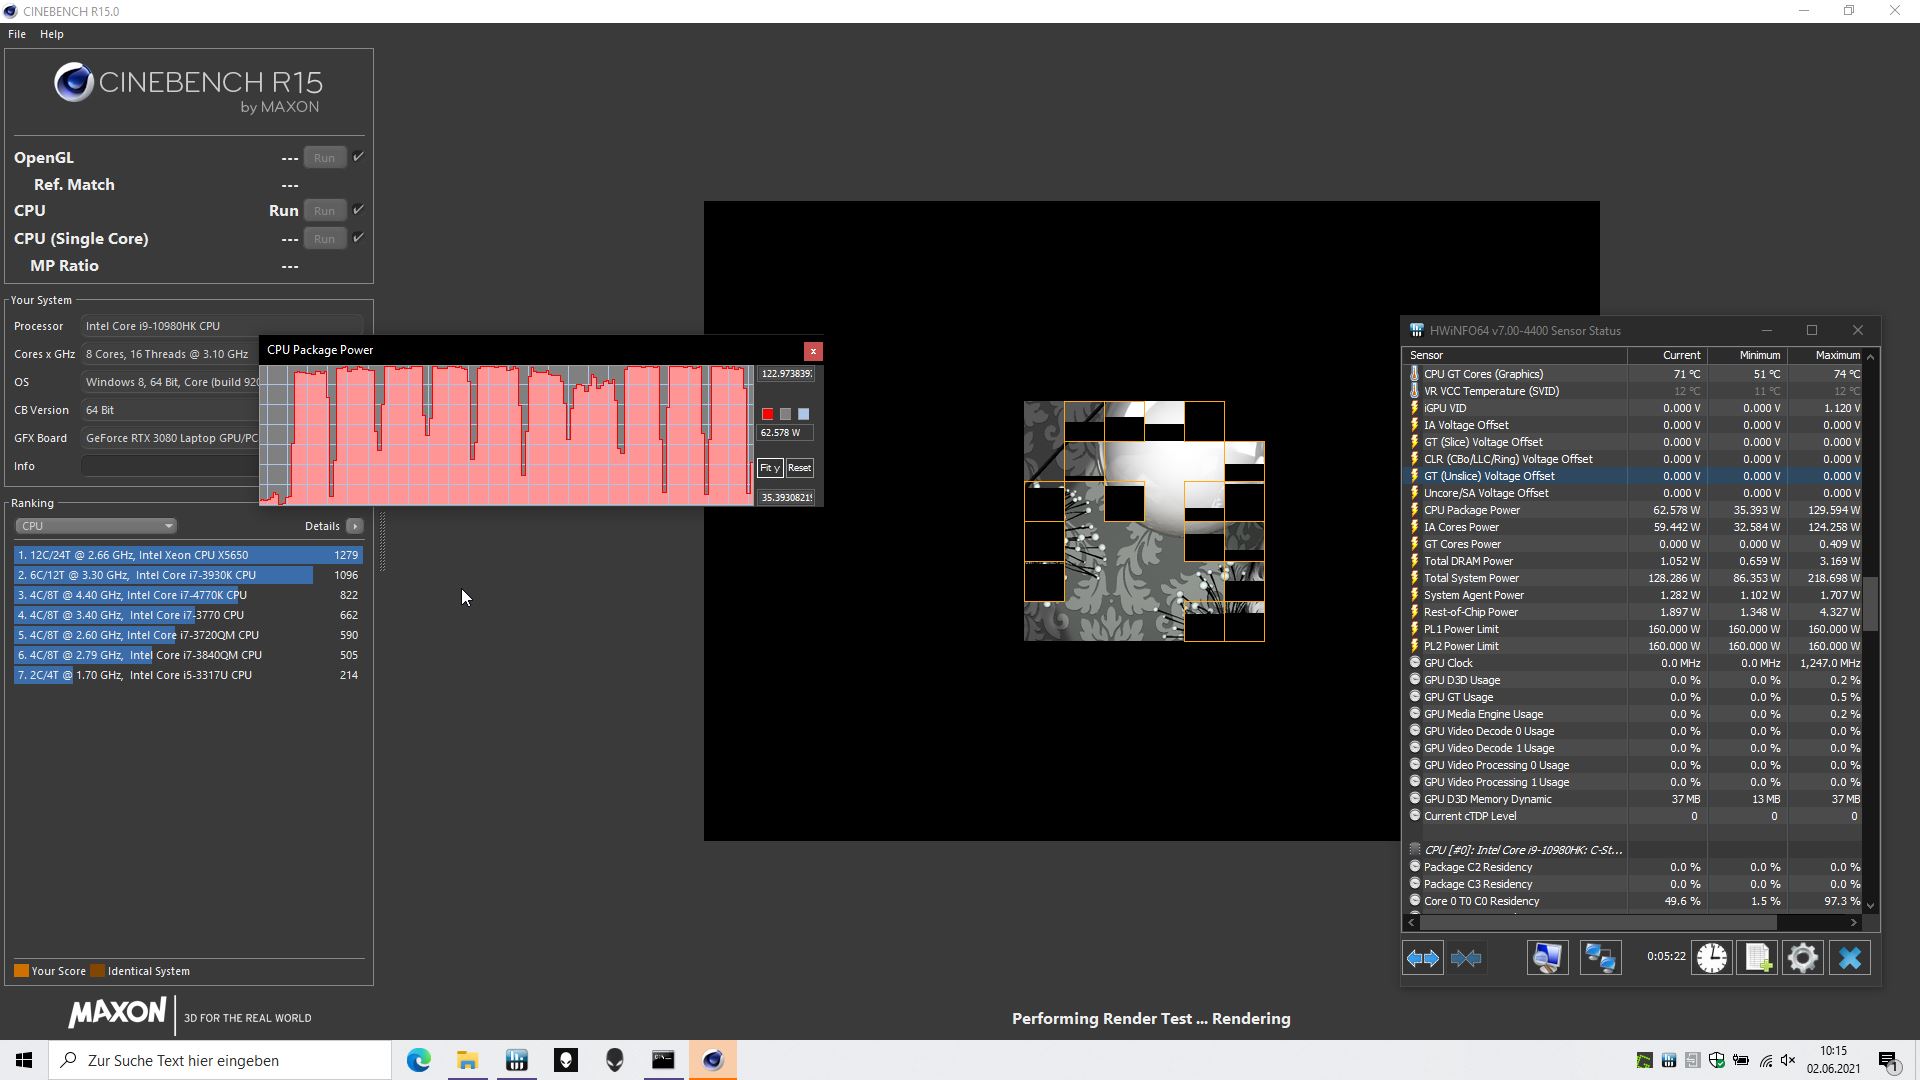
The potentially more powerful processor is installed in our test unit. Performance in the Cinebench R15 loop is quite consistent, and it does not drop significantly even after the first few runs, unlike in the XMG Pro 15, for example. The Core i9-10980HK proves to be a very strong CPU that is clearly better than the ones in most competitors with slightly weaker Intel CPUs. However, the AMD Ryzen 9 5900HS in the ROG Zephyrus is even faster; this is also true for the single-core tests of the various Cinebench versions.
The TDP remains constant at 122 watts throughout all runs, and the power limit is specified at 135 to 210 watts depending on the fan/power mode.
When the device is running on battery power, the CPU performance is limited despite the power mode being the same. Instead of 1,755 points, we only measured 1,255 points in the Cinebench R15 multi-core test.
* ... smaller is better
System performance
The m15 R4 only just takes the top position in PCMark 10, closely followed by the ROG Zephyrus G15. System performance is correspondingly excellent.
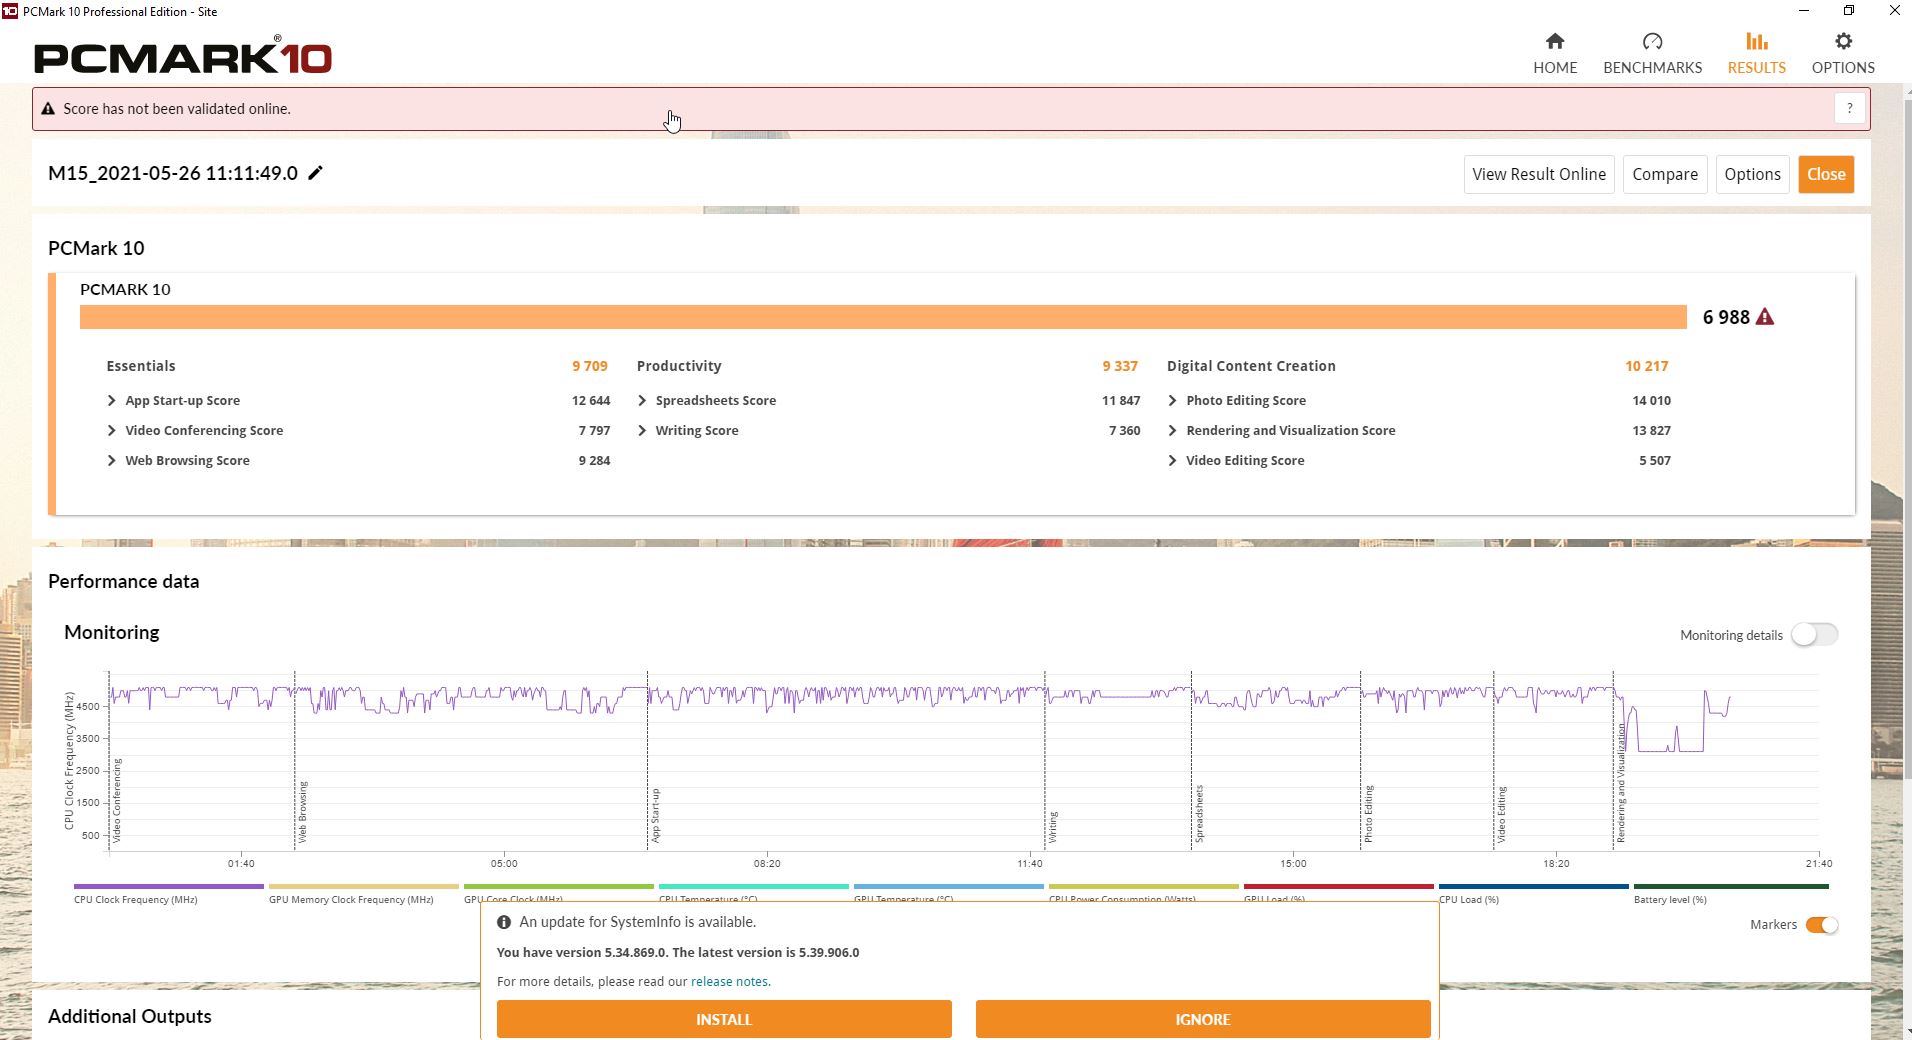
| PCMark 10 Score | 6988 points | |
Help | ||
DPC latencies
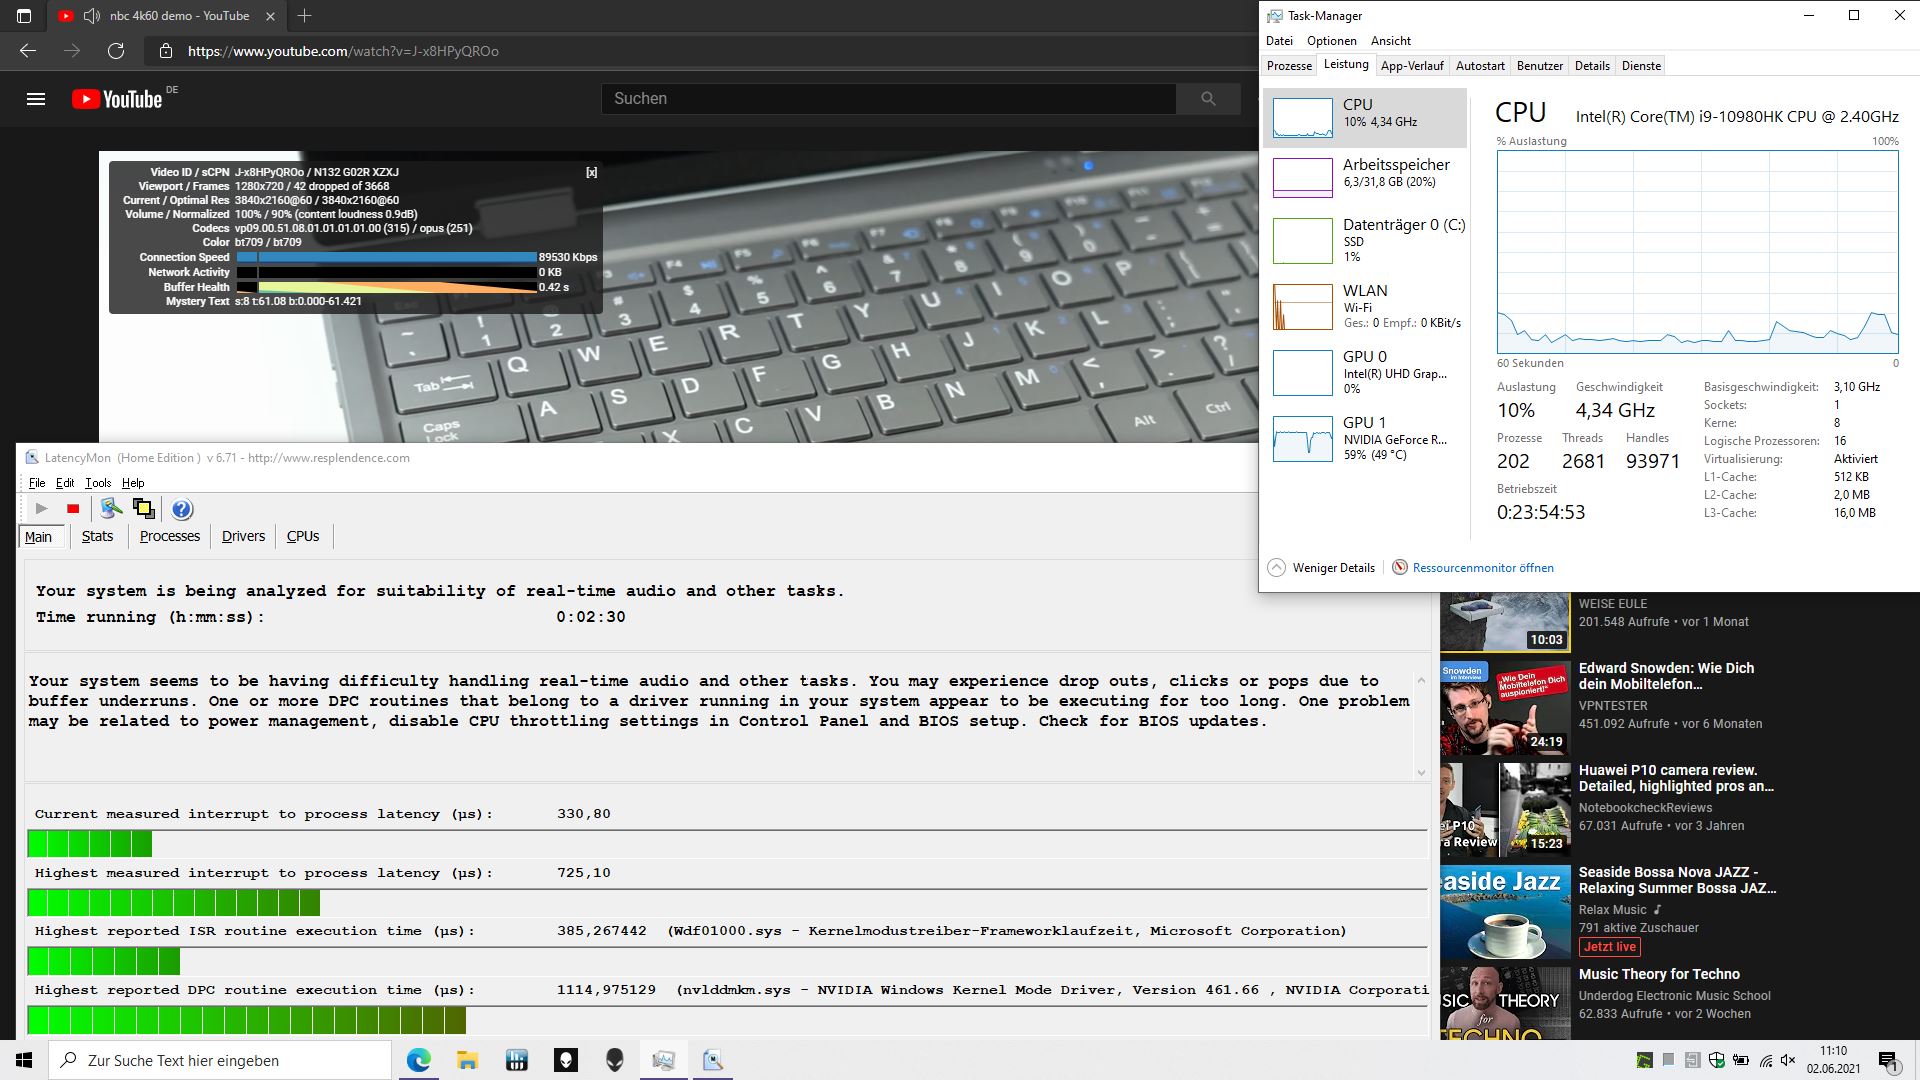
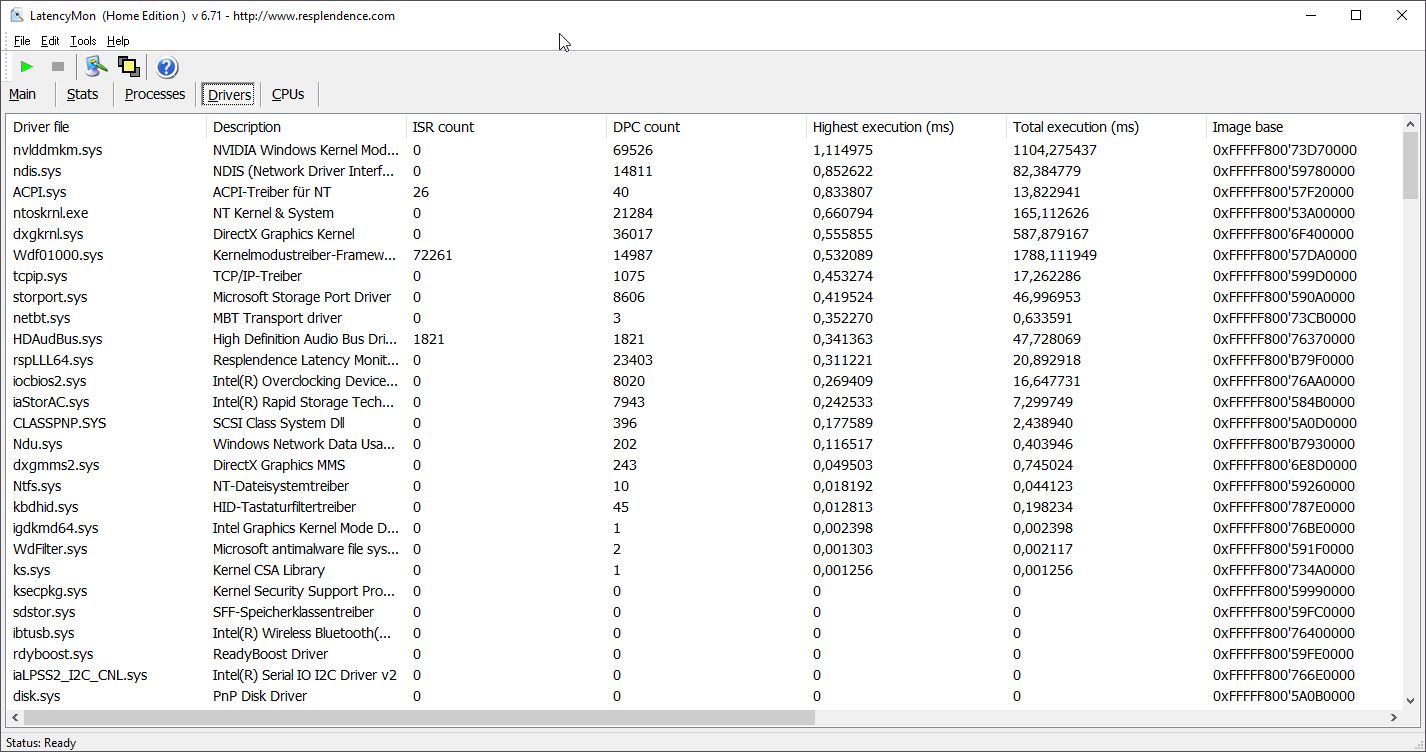
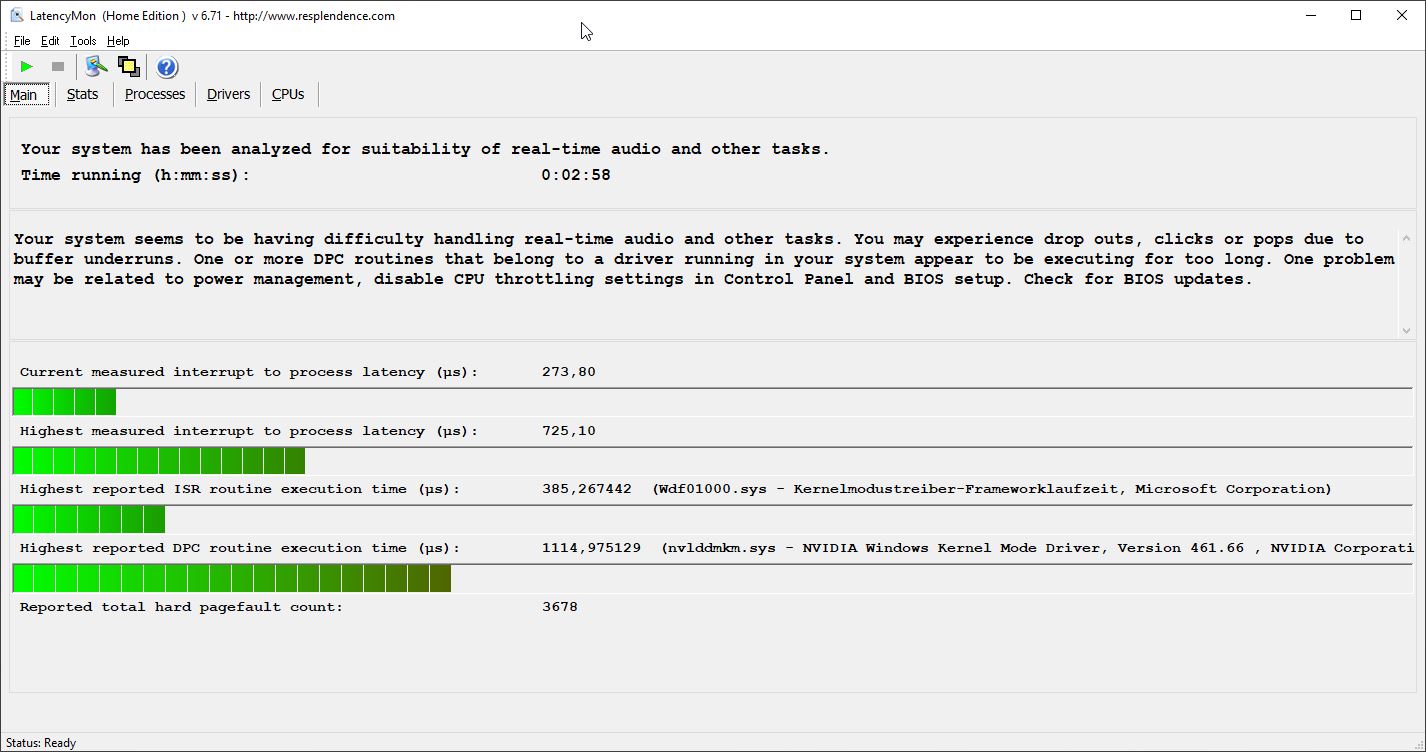
The first latencies already appear when opening our Notebookcheck page, and unfortunately, they increase even more when opening several tabs. The m15 R4 completes our YouTube test with a 4K/60 fps video with 42 dropped frames. We would expect more from a high-end gaming laptop. In comparison, the different Alienware models seem to suffer from the highest latencies.
An Nvidia driver and a network driver are mainly to blame here, and the infamous ACPI.sys can't be left out of this list either.
| DPC Latencies / LatencyMon - interrupt to process latency (max), Web, Youtube, Prime95 | |
| Alienware m15 R4 | |
| Alienware m15 R3 P87F | |
| Alienware m15 R4 RTX 3080 | |
| SCHENKER XMG Pro 15 (Early 2021, RTX 3080) | |
| Razer Blade 15 Advanced Model Early 2021 | |
| Asus ROG Zephyrus G15 GA503Q | |
* ... smaller is better
Storage
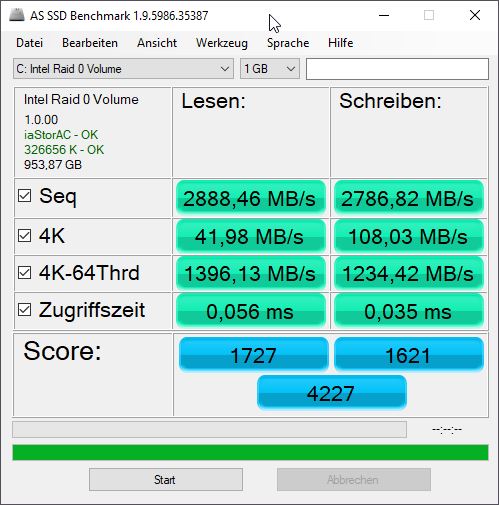
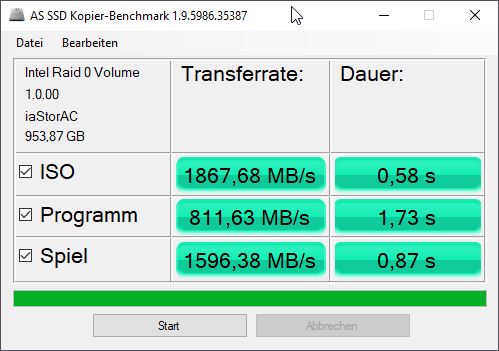
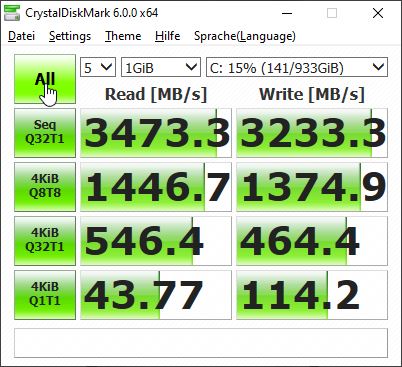
The two PCIe SSDs from Western Digital are combined in a RAID 0 array and offer a total storage capacity of 1 TB (2x 512 GB). The individual drive is ranked 102nd in our HDD/SSD Benchmarks article, which means that it theoretically doesn't stand out with turbo speeds. However, speed increases in a RAID configuration, so that the pair's rates end up in 18th place.
In this way, the drive can keep up with the competition, even though the SSDs in the Razer Blade, the Zephyrus, and especially the XMG Pro are slightly faster.
| Alienware m15 R4 RTX 3080 2x WDC PC SN730 SDBPNTY-512G (RAID 0) | Alienware m15 R4 Micron 2300 1TB MTFDHBA1T0TDV | Alienware m15 R3 P87F 2x Micron 2200S 512 GB (RAID 0) | Razer Blade 15 Advanced Model Early 2021 Samsung PM981a MZVLB1T0HBLR | Asus ROG Zephyrus G15 GA503Q SK Hynix HFM001TD3JX013N | SCHENKER XMG Pro 15 (Early 2021, RTX 3080) Samsung SSD 970 EVO Plus 1TB | |
|---|---|---|---|---|---|---|
| CrystalDiskMark 5.2 / 6 | -2% | -11% | 1% | 14% | 14% | |
| Write 4K | 114.2 | 93.7 -18% | 67.3 -41% | 138 21% | 156.4 37% | 160.9 41% |
| Read 4K | 43.77 | 48.1 10% | 41.47 -5% | 47.41 8% | 66.7 52% | 54 23% |
| Write Seq | 2785 | 2239 | 1922 | 2318 | 2944 | |
| Read Seq | 2598 | 2112 | 1673 | 2151 | 2781 | |
| Write 4K Q32T1 | 464.5 | 481.9 4% | 488.9 5% | 445.5 -4% | 525 13% | 495.2 7% |
| Read 4K Q32T1 | 546 | 521 -5% | 557 2% | 534 -2% | 452.1 -17% | 593 9% |
| Write Seq Q32T1 | 3233 | 3362 4% | 2654 -18% | 2976 -8% | 3055 -6% | 3283 2% |
| Read Seq Q32T1 | 3473 | 3200 -8% | 3137 -10% | 3232 -7% | 3607 4% | 3549 2% |
| Write 4K Q8T8 | 1375 | |||||
| Read 4K Q8T8 | 1447 | |||||
| AS SSD | -18% | -83% | 6% | 15% | 28% | |
| Seq Read | 2888 | 2658 -8% | 2058 -29% | 2112 -27% | 2950 2% | 2959 2% |
| Seq Write | 2786 | 2769 -1% | 2316 -17% | 2024 -27% | 1600 -43% | 2521 -10% |
| 4K Read | 41.98 | 46.07 10% | 39.72 -5% | 46.53 11% | 53.6 28% | 50.9 21% |
| 4K Write | 108 | 87.2 -19% | 62.9 -42% | 89.7 -17% | 126.8 17% | 141.1 31% |
| 4K-64 Read | 1396 | 1372 -2% | 1334 -4% | 1747 25% | 1429 2% | 2110 51% |
| 4K-64 Write | 1234 | 1247 1% | 1271 3% | 1962 59% | 2177 76% | 2329 89% |
| Access Time Read * | 0.056 | 0.052 7% | 0.062 -11% | 0.052 7% | 0.064 -14% | 0.034 39% |
| Access Time Write * | 0.035 | 0.098 -180% | 0.388 -1009% | 0.04 -14% | 0.029 17% | 0.026 26% |
| Score Read | 1727 | 1684 -2% | 1580 -9% | 2004 16% | 1778 3% | 2457 42% |
| Score Write | 1621 | 1611 -1% | 1565 -3% | 2254 39% | 2464 52% | 2722 68% |
| Score Total | 4227 | 4166 -1% | 3968 -6% | 5280 25% | 5090 20% | 6412 52% |
| Copy ISO MB/s | 1868 | 1685 -10% | 2128 14% | 2275 22% | ||
| Copy Program MB/s | 812 | 669 -18% | 707 -13% | 593 -27% | ||
| Copy Game MB/s | 1596 | 1493 -6% | 1471 -8% | 1408 -12% | ||
| Total Average (Program / Settings) | -10% /
-12% | -47% /
-62% | 4% /
5% | 15% /
14% | 21% /
24% |
* ... smaller is better

Continuous load read: DiskSpd Read Loop, Queue Depth 8
Graphics card
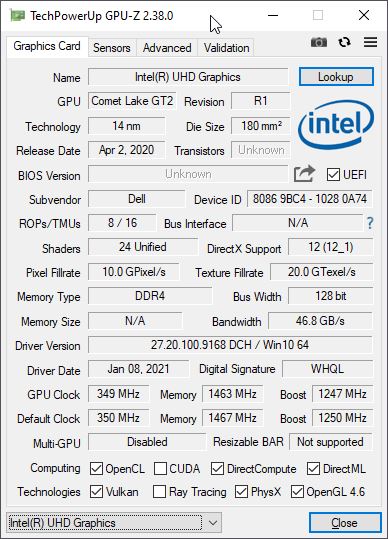
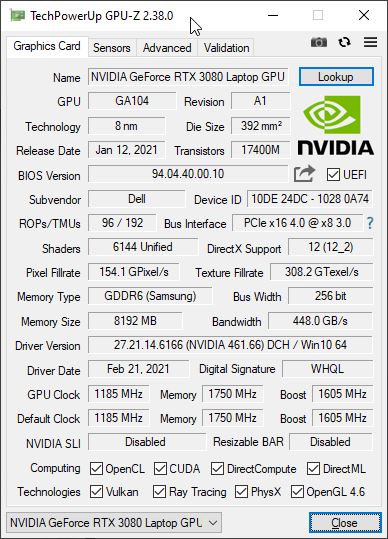
The laptop with the alien head contains two GPUs, the UHD Graphics 630 that's integrated into the processor and the dedicated Nvidia GeForce RTX 3080, which is currently (still) the fastest graphics card for laptops. The maximum TGP is around 140 watts and consequently the same as in the sibling model with the RTX 3070; in the Alienware m17 R4, the TGP for the RTX 3080 is considerably higher at 165 watts.
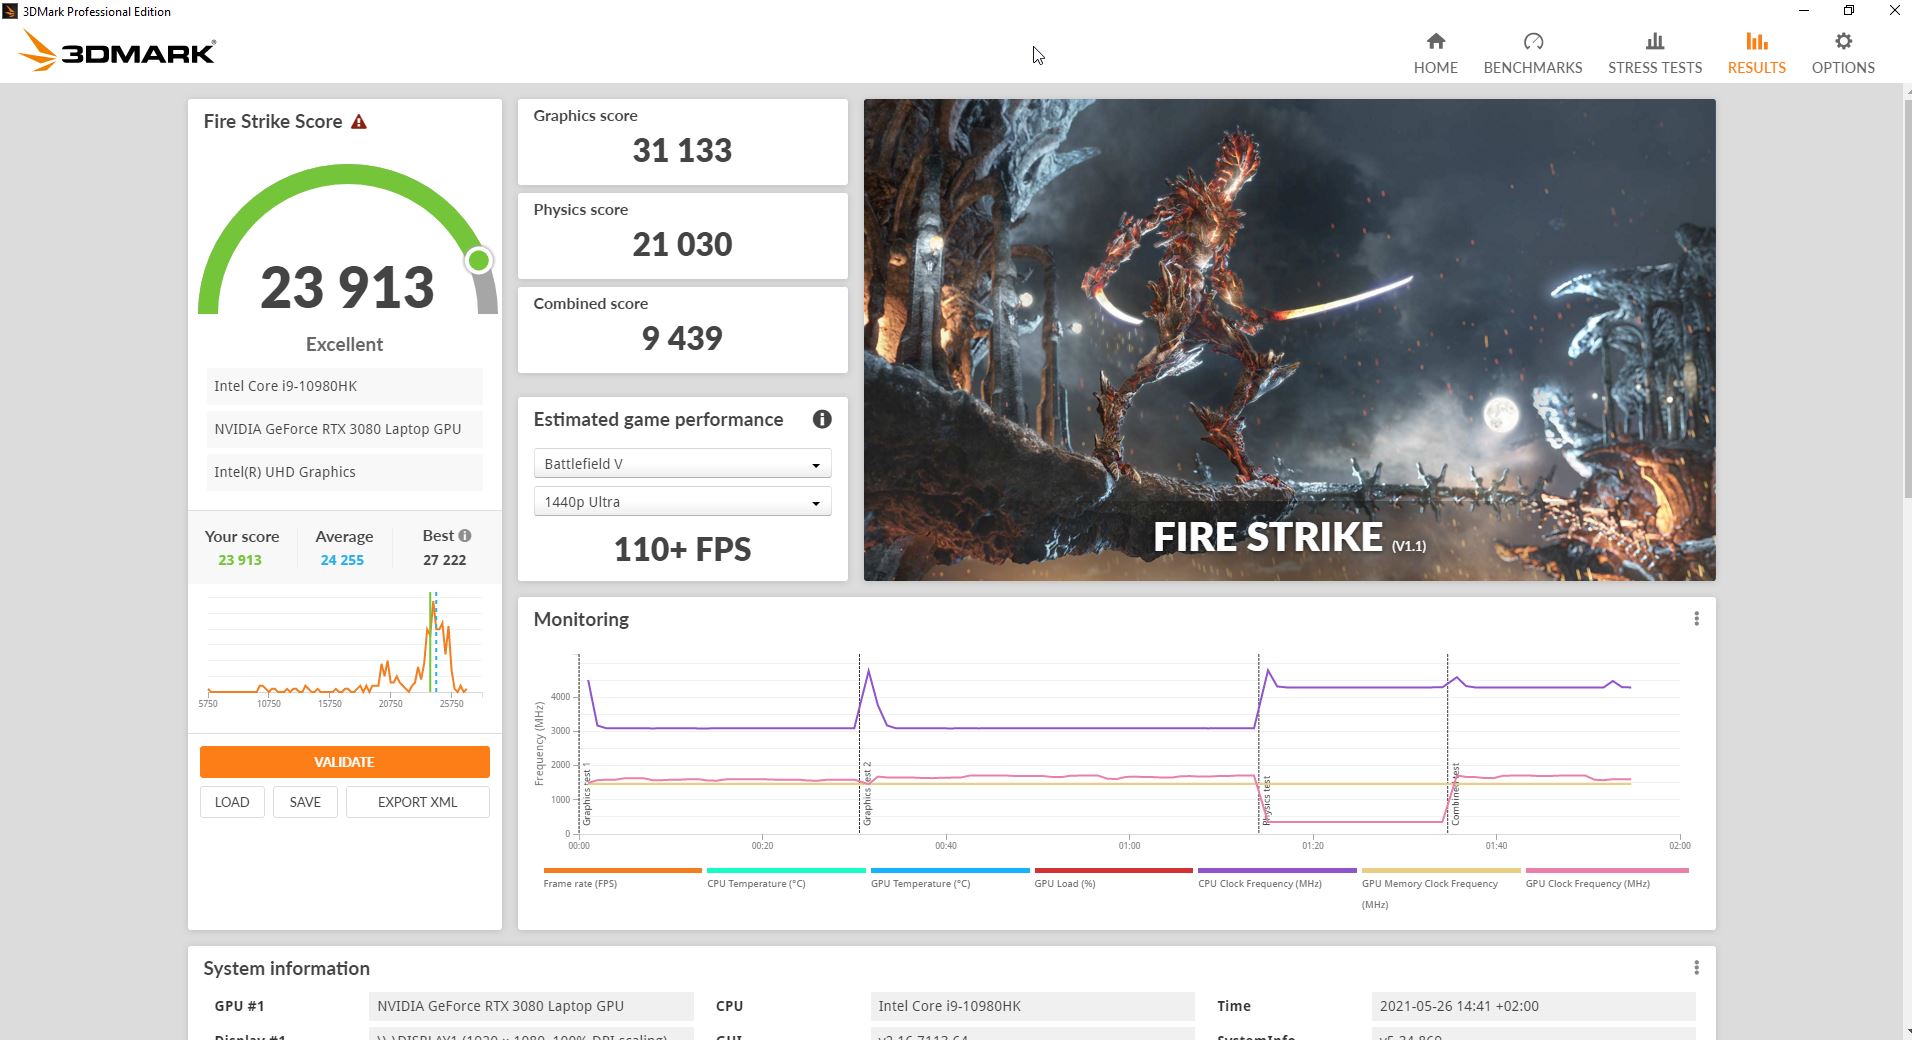
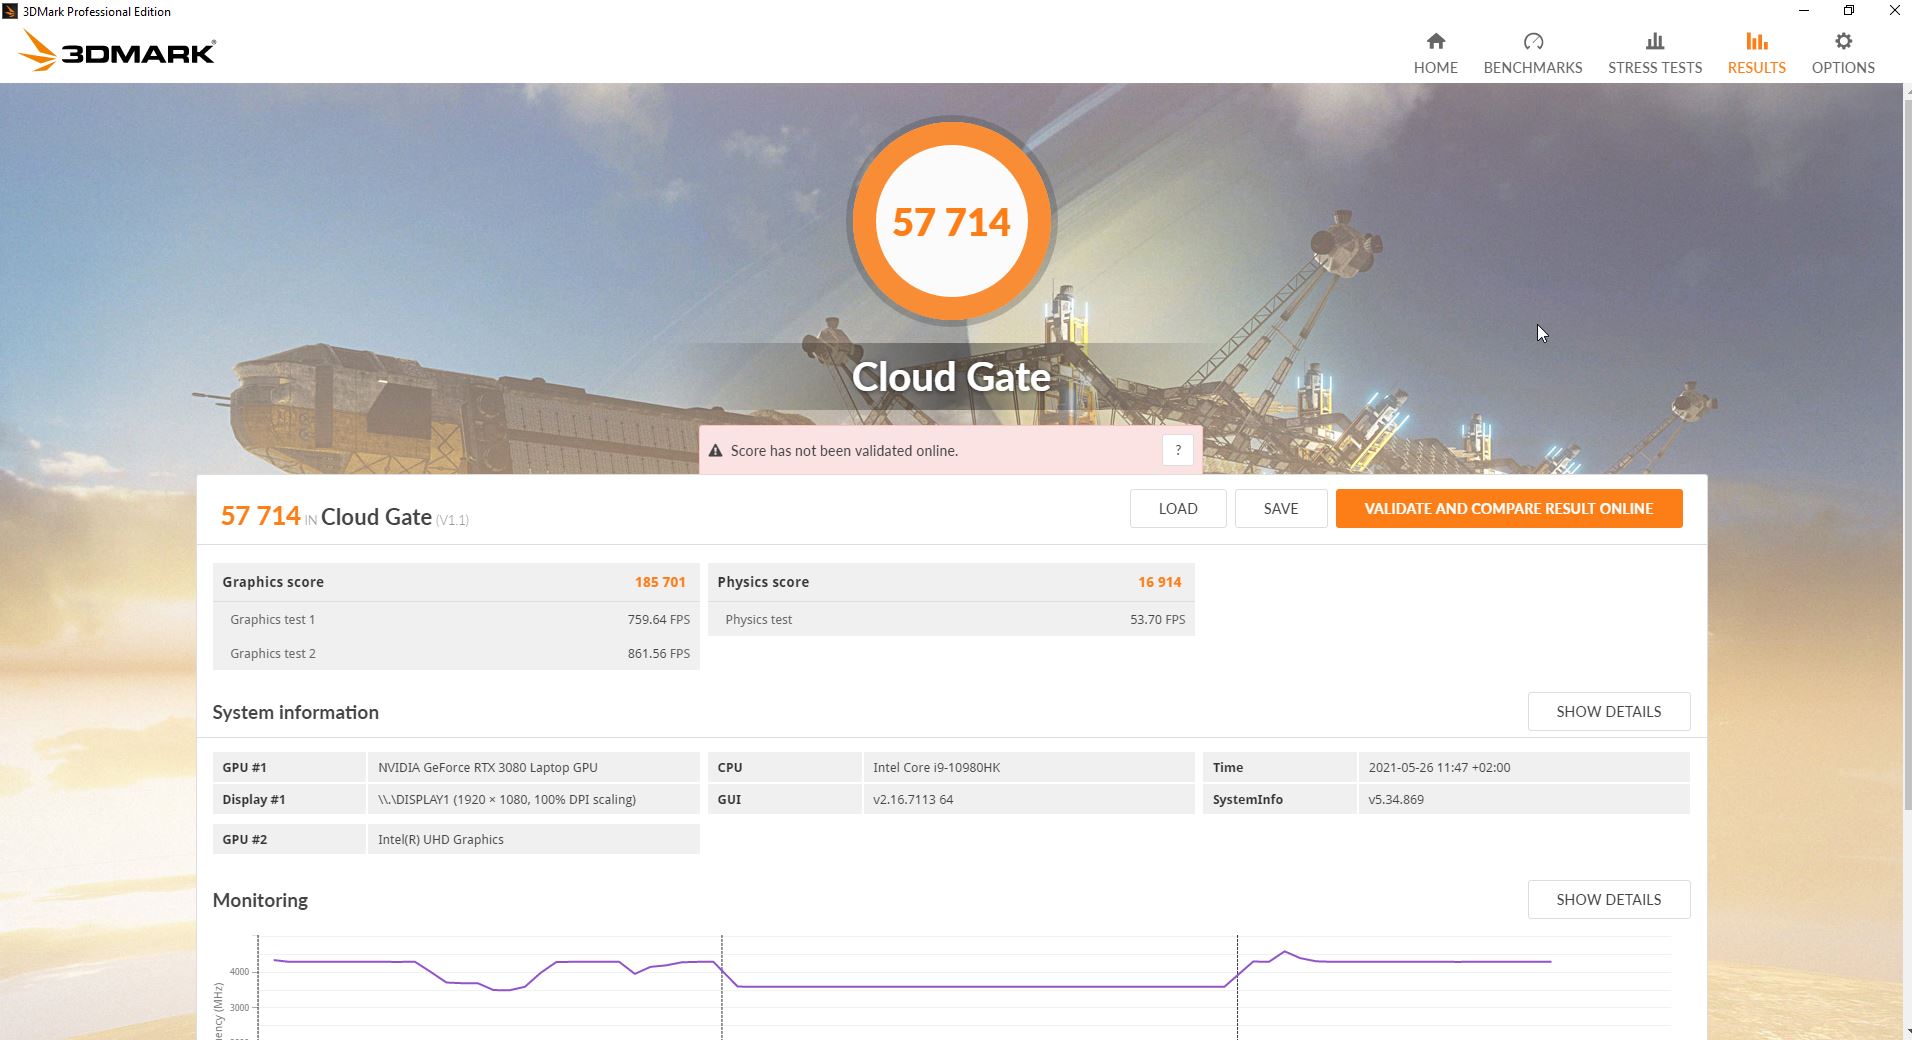
Nevertheless, the m15 R4 takes the top spot in the 3DMark benchmarks, because the RTX 3080 models of the 15-inch competition use an even lower TGP (95 - 105 watts) and are therefore even beaten by the RTX 3070 in the sibling model. Overall, the m15 R4 is consequently still above the average of all laptops with the RTX 3080. It's about 8% to 10% ahead of its sibling model.
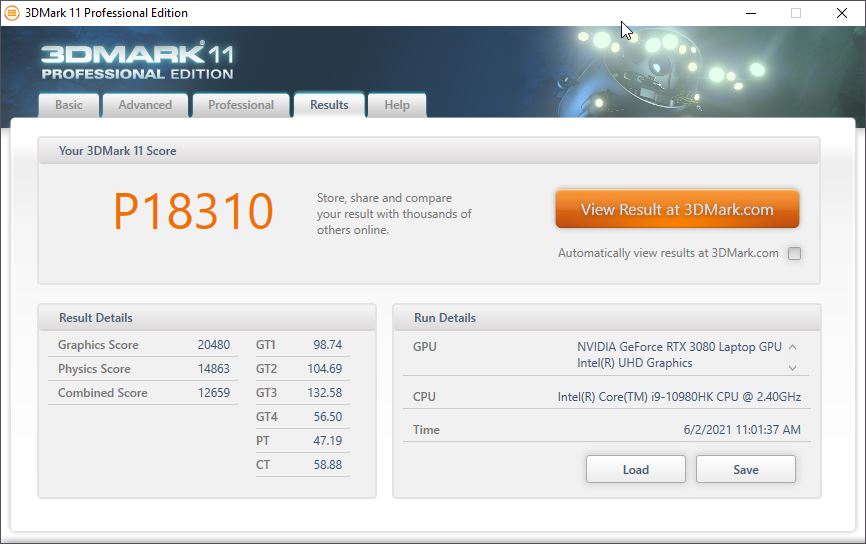
On battery power, a new 3DMark 11 run results in a graphics score of only 20,480 points instead of the previous 40,754 points that were obtained when plugged in. This means that performance is cut in half when you're on the move.
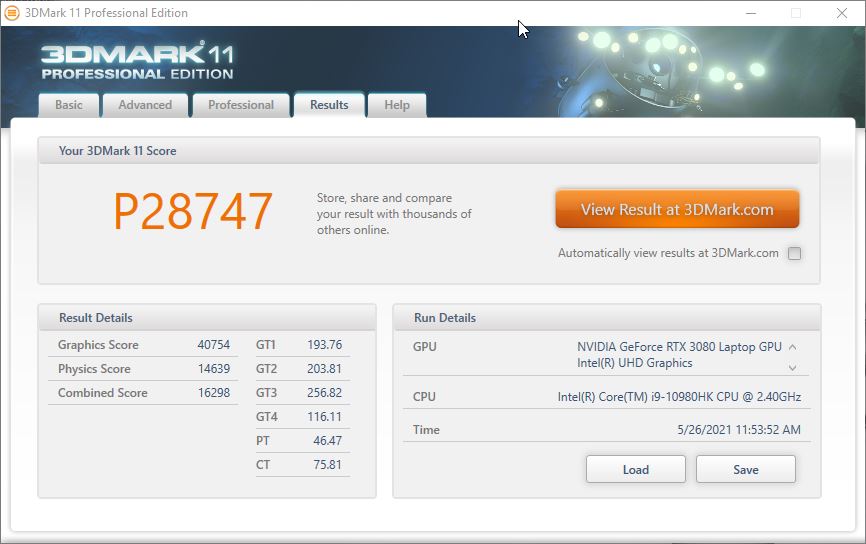
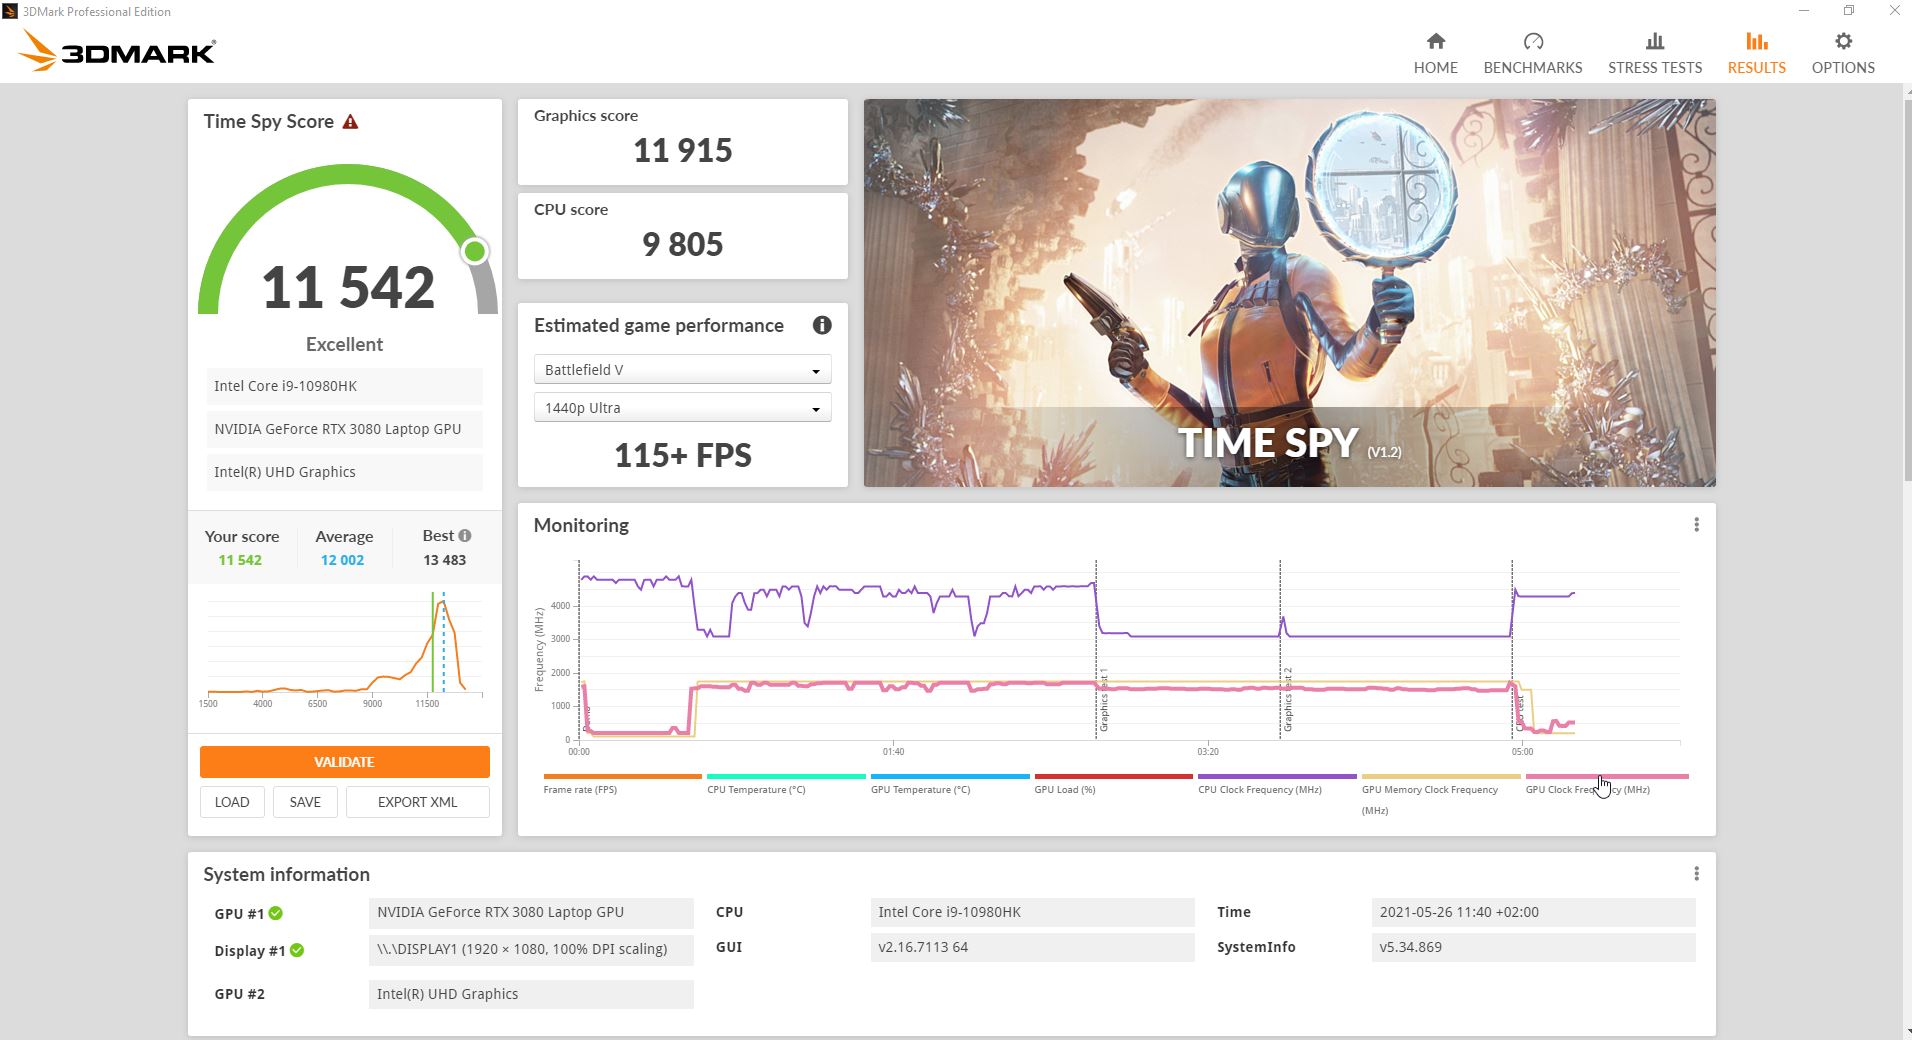
| 3DMark 11 Performance | 28747 points | |
| 3DMark Cloud Gate Standard Score | 57714 points | |
| 3DMark Fire Strike Score | 23913 points | |
| 3DMark Time Spy Score | 11542 points | |
Help | ||
Gaming performance
The strong GPU in the Alienware laptop virtually runs all modern titles at high resolutions and detail levels, and it can easily exploit the Full HD resolution of the integrated display in all games.
The results of the synthetic benchmarks can be confirmed by our real-world gaming tests: In most games, the m15 R4 performs marginally above an average mobile RTX 3080 and consequently places itself at the top of the 15-inch competition. RTX 3080 models with higher TGPs are usually only found in 17-inch gaming laptops. Compared to the sibling model with the RTX 3070 and 140 watts as well, the RTX 3080 has a lead of about 10%.
Therefore, the overall gaming performance is beyond reproach, which puts the m15 R4 at the very top of the 15-inch gaming class.
| GTA V | |
| 1920x1080 High/On (Advanced Graphics Off) AA:2xMSAA + FX AF:8x | |
| Alienware m15 R4 RTX 3080 | |
| Average of class Gaming (15.3 - 187.1, n=181, last 2 years) | |
| Average NVIDIA GeForce RTX 3080 Laptop GPU (137 - 176, n=29) | |
| Asus ROG Zephyrus G15 GA503Q | |
| 1920x1080 Highest Settings possible AA:4xMSAA + FX AF:16x | |
| Average of class Gaming (6.38 - 167.7, n=216, last 2 years) | |
| Alienware m15 R4 RTX 3080 | |
| Average NVIDIA GeForce RTX 3080 Laptop GPU (68.6 - 112, n=33) | |
| Asus ROG Zephyrus G15 GA503Q | |
The frame rates observed when running The Witcher 3 for about an hour are relatively stable, so that major performance drops are not to be expected over prolonged periods of time.
| low | med. | high | ultra | |
| GTA V (2015) | 182 | 177 | 165 | 98.2 |
| The Witcher 3 (2015) | 350.8 | 276.5 | 200 | 112 |
| Dota 2 Reborn (2015) | 148 | 137 | 133 | 128 |
| X-Plane 11.11 (2018) | 118 | 101 | 84.7 | |
| Far Cry 5 (2018) | 159 | 137 | 129 | 120 |
| Shadow of the Tomb Raider (2018) | 152 | 130 | 127 | 118 |
Emissions - Particularly loud and hot under load
Noise emissions
Like nearly all manufacturers these days, Dell also provides its own fan-control software - the Alienware Control Center. The fan mode that is set here has a decisive impact on noise level. Our measurements in the table below are based on the balanced mode. In idle mode, the fans are actually often (but not always) silent; under high load, the noise level is similar to that of the competition.
However, we conduct our benchmarks in performance mode, which is disproportionately louder, at least subjectively. After all, the fans run at full speed almost nonstop, even in idle usage. If you want to get the maximum performance out of the m15 R4, you'll have to put up with a higher noise level than our measurements suggest. Therefore, you should change the fan mode in the software depending on the workload. Silent mode is sufficient for browsing and typing.
Noise Level
| Idle |
| 25 / 29 / 33 dB(A) |
| Load |
| 48 / 49 dB(A) |
 | ||
30 dB silent 40 dB(A) audible 50 dB(A) loud |
||
min: | ||
| Alienware m15 R4 RTX 3080 GeForce RTX 3080 Laptop GPU, i9-10980HK | Alienware m15 R4 GeForce RTX 3070 Laptop GPU, i9-10980HK | Alienware m15 R3 P87F GeForce RTX 2070 Mobile, i7-10750H | Razer Blade 15 Advanced Model Early 2021 GeForce RTX 3080 Laptop GPU, i7-10875H | Asus ROG Zephyrus G15 GA503Q GeForce RTX 3080 Laptop GPU, R9 5900HS | SCHENKER XMG Pro 15 (Early 2021, RTX 3080) GeForce RTX 3080 Laptop GPU, i7-10870H | |
|---|---|---|---|---|---|---|
| Noise | 0% | -2% | 0% | -1% | -13% | |
| off / environment * | 25 | 24 4% | 26.3 -5% | 24 4% | 25 -0% | 25 -0% |
| Idle Minimum * | 25 | 25 -0% | 26.7 -7% | 26 -4% | 26 -4% | 33 -32% |
| Idle Average * | 29 | 26 10% | 26.7 8% | 28 3% | 27 7% | 34 -17% |
| Idle Maximum * | 33 | 37 -12% | 30.7 7% | 40 -21% | 31 6% | 35 -6% |
| Load Average * | 48 | 48 -0% | 40.2 16% | 45 6% | 49 -2% | 51 -6% |
| Witcher 3 ultra * | 46 | 47 -2% | 51 -11% | 43 7% | 49 -7% | 52 -13% |
| Load Maximum * | 49 | 49 -0% | 59.7 -22% | 45 8% | 51 -4% | 57 -16% |
* ... smaller is better
Temperature
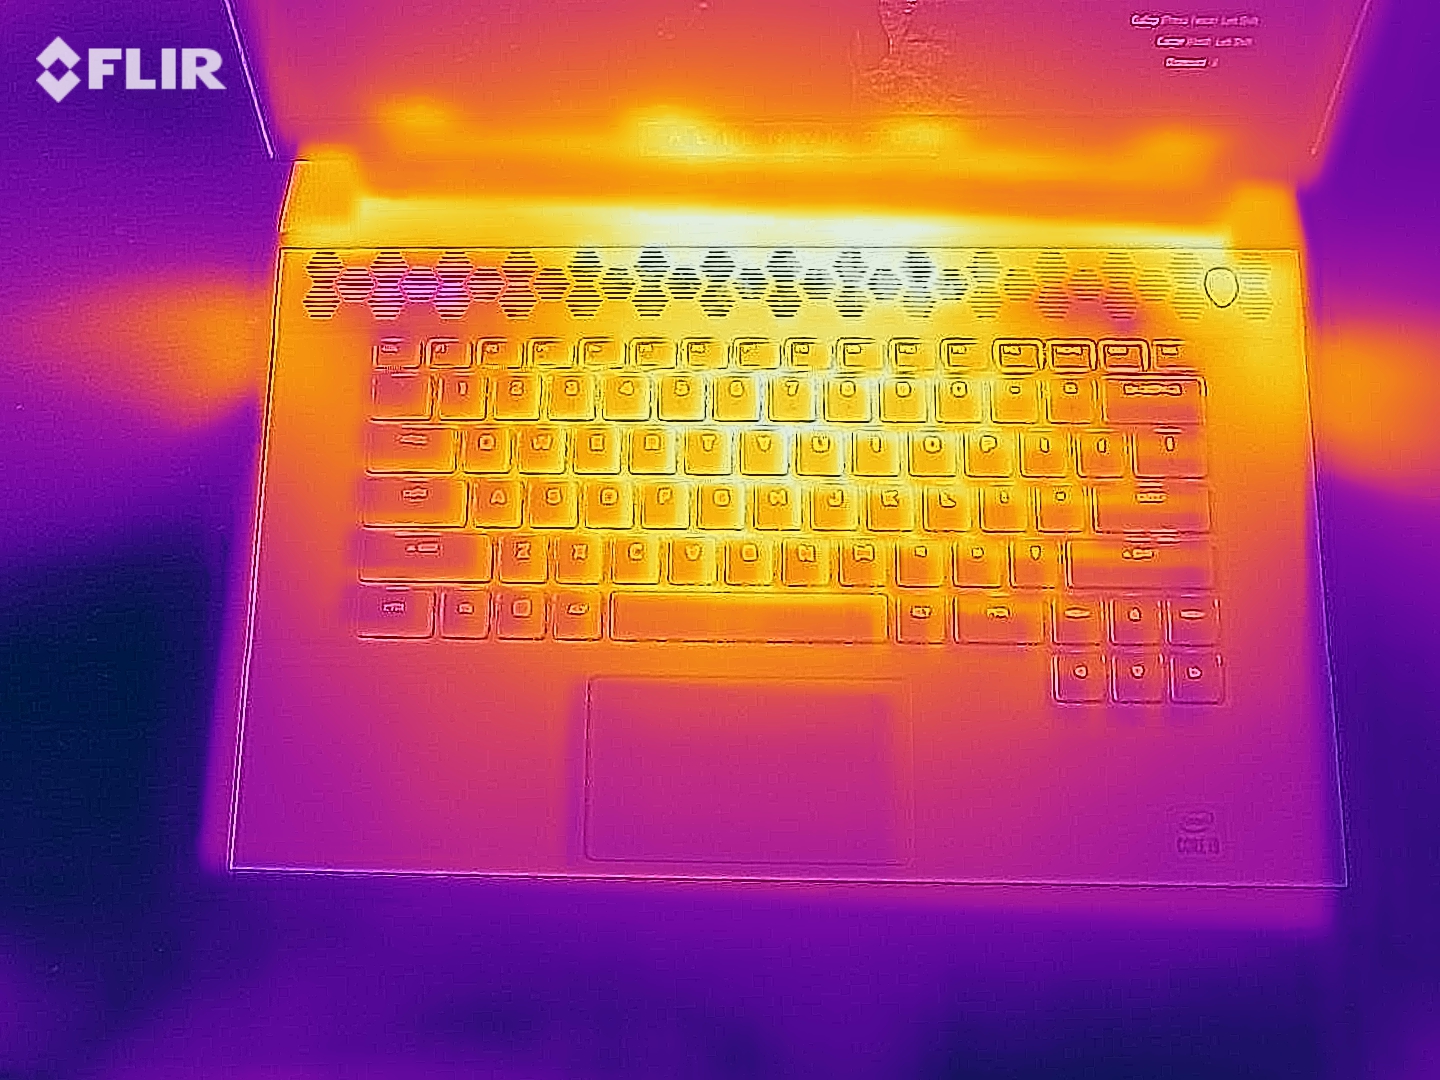
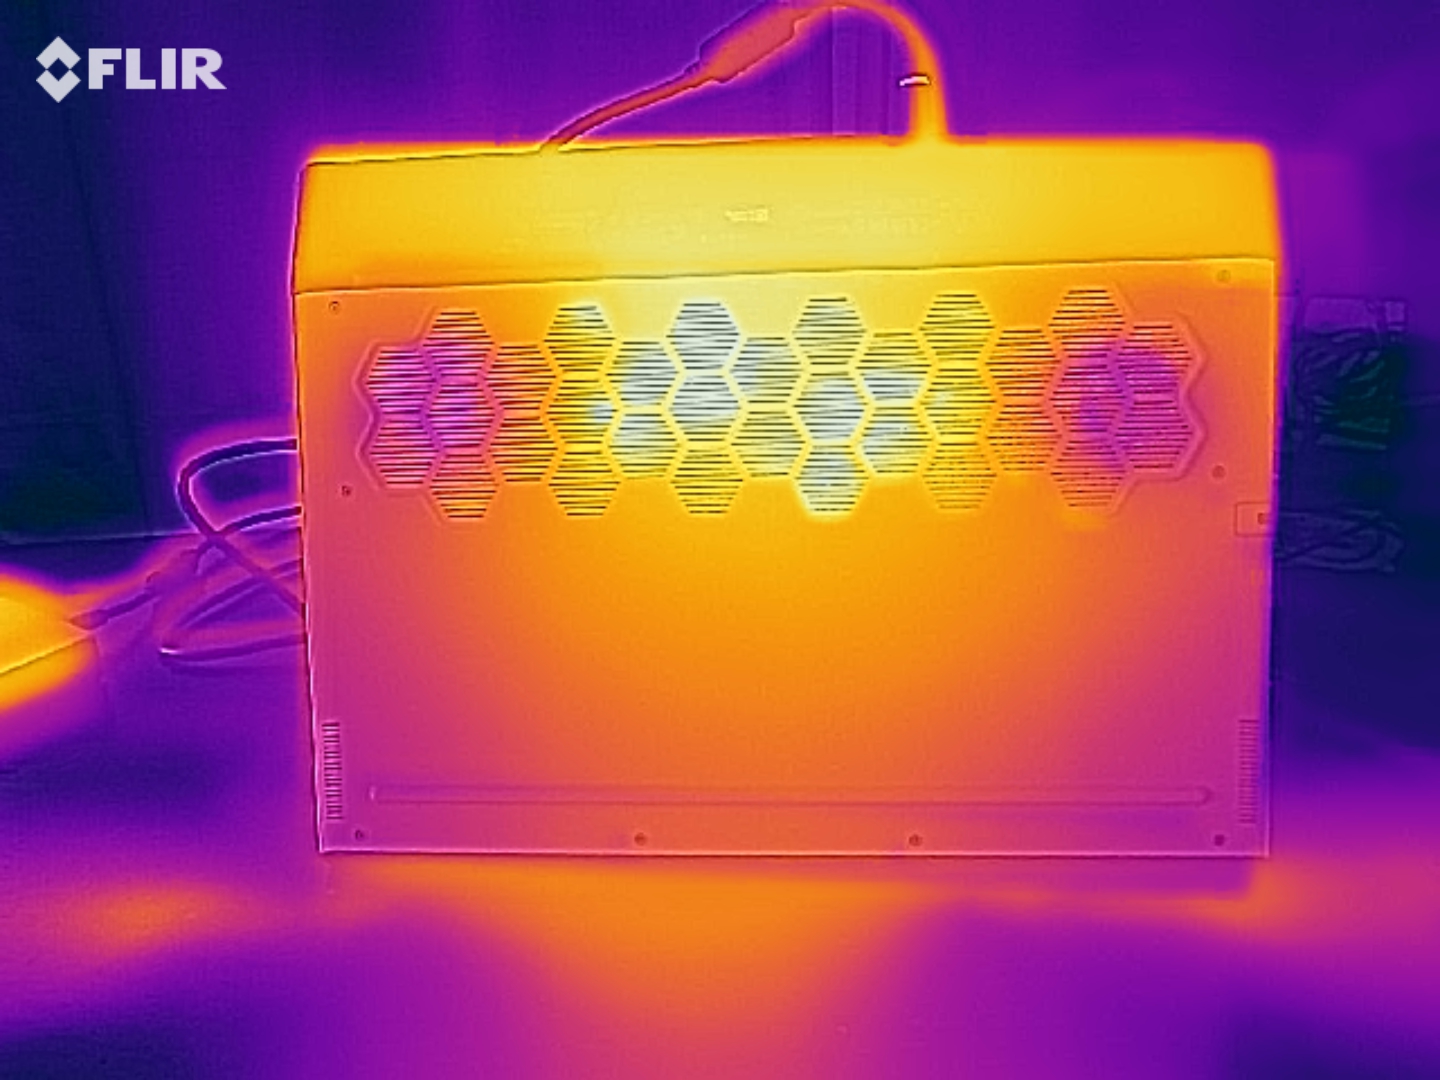
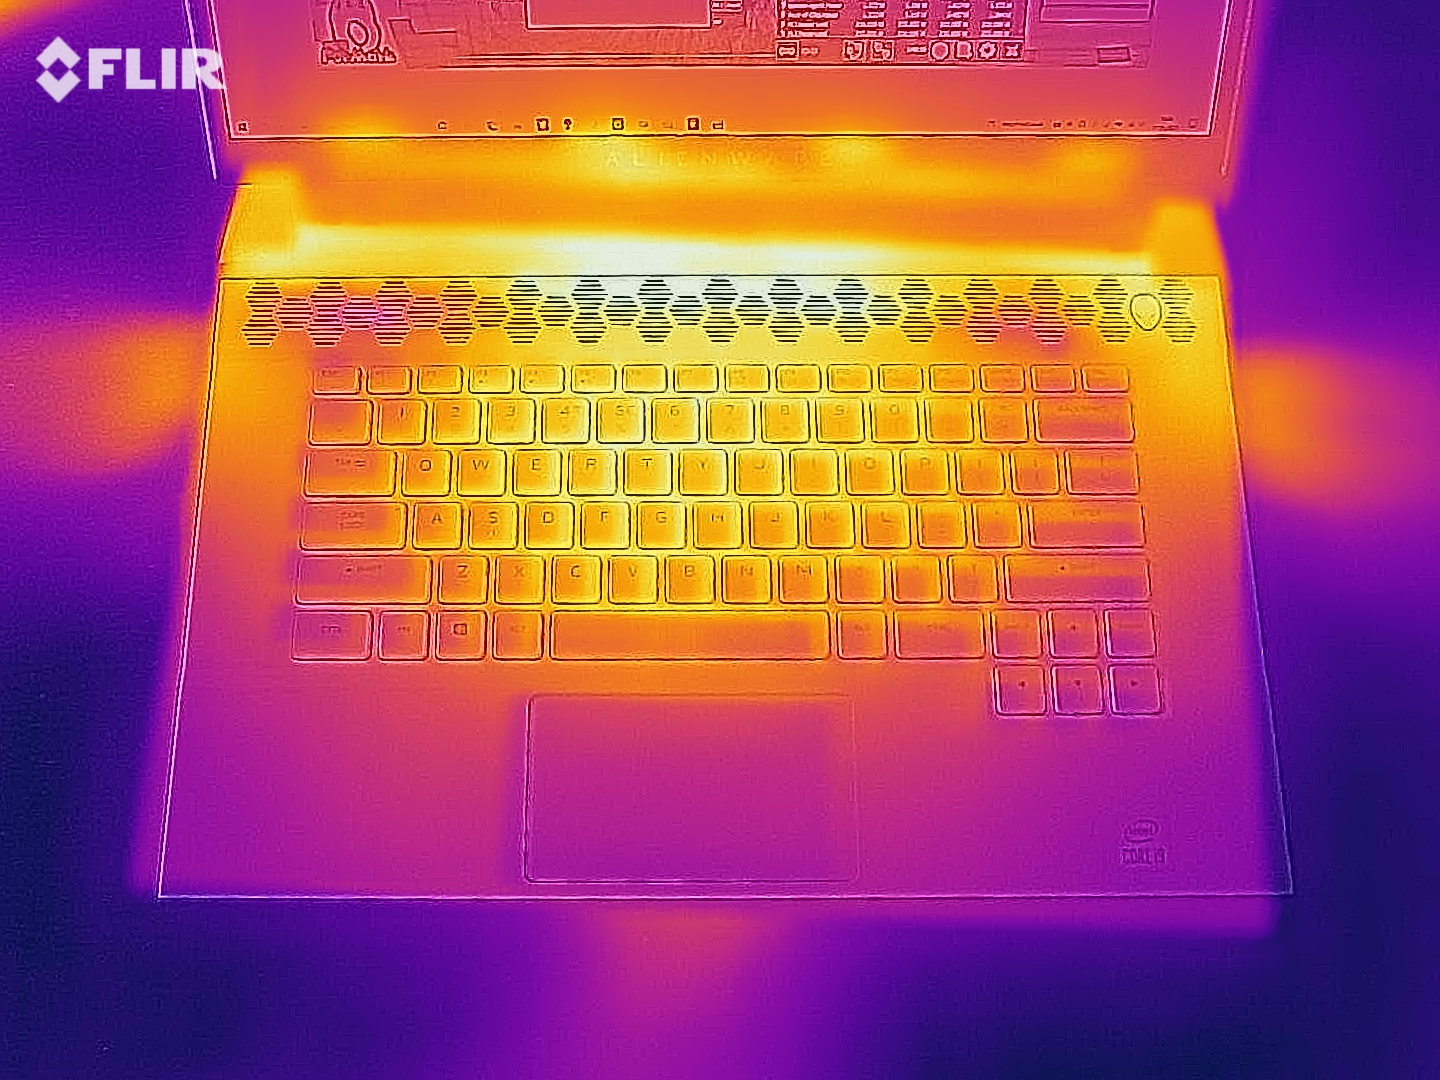
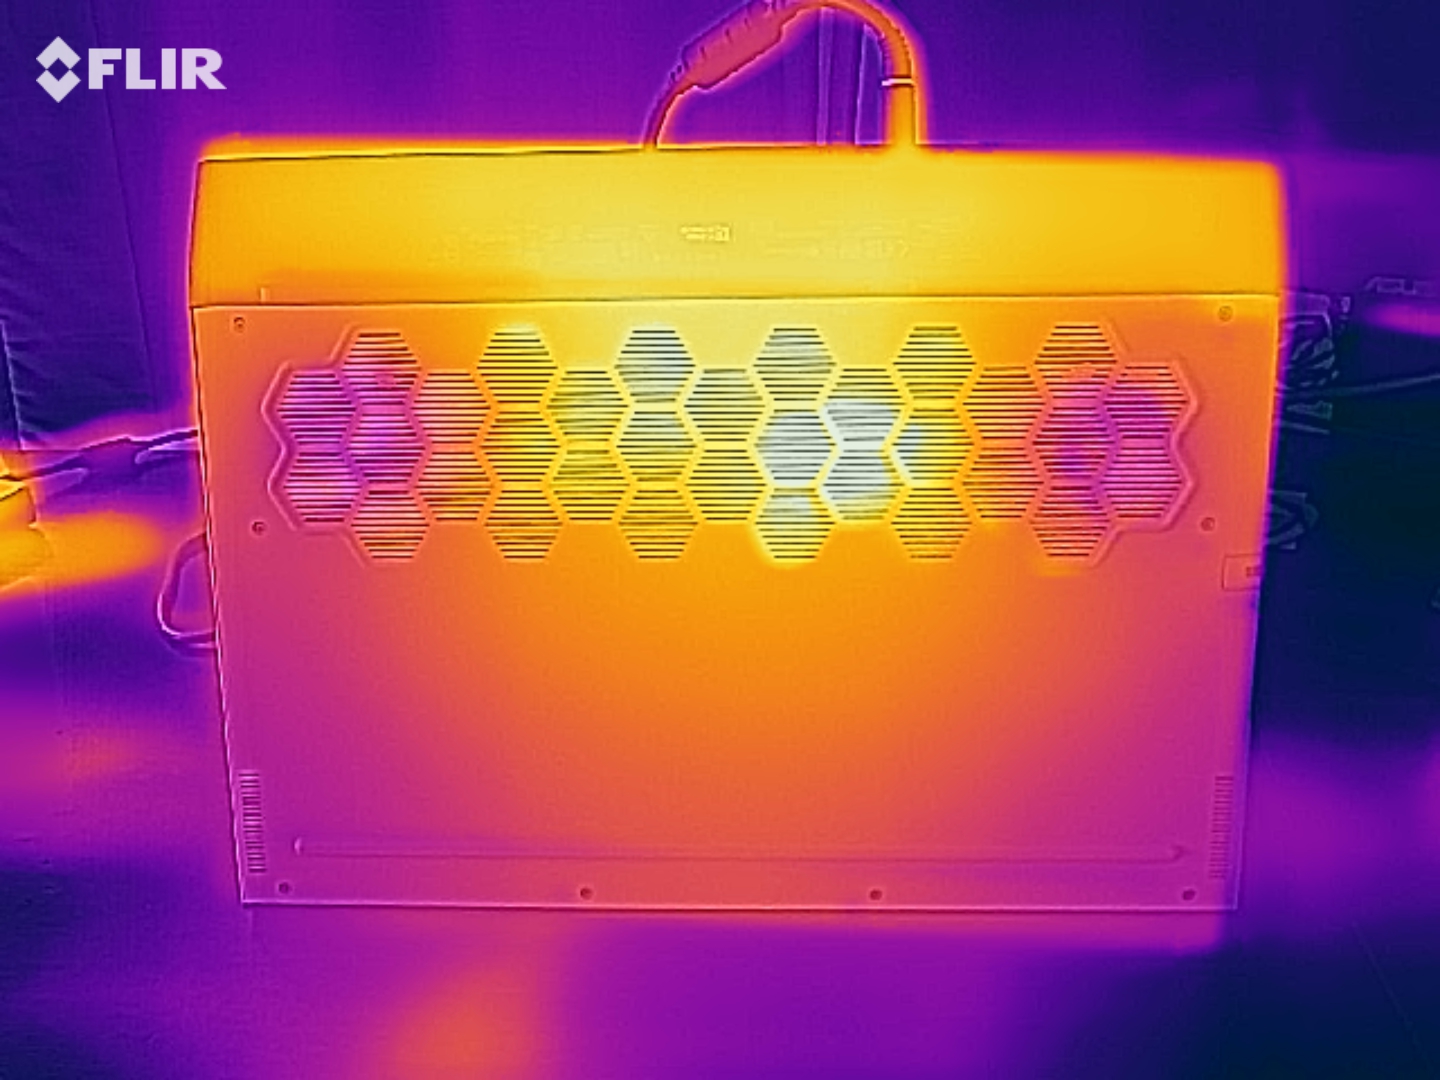
The Alienware is a model that runs hot. This applies to the surface temperatures but also to other aspects. Around 60 °C (~140 °F) at the top and bottom is not a low temperature, and you won't want to place the device on your lap despite its actually cool look.
Everything behind the palm rests gets very warm, and even those can heat up to 38 °C (~100 °F); in addition, the WASD keyboard area exceeds the 50 °C (~122 °F) at times. The competition usually stays much cooler.
(-) The maximum temperature on the upper side is 59 °C / 138 F, compared to the average of 40.4 °C / 105 F, ranging from 21.2 to 68.8 °C for the class Gaming.
(-) The bottom heats up to a maximum of 61 °C / 142 F, compared to the average of 43.2 °C / 110 F
(-) In idle usage, the average temperature for the upper side is 38.8 °C / 102 F, compared to the device average of 33.8 °C / 93 F.
(-) Playing The Witcher 3, the average temperature for the upper side is 47.9 °C / 118 F, compared to the device average of 33.8 °C / 93 F.
(-) The palmrests and touchpad can get very hot to the touch with a maximum of 40 °C / 104 F.
(-) The average temperature of the palmrest area of similar devices was 28.9 °C / 84 F (-11.1 °C / -20 F).
| Alienware m15 R4 RTX 3080 GeForce RTX 3080 Laptop GPU, i9-10980HK | Alienware m15 R4 GeForce RTX 3070 Laptop GPU, i9-10980HK | Alienware m15 R3 P87F GeForce RTX 2070 Mobile, i7-10750H | Razer Blade 15 Advanced Model Early 2021 GeForce RTX 3080 Laptop GPU, i7-10875H | Asus ROG Zephyrus G15 GA503Q GeForce RTX 3080 Laptop GPU, R9 5900HS | SCHENKER XMG Pro 15 (Early 2021, RTX 3080) GeForce RTX 3080 Laptop GPU, i7-10870H | |
|---|---|---|---|---|---|---|
| Heat | -3% | 0% | 20% | 18% | 14% | |
| Maximum Upper Side * | 59 | 60 -2% | 55.8 5% | 49 17% | 51 14% | 51 14% |
| Maximum Bottom * | 61 | 60 2% | 62 -2% | 54 11% | 56 8% | 66 -8% |
| Idle Upper Side * | 43 | 46 -7% | 43.4 -1% | 30 30% | 29 33% | 32 26% |
| Idle Bottom * | 41 | 43 -5% | 42 -2% | 32 22% | 34 17% | 32 22% |
* ... smaller is better
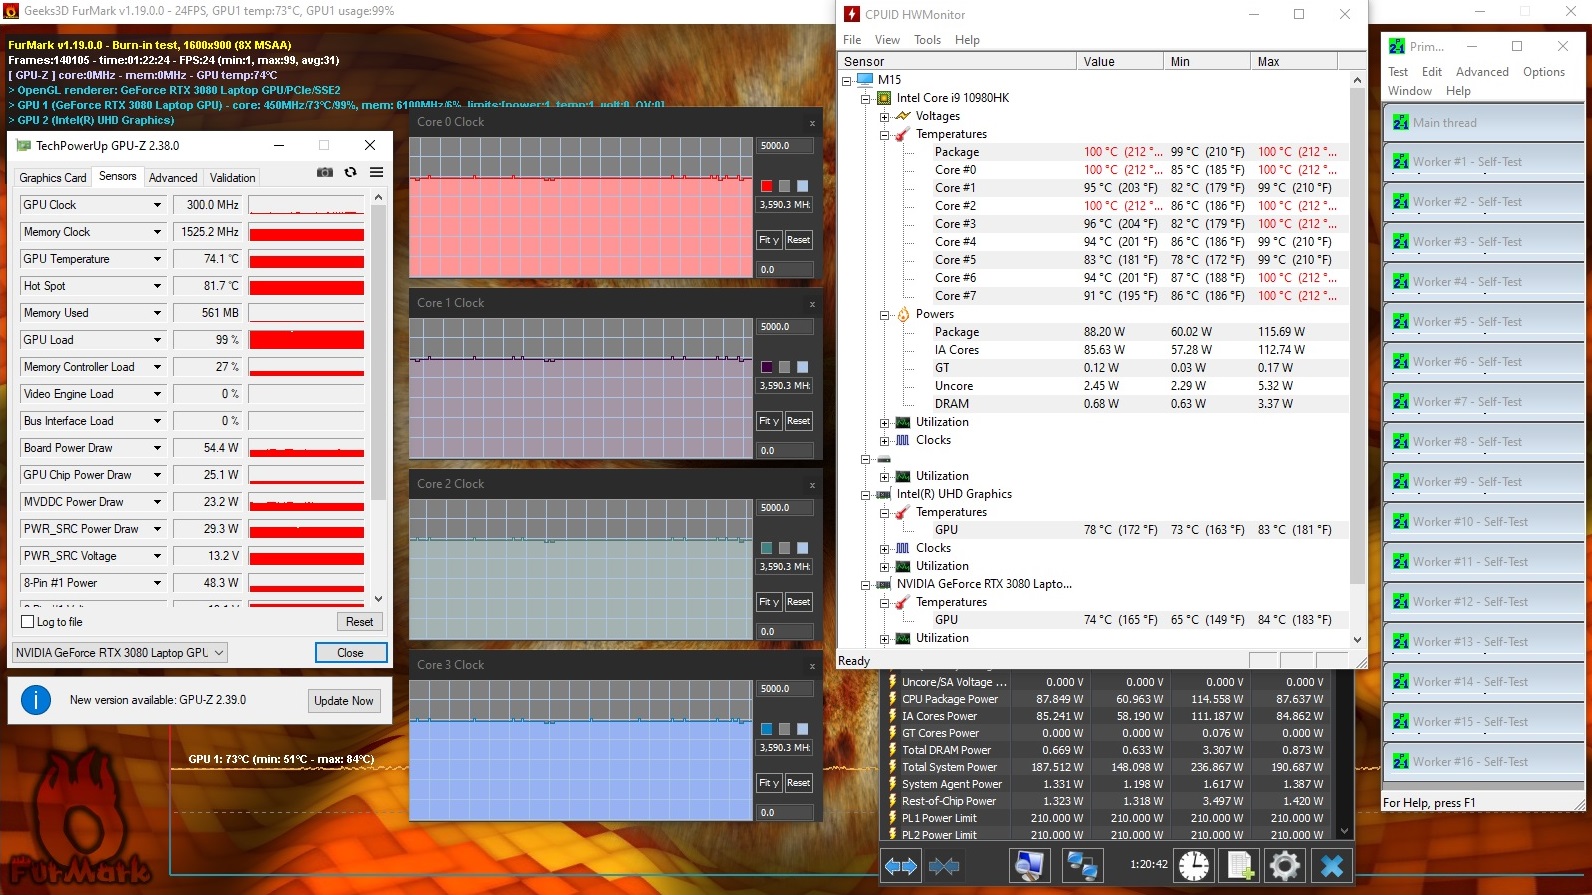
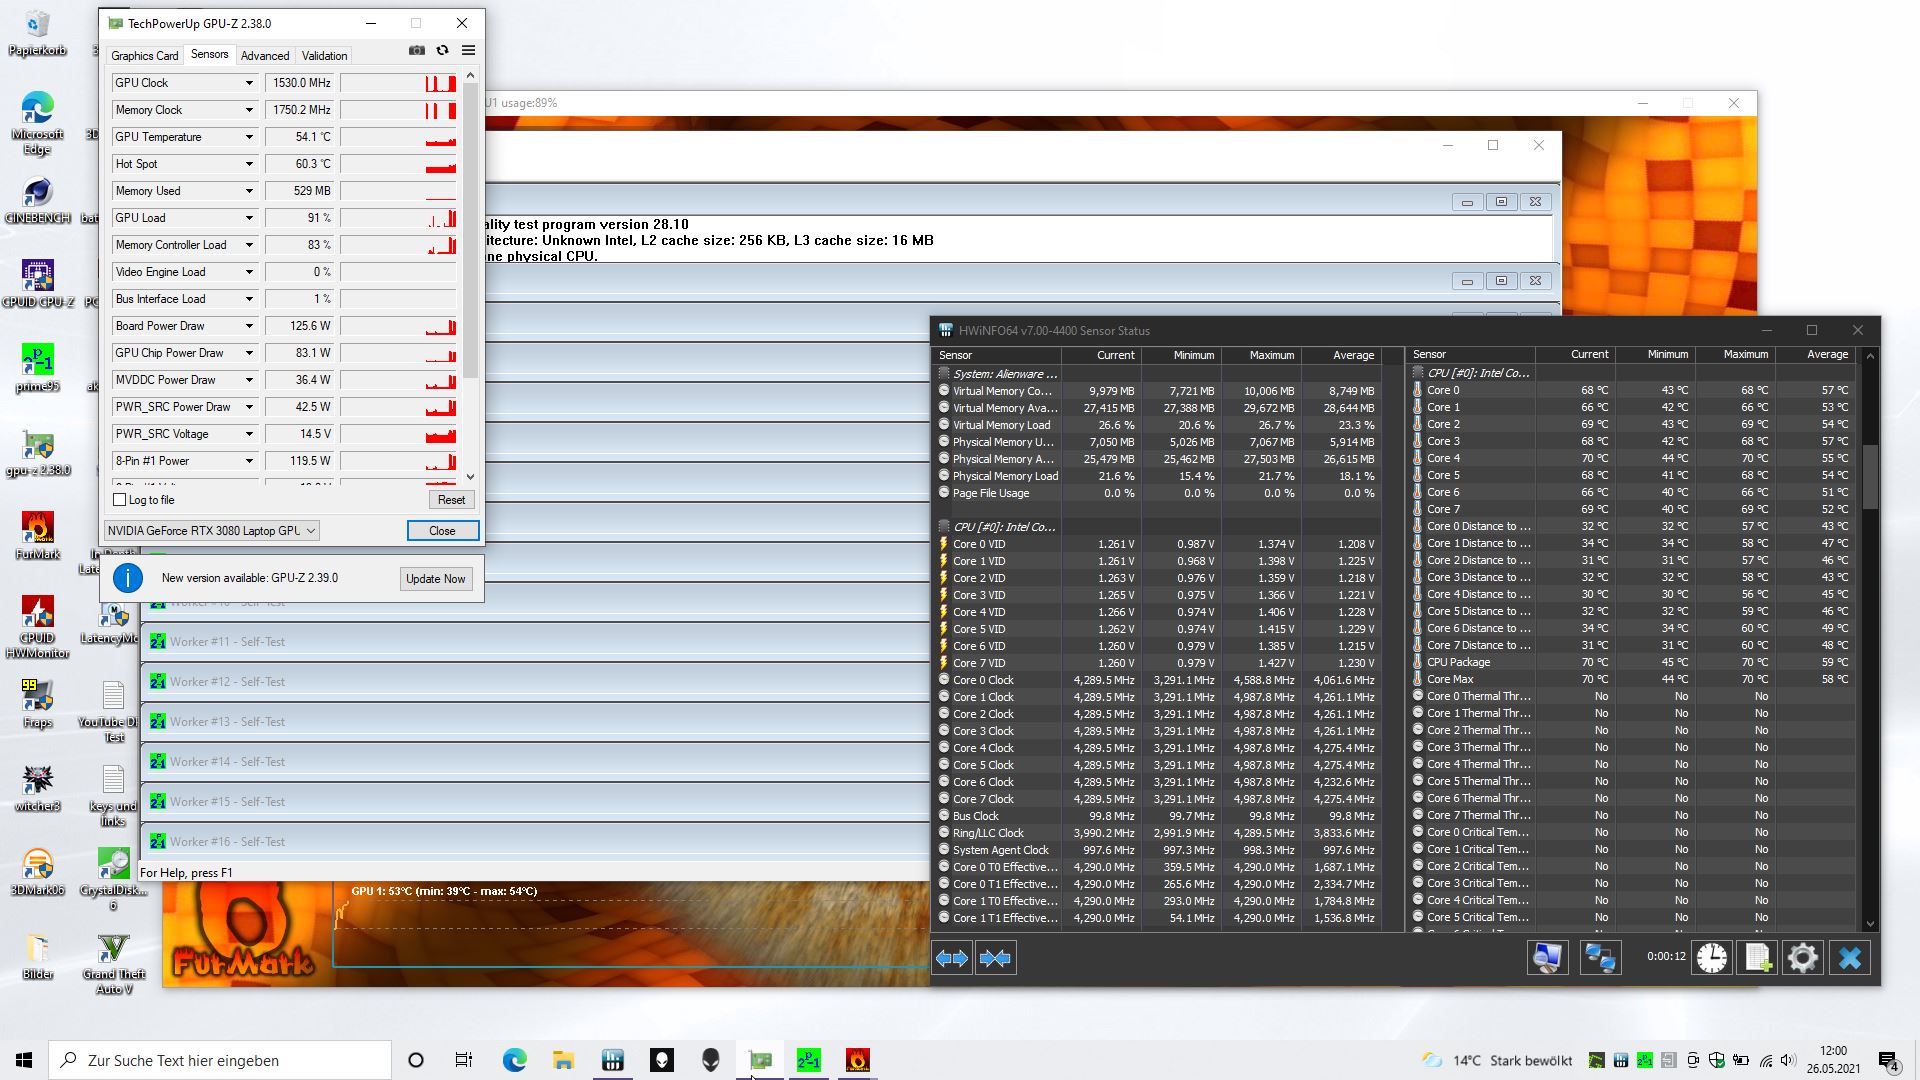
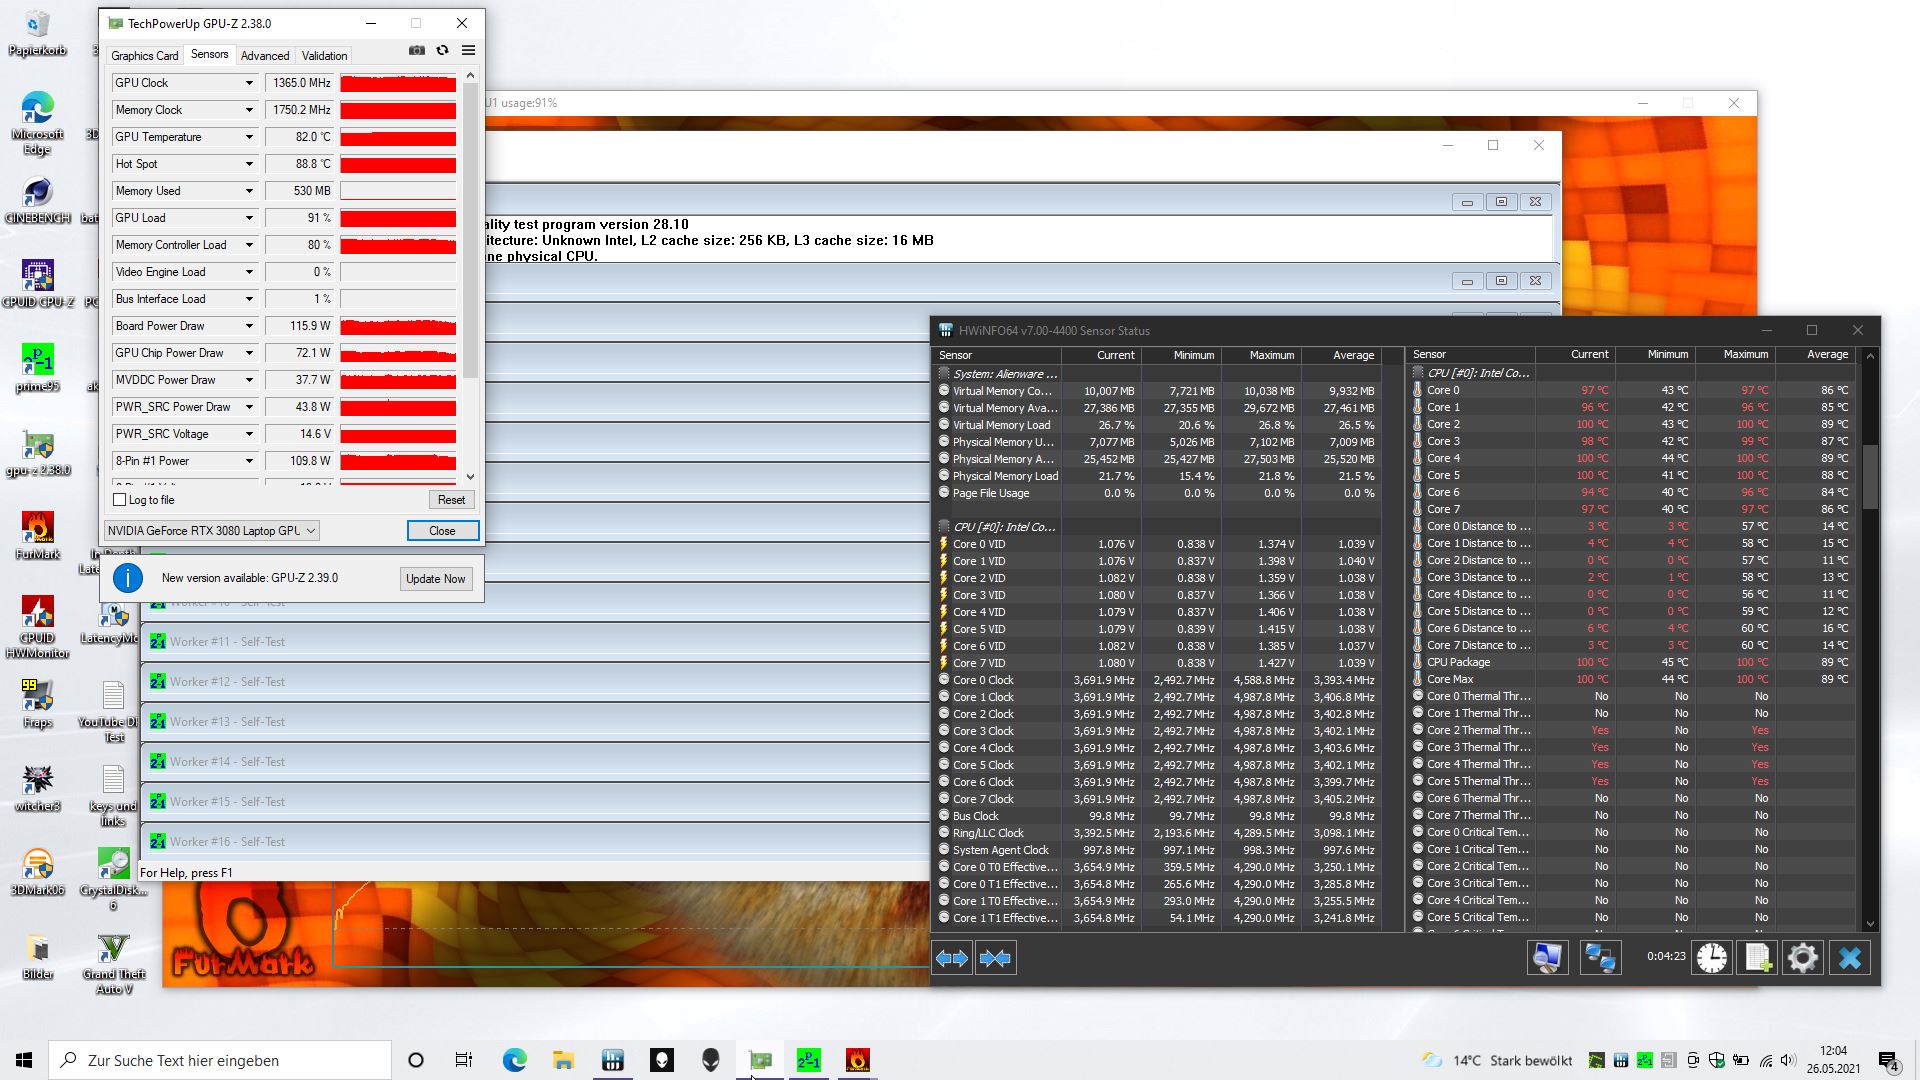
All cores begin the stress test at around 4.3 GHz, but the core temperature is already at 100 °C (~212 °F) and above after just a few seconds, so that thermal throttling kicks in. The clock speed drops to 2.6 GHz at times, but it finally stabilizes between 3.3 and 3.7 GHz, whereby the core temperatures actually remain constantly just below the 100 °C mark (~212 °F) starting at minute 4.
This means that the Alienware laptop has to deal with consistently very high CPU core temperatures in exchange for its rather high performance, which could possibly have a negative impact on the laptop's longevity, at least in performance mode.
Speakers
The stereo speakers are quite decent for this class. They are comparatively loud, reproduce high and even low tones relatively linearly, and there's even some bass present. Nevertheless, due to the high fan volume when gaming, it's recommended to use a headset that can be connected via a combined headset jack.
Alienware m15 R4 RTX 3080 audio analysis
(+) | speakers can play relatively loud (85 dB)
Bass 100 - 315 Hz
(±) | reduced bass - on average 12.3% lower than median
(±) | linearity of bass is average (9.6% delta to prev. frequency)
Mids 400 - 2000 Hz
(±) | higher mids - on average 6.3% higher than median
(±) | linearity of mids is average (7.1% delta to prev. frequency)
Highs 2 - 16 kHz
(±) | higher highs - on average 5.7% higher than median
(+) | highs are linear (6.3% delta to prev. frequency)
Overall 100 - 16.000 Hz
(+) | overall sound is linear (14.5% difference to median)
Compared to same class
» 25% of all tested devices in this class were better, 6% similar, 69% worse
» The best had a delta of 6%, average was 18%, worst was 132%
Compared to all devices tested
» 15% of all tested devices were better, 3% similar, 82% worse
» The best had a delta of 4%, average was 25%, worst was 134%
SCHENKER XMG Pro 15 (Early 2021, RTX 3080) audio analysis
(+) | speakers can play relatively loud (84 dB)
Bass 100 - 315 Hz
(-) | nearly no bass - on average 27.2% lower than median
(+) | bass is linear (6.2% delta to prev. frequency)
Mids 400 - 2000 Hz
(±) | reduced mids - on average 5.7% lower than median
(±) | linearity of mids is average (7% delta to prev. frequency)
Highs 2 - 16 kHz
(+) | balanced highs - only 4.6% away from median
(+) | highs are linear (5.4% delta to prev. frequency)
Overall 100 - 16.000 Hz
(±) | linearity of overall sound is average (20.1% difference to median)
Compared to same class
» 68% of all tested devices in this class were better, 7% similar, 25% worse
» The best had a delta of 6%, average was 18%, worst was 132%
Compared to all devices tested
» 46% of all tested devices were better, 8% similar, 45% worse
» The best had a delta of 4%, average was 25%, worst was 134%
Energy management - Wasteful Alien
Energy consumption
The sibling model already had pretty high power consumption, and switching from an RTX 3070 to an RTX 3080 increases it further - or so you would think. However, consumption isn't really higher but rather comparable with that of the sibling model. However, the rest of the competition is significantly more economical across all load conditions. Whether this justifies the performance plus of the Alienware is up to each individual user. On the other hand, too much energy is transformed into waste heat in the m15 R4.
We measure a maximum of 246 watts, and the Alien device consumes 193 watts in The Witcher 3. Therefore, the slim (~2.5 cm) but rather large (~19.9 x 9.9 cm) 240-watt power adapter should provide enough energy.
| Off / Standby | |
| Idle | |
| Load |
|
| Alienware m15 R4 RTX 3080 i9-10980HK, GeForce RTX 3080 Laptop GPU | Alienware m15 R4 i9-10980HK, GeForce RTX 3070 Laptop GPU | Alienware m15 R3 P87F i7-10750H, GeForce RTX 2070 Mobile | Razer Blade 15 Advanced Model Early 2021 i7-10875H, GeForce RTX 3080 Laptop GPU | Asus ROG Zephyrus G15 GA503Q R9 5900HS, GeForce RTX 3080 Laptop GPU | SCHENKER XMG Pro 15 (Early 2021, RTX 3080) i7-10870H, GeForce RTX 3080 Laptop GPU | Average of class Gaming | |
|---|---|---|---|---|---|---|---|
| Power Consumption | 0% | -8% | 45% | 47% | 40% | 34% | |
| Idle Minimum * | 37 | 35 5% | 34 8% | 13 65% | 10 73% | 8 78% | 13.8 ? 63% |
| Idle Average * | 40 | 39 2% | 48.6 -22% | 15 62% | 12 70% | 13 67% | 19.2 ? 52% |
| Idle Maximum * | 53 | 48 9% | 58.2 -10% | 22 58% | 17 68% | 22 58% | 27 ? 49% |
| Load Average * | 121 | 135 -12% | 129.4 -7% | 98 19% | 108 11% | 97 20% | 111.3 ? 8% |
| Witcher 3 ultra * | 193 | 194 -1% | 214.5 -11% | 126 35% | 123 36% | 179 7% | |
| Load Maximum * | 246 | 252 -2% | 257.3 -5% | 165 33% | 182 26% | 225 9% | 251 ? -2% |
* ... smaller is better
Battery life
The high consumption suggested that battery life wouldn't be very good. But our measurements are even below our conservative expectations, as well as below the already weak values of the sibling model with the RTX 3070, even after having switched back to Balanced mode. If you want to play games on the go, you should expect a weak 45 minutes of The Witcher 3. You can only watch a movie on the go if it's not two hours long, so goodbye to binge-watching. It might be possible to save some more energy using the silent fan mode, but the competition is sometimes miles ahead with roughly the same battery size.
| Alienware m15 R4 RTX 3080 i9-10980HK, GeForce RTX 3080 Laptop GPU, 86 Wh | Alienware m15 R4 i9-10980HK, GeForce RTX 3070 Laptop GPU, 86 Wh | Alienware m15 R3 P87F i7-10750H, GeForce RTX 2070 Mobile, 86 Wh | Razer Blade 15 Advanced Model Early 2021 i7-10875H, GeForce RTX 3080 Laptop GPU, 80 Wh | Asus ROG Zephyrus G15 GA503Q R9 5900HS, GeForce RTX 3080 Laptop GPU, 90 Wh | SCHENKER XMG Pro 15 (Early 2021, RTX 3080) i7-10870H, GeForce RTX 3080 Laptop GPU, 73 Wh | Average of class Gaming | |
|---|---|---|---|---|---|---|---|
| Battery Runtime | 33% | 25% | 309% | 257% | 200% | 162% | |
| H.264 | 114 | 536 370% | 332 191% | 399 ? 250% | |||
| WiFi v1.3 | 110 | 164 49% | 167 52% | 538 389% | 564 413% | 433 294% | 368 ? 235% |
| Witcher 3 ultra | 46 | 80.6 ? 75% | |||||
| Load | 45 | 52 16% | 44 -2% | 120 167% | 90 100% | 97 116% | 84.2 ? 87% |
| Reader / Idle | 220 | 299 | 866 | 728 | 506 | 544 ? |
Pros
Cons
Verdict - Convincing performance, poor cooling-system optimizations
Dell focused completely on performance with the Alienware m15 R4, and the gaming laptop can also make good use of it. However, the automatically associated drawbacks like fan noise and temperatures are particularly glaring in the Alienware device. While the statement "Vapor Chamber saves the day" was still true for cooling a year ago, even this solution is no longer able to fully cope with the high waste heat generated by the performance-geared m15 R4. The sibling model with the RTX 3070 also has a TGP of 140 watts and is therefore only slightly slower but (somewhat) less expensive.
The Alienware with the RTX 3080 and a mechanical keyboard is a performance monster in its class, but it doesn't solve the associated problems regarding noise and waste heat very well. Another shortcoming is the almost unacceptable battery life compared to the competition.
Price and availability
You can find the Alienware m15 R4 with the RTX 3080 in Dell's online store at a current price of $3,099.99 (Core i9-10980HK, RTX 3080, 32 GB of RAM, 1 TB RAID 0 storage, 300 Hz Full HD display). Configurations with the i7-10870H start at $1,579.99.
Alternatively, you can also wait for the device to be available in other online stores such as Amazon or Best Buy.
Alienware m15 R4 RTX 3080
-
06/04/2021 v7
Christian Hintze
More articles related to this device
Alienware m15 R4 RTX 3080 (m15 Series)Related Articles


Pricecompare

