

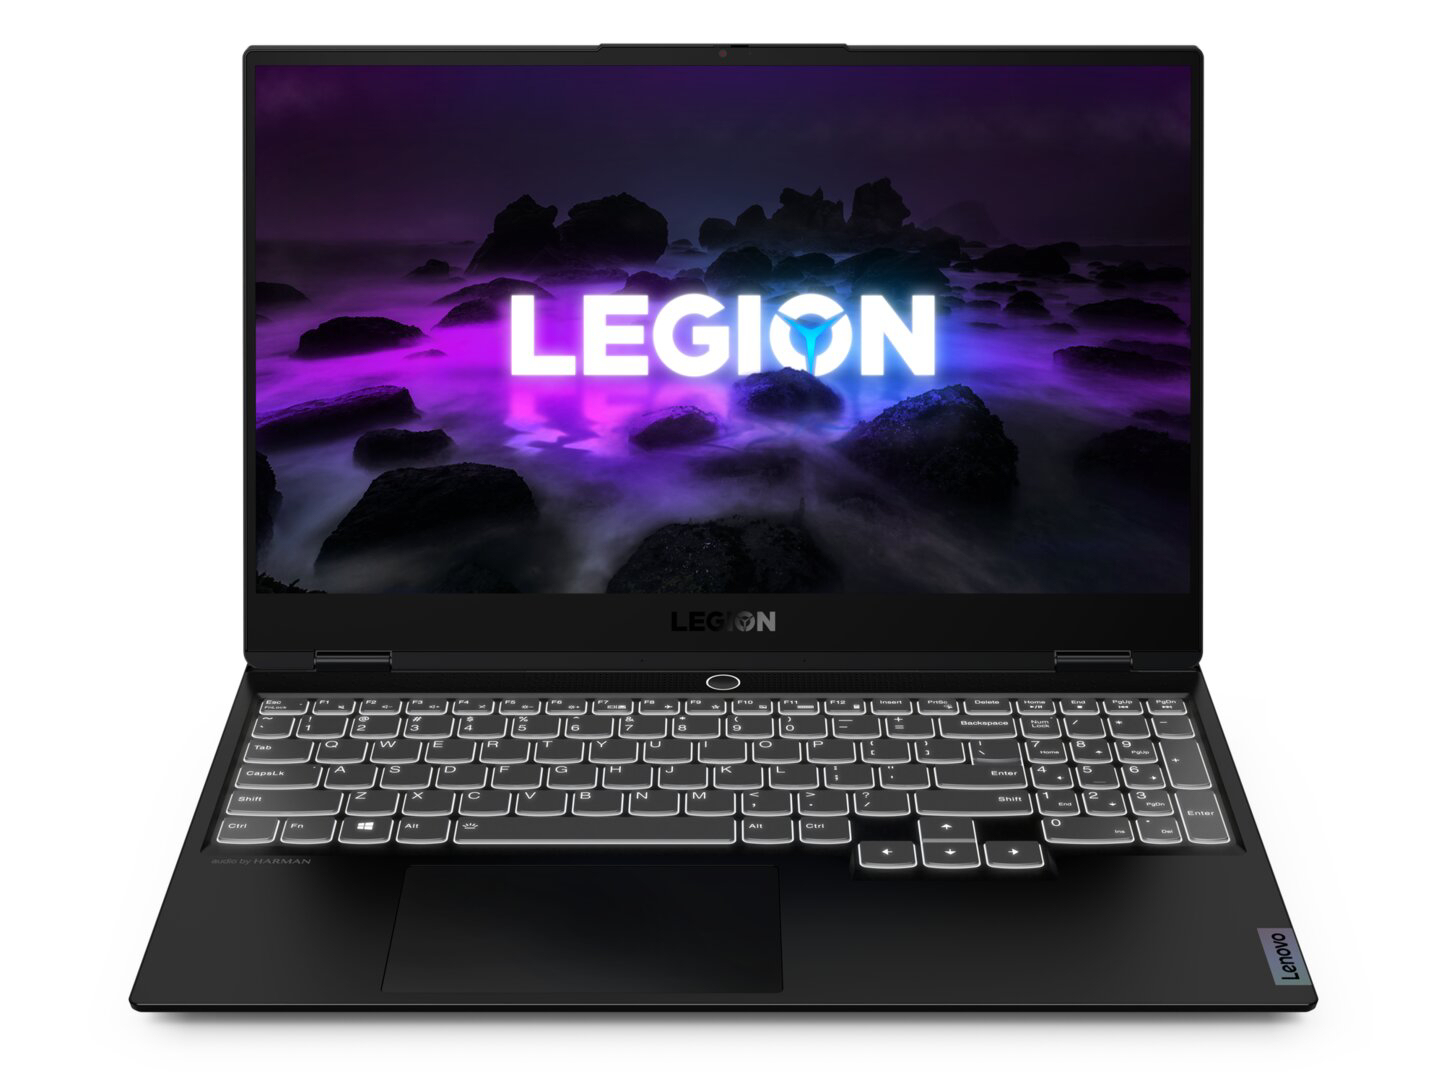
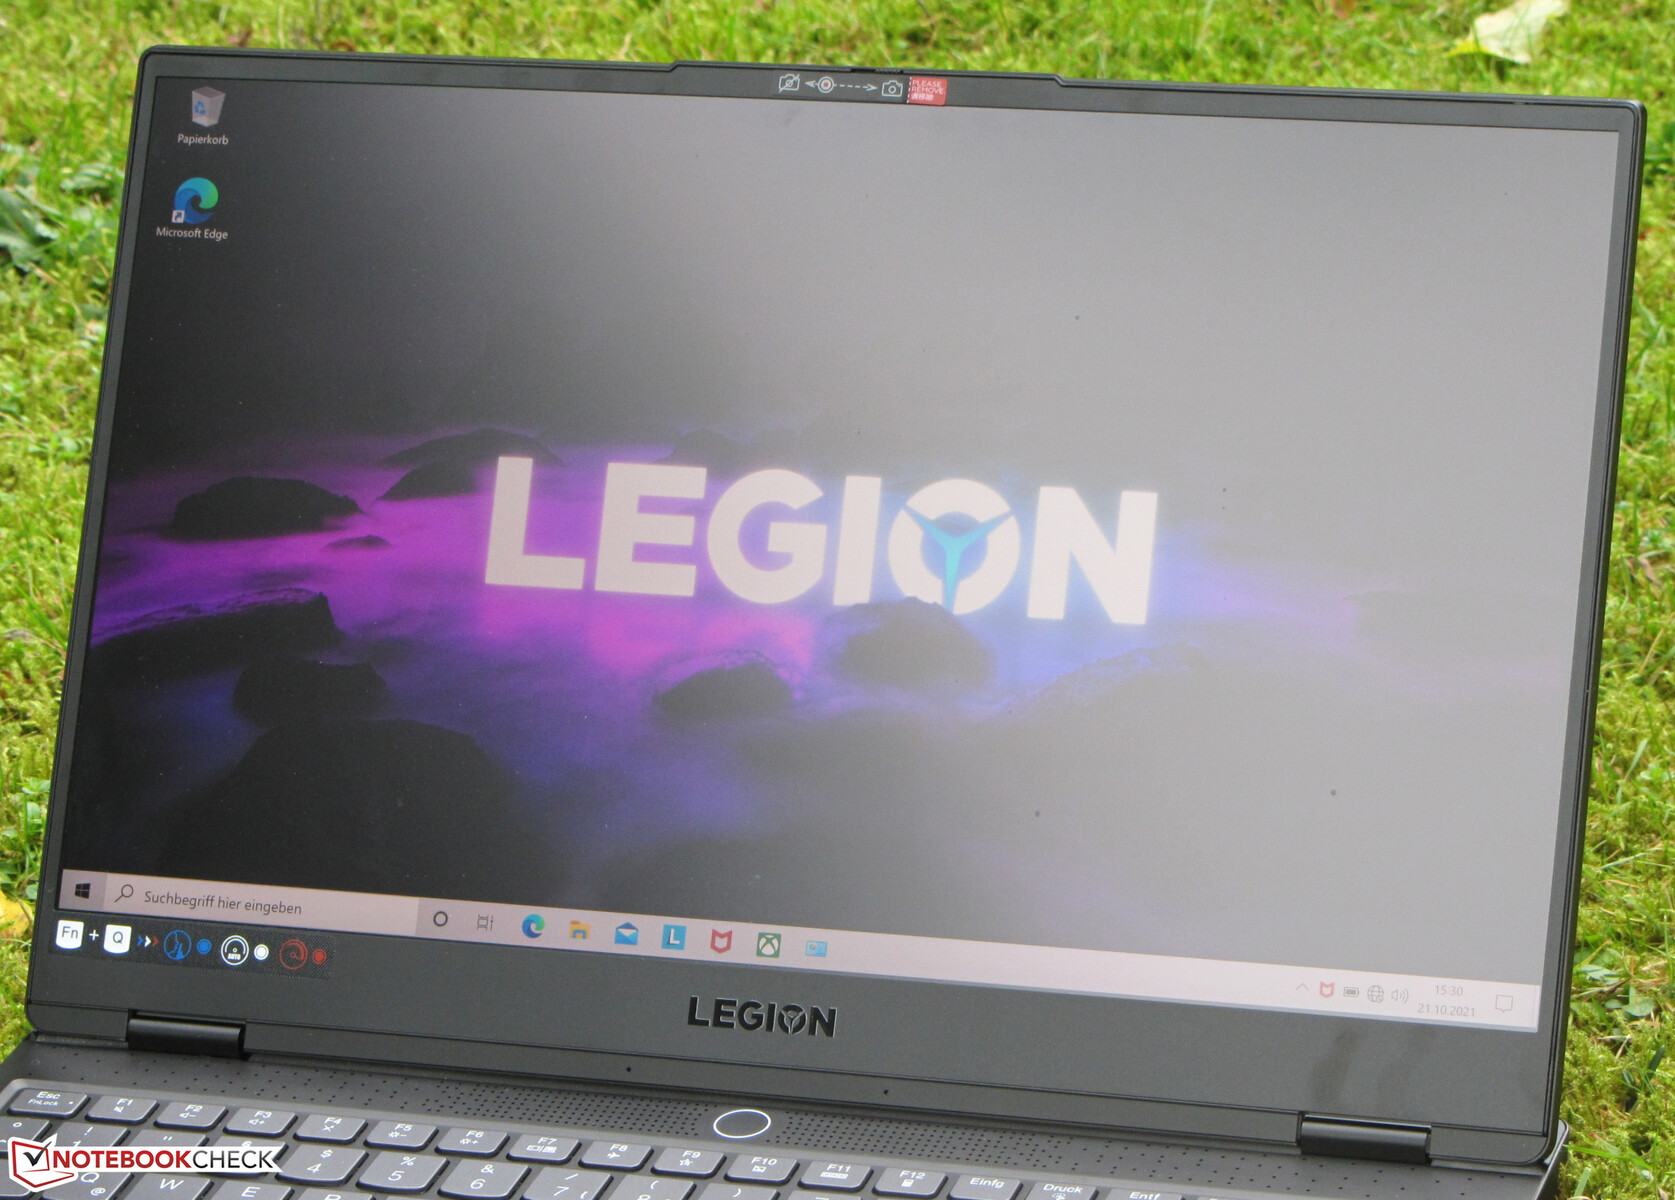
Lenovo Legion S7 15ACH6 in review: 4K gaming laptop with good battery life

With the Legion S7, Lenovo has a compact and lightweight 15.6-inch gaming laptop in its lineup. Our review sample - a series top model - should be available for around 1,900 to 2,000 Euros (~$2,194 to ~$2,309). Its configuration level is correspondingly good: A Ryzen 9 5900HX APU, the GeForce RTX 3060 laptop GPU, 32 GB of RAM, and a 1 TB NVMe SSD. The highlight of the laptop is the bright 4K display.
Competitors include devices like the Alienware m15 R5 Ryzen Edition, the MSI Delta 15 A5EFK, the Acer Nitro 5 AN515-45, and the Razer Blade 15 Base Model 2021.
Possible contenders in comparison
Rating | Date | Model | Weight | Height | Size | Resolution | Price |
|---|---|---|---|---|---|---|---|
| 87.9 % v7 (old) | 11 / 2021 | Lenovo Legion S7 15ACH6 82K80030GE R9 5900HX, GeForce RTX 3060 Laptop GPU | 2 kg | 18.9 mm | 15.60" | 3840x2160 | |
| 85.5 % v7 (old) | 03 / 2021 | Razer Blade 15 Base Edition 2021, i7-10750H RTX 3060 i7-10750H, GeForce RTX 3060 Laptop GPU | 2.1 kg | 19.9 mm | 15.60" | 1920x1080 | |
| 82.9 % v7 (old) | 10 / 2021 | MSI Delta 15 A5EFK R9 5900HX, Radeon RX 6700M | 2 kg | 19 mm | 15.60" | 1920x1080 | |
| 84.7 % v7 (old) | 06 / 2021 | Alienware m15 R5 Ryzen Edition R7 5800H, GeForce RTX 3060 Laptop GPU | 2.5 kg | 22.85 mm | 15.60" | 1920x1080 | |
| 82.2 % v7 (old) | 08 / 2021 | Acer Nitro 5 AN515-45-R1JH R7 5800H, GeForce RTX 3070 Laptop GPU | 2.3 kg | 23.9 mm | 15.60" | 2560x1440 |
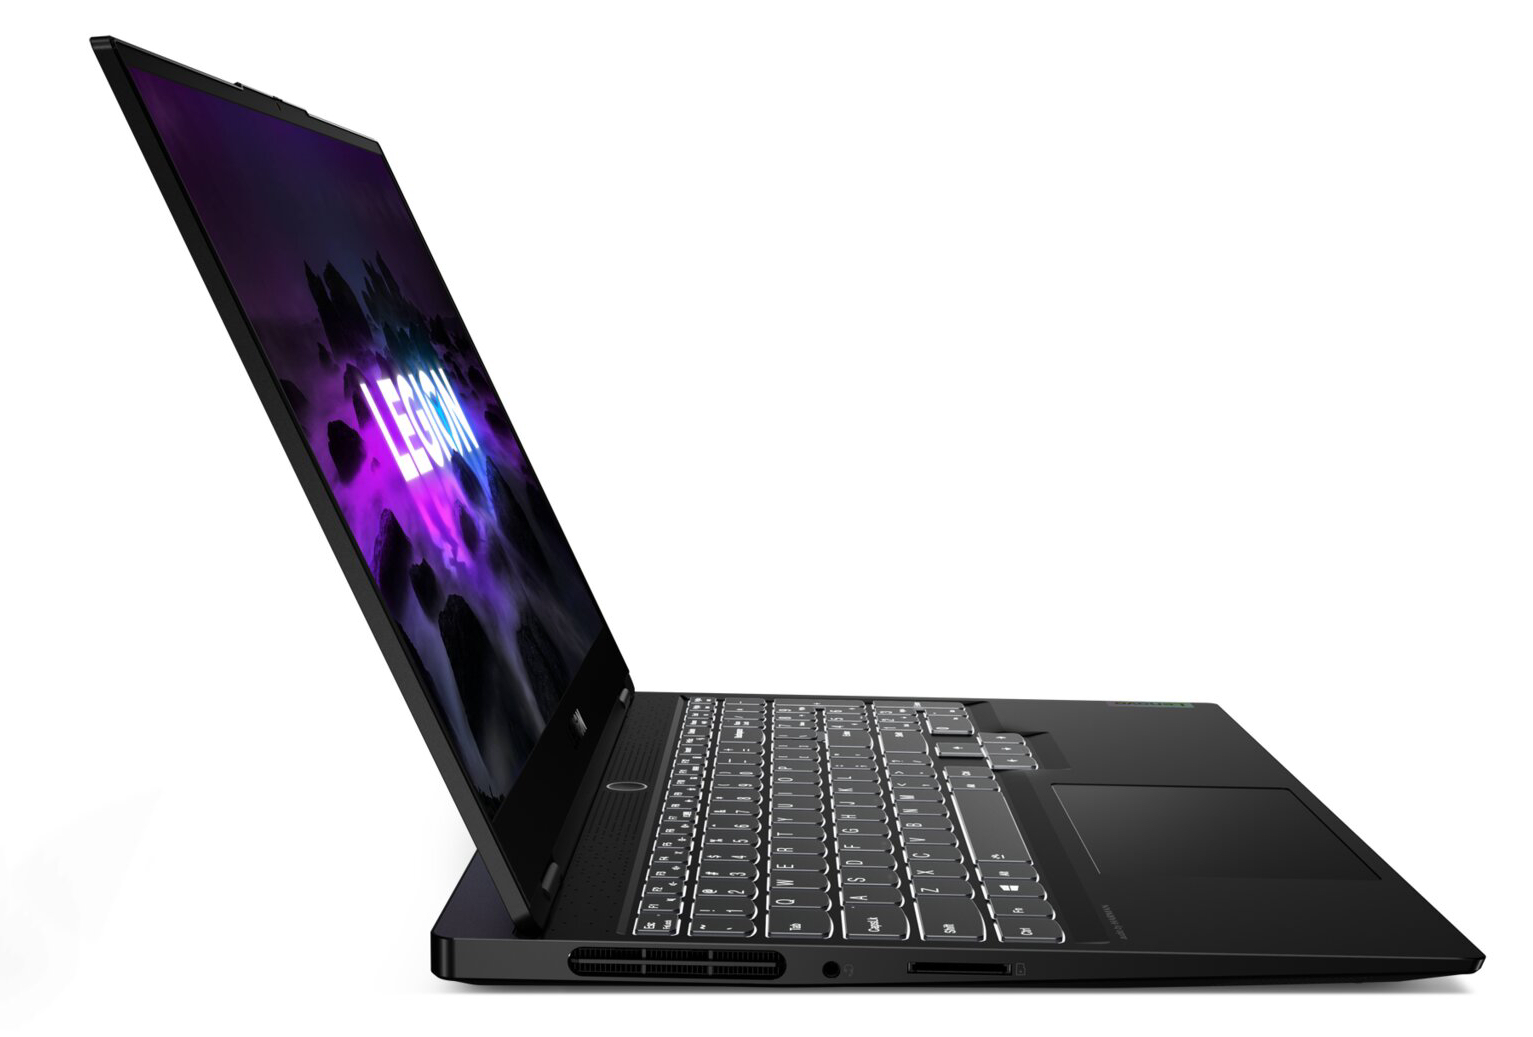
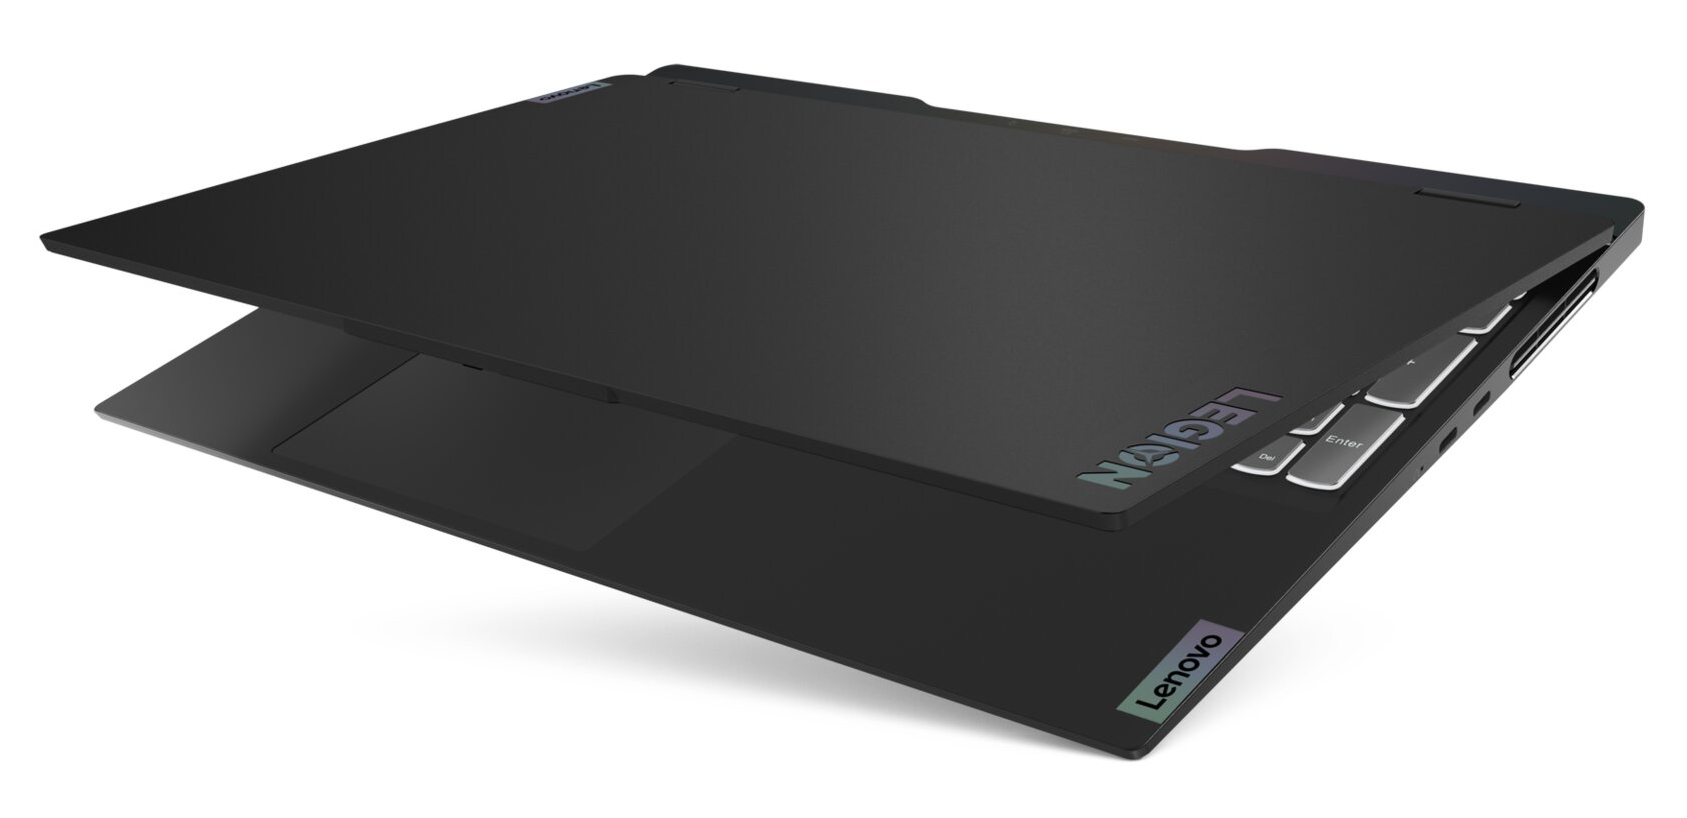
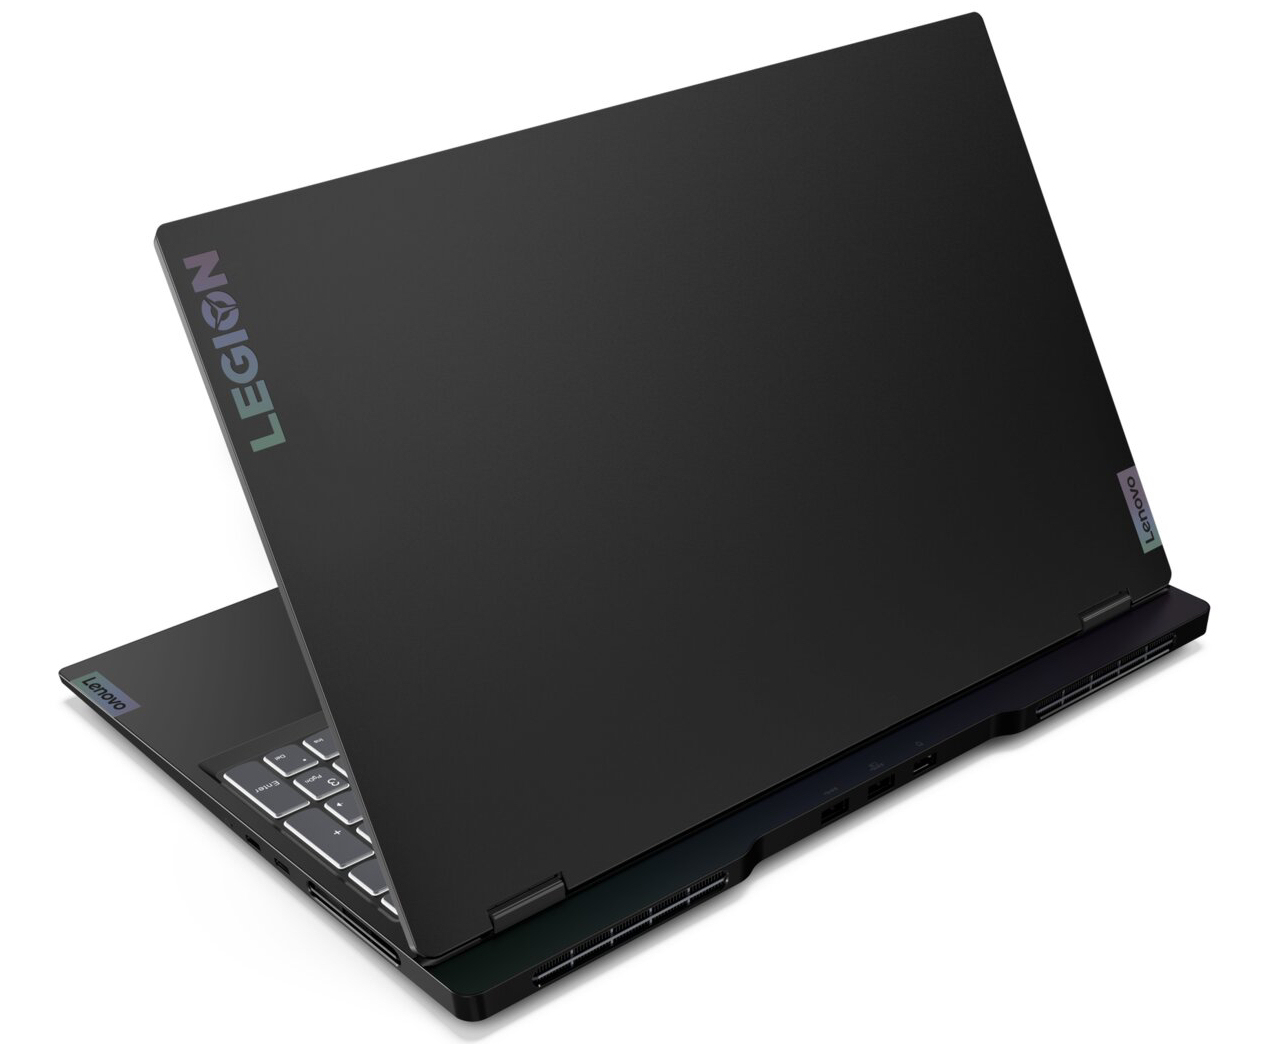
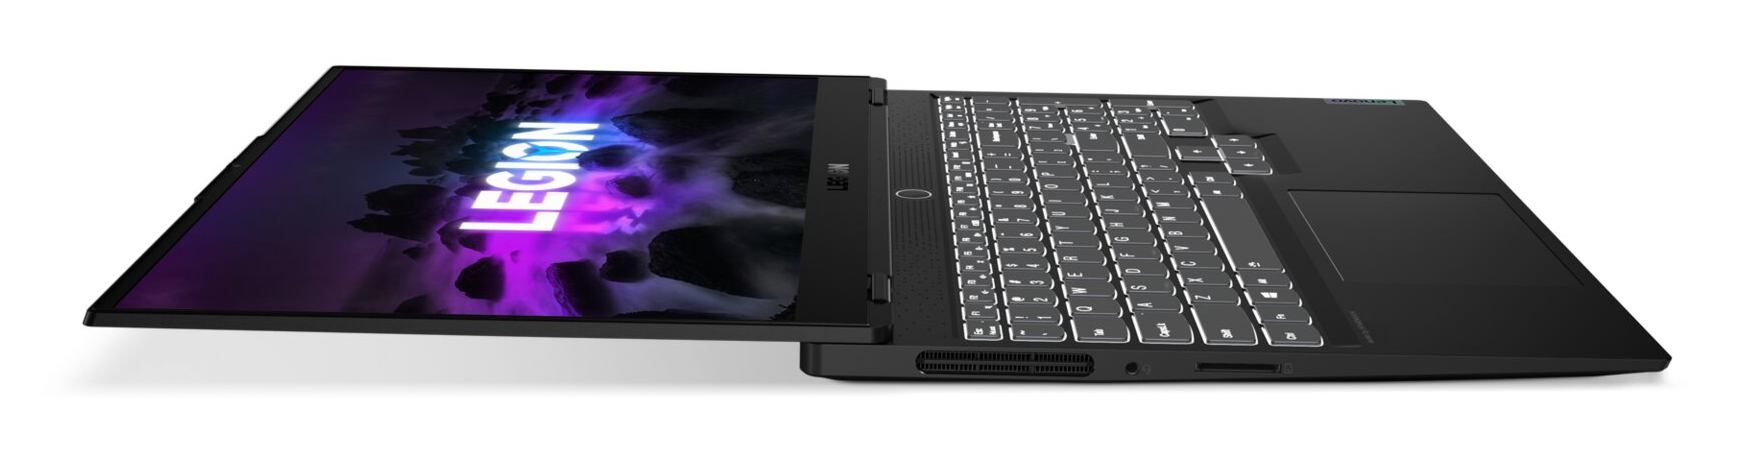
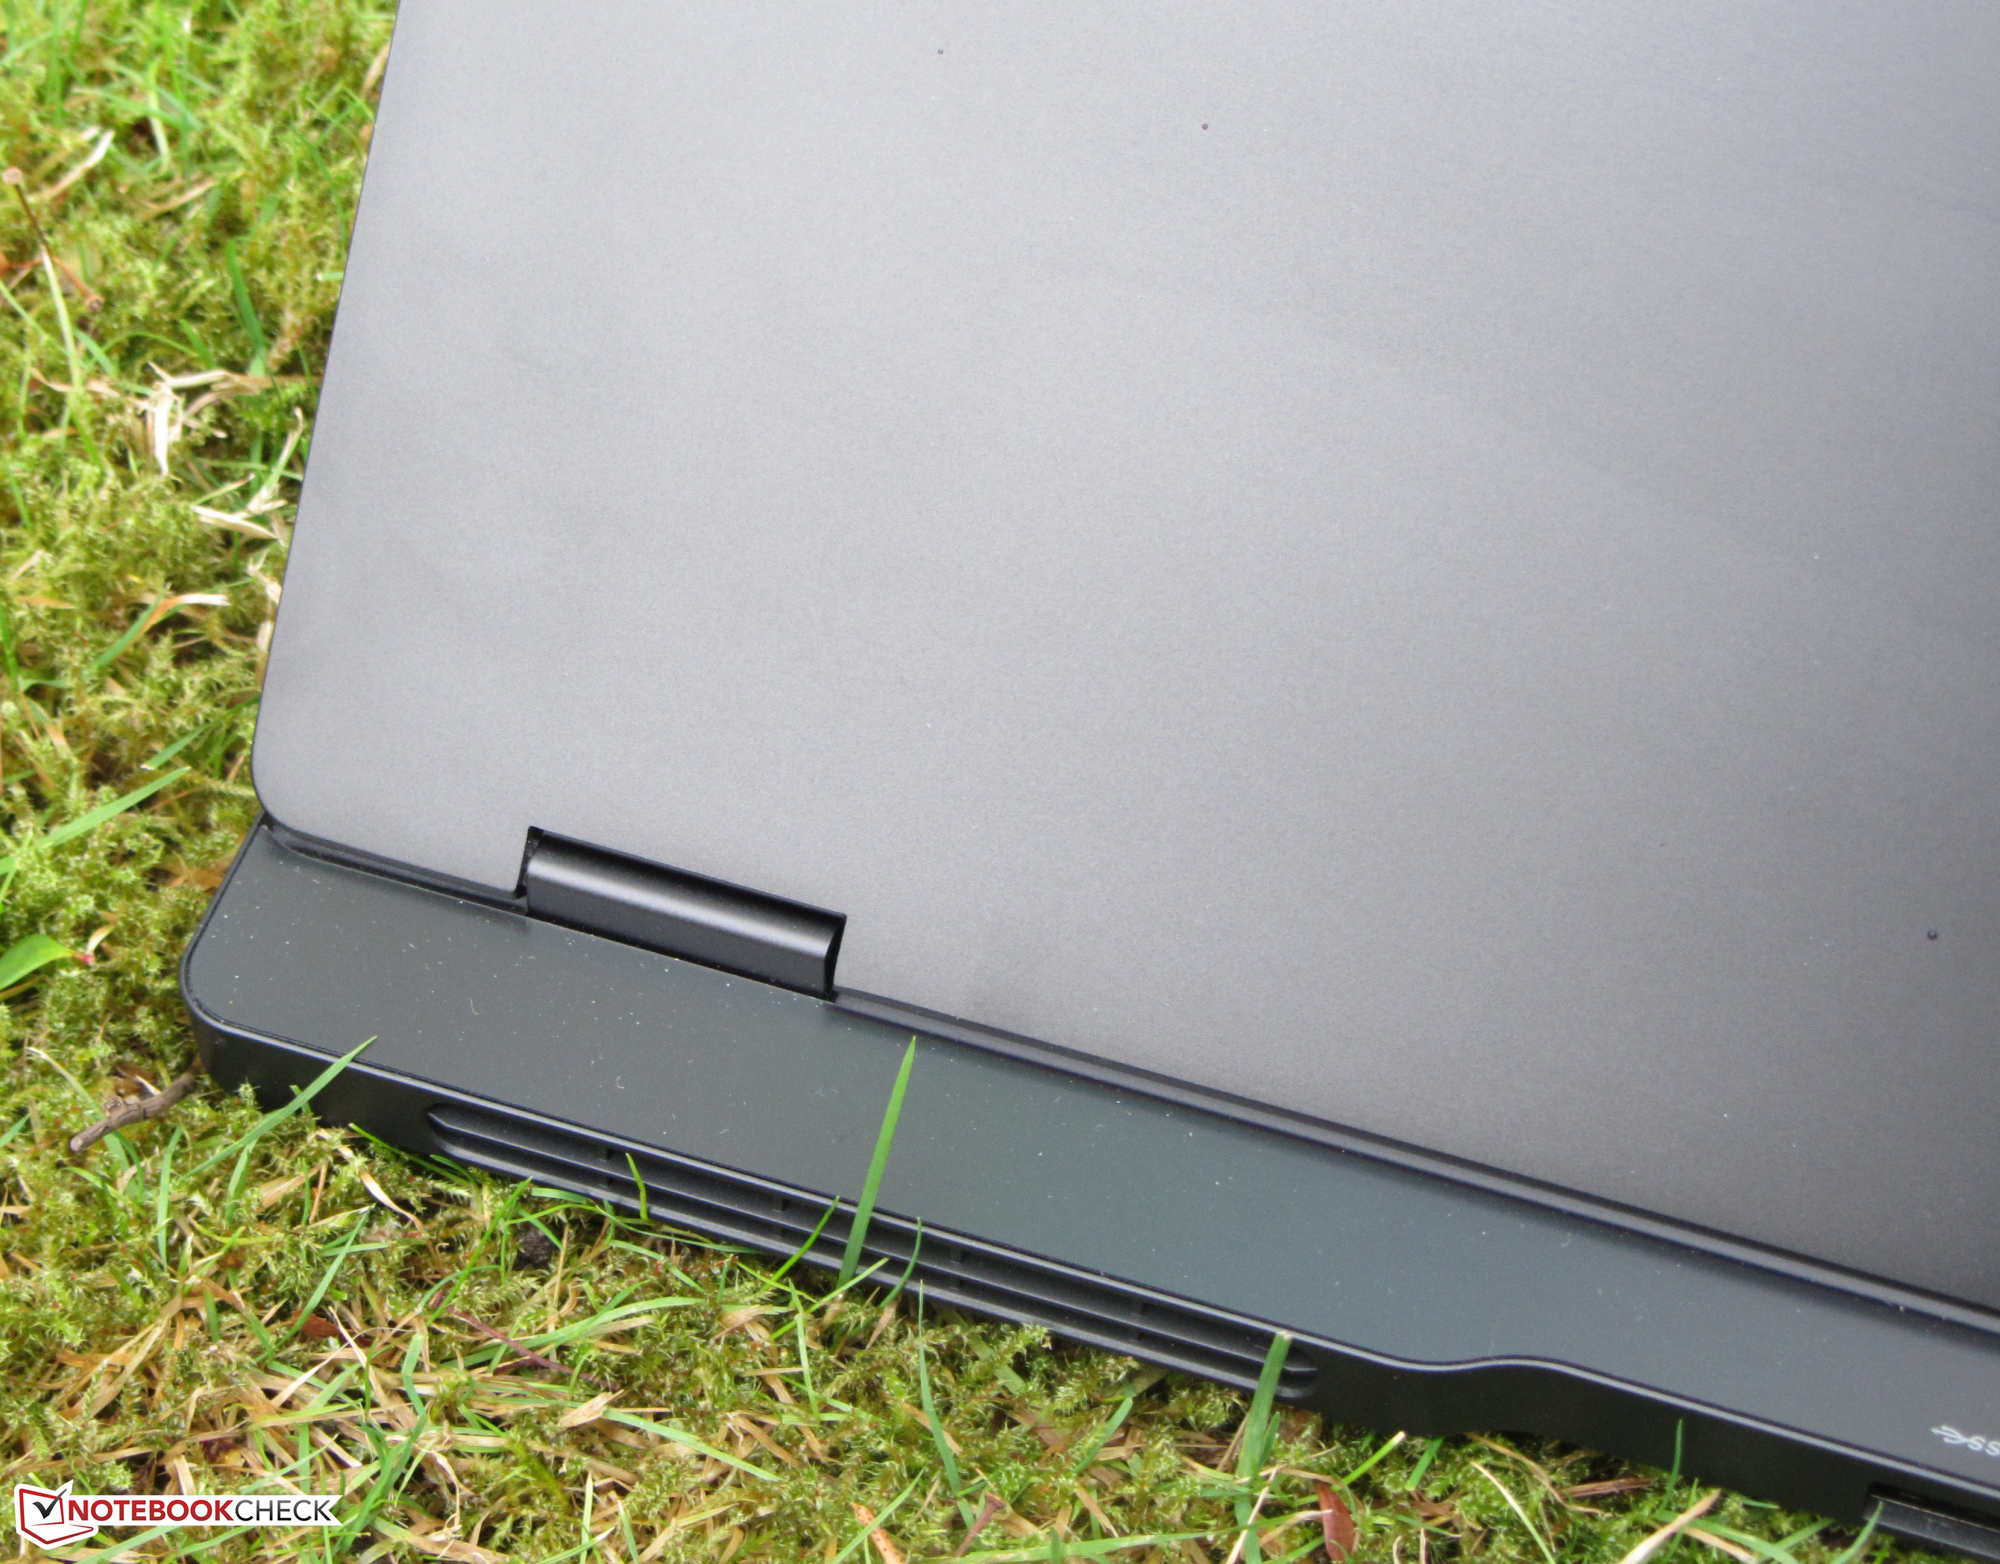
Case - Legion with aluminum chassis
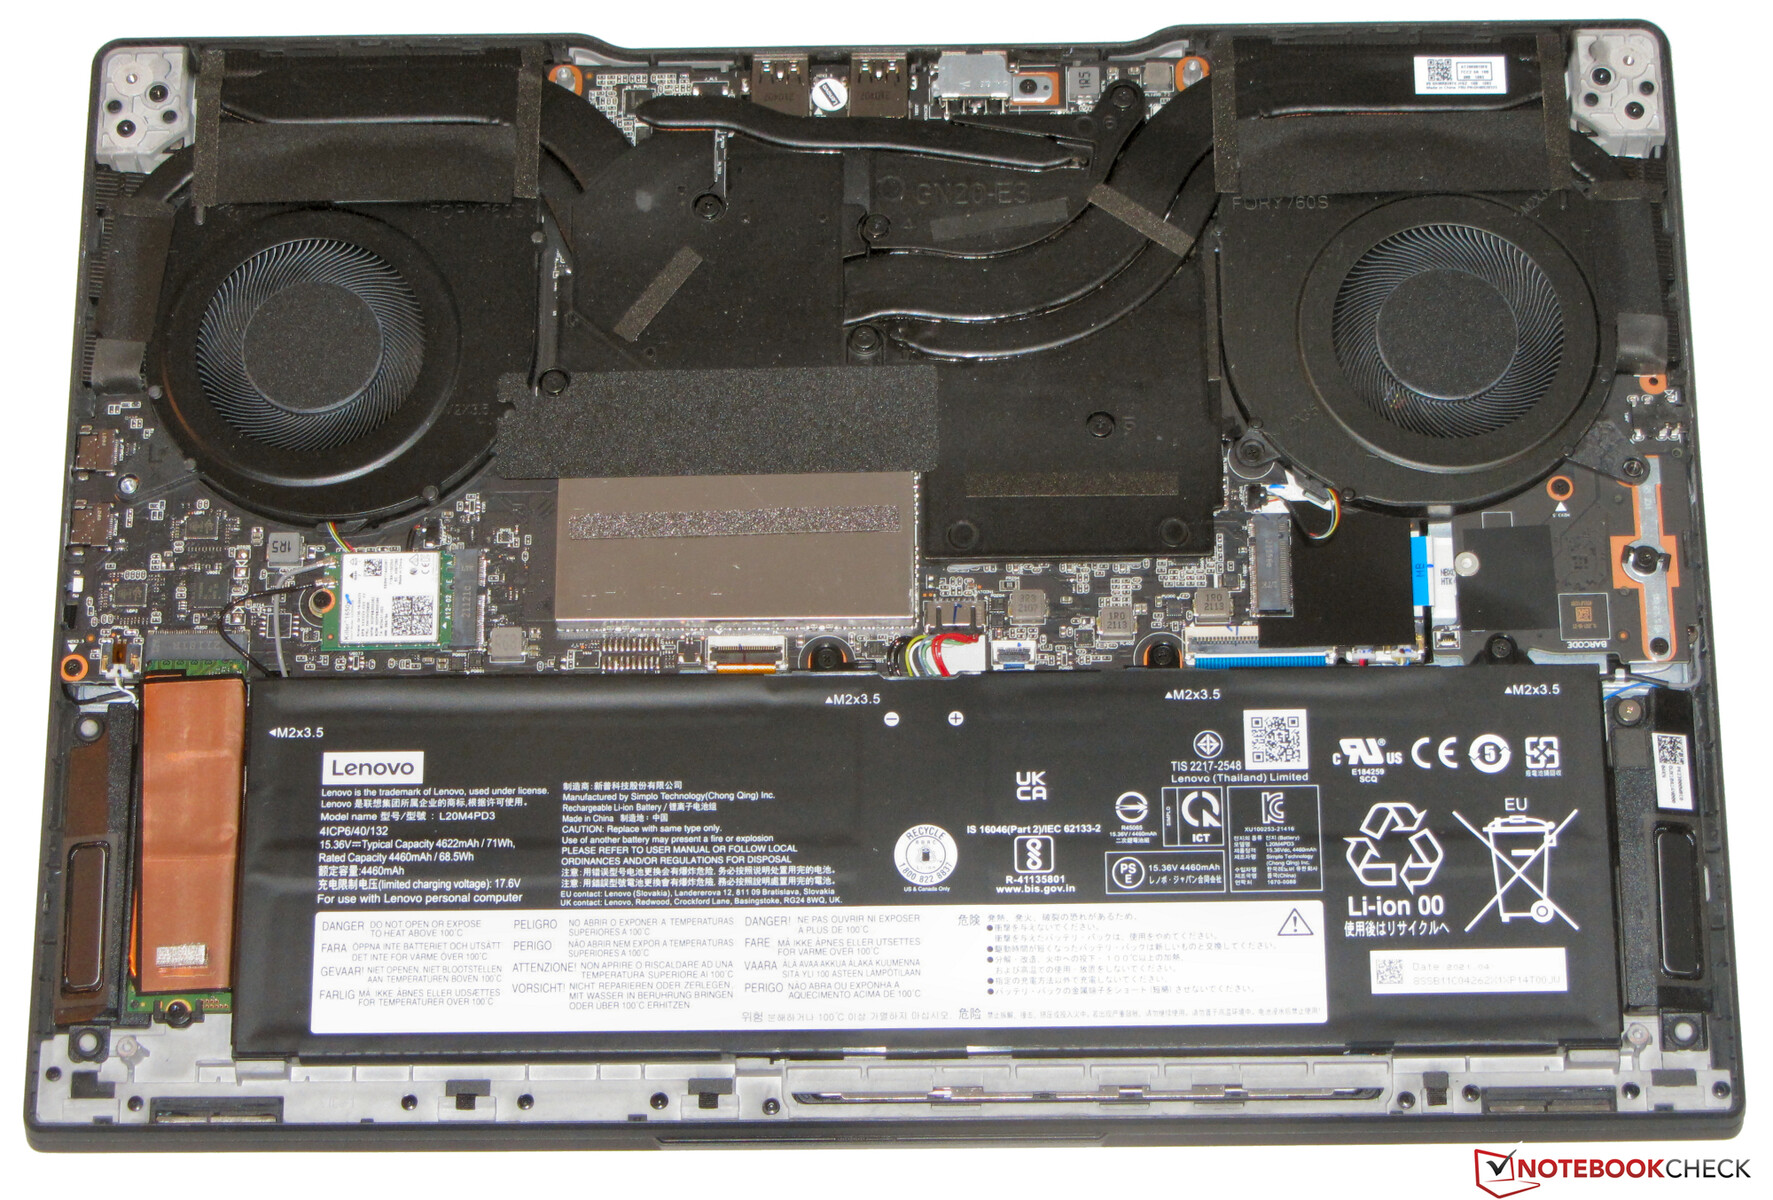
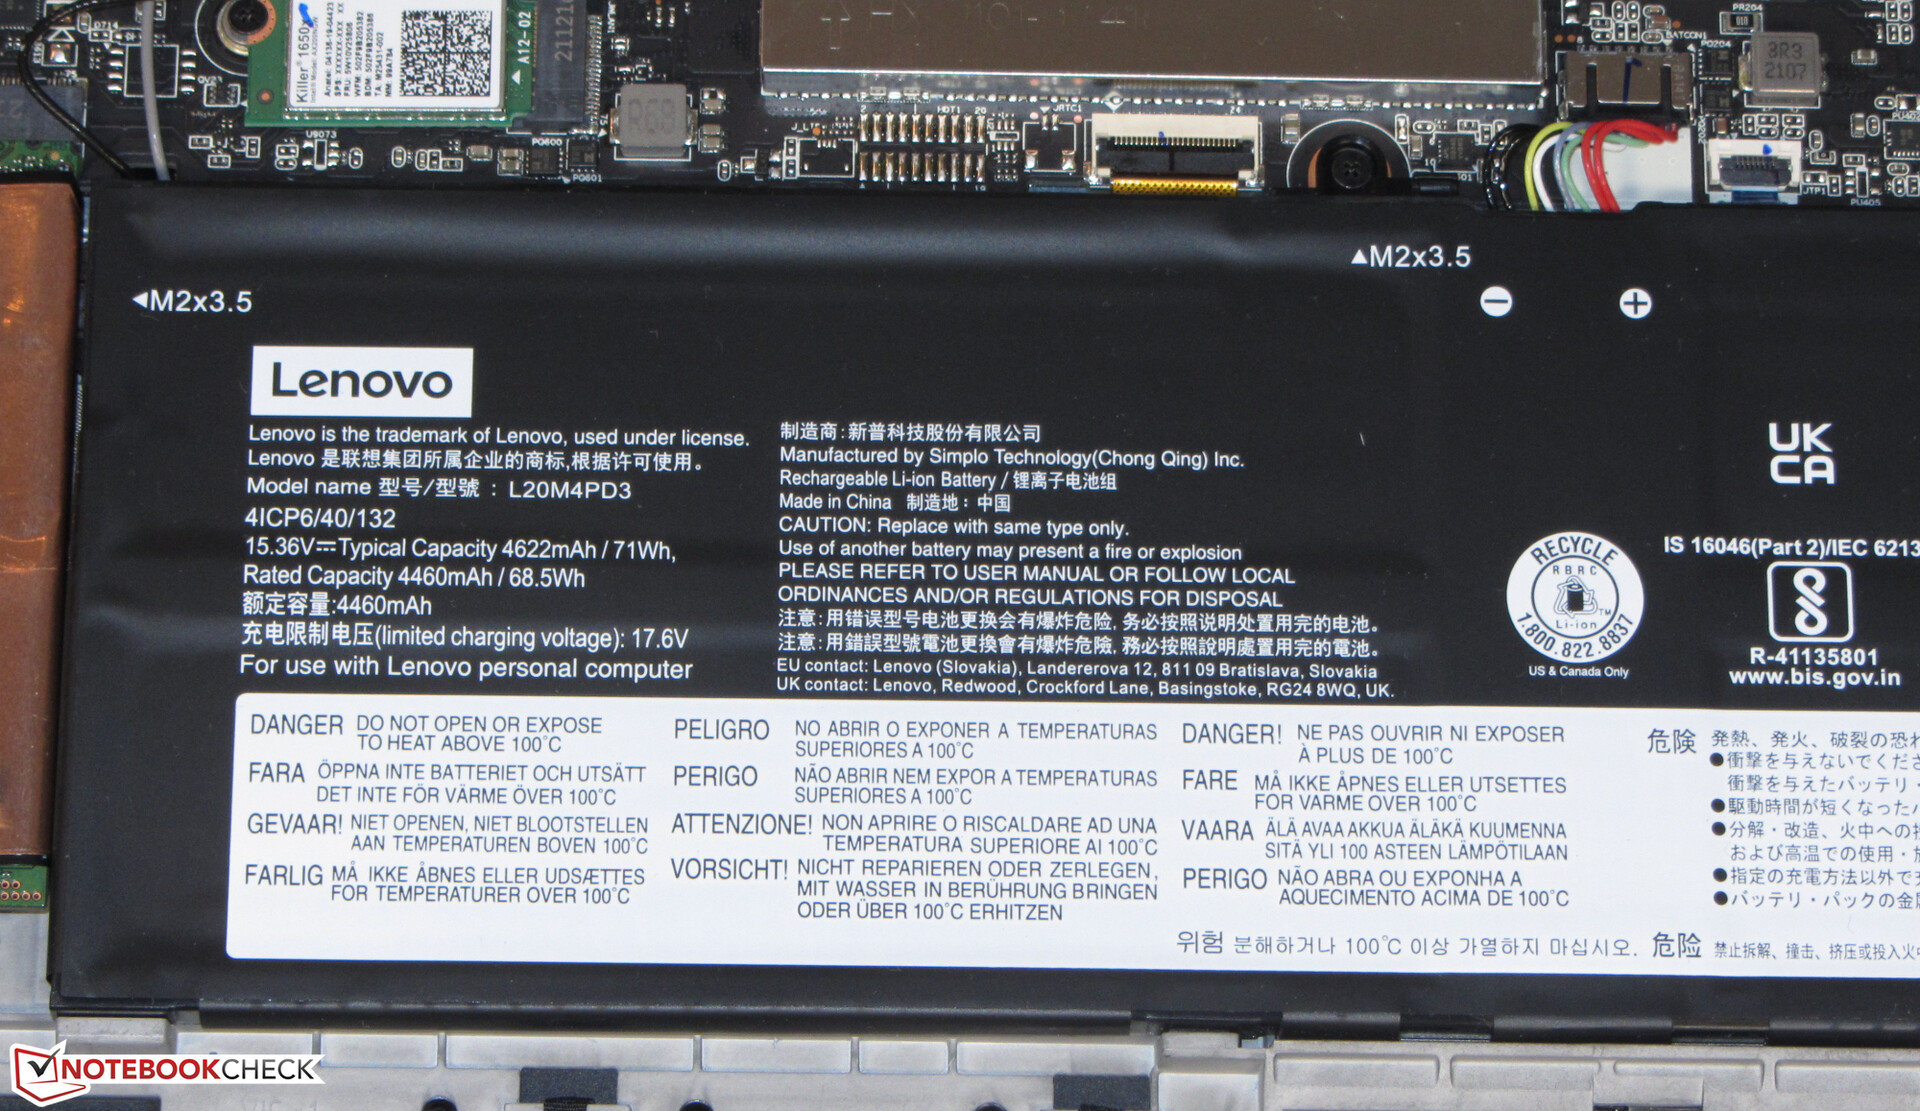
The chassis of the Legion S7 adheres to the familiar Lenovo Legion design: The lid is not flush with the back, but it is offset by a few millimeters towards the keyboard - in the case of our test device, this is just under 20 mm. Lenovo has opted for a black (Shadow Black) aluminum case with matte, smooth surfaces. The keyboard's RGB lighting provides some color accents. The battery is firmly built into the device. The internals are accessible after removing the bottom cover.
The laptop doesn't reveal any shortcomings in workmanship and/or stability. The gaps are accurate, and there are no material protrusions. Both the base unit and the lid can be twisted a bit, but the whole situation remains within limits. The tight hinges hold the lid firmly in position, so that it hardly wobbles. The maximum opening angle is about 180 degrees. A one-hand opening of the lid is possible.


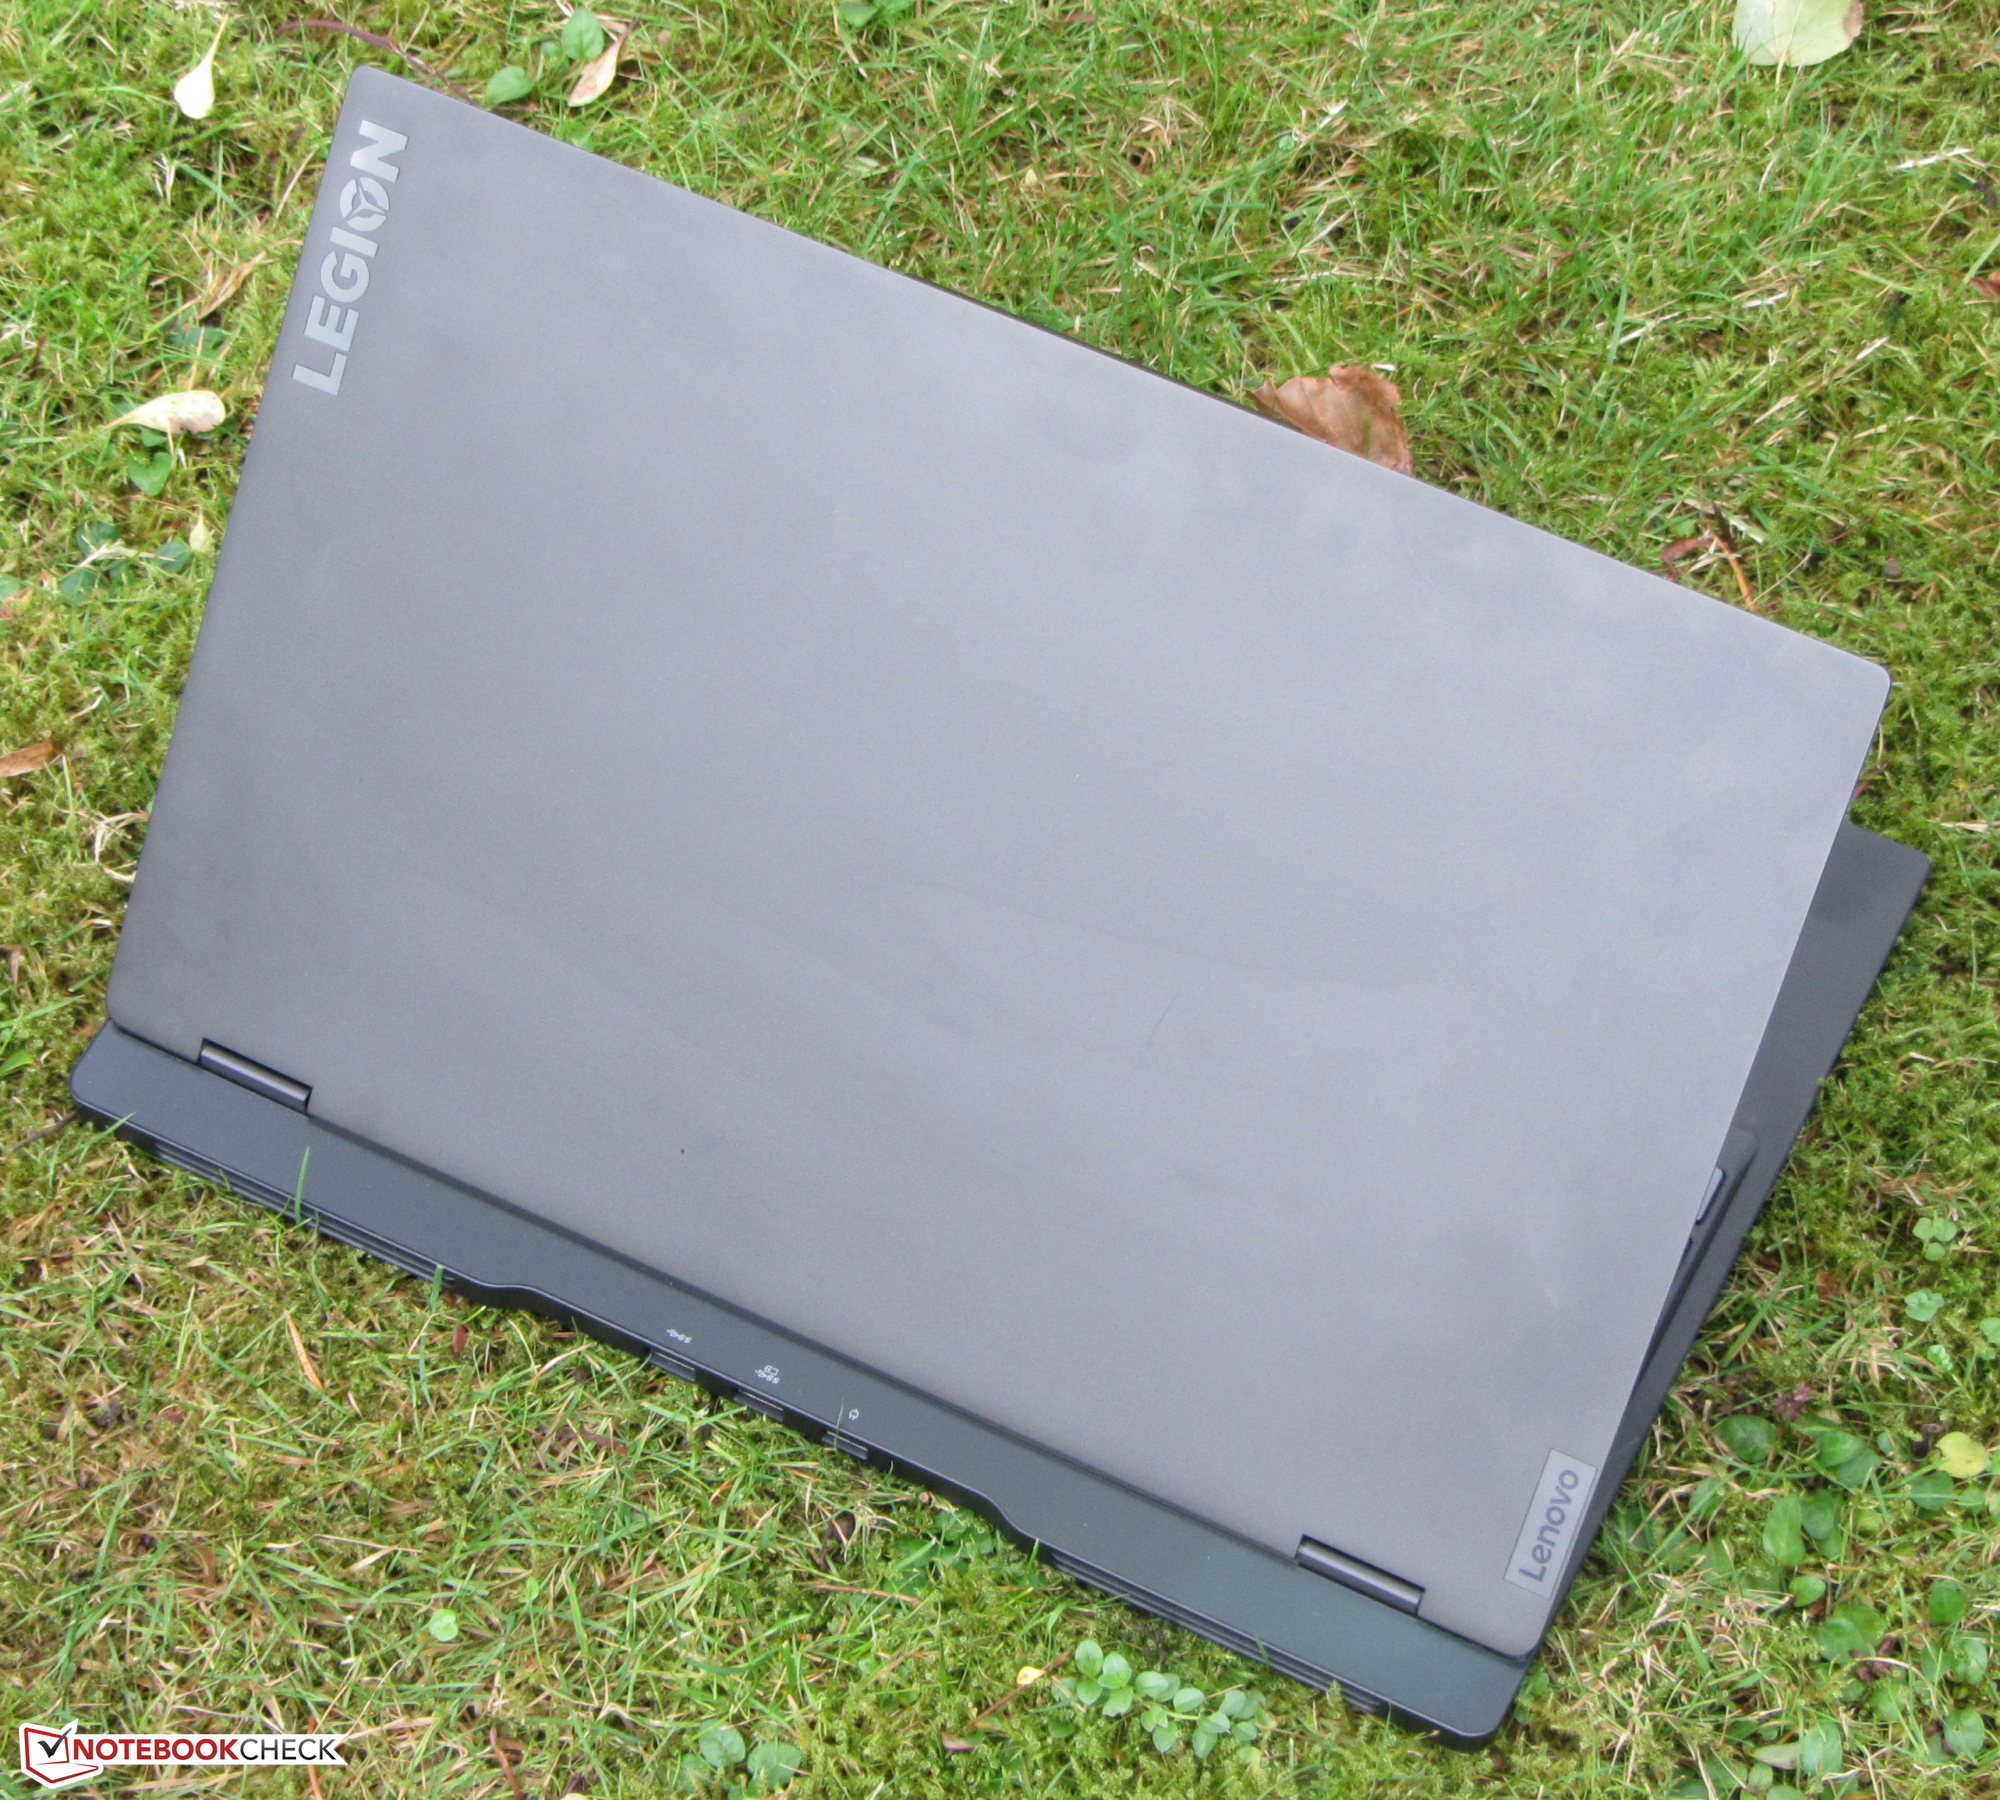


Within our comparison field, the S7 is one of the lightest devices with a weight of just under 2 kg, which is marginally below that of the Razer Blade 15. The latter has more compact dimensions than the Lenovo laptop.
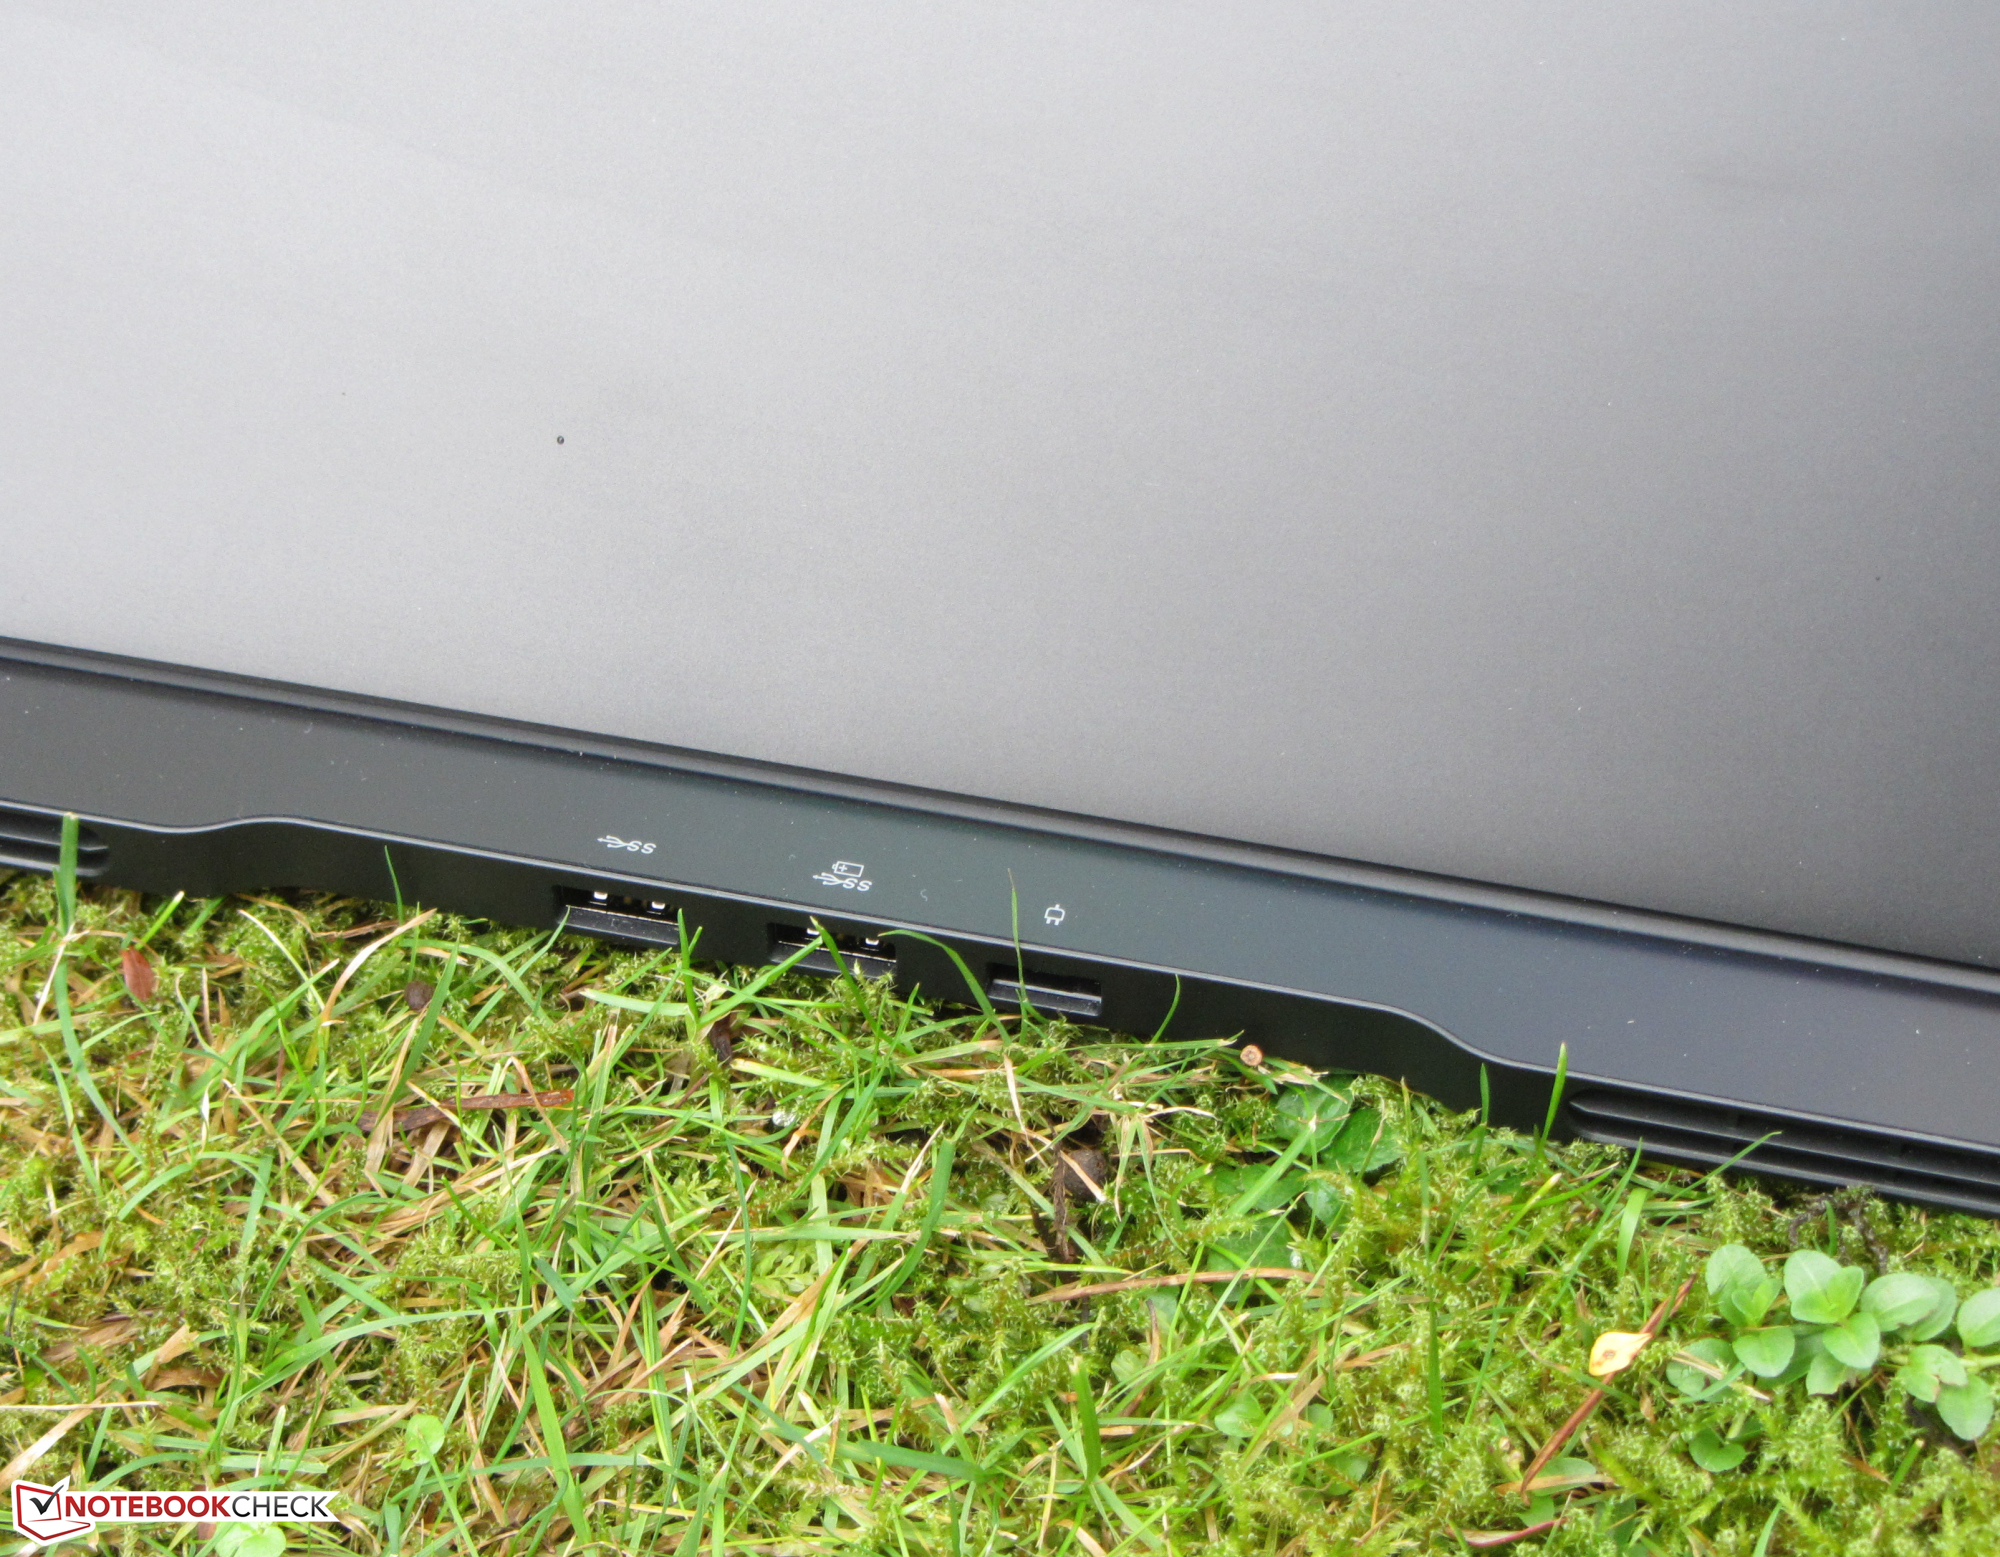
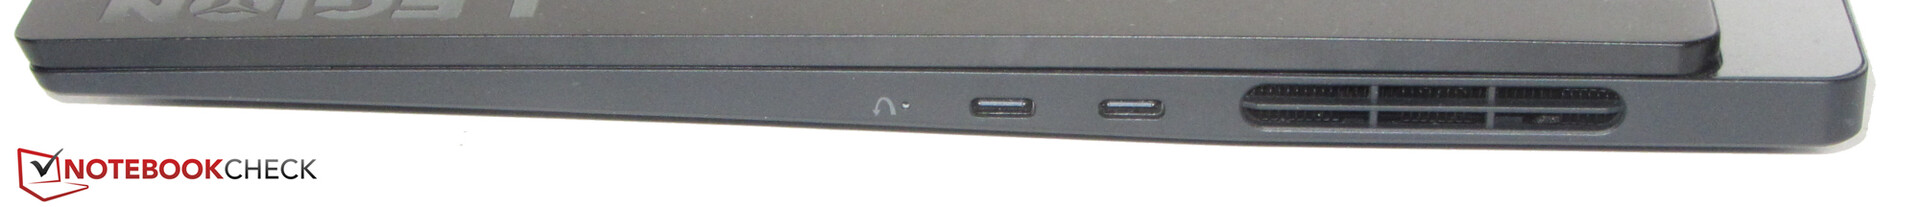
Connectivity - Lenovo S7 without Thunderbolt
All four USB ports (2x USB-A, 2x USB-C) of the Slim 7 operate according to the USB 3.2 Gen 2 standard. The two USB-C ports support Power Delivery and DisplayPort. This gives the laptop a total of two video outputs. If an HDMI and/or VGA output is needed, the included 3-in-1 hub (USB-C to VGA, HDMI, USB-A) will come in handy.
The USB-C ports also allow charging the battery. A 45-watt USB-C power adapter (20 V, 2.25 A) is sufficient to charge the device when it's in standby mode, idle mode, or turned off. At least a 65-watt power adapter (20 V, 3.25 A) is required to charge it when it's turned on. It is not possible to completely power this model off of USB-C since the charge rate will be limited to 100 watts.
The ports are distributed along the three sides of the laptop. The power supply connection and the two USB-A ports are at the back. Consequently, connected cables run towards the back without getting in the way. Positive: The illuminated labels of the ports on the back make it much easier to plug in a connector without looking.
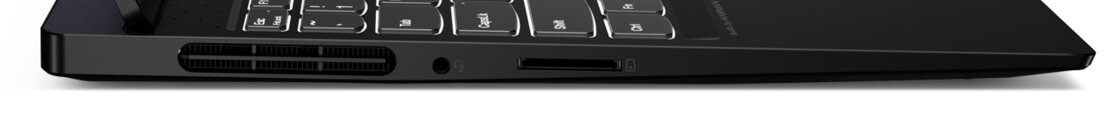


SD card reader
The memory card reader (reference card: 128 GB AV PRO SD V60) has transfer rates of 85 MB/s (copying large data blocks) and 79 MB/s (transferring 250 jpg image files of around 5 MB each), which means it offers medium speeds. However, the rates remain below the average of the gaming laptops tested in the last two years. A comparison with the rates of the Dell XPS 15 proves that considerably better speeds can be achieved. The reader does not accommodate SD cards completely. They stick out by a good 15 mm.
| SD Card Reader | |
| average JPG Copy Test (av. of 3 runs) | |
| Dell XPS 15 9510 i5 11400H FHD (AV Pro V60) | |
| Average of class Gaming (20 - 207, n=73, last 2 years) | |
| Lenovo Legion S7 15ACH6 82K80030GE (AV PRO microSD 128 GB V60) | |
| maximum AS SSD Seq Read Test (1GB) | |
| Dell XPS 15 9510 i5 11400H FHD (AV Pro V60) | |
| Average of class Gaming (25.8 - 261, n=72, last 2 years) | |
| Lenovo Legion S7 15ACH6 82K80030GE (AV PRO microSD 128 GB V60) | |
Communication
The Intel AX200-based Killer WLAN module supports 802.11a/b/g/n/ac/ax standards. The transmission speeds determined under optimal conditions (no other WLAN devices nearby, short distance between laptop and server PC) range from good to very good. The Legion doesn't have a Gigabit Ethernet port - unusual for a gaming laptop. An appropriate USB adapter would have to be used here if LAN is required.
Webcam
The webcam (0.9 MP) produces images with a maximum resolution of 1280x720 pixels. Color accuracy is a problem: Colors deviate significantly from the target.


Accessories
Besides the usual documents (Quick Start guide, warranty information), a 3-in-1 hub (USB-C to VGA, HDMI, USB-A) is included with the laptop.
Maintenance
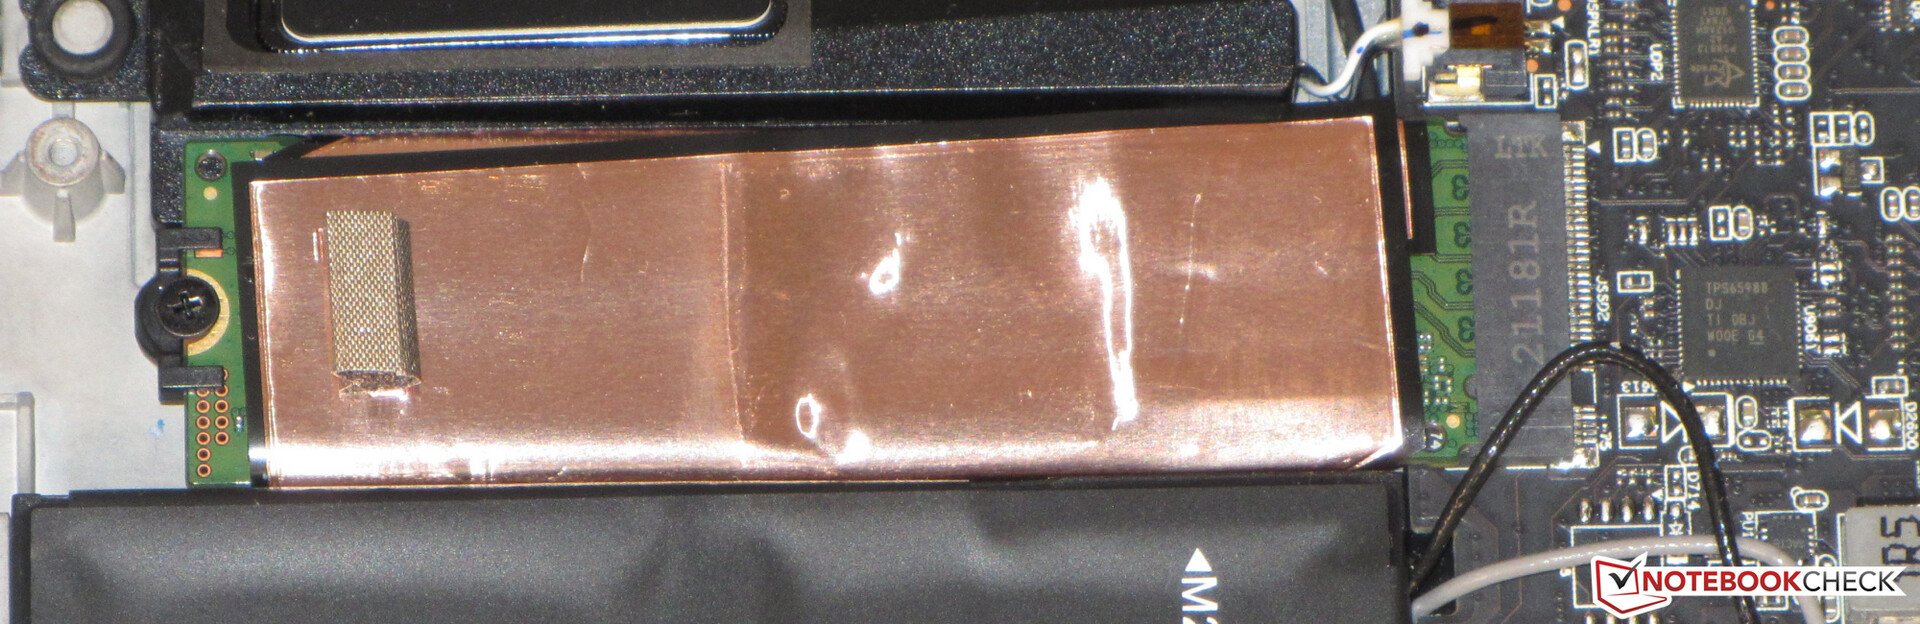
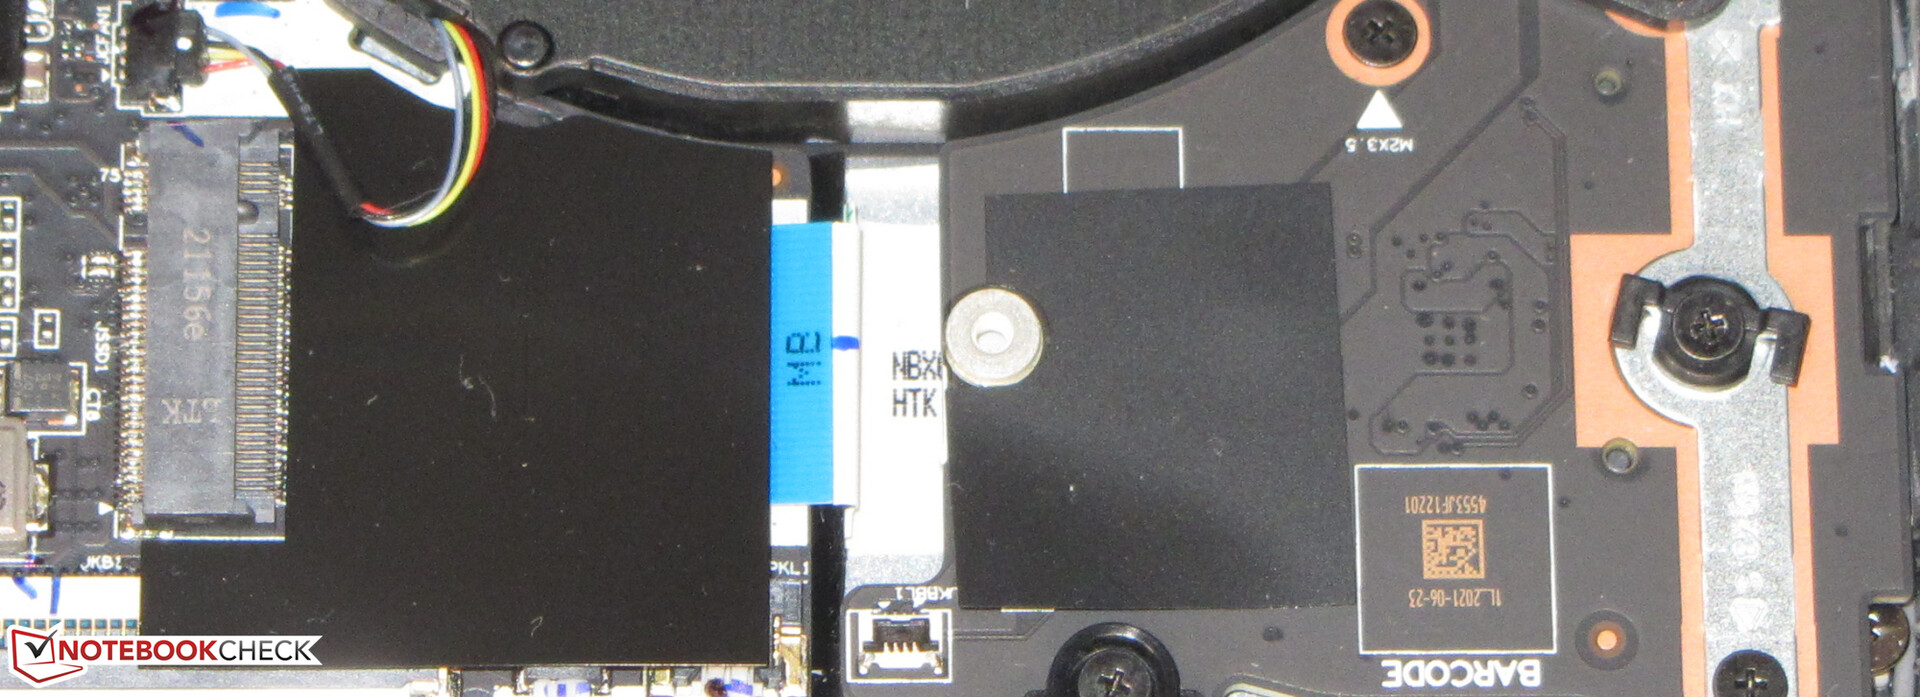
The internals are accessible after taking off the bottom cover. For this purpose, all the screws on the bottom of the device need to be removed. Afterwards, the bottom cover can be lifted off with the help of a flat spatula. You have to be careful when doing this: The bottom cover sits very tight. You will then have access to the SSD, the slot for a second SSD (NVMe; 2280 or 2242), the fans, the RAM module (located behind the metal plate), the WLAN module, and the battery.
Warranty
Lenovo grants the 15.6-incher a three-year on-site warranty. Extending the warranty to four years would cost about 50 Euros (~$58).
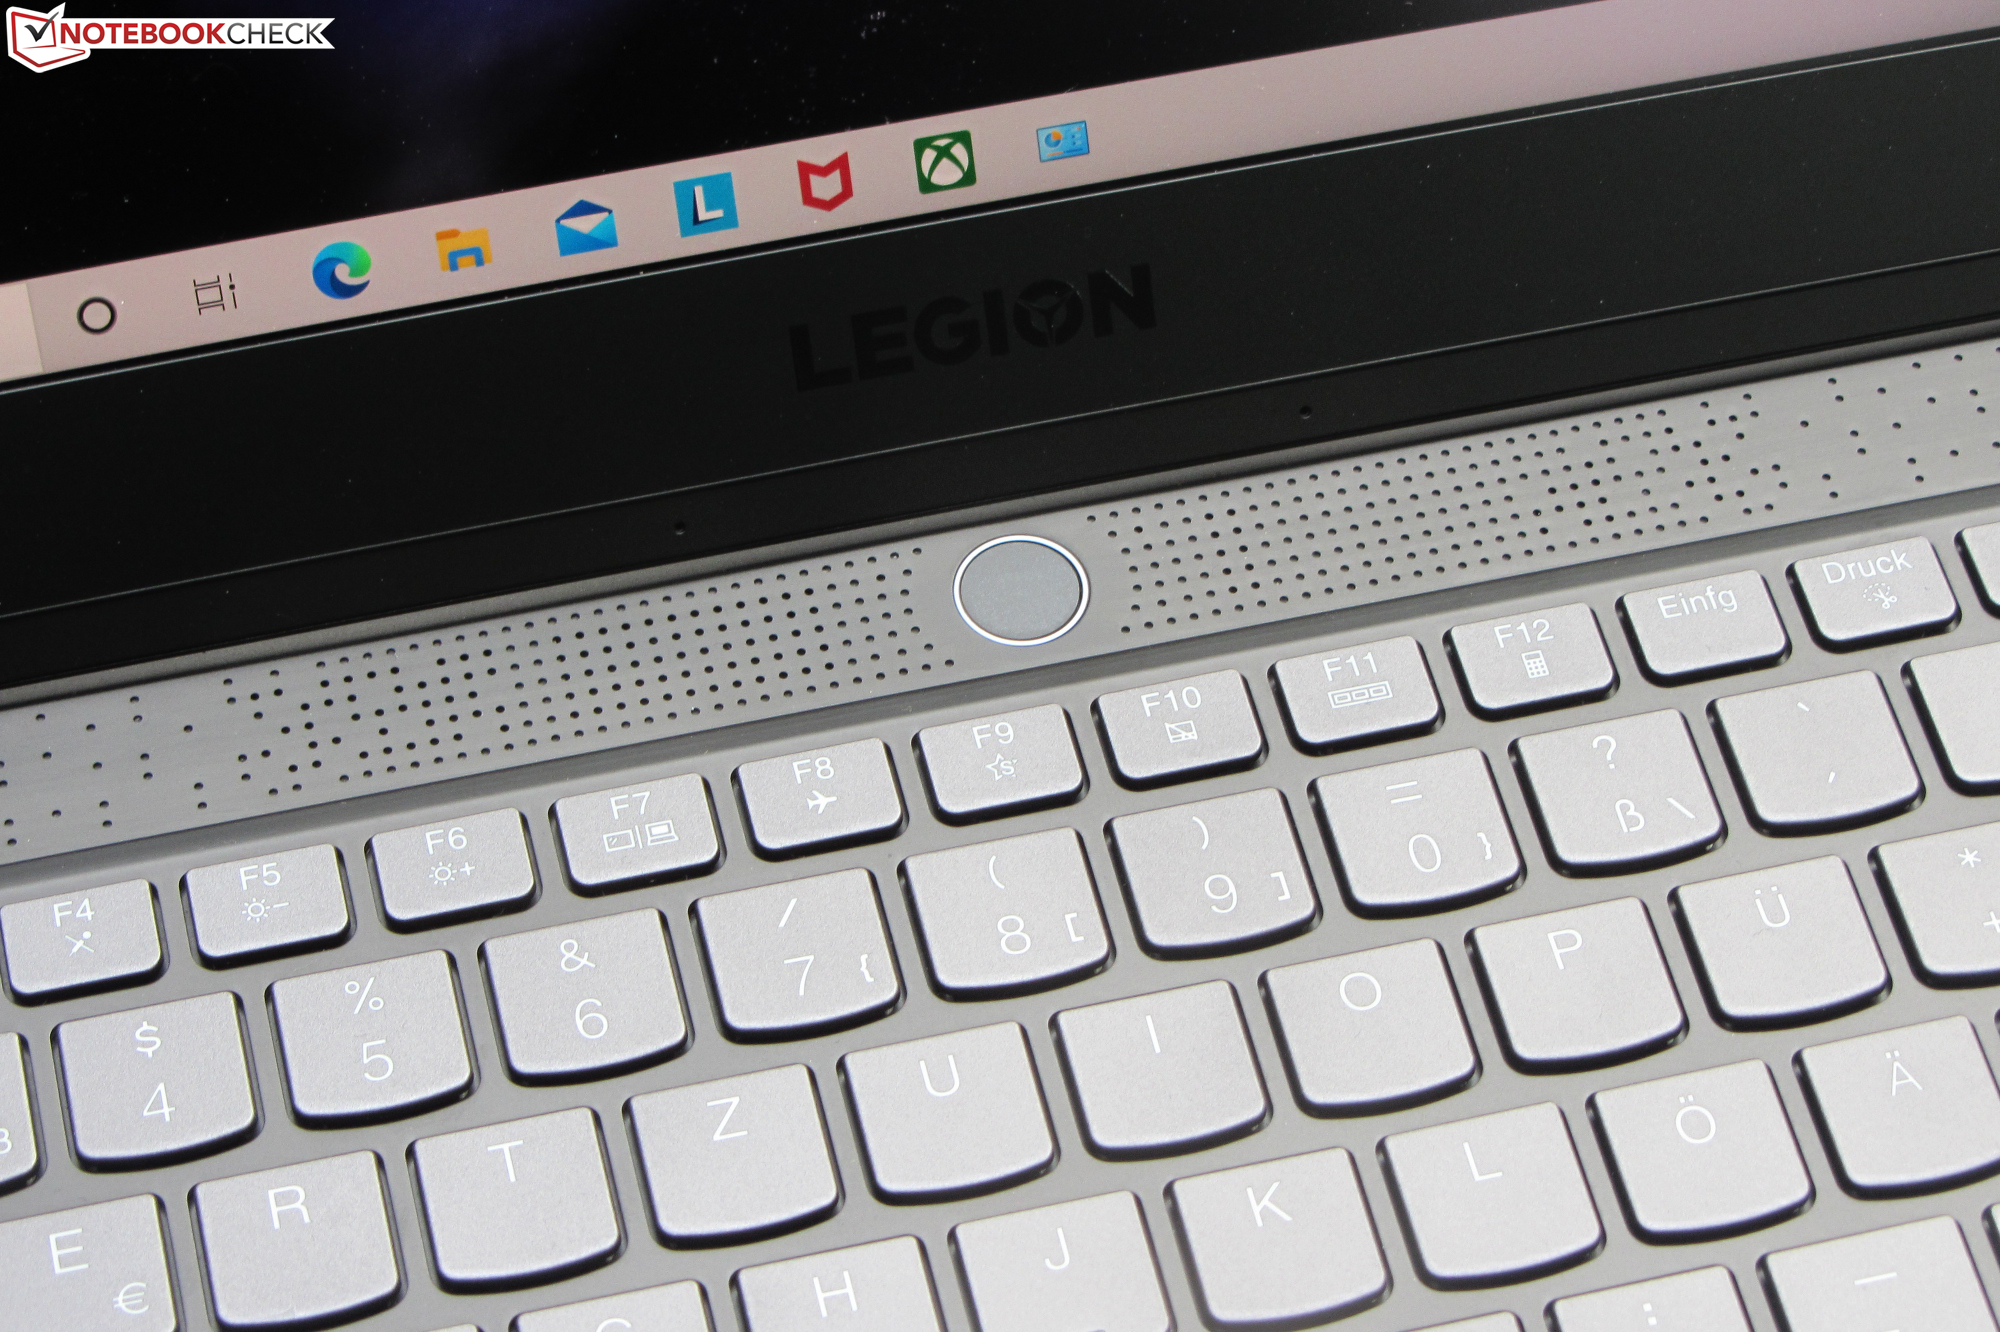
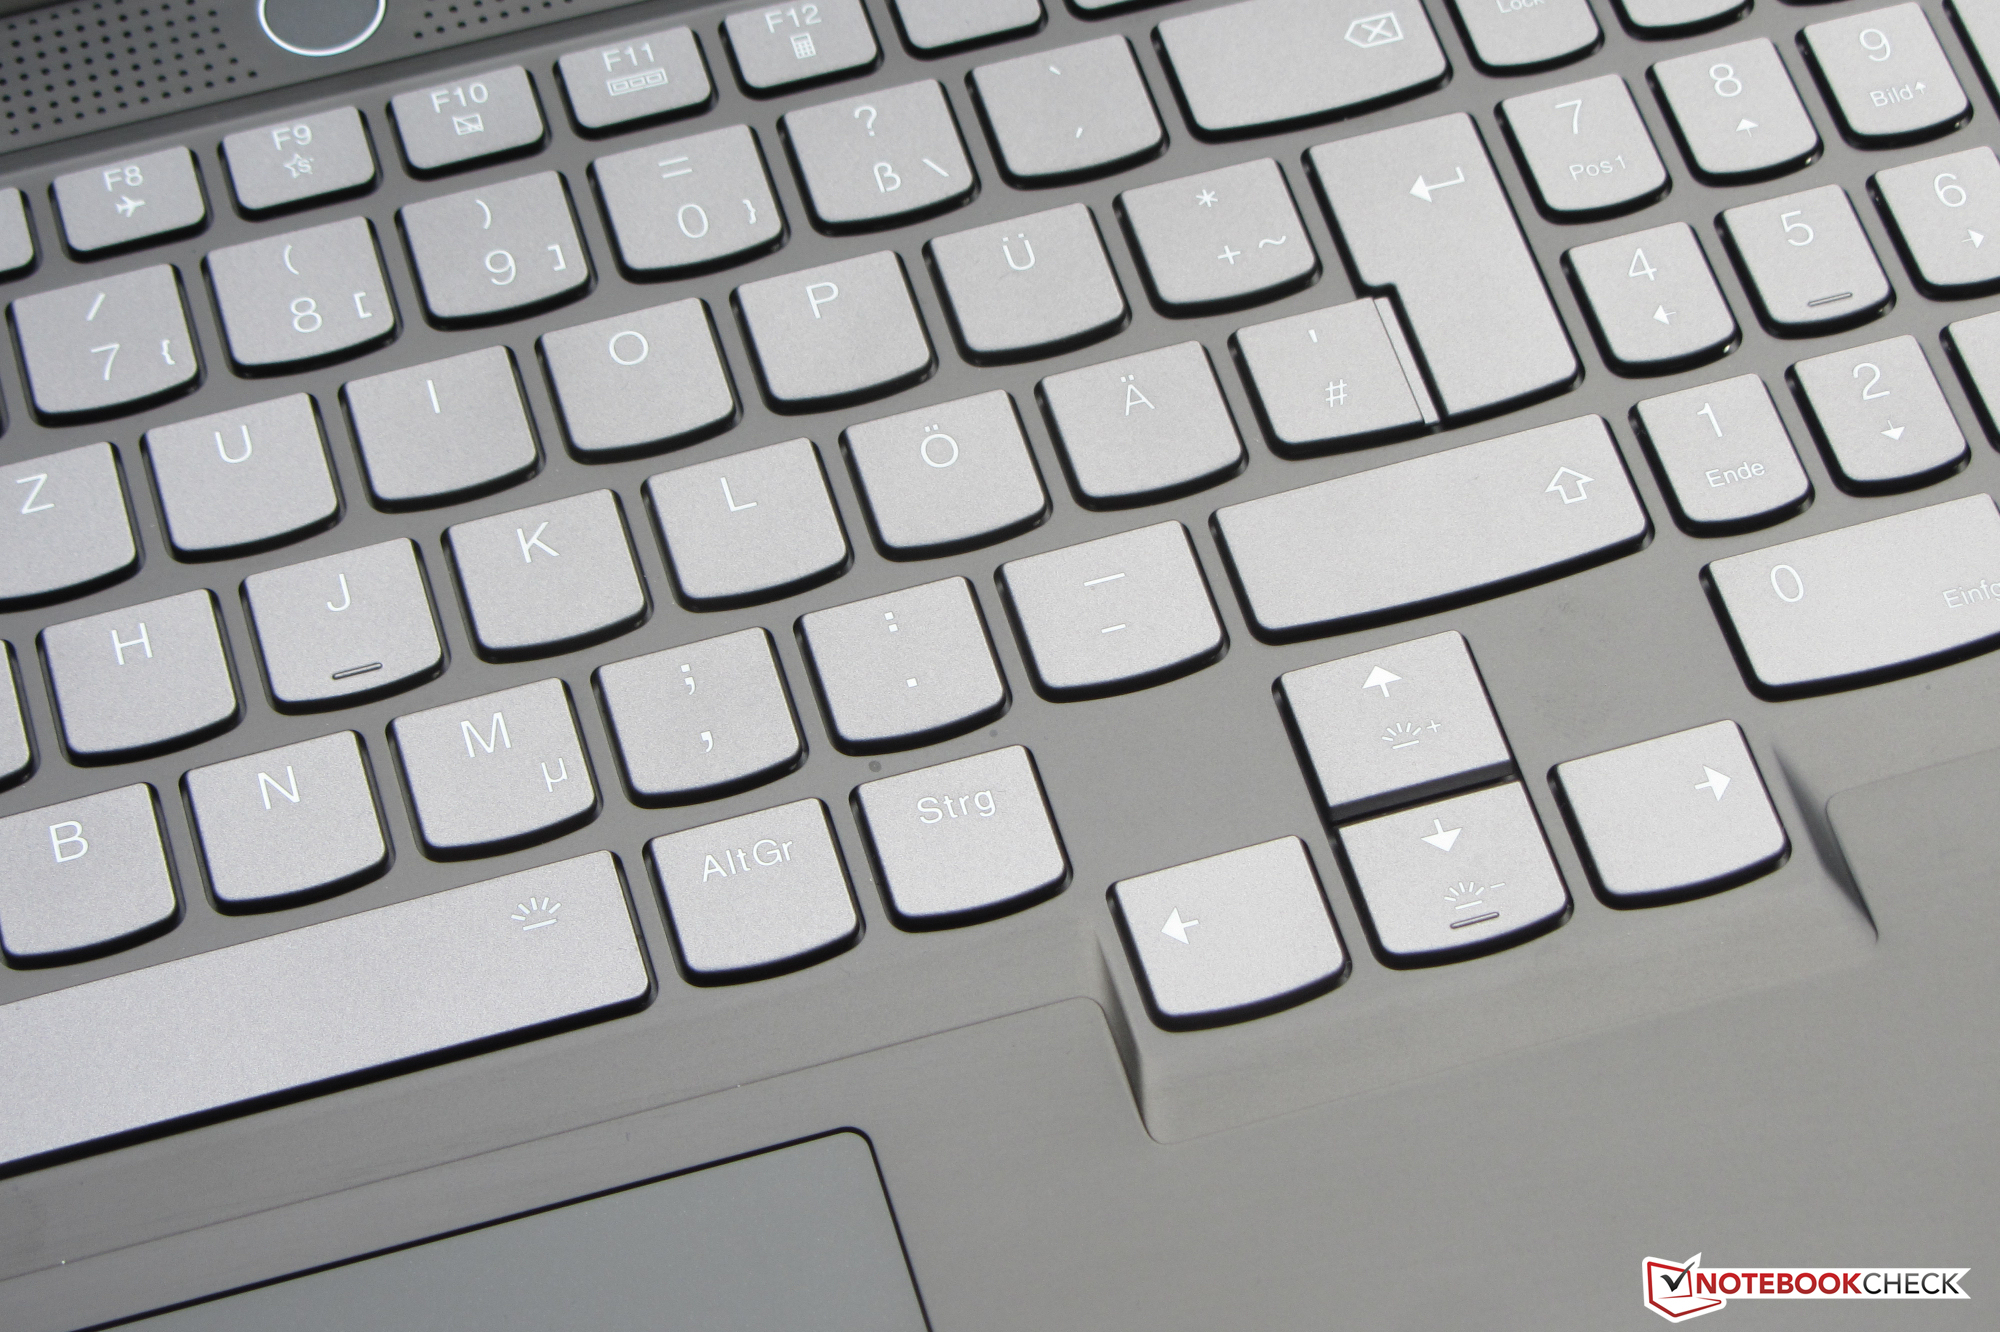
Input devices - The keyboard of the Lenovo laptop features RGB lighting
Keyboard
Lenovo has equipped the Legion S7 with a backlit chiclet keyboard (including a number pad), which has keys with a short travel and a clear pressure point. The resistance provided by the keys is pleasing. The keyboard yields just minimally if at all while typing which didn't prove to be bothersome. The brightness of the three-stage key illumination is controlled with two function keys. All in all, Lenovo delivers a keyboard that is suitable for everyday use here.
Touchpad
A multitouch-capable ClickPad (approx. 12 x 7.5 cm) serves as mouse replacement, and it also responds to inputs in the corners. The smooth surface doesn't prevent the fingers from gliding. The pad offers a short travel and a clear pressure point.

Display - Gaming laptop with bright 4K panel
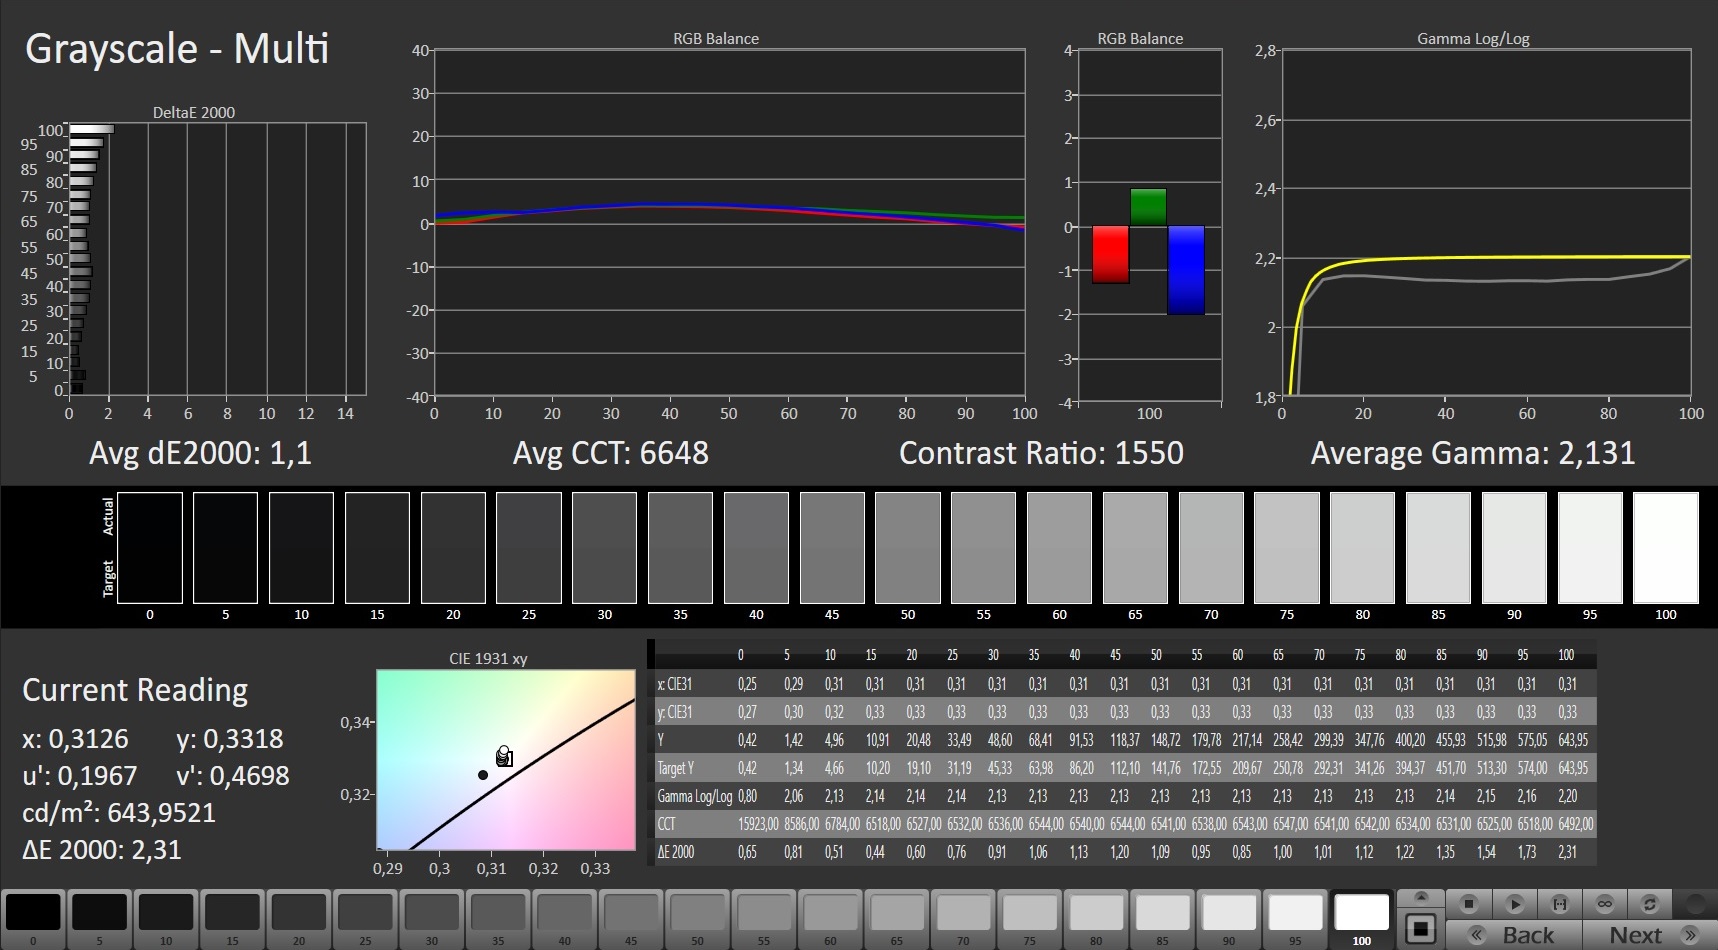
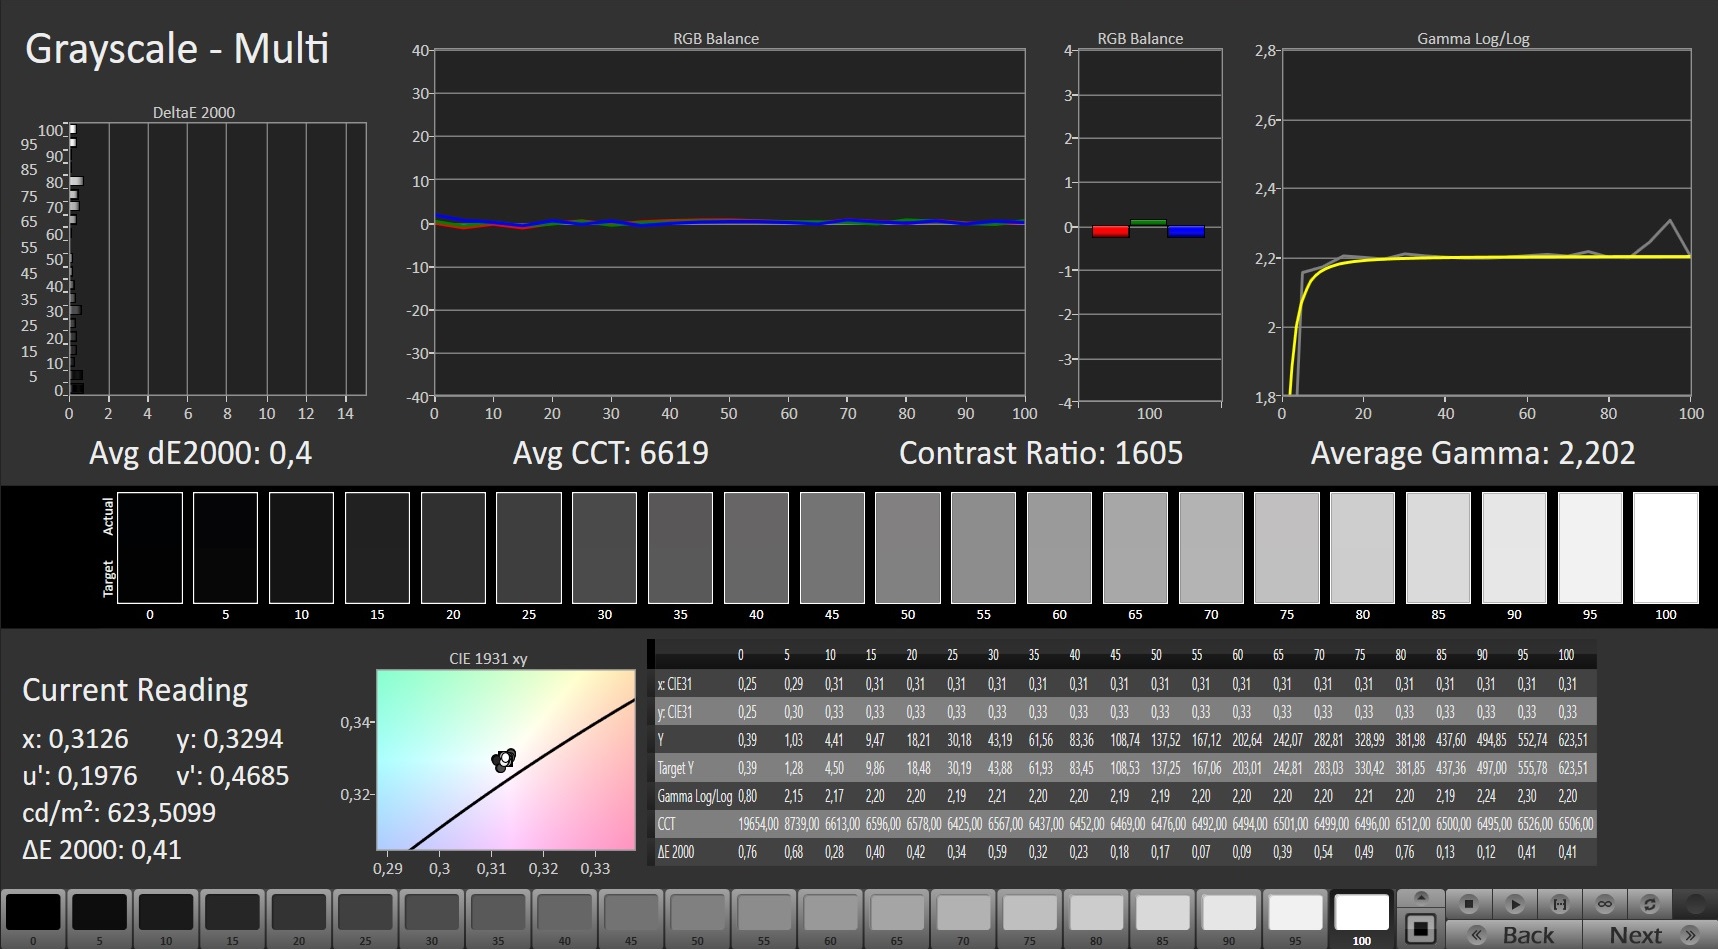
The brightness (605 cd/m²) and contrast (1,480:1) of the matte 15.6-inch display (3840x2160 pixels) are excellent and good, respectively. There was no PWM flickering detected. The display supports AMD's Free Sync technology. As a result, the refresh rates of the display and the GPU are dynamically synchronized. This should produce the smoothest possible picture - especially in computer games.
The S7 is alternatively available with a Full HD or a WQHD display. Both of those 165 Hz panels deliver better response times than the 60 Hz model installed here. Free Sync and G-Sync (Nvidia's counterpart) are supported as well. However, the brightness, contrast, and color-space coverage are lower than those of the 4K display.
| |||||||||||||||||||||||||
Brightness Distribution: 93 %
Center on Battery: 607 cd/m²
Contrast: 1480:1 (Black: 0.41 cd/m²)
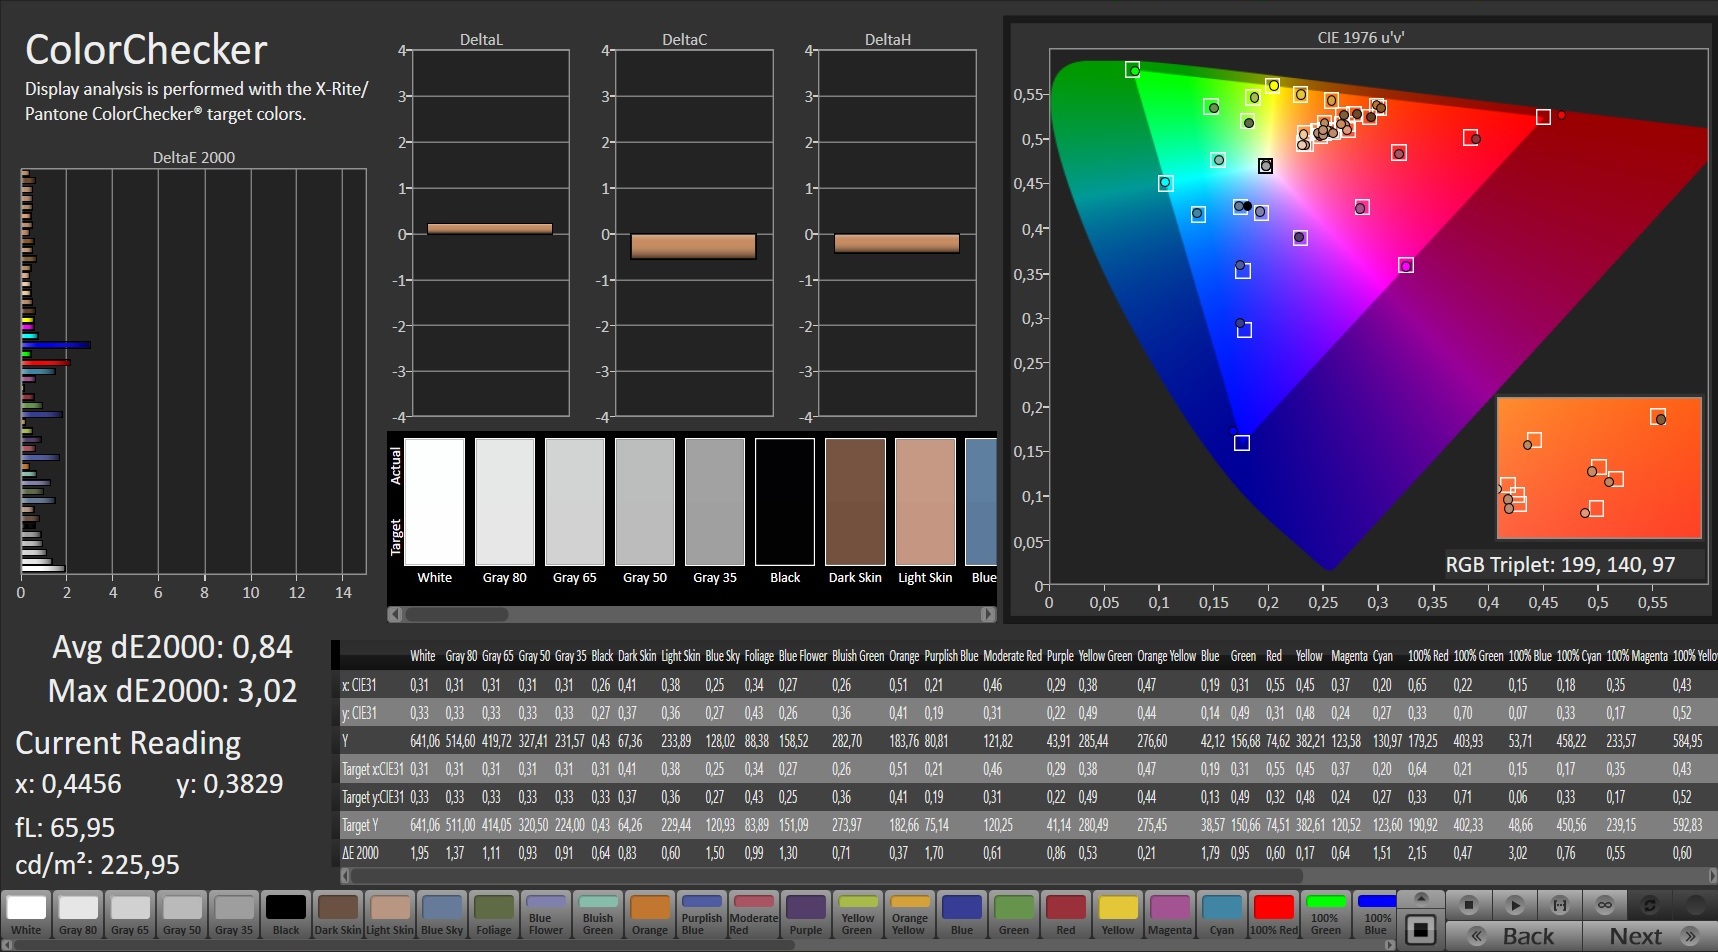
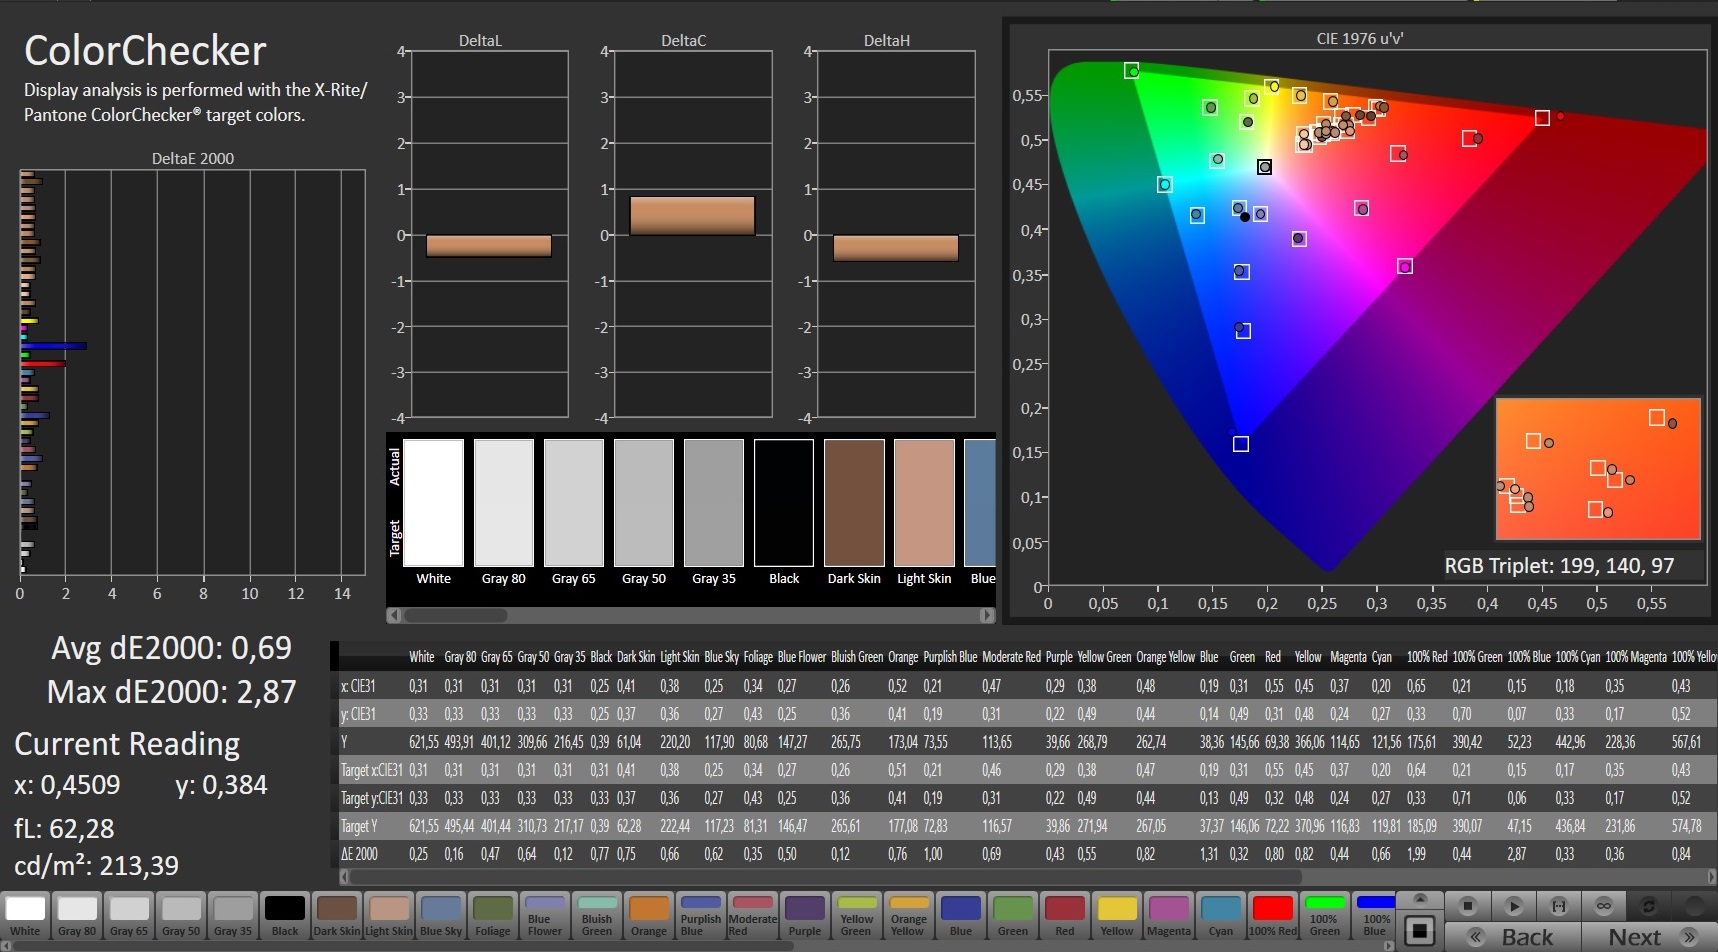
ΔE ColorChecker Calman: 0.84 | ∀{0.5-29.43 Ø4.83}
calibrated: 0.69
ΔE Greyscale Calman: 1.1 | ∀{0.09-98 Ø5.1}
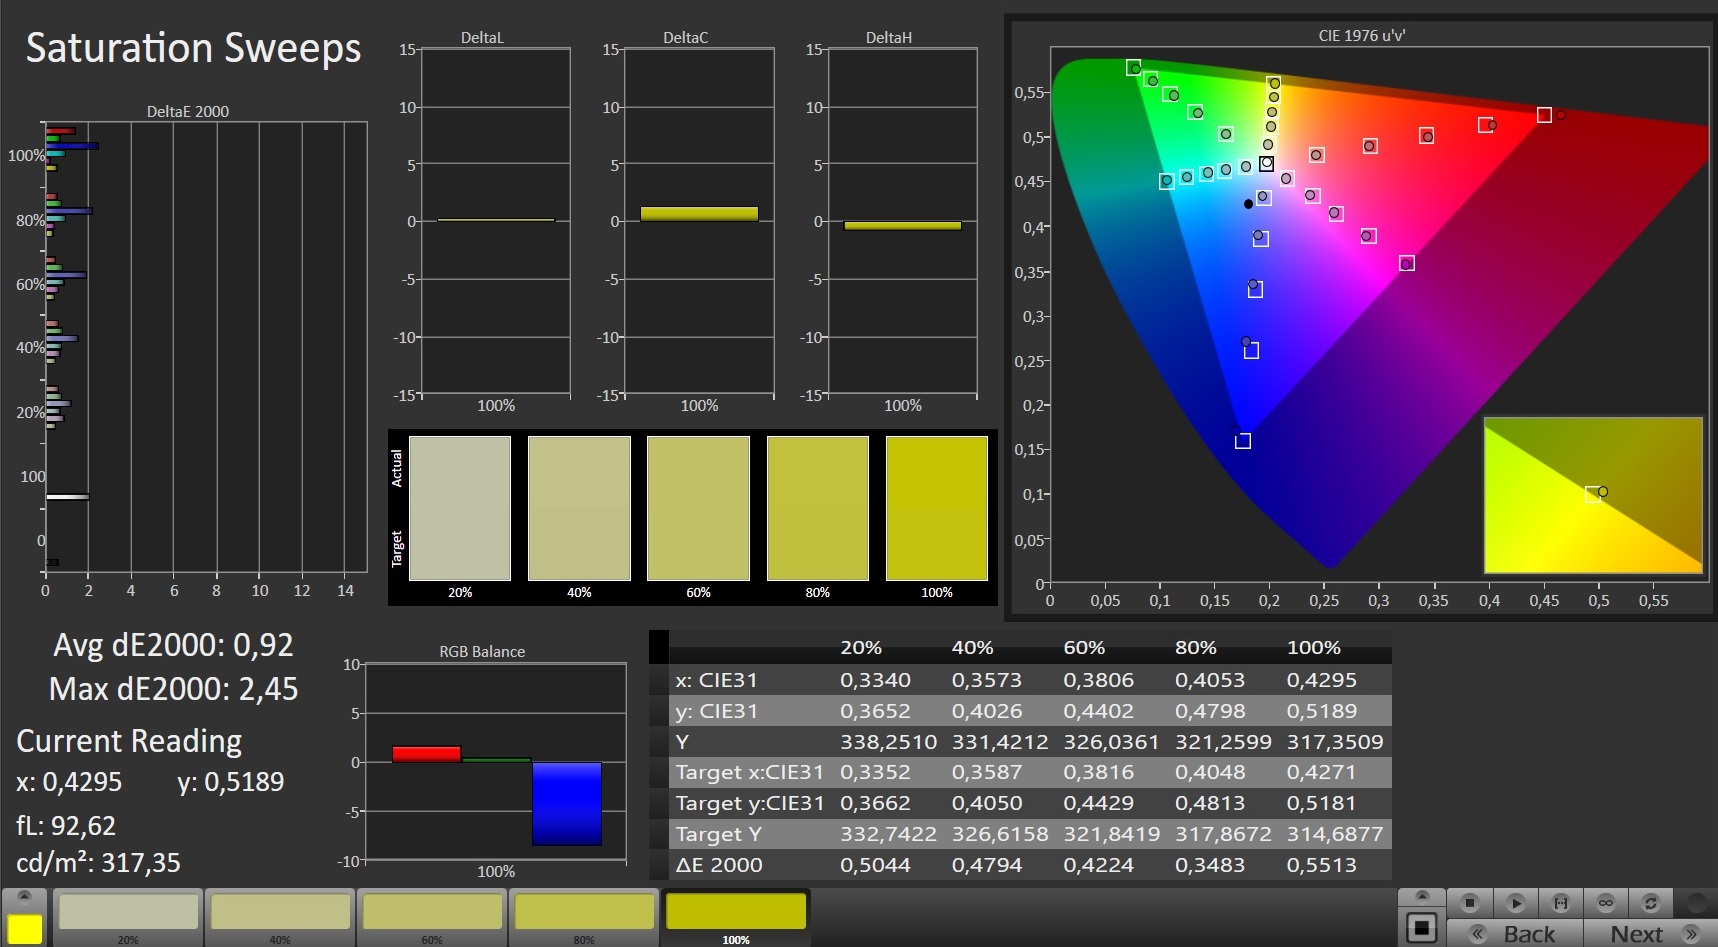
98.2% AdobeRGB 1998 (Argyll 3D)
98.8% sRGB (Argyll 3D)
85.2% Display P3 (Argyll 3D)
Gamma: 2.131
CCT: 6648 K
| Lenovo Legion S7 15ACH6 82K80030GE CSOT T3 MNF601EA1-6, IPS, 3840x2160, 15.6" | Razer Blade 15 Base Edition 2021, i7-10750H RTX 3060 BOE NV156FHM-N4K, IPS, 1920x1080, 15.6" | MSI Delta 15 A5EFK LQ156M1JW03 (SHP155D), IPS-Level, 1920x1080, 15.6" | Alienware m15 R5 Ryzen Edition B156HAN, IPS, 1920x1080, 15.6" | Acer Nitro 5 AN515-45-R1JH BOE BOE09B8, IPS, 2560x1440, 15.6" | |
|---|---|---|---|---|---|
| Display | -22% | -18% | -19% | ||
| Display P3 Coverage | 85.2 | 64.3 -25% | 66.5 -22% | 66.2 -22% | |
| sRGB Coverage | 98.8 | 91.8 -7% | 97.8 -1% | 96.3 -3% | |
| AdobeRGB 1998 Coverage | 98.2 | 65.5 -33% | 67.6 -31% | 67.1 -32% | |
| Response Times | 55% | 47% | 67% | 53% | |
| Response Time Grey 50% / Grey 80% * | 31.6 ? | 8.8 ? 72% | 12.8 ? 59% | 4 ? 87% | 14 ? 56% |
| Response Time Black / White * | 16 ? | 10 ? 37% | 10.4 ? 35% | 8.4 ? 47% | 8 ? 50% |
| PWM Frequency | 1000 ? | 23580 ? | |||
| Screen | -138% | -96% | -70% | -130% | |
| Brightness middle | 607 | 317.2 -48% | 291 -52% | 329 -46% | 349 -43% |
| Brightness | 605 | 306 -49% | 266 -56% | 321 -47% | 304 -50% |
| Brightness Distribution | 93 | 89 -4% | 88 -5% | 92 -1% | 79 -15% |
| Black Level * | 0.41 | 0.31 24% | 0.36 12% | 0.27 34% | 0.535 -30% |
| Contrast | 1480 | 1023 -31% | 808 -45% | 1219 -18% | 652 -56% |
| Colorchecker dE 2000 * | 0.84 | 4.37 -420% | 2.98 -255% | 2.78 -231% | 3.11 -270% |
| Colorchecker dE 2000 max. * | 3.02 | 6.62 -119% | 7.59 -151% | 4.88 -62% | 9.57 -217% |
| Colorchecker dE 2000 calibrated * | 0.69 | 2.67 -287% | 0.91 -32% | 1.63 -136% | |
| Greyscale dE 2000 * | 1.1 | 4.5 -309% | 4.2 -282% | 2.5 -127% | 5 -355% |
| Gamma | 2.131 103% | 2.4 92% | 2.293 96% | 2.106 104% | 2.36 93% |
| CCT | 6648 98% | 7418 88% | 7624 85% | 6201 105% | 6976 93% |
| Color Space (Percent of AdobeRGB 1998) | 59.2 | 76 | |||
| Color Space (Percent of sRGB) | 91.4 | 99 | |||
| Total Average (Program / Settings) | -35% /
-86% | -22% /
-59% | -2% /
-45% | -32% /
-76% |
* ... smaller is better
The display's X-Rite Pantone certification guarantees a very natural color reproduction. Already out of the box, the colors only deviate from the target to a very small extent - you can't even perceive this. The display doesn't suffer from a blue tint. Furthermore, calibration can improve these rates a bit. The color-space coverage is impressive as well: The AdobeRGB 1998 and sRGB color spaces are reproduced to 99%, and the DCI-P3 color space to 85%.


Display Response Times
| ↔ Response Time Black to White | ||
|---|---|---|
| 16 ms ... rise ↗ and fall ↘ combined | ↗ 4 ms rise | 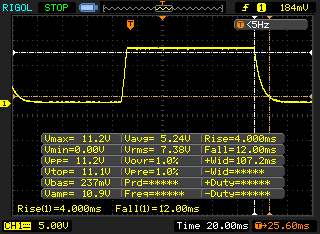 |
| ↘ 12 ms fall | ||
| The screen shows good response rates in our tests, but may be too slow for competitive gamers. In comparison, all tested devices range from 0.1 (minimum) to 240 (maximum) ms. » 35 % of all devices are better. This means that the measured response time is better than the average of all tested devices (20.5 ms). | ||
| ↔ Response Time 50% Grey to 80% Grey | ||
| 31.6 ms ... rise ↗ and fall ↘ combined | ↗ 8 ms rise | 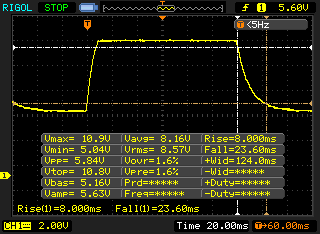 |
| ↘ 23.6 ms fall | ||
| The screen shows slow response rates in our tests and will be unsatisfactory for gamers. In comparison, all tested devices range from 0.165 (minimum) to 636 (maximum) ms. » 40 % of all devices are better. This means that the measured response time is similar to the average of all tested devices (32.1 ms). | ||
Screen Flickering / PWM (Pulse-Width Modulation)
| Screen flickering / PWM not detected | 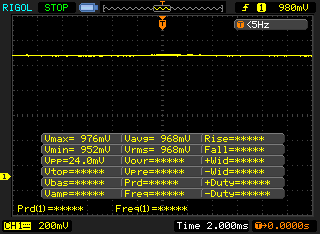 | ||
In comparison: 53 % of all tested devices do not use PWM to dim the display. If PWM was detected, an average of 8327 (minimum: 5 - maximum: 343500) Hz was measured. | |||
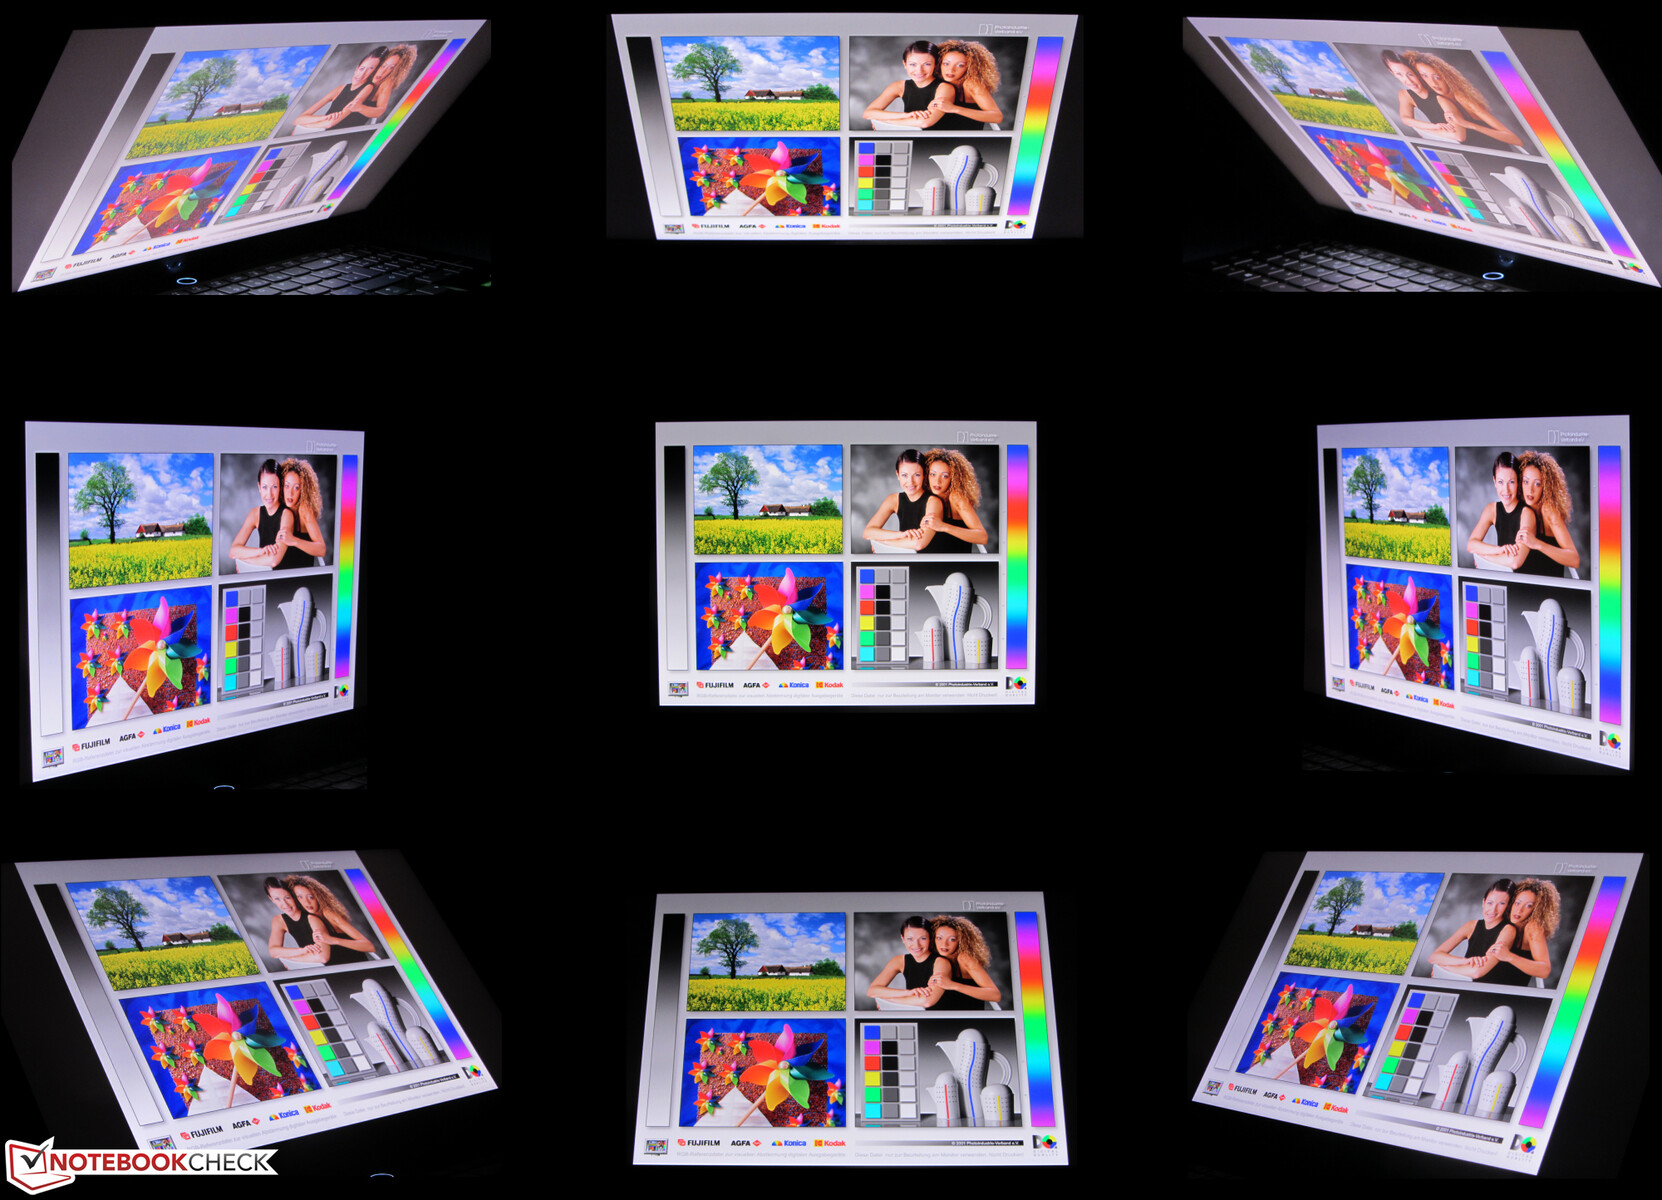
The viewing-angle stable IPS panel is legible from any position. Outdoor readability is decent thanks to the high backlight brightness.
Performance - Sufficient for years to come
The Lenovo Legion S7 15ACH6 brings every modern game smoothly onto the screen and also cuts a fine figure in all other application areas.


Test conditions
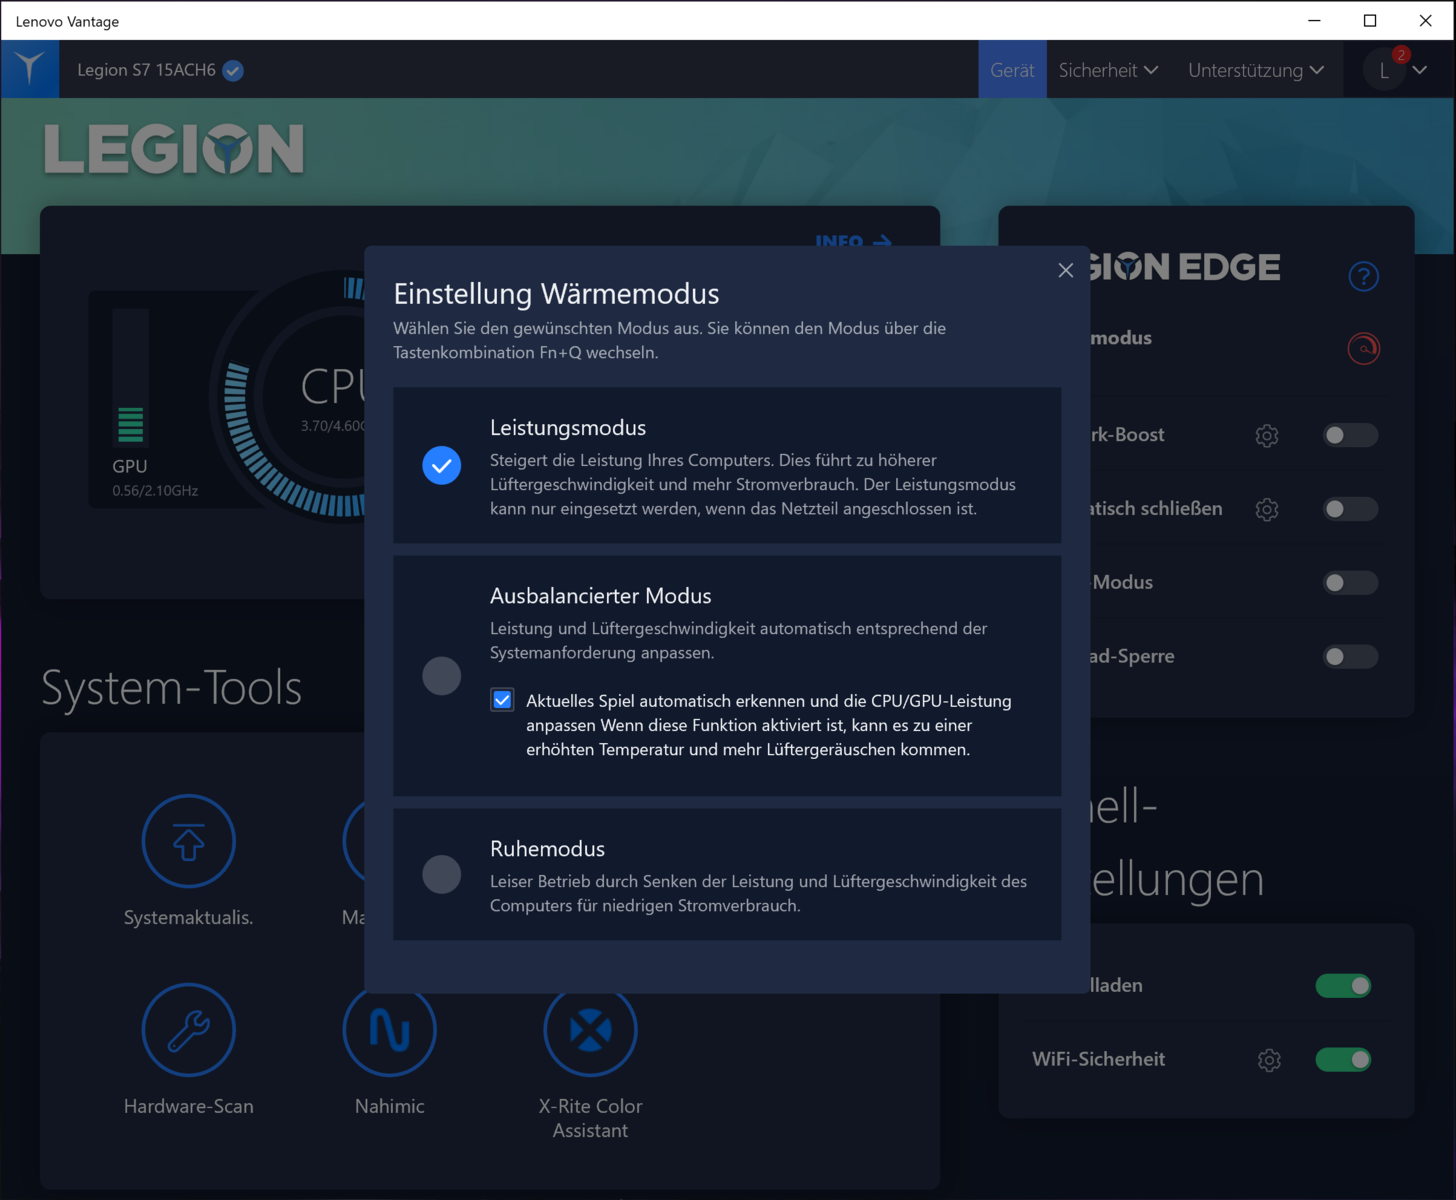
The review was performed using the "Performance Mode" profile, which is only available when plugged in. The profile "Balanced Mode" was used for the battery tests. In addition, Nvidia's Optimus graphics-switching solution was active. You can switch between the three laptop profiles (Performance Mode, Balanced Mode, Silent Mode) using a key combination ("Fn" + "Q") or Lenovo's preinstalled Vantage software. The color of the LED ring surrounding the power button indicates which profile is active.
| Performance Mode | Balanced Mode | Silent Mode | |
|---|---|---|---|
| Power Limit 1 | 87.8 watts | 54 watts | 30 watts |
| Power Limit 2 | 87.8 watts | 65 watts | 38.4 watts |
Some benchmarks were additionally performed with the graphics-switching solution disabled and the overclocking function enabled. The results can be found in the comparison tables. The iGPU (and therefore Optimus) can be disabled using Lenovo's Vantage software ("Hybrid Mode").

Overclocking
The laptop's BIOS offers the option to overclock the GPU and graphics memory. We tested this and used the values offered by the system. No problems occurred in the case of our test device. The system remained stable. Overclocking is always done at the user's own risk.


Processor
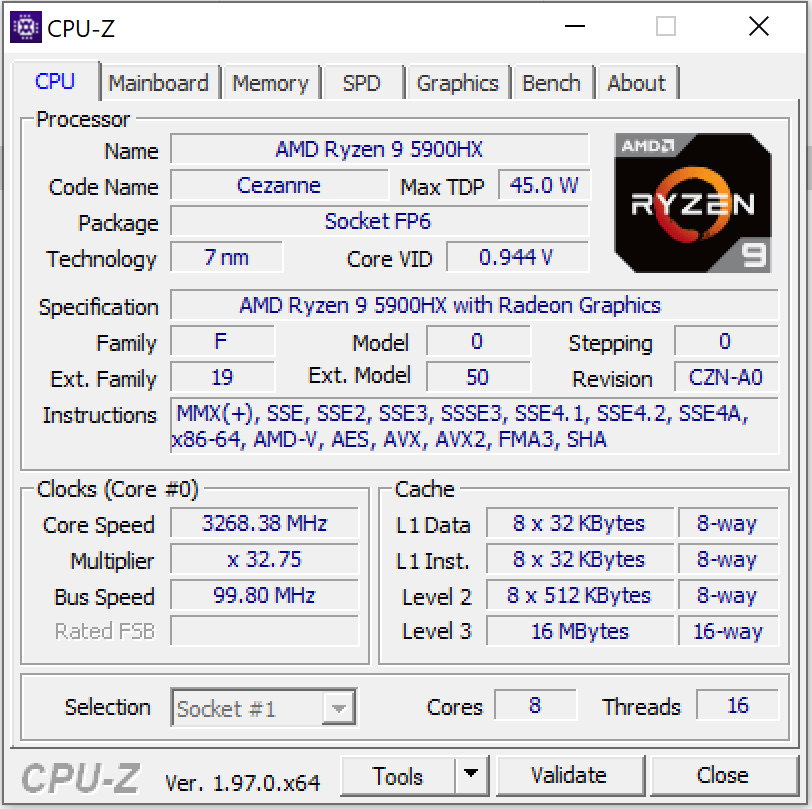
The CPU part of the Ryzen 9 5900HX APU (Cezanne) consists of an octa-core processor that operates at a base clock speed of 3.3 GHz. An increase up to 4.7 GHz is possible via Turbo. Simultaneous multithreading (two threads per core) is supported.
The multithread CPU test of the Cinebench R15 benchmark is processed at 4.1 to 4.3 GHz (plugged in) and 3 to 3.2 GHz (battery power), respectively. The single-thread test is always run at 3.6 to 4.5 GHz.

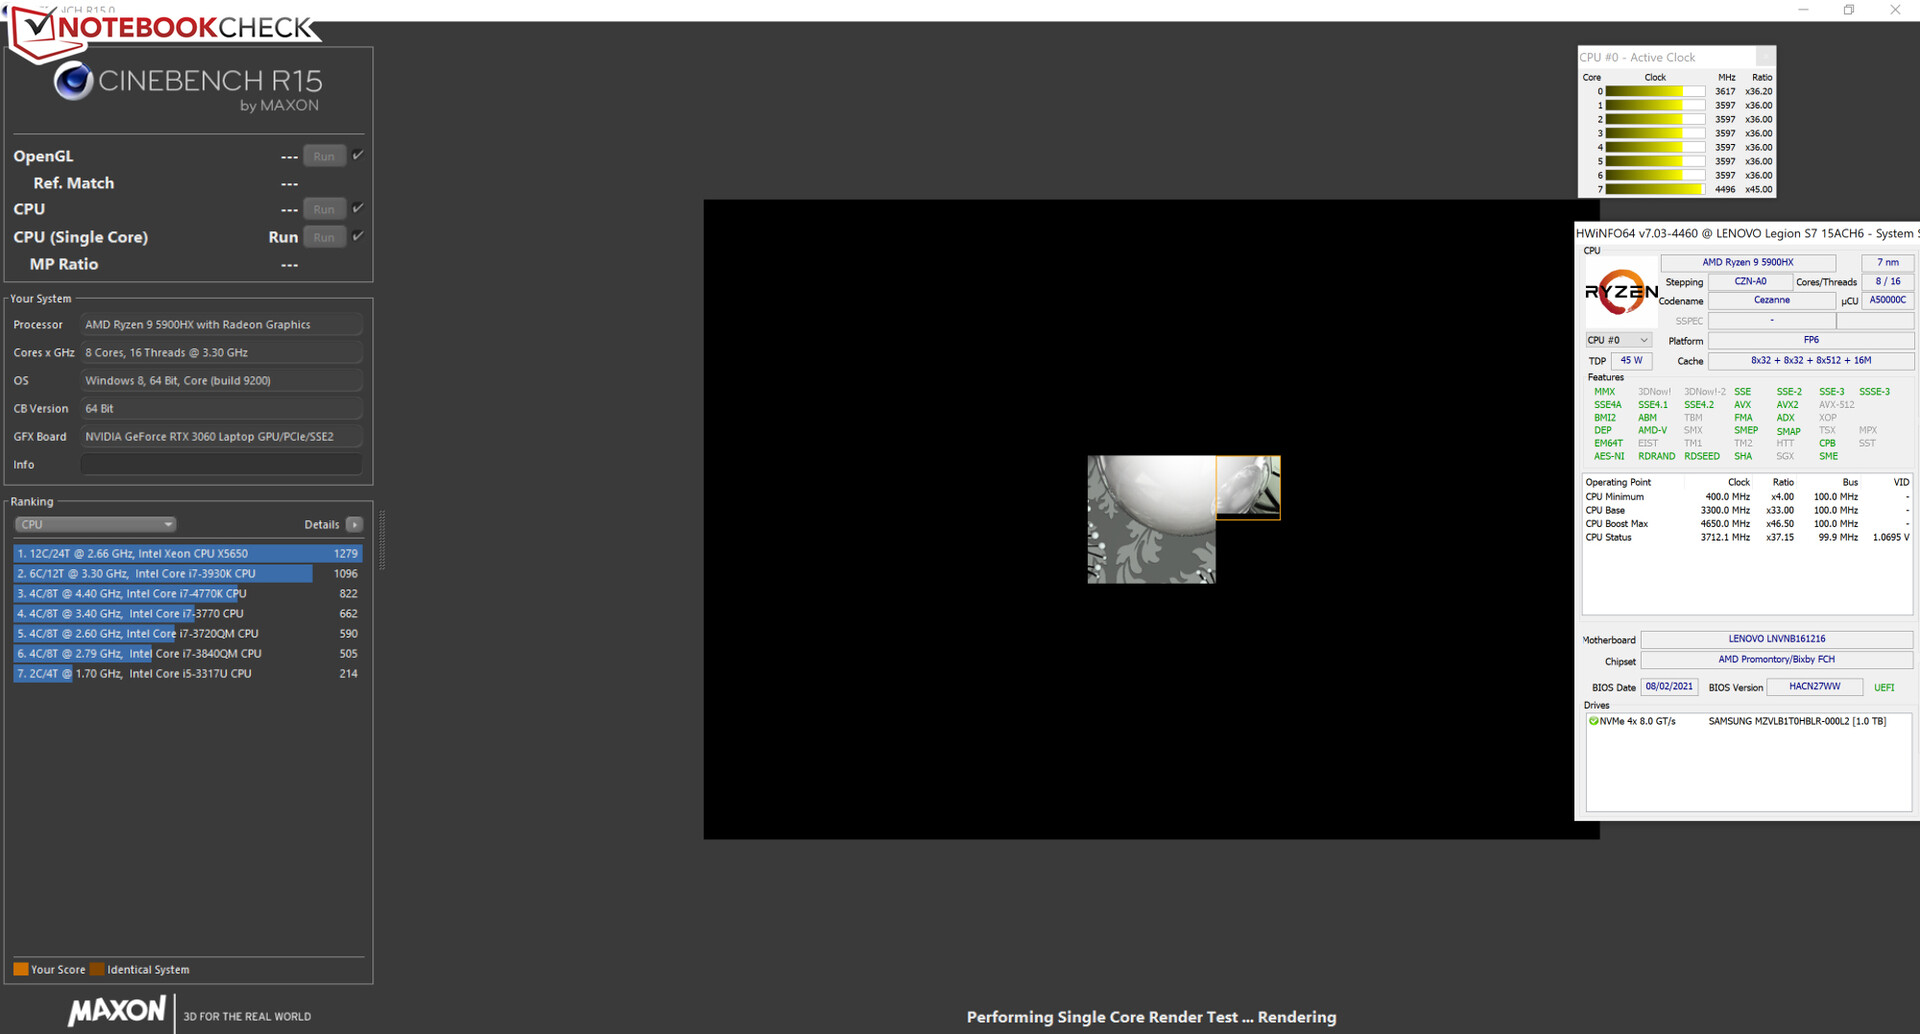
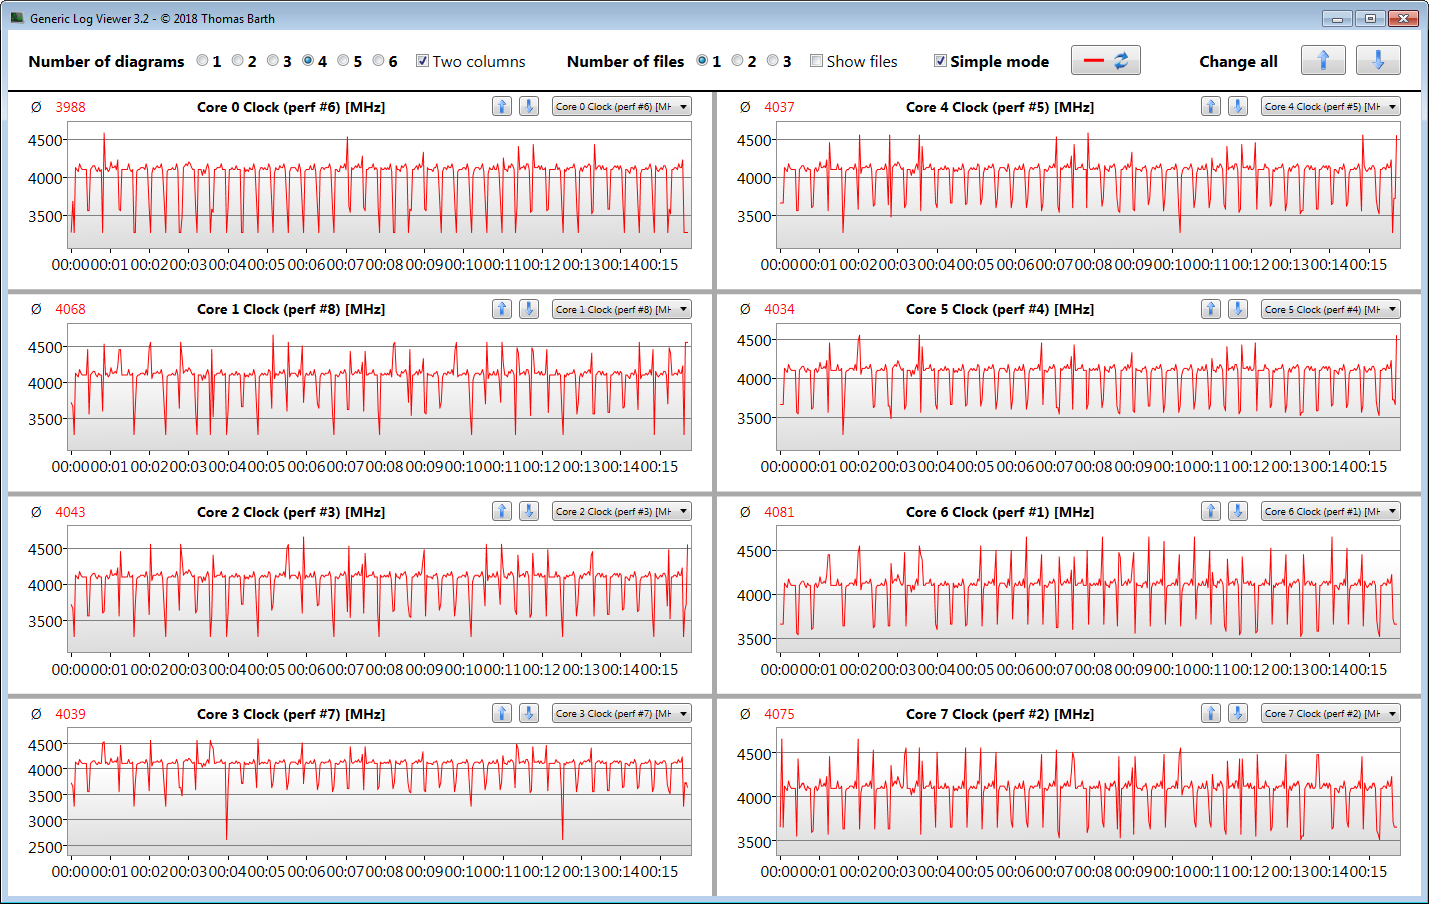
We verify if the CPU Turbo is consistently used when plugged in by running the Cinebench R15 benchmark's multithread test in a continuous loop for at least 30 minutes. Turbo is used to a great extent.
Cinebench R15 Multi endurance test
* ... smaller is better
AIDA64: FP32 Ray-Trace | FPU Julia | CPU SHA3 | CPU Queen | FPU SinJulia | FPU Mandel | CPU AES | CPU ZLib | FP64 Ray-Trace | CPU PhotoWorxx
| Performance Rating | |
| Average of class Gaming | |
| Lenovo Legion S7 15ACH6 82K80030GE | |
| MSI Delta 15 A5EFK | |
| Average AMD Ryzen 9 5900HX | |
| Acer Nitro 5 AN515-45-R1JH | |
| Alienware m15 R5 Ryzen Edition | |
| AIDA64 / FP32 Ray-Trace | |
| Average of class Gaming (7192 - 85542, n=143, last 2 years) | |
| Lenovo Legion S7 15ACH6 82K80030GE (v6.33.5700) | |
| MSI Delta 15 A5EFK (v6.33.5700) | |
| Average AMD Ryzen 9 5900HX (12470 - 16014, n=26) | |
| Alienware m15 R5 Ryzen Edition (v6.33.5700) | |
| Acer Nitro 5 AN515-45-R1JH (v6.33.5700) | |
| AIDA64 / FPU Julia | |
| Average of class Gaming (35040 - 252486, n=143, last 2 years) | |
| Lenovo Legion S7 15ACH6 82K80030GE (v6.33.5700) | |
| MSI Delta 15 A5EFK (v6.33.5700) | |
| Average AMD Ryzen 9 5900HX (79554 - 101008, n=26) | |
| Alienware m15 R5 Ryzen Edition (v6.33.5700) | |
| Acer Nitro 5 AN515-45-R1JH (v6.33.5700) | |
| AIDA64 / CPU SHA3 | |
| Average of class Gaming (1728 - 10389, n=143, last 2 years) | |
| Lenovo Legion S7 15ACH6 82K80030GE (v6.33.5700) | |
| MSI Delta 15 A5EFK (v6.33.5700) | |
| Average AMD Ryzen 9 5900HX (2754 - 3444, n=26) | |
| Alienware m15 R5 Ryzen Edition (v6.33.5700) | |
| Acer Nitro 5 AN515-45-R1JH (v6.33.5700) | |
| AIDA64 / CPU Queen | |
| Average of class Gaming (50699 - 200651, n=143, last 2 years) | |
| MSI Delta 15 A5EFK (v6.33.5700) | |
| Lenovo Legion S7 15ACH6 82K80030GE (v6.33.5700) | |
| Average AMD Ryzen 9 5900HX (87865 - 105123, n=26) | |
| Acer Nitro 5 AN515-45-R1JH (v6.33.5700) | |
| Alienware m15 R5 Ryzen Edition (v6.33.5700) | |
| AIDA64 / FPU SinJulia | |
| Average of class Gaming (5020 - 33636, n=143, last 2 years) | |
| MSI Delta 15 A5EFK (v6.33.5700) | |
| Lenovo Legion S7 15ACH6 82K80030GE (v6.33.5700) | |
| Average AMD Ryzen 9 5900HX (10899 - 12806, n=26) | |
| Acer Nitro 5 AN515-45-R1JH (v6.33.5700) | |
| Alienware m15 R5 Ryzen Edition (v6.33.5700) | |
| AIDA64 / FPU Mandel | |
| Average of class Gaming (17585 - 134044, n=143, last 2 years) | |
| Lenovo Legion S7 15ACH6 82K80030GE (v6.33.5700) | |
| MSI Delta 15 A5EFK (v6.33.5700) | |
| Average AMD Ryzen 9 5900HX (43685 - 55702, n=26) | |
| Acer Nitro 5 AN515-45-R1JH (v6.33.5700) | |
| Alienware m15 R5 Ryzen Edition (v6.33.5700) | |
| AIDA64 / CPU AES | |
| Lenovo Legion S7 15ACH6 82K80030GE (v6.33.5700) | |
| MSI Delta 15 A5EFK (v6.33.5700) | |
| Average AMD Ryzen 9 5900HX (109927 - 137901, n=26) | |
| Alienware m15 R5 Ryzen Edition (v6.33.5700) | |
| Acer Nitro 5 AN515-45-R1JH (v6.33.5700) | |
| Average of class Gaming (19065 - 328679, n=143, last 2 years) | |
| AIDA64 / CPU ZLib | |
| Average of class Gaming (373 - 2531, n=143, last 2 years) | |
| Lenovo Legion S7 15ACH6 82K80030GE (v6.33.5700) | |
| MSI Delta 15 A5EFK (v6.33.5700) | |
| Average AMD Ryzen 9 5900HX (706 - 878, n=26) | |
| Alienware m15 R5 Ryzen Edition (v6.33.5700) | |
| Acer Nitro 5 AN515-45-R1JH (v6.33.5700) | |
| AIDA64 / FP64 Ray-Trace | |
| Average of class Gaming (3856 - 45446, n=143, last 2 years) | |
| Lenovo Legion S7 15ACH6 82K80030GE (v6.33.5700) | |
| Average AMD Ryzen 9 5900HX (6664 - 8644, n=26) | |
| MSI Delta 15 A5EFK (v6.33.5700) | |
| Alienware m15 R5 Ryzen Edition (v6.33.5700) | |
| Acer Nitro 5 AN515-45-R1JH (v6.33.5700) | |
| AIDA64 / CPU PhotoWorxx | |
| Average of class Gaming (10805 - 62916, n=143, last 2 years) | |
| MSI Delta 15 A5EFK (v6.33.5700) | |
| Lenovo Legion S7 15ACH6 82K80030GE (v6.33.5700) | |
| Average AMD Ryzen 9 5900HX (14344 - 25533, n=26) | |
| Acer Nitro 5 AN515-45-R1JH (v6.33.5700) | |
| Alienware m15 R5 Ryzen Edition (v6.33.5700) | |
System performance
The fast and smooth system offers enough computing power for demanding applications like gaming, video editing, and image processing for years to come. This is accompanied by very good PCMark results.

| PCMark 8 Home Score Accelerated v2 | 4537 points | |
| PCMark 8 Creative Score Accelerated v2 | 5749 points | |
| PCMark 8 Work Score Accelerated v2 | 4936 points | |
| PCMark 10 Score | 6505 points | |
Help | ||
| PCMark 10 / Score | |
| Average of class Gaming (5776 - 9852, n=130, last 2 years) | |
| MSI Delta 15 A5EFK | |
| Acer Nitro 5 AN515-45-R1JH | |
| Average AMD Ryzen 9 5900HX, NVIDIA GeForce RTX 3060 Laptop GPU (6505 - 6725, n=2) | |
| Lenovo Legion S7 15ACH6 82K80030GE | |
| Alienware m15 R5 Ryzen Edition | |
| Razer Blade 15 Base Edition 2021, i7-10750H RTX 3060 | |
| PCMark 10 / Essentials | |
| Average of class Gaming (9057 - 12600, n=130, last 2 years) | |
| MSI Delta 15 A5EFK | |
| Razer Blade 15 Base Edition 2021, i7-10750H RTX 3060 | |
| Average AMD Ryzen 9 5900HX, NVIDIA GeForce RTX 3060 Laptop GPU (9827 - 10324, n=2) | |
| Acer Nitro 5 AN515-45-R1JH | |
| Lenovo Legion S7 15ACH6 82K80030GE | |
| Alienware m15 R5 Ryzen Edition | |
| PCMark 10 / Productivity | |
| Average of class Gaming (6662 - 14612, n=130, last 2 years) | |
| MSI Delta 15 A5EFK | |
| Acer Nitro 5 AN515-45-R1JH | |
| Average AMD Ryzen 9 5900HX, NVIDIA GeForce RTX 3060 Laptop GPU (8803 - 9128, n=2) | |
| Alienware m15 R5 Ryzen Edition | |
| Lenovo Legion S7 15ACH6 82K80030GE | |
| Razer Blade 15 Base Edition 2021, i7-10750H RTX 3060 | |
| PCMark 10 / Digital Content Creation | |
| Average of class Gaming (7440 - 19351, n=130, last 2 years) | |
| MSI Delta 15 A5EFK | |
| Acer Nitro 5 AN515-45-R1JH | |
| Average AMD Ryzen 9 5900HX, NVIDIA GeForce RTX 3060 Laptop GPU (8634 - 8759, n=2) | |
| Lenovo Legion S7 15ACH6 82K80030GE | |
| Alienware m15 R5 Ryzen Edition | |
| Razer Blade 15 Base Edition 2021, i7-10750H RTX 3060 | |
| AIDA64 / Memory Copy | |
| Average of class Gaming (21750 - 97515, n=143, last 2 years) | |
| MSI Delta 15 A5EFK (v6.33.5700) | |
| Lenovo Legion S7 15ACH6 82K80030GE (v6.33.5700) | |
| Average AMD Ryzen 9 5900HX (36725 - 43318, n=26) | |
| Alienware m15 R5 Ryzen Edition (v6.33.5700) | |
| Acer Nitro 5 AN515-45-R1JH (v6.33.5700) | |
| AIDA64 / Memory Read | |
| Average of class Gaming (22956 - 104349, n=143, last 2 years) | |
| MSI Delta 15 A5EFK (v6.33.5700) | |
| Average AMD Ryzen 9 5900HX (41378 - 47593, n=26) | |
| Lenovo Legion S7 15ACH6 82K80030GE (v6.33.5700) | |
| Alienware m15 R5 Ryzen Edition (v6.33.5700) | |
| Acer Nitro 5 AN515-45-R1JH (v6.33.5700) | |
| AIDA64 / Memory Write | |
| Average of class Gaming (22297 - 133486, n=143, last 2 years) | |
| MSI Delta 15 A5EFK (v6.33.5700) | |
| Average AMD Ryzen 9 5900HX (32536 - 46718, n=26) | |
| Lenovo Legion S7 15ACH6 82K80030GE (v6.33.5700) | |
| Alienware m15 R5 Ryzen Edition (v6.33.5700) | |
| Acer Nitro 5 AN515-45-R1JH (v6.33.5700) | |
| AIDA64 / Memory Latency | |
| Average of class Gaming (59.5 - 259, n=143, last 2 years) | |
| Average AMD Ryzen 9 5900HX (73.5 - 97.1, n=26) | |
| Lenovo Legion S7 15ACH6 82K80030GE (v6.33.5700) | |
| Alienware m15 R5 Ryzen Edition (v6.33.5700) | |
| MSI Delta 15 A5EFK (v6.33.5700) | |
| Acer Nitro 5 AN515-45-R1JH (v6.33.5700) | |
* ... smaller is better
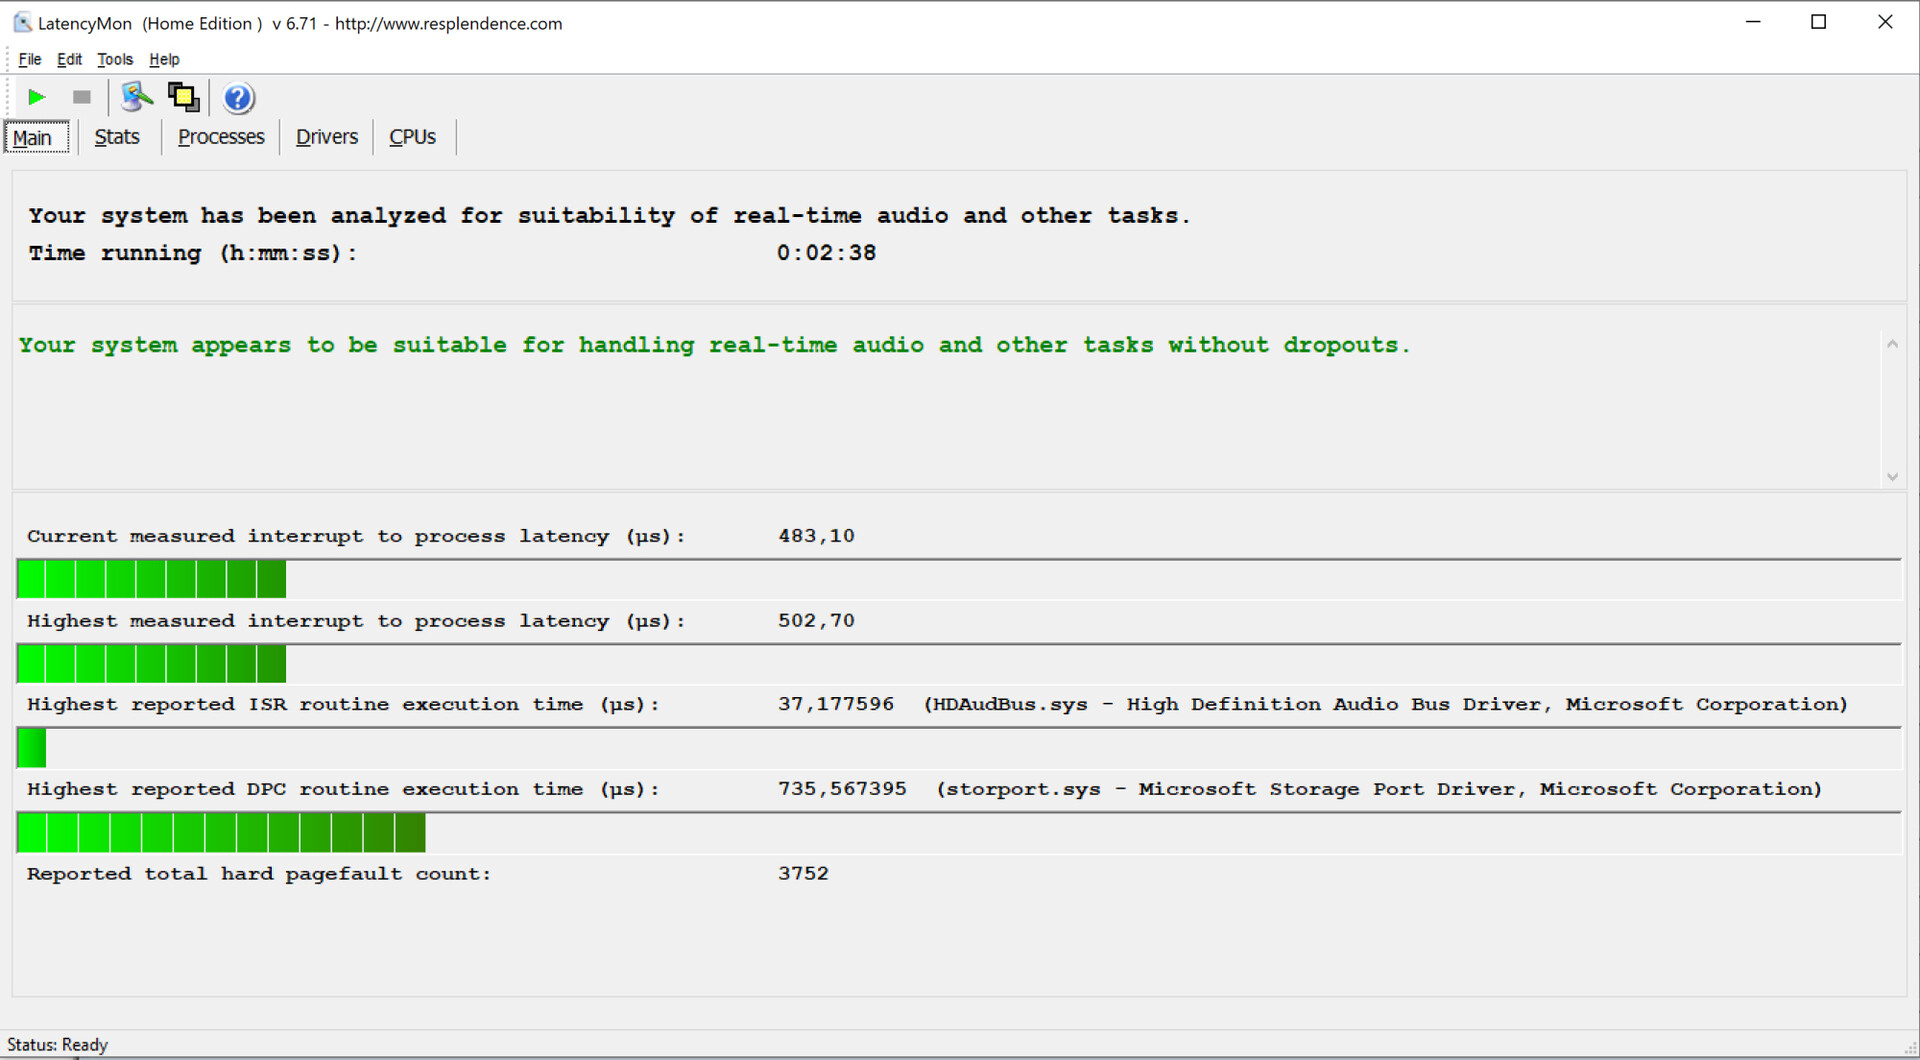
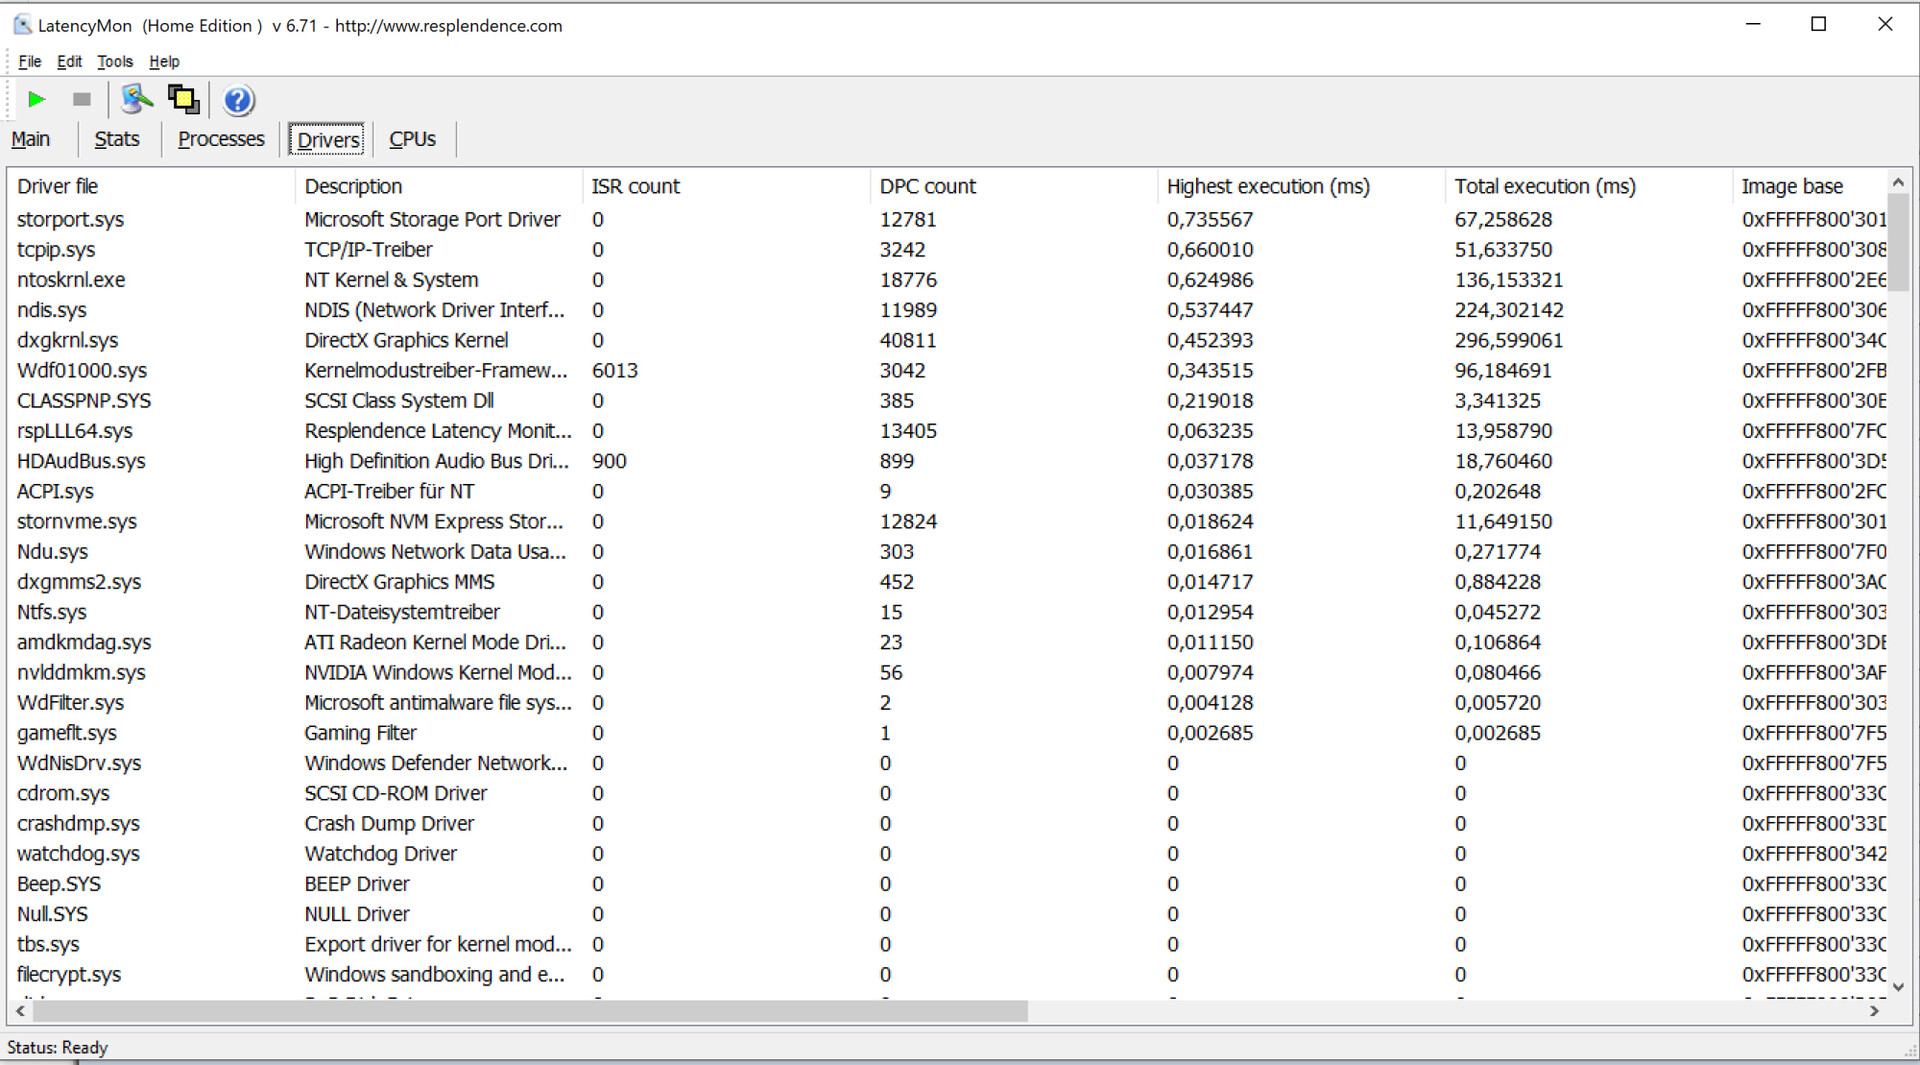
DPC latencies
Our standardized latency monitoring test (web surfing, 4K video playback, high-load Prime95) didn't reveal any irregularities with DPC latencies. The system seems to be suitable for real-time video and audio editing. This statement is based on our review device running the latest software at the time of testing. Future software and firmware updates may or may not change the system's behaviour in regards to the latencies.
| DPC Latencies / LatencyMon - interrupt to process latency (max), Web, Youtube, Prime95 | |
| MSI Delta 15 A5EFK | |
| Razer Blade 15 Base Edition 2021, i7-10750H RTX 3060 | |
| Lenovo Legion S7 15ACH6 82K80030GE | |
| Alienware m15 R5 Ryzen Edition | |
| Acer Nitro 5 AN515-45-R1JH | |
* ... smaller is better
Storage
An NVMe SSD (M.2 2280; 2242 models also fit) from Samsung serves as the system drive. It offers 1 TB of storage space and delivers good transfer rates. The laptop can accommodate a second NVMe SSD (M.2 2280/M.2 2242).
* ... smaller is better

Continuous load read: DiskSpd Read Loop, Queue Depth 8
Graphics card
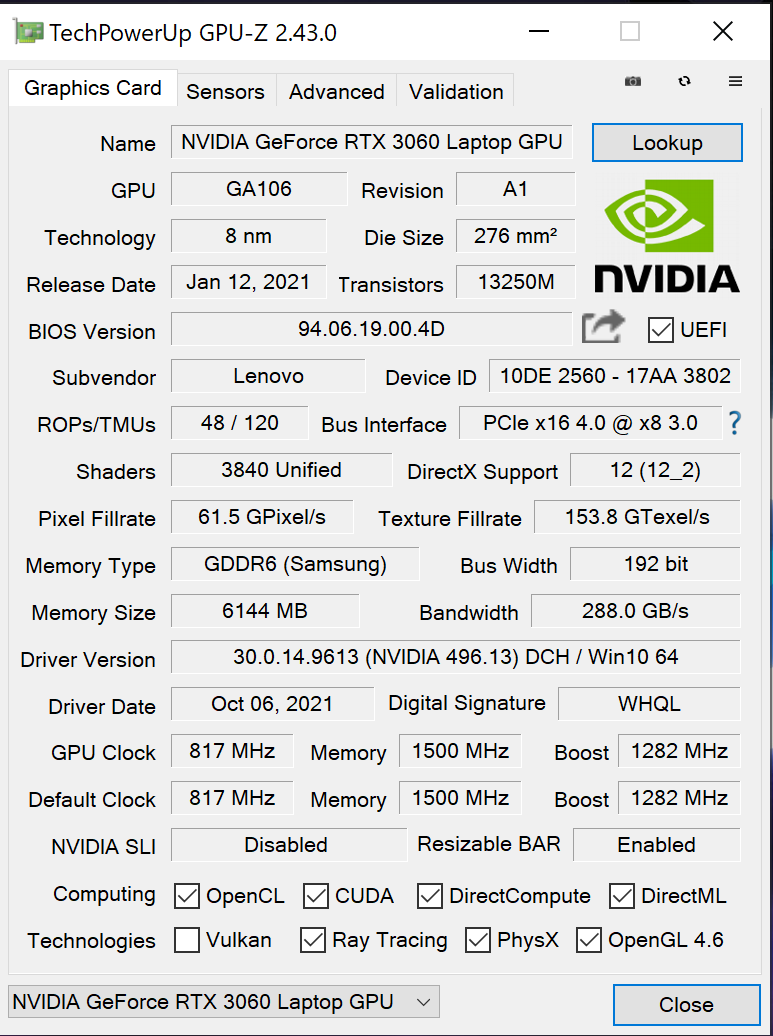
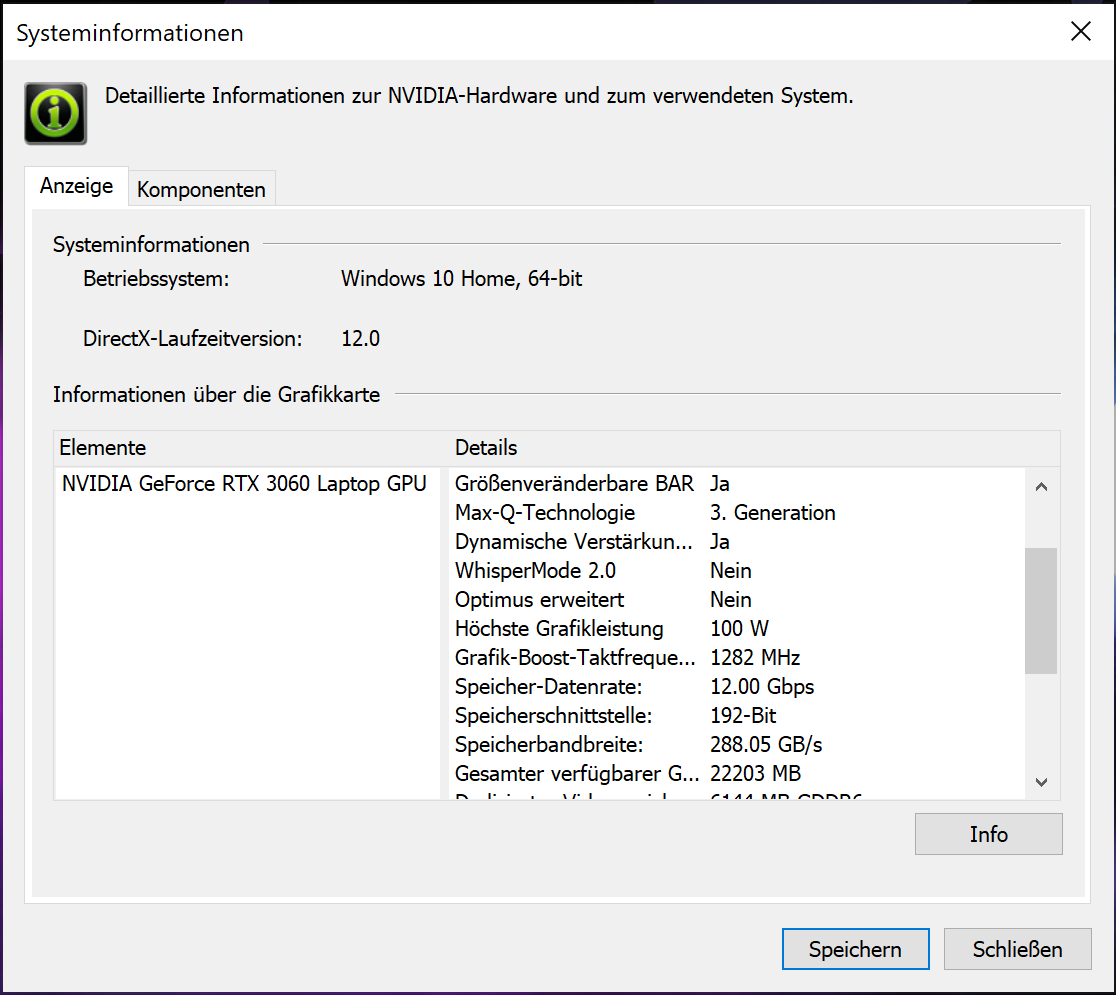
The actual performance of an RTX 3000 GPU depends on a few factors: Cooling, memory configuration, and the maximum TGP that a laptop manufacturer sets within the limits defined by Nvidia. Lenovo grants the GeForce RTX 3060 laptop GPU (overview of all RTX 3060 laptops including their TGPs) a maximum TGP of 100 watts. The GPU has access to fast GDDR6 graphics memory (6,144 MB).
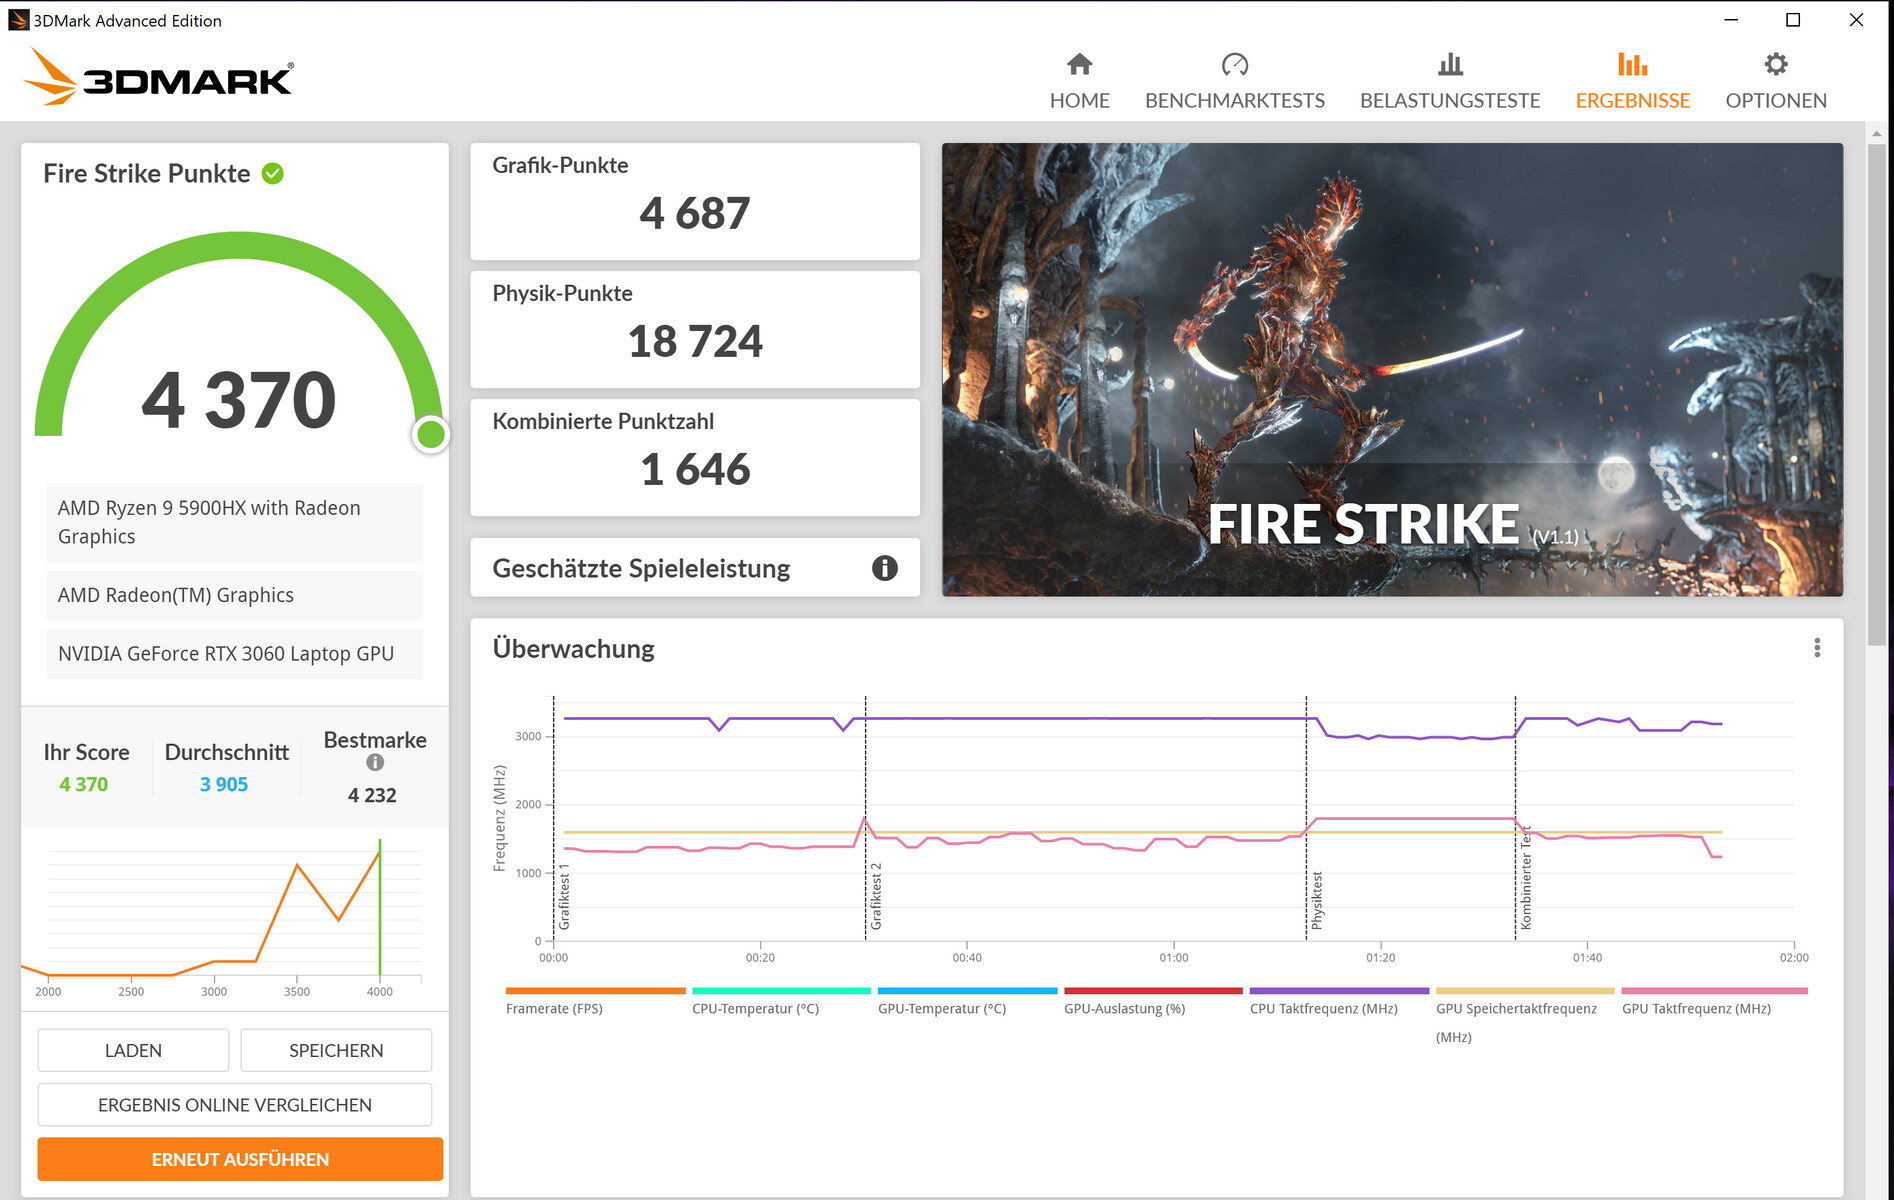
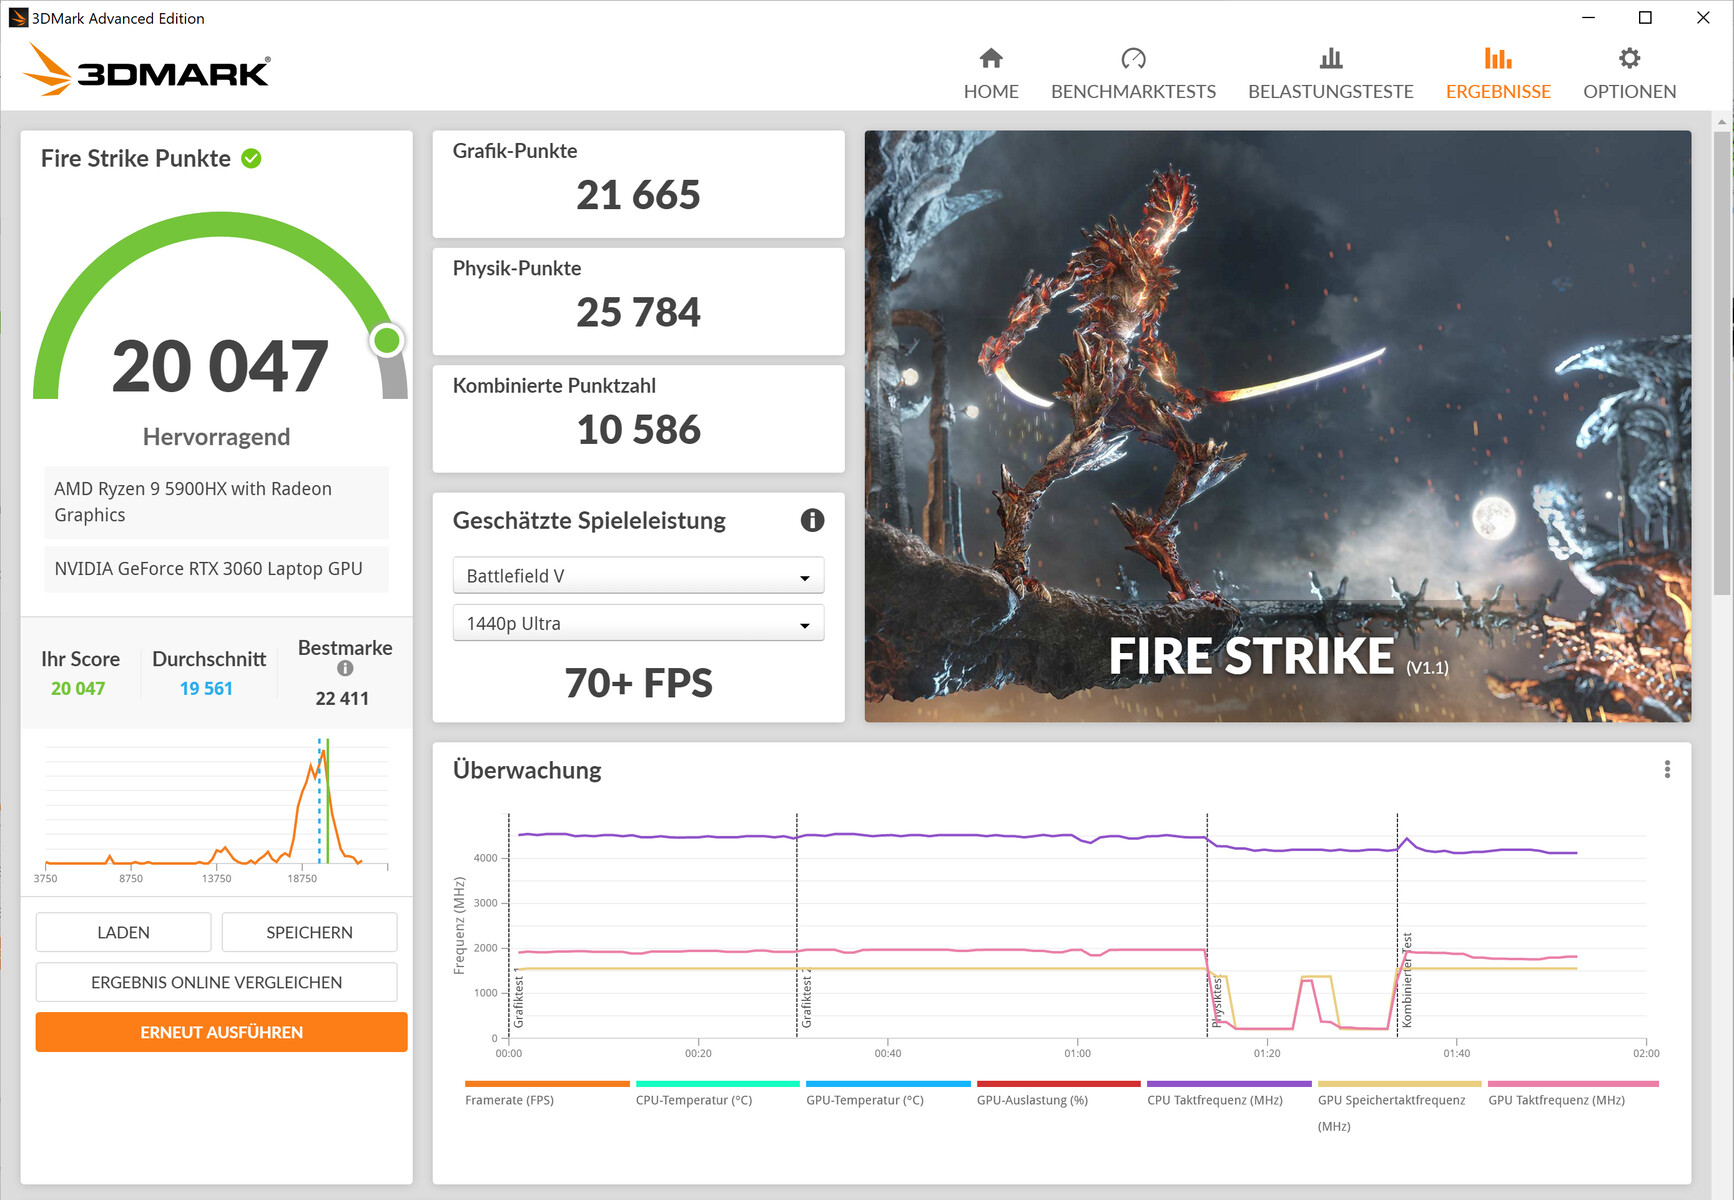
The 3DMark results are slightly above or below the average RTX 3060 from our database, depending on the benchmark. Disabling the integrated GPU (Hybrid Mode off) leads to a small increase in graphics performance. Activating the overclocking function in the BIOS provides an additional performance increase.


| 3DMark 06 Standard Score | 46503 points | |
| 3DMark 11 Performance | 23694 points | |
| 3DMark Fire Strike Score | 17397 points | |
| 3DMark Time Spy Score | 8325 points | |
Help | ||
| 3DMark Performance Rating - Percent | |
| Average of class Gaming | |
| MSI Delta 15 A5EFK -1! | |
| Lenovo Legion S7 15ACH6 82K80030GE -2! | |
| Lenovo Legion S7 15ACH6 82K80030GE -1! | |
| Acer Nitro 5 AN515-45-R1JH | |
| Alienware m15 R5 Ryzen Edition | |
| Average NVIDIA GeForce RTX 3060 Laptop GPU | |
| Lenovo Legion S7 15ACH6 82K80030GE | |
| Razer Blade 15 Base Edition 2021, i7-10750H RTX 3060 | |
Gaming performance
The laptop brings all modern games at Full HD resolution (1920x1080 pixels) and maximum quality settings smoothly onto the screen. Even the full screen resolution (3840x2160 pixels) can theoretically be used. But many titles will then require a significant reduction in quality level. The frame rates are slightly above average compared to other RTX 3060 devices. The rates of the Alienware m15 R5 Ryzen Edition competitor are on par.
The gaming benchmarks reflect the same behavior as the 3DMark benchmarks: Disabling the integrated GPU (Hybrid Mode off) and activating the overclocking function in the BIOS at the same time results in a performance increase. On average, 5% to 10% higher frame rates should be realistic.
| The Witcher 3 - 1920x1080 Ultra Graphics & Postprocessing (HBAO+) | |
| Average of class Gaming (18.4 - 224, n=82, last 2 years) | |
| MSI Delta 15 A5EFK | |
| Lenovo Legion S7 15ACH6 82K80030GE (Hybrid Mode off, OC) | |
| Acer Nitro 5 AN515-45-R1JH | |
| Razer Blade 15 Base Edition 2021, i7-10750H RTX 3060 | |
| Lenovo Legion S7 15ACH6 82K80030GE | |
| Average NVIDIA GeForce RTX 3060 Laptop GPU (58.2 - 91.5, n=48) | |
| Alienware m15 R5 Ryzen Edition | |
| Dota 2 Reborn | |
| 1920x1080 ultra (3/3) best looking | |
| Average of class Gaming (65.1 - 248, n=144, last 2 years) | |
| Average NVIDIA GeForce RTX 3060 Laptop GPU (90.7 - 154.8, n=49) | |
| Lenovo Legion S7 15ACH6 82K80030GE (Hybrid Mode off) | |
| Lenovo Legion S7 15ACH6 82K80030GE (Hybrid Mode off, OC) | |
| Razer Blade 15 Base Edition 2021, i7-10750H RTX 3060 | |
| Lenovo Legion S7 15ACH6 82K80030GE | |
| MSI Delta 15 A5EFK | |
| Acer Nitro 5 AN515-45-R1JH | |
| Alienware m15 R5 Ryzen Edition | |
| 3840x2160 ultra (3/3) best looking | |
| Average of class Gaming (106.2 - 205, n=47, last 2 years) | |
| Lenovo Legion S7 15ACH6 82K80030GE (Hybrid Mode off, OC) | |
| Lenovo Legion S7 15ACH6 82K80030GE (Hybrid Mode off) | |
| Lenovo Legion S7 15ACH6 82K80030GE | |
| Average NVIDIA GeForce RTX 3060 Laptop GPU (46.9 - 107, n=11) | |
| X-Plane 11.11 | |
| 1920x1080 high (fps_test=3) | |
| Average of class Gaming (33.4 - 166.2, n=146, last 2 years) | |
| Average NVIDIA GeForce RTX 3060 Laptop GPU (61.9 - 109.3, n=48) | |
| Lenovo Legion S7 15ACH6 82K80030GE (Hybrid Mode off, OC) | |
| Lenovo Legion S7 15ACH6 82K80030GE (Hybrid Mode off) | |
| Razer Blade 15 Base Edition 2021, i7-10750H RTX 3060 | |
| Lenovo Legion S7 15ACH6 82K80030GE | |
| Acer Nitro 5 AN515-45-R1JH | |
| Alienware m15 R5 Ryzen Edition | |
| 3840x2160 high (fps_test=3) | |
| Average of class Gaming (64.3 - 145.5, n=47, last 2 years) | |
| Average NVIDIA GeForce RTX 3060 Laptop GPU (58.5 - 92.3, n=12) | |
| Lenovo Legion S7 15ACH6 82K80030GE (Hybrid Mode off, OC) | |
| Lenovo Legion S7 15ACH6 82K80030GE (Hybrid Mode off) | |
| Lenovo Legion S7 15ACH6 82K80030GE | |
| Strange Brigade | |
| 1920x1080 ultra AA:ultra AF:16 | |
| Average of class Gaming (38.9 - 456, n=131, last 2 years) | |
| MSI Delta 15 A5EFK (1.47.22.14 D3D12) | |
| Lenovo Legion S7 15ACH6 82K80030GE (1.47.22.14 D3D12, Hybrid Mode off, OC) | |
| Razer Blade 15 Base Edition 2021, i7-10750H RTX 3060 (1.47.22.14 D3D12) | |
| Acer Nitro 5 AN515-45-R1JH (1.47.22.14 D3D12) | |
| Lenovo Legion S7 15ACH6 82K80030GE (1.47.22.14 D3D12, Hybrid Mode off) | |
| Average NVIDIA GeForce RTX 3060 Laptop GPU (102.2 - 166.3, n=43) | |
| Lenovo Legion S7 15ACH6 82K80030GE (1.47.22.14 D3D12) | |
| Alienware m15 R5 Ryzen Edition (1.47.22.14 D3D12) | |
| 2560x1440 ultra AA:ultra AF:16 | |
| Average of class Gaming (52.8 - 350, n=99, last 2 years) | |
| Lenovo Legion S7 15ACH6 82K80030GE (1.47.22.14 D3D12, Hybrid Mode off, OC) | |
| Acer Nitro 5 AN515-45-R1JH (1.47.22.14 D3D12) | |
| Lenovo Legion S7 15ACH6 82K80030GE (1.47.22.14 D3D12, Hybrid Mode off) | |
| Lenovo Legion S7 15ACH6 82K80030GE (1.47.22.14 D3D12) | |
| Average NVIDIA GeForce RTX 3060 Laptop GPU (75.4 - 118.4, n=17) | |
| 3840x2160 ultra AA:ultra AF:16 | |
| Average of class Gaming (54.5 - 298, n=39, last 2 years) | |
| Lenovo Legion S7 15ACH6 82K80030GE (1.47.22.14 D3D12, Hybrid Mode off, OC) | |
| Lenovo Legion S7 15ACH6 82K80030GE (1.47.22.14 D3D12) | |
| Lenovo Legion S7 15ACH6 82K80030GE (1.47.22.14 D3D12, Hybrid Mode off) | |
| Average NVIDIA GeForce RTX 3060 Laptop GPU (40 - 63.5, n=4) | |
| Call of Duty Black Ops Cold War | |
| 1920x1080 Highest Settings | |
| Lenovo Legion S7 15ACH6 82K80030GE | |
| Average NVIDIA GeForce RTX 3060 Laptop GPU (59.4 - 85.9, n=2) | |
| 1920x1080 Highest Settings + Ultra Ray Tracing | |
| Lenovo Legion S7 15ACH6 82K80030GE | |
| Average NVIDIA GeForce RTX 3060 Laptop GPU (39.6 - 47.5, n=2) | |
| F1 2021 | |
| 1920x1080 Ultra High Preset + Raytracing AA:T AF:16x | |
| Average of class Gaming (119.5 - 271, n=5, last 2 years) | |
| MSI Delta 15 A5EFK | |
| Lenovo Legion S7 15ACH6 82K80030GE (815237) | |
| Average NVIDIA GeForce RTX 3060 Laptop GPU (67 - 112.8, n=9) | |
| 2560x1440 Ultra High Preset + Raytracing AA:T AF:16x | |
| Average of class Gaming (95.2 - 204, n=4, last 2 years) | |
| Lenovo Legion S7 15ACH6 82K80030GE (815237) | |
| Average NVIDIA GeForce RTX 3060 Laptop GPU (47.5 - 70.2, n=2) | |
| 3840x2160 Ultra High Preset + Raytracing AA:T AF:16x | |
| Average of class Gaming (n=1last 2 years) | |
| Lenovo Legion S7 15ACH6 82K80030GE (815237) | |
| Average NVIDIA GeForce RTX 3060 Laptop GPU (25.9 - 38, n=2) | |
| Deathloop | |
| 1920x1080 Ultra Preset | |
| Lenovo Legion S7 15ACH6 82K80030GE | |
| MSI Delta 15 A5EFK | |
| Average NVIDIA GeForce RTX 3060 Laptop GPU (63.5 - 82.4, n=3) | |
| 2560x1440 Ultra Preset | |
| Average NVIDIA GeForce RTX 3060 Laptop GPU (49.9 - 58.7, n=2) | |
| Lenovo Legion S7 15ACH6 82K80030GE | |
| 3840x2160 Ultra Preset | |
| Average NVIDIA GeForce RTX 3060 Laptop GPU (28 - 32.8, n=2) | |
| Lenovo Legion S7 15ACH6 82K80030GE | |
| New World | |
| 1920x1080 Very High Video Quality | |
| MSI Delta 15 A5EFK | |
| Lenovo Legion S7 15ACH6 82K80030GE | |
| Average NVIDIA GeForce RTX 3060 Laptop GPU (62.3 - 84, n=4) | |
| 2560x1440 Very High Video Quality | |
| Lenovo Legion S7 15ACH6 82K80030GE | |
| Average NVIDIA GeForce RTX 3060 Laptop GPU (52.9 - 54.2, n=3) | |
| 3840x2160 Very High Video Quality | |
| Average NVIDIA GeForce RTX 3060 Laptop GPU (28.2 - 29.7, n=2) | |
| Lenovo Legion S7 15ACH6 82K80030GE | |
| Alan Wake Remastered | |
| 1920x1080 High Preset | |
| Average of class Gaming (n=1last 2 years) | |
| Average NVIDIA GeForce RTX 3060 Laptop GPU (81.5 - 89.3, n=3) | |
| Lenovo Legion S7 15ACH6 82K80030GE | |
| 2560x1440 High Preset | |
| Average of class Gaming (n=1last 2 years) | |
| Average NVIDIA GeForce RTX 3060 Laptop GPU (77 - 82.9, n=2) | |
| Lenovo Legion S7 15ACH6 82K80030GE | |
| 3840x2160 High Preset | |
| Average NVIDIA GeForce RTX 3060 Laptop GPU (46.5 - 50.9, n=2) | |
| Lenovo Legion S7 15ACH6 82K80030GE | |
| Far Cry 6 | |
| 1920x1080 Ultra Graphics Quality + HD Textures AA:T | |
| Average of class Gaming (94 - 167, n=6, last 2 years) | |
| Lenovo Legion S7 15ACH6 82K80030GE | |
| Average NVIDIA GeForce RTX 3060 Laptop GPU (59.8 - 94.3, n=6) | |
| MSI Delta 15 A5EFK | |
| 2560x1440 Ultra Graphics Quality + HD Textures AA:T | |
| Average of class Gaming (74.5 - 146, n=5, last 2 years) | |
| Average NVIDIA GeForce RTX 3060 Laptop GPU (61 - 70.3, n=4) | |
| Lenovo Legion S7 15ACH6 82K80030GE | |
| 1920x1080 Ultra Graphics Quality + HD Textures + DXR AA:T | |
| Lenovo Legion S7 15ACH6 82K80030GE | |
| MSI Delta 15 A5EFK | |
| Average NVIDIA GeForce RTX 3060 Laptop GPU (34 - 66, n=2) | |
| Back 4 Blood | |
| 1920x1080 Epic Preset (DX12) AA:T | |
| Average NVIDIA GeForce RTX 3060 Laptop GPU (152 - 163, n=3) | |
| Lenovo Legion S7 15ACH6 82K80030GE | |
| MSI Delta 15 A5EFK | |
| Average of class Gaming (n=1last 2 years) | |
| 2560x1440 Epic Preset (DX12) AA:T | |
| Average NVIDIA GeForce RTX 3060 Laptop GPU (104 - 111, n=2) | |
| Lenovo Legion S7 15ACH6 82K80030GE | |
| 3840x2160 Epic Preset (DX12) AA:T | |
| Average NVIDIA GeForce RTX 3060 Laptop GPU (53.3 - 57.2, n=2) | |
| Lenovo Legion S7 15ACH6 82K80030GE | |
| Guardians of the Galaxy | |
| 1920x1080 Ultra Preset | |
| Lenovo Legion S7 15ACH6 82K80030GE | |
| Average NVIDIA GeForce RTX 3060 Laptop GPU (87 - 110, n=4) | |
| Average of class Gaming (42 - 42, n=2, last 2 years) | |
| 2560x1440 Ultra Preset | |
| Average NVIDIA GeForce RTX 3060 Laptop GPU (76 - 79, n=2) | |
| Lenovo Legion S7 15ACH6 82K80030GE | |
| Average of class Gaming (n=1last 2 years) | |
| 3840x2160 Ultra Preset | |
| Average NVIDIA GeForce RTX 3060 Laptop GPU (35 - 44, n=2) | |
| Lenovo Legion S7 15ACH6 82K80030GE | |
| 1920x1080 Ultra Preset + Ultra Ray-Tracing | |
| Average NVIDIA GeForce RTX 3060 Laptop GPU (28 - 58, n=3) | |
| Lenovo Legion S7 15ACH6 82K80030GE | |
| Riders Republic | |
| 1920x1080 Ultra Preset | |
| Average NVIDIA GeForce RTX 3060 Laptop GPU (80 - 86, n=3) | |
| Lenovo Legion S7 15ACH6 82K80030GE | |
| 2560x1440 Ultra Preset | |
| Average NVIDIA GeForce RTX 3060 Laptop GPU (58 - 60, n=2) | |
| Lenovo Legion S7 15ACH6 82K80030GE | |
| 3840x2160 Ultra Preset | |
| Average NVIDIA GeForce RTX 3060 Laptop GPU (30 - 31, n=2) | |
| Lenovo Legion S7 15ACH6 82K80030GE | |
In order to verify whether the frame rates remain largely constant over a prolonged period of time, we let the game The Witcher 3 run for about 60 minutes at Full HD resolution and maximum quality settings. The character is not moved. A drop in frame rates wasn't found.
The Witcher 3 FPS diagram
| low | med. | high | ultra | QHD | 4K | |
|---|---|---|---|---|---|---|
| GTA V (2015) | 179 | 172 | 153 | 92.6 | 72 | 70 |
| The Witcher 3 (2015) | 295 | 218 | 141 | 79.3 | 55.3 | |
| Dota 2 Reborn (2015) | 144 | 138 | 123 | 119 | 95.5 | |
| Final Fantasy XV Benchmark (2018) | 163 | 103 | 77.1 | 58.4 | 34.3 | |
| X-Plane 11.11 (2018) | 103 | 88.2 | 72.6 | 58.5 | ||
| Far Cry 5 (2018) | 142 | 118 | 113 | 106 | 82 | 44 |
| Strange Brigade (2018) | 361 | 194 | 155 | 135 | 101 | 59.9 |
| Call of Duty Black Ops Cold War (2020) | 188 | 102 | 93 | 85.9 | 62.4 | 32.6 |
| F1 2021 (2021) | 290 | 181 | 157 | 93.4 | 70.2 | 38 |
| Deathloop (2021) | 132 | 102 | 81.8 | 82.4 | 49.9 | 28 |
| New World (2021) | 90.5 | 75.8 | 76.1 | 71.1 | 54.2 | 28.2 |
| Alan Wake Remastered (2021) | 93.7 | 86.2 | 81.5 | 77 | 46.5 | |
| Far Cry 6 (2021) | 118 | 105 | 97 | 84 | 63 | |
| Back 4 Blood (2021) | 293 | 190 | 170 | 152 | 104 | 53.3 |
| Guardians of the Galaxy (2021) | 110 | 107 | 107 | 105 | 76 | 35 |
| Riders Republic (2021) | 159 | 106 | 88 | 81 | 58 | 30 |
Emissions - The Lenovo laptop can get really hot
Noise emissions
Noise development is within limits in everyday use (office, Internet). The fans usually operate at low speeds and are sometimes idle. However, things get pretty loud under load with maximum sound pressure levels of 54 dB(A) (stress test) and 53 dB(A) (The Witcher 3 test), respectively. To all but the most sensitive of users, this level of noise will be acceptable, in our opinion.
Noise Level
| Idle |
| 25 / 30 / 36 dB(A) |
| Load |
| 42 / 54 dB(A) |
 | ||
30 dB silent 40 dB(A) audible 50 dB(A) loud |
||
min: | ||
| Lenovo Legion S7 15ACH6 82K80030GE R9 5900HX, GeForce RTX 3060 Laptop GPU | Razer Blade 15 Base Edition 2021, i7-10750H RTX 3060 i7-10750H, GeForce RTX 3060 Laptop GPU | MSI Delta 15 A5EFK R9 5900HX, Radeon RX 6700M | Alienware m15 R5 Ryzen Edition R7 5800H, GeForce RTX 3060 Laptop GPU | Acer Nitro 5 AN515-45-R1JH R7 5800H, GeForce RTX 3070 Laptop GPU | Average of class Gaming | |
|---|---|---|---|---|---|---|
| Noise | 9% | -1% | 6% | 5% | 4% | |
| off / environment * | 25 | 25.3 -1% | 25 -0% | 24 4% | 25 -0% | 24 ? 4% |
| Idle Minimum * | 25 | 25.4 -2% | 25 -0% | 24 4% | 25 -0% | 25.9 ? -4% |
| Idle Average * | 30 | 25.4 15% | 30 -0% | 25 17% | 25 17% | 27.7 ? 8% |
| Idle Maximum * | 36 | 25.4 29% | 40 -11% | 35 3% | 32.2 11% | 30.2 ? 16% |
| Load Average * | 42 | 42.5 -1% | 47 -12% | 44 -5% | 45.8 -9% | 42.3 ? -1% |
| Witcher 3 ultra * | 53 | 42 21% | 48 9% | 48 9% | ||
| Load Maximum * | 54 | 52.2 3% | 51 6% | 50 7% | 49.1 9% | 53.5 ? 1% |
* ... smaller is better
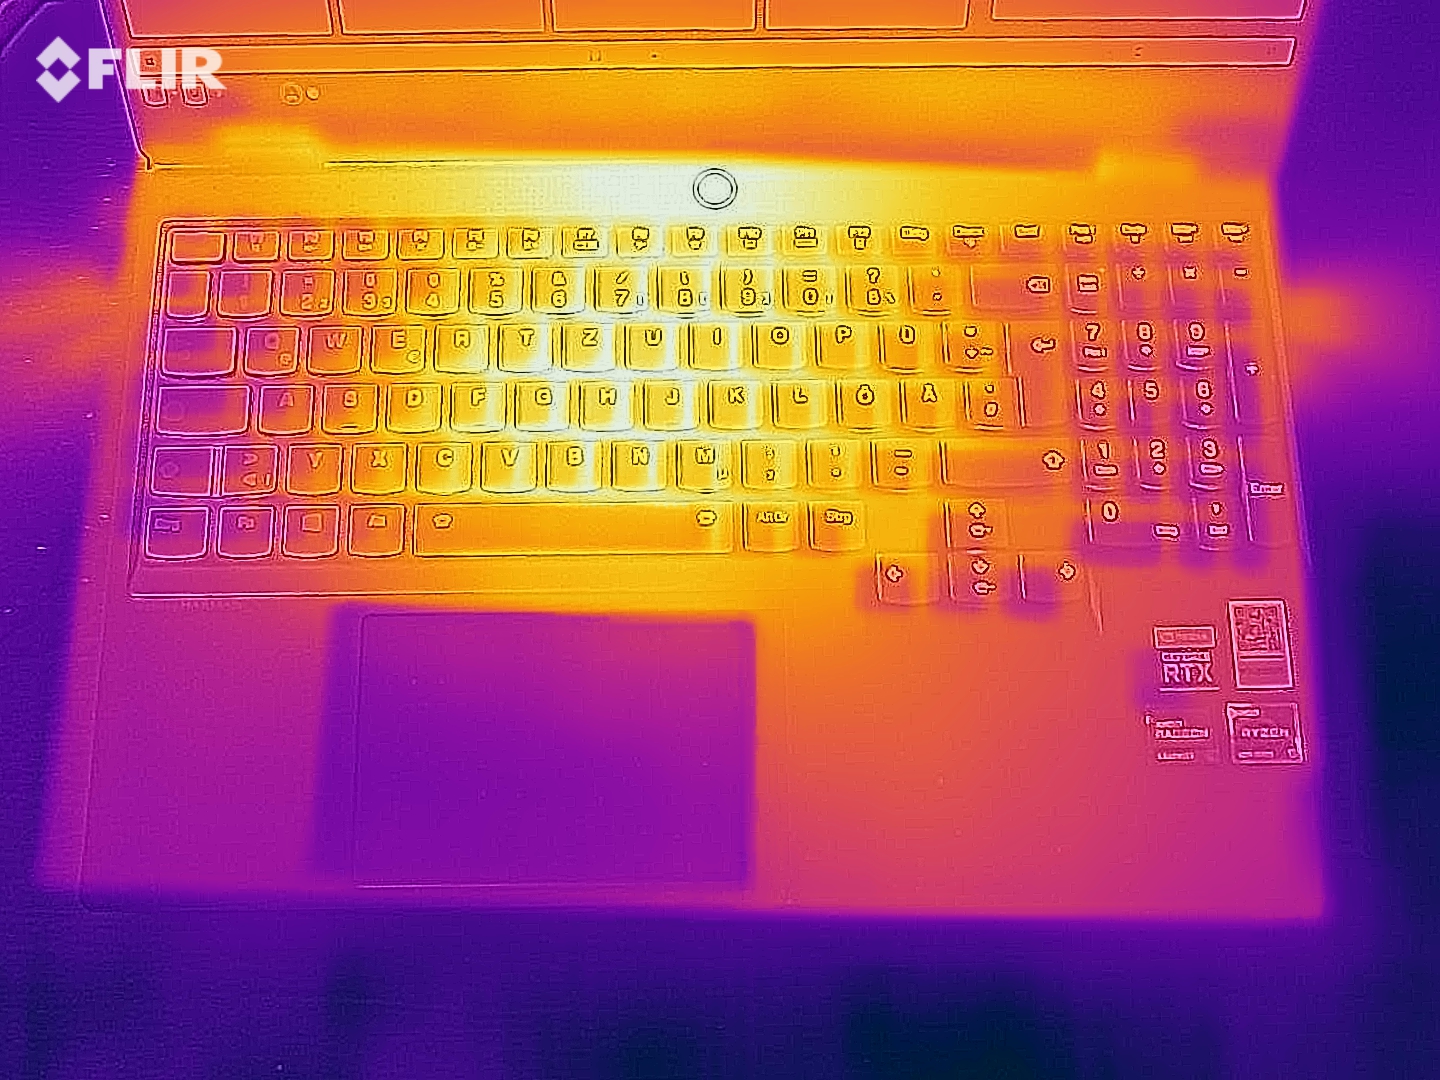
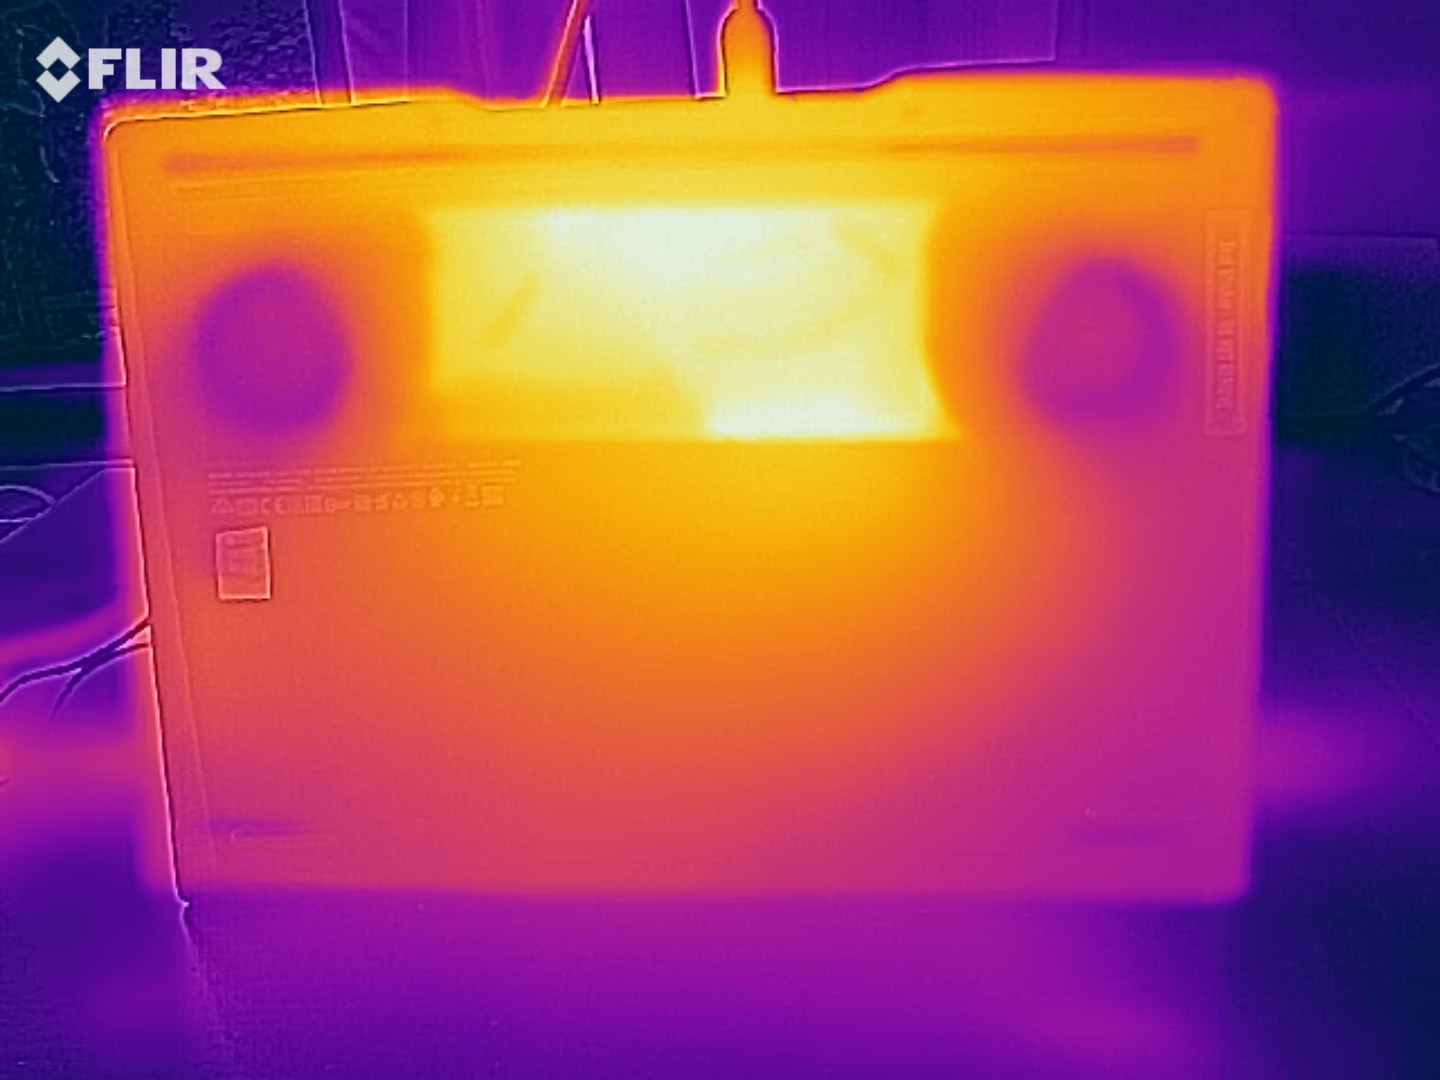
Temperature
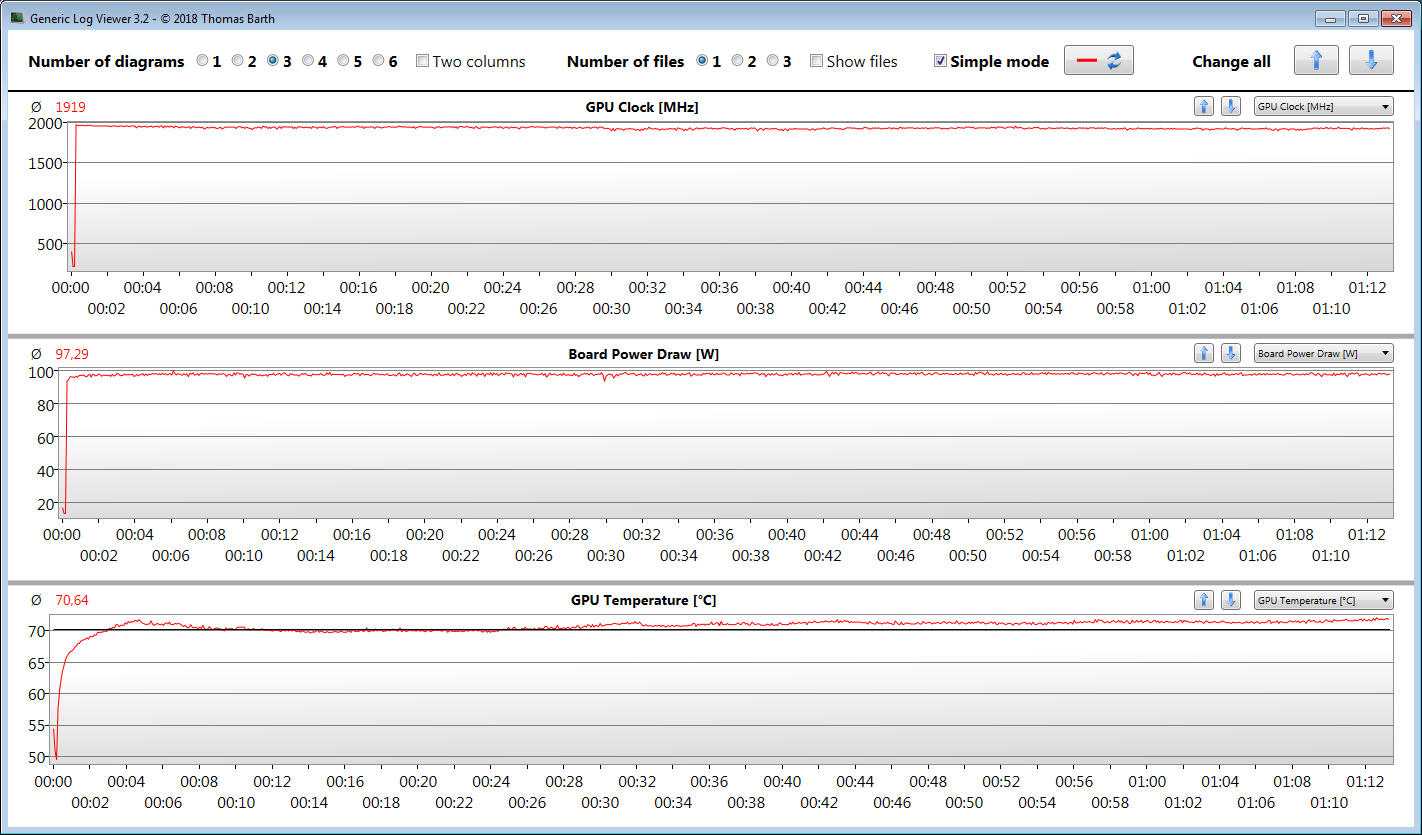
Everyday office and Internet applications don't put much strain on the hardware. Consequently, the case temperatures remain well within the green range. The laptop heats up considerably under load - most notably during our The Witcher 3 test. The CPU temperatures are still within acceptable territory with an average of 82 °C (~180 °F) (The Witcher 3 test) and 94 °C (~201 °F) (stress test), respectively.


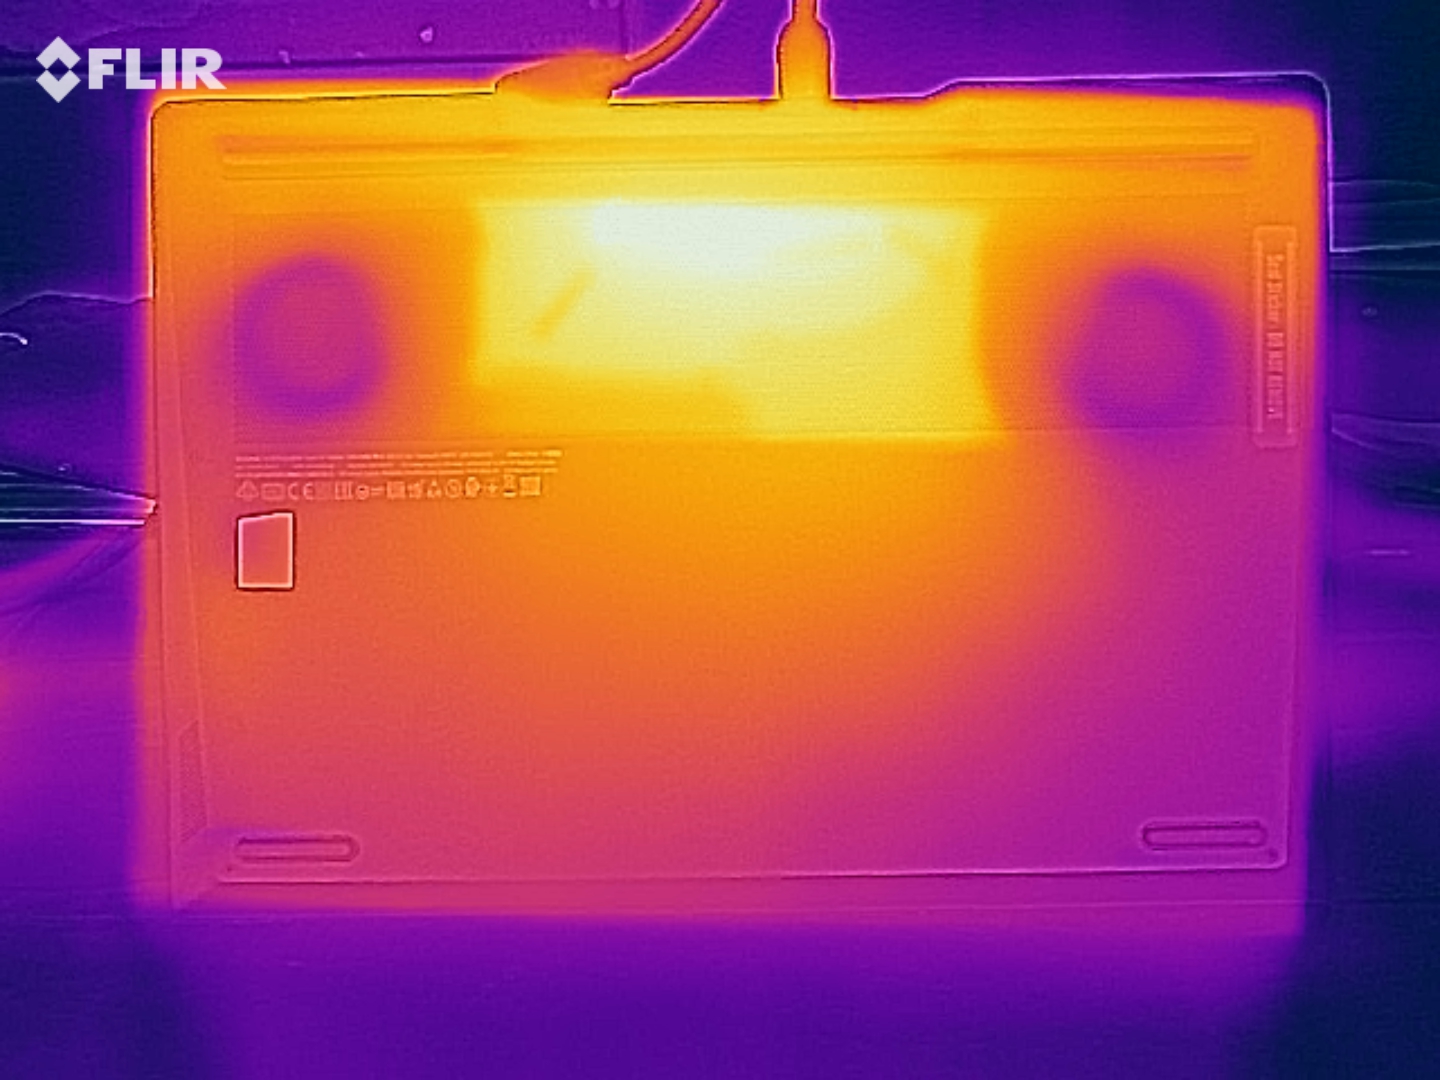
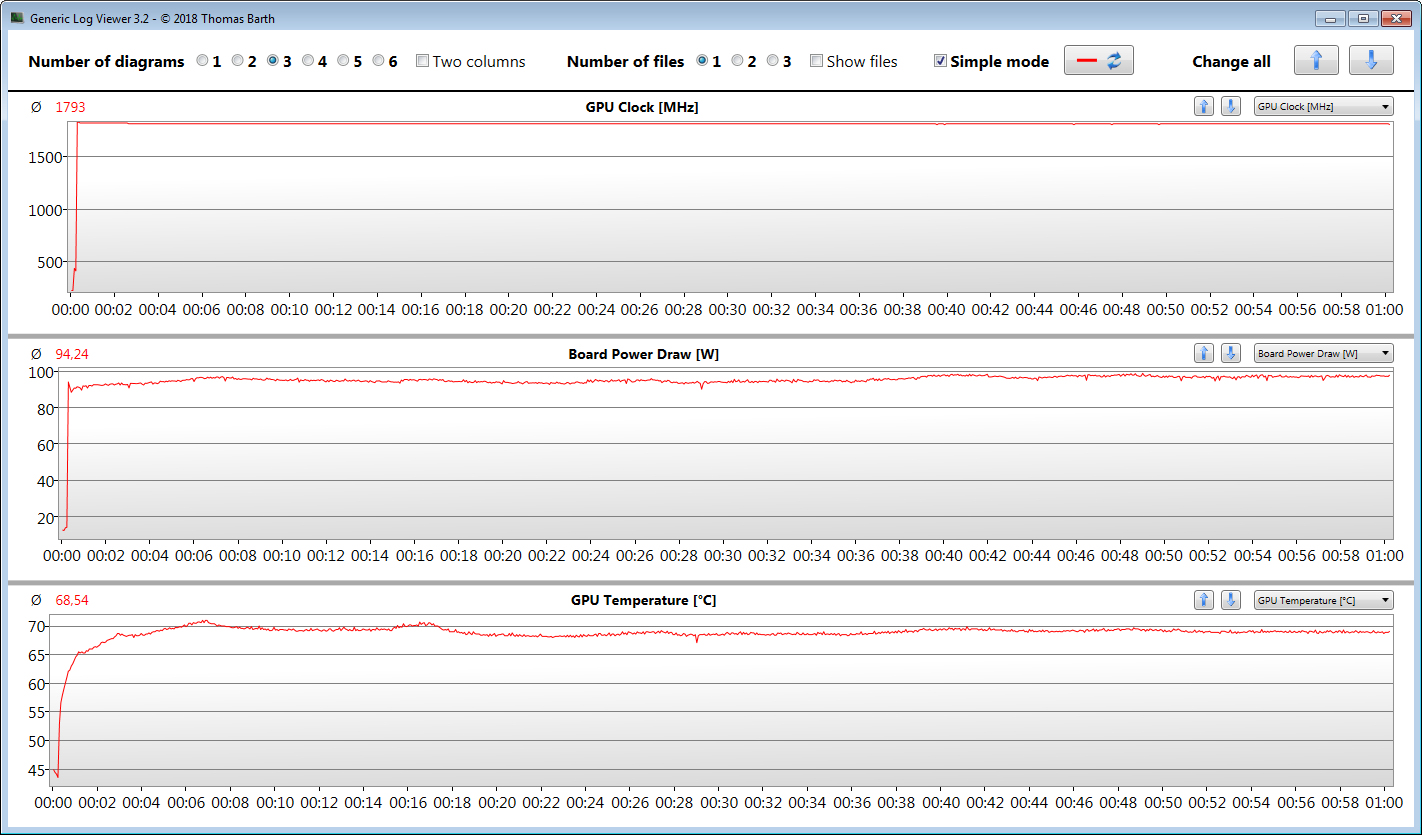
The CPU completes the stress test (Prime95 and FurMark run for at least an hour) at a clock speed of about 3.8 GHz, while the graphics core works at heavily fluctuating speeds. This would also explain why the device heats up less during the stress test. The stress test represents an extreme scenario. We use this test to check whether the system remains stable under full load.
(-) The maximum temperature on the upper side is 49 °C / 120 F, compared to the average of 40.5 °C / 105 F, ranging from 21.2 to 68.8 °C for the class Gaming.
(-) The bottom heats up to a maximum of 50 °C / 122 F, compared to the average of 43.3 °C / 110 F
(+) In idle usage, the average temperature for the upper side is 27.9 °C / 82 F, compared to the device average of 33.9 °C / 93 F.
(-) Playing The Witcher 3, the average temperature for the upper side is 44.8 °C / 113 F, compared to the device average of 33.9 °C / 93 F.
(±) The palmrests and touchpad can get very hot to the touch with a maximum of 39 °C / 102.2 F.
(-) The average temperature of the palmrest area of similar devices was 28.9 °C / 84 F (-10.1 °C / -18.2 F).
| Lenovo Legion S7 15ACH6 82K80030GE R9 5900HX, GeForce RTX 3060 Laptop GPU | Razer Blade 15 Base Edition 2021, i7-10750H RTX 3060 i7-10750H, GeForce RTX 3060 Laptop GPU | MSI Delta 15 A5EFK R9 5900HX, Radeon RX 6700M | Alienware m15 R5 Ryzen Edition R7 5800H, GeForce RTX 3060 Laptop GPU | Acer Nitro 5 AN515-45-R1JH R7 5800H, GeForce RTX 3070 Laptop GPU | Average of class Gaming | |
|---|---|---|---|---|---|---|
| Heat | -8% | -5% | -21% | -8% | -3% | |
| Maximum Upper Side * | 49 | 45.2 8% | 50 -2% | 62 -27% | 53.2 -9% | 45.9 ? 6% |
| Maximum Bottom * | 50 | 48 4% | 55 -10% | 61 -22% | 58.2 -16% | 48.7 ? 3% |
| Idle Upper Side * | 29 | 34.4 -19% | 31 -7% | 36 -24% | 29.5 -2% | 31.4 ? -8% |
| Idle Bottom * | 30 | 37.2 -24% | 30 -0% | 33 -10% | 31.2 -4% | 34.3 ? -14% |
* ... smaller is better
Speakers
The stereo speakers produce a very decent sound, but there's hardly any bass. Headphones or external speakers are recommended for a better audio experience.
Lenovo Legion S7 15ACH6 82K80030GE audio analysis
(+) | speakers can play relatively loud (82 dB)
Bass 100 - 315 Hz
(-) | nearly no bass - on average 16.4% lower than median
(±) | linearity of bass is average (9.3% delta to prev. frequency)
Mids 400 - 2000 Hz
(+) | balanced mids - only 2.9% away from median
(+) | mids are linear (3.4% delta to prev. frequency)
Highs 2 - 16 kHz
(+) | balanced highs - only 3% away from median
(+) | highs are linear (6.4% delta to prev. frequency)
Overall 100 - 16.000 Hz
(+) | overall sound is linear (13.4% difference to median)
Compared to same class
» 19% of all tested devices in this class were better, 7% similar, 74% worse
» The best had a delta of 6%, average was 18%, worst was 132%
Compared to all devices tested
» 13% of all tested devices were better, 4% similar, 84% worse
» The best had a delta of 4%, average was 24%, worst was 134%
MSI Delta 15 A5EFK audio analysis
(±) | speaker loudness is average but good (80 dB)
Bass 100 - 315 Hz
(±) | reduced bass - on average 12.9% lower than median
(±) | linearity of bass is average (10.3% delta to prev. frequency)
Mids 400 - 2000 Hz
(+) | balanced mids - only 4.8% away from median
(+) | mids are linear (5.3% delta to prev. frequency)
Highs 2 - 16 kHz
(+) | balanced highs - only 4.1% away from median
(±) | linearity of highs is average (9.4% delta to prev. frequency)
Overall 100 - 16.000 Hz
(±) | linearity of overall sound is average (16.2% difference to median)
Compared to same class
» 39% of all tested devices in this class were better, 7% similar, 54% worse
» The best had a delta of 6%, average was 18%, worst was 132%
Compared to all devices tested
» 24% of all tested devices were better, 5% similar, 70% worse
» The best had a delta of 4%, average was 24%, worst was 134%
Energy management - The Lenovo S7 offers impressive battery life
Energy consumption
The Legion S7 doesn't hold any surprises in store in terms of energy consumption. Power consumption is at a normal level for the hardware installed here across the entire load range. The power adapter's nominal output is 230 watts. The following diagram illustrates the stable power consumption of the laptop during our The Witcher 3 test.
| Off / Standby | |
| Idle | |
| Load |
|
Key:
min: | |
Energy consumption during The Witcher 3 / stress test
| Lenovo Legion S7 15ACH6 82K80030GE R9 5900HX, GeForce RTX 3060 Laptop GPU | Razer Blade 15 Base Edition 2021, i7-10750H RTX 3060 i7-10750H, GeForce RTX 3060 Laptop GPU | MSI Delta 15 A5EFK R9 5900HX, Radeon RX 6700M | Alienware m15 R5 Ryzen Edition R7 5800H, GeForce RTX 3060 Laptop GPU | Acer Nitro 5 AN515-45-R1JH R7 5800H, GeForce RTX 3070 Laptop GPU | Average of class Gaming | |
|---|---|---|---|---|---|---|
| Power Consumption | -2% | -7% | -7% | 13% | -20% | |
| Idle Minimum * | 13 | 11.7 10% | 10 23% | 11 15% | 8.8 32% | 14.2 ? -9% |
| Idle Average * | 16 | 16 -0% | 18 -13% | 14 12% | 13 19% | 20.2 ? -26% |
| Idle Maximum * | 23 | 29.3 -27% | 25 -9% | 25 -9% | 14.6 37% | 27.2 ? -18% |
| Load Average * | 95 | 95.6 -1% | 101 -6% | 123 -29% | 133 -40% | 107.7 ? -13% |
| Witcher 3 ultra * | 156 | 141.3 9% | 187 -20% | 176 -13% | 134 14% | |
| Load Maximum * | 191 | 197 -3% | 217 -14% | 226 -18% | 164 14% | 260 ? -36% |
* ... smaller is better
Battery life
The 15.6-incher achieves runtimes of 7:01 hours and 7:29 hours in the Wi-Fi test (accessing websites via a script) and video test (short film Big Buck Bunny (H.264 encoding, Full HD) running in a loop), respectively. The laptop's power-saving features are disabled during both tests, and the display brightness is set to about 150 cd/m². The wireless modules are also disabled for the video test.
| Lenovo Legion S7 15ACH6 82K80030GE R9 5900HX, GeForce RTX 3060 Laptop GPU, 71 Wh | Razer Blade 15 Base Edition 2021, i7-10750H RTX 3060 i7-10750H, GeForce RTX 3060 Laptop GPU, 65 Wh | MSI Delta 15 A5EFK R9 5900HX, Radeon RX 6700M, 82 Wh | Alienware m15 R5 Ryzen Edition R7 5800H, GeForce RTX 3060 Laptop GPU, 86 Wh | Acer Nitro 5 AN515-45-R1JH R7 5800H, GeForce RTX 3070 Laptop GPU, 57.5 Wh | Average of class Gaming | |
|---|---|---|---|---|---|---|
| Battery Runtime | -15% | 10% | -6% | -18% | -4% | |
| Reader / Idle | 841 | 466 -45% | 664 -21% | 881 5% | 552 -34% | 570 ? -32% |
| H.264 | 449 | 525 17% | 413 -8% | 457 ? 2% | ||
| WiFi v1.3 | 421 | 289 -31% | 474 13% | 306 -27% | 340 -19% | 387 ? -8% |
| Load | 69 | 91 32% | 96 39% | 55 -20% | 62 -10% | 85.8 ? 24% |
| Witcher 3 ultra | 96 | 69.5 ? |
Pros
Cons
Verdict - The Lenovo Legion S7 15ACH6 is not only meant for gamers, but for creators as well
Lenovo introduces a light, compact gaming laptop that didn't reveal any problems in terms of performance development. The Ryzen 9 5900HX APU and the GeForce RTX 3060 laptop GPU (max TGP: 100 watts) can operate at consistently high clock rates. You can get a bit of an additional performance out of the GeForce GPU via the built-in overclocking features.
Light, slim, fast - Lenovo does a lot right with the Legion S7 15ACH6.
The hardware brings almost all the latest games smoothly onto the 4K screen. The full resolution can generally be used - but not always at high to maximum quality settings. The S7's heat and noise development in gaming mode are normal for the hardware installed here. The laptop can definitely run quietly in everyday use while only heating up to a minor extent.
Lenovo deserves praise for the matte 15.6-inch display (4K, IPS, 60 Hz). It scores points with high brightness, good contrast, HDR, stable viewing angles, excellent color reproduction, and good color-space coverage. In addition, Free Sync is supported. There's room for improvement in terms of response times, though.
Real-world battery runtimes of about 7 hours are more than acceptable for a gaming laptop with a 4K display. Full HD variants of the Legion should last a few minutes longer. Good: The battery can be charged using a universal USB-C power adapter (at least 45 watts). This means that the bulky 230-watt power adapter doesn't necessarily have to be carried around.
An alternative to the Legion S7 would be the MSI Delta 15 A5EFK, for example. It has a stronger graphics core (including 10 GB of video memory) and offers slightly better battery life. Its weaknesses are the modest display and the limited maintainability.
Price and availability
At the time of writing, you can find the Lenovo Legion S7 15ACH6 in our test configuration (Ryzen 9 5900HX APU, GeForce RTX 3060 laptop GPU, 32 GB of RAM, 60 Hz 4K display) with 2 TB of SSD storage space at a discounted price of $1,899.99 on Lenovo's online store. There are several other configurations here, including less expensive ones with the Ryzen 7 5800H and the RTX 3050 Ti. You can also find additional configurations on Best Buy, for example.
Lenovo Legion S7 15ACH6 82K80030GE
- 10/31/2021 v7 (old)
Sascha Mölck
More articles related to this device
Lenovo Legion S7 15ACH6 82K80030GE (Legion S7 Series)Related Articles


Price comparison

