 Deutsch
 English
 Español
 Français
 Italiano
 Nederlands
 Polski
 Português
 Русский
 Türkçe
 Svenska
 Chinese
 Magyar
MSI Delta 15 gaming laptop review: The Radeon RX 6700M makes its debut

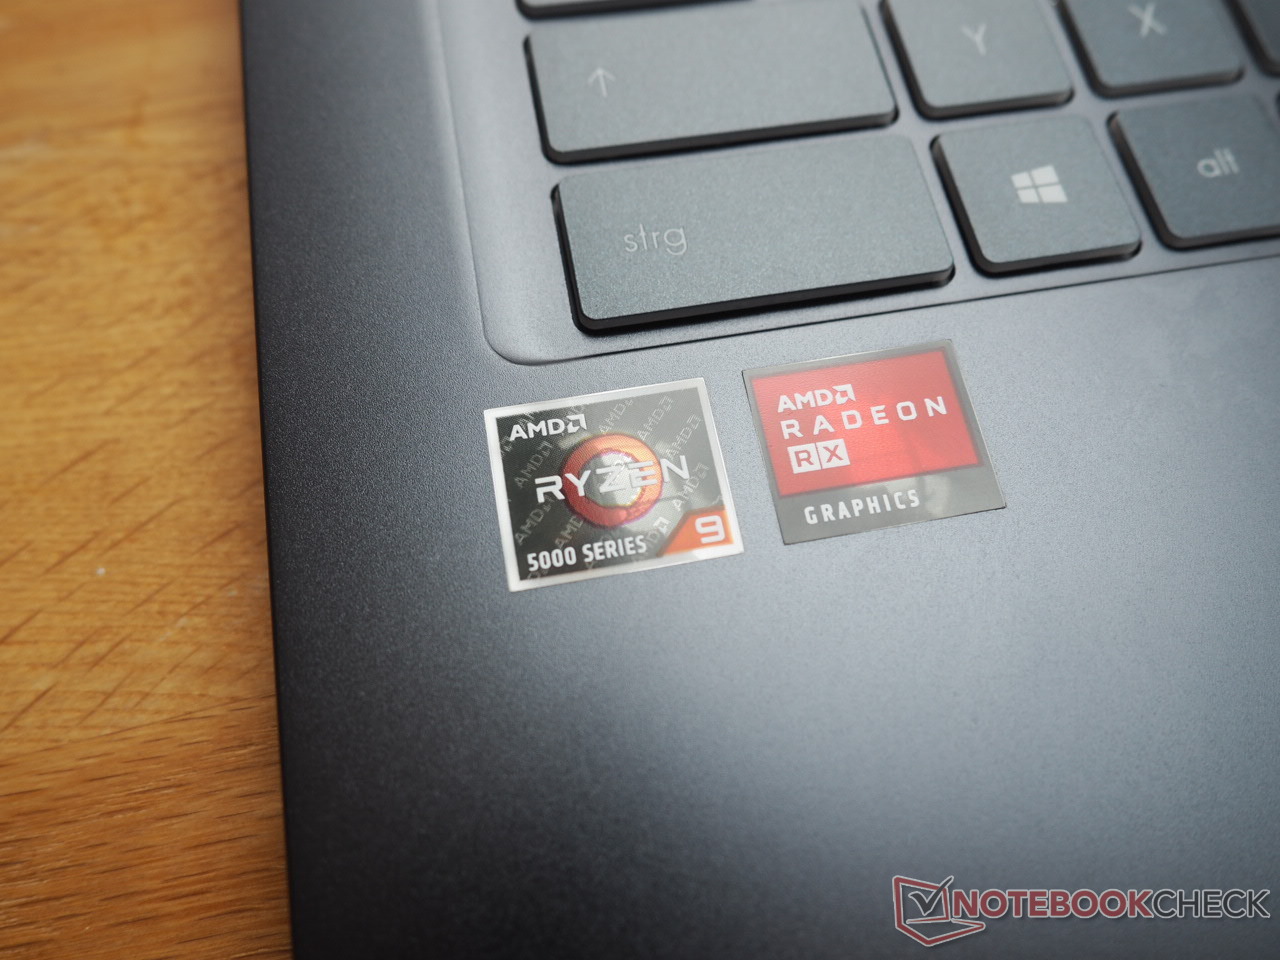
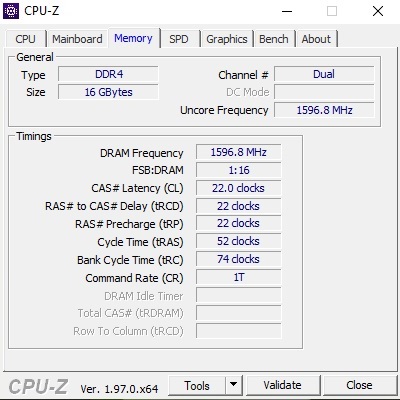
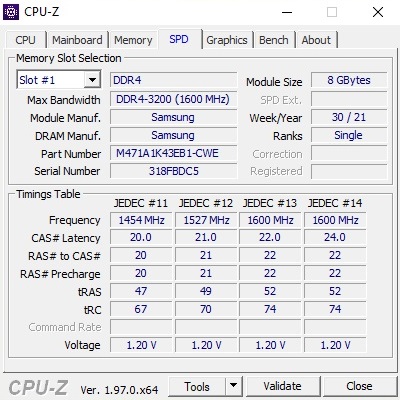
The MSI Delta 15 A5EFK is one of the first laptops to feature the brand-new Radeon RX 6700M. Fittingly, a high-end CPU from the latest Ryzen series runs under the hood: The R9 5900HX is one of the most powerful laptop processors on the market. Graphics are displayed on a matte Full HD panel with 240 Hz and FreeSync support.
16 GB of DDR4 RAM (dual channel) and a 1 TB SSD aren't bad either. Our review sample came with Windows 10 Home 64-bit as its operating system. At a price of just under 2,000 Euros (~$2,320), the 15-inch device will mainly have to compete against laptops based on the GeForce RTX 3070.
The Delta 15's biggest rivals include similarly sized gaming laptops with a Ryzen CPU and a high-end GPU from Nvidia's Ampere generation, such as the Asus TUF Gaming A15 FA506QR, the Asus ROG Strix G15 G513QR, the Asus ROG Zephyrus G15 GA503Q, and the Asus ROG Strix Scar 15 G533QS.
While the first two laptops sport the RTX 3070 (TGPs of 90 and 130 watts, respectively), the latter laptops feature the RTX 3080 (100 and 130 watts, respectively). We chose two different comparison alternatives in each case in order to cover the TGP spectrum of the Ampere chips to some extent. The tables also include the first RX 6800M device that we reviewed, the Asus ROG Strix G15 513QY.
Possible contenders in comparison
Rating | Date | Model | Weight | Height | Size | Resolution | Best Price |
|---|---|---|---|---|---|---|---|
| 82.9 % | 10/2021 | MSI Delta 15 A5EFK R9 5900HX, Radeon RX 6700M | 2 kg | 19 mm | 15.60" | 1920x1080 | |
| 84.7 % | 07/2021 | Asus ROG Strix G15 G513QY R9 5900HX, Radeon RX 6800M | 2.4 kg | 27.9 mm | 15.60" | 1920x1080 | |
| 86.3 % | 07/2021 | Asus ROG Strix Scar 15 G533QS R9 5900HX, GeForce RTX 3080 Laptop GPU | 2.3 kg | 27.2 mm | 15.60" | 2560x1440 | |
| 83.8 % | 02/2021 | Asus ROG Zephyrus G15 GA503Q R9 5900HS, GeForce RTX 3080 Laptop GPU | 2 kg | 20 mm | 15.60" | 2560x1440 | |
| 85 % | 02/2021 | Asus ROG Strix G15 G513QR R9 5900HX, GeForce RTX 3070 Laptop GPU | 2.3 kg | 27.2 mm | 15.60" | 1920x1080 | |
| 85 % | 07/2021 | Asus TUF Gaming A15 FA506QR-AZ061T R7 5800H, GeForce RTX 3070 Laptop GPU | 2.3 kg | 24 mm | 15.60" | 1920x1080 |
Case
The case leaves a good impression. Although its stability could be better in some areas (e.g. at the center of the palm rest), the Delta 15 doesn't allow as much torsion compared to the similarly thin GS series. The build quality hardly offers any room for criticism. Nearly all the elements in our review sample merge smoothly with each other.
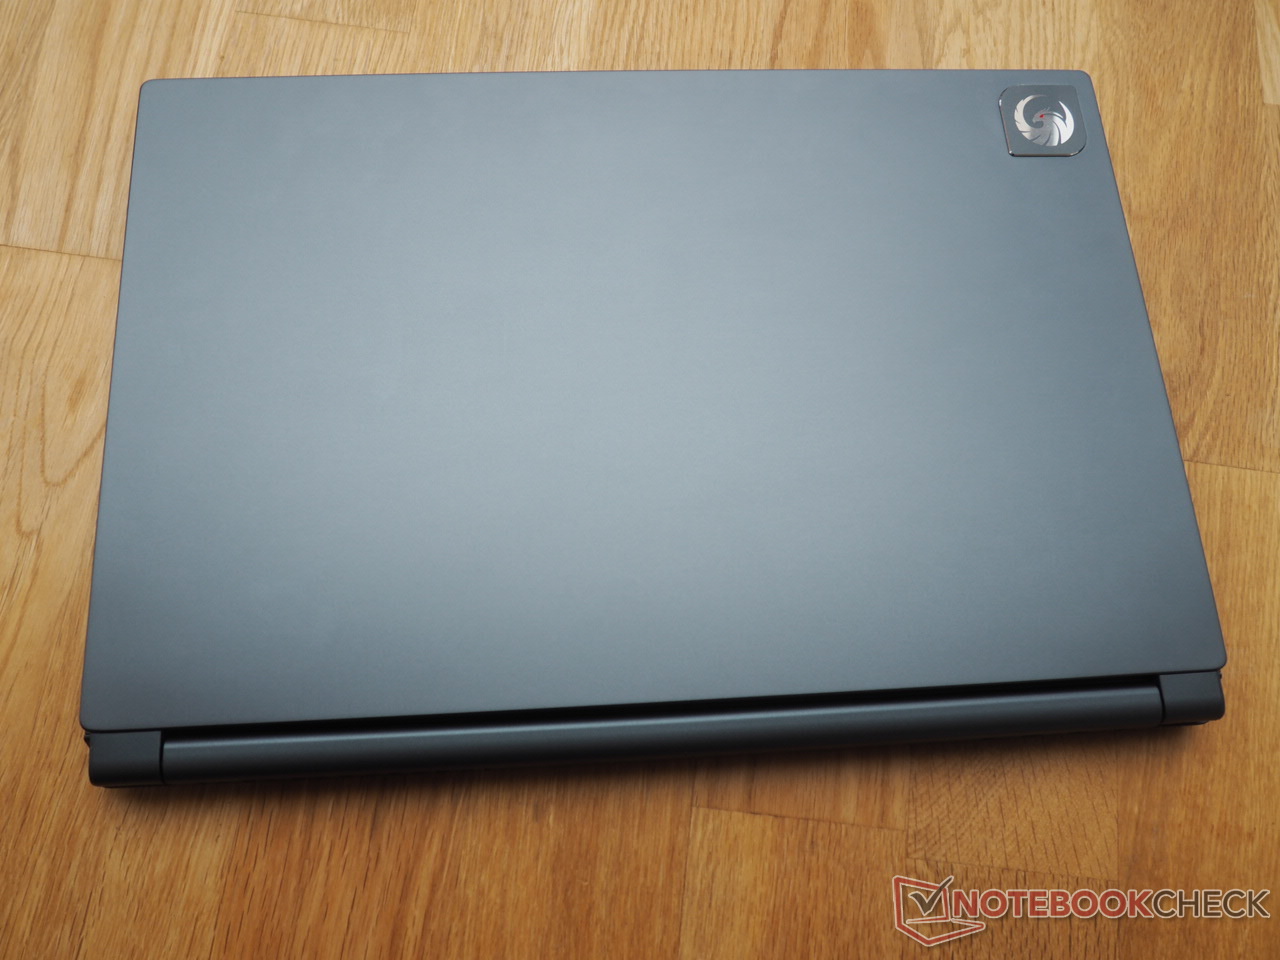
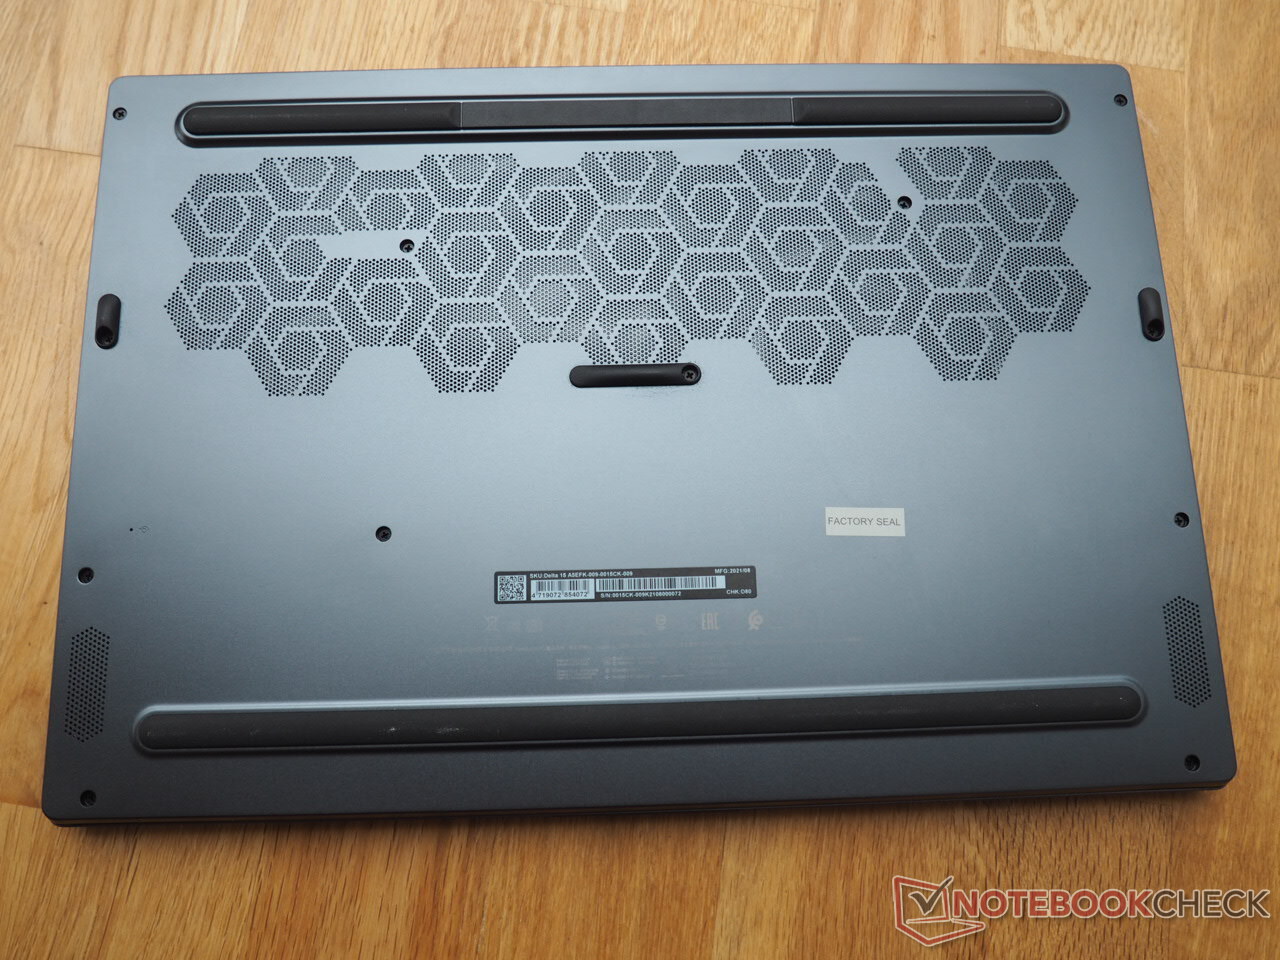
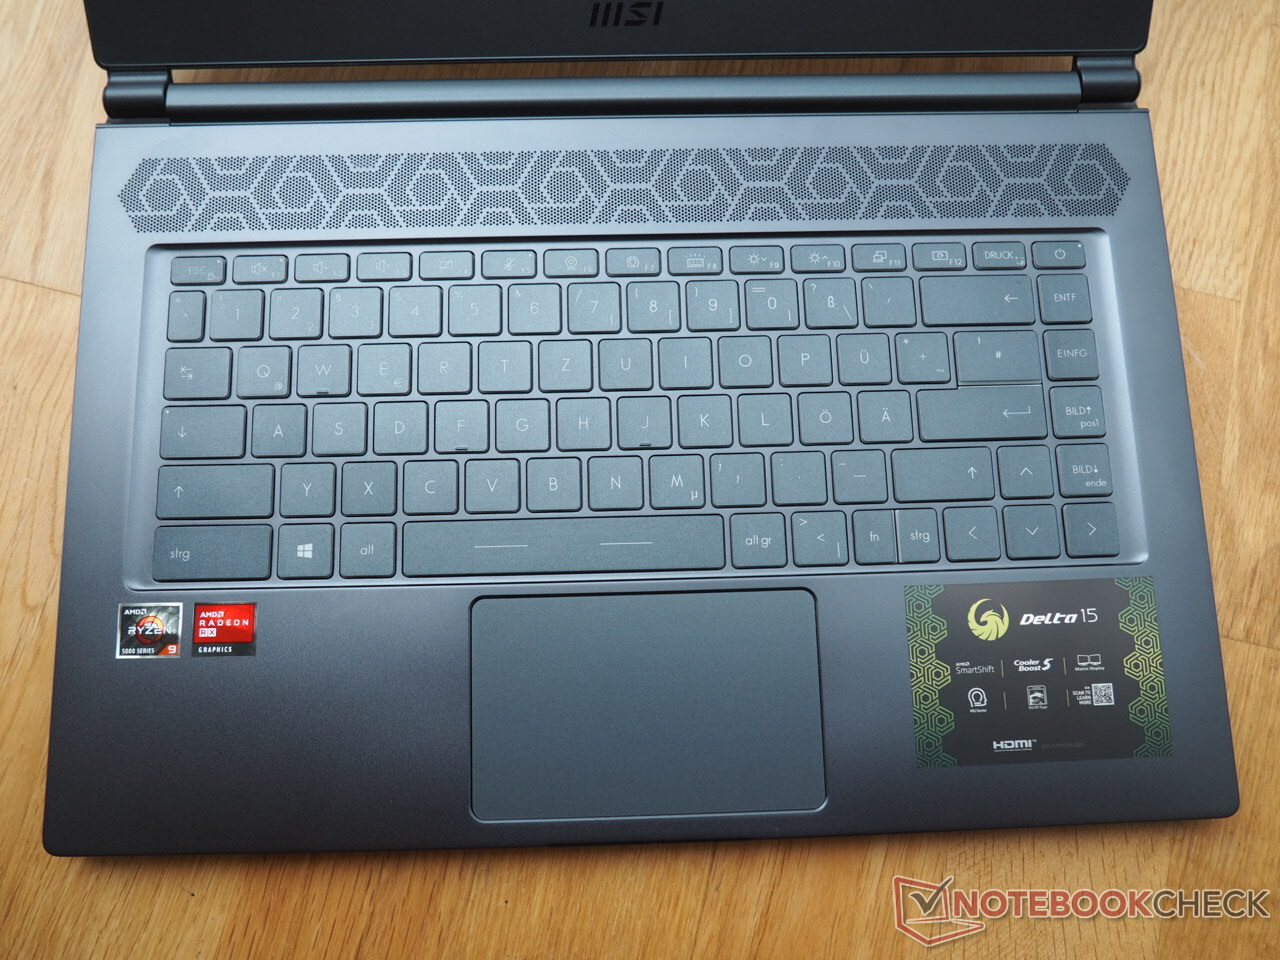
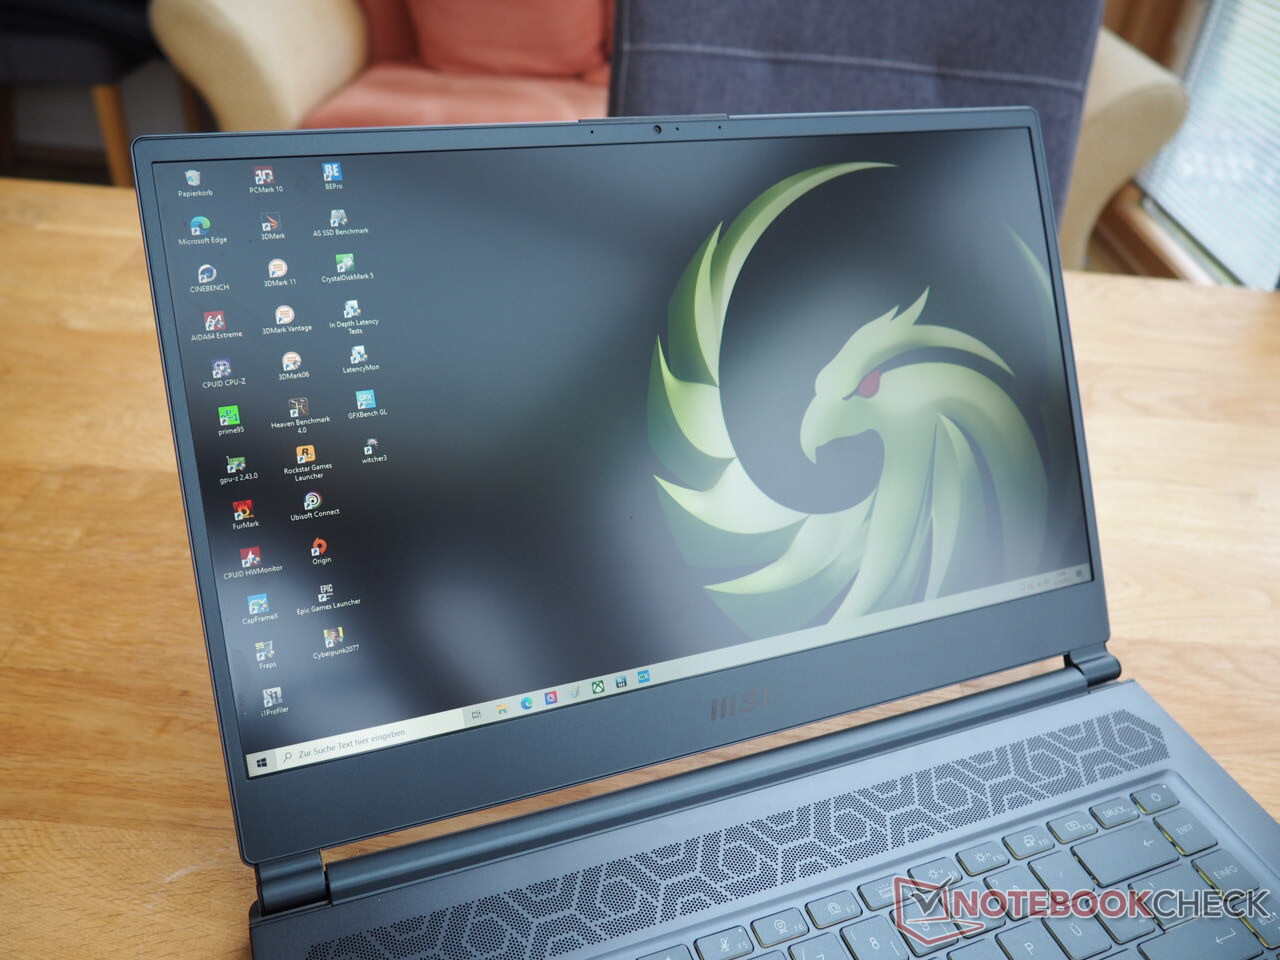
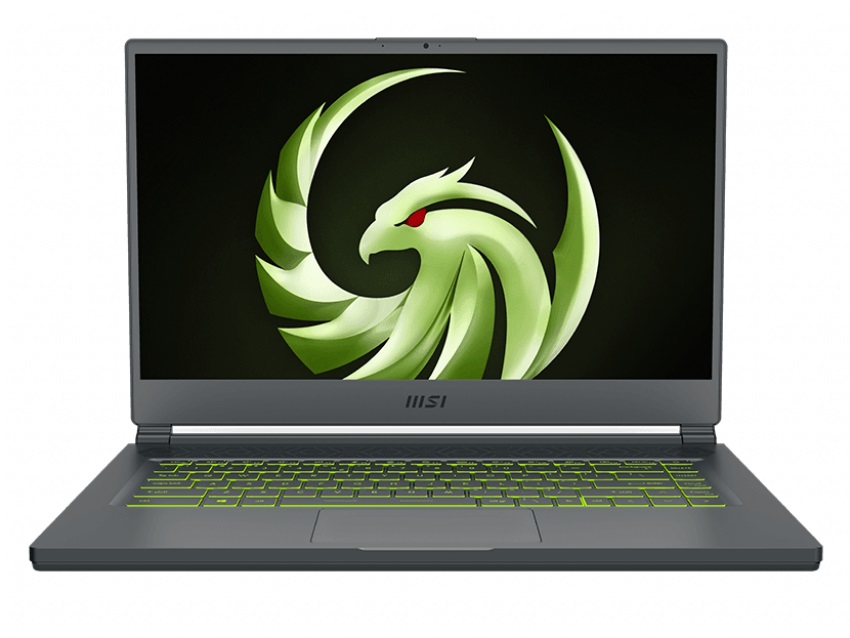
The 15-incher is visually appealing as well. Its design looks fresh and slightly playful, especially due to the dragon logo on the lid and the streamlined ventilation grilles on the base unit. Nevertheless, the Delta 15 is still quite discreet thanks to its dark gray surfaces (the cover is made of metal). The wide aperture angle is another highlight (see photos): Only very few laptops can manage 180°.
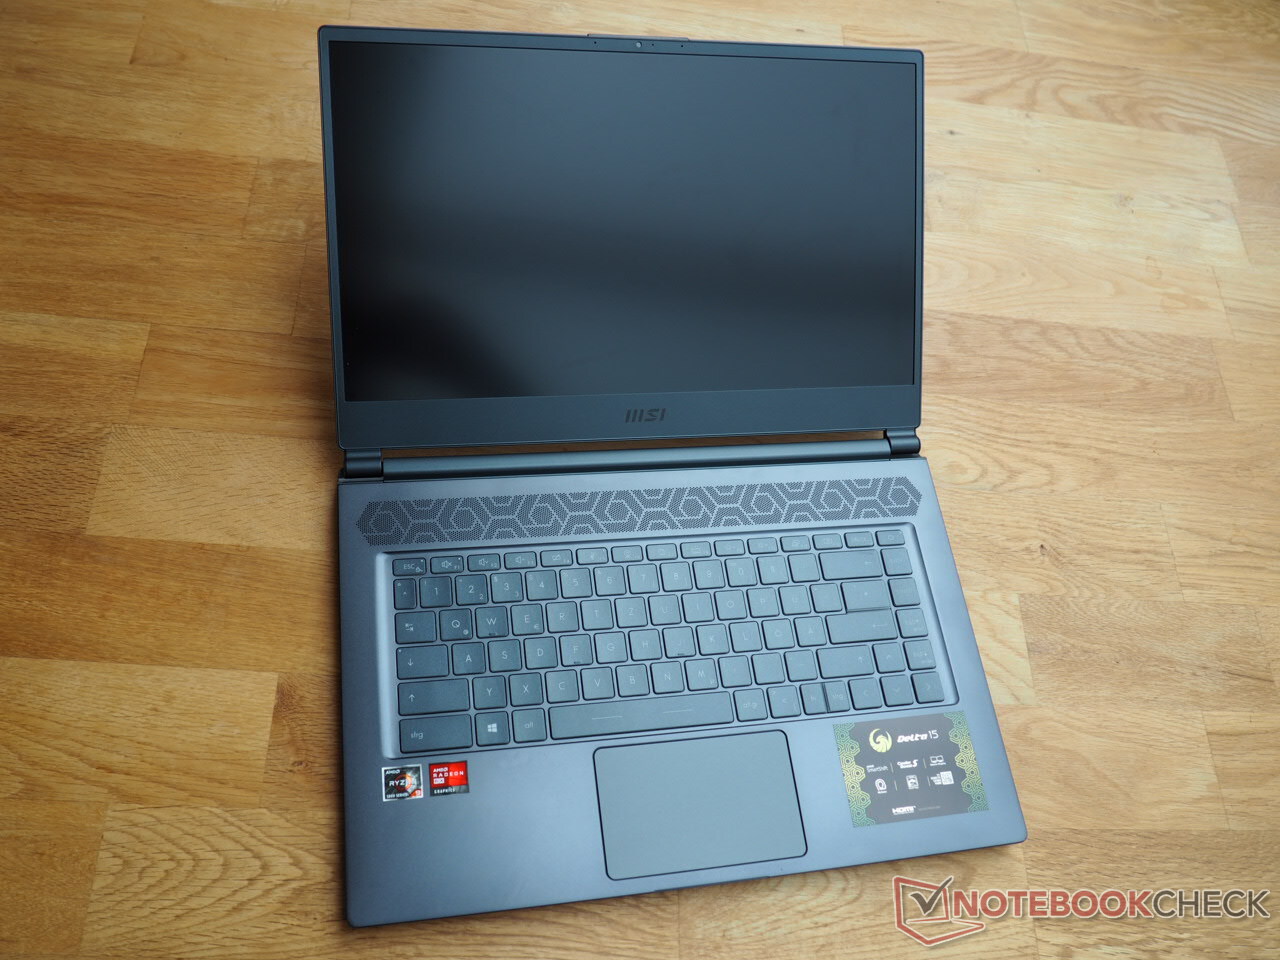
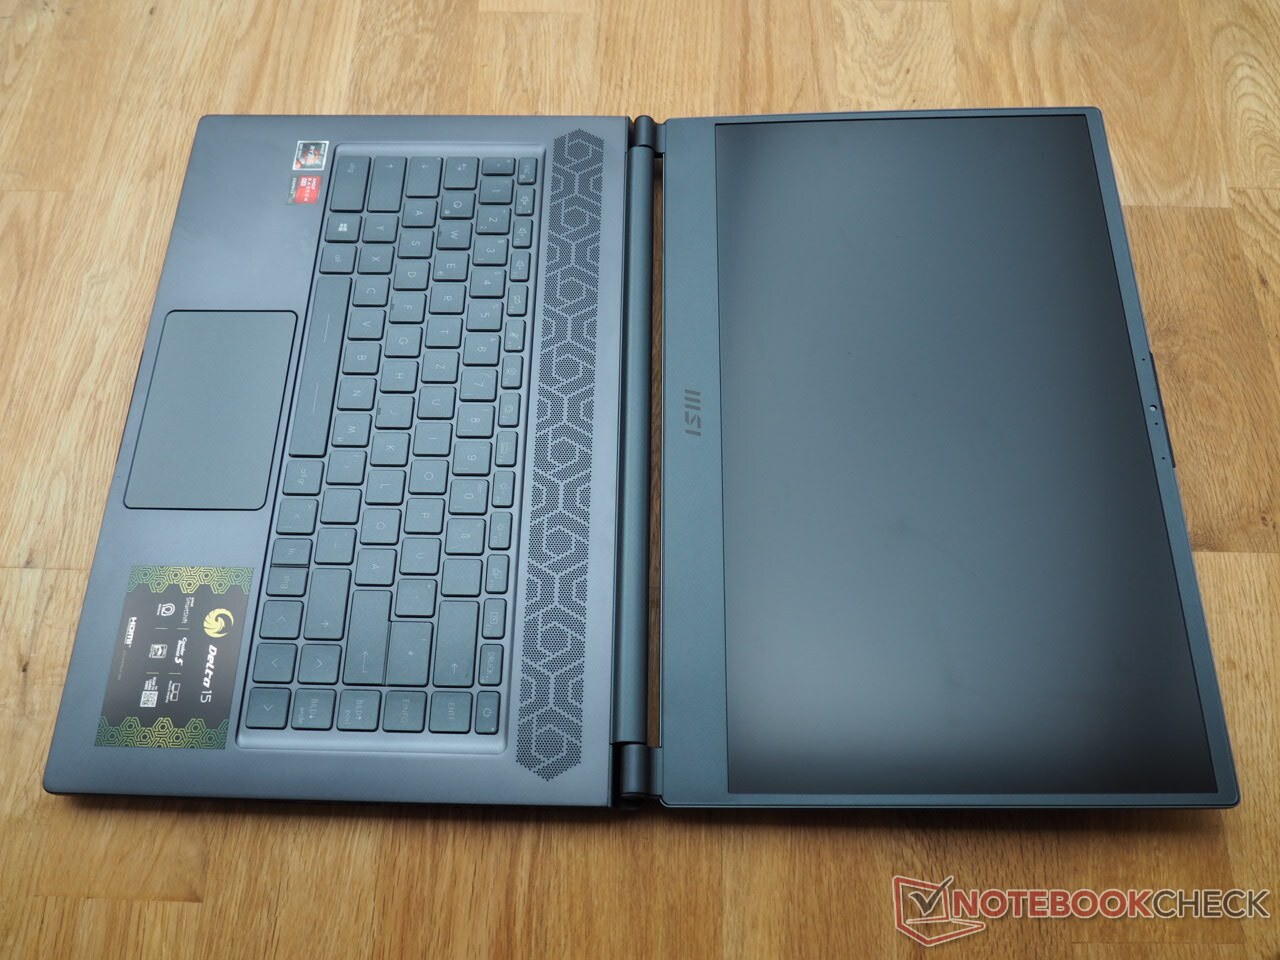
Despite its extremely powerful hardware, the Delta 15 is a lightweight among gaming laptops. Most competitors exceed a weight of just under 2 kg. Things are even better when it comes to the build height: At 1.9 cm (without the case feet), the Delta 15 is the thinnest device in the test field (the rest are between 2.0 and 2.8 cm tall). Later on, we'll analyze if the low build height has a negative impact on the cooling system or the emissions.
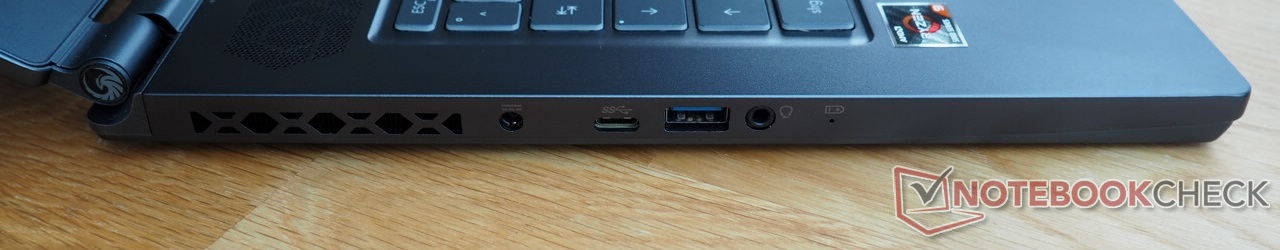
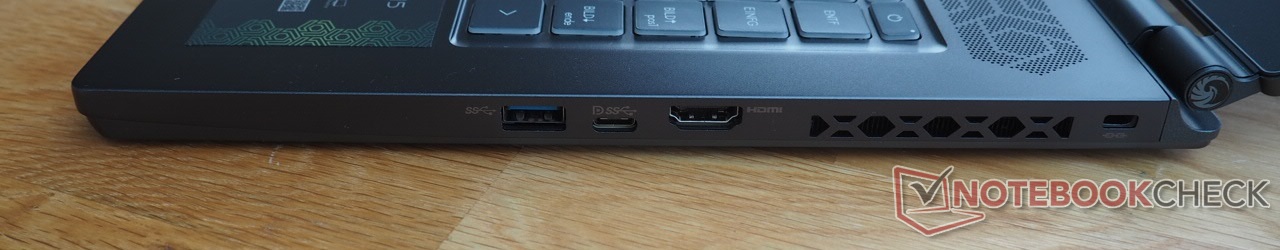
Connectivity
Ports
The Delta 15's connectivity could have been a bit more comprehensive. In addition to a card reader and an RJ45 port, a Thunderbolt port is also missing (this is an AMD-related issue). In exchange, all the available USB ports (2x Type-A, 2x Type-C) support the modern 3.2 Gen 2 standard. An HDMI port (4K @60 Hz) is also included for image output. Since one of the Type-C ports offers DisplayPort functionality as an alternative, it's possible to connect two external monitors.
The port distribution is rather suboptimal. Since they are positioned relatively in the center of the side areas, you might face movement limitations when connecting a mouse.
Communication
Although the Delta 15 is equipped with Intel's latest wireless module (Wi-Fi 6E AX210), this isn't enough to make it to the top in the Wi-Fi test. The 15-incher comes in fifth place both when sending and receiving data (1 m distance to our Netgear Nighthawk AX12 reference router).
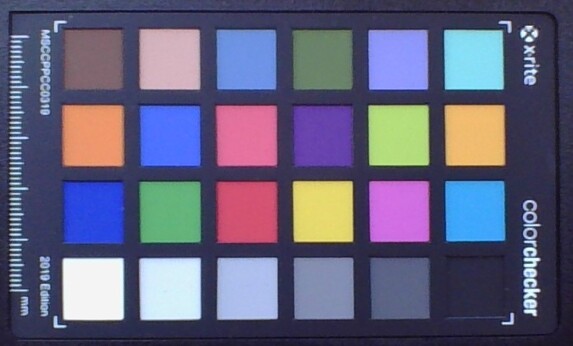
Webcam
The webcam quality won't knock anyone's socks off. As expected, image sharpness and color accuracy are quite modest.


Accessories
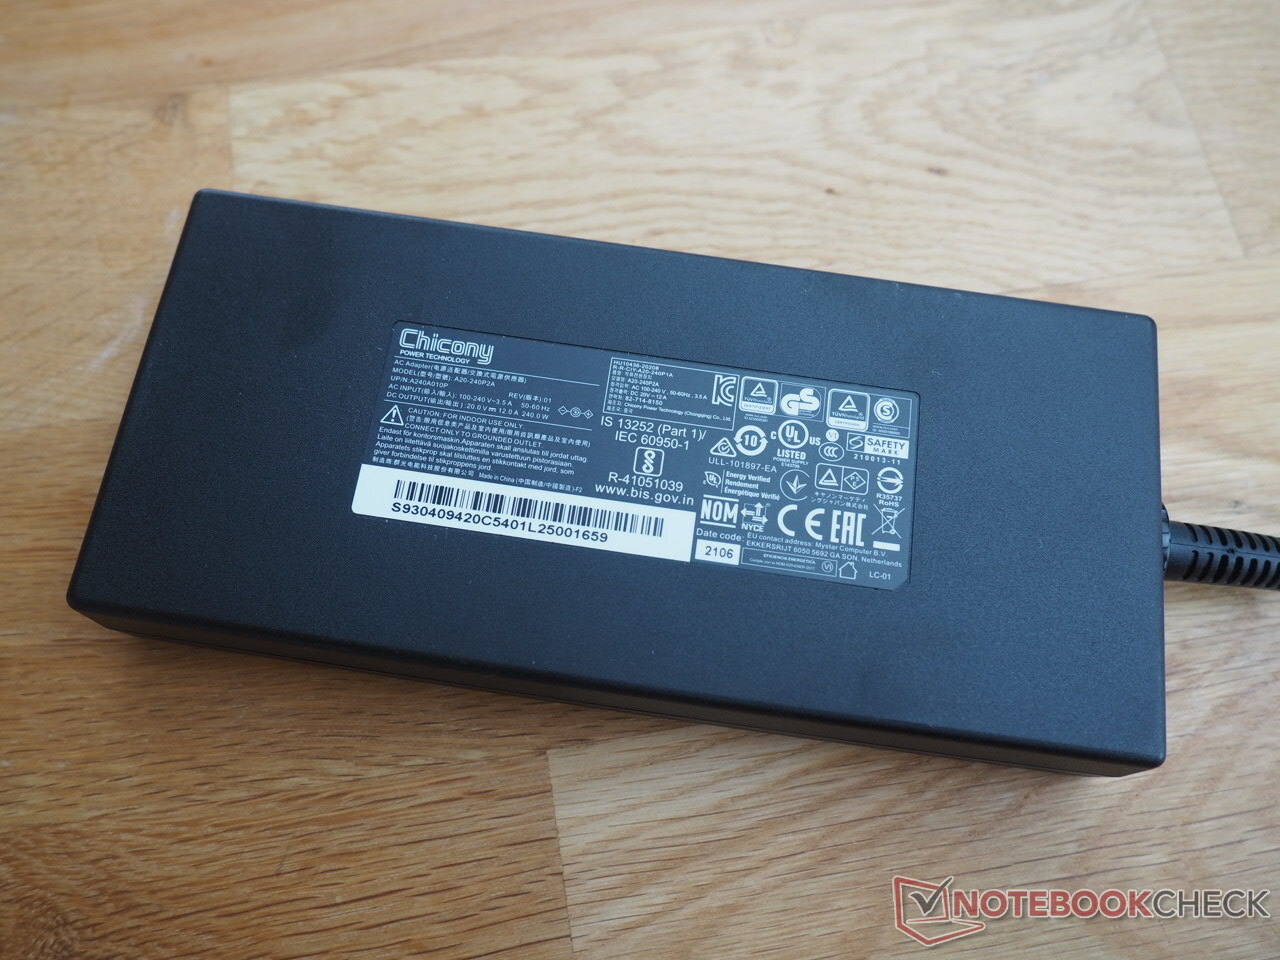
The contents included in the box consist of a medium-sized 240-watt power adapter (572 g) and a few information booklets.
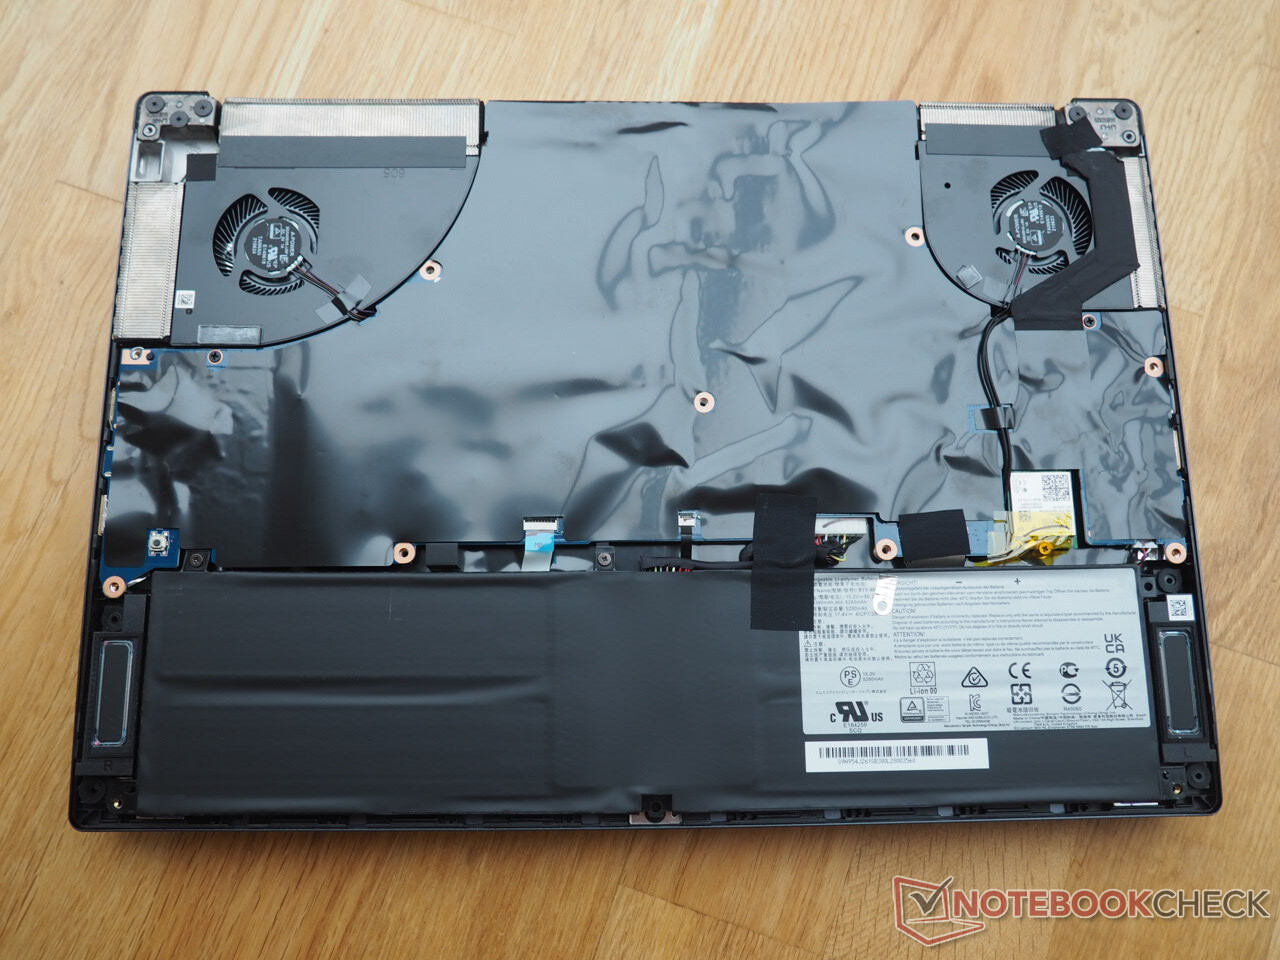
Maintenance
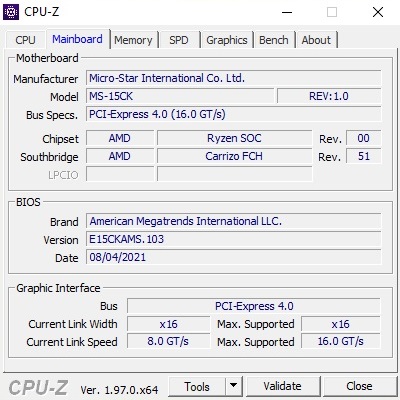
MSI deserves some criticism for the limited maintenance options. Although the base cover can be removed after taking out 13 screws, only the fans, the battery, and the wireless module are accessible inside the case due to the extensive use of adhesive foil. The RAM slots (2x SO-DIMM) as well as the mass storage slots (2x M.2 PCIe 3.0 x4) would involve further disassembly. This is often solved in a much better way by the competition.
Warranty
As usual, the warranty covers a period of two years (Pick Up and Return Service).
Input devices
Keyboard
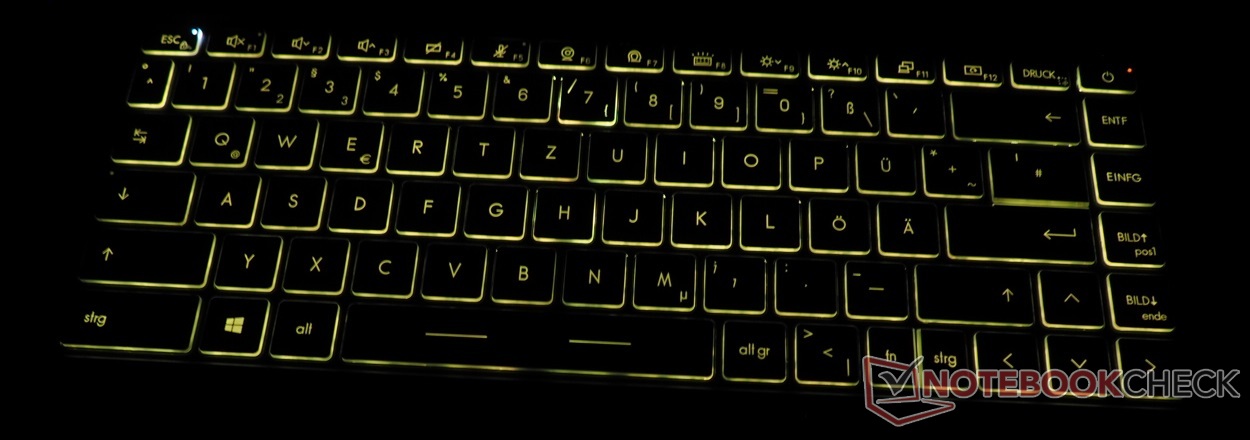
The positive aspect first: Users who like to play using the directional arrows will get their money's worth with the Delta 15. With the exception of the somewhat narrow F-row (a typical problem), nearly all keys are generously sized. Only the °^ key and the right Ctrl key could be a bit wider. The fact that MSI has once again used its peculiar base layout is a matter of taste. Besides the <>| key, the Fn key is also found in an unusual place. A single-line Enter key will also take some getting used to for many German users. Buyers generally have to give up a numeric keypad.
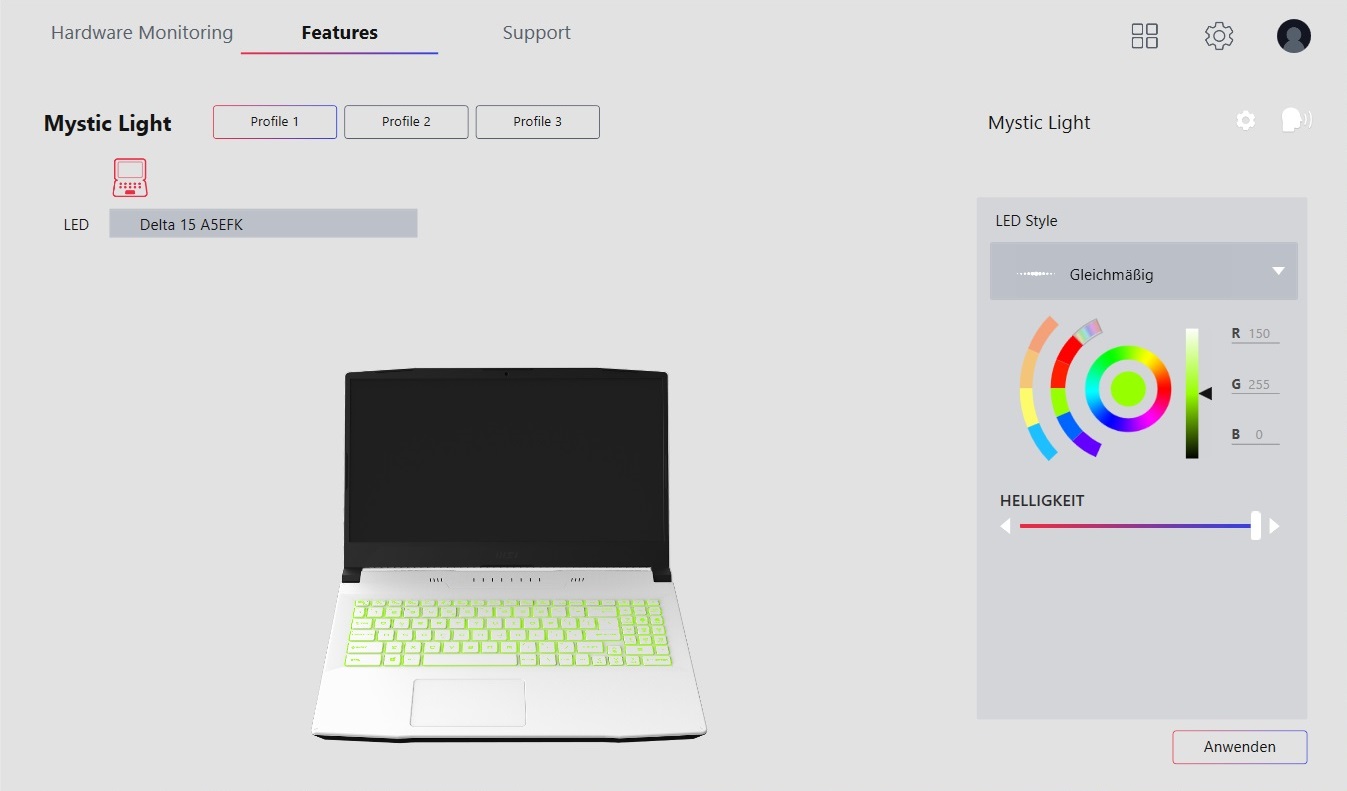
The typing experience provided by the keyboard ranges from decent to good. In the author's opinion, the pressure point and stroke could have been a bit crisper and better defined. As is typical for a modern gaming laptop, MSI has implemented a (fairly uniform) RGB backlight, although you can't control each key individually, and there are no special zones. However, there are several lighting modes instead that can be cycled through by pressing F8.
Touchpad
The touchpad is rather small in view of its size of 10.5 x 6.5 cm, but its operation has been designed in such a way that you rarely have to lift your finger in order to reposition it. The smooth surface provides good gliding properties. The pad's accuracy and multitouch support didn't show any problems in the test. On the other hand, the mouse click noise is quite noticeable. In general, the touchpad sounds quite clattery and therefore of inferior quality. Most gamers will probably connect an external mouse anyway.
Display
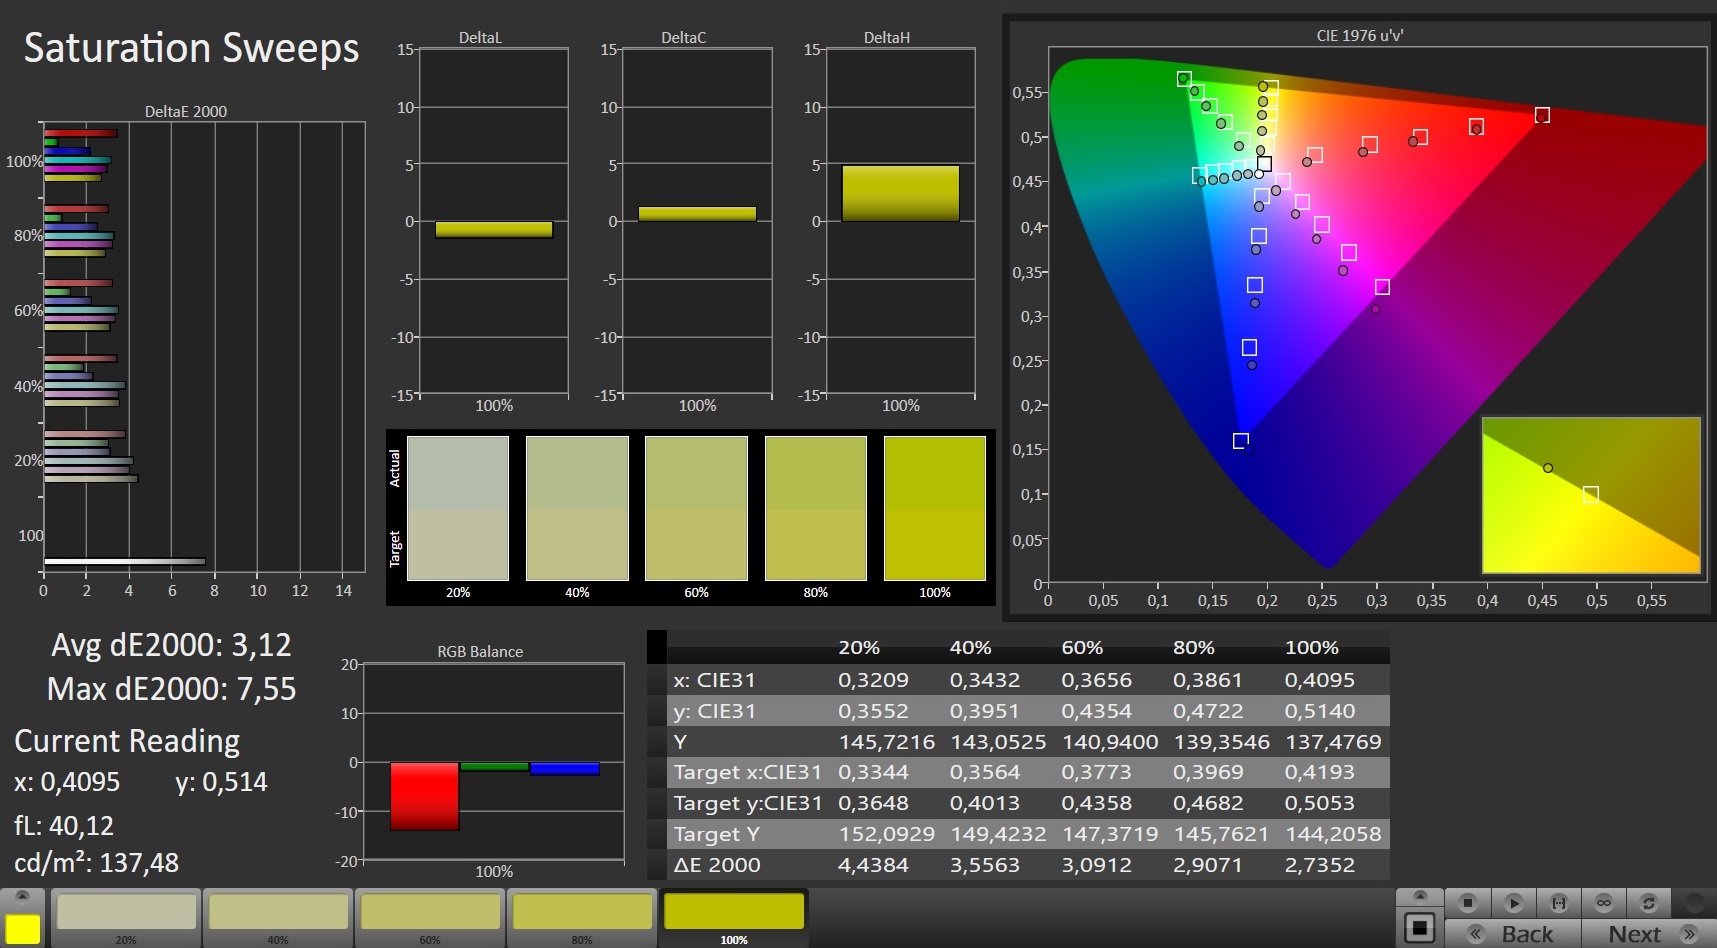
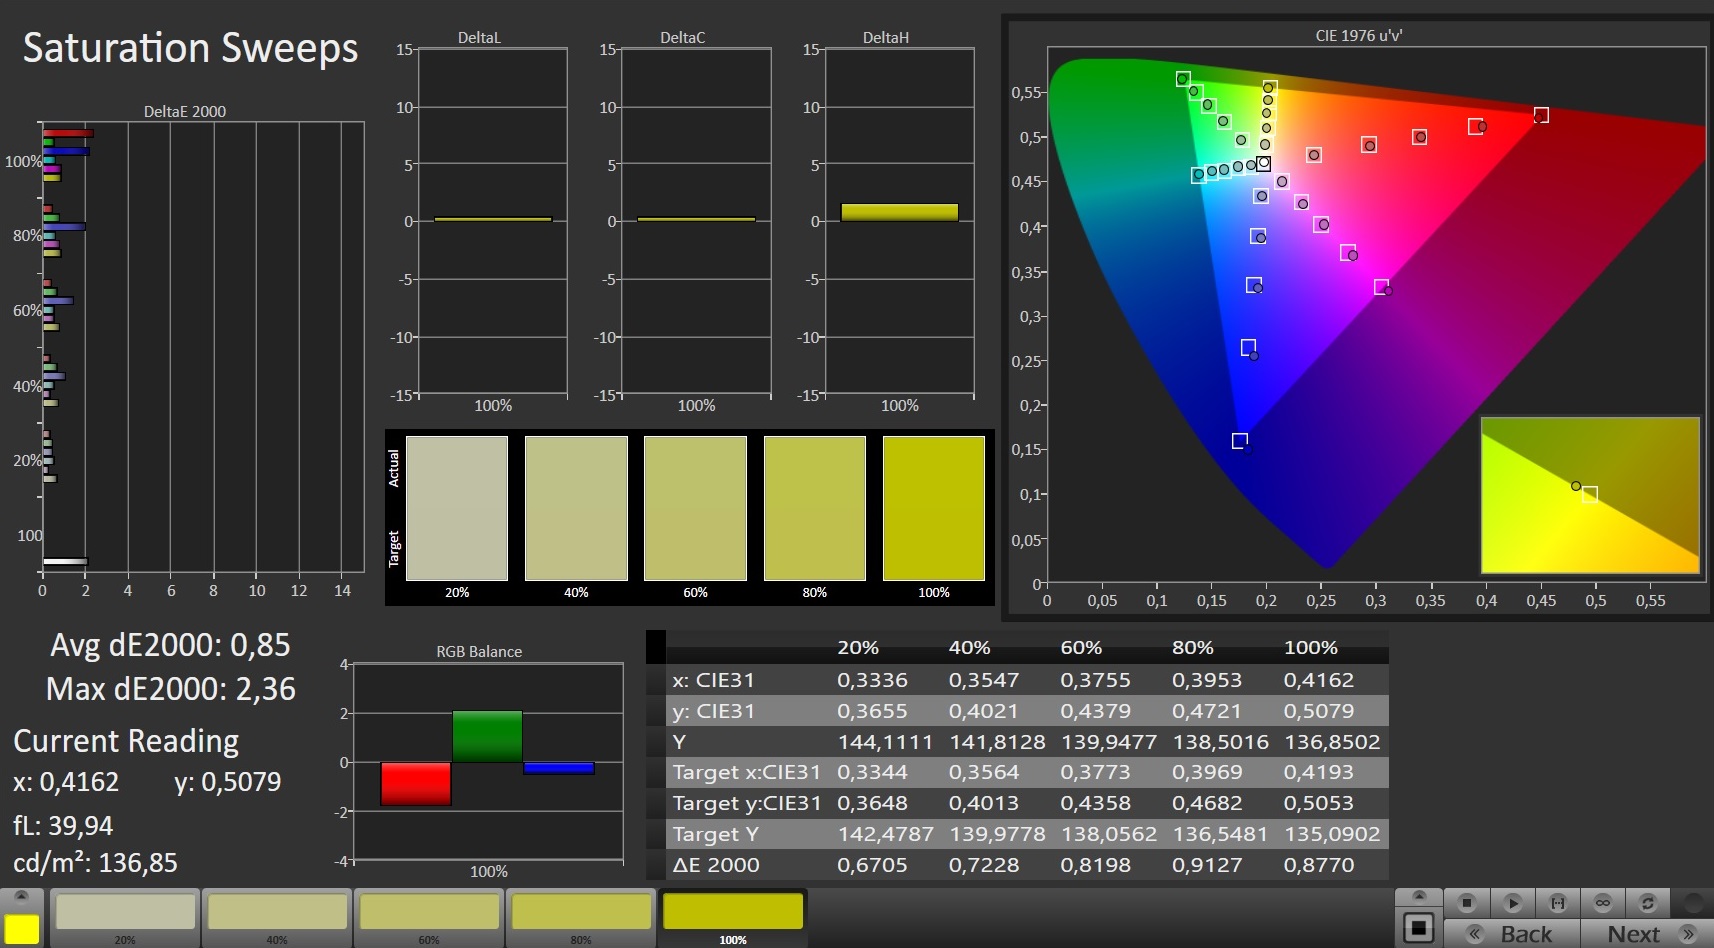
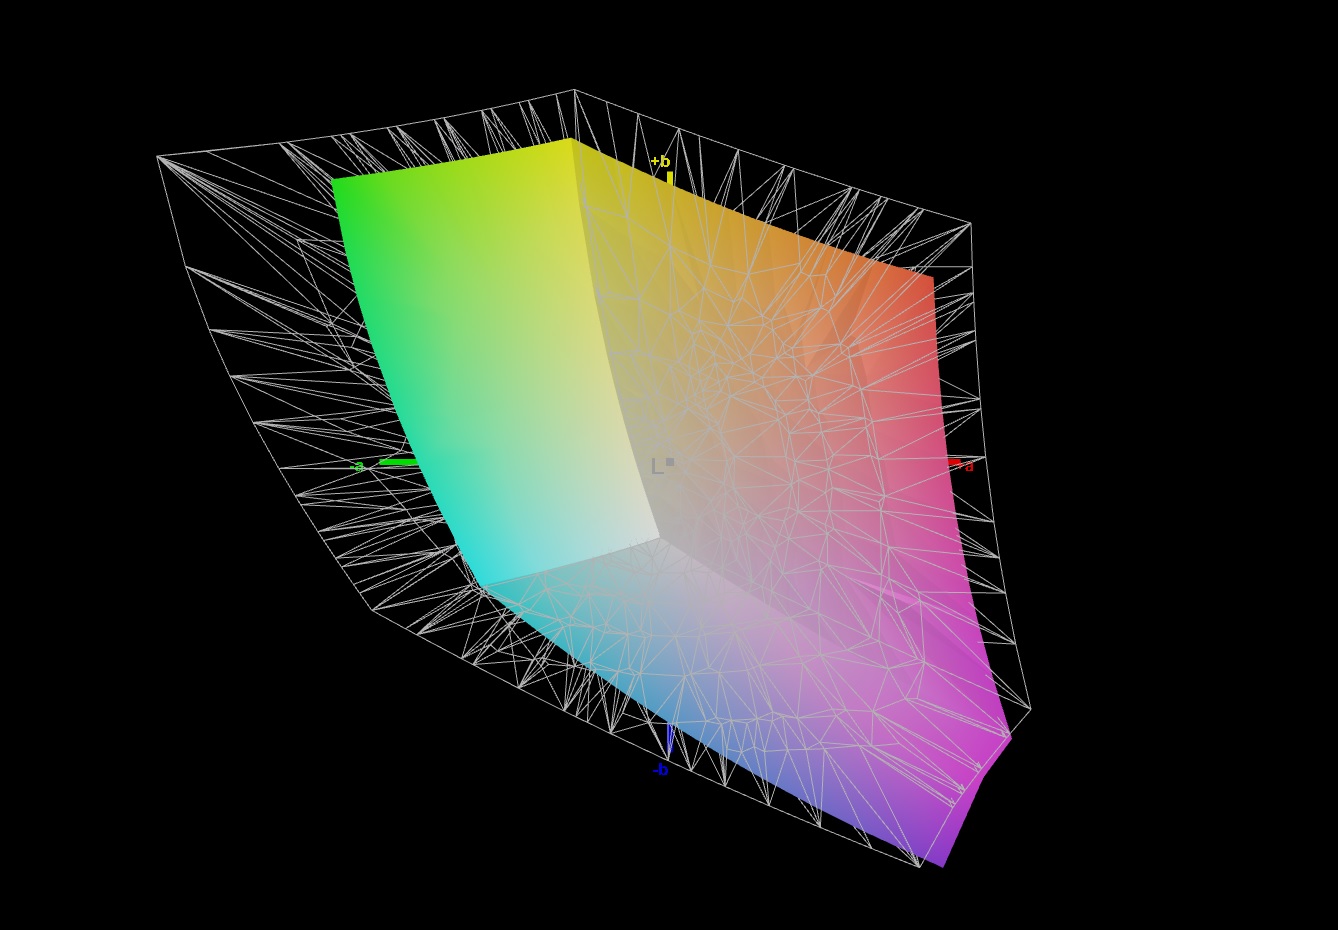
When it comes to the display, the Delta 15 isn't quite able to keep up with the competition. Although the color-space coverage (98% sRGB) and response times are roughly on par, the MSI laptop struggles in the remaining categories.
| |||||||||||||||||||||||||
Brightness Distribution: 88 %
Center on Battery: 291 cd/m²
Contrast: 808:1 (Black: 0.36 cd/m²)
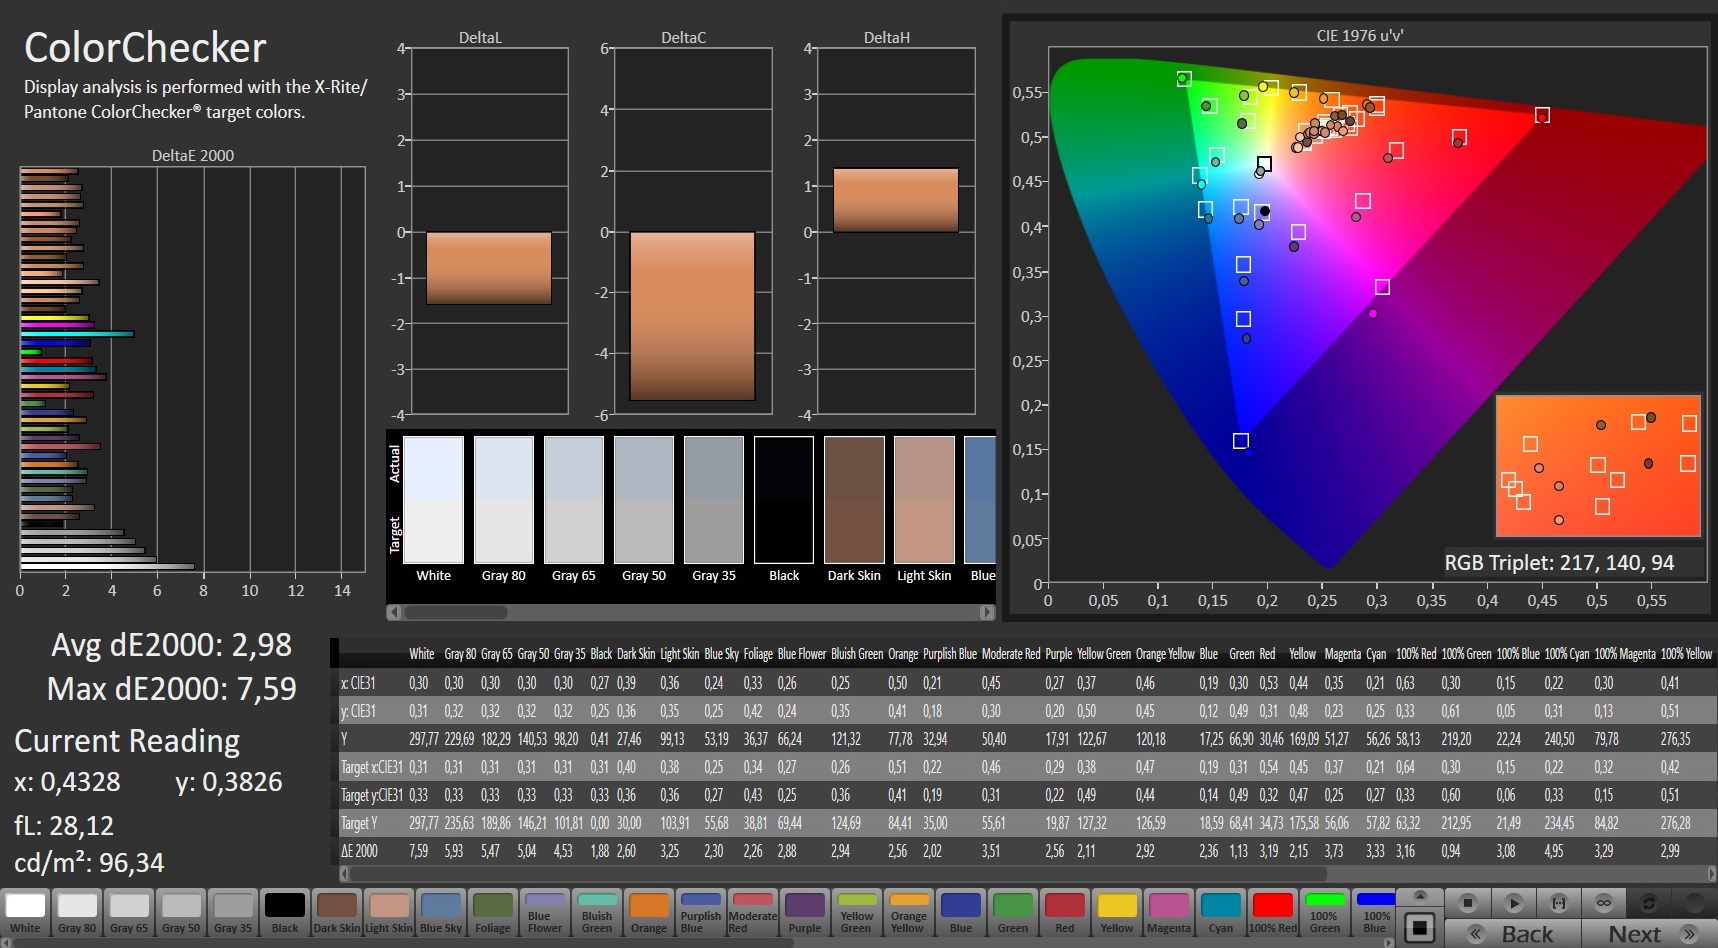
ΔE Color 2.98 | 0.5-29.43 Ø5, calibrated: 0.91
ΔE Greyscale 4.2 | 0.57-98 Ø5.3
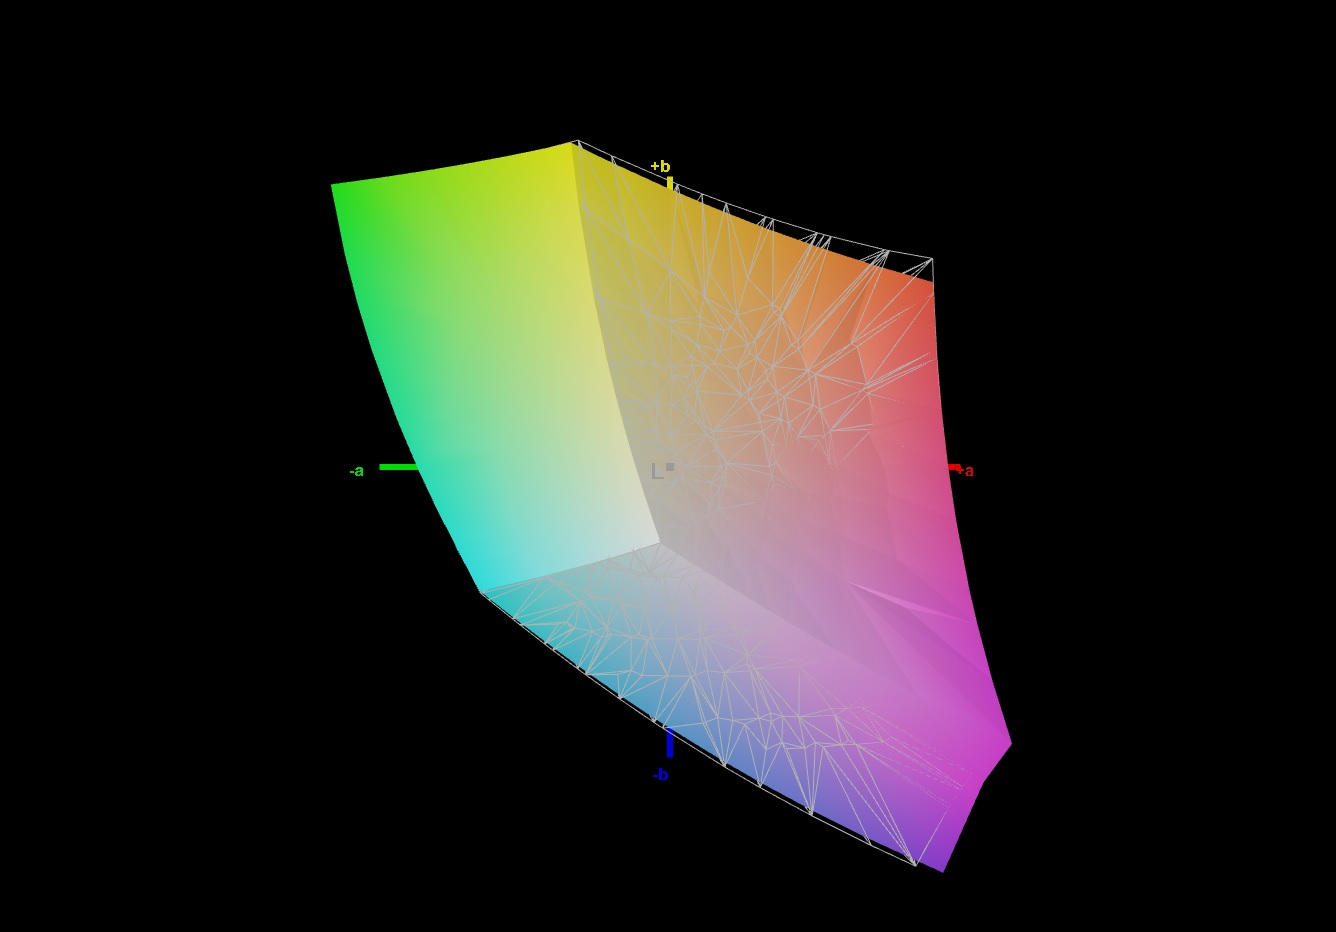
67.6% AdobeRGB 1998 (Argyll 2.2.0 3D)
97.8% sRGB (Argyll 2.2.0 3D)
66.5% Display P3 (Argyll 2.2.0 3D)
Gamma: 2.293
| MSI Delta 15 A5EFK LQ156M1JW03 (SHP155D), IPS-Level, 1920x1080, 15.60 | Asus ROG Strix G15 G513QY Sharp SHP152C, IPS, 1920x1080, 15.60 | Asus ROG Strix Scar 15 G533QS BOE CQ NE156QHM-NY1, IPS, 2560x1440, 15.60 | Asus ROG Zephyrus G15 GA503Q CMN N156KME-GNA (CMN152A), IPS-Level, 2560x1440, 15.60 | Asus ROG Strix G15 G513QR LQ156M1JW25, IPS, 1920x1080, 15.60 | Asus TUF Gaming A15 FA506QR-AZ061T Sharp SHP1532, IPS, 1920x1080, 15.60 | |
|---|---|---|---|---|---|---|
| Display | 0% | 25% | 25% | -0% | ||
| Display P3 Coverage | 66.5 | 66.5 0% | 97.6 47% | 97.3 46% | 67.7 2% | |
| sRGB Coverage | 97.8 | 97.7 0% | 99.9 2% | 99.9 2% | 94.3 -4% | |
| AdobeRGB 1998 Coverage | 67.6 | 67.6 0% | 85.3 26% | 86.2 28% | 68.2 1% | |
| Response Times | 21% | -14% | 12% | 24% | -22% | |
| Response Time Grey 50% / Grey 80% * | 12.8 ? | 8 ? 37% | 14 ? -9% | 8.8 ? 31% | 8.2 ? 36% | 12 ? 6% |
| Response Time Black / White * | 10.4 ? | 10 ? 4% | 12.4 ? -19% | 11.2 ? -8% | 9.2 ? 12% | 8 ? 23% |
| PWM Frequency | 23580 ? | 1250 ? -95% | ||||
| Screen | -6% | -11% | -17% | 9% | 33% | |
| Brightness middle | 291 | 306 5% | 304.3 5% | 327 12% | 308 6% | 297 2% |
| Brightness | 266 | 283 6% | 286 8% | 309 16% | 288 8% | 268 1% |
| Brightness Distribution | 88 | 86 -2% | 76 -14% | 89 1% | 86 -2% | 84 -5% |
| Black Level * | 0.36 | 0.25 31% | 0.33 8% | 0.33 8% | 0.23 36% | 0.22 39% |
| Contrast | 808 | 1224 51% | 922 14% | 991 23% | 1339 66% | 1350 67% |
| Colorchecker dE 2000 * | 2.98 | 4.97 -67% | 2.76 7% | 4.49 -51% | 3.28 -10% | 1.36 54% |
| Colorchecker dE 2000 max. * | 7.59 | 10.12 -33% | 5.57 27% | 8.42 -11% | 8.51 -12% | 3.82 50% |
| Colorchecker dE 2000 calibrated * | 0.91 | 0.7 23% | 2.38 -162% | 2.27 -149% | 0.83 9% | |
| Greyscale dE 2000 * | 4.2 | 7.2 -71% | 4 5% | 4.2 -0% | 5 -19% | 1.88 55% |
| Gamma | 2.293 96% | 2.23 99% | 2.14 103% | 2.173 101% | 2.057 107% | 2.48 89% |
| CCT | 7624 85% | 7784 84% | 6844 95% | 7014 93% | 7393 88% | 6768 96% |
| Color Space (Percent of AdobeRGB 1998) | 67.6 | 86 | 68 | 63 | ||
| Color Space (Percent of sRGB) | 97.7 | 99 | 90 | 99 | ||
| Total Average (Program / Settings) | 5% /
-1% | 0% /
-4% | 7% /
-4% | 11% /
9% | 6% /
18% |
* ... smaller is better
Besides the brightness (266 cd/m² on average) and the black level (0.36 cd/m²), the contrast (808:1) is also weaker compared with the competition. The Delta 15 is hardly suitable for outdoor use or brightly lit rooms due to its poor brightness.
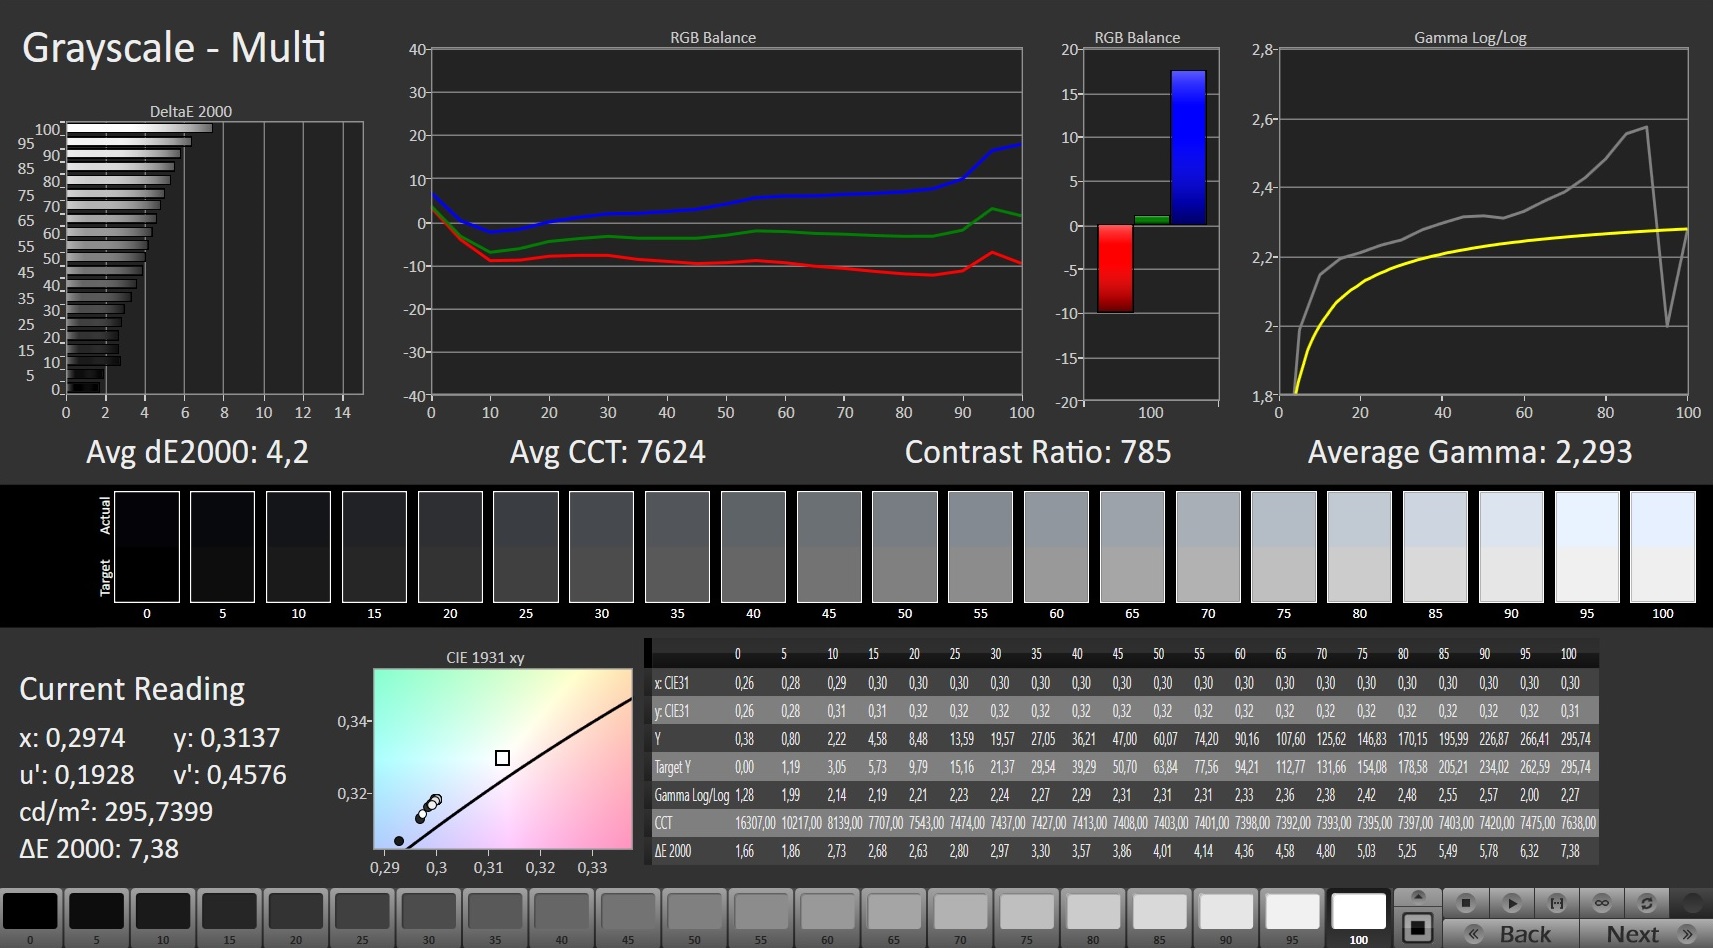
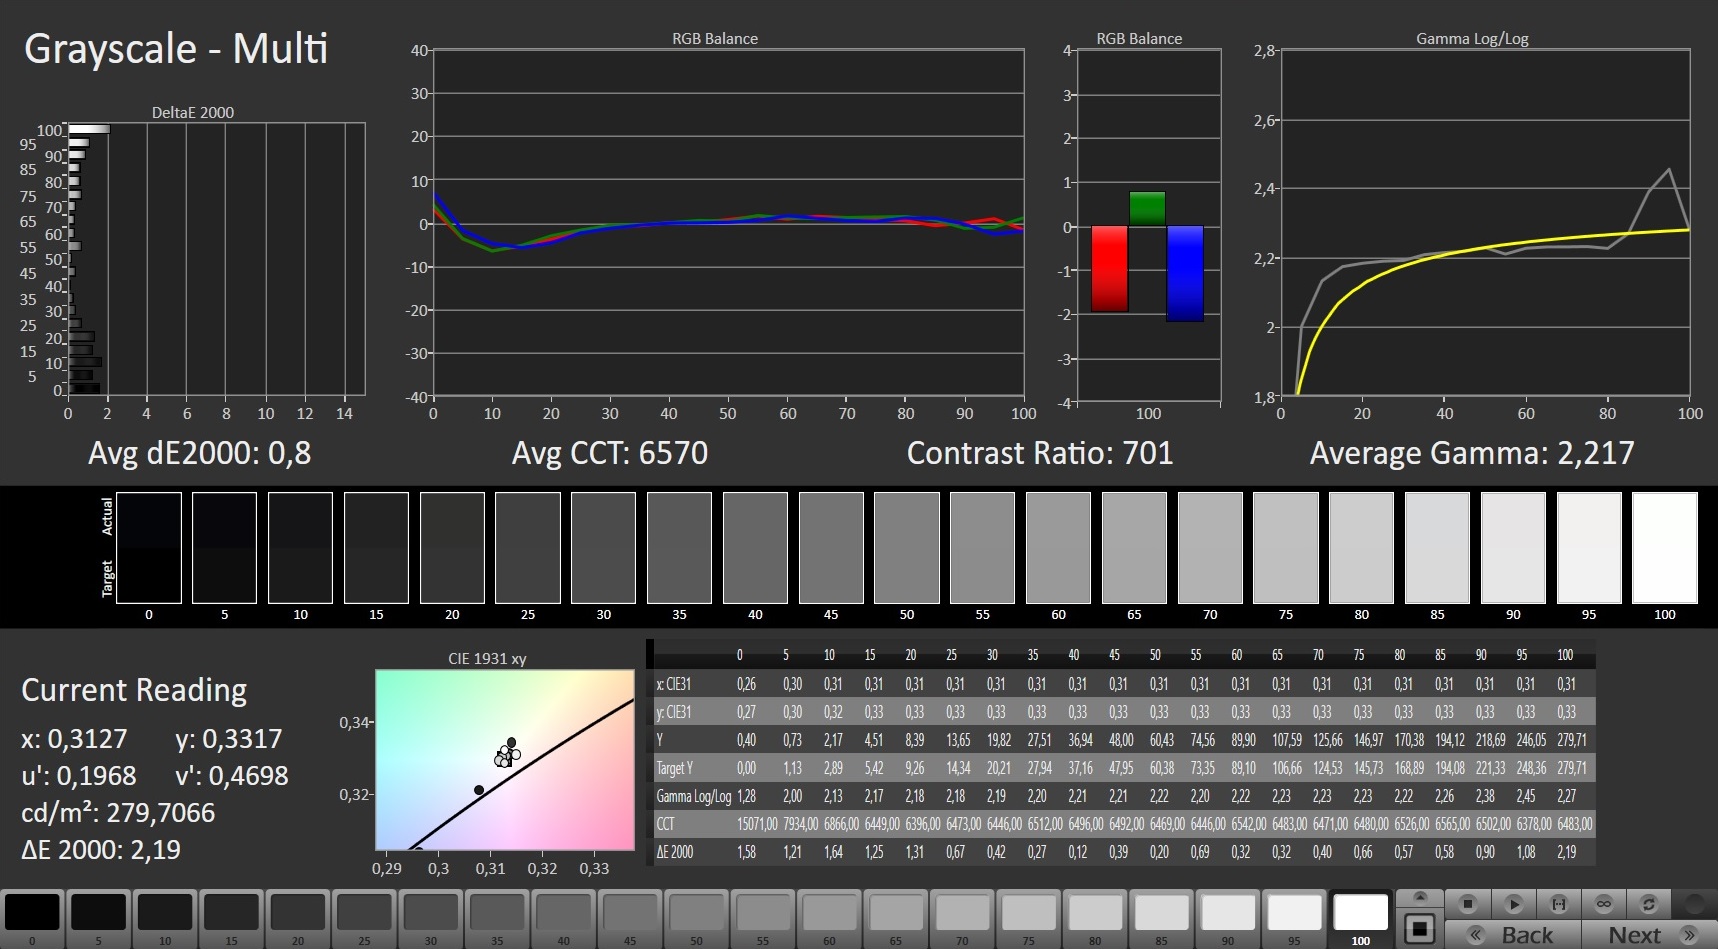
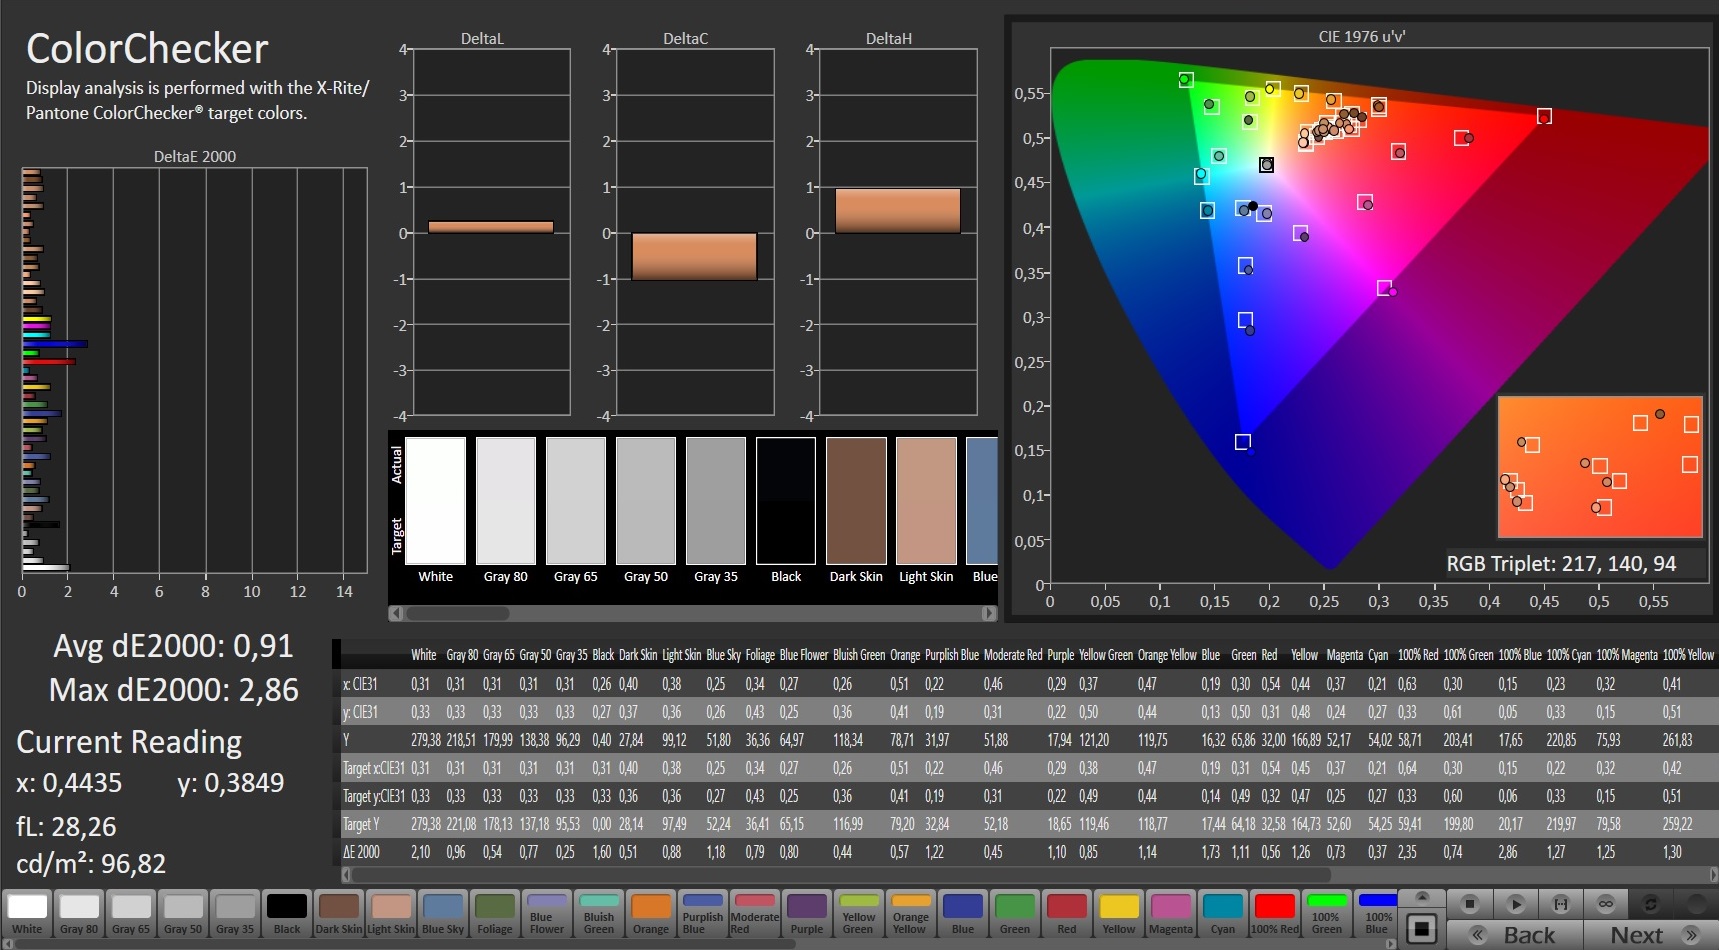
This is accompanied by a slight blue tint that can be corrected by calibrating the display. Our ICC file can be downloaded in the area corresponding to the brightness distribution found above.
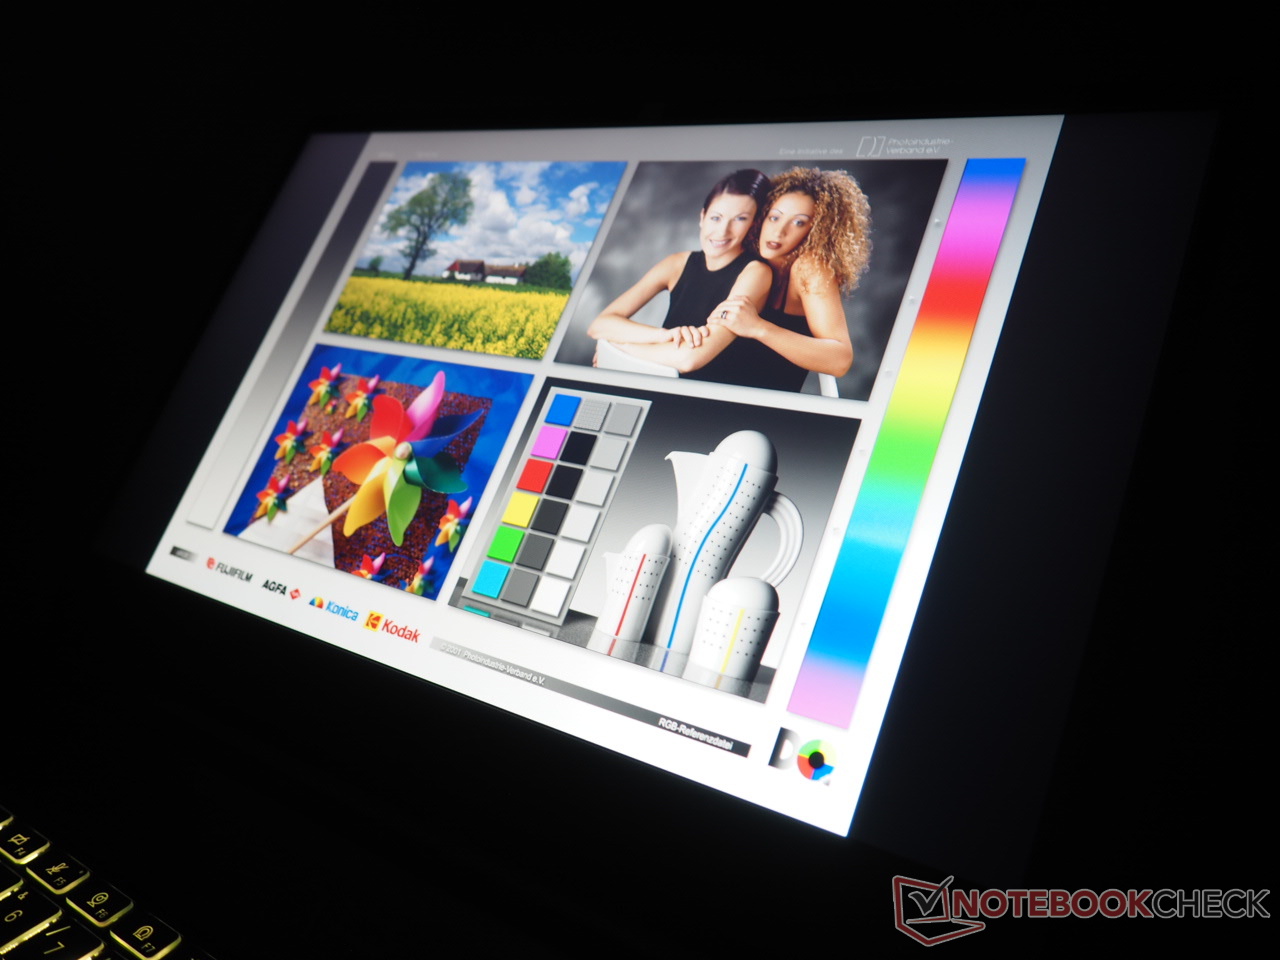
The fact that the display flickers below brightness levels of 23% shouldn't be a problem even for sensitive users due to the high frequency (23 kHz). The viewing angles of the wide-view panel are in line with the typical IPS standard.
Display Response Times
| ↔ Response Time Black to White | ||
|---|---|---|
| 10.4 ms ... rise ↗ and fall ↘ combined | ↗ 5.2 ms rise | 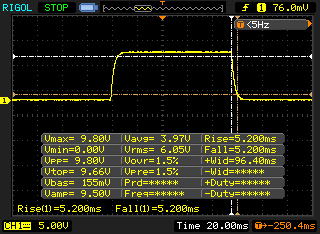 |
| ↘ 5.2 ms fall | ||
| The screen shows good response rates in our tests, but may be too slow for competitive gamers. In comparison, all tested devices range from 0.1 (minimum) to 240 (maximum) ms. » 23 % of all devices are better. This means that the measured response time is better than the average of all tested devices (21.5 ms). | ||
| ↔ Response Time 50% Grey to 80% Grey | ||
| 12.8 ms ... rise ↗ and fall ↘ combined | ↗ 6.8 ms rise | 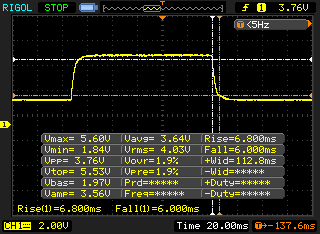 |
| ↘ 6 ms fall | ||
| The screen shows good response rates in our tests, but may be too slow for competitive gamers. In comparison, all tested devices range from 0.2 (minimum) to 636 (maximum) ms. » 21 % of all devices are better. This means that the measured response time is better than the average of all tested devices (33.7 ms). | ||
Screen Flickering / PWM (Pulse-Width Modulation)
| Screen flickering / PWM detected | 23580 Hz | ≤ 22 % brightness setting | 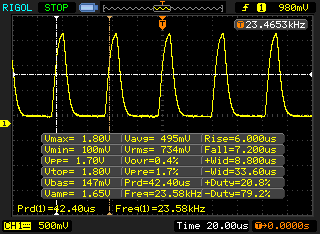 |
The display backlight flickers at 23580 Hz (worst case, e.g., utilizing PWM) Flickering detected at a brightness setting of 22 % and below. There should be no flickering or PWM above this brightness setting. The frequency of 23580 Hz is quite high, so most users sensitive to PWM should not notice any flickering. In comparison: 53 % of all tested devices do not use PWM to dim the display. If PWM was detected, an average of 17924 (minimum: 5 - maximum: 3846000) Hz was measured. | |||
Test conditions
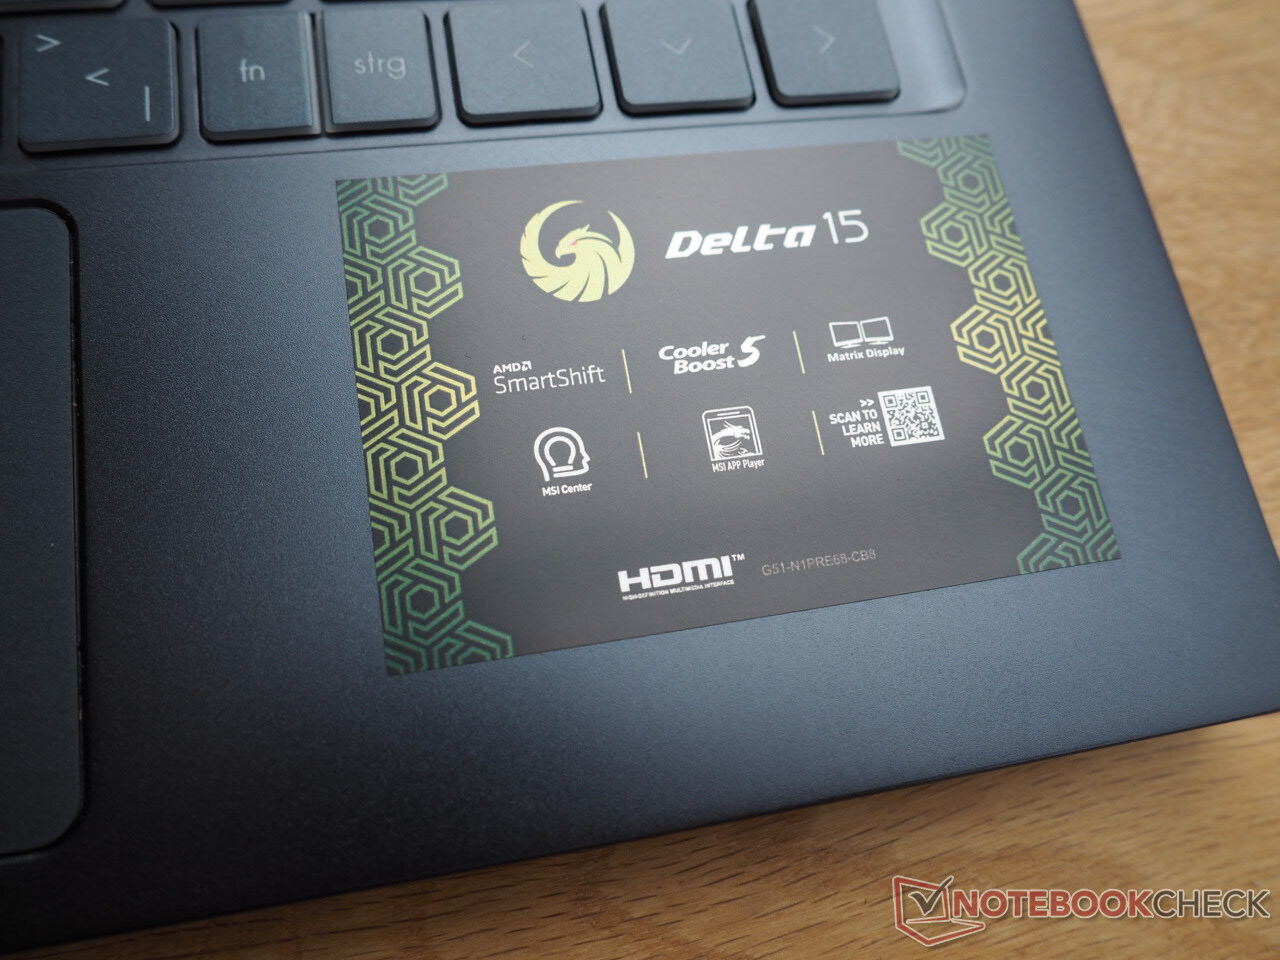
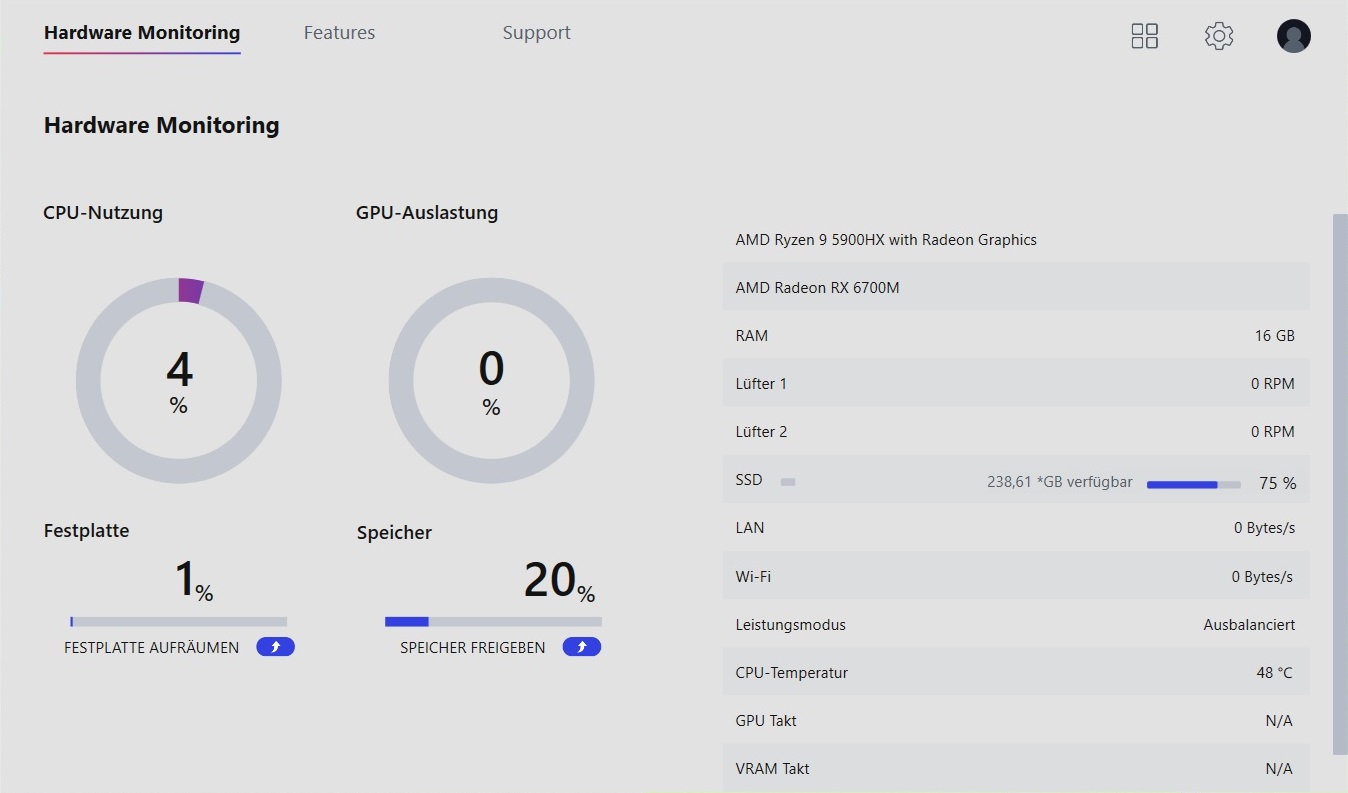
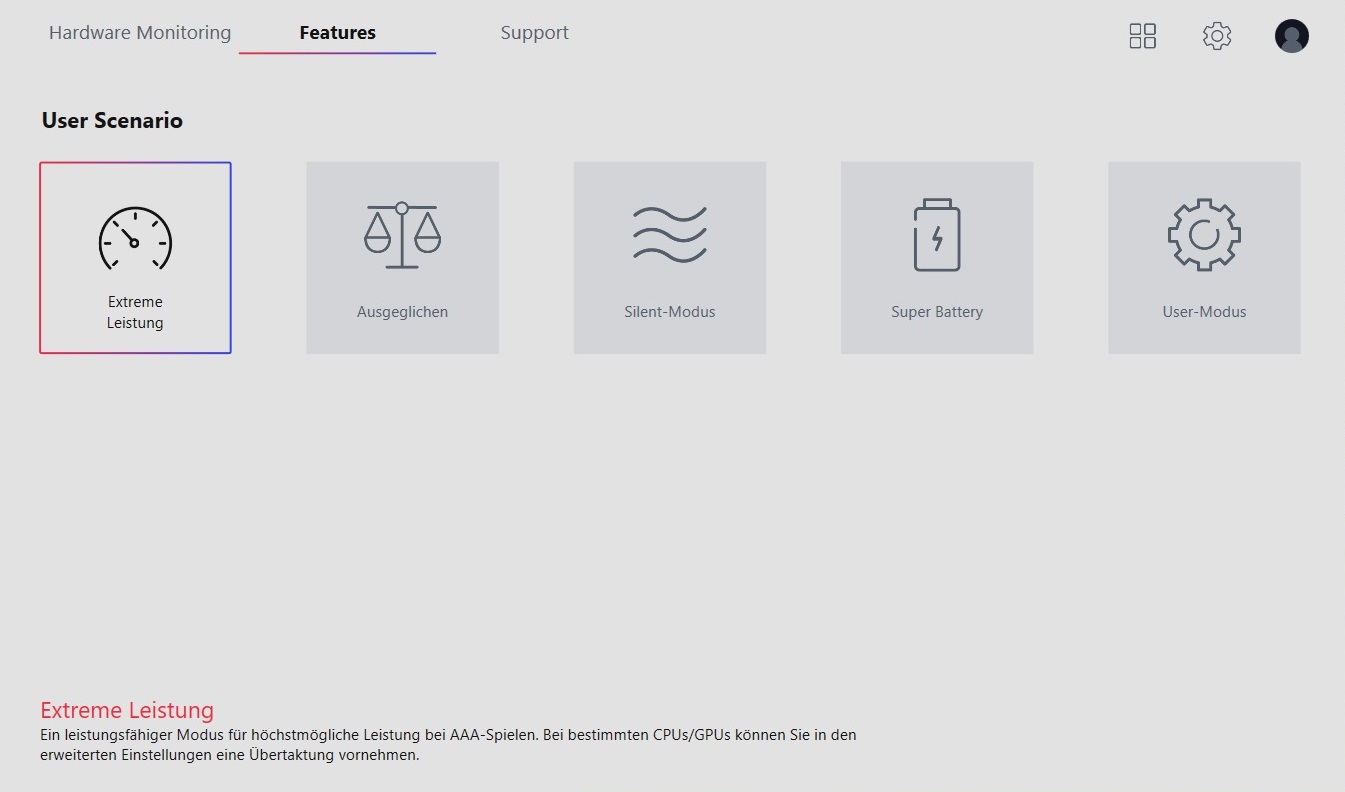
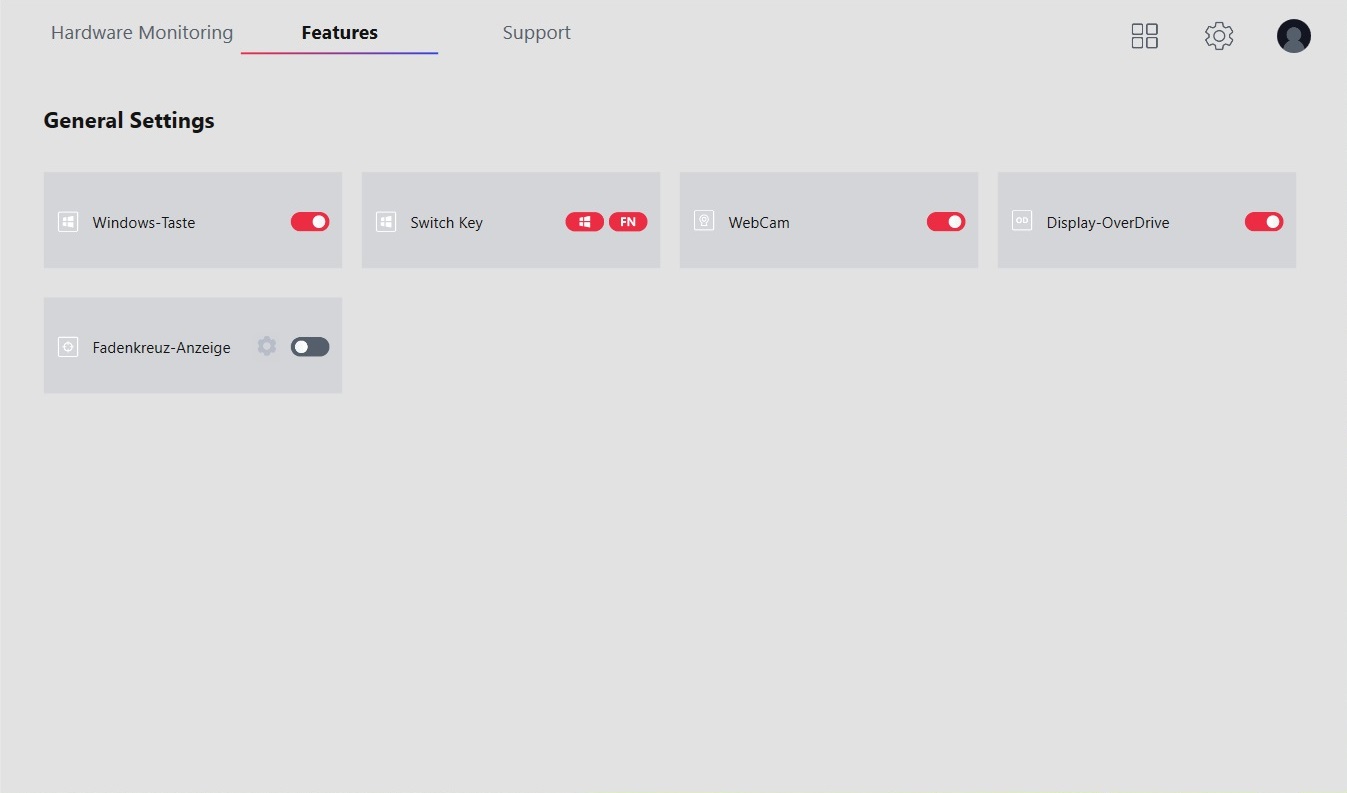
The preinstalled MSI Center not only allows you to monitor the hardware (load, fan speed, ...), but it also lets you adjust various system settings. The most important feature is the "User Scenario" menu, which contains four predefined profiles plus a user mode. In order to get the most out of the hardware, we used the "Extreme Performance" mode for all our tests. Only the battery tests were performed using the "Balanced" mode.
Performance
AMD is finally returning to the high-end graphics card segment. This should lead to increased competition as soon as the situation regarding component supply has eased (keywords: "Chip shortage", etc.). Thanks to the octa-core CPU and the powerful RX 6700M, the Delta 15 is a true gaming laptop that will also appeal to enthusiast gamers due to its high performance.
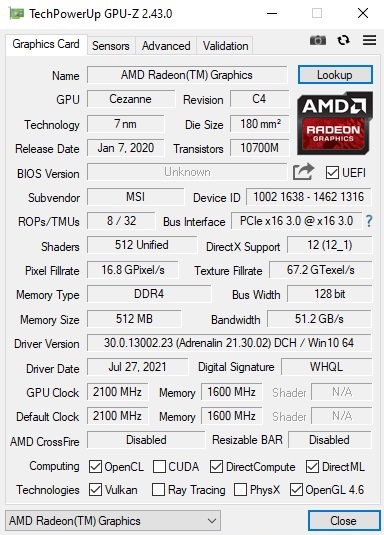
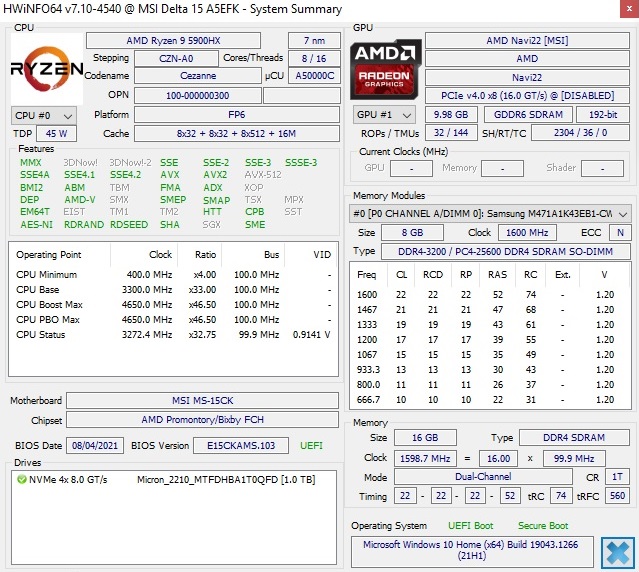
Processor
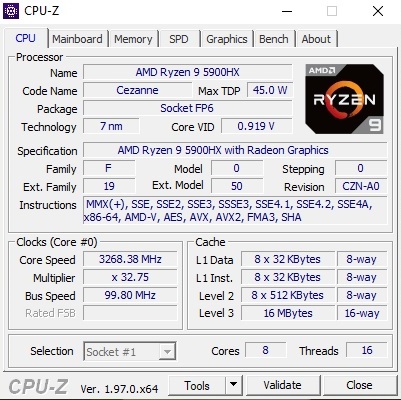
The Ryzen 9 5900HX almost looks too powerful in view of the laptop's dimensions and weight. The AMD octa-core model runs at 3.3 to 4.6 GHz under load and can process up to 16 threads in parallel via SMT. The L3 cache is 16 MB.
We examined the performance of the 7 nm CPU over a prolonged period of time with our Cinebench R15 loop. The result: Performance remains surprisingly stable and ranks at a medium level for the Ryzen 9 5900HX. In the newer Cinebench versions (R20 and R23), however, the Delta 15 comes in last among the comparison devices, which are mostly thicker and heavier though.
Cinebench R15 Multi endurance test
* ... smaller is better
System performance
The MSI laptop can really impress in terms of system performance. 7,316 points in PCMark 10 represent the top position. Subjectively as well, the operating system runs very fast and responds quickly.
| PCMark 10 / Score | |
| MSI Delta 15 A5EFK | |
| Asus ROG Strix Scar 15 G533QS | |
| Asus ROG Strix G15 G513QY | |
| Asus ROG Strix G15 G513QR | |
| Asus TUF Gaming A15 FA506QR-AZ061T | |
| Asus ROG Zephyrus G15 GA503Q | |
| PCMark 10 / Essentials | |
| MSI Delta 15 A5EFK | |
| Asus ROG Strix Scar 15 G533QS | |
| Asus ROG Strix G15 G513QY | |
| Asus TUF Gaming A15 FA506QR-AZ061T | |
| Asus ROG Zephyrus G15 GA503Q | |
| PCMark 10 / Productivity | |
| Asus ROG Strix Scar 15 G533QS | |
| Asus TUF Gaming A15 FA506QR-AZ061T | |
| MSI Delta 15 A5EFK | |
| Asus ROG Zephyrus G15 GA503Q | |
| Asus ROG Strix G15 G513QY | |
| PCMark 10 / Digital Content Creation | |
| Asus ROG Strix G15 G513QY | |
| MSI Delta 15 A5EFK | |
| Asus ROG Strix Scar 15 G533QS | |
| Asus ROG Zephyrus G15 GA503Q | |
| Asus TUF Gaming A15 FA506QR-AZ061T | |
| PCMark 10 Score | 7316 points | |
Help | ||
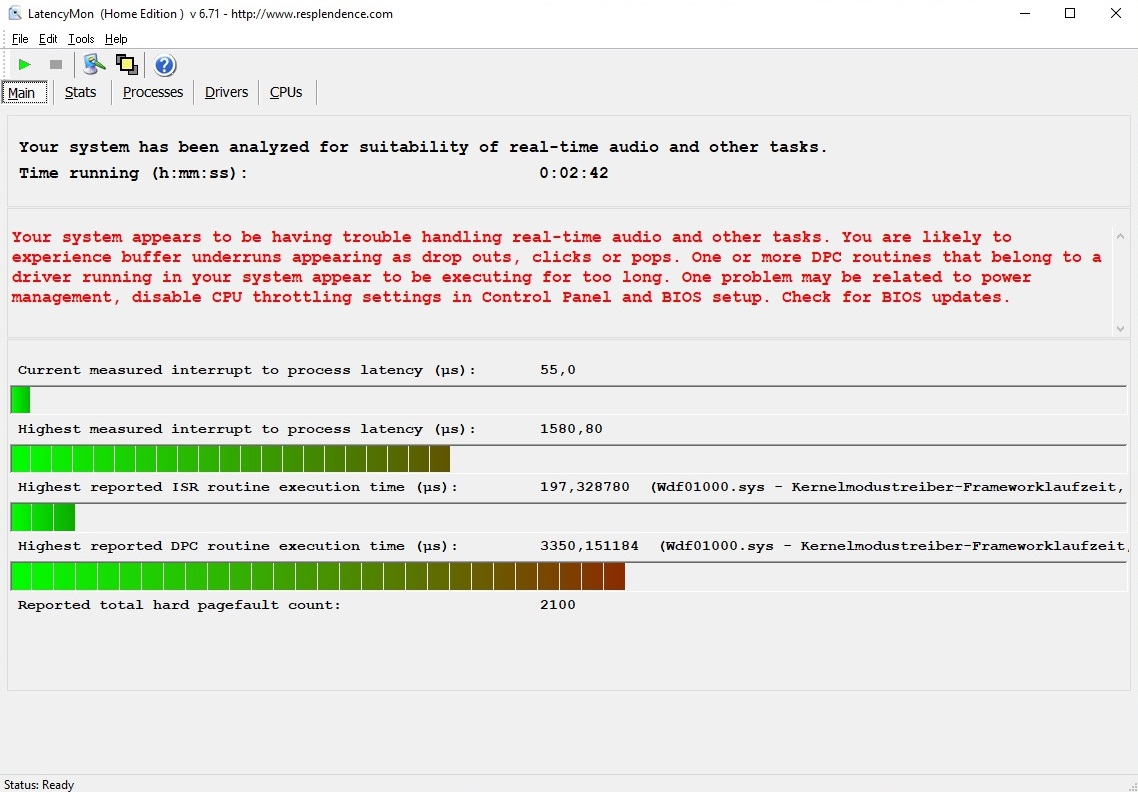
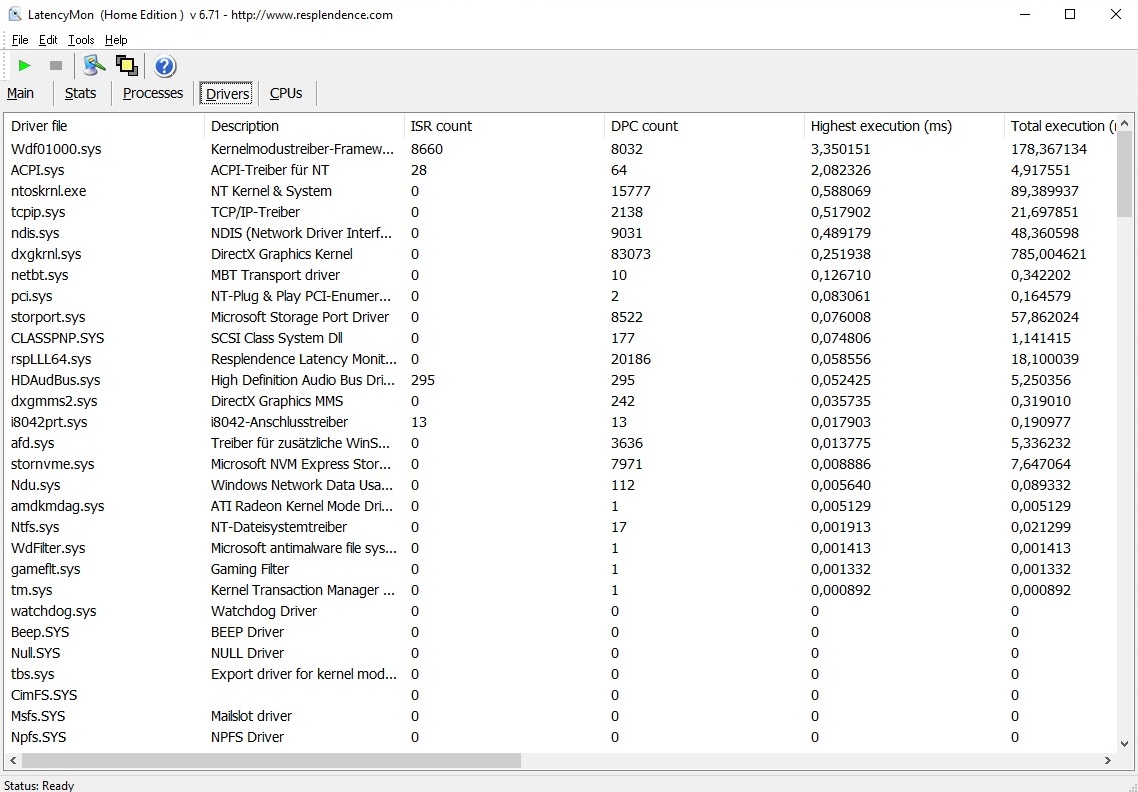
DPC latencies
Users who want to edit audio and/or video in real time will probably need to make some changes. According to the tool LatencyMon, latencies are quite high out of the box, and they could lead to problems in the corresponding application scenarios.
| DPC Latencies / LatencyMon - interrupt to process latency (max), Web, Youtube, Prime95 | |
| Asus ROG Strix G15 G513QY | |
| MSI Delta 15 A5EFK | |
| Asus ROG Strix Scar 15 G533QS | |
| Asus TUF Gaming A15 FA506QR-AZ061T | |
| Asus ROG Strix G15 G513QR | |
| Asus ROG Zephyrus G15 GA503Q | |
* ... smaller is better
Storage
MSI installs a 1000 GB NVMe SSD as the mass storage device in the Delta 15's test configuration. Based on our benchmarks, the Micron 2210 is roughly on par with the Samsung PM991 (Asus G513QY). The ADATA SSD in the Asus G533QS is slower, but the SK Hynix SSD in the Asus GA503Q and FA506QR is even faster.
| MSI Delta 15 A5EFK Micron 2210 MTFDHBA1T0QFD | Asus ROG Strix G15 G513QY Samsung PM991 MZVLQ512HALU | Asus ROG Strix Scar 15 G533QS ADATA Swordfish 2 TB | Asus ROG Zephyrus G15 GA503Q SK Hynix HFM001TD3JX013N | Asus TUF Gaming A15 FA506QR-AZ061T SK Hynix HFM001TD3JX013N | |
|---|---|---|---|---|---|
| CrystalDiskMark 5.2 / 6 | 8% | -12% | 30% | 36% | |
| Write 4K | 136.2 | 140.4 3% | 134.7 -1% | 156.4 15% | 182.5 34% |
| Read 4K | 59.9 | 48.91 -18% | 34.46 -42% | 66.7 11% | 73.2 22% |
| Write Seq | 1846 | 1613 -13% | 1123 -39% | 2318 26% | 3005 63% |
| Read Seq | 1714 | 2043 19% | 1691 -1% | 2151 25% | 2358 38% |
| Write 4K Q32T1 | 344.2 | 482.5 40% | 581 69% | 525 53% | 389.5 13% |
| Read 4K Q32T1 | 582 | 553 -5% | 423.6 -27% | 452.1 -22% | 463.8 -20% |
| Write Seq Q32T1 | 1874 | 1612 -14% | 1131 -40% | 3055 63% | 3166 69% |
| Read Seq Q32T1 | 2096 | 3105 48% | 1859 -11% | 3607 72% | 3590 71% |
| AS SSD | 9% | -117% | 35% | 50% | |
| Seq Read | 2023 | 2706 34% | 1757 -13% | 2950 46% | 3133 55% |
| Seq Write | 1836 | 1652 -10% | 1071 -42% | 1600 -13% | 2969 62% |
| 4K Read | 56.4 | 45.46 -19% | 22.07 -61% | 53.6 -5% | 55.2 -2% |
| 4K Write | 130.2 | 128.5 -1% | 124.2 -5% | 126.8 -3% | 129.7 0% |
| 4K-64 Read | 899 | 1342 49% | 439.4 -51% | 1429 59% | 1891 110% |
| 4K-64 Write | 1164 | 1066 -8% | 651 -44% | 2177 87% | 1795 54% |
| Access Time Read * | 0.096 | 0.095 1% | 0.043 55% | 0.064 33% | 0.052 46% |
| Access Time Write * | 0.031 | 0.03 3% | 0.341 -1000% | 0.029 6% | 0.028 10% |
| Score Read | 1158 | 1658 43% | 637 -45% | 1778 54% | 2259 95% |
| Score Write | 1478 | 1360 -8% | 882 -40% | 2464 67% | 2221 50% |
| Score Total | 3233 | 3818 18% | 1814 -44% | 5090 57% | 5630 74% |
| Total Average (Program / Settings) | 9% /
9% | -65% /
-73% | 33% /
33% | 43% /
44% |
* ... smaller is better

Continuous load read: DiskSpd Read Loop, Queue Depth 8
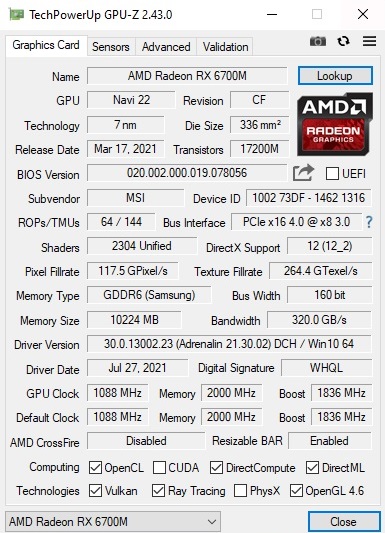
Graphics card
The main highlight of the Delta 15 is definitely the brand-new GPU. With the Radeon RX 6700M, AMD offers a high-end counterpart to Nvidia's renowned Ampere generation (RTX 3060 to RTX 3080). The amount of video memory alone reveals that AMD is taking matters seriously. 10 GB of GDDR6 memory is appropriate for a top-of-the-range mobile gaming model. In comparison, the RTX 3070 has to make do with 8 GB, and the RTX 3060 only has 6 GB.
In view of the increasingly extreme VRAM requirements of modern games (e.g. Deathloop, Resident Evil Village, or Far Cry 6), this is a thoughtful and pleasing decision that also ensures a high degree of future-proofing for users. Additional specifications like the clock rate, the number of shaders, and the memory interface can be found on our dedicated GPU article.
The RX 6700M does very well against the Nvidia competition in our benchmark course. In this way, the AMD chip usually performs at the level of the GeForce RTX 3070, which is in line with the initial expectations. In 3DMark's Fire Strike test, the RX 6700M actually surpasses the top model from Nvidia, the GeForce RTX 3080 (at least in the TGP versions of the comparison devices). The Radeon RX 6800M, which isn't very widespread yet, is about 20% ahead on average.
| 3DMark 11 - 1280x720 Performance GPU | |
| Asus ROG Strix G15 G513QY | |
| Asus ROG Strix Scar 15 G533QS | |
| Asus ROG Strix G15 G513QR | |
| MSI Delta 15 A5EFK | |
| Asus TUF Gaming A15 FA506QR-AZ061T | |
| 3DMark 06 Standard Score | 46372 points | |
| 3DMark Vantage P Result | 66973 points | |
| 3DMark 11 Performance | 25929 points | |
| 3DMark Ice Storm Standard Score | 136454 points | |
| 3DMark Cloud Gate Standard Score | 47472 points | |
| 3DMark Fire Strike Score | 24294 points | |
| 3DMark Time Spy Score | 9360 points | |
Help | ||
Gaming performance
The gaming performance rating depends strongly on ray tracing. When ray tracing is enabled, the Radeon RX 6700M is often beaten by the Ampere generation, tending to be on par with its older Turing counterpart. As a result, fans of this new technology are still better off with Nvidia.
If you play without ray tracing, which isn't available in most games anyway, the Delta 15 delivers a very good performance. As in the synthetic graphics benchmarks, the Radeon RX 6700M is a threat to the GeForce RTX 3070 and sometimes even to the RTX 3080 in everyday gaming. So Nvidia needs to be careful here.
In general, the Radeon RX 6700M is fast enough to bring any modern game at the native Full HD resolution (1920x1080) and maximum settings smoothly onto the screen. Only in extremely demanding or poorly programmed games like Crysis Remastered or Cyberpunk 2077 does the frame rate drop below the 60 FPS mark.
| Far Cry 6 | |
| 1920x1080 Ultra Graphics Quality + HD Textures AA:T | |
| XMG Neo 15 @165 W TGP | |
| Asus ROG Strix G15 G513QY | |
| XMG Neo 17 @140 W TGP | |
| MSI Delta 15 A5EFK | |
| XMG Core 15 @130 W TGP | |
| 1920x1080 Ultra Graphics Quality + HD Textures + DXR AA:T | |
| XMG Neo 15 @165 W TGP | |
| XMG Neo 17 @140 W TGP | |
| MSI Delta 15 A5EFK | |
| XMG Core 15 @130 W TGP | |
| Cyberpunk 2077 1.0 | |
| 1920x1080 Ultra Preset | |
| Asus ROG Zephyrus G15 GA503Q | |
| Asus TUF Gaming A15 FA506QR-AZ061T | |
| MSI Delta 15 A5EFK | |
| 1920x1080 Ray Tracing Ultra Preset (DLSS off) | |
| Asus ROG Zephyrus G15 GA503Q | |
| MSI Delta 15 A5EFK | |
| Watch Dogs Legion | |
| 1920x1080 Ultra Preset (DX12) | |
| Asus ROG Zephyrus G15 GA503Q | |
| MSI Delta 15 A5EFK | |
| 1920x1080 Ultra Preset + Ultra Ray Tracing (DX12) | |
| Asus ROG Zephyrus G15 GA503Q | |
| MSI Delta 15 A5EFK | |
| Control | |
| 1920x1080 High Quality Preset (DX11) | |
| Asus ROG Zephyrus G15 GA503Q | |
| MSI Delta 15 A5EFK | |
| 1920x1080 High Quality Preset & High Ray Tracing Preset (DX12) | |
| Asus ROG Zephyrus G15 GA503Q | |
| MSI Delta 15 A5EFK | |
| Resident Evil Village | |
| 1920x1080 Max Preset | |
| MSI Delta 15 A5EFK | |
| Asus ROG Strix G15 G513QY | |
| 1920x1080 Ray Tracing Preset | |
| MSI Delta 15 A5EFK | |
| The Witcher 3 - 1920x1080 Ultra Graphics & Postprocessing (HBAO+) | |
| Asus ROG Strix G15 G513QY | |
| Asus ROG Strix Scar 15 G533QS | |
| MSI Delta 15 A5EFK | |
| Asus ROG Strix G15 G513QR | |
| Asus ROG Zephyrus G15 GA503Q | |
| Asus TUF Gaming A15 FA506QR-AZ061T | |
A minor drawback: According to our 60-minute test with The Witcher 3 (Full HD/Ultra), the 3D performance drops a bit after prolonged load. This issue is mainly related to the laptop (cooling system) and not necessarily to the graphics card.
The Witcher 3 FPS diagram
| low | med. | high | ultra | |
| GTA V (2015) | 169 | 147 | 86.2 | |
| The Witcher 3 (2015) | 223 | 164 | 95.4 | |
| Dota 2 Reborn (2015) | 130 | 123 | 112 | |
| Final Fantasy XV Benchmark (2018) | 113 | 83.8 | ||
| Far Cry 5 (2018) | 103 | 97 | 91 | |
| Strange Brigade (2018) | 202 | 186 | 170 | |
| Control (2019) | 117 | 82.2 | ||
| Borderlands 3 (2019) | 100 | 86.9 | 71.2 | |
| Need for Speed Heat (2019) | 98.2 | 90.5 | 82.8 | |
| Star Wars Jedi Fallen Order (2019) | 100 | 90.6 | 87.9 | |
| Hunt Showdown (2020) | 125 | 100 | ||
| Doom Eternal (2020) | 200 | 182 | 175 | |
| Gears Tactics (2020) | 208 | 134 | 96.2 | |
| Death Stranding (2020) | 144 | 134 | 131 | |
| Crysis Remastered (2020) | 146 | 63.6 | 45.9 | |
| Serious Sam 4 (2020) | 105 | 98 | 79.8 | |
| Mafia Definitive Edition (2020) | 93.4 | 85.5 | ||
| Star Wars Squadrons (2020) | 233 | 232 | 219 | |
| Watch Dogs Legion (2020) | 96 | 87 | 64 | |
| Dirt 5 (2020) | 119 | 98.8 | 80.6 | |
| Assassin´s Creed Valhalla (2020) | 98 | 82 | 71 | |
| Yakuza Like a Dragon (2020) | 111 | 96.2 | 90.2 | |
| Immortals Fenyx Rising (2020) | 83 | 81 | 78 | |
| Cyberpunk 2077 1.0 (2020) | 85.4 | 67.9 | 56.5 | |
| Hitman 3 (2021) | 175 | 154 | 144 | |
| Outriders (2021) | 107 | 98.1 | 94.6 | |
| Resident Evil Village (2021) | 171 | 161 | 140 | |
| Mass Effect Legendary Edition (2021) | 99.6 | |||
| Days Gone (2021) | 113 | 106 | 80.5 | |
| Monster Hunter Stories 2 (2021) | 143 | 142 | ||
| F1 2021 (2021) | 212 | 185 | 100 | |
| Deathloop (2021) | 99.8 | 85.1 | 77.3 | |
| New World (2021) | 82.2 | 78.5 | 73 | |
| FIFA 22 (2021) | 229 | 224 | 217 | |
| Far Cry 6 (2021) | 97 | 82 | 74 | |
| Back 4 Blood (2021) | 195 | 163 | 149 |
Emissions
Noise emissions
When it comes to noise development, there are no surprises. 47 to 51 dB(A) under load are typical values for a gaming laptop, which are also in line with the competition. At this level, the 15-incher is neither quiet nor extremely loud in 3D mode.
When the laptop is idle, the fans are occasionally silent. However, smaller tasks like launching programs can quickly cause the fans to rev up, which is quite annoying. That said, as already mentioned, we used the highest performance mode (there is also a "Silent" profile, for example).
Noise Level
| Idle |
| 25 / 30 / 40 dB(A) |
| Load |
| 47 / 51 dB(A) |
 | ||
30 dB silent 40 dB(A) audible 50 dB(A) loud |
||
min: | ||
| MSI Delta 15 A5EFK R9 5900HX, Radeon RX 6700M | Asus ROG Strix G15 G513QY R9 5900HX, Radeon RX 6800M | Asus ROG Strix Scar 15 G533QS R9 5900HX, GeForce RTX 3080 Laptop GPU | Asus ROG Zephyrus G15 GA503Q R9 5900HS, GeForce RTX 3080 Laptop GPU | Asus ROG Strix G15 G513QR R9 5900HX, GeForce RTX 3070 Laptop GPU | Asus TUF Gaming A15 FA506QR-AZ061T R7 5800H, GeForce RTX 3070 Laptop GPU | |
|---|---|---|---|---|---|---|
| Noise | 2% | 4% | 3% | 3% | 7% | |
| off / environment * | 25 | 26 -4% | 25.5 -2% | 25 -0% | 24 4% | 26 -4% |
| Idle Minimum * | 25 | 26 -4% | 25.5 -2% | 26 -4% | 25 -0% | 26 -4% |
| Idle Average * | 30 | 31 -3% | 25.5 15% | 27 10% | 31 -3% | 26 13% |
| Idle Maximum * | 40 | 34 15% | 37.1 7% | 31 22% | 33 17% | 27.4 31% |
| Load Average * | 47 | 44 6% | 39.2 17% | 49 -4% | 45 4% | 46.6 1% |
| Witcher 3 ultra * | 48 | 48.5 -1% | 50.5 -5% | 49 -2% | 48 -0% | |
| Load Maximum * | 51 | 49 4% | 51.8 -2% | 51 -0% | 50 2% | 49.3 3% |
* ... smaller is better
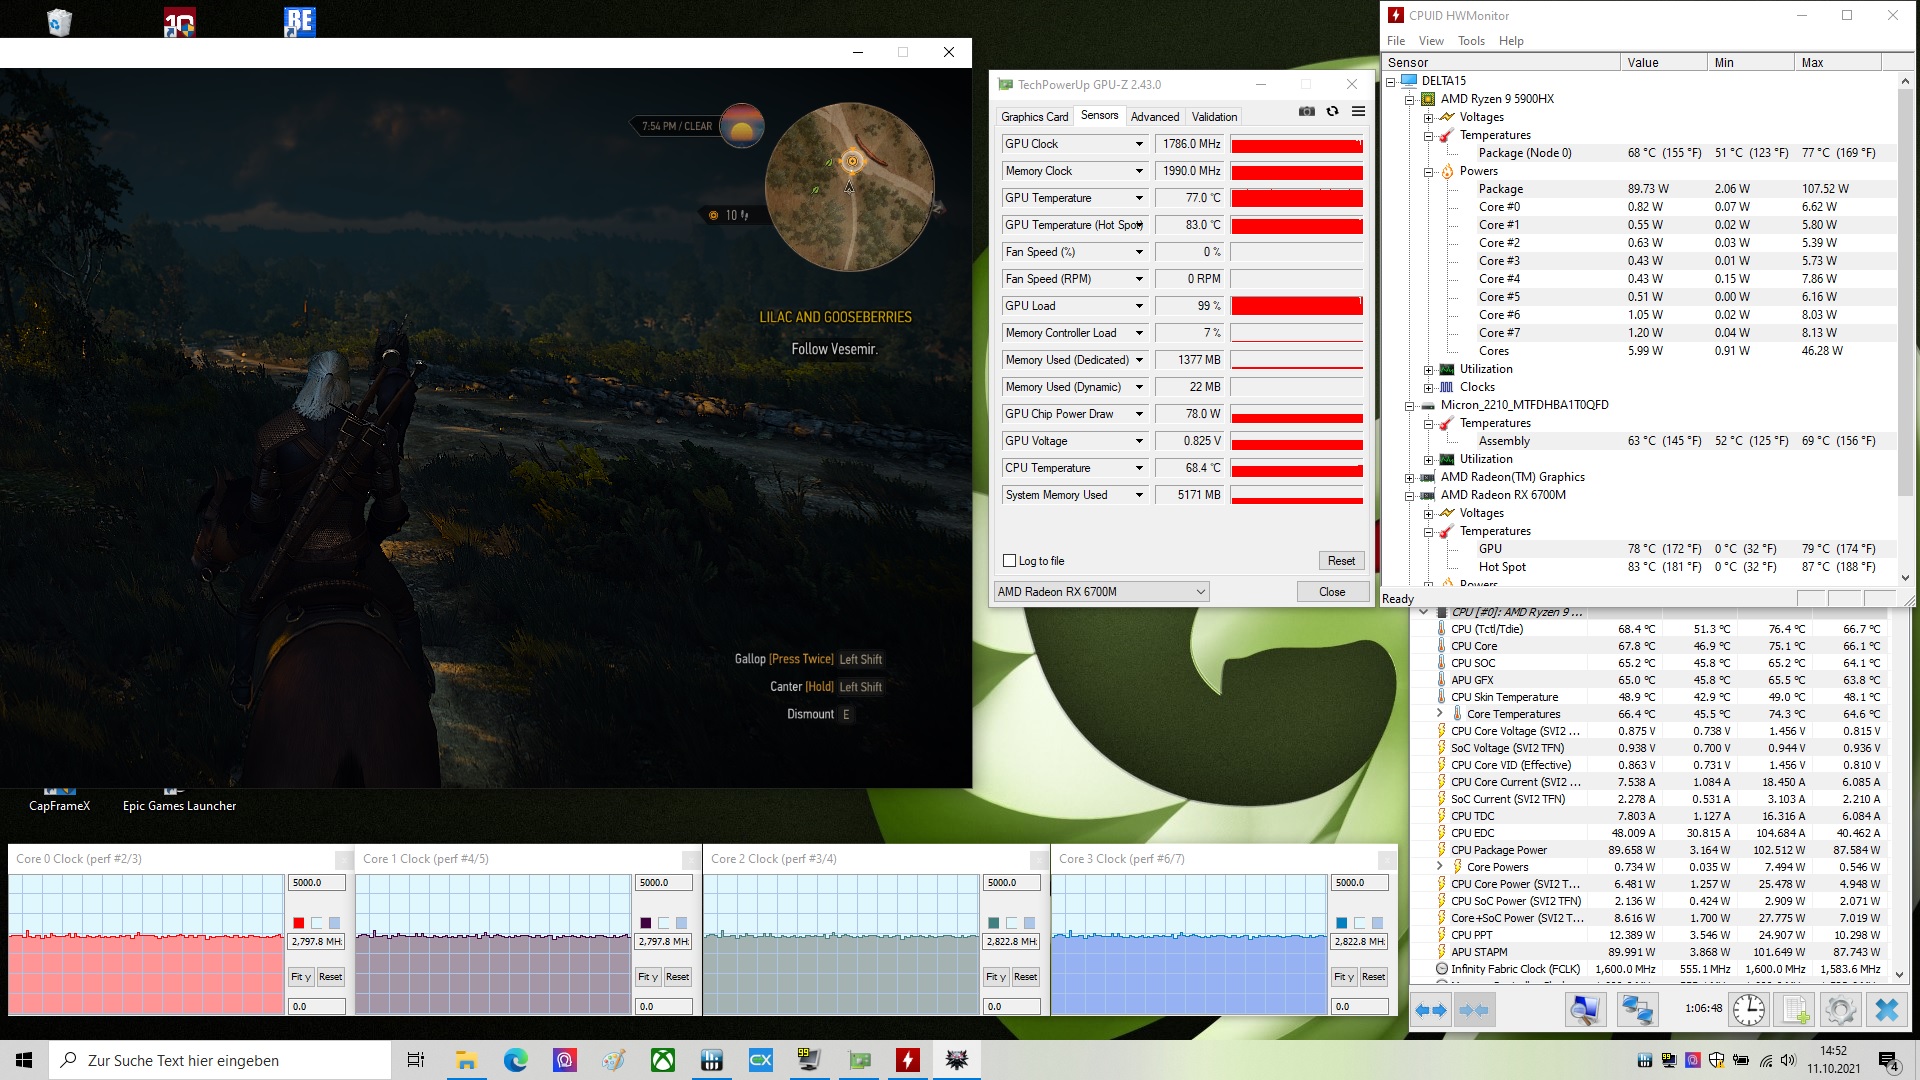
Temperature
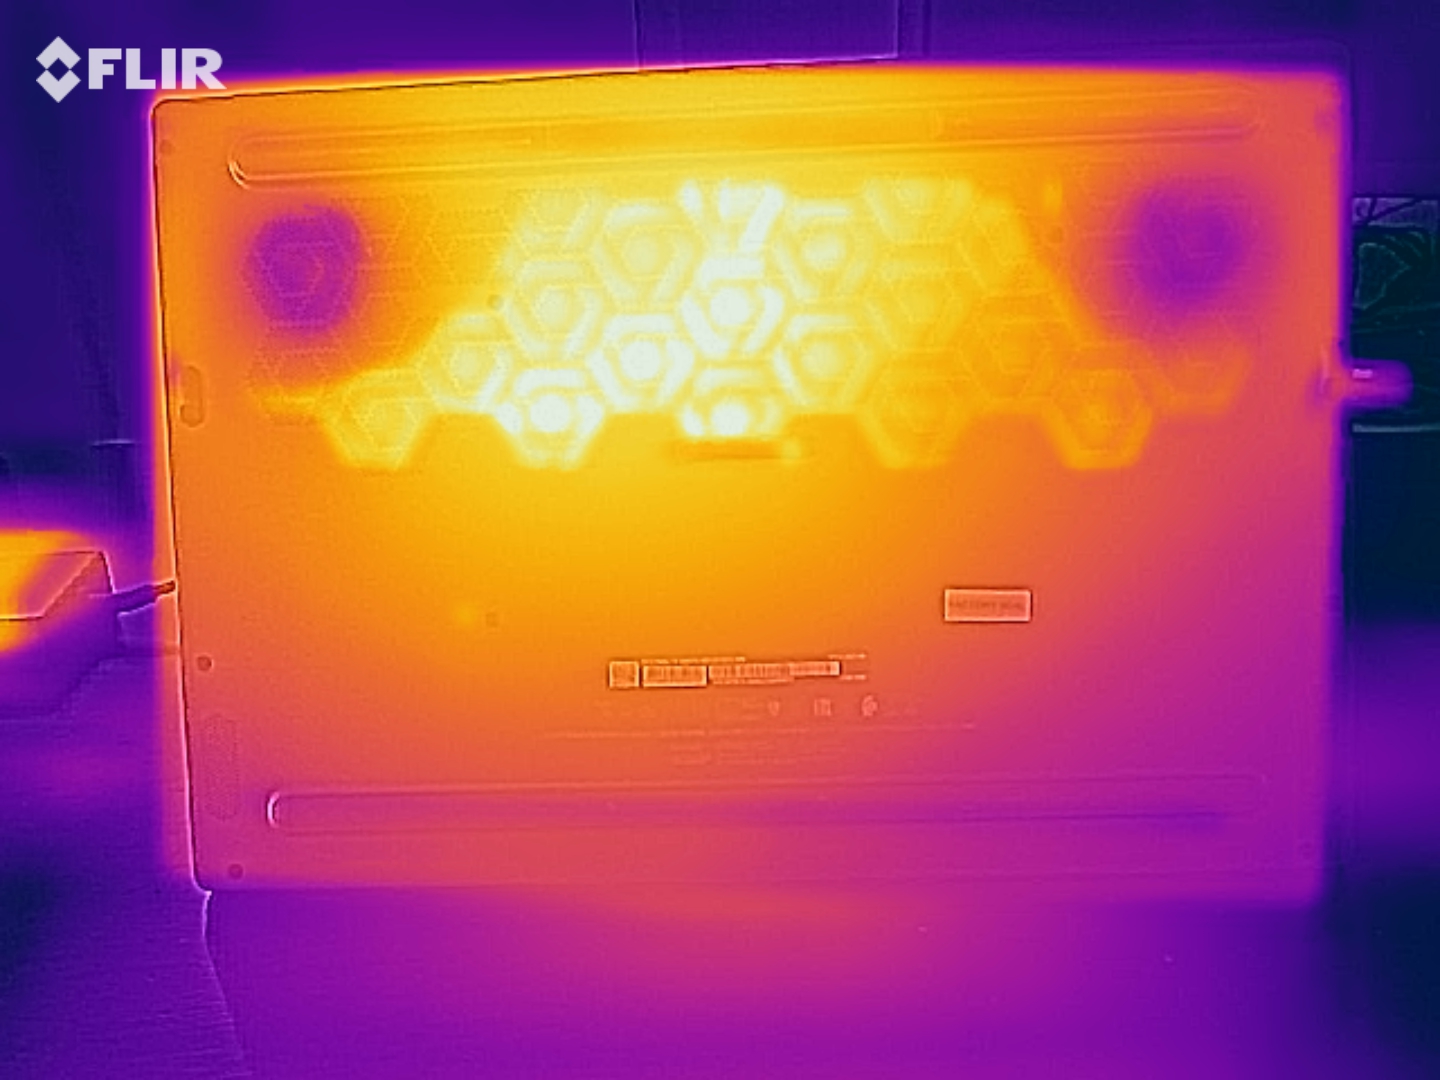
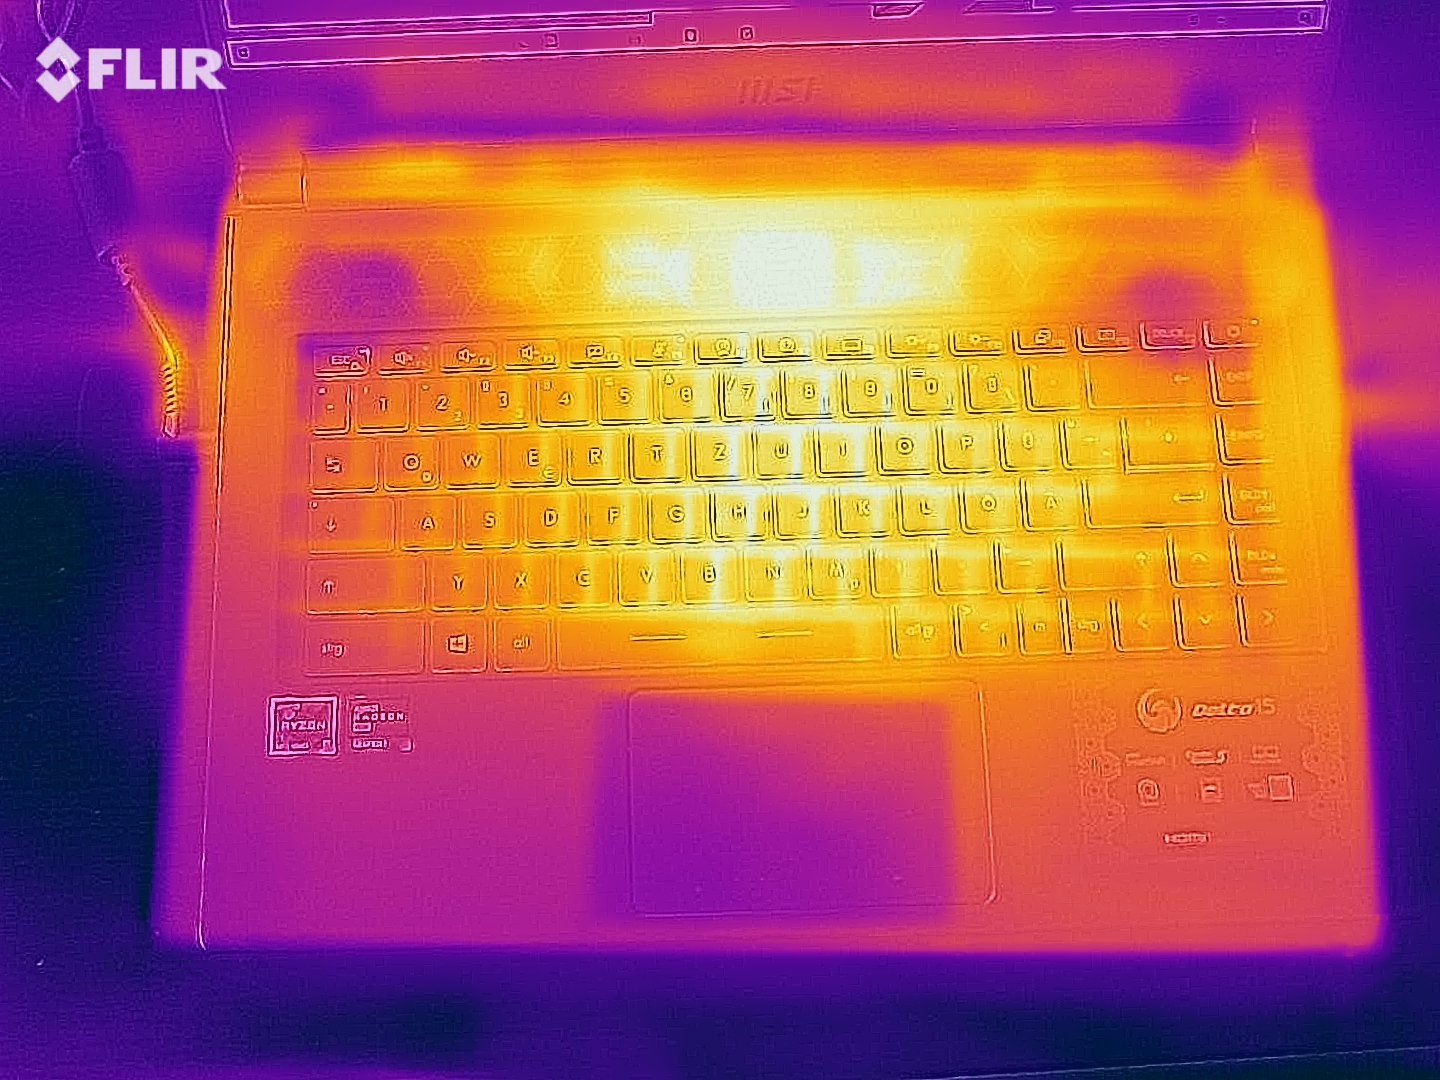
Compared with the competition, temperature development is average as well. The chassis heated up to 50 °C (~122 °F) (top) and 55 °C (~131 °F) (bottom), respectively, in the stress test with the FurMark and Prime95 tools. The results were similar in our The Witcher 3 test. Consequently, you shouldn't place the device on your lap when gaming, if possible. The entire chassis remains pleasantly cool in idle usage. A large part of the surfaces remains below the 30 °C (~86 °F) mark.
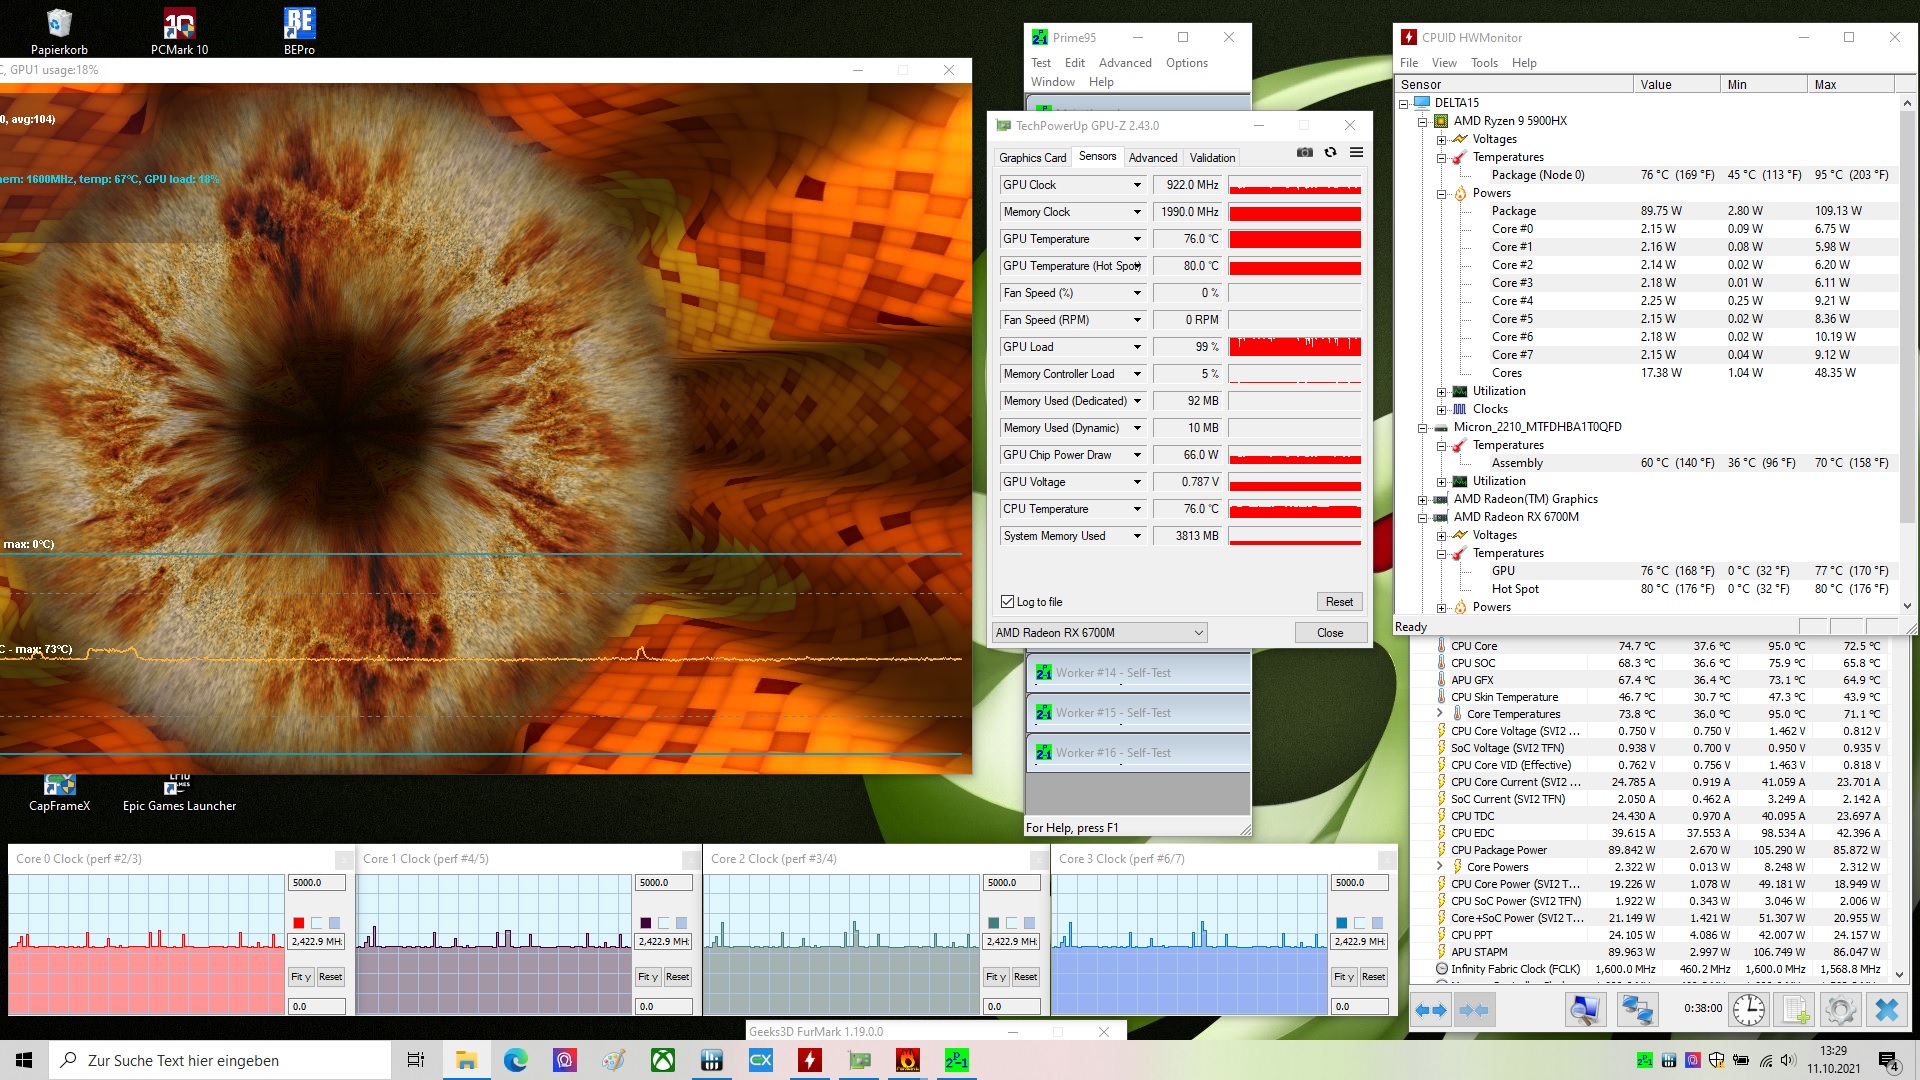
The screenshots below show how the components behave under load. Nice: Both the CPU and the GPU never exceed 80 °C (~176 °F).
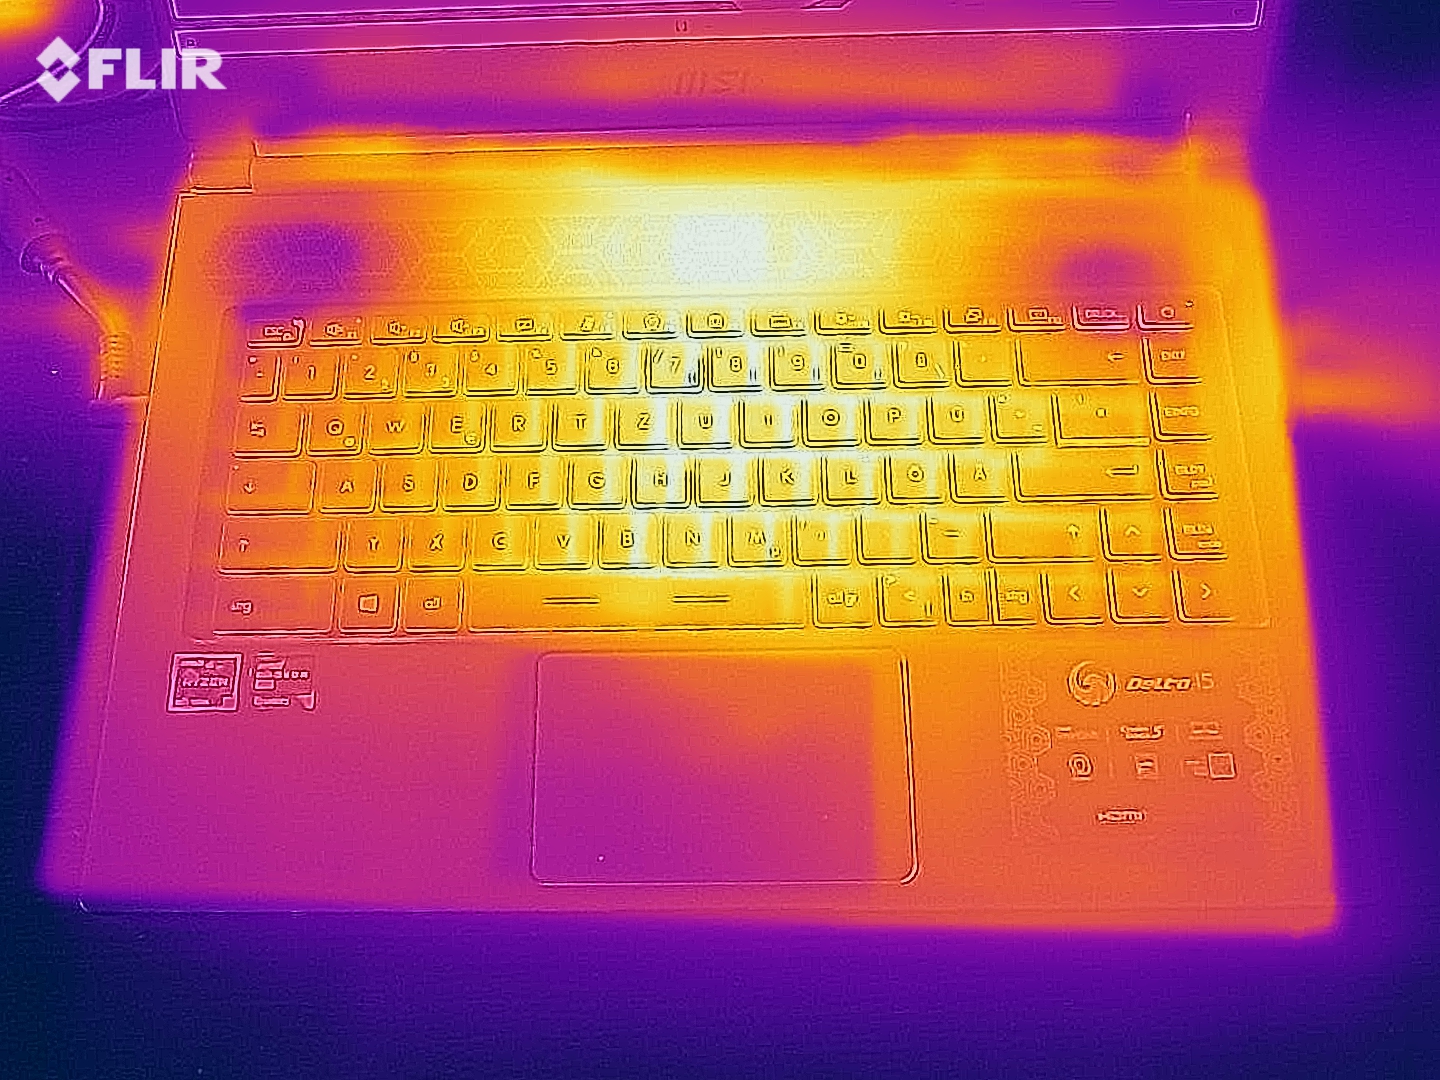
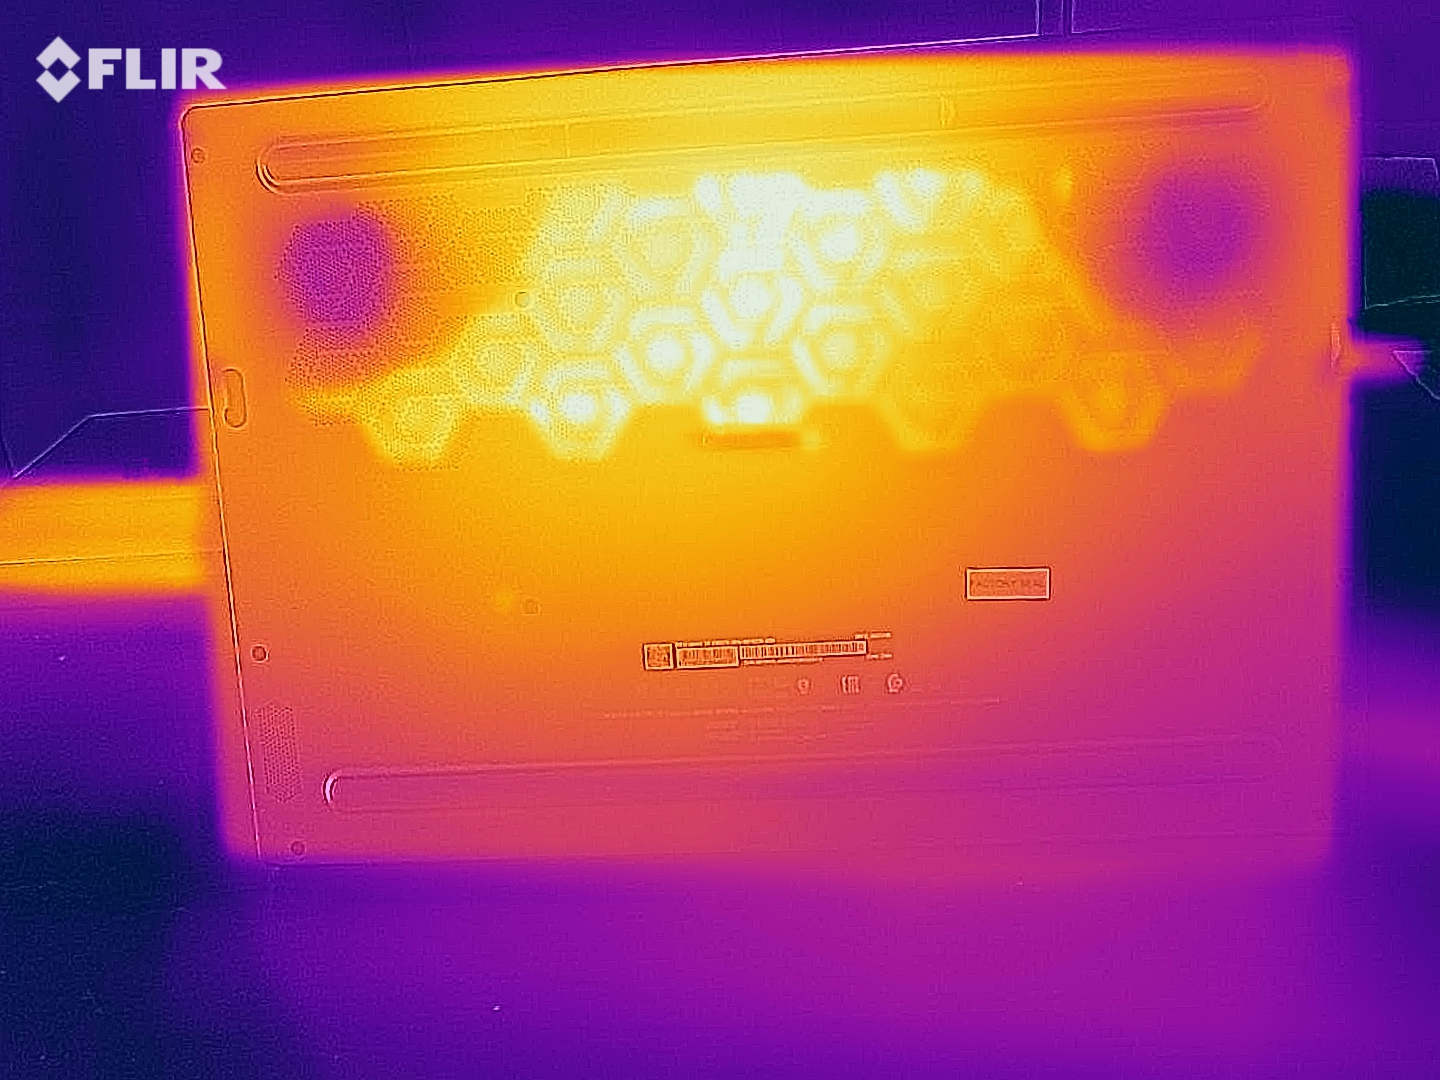
(-) The maximum temperature on the upper side is 50 °C / 122 F, compared to the average of 40.4 °C / 105 F, ranging from 21.2 to 68.8 °C for the class Gaming.
(-) The bottom heats up to a maximum of 55 °C / 131 F, compared to the average of 43.2 °C / 110 F
(+) In idle usage, the average temperature for the upper side is 28.6 °C / 83 F, compared to the device average of 33.8 °C / 93 F.
(-) Playing The Witcher 3, the average temperature for the upper side is 43.3 °C / 110 F, compared to the device average of 33.8 °C / 93 F.
(±) The palmrests and touchpad can get very hot to the touch with a maximum of 39 °C / 102.2 F.
(-) The average temperature of the palmrest area of similar devices was 28.9 °C / 84 F (-10.1 °C / -18.2 F).
| MSI Delta 15 A5EFK R9 5900HX, Radeon RX 6700M | Asus ROG Strix G15 G513QY R9 5900HX, Radeon RX 6800M | Asus ROG Strix Scar 15 G533QS R9 5900HX, GeForce RTX 3080 Laptop GPU | Asus ROG Zephyrus G15 GA503Q R9 5900HS, GeForce RTX 3080 Laptop GPU | Asus ROG Strix G15 G513QR R9 5900HX, GeForce RTX 3070 Laptop GPU | Asus TUF Gaming A15 FA506QR-AZ061T R7 5800H, GeForce RTX 3070 Laptop GPU | |
|---|---|---|---|---|---|---|
| Heat | 8% | -3% | -3% | 1% | -11% | |
| Maximum Upper Side * | 50 | 38.9 22% | 43.4 13% | 51 -2% | 49 2% | 46.7 7% |
| Maximum Bottom * | 55 | 34.6 37% | 48.2 12% | 56 -2% | 48 13% | 55.9 -2% |
| Idle Upper Side * | 31 | 34.4 -11% | 35.2 -14% | 29 6% | 31 -0% | 37.1 -20% |
| Idle Bottom * | 30 | 34.4 -15% | 37 -23% | 34 -13% | 33 -10% | 38.1 -27% |
* ... smaller is better
Speakers
We would describe the sound quality of the built-in 2.0 system as decent, although the bass and the maximum volume leave something to be desired as is typical for laptops.
MSI Delta 15 A5EFK audio analysis
(±) | speaker loudness is average but good (80 dB)
Bass 100 - 315 Hz
(±) | reduced bass - on average 12.9% lower than median
(±) | linearity of bass is average (10.3% delta to prev. frequency)
Mids 400 - 2000 Hz
(+) | balanced mids - only 4.8% away from median
(+) | mids are linear (5.3% delta to prev. frequency)
Highs 2 - 16 kHz
(+) | balanced highs - only 4.1% away from median
(±) | linearity of highs is average (9.4% delta to prev. frequency)
Overall 100 - 16.000 Hz
(±) | linearity of overall sound is average (16.2% difference to median)
Compared to same class
» 37% of all tested devices in this class were better, 7% similar, 56% worse
» The best had a delta of 6%, average was 18%, worst was 132%
Compared to all devices tested
» 21% of all tested devices were better, 5% similar, 74% worse
» The best had a delta of 4%, average was 25%, worst was 134%
Asus ROG Strix G15 G513QY audio analysis
(±) | speaker loudness is average but good (77.5 dB)
Bass 100 - 315 Hz
(±) | reduced bass - on average 5% lower than median
(±) | linearity of bass is average (7.4% delta to prev. frequency)
Mids 400 - 2000 Hz
(+) | balanced mids - only 3% away from median
(+) | mids are linear (3.9% delta to prev. frequency)
Highs 2 - 16 kHz
(+) | balanced highs - only 1.7% away from median
(+) | highs are linear (6.3% delta to prev. frequency)
Overall 100 - 16.000 Hz
(+) | overall sound is linear (8.2% difference to median)
Compared to same class
» 1% of all tested devices in this class were better, 1% similar, 98% worse
» The best had a delta of 6%, average was 18%, worst was 132%
Compared to all devices tested
» 1% of all tested devices were better, 1% similar, 98% worse
» The best had a delta of 4%, average was 25%, worst was 134%
Energy management
Energy consumption
Power consumption is rather unremarkable. 10 to 25 watts of idle consumption and 101 to 217 watts under load are reasonable in view of the provided performance, and they're also in line with the competition from Nvidia.
| Off / Standby | |
| Idle | |
| Load |
|
| MSI Delta 15 A5EFK R9 5900HX, Radeon RX 6700M | Asus ROG Strix G15 G513QY R9 5900HX, Radeon RX 6800M | Asus ROG Strix Scar 15 G533QS R9 5900HX, GeForce RTX 3080 Laptop GPU | Asus ROG Zephyrus G15 GA503Q R9 5900HS, GeForce RTX 3080 Laptop GPU | Asus ROG Strix G15 G513QR R9 5900HX, GeForce RTX 3070 Laptop GPU | Asus TUF Gaming A15 FA506QR-AZ061T R7 5800H, GeForce RTX 3070 Laptop GPU | |
|---|---|---|---|---|---|---|
| Power Consumption | 5% | -4% | 18% | 7% | 13% | |
| Idle Minimum * | 10 | 12.1 -21% | 11.2 -12% | 10 -0% | 4 60% | 10.2 -2% |
| Idle Average * | 18 | 13 28% | 16.4 9% | 12 33% | 9 50% | 12.8 29% |
| Idle Maximum * | 25 | 14.7 41% | 29.4 -18% | 17 32% | 36 -44% | 15 40% |
| Load Average * | 101 | 90.3 11% | 106.2 -5% | 108 -7% | 130 -29% | 130 -29% |
| Witcher 3 ultra * | 187 | 200 -7% | 189 -1% | 123 34% | 174 7% | 137 27% |
| Load Maximum * | 217 | 263.4 -21% | 213.6 2% | 182 16% | 227 -5% | 184 15% |
* ... smaller is better
Energy consumption during The Witcher 3
Battery life
MSI equips the Delta 15 with a 4-cell battery. 82 Wh is quite a lot, but the competing laptops from Asus have an even higher battery capacity of 90 Wh. In order to determine a realistic runtime, we executed our browser script (accessing various websites using Wi-Fi at medium brightness) on the 15-incher. The MSI laptop lasted around 8 hours with one battery charge - a respectable rate.
| MSI Delta 15 A5EFK R9 5900HX, Radeon RX 6700M, 82 Wh | Asus ROG Strix G15 G513QY R9 5900HX, Radeon RX 6800M, 90 Wh | Asus ROG Strix Scar 15 G533QS R9 5900HX, GeForce RTX 3080 Laptop GPU, 90 Wh | Asus ROG Zephyrus G15 GA503Q R9 5900HS, GeForce RTX 3080 Laptop GPU, 90 Wh | Asus ROG Strix G15 G513QR R9 5900HX, GeForce RTX 3070 Laptop GPU, 90 Wh | Asus TUF Gaming A15 FA506QR-AZ061T R7 5800H, GeForce RTX 3070 Laptop GPU, 90 Wh | |
|---|---|---|---|---|---|---|
| Battery Runtime | 36% | -6% | 8% | -2% | 51% | |
| Reader / Idle | 664 | 963 45% | 668 1% | 728 10% | 1043 57% | |
| WiFi v1.3 | 474 | 553 17% | 440 -7% | 564 19% | 441 -7% | 685 45% |
| Load | 96 | 139 45% | 85 -11% | 90 -6% | 100 4% | 145 51% |
| H.264 | 809 |
Pros
Cons
Verdict
After already catering well to the CPU market, AMD is now making an impressive return to the dance floor in the mobile high-end graphics cards segment as well. Apart from the rather poor ray tracing performance, the highlight of the MSI Delta 15, the Radeon RX 6700M, impresses nearly in every respect.
The GeForce RTX 3070, which only has 8 instead of 10 GB of VRAM, has finally found an equivalent opponent. Both graphics cards usually go head-to-head, with AMD taking the lead at times and Nvidia at other times. According to the latest information, there's hardly any price difference between the two laptops.
With the Delta 15, MSI has created a good debut device for the RX 6700M.
Yes, some display parameters could be a bit better (e.g. brightness and contrast). And yes, the port configuration isn't particularly comprehensive (no card reader, no RJ45 port, no Thunderbolt). Otherwise, the 15-incher definitely doesn't need to shy away from the competition. The stylish case looks elegant and houses solid input devices.
Furthermore, the 82 Wh battery provides great runtimes when the device is not connected to the power outlet. Thanks to its low weight and thin build, the Delta 15 is also easy to transport. The sound quality and cooling system are average.
AMD fans looking for a bit more performance should consider the Asus ROG Strix G15 G513QY with the Radeon RX 6800M.
Price and availability
MSI Delta 15 A5EFK
-
10/13/2021 v7
Florian Glaser
Pricecompare

