

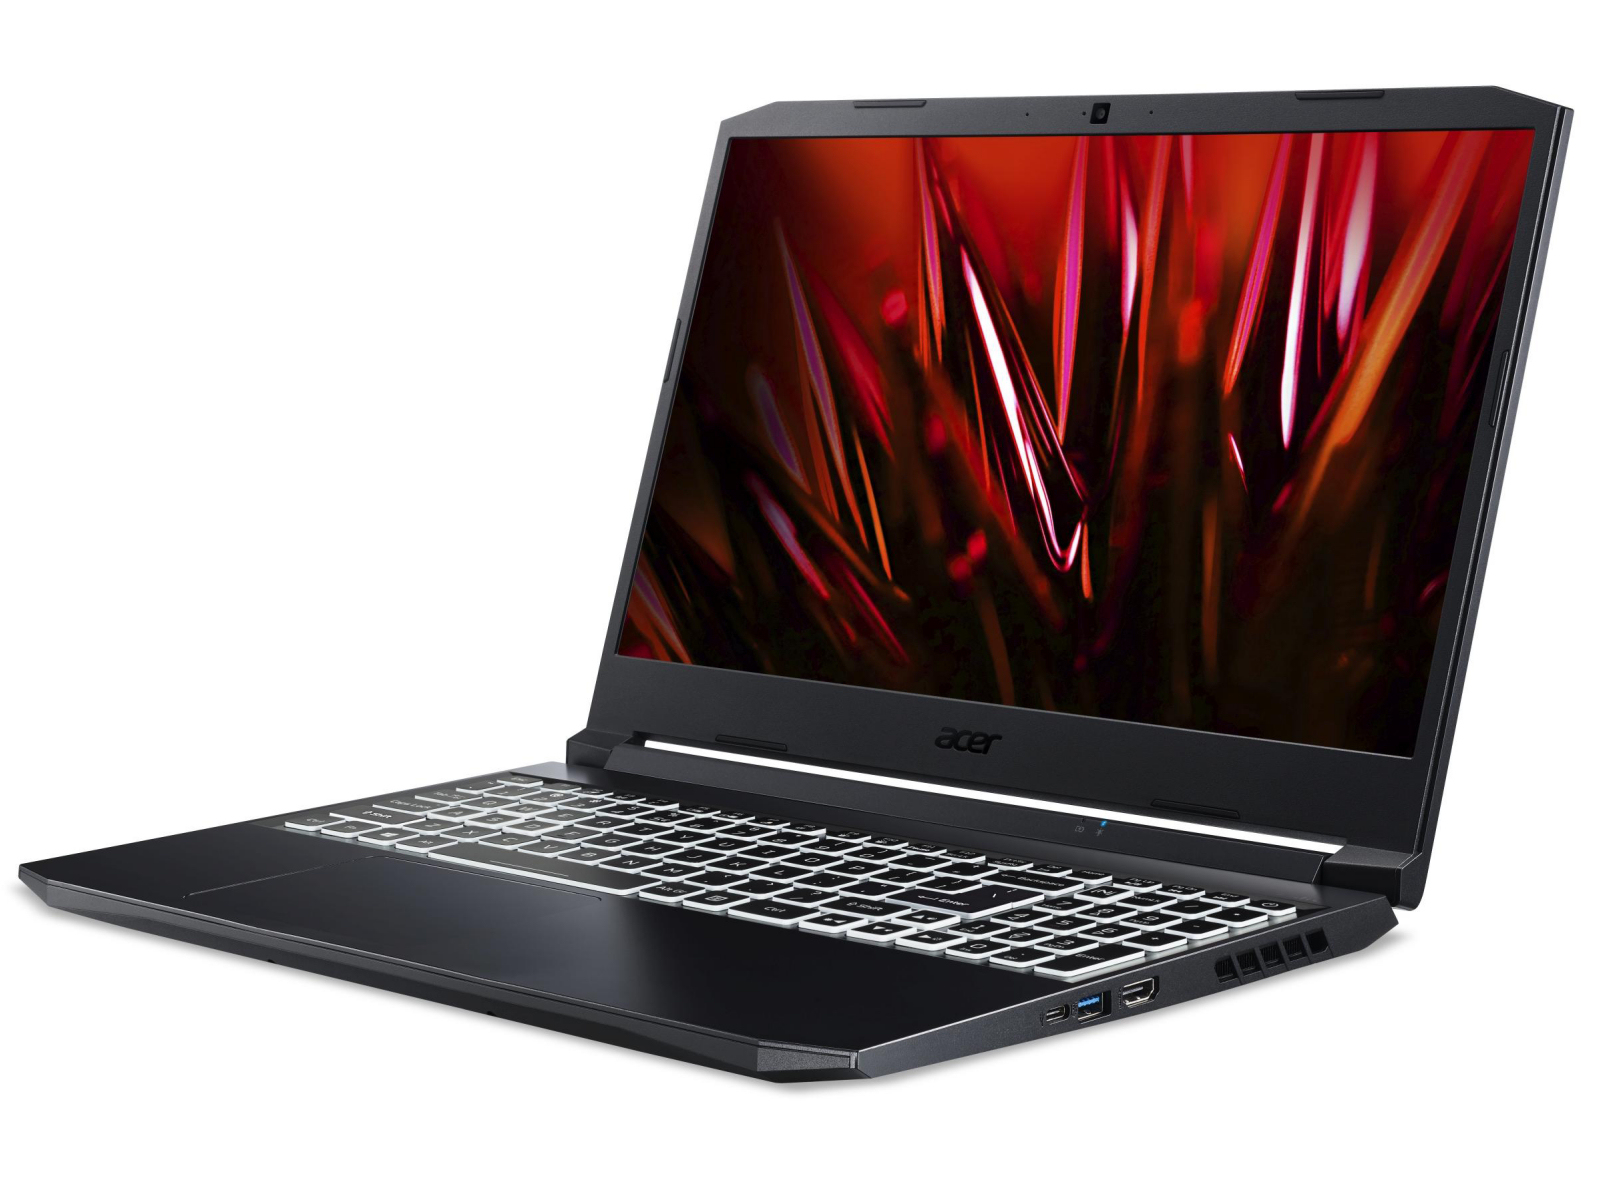
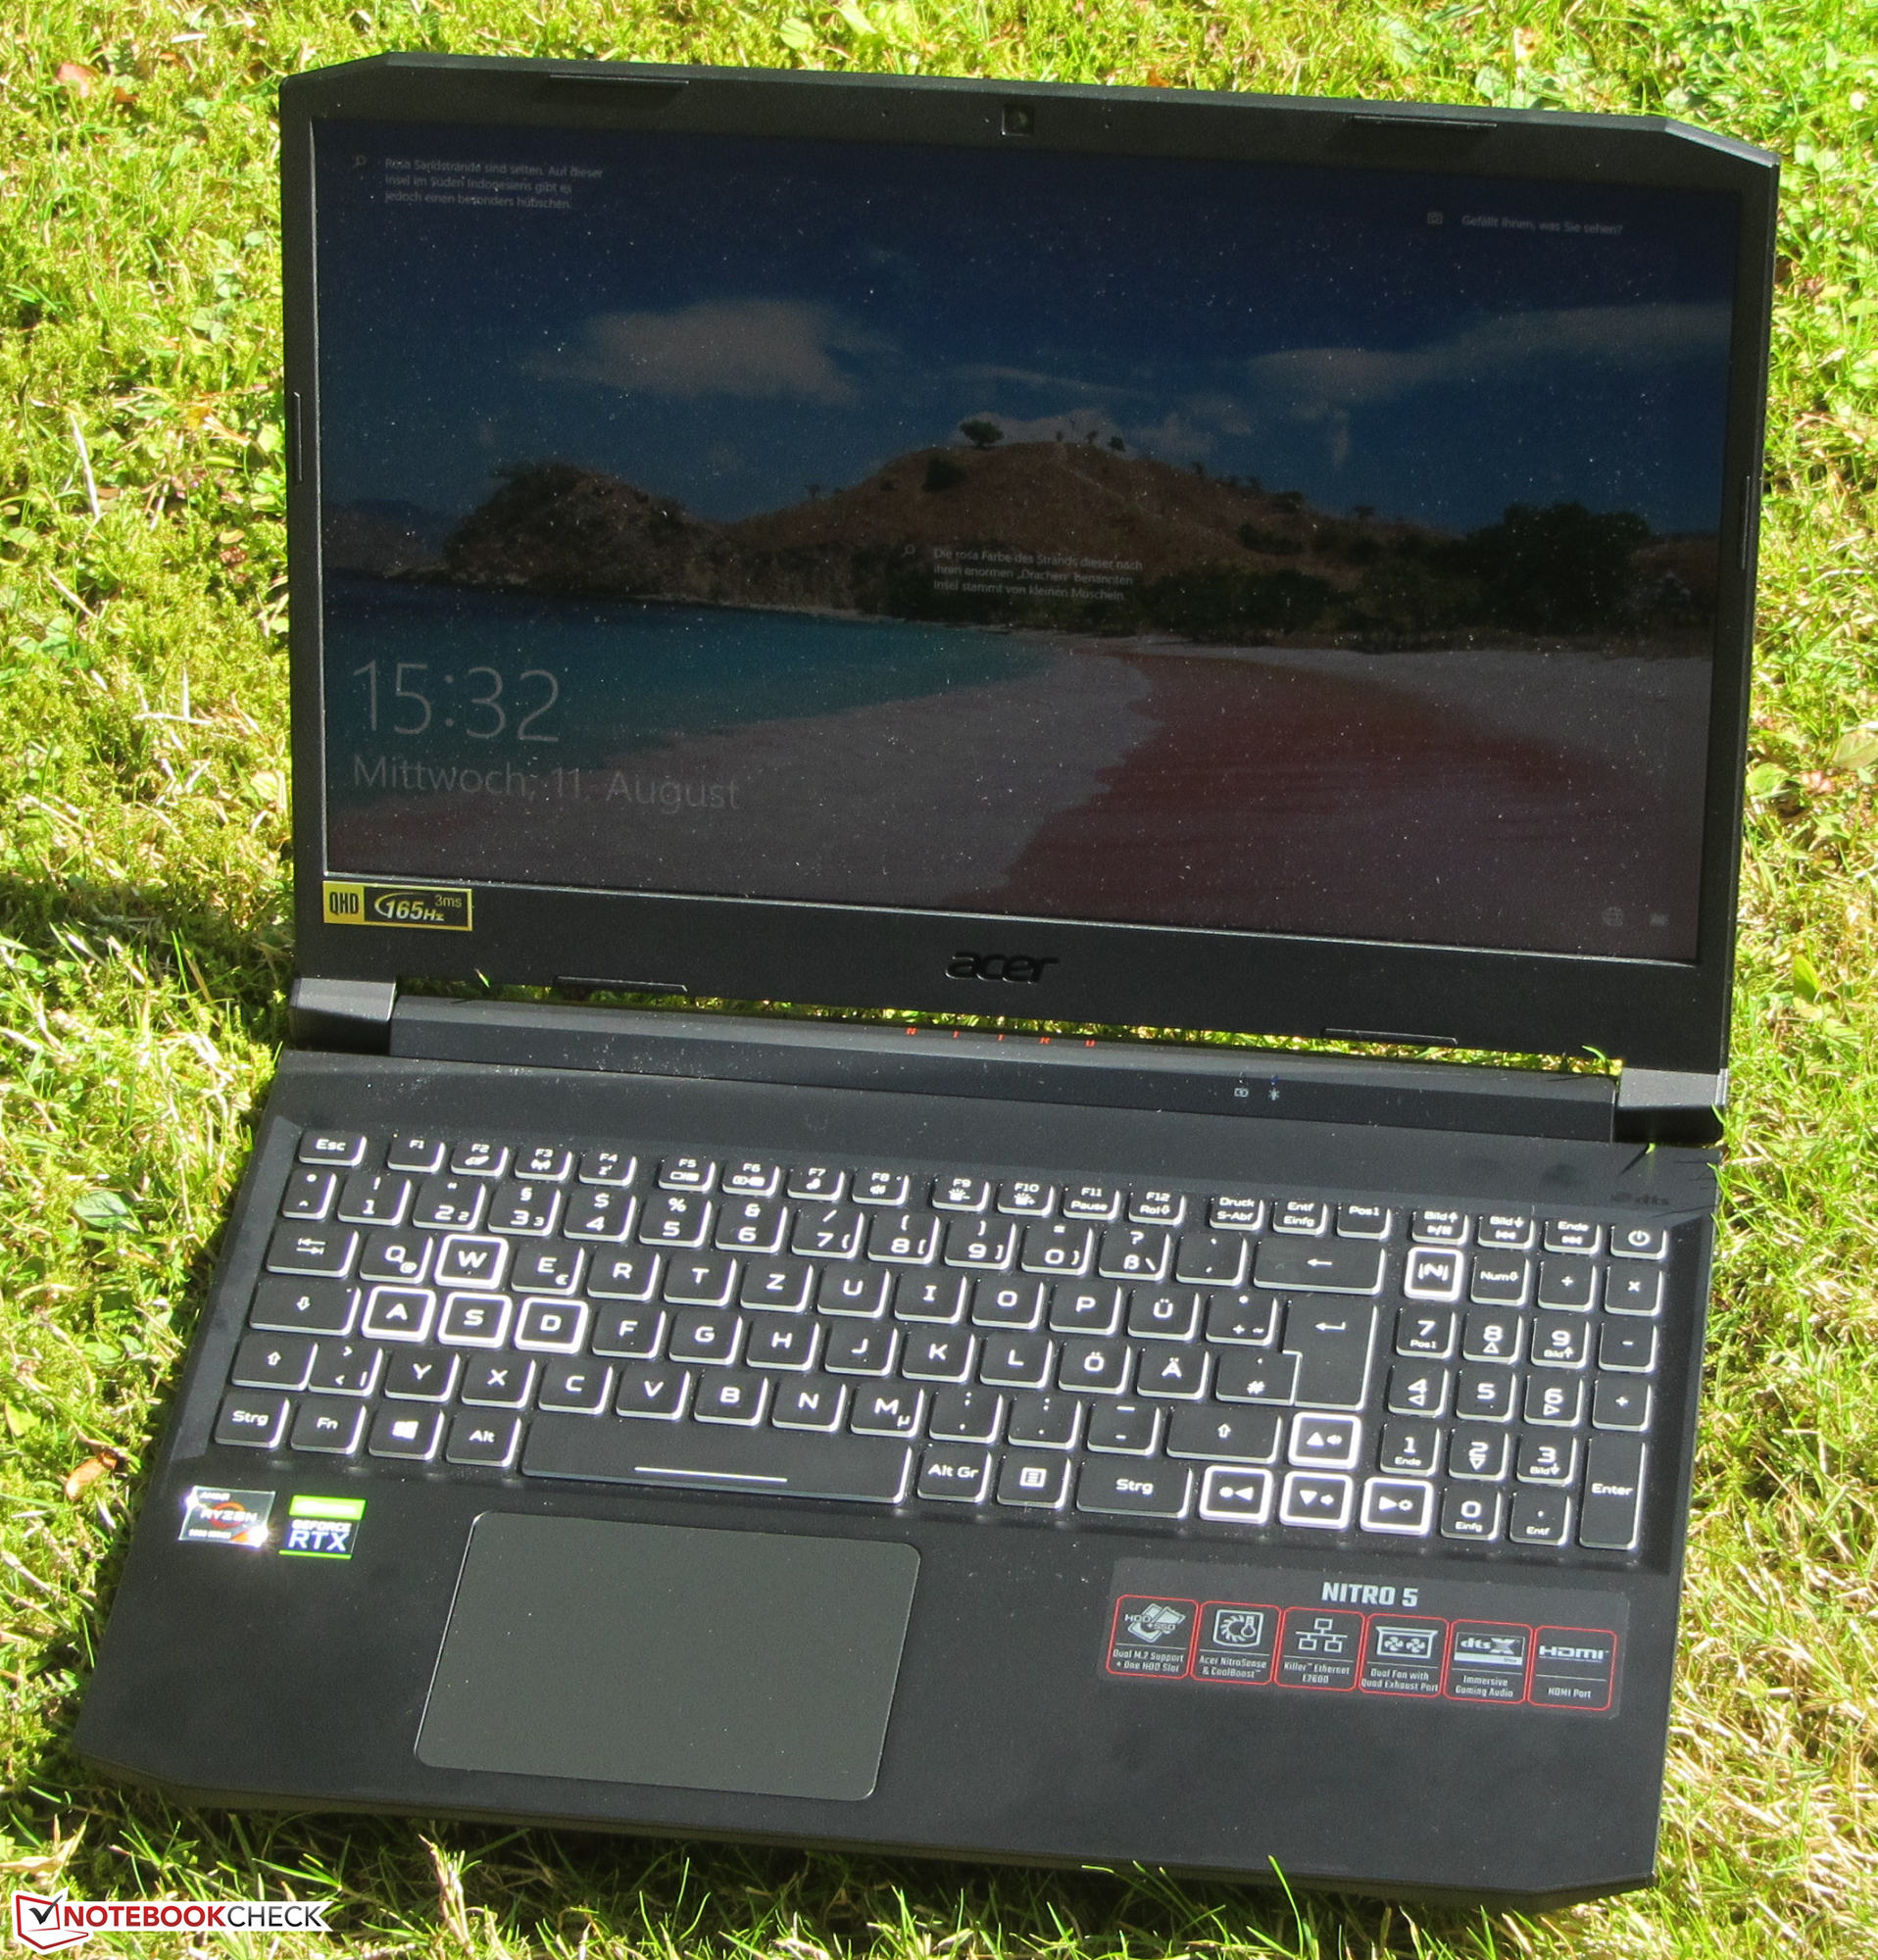
Acer Nitro 5 AN515-45 in review: Compact QHD gaming laptop

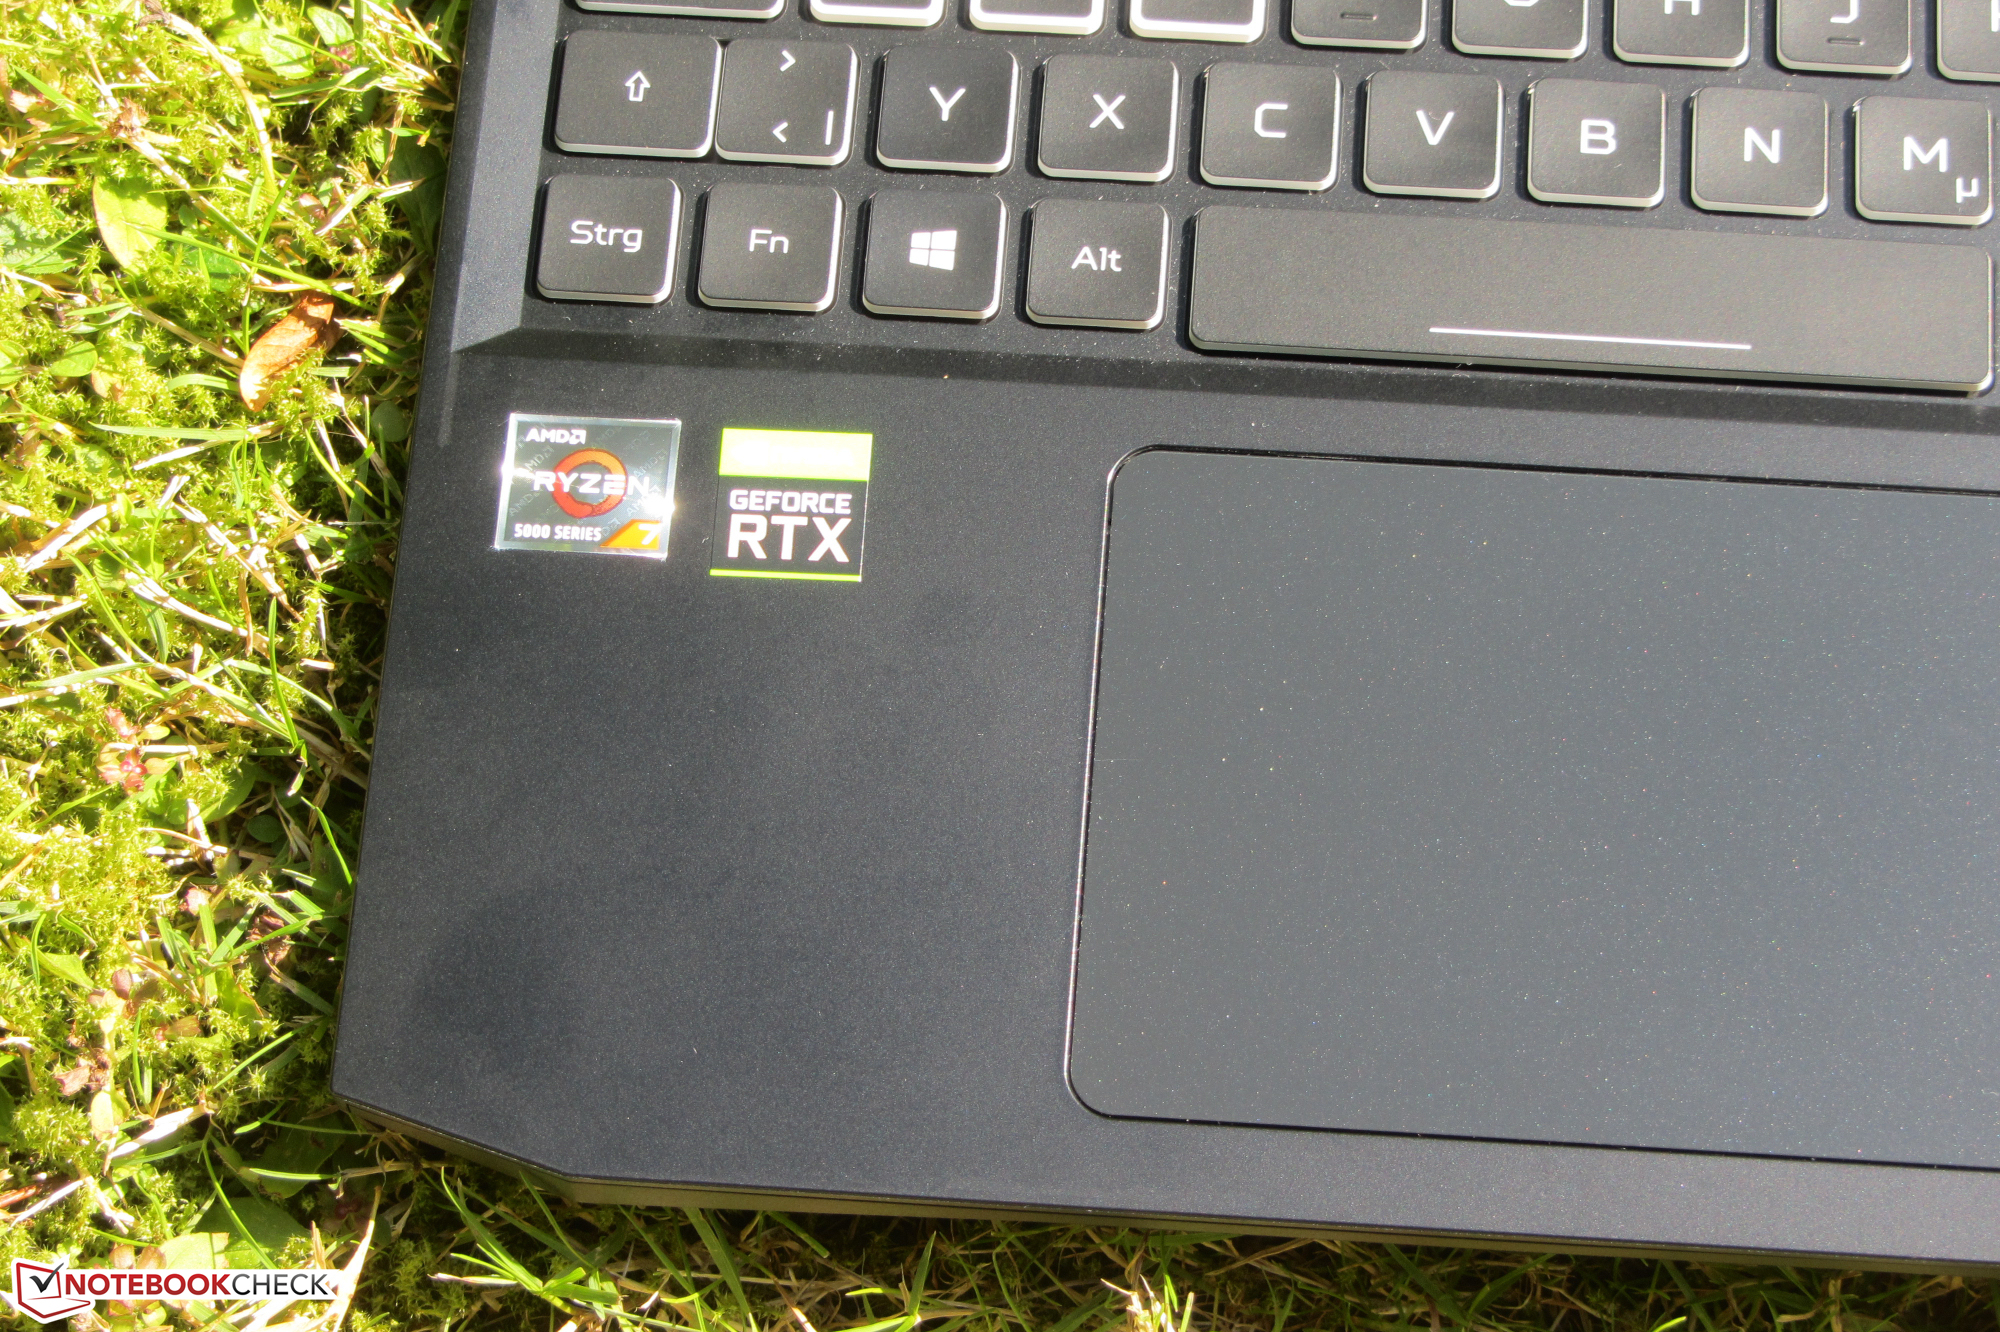
Acer's 15.6-inch gaming laptop is powered by a Ryzen 7 5800H APU and a GeForce RTX 3070 Laptop GPU. Our configuration variant is available for just under 1,700 Euros (~$1,993). Among the competitors are devices like the Asus ROG Strix G15 G513QY, the Aorus 15P XC, the MSI GF65 Thin 10UE, the Asus TUF Gaming A15 FA506QR, and the Razer Blade 15 Base Edition 2021.
Possible contenders in comparison
Rating | Date | Model | Weight | Height | Size | Resolution | Price |
|---|---|---|---|---|---|---|---|
| 82.2 % v7 (old) | 08 / 2021 | Acer Nitro 5 AN515-45-R1JH R7 5800H, GeForce RTX 3070 Laptop GPU | 2.3 kg | 23.9 mm | 15.60" | 2560x1440 | |
| 84.7 % v7 (old) | 07 / 2021 | Asus ROG Strix G15 G513QY R9 5900HX, Radeon RX 6800M | 2.4 kg | 27.9 mm | 15.60" | 1920x1080 | |
| 86.1 % v7 (old) | 02 / 2021 | Aorus 15P XC i7-10870H, GeForce RTX 3070 Laptop GPU | 2.2 kg | 27 mm | 15.60" | 1920x1080 | |
| 80.4 % v7 (old) | 03 / 2021 | MSI GF65 Thin 10UE i7-10750H, GeForce RTX 3060 Laptop GPU | 1.9 kg | 21.7 mm | 15.60" | 1920x1080 | |
| 85 % v7 (old) | 07 / 2021 | Asus TUF Gaming A15 FA506QR-AZ061T R7 5800H, GeForce RTX 3070 Laptop GPU | 2.3 kg | 24 mm | 15.60" | 1920x1080 | |
| 85.5 % v7 (old) | 03 / 2021 | Razer Blade 15 Base Edition 2021, i7-10750H RTX 3060 i7-10750H, GeForce RTX 3060 Laptop GPU | 2.1 kg | 19.9 mm | 15.60" | 1920x1080 |
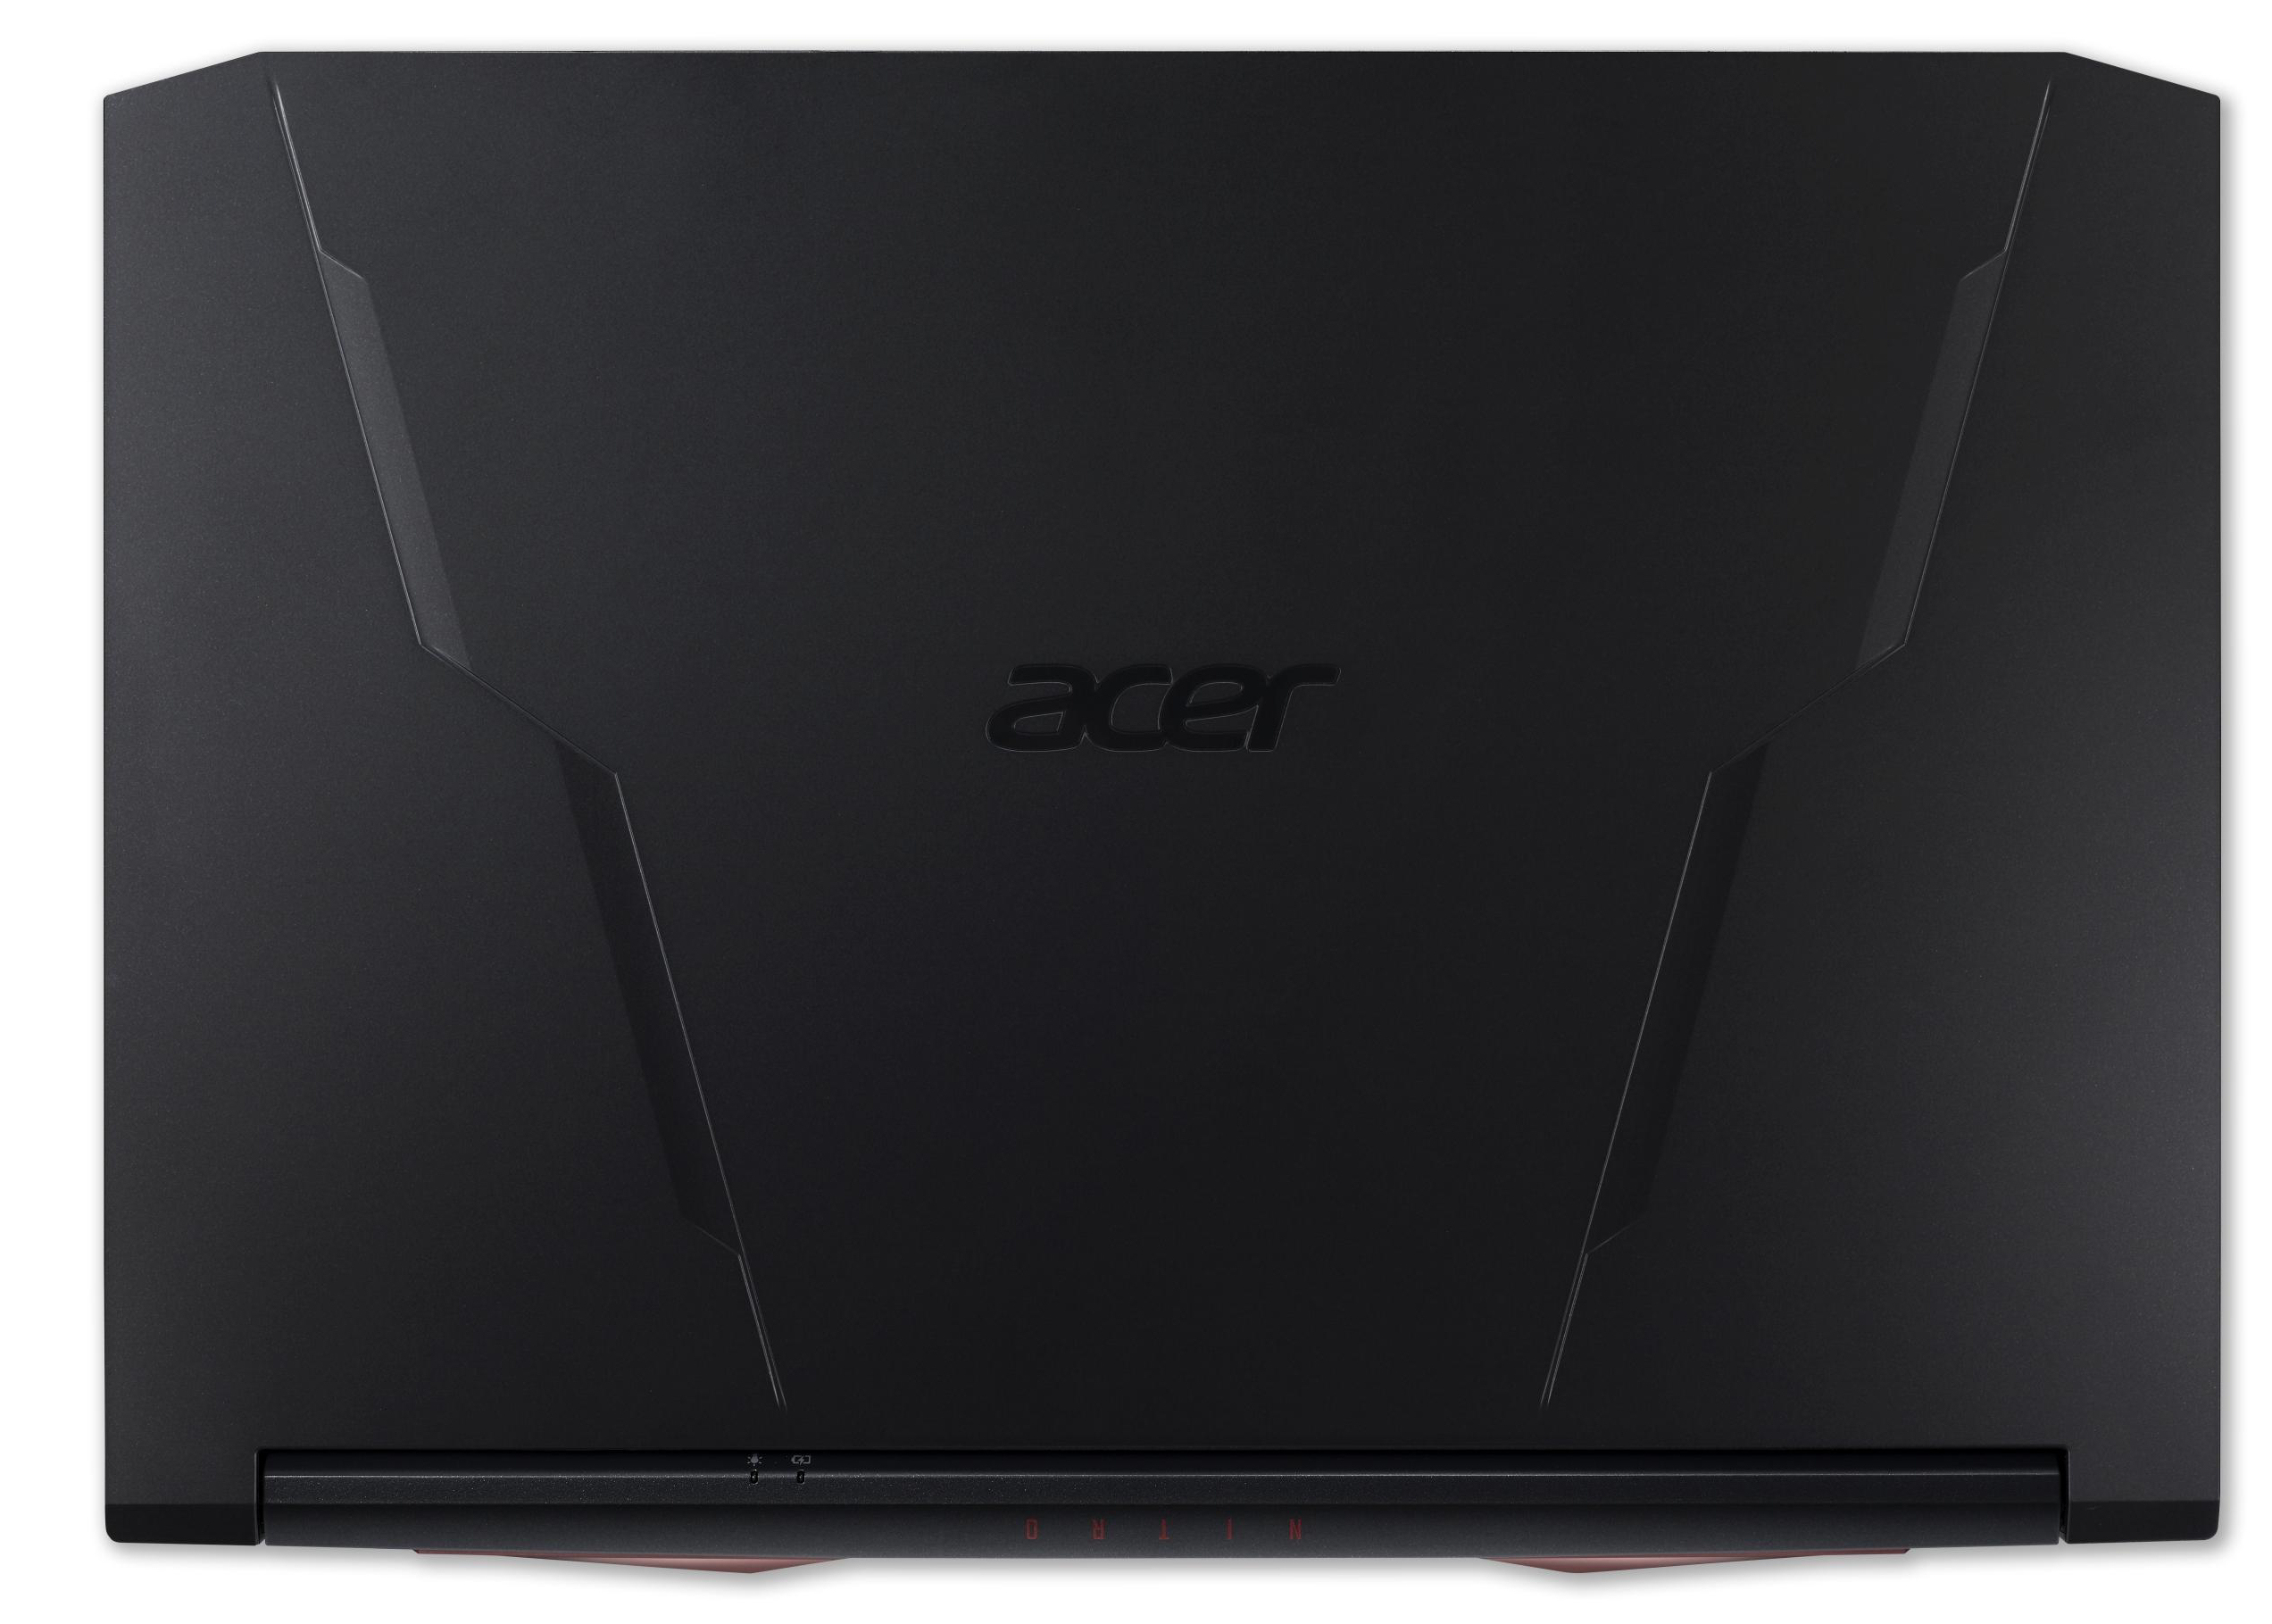
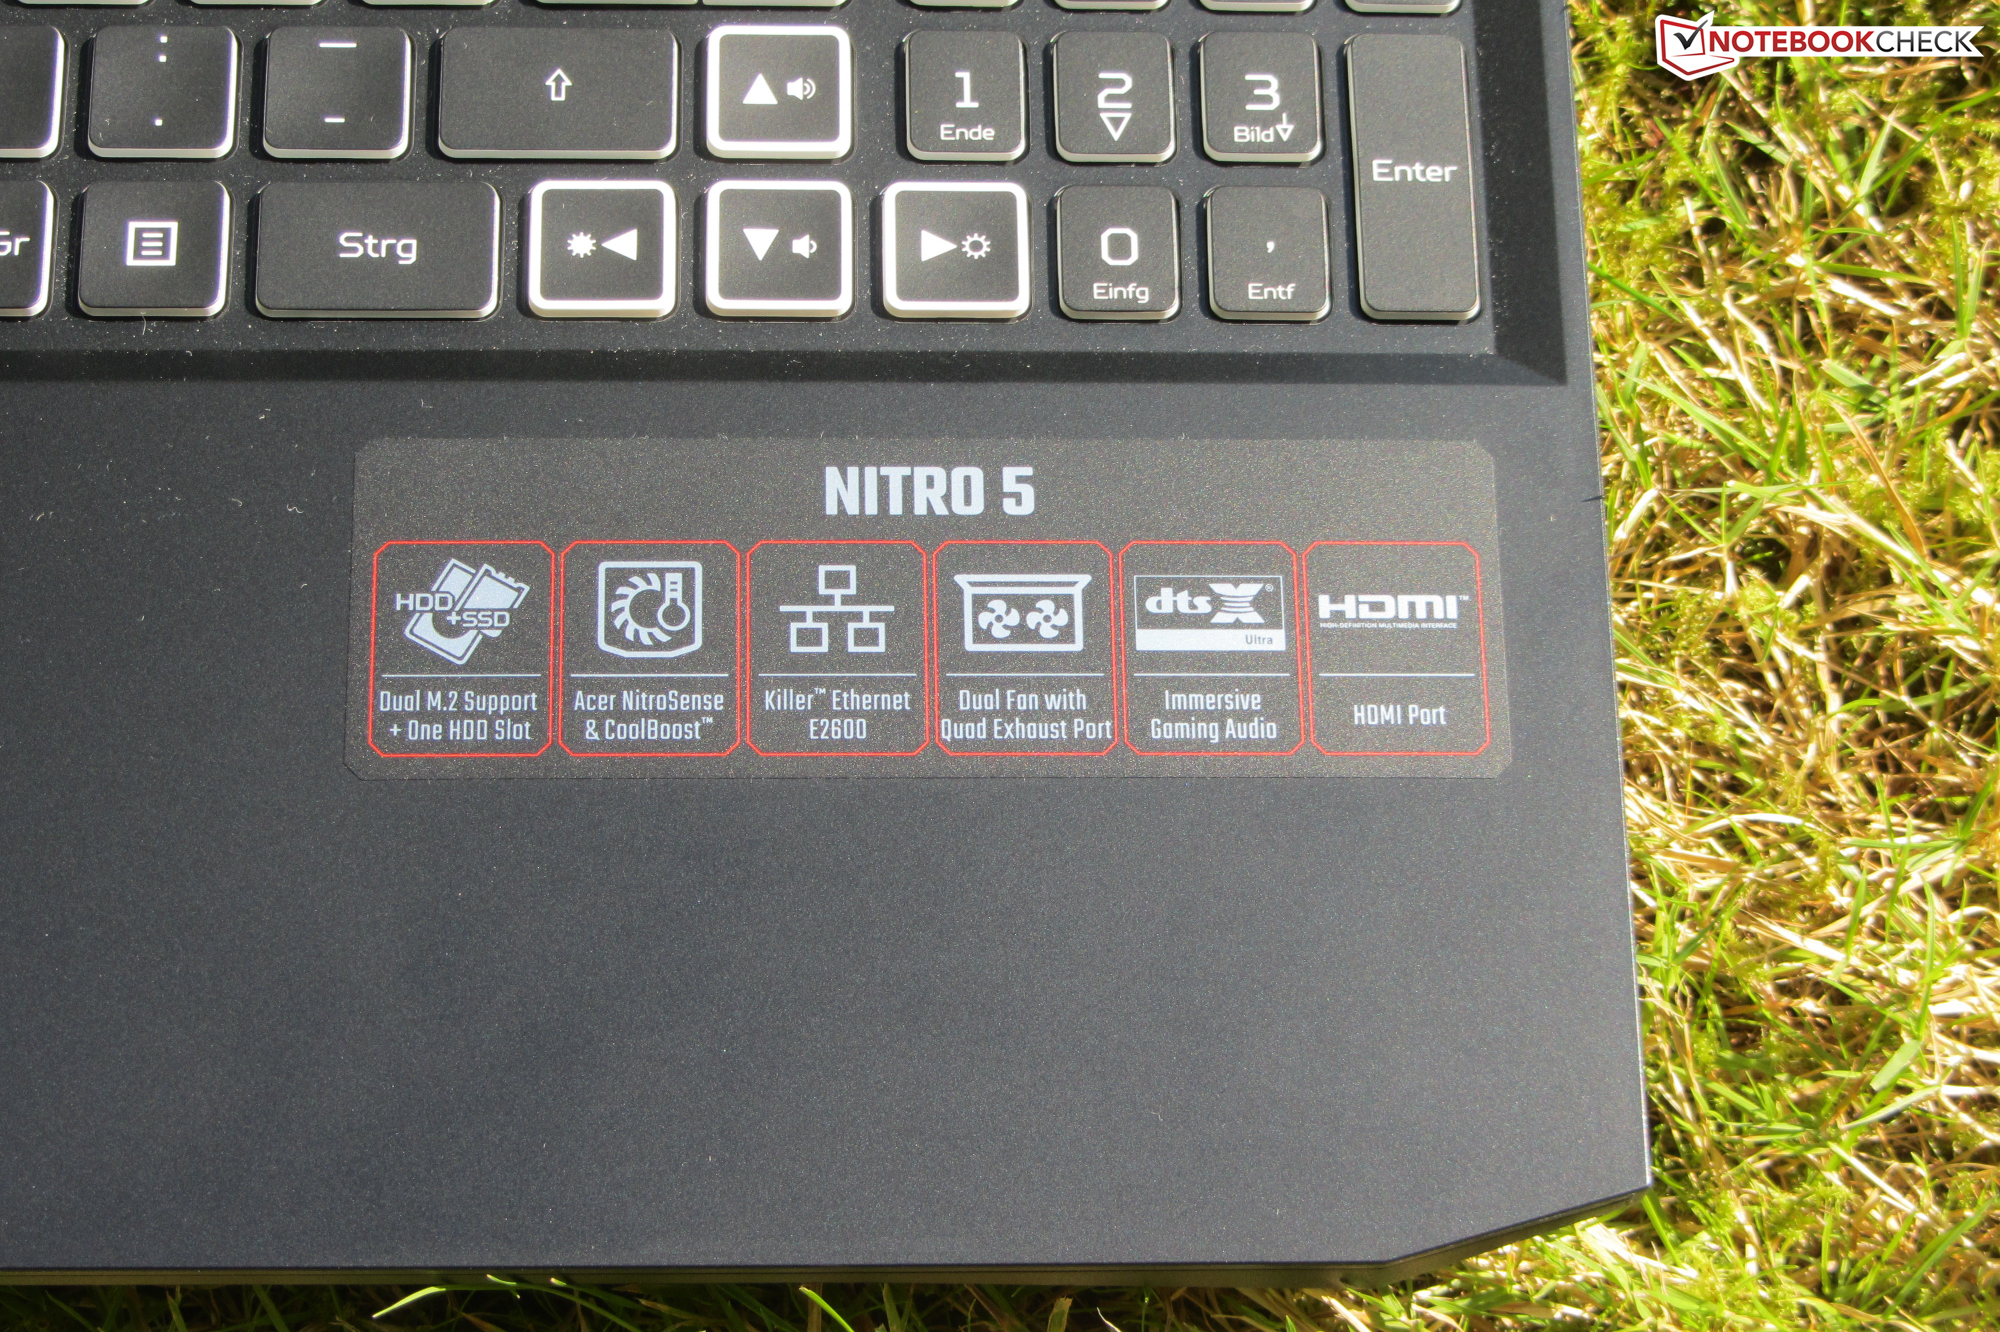
Case - Acer chooses plastic
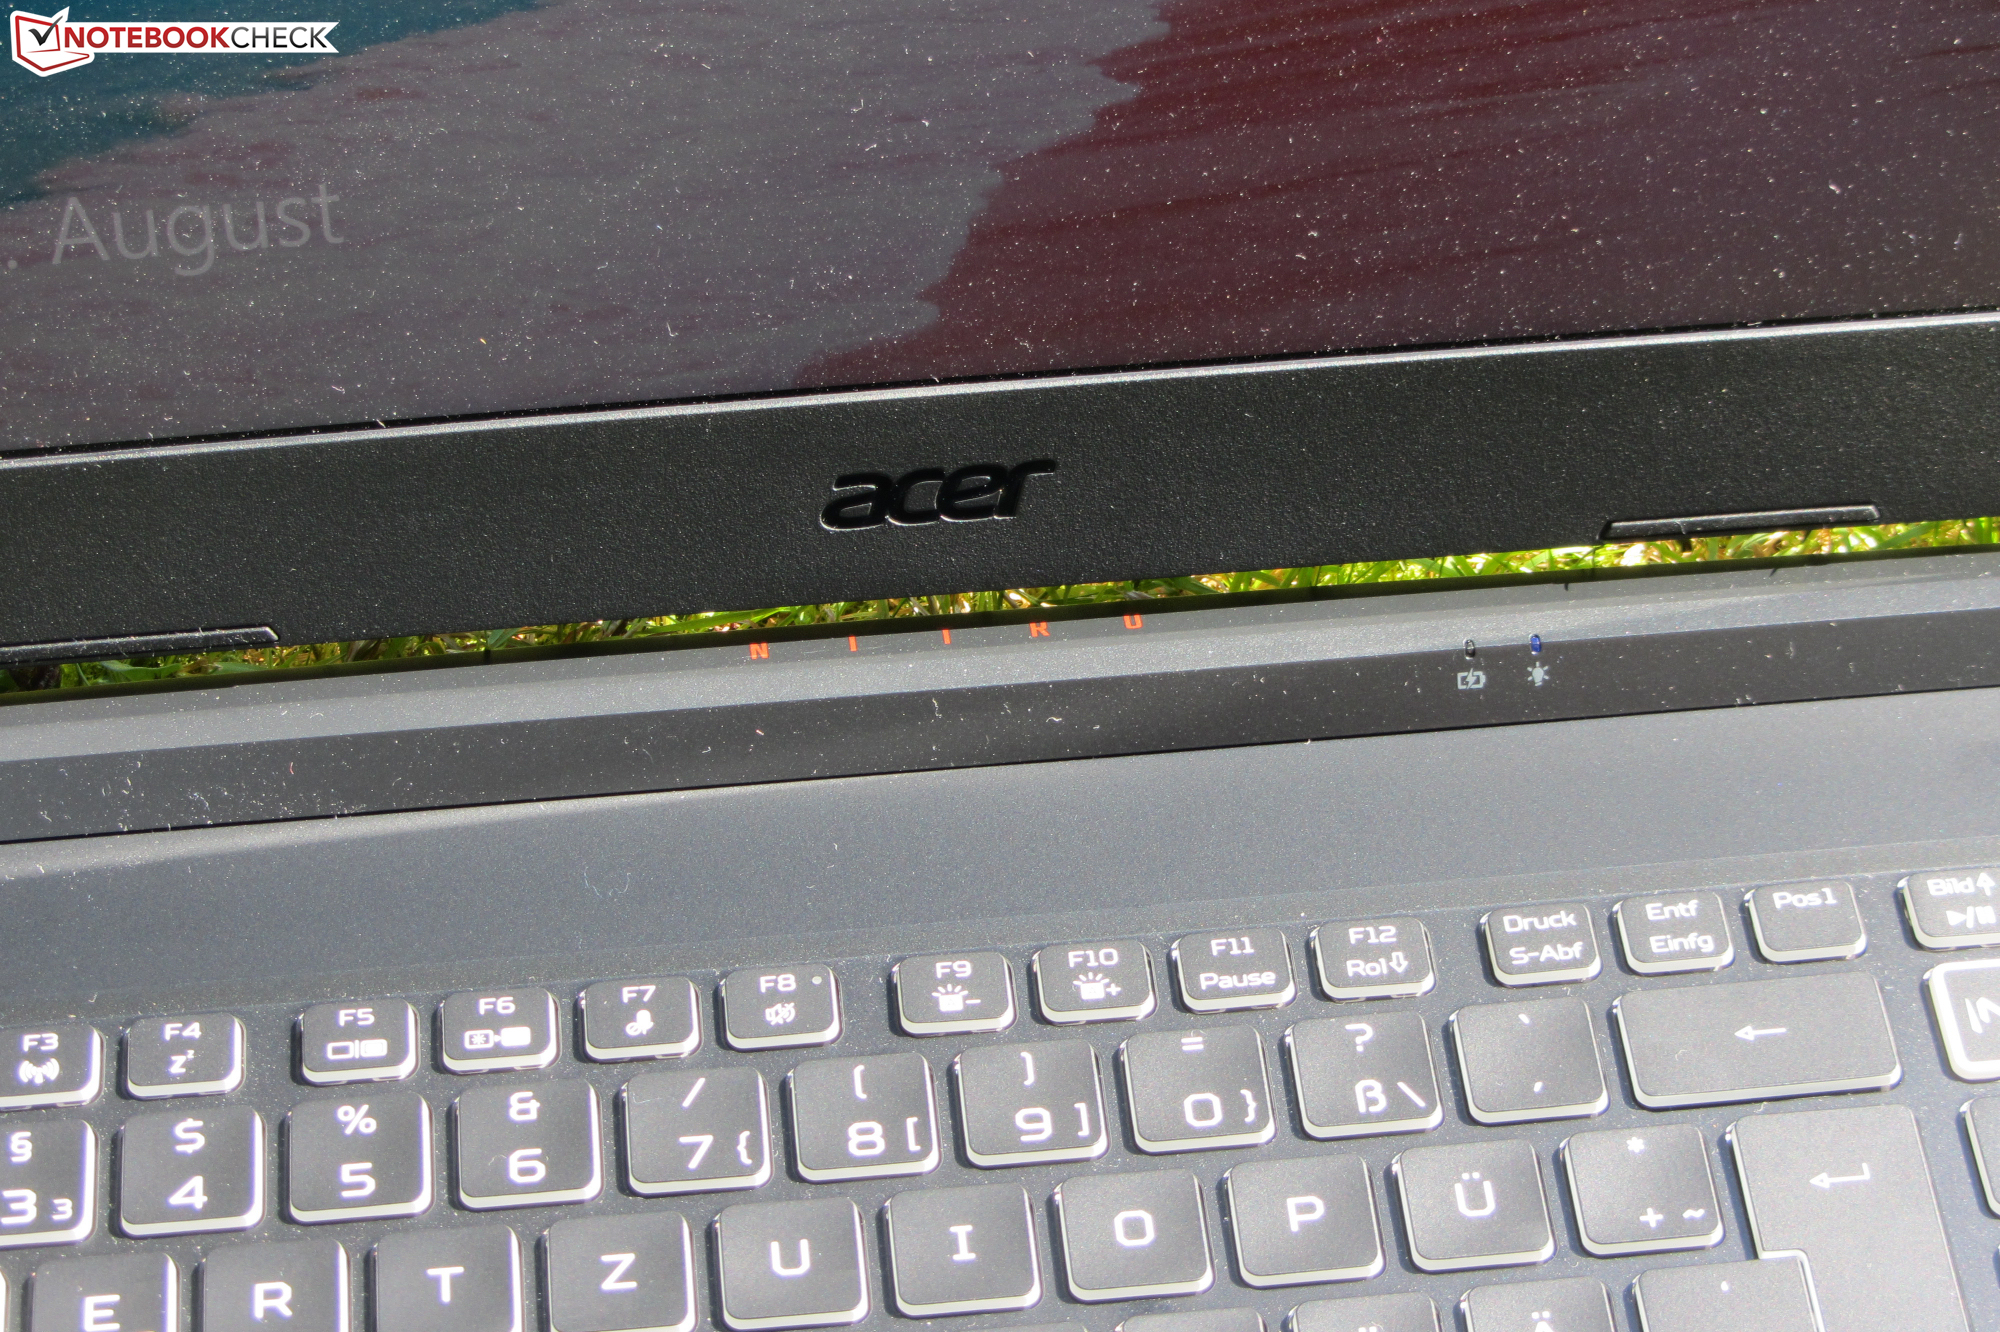
The entire case of the Nitro 5 is made of matte black plastic. Apart from the RGB key lighting, the wine-red area between the rear air vents and the red "Nitro" logo on the hinge cover add some color. The smooth surfaces of the chassis prove to be quite susceptible to fingerprints. There is no maintenance hatch, and the battery is firmly built into the device.
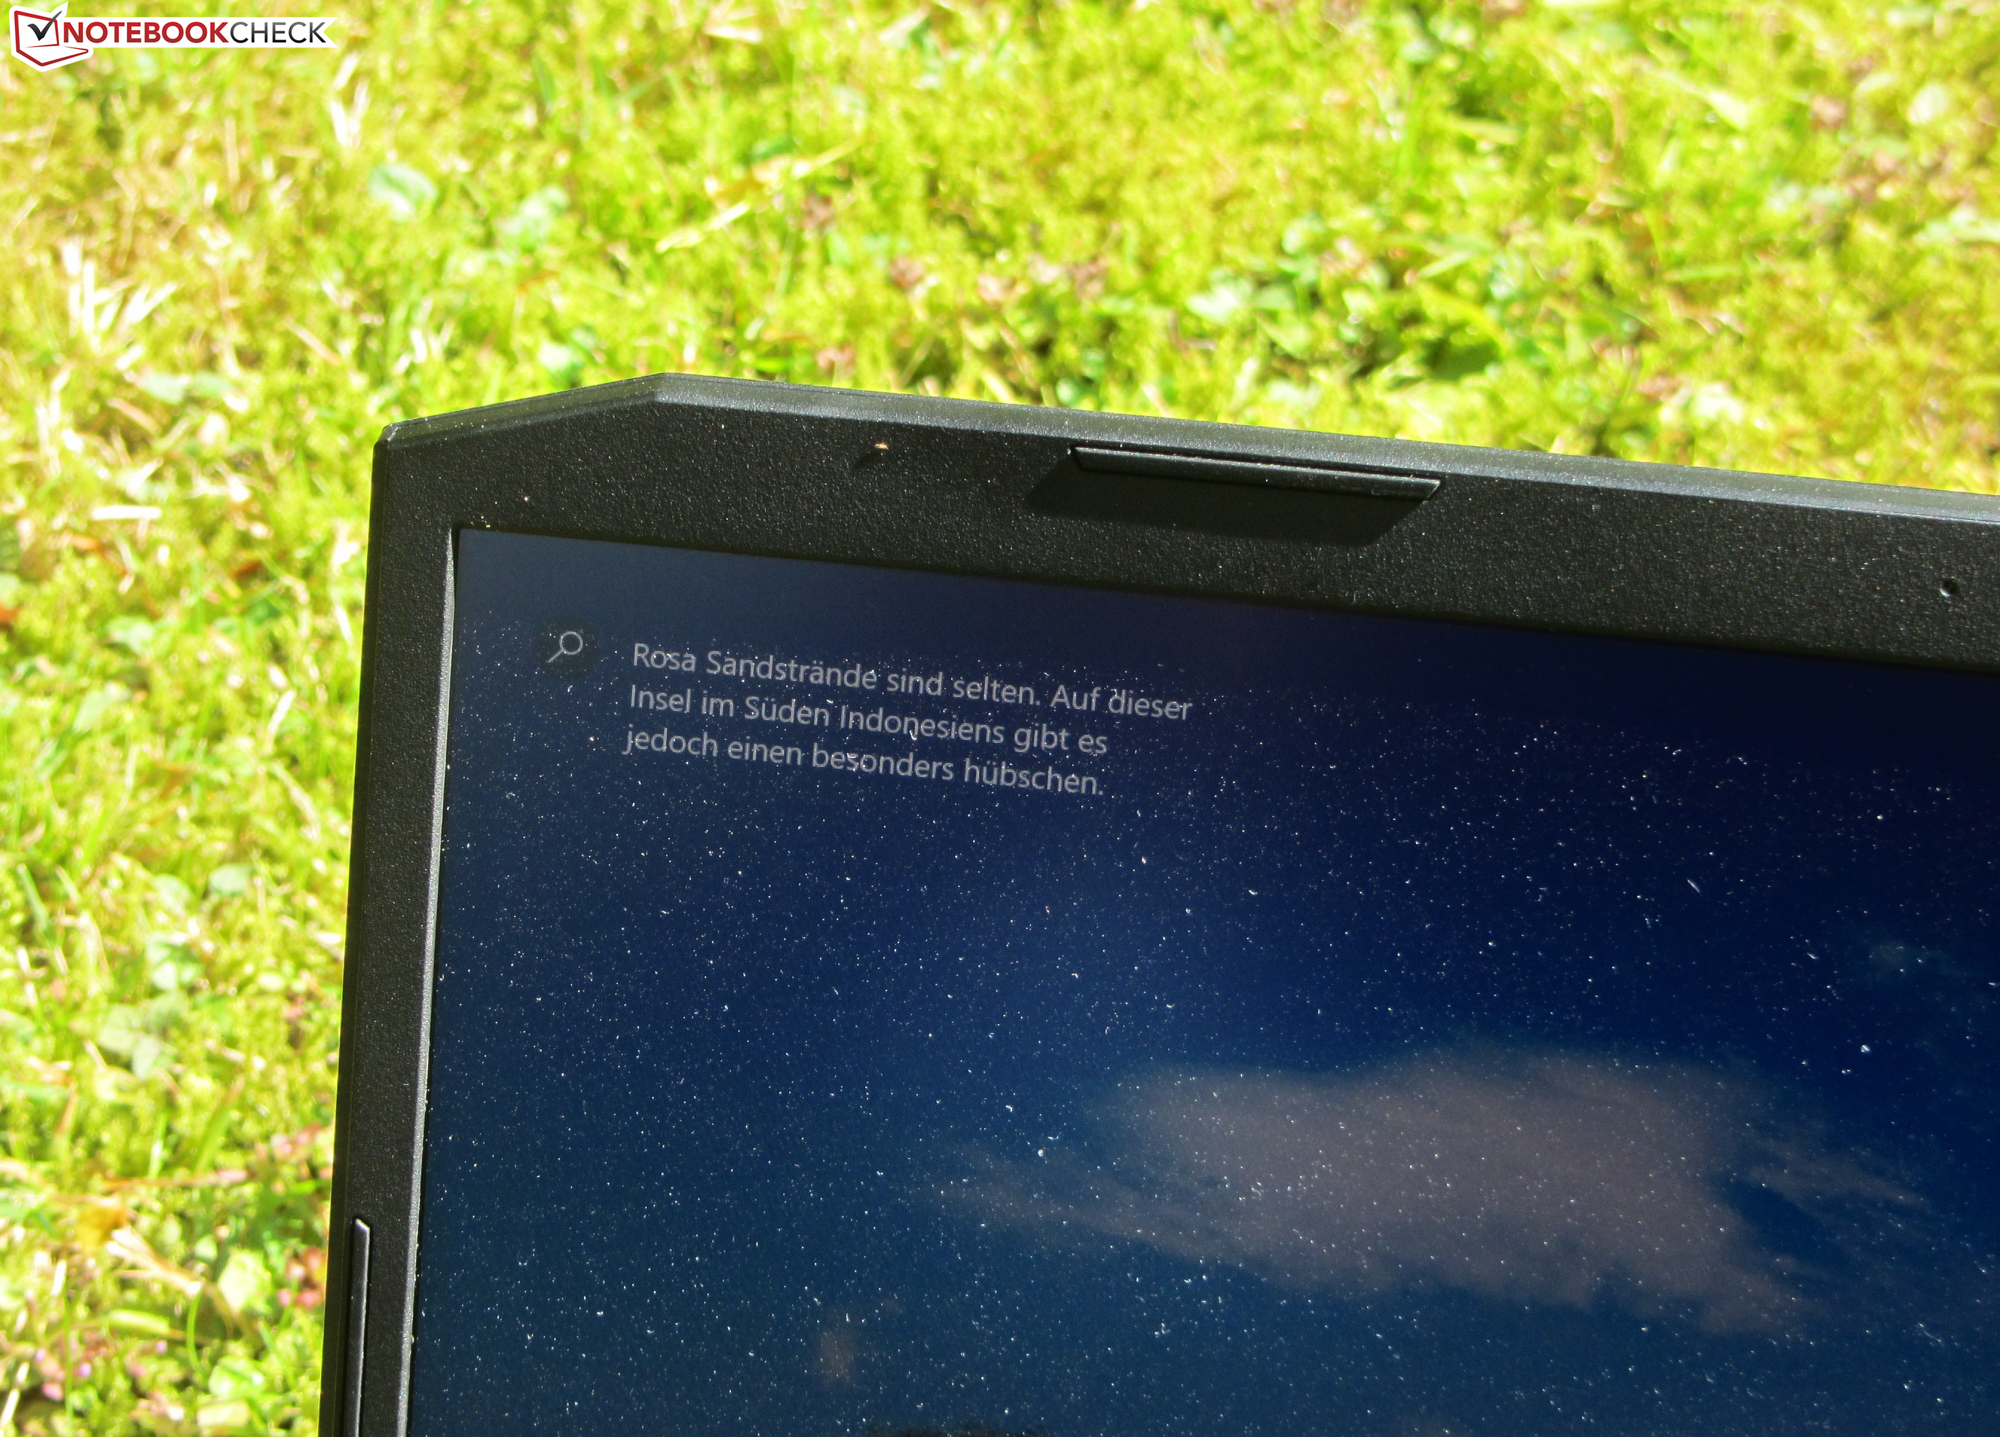
The laptop doesn't exhibit any major weaknesses in terms of workmanship. The gap dimensions are accurate, and there are no material protrusions. The base unit can be twisted a bit, but the whole situation is kept within limits. On the other hand, the lid could be more rigid. Moreover, applying pressure on the lid's back doesn't lead to alterations in the display. The hinges keep the screen firmly in position, and a one-handed opening of the lid is possible. The maximum aperture angle is about 150 degrees.
In terms of dimensions and weight, there aren't many differences between most of the devices in our comparison field. The Razer Blade 15 stands out as the most compact device, and the MSI GF65 Thin 10UE has the lowest weight.
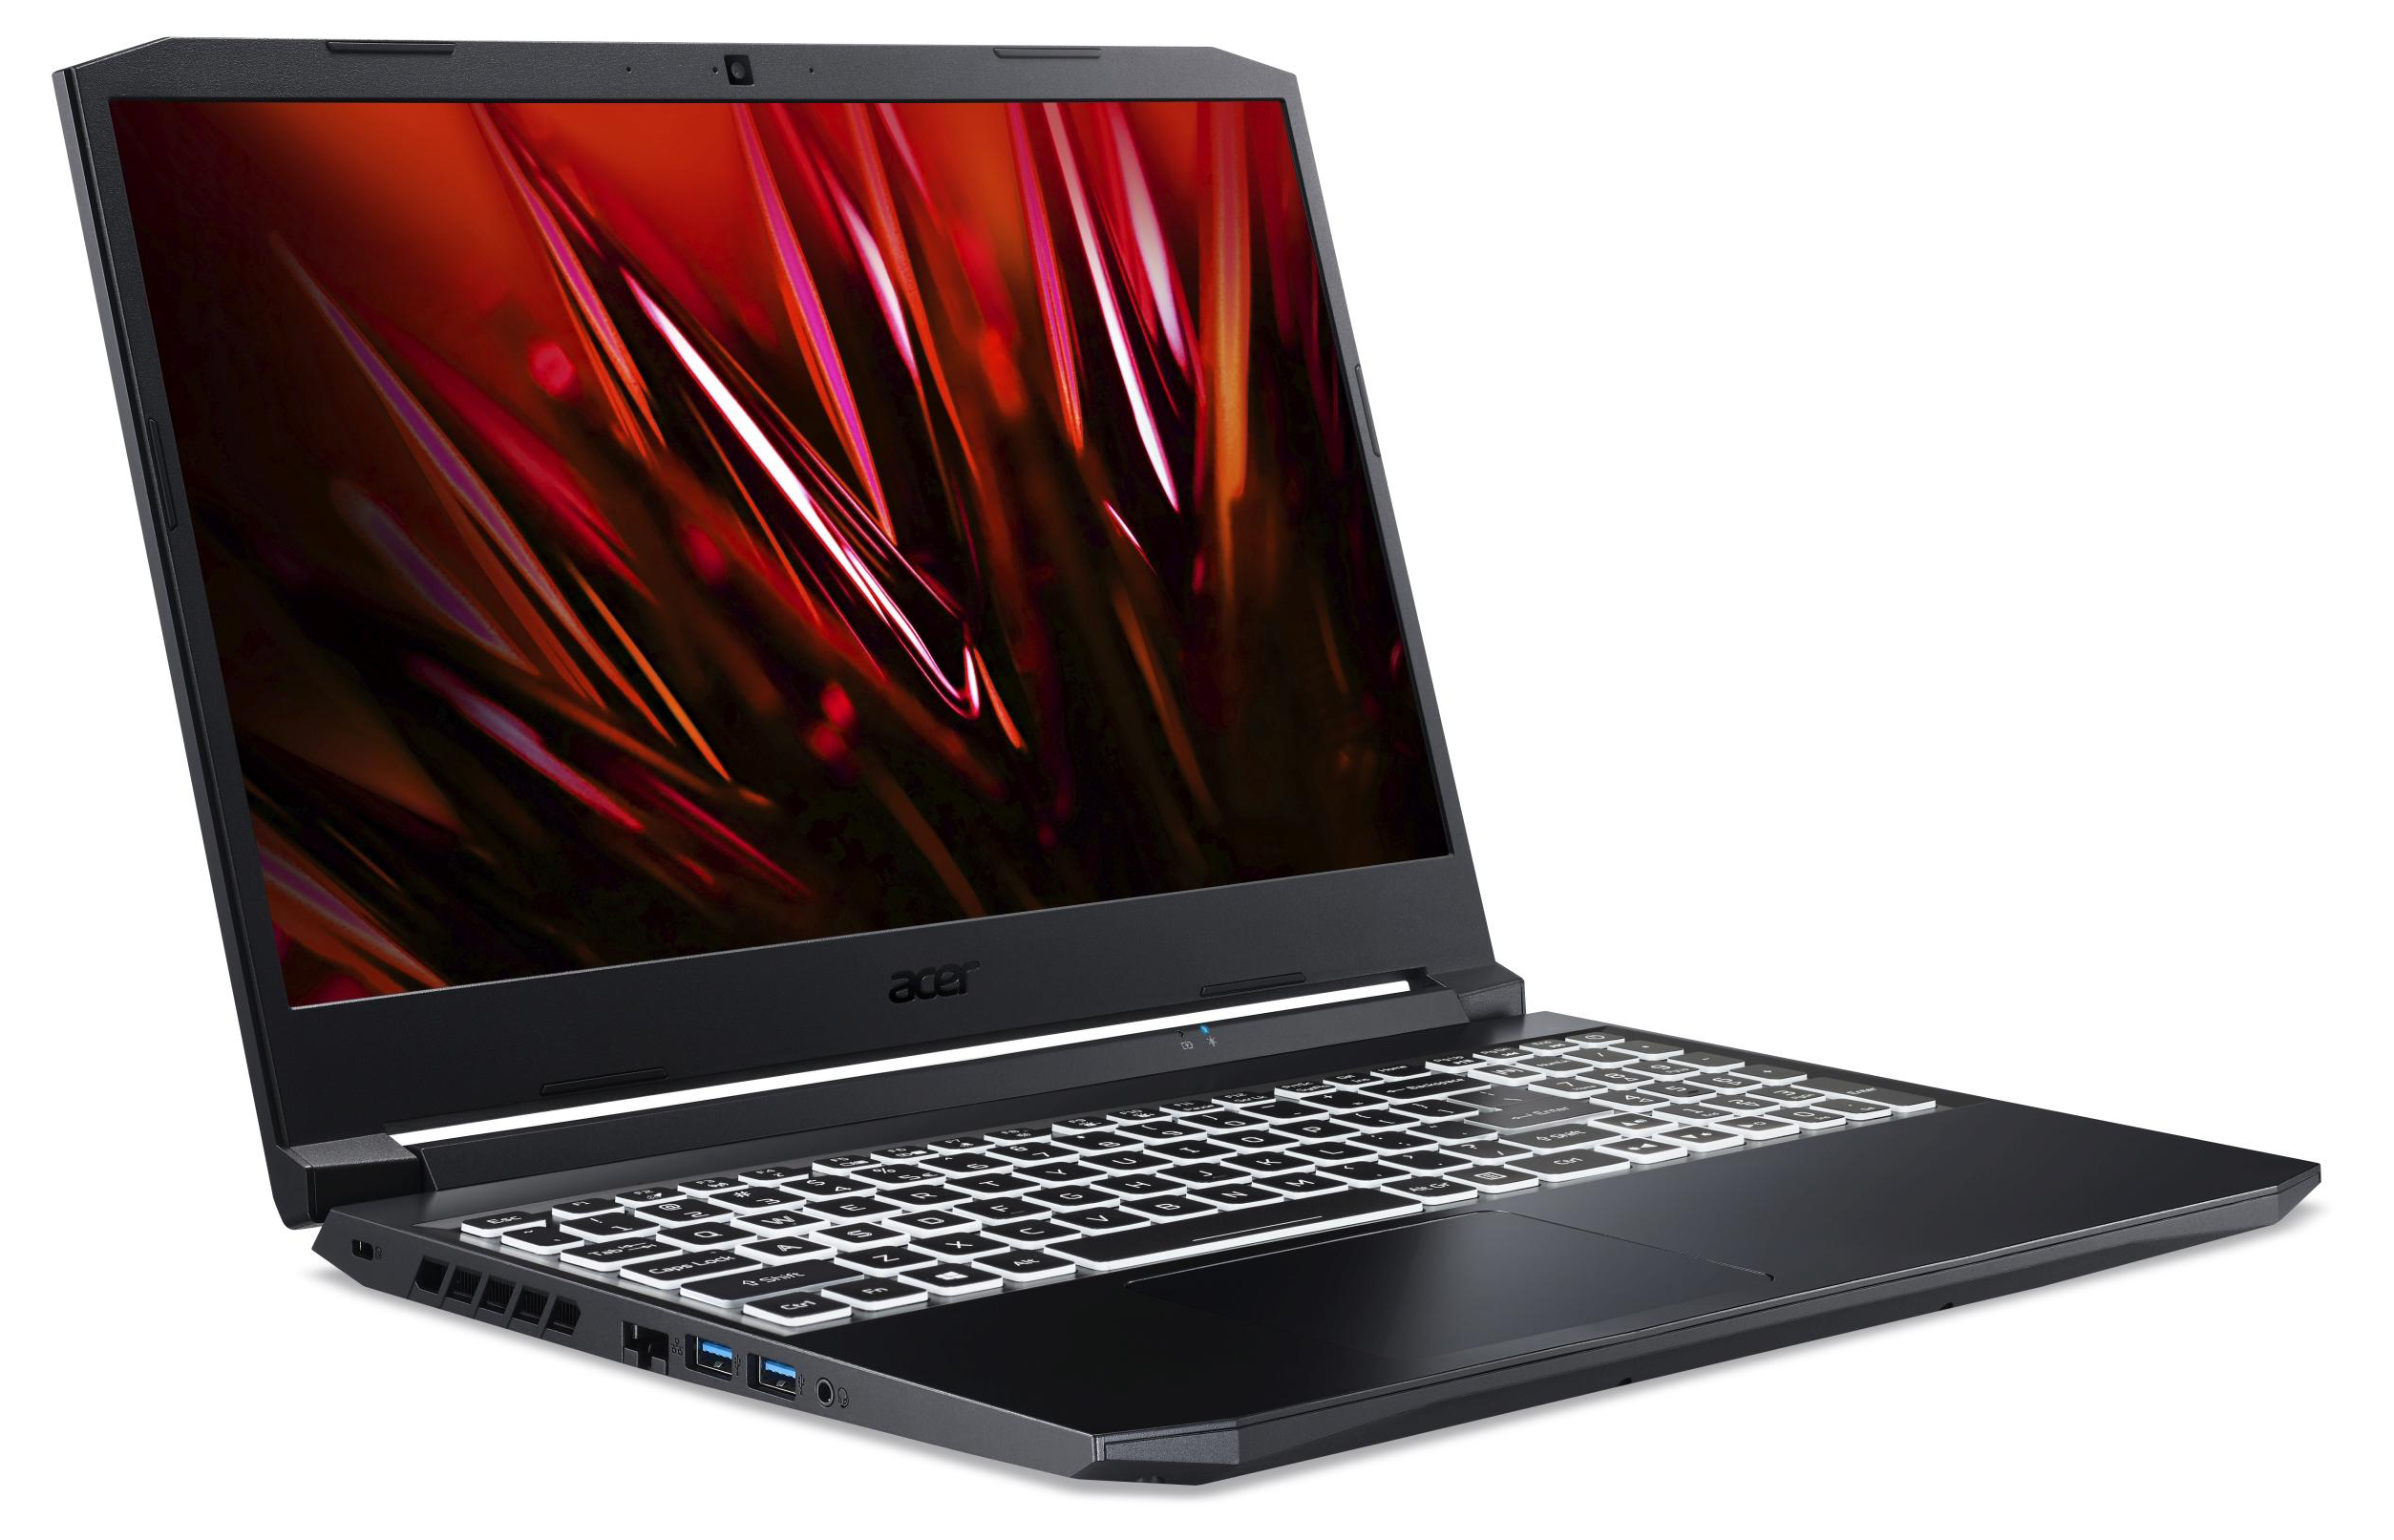
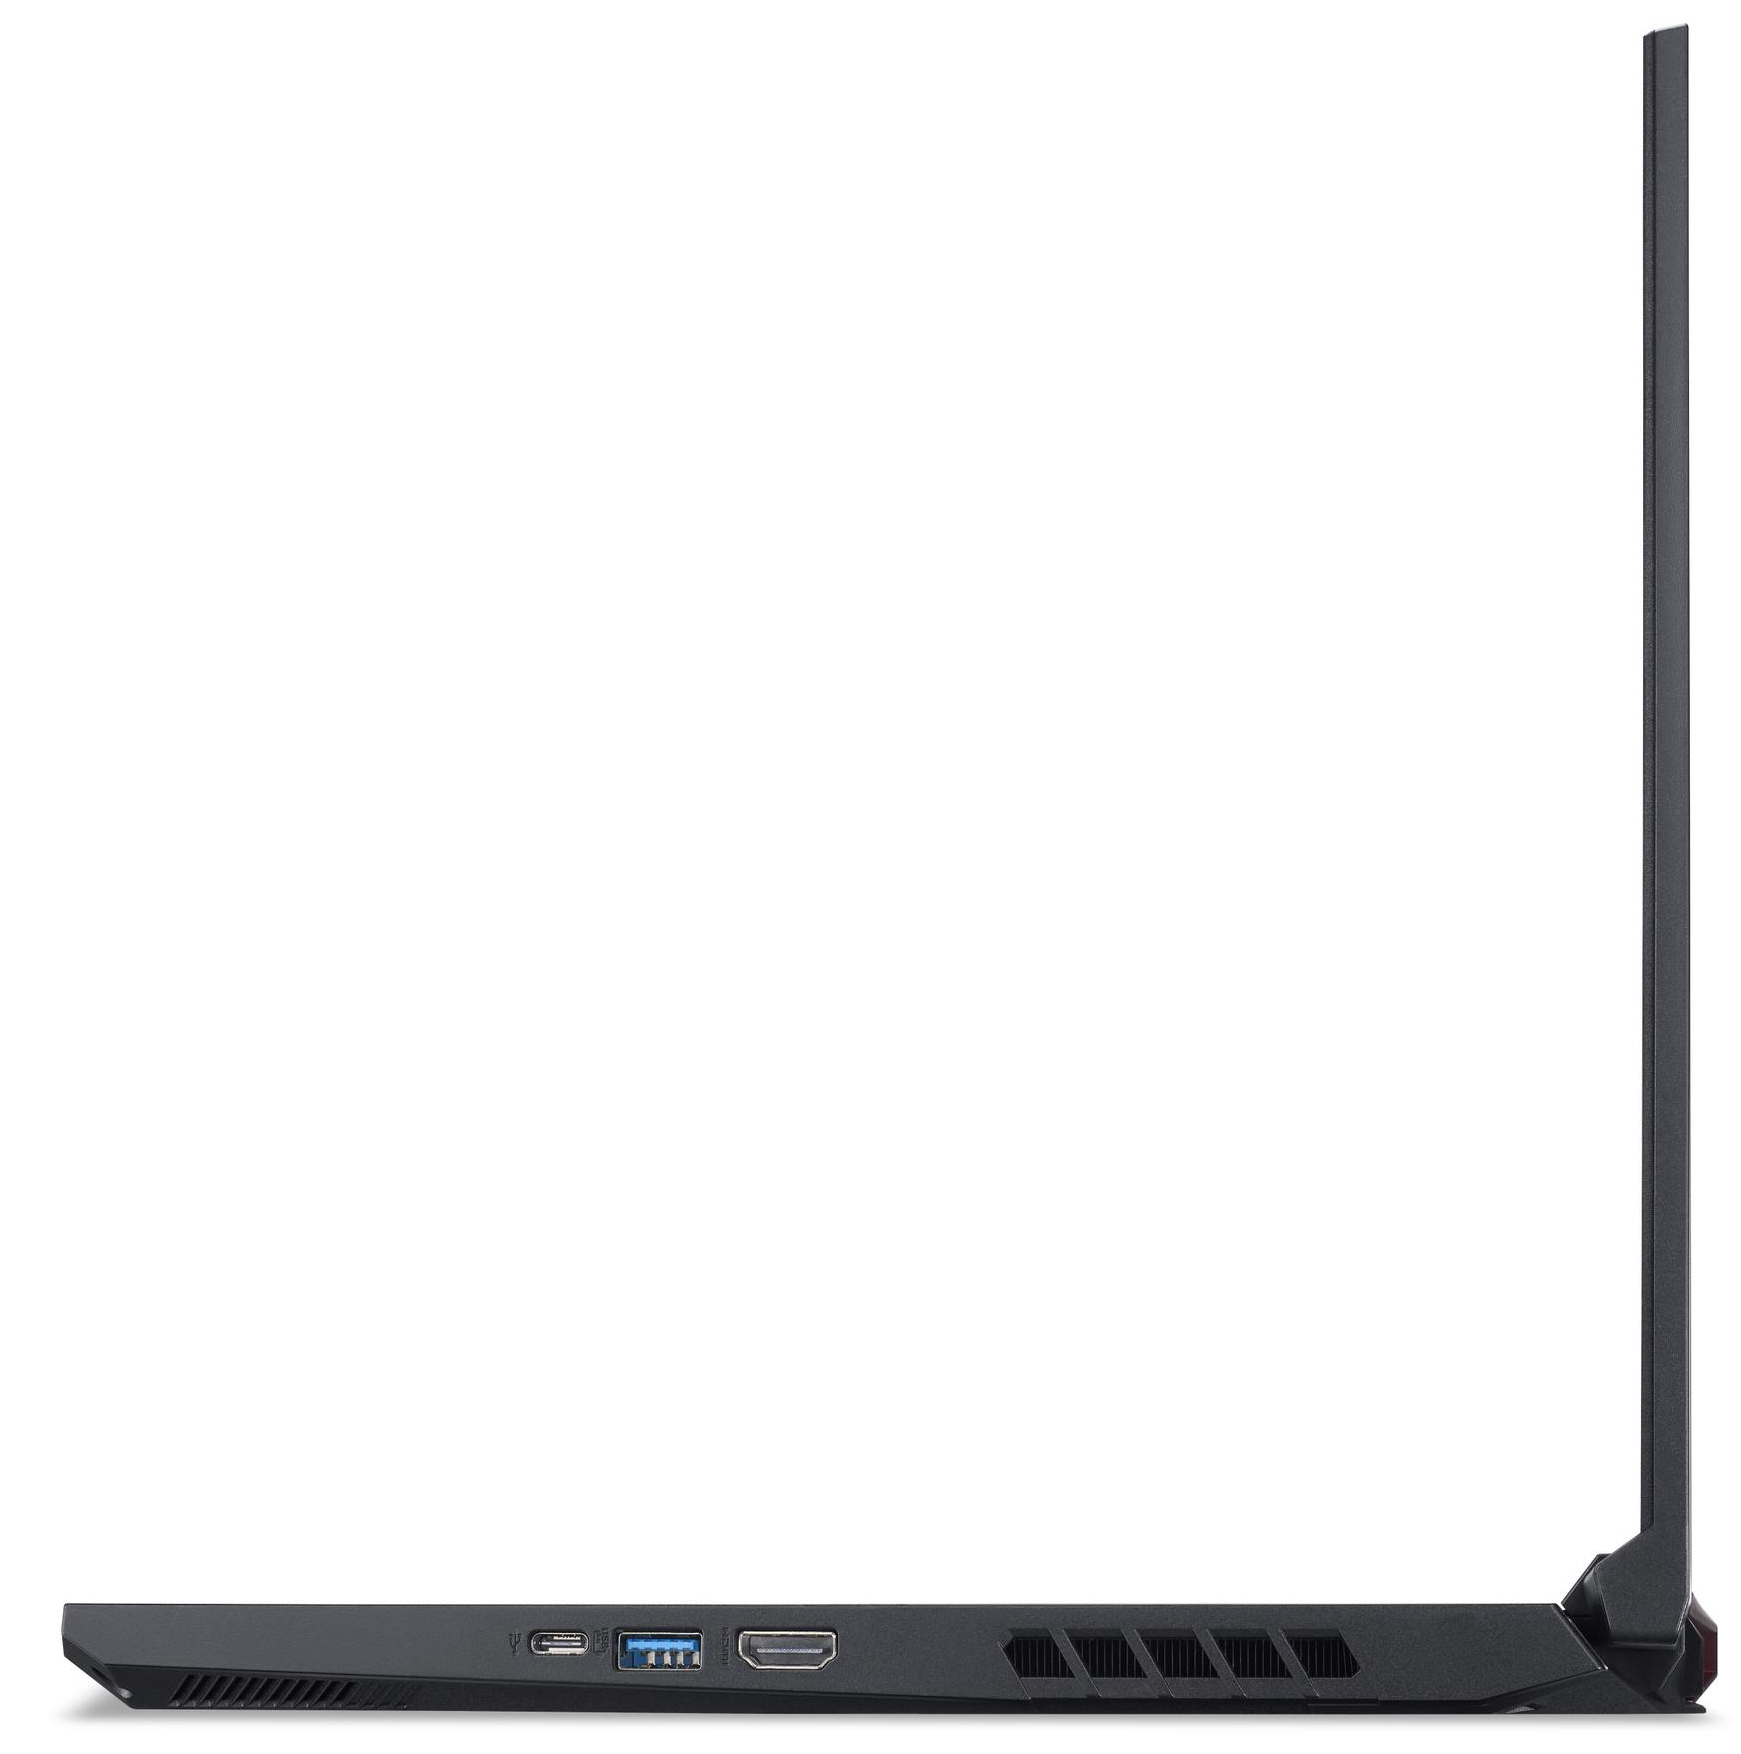
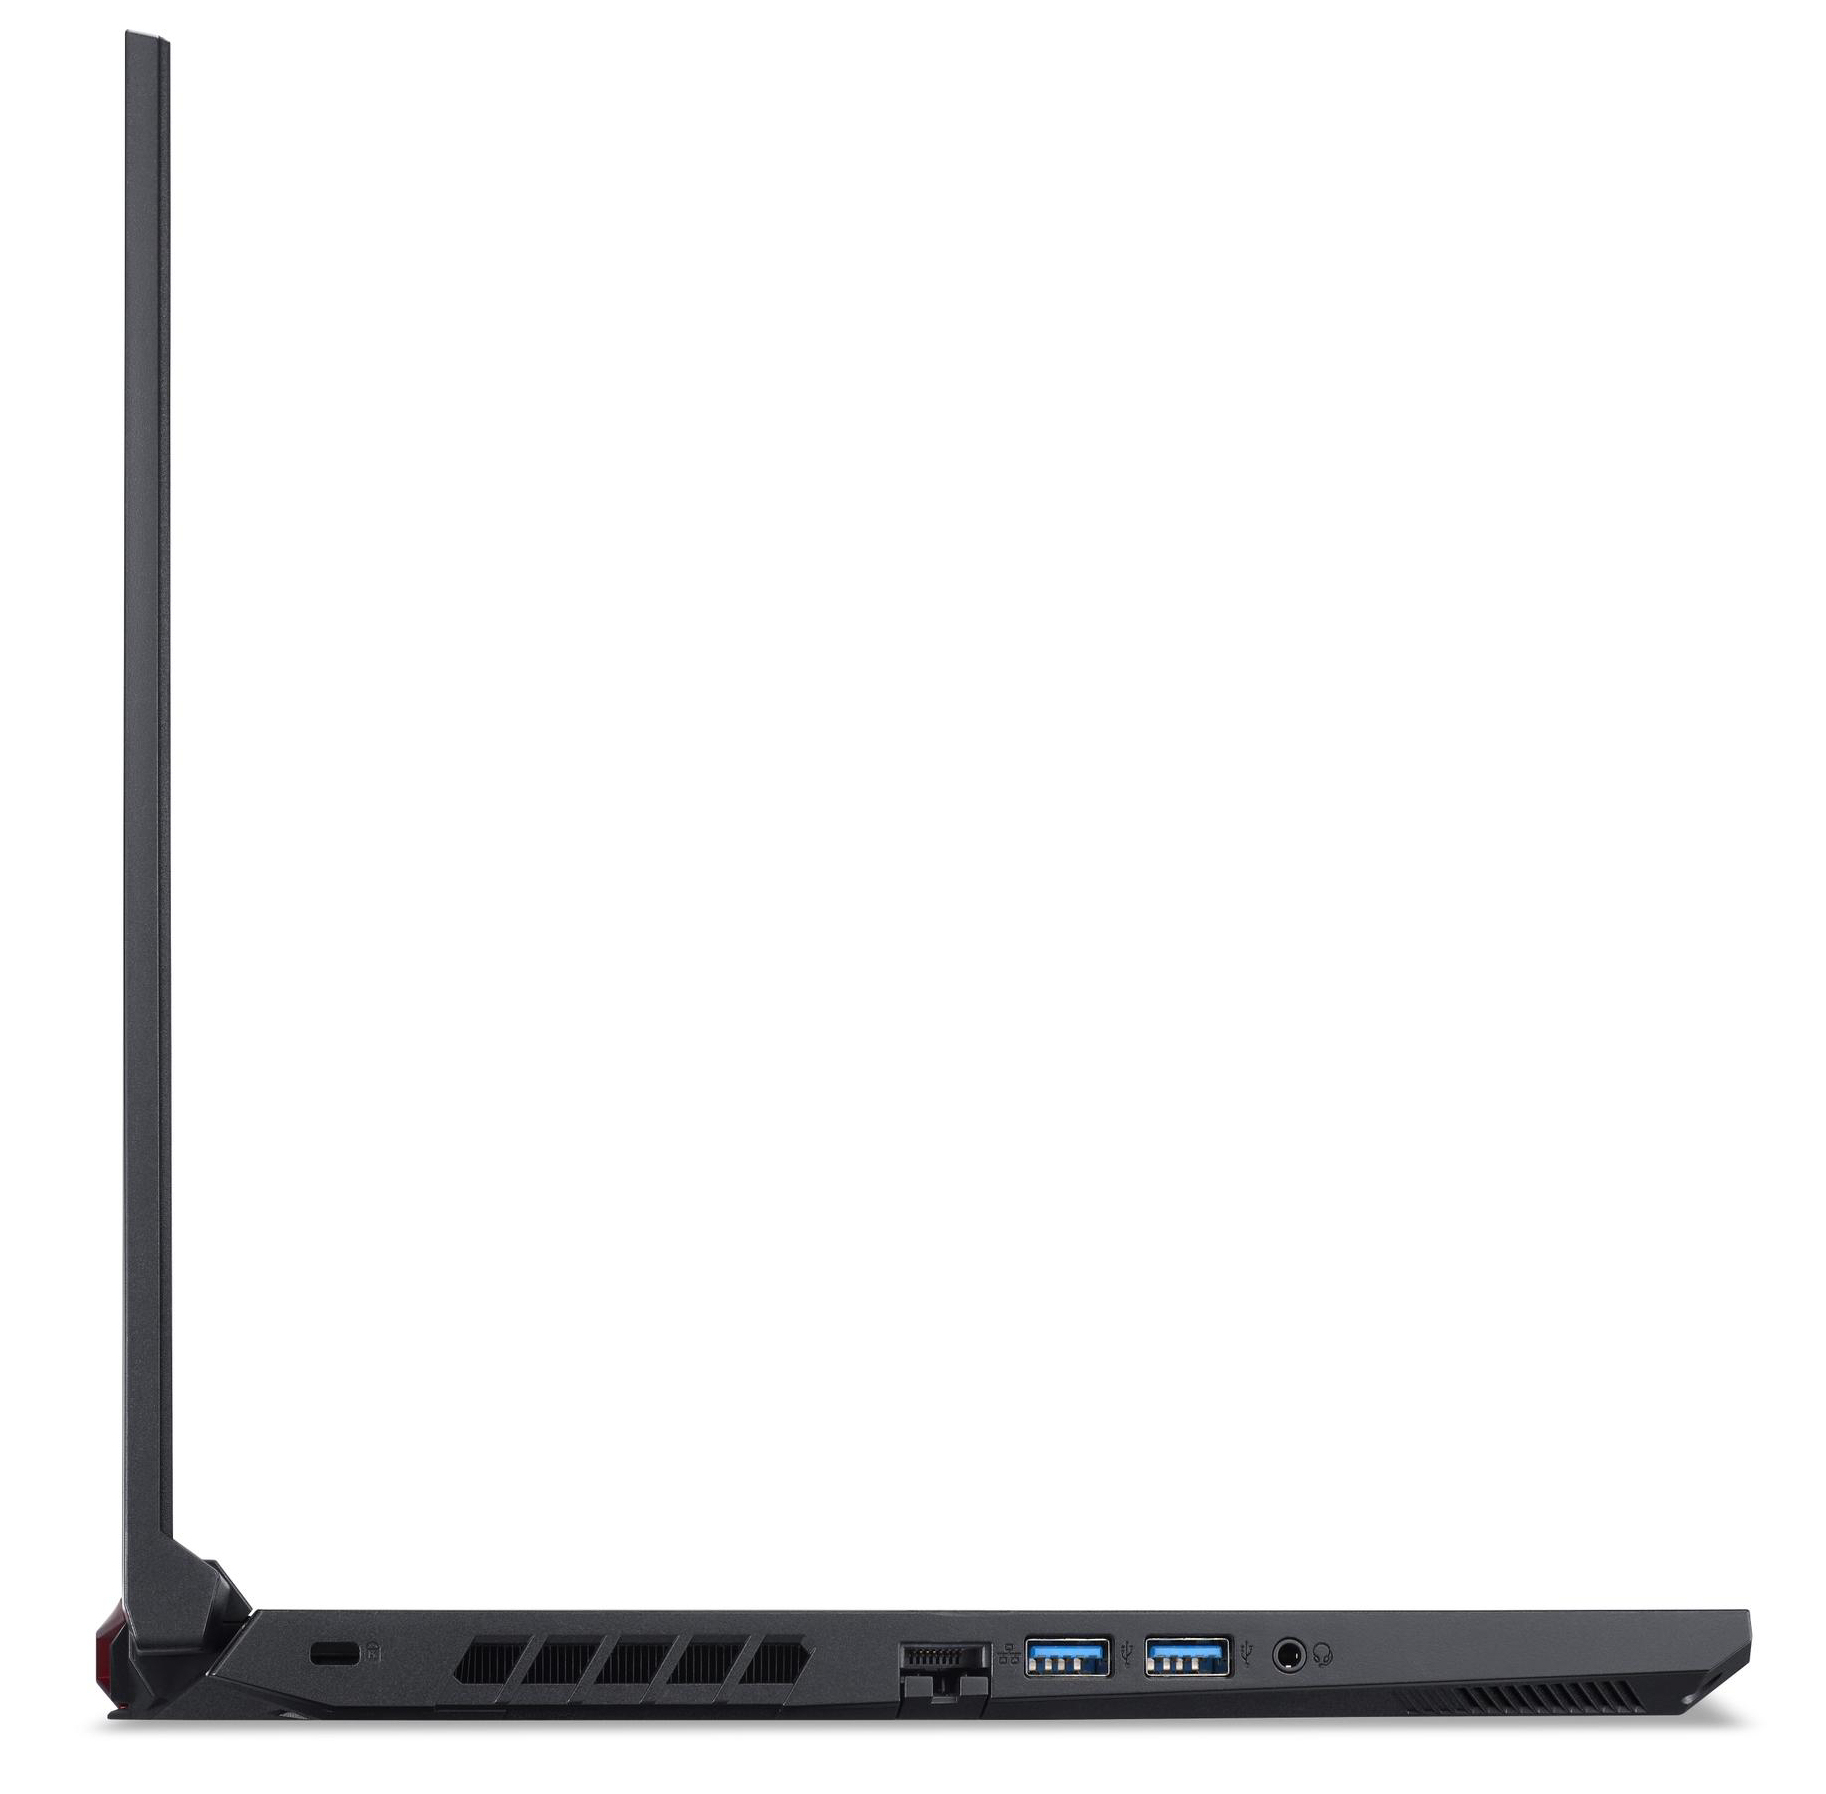
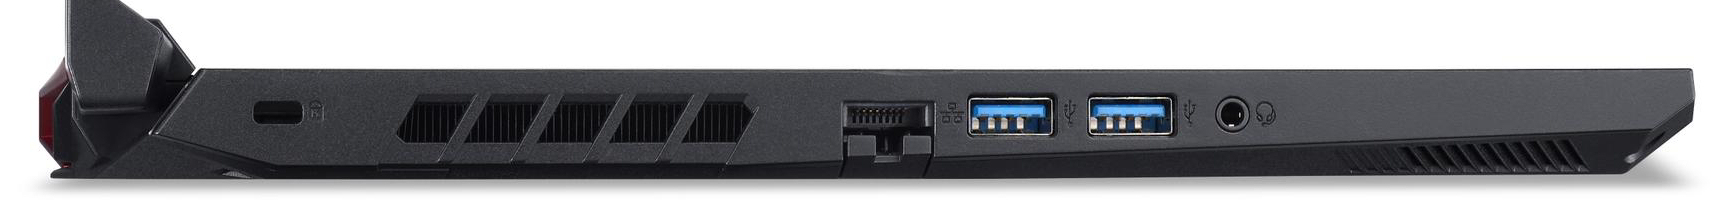
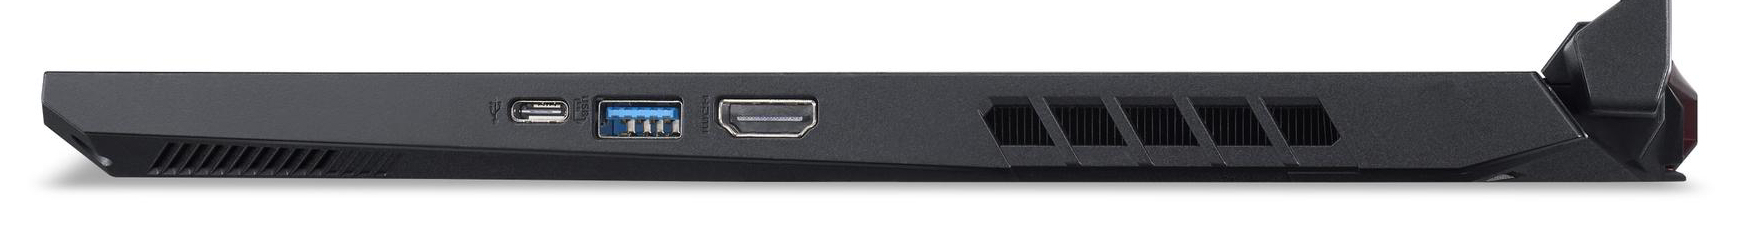
Connectivity - Nitro 5 without Thunderbolt
The Nitro 5 comes with three USB-A ports (2x USB 3.2 Gen 1, 1x USB 3.2 Gen 2) and one USB-C port (USB 3.2 Gen 2). The latter doesn't support Power Delivery or DisplayPort via USB-C. Consequently, there's only one video output with the HDMI connection. A memory card reader isn't available, either.
Communication
The WLAN chip (MediaTek MT7921) supports the 802.11ax standard and offers Bluetooth 5 functionality. The data rates determined under optimal conditions (no other WLAN devices nearby, short distance between laptop and server PC) lag behind the chip's capabilities. The tests were repeated with time intervals - without any changes in the final result. We suspect a driver problem. Moreover, wired network connections are handled by a Killer E2600 Gigabit Ethernet controller. It performs its tasks smoothly.
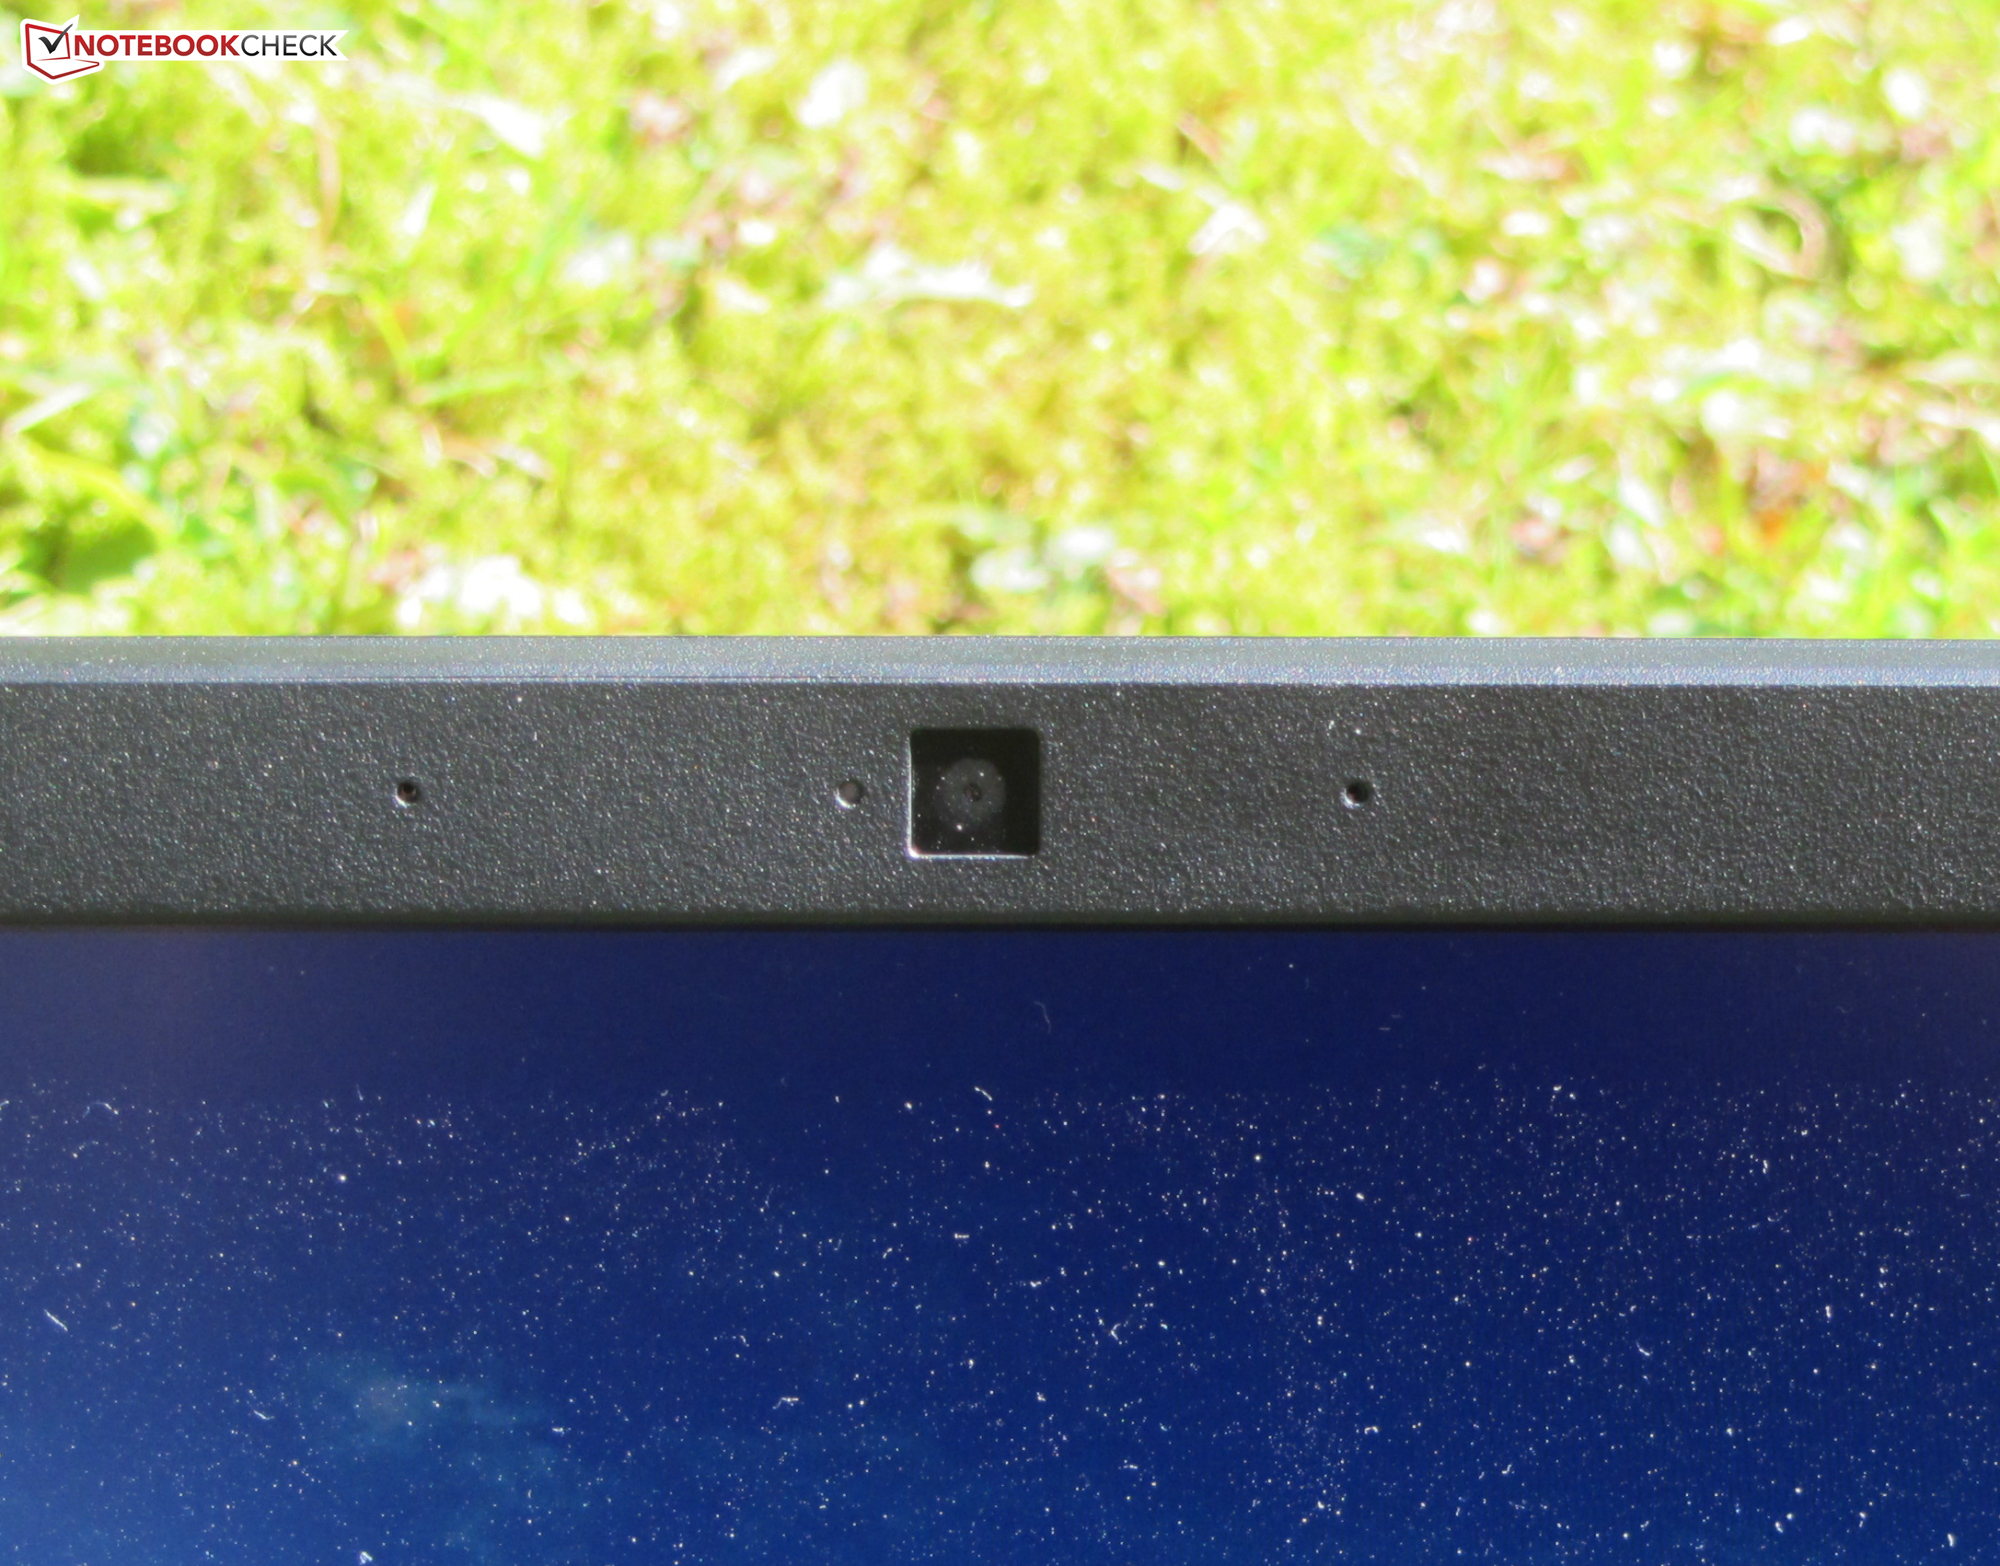
Webcam
The webcam (0.9 MP) generates images with a maximum resolution of 1280x720 pixels. There are problems with color accuracy. With a deviation of almost 12, the target (DeltaE less than 3) is clearly missed.


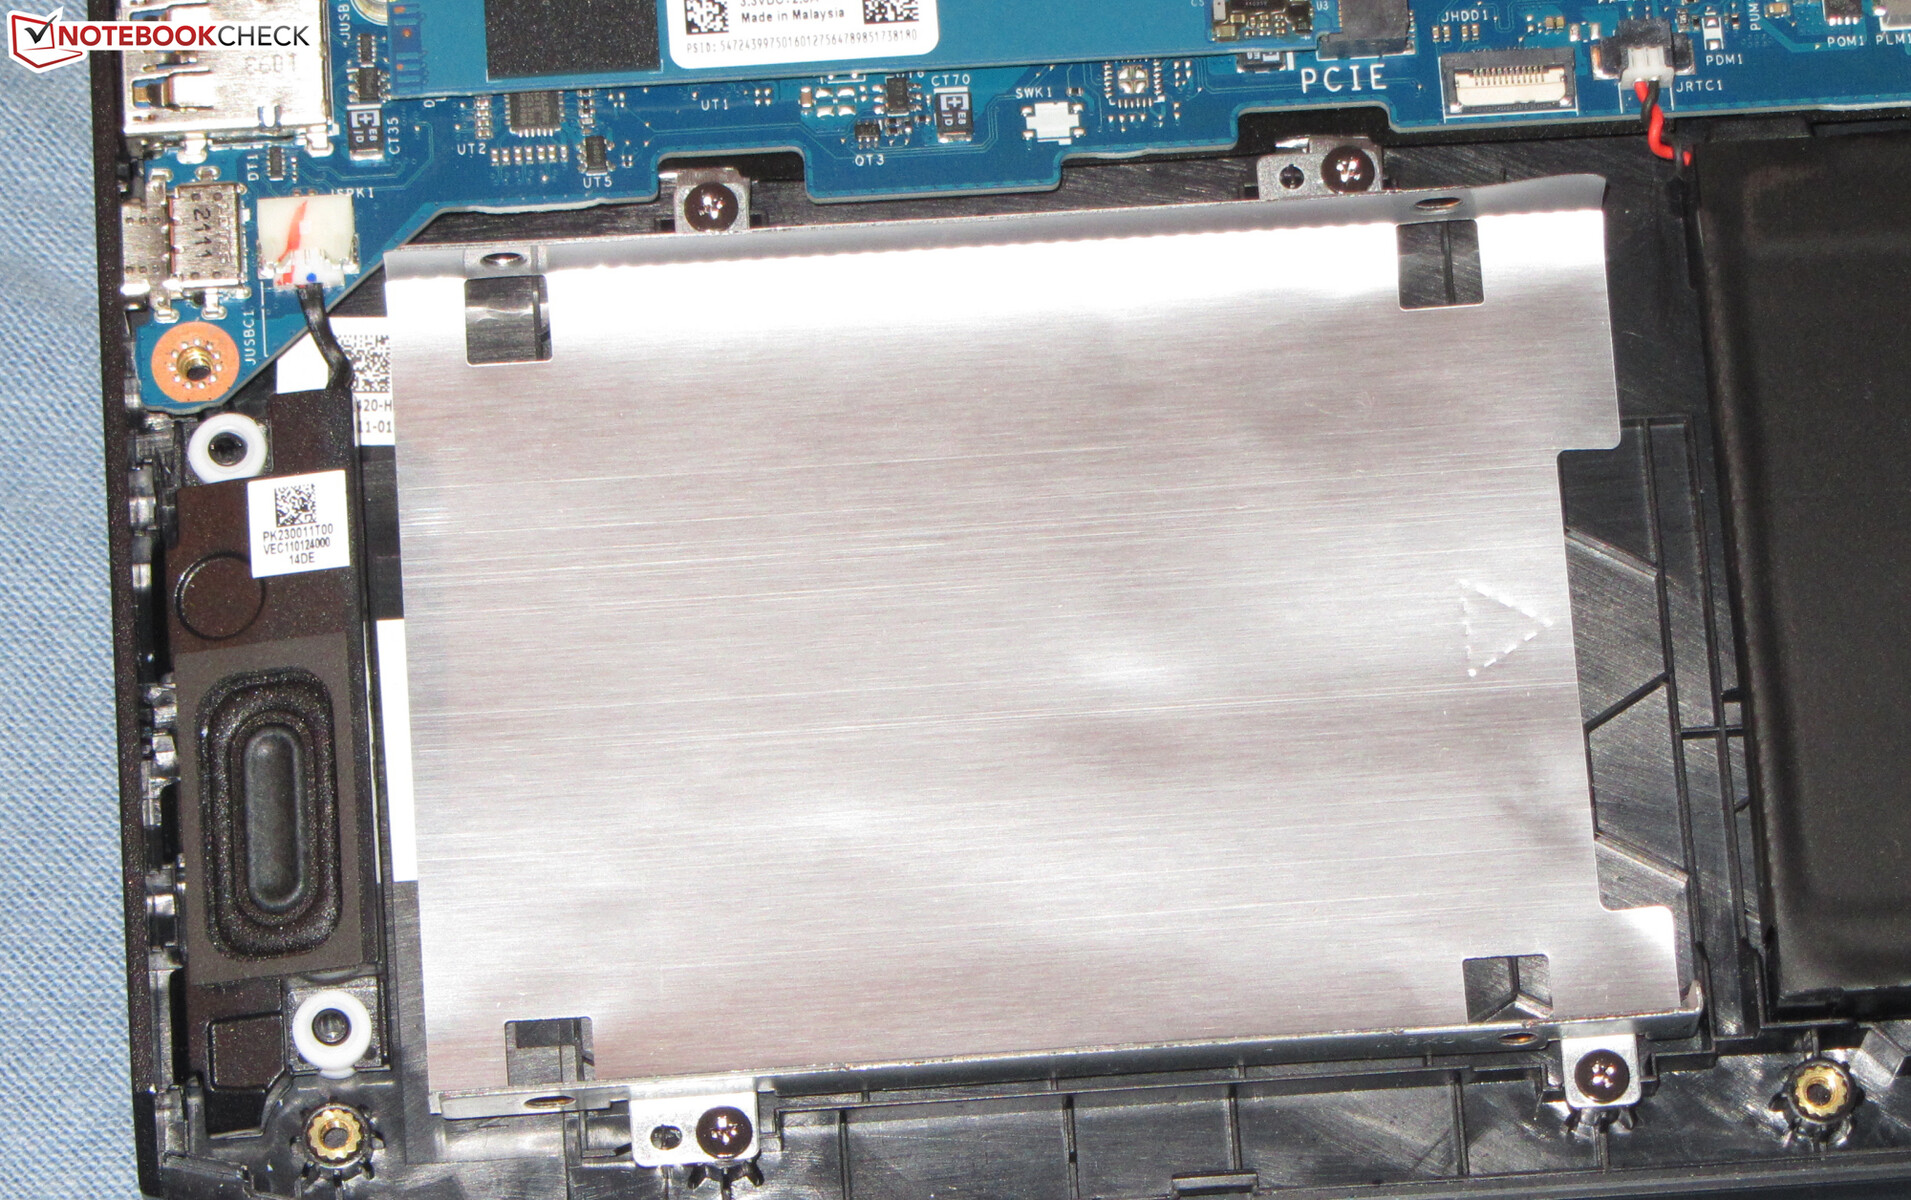
Accessories
The laptop comes with the usual documents: A quick-start guide and warranty information. In addition, a short ribbon cable including a SATA connector is also included, which would be required to install a 2.5-inch storage drive. The corresponding mounting frame is already integrated inside the laptop.
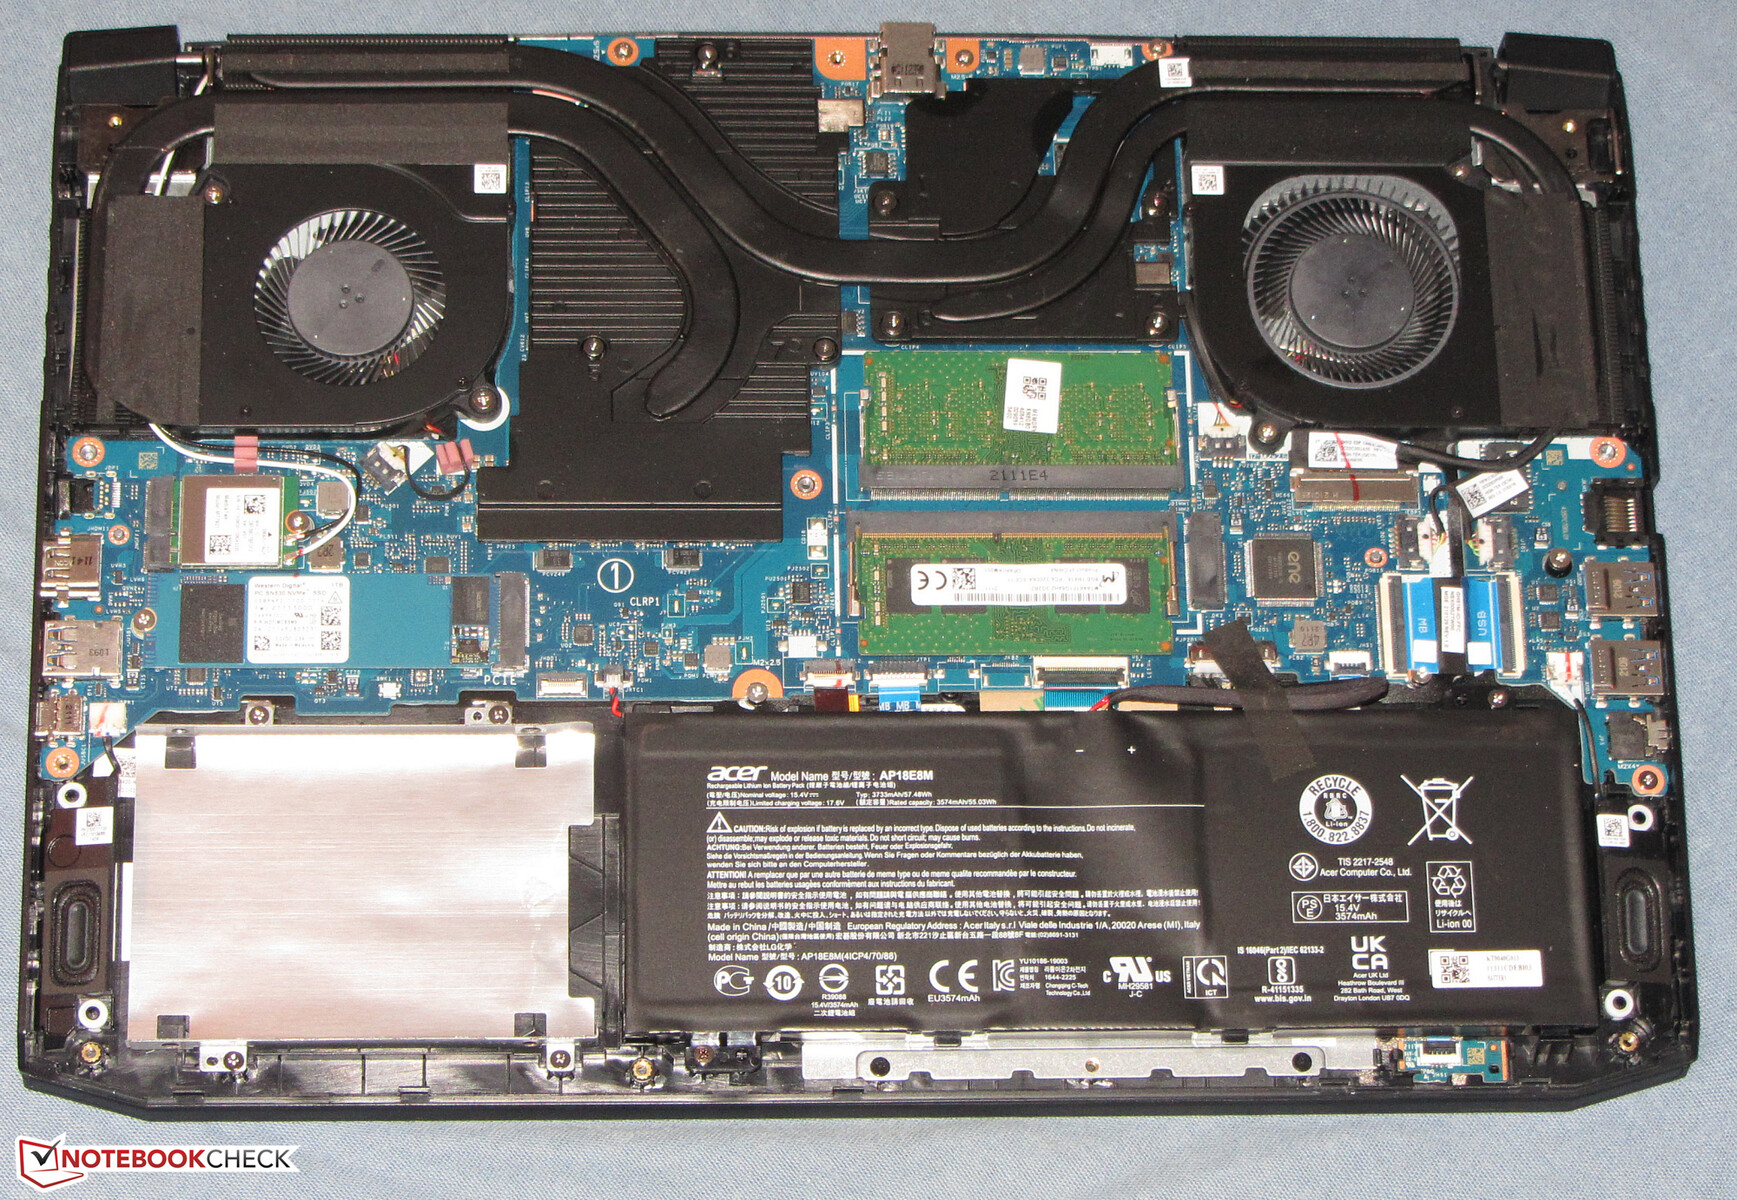
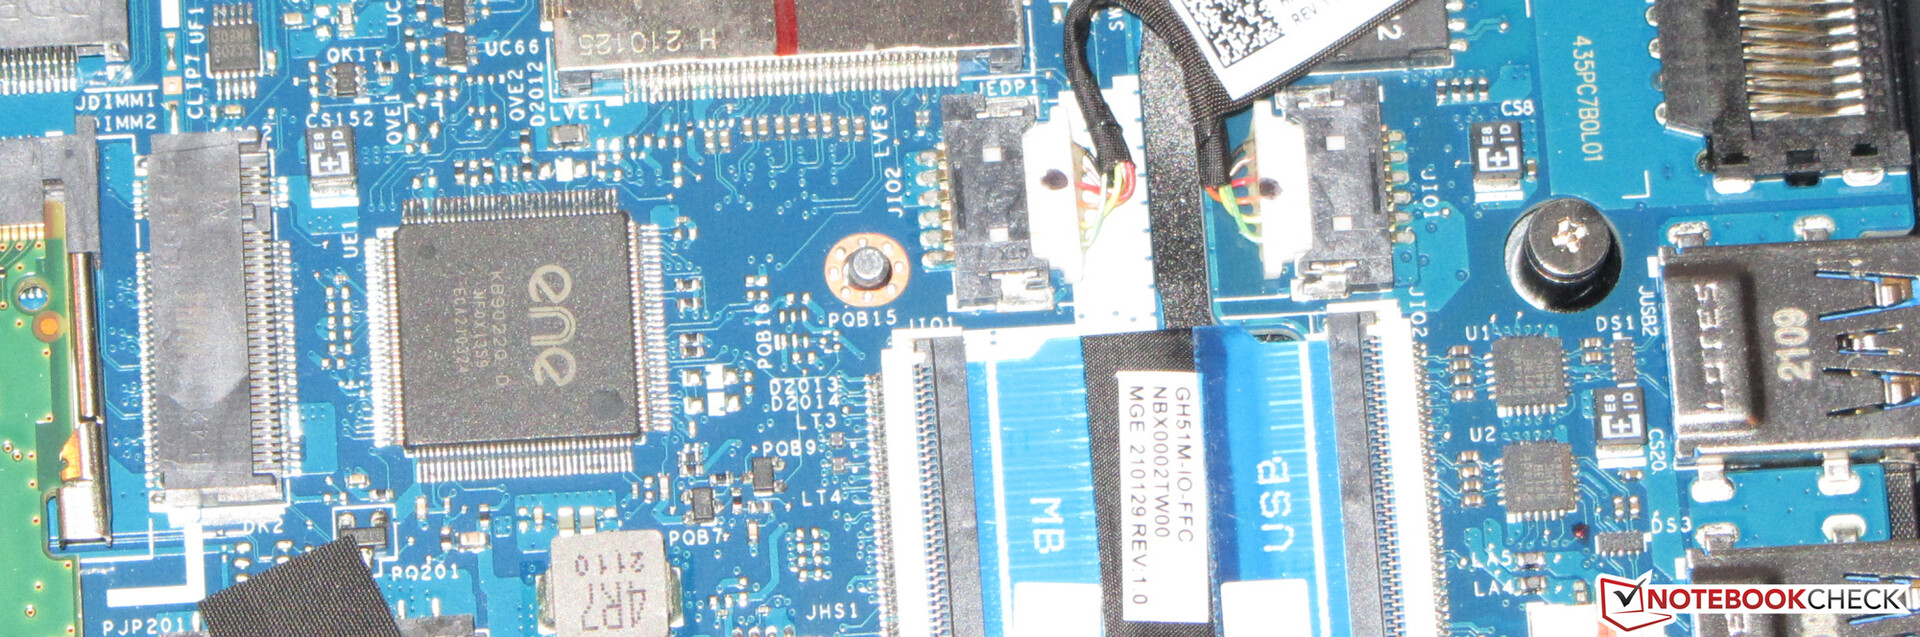
Maintenance
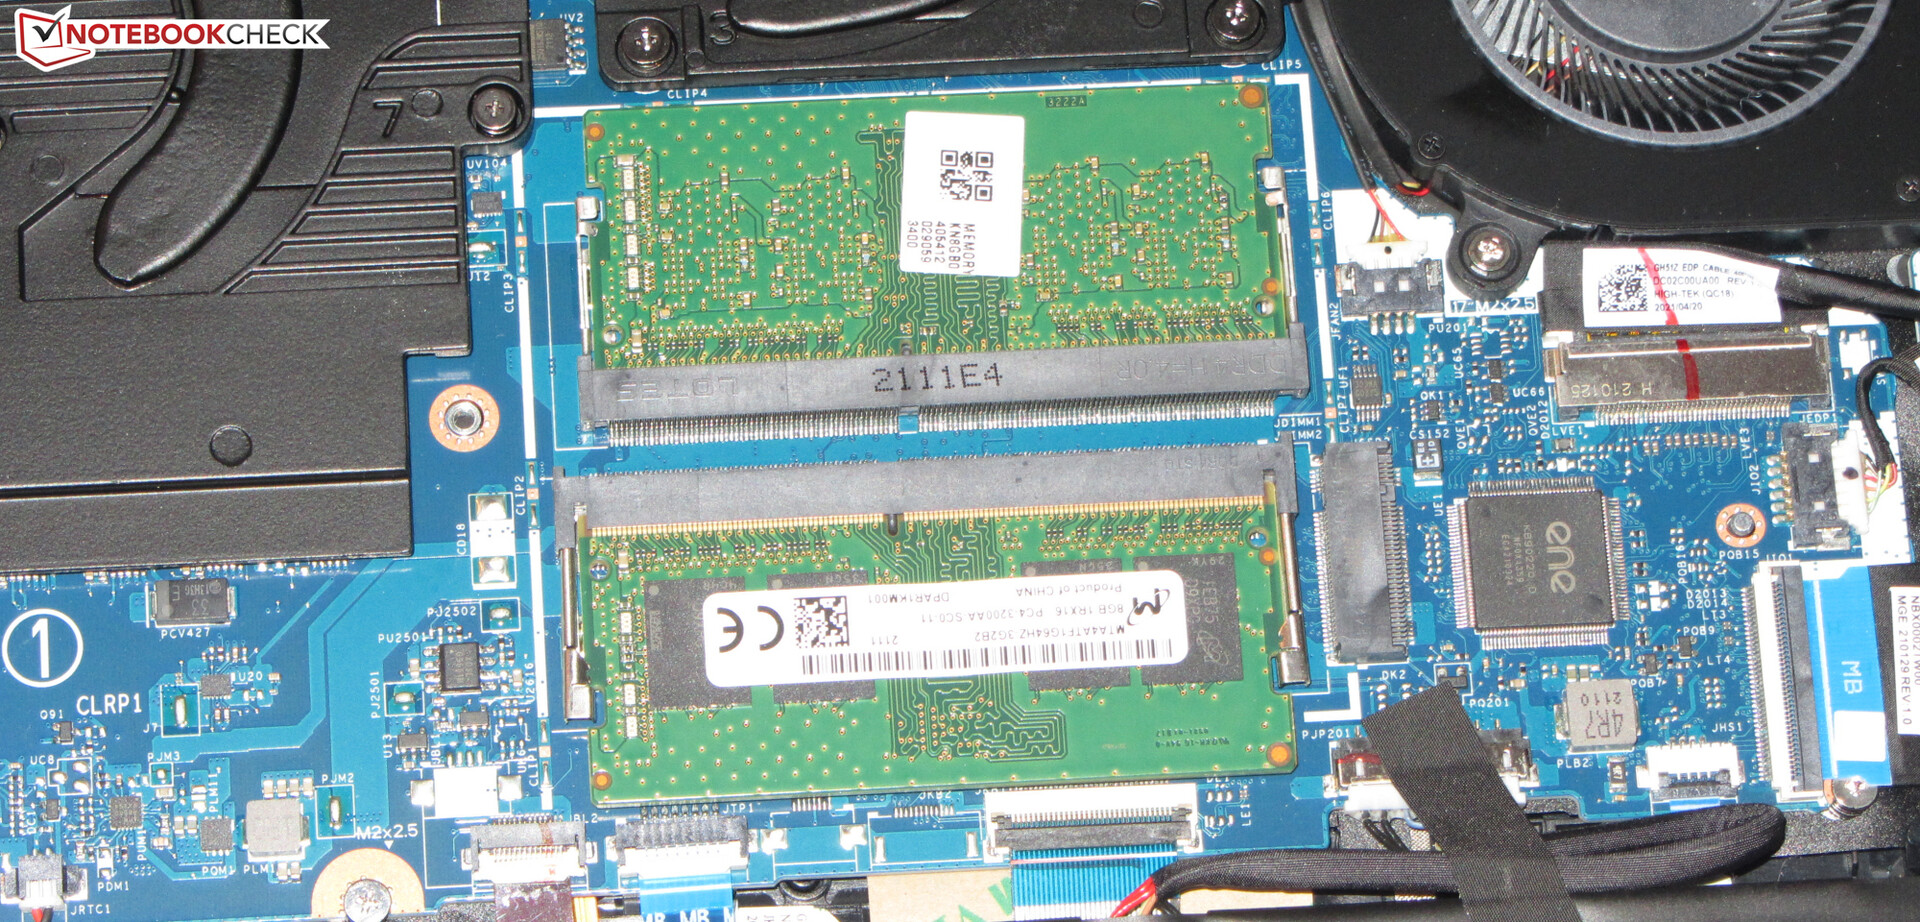
After removing all screws on the bottom of the device, the bottom cover can be lifted off with the help of a flat spatula or a joint smoother - the bottom cover sits quite tightly in its place in some sections. You will then have access to the SSD, the WLAN module, the RAM, the battery, and the fans.
Warranty
Acer provides the 15.6-inch device with a two-year warranty. Extending the warranty to three years costs just under 100 Euros (~$117).
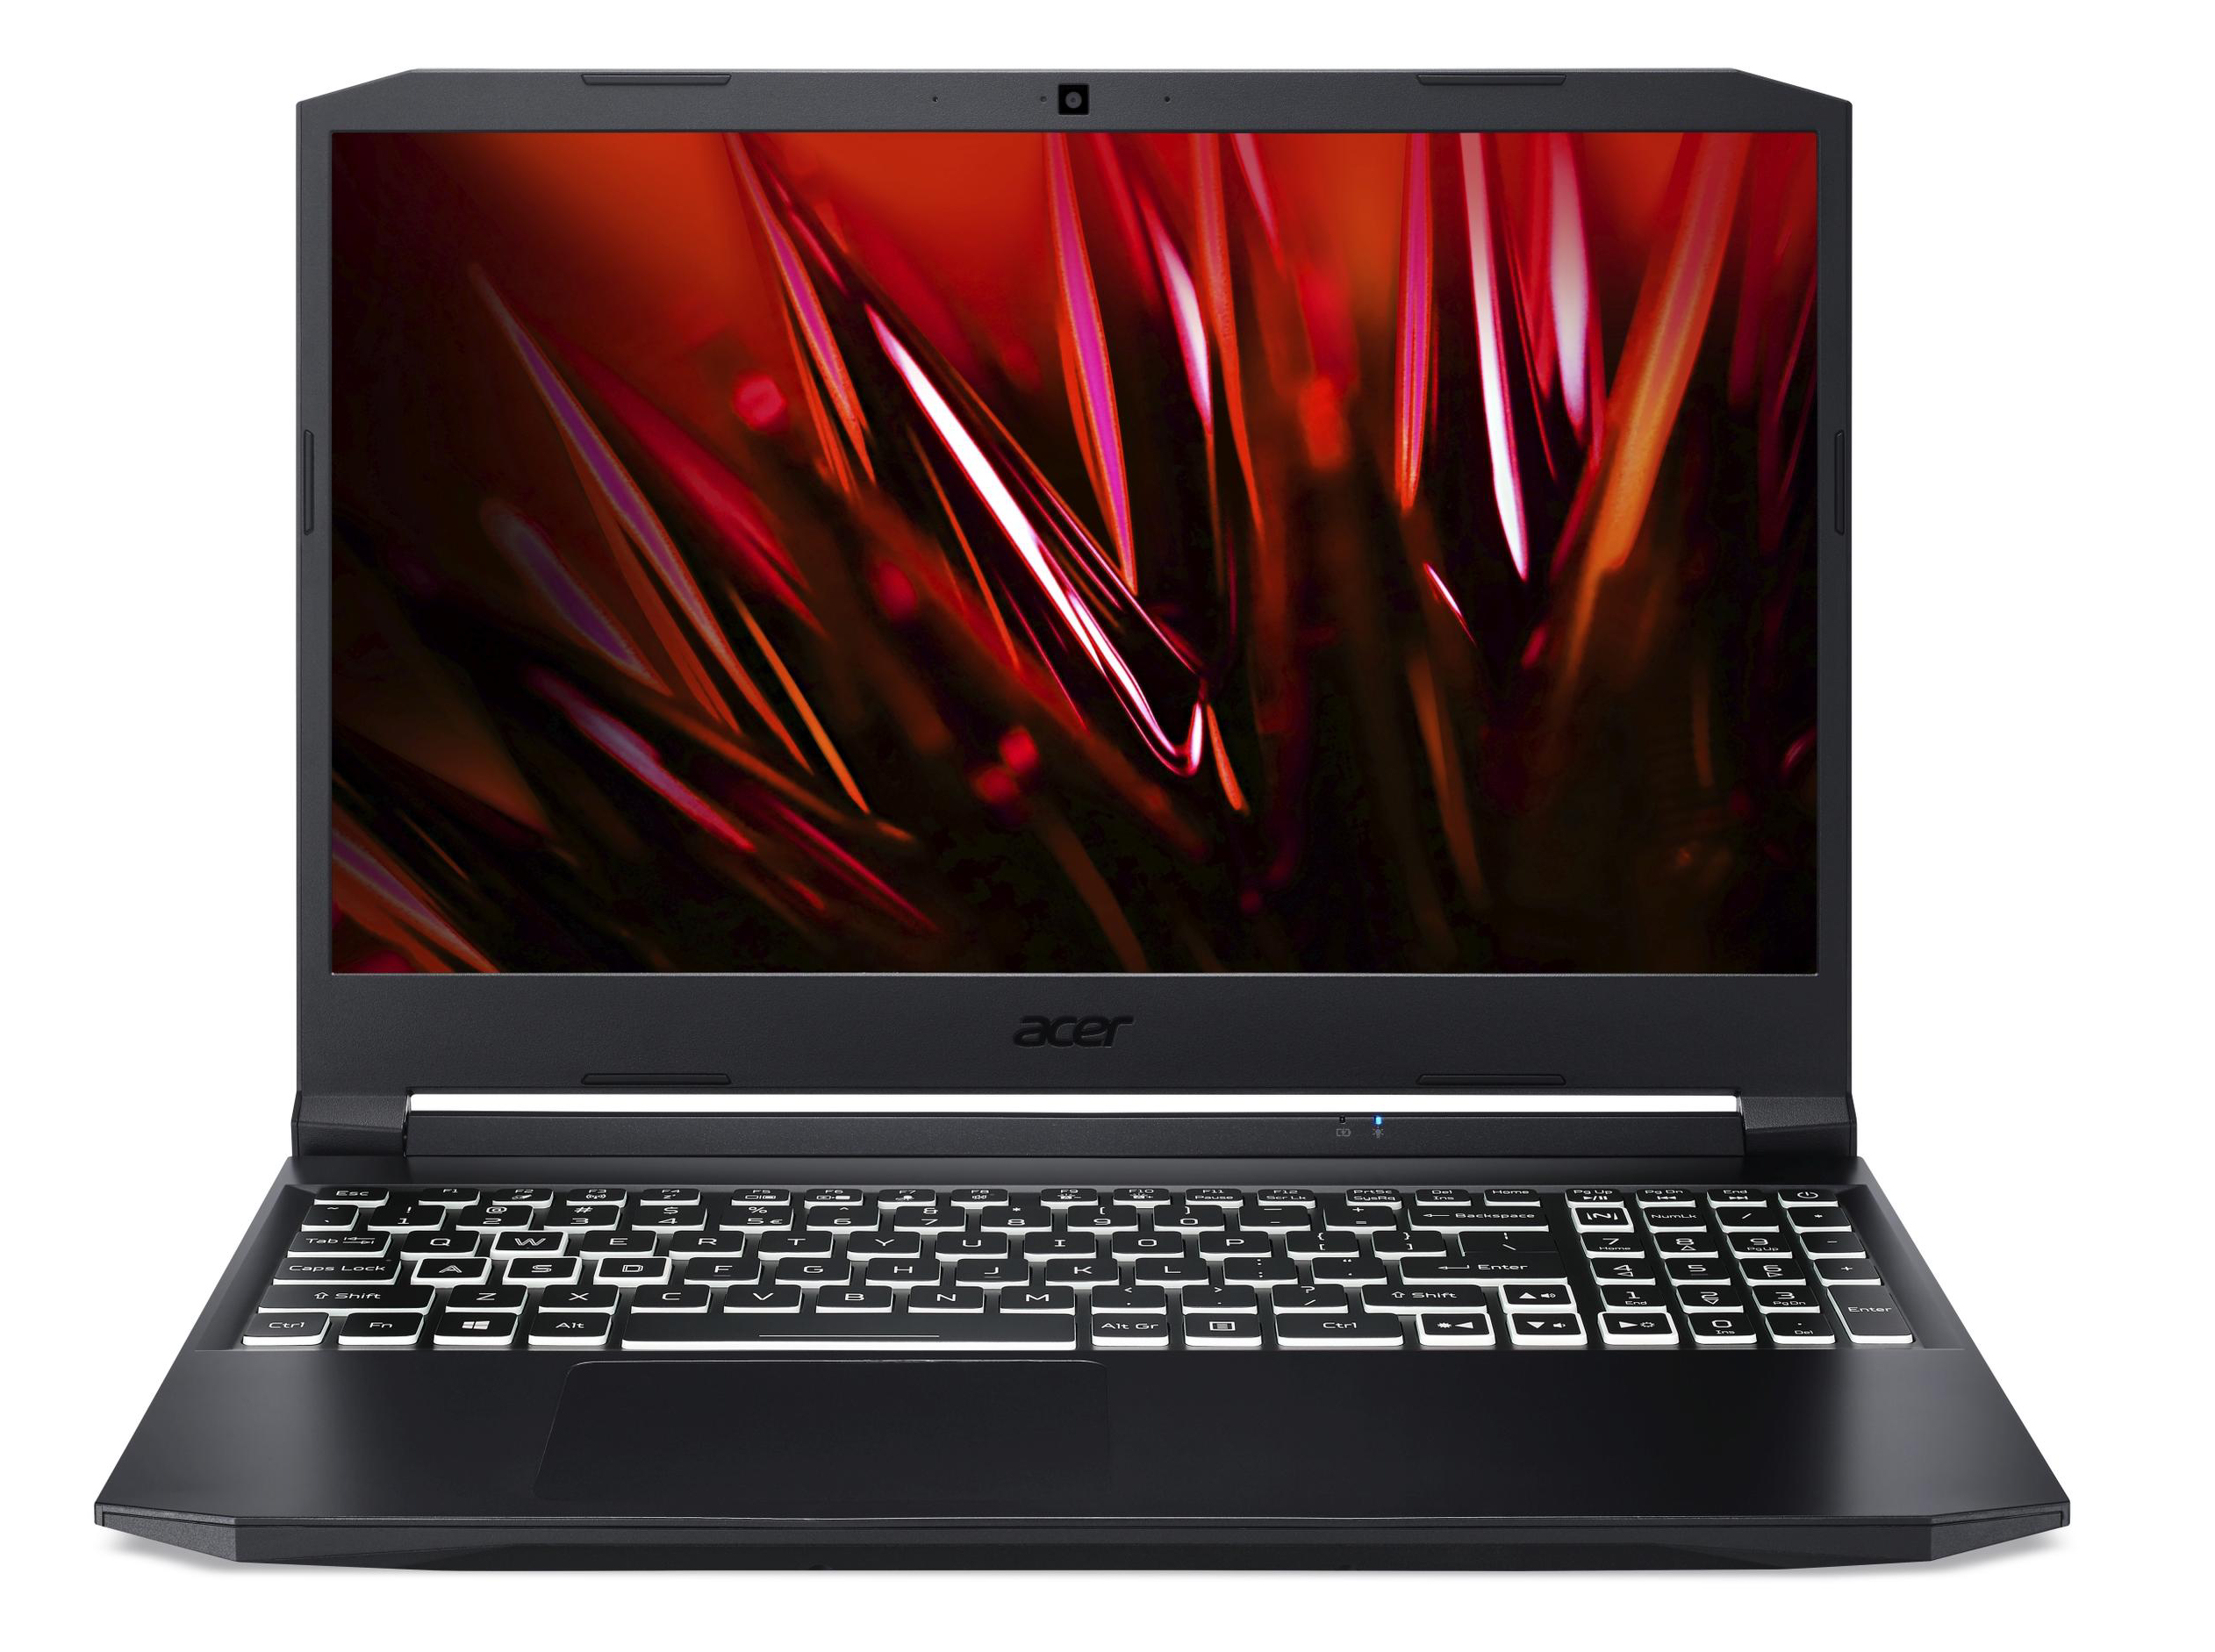
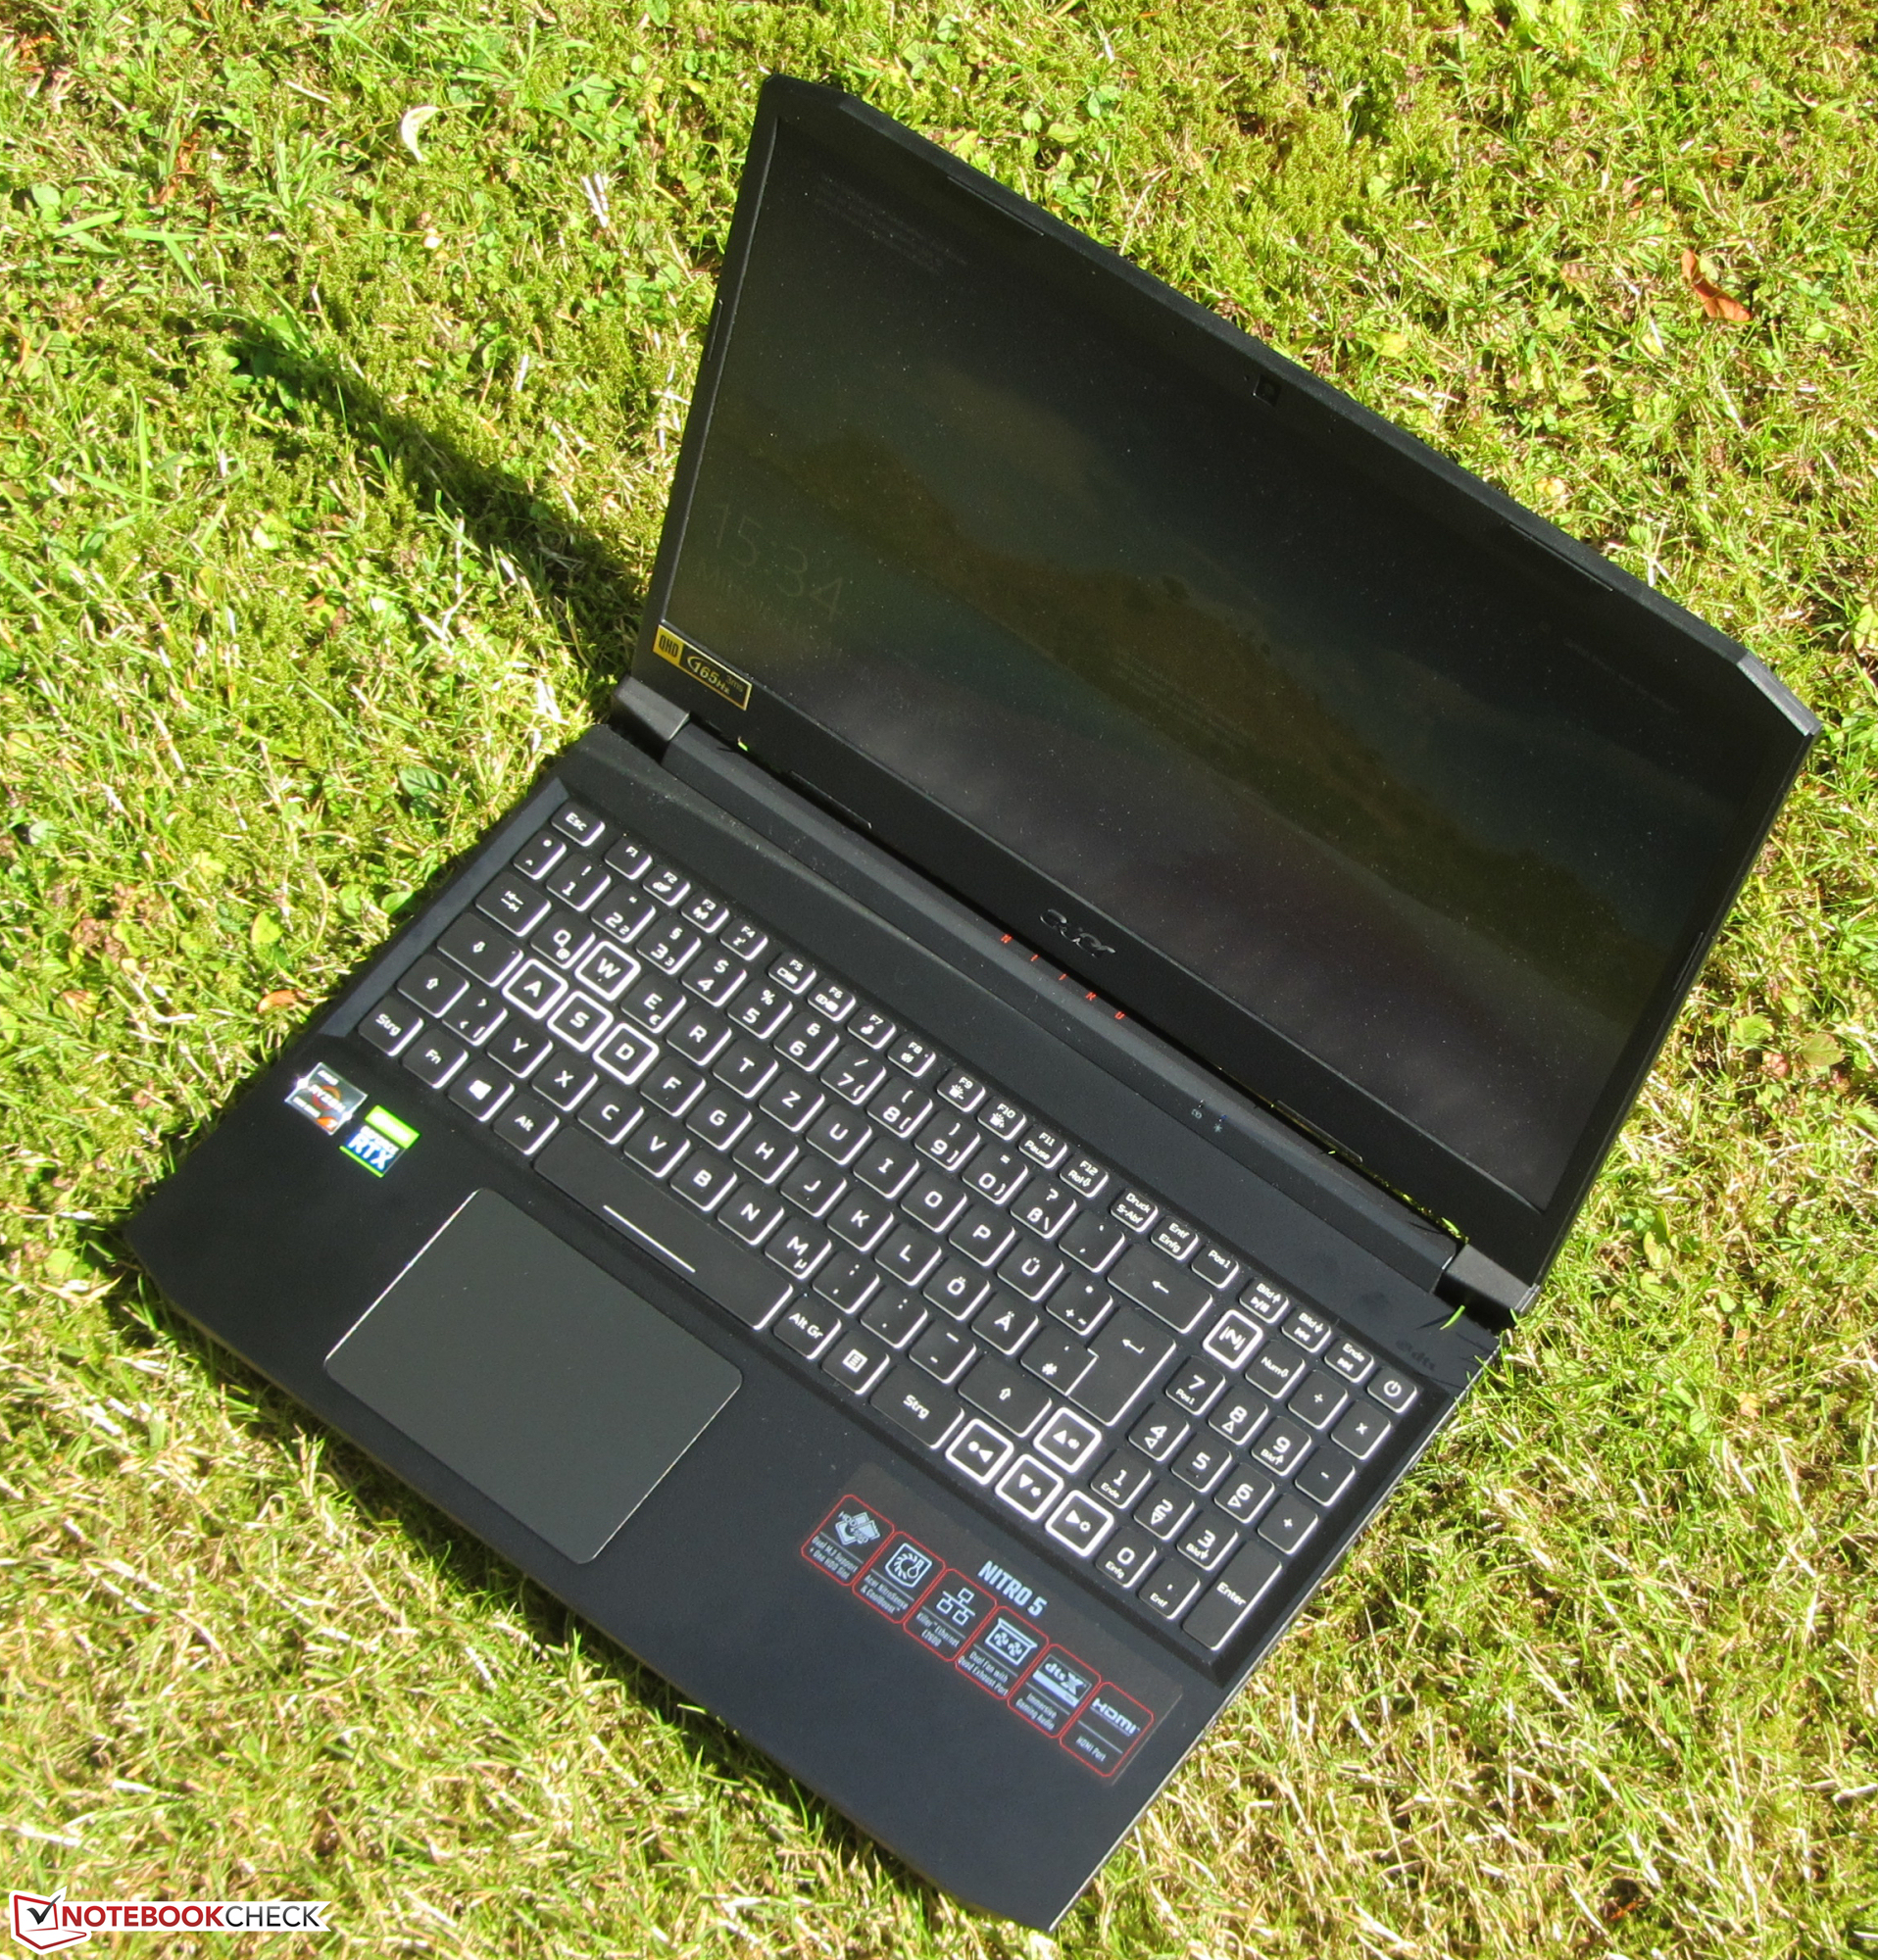
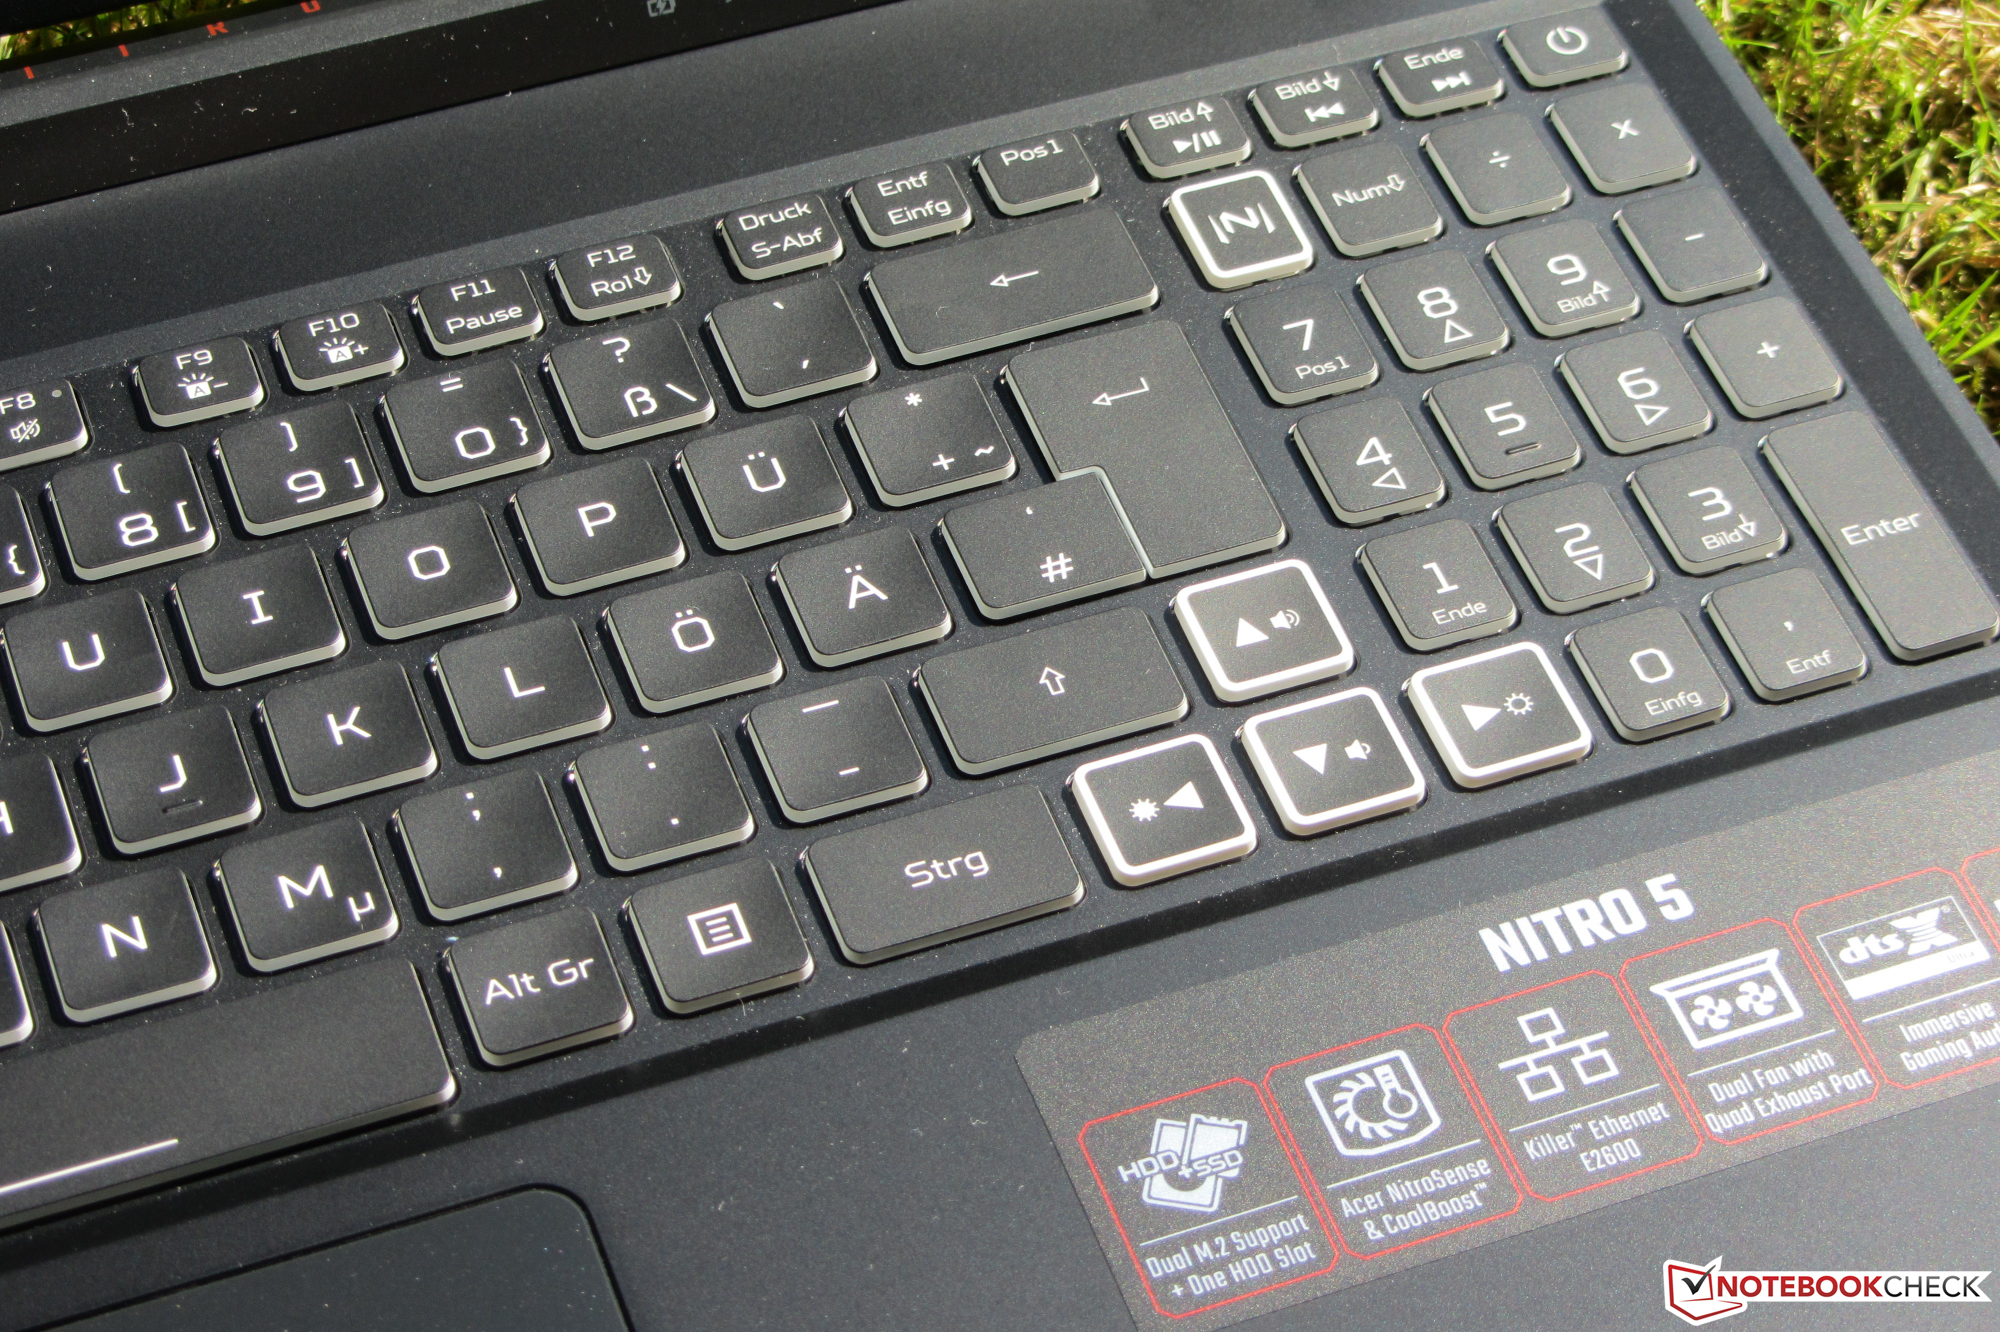
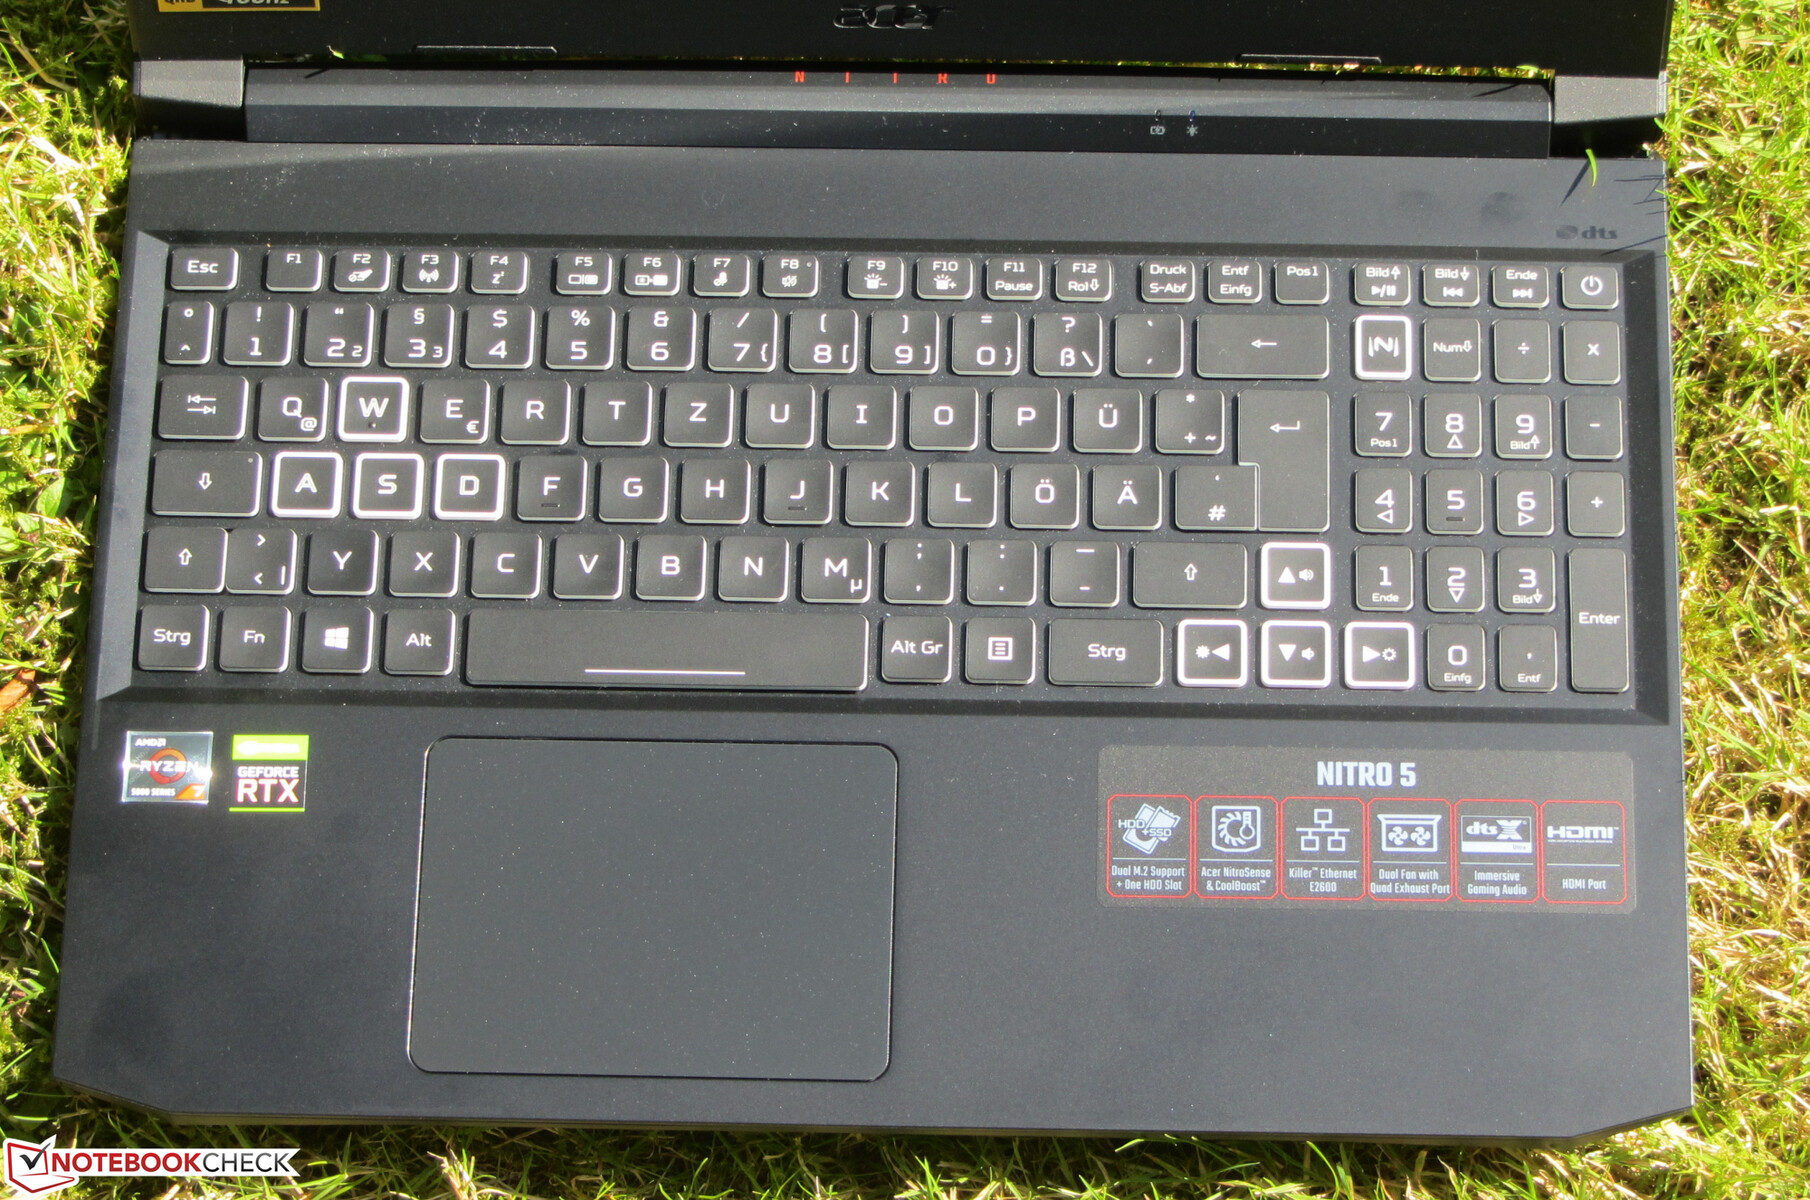
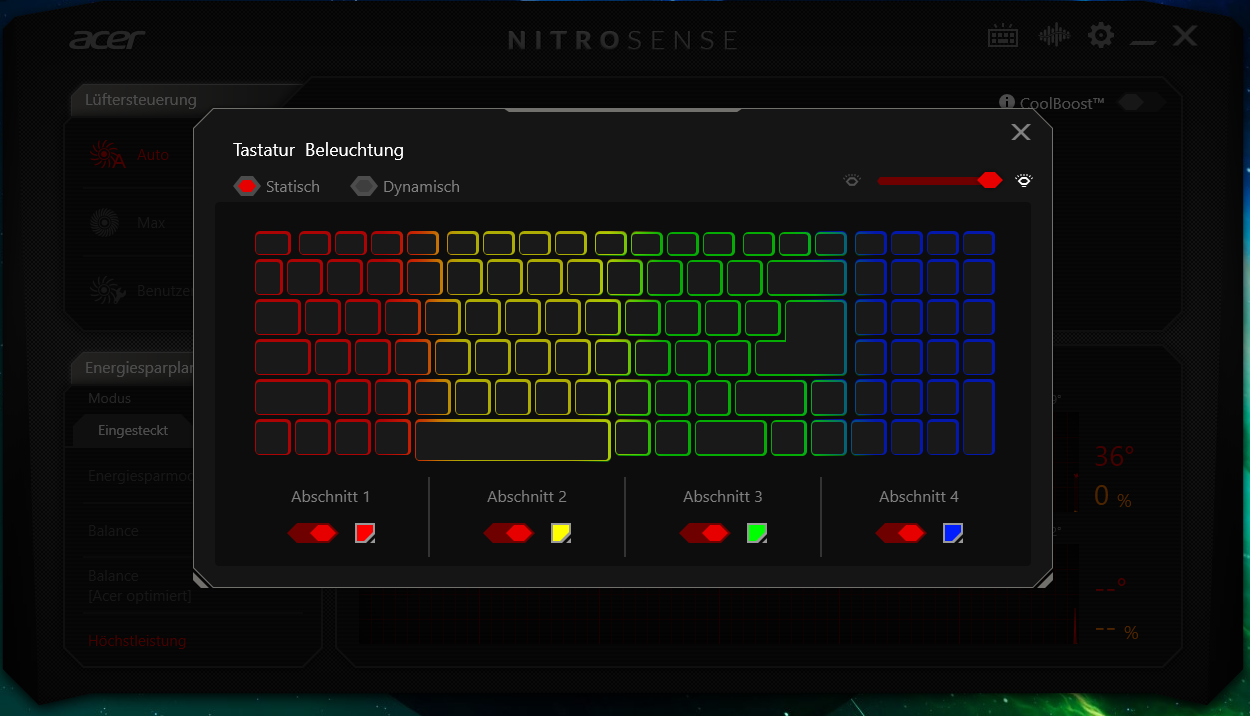
Input devices - Keyboard with RGB lighting
Keyboard
The backlit chiclet keyboard consists of differently shaped keys: The concave main keys (letters, number row), and the remaining flat-shaped keys (function keys, numeric keypad). The resistance provided by the keys could be crisper in our opinion. Moreover, the keyboard yields a bit during typing. This didn't prove to be bothersome, though. All in all, Acer delivers a keyboard that's suitable for everyday use here.
Touchpad
The smooth surface of the multitouch-capable ClickPad (about 10.6 x 7.8 cm) makes it easy for fingers to glide on it. It also responds to inputs in the corners. The pad has a short travel and a clear pressure point.
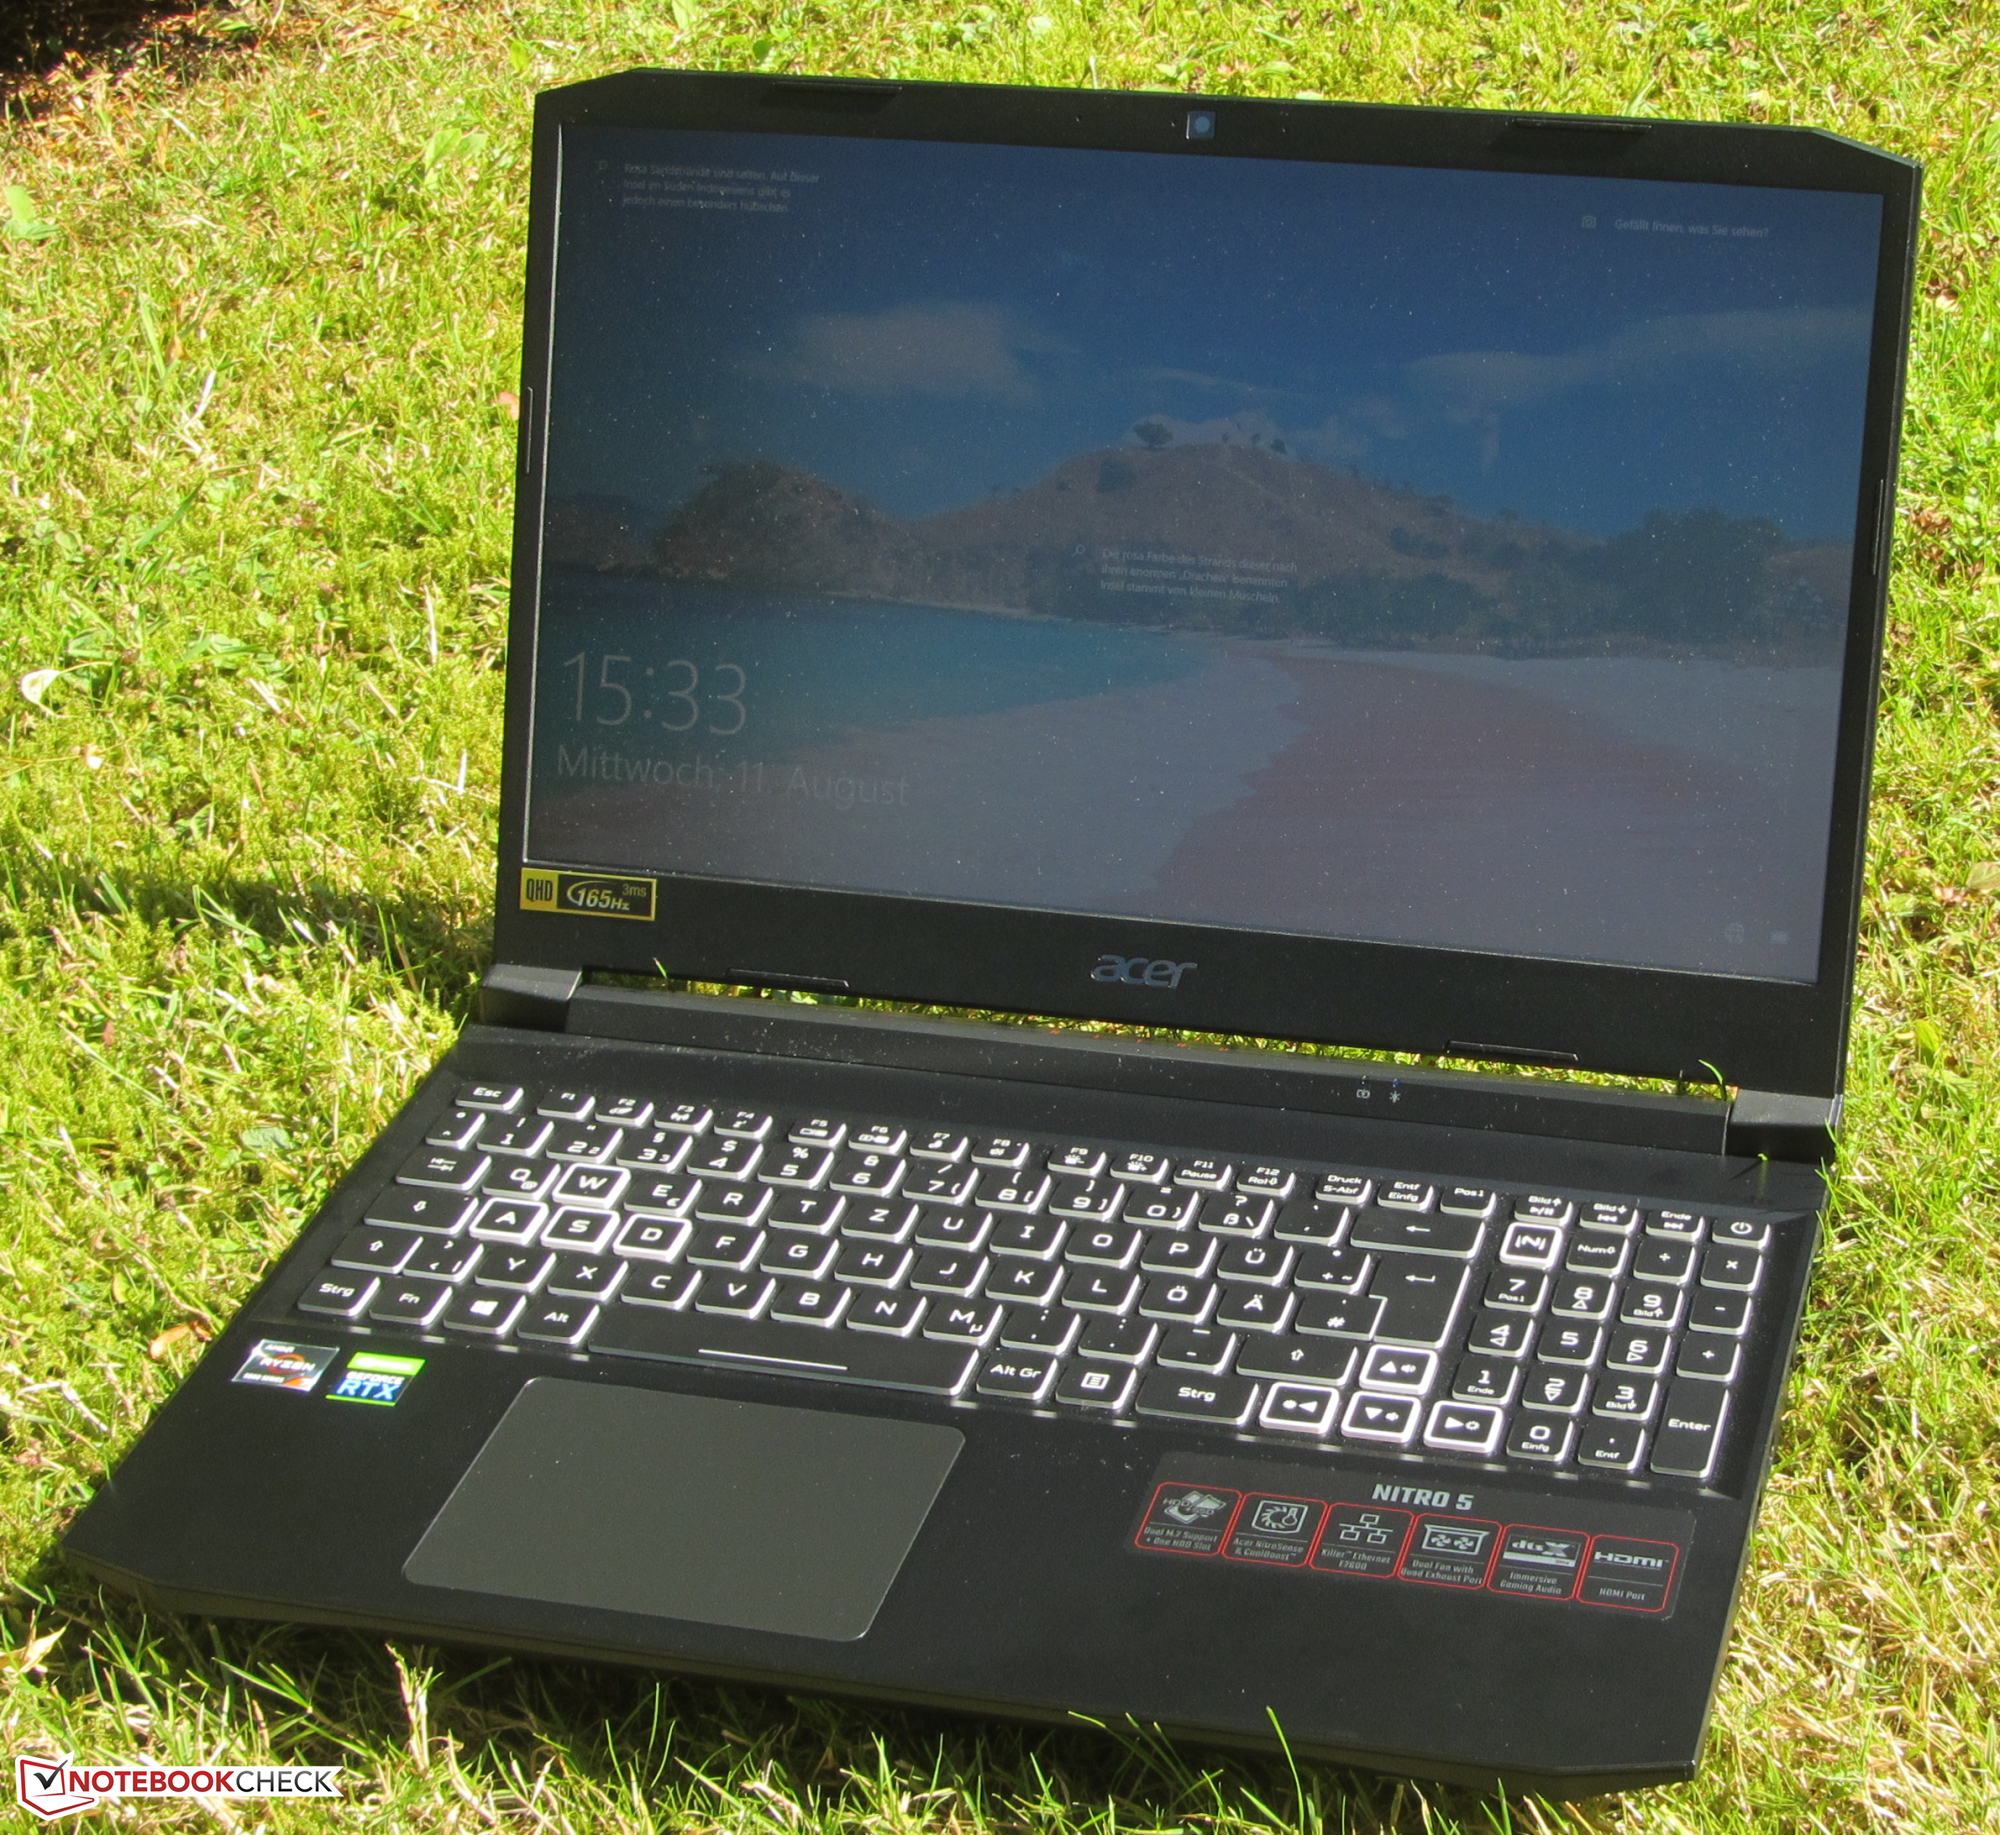
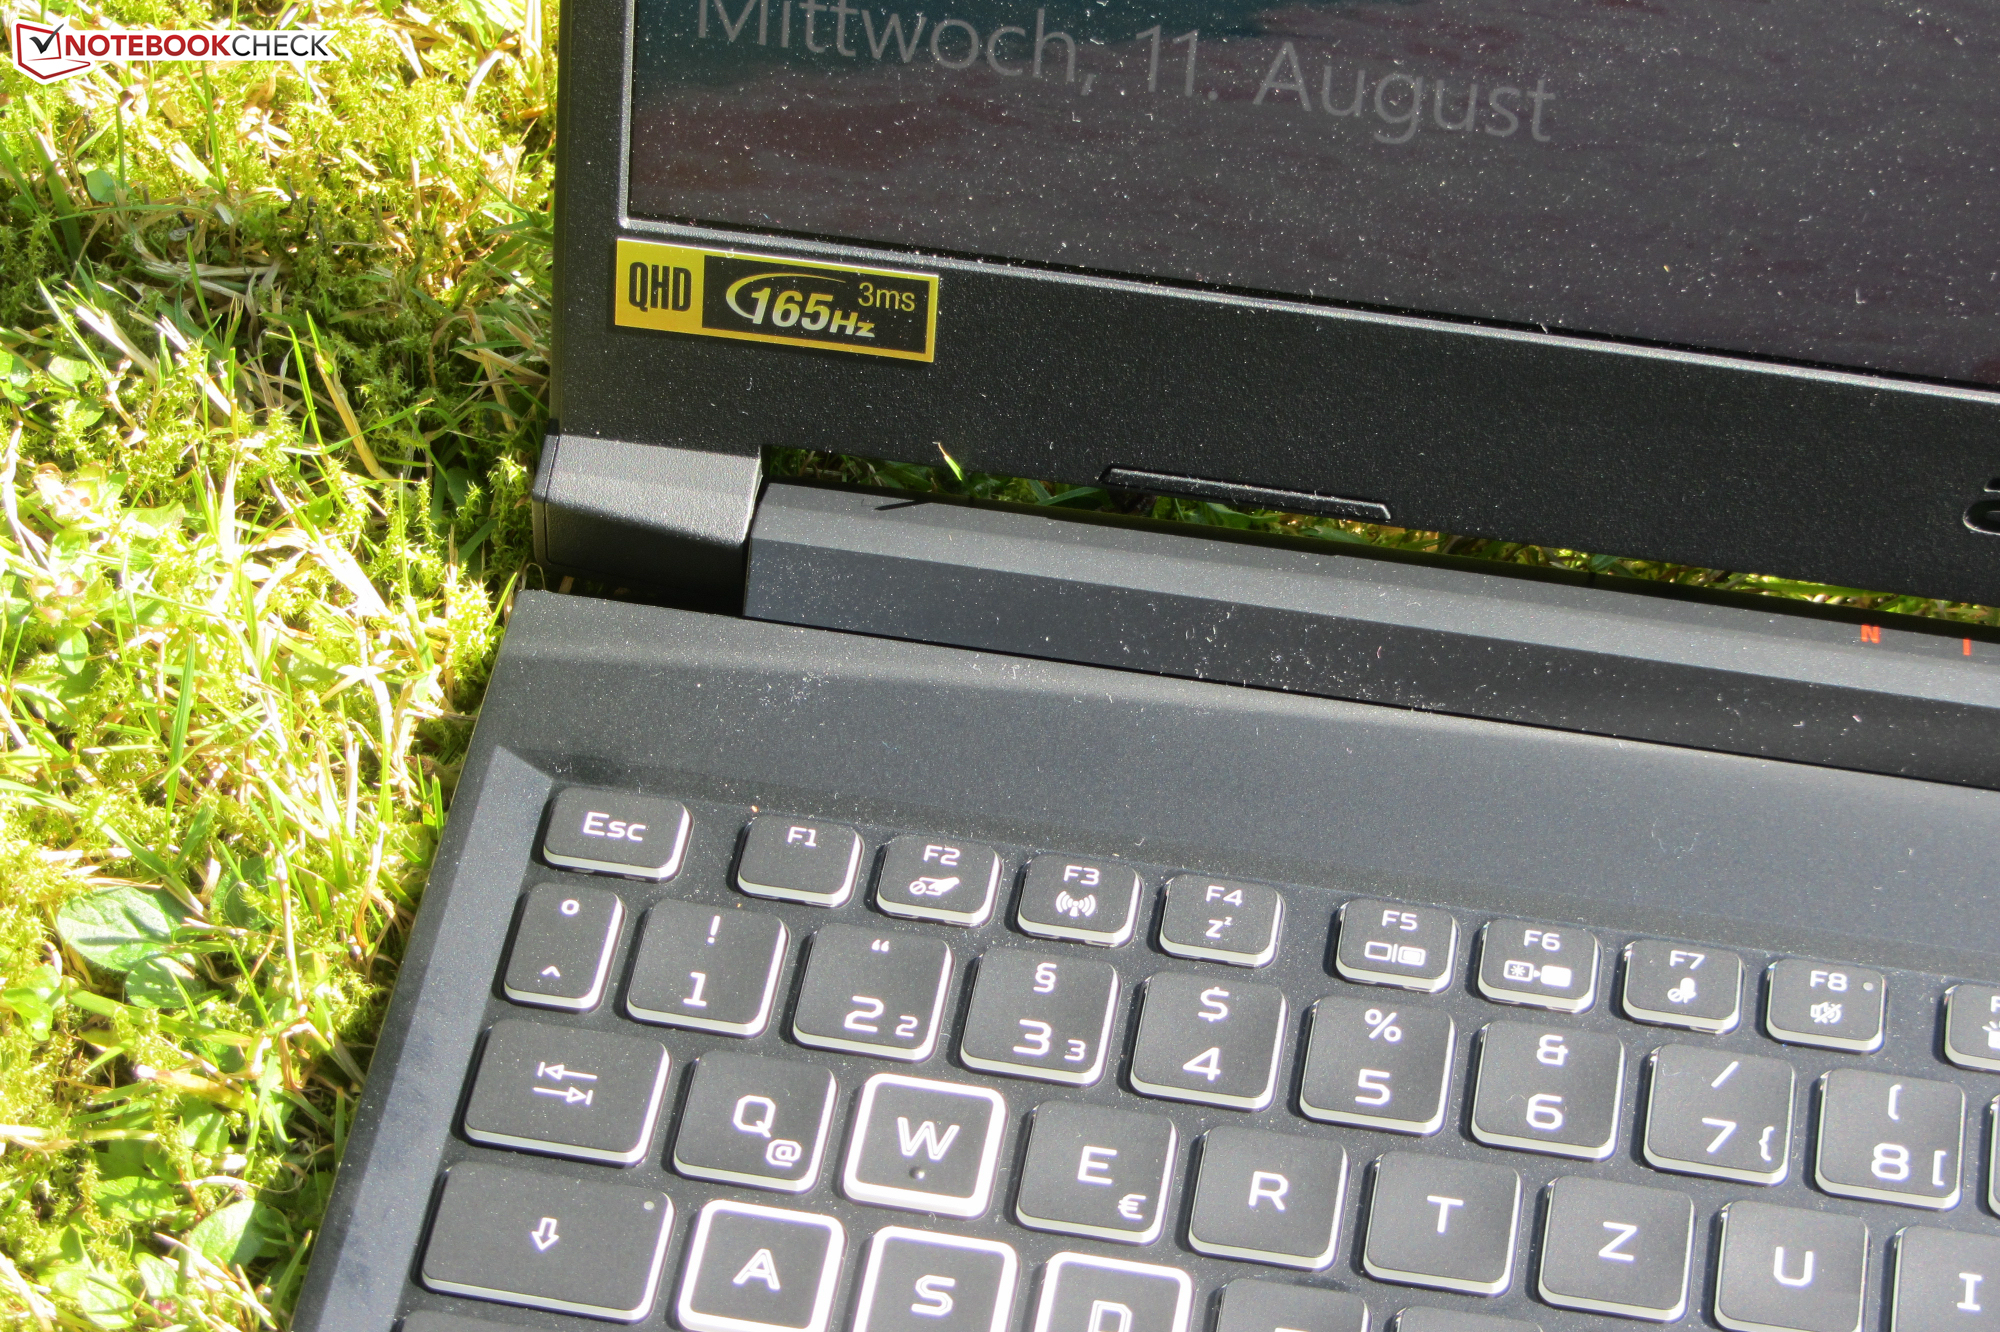
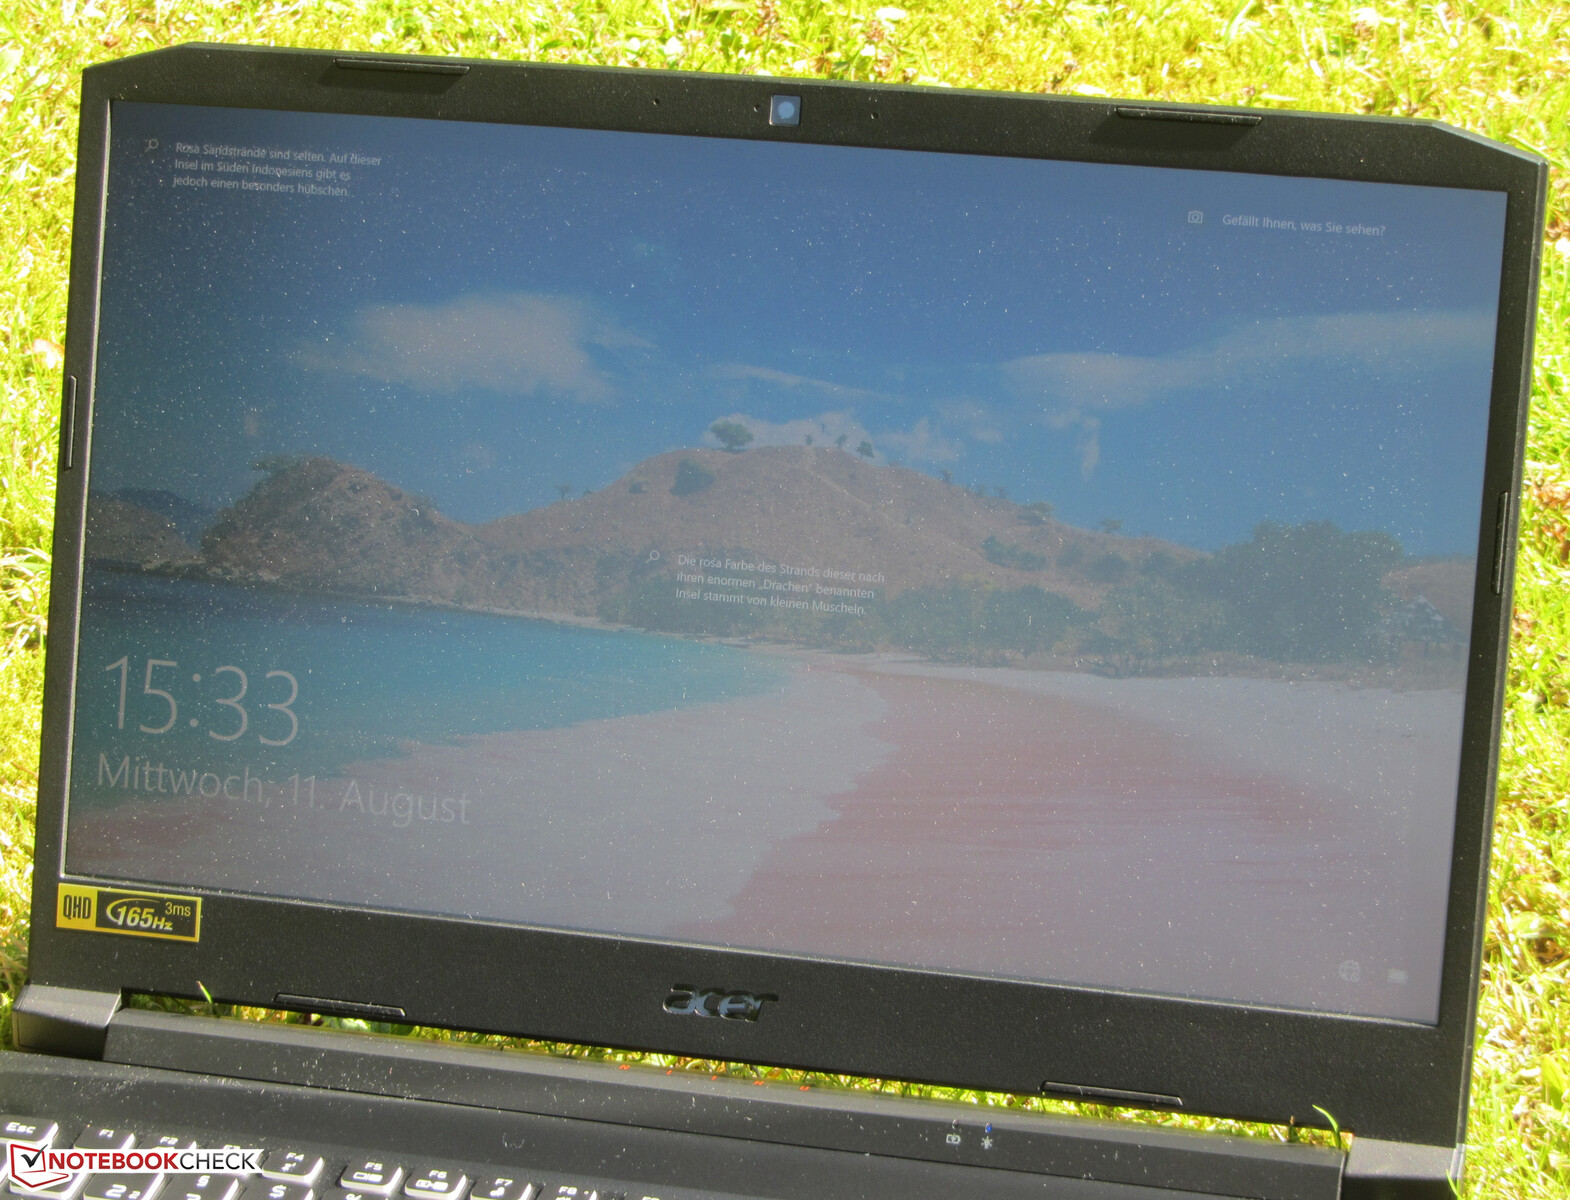
Display - Fast QHD panel
While the matte 15.6-inch display (2560x1440 pixels) delivers a good average brightness (304.4 cd/m²), the contrast (652:1) is too low. We consider values beyond 1,000:1 to be good. The 144 Hz panel offers quick response times. We didn't detect any PWM flickering.


| |||||||||||||||||||||||||
Brightness Distribution: 79 %
Center on Battery: 349 cd/m²
Contrast: 652:1 (Black: 0.535 cd/m²)
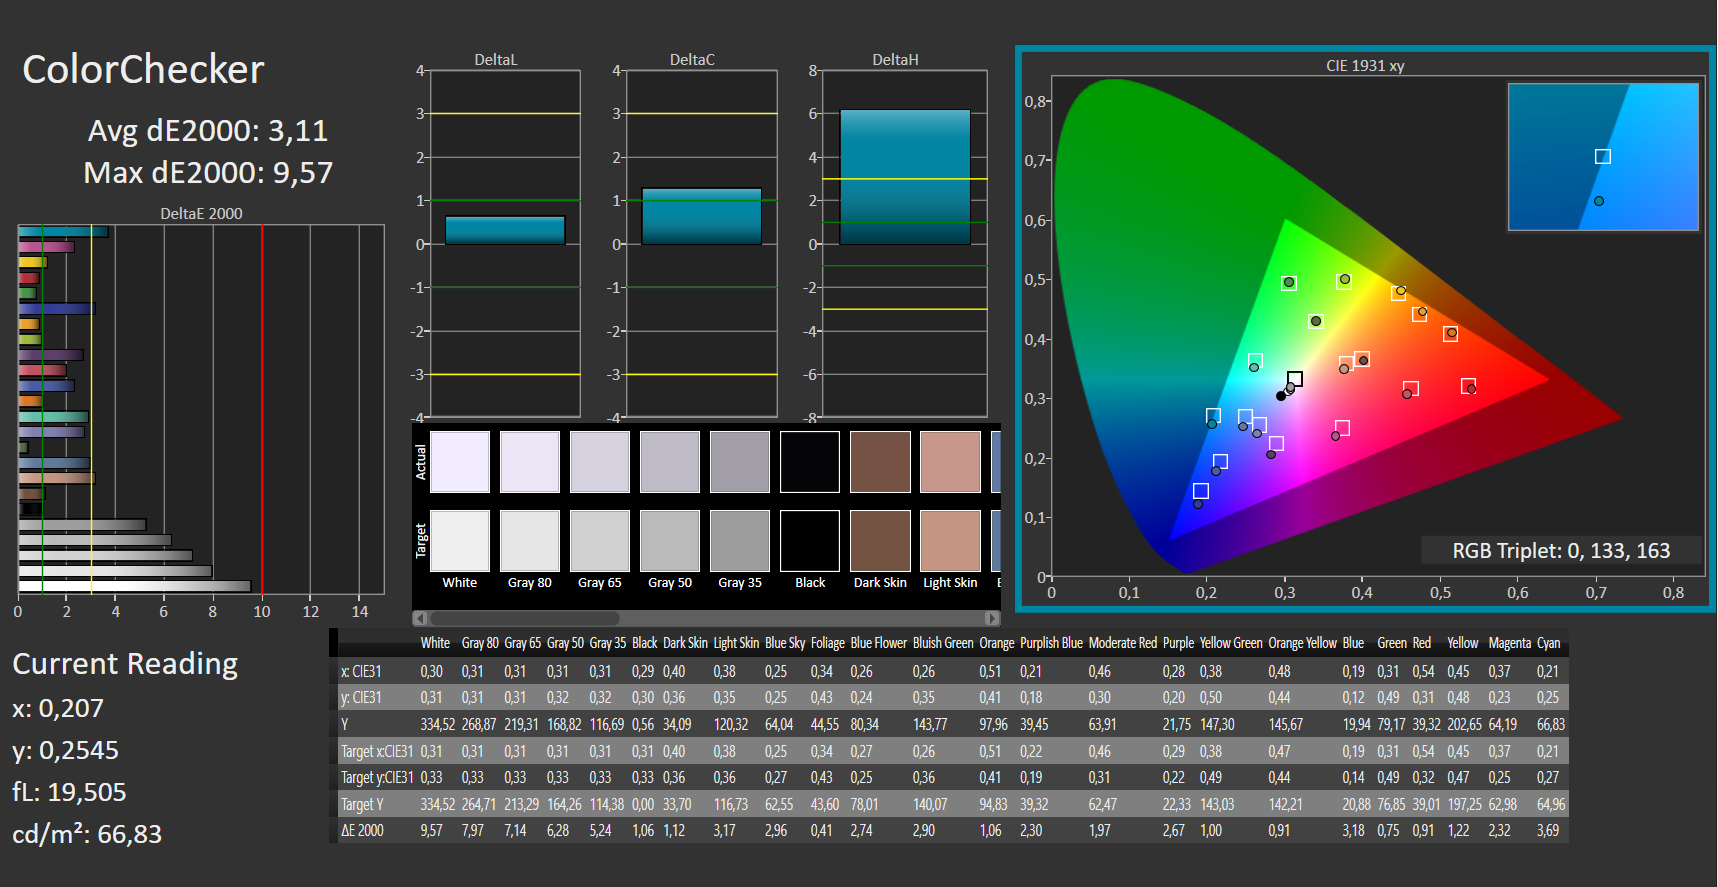
ΔE ColorChecker Calman: 3.11 | ∀{0.5-29.43 Ø4.83}
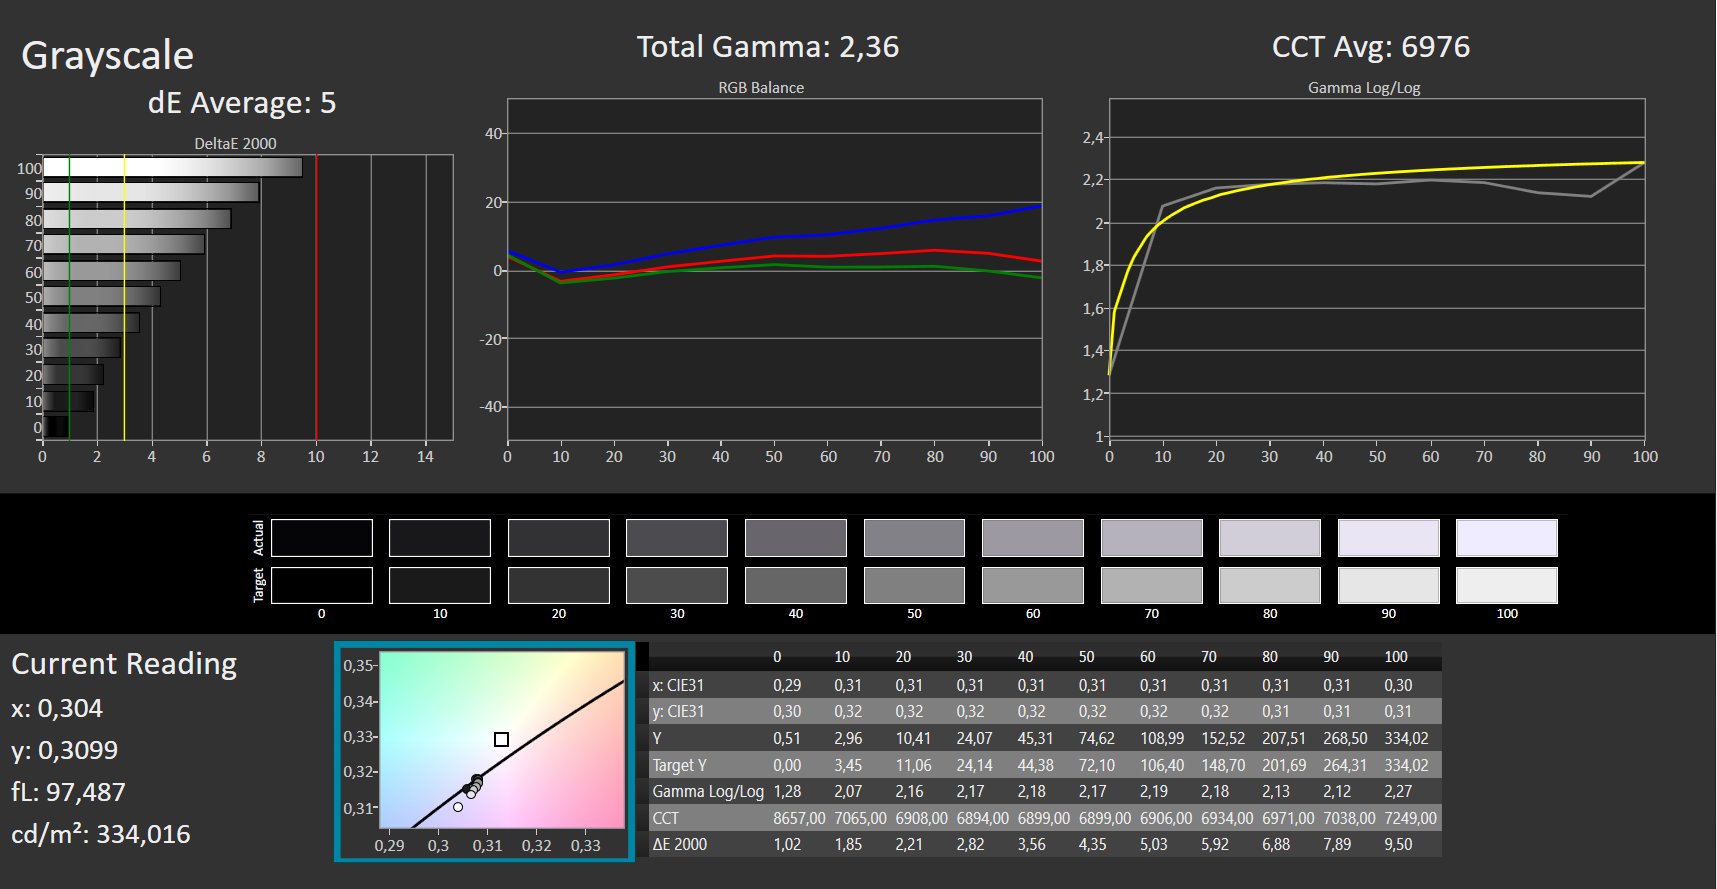
ΔE Greyscale Calman: 5 | ∀{0.09-98 Ø5.1}
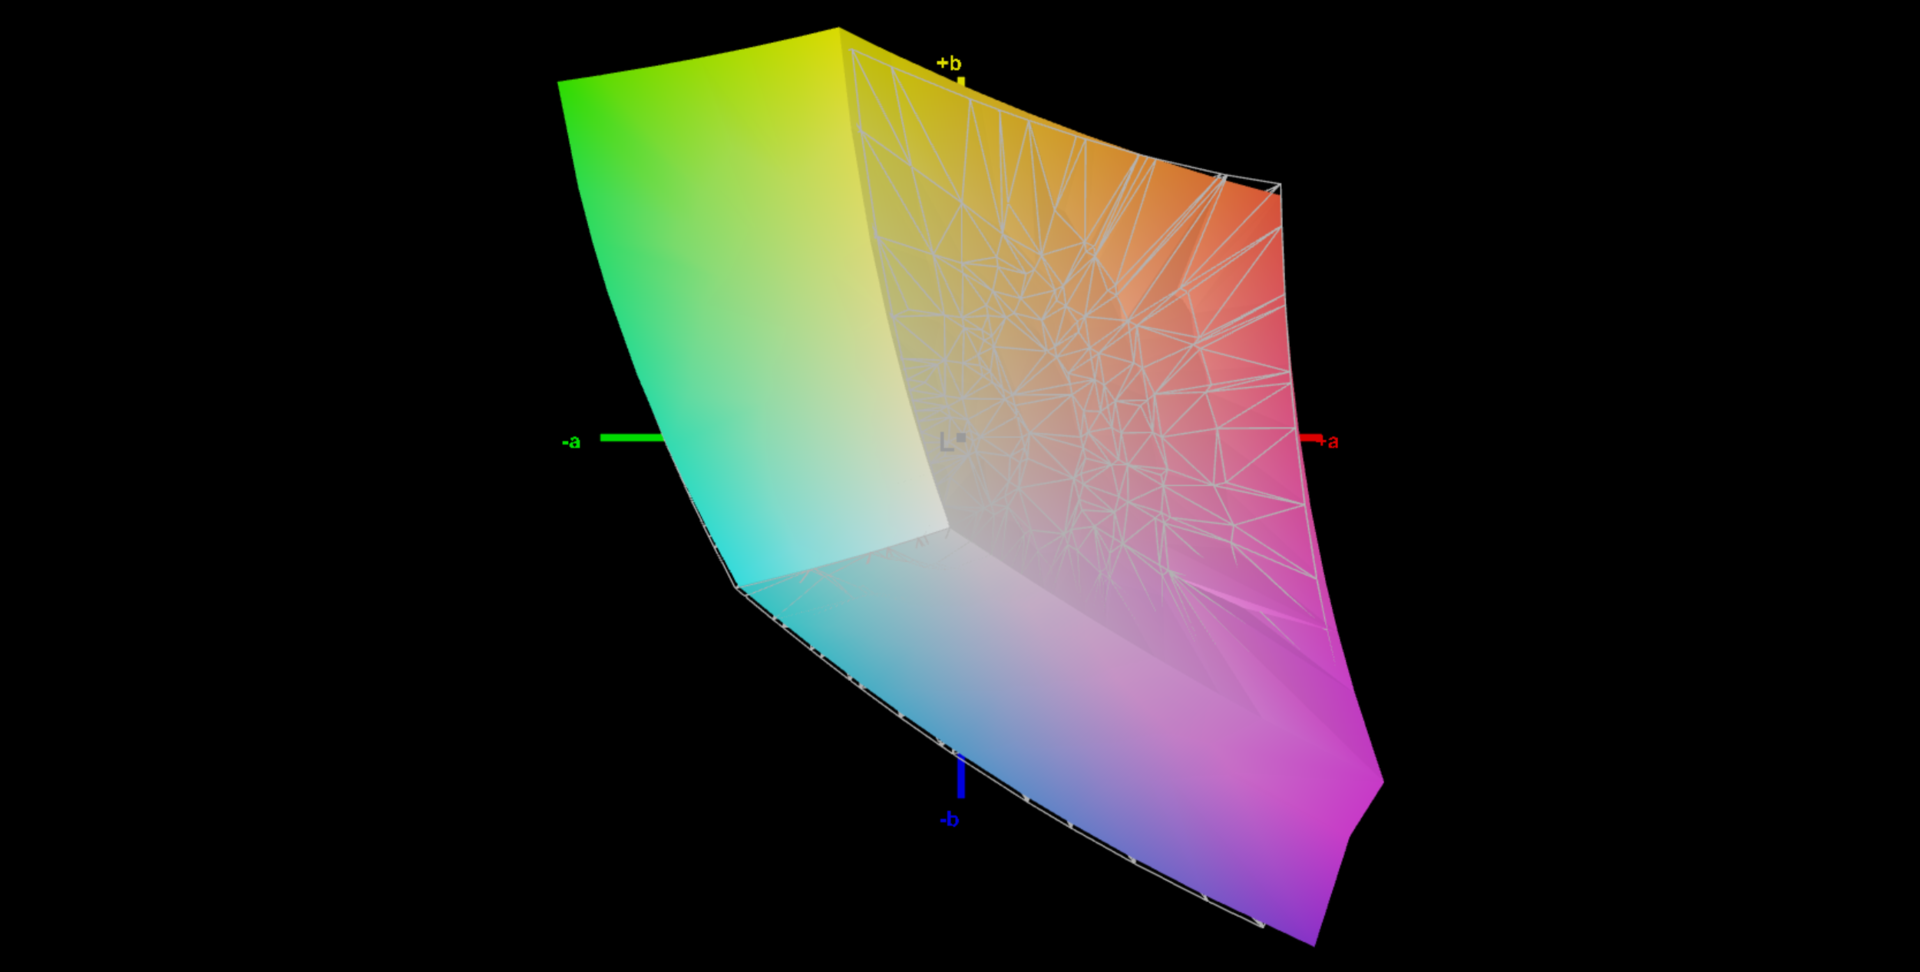
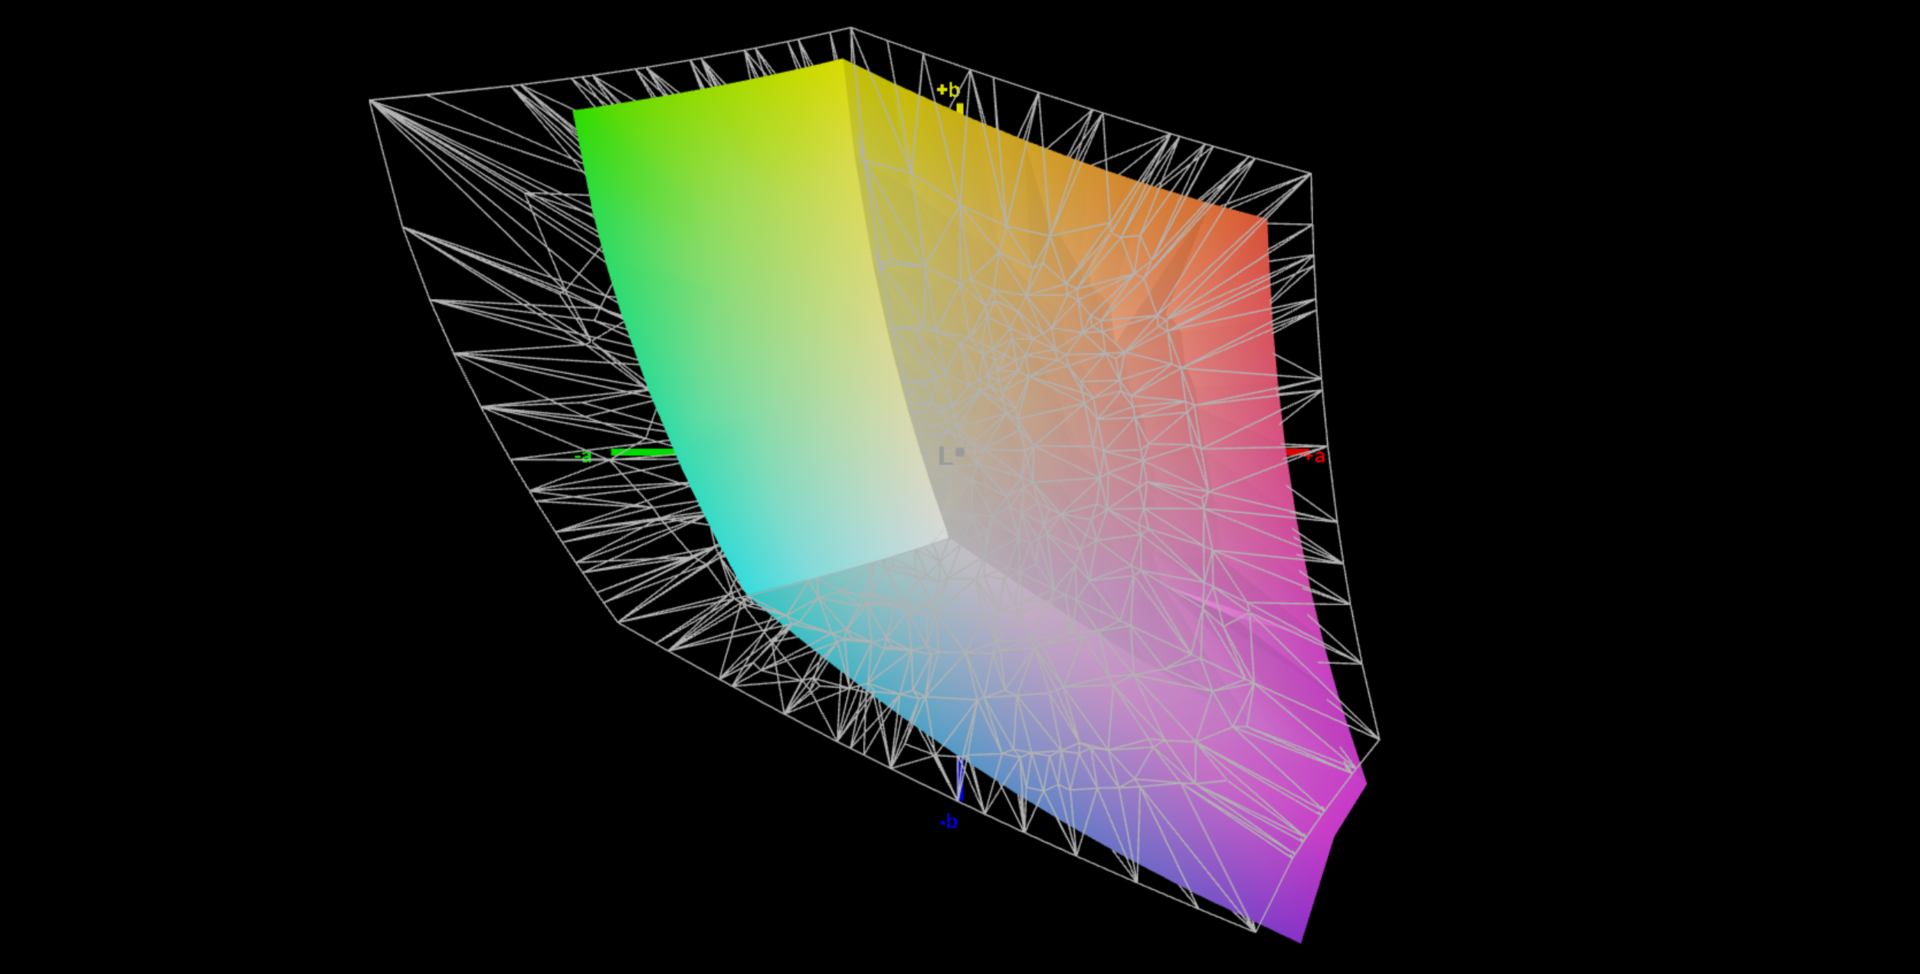
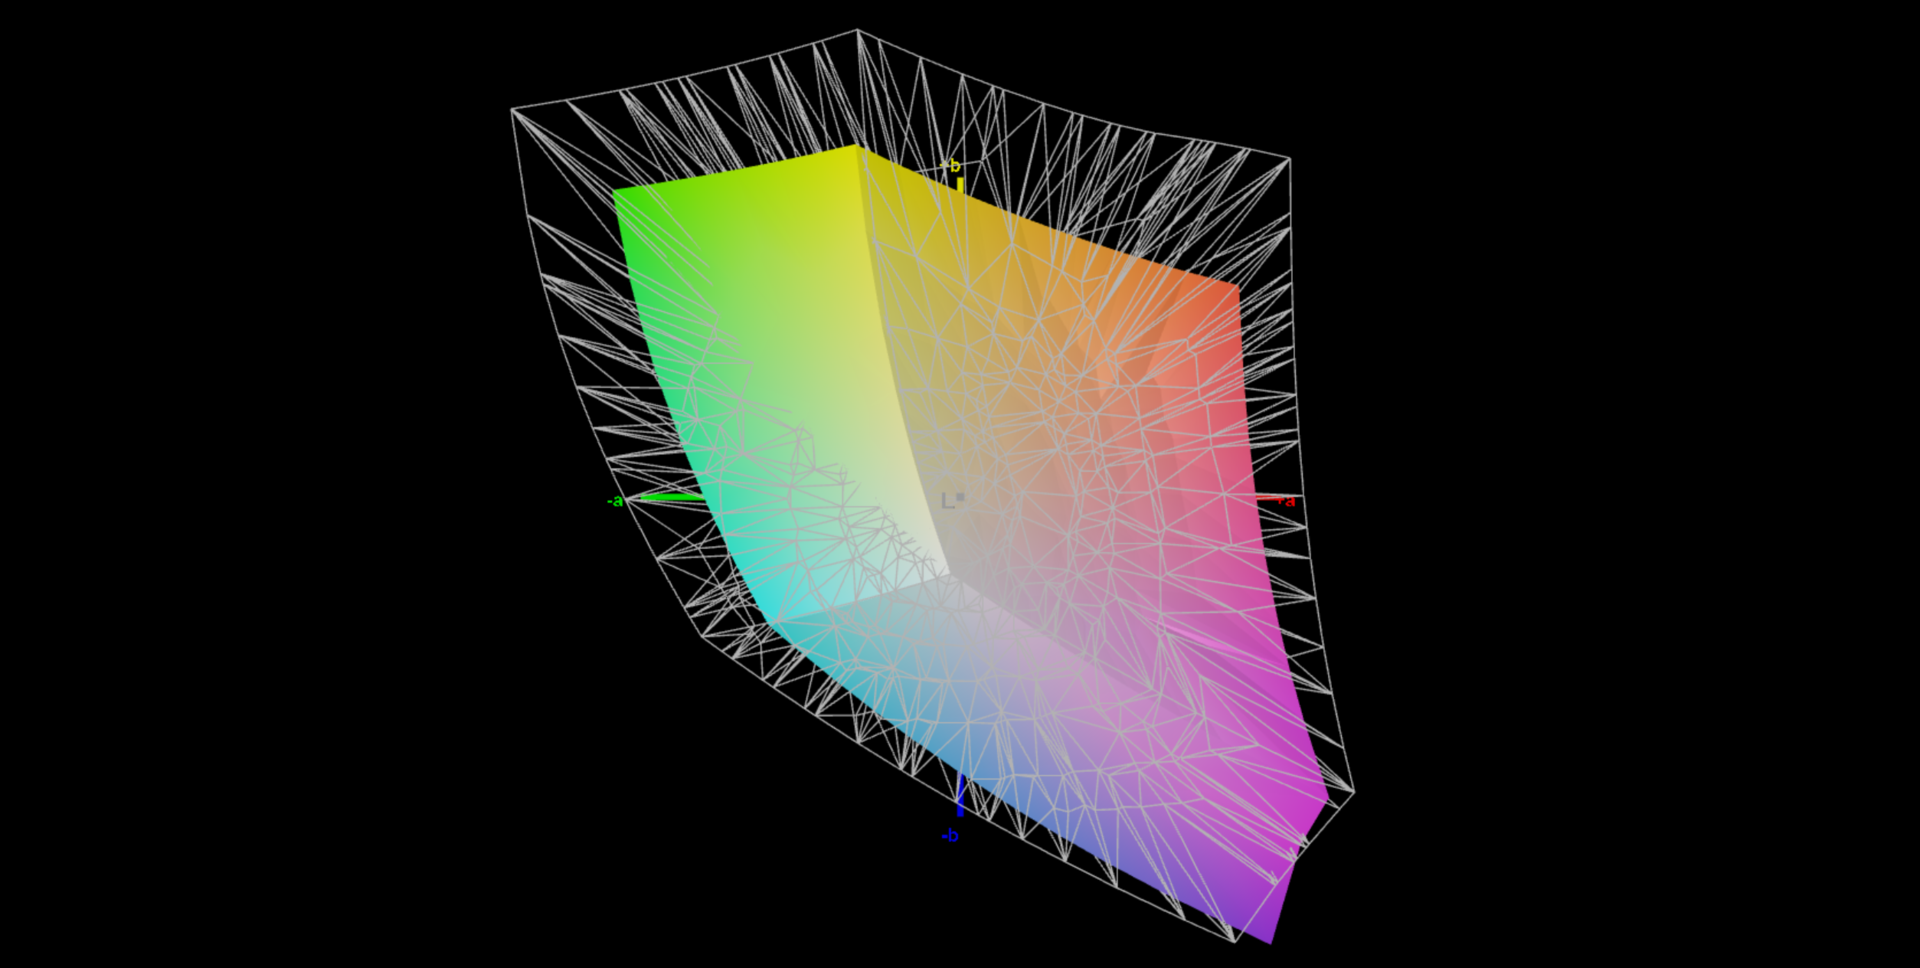
67.1% AdobeRGB 1998 (Argyll 3D)
96.3% sRGB (Argyll 3D)
66.2% Display P3 (Argyll 3D)
Gamma: 2.36
CCT: 6976 K
| Acer Nitro 5 AN515-45-R1JH BOE BOE09B8, IPS, 2560x1440, 15.6" | Asus ROG Strix G15 G513QY Sharp SHP152C, IPS, 1920x1080, 15.6" | Aorus 15P XC Sharp LQ156M1JW03, IPS, 1920x1080, 15.6" | MSI GF65 Thin 10UE AU Optronics B156HAN08.4, IPS, 1920x1080, 15.6" | Asus TUF Gaming A15 FA506QR-AZ061T Sharp SHP1532, IPS, 1920x1080, 15.6" | Razer Blade 15 Base Edition 2021, i7-10750H RTX 3060 BOE NV156FHM-N4K, IPS, 1920x1080, 15.6" | |
|---|---|---|---|---|---|---|
| Display | 1% | 2% | -42% | -3% | ||
| Display P3 Coverage | 66.2 | 66.5 0% | 67.2 2% | 37.65 -43% | 64.3 -3% | |
| sRGB Coverage | 96.3 | 97.7 1% | 98.7 2% | 56.3 -42% | 91.8 -5% | |
| AdobeRGB 1998 Coverage | 67.1 | 67.6 1% | 68.6 2% | 38.9 -42% | 65.5 -2% | |
| Response Times | 9% | 0% | -229% | 7% | 6% | |
| Response Time Grey 50% / Grey 80% * | 14 ? | 8 ? 43% | 11.2 ? 20% | 36.8 ? -163% | 12 ? 14% | 8.8 ? 37% |
| Response Time Black / White * | 8 ? | 10 ? -25% | 9.6 ? -20% | 31.6 ? -295% | 8 ? -0% | 10 ? -25% |
| PWM Frequency | 24040 ? | 1250 ? | 1000 ? | |||
| Screen | 3% | 38% | 2% | 40% | 13% | |
| Brightness middle | 349 | 306 -12% | 298 -15% | 266.5 -24% | 297 -15% | 317.2 -9% |
| Brightness | 304 | 283 -7% | 278 -9% | 262 -14% | 268 -12% | 306 1% |
| Brightness Distribution | 79 | 86 9% | 88 11% | 91 15% | 84 6% | 89 13% |
| Black Level * | 0.535 | 0.25 53% | 0.29 46% | 0.18 66% | 0.22 59% | 0.31 42% |
| Contrast | 652 | 1224 88% | 1028 58% | 1481 127% | 1350 107% | 1023 57% |
| Colorchecker dE 2000 * | 3.11 | 4.97 -60% | 0.96 69% | 5.33 -71% | 1.36 56% | 4.37 -41% |
| Colorchecker dE 2000 max. * | 9.57 | 10.12 -6% | 3.22 66% | 18.28 -91% | 3.82 60% | 6.62 31% |
| Greyscale dE 2000 * | 5 | 7.2 -44% | 1.3 74% | 4.5 10% | 1.88 62% | 4.5 10% |
| Gamma | 2.36 93% | 2.23 99% | 2.242 98% | 2.35 94% | 2.48 89% | 2.4 92% |
| CCT | 6976 93% | 7784 84% | 6519 100% | 6289 103% | 6768 96% | 7418 88% |
| Colorchecker dE 2000 calibrated * | 0.7 | 0.83 | 4.36 | 2.67 | ||
| Color Space (Percent of AdobeRGB 1998) | 67.6 | 69 | 35.6 | 63 | 59.2 | |
| Color Space (Percent of sRGB) | 97.7 | 91 | 55.8 | 99 | 91.4 | |
| Total Average (Program / Settings) | 4% /
3% | 13% /
24% | -90% /
-44% | 24% /
34% | 5% /
8% |
* ... smaller is better
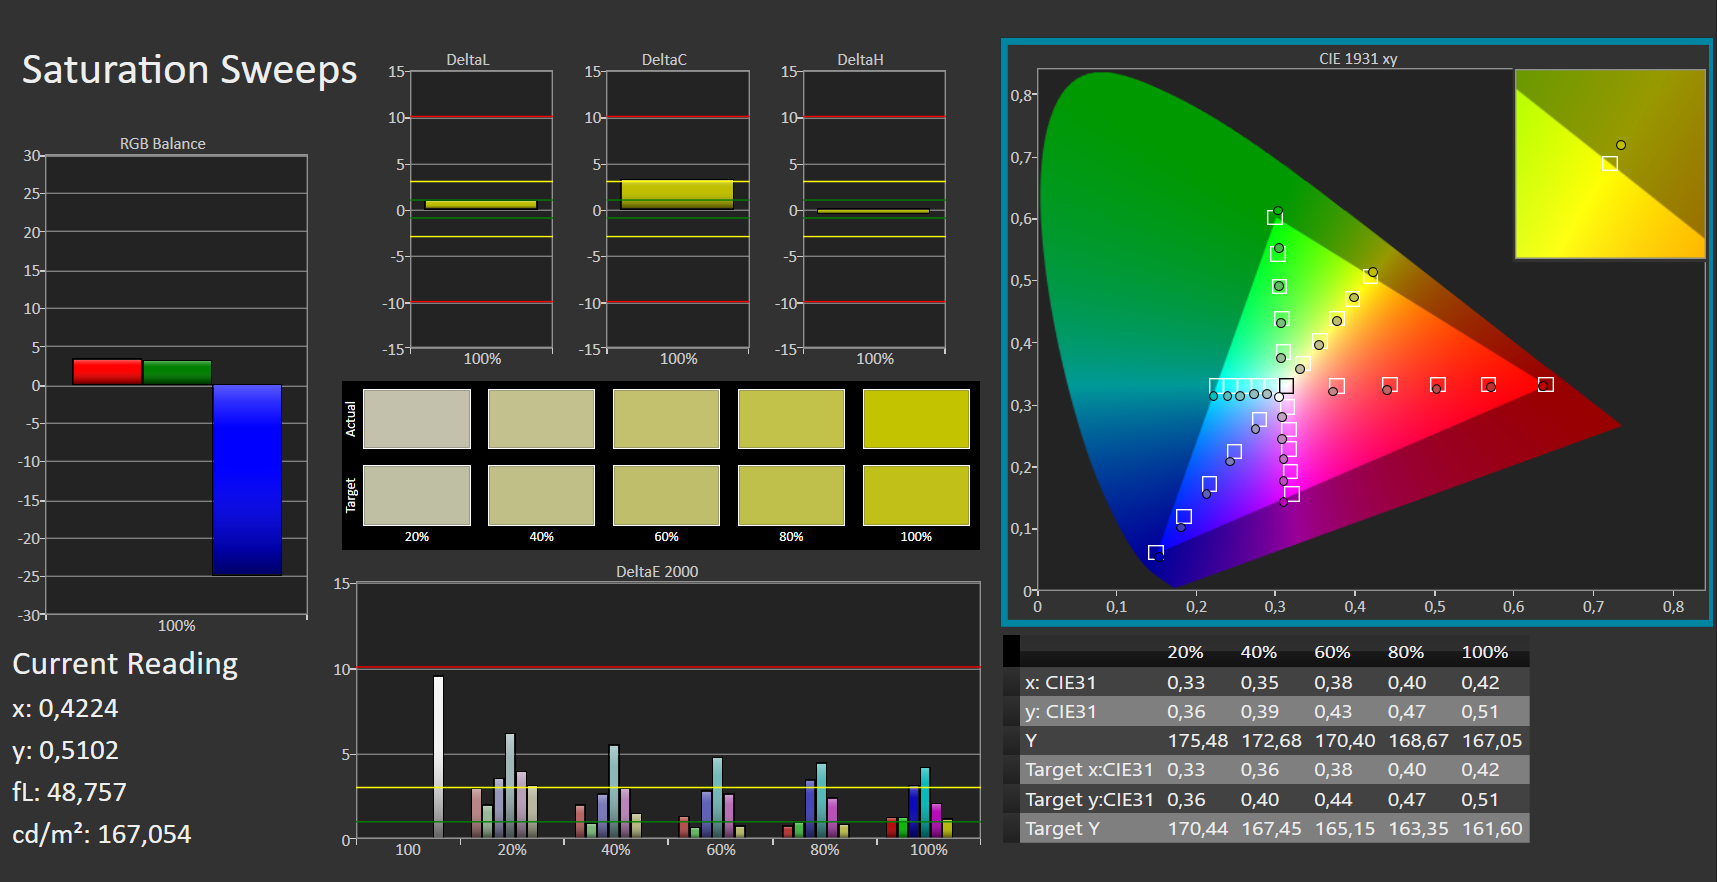
Out of the box, the display shows a very decent color reproduction and only just misses the target with a color deviation of 3.11 (DeltaE less than 3). It doesn't suffer from a blue tint. The AdobeRGB (67%), sRGB (96%), and DCI-P3 (66%) color spaces aren't completely mapped.
Display Response Times
| ↔ Response Time Black to White | ||
|---|---|---|
| 8 ms ... rise ↗ and fall ↘ combined | ↗ 4 ms rise |  |
| ↘ 4 ms fall | ||
| The screen shows fast response rates in our tests and should be suited for gaming. In comparison, all tested devices range from 0.1 (minimum) to 240 (maximum) ms. » 20 % of all devices are better. This means that the measured response time is better than the average of all tested devices (20.5 ms). | ||
| ↔ Response Time 50% Grey to 80% Grey | ||
| 14 ms ... rise ↗ and fall ↘ combined | ↗ 7 ms rise |  |
| ↘ 7 ms fall | ||
| The screen shows good response rates in our tests, but may be too slow for competitive gamers. In comparison, all tested devices range from 0.165 (minimum) to 636 (maximum) ms. » 26 % of all devices are better. This means that the measured response time is better than the average of all tested devices (32.1 ms). | ||
Screen Flickering / PWM (Pulse-Width Modulation)
| Screen flickering / PWM not detected |  | ||
In comparison: 53 % of all tested devices do not use PWM to dim the display. If PWM was detected, an average of 8327 (minimum: 5 - maximum: 343500) Hz was measured. | |||
The viewing-angle stable IPS panel is legible from any position. Outdoors, reading the display is possible when the sun isn't shining too brightly.

Performance - RTX 3070 with low TGP
With the Nitro 5 AN515-45, Acer has a 15.6-inch gaming laptop in its lineup that brings every modern game smoothly onto the screen.
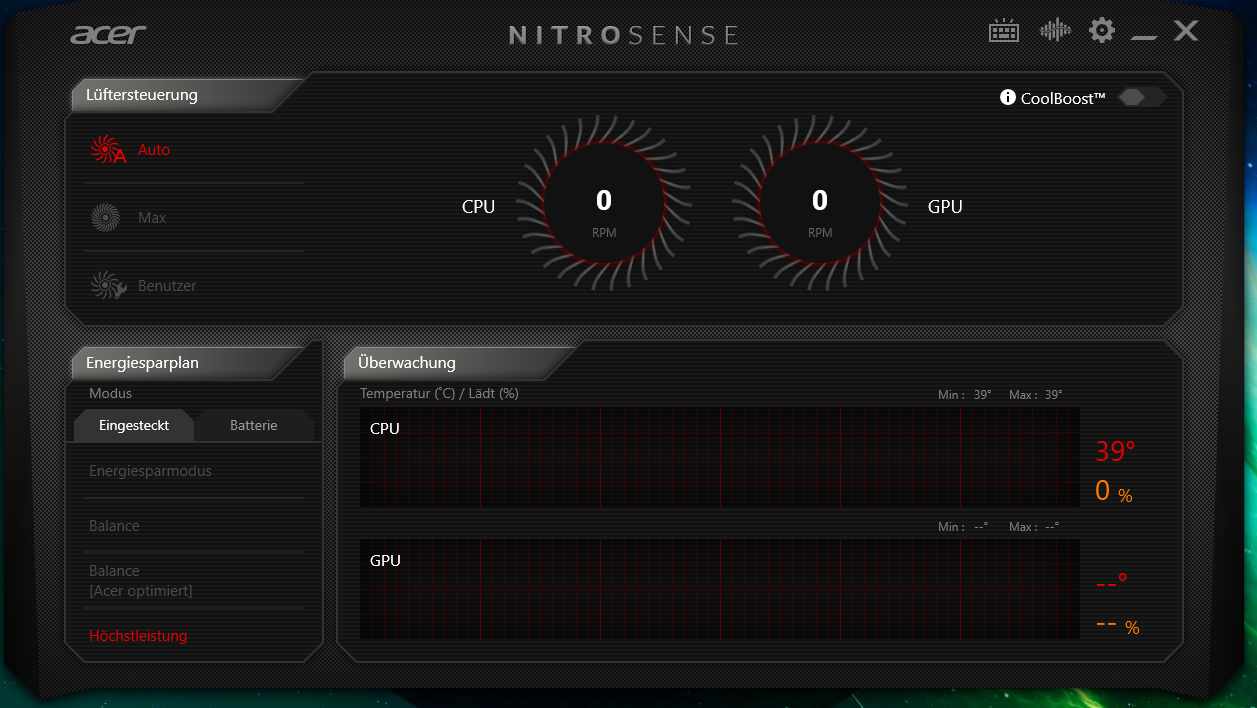
Test conditions
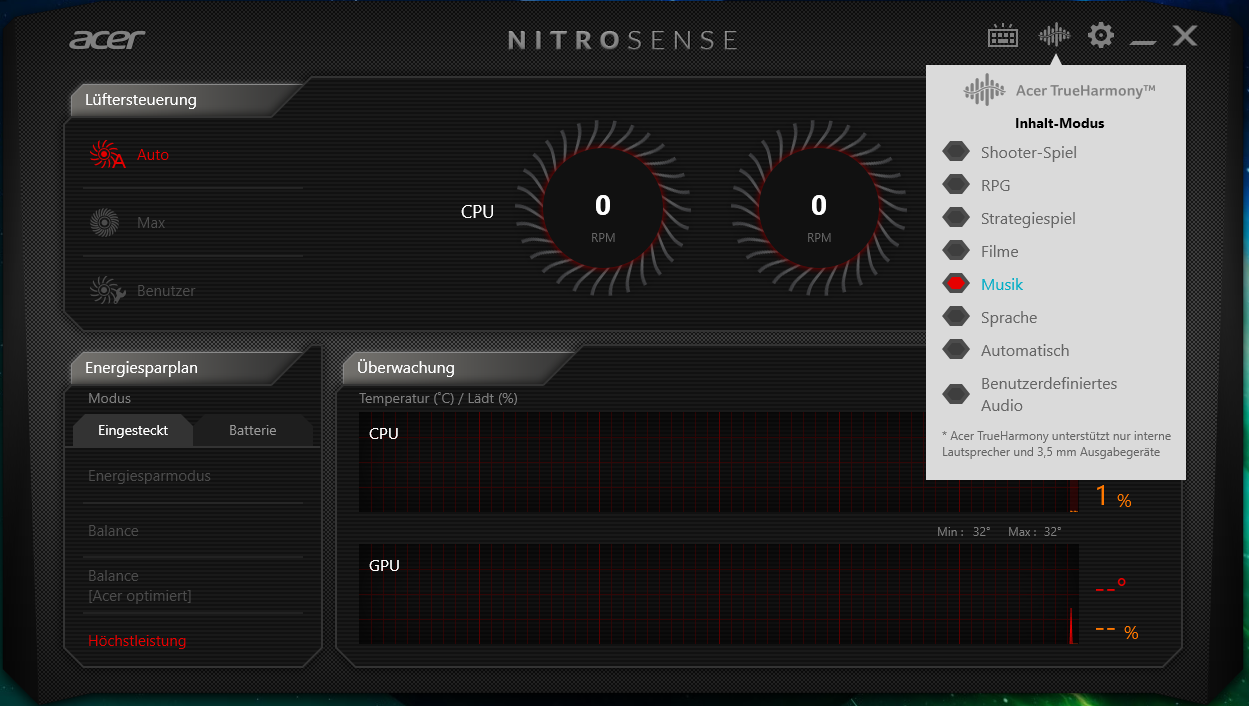
The preinstalled NitroSense software offers various performance profiles and allows the user to adjust the two fans. We ran all benchmarks using the performance profile "High Performance" and enabled the automatic fan control. The performance profiles correspond to the standard Windows 10 profiles.
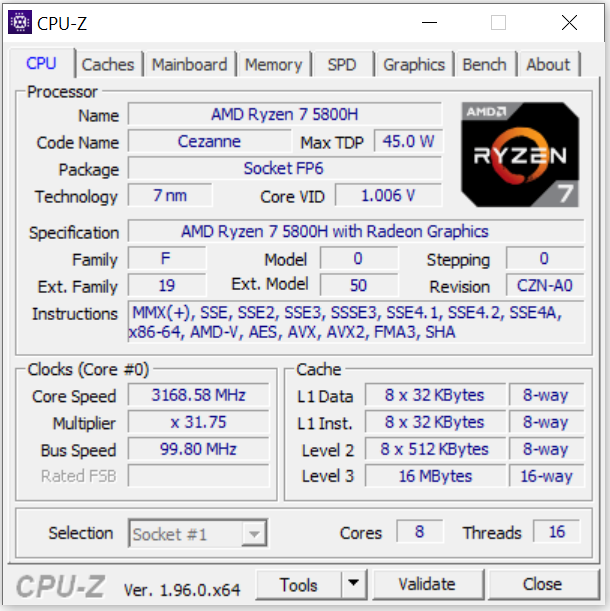
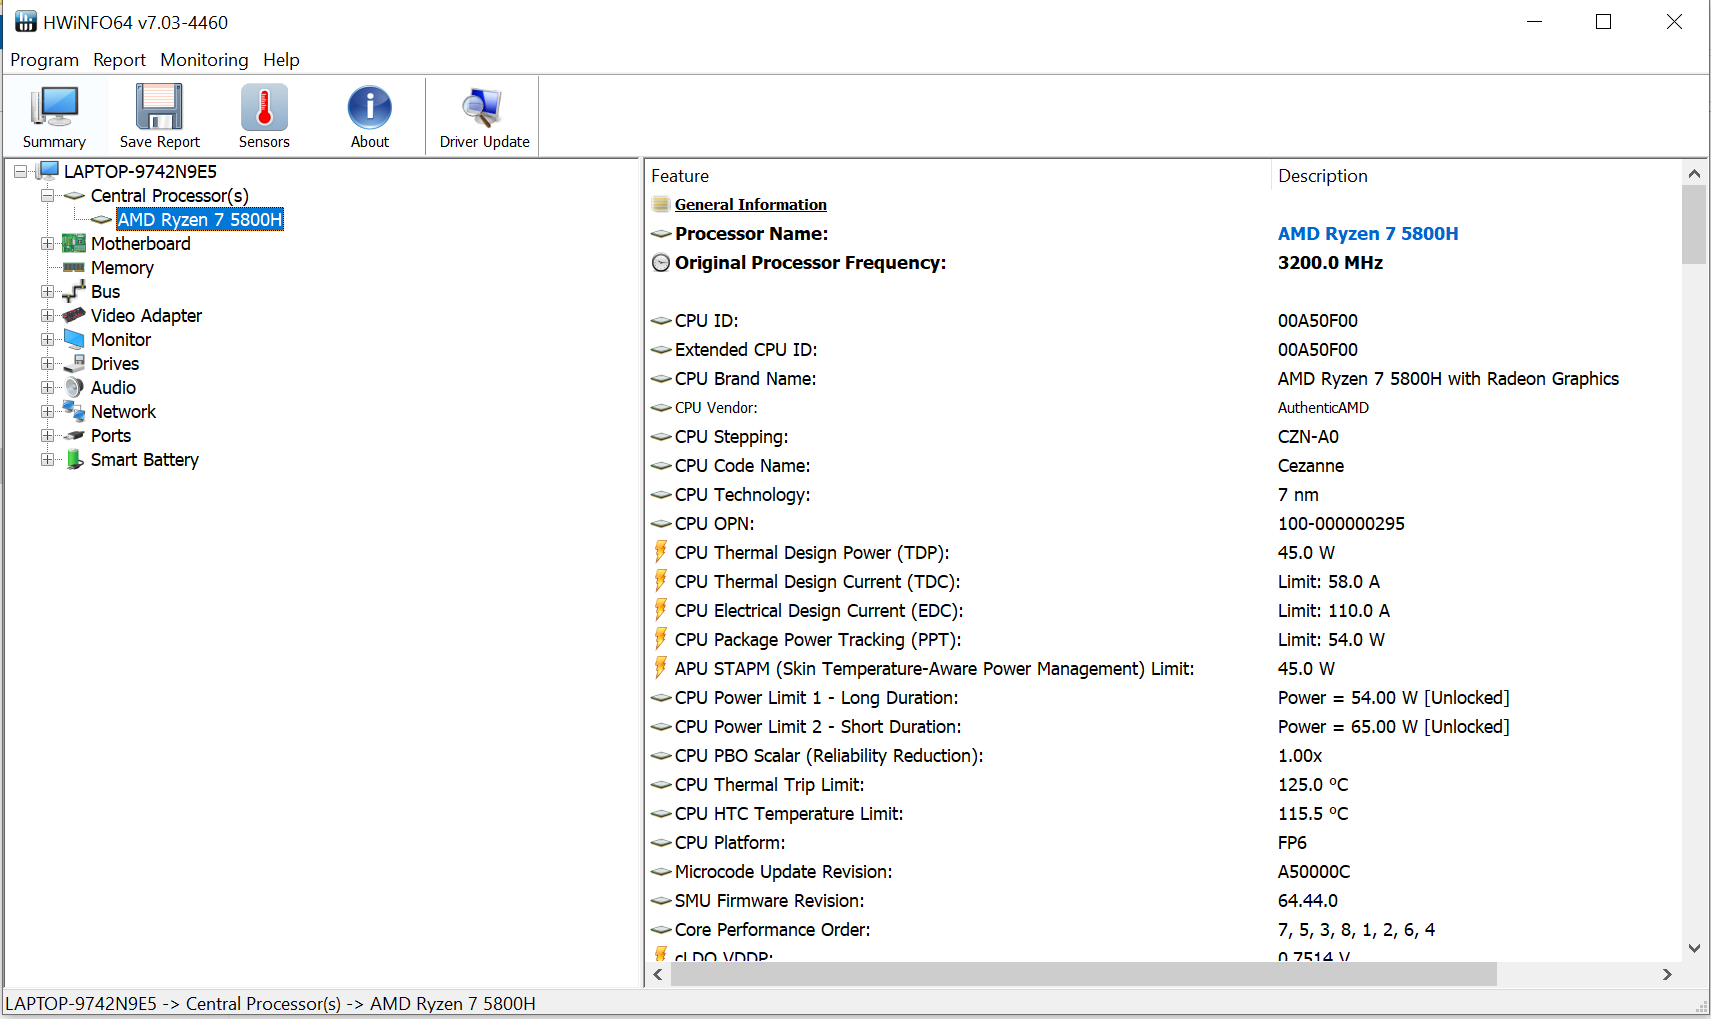
Processor
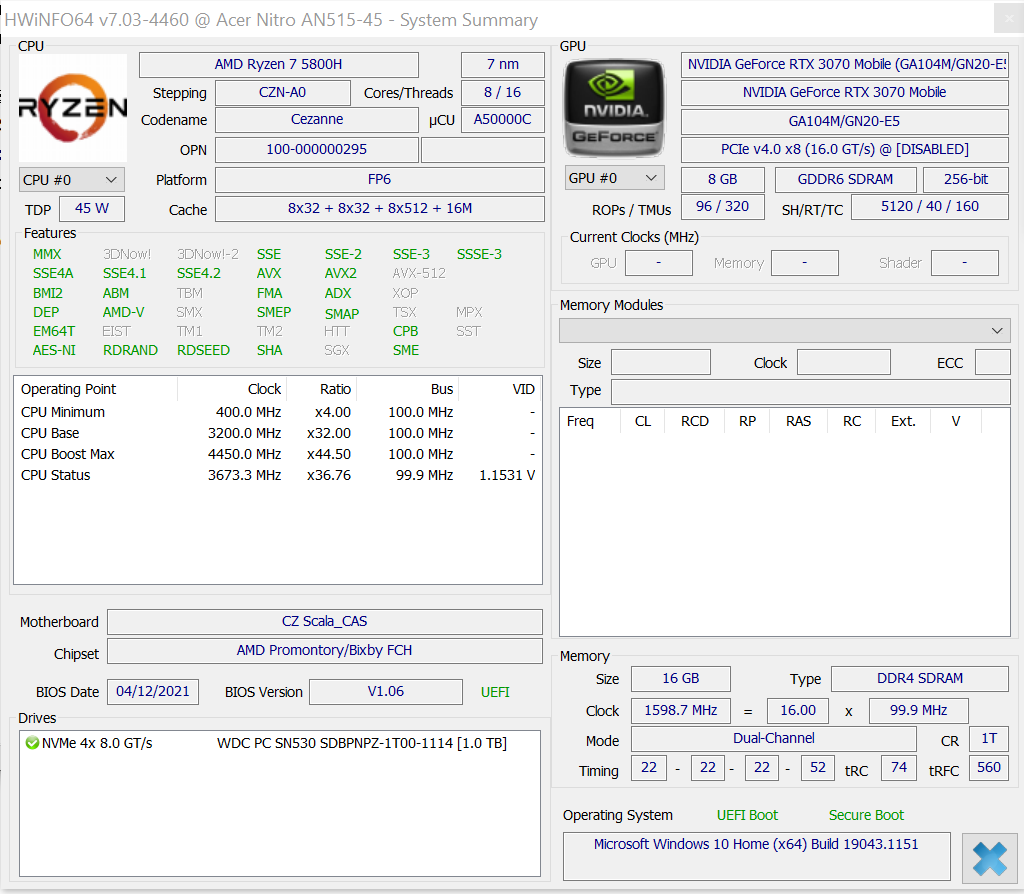
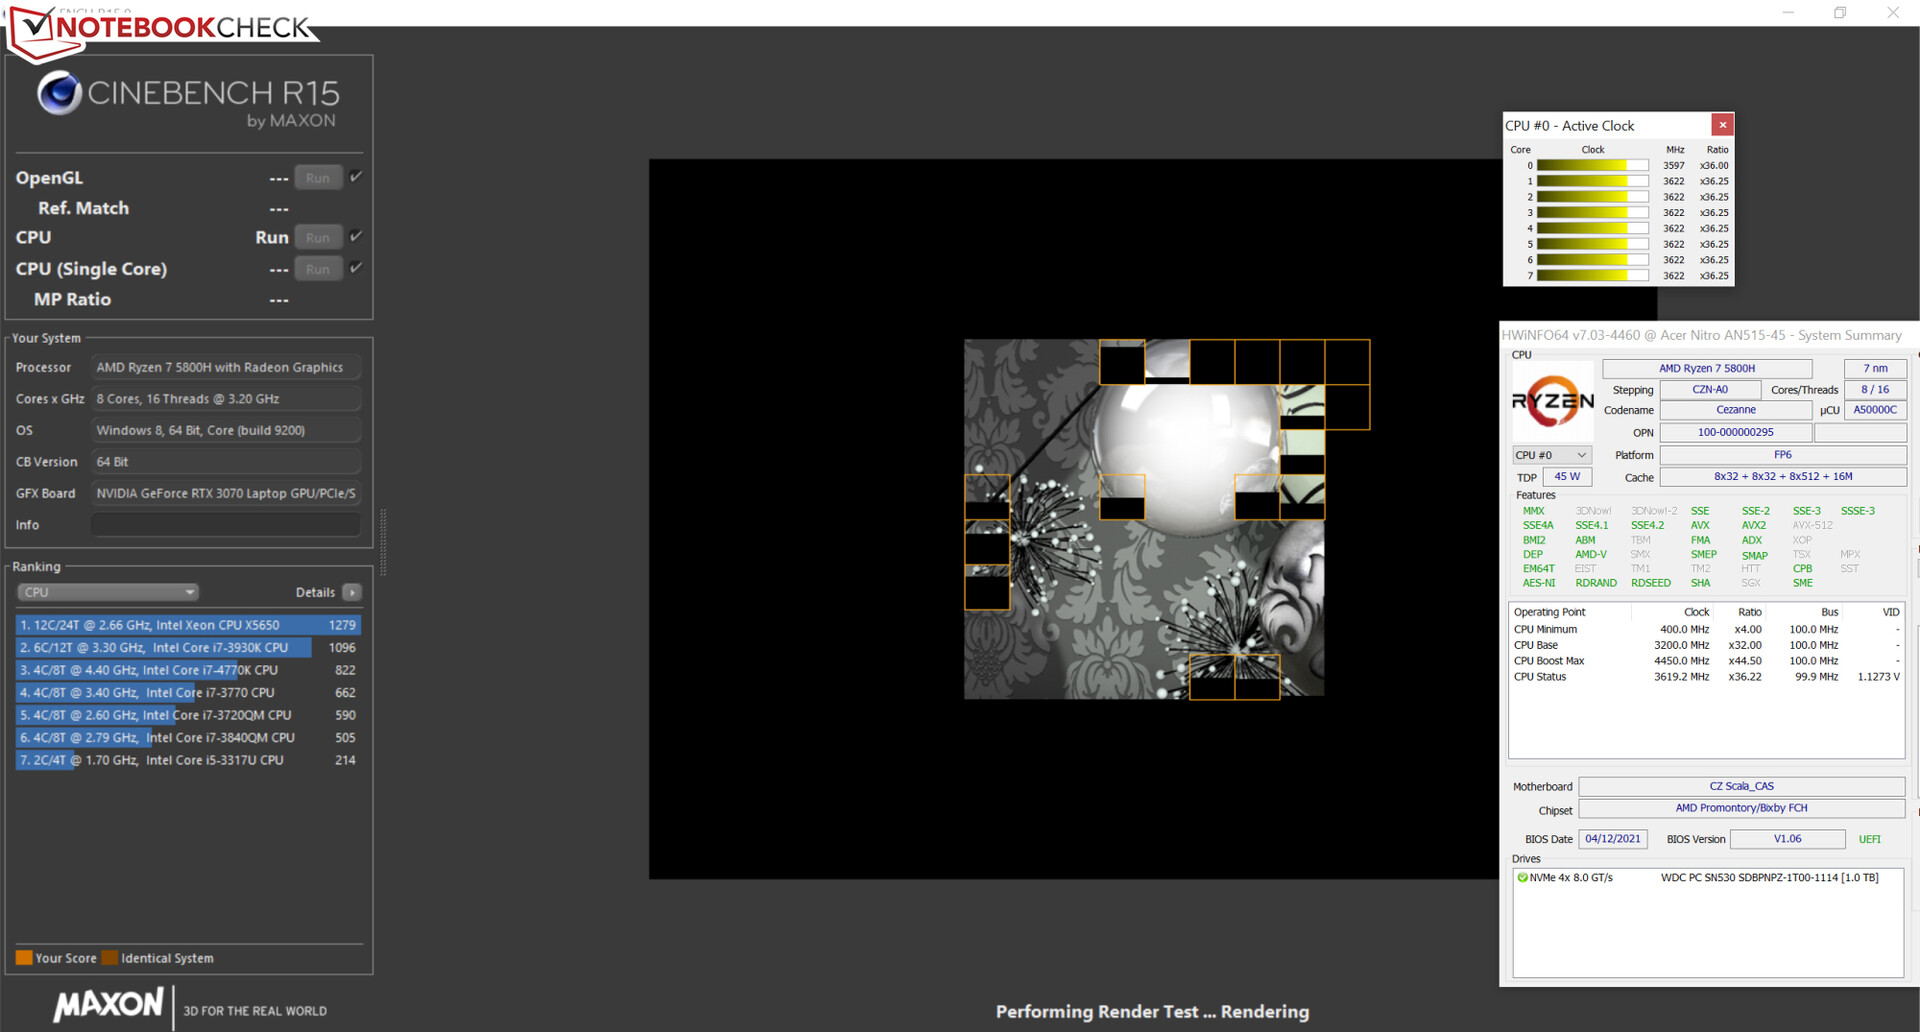
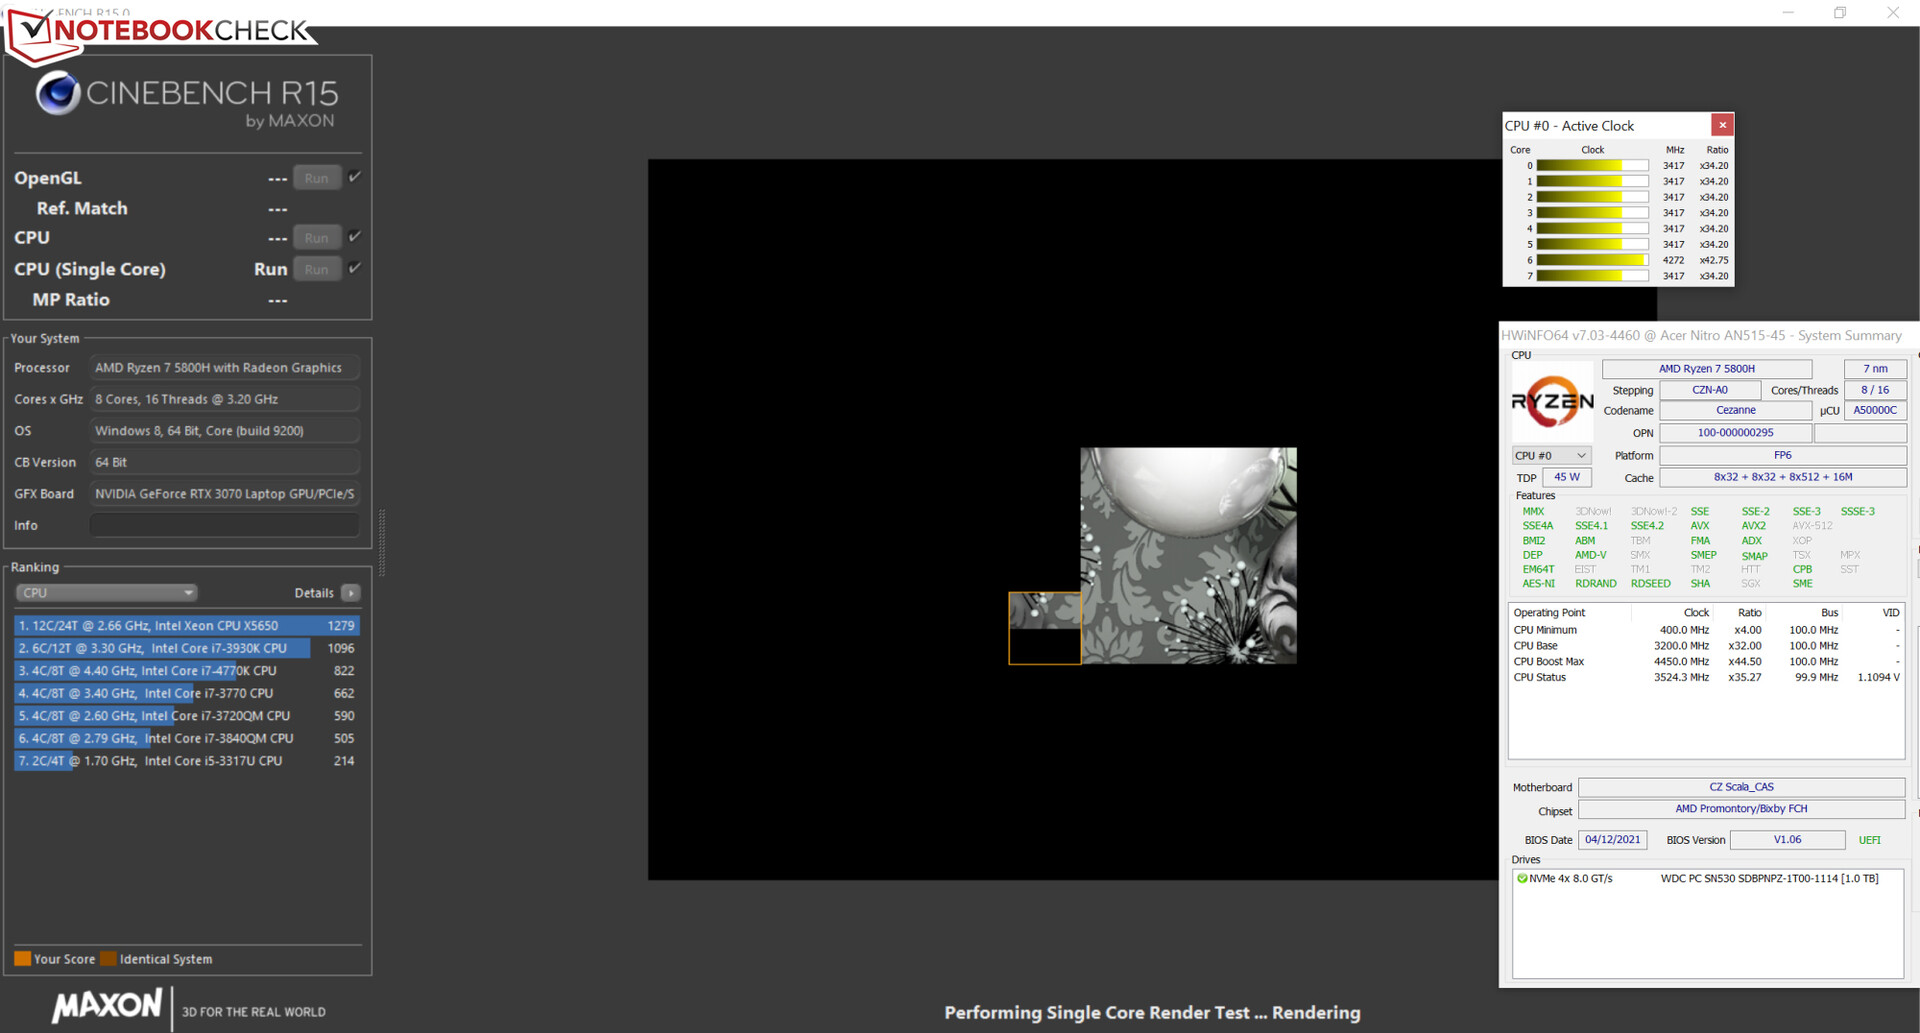
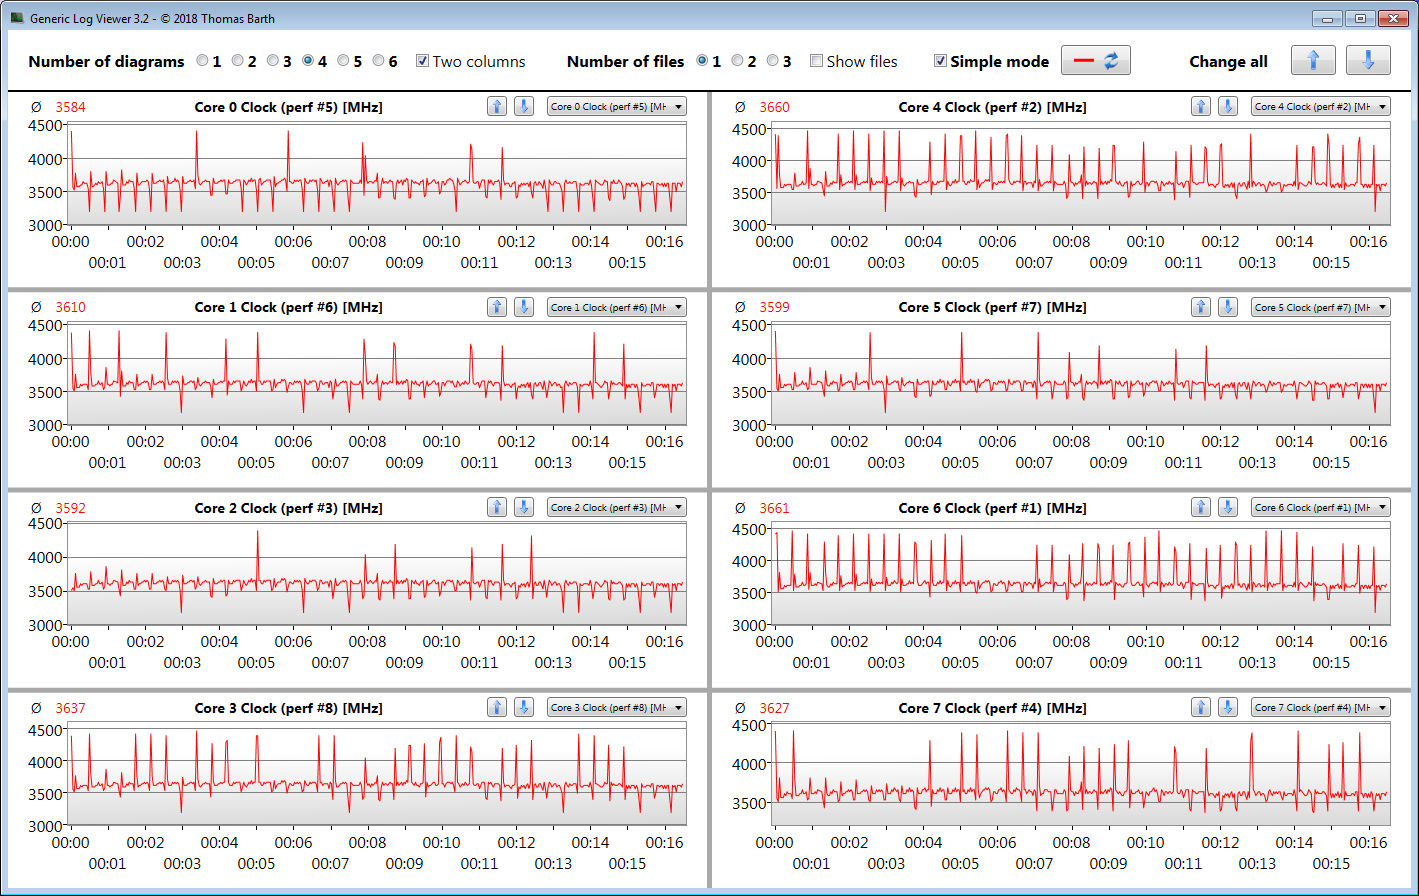
The CPU part of the Ryzen 7 5800H APU (Cezanne) consists of an octa-core processor that operates at a base clock speed of 3.2 GHz. An increase up to 4.4 GHz is possible via Turbo. Simultaneous multithreading (two threads per core) is supported.
The Cinebench R15 benchmark's multithread test is processed at 3.6 to 3.8 GHz (plugged in) and 2.5 to 3.3 GHz (battery power), respectively. The single-thread test is always run at 3.4 to 4.4 GHz.
We verify if the CPU Turbo is also consistently used when plugged in by running the Cinebench R15 benchmark's multithread test in a continuous loop for at least 30 minutes. Turbo is used at a moderate extent.
Cinebench R15 Multi endurance test
* ... smaller is better
System performance
The fast and smooth system has enough computing power for all common application areas. Gaming, video editing, and image processing don't pose a big challenge for the Nitro. This is complemented by good PCMark results.
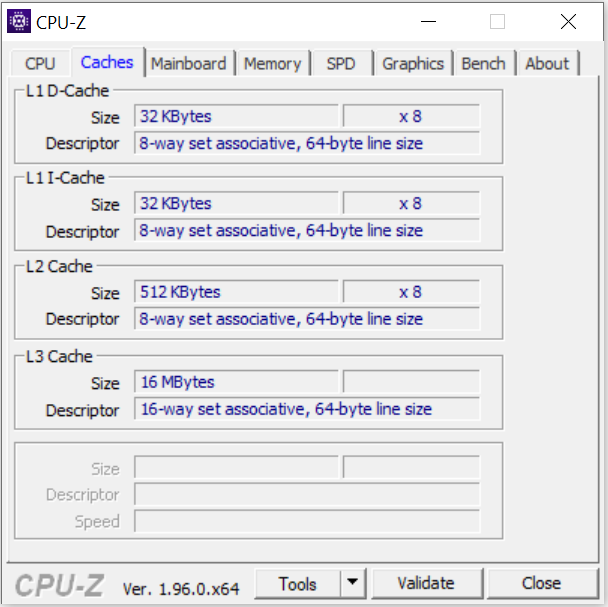
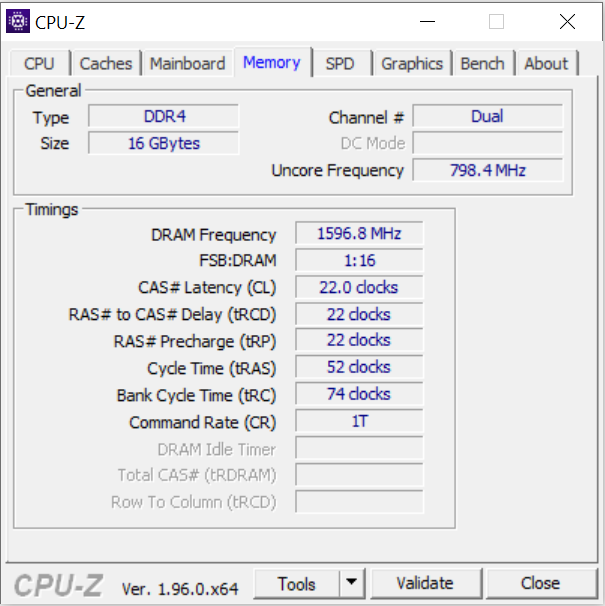
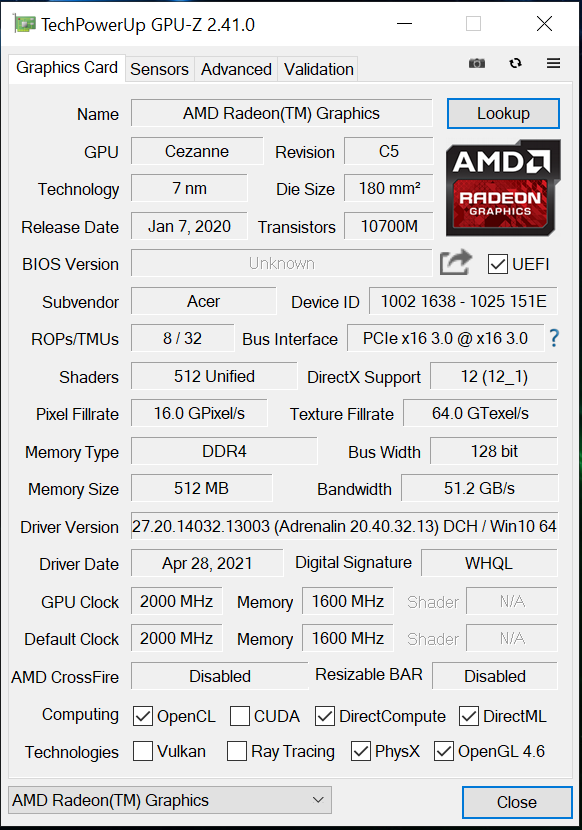
Acer equips the laptop with two single-sided 8 GB RAM modules (DDR4-3200) that have relatively slow transfer rates and memory timings. Among the laptops that we've tested so far with this CPU-GPU combination, memory ranks in the lower range of the table.
On average, the low values can lead to a drop in gaming performance of up to 10%. Replacing the memory modules with models with better timings could slightly increase gaming performance further.
| PCMark 8 Home Score Accelerated v2 | 4995 points | |
| PCMark 8 Creative Score Accelerated v2 | 6161 points | |
| PCMark 8 Work Score Accelerated v2 | 5916 points | |
| PCMark 10 Score | 6738 points | |
Help | ||
| PCMark 10 / Score | |
| Average of class Gaming (5776 - 9852, n=130, last 2 years) | |
| Asus ROG Strix G15 G513QY | |
| Asus TUF Gaming A15 FA506QR-AZ061T | |
| Average AMD Ryzen 7 5800H, NVIDIA GeForce RTX 3070 Laptop GPU (6717 - 6983, n=6) | |
| Acer Nitro 5 AN515-45-R1JH | |
| Aorus 15P XC | |
| Razer Blade 15 Base Edition 2021, i7-10750H RTX 3060 | |
| MSI GF65 Thin 10UE | |
| Acer Aspire Nitro 5 AN515-55-57GF | |
| PCMark 10 / Essentials | |
| Average of class Gaming (9057 - 12600, n=130, last 2 years) | |
| Asus ROG Strix G15 G513QY | |
| Asus TUF Gaming A15 FA506QR-AZ061T | |
| Razer Blade 15 Base Edition 2021, i7-10750H RTX 3060 | |
| Average AMD Ryzen 7 5800H, NVIDIA GeForce RTX 3070 Laptop GPU (9548 - 10226, n=6) | |
| Acer Nitro 5 AN515-45-R1JH | |
| Aorus 15P XC | |
| MSI GF65 Thin 10UE | |
| Acer Aspire Nitro 5 AN515-55-57GF | |
| PCMark 10 / Productivity | |
| Average of class Gaming (6662 - 14612, n=130, last 2 years) | |
| Asus TUF Gaming A15 FA506QR-AZ061T | |
| Acer Nitro 5 AN515-45-R1JH | |
| Average AMD Ryzen 7 5800H, NVIDIA GeForce RTX 3070 Laptop GPU (8849 - 9514, n=6) | |
| Asus ROG Strix G15 G513QY | |
| Aorus 15P XC | |
| Razer Blade 15 Base Edition 2021, i7-10750H RTX 3060 | |
| MSI GF65 Thin 10UE | |
| Acer Aspire Nitro 5 AN515-55-57GF | |
| PCMark 10 / Digital Content Creation | |
| Average of class Gaming (7440 - 19351, n=130, last 2 years) | |
| Asus ROG Strix G15 G513QY | |
| Aorus 15P XC | |
| Average AMD Ryzen 7 5800H, NVIDIA GeForce RTX 3070 Laptop GPU (8948 - 10389, n=6) | |
| Asus TUF Gaming A15 FA506QR-AZ061T | |
| Acer Nitro 5 AN515-45-R1JH | |
| Razer Blade 15 Base Edition 2021, i7-10750H RTX 3060 | |
| MSI GF65 Thin 10UE | |
| Acer Aspire Nitro 5 AN515-55-57GF | |
| Acer Nitro 5 AN515-45-R1JH R7 5800H, GeForce RTX 3070 Laptop GPU | Asus ROG Strix G15 G513QY R9 5900HX, Radeon RX 6800M | Aorus 15P XC i7-10870H, GeForce RTX 3070 Laptop GPU | Asus TUF Gaming A15 FA506QR-AZ061T R7 5800H, GeForce RTX 3070 Laptop GPU | Average NVIDIA GeForce RTX 3070 Laptop GPU | Average AMD Ryzen 7 5800H | |
|---|---|---|---|---|---|---|
| AIDA64 | -5% | 8% | 1% | 14% | 2% | |
| Memory Write | 34298 | 32536 -5% | 40730 19% | 33705 -2% | 43176 ? 26% | 37769 ? 10% |
| Memory Read | 43642 | 41984 -4% | 40189 -8% | 45970 5% | 45987 ? 5% | 44498 ? 2% |
| Memory Latency * | 76.3 | 81.3 -7% | 57.9 24% | 79.2 -4% | 66.4 ? 13% | 83.3 ? -9% |
| Memory Copy | 37654 | 36725 -2% | 35818 -5% | 39623 5% | 41820 ? 11% | 39512 ? 5% |
* ... smaller is better
DPC latencies
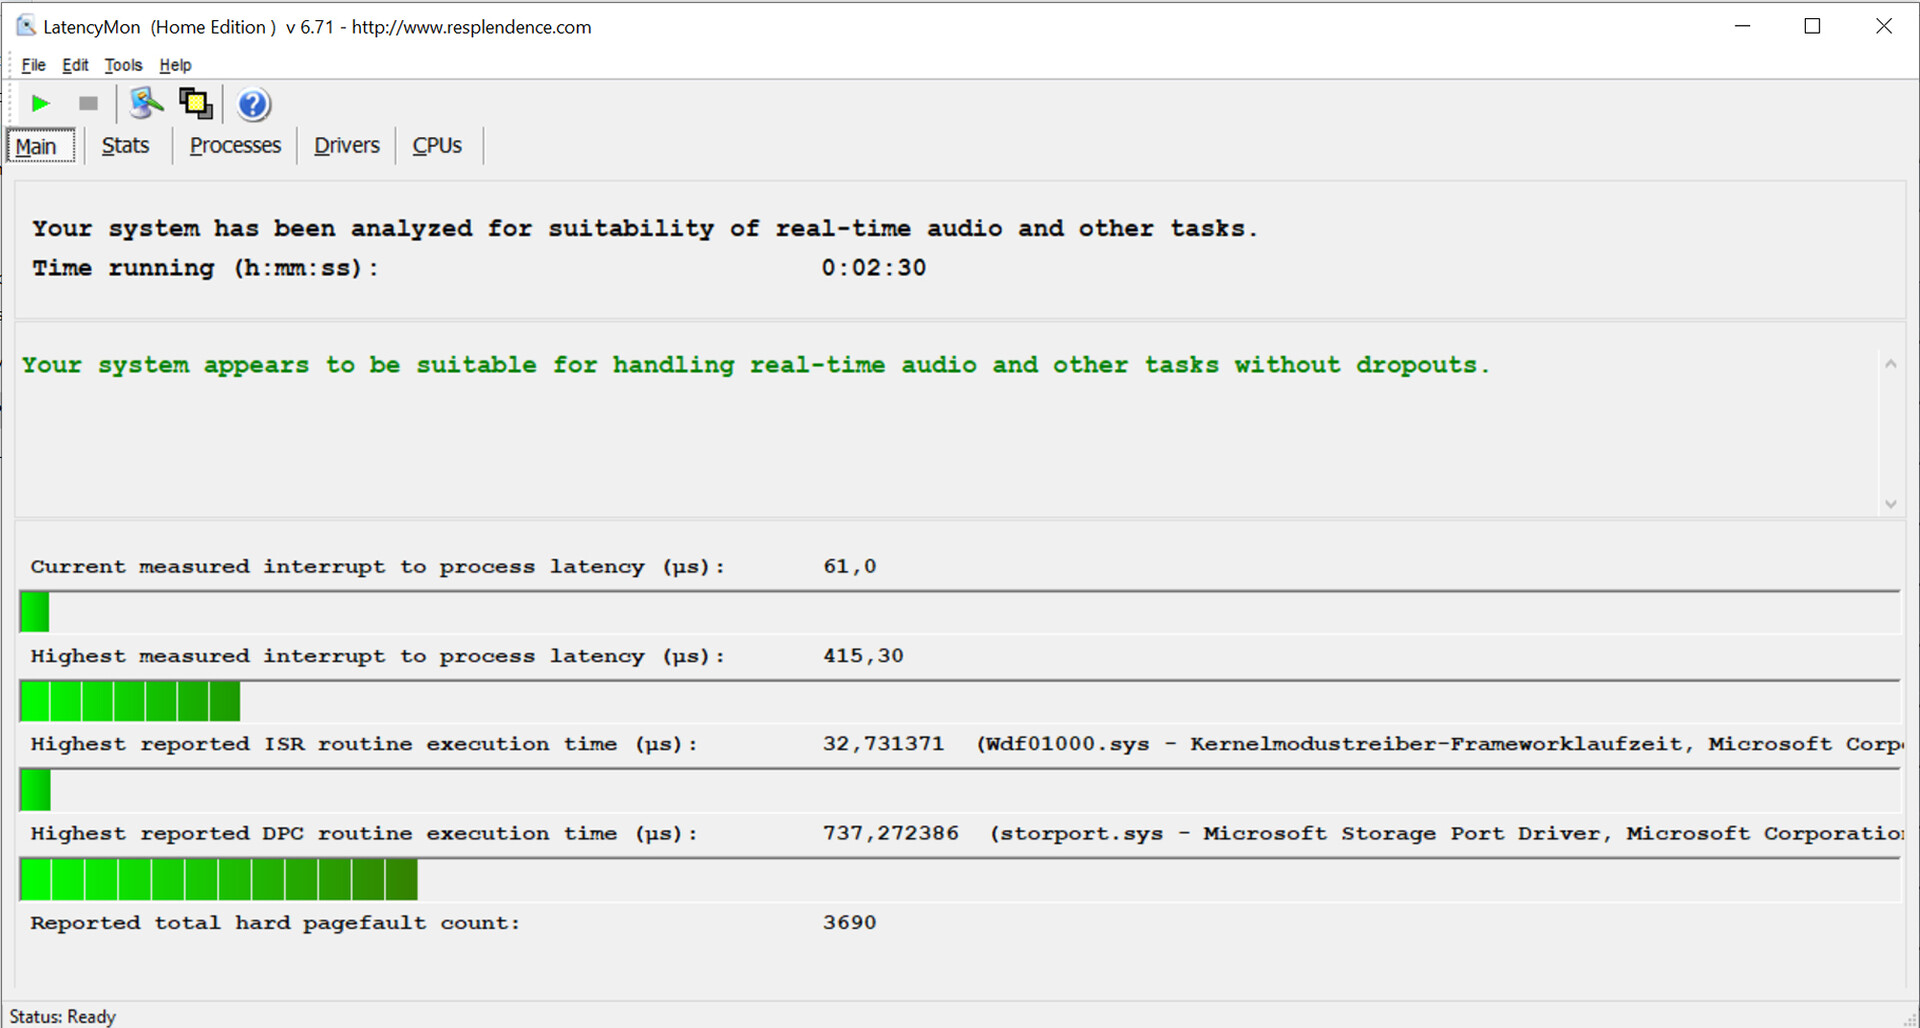
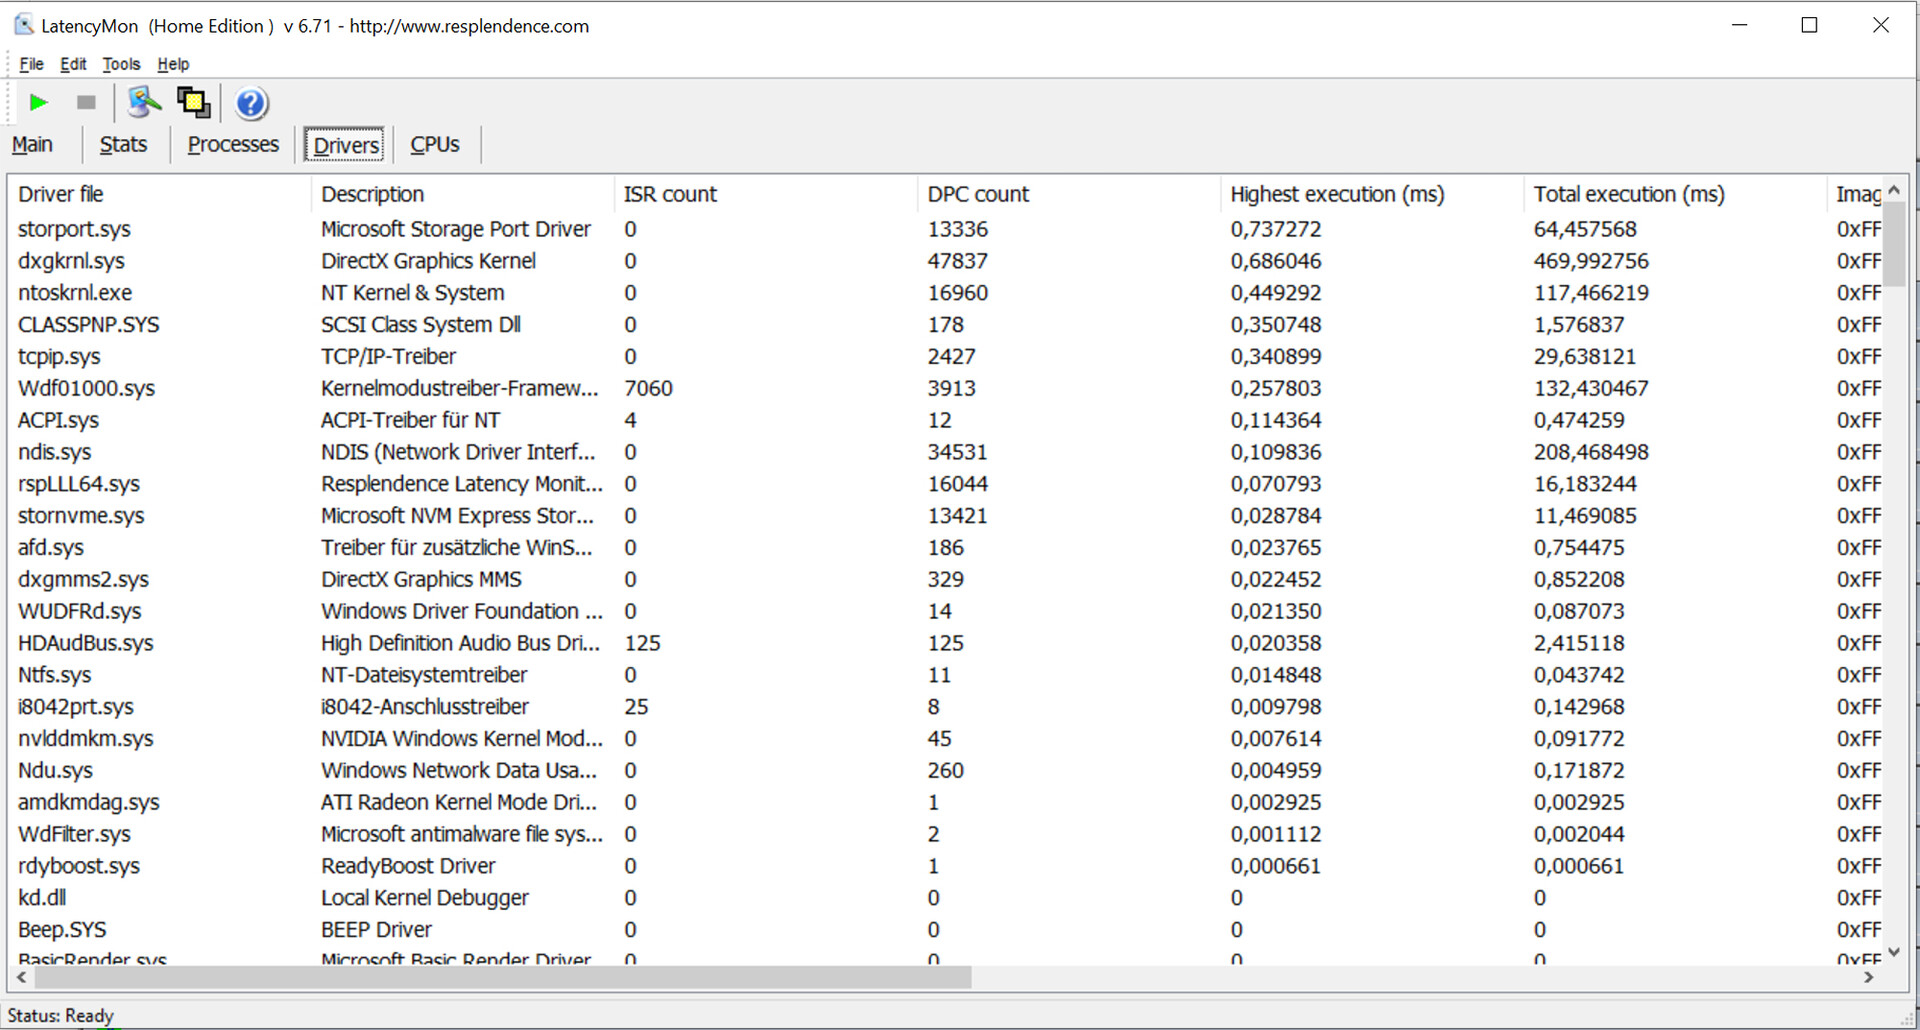
The standardized latency monitor test (web browsing, 4K video playback, high-load Prime95) didn't reveal any irregularities in the DPC latencies. The system seems to be suitable for real-time video and audio editing. This assessment is based on our test device running the latest software available at the time of testing. Future updates could lead to improvements or even to worse performance.
| DPC Latencies / LatencyMon - interrupt to process latency (max), Web, Youtube, Prime95 | |
| Asus ROG Strix G15 G513QY | |
| Aorus 15P XC | |
| Asus TUF Gaming A15 FA506QR-AZ061T | |
| MSI GF65 Thin 10UE | |
| Razer Blade 15 Base Edition 2021, i7-10750H RTX 3060 | |
| Acer Aspire Nitro 5 AN515-55-57GF | |
| Acer Nitro 5 AN515-45-R1JH | |
* ... smaller is better
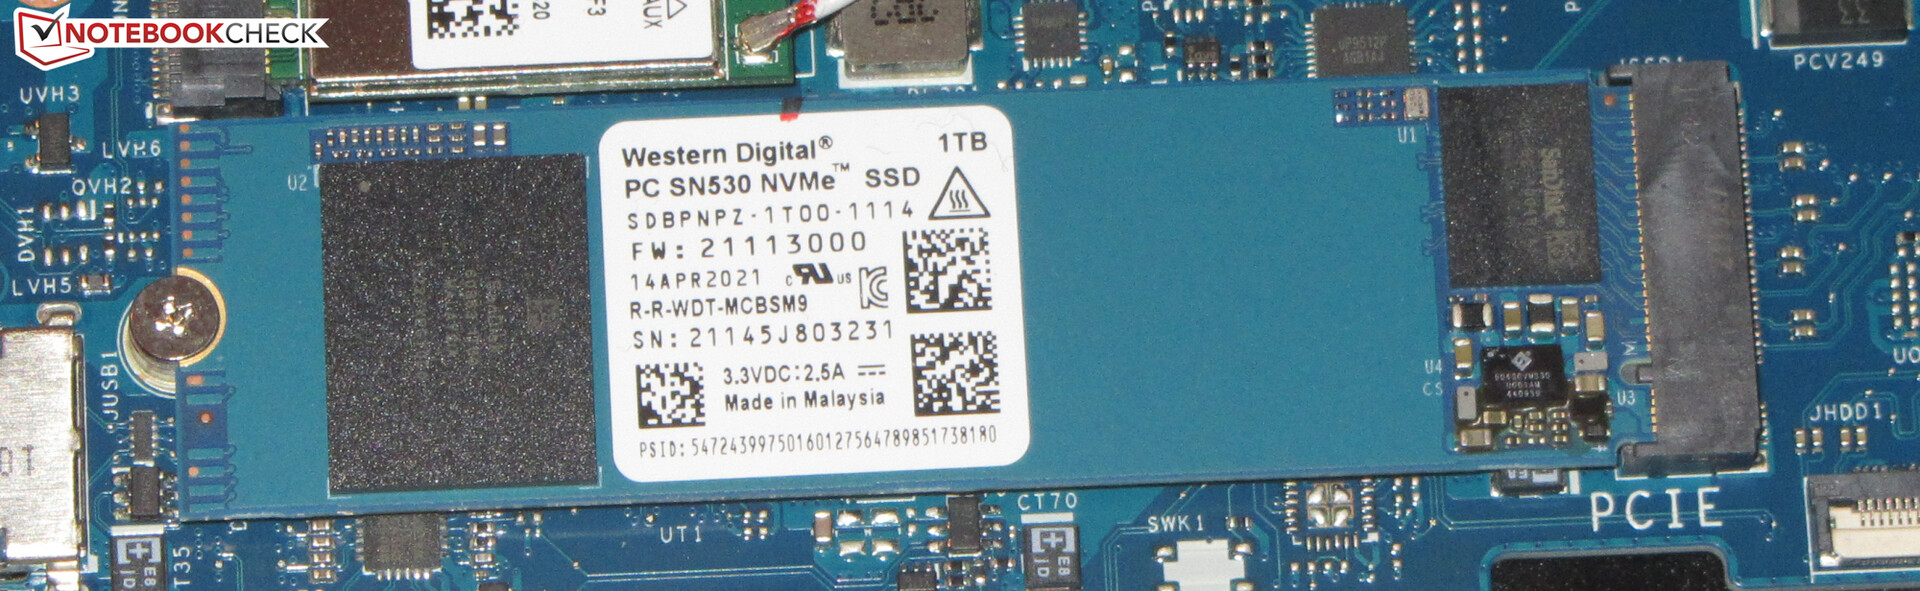
Storage
An NVMe SSD (M.2-2280) from Western Digital serves as the system drive. It provides 1 TB of storage space and delivers good transfer rates. In addition, the laptop offers room for a second M.2-2280 SSD (NVMe) as well as a 2.5-inch storage device (SATA slot and screws are in the box, and the mounting frame is found inside the laptop).

| Acer Nitro 5 AN515-45-R1JH WDC PC SN530 SDBPNPZ-1T00 | Asus ROG Strix G15 G513QY Samsung PM991 MZVLQ512HALU | Aorus 15P XC ESR512GTLCG-EAC-4 | MSI GF65 Thin 10UE Samsung SSD PM981 MZVLB1T0HALR | Asus TUF Gaming A15 FA506QR-AZ061T SK Hynix HFM001TD3JX013N | Razer Blade 15 Base Edition 2021, i7-10750H RTX 3060 Samsung SSD PM981a MZVLB512HBJQ | Average WDC PC SN530 SDBPNPZ-1T00 | |
|---|---|---|---|---|---|---|---|
| CrystalDiskMark 5.2 / 6 | -0% | 11% | 10% | 28% | 10% | 3% | |
| Write 4K | 161.3 | 140.4 -13% | 130.2 -19% | 157.3 -2% | 182.5 13% | 123.8 -23% | 182.7 ? 13% |
| Read 4K | 49.49 | 48.91 -1% | 45.47 -8% | 46.69 -6% | 73.2 48% | 45.53 -8% | 48.6 ? -2% |
| Write Seq | 1970 | 1613 -18% | 2269 15% | 2389 21% | 3005 53% | 2132 8% | 1979 ? 0% |
| Read Seq | 2007 | 2043 2% | 1643 -18% | 2196 9% | 2358 17% | 2067 3% | 1828 ? -9% |
| Write 4K Q32T1 | 416.8 | 482.5 16% | 547 31% | 407.6 -2% | 389.5 -7% | 462.9 11% | 498 ? 19% |
| Read 4K Q32T1 | 554 | 553 0% | 654 18% | 519 -6% | 463.8 -16% | 553 0% | 573 ? 3% |
| Write Seq Q32T1 | 1965 | 1612 -18% | 2512 28% | 2401 22% | 3166 61% | 2955 50% | 1980 ? 1% |
| Read Seq Q32T1 | 2369 | 3105 31% | 3382 43% | 3344 41% | 3590 52% | 3246 37% | 2336 ? -1% |
| Write 4K Q8T8 | 1202 | 563 ? | |||||
| Read 4K Q8T8 | 1451 | 1498 ? | |||||
| AS SSD | 98% | 135% | 143% | 173% | 120% | 54% | |
| Seq Read | 2217 | 2706 22% | 2694 22% | 3002 35% | 3133 41% | 2401 8% | 2059 ? -7% |
| Seq Write | 1929 | 1652 -14% | 2327 21% | 2420 25% | 2969 54% | 2087 8% | 1812 ? -6% |
| 4K Read | 28.71 | 45.46 58% | 47.77 66% | 48.46 69% | 55.2 92% | 49.58 73% | 37.4 ? 30% |
| 4K Write | 146.3 | 128.5 -12% | 98.8 -32% | 114.3 -22% | 129.7 -11% | 98.8 -32% | 164.6 ? 13% |
| 4K-64 Read | 215.9 | 1342 522% | 1746 709% | 1873 768% | 1891 776% | 1601 642% | 765 ? 254% |
| 4K-64 Write | 1475 | 1066 -28% | 2267 54% | 1882 28% | 1795 22% | 1862 26% | 1431 ? -3% |
| Access Time Read * | 0.095 | 0.079 | 0.045 | 0.052 | 0.06 | 0.0364 ? | |
| Access Time Write * | 0.105 | 0.03 71% | 0.039 63% | 0.101 4% | 0.028 73% | 0.11 -5% | 0.07029 ? 33% |
| Score Read | 466 | 1658 256% | 2063 343% | 2221 377% | 2259 385% | 1890 306% | 1008 ? 116% |
| Score Write | 814 | 1360 67% | 2598 219% | 2238 175% | 2221 173% | 2170 167% | 1677 ? 106% |
| Score Total | 2513 | 3818 52% | 5698 127% | 5565 121% | 5630 124% | 5015 100% | 3337 ? 33% |
| Copy ISO MB/s | 1698 | 1838 8% | 1877 11% | 2421 43% | 2206 30% | 1653 ? -3% | |
| Copy Program MB/s | 284.7 | 848 198% | 555 95% | 705 148% | 694 144% | 528 ? 85% | |
| Copy Game MB/s | 786 | 1409 79% | 1201 53% | 1490 90% | 1555 98% | 1173 ? 49% | |
| Total Average (Program / Settings) | 49% /
61% | 73% /
88% | 77% /
92% | 101% /
108% | 65% /
78% | 29% /
34% |
* ... smaller is better
Continuous load read: DiskSpd Read Loop, Queue Depth 8
Graphics card
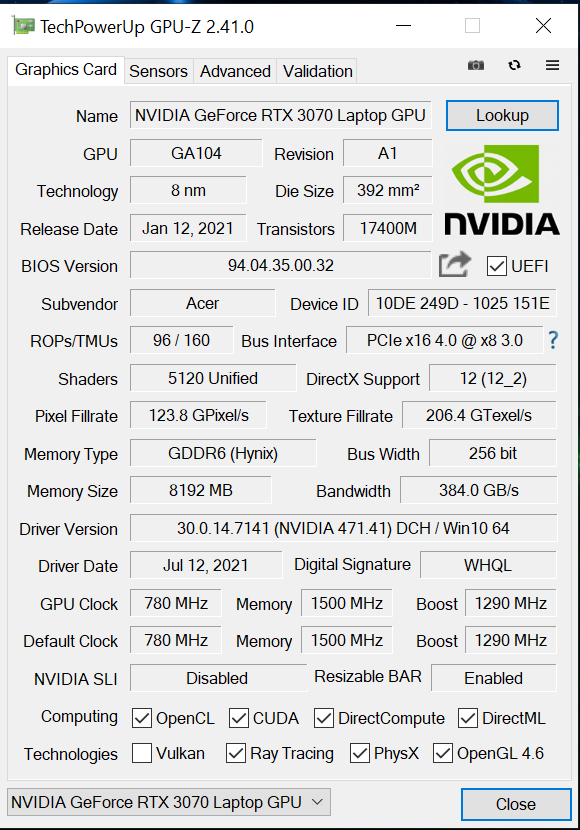
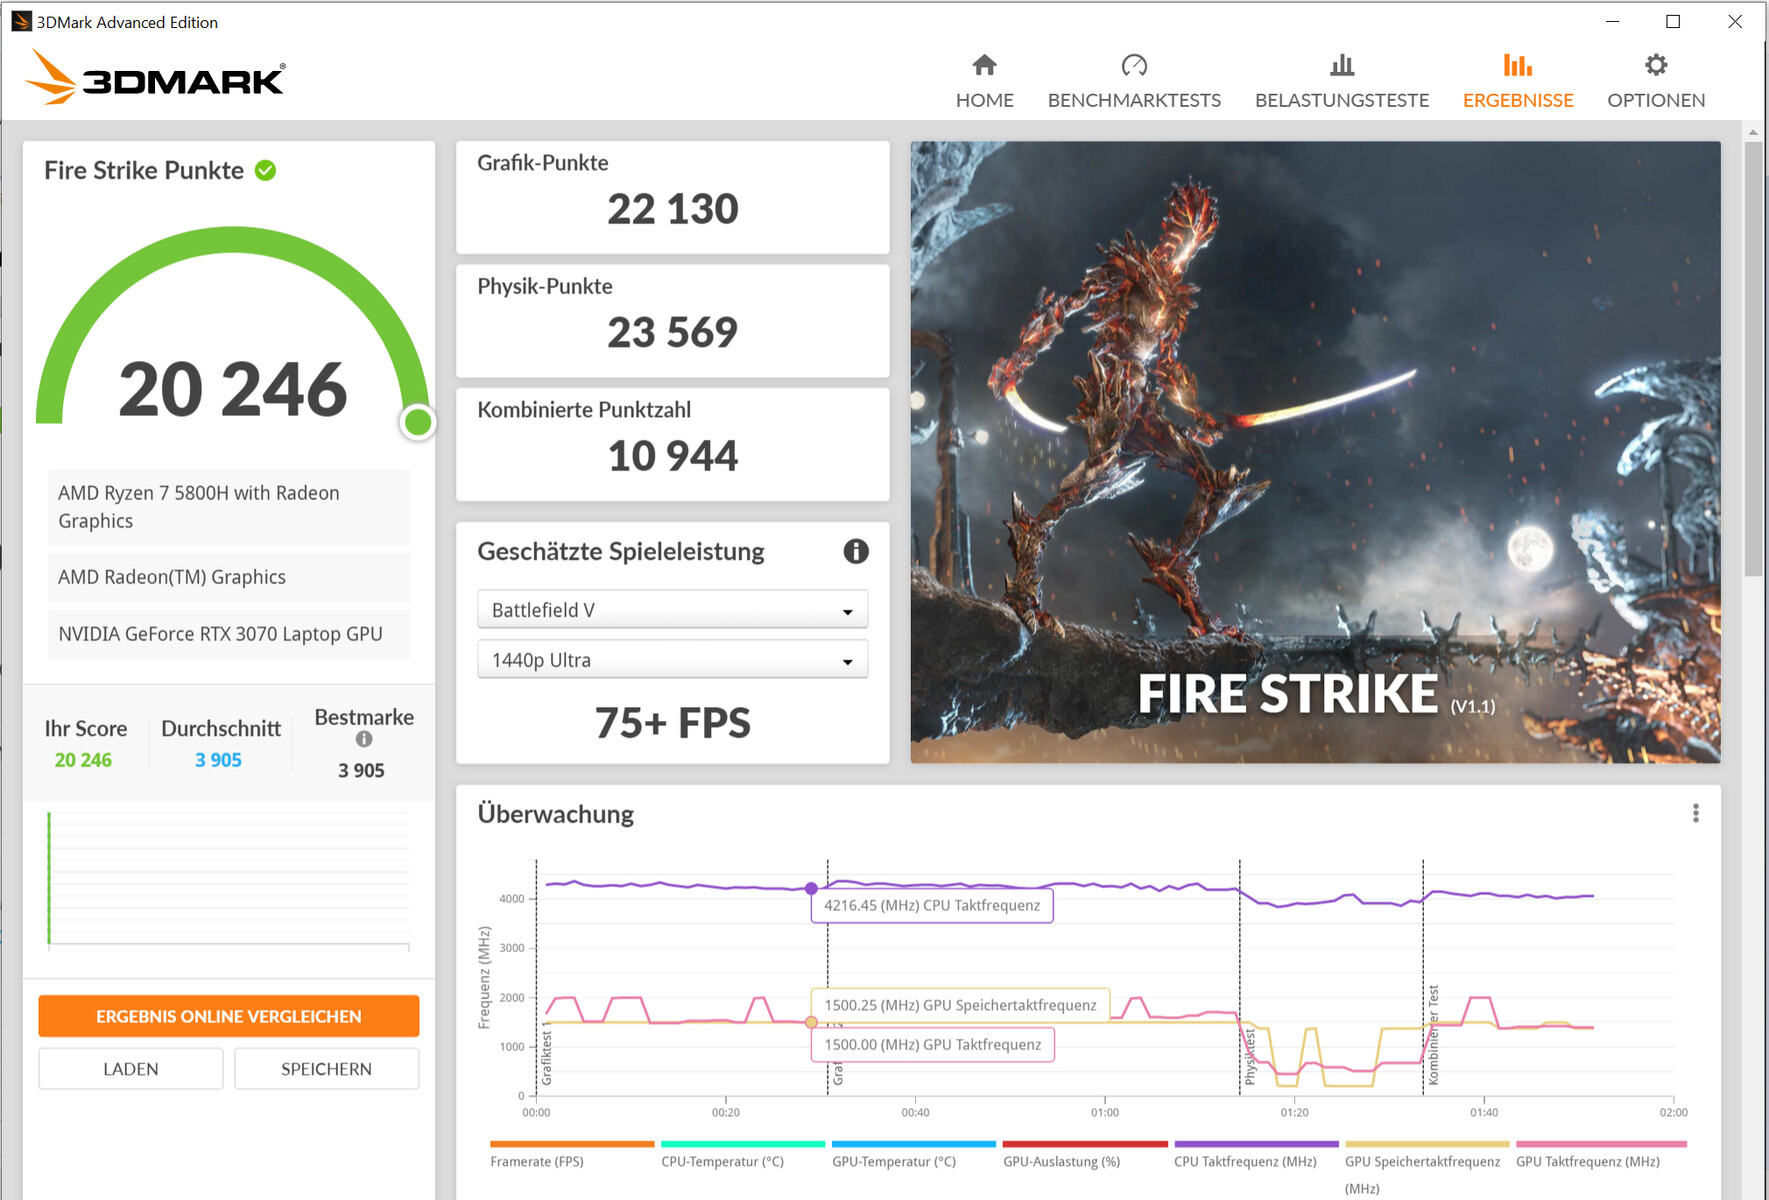
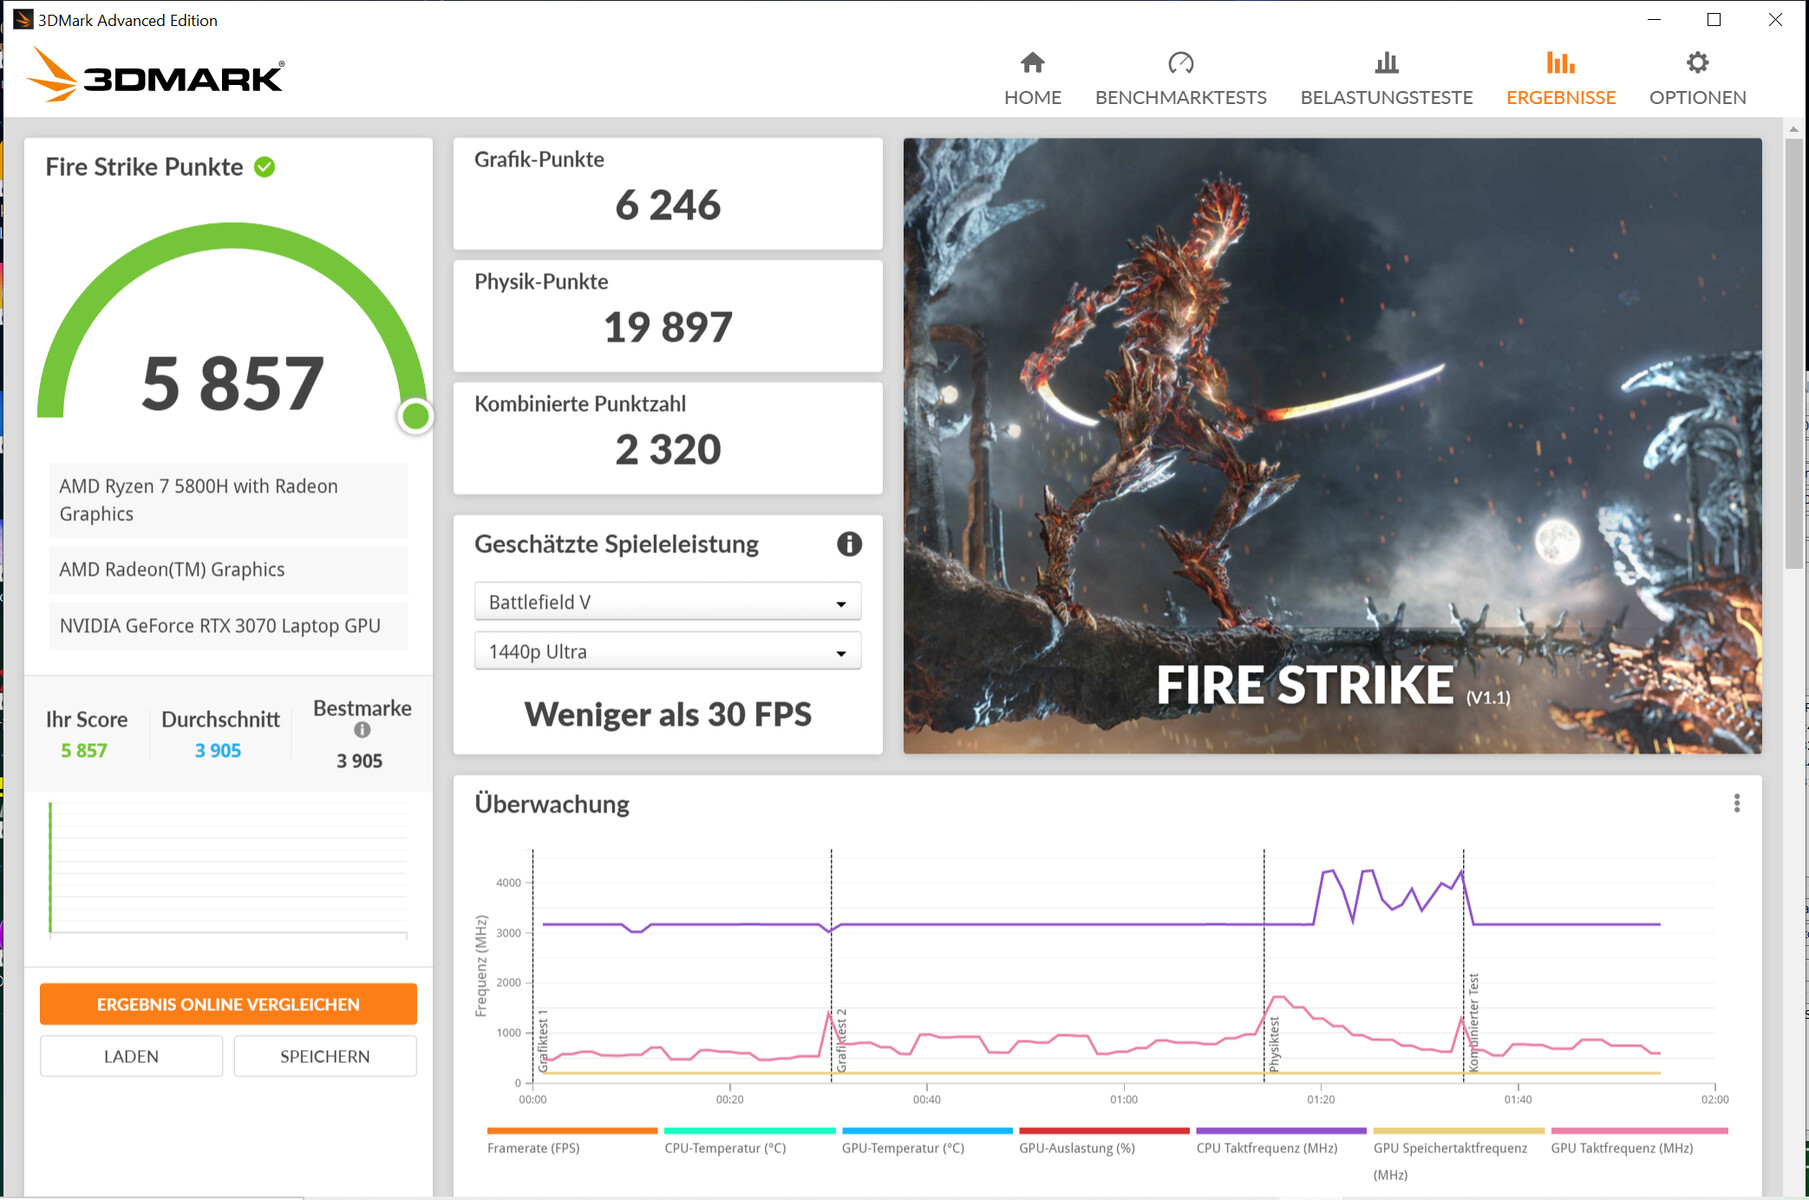
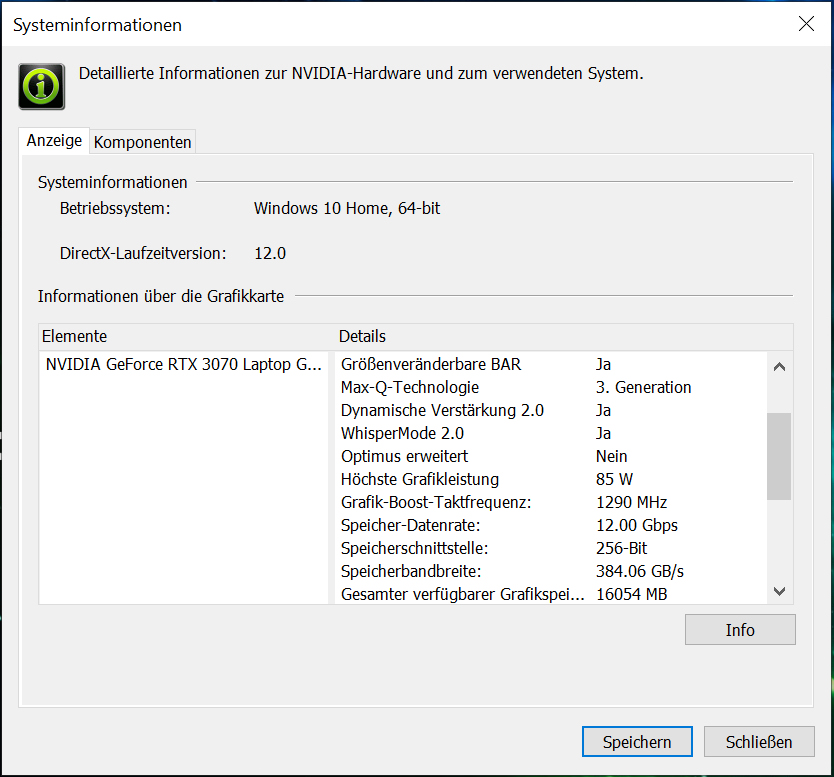
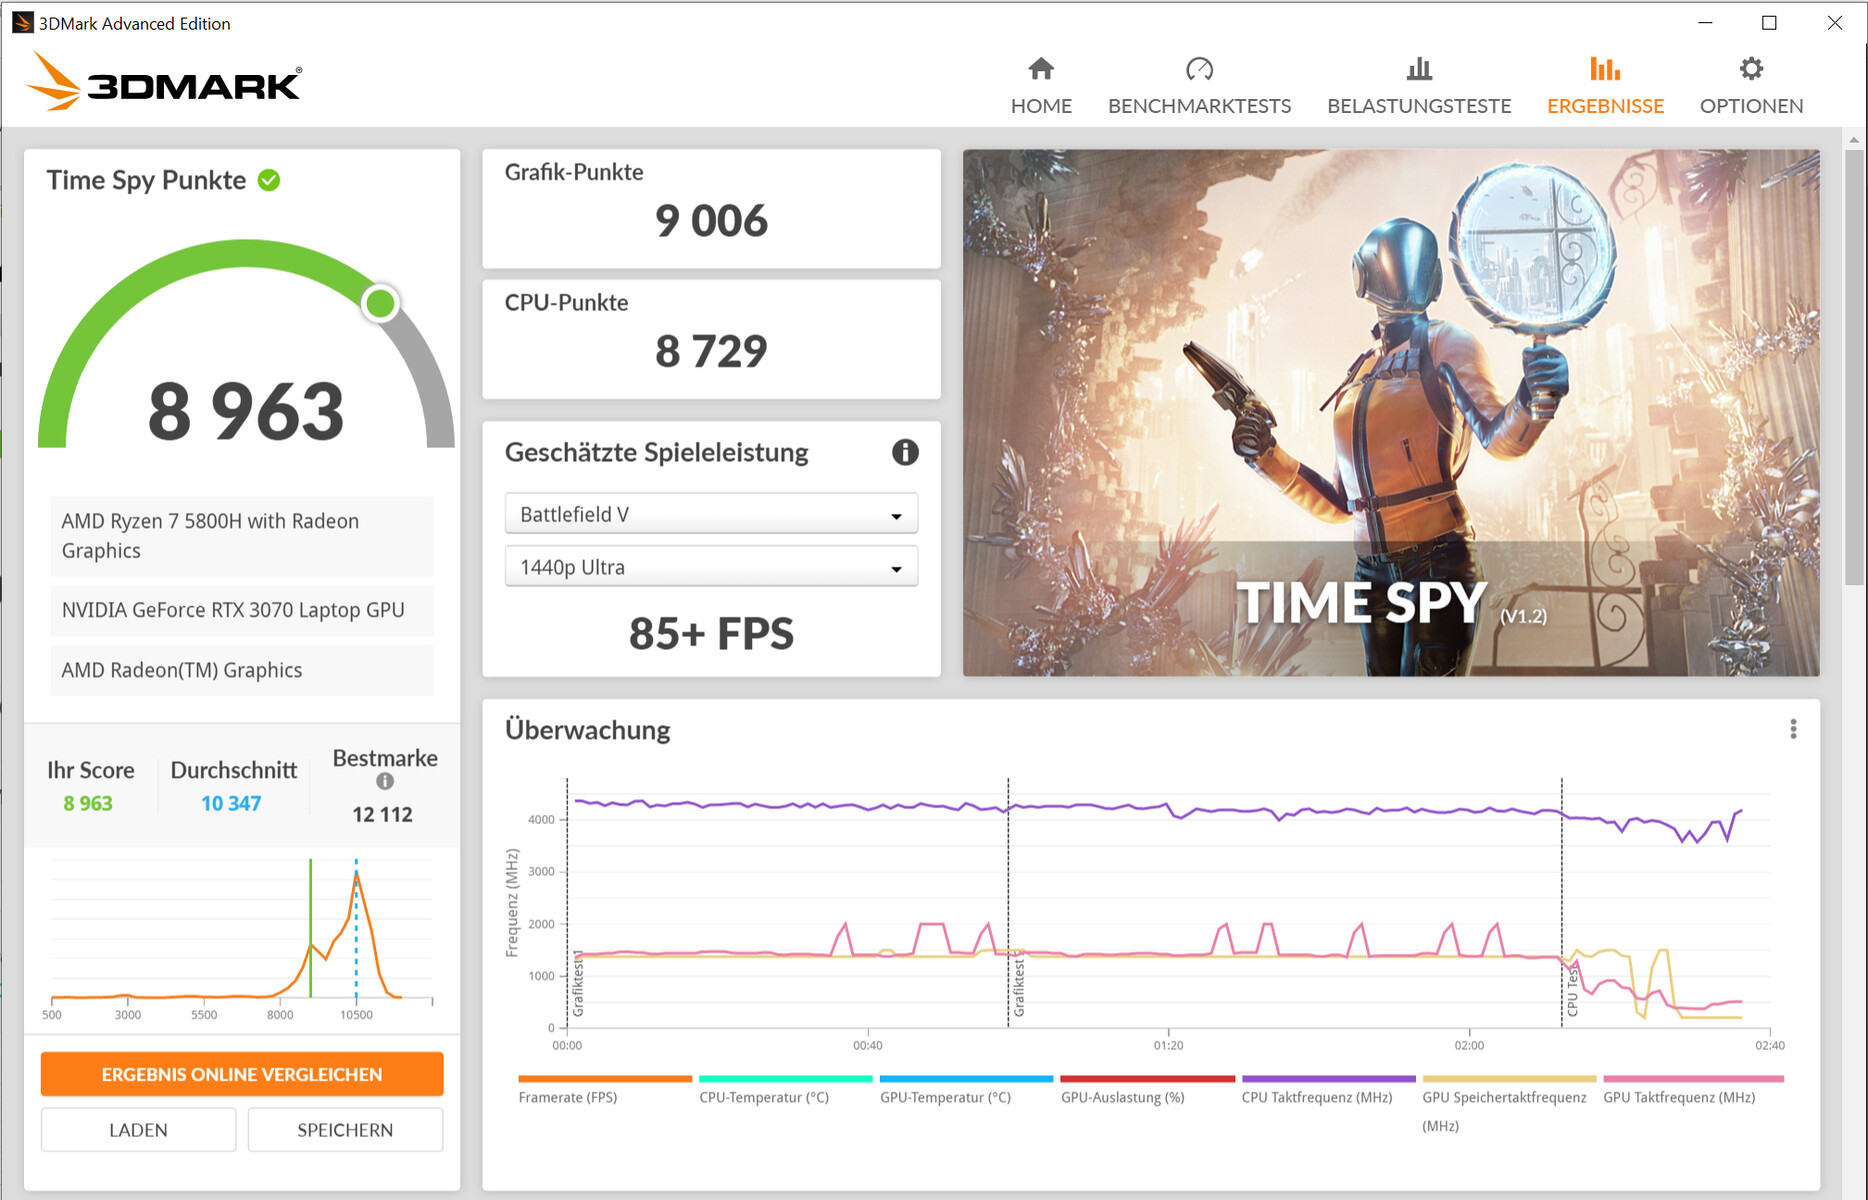
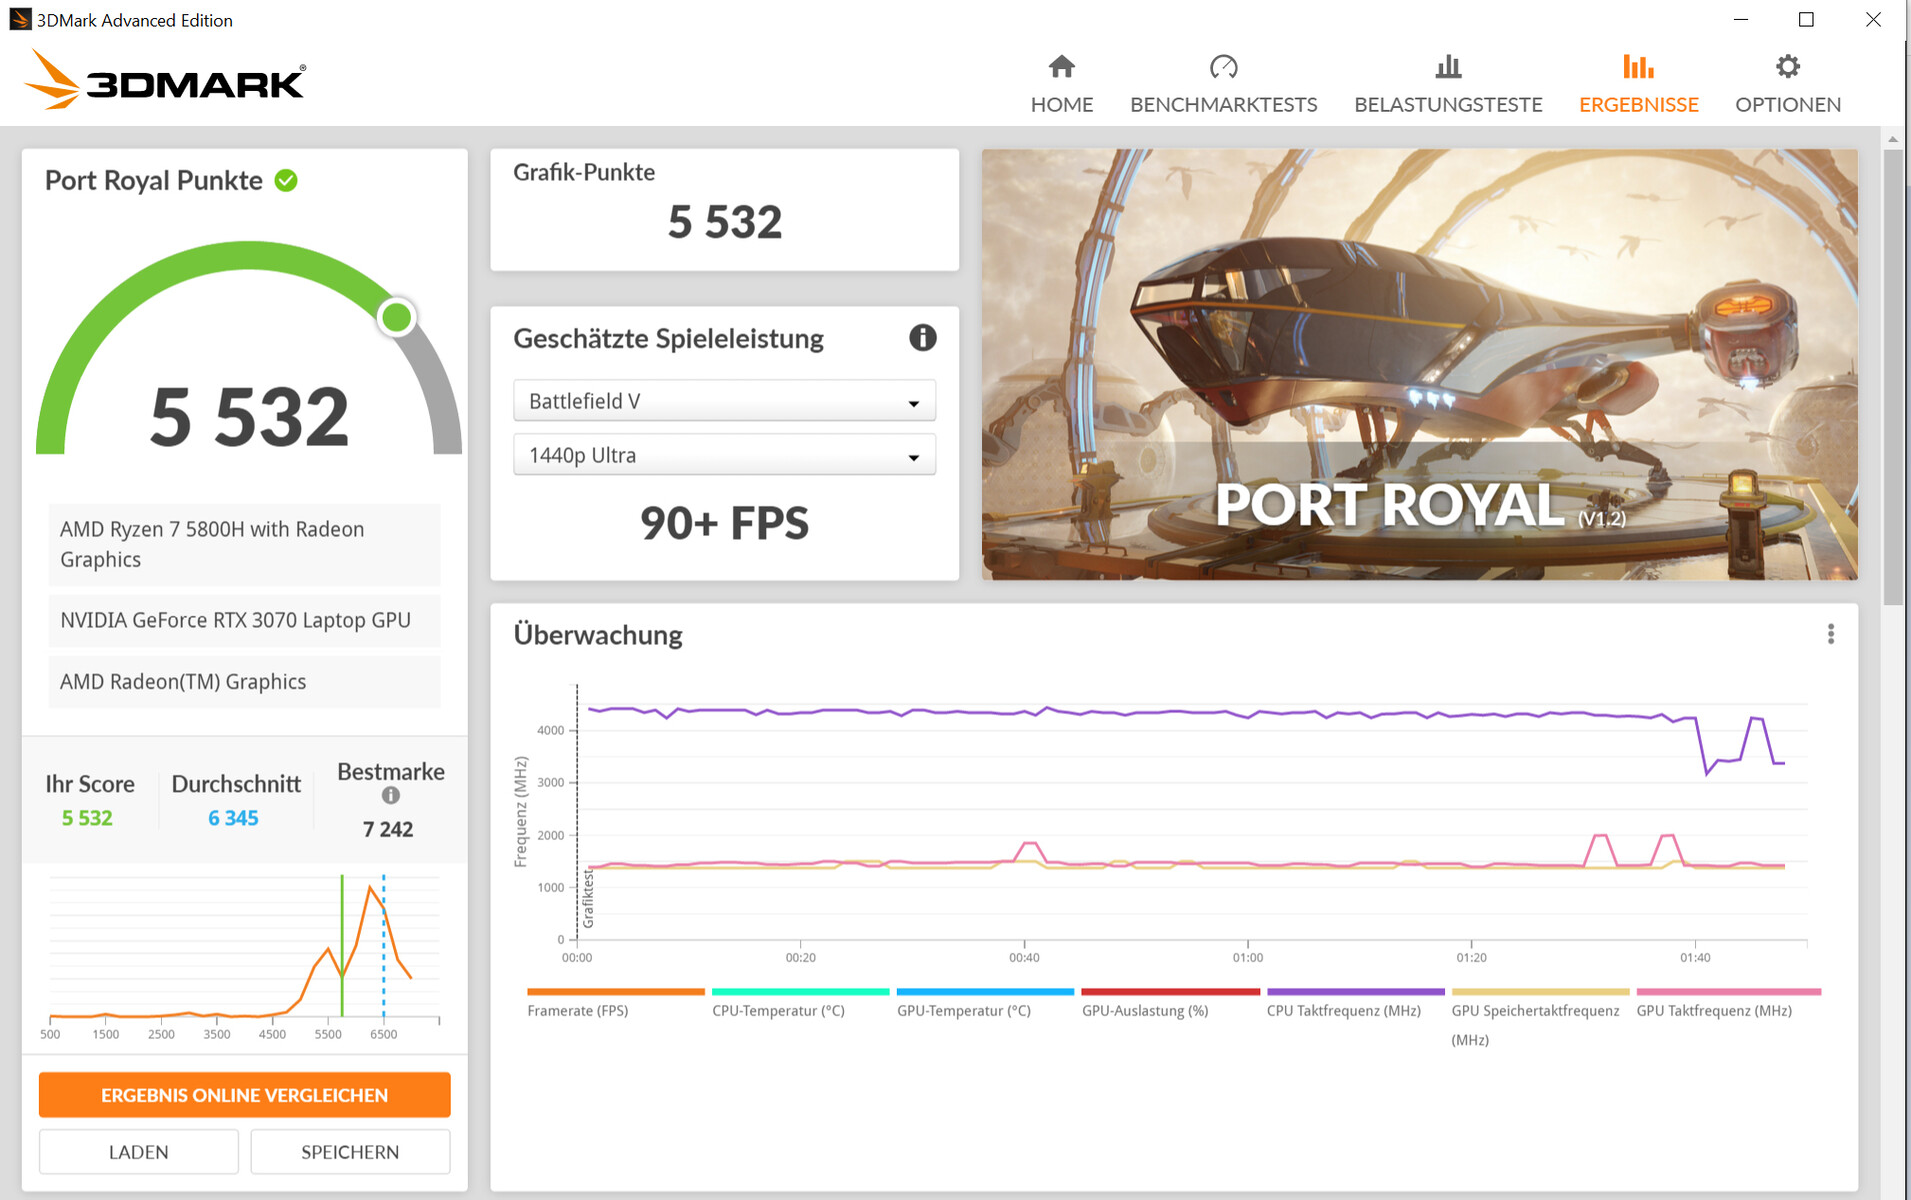
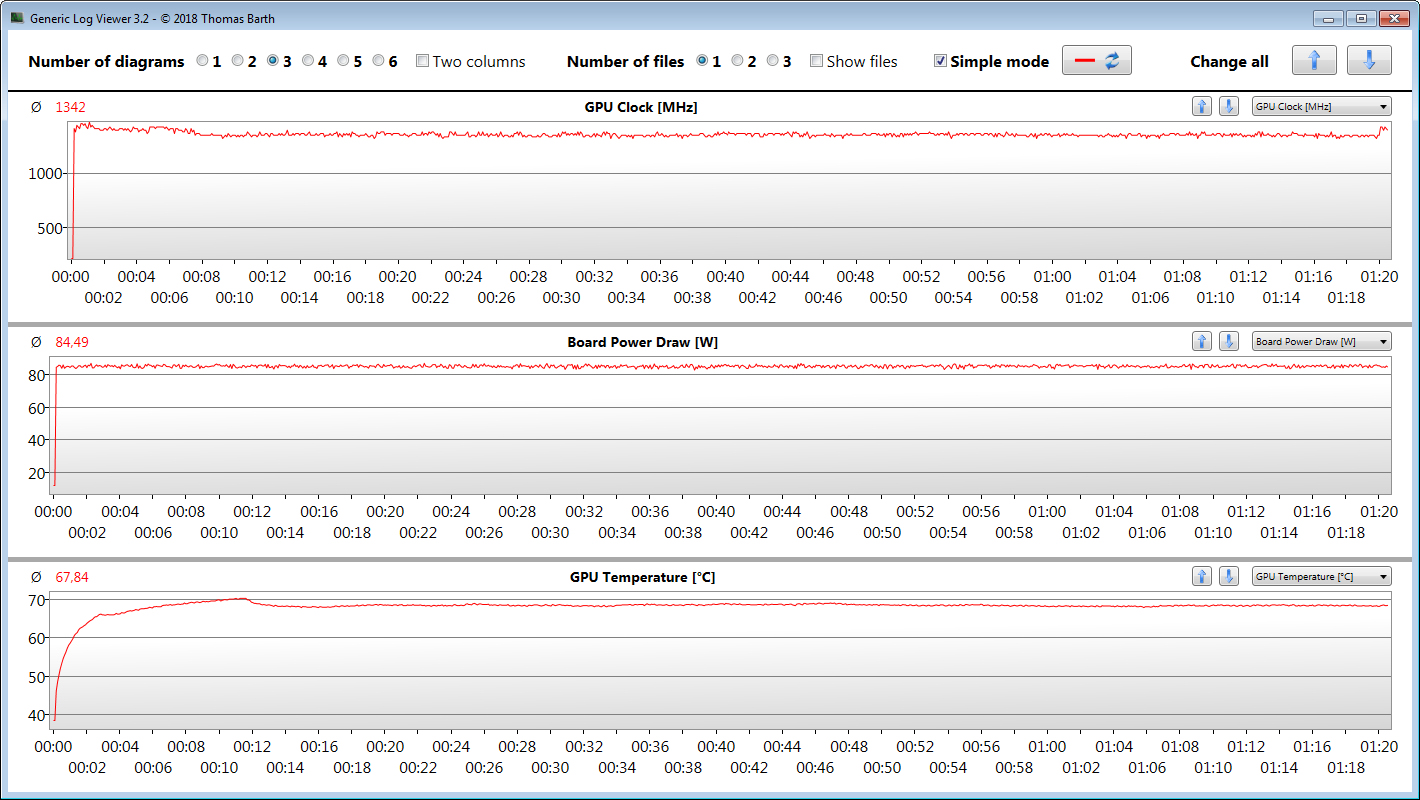
The actual performance of an RTX 3000 GPU depends on a few factors: The cooling, the memory configuration, and the maximum TGP that a laptop manufacturer chooses within the limits defined by Nvidia. Acer allows the GeForce RTX 3070 laptop GPU (overview of all RTX 3070 laptops including their TGPs) a maximum TGP of 85 watts.
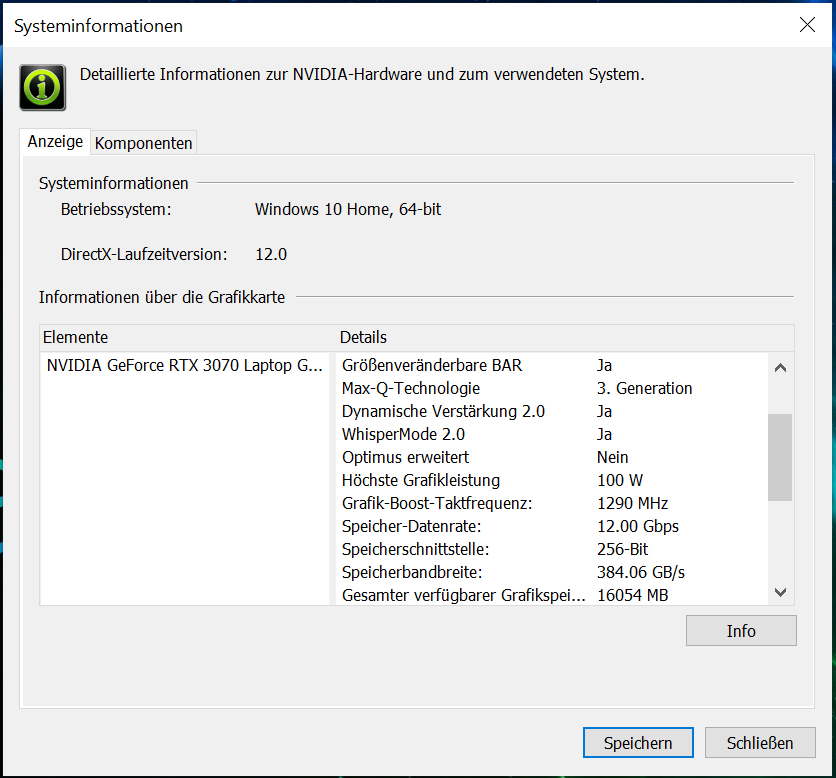
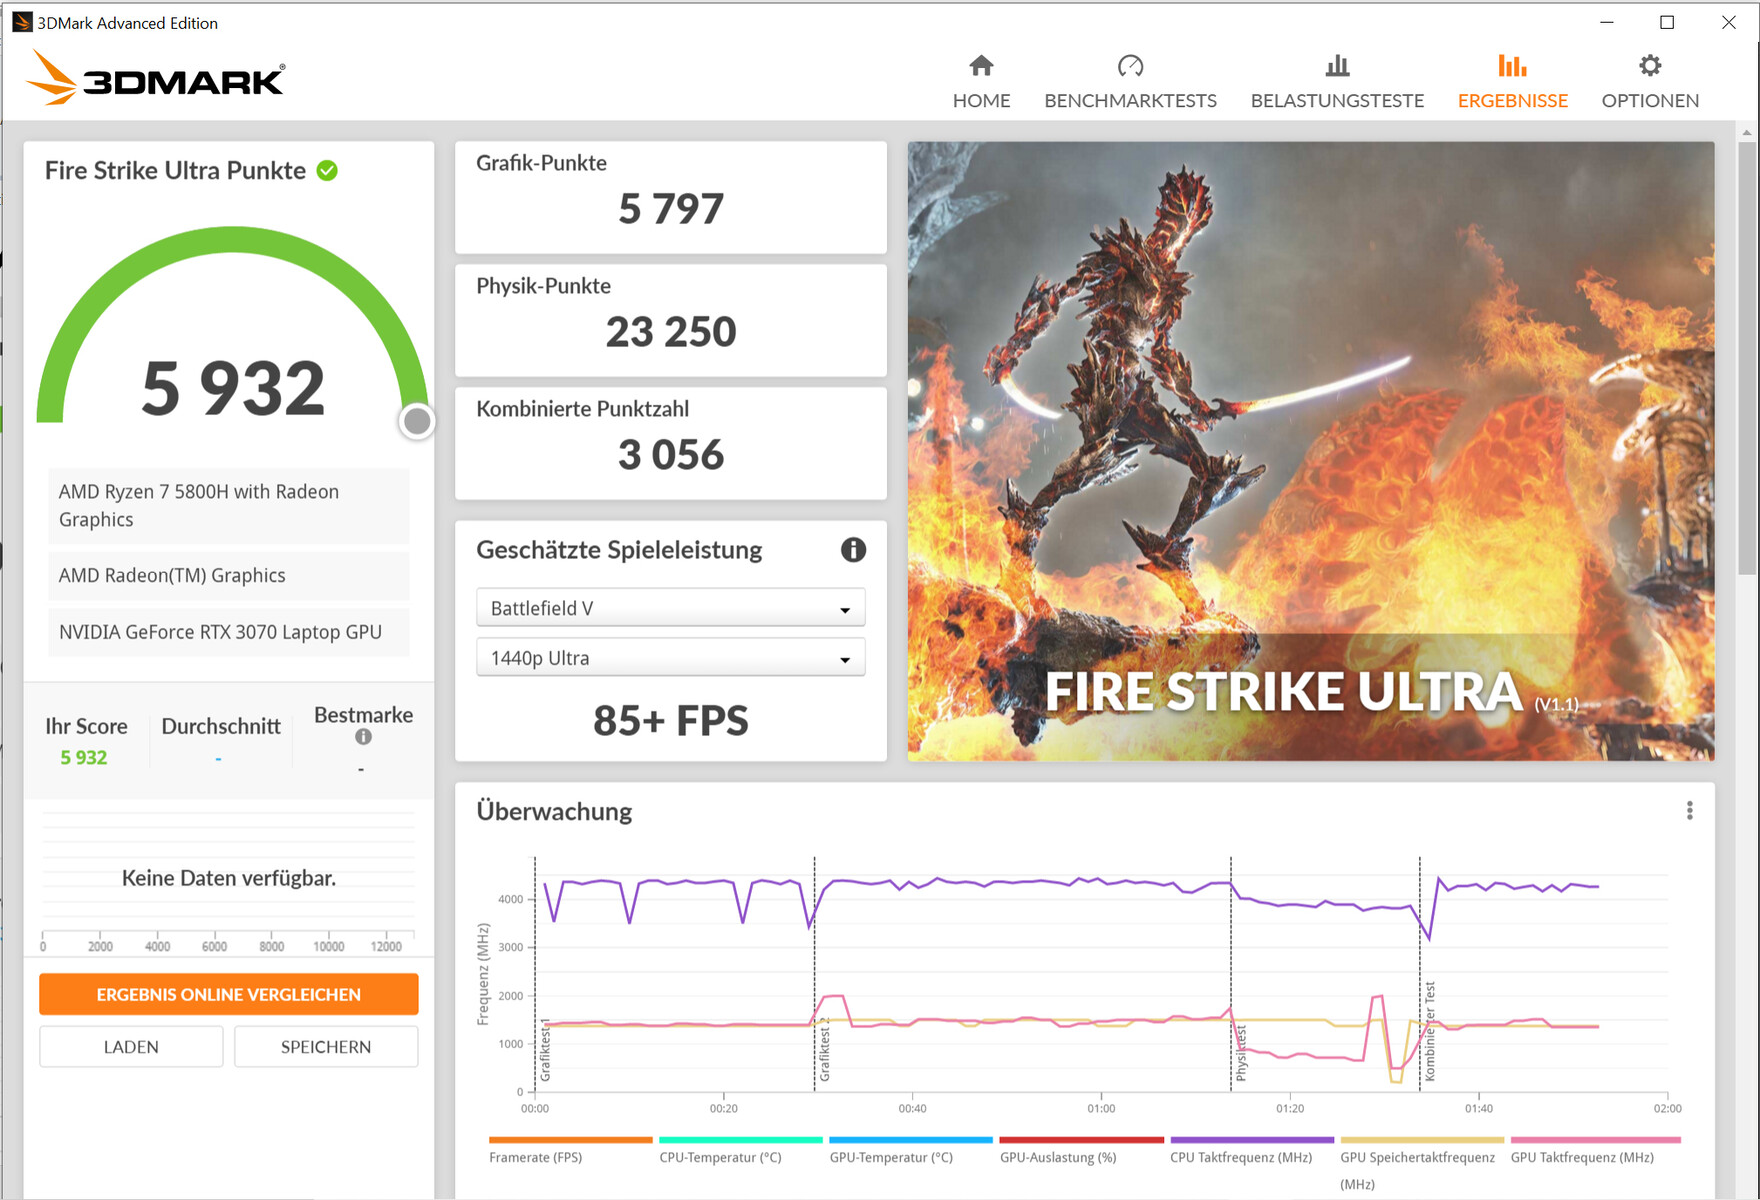
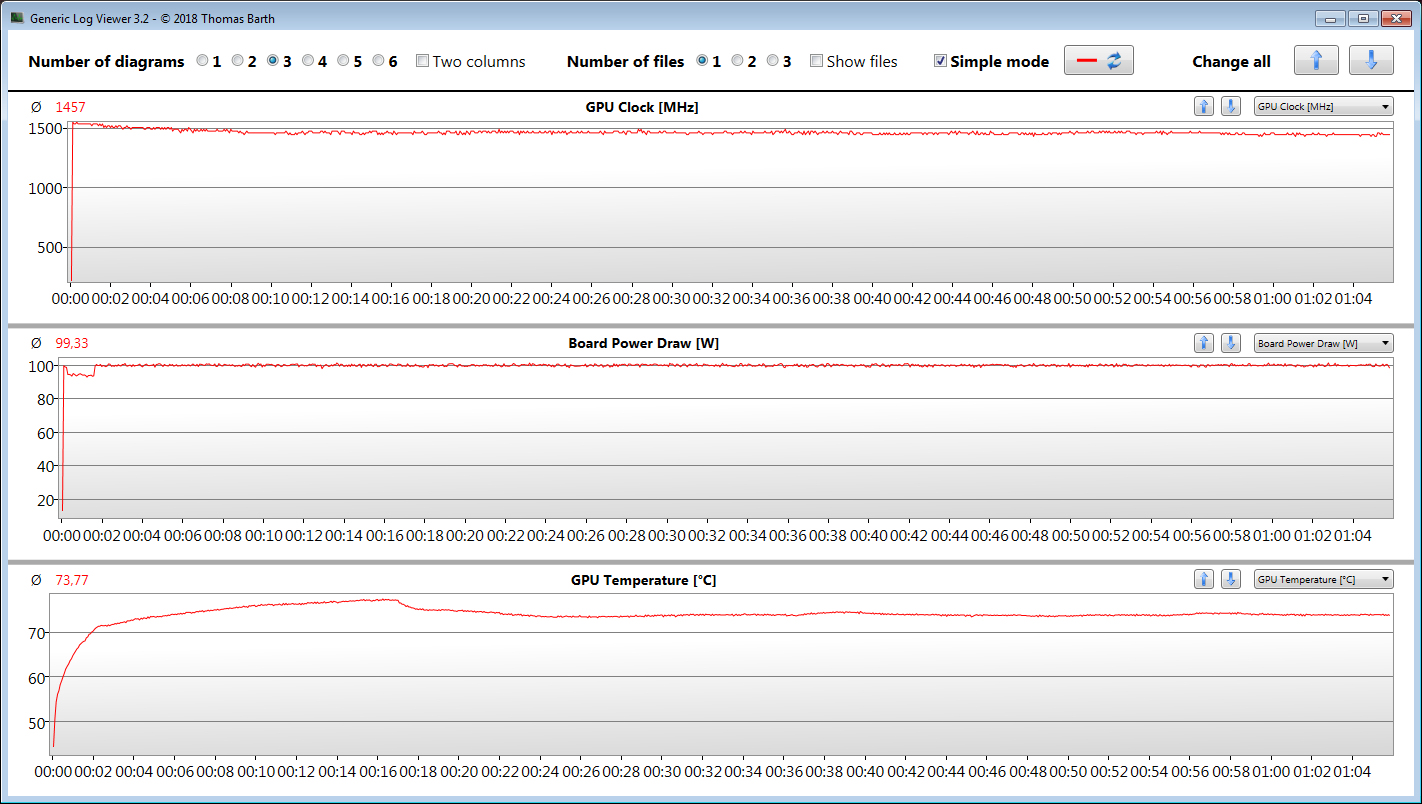
The GPU delivers benchmark results that are clearly below the average RTX 3070. Consequently, there's room for improvement: A firmware update increases the TGP to 100 watts and brings the results closer to those of an average RTX 3070. The new maximum TGP can be maintained over a prolonged period of time (see our The Witcher 3 test).
The RTX 3070 can access fast GDDR6 graphics memory (8,192 MB). The Vega 8 graphics core that's integrated into the processor is active, and the laptop works with Nvidia's Optimus graphics-switching solution.
| 3DMark 11 Performance | 23271 points | |
| 3DMark Cloud Gate Standard Score | 40183 points | |
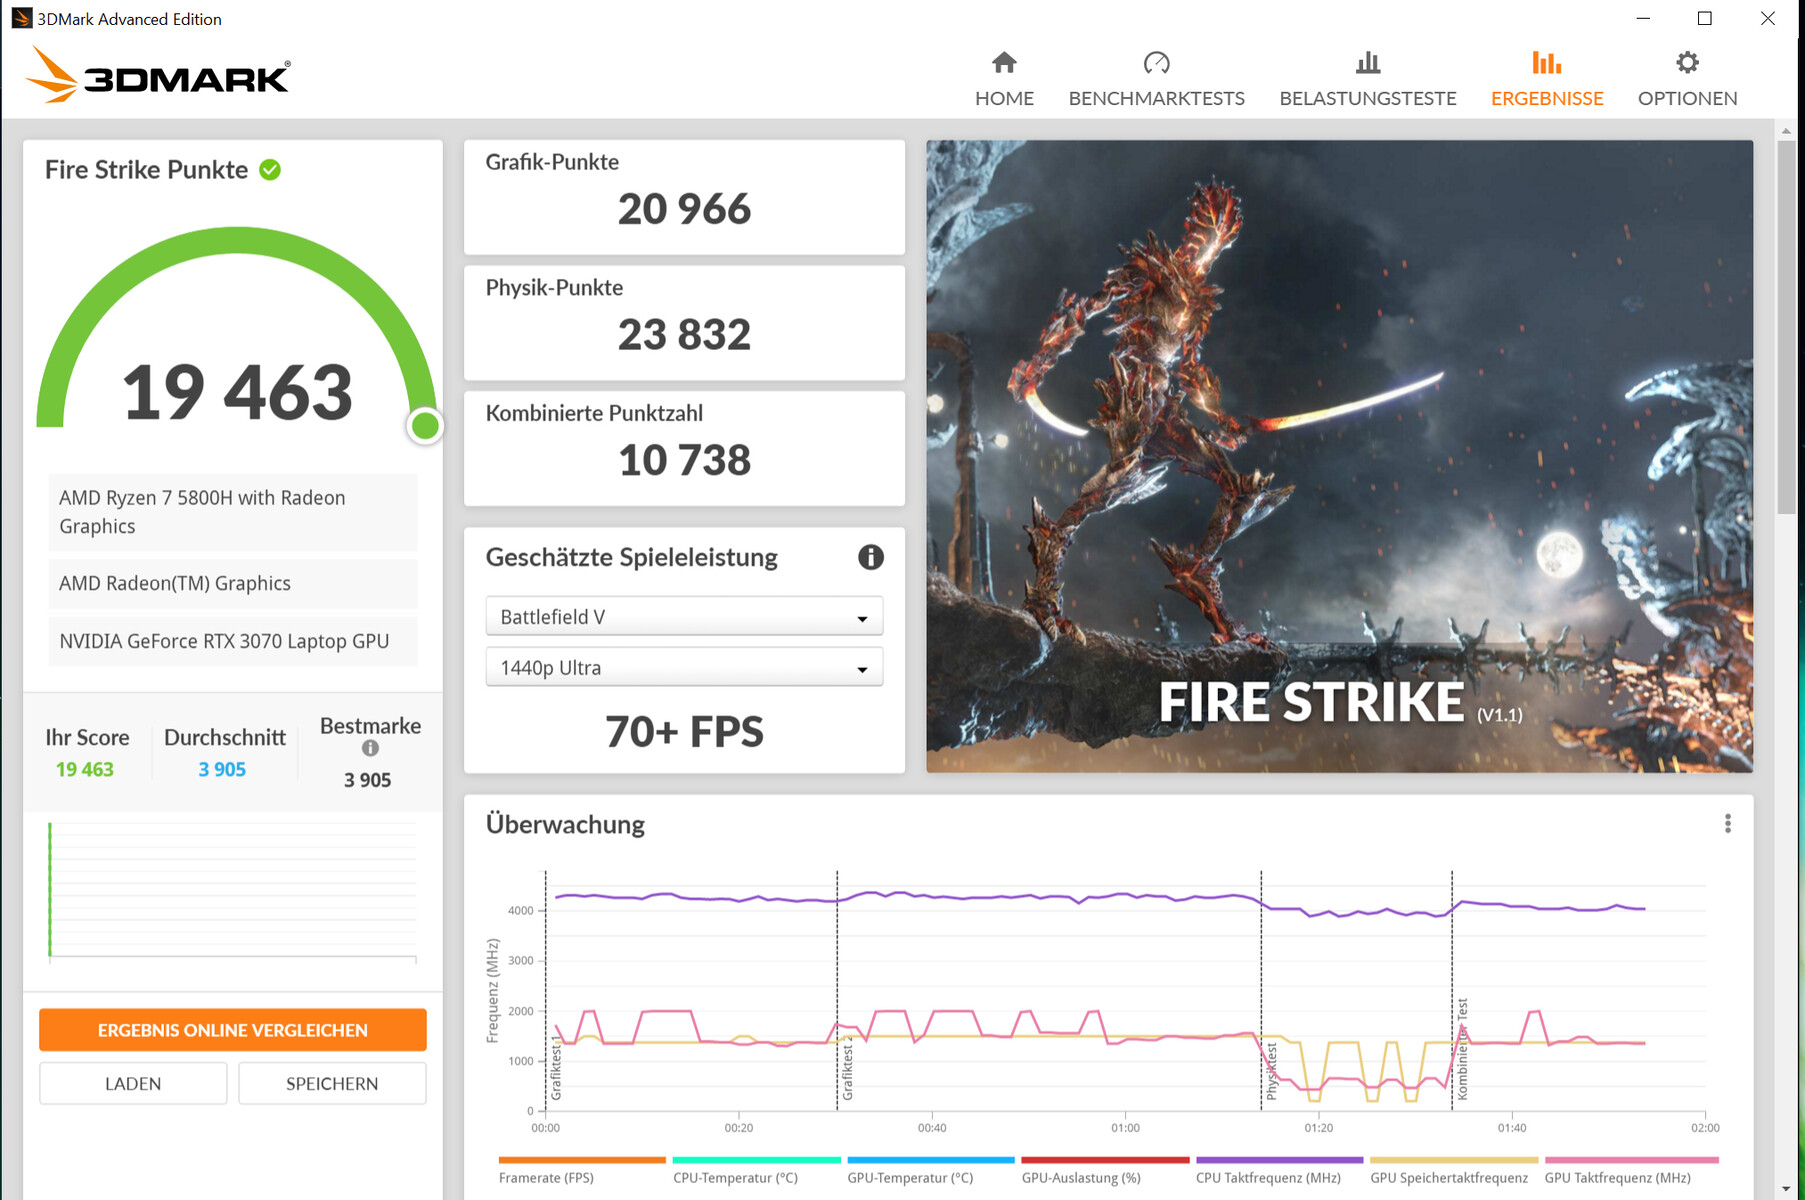
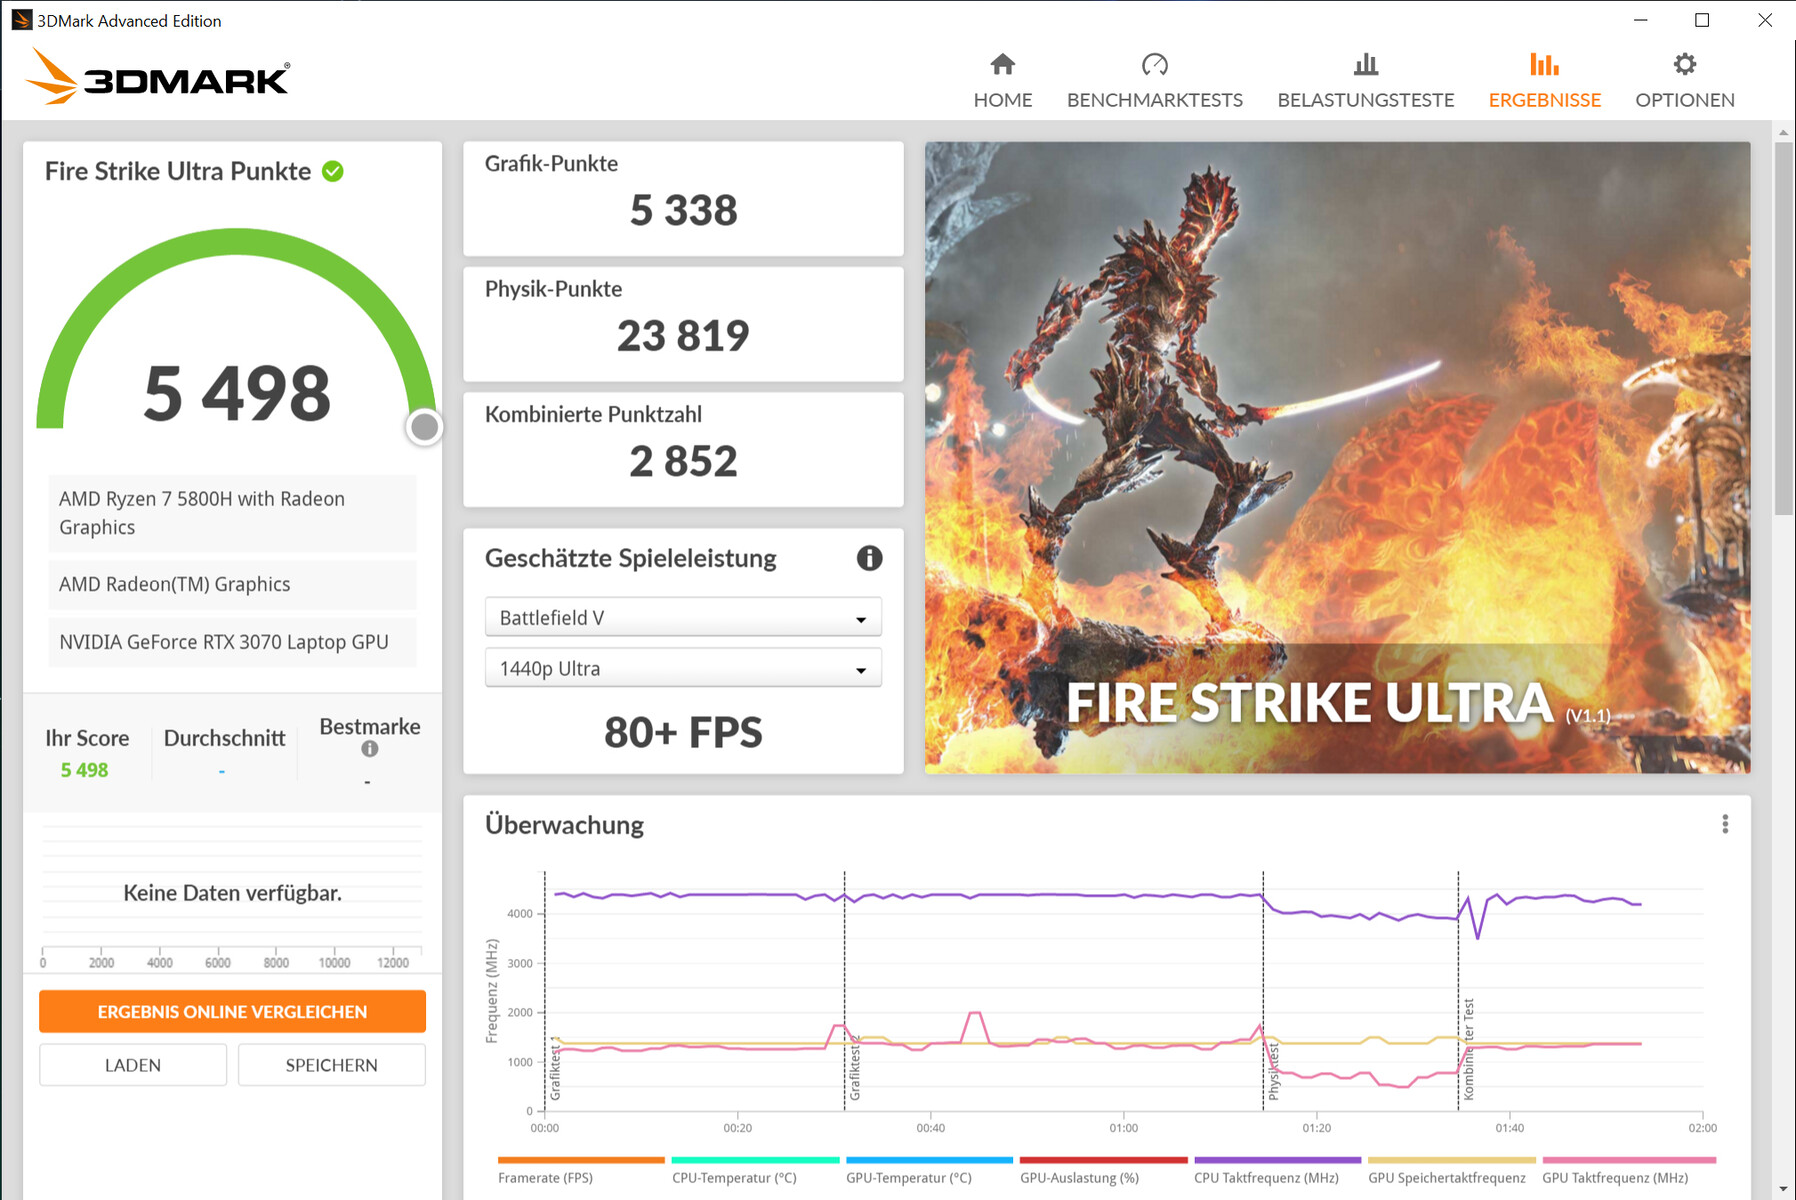
| 3DMark Fire Strike Score | 19463 points | |
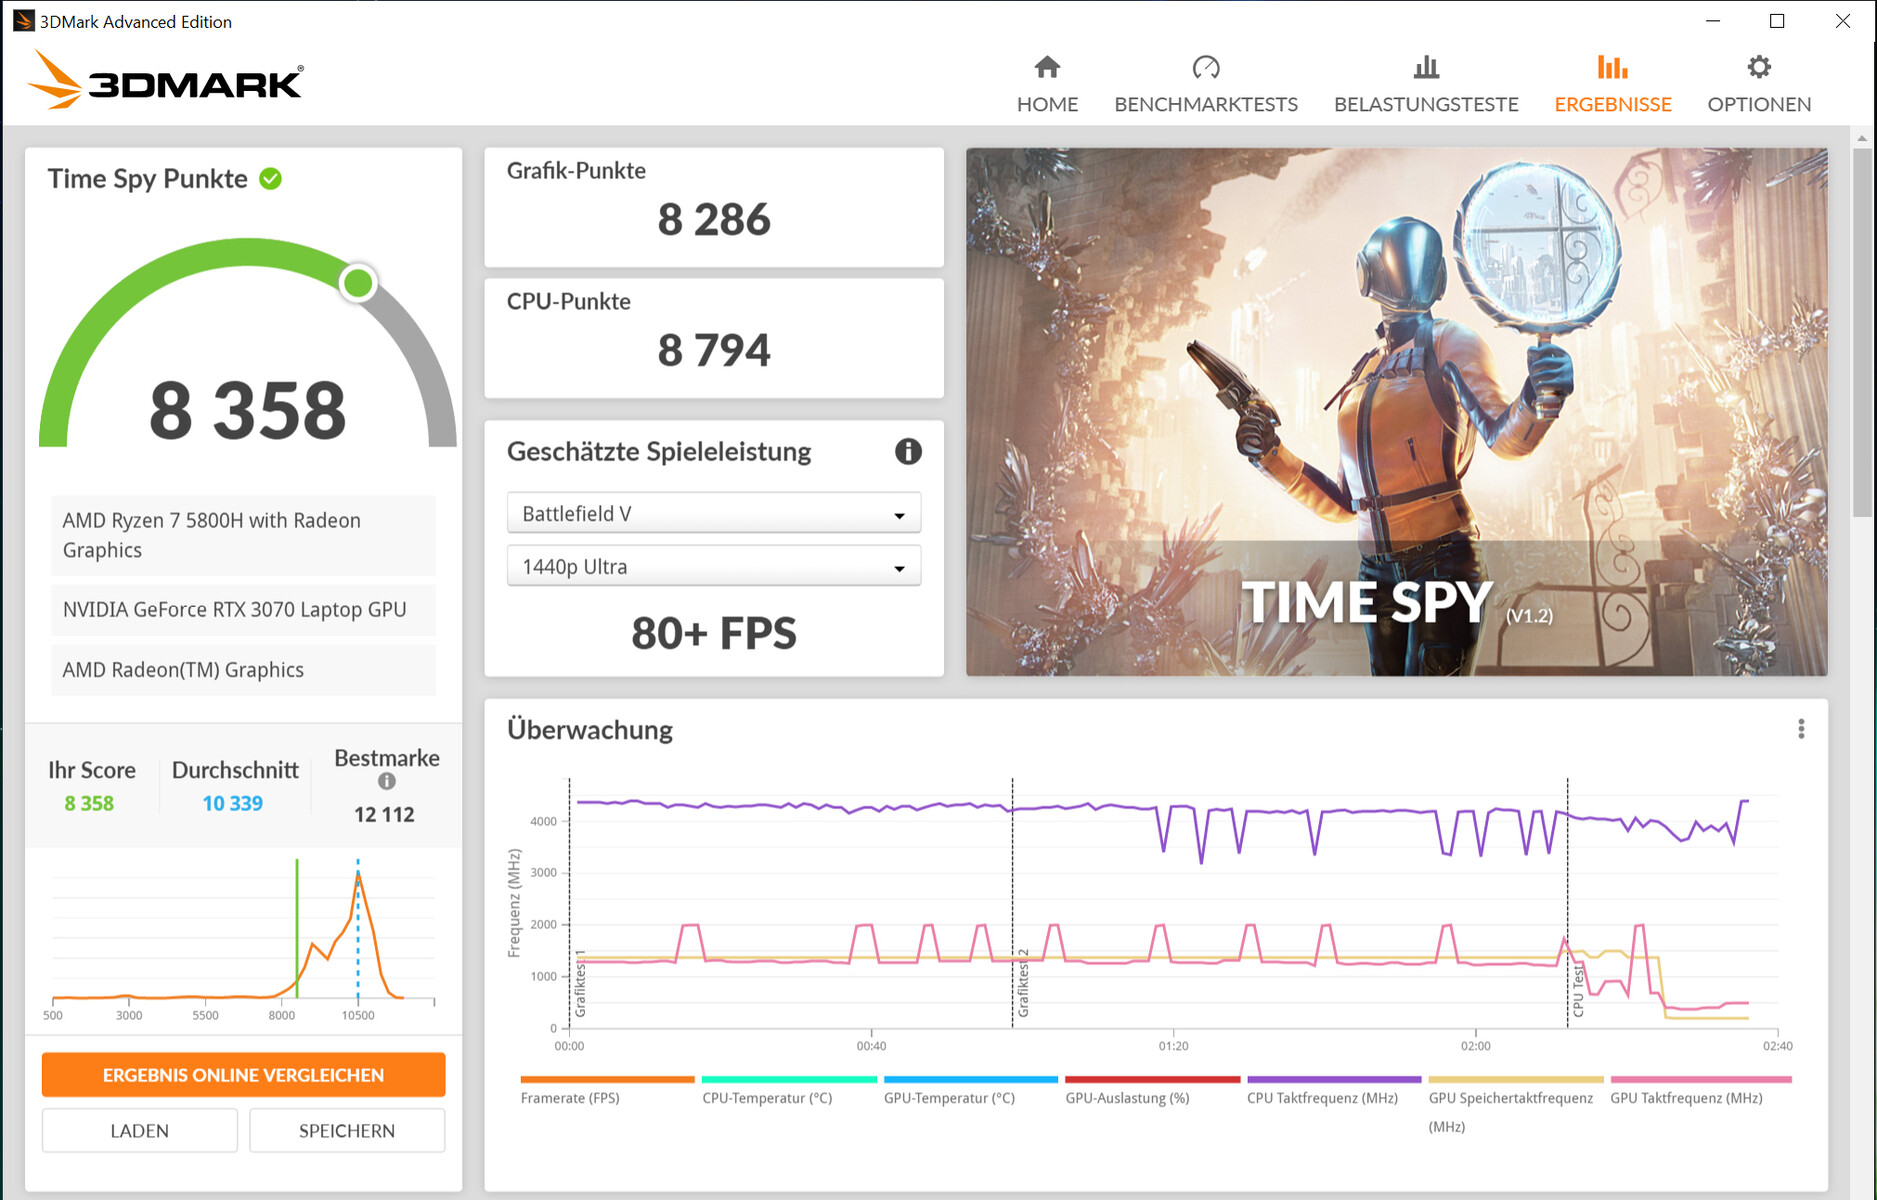
| 3DMark Time Spy Score | 8358 points | |
Help | ||
Gaming performance
The laptop displays all modern games smoothly onto the screen. The full screen resolution (2560x1440 pixels) and high to maximum quality settings can usually be selected. The frame rates are below average in comparison with the RTX 3070. In many cases, the Nitro has to admit defeat to a nominally weaker RTX-3060 laptop like the Razer Blade 15 Base model.
The frame rates increase by up to 10% after installing the previously mentioned firmware update. An overall performance increase can't be observed, though. Even after executing the update, the Nitro 5 isn't able to outperform the Blade 15.
| Final Fantasy XV Benchmark | |
| 1920x1080 High Quality | |
| Average of class Gaming (19.2 - 215, n=141, last 2 years) | |
| Asus ROG Strix G15 G513QY (1.3) | |
| Average NVIDIA GeForce RTX 3070 Laptop GPU (27.9 - 107, n=49) | |
| Acer Nitro 5 AN515-45-R1JH (1.3, FW-Update) | |
| Razer Blade 15 Base Edition 2021, i7-10750H RTX 3060 (1.3) | |
| Asus TUF Gaming A15 FA506QR-AZ061T (1.3) | |
| Acer Nitro 5 AN515-45-R1JH (1.3) | |
| Acer Aspire Nitro 5 AN515-55-57GF (1.3) | |
| MSI GF65 Thin 10UE (1.3) | |
| 2560x1440 High Quality | |
| Average of class Gaming (32.5 - 183.6, n=112, last 2 years) | |
| Average NVIDIA GeForce RTX 3070 Laptop GPU (19.8 - 79.9, n=25) | |
| Acer Nitro 5 AN515-45-R1JH (1.3, FW-Update) | |
| Acer Nitro 5 AN515-45-R1JH (1.3) | |
| MSI GF65 Thin 10UE (1.3) | |
| GTA V | |
| 1920x1080 Highest Settings possible AA:4xMSAA + FX AF:16x | |
| Average of class Gaming (12.1 - 186.9, n=126, last 2 years) | |
| Average NVIDIA GeForce RTX 3070 Laptop GPU (21.7 - 125.8, n=50) | |
| Razer Blade 15 Base Edition 2021, i7-10750H RTX 3060 | |
| Asus TUF Gaming A15 FA506QR-AZ061T | |
| Acer Nitro 5 AN515-45-R1JH (FW-Update) | |
| Acer Nitro 5 AN515-45-R1JH | |
| Asus ROG Strix G15 G513QY | |
| Acer Aspire Nitro 5 AN515-55-57GF | |
| MSI GF65 Thin 10UE | |
| 2560x1440 Highest Settings possible AA:4xMSAA + FX AF:16x | |
| Average of class Gaming (36.9 - 183.9, n=91, last 2 years) | |
| Average NVIDIA GeForce RTX 3070 Laptop GPU (70.8 - 97.1, n=19) | |
| Acer Nitro 5 AN515-45-R1JH (FW-Update) | |
| Acer Nitro 5 AN515-45-R1JH | |
| Strange Brigade | |
| 1920x1080 ultra AA:ultra AF:16 | |
| Average of class Gaming (38.9 - 456, n=131, last 2 years) | |
| Asus ROG Strix G15 G513QY (1.47.22.14 D3D12) | |
| Average NVIDIA GeForce RTX 3070 Laptop GPU (36.2 - 194, n=46) | |
| Acer Nitro 5 AN515-45-R1JH (1.47.22.14 D3D12, FW-Update) | |
| Razer Blade 15 Base Edition 2021, i7-10750H RTX 3060 (1.47.22.14 D3D12) | |
| Acer Nitro 5 AN515-45-R1JH (1.47.22.14 D3D12) | |
| Asus TUF Gaming A15 FA506QR-AZ061T (1.47.22.14 D3D12) | |
| Acer Aspire Nitro 5 AN515-55-57GF (1.47.22.14 D3D12) | |
| MSI GF65 Thin 10UE (1.47.22.14 D3D12) | |
| 2560x1440 ultra AA:ultra AF:16 | |
| Average of class Gaming (52.8 - 350, n=99, last 2 years) | |
| Average NVIDIA GeForce RTX 3070 Laptop GPU (82.3 - 140.5, n=18) | |
| Acer Nitro 5 AN515-45-R1JH (1.47.22.14 D3D12, FW-Update) | |
| Acer Nitro 5 AN515-45-R1JH (1.47.22.14 D3D12) | |
| Dirt 5 | |
| 1920x1080 Ultra High Preset | |
| Average NVIDIA GeForce RTX 3070 Laptop GPU (50 - 96, n=11) | |
| Acer Nitro 5 AN515-45-R1JH (FW-Update) | |
| Acer Nitro 5 AN515-45-R1JH | |
| 2560x1440 Ultra High Preset | |
| Average NVIDIA GeForce RTX 3070 Laptop GPU (58.6 - 75, n=6) | |
| Acer Nitro 5 AN515-45-R1JH (FW-Update) | |
| Acer Nitro 5 AN515-45-R1JH | |
In order to verify whether the frame rates remain largely constant over a prolonged period of time, we let the game The Witcher 3 run for about 60 minutes at Full HD resolution and maximum quality settings. The character is not moved. A drop in frame rates wasn't found.
The Witcher 3 FPS diagram
| low | med. | high | ultra | QHD | |
|---|---|---|---|---|---|
| GTA V (2015) | 174 | 165 | 136 | 80.7 | 70.8 |
| The Witcher 3 (2015) | 262 | 217 | 141 | 81.5 | |
| Dota 2 Reborn (2015) | 139 | 131 | 115 | 111 | |
| Final Fantasy XV Benchmark (2018) | 144 | 104 | 79.2 | 61 | |
| X-Plane 11.11 (2018) | 95.3 | 85.5 | 70.7 | ||
| Far Cry 5 (2018) | 125 | 106 | 101 | 95 | 81 |
| Strange Brigade (2018) | 309 | 173 | 157 | 141 | 107 |
| Dirt 5 (2020) | 181 | 107 | 86 | 72.2 | 58.6 |
Emissions - The Acer laptop is on par with the rest of its class
Noise emissions
Noise development is at a normal level over the entire load range considering the hardware installed here. The fans run at low speeds in everyday use and are barely audible. From time to time, they come to a halt. The maximum sound pressure level is 49.1 dB(A) - determined during the stress test. The laptop produces slightly less noise during gaming.
Noise Level
| Idle |
| 25 / 25 / 32.2 dB(A) |
| Load |
| 45.8 / 49.1 dB(A) |
 | ||
30 dB silent 40 dB(A) audible 50 dB(A) loud |
||
min: | ||
| Acer Nitro 5 AN515-45-R1JH R7 5800H, GeForce RTX 3070 Laptop GPU | Asus ROG Strix G15 G513QY R9 5900HX, Radeon RX 6800M | Aorus 15P XC i7-10870H, GeForce RTX 3070 Laptop GPU | MSI GF65 Thin 10UE i7-10750H, GeForce RTX 3060 Laptop GPU | Asus TUF Gaming A15 FA506QR-AZ061T R7 5800H, GeForce RTX 3070 Laptop GPU | Razer Blade 15 Base Edition 2021, i7-10750H RTX 3060 i7-10750H, GeForce RTX 3060 Laptop GPU | Average NVIDIA GeForce RTX 3070 Laptop GPU | Average of class Gaming | |
|---|---|---|---|---|---|---|---|---|
| Noise | -6% | -4% | -13% | 0% | 3% | -4% | -1% | |
| off / environment * | 25 | 26 -4% | 24 4% | 24.7 1% | 26 -4% | 25.3 -1% | 24.9 ? -0% | 24 ? 4% |
| Idle Minimum * | 25 | 26 -4% | 25 -0% | 33.1 -32% | 26 -4% | 25.4 -2% | 26.7 ? -7% | 25.9 ? -4% |
| Idle Average * | 25 | 31 -24% | 29 -16% | 33.1 -32% | 26 -4% | 25.4 -2% | 28.7 ? -15% | 27.7 ? -11% |
| Idle Maximum * | 32.2 | 34 -6% | 34 -6% | 33.1 -3% | 27.4 15% | 25.4 21% | 31.7 ? 2% | 30.2 ? 6% |
| Load Average * | 45.8 | 44 4% | 44 4% | 42.7 7% | 46.6 -2% | 42.5 7% | 45 ? 2% | 42.3 ? 8% |
| Load Maximum * | 49.1 | 49 -0% | 53 -8% | 59.4 -21% | 49.3 -0% | 52.2 -6% | 52.6 ? -7% | 53.5 ? -9% |
| Witcher 3 ultra * | 48.5 | 49 | 40.6 | 42 |
* ... smaller is better
Temperature
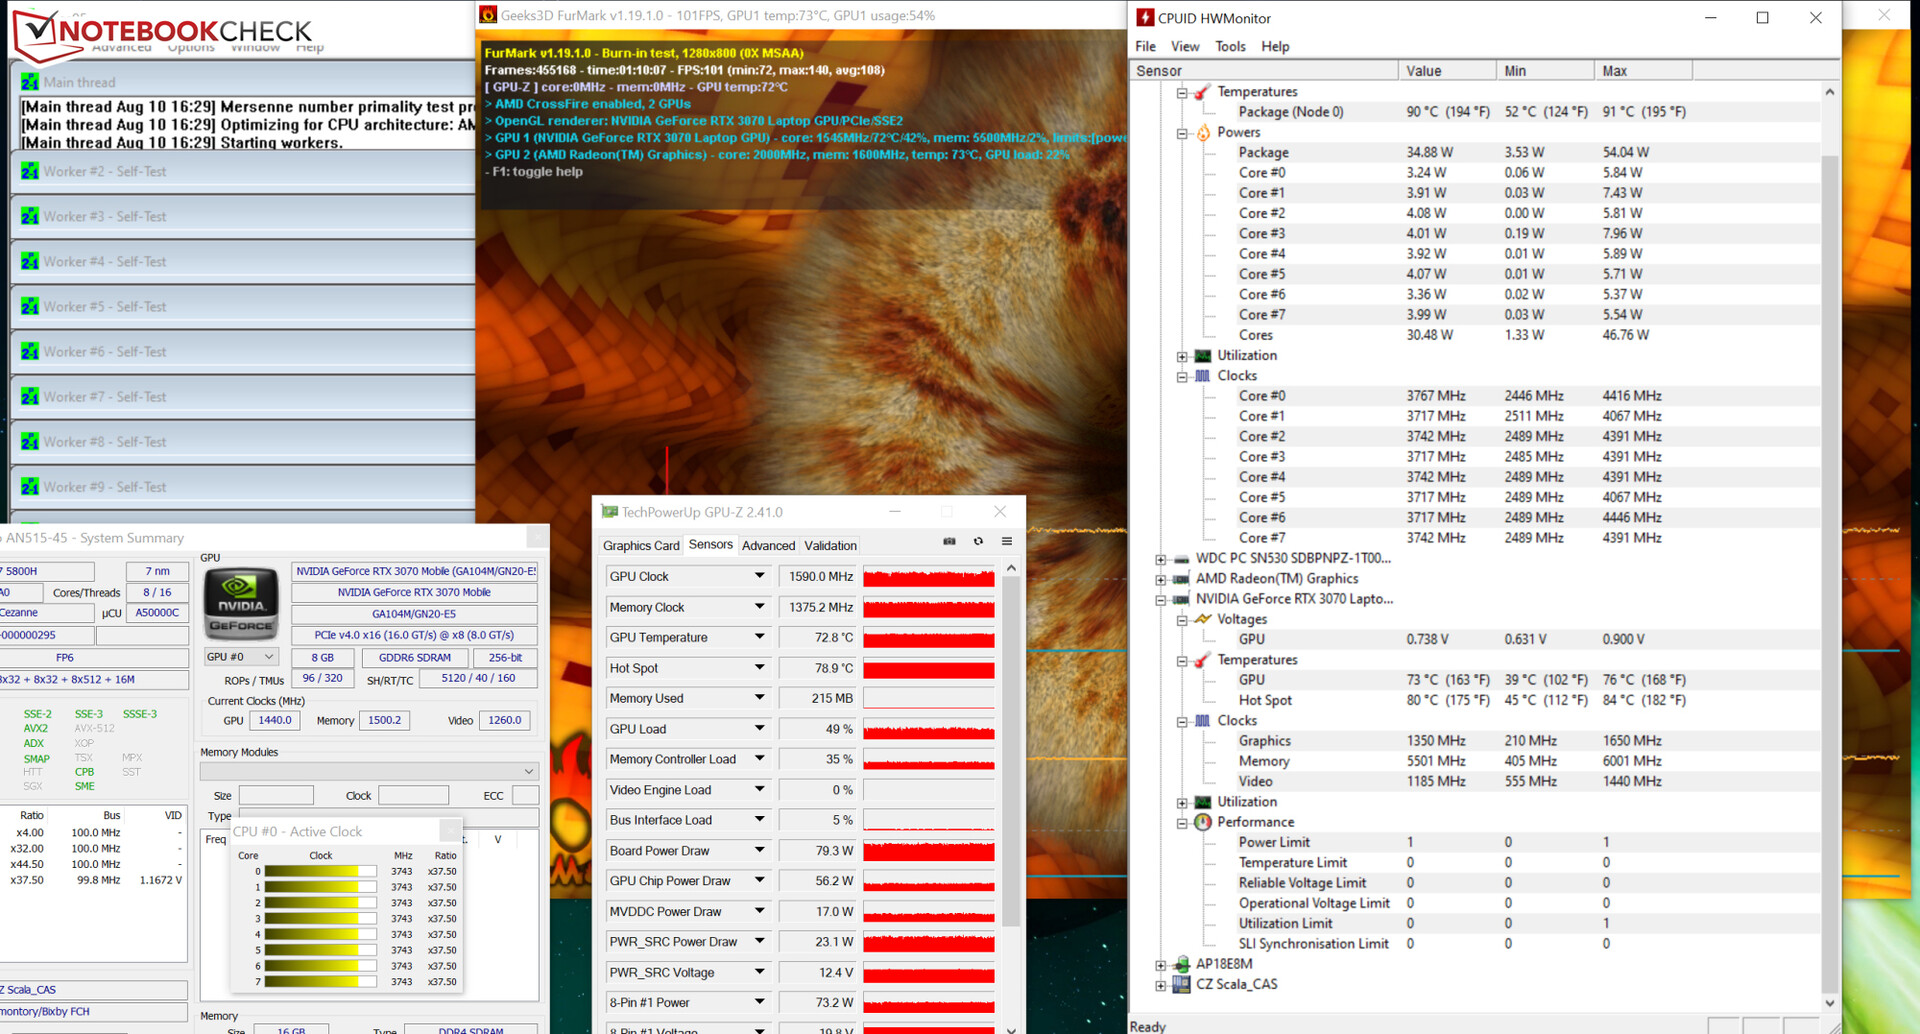
Our stress test (Prime95 and FurMark run for at least an hour) is performed by the CPU and GPU at 3.7 GHz and 1,590 MHz, respectively. The stress test represents an extreme scenario. With this test, we check whether the system remains stable under full load.
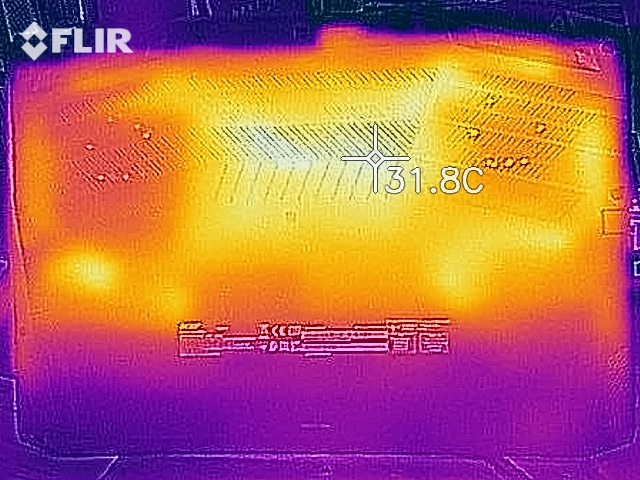
The laptop heats up noticeably under load, but not excessively. During the stress test, the 50 °C (~122 °F) mark is exceeded at three measuring points. The temperatures remain within the green range in everyday use.
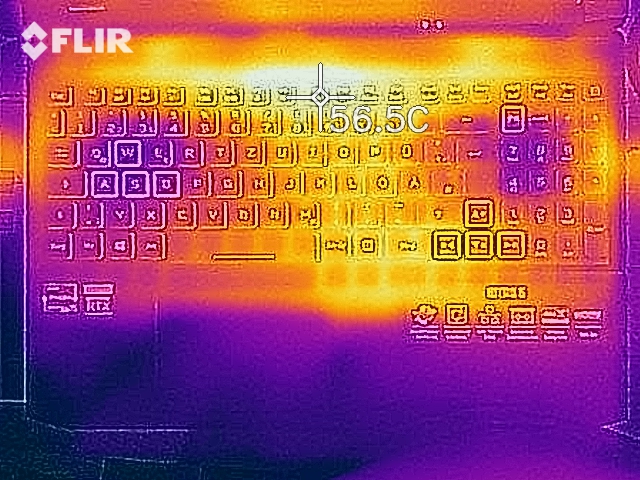
(-) The maximum temperature on the upper side is 53.2 °C / 128 F, compared to the average of 40.5 °C / 105 F, ranging from 21.2 to 68.8 °C for the class Gaming.
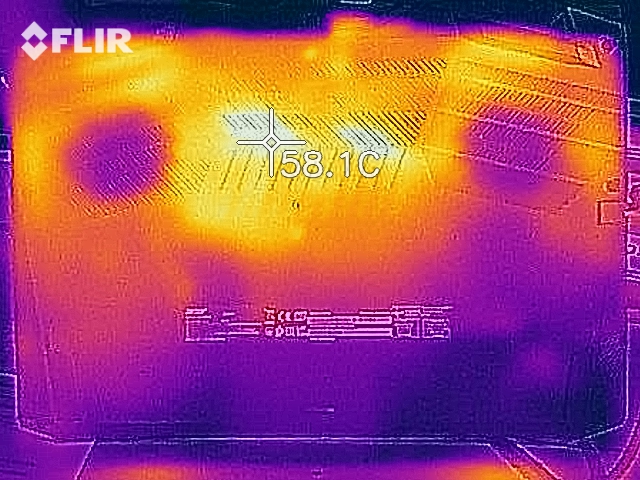
(-) The bottom heats up to a maximum of 58.2 °C / 137 F, compared to the average of 43.3 °C / 110 F
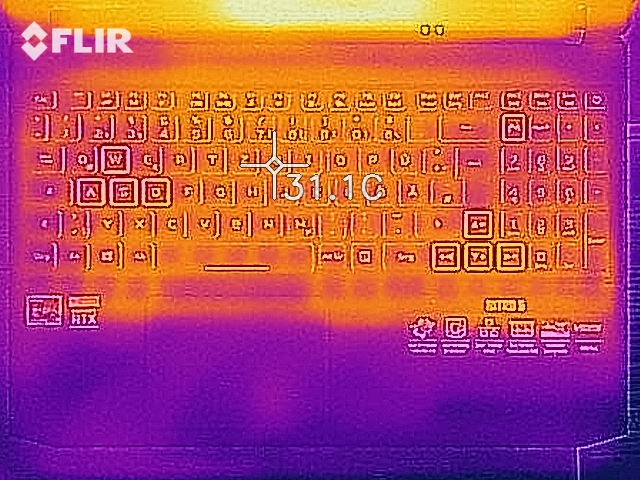
(+) In idle usage, the average temperature for the upper side is 26.2 °C / 79 F, compared to the device average of 33.9 °C / 93 F.
(+) The palmrests and touchpad are cooler than skin temperature with a maximum of 26.2 °C / 79.2 F and are therefore cool to the touch.
(+) The average temperature of the palmrest area of similar devices was 28.9 °C / 84 F (+2.7 °C / 4.8 F).
| Acer Nitro 5 AN515-45-R1JH R7 5800H, GeForce RTX 3070 Laptop GPU | Asus ROG Strix G15 G513QY R9 5900HX, Radeon RX 6800M | Aorus 15P XC i7-10870H, GeForce RTX 3070 Laptop GPU | MSI GF65 Thin 10UE i7-10750H, GeForce RTX 3060 Laptop GPU | Asus TUF Gaming A15 FA506QR-AZ061T R7 5800H, GeForce RTX 3070 Laptop GPU | Razer Blade 15 Base Edition 2021, i7-10750H RTX 3060 i7-10750H, GeForce RTX 3060 Laptop GPU | Average NVIDIA GeForce RTX 3070 Laptop GPU | Average of class Gaming | |
|---|---|---|---|---|---|---|---|---|
| Heat | 10% | 10% | 13% | -8% | -1% | -0% | 4% | |
| Maximum Upper Side * | 53.2 | 38.9 27% | 47 12% | 43.4 18% | 46.7 12% | 45.2 15% | 47.8 ? 10% | 45.9 ? 14% |
| Maximum Bottom * | 58.2 | 34.6 41% | 57 2% | 41.8 28% | 55.9 4% | 48 18% | 52.9 ? 9% | 48.7 ? 16% |
| Idle Upper Side * | 29.5 | 34.4 -17% | 26 12% | 30.2 -2% | 37.1 -26% | 34.4 -17% | 32.4 ? -10% | 31.4 ? -6% |
| Idle Bottom * | 31.2 | 34.4 -10% | 27 13% | 28.4 9% | 38.1 -22% | 37.2 -19% | 34.2 ? -10% | 34.3 ? -10% |
* ... smaller is better
Speakers
The stereo speakers produce a decent sound that lacks bass. We recommend headphones or external speakers for a better sound experience.
Acer Nitro 5 AN515-45-R1JH audio analysis
(±) | speaker loudness is average but good (75.5 dB)
Bass 100 - 315 Hz
(-) | nearly no bass - on average 33.4% lower than median
(±) | linearity of bass is average (12.8% delta to prev. frequency)
Mids 400 - 2000 Hz
(+) | balanced mids - only 3.4% away from median
(±) | linearity of mids is average (8.6% delta to prev. frequency)
Highs 2 - 16 kHz
(±) | higher highs - on average 5% higher than median
(±) | linearity of highs is average (7.3% delta to prev. frequency)
Overall 100 - 16.000 Hz
(±) | linearity of overall sound is average (25.1% difference to median)
Compared to same class
» 89% of all tested devices in this class were better, 3% similar, 8% worse
» The best had a delta of 6%, average was 18%, worst was 132%
Compared to all devices tested
» 75% of all tested devices were better, 5% similar, 19% worse
» The best had a delta of 4%, average was 24%, worst was 134%
Asus TUF Gaming A15 FA506QR-AZ061T audio analysis
(±) | speaker loudness is average but good (74 dB)
Bass 100 - 315 Hz
(-) | nearly no bass - on average 22.4% lower than median
(±) | linearity of bass is average (10.8% delta to prev. frequency)
Mids 400 - 2000 Hz
(+) | balanced mids - only 2.4% away from median
(+) | mids are linear (5.9% delta to prev. frequency)
Highs 2 - 16 kHz
(±) | higher highs - on average 5.8% higher than median
(+) | highs are linear (5.6% delta to prev. frequency)
Overall 100 - 16.000 Hz
(±) | linearity of overall sound is average (20.1% difference to median)
Compared to same class
» 70% of all tested devices in this class were better, 6% similar, 24% worse
» The best had a delta of 6%, average was 18%, worst was 132%
Compared to all devices tested
» 50% of all tested devices were better, 8% similar, 42% worse
» The best had a delta of 4%, average was 24%, worst was 134%
Energy management - Gaming laptop with solid battery life
Energy consumption
All in all, the Nitro's power consumption is at a normal level over the entire load range considering the hardware installed here. We register a maximum power consumption of 14.6 watts in idle usage. Competitors like the Razer Blade 15 and the Aorus 15P XC require considerably more energy.
The stress test and our The Witcher 3 test let the Acer laptop's energy consumption rise up to 164 watts and an average of 134 watts, respectively. This makes the AN515 one of the more frugal laptops in our comparison field. The following diagram illustrates the laptop's rather constant power consumption during our the Witcher 3 test and the stress test. The power adapter's nominal capacity is 180 watts.
| Off / Standby | |
| Idle | |
| Load |
|
Key:
min: | |
Energy consumption during The Witcher 3 / Stress test
| Acer Nitro 5 AN515-45-R1JH R7 5800H, GeForce RTX 3070 Laptop GPU | Asus ROG Strix G15 G513QY R9 5900HX, Radeon RX 6800M | Aorus 15P XC i7-10870H, GeForce RTX 3070 Laptop GPU | MSI GF65 Thin 10UE i7-10750H, GeForce RTX 3060 Laptop GPU | Asus TUF Gaming A15 FA506QR-AZ061T R7 5800H, GeForce RTX 3070 Laptop GPU | Razer Blade 15 Base Edition 2021, i7-10750H RTX 3060 i7-10750H, GeForce RTX 3060 Laptop GPU | Average NVIDIA GeForce RTX 3070 Laptop GPU | Average of class Gaming | |
|---|---|---|---|---|---|---|---|---|
| Power Consumption | -20% | -46% | 8% | -5% | -26% | -49% | -48% | |
| Idle Minimum * | 8.8 | 12.1 -38% | 14 -59% | 5.4 39% | 10.2 -16% | 11.7 -33% | 15.6 ? -77% | 14.2 ? -61% |
| Idle Average * | 13 | 13 -0% | 17 -31% | 12.8 2% | 12.8 2% | 16 -23% | 20.1 ? -55% | 20.2 ? -55% |
| Idle Maximum * | 14.6 | 14.7 -1% | 33 -126% | 19.5 -34% | 15 -3% | 29.3 -101% | 29.4 ? -101% | 27.2 ? -86% |
| Load Average * | 133 | 90.3 32% | 96 28% | 86.6 35% | 130 2% | 95.6 28% | 110.8 ? 17% | 107.7 ? 19% |
| Witcher 3 ultra * | 134 | 200 -49% | 179 -34% | 115.7 14% | 137 -2% | 141.3 -5% | ||
| Load Maximum * | 164 | 263.4 -61% | 256 -56% | 175.2 -7% | 184 -12% | 197 -20% | 214 ? -30% | 260 ? -59% |
* ... smaller is better
Battery life
The 15.6-incher achieves runtimes of 5:40 hours and 6:53 hours in our Wi-Fi test (accessing websites using a script) and video test (short film Big Buck Bunny (H.264 encoding, Full HD) running in a loop), respectively. During both tests, the laptop's power-saving features are disabled, and the display brightness is set to about 150 cd/m². The wireless modules are also disabled for the video test.
Within our comparison field, the Nitro 5 is among the laptops with the lowest battery capacities. Nevertheless, the device delivers decent battery life. However, it doesn't come close to the excellent rates of the two Asus laptops. The two machines benefit from their 90 Wh batteries.
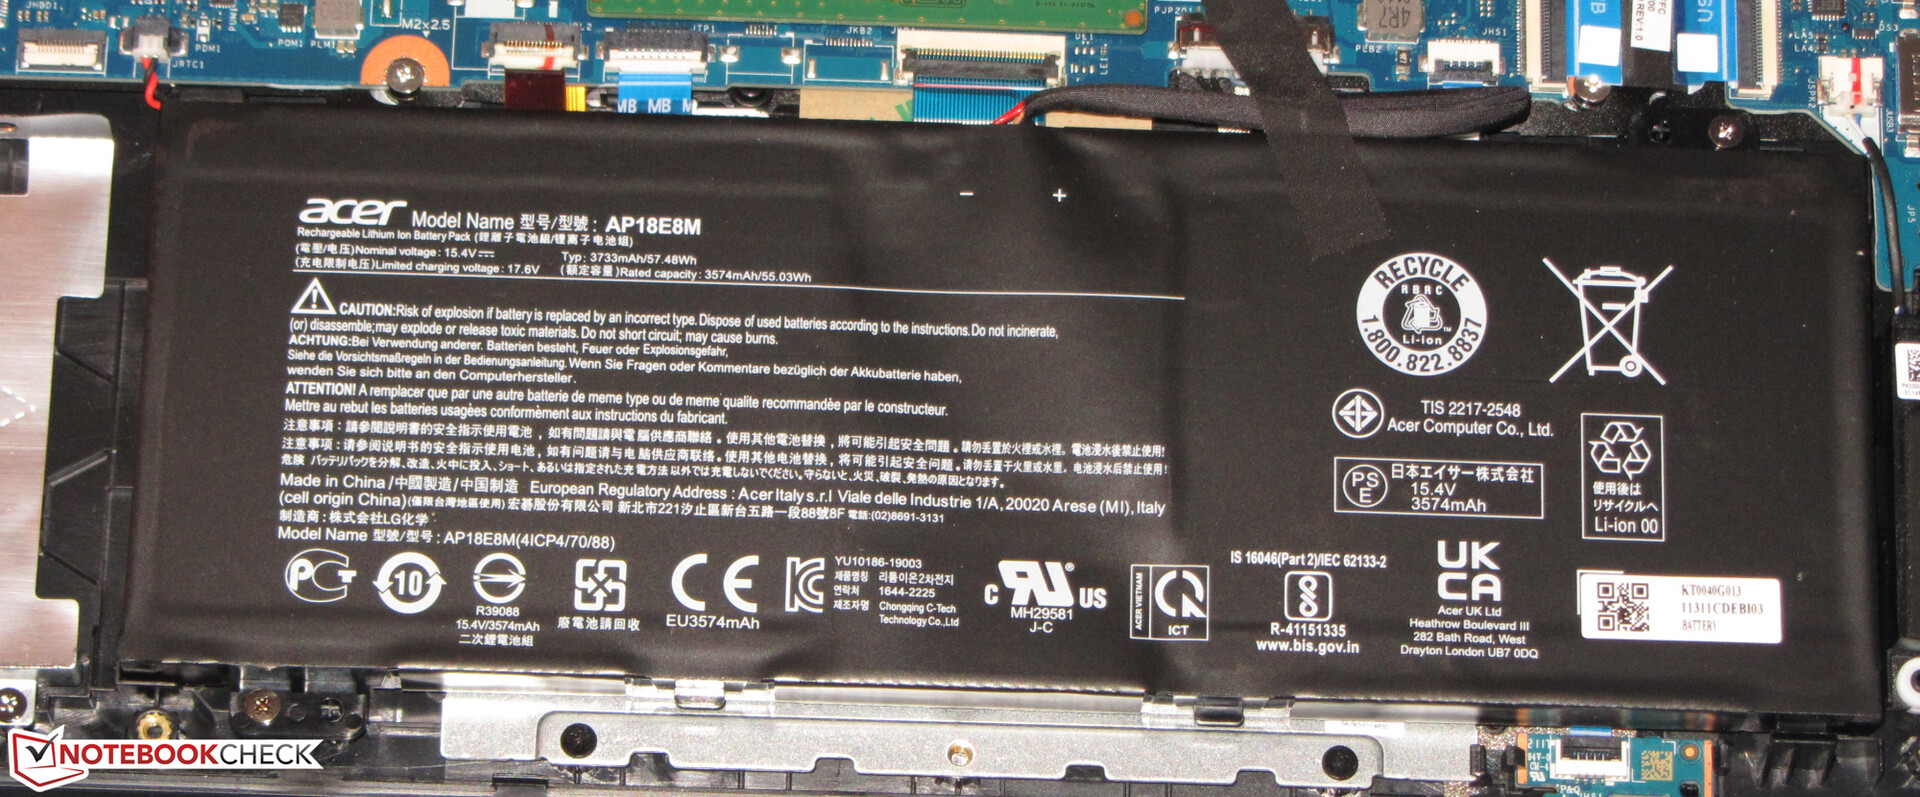
| Acer Nitro 5 AN515-45-R1JH R7 5800H, GeForce RTX 3070 Laptop GPU, 57.5 Wh | Asus ROG Strix G15 G513QY R9 5900HX, Radeon RX 6800M, 90 Wh | Aorus 15P XC i7-10870H, GeForce RTX 3070 Laptop GPU, 99 Wh | MSI GF65 Thin 10UE i7-10750H, GeForce RTX 3060 Laptop GPU, 51 Wh | Asus TUF Gaming A15 FA506QR-AZ061T R7 5800H, GeForce RTX 3070 Laptop GPU, 90 Wh | Razer Blade 15 Base Edition 2021, i7-10750H RTX 3060 i7-10750H, GeForce RTX 3060 Laptop GPU, 65 Wh | Average of class Gaming | |
|---|---|---|---|---|---|---|---|
| Battery Runtime | 87% | 16% | 2% | 108% | 5% | 17% | |
| Reader / Idle | 552 | 963 74% | 571 3% | 667 21% | 1043 89% | 466 -16% | 570 ? 3% |
| H.264 | 413 | 418 1% | 457 ? 11% | ||||
| WiFi v1.3 | 340 | 553 63% | 399 17% | 276 -19% | 685 101% | 289 -15% | 387 ? 14% |
| Load | 62 | 139 124% | 89 44% | 65 5% | 145 134% | 91 47% | 85.8 ? 38% |
Pros
Cons
Verdict - Well-rounded QHD gaming laptop


The compact Nitro 5 performs decently overall, but it delivers below-average frame rates compared with the RTX 3070 laptops that we've reviewed so far. The reason for this: Acer opted for a TGP at the lower end of the allowed range - 85 watts. The GPU performance can be slightly increased via a firmware update.
Acer has a solid gaming laptop in its lineup with the Nitro 5 AN515-45.
No problems arise in terms of performance development. The CPU and GPU can work at consistently high clock rates. The laptop heats up noticeably under load, but not excessively. Noise development is in line with the class standard. Installing the firmware update should cause a slight increase in heat and noise development.
The display (QHD, IPS, 144 Hz) offers stable viewing angles, a good average brightness, a matte surface, fast response times, decent color reproduction, and good color-space coverage. The contrast is too low, though.
An alternative to the Nitro 5 could be the Asus TUF Gaming A15 FA506QR. It's on par with the Nitro in terms of performance and price, but it offers much better battery life.
Price and availability
At the time of writing, you can find the Acer Nitro 5 AN515-45 on Amazon (Ryzen 7 5800H, GeForce RTX 3070, 16 GB RAM, 1 TB SSD, QHD 165 Hz IPS display, Windows 10 Home) at $1,699.99.
Acer Nitro 5 AN515-45-R1JH
- 08/14/2021 v7 (old)
Sascha Mölck
More articles related to this device
Acer Nitro 5 AN515-45-R1JH (Nitro 5 AN515 Series)Related Articles

Price comparison

