Asus TUF Gaming A15 with Ryzen 7 in review: Entry-level gaming laptop with AMD CPU

With the Asus TUF Gaming F15, we were already able to test an almost identically equipped version of our test device with an Intel CPU. Now we have the AMD version with a Ryzen 7 5800H in the form of the Asus TUF Gaming A15, which is supported by 16 GB of RAM. An Nvidia GeForce RTX 3070 is responsible for displaying image content, and a 1 TB SSD is also available.
This configuration is offered at a price of approximately 1,700 Euros (~$2,008), meaning that the TUF Gaming A15 has to face the comparison with the competition listed below. You can also add more laptops from our database for comparison under each section.
Possible contenders in comparison
Rating | Date | Model | Weight | Height | Size | Resolution | Price |
|---|---|---|---|---|---|---|---|
| 85 % v7 (old) | 07 / 2021 | Asus TUF Gaming A15 FA506QR-AZ061T R7 5800H, GeForce RTX 3070 Laptop GPU | 2.3 kg | 24 mm | 15.60" | 1920x1080 | |
| 85.9 % v7 (old) | 06 / 2021 | Asus TUF Gaming F15 FX506HM i7-11800H, GeForce RTX 3060 Laptop GPU | 2.3 kg | 24.9 mm | 15.60" | 1920x1080 | |
| 84.7 % v7 (old) | 06 / 2021 | Alienware m15 R5 Ryzen Edition R7 5800H, GeForce RTX 3060 Laptop GPU | 2.5 kg | 22.85 mm | 15.60" | 1920x1080 | |
| 86.1 % v7 (old) | 02 / 2021 | Aorus 15P XC i7-10870H, GeForce RTX 3070 Laptop GPU | 2.2 kg | 27 mm | 15.60" | 1920x1080 | |
| 80.4 % v7 (old) | 03 / 2021 | MSI GF65 Thin 10UE i7-10750H, GeForce RTX 3060 Laptop GPU | 1.9 kg | 21.7 mm | 15.60" | 1920x1080 |
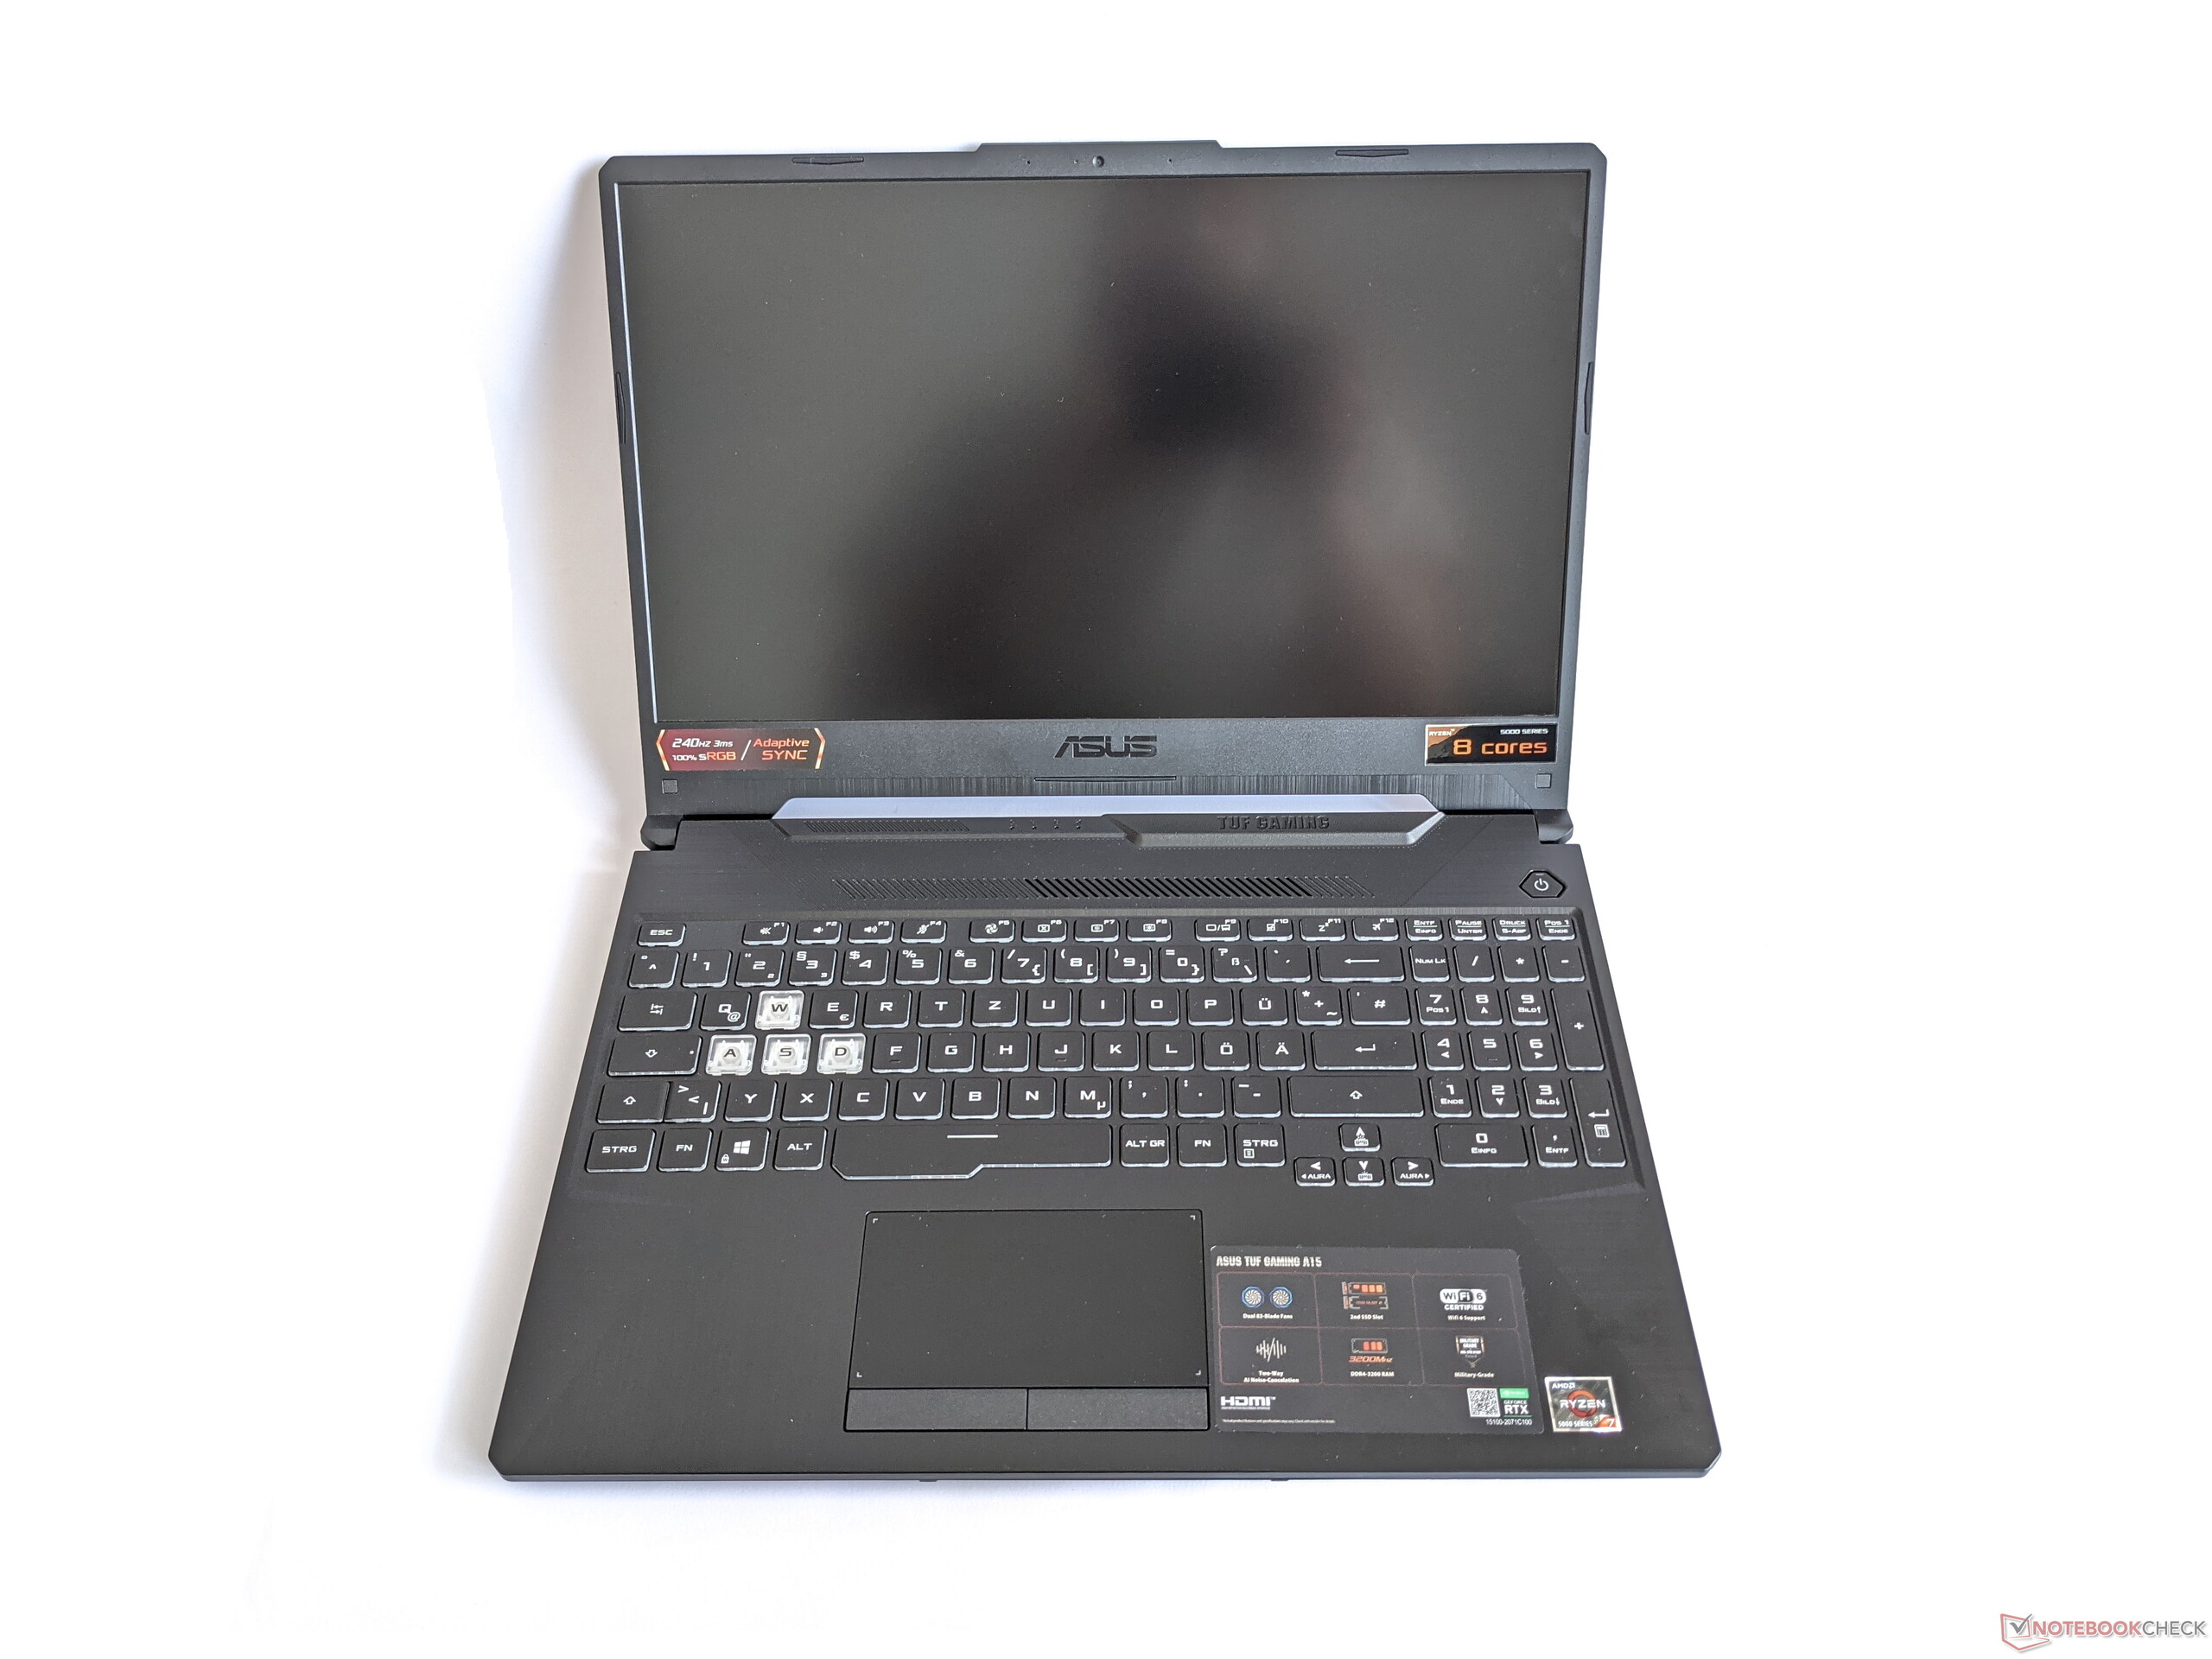
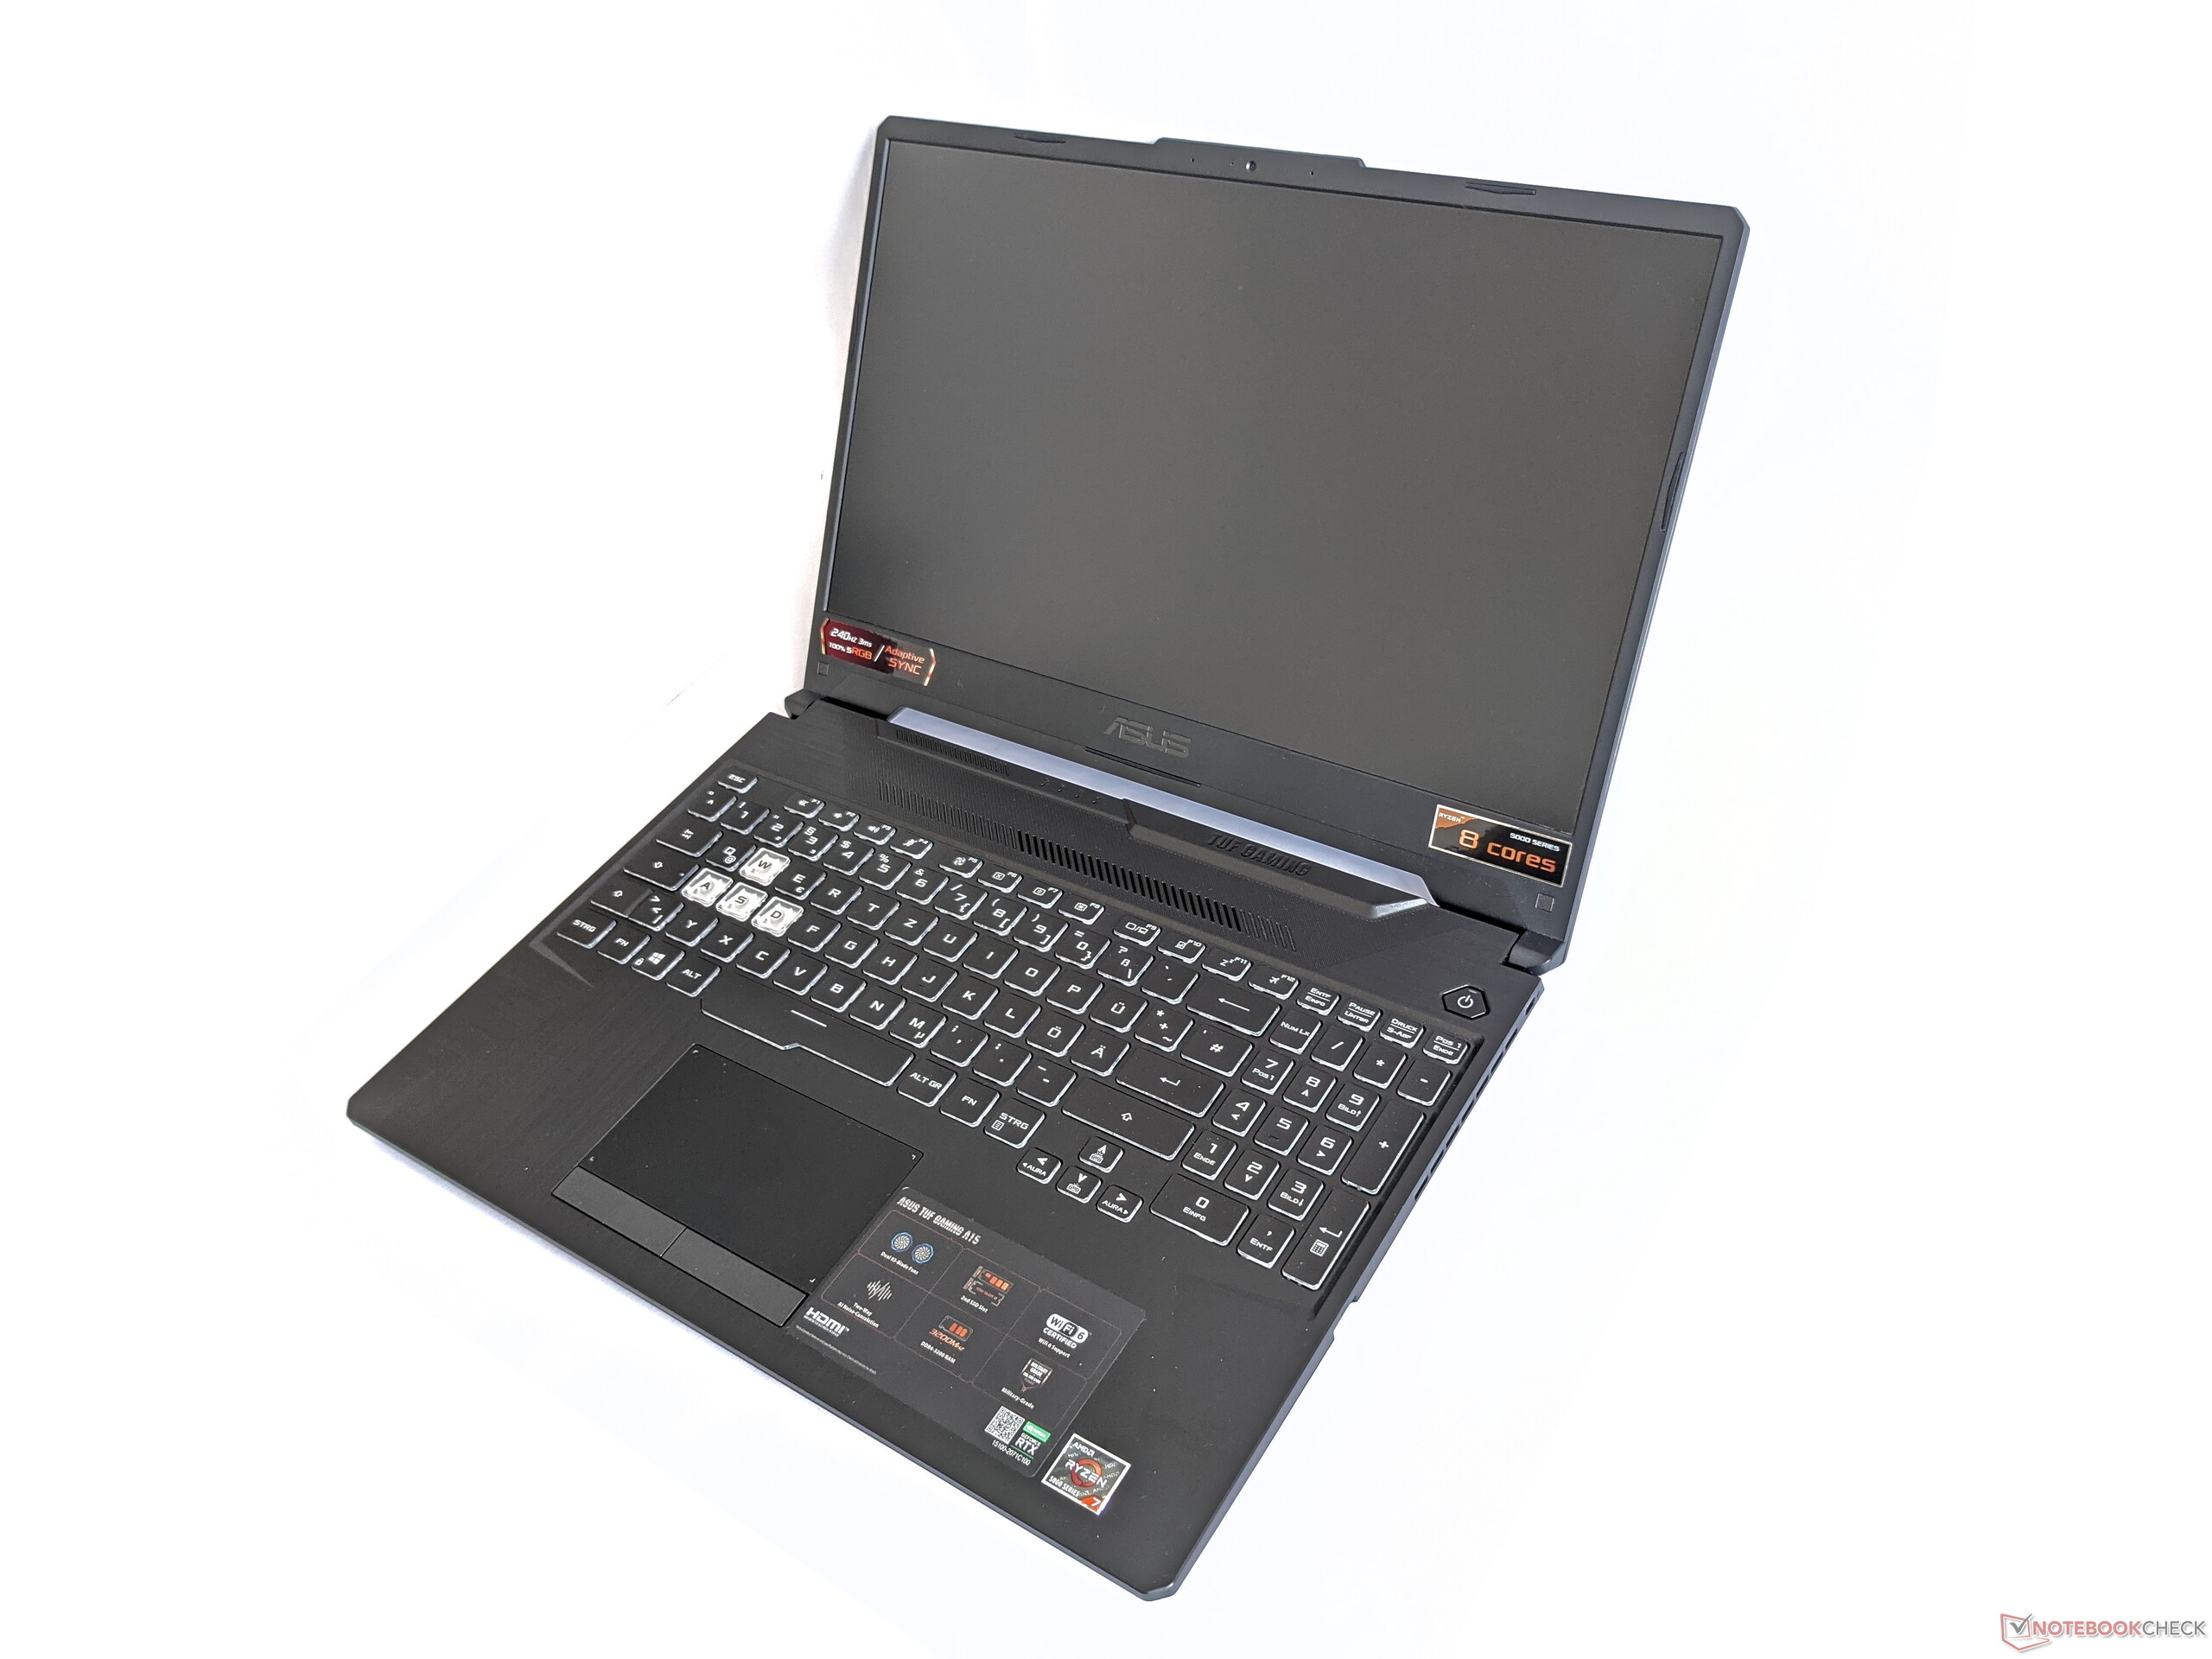
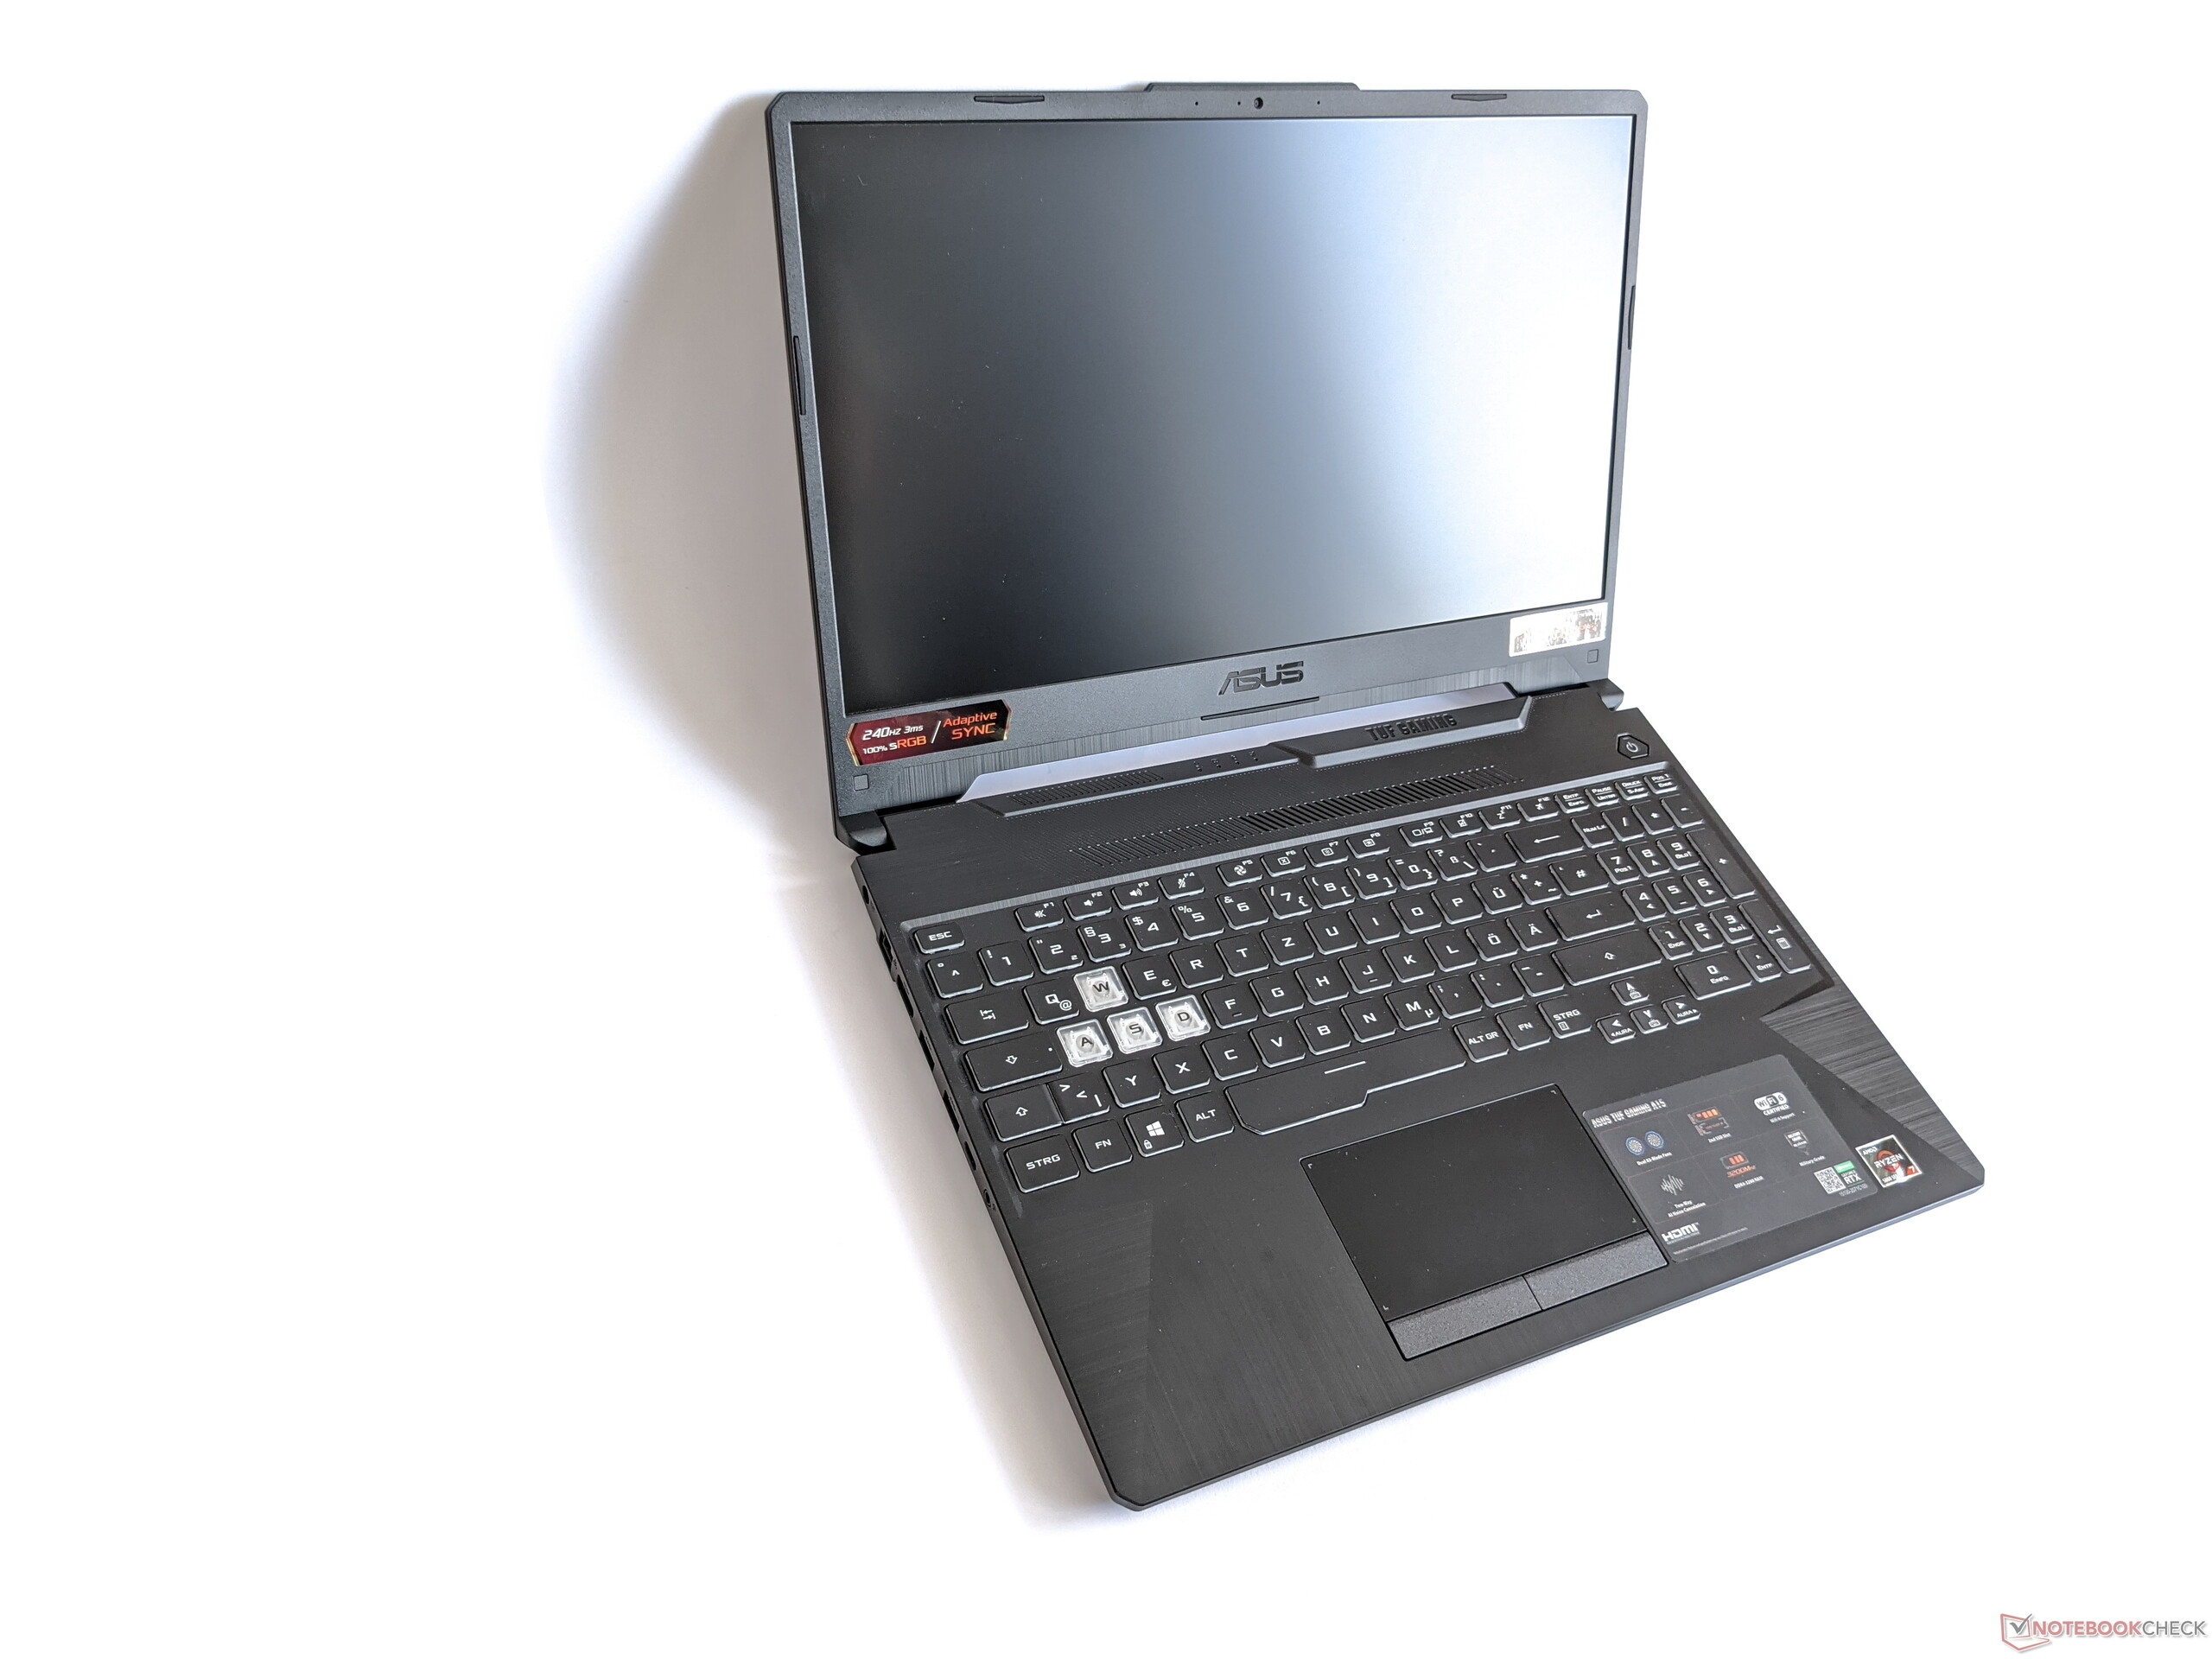
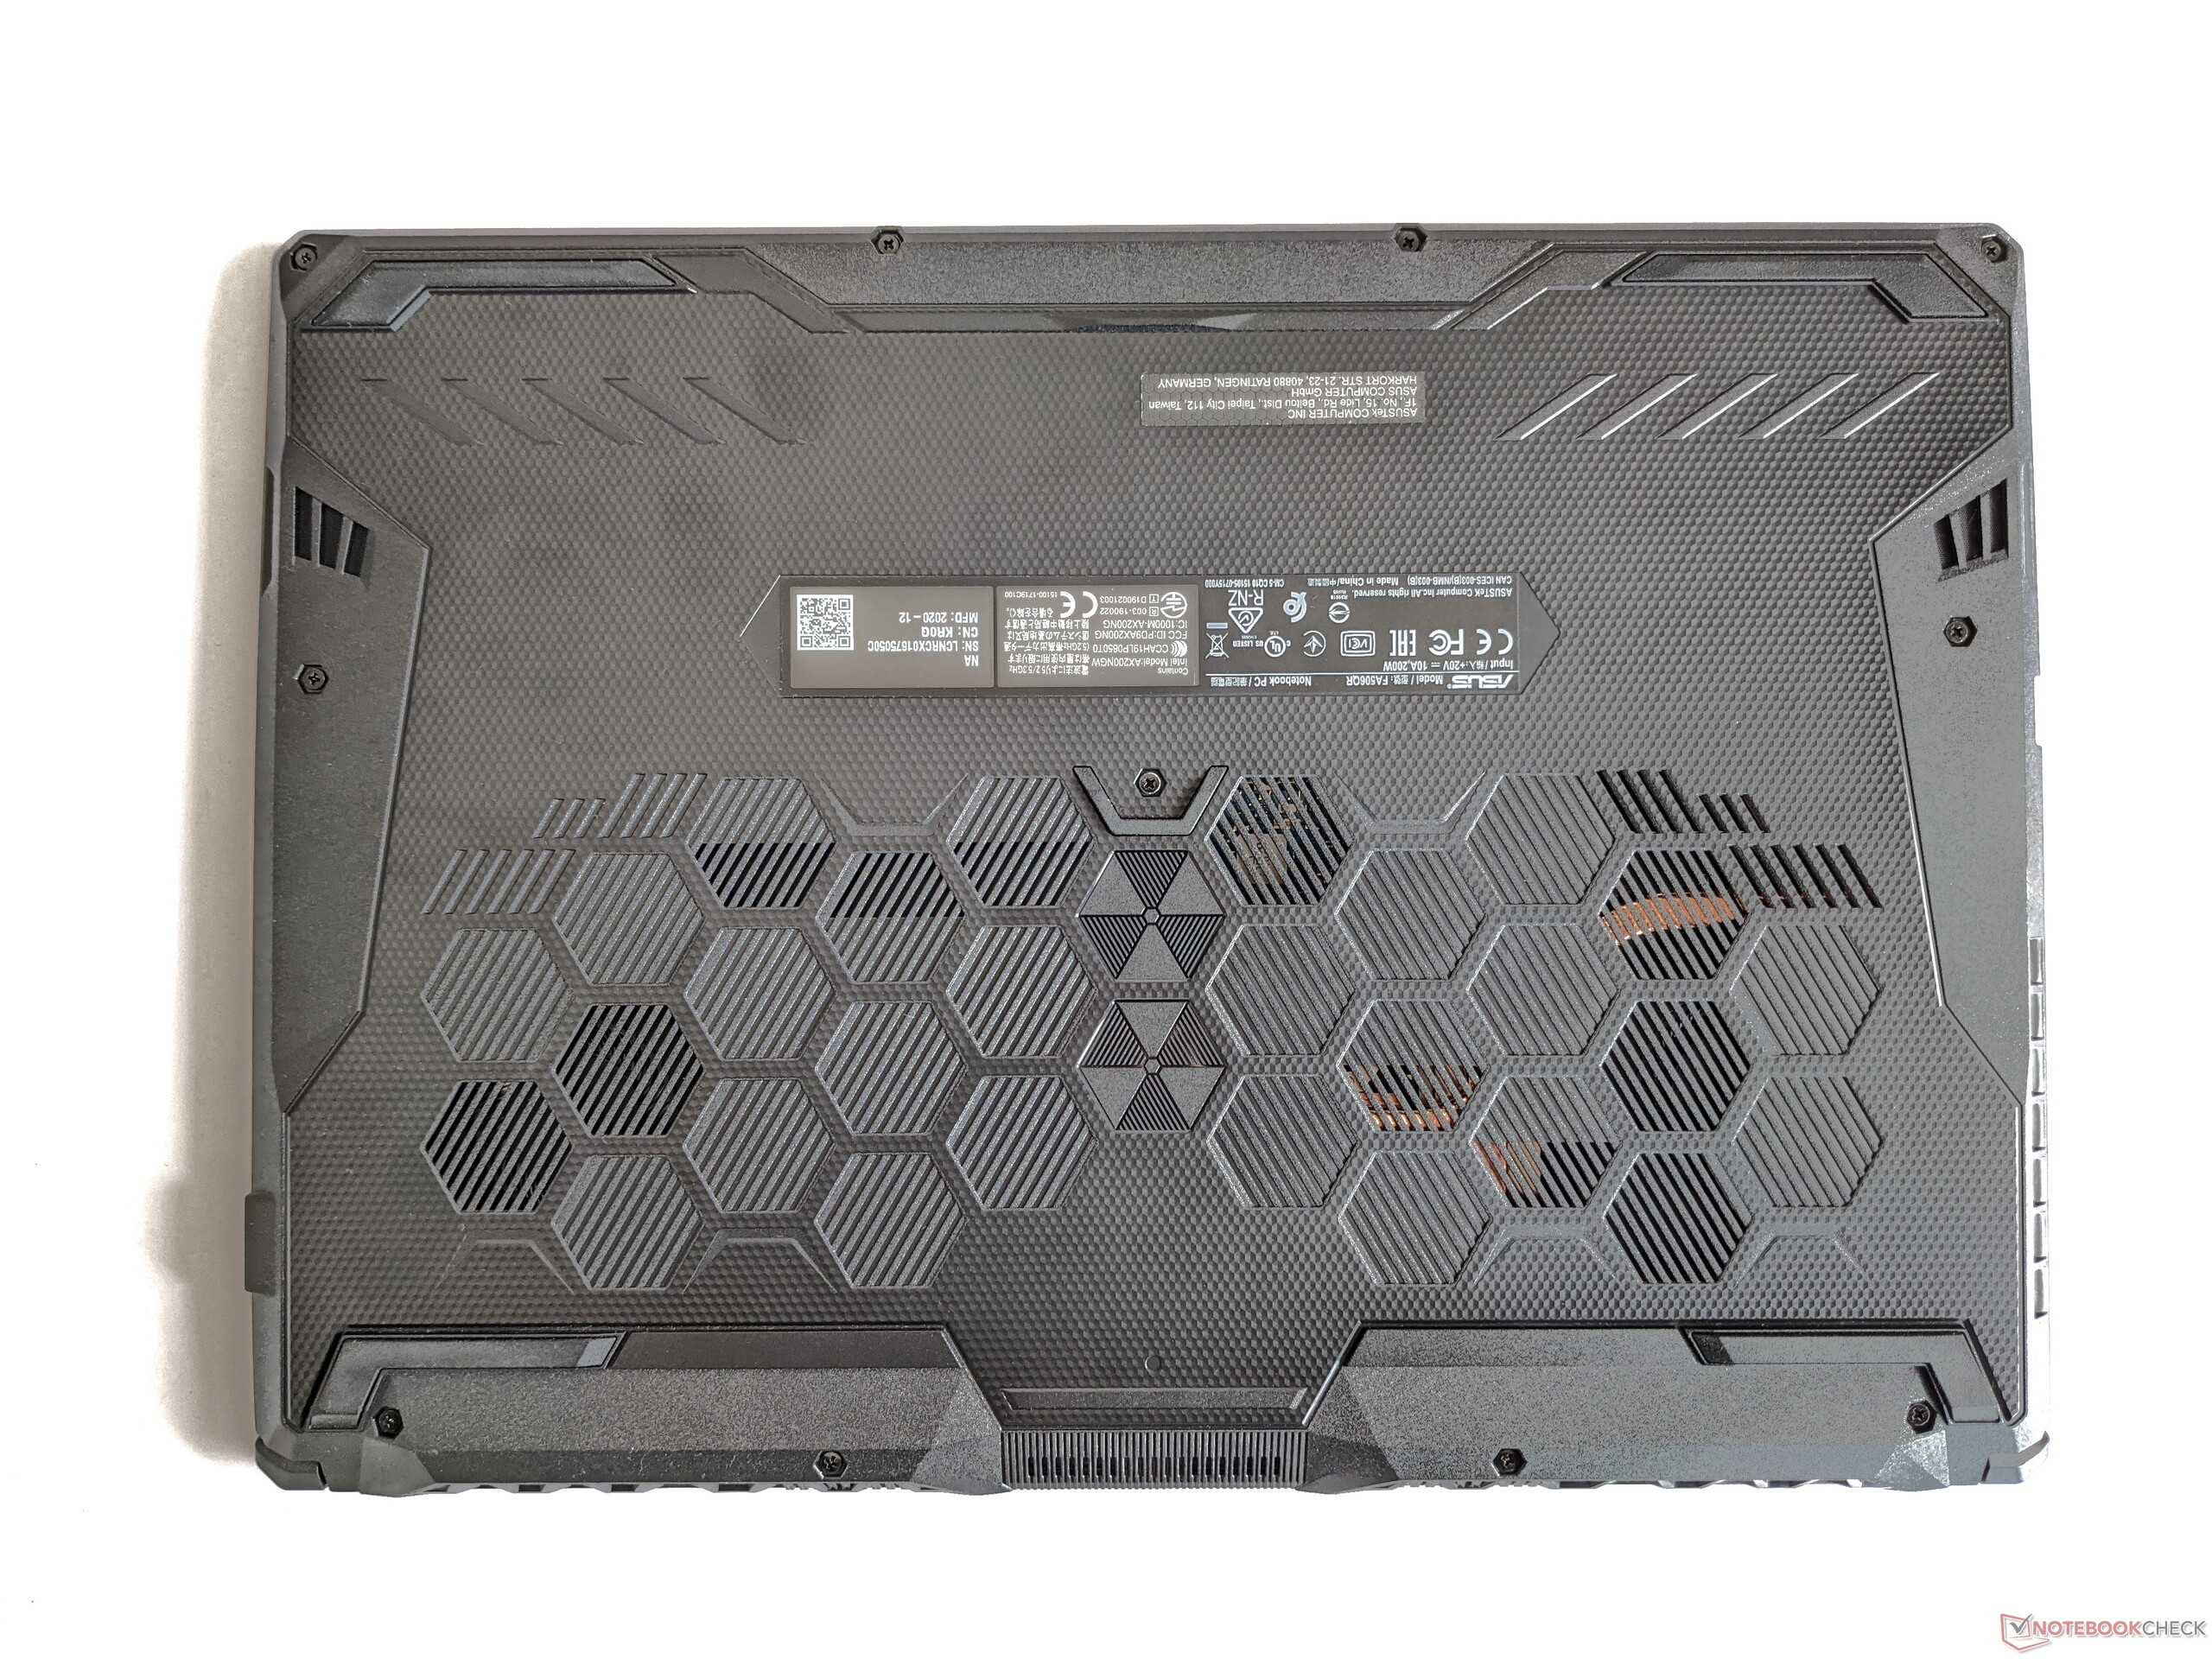
Case - Solid Gaming laptop made of plastic
Asus builds the case of the TUF Gaming A15 from a sturdy plastic and decorates it with a number of distinctive accents. For example, the lid is adorned with simulated screws, and the palm rests feature an extensive brushed finish. The display is surrounded by narrow bezels and can be opened up to an angle of approximately 120 degrees. A detailed description of the design can be found in the review of the Asus TUF Gaming F15.
The TUF A15's weight and dimensions are similar to those of other 15-inch gaming laptops. Only the Alienware m15 is heavier and has a significantly greater depth.
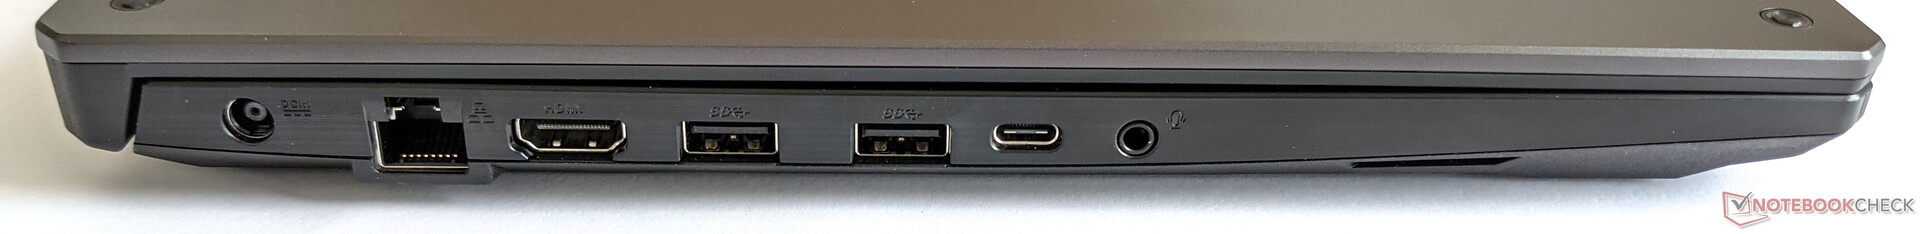
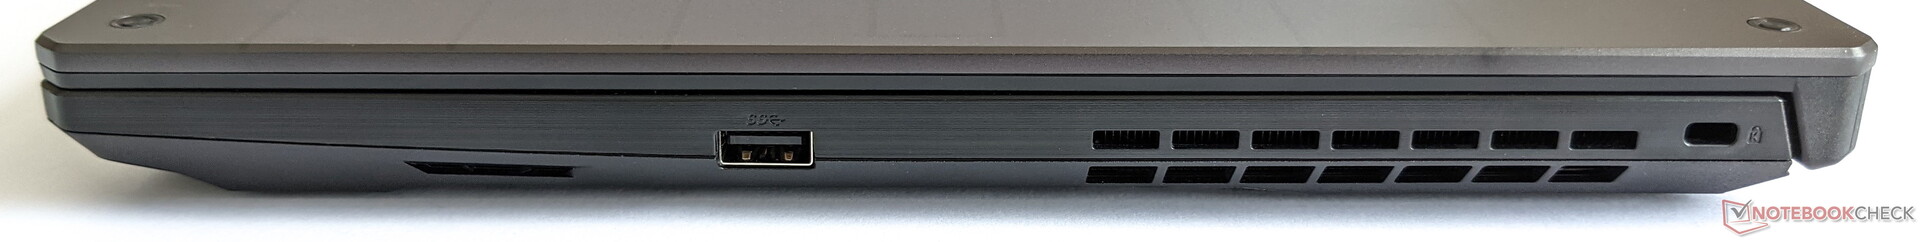
Connectivity - No Thunderbolt, but fast WLAN
The port configuration of the Asus TUF Gaming A15 is versatile, and everything necessary for most applications is provided. In contrast to the TUF Gaming F15 Intel variant, however, you have to do without Thunderbolt here.
Communication
The Asus TUF Gaming A15 can connect wirelessly via Bluetooth 5.2 and Wi-Fi 6. In combination with our Netgear Nighthawk AX12 reference router, average data transfer speeds of 1,480 Mb/s and data reception speeds of 1,613 Mb/s are achieved, which puts the A15 in first place in our test field.
Webcam
The webcam in the TUF Gaming A15 produces 0.9 MP images and consequently offers the same low resolution as most current laptops. Quality is correspondingly poor, even in good lighting conditions.


Accessories
Besides the laptop itself, only the power adapter is included in the Asus gaming device's box. However, additional general accessories can be bought on the manufacturer's website.
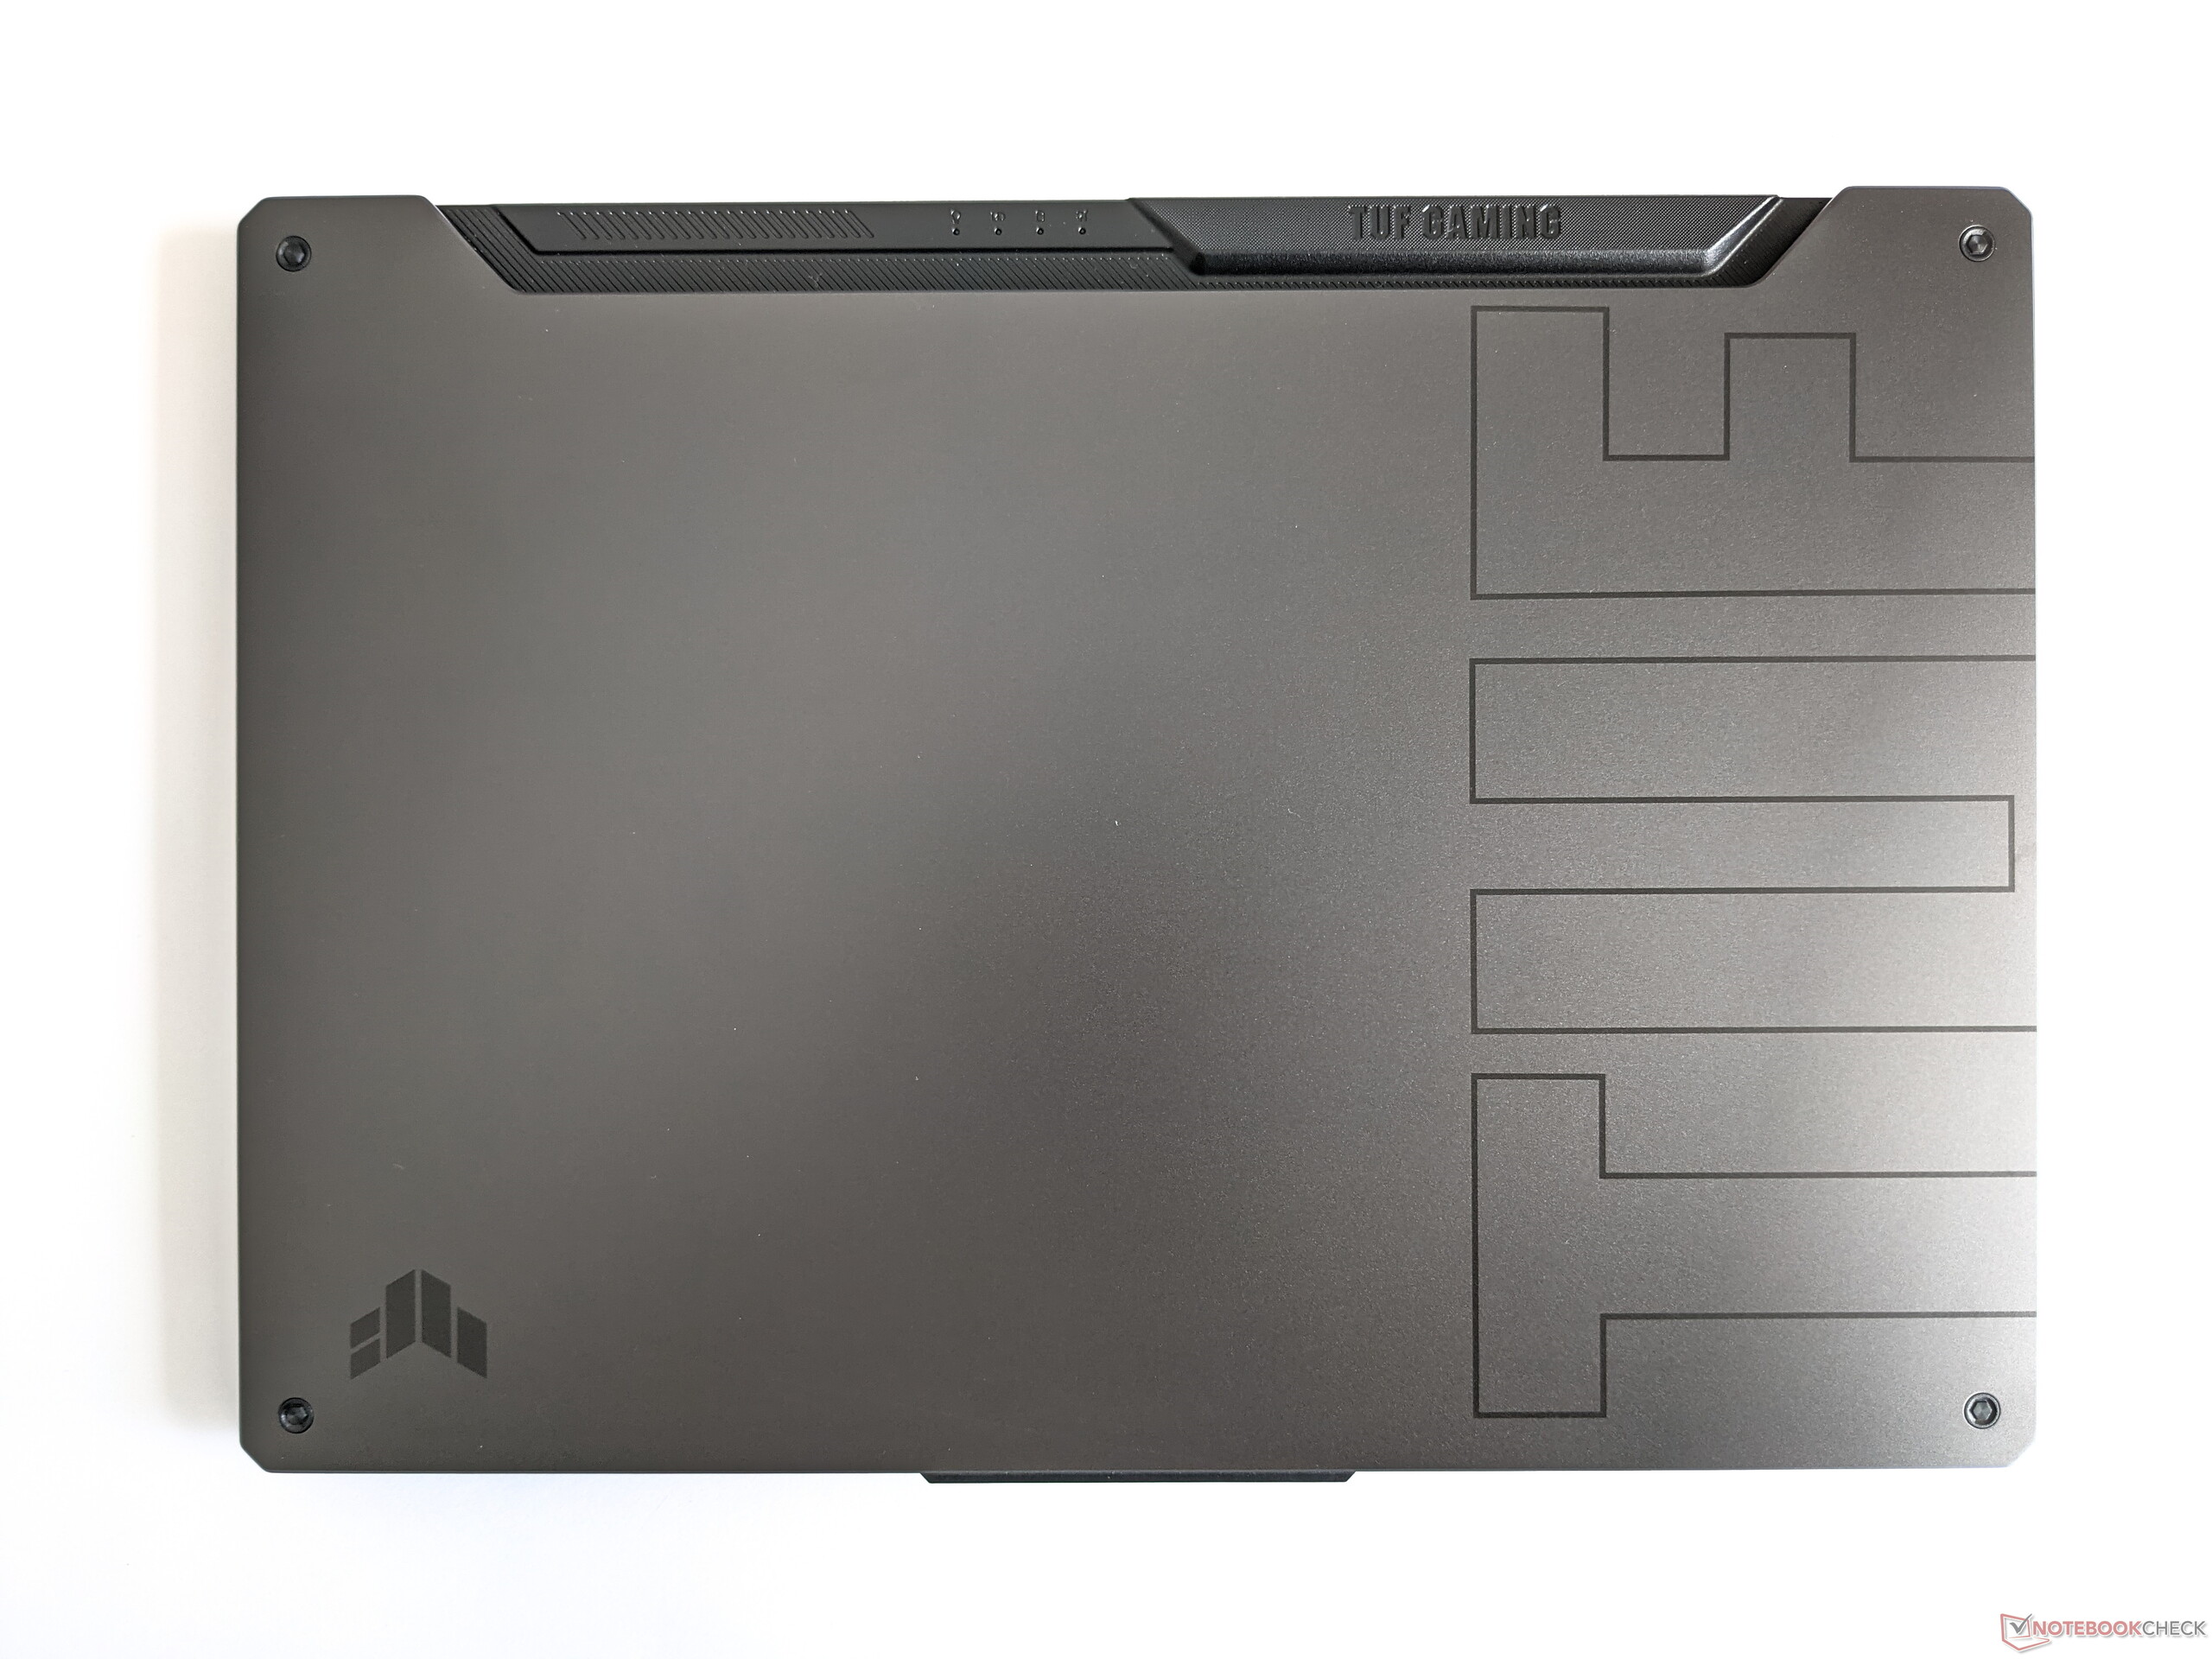
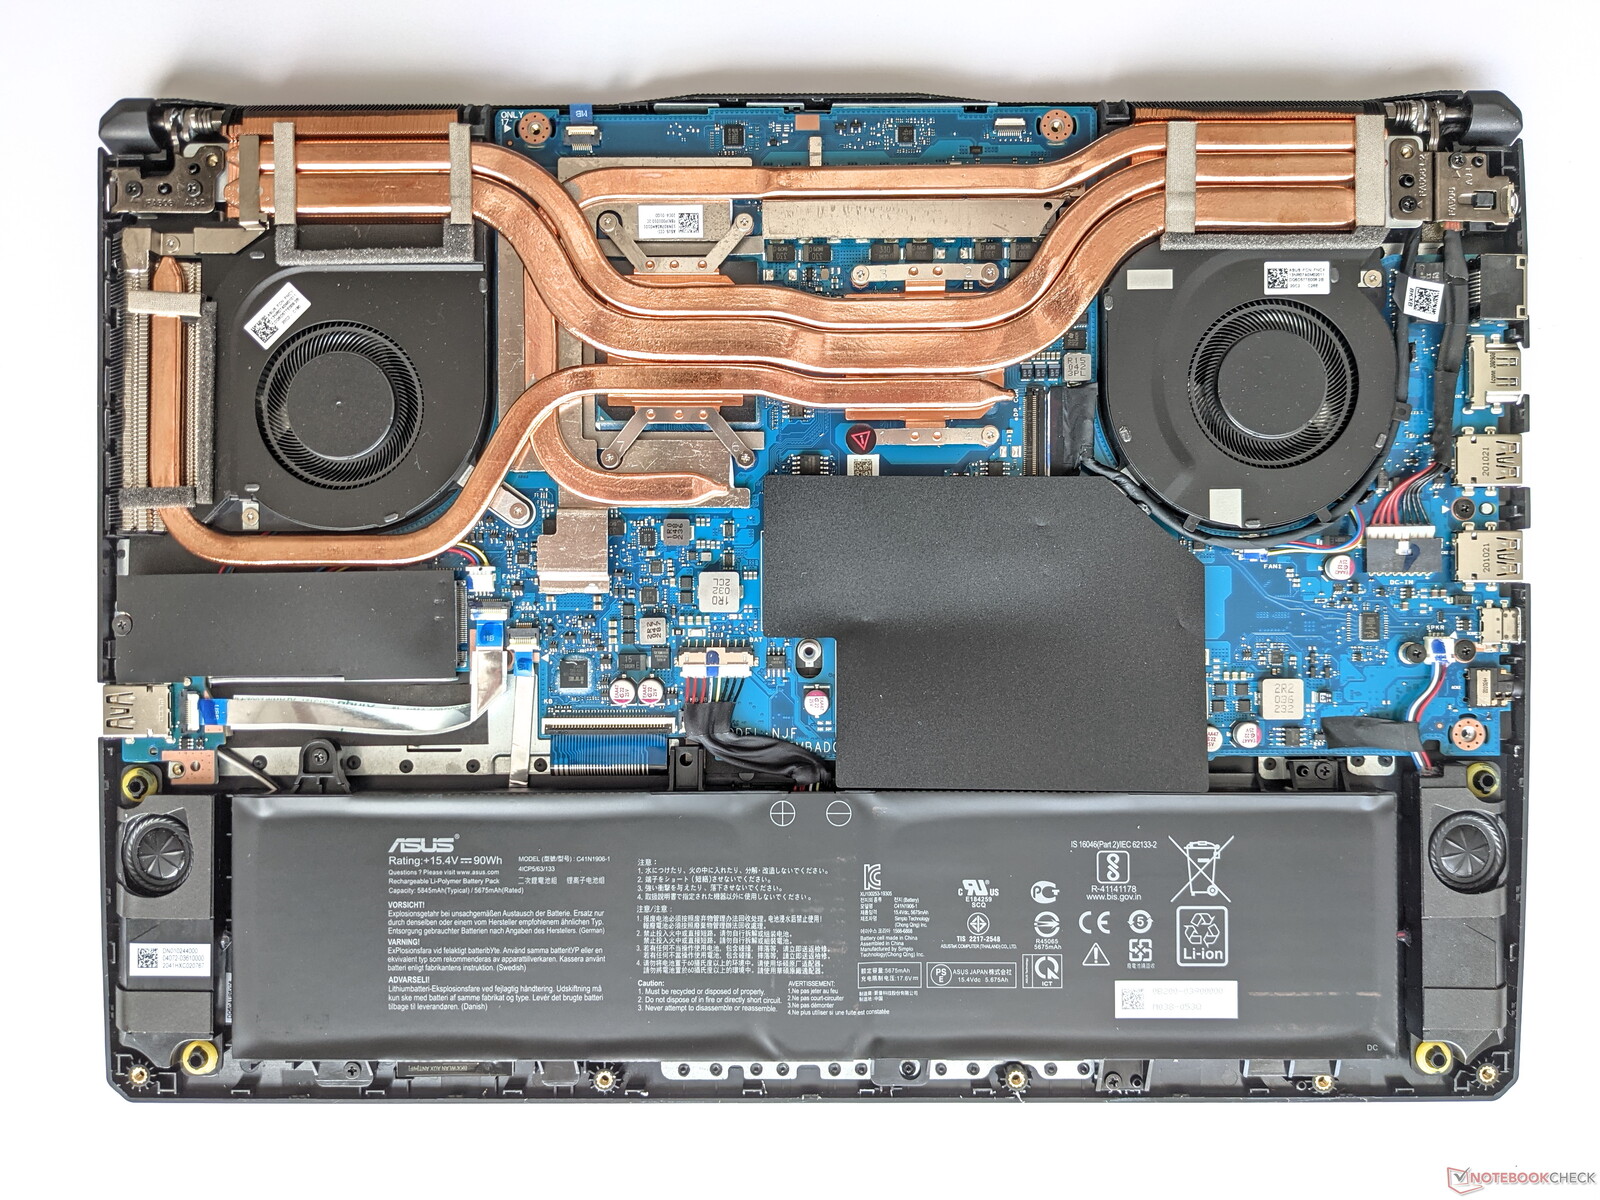
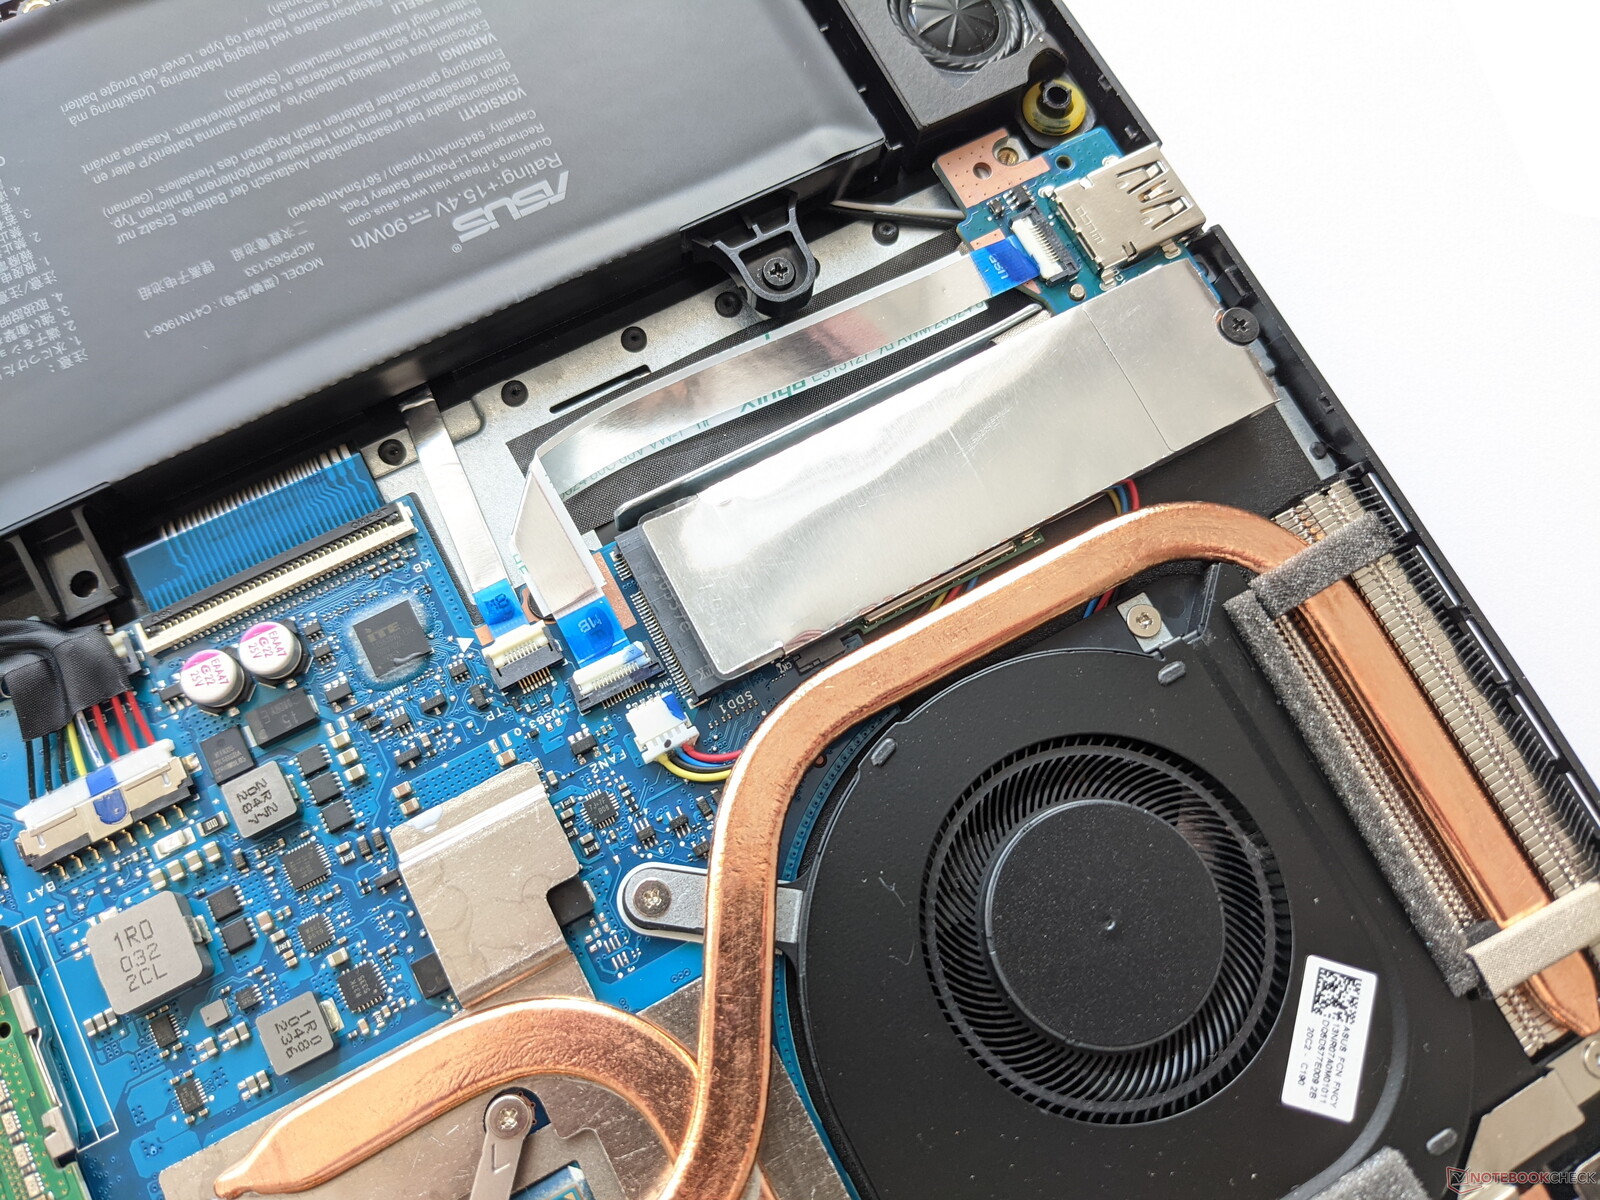
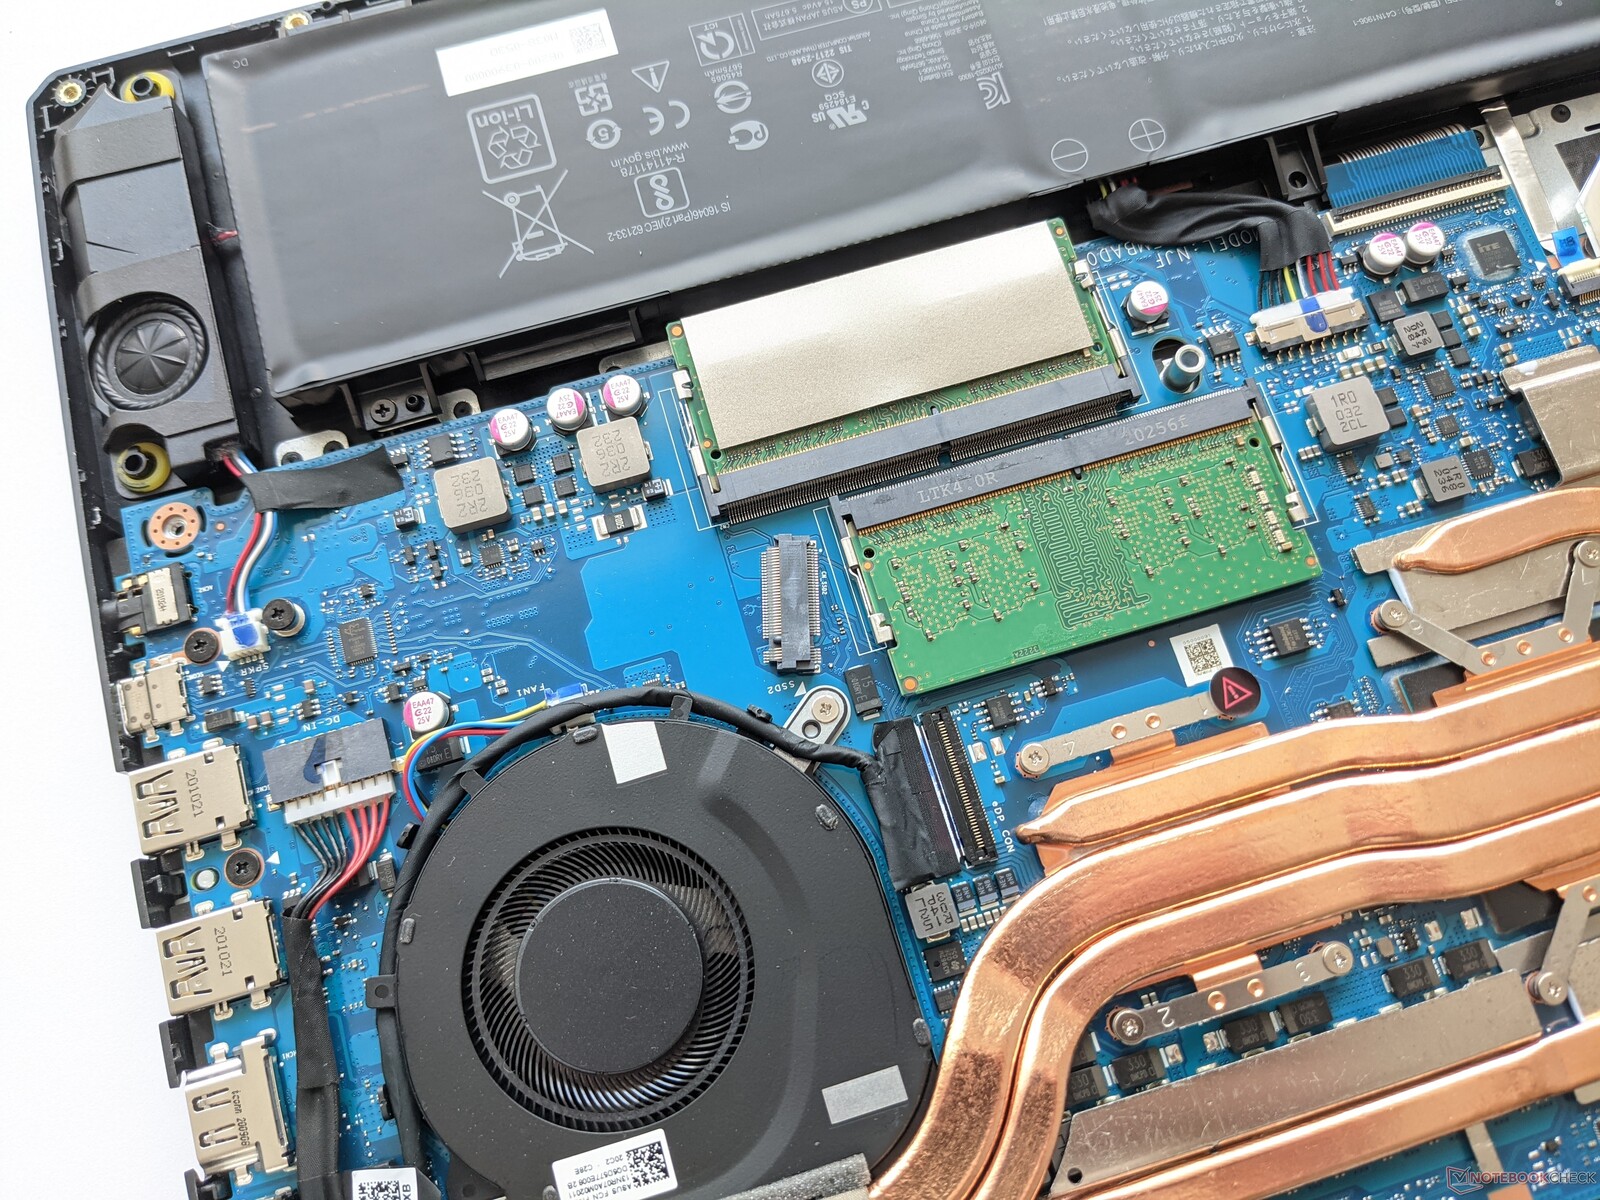
Maintenance
The bottom cover of the Asus TUF Gaming A15 can be removed after loosening all screws on the underside. Two RAM and two SSD slots are found inside, allowing you to expand or replace memory or mass storage. The WLAN module below the primary SSD can also be accessed in this way.
Warranty
Asus grants buyers of the TUF Gaming A15 a 12-month warranty period.
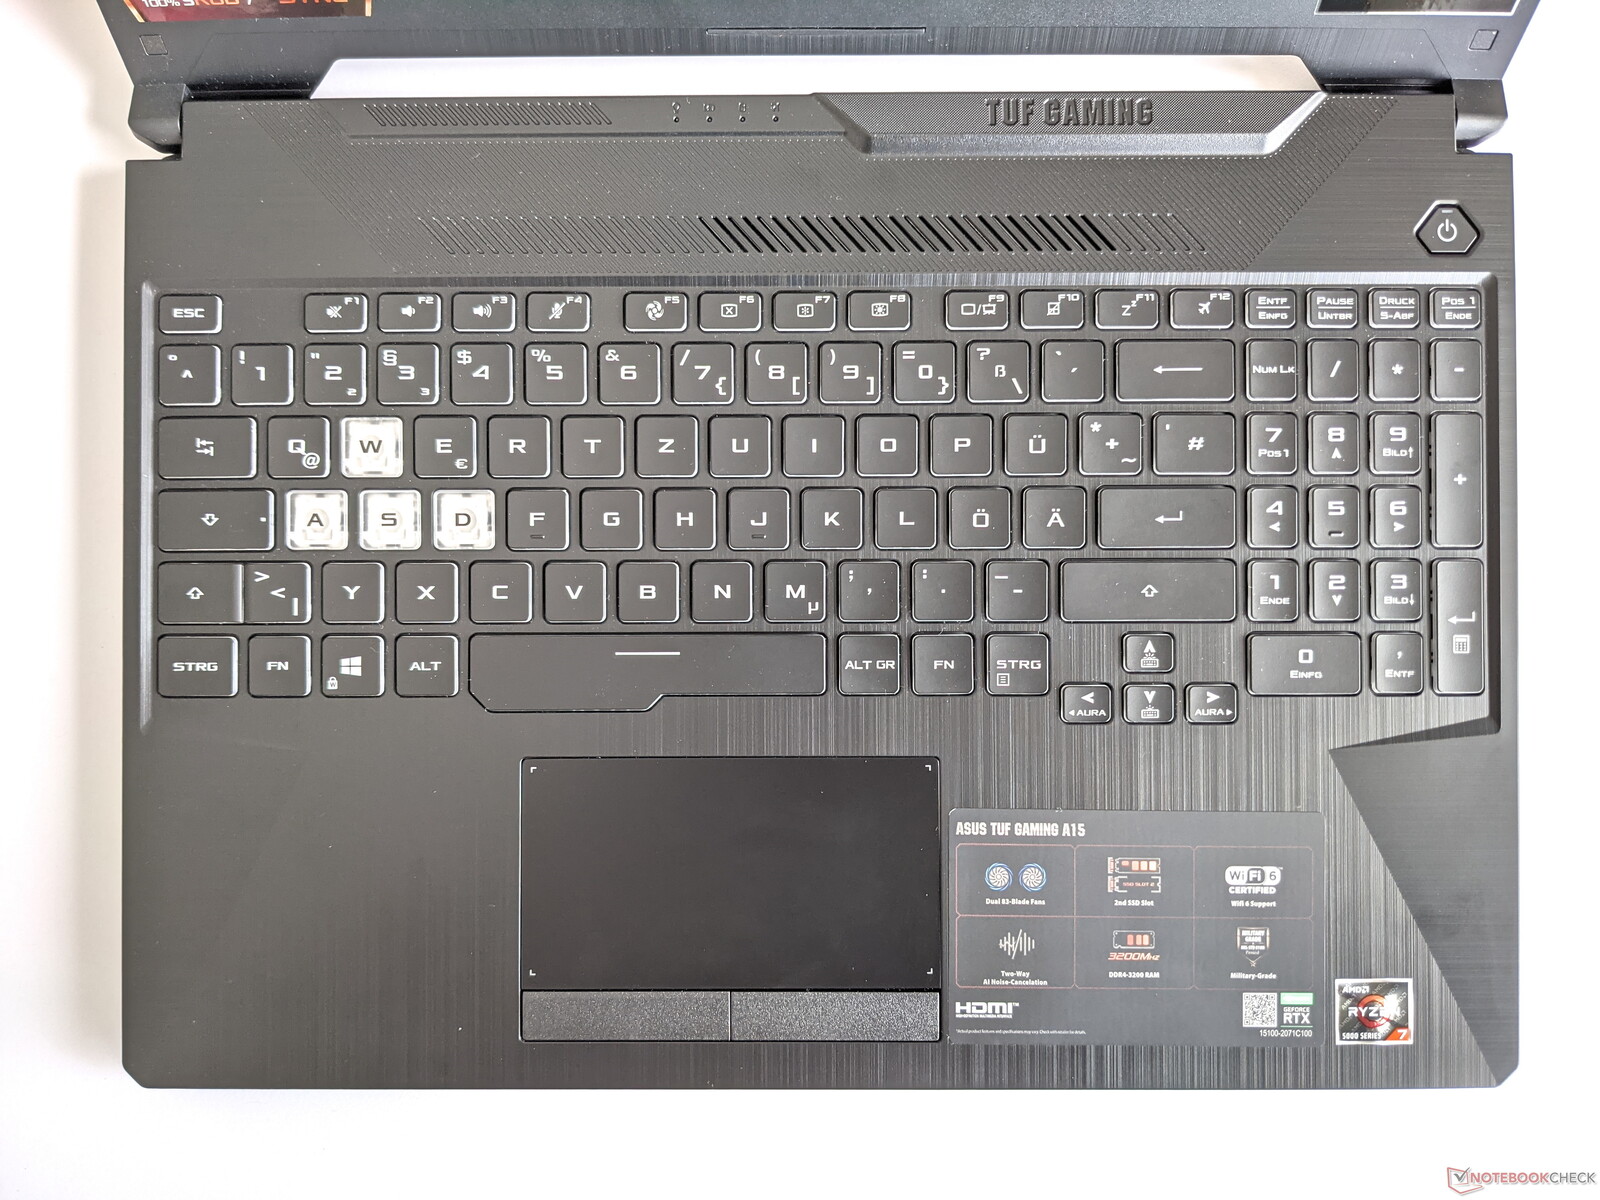
Input devices - No individual key lighting
Keyboard
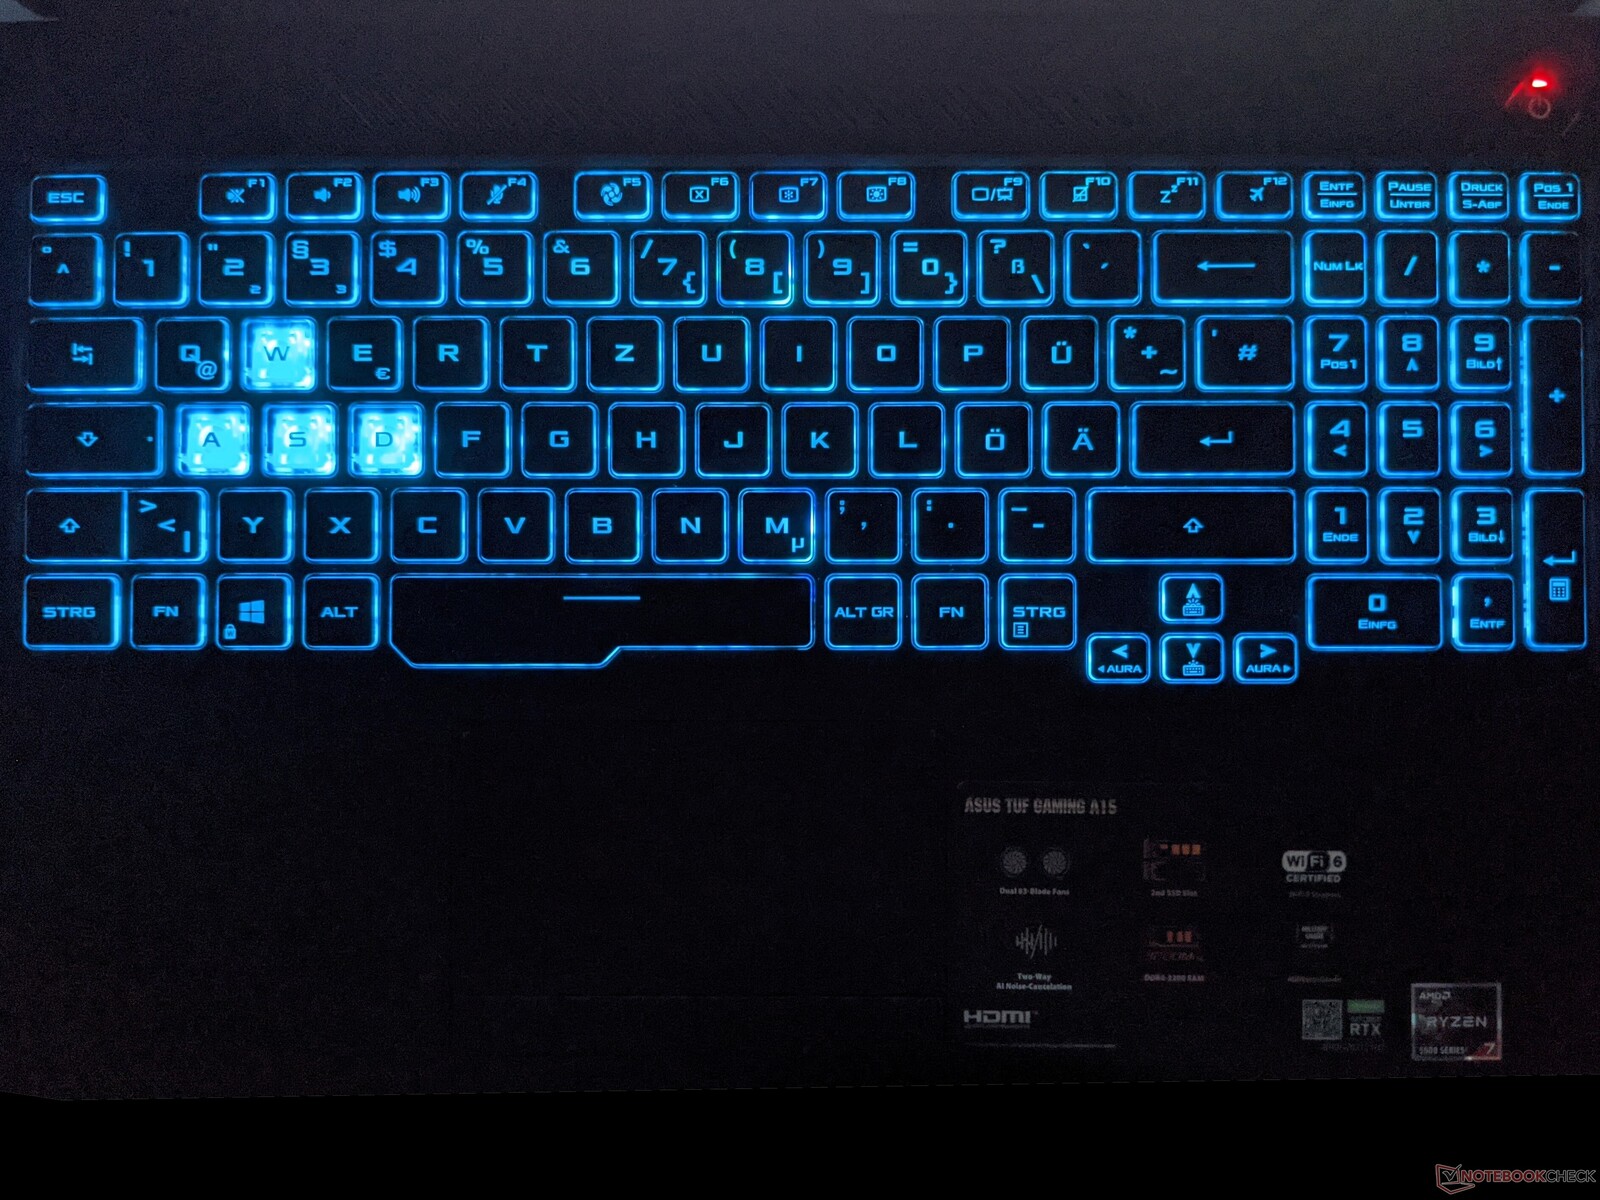
The keys of the Asus TUF Gaming A15 offer a medium feedback with a less easily perceptible pressure point, but they're also suitable for typing longer text after a short familiarization period. The WASD keys stand out from the rest of the keyboard thanks to their transparent design, making them more prominent when using the three-stage key illumination. The latter can be configured in different colors, but it doesn't offer individual key illumination or different zones.
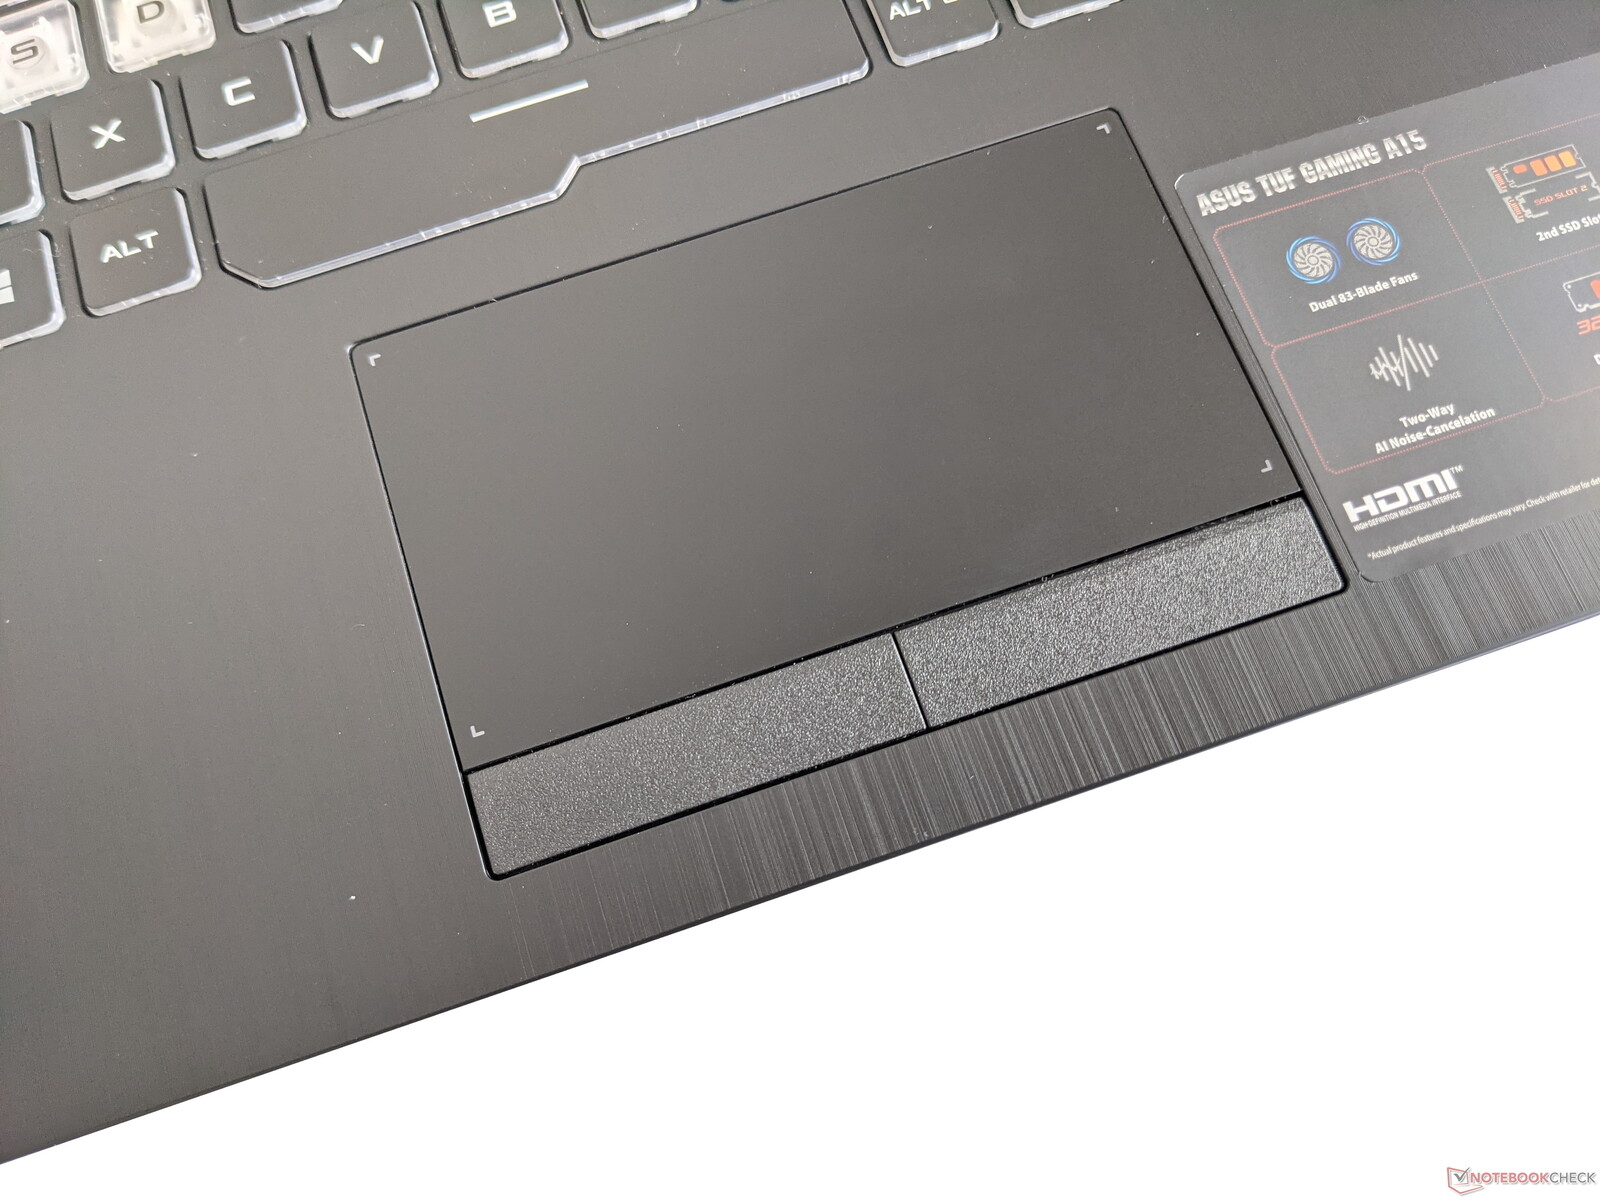
Touchpad
Asus opts for a classic touchpad with separate mouse buttons as mouse replacement. These buttons have a soft pressure point, but they trigger reliably. The touchpad also responds precisely to touch and is well suited for navigating the mouse pointer.
Display - 360 Hz and strong contrast

The display of the Asus TUF Gaming A15 consists of a 15-inch IPS panel that offers a resolution of 1920x1080 pixels as well as a refresh rate of 240 Hz. Adaptive Sync is also supported. The maximum brightness of 268 cd/m² on average is in the middle of our test field. The same is true for the brightness distribution of 84%. Further display variants aren't offered by Asus.
PWM at a frequency of 1,250 MHz is used for brightness control. But since this only takes effect from brightness levels of 20%, it should be possible to use the display without issues even with sensitive eyes.
| |||||||||||||||||||||||||
Brightness Distribution: 84 %
Center on Battery: 297 cd/m²
Contrast: 1350:1 (Black: 0.22 cd/m²)
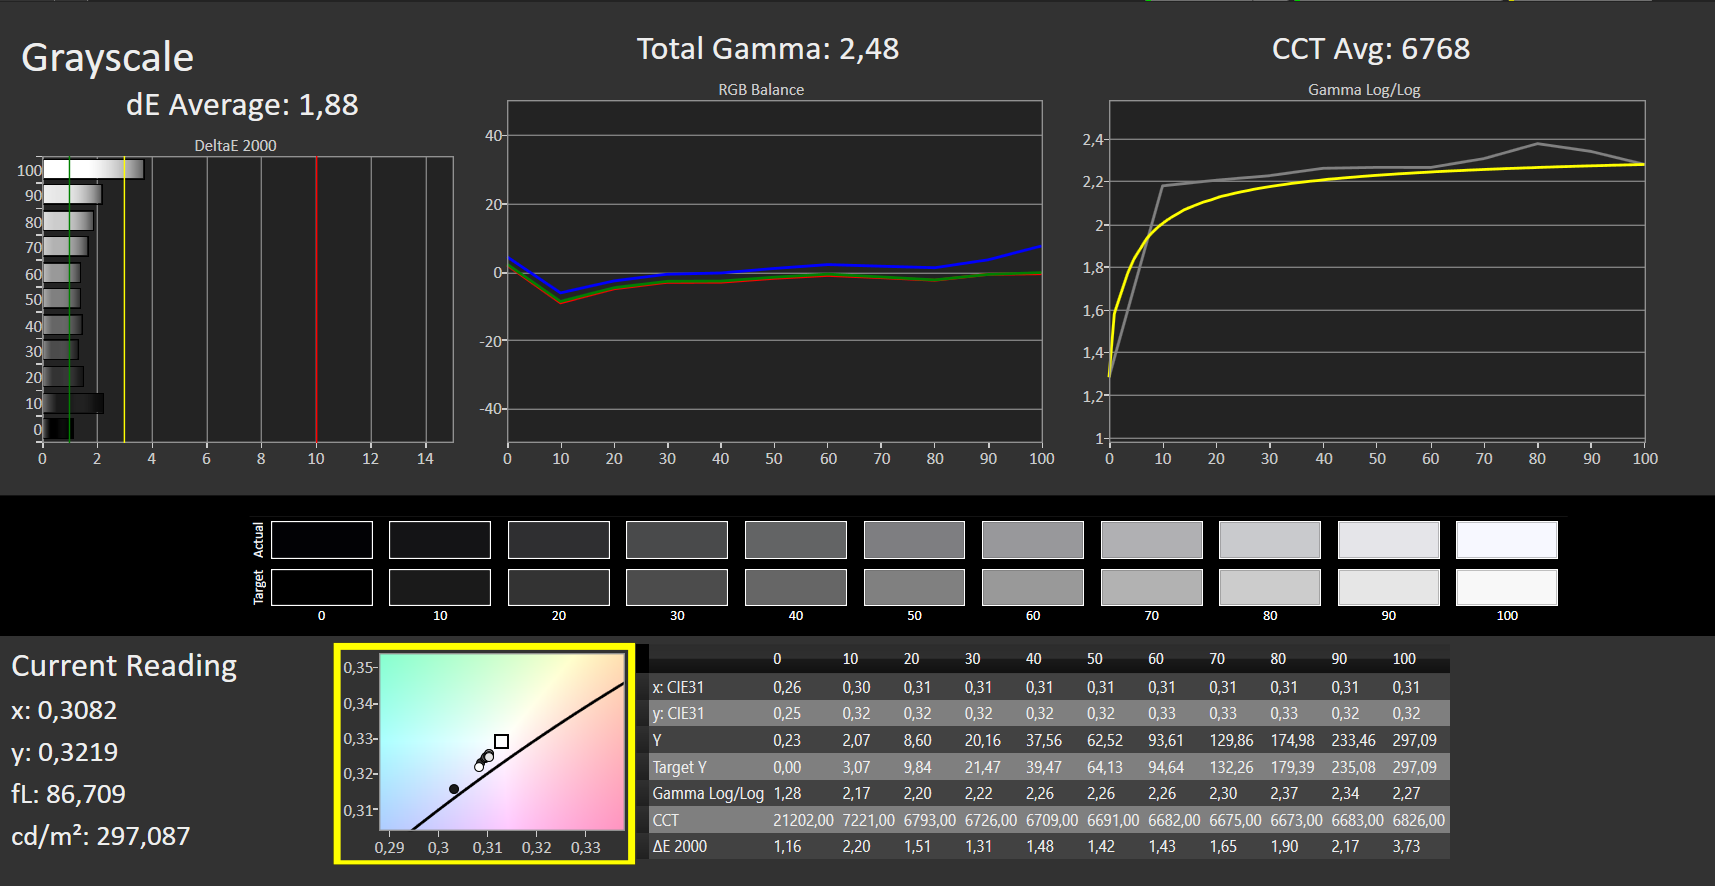
ΔE ColorChecker Calman: 1.36 | ∀{0.5-29.43 Ø4.73}
ΔE Greyscale Calman: 1.88 | ∀{0.09-98 Ø4.97}
99% sRGB (Argyll 1.6.3 3D)
63% AdobeRGB 1998 (Argyll 1.6.3 3D)
Gamma: 2.48
CCT: 6768 K
| Asus TUF Gaming A15 FA506QR-AZ061T Sharp SHP1532, IPS, 1920x1080, 15.6" | Asus TUF Gaming F15 FX506HM Chi Mei N156HRA-EA1, IPS, 1920x1080, 15.6" | Alienware m15 R5 Ryzen Edition B156HAN, IPS, 1920x1080, 15.6" | Aorus 15P XC Sharp LQ156M1JW03, IPS, 1920x1080, 15.6" | MSI GF65 Thin 10UE AU Optronics B156HAN08.4, IPS, 1920x1080, 15.6" | |
|---|---|---|---|---|---|
| Display | |||||
| Display P3 Coverage (%) | 41.9 | 67.2 | 37.65 | ||
| sRGB Coverage (%) | 62.9 | 98.7 | 56.3 | ||
| AdobeRGB 1998 Coverage (%) | 43.3 | 68.6 | 38.9 | ||
| Response Times | -154% | 31% | -7% | -251% | |
| Response Time Grey 50% / Grey 80% * (ms) | 12 ? | 28.4 ? -137% | 4 ? 67% | 11.2 ? 7% | 36.8 ? -207% |
| Response Time Black / White * (ms) | 8 ? | 21.6 ? -170% | 8.4 ? -5% | 9.6 ? -20% | 31.6 ? -295% |
| PWM Frequency (Hz) | 1250 ? | 24040 ? | |||
| Screen | -110% | -14% | 3% | -87% | |
| Brightness middle (cd/m²) | 297 | 268.3 -10% | 329 11% | 298 0% | 266.5 -10% |
| Brightness (cd/m²) | 268 | 257 -4% | 321 20% | 278 4% | 262 -2% |
| Brightness Distribution (%) | 84 | 84 0% | 92 10% | 88 5% | 91 8% |
| Black Level * (cd/m²) | 0.22 | 0.34 -55% | 0.27 -23% | 0.29 -32% | 0.18 18% |
| Contrast (:1) | 1350 | 789 -42% | 1219 -10% | 1028 -24% | 1481 10% |
| Colorchecker dE 2000 * | 1.36 | 5.05 -271% | 2.78 -104% | 0.96 29% | 5.33 -292% |
| Colorchecker dE 2000 max. * | 3.82 | 15.43 -304% | 4.88 -28% | 3.22 16% | 18.28 -379% |
| Greyscale dE 2000 * | 1.88 | 5.5 -193% | 2.5 -33% | 1.3 31% | 4.5 -139% |
| Gamma | 2.48 89% | 2.35 94% | 2.106 104% | 2.242 98% | 2.35 94% |
| CCT | 6768 96% | 7392 88% | 6201 105% | 6519 100% | 6289 103% |
| Color Space (Percent of AdobeRGB 1998) (%) | 63 | 76 21% | 69 10% | 35.6 -43% | |
| Color Space (Percent of sRGB) (%) | 99 | 99 0% | 91 -8% | 55.8 -44% | |
| Colorchecker dE 2000 calibrated * | 3.21 | 1.63 | 0.83 | 4.36 | |
| Total Average (Program / Settings) | -132% /
-119% | 9% /
-6% | -2% /
2% | -169% /
-115% |
* ... smaller is better
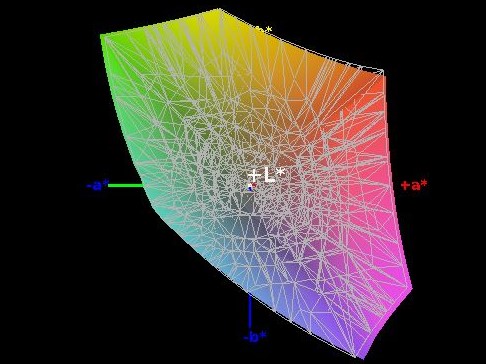
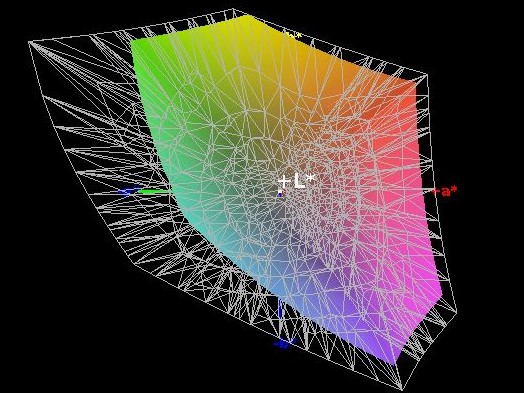
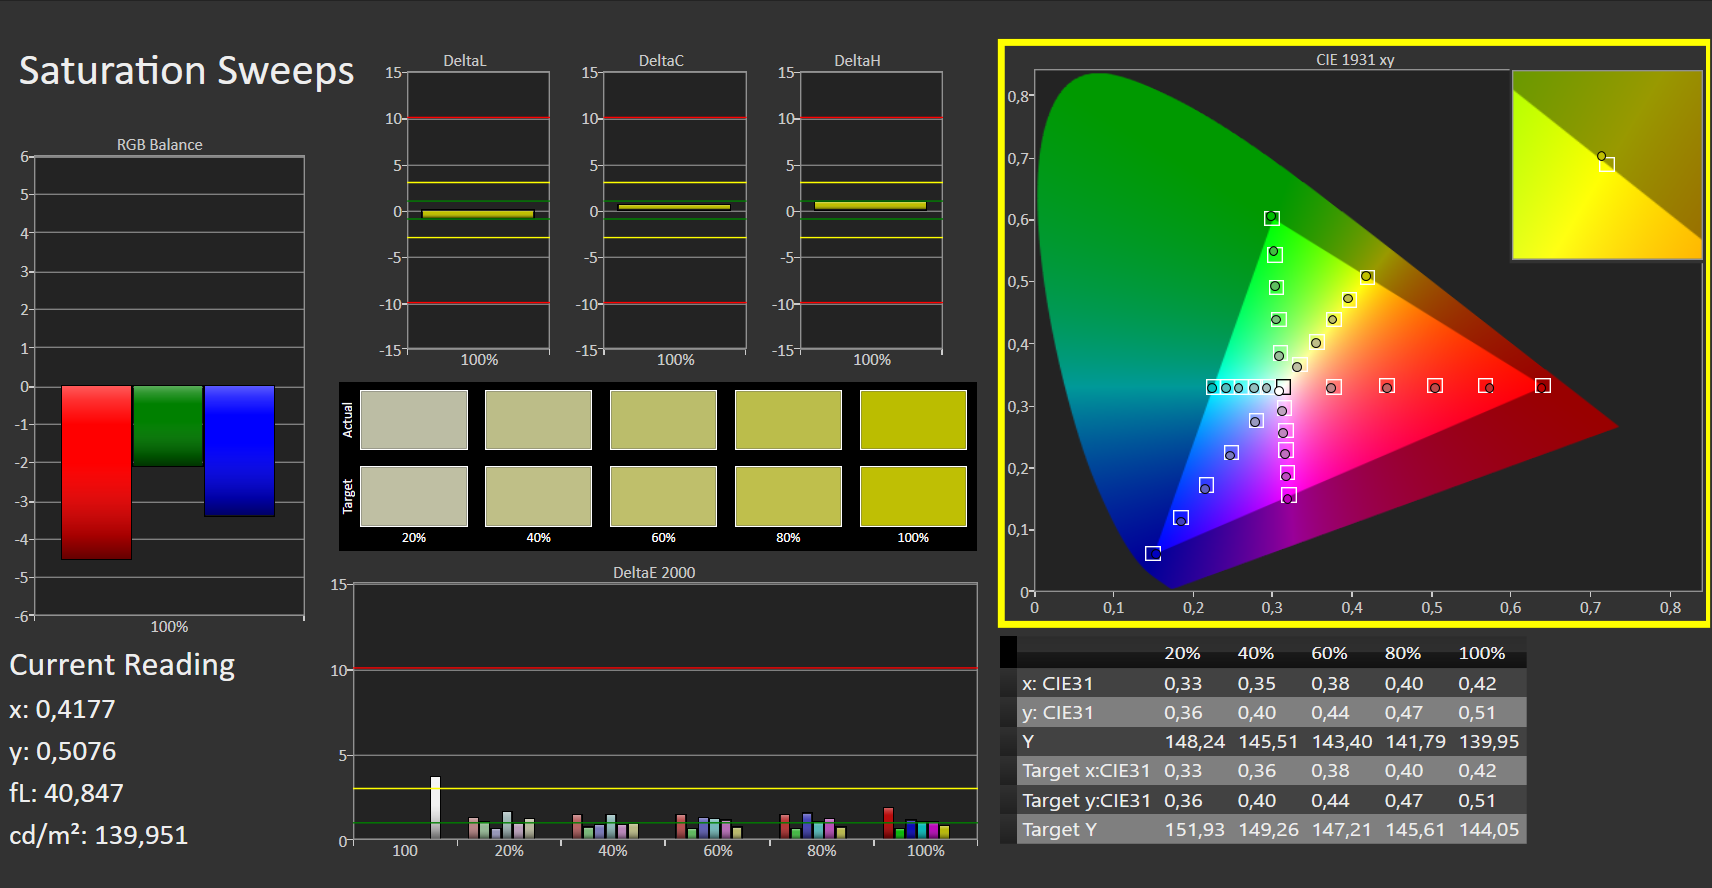
Our measurements show that the display of the Asus TUF Gaming A15 has a good contrast ratio of 1,350:1 and an only slightly elevated black level of 0.22 cd/m². Color-space coverage is very good at 99% (sRGB) and 63% (AdobeRGB).
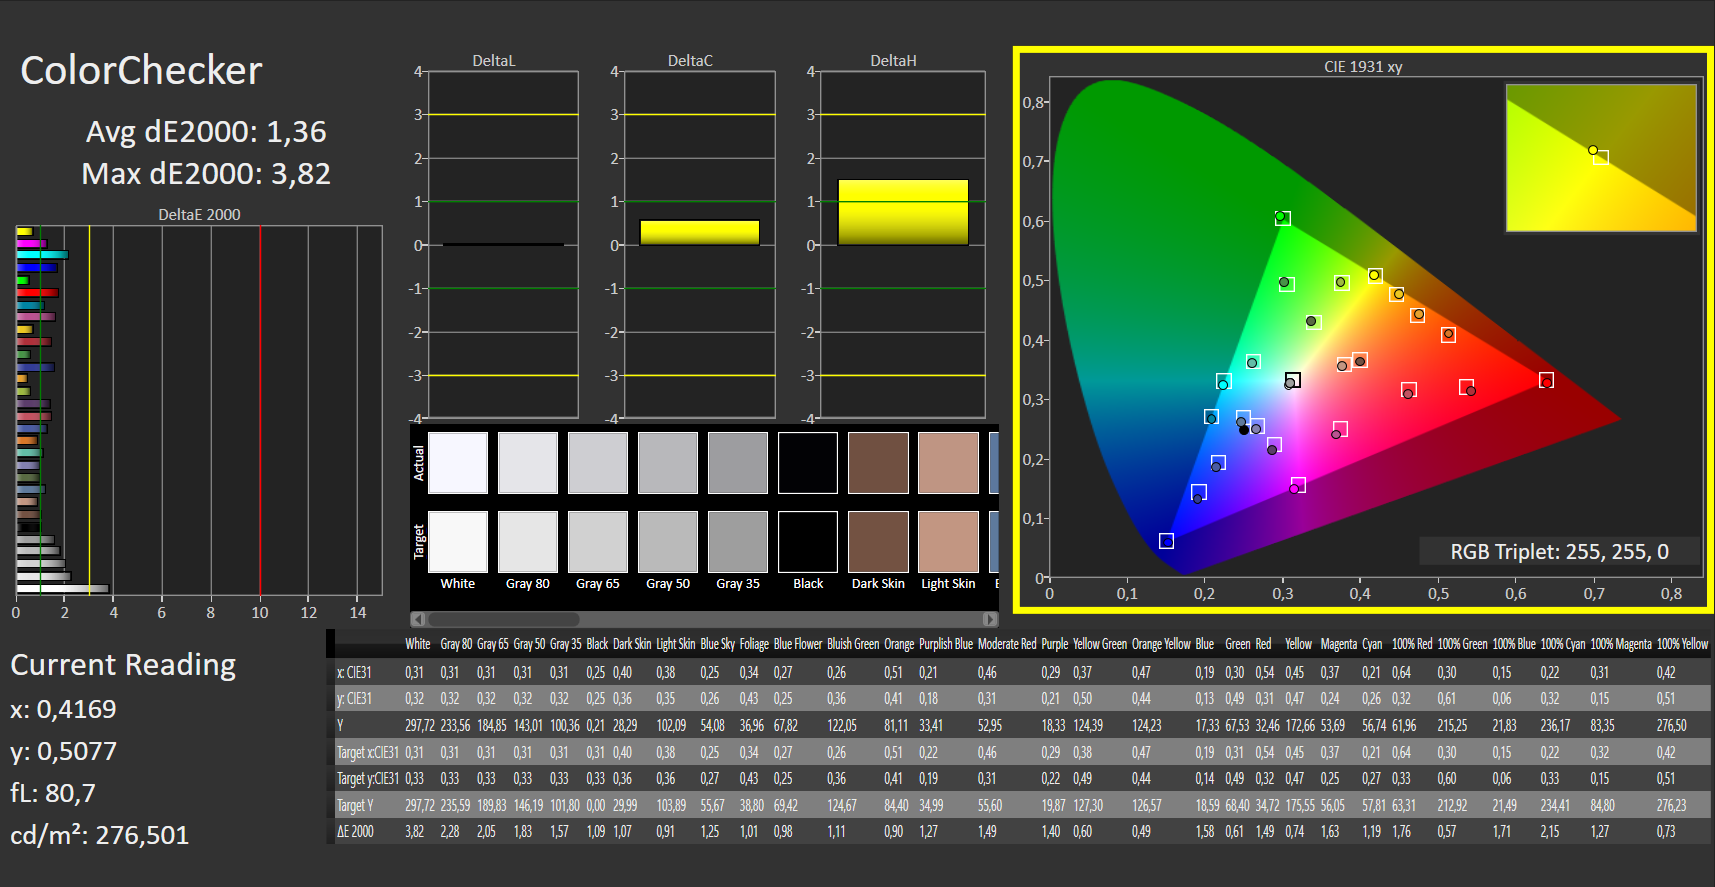
The CalMAN analysis also shows that the display already reproduces colors in a very balanced way out of the box. Consequently, calibration only leads to a slight improvement. The corresponding ICC file can be downloaded in the window located at the top, to the right of the display's brightness distribution graph.
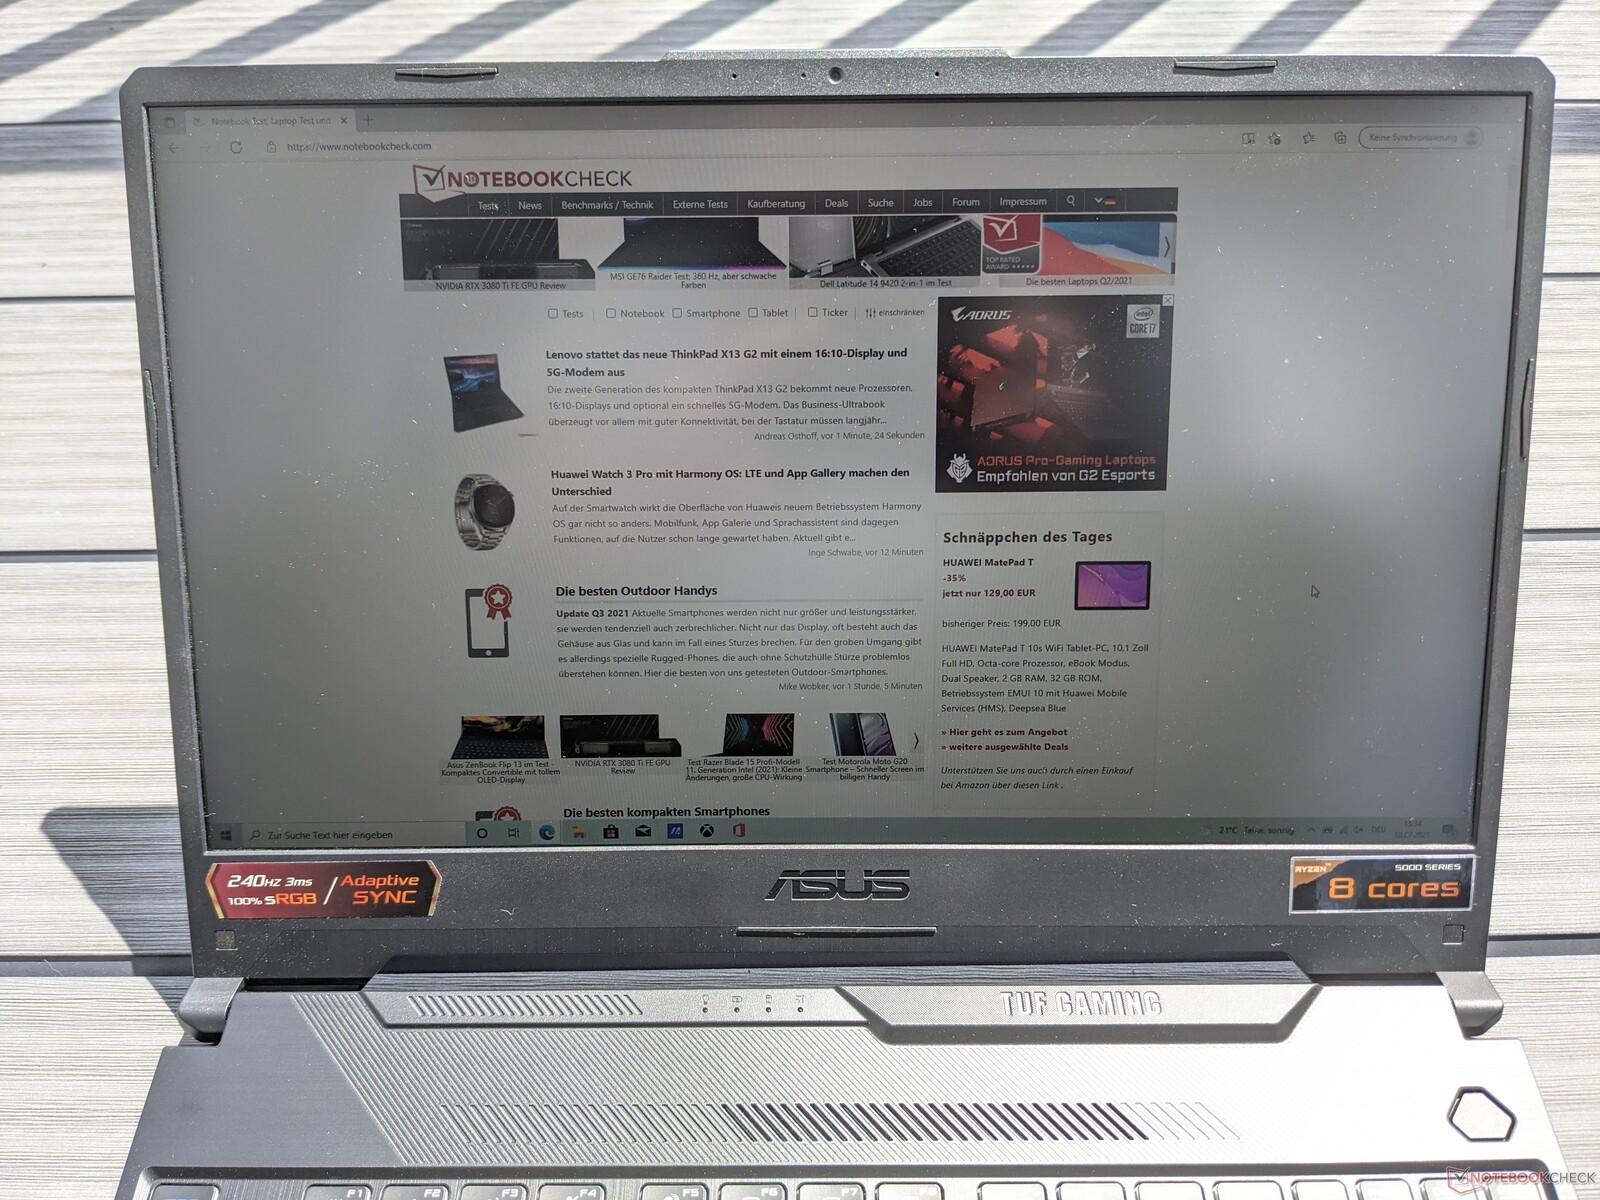
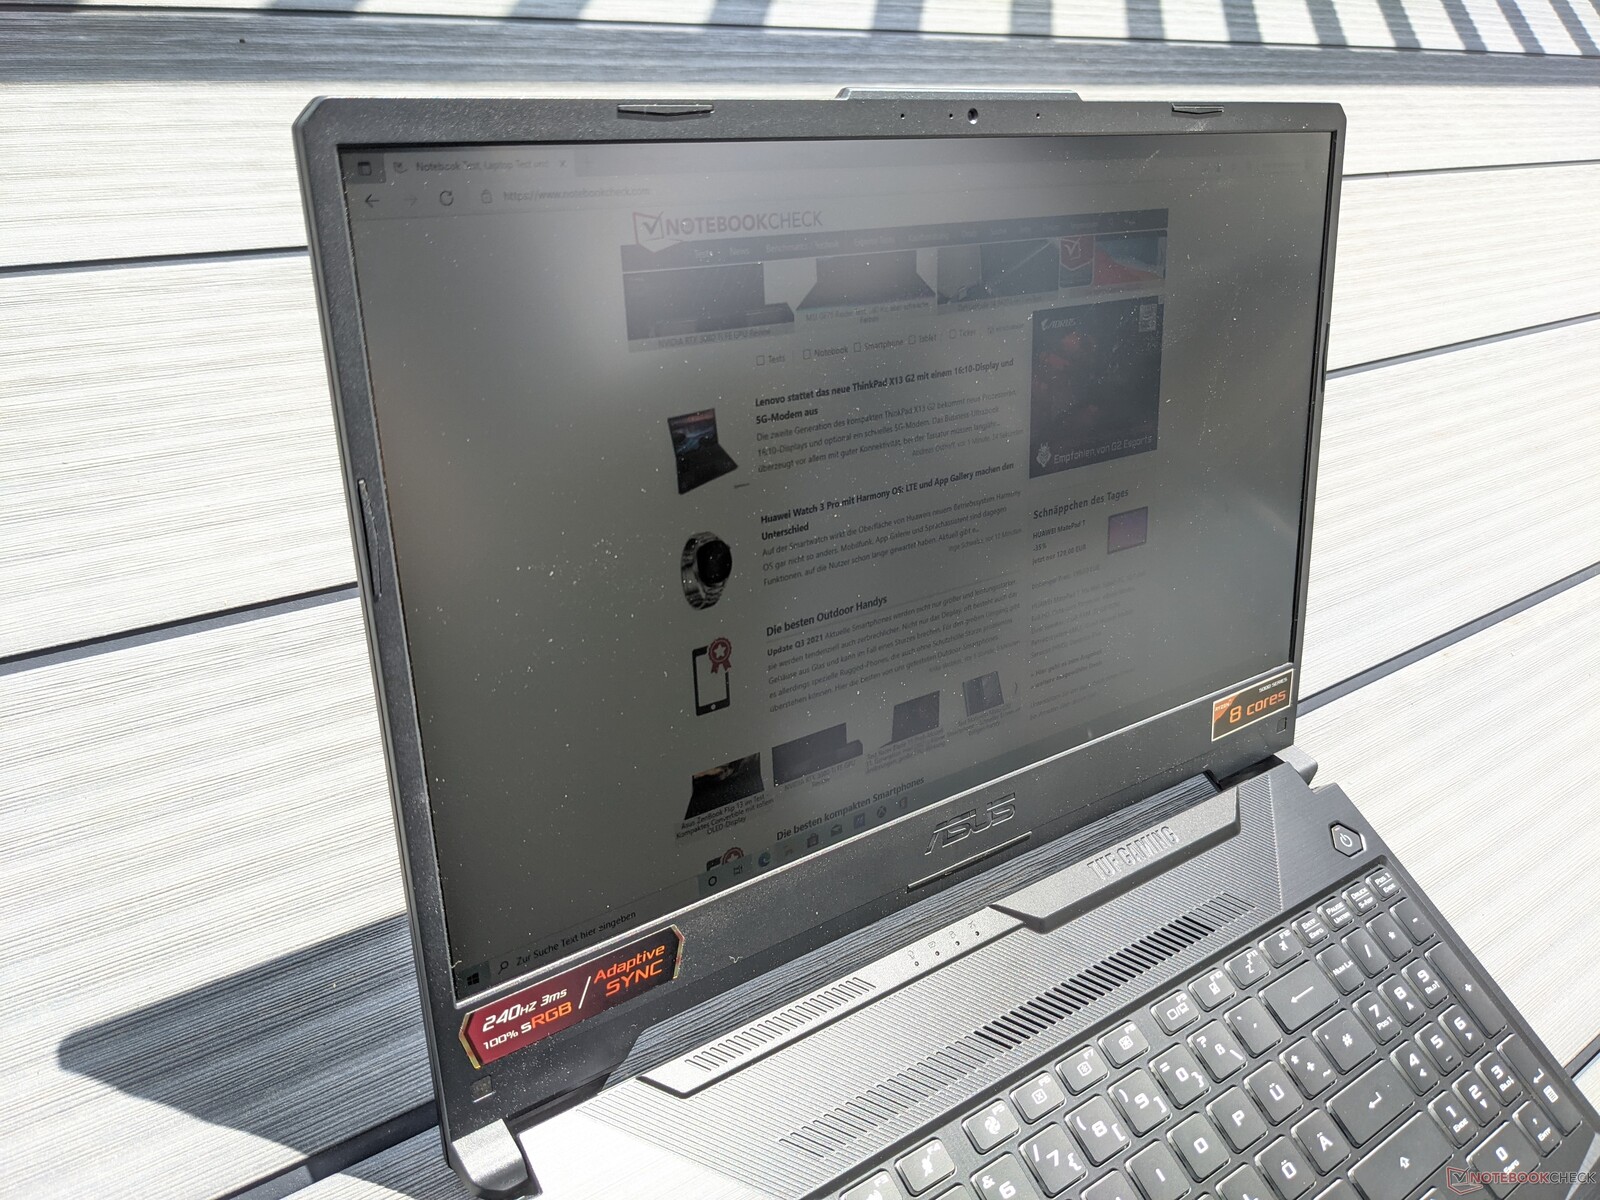
The TUF Gaming A15 can be used outdoors as long as places in the shade are prioritized. The screen's brightness isn't sufficient to display content legibly in direct sunlight.
Display Response Times
| ↔ Response Time Black to White | ||
|---|---|---|
| 8 ms ... rise ↗ and fall ↘ combined | ↗ 4 ms rise |  |
| ↘ 4 ms fall | ||
| The screen shows fast response rates in our tests and should be suited for gaming. In comparison, all tested devices range from 0.1 (minimum) to 240 (maximum) ms. » 22 % of all devices are better. This means that the measured response time is better than the average of all tested devices (19.9 ms). | ||
| ↔ Response Time 50% Grey to 80% Grey | ||
| 12 ms ... rise ↗ and fall ↘ combined | ↗ 6 ms rise |  |
| ↘ 6 ms fall | ||
| The screen shows good response rates in our tests, but may be too slow for competitive gamers. In comparison, all tested devices range from 0.165 (minimum) to 636 (maximum) ms. » 25 % of all devices are better. This means that the measured response time is better than the average of all tested devices (31.1 ms). | ||
Screen Flickering / PWM (Pulse-Width Modulation)
| Screen flickering / PWM detected | 1250 Hz | ≤ 20 % brightness setting |  |
The display backlight flickers at 1250 Hz (worst case, e.g., utilizing PWM) Flickering detected at a brightness setting of 20 % and below. There should be no flickering or PWM above this brightness setting. The frequency of 1250 Hz is quite high, so most users sensitive to PWM should not notice any flickering. In comparison: 52 % of all tested devices do not use PWM to dim the display. If PWM was detected, an average of 7798 (minimum: 5 - maximum: 343500) Hz was measured. | |||
The Asus laptop's IPS panel is very viewing-angle stable. Image content can be read from almost any angle without appearing distorted or showing incorrect colors.

Performance - Powerful gaming laptop with AMD processor
Asus positions the TUF Gaming A15 as an entry-level gaming laptop and equips it with the corresponding hardware. Although it's very well suited for modern games, the configuration options available are more limited than with more expensive laptops. For example, besides the configuration tested here, there's only one other variant available in the form of the Asus TUF Gaming F15 equipped with an Intel CPU.
Processor
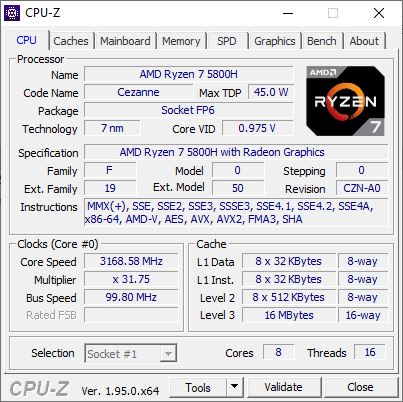
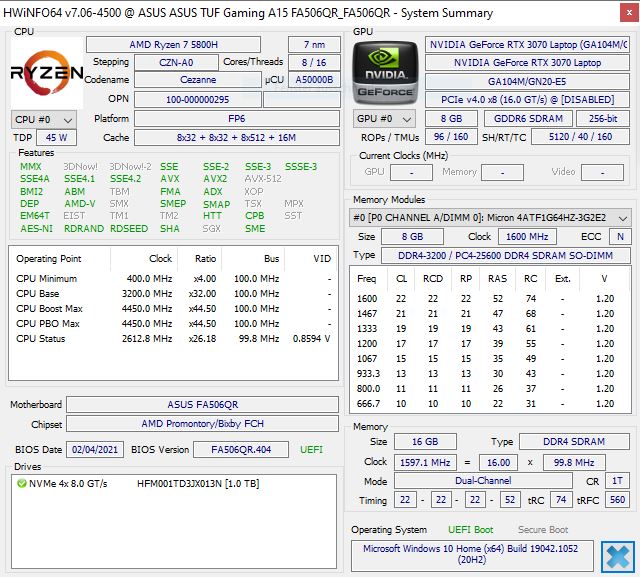
The AMD Ryzen 7 5800H used here is an octa-core-processor that can handle up to 16 tasks simultaneously. Its clock rates are between 3.2 and 4.4 GHz, and the duration for which maximum clock rates can be maintained depends heavily on the cooling system. Short-term power consumption is configured at 65 watts, while the Ryzen 7 5800H in the TUF Gaming A15 can operate at 35 watts on a long-term basis.
As our Cinebench R15 endurance test shows, the CPU can maintain its performance for a prolonged period of time before performance drops by about 8%. This isn't the case with devices like the Alienware m15 and the TUF Gaming F15 when the initial performance is the same. In the individual benchmarks, the CPU achieves rates within the upper range of our test field.
Cinebench R20: CPU (Single Core) | CPU (Multi Core)
Cinebench R15: CPU Single 64Bit | CPU Multi 64Bit
Blender: v2.79 BMW27 CPU
7-Zip 18.03: 7z b 4 -mmt1 | 7z b 4
Geekbench 5.5: Single-Core | Multi-Core
HWBOT x265 Benchmark v2.2: 4k Preset
LibreOffice : 20 Documents To PDF
R Benchmark 2.5: Overall mean
| Cinebench R23 / Single Core | |
| Average of class Gaming (1166 - 2356, n=112, last 2 years) | |
| Asus TUF Gaming F15 FX506HM | |
| Alienware m15 R5 Ryzen Edition | |
| Average AMD Ryzen 7 5800H (1294 - 1441, n=29) | |
| MSI GF65 Thin 10UE | |
| Aorus 15P XC | |
| Cinebench R23 / Multi Core | |
| Average of class Gaming (10488 - 40970, n=112, last 2 years) | |
| Asus TUF Gaming F15 FX506HM | |
| Alienware m15 R5 Ryzen Edition | |
| Average AMD Ryzen 7 5800H (8812 - 13214, n=29) | |
| Aorus 15P XC | |
| MSI GF65 Thin 10UE | |
| Cinebench R20 / CPU (Single Core) | |
| Average of class Gaming (442 - 895, n=111, last 2 years) | |
| Asus TUF Gaming F15 FX506HM | |
| Alienware m15 R5 Ryzen Edition | |
| Asus TUF Gaming A15 FA506QR-AZ061T | |
| Average AMD Ryzen 7 5800H (502 - 560, n=30) | |
| MSI GF65 Thin 10UE | |
| Aorus 15P XC | |
| Cinebench R20 / CPU (Multi Core) | |
| Average of class Gaming (4029 - 16108, n=111, last 2 years) | |
| Asus TUF Gaming F15 FX506HM | |
| Alienware m15 R5 Ryzen Edition | |
| Average AMD Ryzen 7 5800H (3430 - 5020, n=31) | |
| Asus TUF Gaming A15 FA506QR-AZ061T | |
| Aorus 15P XC | |
| MSI GF65 Thin 10UE | |
| Cinebench R15 / CPU Single 64Bit | |
| Average of class Gaming (188.8 - 343, n=111, last 2 years) | |
| Asus TUF Gaming A15 FA506QR-AZ061T | |
| Alienware m15 R5 Ryzen Edition | |
| Asus TUF Gaming F15 FX506HM | |
| Average AMD Ryzen 7 5800H (209 - 234, n=29) | |
| MSI GF65 Thin 10UE | |
| Aorus 15P XC | |
| Cinebench R15 / CPU Multi 64Bit | |
| Average of class Gaming (1578 - 6271, n=111, last 2 years) | |
| Asus TUF Gaming F15 FX506HM | |
| Asus TUF Gaming A15 FA506QR-AZ061T | |
| Alienware m15 R5 Ryzen Edition | |
| Average AMD Ryzen 7 5800H (1487 - 2119, n=28) | |
| Aorus 15P XC | |
| MSI GF65 Thin 10UE | |
| Blender / v2.79 BMW27 CPU | |
| MSI GF65 Thin 10UE | |
| Aorus 15P XC | |
| Asus TUF Gaming A15 FA506QR-AZ061T | |
| Average AMD Ryzen 7 5800H (237 - 340, n=29) | |
| Alienware m15 R5 Ryzen Edition | |
| Asus TUF Gaming F15 FX506HM | |
| Average of class Gaming (80 - 330, n=109, last 2 years) | |
| 7-Zip 18.03 / 7z b 4 -mmt1 | |
| Average of class Gaming (4199 - 7436, n=110, last 2 years) | |
| Asus TUF Gaming F15 FX506HM | |
| Alienware m15 R5 Ryzen Edition | |
| Asus TUF Gaming A15 FA506QR-AZ061T | |
| Average AMD Ryzen 7 5800H (5038 - 5632, n=29) | |
| Aorus 15P XC | |
| MSI GF65 Thin 10UE | |
| 7-Zip 18.03 / 7z b 4 | |
| Average of class Gaming (33491 - 148086, n=110, last 2 years) | |
| Average AMD Ryzen 7 5800H (45773 - 59986, n=28) | |
| Alienware m15 R5 Ryzen Edition | |
| Asus TUF Gaming A15 FA506QR-AZ061T | |
| Asus TUF Gaming F15 FX506HM | |
| Aorus 15P XC | |
| MSI GF65 Thin 10UE | |
| Geekbench 5.5 / Single-Core | |
| Average of class Gaming (986 - 2474, n=110, last 2 years) | |
| Alienware m15 R5 Ryzen Edition | |
| Average AMD Ryzen 7 5800H (1336 - 1505, n=28) | |
| Asus TUF Gaming A15 FA506QR-AZ061T | |
| MSI GF65 Thin 10UE | |
| Aorus 15P XC | |
| Geekbench 5.5 / Multi-Core | |
| Average of class Gaming (6460 - 27010, n=110, last 2 years) | |
| Average AMD Ryzen 7 5800H (6551 - 9062, n=28) | |
| Aorus 15P XC | |
| Asus TUF Gaming A15 FA506QR-AZ061T | |
| Alienware m15 R5 Ryzen Edition | |
| MSI GF65 Thin 10UE | |
| HWBOT x265 Benchmark v2.2 / 4k Preset | |
| Average of class Gaming (11.5 - 44.3, n=110, last 2 years) | |
| Asus TUF Gaming F15 FX506HM | |
| Alienware m15 R5 Ryzen Edition | |
| Average AMD Ryzen 7 5800H (11.6 - 16.1, n=29) | |
| Asus TUF Gaming A15 FA506QR-AZ061T | |
| Aorus 15P XC | |
| MSI GF65 Thin 10UE | |
| LibreOffice / 20 Documents To PDF | |
| Average AMD Ryzen 7 5800H (47.4 - 113, n=29) | |
| Alienware m15 R5 Ryzen Edition | |
| Aorus 15P XC | |
| Average of class Gaming (19 - 88.8, n=110, last 2 years) | |
| Asus TUF Gaming A15 FA506QR-AZ061T | |
| MSI GF65 Thin 10UE | |
| Asus TUF Gaming F15 FX506HM | |
| R Benchmark 2.5 / Overall mean | |
| MSI GF65 Thin 10UE | |
| Aorus 15P XC | |
| Asus TUF Gaming F15 FX506HM | |
| Average AMD Ryzen 7 5800H (0.511 - 0.559, n=28) | |
| Alienware m15 R5 Ryzen Edition | |
| Asus TUF Gaming A15 FA506QR-AZ061T | |
| Average of class Gaming (0.3439 - 0.759, n=111, last 2 years) | |
* ... smaller is better
System performance
In the PCMark 10 test for evaluating system performance, the Asus TUF Gaming A15 takes first place in our test field. In the individual disciplines, it scores the highest result in the "Productivity" test, while it's only surpassed by the TUF Gaming F15 in the "Essentials" score. The gaming laptop provides a very smooth operation in everyday use. We didn't notice any micro stuttering or the like during the test period.
The performance that can be expected from other laptops in comparison can be found in our CPU Benchmarks article.
| PCMark 10 / Score | |
| Average of class Gaming (5828 - 11574, n=95, last 2 years) | |
| Asus TUF Gaming A15 FA506QR-AZ061T | |
| Asus TUF Gaming F15 FX506HM | |
| Average AMD Ryzen 7 5800H, NVIDIA GeForce RTX 3070 Laptop GPU (6717 - 6983, n=6) | |
| Alienware m15 R5 Ryzen Edition | |
| Aorus 15P XC | |
| MSI GF65 Thin 10UE | |
| PCMark 10 / Essentials | |
| Average of class Gaming (8810 - 12600, n=99, last 2 years) | |
| Asus TUF Gaming F15 FX506HM | |
| Asus TUF Gaming A15 FA506QR-AZ061T | |
| Average AMD Ryzen 7 5800H, NVIDIA GeForce RTX 3070 Laptop GPU (9548 - 10226, n=6) | |
| Alienware m15 R5 Ryzen Edition | |
| Aorus 15P XC | |
| MSI GF65 Thin 10UE | |
| PCMark 10 / Productivity | |
| Average of class Gaming (6845 - 18766, n=97, last 2 years) | |
| Asus TUF Gaming A15 FA506QR-AZ061T | |
| Average AMD Ryzen 7 5800H, NVIDIA GeForce RTX 3070 Laptop GPU (8849 - 9514, n=6) | |
| Alienware m15 R5 Ryzen Edition | |
| Asus TUF Gaming F15 FX506HM | |
| Aorus 15P XC | |
| MSI GF65 Thin 10UE | |
| PCMark 10 / Digital Content Creation | |
| Average of class Gaming (7602 - 19657, n=97, last 2 years) | |
| Aorus 15P XC | |
| Average AMD Ryzen 7 5800H, NVIDIA GeForce RTX 3070 Laptop GPU (8948 - 10389, n=6) | |
| Asus TUF Gaming F15 FX506HM | |
| Asus TUF Gaming A15 FA506QR-AZ061T | |
| Alienware m15 R5 Ryzen Edition | |
| MSI GF65 Thin 10UE | |
| PCMark 10 Score | 6917 points | |
Help | ||
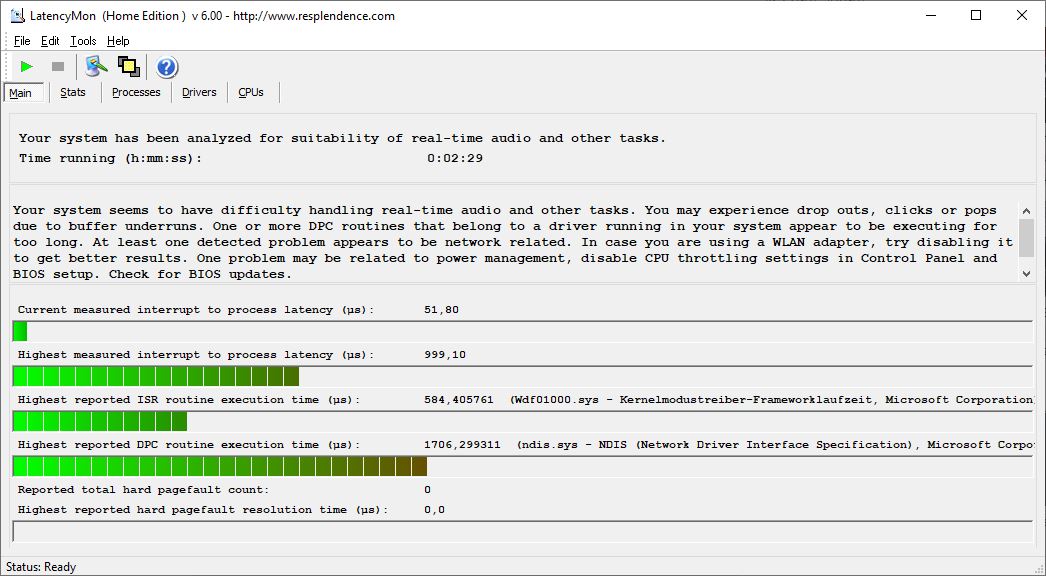
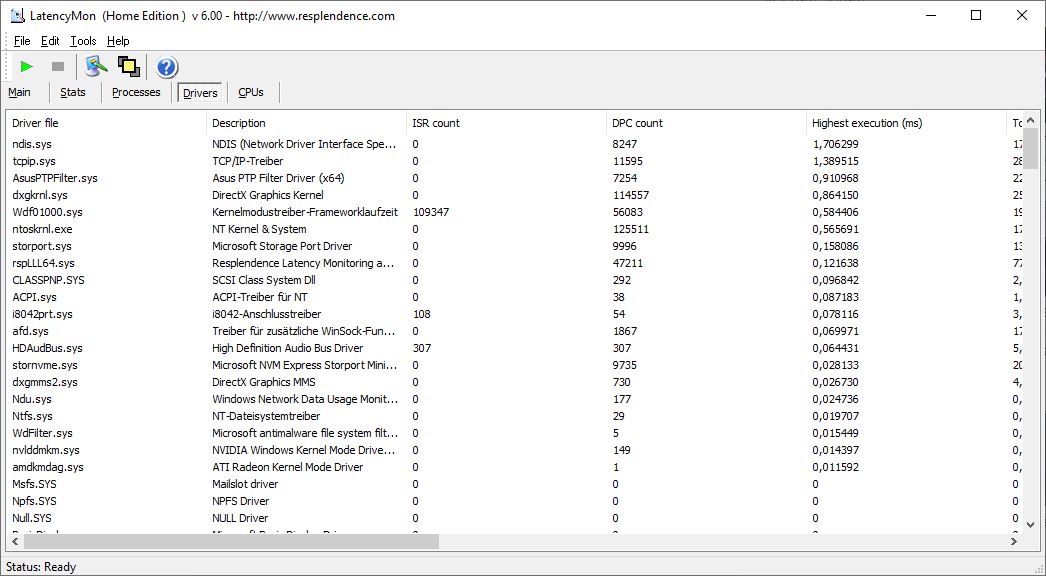
DPC latencies
In the test with LatencyMon, the gaming laptop from Asus only shows slightly elevated interruption times. This makes it suitable for real-time applications to a limited extent.
| DPC Latencies / LatencyMon - interrupt to process latency (max), Web, Youtube, Prime95 | |
| Asus TUF Gaming F15 FX506HM | |
| Aorus 15P XC | |
| Asus TUF Gaming A15 FA506QR-AZ061T | |
| MSI GF65 Thin 10UE | |
| Alienware m15 R5 Ryzen Edition | |
* ... smaller is better
Storage
Asus installs a 1 TB SSD from SK Hynix in the TUF Gaming A15. It achieves very good read and write speeds in the storage benchmarks, which are slightly above the competition's level.
How other mass storage devices were able to perform in comparison is listed in our HDD/SSD Benchmarks article.
| Asus TUF Gaming A15 FA506QR-AZ061T SK Hynix HFM001TD3JX013N | Asus TUF Gaming F15 FX506HM SK Hynix HFM001TD3JX013N | Alienware m15 R5 Ryzen Edition Toshiba KBG40ZNS512G NVMe | Aorus 15P XC ESR512GTLCG-EAC-4 | MSI GF65 Thin 10UE Samsung SSD PM981 MZVLB1T0HALR | Average SK Hynix HFM001TD3JX013N | |
|---|---|---|---|---|---|---|
| CrystalDiskMark 5.2 / 6 | -6% | -27% | -8% | -11% | -2% | |
| Write 4K (MB/s) | 182.5 | 168.1 -8% | 116.9 -36% | 130.2 -29% | 157.3 -14% | 155.8 ? -15% |
| Read 4K (MB/s) | 73.2 | 65.1 -11% | 44.56 -39% | 45.47 -38% | 46.69 -36% | 57 ? -22% |
| Write Seq (MB/s) | 3005 | 2124 -29% | 1552 -48% | 2269 -24% | 2389 -20% | 3943 ? 31% |
| Read Seq (MB/s) | 2358 | 2204 -7% | 1682 -29% | 1643 -30% | 2196 -7% | 2180 ? -8% |
| Write 4K Q32T1 (MB/s) | 389.5 | 455.3 17% | 497.8 28% | 547 40% | 407.6 5% | 452 ? 16% |
| Read 4K Q32T1 (MB/s) | 463.8 | 465.6 0% | 436.8 -6% | 654 41% | 519 12% | 447 ? -4% |
| Write Seq Q32T1 (MB/s) | 3166 | 2911 -8% | 1461 -54% | 2512 -21% | 2401 -24% | 2859 ? -10% |
| Read Seq Q32T1 (MB/s) | 3590 | 3519 -2% | 2364 -34% | 3382 -6% | 3344 -7% | 3515 ? -2% |
| AS SSD | -22% | -91% | -12% | -27% | -17% | |
| Seq Read (MB/s) | 3133 | 2873 -8% | 2082 -34% | 2694 -14% | 3002 -4% | 2839 ? -9% |
| Seq Write (MB/s) | 2969 | 1619 -45% | 825 -72% | 2327 -22% | 2420 -18% | 1917 ? -35% |
| 4K Read (MB/s) | 55.2 | 57.5 4% | 42.41 -23% | 47.77 -13% | 48.46 -12% | 53 ? -4% |
| 4K Write (MB/s) | 129.7 | 149.6 15% | 98.3 -24% | 98.8 -24% | 114.3 -12% | 127.3 ? -2% |
| 4K-64 Read (MB/s) | 1891 | 1252 -34% | 1255 -34% | 1746 -8% | 1873 -1% | 1369 ? -28% |
| 4K-64 Write (MB/s) | 1795 | 2196 22% | 738 -59% | 2267 26% | 1882 5% | 1939 ? 8% |
| Access Time Read * (ms) | 0.052 | 0.04 23% | 0.109 -110% | 0.079 -52% | 0.045 13% | 0.0468 ? 10% |
| Access Time Write * (ms) | 0.028 | 0.082 -193% | 0.17 -507% | 0.039 -39% | 0.101 -261% | 0.0532 ? -90% |
| Score Read (Points) | 2259 | 1597 -29% | 1506 -33% | 2063 -9% | 2221 -2% | 1706 ? -24% |
| Score Write (Points) | 2221 | 2508 13% | 918 -59% | 2598 17% | 2238 1% | 2258 ? 2% |
| Score Total (Points) | 5630 | 4869 -14% | 3136 -44% | 5698 1% | 5565 -1% | 4797 ? -15% |
| Total Average (Program / Settings) | -14% /
-15% | -59% /
-64% | -10% /
-11% | -19% /
-20% | -10% /
-11% |
* ... smaller is better

Continuous load read: DiskSpd Read Loop, Queue Depth 8
Graphics card
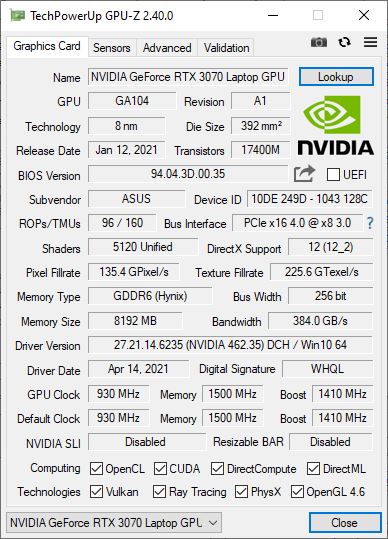
Asus uses an Nvidia GeForce RTX 3070 in the TUF Gaming A15. This graphics card is currently one of the most powerful models available for laptops, although the actual performance strongly depends on the configured TGP. This can be as high as 125 watts but is limited to 90 watts in the A15. This leads to values in the middle of our test field in 3DMark benchmarks, which speaks for good performance in this price range.
The performance offered by other graphics cards can be found in our GPU Benchmarks article.
| 3DMark 11 Performance | 23459 points | |
| 3DMark Cloud Gate Standard Score | 46591 points | |
| 3DMark Fire Strike Score | 20237 points | |
| 3DMark Time Spy Score | 8446 points | |
Help | ||
Gaming performance
The Nvidia GeForce RTX 3070 built in here is very well suited for gaming. The latest titles are rendered smoothly at Full HD resolution and high detail settings at high frame rates. Only very demanding games, such as Cyberpunk 2077, can experience frame rates below 60 fps on high graphics settings.
Our GPU Games article shows the performance that can be expected in other titles.
| The Witcher 3 - 1920x1080 Ultra Graphics & Postprocessing (HBAO+) | |
| Average of class Gaming (95 - 240, n=8, last 2 years) | |
| Aorus 15P XC | |
| Average NVIDIA GeForce RTX 3070 Laptop GPU (34.9 - 109, n=52) | |
| Asus TUF Gaming A15 FA506QR-AZ061T | |
| Alienware m15 R5 Ryzen Edition | |
| Asus TUF Gaming F15 FX506HM | |
| MSI GF65 Thin 10UE | |
| Cyberpunk 2077 1.0 - 1920x1080 Ultra Preset | |
| Aorus 15P XC | |
| Average NVIDIA GeForce RTX 3070 Laptop GPU (50 - 70.5, n=11) | |
| Asus TUF Gaming A15 FA506QR-AZ061T | |
| Alienware m15 R5 Ryzen Edition | |
| Final Fantasy XV Benchmark - 1920x1080 High Quality | |
| Average of class Gaming (41 - 215, n=103, last 2 years) | |
| Average NVIDIA GeForce RTX 3070 Laptop GPU (27.9 - 107, n=49) | |
| Asus TUF Gaming A15 FA506QR-AZ061T | |
| Alienware m15 R5 Ryzen Edition | |
| Asus TUF Gaming F15 FX506HM | |
| MSI GF65 Thin 10UE | |
| Strange Brigade - 1920x1080 ultra AA:ultra AF:16 | |
| Average of class Gaming (76.3 - 456, n=93, last 2 years) | |
| Average NVIDIA GeForce RTX 3070 Laptop GPU (36.2 - 194, n=46) | |
| Asus TUF Gaming A15 FA506QR-AZ061T | |
| Alienware m15 R5 Ryzen Edition | |
| Asus TUF Gaming F15 FX506HM | |
| MSI GF65 Thin 10UE | |
The endurance test with The Witcher 3 on Ultra graphics settings shows that although performance decreases a bit over time, the system is also able to recover from this drop. Therefore, performance drops aren't to be expected even during long gaming sessions.
The Witcher 3 FPS diagram
| low | med. | high | ultra | |
|---|---|---|---|---|
| GTA V (2015) | 174 | 141 | 83.1 | |
| The Witcher 3 (2015) | 78 | |||
| Dota 2 Reborn (2015) | 140 | 131 | 115 | 110 |
| Final Fantasy XV Benchmark (2018) | 152 | 106 | 80.1 | |
| X-Plane 11.11 (2018) | 92.7 | 81.4 | 68 | |
| Far Cry 5 (2018) | 127 | 106 | 104 | 100 |
| Strange Brigade (2018) | 272 | 170 | 152 | 139 |
| Cyberpunk 2077 1.0 (2020) | 97.3 | 76.8 | 64.6 | 57 |
Emissions - TUF Gaming A15 has good speakers
Noise emissions
The fans in the Asus TUF Gaming A15 reach noise levels of up to 49 dB(A) and are consequently clearly audible under heavy load. A steady noise is produced here, which can be tolerated well. Coil whine occurred very rarely in our test device, but it disappeared quickly.
Noise level
| Idle |
| 26 / 26 / 27.4 dB(A) |
| Load |
| 46.6 / 49.3 dB(A) |
 | ||
30 dB silent 40 dB(A) audible 50 dB(A) loud |
||
min: | ||
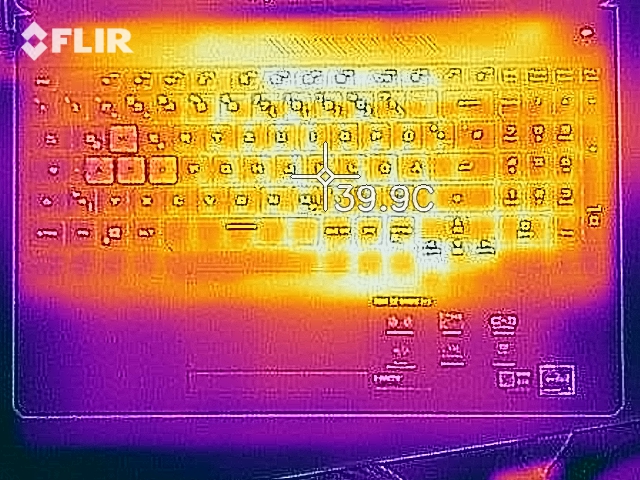
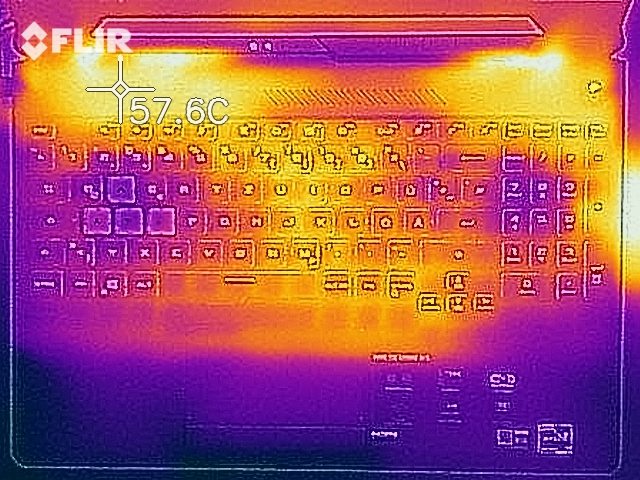
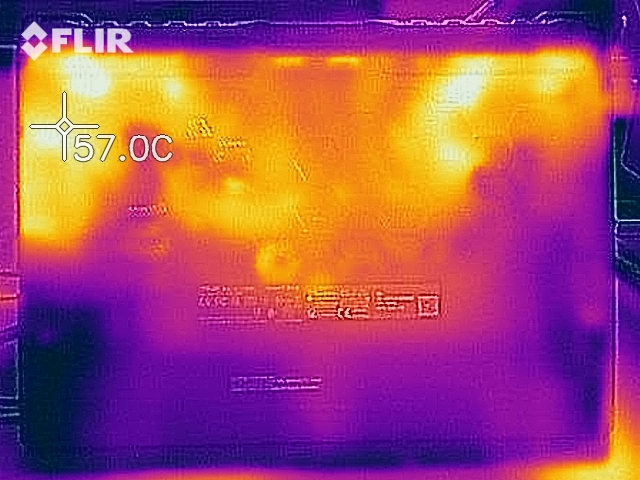
Temperature
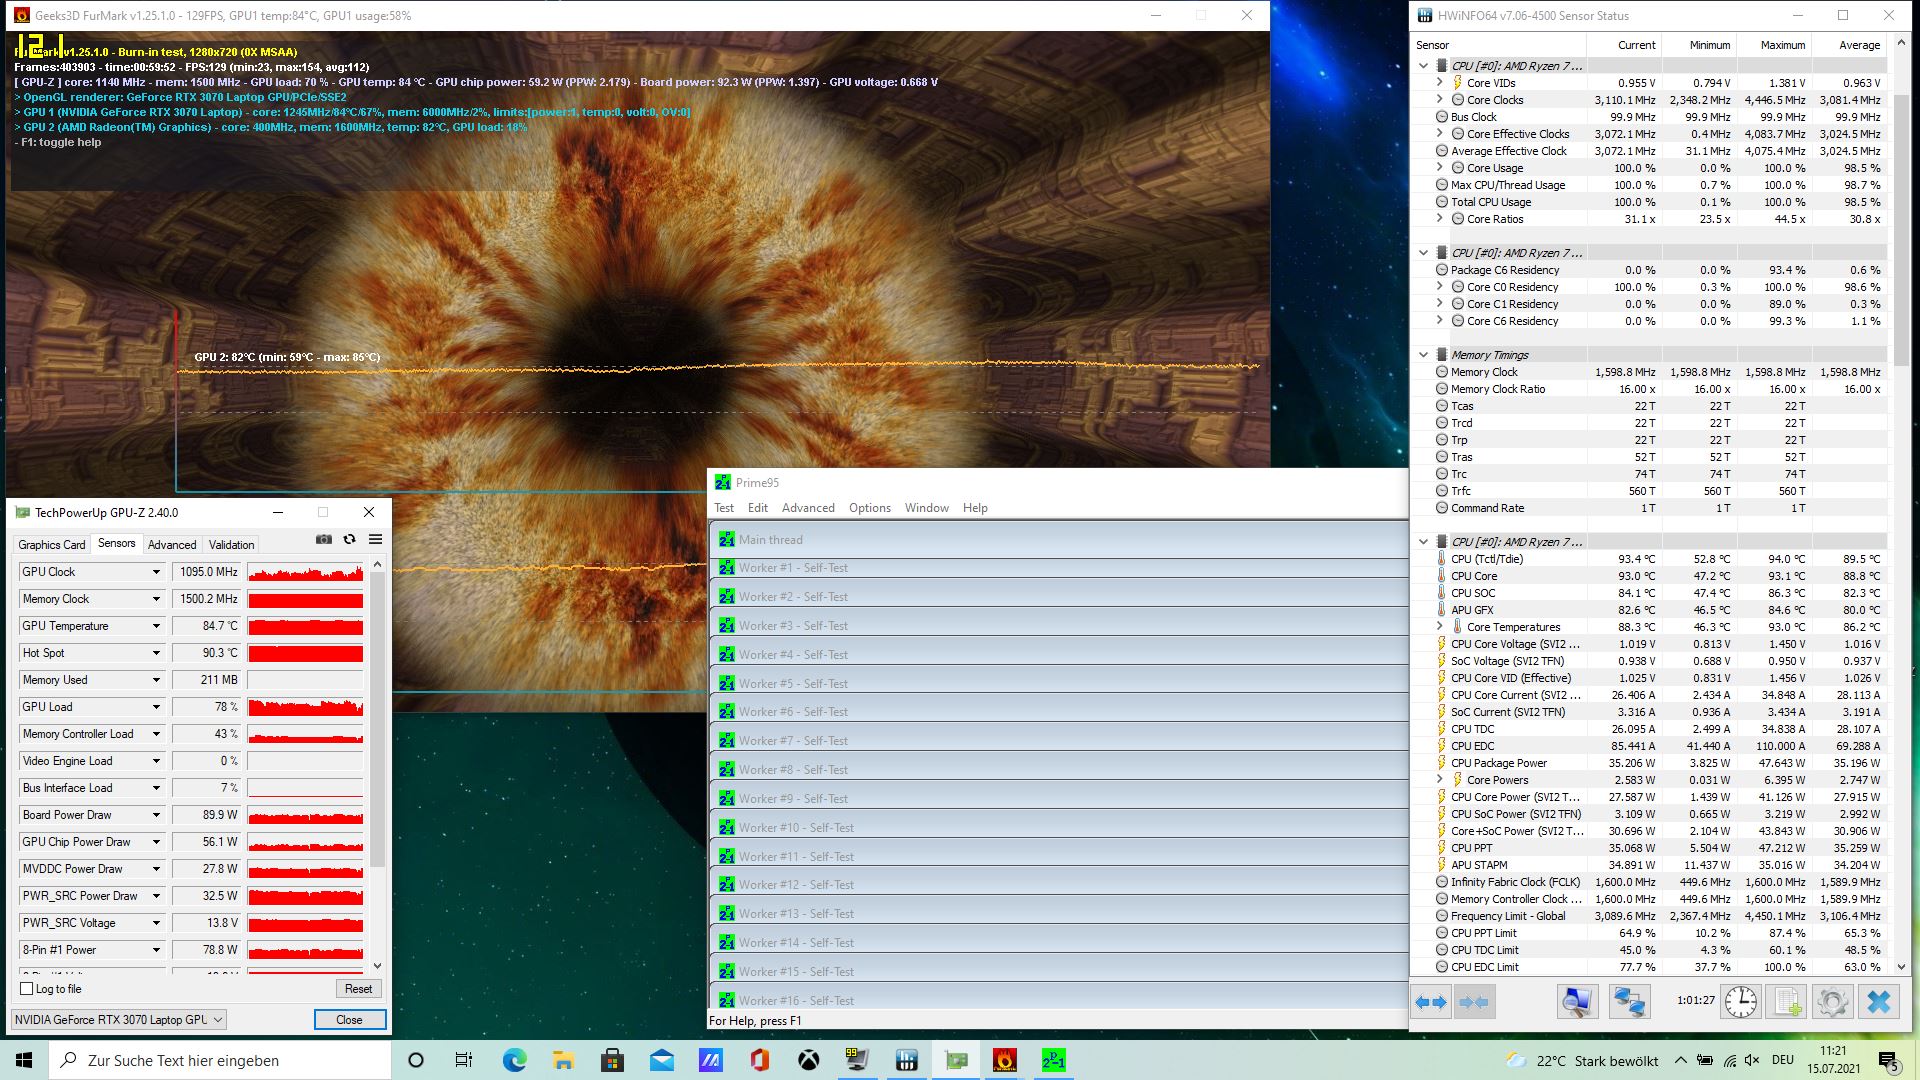
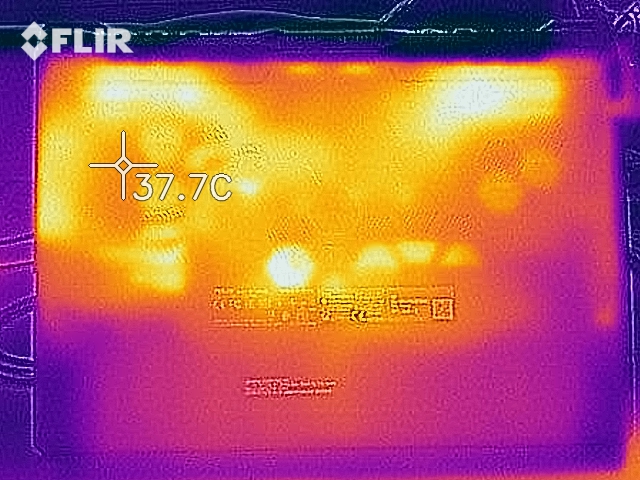
According to our measurements, the surfaces of the TUF Gaming A15 heat up to 55.9 °C (~133 °F) under load. The warmest point here is at the rear right corner of the underside. The palm rests always remain cool enough at temperatures below 30 °C (~86 °F), so that the laptop stays usable at all times.
The temperatures inside the A15 increased to up to 94 °C (~201 °F) during our approximately one-hour endurance stress test. In the process, the clock rates dropped to around 2.4 GHz, which is below the base clock speed of 3.2 GHz. However, the system could still be operated smoothly, and it quickly stabilized again after the end of the test. Therefore, restrictions due to excessively high temperatures are not expected.
(-) The maximum temperature on the upper side is 46.7 °C / 116 F, compared to the average of 40.4 °C / 105 F, ranging from 21.2 to 68.8 °C for the class Gaming.
(-) The bottom heats up to a maximum of 55.9 °C / 133 F, compared to the average of 43.2 °C / 110 F
(±) In idle usage, the average temperature for the upper side is 33 °C / 91 F, compared to the device average of 33.9 °C / 93 F.
(+) The palmrests and touchpad are cooler than skin temperature with a maximum of 29.4 °C / 84.9 F and are therefore cool to the touch.
(±) The average temperature of the palmrest area of similar devices was 28.8 °C / 83.8 F (-0.6 °C / -1.1 F).
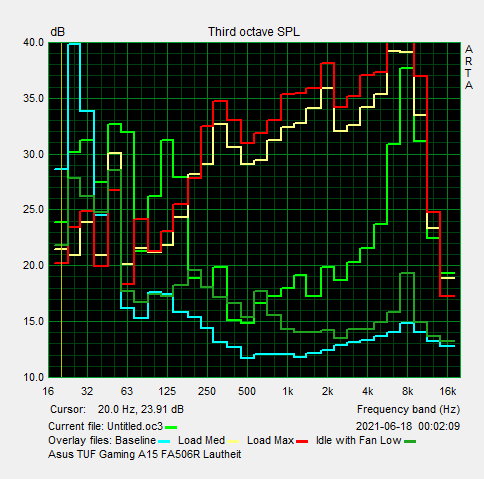
Speakers
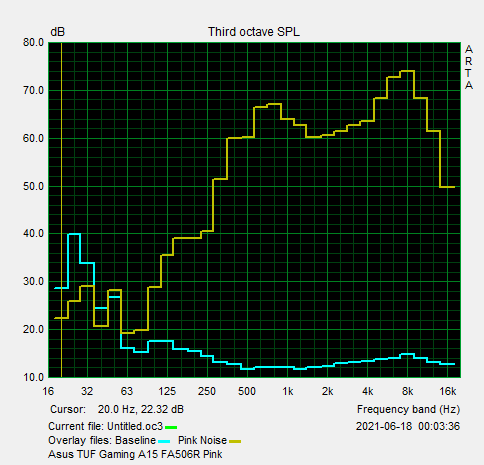
The speakers in the TUF Gaming A15 offer moderate volume and a fairly broad sound spectrum. This makes them suitable for consuming media content, but external speakers or headphones are still recommended for listening to music or gaming.
Asus TUF Gaming A15 FA506QR-AZ061T audio analysis
(±) | speaker loudness is average but good (74 dB)
Bass 100 - 315 Hz
(-) | nearly no bass - on average 22.4% lower than median
(±) | linearity of bass is average (10.8% delta to prev. frequency)
Mids 400 - 2000 Hz
(+) | balanced mids - only 2.4% away from median
(+) | mids are linear (5.9% delta to prev. frequency)
Highs 2 - 16 kHz
(±) | higher highs - on average 5.8% higher than median
(+) | highs are linear (5.6% delta to prev. frequency)
Overall 100 - 16.000 Hz
(±) | linearity of overall sound is average (20.1% difference to median)
Compared to same class
» 71% of all tested devices in this class were better, 6% similar, 23% worse
» The best had a delta of 6%, average was 18%, worst was 132%
Compared to all devices tested
» 52% of all tested devices were better, 8% similar, 40% worse
» The best had a delta of 4%, average was 24%, worst was 134%
Aorus 15P XC audio analysis
(+) | speakers can play relatively loud (84 dB)
Bass 100 - 315 Hz
(-) | nearly no bass - on average 20.8% lower than median
(±) | linearity of bass is average (10.8% delta to prev. frequency)
Mids 400 - 2000 Hz
(±) | higher mids - on average 7.1% higher than median
(+) | mids are linear (4.9% delta to prev. frequency)
Highs 2 - 16 kHz
(+) | balanced highs - only 1.9% away from median
(+) | highs are linear (4.6% delta to prev. frequency)
Overall 100 - 16.000 Hz
(±) | linearity of overall sound is average (17% difference to median)
Compared to same class
» 45% of all tested devices in this class were better, 12% similar, 43% worse
» The best had a delta of 6%, average was 18%, worst was 132%
Compared to all devices tested
» 30% of all tested devices were better, 8% similar, 62% worse
» The best had a delta of 4%, average was 24%, worst was 134%
Energy management - Gaming laptop with good battery life
Energy consumption
Our measurements show a power consumption of up to 184 watts under load for the Asus gaming laptop. While the A15 exhibits a low power consumption on par with our test field with its average of 12.8 watts in our idle scenario, the average value under load is comparatively high at 120 watts.
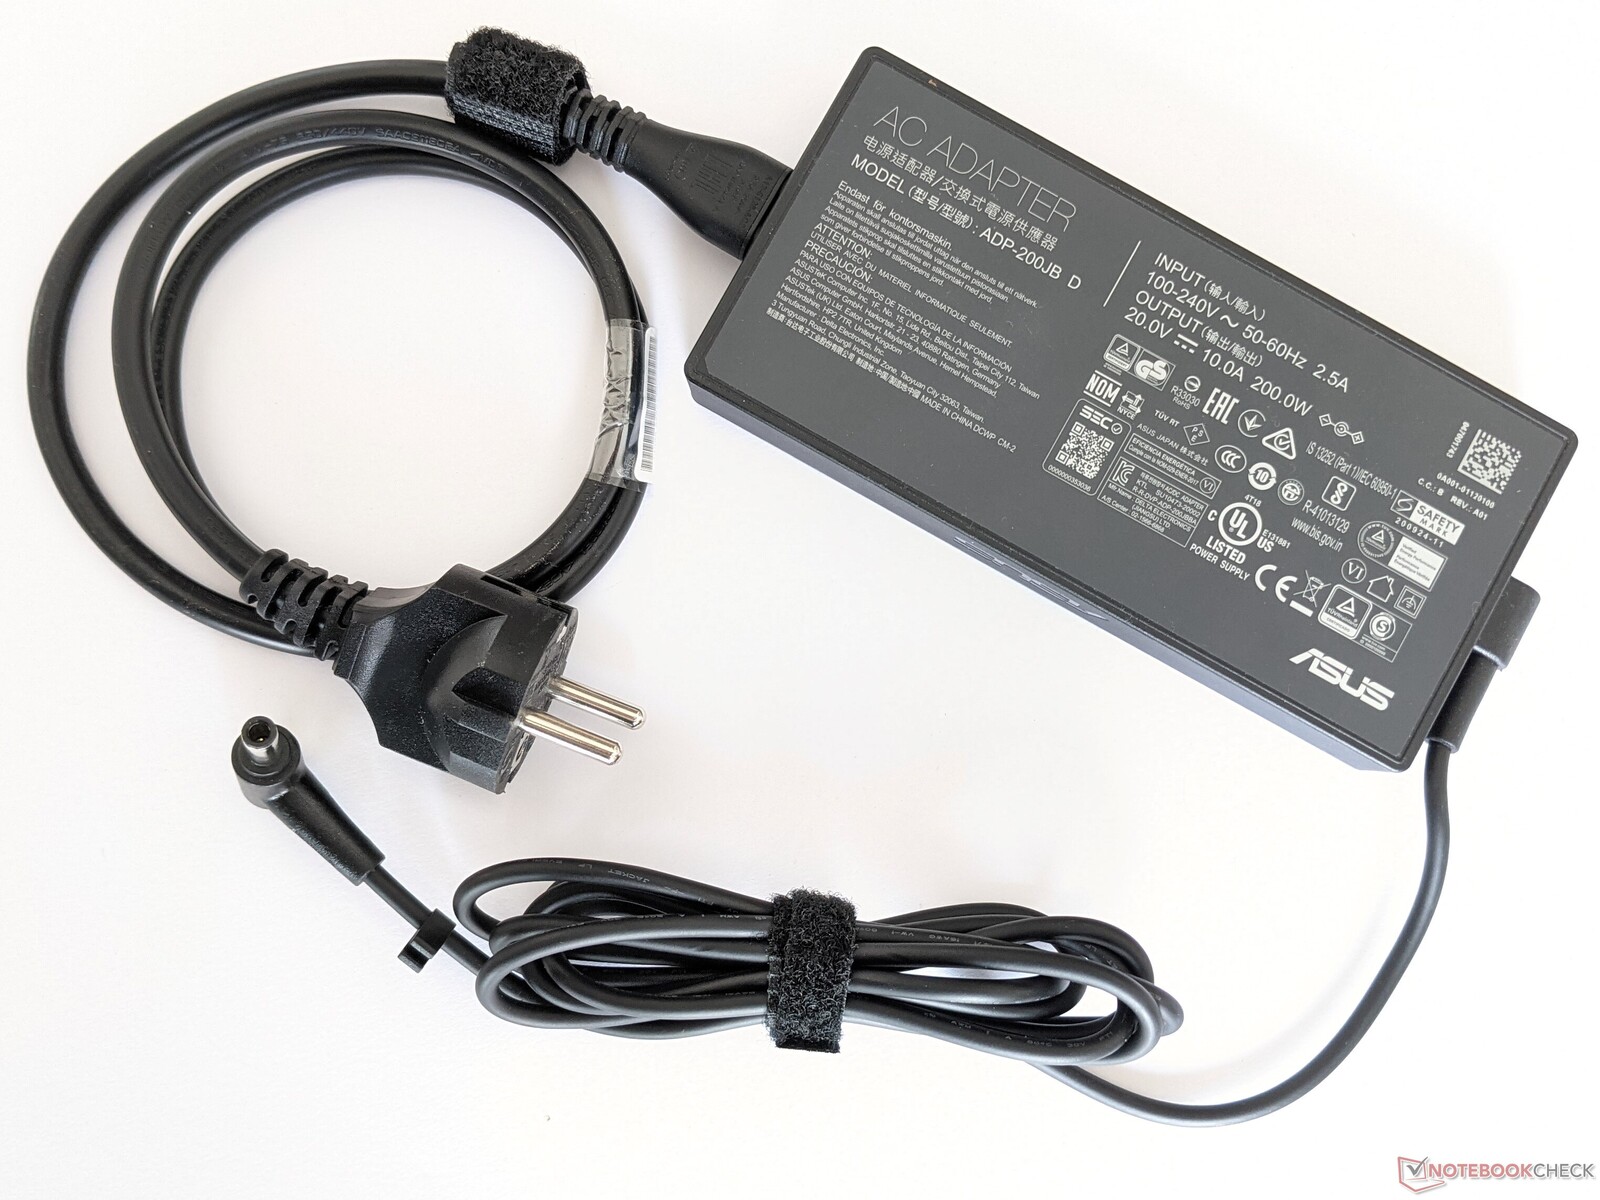
The included power adapter has a sufficiently high output of 200 watts.
| Off / Standby | |
| Idle | |
| Load |
|
Key:
min: | |
| Asus TUF Gaming A15 FA506QR-AZ061T R7 5800H, GeForce RTX 3070 Laptop GPU, SK Hynix HFM001TD3JX013N, IPS, 1920x1080, 15.6" | Asus TUF Gaming F15 FX506HM i7-11800H, GeForce RTX 3060 Laptop GPU, SK Hynix HFM001TD3JX013N, IPS, 1920x1080, 15.6" | Alienware m15 R5 Ryzen Edition R7 5800H, GeForce RTX 3060 Laptop GPU, Toshiba KBG40ZNS512G NVMe, IPS, 1920x1080, 15.6" | Aorus 15P XC i7-10870H, GeForce RTX 3070 Laptop GPU, ESR512GTLCG-EAC-4, IPS, 1920x1080, 15.6" | MSI GF65 Thin 10UE i7-10750H, GeForce RTX 3060 Laptop GPU, Samsung SSD PM981 MZVLB1T0HALR, IPS, 1920x1080, 15.6" | Average NVIDIA GeForce RTX 3070 Laptop GPU | Average of class Gaming | |
|---|---|---|---|---|---|---|---|
| Power Consumption | -4% | -22% | -39% | 12% | -41% | -32% | |
| Idle Minimum * (Watt) | 10.2 | 9.5 7% | 11 -8% | 14 -37% | 5.4 47% | 15.6 ? -53% | 13.2 ? -29% |
| Idle Average * (Watt) | 12.8 | 12.1 5% | 14 -9% | 17 -33% | 12.8 -0% | 20.1 ? -57% | 18.9 ? -48% |
| Idle Maximum * (Watt) | 15 | 22.5 -50% | 25 -67% | 33 -120% | 19.5 -30% | 29.4 ? -96% | 24.3 ? -62% |
| Load Average * (Watt) | 130 | 99.5 23% | 123 5% | 96 26% | 86.6 33% | 110.8 ? 15% | 108 ? 17% |
| Witcher 3 ultra * (Watt) | 137 | 157 -15% | 176 -28% | 179 -31% | 115.7 16% | ||
| Load Maximum * (Watt) | 184 | 173.5 6% | 226 -23% | 256 -39% | 175.2 5% | 214 ? -16% | 254 ? -38% |
* ... smaller is better
Energy consumption during The Witcher 3
Battery life
During our real-world Wi-Fi test, the TUF Gaming A15 achieves a runtime of 11:25 hours. This is a very good value and speaks for a good utilization of the 90 Wh battery. In addition, it's the best result in our test field.
| Asus TUF Gaming A15 FA506QR-AZ061T R7 5800H, GeForce RTX 3070 Laptop GPU, 90 Wh | Asus TUF Gaming F15 FX506HM i7-11800H, GeForce RTX 3060 Laptop GPU, 90 Wh | Alienware m15 R5 Ryzen Edition R7 5800H, GeForce RTX 3060 Laptop GPU, 86 Wh | Aorus 15P XC i7-10870H, GeForce RTX 3070 Laptop GPU, 99 Wh | MSI GF65 Thin 10UE i7-10750H, GeForce RTX 3060 Laptop GPU, 51 Wh | Average of class Gaming | |
|---|---|---|---|---|---|---|
| Battery runtime | -28% | -44% | -41% | -50% | -42% | |
| Reader / Idle (h) | 17.4 | 11 -37% | 14.7 -16% | 9.5 -45% | 11.1 -36% | 8.71 ? -50% |
| WiFi v1.3 (h) | 11.4 | 7.9 -31% | 5.1 -55% | 6.7 -41% | 4.6 -60% | 7.02 ? -38% |
| Load (h) | 2.4 | 2 -17% | 0.9 -62% | 1.5 -37% | 1.1 -54% | 1.47 ? -39% |
| Witcher 3 ultra (h) | 1.6 |
Pros
Cons
Verdict - Suitable for entry-level gaming
The TUF Gaming A15 is a good gaming laptop for the price established by Asus of approximately 1,800 Euros (~$2,126). Despite the limited TGP, it offers a high gaming performance, and both the Wi-Fi speed and the display quality are decent. The gaming laptop doesn't need to hide when compared with the competition, and it can also convince with an original design.
The Asus TUF Gaming A15 offers good gaming performance within the scope of the installed hardware.
In a direct comparison, the AMD Ryzen 7 5800H installed here performs well, but devices like the TUF Gaming F15 and the Alienware m15 are slightly better equipped in terms of long-term performance. The A15's battery life is very good as well, and it's much better than the rest of our test field. The maintenance options are very good, too, with expandable RAM and a second SSD slot.
As a result, the Asus TUF Gaming A15 isn't only interesting as an entry-level device, but it also meets more ambitious demands instead. If the price is still too high for your budget, it's worth taking a look at the MSI GF65 Thin 10UE, which is available for less than 1,200 Euros (~$1,417).
Price and availability
Asus TUF Gaming A15 FA506QR-AZ061T
- 07/15/2021 v7 (old)
Mike Wobker
Price comparison

