

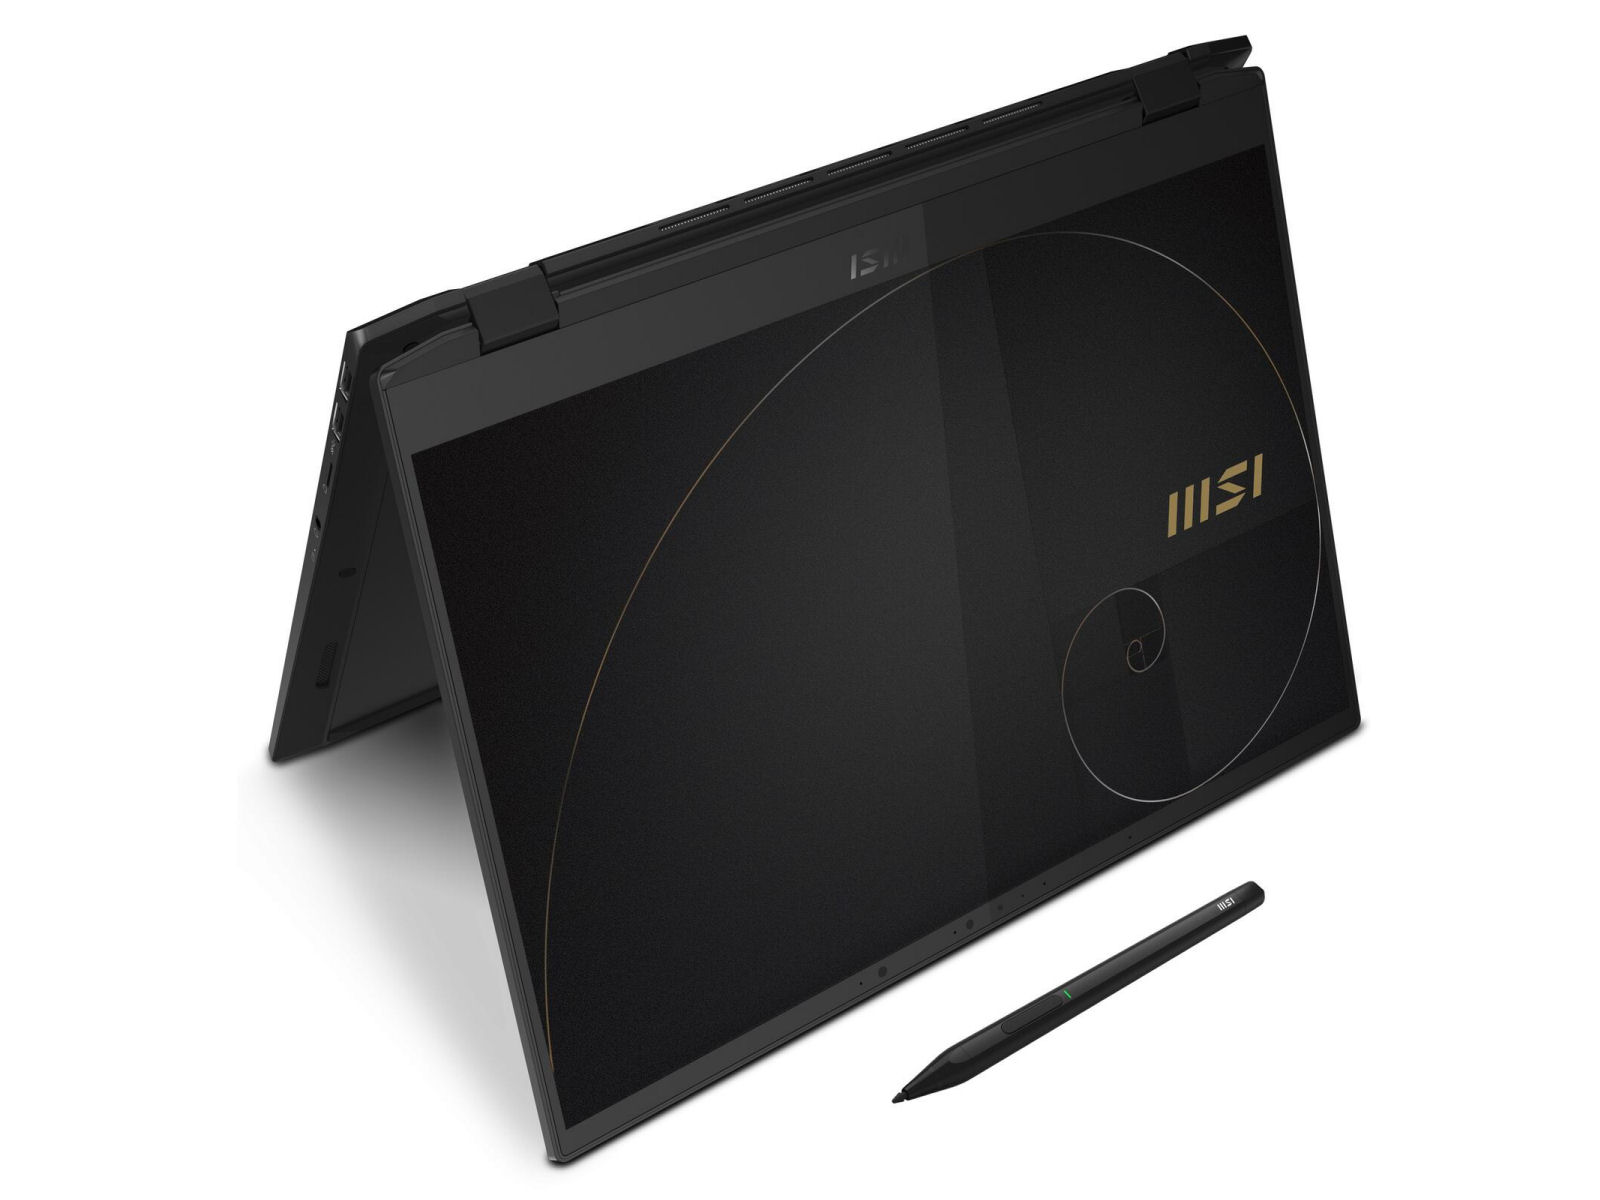
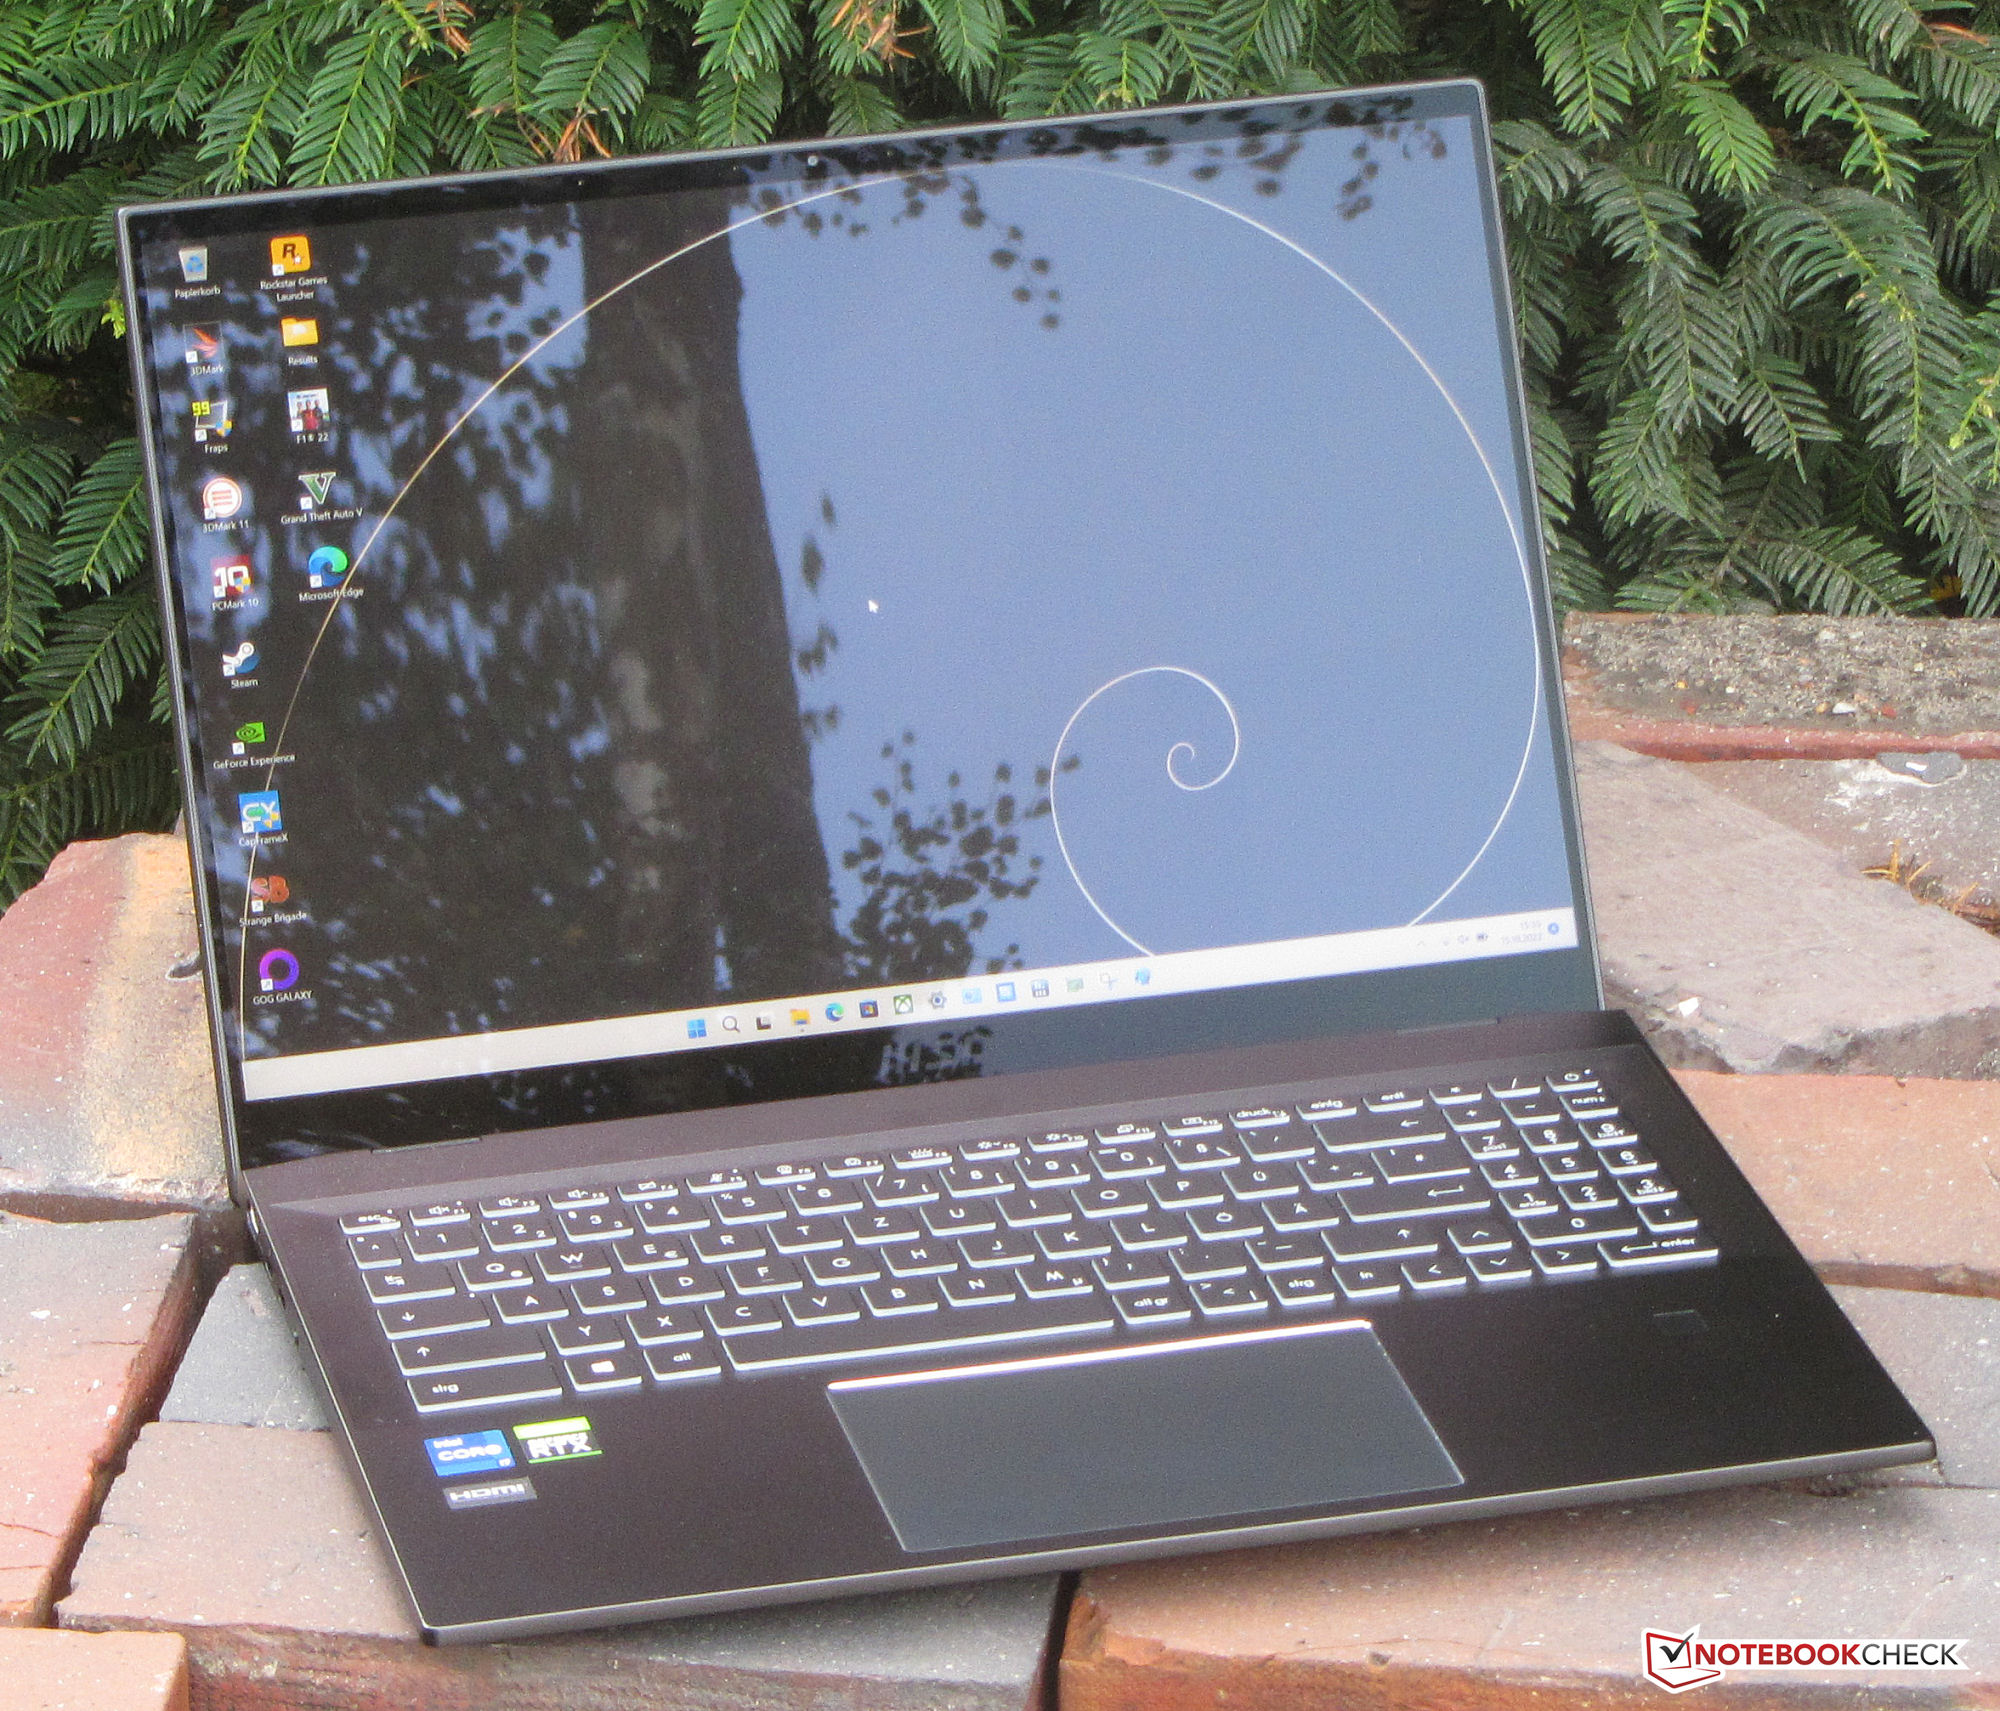
MSI Summit E16 Flip review: 2-in-1 laptop with pen, 16:10 display, and RTX 3050 Ti

With the Summit E16 Flip, MSI offers a 2-in-1 laptop whose distinguishing characteristic is the combination of a 16-inch touchscreen display in the 16:10 format and a midrange GPU. Our database does not include any direct competitors, since the corresponding convertibles usually don't offer dedicated GPUs. An expanded set of competitors includes devices such as the Asus ExpertBook B2 Flip B2502FBA, the Samsung Galaxy Book Pro 360 15 NP950QDB, and the Dell Inspiron 16 7620 2-in-1.
Possible Competitors in Comparison
Rating | Date | Model | Weight | Height | Size | Resolution | Price |
|---|---|---|---|---|---|---|---|
| 84.2 % v7 (old) | 10 / 2022 | MSI Summit E16 Flip A12UDT-031 i7-1280P, GeForce RTX 3050 Ti Laptop GPU | 1.9 kg | 16.85 mm | 16.00" | 2560x1600 | |
| 83.3 % v7 (old) | 09 / 2022 | Asus ExpertBook B2 Flip B2502FBA-N80141X i7-1260P, Iris Xe G7 96EUs | 1.9 kg | 19.9 mm | 15.60" | 1920x1080 | |
| 85.7 % v7 (old) | 06 / 2022 | Dell Inspiron 16 7620 2-in-1 i7-1260P, Iris Xe G7 96EUs | 2.1 kg | 18.41 mm | 16.00" | 1920x1200 | |
| 86.6 % v7 (old) | 03 / 2022 | Samsung Galaxy Book Pro 360 15 NP950QDB-KC3DE i5-1135G7, Iris Xe G7 80EUs | 1.4 kg | 11 mm | 15.60" | 1920x1080 |
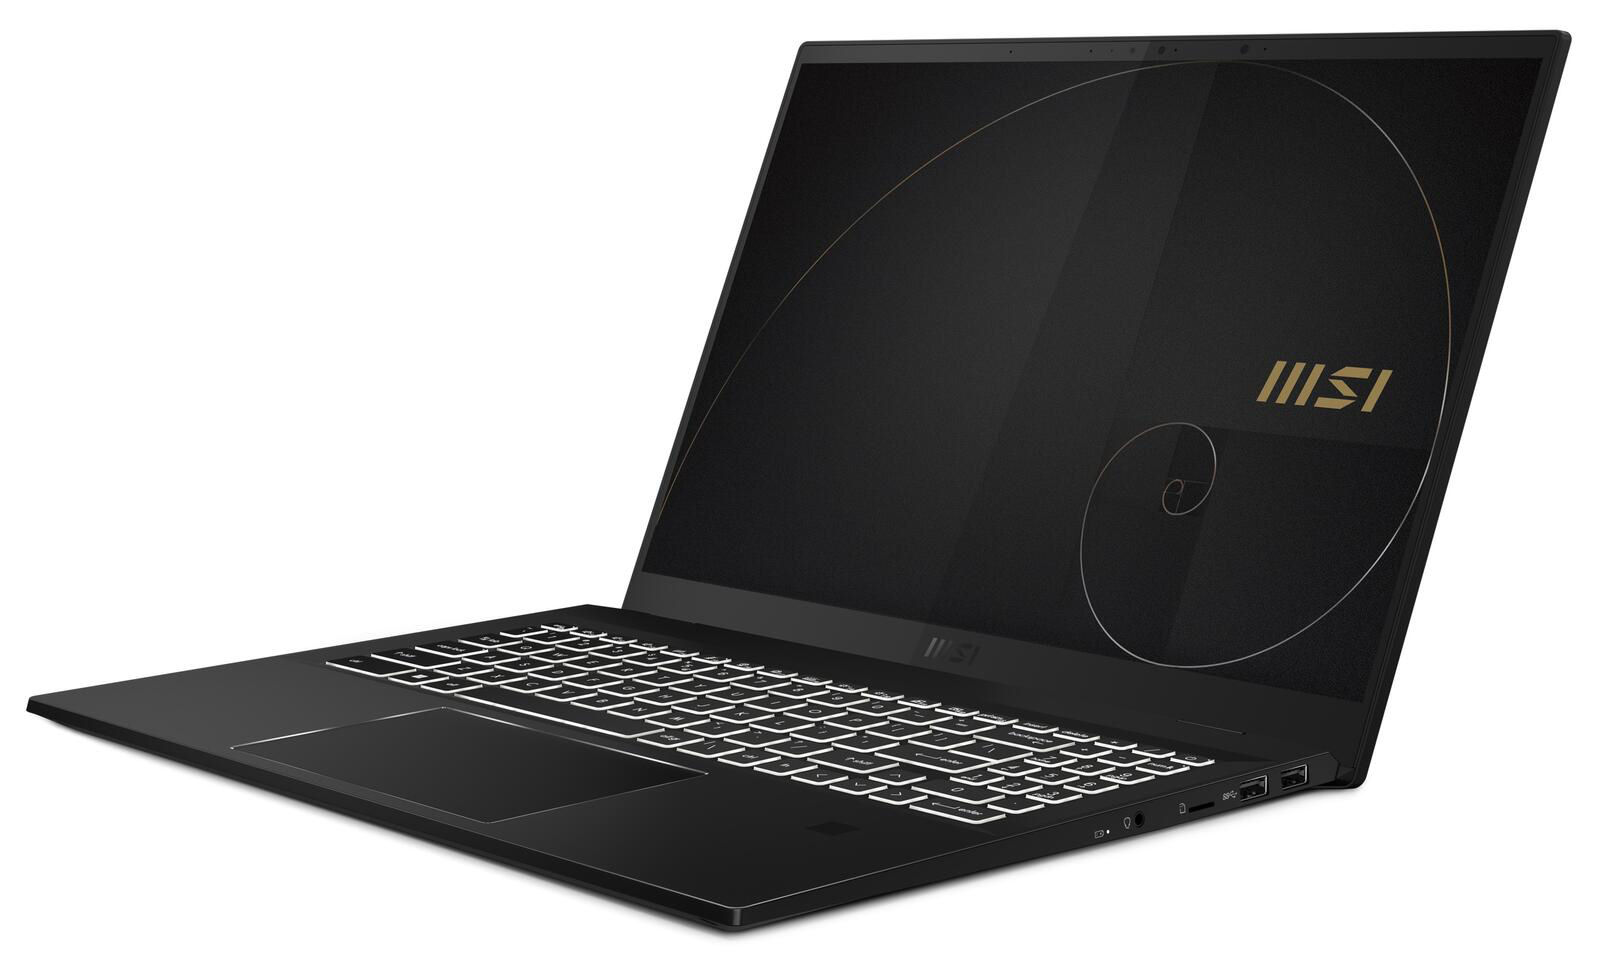
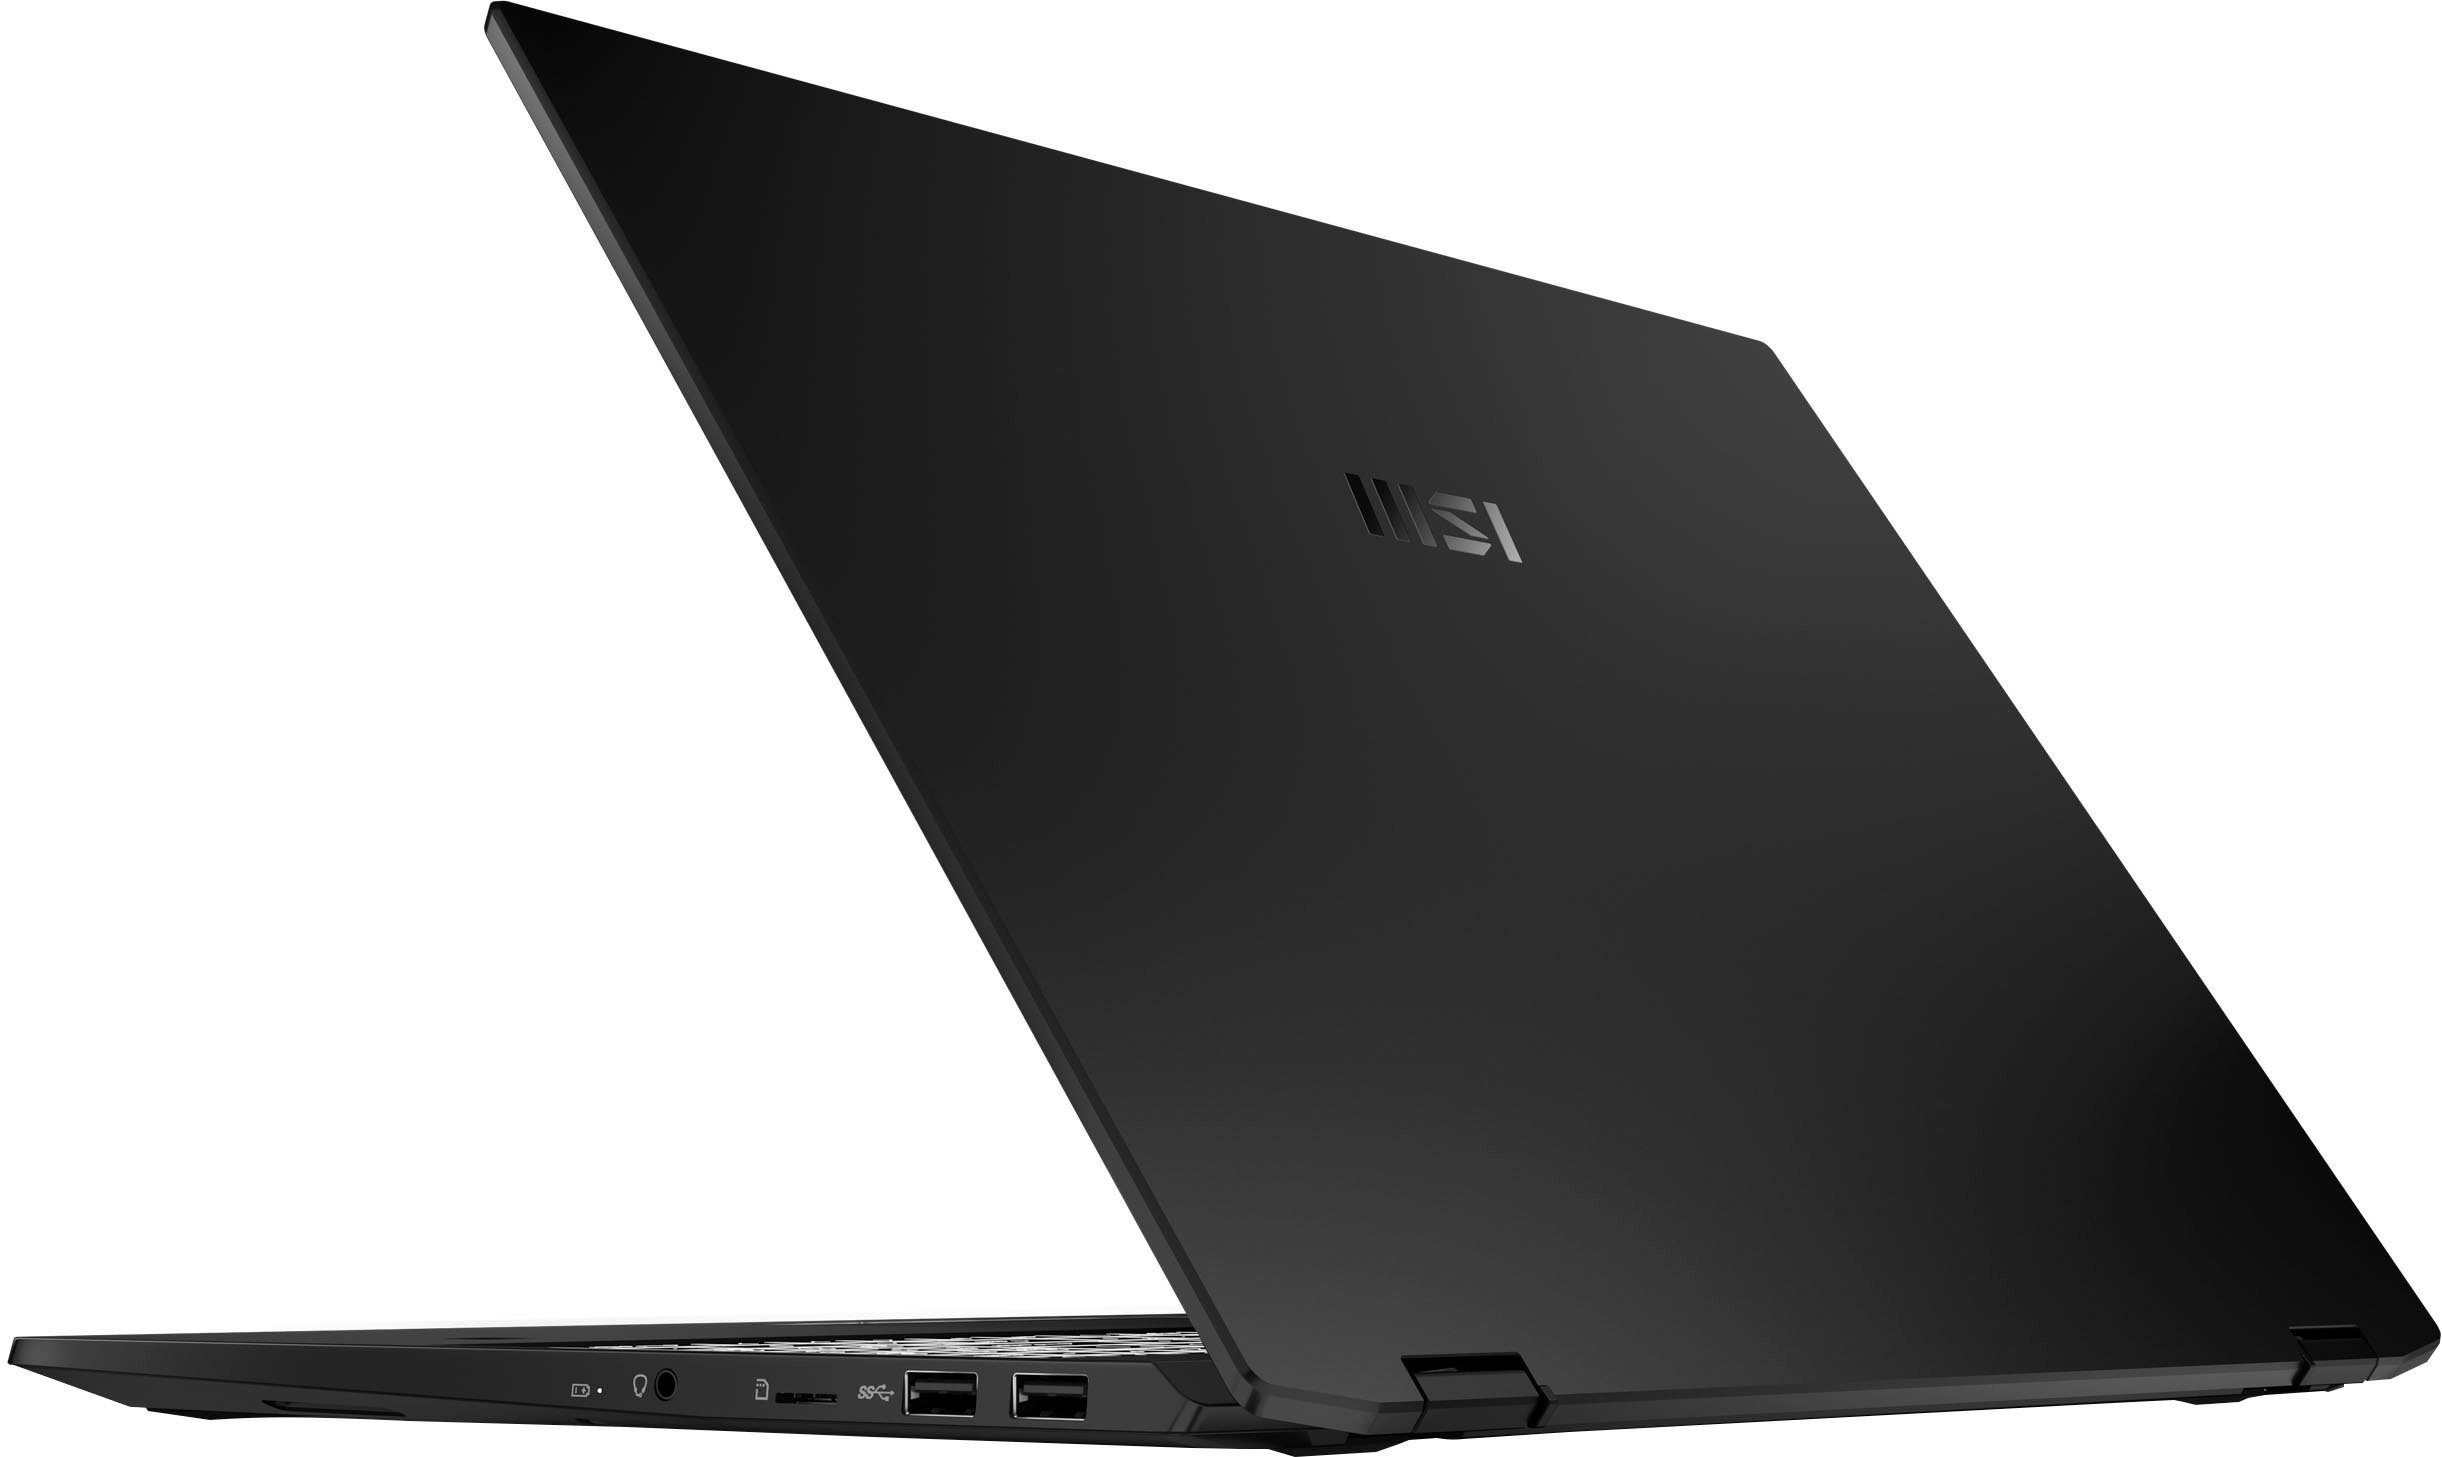
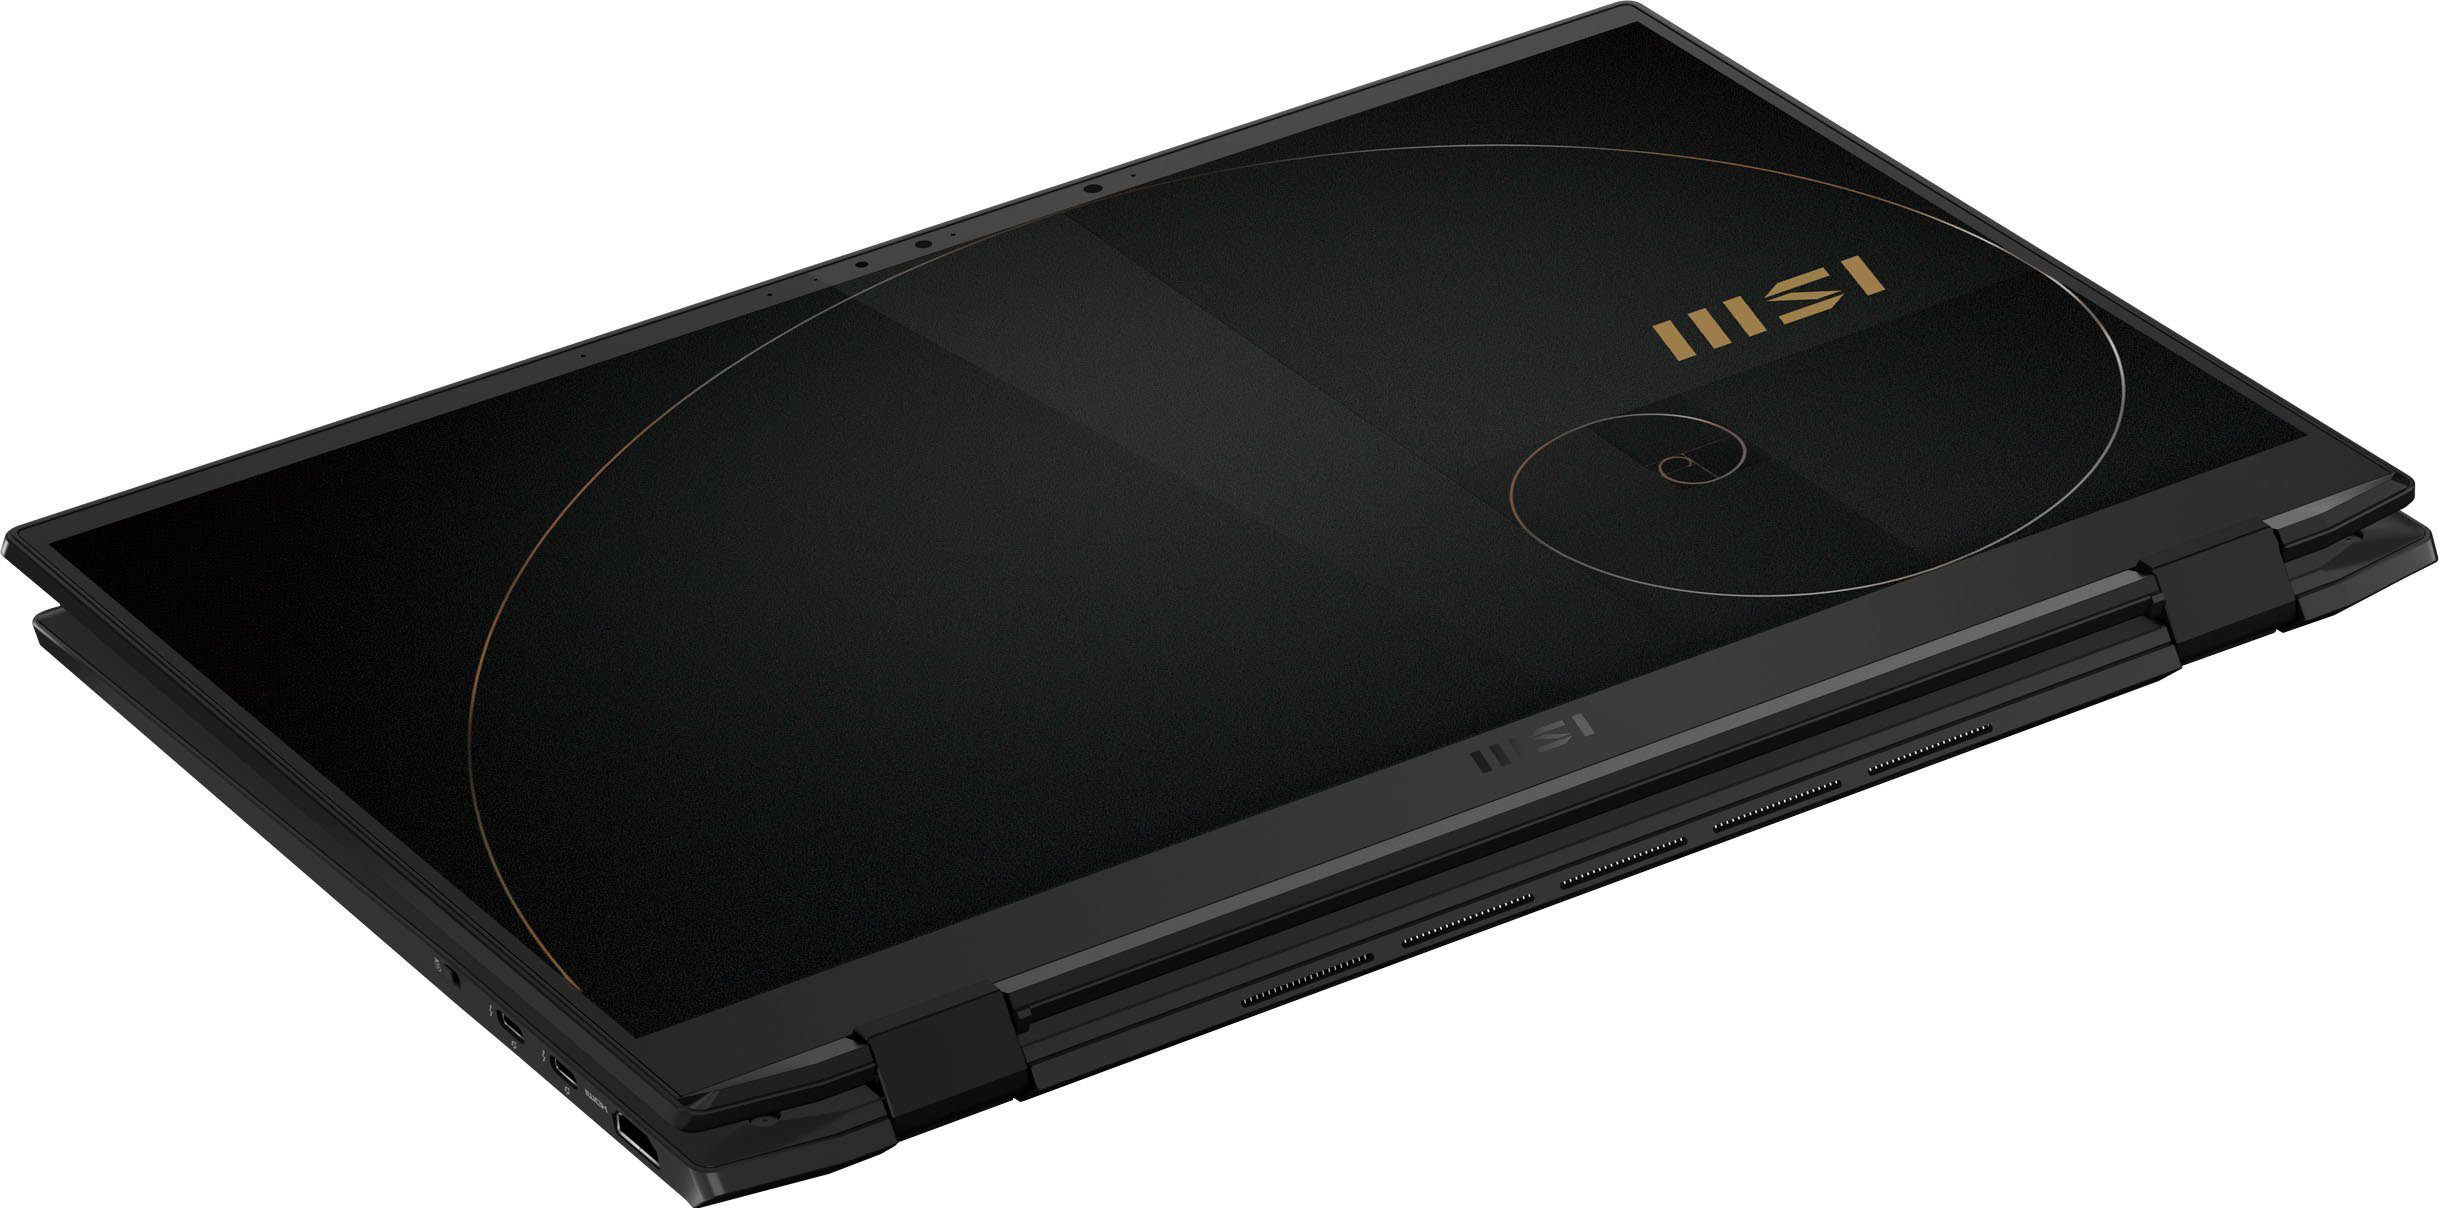
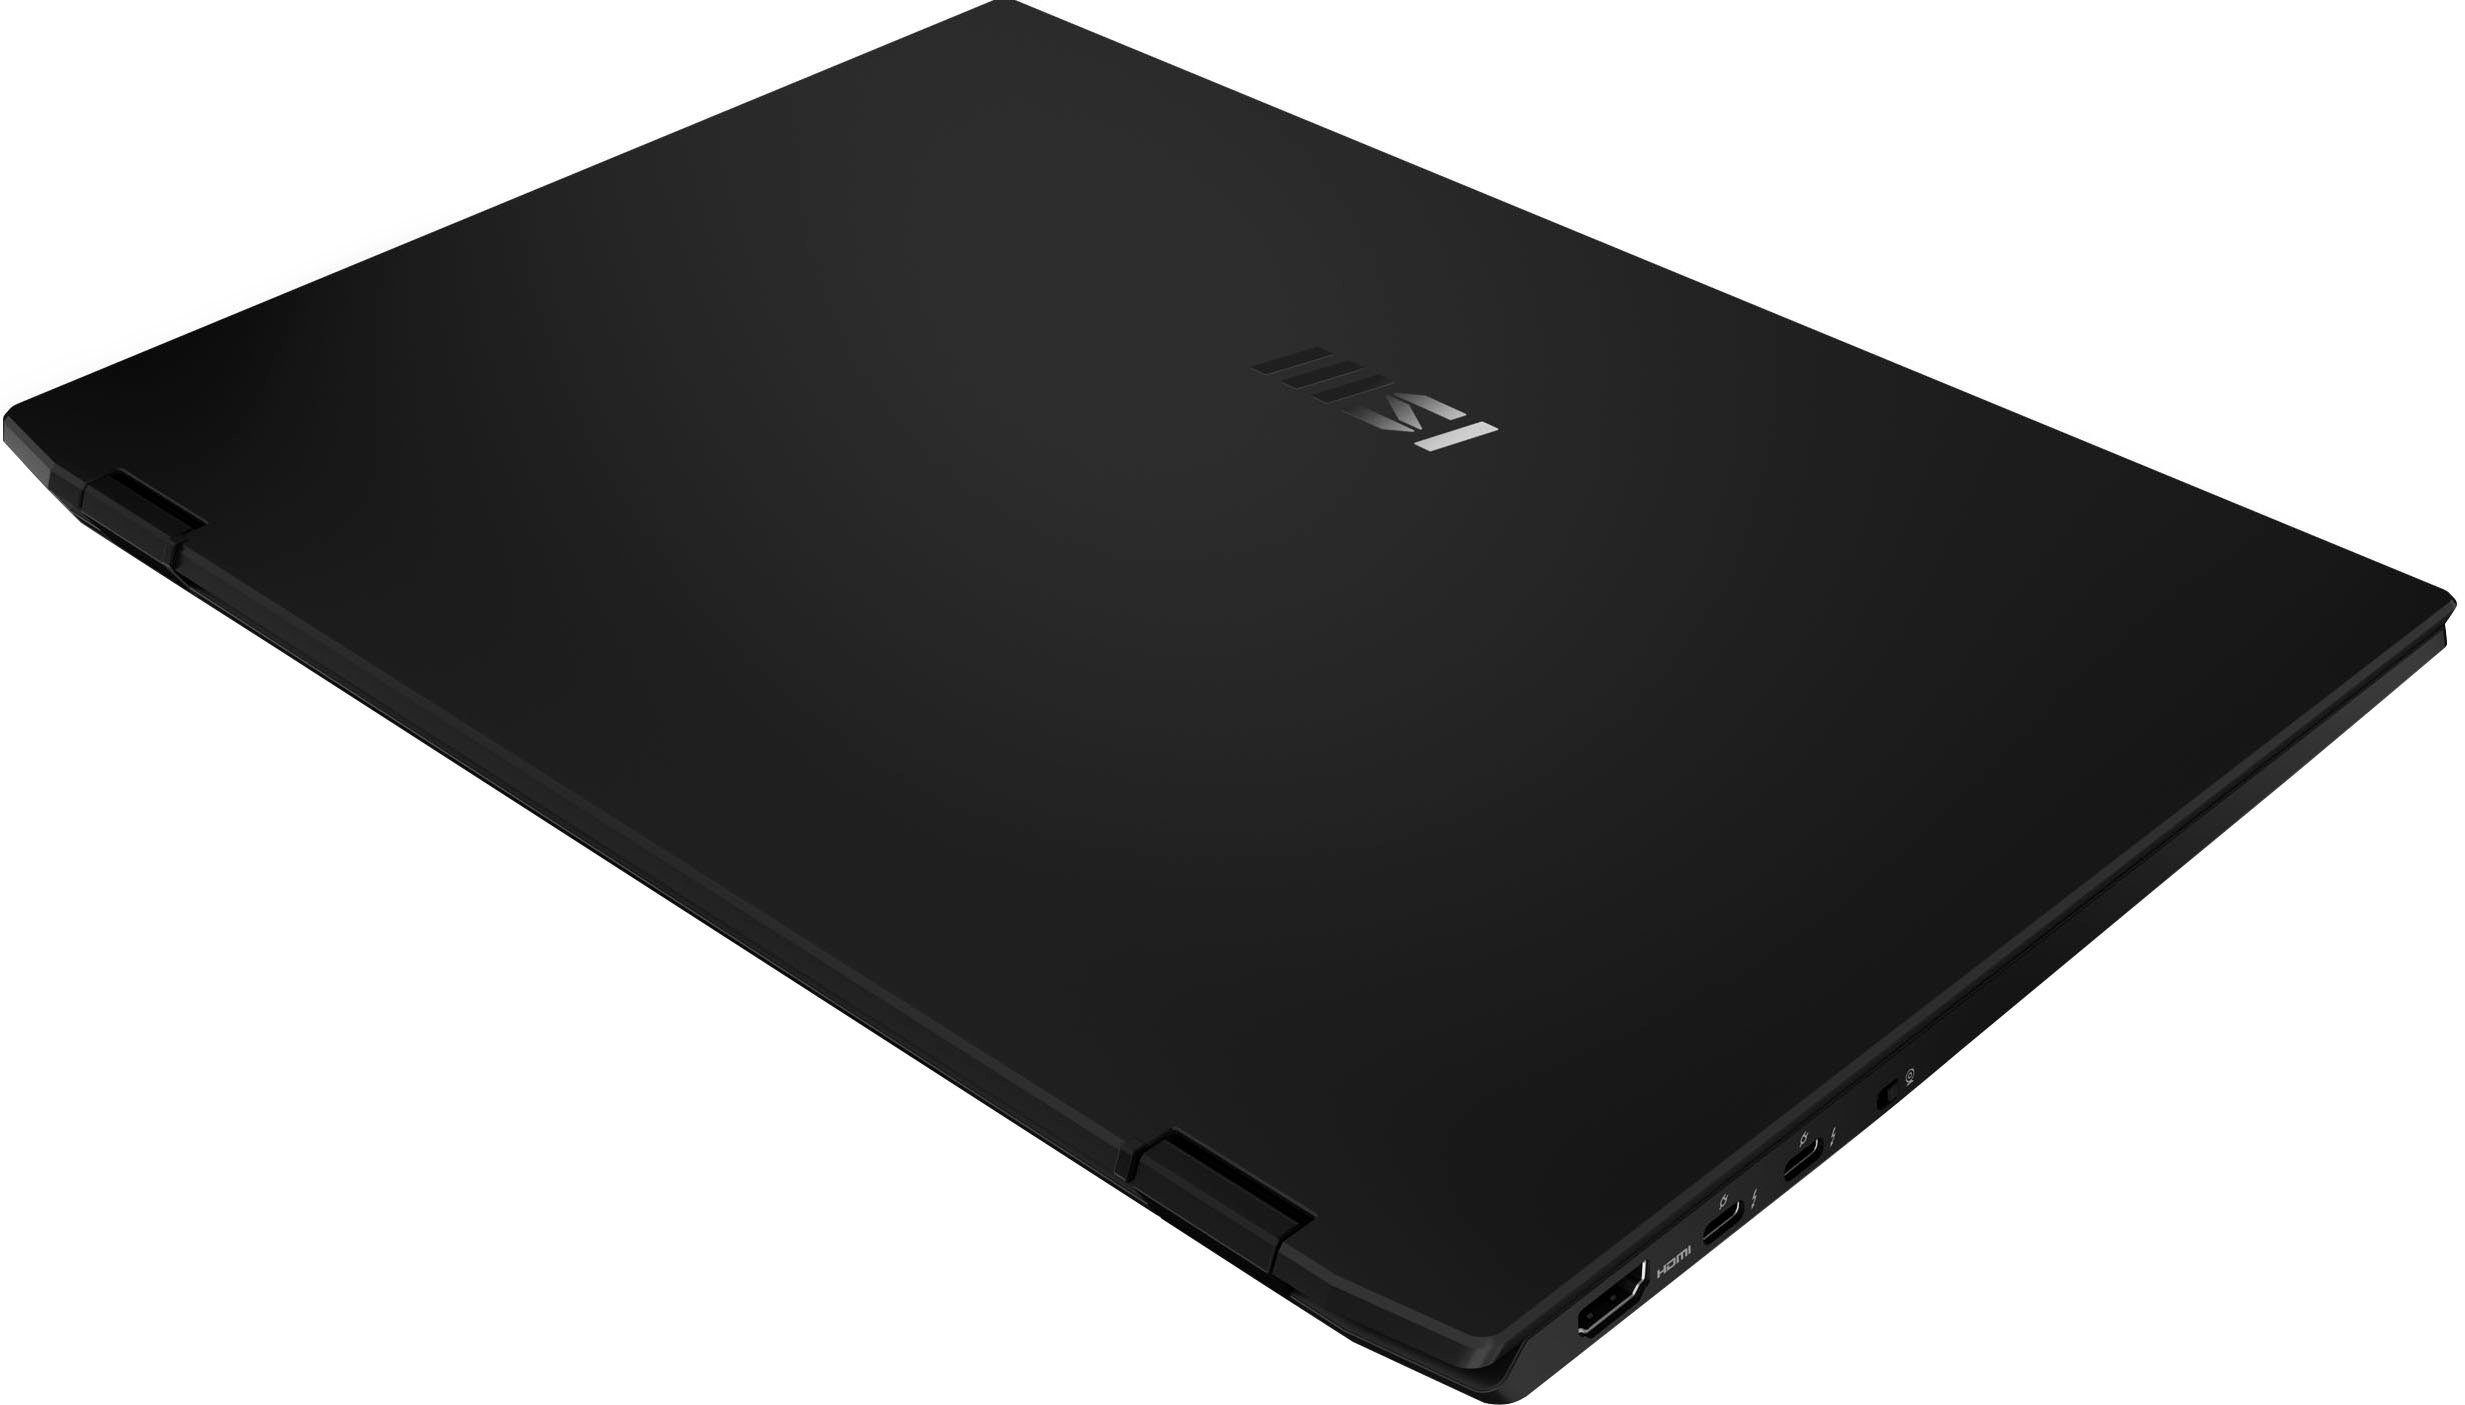
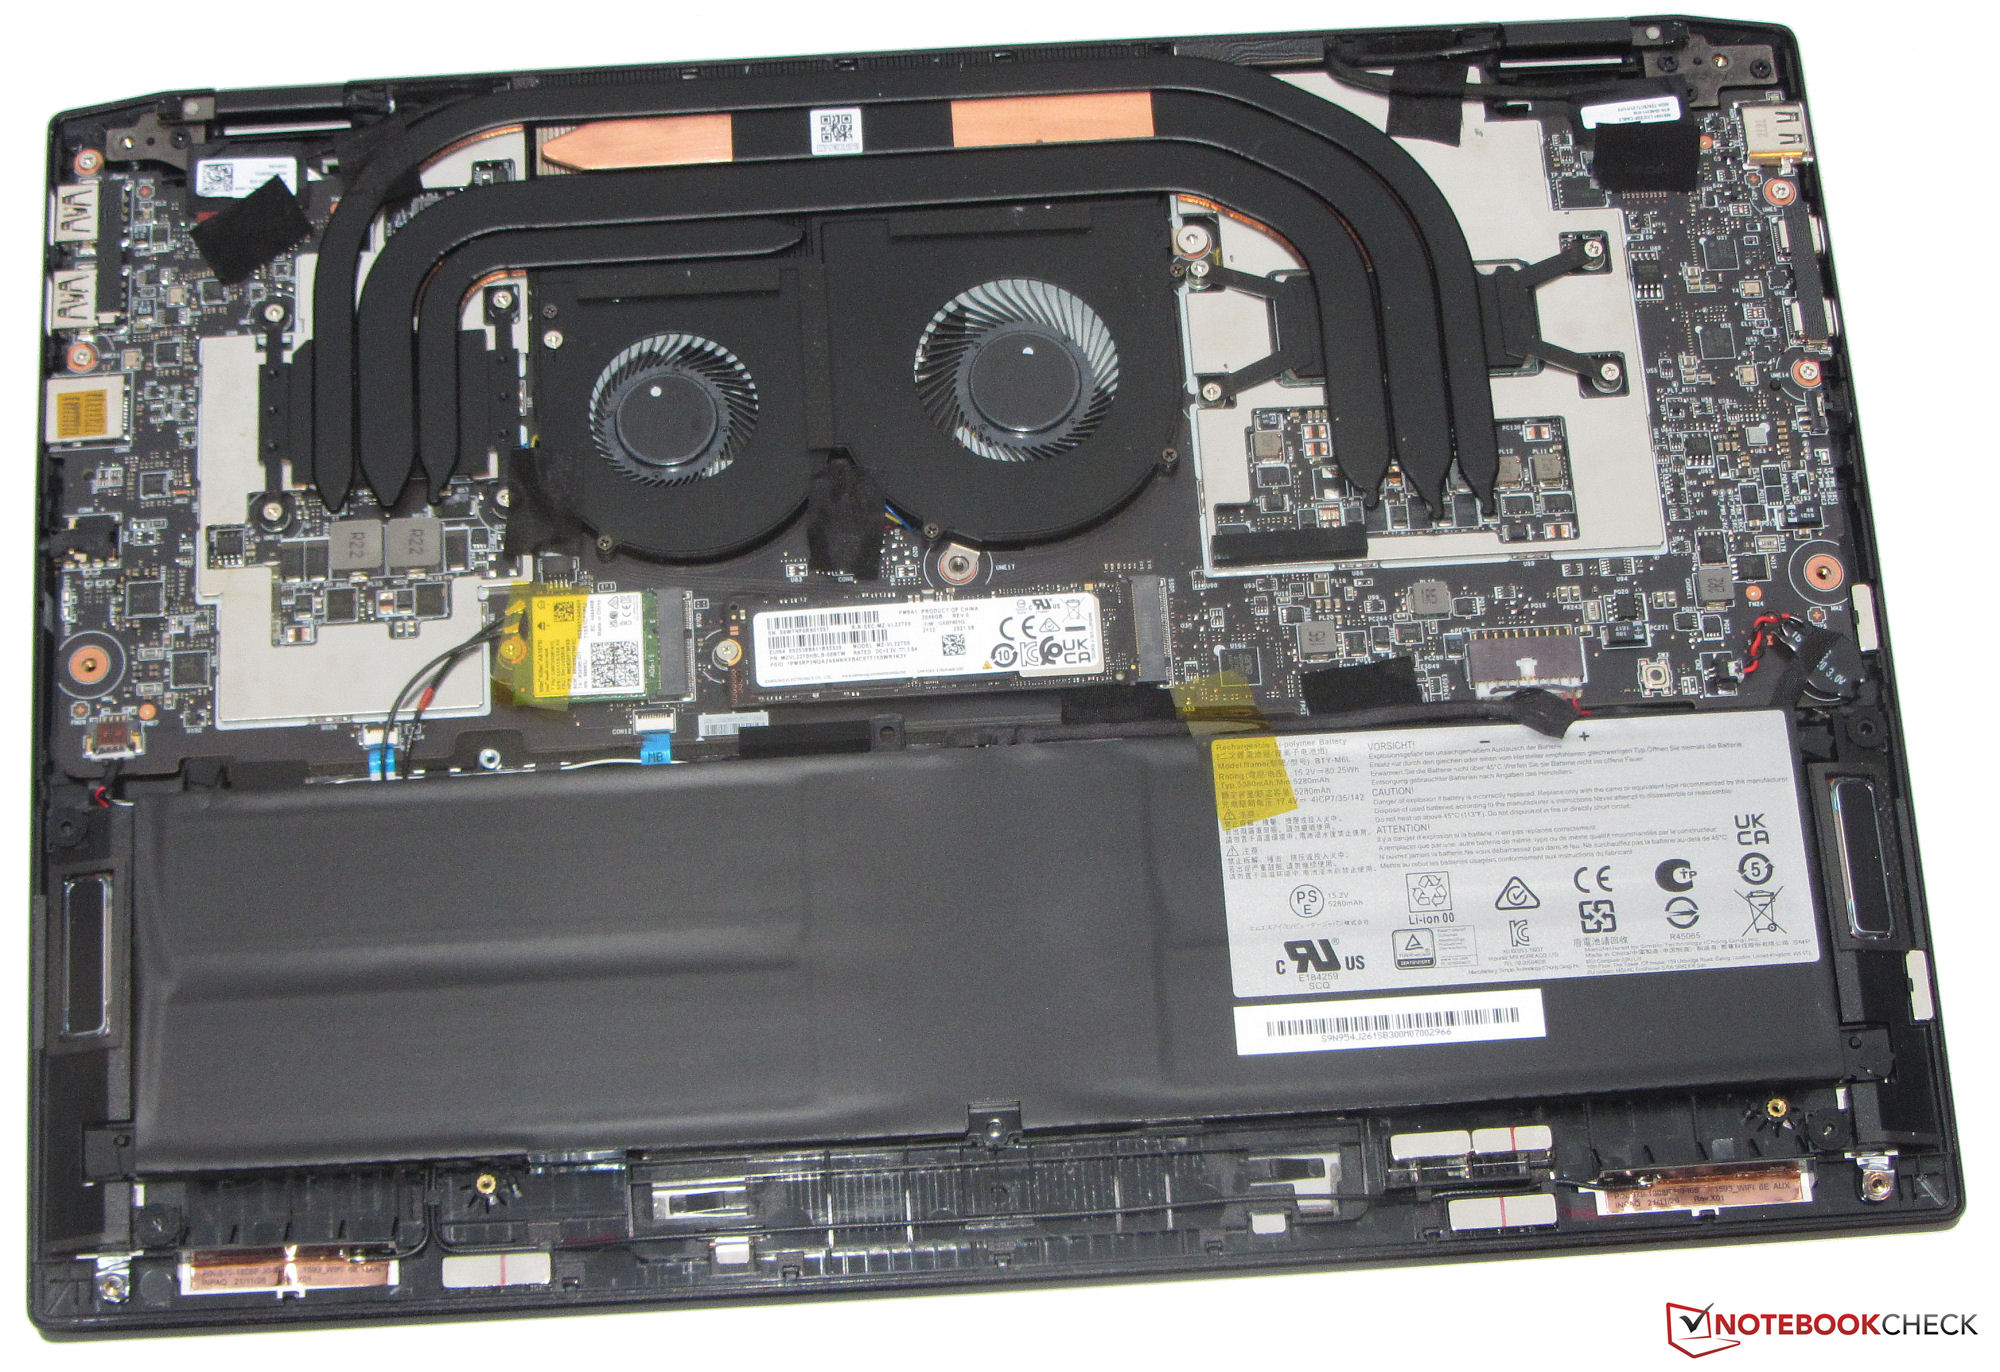
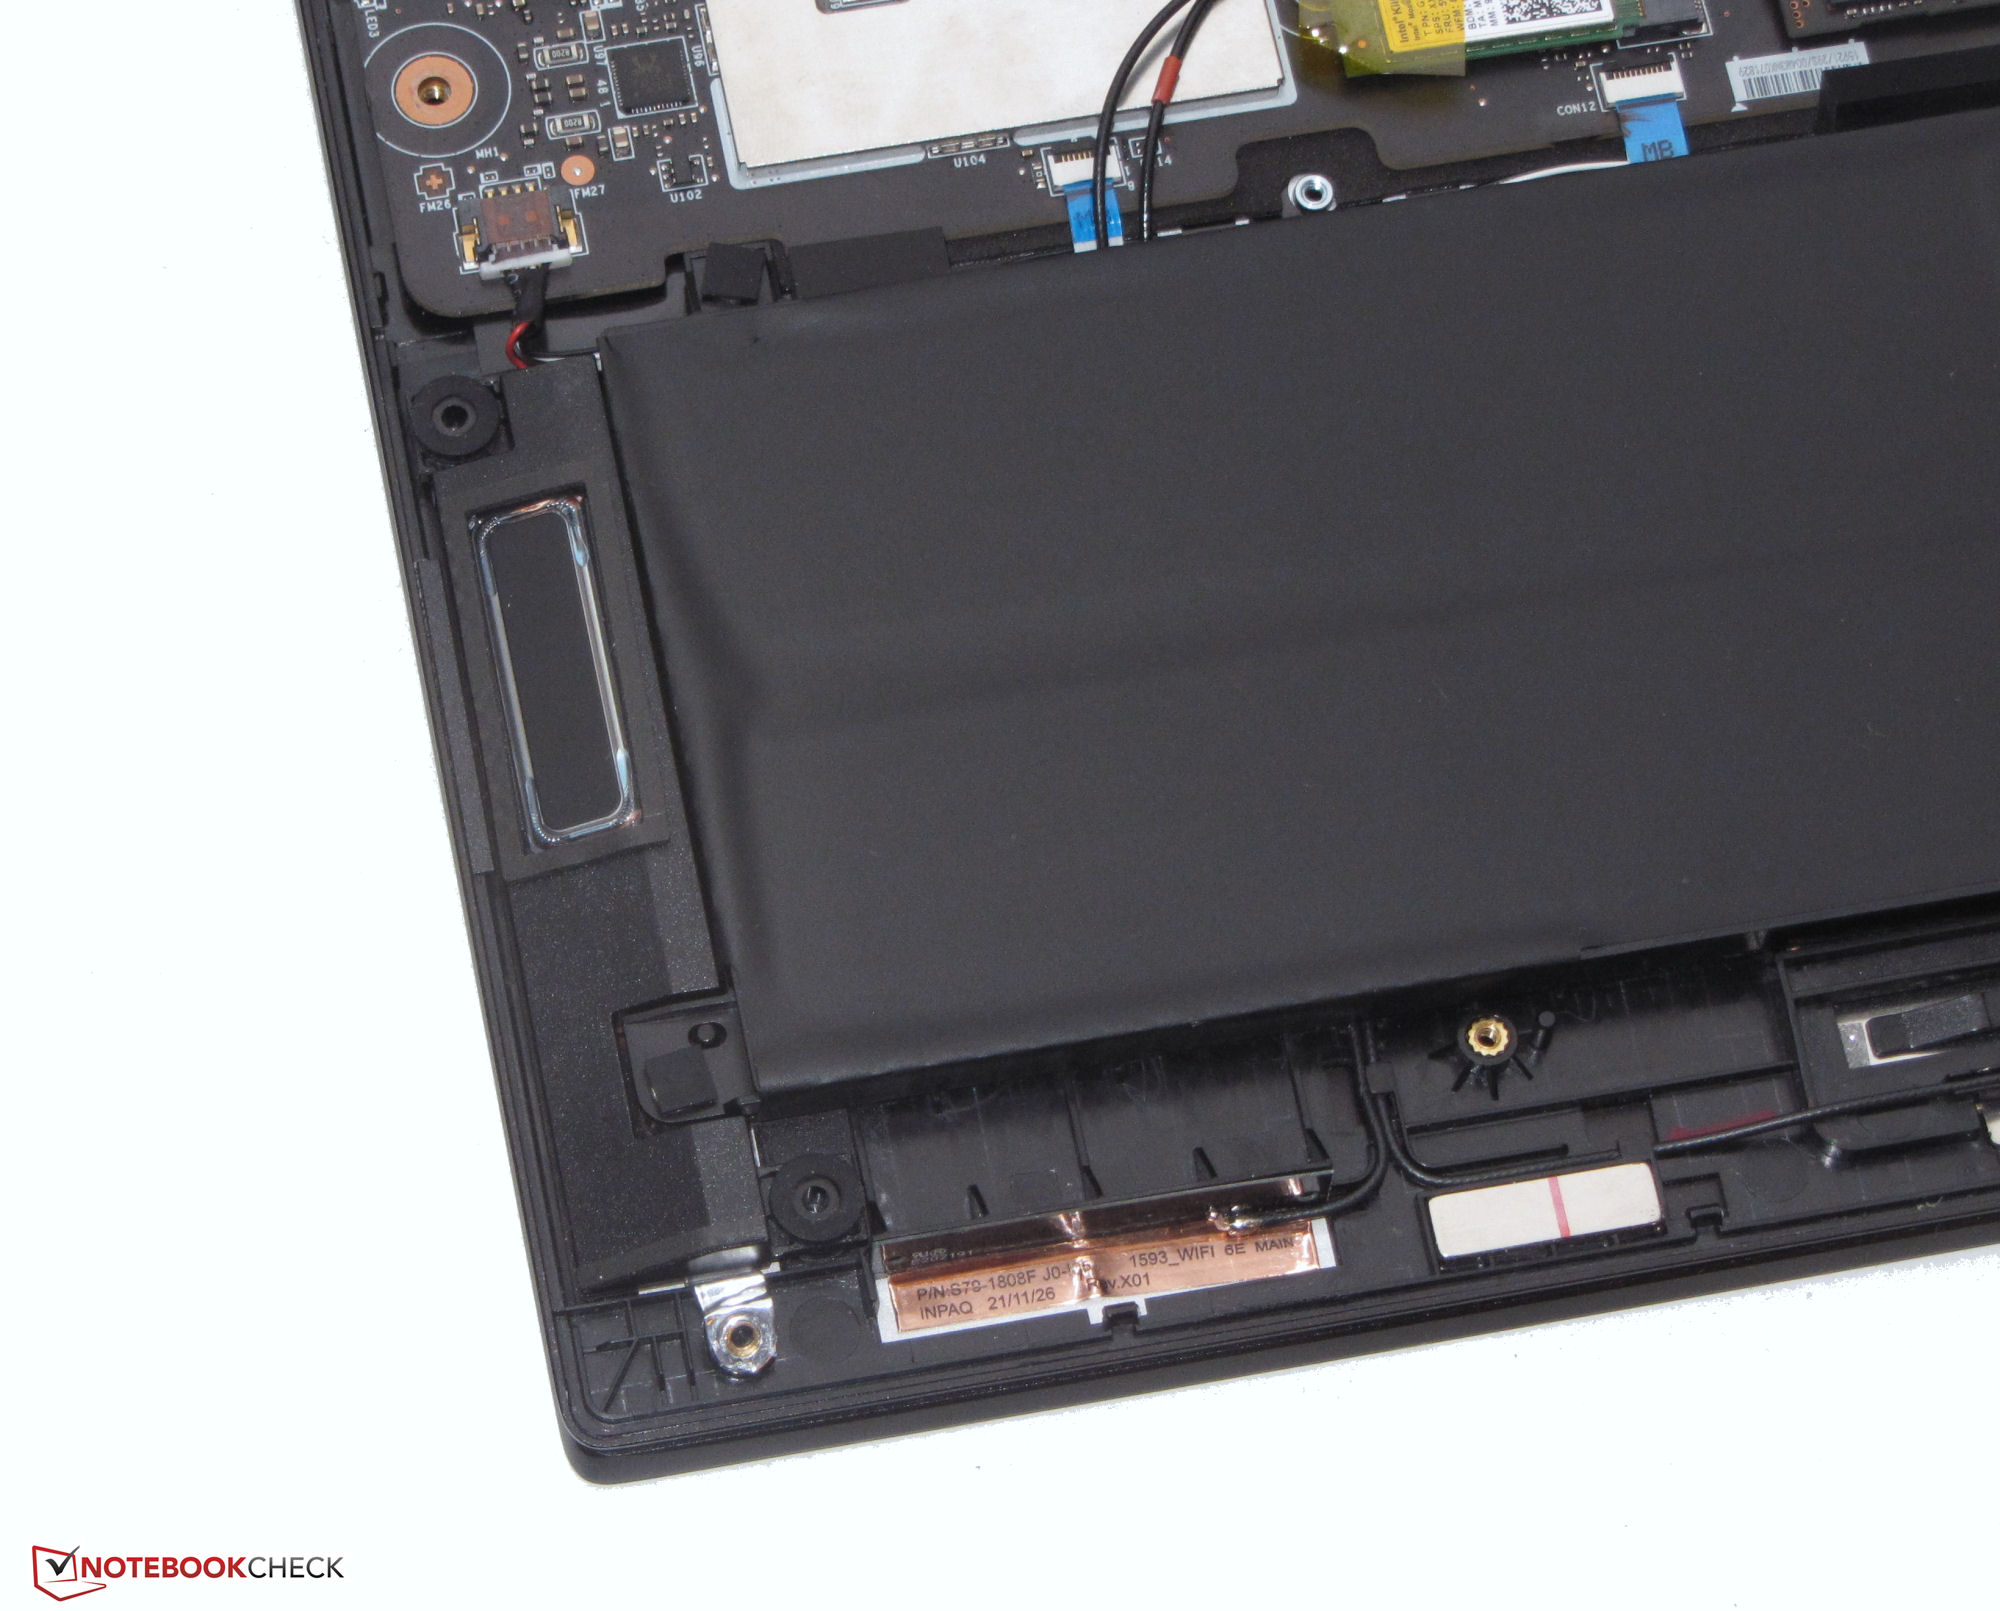
Case and Equipment - MSI Flip offers Thunderbolt 4
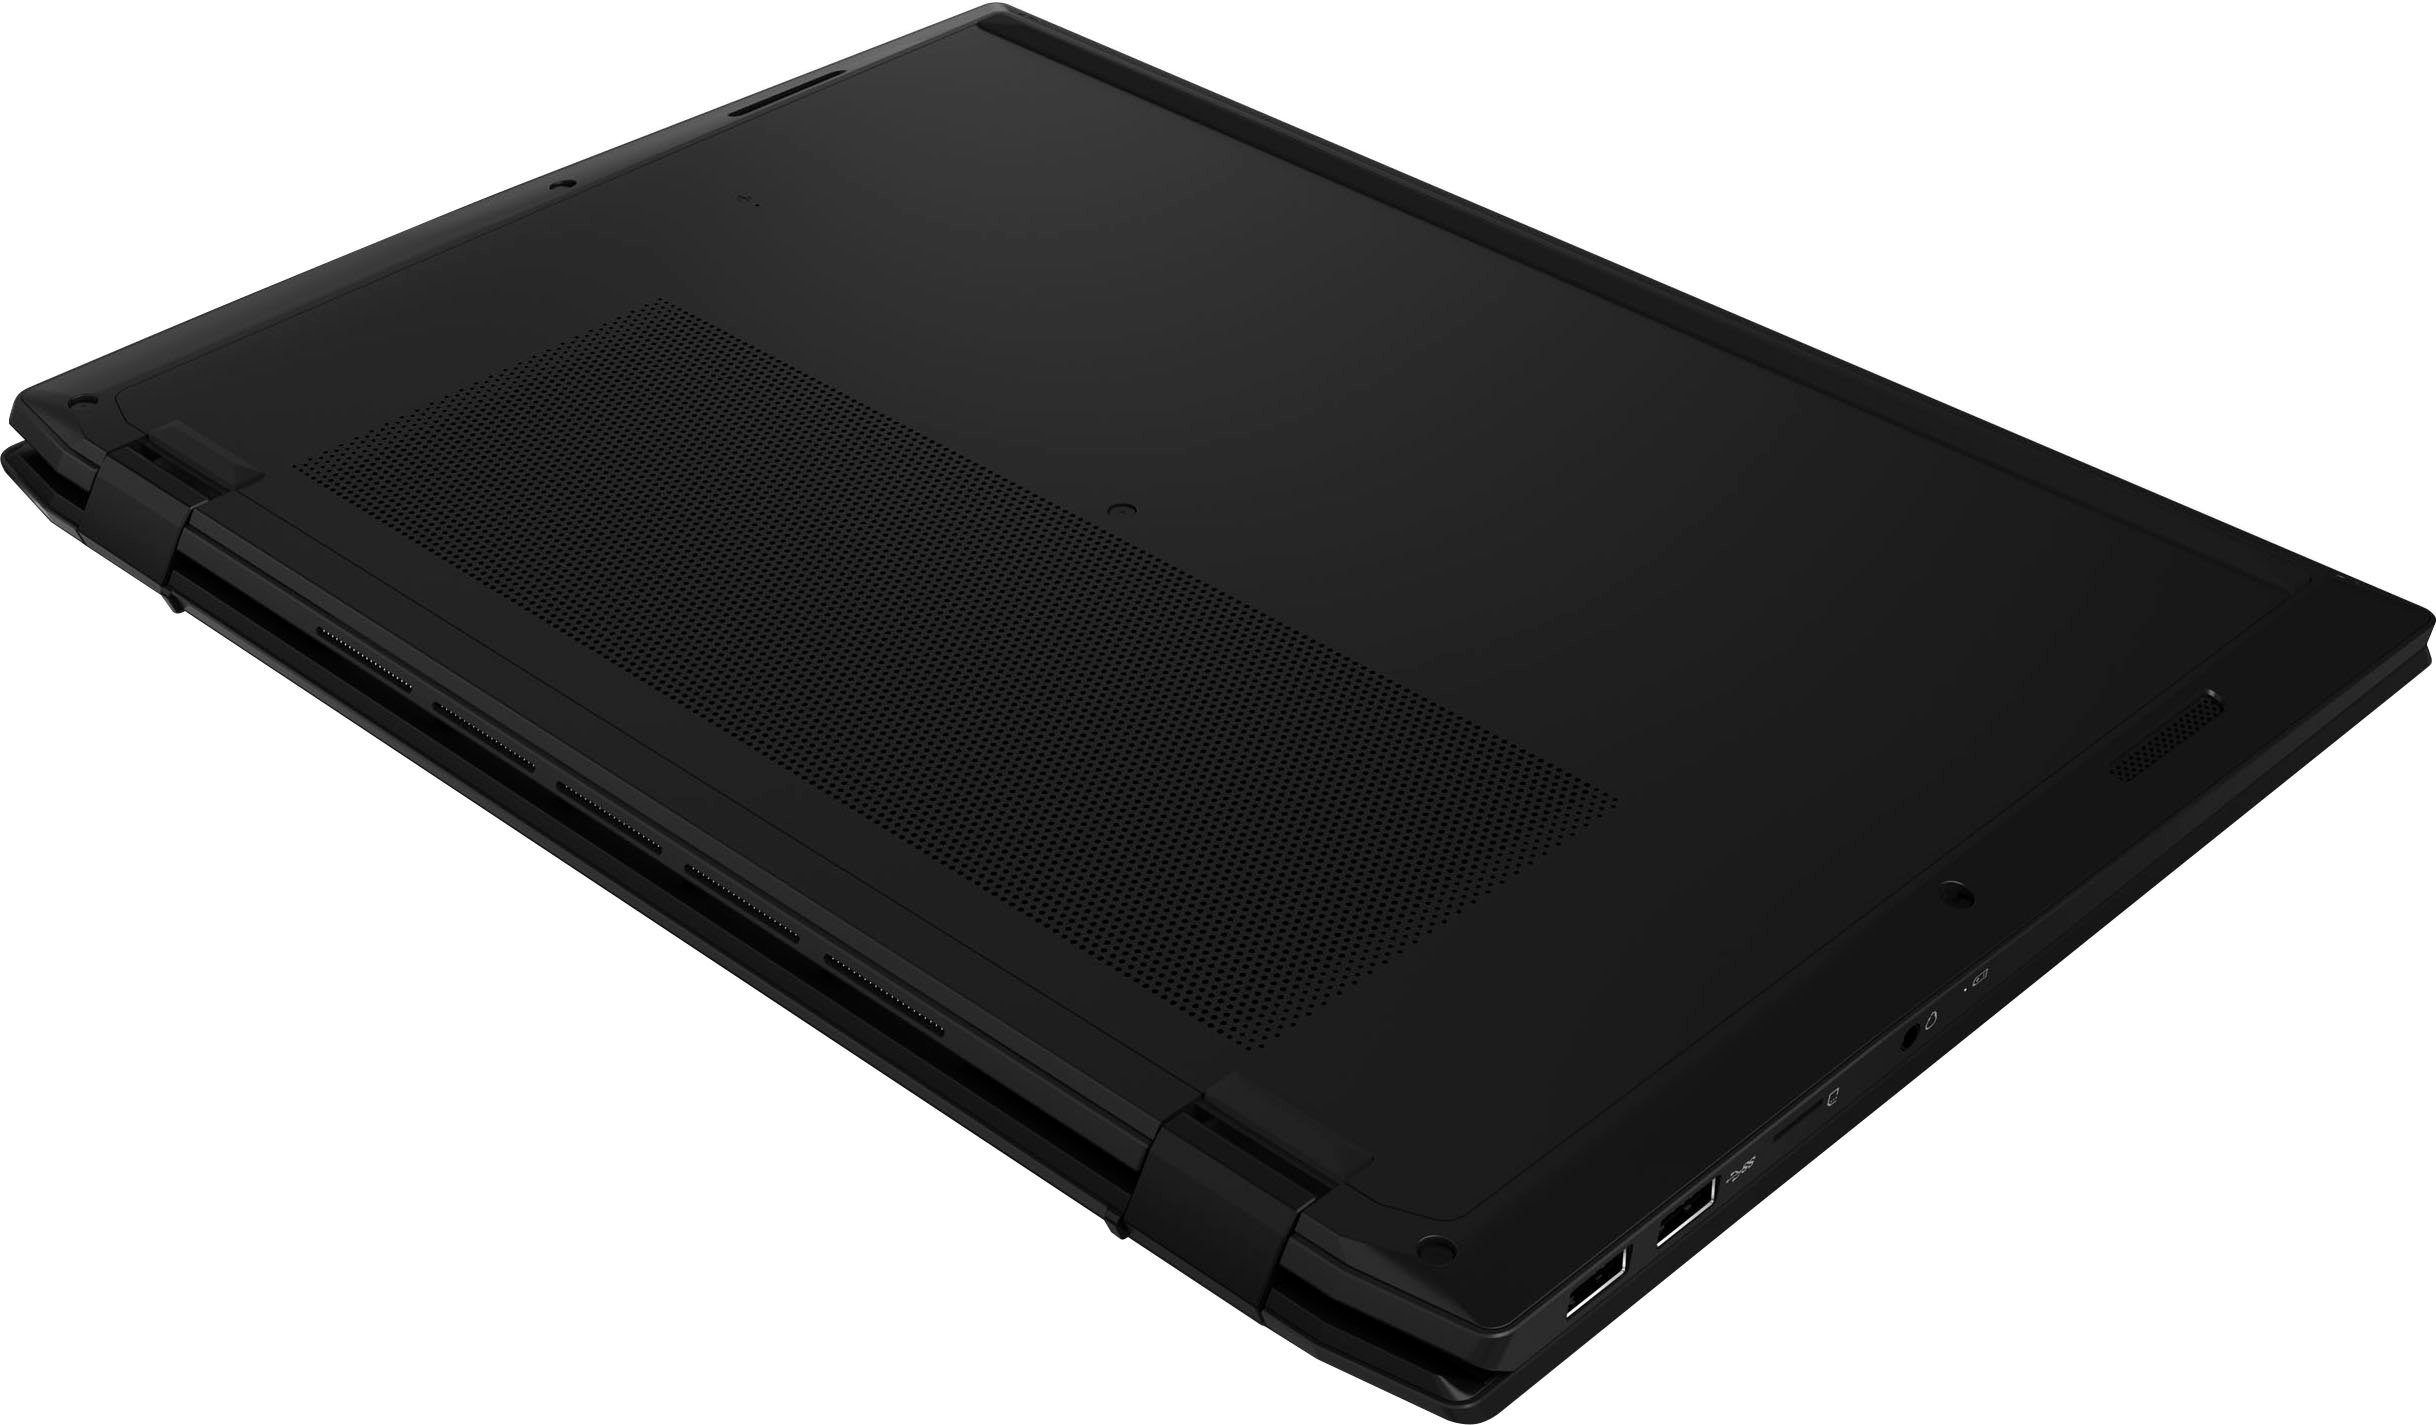
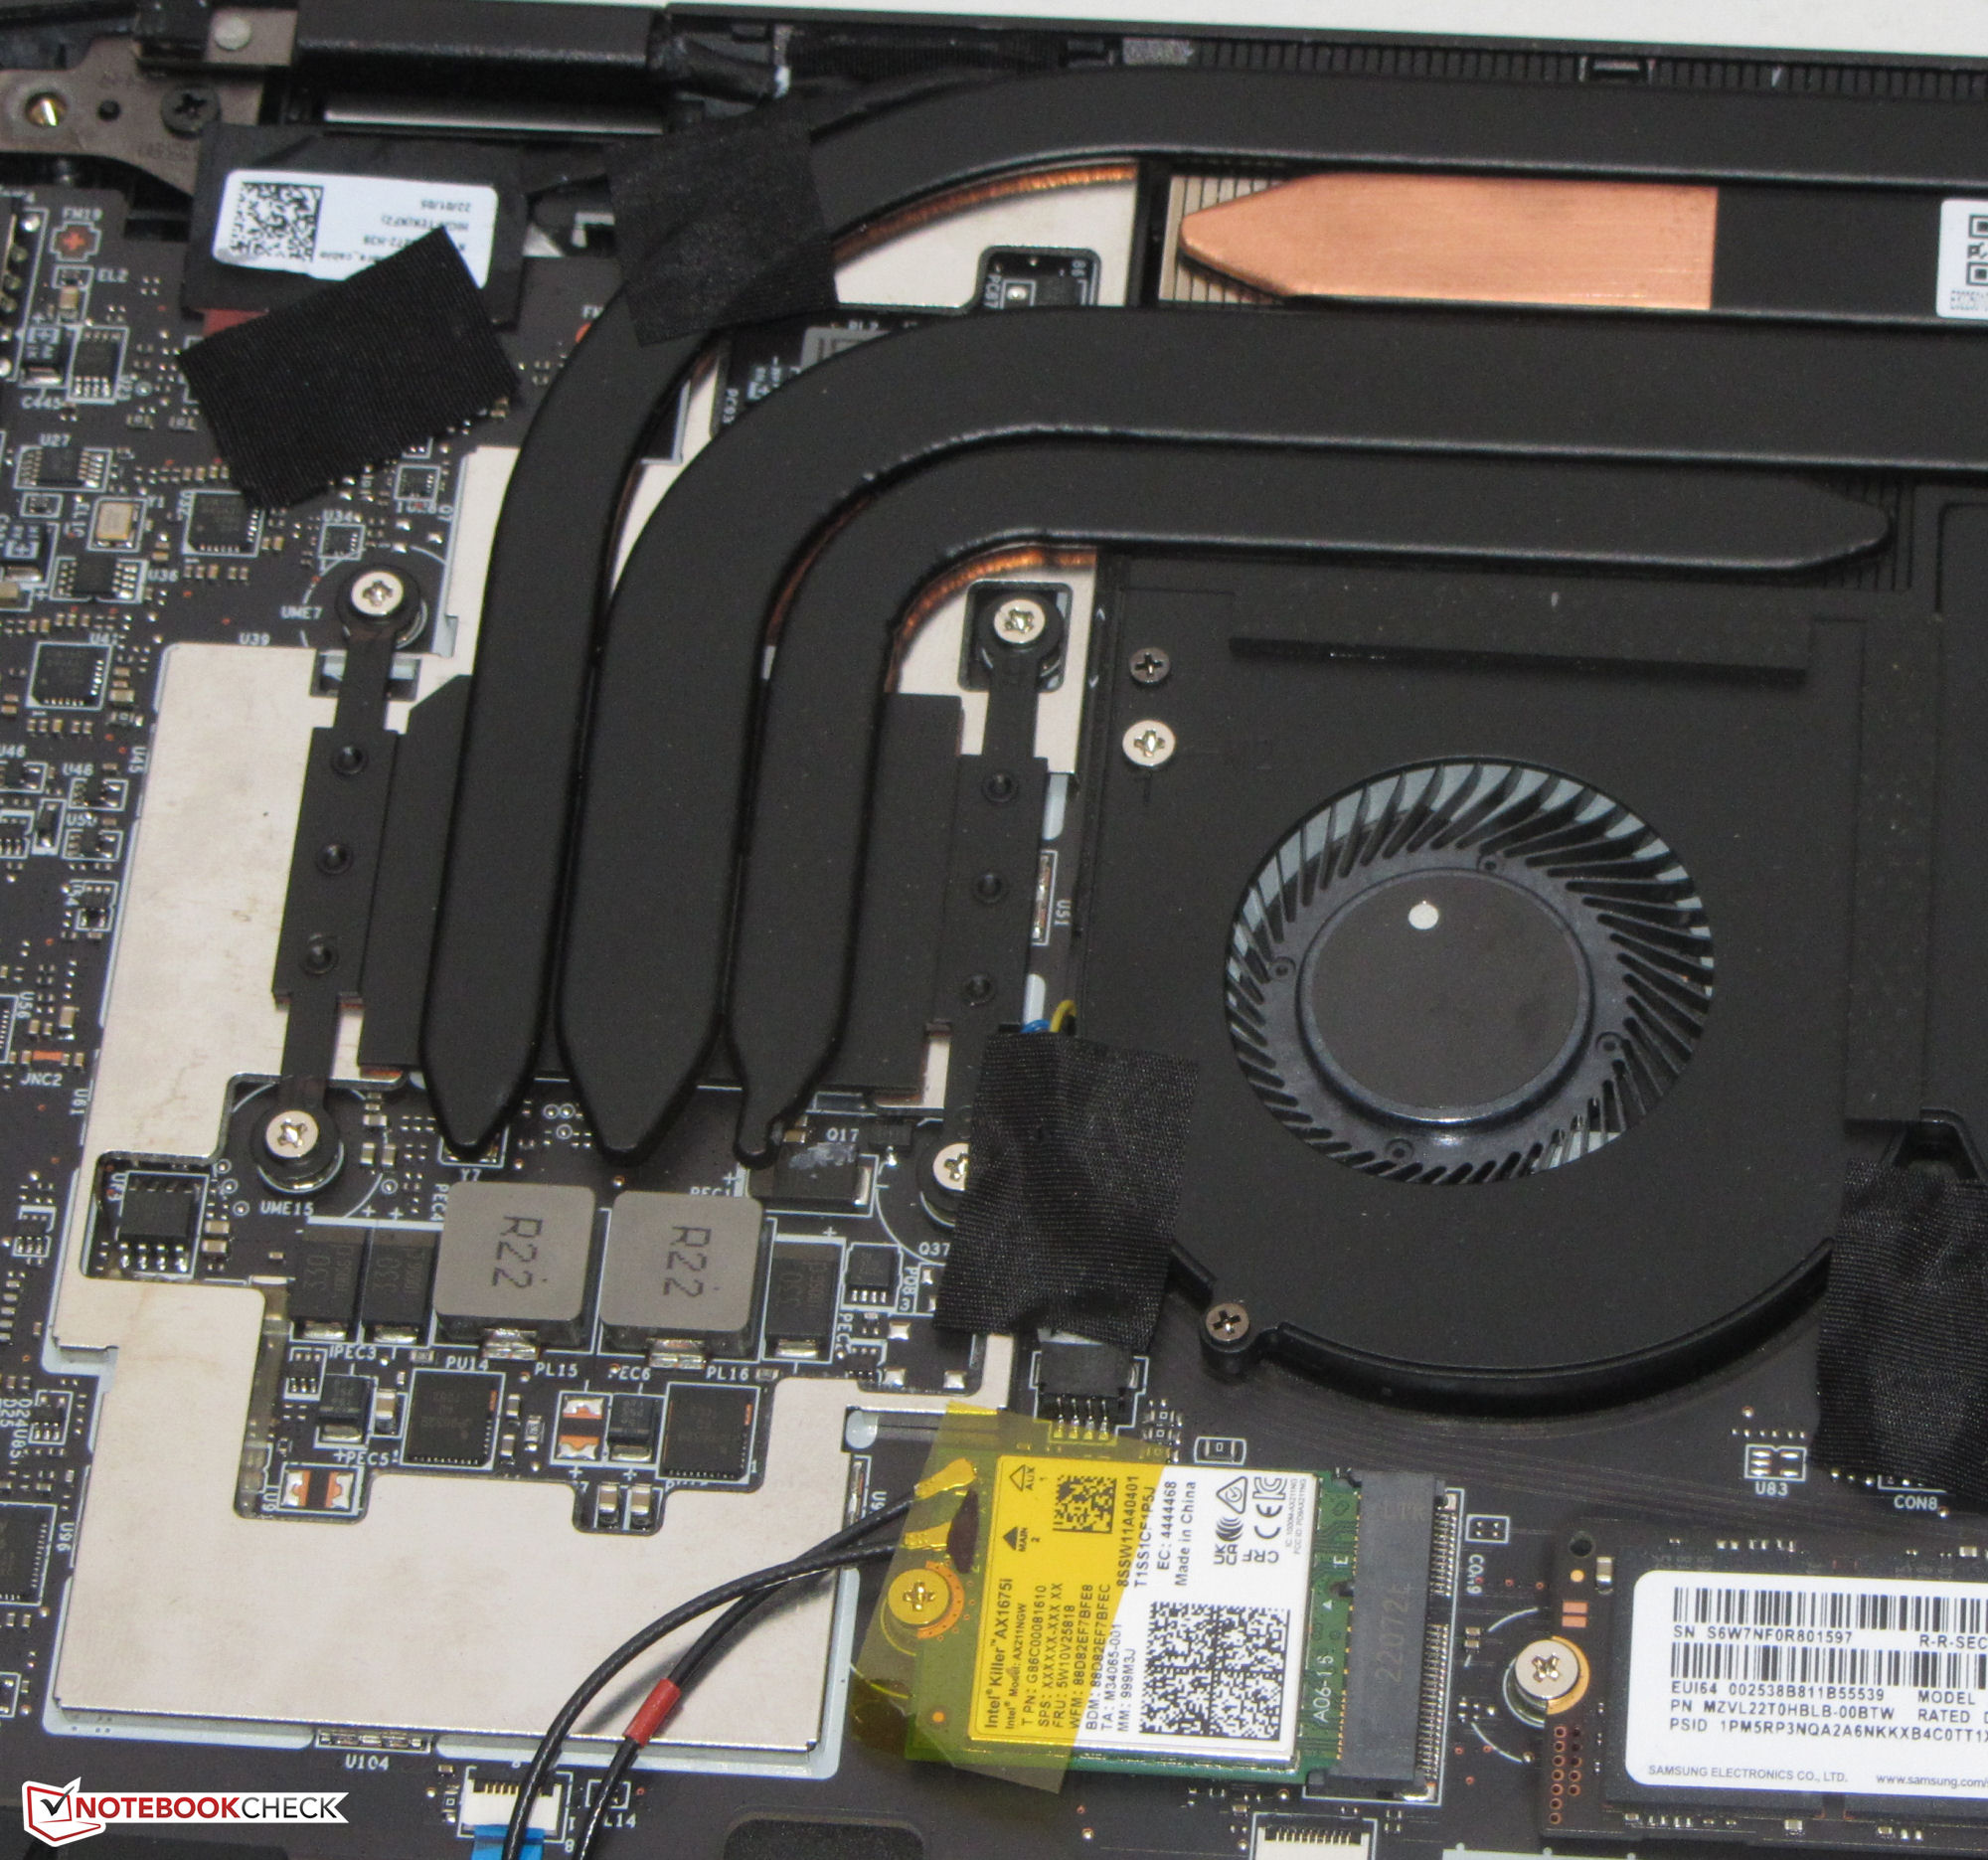
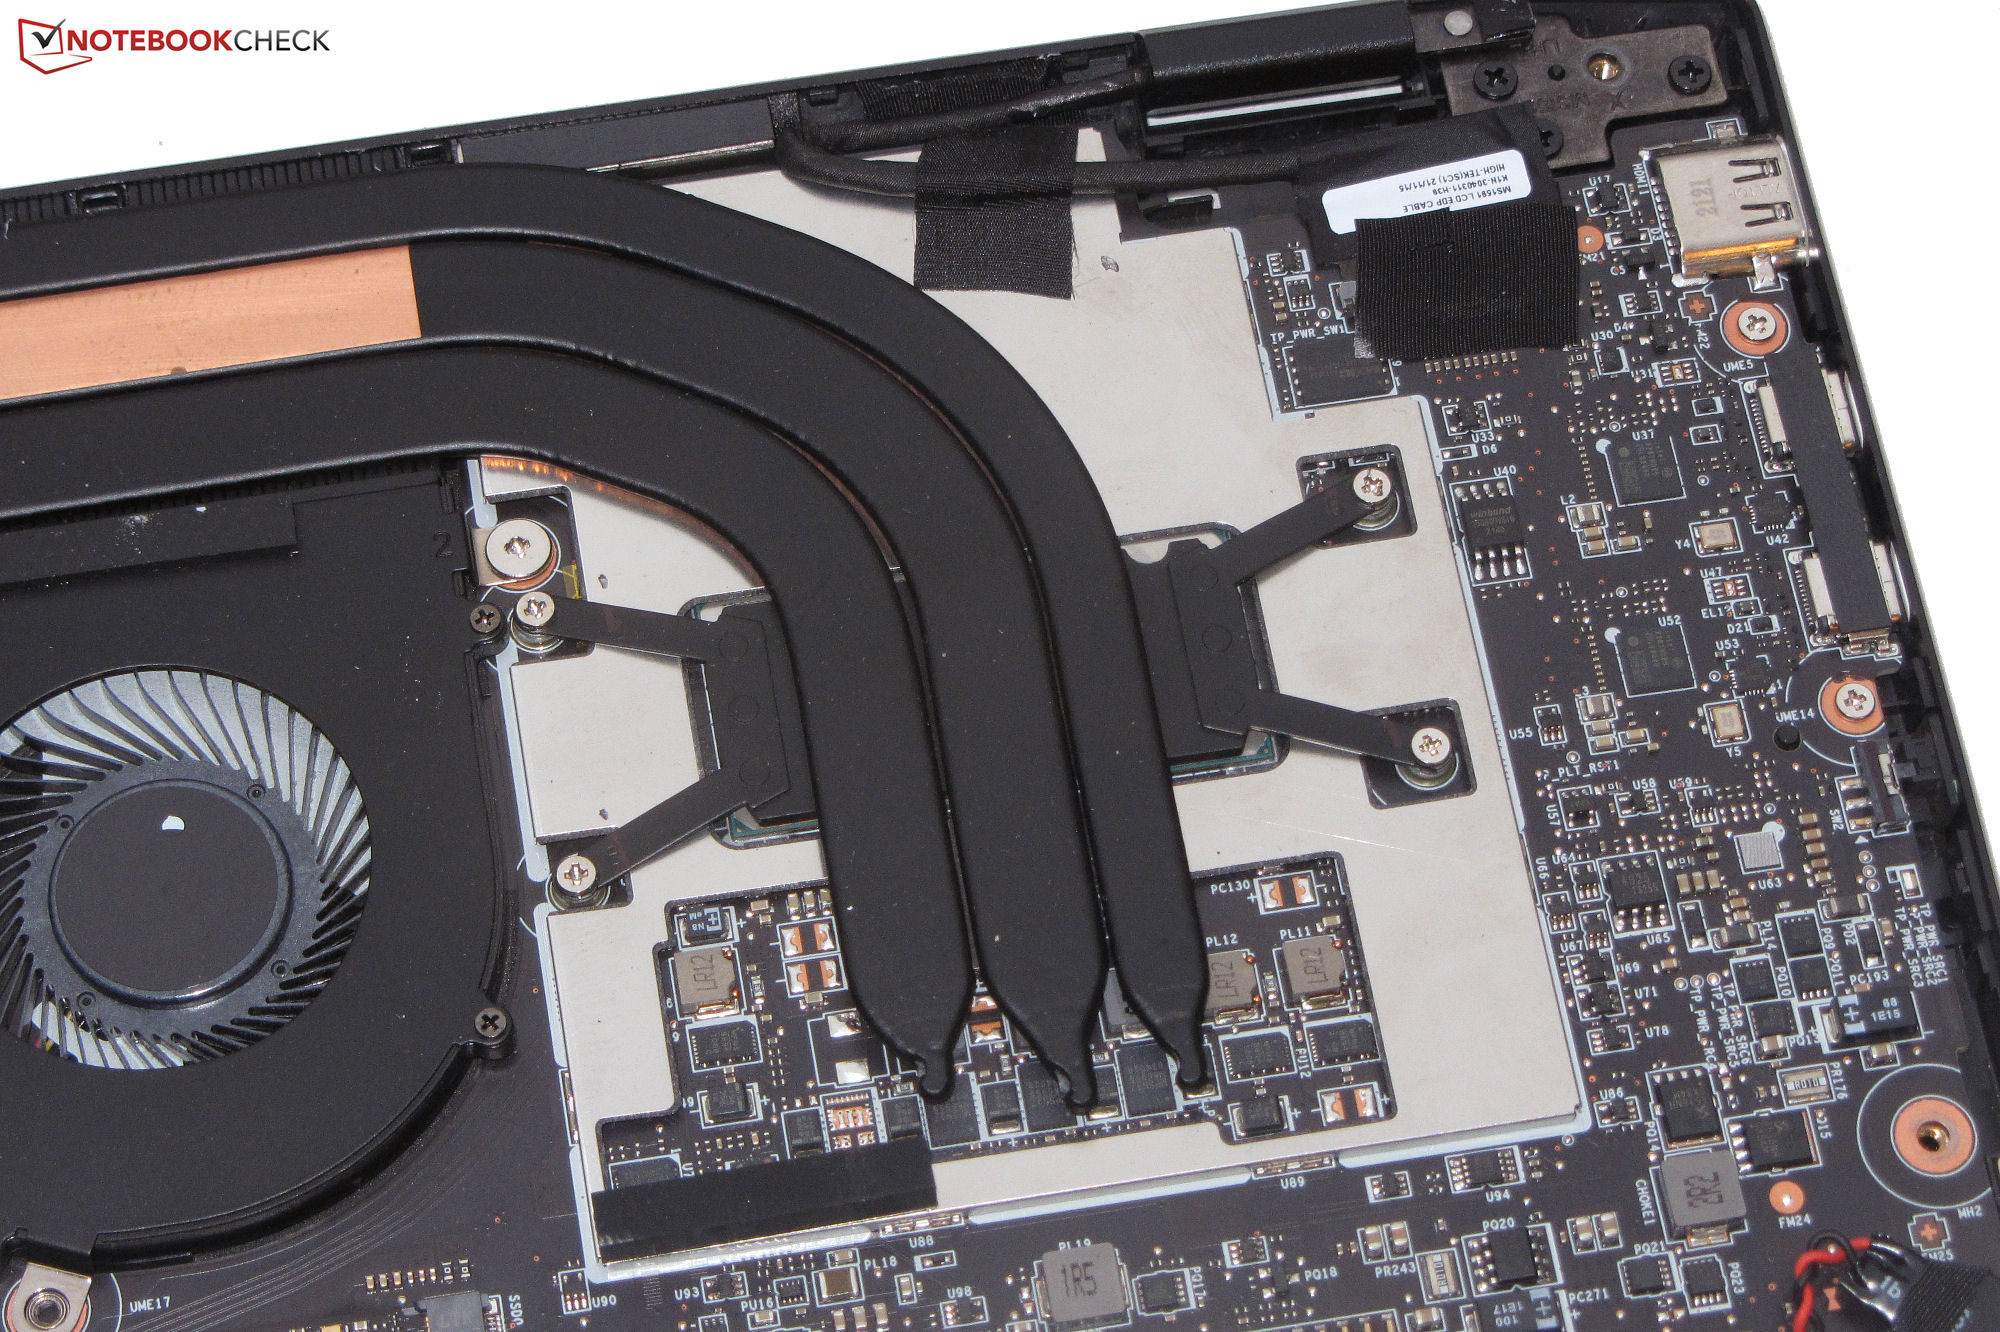
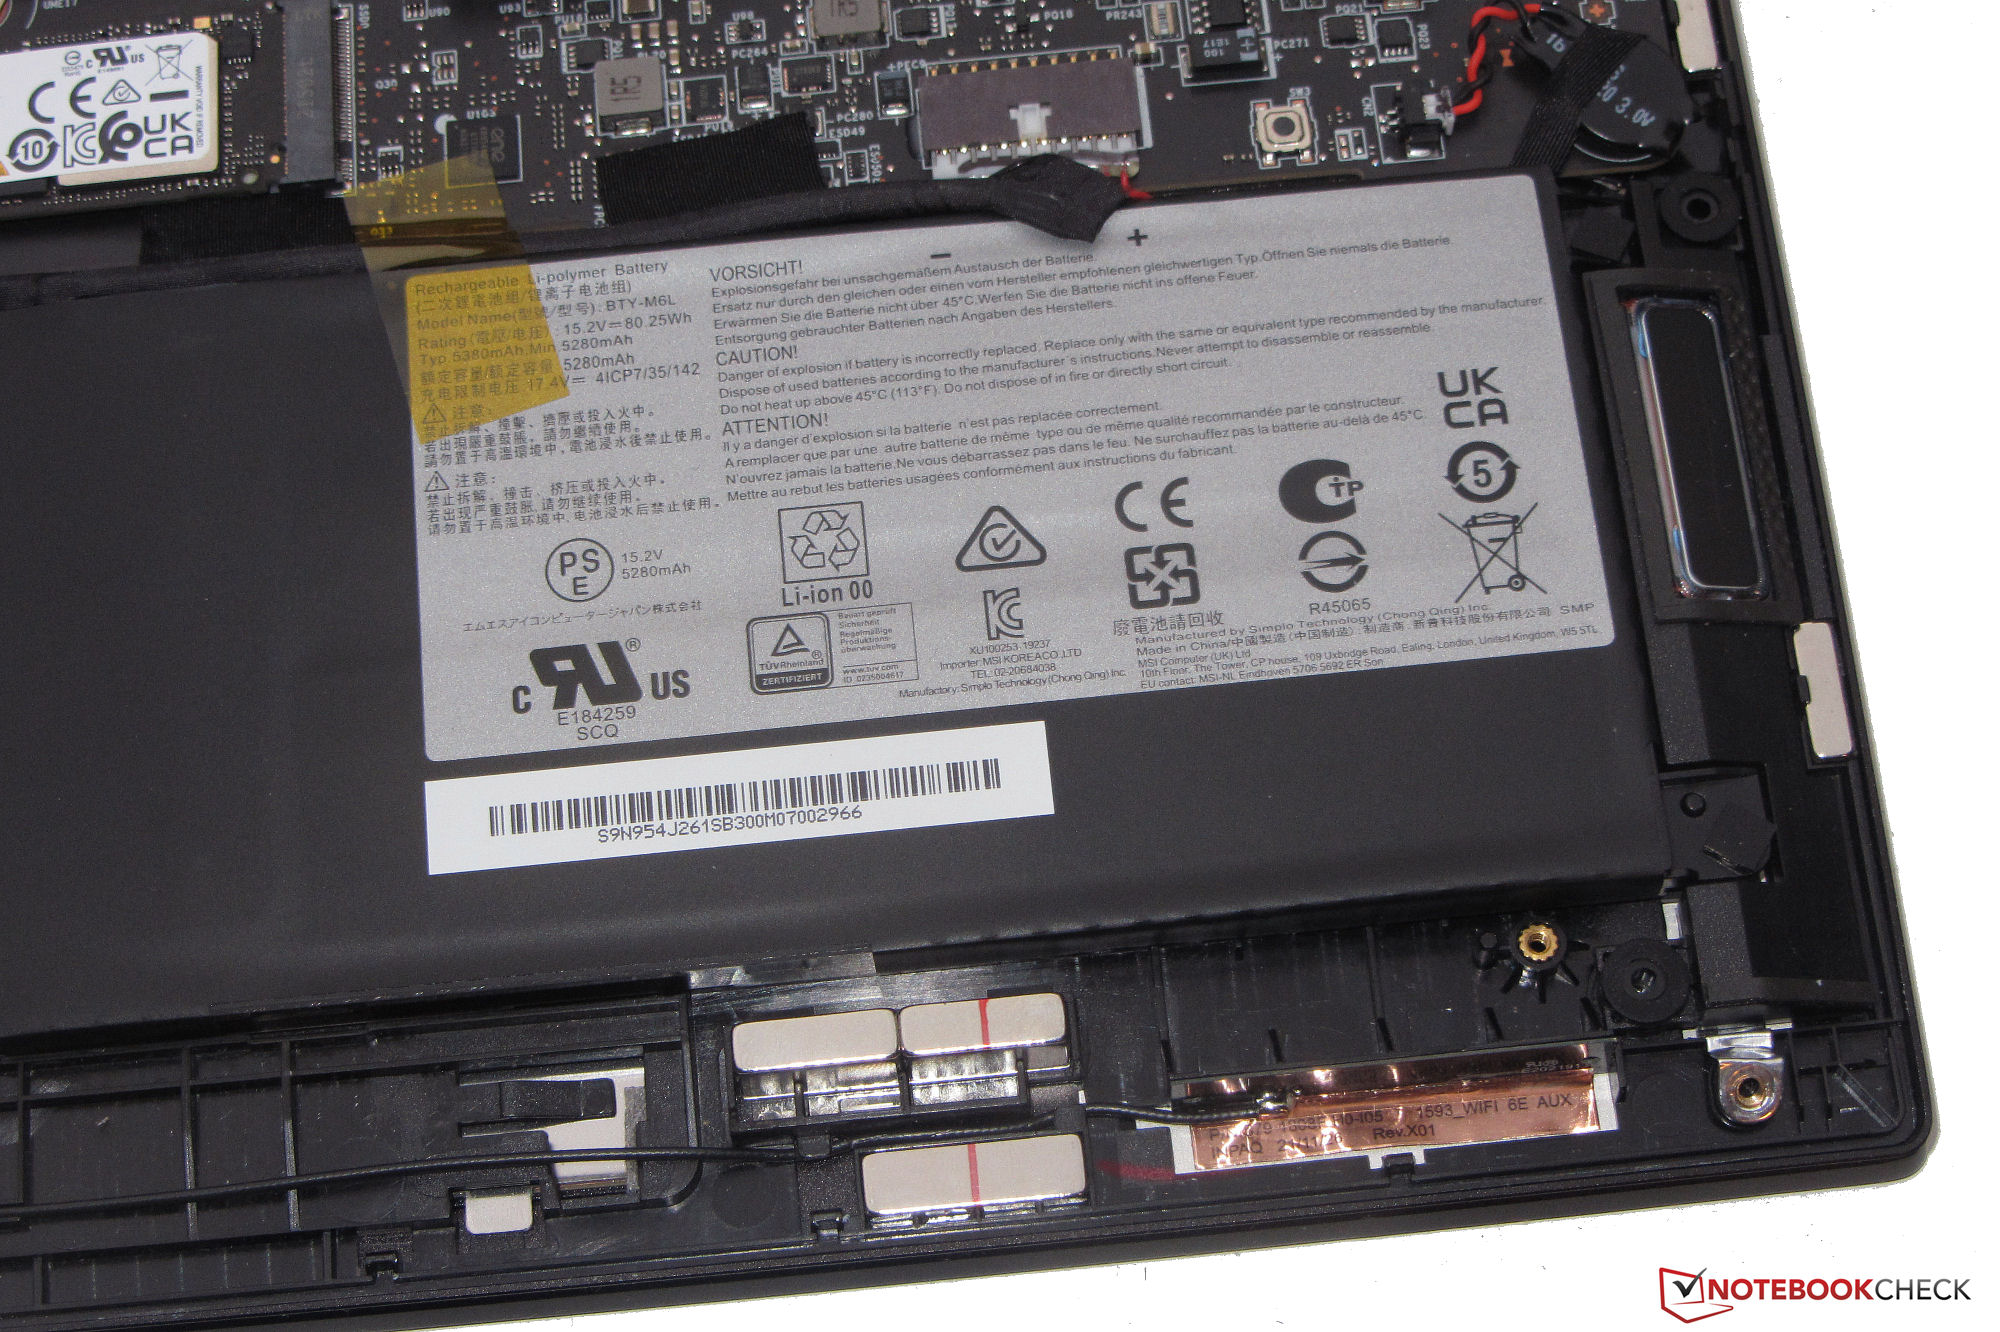
The slim, black metal case of the E16 does not show any faults in the workmanship. We do not find any excessive gaps or material protrusions. While the lid and base unit can be warped slightly, this remains within limits. The smooth, matte surfaces of the case are slightly prone to showing fingerprints. The battery, which is screwed instead of glued in, as well as the rest of the insides are accessible after an easy removal of the case bottom.
The E16 includes two USB-A connections (USB 3.2 Gen 2) and two USB-C connections (Thunderbolt 4; Power Delivery, Displayport). The 16-inch laptop offers a total of three video outputs (2x DP, 1x HDMI). The microSD storage card reader belongs to the faster representatives of its kind (using our AV PRO SD 128 GB V60 reference storage card). The built-in webcam (2.1 MP, IR, max. 1920 x 1080 pixels) does not have a mechanic cover. Instead, there is an on/off button on the left side of the case.
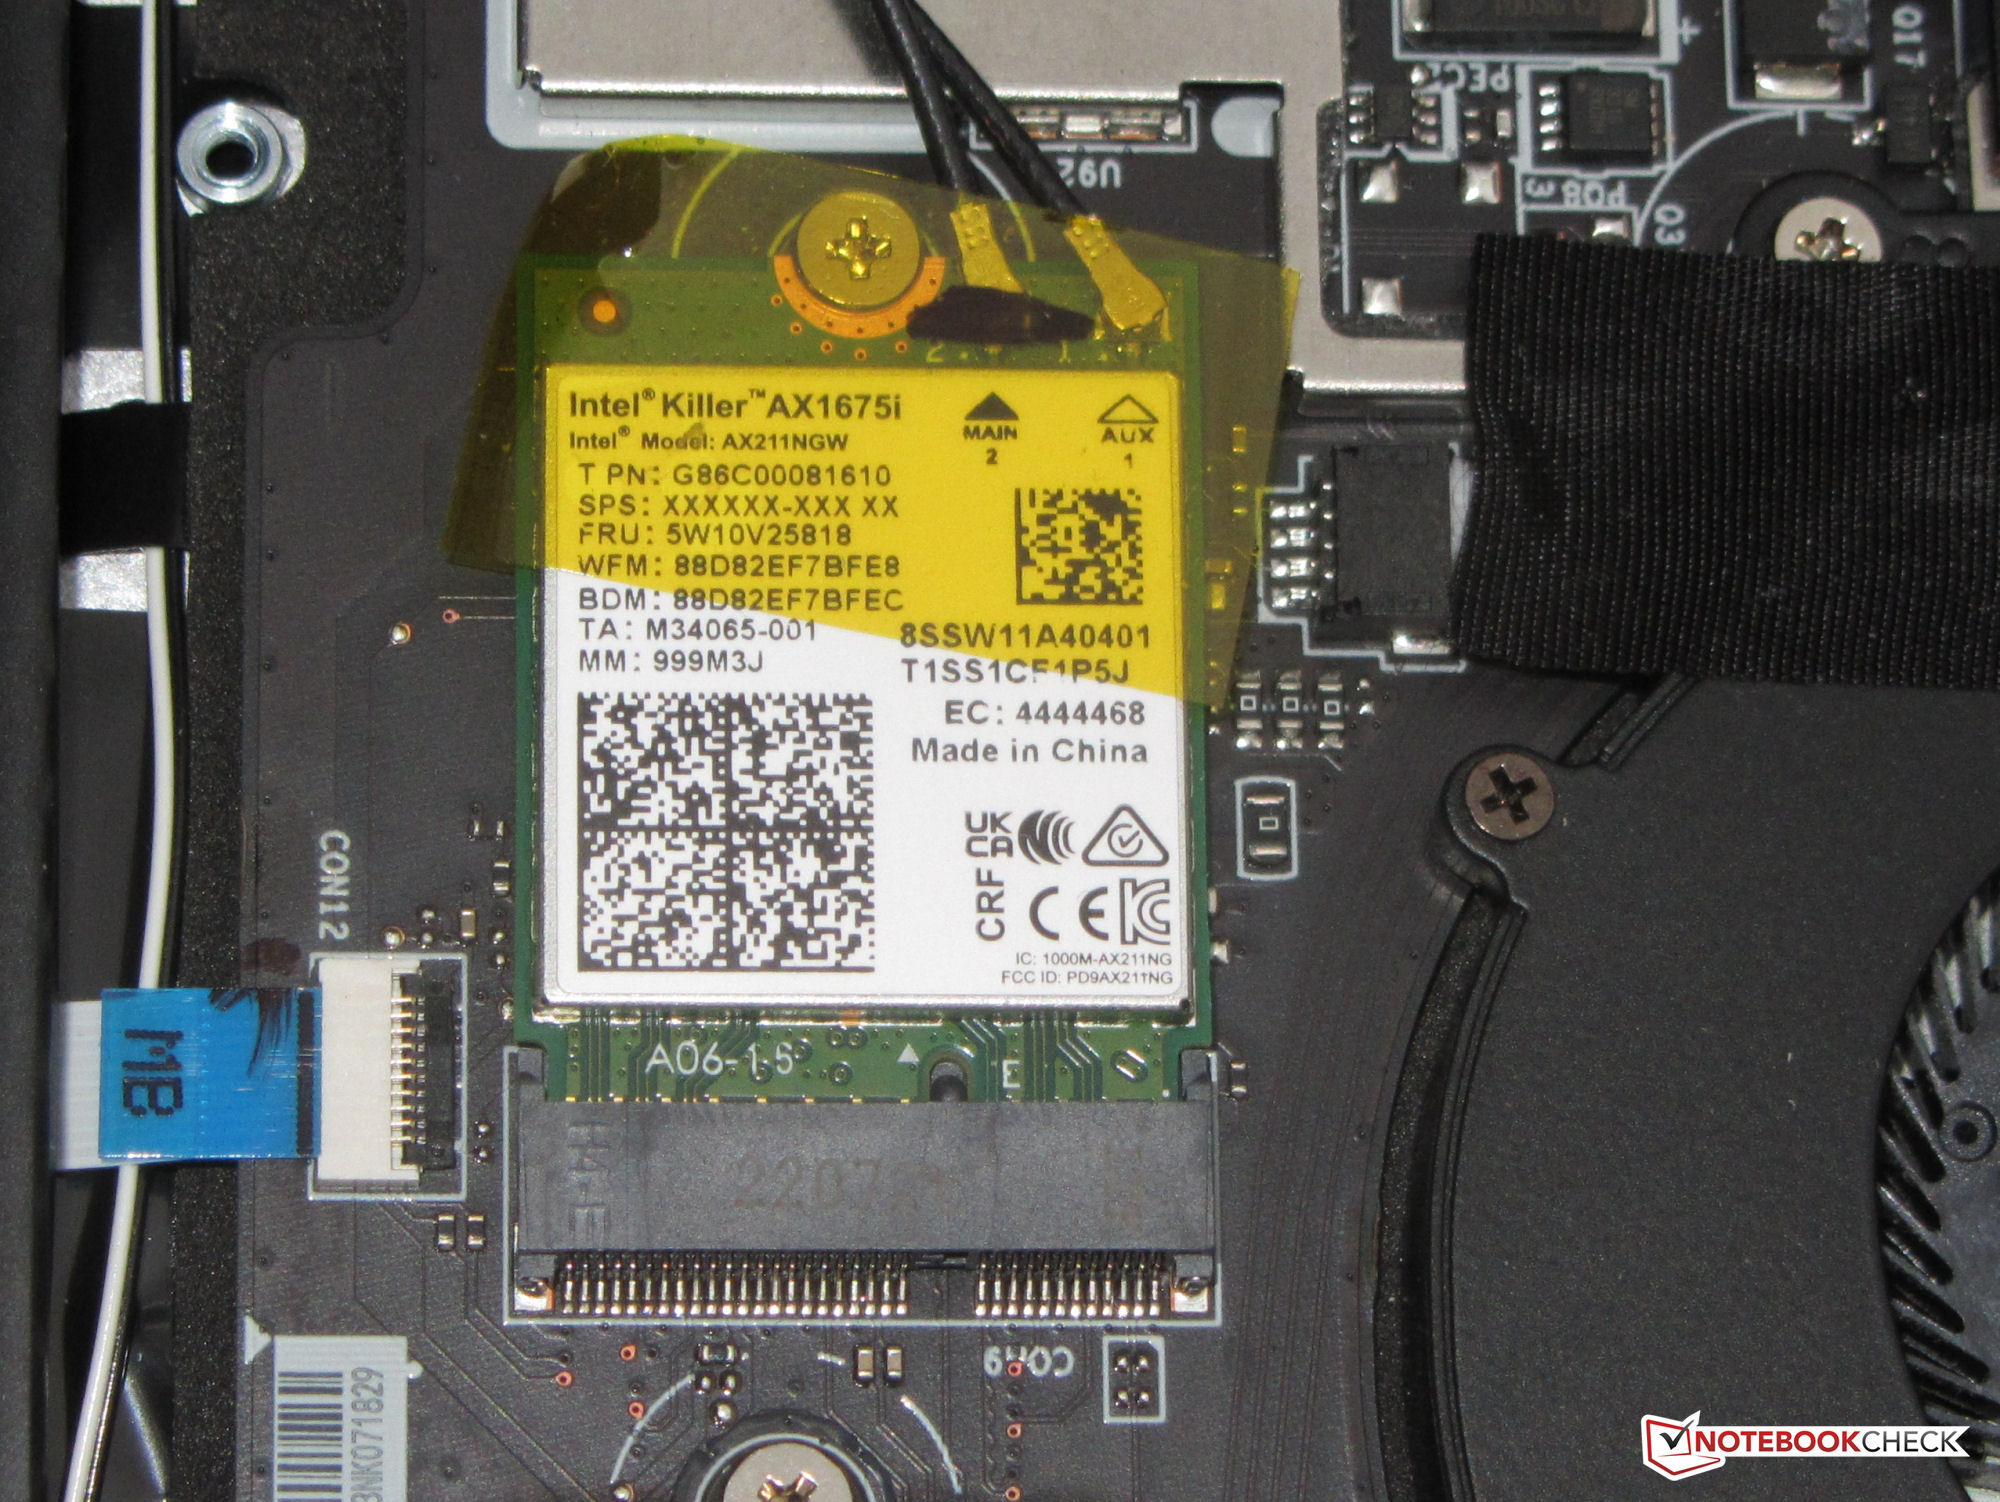
The WLAN transfer rates that we determine under optimal conditions (with no additional WLAN devices nearby and the laptop and server PC in close proximity) turn out excellent and correspond to the capabilities of the WiFi chip (Killer Wi-Fi 6E AX1675i; 802.11 ax).


| SD Card Reader | |
| average JPG Copy Test (av. of 3 runs) | |
| MSI Summit E16 Flip A12UDT-031 (AV Pro SD microSD 128 GB V60) | |
| Average of class Convertible (28.1 - 209, n=23, last 2 years) | |
| Samsung Galaxy Book Pro 360 15 NP950QDB-KC3DE (AV Pro SD microSD 128 GB V60) | |
| Dell Inspiron 16 7620 2-in-1 (Toshiba Exceria Pro SDXC 64 GB UHS-II) | |
| maximum AS SSD Seq Read Test (1GB) | |
| MSI Summit E16 Flip A12UDT-031 (AV Pro SD microSD 128 GB V60) | |
| Average of class Convertible (28.9 - 253, n=22, last 2 years) | |
| Dell Inspiron 16 7620 2-in-1 (Toshiba Exceria Pro SDXC 64 GB UHS-II) | |
| Samsung Galaxy Book Pro 360 15 NP950QDB-KC3DE (AV Pro SD microSD 128 GB V60) | |


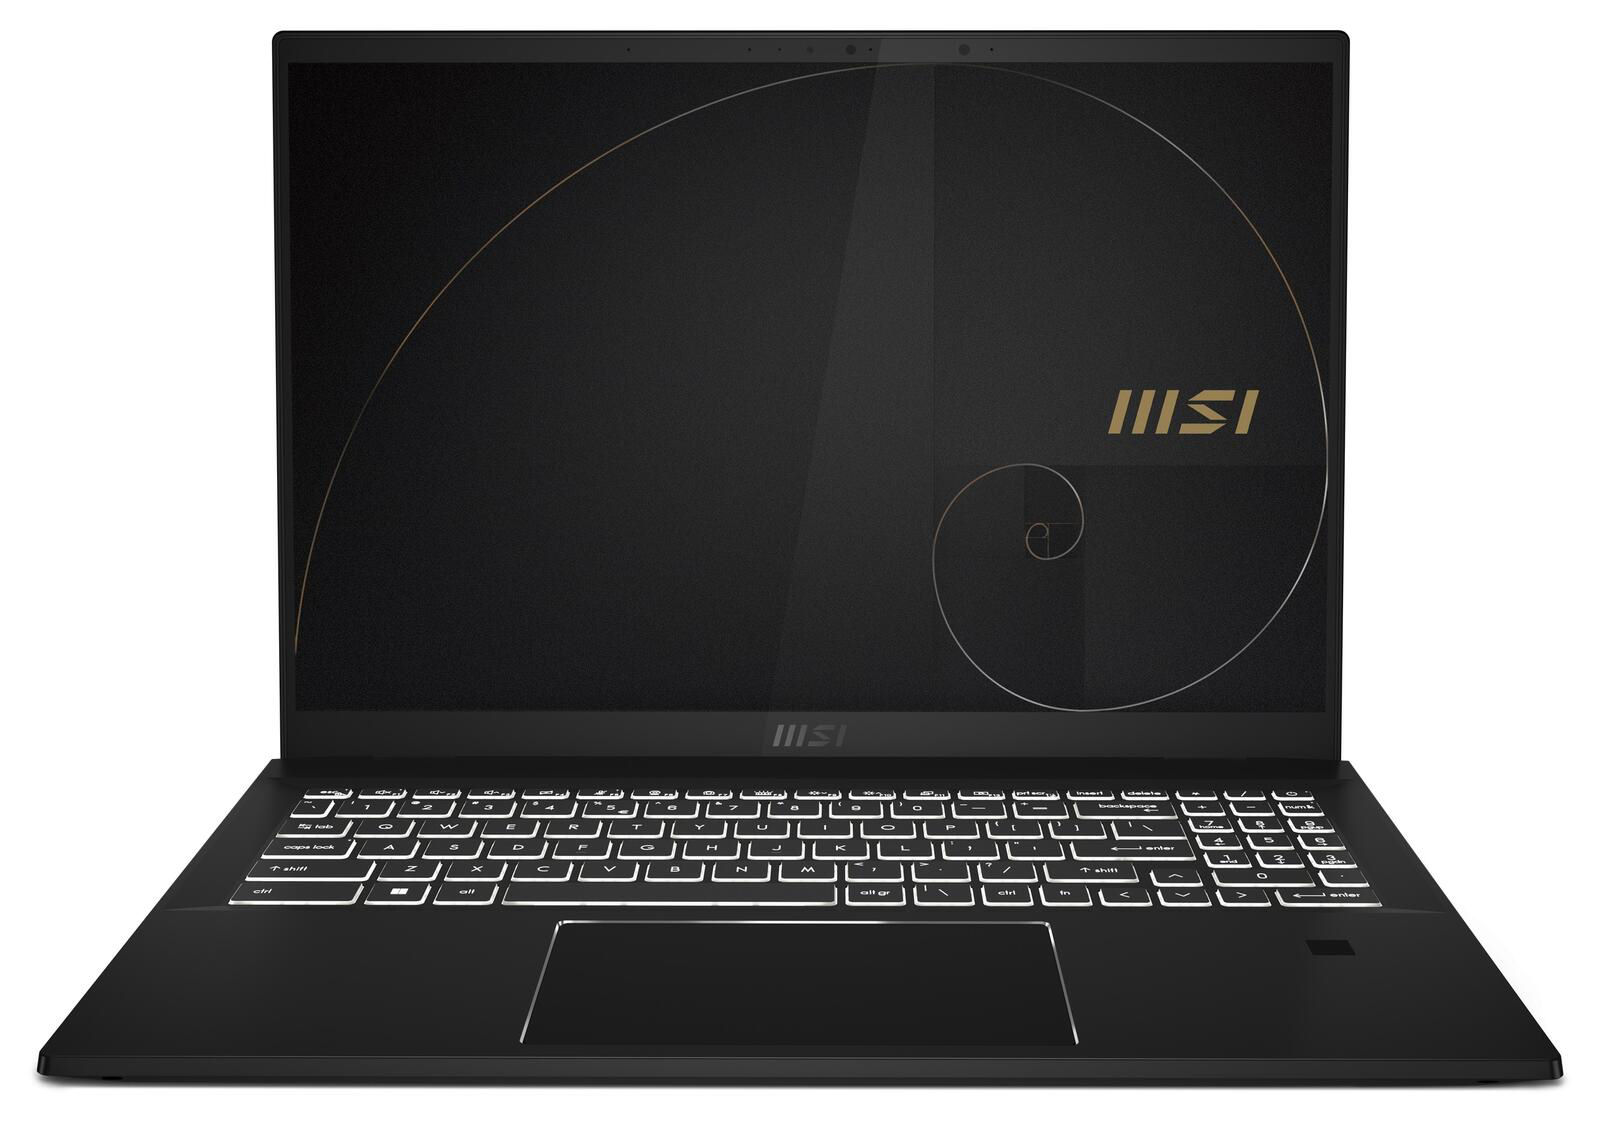
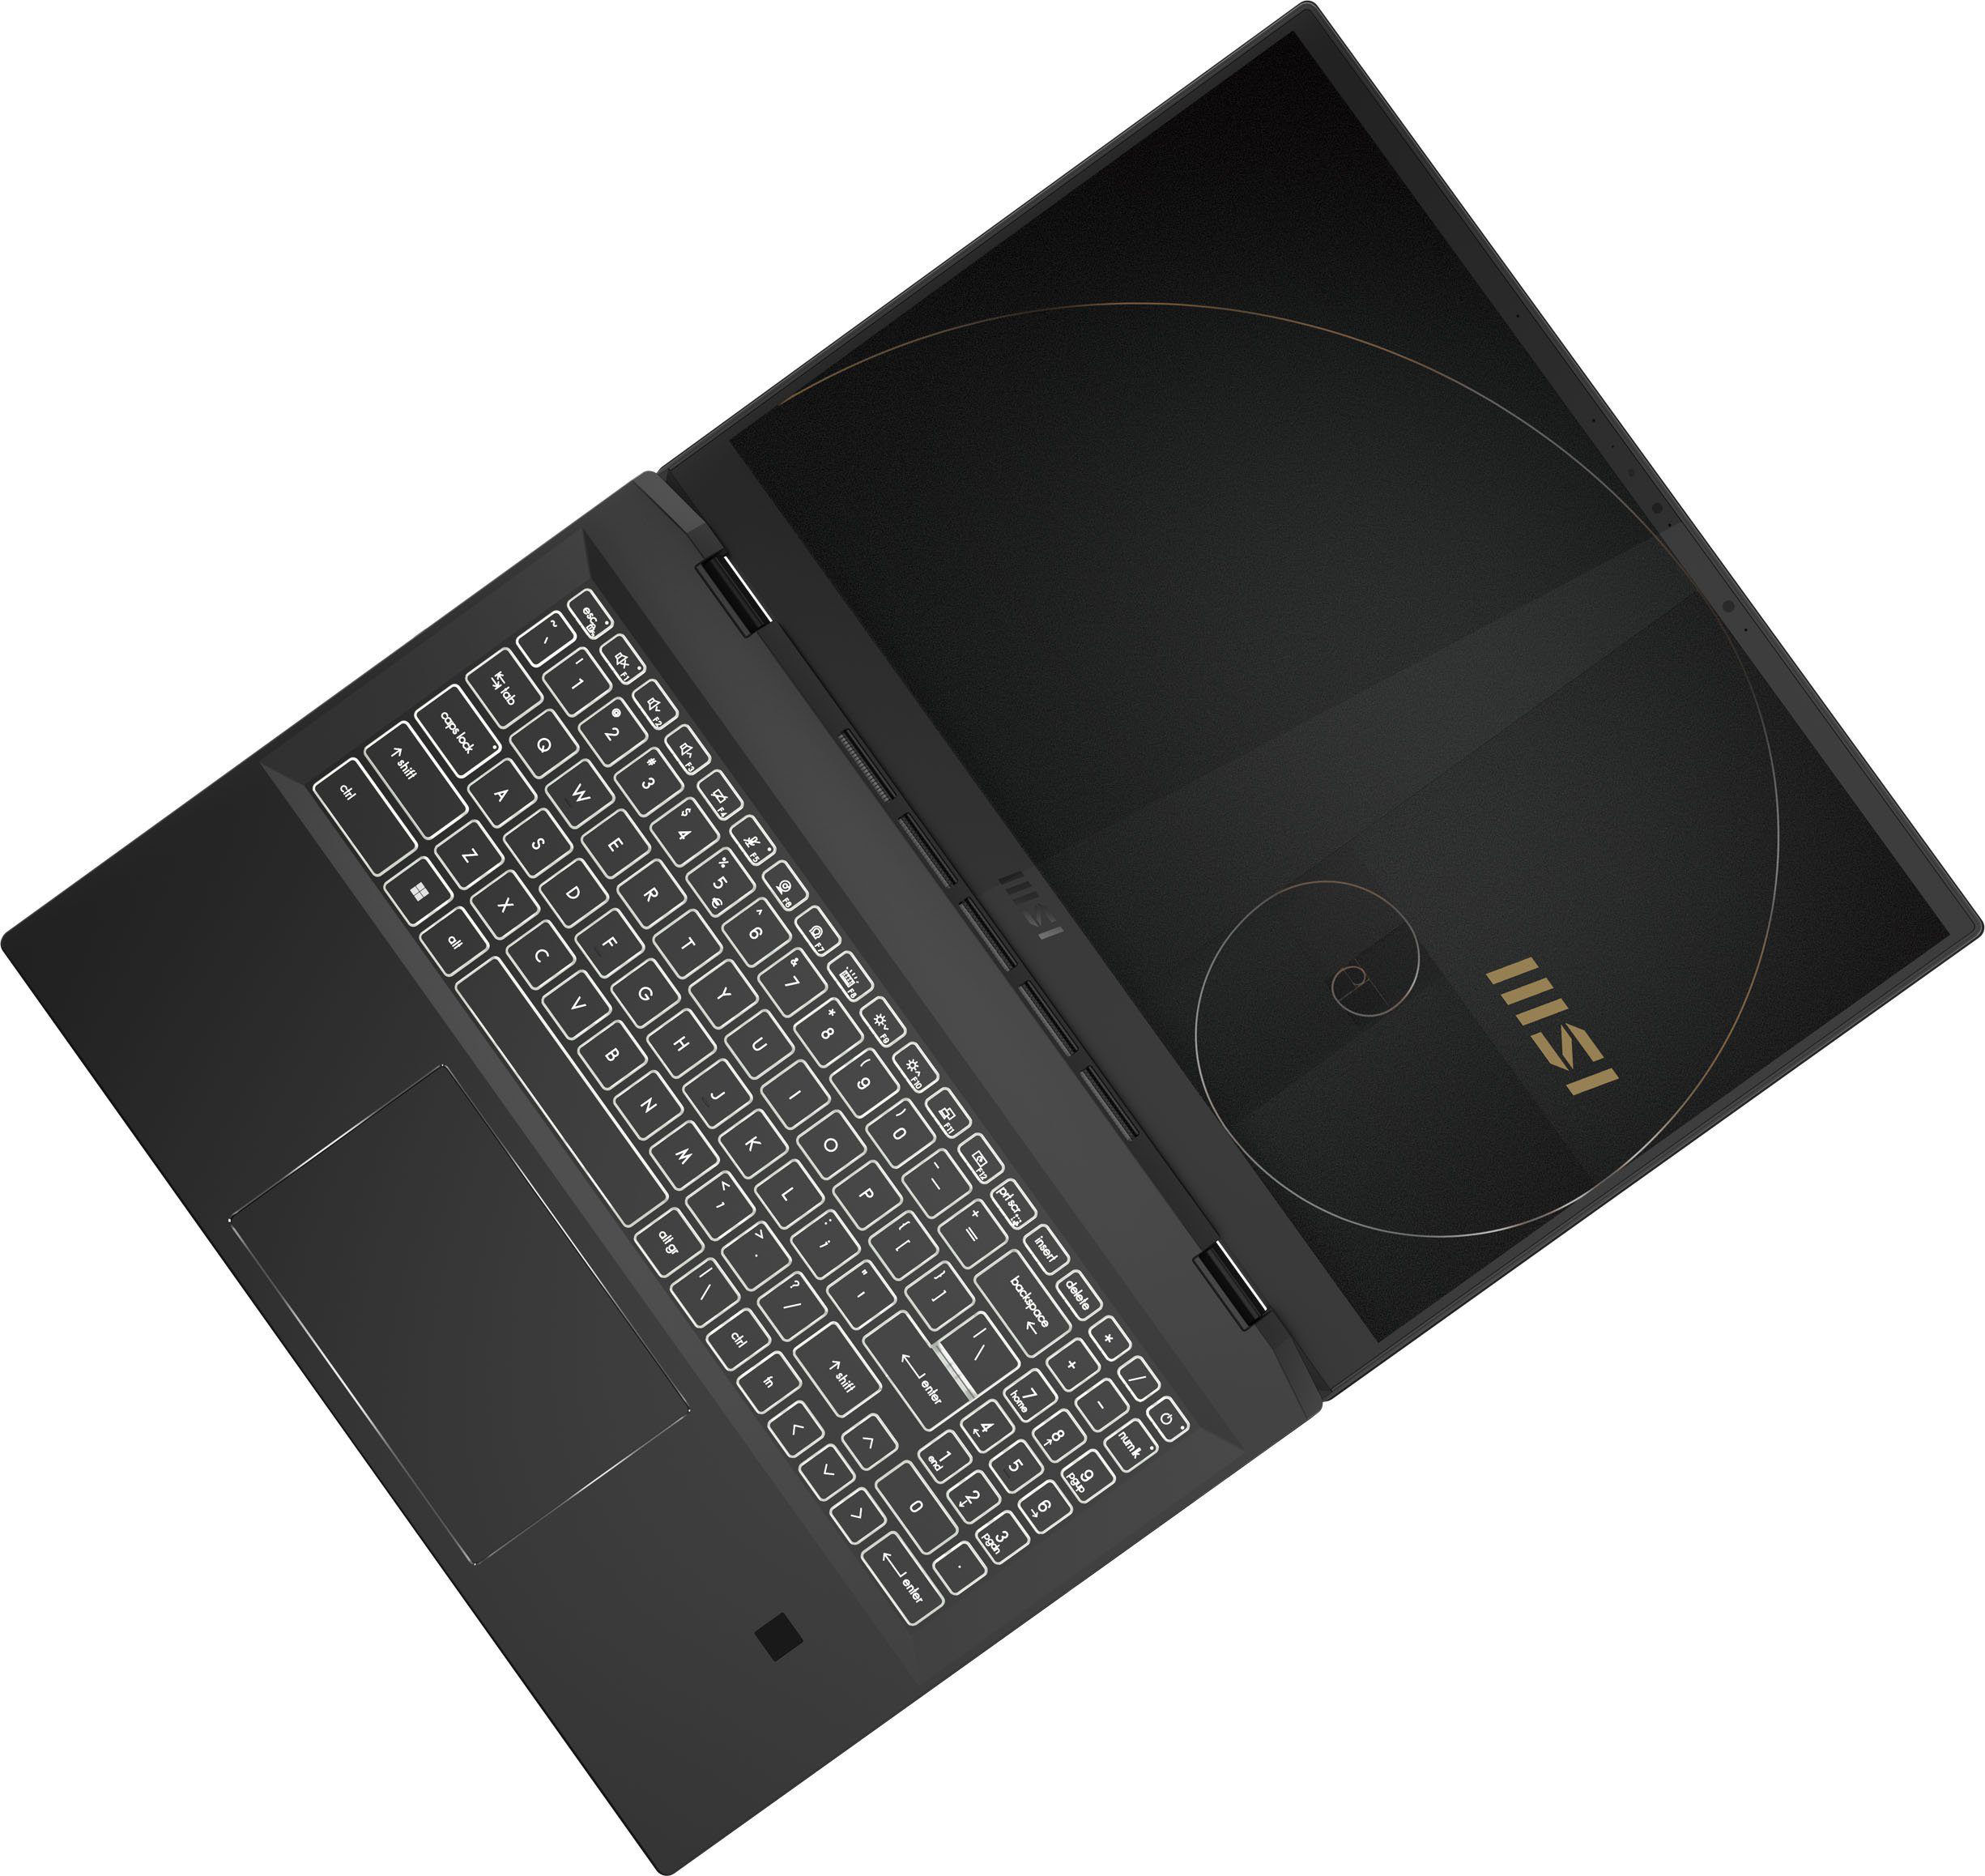
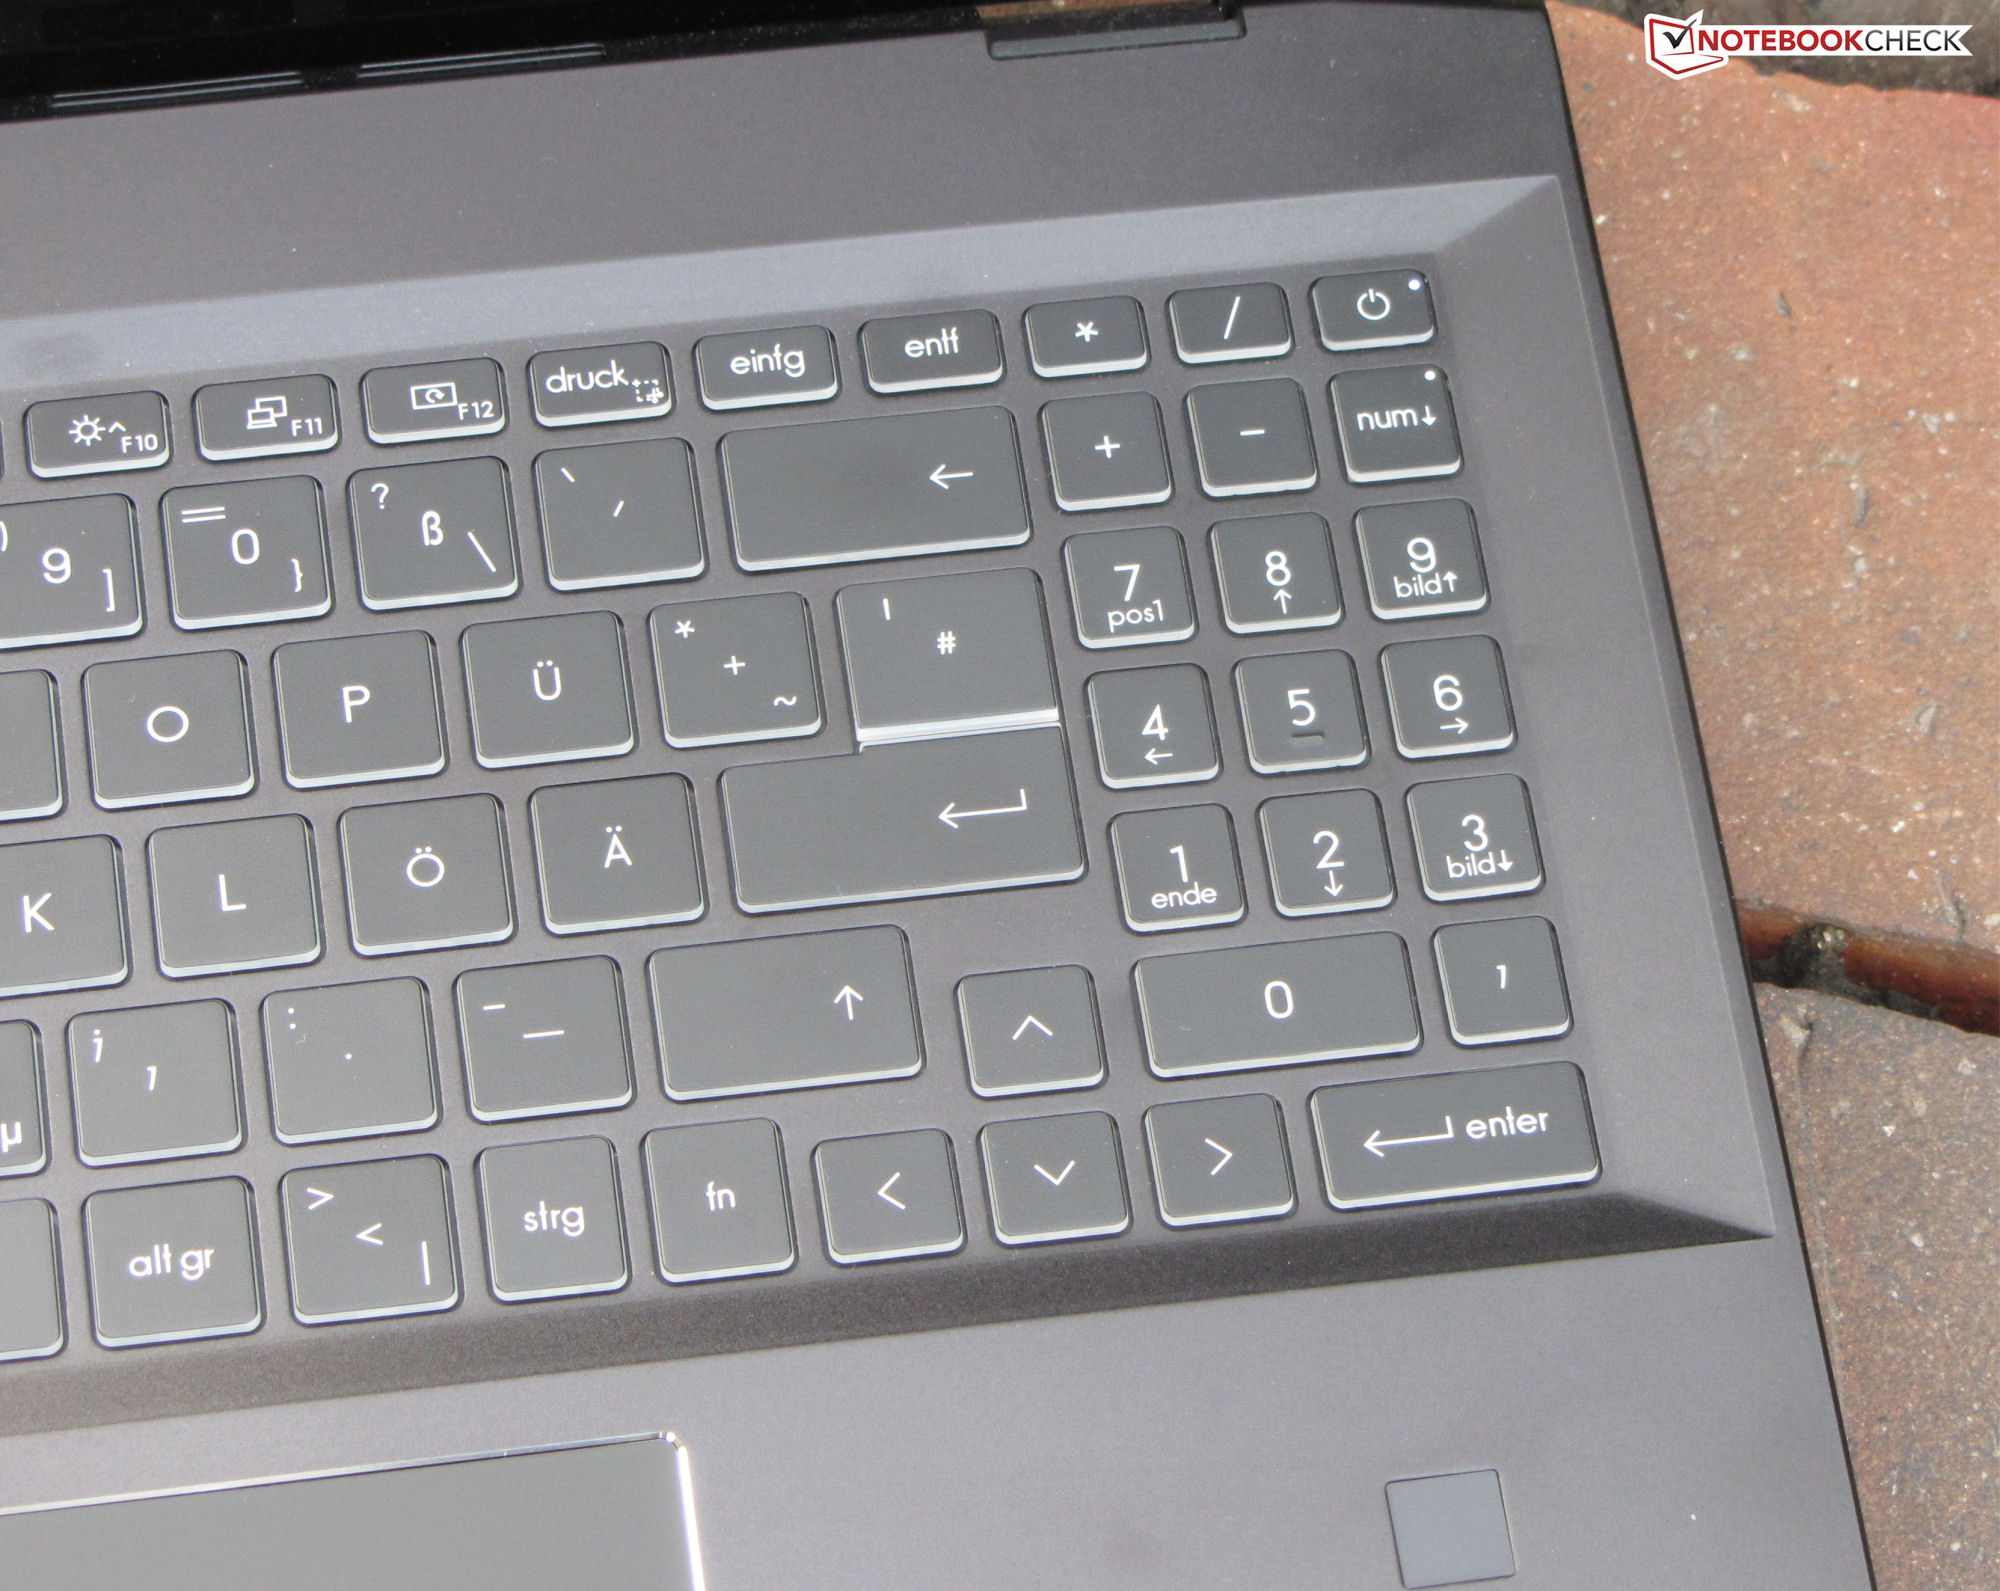
Input Devices - The Summit 16 includes an input pen
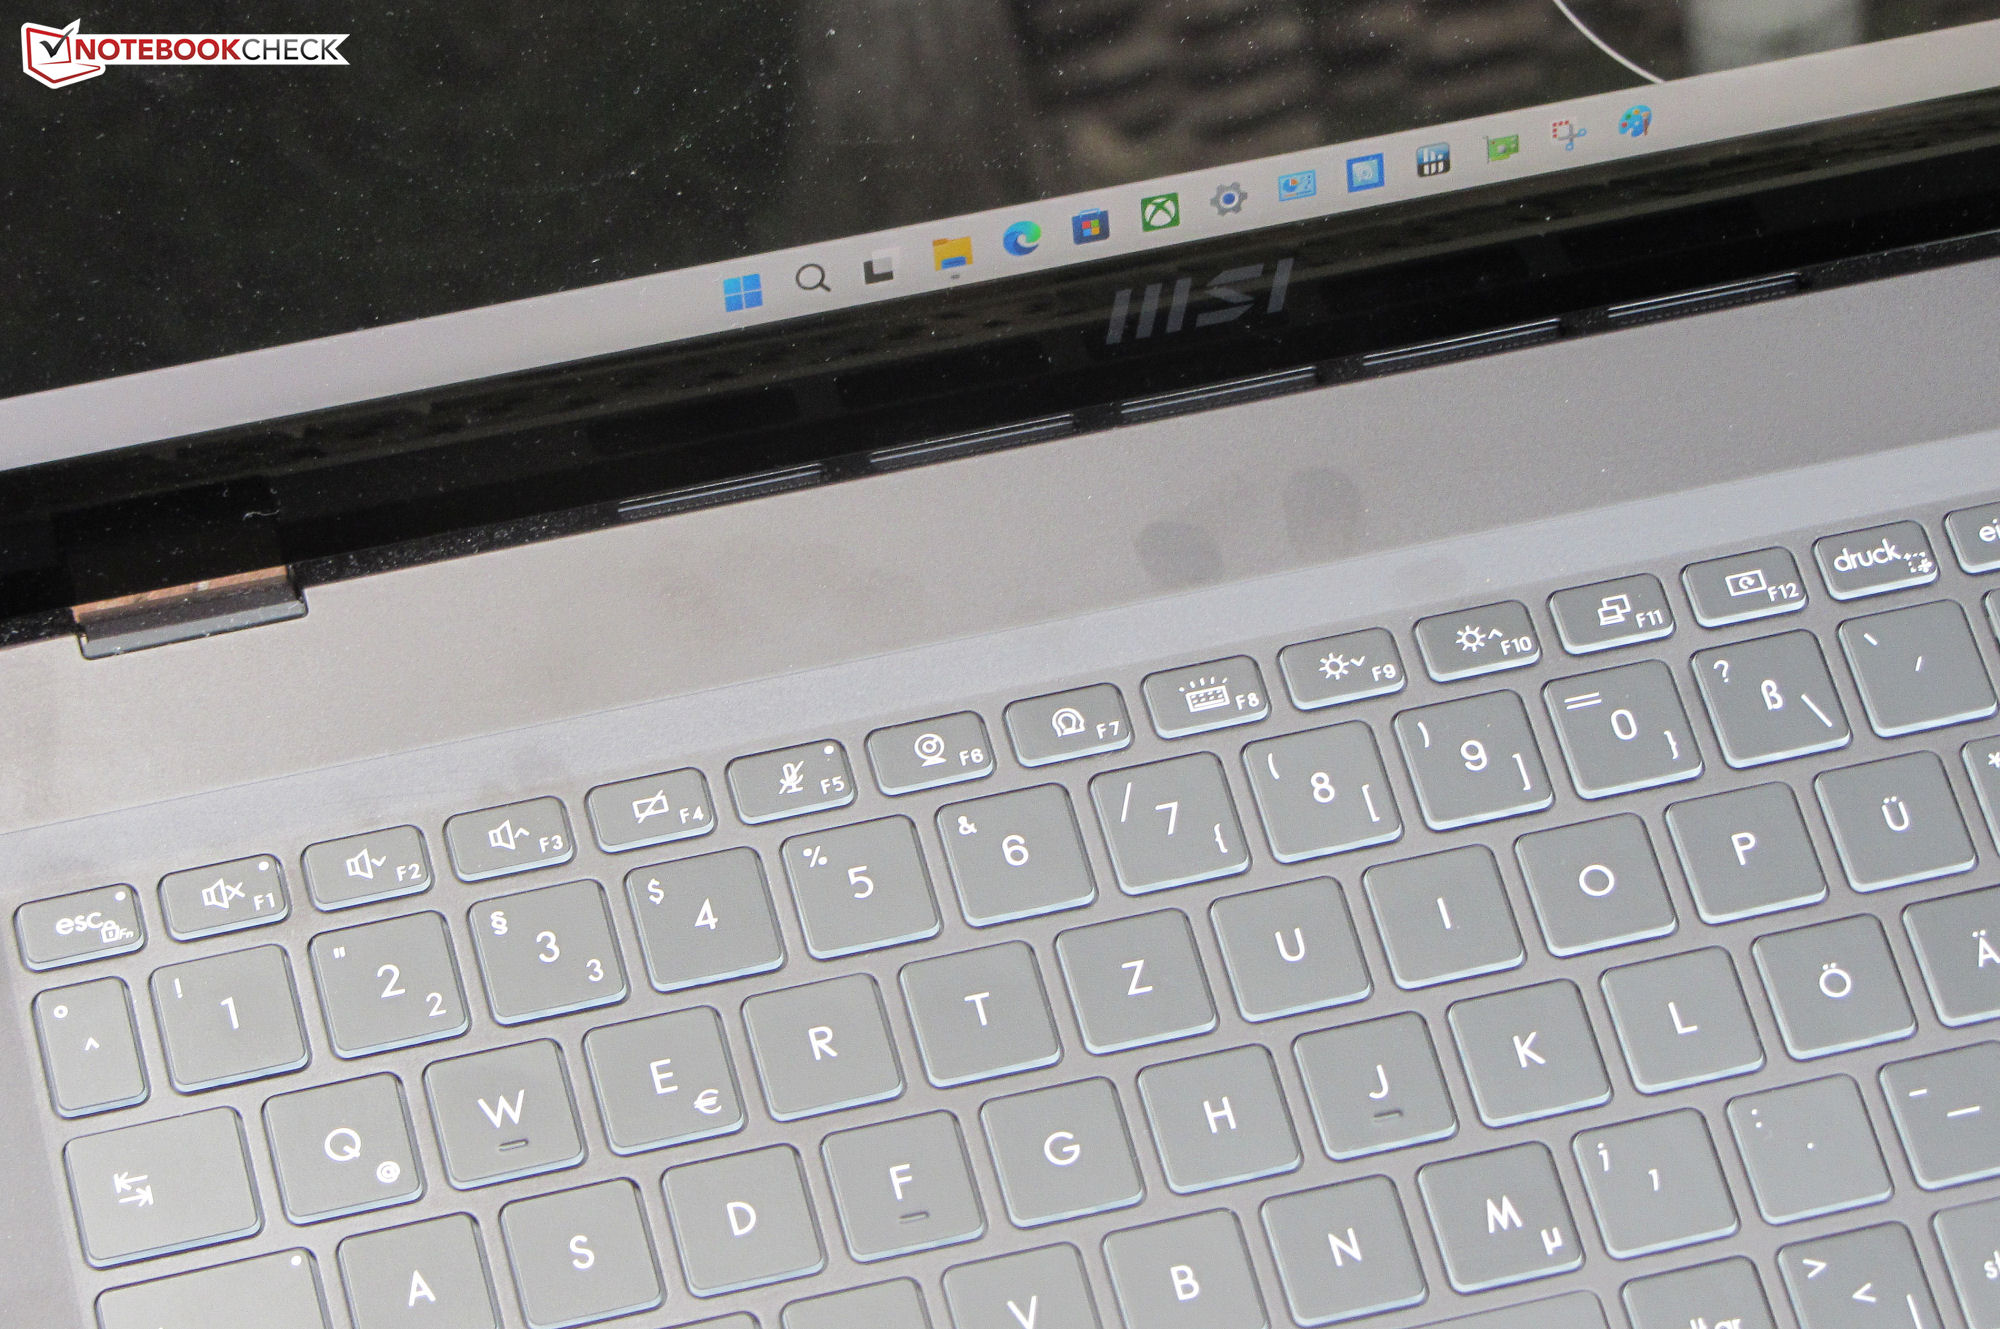
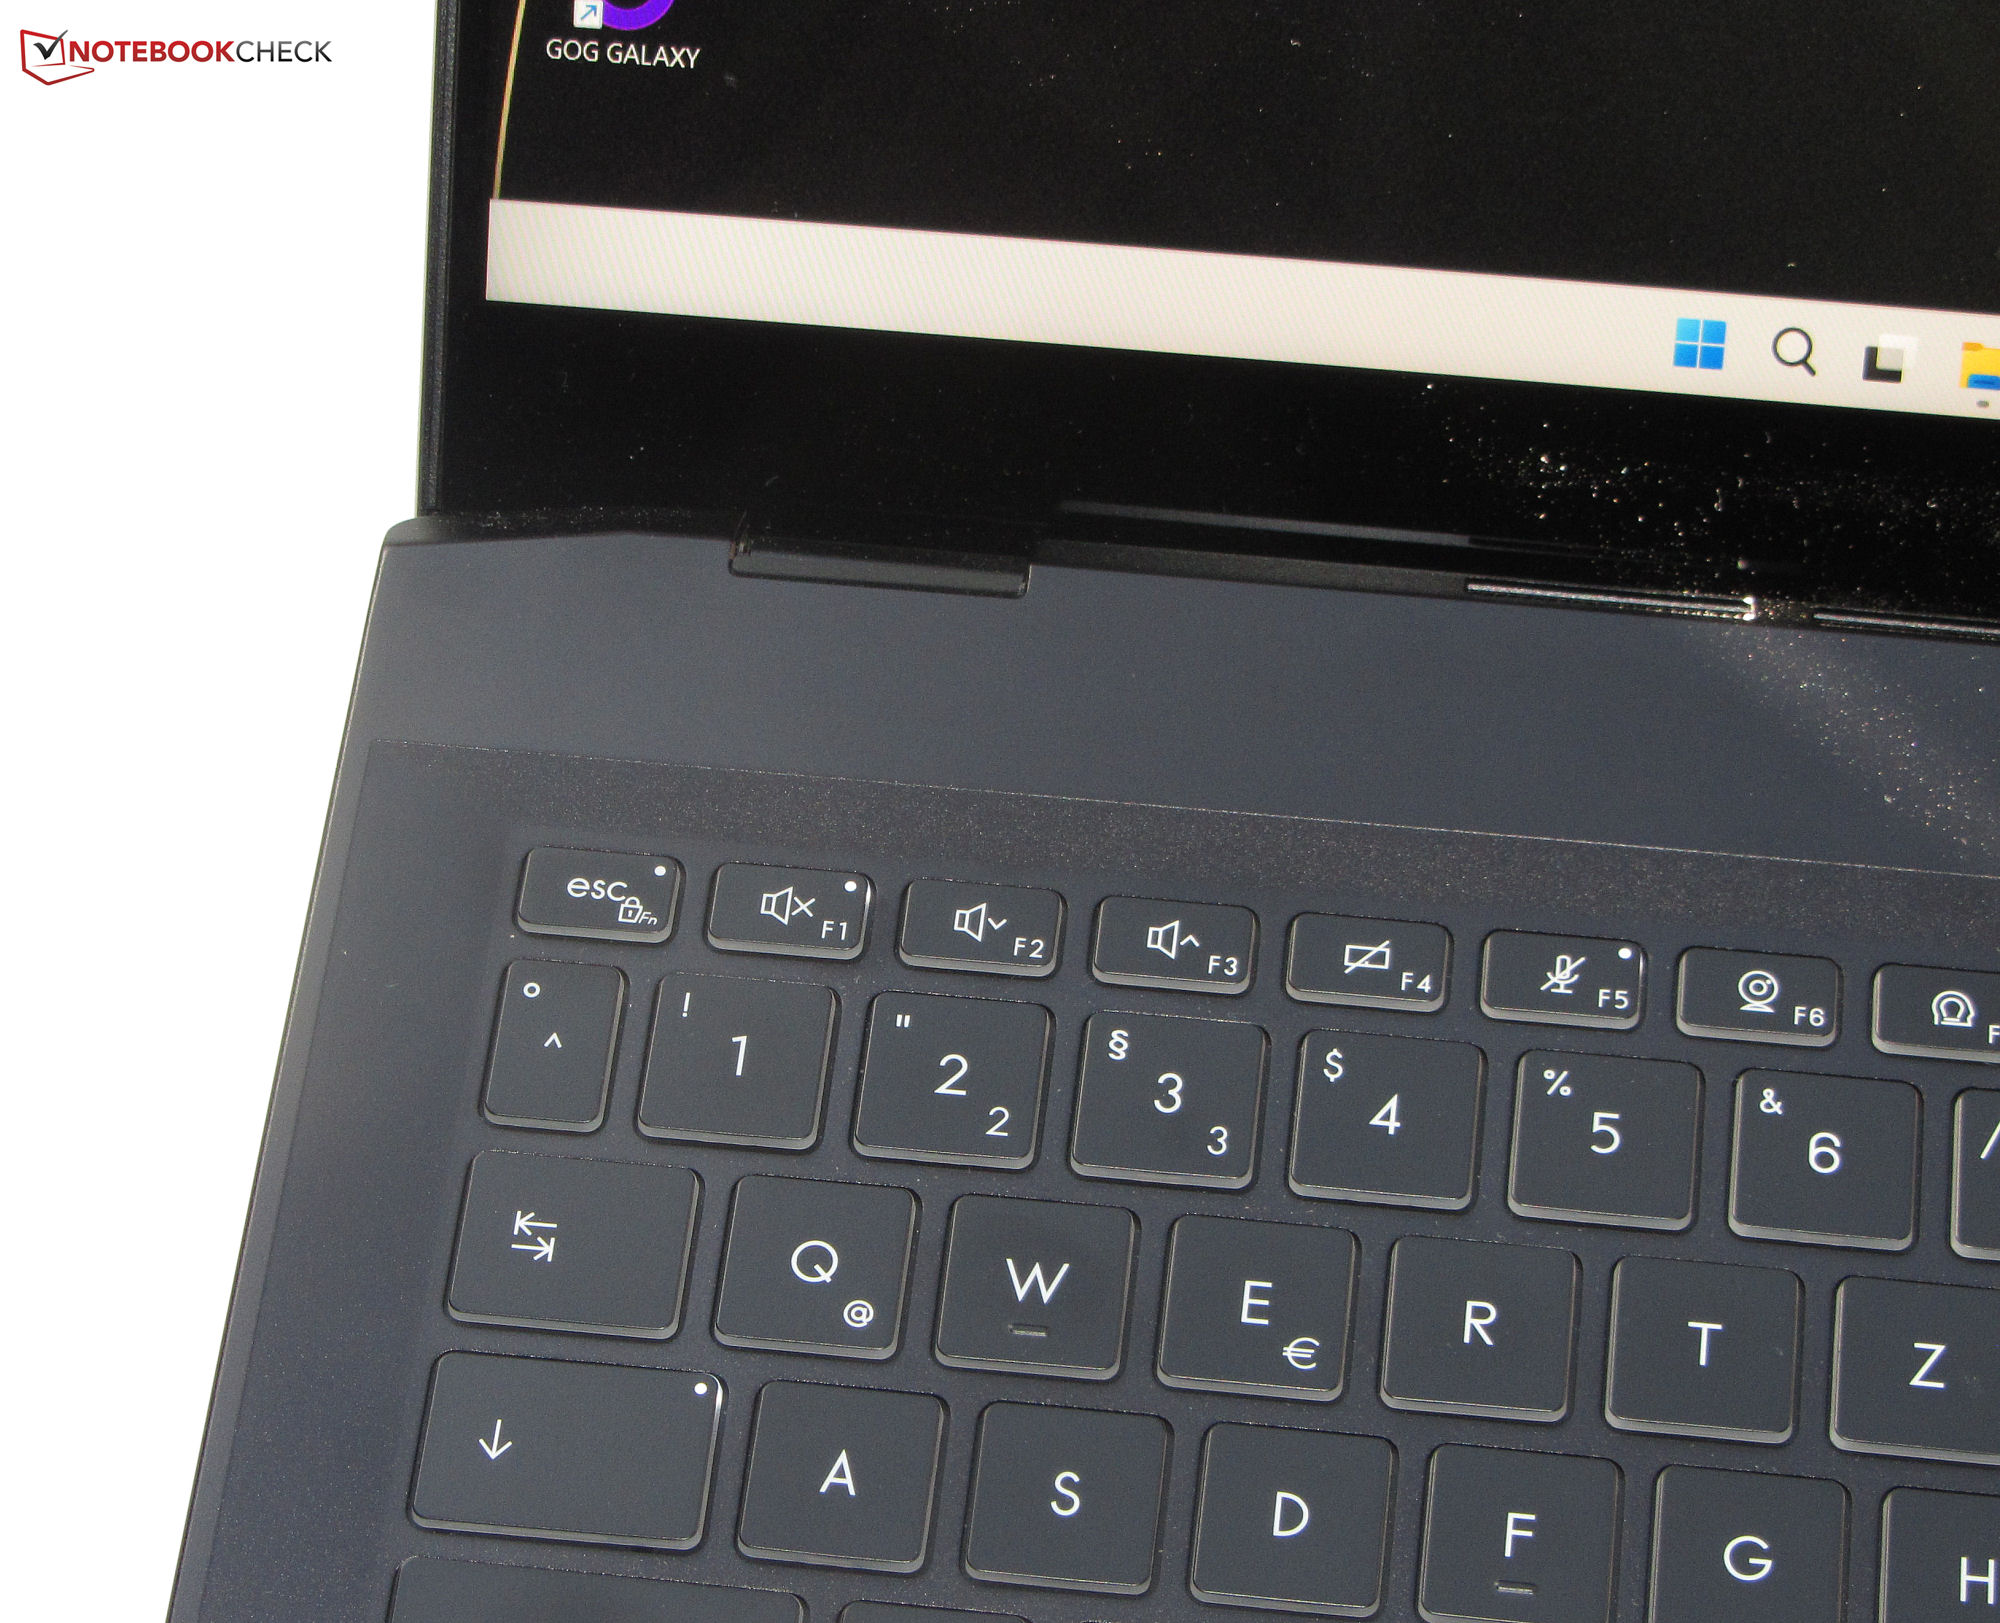
The flat, smooth keys of the chiclet keyboard (three-step illumination) offer a short stroke and clear pressure point. We like their resistance. While typing, the keyboard has a minimal give at most, so it did not create any annoyance. Overall, MSI delivers a keyboard here that is suitable for everyday tasks.
The smooth surface of the multitouch-capable ClickPad (~13 x 8.2 cm, ~5.1 x 3.2 in) facilitates sliding of the fingers. The ClickPad also responds to inputs in the corners. It has a short stroke and clear pressure point.
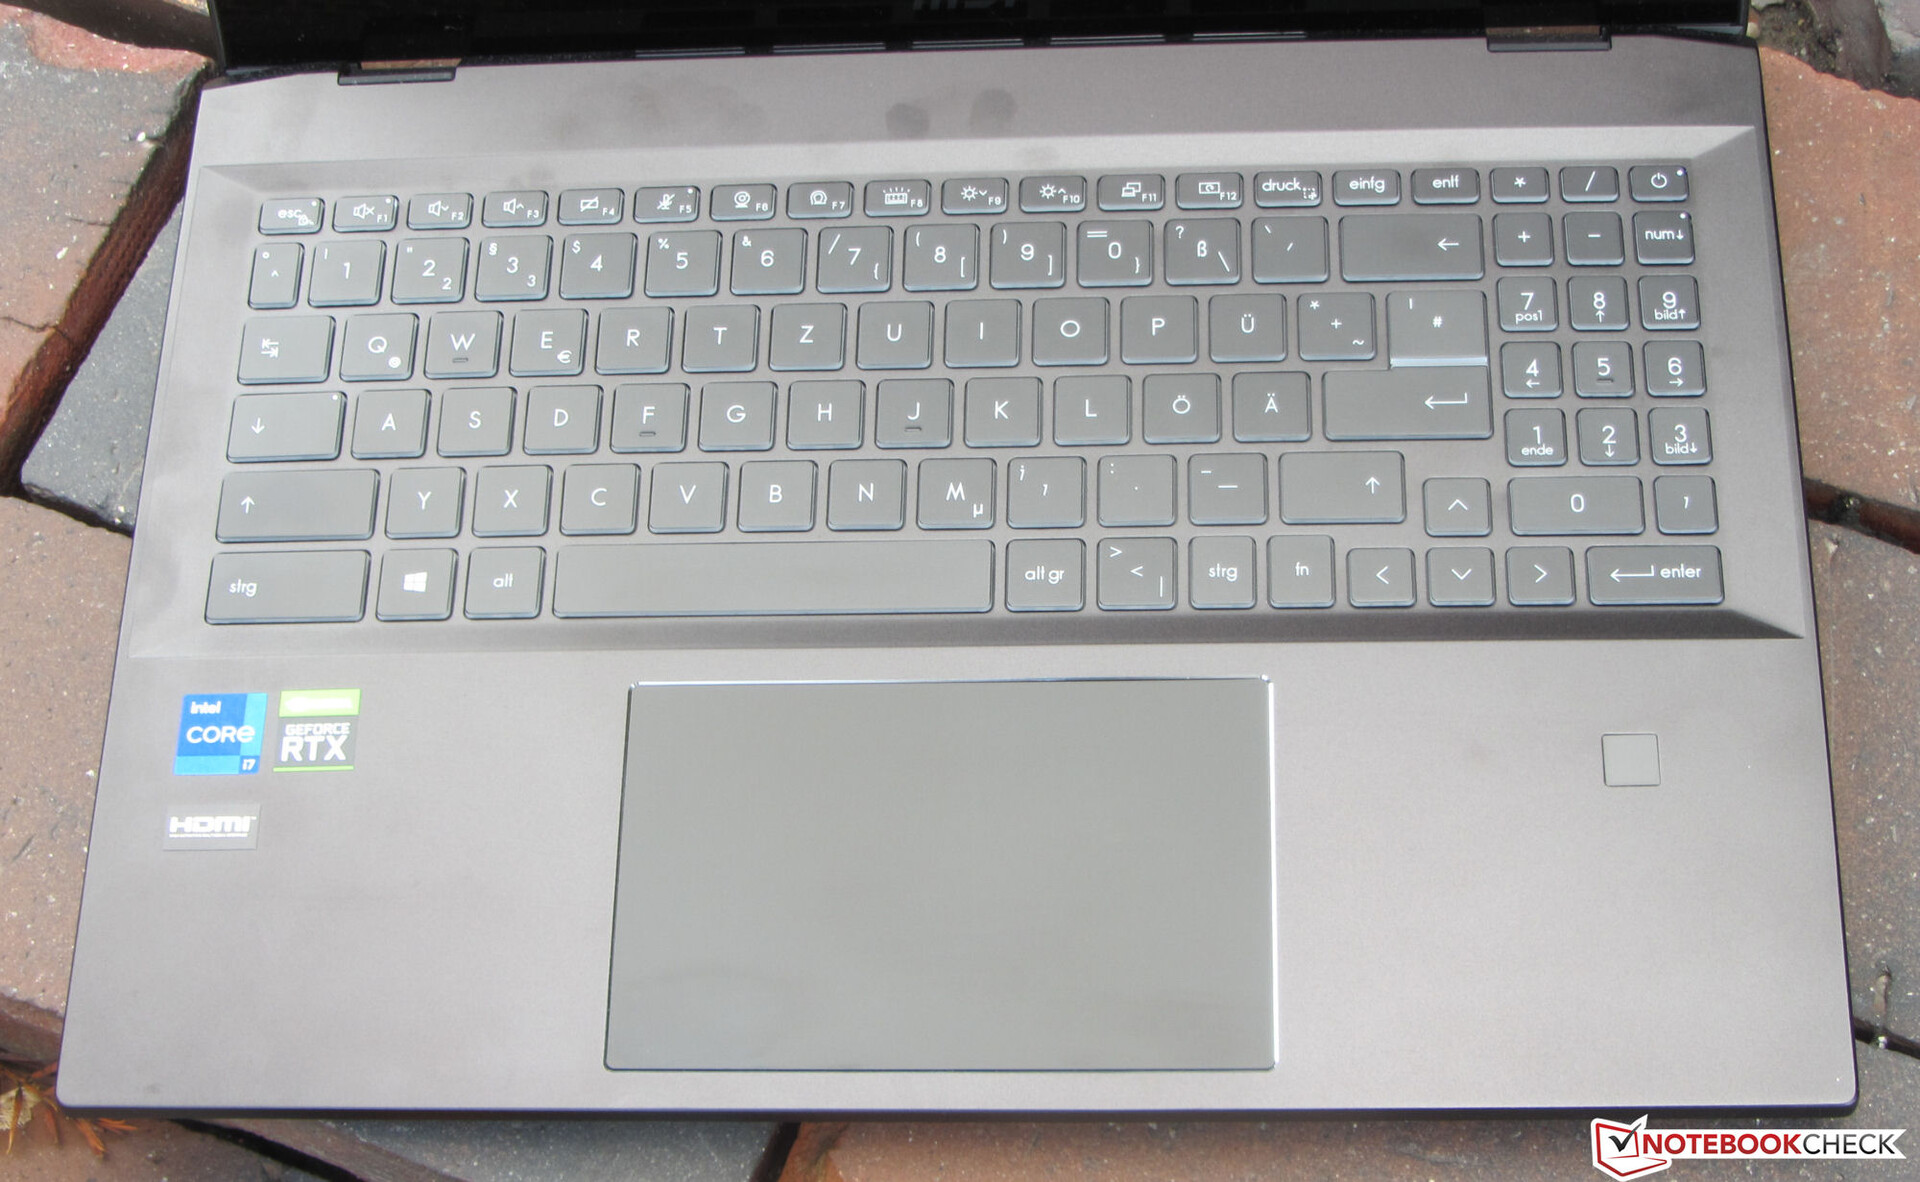
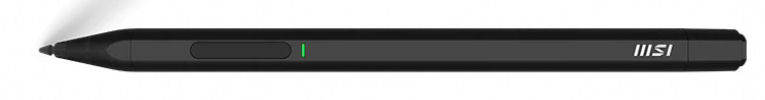
The touchscreen (10 touch points) can be operated with fingers or the included MSI input pen (1P 14; MPP 2.0). The latter feels good in the hand, and the pen tip slides easily across the screen. The pen can be attached magnetically to the left side of the base unit. The integrated battery is charged via the included USB-A-to-USB-C cable. Additional pen tips are also included.
Display - IPS onboard

While the 1121:1 contrast of the reflective 16-inch display (2560 x 1600 pixels) meets the target (> 1000:1), the maximum brightness turns out a bit low at 294.3 cd/m². We consider values above 300 cd/m² good. The 165-Hz panel offers short response times. We do not notice any PWM flickering.
| |||||||||||||||||||||||||
Brightness Distribution: 89 %
Center on Battery: 314 cd/m²
Contrast: 1121:1 (Black: 0.28 cd/m²)
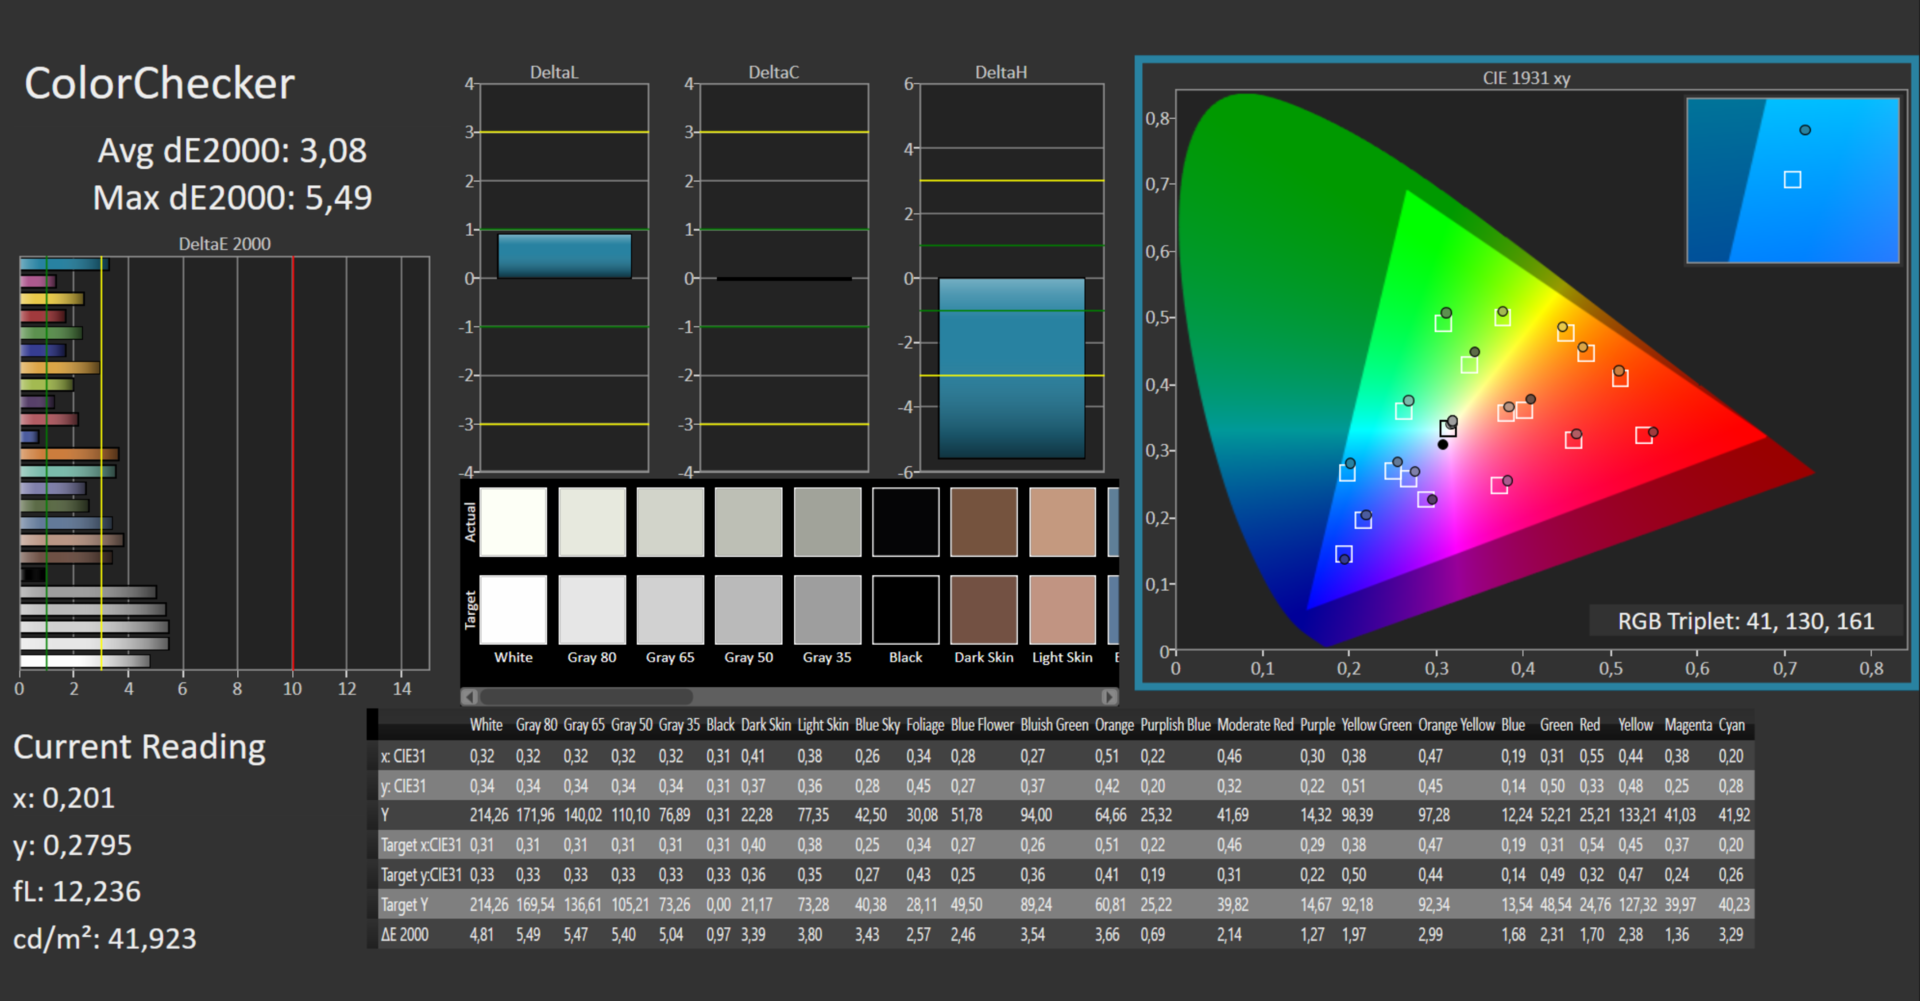
ΔE ColorChecker Calman: 3.08 | ∀{0.5-29.43 Ø4.78}
calibrated: 0.88
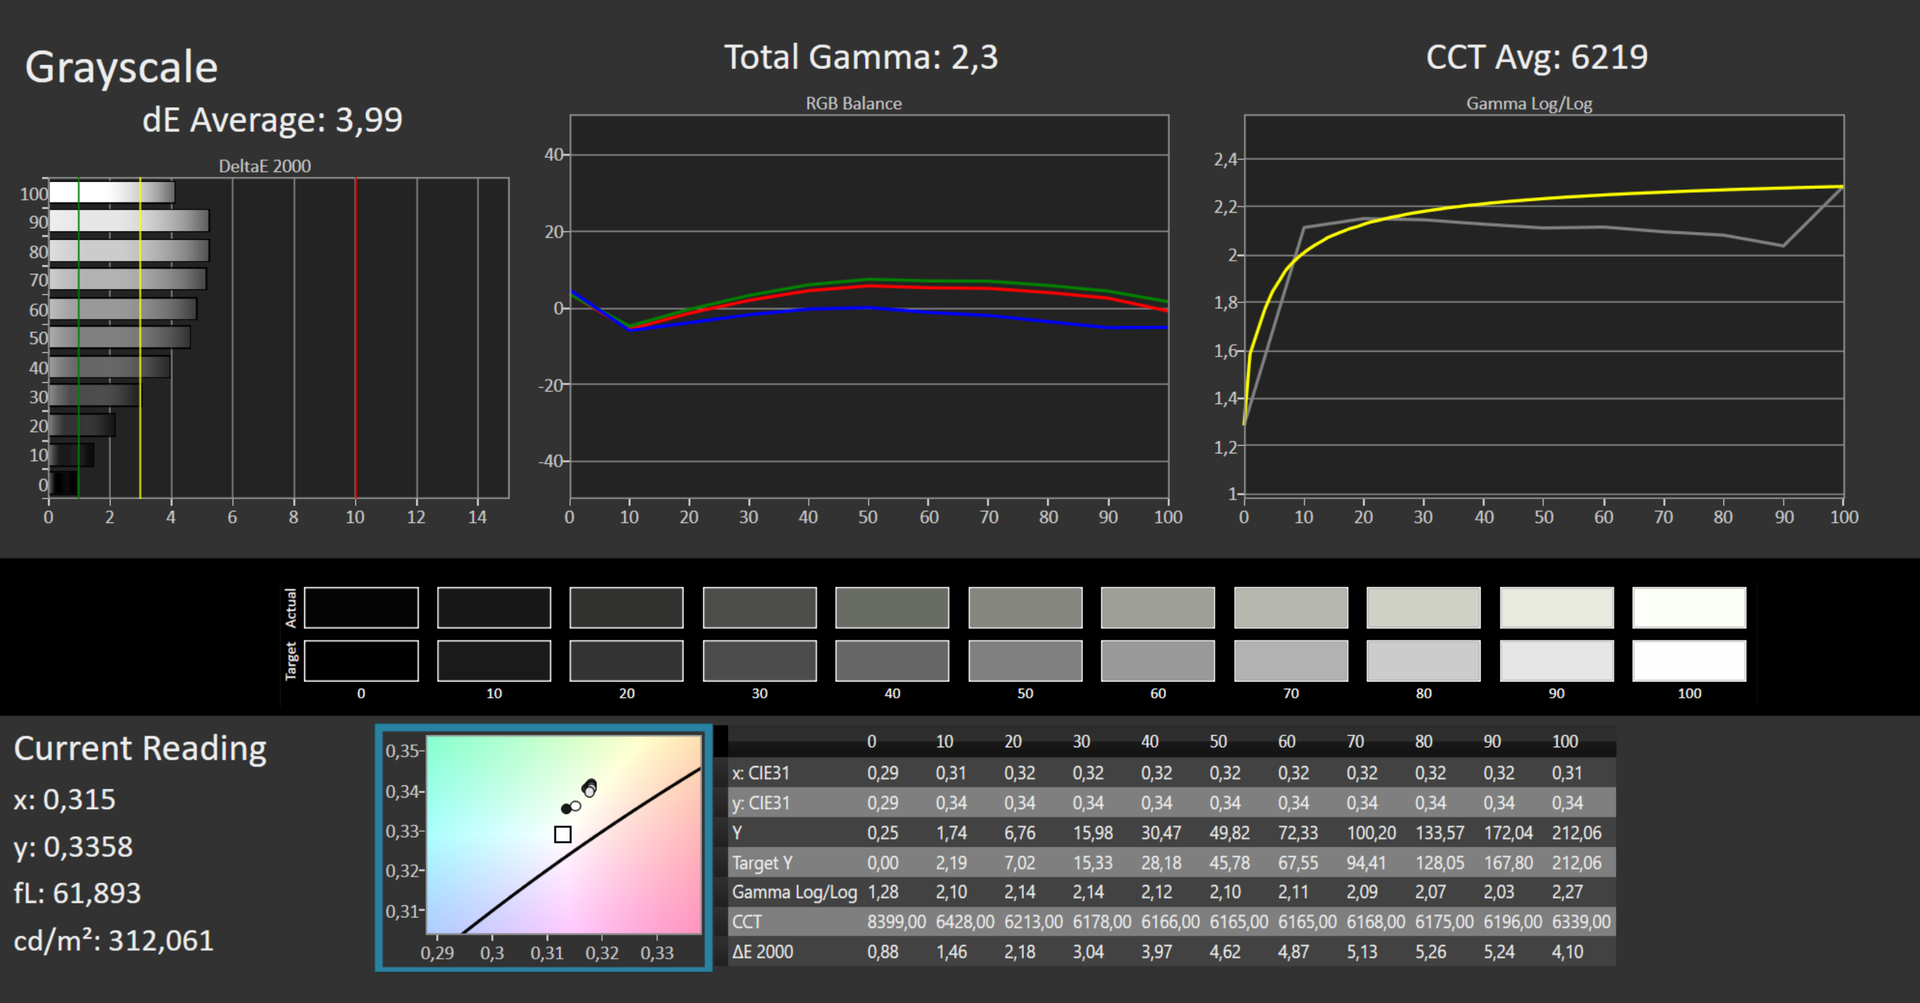
ΔE Greyscale Calman: 3.99 | ∀{0.09-98 Ø5}
86.5% AdobeRGB 1998 (Argyll 3D)
100% sRGB (Argyll 3D)
98.9% Display P3 (Argyll 3D)
Gamma: 2.3
CCT: 6219 K
| MSI Summit E16 Flip A12UDT-031 AU Optronics B16QAN02.N, IPS, 2560x1600, 16" | Asus ExpertBook B2 Flip B2502FBA-N80141X AU Optronics B156HAN02.1, IPS, 1920x1080, 15.6" | Samsung Galaxy Book Pro 360 15 NP950QDB-KC3DE SDC4159, OLED, 1920x1080, 15.6" | Dell Inspiron 16 7620 2-in-1 BOE NV16N45, IPS, 1920x1200, 16" | |
|---|---|---|---|---|
| Display | -54% | 5% | -19% | |
| Display P3 Coverage (%) | 98.9 | 37.2 -62% | 99.9 1% | 67 -32% |
| sRGB Coverage (%) | 100 | 55.8 -44% | 100 0% | 95.9 -4% |
| AdobeRGB 1998 Coverage (%) | 86.5 | 38.4 -56% | 97.6 13% | 69.3 -20% |
| Response Times | -101% | 82% | -139% | |
| Response Time Grey 50% / Grey 80% * (ms) | 13 ? | 32 ? -146% | 2 ? 85% | 32 ? -146% |
| Response Time Black / White * (ms) | 9 ? | 14 ? -56% | 2 ? 78% | 20.8 ? -131% |
| PWM Frequency (Hz) | 60 | |||
| Screen | -68% | 48% | -20% | |
| Brightness middle (cd/m²) | 314 | 239 -24% | 290 -8% | 320.7 2% |
| Brightness (cd/m²) | 294 | 221 -25% | 290 -1% | 309 5% |
| Brightness Distribution (%) | 89 | 89 0% | 99 11% | 90 1% |
| Black Level * (cd/m²) | 0.28 | 0.51 -82% | 0.05 82% | 0.36 -29% |
| Contrast (:1) | 1121 | 469 -58% | 5800 417% | 891 -21% |
| Colorchecker dE 2000 * | 3.08 | 5.66 -84% | 1.84 40% | 4.18 -36% |
| Colorchecker dE 2000 max. * | 5.49 | 20.35 -271% | 3.83 30% | 8.48 -54% |
| Colorchecker dE 2000 calibrated * | 0.88 | 2.69 -206% | 0.77 12% | |
| Greyscale dE 2000 * | 3.99 | 3.89 3% | 1.24 69% | 6.3 -58% |
| Gamma | 2.3 96% | 2.43 91% | 2.2 100% | 2.21 100% |
| CCT | 6219 105% | 6183 105% | 6686 97% | 6258 104% |
| Total Average (Program / Settings) | -74% /
-70% | 45% /
44% | -59% /
-37% |
* ... smaller is better
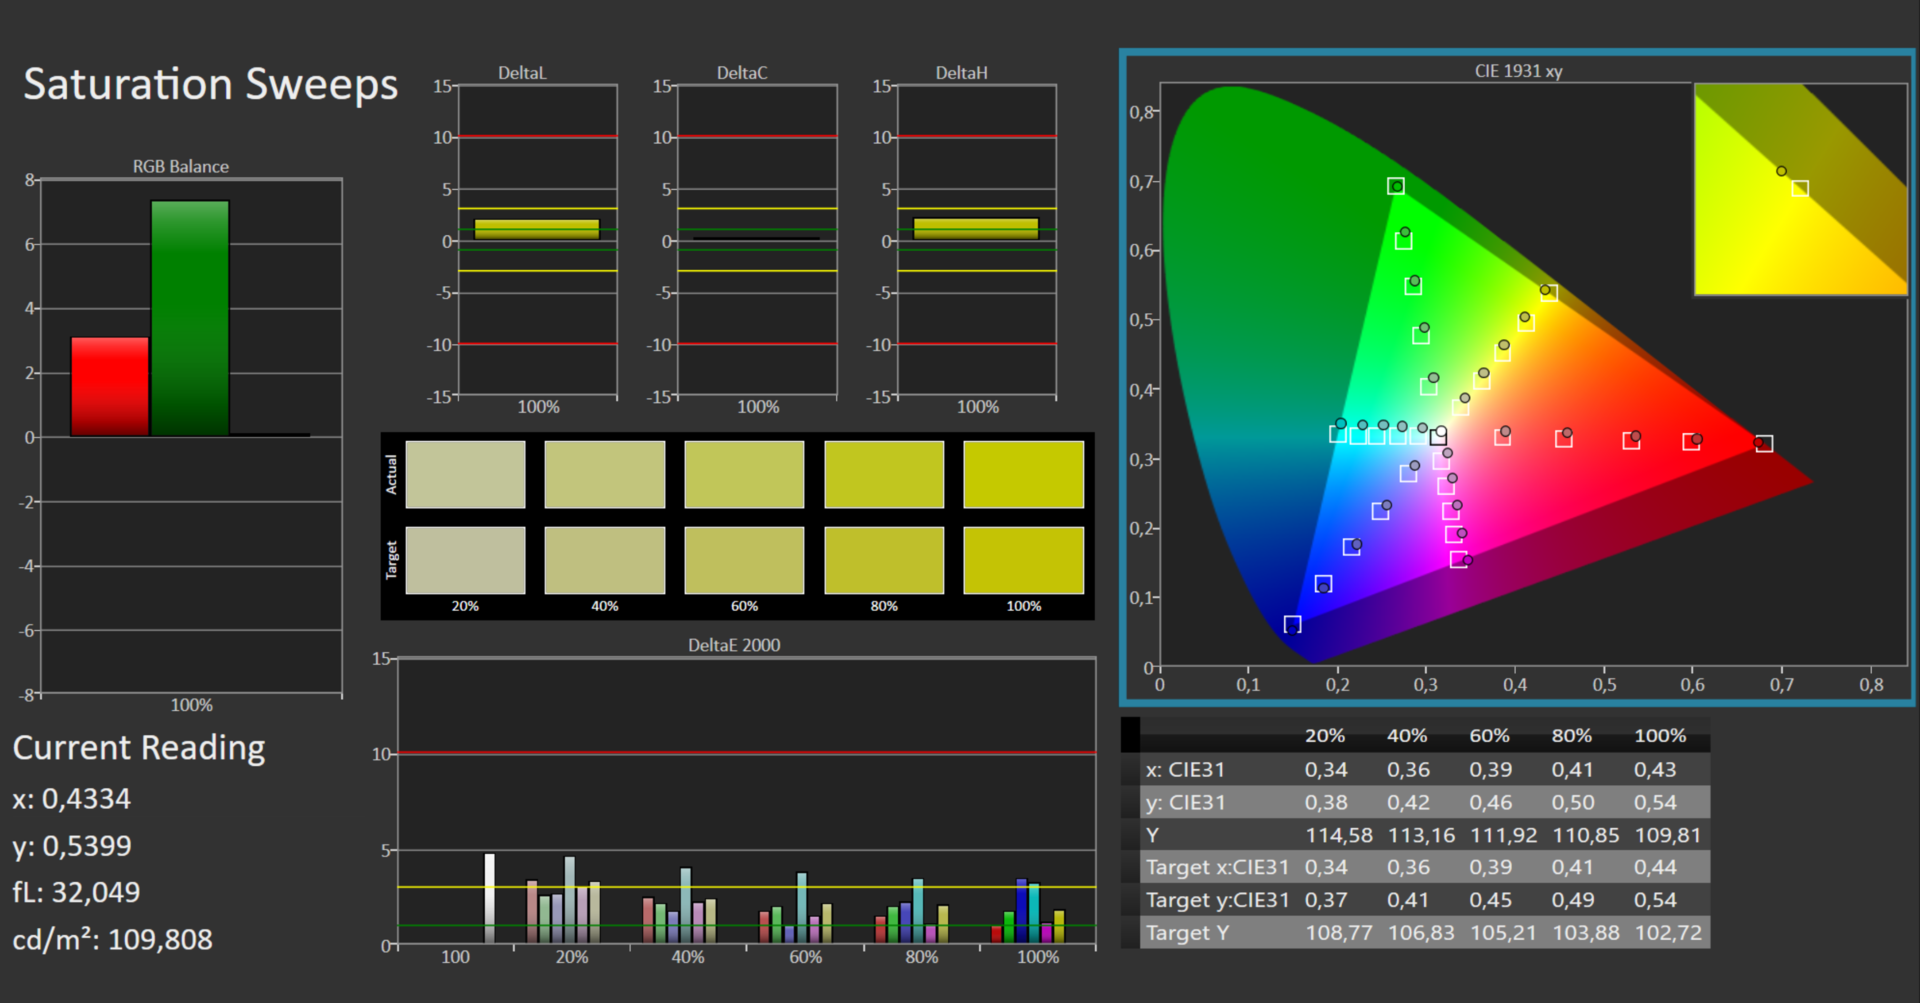
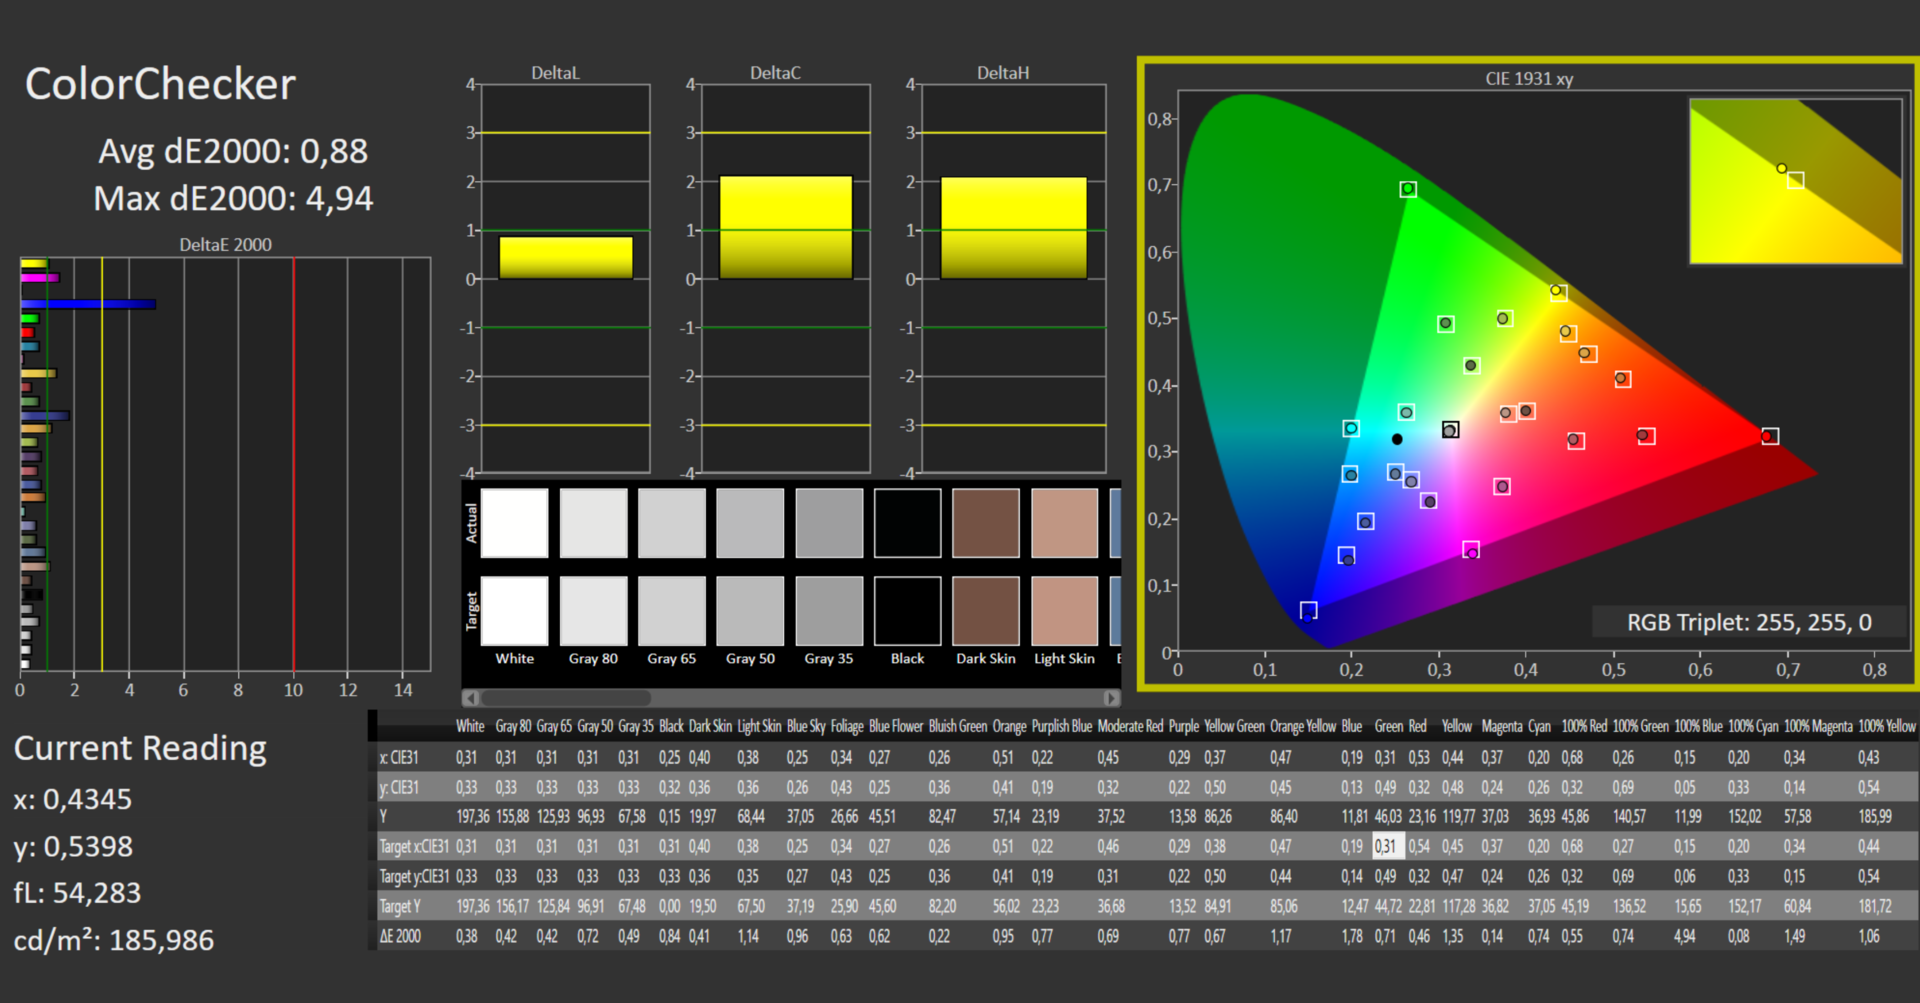
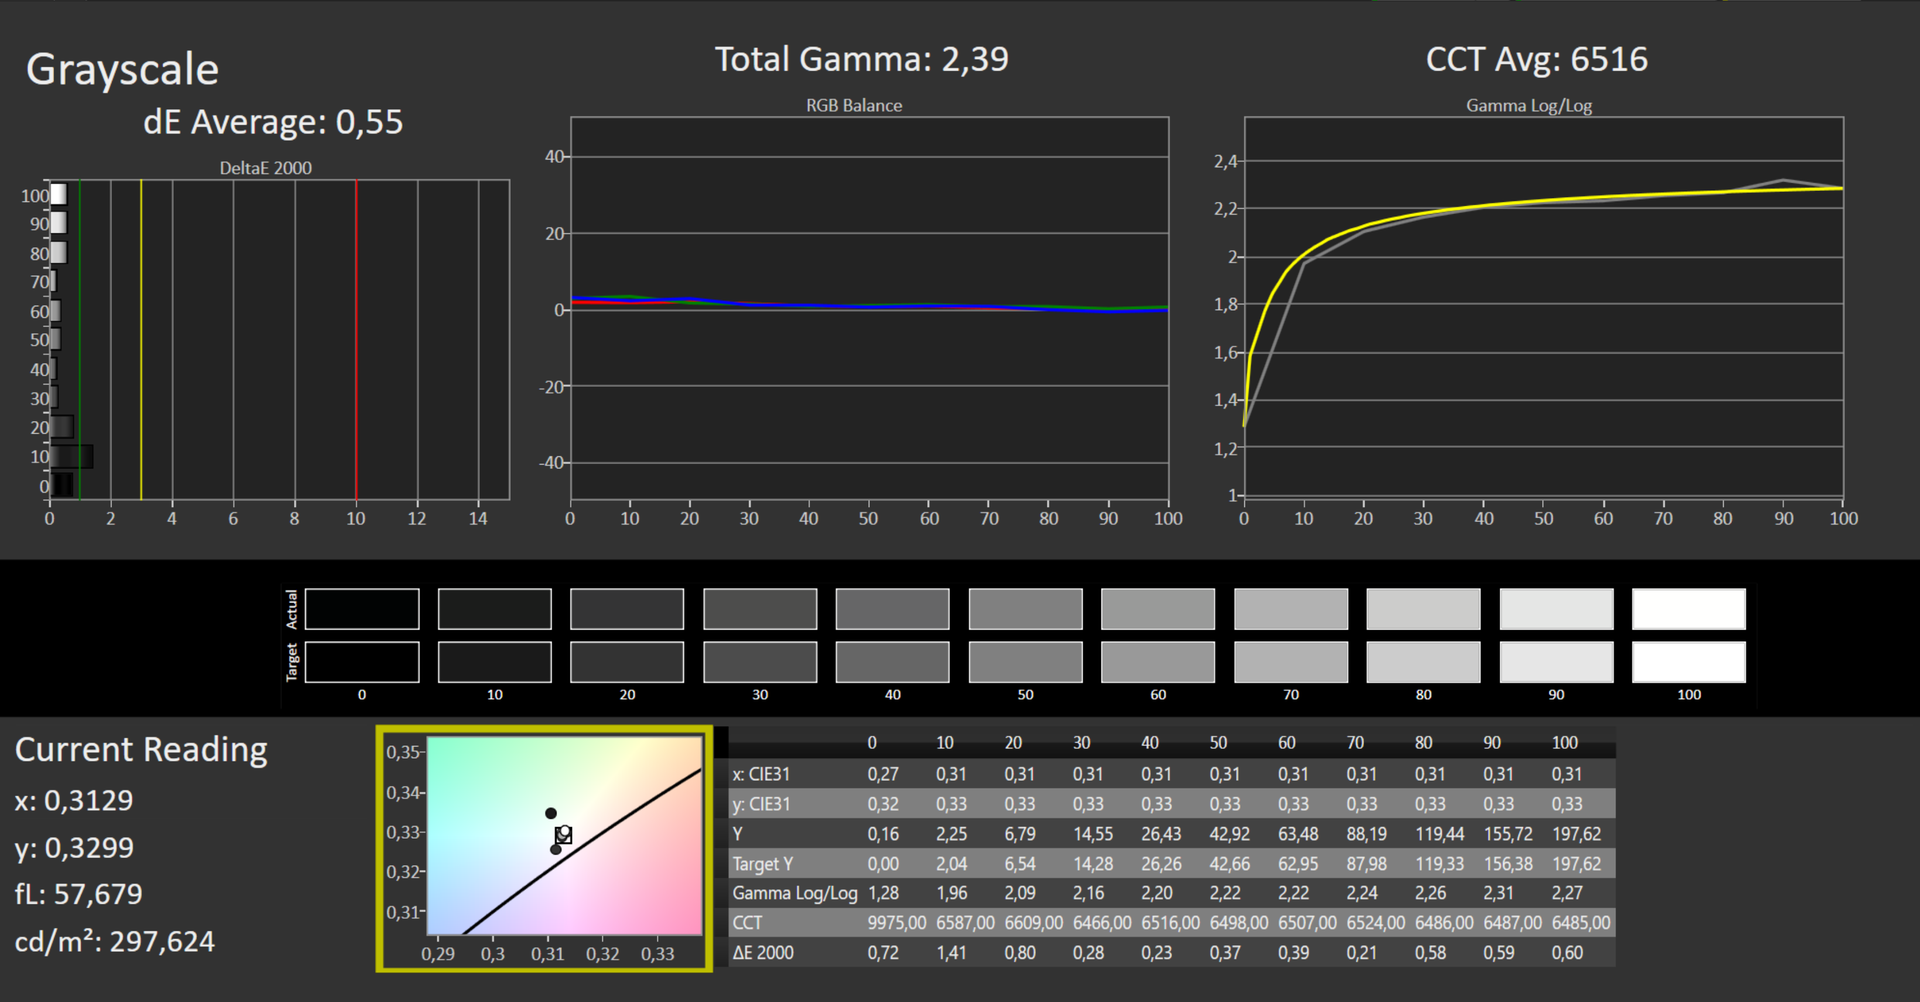
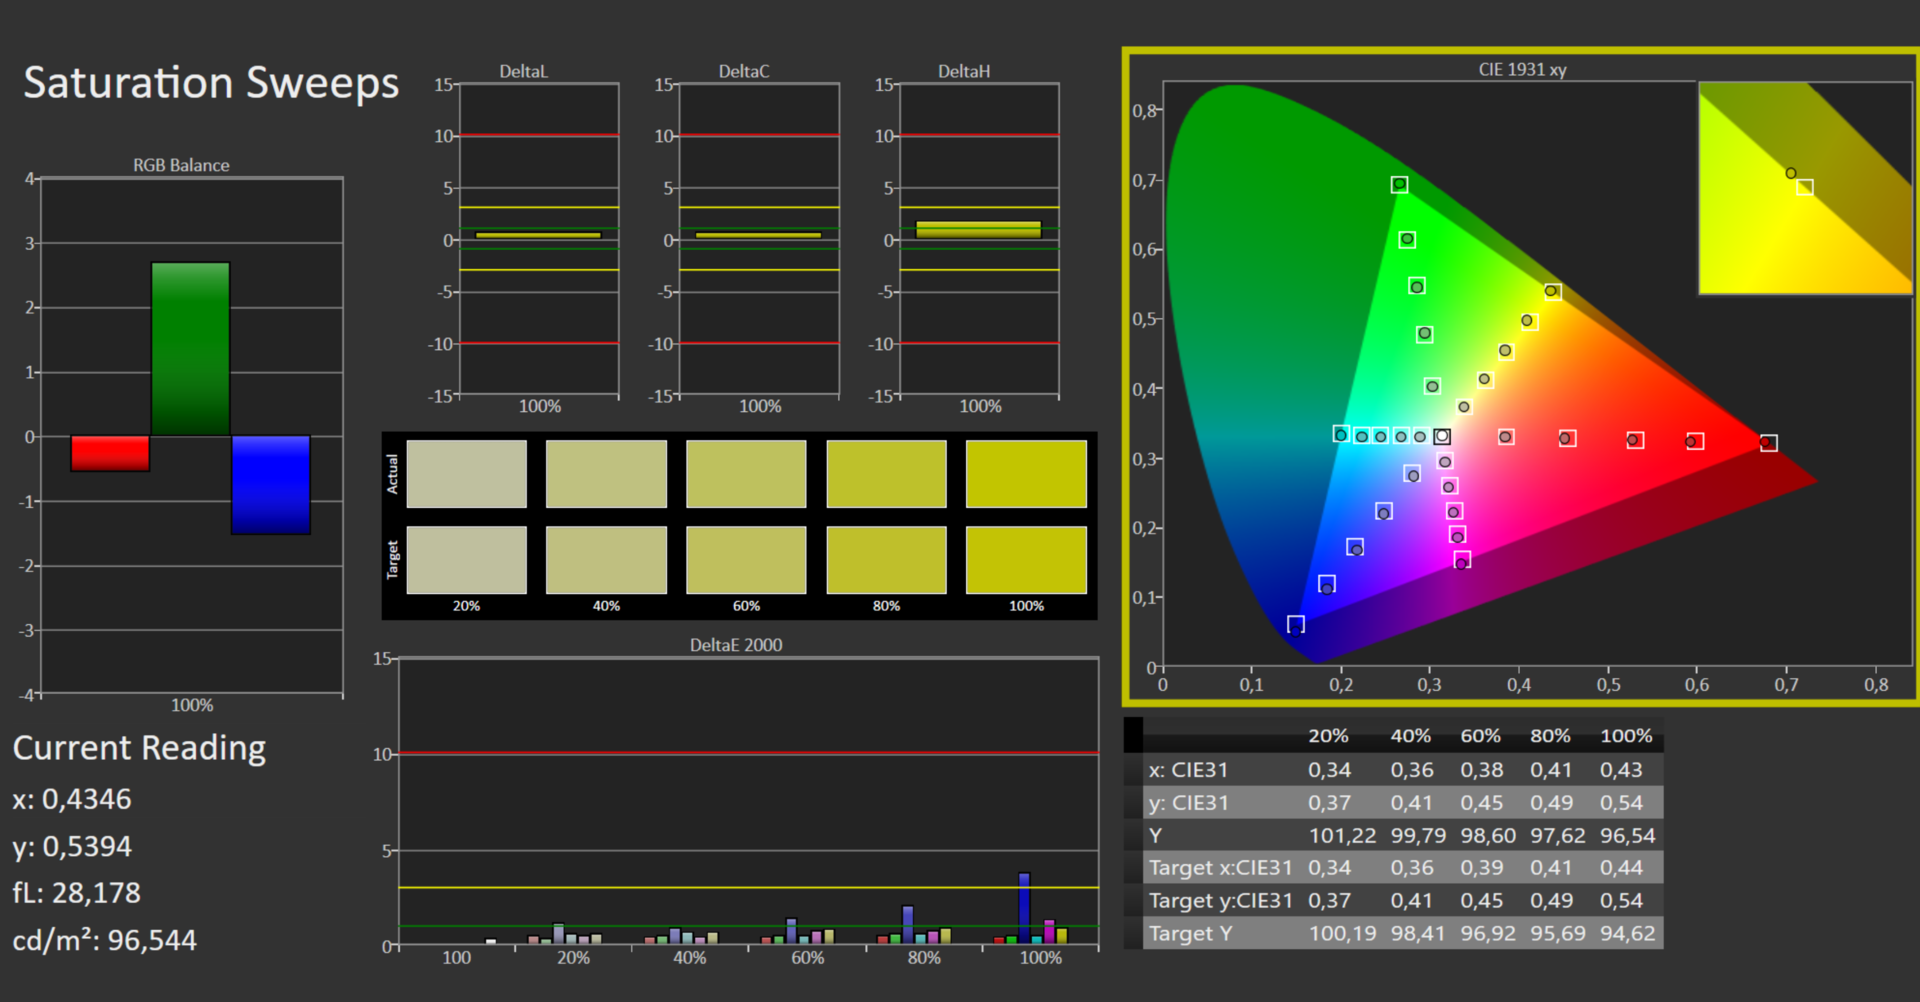
In the state of delivery, the screen displays the colors very accurately. At a value of 3.08, the color deviation barely misses the target of DeltaE < 3. A calibration lowers the deviation to 0.88 and ensures a more balanced display of the Grayscale. The sRGB color space is reproduced completely, the DCI P3 color space almost completely, and the Adobe RGB color space to 87%.
You can download and use the color profile we created for free. The link is in the info box above on the display.
Display Response Times
| ↔ Response Time Black to White | ||
|---|---|---|
| 9 ms ... rise ↗ and fall ↘ combined | ↗ 5 ms rise |  |
| ↘ 4 ms fall | ||
| The screen shows fast response rates in our tests and should be suited for gaming. In comparison, all tested devices range from 0.1 (minimum) to 240 (maximum) ms. » 24 % of all devices are better. This means that the measured response time is better than the average of all tested devices (20.2 ms). | ||
| ↔ Response Time 50% Grey to 80% Grey | ||
| 13 ms ... rise ↗ and fall ↘ combined | ↗ 6 ms rise |  |
| ↘ 7 ms fall | ||
| The screen shows good response rates in our tests, but may be too slow for competitive gamers. In comparison, all tested devices range from 0.165 (minimum) to 636 (maximum) ms. » 25 % of all devices are better. This means that the measured response time is better than the average of all tested devices (31.6 ms). | ||
Screen Flickering / PWM (Pulse-Width Modulation)
| Screen flickering / PWM not detected |  | ||
In comparison: 53 % of all tested devices do not use PWM to dim the display. If PWM was detected, an average of 8111 (minimum: 5 - maximum: 343500) Hz was measured. | |||
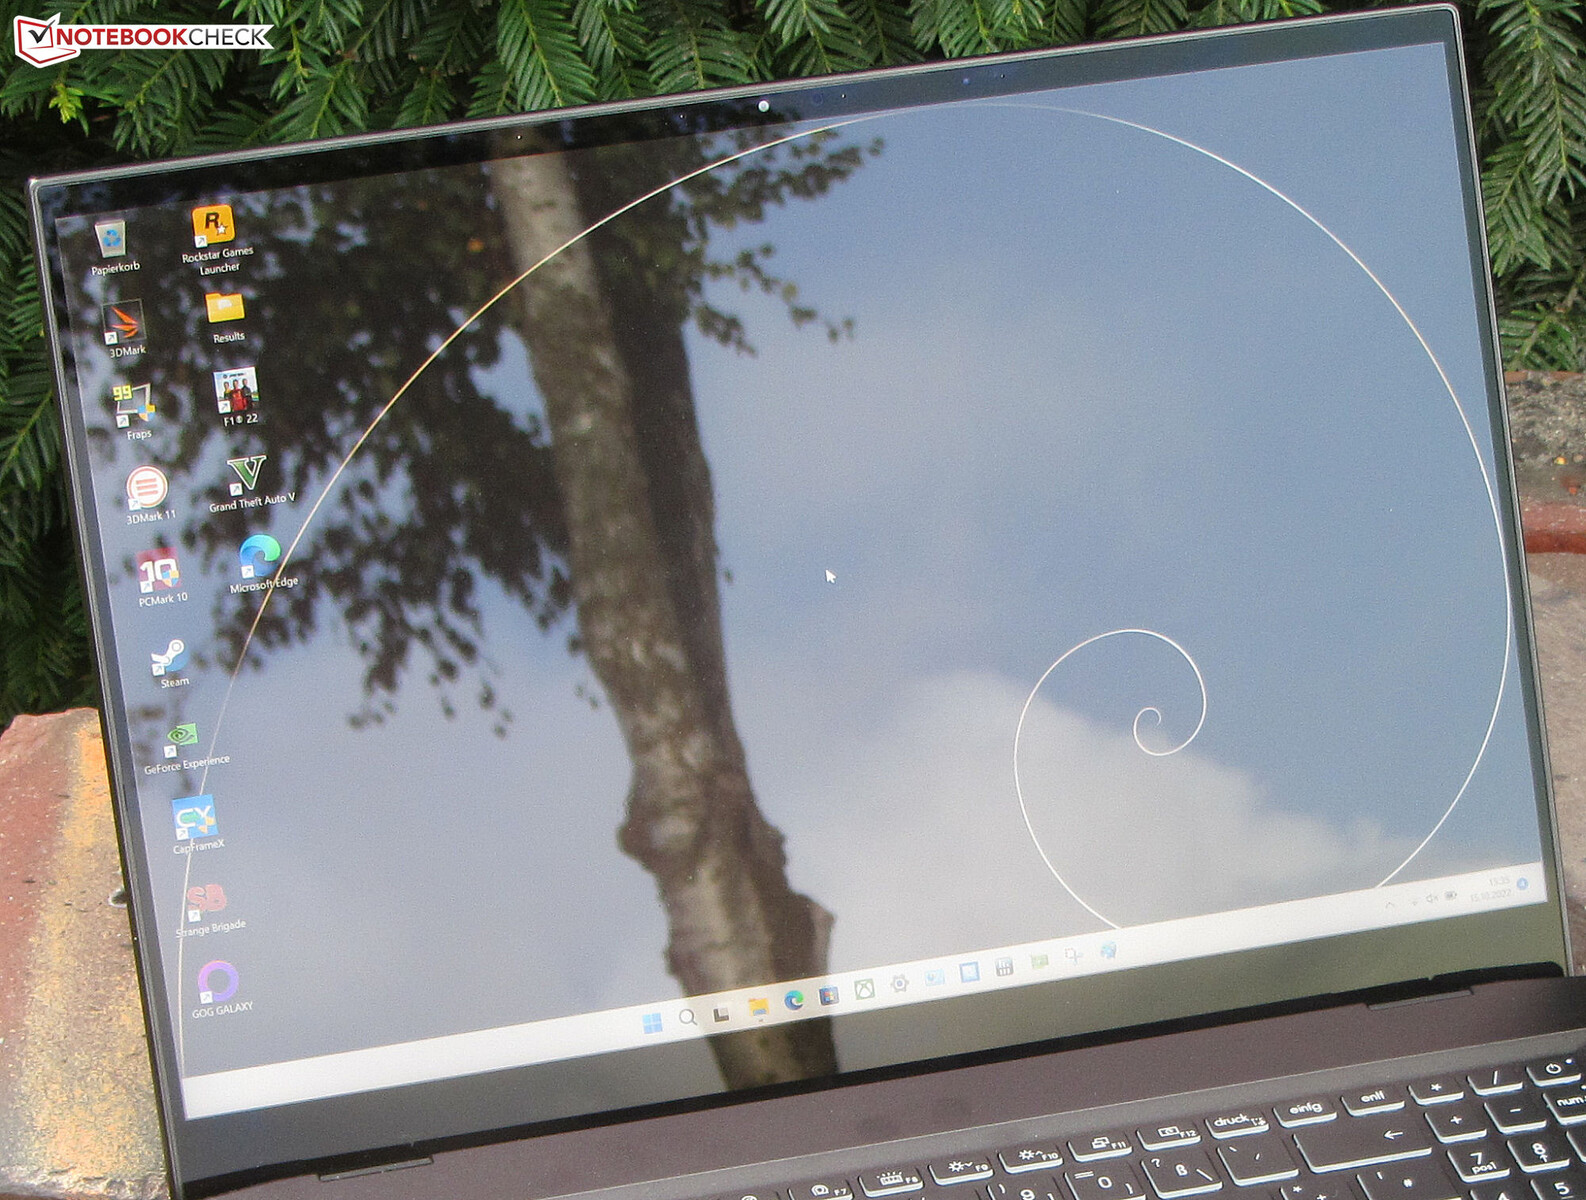
The viewing angles of the IPS panel are stable, and it can be read from any position. Outdoors, the reflective display surface makes reading the display difficult.
Performance - Alder Lake meets Ampere
The Summit E16 Flip offers more than sufficient computing performance for Office and Internet tasks. A dedicated GPU accelerates graphics intensive applications and allows playing computer games.
Test Conditions
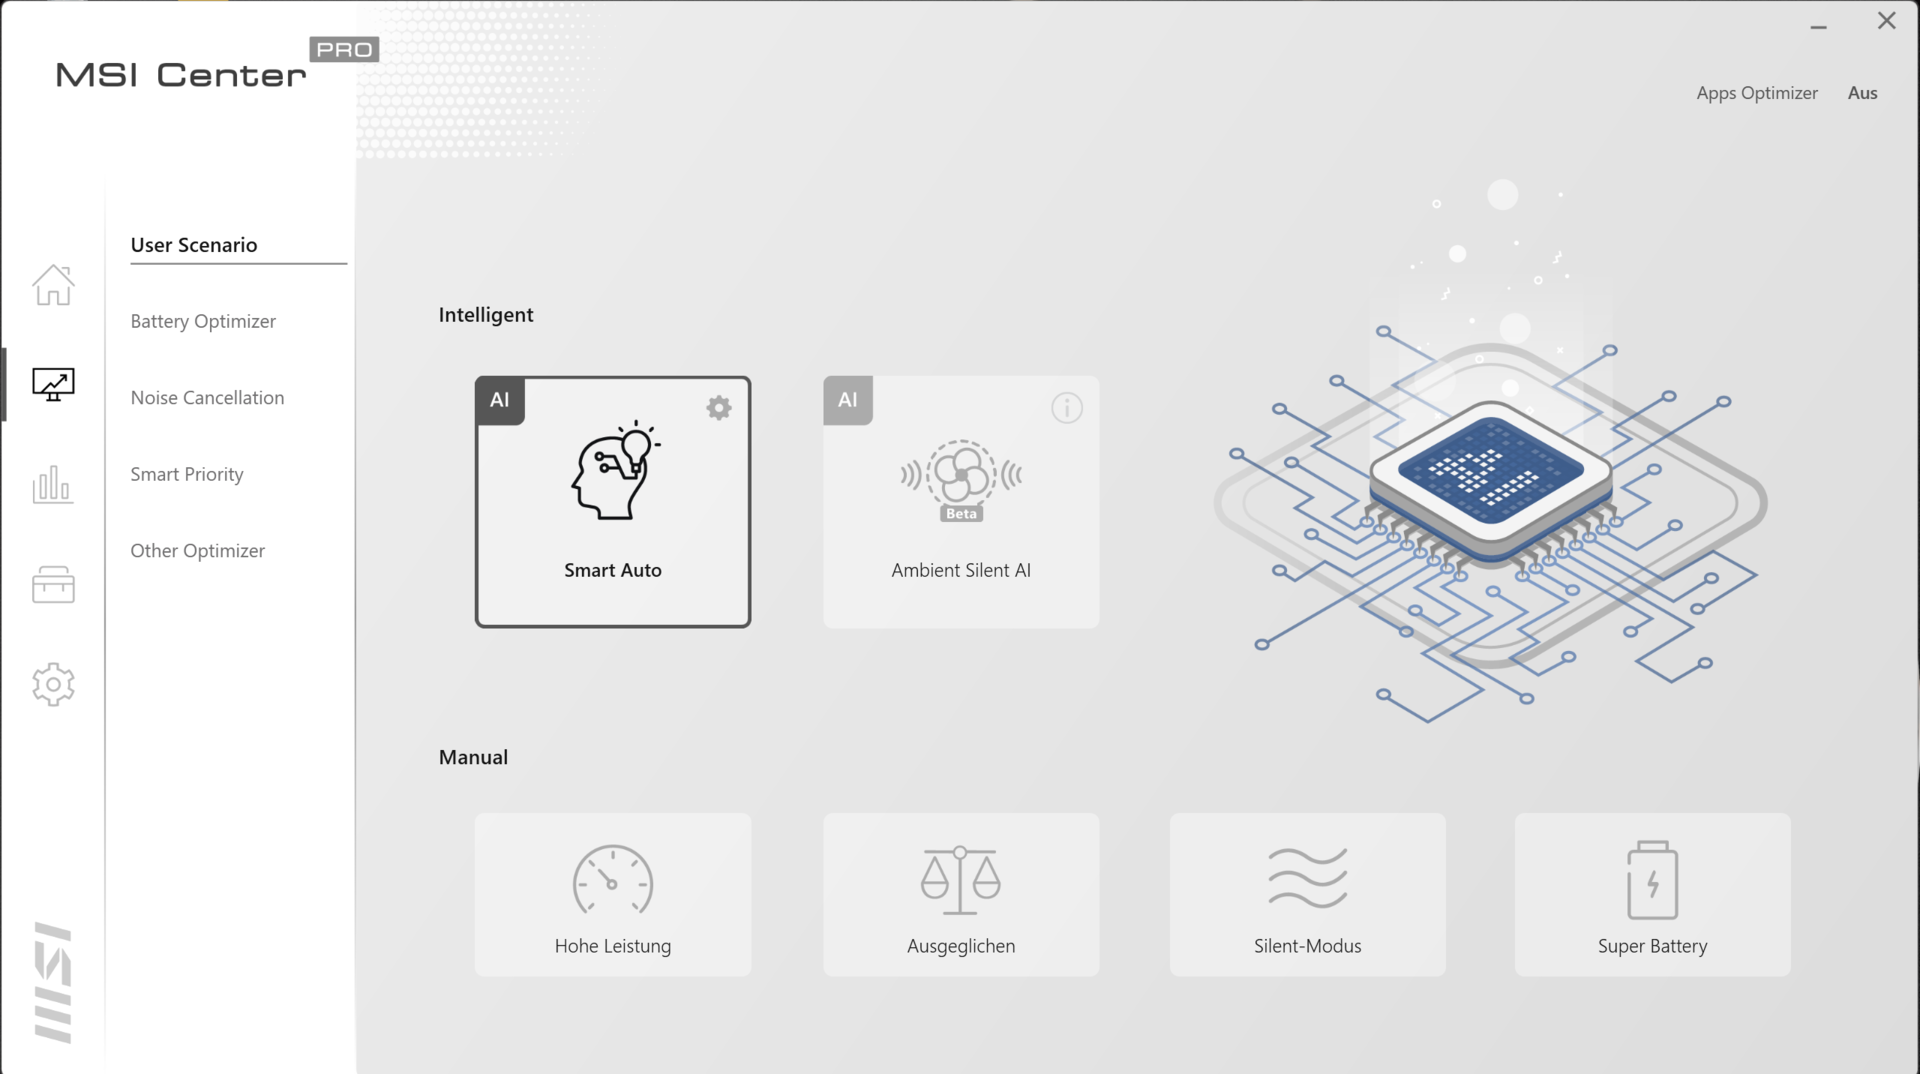
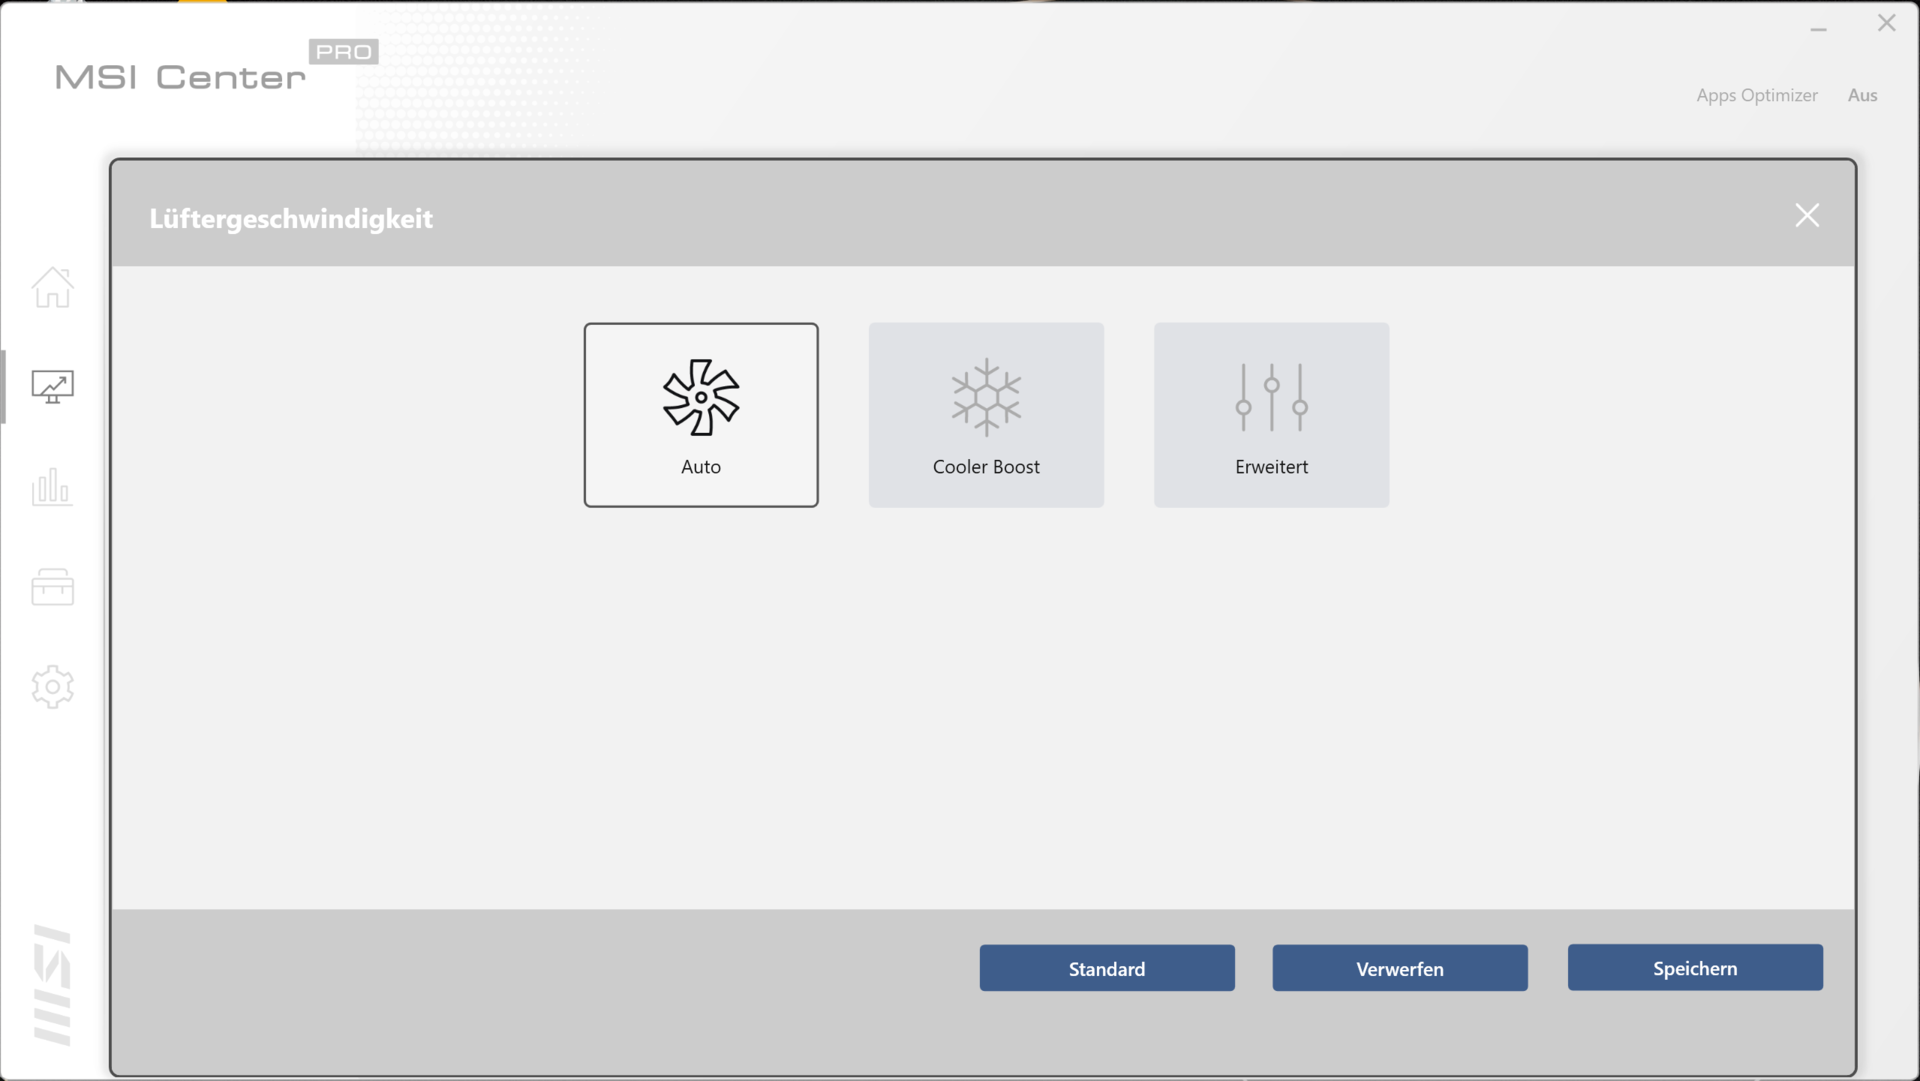
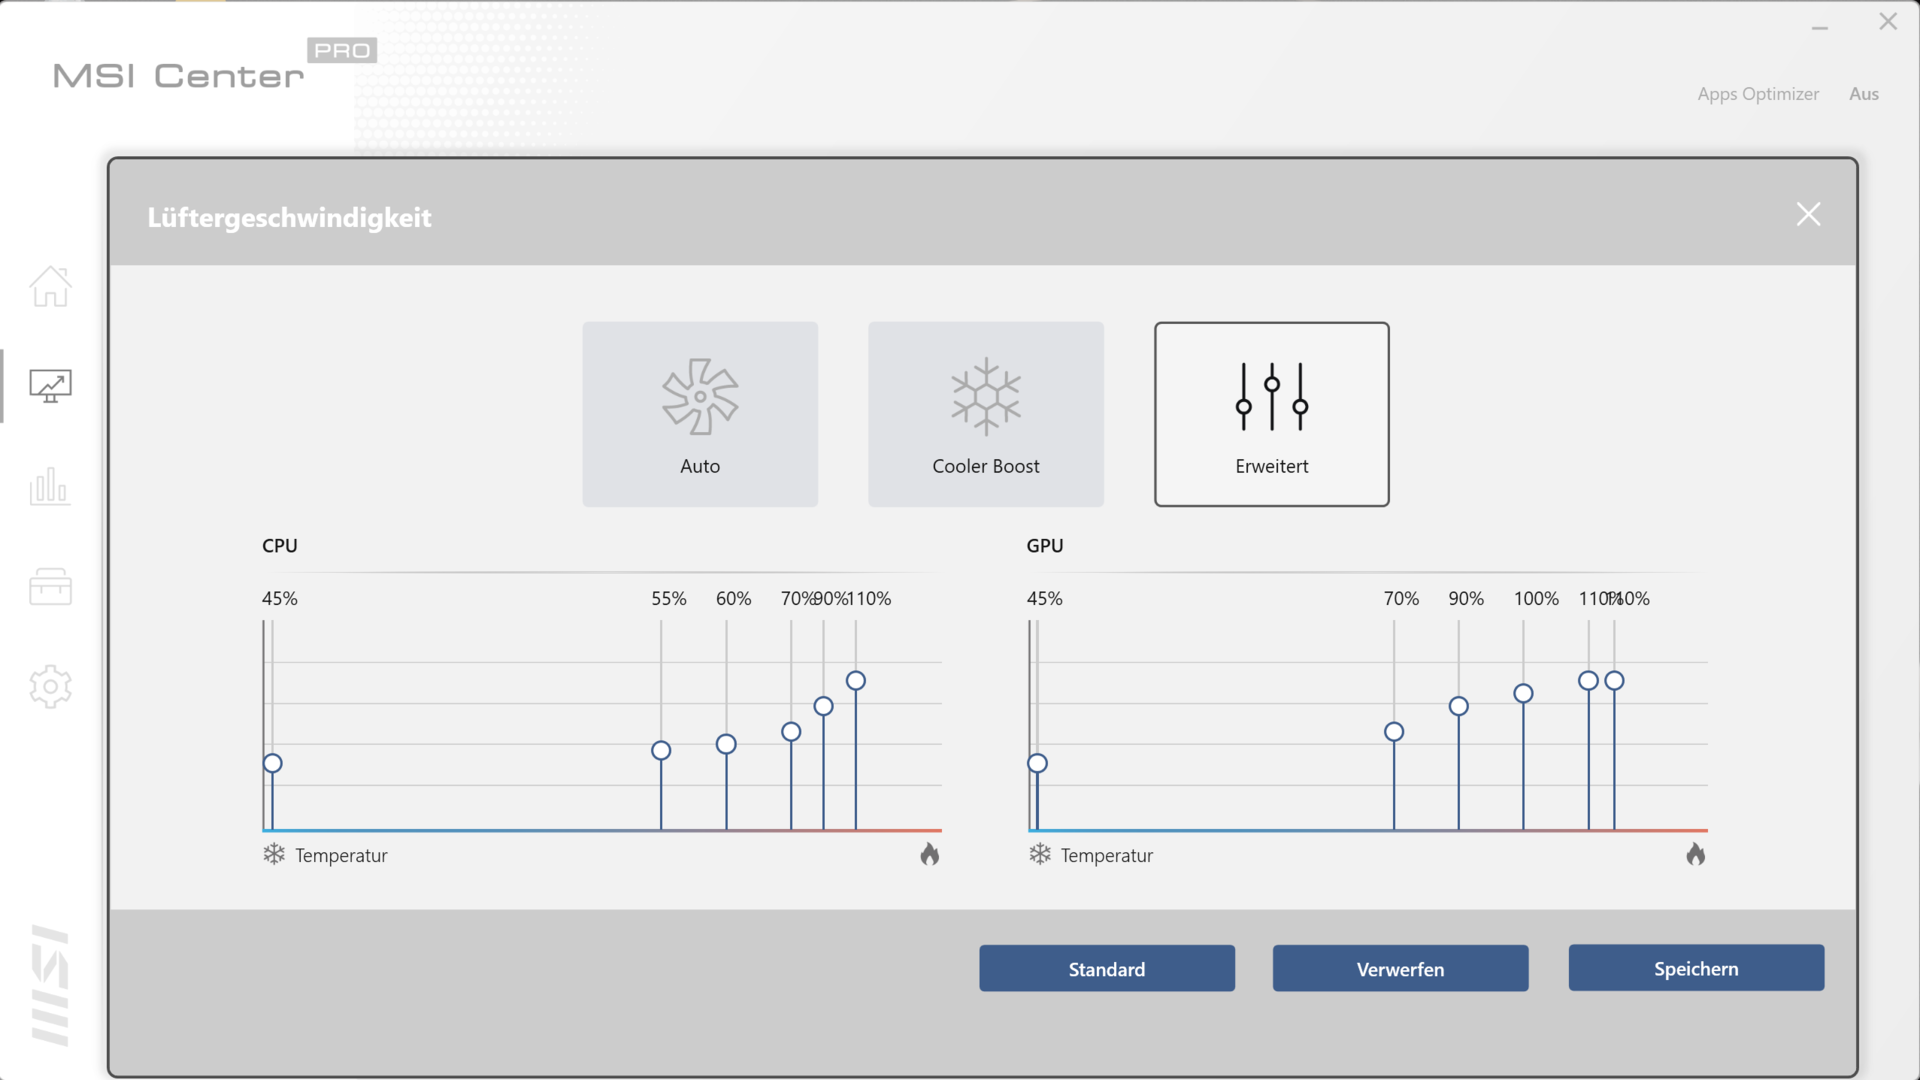
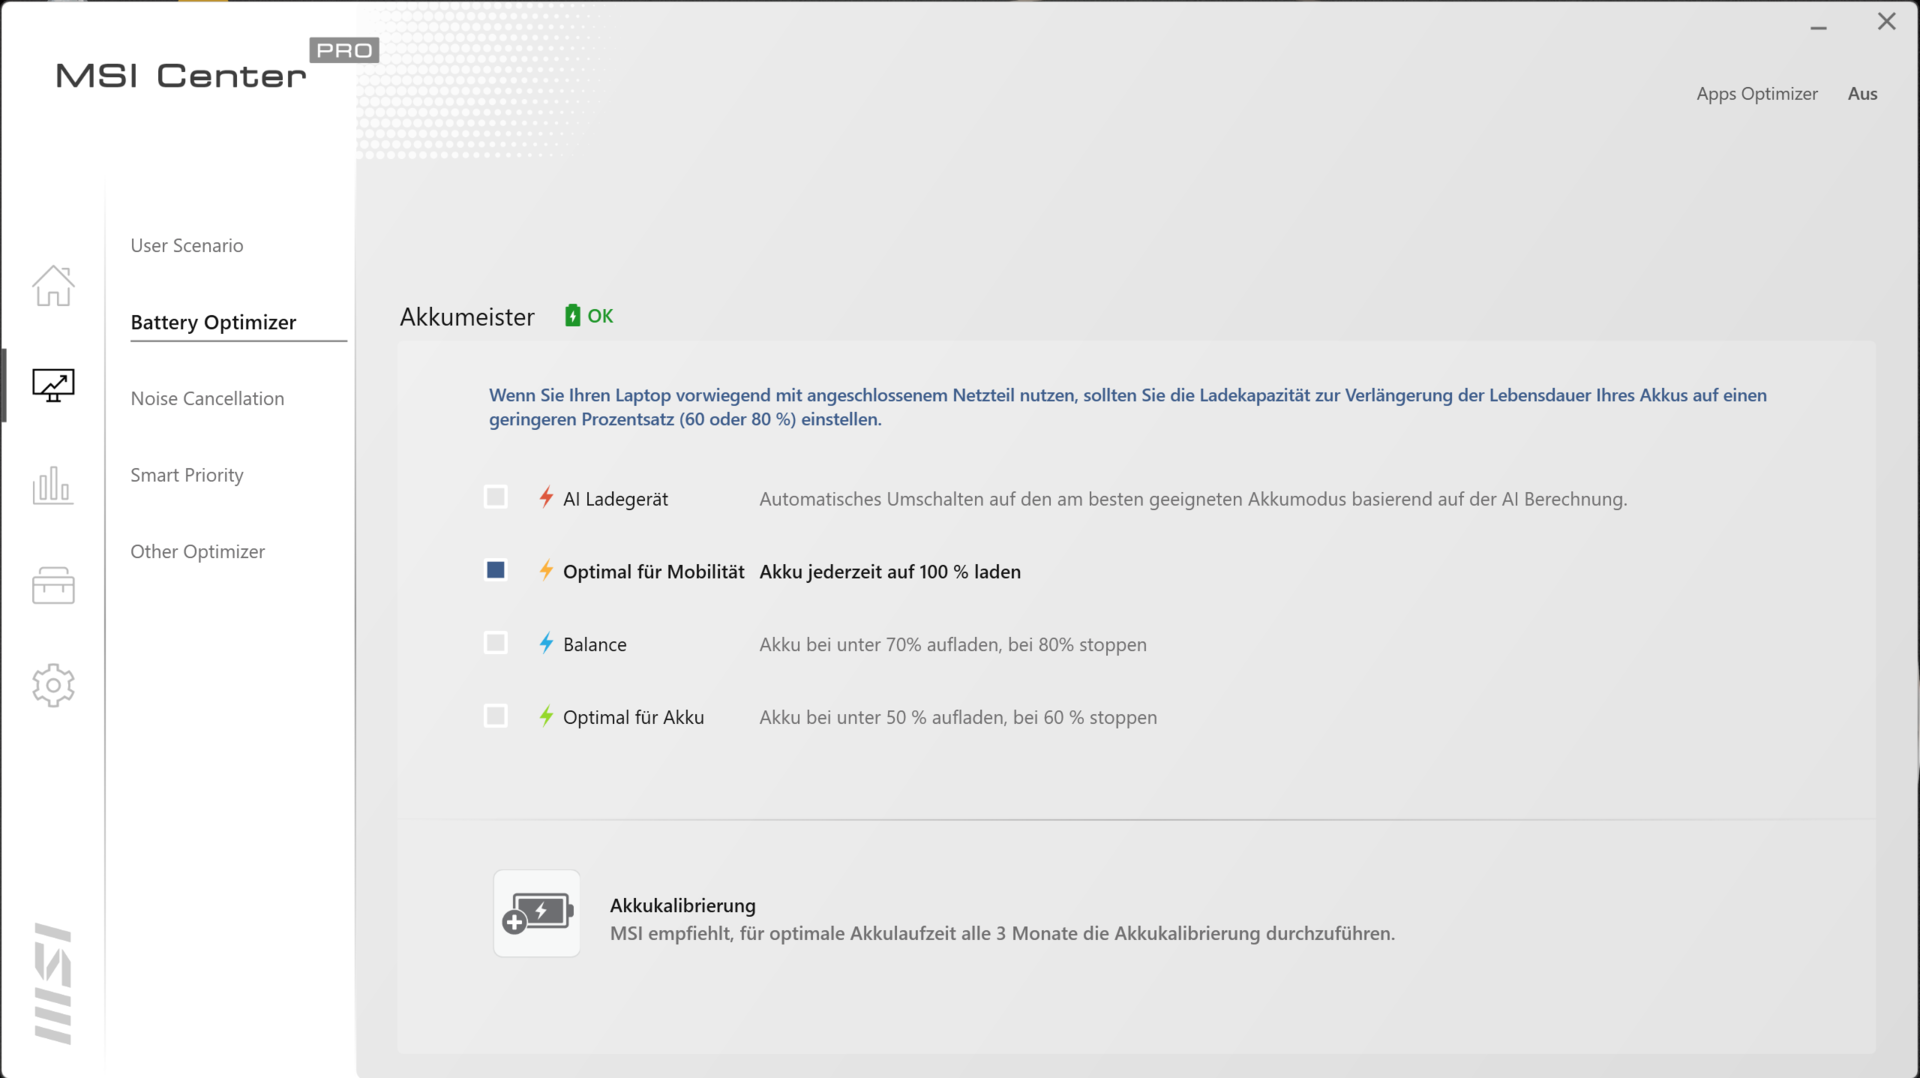
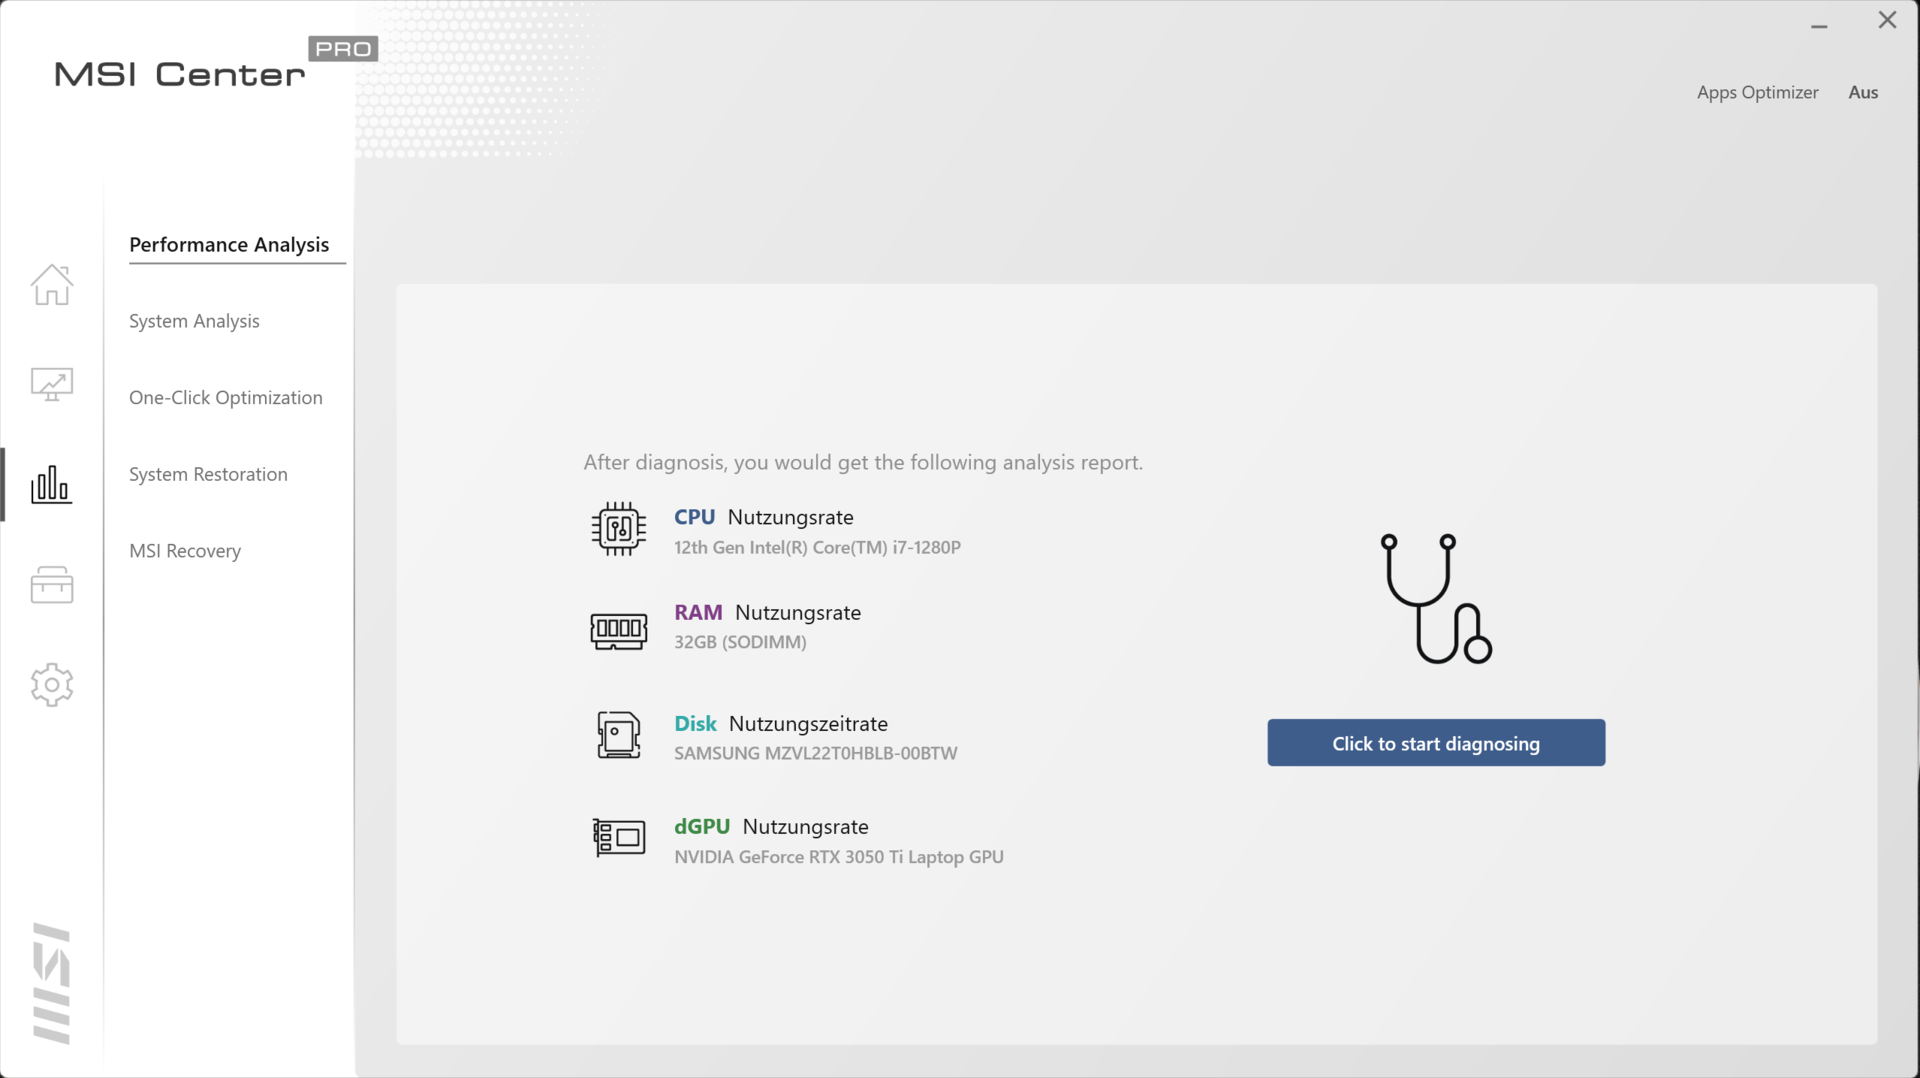
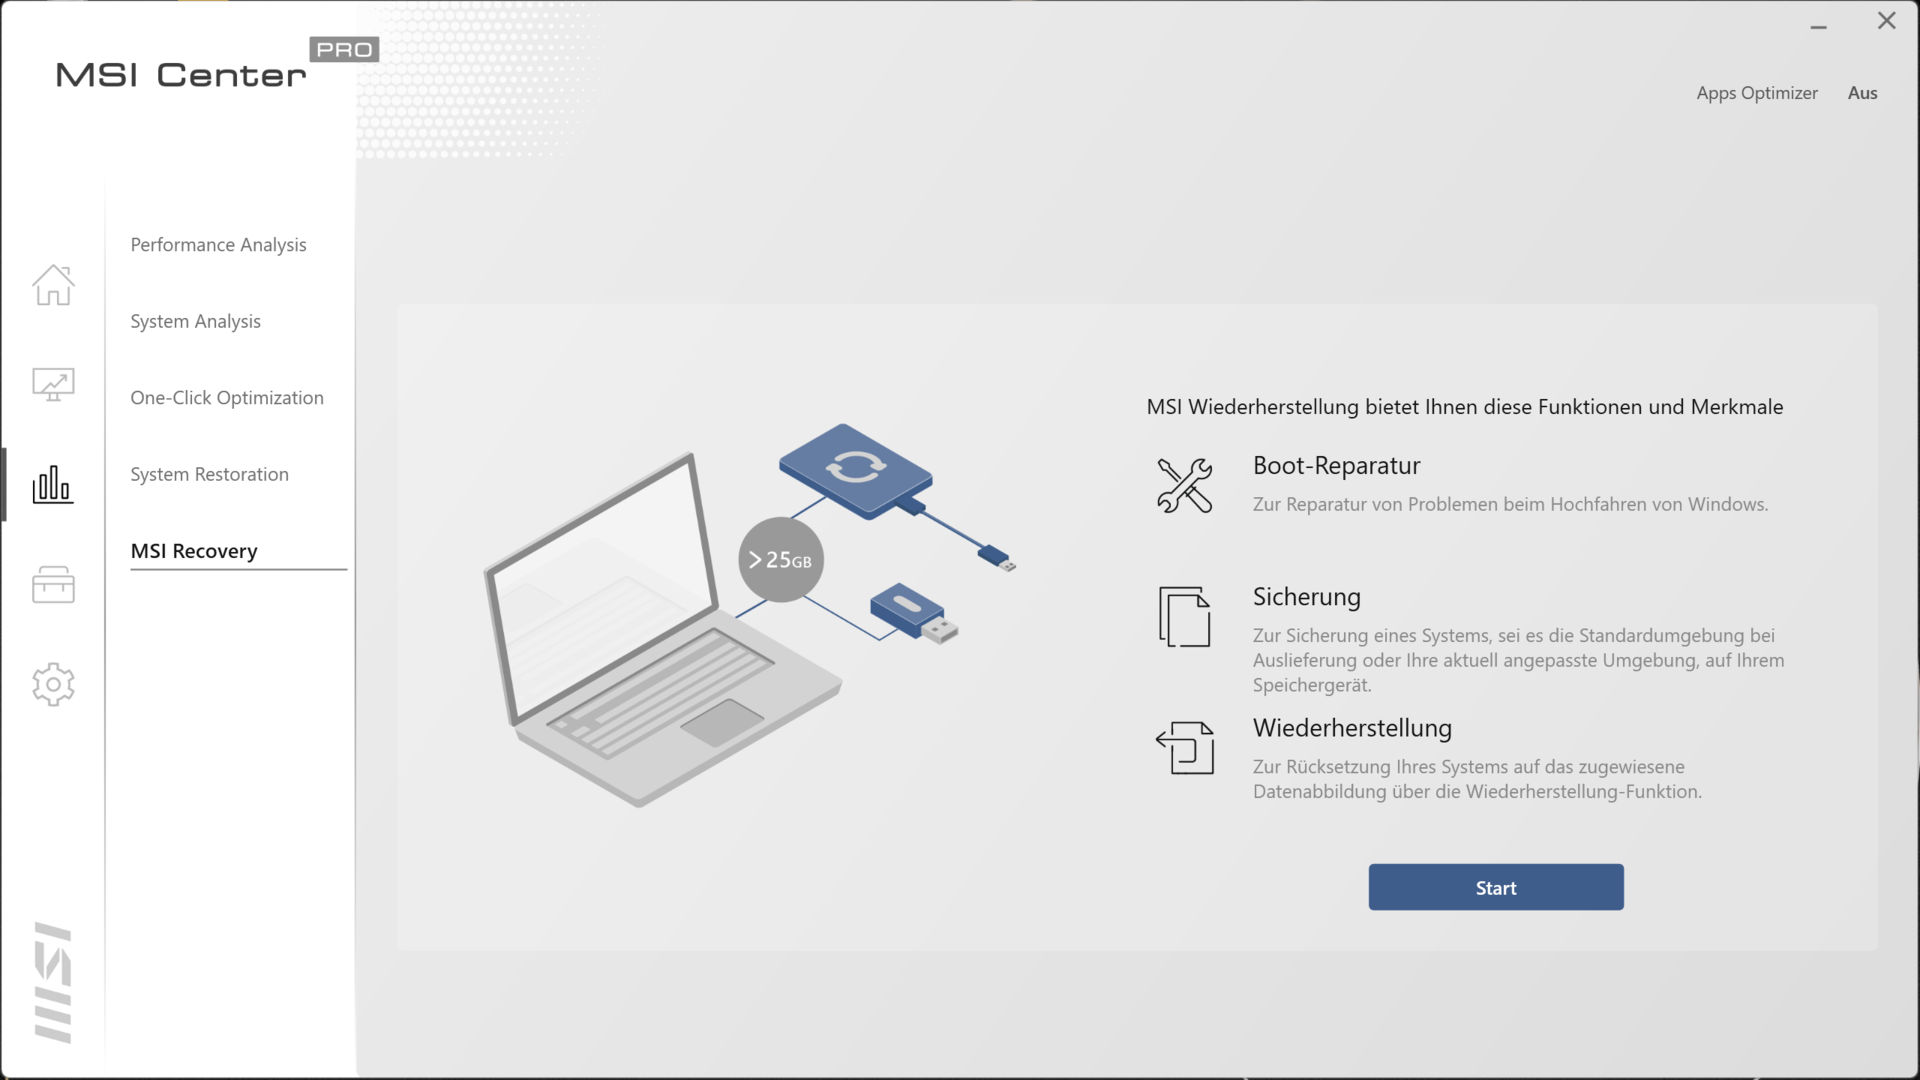
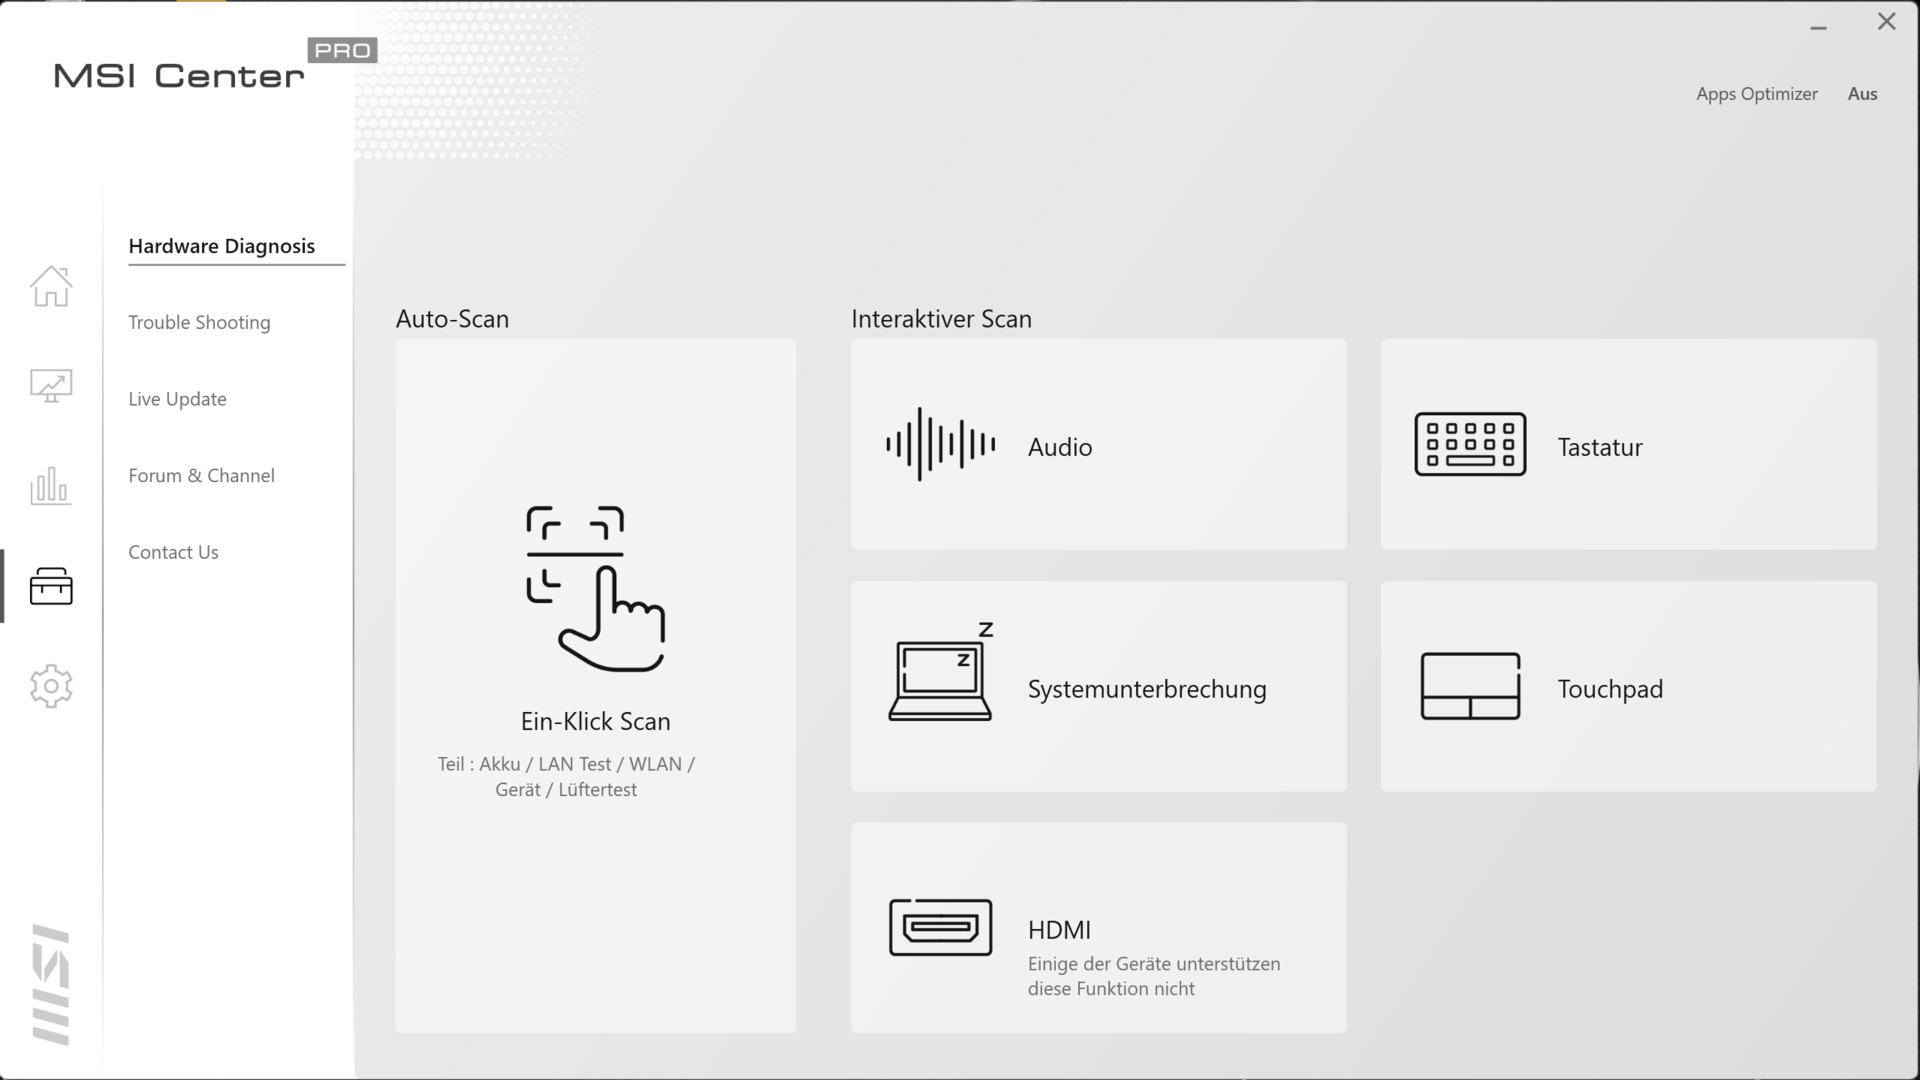
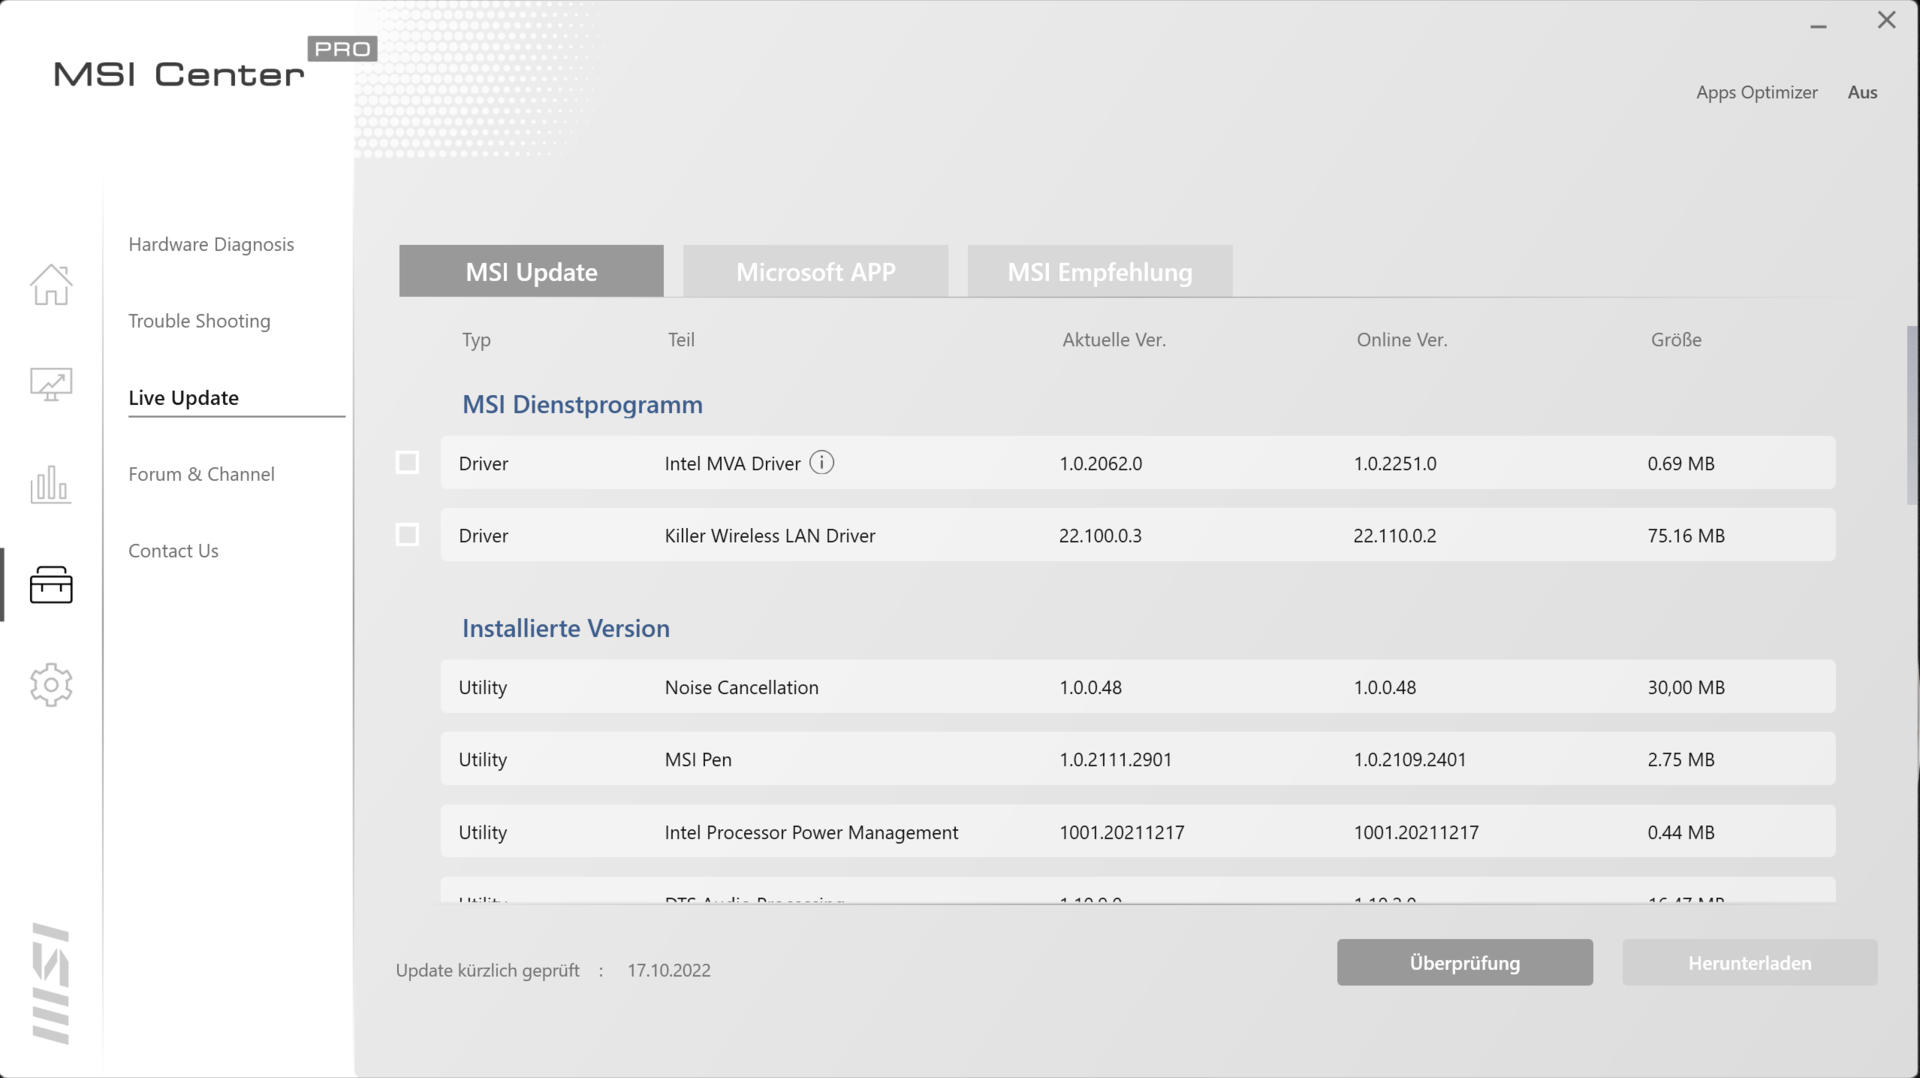
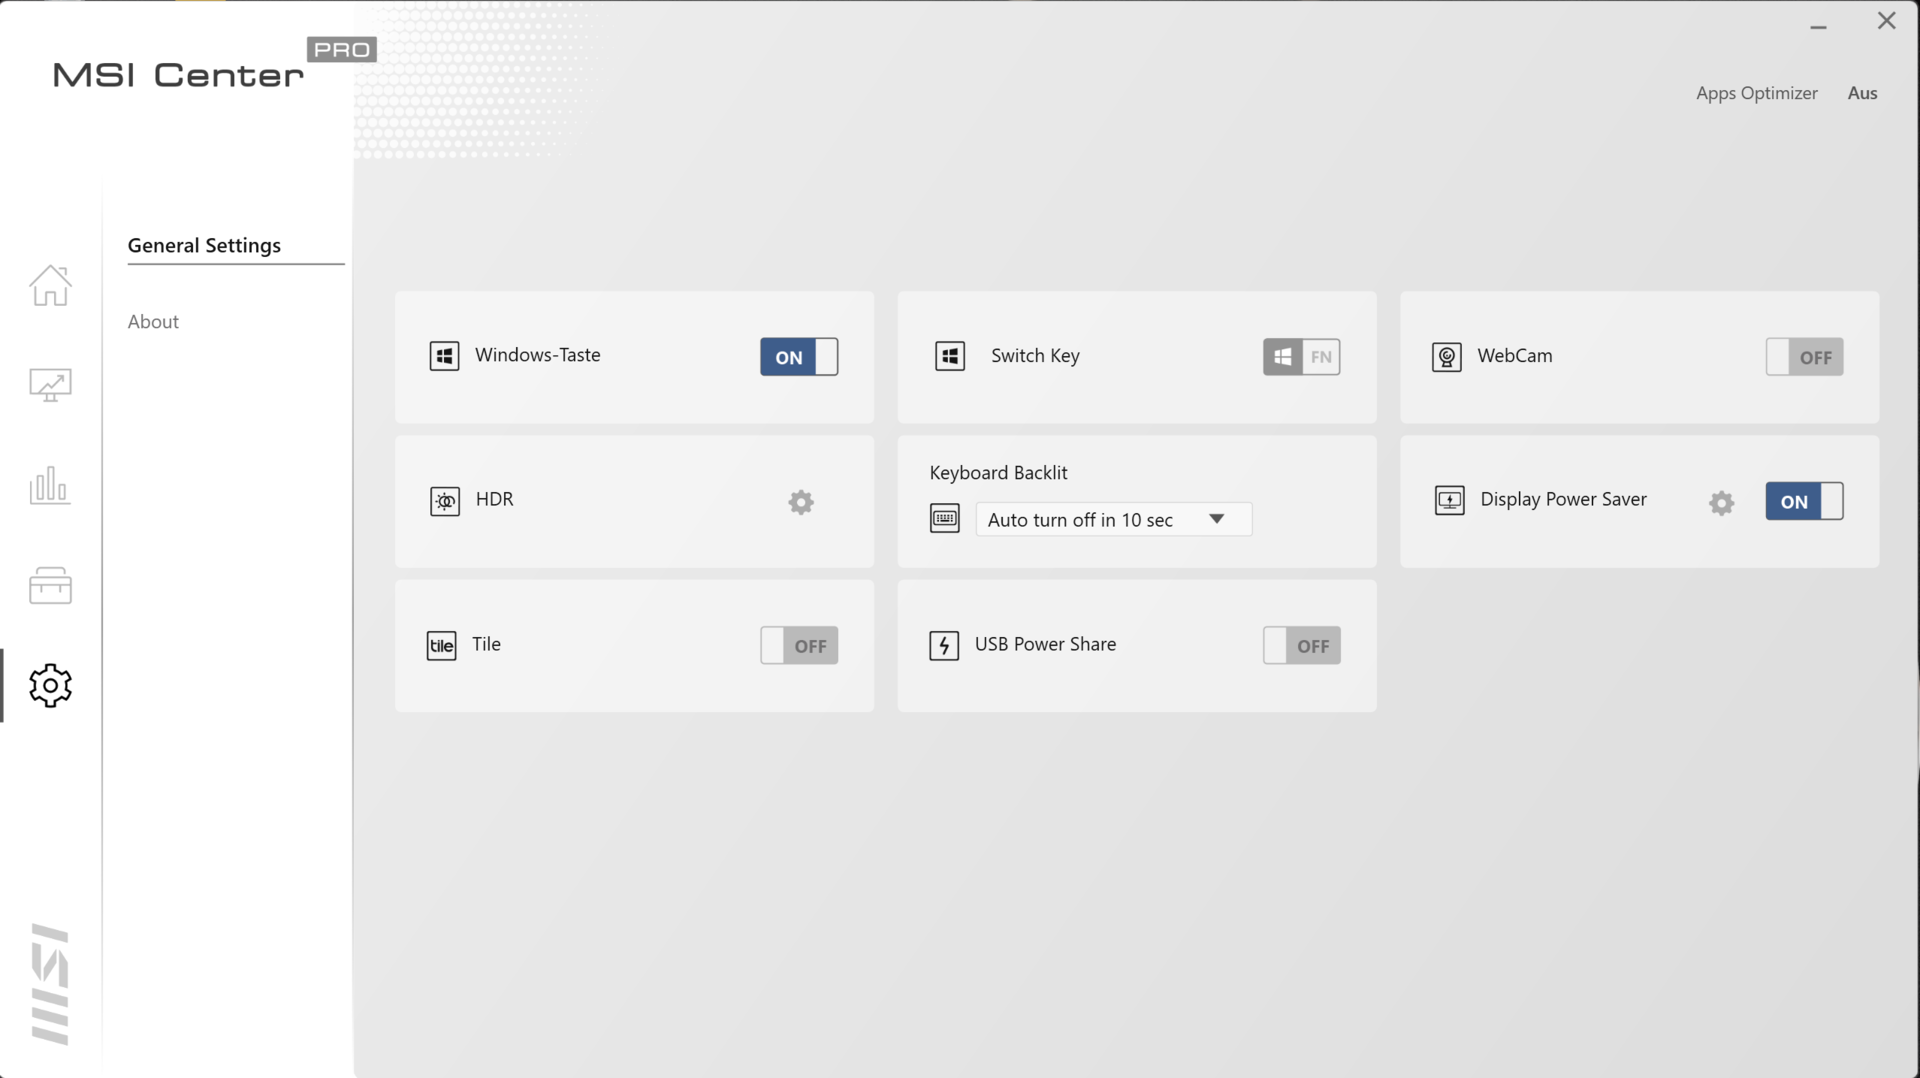
The preinstalled MSI Center Pro software (see images) and F7 key allow you to switch between four power profiles (High Performance, Balanced, Silent Mode, Super Battery) of the laptop. When you use the overriding, AI based "Smart Auto" function, as in our case, the MSI Center automatically choses the profile that fits the scenario. The profiles influence only the CPU performance and not the GPU performance.
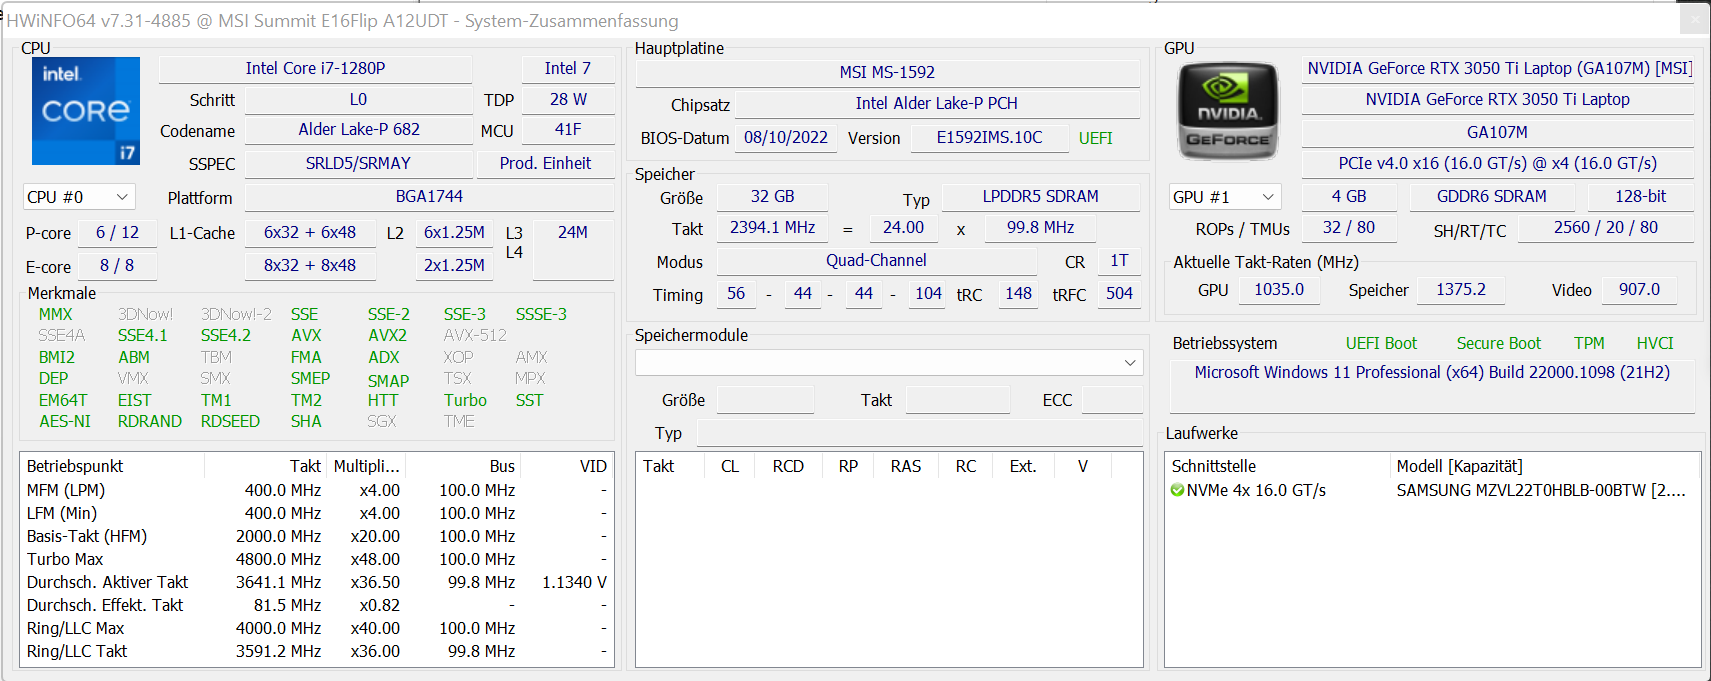
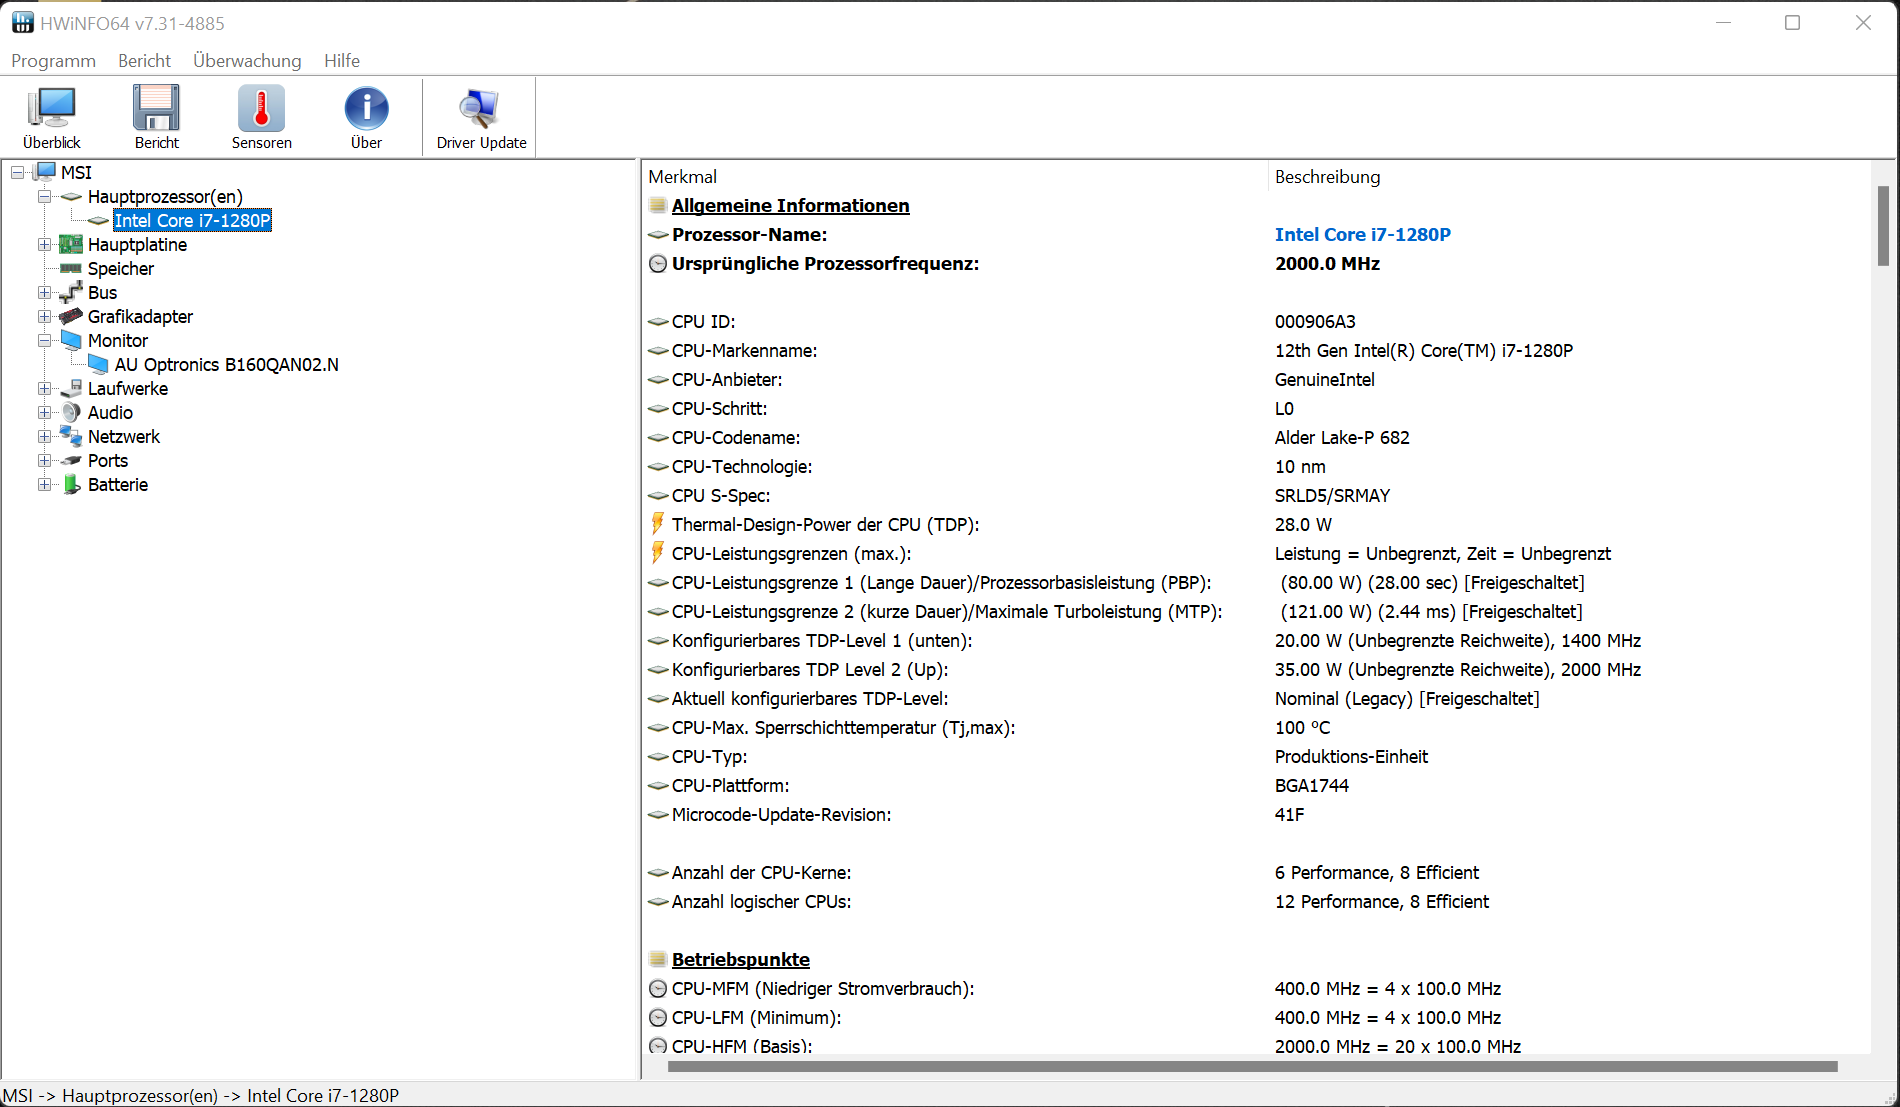
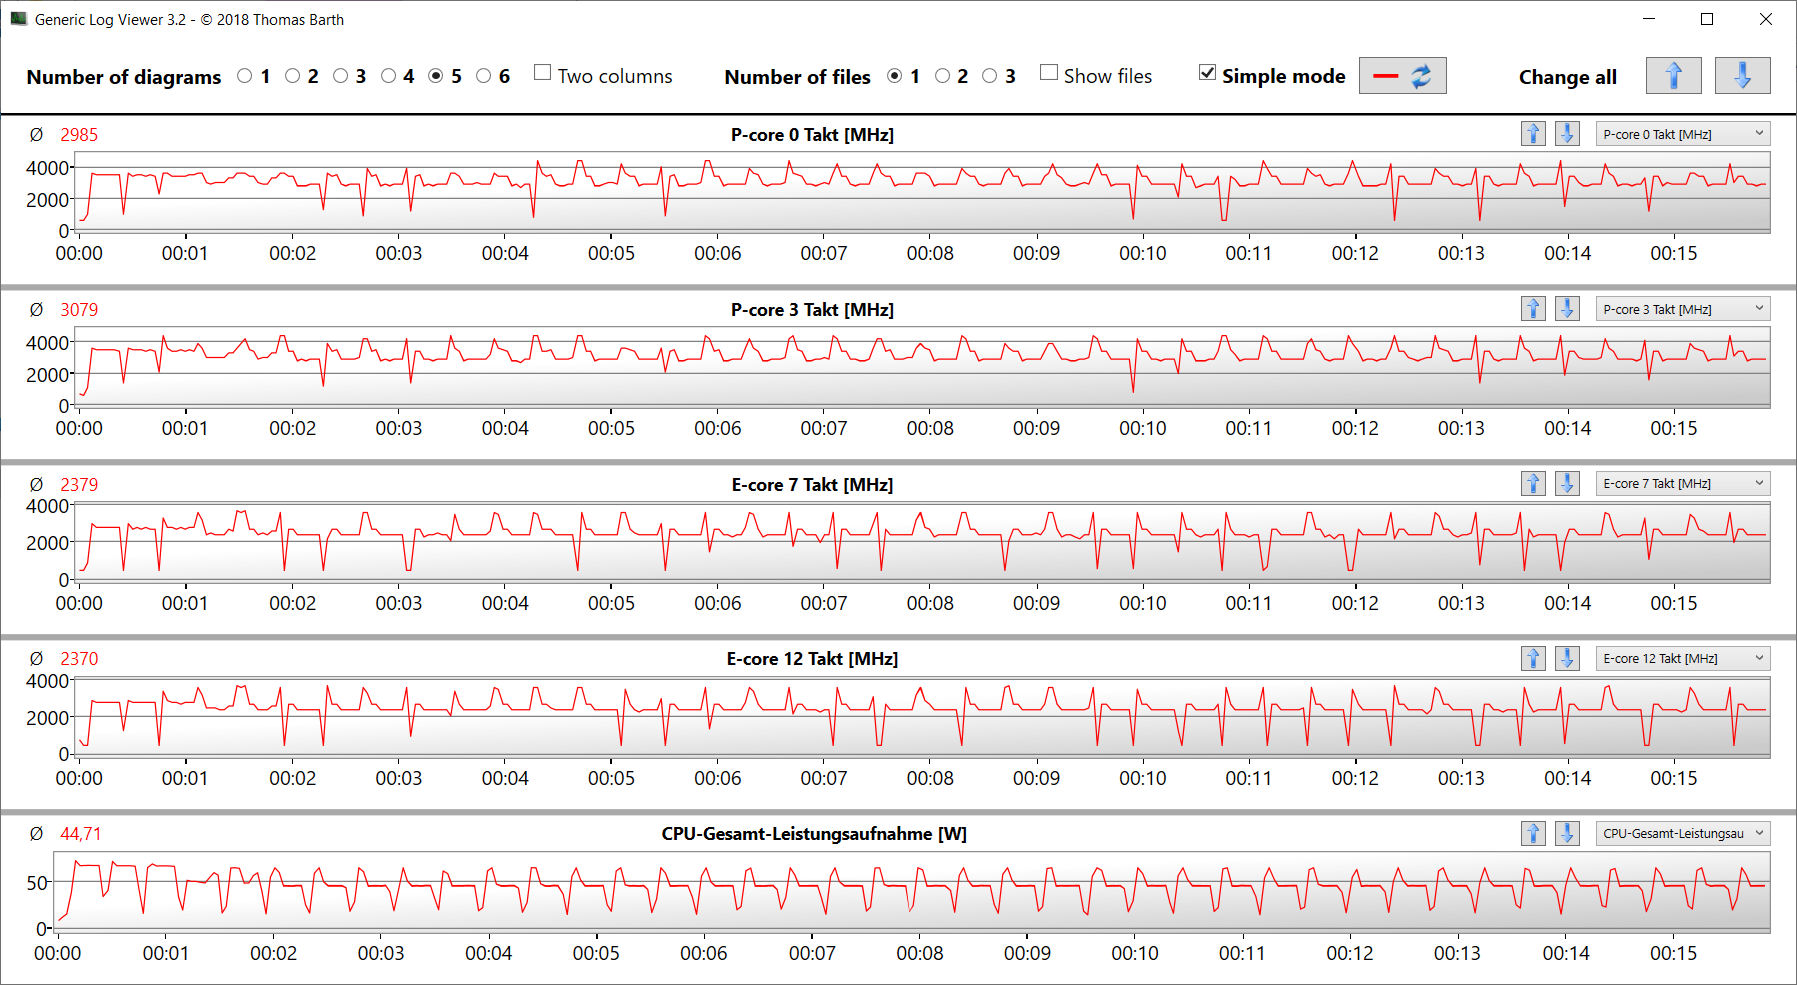
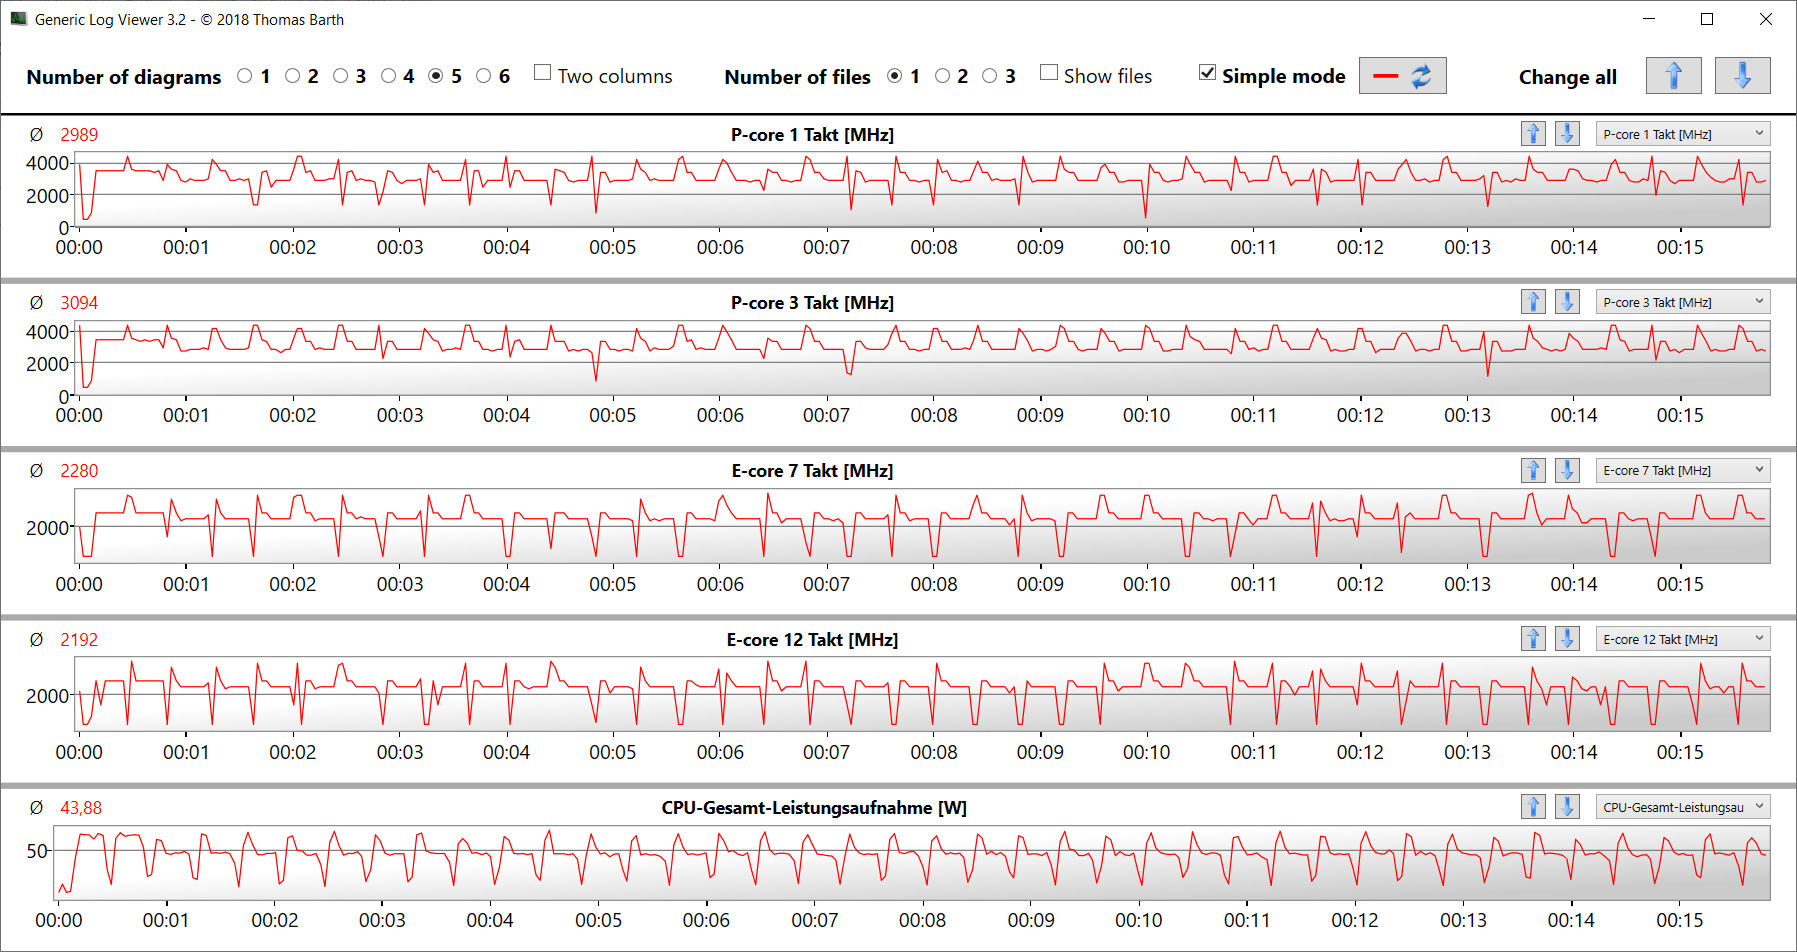
Processor
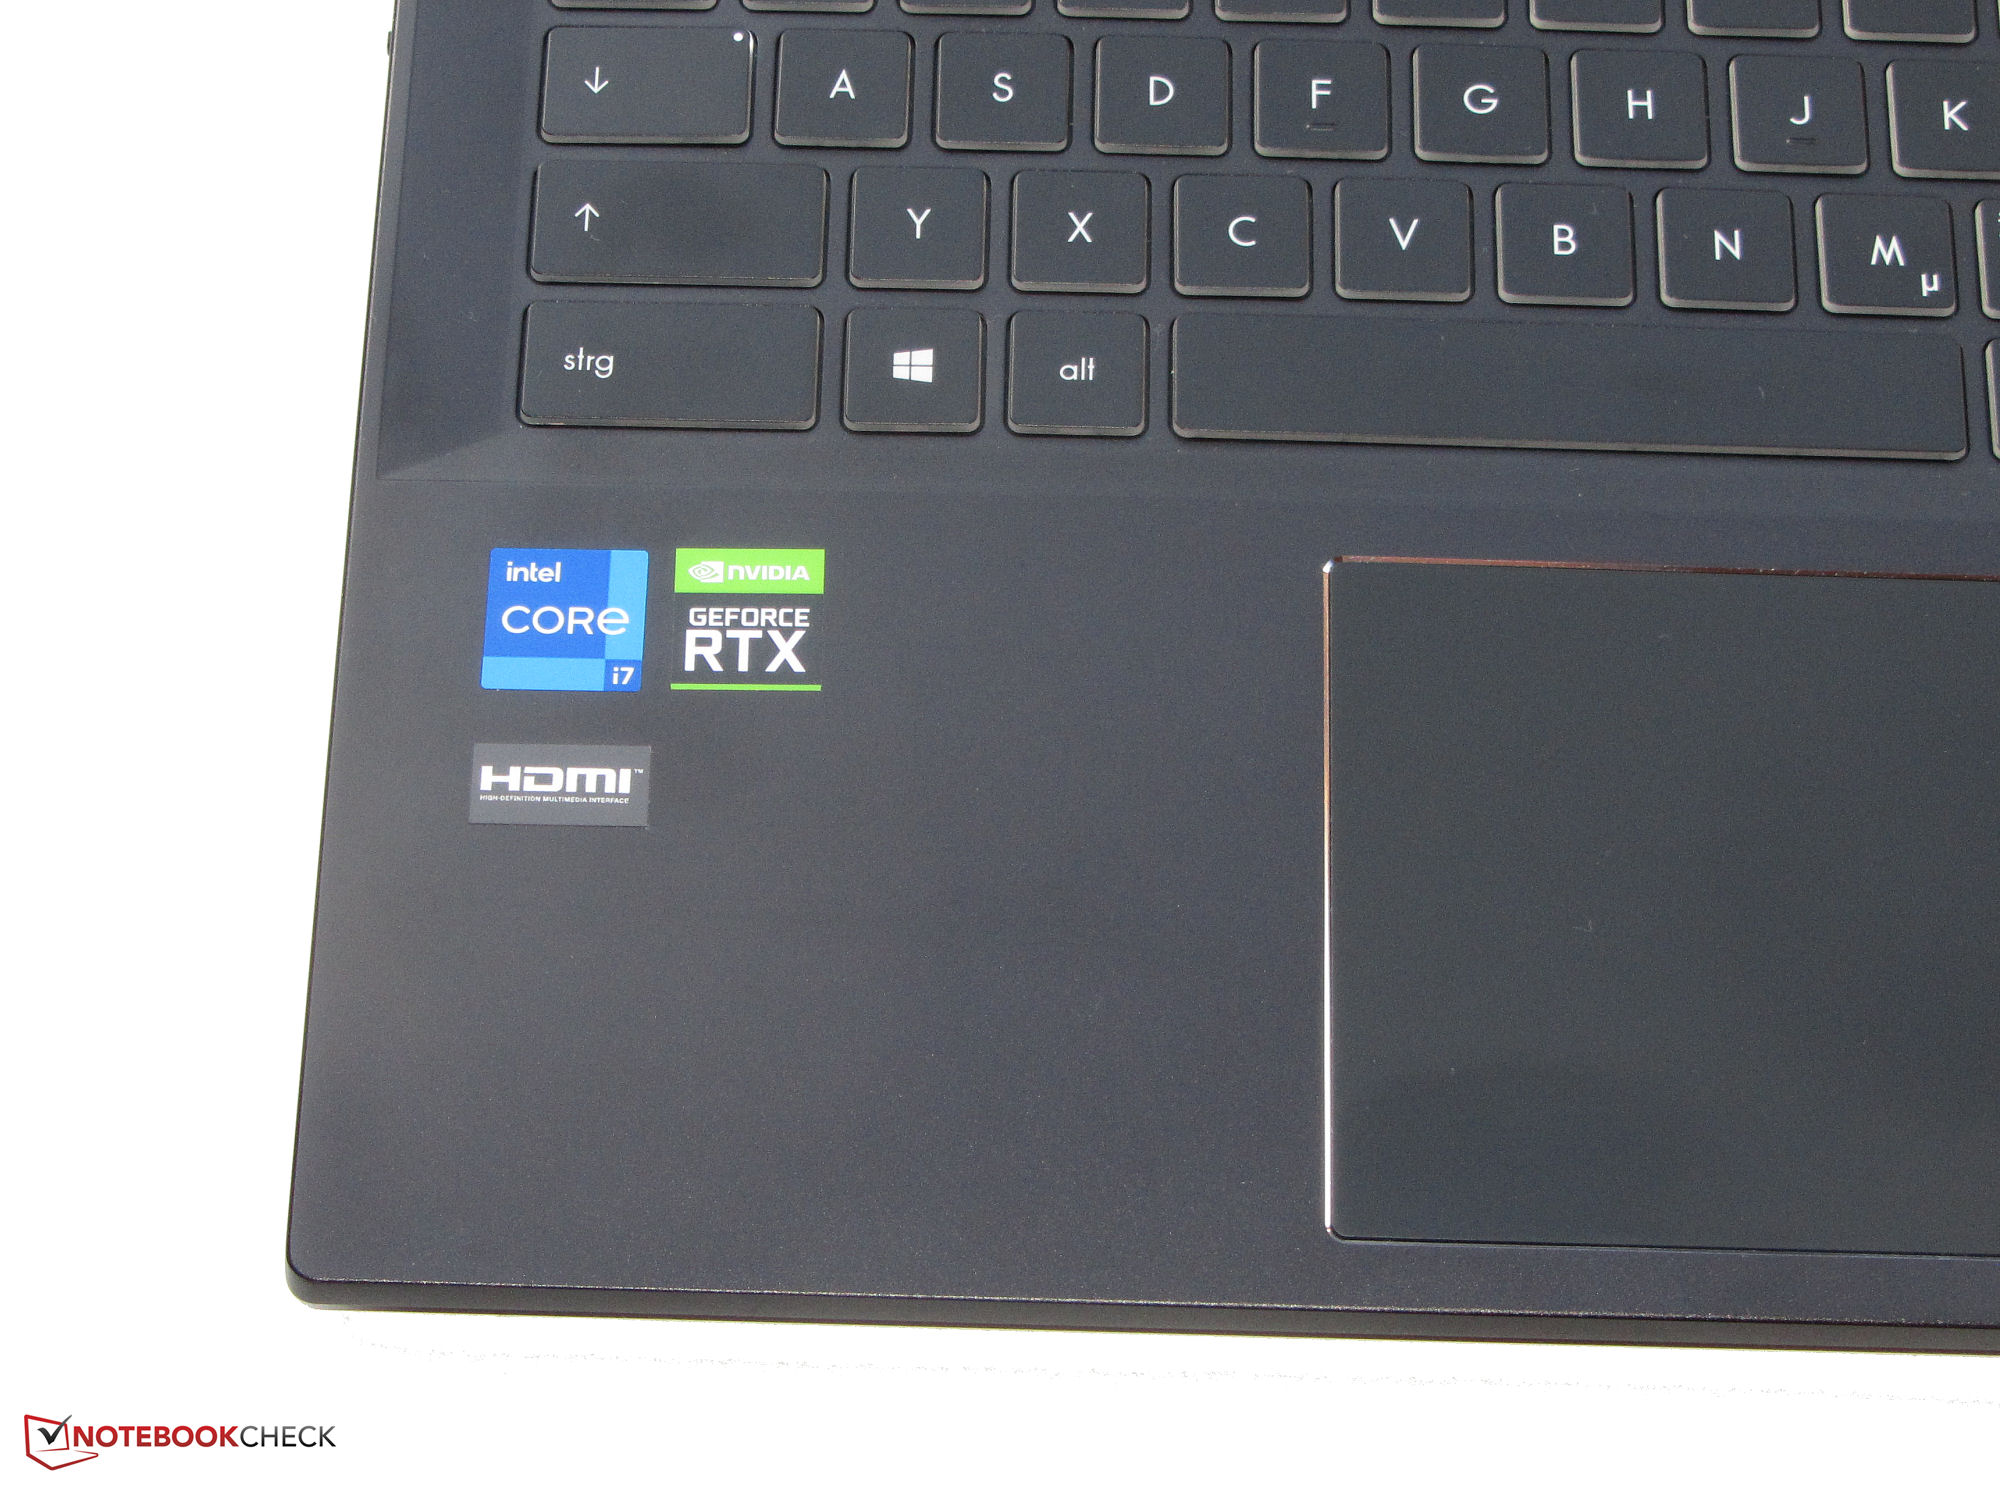
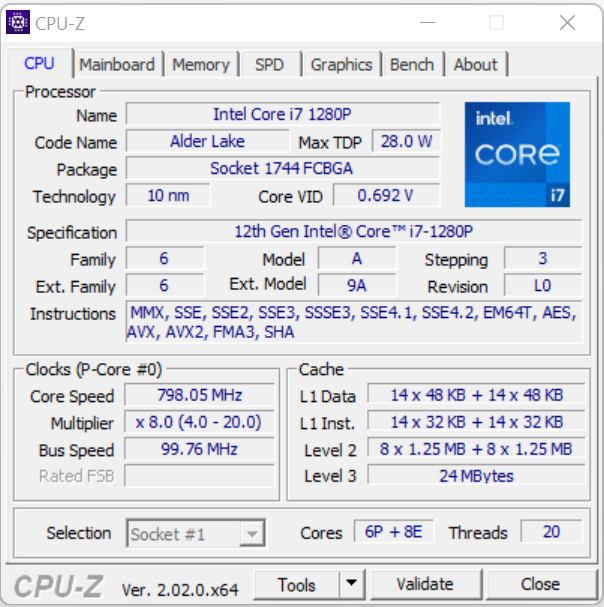
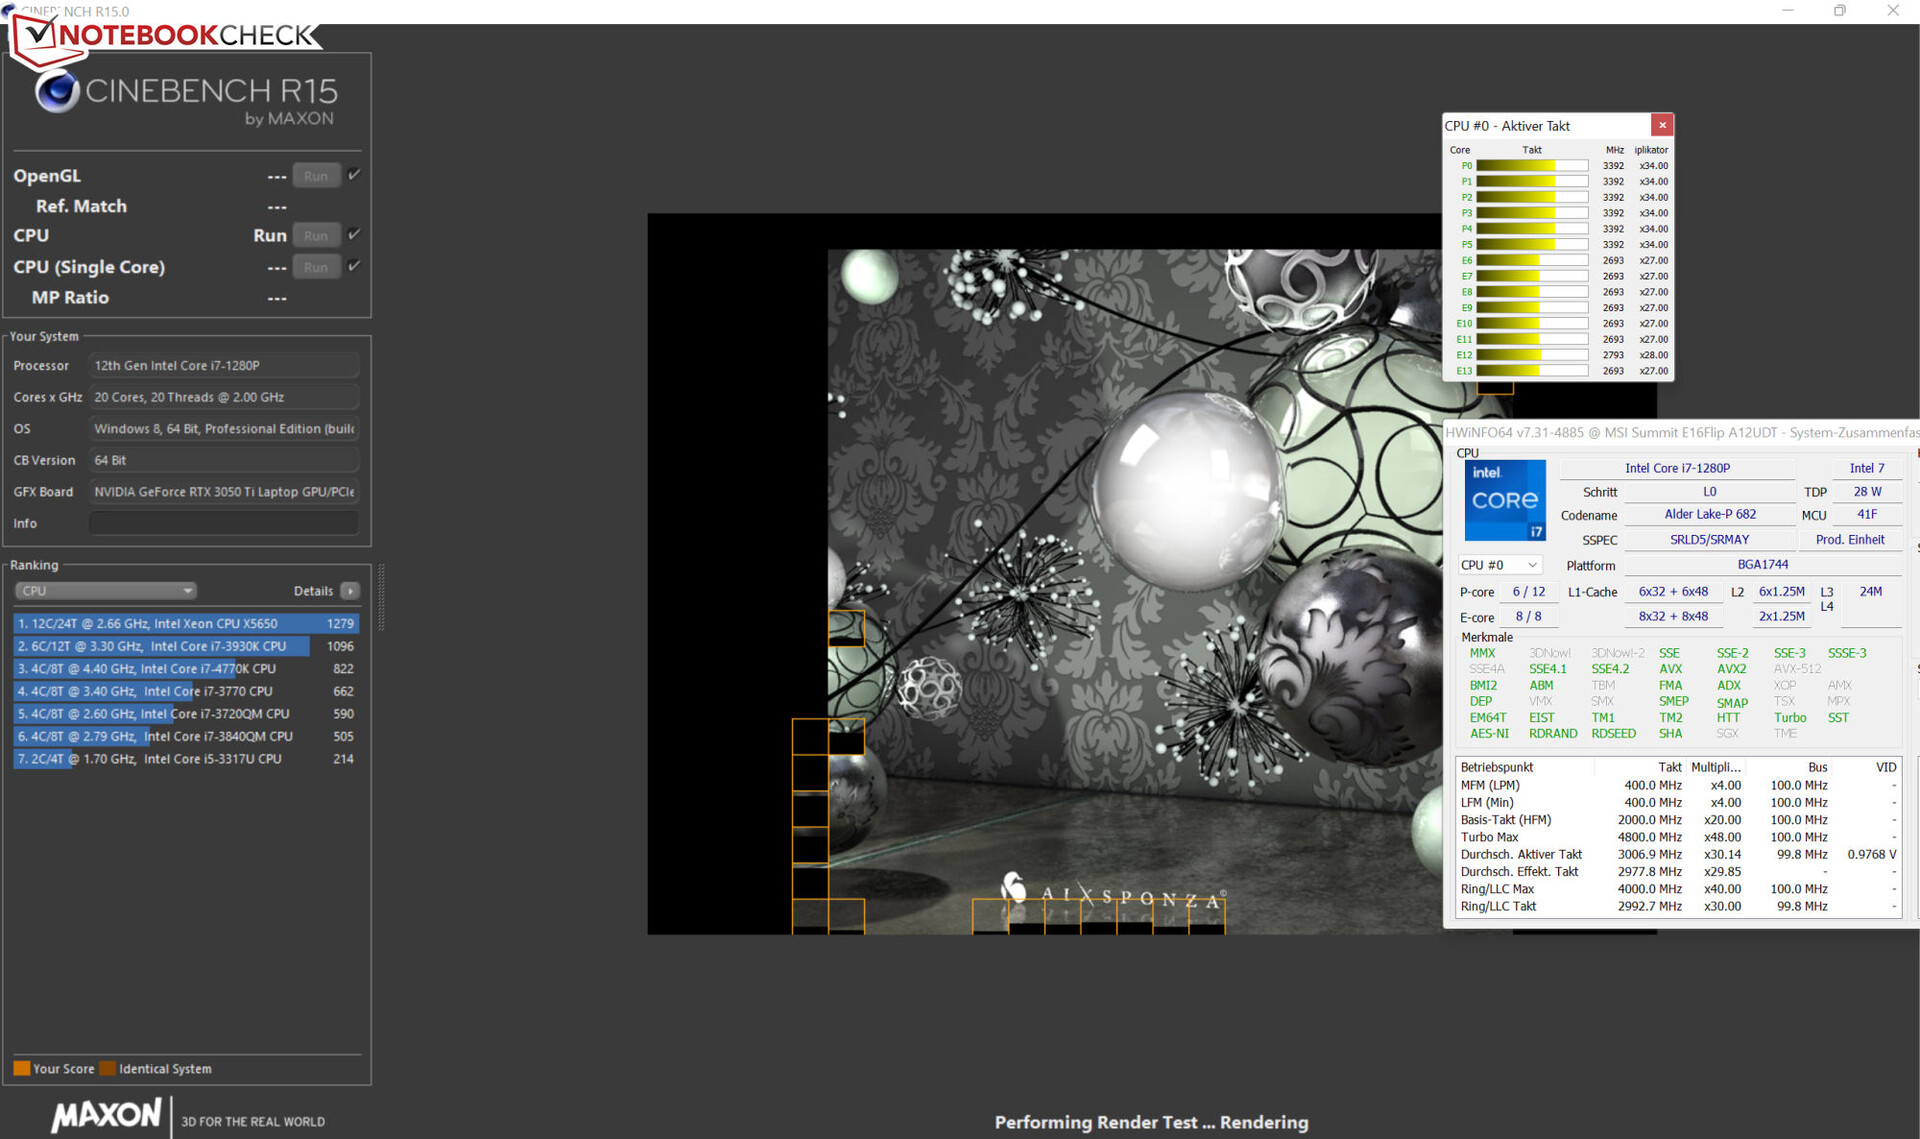
The Alder Lake Core-i7-1280P processor consists of 6 Performance cores (hyperthreading, 2.4 to 4.8 GHz) and 8 Efficiency cores (no hyperthreading, 1.8 to 3.7 GHz), resulting in a total of 20 logical CPU cores.
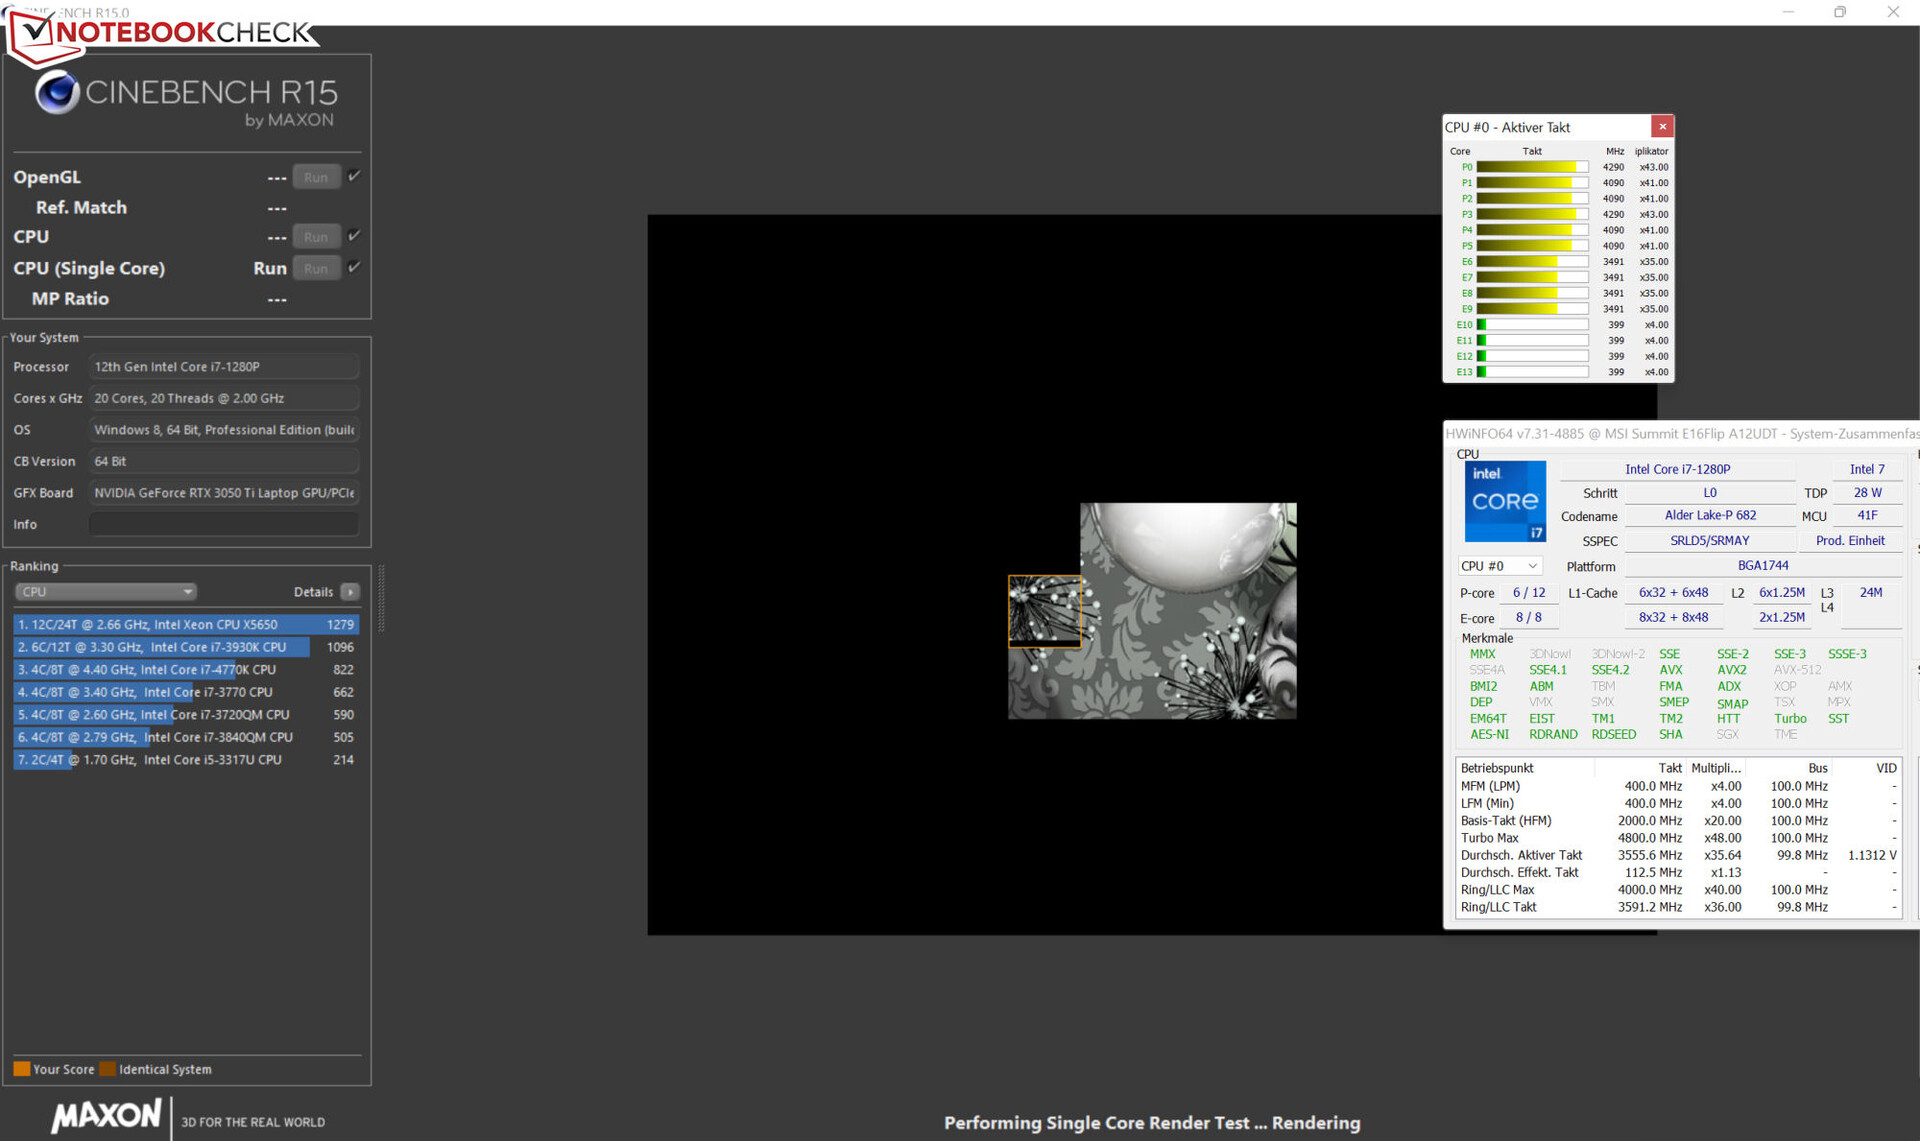
The processor runs through the multi-thread test of the Cinebench R15 benchmark with clock speeds in the medium Turbo range (P: 3.3 - 3.4 GHz, E: 2.8 - 2.9 GHz). The single-thread test uses the full Turbo clock speed (P: 3.5 - 4.8 GHz, E: 400 MHz - 3.5 GHz). In battery operation, the clock speeds are minimally lower. We use the "High Performance" profile here. When using the other three power profiles, the clock speeds are significantly lower in parts.
While the CB15 loop test confirms constant usage of the CPU Turbo speed, the clock speed drops slightly after the third run.
Cinebench R15 Multi Constant Load Test
* ... smaller is better
AIDA64: FP32 Ray-Trace | FPU Julia | CPU SHA3 | CPU Queen | FPU SinJulia | FPU Mandel | CPU AES | CPU ZLib | FP64 Ray-Trace | CPU PhotoWorxx
| Performance rating | |
| MSI Summit E16 Flip A12UDT-031 | |
| Average Intel Core i7-1280P | |
| Average of class Convertible | |
| Samsung Galaxy Book Pro 360 15 NP950QDB-KC3DE | |
| Dell Inspiron 16 7620 2-in-1 | |
| Asus ExpertBook B2 Flip B2502FBA-N80141X | |
| AIDA64 / FP32 Ray-Trace | |
| MSI Summit E16 Flip A12UDT-031 | |
| Average of class Convertible (1480 - 64158, n=55, last 2 years) | |
| Average Intel Core i7-1280P (7466 - 13068, n=6) | |
| Samsung Galaxy Book Pro 360 15 NP950QDB-KC3DE | |
| Asus ExpertBook B2 Flip B2502FBA-N80141X | |
| Dell Inspiron 16 7620 2-in-1 | |
| AIDA64 / FPU Julia | |
| MSI Summit E16 Flip A12UDT-031 | |
| Average of class Convertible (11392 - 183760, n=55, last 2 years) | |
| Average Intel Core i7-1280P (38904 - 66081, n=6) | |
| Asus ExpertBook B2 Flip B2502FBA-N80141X | |
| Samsung Galaxy Book Pro 360 15 NP950QDB-KC3DE | |
| Dell Inspiron 16 7620 2-in-1 | |
| AIDA64 / CPU SHA3 | |
| MSI Summit E16 Flip A12UDT-031 | |
| Average of class Convertible (797 - 8151, n=55, last 2 years) | |
| Average Intel Core i7-1280P (1826 - 2992, n=6) | |
| Samsung Galaxy Book Pro 360 15 NP950QDB-KC3DE | |
| Dell Inspiron 16 7620 2-in-1 | |
| Asus ExpertBook B2 Flip B2502FBA-N80141X | |
| AIDA64 / CPU Queen | |
| MSI Summit E16 Flip A12UDT-031 | |
| Average Intel Core i7-1280P (80180 - 100358, n=6) | |
| Dell Inspiron 16 7620 2-in-1 | |
| Average of class Convertible (14686 - 145339, n=55, last 2 years) | |
| Asus ExpertBook B2 Flip B2502FBA-N80141X | |
| Samsung Galaxy Book Pro 360 15 NP950QDB-KC3DE | |
| AIDA64 / FPU SinJulia | |
| MSI Summit E16 Flip A12UDT-031 | |
| Average Intel Core i7-1280P (5880 - 8571, n=6) | |
| Average of class Convertible (1120 - 29155, n=55, last 2 years) | |
| Dell Inspiron 16 7620 2-in-1 | |
| Asus ExpertBook B2 Flip B2502FBA-N80141X | |
| Samsung Galaxy Book Pro 360 15 NP950QDB-KC3DE | |
| AIDA64 / FPU Mandel | |
| MSI Summit E16 Flip A12UDT-031 | |
| Average of class Convertible (4929 - 97193, n=55, last 2 years) | |
| Average Intel Core i7-1280P (18907 - 32766, n=6) | |
| Samsung Galaxy Book Pro 360 15 NP950QDB-KC3DE | |
| Asus ExpertBook B2 Flip B2502FBA-N80141X | |
| Dell Inspiron 16 7620 2-in-1 | |
| AIDA64 / CPU AES | |
| Samsung Galaxy Book Pro 360 15 NP950QDB-KC3DE | |
| MSI Summit E16 Flip A12UDT-031 | |
| Average Intel Core i7-1280P (40691 - 99367, n=6) | |
| Average of class Convertible (15752 - 139734, n=55, last 2 years) | |
| Dell Inspiron 16 7620 2-in-1 | |
| Asus ExpertBook B2 Flip B2502FBA-N80141X | |
| AIDA64 / CPU ZLib | |
| MSI Summit E16 Flip A12UDT-031 | |
| Average Intel Core i7-1280P (540 - 880, n=6) | |
| Average of class Convertible (218 - 2001, n=55, last 2 years) | |
| Dell Inspiron 16 7620 2-in-1 | |
| Asus ExpertBook B2 Flip B2502FBA-N80141X | |
| Samsung Galaxy Book Pro 360 15 NP950QDB-KC3DE | |
| AIDA64 / FP64 Ray-Trace | |
| MSI Summit E16 Flip A12UDT-031 | |
| Average of class Convertible (1169 - 34297, n=55, last 2 years) | |
| Average Intel Core i7-1280P (4006 - 7184, n=6) | |
| Samsung Galaxy Book Pro 360 15 NP950QDB-KC3DE | |
| Asus ExpertBook B2 Flip B2502FBA-N80141X | |
| Dell Inspiron 16 7620 2-in-1 | |
| AIDA64 / CPU PhotoWorxx | |
| Average of class Convertible (14193 - 81626, n=55, last 2 years) | |
| Average Intel Core i7-1280P (36663 - 48416, n=6) | |
| MSI Summit E16 Flip A12UDT-031 | |
| Samsung Galaxy Book Pro 360 15 NP950QDB-KC3DE | |
| Asus ExpertBook B2 Flip B2502FBA-N80141X | |
| Dell Inspiron 16 7620 2-in-1 | |
System Performance
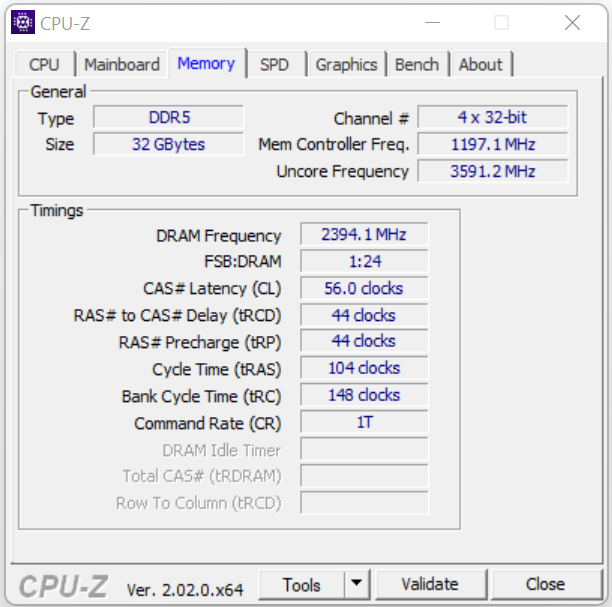
The smoothly running system delivers more than sufficient performance for Office and Internet applications. The dedicated graphics core also allows running graphics intensive tasks. The transfer rates of the working memory are at a normal level for LPDDR5-4800 storage (dual-channel mode, soldered, no storage banks). This is accompanied by very good PC-Mark results.
CrossMark: Overall | Productivity | Creativity | Responsiveness
| PCMark 10 / Score | |
| Average of class Convertible (3229 - 9125, n=53, last 2 years) | |
| Average Intel Core i7-1280P, NVIDIA GeForce RTX 3050 Ti Laptop GPU (5984 - 6379, n=2) | |
| MSI Summit E16 Flip A12UDT-031 | |
| Dell Inspiron 16 7620 2-in-1 | |
| Samsung Galaxy Book Pro 360 15 NP950QDB-KC3DE | |
| Asus ExpertBook B2 Flip B2502FBA-N80141X | |
| PCMark 10 / Essentials | |
| Average of class Convertible (7233 - 12222, n=53, last 2 years) | |
| Average Intel Core i7-1280P, NVIDIA GeForce RTX 3050 Ti Laptop GPU (9687 - 10227, n=2) | |
| MSI Summit E16 Flip A12UDT-031 | |
| Samsung Galaxy Book Pro 360 15 NP950QDB-KC3DE | |
| Dell Inspiron 16 7620 2-in-1 | |
| Asus ExpertBook B2 Flip B2502FBA-N80141X | |
| PCMark 10 / Productivity | |
| Average of class Convertible (5062 - 10643, n=53, last 2 years) | |
| Average Intel Core i7-1280P, NVIDIA GeForce RTX 3050 Ti Laptop GPU (7521 - 9165, n=2) | |
| MSI Summit E16 Flip A12UDT-031 | |
| Samsung Galaxy Book Pro 360 15 NP950QDB-KC3DE | |
| Asus ExpertBook B2 Flip B2502FBA-N80141X | |
| Dell Inspiron 16 7620 2-in-1 | |
| PCMark 10 / Digital Content Creation | |
| Average of class Convertible (2496 - 16551, n=53, last 2 years) | |
| MSI Summit E16 Flip A12UDT-031 | |
| Average Intel Core i7-1280P, NVIDIA GeForce RTX 3050 Ti Laptop GPU (7518 - 7980, n=2) | |
| Dell Inspiron 16 7620 2-in-1 | |
| Asus ExpertBook B2 Flip B2502FBA-N80141X | |
| Samsung Galaxy Book Pro 360 15 NP950QDB-KC3DE | |
| CrossMark / Overall | |
| Average Intel Core i7-1280P, NVIDIA GeForce RTX 3050 Ti Laptop GPU (1652 - 1671, n=2) | |
| MSI Summit E16 Flip A12UDT-031 | |
| Average of class Convertible (524 - 2274, n=56, last 2 years) | |
| Dell Inspiron 16 7620 2-in-1 | |
| Asus ExpertBook B2 Flip B2502FBA-N80141X | |
| CrossMark / Productivity | |
| Average Intel Core i7-1280P, NVIDIA GeForce RTX 3050 Ti Laptop GPU (1583 - 1618, n=2) | |
| MSI Summit E16 Flip A12UDT-031 | |
| Asus ExpertBook B2 Flip B2502FBA-N80141X | |
| Average of class Convertible (554 - 1925, n=56, last 2 years) | |
| Dell Inspiron 16 7620 2-in-1 | |
| CrossMark / Creativity | |
| MSI Summit E16 Flip A12UDT-031 | |
| Average Intel Core i7-1280P, NVIDIA GeForce RTX 3050 Ti Laptop GPU (1752 - 1761, n=2) | |
| Average of class Convertible (550 - 2949, n=56, last 2 years) | |
| Dell Inspiron 16 7620 2-in-1 | |
| Asus ExpertBook B2 Flip B2502FBA-N80141X | |
| CrossMark / Responsiveness | |
| Average Intel Core i7-1280P, NVIDIA GeForce RTX 3050 Ti Laptop GPU (1550 - 1594, n=2) | |
| MSI Summit E16 Flip A12UDT-031 | |
| Asus ExpertBook B2 Flip B2502FBA-N80141X | |
| Average of class Convertible (381 - 1719, n=56, last 2 years) | |
| Dell Inspiron 16 7620 2-in-1 | |
| PCMark 10 Score | 5984 points | |
Help | ||
| AIDA64 / Memory Copy | |
| Average of class Convertible (23880 - 158525, n=55, last 2 years) | |
| Average Intel Core i7-1280P (56337 - 73486, n=6) | |
| MSI Summit E16 Flip A12UDT-031 | |
| Samsung Galaxy Book Pro 360 15 NP950QDB-KC3DE | |
| Asus ExpertBook B2 Flip B2502FBA-N80141X | |
| Dell Inspiron 16 7620 2-in-1 | |
| AIDA64 / Memory Read | |
| Average of class Convertible (19931 - 126725, n=55, last 2 years) | |
| Average Intel Core i7-1280P (63221 - 73719, n=6) | |
| MSI Summit E16 Flip A12UDT-031 | |
| Samsung Galaxy Book Pro 360 15 NP950QDB-KC3DE | |
| Asus ExpertBook B2 Flip B2502FBA-N80141X | |
| Dell Inspiron 16 7620 2-in-1 | |
| AIDA64 / Memory Write | |
| Average of class Convertible (17473 - 216896, n=55, last 2 years) | |
| Samsung Galaxy Book Pro 360 15 NP950QDB-KC3DE | |
| Average Intel Core i7-1280P (58729 - 68247, n=6) | |
| MSI Summit E16 Flip A12UDT-031 | |
| Asus ExpertBook B2 Flip B2502FBA-N80141X | |
| Dell Inspiron 16 7620 2-in-1 | |
| AIDA64 / Memory Latency | |
| MSI Summit E16 Flip A12UDT-031 | |
| Average of class Convertible (6.9 - 536, n=54, last 2 years) | |
| Average Intel Core i7-1280P (93.1 - 153.3, n=6) | |
| Samsung Galaxy Book Pro 360 15 NP950QDB-KC3DE | |
| Asus ExpertBook B2 Flip B2502FBA-N80141X | |
* ... smaller is better
DPC Latencies
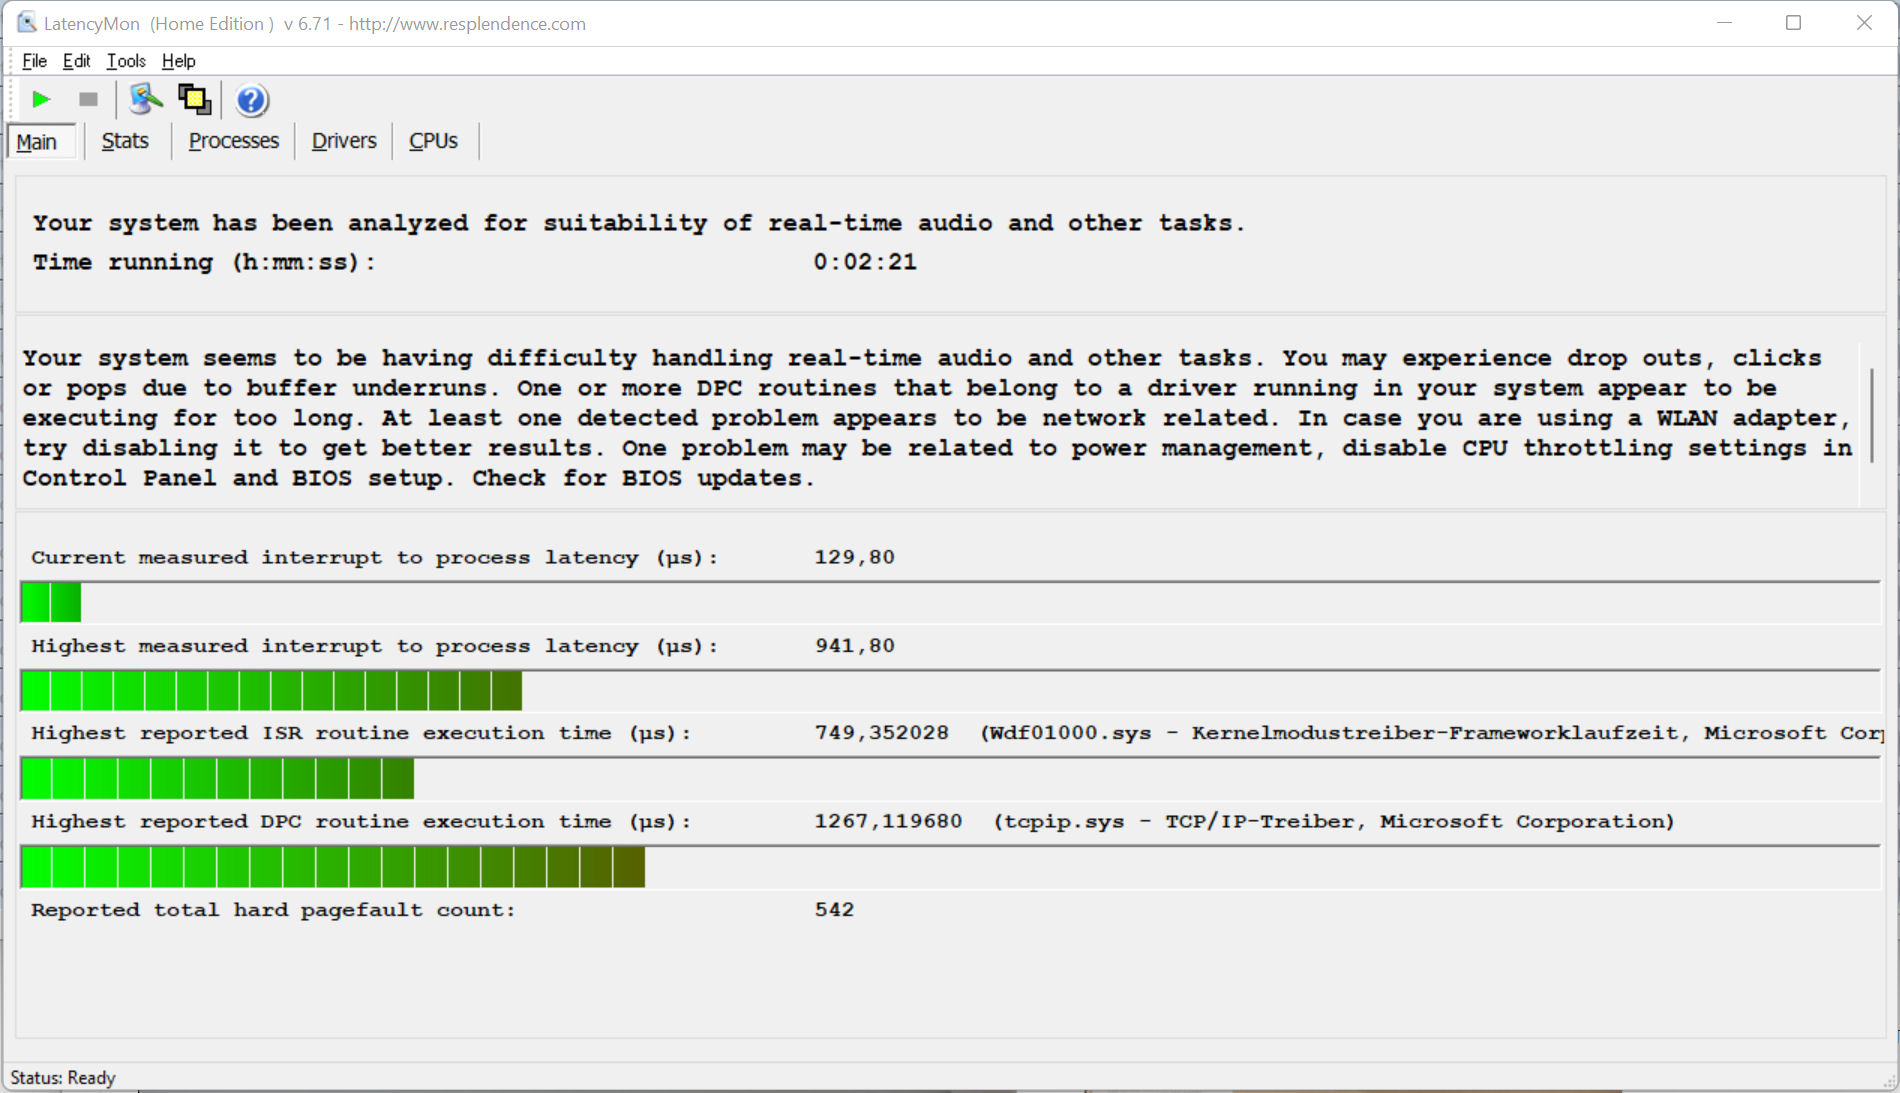
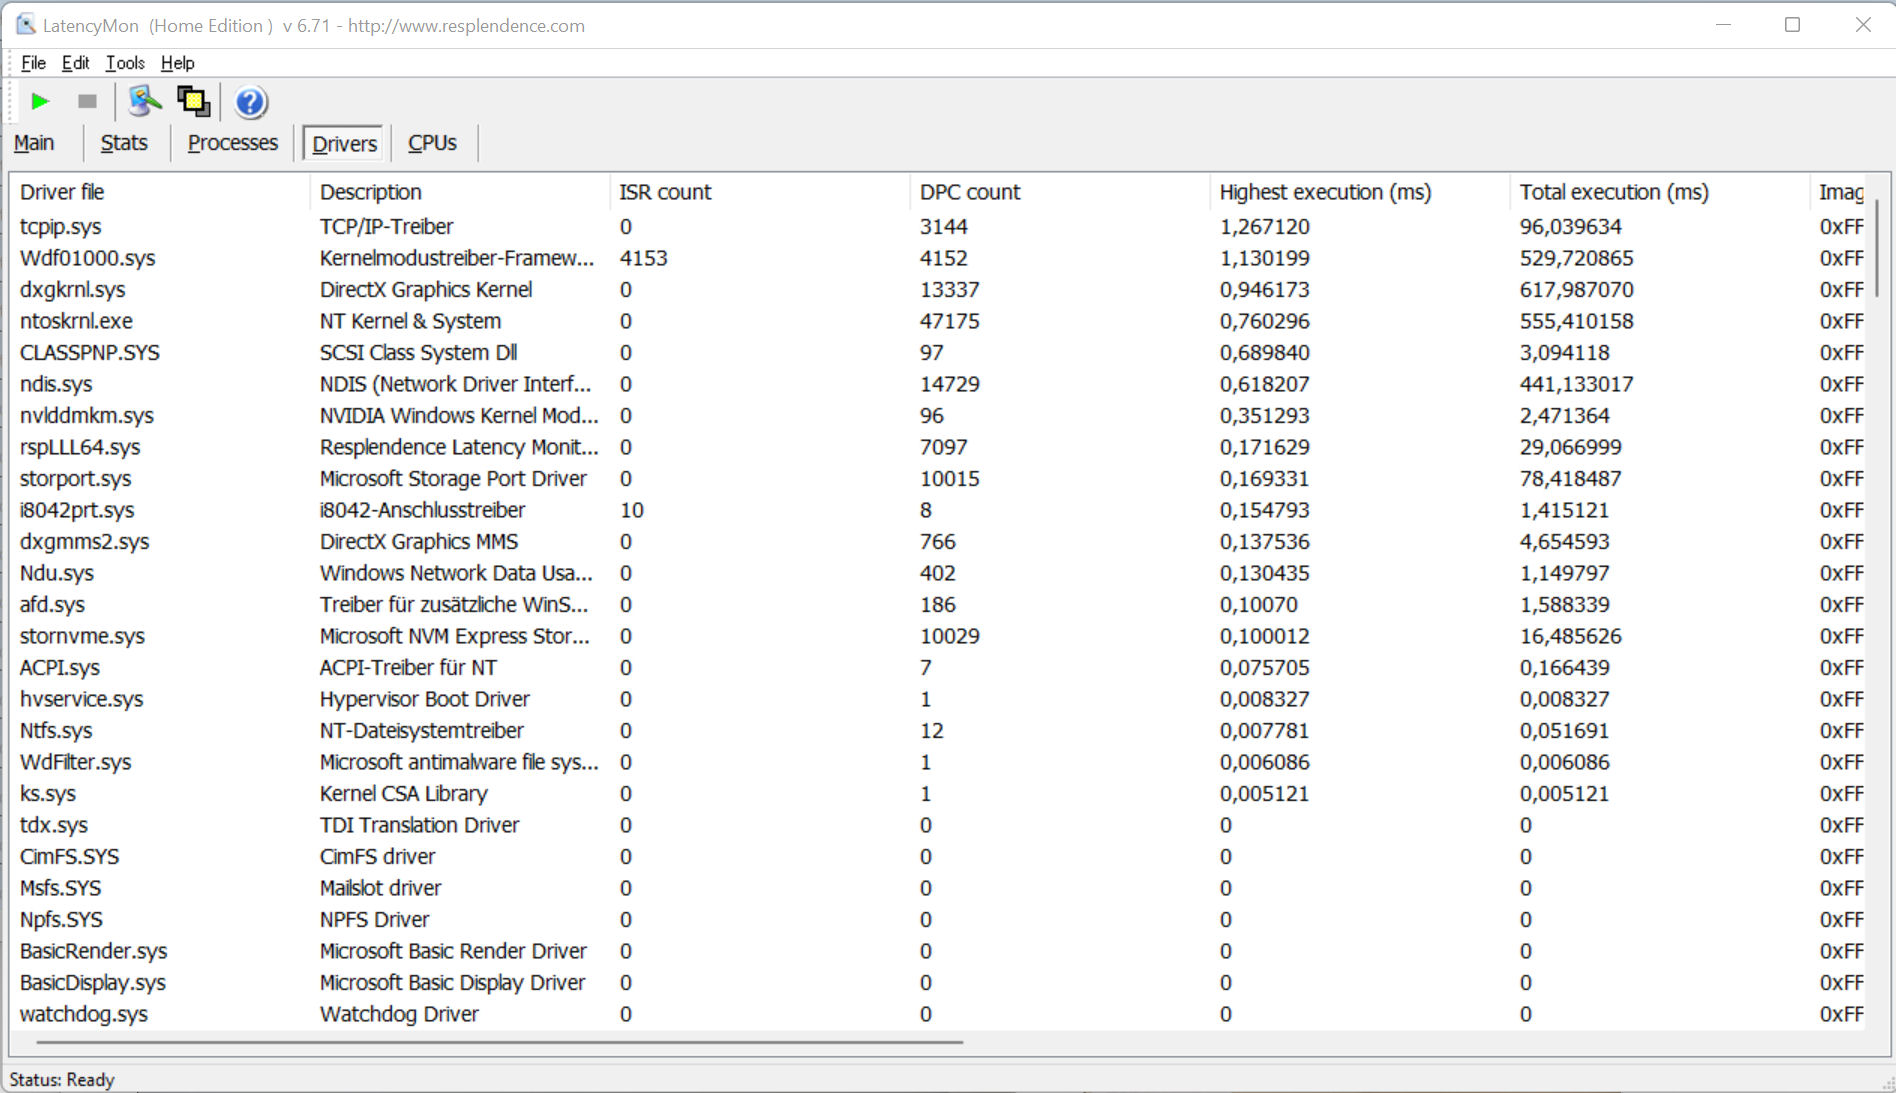
The standardized Latency Monitor test (web surfing, playing 4k videos, Prime95 High Load) reveals some conspicuous behavior in the DCP latencies. The system doesn't appear to be suited for real-time video and audio processing. Some future software updates might bring some improvements or even make things worse.
| DPC Latencies / LatencyMon - interrupt to process latency (max), Web, Youtube, Prime95 | |
| Samsung Galaxy Book Pro 360 15 NP950QDB-KC3DE | |
| MSI Summit E16 Flip A12UDT-031 | |
| Asus ExpertBook B2 Flip B2502FBA-N80141X | |
| Dell Inspiron 16 7620 2-in-1 | |
* ... smaller is better
Storage Solution
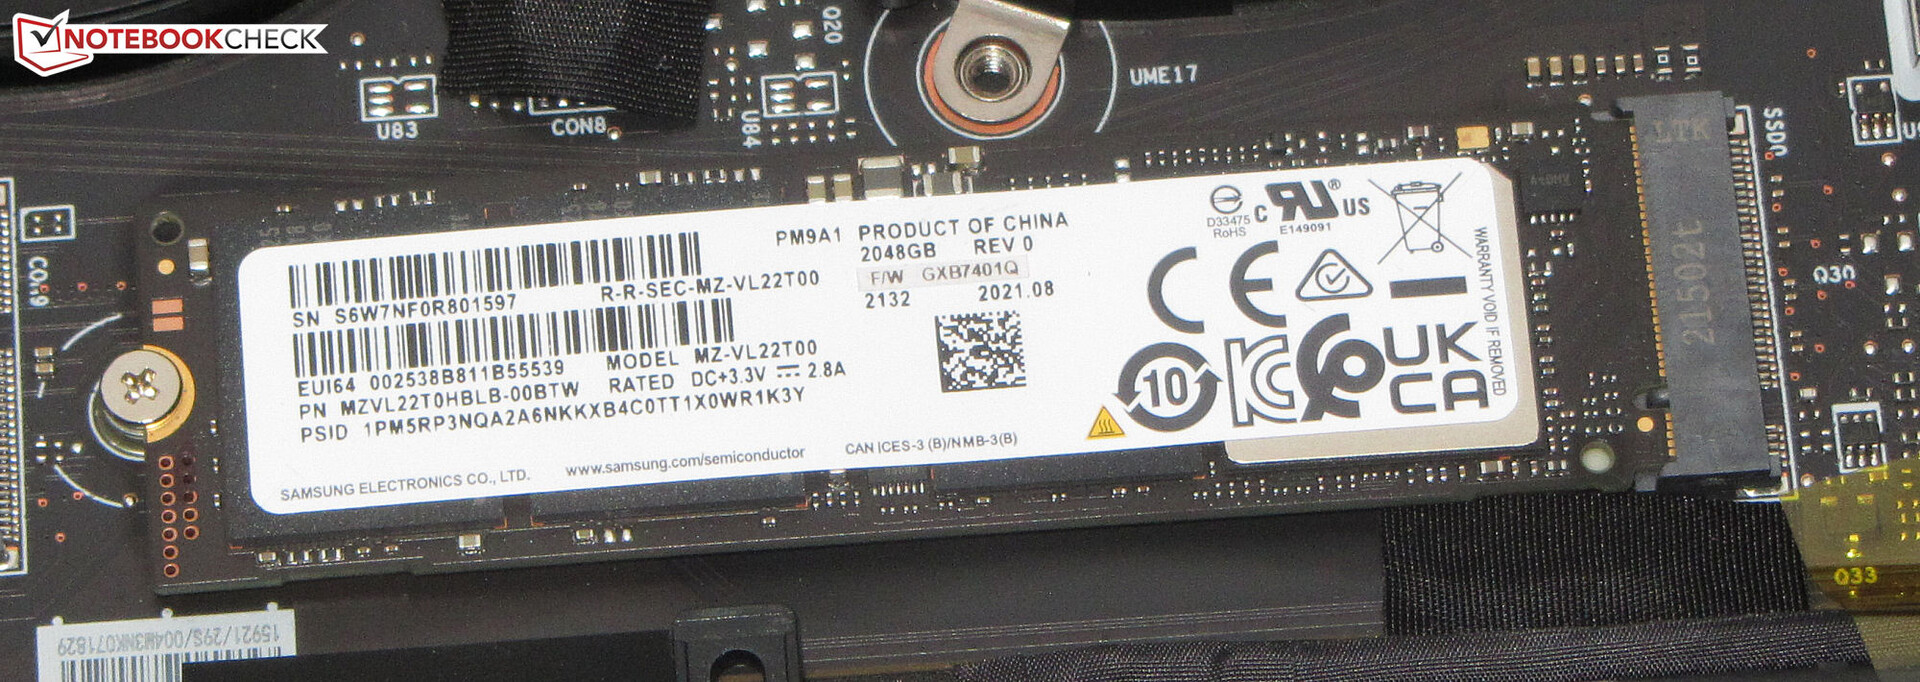
A PCIe 4 SSD (M.2-2280) from Samsung with a storage capacity of 2 TB serves as the system drive. The transfer rates turn out excellent.

* ... smaller is better
Constant Performance Reading: DiskSpd Read Loop, Queue Depth 8
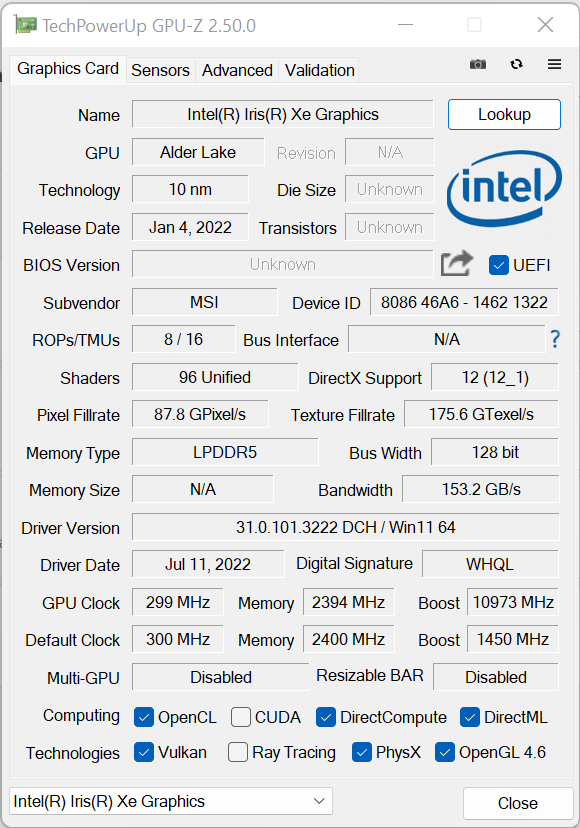
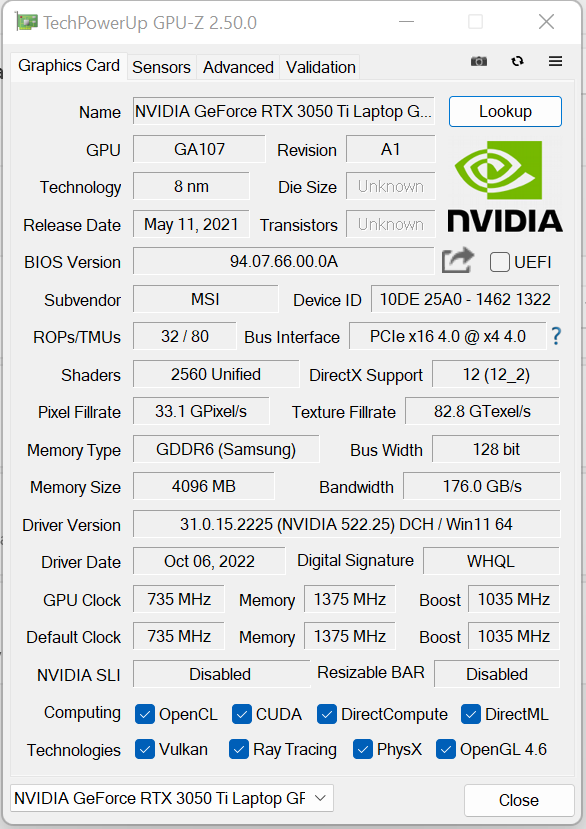
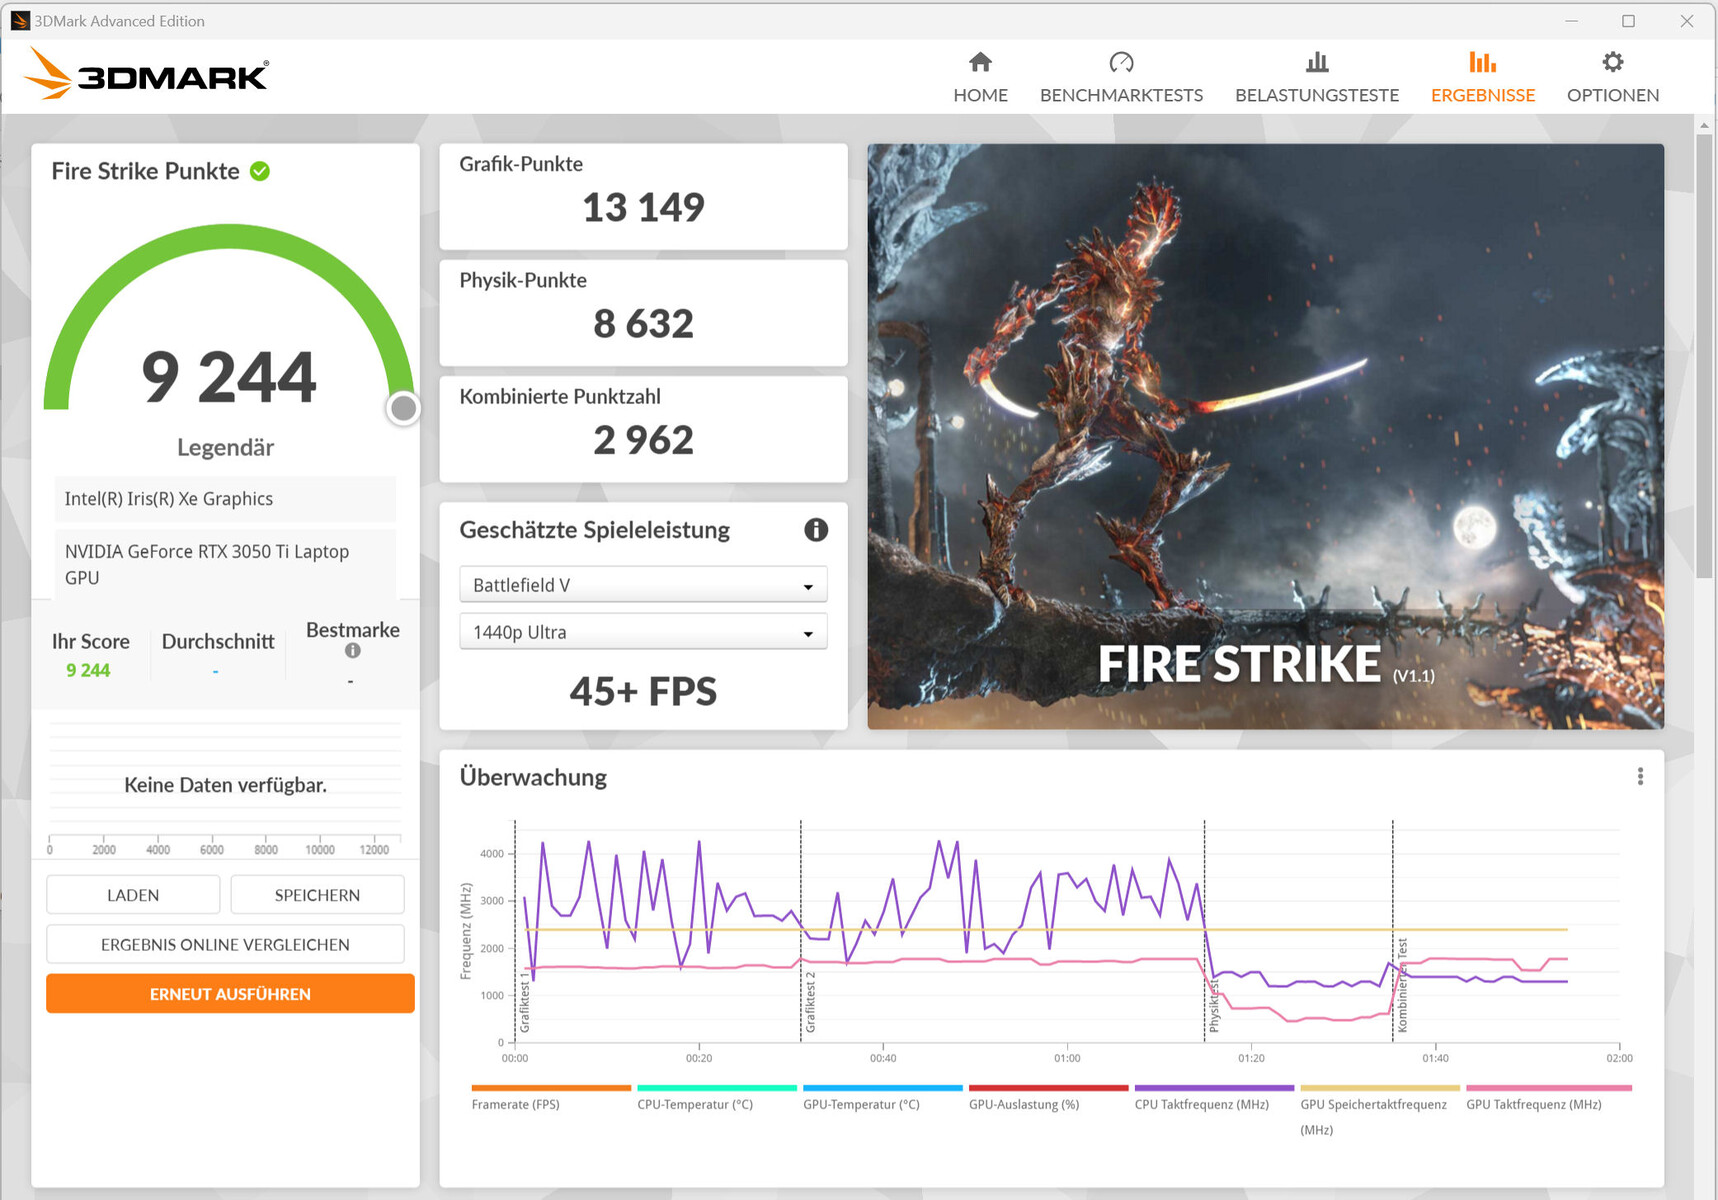
Graphics Card
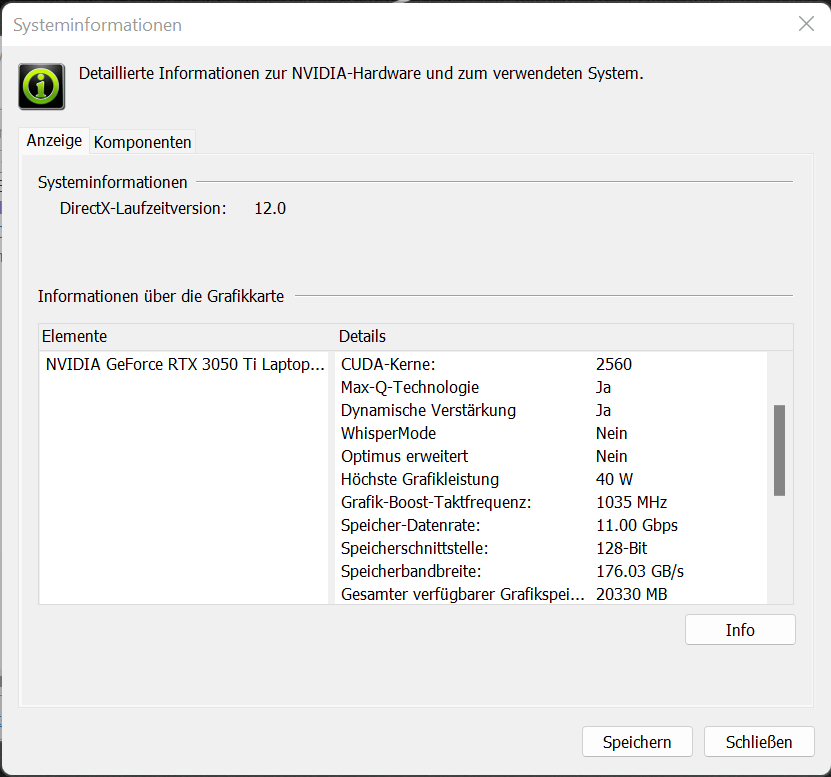
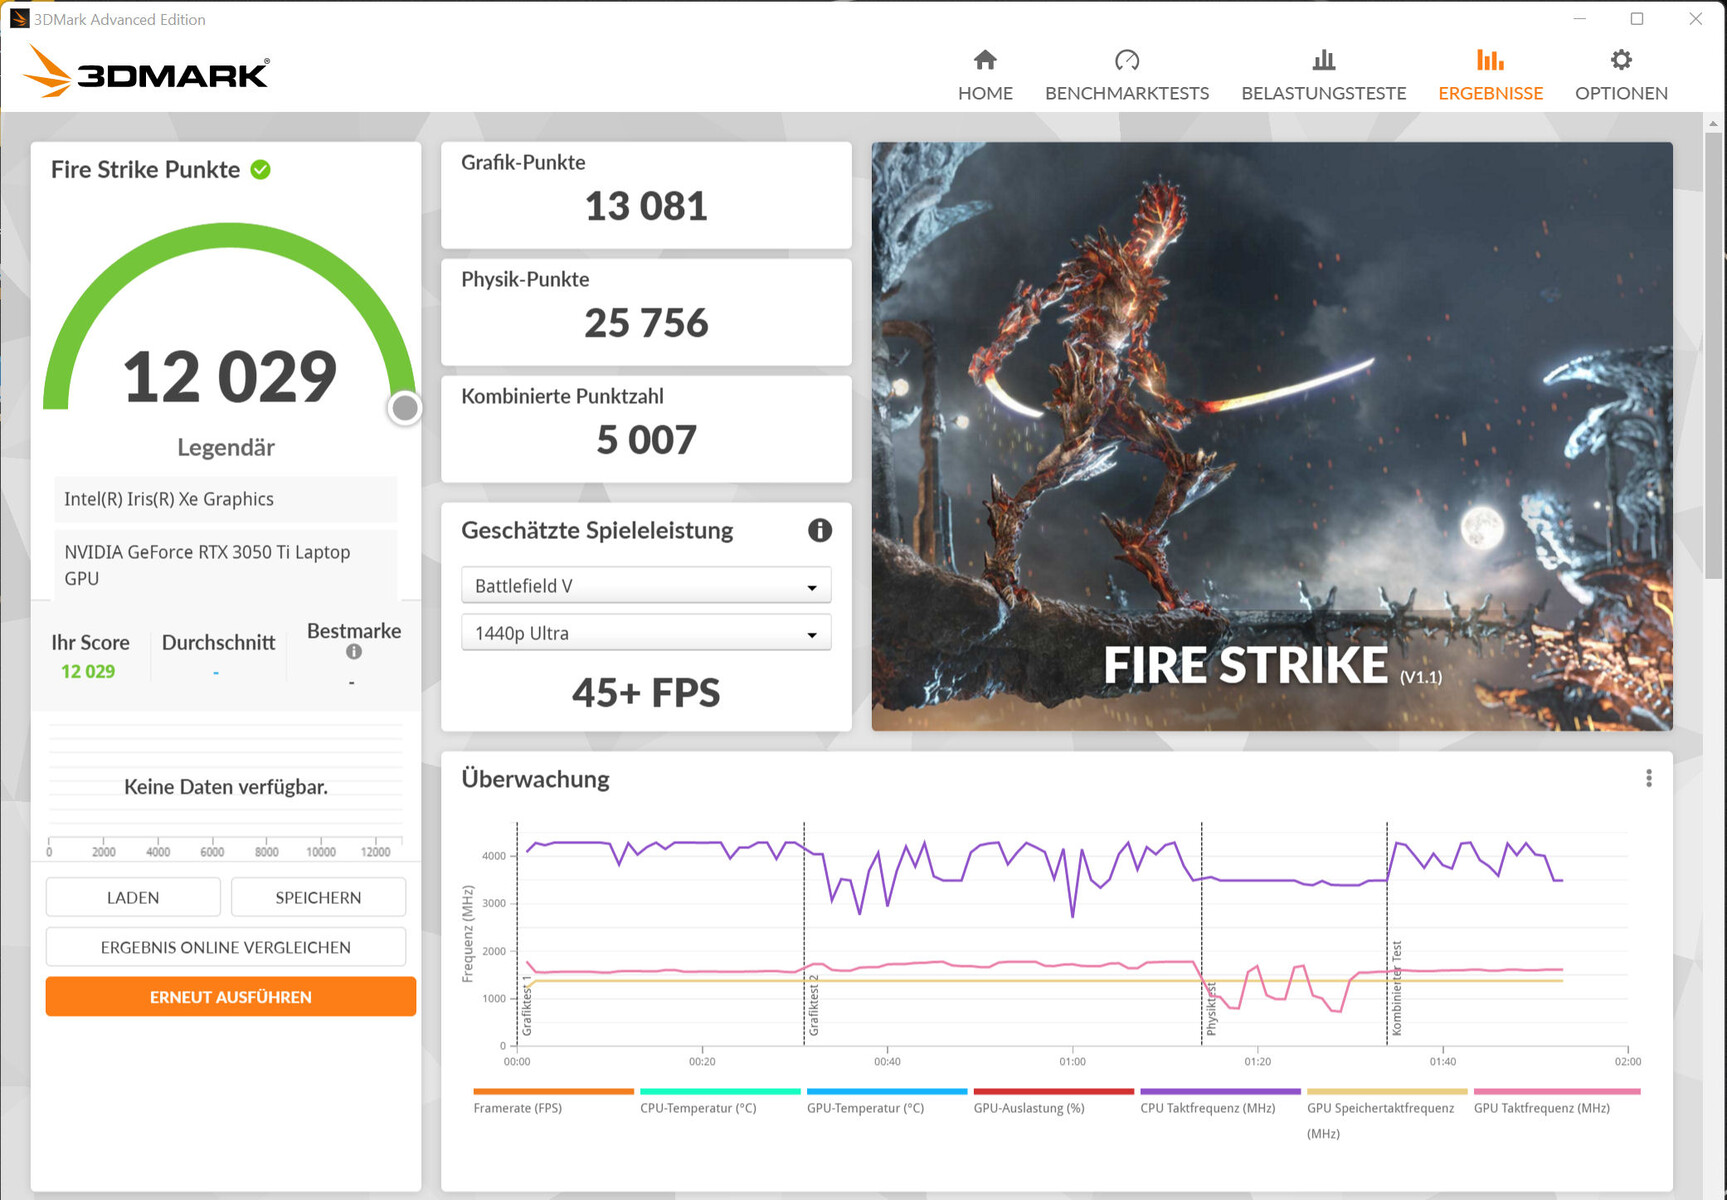
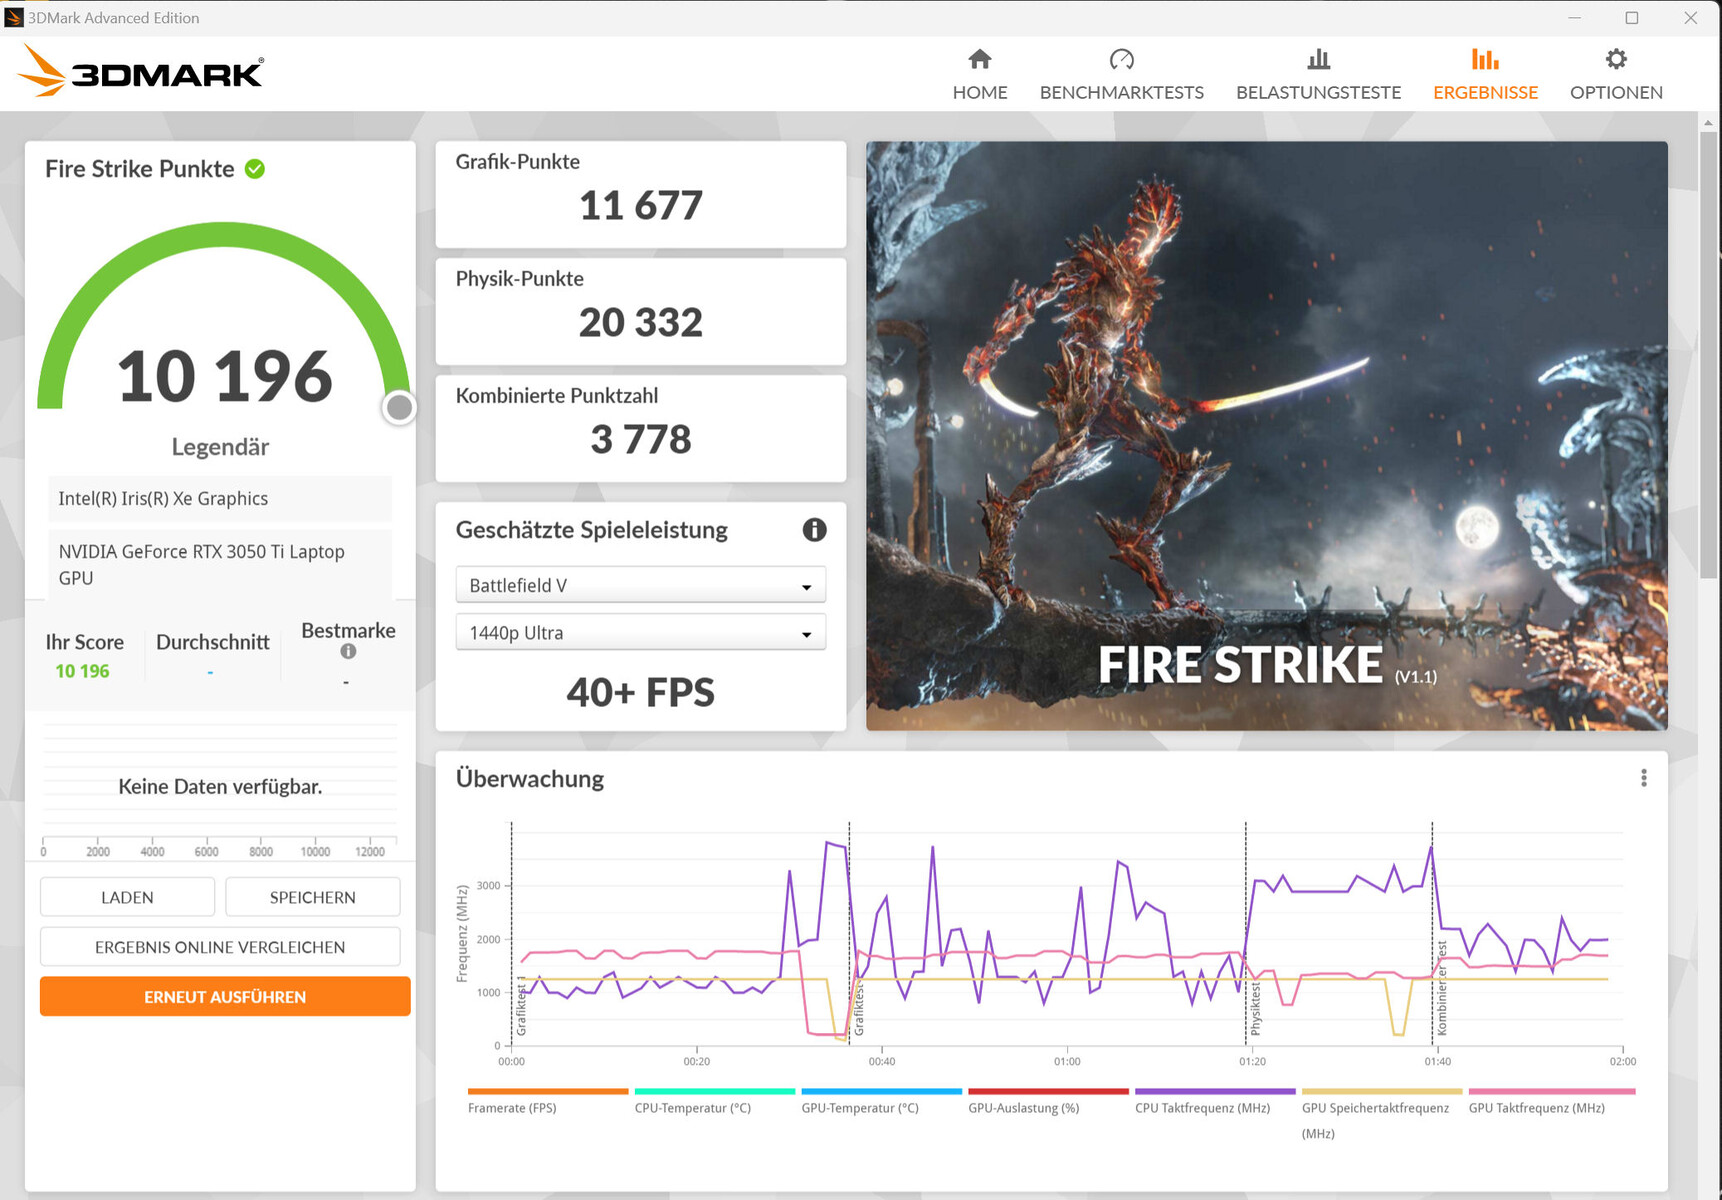
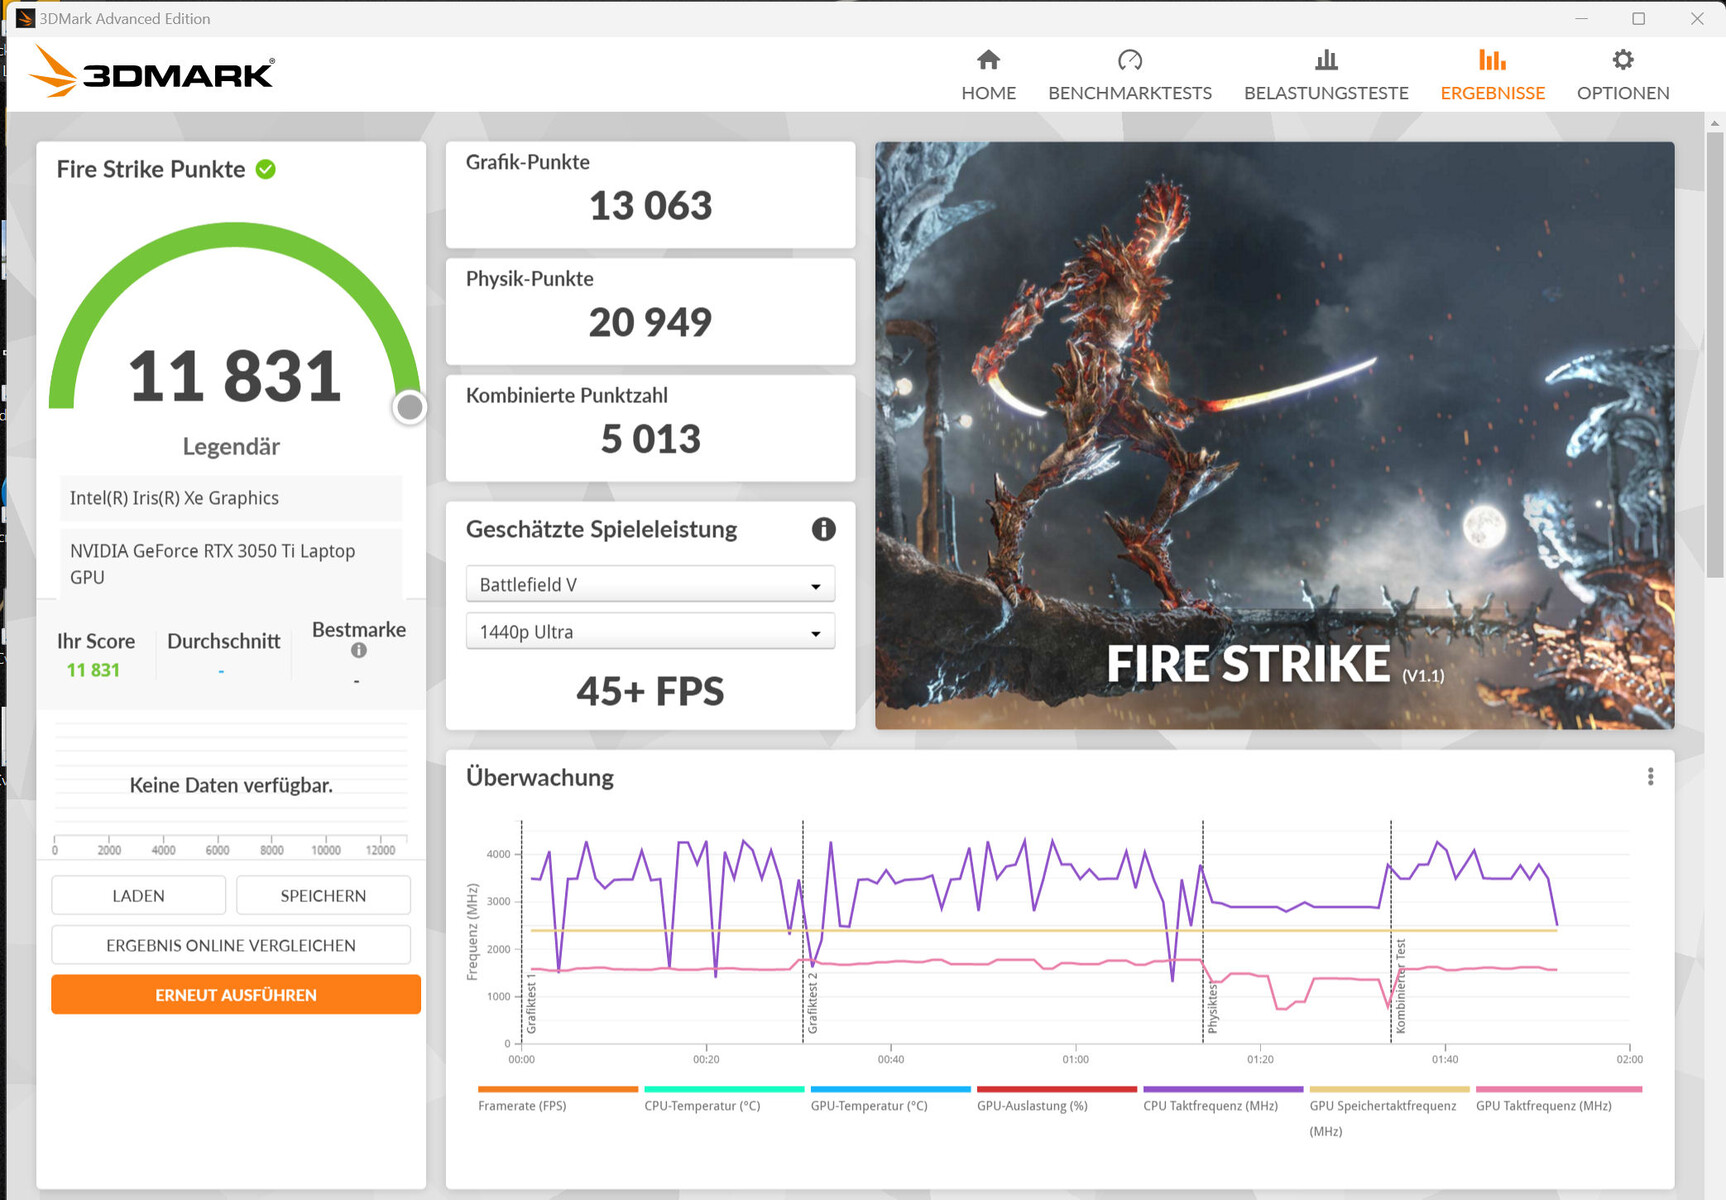
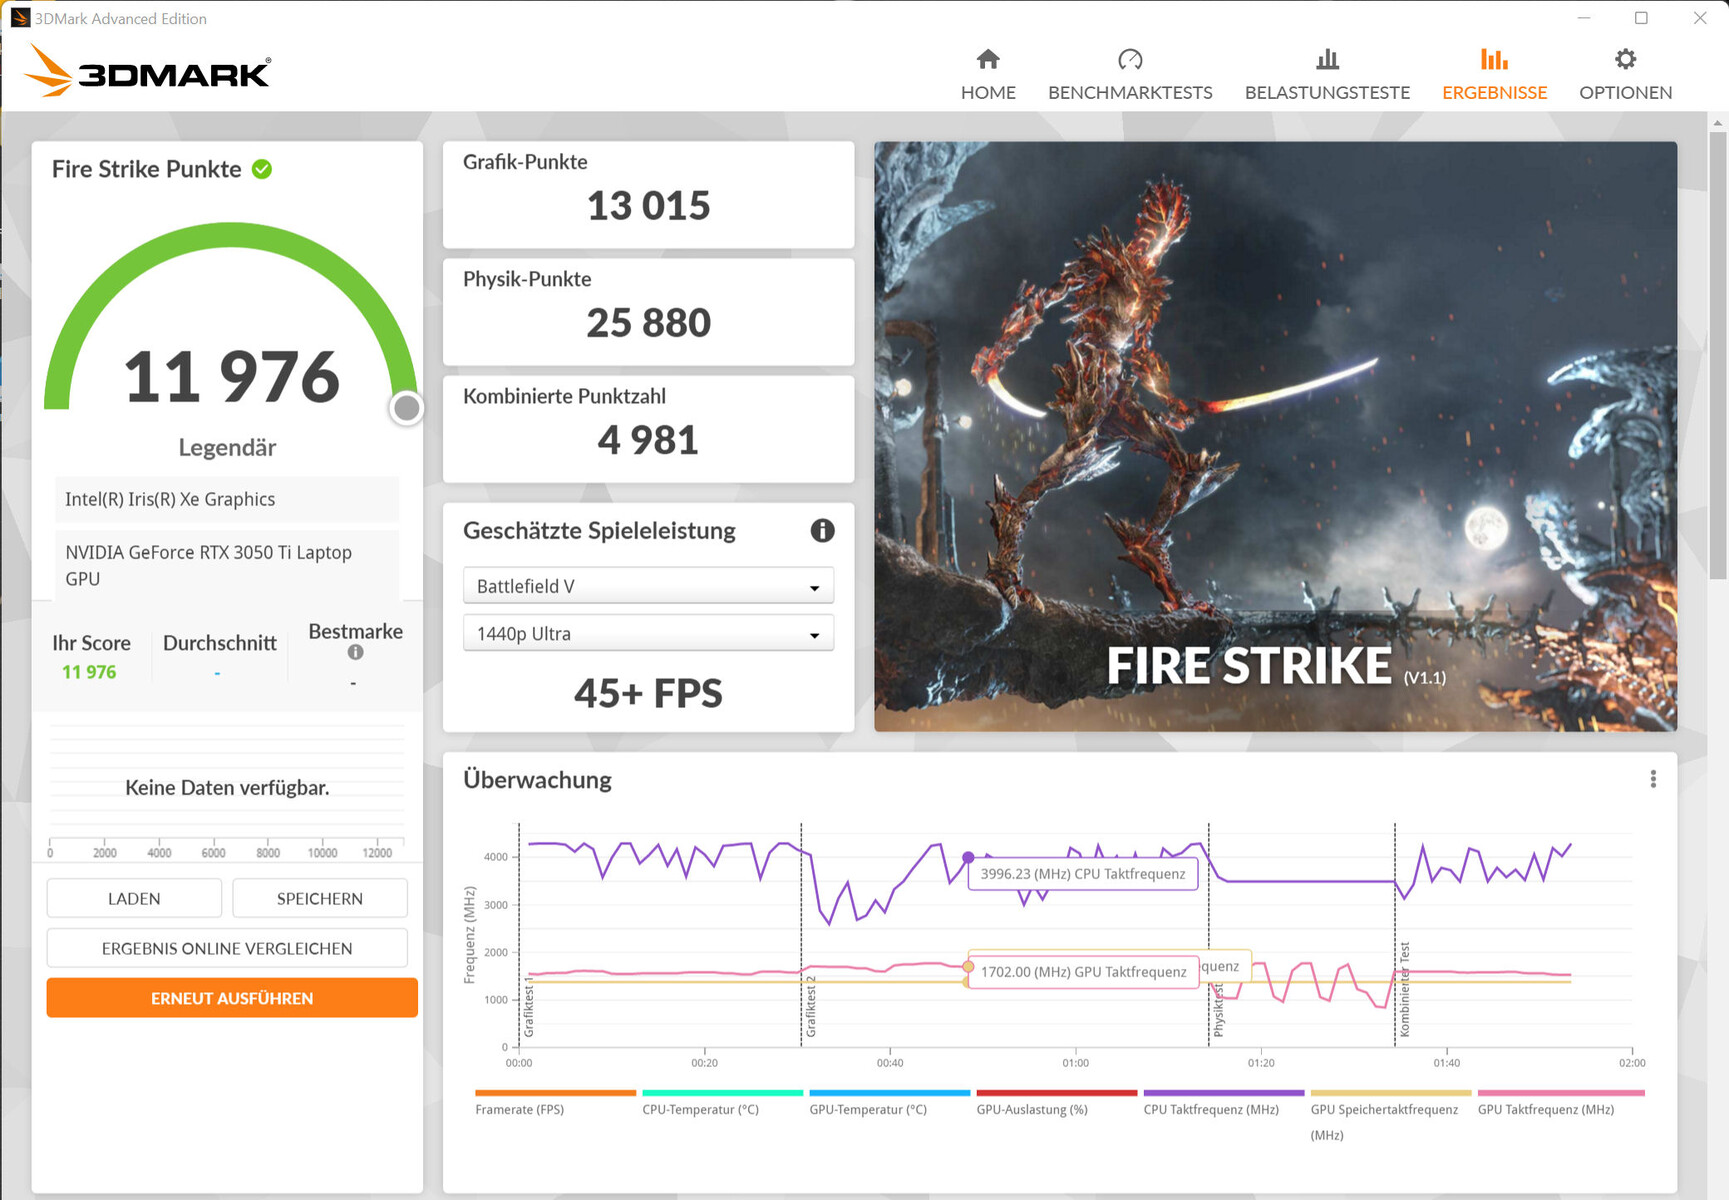
Despite a TGP setting of 40 watts at the bottom of the possibilities, the built-in GeForce RTX 3050 Ti Laptop GPU (VRAM: 4 GB GDDR6) delivers benchmark results and frame rates that approach the average for the RTX 3050 Ti determined until now. However, the TGP isn't used fully, as the Witcher 3 test shows.
The laptop allows FHD gaming at high to maximum settings. Using the full display resolution often requires reducing the settings. The convertible doesn't offer a dGPU mode.

| 3DMark 11 Performance | 17757 points | |
| 3DMark Cloud Gate Standard Score | 42521 points | |
| 3DMark Fire Strike Score | 12029 points | |
| 3DMark Time Spy Score | 5563 points | |
Help | ||
| Blender | |
| v3.3 Classroom OPTIX/RTX | |
| MSI Summit E16 Flip A12UDT-031 | |
| Average of class Convertible (n=1last 2 years) | |
| v3.3 Classroom CUDA | |
| MSI Summit E16 Flip A12UDT-031 | |
| Average of class Convertible (n=1last 2 years) | |
| v3.3 Classroom CPU | |
| Asus ExpertBook B2 Flip B2502FBA-N80141X | |
| Average of class Convertible (163 - 2067, n=57, last 2 years) | |
| MSI Summit E16 Flip A12UDT-031 | |
* ... smaller is better
| The Witcher 3 - 1920x1080 Ultra Graphics & Postprocessing (HBAO+) | |
| Dell Inspiron 16 Plus 7620 | |
| Asus Zenbook Pro 15 OLED UM535Q | |
| Average NVIDIA GeForce RTX 3050 Ti Laptop GPU (19 - 58.5, n=29) | |
| MSI Summit E16 Flip A12UDT-031 | |
| Average of class Convertible (11 - 101, n=21, last 2 years) | |
| Dell Inspiron 16 7620 2-in-1 | |
| Asus ExpertBook B2 Flip B2502FBA-N80141X | |
| F1 22 - 1920x1080 High Preset AA:T AF:16x | |
| Average NVIDIA GeForce RTX 3050 Ti Laptop GPU (48 - 113, n=7) | |
| MSI Summit E16 Flip A12UDT-031 | |
| Average of class Convertible (22 - 124.6, n=21, last 2 years) | |
The Witcher 3 FPS Chart
| low | med. | high | ultra | QHD | |
|---|---|---|---|---|---|
| GTA V (2015) | 179.7 | 173.8 | 114.3 | 57.1 | 41.4 |
| The Witcher 3 (2015) | 186.1 | 109.3 | 63.7 | 46.4 | |
| Dota 2 Reborn (2015) | 134.8 | 122.8 | 117.9 | 114.1 | |
| Final Fantasy XV Benchmark (2018) | 104.9 | 59.2 | 44.9 | 35.1 | |
| X-Plane 11.11 (2018) | 125.7 | 105.9 | 88.1 | ||
| Strange Brigade (2018) | 270 | 114.8 | 104.9 | 88.2 | 66.2 |
| F1 22 (2022) | 122.2 | 107.9 | 79.2 | 29.3 | 13.7 |
Emissions and Power Management - The 2-in-1 laptop gets very loud under load
Noise Emissions
In everyday operation (Office, Internet), the two fans don't produce an excessive amount of noise and can even remain silent occasionally. However, under medium and high load, they get quite loud at a maximum noise level of 49.3 dB(A) or 48.2 dB(A) during the stress test.
For quieter operation, the laptop offers the "Silent Mode" and "Super Battery" profiles, but this goes at the cost of computing performance. The "Super Battery" battery ensures the lowest noise level but also delivers the lowest performance level.
Noise level
| Idle |
| 25 / 25 / 28.9 dB(A) |
| Load |
| 49.3 / 48.2 dB(A) |
 | ||
30 dB silent 40 dB(A) audible 50 dB(A) loud |
||
min: | ||
| MSI Summit E16 Flip A12UDT-031 GeForce RTX 3050 Ti Laptop GPU, i7-1280P, Samsung PM9A1 MZVL22T0HBLB | Asus ExpertBook B2 Flip B2502FBA-N80141X Iris Xe G7 96EUs, i7-1260P, Samsung PM9A1 MZVL21T0HCLR | Samsung Galaxy Book Pro 360 15 NP950QDB-KC3DE Iris Xe G7 80EUs, i5-1135G7, Samsung PM991 MZVLQ256HAJD | Dell Inspiron 16 7620 2-in-1 Iris Xe G7 96EUs, i7-1260P, Toshiba KBG40ZNS512G NVMe | |
|---|---|---|---|---|
| Noise | -1% | 10% | 16% | |
| off / environment * (dB) | 25 | 26 -4% | 25 -0% | 23.2 7% |
| Idle Minimum * (dB) | 25 | 26.6 -6% | 25 -0% | 23.5 6% |
| Idle Average * (dB) | 25 | 27 -8% | 25 -0% | 23.5 6% |
| Idle Maximum * (dB) | 28.9 | 27 7% | 25 13% | 23.5 19% |
| Load Average * (dB) | 49.3 | 46.7 5% | 32.7 34% | 29.4 40% |
| Load Maximum * (dB) | 48.2 | 46.7 3% | 42 13% | 39.7 18% |
| Witcher 3 ultra * (dB) | 35.6 |
* ... smaller is better
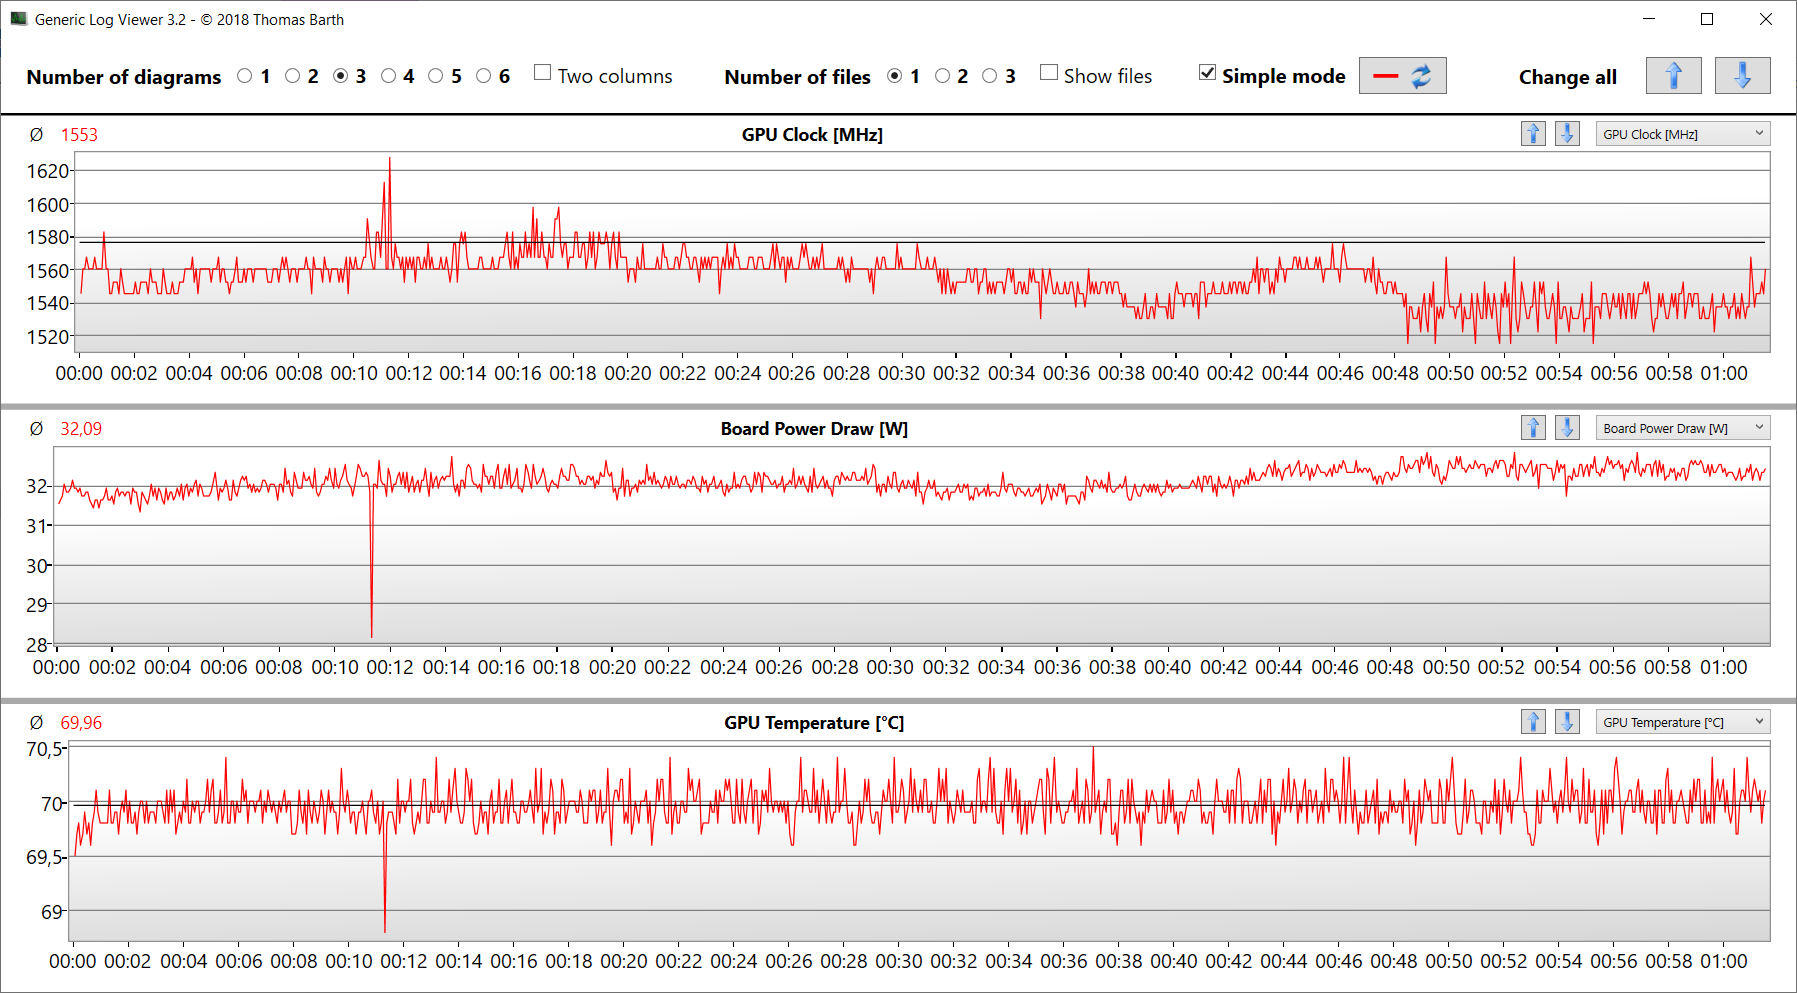
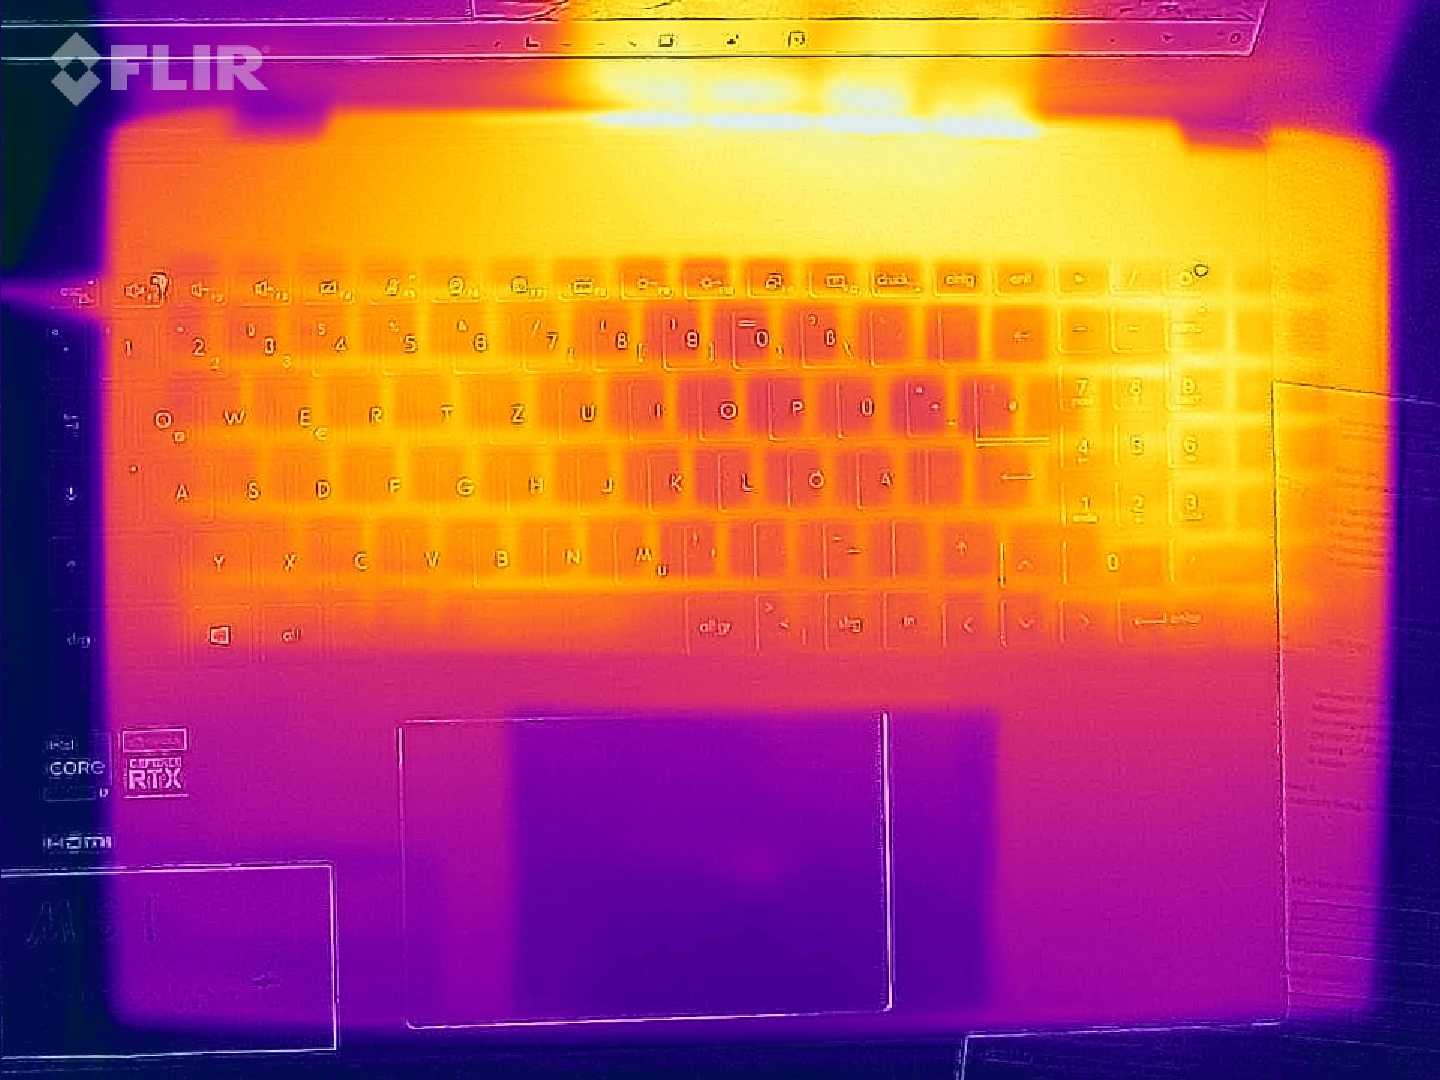
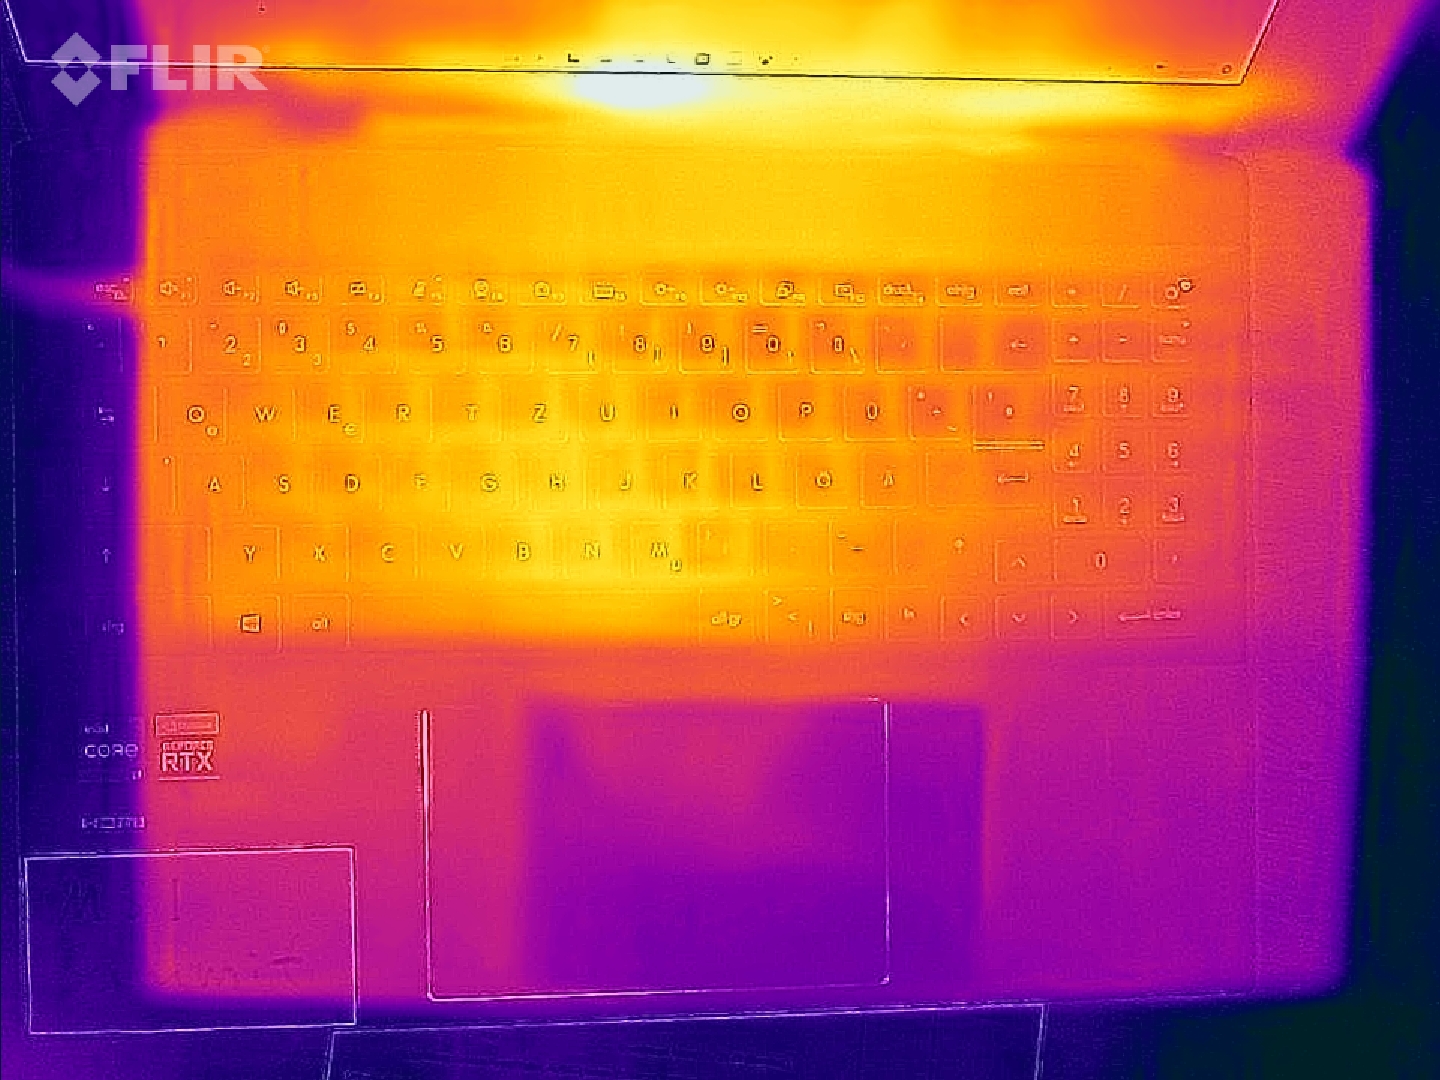
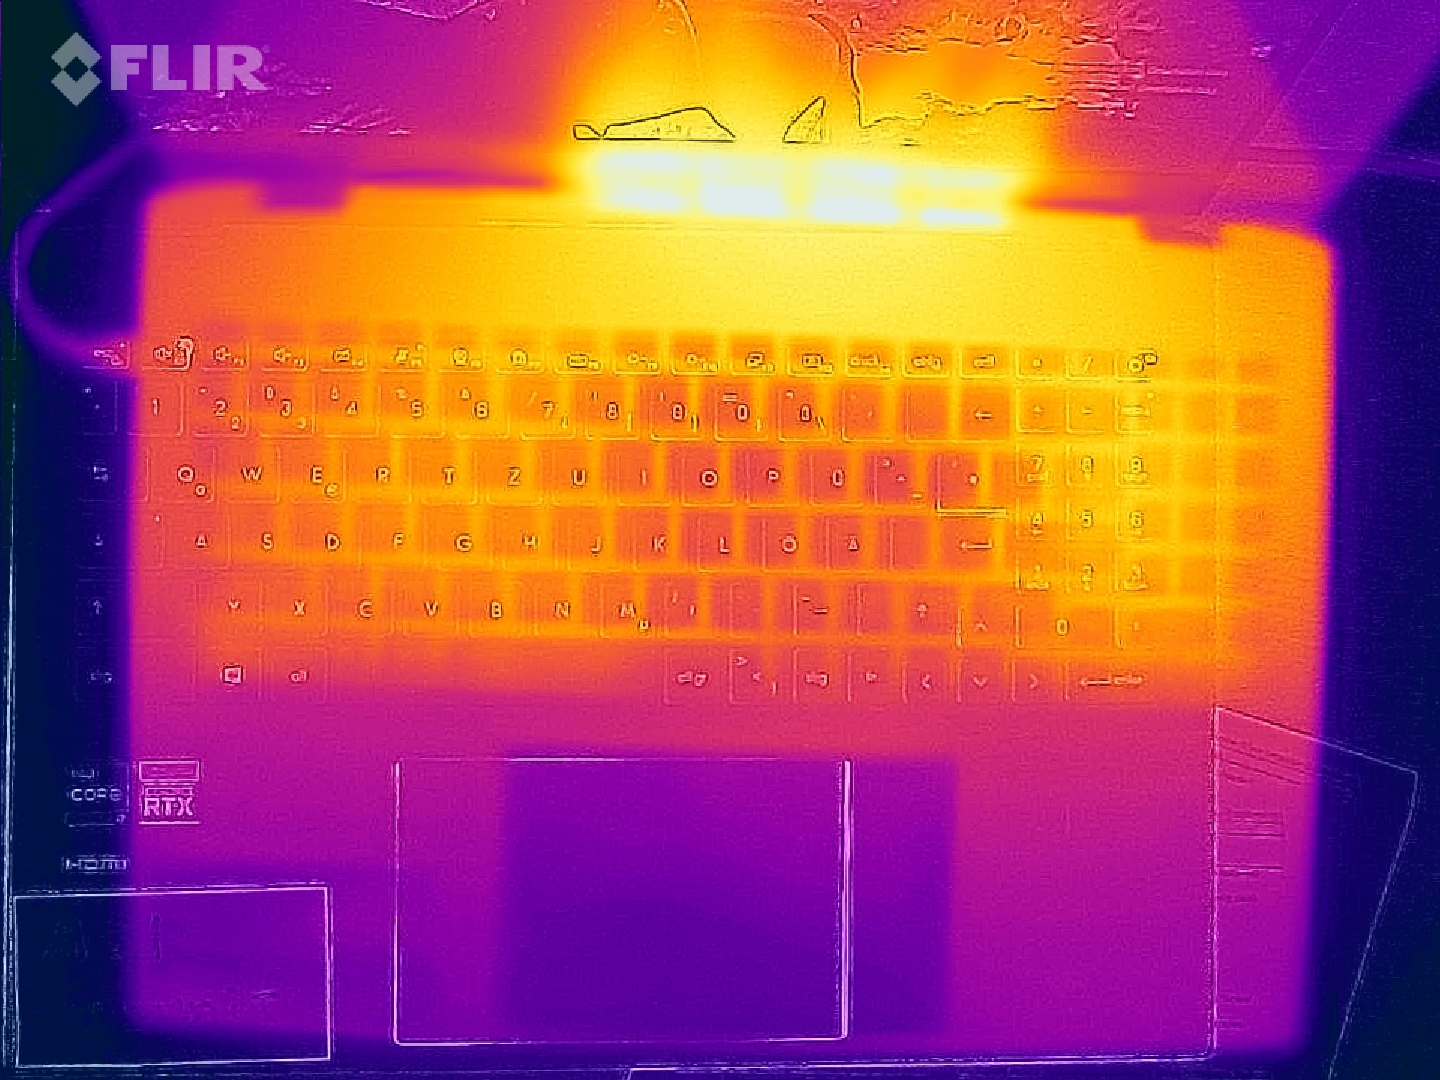
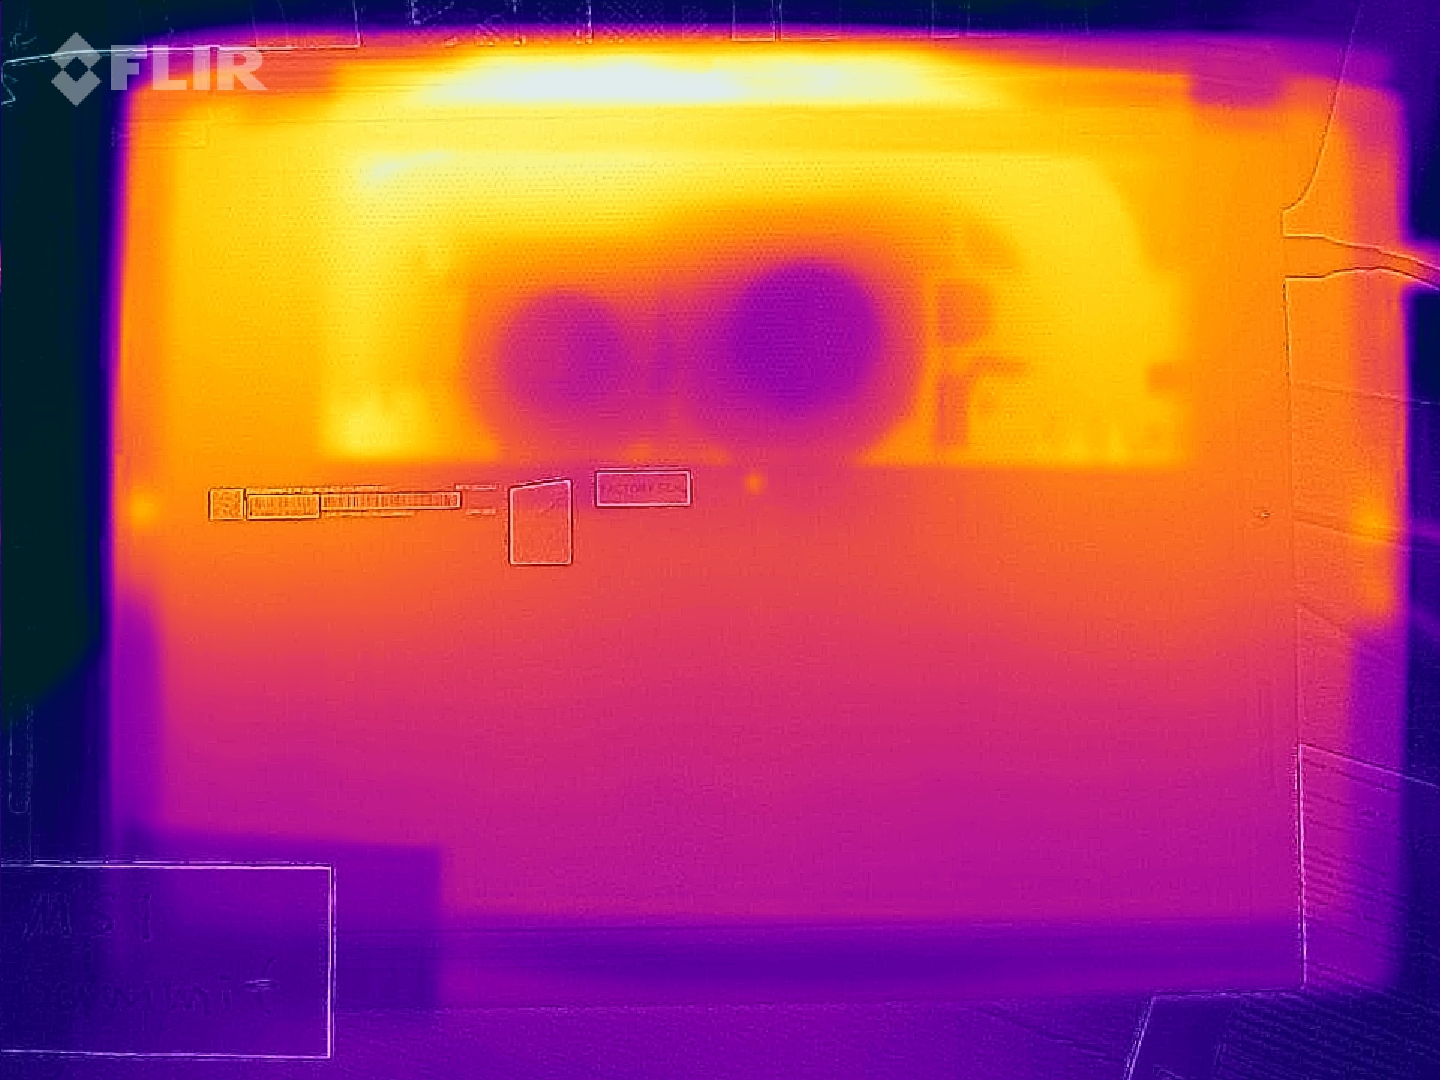
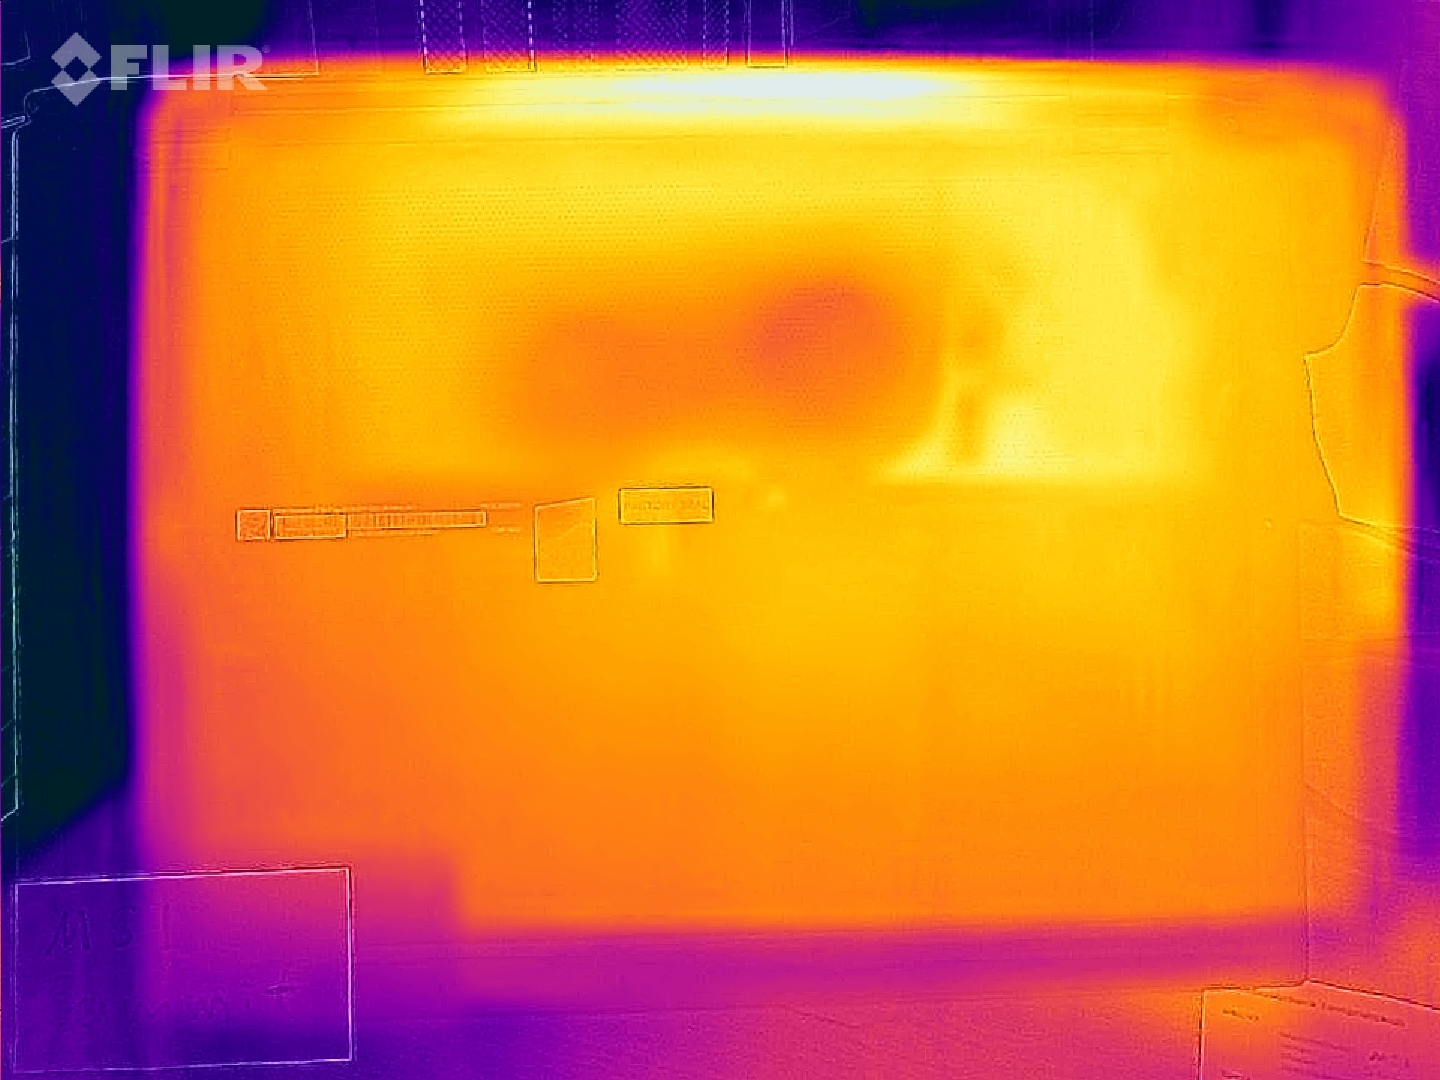
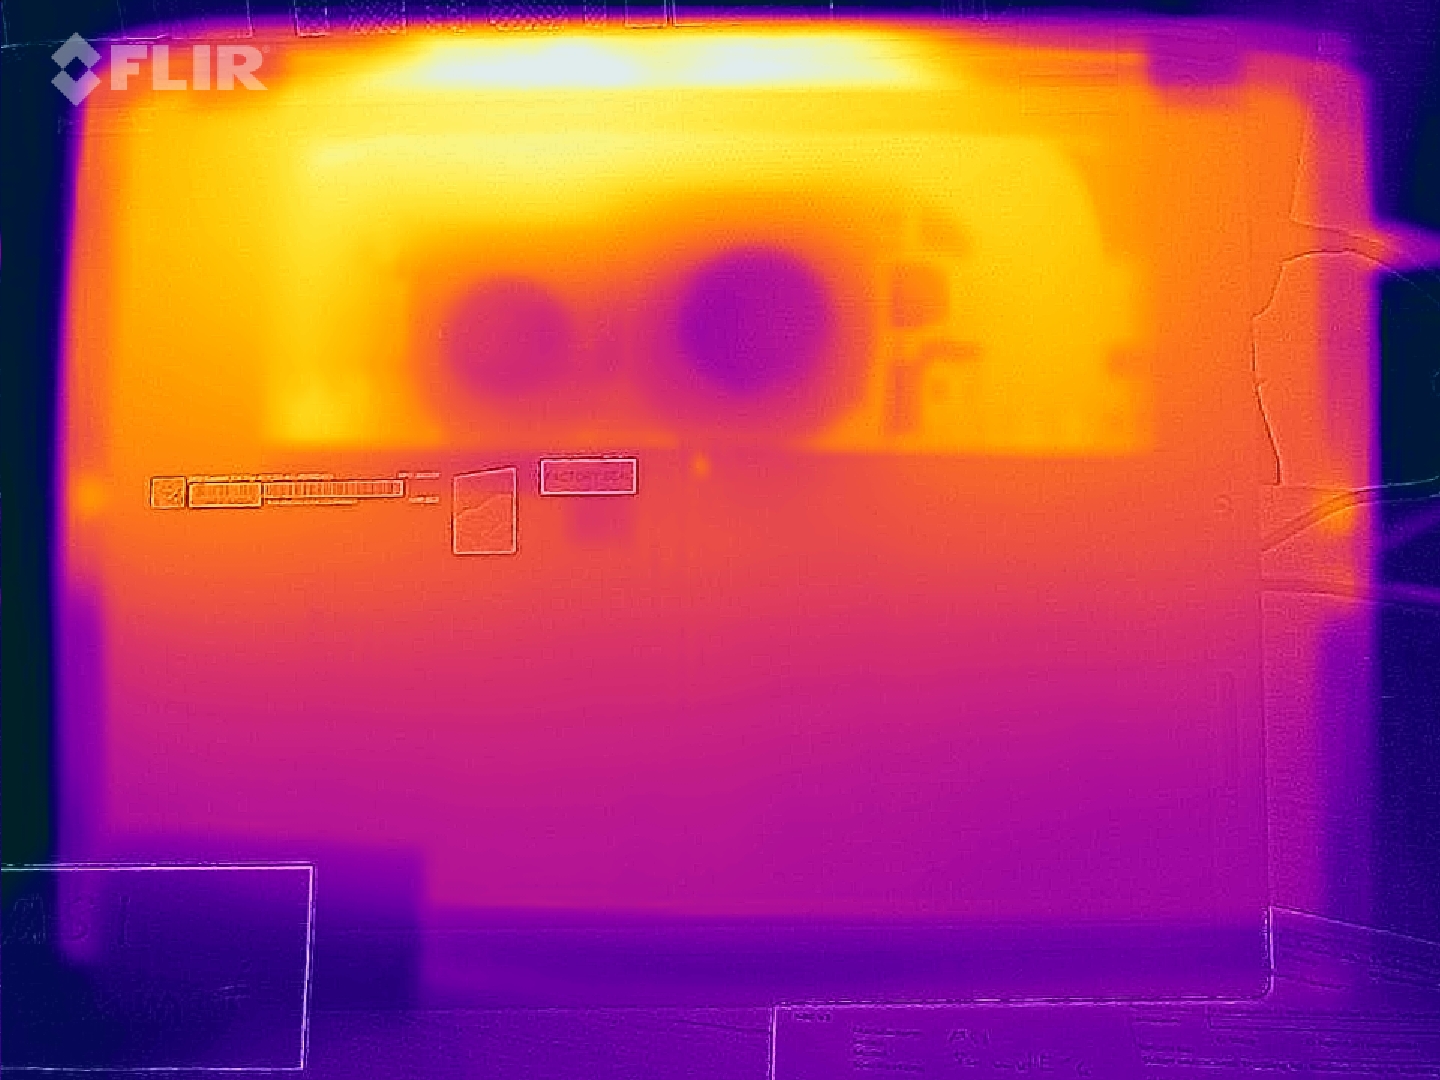
Temperatures
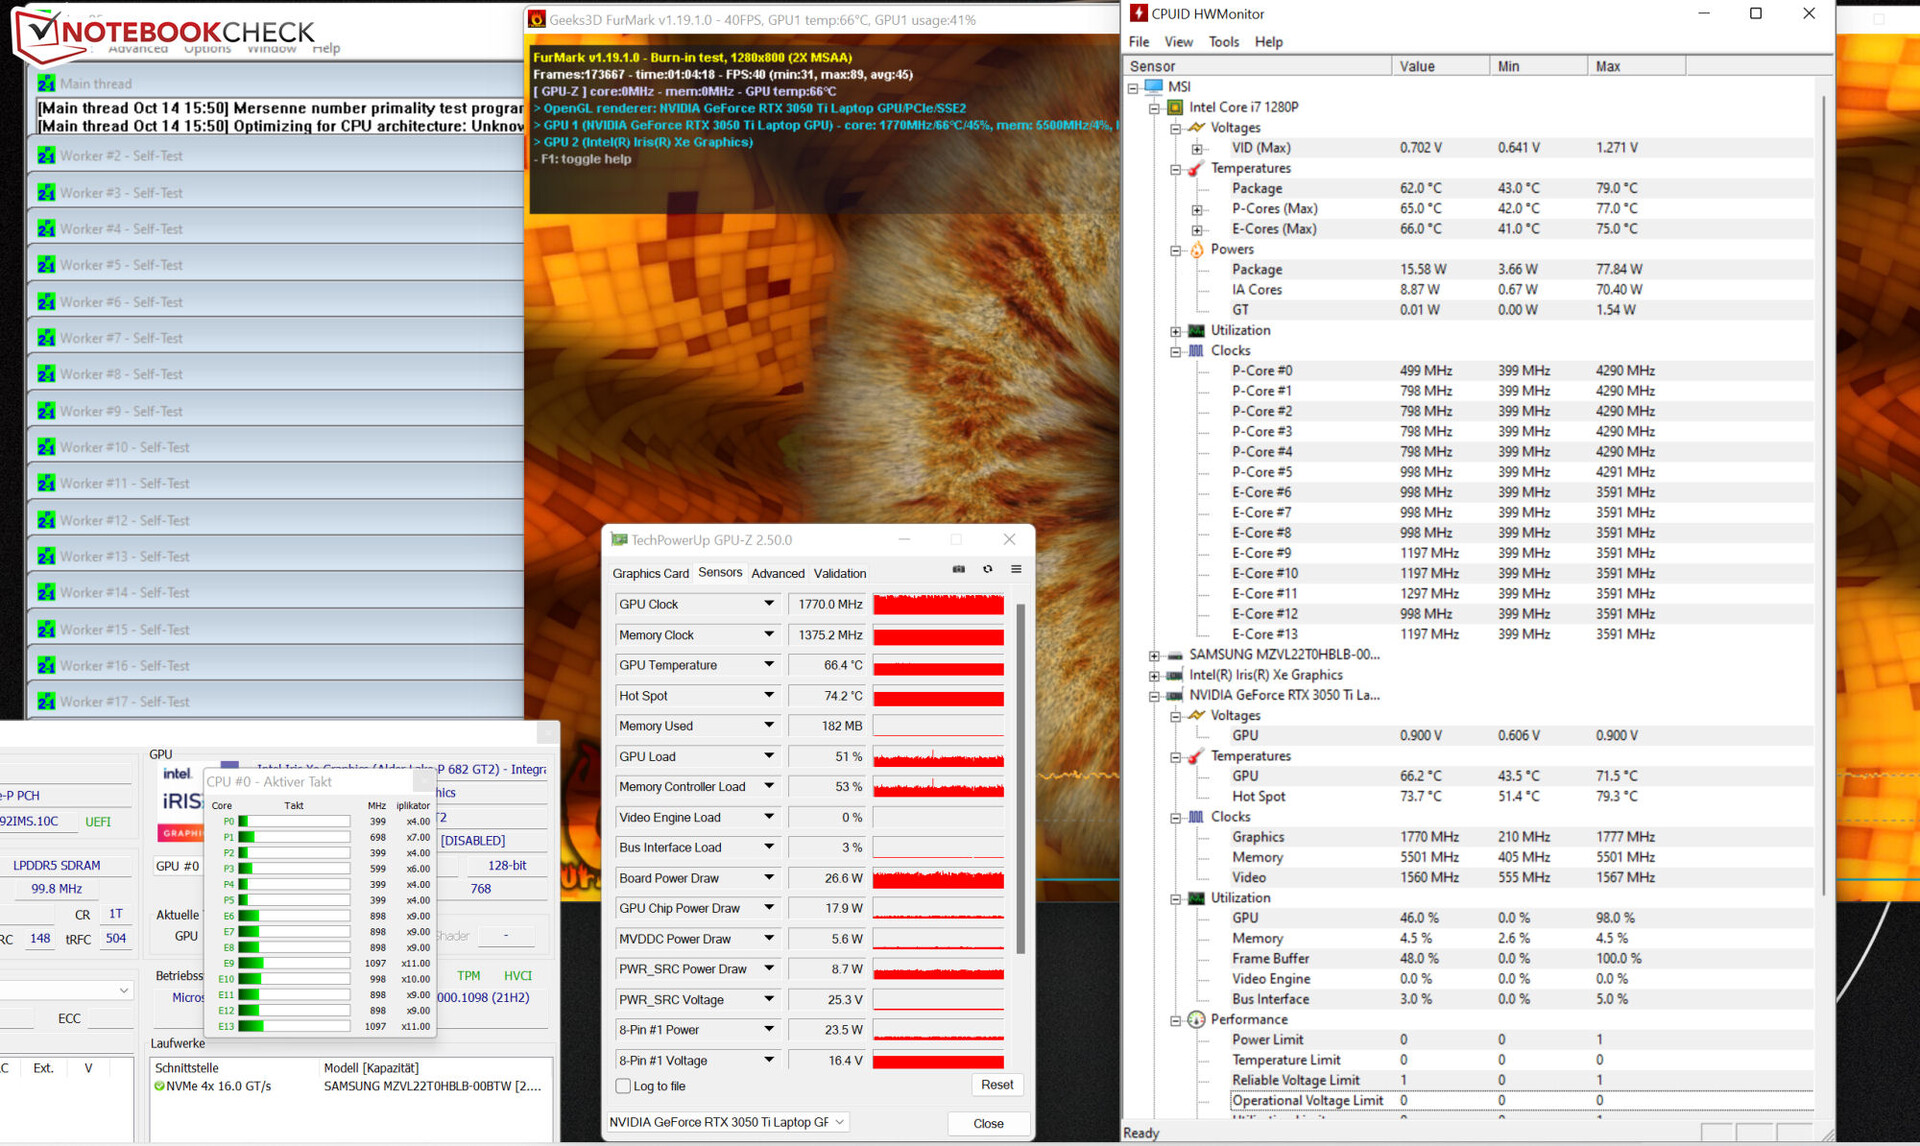
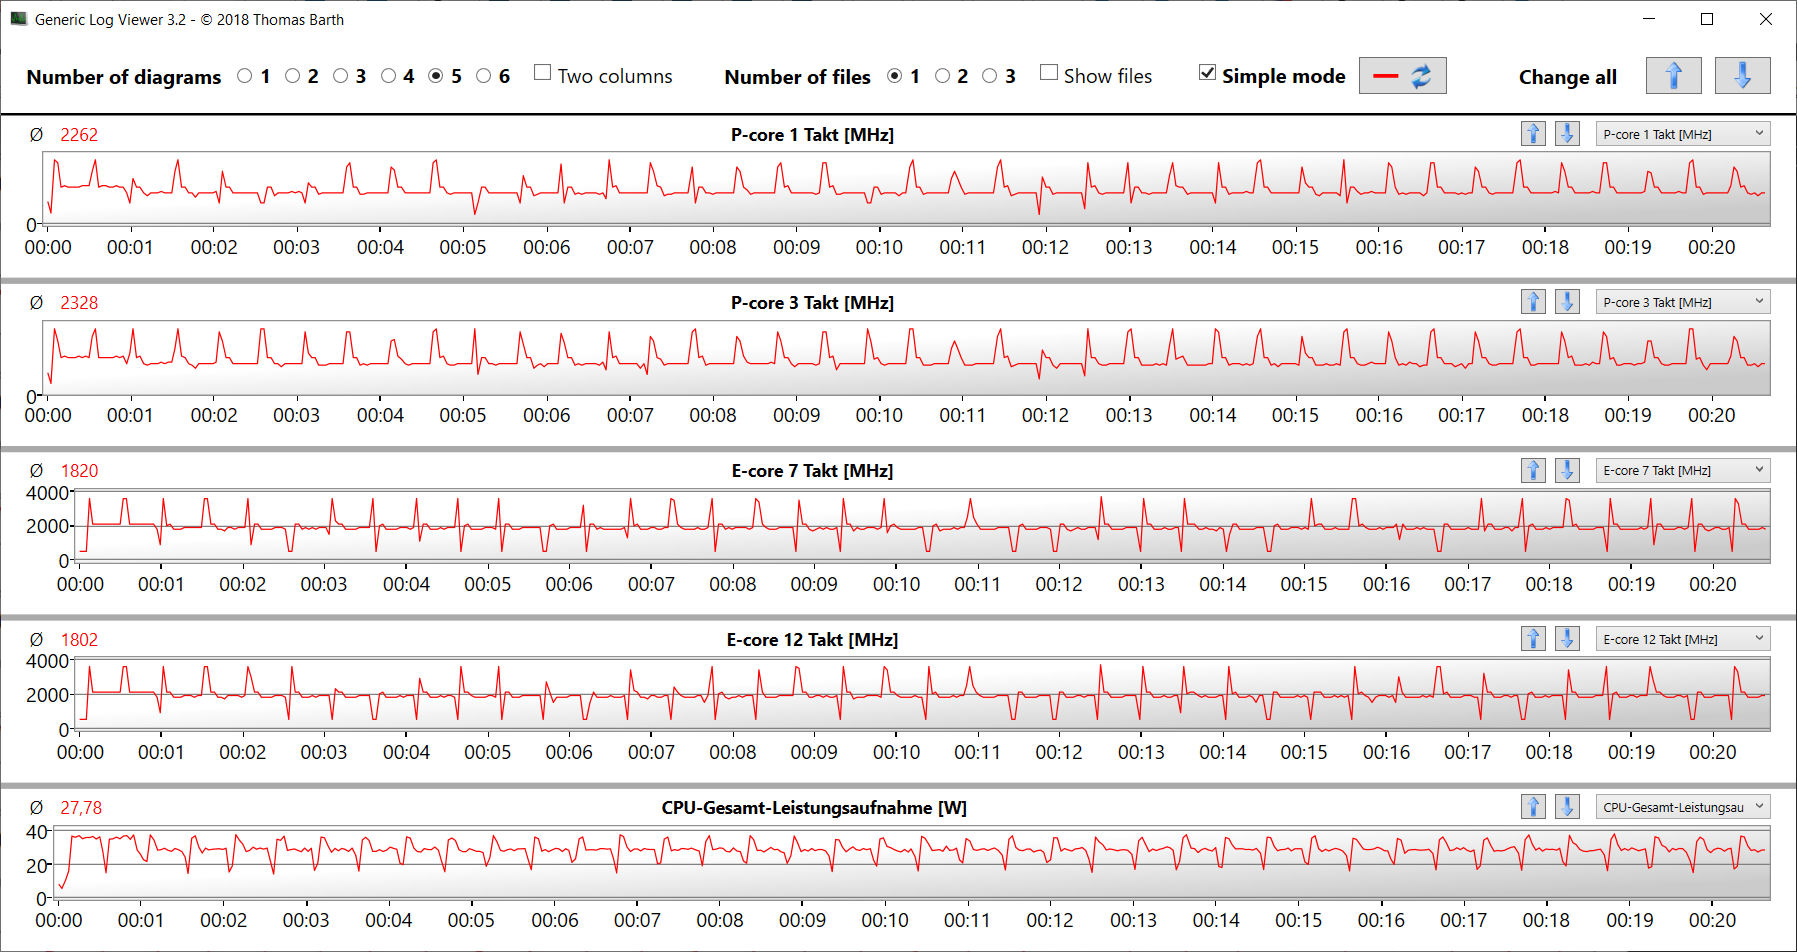
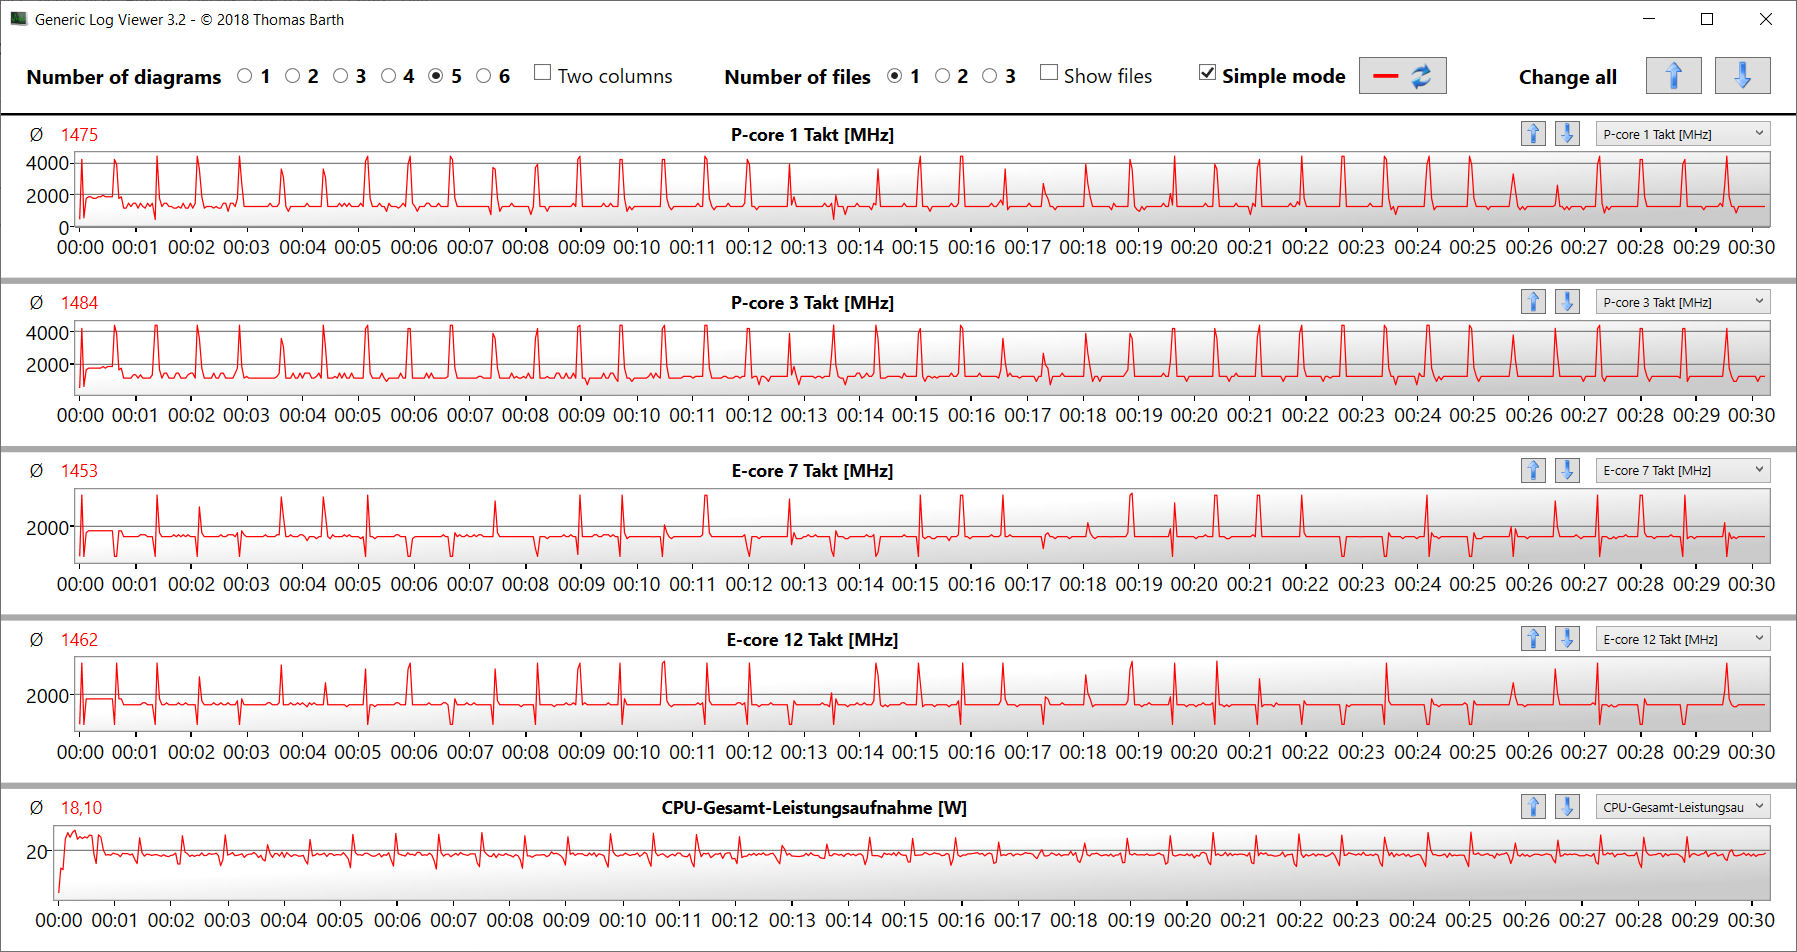
Under load (stress test, The Witcher 3), the laptop warms up noticeably but not excessively. Otherwise, the temperatures remain within the green range.
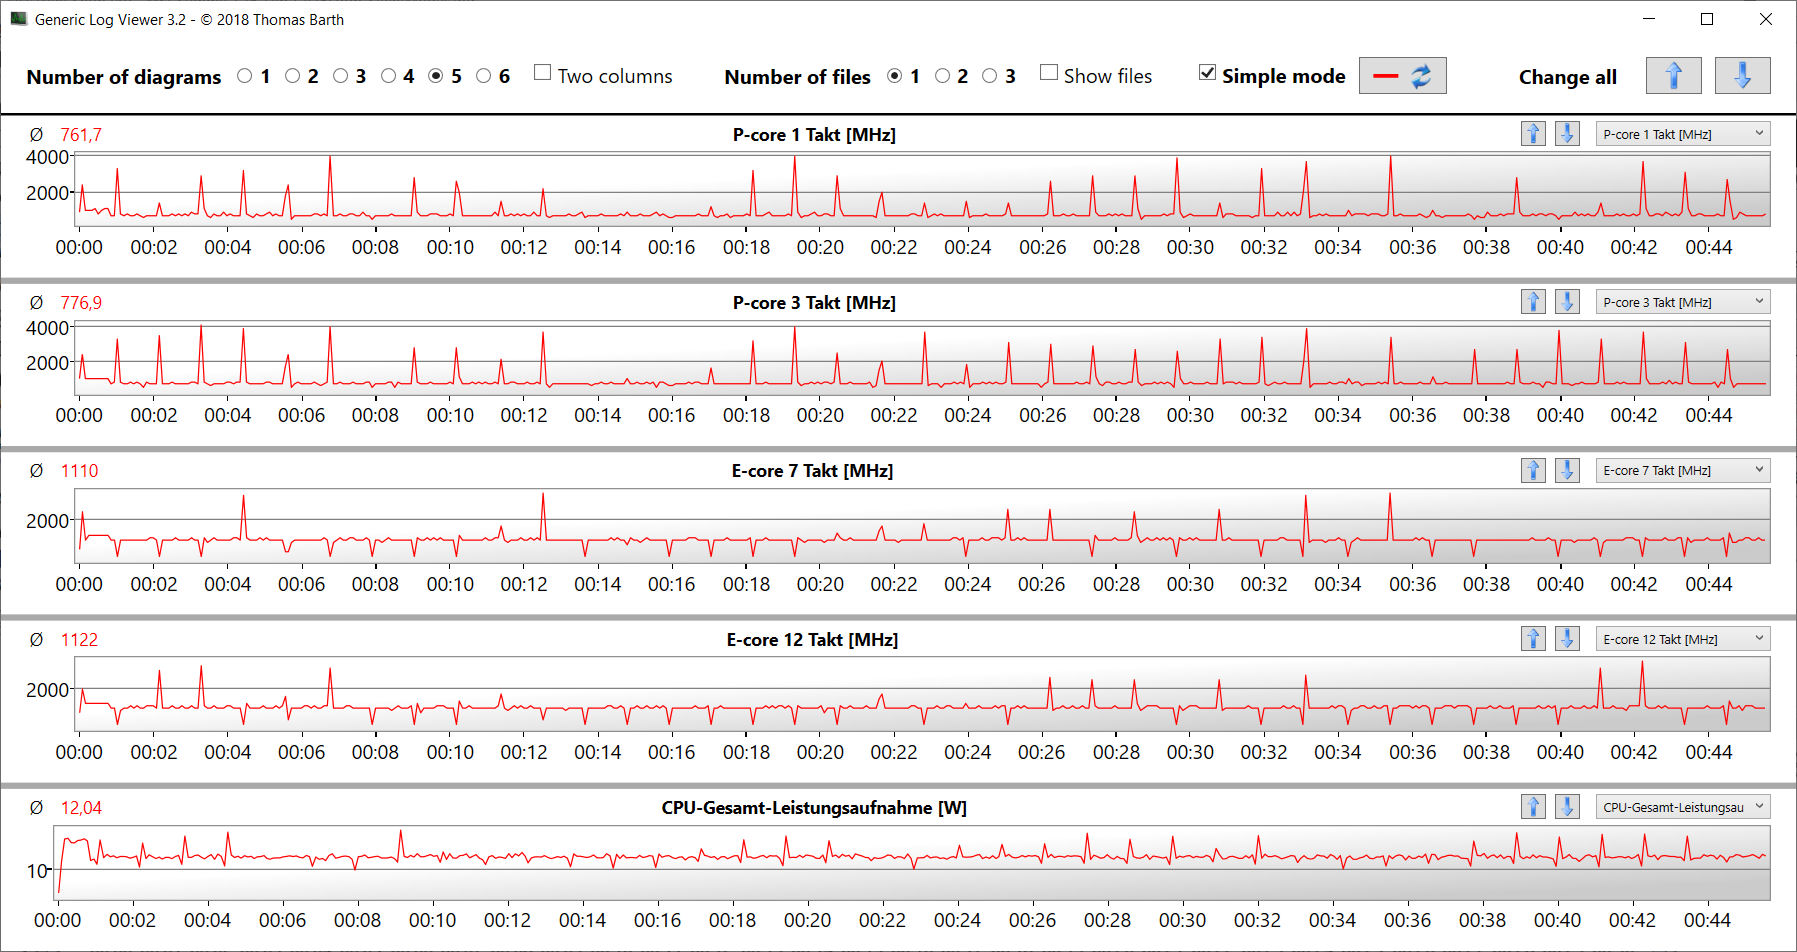
The stress test (Prime95 and Furmark running constantly) represents an extreme scenario that we use to evaluate the system stability under full load. The CPU starts the test at low clock speeds (P: 1.6 - 2.8 GHz; E: 1.6 - 1.7 GHz), and the graphics core runs at 1,400 to 1,800 MHz. While the CPU speed drops during the continuation of the test, the GPU speed stabilizes at a high level.
(-) The maximum temperature on the upper side is 49.2 °C / 121 F, compared to the average of 35.4 °C / 96 F, ranging from 19.6 to 60 °C for the class Convertible.
(-) The bottom heats up to a maximum of 50.2 °C / 122 F, compared to the average of 36.8 °C / 98 F
(+) In idle usage, the average temperature for the upper side is 27.6 °C / 82 F, compared to the device average of 30.3 °C / 87 F.
(-) Playing The Witcher 3, the average temperature for the upper side is 39.1 °C / 102 F, compared to the device average of 30.3 °C / 87 F.
(+) The palmrests and touchpad are reaching skin temperature as a maximum (33.7 °C / 92.7 F) and are therefore not hot.
(-) The average temperature of the palmrest area of similar devices was 27.9 °C / 82.2 F (-5.8 °C / -10.5 F).
| MSI Summit E16 Flip A12UDT-031 Intel Core i7-1280P, NVIDIA GeForce RTX 3050 Ti Laptop GPU | Asus ExpertBook B2 Flip B2502FBA-N80141X Intel Core i7-1260P, Intel Iris Xe Graphics G7 96EUs | Samsung Galaxy Book Pro 360 15 NP950QDB-KC3DE Intel Core i5-1135G7, Intel Iris Xe Graphics G7 80EUs | Dell Inspiron 16 7620 2-in-1 Intel Core i7-1260P, Intel Iris Xe Graphics G7 96EUs | |
|---|---|---|---|---|
| Heat | 5% | 14% | -1% | |
| Maximum Upper Side * (°C) | 49.2 | 36.6 26% | 42.6 13% | 42.2 14% |
| Maximum Bottom * (°C) | 50.2 | 42.2 16% | 40.8 19% | 47.4 6% |
| Idle Upper Side * (°C) | 29.4 | 31.3 -6% | 25.9 12% | 32.2 -10% |
| Idle Bottom * (°C) | 30 | 34.8 -16% | 26.1 13% | 33.6 -12% |
* ... smaller is better
Speakers
The stereo speakers produce a decent sound that includes hardly any bass.
MSI Summit E16 Flip A12UDT-031 audio analysis
(±) | speaker loudness is average but good (79.8 dB)
Bass 100 - 315 Hz
(-) | nearly no bass - on average 23.6% lower than median
(-) | bass is not linear (15.1% delta to prev. frequency)
Mids 400 - 2000 Hz
(±) | higher mids - on average 5.6% higher than median
(±) | linearity of mids is average (7.4% delta to prev. frequency)
Highs 2 - 16 kHz
(±) | higher highs - on average 5.6% higher than median
(+) | highs are linear (4.5% delta to prev. frequency)
Overall 100 - 16.000 Hz
(±) | linearity of overall sound is average (22.6% difference to median)
Compared to same class
» 68% of all tested devices in this class were better, 5% similar, 27% worse
» The best had a delta of 6%, average was 20%, worst was 57%
Compared to all devices tested
» 66% of all tested devices were better, 6% similar, 29% worse
» The best had a delta of 4%, average was 24%, worst was 134%
Dell Inspiron 16 7620 2-in-1 audio analysis
(+) | speakers can play relatively loud (89.8 dB)
Bass 100 - 315 Hz
(-) | nearly no bass - on average 15.3% lower than median
(±) | linearity of bass is average (8.8% delta to prev. frequency)
Mids 400 - 2000 Hz
(+) | balanced mids - only 3.3% away from median
(+) | mids are linear (4.8% delta to prev. frequency)
Highs 2 - 16 kHz
(+) | balanced highs - only 3.2% away from median
(+) | highs are linear (5% delta to prev. frequency)
Overall 100 - 16.000 Hz
(+) | overall sound is linear (11.5% difference to median)
Compared to same class
» 9% of all tested devices in this class were better, 3% similar, 88% worse
» The best had a delta of 6%, average was 20%, worst was 57%
Compared to all devices tested
» 7% of all tested devices were better, 2% similar, 91% worse
» The best had a delta of 4%, average was 24%, worst was 134%
Power Consumption
Overall, the power consumption ranges at a normal level for the hardware used here. While the laptop runs through the Witcher 3 test with a constant power consumption, during the stress tests the consumption regularly drops for a brief time period. The included power supply (100 watts) is sufficiently sized.
| Off / Standby | |
| Idle | |
| Load |
|
Key:
min: | |
Power Consumption The Witcher 3 / Stress Test
Power Consumption With External Monitor
Battery Life
In our realistic WLAN test, the 16-inch achieves a battery life of 7:08 hours. This test simulates the load when rendering websites via a a script.
Pros
Cons
Verdict - A 2-in-1 laptop for mobile creative work
The Summit E16 Flip is a 2-in-1 laptop from the business segment that primarily targets creative users. MSI combines a 16-inch touchscreen in the 16:10 format with a powerful midrange GPU.
While the 2-in-1 laptop from MSI isn't meant for everybody, it should definitely attract some followers.
The Core i7-1280P and GeForce RTX 3050 Ti are able to run constantly at high clock speeds. The GPU performance almost reaches the average value for the RTX 3050 Ti graphics. Although the laptop doesn't get excessively hot under load, it can get quite loud. In everyday operation, things remain quieter, though.
The touchscreen display (2,560 x 1,600 pixels) covers the DCI-P3 color space. This is accompanied by stable viewing angles, a good color reproduction, short response times, and a good contrast level. Unfortunately, the panel has a reflective surface. In addition, the maximum brightness could have been higher. The touchscreen can be operated with the fingers as well as the included MSI input pen.
Despite its size, we can attest the device some mobility. The whole package brings about 1.9 kg (~4.2 lb) to the scale. The E16 manages to get a WLAN runtime of about 7 hours from its 82-Wh battery, which is a quite a good value, considering the hardware equipment.
Our database doesn't include a direct competitor to the E16. What might come closest in this category is the Dell Inspiron 16 7620 2-in-1, which is optionally available with a GeForce MX550 graphics core. In addition, that device scores with a significantly better battery life and replaceable/expandable working memory.
Price and Availability
The MSI Summit E16 Flip A12UDT is available from Amazon for $1849, for example.
MSI Summit E16 Flip A12UDT-031
- 10/19/2022 v7 (old)
Sascha Mölck
Price comparison

