 Deutsch
 English
 Español
 Français
 Italiano
 Nederlands
 Polski
 Português
 Русский
 Türkçe
 Svenska
 Chinese
 Magyar
Alienware x15 R2 Laptop Review: Ultrabook-like UFO soars with Core i9-12900H and 140 W RTX 3080 Ti
It's been some time since Dell has replaced the Alienware m15 series with the x15. The x15 series basically sports the same design language as the m15's Legend chassis but is now slimmer. This year, we have the Alienware x15 R2 and the Alienware x17 R2 vying for a slice of your hard-earned pie.
We have previously reviewed the Alienware x15 R1 and the Alienware x17 R2, so now it's time to check out the Alienware x15 R2 as well and see what this year's Alder Lake-H refresh has in store for us.
This year's Alienware x15 R2 is more or less a rehash of the last gen x15 R1. However, we see some much-needed internal improvements including upgrades to Intel 12th gen Alder Lake-H, Nvidia RTX 30 Ti graphics, Dolby Vision displays, and more.
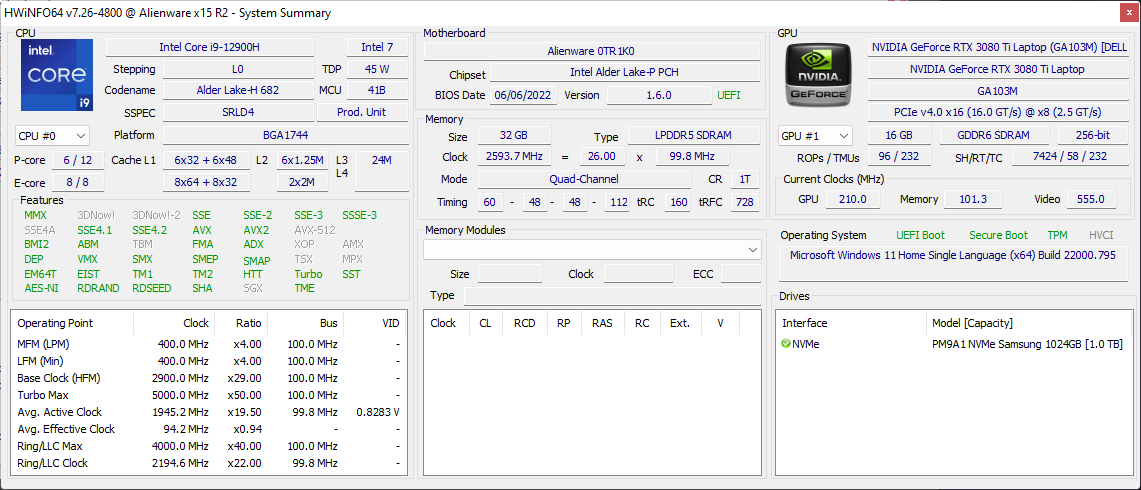
Our test Alienware x15 R2 is equipped with an Intel Core i9-12900H, Nvidia GeForce RTX 3080 Ti Laptop GPU, a 1080p 360 Hz display, 32 GB LPDDR5-4800 RAM, and a 1 TB Samsung PM9A1 NVMe SSD. This configuration will set you back by ₹3,68,190 (~US$4,500 or €4,583) if ordered online via Dell India.
In this review, we put the Alienware x15 R2 through its paces and see whether the new upgrades add up to a great experience for the asking price.
Potential Competitors in Comparison
Rating | Date | Model | Weight | Height | Size | Resolution | Best Price |
|---|---|---|---|---|---|---|---|
| 87.7 % | 10/2022 | Alienware x15 R2 P111F i9-12900H, GeForce RTX 3080 Ti Laptop GPU | 2.4 kg | 15.9 mm | 15.60" | 1920x1080 | |
| 86.3 % | 05/2022 | Asus ROG Strix Scar 15 G533ZW-LN106WS i9-12900H, GeForce RTX 3070 Ti Laptop GPU | 2.3 kg | 27.2 mm | 15.60" | 2560x1440 | |
| 88.2 % | 05/2022 | Asus ROG Zephyrus Duo 16 GX650RX R9 6900HX, GeForce RTX 3080 Ti Laptop GPU | 2.6 kg | 20.5 mm | 16.00" | 3840x2400 | |
| 87.4 % | 06/2022 | MSI Raider GE66 12UHS i9-12900HK, GeForce RTX 3080 Ti Laptop GPU | 2.4 kg | 23.4 mm | 15.60" | 3840x2160 | |
| 88.3 % | 08/2022 | MSI Titan GT77 12UHS i9-12900HX, GeForce RTX 3080 Ti Laptop GPU | 3.3 kg | 23 mm | 17.30" | 1920x1080 | |
| 86.9 % | 03/2022 | MSI Vector GP66 12UGS i9-12900H, GeForce RTX 3070 Ti Laptop GPU | 2.3 kg | 23.4 mm | 15.60" | 1920x1080 | |
| 88.3 % | 05/2022 | Razer Blade 15 Advanced Model Early 2022 i7-12800H, GeForce RTX 3080 Ti Laptop GPU | 2.1 kg | 16.99 mm | 15.60" | 1920x1080 |
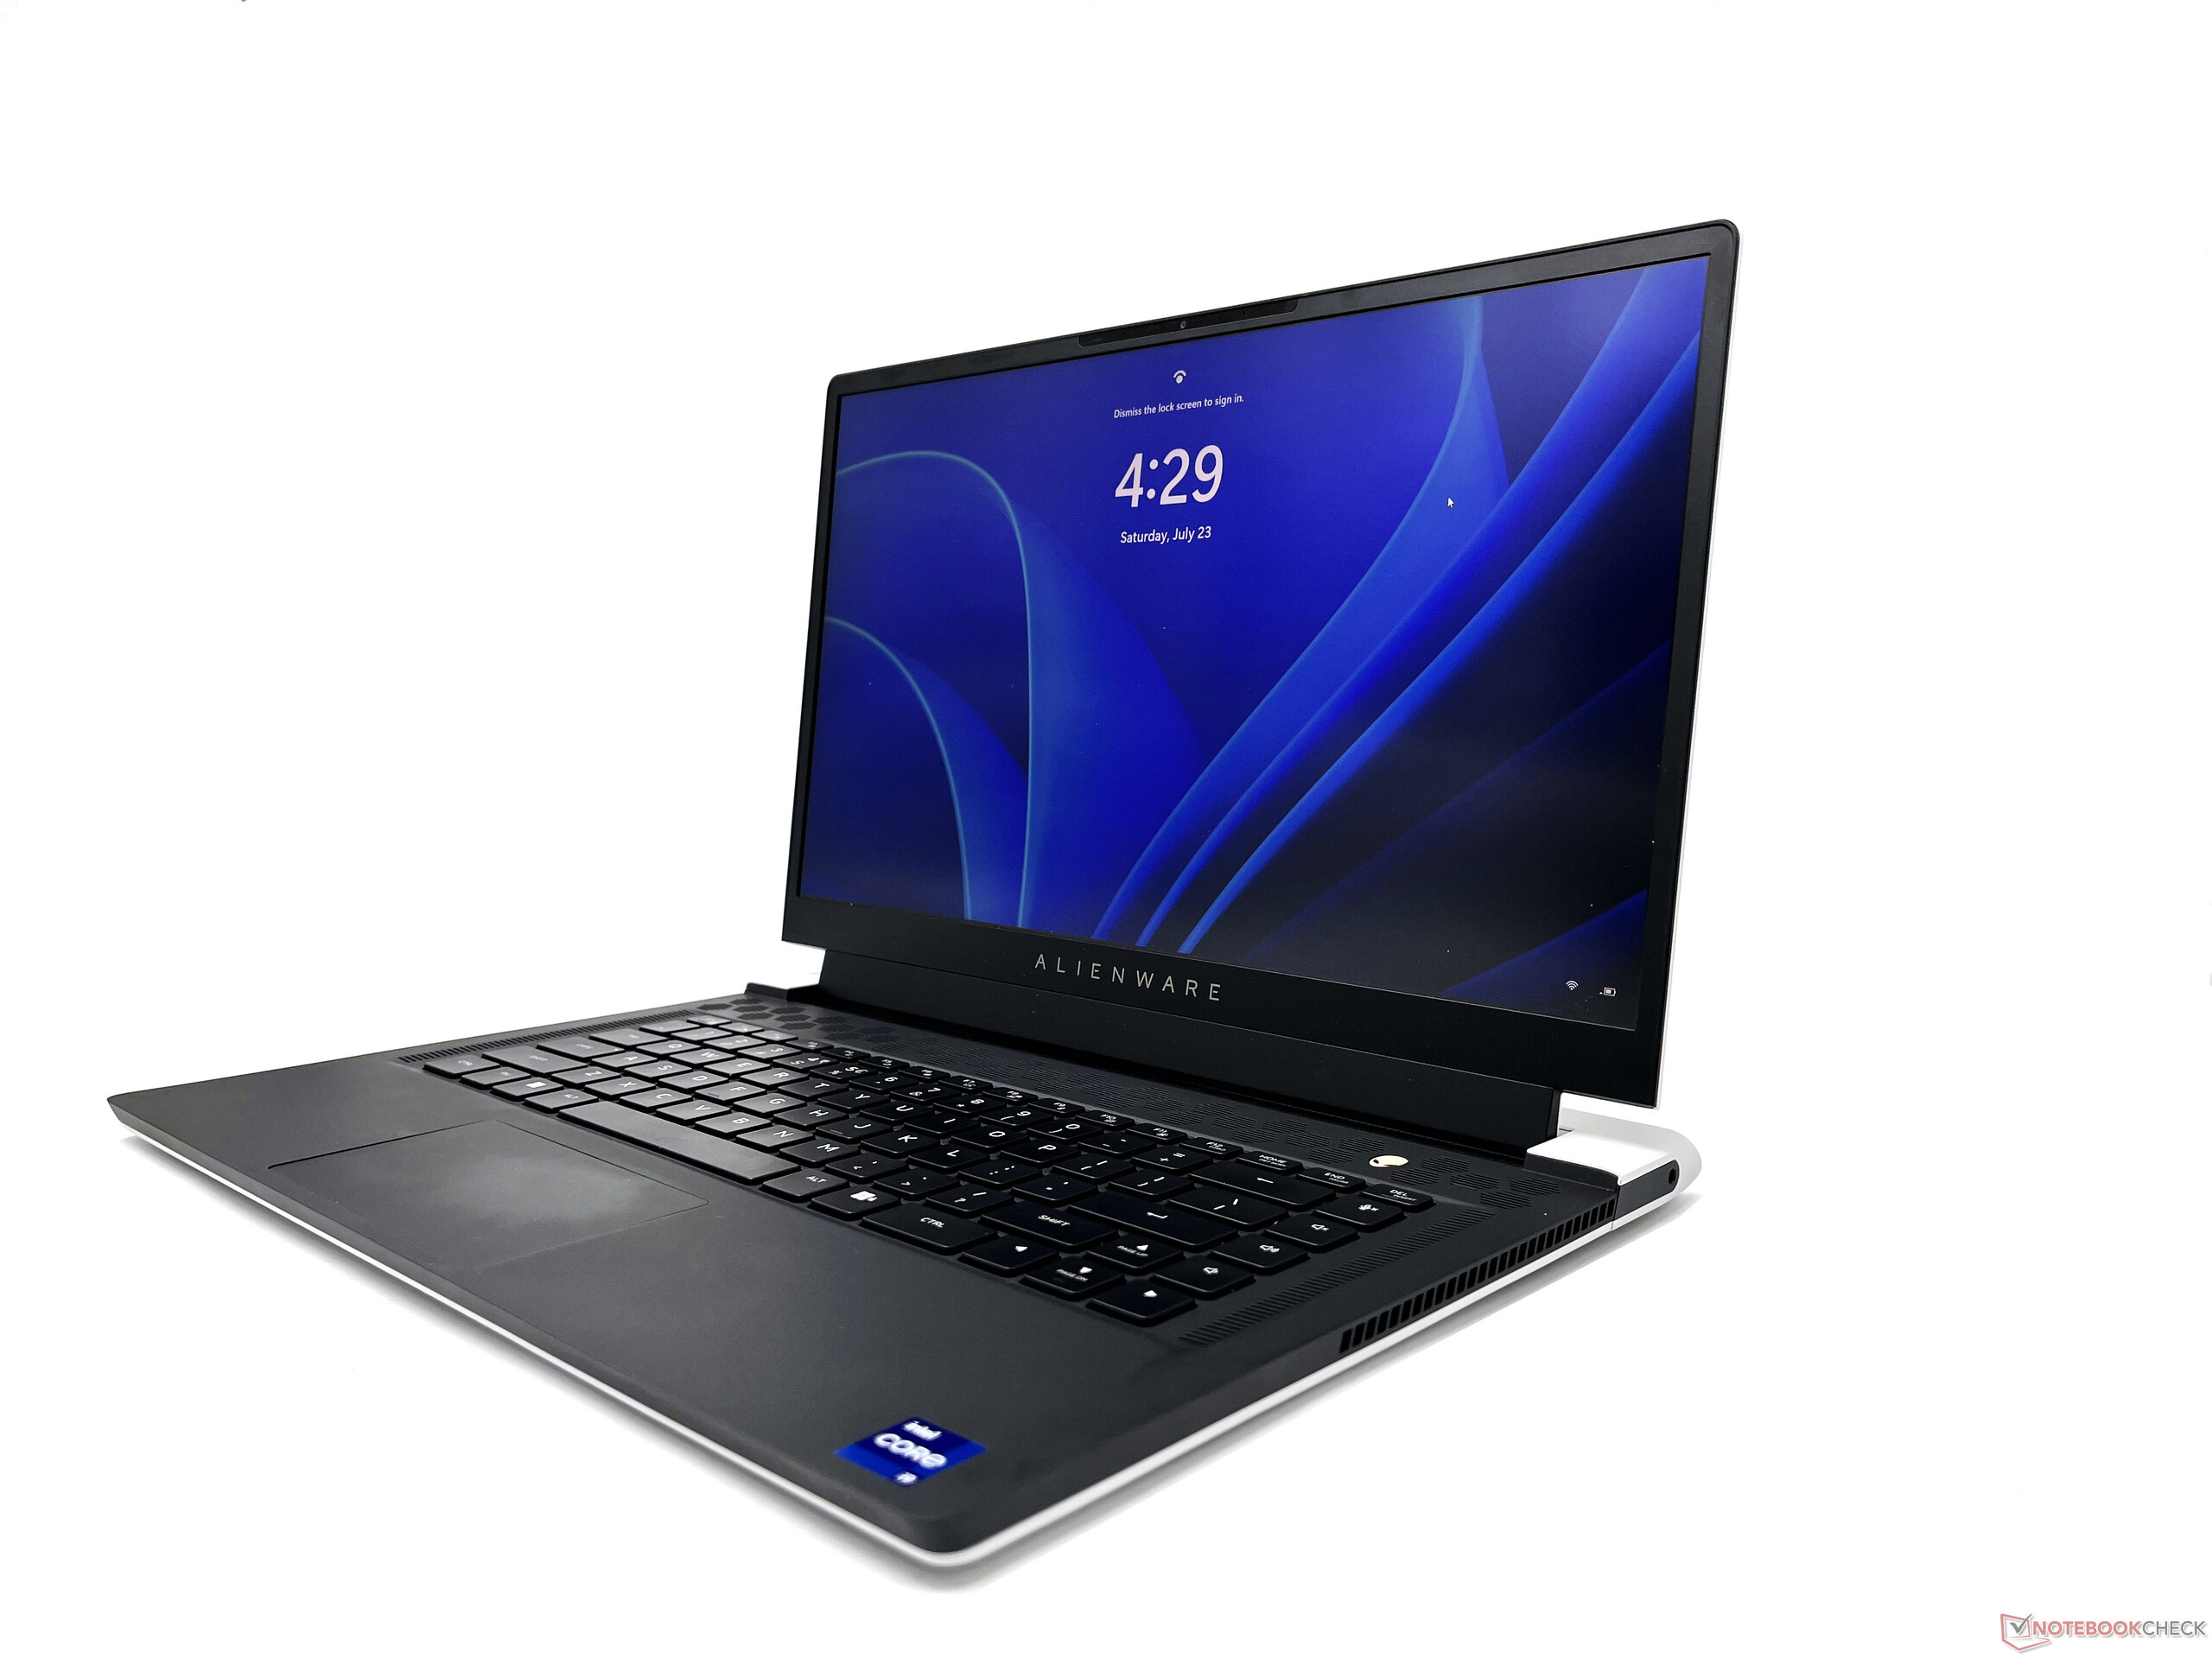
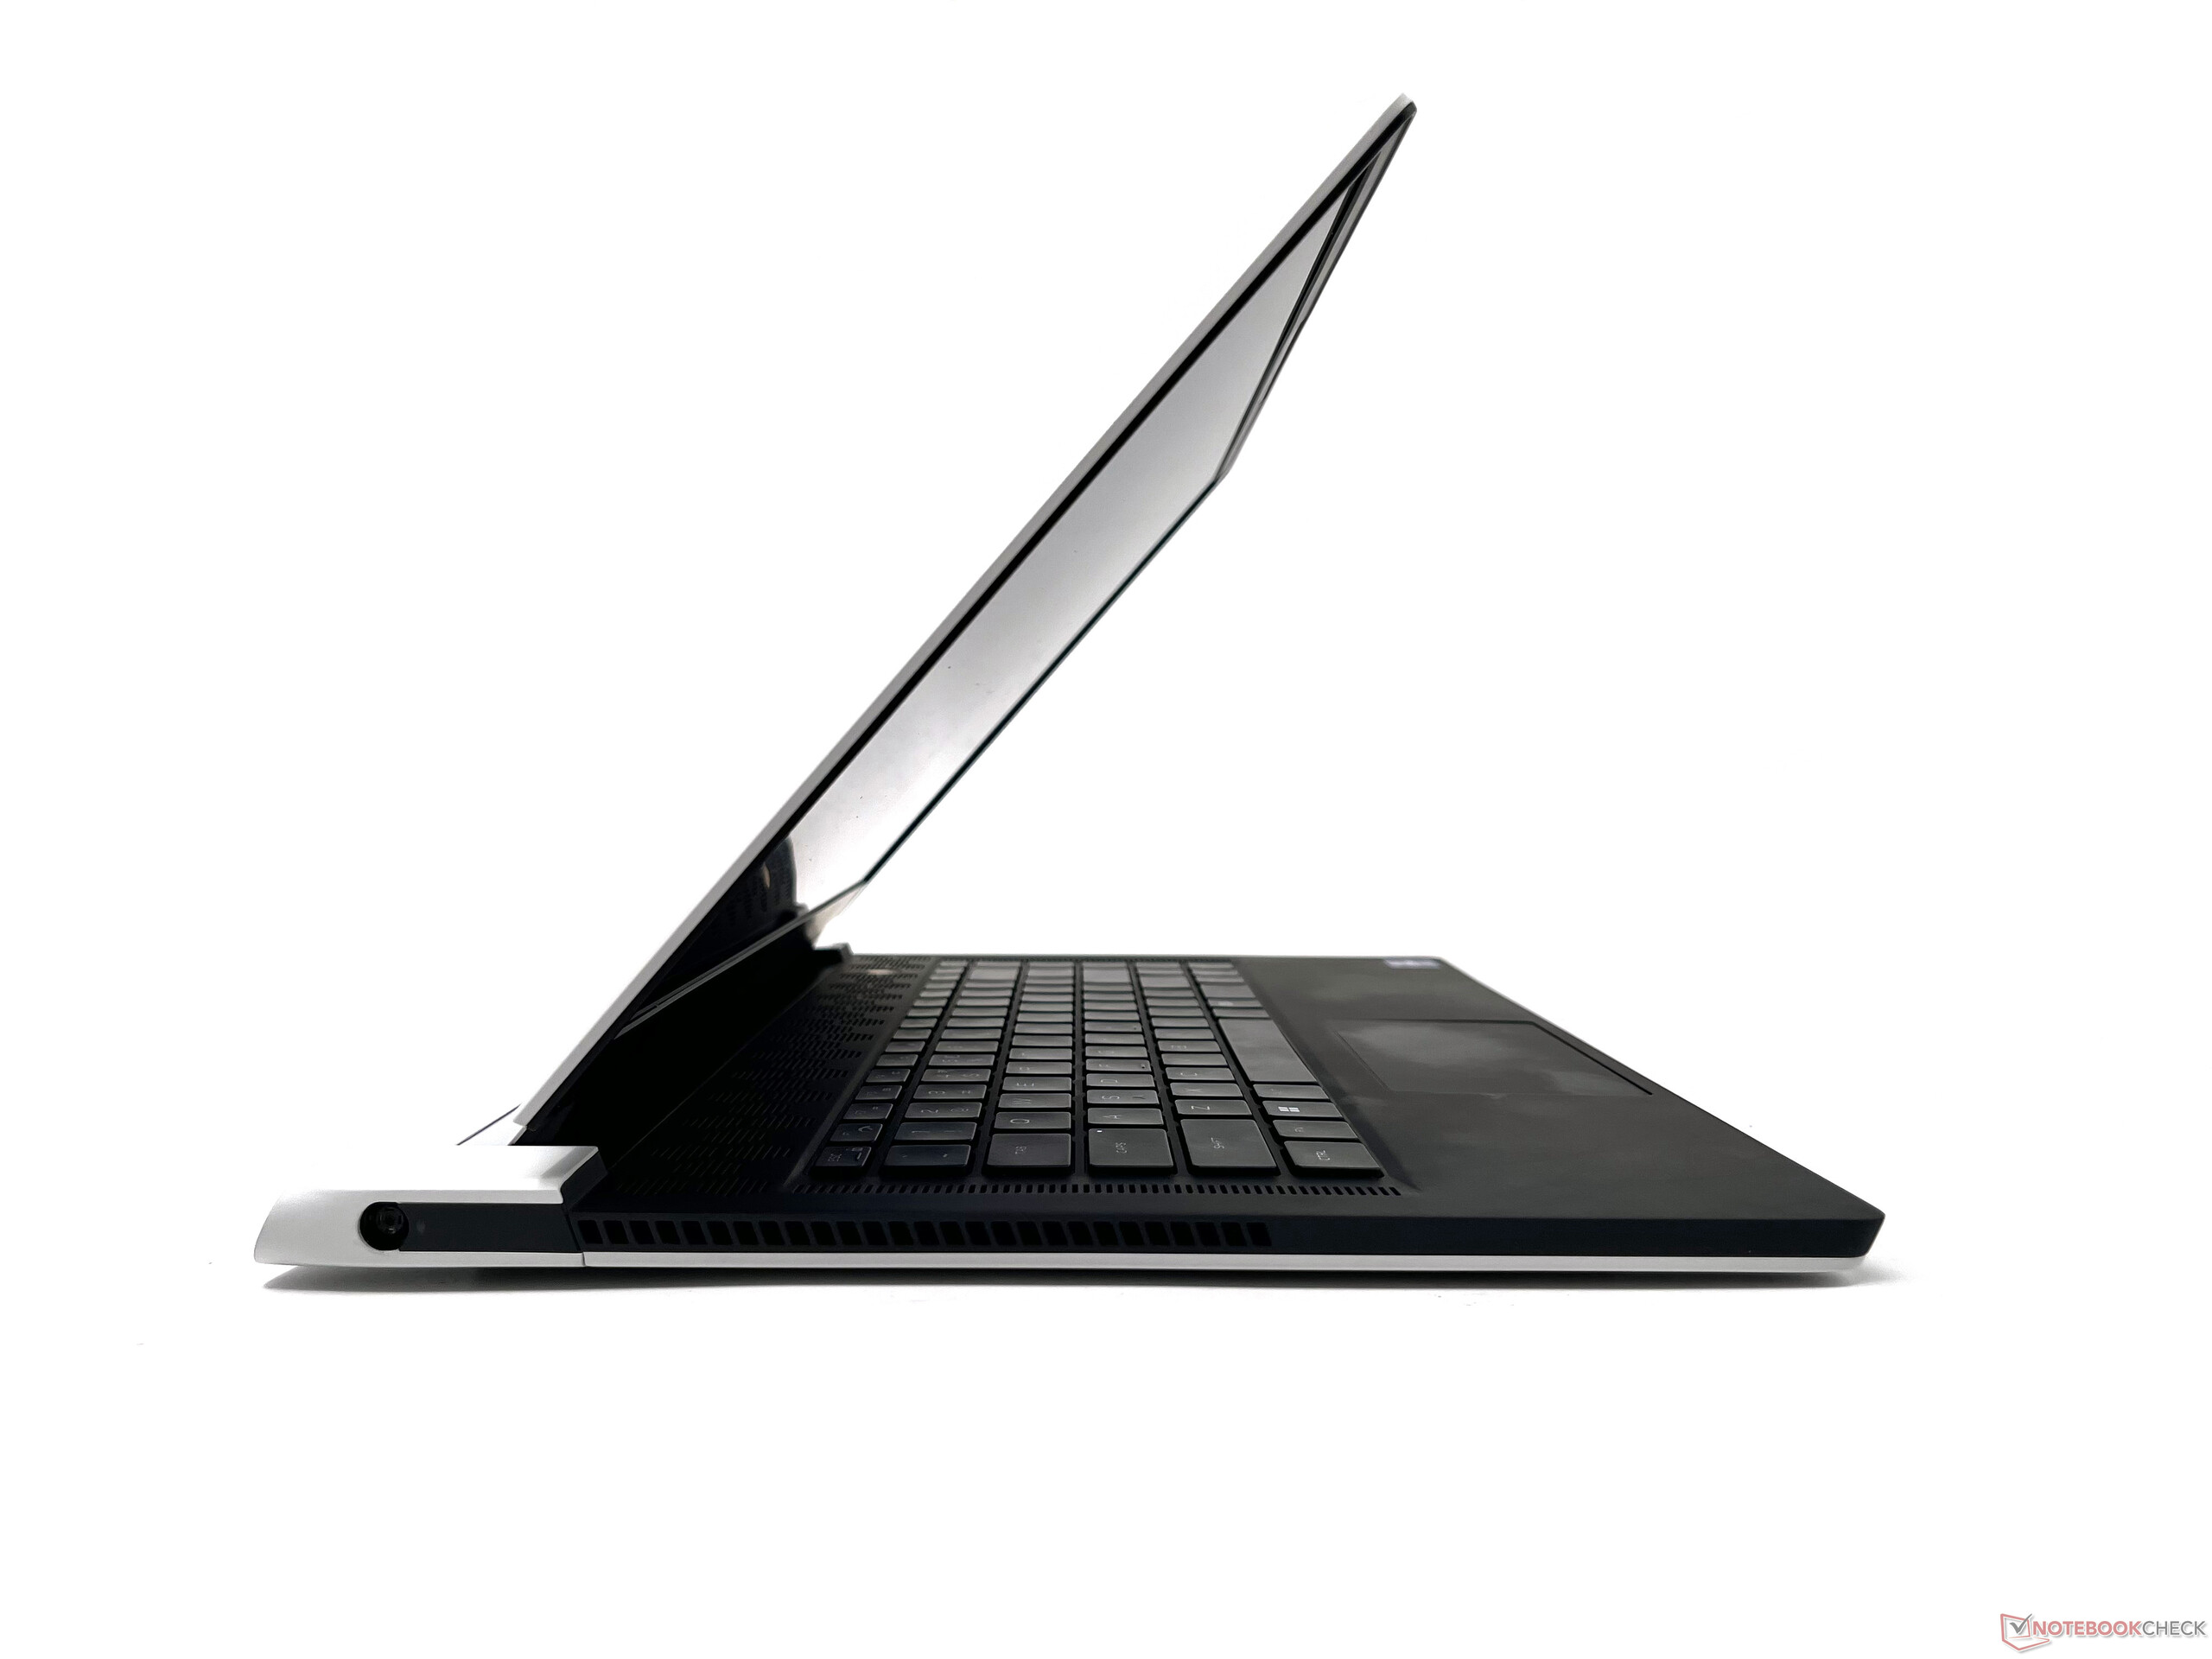
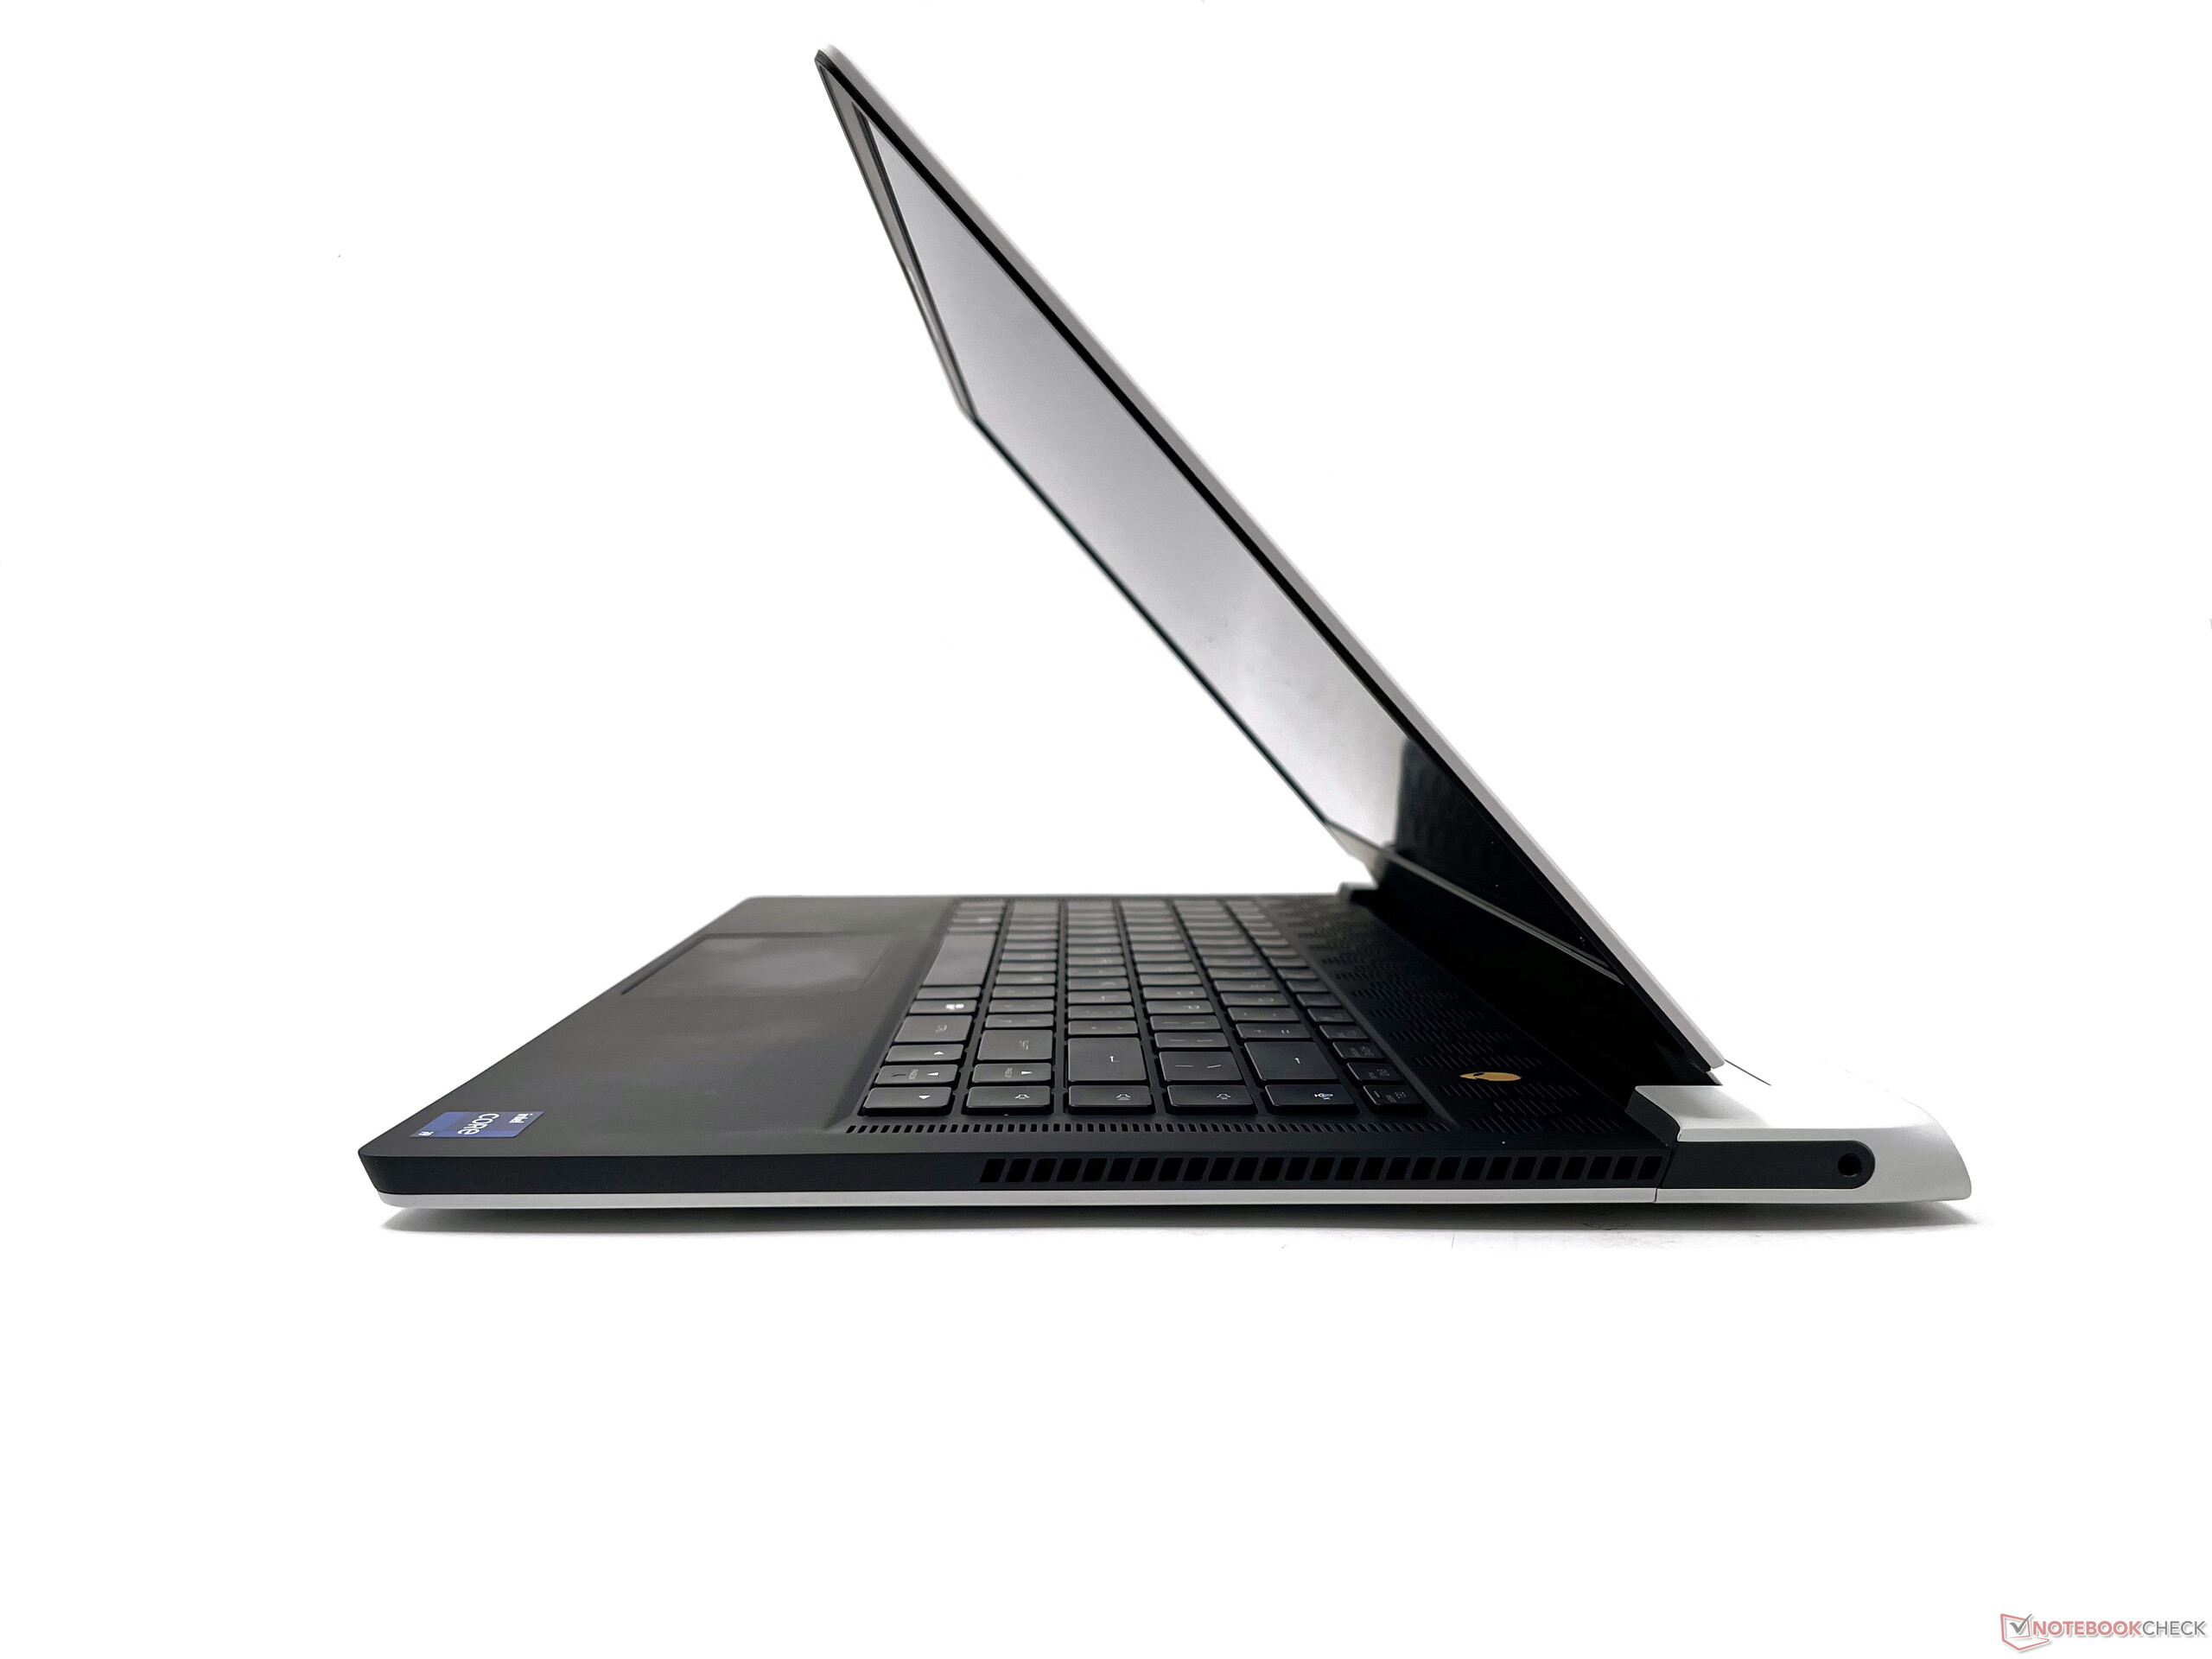
Case: Every inch an Alienware in a near-ultrabook chassis
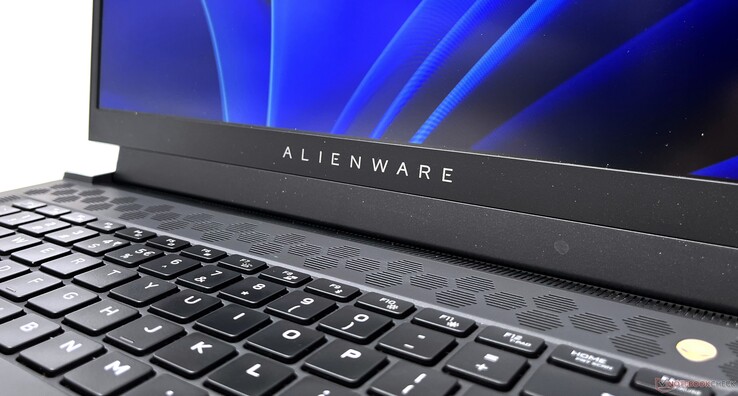
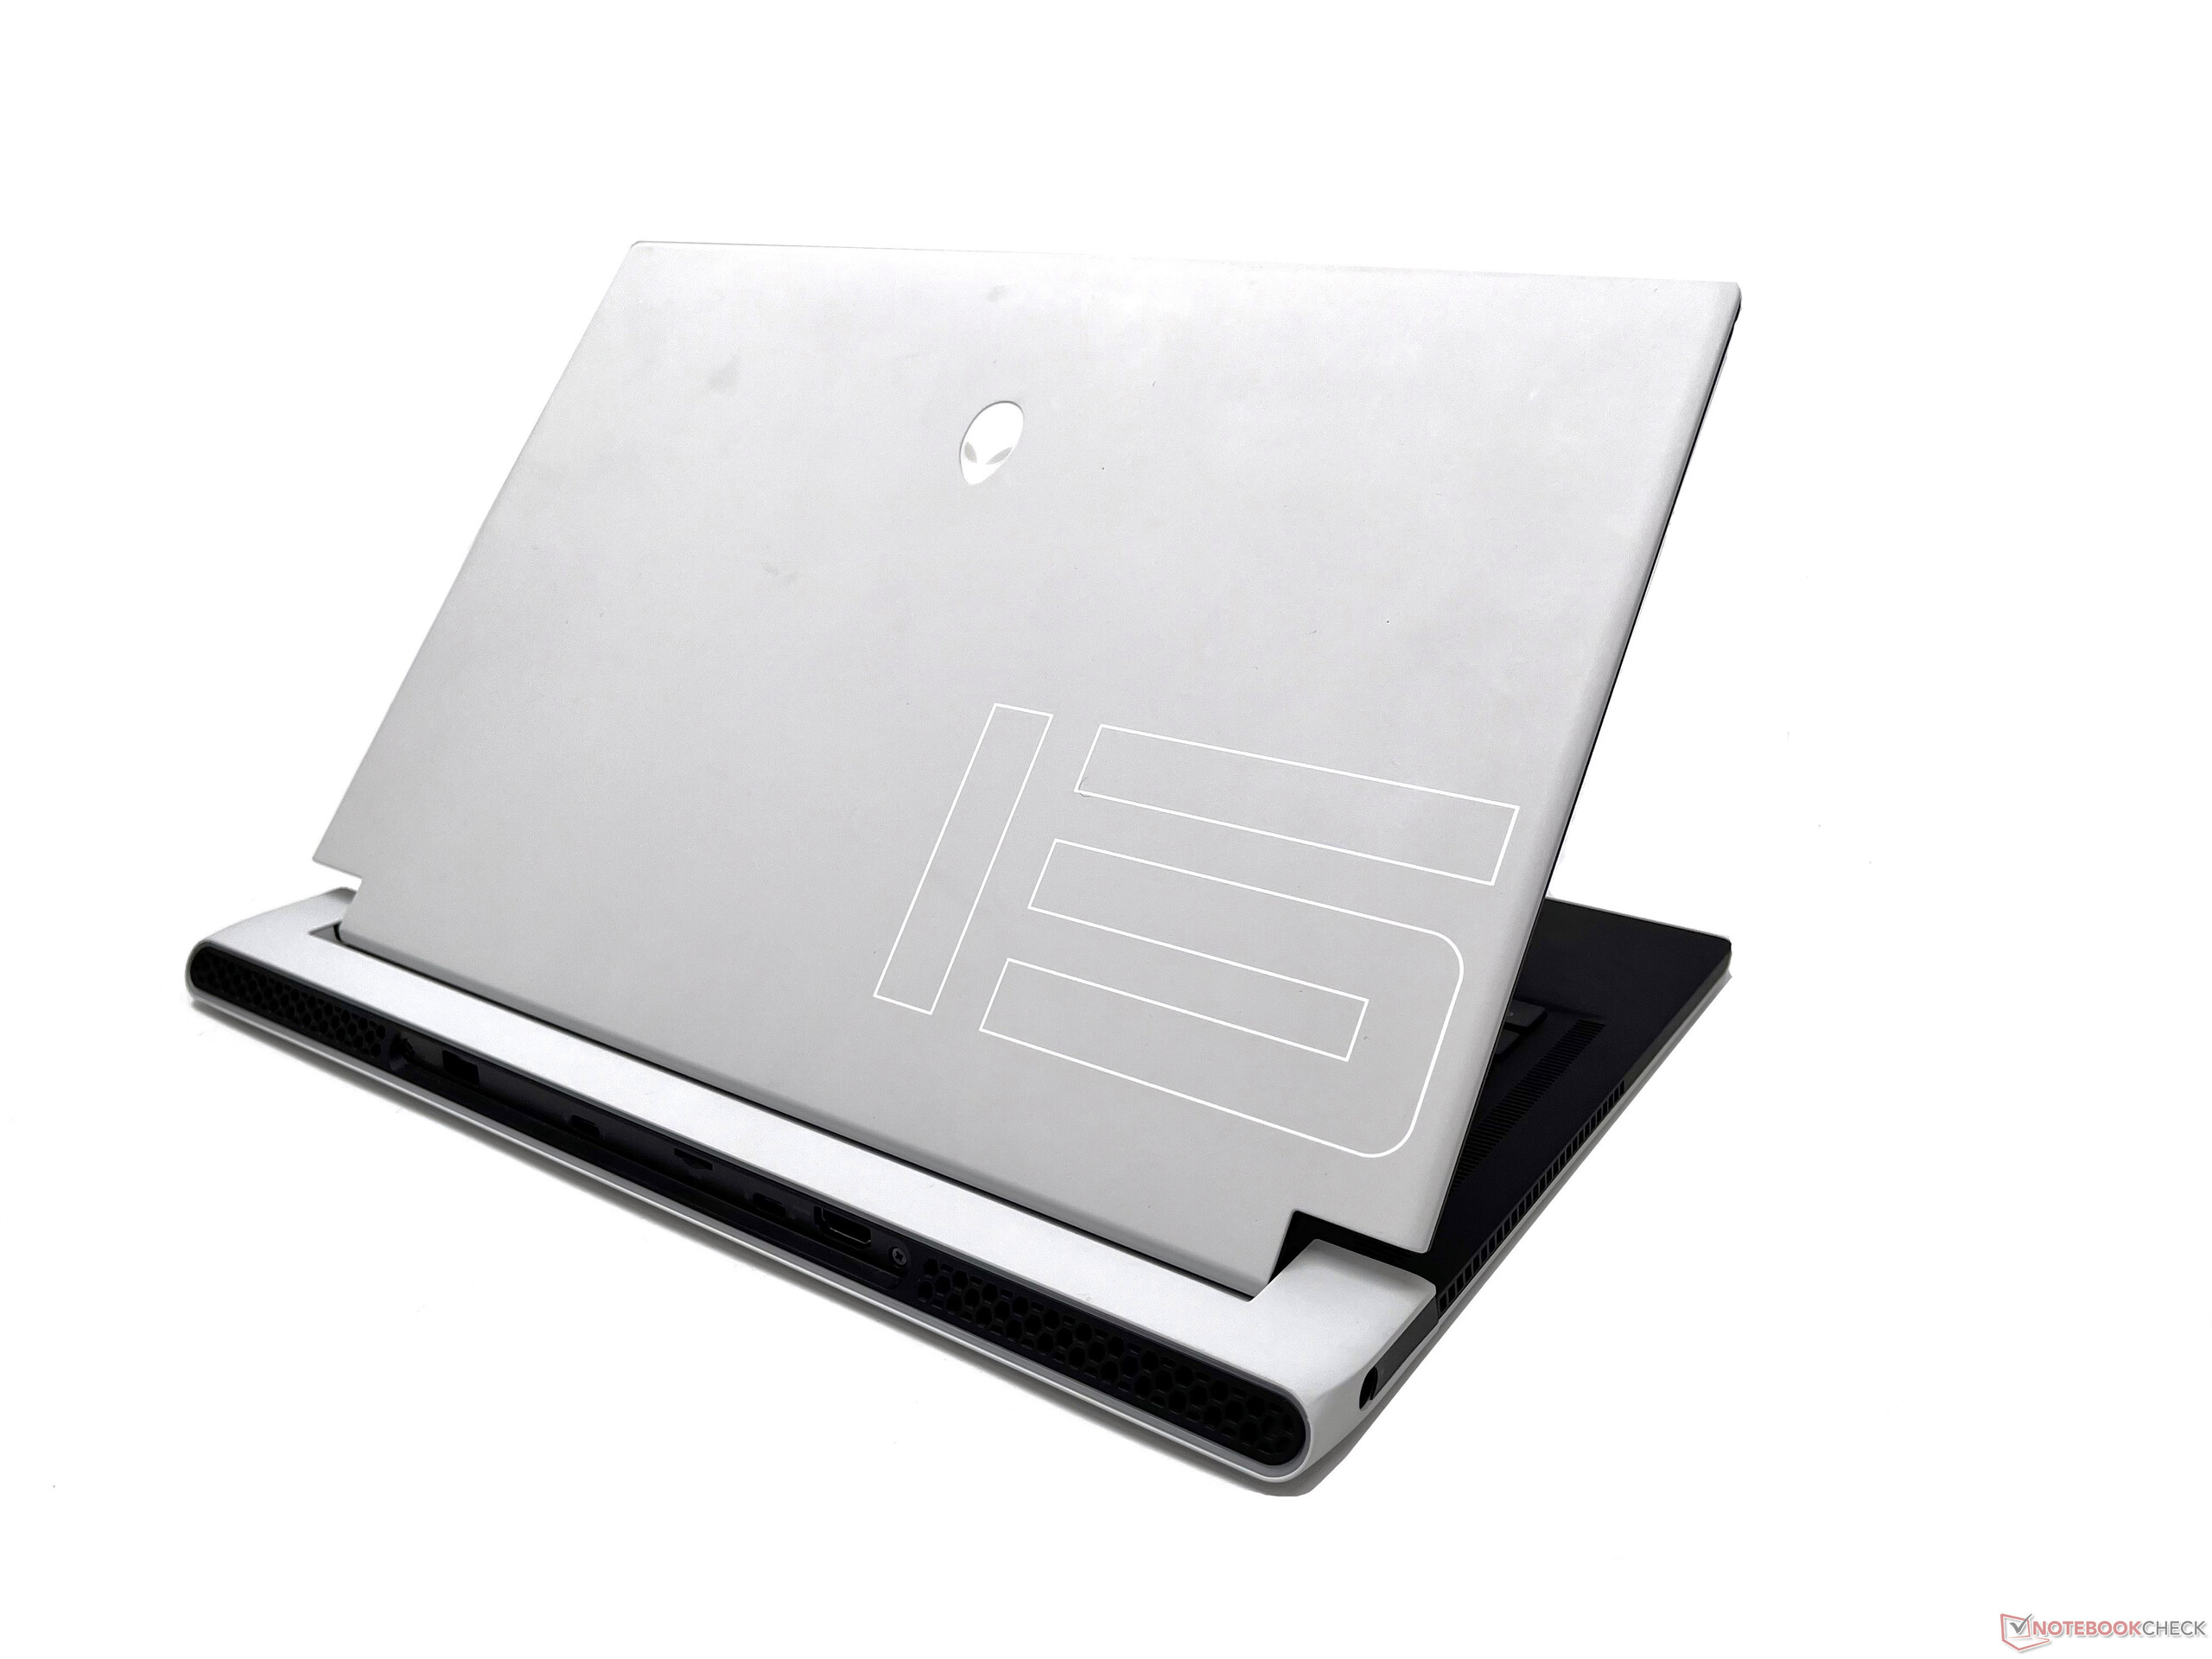
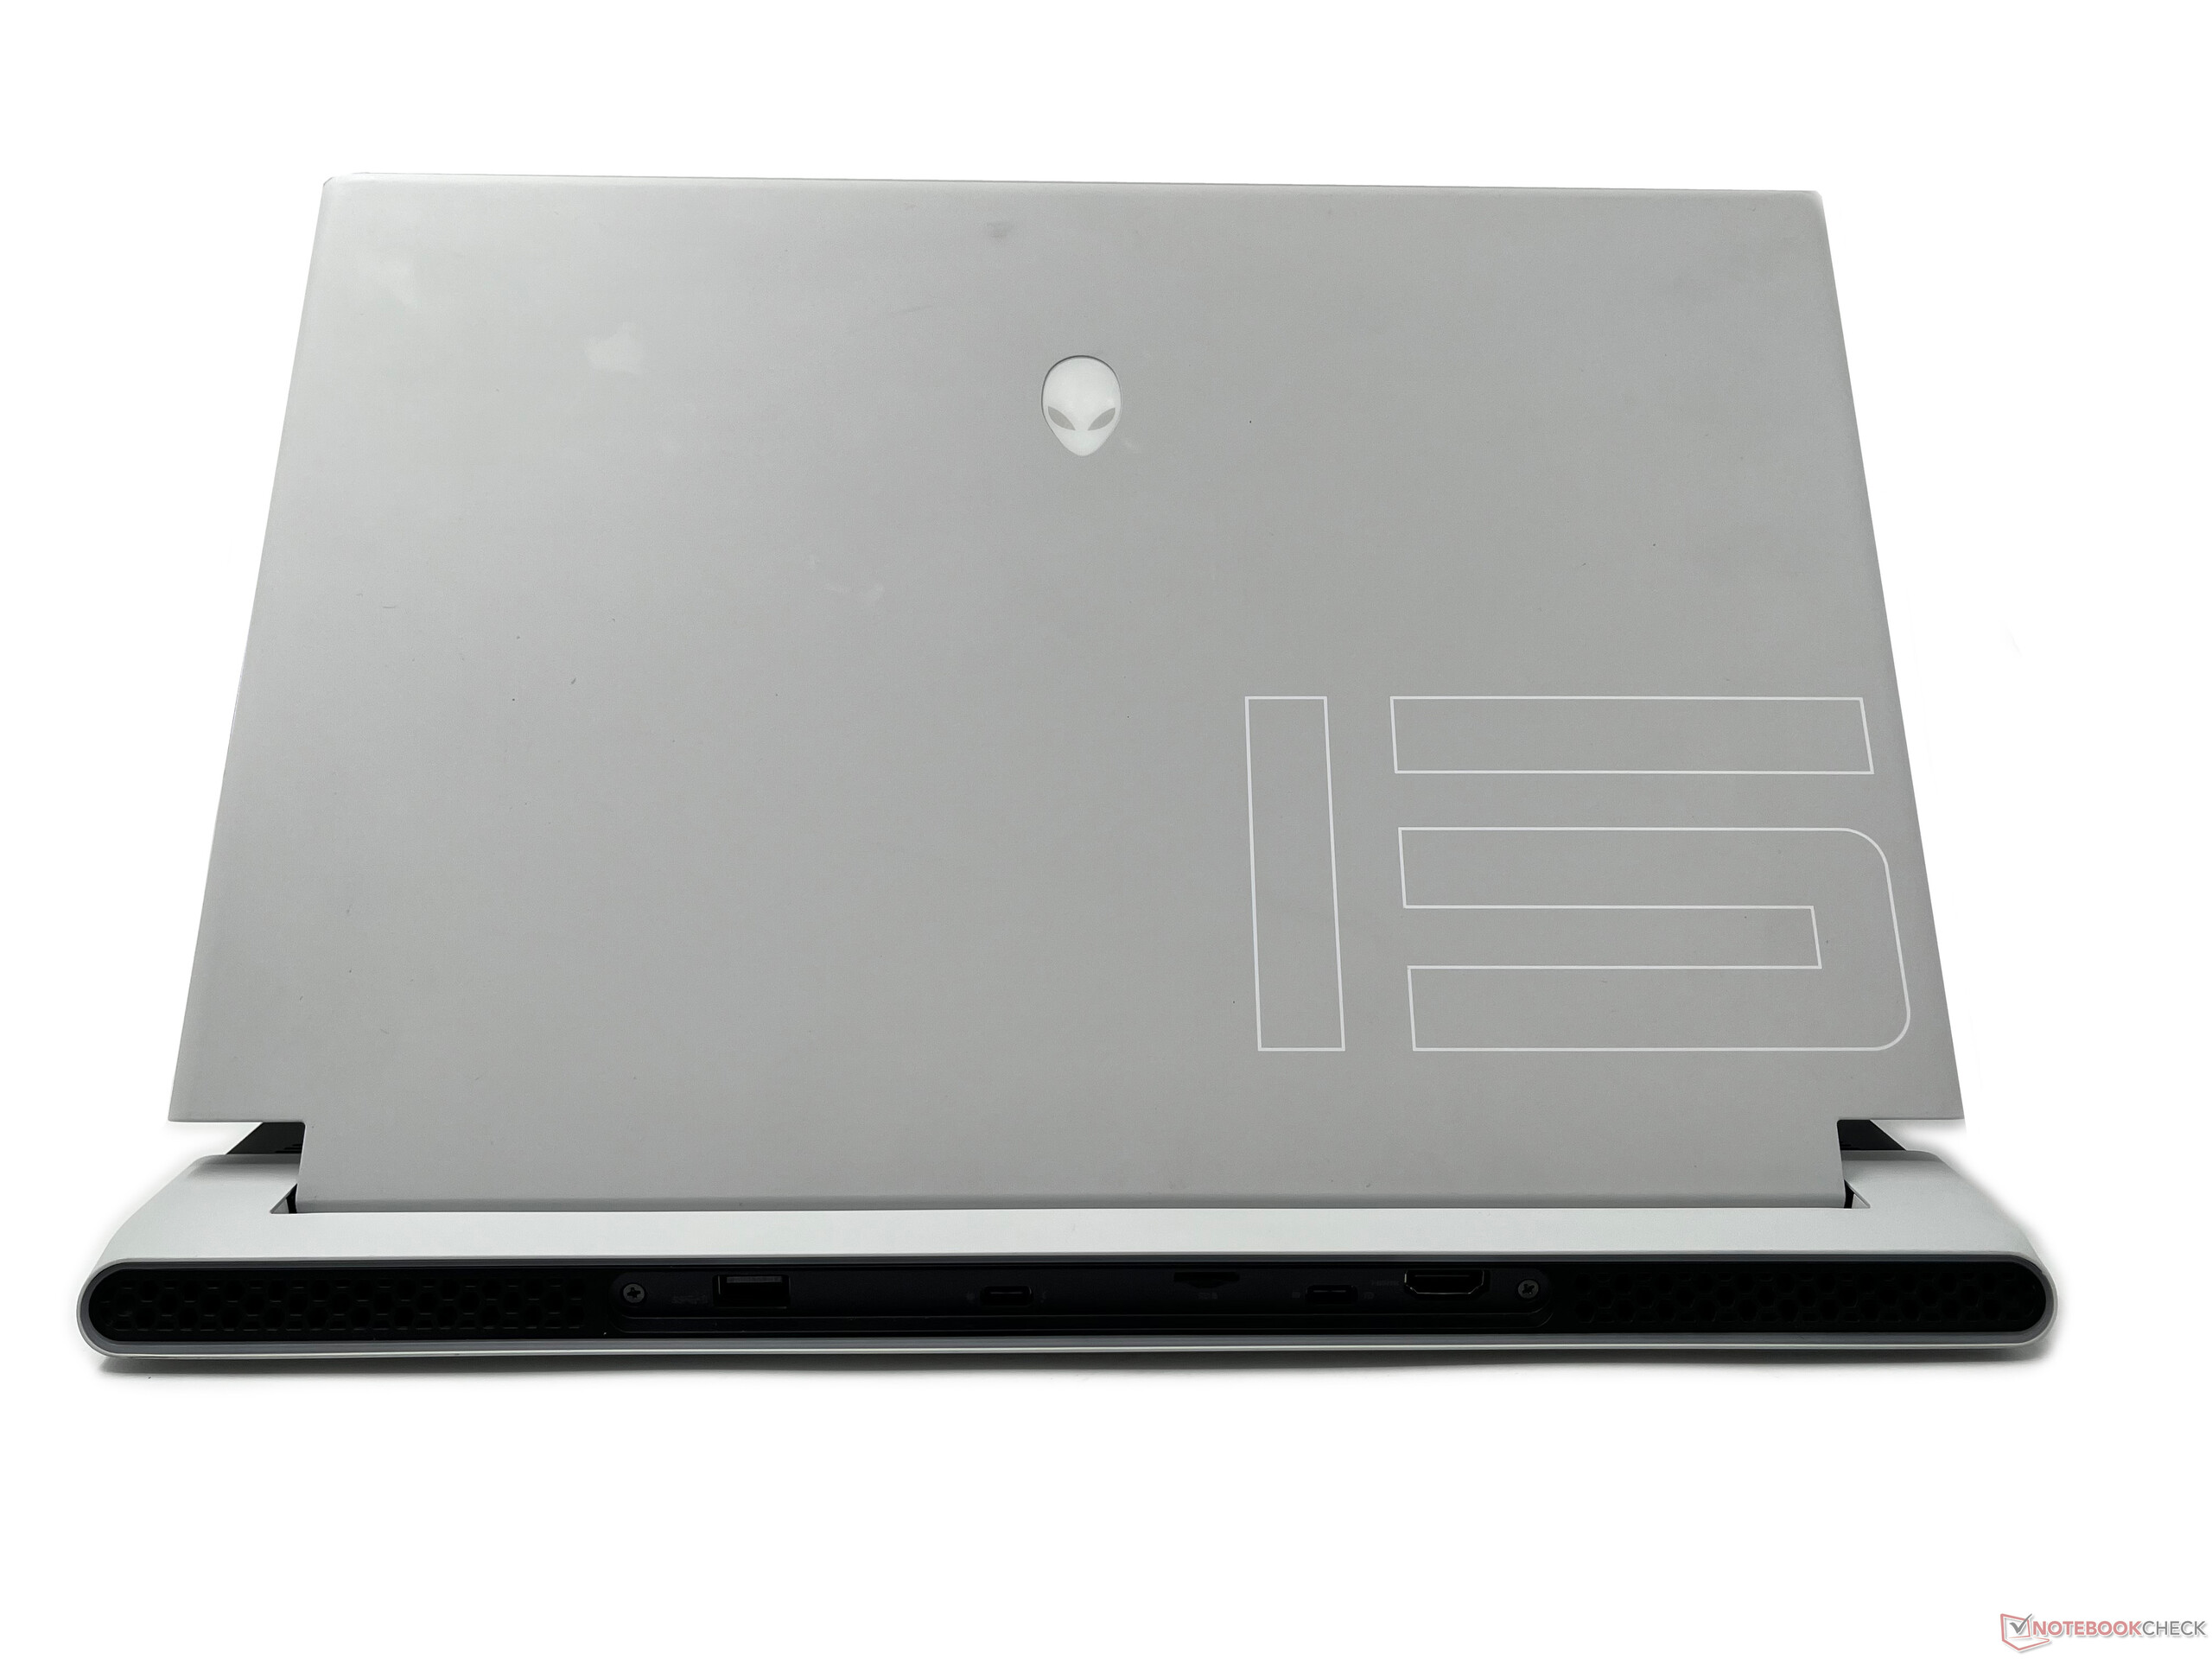
The Legend 2.0 chassis is largely unchanged from the x15 R1 and is just as eye-catching. The x15 R2 looks quite slim for the hardware on offer, and Alienware has managed to get the mix of class and gamery aesthetics just right.
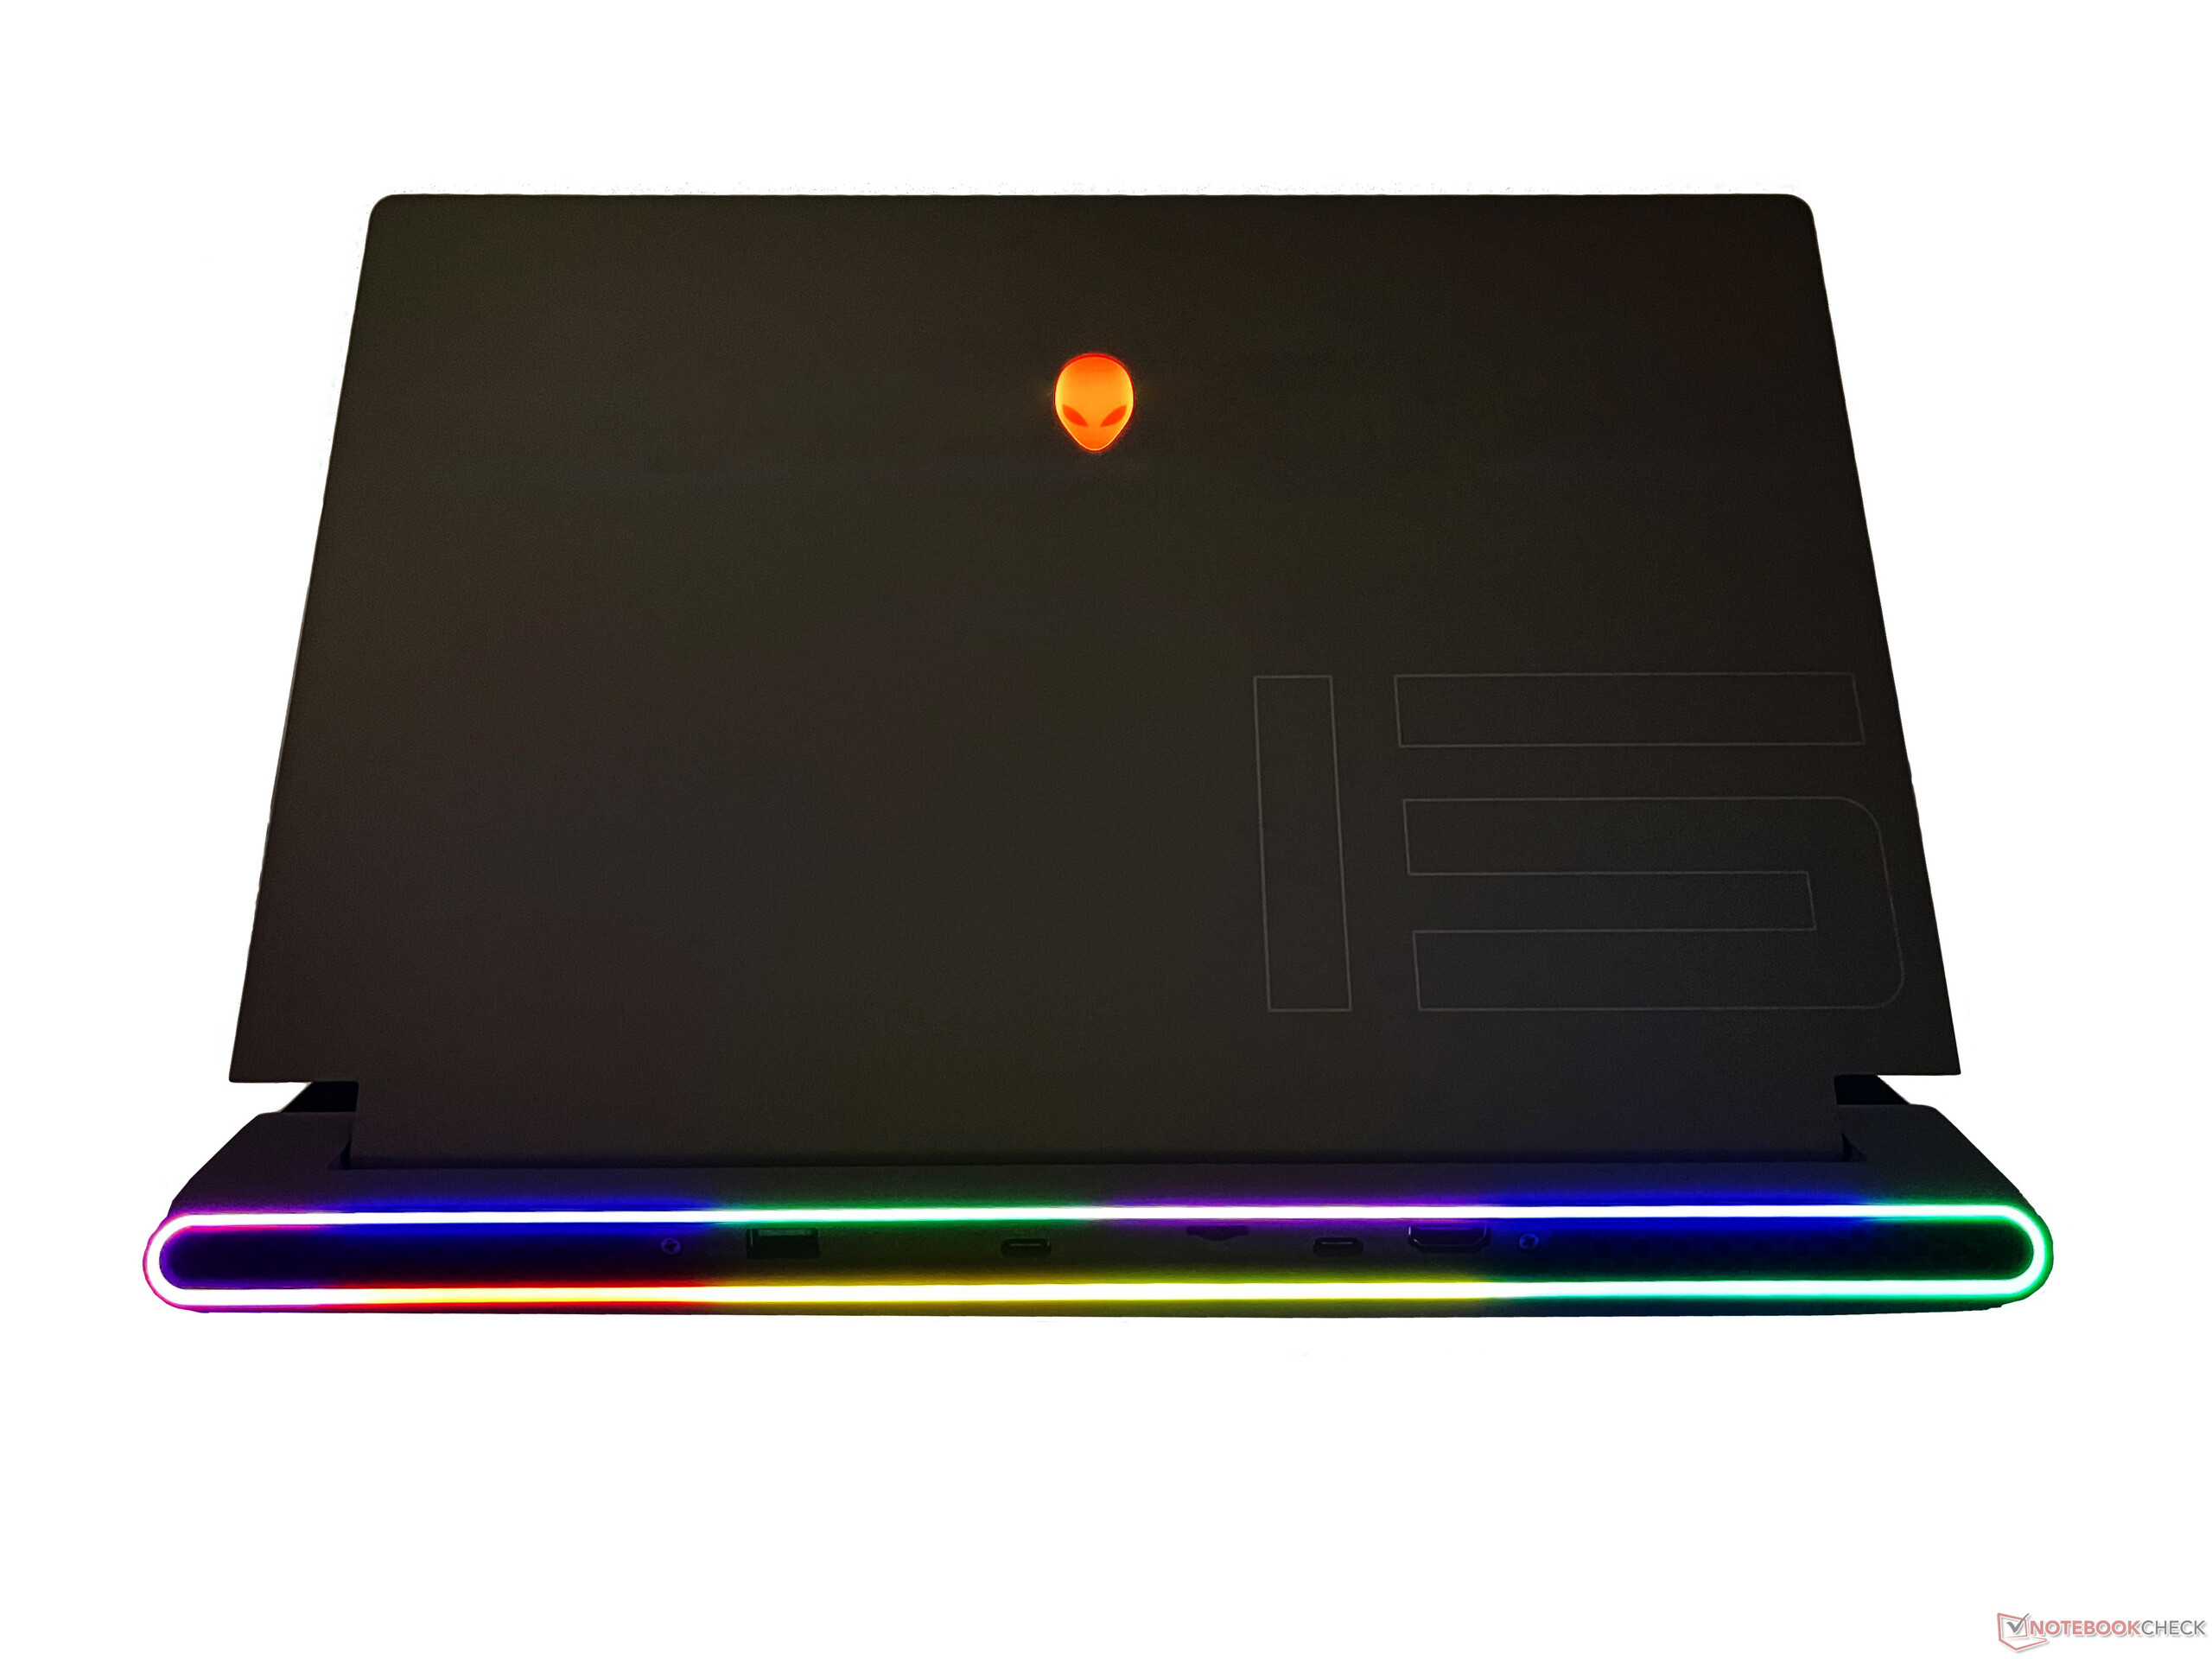
The two-tone paint job with a white chassis and a black keyboard deck looks appealing and smooth to touch. The hallmark alien head logo on the back of the lid and the power button glows in pristine RGB as do the rear stadium RGB lights made of 90 micro-LEDs, all of which can be fully customized or turned off in the Alienware Command Center.
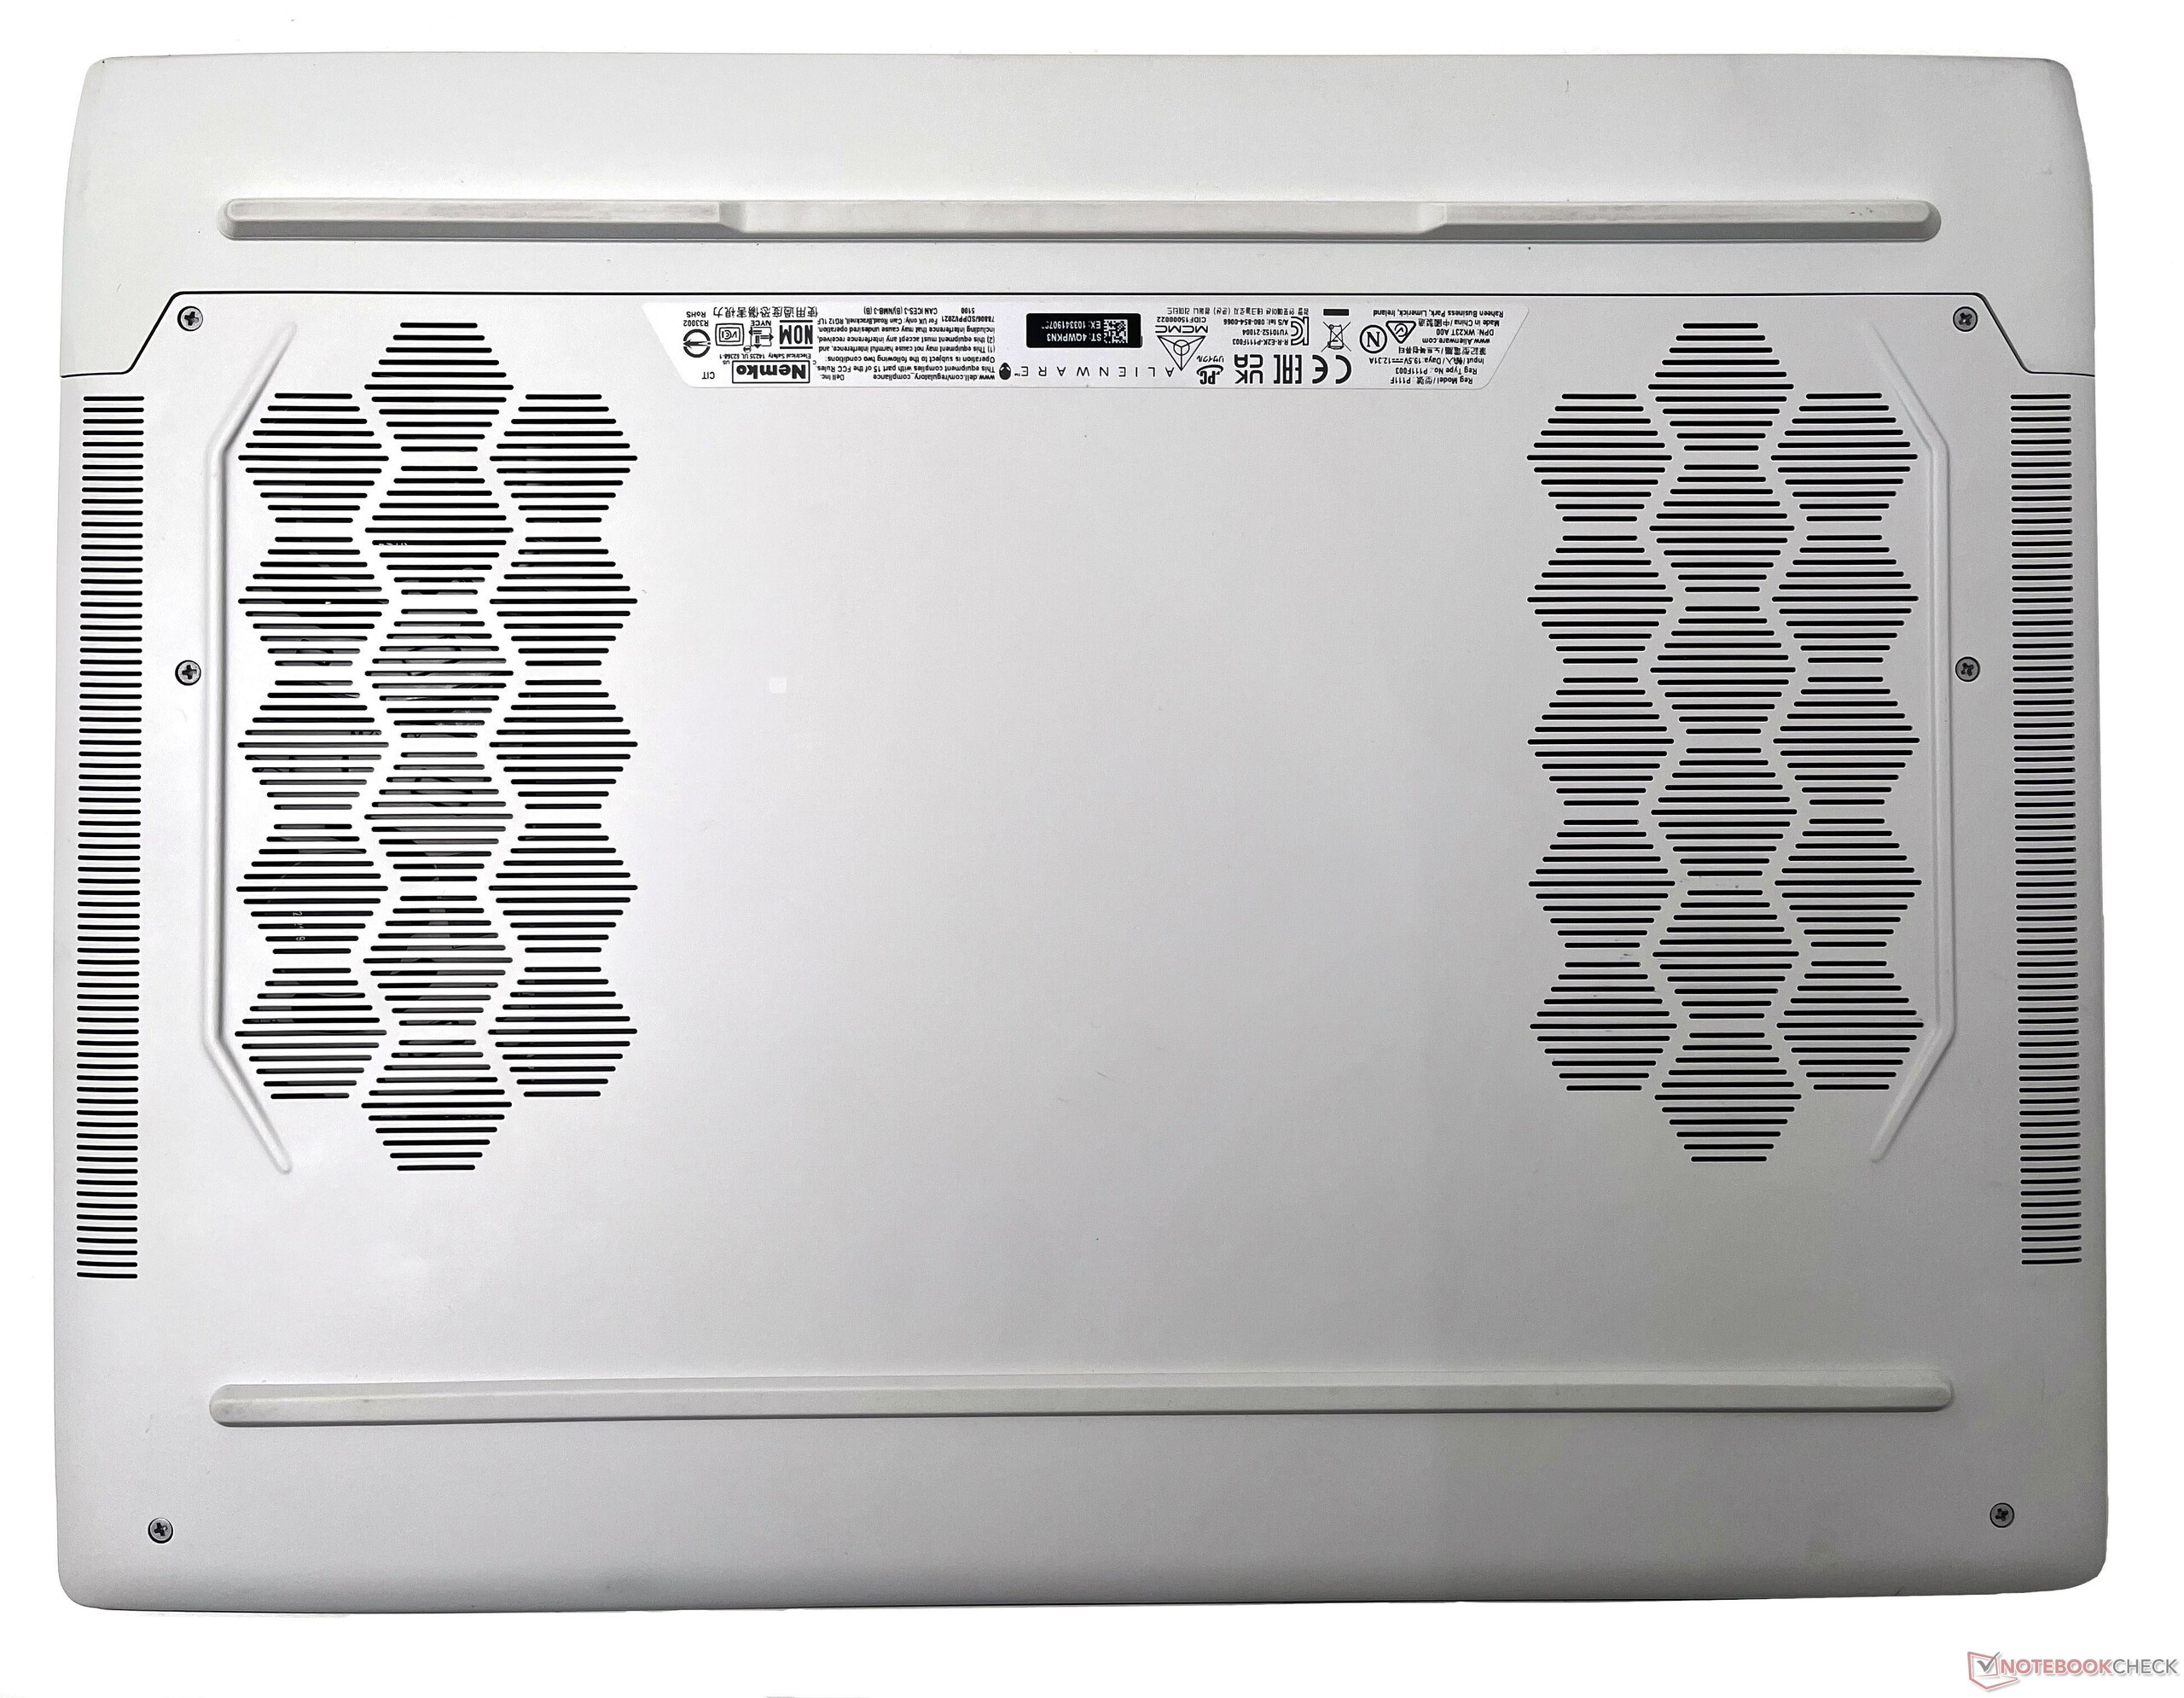
The rear vents sport a honeycomb pattern to add a bit of suave. The bottom panel has a plastic construction as well and sports patterned intake vents.
Though the keyboard deck construction is largely plastic, it feels quite premium and uniform without any sharp edges or wanton flex — something that previous generation Alienwares were notoriously famous for. There is some flex, but that is observed only when deliberately applying pressure. The display lid is made of magnesium alloy for rigidity with the number "15" distinctly etched.
Overall, the Alienware x15 R2 gives off great vibes on first look with its ultrabook-like form factor while retaining signature Alienware features.
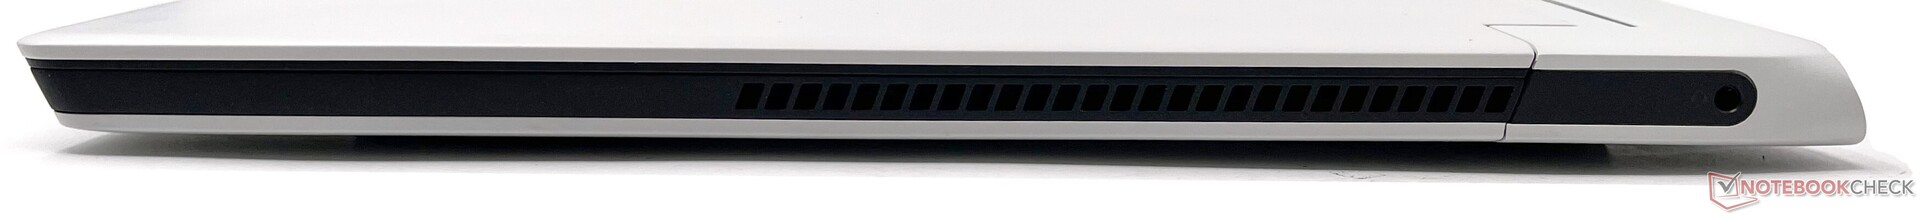
Connectivity: All ports stern side
The arrangement of ports in the Alienware x15 R2 is akin to what we've seen with the x15 R1.
Towards the left, we have a power adapter port while the right houses just the 3.5 mm combo audio jack. The audio jack is placed farther towards the rear, which can be irksome if your wired headsets use shorter cables.
The rear houses a USB 3.2 Gen 1 Type-A port with PowerShare, a USB 3.2 Gen 2 Type-C port, and a Thunderbolt 4 port. The USB Type-C and Thunderbolt 4 ports support Power Delivery. A microSD card reader and a HDMI 2.1-out port round up the port selection. A Kensington lock slot and an RJ-45 jack are not available. However, Dell bundles a USB Type-C to RJ-45 dongle in the box that offers 2.5 GbE LAN connectivity.
The port placement poses no hindrance while attaching multiple peripherals. That being said, the unilateral placement of all major ports at the rear can make accessing them a tad cumbersome especially if you swap peripherals a lot.


SD Card Reader
The microSD card reader performs admirably in our tests. The performance seems a bit slower than what we had seen previously with the x15 R1, but it is in the same league as that of the Asus ROG Zephyrus Duo 16 and the Razer Blade 15 Advanced.
| SD Card Reader | |
| average JPG Copy Test (av. of 3 runs) | |
| Alienware x15 RTX 3070 P111F (AV Pro V60) | |
| Razer Blade 15 Advanced Model Early 2022 (AV PRO microSD 128 GB V60) | |
| Asus ROG Zephyrus Duo 16 GX650RX (AV PRO microSD 128 GB V60) | |
| Alienware x15 R2 P111F (AV PRO microSD 128 GB V60) | |
| Average of class Gaming (19 - 202, n=99, last 2 years) | |
| MSI Raider GE66 12UHS (AV PRO microSD 128 GB V60) | |
| MSI Titan GT77 12UHS (AV PRO microSD 128 GB V60) | |
| maximum AS SSD Seq Read Test (1GB) | |
| Alienware x15 RTX 3070 P111F (AV Pro V60) | |
| Alienware x15 R2 P111F (AV PRO microSD 128 GB V60) | |
| Asus ROG Zephyrus Duo 16 GX650RX (AV PRO microSD 128 GB V60) | |
| Average of class Gaming (26 - 269, n=92, last 2 years) | |
| MSI Titan GT77 12UHS (AV PRO microSD 128 GB V60) | |
Communication
The x15 R2 is equipped with a Killer Wi-Fi 6E AX1675i WLAN card. The performance is decent, but we've seen faster throughput from this card in other laptops. We did observe some dips in the 5 GHz transmit test, but the connection overall was quite stable during testing with our reference Asus ROG Rapture GT-AXE11000 router.
We did not notice any tangible benefits in switching over to the 6 GHz band, save for slightly higher average receive speeds and higher peak throughput values.
Webcam
In the age of FHD webcams, Dell includes a paltry 720p shooter in the Alienware x15 R2. The webcam is just about serviceable for the occasional video call. Colors show large deviations and dark areas turn out to be quite noisy. Image sharpness and detailing is subpar even under adequate ambient lighting conditions. There is no physical webcam shutter provided.


Security
The x15 R2 sports an integrated IR camera that supports Windows Hello-based biometric authentication. There is no fingerprint reader available.
The IR camera is easy to enroll and is quite responsive. A TPM 2.0 module is also present.
Accessories
Apart from the 240 W power adapter and the usual paperwork, Dell also bundles a USB Type-C to RJ-45 2.5 Gb Ethernet dongle in the box.
Maintenance
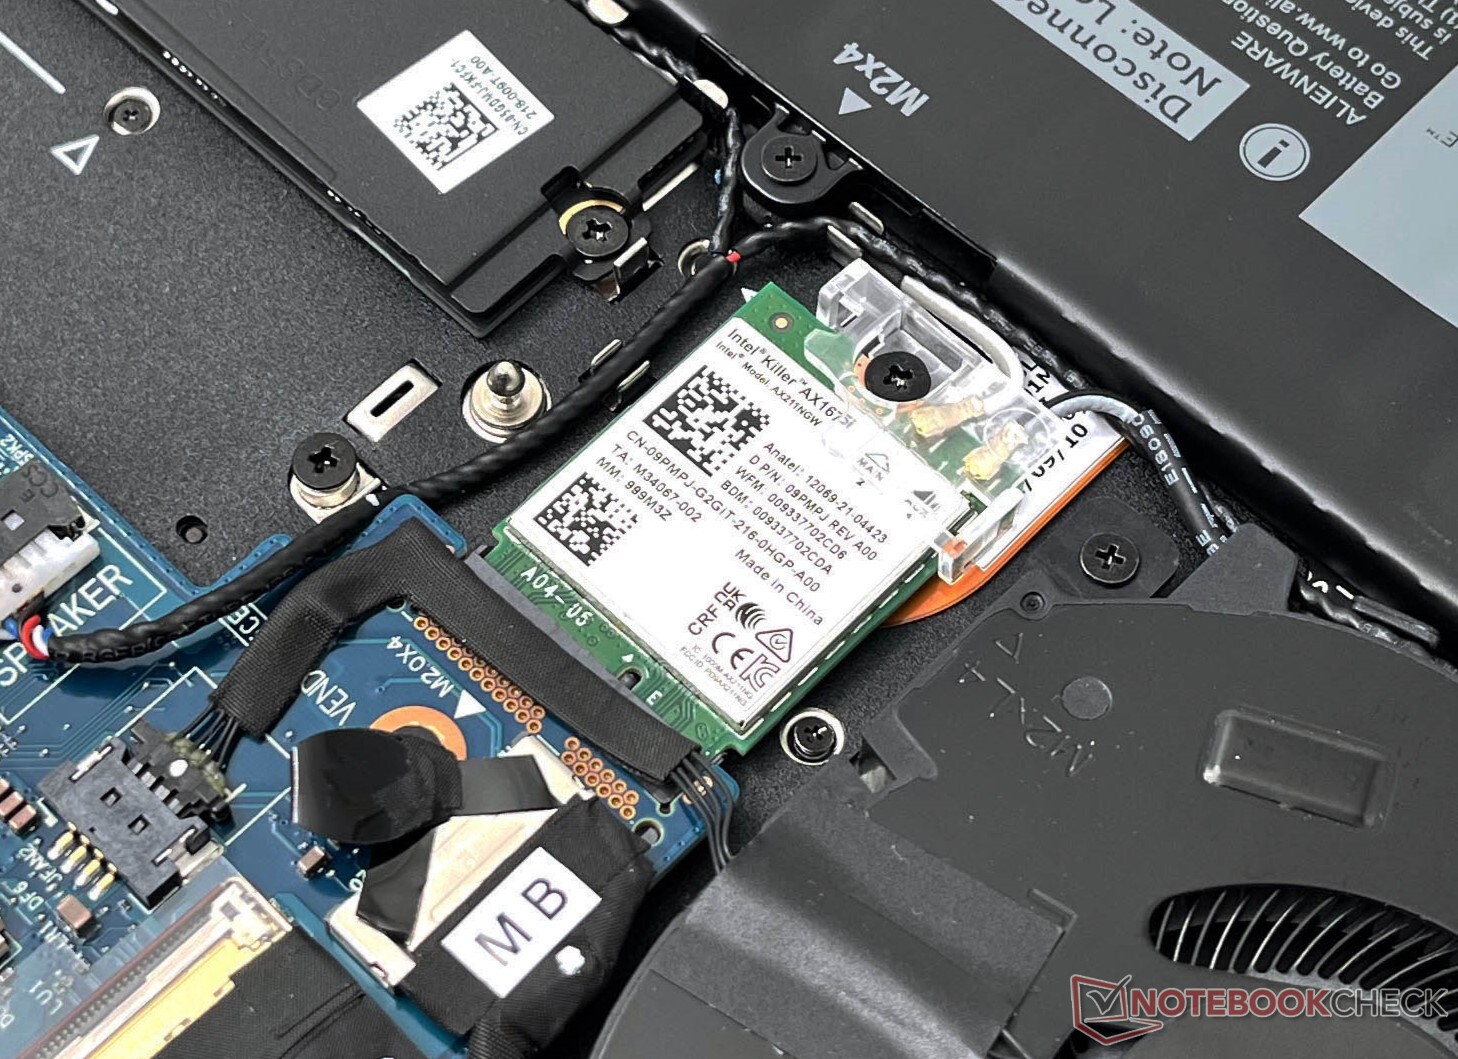
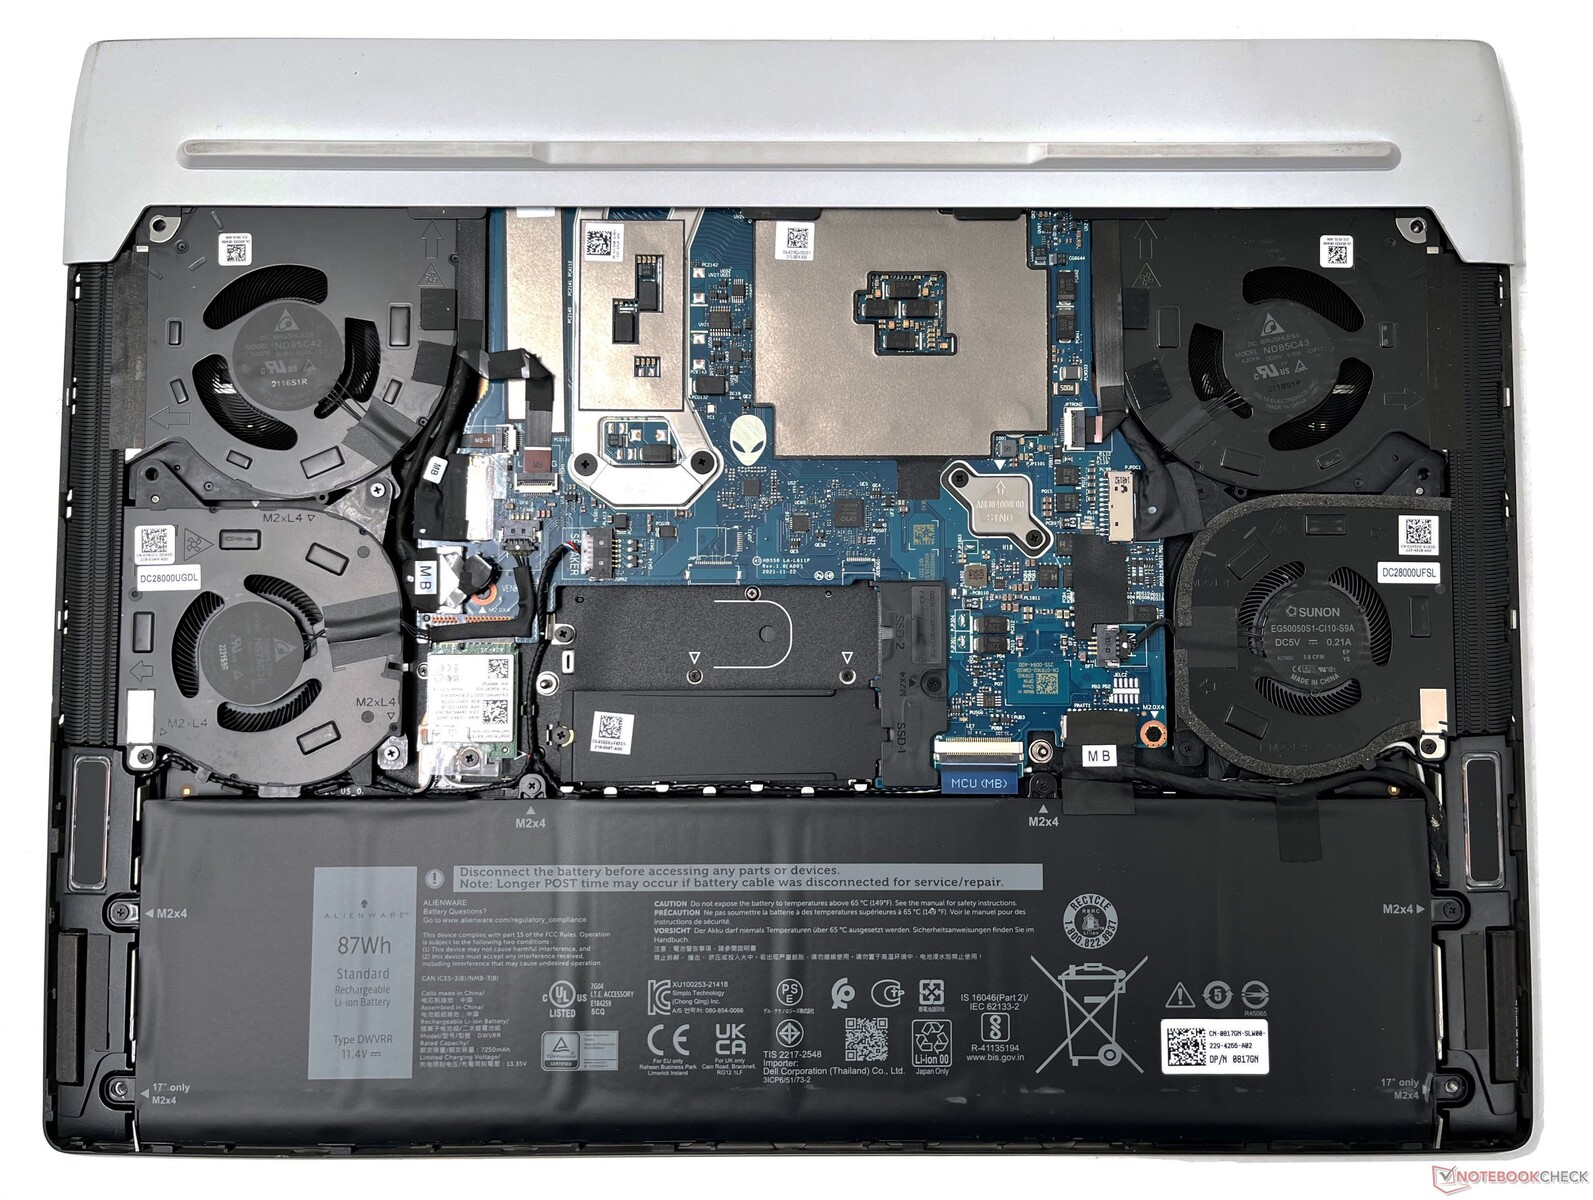
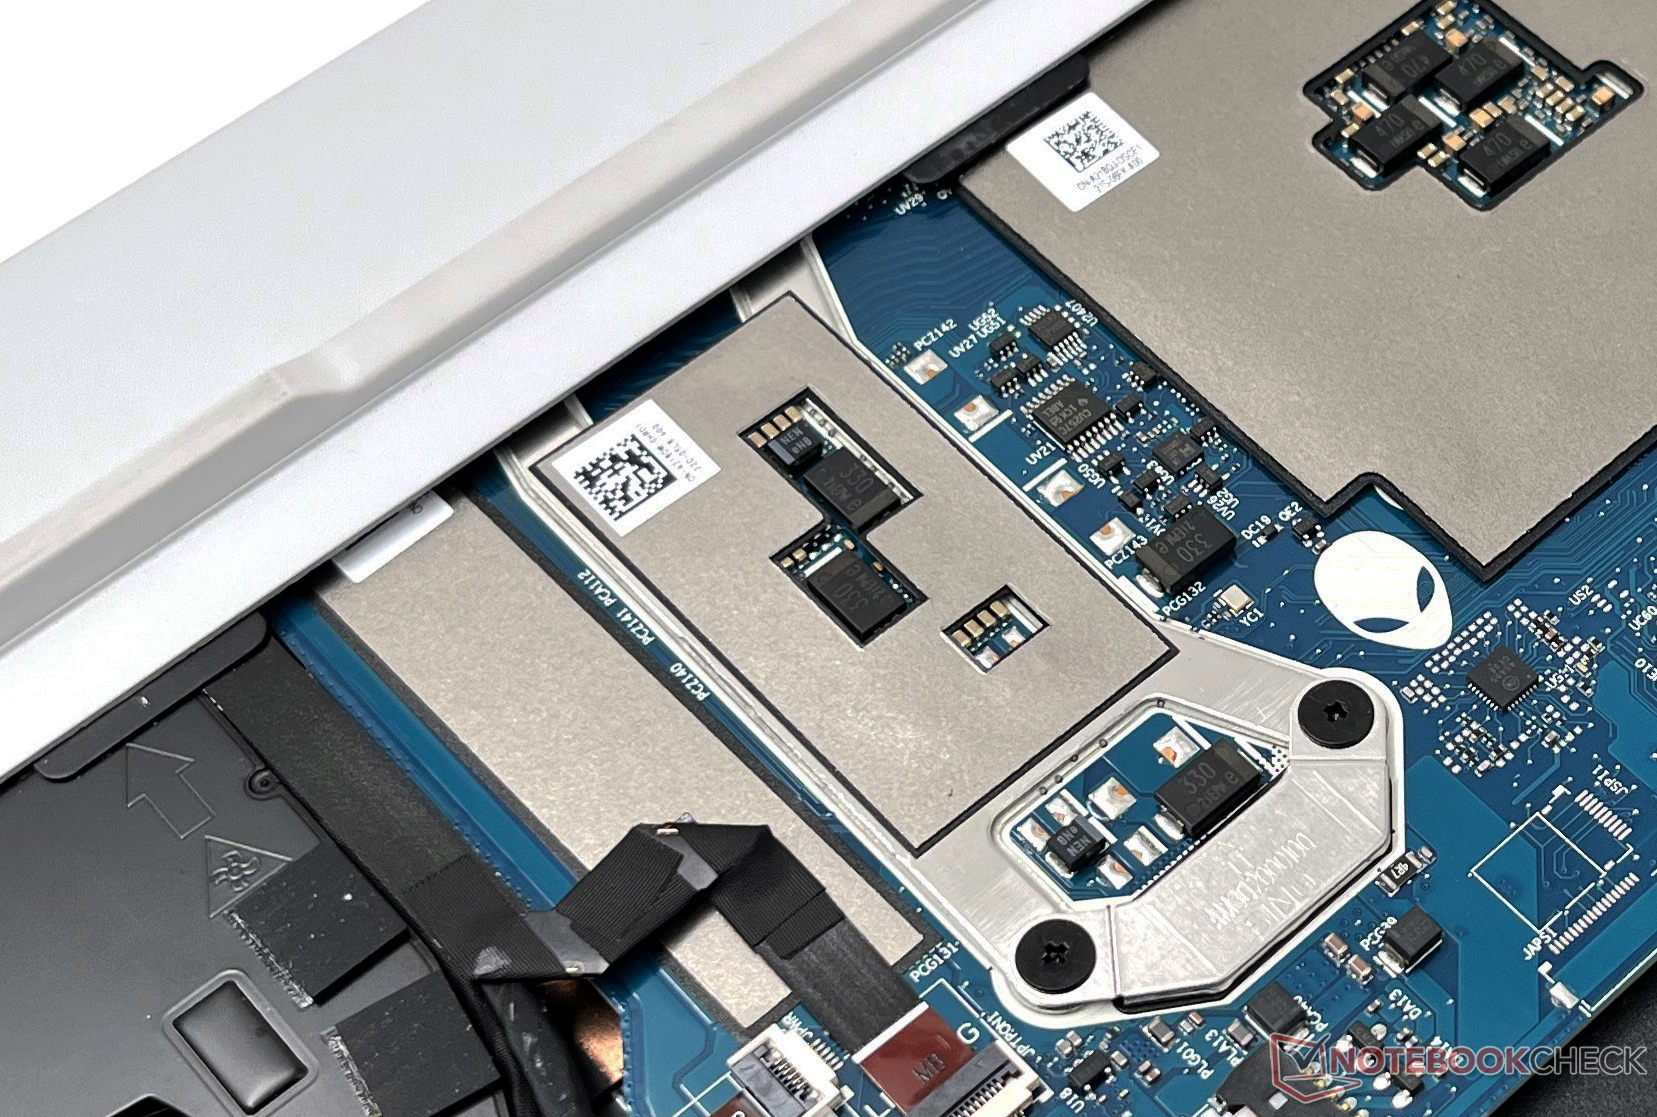
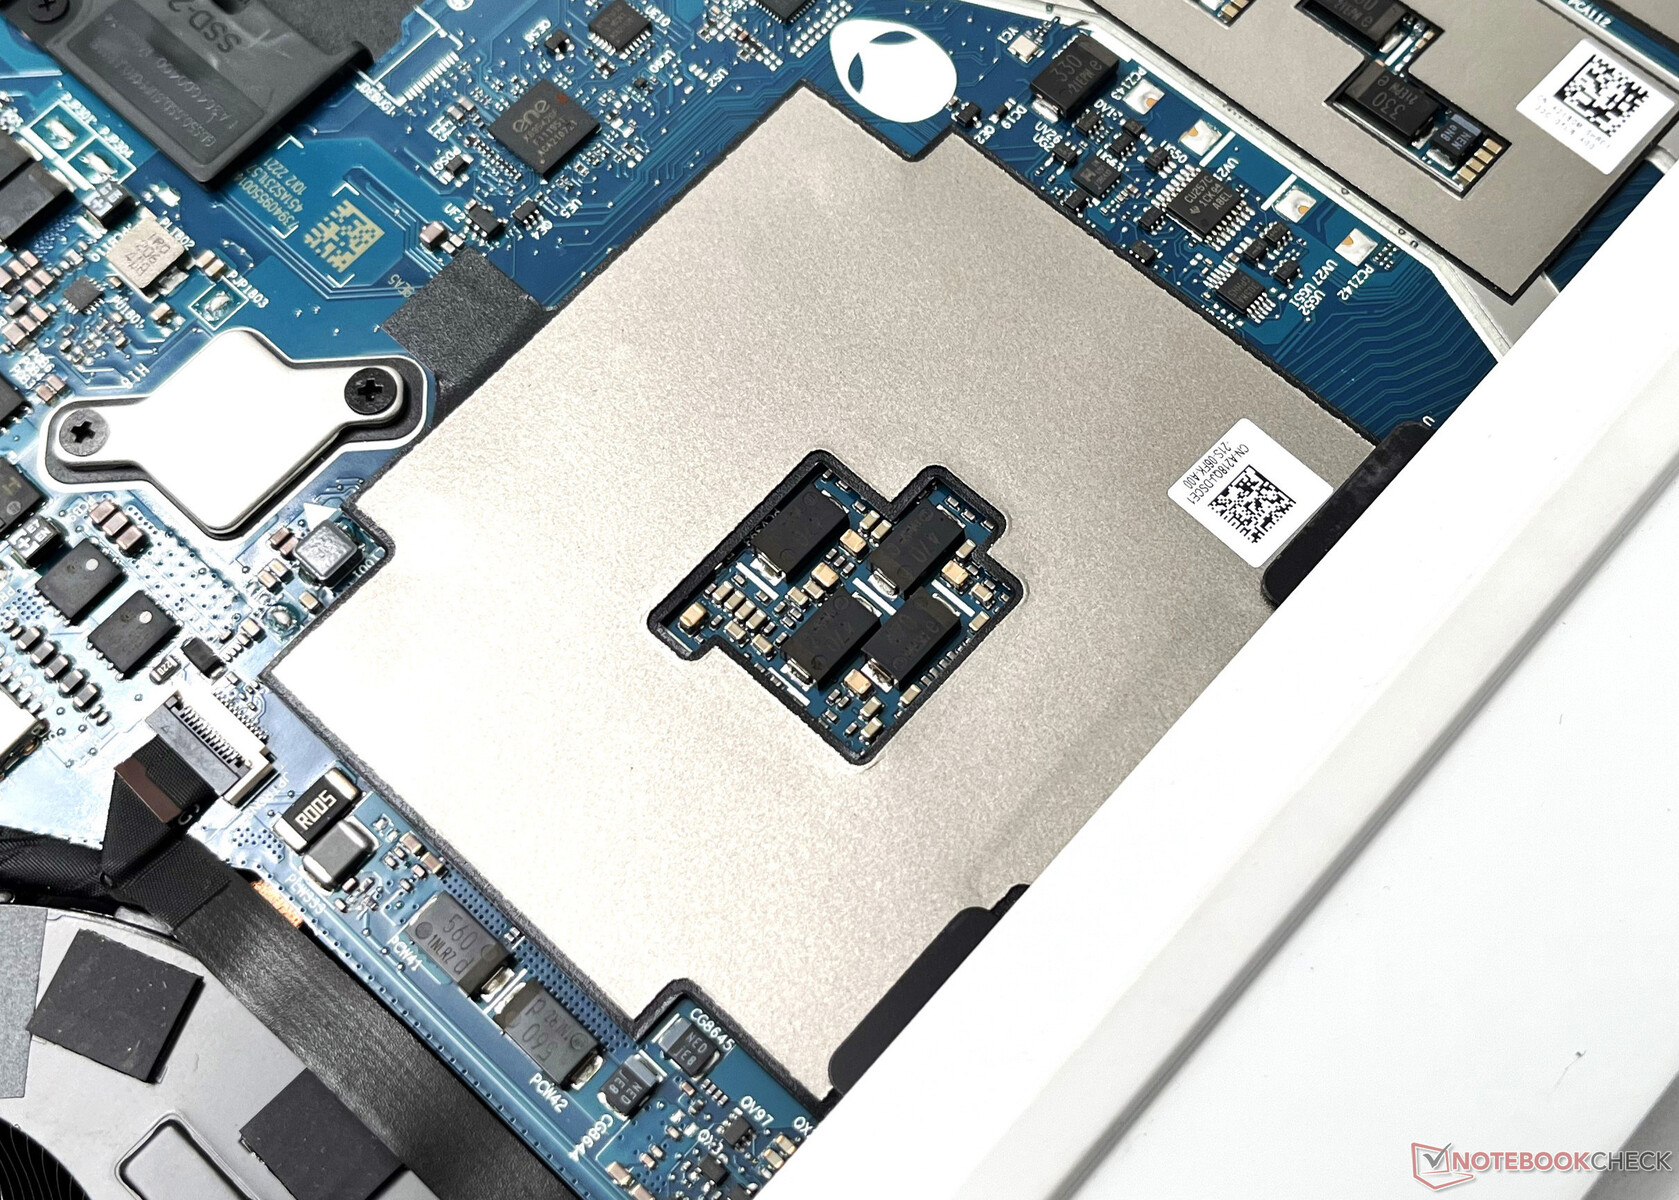
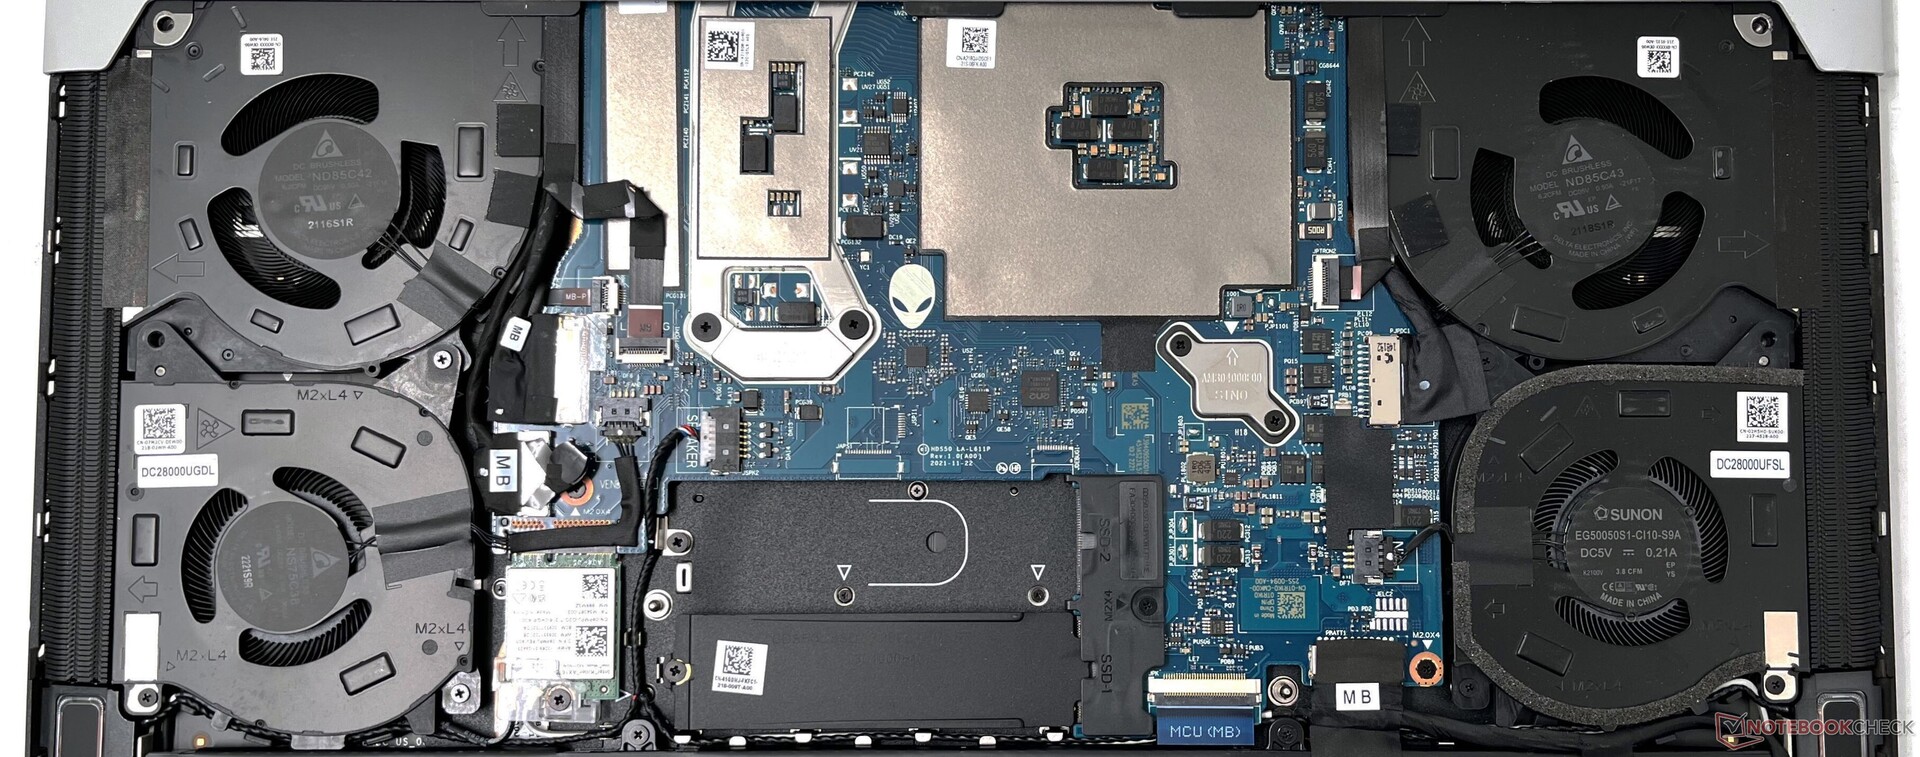
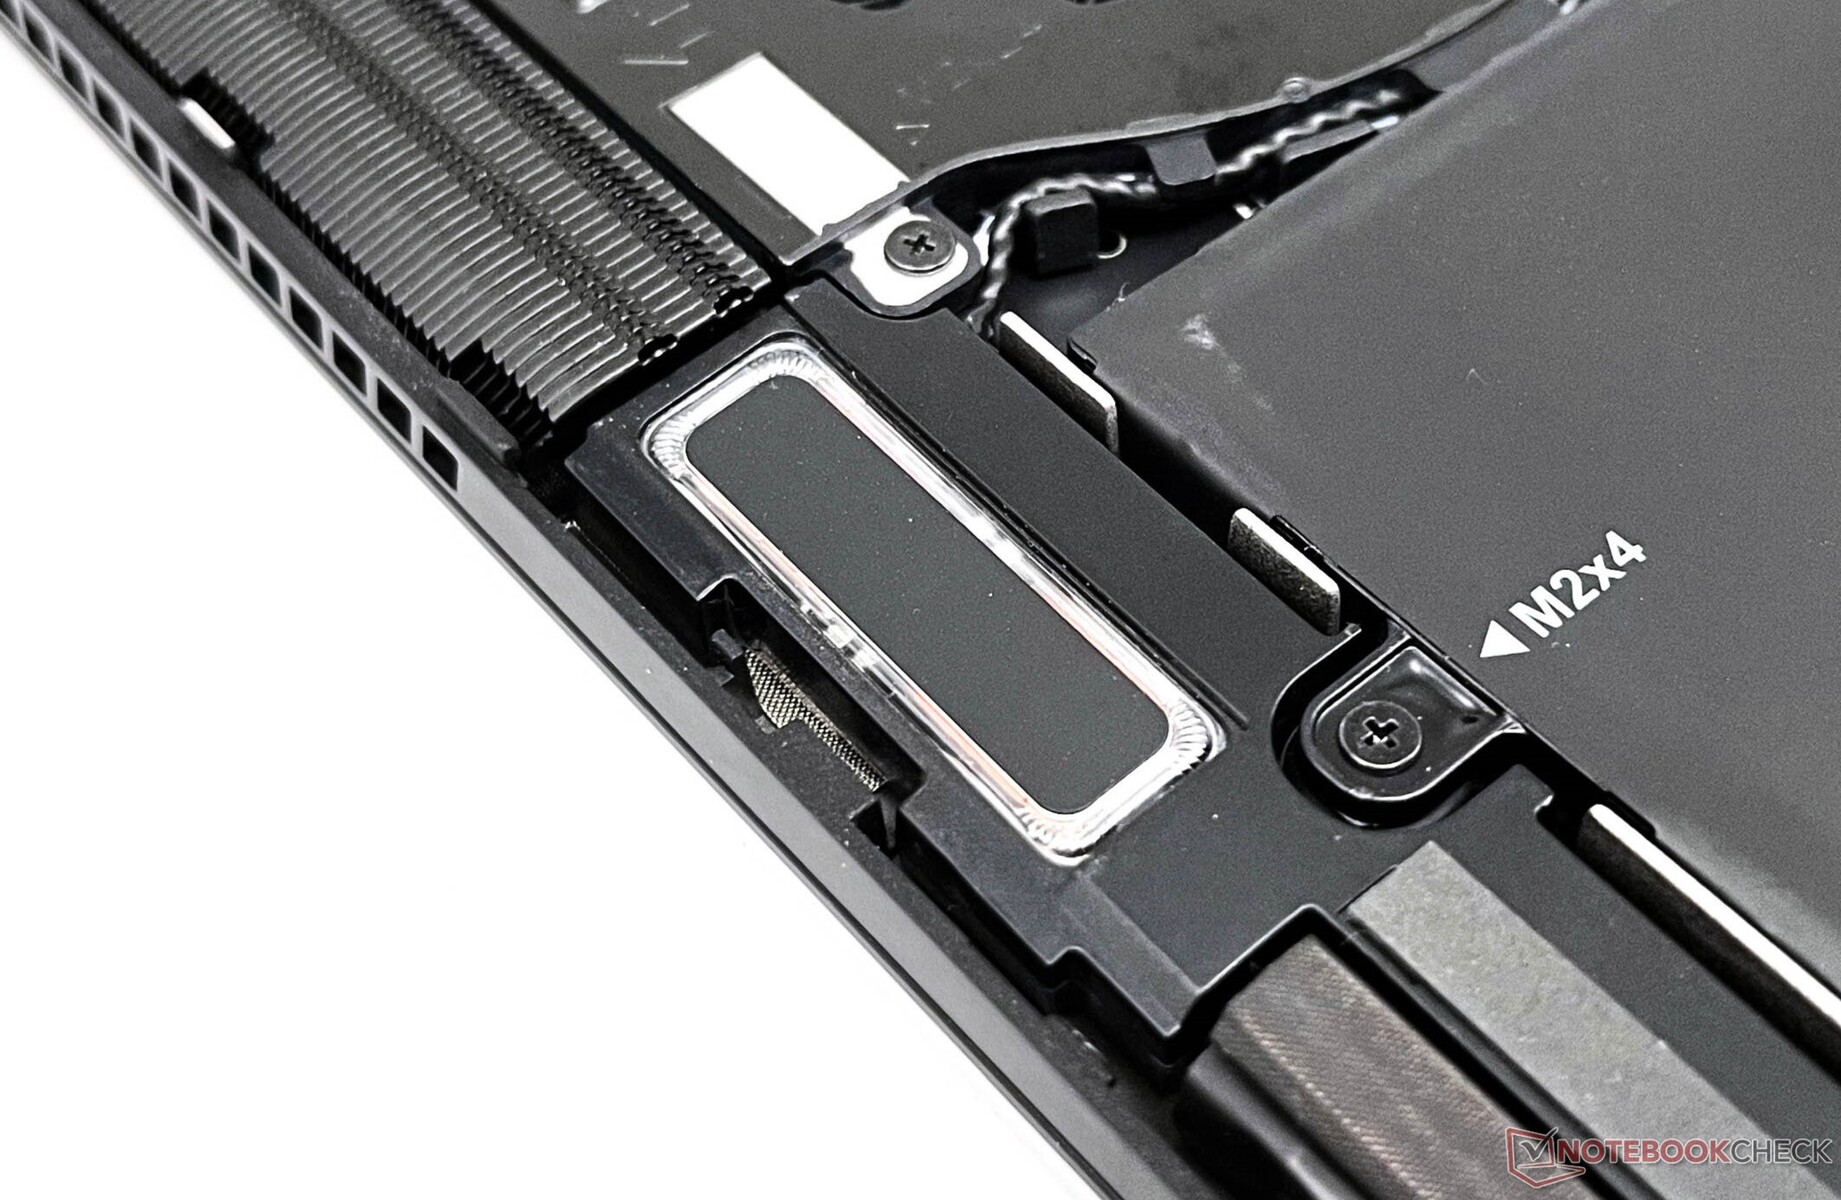
The internals can be accessed by simply removing the six Philips screws on the bottom panel. It does take some effort to fully pry open the bottom panel from the chassis. There is no maintenance hatch provided.
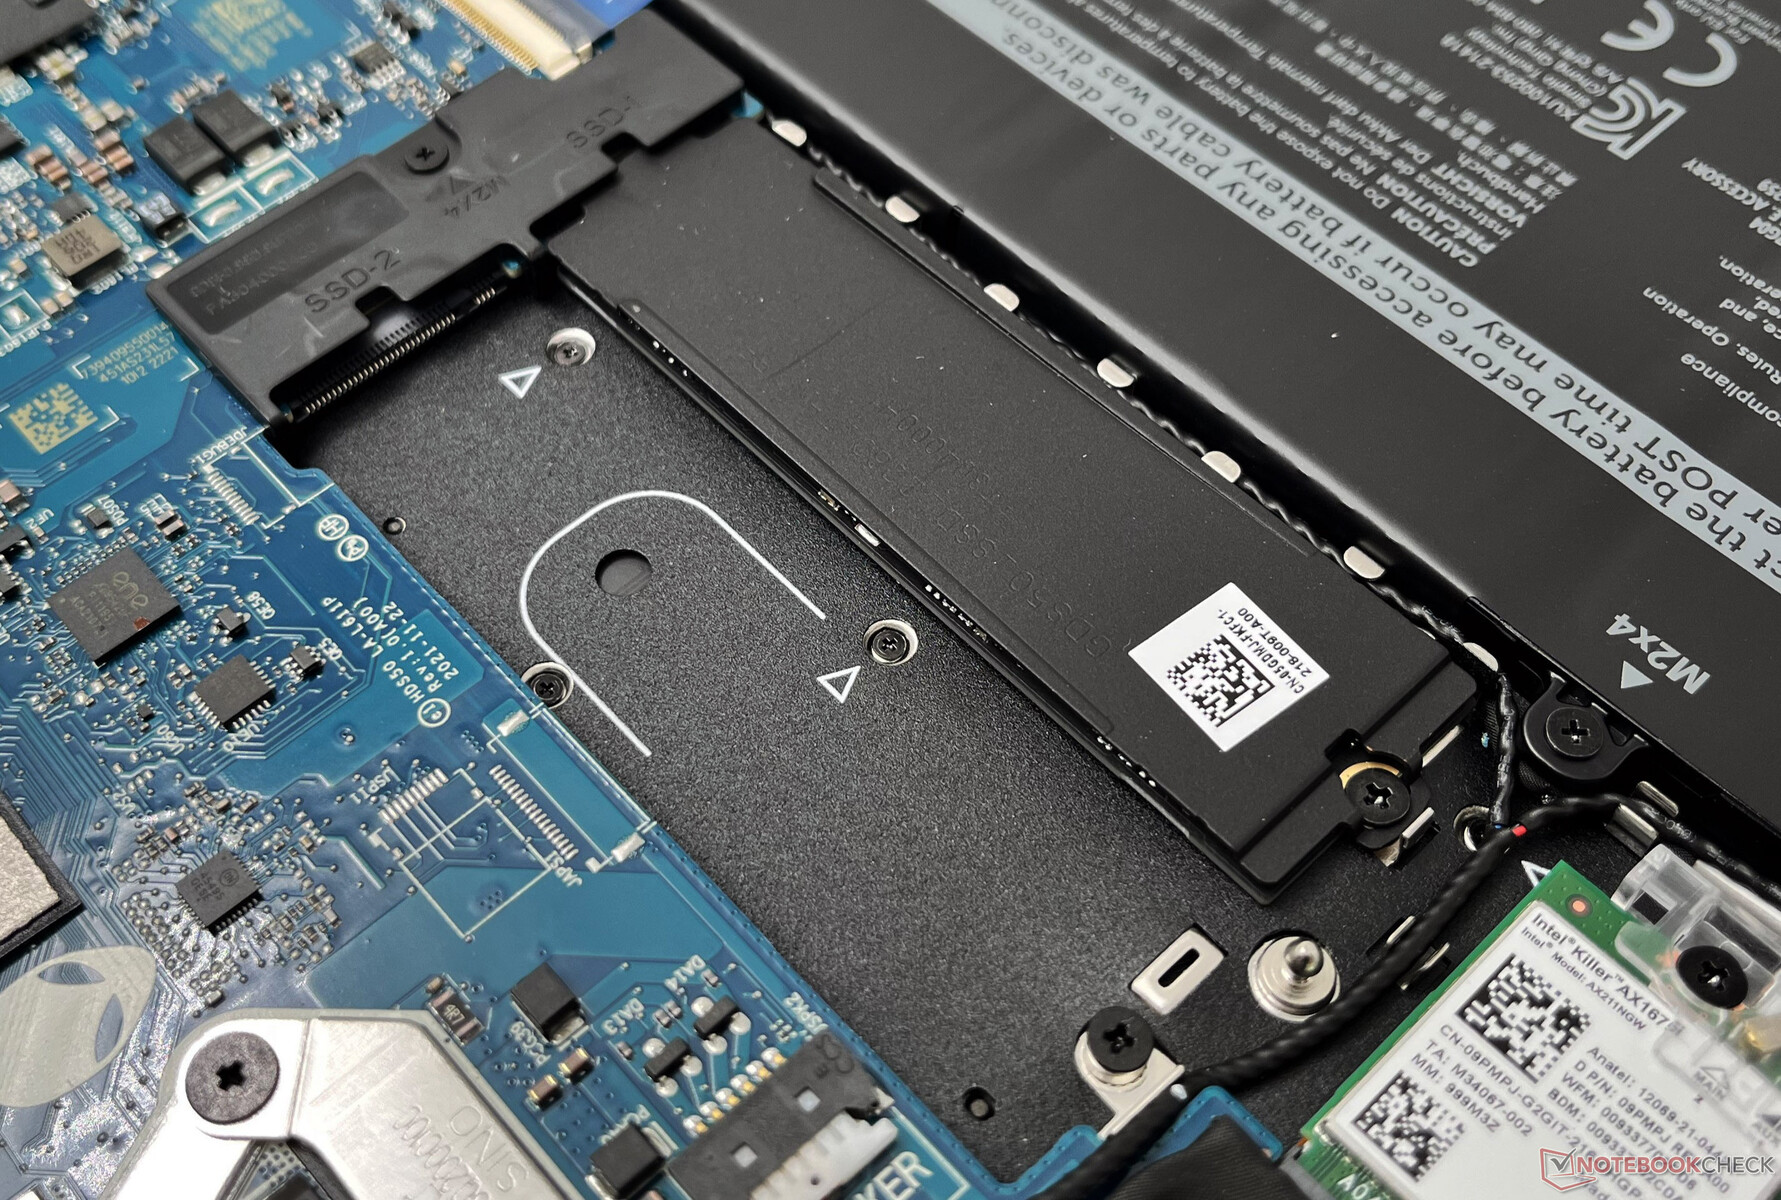
The internal layout is unchanged from last year, which also means that once again you have to put up with soldered RAM. The NVMe SSD, Killer Wi-Fi card, and the 87 WHr battery can be replaced if needed.
Warranty
The Alienware x15 R2 comes with Dell's one-year Premium Support Plus and Onsite Service facility as standard. Additional warranty and support options can be added during checkout at Dell.com.
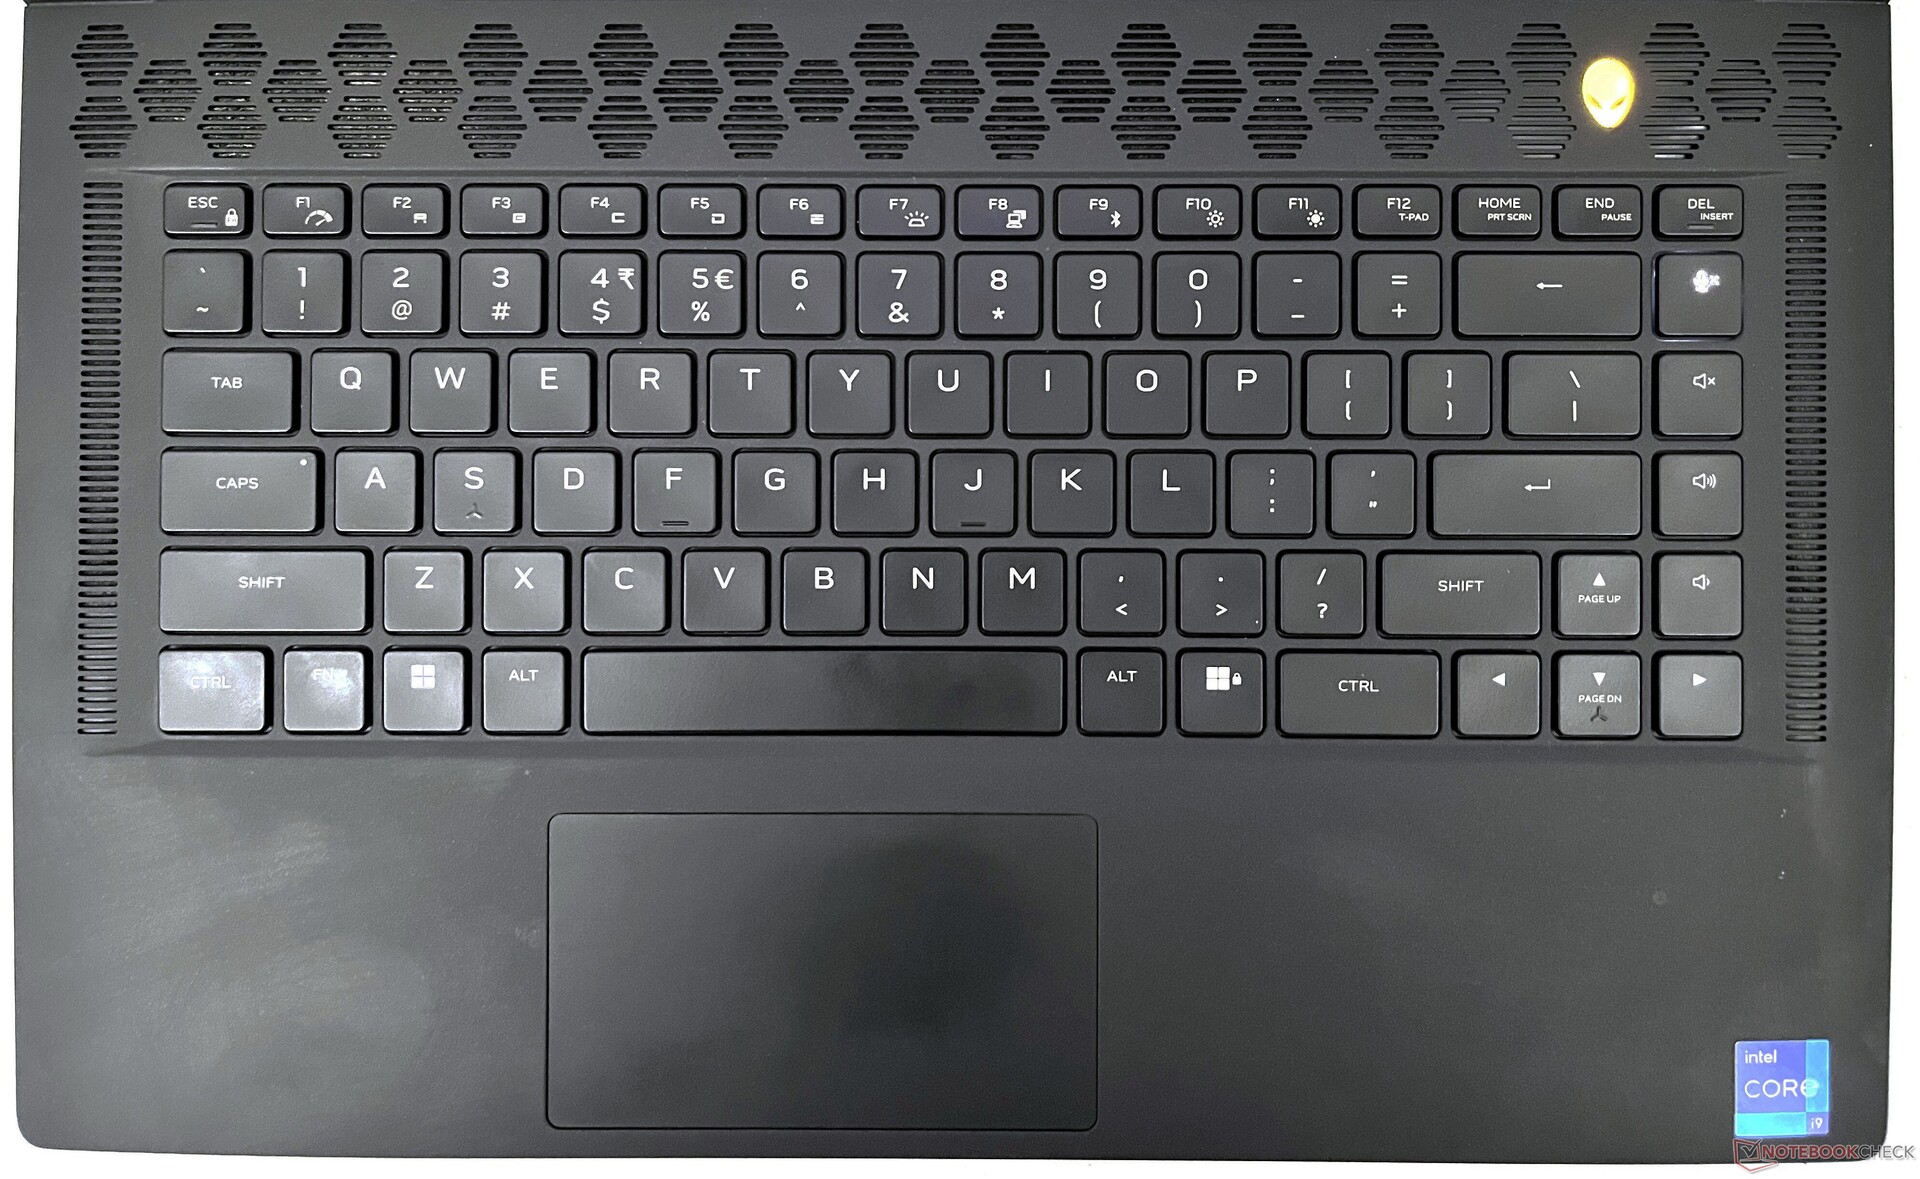
Input Devices: Secondary keys remain unlit
Keyboard
The keyboard remains unchanged from the x15 R1. Dell employs an Alienware X Series thin keyboard with a 1.5 mm key travel, N-key rollover, and anti-ghosting technology. There are no mechanical keys owing to the thin chassis.
Typing on the x15 R2's keyboard is generally a pleasant experience owing to good tactile feedback. The full-size arrow keys are also carried forward from the x15 R1 and are a welcome addition. However, the secondary symbols on the Function keys continue to remain unlit, which makes it irksome to use them in the dark.
Touchpad
The 10.5 cm x 6 cm touchpad feels a bit smaller compared to the competition but offers a smooth gliding experience. Windows Precision gestures are supported. Clicking does require some effort at times and can also benefit from some added feedback.
Unlike the x15 R1, the x15 R2's touchpad color scheme matches the rest of the keyboard deck but is still a fingerprint and grime magnet.
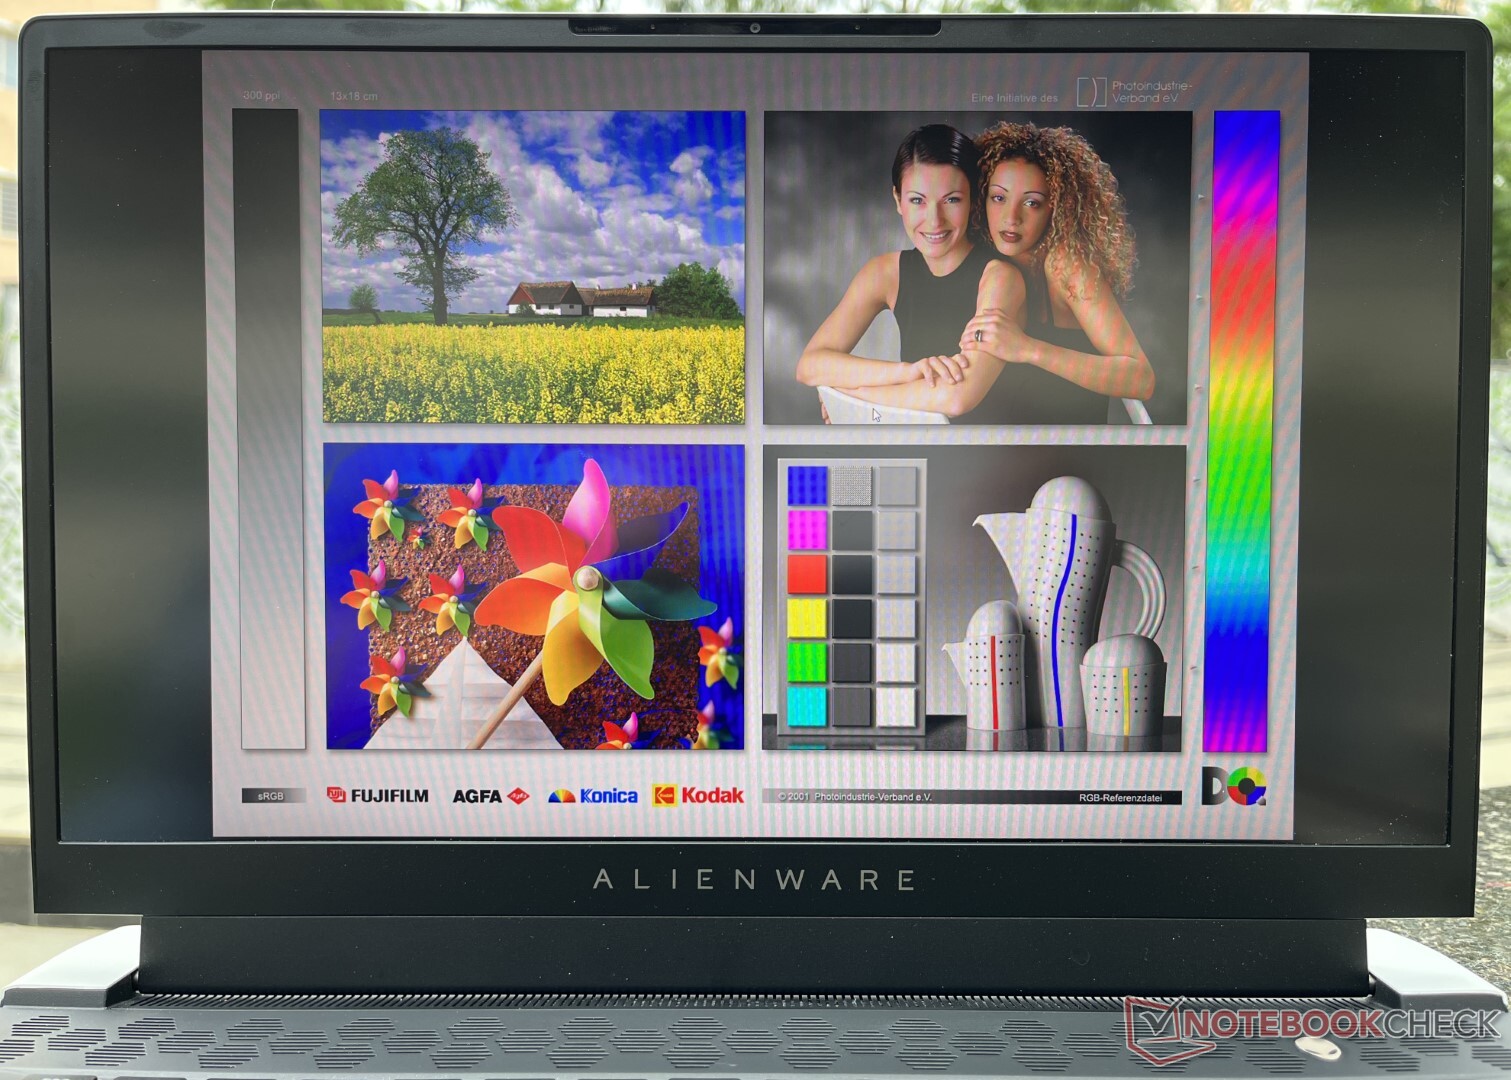
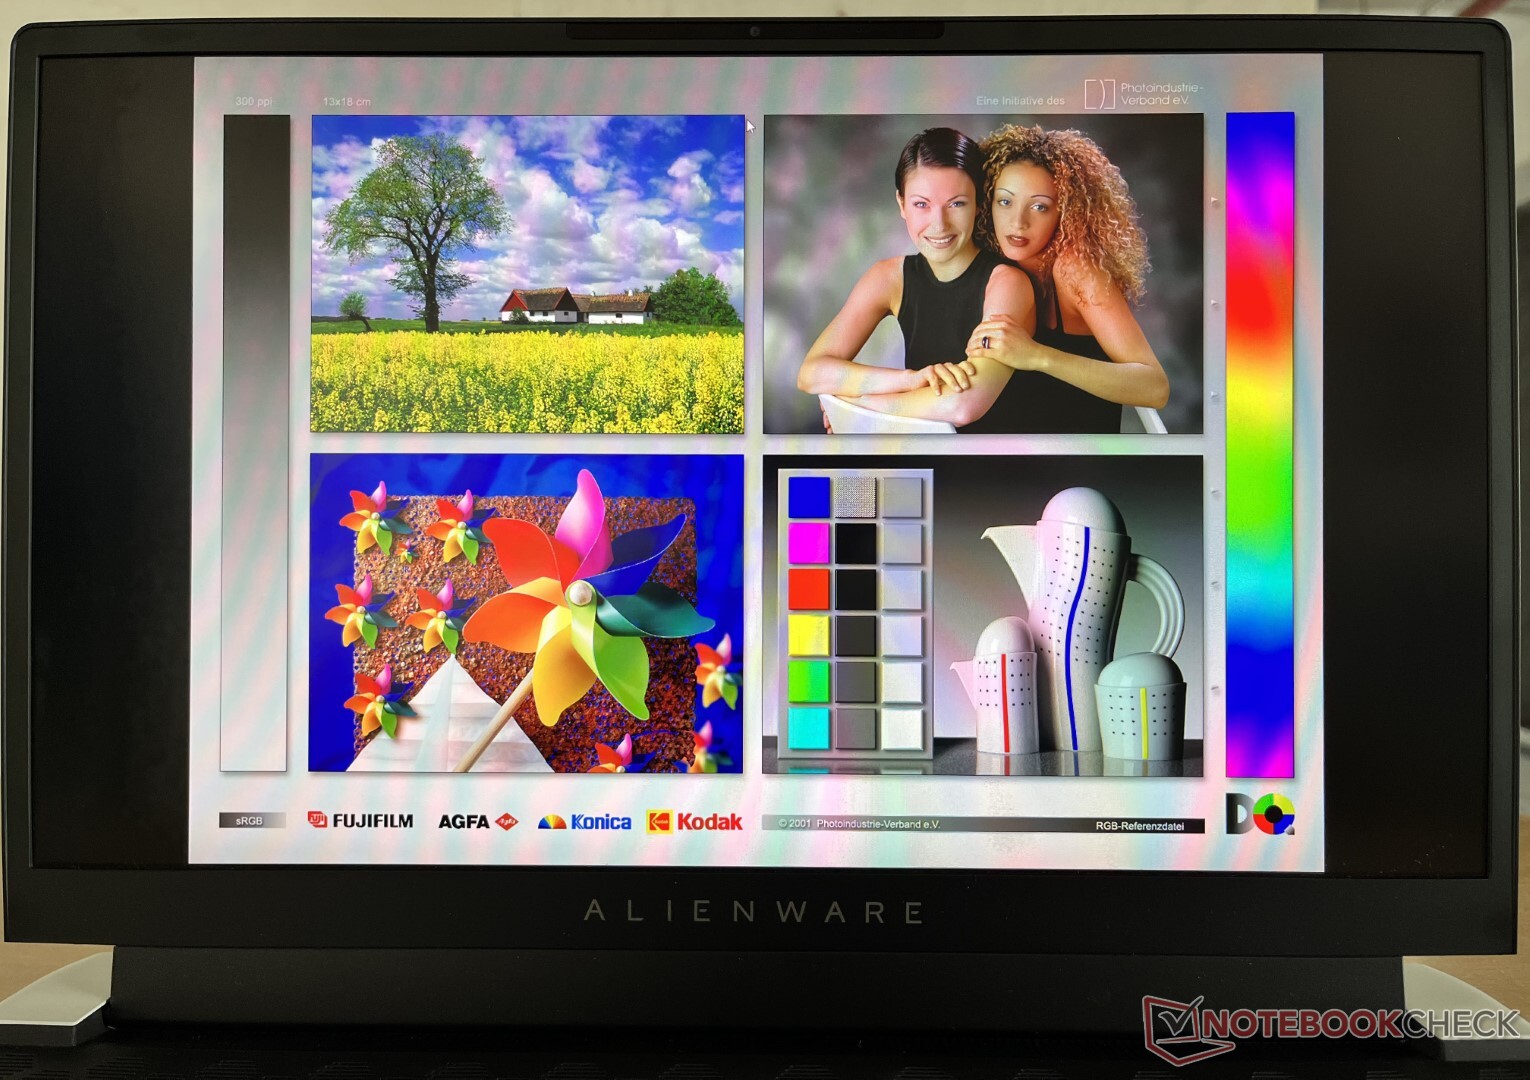
Display: 360 Hz G-Sync panel with Dolby Vision and no PWM
Our Alienware x15 R2 is equipped with a 1080p 360 Hz panel. This is an Nvidia G-Sync panel with support for Dolby Vision HDR. Users can also configure the x15 R2 with FHD 165 Hz and QHD 240 Hz panel options with G-Sync and Dolby Vision support.
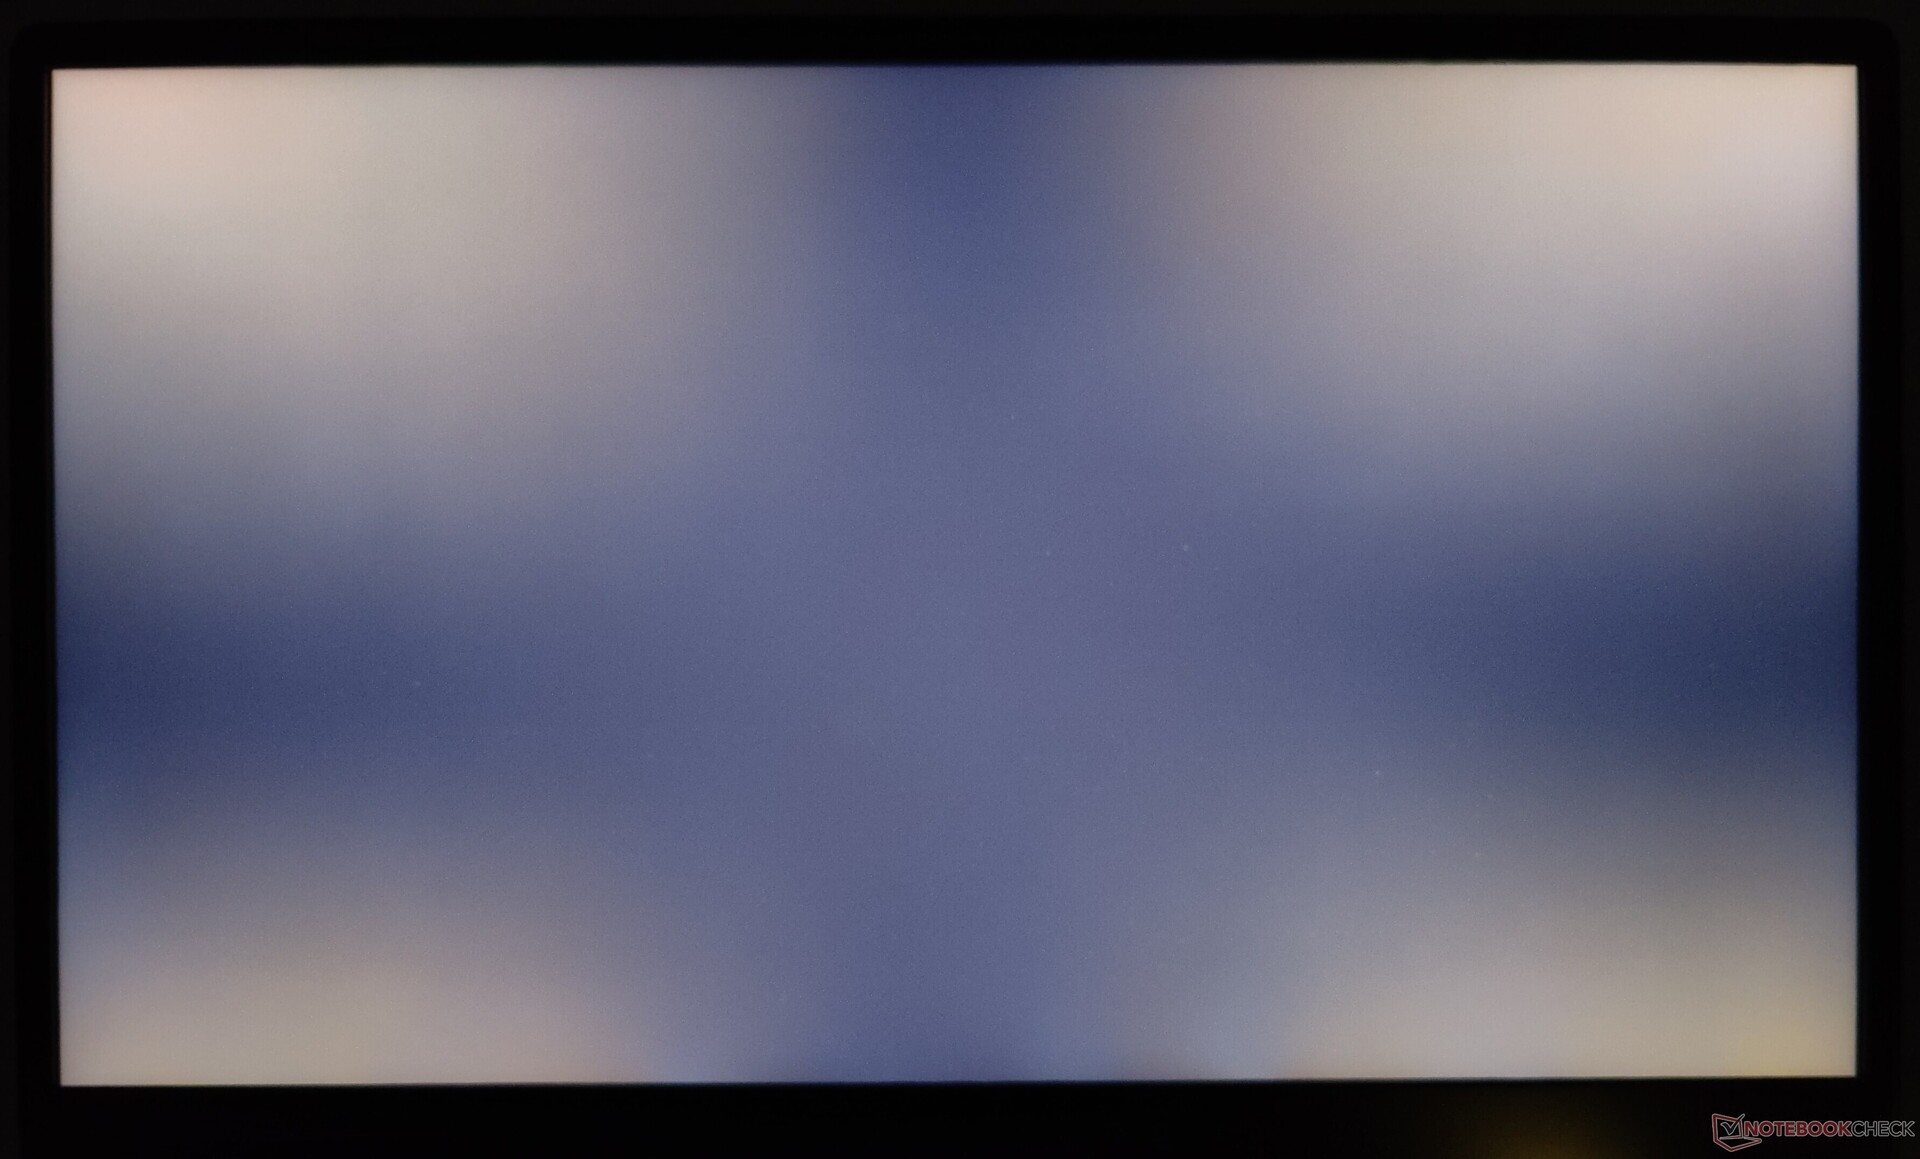
The 1080p resolution results in a larger pixel size with an overall density of 141 PPI. We observed significant backlight bleeding at all four corners under long exposure.
The x15 R2's display characteristics are similar to what we had seen before with the 2020 Alienware m15 R3, which also features the same panel. Brightness distribution is decent at 82%, and the 1033:1 measured contrast ratio offers a good subjective viewing experience.

| |||||||||||||||||||||||||
Brightness Distribution: 82 %
Center on Battery: 341 cd/m²
Contrast: 1033:1 (Black: 0.33 cd/m²)
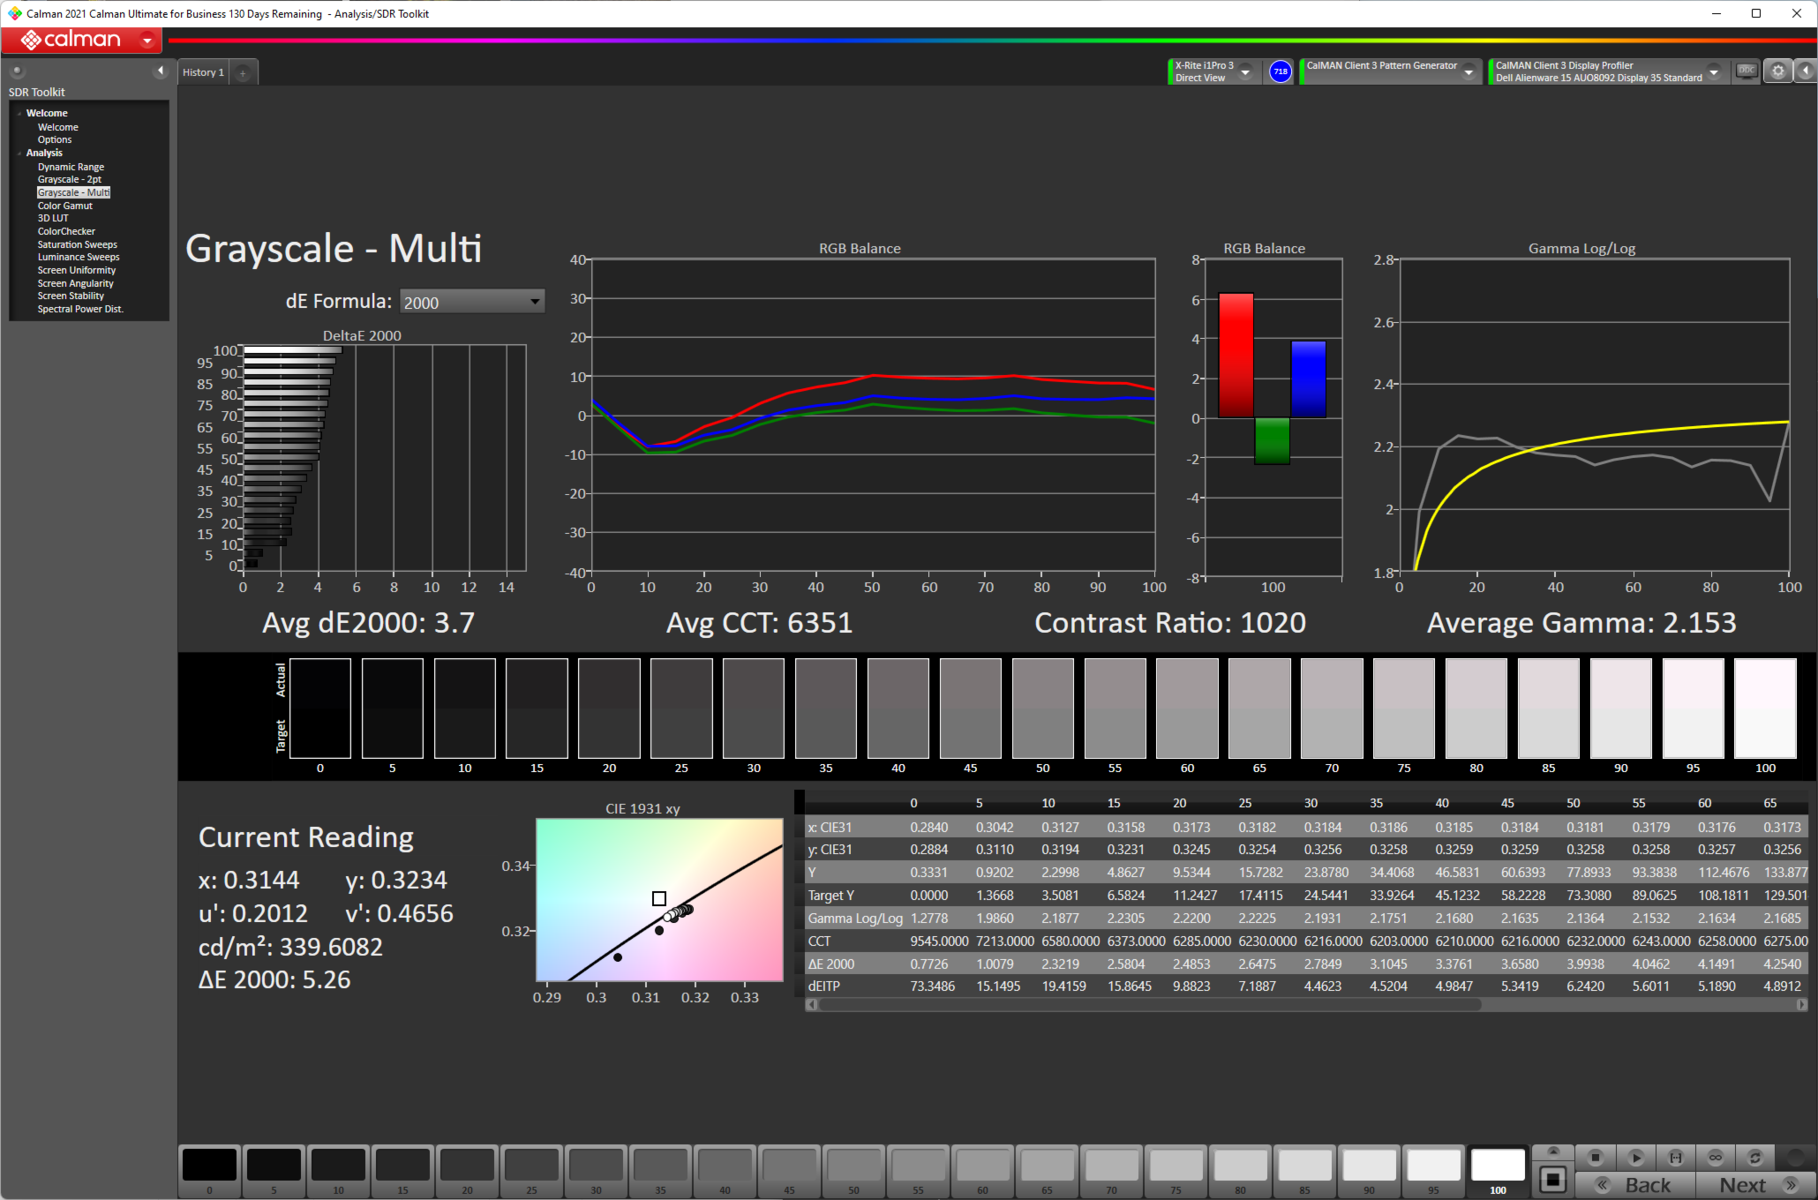
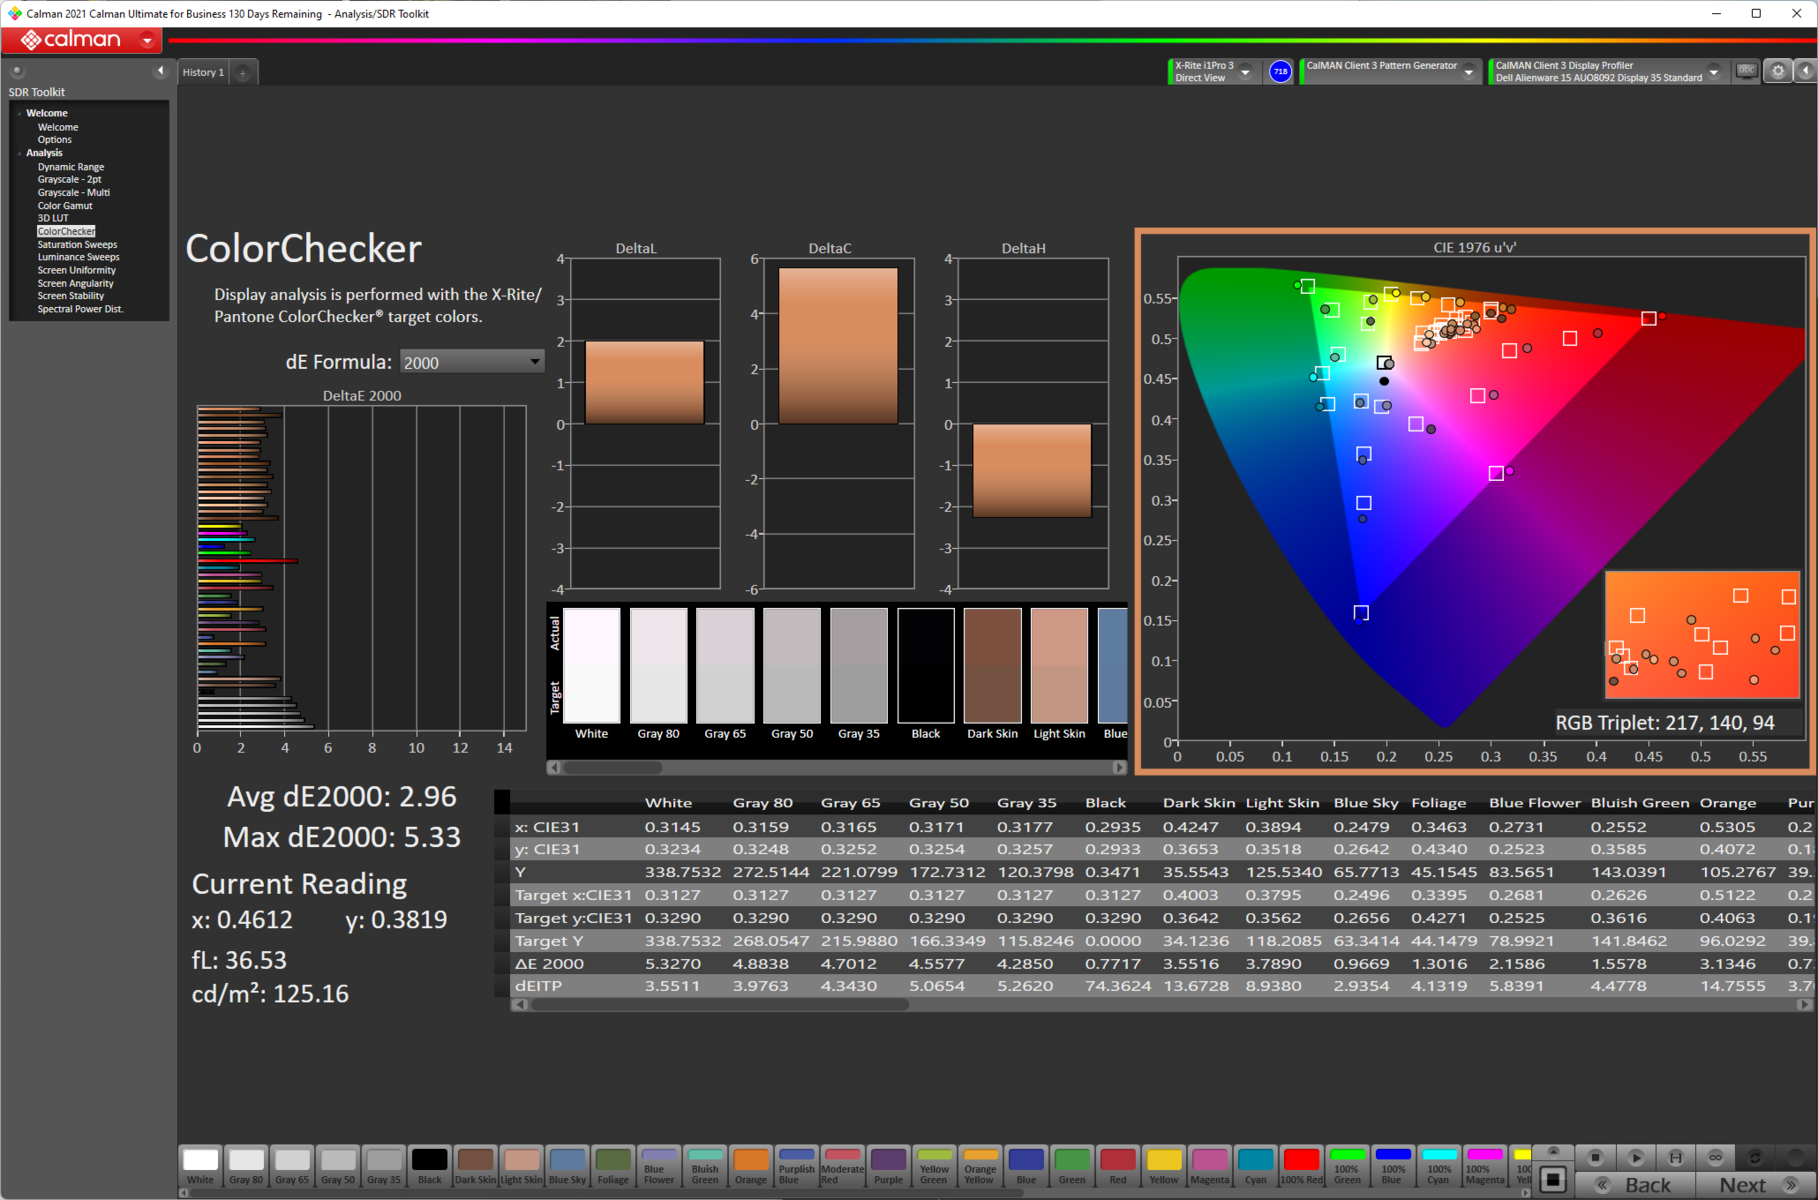
ΔE Color 2.96 | 0.5-29.43 Ø5, calibrated: 1.46
ΔE Greyscale 3.7 | 0.57-98 Ø5.3
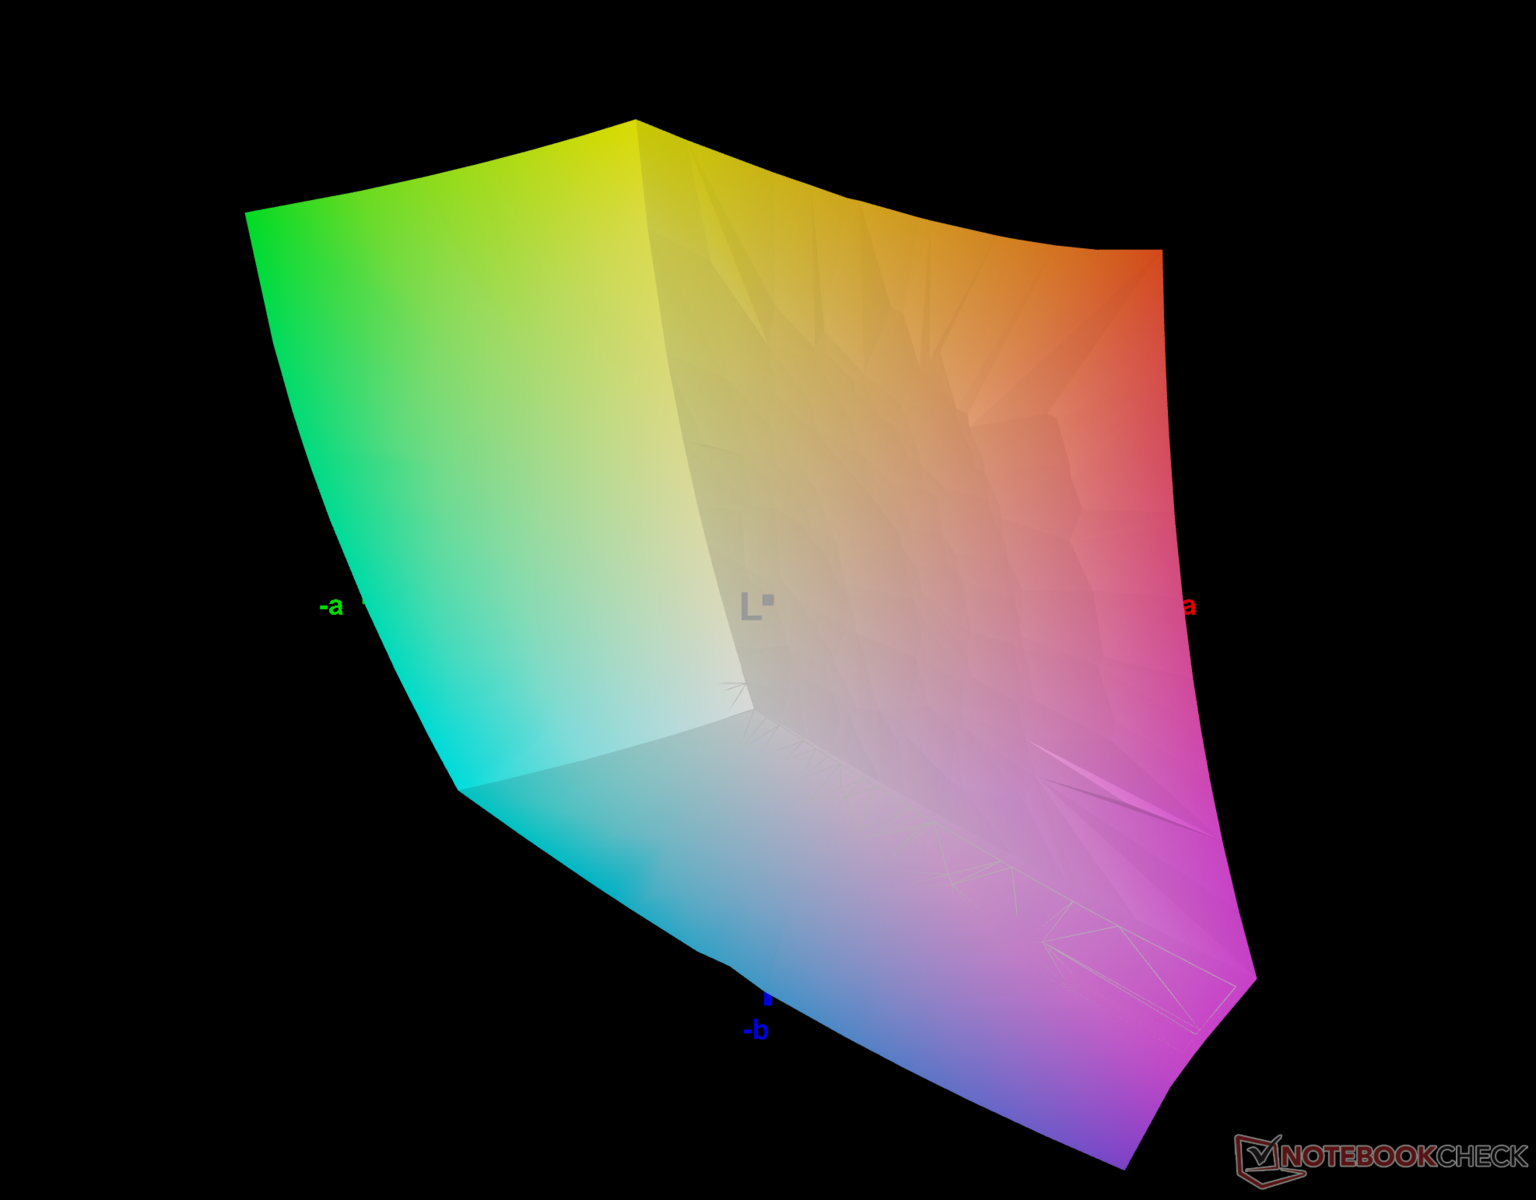
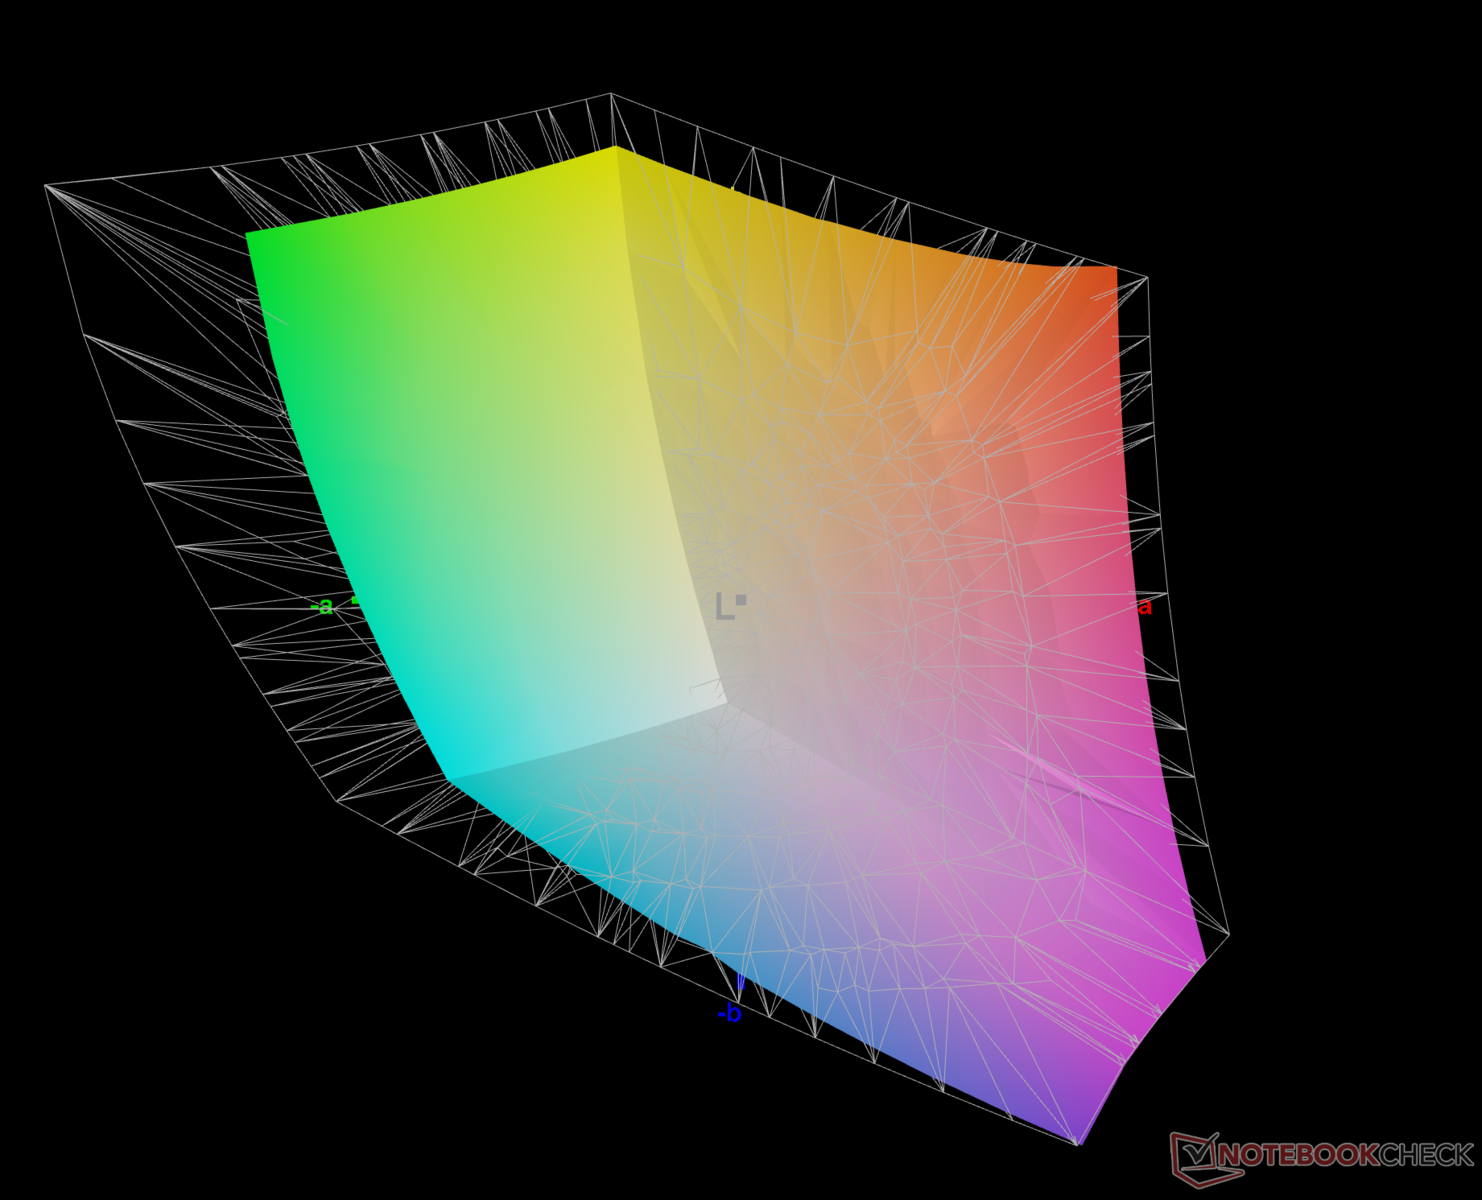
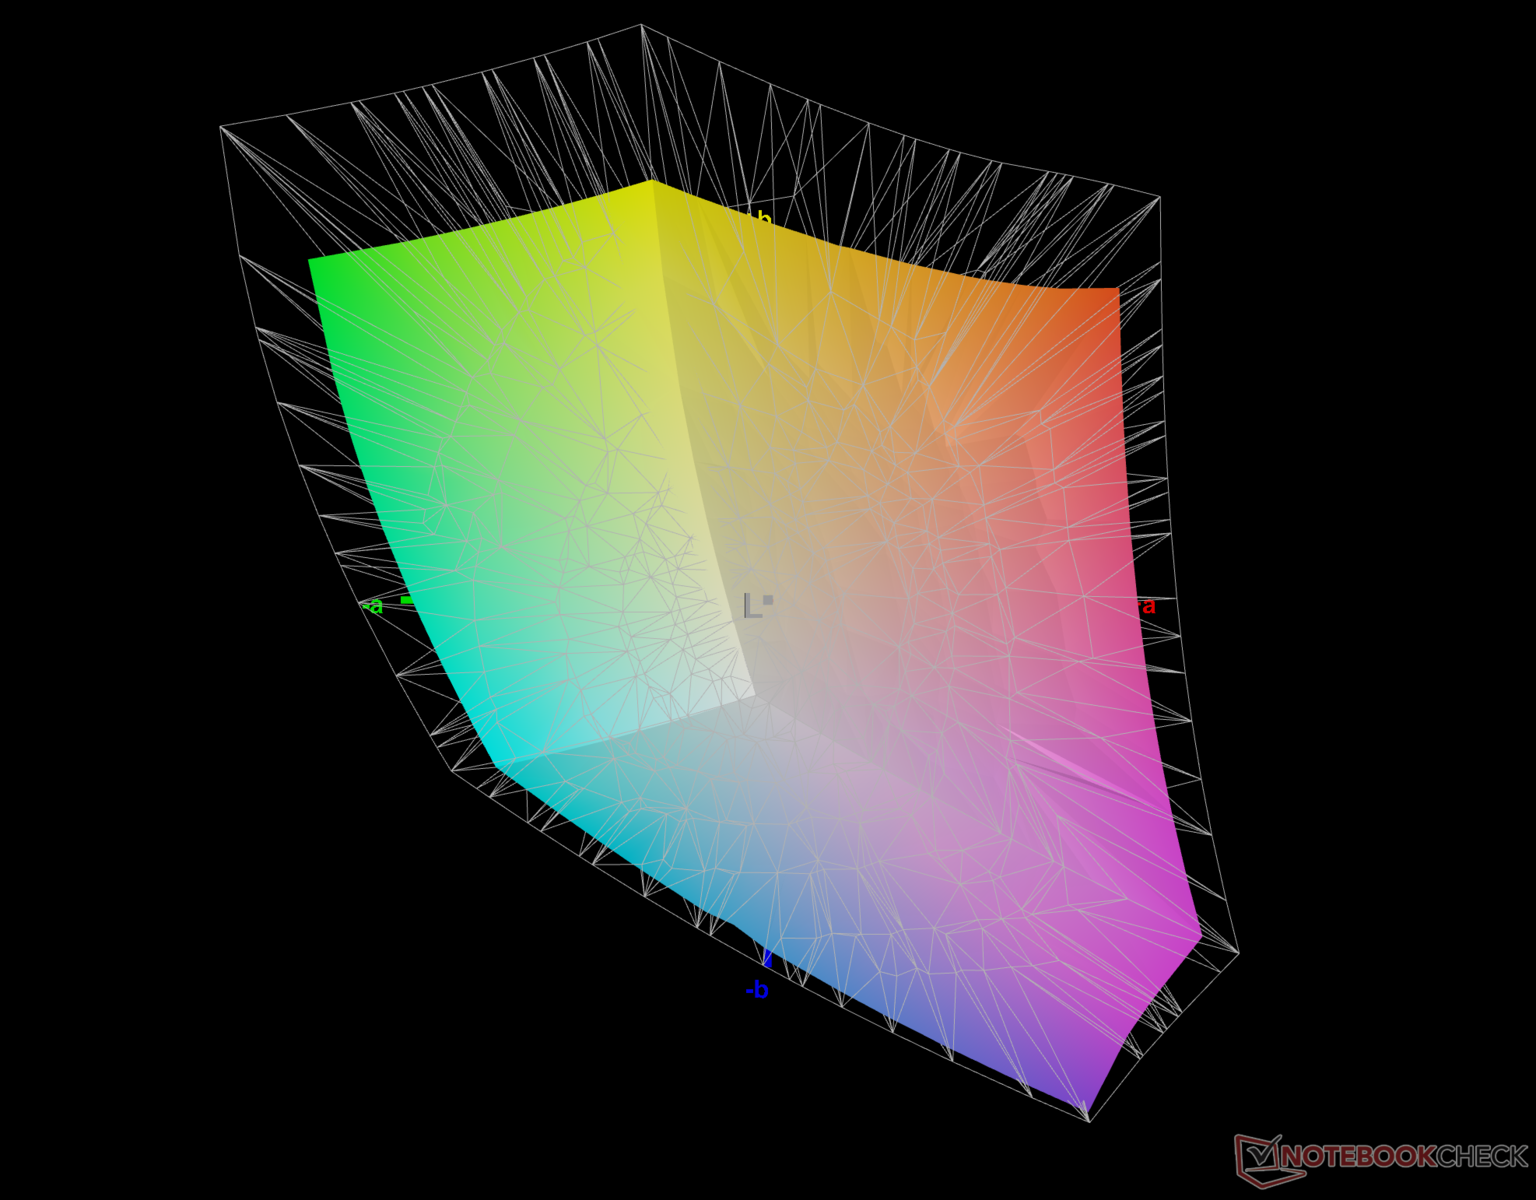
75.7% AdobeRGB 1998 (Argyll 2.2.0 3D)
100% sRGB (Argyll 2.2.0 3D)
74.7% Display P3 (Argyll 2.2.0 3D)
Gamma: 2.15
| Alienware x15 R2 P111F AU Optronics B156HAN (AUO8092), IPS, 1920x1080, 15.60 | Alienware x15 RTX 3070 P111F LG Philips 156QHG, IPS, 2560x1440, 15.60 | Asus ROG Strix Scar 15 G533ZW-LN106WS BOE CQ NE156QHM-NZ2, IPS-level, 2560x1440, 15.60 | MSI Titan GT77 12UHS Sharp SHP1544 LQ173M1JW08, IPS-Level, 1920x1080, 17.30 | MSI Vector GP66 12UGS BOE NE156FHM-NZ3, IPS, 1920x1080, 15.60 | Razer Blade 15 Advanced Model Early 2022 TL156VDXP02-0, IPS, 1920x1080, 15.60 | |
|---|---|---|---|---|---|---|
| Display | 16% | 14% | -3% | -4% | -13% | |
| Display P3 Coverage | 74.7 | 97.8 31% | 96.2 29% | 70.8 -5% | 70.1 -6% | 65.3 -13% |
| sRGB Coverage | 100 | 99.9 0% | 99.9 0% | 98.9 -1% | 99.5 0% | 85.1 -15% |
| AdobeRGB 1998 Coverage | 75.7 | 84.5 12% | 73 -4% | 72.1 -5% | 67.4 -11% | |
| Response Times | -429% | -232% | -64% | -209% | -168% | |
| Response Time Grey 50% / Grey 80% * | 1.47 ? | 12 ? -716% | 7.86 ? -435% 4.21 ? -186% | 3.03 ? -106% | 5.8 ? -295% | 4.3 ? -193% |
| Response Time Black / White * | 4.32 ? | 10.4 ? -141% | 7.5 ? -74% | 5.28 ? -22% | 9.6 ? -122% | 10.5 ? -143% |
| PWM Frequency | ||||||
| Screen | -4% | -24% | -7% | 4% | 30% | |
| Brightness middle | 341 | 409.5 20% | 346 1% | 280 -18% | 353.1 4% | 330 -3% |
| Brightness | 316 | 390 23% | 329 4% | 275 -13% | 325 3% | 315 0% |
| Brightness Distribution | 82 | 88 7% | 91 11% | 79 -4% | 85 4% | 89 9% |
| Black Level * | 0.33 | 0.47 -42% | 0.59 -79% | 0.4 -21% | 0.38 -15% | 0.24 27% |
| Contrast | 1033 | 871 -16% | 586 -43% | 700 -32% | 929 -10% | 1375 33% |
| Colorchecker dE 2000 * | 2.96 | 3.48 -18% | 3.06 -3% | 2.1 29% | 2.24 24% | 1.47 50% |
| Colorchecker dE 2000 max. * | 5.33 | 6.31 -18% | 5.81 -9% | 5.83 -9% | 5 6% | 2.73 49% |
| Colorchecker dE 2000 calibrated * | 1.46 | 0.89 39% | 2.57 -76% | 1.58 -8% | 1.02 30% | 0.63 57% |
| Greyscale dE 2000 * | 3.7 | 5 -35% | 3.3 11% | 4 -8% | 1.8 51% | |
| Gamma | 2.15 102% | 2.16 102% | 2.12 104% | 2.13 103% | 2.24 98% | 2.282 96% |
| CCT | 6351 102% | 6591 99% | 7021 93% | 7060 92% | 6864 95% | 6499 100% |
| Total Average (Program / Settings) | -139% /
-67% | -81% /
-61% | -25% /
-15% | -70% /
-28% | -50% /
-7% |
* ... smaller is better
The Alienware x15 R2's color space coverage is good considering that this is primarily a gaming laptop. The sRGB color gamut is fully covered, and the 75.7% AdobeRGB coverage should still be amenable for non-professional content creation. Display P3 coverage is also decent at 74.7%.
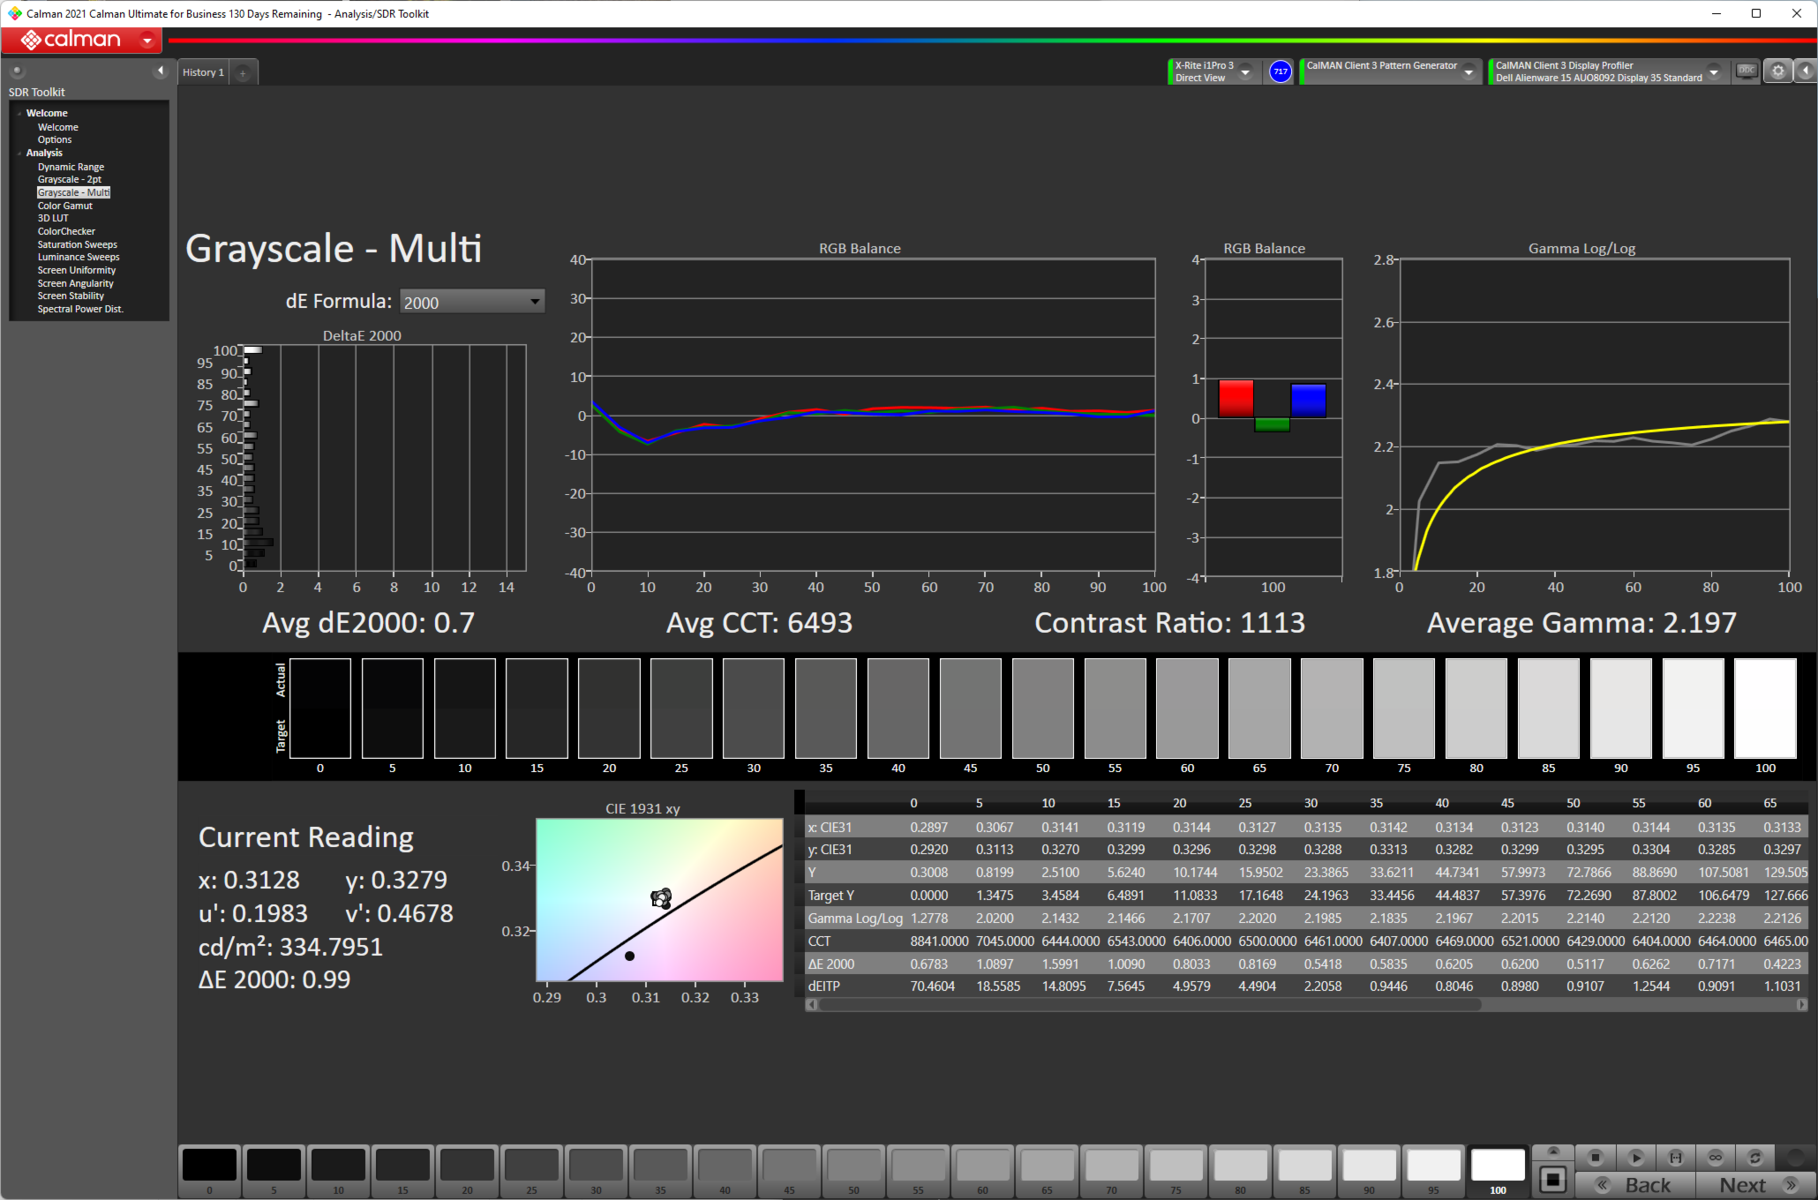
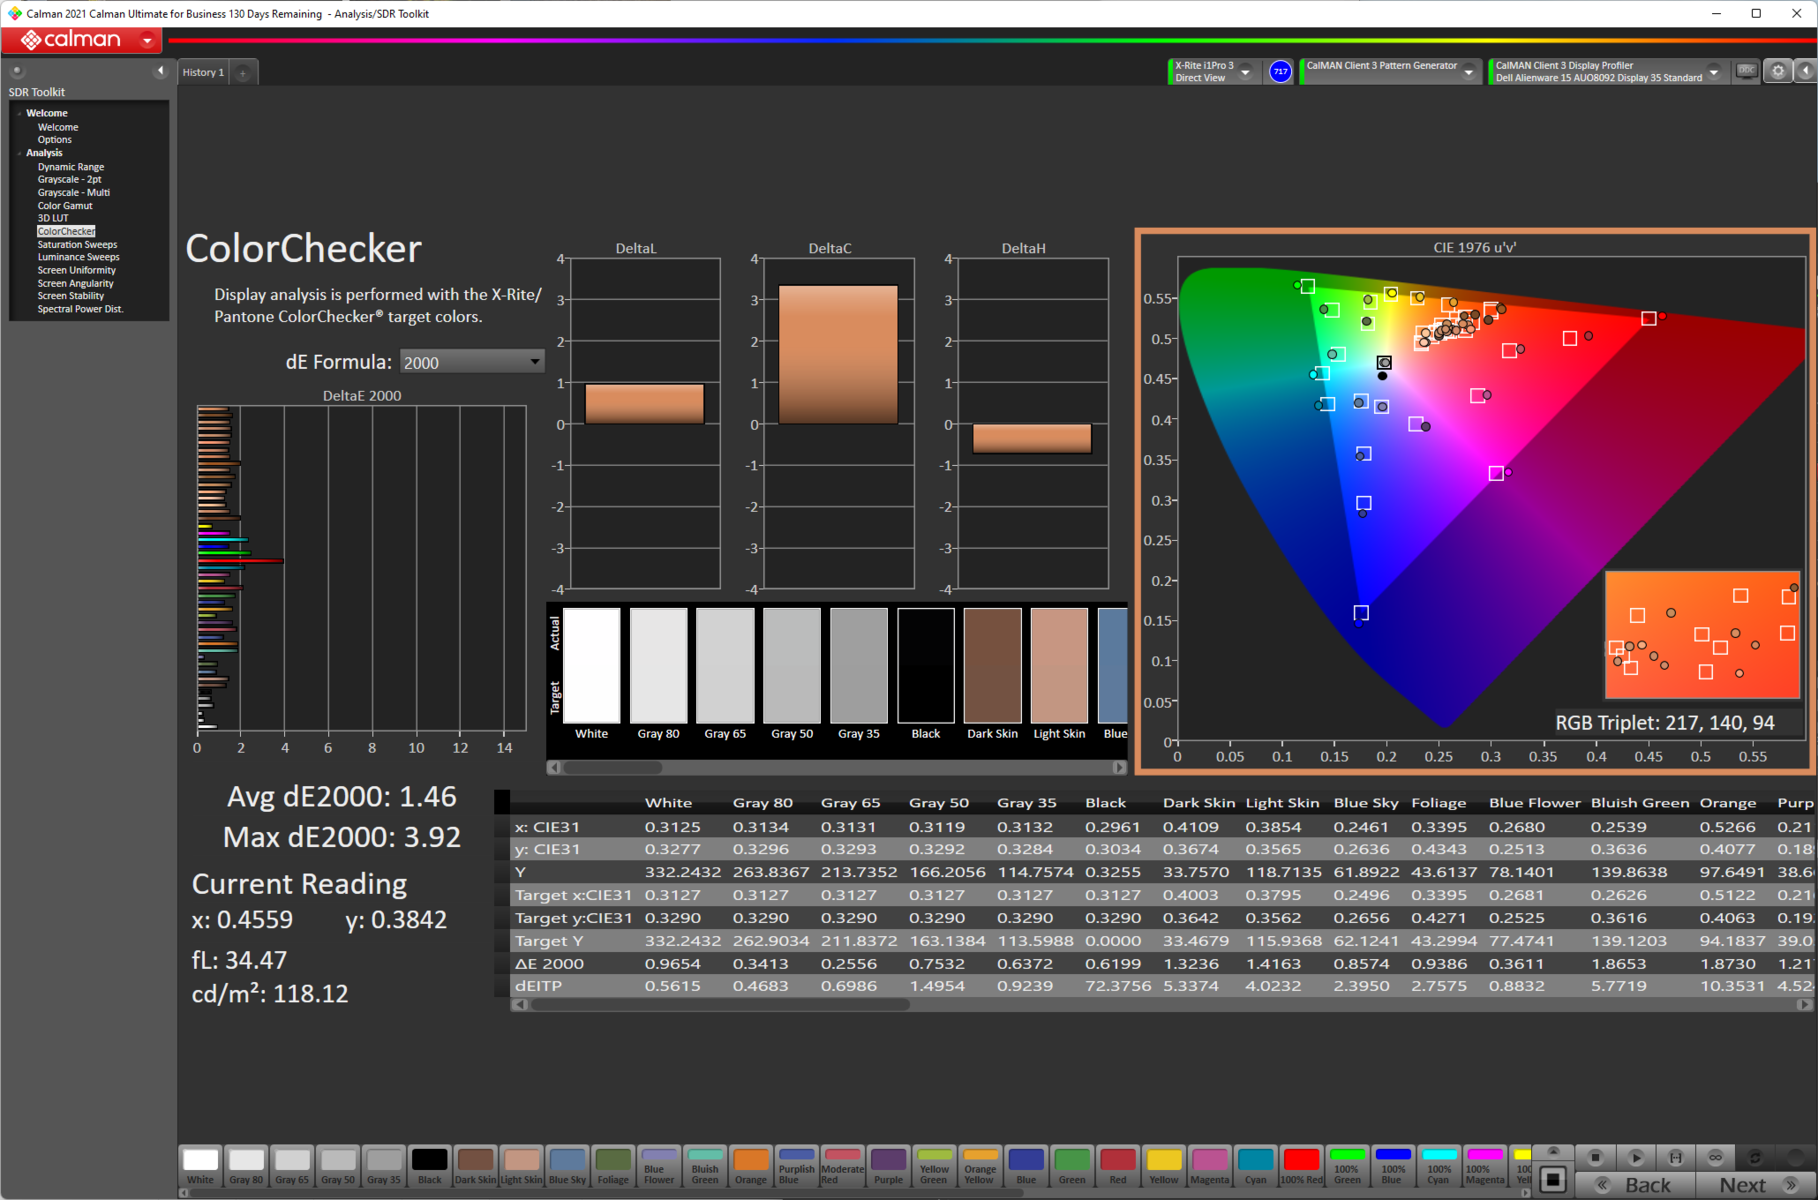
Out-of-the-box color accuracy is nothing to write home about but is nevertheless serviceable with an average grayscale Delta E of 3.7 and an average ColorChecker Delta E of 2.96.
Our standardized calibration routine using the X-rite i1Basic Pro 3 spectrophotometer and Calman Ultimate color calibration software from Portrait Displays helps in perceivable improvements in color accuracy by narrowing the average grayscale Delta E to 0.7 and the average ColorChecker Delta E to 1.46. We still notice higher deviations in the red color.
The calibrated ICC file can be downloaded from the link above.
Display Response Times
| ↔ Response Time Black to White | ||
|---|---|---|
| 4.32 ms ... rise ↗ and fall ↘ combined | ↗ 2.17 ms rise | 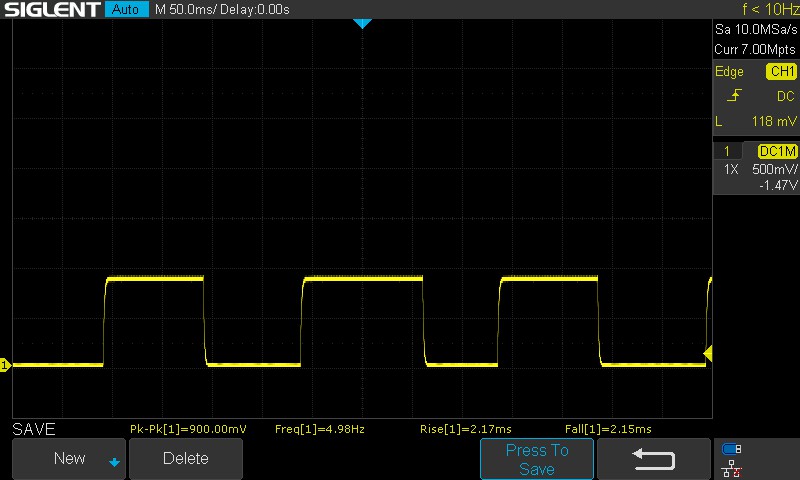 |
| ↘ 2.15 ms fall | ||
| The screen shows very fast response rates in our tests and should be very well suited for fast-paced gaming. In comparison, all tested devices range from 0.1 (minimum) to 240 (maximum) ms. » 12 % of all devices are better. This means that the measured response time is better than the average of all tested devices (21.5 ms). | ||
| ↔ Response Time 50% Grey to 80% Grey | ||
| 1.47 ms ... rise ↗ and fall ↘ combined | ↗ 0.49 ms rise |  |
| ↘ 0.98 ms fall | ||
| The screen shows very fast response rates in our tests and should be very well suited for fast-paced gaming. In comparison, all tested devices range from 0.2 (minimum) to 636 (maximum) ms. » 3 % of all devices are better. This means that the measured response time is better than the average of all tested devices (33.8 ms). | ||
The Alienware x15 R2's panel uses overdrive by default, and this is seen as a "horn" in the 50% grey to 80% grey response time graph. Consequently, we see a very fast 1.47 ms combined response time; it is not OLED-level but should augur well for fast-paced games. The combined 100% black to 100% white response time is also decent at 4.32 ms.
Panel overdrive is disabled at 60 Hz refresh and the combined 50% grey to 80% grey response time increases to 7.3 ms.
Screen Flickering / PWM (Pulse-Width Modulation)
| Screen flickering / PWM not detected |  | ||
In comparison: 53 % of all tested devices do not use PWM to dim the display. If PWM was detected, an average of 17933 (minimum: 5 - maximum: 3846000) Hz was measured. | |||
No PWM flickering was observed across all tested brightness levels, which should bode well for reduced eye strain while gaming.
For more information, refer to our article "Why Pulse Width Modulation (PWM) is such a headache", and also check out our PWM Ranking Table for PWM frequency comparison across all reviewed devices.
Despite the somewhat lower peak brightness, the Alienware x15 R2's display is quite amenable for outdoor viewing as long as there is no harsh sunlight falling directly on the screen.
We did not observe any significant loss of brightness or color information at extreme viewing angles.

Performance: Core i9-12900H offers good sustained performance
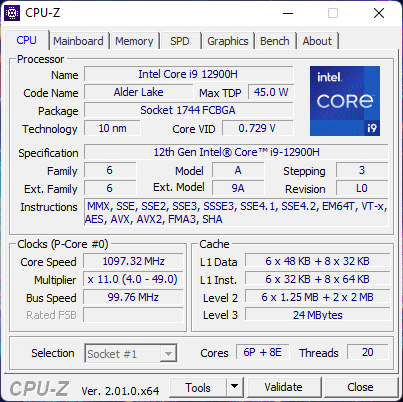
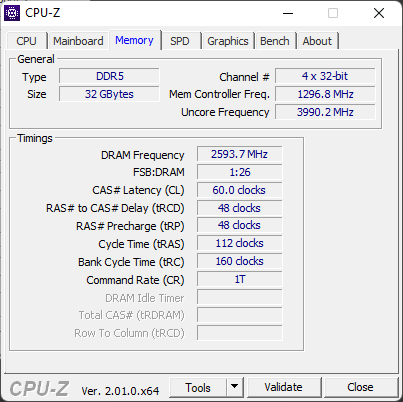
Our Alienware x15 R2 is powered by an Intel Core i9-12900H processor and a 140 W Nvidia GeForce RTX 3080 Ti Laptop GPU. Buyers can also configure the x15 R2 with a Core i7-12700H and an RTX 3060 or RTX 3070 Ti Laptop GPU options along with 16 GB or 32 GB LPDDR5-5200 RAM.
Testing Conditions
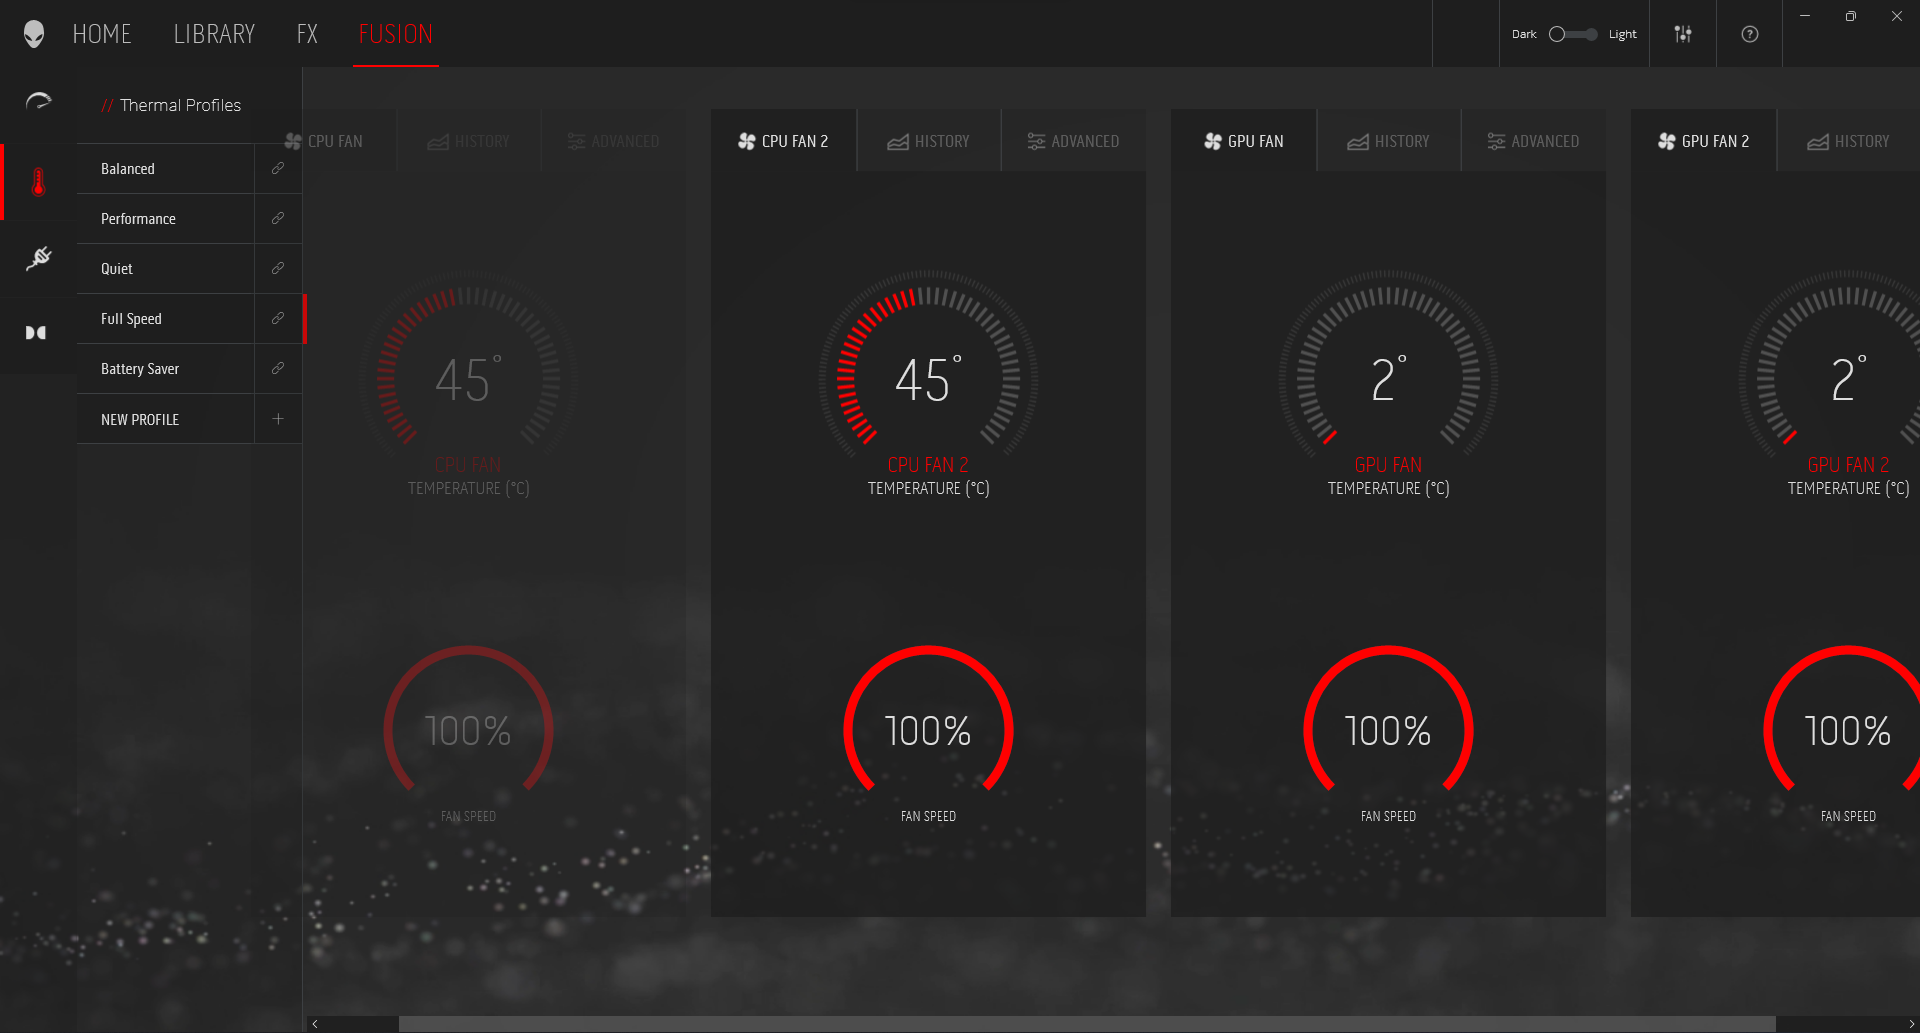
The laptop's performance can be tuned using Alienware Command Center. We had to install the app manually as it was not present in the default factory image for some reason. We ran all tests in the Full Speed thermal profile. This results in an unlocked processor base power (PL1) and maximum turbo power (PL2) of 140 W.
Most thermal profiles including Balanced use a PL1/PL2 of 140 W whereas Battery Saver and Quiet modes use a 65 W PL1 and 140 W PL2. The choice of thermal profile mainly has an impact on fan noise, which we will come to shortly.
The Alienware x15 R2 supports Advanced Optimus. All graphics tests were run in the MSHybrid mode, but it is possible to change the GPU routing either via the BIOS or via Nvidia Control Panel.
Processor
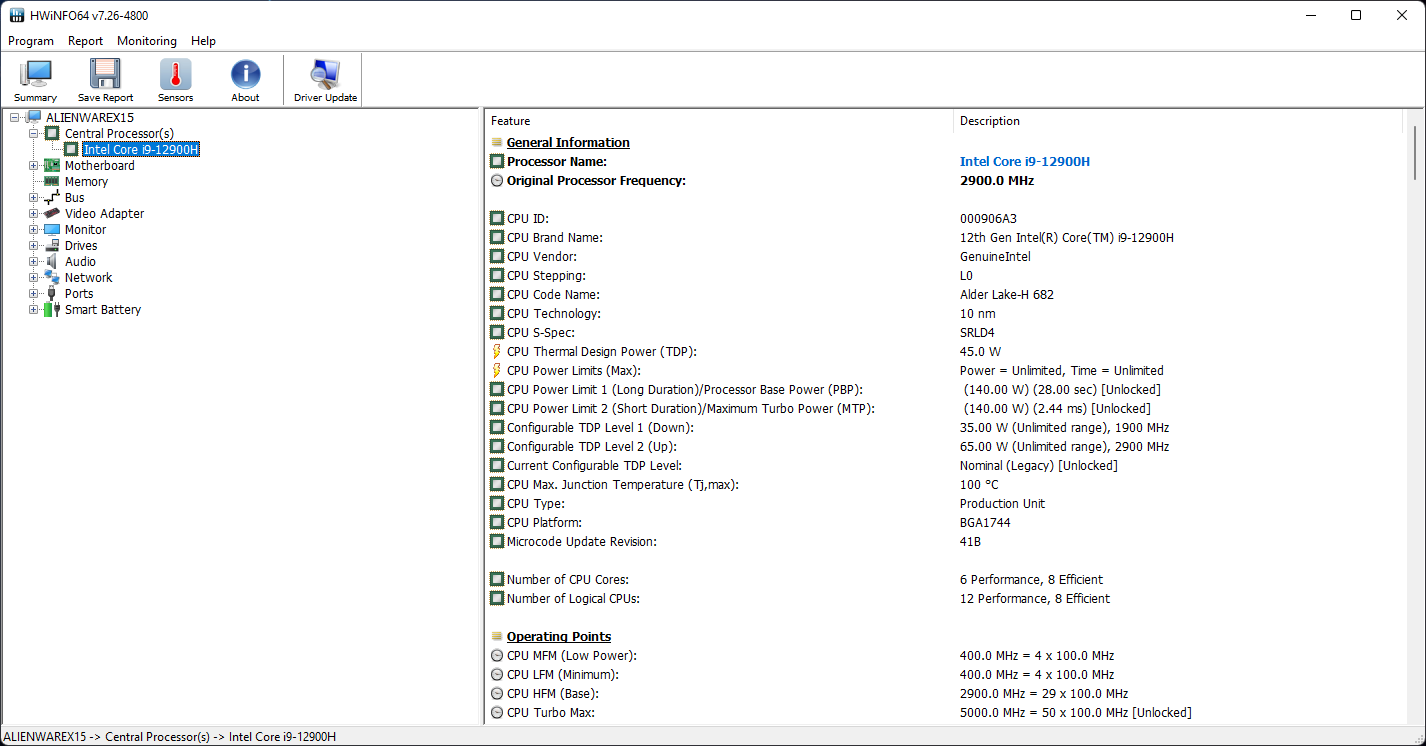
The Core i9-12900H is a 14-core 20-thread Alder Lake-H processor with boosts up to 5 GHz. Of the 14 cores, eight of them are Golden Cove performance (P) cores while the remaining six are Gracemont efficiency (E) ones. The P-cores support hyperthreading.
Dell's implementation of an Element 31 (which denotes gallium in the periodic table by the way) gallium-silicone thermal interface material (TIM) seems to be working as advertised. We observed a well-sustained performance in the Cinebench R15 multi-core loop test throughout the duration of the run.
That being said, the Alienware x15 R2 seems to be about 9% slower in this test compared to the Asus ROG Strix Scar 15, which also uses the same processor at 135 W.
Cinebench R15 Multi Loop
Single-core performance is on par with other Alder Lake-H chips and even the Alder Lake-HX Core i9-12900HX in the MSI Titan GT77. We see between 1% and 21% leads in single core for the Core i9-12900H compared to the AMD Ryzen 9 6900HX in the Asus ROG Zephyrus Duo 16 depending on the benchmark. The Scar 15 is able to edge out the X15 R2 in most multi-core benchmarks.
We noticed an 11% drop in Cinebench R20 multi-core performance on battery power likely due to the PL1 dropping down to 65 W.
Overall, the Alienware x15 R2 does not throw any surprises in our CPU benchmark suite and offers a 33% increased CPU performance compared to the x15 R1. The thin chassis may have contributed to the slightly lower scores, but Dell's thermal management is able to ensure a good sustained performance.
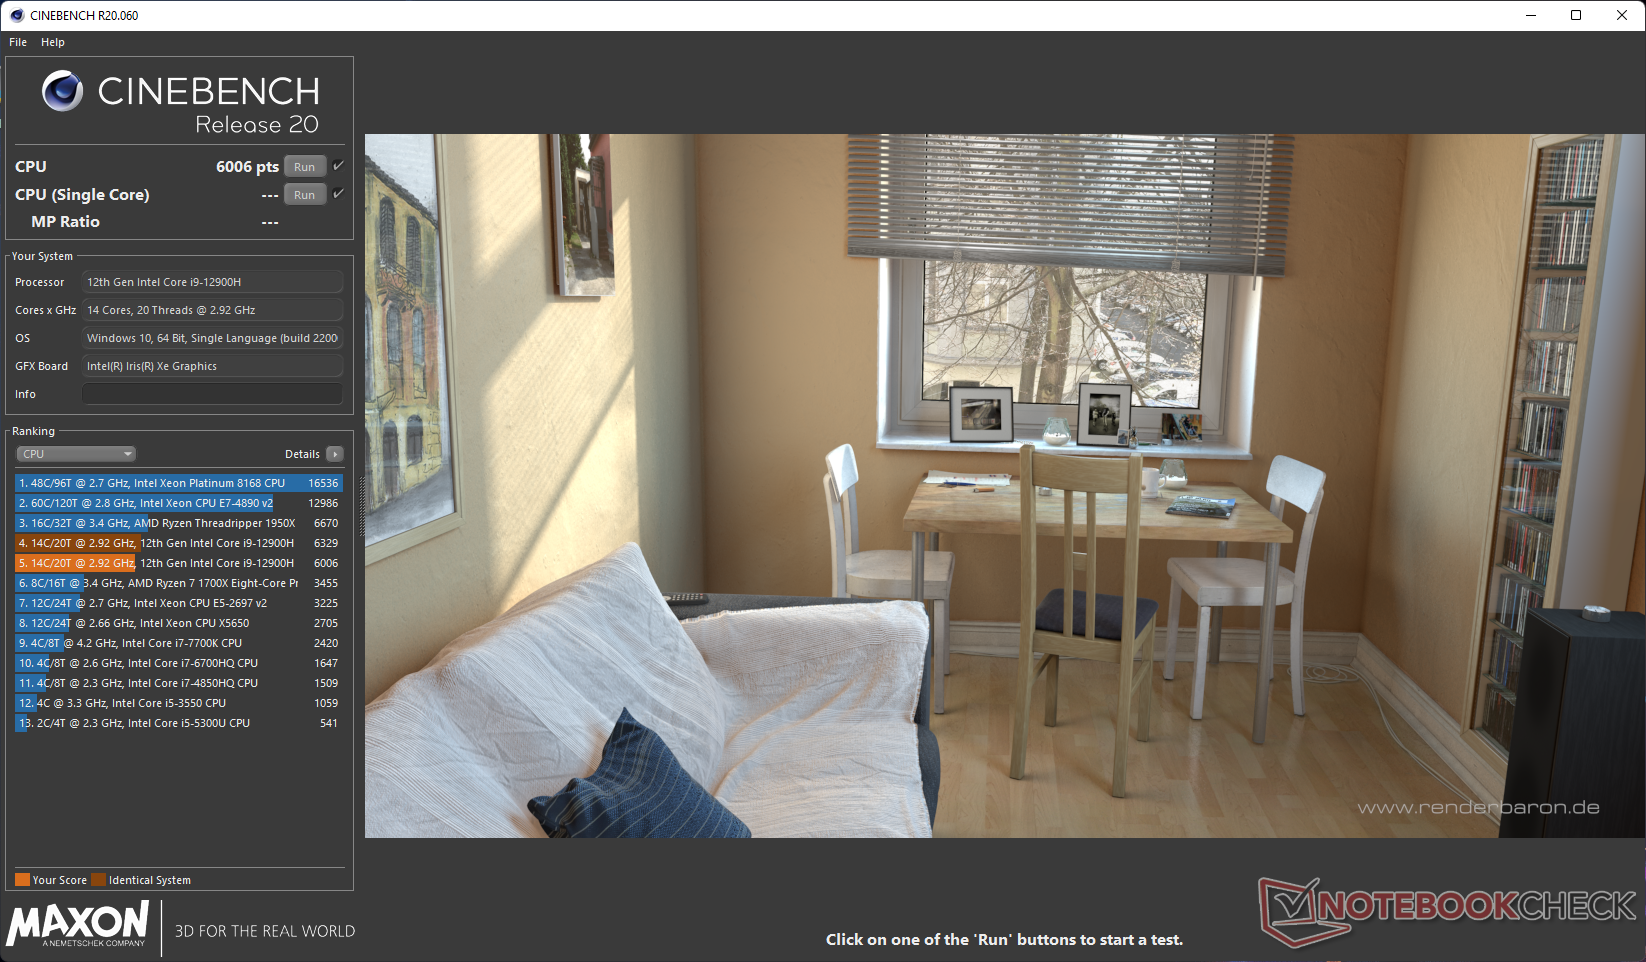
Cinebench R23: Multi Core | Single Core
Cinebench R20: CPU (Multi Core) | CPU (Single Core)
Cinebench R15: CPU Multi 64Bit | CPU Single 64Bit
Blender: v2.79 BMW27 CPU
7-Zip 18.03: 7z b 4 | 7z b 4 -mmt1
Geekbench 5.5: Multi-Core | Single-Core
HWBOT x265 Benchmark v2.2: 4k Preset
LibreOffice : 20 Documents To PDF
R Benchmark 2.5: Overall mean
| CPU Performance Rating | |
| MSI Titan GT77 12UHS | |
| Asus ROG Strix Scar 15 G533ZW-LN106WS | |
| Average of class Gaming | |
| Alienware x15 R2 P111F | |
| MSI Raider GE66 12UHS | |
| MSI Vector GP66 12UGS | |
| Average Intel Core i9-12900H | |
| Asus ROG Zephyrus Duo 16 GX650RX | |
| Razer Blade 15 Advanced Model Early 2022 | |
| Alienware x15 RTX 3070 P111F -2! | |
| Cinebench R23 / Multi Core | |
| MSI Titan GT77 12UHS | |
| Average of class Gaming (2435 - 34613, n=229, last 2 years) | |
| Asus ROG Strix Scar 15 G533ZW-LN106WS | |
| MSI Vector GP66 12UGS | |
| Alienware x15 R2 P111F | |
| MSI Raider GE66 12UHS | |
| Average Intel Core i9-12900H (7359 - 19648, n=25) | |
| Asus ROG Zephyrus Duo 16 GX650RX | |
| Alienware x15 RTX 3070 P111F | |
| Razer Blade 15 Advanced Model Early 2022 | |
| Cinebench R23 / Single Core | |
| Asus ROG Strix Scar 15 G533ZW-LN106WS | |
| MSI Titan GT77 12UHS | |
| Alienware x15 R2 P111F | |
| MSI Vector GP66 12UGS | |
| MSI Raider GE66 12UHS | |
| Average Intel Core i9-12900H (1634 - 1921, n=25) | |
| Average of class Gaming (527 - 2235, n=227, last 2 years) | |
| Razer Blade 15 Advanced Model Early 2022 | |
| Asus ROG Zephyrus Duo 16 GX650RX | |
| Alienware x15 RTX 3070 P111F | |
| Cinebench R20 / CPU (Multi Core) | |
| MSI Titan GT77 12UHS | |
| Average of class Gaming (930 - 13769, n=227, last 2 years) | |
| Asus ROG Strix Scar 15 G533ZW-LN106WS | |
| Alienware x15 R2 P111F | |
| MSI Vector GP66 12UGS | |
| MSI Raider GE66 12UHS | |
| Average Intel Core i9-12900H (2681 - 7471, n=25) | |
| Asus ROG Zephyrus Duo 16 GX650RX | |
| Alienware x15 RTX 3070 P111F | |
| Razer Blade 15 Advanced Model Early 2022 | |
| Cinebench R20 / CPU (Single Core) | |
| MSI Titan GT77 12UHS | |
| Alienware x15 R2 P111F | |
| MSI Vector GP66 12UGS | |
| Asus ROG Strix Scar 15 G533ZW-LN106WS | |
| MSI Raider GE66 12UHS | |
| Average Intel Core i9-12900H (624 - 738, n=25) | |
| Average of class Gaming (169 - 855, n=227, last 2 years) | |
| Razer Blade 15 Advanced Model Early 2022 | |
| Asus ROG Zephyrus Duo 16 GX650RX | |
| Alienware x15 RTX 3070 P111F | |
| Cinebench R15 / CPU Multi 64Bit | |
| MSI Titan GT77 12UHS | |
| Average of class Gaming (400 - 5663, n=231, last 2 years) | |
| Asus ROG Strix Scar 15 G533ZW-LN106WS | |
| Alienware x15 R2 P111F | |
| MSI Raider GE66 12UHS | |
| Average Intel Core i9-12900H (1395 - 3077, n=25) | |
| MSI Vector GP66 12UGS | |
| Asus ROG Zephyrus Duo 16 GX650RX | |
| Alienware x15 RTX 3070 P111F | |
| Razer Blade 15 Advanced Model Early 2022 | |
| Cinebench R15 / CPU Single 64Bit | |
| MSI Titan GT77 12UHS | |
| Asus ROG Strix Scar 15 G533ZW-LN106WS | |
| Alienware x15 R2 P111F | |
| MSI Vector GP66 12UGS | |
| Average of class Gaming (79.2 - 318, n=230, last 2 years) | |
| MSI Raider GE66 12UHS | |
| Average Intel Core i9-12900H (235 - 277, n=26) | |
| Asus ROG Zephyrus Duo 16 GX650RX | |
| Razer Blade 15 Advanced Model Early 2022 | |
| Alienware x15 RTX 3070 P111F | |
| Blender / v2.79 BMW27 CPU | |
| Razer Blade 15 Advanced Model Early 2022 | |
| Average Intel Core i9-12900H (160 - 451, n=25) | |
| Alienware x15 RTX 3070 P111F | |
| Asus ROG Zephyrus Duo 16 GX650RX | |
| Average of class Gaming (87 - 1259, n=225, last 2 years) | |
| MSI Vector GP66 12UGS | |
| MSI Raider GE66 12UHS | |
| Alienware x15 R2 P111F | |
| Asus ROG Strix Scar 15 G533ZW-LN106WS | |
| MSI Titan GT77 12UHS | |
| 7-Zip 18.03 / 7z b 4 | |
| MSI Titan GT77 12UHS | |
| Average of class Gaming (11386 - 140932, n=226, last 2 years) | |
| Alienware x15 R2 P111F | |
| MSI Raider GE66 12UHS | |
| Asus ROG Strix Scar 15 G533ZW-LN106WS | |
| MSI Vector GP66 12UGS | |
| Asus ROG Zephyrus Duo 16 GX650RX | |
| Average Intel Core i9-12900H (34684 - 76677, n=25) | |
| Alienware x15 RTX 3070 P111F | |
| Razer Blade 15 Advanced Model Early 2022 | |
| 7-Zip 18.03 / 7z b 4 -mmt1 | |
| MSI Titan GT77 12UHS | |
| Average of class Gaming (2685 - 7581, n=226, last 2 years) | |
| MSI Vector GP66 12UGS | |
| MSI Raider GE66 12UHS | |
| Razer Blade 15 Advanced Model Early 2022 | |
| Asus ROG Strix Scar 15 G533ZW-LN106WS | |
| Alienware x15 R2 P111F | |
| Average Intel Core i9-12900H (5302 - 6289, n=25) | |
| Asus ROG Zephyrus Duo 16 GX650RX | |
| Alienware x15 RTX 3070 P111F | |
| Geekbench 5.5 / Multi-Core | |
| MSI Titan GT77 12UHS | |
| Asus ROG Strix Scar 15 G533ZW-LN106WS | |
| Alienware x15 R2 P111F | |
| MSI Raider GE66 12UHS | |
| Average of class Gaming (1946 - 22200, n=231, last 2 years) | |
| MSI Vector GP66 12UGS | |
| Average Intel Core i9-12900H (8519 - 14376, n=26) | |
| Asus ROG Zephyrus Duo 16 GX650RX | |
| Razer Blade 15 Advanced Model Early 2022 | |
| Geekbench 5.5 / Single-Core | |
| MSI Titan GT77 12UHS | |
| MSI Vector GP66 12UGS | |
| Alienware x15 R2 P111F | |
| MSI Raider GE66 12UHS | |
| Asus ROG Strix Scar 15 G533ZW-LN106WS | |
| Razer Blade 15 Advanced Model Early 2022 | |
| Average of class Gaming (158 - 2193, n=231, last 2 years) | |
| Average Intel Core i9-12900H (1631 - 1892, n=26) | |
| Asus ROG Zephyrus Duo 16 GX650RX | |
| HWBOT x265 Benchmark v2.2 / 4k Preset | |
| MSI Titan GT77 12UHS | |
| Asus ROG Strix Scar 15 G533ZW-LN106WS | |
| Average of class Gaming (3 - 37.6, n=229, last 2 years) | |
| Alienware x15 R2 P111F | |
| MSI Vector GP66 12UGS | |
| MSI Raider GE66 12UHS | |
| Asus ROG Zephyrus Duo 16 GX650RX | |
| Average Intel Core i9-12900H (8.05 - 22.5, n=25) | |
| Alienware x15 RTX 3070 P111F | |
| Razer Blade 15 Advanced Model Early 2022 | |
| LibreOffice / 20 Documents To PDF | |
| Average of class Gaming (32.8 - 332, n=223, last 2 years) | |
| Alienware x15 RTX 3070 P111F | |
| Alienware x15 R2 P111F | |
| Asus ROG Zephyrus Duo 16 GX650RX | |
| Razer Blade 15 Advanced Model Early 2022 | |
| Average Intel Core i9-12900H (36.8 - 59.8, n=25) | |
| MSI Vector GP66 12UGS | |
| Asus ROG Strix Scar 15 G533ZW-LN106WS | |
| MSI Titan GT77 12UHS | |
| MSI Raider GE66 12UHS | |
| R Benchmark 2.5 / Overall mean | |
| Alienware x15 RTX 3070 P111F | |
| Asus ROG Zephyrus Duo 16 GX650RX | |
| Average of class Gaming (0.3609 - 4.47, n=226, last 2 years) | |
| Average Intel Core i9-12900H (0.4218 - 0.506, n=25) | |
| Razer Blade 15 Advanced Model Early 2022 | |
| MSI Raider GE66 12UHS | |
| Alienware x15 R2 P111F | |
| Asus ROG Strix Scar 15 G533ZW-LN106WS | |
| MSI Vector GP66 12UGS | |
| MSI Titan GT77 12UHS | |
* ... smaller is better
AIDA64: FP32 Ray-Trace | FPU Julia | CPU SHA3 | CPU Queen | FPU SinJulia | FPU Mandel | CPU AES | CPU ZLib | FP64 Ray-Trace | CPU PhotoWorxx
| Performance Rating | |
| MSI Titan GT77 12UHS | |
| Average of class Gaming | |
| Asus ROG Zephyrus Duo 16 GX650RX | |
| Alienware x15 R2 P111F | |
| Asus ROG Strix Scar 15 G533ZW-LN106WS | |
| Average Intel Core i9-12900H | |
| MSI Raider GE66 12UHS | |
| MSI Vector GP66 12UGS | |
| Razer Blade 15 Advanced Model Early 2022 | |
| Alienware x15 RTX 3070 P111F -9! | |
| AIDA64 / FP32 Ray-Trace | |
| MSI Titan GT77 12UHS | |
| Average of class Gaming (3069 - 60169, n=222, last 2 years) | |
| Asus ROG Zephyrus Duo 16 GX650RX | |
| Alienware x15 R2 P111F | |
| Average Intel Core i9-12900H (4074 - 18289, n=25) | |
| Asus ROG Strix Scar 15 G533ZW-LN106WS | |
| MSI Raider GE66 12UHS | |
| MSI Vector GP66 12UGS | |
| Razer Blade 15 Advanced Model Early 2022 | |
| AIDA64 / FPU Julia | |
| MSI Titan GT77 12UHS | |
| Asus ROG Zephyrus Duo 16 GX650RX | |
| Average of class Gaming (18567 - 252486, n=222, last 2 years) | |
| Alienware x15 R2 P111F | |
| Average Intel Core i9-12900H (22307 - 93236, n=25) | |
| Asus ROG Strix Scar 15 G533ZW-LN106WS | |
| MSI Raider GE66 12UHS | |
| MSI Vector GP66 12UGS | |
| Razer Blade 15 Advanced Model Early 2022 | |
| AIDA64 / CPU SHA3 | |
| MSI Titan GT77 12UHS | |
| Average of class Gaming (629 - 10389, n=222, last 2 years) | |
| Alienware x15 R2 P111F | |
| Asus ROG Zephyrus Duo 16 GX650RX | |
| Asus ROG Strix Scar 15 G533ZW-LN106WS | |
| Average Intel Core i9-12900H (1378 - 4215, n=25) | |
| MSI Vector GP66 12UGS | |
| MSI Raider GE66 12UHS | |
| Razer Blade 15 Advanced Model Early 2022 | |
| AIDA64 / CPU Queen | |
| Alienware x15 R2 P111F | |
| Average of class Gaming (15371 - 200651, n=222, last 2 years) | |
| MSI Vector GP66 12UGS | |
| MSI Raider GE66 12UHS | |
| Asus ROG Zephyrus Duo 16 GX650RX | |
| Asus ROG Strix Scar 15 G533ZW-LN106WS | |
| MSI Titan GT77 12UHS | |
| Average Intel Core i9-12900H (78172 - 111241, n=25) | |
| Razer Blade 15 Advanced Model Early 2022 | |
| AIDA64 / FPU SinJulia | |
| MSI Titan GT77 12UHS | |
| Asus ROG Zephyrus Duo 16 GX650RX | |
| Average of class Gaming (2137 - 32988, n=222, last 2 years) | |
| Asus ROG Strix Scar 15 G533ZW-LN106WS | |
| Alienware x15 R2 P111F | |
| MSI Vector GP66 12UGS | |
| MSI Raider GE66 12UHS | |
| Average Intel Core i9-12900H (5709 - 10410, n=25) | |
| Razer Blade 15 Advanced Model Early 2022 | |
| AIDA64 / FPU Mandel | |
| Asus ROG Zephyrus Duo 16 GX650RX | |
| MSI Titan GT77 12UHS | |
| Average of class Gaming (10291 - 134044, n=222, last 2 years) | |
| Alienware x15 R2 P111F | |
| Average Intel Core i9-12900H (11257 - 45581, n=25) | |
| Asus ROG Strix Scar 15 G533ZW-LN106WS | |
| MSI Raider GE66 12UHS | |
| MSI Vector GP66 12UGS | |
| Razer Blade 15 Advanced Model Early 2022 | |
| AIDA64 / CPU AES | |
| MSI Titan GT77 12UHS | |
| Alienware x15 R2 P111F | |
| Asus ROG Zephyrus Duo 16 GX650RX | |
| Average of class Gaming (19065 - 328679, n=222, last 2 years) | |
| Asus ROG Strix Scar 15 G533ZW-LN106WS | |
| MSI Vector GP66 12UGS | |
| MSI Raider GE66 12UHS | |
| Average Intel Core i9-12900H (31935 - 151546, n=25) | |
| Razer Blade 15 Advanced Model Early 2022 | |
| AIDA64 / CPU ZLib | |
| MSI Titan GT77 12UHS | |
| Average of class Gaming (150.9 - 2409, n=222, last 2 years) | |
| Asus ROG Strix Scar 15 G533ZW-LN106WS | |
| Alienware x15 R2 P111F | |
| MSI Vector GP66 12UGS | |
| MSI Raider GE66 12UHS | |
| Average Intel Core i9-12900H (449 - 1193, n=25) | |
| Asus ROG Zephyrus Duo 16 GX650RX | |
| Razer Blade 15 Advanced Model Early 2022 | |
| Alienware x15 RTX 3070 P111F | |
| AIDA64 / FP64 Ray-Trace | |
| MSI Titan GT77 12UHS | |
| Average of class Gaming (1518 - 31796, n=222, last 2 years) | |
| Asus ROG Zephyrus Duo 16 GX650RX | |
| Alienware x15 R2 P111F | |
| Average Intel Core i9-12900H (2235 - 10511, n=25) | |
| Asus ROG Strix Scar 15 G533ZW-LN106WS | |
| MSI Raider GE66 12UHS | |
| MSI Vector GP66 12UGS | |
| Razer Blade 15 Advanced Model Early 2022 | |
| AIDA64 / CPU PhotoWorxx | |
| MSI Titan GT77 12UHS | |
| MSI Raider GE66 12UHS | |
| Asus ROG Strix Scar 15 G533ZW-LN106WS | |
| Alienware x15 R2 P111F | |
| Razer Blade 15 Advanced Model Early 2022 | |
| Average Intel Core i9-12900H (20960 - 48269, n=26) | |
| Average of class Gaming (10805 - 60161, n=223, last 2 years) | |
| Asus ROG Zephyrus Duo 16 GX650RX | |
| MSI Vector GP66 12UGS | |
Check out our dedicated Intel Core i9-12900H page for more benchmarks and performance comparisons.
System Performance
The Alienware x15 R2 is only 9% behind the MSI Titan GT77 in overall PCMark 10 performance with the greatest deficit being seen in the Digital Content Creation component of the benchmark. CrossMark scores are comparable to that of the Scar 15 and are about 15% higher than the Ryzen 9 6900HX-powered Zephyrus Duo 16.
Subjectively, we did not experience any hiccups in day-to-day productivity and web browsing tasks.
CrossMark: Overall | Productivity | Creativity | Responsiveness
| PCMark 10 / Score | |
| MSI Titan GT77 12UHS | |
| MSI Raider GE66 12UHS | |
| MSI Vector GP66 12UGS | |
| Asus ROG Strix Scar 15 G533ZW-LN106WS | |
| Average Intel Core i9-12900H, NVIDIA GeForce RTX 3080 Ti Laptop GPU (7139 - 8083, n=6) | |
| Average of class Gaming (5235 - 9852, n=197, last 2 years) | |
| Alienware x15 R2 P111F | |
| Razer Blade 15 Advanced Model Early 2022 | |
| Alienware x15 RTX 3070 P111F | |
| Asus ROG Zephyrus Duo 16 GX650RX | |
| PCMark 10 / Essentials | |
| Alienware x15 R2 P111F | |
| MSI Titan GT77 12UHS | |
| MSI Raider GE66 12UHS | |
| MSI Vector GP66 12UGS | |
| Average Intel Core i9-12900H, NVIDIA GeForce RTX 3080 Ti Laptop GPU (10254 - 11178, n=6) | |
| Asus ROG Strix Scar 15 G533ZW-LN106WS | |
| Average of class Gaming (8300 - 12334, n=196, last 2 years) | |
| Razer Blade 15 Advanced Model Early 2022 | |
| Alienware x15 RTX 3070 P111F | |
| Asus ROG Zephyrus Duo 16 GX650RX | |
| PCMark 10 / Productivity | |
| Asus ROG Strix Scar 15 G533ZW-LN106WS | |
| MSI Raider GE66 12UHS | |
| Alienware x15 R2 P111F | |
| MSI Titan GT77 12UHS | |
| MSI Vector GP66 12UGS | |
| Average Intel Core i9-12900H, NVIDIA GeForce RTX 3080 Ti Laptop GPU (9102 - 11186, n=6) | |
| Average of class Gaming (7244 - 11833, n=196, last 2 years) | |
| Razer Blade 15 Advanced Model Early 2022 | |
| Alienware x15 RTX 3070 P111F | |
| Asus ROG Zephyrus Duo 16 GX650RX | |
| PCMark 10 / Digital Content Creation | |
| MSI Titan GT77 12UHS | |
| MSI Raider GE66 12UHS | |
| MSI Vector GP66 12UGS | |
| Asus ROG Strix Scar 15 G533ZW-LN106WS | |
| Average Intel Core i9-12900H, NVIDIA GeForce RTX 3080 Ti Laptop GPU (9847 - 12627, n=6) | |
| Average of class Gaming (6462 - 18475, n=196, last 2 years) | |
| Alienware x15 RTX 3070 P111F | |
| Razer Blade 15 Advanced Model Early 2022 | |
| Alienware x15 R2 P111F | |
| Asus ROG Zephyrus Duo 16 GX650RX | |
| CrossMark / Overall | |
| MSI Titan GT77 12UHS | |
| Asus ROG Strix Scar 15 G533ZW-LN106WS | |
| Alienware x15 R2 P111F | |
| Average of class Gaming (1247 - 2334, n=167, last 2 years) | |
| Average Intel Core i9-12900H, NVIDIA GeForce RTX 3080 Ti Laptop GPU (1696 - 1965, n=3) | |
| Razer Blade 15 Advanced Model Early 2022 | |
| Asus ROG Zephyrus Duo 16 GX650RX | |
| CrossMark / Productivity | |
| MSI Titan GT77 12UHS | |
| Asus ROG Strix Scar 15 G533ZW-LN106WS | |
| Alienware x15 R2 P111F | |
| Average of class Gaming (1299 - 2204, n=167, last 2 years) | |
| Average Intel Core i9-12900H, NVIDIA GeForce RTX 3080 Ti Laptop GPU (1622 - 1870, n=3) | |
| Razer Blade 15 Advanced Model Early 2022 | |
| Asus ROG Zephyrus Duo 16 GX650RX | |
| CrossMark / Creativity | |
| MSI Titan GT77 12UHS | |
| Alienware x15 R2 P111F | |
| Asus ROG Strix Scar 15 G533ZW-LN106WS | |
| Average of class Gaming (1275 - 2514, n=167, last 2 years) | |
| Average Intel Core i9-12900H, NVIDIA GeForce RTX 3080 Ti Laptop GPU (1855 - 2135, n=3) | |
| Razer Blade 15 Advanced Model Early 2022 | |
| Asus ROG Zephyrus Duo 16 GX650RX | |
| CrossMark / Responsiveness | |
| Asus ROG Strix Scar 15 G533ZW-LN106WS | |
| MSI Titan GT77 12UHS | |
| Alienware x15 R2 P111F | |
| Asus ROG Zephyrus Duo 16 GX650RX | |
| Average of class Gaming (1030 - 2330, n=167, last 2 years) | |
| Average Intel Core i9-12900H, NVIDIA GeForce RTX 3080 Ti Laptop GPU (1483 - 1777, n=3) | |
| Razer Blade 15 Advanced Model Early 2022 | |
| PCMark 8 Home Score Accelerated v2 | 6653 points | |
| PCMark 8 Creative Score Accelerated v2 | 10574 points | |
| PCMark 8 Work Score Accelerated v2 | 6944 points | |
| PCMark 10 Score | 7496 points | |
Help | ||
| AIDA64 / Memory Copy | |
| Alienware x15 R2 P111F | |
| MSI Titan GT77 12UHS | |
| MSI Raider GE66 12UHS | |
| Razer Blade 15 Advanced Model Early 2022 | |
| Asus ROG Strix Scar 15 G533ZW-LN106WS | |
| Average Intel Core i9-12900H (34438 - 74264, n=25) | |
| Average of class Gaming (21842 - 92565, n=222, last 2 years) | |
| Asus ROG Zephyrus Duo 16 GX650RX | |
| MSI Vector GP66 12UGS | |
| AIDA64 / Memory Read | |
| MSI Raider GE66 12UHS | |
| Razer Blade 15 Advanced Model Early 2022 | |
| Alienware x15 R2 P111F | |
| Asus ROG Strix Scar 15 G533ZW-LN106WS | |
| Average of class Gaming (24879 - 90647, n=222, last 2 years) | |
| MSI Titan GT77 12UHS | |
| Average Intel Core i9-12900H (36365 - 74642, n=25) | |
| Asus ROG Zephyrus Duo 16 GX650RX | |
| MSI Vector GP66 12UGS | |
| AIDA64 / Memory Write | |
| Razer Blade 15 Advanced Model Early 2022 | |
| MSI Raider GE66 12UHS | |
| Asus ROG Strix Scar 15 G533ZW-LN106WS | |
| Average of class Gaming (21619 - 103259, n=222, last 2 years) | |
| Alienware x15 R2 P111F | |
| MSI Titan GT77 12UHS | |
| Average Intel Core i9-12900H (32276 - 67858, n=25) | |
| Asus ROG Zephyrus Duo 16 GX650RX | |
| MSI Vector GP66 12UGS | |
| AIDA64 / Memory Latency | |
| Alienware x15 R2 P111F | |
| Asus ROG Strix Scar 15 G533ZW-LN106WS | |
| Razer Blade 15 Advanced Model Early 2022 | |
| MSI Raider GE66 12UHS | |
| Asus ROG Zephyrus Duo 16 GX650RX | |
| MSI Vector GP66 12UGS | |
| MSI Titan GT77 12UHS | |
| Average of class Gaming (59.5 - 152.5, n=219, last 2 years) | |
| Average Intel Core i9-12900H (88 - 118.1, n=24) | |
| Alienware x15 RTX 3070 P111F | |
* ... smaller is better
DPC Latency
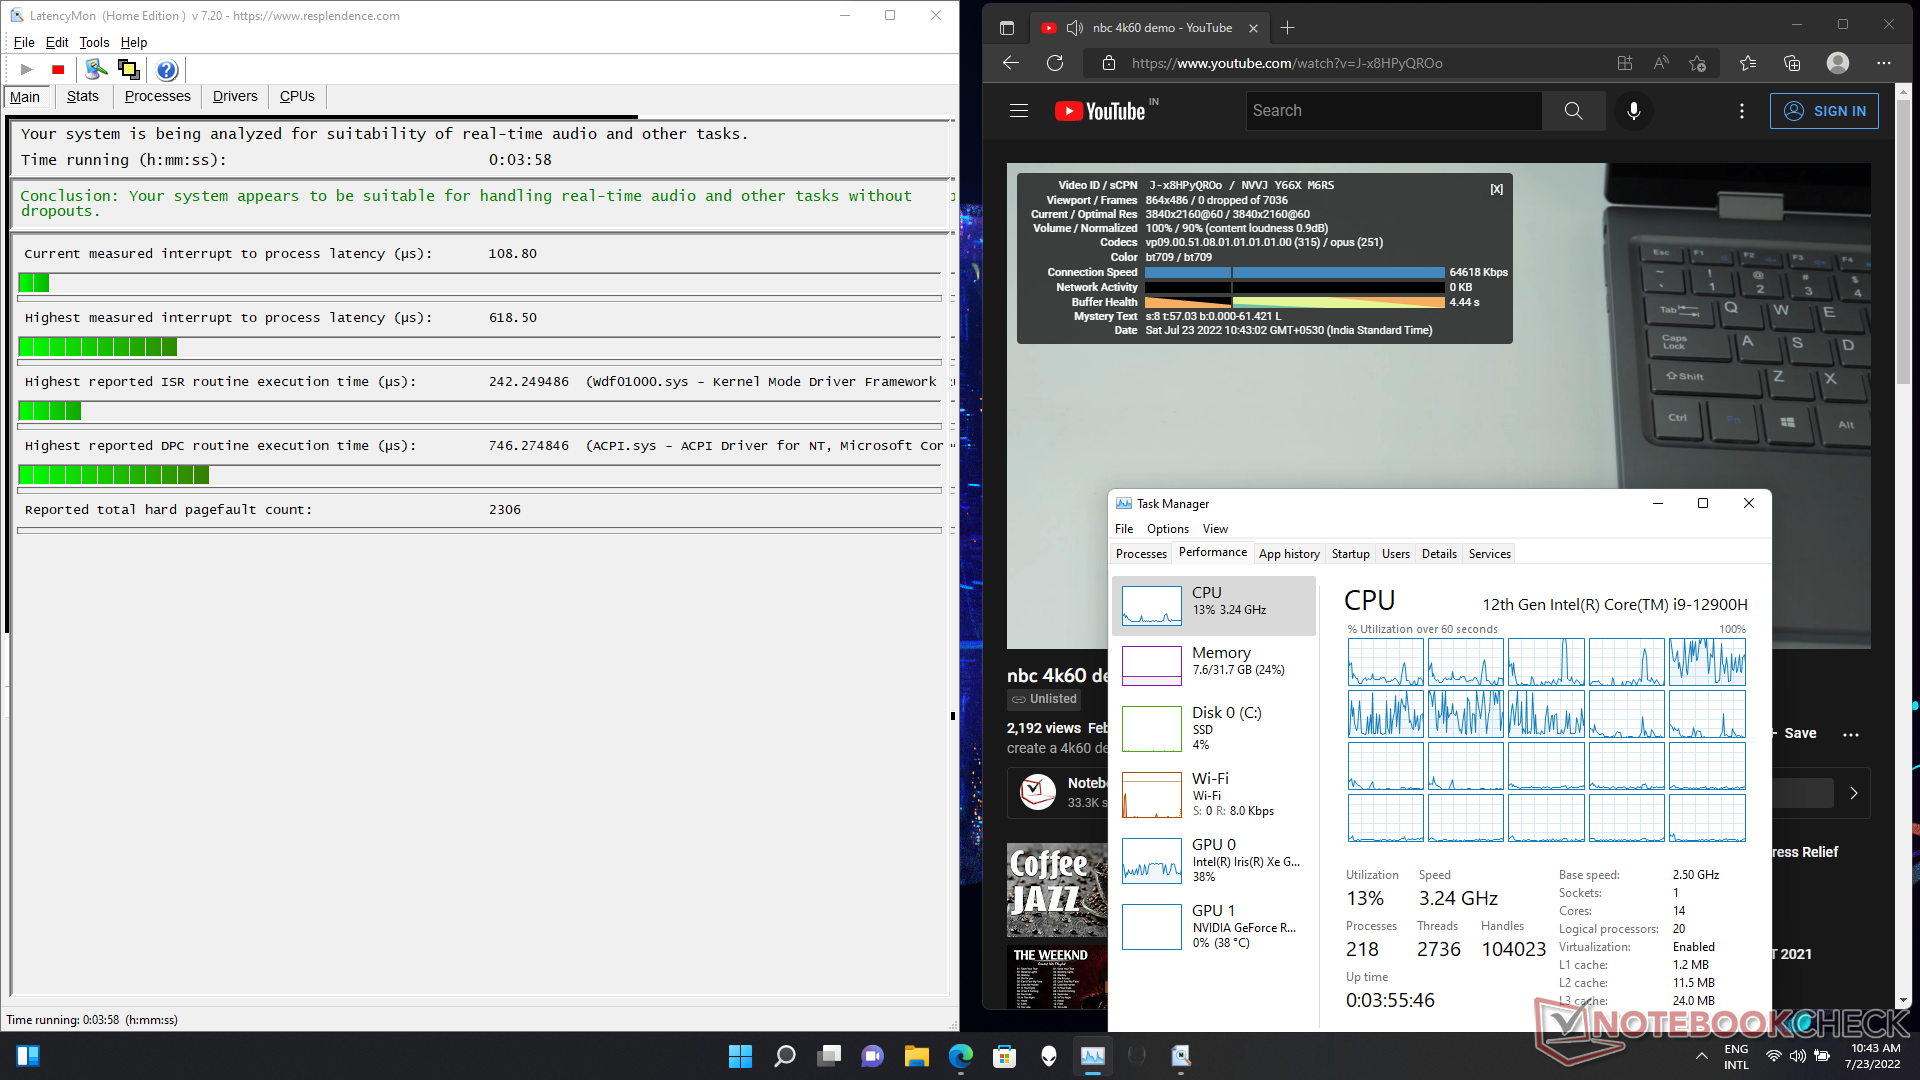
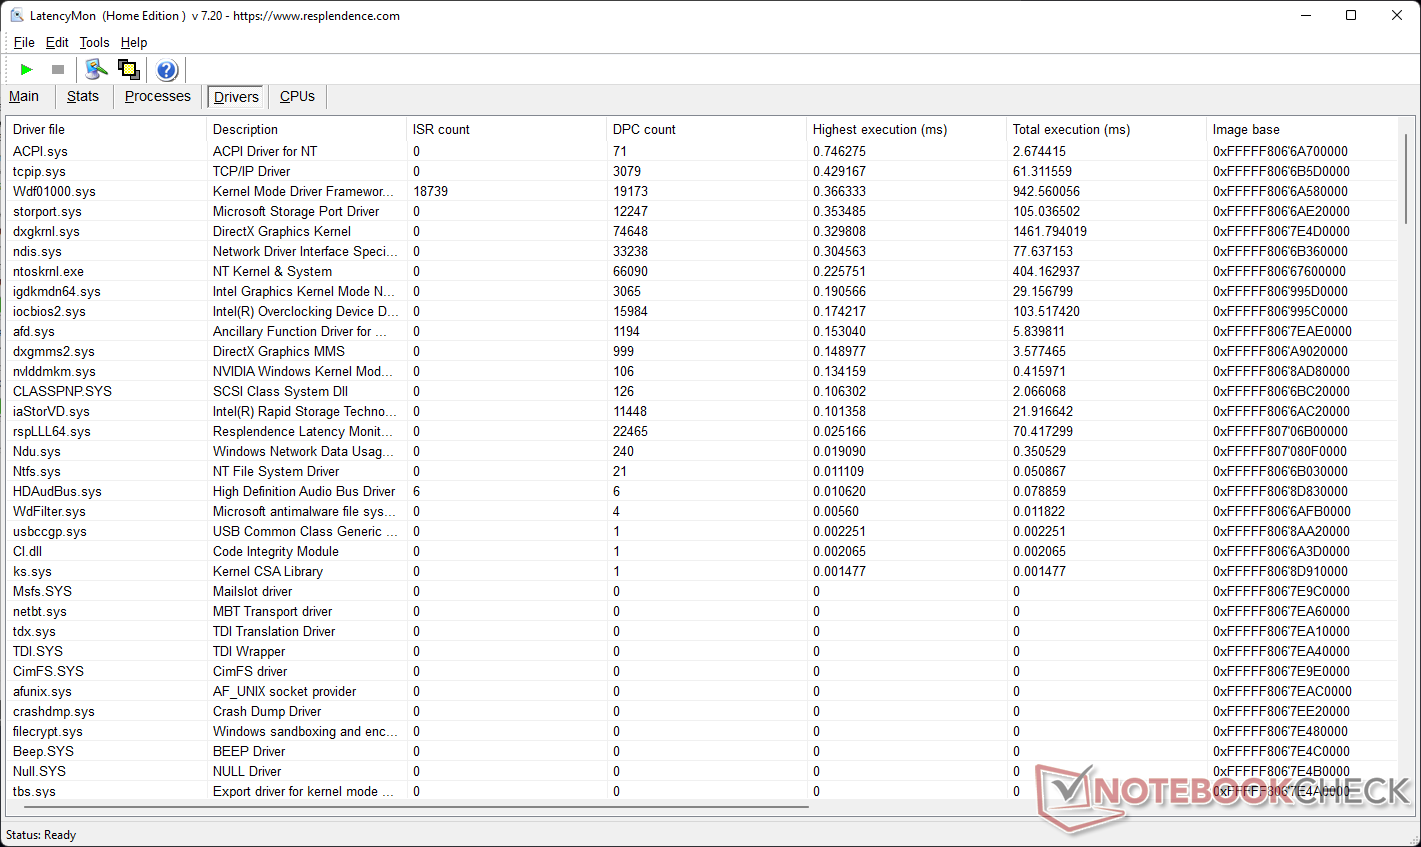
The Alienware x15 R2's DPC latency is somewhat on the higher side, but our LatencyMon tests indicate that it should still be suitable for real-time audio and video workflows. The Windows ACPI.sys driver seems to be contributing to the observed latency.
| DPC Latencies / LatencyMon - interrupt to process latency (max), Web, Youtube, Prime95 | |
| MSI Raider GE66 12UHS | |
| Razer Blade 15 Advanced Model Early 2022 | |
| MSI Vector GP66 12UGS | |
| MSI Titan GT77 12UHS | |
| MSI Titan GT77 12UHS | |
| Alienware x15 RTX 3070 P111F | |
| Asus ROG Strix Scar 15 G533ZW-LN106WS | |
| Alienware x15 R2 P111F | |
| Asus ROG Zephyrus Duo 16 GX650RX | |
* ... smaller is better
More comparisons across reviewed devices can be found on our DPC Latency Ranking page.
Storage Devices
The storage subsystem is one area where the x15 R2 falls short — we've seen better performance with the Samsung PM9A1 drive before. That being said, the sequential Q32T1 read and write speeds come close to the advertised values for this drive. This year's x15 R2 offers a 40% improved disk performance compared to the x15 R1's Western Digital SN730 SSD.
Disk throttling was observed towards the 43rd run of the DiskSpd read loop test at a queue depth of 8. There is no thermal solution provided either on the SSD or on the bottom panel.
Given the thin chassis, Dell does not offer space for a 2.5-inch SATA drive. However, there is a provision to add another M.2 NVMe SSD.

* ... smaller is better
Disk Throttling: DiskSpd Read Loop, Queue Depth 8
Our dedicated SSD and HDD Benchmarks page offers more storage device performance comparisons.
GPU Performance
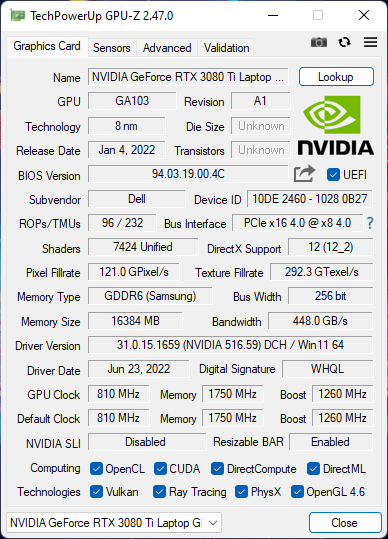
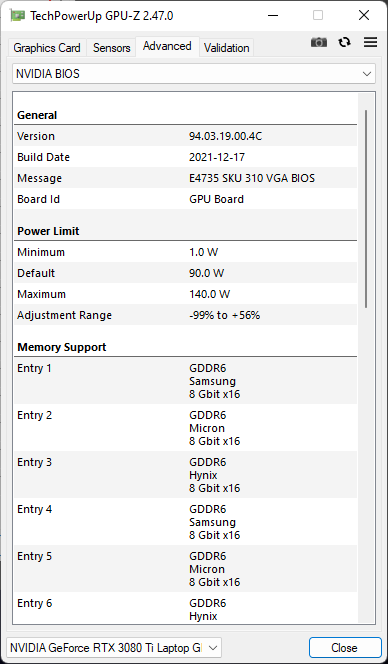
Our Alienware x15 R2 unit features an Nvidia GeForce RTX 3080 Ti Laptop GPU with 16 GB GDDR6 VRAM and a total graphics power (TGP) of 140 W. Dell does not specify the Dynamic Boost wattage for this GPU.
Overall 3DMark performance of the RTX 3080 Ti in the x15 R2 is comparable to that of the MSI Raider GE66 (150 W) and the MSI Titan GT77 (175 W). The somewhat lower scoring is due to the lower wattage necessary for the thin chassis. The Razer Blade 15 Advanced's RTX 3080 Ti trails behind owing to the low 110 W rating.
| 3DMark 11 Performance | 33756 points | |
| 3DMark Ice Storm Standard Score | 265376 points | |
| 3DMark Cloud Gate Standard Score | 62500 points | |
| 3DMark Fire Strike Score | 24365 points | |
| 3DMark Fire Strike Extreme Score | 14539 points | |
| 3DMark Time Spy Score | 12393 points | |
Help | ||
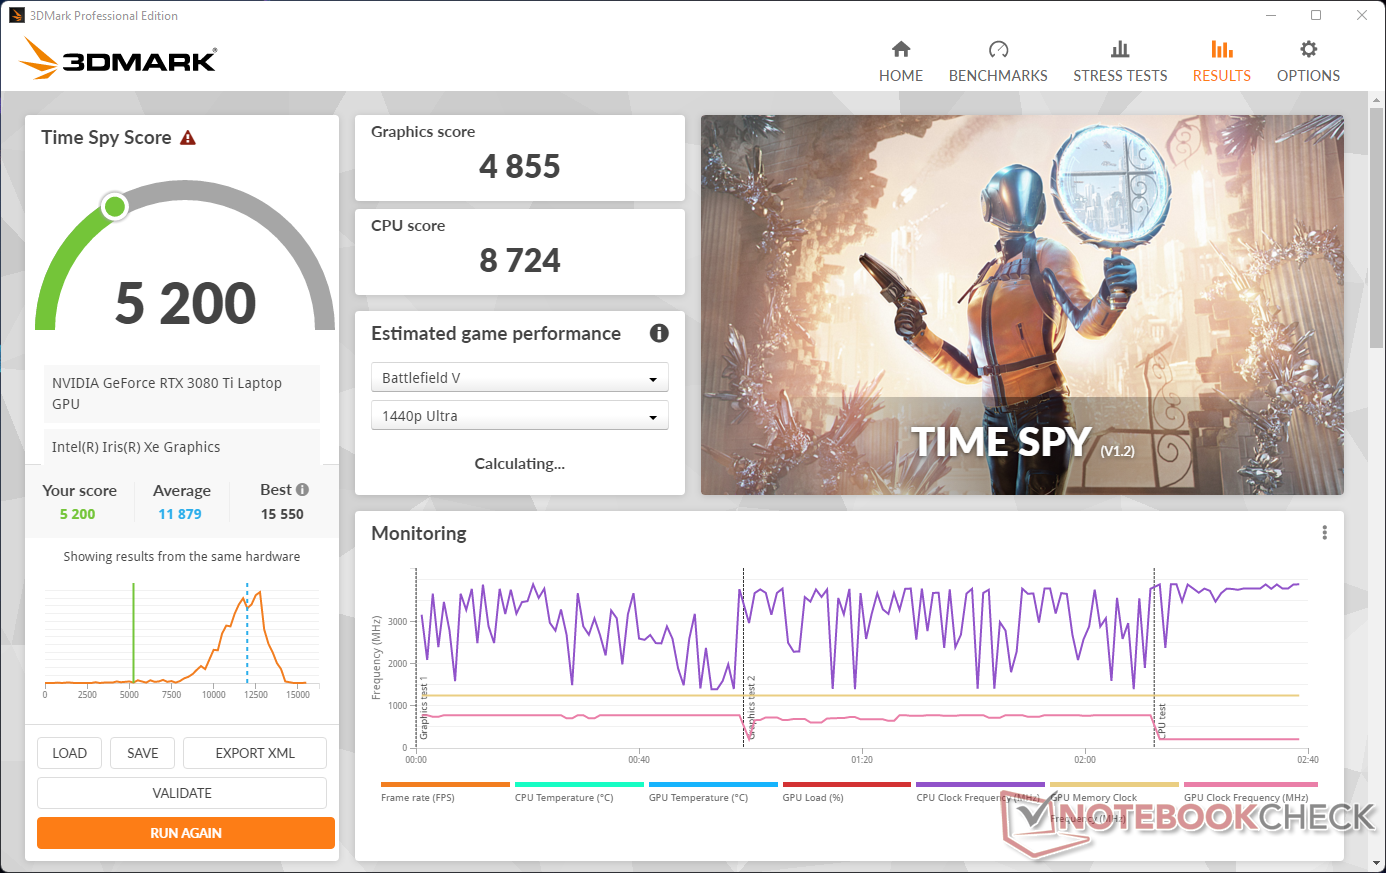
On battery power, we see a significant drop in 3DMark Time Spy scores. The overall score drops by 58% while the graphics performance takes a massive 60% hit.
The screen refresh rate automatically switches from 360 Hz to 60 Hz when disconnected from the mains.
Gaming Performance
The Alienware x15 R2's gaming performance is on expected lines for the hardware on offer and is generally on par with other RTX 3080 Ti-powered laptops. Very low-quality settings see the Asus ROG Strix Scar 15 leading with its 150 W RTX 3070 Ti Laptop GPU in games such as F1 2021, The Witcher 3, and Cyberpunk 2077, but the x15 R2 gains lost ground once graphics settings are cranked up.
| Watch Dogs Legion | |
| 1920x1080 Ultra Preset (DX12) | |
| MSI Titan GT77 12UHS | |
| Average NVIDIA GeForce RTX 3080 Ti Laptop GPU (78.2 - 87, n=4) | |
| Alienware x15 R2 P111F | |
| Average of class Gaming (18 - 127, n=14, last 2 years) | |
| 1920x1080 Ultra Preset + Ultra Ray Tracing (DX12) | |
| Average NVIDIA GeForce RTX 3080 Ti Laptop GPU (50 - 70, n=3) | |
| MSI Titan GT77 12UHS | |
| Alienware x15 R2 P111F | |
| Average of class Gaming (9 - 90, n=10, last 2 years) | |
| Tiny Tina's Wonderlands | |
| 1920x1080 High Preset (DX12) | |
| Average NVIDIA GeForce RTX 3080 Ti Laptop GPU (123.5 - 137.1, n=4) | |
| Asus ROG Zephyrus Duo 16 GX650RX | |
| Alienware x15 R2 P111F | |
| Average of class Gaming (8.5 - 233, n=51, last 2 years) | |
| 1920x1080 Badass Preset (DX12) | |
| Average of class Gaming (9.7 - 189.4, n=60, last 2 years) | |
| Average NVIDIA GeForce RTX 3080 Ti Laptop GPU (100.7 - 110.5, n=4) | |
| Asus ROG Zephyrus Duo 16 GX650RX | |
| Alienware x15 R2 P111F | |
The Witcher 3 FPS Chart
Sustained performance in The Witcher 3 at 1080p Ultra is decent although we see do frame rate fluctuations. There is a slight dip in fps towards the end of the run, but the x15 R2 is able to quickly recover itself.
| low | med. | high | ultra | |
| The Witcher 3 (2015) | 391 | 345 | 229 | 116 |
| Dota 2 Reborn (2015) | 174.7 | 162.2 | 151.6 | 145.7 |
| Final Fantasy XV Benchmark (2018) | 209 | 156.4 | 120.5 | |
| X-Plane 11.11 (2018) | 146.9 | 137.7 | 105.5 | |
| Far Cry 5 (2018) | 172 | 152 | 143 | 135 |
| Strange Brigade (2018) | 458 | 246 | 200 | 180.5 |
| Watch Dogs Legion (2020) | 133.2 | 122.4 | 107.4 | 78.2 |
| F1 2021 (2021) | 361 | 319 | 248 | 146.9 |
| Cyberpunk 2077 1.6 (2022) | 133.7 | 124.6 | 102.6 | 86.1 |
| Tiny Tina's Wonderlands (2022) | 209 | 178.2 | 126.6 | 100.7 |
| Call of Duty Modern Warfare 2 2022 (2022) | 96 |
Check out our Nvidia GeForce RTX 3080 Ti Laptop GPU for more information and benchmark comparisons.
Emissions: This hot rod runs hot
System Noise
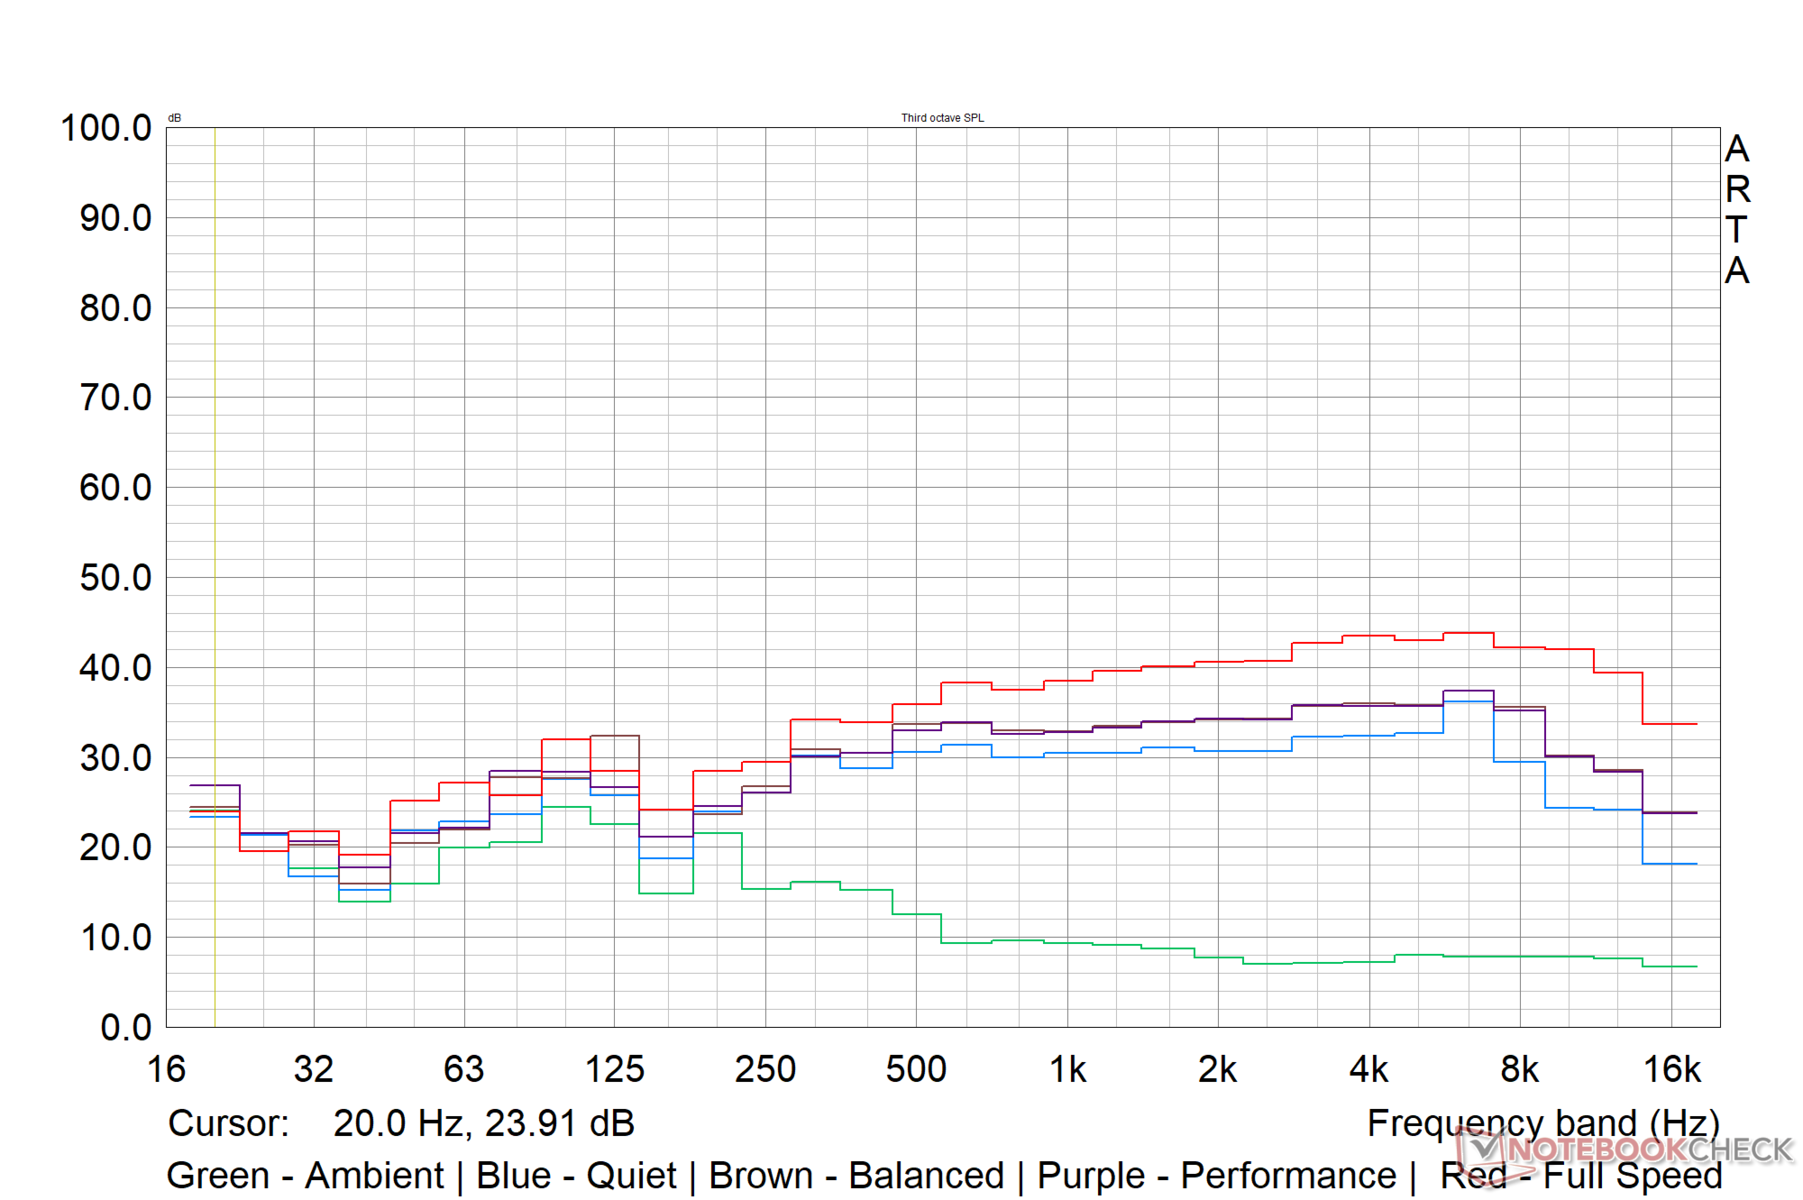
As discussed before, Dell offers four thermal profiles to choose from. For the majority of purposes, the Balanced and Performance modes get the job done well. Full Speed mode is only needed if you want absolutely unhindered cooling.
In Quiet mode, Dell limits fan noise to 45 dB(A) no matter the load. We recorded close to 47 db(A) fan noise while running The Witcher 3 in 1080p Ultra in both Balanced and Performance modes.
We measured fan noise levels in the Balanced mode. Dell seems to have set the fan noise level at the 53 db(A) mark in Full Speed mode irrespective of load and even during idling.
Noise Level
| Idle |
| 21.94 / 21.94 / 21.94 dB(A) |
| Load |
| 45.1 / 45.58 dB(A) |
 | ||
30 dB silent 40 dB(A) audible 50 dB(A) loud |
||
min: | ||
| Alienware x15 R2 P111F Intel Core i9-12900H, NVIDIA GeForce RTX 3080 Ti Laptop GPU | Asus ROG Strix Scar 15 G533ZW-LN106WS Intel Core i9-12900H, NVIDIA GeForce RTX 3070 Ti Laptop GPU | Asus ROG Zephyrus Duo 16 GX650RX AMD Ryzen 9 6900HX, NVIDIA GeForce RTX 3080 Ti Laptop GPU | MSI Vector GP66 12UGS Intel Core i9-12900H, NVIDIA GeForce RTX 3070 Ti Laptop GPU | Razer Blade 15 Advanced Model Early 2022 Intel Core i7-12800H, NVIDIA GeForce RTX 3080 Ti Laptop GPU | |
|---|---|---|---|---|---|
| Noise | -46% | -14% | -11% | -10% | |
| off / environment * | 21.79 | 26.86 -23% | 26 -19% | 22.9 -5% | 26 -19% |
| Idle Minimum * | 21.94 | 39.07 -78% | 26 -19% | 23.4 -7% | 26 -19% |
| Idle Average * | 21.94 | 39.07 -78% | 27 -23% | 23.4 -7% | 27 -23% |
| Idle Maximum * | 21.94 | 39.07 -78% | 29 -32% | 27.4 -25% | 29 -32% |
| Load Average * | 45.1 | 53.34 -18% | 41 9% | 36 20% | 37 18% |
| Witcher 3 ultra * | 46.56 | 56.6 -22% | 48 -3% | 58.2 -25% | 44 5% |
| Load Maximum * | 45.58 | 56.6 -24% | 50 -10% | 58 -27% | 45 1% |
* ... smaller is better
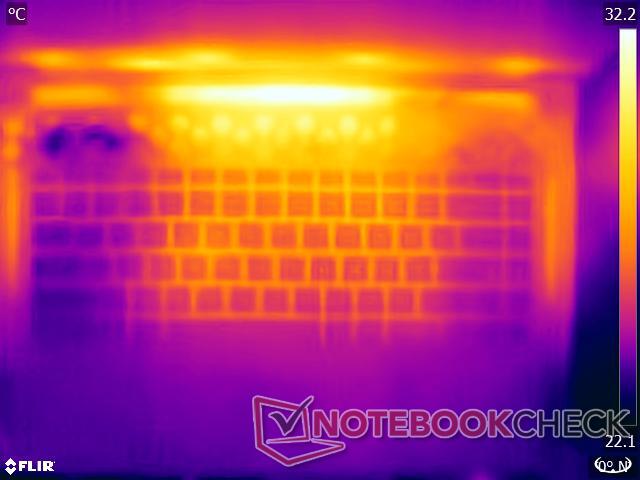
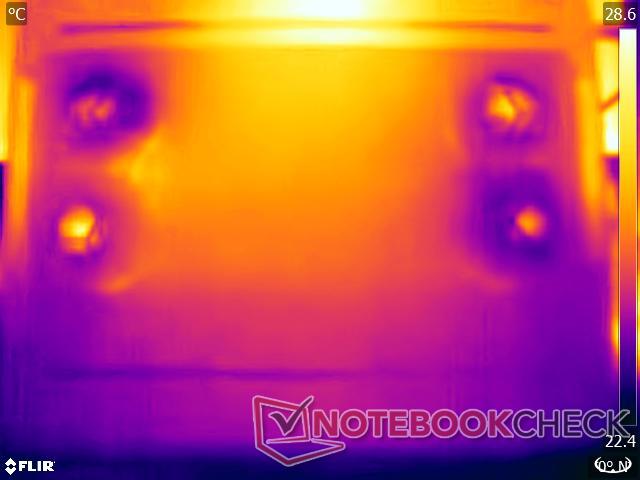
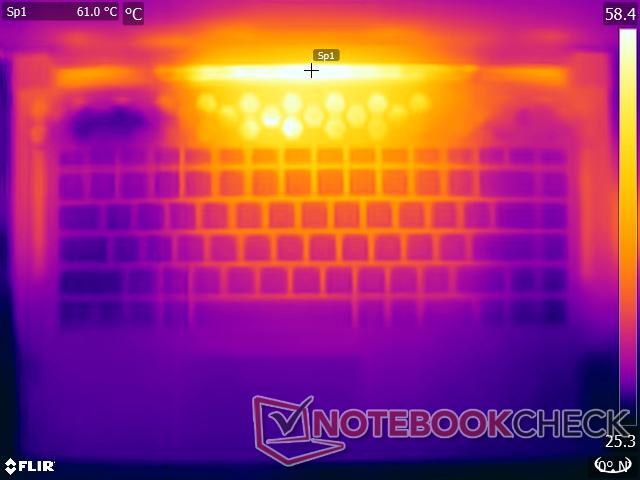
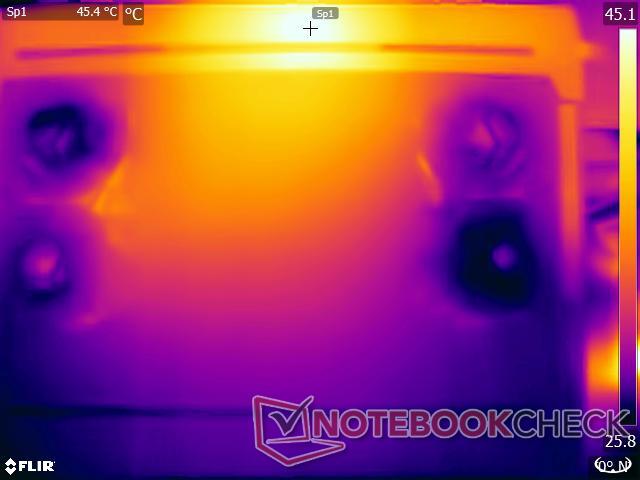
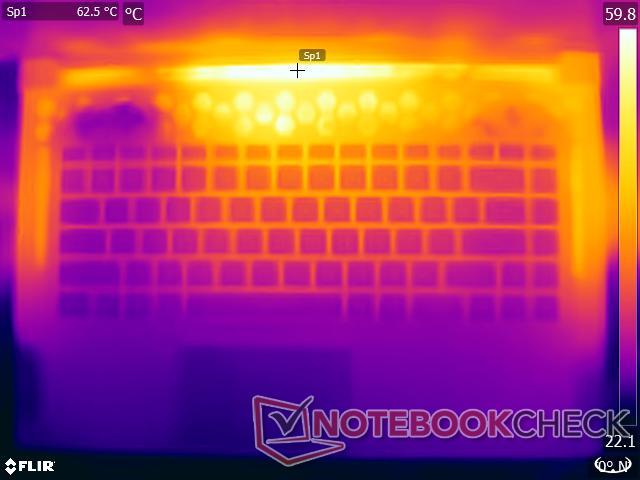
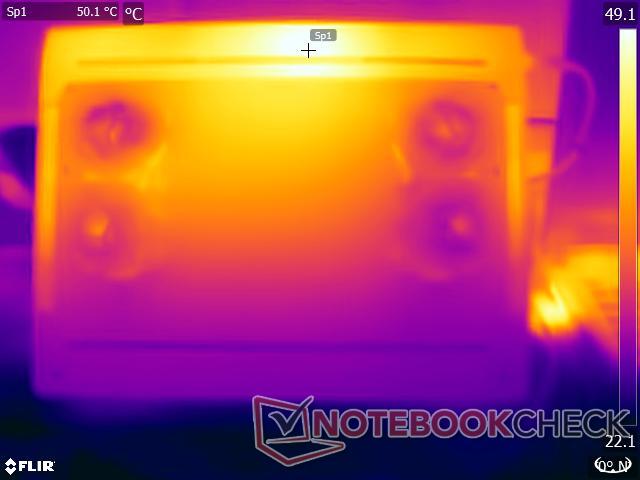
Temperature
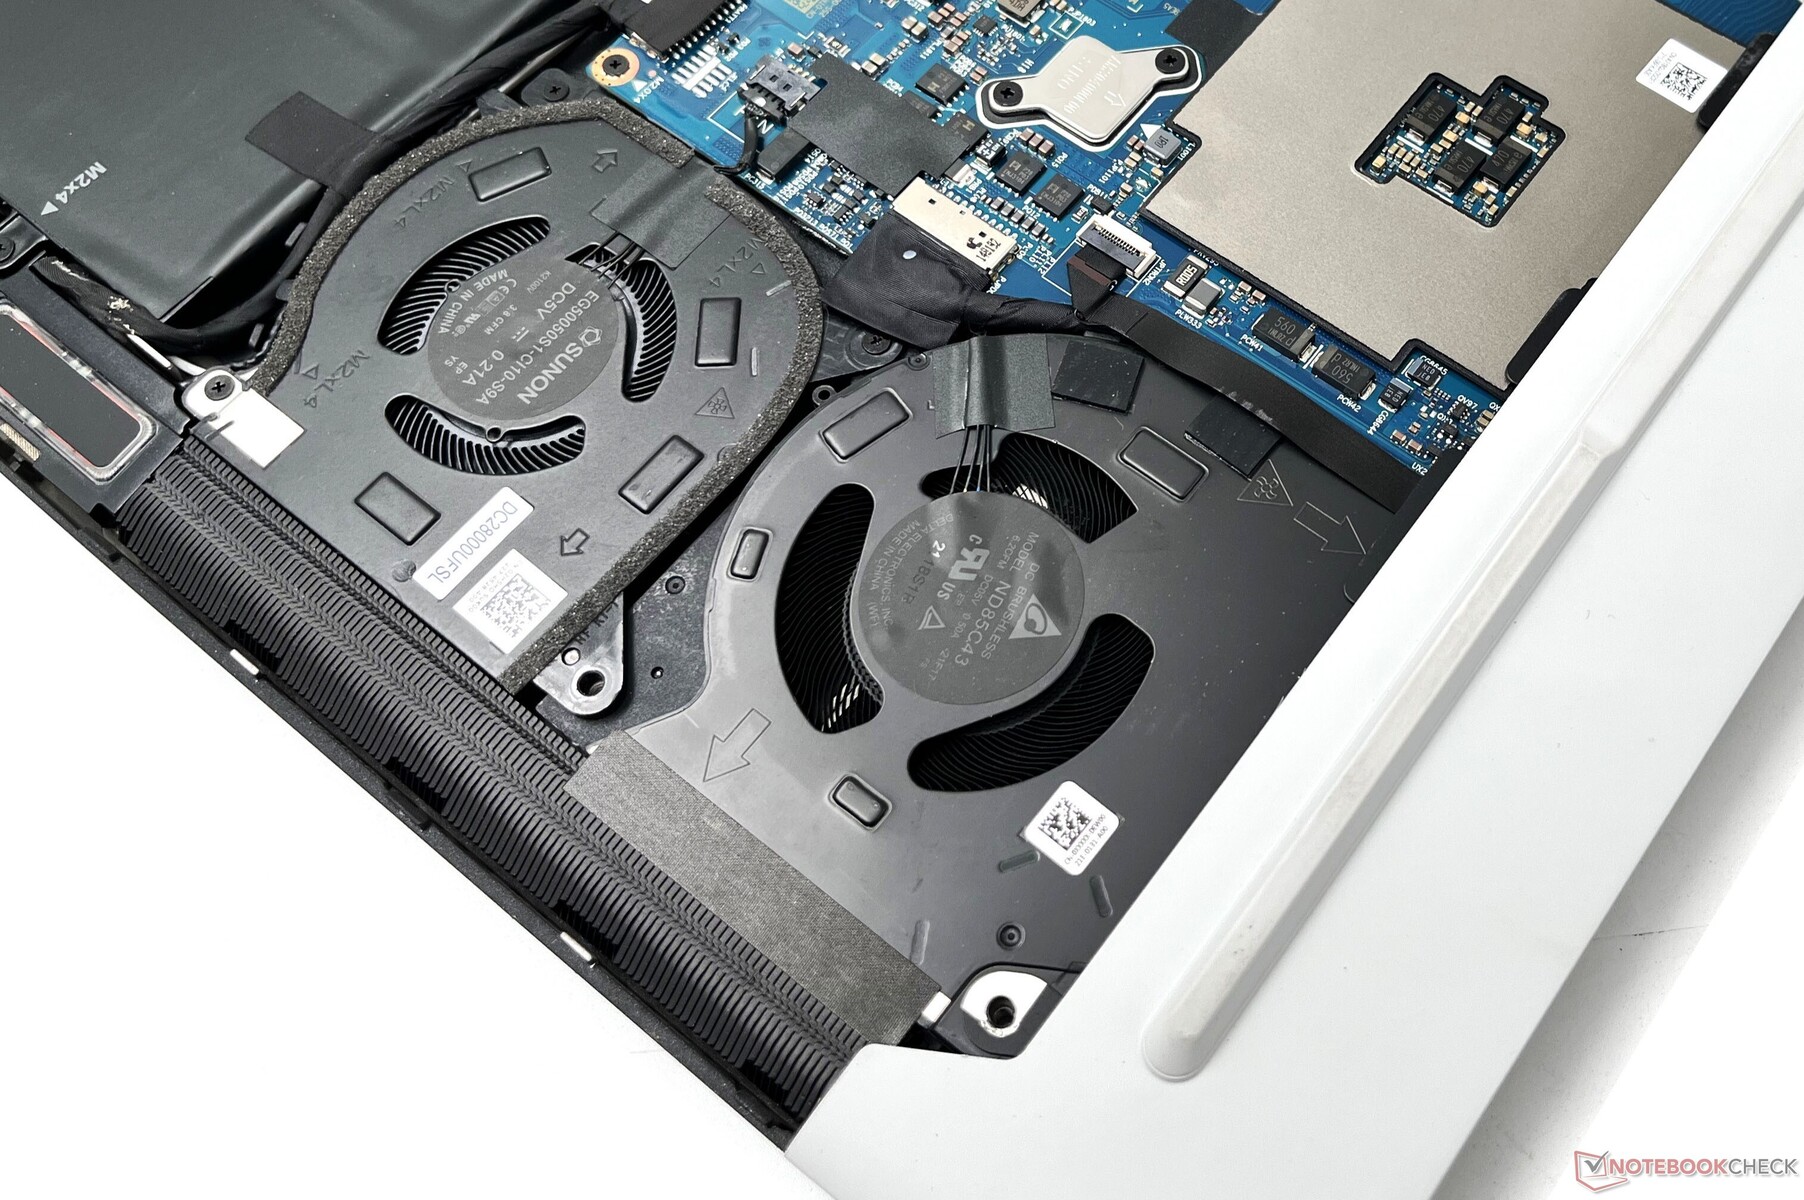
Even with four independently-controlled fans and four heatpipes running in the Full Speed profile, we observed surface temperatures reaching as high as 66.2 °C during The Witcher 3 stress test. That being said, the palm rest areas are relatively cool even under load.
(-) The maximum temperature on the upper side is 58.6 °C / 137 F, compared to the average of 40.4 °C / 105 F, ranging from 21.2 to 68.8 °C for the class Gaming.
(-) The bottom heats up to a maximum of 51.8 °C / 125 F, compared to the average of 43.2 °C / 110 F
(+) In idle usage, the average temperature for the upper side is 31.4 °C / 89 F, compared to the device average of 33.8 °C / 93 F.
(-) Playing The Witcher 3, the average temperature for the upper side is 46.9 °C / 116 F, compared to the device average of 33.8 °C / 93 F.
(+) The palmrests and touchpad are reaching skin temperature as a maximum (33.4 °C / 92.1 F) and are therefore not hot.
(-) The average temperature of the palmrest area of similar devices was 28.9 °C / 84 F (-4.5 °C / -8.1 F).
Our stress tests represent extreme scenarios, but we recommend using the x15 R2 on the lap only when running in the Quiet or Balanced thermal profiles without much stress to ensure tolerable surface temperatures.
| Alienware x15 R2 P111F Intel Core i9-12900H, NVIDIA GeForce RTX 3080 Ti Laptop GPU | Asus ROG Strix Scar 15 G533ZW-LN106WS Intel Core i9-12900H, NVIDIA GeForce RTX 3070 Ti Laptop GPU | Asus ROG Zephyrus Duo 16 GX650RX AMD Ryzen 9 6900HX, NVIDIA GeForce RTX 3080 Ti Laptop GPU | MSI Vector GP66 12UGS Intel Core i9-12900H, NVIDIA GeForce RTX 3070 Ti Laptop GPU | Razer Blade 15 Advanced Model Early 2022 Intel Core i7-12800H, NVIDIA GeForce RTX 3080 Ti Laptop GPU | |
|---|---|---|---|---|---|
| Heat | 0% | 7% | 8% | -4% | |
| Maximum Upper Side * | 58.6 | 42.6 27% | 45 23% | 40.2 31% | 53 10% |
| Maximum Bottom * | 51.8 | 50.2 3% | 50 3% | 43.8 15% | 53 -2% |
| Idle Upper Side * | 36.4 | 36.2 1% | 33 9% | 34.8 4% | 36 1% |
| Idle Bottom * | 31 | 40.2 -30% | 33 -6% | 37 -19% | 38 -23% |
* ... smaller is better
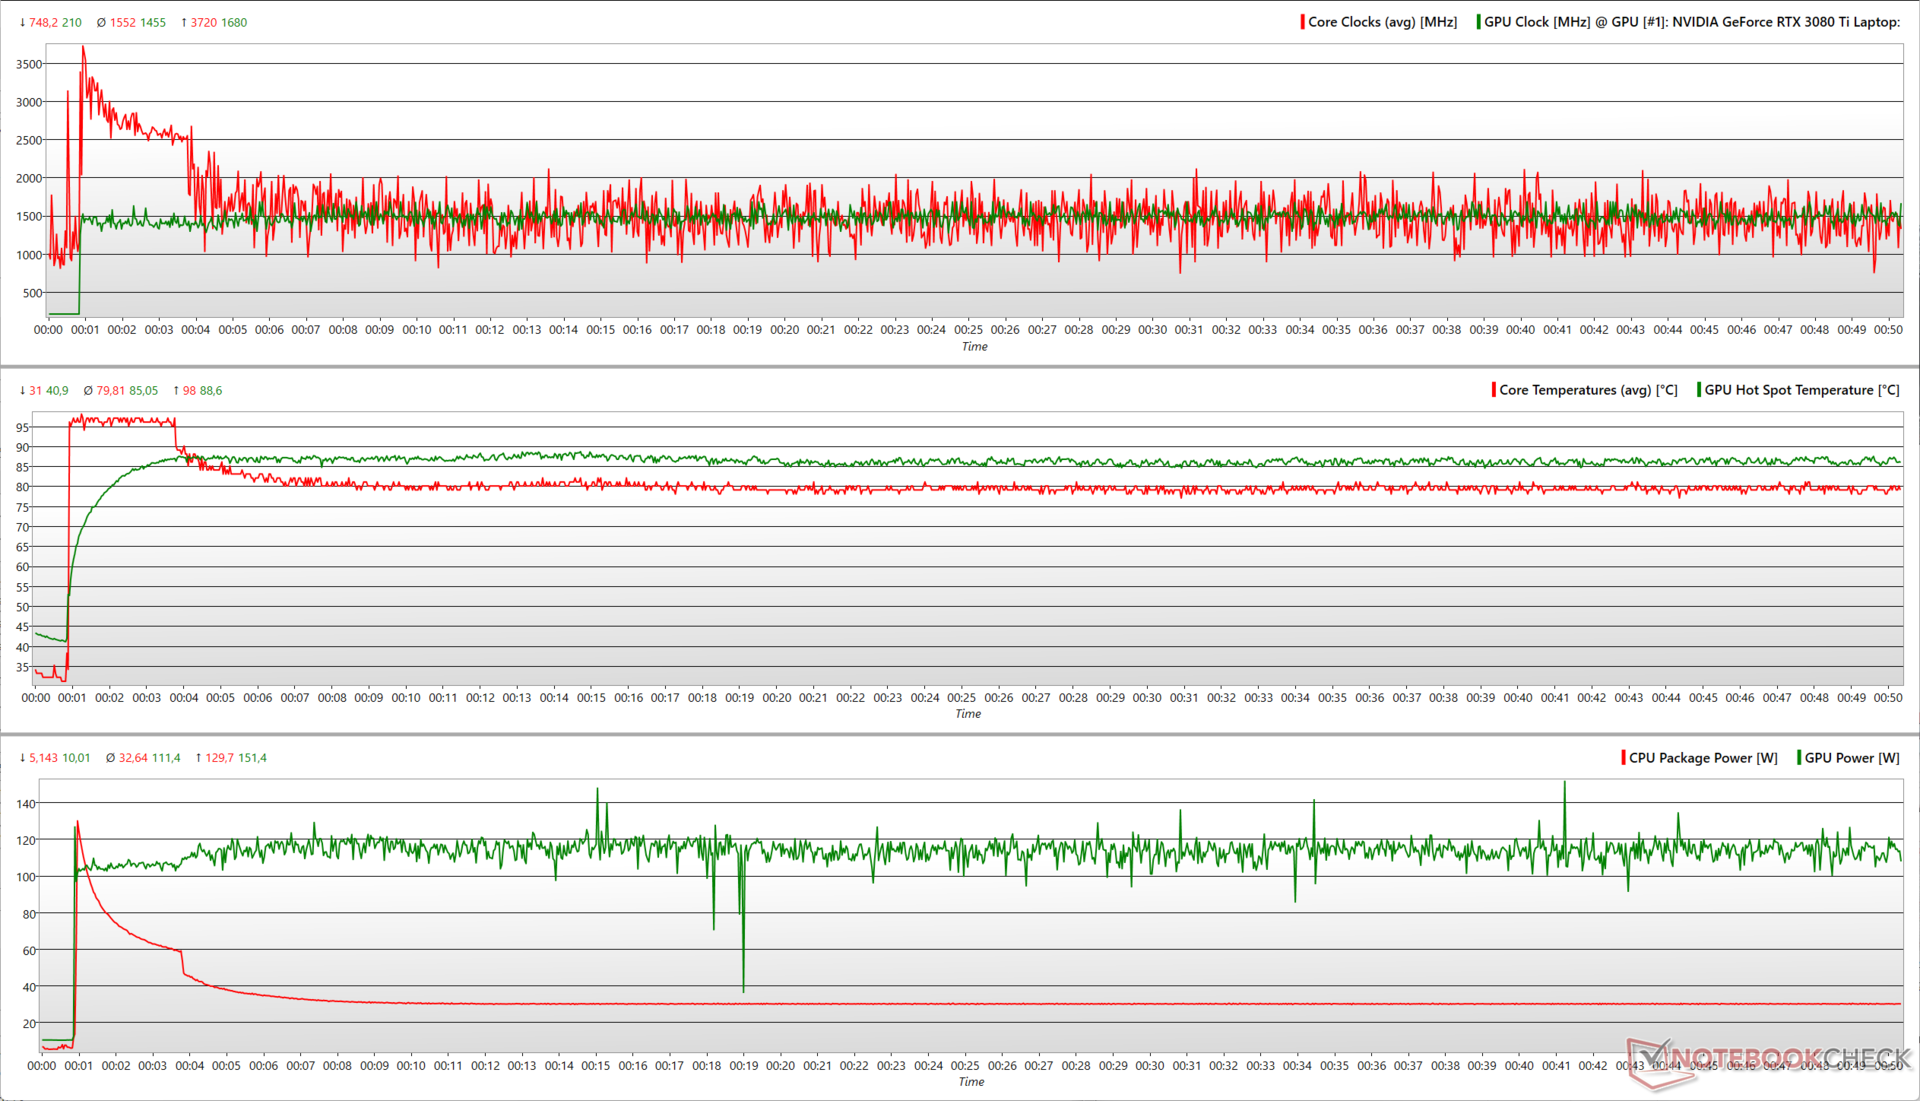
Stress Test
Stress testing the Alienware x15 R2 tells us how various CPU and GPU parameters vary under different loads.
With Prime95 in-place FFTs alone, the Core i9-12900H initially attains a peak clock close to 3.7 GHz while consuming 131 W. Subsequently, the clocks oscillate between 2.6 GHz and 3 GHz corresponding to 75 W and 80 W PL1.
| Stress Test | CPU Clock (GHz) | GPU Clock (MHz) | Average CPU Temperature (°C) | Average GPU Temperature (°C) |
| System Idle | 3.2 | — | 40 | — |
| Prime95 | 2.69 | — | 95 | 57.2 |
| Prime95 + FurMark | 1.83 | 1,275 | 79 | 76 |
| The Witcher 3 | 3.35 | 1,672 | 74 | 83 |
Upon adding FurMark to the mix, we see that the Core i9-12900H is able to attain 130 W but quickly drops down to 60 W and then gradually to 30 W. This is to accommodate the 120 W power requirement of the RTX 3080 Ti that occasionally spikes up to 150 W.
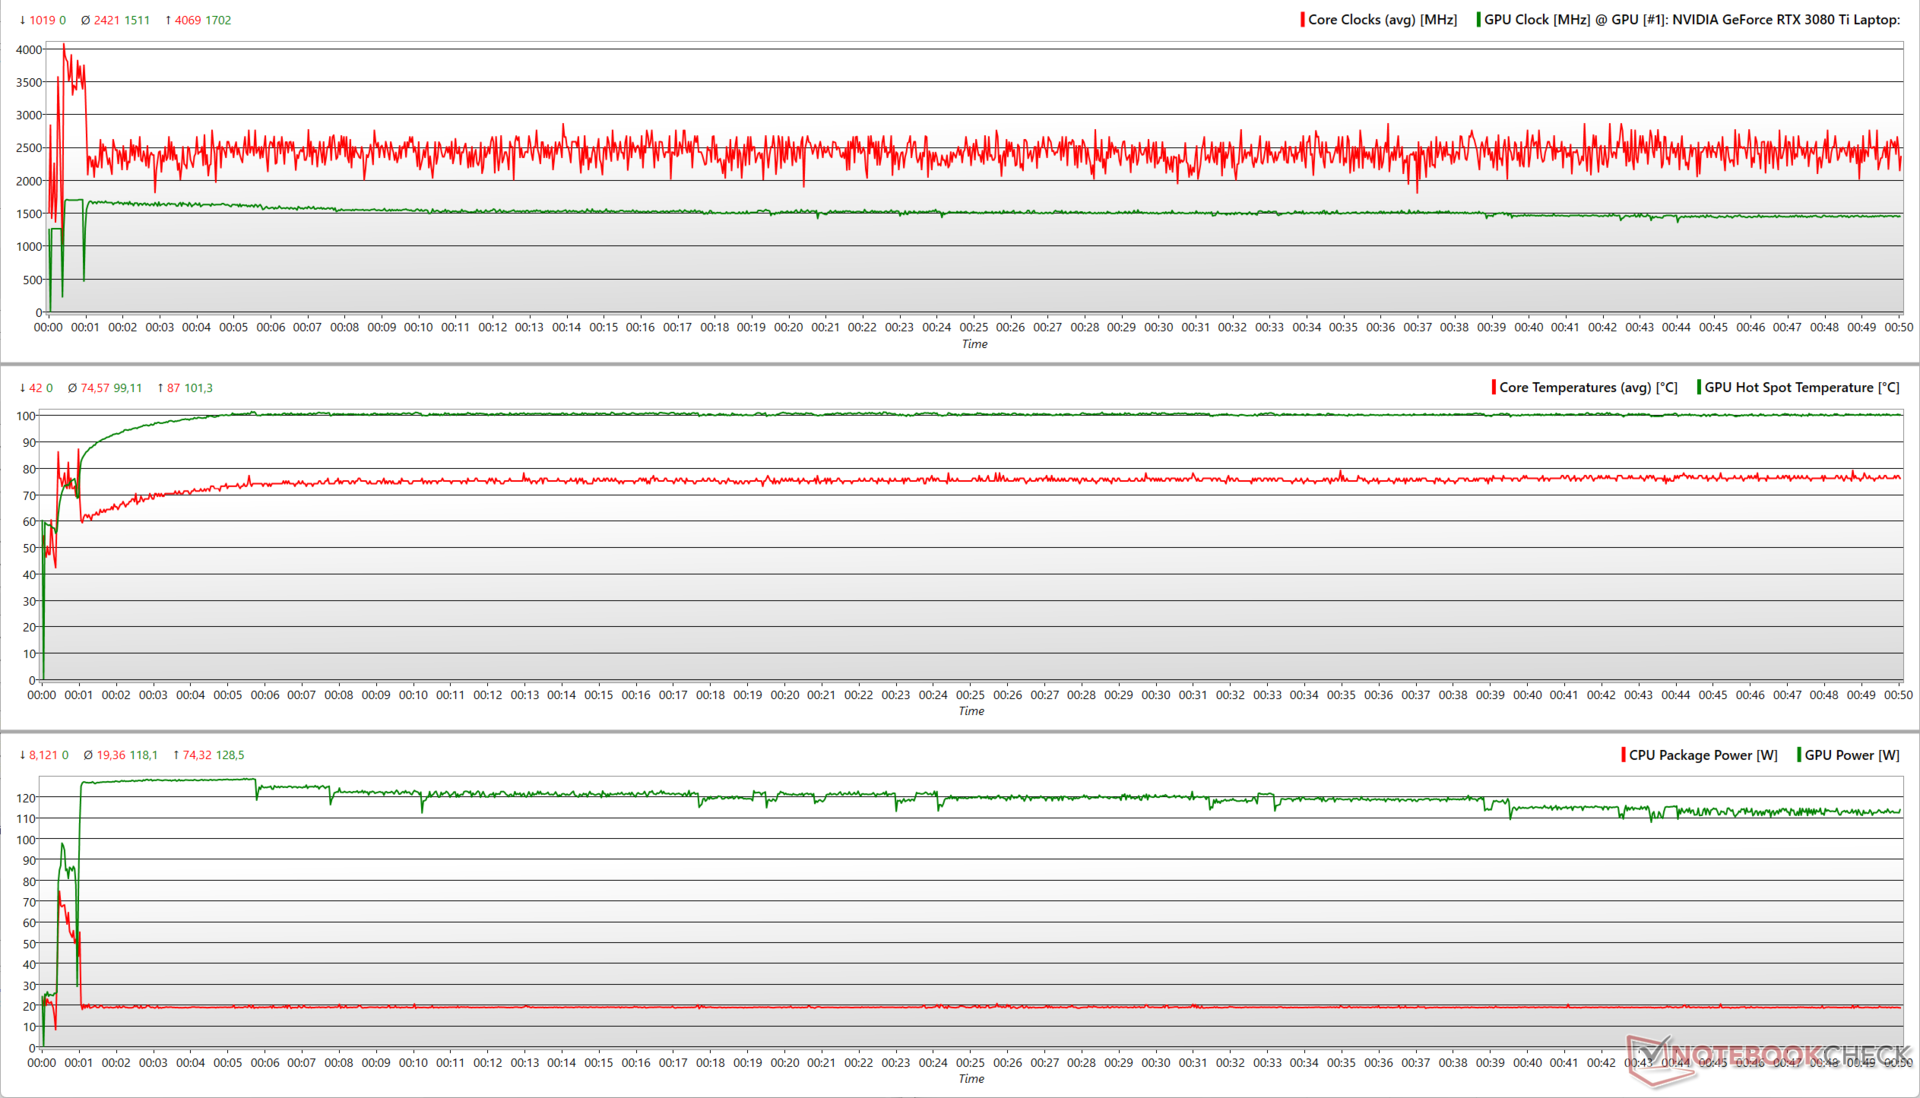
Stressing with The Witcher 3 presents a more real-world scenario, and we find CPU clocks peaking at 4 GHz and soon settling near the 2.5 GHz mark while RTX 3080 Ti drops from an initial high of 1,702 MHz and stabilizes at around 1,500 MHz. The RTX 3080 Ti consumes close to 130 W initially but soon drops down to 120 W. The Core i9-12900H drops from about 75 W to 20 W during the run.
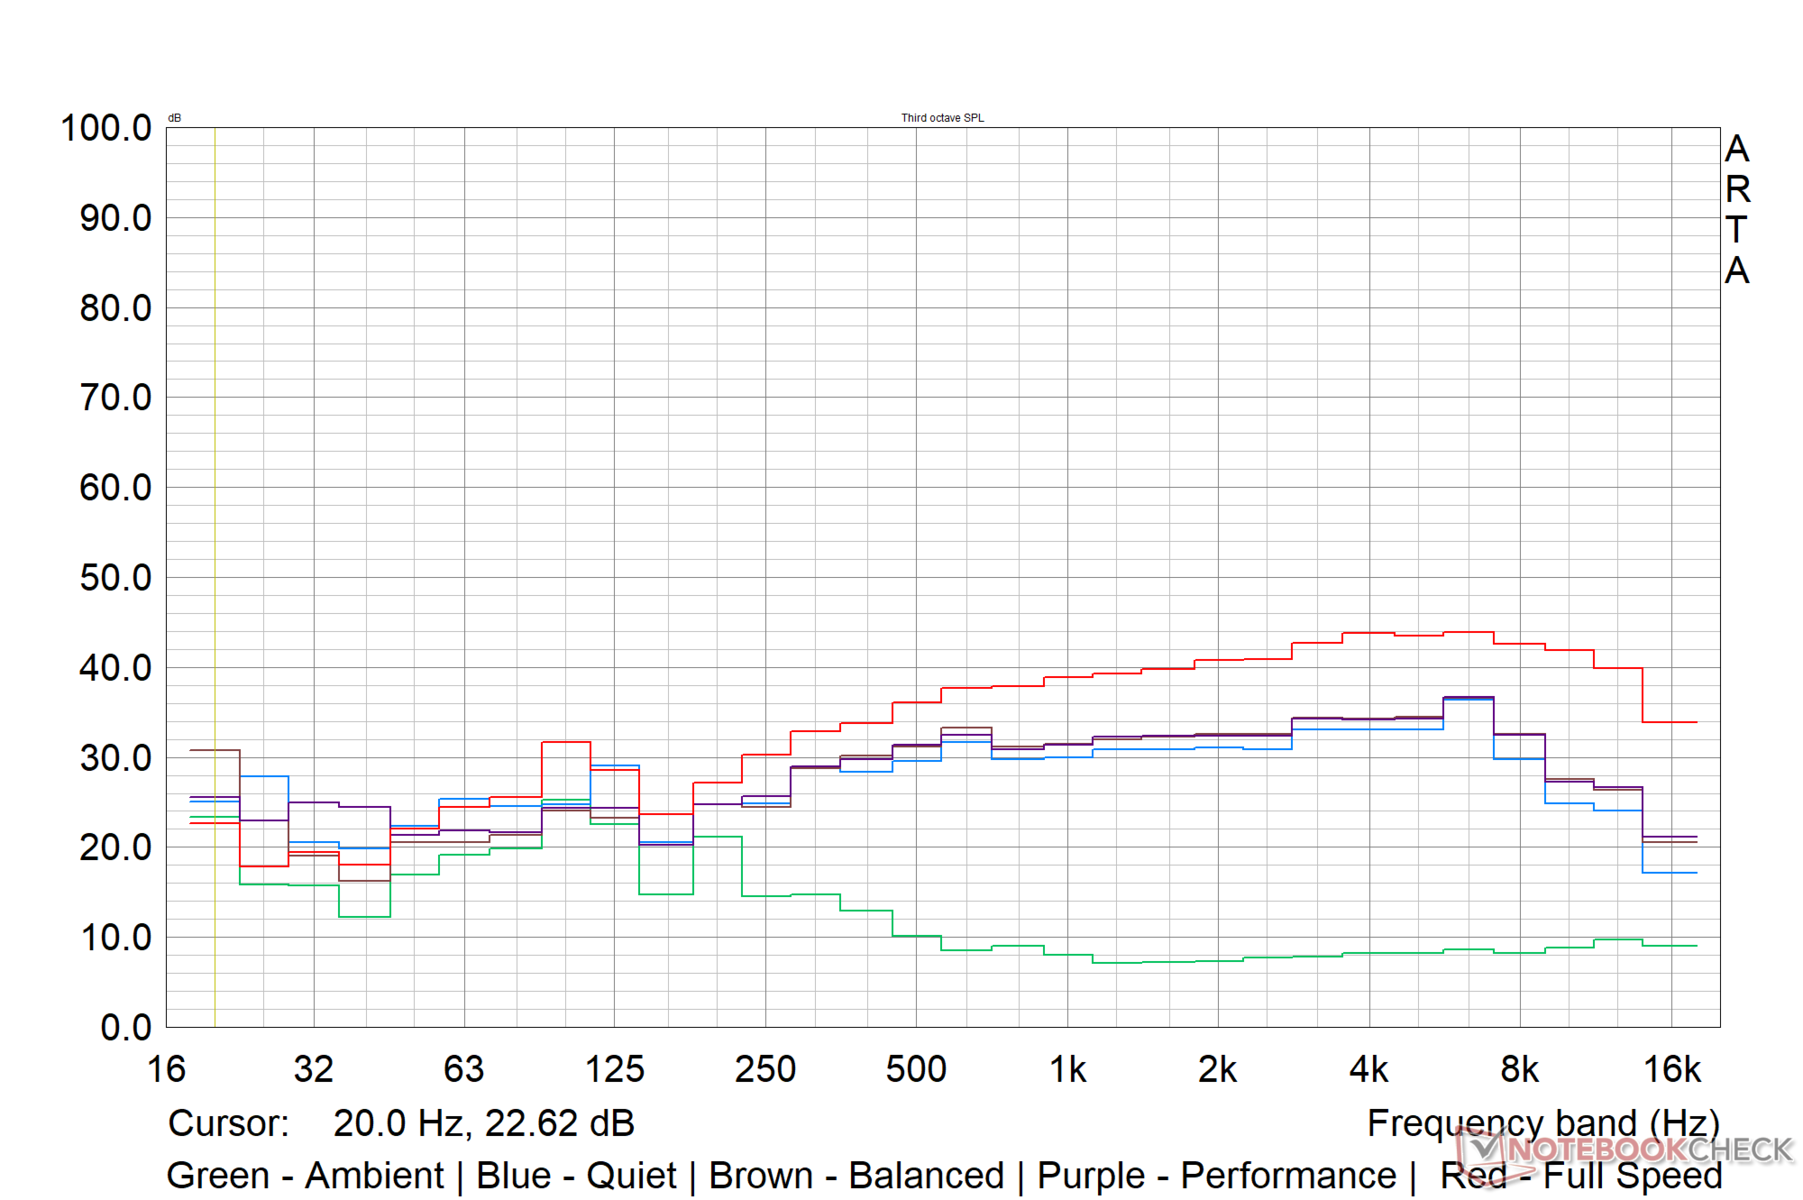
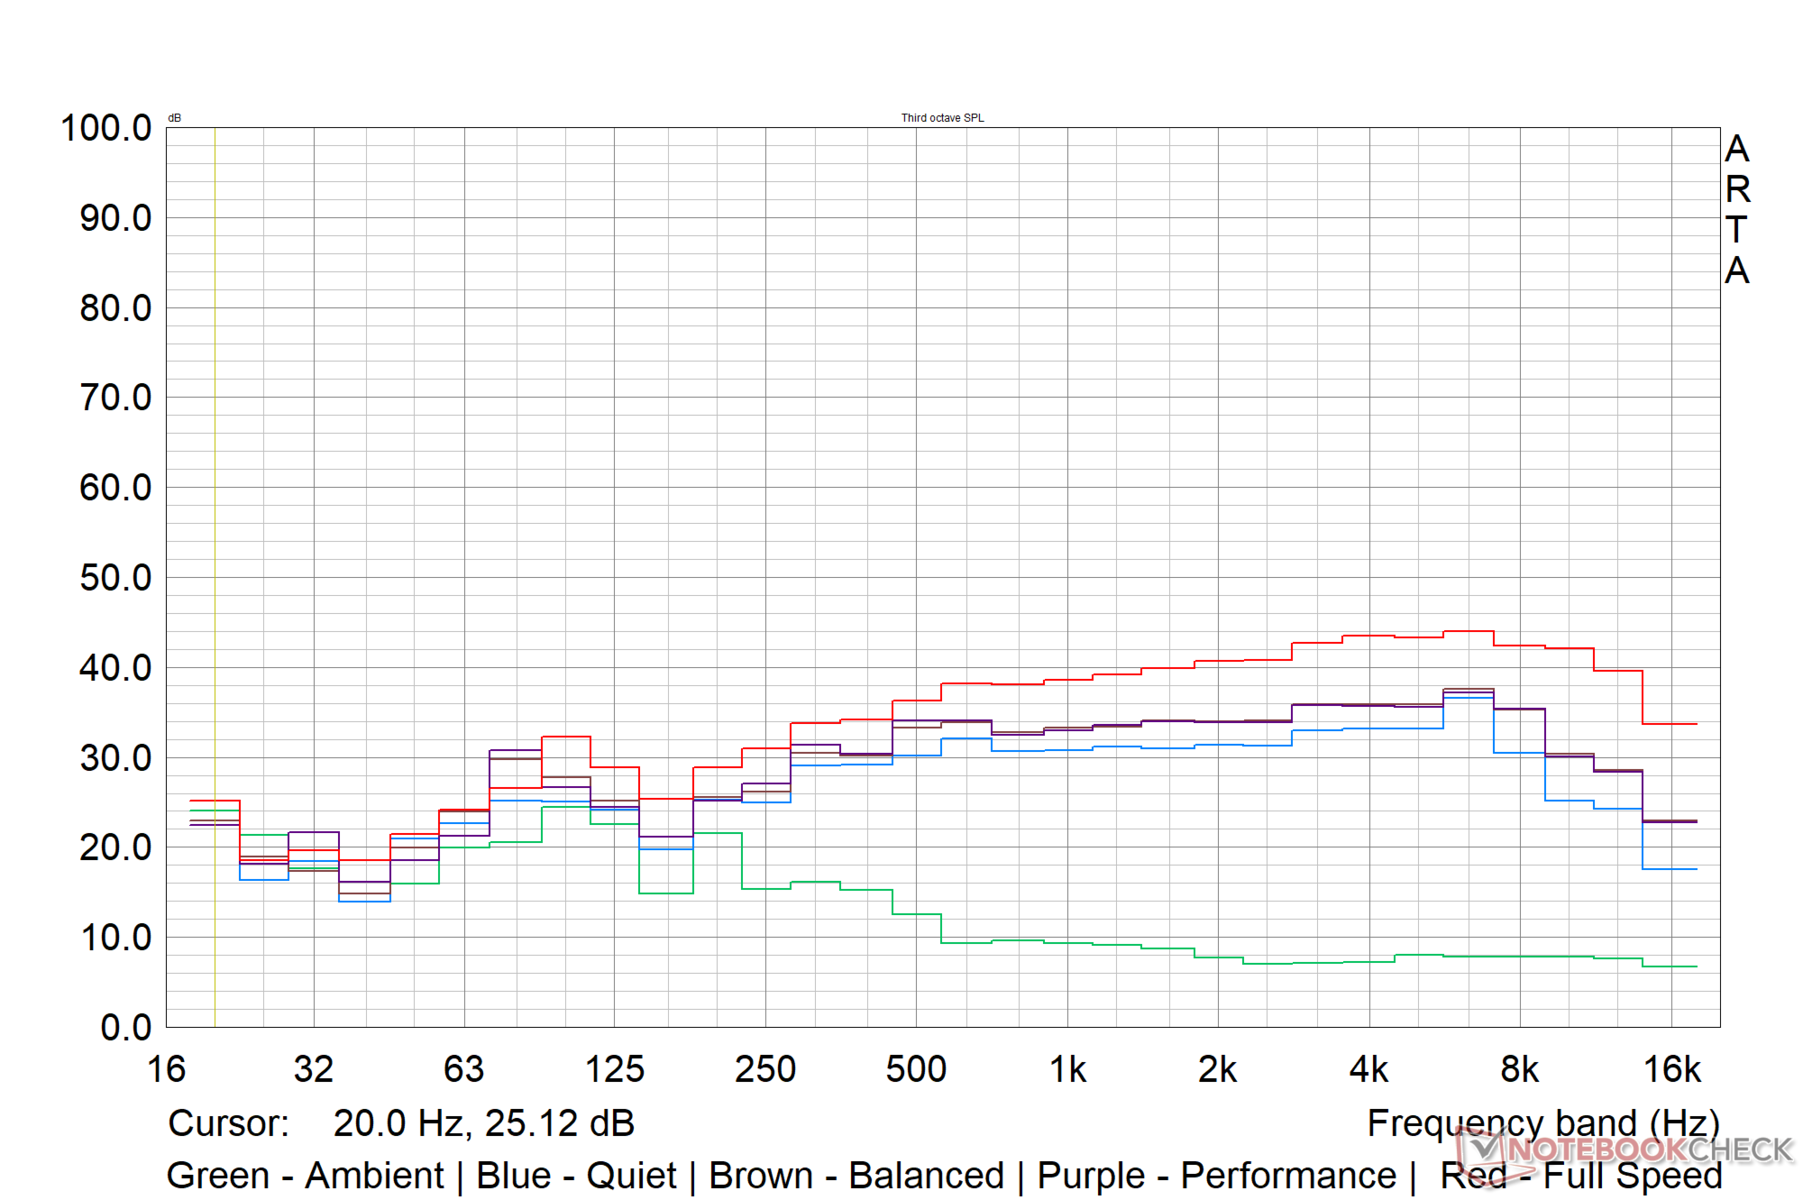
Speakers
For a thin chassis, the Alienware x15 R2's onboard audio is quite decent. The 2x 2 W speakers produce 80.2 db(A) loudness, which should be discernable across an average-sized room. All Alienware 2022 launches are Dolby Atmos-certified.
The bass response is strictly ok, but the mids and highs are more clearly defined. There is no perceivable distortion at higher volumes. Subjectively, the onboard audio can get the job done for most regular work.
Gamers can connect a better pair of cans via Bluetooth 5.2 or the 3.5 mm combo audio jack.
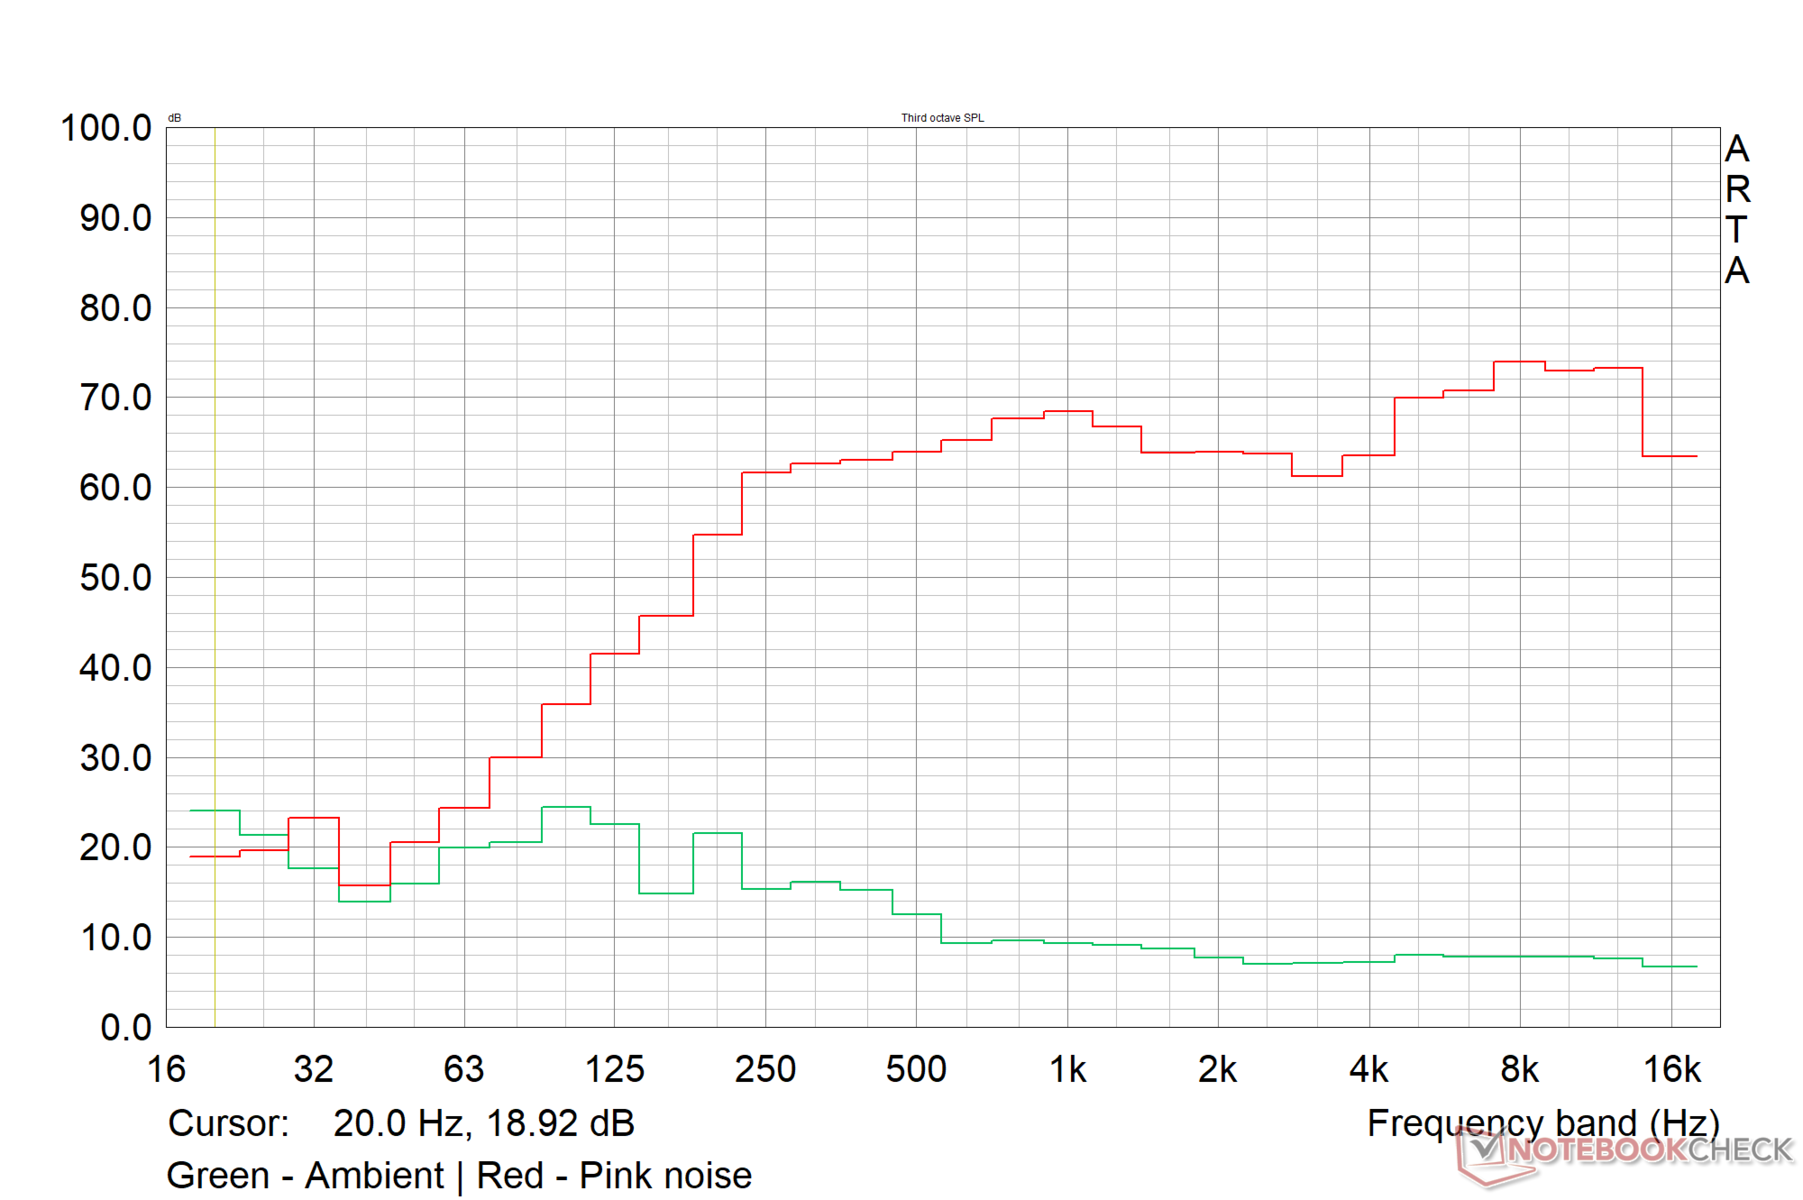
Alienware x15 R2 P111F audio analysis
(±) | speaker loudness is average but good (80.2 dB)
Bass 100 - 315 Hz
(±) | reduced bass - on average 13.5% lower than median
(±) | linearity of bass is average (9.9% delta to prev. frequency)
Mids 400 - 2000 Hz
(+) | balanced mids - only 1.7% away from median
(+) | mids are linear (2.4% delta to prev. frequency)
Highs 2 - 16 kHz
(±) | higher highs - on average 5% higher than median
(+) | highs are linear (4.3% delta to prev. frequency)
Overall 100 - 16.000 Hz
(+) | overall sound is linear (12.6% difference to median)
Compared to same class
» 14% of all tested devices in this class were better, 3% similar, 83% worse
» The best had a delta of 6%, average was 18%, worst was 132%
Compared to all devices tested
» 8% of all tested devices were better, 2% similar, 89% worse
» The best had a delta of 4%, average was 25%, worst was 134%
Apple MacBook Pro 16 2021 M1 Pro audio analysis
(+) | speakers can play relatively loud (84.7 dB)
Bass 100 - 315 Hz
(+) | good bass - only 3.8% away from median
(+) | bass is linear (5.2% delta to prev. frequency)
Mids 400 - 2000 Hz
(+) | balanced mids - only 1.3% away from median
(+) | mids are linear (2.1% delta to prev. frequency)
Highs 2 - 16 kHz
(+) | balanced highs - only 1.9% away from median
(+) | highs are linear (2.7% delta to prev. frequency)
Overall 100 - 16.000 Hz
(+) | overall sound is linear (4.6% difference to median)
Compared to same class
» 0% of all tested devices in this class were better, 0% similar, 100% worse
» The best had a delta of 5%, average was 18%, worst was 45%
Compared to all devices tested
» 0% of all tested devices were better, 0% similar, 100% worse
» The best had a delta of 4%, average was 25%, worst was 134%
Energy Management: Economical at max load
Power Consumption
The supplied 240 W power adapter is sufficient to power the 15 R2 in various workloads. Power consumption is on the higher side, but it is on expected lines given the internals. We notice that the maximum load power consumption can spike up to nearly 242 W before settling close to the 180 W mark.
Nevertheless, the x15 R2's power consumption is still economical compared to the competition, especially at maximum load. The Razer Blade 15 Advanced has a lower power requirement overall, likely due to the 110 W RTX 3080 Ti.
| Off / Standby | |
| Idle | |
| Load |
|
| Alienware x15 R2 P111F i9-12900H, GeForce RTX 3080 Ti Laptop GPU, IPS, 1920x1080 | Asus ROG Strix Scar 15 G533ZW-LN106WS i9-12900H, GeForce RTX 3070 Ti Laptop GPU, IPS-level, 2560x1440 | Asus ROG Zephyrus Duo 16 GX650RX R9 6900HX, GeForce RTX 3080 Ti Laptop GPU, IPS-Level, 3840x2400 | MSI Vector GP66 12UGS i9-12900H, GeForce RTX 3070 Ti Laptop GPU, IPS, 1920x1080 | Razer Blade 15 Advanced Model Early 2022 i7-12800H, GeForce RTX 3080 Ti Laptop GPU, IPS, 1920x1080 | Average NVIDIA GeForce RTX 3080 Ti Laptop GPU | Average of class Gaming | |
|---|---|---|---|---|---|---|---|
| Power Consumption | 15% | -11% | -24% | 8% | -16% | -0% | |
| Idle Minimum * | 16.2 | 7.56 53% | 19 -17% | 17.5 -8% | 17 -5% | 17.2 ? -6% | 13.7 ? 15% |
| Idle Average * | 20 | 13.5 32% | 24 -20% | 20.1 -1% | 19 5% | 23.3 ? -17% | 19.1 ? 4% |
| Idle Maximum * | 21.2 | 16.87 20% | 31 -46% | 47.3 -123% | 25 -18% | 30.8 ? -45% | 26.8 ? -26% |
| Load Average * | 122.1 | 128.9 -6% | 104 15% | 107.3 12% | 108 12% | 121.2 ? 1% | 110.9 ? 9% |
| Witcher 3 ultra * | 207 | 196.2 5% | 186.5 10% | 225 -9% | 150 28% | ||
| Load Maximum * | 241.9 | 274.86 -14% | 256 -6% | 277.7 -15% | 179 26% | 276 ? -14% | 250 ? -3% |
* ... smaller is better
Power Consumption - The Witcher 3 / Stress test
Power Consumption - External monitor
Battery Life
We used our standardized webpage script to assess battery runtimes in both full brightness and 150 cd/m2 settings. The battery runtime tests were performed in the MSHybrid mode at a 60 Hz screen refresh rate.
The x15 R2's 87 WHr battery could muster a little more than six hours at 150 cd/m2. Similar runtimes were observed at full brightness as well. In dGPU mode, we could manage just 3 hours and 36 minutes of battery life at 150 cd/m2 brightness.
| Alienware x15 R2 P111F i9-12900H, GeForce RTX 3080 Ti Laptop GPU, 87 Wh | Alienware x15 RTX 3070 P111F i7-11800H, GeForce RTX 3070 Laptop GPU, 87 Wh | Asus ROG Strix Scar 15 G533ZW-LN106WS i9-12900H, GeForce RTX 3070 Ti Laptop GPU, 90 Wh | Asus ROG Zephyrus Duo 16 GX650RX R9 6900HX, GeForce RTX 3080 Ti Laptop GPU, 90 Wh | Razer Blade 15 Advanced Model Early 2022 i7-12800H, GeForce RTX 3080 Ti Laptop GPU, 80 Wh | Average of class Gaming | |
|---|---|---|---|---|---|---|
| Battery Runtime | 1% | 38% | 29% | -19% | 2% | |
| WiFi v1.3 | 362.5 | 366 1% | 501.4 38% | 469 29% | 293 -19% | 368 ? 2% |
| Reader / Idle | 582 | 749 | 484 | 544 ? | ||
| Load | 53 | 52 | 62 | 122 | 84.2 ? | |
| H.264 | 510 | 559 | 356 | 399 ? | ||
| Witcher 3 ultra | 70 | 81.6 ? |
Pros
Cons
Verdict: This alien ticks most boxes
The Alienware x15 R2 is an evolution from last year's x15 R1 and does not bring any revolutionary changes to the table. There are some standard features in place across all Alienware configurations this year, such as Dolby Vision and Dolby Atmos certifications, Element 31 TIM, and Advanced Optimus to name a few.
The ultrabook-like chassis comes across as being distinctly Alienware with all the relevant insignia. Port placement is not the most ideal, but the essentials are covered. Webcam quality continues to remain an afterthought. The keyboard offers good tactile feedback, but secondary functions continue to remain unlit.
Display quality is good for its primary application as a gaming laptop. However, most buyers would want to opt for the QHD variant given the powerful internals. There is no PWM, and the response times are good when overdrive is enabled at 360 Hz.
The Alienware x15 R2 should be high on your merit list if you are on the lookout for a gaming laptop that effectively marries an ultrabook-like form factor with top-of-the-line modern hardware as long as the higher heat and noise emissions are not grave concerns."
Despite the thin chassis, Dell has done a good job with the thermals in ensuring that there is no significant throttling under load. Other competitors such as the MSI Vector GP66 and the Asus ROG Strix Scar 15 featuring the Core i9-12900H do post somewhat higher scores, but the x15 R2 holds its ground well. The performance uplift compared to last year's x15 R1 is pretty significant.
Perhaps the biggest peeve with the Alienware x15 R2 is its high heat and noise emissions. While fan noise levels can be controlled to an extent by choosing the appropriate thermal profile, the surface temperatures definitely seem to be on the higher side. Power consumption and battery life are on expected lines for this configuration, although the Scar 15 and the Razer Blade 15 Advanced are more economical power guzzlers.
The Alienware x15 R2 offers a unique combination of aesthetics and flagship performance that many other laptops aspire to. However, at a price of ₹3,68,190 (~US$4,500 or €4,583), the Alienware x15 R2 is not competitively priced in the Indian market, particularly when options such as the Asus ROG Strix Scar 15 G533 exist.
Price and Availability
The reviewed Alienware x15 R2 configuration is available for ~US$4,137 on Amazon India, Amazon US, and Dell.com. A Core i7-12700H and RTX 3070 Ti-powered variant of the x15 R2 is available on Best Buy for US$2,700.
Alienware x15 R2 P111F
-
10/04/2022 v7
Vaidyanathan Subramaniam


Pricecompare
