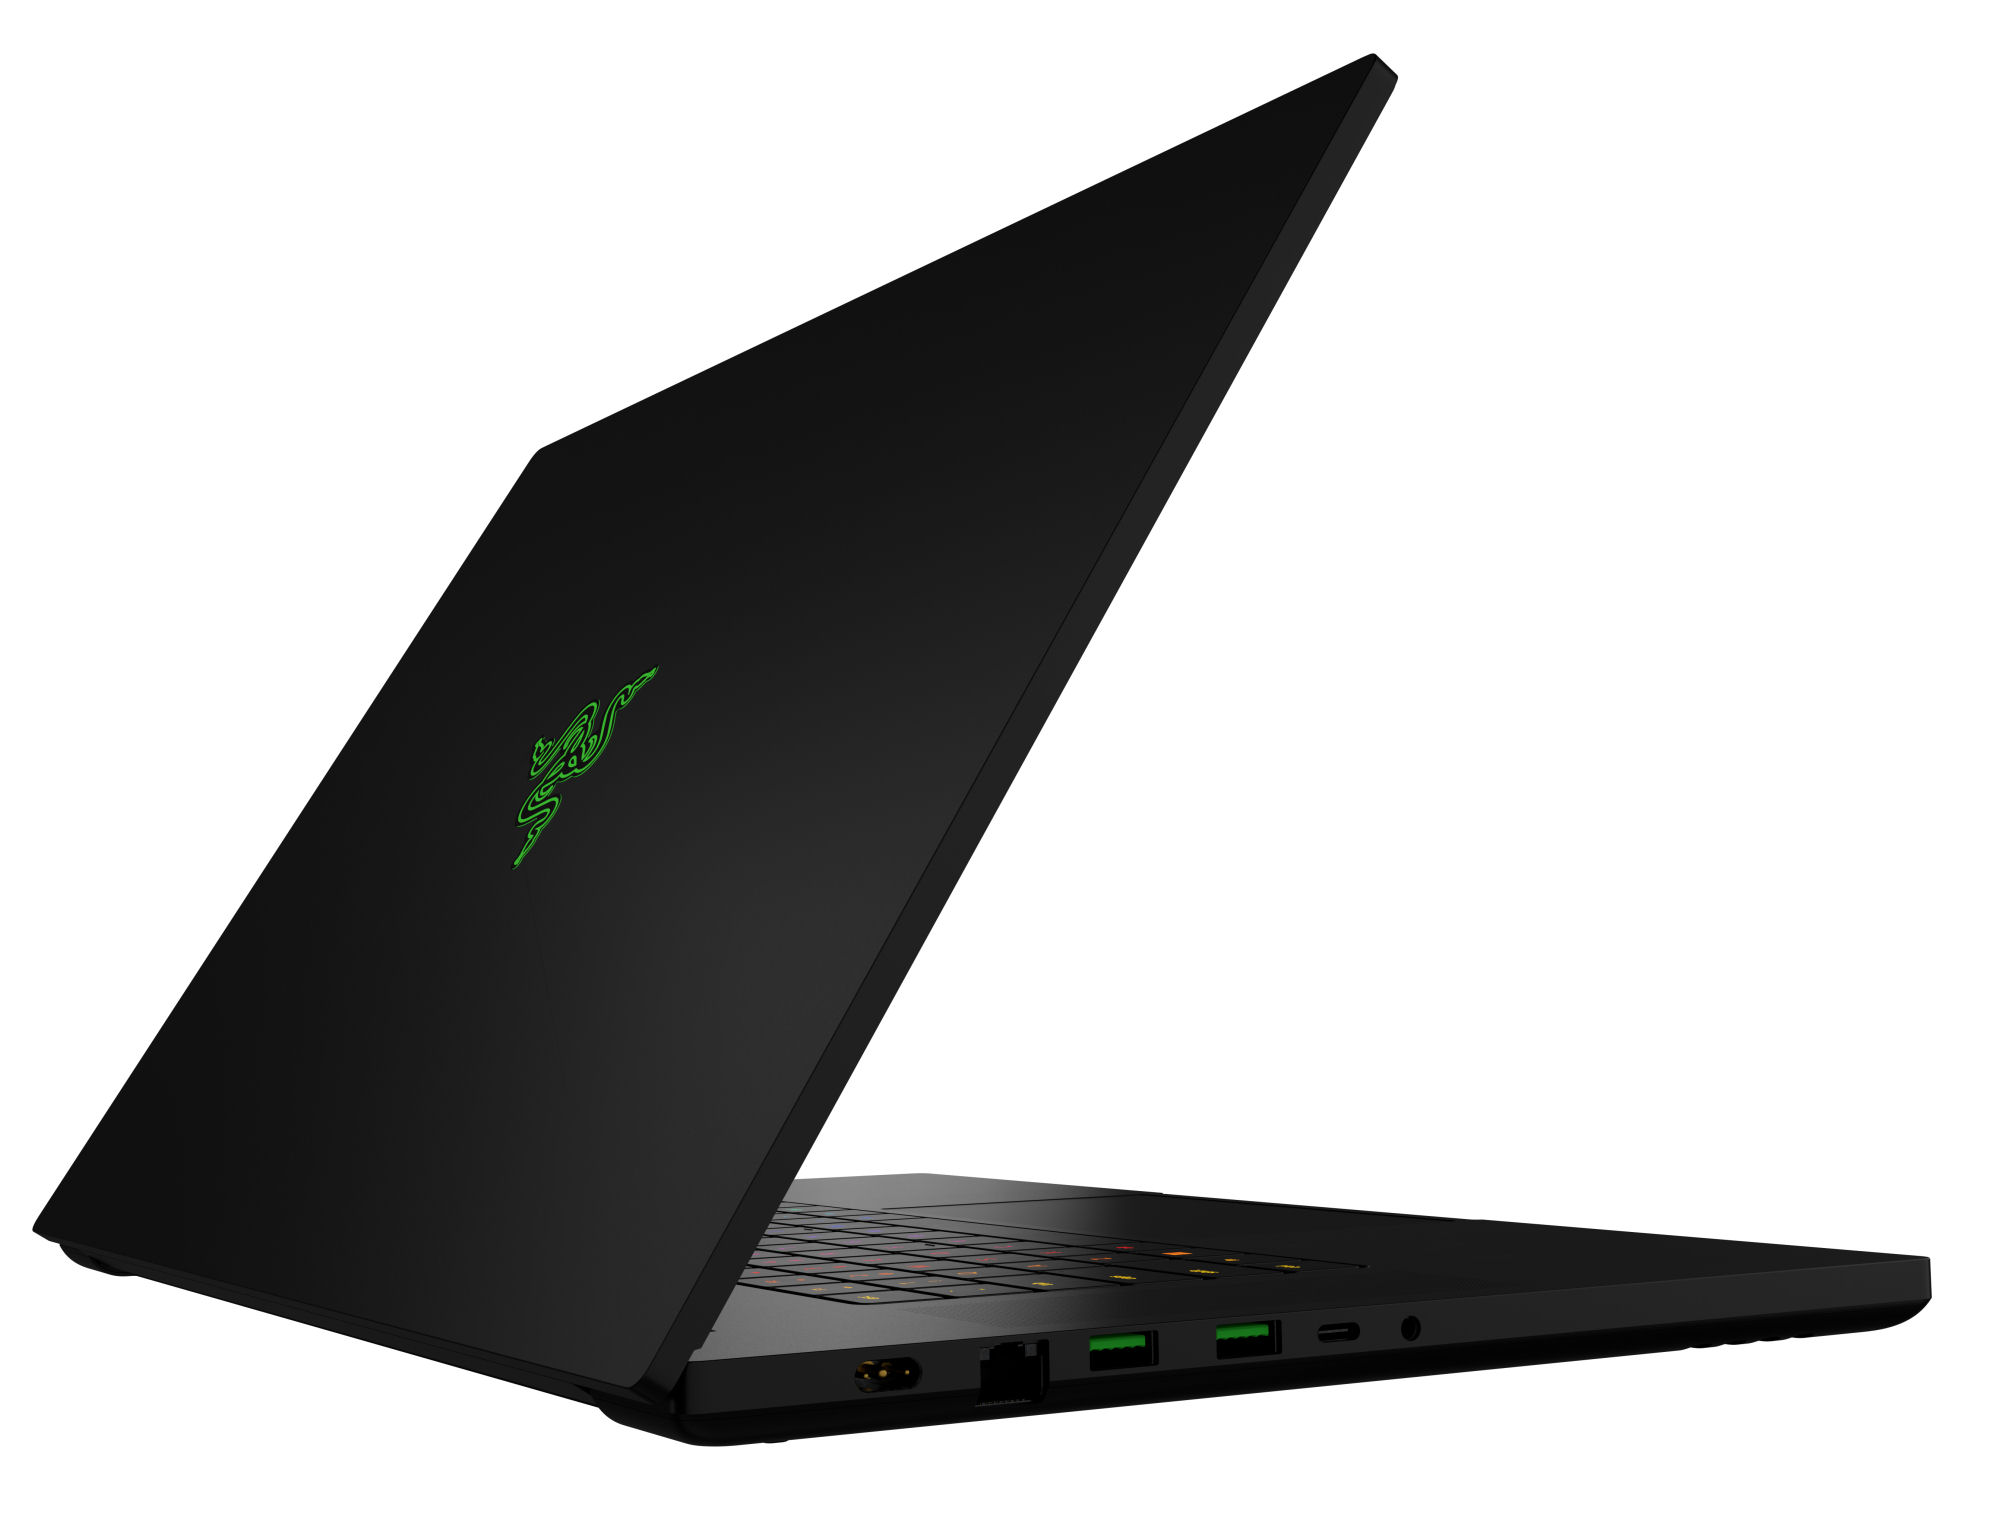
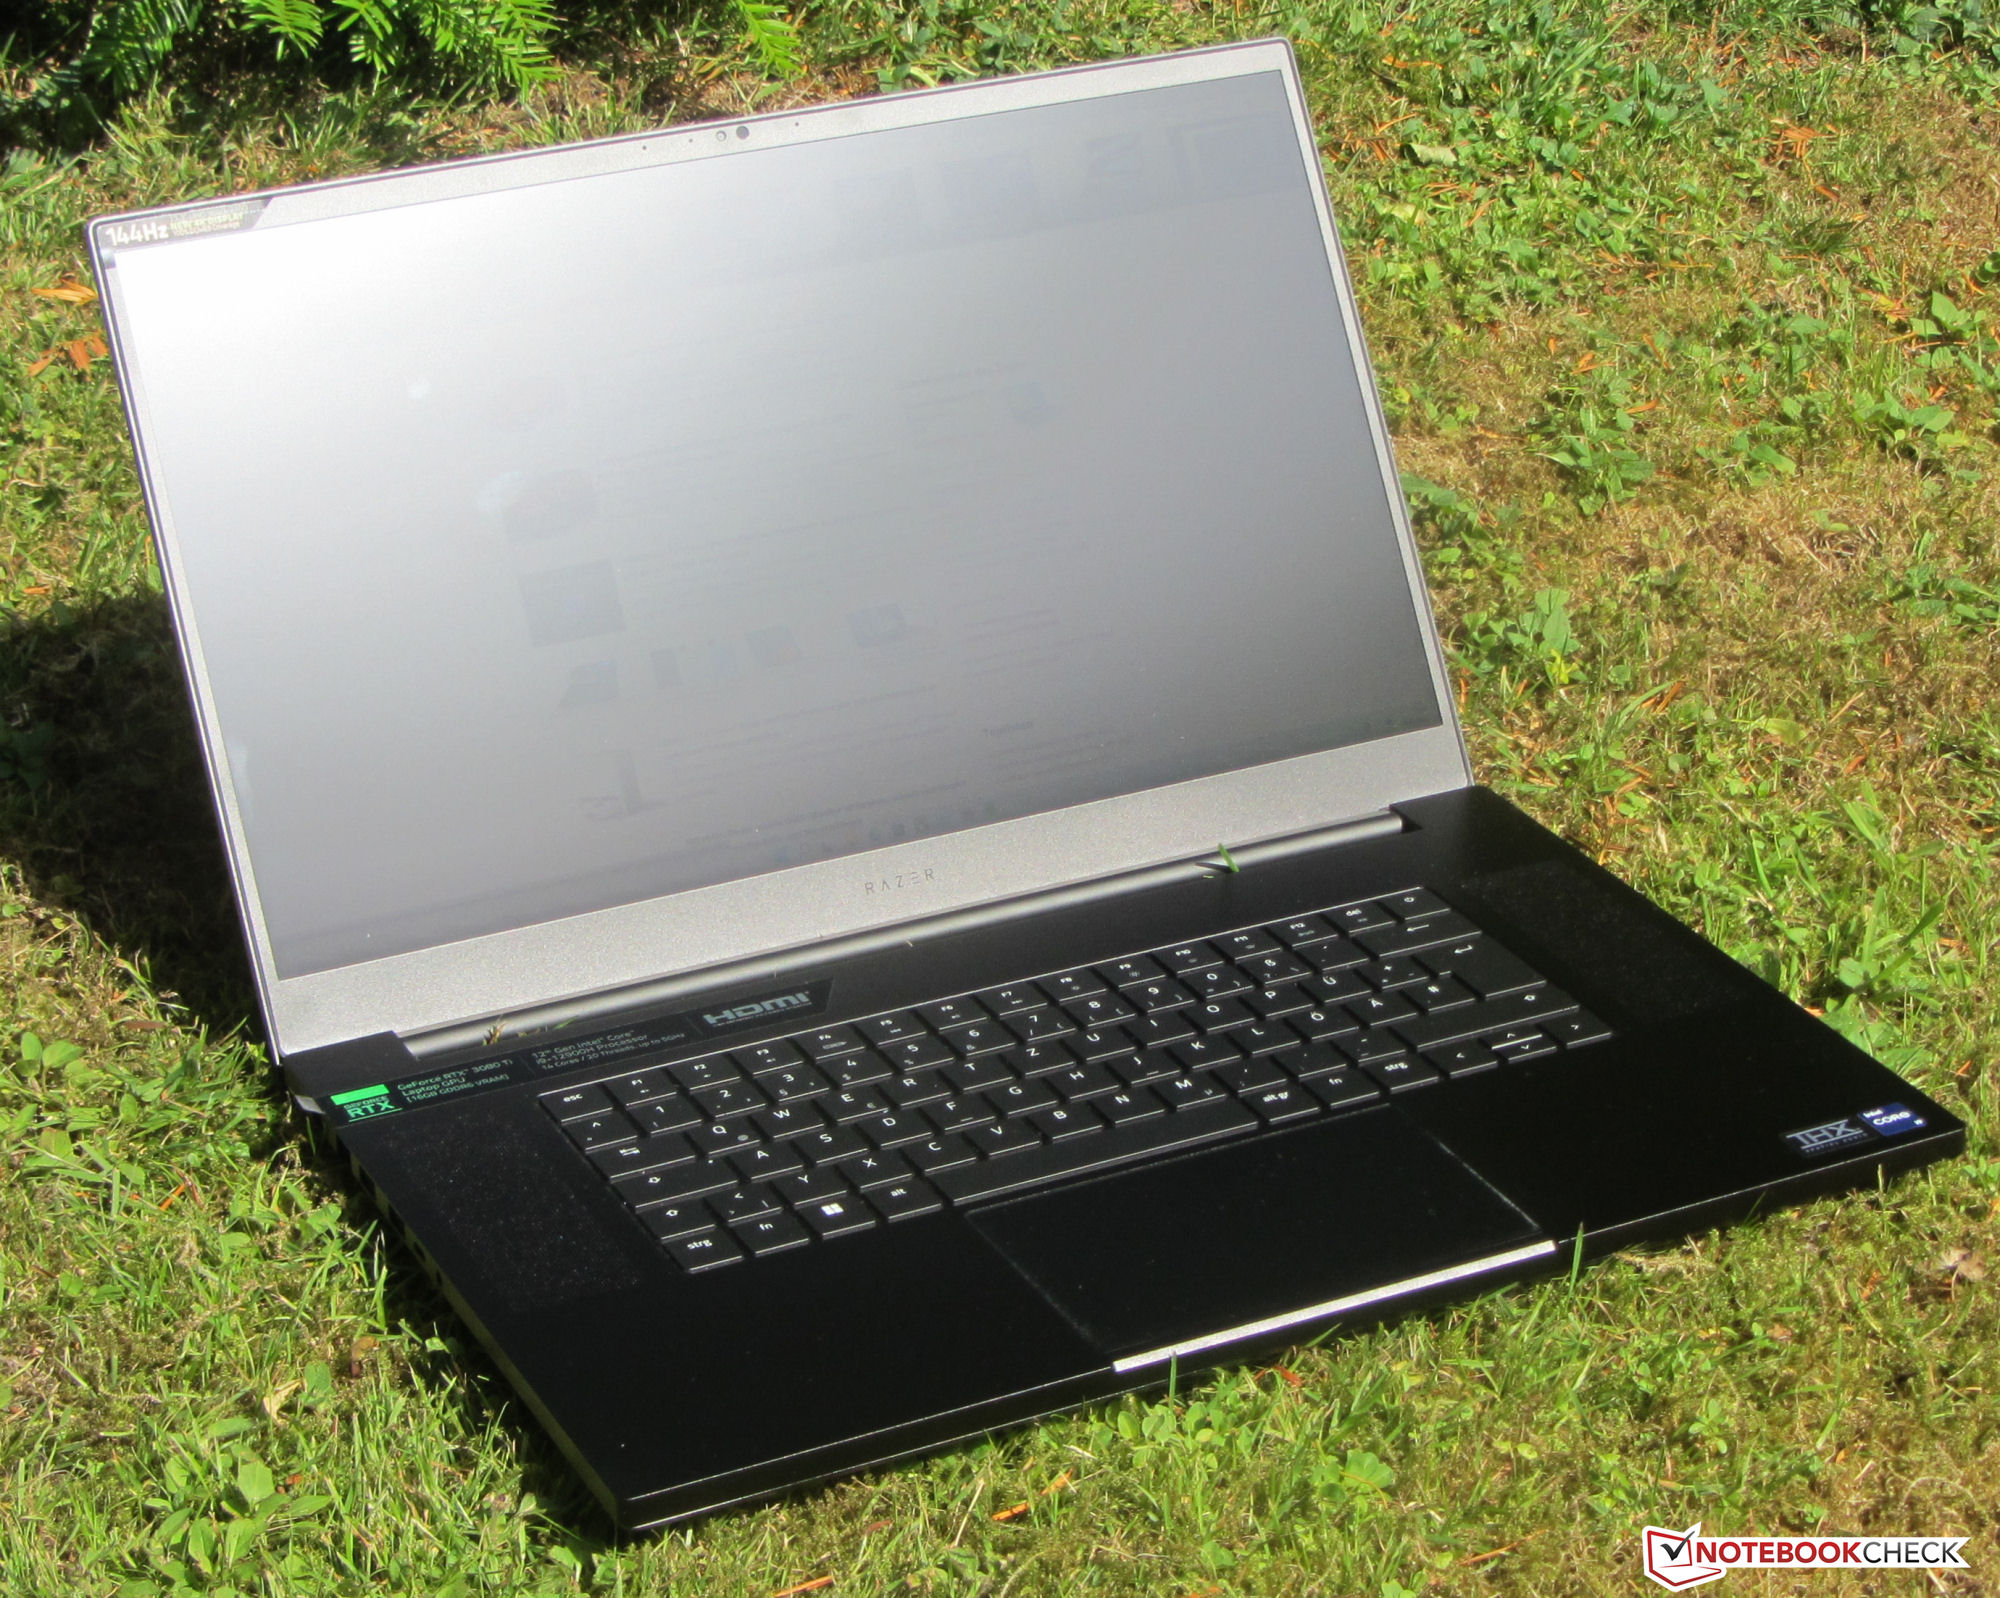
Razer Blade 17 (Early 2022) review: Elegant 4k gaming laptop with a bright screen
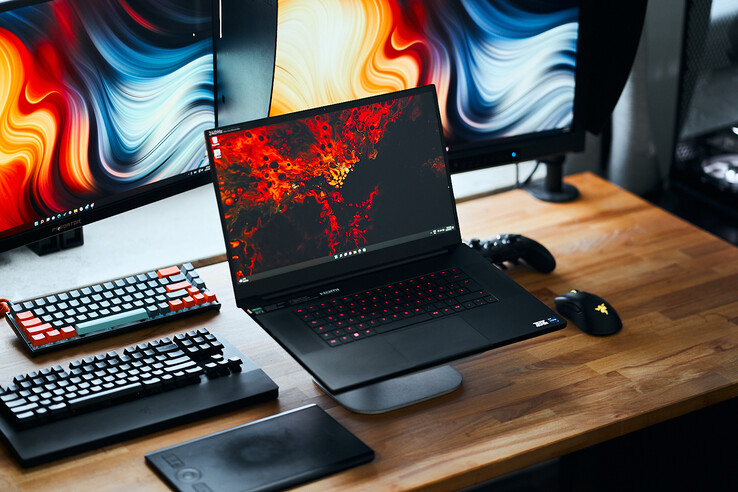
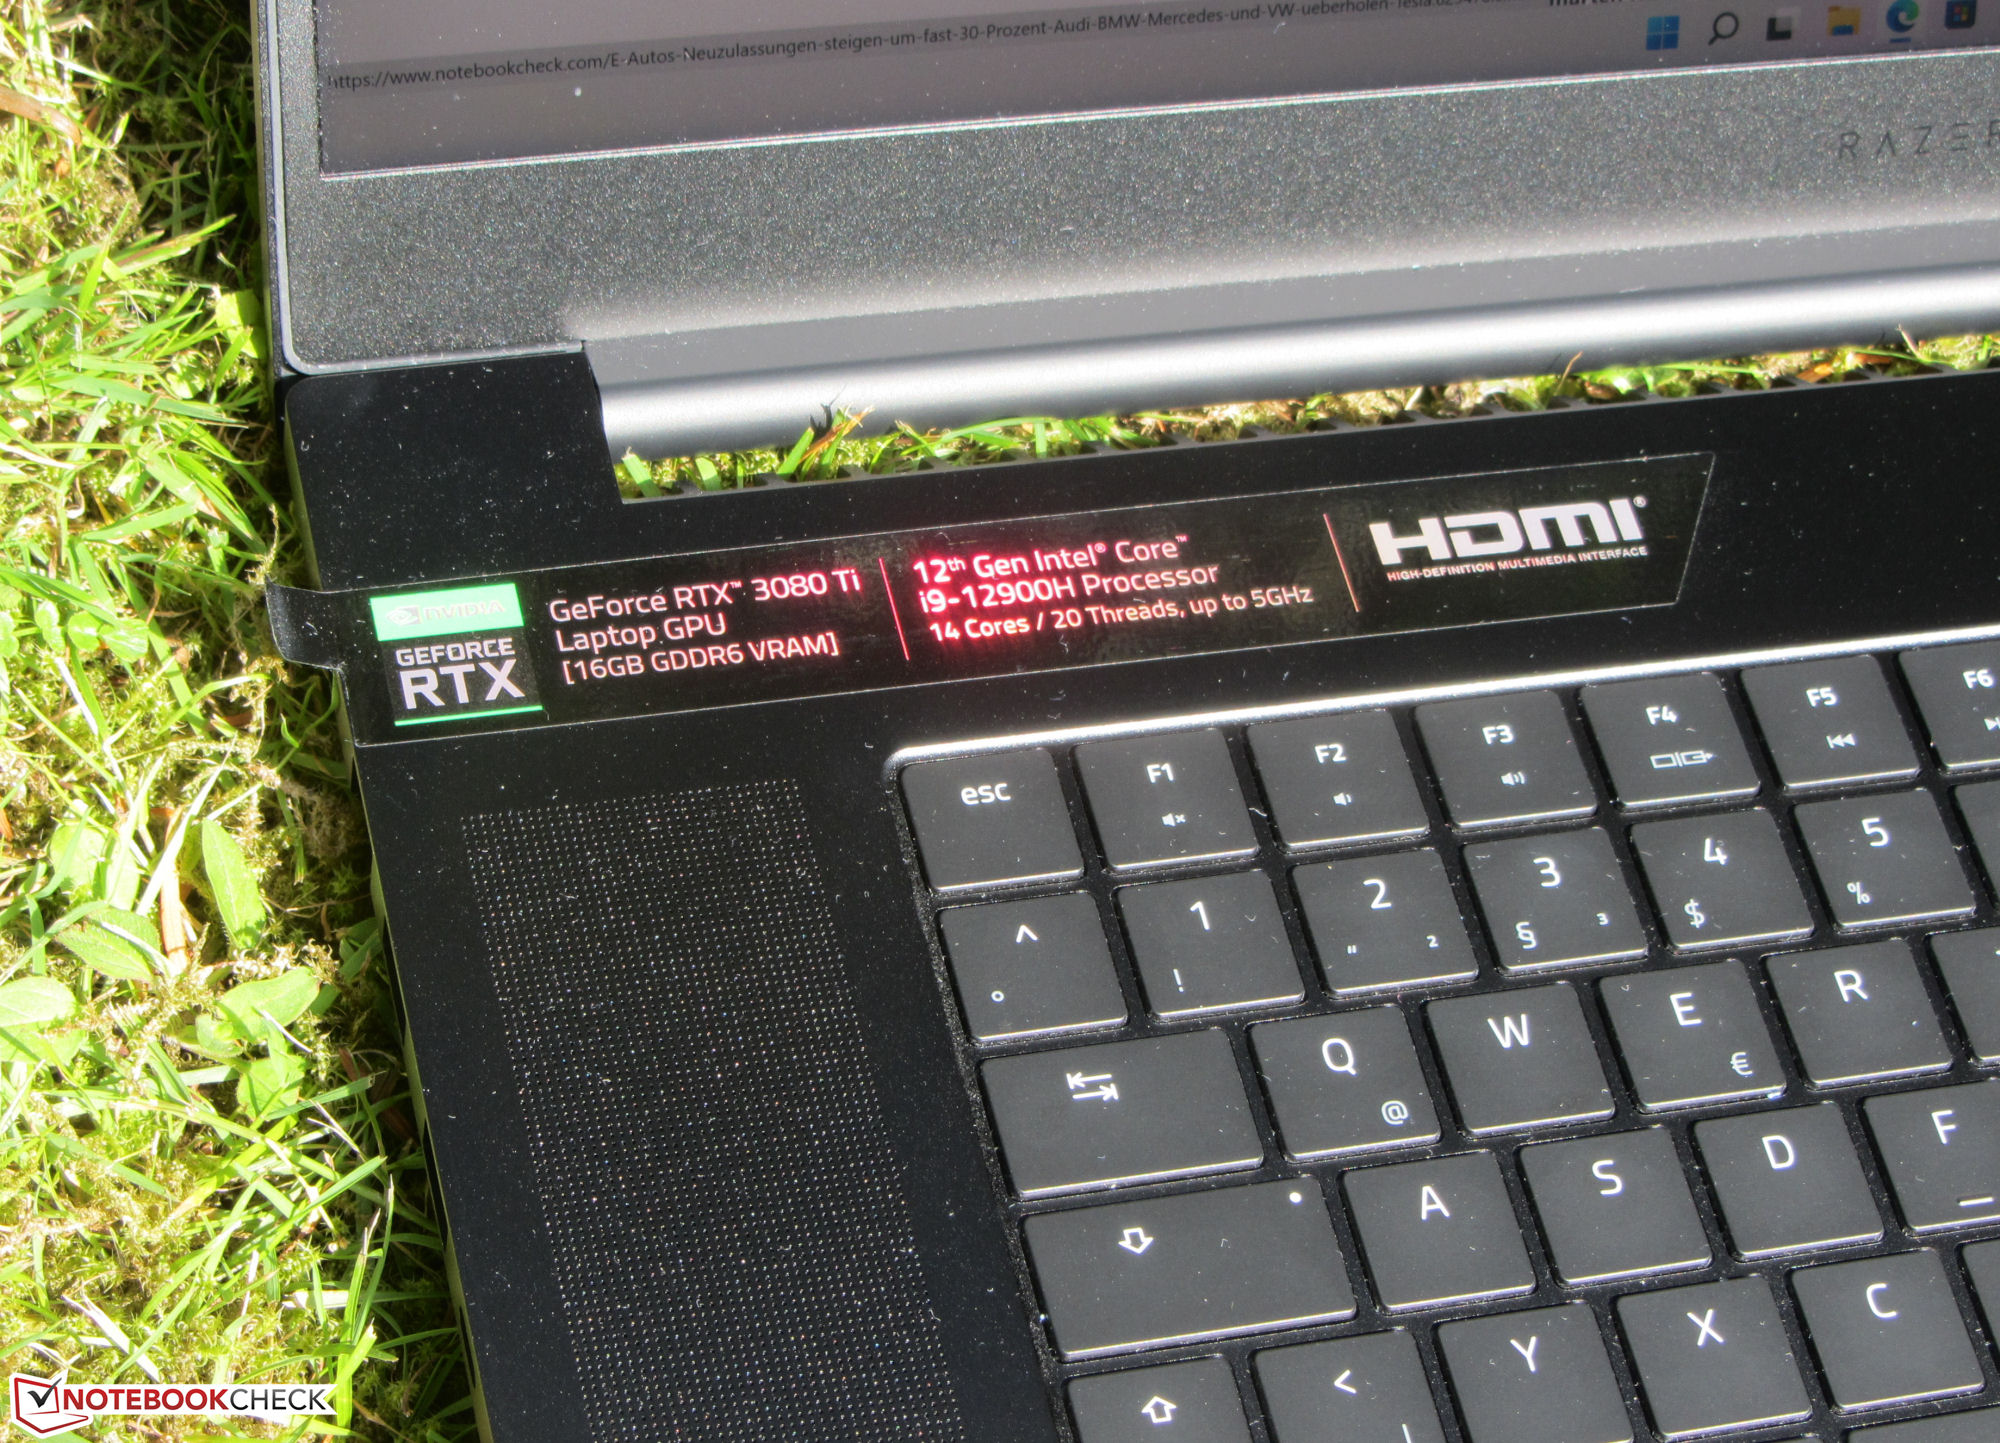
The Razer Blade 17 is targeted towards gamers and creative professionals - particularly in our tested high-end configuration with a Core i9-12900H CPU, GeForce RTX 3080 Ti Laptop GPU, and 17.3-inch 4k display with accurate colors. The price point lies at around 4,700 Euros (~$4,900). In addition to the RTX 3080 Ti, its US sibling that we already tested had a Core i7-12800H CPU and a QHD-Panel (240 Hz). The competitors include extremely powerful laptops such as the Alienware x17 R2 P48E, the Medion Erazer Beast X30, and the MSI Stealth GS77 12UHS.
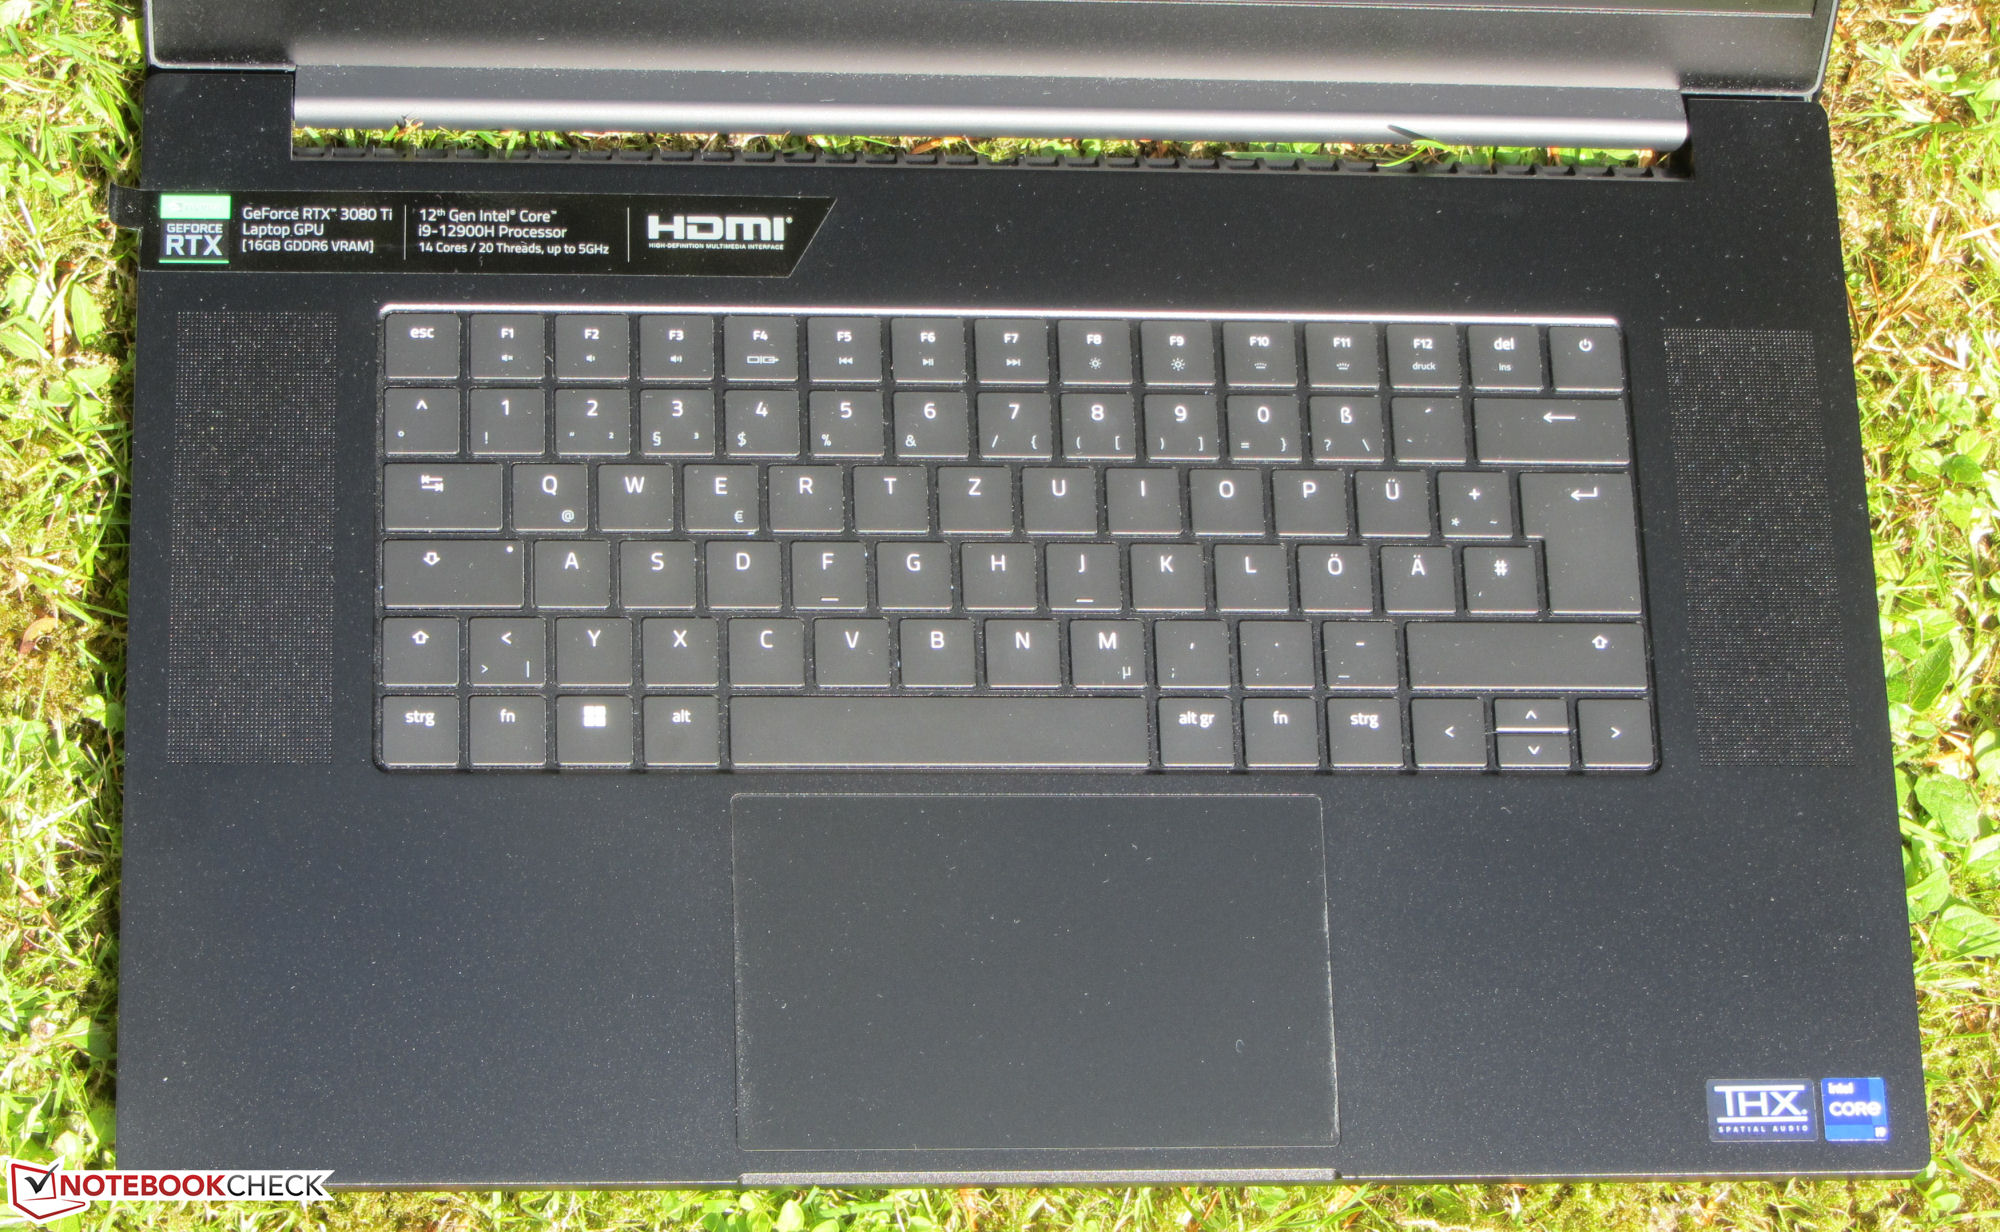
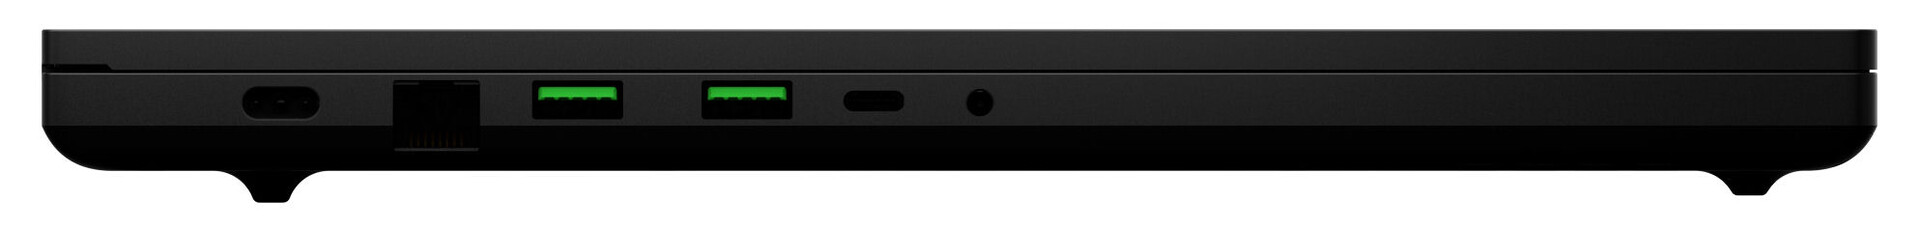
You can find information on the case, connection equipment, input devices, and speakers in our review of the identically constructed Blade 17 2022 (Core i7, QHD).
Possible Competitors in Comparison
Rating | Date | Model | Weight | Height | Size | Resolution | Price |
|---|---|---|---|---|---|---|---|
| 89.9 % v7 (old) | 07 / 2022 | Razer Blade 17 Early 2022 i9-12900H, GeForce RTX 3080 Ti Laptop GPU | 2.8 kg | 19.9 mm | 17.30" | 3840x2160 | |
| 89.2 % v7 (old) | 05 / 2022 | Alienware x17 R2 P48E i9-12900HK, GeForce RTX 3080 Ti Laptop GPU | 3.1 kg | 20.9 mm | 17.30" | 1920x1080 | |
| 86.7 % v7 (old) | 05 / 2022 | Medion Erazer Beast X30 i9-12900HK, GeForce RTX 3080 Ti Laptop GPU | 2.2 kg | 23 mm | 17.30" | 2560x1440 | |
| 87.2 % v7 (old) | 04 / 2022 | MSI Stealth GS77 12UHS-083US i7-12700H, GeForce RTX 3080 Ti Laptop GPU | 2.9 kg | 20.8 mm | 17.30" | 2560x1440 |
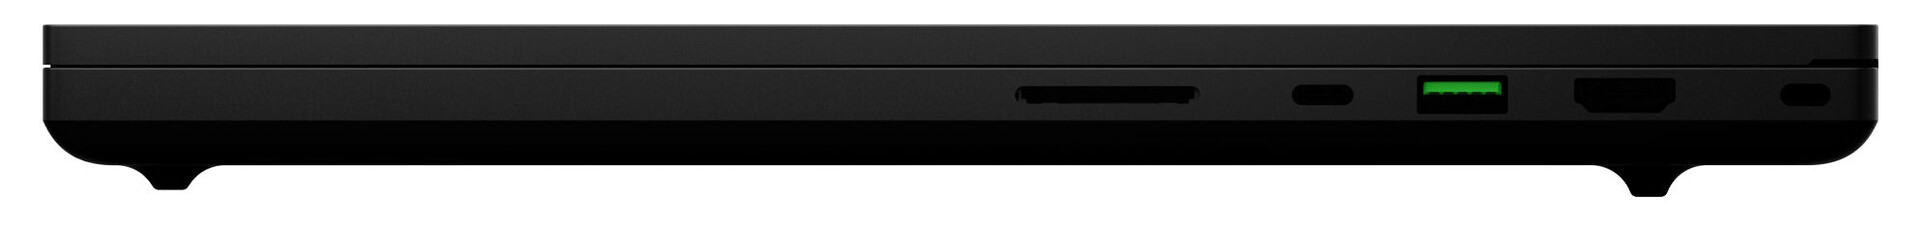
| SD Card Reader | |
| average JPG Copy Test (av. of 3 runs) | |
| Alienware x17 R2 P48E (AV Pro V60) | |
| Razer Blade 17 Early 2022 (AV PRO microSD 128 GB V60) | |
| Razer Blade 17 RTX 3080 Ti (AV Pro V60) | |
| Average of class Gaming (20.9 - 210, n=54, last 2 years) | |
| MSI Stealth GS77 12UHS-083US (AV Pro V60) | |
| Medion Erazer Beast X30 (AV PRO microSD 128 GB V60) | |
| maximum AS SSD Seq Read Test (1GB) | |
| Alienware x17 R2 P48E (AV Pro V60) | |
| Razer Blade 17 RTX 3080 Ti (AV Pro V60) | |
| Average of class Gaming (25.5 - 261, n=51, last 2 years) | |
| Medion Erazer Beast X30 (AV PRO microSD 128 GB V60) | |
| MSI Stealth GS77 12UHS-083US (AV Pro V60) | |
| Networking - iperf3 receive AXE11000 | |
| Medion Erazer Beast X30 | |
| Razer Blade 17 Early 2022 | |
| Average of class Gaming (680 - 1745, n=88, last 2 years) | |
| Average Killer Wi-Fi 6E AX1690i 160MHz (917 - 1727, n=9) | |


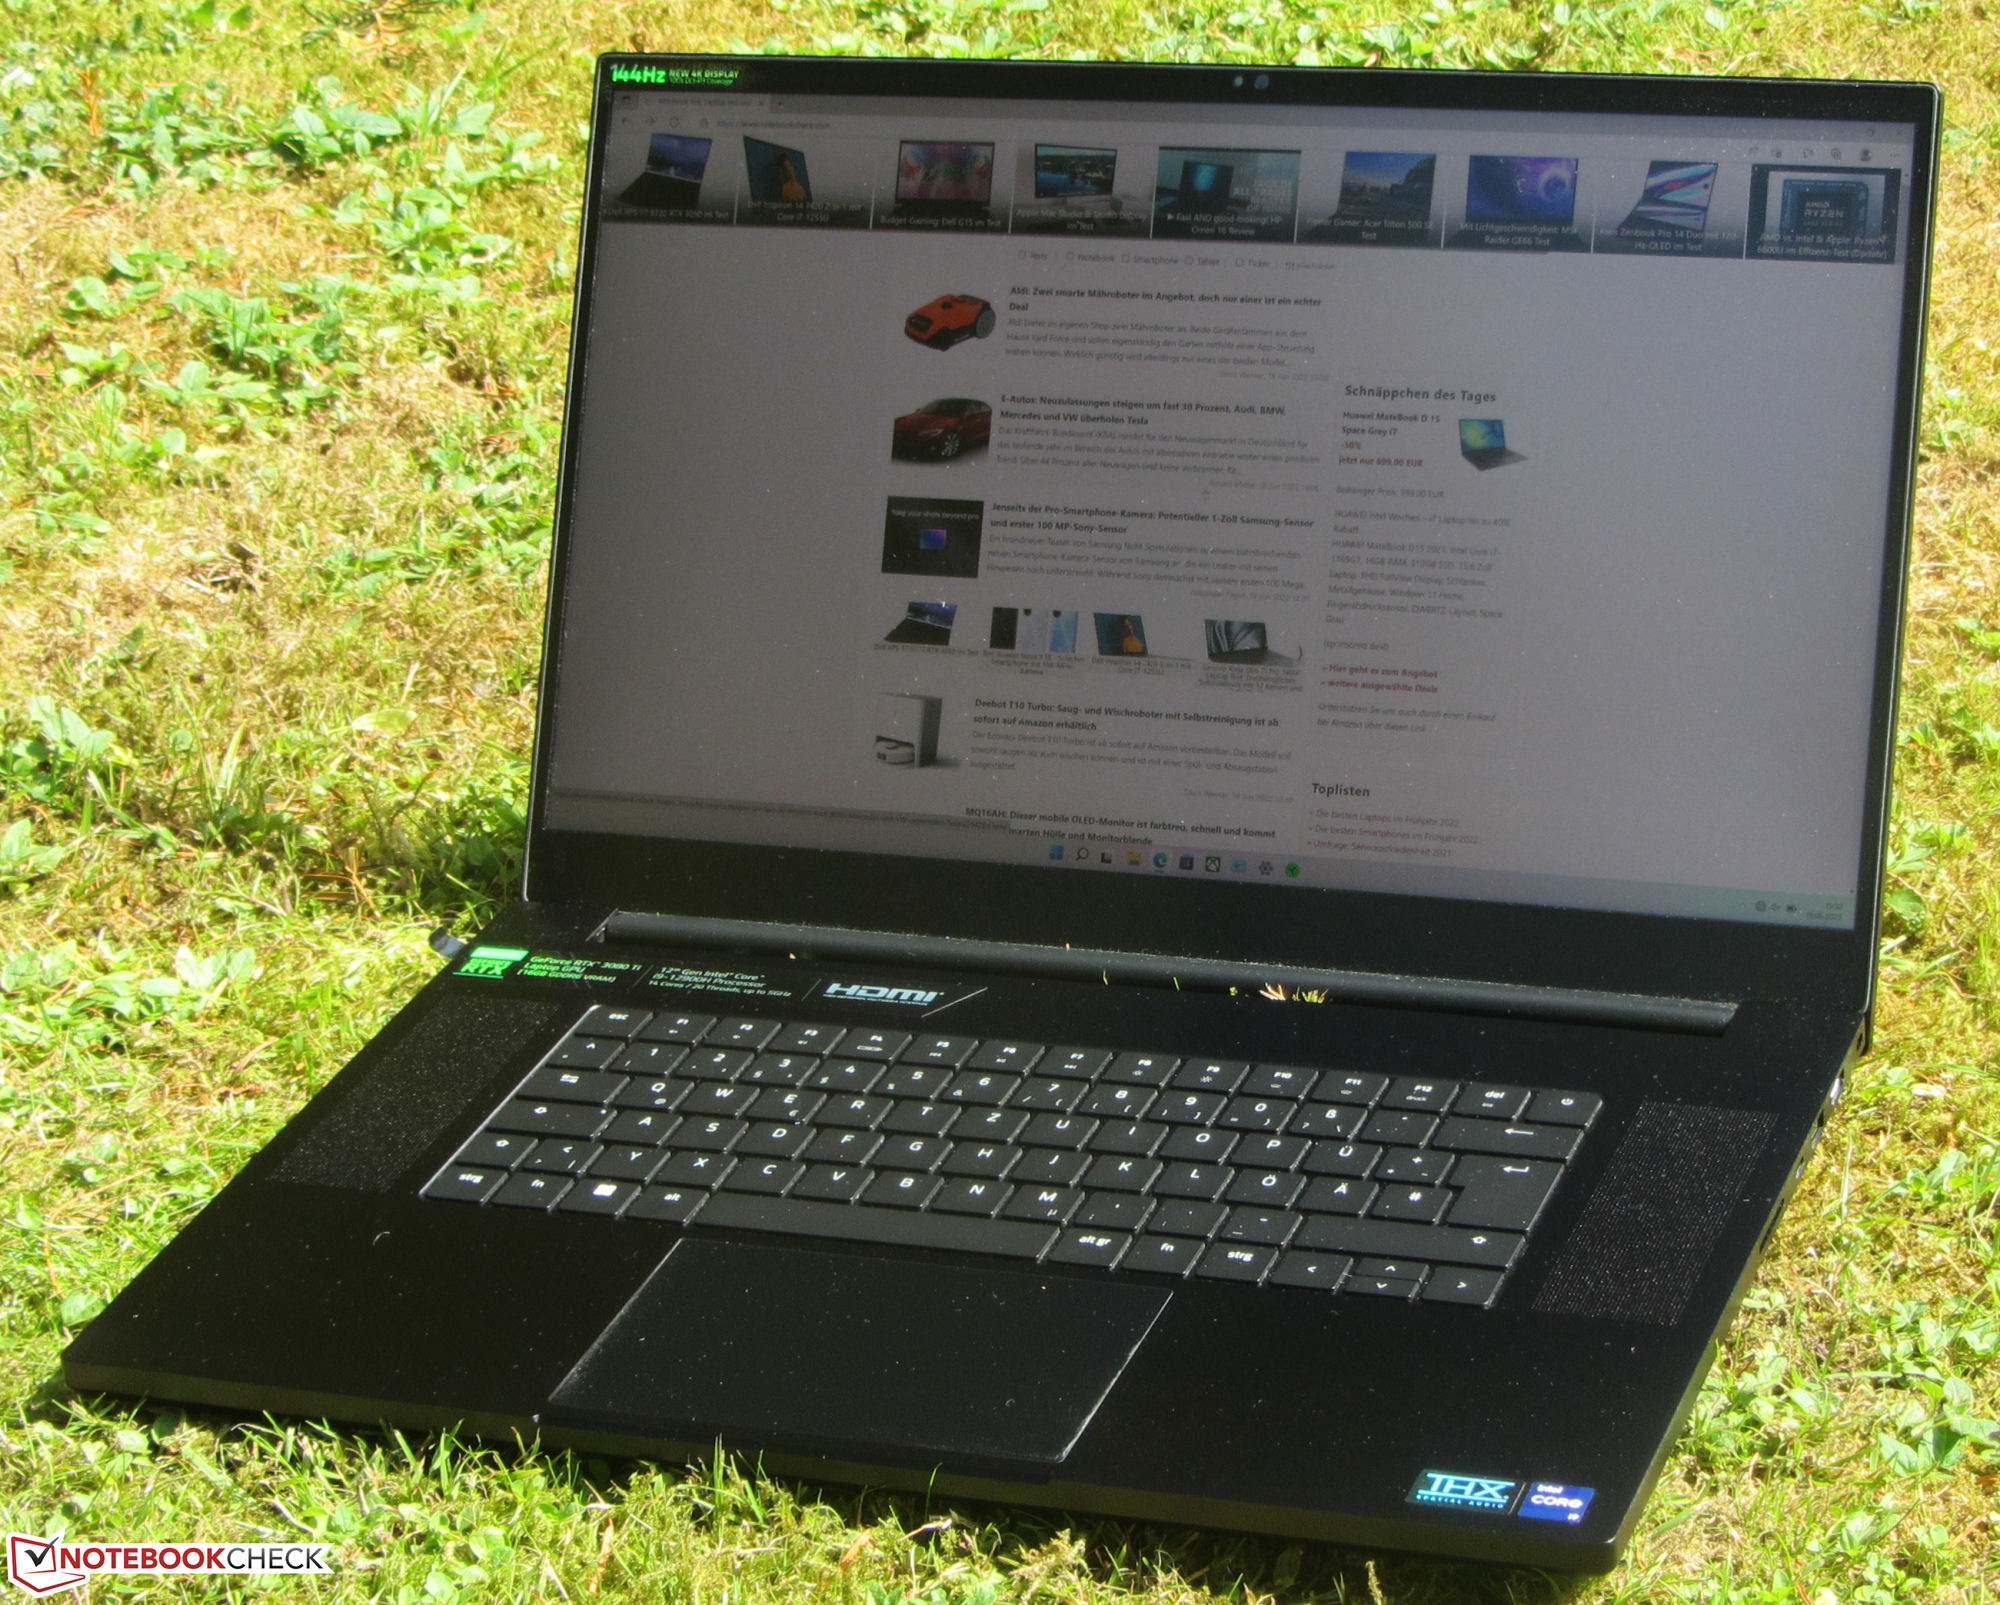
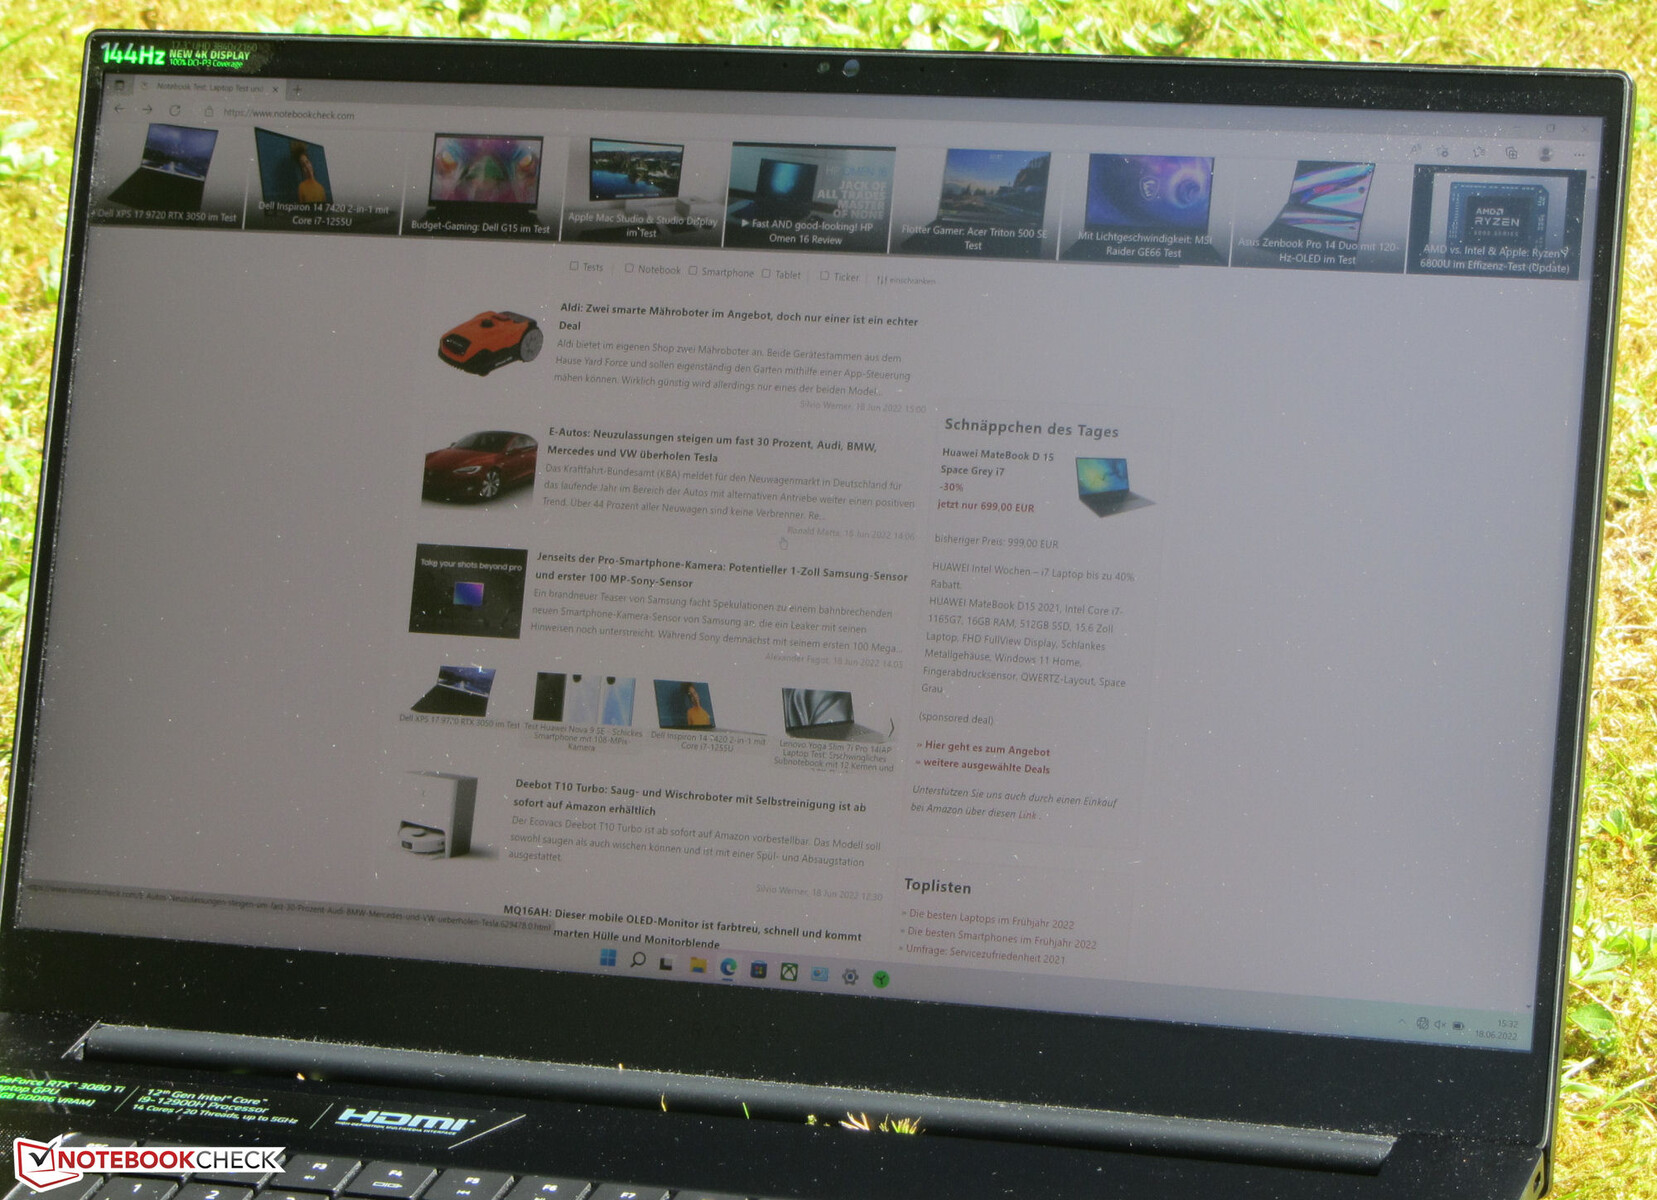
Display - Bright and with accurate colors
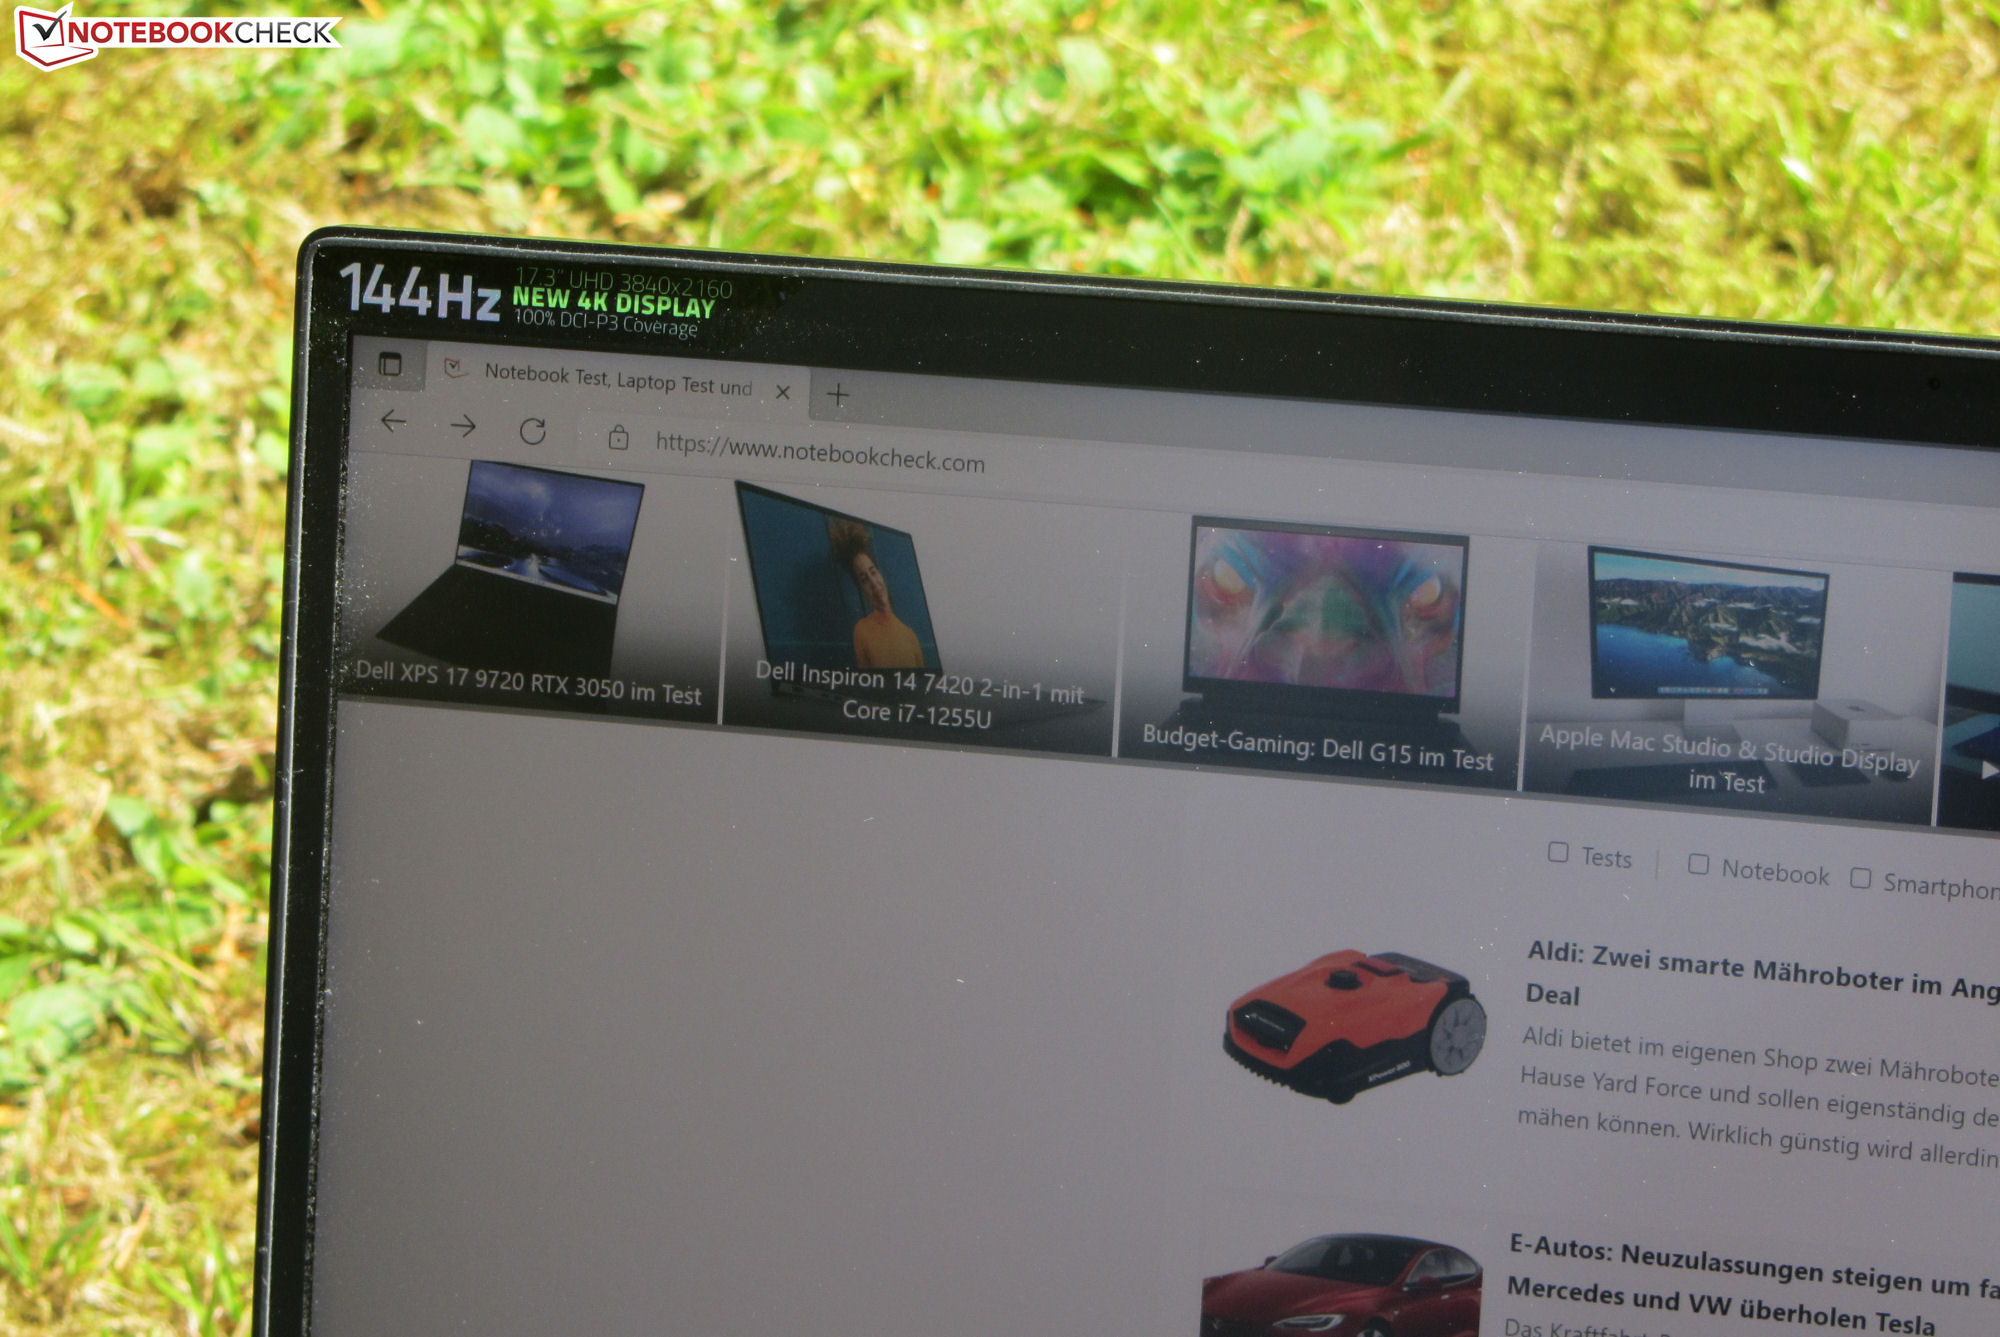
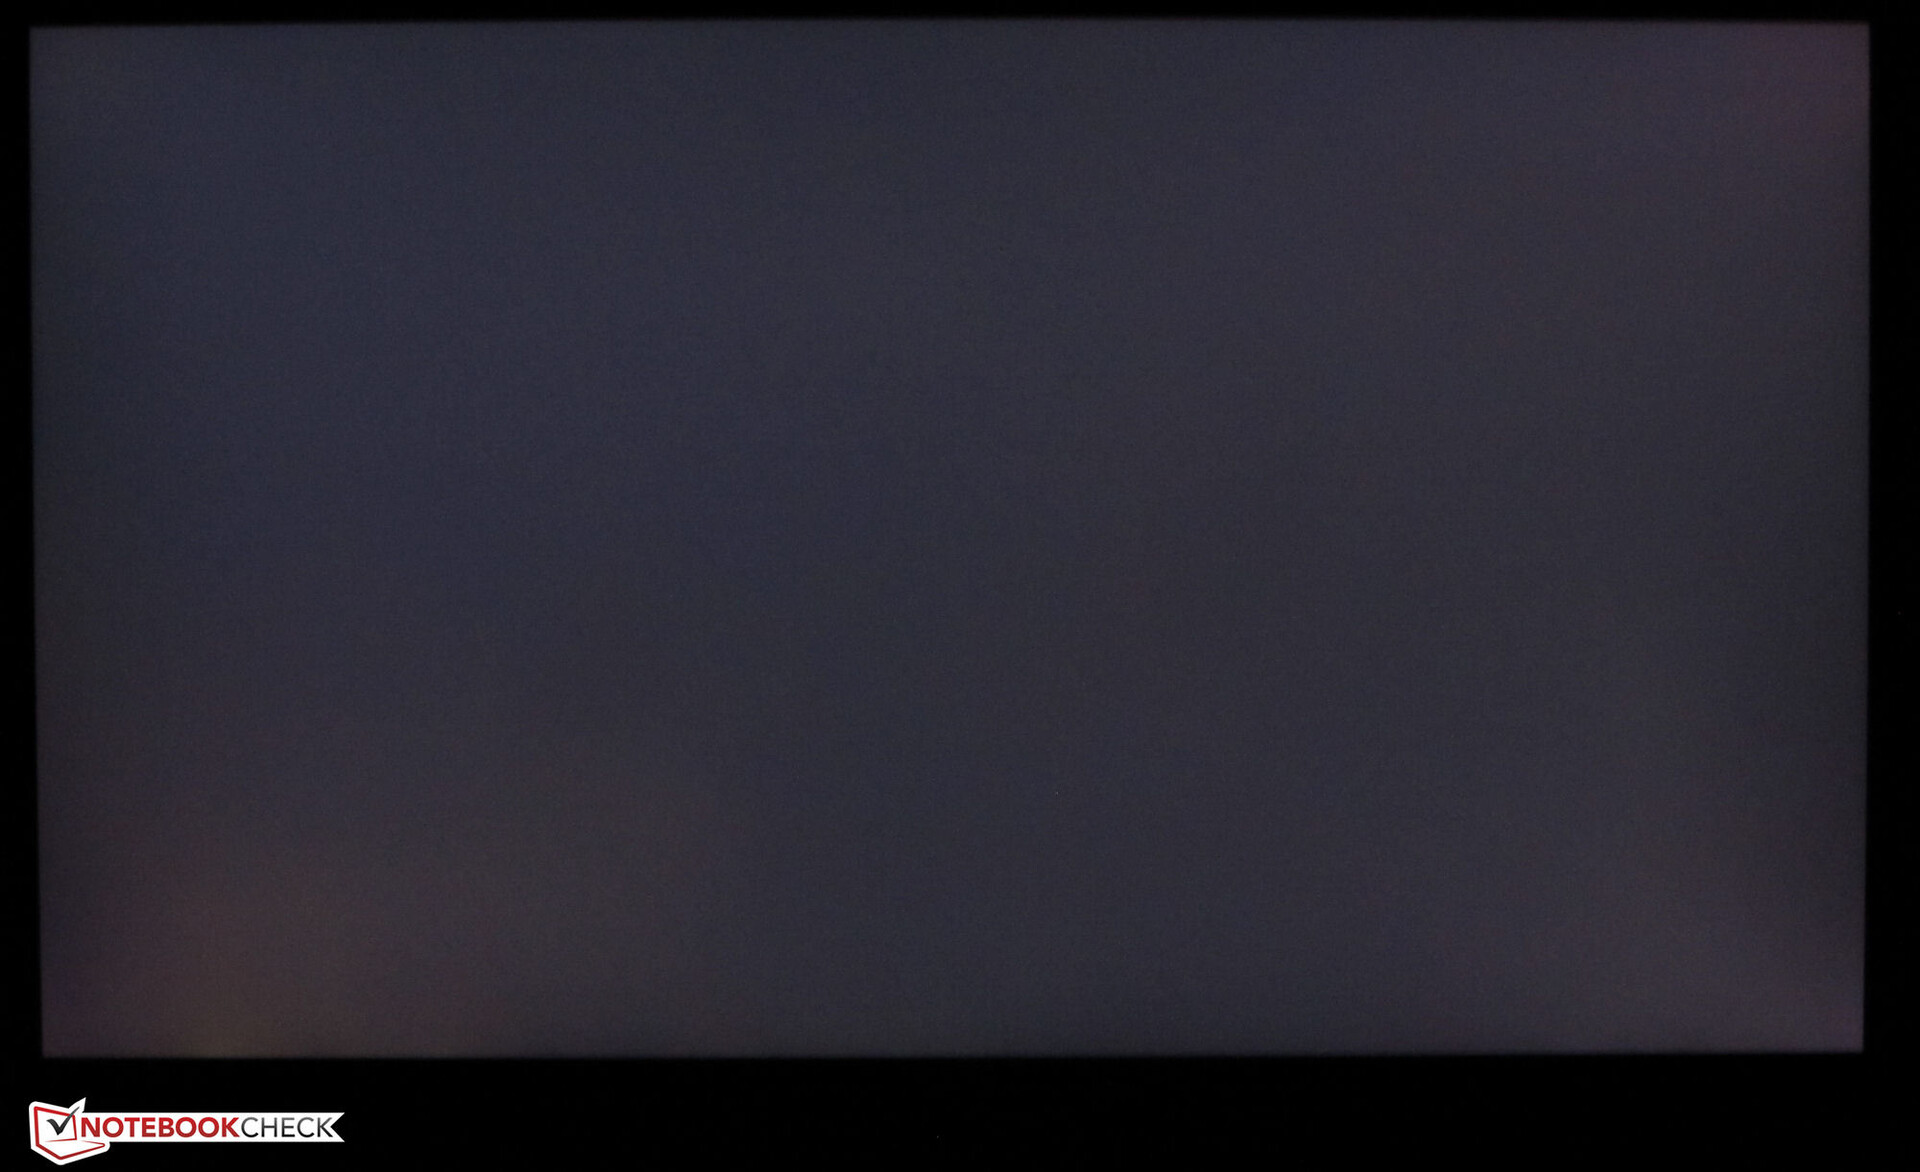
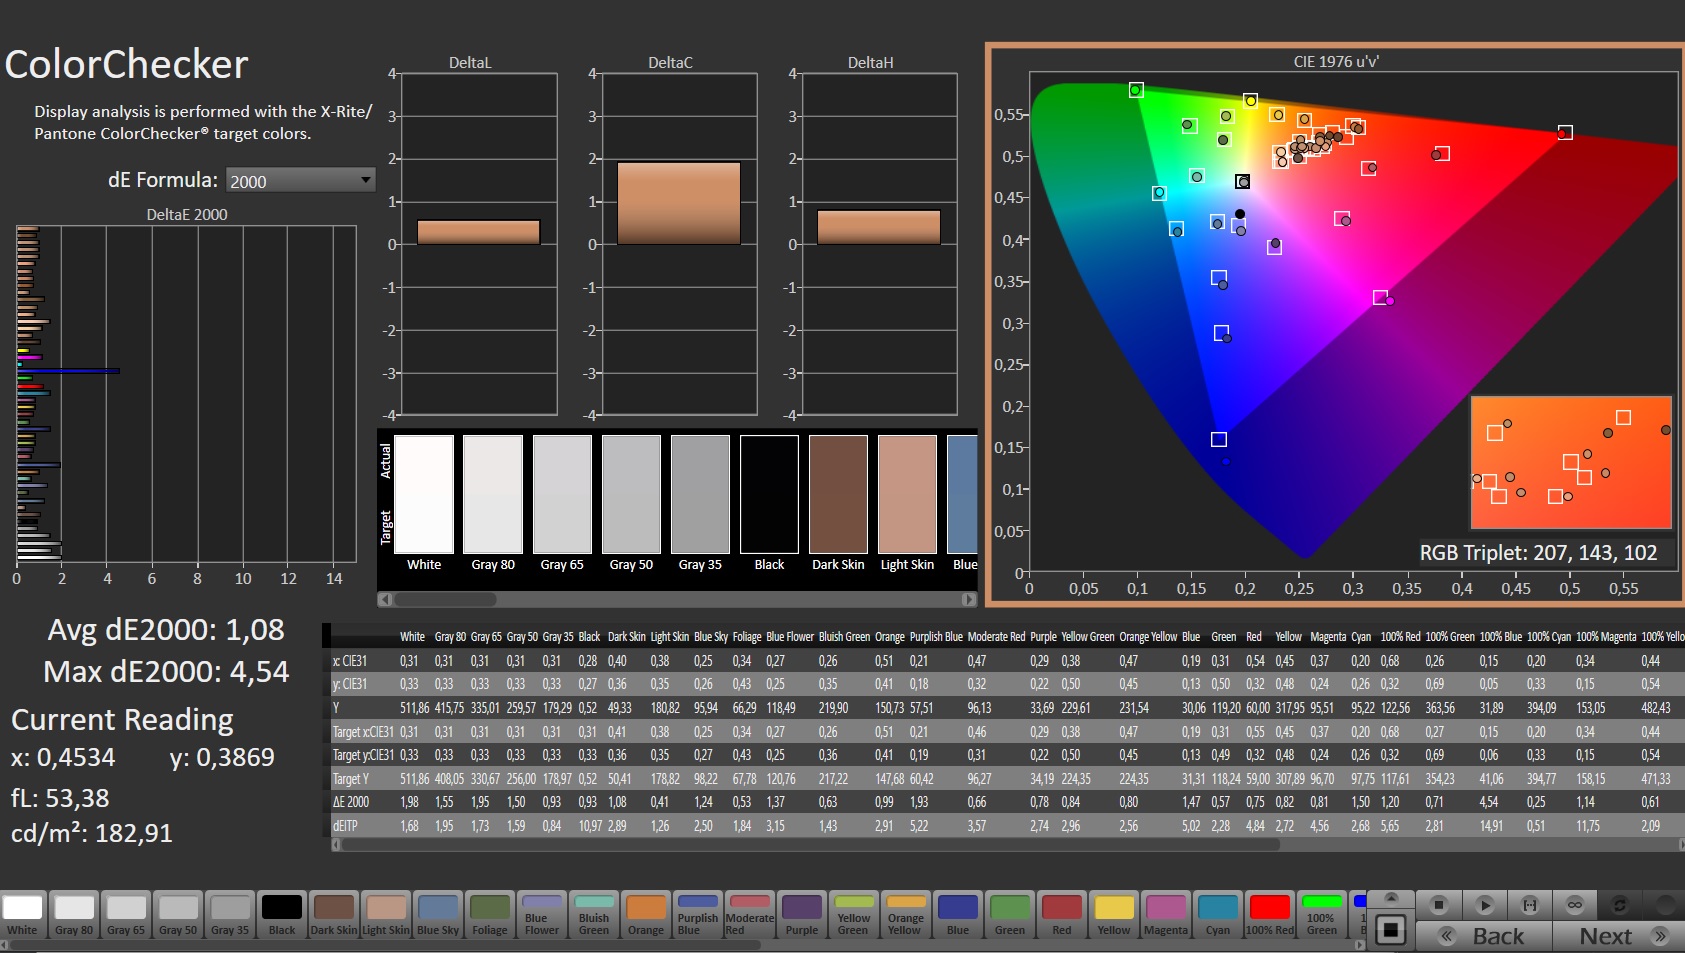
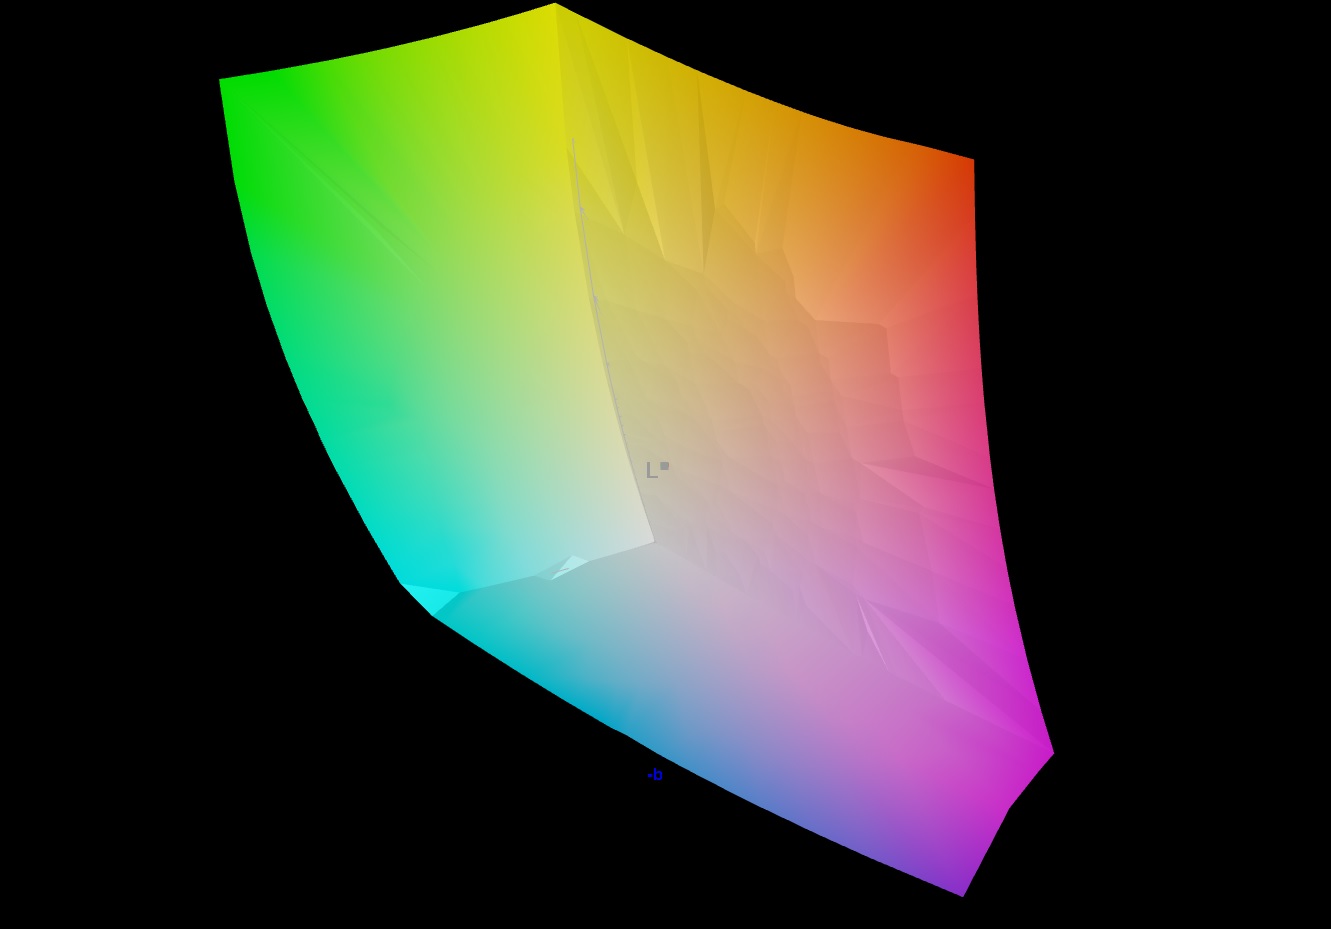
In our test unit, Razer uses an impressive 17.3-inch display with a 4K resolution (3840 x 2160 pixels) and 144 Hz refresh rate that offers a higher brightness (486.3 cd/m²) and shorter response times than the displays of the competitors. This also goes for the comparison with the QHD panel of the US sibling model that we already tested. The contrast of 1,143:1 is also at a high level, and we did not observe any PWM flickering during our measurements.
| |||||||||||||||||||||||||
Brightness Distribution: 84 %
Center on Battery: 503 cd/m²
Contrast: 1143:1 (Black: 0.44 cd/m²)
ΔE ColorChecker Calman: 1.08 | ∀{0.5-29.43 Ø4.71}
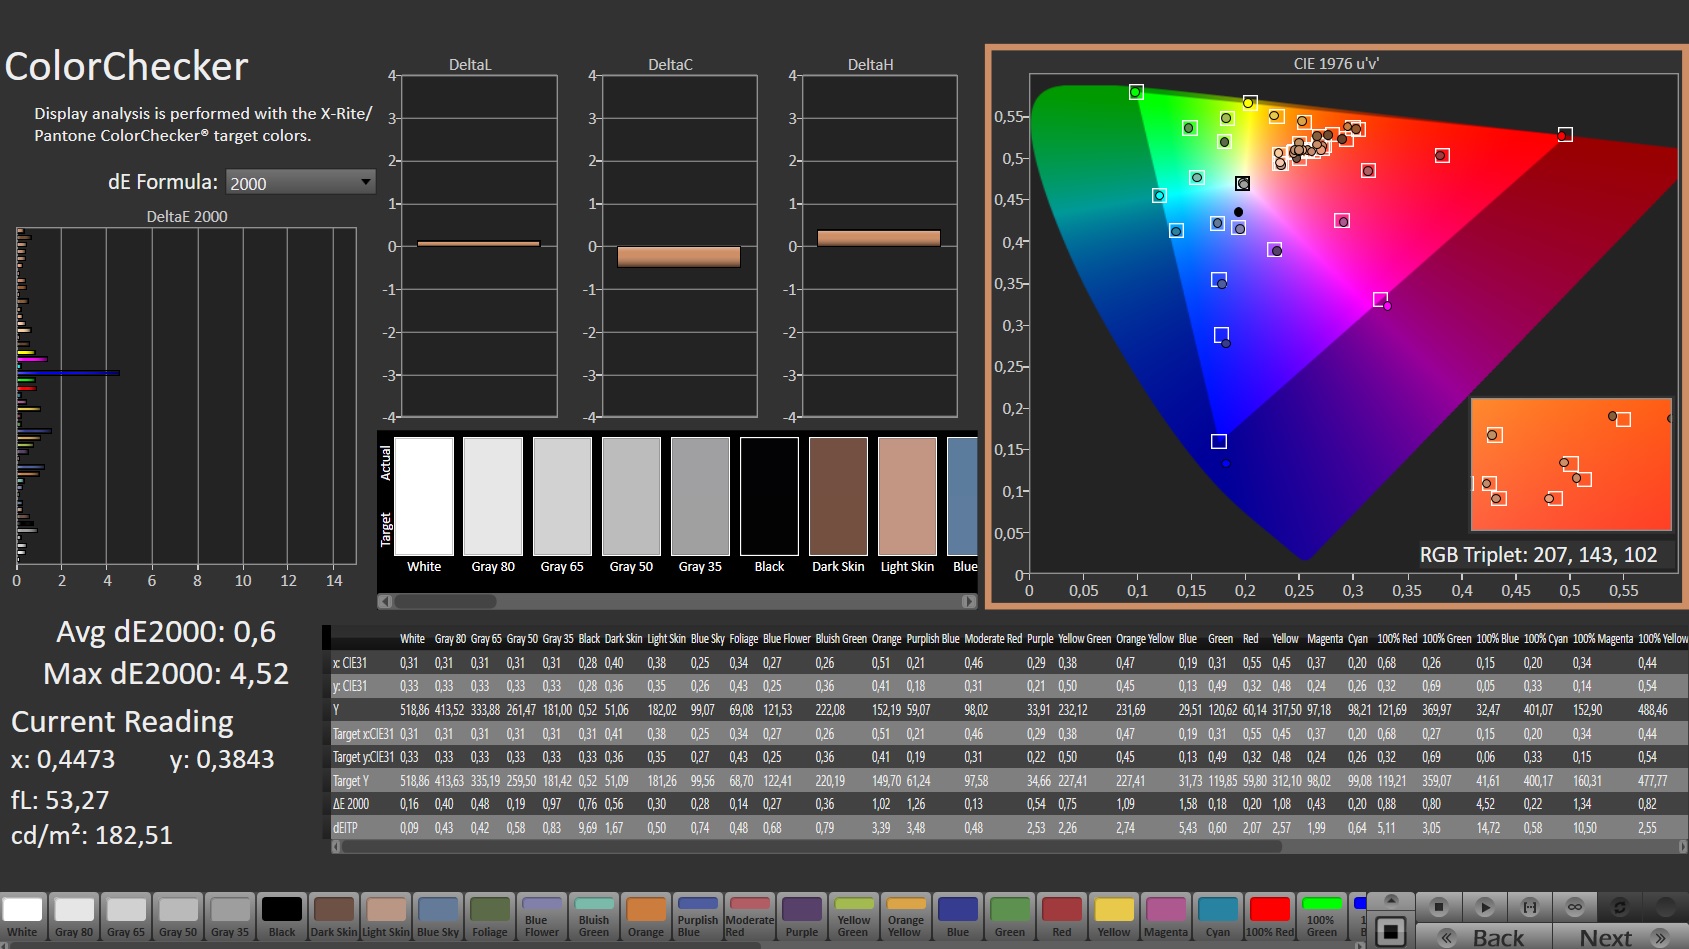
calibrated: 0.6
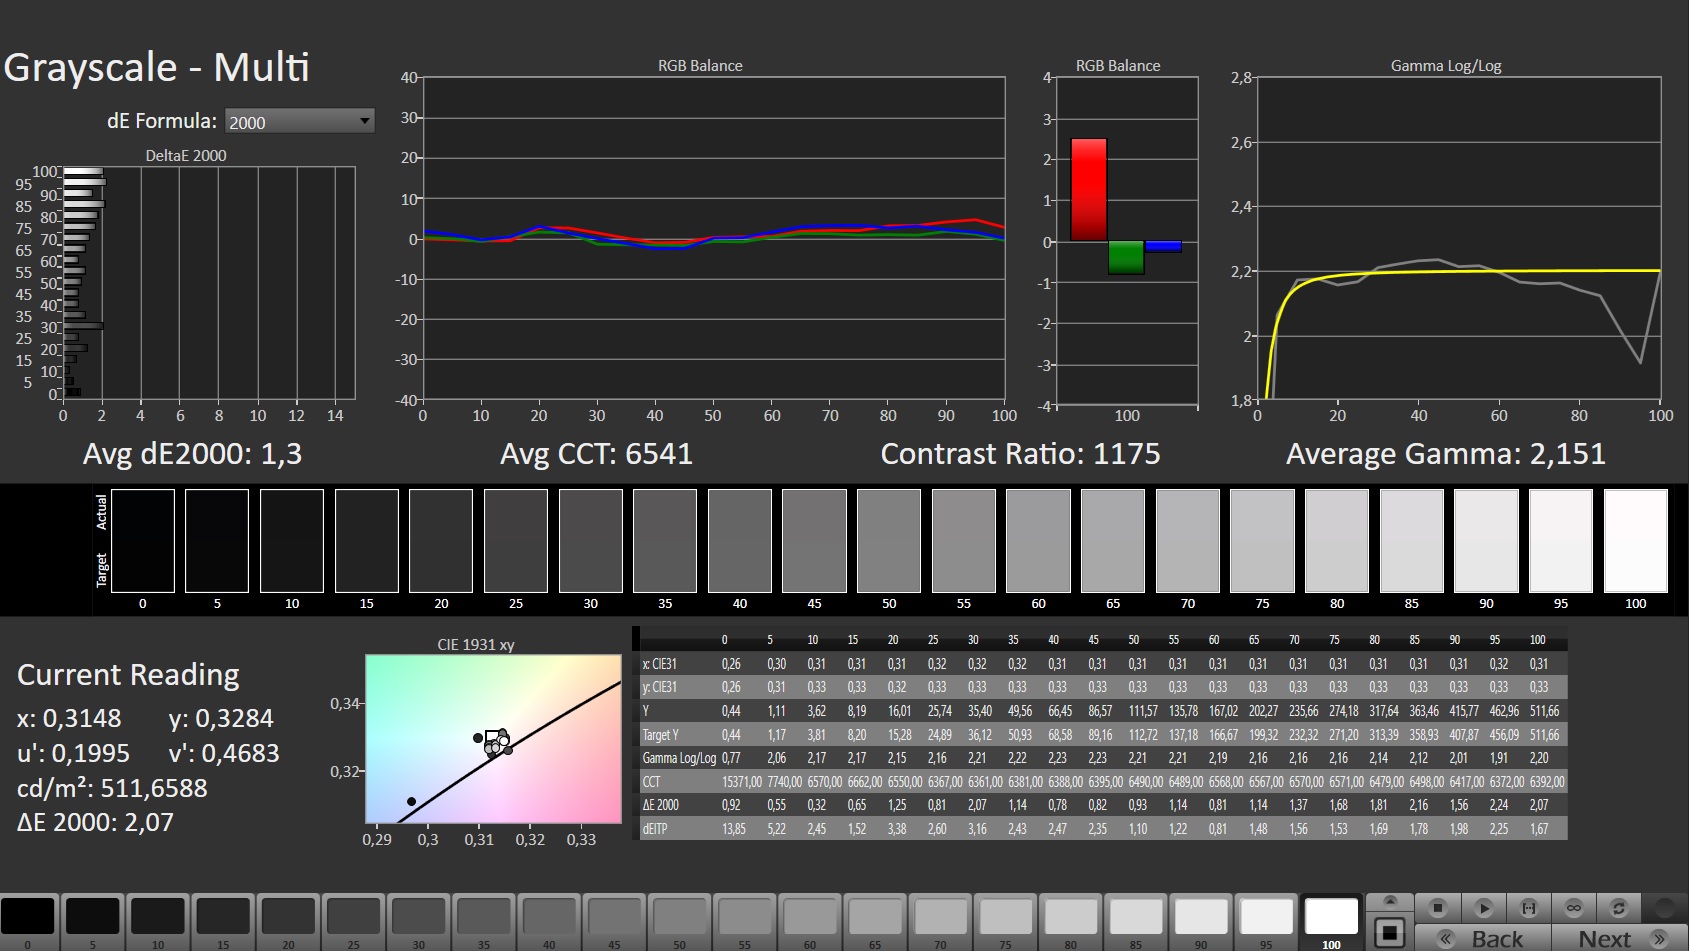
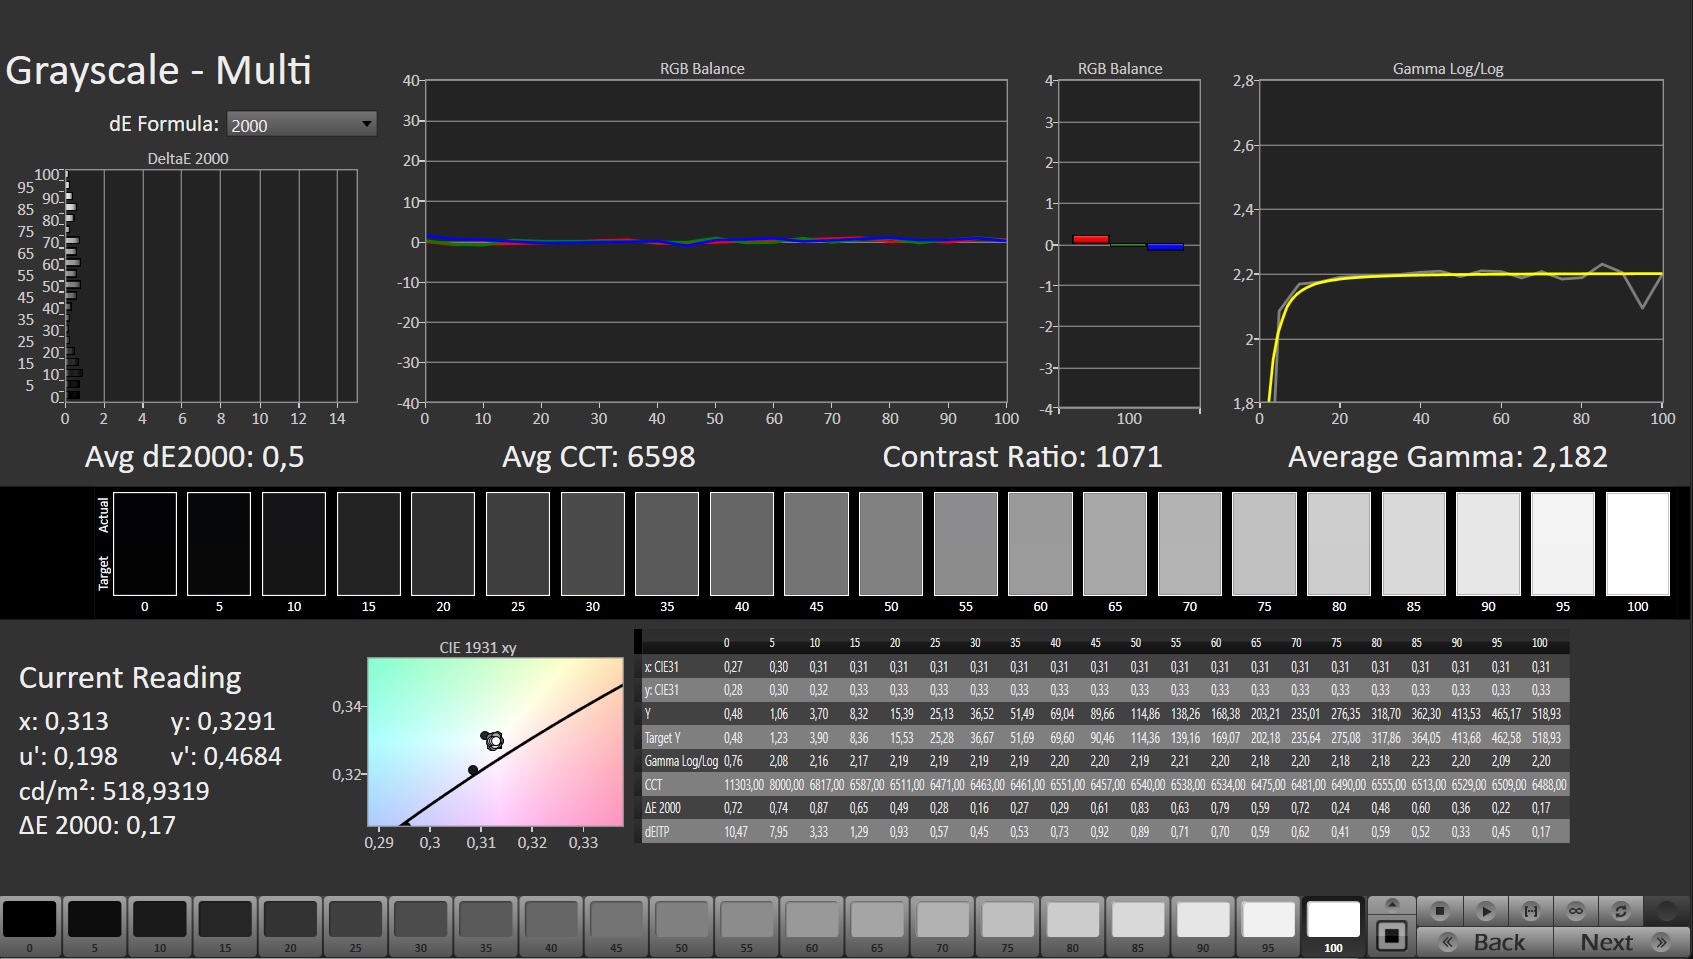
ΔE Greyscale Calman: 1.3 | ∀{0.09-98 Ø4.96}
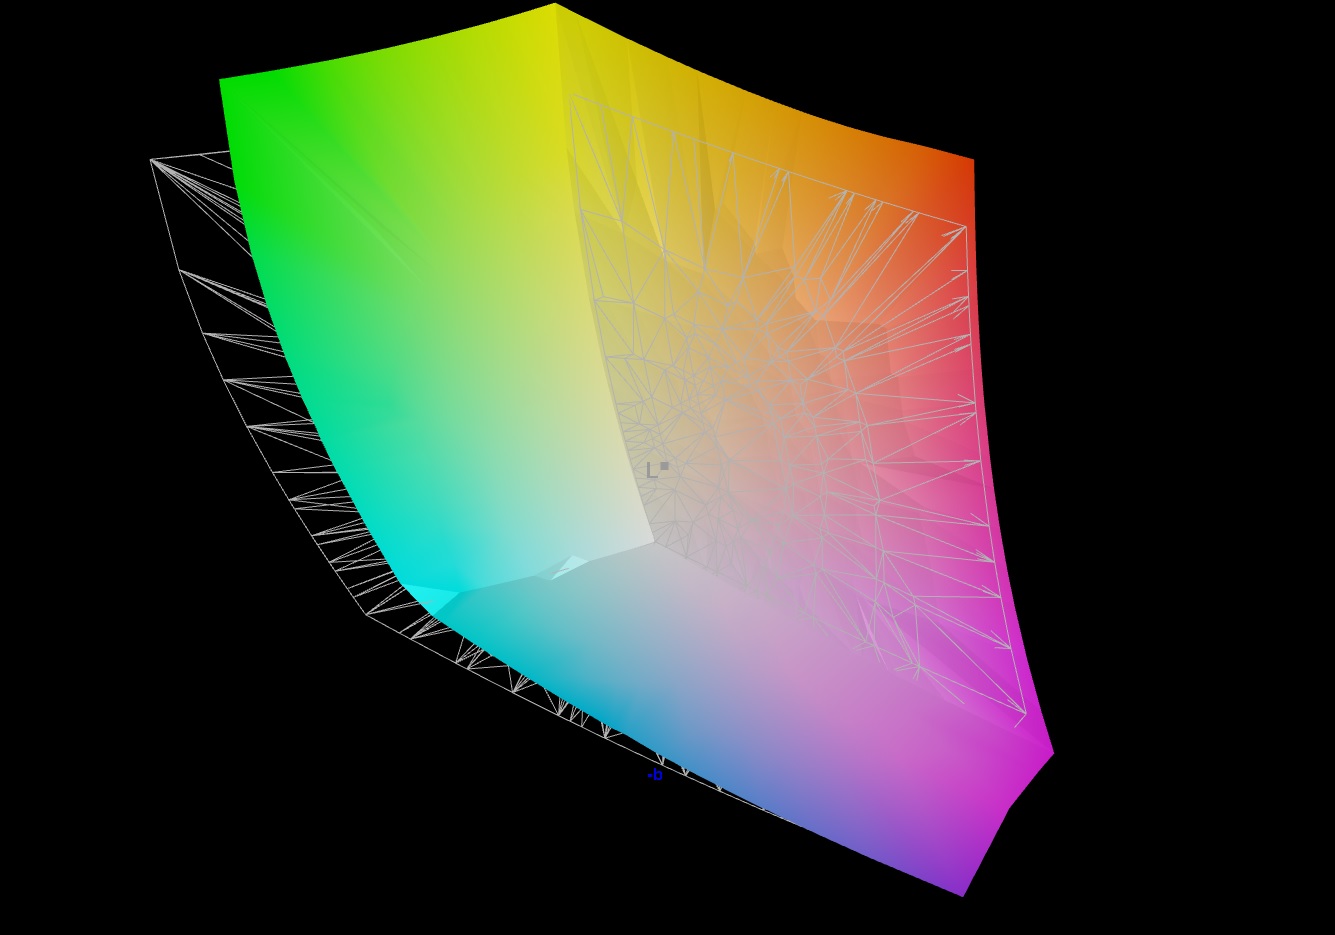
87.3% AdobeRGB 1998 (Argyll 3D)
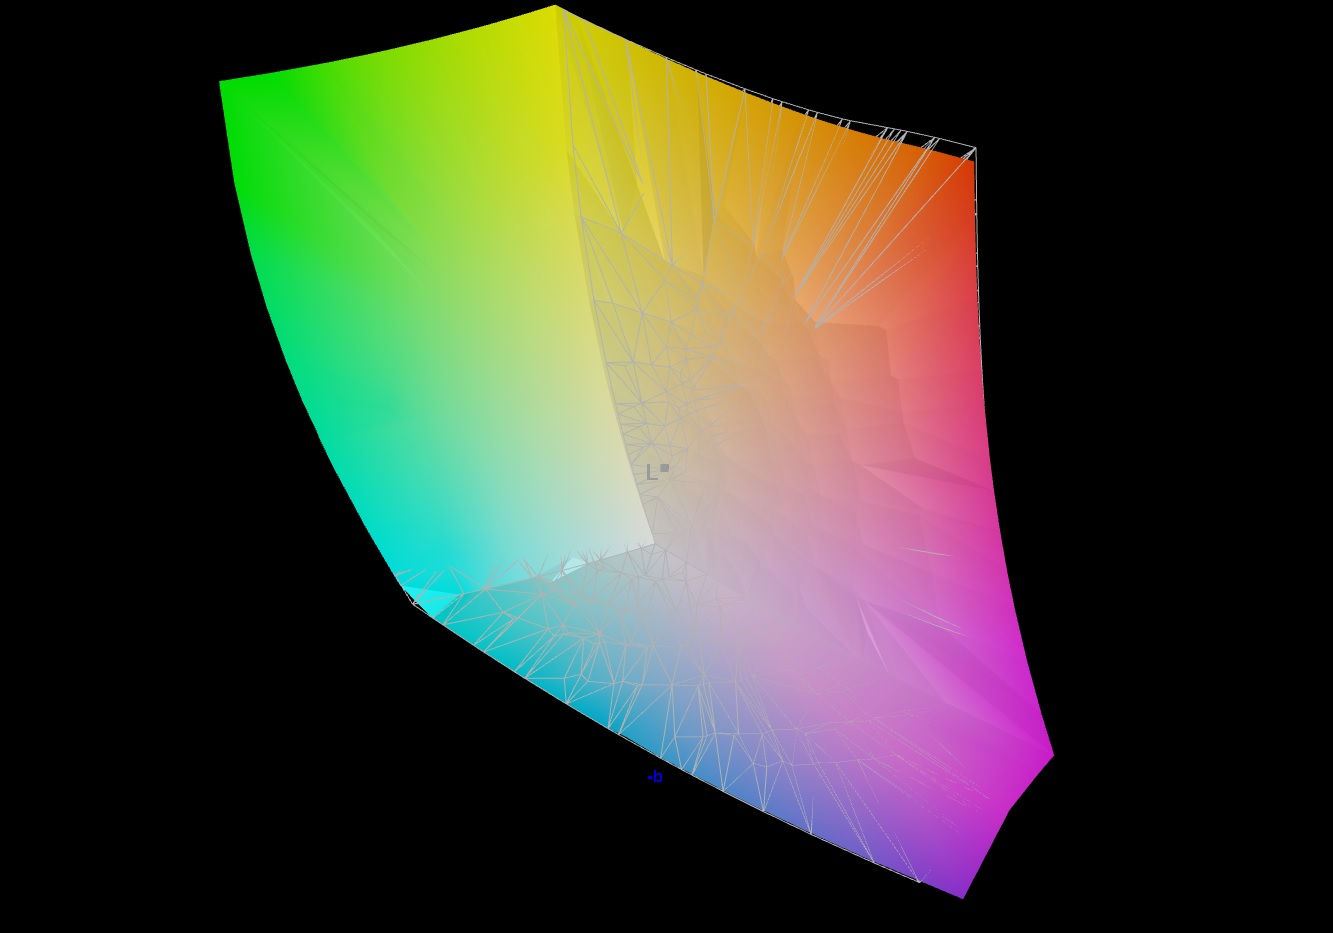
100% sRGB (Argyll 3D)
99.4% Display P3 (Argyll 3D)
Gamma: 2.151
CCT: 6541 K
| Razer Blade 17 Early 2022 AU Optronics B173ZAN06.9, IPS, 3840x2160, 17.3" | Alienware x17 R2 P48E AU Optronics B173HAN, IPS, 1920x1080, 17.3" | Medion Erazer Beast X30 BOE CQ NE173QHM-NZ3, IPS, 2560x1440, 17.3" | MSI Stealth GS77 12UHS-083US BOE NE173QHM-NZ1, IPS, 2560x1440, 17.3" | Razer Blade 17 RTX 3080 Ti BOE NE173QHM-NZ1, IPS, 2560x1440, 17.3" | |
|---|---|---|---|---|---|
| Display | -10% | -18% | -2% | -1% | |
| Display P3 Coverage (%) | 99.4 | 79.2 -20% | 67.7 -32% | 96.2 -3% | 98.7 -1% |
| sRGB Coverage (%) | 100 | 99.8 0% | 97.6 -2% | 99.7 0% | 99.9 0% |
| AdobeRGB 1998 Coverage (%) | 87.3 | 79.6 -9% | 69.2 -21% | 85.8 -2% | 86.2 -1% |
| Response Times | -65% | -73% | -132% | -120% | |
| Response Time Grey 50% / Grey 80% * (ms) | 7.5 ? | 12.4 ? -65% | 14.7 ? -96% | 17.6 ? -135% | 17.6 ? -135% |
| Response Time Black / White * (ms) | 5.6 ? | 9.2 ? -64% | 8.4 ? -50% | 12.8 ? -129% | 11.4 ? -104% |
| PWM Frequency (Hz) | |||||
| Screen | -63% | -58% | -92% | -37% | |
| Brightness middle (cd/m²) | 503 | 365.4 -27% | 377 -25% | 334.8 -33% | 335.9 -33% |
| Brightness (cd/m²) | 486 | 344 -29% | 352 -28% | 305 -37% | 294 -40% |
| Brightness Distribution (%) | 84 | 85 1% | 86 2% | 79 -6% | 75 -11% |
| Black Level * (cd/m²) | 0.44 | 0.29 34% | 0.32 27% | 0.34 23% | 0.38 14% |
| Contrast (:1) | 1143 | 1260 10% | 1178 3% | 985 -14% | 884 -23% |
| Colorchecker dE 2000 * | 1.08 | 3.17 -194% | 2.91 -169% | 4.1 -280% | 2.82 -161% |
| Colorchecker dE 2000 max. * | 4.54 | 7.69 -69% | 6.78 -49% | 7.28 -60% | 5.04 -11% |
| Colorchecker dE 2000 calibrated * | 0.6 | 0.51 15% | 1.3 -117% | ||
| Greyscale dE 2000 * | 1.3 | 5.3 -308% | 3.4 -162% | 5.6 -331% | 1.7 -31% |
| Gamma | 2.151 102% | 2.18 101% | 2.109 104% | 2.16 102% | 2.14 103% |
| CCT | 6541 99% | 5879 111% | 7273 89% | 6314 103% | 6382 102% |
| Total Average (Program / Settings) | -46% /
-52% | -50% /
-51% | -75% /
-77% | -53% /
-41% |
* ... smaller is better
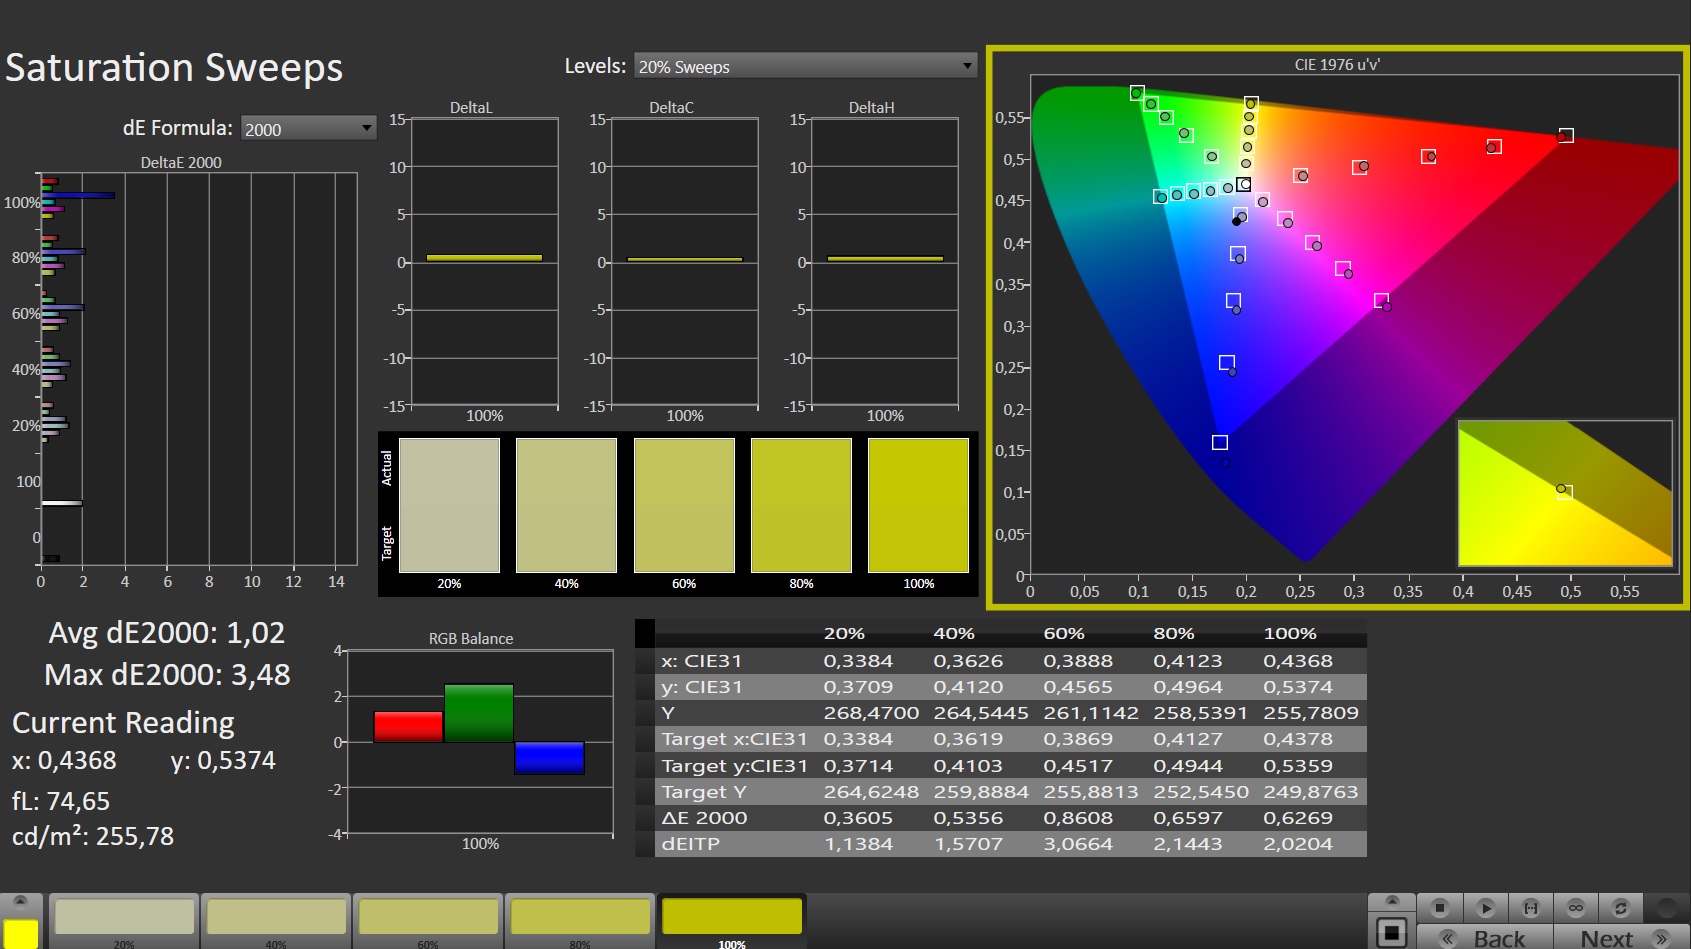
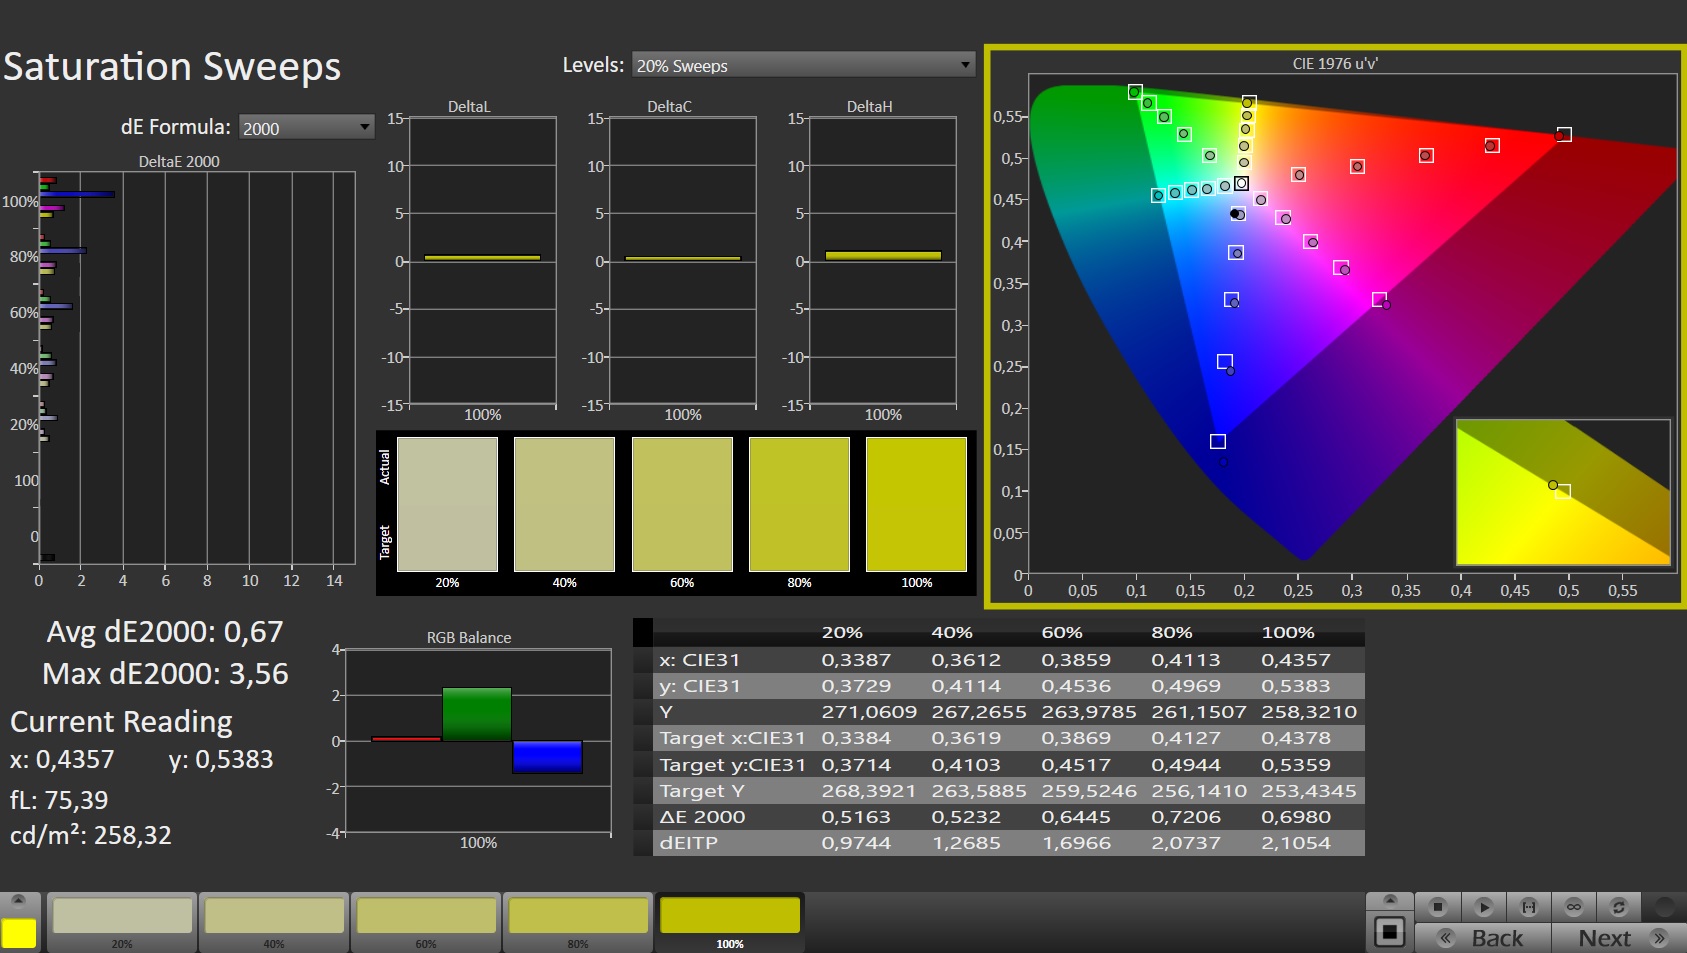
In terms of the color reproduction and color space coverage, the 4K panel and the QHD panel of the sibling model are similar, with both models delivering good values of almost identical levels already in the state of delivery. The average color deviations remain within the target range of DeltaE < 3. A calibration brings further improvements, and our profile file is linked in the info window on the display above for your free download. However, the 4K panel shows some slight weakness in the blue tones even after the calibration. Both displays are able to cover the sRGB and DCI-P3 color spaces completely, and the AdobeRGB color space is at least covered to 86 and 87% respectively.
Display Response Times
| ↔ Response Time Black to White | ||
|---|---|---|
| 5.6 ms ... rise ↗ and fall ↘ combined | ↗ 1.6 ms rise | 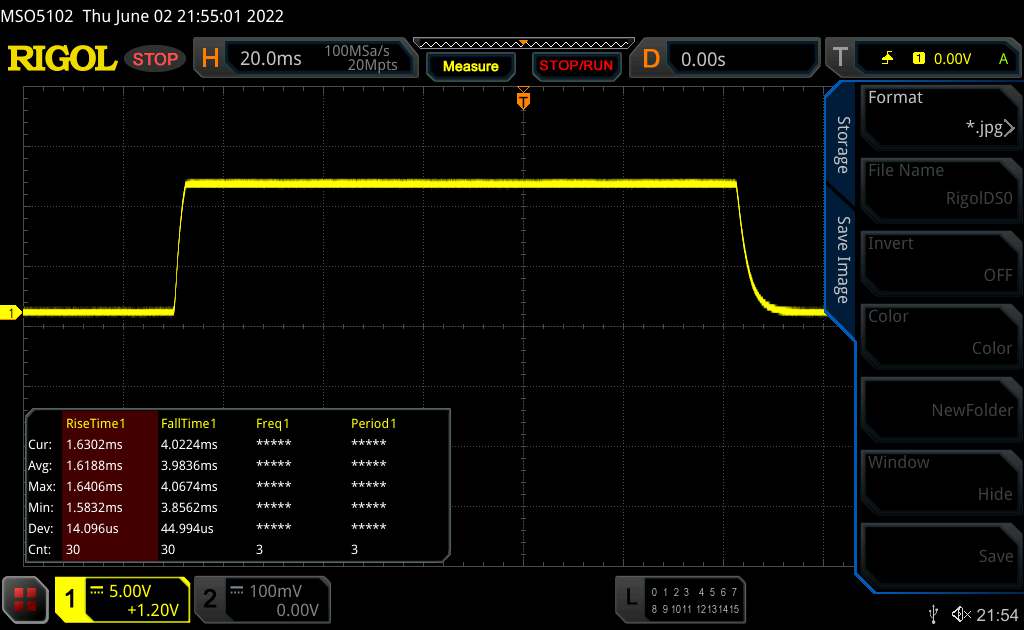 |
| ↘ 4 ms fall | ||
| The screen shows very fast response rates in our tests and should be very well suited for fast-paced gaming. In comparison, all tested devices range from 0.1 (minimum) to 240 (maximum) ms. » 18 % of all devices are better. This means that the measured response time is better than the average of all tested devices (19.8 ms). | ||
| ↔ Response Time 50% Grey to 80% Grey | ||
| 7.5 ms ... rise ↗ and fall ↘ combined | ↗ 2.1 ms rise | 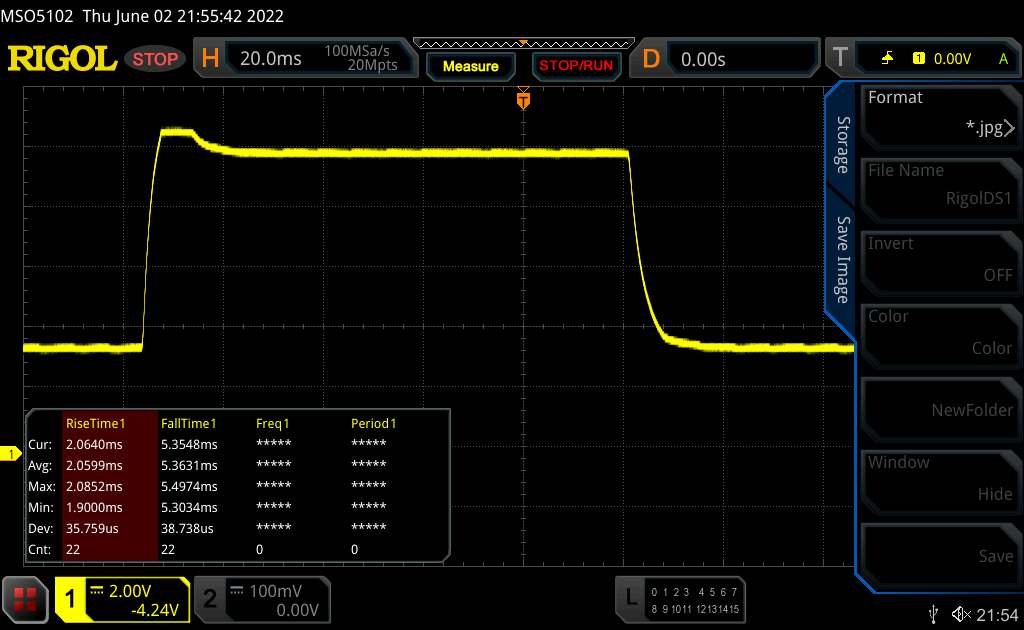 |
| ↘ 5.4 ms fall | ||
| The screen shows very fast response rates in our tests and should be very well suited for fast-paced gaming. In comparison, all tested devices range from 0.165 (minimum) to 636 (maximum) ms. » 20 % of all devices are better. This means that the measured response time is better than the average of all tested devices (31 ms). | ||
Screen Flickering / PWM (Pulse-Width Modulation)
| Screen flickering / PWM not detected | 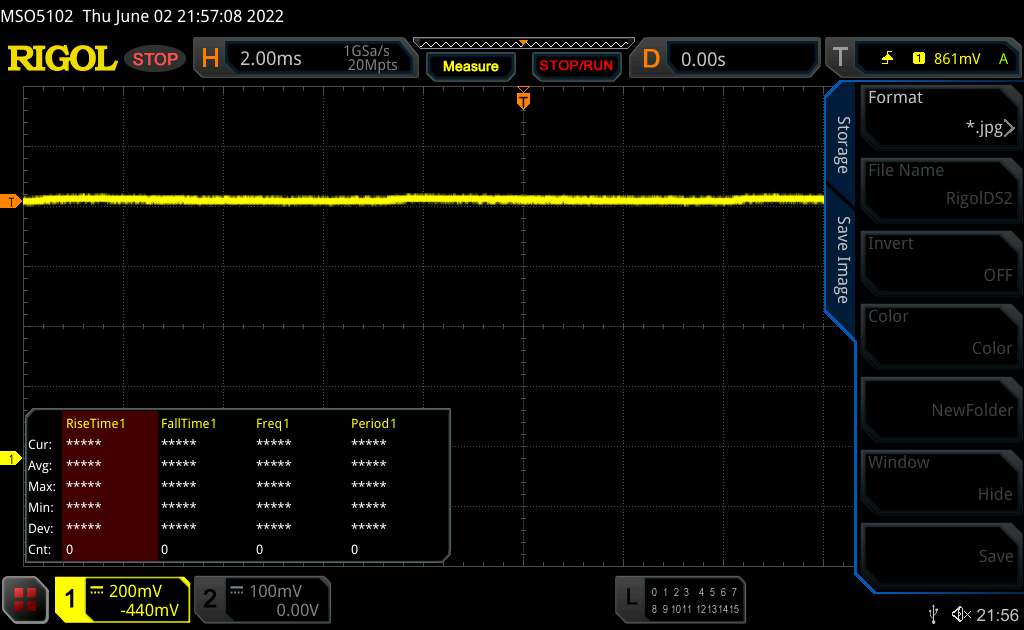 | ||
In comparison: 52 % of all tested devices do not use PWM to dim the display. If PWM was detected, an average of 7757 (minimum: 5 - maximum: 343500) Hz was measured. | |||
The IPS panel offers stable viewing angles and can be read from any angle. Thanks to the fairly high display brightness, you can also read its contents easily outdoors.

Performance - The Razer laptop uses Alder Lake and Ampere
With the Blade 17, Razer offers a 17.3-inch gaming laptop that is able to bring all the current games to the display smoothly.
Test Conditions
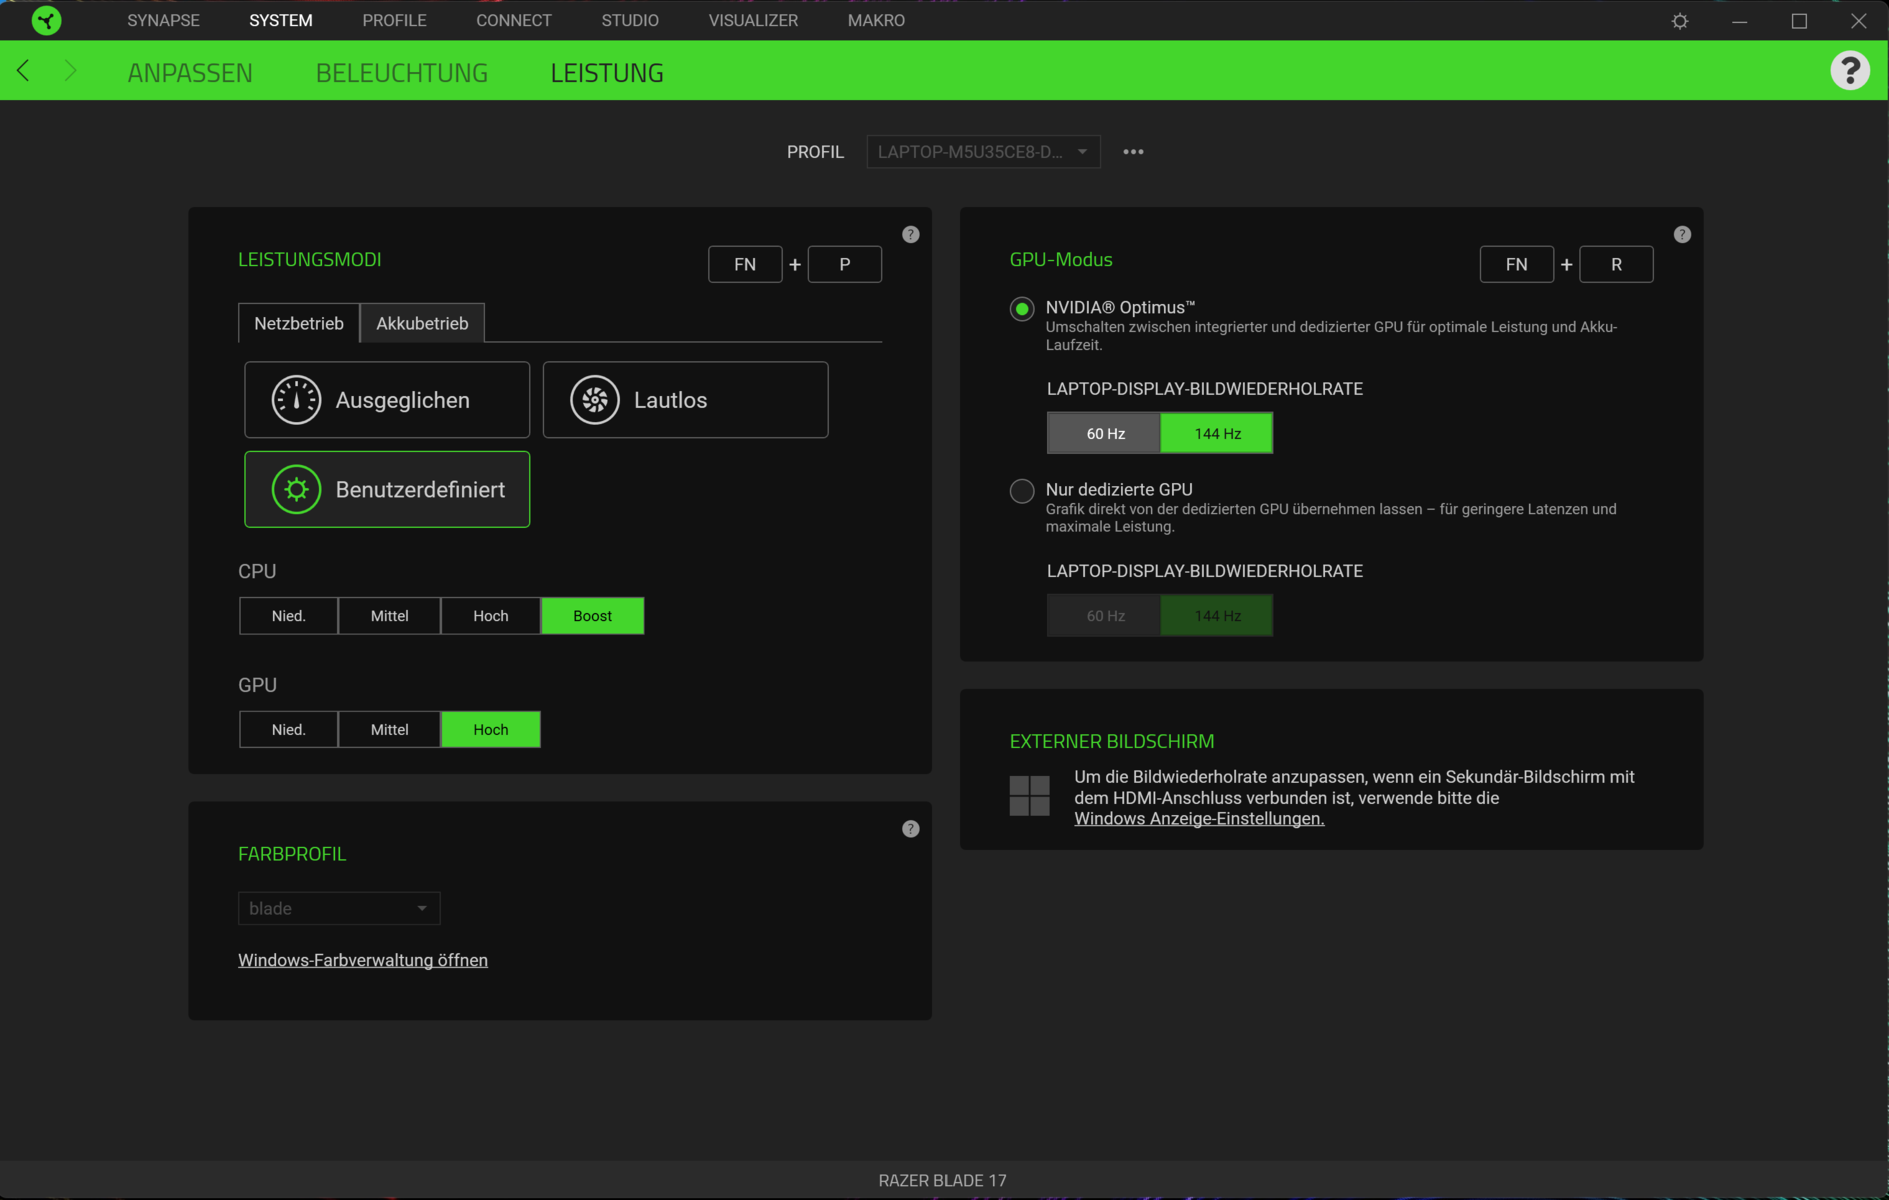
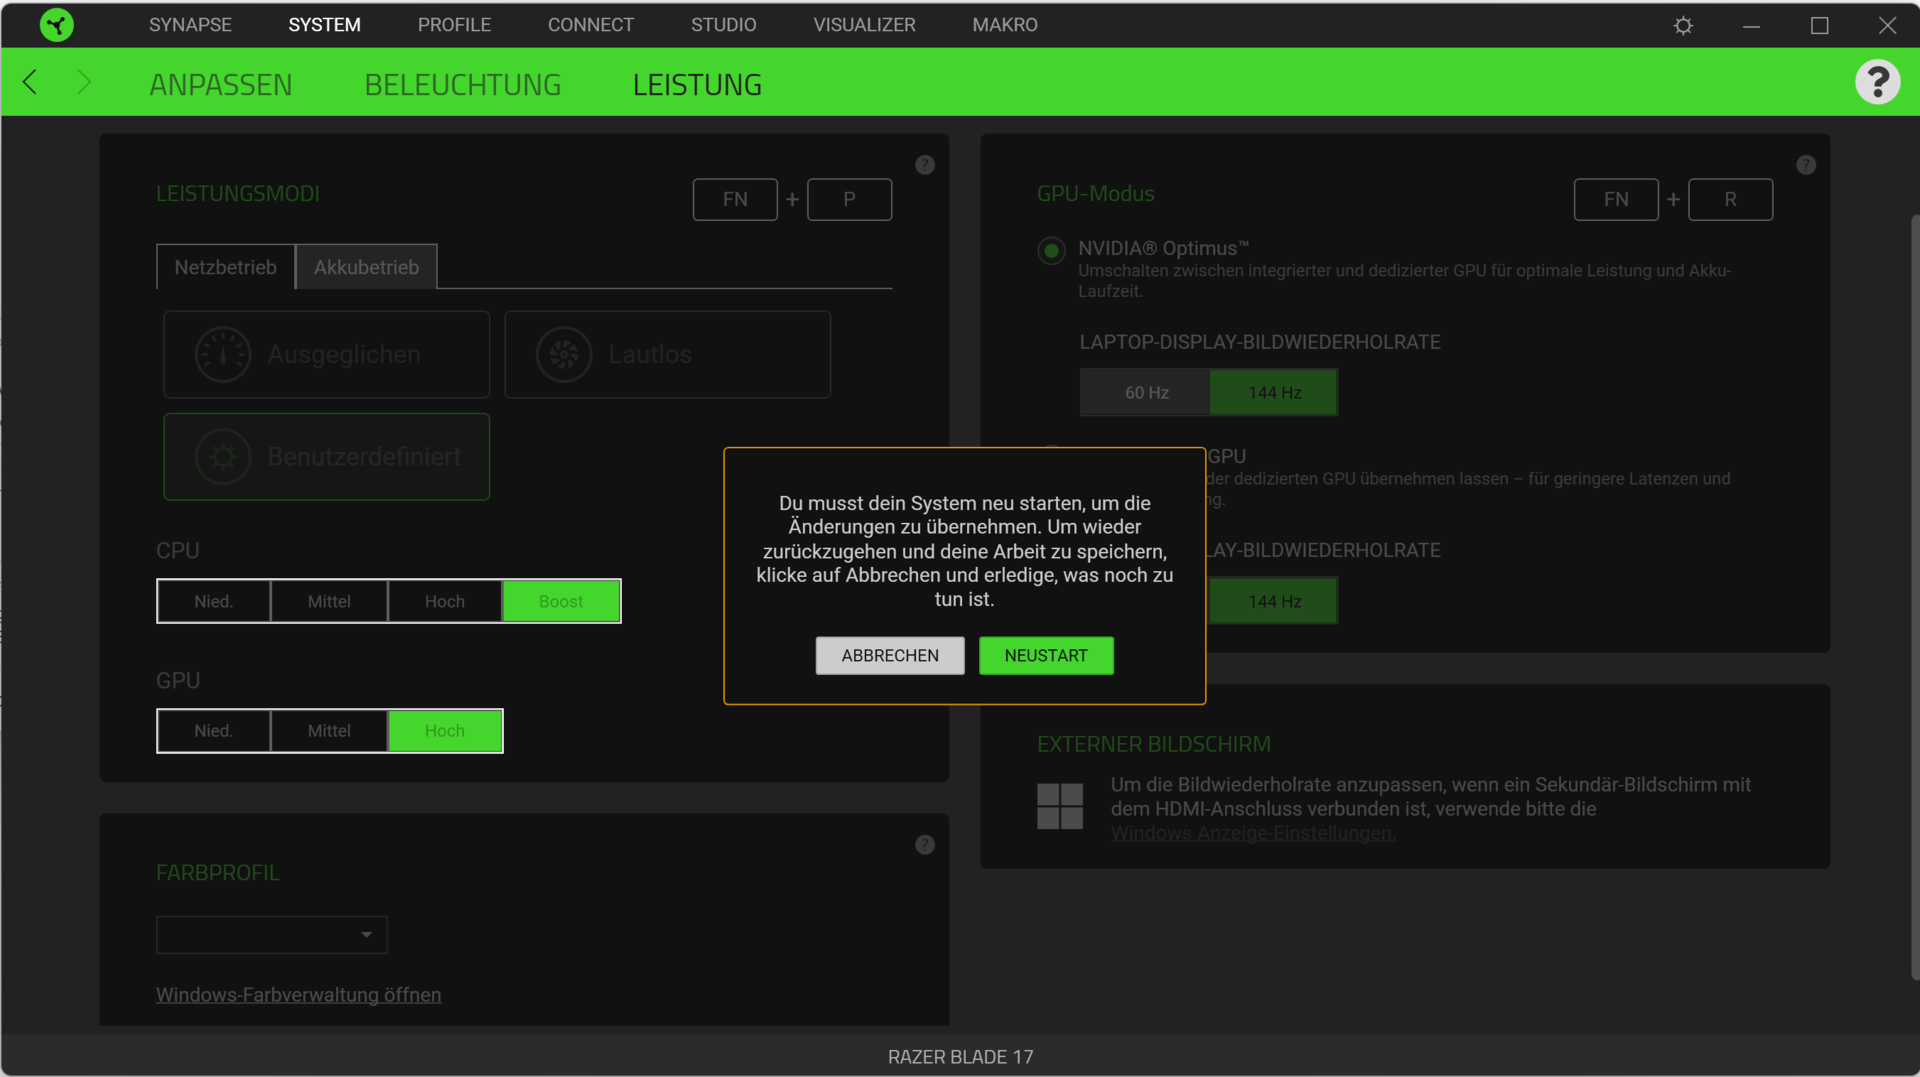
You can switch between the three available performance profiles ("Balanced," "Silent," and "User defined") by using the "Fn" + "P" key combination. The "User defined" profile allows you to set the sub-presets for the CPU ("Low," "Medium," "High," and "Boost") and GPU ("Low," "Medium," and "High") via the Razer Synapse software. In battery operation, the only profile available is "Balanced."
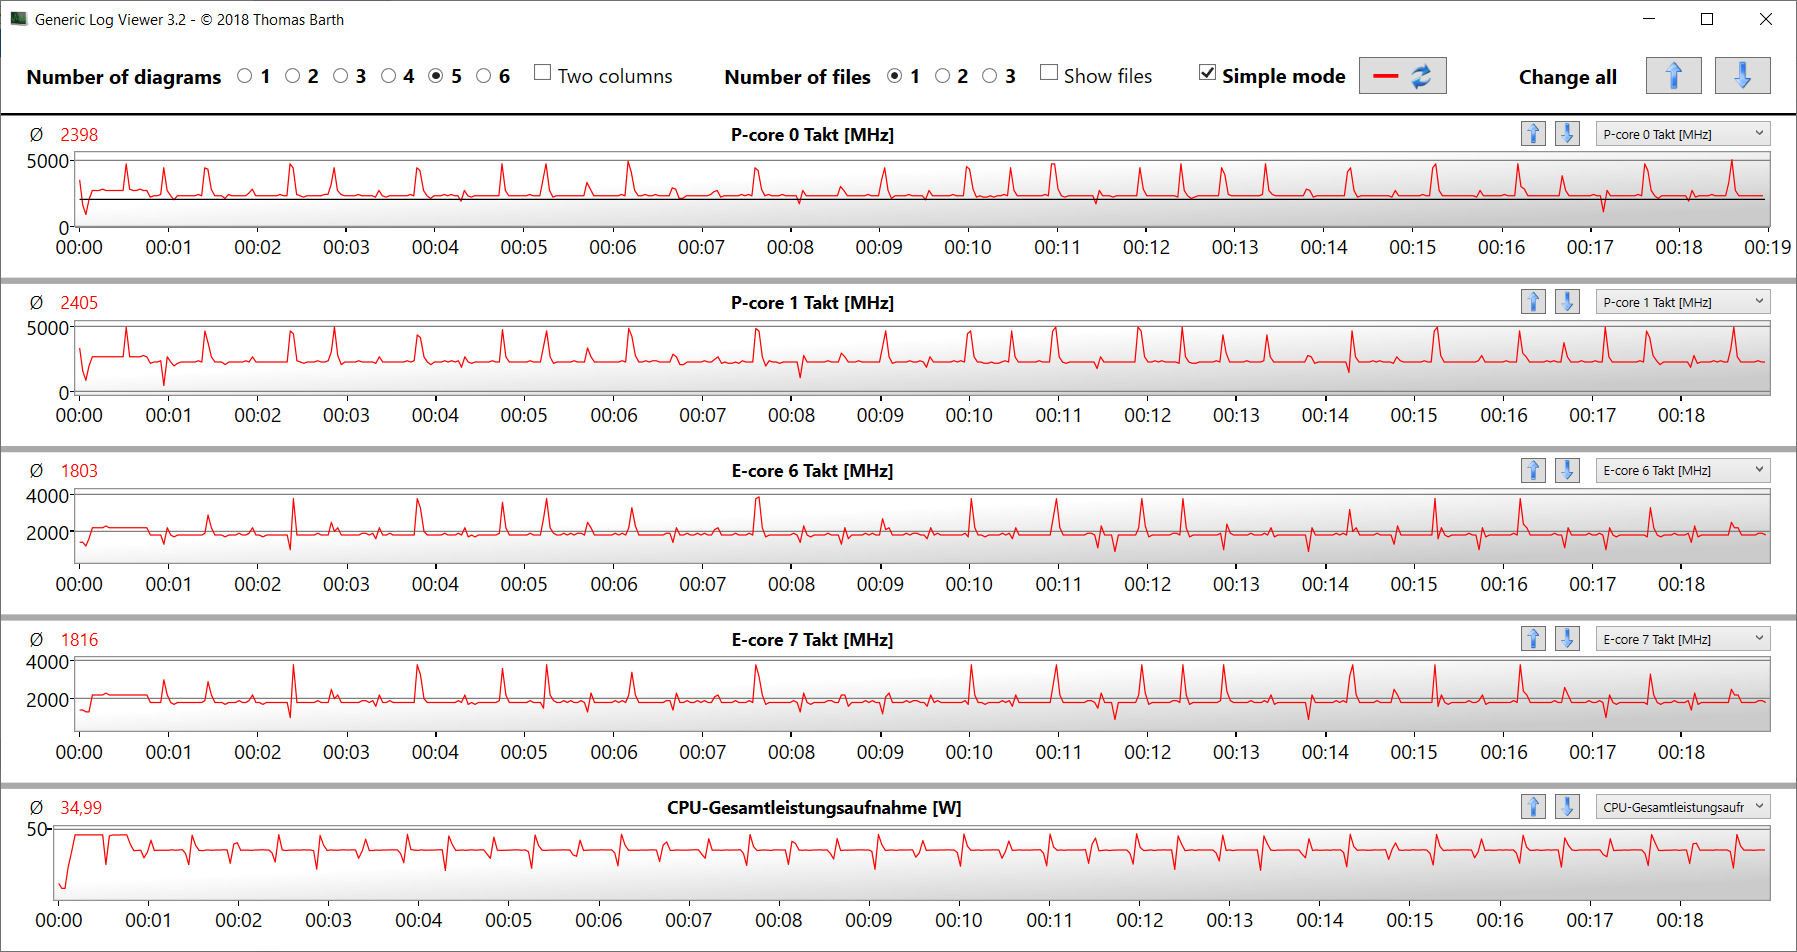
During our test, we used the "User defined" profile with the "Medium" (CPU) and "High" (GPU) sub-presets, which is the default setting in the state of delivery. In addition, we ran several benchmarks using the "Silent" profile, at maximum performance (CPU: "Boost", GPU: "High"), and in the dGPU mode. You can find the results in the charts below.
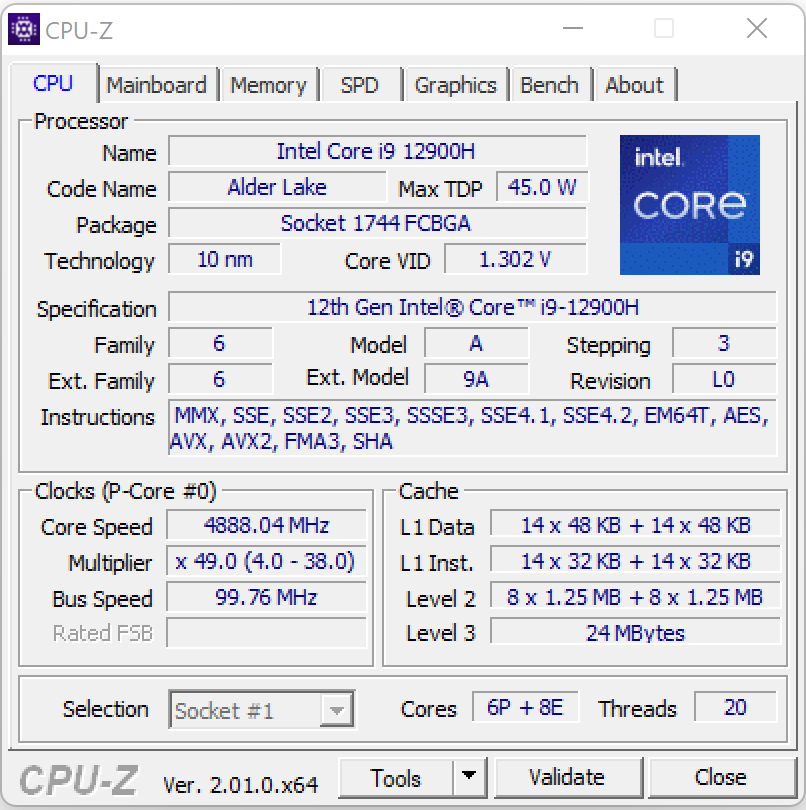
Processor
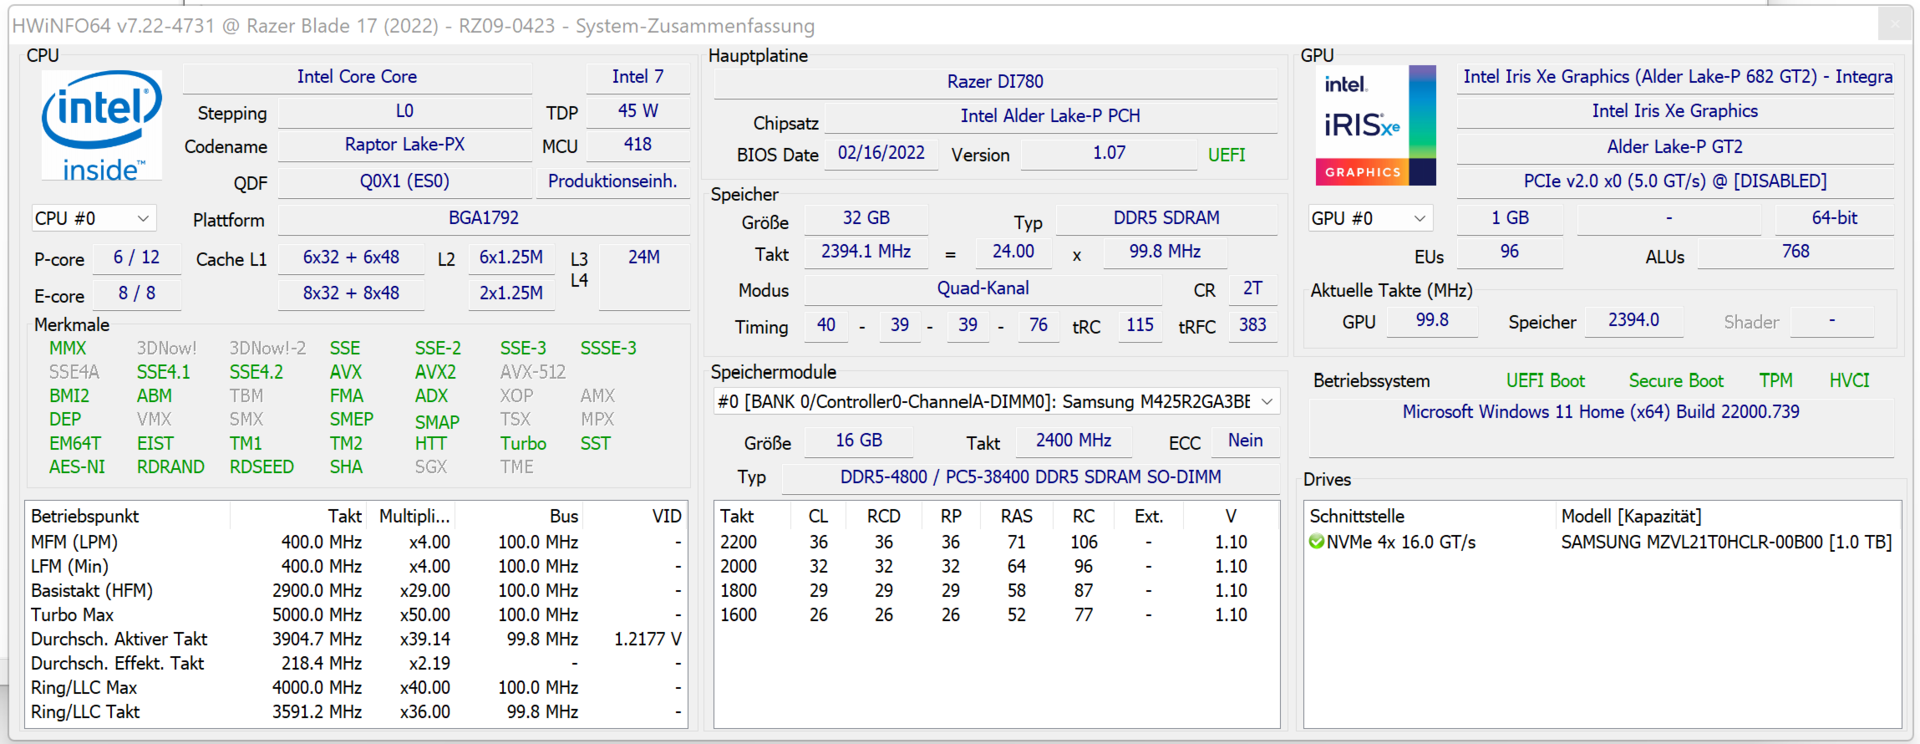
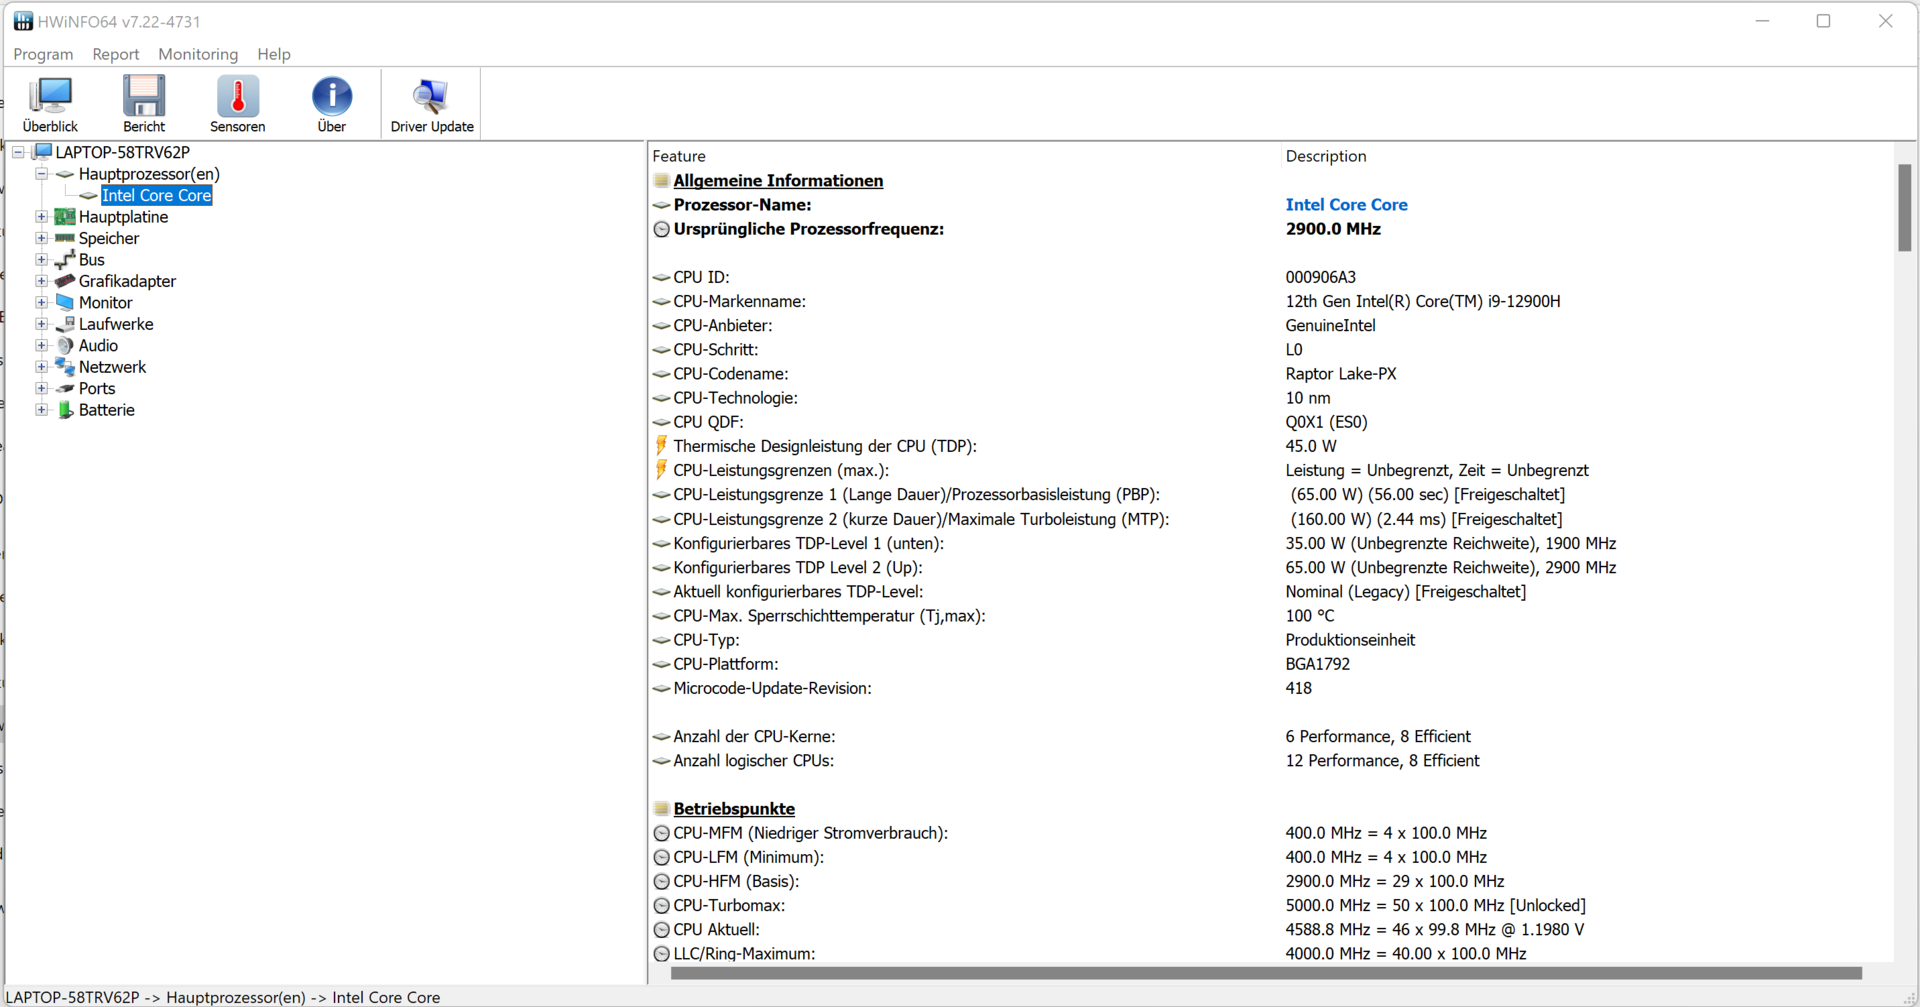
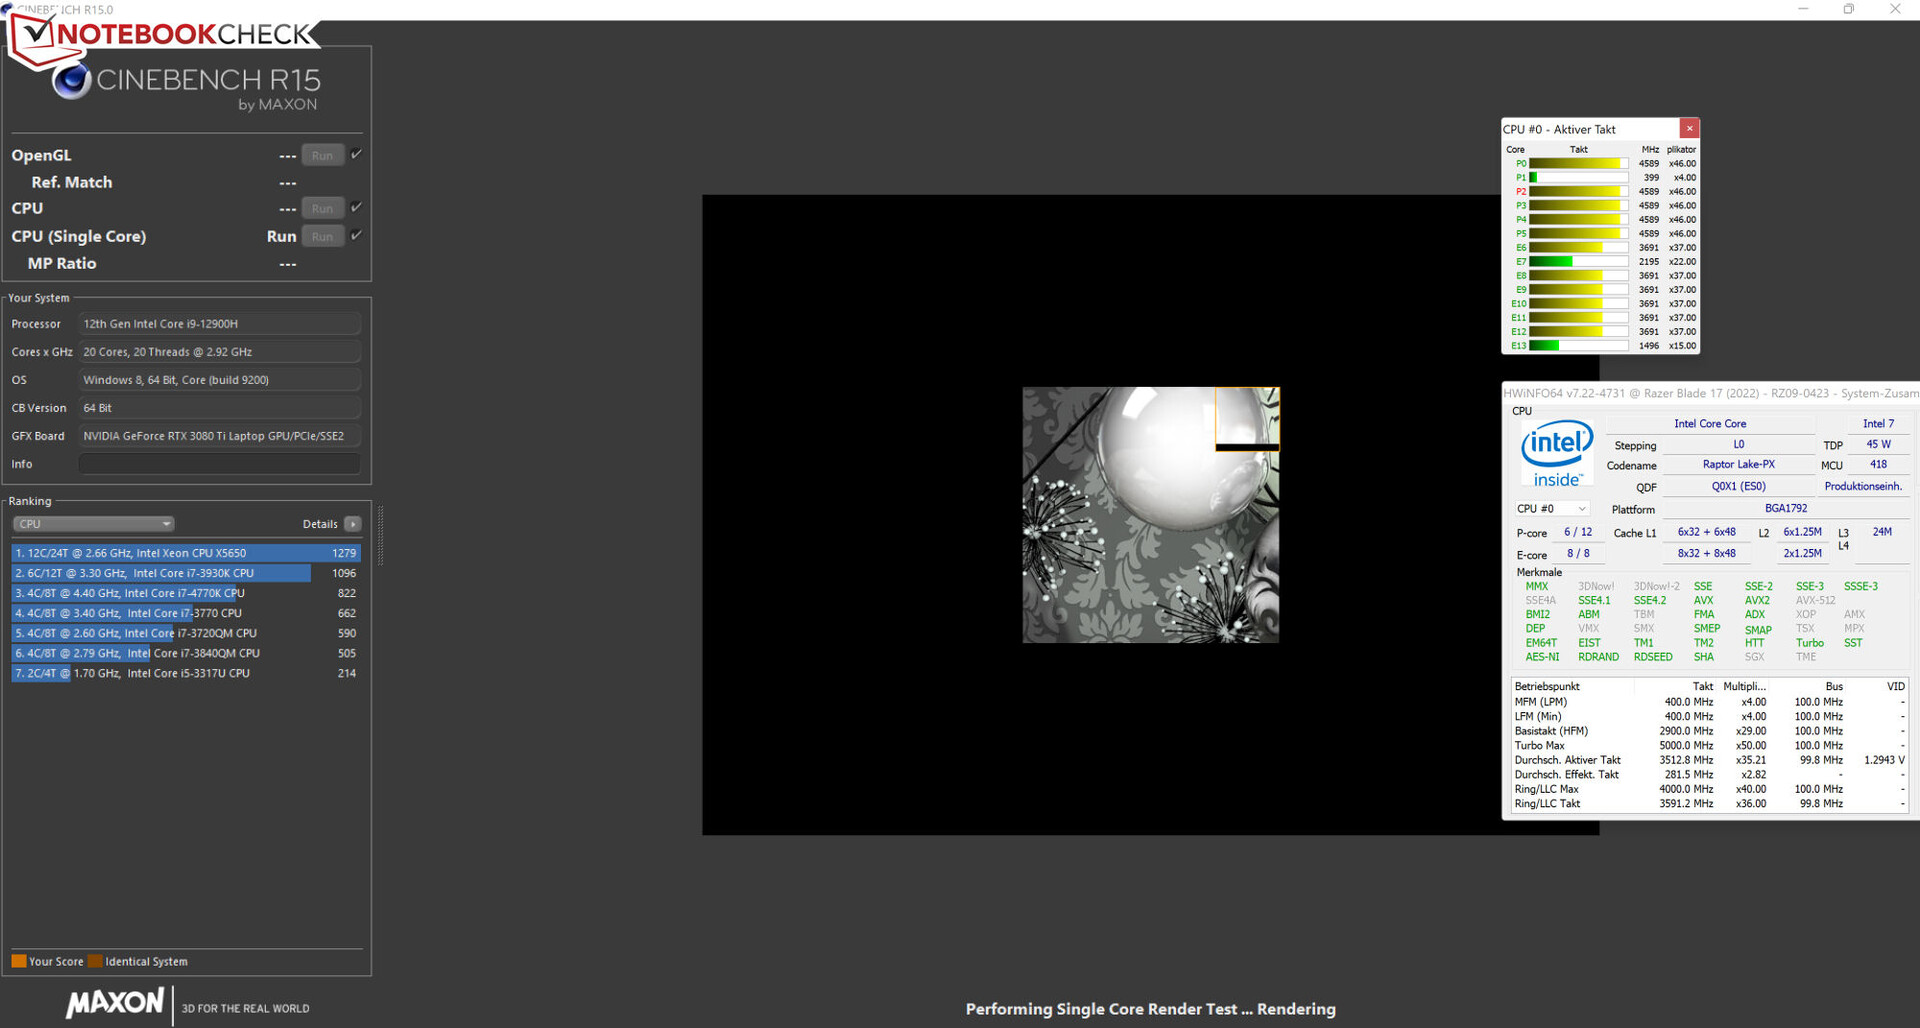
The Core i9-12900H processor (Alder Lake) consists of six performance cores (Hyperthreading, 2.5 to 5 GHz) and eight efficiency cores (no Hyperthreading, 1.8 to 3.8 GHz). In total, this results in 20 logical CPU cores.
During the CB15 Multi Thread test, the "Medium" CPU sub-preset ensures speeds (P cores: 2.6 to 2.7 GHz, E cores: 2.1 GHz) just above the basic clock speed. The Single Thread test completes with high clock speeds (P cores: 4 to 4.6 GHz, E cores: 2.1 to 3.7 GHz). In battery operation, the values are significantly lower.
Using the same CPU presets, the Core i9 only delivers a slight performance advantage in the peaks compared to the Core i7-12800H processor of the sibling model. This is not surprising, since both CPUs offer the same amount of cores and the Core i9 offers a slightly higher maximum speed (5 GHz vs. 4.8 GHz).

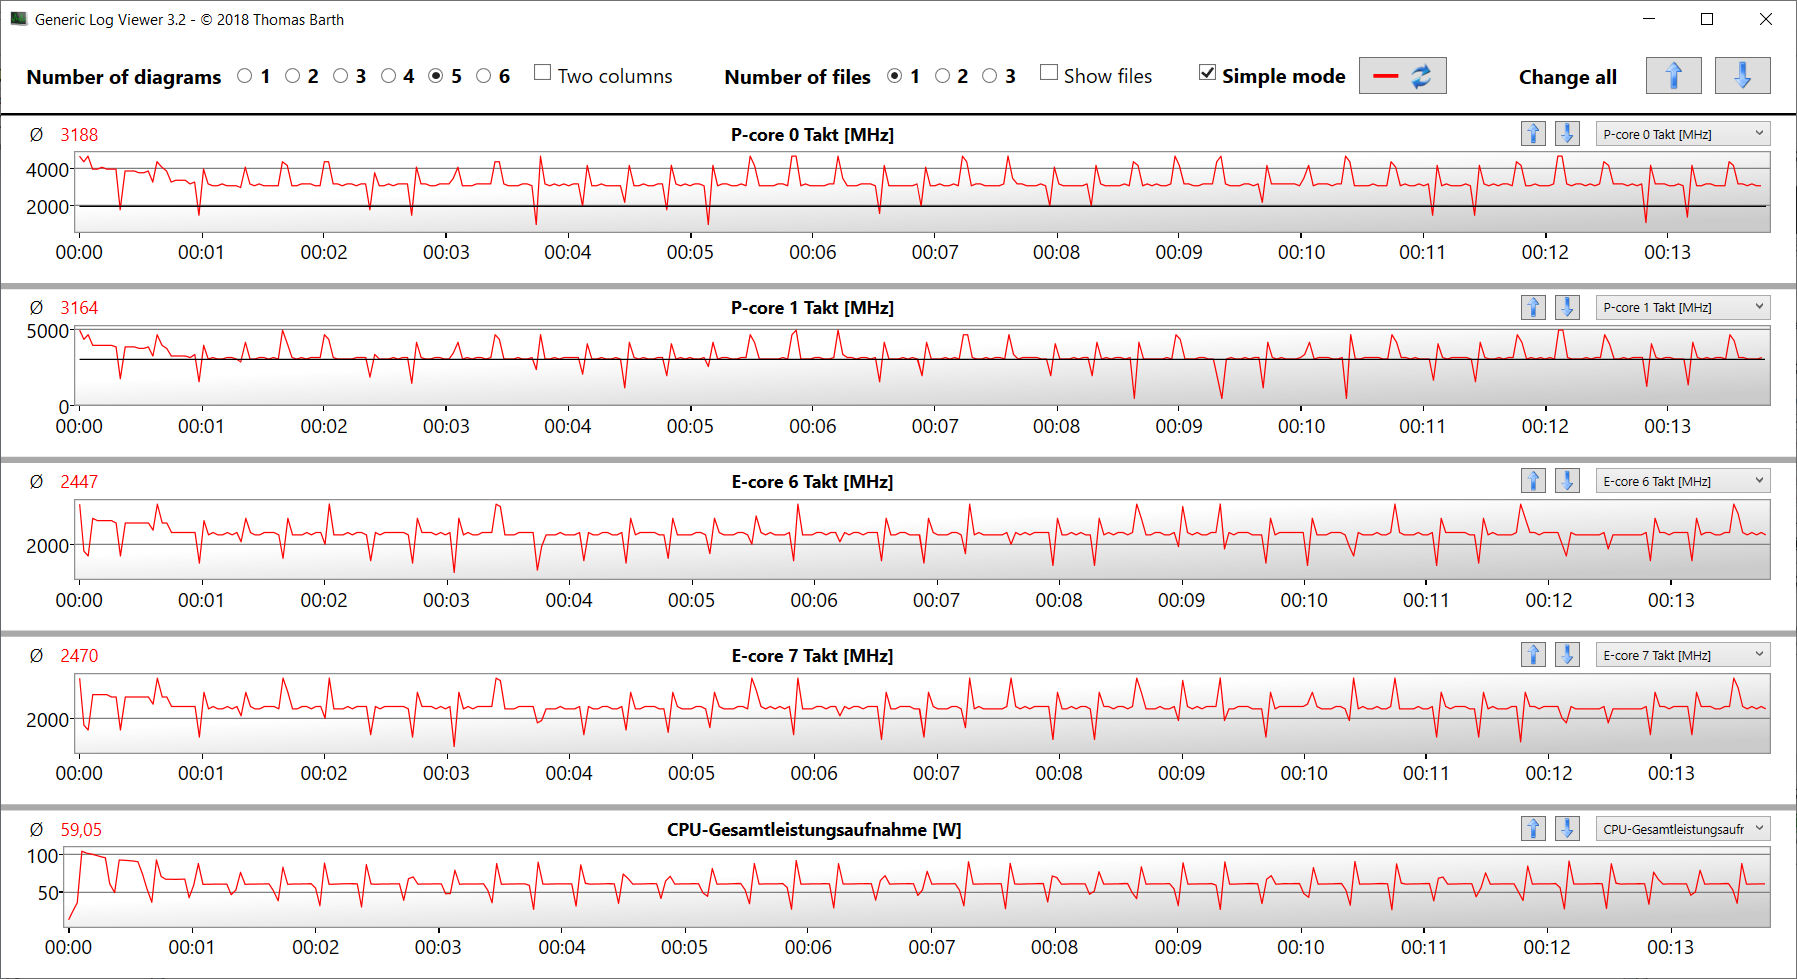
In multi-thread operation, the intensity of the Turbo usage depends a lot on the selected CPU sub-preset. In all cases, the CPU is able to run constantly at an even clock speed, which is shown by the CB15 loop test. It is noticeable that the CPU clock speed drops slightly from the first to the second/third run, regardless of the selected preset. The i9 CPU will only bring a noteworthy advantage to the user compared to the i7 CPU in some brief load peaks. Under longer loads, the performance gap between both processors is narrowing, and they end up very close to each other.
Cinebench R15 Multi Constant Load Test
| CPU Performance rating - Percent | |
| Average of class Gaming | |
| Alienware x17 R2 P48E | |
| MSI Stealth GS77 12UHS-083US | |
| Razer Blade 17 Early 2022 | |
| Medion Erazer Beast X30 | |
| Average Intel Core i9-12900H | |
| Razer Blade 17 RTX 3080 Ti | |
| Razer Blade 17 Early 2022 | |
| Razer Blade 17 Early 2022 | |
| Cinebench R23 | |
| Multi Core | |
| Average of class Gaming (10488 - 42661, n=107, last 2 years) | |
| Medion Erazer Beast X30 | |
| Alienware x17 R2 P48E | |
| MSI Stealth GS77 12UHS-083US | |
| Razer Blade 17 Early 2022 (Max.) | |
| Razer Blade 17 RTX 3080 Ti | |
| Average Intel Core i9-12900H (7359 - 19648, n=28) | |
| Razer Blade 17 Early 2022 | |
| Razer Blade 17 Early 2022 (Lautlos) | |
| Single Core | |
| Average of class Gaming (1166 - 2415, n=107, last 2 years) | |
| Razer Blade 17 Early 2022 | |
| Alienware x17 R2 P48E | |
| Razer Blade 17 Early 2022 (Max.) | |
| Razer Blade 17 RTX 3080 Ti | |
| Average Intel Core i9-12900H (1634 - 1930, n=28) | |
| MSI Stealth GS77 12UHS-083US | |
| Razer Blade 17 Early 2022 (Lautlos) | |
| Medion Erazer Beast X30 | |
| Cinebench R20 | |
| CPU (Multi Core) | |
| Average of class Gaming (4029 - 16433, n=106, last 2 years) | |
| Medion Erazer Beast X30 | |
| Alienware x17 R2 P48E | |
| MSI Stealth GS77 12UHS-083US | |
| Razer Blade 17 Early 2022 (Max.) | |
| Razer Blade 17 RTX 3080 Ti | |
| Average Intel Core i9-12900H (2681 - 7471, n=28) | |
| Razer Blade 17 Early 2022 | |
| Razer Blade 17 Early 2022 (Lautlos) | |
| CPU (Single Core) | |
| Average of class Gaming (442 - 913, n=106, last 2 years) | |
| Alienware x17 R2 P48E | |
| Razer Blade 17 Early 2022 (Max.) | |
| Razer Blade 17 RTX 3080 Ti | |
| Average Intel Core i9-12900H (624 - 738, n=28) | |
| Razer Blade 17 Early 2022 | |
| MSI Stealth GS77 12UHS-083US | |
| Razer Blade 17 Early 2022 (Lautlos) | |
| Medion Erazer Beast X30 | |
| Cinebench R15 | |
| CPU Multi 64Bit | |
| Average of class Gaming (1578 - 6330, n=105, last 2 years) | |
| Alienware x17 R2 P48E | |
| Medion Erazer Beast X30 | |
| Razer Blade 17 Early 2022 (Max.) | |
| MSI Stealth GS77 12UHS-083US | |
| Average Intel Core i9-12900H (1395 - 3077, n=28) | |
| Razer Blade 17 RTX 3080 Ti | |
| Razer Blade 17 Early 2022 | |
| Razer Blade 17 Early 2022 (Lautlos) | |
| CPU Single 64Bit | |
| Average of class Gaming (188.8 - 350, n=106, last 2 years) | |
| Alienware x17 R2 P48E | |
| Razer Blade 17 Early 2022 (Max.) | |
| Razer Blade 17 RTX 3080 Ti | |
| Average Intel Core i9-12900H (235 - 277, n=29) | |
| MSI Stealth GS77 12UHS-083US | |
| Razer Blade 17 Early 2022 | |
| Razer Blade 17 Early 2022 (Lautlos) | |
| Medion Erazer Beast X30 | |
| Blender - v2.79 BMW27 CPU | |
| Razer Blade 17 Early 2022 (Lautlos) | |
| Razer Blade 17 Early 2022 | |
| Average Intel Core i9-12900H (160 - 451, n=28) | |
| Razer Blade 17 RTX 3080 Ti | |
| Razer Blade 17 Early 2022 (Max.) | |
| MSI Stealth GS77 12UHS-083US | |
| Medion Erazer Beast X30 | |
| Alienware x17 R2 P48E | |
| Average of class Gaming (79 - 330, n=104, last 2 years) | |
| 7-Zip 18.03 | |
| 7z b 4 | |
| Average of class Gaming (33491 - 148086, n=105, last 2 years) | |
| Medion Erazer Beast X30 | |
| Alienware x17 R2 P48E | |
| MSI Stealth GS77 12UHS-083US | |
| Razer Blade 17 Early 2022 (Max.) | |
| Razer Blade 17 RTX 3080 Ti | |
| Average Intel Core i9-12900H (34684 - 76677, n=28) | |
| Razer Blade 17 Early 2022 | |
| Razer Blade 17 Early 2022 (Lautlos) | |
| 7z b 4 -mmt1 | |
| Average of class Gaming (4199 - 7436, n=105, last 2 years) | |
| Razer Blade 17 Early 2022 | |
| Average Intel Core i9-12900H (5302 - 6289, n=28) | |
| Razer Blade 17 RTX 3080 Ti | |
| Alienware x17 R2 P48E | |
| Razer Blade 17 Early 2022 (Max.) | |
| MSI Stealth GS77 12UHS-083US | |
| Razer Blade 17 Early 2022 (Lautlos) | |
| Medion Erazer Beast X30 | |
| Geekbench 5.5 | |
| Multi-Core | |
| Average of class Gaming (6460 - 28263, n=105, last 2 years) | |
| Alienware x17 R2 P48E | |
| Razer Blade 17 Early 2022 (Max.) | |
| MSI Stealth GS77 12UHS-083US | |
| Razer Blade 17 RTX 3080 Ti | |
| Medion Erazer Beast X30 | |
| Average Intel Core i9-12900H (8519 - 14376, n=31) | |
| Razer Blade 17 Early 2022 | |
| Razer Blade 17 Early 2022 (Lautlos) | |
| Single-Core | |
| Average of class Gaming (986 - 2474, n=105, last 2 years) | |
| Alienware x17 R2 P48E | |
| Average Intel Core i9-12900H (1631 - 1897, n=31) | |
| Razer Blade 17 Early 2022 | |
| Razer Blade 17 Early 2022 (Max.) | |
| Razer Blade 17 Early 2022 (Lautlos) | |
| Razer Blade 17 RTX 3080 Ti | |
| MSI Stealth GS77 12UHS-083US | |
| Medion Erazer Beast X30 | |
| HWBOT x265 Benchmark v2.2 - 4k Preset | |
| Average of class Gaming (11.5 - 44.4, n=105, last 2 years) | |
| Alienware x17 R2 P48E | |
| Medion Erazer Beast X30 | |
| MSI Stealth GS77 12UHS-083US | |
| Razer Blade 17 Early 2022 (Max.) | |
| Average Intel Core i9-12900H (8.05 - 22.5, n=28) | |
| Razer Blade 17 RTX 3080 Ti | |
| Razer Blade 17 Early 2022 | |
| Razer Blade 17 Early 2022 (Lautlos) | |
| LibreOffice - 20 Documents To PDF | |
| Average of class Gaming (33.2 - 88.8, n=105, last 2 years) | |
| Medion Erazer Beast X30 | |
| Razer Blade 17 Early 2022 (Lautlos) | |
| Razer Blade 17 RTX 3080 Ti | |
| Razer Blade 17 Early 2022 (Max.) | |
| MSI Stealth GS77 12UHS-083US | |
| Average Intel Core i9-12900H (36.8 - 59.8, n=28) | |
| Alienware x17 R2 P48E | |
| Razer Blade 17 Early 2022 | |
| R Benchmark 2.5 - Overall mean | |
| Medion Erazer Beast X30 | |
| Razer Blade 17 Early 2022 (Lautlos) | |
| MSI Stealth GS77 12UHS-083US | |
| Razer Blade 17 RTX 3080 Ti | |
| Average Intel Core i9-12900H (0.4218 - 0.506, n=28) | |
| Razer Blade 17 Early 2022 (Max.) | |
| Razer Blade 17 Early 2022 | |
| Alienware x17 R2 P48E | |
| Average of class Gaming (0.3439 - 0.759, n=106, last 2 years) | |
* ... smaller is better
AIDA64: FP32 Ray-Trace | FPU Julia | CPU SHA3 | CPU Queen | FPU SinJulia | FPU Mandel | CPU AES | CPU ZLib | FP64 Ray-Trace | CPU PhotoWorxx
| Performance rating | |
| Average of class Gaming | |
| Alienware x17 R2 P48E | |
| Medion Erazer Beast X30 | |
| Average Intel Core i9-12900H | |
| MSI Stealth GS77 12UHS-083US | |
| Razer Blade 17 Early 2022 | |
| Razer Blade 17 RTX 3080 Ti | |
| Razer Blade 17 Early 2022 | |
| Razer Blade 17 Early 2022 | |
| AIDA64 / FP32 Ray-Trace | |
| Average of class Gaming (10227 - 85542, n=105, last 2 years) | |
| Average Intel Core i9-12900H (4074 - 18289, n=29) | |
| Alienware x17 R2 P48E (v6.50.5800) | |
| Medion Erazer Beast X30 (v6.50.5800) | |
| MSI Stealth GS77 12UHS-083US (v6.50.5800) | |
| Razer Blade 17 Early 2022 (v6.50.5800, Max.) | |
| Razer Blade 17 RTX 3080 Ti (v6.50.5800) | |
| Razer Blade 17 Early 2022 (v6.50.5800) | |
| Razer Blade 17 Early 2022 (v6.50.5800, Lautlos) | |
| AIDA64 / FPU Julia | |
| Average of class Gaming (51376 - 238426, n=105, last 2 years) | |
| Average Intel Core i9-12900H (22307 - 93236, n=29) | |
| Alienware x17 R2 P48E (v6.50.5800) | |
| Medion Erazer Beast X30 (v6.50.5800) | |
| MSI Stealth GS77 12UHS-083US (v6.50.5800) | |
| Razer Blade 17 Early 2022 (v6.50.5800, Max.) | |
| Razer Blade 17 RTX 3080 Ti (v6.50.5800) | |
| Razer Blade 17 Early 2022 (v6.50.5800) | |
| Razer Blade 17 Early 2022 (v6.50.5800, Lautlos) | |
| AIDA64 / CPU SHA3 | |
| Average of class Gaming (2180 - 10115, n=105, last 2 years) | |
| Alienware x17 R2 P48E (v6.50.5800) | |
| Medion Erazer Beast X30 (v6.50.5800) | |
| MSI Stealth GS77 12UHS-083US (v6.50.5800) | |
| Average Intel Core i9-12900H (1378 - 4215, n=29) | |
| Razer Blade 17 Early 2022 (v6.50.5800, Max.) | |
| Razer Blade 17 RTX 3080 Ti (v6.50.5800) | |
| Razer Blade 17 Early 2022 (v6.50.5800) | |
| Razer Blade 17 Early 2022 (v6.50.5800, Lautlos) | |
| AIDA64 / CPU Queen | |
| Average of class Gaming (49785 - 173351, n=90, last 2 years) | |
| Alienware x17 R2 P48E (v6.50.5800) | |
| Razer Blade 17 Early 2022 (v6.50.5800, Max.) | |
| Medion Erazer Beast X30 (v6.50.5800) | |
| Razer Blade 17 RTX 3080 Ti (v6.50.5800) | |
| Average Intel Core i9-12900H (78172 - 111241, n=28) | |
| MSI Stealth GS77 12UHS-083US (v6.50.5800) | |
| Razer Blade 17 Early 2022 (v6.50.5800) | |
| Razer Blade 17 Early 2022 (v6.50.5800, Lautlos) | |
| AIDA64 / FPU SinJulia | |
| Average of class Gaming (4424 - 33636, n=105, last 2 years) | |
| Alienware x17 R2 P48E (v6.50.5800) | |
| Medion Erazer Beast X30 (v6.50.5800) | |
| MSI Stealth GS77 12UHS-083US (v6.50.5800) | |
| Razer Blade 17 Early 2022 (v6.50.5800, Max.) | |
| Razer Blade 17 RTX 3080 Ti (v6.50.5800) | |
| Average Intel Core i9-12900H (5709 - 10410, n=29) | |
| Razer Blade 17 Early 2022 (v6.50.5800) | |
| Razer Blade 17 Early 2022 (v6.50.5800, Lautlos) | |
| AIDA64 / FPU Mandel | |
| Average of class Gaming (25115 - 128721, n=105, last 2 years) | |
| Average Intel Core i9-12900H (11257 - 45581, n=29) | |
| Alienware x17 R2 P48E (v6.50.5800) | |
| Medion Erazer Beast X30 (v6.50.5800) | |
| MSI Stealth GS77 12UHS-083US (v6.50.5800) | |
| Razer Blade 17 Early 2022 (v6.50.5800, Max.) | |
| Razer Blade 17 RTX 3080 Ti (v6.50.5800) | |
| Razer Blade 17 Early 2022 (v6.50.5800) | |
| Razer Blade 17 Early 2022 (v6.50.5800, Lautlos) | |
| AIDA64 / CPU AES | |
| Average of class Gaming (39258 - 247074, n=105, last 2 years) | |
| Alienware x17 R2 P48E (v6.50.5800) | |
| MSI Stealth GS77 12UHS-083US (v6.50.5800) | |
| Average Intel Core i9-12900H (31935 - 151546, n=29) | |
| Medion Erazer Beast X30 (v6.50.5800) | |
| Razer Blade 17 Early 2022 (v6.50.5800, Max.) | |
| Razer Blade 17 RTX 3080 Ti (v6.50.5800) | |
| Razer Blade 17 Early 2022 (v6.50.5800) | |
| Razer Blade 17 Early 2022 (v6.50.5800, Lautlos) | |
| AIDA64 / CPU ZLib | |
| Average of class Gaming (574 - 2531, n=105, last 2 years) | |
| Alienware x17 R2 P48E (v6.50.5800) | |
| Medion Erazer Beast X30 (v6.50.5800) | |
| MSI Stealth GS77 12UHS-083US (v6.50.5800) | |
| Razer Blade 17 Early 2022 (v6.50.5800, Max.) | |
| Average Intel Core i9-12900H (449 - 1193, n=29) | |
| Razer Blade 17 RTX 3080 Ti (v6.50.5800) | |
| Razer Blade 17 Early 2022 (v6.50.5800) | |
| Razer Blade 17 Early 2022 (v6.50.5800, Lautlos) | |
| AIDA64 / FP64 Ray-Trace | |
| Average of class Gaming (5509 - 45446, n=105, last 2 years) | |
| Average Intel Core i9-12900H (2235 - 10511, n=29) | |
| Alienware x17 R2 P48E (v6.50.5800) | |
| Medion Erazer Beast X30 (v6.50.5800) | |
| MSI Stealth GS77 12UHS-083US (v6.50.5800) | |
| Razer Blade 17 Early 2022 (v6.50.5800, Max.) | |
| Razer Blade 17 RTX 3080 Ti (v6.50.5800) | |
| Razer Blade 17 Early 2022 (v6.50.5800) | |
| Razer Blade 17 Early 2022 (v6.50.5800, Lautlos) | |
| AIDA64 / CPU PhotoWorxx | |
| Average of class Gaming (12271 - 89891, n=105, last 2 years) | |
| Razer Blade 17 RTX 3080 Ti (v6.50.5800) | |
| Razer Blade 17 Early 2022 (v6.50.5800, Max.) | |
| Medion Erazer Beast X30 (v6.50.5800) | |
| MSI Stealth GS77 12UHS-083US (v6.50.5800) | |
| Razer Blade 17 Early 2022 (v6.50.5800) | |
| Average Intel Core i9-12900H (20960 - 48269, n=30) | |
| Razer Blade 17 Early 2022 (v6.50.5800, Lautlos) | |
| Alienware x17 R2 P48E (v6.50.5800) | |
System Performance
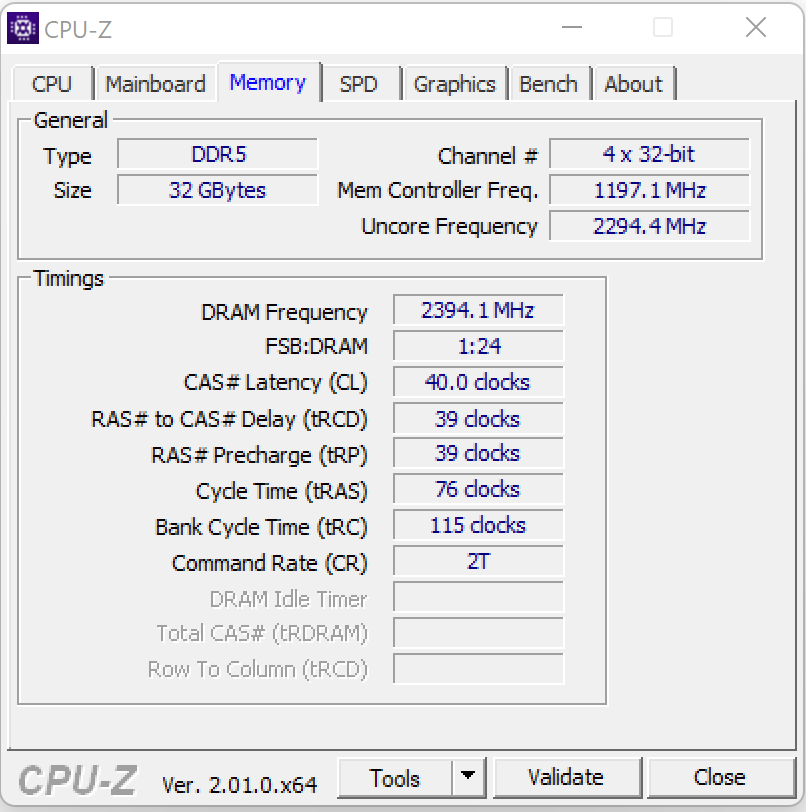
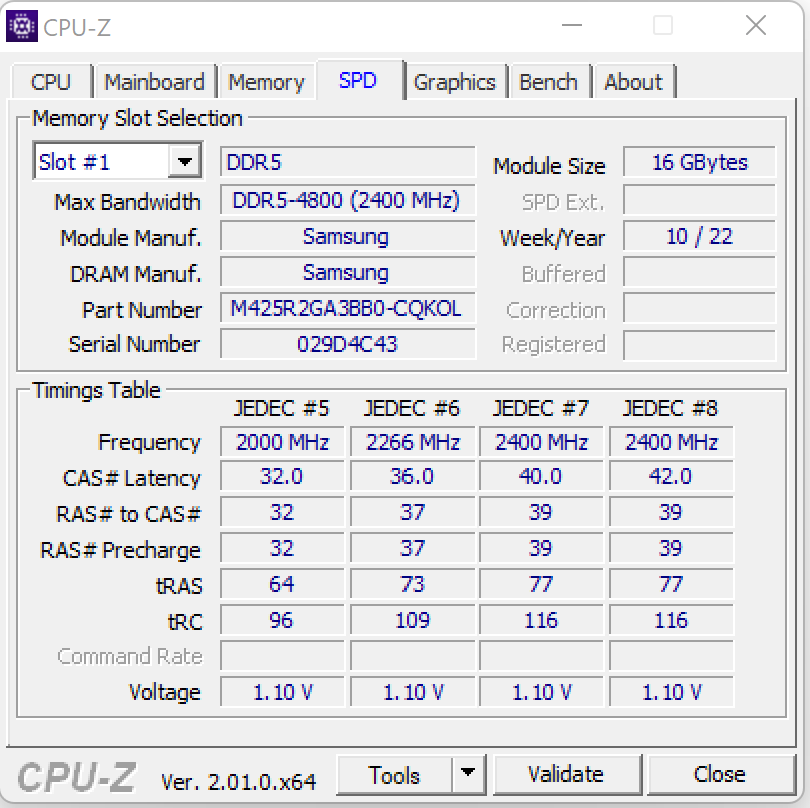
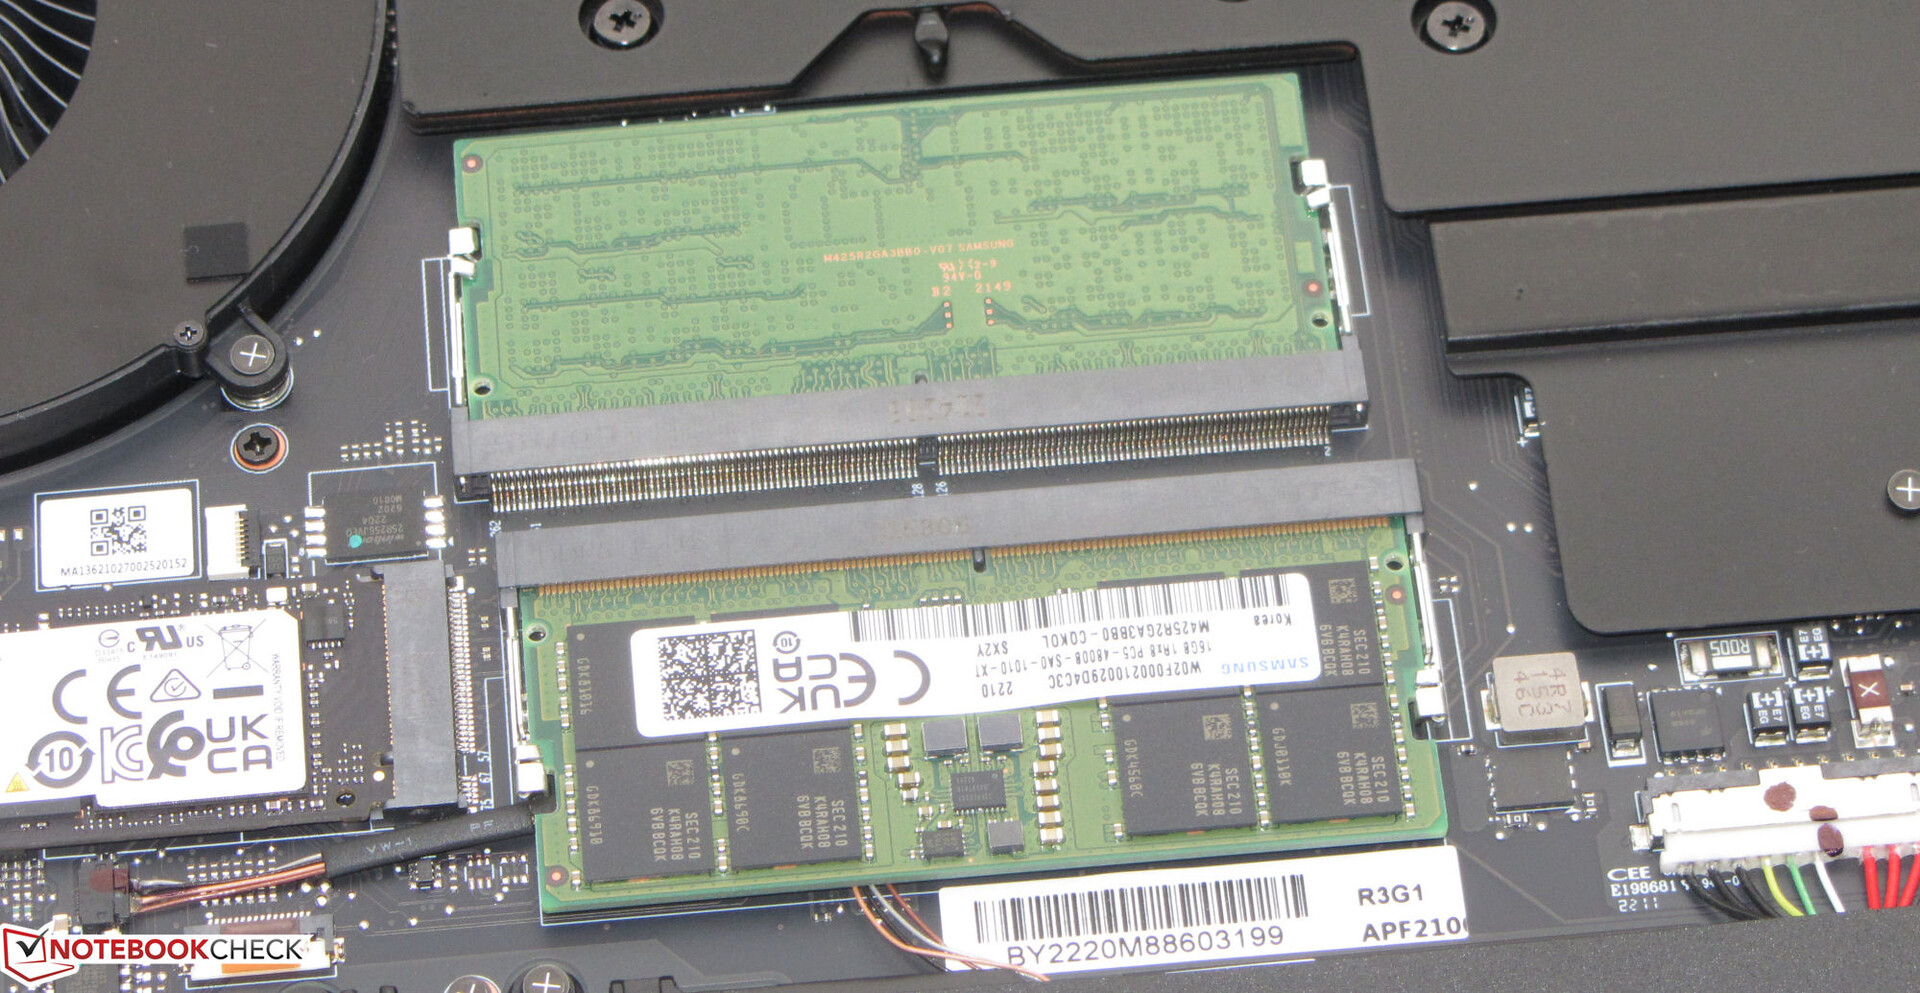
The hardware of the smoothly running system delivers more than sufficient computing performance for gaming, video cutting, and rendering. The transfer rates of the working memory range at normal levels for the DDR5-4800 storage. They are accompanied by good PC Mark results.
CrossMark: Overall | Productivity | Creativity | Responsiveness
| PCMark 10 / Score | |
| Average of class Gaming (5828 - 12414, n=93, last 2 years) | |
| Alienware x17 R2 P48E | |
| Razer Blade 17 RTX 3080 Ti | |
| Average Intel Core i9-12900H, NVIDIA GeForce RTX 3080 Ti Laptop GPU (7139 - 8083, n=6) | |
| MSI Stealth GS77 12UHS-083US | |
| Medion Erazer Beast X30 | |
| Razer Blade 17 Early 2022 | |
| PCMark 10 / Essentials | |
| Alienware x17 R2 P48E | |
| Razer Blade 17 RTX 3080 Ti | |
| Average Intel Core i9-12900H, NVIDIA GeForce RTX 3080 Ti Laptop GPU (10254 - 11178, n=6) | |
| Average of class Gaming (8810 - 11935, n=97, last 2 years) | |
| MSI Stealth GS77 12UHS-083US | |
| Razer Blade 17 Early 2022 | |
| Medion Erazer Beast X30 | |
| PCMark 10 / Productivity | |
| Average of class Gaming (6845 - 25323, n=95, last 2 years) | |
| Alienware x17 R2 P48E | |
| Average Intel Core i9-12900H, NVIDIA GeForce RTX 3080 Ti Laptop GPU (9102 - 11186, n=6) | |
| MSI Stealth GS77 12UHS-083US | |
| Razer Blade 17 RTX 3080 Ti | |
| Medion Erazer Beast X30 | |
| Razer Blade 17 Early 2022 | |
| PCMark 10 / Digital Content Creation | |
| Average of class Gaming (7602 - 19954, n=95, last 2 years) | |
| Alienware x17 R2 P48E | |
| Razer Blade 17 RTX 3080 Ti | |
| Average Intel Core i9-12900H, NVIDIA GeForce RTX 3080 Ti Laptop GPU (9847 - 12627, n=6) | |
| MSI Stealth GS77 12UHS-083US | |
| Medion Erazer Beast X30 | |
| Razer Blade 17 Early 2022 | |
| CrossMark / Overall | |
| Average of class Gaming (1366 - 2409, n=94, last 2 years) | |
| Alienware x17 R2 P48E | |
| Average Intel Core i9-12900H, NVIDIA GeForce RTX 3080 Ti Laptop GPU (1696 - 1965, n=3) | |
| Razer Blade 17 Early 2022 | |
| Medion Erazer Beast X30 | |
| CrossMark / Productivity | |
| Average of class Gaming (1386 - 2254, n=94, last 2 years) | |
| Alienware x17 R2 P48E | |
| Average Intel Core i9-12900H, NVIDIA GeForce RTX 3080 Ti Laptop GPU (1622 - 1870, n=3) | |
| Razer Blade 17 Early 2022 | |
| Medion Erazer Beast X30 | |
| CrossMark / Creativity | |
| Average of class Gaming (1343 - 2786, n=94, last 2 years) | |
| Alienware x17 R2 P48E | |
| Medion Erazer Beast X30 | |
| Average Intel Core i9-12900H, NVIDIA GeForce RTX 3080 Ti Laptop GPU (1855 - 2135, n=3) | |
| Razer Blade 17 Early 2022 | |
| CrossMark / Responsiveness | |
| Average of class Gaming (1226 - 2334, n=94, last 2 years) | |
| Alienware x17 R2 P48E | |
| Razer Blade 17 Early 2022 | |
| Average Intel Core i9-12900H, NVIDIA GeForce RTX 3080 Ti Laptop GPU (1483 - 1777, n=3) | |
| Medion Erazer Beast X30 | |
| PCMark 8 Home Score Accelerated v2 | 4671 points | |
| PCMark 8 Creative Score Accelerated v2 | 6358 points | |
| PCMark 8 Work Score Accelerated v2 | 5464 points | |
| PCMark 10 Score | 7139 points | |
Help | ||
| AIDA64 / Memory Copy | |
| Average of class Gaming (21750 - 129946, n=105, last 2 years) | |
| Razer Blade 17 RTX 3080 Ti (v6.50.5800) | |
| MSI Stealth GS77 12UHS-083US (v6.50.5800) | |
| Medion Erazer Beast X30 (v6.50.5800) | |
| Razer Blade 17 Early 2022 (v6.50.5800, Max.) | |
| Razer Blade 17 Early 2022 (v6.50.5800, Lautlos) | |
| Razer Blade 17 Early 2022 (v6.50.5800) | |
| Average Intel Core i9-12900H (34438 - 74264, n=29) | |
| Alienware x17 R2 P48E (v6.50.5800) | |
| AIDA64 / Memory Read | |
| Average of class Gaming (22956 - 118858, n=105, last 2 years) | |
| Razer Blade 17 RTX 3080 Ti (v6.50.5800) | |
| Medion Erazer Beast X30 (v6.50.5800) | |
| Razer Blade 17 Early 2022 (v6.50.5800, Max.) | |
| MSI Stealth GS77 12UHS-083US (v6.50.5800) | |
| Razer Blade 17 Early 2022 (v6.50.5800, Lautlos) | |
| Razer Blade 17 Early 2022 (v6.50.5800) | |
| Average Intel Core i9-12900H (36365 - 74642, n=29) | |
| Alienware x17 R2 P48E (v6.50.5800) | |
| AIDA64 / Memory Write | |
| Average of class Gaming (22297 - 135096, n=105, last 2 years) | |
| Razer Blade 17 RTX 3080 Ti (v6.50.5800) | |
| MSI Stealth GS77 12UHS-083US (v6.50.5800) | |
| Razer Blade 17 Early 2022 (v6.50.5800, Max.) | |
| Medion Erazer Beast X30 (v6.50.5800) | |
| Razer Blade 17 Early 2022 (v6.50.5800, Lautlos) | |
| Average Intel Core i9-12900H (32276 - 67858, n=29) | |
| Razer Blade 17 Early 2022 (v6.50.5800) | |
| Alienware x17 R2 P48E (v6.50.5800) | |
| AIDA64 / Memory Latency | |
| Average of class Gaming (75.3 - 259, n=105, last 2 years) | |
| Alienware x17 R2 P48E (v6.50.5800) | |
| MSI Stealth GS77 12UHS-083US (v6.50.5800) | |
| Average Intel Core i9-12900H (74.7 - 118.1, n=28) | |
| Razer Blade 17 RTX 3080 Ti (v6.50.5800) | |
| Medion Erazer Beast X30 (v6.50.5800) | |
| Razer Blade 17 Early 2022 (v6.50.5800, Max.) | |
| Razer Blade 17 Early 2022 (v6.50.5800, Lautlos) | |
* ... smaller is better
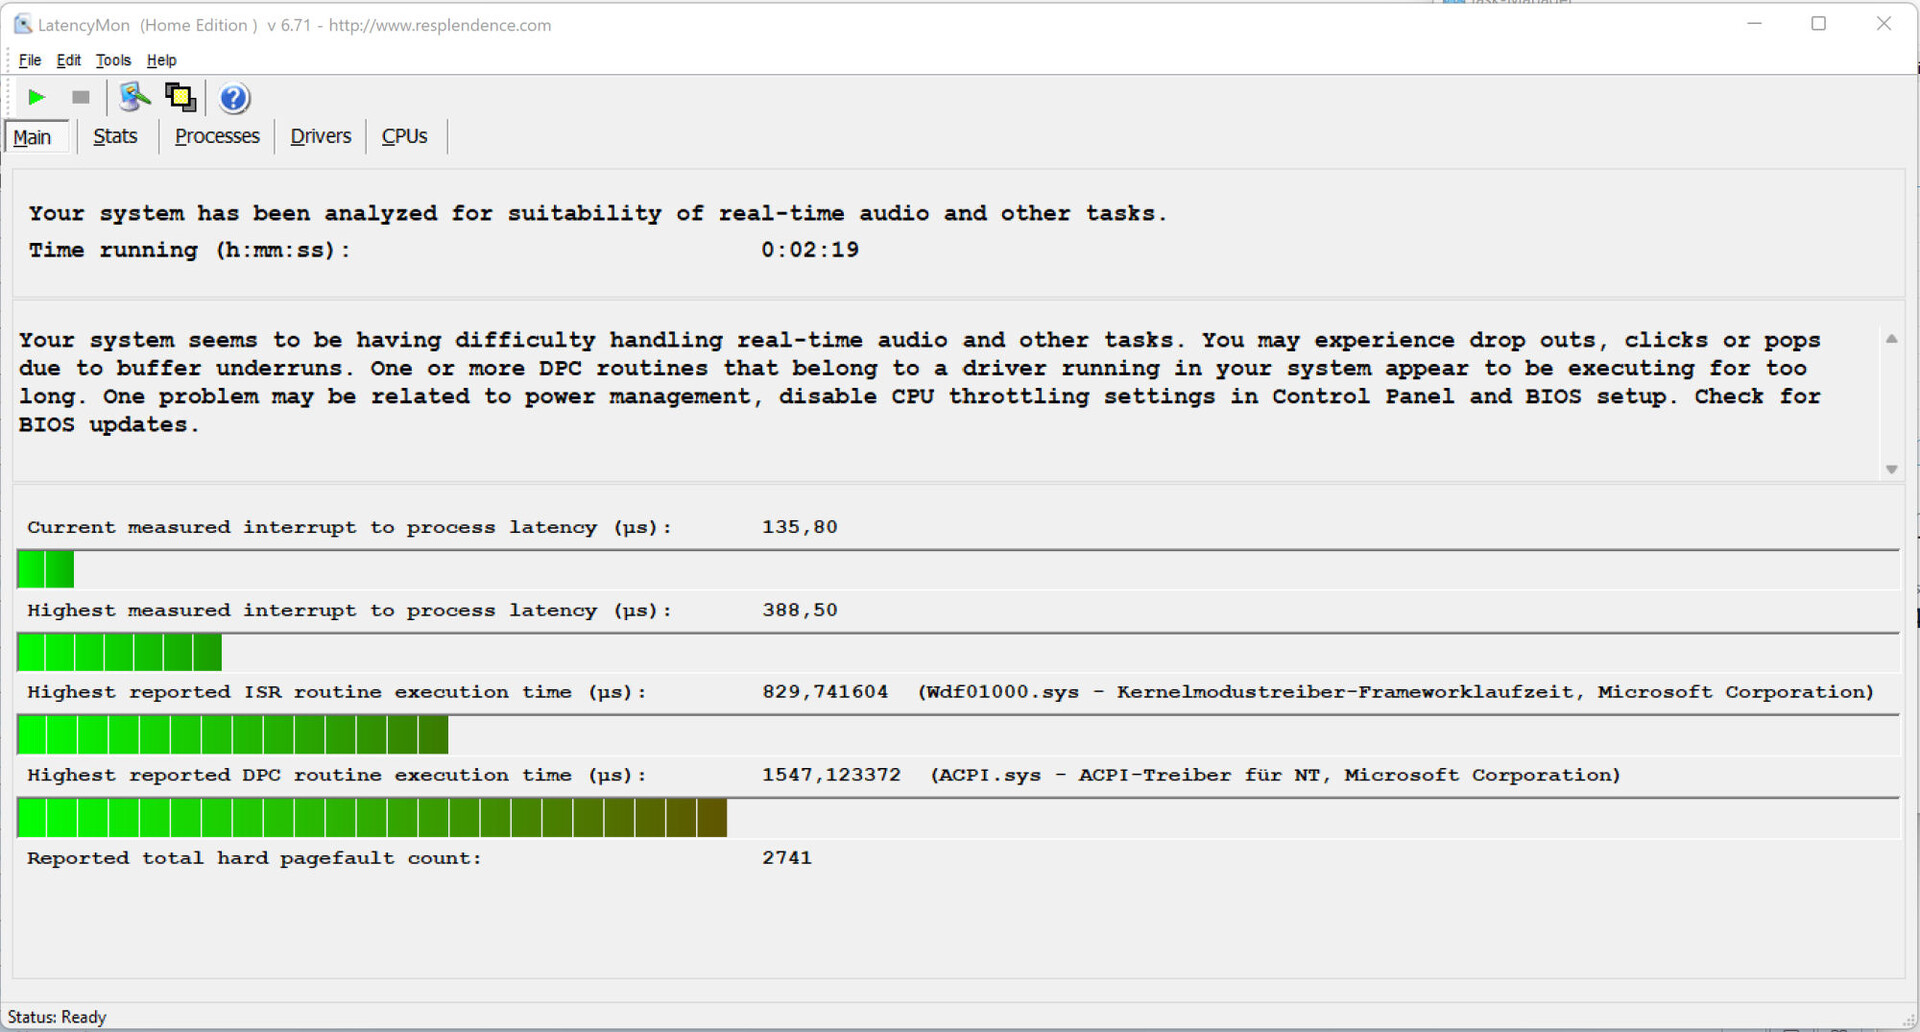
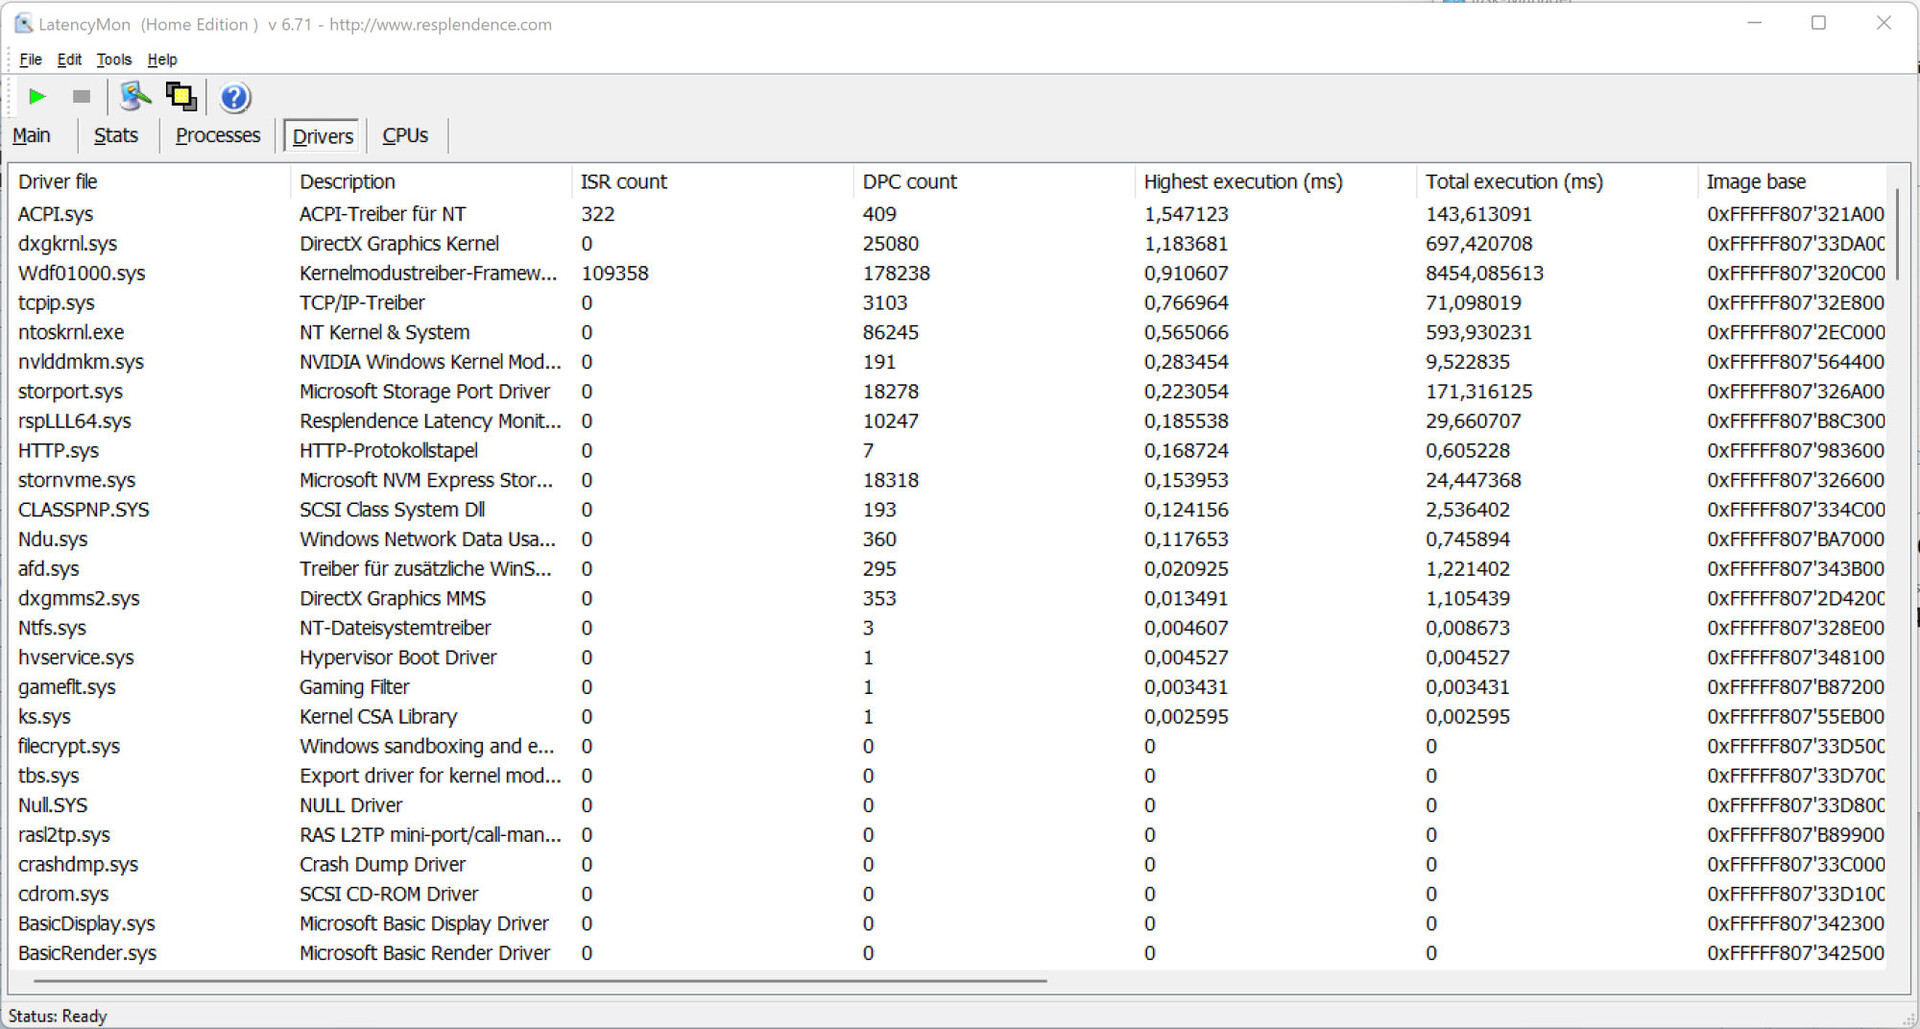
DPC Latencies
The standardized Latency Monitor test (web surfing, 4k video reproduction, Prime95 High Load) revealed some conspicuous behavior in the DPC latencies. The system doesn't appear to be suited for real-time video and audio processing. Future software updates might lead to improvements or even make things worse.
| DPC Latencies / LatencyMon - interrupt to process latency (max), Web, Youtube, Prime95 | |
| MSI Stealth GS77 12UHS-083US | |
| Alienware x17 R2 P48E | |
| Razer Blade 17 RTX 3080 Ti | |
| Medion Erazer Beast X30 | |
| Razer Blade 17 Early 2022 | |
* ... smaller is better
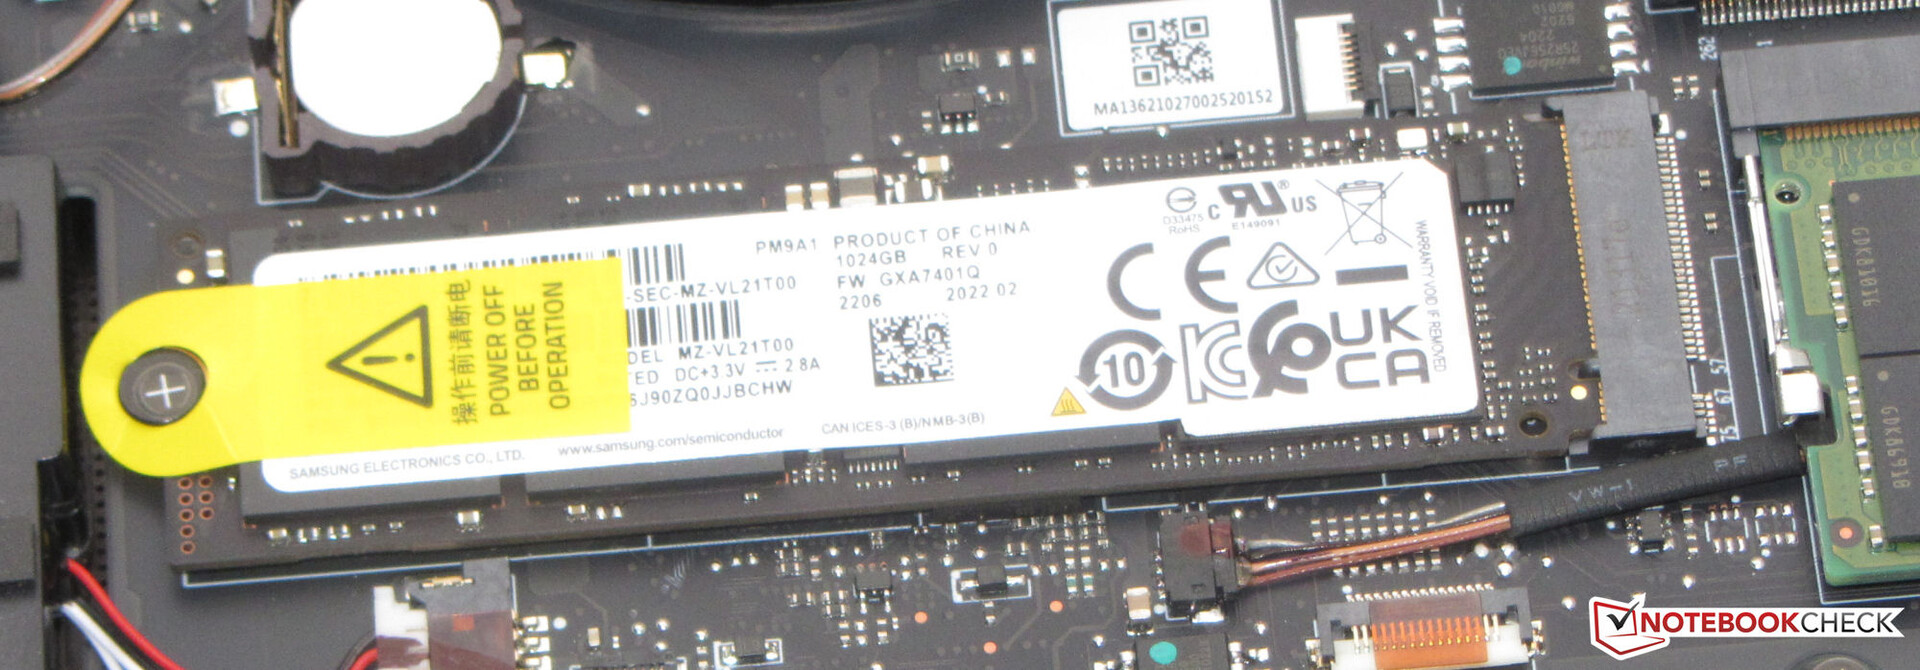
Storage Solution
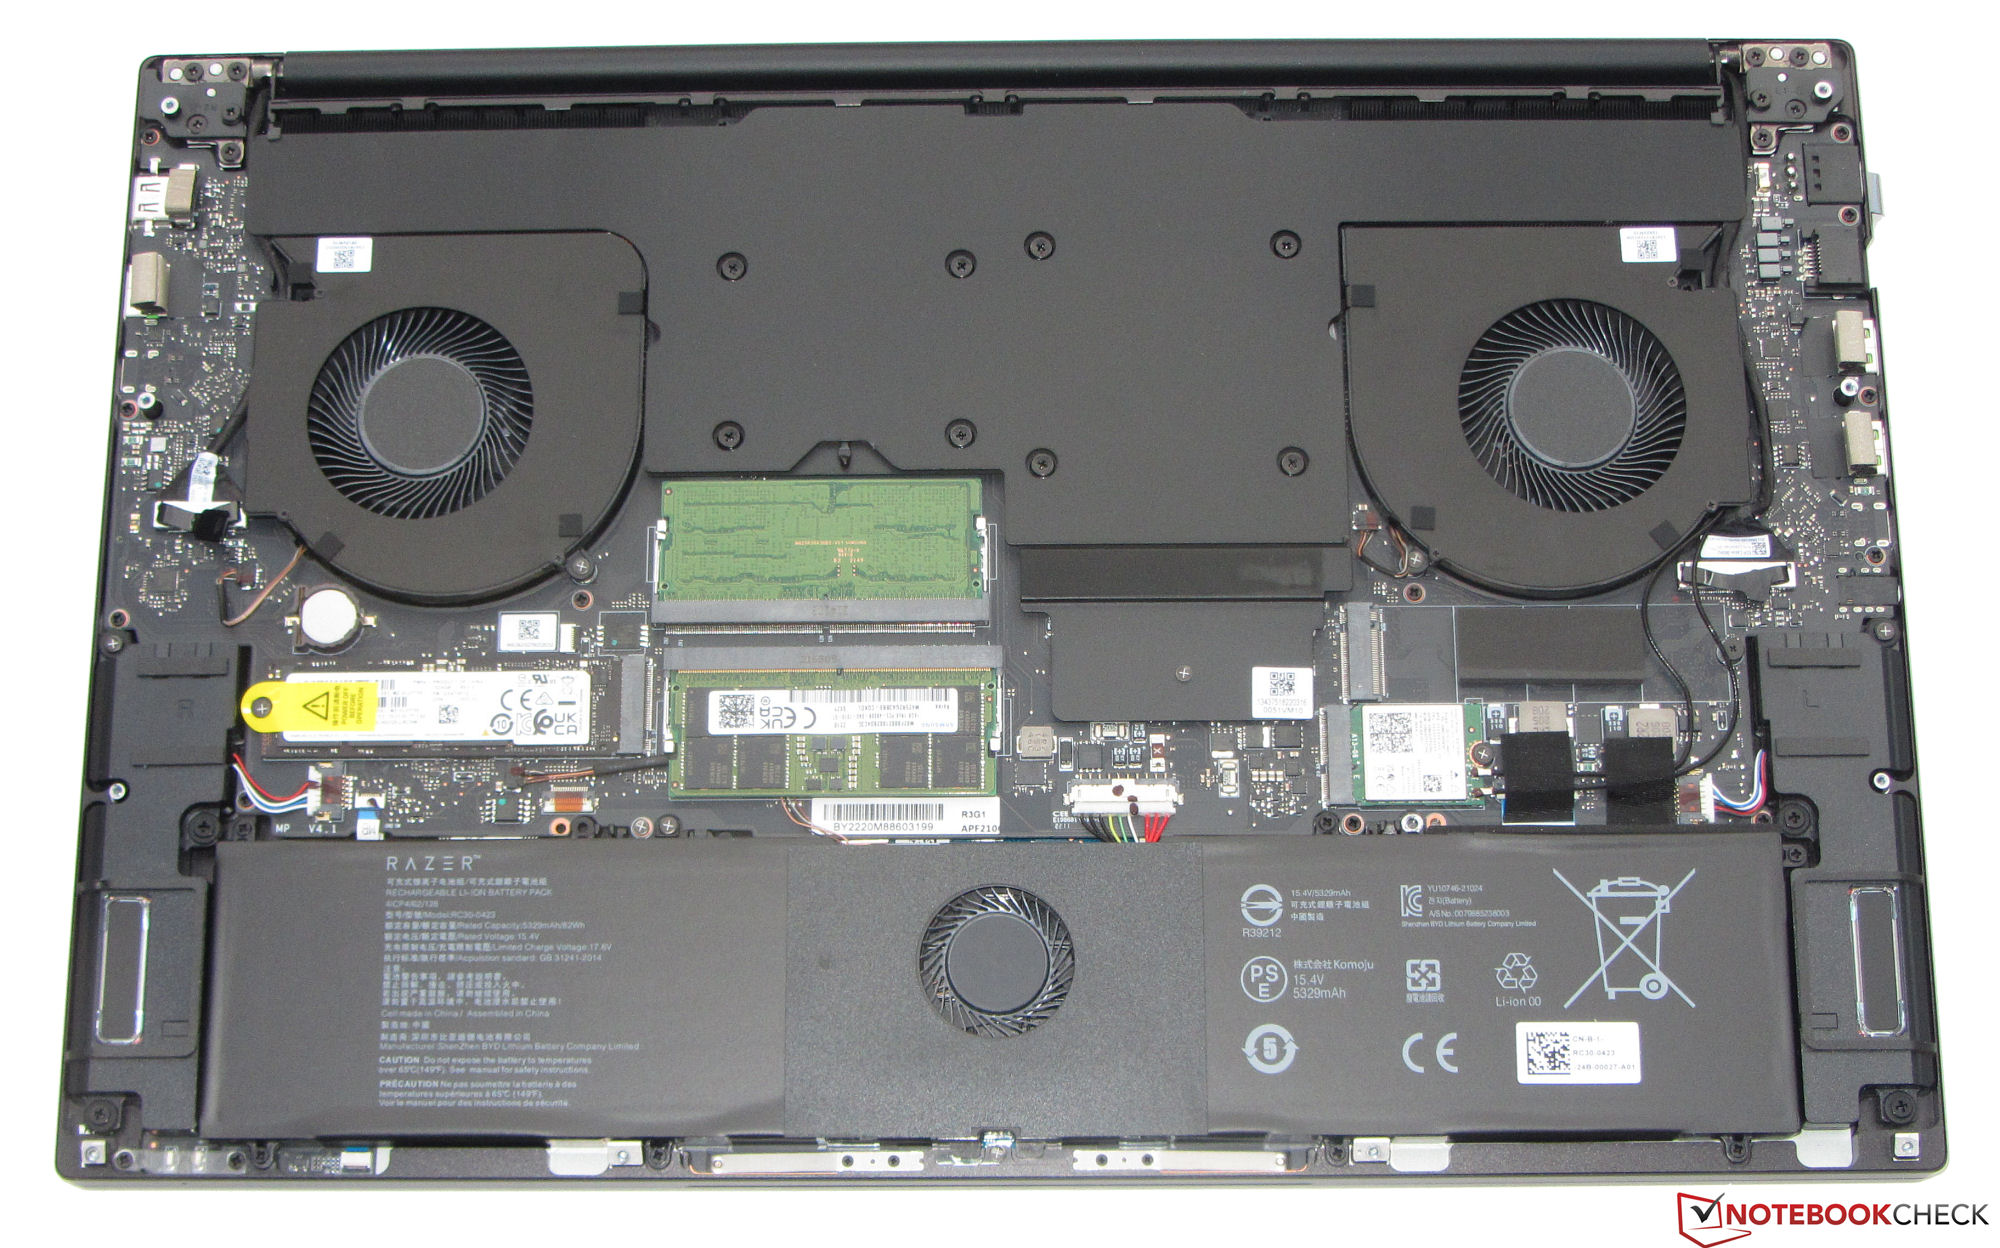
Razer has equipped the Blade with a 1-TB SSD (PCIe 4, M.2-2280) from Samsung that delivers very good transfer rates. In addition, the laptop offers space for a second SSD (PCIe 4, M.2-2280).

* ... smaller is better
Constant Performance Reading: DiskSpd Read Loop, Queue Depth 8
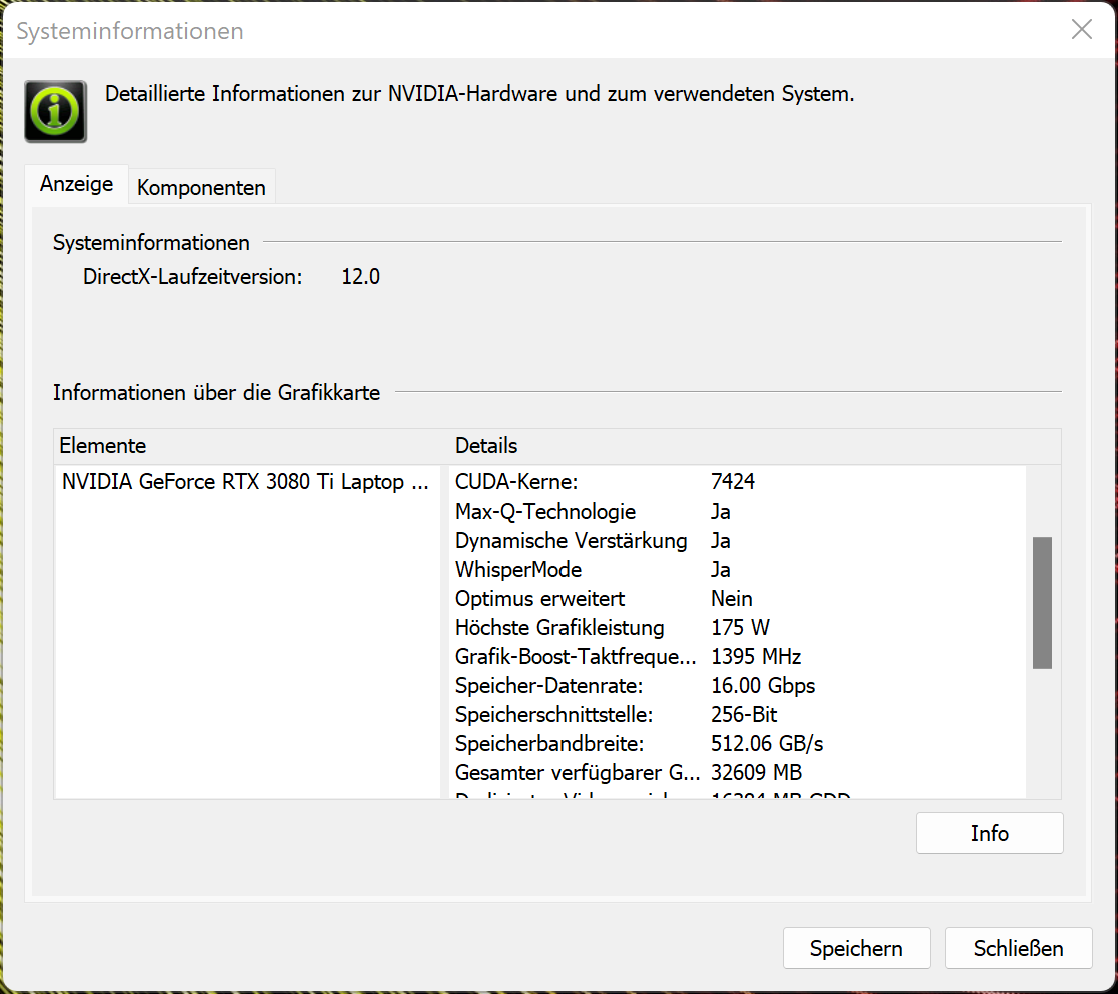
Graphics Card
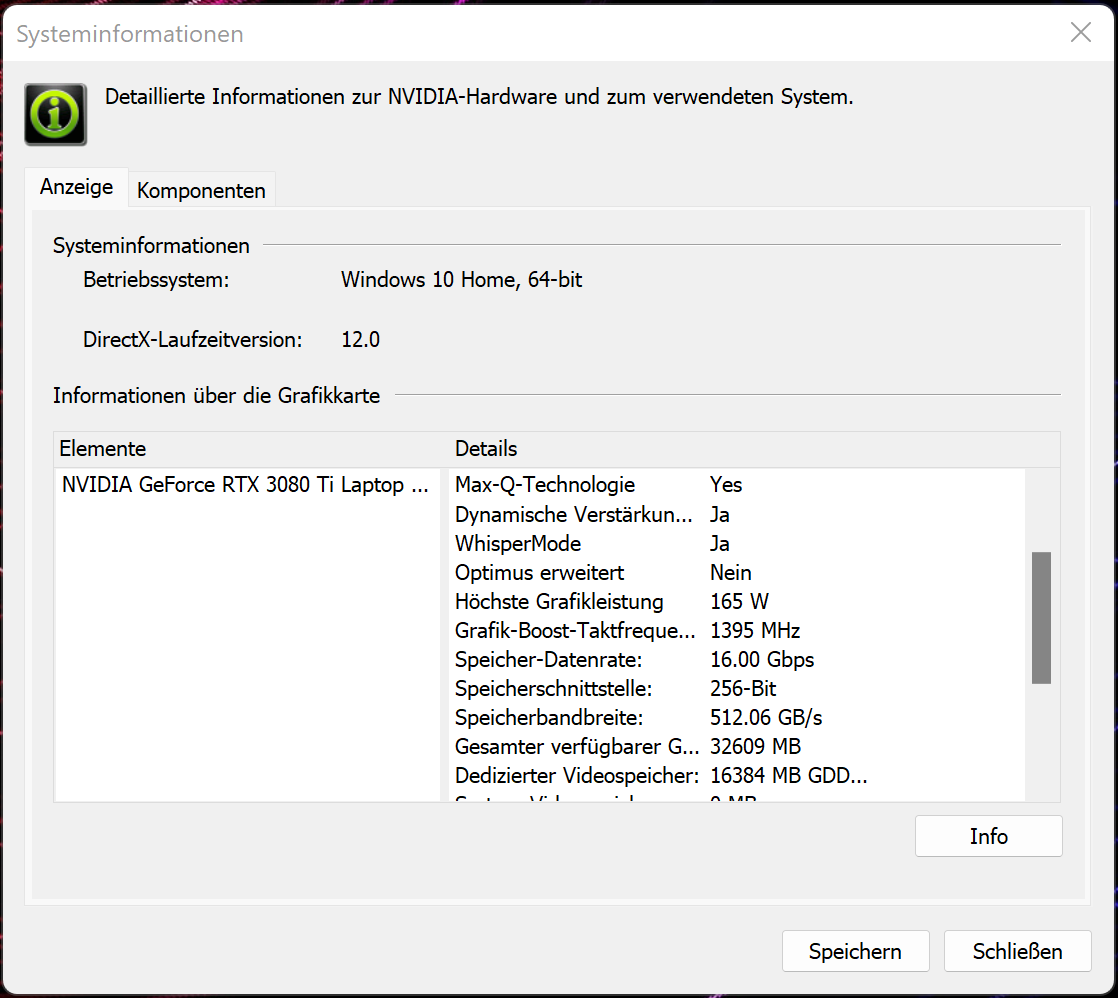
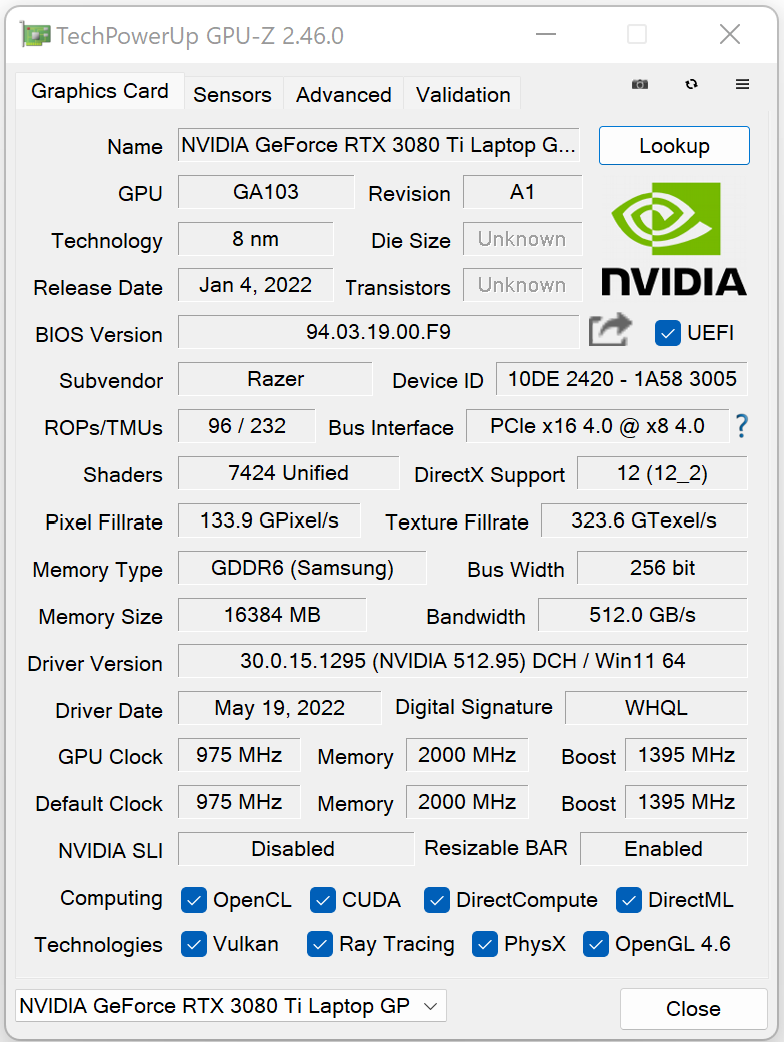
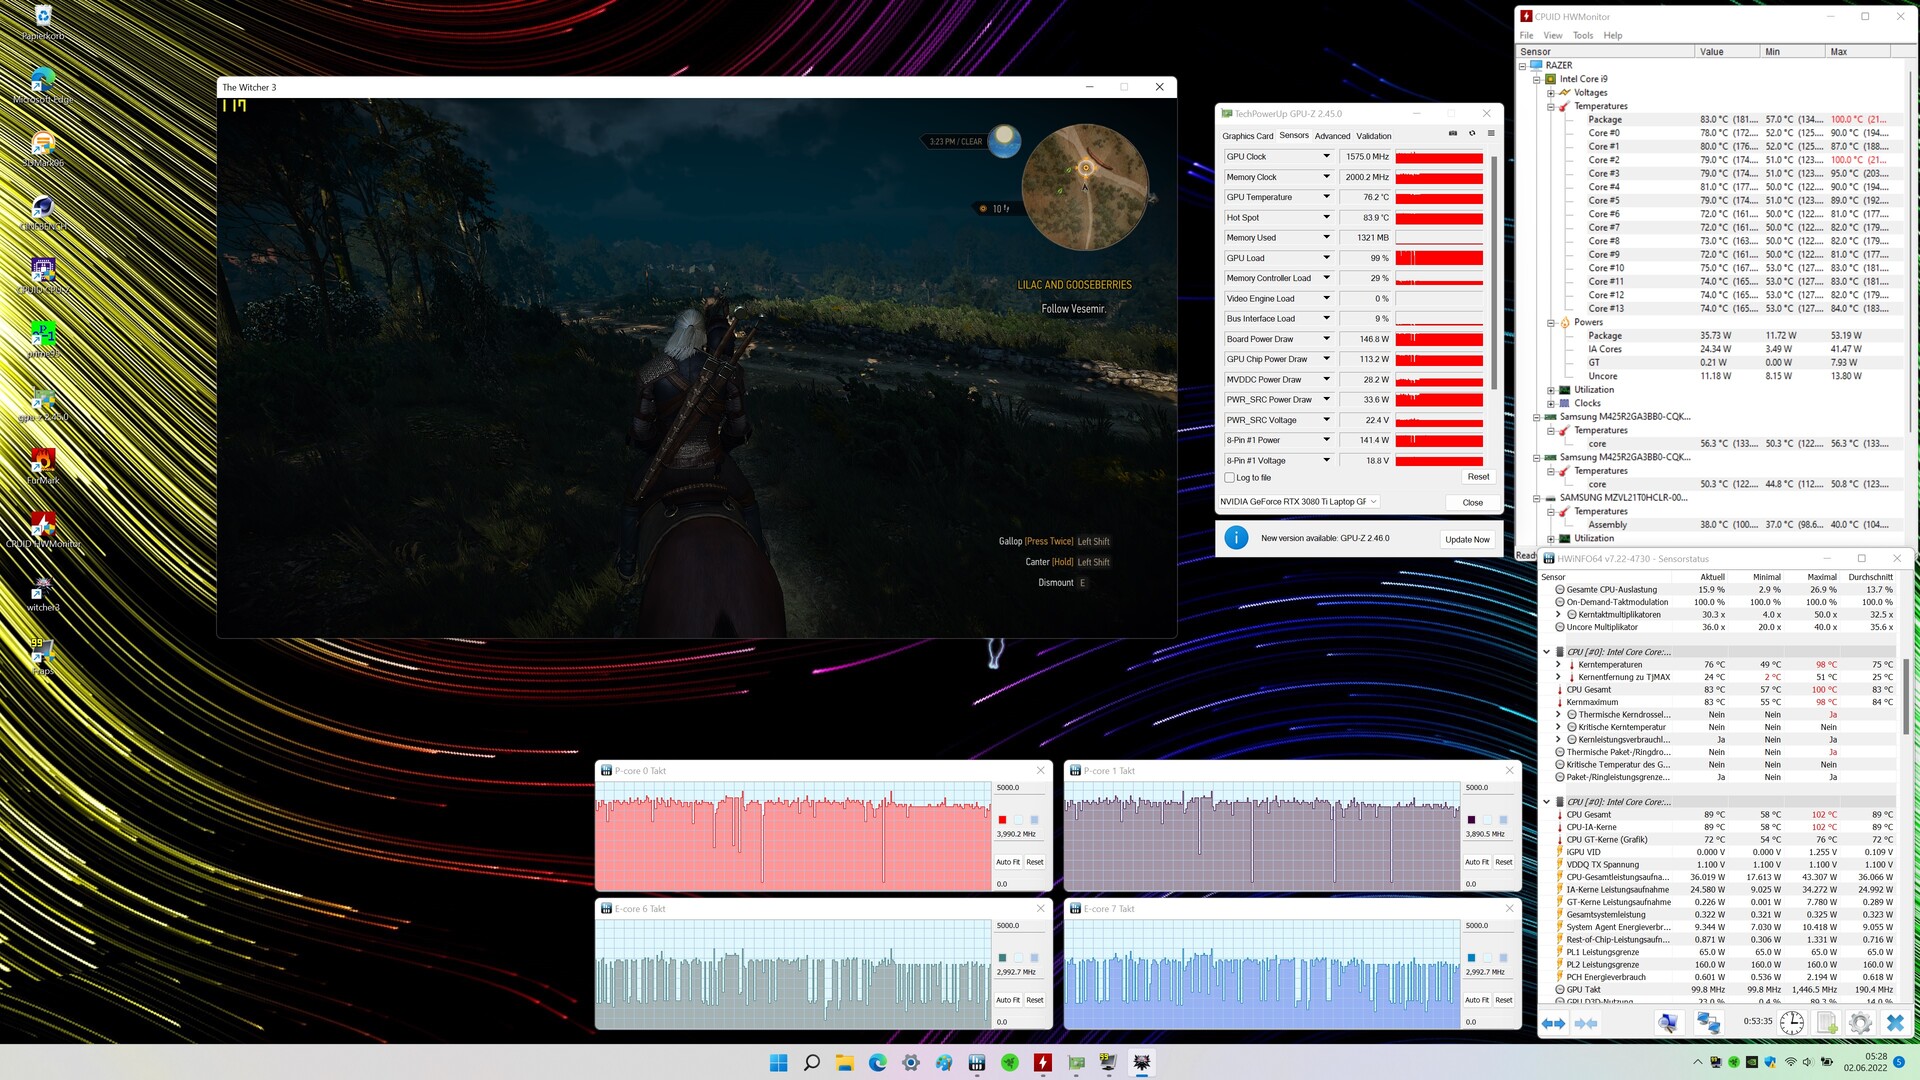
A BIOS update from June 2022 increases the TGP of the built-in GeForce RTX 3080 Ti Laptop GPU (VRAM: 16,384 MB GDDR6) from 165 to 175 watts - without showing any effect on the benchmark results. However, in all cases, the results still range above the average of the RTX 3080 Ti average that we determined previously. The TGP is not fully used, which is shown by our The Witcher 3 test. The graphics performance can be increased without a BIOS update, since the laptop offers the option for direct image output via GeForce GPU.
| 3DMark Performance rating - Percent | |
| Average of class Gaming -2! | |
| Alienware x17 R2 P48E -25! | |
| Razer Blade 17 RTX 3080 Ti -25! | |
| Razer Blade 17 Early 2022 -2! | |
| Razer Blade 17 Early 2022 -25! | |
| Razer Blade 17 Early 2022 -25! | |
| Medion Erazer Beast X30 -25! | |
| Average NVIDIA GeForce RTX 3080 Ti Laptop GPU | |
| Asus ROG Zephyrus Duo 16 GX650RX -2! | |
| Razer Blade 17 Early 2022 -25! | |
| MSI Stealth GS77 12UHS-083US -25! | |
| Gigabyte Aero 16 YE5 -1! | |
| 3DMark 11 - 1280x720 Performance GPU | |
| Average of class Gaming (21841 - 80022, n=104, last 2 years) | |
| Alienware x17 R2 P48E | |
| Razer Blade 17 Early 2022 (Max.) | |
| Razer Blade 17 Early 2022 | |
| Razer Blade 17 RTX 3080 Ti | |
| Medion Erazer Beast X30 | |
| Razer Blade 17 Early 2022 (dGPU, 175W) | |
| Asus ROG Zephyrus Duo 16 GX650RX | |
| Average NVIDIA GeForce RTX 3080 Ti Laptop GPU (13920 - 45841, n=45) | |
| Razer Blade 17 Early 2022 (Lautlos) | |
| MSI Stealth GS77 12UHS-083US | |
| Gigabyte Aero 16 YE5 | |
| 3DMark 11 Performance | 30538 points | |
| 3DMark Cloud Gate Standard Score | 42346 points | |
| 3DMark Fire Strike Score | 24291 points | |
| 3DMark Time Spy Score | 11457 points | |
| 3DMark Steel Nomad Score | 3076 points | |
Help | ||
Gaming Performance
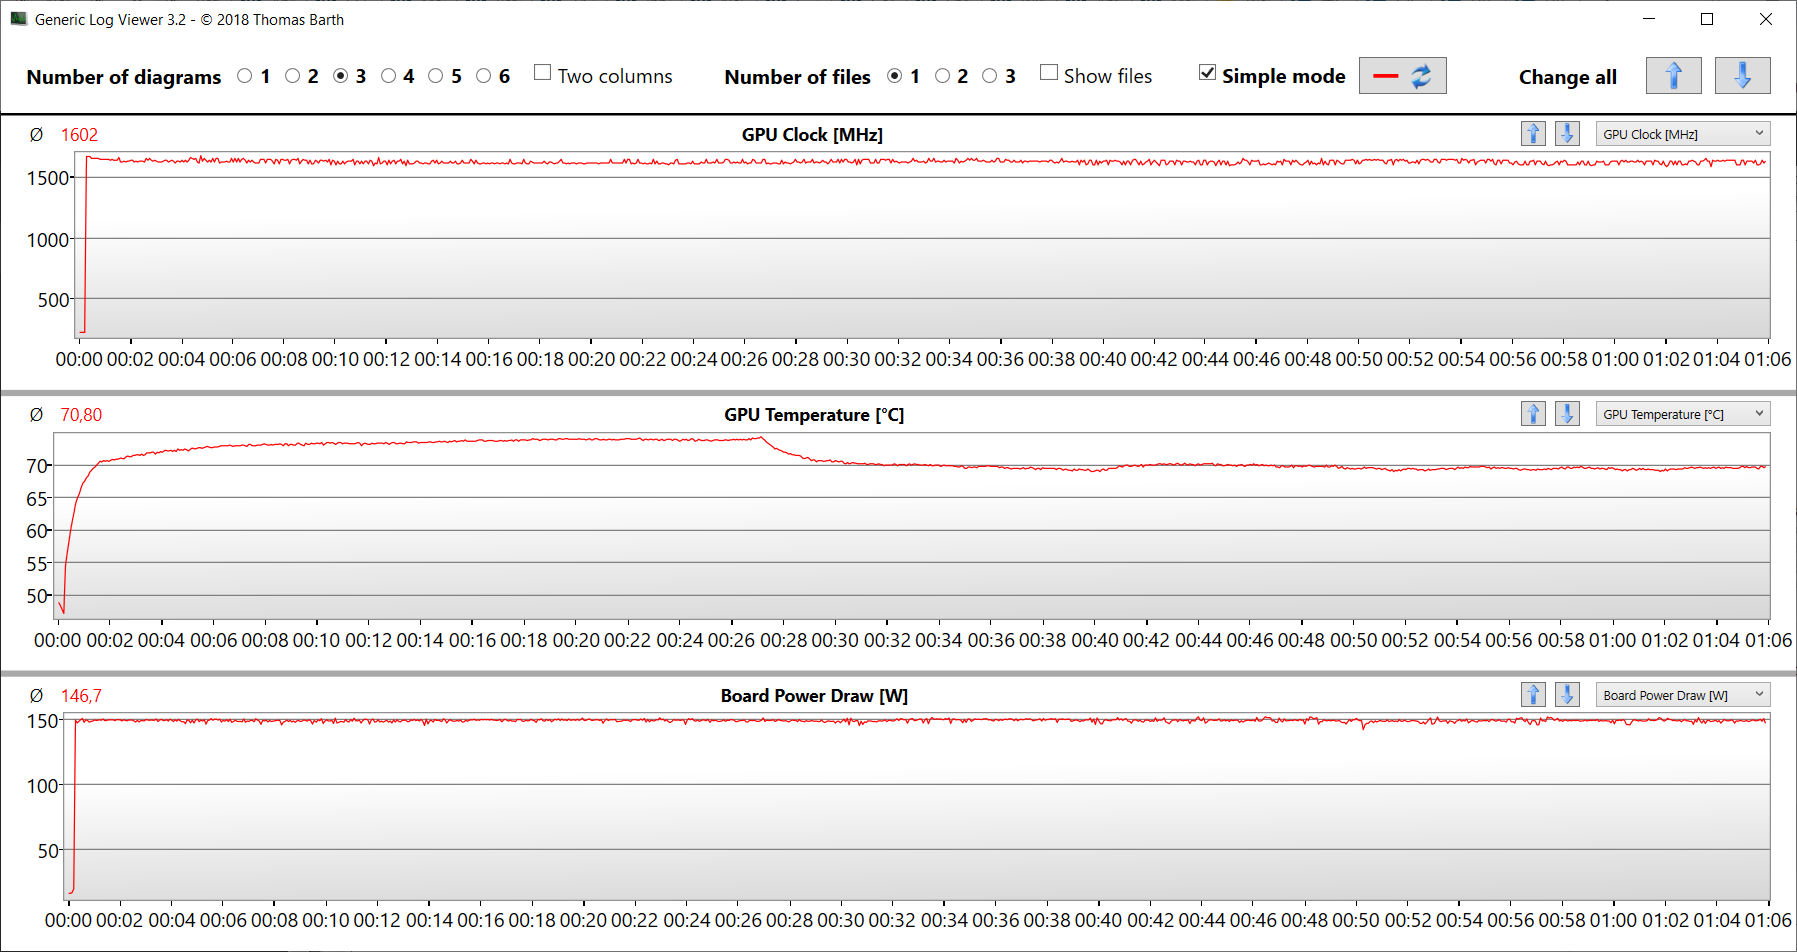
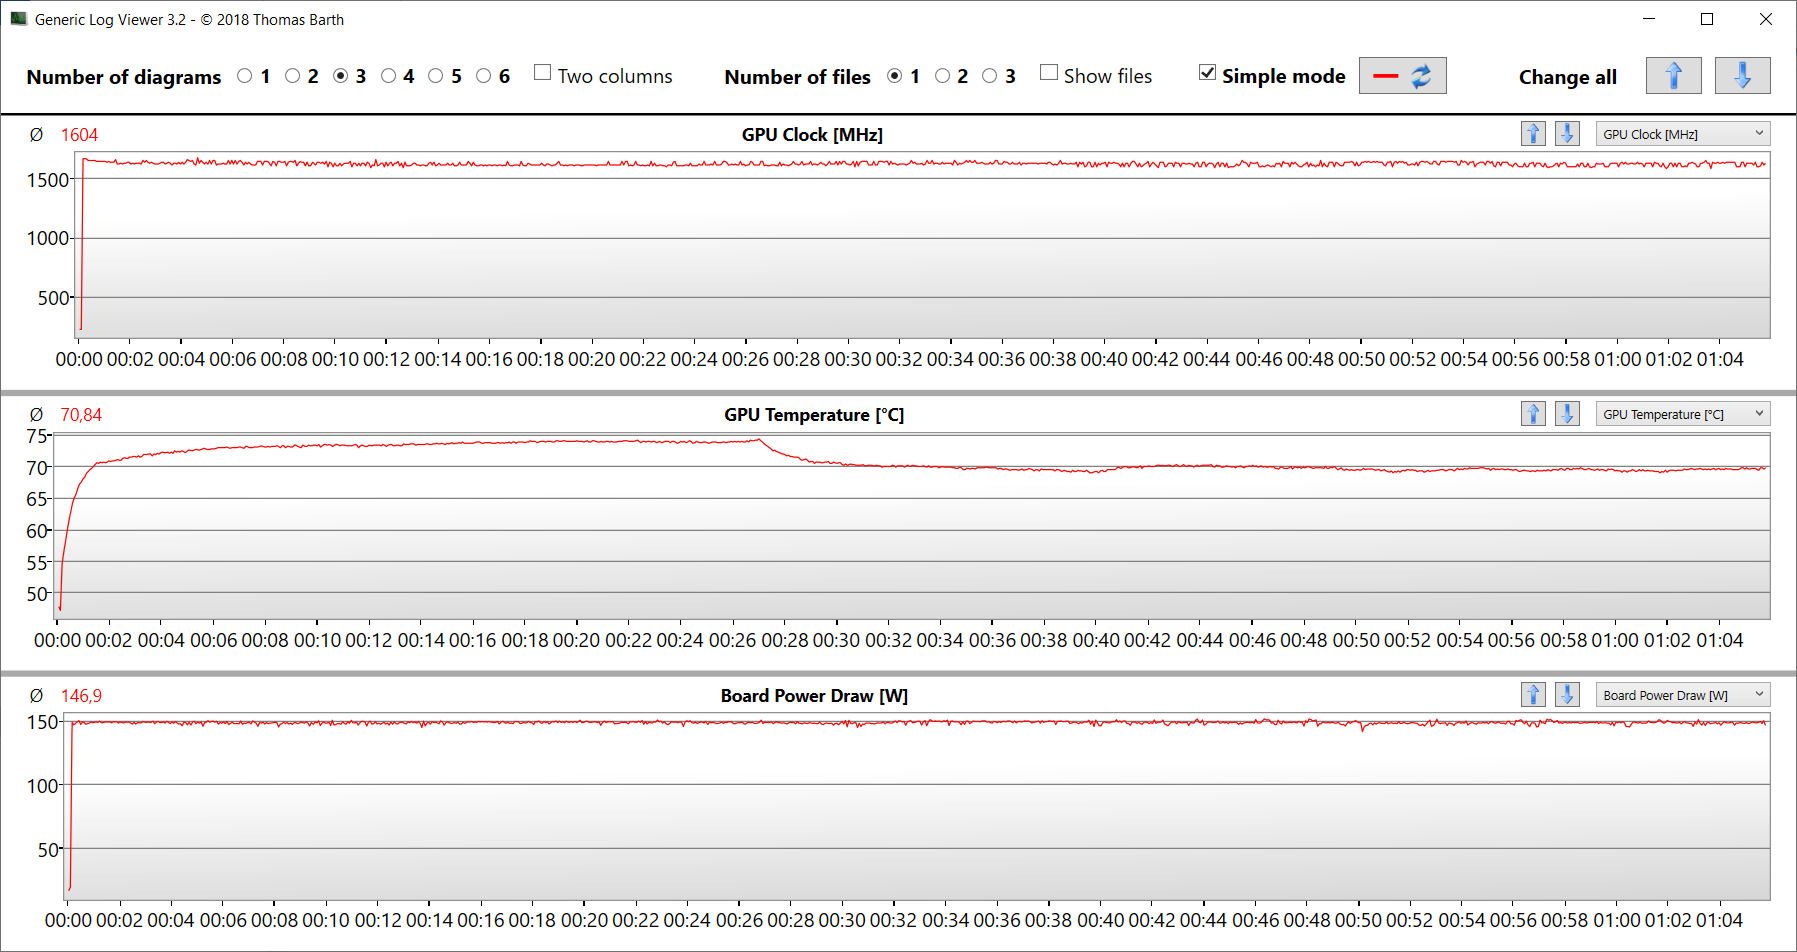
The hardware allows 4k gaming at high to maximum settings. Usually, the frame rates range above the average for the RTX 3080 Ti. The direct image output via GeForce GPU leads to a sometimes significant increase in the values. With similar performance settings, the sibling model produces values at an identical level. The frame rates remain at a constant level even over a longer time period, which is shown by our The Witcher 3 test (FHD, max. settings, 60 min. runtime).
| The Witcher 3 - 1920x1080 Ultra Graphics & Postprocessing (HBAO+) | |
| Average of class Gaming (104.7 - 240, n=7, last 2 years) | |
| Alienware x17 R2 P48E | |
| Razer Blade 17 RTX 3080 Ti | |
| Razer Blade 17 Early 2022 (dGPU, 175W) | |
| Razer Blade 17 Early 2022 (Max.) | |
| Razer Blade 17 Early 2022 | |
| Medion Erazer Beast X30 | |
| Razer Blade 17 Early 2022 (Lautlos) | |
| Average NVIDIA GeForce RTX 3080 Ti Laptop GPU (30 - 130.6, n=43) | |
| MSI Stealth GS77 12UHS-083US | |
| Dota 2 Reborn | |
| 1920x1080 ultra (3/3) best looking | |
| Alienware x17 R2 P48E | |
| Razer Blade 17 RTX 3080 Ti | |
| MSI Stealth GS77 12UHS-083US | |
| Average of class Gaming (84.8 - 248, n=107, last 2 years) | |
| Razer Blade 17 Early 2022 (Max.) | |
| Razer Blade 17 Early 2022 (dGPU, 175W) | |
| Medion Erazer Beast X30 | |
| Average NVIDIA GeForce RTX 3080 Ti Laptop GPU (29.9 - 170.5, n=45) | |
| Razer Blade 17 Early 2022 | |
| Razer Blade 17 Early 2022 (Lautlos) | |
| 3840x2160 ultra (3/3) best looking | |
| Average of class Gaming (114.9 - 199.2, n=32, last 2 years) | |
| Razer Blade 17 Early 2022 (dGPU, 175W) | |
| Razer Blade 17 Early 2022 (Max.) | |
| Average NVIDIA GeForce RTX 3080 Ti Laptop GPU (70.8 - 155.6, n=19) | |
| Razer Blade 17 Early 2022 | |
| Razer Blade 17 Early 2022 (Lautlos) | |
| X-Plane 11.11 | |
| 3840x2160 high (fps_test=3) | |
| Razer Blade 17 Early 2022 (dGPU, 175W) | |
| Average of class Gaming (60 - 124.1, n=32, last 2 years) | |
| Razer Blade 17 Early 2022 (Max.) | |
| Average NVIDIA GeForce RTX 3080 Ti Laptop GPU (32.9 - 109.5, n=20) | |
| Razer Blade 17 Early 2022 | |
| Razer Blade 17 Early 2022 (Lautlos) | |
| 1920x1080 high (fps_test=3) | |
| Alienware x17 R2 P48E | |
| Razer Blade 17 Early 2022 (dGPU, 175W) | |
| Razer Blade 17 RTX 3080 Ti | |
| Razer Blade 17 Early 2022 (Max.) | |
| MSI Stealth GS77 12UHS-083US | |
| Average NVIDIA GeForce RTX 3080 Ti Laptop GPU (32.6 - 127, n=45) | |
| Medion Erazer Beast X30 | |
| Average of class Gaming (55.5 - 143.5, n=109, last 2 years) | |
| Razer Blade 17 Early 2022 | |
| Razer Blade 17 Early 2022 (Lautlos) | |
| Final Fantasy XV Benchmark | |
| 3840x2160 High Quality | |
| Average of class Gaming (49.1 - 111.8, n=33, last 2 years) | |
| Razer Blade 17 Early 2022 (1.3, dGPU, 175W) | |
| Razer Blade 17 Early 2022 (1.3, Max.) | |
| Razer Blade 17 Early 2022 (1.3) | |
| Average NVIDIA GeForce RTX 3080 Ti Laptop GPU (35.1 - 61.2, n=18) | |
| Razer Blade 17 Early 2022 (1.3, Lautlos) | |
| 1920x1080 High Quality | |
| Average of class Gaming (41 - 215, n=95, last 2 years) | |
| Alienware x17 R2 P48E (1.3) | |
| Razer Blade 17 Early 2022 (1.3, dGPU, 175W) | |
| Razer Blade 17 RTX 3080 Ti (1.3) | |
| Razer Blade 17 Early 2022 (1.3, Max.) | |
| Average NVIDIA GeForce RTX 3080 Ti Laptop GPU (30.7 - 140.6, n=42) | |
| Razer Blade 17 Early 2022 (1.3) | |
| MSI Stealth GS77 12UHS-083US (1.3) | |
| Medion Erazer Beast X30 (1.3) | |
| Razer Blade 17 Early 2022 (1.3, Lautlos) | |
| GTA V | |
| 1920x1080 Highest AA:4xMSAA + FX AF:16x | |
| Average of class Gaming (48.3 - 186.9, n=94, last 2 years) | |
| Alienware x17 R2 P48E | |
| Razer Blade 17 Early 2022 (Max.) | |
| Razer Blade 17 Early 2022 (dGPU, 175W) | |
| Razer Blade 17 RTX 3080 Ti | |
| MSI Stealth GS77 12UHS-083US | |
| Average NVIDIA GeForce RTX 3080 Ti Laptop GPU (30 - 139.2, n=42) | |
| Medion Erazer Beast X30 | |
| Razer Blade 17 Early 2022 | |
| Razer Blade 17 Early 2022 (Lautlos) | |
| 3840x2160 Highest AA:4xMSAA + FX AF:16x | |
| Average of class Gaming (53.9 - 123.2, n=25, last 2 years) | |
| Razer Blade 17 Early 2022 (Max.) | |
| Razer Blade 17 Early 2022 | |
| Razer Blade 17 Early 2022 (dGPU, 175W) | |
| Average NVIDIA GeForce RTX 3080 Ti Laptop GPU (37.7 - 67.2, n=14) | |
| Razer Blade 17 Early 2022 (Lautlos) | |
| Strange Brigade | |
| 3840x2160 ultra AA:ultra AF:16 | |
| Average of class Gaming (83 - 187.2, n=34, last 2 years) | |
| Razer Blade 17 Early 2022 (1.47.22.14 D3D12, dGPU, 175W) | |
| Razer Blade 17 Early 2022 (1.47.22.14 D3D12) | |
| Average NVIDIA GeForce RTX 3080 Ti Laptop GPU (61.7 - 100.7, n=15) | |
| Razer Blade 17 Early 2022 (1.47.22.14 D3D12, Lautlos) | |
| 1920x1080 ultra AA:ultra AF:16 | |
| Average of class Gaming (76.3 - 458, n=87, last 2 years) | |
| Razer Blade 17 RTX 3080 Ti (1.47.22.14 D3D12) | |
| Razer Blade 17 Early 2022 (1.47.22.14 D3D12, dGPU, 175W) | |
| Alienware x17 R2 P48E (1.47.22.14 D3D12) | |
| Razer Blade 17 Early 2022 (1.47.22.14 D3D12) | |
| Medion Erazer Beast X30 (1.47.22.14 D3D12) | |
| Average NVIDIA GeForce RTX 3080 Ti Laptop GPU (42.3 - 224, n=41) | |
| Razer Blade 17 Early 2022 (1.47.22.14 D3D12, Lautlos) | |
| MSI Stealth GS77 12UHS-083US (1.47.22.14 D3D12) | |
| F1 2021 | |
| 3840x2160 Ultra High Preset + Raytracing AA:T AF:16x | |
| Razer Blade 17 Early 2022 (874931, dGPU, 175W) | |
| Razer Blade 17 Early 2022 (874931, Max.) | |
| Razer Blade 17 Early 2022 (874931) | |
| Average NVIDIA GeForce RTX 3080 Ti Laptop GPU (41.1 - 70.2, n=18) | |
| Razer Blade 17 Early 2022 (874931, Lautlos) | |
| 1920x1080 Ultra High Preset + Raytracing AA:T AF:16x | |
| Razer Blade 17 Early 2022 (874931, dGPU, 175W) | |
| Razer Blade 17 Early 2022 (874931, Max.) | |
| Razer Blade 17 Early 2022 (874931) | |
| Medion Erazer Beast X30 (874931) | |
| Average NVIDIA GeForce RTX 3080 Ti Laptop GPU (30.2 - 160.6, n=30) | |
| Razer Blade 17 Early 2022 (874931, Lautlos) | |
| Far Cry 5 | |
| 3840x2160 Ultra Preset AA:T | |
| Average of class Gaming (n=1last 2 years) | |
| Razer Blade 17 Early 2022 | |
| Razer Blade 17 Early 2022 (dGPU, 175W) | |
| Average NVIDIA GeForce RTX 3080 Ti Laptop GPU (45 - 76, n=9) | |
| 1920x1080 Ultra Preset AA:T | |
| Average NVIDIA GeForce RTX 3080 Ti Laptop GPU (111 - 162, n=24) | |
| Medion Erazer Beast X30 | |
| MSI Stealth GS77 12UHS-083US | |
| Razer Blade 17 RTX 3080 Ti | |
| Razer Blade 17 Early 2022 (dGPU, 175W) | |
| Razer Blade 17 Early 2022 | |
| Average of class Gaming (70 - 151, n=6, last 2 years) | |
The Witcher 3 FPS Chart
| low | med. | high | ultra | QHD | 4K | |
|---|---|---|---|---|---|---|
| GTA V (2015) | 179.4 | 175.2 | 166 | 106 | 102.7 | 118 |
| The Witcher 3 (2015) | 328 | 289 | 218 | 119.6 | 89.6 | |
| Dota 2 Reborn (2015) | 176.1 | 149.2 | 140 | 131.9 | 117.3 | |
| Final Fantasy XV Benchmark (2018) | 155.9 | 139.3 | 112.2 | 90.8 | 55.2 | |
| X-Plane 11.11 (2018) | 127.9 | 115.5 | 95.6 | 82.1 | ||
| Far Cry 5 (2018) | 148 | 127 | 122 | 116 | 110 | 70 |
| Strange Brigade (2018) | 382 | 272 | 229 | 204 | 152.7 | 91.1 |
| F1 2021 (2021) | 295 | 255 | 219 | 132.8 | 104.3 | 62.5 |
| Baldur's Gate 3 (2023) | 117.7 | 84.4 | 46 | |||
| Cyberpunk 2077 (2023) | 91.43 | 57.12 | 25.46 |
Emissions - The Blade 17 doesn't warm up excessively
Noise Emissions
In everyday operation (office, Internet), the laptop doesn't produce excessive noise. Occasionally, the fans even remain completely turned off and there is silence. Under load, it can get loud with a maximum noise level of up to 51 dB(A) (stress test, The Witcher 3 test).
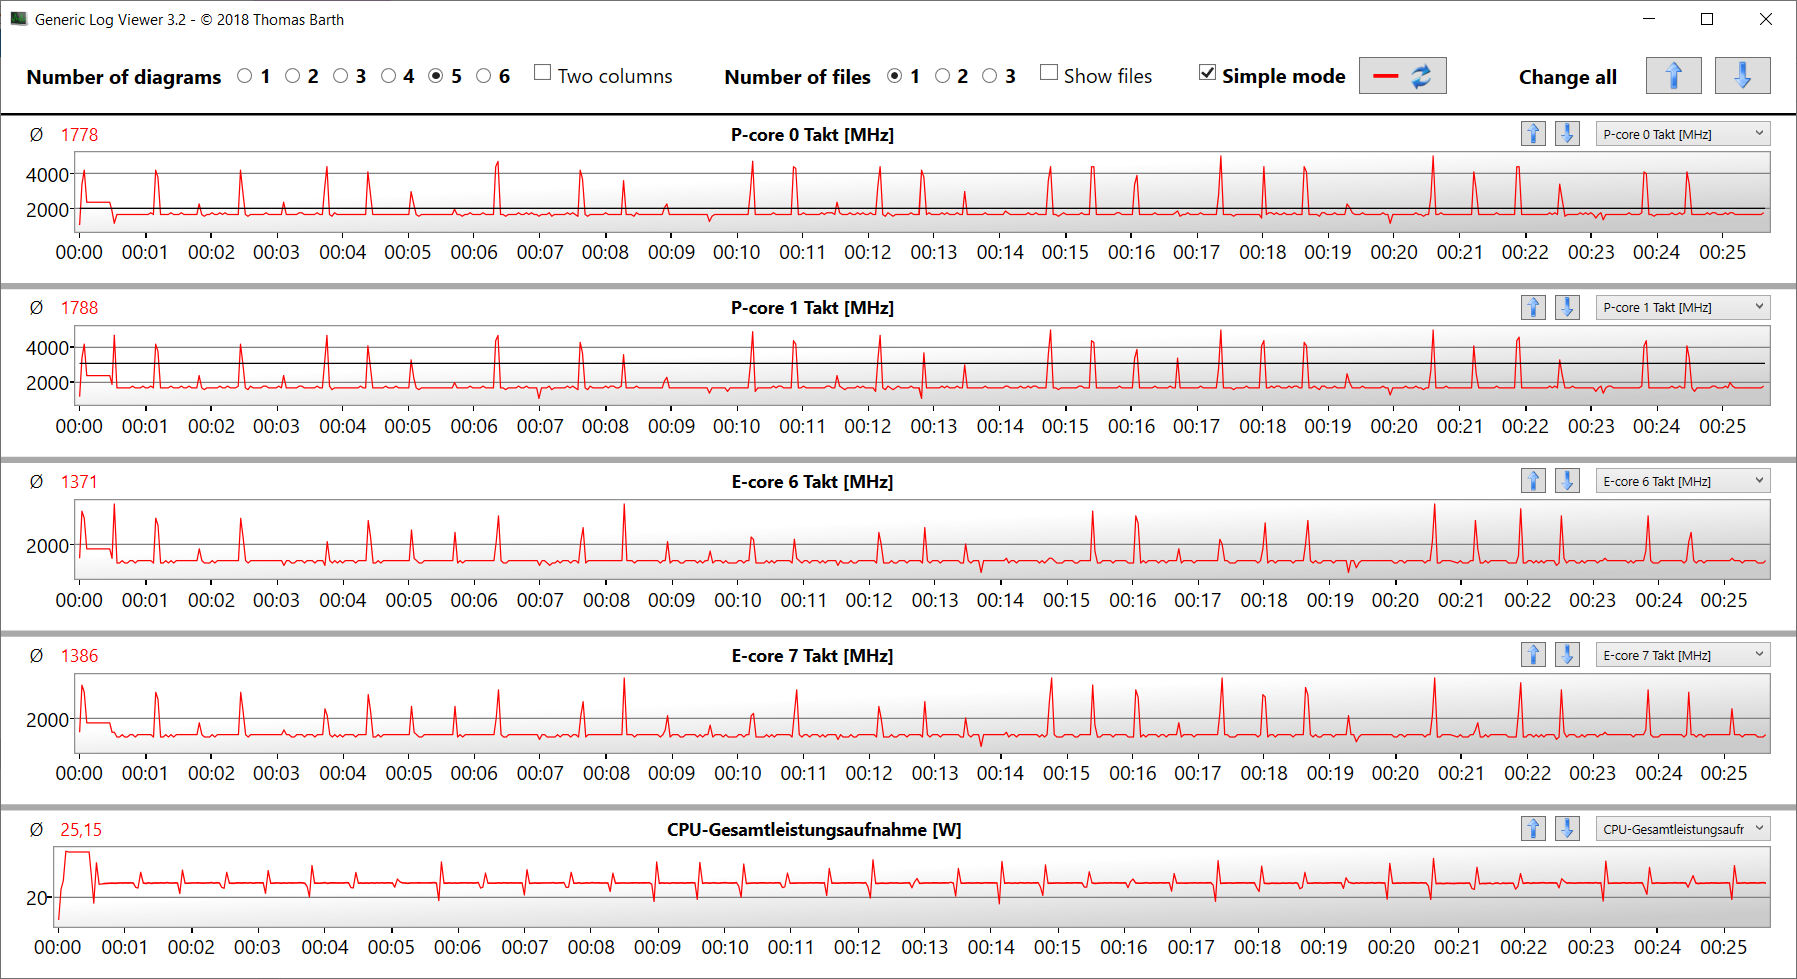
The "Silent" performance profile offers itself for everyday operation. Although the laptop then doesn't run silently, it still produces less noise and heat. The reduced computing performance is also sufficient for gaming.
Noise level
| Idle |
| 26 / 27 / 32 dB(A) |
| Load |
| 50 / 51 dB(A) |
 | ||
30 dB silent 40 dB(A) audible 50 dB(A) loud |
||
min: | ||
| Razer Blade 17 Early 2022 GeForce RTX 3080 Ti Laptop GPU, i9-12900H, Samsung PM9A1 MZVL21T0HCLR | Alienware x17 R2 P48E GeForce RTX 3080 Ti Laptop GPU, i9-12900HK, 2x Samsung PM9A1 1TB (RAID 0) | Medion Erazer Beast X30 GeForce RTX 3080 Ti Laptop GPU, i9-12900HK, Samsung PM9A1 MZVL21T0HCLR | MSI Stealth GS77 12UHS-083US GeForce RTX 3080 Ti Laptop GPU, i7-12700H, Micron 3400 1TB MTFDKBA1T0TFH | Razer Blade 17 RTX 3080 Ti GeForce RTX 3080 Ti Laptop GPU, i7-12800H, Samsung PM9A1 MZVL21T0HCLR | |
|---|---|---|---|---|---|
| Noise | 14% | -2% | 8% | 11% | |
| off / environment * (dB) | 26 | 22.7 13% | 26 -0% | 24.5 6% | 23.3 10% |
| Idle Minimum * (dB) | 26 | 23.1 11% | 27 -4% | 24.5 6% | 23.3 10% |
| Idle Average * (dB) | 27 | 23.1 14% | 29 -7% | 24.5 9% | 23.3 14% |
| Idle Maximum * (dB) | 32 | 23.1 28% | 34 -6% | 30.8 4% | 26.3 18% |
| Load Average * (dB) | 50 | 31.9 36% | 48 4% | 34.6 31% | 38.2 24% |
| Witcher 3 ultra * (dB) | 51 | 52.5 -3% | 51 -0% | 46.2 9% | 50.9 -0% |
| Load Maximum * (dB) | 51 | 52.5 -3% | 53 -4% | 56.8 -11% | 49.1 4% |
* ... smaller is better
Temperatures
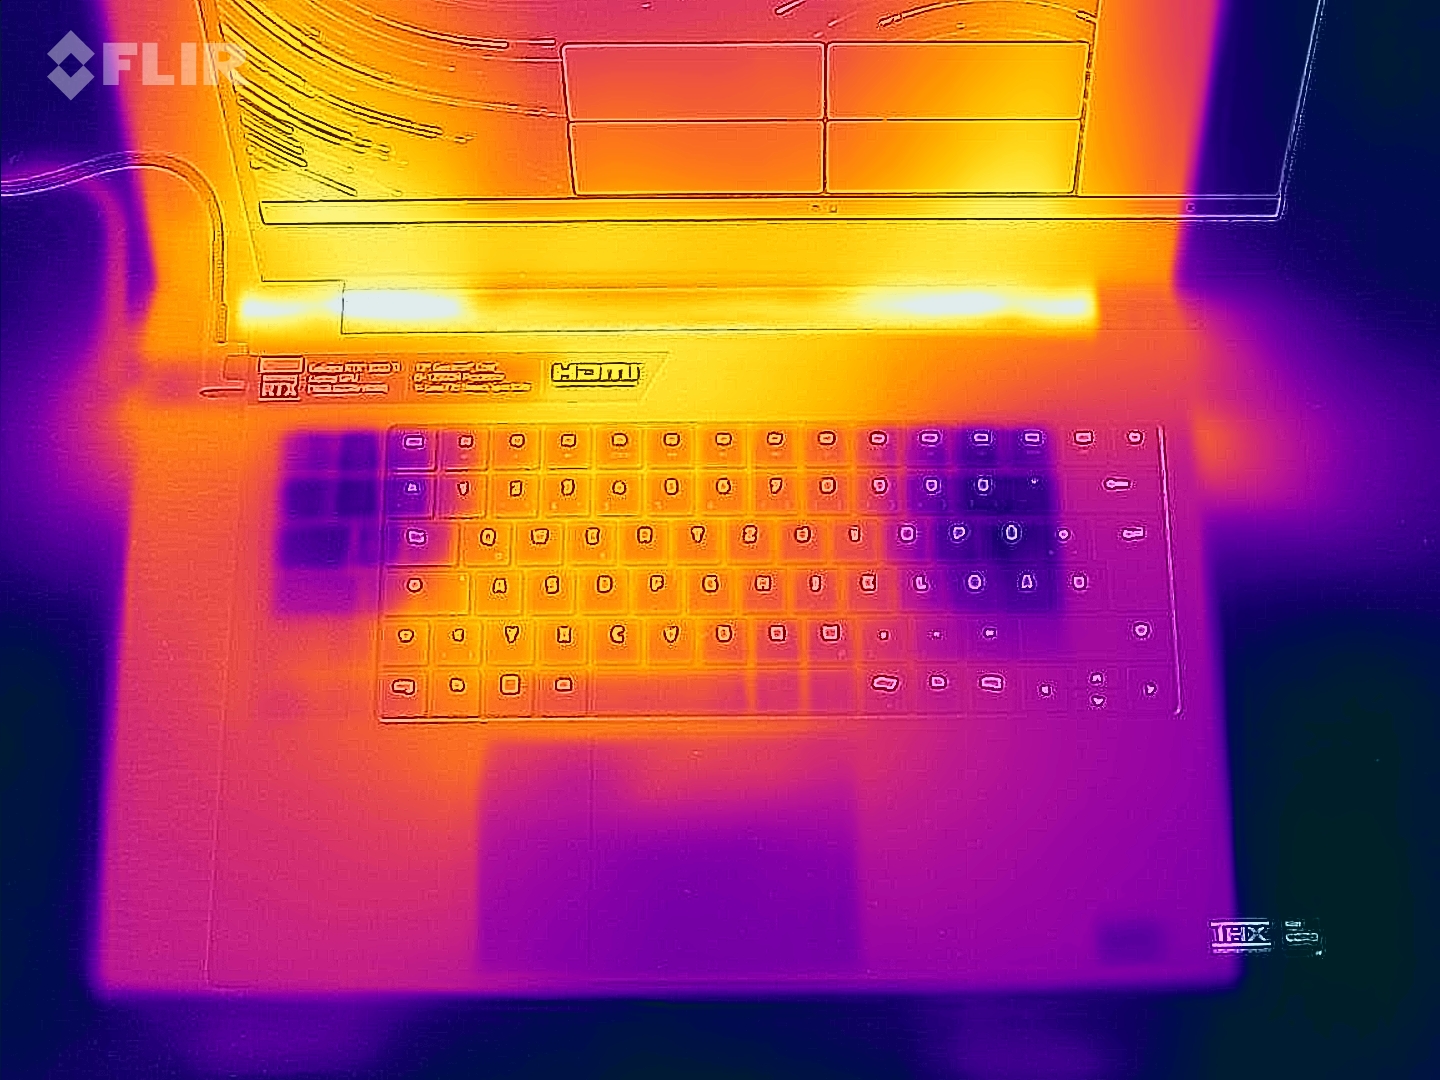
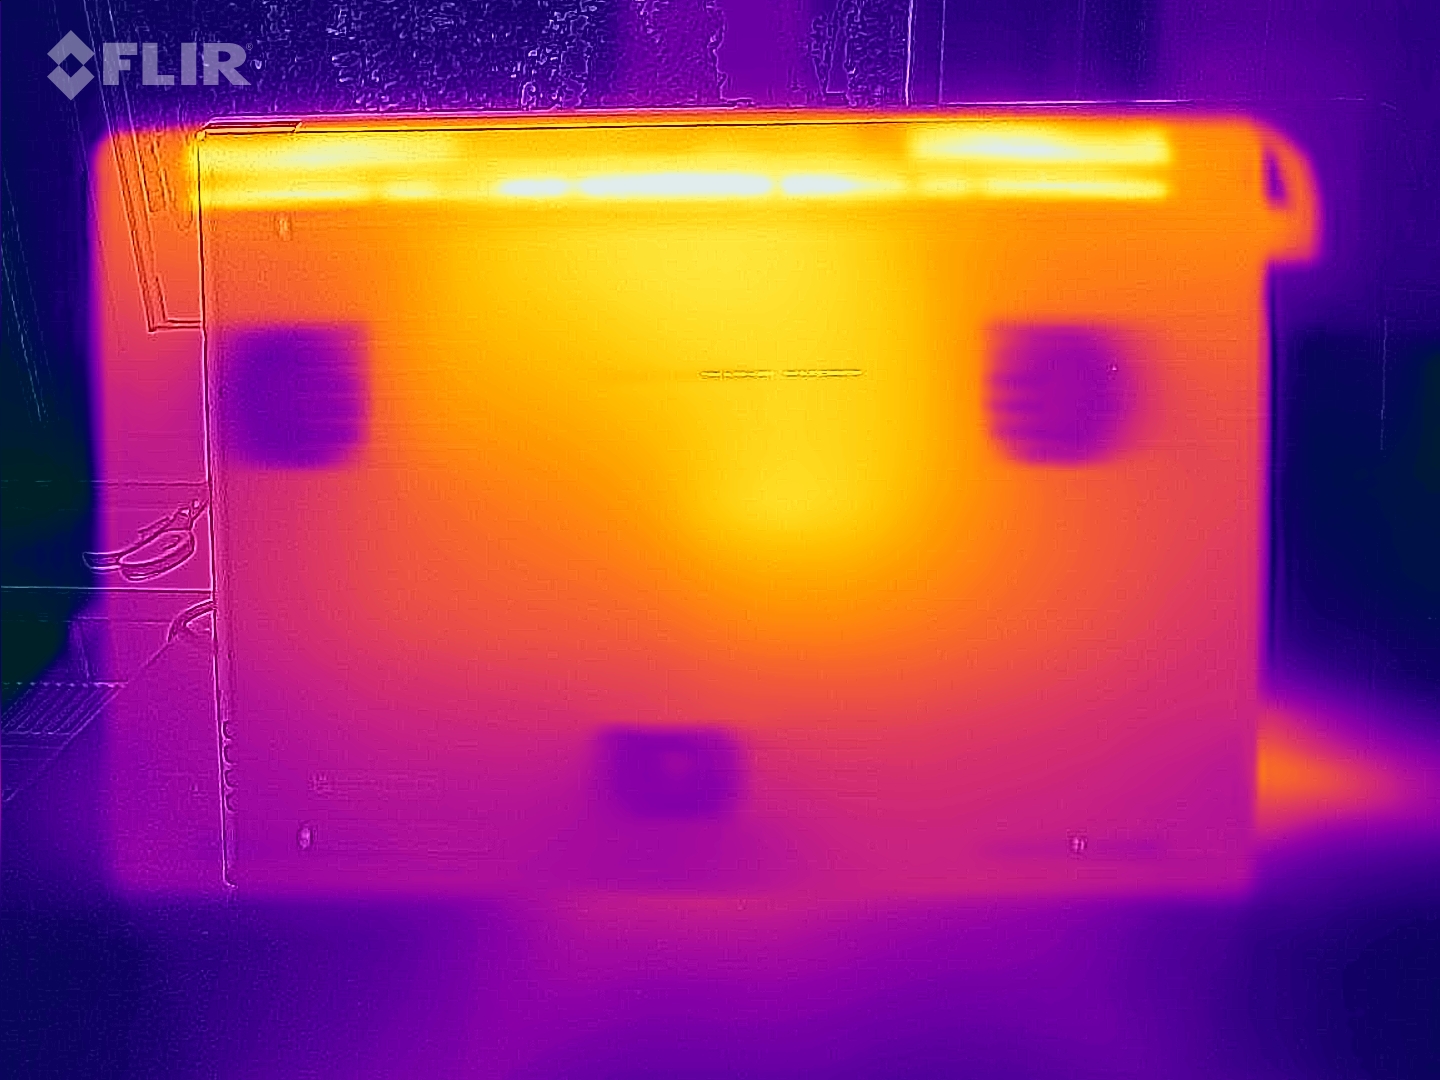
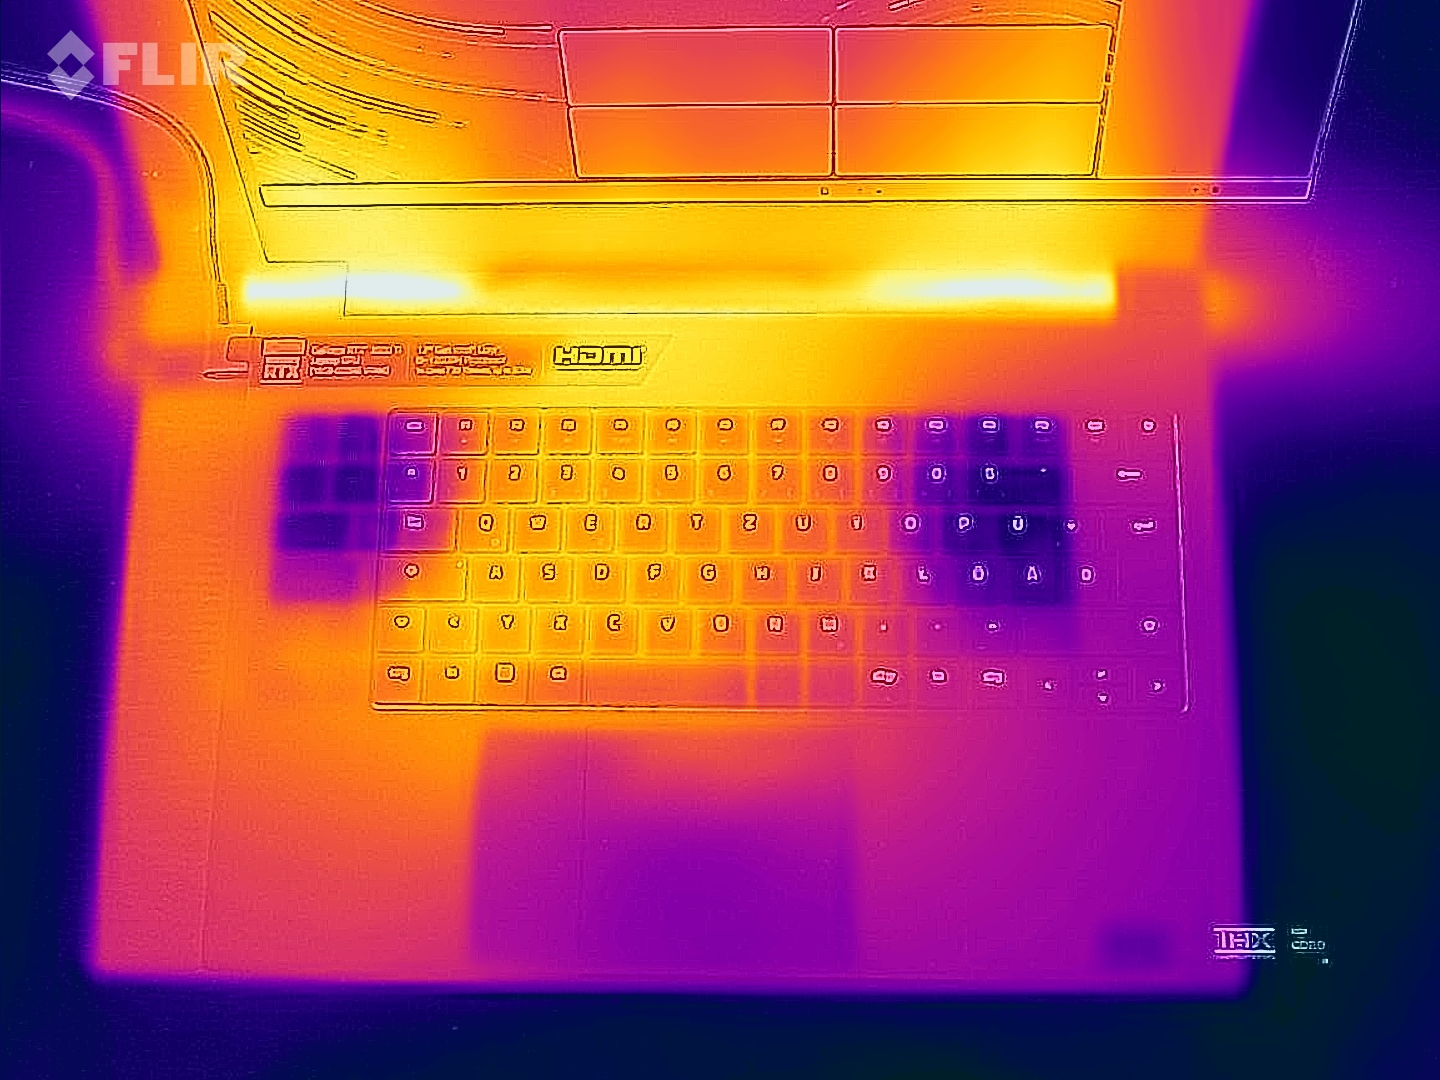
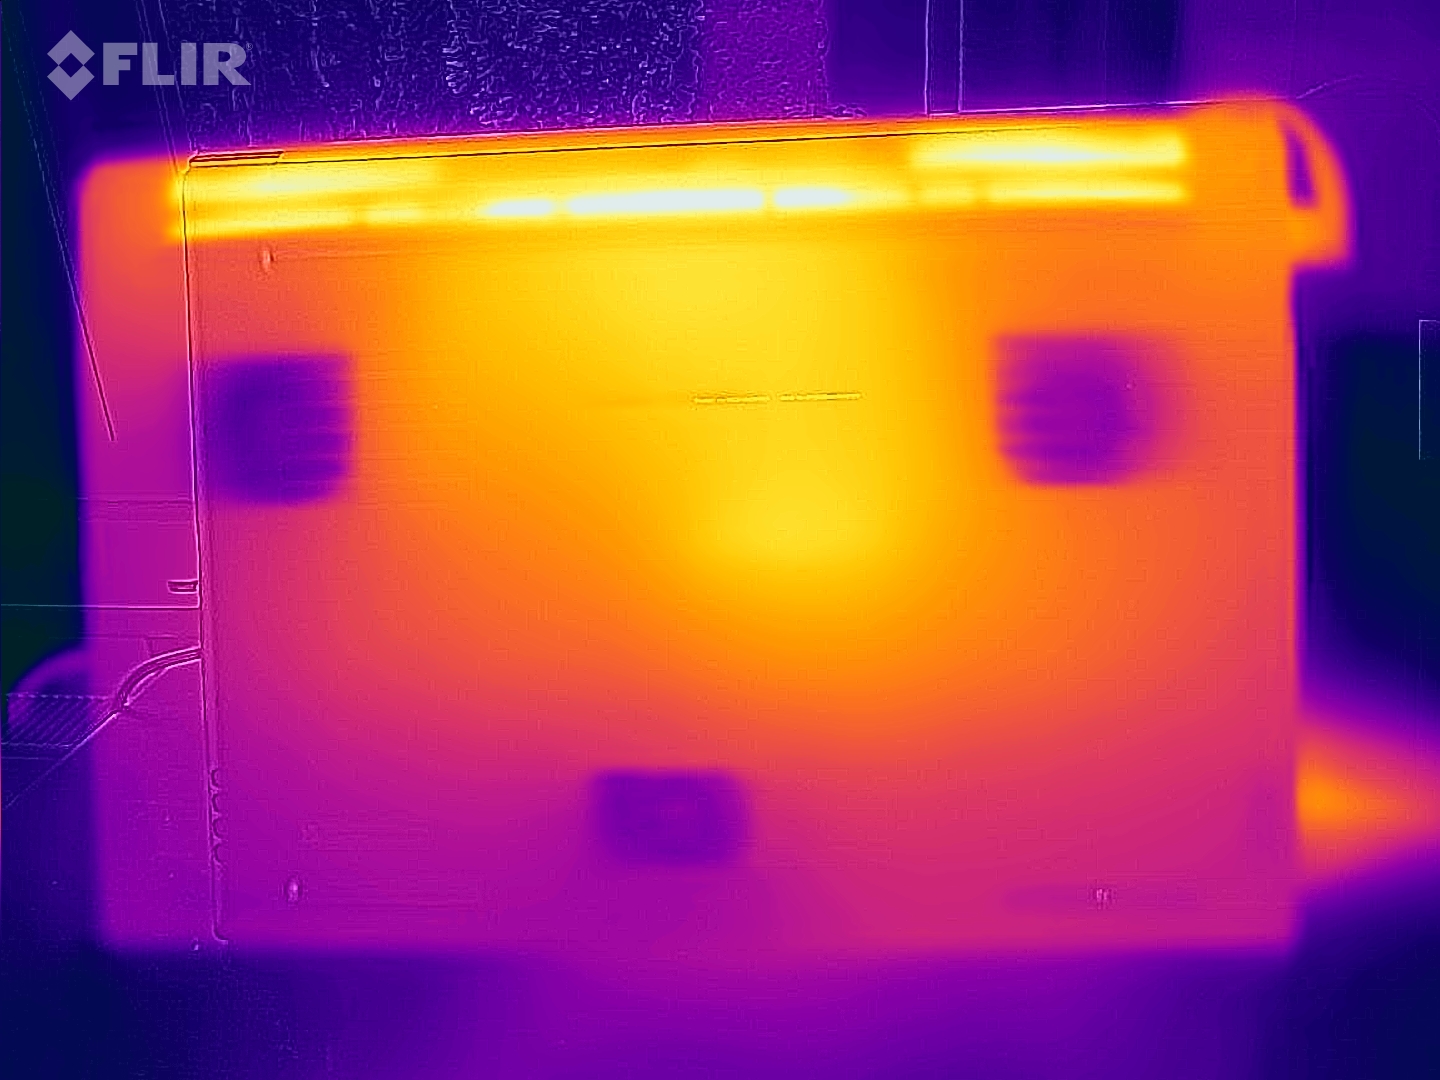
In everyday operation (office, Internet), the case temperatures remain within a green range. While the laptop warms up noticeably under load (stress test, The Witcher 3 test), the heat development still remains within acceptable limits. However, the CPU temperatures can reach up into the red range at times.
(-) The maximum temperature on the upper side is 50 °C / 122 F, compared to the average of 40.4 °C / 105 F, ranging from 21.2 to 68.8 °C for the class Gaming.
(-) The bottom heats up to a maximum of 56 °C / 133 F, compared to the average of 43.2 °C / 110 F
(±) In idle usage, the average temperature for the upper side is 33 °C / 91 F, compared to the device average of 33.9 °C / 93 F.
(-) Playing The Witcher 3, the average temperature for the upper side is 42.7 °C / 109 F, compared to the device average of 33.9 °C / 93 F.
(-) The palmrests and touchpad can get very hot to the touch with a maximum of 42 °C / 107.6 F.
(-) The average temperature of the palmrest area of similar devices was 28.8 °C / 83.8 F (-13.2 °C / -23.8 F).
| Razer Blade 17 Early 2022 Intel Core i9-12900H, NVIDIA GeForce RTX 3080 Ti Laptop GPU | Alienware x17 R2 P48E Intel Core i9-12900HK, NVIDIA GeForce RTX 3080 Ti Laptop GPU | Medion Erazer Beast X30 Intel Core i9-12900HK, NVIDIA GeForce RTX 3080 Ti Laptop GPU | MSI Stealth GS77 12UHS-083US Intel Core i7-12700H, NVIDIA GeForce RTX 3080 Ti Laptop GPU | Razer Blade 17 RTX 3080 Ti Intel Core i7-12800H, NVIDIA GeForce RTX 3080 Ti Laptop GPU | |
|---|---|---|---|---|---|
| Heat | 15% | -1% | 3% | 5% | |
| Maximum Upper Side * (°C) | 50 | 49.6 1% | 55 -10% | 50.6 -1% | 46 8% |
| Maximum Bottom * (°C) | 56 | 42.4 24% | 62 -11% | 59.6 -6% | 46.8 16% |
| Idle Upper Side * (°C) | 36 | 29.2 19% | 32 11% | 30 17% | 36.2 -1% |
| Idle Bottom * (°C) | 38 | 32 16% | 36 5% | 37.4 2% | 38.6 -2% |
* ... smaller is better
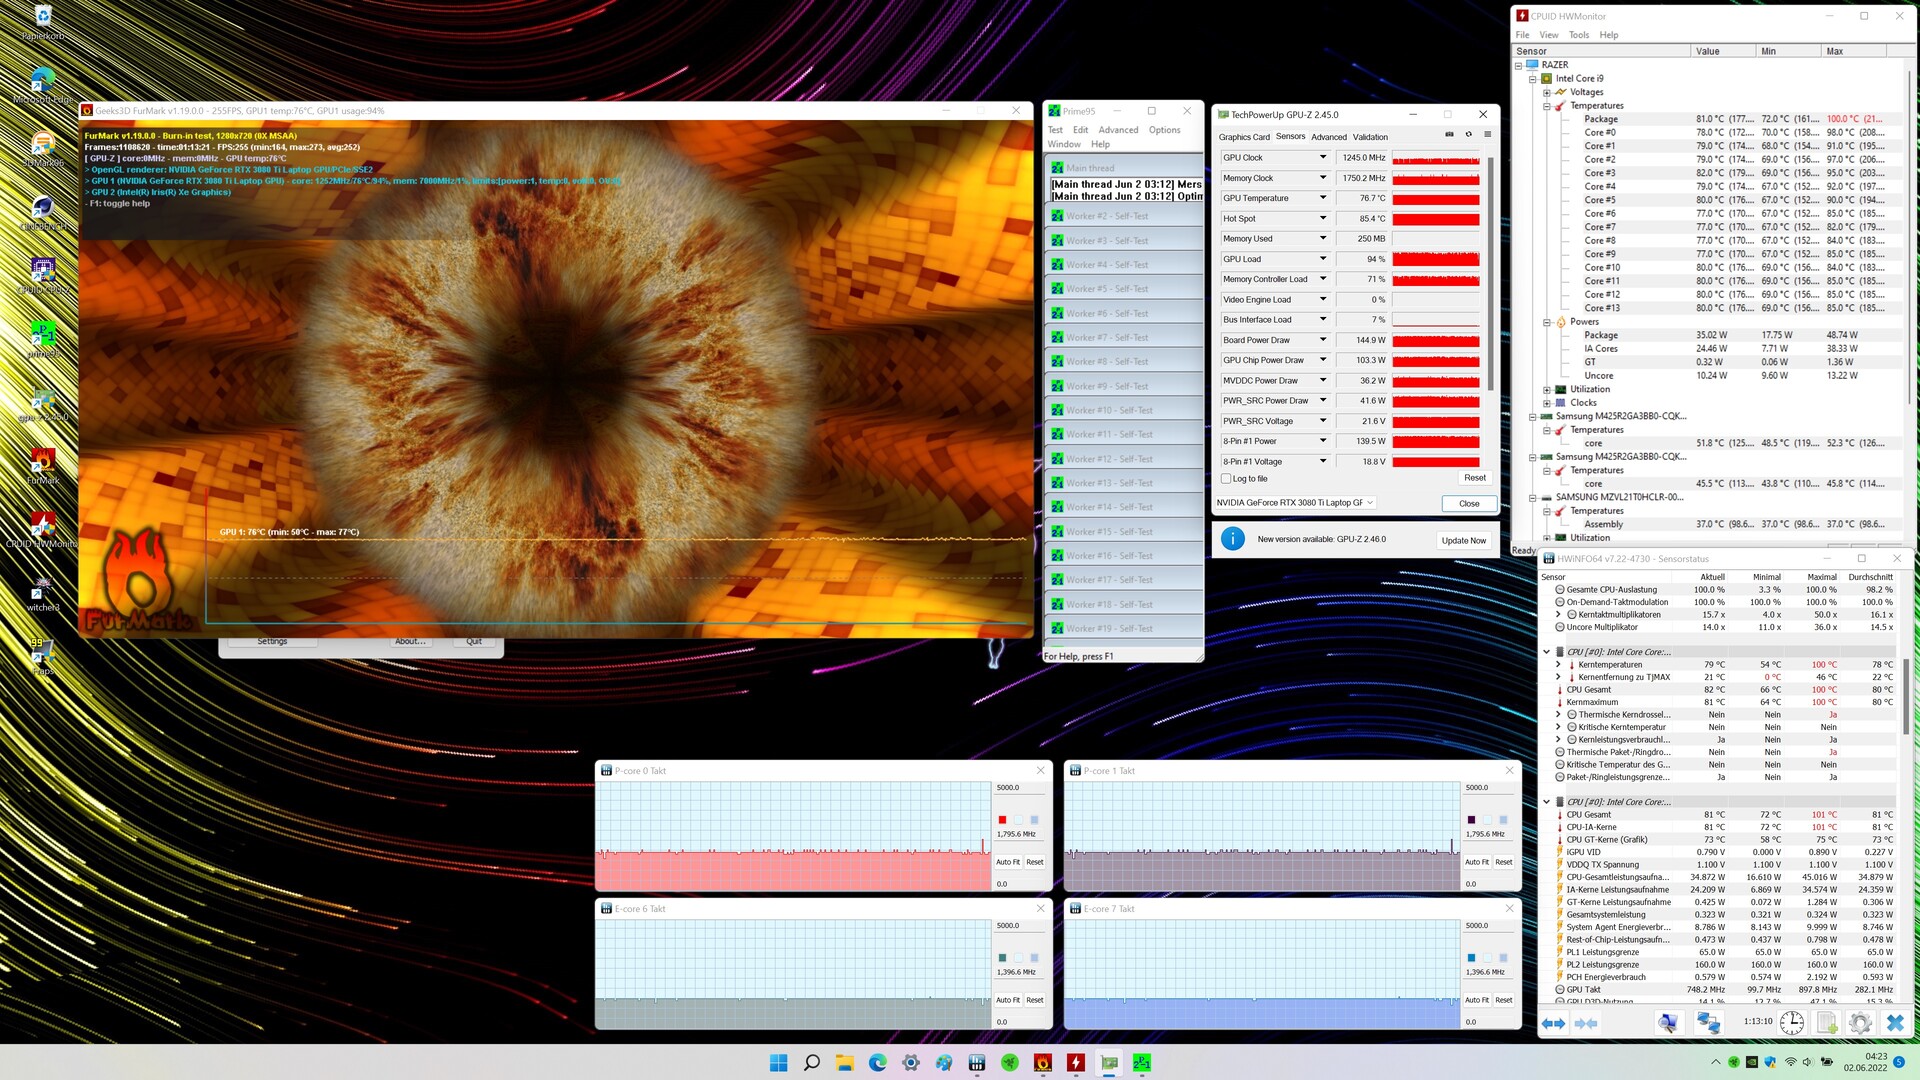
Stress Test
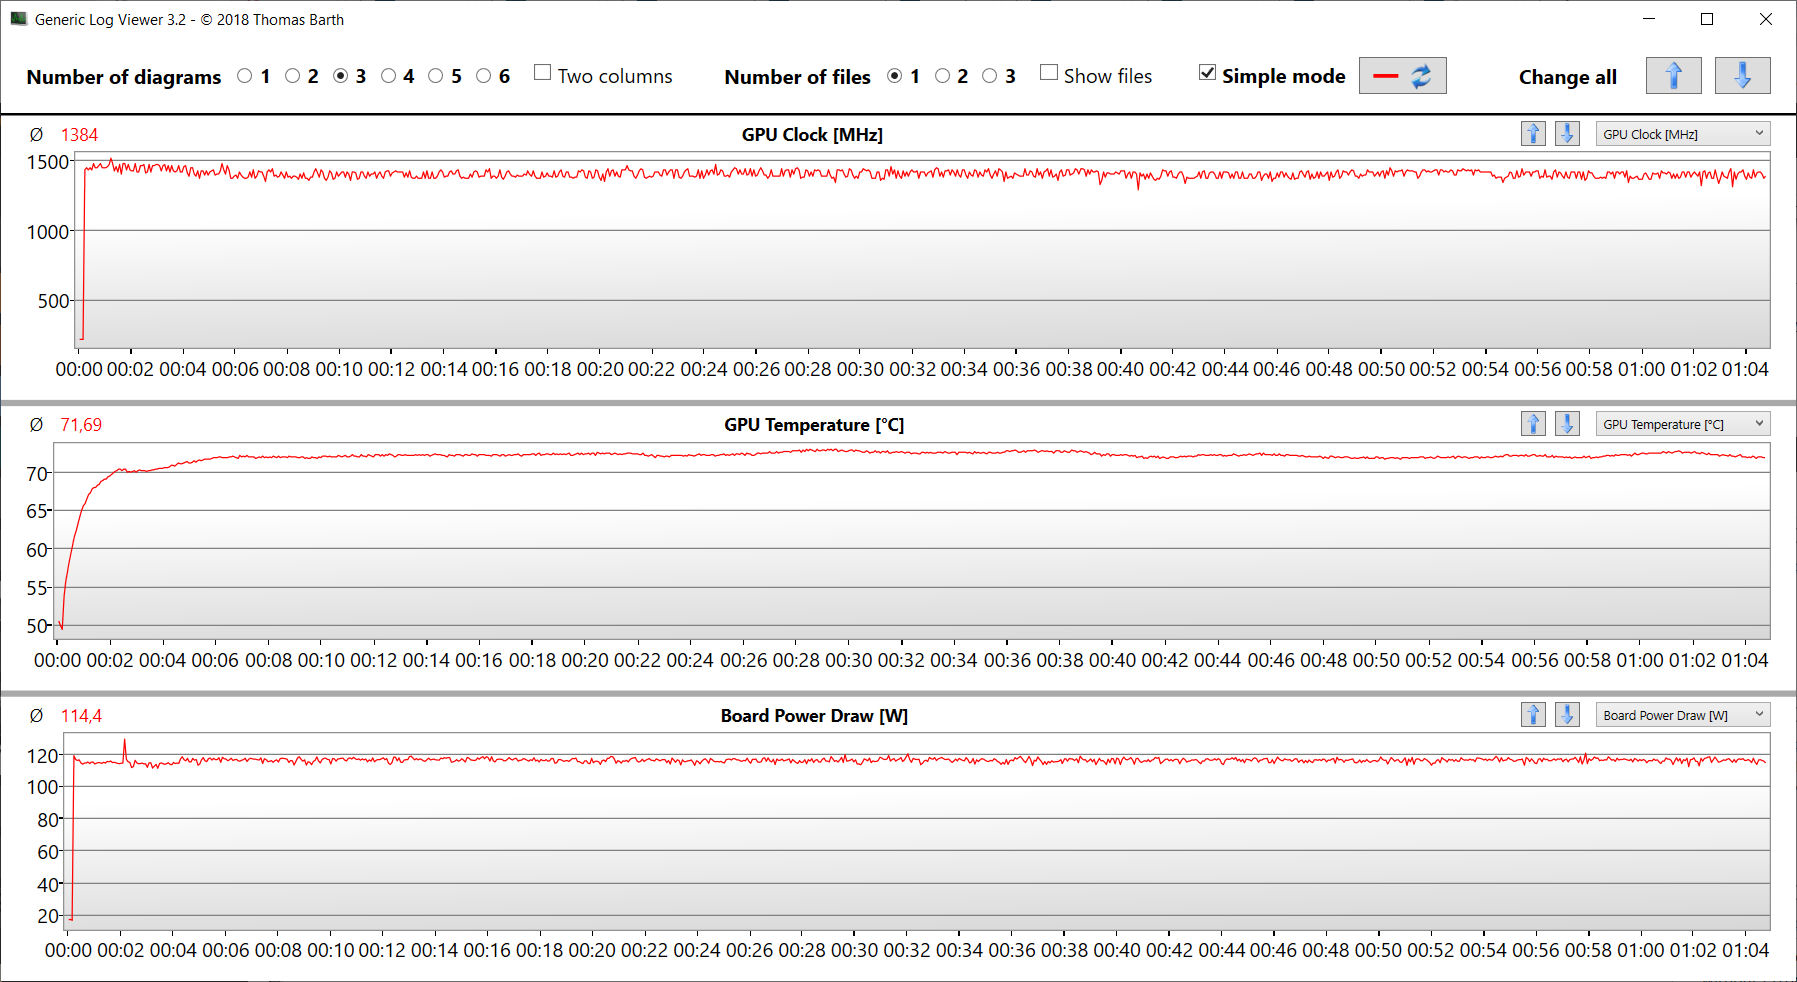
Already at the beginning of the stress test (with Prime95 and Furmark running for at least one hour), the CPU runs at low clock speeds (P cores: 2.1 to 2.2 GHz; E cores: 1.6 to 1.7 GHz). Continuing, the values drop to 1.8 GHz for the P cores and 1.4 GHz for the E cores. The GPU clock speed drops from about 1500 MHz to around 1250 MHz. The stress test represents an extreme scenario, and we use it to evaluate whether the system remains stable at full load.
Speakers
Razer Blade 17 Early 2022 audio analysis
(+) | speakers can play relatively loud (83 dB)
Bass 100 - 315 Hz
(±) | reduced bass - on average 7.4% lower than median
(±) | linearity of bass is average (9.7% delta to prev. frequency)
Mids 400 - 2000 Hz
(+) | balanced mids - only 3% away from median
(+) | mids are linear (3.7% delta to prev. frequency)
Highs 2 - 16 kHz
(+) | balanced highs - only 2.5% away from median
(+) | highs are linear (6.1% delta to prev. frequency)
Overall 100 - 16.000 Hz
(+) | overall sound is linear (9.2% difference to median)
Compared to same class
» 3% of all tested devices in this class were better, 1% similar, 96% worse
» The best had a delta of 6%, average was 18%, worst was 132%
Compared to all devices tested
» 3% of all tested devices were better, 1% similar, 96% worse
» The best had a delta of 4%, average was 23%, worst was 134%
MSI Stealth GS77 12UHS-083US audio analysis
(+) | speakers can play relatively loud (84.8 dB)
Bass 100 - 315 Hz
(±) | reduced bass - on average 9.4% lower than median
(±) | linearity of bass is average (9.8% delta to prev. frequency)
Mids 400 - 2000 Hz
(±) | higher mids - on average 7% higher than median
(+) | mids are linear (4.9% delta to prev. frequency)
Highs 2 - 16 kHz
(±) | higher highs - on average 5.8% higher than median
(±) | linearity of highs is average (7.9% delta to prev. frequency)
Overall 100 - 16.000 Hz
(±) | linearity of overall sound is average (15.9% difference to median)
Compared to same class
» 38% of all tested devices in this class were better, 7% similar, 56% worse
» The best had a delta of 6%, average was 18%, worst was 132%
Compared to all devices tested
» 25% of all tested devices were better, 5% similar, 70% worse
» The best had a delta of 4%, average was 23%, worst was 134%
Power Management - The Razer laptop offers a meager battery life
Power Consumption
During idle operation, the power consumption turns out relatively high at up to 34 watts, and some of the competitors are more efficient here. Under high load, the consumption of the Blade is at a level similar to the competitors, and sometimes even lower. The Alienware x17 R2 P48E represents an outlier toward the top. While it consumes significantly more power, it generally also produces the best benchmark results. The included 280-Watt power supply is sufficiently large.
Note: The QHD sibling model was tested with the "Boost" CPU preset and dGPU mode activated. This explains its higher consumption during idle operation and under low loads.
| Off / Standby | |
| Idle | |
| Load |
|
Key:
min: | |
| Razer Blade 17 Early 2022 i9-12900H, GeForce RTX 3080 Ti Laptop GPU, Samsung PM9A1 MZVL21T0HCLR, IPS, 3840x2160, 17.3" | Alienware x17 R2 P48E i9-12900HK, GeForce RTX 3080 Ti Laptop GPU, 2x Samsung PM9A1 1TB (RAID 0), IPS, 1920x1080, 17.3" | Medion Erazer Beast X30 i9-12900HK, GeForce RTX 3080 Ti Laptop GPU, Samsung PM9A1 MZVL21T0HCLR, IPS, 2560x1440, 17.3" | MSI Stealth GS77 12UHS-083US i7-12700H, GeForce RTX 3080 Ti Laptop GPU, Micron 3400 1TB MTFDKBA1T0TFH, IPS, 2560x1440, 17.3" | Razer Blade 17 RTX 3080 Ti i7-12800H, GeForce RTX 3080 Ti Laptop GPU, Samsung PM9A1 MZVL21T0HCLR, IPS, 2560x1440, 17.3" | Average NVIDIA GeForce RTX 3080 Ti Laptop GPU | Average of class Gaming | |
|---|---|---|---|---|---|---|---|
| Power Consumption | -32% | 13% | 9% | -41% | -2% | 14% | |
| Idle Minimum * (Watt) | 17 | 24.1 -42% | 12 29% | 20 -18% | 29.8 -75% | 17.2 ? -1% | 13 ? 24% |
| Idle Average * (Watt) | 23 | 28.5 -24% | 16 30% | 21.4 7% | 37.1 -61% | 23.3 ? -1% | 19 ? 17% |
| Idle Maximum * (Watt) | 34 | 60 -76% | 22 35% | 27 21% | 60.8 -79% | 30.8 ? 9% | 24.6 ? 28% |
| Load Average * (Watt) | 120 | 128.7 -7% | 118 2% | 100.5 16% | 135.3 -13% | 121.2 ? -1% | 110.7 ? 8% |
| Witcher 3 ultra * (Watt) | 229 | 254 -11% | 223 3% | 165 28% | 243 -6% | ||
| Load Maximum * (Watt) | 243 | 323 -33% | 290 -19% | 247.1 -2% | 273.1 -12% | 276 ? -14% | 259 ? -7% |
* ... smaller is better
Power Consumption The Witcher 3 / Stress Test
Power Consumption With External Monitor
Battery Life
In the WLAN test (loading web sites via script) and video test (playing the short film Big Buck Bunny (H.264 coding, FHD) in a constant loop), the 17.3-inch laptop achieves runtimes of 3:49 h and 4:50 h respectively. Due to lower display resolution of the QHD Blade, it is not surprising that it can achieve a longer battery life using the same 82-Wh battery.
| Razer Blade 17 Early 2022 i9-12900H, GeForce RTX 3080 Ti Laptop GPU, 82 Wh | Alienware x17 R2 P48E i9-12900HK, GeForce RTX 3080 Ti Laptop GPU, 87 Wh | Medion Erazer Beast X30 i9-12900HK, GeForce RTX 3080 Ti Laptop GPU, 91.2 Wh | MSI Stealth GS77 12UHS-083US i7-12700H, GeForce RTX 3080 Ti Laptop GPU, 99 Wh | Razer Blade 17 RTX 3080 Ti i7-12800H, GeForce RTX 3080 Ti Laptop GPU, 82 Wh | Average of class Gaming | |
|---|---|---|---|---|---|---|
| Battery runtime | -48% | 33% | 32% | 8% | 41% | |
| Reader / Idle (h) | 7.1 | 3.9 -45% | 7.7 8% | 10.8 52% | 8 13% | 8.27 ? 16% |
| H.264 (h) | 4.8 | 6.4 33% | 8.32 ? 73% | |||
| WiFi v1.3 (h) | 3.8 | 2 -47% | 5.7 50% | 6.2 63% | 5.5 45% | 7.11 ? 87% |
| Load (h) | 1.7 | 0.8 -53% | 2.4 41% | 1.4 -18% | 1.1 -35% | 1.502 ? -12% |
Pros
Cons
Verdict - A lot of performance in a compact case
Our test configuration of the Blade 17 targets gamers and creative professionals. A Core i9-12900H processor, GeForce RTX 3080 Ti Laptop GPU (175 watts TGP after the BIOS update, 16 GB of VRAM), and 32 GB of working memory equip the laptop for video processing, rending, and 4k gaming at the highest level. In addition, a fast PCIe-4 SSD (1 TB) ensures short load and storage times.
With the Blade 17 (Early 2022), Razer delivers a successful and powerful work device for creative professionals. But this also has its price.
The CPU and GPU are able to run constantly at high clock speeds. As usual for this device class, the noise and heat development are at a high level. A realistic battery life of between 4 and 5 hours is still okay for a powerful 4K laptop. The highlight is the bright and responsive 17.3-inch display (4K, IPS, 144 Hz) with an accurate color reproduction (DCI-P3: 100%).
The Blade costs about 4,650 Euros (~$4847), which is about 400 Euros (~$417) more than the QHD model. Is it worth it? The Core i9 delivers hardly any additional power compared to the Core i7 of the sibling model, particularly under constant load. And the sibling offers a better battery life. Another point for the QHD model that we tested previously is the support of Advanced Optimus. The 4k Blade doesn't offer this.
The 4K display offers a significantly higher brightness and shorter response times than the QHD panel. If in addition to the higher resolution, these criteria aren't the deciding factors, you can safely choose a QHD Blade. The QHD and 4K panel are equally good in terms of the color reproduction and color space coverage.
As an alternative to the Blade 17, you could also get the Medion Erazer Beast X30. It has almost the same dimensions but brings less weight to the scale. In terms of the graphics performance, it remains slightly behind the Razer laptop.
Price and Availability
The Razer Blade 17 in a similar configuration (Core i9-12900H, GeForce RTX 3080 Ti Laptop, 32 GB RAM, 1 TB SSD, 4k display) is available for $4,300 from Amazon and also from Razer directly for the same price.
Razer Blade 17 Early 2022
- 07/05/2022 v7 (old)
Sascha Mölck
Price comparison

