 Deutsch
 English
 Español
 Français
 Italiano
 Nederlands
 Polski
 Português
 Русский
 Türkçe
 Svenska
 Chinese
 Magyar
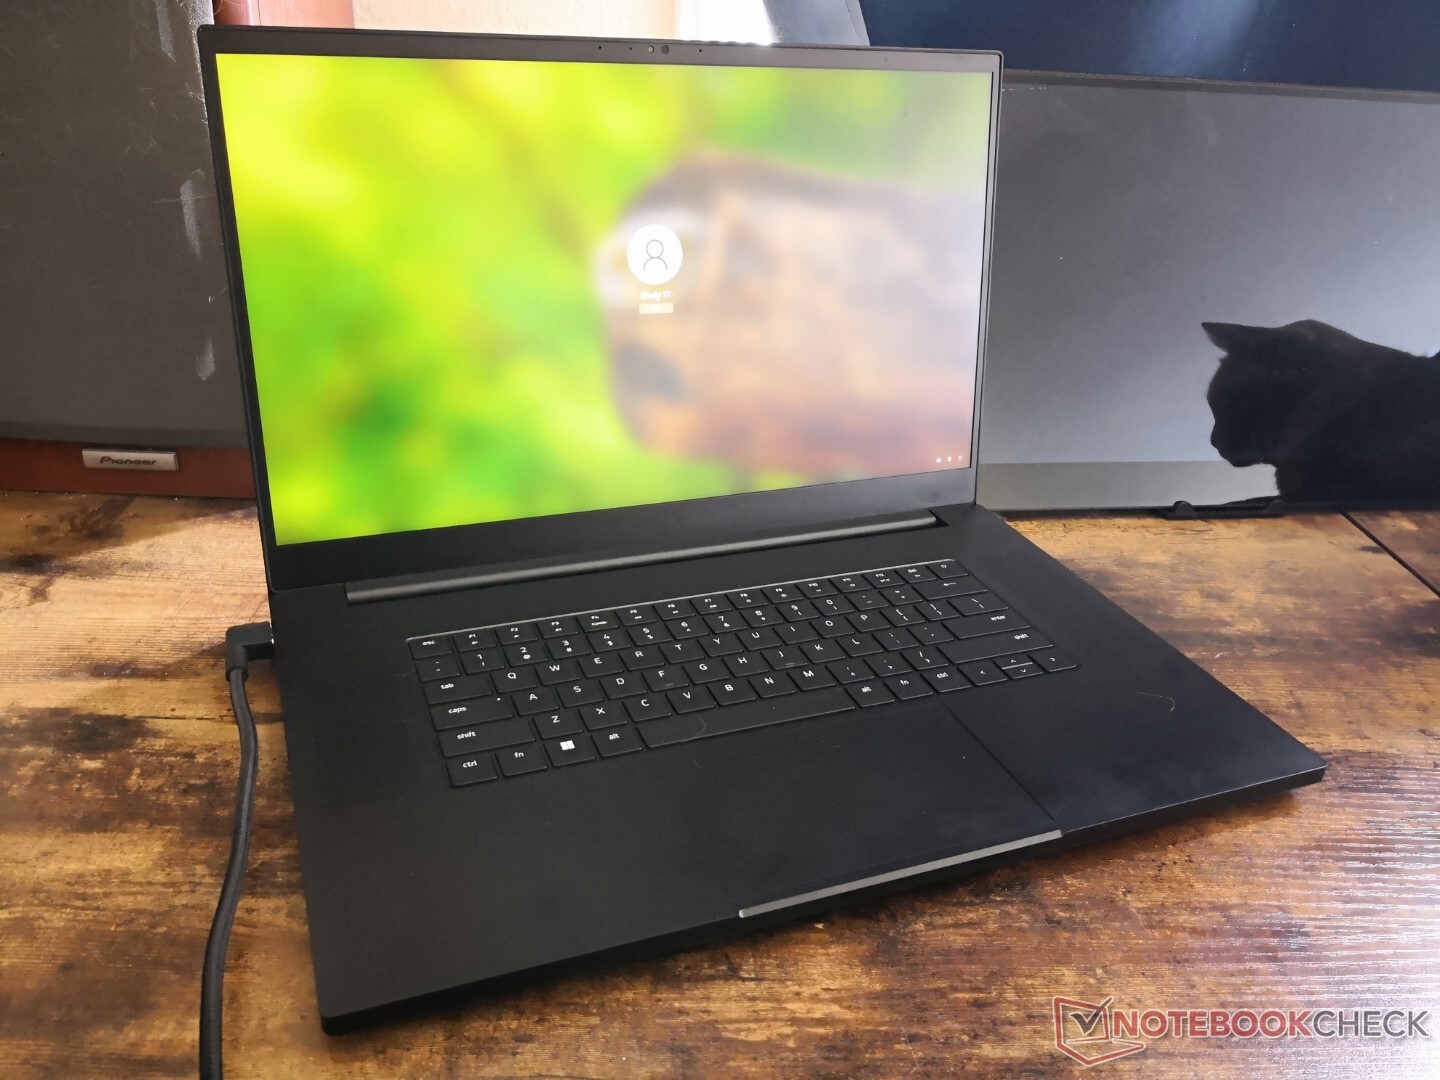
Razer Blade 17 2022 Core i7 RTX 3080 Ti laptop review: Supercharged performance
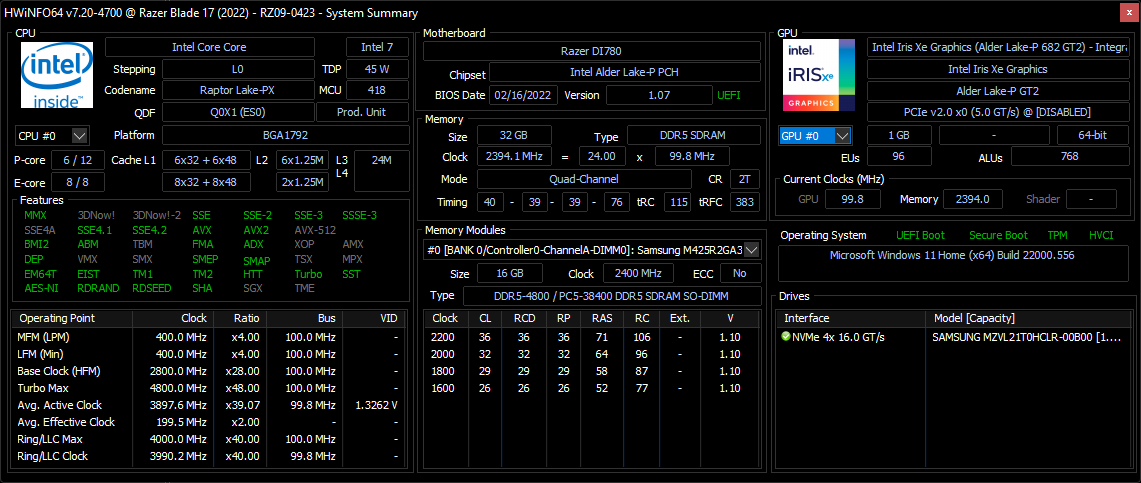
Whenever a new generation of processors from Intel or Nvidia becomes available, you can count on Razer to update its Blade series with the latest CPU or GPU options. The 2022 Blade 17 is an internal update to the 2021 Blade 17 with 12th gen Intel Alder Lake-H CPUs and GeForce RTX 3070 Ti and 3080 Ti GPUs replacing the 11th gen Tiger Lake-H and RTX 3070 and 3080 options of yesteryear. As detailed in our overview of Alder Lake, the new 12th gen CPUs introduce performance P-cores and efficient E-cores while the mobile GeForce Ti series is intended to squeeze more performance from essentially the same Nvidia Ampere chipset.
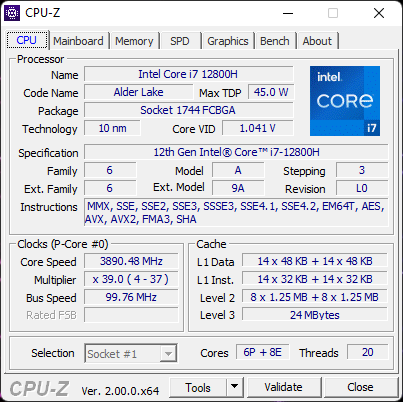
Our Blade 17 unit as reviewed is a high-end configuration with the Core i7-12800H, RTX 3080 Ti GPU, and 240 Hz QHD panel for approximately $4000 USD. Other SKUs are available with the RTX 3060 or RTX 3070 Ti GPUs, FHD or UHD displays, or the Core i9-12900H CPU at various starting points. Unlike the 100 W GPU of the 10th gen Intel Blade 17 or 130 W GPU of the 11th gen Blade 17, the GPU in this 12th gen Blade 17 is targeting an even higher TGP of 165 W for potentially more performance.
Alternatives to the Blade 17 include other flagship ultrathin gaming laptops like the MSI GS76 or GS77, Asus Zephyrus S17, Aorus 17G, Alienware x17, or Maingear Vector Pro.
More Razer reviews:
Potential Competitors in Comparison
Rating | Date | Model | Weight | Height | Size | Resolution | Best Price |
|---|---|---|---|---|---|---|---|
| 91.2 % | 03/2022 | Razer Blade 17 RTX 3080 Ti i7-12800H, GeForce RTX 3080 Ti Laptop GPU | 2.7 kg | 19.9 mm | 17.30" | 2560x1440 | |
| 87.8 % | 02/2021 | Razer Blade Pro 17 2021 (QHD Touch) i7-10875H, GeForce RTX 3080 Laptop GPU | 3 kg | 19.9 mm | 17.30" | 3840x2160 | |
| 86.2 % | 09/2021 | MSI GS76 Stealth 11UH i9-11900H, GeForce RTX 3080 Laptop GPU | 2.4 kg | 20 mm | 17.30" | 3840x2160 | |
| 90.1 % | 07/2021 | Asus ROG Zephyrus S17 GX703HSD i9-11900H, GeForce RTX 3080 Laptop GPU | 2.8 kg | 19.9 mm | 17.30" | 2560x1440 | |
| 86 % | 06/2021 | Aorus 17G YD i7-11800H, GeForce RTX 3080 Laptop GPU | 2.8 kg | 26 mm | 17.30" | 1920x1080 | |
| 89 % | 09/2021 | Alienware x17 RTX 3080 P48E i7-11800H, GeForce RTX 3080 Laptop GPU | 3.2 kg | 21.4 mm | 17.30" | 3840x2160 |
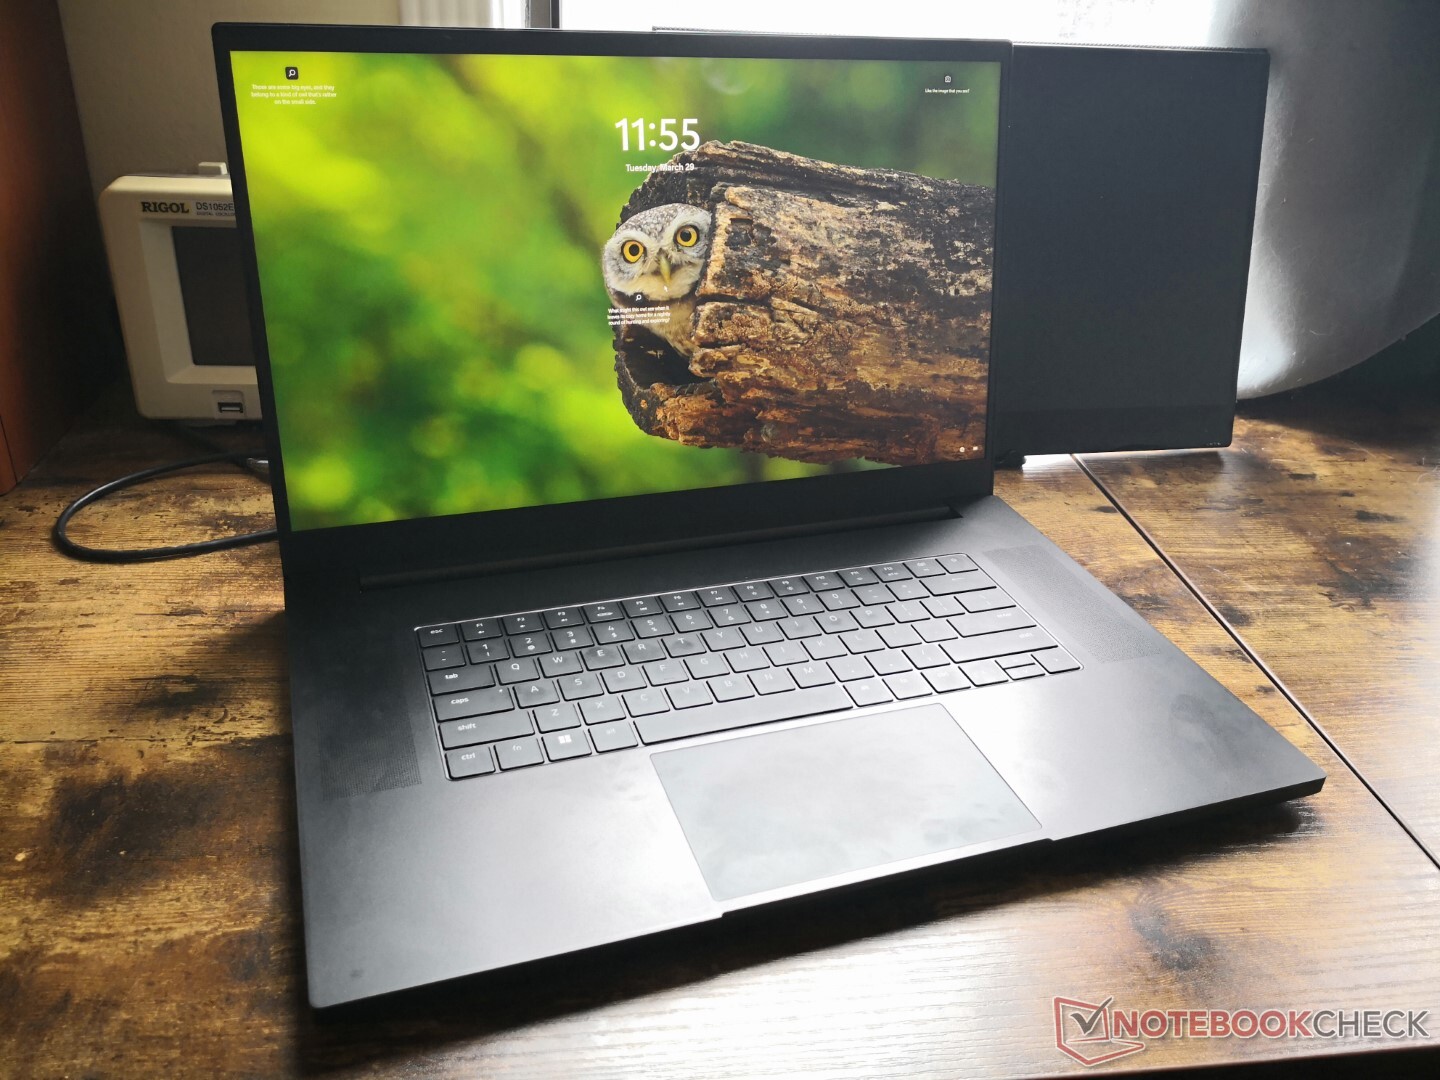
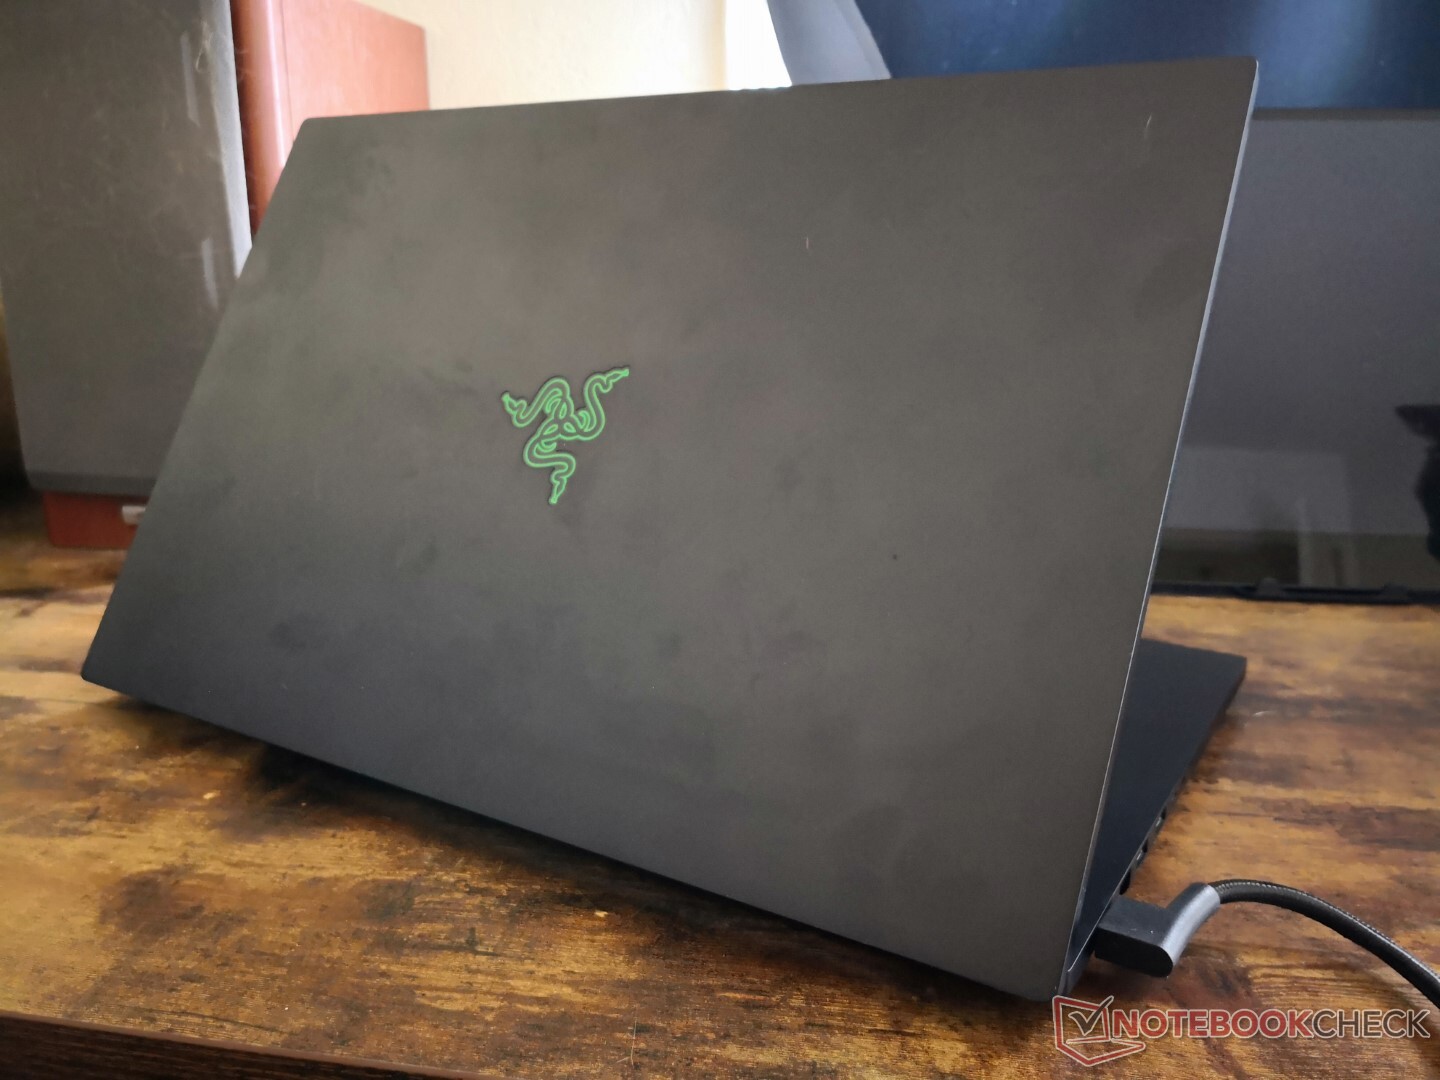
Case — Same, But Different
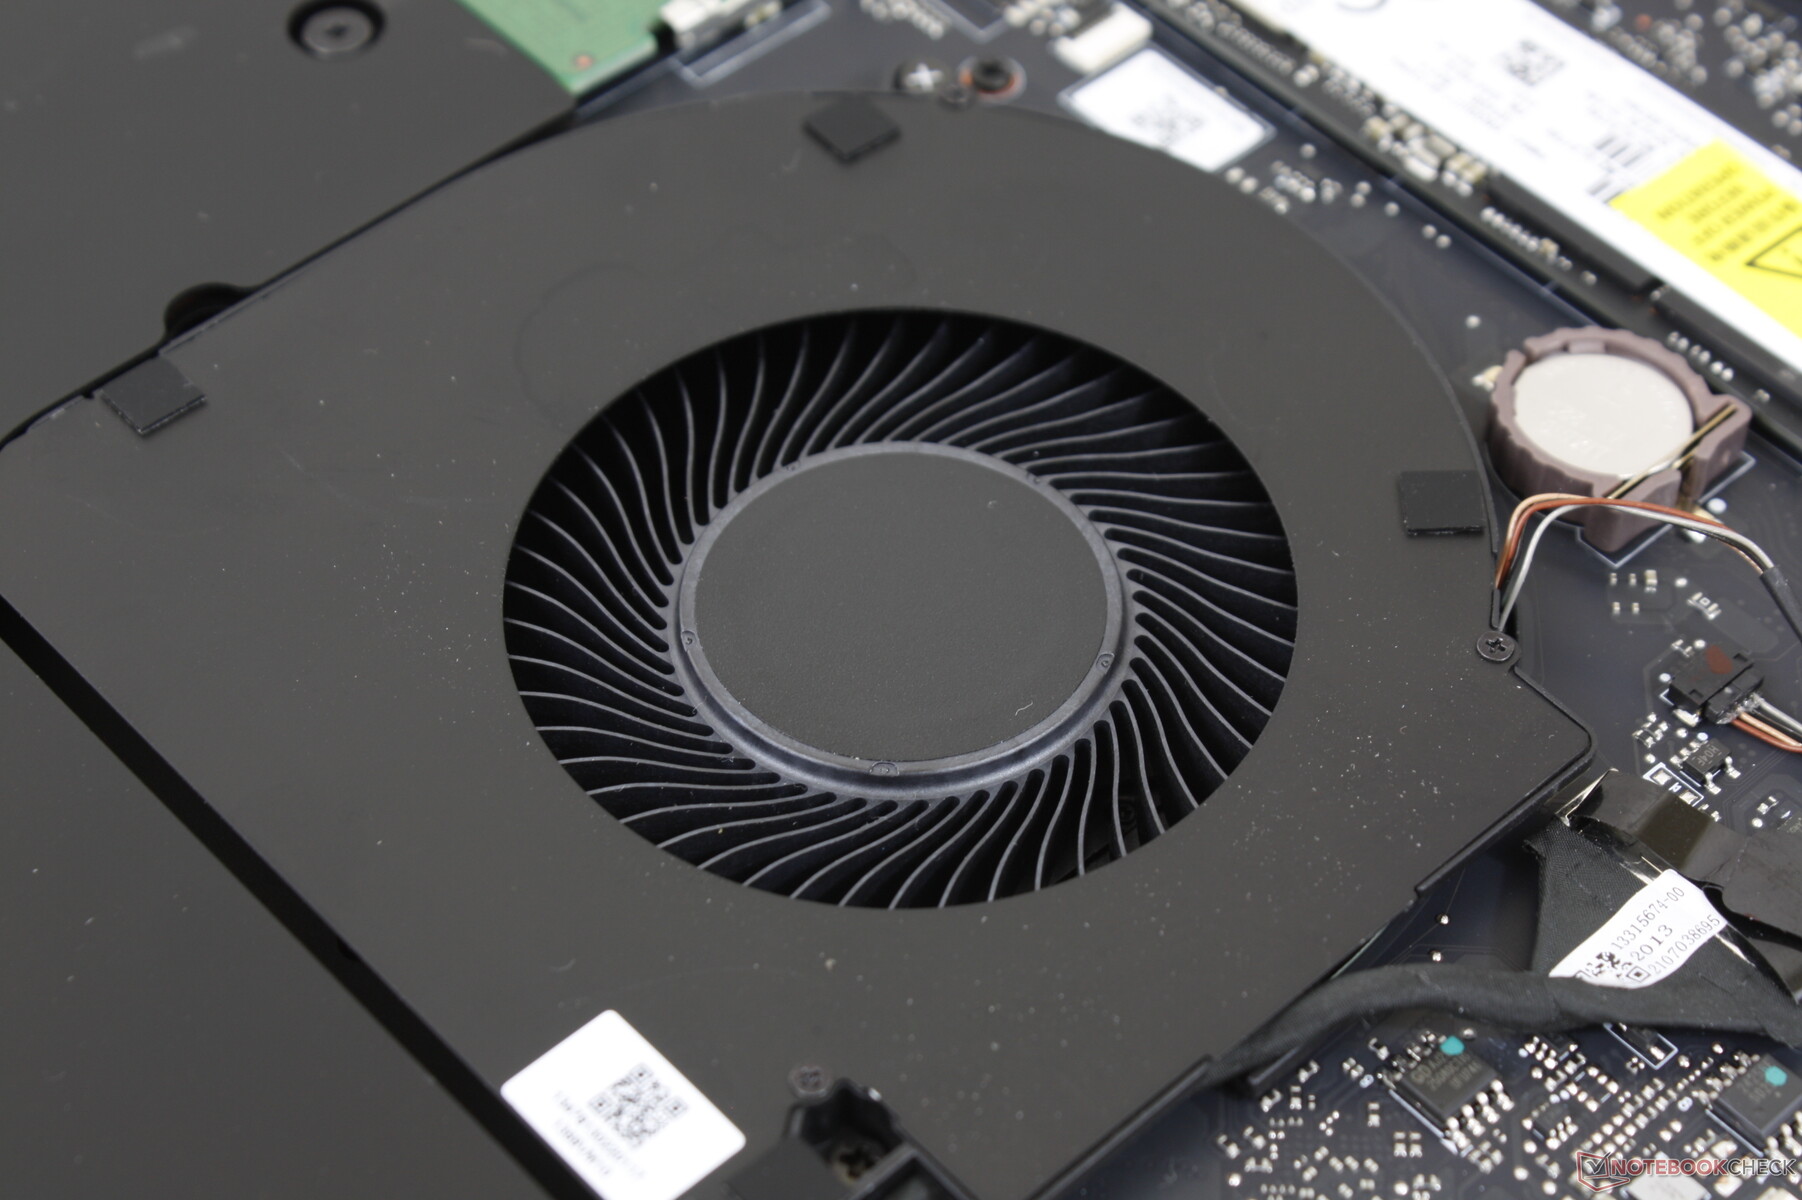
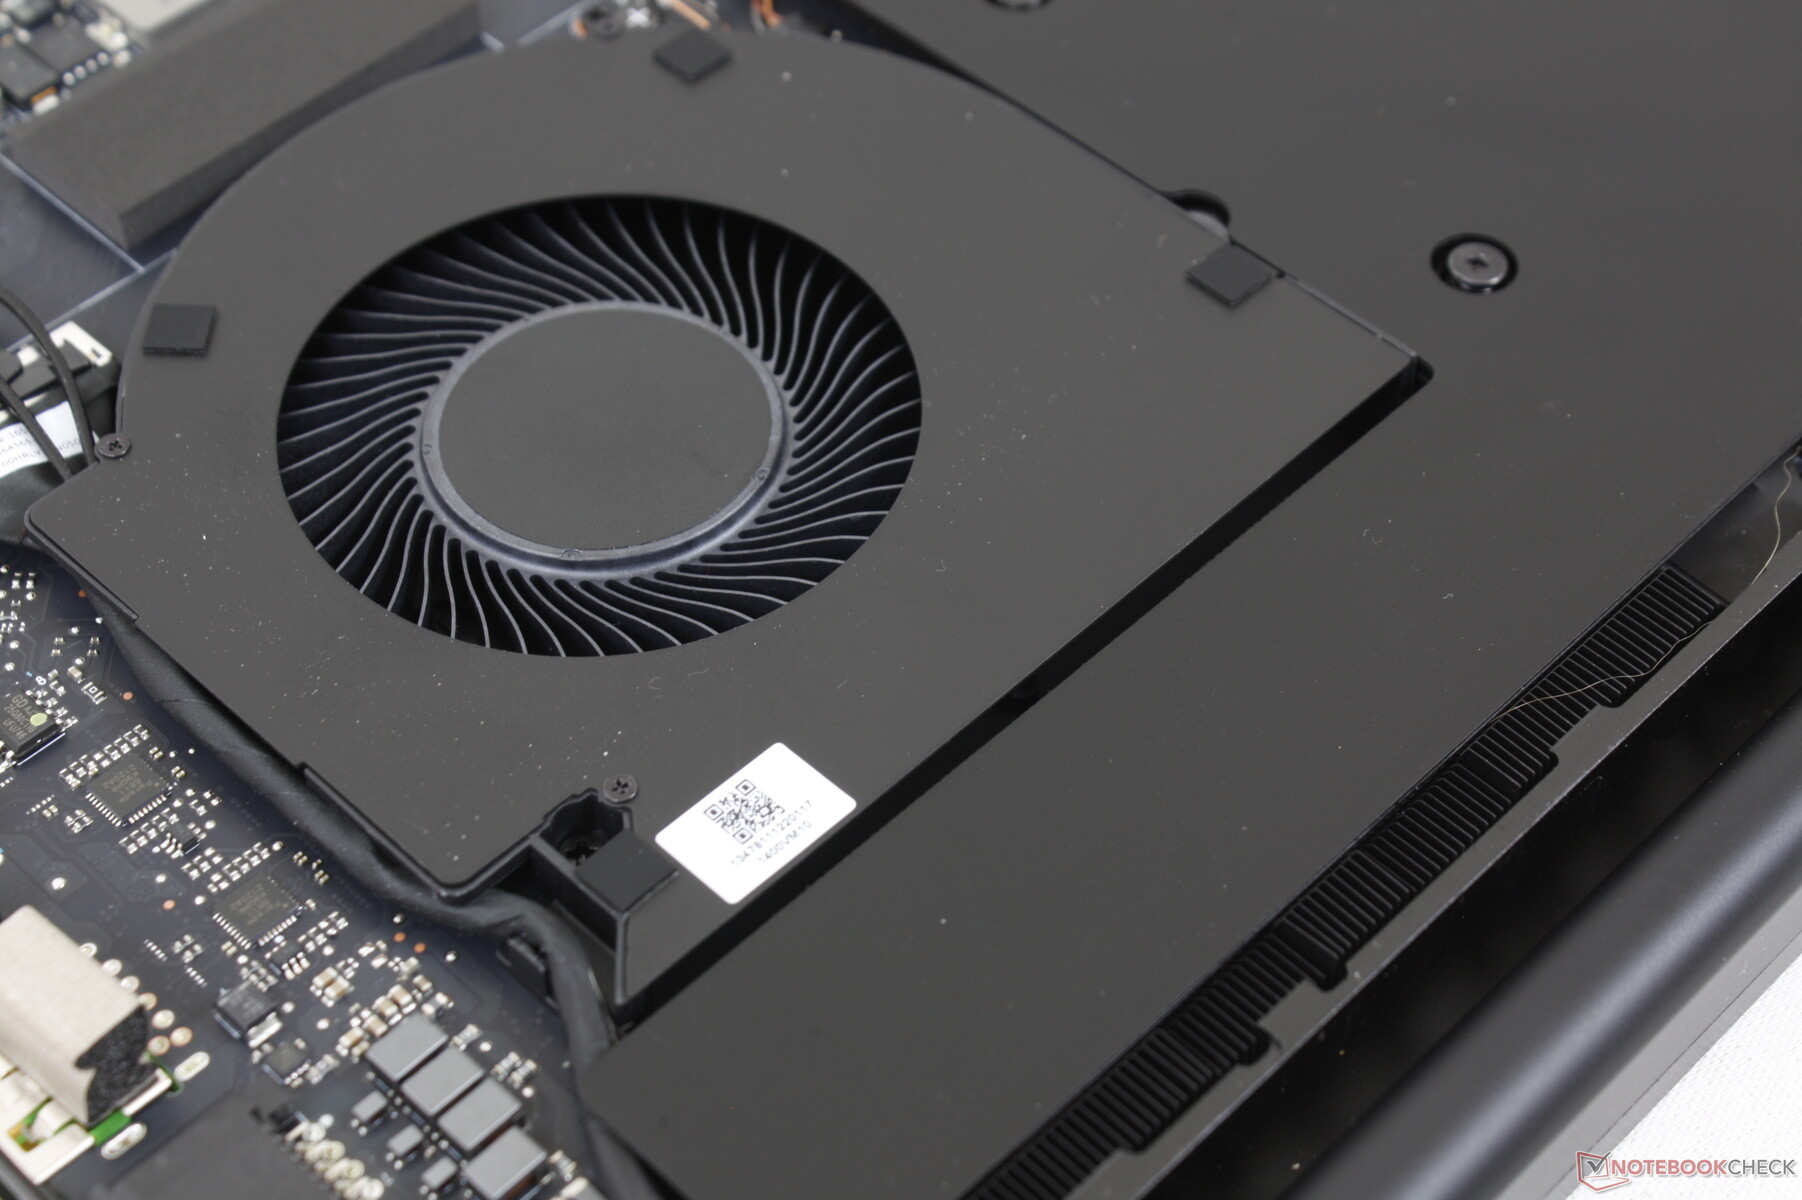
The external chassis is identical to last year's model but with two key visual differences. Firstly, the keyboard keycaps are now larger than they were on older models. Secondly, you can now only see three fans through the grilles on the bottom of the unit instead of four since Razer has removed one of the fans. These small changes have an impact on the battery and overall temperatures as our review will show.
Connectivity — Now With Two Thunderbolt 4 Ports
Port options remain identical to the 10th gen Intel model except for one key difference: both USB-C ports now support Thunderbolt instead of only one. The new model is compatible with last year's AC adapter as well, but performance may be affected since the newer 2022 model utilizes a higher capacity 280 W adapter.
SD Card Reader
| SD Card Reader | |
| average JPG Copy Test (av. of 3 runs) | |
| Razer Blade Pro 17 2021 (QHD Touch) (Toshiba Exceria Pro SDXC 64 GB UHS-II) | |
| MSI GS76 Stealth 11UH (AV PRO microSD 128 GB V60) | |
| Aorus 17G YD (AV PRO microSD 128 GB V60) | |
| Asus ROG Zephyrus S17 GX703HSD | |
| Alienware x17 RTX 3080 P48E (AV Pro V60) | |
| Razer Blade 17 RTX 3080 Ti (AV Pro V60) | |
| maximum AS SSD Seq Read Test (1GB) | |
| Asus ROG Zephyrus S17 GX703HSD | |
| Alienware x17 RTX 3080 P48E (AV Pro V60) | |
| MSI GS76 Stealth 11UH (AV PRO microSD 128 GB V60) | |
| Aorus 17G YD (AV PRO microSD 128 GB V60) | |
| Razer Blade Pro 17 2021 (QHD Touch) (Toshiba Exceria Pro SDXC 64 GB UHS-II) | |
| Razer Blade 17 RTX 3080 Ti (AV Pro V60) | |
Communication
Webcam
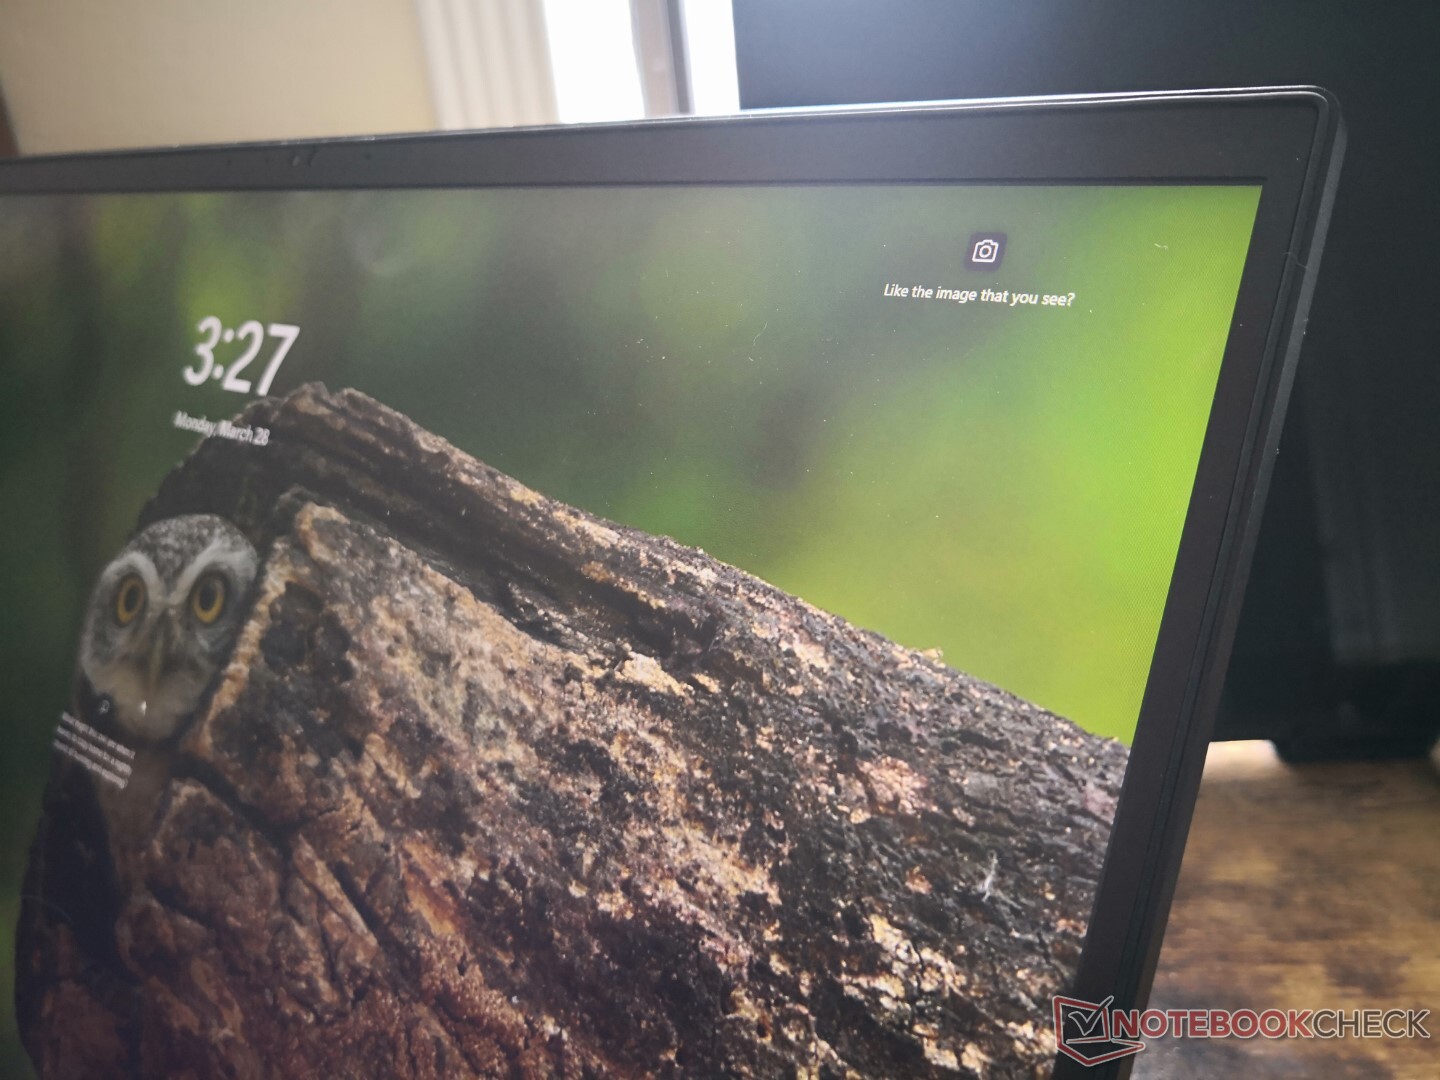
The webcam is 1080p or 2 MP unlike the 720p or 1 MP webcams on most other laptops for a sharper image. Windows Hello is also supported, but there continues to be no privacy shutter.


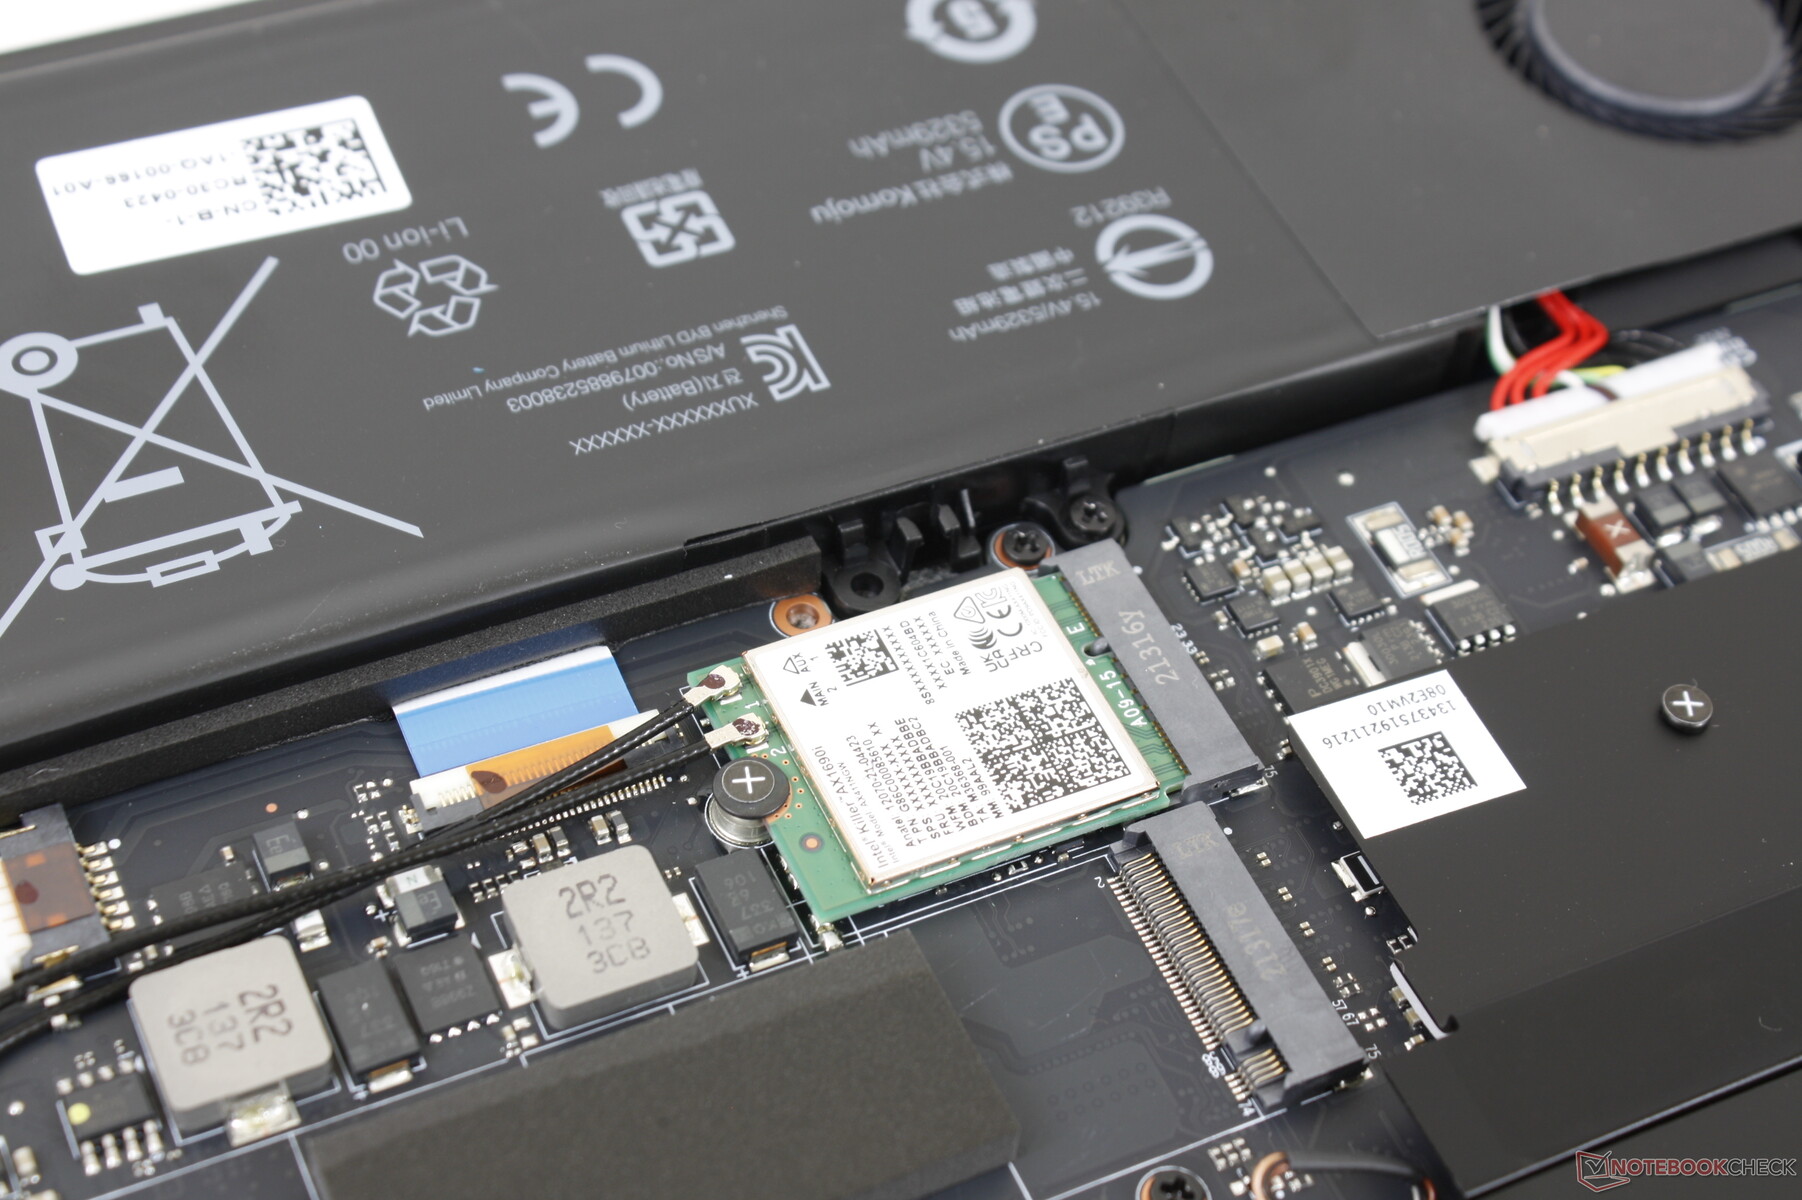
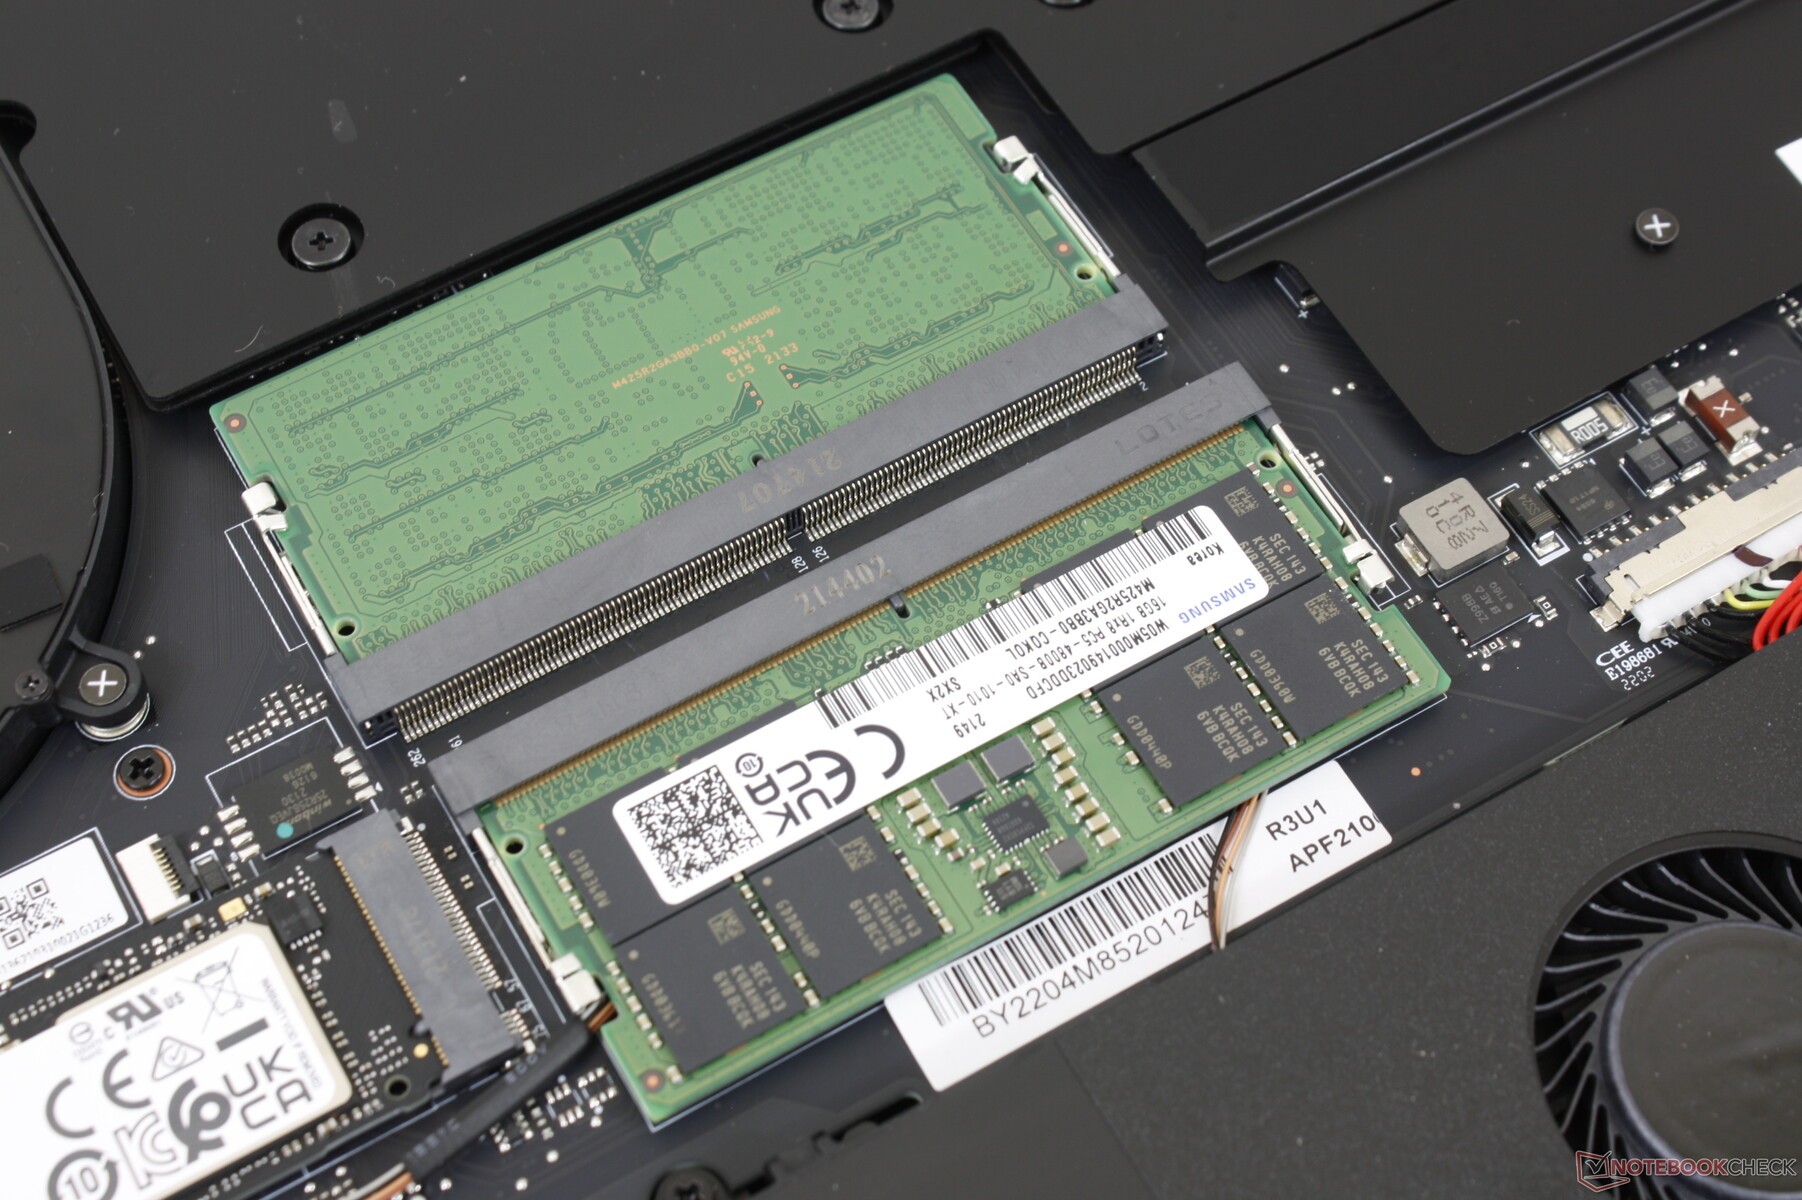
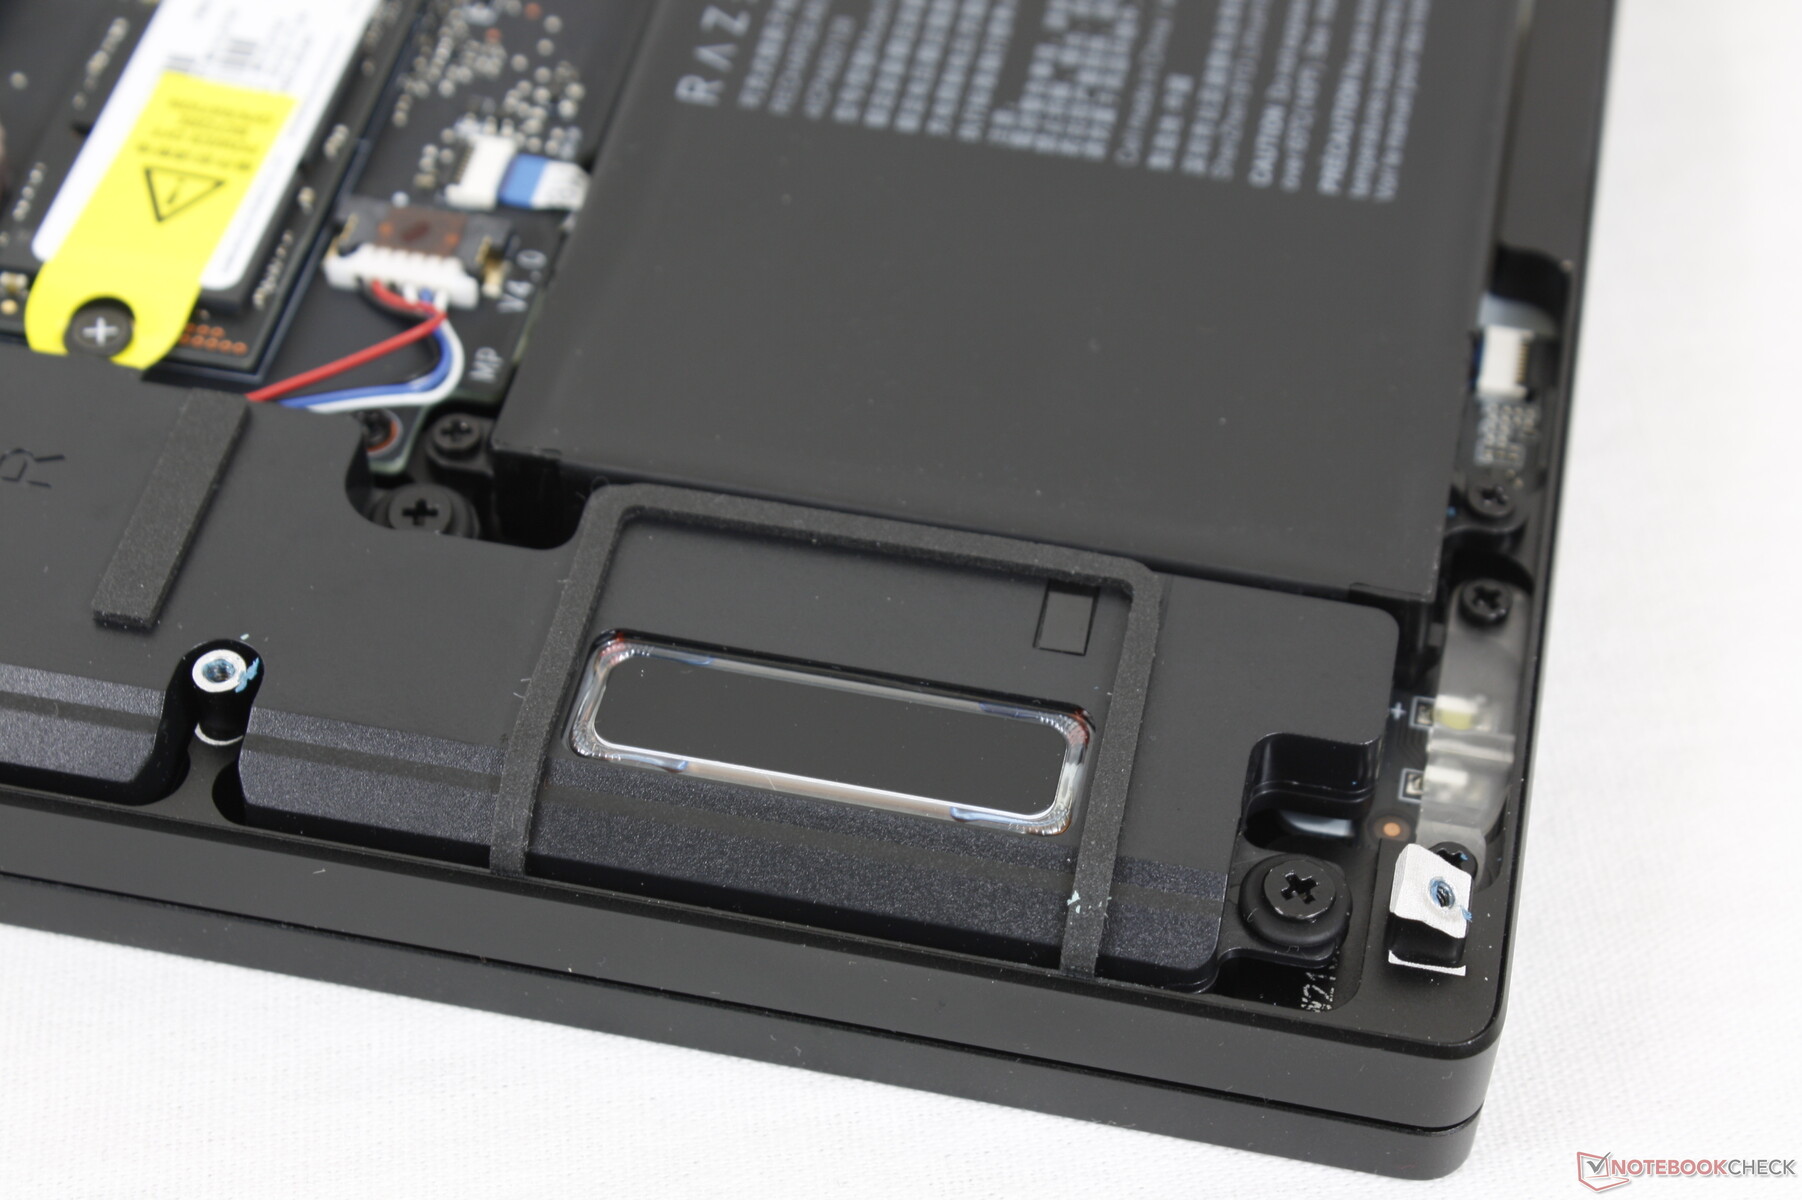
Maintenance
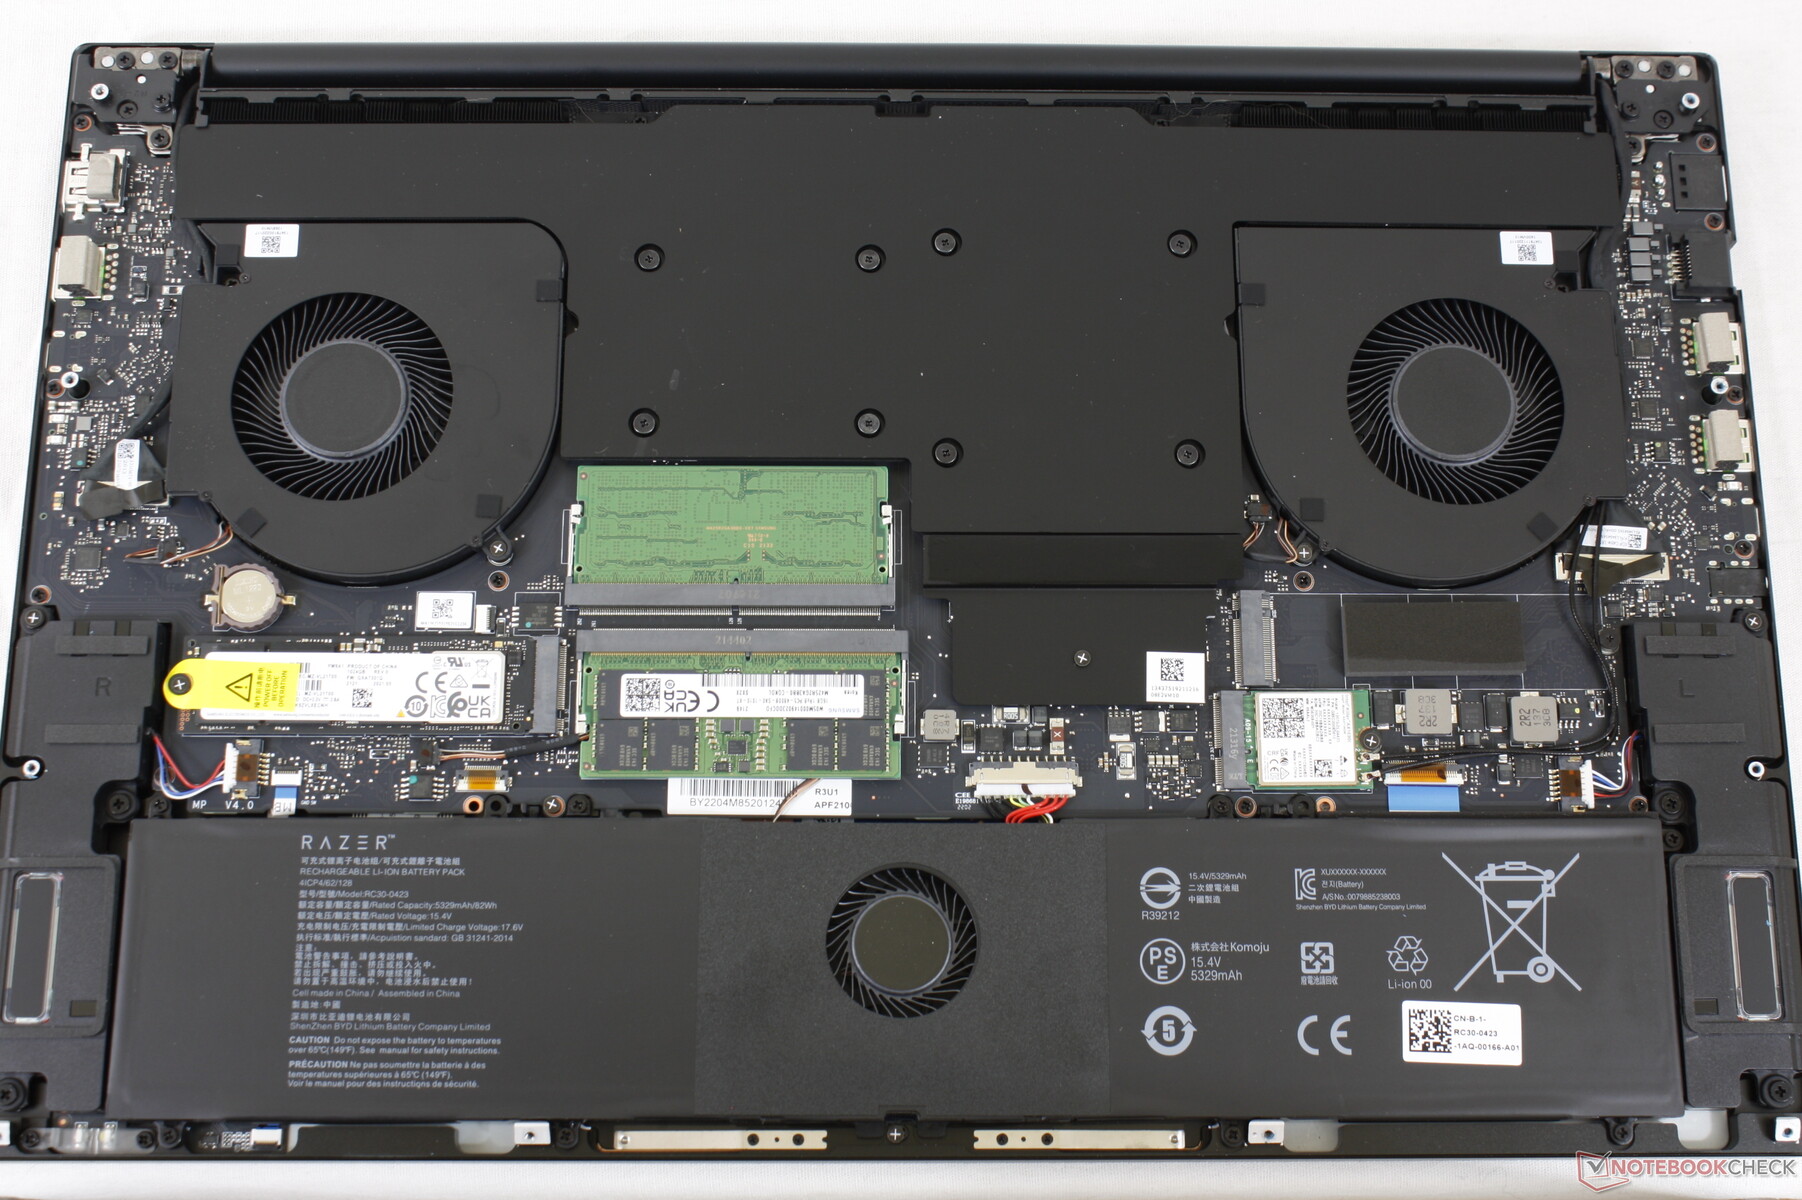
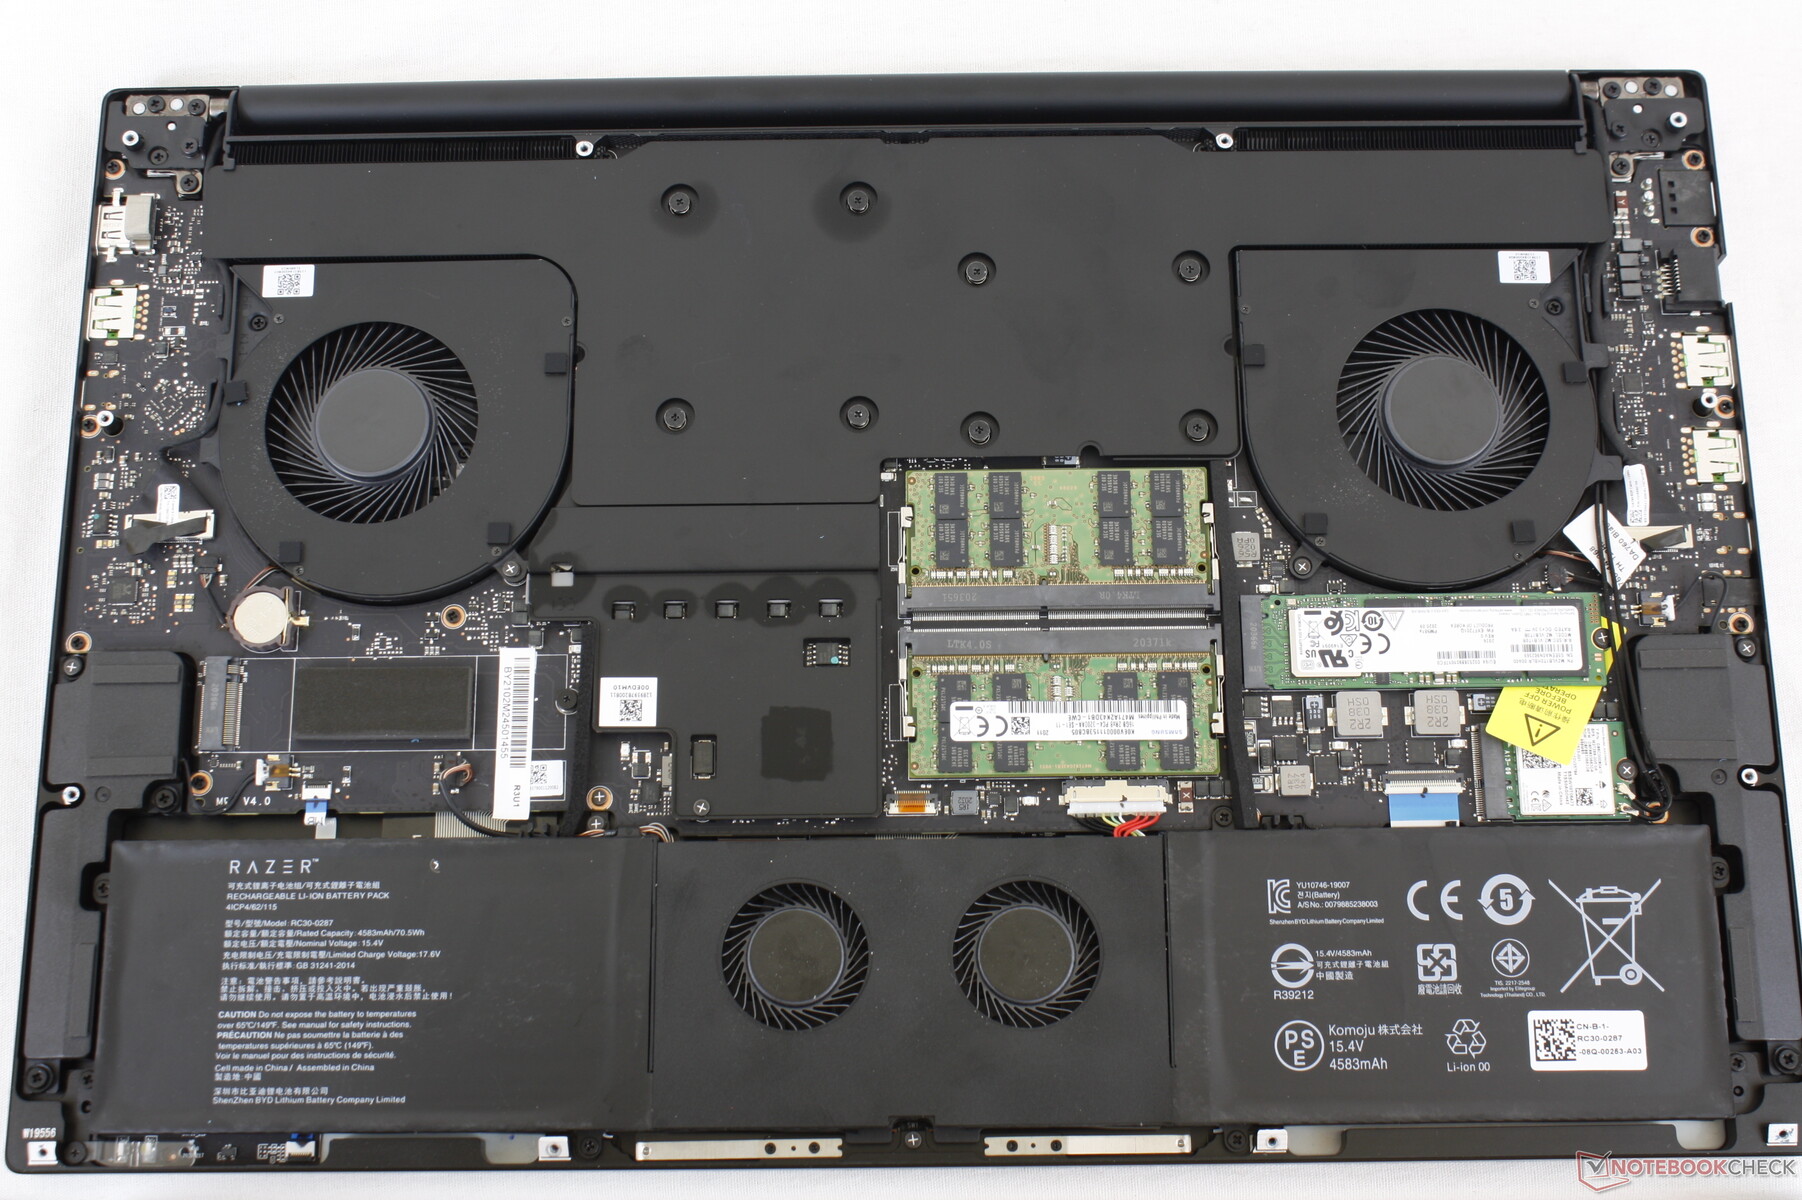
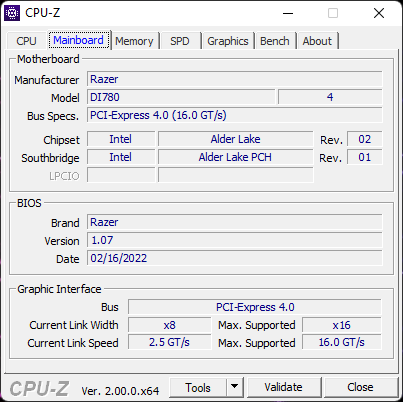
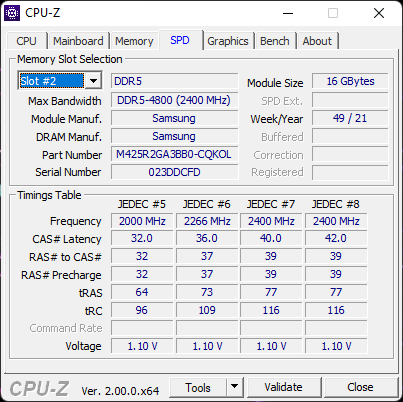
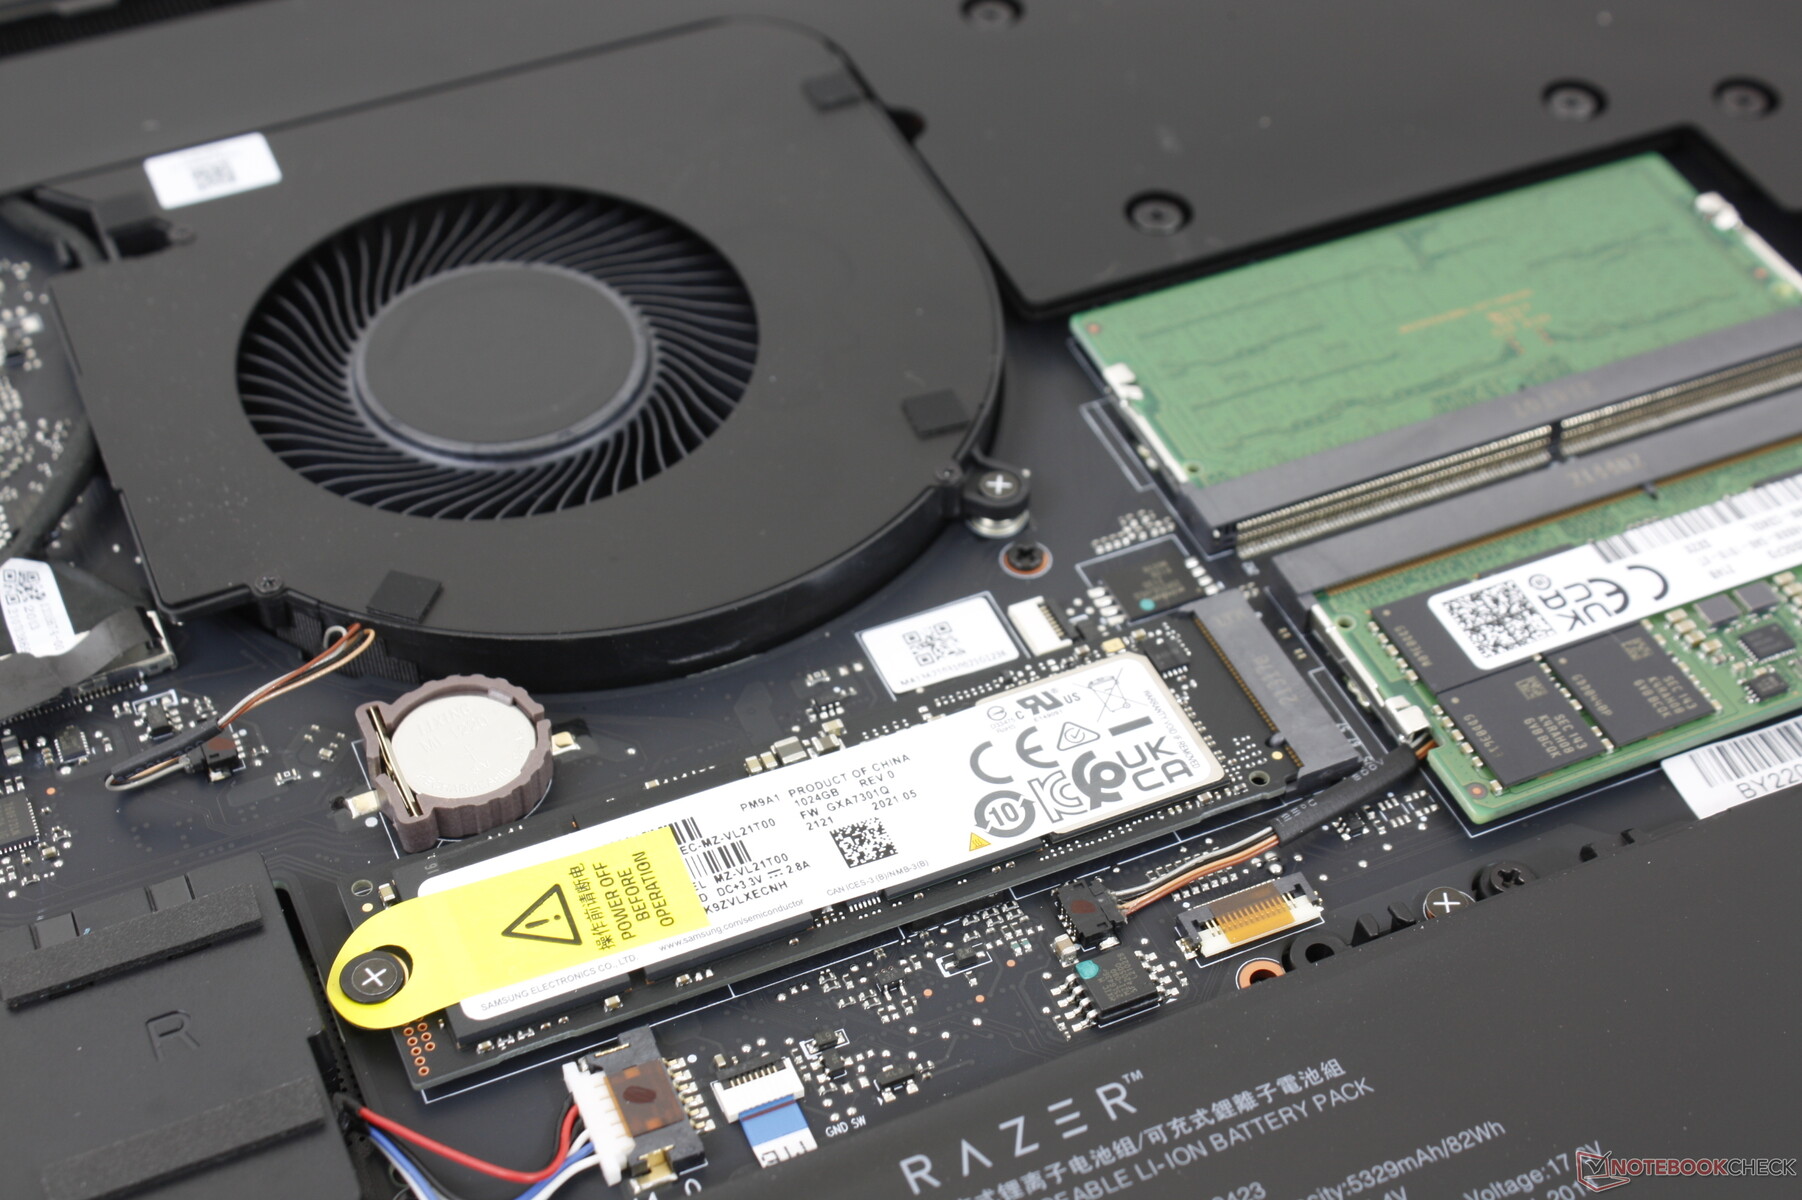
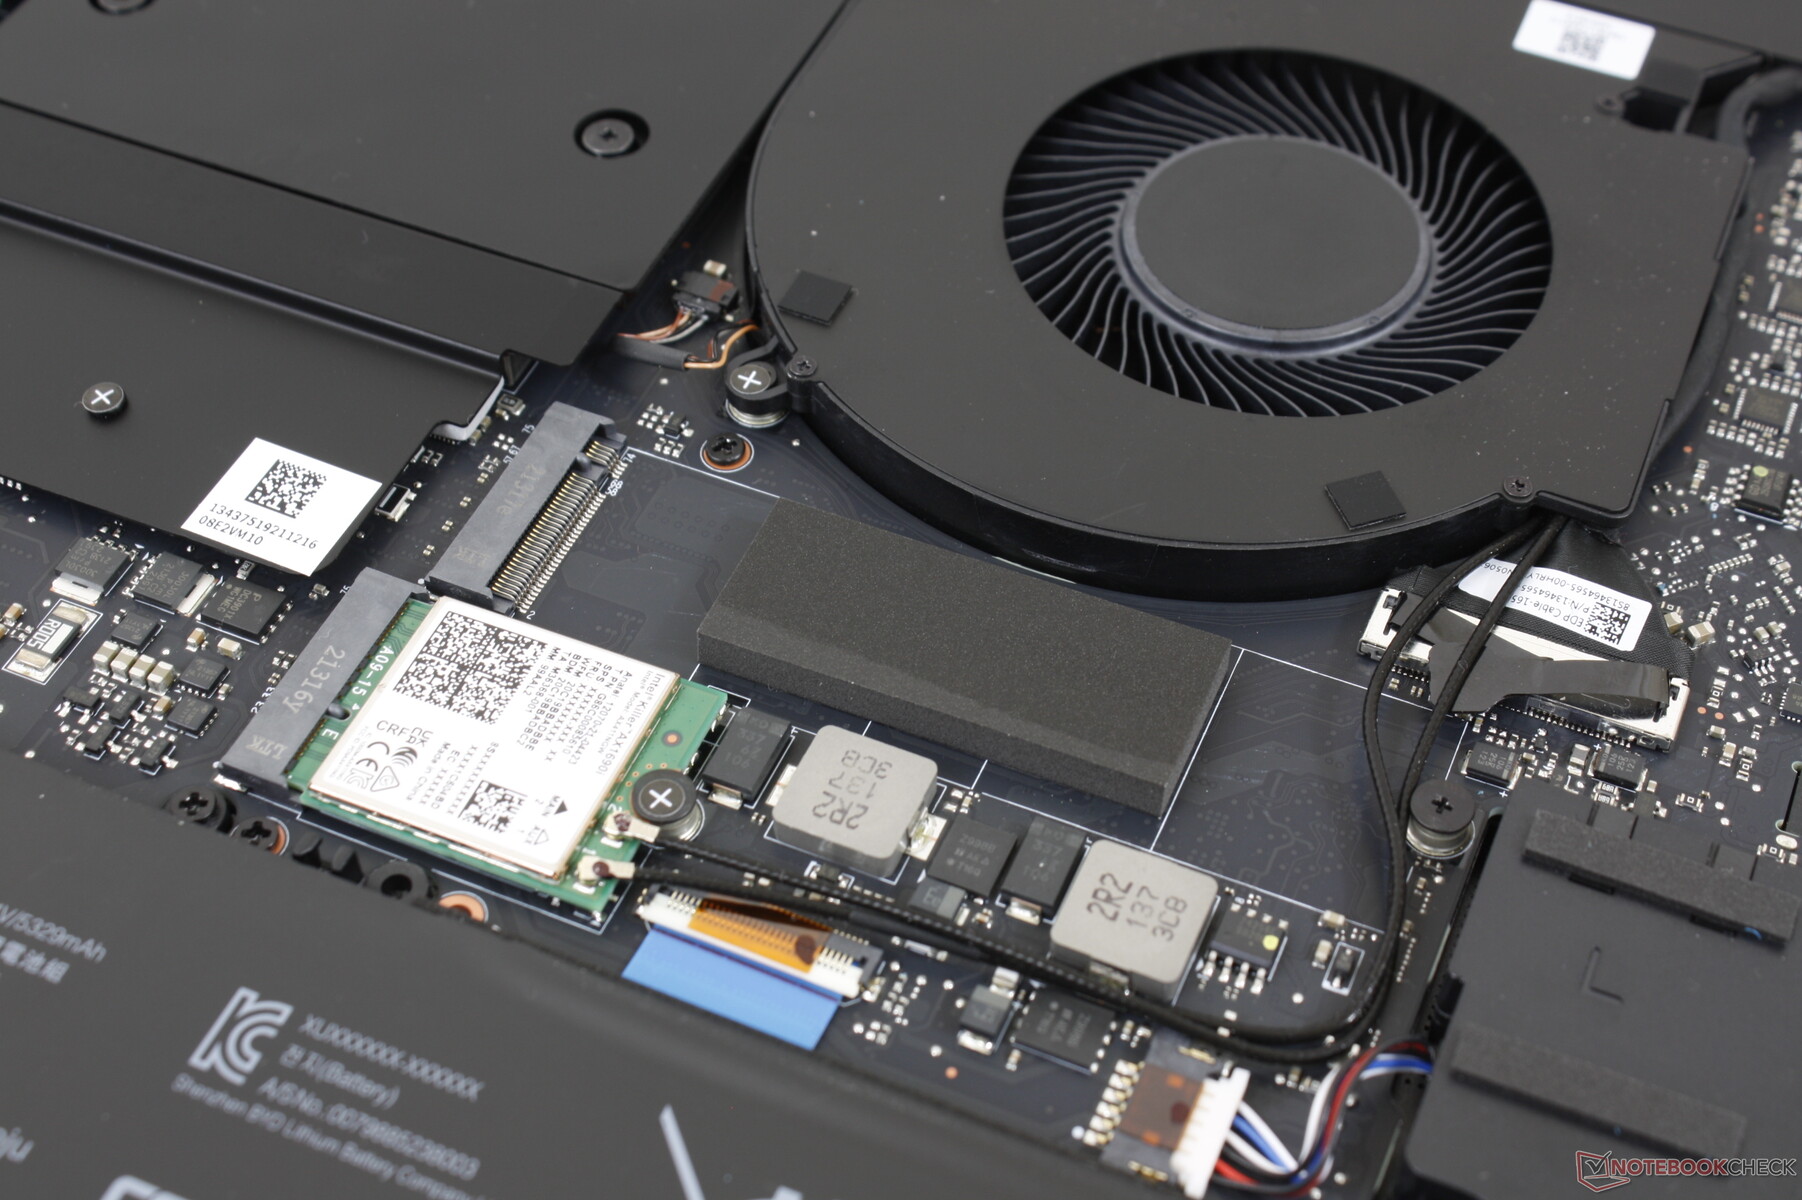
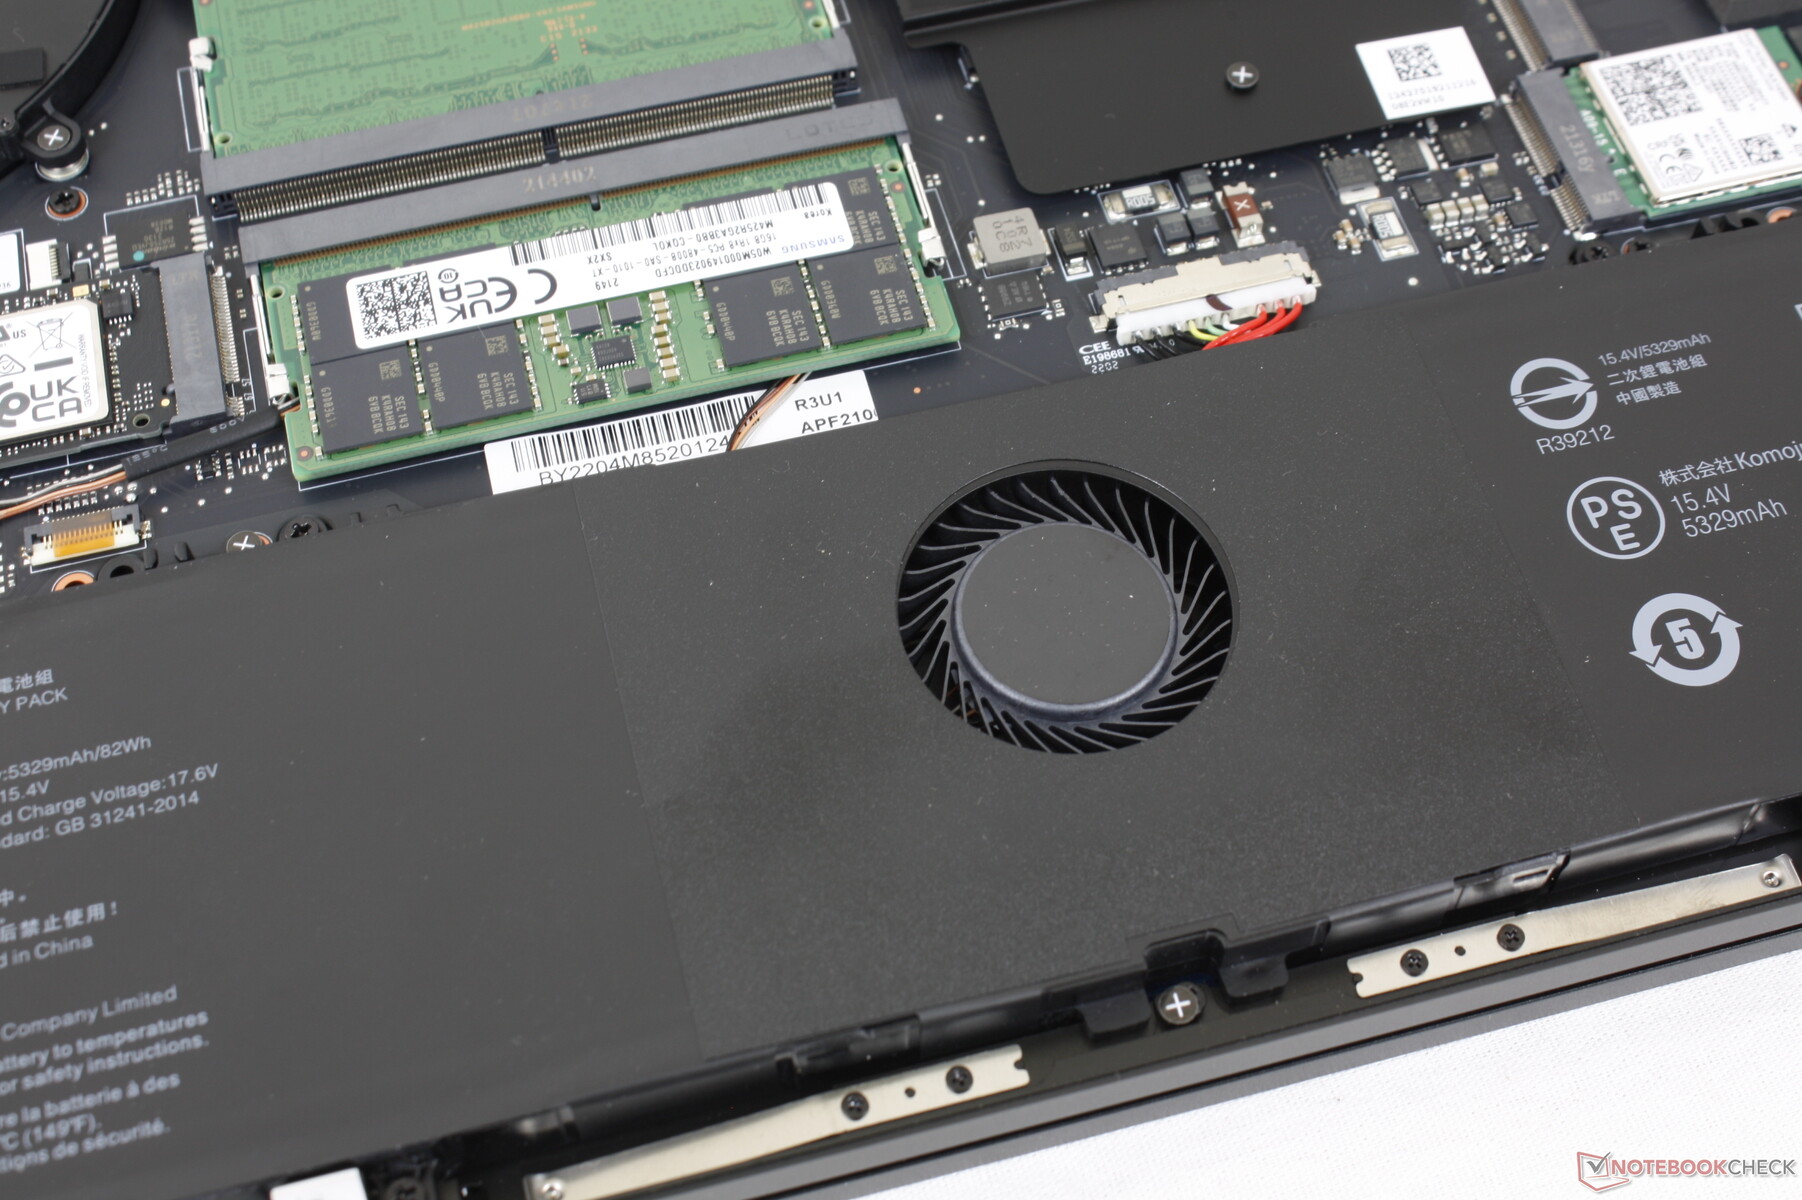
The bottom panel is again relatively easy to remove with a T5 Torx wrench. While users have direct access to the 2x DDR5 SODIMM slots and 2x M.2 PCIe4 SSD slots, the layout of the motherboard has changed noticeably from last year's model as shown by the comparison images below.
Accessories and Warranty
The box includes the AC adapter, paperwork, and a sheet of Razer logo stickers. Razer is introducing a two-year limited battery warranty as standard alongside the base one-year limited laptop warranty with each new purchase of a 12th gen Blade model.
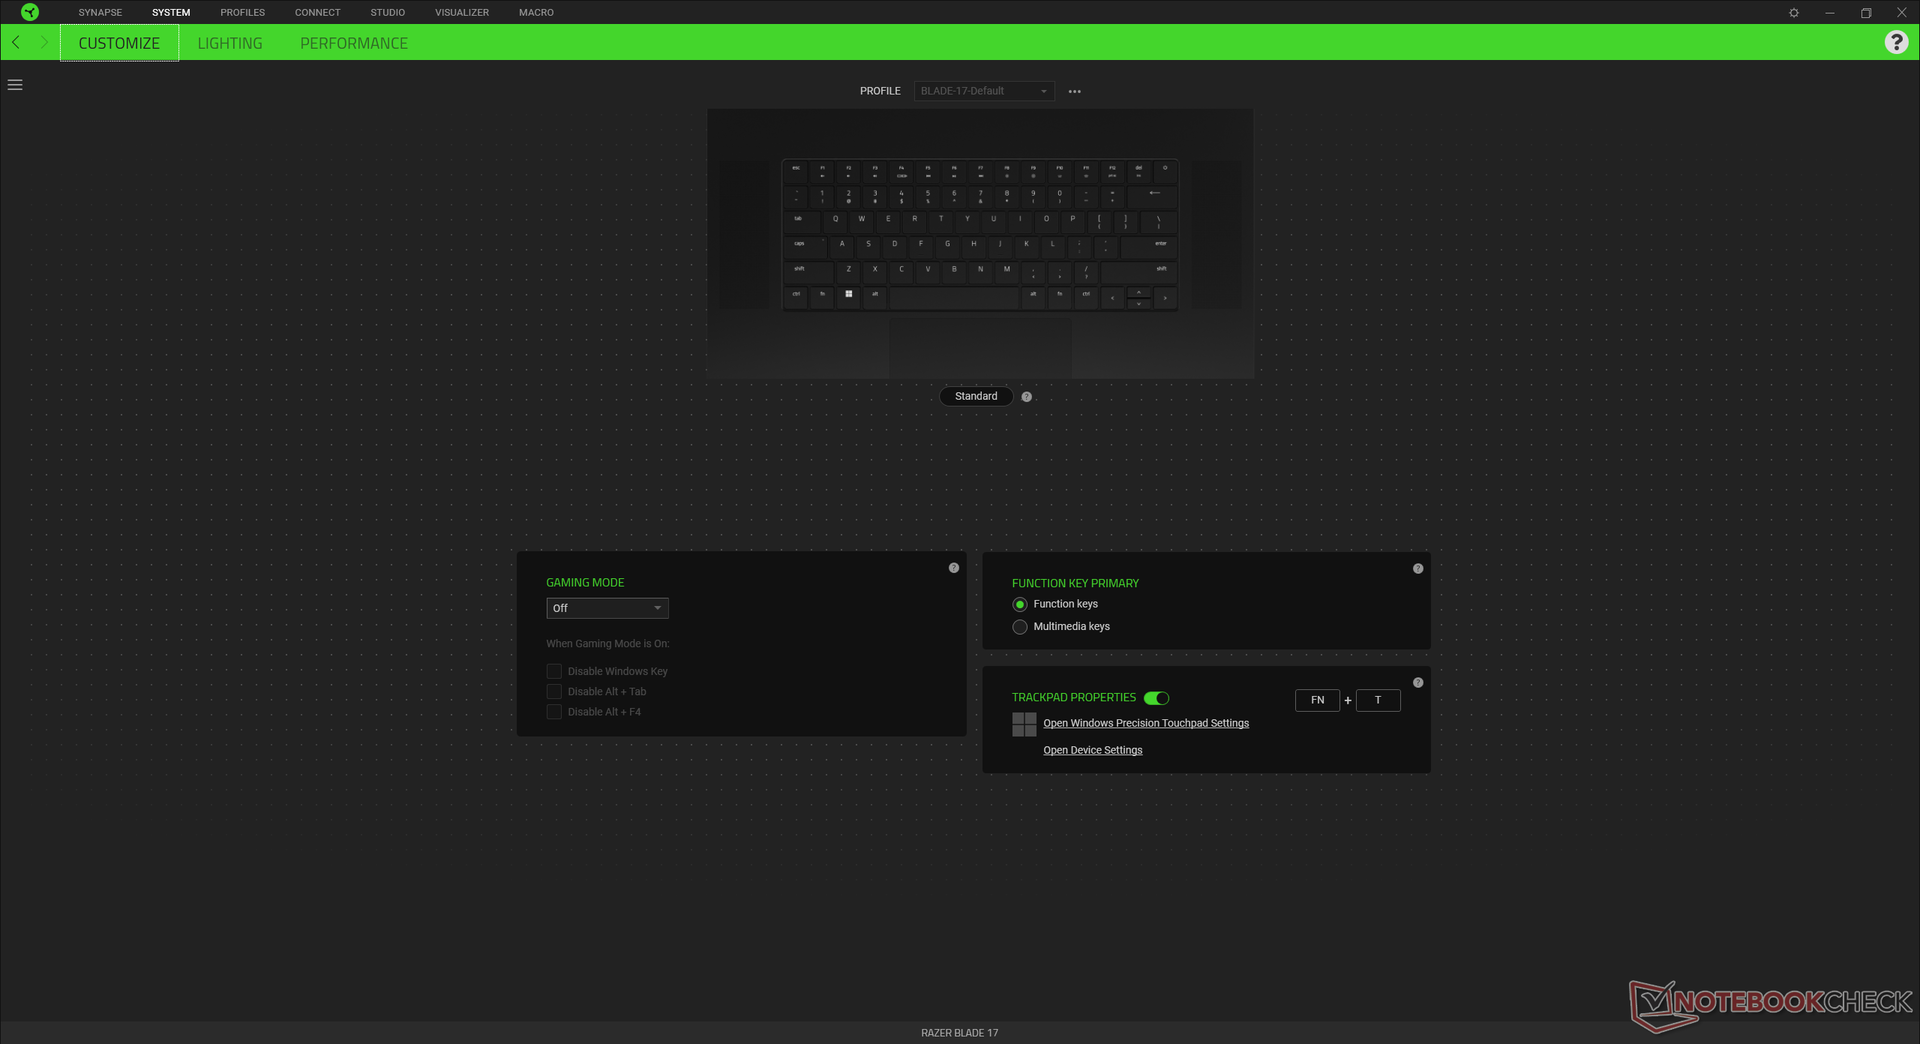
Input Devices — Larger Keys, Same Clickpad
Keyboard
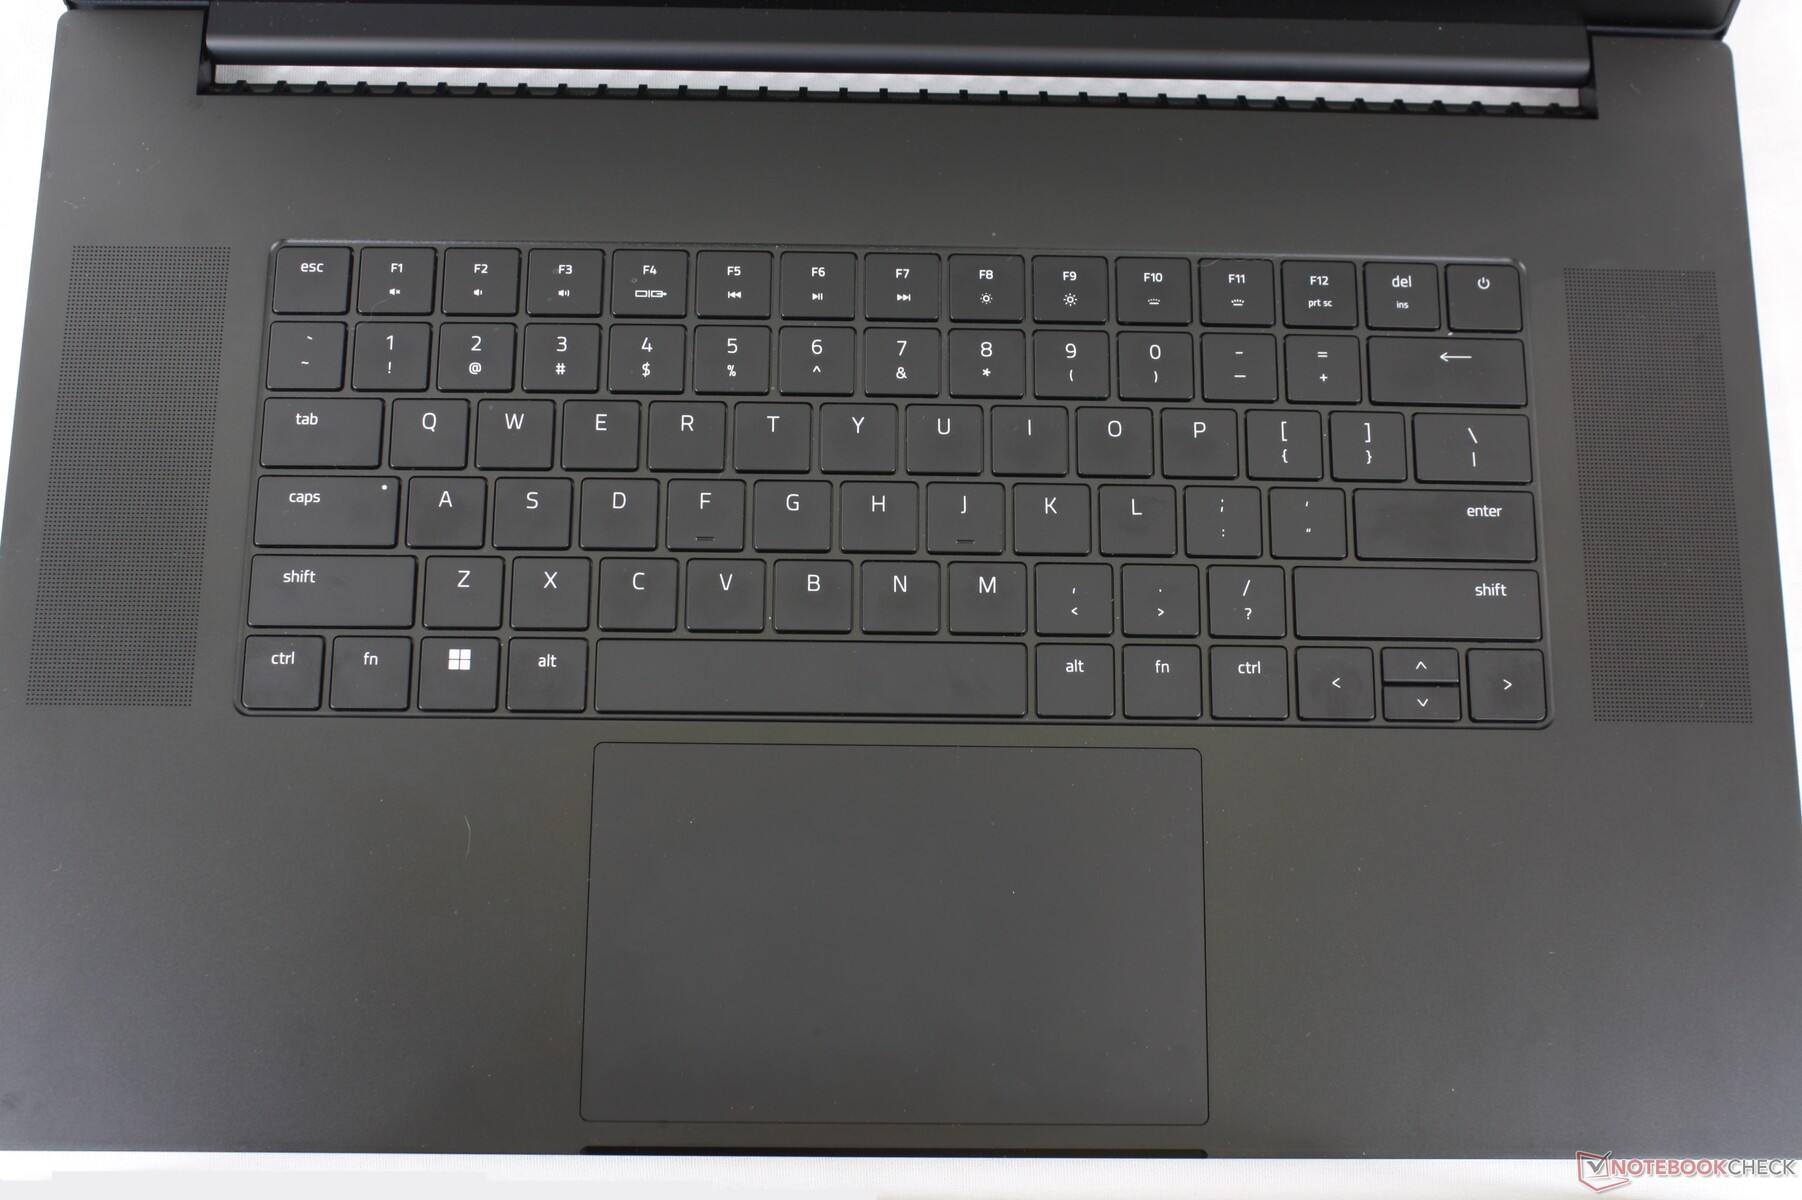
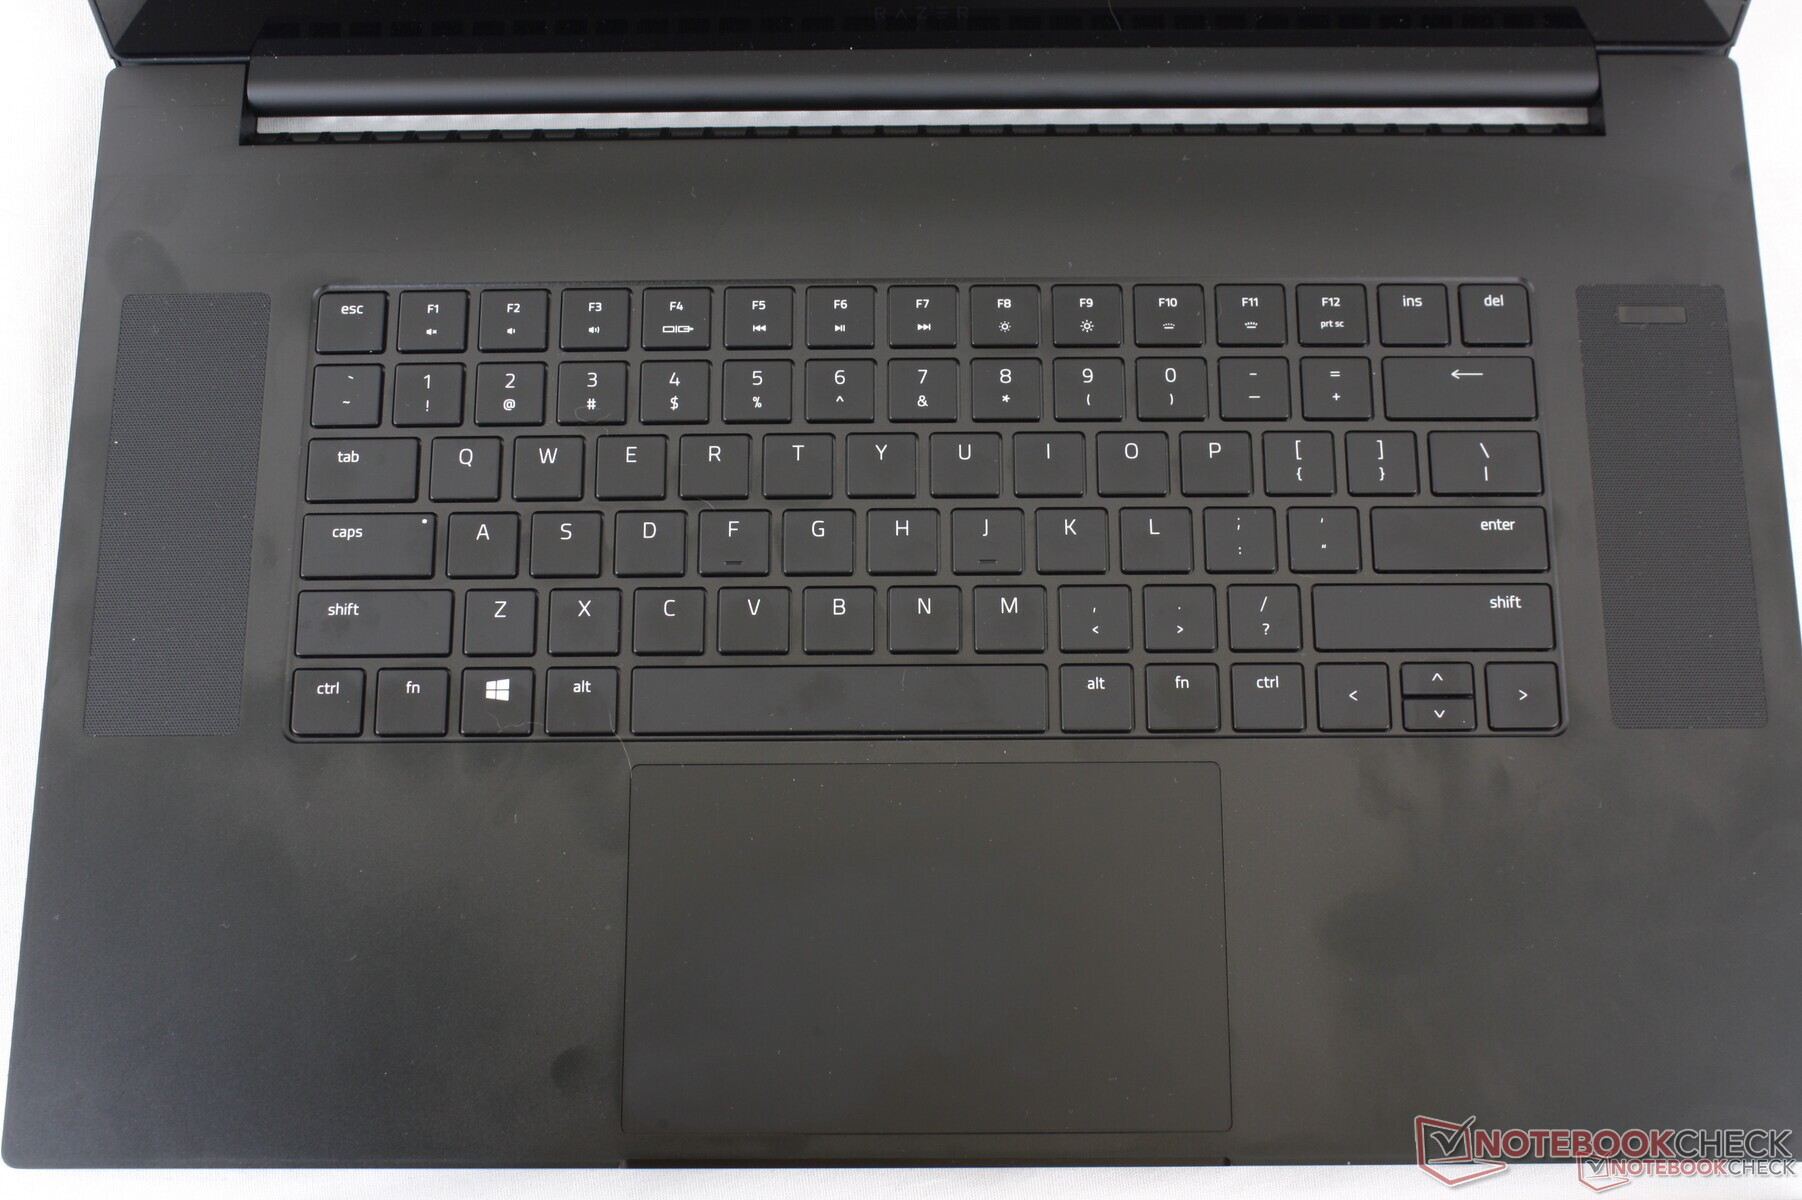
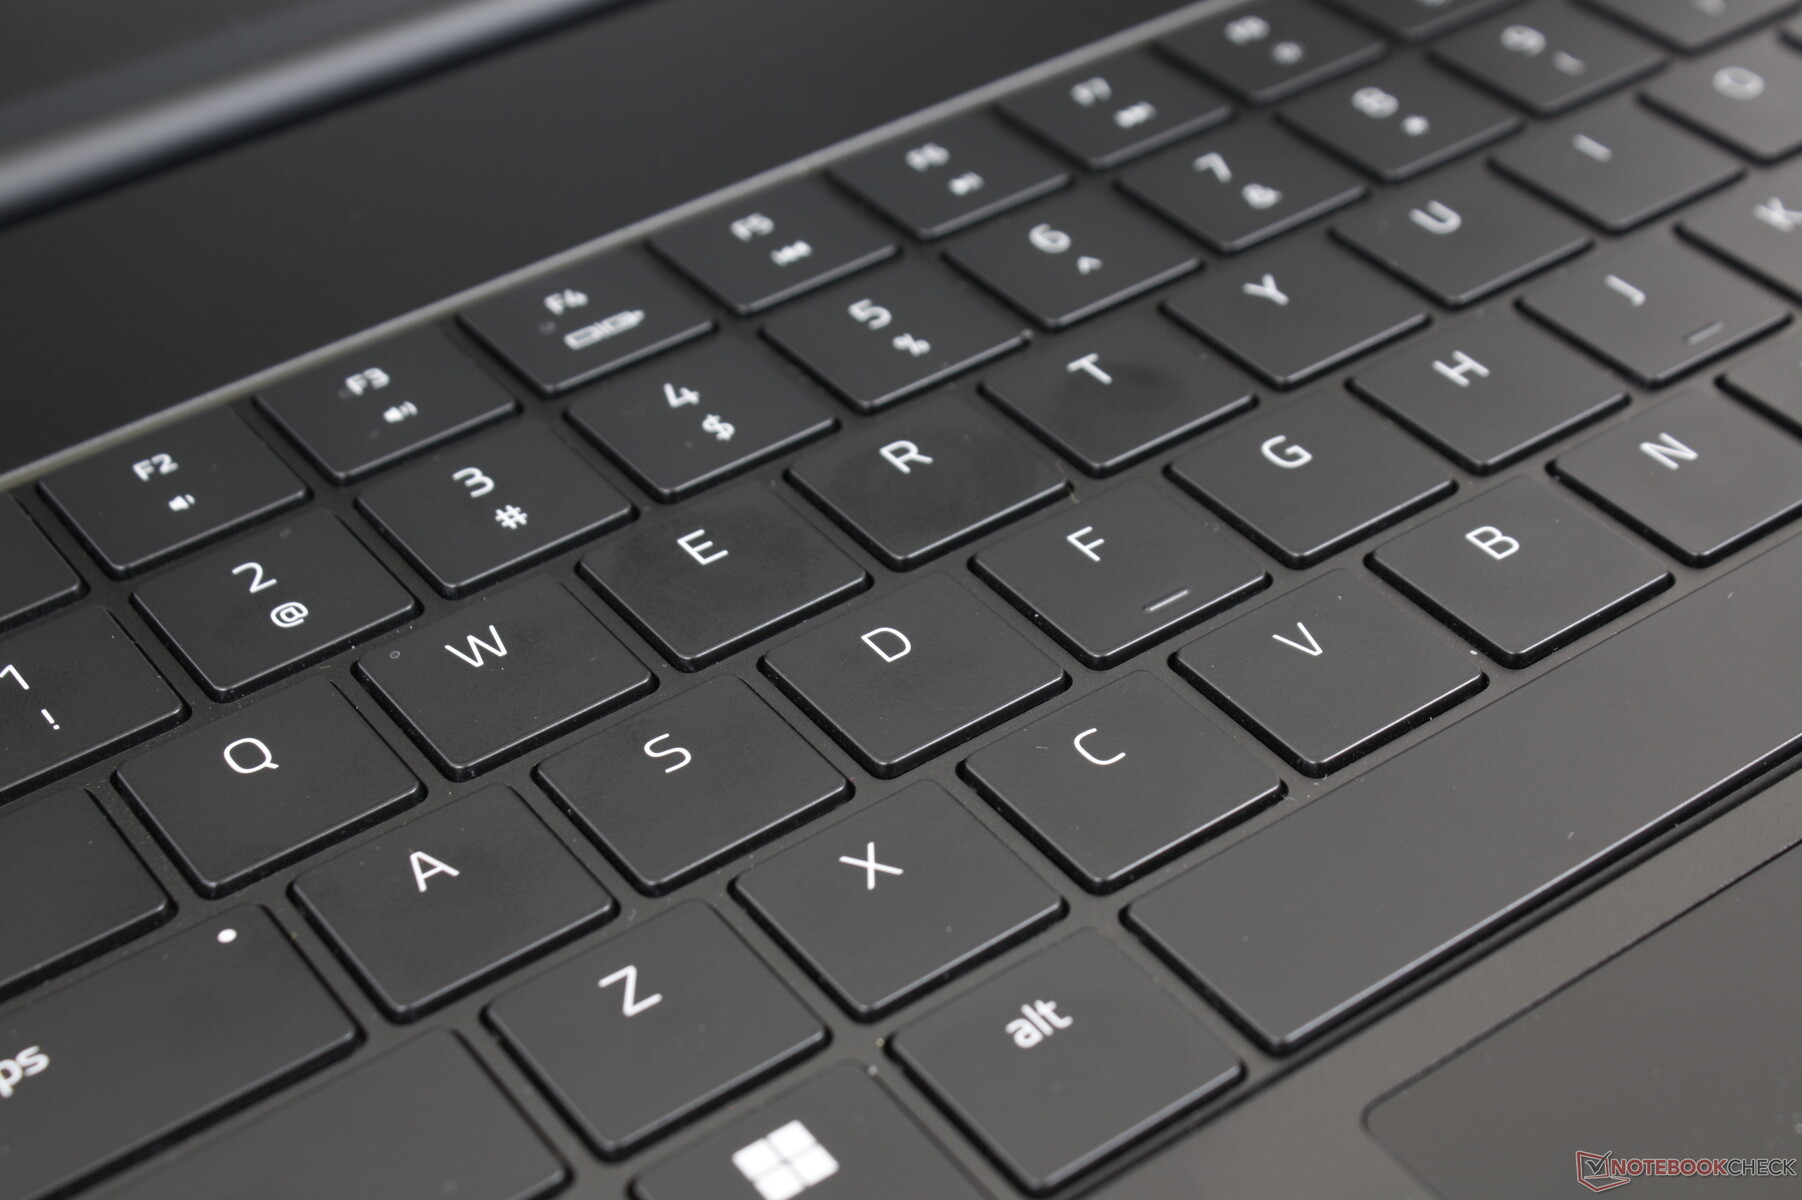
The 2022 Blade 17 shares the same keyboard as on the 2022 Blade 15. Razer has increased the size of the keycaps while maintaining the same overall length and width of the keyboard deck for easier typing. Feedback and travel are otherwise identical to last year's model despite the size change. We suspect that more users will embrace this small year-over-year update rather than a full-on swap to optical or mechanical keys which would have likely divided Razer fans.
Touchpad
There are no changes to the touchpad for better or worse. Though we like the spacious surface area (13 x 8 cm) and smooth traction, the spongy feedback when pressed remains unsatisfying. Drag-and-drop actions are therefore more difficult when compared to laptops with dedicated mouse buttons like the Asus TUF FX506 series. Unsightly grease tends to accumulate on the matte surface as well.

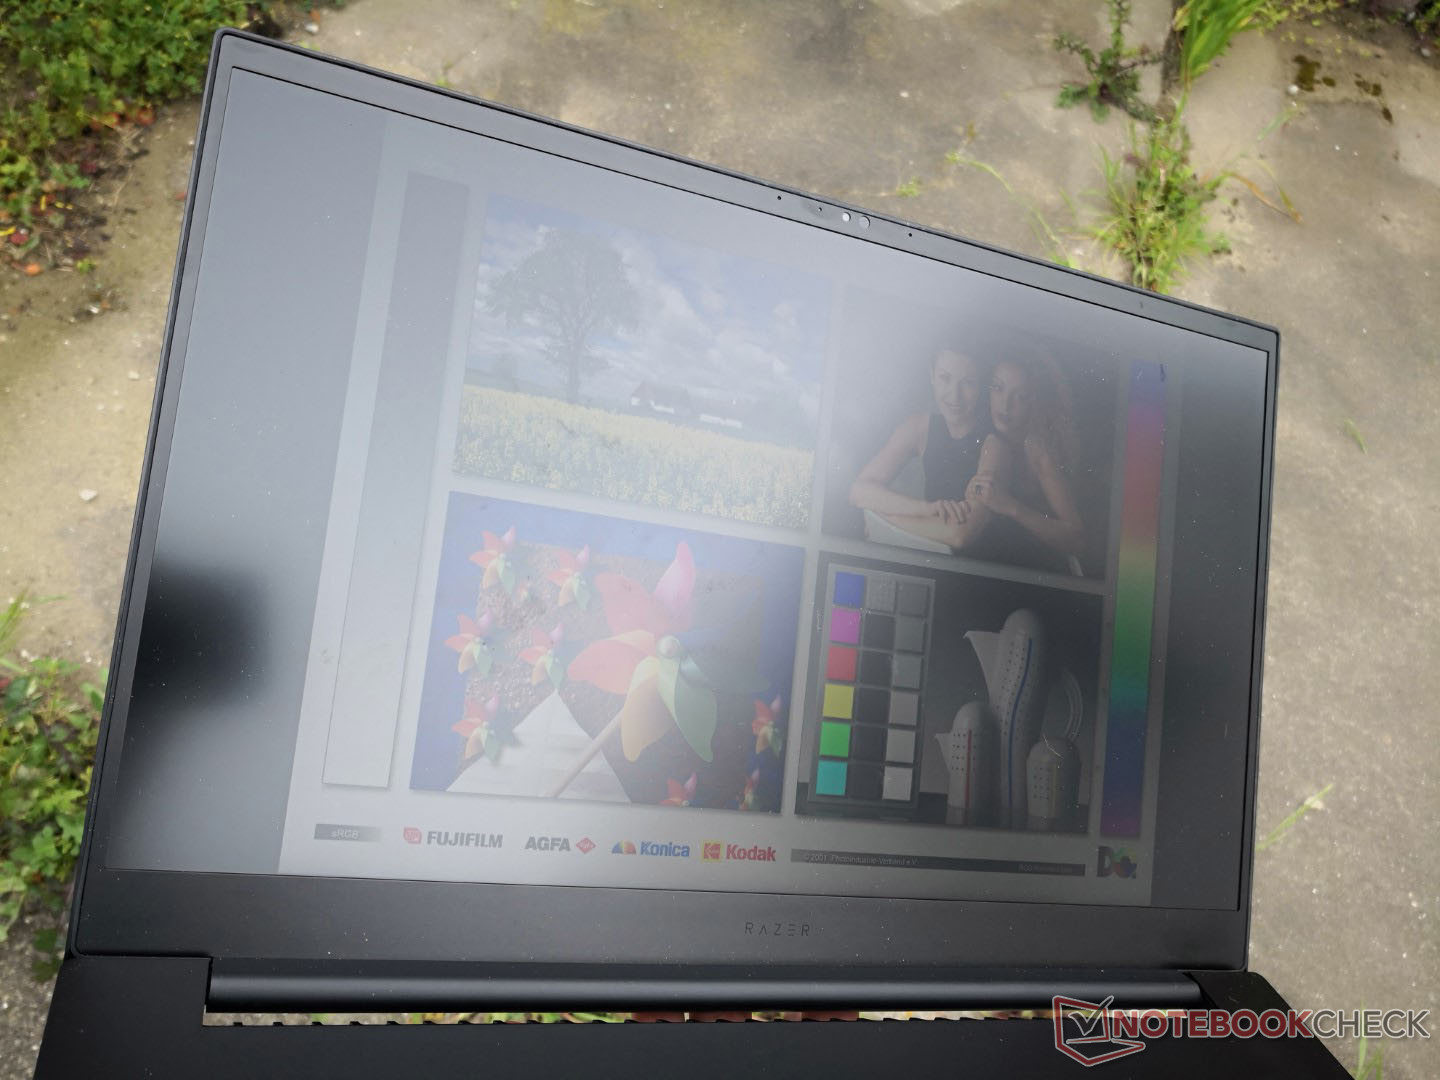
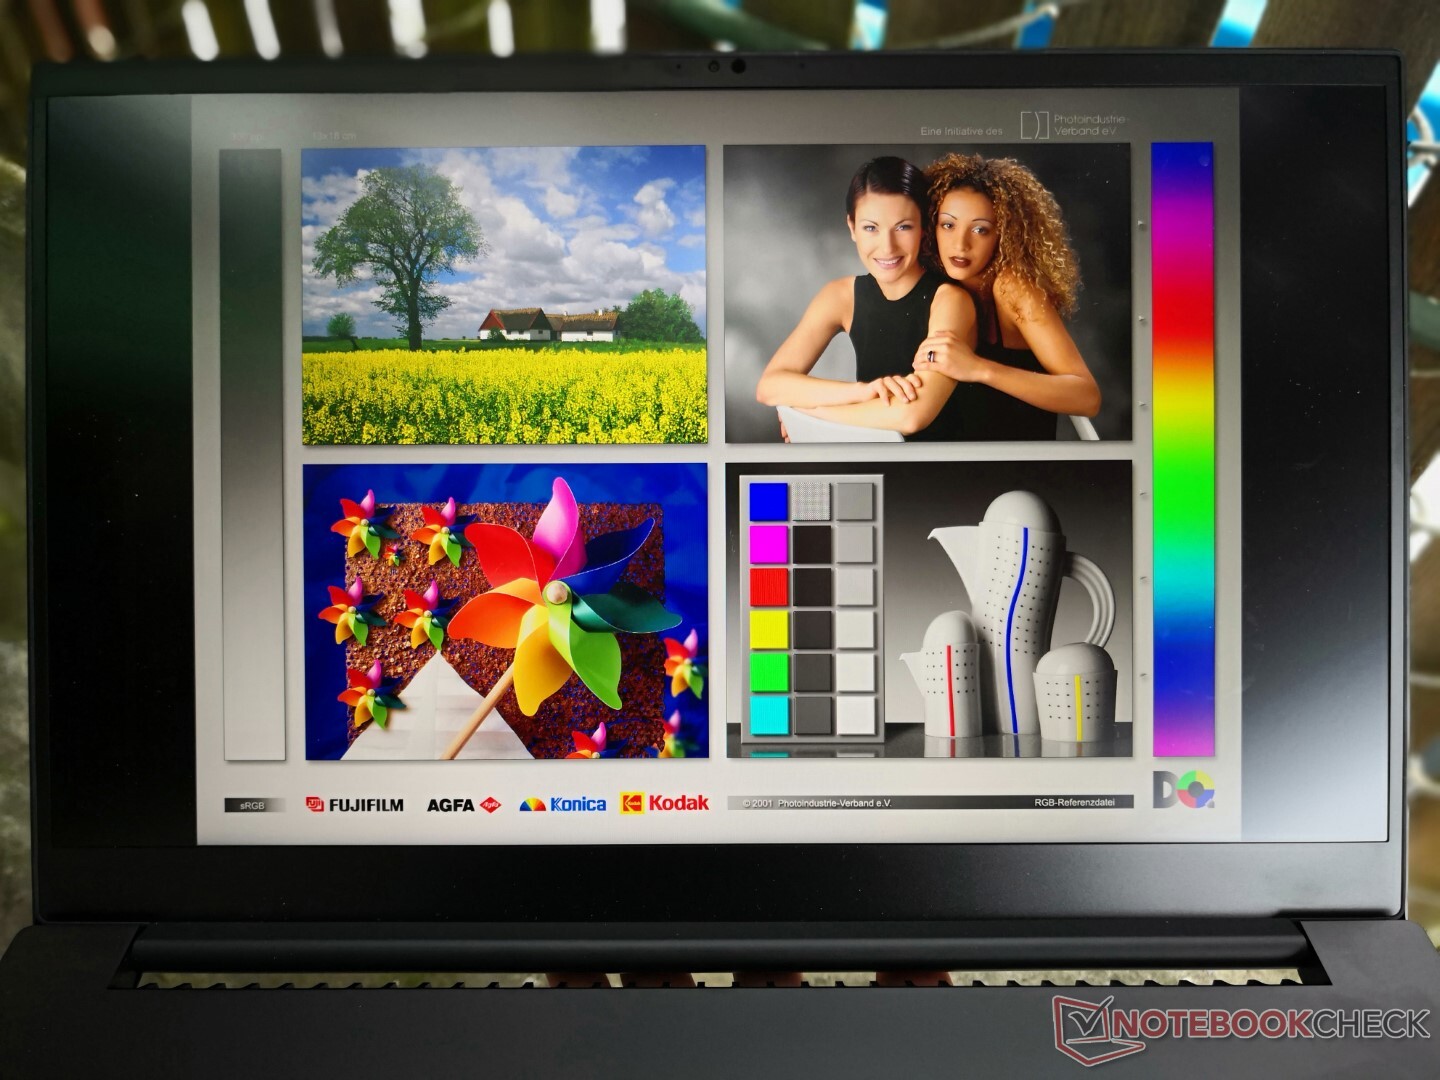
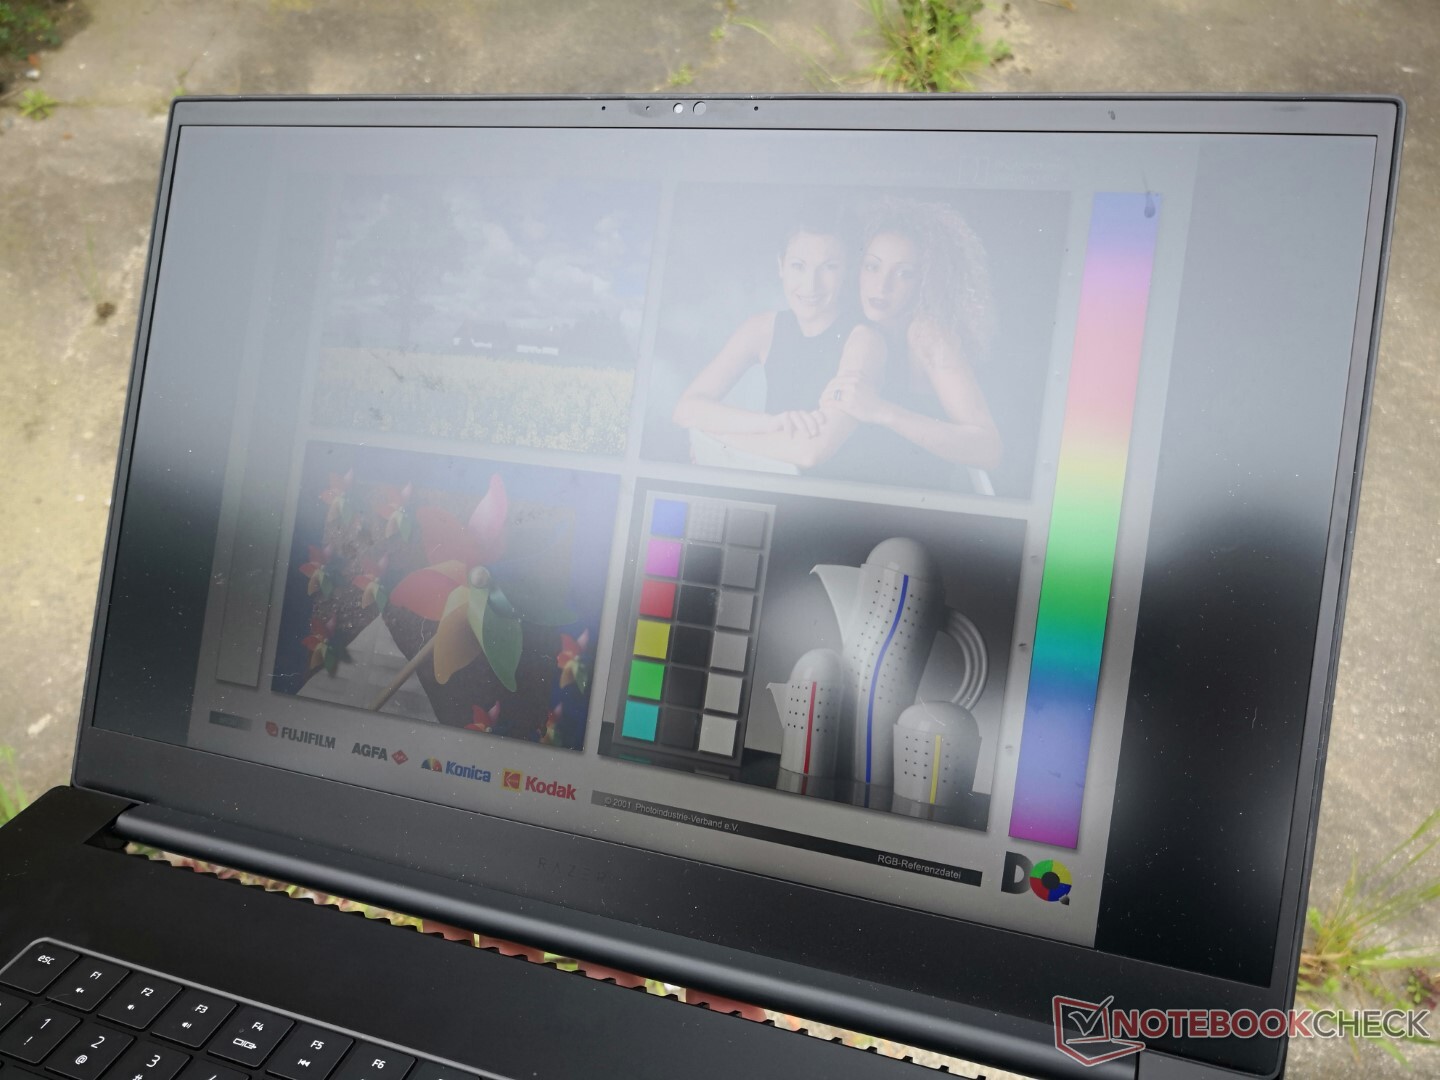
Display — No OLED Options For Now
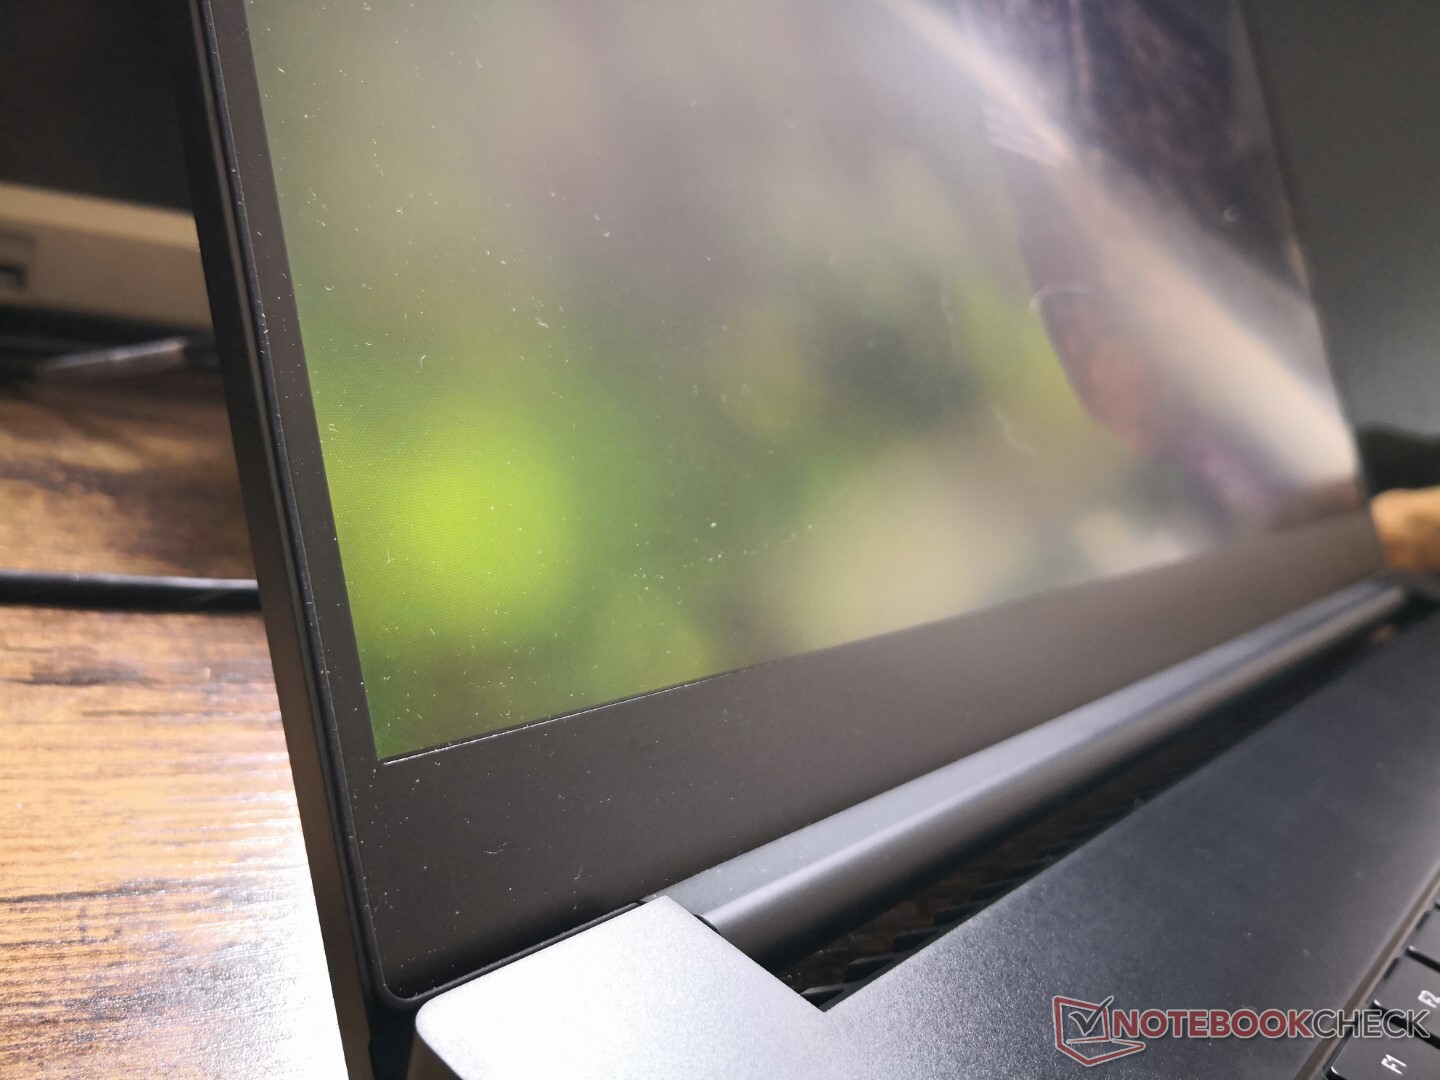
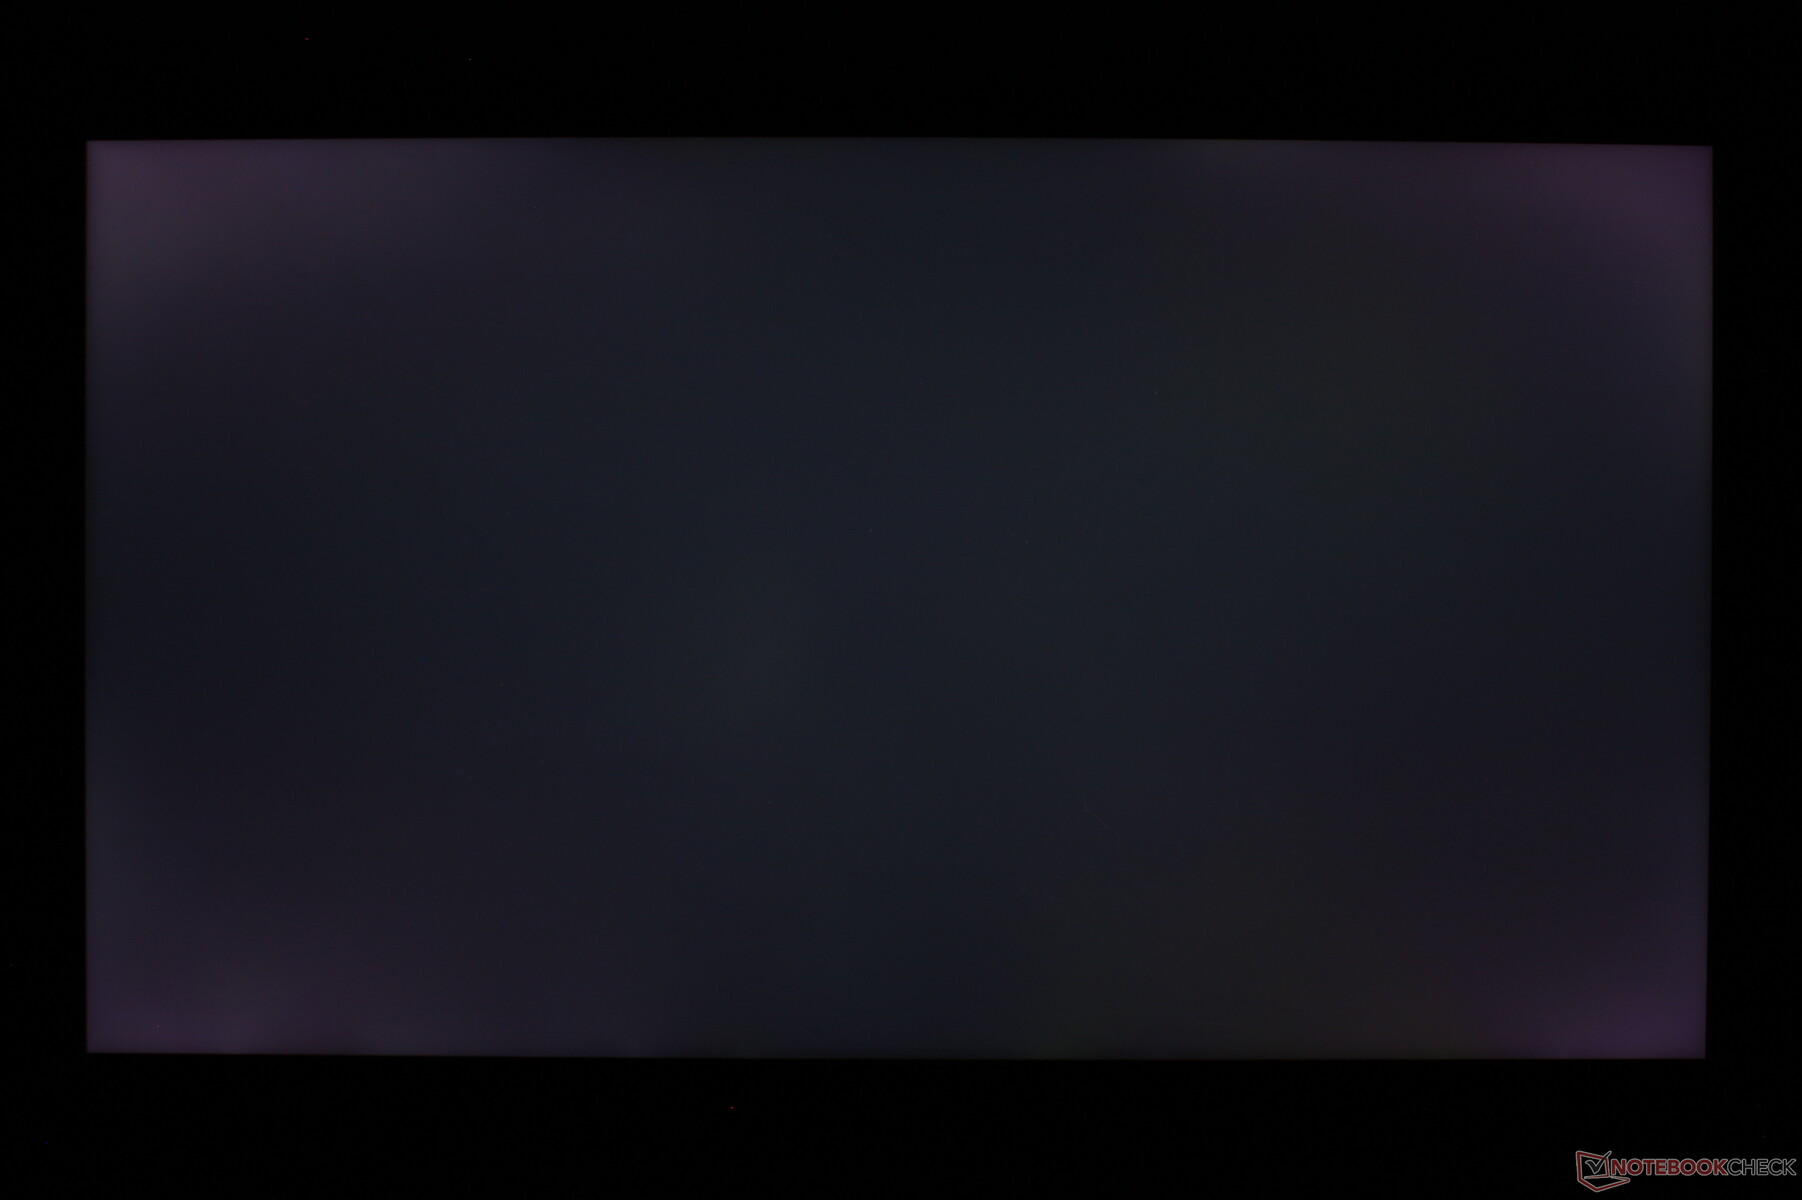
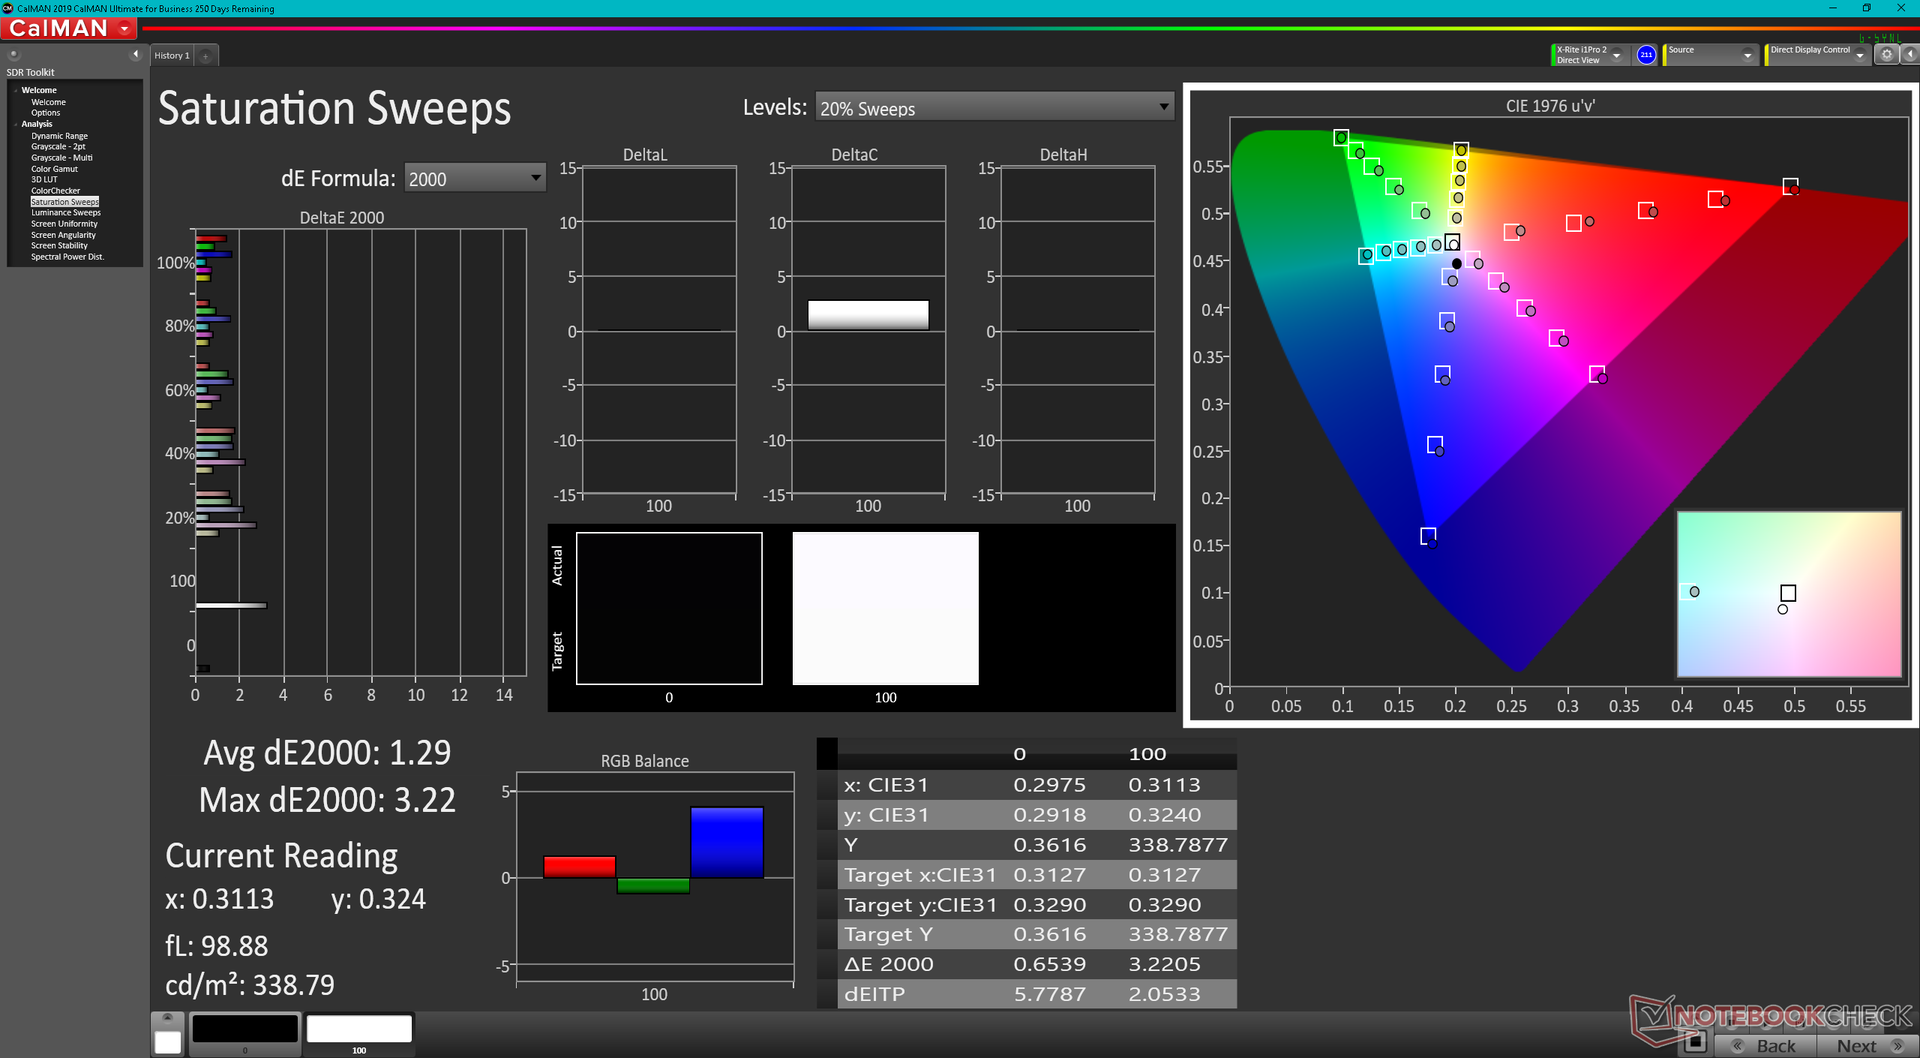
The BOE NE173QHM-NZ1 IPS panel on our test unit is fit for both graphics editing and gaming purposes. It covers the DCI-P3 color gamut completely to satisfy digital artists while offering the fast black-white response times, fast refresh rates, and G-Sync compatibility that gamers will want. Contrast could be better especially when compared to the OLED options that Razer has available on some Blade 15 units, but this is typical of IPS panels.

| |||||||||||||||||||||||||
Brightness Distribution: 75 %
Center on Battery: 335.8 cd/m²
Contrast: 884:1 (Black: 0.38 cd/m²)
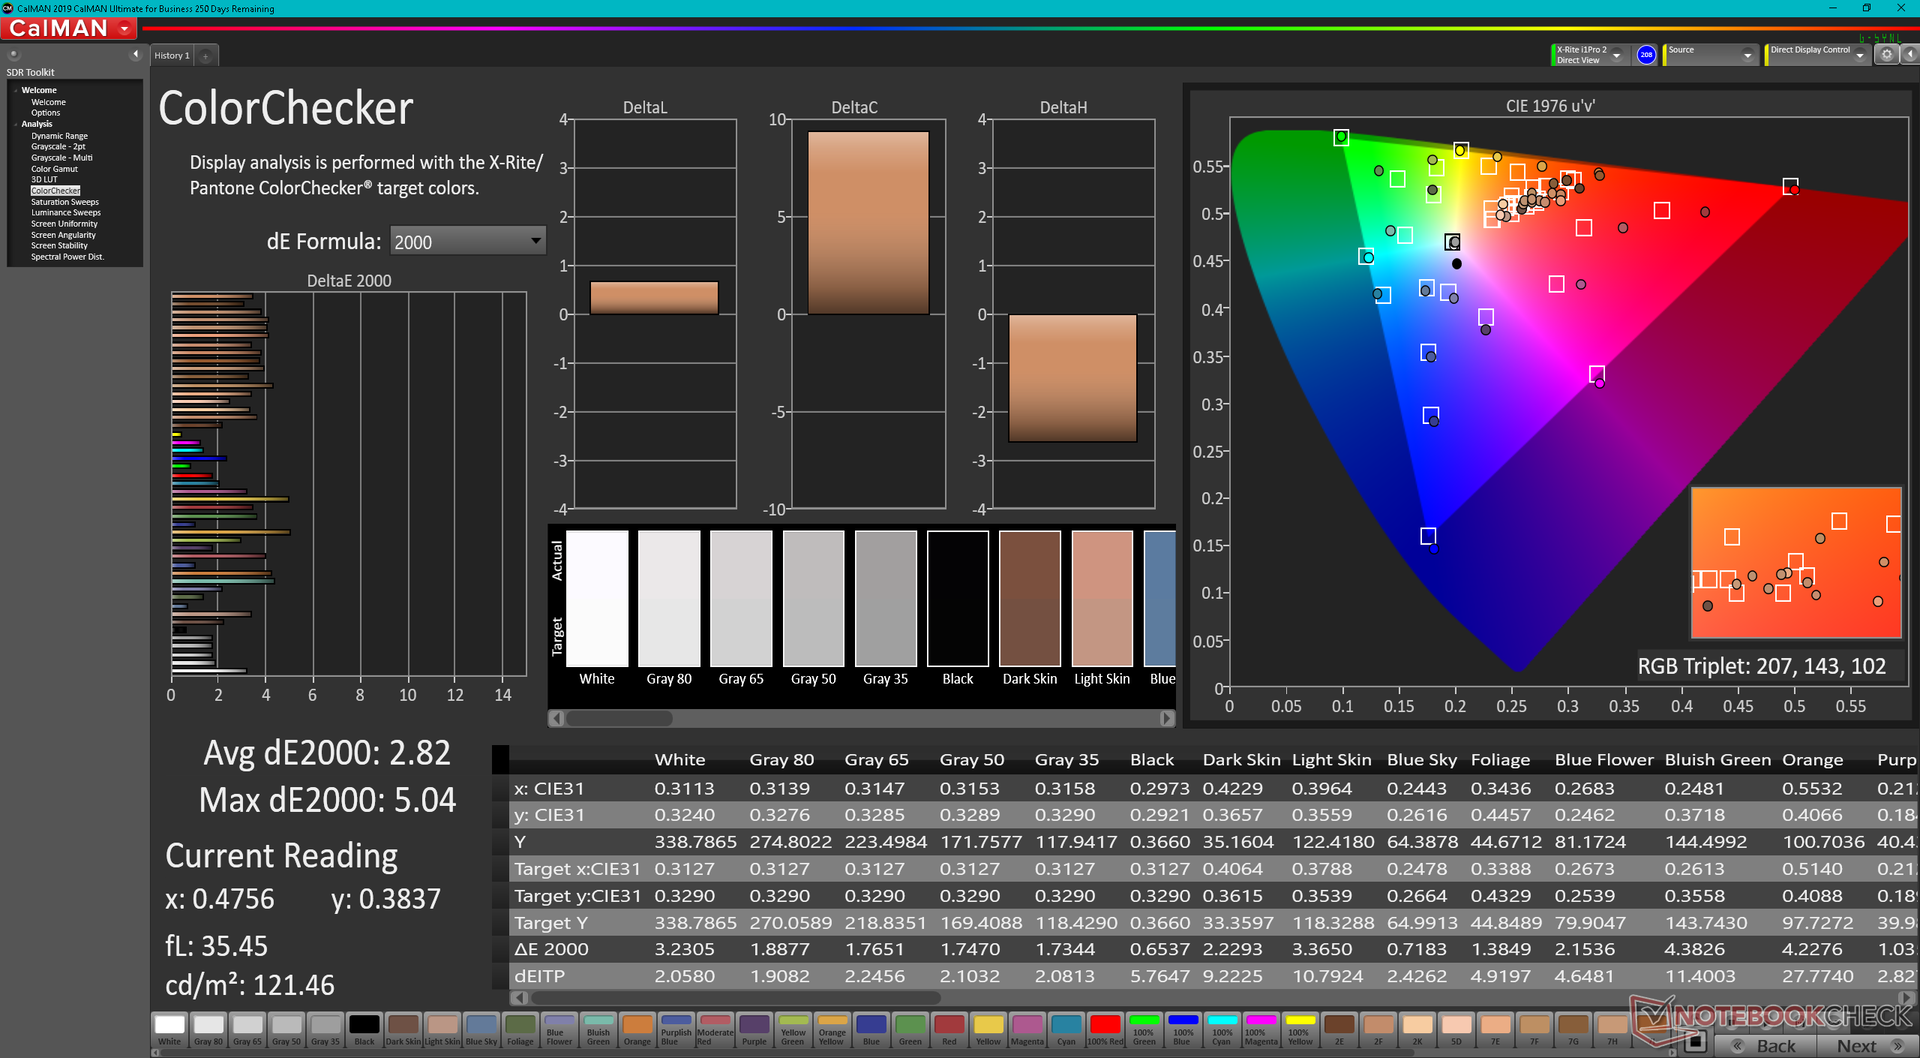
ΔE Color 2.82 | 0.5-29.43 Ø5
ΔE Greyscale 1.7 | 0.57-98 Ø5.3
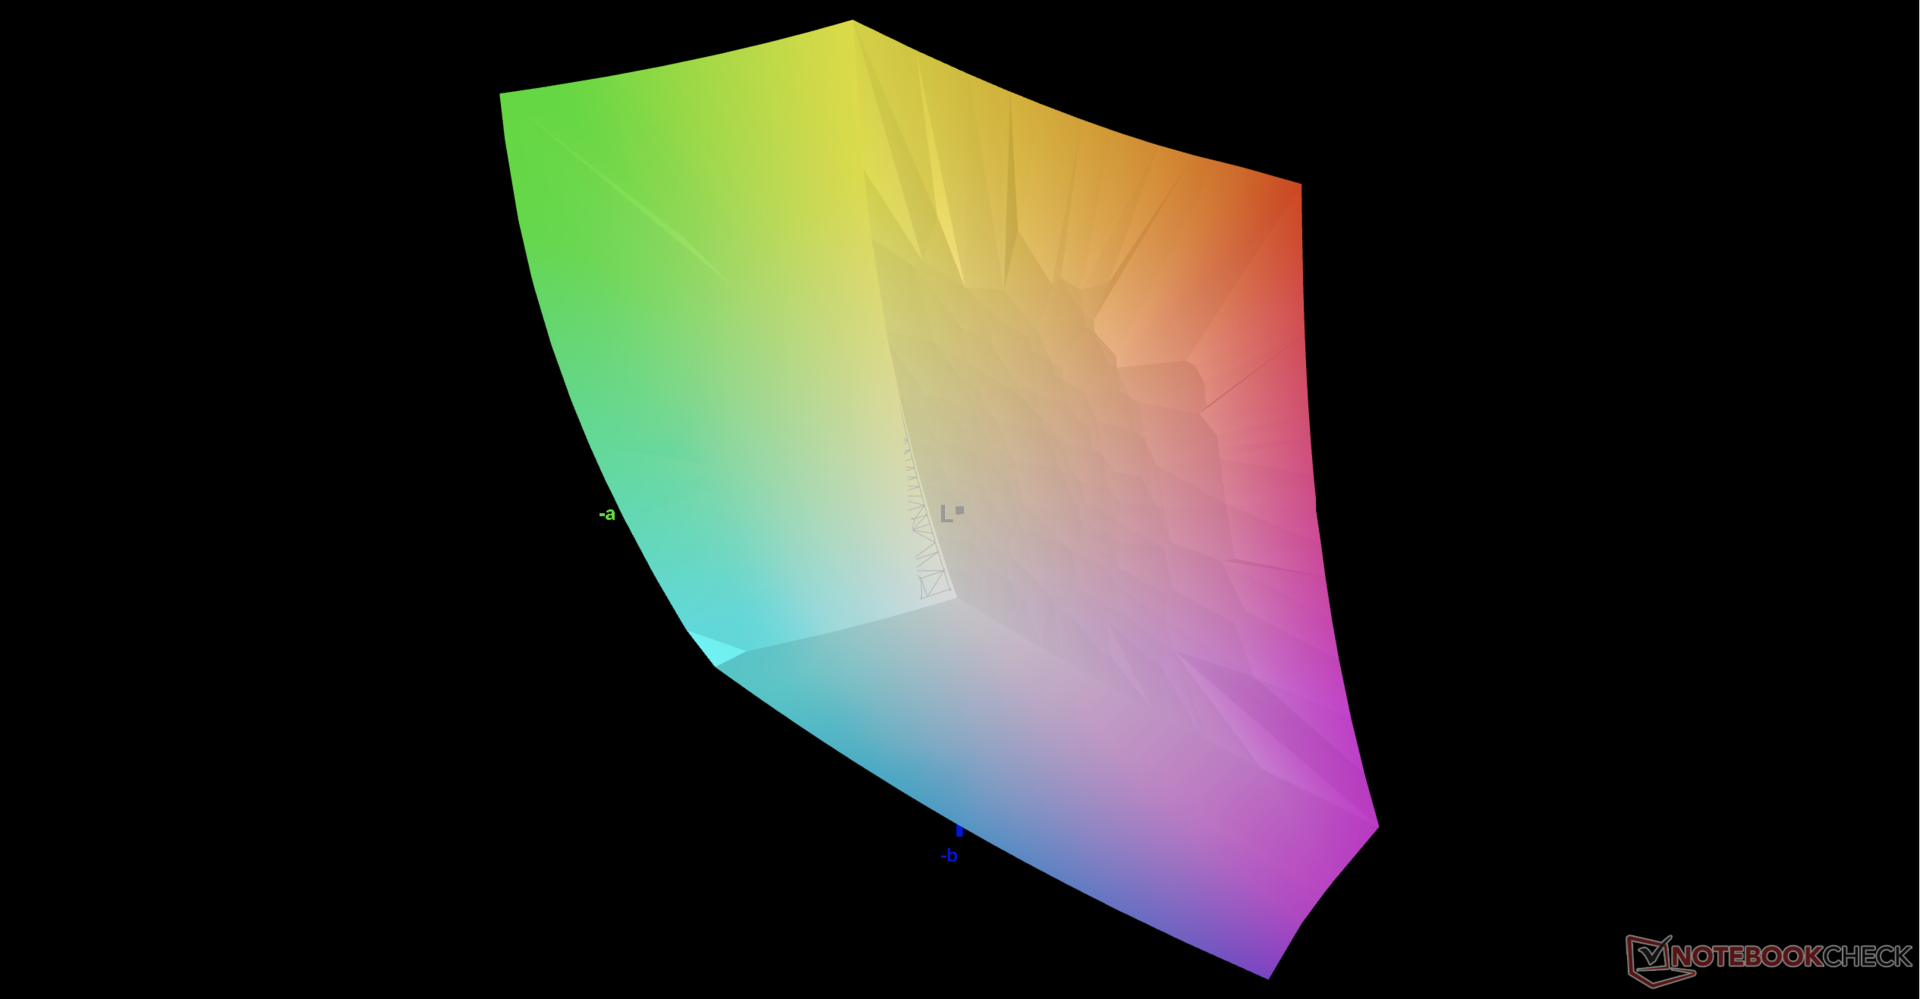
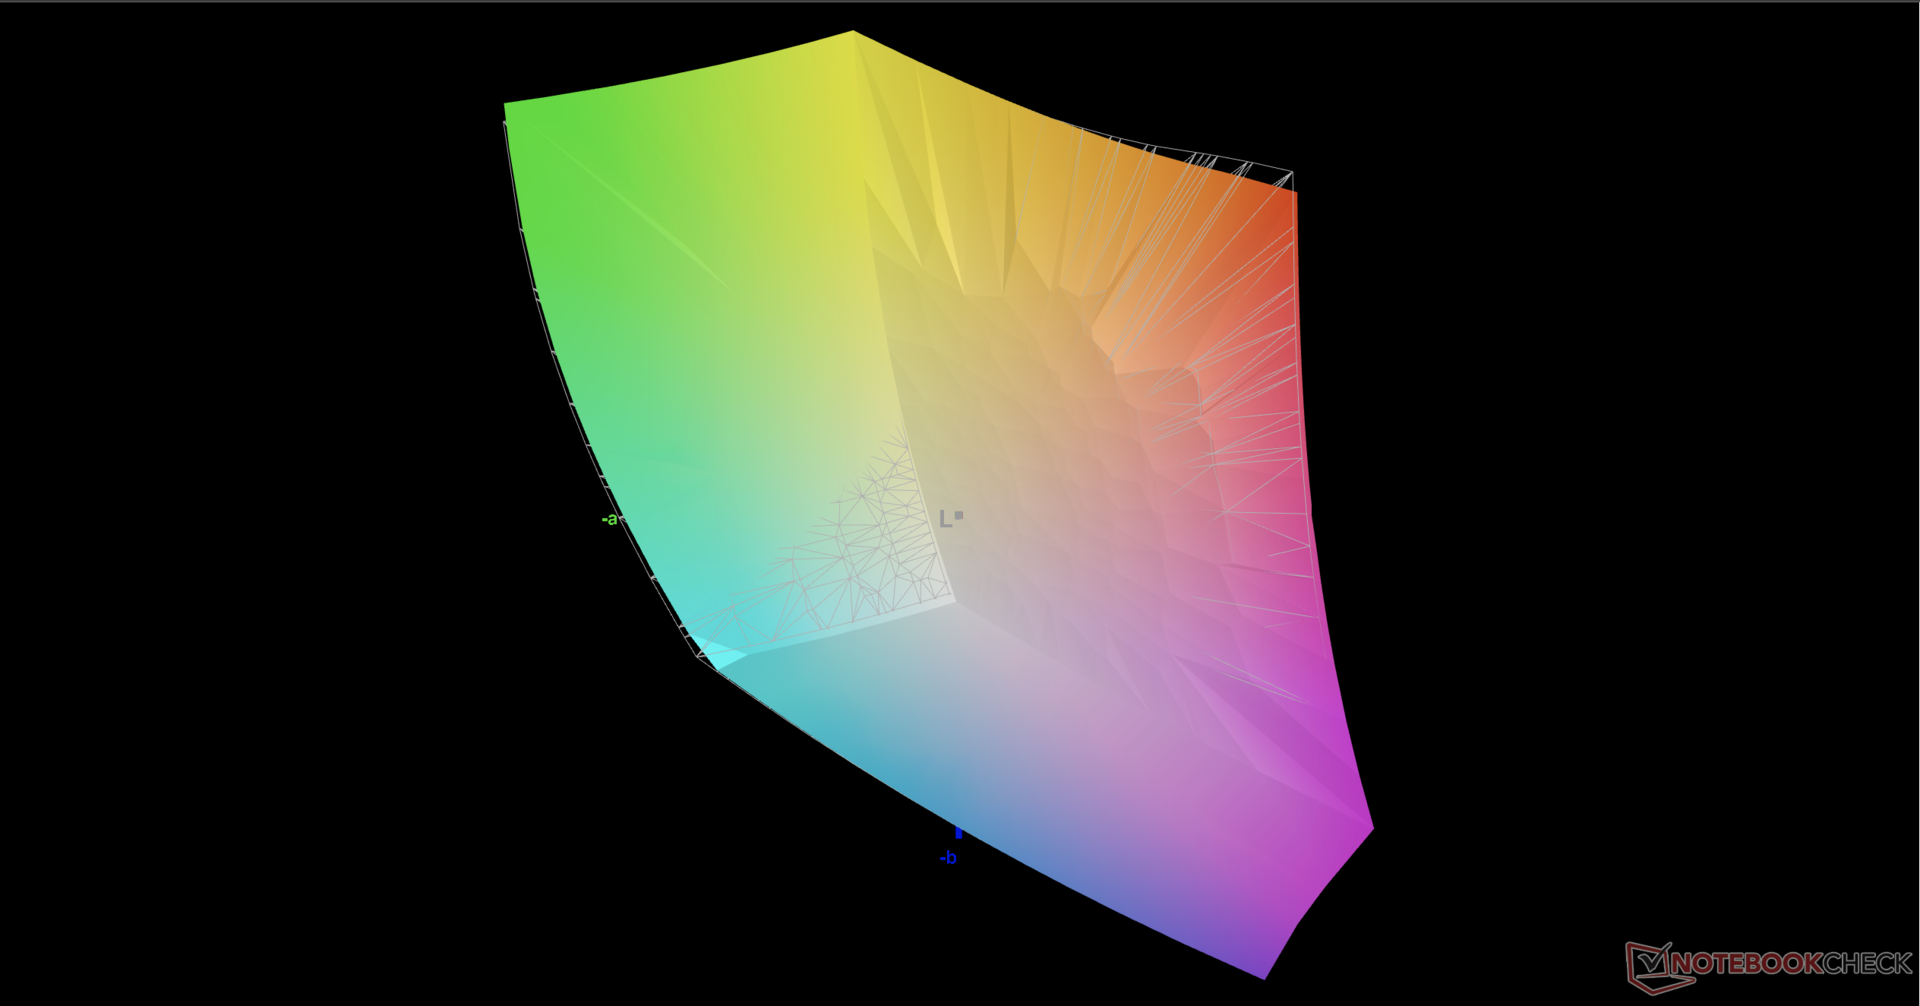
86.2% AdobeRGB 1998 (Argyll 2.2.0 3D)
99.9% sRGB (Argyll 2.2.0 3D)
98.7% Display P3 (Argyll 2.2.0 3D)
Gamma: 2.14
| Razer Blade 17 RTX 3080 Ti BOE NE173QHM-NZ1, IPS, 2560x1440, 17.30 | Razer Blade Pro 17 2021 (QHD Touch) AU Optronics B173ZAN03.3, IPS, 3840x2160, 17.30 | MSI GS76 Stealth 11UH AUO B173ZAN06.1 (AUODE95), IPS, 3840x2160, 17.30 | Asus ROG Zephyrus S17 GX703HSD BOE099D (BOE CQ NE173QHM-NY3), IPS, 2560x1440, 17.30 | Aorus 17G YD Sharp LQ173M1JW04, IPS, 1920x1080, 17.30 | Alienware x17 RTX 3080 P48E AU Optronics B173ZAN, IPS, 3840x2160, 17.30 | |
|---|---|---|---|---|---|---|
| Display | 2% | -22% | -3% | -14% | 2% | |
| Display P3 Coverage | 98.7 | 88.6 -10% | 63 -36% | 94.2 -5% | 72.3 -27% | 88.3 -11% |
| sRGB Coverage | 99.9 | 100 0% | 94.8 -5% | 98.7 -1% | 100 0% | 100 0% |
| AdobeRGB 1998 Coverage | 86.2 | 99.9 16% | 65 -25% | 84.4 -2% | 73.7 -15% | 100 16% |
| Response Times | 5% | 47% | 52% | 21% | 14% | |
| Response Time Grey 50% / Grey 80% * | 17.6 ? | 15.2 ? 14% | 8.8 ? 50% | 4.8 73% | 13.6 ? 23% | 14.4 ? 18% |
| Response Time Black / White * | 11.4 ? | 12 ? -5% | 6.4 ? 44% | 8 30% | 9.2 ? 19% | 10.4 ? 9% |
| PWM Frequency | ||||||
| Screen | -76% | 10% | -8% | -10% | -8% | |
| Brightness middle | 335.9 | 407.2 21% | 474 41% | 322 -4% | 286 -15% | 438.7 31% |
| Brightness | 294 | 403 37% | 454 54% | 288 -2% | 282 -4% | 435 48% |
| Brightness Distribution | 75 | 90 20% | 88 17% | 72 -4% | 73 -3% | 91 21% |
| Black Level * | 0.38 | 0.42 -11% | 0.46 -21% | 0.3 21% | 0.24 37% | 0.48 -26% |
| Contrast | 884 | 970 10% | 1030 17% | 1073 21% | 1192 35% | 914 3% |
| Colorchecker dE 2000 * | 2.82 | 7.25 -157% | 1.5 47% | 3.05 -8% | 2.79 1% | 4.34 -54% |
| Colorchecker dE 2000 max. * | 5.04 | 12.51 -148% | 5.59 -11% | 5.23 -4% | 6.23 -24% | 7.3 -45% |
| Greyscale dE 2000 * | 1.7 | 8.1 -376% | 2.8 -65% | 3.11 -83% | 3.5 -106% | 2.4 -41% |
| Gamma | 2.14 103% | 2.24 98% | 2.158 102% | 2.13 103% | 2.358 93% | 2.09 105% |
| CCT | 6382 102% | 5925 110% | 6597 99% | 6553 99% | 6147 106% | 6413 101% |
| Colorchecker dE 2000 calibrated * | 3.62 | 0.86 | 1.92 | 0.82 | 0.72 | |
| Color Space (Percent of AdobeRGB 1998) | 88.1 | 84 | 74 | |||
| Color Space (Percent of sRGB) | 100 | 99 | 96 | |||
| Total Average (Program / Settings) | -23% /
-45% | 12% /
8% | 14% /
2% | -1% /
-6% | 3% /
-2% |
* ... smaller is better
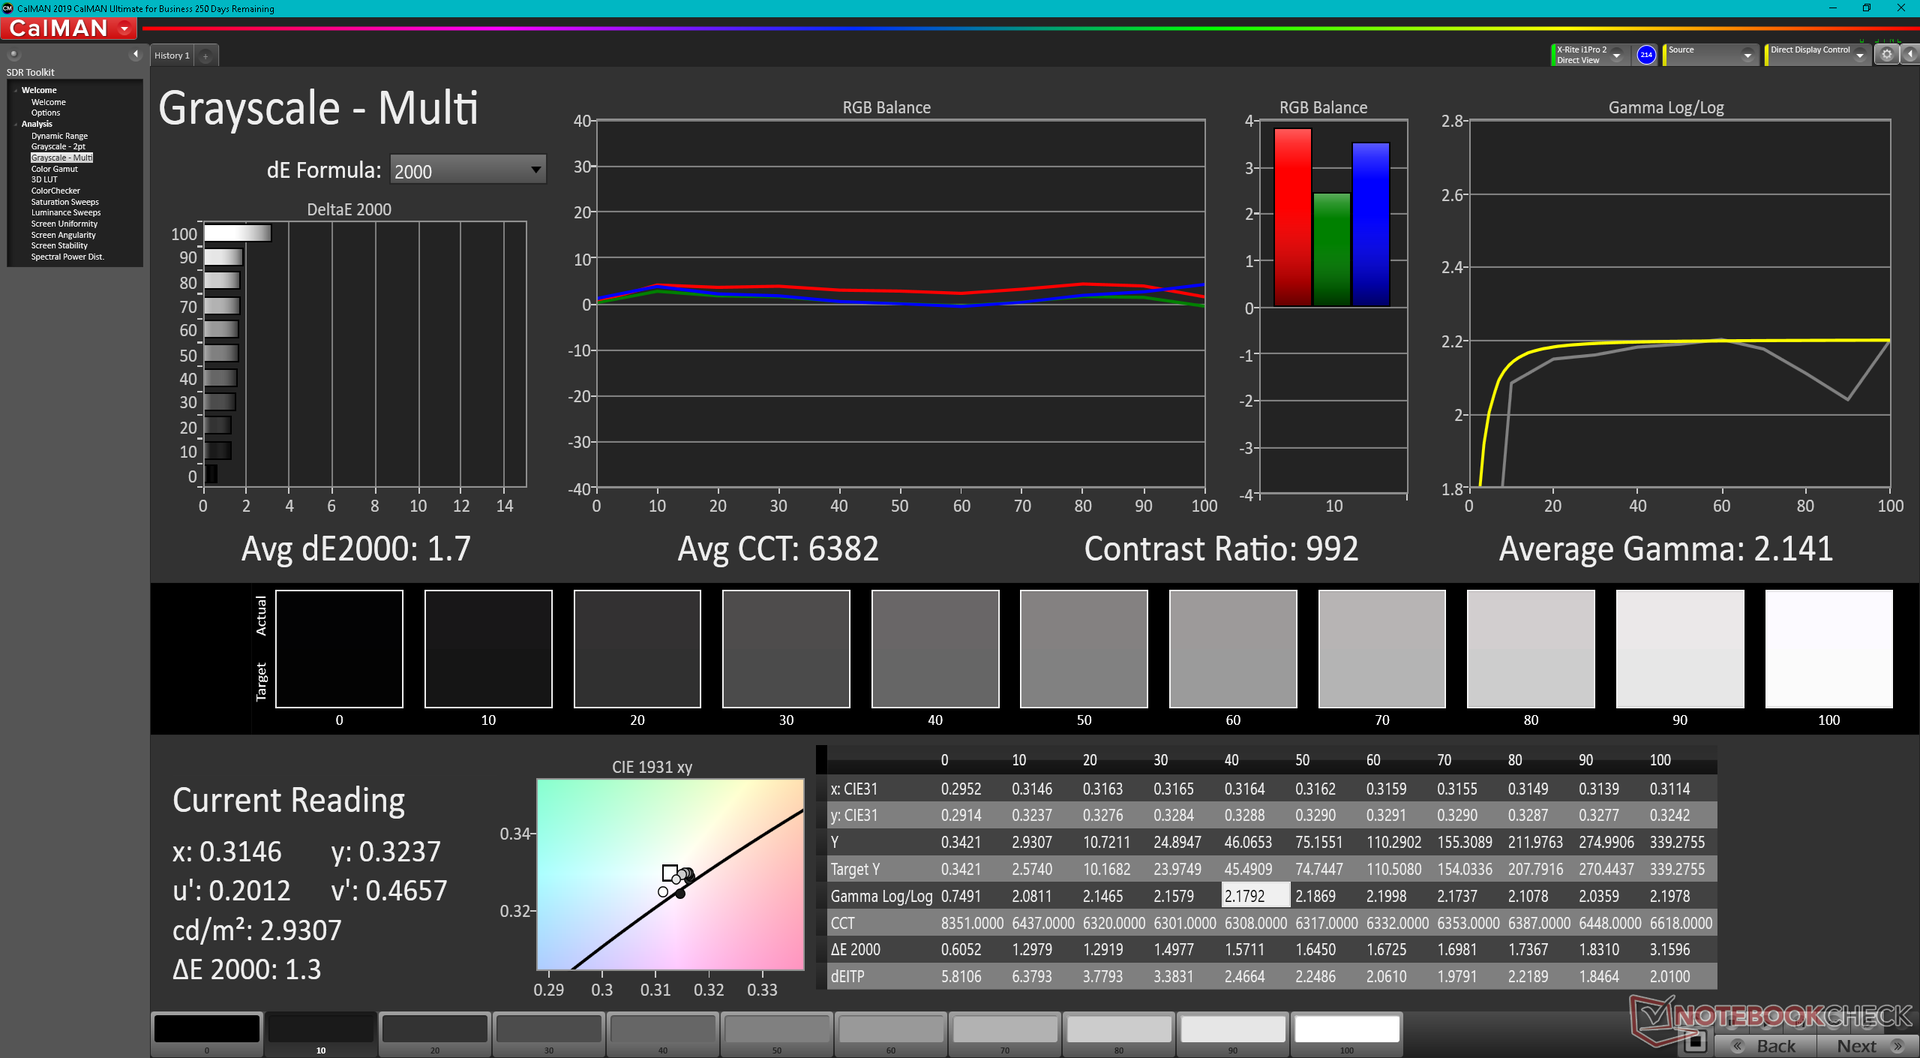
Razer calibrates each display at factory and our independent measurements with an X-Rite colorimeter prove as much. Average grayscale and ColorChecker DeltaE values are only 1.7 and 2.82, respectively, to show that end-user calibration is not needed.
Display Response Times
| ↔ Response Time Black to White | ||
|---|---|---|
| 11.4 ms ... rise ↗ and fall ↘ combined | ↗ 4.8 ms rise | 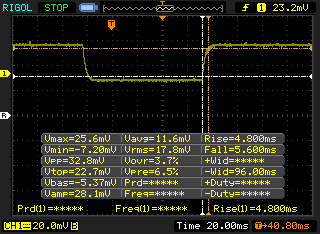 |
| ↘ 5.6 ms fall | ||
| The screen shows good response rates in our tests, but may be too slow for competitive gamers. In comparison, all tested devices range from 0.1 (minimum) to 240 (maximum) ms. » 26 % of all devices are better. This means that the measured response time is better than the average of all tested devices (21.5 ms). | ||
| ↔ Response Time 50% Grey to 80% Grey | ||
| 17.6 ms ... rise ↗ and fall ↘ combined | ↗ 8.4 ms rise | 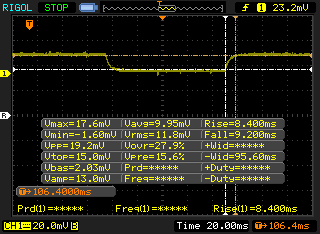 |
| ↘ 9.2 ms fall | ||
| The screen shows good response rates in our tests, but may be too slow for competitive gamers. In comparison, all tested devices range from 0.2 (minimum) to 636 (maximum) ms. » 26 % of all devices are better. This means that the measured response time is better than the average of all tested devices (33.7 ms). | ||
Screen Flickering / PWM (Pulse-Width Modulation)
| Screen flickering / PWM not detected | 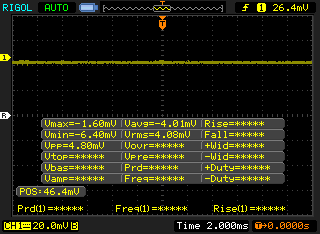 | ||
In comparison: 53 % of all tested devices do not use PWM to dim the display. If PWM was detected, an average of 17900 (minimum: 5 - maximum: 3846000) Hz was measured. | |||

Performance — 165 W Graphics With 12th Gen Intel
Testing Conditions
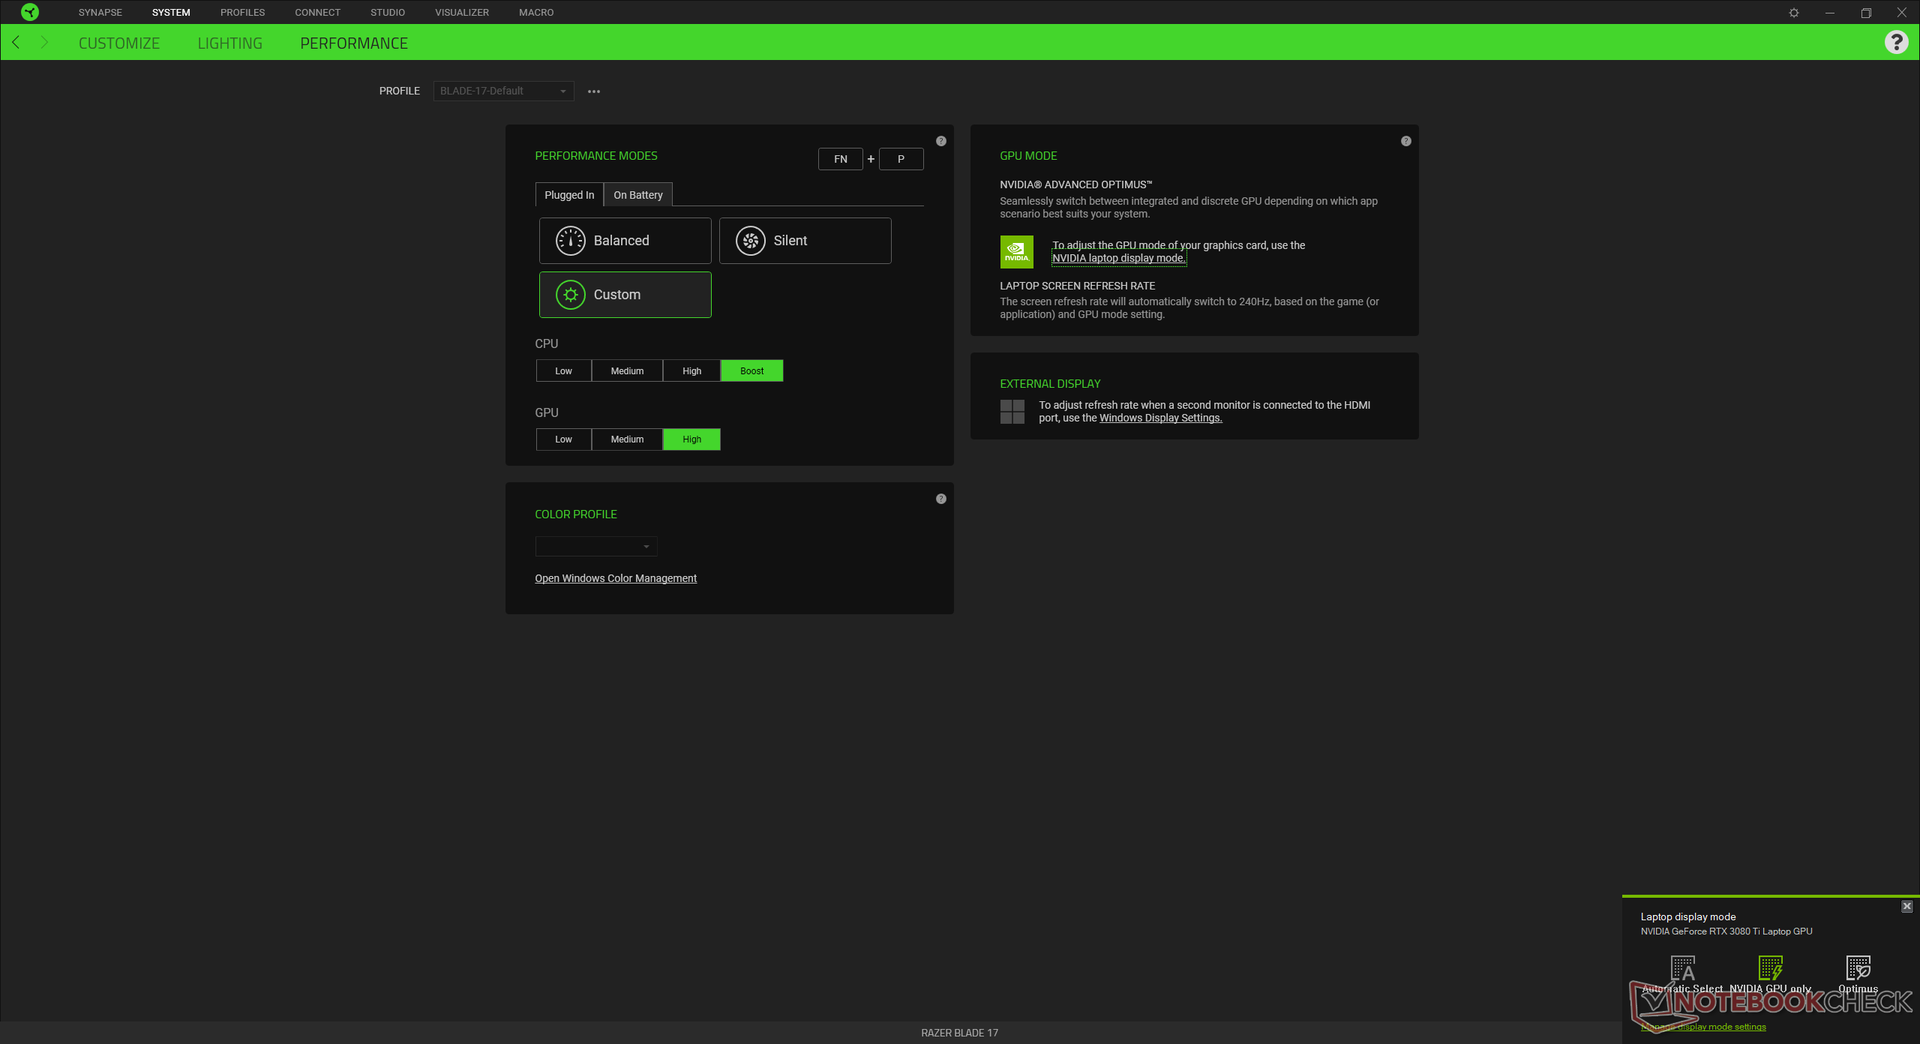
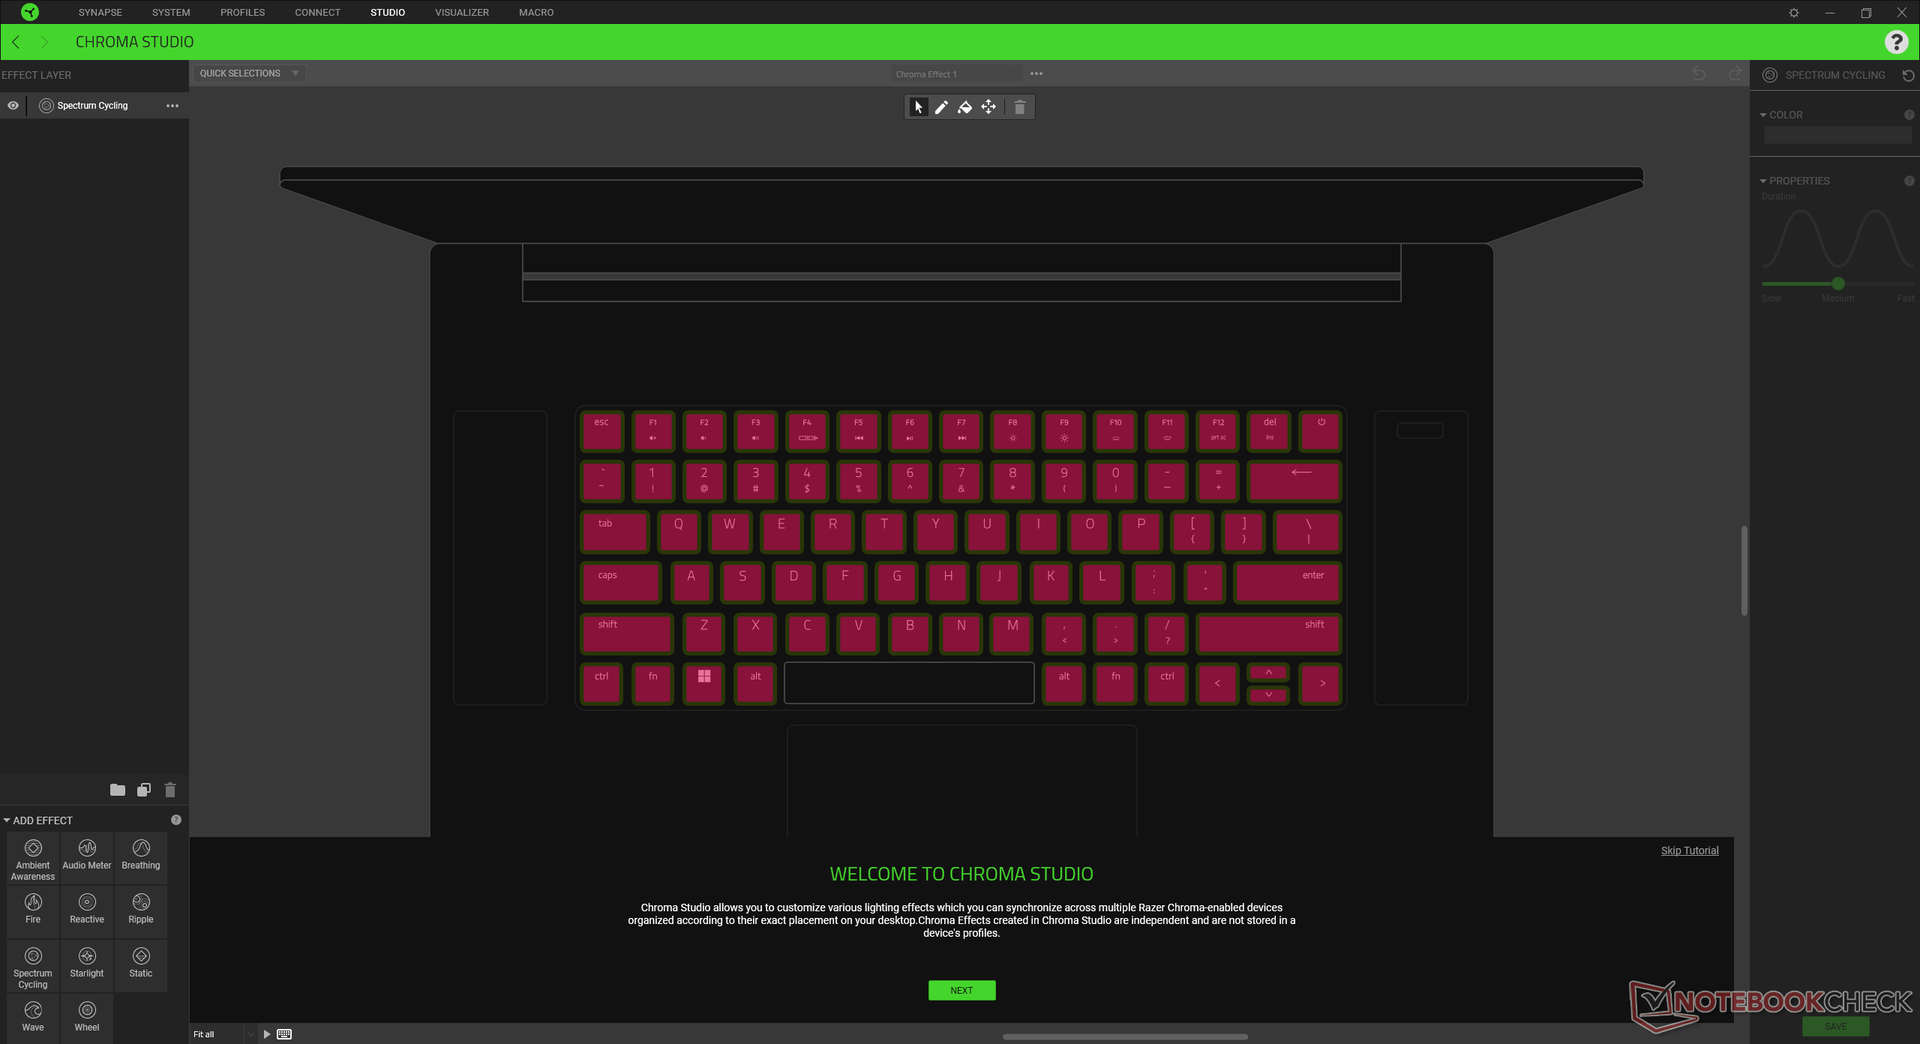
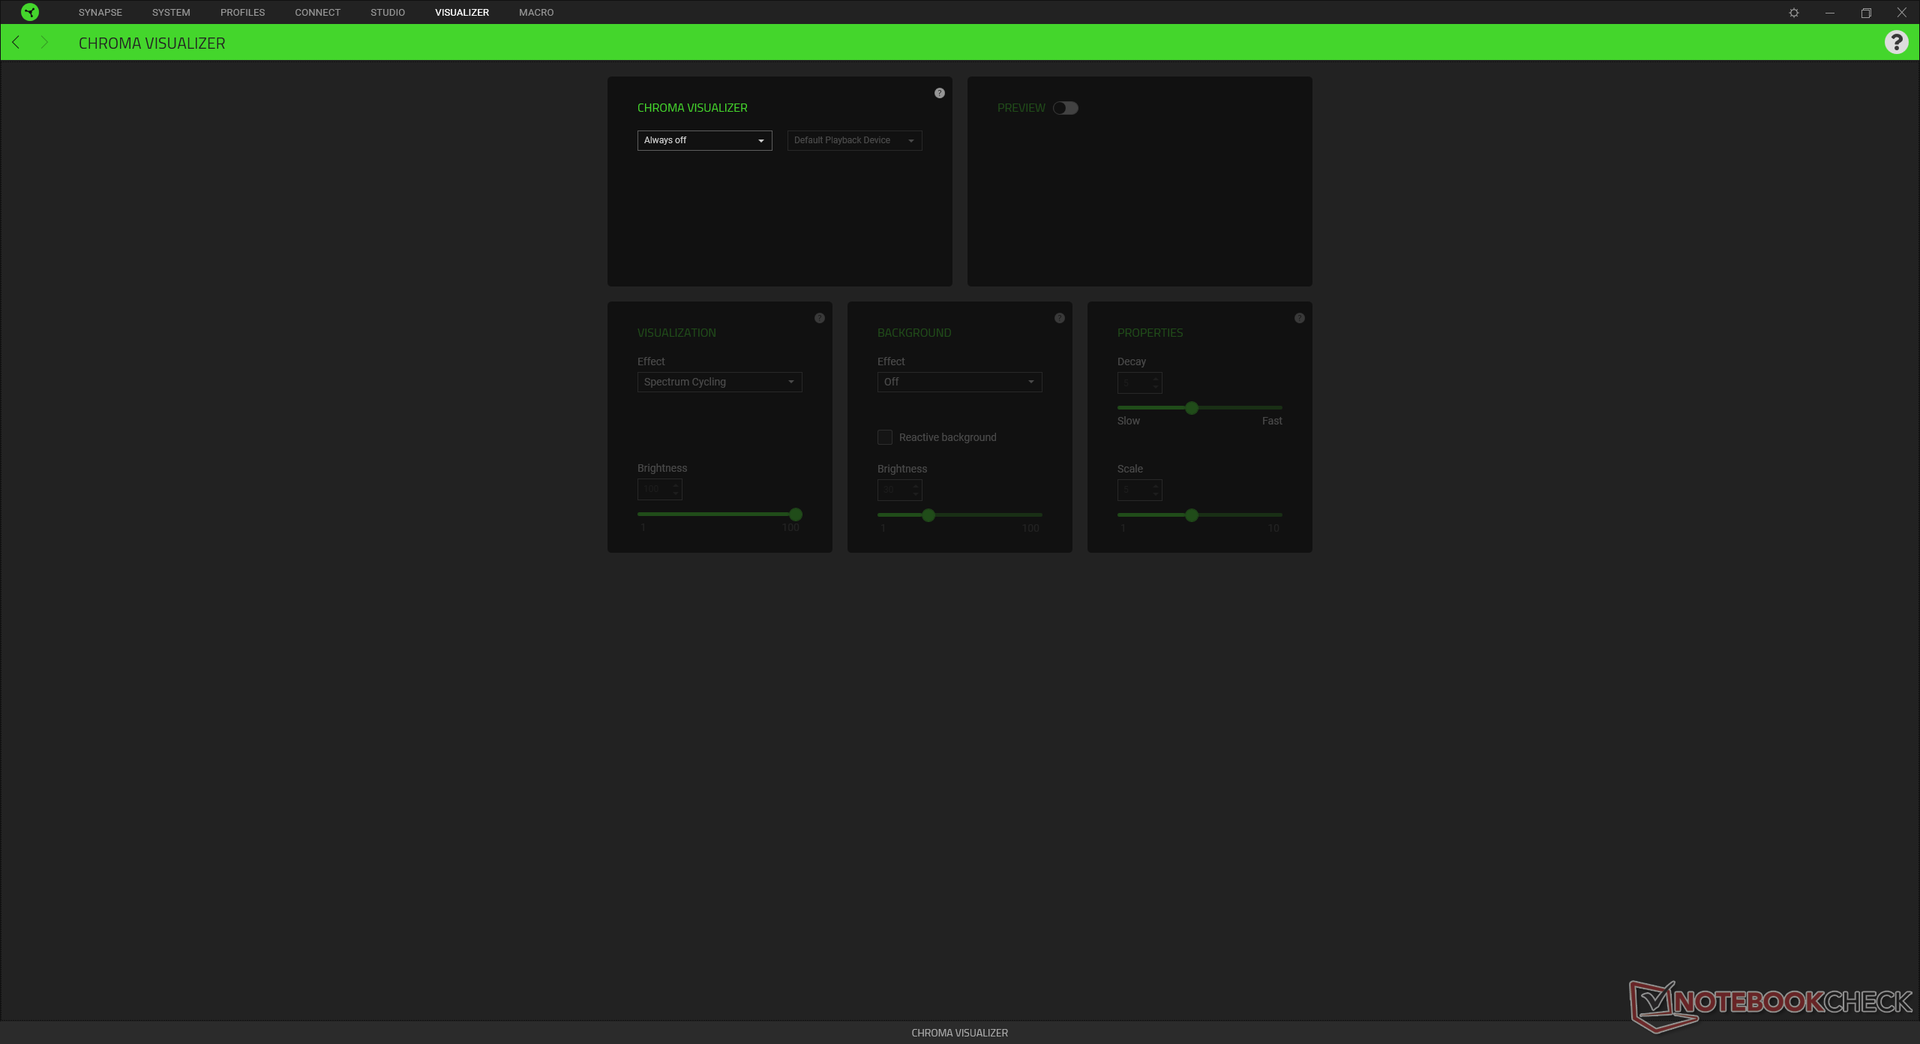
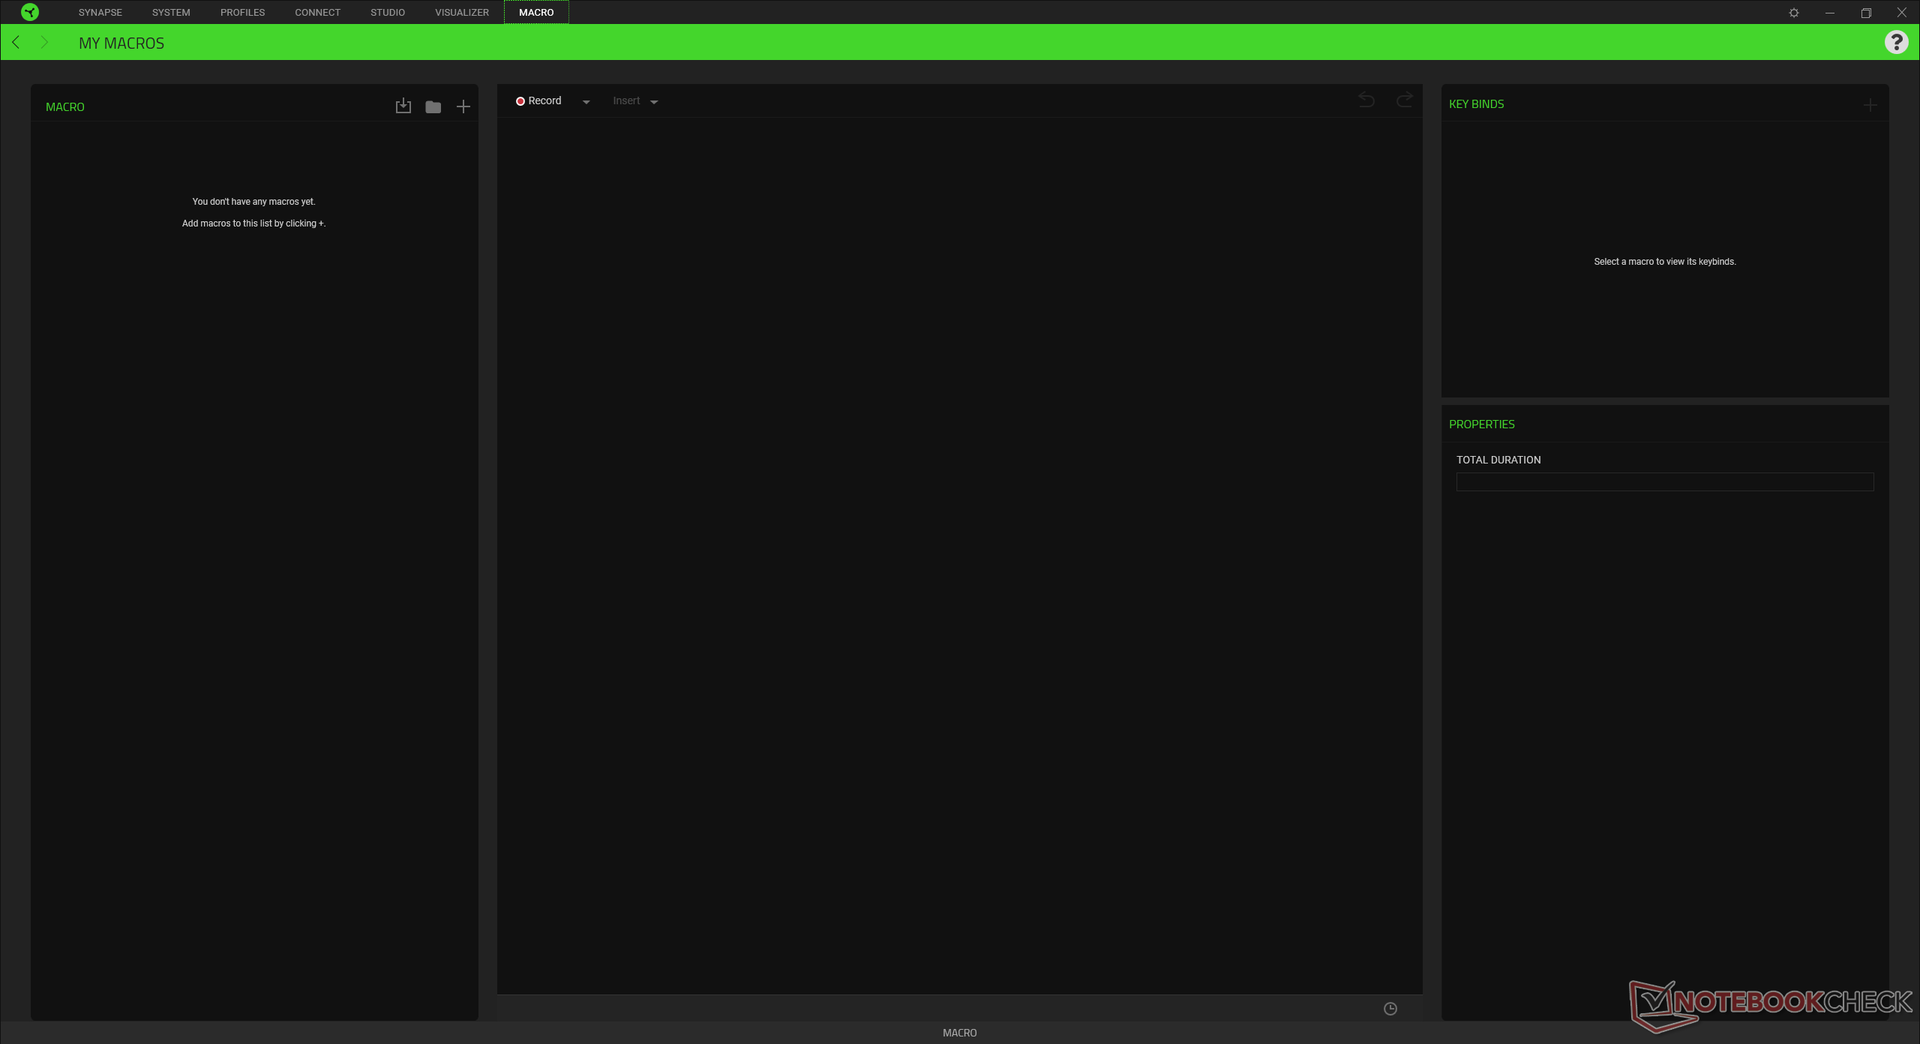
Our unit was set to Manual mode with the CPU and GPU on Boost and High, respectively, for the highest possible benchmark scores. Users should become familiar with the Synapse software as it serves as the control hub for system-specific features and performance profiles.
The Blade 17 is one of the few gaming laptops to support Advanced Optimus meaning that users can switch between Optimus and dGPU G-Sync modes without needing to reboot.
Processor
CPU performance is where we expect it to be relative to other laptops running on the same Core i7-12800H processor. Raw performance is about 20 to 25 percent and 50 to 70 percent over the 11th gen Core i7-11800H and 10th gen Core i7-10875H, respectively, on the older generation Blade 17 models. Upgrading to the Core i9-12900H SKU is only expected to offer a 10 percent performance boost over our Core i7-12800H configuration.
Performance sustainability is excellent with no major dips in clock rates over time when running CineBench R15 xT in a loop.
Cinebench R15 Multi Loop
Cinebench R20: CPU (Multi Core) | CPU (Single Core)
Cinebench R15: CPU Multi 64Bit | CPU Single 64Bit
Blender: v2.79 BMW27 CPU
7-Zip 18.03: 7z b 4 | 7z b 4 -mmt1
Geekbench 5.5: Multi-Core | Single-Core
HWBOT x265 Benchmark v2.2: 4k Preset
LibreOffice : 20 Documents To PDF
R Benchmark 2.5: Overall mean
| HWBOT x265 Benchmark v2.2 / 4k Preset | |
| MSI GE76 Raider | |
| SCHENKER Uniwill Technology GM7AG8P | |
| Razer Blade 17 RTX 3080 Ti | |
| Average Intel Core i7-12800H (11.7 - 19.4, n=5) | |
| SCHENKER XMG Apex 17 M21 | |
| Razer Blade 17 RTX 3070 | |
| Gigabyte A7 X1 | |
| MSI GE76 Raider 10UH | |
| Lenovo Legion 5 17ACH6H-82JY0003GE | |
| Razer Blade Pro 17 2021 (QHD Touch) | |
| Acer Nitro 5 AN517-53-54DQ | |
* ... smaller is better
AIDA64: FP32 Ray-Trace | FPU Julia | CPU SHA3 | CPU Queen | FPU SinJulia | FPU Mandel | CPU AES | CPU ZLib | FP64 Ray-Trace | CPU PhotoWorxx
| Performance Rating | |
| SCHENKER XMG Pro 17 (Late 2021, RTX 3080) | |
| MSI GE76 Raider | |
| Lenovo Legion 5 17ACH6H-82JY0003GE | |
| SCHENKER Uniwill Technology GM7AG8P | |
| Average Intel Core i7-12800H | |
| Razer Blade 17 RTX 3080 Ti | |
| AIDA64 / FP32 Ray-Trace | |
| SCHENKER XMG Pro 17 (Late 2021, RTX 3080) | |
| Lenovo Legion 5 17ACH6H-82JY0003GE | |
| MSI GE76 Raider | |
| Average Intel Core i7-12800H (5839 - 15206, n=5) | |
| SCHENKER Uniwill Technology GM7AG8P | |
| Razer Blade 17 RTX 3080 Ti | |
| AIDA64 / FPU Julia | |
| Lenovo Legion 5 17ACH6H-82JY0003GE | |
| SCHENKER XMG Pro 17 (Late 2021, RTX 3080) | |
| Average Intel Core i7-12800H (27801 - 80002, n=5) | |
| MSI GE76 Raider | |
| SCHENKER Uniwill Technology GM7AG8P | |
| Razer Blade 17 RTX 3080 Ti | |
| AIDA64 / CPU SHA3 | |
| SCHENKER XMG Pro 17 (Late 2021, RTX 3080) | |
| MSI GE76 Raider | |
| SCHENKER Uniwill Technology GM7AG8P | |
| Average Intel Core i7-12800H (2013 - 3684, n=5) | |
| Lenovo Legion 5 17ACH6H-82JY0003GE | |
| Razer Blade 17 RTX 3080 Ti | |
| AIDA64 / CPU Queen | |
| MSI GE76 Raider | |
| Razer Blade 17 RTX 3080 Ti | |
| SCHENKER Uniwill Technology GM7AG8P | |
| Average Intel Core i7-12800H (85965 - 108084, n=5) | |
| SCHENKER XMG Pro 17 (Late 2021, RTX 3080) | |
| Lenovo Legion 5 17ACH6H-82JY0003GE | |
| AIDA64 / FPU SinJulia | |
| MSI GE76 Raider | |
| SCHENKER Uniwill Technology GM7AG8P | |
| SCHENKER XMG Pro 17 (Late 2021, RTX 3080) | |
| Lenovo Legion 5 17ACH6H-82JY0003GE | |
| Razer Blade 17 RTX 3080 Ti | |
| Average Intel Core i7-12800H (7027 - 9658, n=5) | |
| AIDA64 / FPU Mandel | |
| Lenovo Legion 5 17ACH6H-82JY0003GE | |
| SCHENKER XMG Pro 17 (Late 2021, RTX 3080) | |
| MSI GE76 Raider | |
| Average Intel Core i7-12800H (15765 - 38179, n=5) | |
| SCHENKER Uniwill Technology GM7AG8P | |
| Razer Blade 17 RTX 3080 Ti | |
| AIDA64 / CPU AES | |
| SCHENKER XMG Pro 17 (Late 2021, RTX 3080) | |
| MSI GE76 Raider | |
| Lenovo Legion 5 17ACH6H-82JY0003GE | |
| SCHENKER Uniwill Technology GM7AG8P | |
| Average Intel Core i7-12800H (55371 - 73928, n=5) | |
| Razer Blade 17 RTX 3080 Ti | |
| AIDA64 / CPU ZLib | |
| MSI GE76 Raider | |
| SCHENKER Uniwill Technology GM7AG8P | |
| Average Intel Core i7-12800H (701 - 1047, n=5) | |
| Razer Blade 17 RTX 3080 Ti | |
| SCHENKER XMG Pro 17 (Late 2021, RTX 3080) | |
| Lenovo Legion 5 17ACH6H-82JY0003GE | |
| AIDA64 / FP64 Ray-Trace | |
| SCHENKER XMG Pro 17 (Late 2021, RTX 3080) | |
| Lenovo Legion 5 17ACH6H-82JY0003GE | |
| MSI GE76 Raider | |
| SCHENKER Uniwill Technology GM7AG8P | |
| Average Intel Core i7-12800H (3257 - 8559, n=5) | |
| Razer Blade 17 RTX 3080 Ti | |
| AIDA64 / CPU PhotoWorxx | |
| Razer Blade 17 RTX 3080 Ti | |
| SCHENKER Uniwill Technology GM7AG8P | |
| MSI GE76 Raider | |
| Average Intel Core i7-12800H (31329 - 40992, n=5) | |
| SCHENKER XMG Pro 17 (Late 2021, RTX 3080) | |
| Lenovo Legion 5 17ACH6H-82JY0003GE | |
System Performance
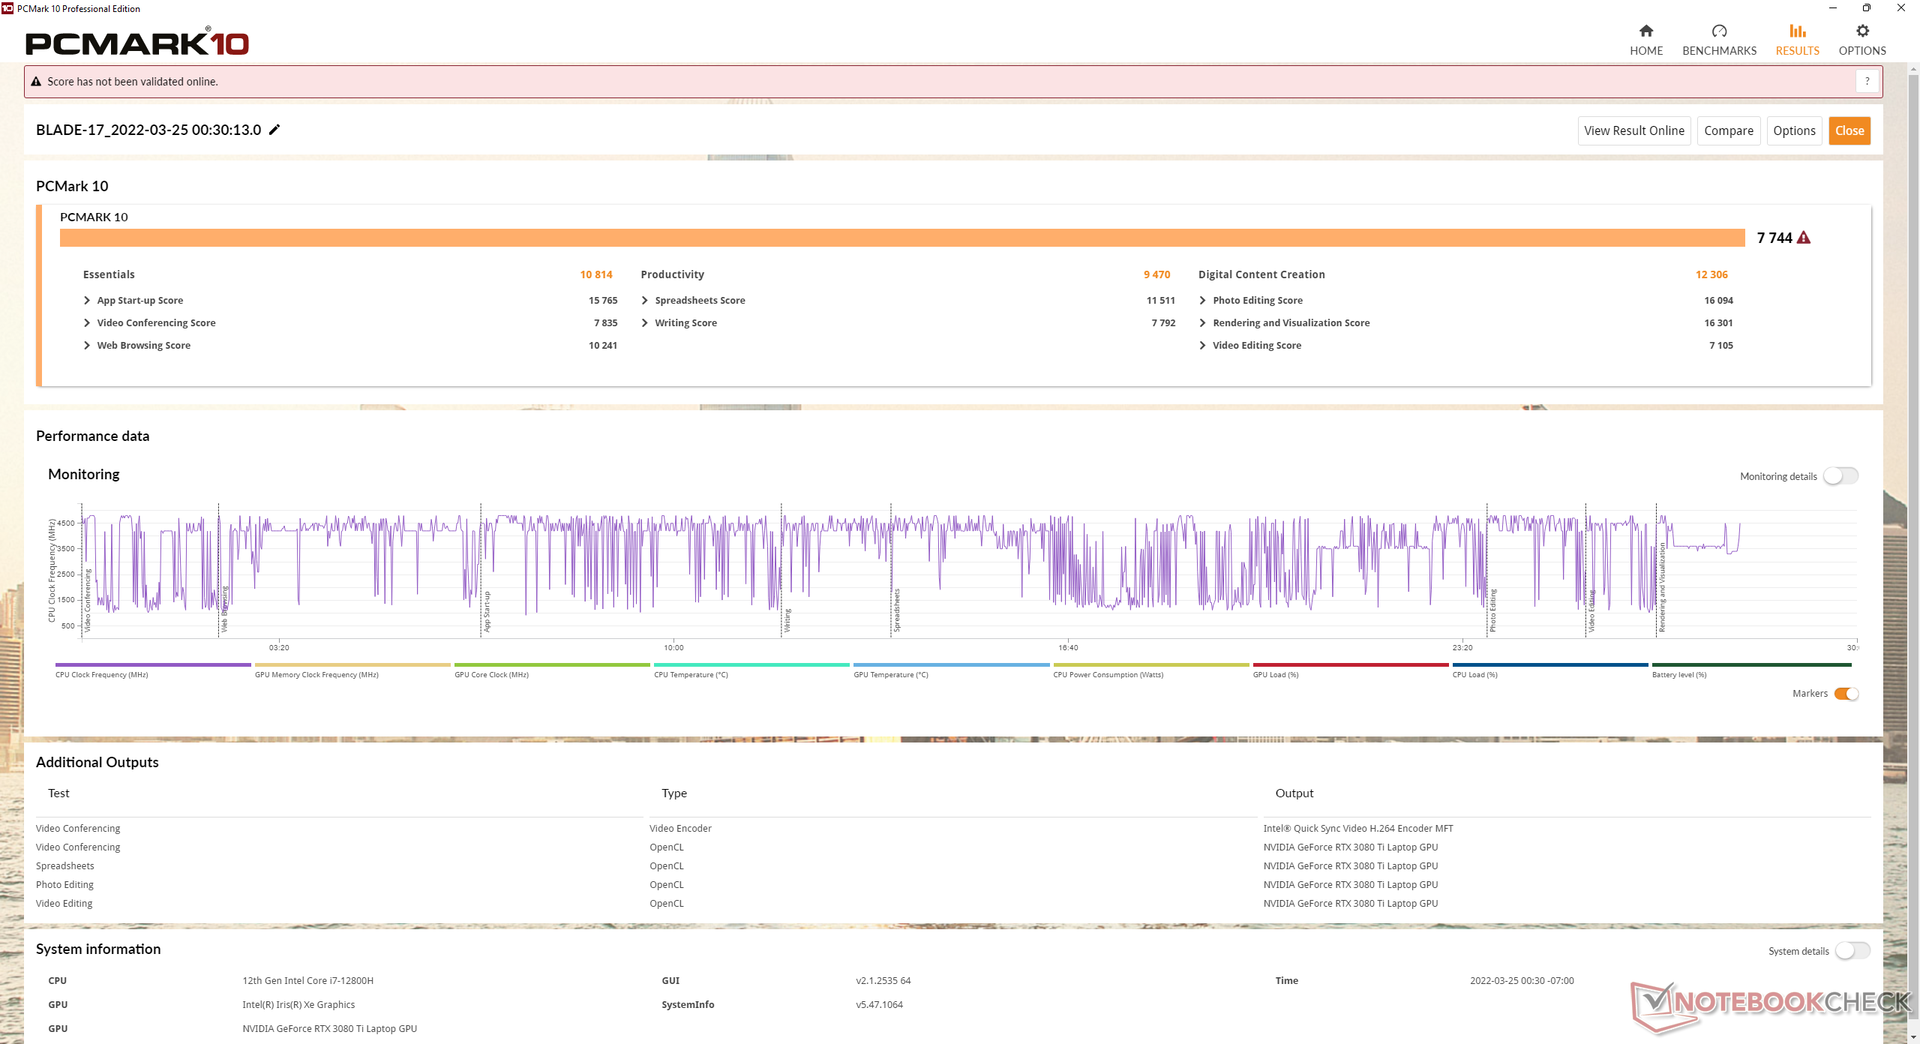
PCMark 10 results are consistently higher than what we recorded on last year's model especially in the Digital Content Creation subtest. Razer also appears to have fixed the issue relating to the Synapse software failing to launch when not connected to the Internet.
| PCMark 10 / Score | |
| Razer Blade 17 RTX 3080 Ti | |
| Average Intel Core i7-12800H, NVIDIA GeForce RTX 3080 Ti Laptop GPU (7313 - 7744, n=3) | |
| Alienware x17 RTX 3080 P48E | |
| Asus ROG Zephyrus S17 GX703HSD | |
| Aorus 17G YD | |
| MSI GS76 Stealth 11UH | |
| Razer Blade Pro 17 2021 (QHD Touch) | |
| PCMark 10 / Essentials | |
| Razer Blade 17 RTX 3080 Ti | |
| Average Intel Core i7-12800H, NVIDIA GeForce RTX 3080 Ti Laptop GPU (10597 - 10814, n=3) | |
| Asus ROG Zephyrus S17 GX703HSD | |
| Aorus 17G YD | |
| Alienware x17 RTX 3080 P48E | |
| Razer Blade Pro 17 2021 (QHD Touch) | |
| MSI GS76 Stealth 11UH | |
| PCMark 10 / Productivity | |
| Alienware x17 RTX 3080 P48E | |
| Average Intel Core i7-12800H, NVIDIA GeForce RTX 3080 Ti Laptop GPU (9470 - 9675, n=3) | |
| Razer Blade 17 RTX 3080 Ti | |
| Aorus 17G YD | |
| Asus ROG Zephyrus S17 GX703HSD | |
| MSI GS76 Stealth 11UH | |
| Razer Blade Pro 17 2021 (QHD Touch) | |
| PCMark 10 / Digital Content Creation | |
| Razer Blade 17 RTX 3080 Ti | |
| Average Intel Core i7-12800H, NVIDIA GeForce RTX 3080 Ti Laptop GPU (10351 - 12306, n=3) | |
| Alienware x17 RTX 3080 P48E | |
| Asus ROG Zephyrus S17 GX703HSD | |
| Aorus 17G YD | |
| MSI GS76 Stealth 11UH | |
| Razer Blade Pro 17 2021 (QHD Touch) | |
| PCMark 10 Score | 7744 points | |
Help | ||
| AIDA64 / Memory Copy | |
| MSI GE76 Raider | |
| Razer Blade 17 RTX 3080 Ti | |
| SCHENKER Uniwill Technology GM7AG8P | |
| Average Intel Core i7-12800H (48643 - 62522, n=5) | |
| SCHENKER XMG Pro 17 (Late 2021, RTX 3080) | |
| SCHENKER XMG Apex 17 M21 | |
| Lenovo Legion 5 17ACH6H-82JY0003GE | |
| AIDA64 / Memory Read | |
| Razer Blade 17 RTX 3080 Ti | |
| MSI GE76 Raider | |
| SCHENKER Uniwill Technology GM7AG8P | |
| Average Intel Core i7-12800H (56629 - 66199, n=5) | |
| SCHENKER XMG Pro 17 (Late 2021, RTX 3080) | |
| SCHENKER XMG Apex 17 M21 | |
| Lenovo Legion 5 17ACH6H-82JY0003GE | |
| AIDA64 / Memory Write | |
| Razer Blade 17 RTX 3080 Ti | |
| SCHENKER Uniwill Technology GM7AG8P | |
| MSI GE76 Raider | |
| Average Intel Core i7-12800H (50923 - 66074, n=5) | |
| SCHENKER XMG Apex 17 M21 | |
| SCHENKER XMG Pro 17 (Late 2021, RTX 3080) | |
| Lenovo Legion 5 17ACH6H-82JY0003GE | |
| AIDA64 / Memory Latency | |
| MSI GE76 Raider | |
| SCHENKER XMG Pro 17 (Late 2021, RTX 3080) | |
| SCHENKER XMG Apex 17 M21 | |
| Lenovo Legion 5 17ACH6H-82JY0003GE | |
| Average Intel Core i7-12800H (89.3 - 95.2, n=5) | |
| SCHENKER Uniwill Technology GM7AG8P | |
| Razer Blade 17 RTX 3080 Ti | |
* ... smaller is better
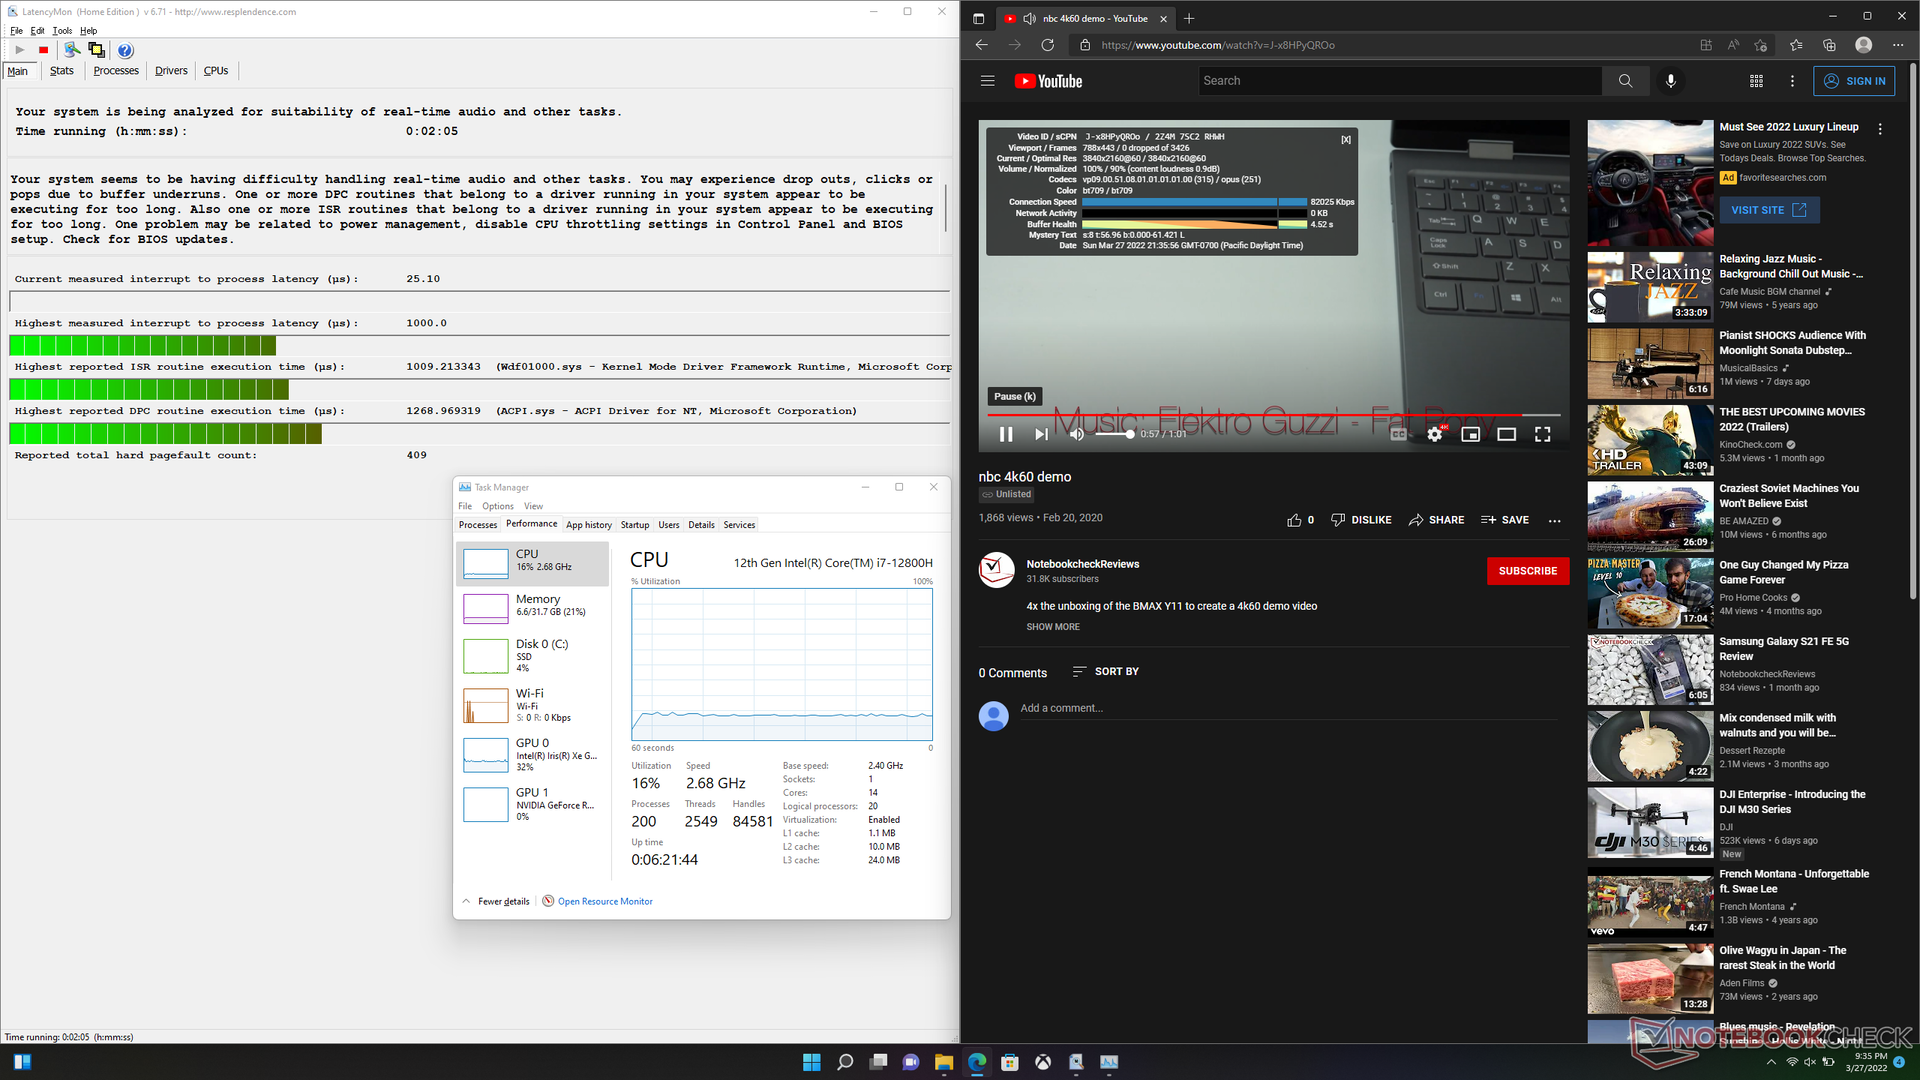
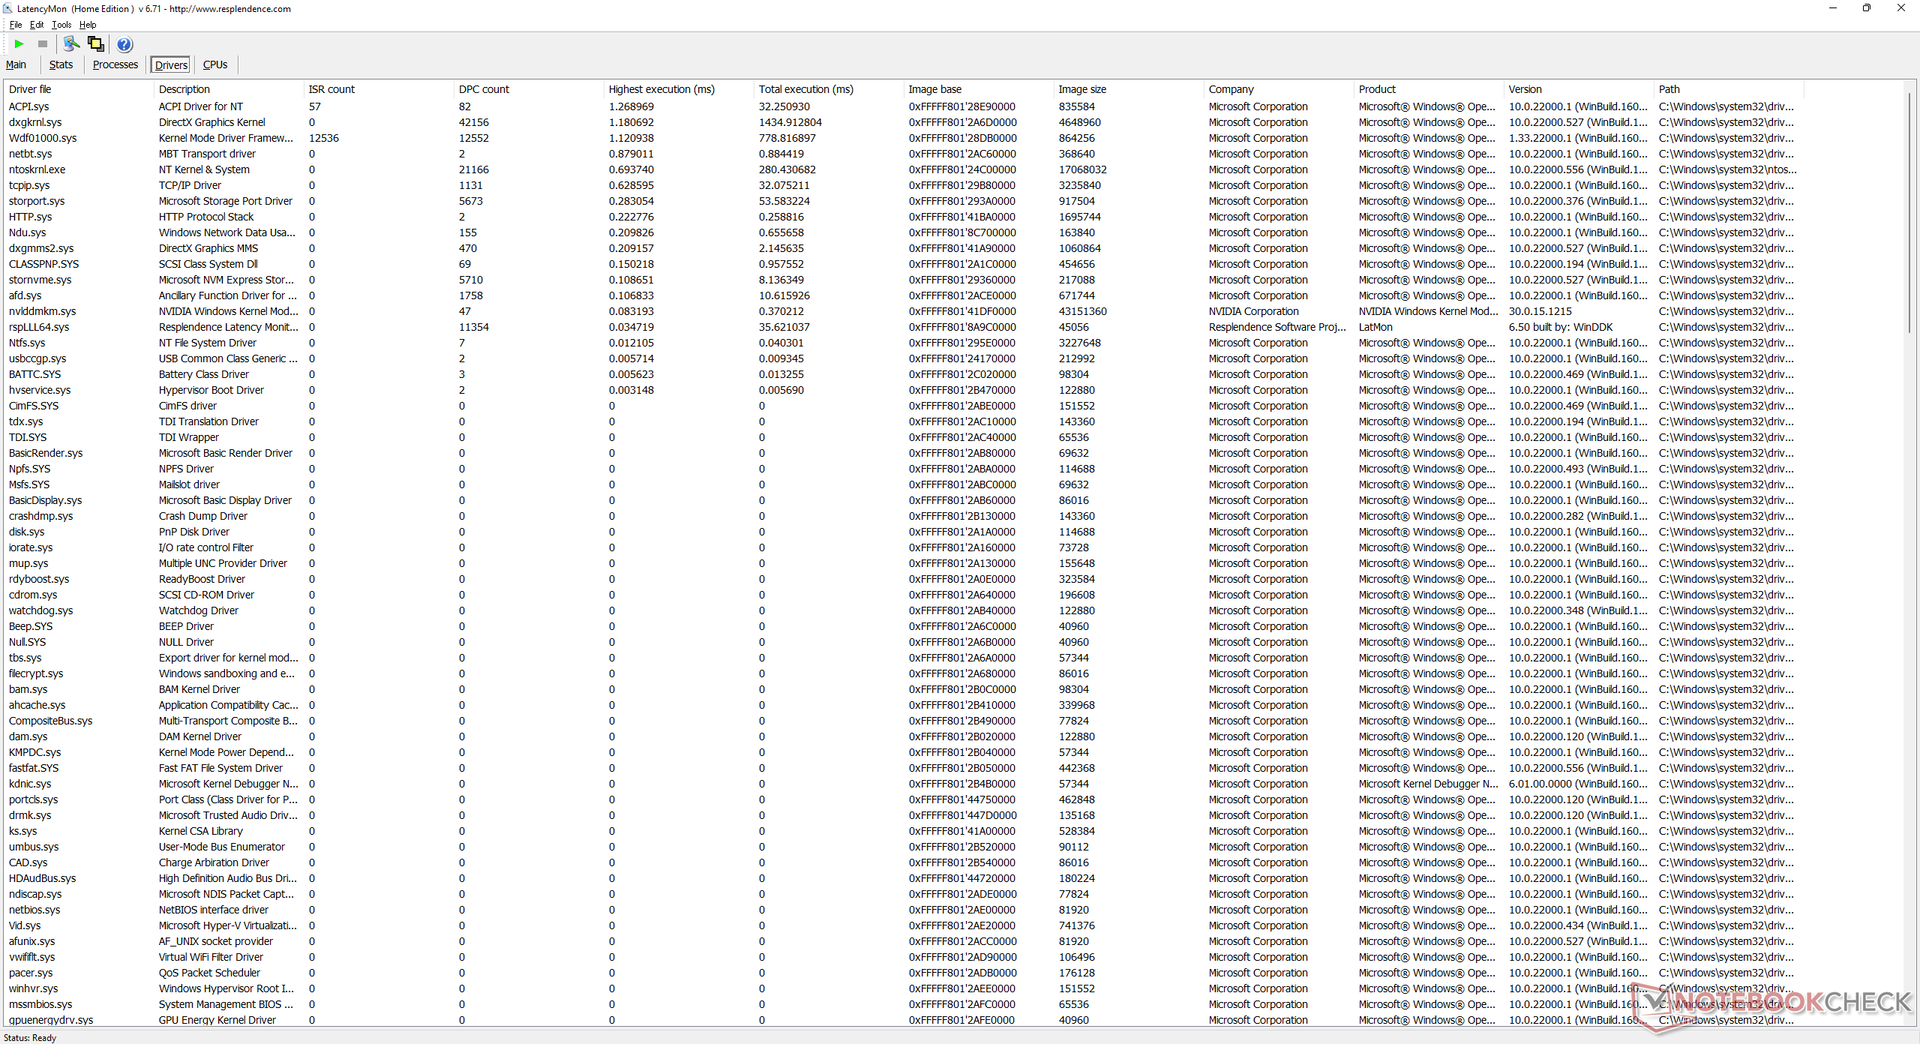
DPC Latency
LatencyMon shows minor DPC issues when opening multiple browser tabs on our homepage. 4K video playback at 60 FPS is otherwise perfect with no dropped frames.
| DPC Latencies / LatencyMon - interrupt to process latency (max), Web, Youtube, Prime95 | |
| Alienware x17 RTX 3080 P48E | |
| Razer Blade Pro 17 2021 (QHD Touch) | |
| Asus ROG Zephyrus S17 GX703HSD | |
| Aorus 17G YD | |
| Razer Blade 17 RTX 3080 Ti | |
| MSI GS76 Stealth 11UH | |
* ... smaller is better
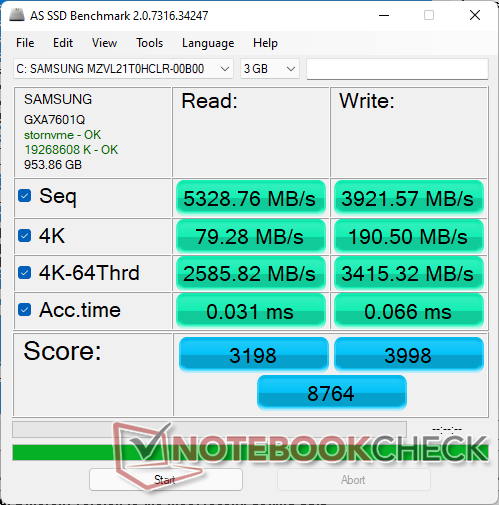
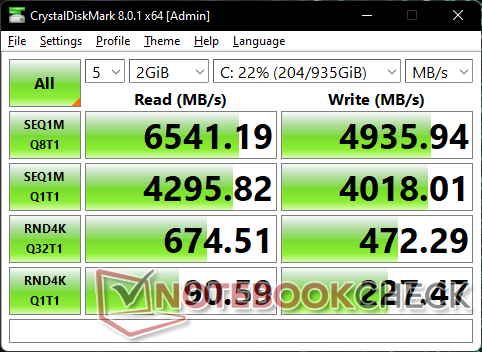
Storage Devices — Up To Two M.2 PCIe4 x4 SSDs
Most, if not all, Blade 17 SKUs ship with Samsung SSDs. Our test unit comes with the Samsung PM9A1 which is one of the fastest consumer-class PCIe4 x4 SSDs available. The drive shows no issues sustaining very fast transfer rates of over 6600 MB/s in our unit to suggest excellent heat dissipation unlike on the Uniwill Technology GM7AG8P.

* ... smaller is better
Disk Throttling: DiskSpd Read Loop, Queue Depth 8
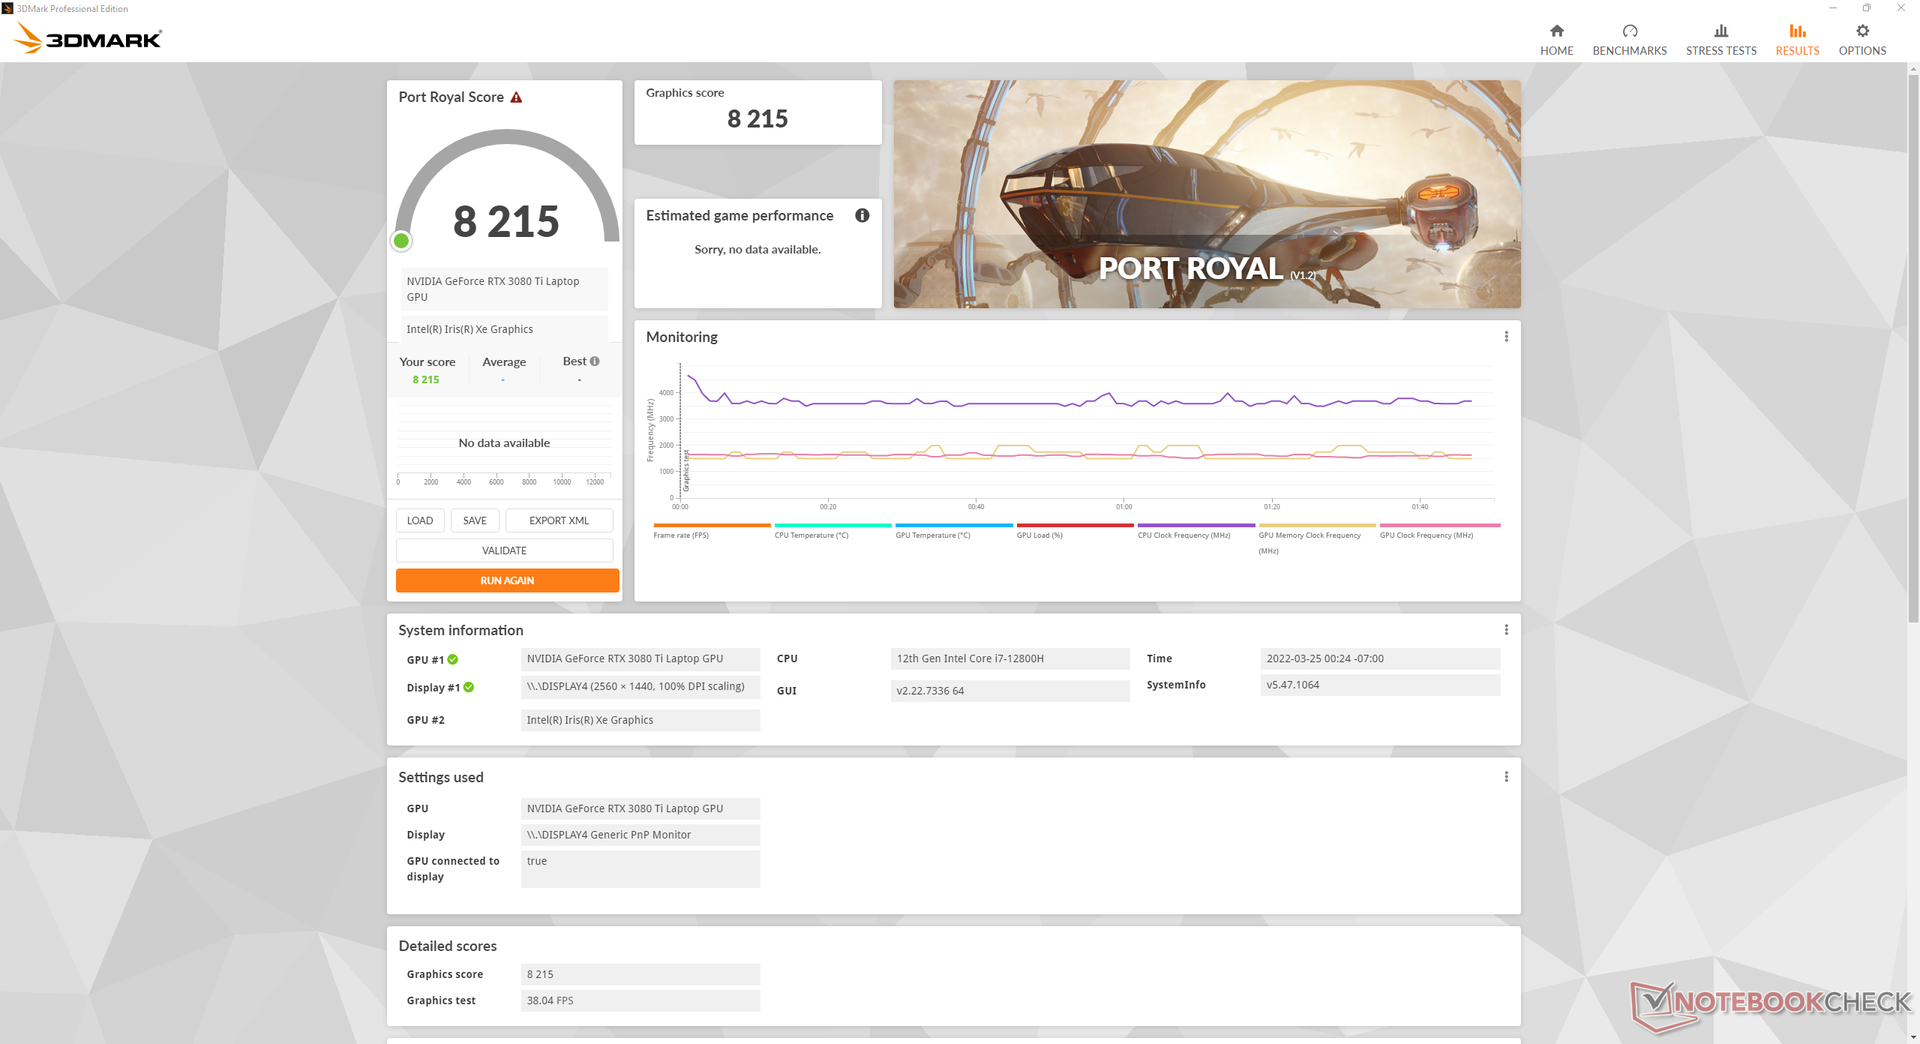
GPU Performance
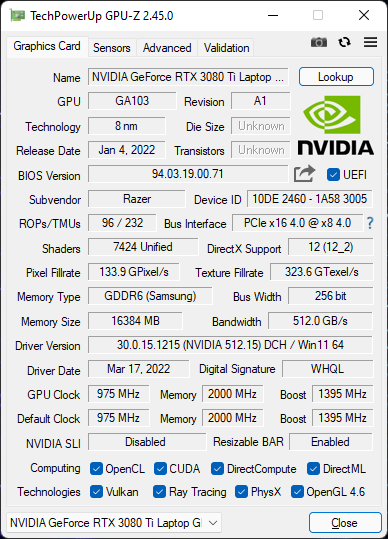
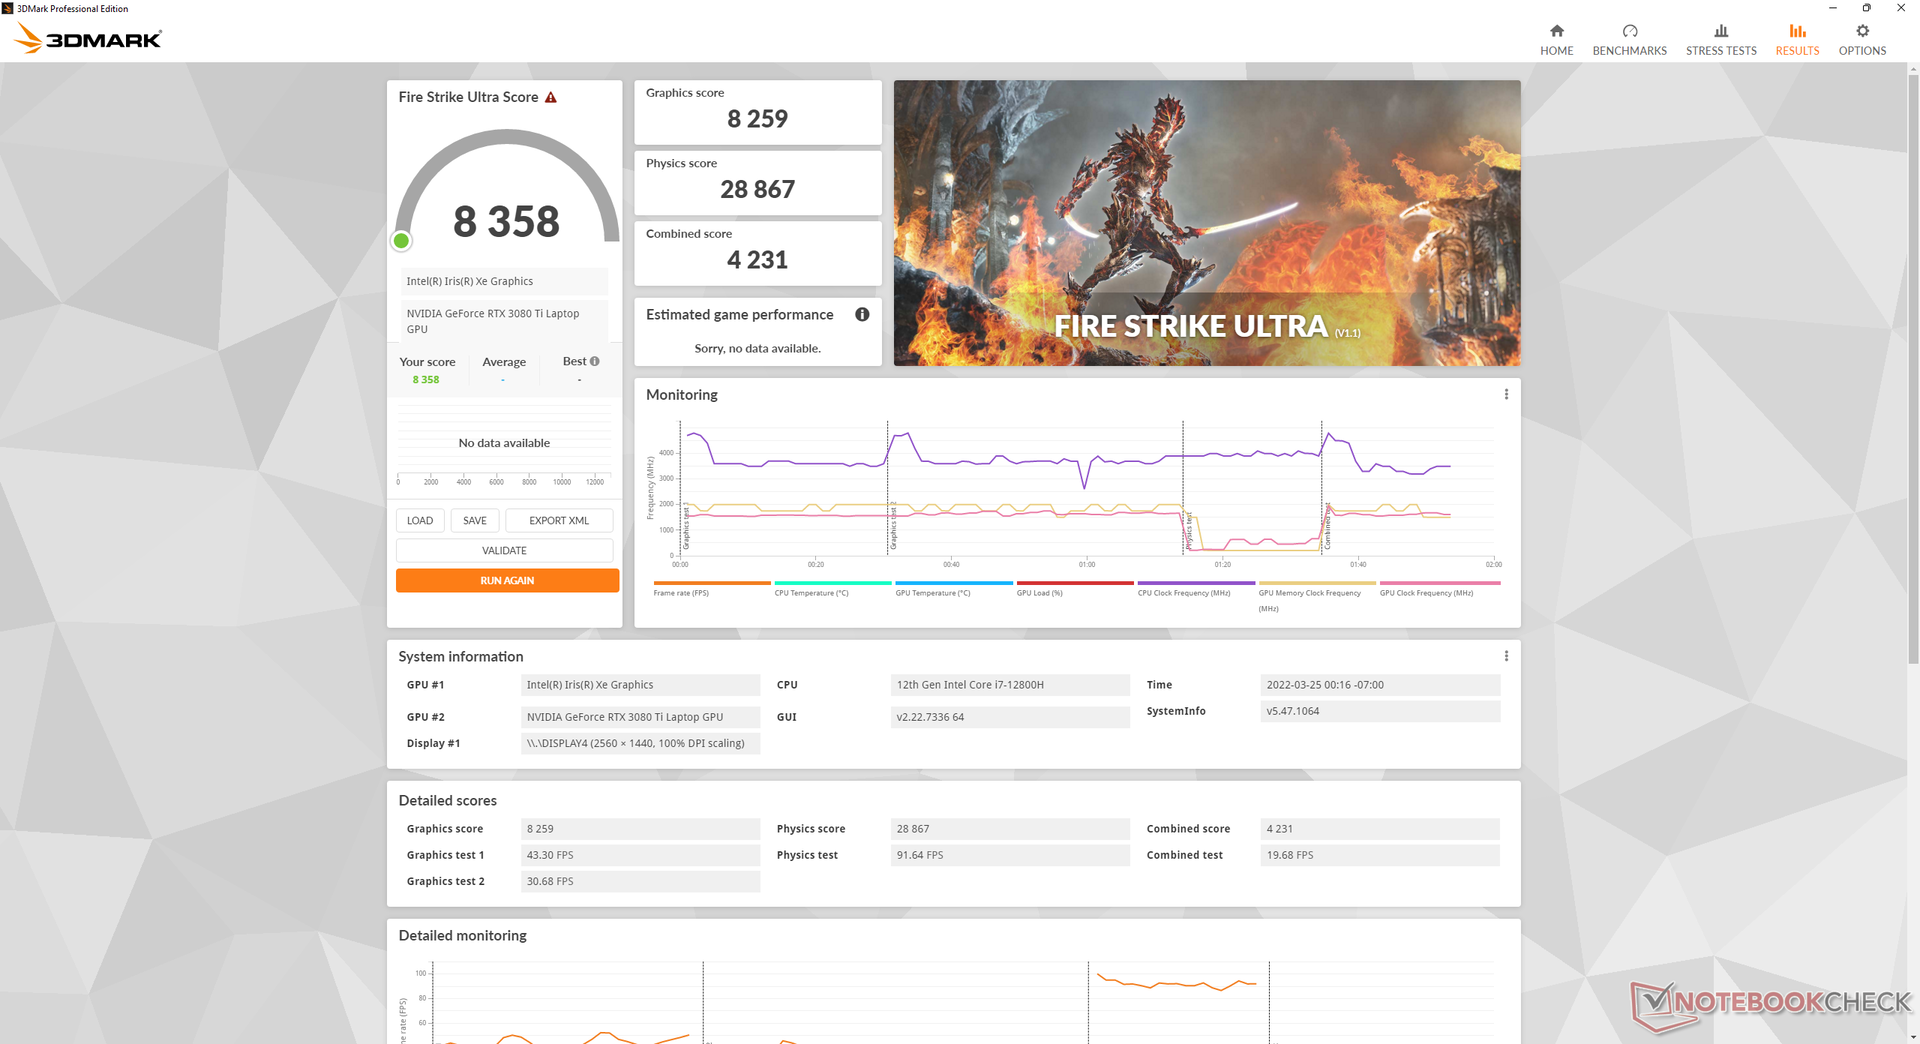
After testing more than a half dozen laptops with mobile GeForce RTX 3080 Ti graphics at the time of review, the one in our Blade 17 is performing comfortably above average by about 15 percent. The high TGP target of 165 W is no doubt a big reason for the performance advantage as other laptops with the same RTX 3080 Ti GPU like the Blade 15 or Gigabyte Aero 16 YE5 tend to aim for much lower TGP targets of around 100 W instead. Users can expect a raw graphics performance boost of about 20 percent over the 10th gen or 11th gen Intel Blade 17 with regular mobile RTX 3080 graphics.
Running the system in Balanced dGPU mode instead of maximum performance dGPU mode will entail a graphics performance deficit of only about 5 to 7 percent.
Downgrading to the mobile RTX 3070 Ti from our mobile RTX 3080 Ti will entail a performance deficit of only about 10 percent.
Of course, the "real" RTX 3080 Ti for desktop will still offer a large leap in GPU performance of almost 50 percent over our mobile version.
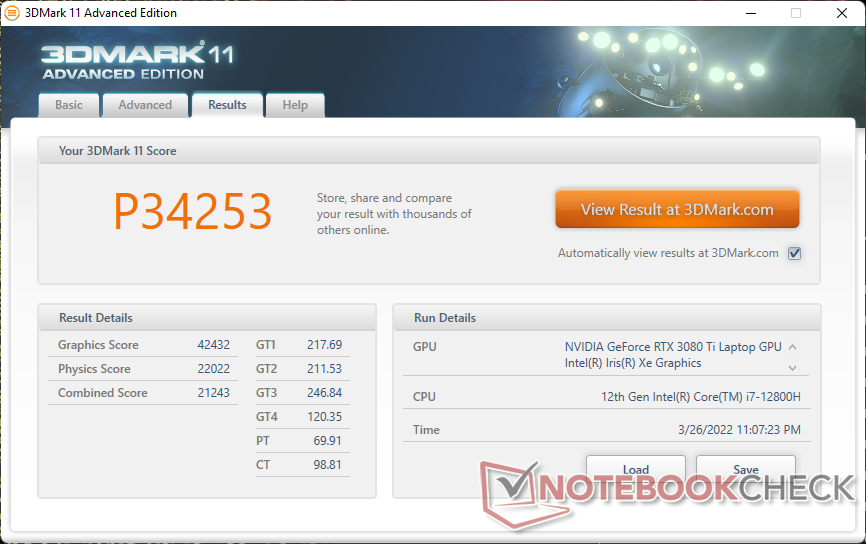


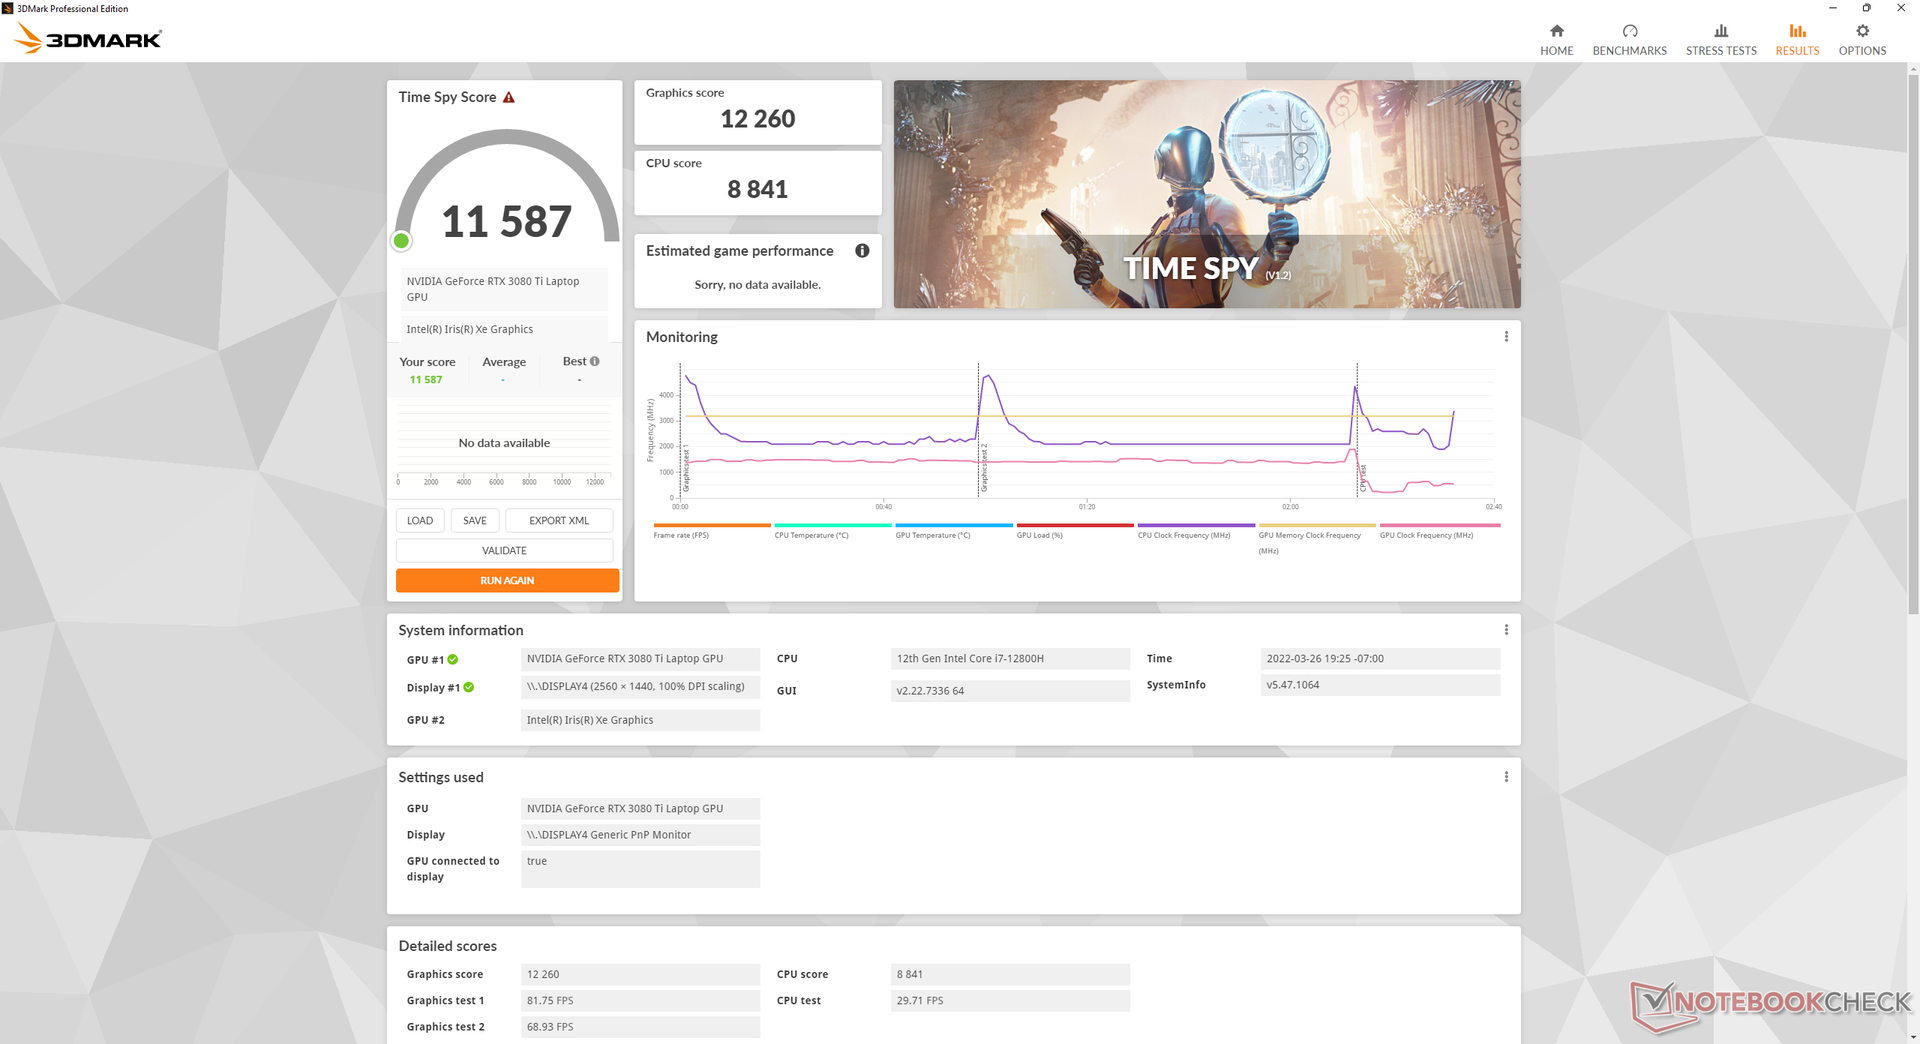
| 3DMark 11 Performance | 34253 points | |
| 3DMark Cloud Gate Standard Score | 62059 points | |
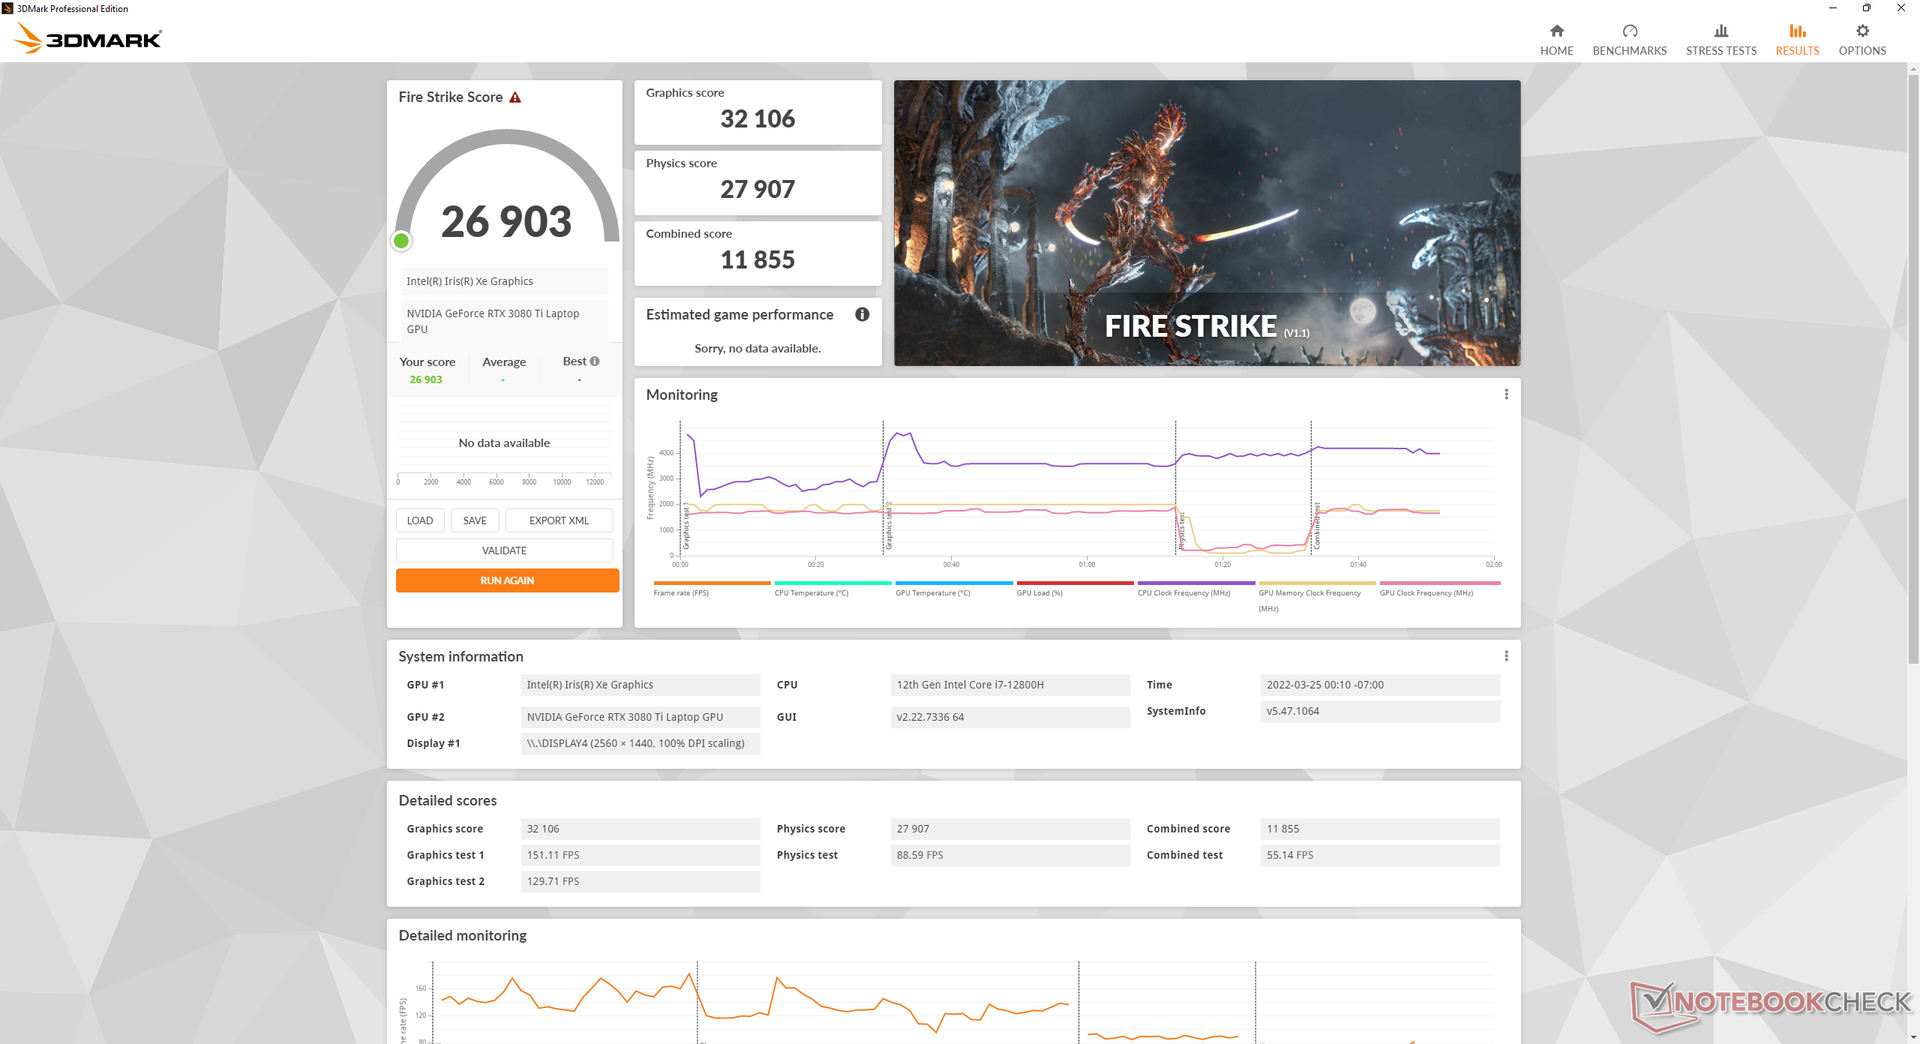
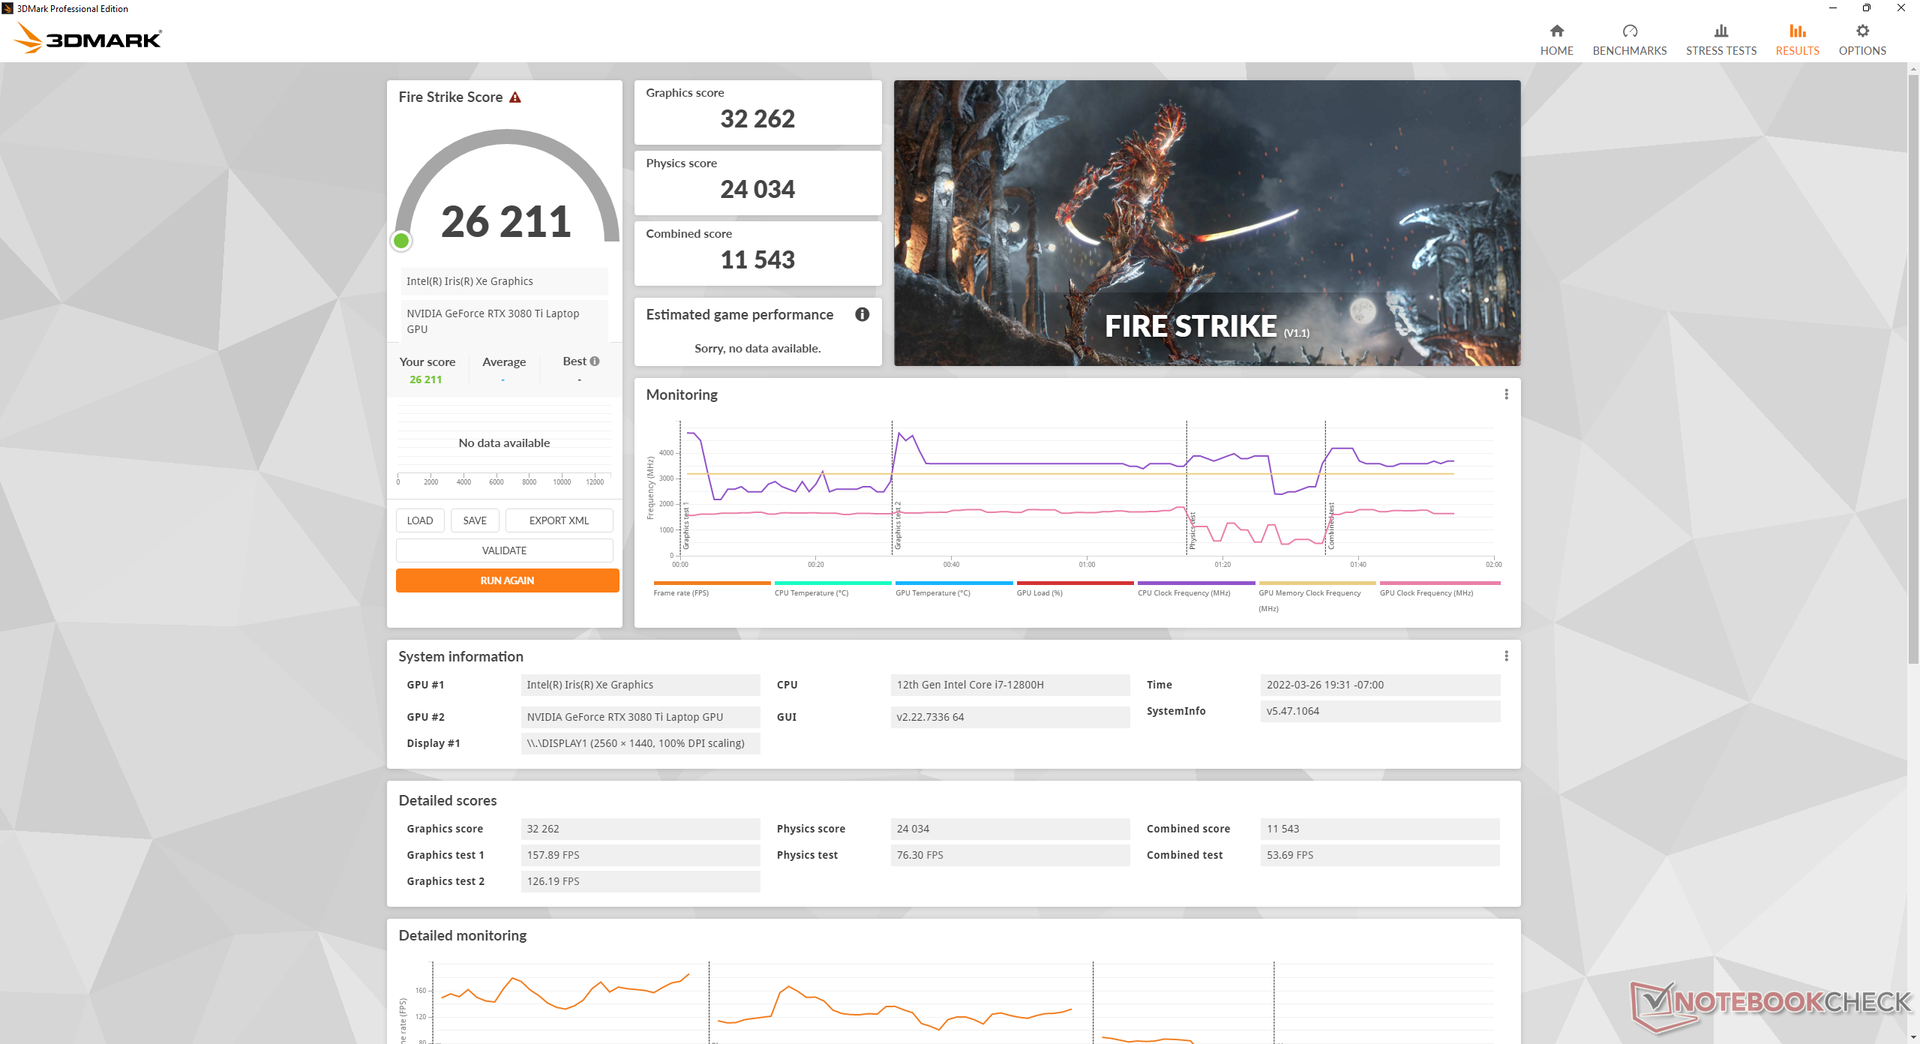
| 3DMark Fire Strike Score | 26903 points | |
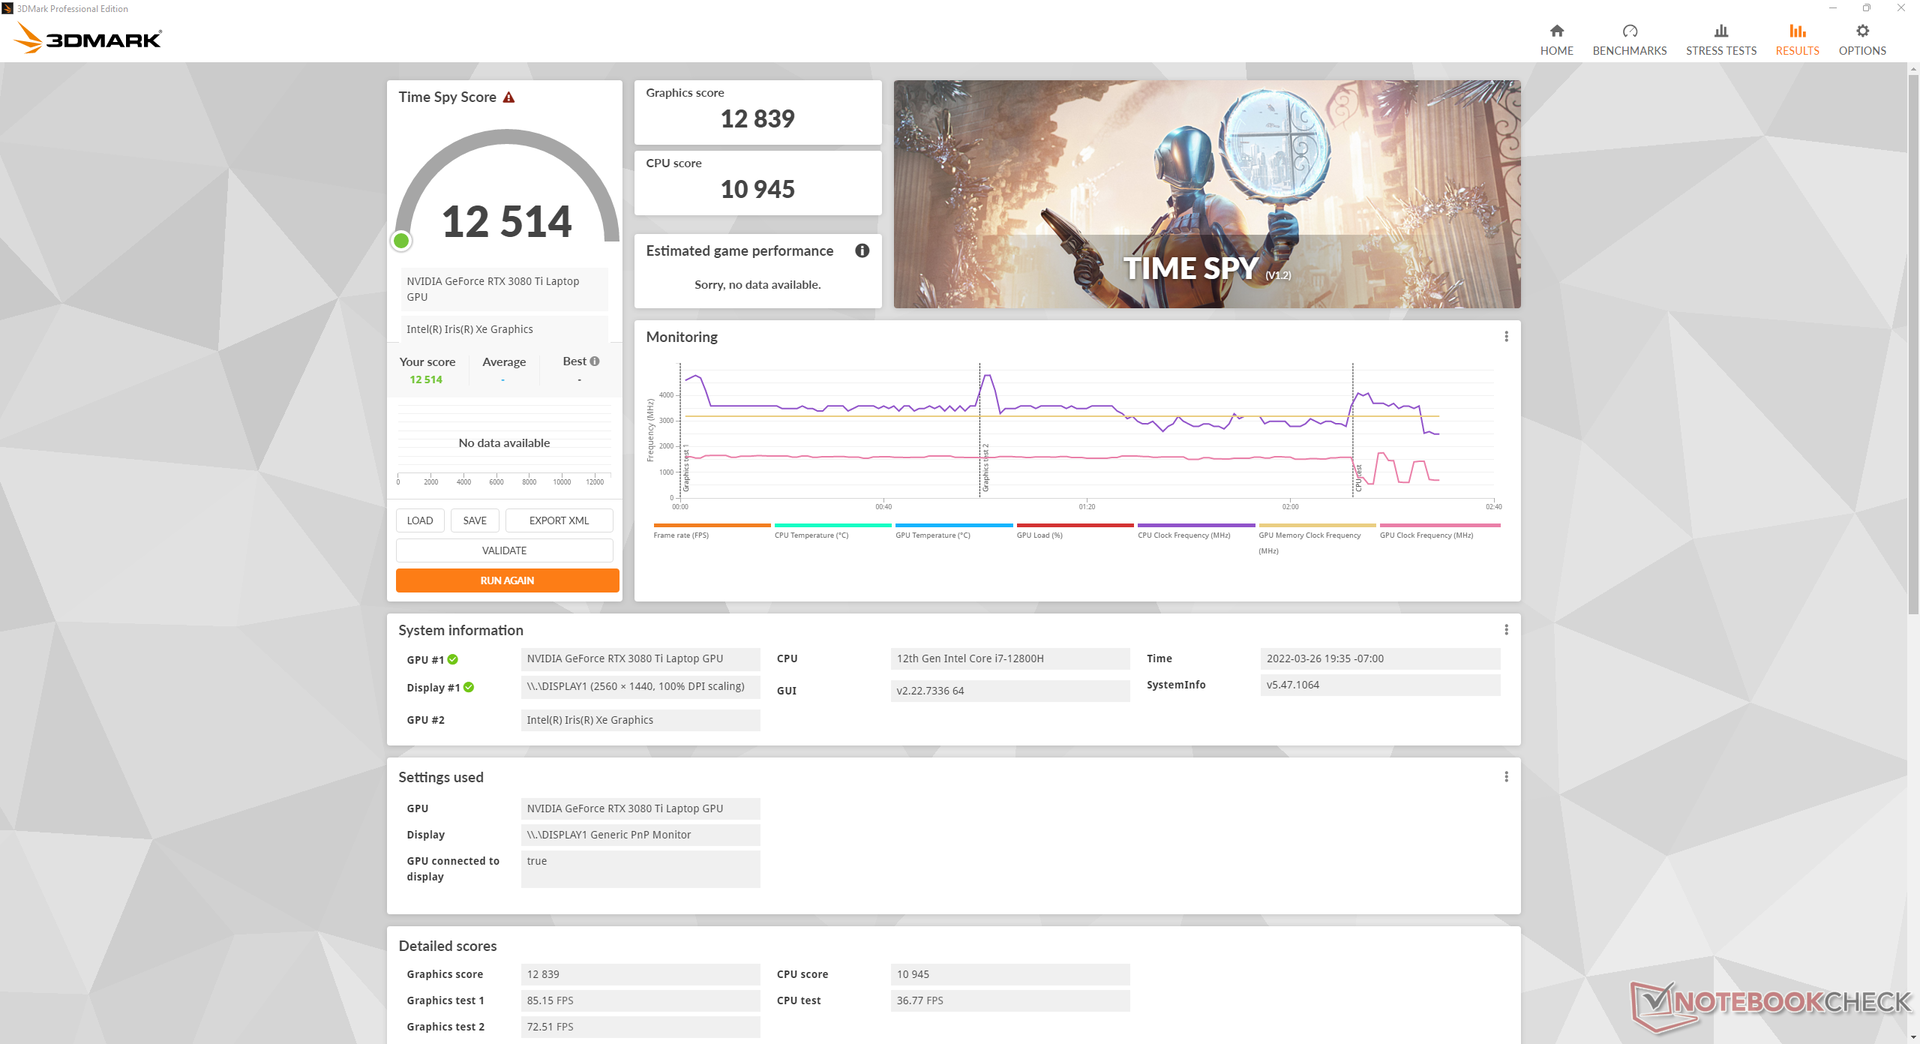
| 3DMark Time Spy Score | 12913 points | |
Help | ||
Witcher 3 FPS Chart
| low | med. | high | ultra | QHD | |
| GTA V (2015) | 186 | 182 | 176 | 113 | 105 |
| The Witcher 3 (2015) | 459 | 340.9 | 250.4 | 124.6 | |
| Dota 2 Reborn (2015) | 183 | 171 | 165 | 157 | |
| Final Fantasy XV Benchmark (2018) | 168 | 152 | 121 | 93.3 | |
| X-Plane 11.11 (2018) | 158 | 139 | 111 | ||
| Far Cry 5 (2018) | 171 | 149 | 134 | 125 | 120 |
| Strange Brigade (2018) | 431 | 296 | 242 | 215 | 158 |
| Cyberpunk 2077 1.6 (2022) | 119.1 | 112.1 | 106 | 106.5 | 59.7 |
Emissions
System Noise — Loud Only When Gaming
There are no significant changes to fan noise despite the move down from four fans to three. Users will want to be on Power Saver or Balanced modes when not running any demanding applications for quieter fans.
Fan noise when gaming on Balanced mode is around 43.2 dB(A) compared to 50.9 dB(A) when gaming on Maximum Performance mode despite the small 5 to 7 percent graphics deficit. Thus, users may want to consider gaming on Balanced mode if fan noise a concern.
Noise Level
| Idle |
| 23.3 / 23.3 / 26.3 dB(A) |
| Load |
| 38.2 / 49.1 dB(A) |
 | ||
30 dB silent 40 dB(A) audible 50 dB(A) loud |
||
min: | ||
| Razer Blade 17 RTX 3080 Ti GeForce RTX 3080 Ti Laptop GPU, i7-12800H, Samsung PM9A1 MZVL21T0HCLR | Razer Blade Pro 17 2021 (QHD Touch) GeForce RTX 3080 Laptop GPU, i7-10875H, Samsung PM981a MZVLB1T0HBLR | MSI GS76 Stealth 11UH GeForce RTX 3080 Laptop GPU, i9-11900H, Samsung PM9A1 MZVL22T0HBLB | Asus ROG Zephyrus S17 GX703HSD GeForce RTX 3080 Laptop GPU, i9-11900H, Samsung PM9A1 MZVL22T0HBLB | Aorus 17G YD GeForce RTX 3080 Laptop GPU, i7-11800H, Samsung PM9A1 MZVL2512HCJQ | Alienware x17 RTX 3080 P48E GeForce RTX 3080 Laptop GPU, i7-11800H, 2x WDC PC SN730 SDBPNTY-1T00 (RAID 0) | |
|---|---|---|---|---|---|---|
| Noise | -12% | -12% | 2% | -25% | -4% | |
| off / environment * | 23.3 | 26.1 -12% | 24 -3% | 23 1% | 25 -7% | 24.9 -7% |
| Idle Minimum * | 23.3 | 26.1 -12% | 24 -3% | 23 1% | 32 -37% | 24.9 -7% |
| Idle Average * | 23.3 | 26.5 -14% | 25 -7% | 23 1% | 33 -42% | 24.9 -7% |
| Idle Maximum * | 26.3 | 30.7 -17% | 42 -60% | 23 13% | 39 -48% | 29.6 -13% |
| Load Average * | 38.2 | 43.5 -14% | 46 -20% | 41 -7% | 43 -13% | 31.1 19% |
| Witcher 3 ultra * | 50.9 | 54 -6% | 48 6% | 45 12% | 52 -2% | 49.7 2% |
| Load Maximum * | 49.1 | 55 -12% | 48 2% | 52 -6% | 61 -24% | 54.8 -12% |
* ... smaller is better
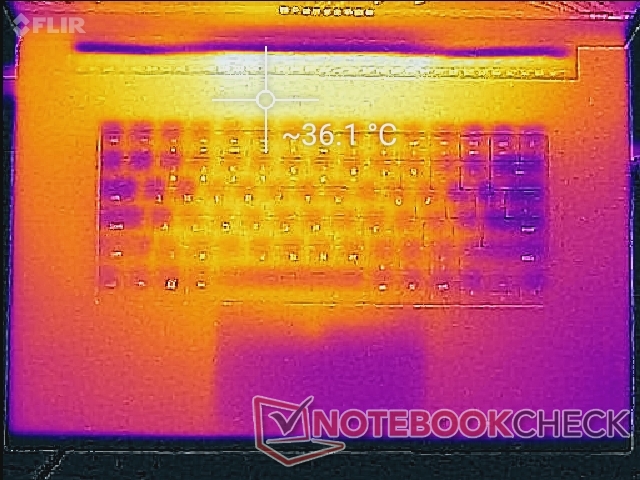
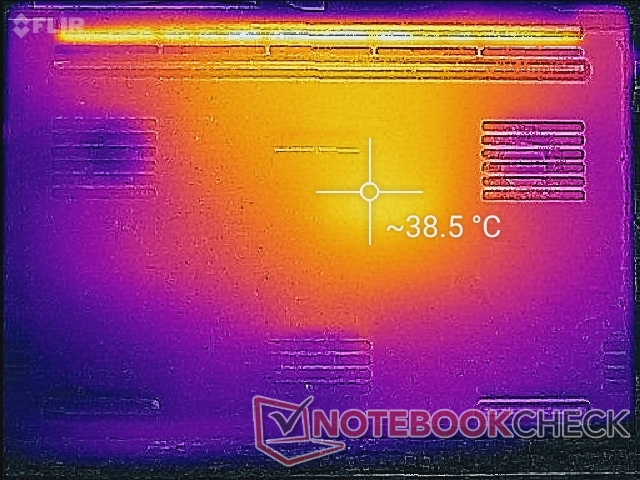
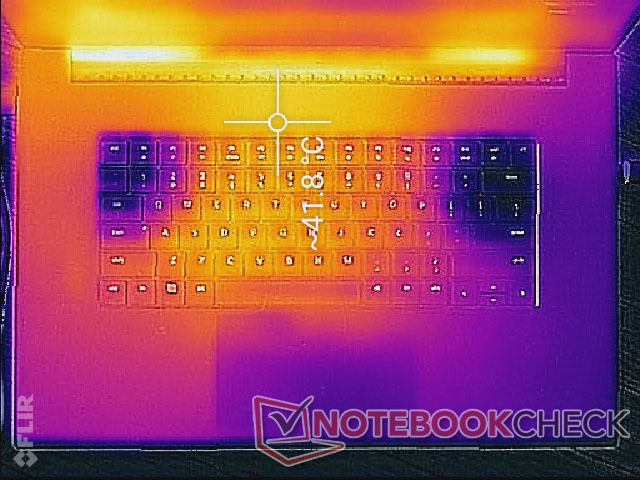
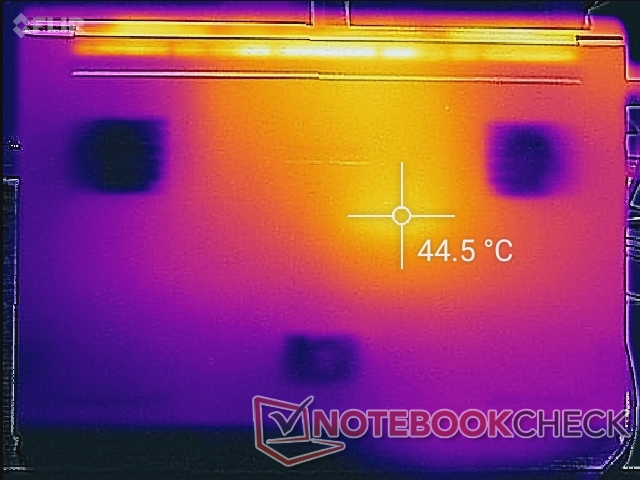
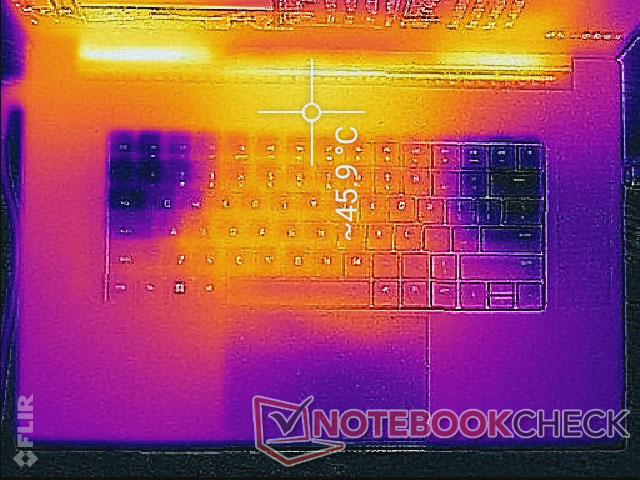
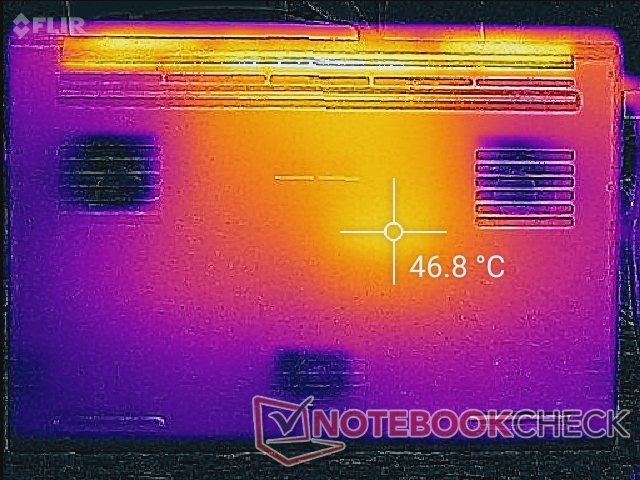
Temperature — Warmer Than Before
Surface temperatures are slightly warmer on the 2022 model when compared to the 2021 model. The keyboard center can be as warm as 38 C when gaming whereas this same spot on the 2021 model would be a bit cooler by a few degrees. Additionally, the system continues to be very warm at around 31 C to 35 C when not running any demanding loads compared to only 27 C to 30 C on the MSI GS76. The higher skin temperatures are the price to pay for overall quieter fans during low processing loads.
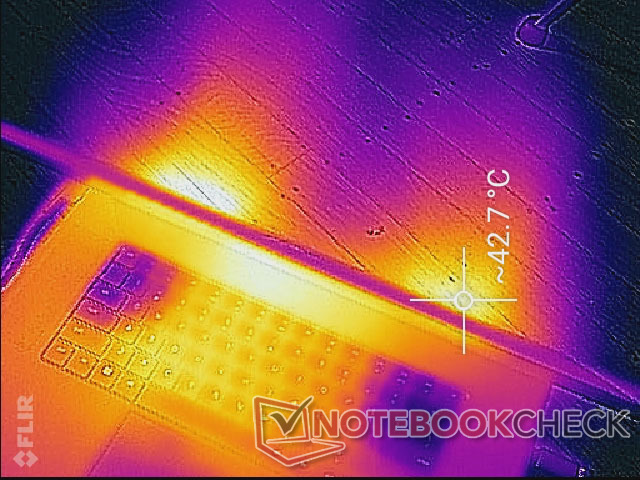
(-) The maximum temperature on the upper side is 46 °C / 115 F, compared to the average of 40.4 °C / 105 F, ranging from 21.2 to 68.8 °C for the class Gaming.
(-) The bottom heats up to a maximum of 46.8 °C / 116 F, compared to the average of 43.2 °C / 110 F
(+) In idle usage, the average temperature for the upper side is 31.5 °C / 89 F, compared to the device average of 33.8 °C / 93 F.
(±) Playing The Witcher 3, the average temperature for the upper side is 33.2 °C / 92 F, compared to the device average of 33.8 °C / 93 F.
(+) The palmrests and touchpad are reaching skin temperature as a maximum (32.4 °C / 90.3 F) and are therefore not hot.
(-) The average temperature of the palmrest area of similar devices was 28.9 °C / 84 F (-3.5 °C / -6.3 F).
| Razer Blade 17 RTX 3080 Ti Intel Core i7-12800H, NVIDIA GeForce RTX 3080 Ti Laptop GPU | Razer Blade Pro 17 2021 (QHD Touch) Intel Core i7-10875H, NVIDIA GeForce RTX 3080 Laptop GPU | MSI GS76 Stealth 11UH Intel Core i9-11900H, NVIDIA GeForce RTX 3080 Laptop GPU | Asus ROG Zephyrus S17 GX703HSD Intel Core i9-11900H, NVIDIA GeForce RTX 3080 Laptop GPU | Aorus 17G YD Intel Core i7-11800H, NVIDIA GeForce RTX 3080 Laptop GPU | Alienware x17 RTX 3080 P48E Intel Core i7-11800H, NVIDIA GeForce RTX 3080 Laptop GPU | |
|---|---|---|---|---|---|---|
| Heat | 10% | 4% | -7% | 12% | -4% | |
| Maximum Upper Side * | 46 | 38.2 17% | 49 -7% | 59 -28% | 36 22% | 58.4 -27% |
| Maximum Bottom * | 46.8 | 42.2 10% | 57 -22% | 53 -13% | 52 -11% | 49 -5% |
| Idle Upper Side * | 36.2 | 33.6 7% | 28 23% | 35 3% | 29 20% | 33.6 7% |
| Idle Bottom * | 38.6 | 36.2 6% | 30 22% | 35 9% | 33 15% | 34.6 10% |
* ... smaller is better
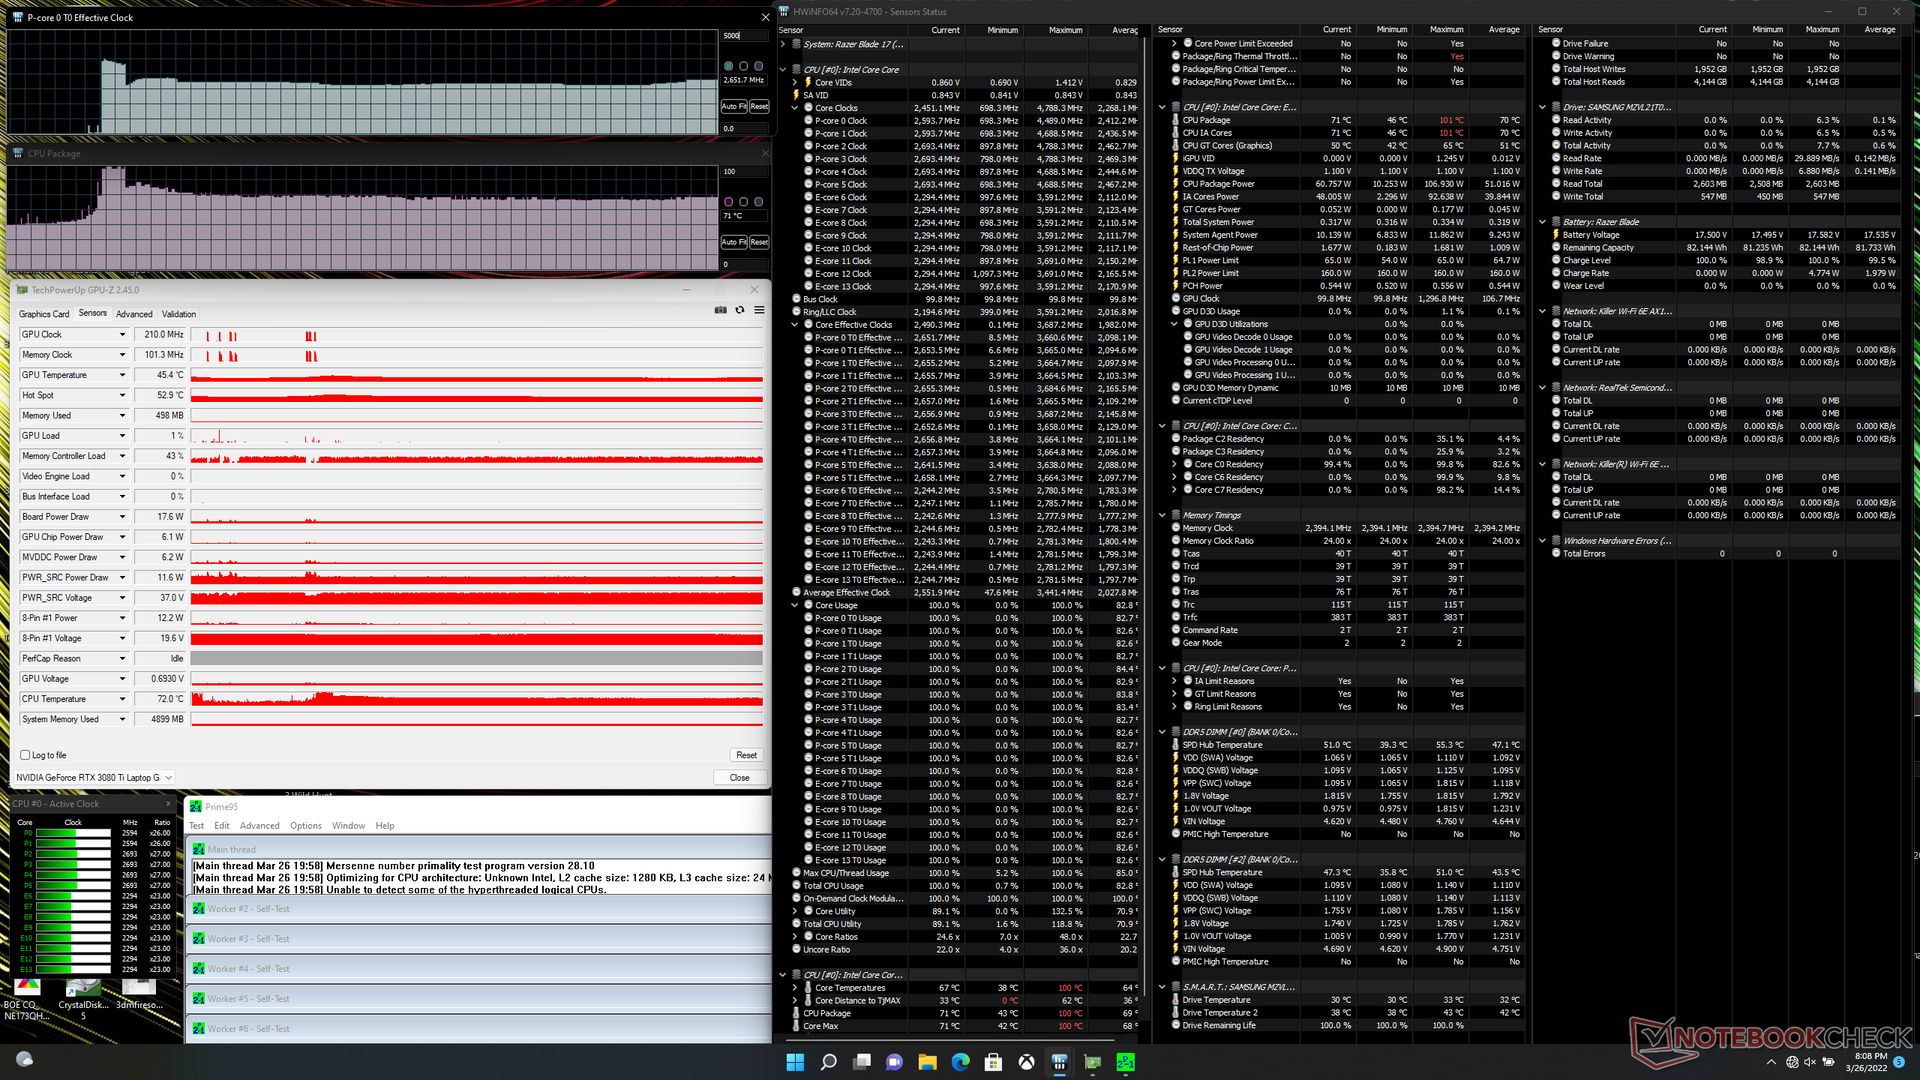
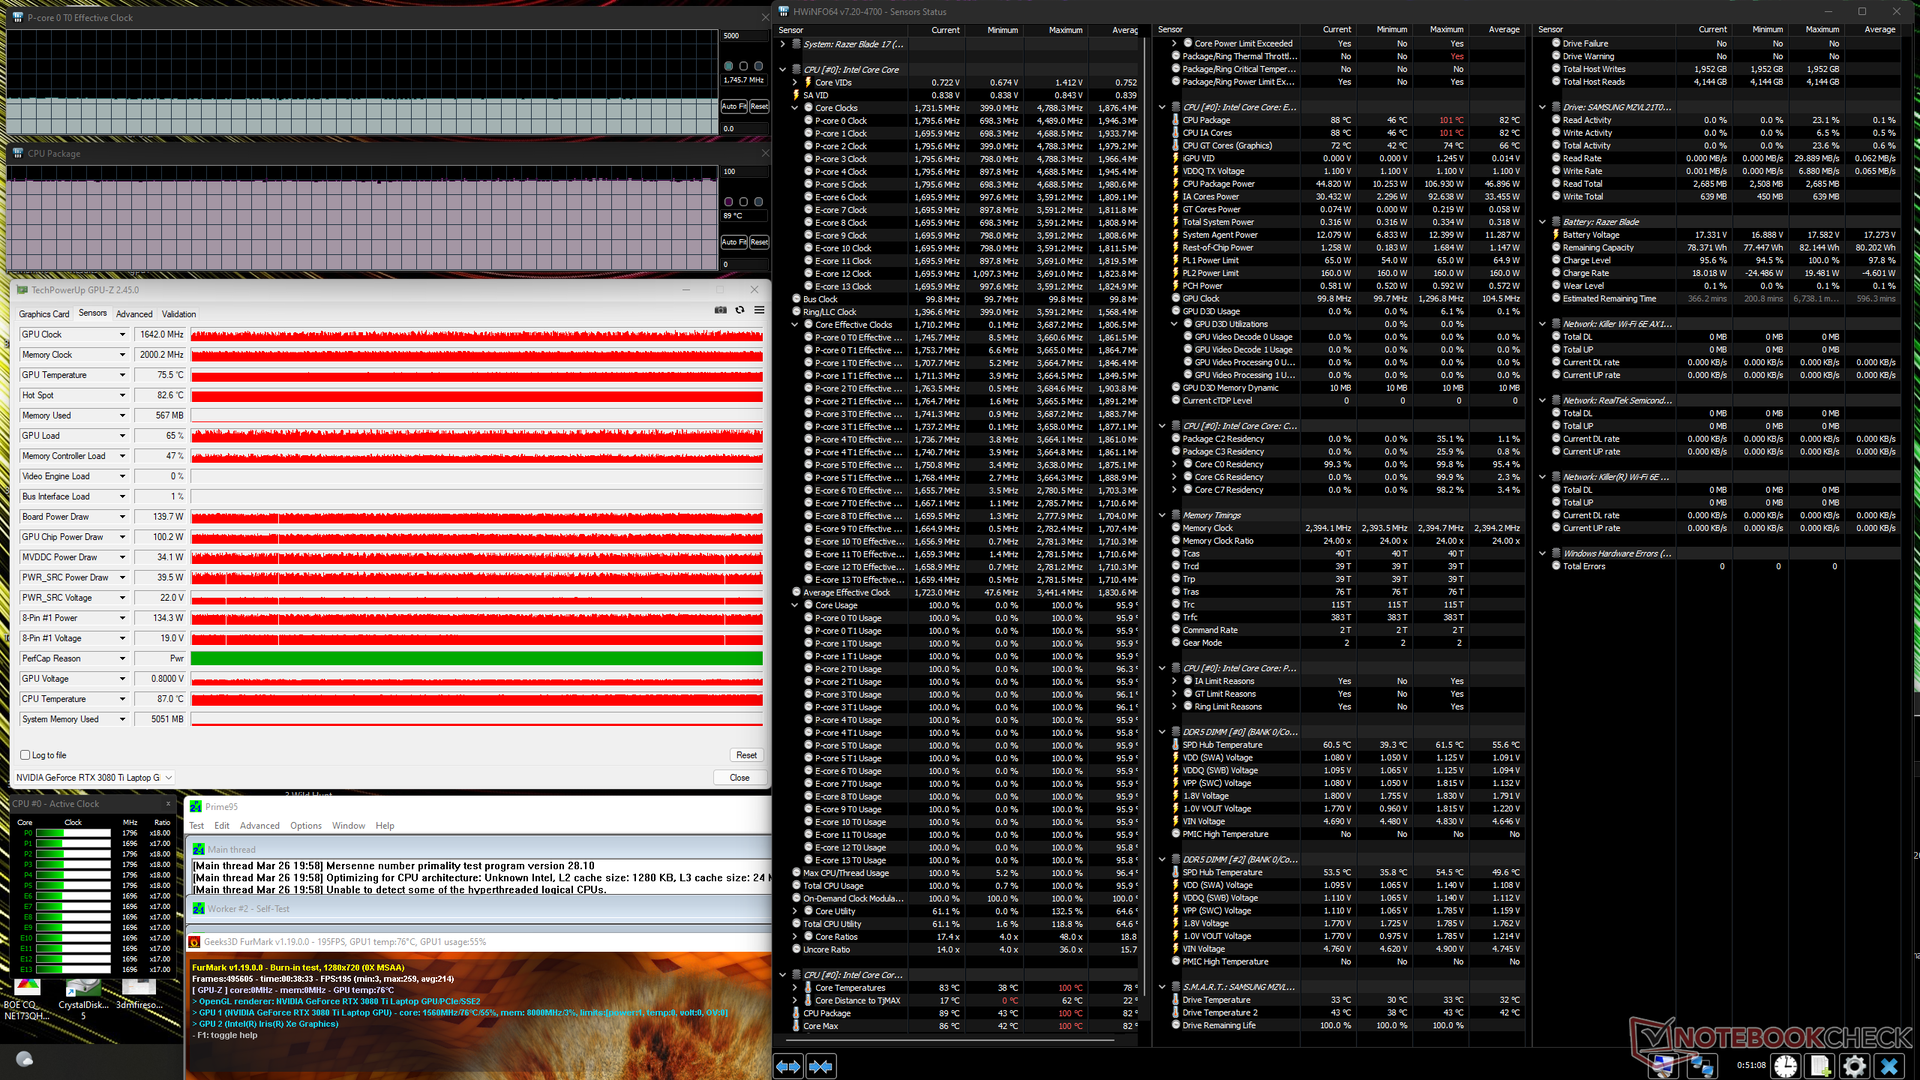
Stress Test
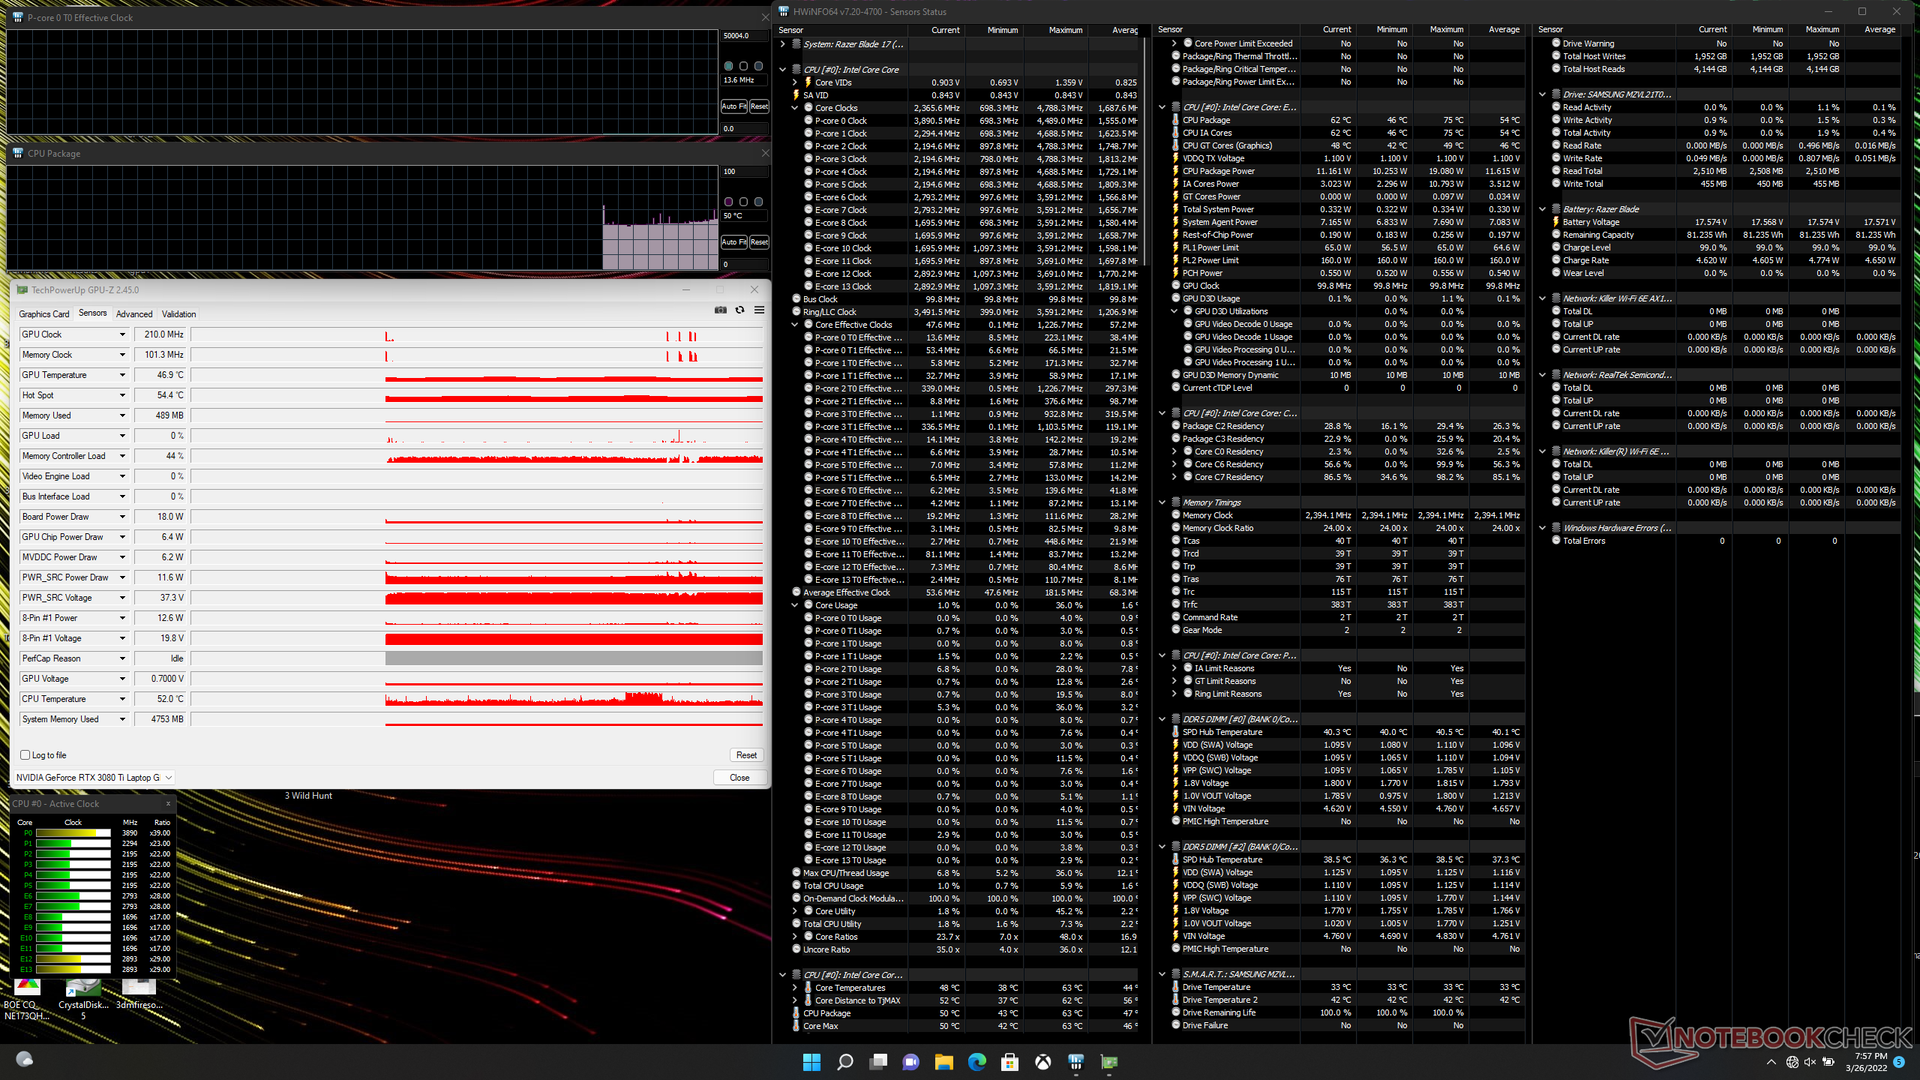
When stressed with Prime95 on Maximum Performance mode, the CPU would boost to 3.6 GHz for the first 20 seconds or so and at a 99 C core temperature. Clock rates and temperature would then fall to 2.7 GHz and 83 C before eventually stabilizing at 2.5 GHz and 72 C. CPU package power would be as high as 107 W during the start of the stress test before stabilizing at 61 W compared to 90 W and 65 W on the 11th gen Intel Blade 17.
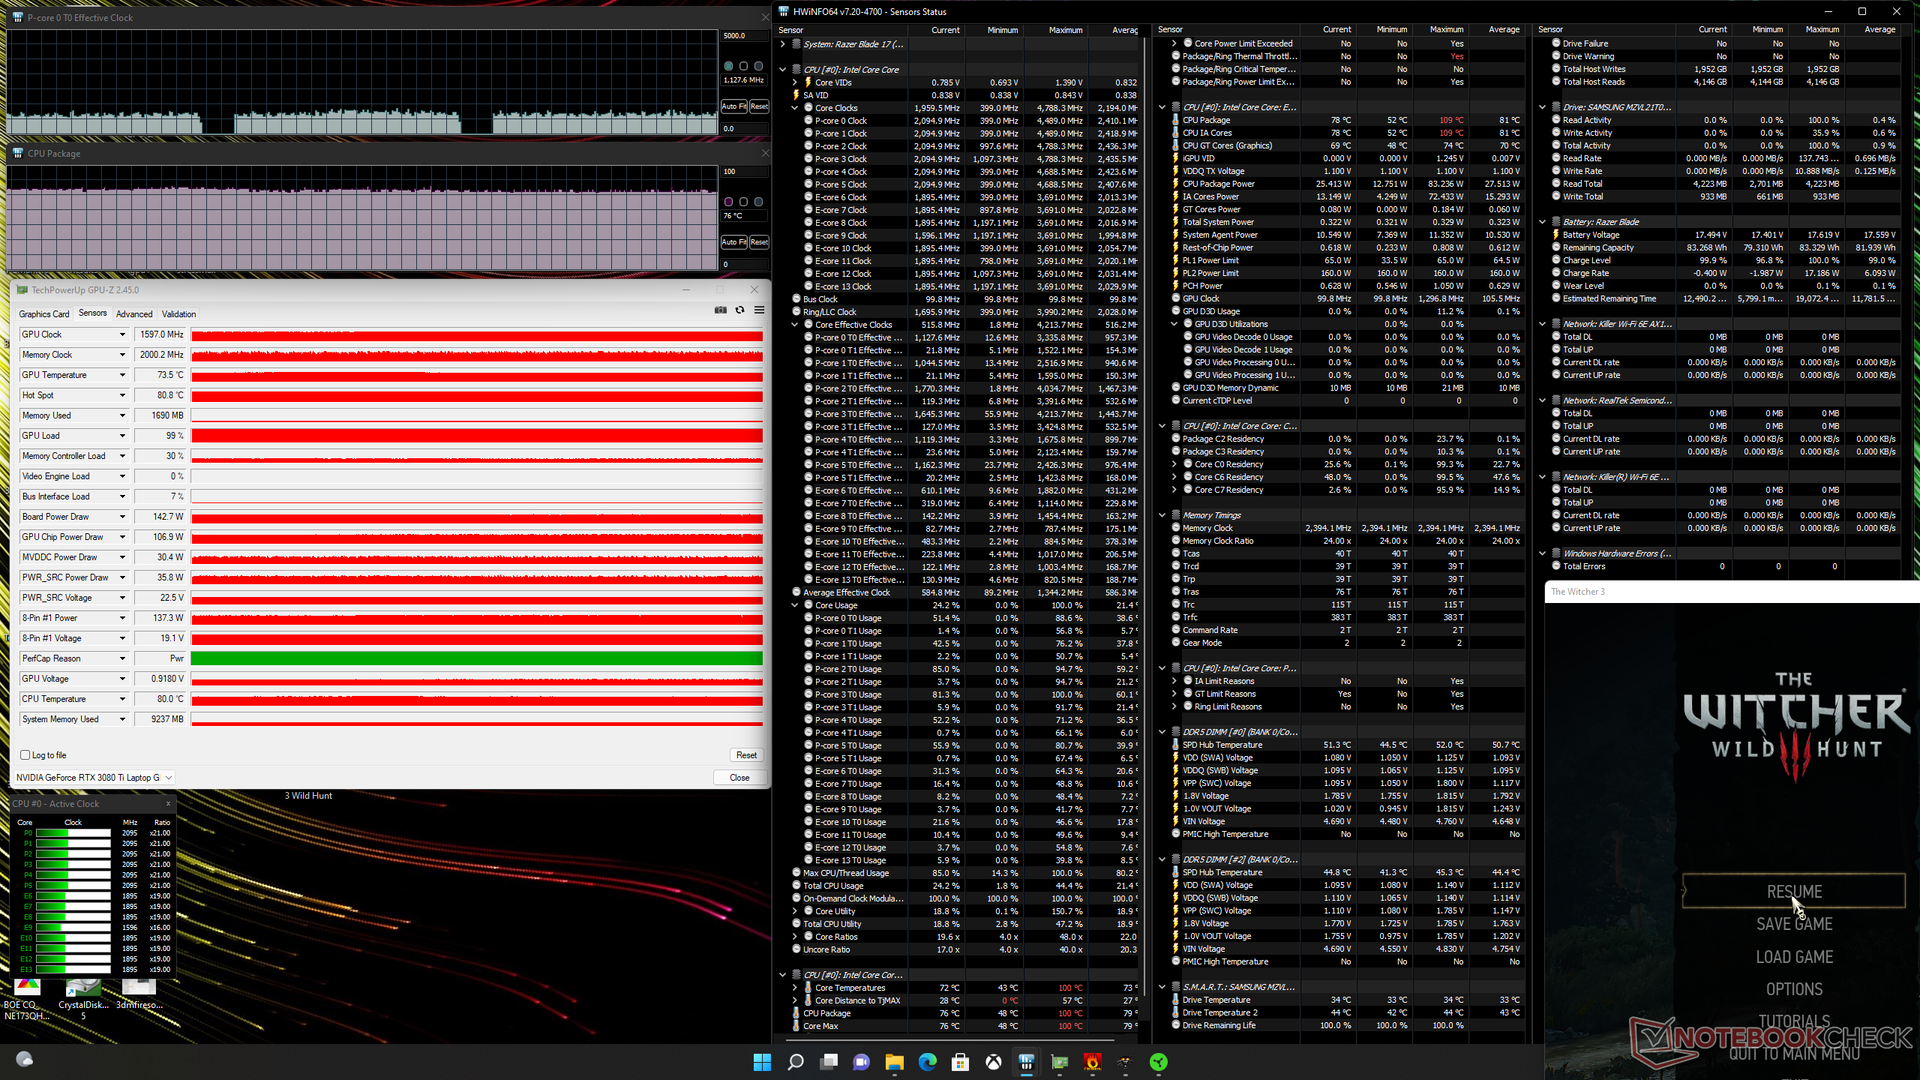
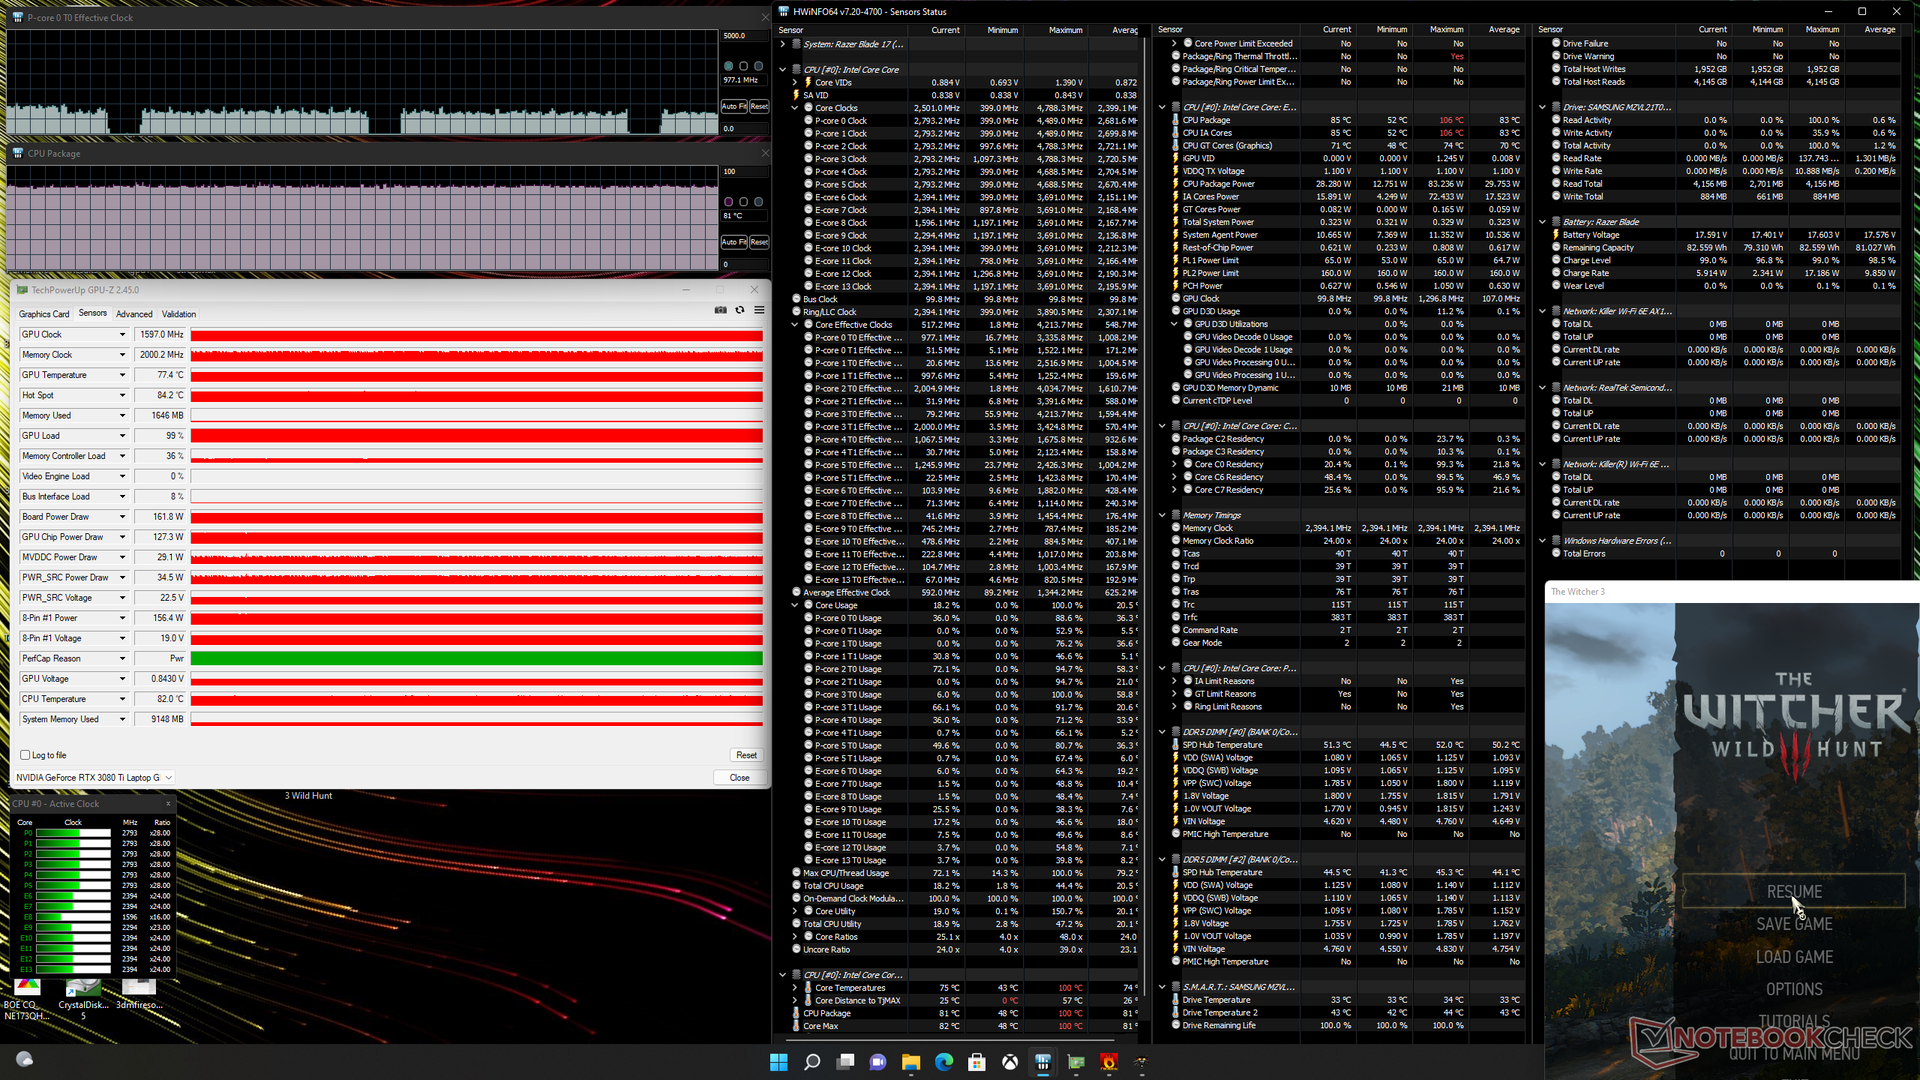
Running Witcher 3 on Maximum Performance mode would result in a steady GPU board power draw of 162 W compared to only 143 W if on Balanced mode. Thus, users must run the Blade 17 on its maximum performance settings to extract as much performance as possible when gaming. CPU and GPU temperatures would stabilize at 81 C and 77 C, respectively, compared to 79 C and 72 C on the 11th gen Intel Blade 17 with RTX 3070 graphics or 65 C and 64 C on the 10th gen Intel Blade 17 with RTX 3080 graphics. The higher core temperatures on our 12th gen Intel model is not surprising given its higher TDP and TGP targets.
Running on battery power limits performance significantly as the system cannot be set to anything higher than the Balanced power profile. A Fire Strike test on batteries would return Physics and Graphics scores of 11785 and 9465 points, respectively, compared to 27907 and 32106 points when on mains.
| CPU Clock (GHz) | GPU Clock (MHz) | Average CPU Temperature (°C) | Average GPU Temperature (°C) | |
| System Idle | -- | -- | 50 | 47 |
| Prime95 Stress | 2.4 - 2.6 | -- | 71 | 45 |
| Prime95 + FurMark Stress | 1.8 | ~1642 | 89 | 76 |
| Witcher 3 Stress (Balanced mode) | ~1.1 | 1597 | 76 | 74 |
| Witcher 3 Stress (Maximum Performance mode) | ~1.1 | 1597 | 81 | 77 |
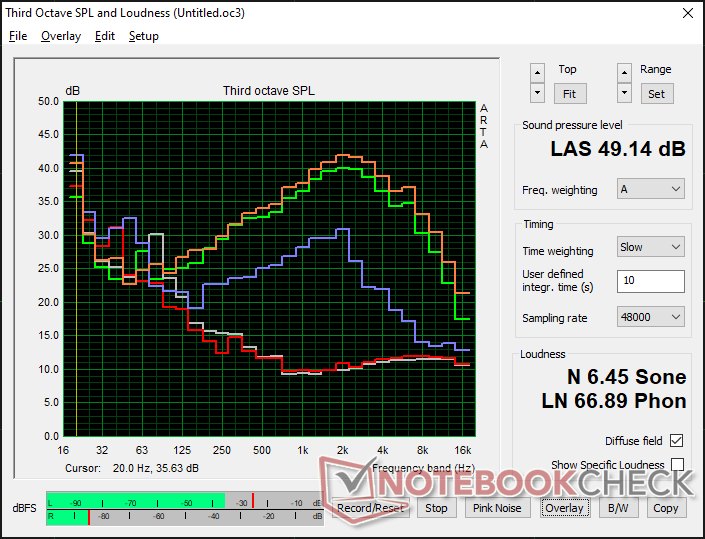
Speakers
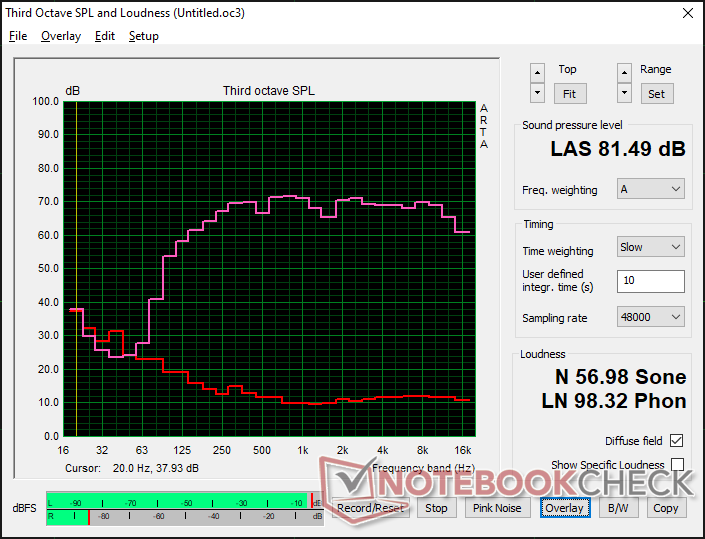
Razer Blade 17 RTX 3080 Ti audio analysis
(±) | speaker loudness is average but good (81.5 dB)
Bass 100 - 315 Hz
(±) | reduced bass - on average 6.7% lower than median
(±) | linearity of bass is average (8.3% delta to prev. frequency)
Mids 400 - 2000 Hz
(+) | balanced mids - only 2.1% away from median
(+) | mids are linear (4.3% delta to prev. frequency)
Highs 2 - 16 kHz
(+) | balanced highs - only 0.7% away from median
(+) | highs are linear (1.7% delta to prev. frequency)
Overall 100 - 16.000 Hz
(+) | overall sound is linear (6.8% difference to median)
Compared to same class
» 0% of all tested devices in this class were better, 0% similar, 100% worse
» The best had a delta of 6%, average was 18%, worst was 132%
Compared to all devices tested
» 1% of all tested devices were better, 0% similar, 99% worse
» The best had a delta of 4%, average was 25%, worst was 134%
Apple MacBook Pro 16 2021 M1 Pro audio analysis
(+) | speakers can play relatively loud (84.7 dB)
Bass 100 - 315 Hz
(+) | good bass - only 3.8% away from median
(+) | bass is linear (5.2% delta to prev. frequency)
Mids 400 - 2000 Hz
(+) | balanced mids - only 1.3% away from median
(+) | mids are linear (2.1% delta to prev. frequency)
Highs 2 - 16 kHz
(+) | balanced highs - only 1.9% away from median
(+) | highs are linear (2.7% delta to prev. frequency)
Overall 100 - 16.000 Hz
(+) | overall sound is linear (4.6% difference to median)
Compared to same class
» 0% of all tested devices in this class were better, 0% similar, 100% worse
» The best had a delta of 5%, average was 18%, worst was 45%
Compared to all devices tested
» 0% of all tested devices were better, 0% similar, 100% worse
» The best had a delta of 4%, average was 25%, worst was 134%
Energy Management
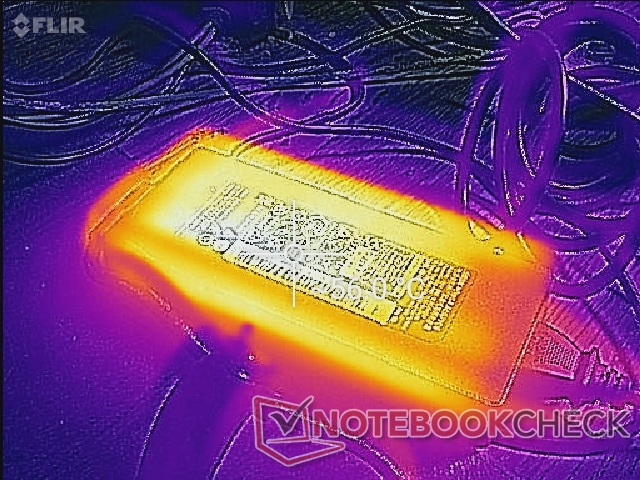
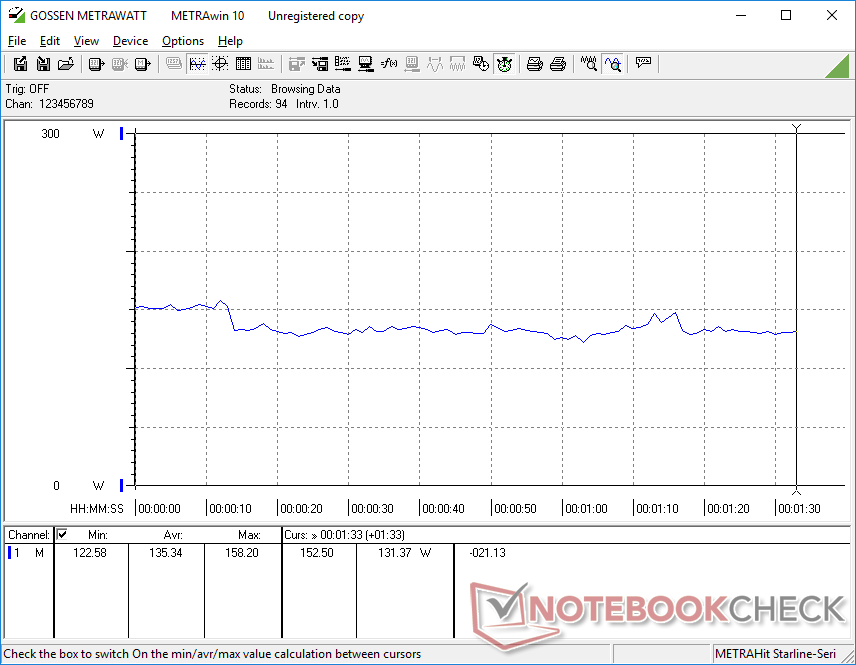
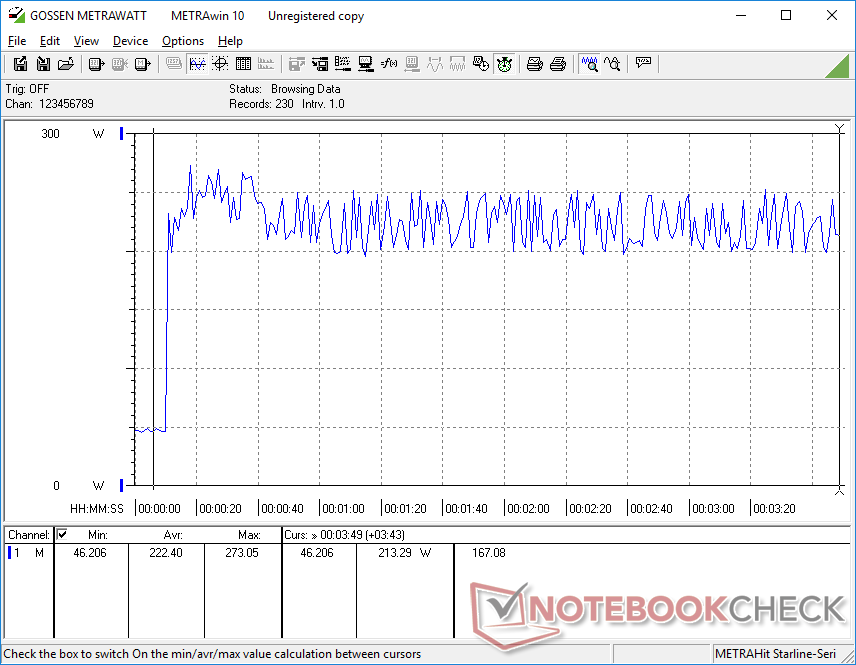
Power Consumption — Highest Yet For The Blade Series
The new model is much more power-hungry than before. Simply idling on desktop would consume between 30 W and 61 W depending on the brightness setting and power profile compared to almost half that on the 2021 Blade 17, MSI GS76, or Asus ROG Zephyrus S17. In fact, running Witcher 3 would consume 30 percent more power for a 20 to 25 percent boost in graphics performance and 25 percent boost in CPU performance over the RTX 3070 and Core i7-11800H in the 2021 Blade 17.
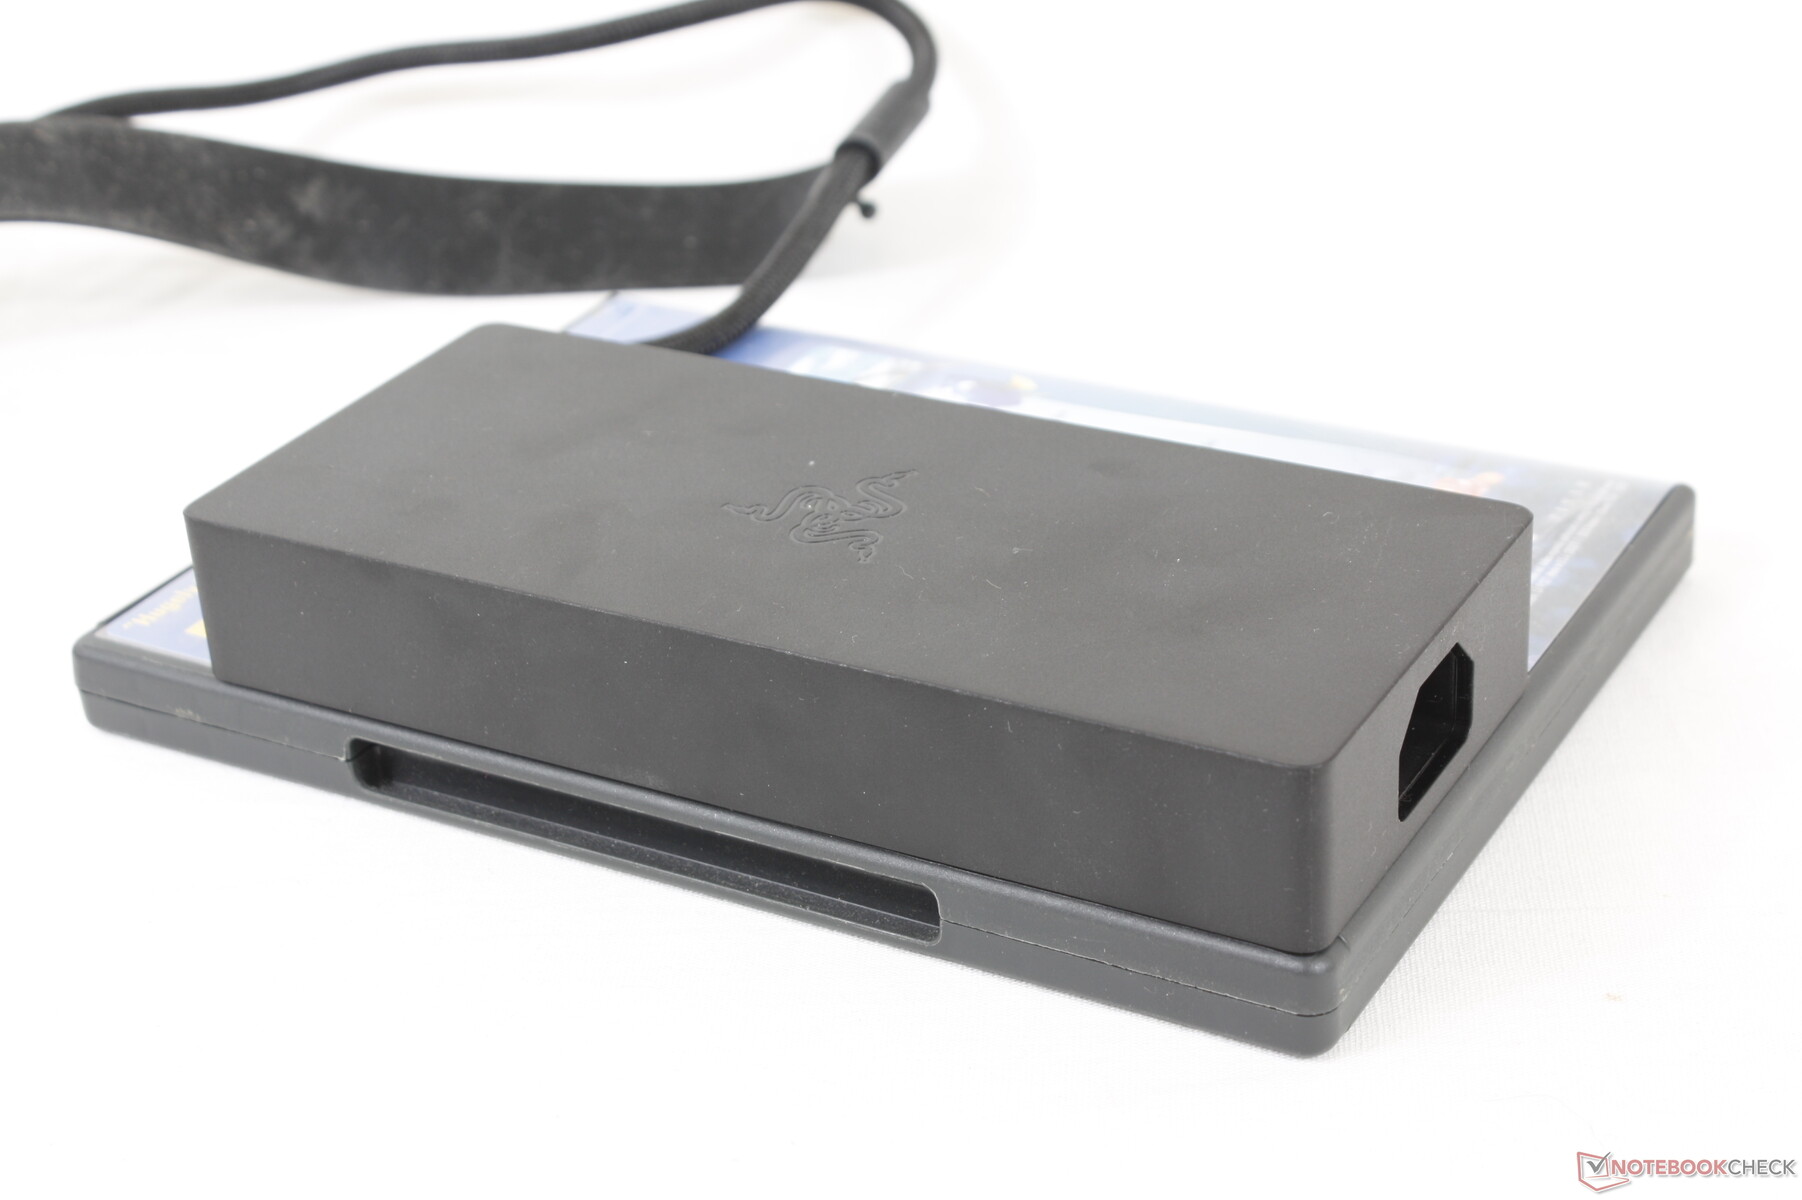
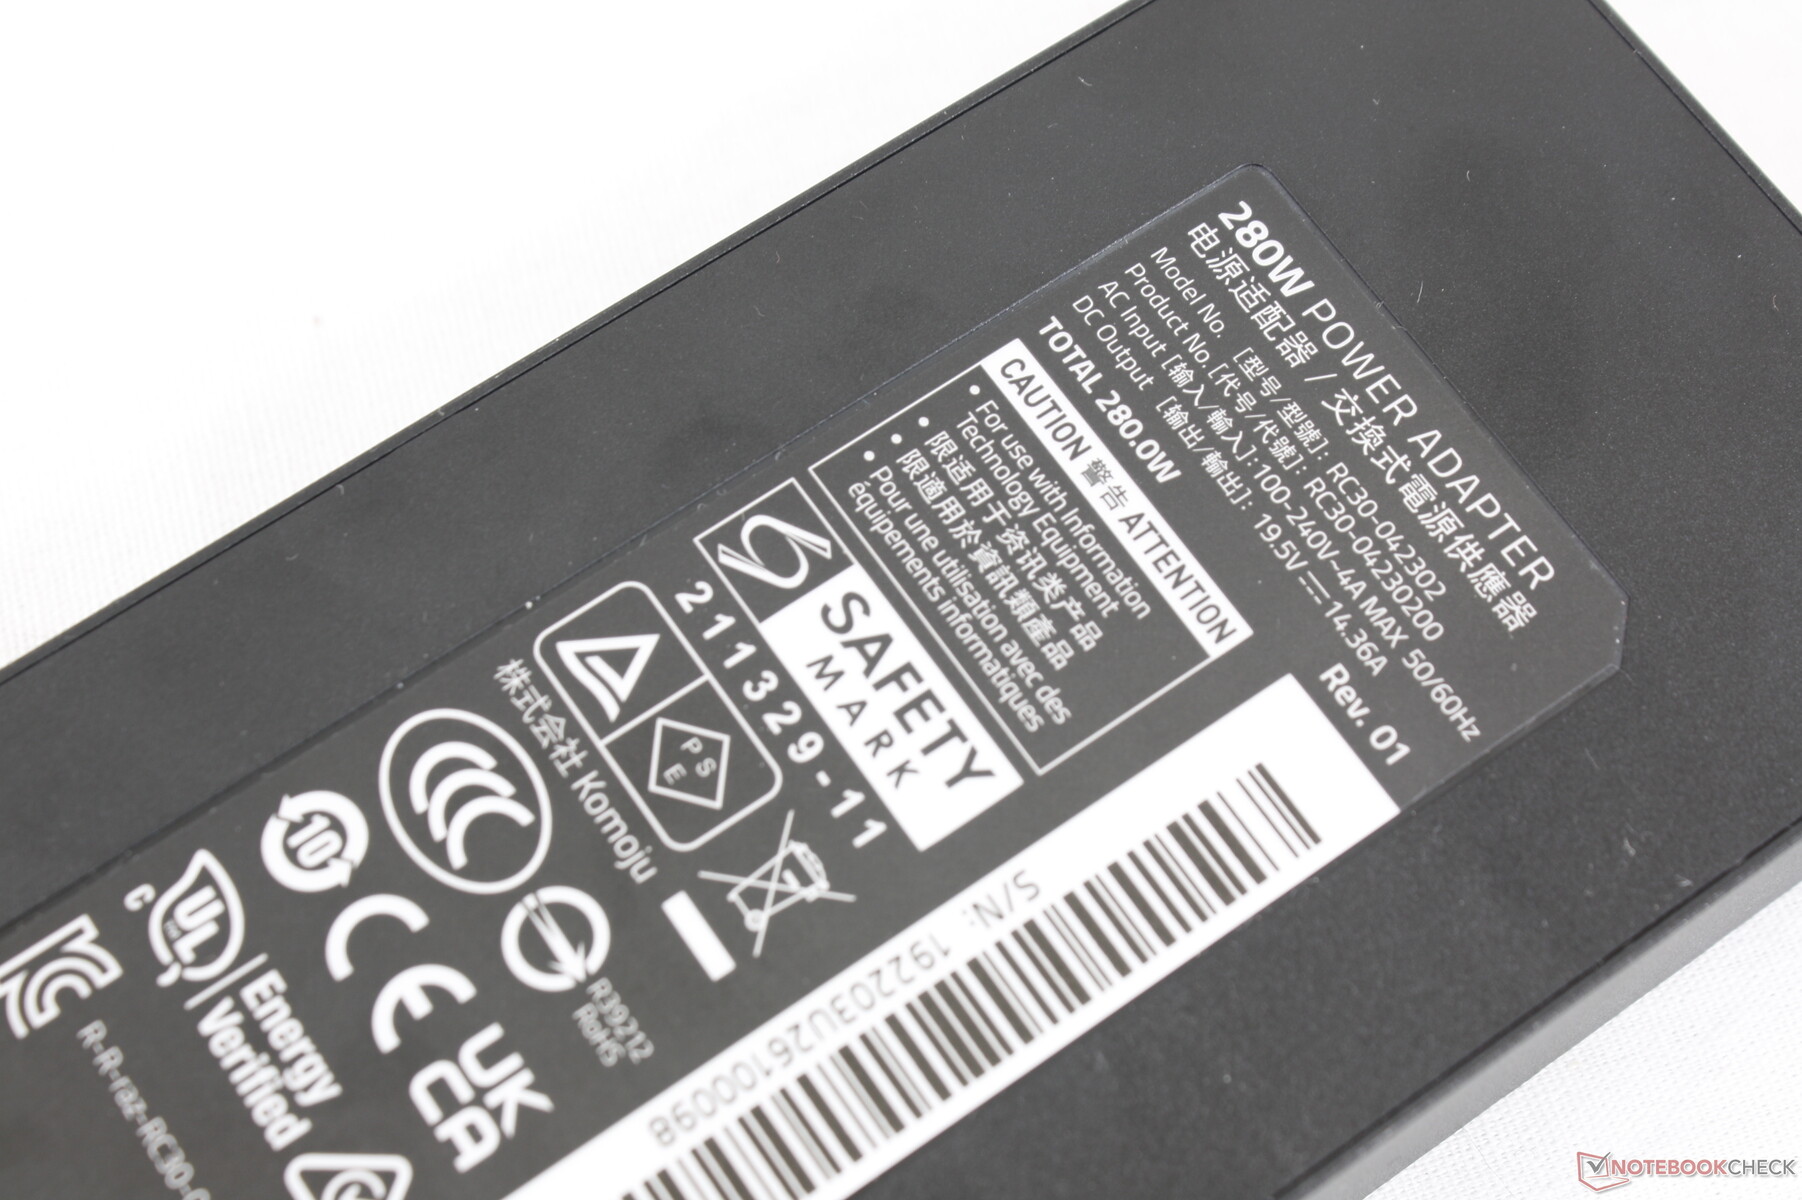
To accommodate the more demanding processors this year, the 2022 Blade 17 ships with a higher capacity 280 W AC adapter compared to the 230 W AC adapter that came with the 2021 model. Fortunately, the overall size of the AC adapter has remained nearly the same year-over-year (~16.4 x 7 x 2.5 cm vs. ~17 x 7 x 2.5 cm) despite the higher power output.
| Off / Standby | |
| Idle | |
| Load |
|
| Razer Blade 17 RTX 3080 Ti i7-12800H, GeForce RTX 3080 Ti Laptop GPU, Samsung PM9A1 MZVL21T0HCLR, IPS, 2560x1440, 17.30 | Razer Blade Pro 17 2021 (QHD Touch) i7-10875H, GeForce RTX 3080 Laptop GPU, Samsung PM981a MZVLB1T0HBLR, IPS, 3840x2160, 17.30 | MSI GS76 Stealth 11UH i9-11900H, GeForce RTX 3080 Laptop GPU, Samsung PM9A1 MZVL22T0HBLB, IPS, 3840x2160, 17.30 | Asus ROG Zephyrus S17 GX703HSD i9-11900H, GeForce RTX 3080 Laptop GPU, Samsung PM9A1 MZVL22T0HBLB, IPS, 2560x1440, 17.30 | Aorus 17G YD i7-11800H, GeForce RTX 3080 Laptop GPU, Samsung PM9A1 MZVL2512HCJQ, IPS, 1920x1080, 17.30 | Alienware x17 RTX 3080 P48E i7-11800H, GeForce RTX 3080 Laptop GPU, 2x WDC PC SN730 SDBPNTY-1T00 (RAID 0), IPS, 3840x2160, 17.30 | |
|---|---|---|---|---|---|---|
| Power Consumption | 34% | 38% | 27% | 27% | 24% | |
| Idle Minimum * | 29.8 | 15.2 49% | 14 53% | 21.7 27% | 24 19% | 10.2 66% |
| Idle Average * | 37.1 | 20.3 45% | 19 49% | 27 27% | 26 30% | 21.2 43% |
| Idle Maximum * | 60.8 | 37.3 39% | 31 49% | 33 46% | 38 37% | 48.4 20% |
| Load Average * | 135.3 | 114.9 15% | 97 28% | 108 20% | 101 25% | 118.7 12% |
| Witcher 3 ultra * | 243 | 158.4 35% | 156 36% | 195 20% | 164 33% | 249 -2% |
| Load Maximum * | 273.1 | 223.7 18% | 231 15% | 210 23% | 230 16% | 262 4% |
* ... smaller is better
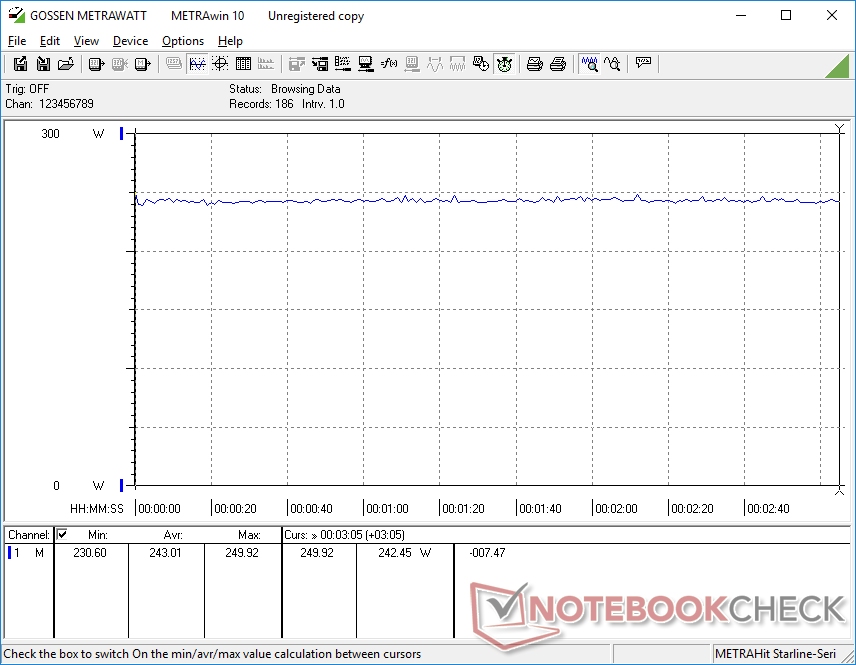
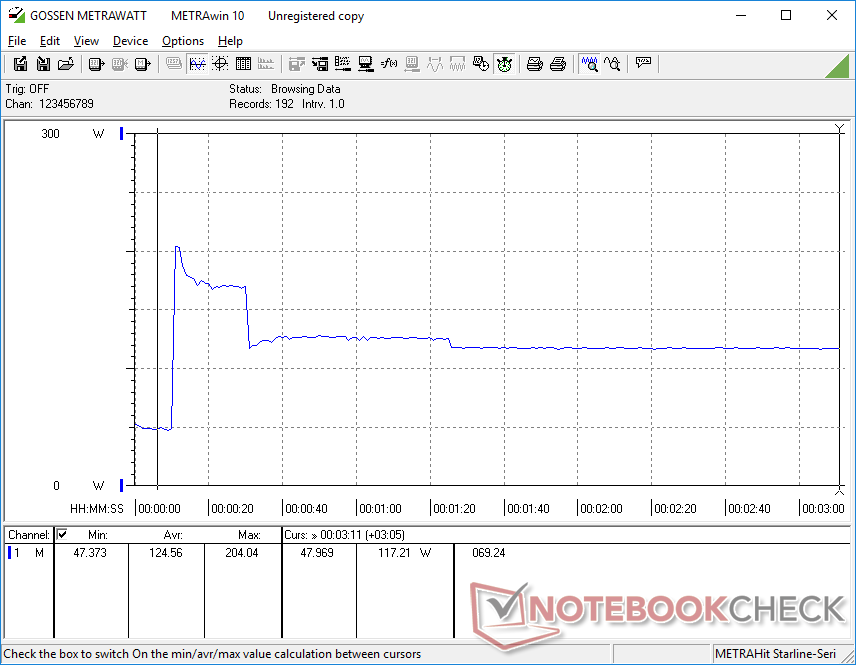
Power Consumption Witcher 3 / Stresstest
Power Consumption external Monitor
Battery Life — Flat Year-Over-Year
Battery capacity is larger than the one in the 2021 Blade 17 due to the removal of the fourth fan. Runtimes are not any better, however, since the newer CPU and GPU are more demanding this time around. We noticed similar results between the 2021 and 2022 Blade 15 models as well.
Charging from empty to full with the included AC adapter takes about 90 minutes. USB-C charging is supported unlike on the Asus TUF Gaming F15.
| Razer Blade 17 RTX 3080 Ti i7-12800H, GeForce RTX 3080 Ti Laptop GPU, 82 Wh | Razer Blade Pro 17 2021 (QHD Touch) i7-10875H, GeForce RTX 3080 Laptop GPU, 70.5 Wh | MSI GS76 Stealth 11UH i9-11900H, GeForce RTX 3080 Laptop GPU, 99.9 Wh | Asus ROG Zephyrus S17 GX703HSD i9-11900H, GeForce RTX 3080 Laptop GPU, 90 Wh | Aorus 17G YD i7-11800H, GeForce RTX 3080 Laptop GPU, 99 Wh | Alienware x17 RTX 3080 P48E i7-11800H, GeForce RTX 3080 Laptop GPU, 87 Wh | |
|---|---|---|---|---|---|---|
| Battery Runtime | 19% | 18% | 87% | 21% | -13% | |
| Reader / Idle | 482 | 593 23% | 592 23% | 541 12% | 419 -13% | |
| WiFi v1.3 | 330 | 356 8% | 382 16% | 449 36% | 360 9% | 353 7% |
| Load | 68 | 86 26% | 79 16% | 162 138% | 96 41% | 45 -34% |
| H.264 | 430 | 370 | ||||
| Witcher 3 ultra | 62 |
Pros
Cons
Verdict — More Watts, More Power
The Blade 17 design was introduced in 2019 with 100 W GeForce graphics. This 2022 refresh carries an even more powerful 165 W GPU without any significant changes to the size or design of the chassis. Performance has improved, of course, but the overall higher power consumption entails higher temperatures, a denser power brick, and generally shorter battery life than preceding Blade 17 models with older processors.
Fortunately, Razer has adjusted some aspects of the 2022 model to offset its higher power requirements. The internal battery, for example, is larger albeit at the expense of a whole fan that would have otherwise aided in cooling. Meanwhile, the often-neglected 280 W AC adapter is one of the smallest and lightest we've seen when compared to other high capacity adapters to make traveling with the Blade 17 a bit easier. The manufacturer was well aware of the increasingly power-hungry components during development and has taken steps to alleviate some of the inevitable drawbacks.
By focusing so strongly on performance, the 165 W GPU in the Razer is able to outperform most other laptops equipped with the same GPU. Other ultrathin laptops tend to have lower TGP targets than the Blade 17 for consistently slower performance. The 2022 Blade 17 is therefore one of the better recommendations for gamers who want to maximize mobile graphics performance without settling for thicker options like the MSI GT series or an Asus ROG Chimera. Perhaps future Blade 17 models could incorporate liquid metal cooling to improve temperatures.
Price and Availability
Razer is now selling our configuration as reviewed for approximately $4000 USD. Amazon and Best Buy do not have stock as of this writing.
Razer Blade 17 RTX 3080 Ti
-
07/05/2022 v7
Allen Ngo
More articles related to this device
Razer Blade 17 RTX 3080 Ti (Blade 17 Series)Related Articles


Pricecompare
