 Deutsch
 English
 Español
 Français
 Italiano
 Nederlands
 Polski
 Português
 Русский
 Türkçe
 Svenska
 Chinese
 Magyar
Razer Blade 14 Ryzen 9 Laptop Review: Blade Pro 17 Performance At Half The Size
The original 14-inch Razer Blade 14 launched almost 10 years ago with the Core i7-4702HQ and GeForce GTX 765M. The manufacturer would later retire the model after a few years to instead focus on the 13.3-inch Blade Stealth and 15.6-inch Blade 15. Now that the Stealth and Blade 15 are well established, Razer has decided to revive the Blade 14 with updated hardware.
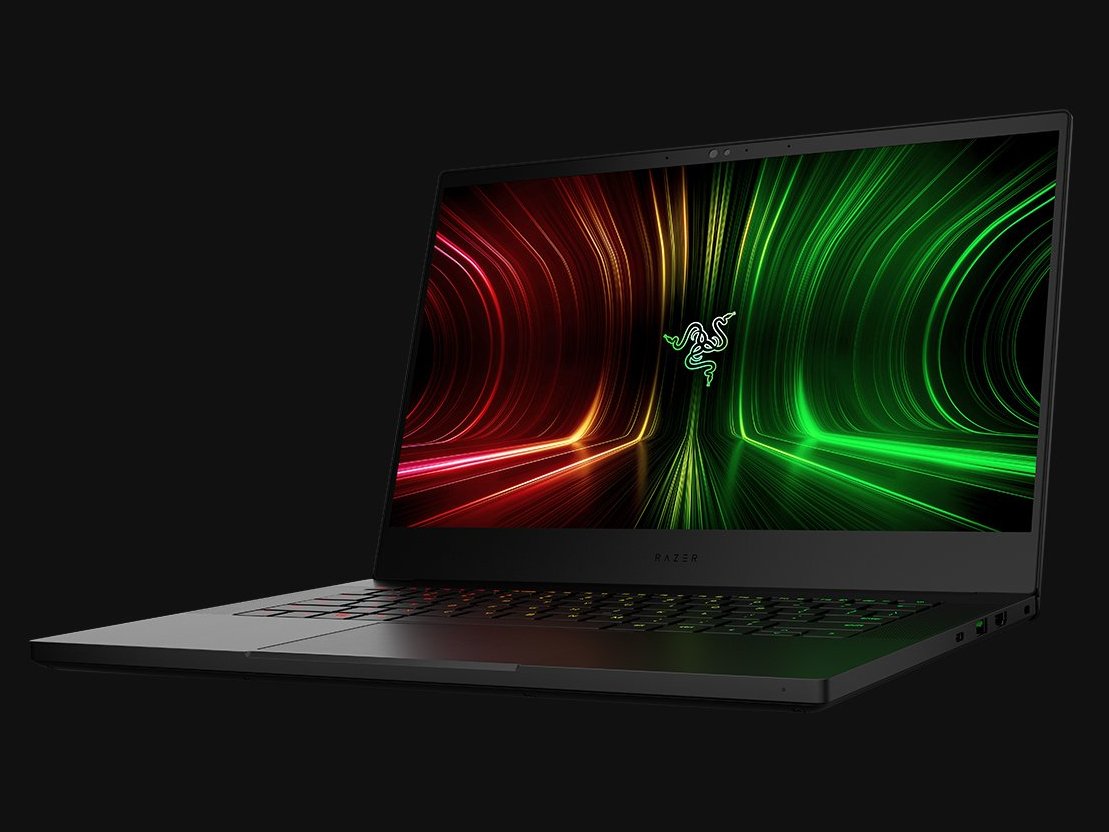
Unveiled at E3 2021, the new Blade 14 is notable not just for its small and attractive form factor, but also for being the first Razer laptop with an AMD CPU. Its core specifications could easily pass for a larger 17.3-inch gaming laptop including its Ryzen 9 5900HX Zen 3 processor, GeForce RTX Ampere graphics, 16 GB RAM, M.2 PCIe 3 NVMe SSD, and 144 Hz FHD or 165 Hz QHD display with DCI-P3 coverage and FreeSync support. Our test unit is the upper mid-range option with the RTX 3070 and 165 Hz QHD display for $2200 USD retail, but other SKUs range from $1800 up to $2800.
Direct competitors in this space are far and few between because there just aren't that many high-power 14-inch gaming laptops like the Blade 14. MSI hasn't had a 14-inch gaming laptop for years leaving the Asus Zephyrus G14 as the only other major 14-inch gaming laptop with similar specifications to the Razer.
More Razer reviews:
potential competitors in comparison
Rating | Date | Model | Weight | Height | Size | Resolution | Best Price |
|---|---|---|---|---|---|---|---|
| 87.5 % | 06/2021 | Razer Blade 14 Ryzen 9 RTX 3070 R9 5900HX, GeForce RTX 3070 Laptop GPU | 1.8 kg | 16.8 mm | 14.00" | 2560x1440 | |
| 87.5 % | 05/2021 | Razer Blade 15 Advanced Model Early 2021 i7-10875H, GeForce RTX 3080 Laptop GPU | 2 kg | 16.99 mm | 15.60" | 1920x1080 | |
| 83.6 % | 03/2020 | Asus Zephyrus G14 GA401IV R9 4900HS, GeForce RTX 2060 Max-Q | 1.6 kg | 17.9 mm | 14.00" | 1920x1080 | |
| 84.7 % | 02/2021 | Asus ROG Flow X13 GV301QH R9 5980HS, GeForce GTX 1650 Max-Q | 1.4 kg | 15.8 mm | 13.40" | 3840x2400 | |
| 90.1 % | 06/2020 | Dell XPS 15 9500 Core i7 4K UHD i7-10875H, GeForce GTX 1650 Ti Mobile | 2 kg | 18 mm | 15.60" | 3840x2400 |
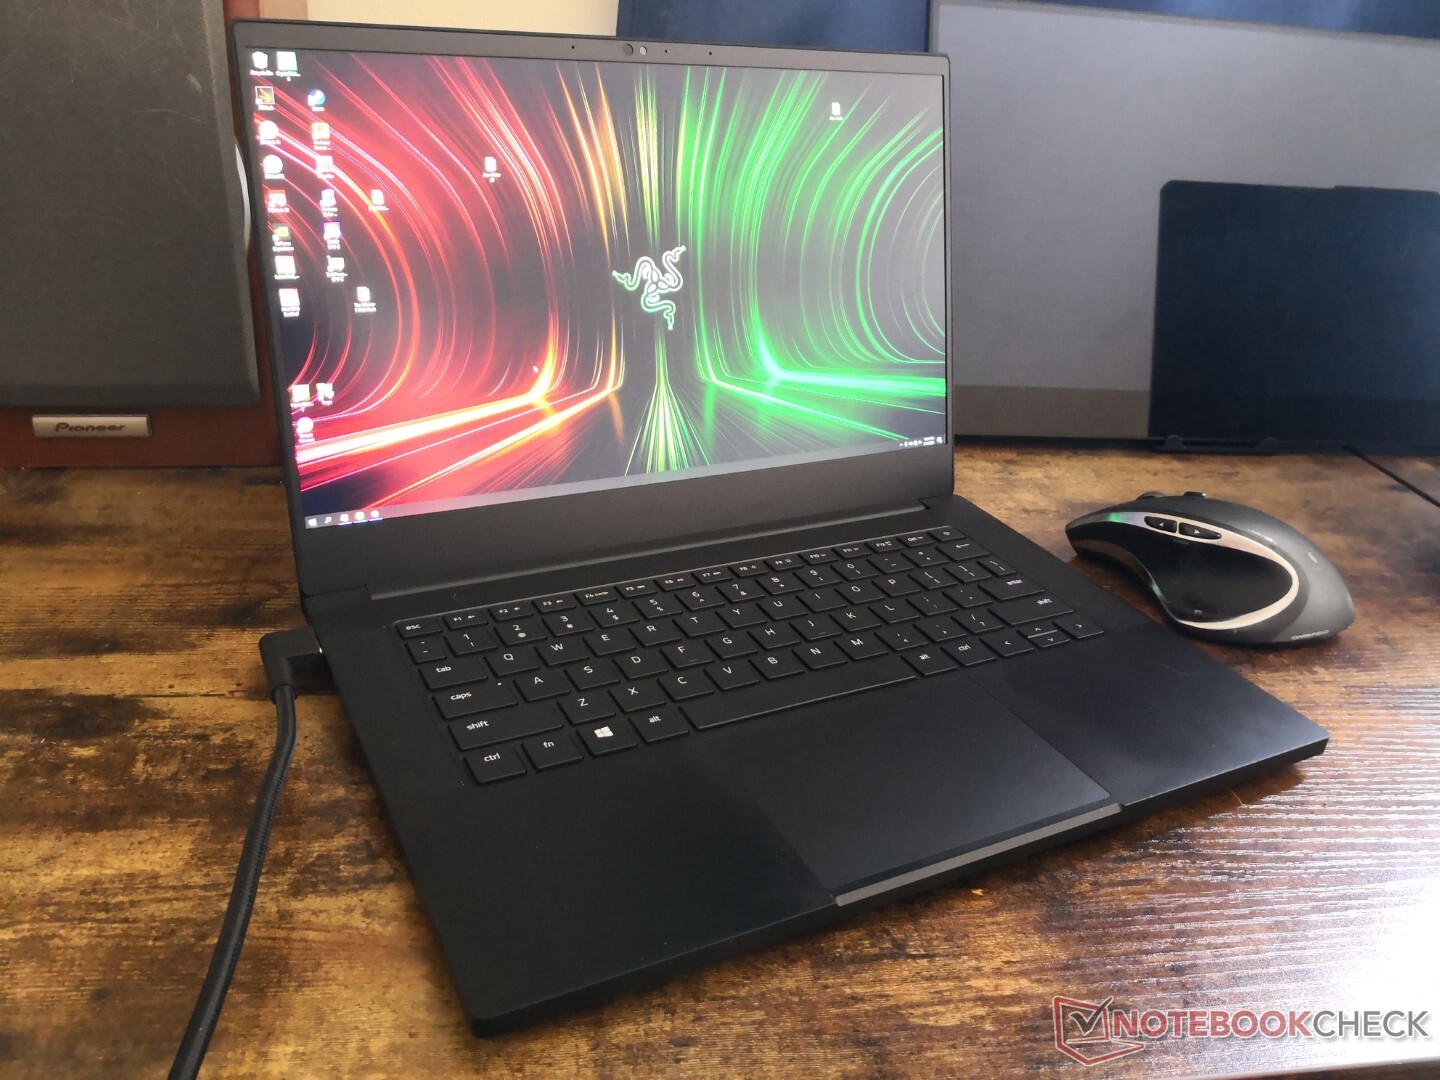
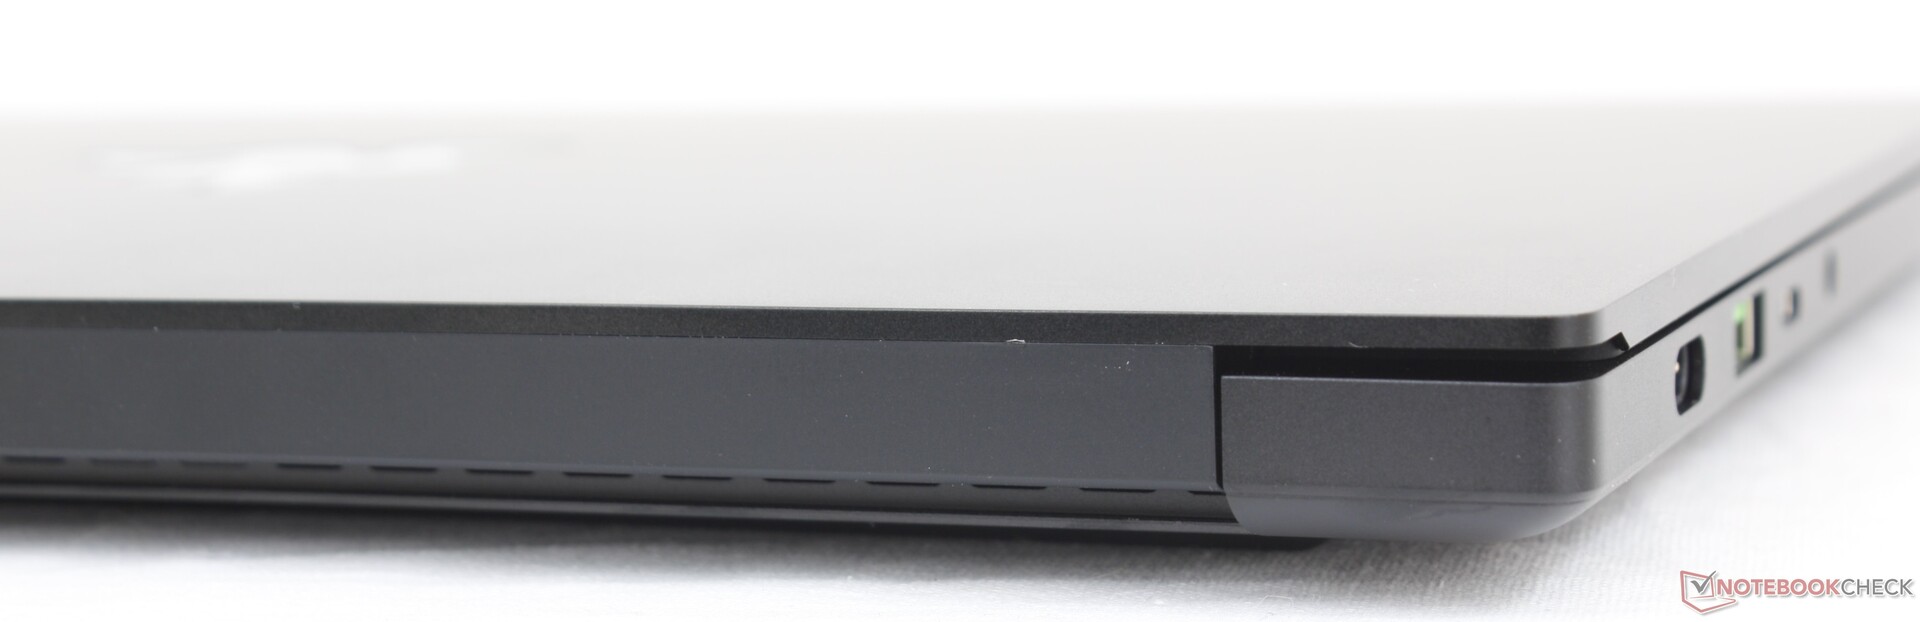
Case — Same Sleek Design, New Smaller Size
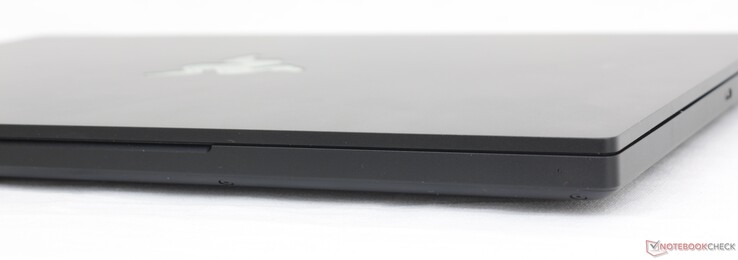
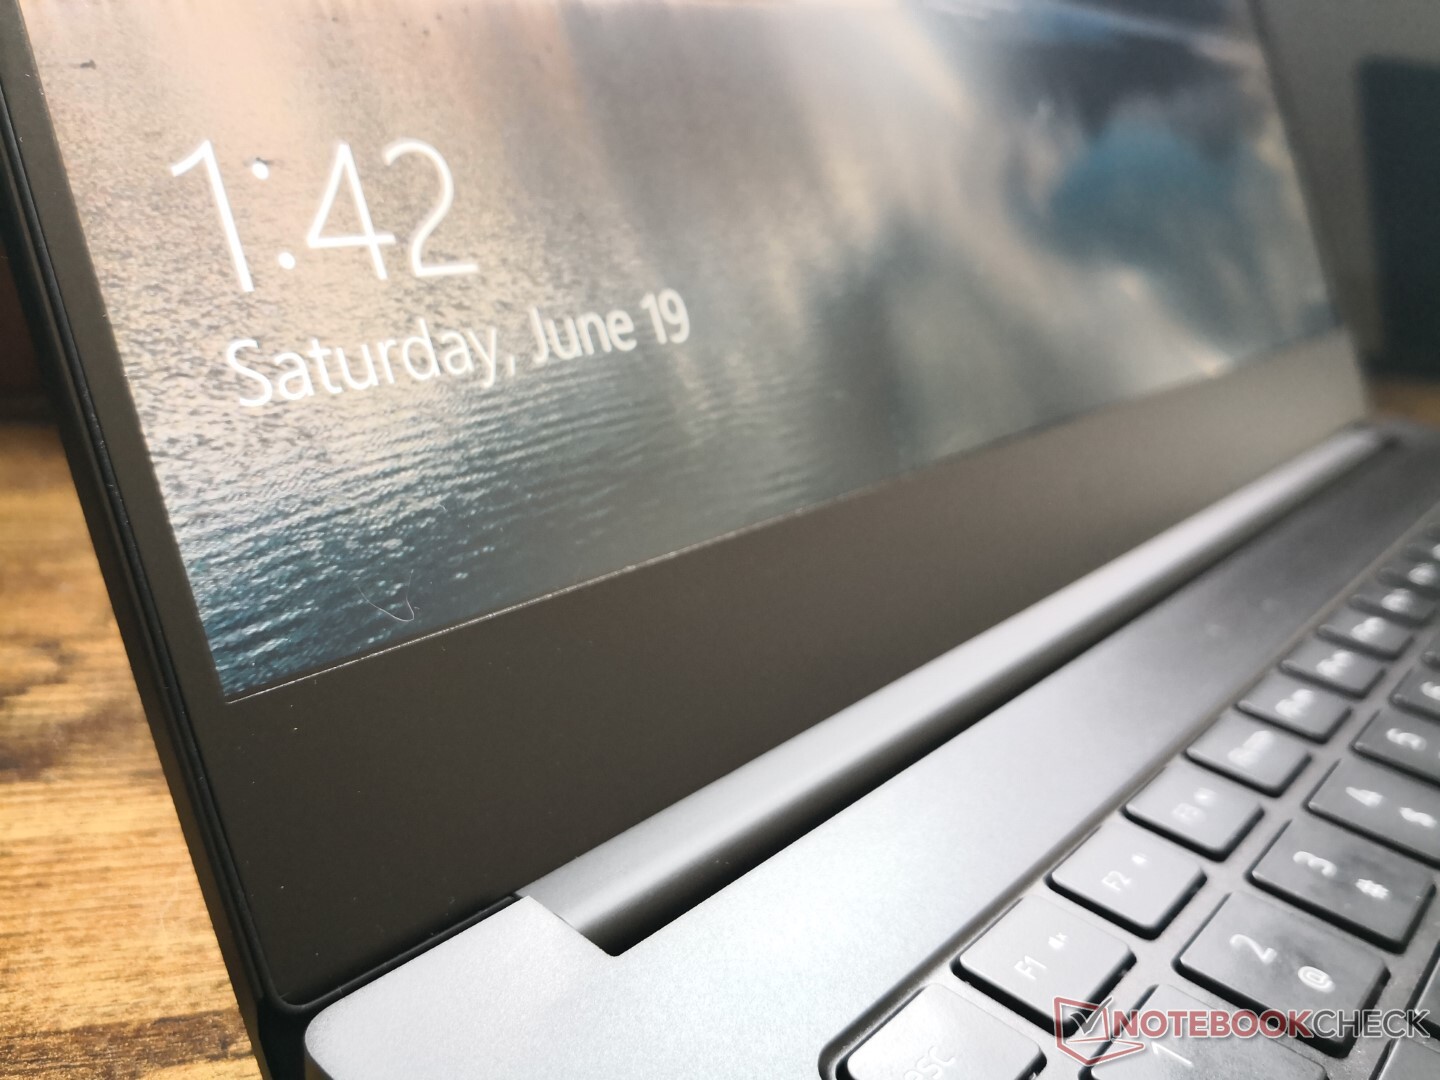
The chassis design and aluminum alloy materials are similar to the latest Blade Stealth, Blade 15, and Blade Pro models. If you've held any of these Blade models in the last few years, then you'll already have a good idea of how the Blade 14 looks and feels. The system is about 20 percent larger than the Blade Stealth with the same strong base and smooth matte surfaces.
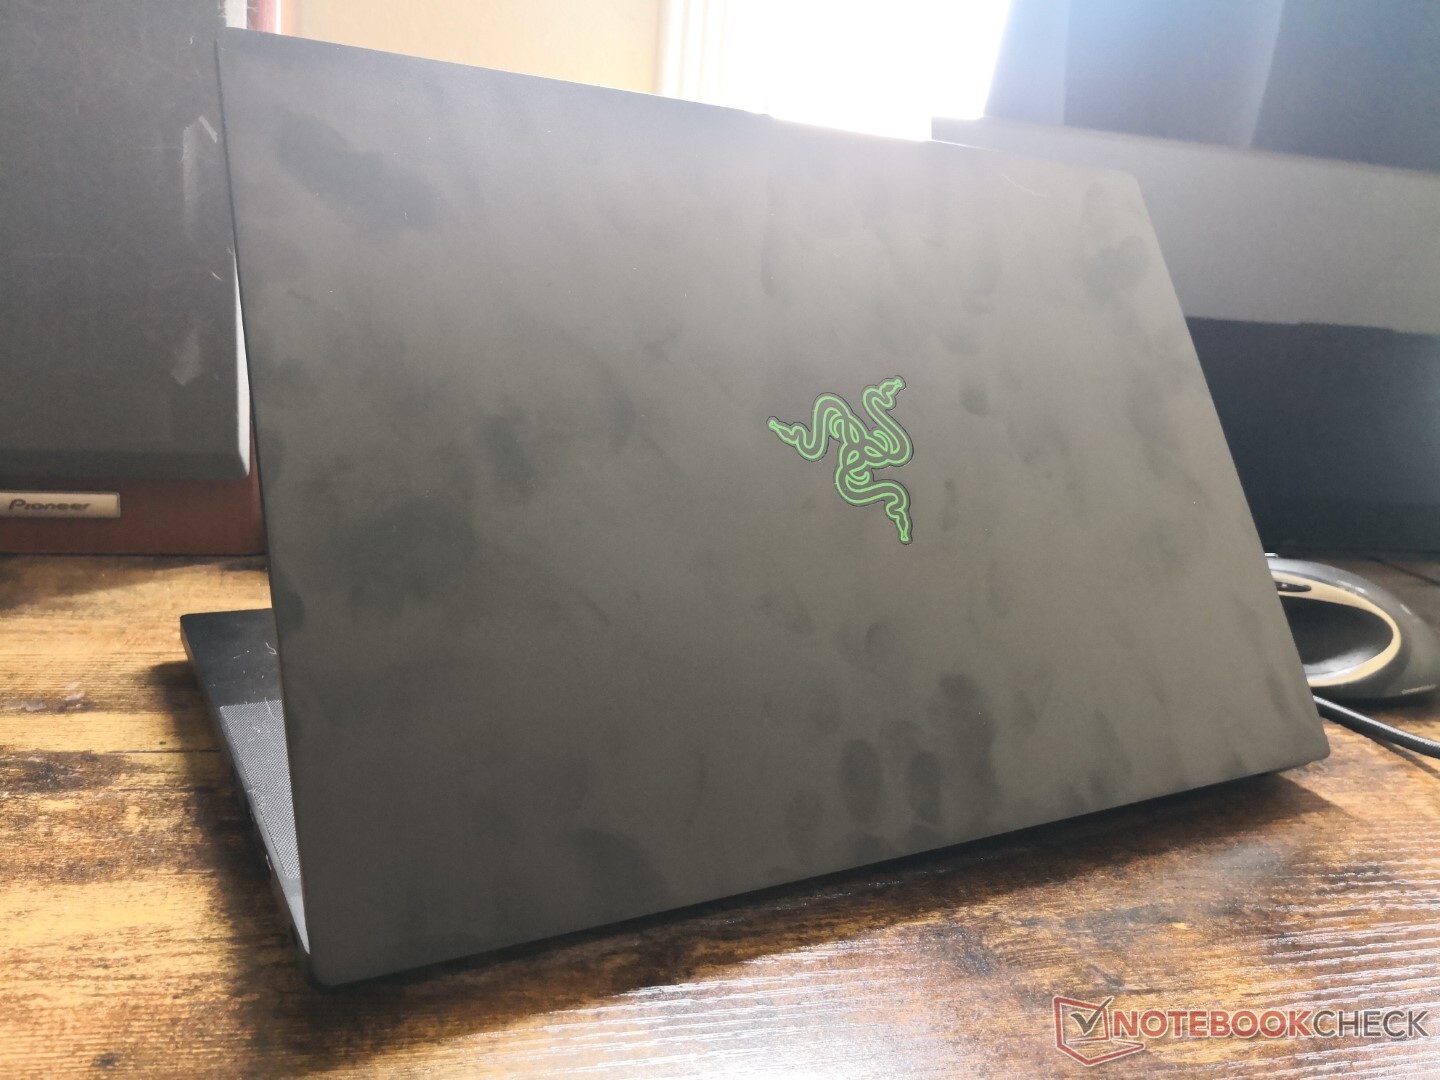
The lid is noticeably more susceptible to twisting and warping than the rest of the laptop. It's not bad by any means, but we do find the lids on the HP Spectre x360 14 or ZenBook Duo 14 to be stiffer for a better sense of longevity.
The system is slightly smaller than the Zephyrus G14 in all three dimensions while being about 200 g heavier in the process. It's noticeably denser as a result, but the small size makes it feel as portable as any other 14-inch Ultrabook including the Asus ZenBook series. The Blade 14 has come a long way since the original 2015 model which is now as big as a 2020 15.6-inch Dell XPS 15.
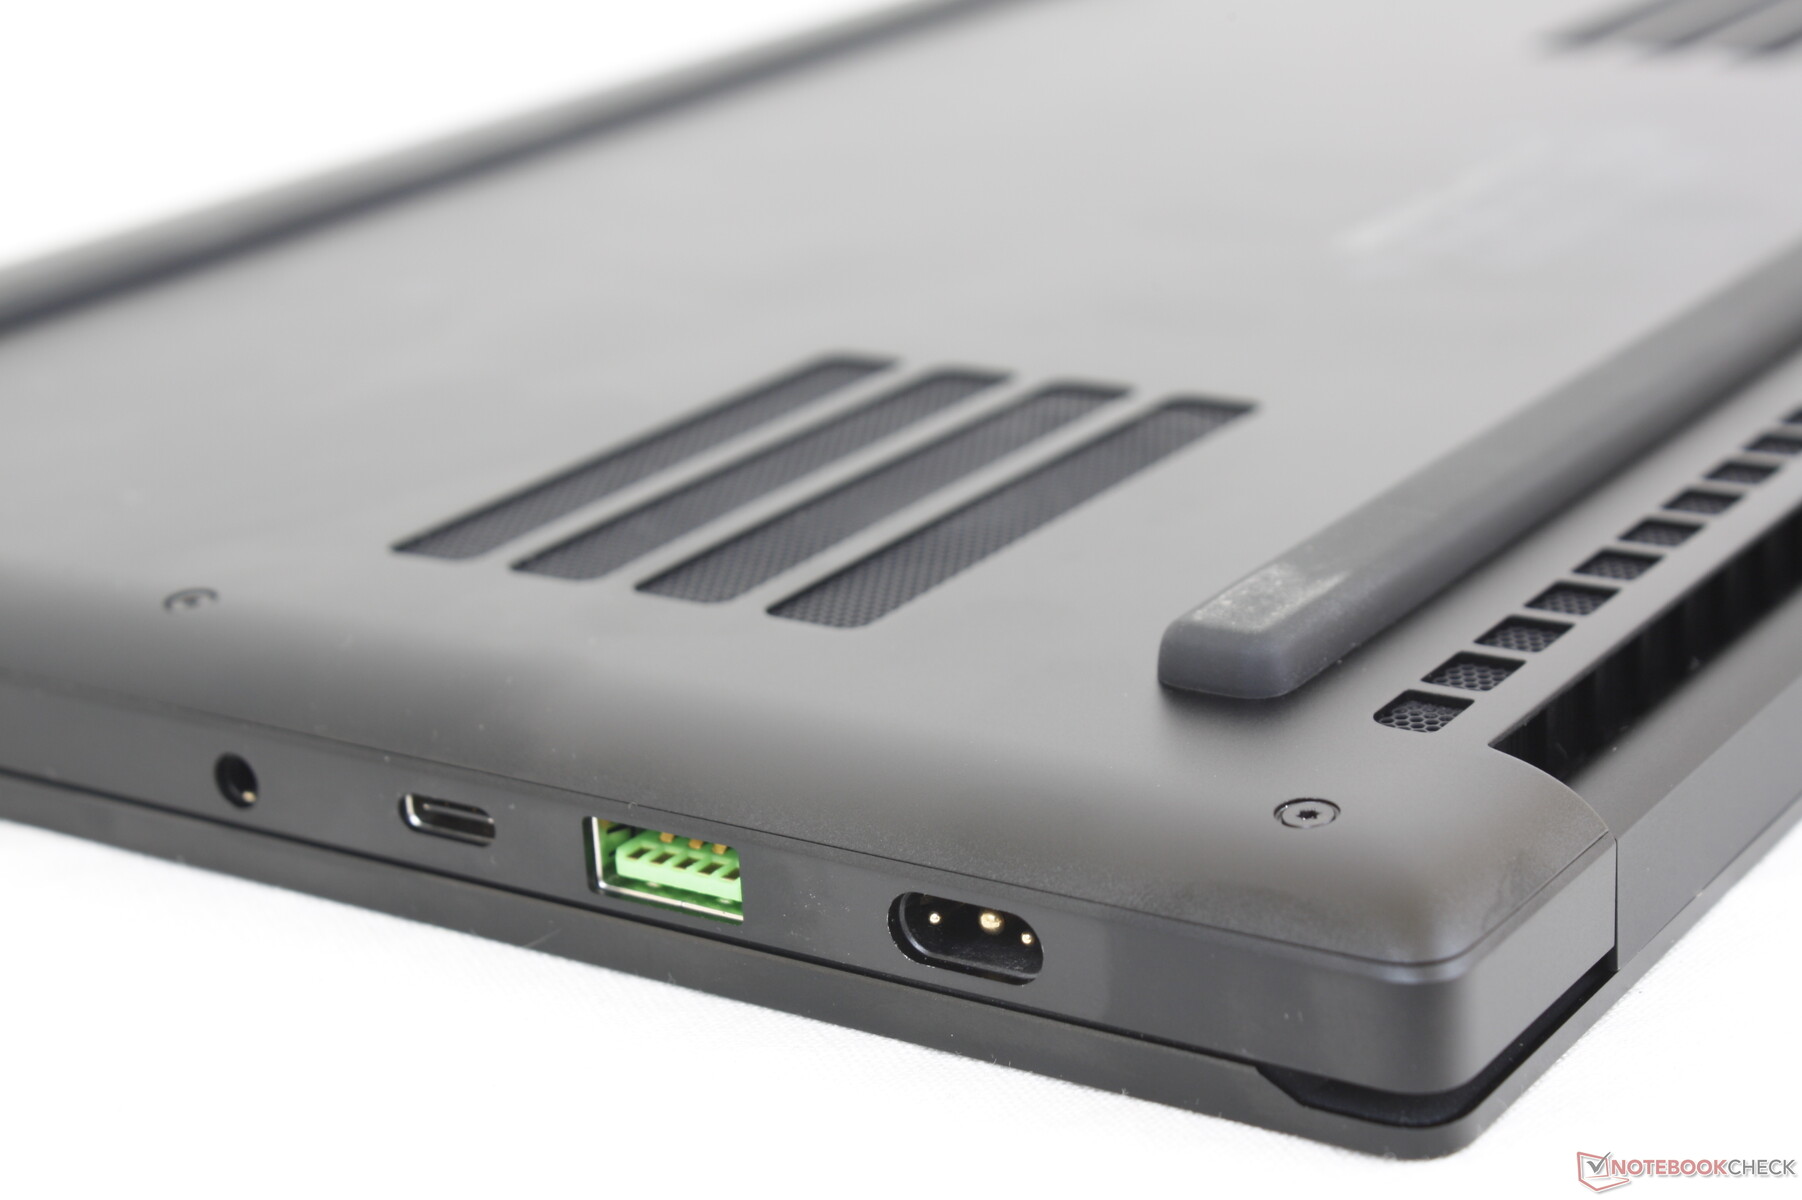
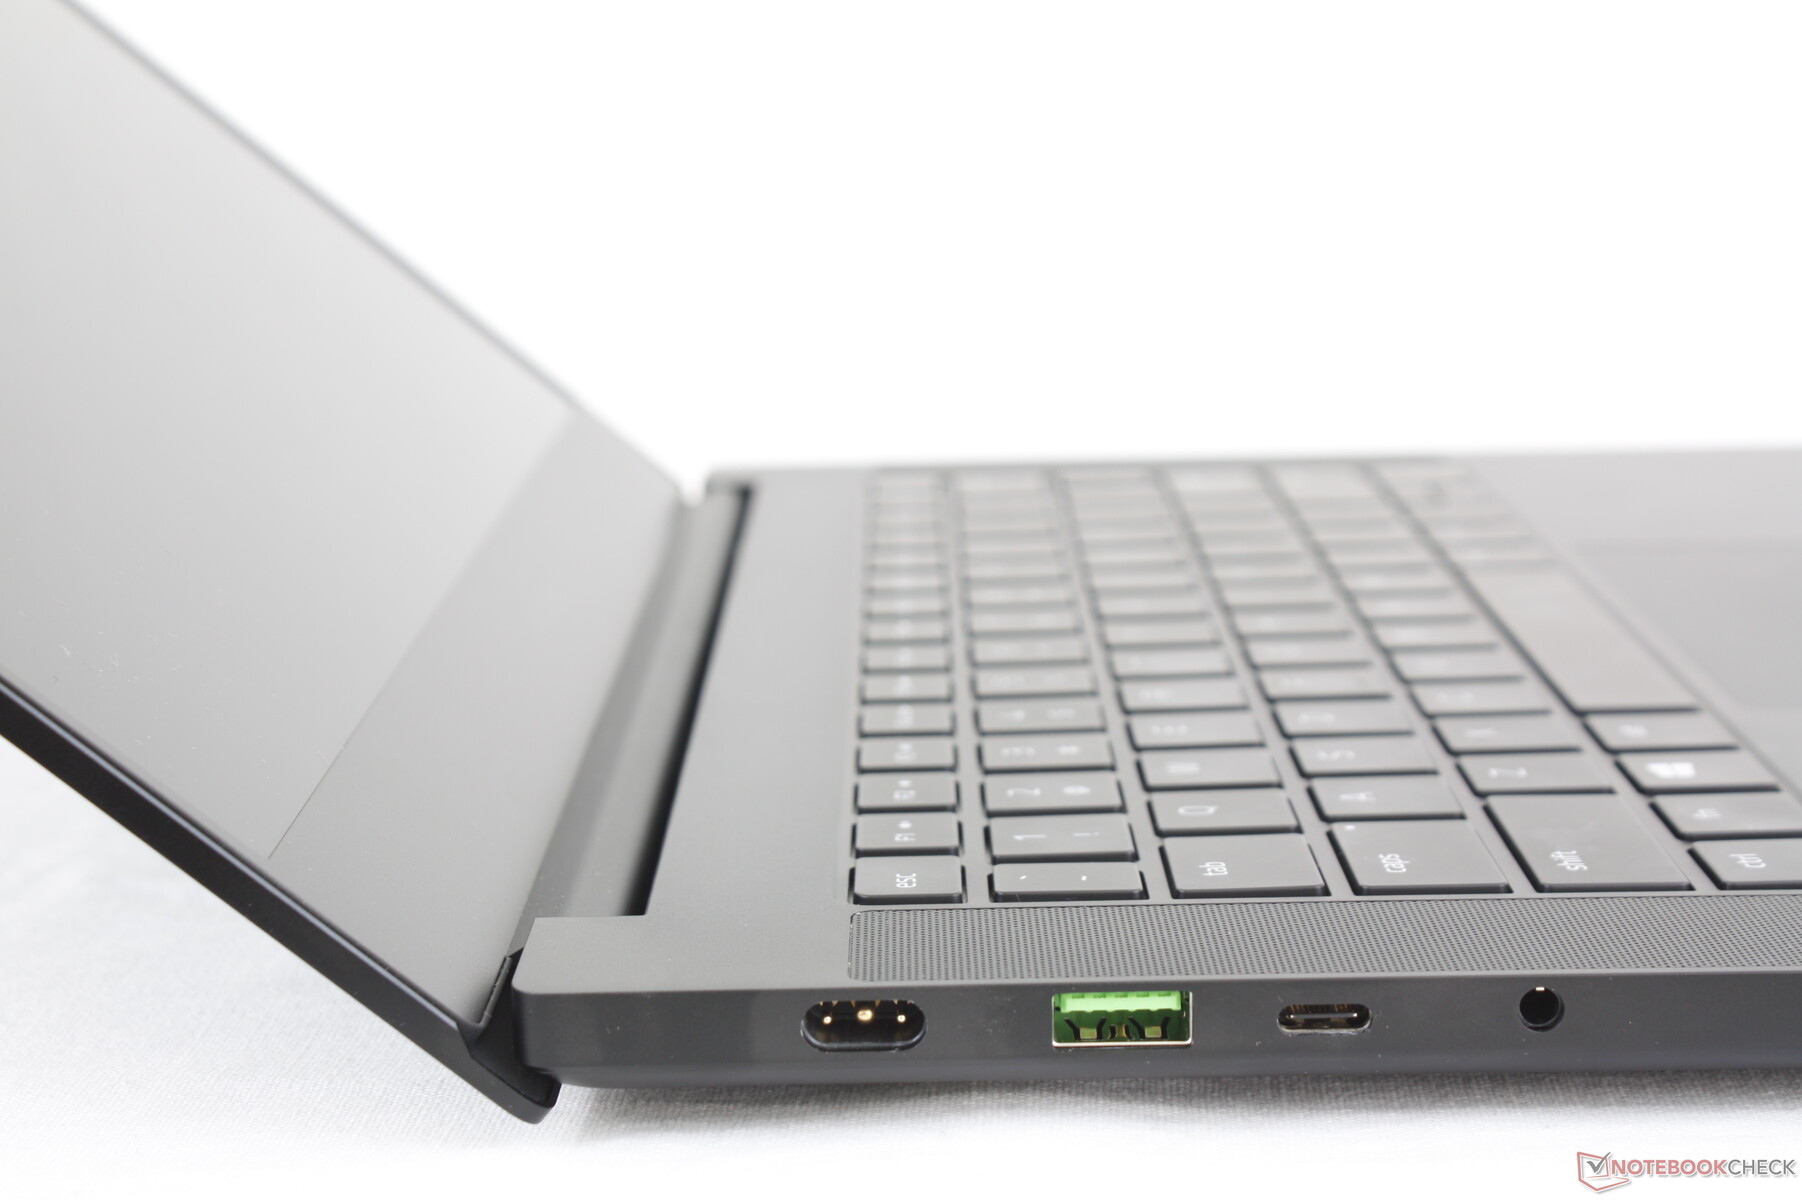

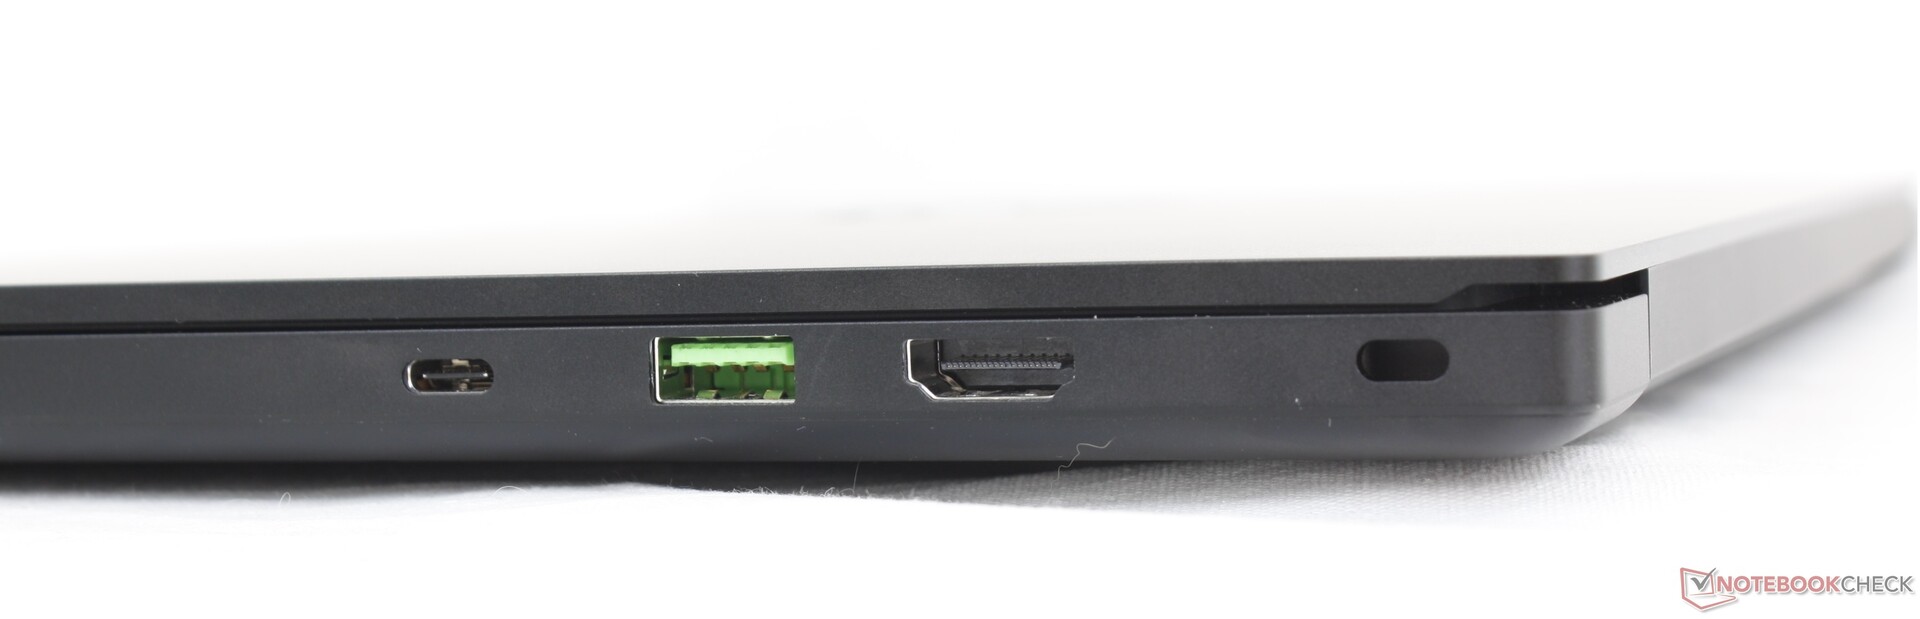
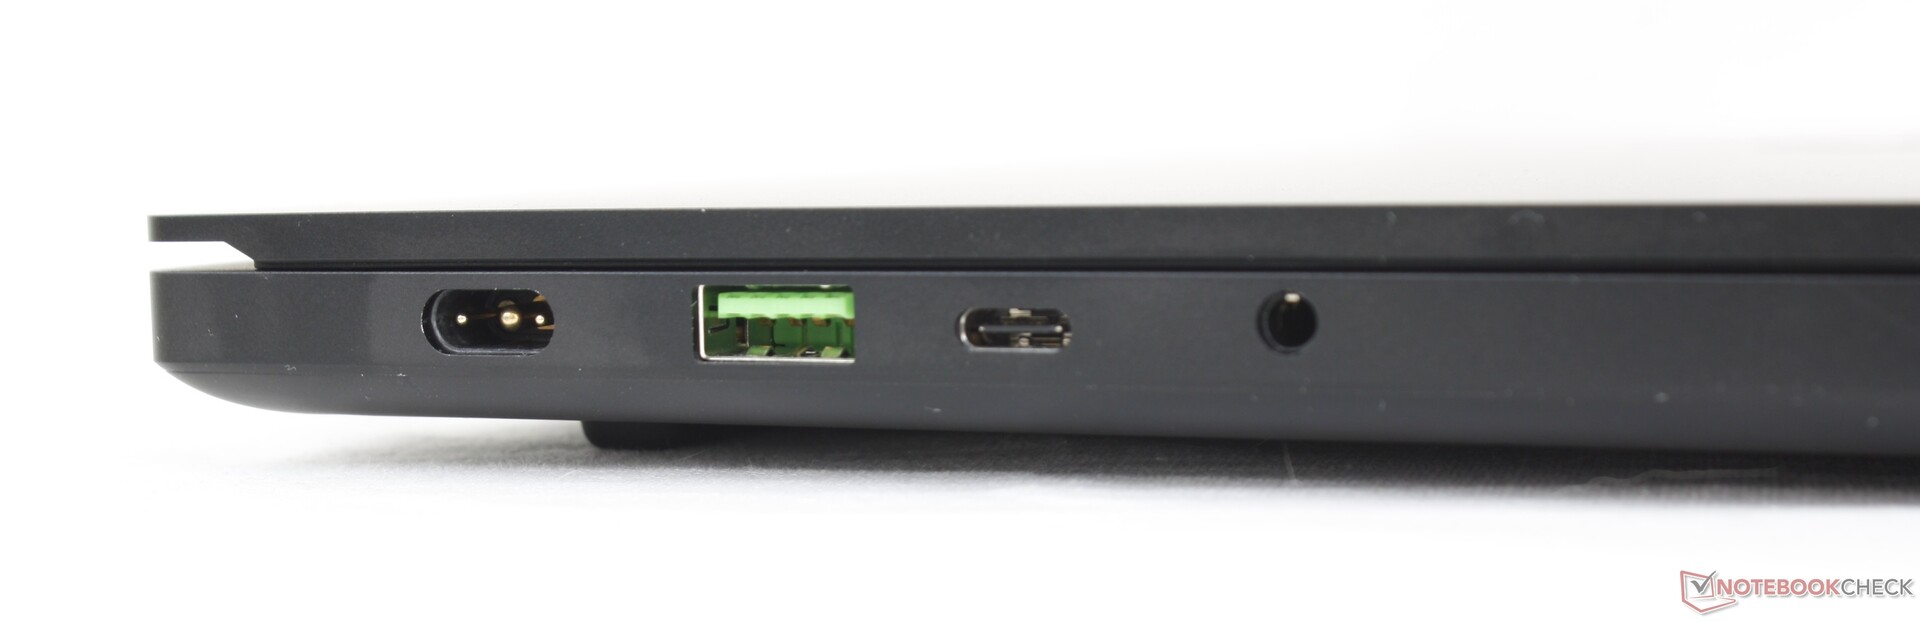
Connectivity — Thunderbolt Is Out
Port options are the same as on the Zephyrus G14 albeit rearranged. Users can connect up to three external monitors or recharge the laptop via USB-C instead of the proprietary barrel charger. There is no Thunderbolt support due to the lack of an integrated controller on AMD processors which makes the Blade 14 the only modern Blade laptop to not support the Razer Core eGPU series. Asus partly got around this issue by introducing its own proprietary connector on the ROG Flow X13 to support specific external GPU docking stations.

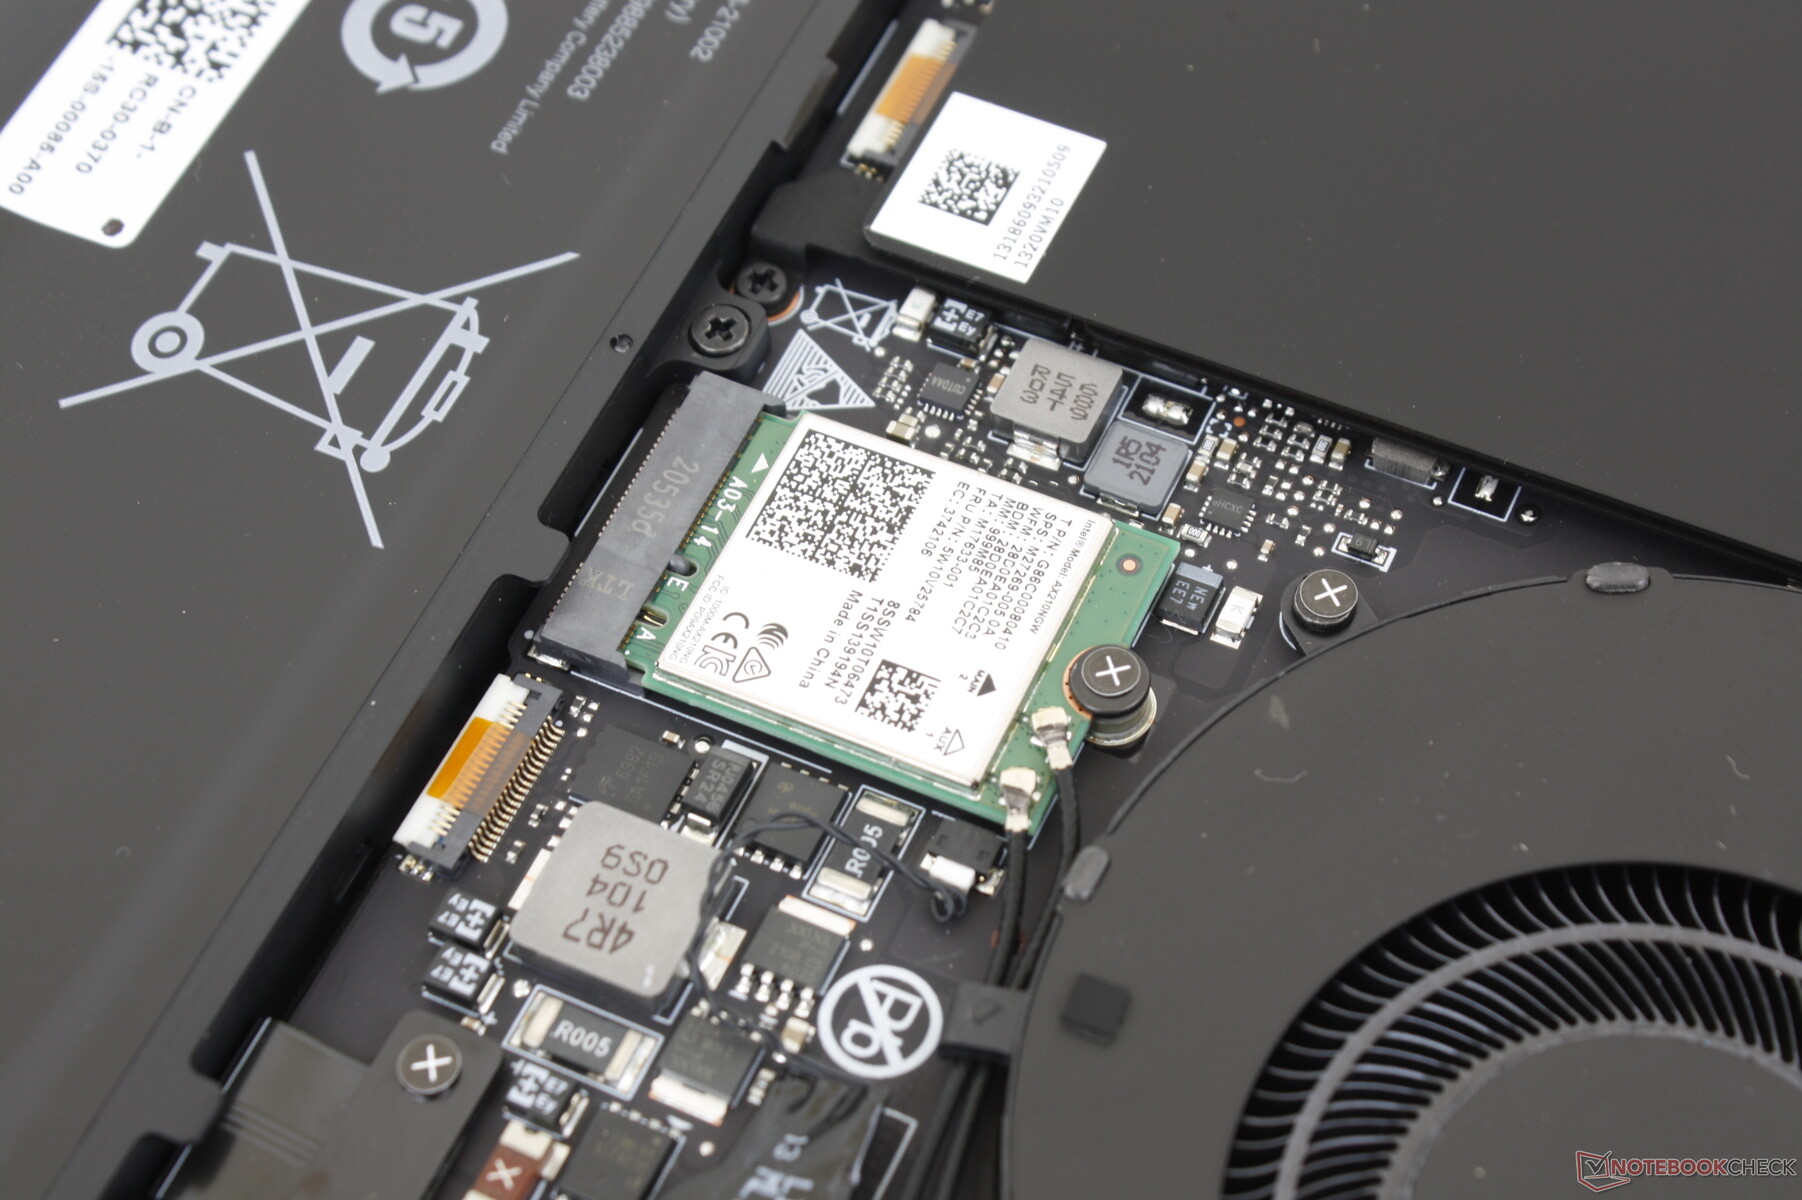
Communication
An Intel AX210 comes standard for both Wi-Fi 6E and Bluetooth 5.2 compatibility whereas most other laptops are still shipping with the Intel AX200/201 for regular Wi-Fi 6 instead. Most users won't be able to fully exploit Wi-Fi 6E as the standard requires yet another router designed around Wi-Fi 6E. This feature is more about future-proofing the Blade 14 more than anything else.
Webcam
The camera has not been upgraded in any meaningful way. Users are getting the same low quality 1 MP webcam that has been commonplace on laptops for years. An IR sensor is present for Windows Hello, but a webcam shutter is still absent.


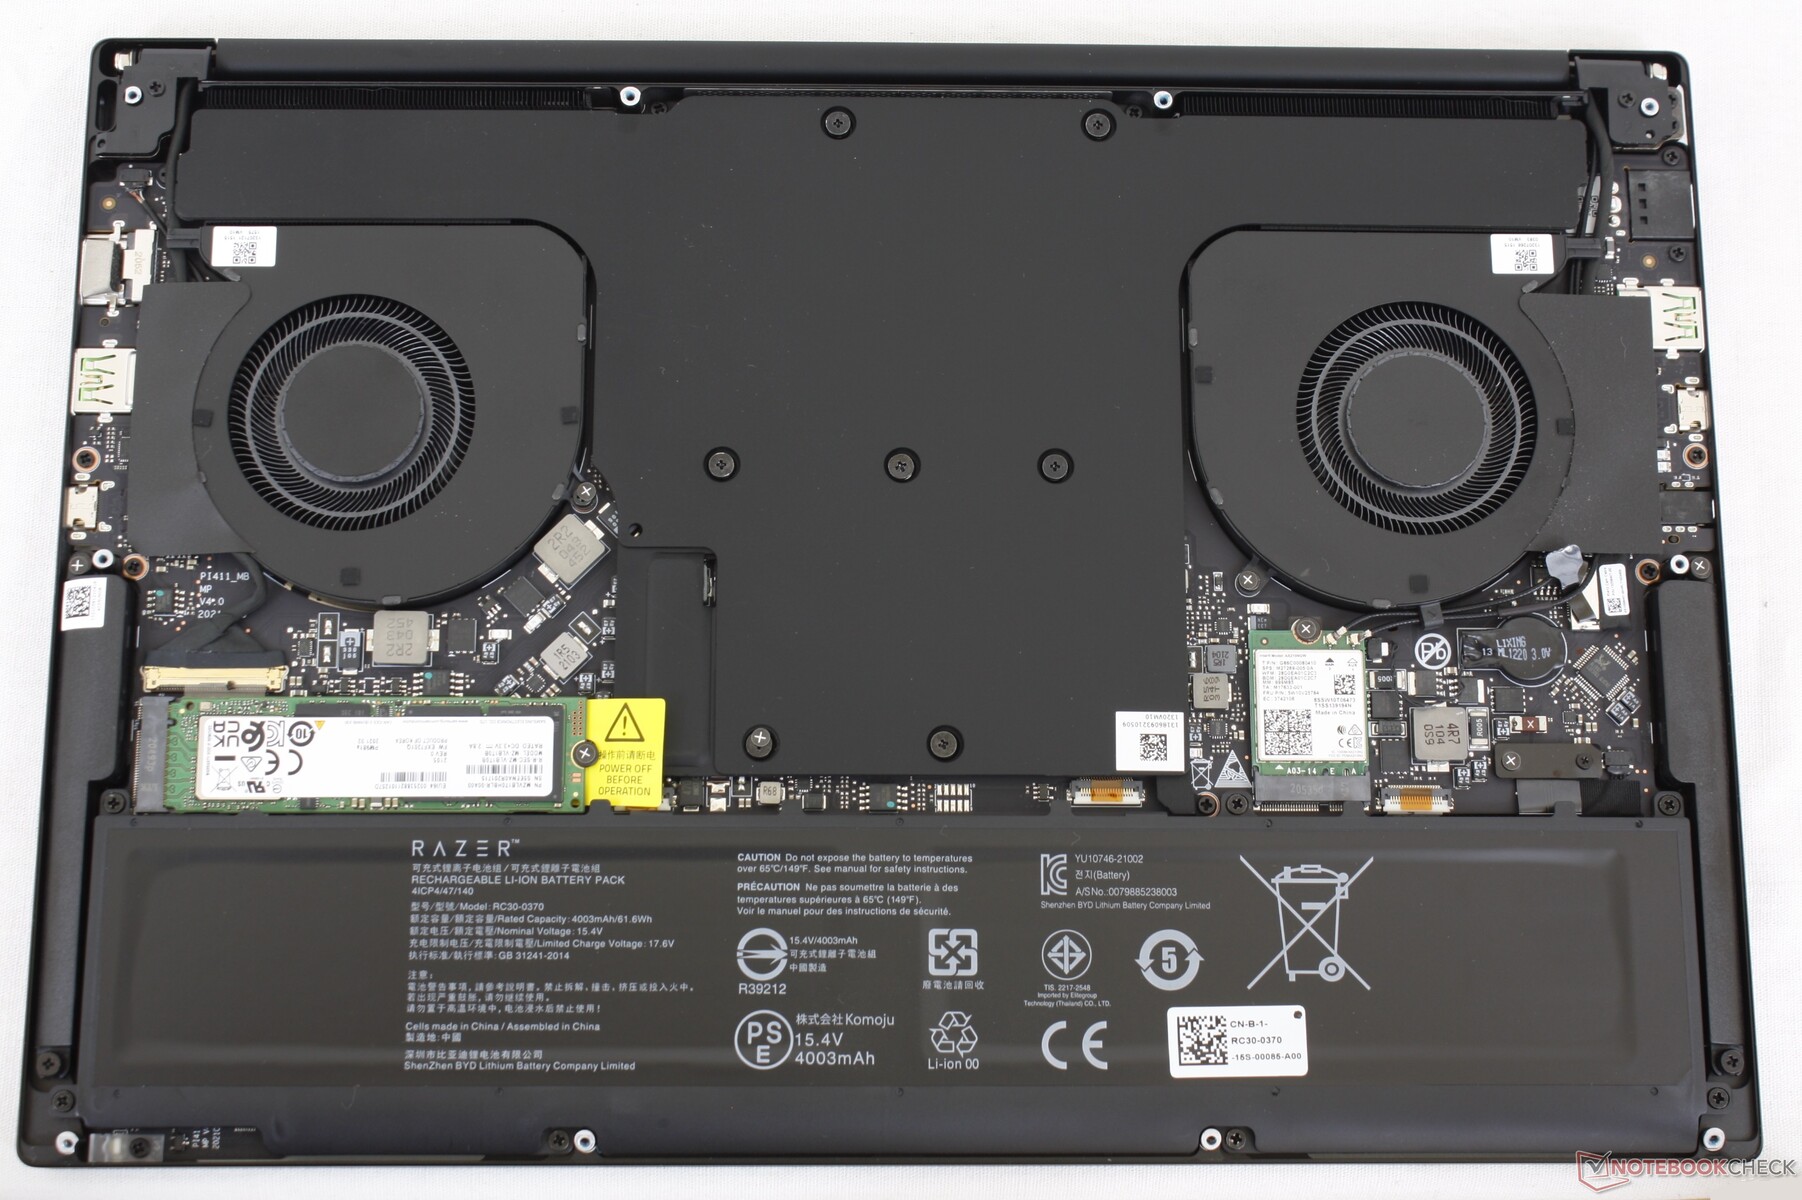
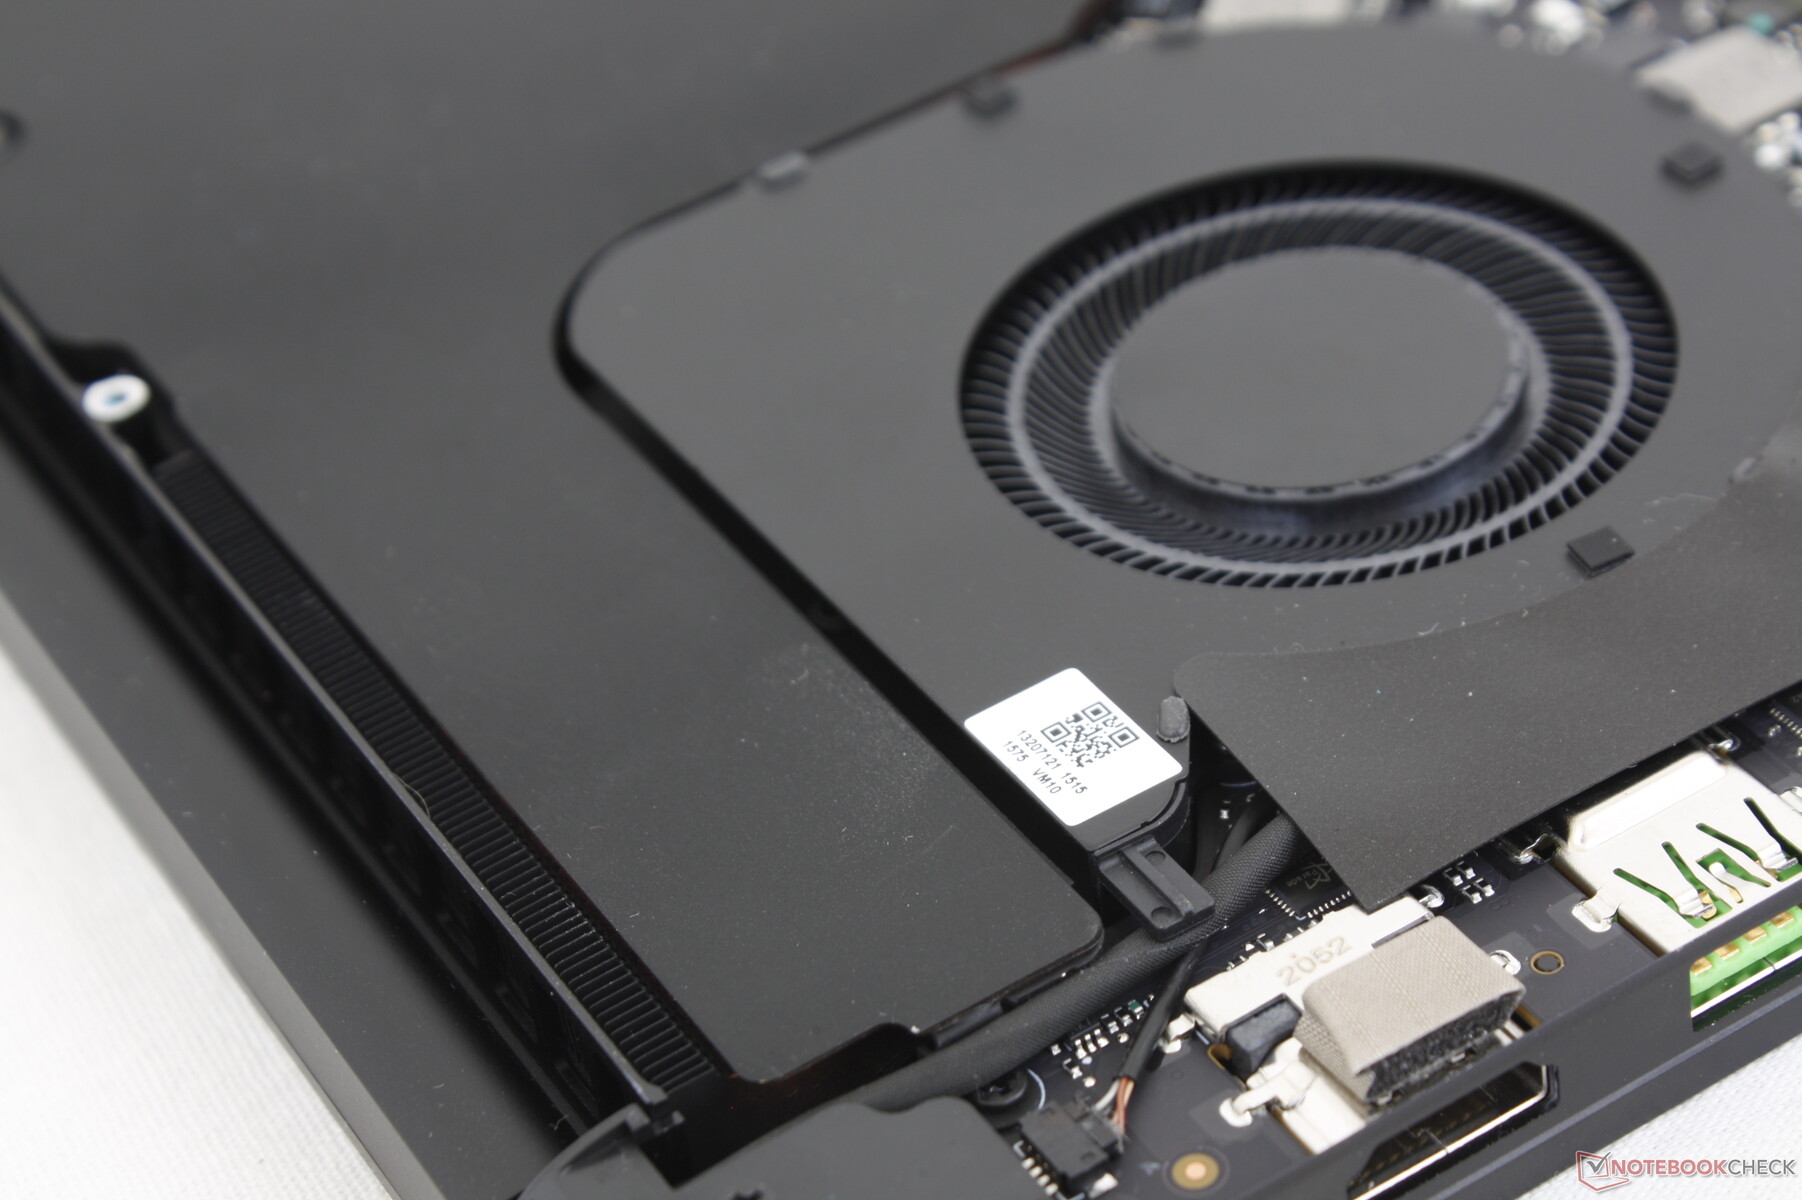
Maintenance
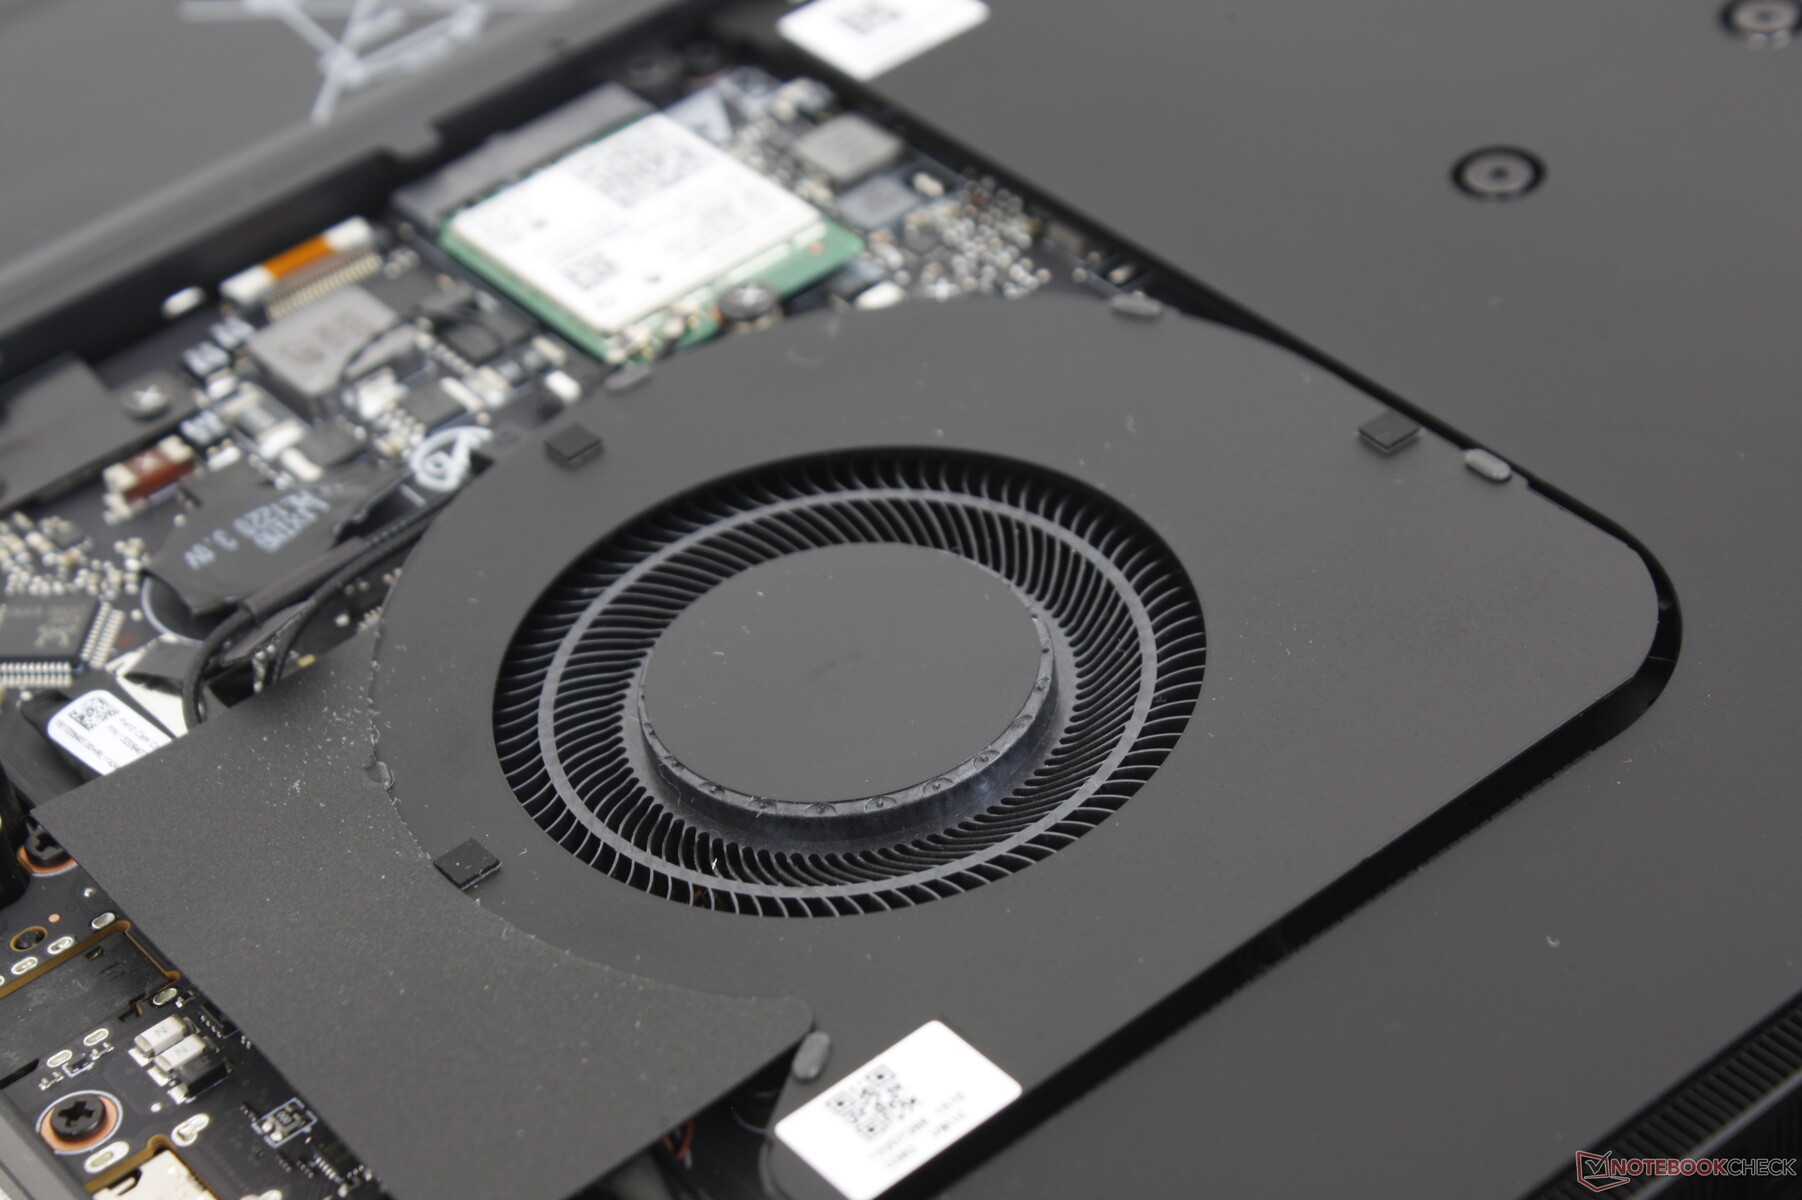
The bottom panel is secured by easily removable T5 Torx screws not unlike on other Blade models. There's not much to upgrade, however, as the system is lacking removable RAM and any secondary M.2 slots. The two fans and vapor chamber cooling solution cover almost the entire motherboard.
Accessories and Warranty
The retail box includes a small velvet wipe and some Razer logo stickers. The standard one-year limited warranty applies with extension options.
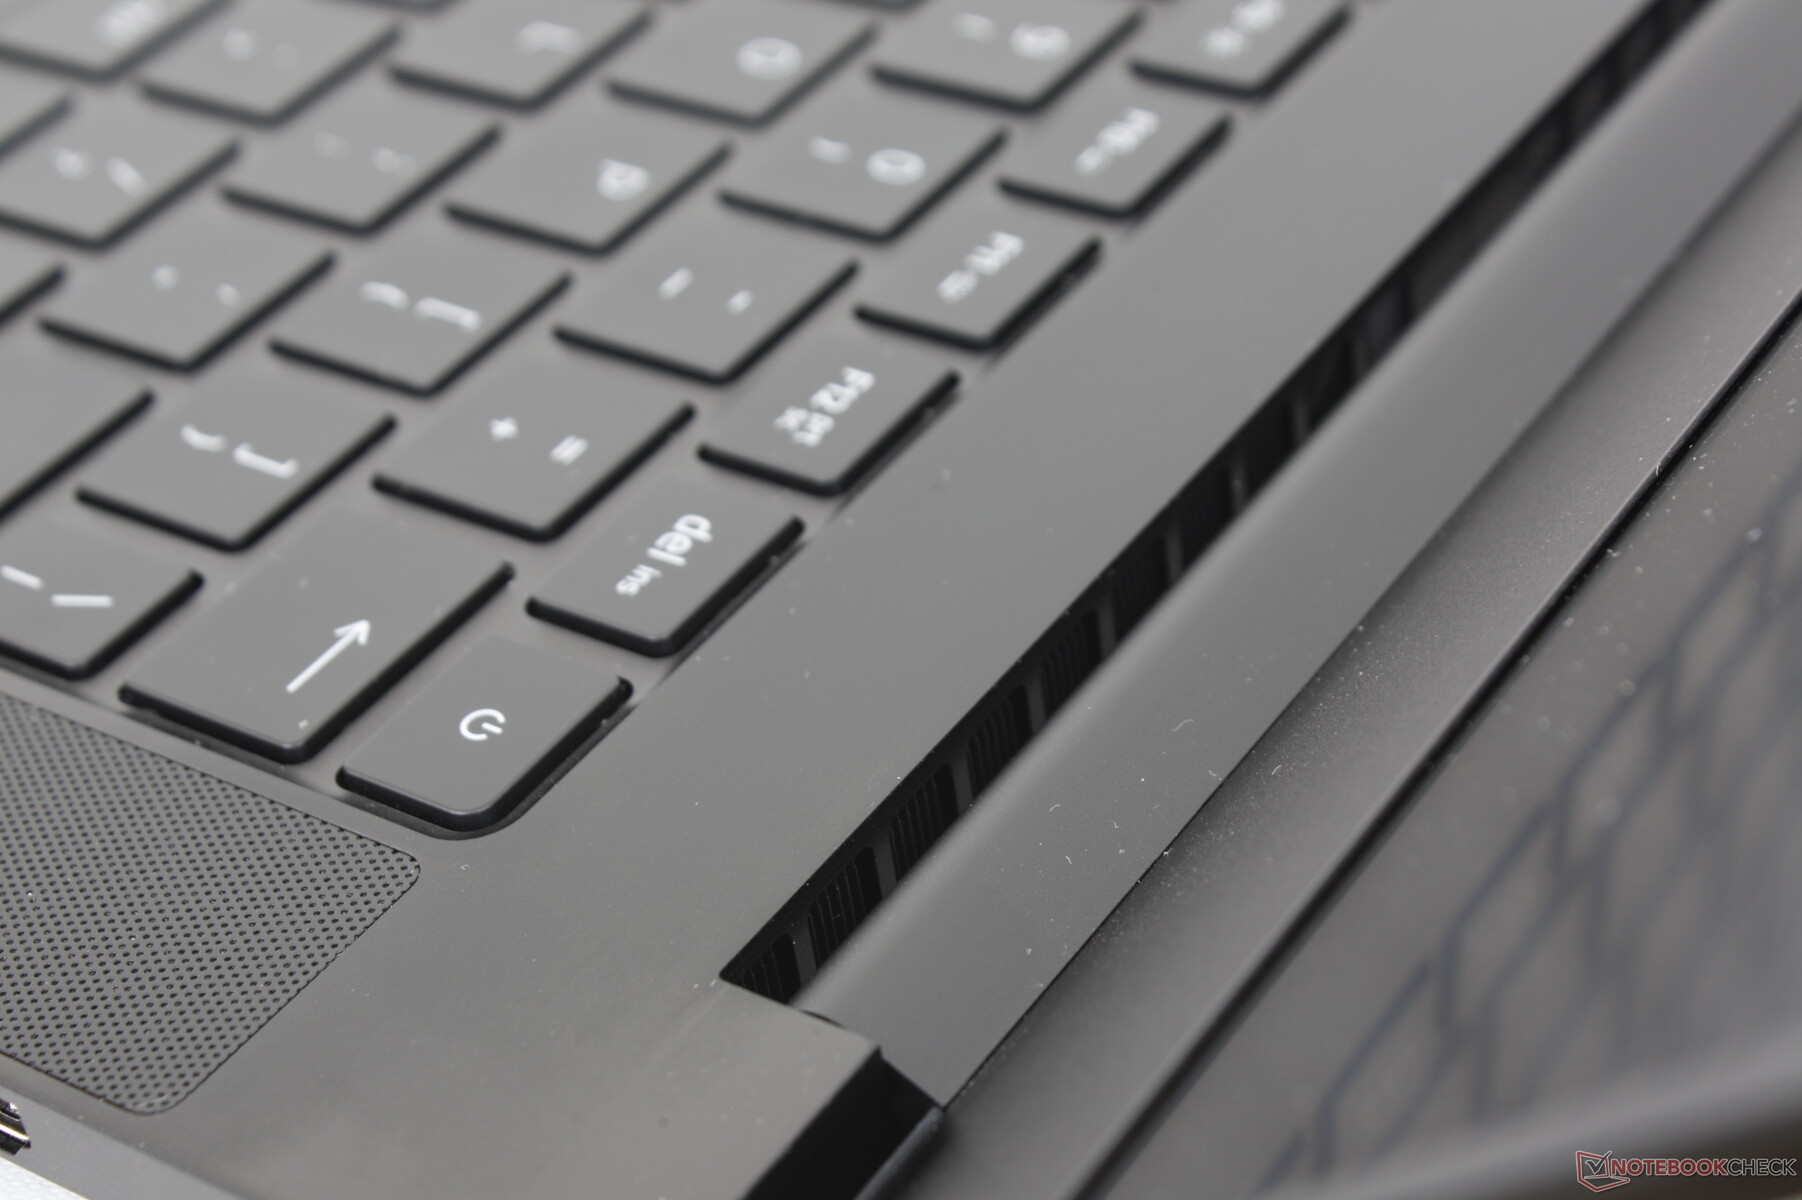
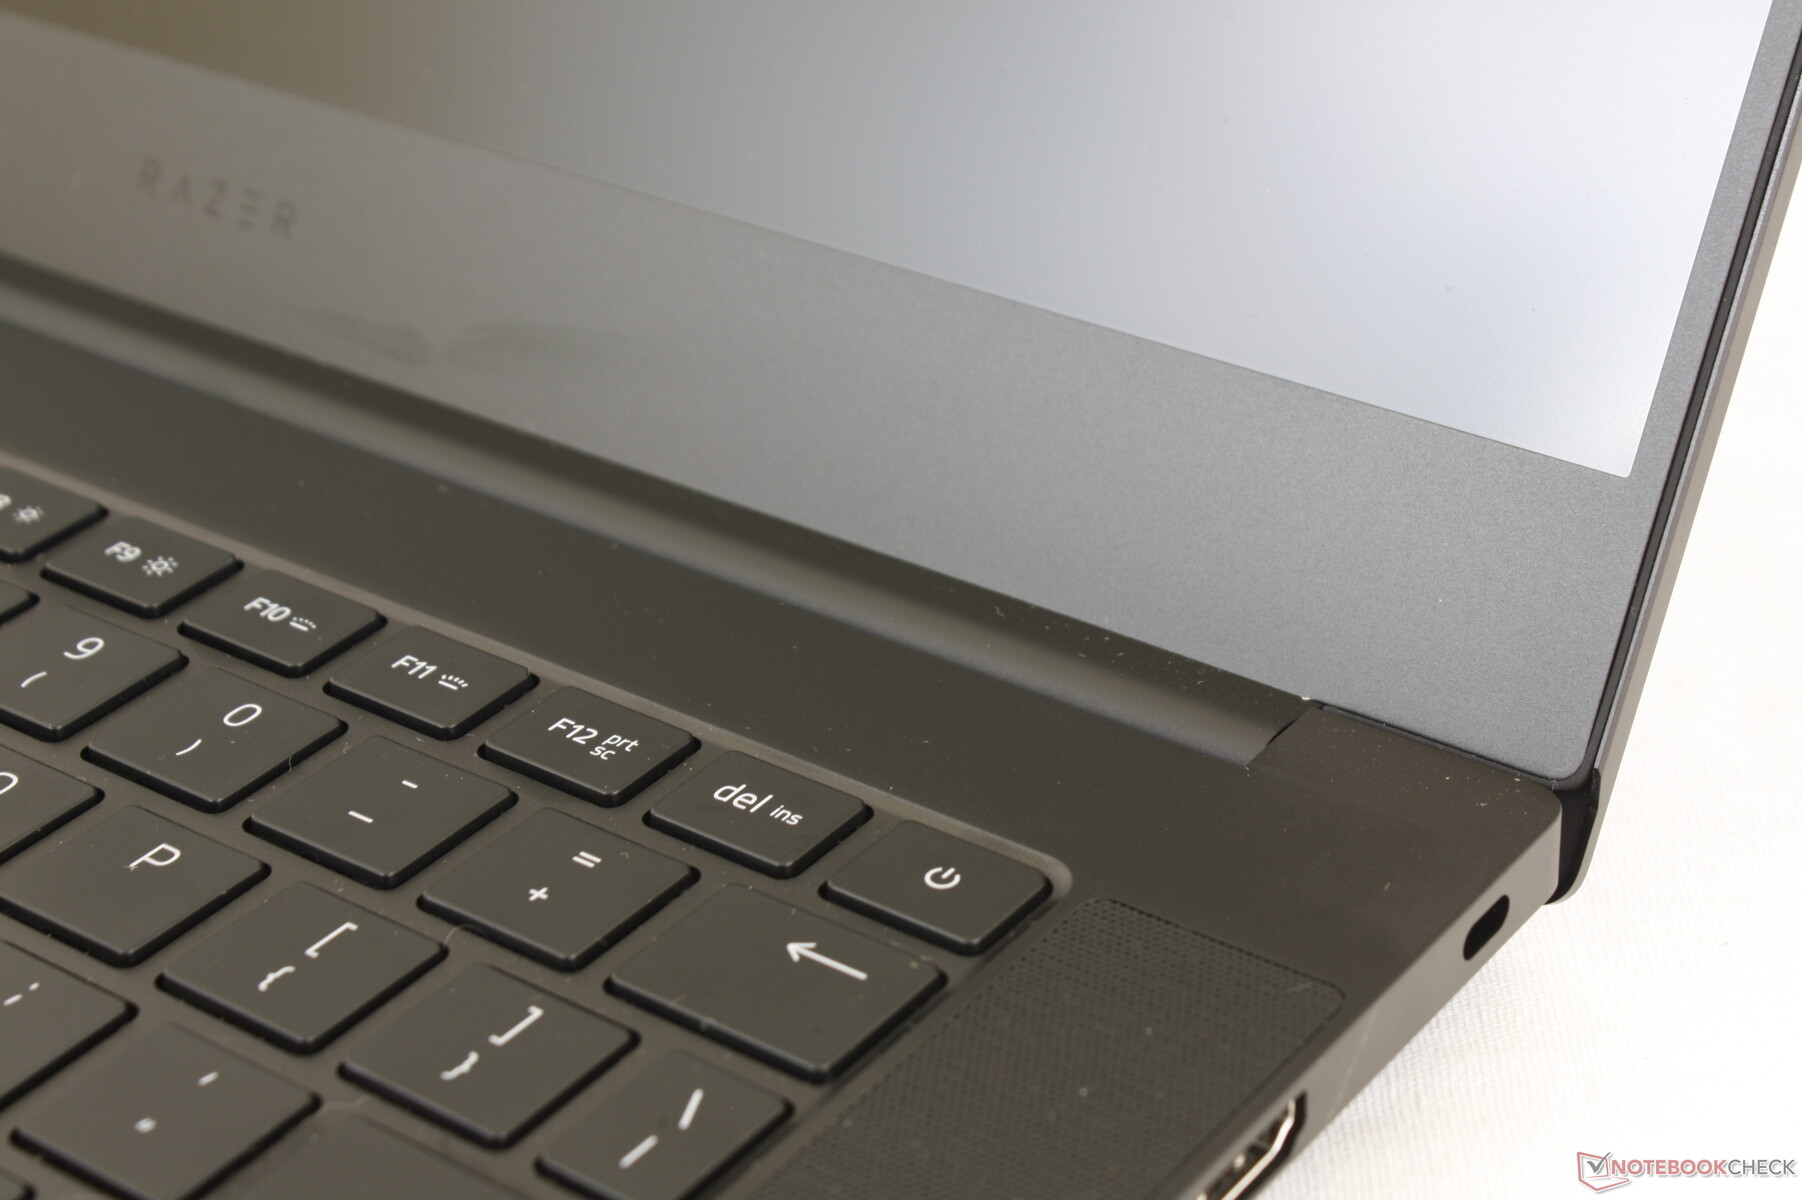
Input Devices — Like a Blade Stealth
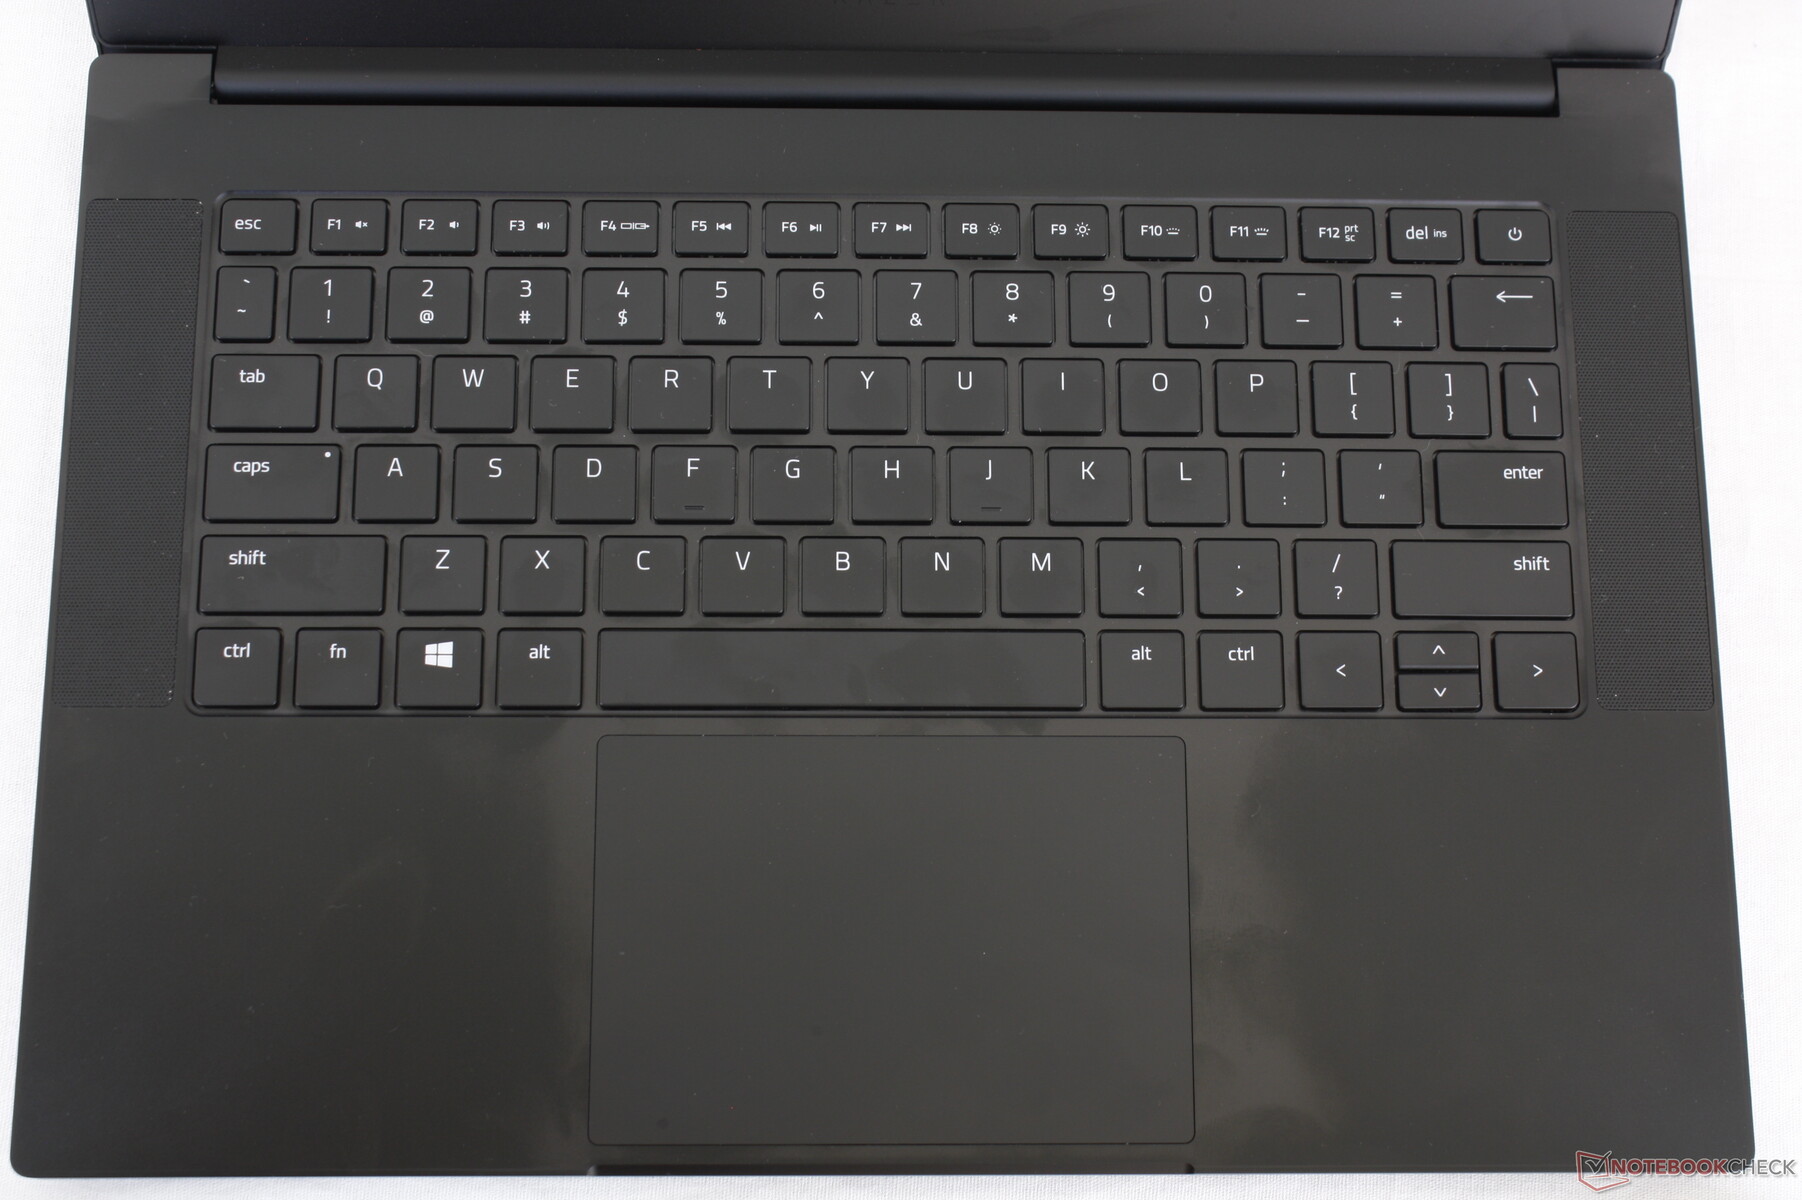
Keyboard
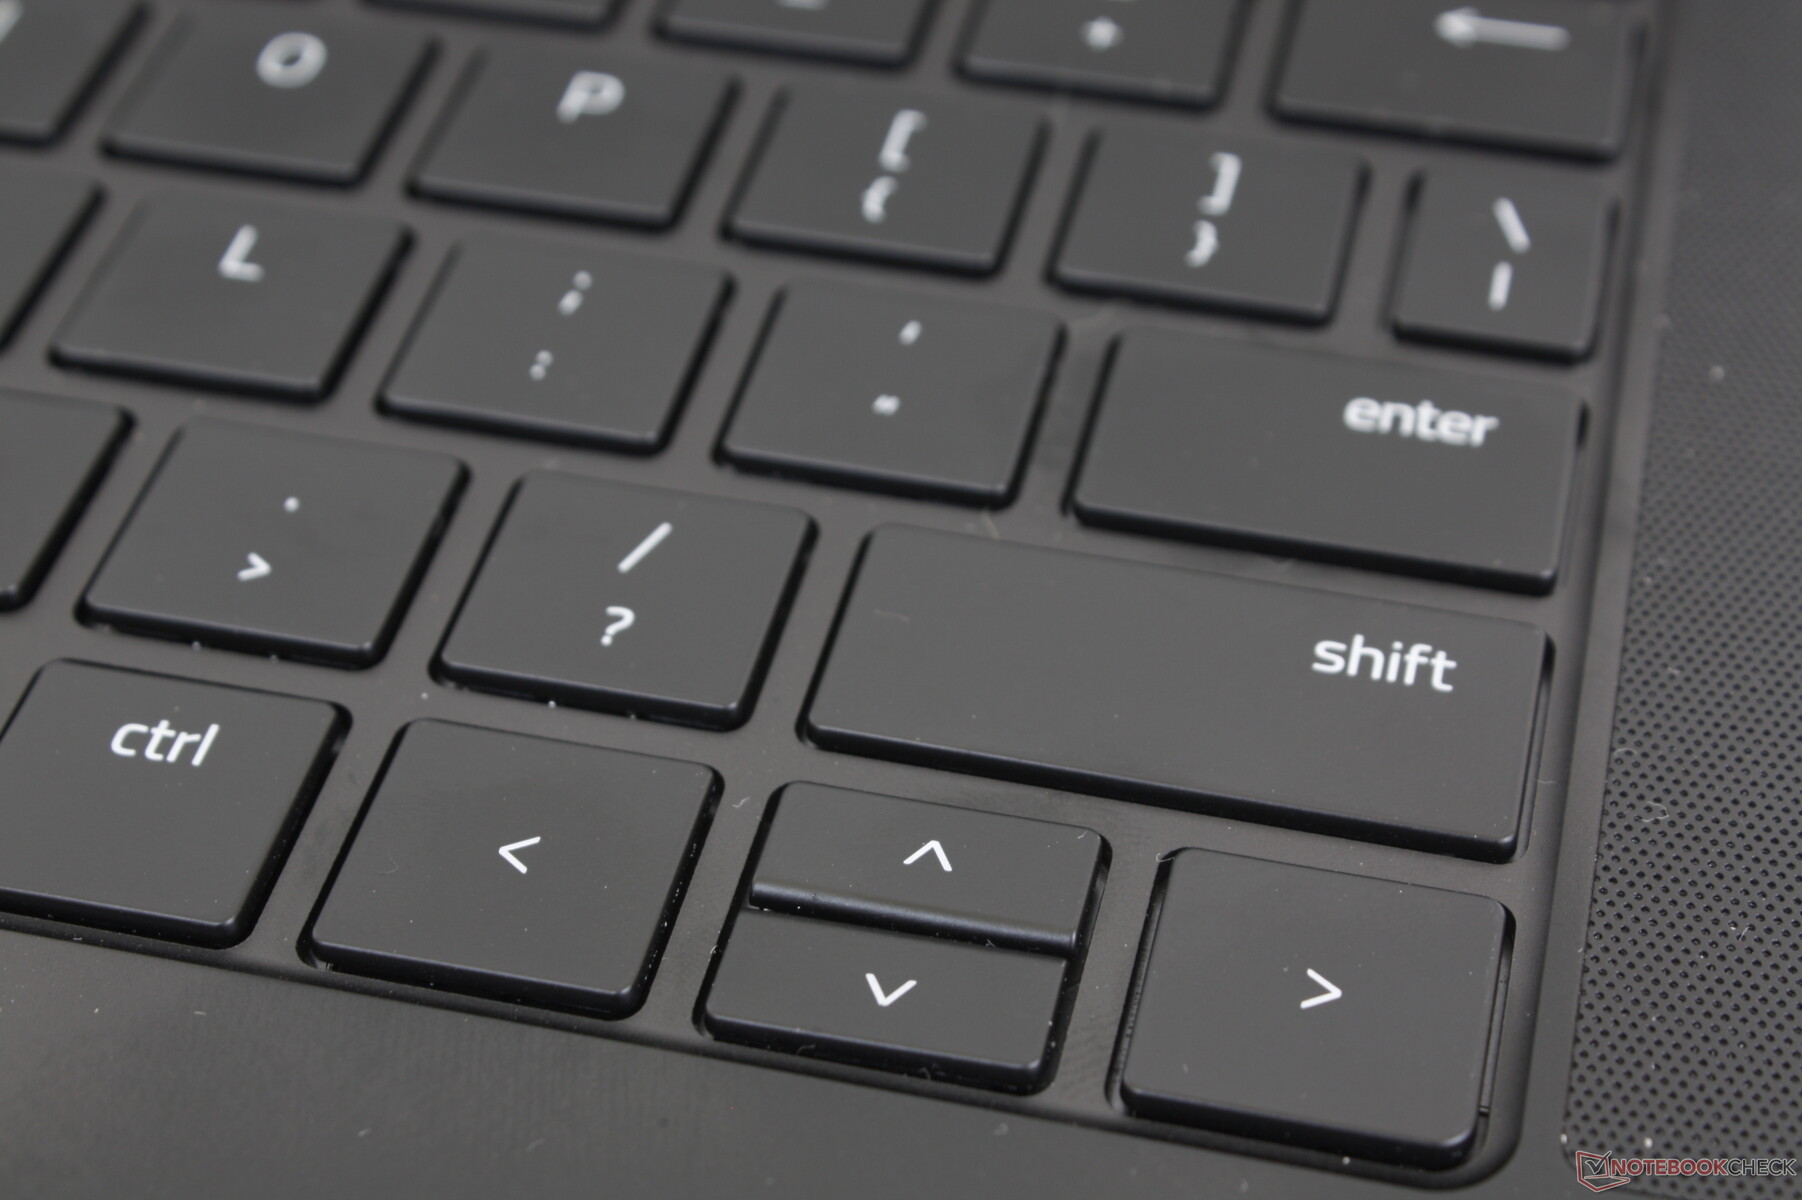
Aside from the short-lived optical switch option, the keyboards and clickpads on Razer Blade laptops have remained very consistent between models and sizes. The typing experience on a 13.3-inch 2018 Blade Stealth, for example, would be close to what you'd get on a 17.3-inch 2021 Blade Pro for better or worse. Key feedback remains lighter and shallower than on other laptops including on the MSI GS66 or Asus Flow X13. We personally prefer deeper and firmer keys closer to what you'd get on the HP Spectre series, but you'll know exactly what to expect from the Blade 14 if you've typed on any other Blade laptop in the past.
The printing on all keys are illuminated when the per-key RGB backlight is active. This may not be true on international models much like on the existing Blade Stealth, 15, or Pro 17 internal models. The competing Zephyrus G14 has no per-key RGB lighting option.
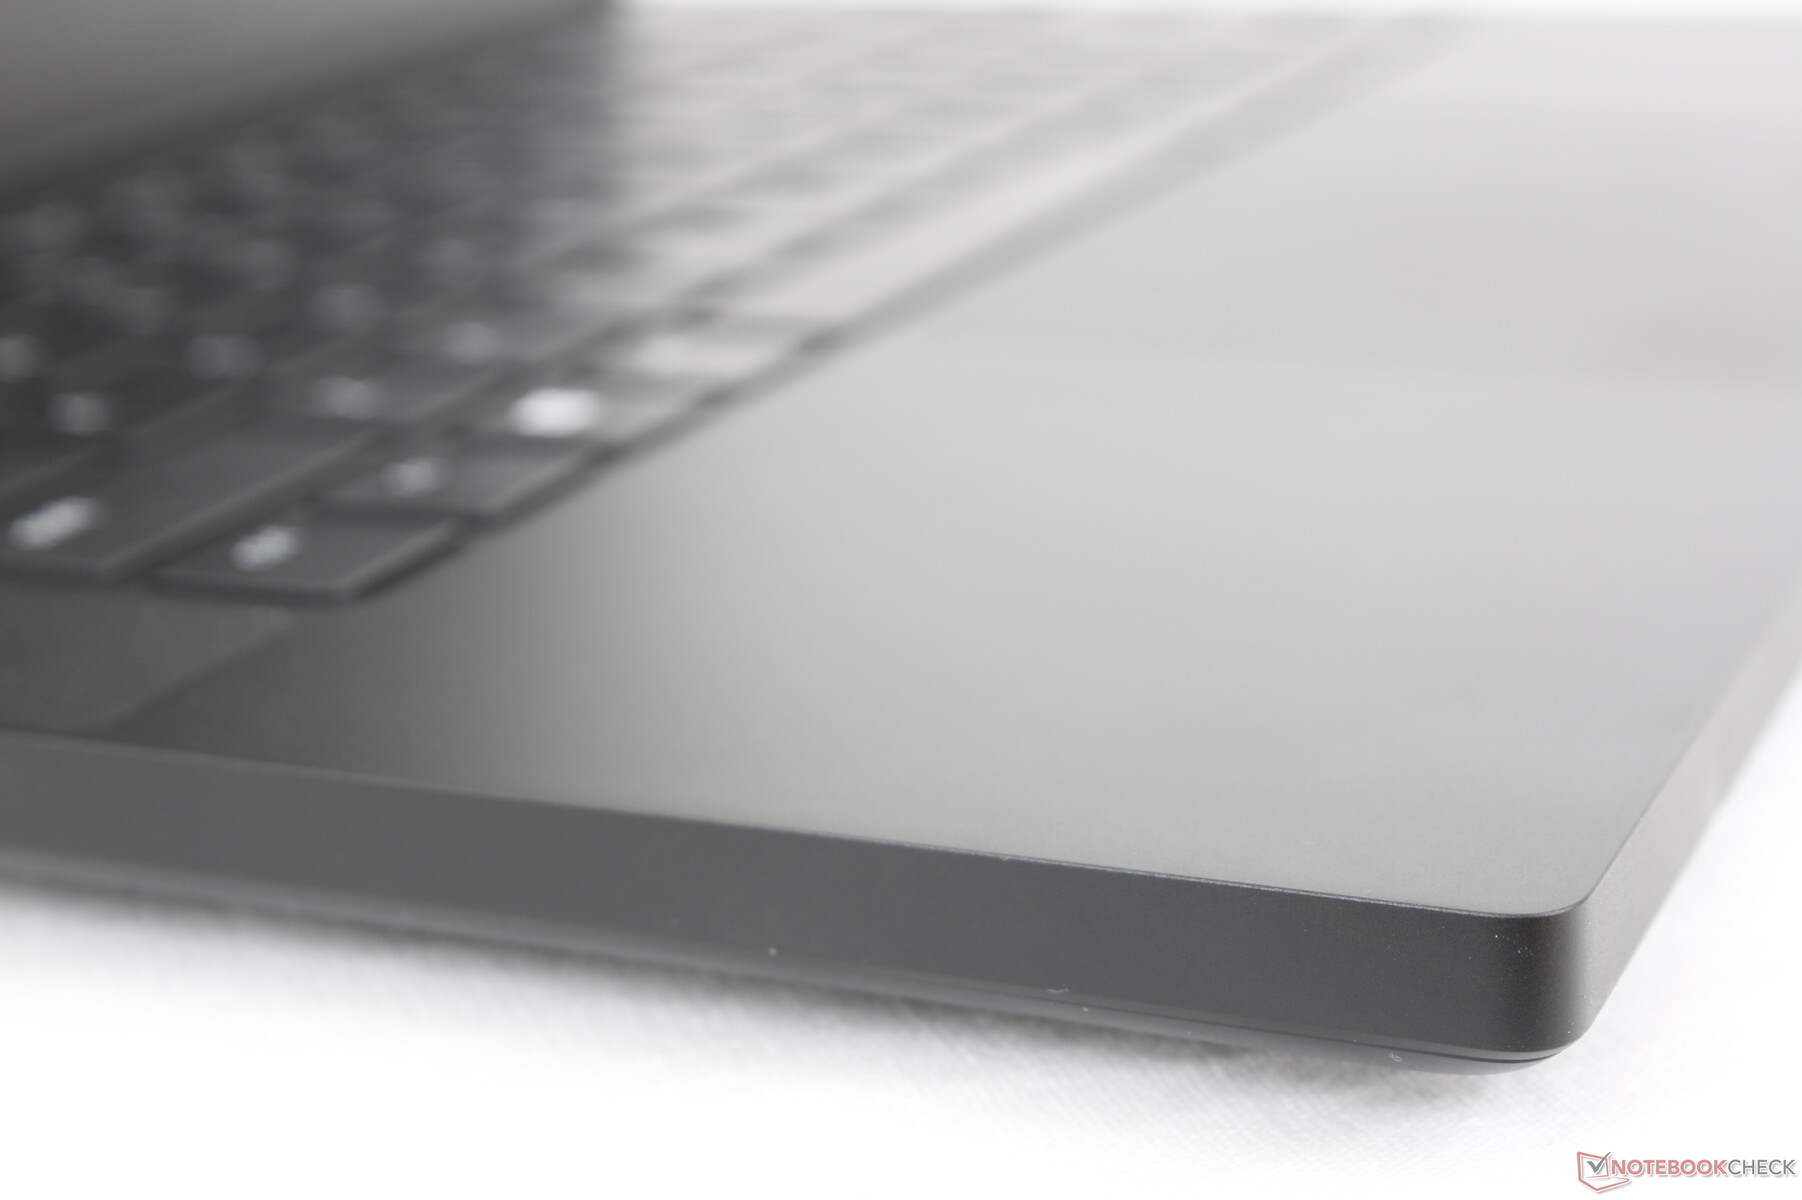
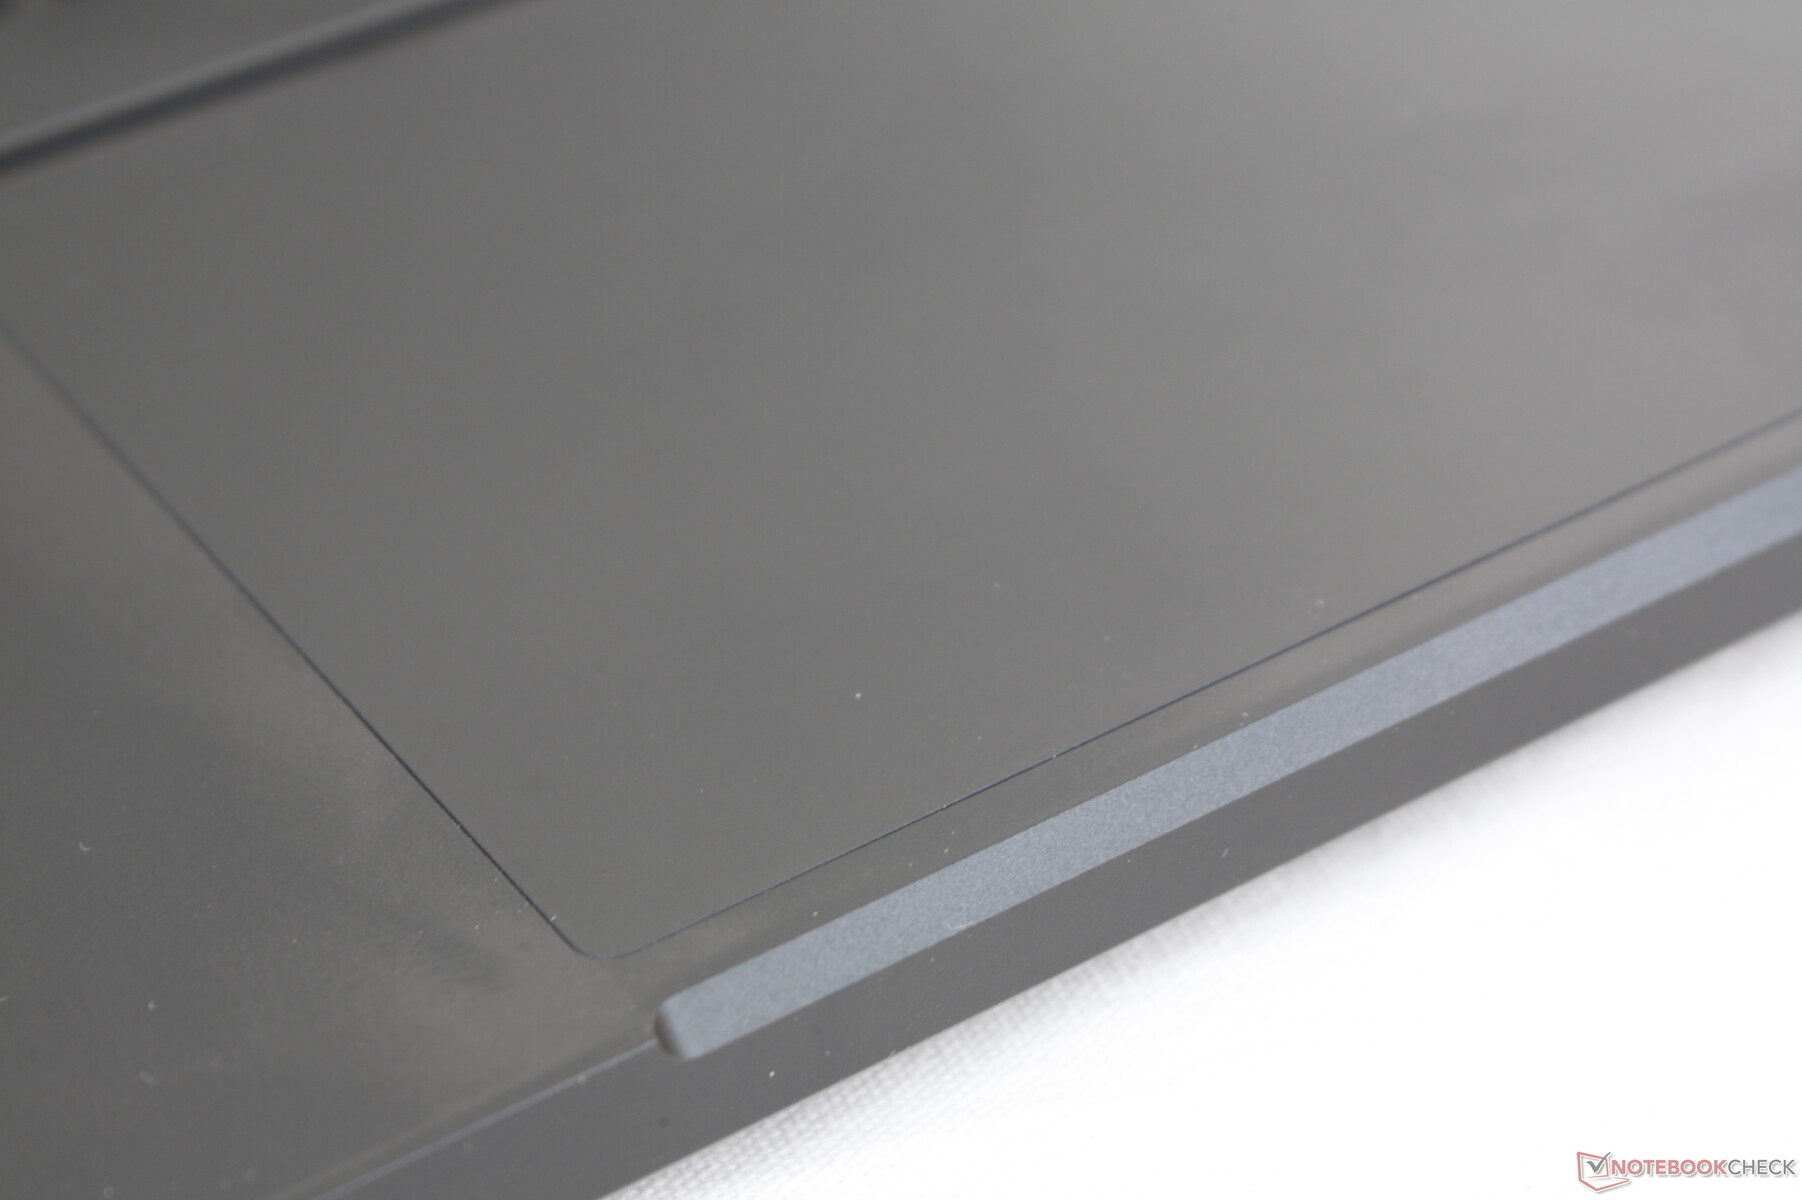
Touchpad
The clickpad (11.1 x 7.6 cm) is smaller and larger than the ones on the Blade 15 (13 x 8 cm) and Zephyrus G14 (10.5 x 6 cm), respectively. It's actually quite spacious given the limited 14-inch form factor. We're still not fans of the quiet and spongy feedback, however, which feels unsatisfying to click on.

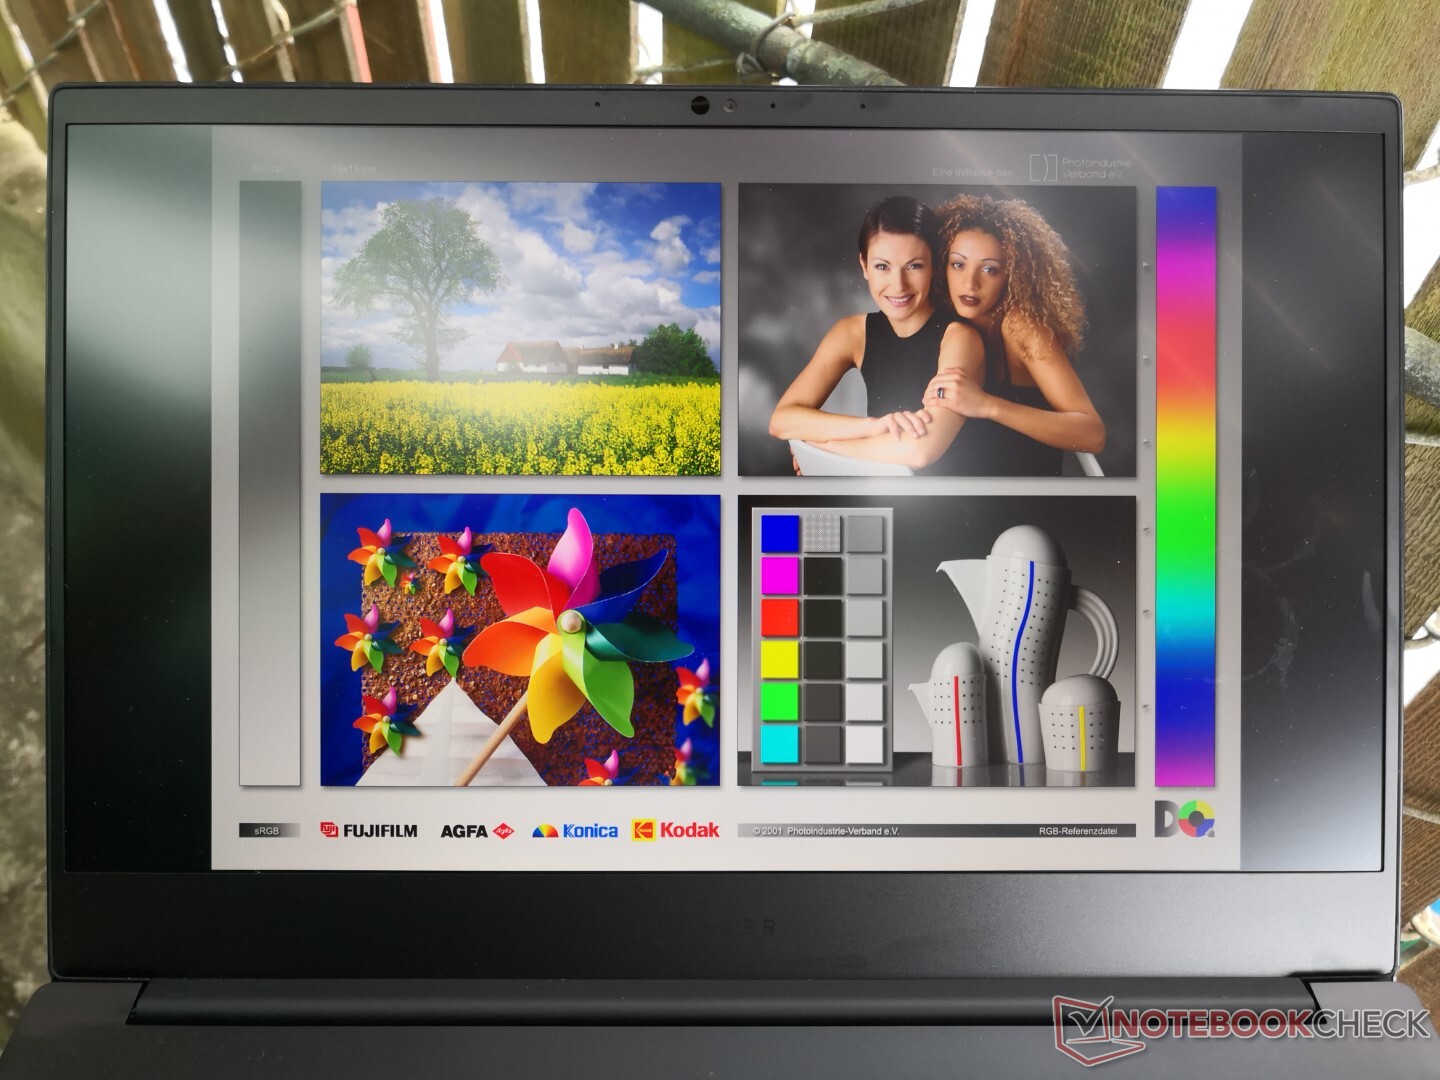
Display — 165 Hz, FreeSync, QHD, and DCI-P3 All-in-One
HWiNFO returns a panel name of TL140BDXP02-2 which appears to be the 14-inch version of the 15.6-inch TL156VDXP02-0 panel on the Blade 15. This is the first time that such a panel has appeared in our database meaning no other laptop available at the moment is using the same 14-inch QHD panel as the Blade 14.
All aspects of the QHD panel here are well above average. Response times aren't as fast as OLED or certain IPS panels like the one on the MSI GS75 or Blade Pro 17, but they're still good enough for fast-paced gaming. Image quality is slightly grainier than on the glossy Blade 15 or Blade Pro 17 due to the matte overlay.
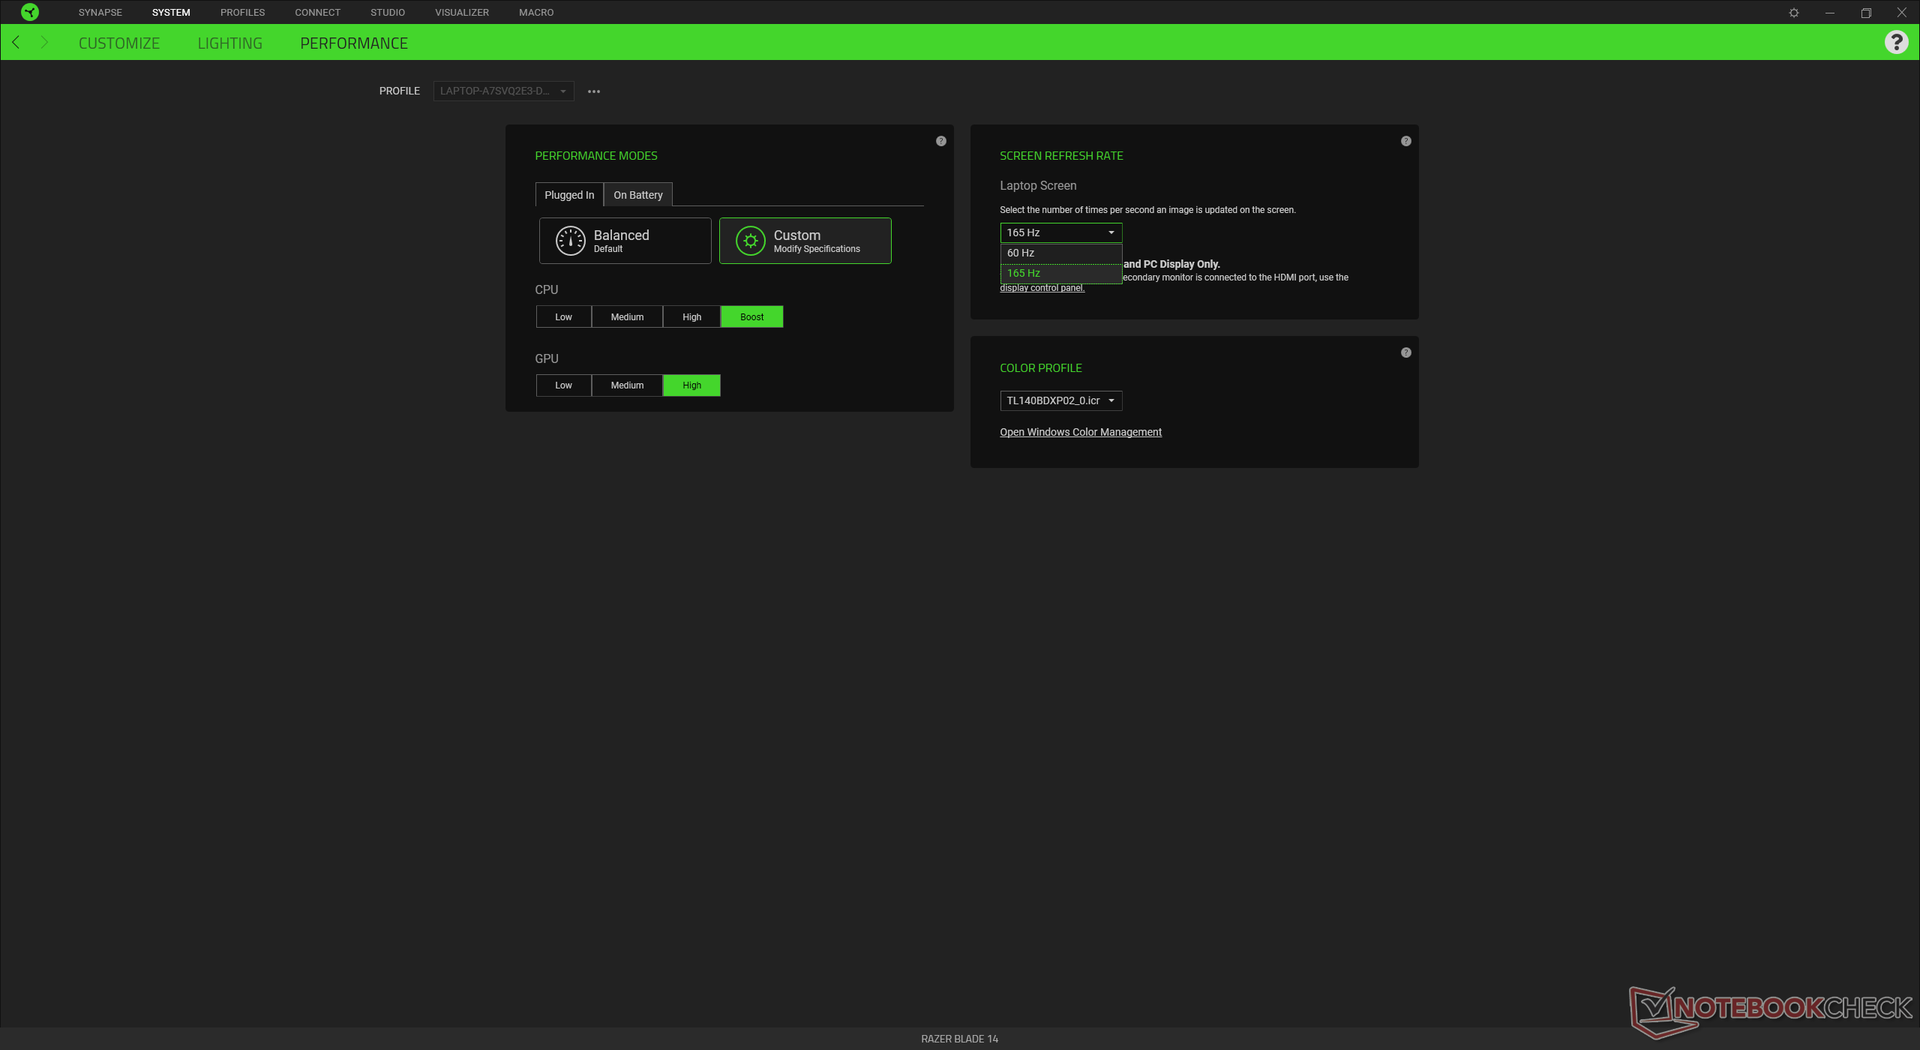
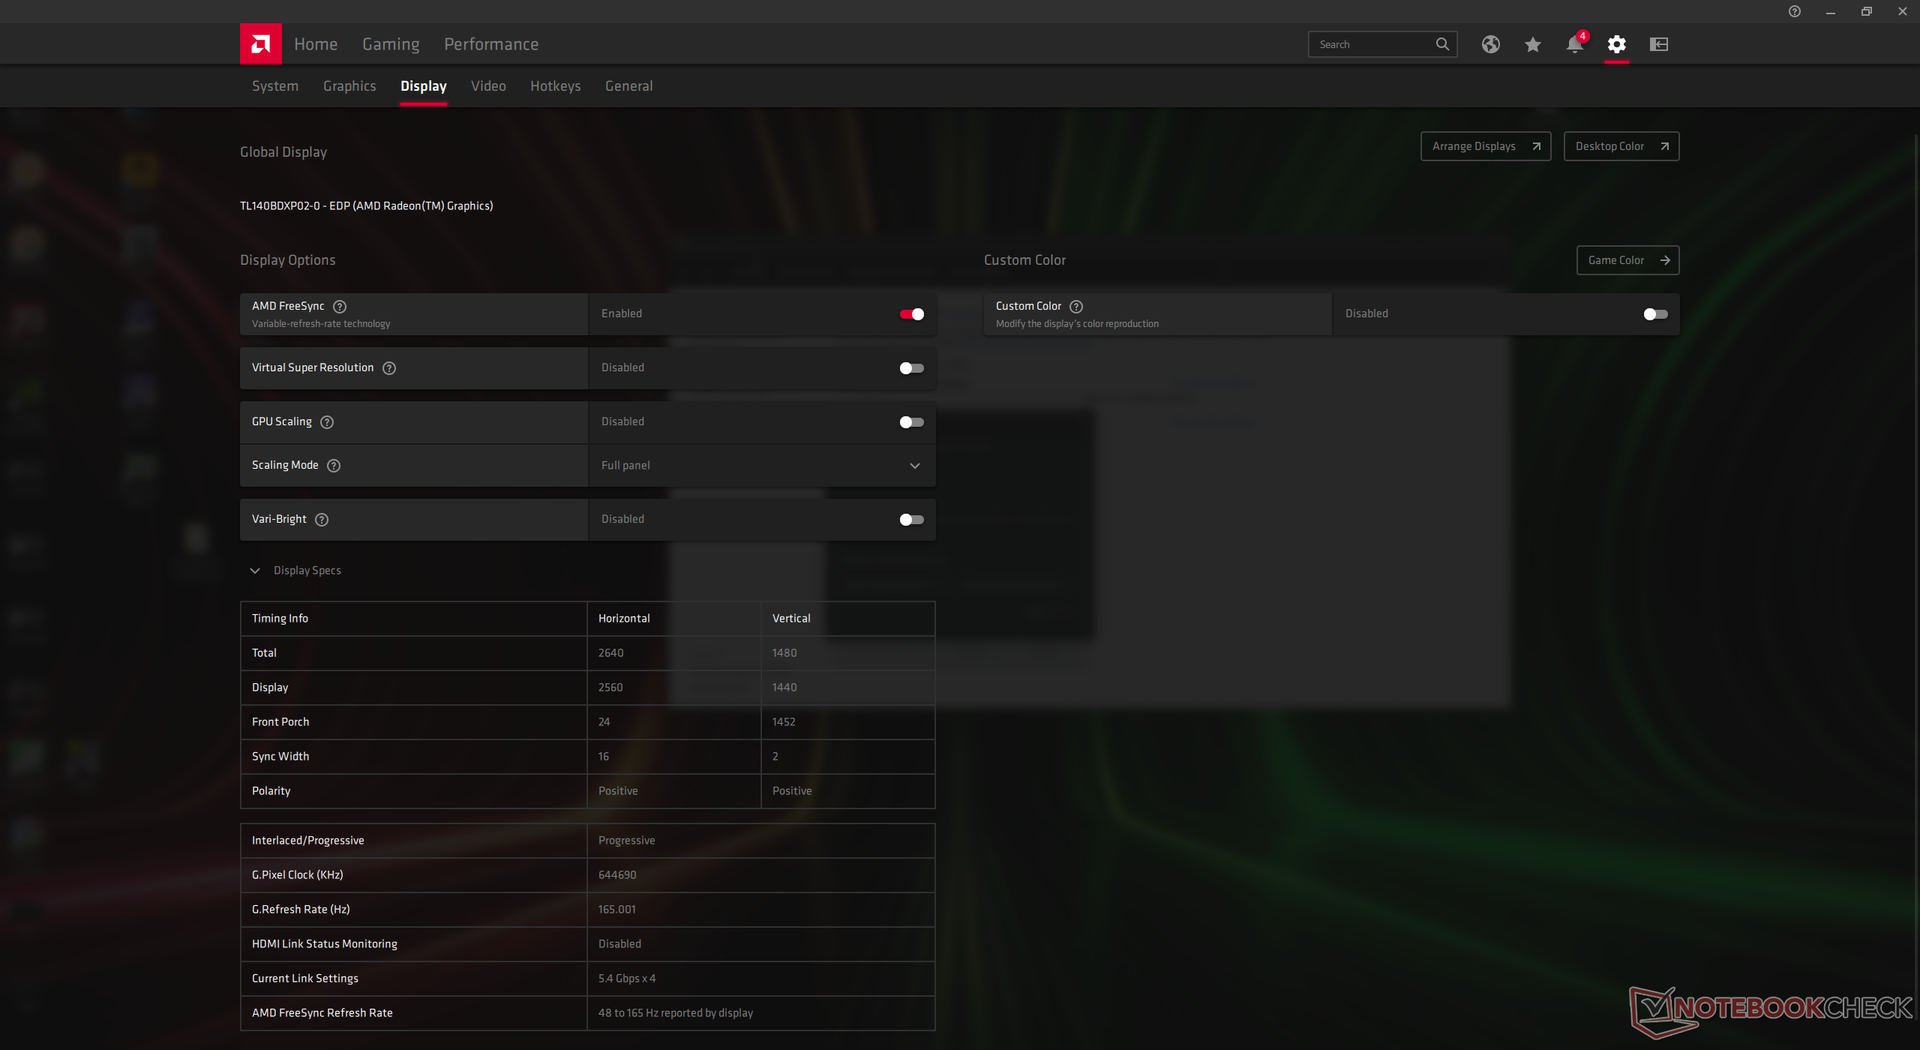
Note that the 165 Hz panel here is limited to 60 Hz or 165 Hz with no "in between" 144 Hz setting. AMD FreeSync is supported and automatically enabled.


| |||||||||||||||||||||||||
Brightness Distribution: 91 %
Center on Battery: 331.1 cd/m²
Contrast: 920:1 (Black: 0.36 cd/m²)
ΔE Color 2.25 | 0.5-29.43 Ø5
ΔE Greyscale 1.7 | 0.57-98 Ø5.3
85.4% AdobeRGB 1998 (Argyll 2.2.0 3D)
99.9% sRGB (Argyll 2.2.0 3D)
97.2% Display P3 (Argyll 2.2.0 3D)
Gamma: 2.3
| Razer Blade 14 Ryzen 9 RTX 3070 TL140BDXP02-2, IPS, 14.00, 2560x1440 | Razer Blade 15 Advanced Model Early 2021 TL156VDXP02-0, IPS, 15.60, 1920x1080 | Asus Zephyrus G14 GA401IV CEC PA LM140LF-1F01, IPS, 14.00, 1920x1080 | LG Gram 14Z90P-G.AA79G LG Display LP140WU1-SPA1, IPS, 14.00, 1920x1200 | MSI GS66 Stealth 10UG AU Optronics B156HAN12.0, IPS, 15.60, 1920x1080 | |
|---|---|---|---|---|---|
| Display | -19% | -20% | 0% | -17% | |
| Display P3 Coverage | 97.2 | 65.9 -32% | 66.5 -32% | 97.6 0% | 67.7 -30% |
| sRGB Coverage | 99.9 | 96.4 -4% | 92 -8% | 99.9 0% | 98.4 -2% |
| AdobeRGB 1998 Coverage | 85.4 | 68 -20% | 67.2 -21% | 85.3 0% | 69.1 -19% |
| Response Times | 3% | -194% | -144% | 3% | |
| Response Time Grey 50% / Grey 80% * | 16.4 ? | 16 ? 2% | 43.6 ? -166% | 45 ? -174% | 14.4 ? 12% |
| Response Time Black / White * | 10.8 ? | 10.4 ? 4% | 34.8 ? -222% | 23 ? -113% | 11.6 ? -7% |
| PWM Frequency | |||||
| Screen | 21% | -8% | -27% | -4% | |
| Brightness middle | 331.1 | 338 2% | 322.2 -3% | 352 6% | 259.5 -22% |
| Brightness | 318 | 334 5% | 302 -5% | 332 4% | 264 -17% |
| Brightness Distribution | 91 | 94 3% | 87 -4% | 91 0% | 90 -1% |
| Black Level * | 0.36 | 0.24 33% | 0.26 28% | 0.22 39% | 0.25 31% |
| Contrast | 920 | 1408 53% | 1239 35% | 1600 74% | 1038 13% |
| Colorchecker dE 2000 * | 2.25 | 1.39 38% | 2.43 -8% | 2.89 -28% | 2.52 -12% |
| Colorchecker dE 2000 max. * | 4.62 | 3.31 28% | 5.07 -10% | 4.66 -1% | 5.55 -20% |
| Greyscale dE 2000 * | 1.7 | 1.6 6% | 3.3 -94% | 6.9 -306% | 1.7 -0% |
| Gamma | 2.3 96% | 2.291 96% | 2.22 99% | 2.34 94% | 2.04 108% |
| CCT | 6751 96% | 6626 98% | 6902 94% | 7904 82% | 6414 101% |
| Colorchecker dE 2000 calibrated * | 0.97 | 2.29 | 2.7 | 1.93 | |
| Color Space (Percent of AdobeRGB 1998) | 68 | 60 | 76 | 63.3 | |
| Color Space (Percent of sRGB) | 89 | 91.9 | 100 | 98.8 | |
| Total Average (Program / Settings) | 2% /
9% | -74% /
-39% | -57% /
-38% | -6% /
-6% |
* ... smaller is better
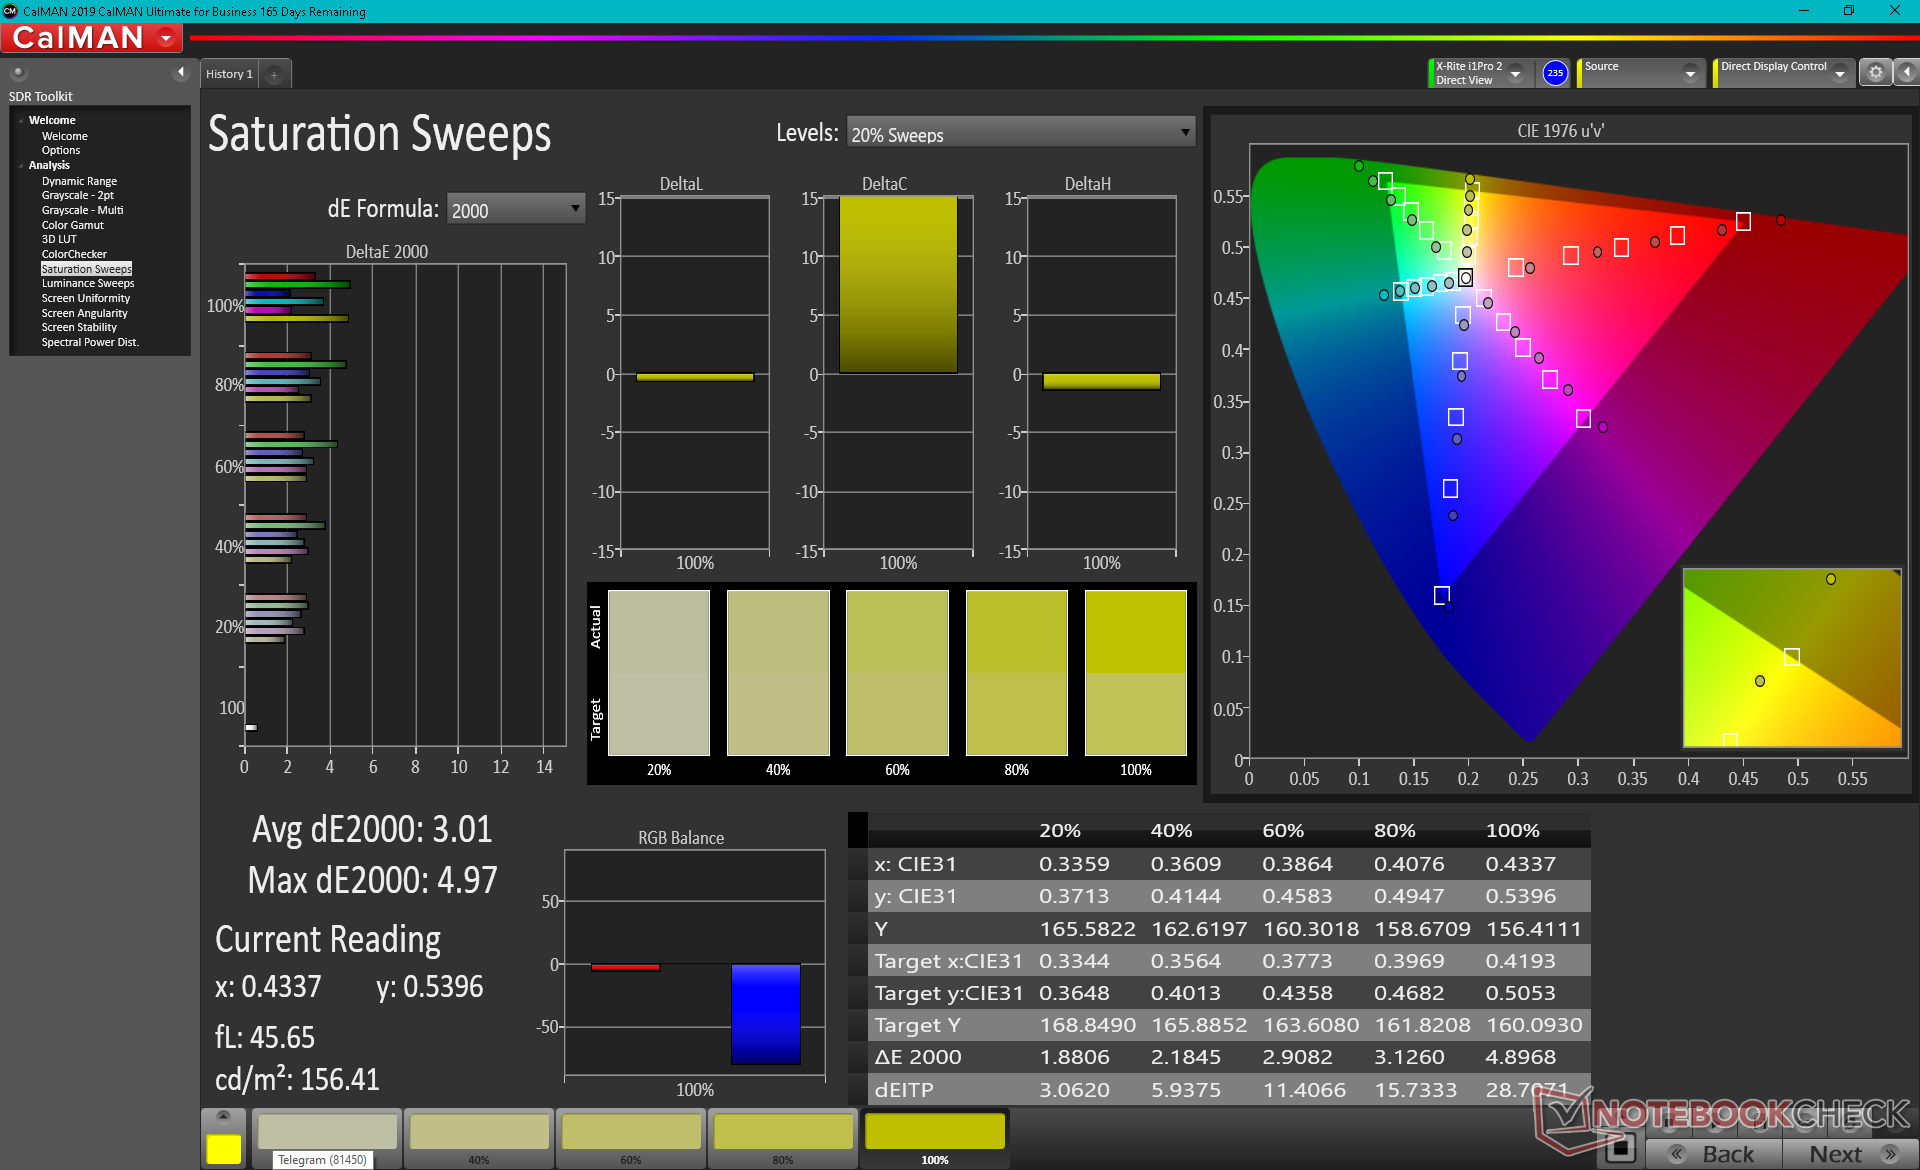
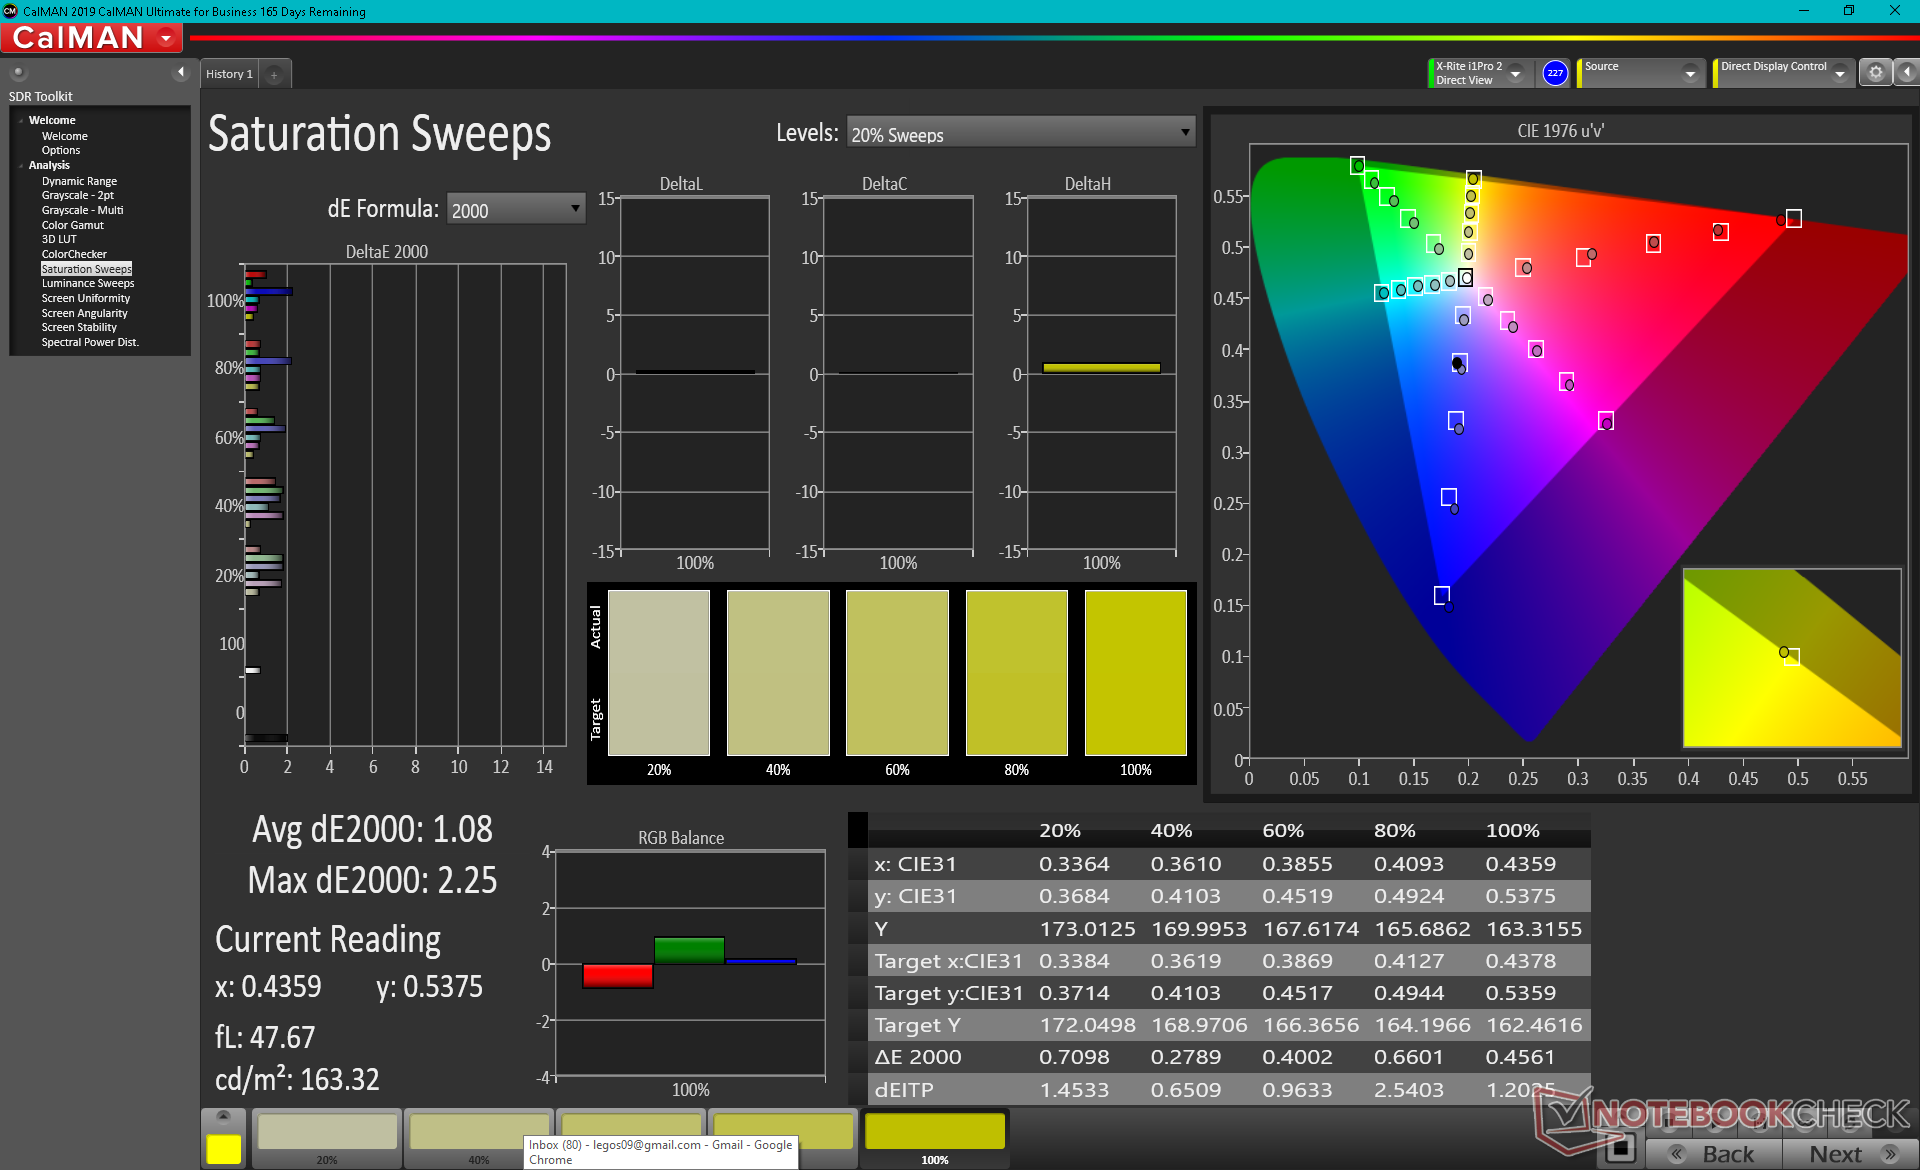
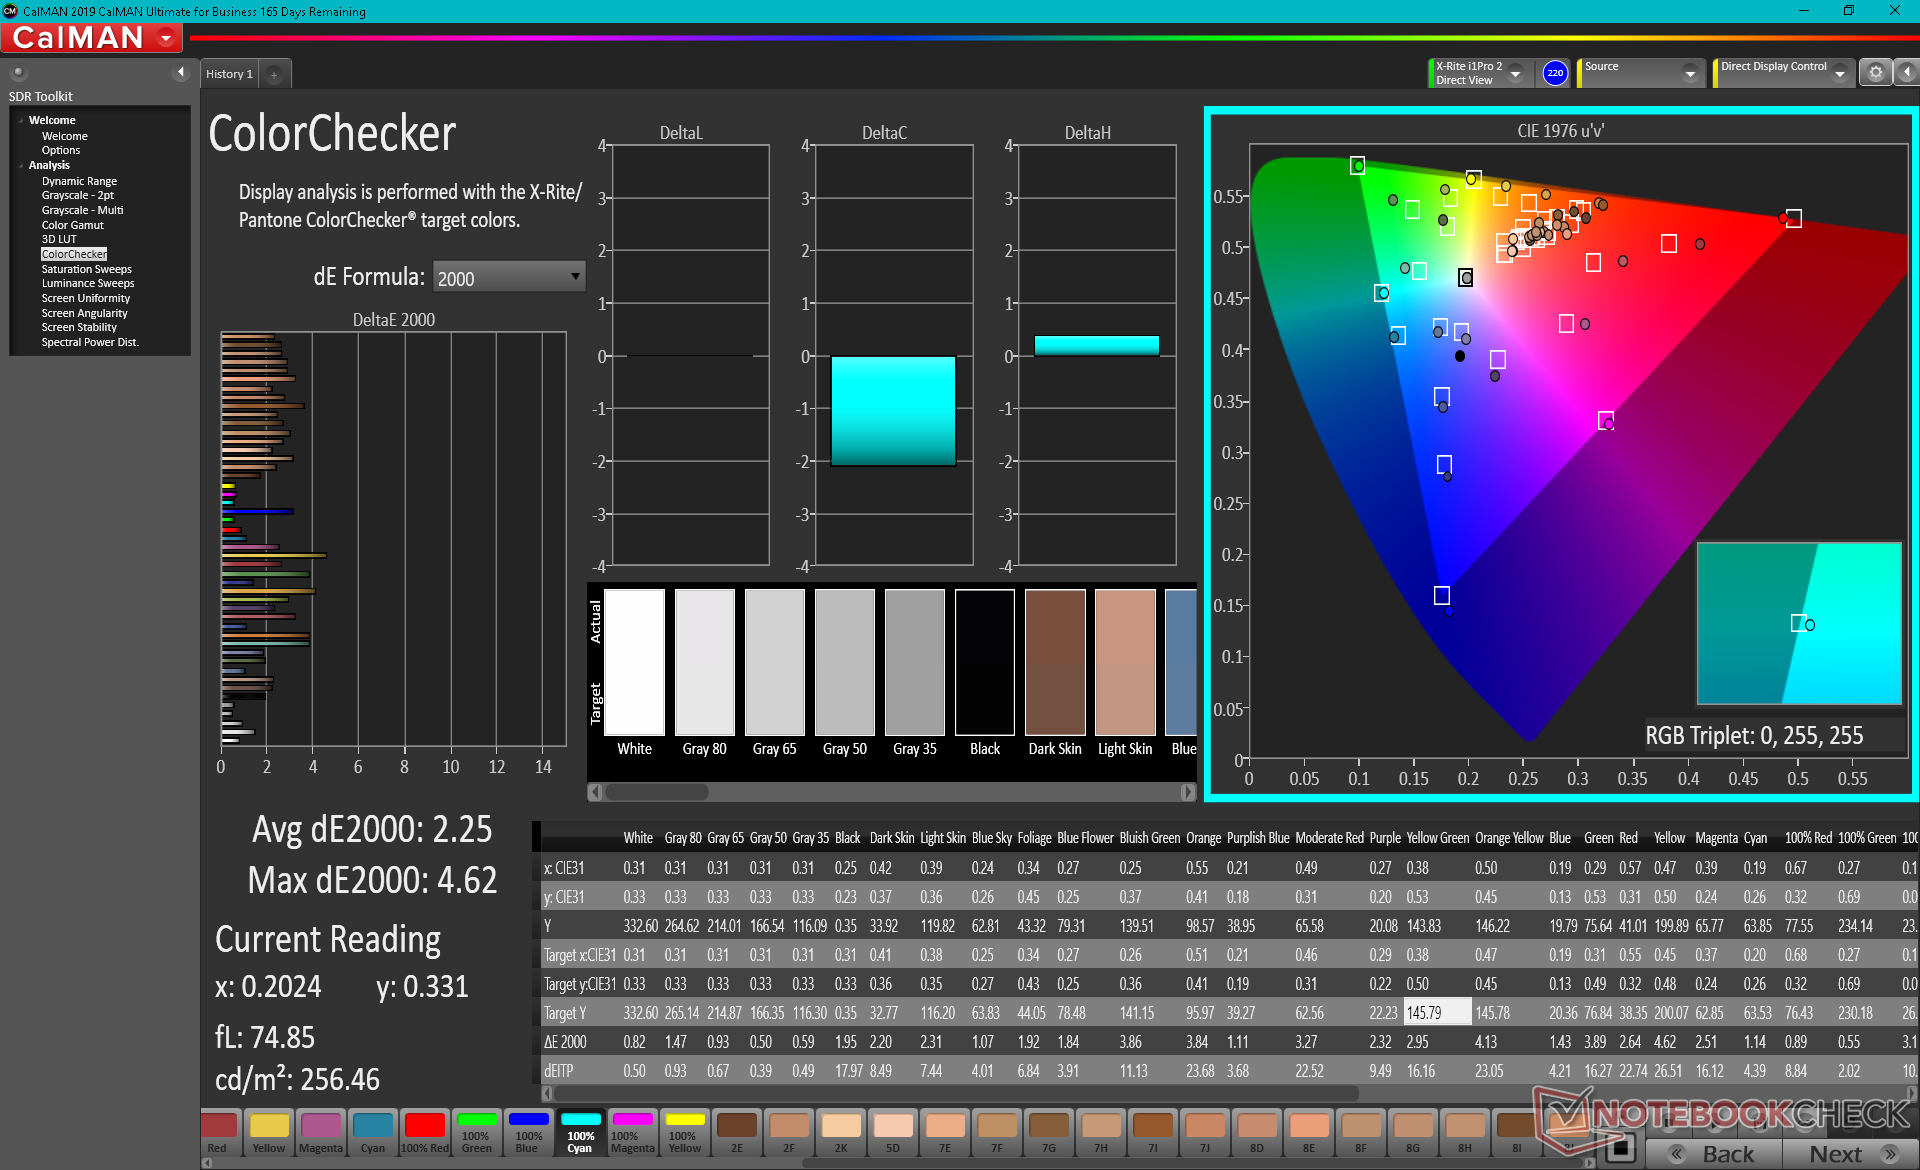
Color space covers essentially all of sRGB and DCI-P3 as advertised by the manufacturer. DCI-P3 coverage was previously only attainable on certain 4K or OLED configurations and so this is the first time we're seeing it on a 165 Hz QHD IPS display. Owners are getting almost everything here with no compromises including fast response times, fast refresh rates, and deep colors whereas most other laptop panels often underperform in at least one of these three areas.
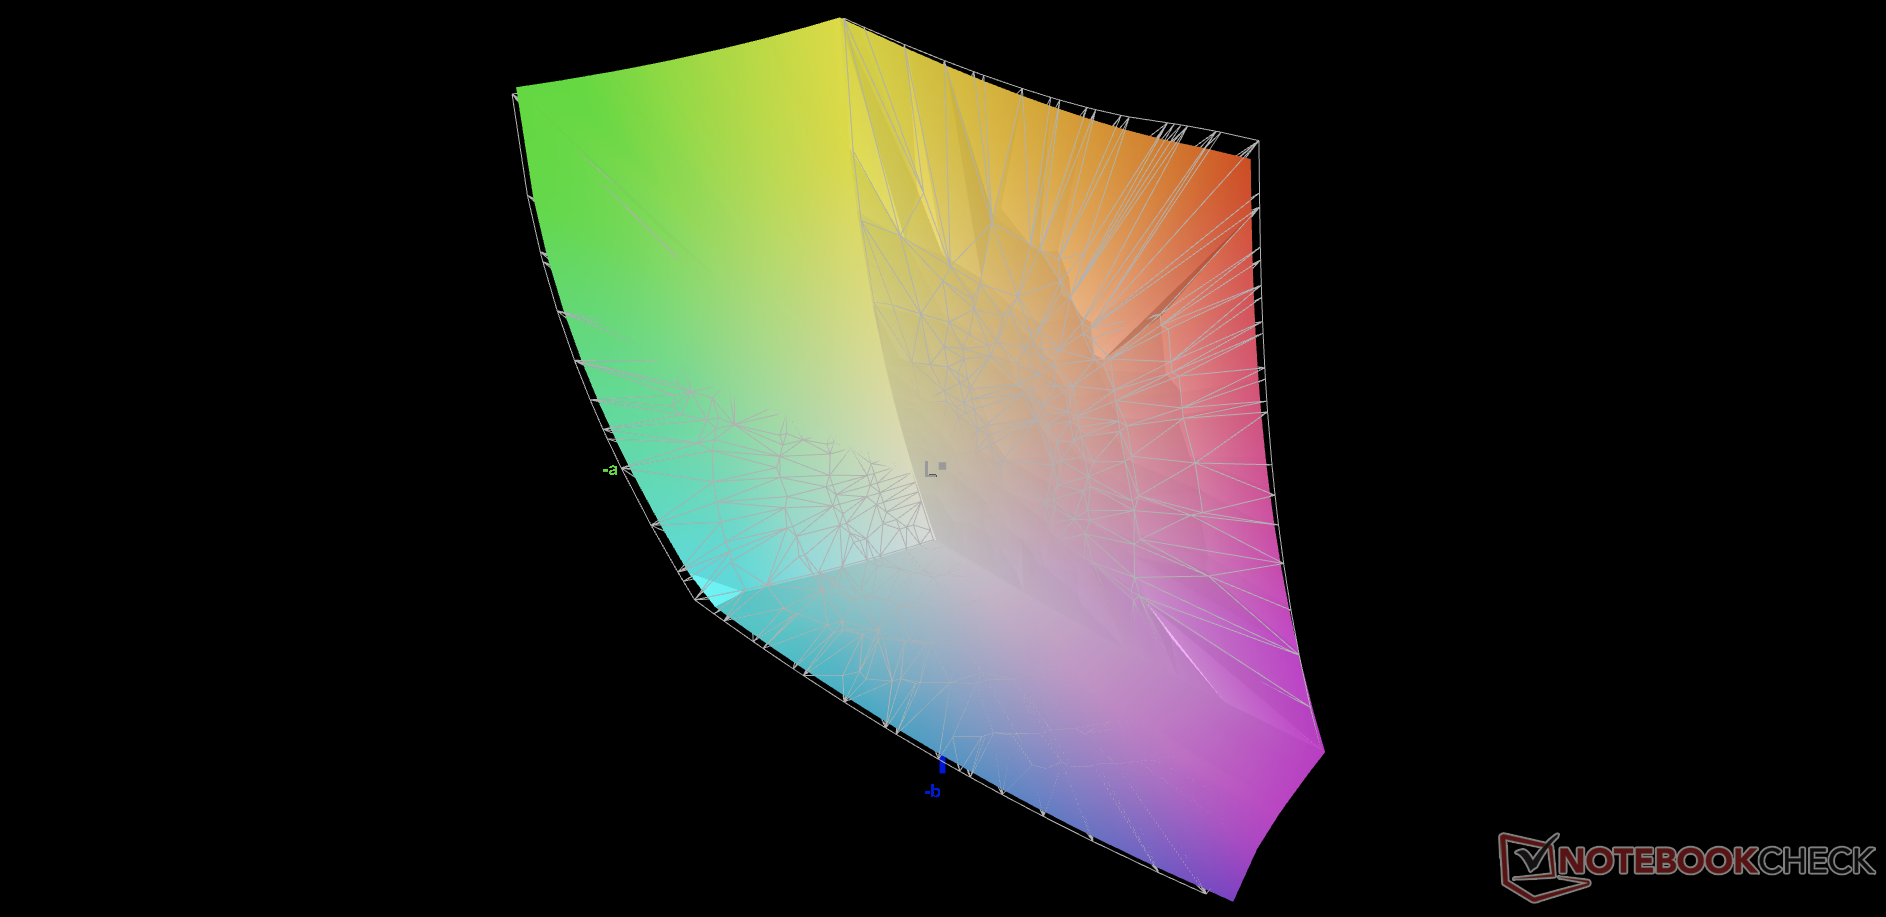
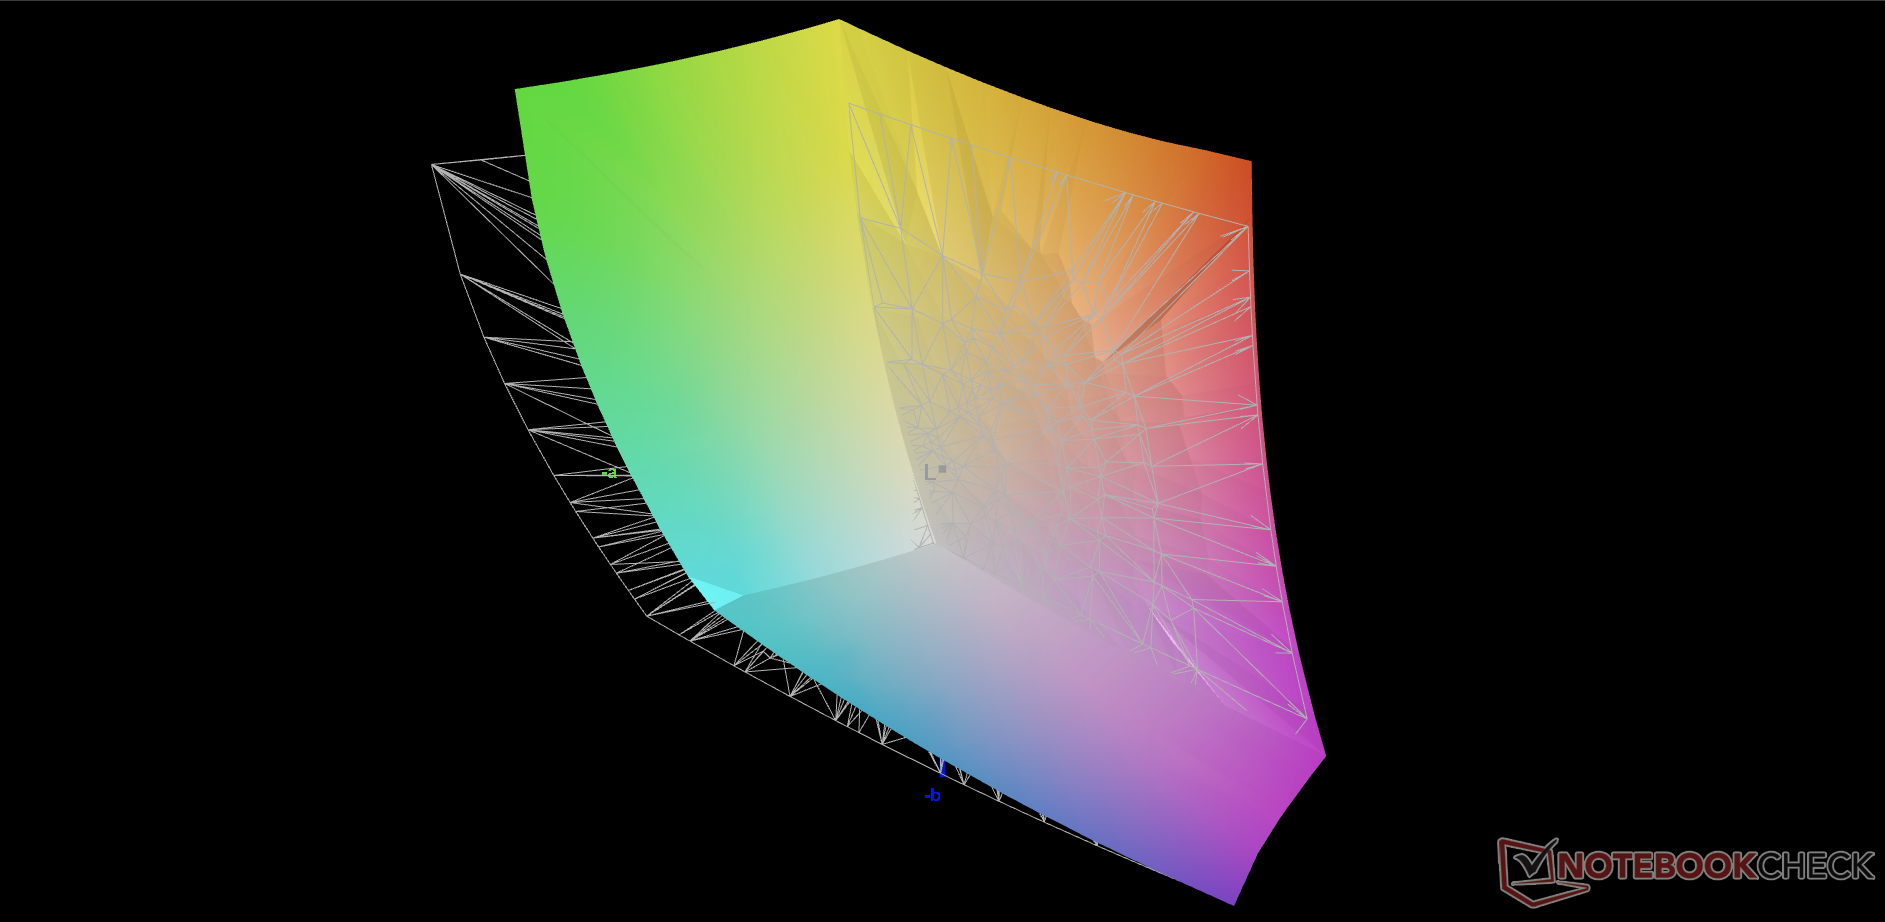
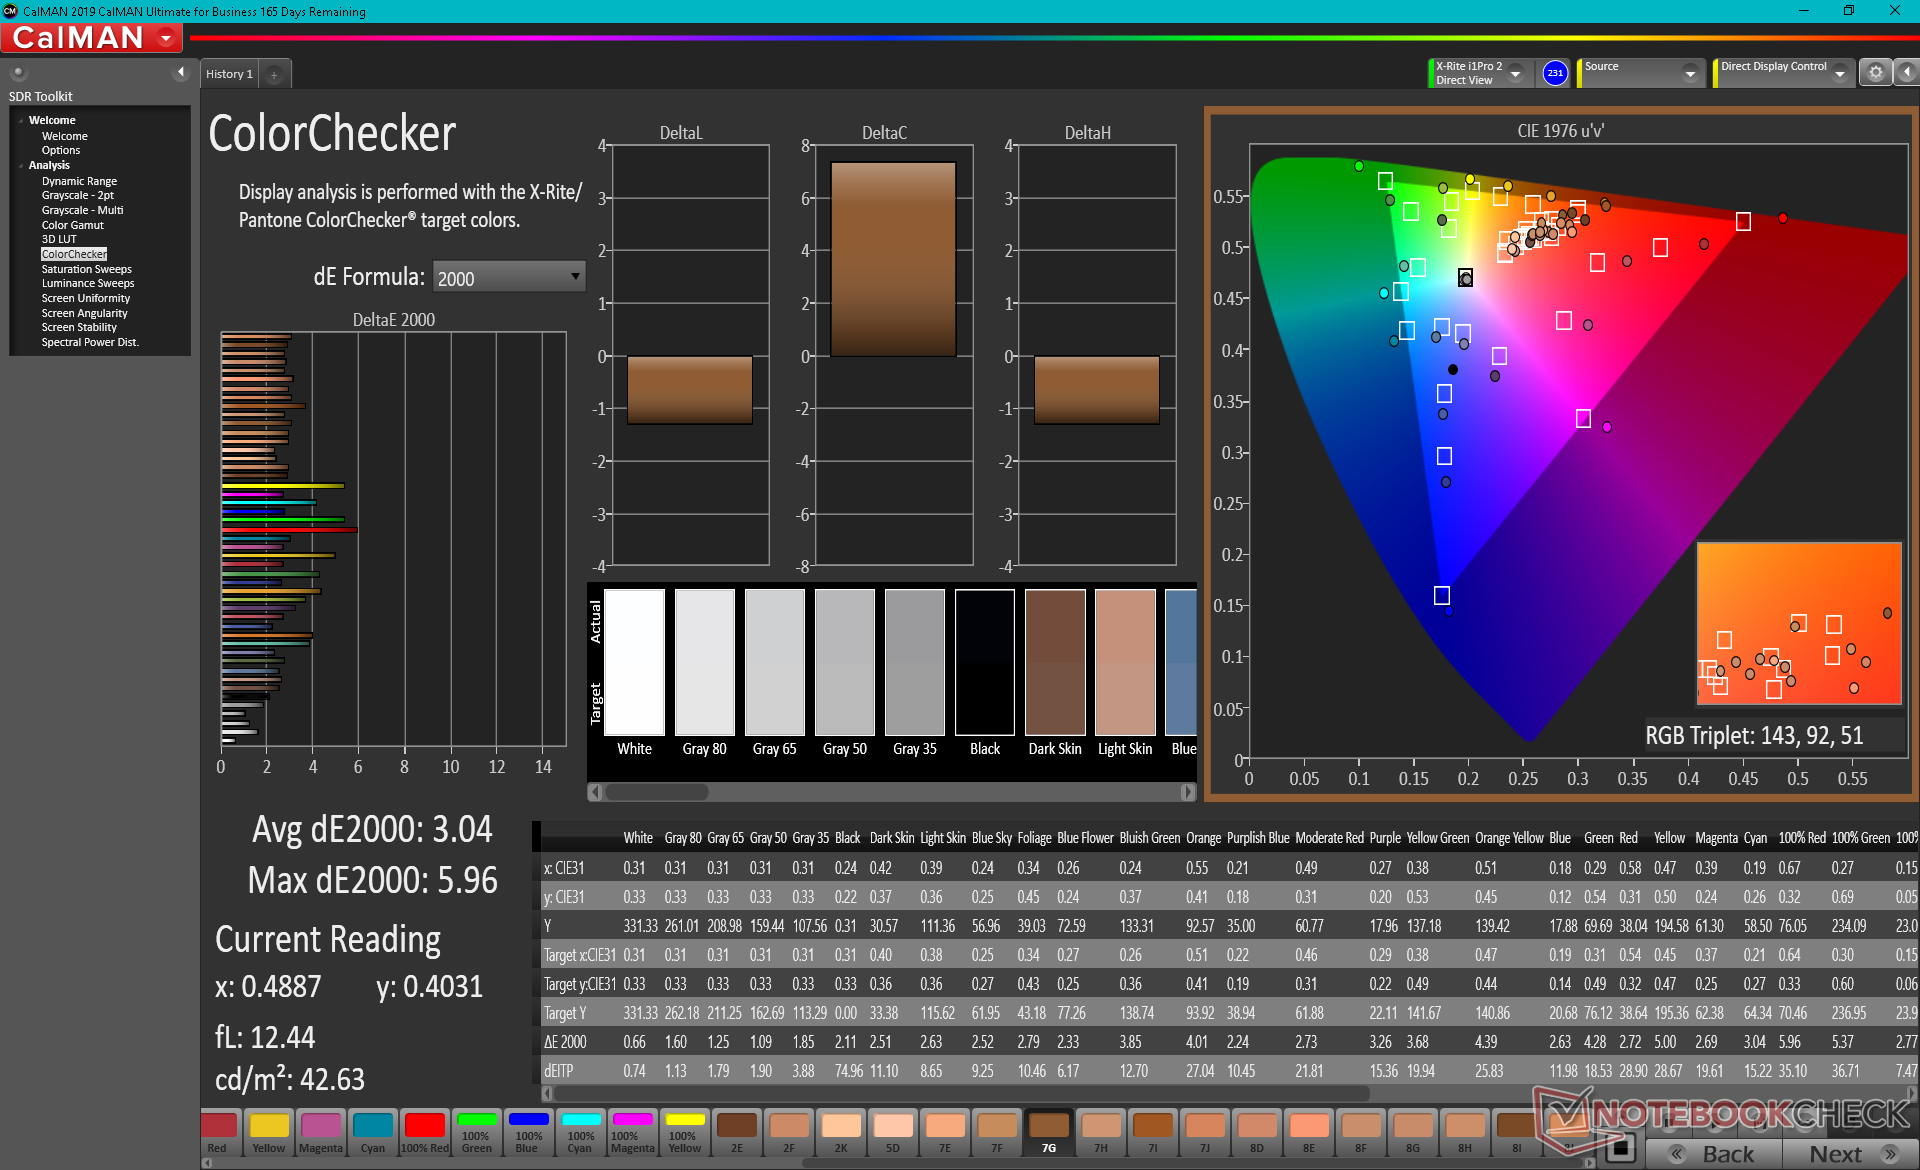
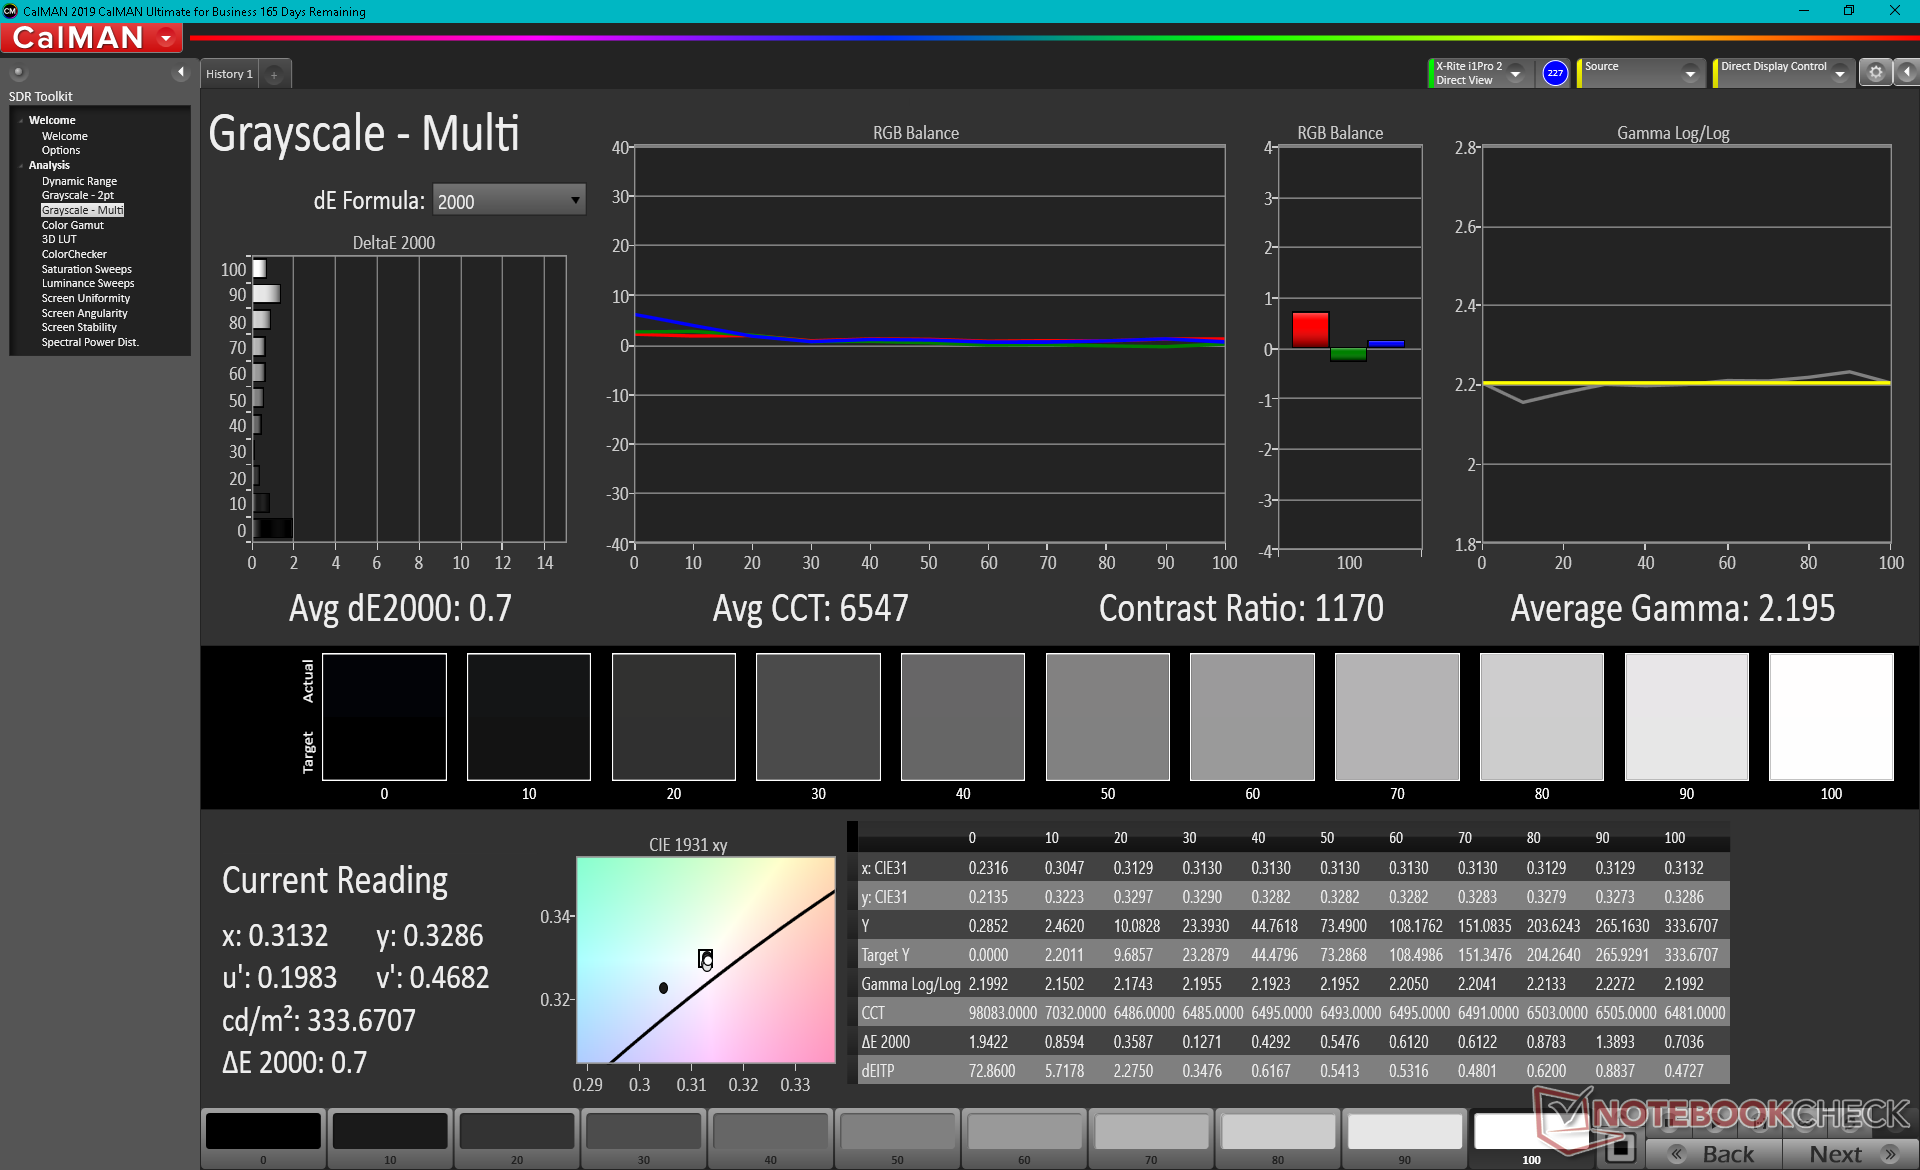
Razer advertises "individually calibrated [displays] for quality and true color accuracy" and, sure enough, our X-Rite colorimeter analysis reveals exactly that. Average grayscale and color deltaE values sit at just 0.7 and 2.25, respectively, to prove that any end-user calibration attempts will have only minor improvements at best. If we are to nitpick, orange colors seem to be slightly more inaccurate than the other tested colors on CalMAN.

Display Response Times
| ↔ Response Time Black to White | ||
|---|---|---|
| 10.8 ms ... rise ↗ and fall ↘ combined | ↗ 5.6 ms rise |  |
| ↘ 5.2 ms fall | ||
| The screen shows good response rates in our tests, but may be too slow for competitive gamers. In comparison, all tested devices range from 0.1 (minimum) to 240 (maximum) ms. » 24 % of all devices are better. This means that the measured response time is better than the average of all tested devices (21.5 ms). | ||
| ↔ Response Time 50% Grey to 80% Grey | ||
| 16.4 ms ... rise ↗ and fall ↘ combined | ↗ 8 ms rise | 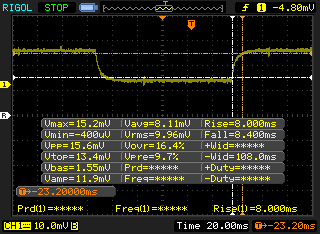 |
| ↘ 8.4 ms fall | ||
| The screen shows good response rates in our tests, but may be too slow for competitive gamers. In comparison, all tested devices range from 0.2 (minimum) to 636 (maximum) ms. » 25 % of all devices are better. This means that the measured response time is better than the average of all tested devices (33.7 ms). | ||
Screen Flickering / PWM (Pulse-Width Modulation)
| Screen flickering / PWM not detected | 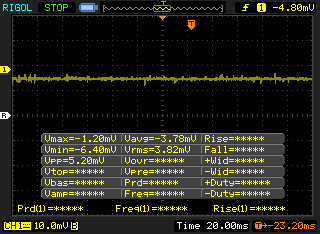 | ||
In comparison: 53 % of all tested devices do not use PWM to dim the display. If PWM was detected, an average of 17844 (minimum: 5 - maximum: 3846000) Hz was measured. | |||
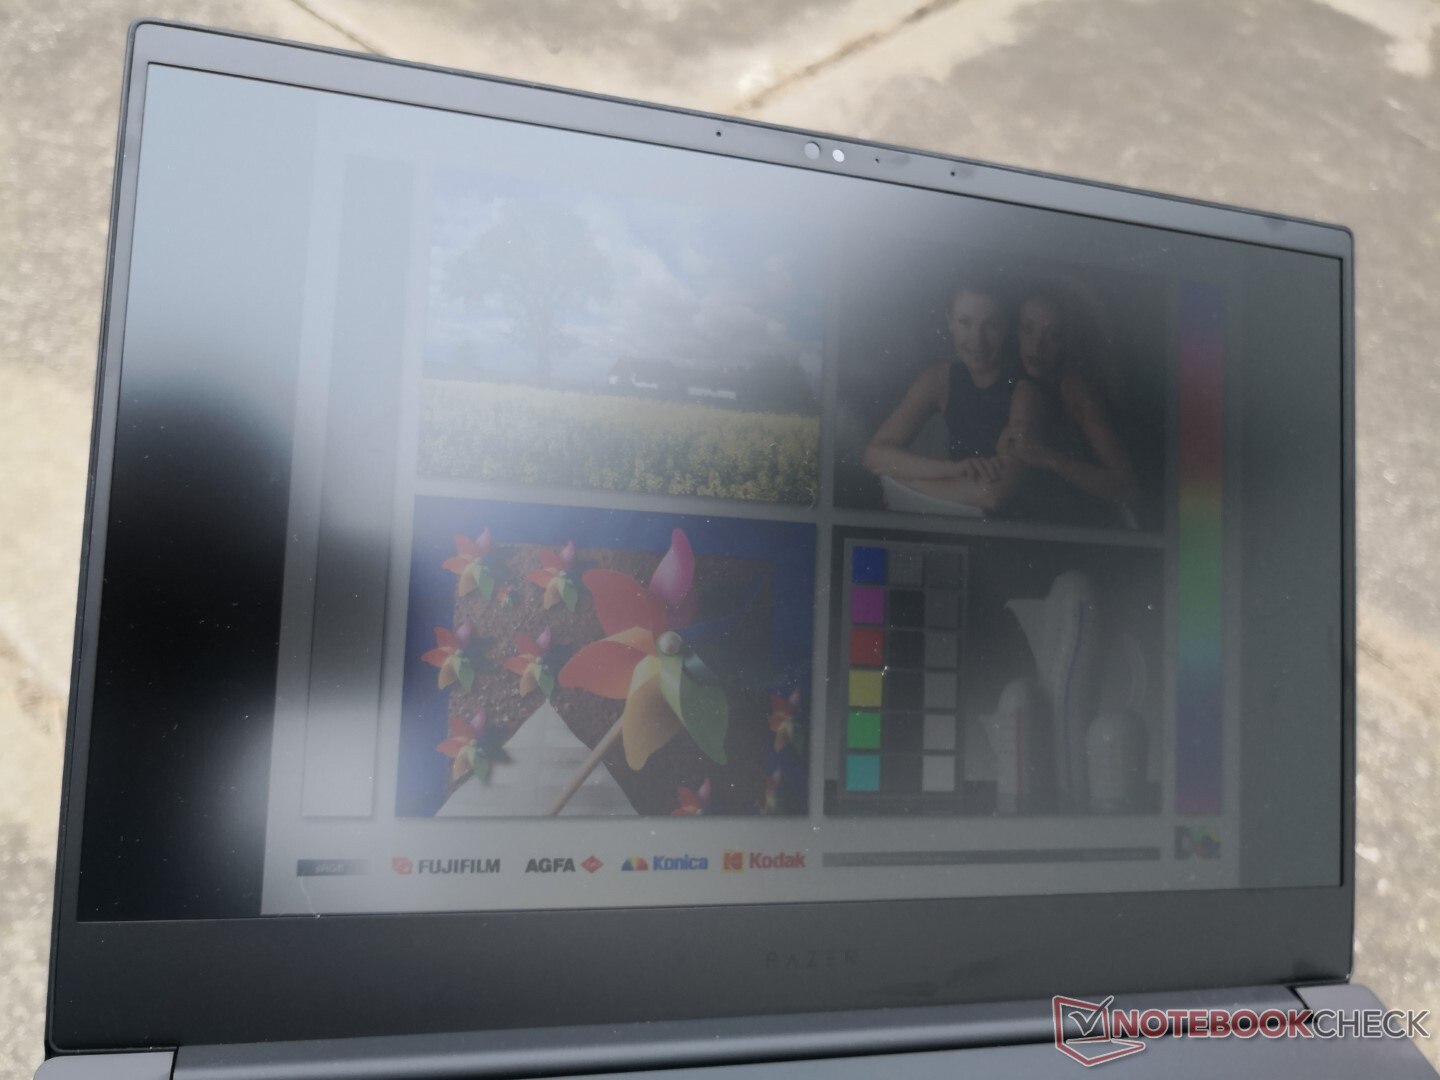
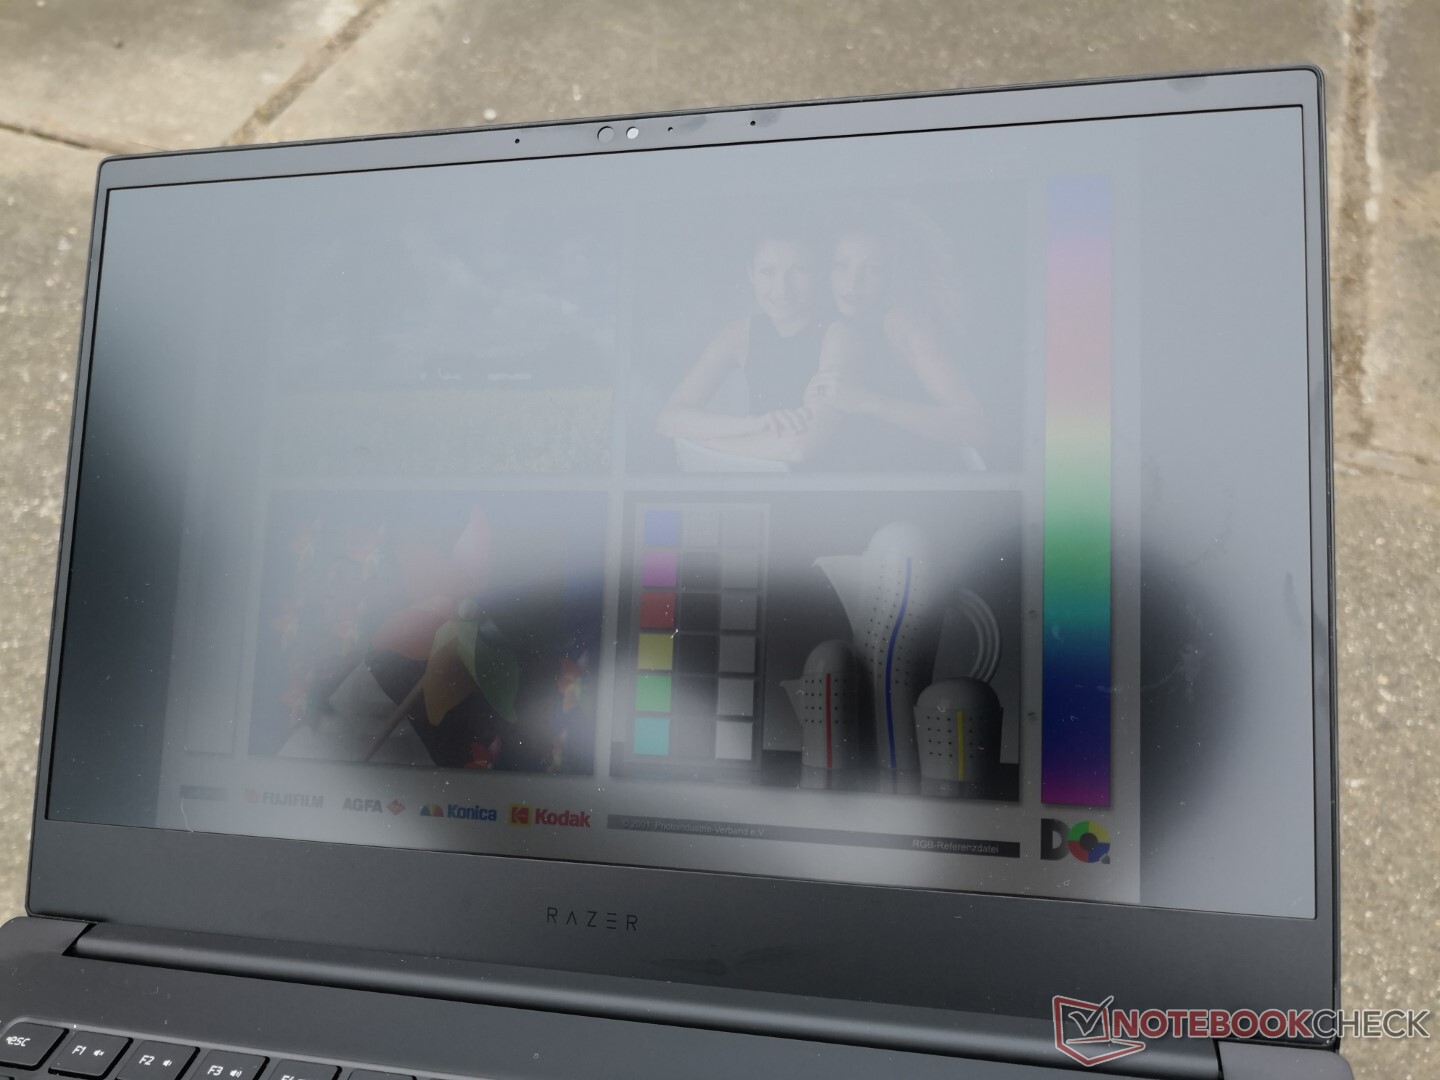
Outdoor visibility is decent only when under shade. At just over 300 nits, the Blade 14 display is about as bright as on the non-OLED display on Blade Stealth or Blade 15. Users may want to disable AMD Vari-Bright via the Radeon settings or else maximum brightness may drop when running on battery power.

Performance — Faster Than Most 15.6-inch and 17.3-inch Laptops
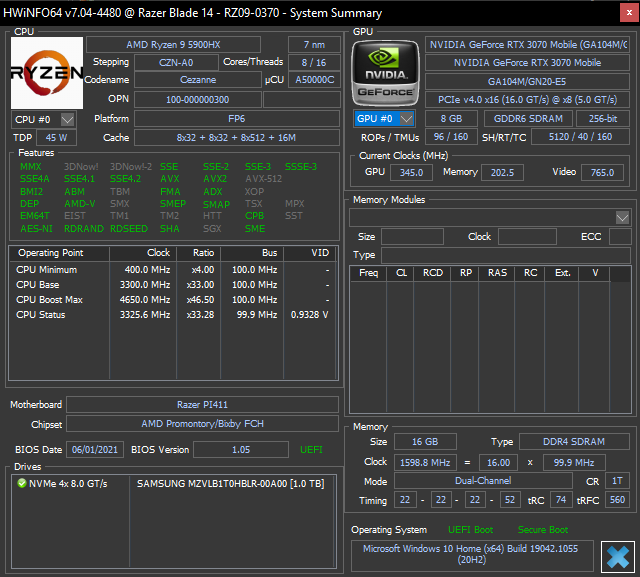
All current SKUs come with the same AMD Ryzen 9 5900HX Zen 3 CPU with no Intel variant. This particular processor is typically found on much larger laptops like the Asus Strix Scar 17 or Lenovo Legion 7 and so it's uncommon to see it here on a 14-inch form factor. Asus beat Razer to market with its own Zen-powered 14-inch gaming laptop last year and then again at CES 2021 with the ROG Flow X13.
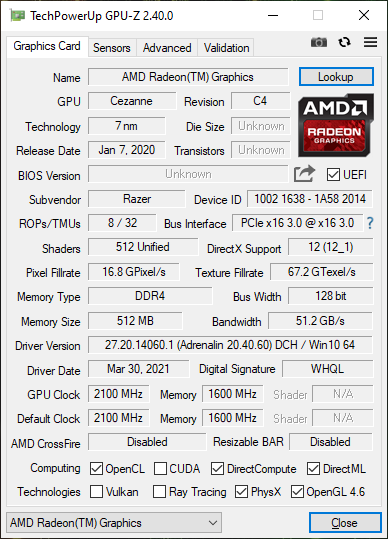
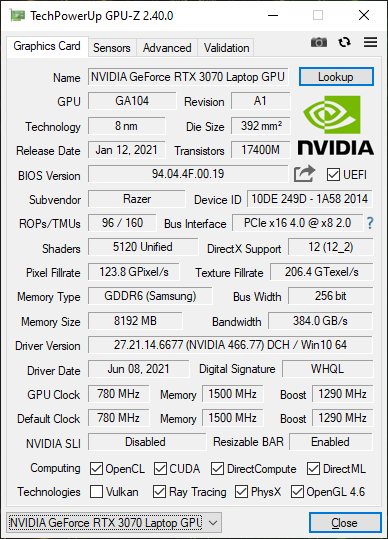
GPU options include the GeForce RTX 3060, 3070, and 3080 each at 100 W TGP with Resizable Bar support. These are essentially the GeForce Max-Q versions as thicker laptops like the Schenker XMG Ultra 17 come with "full power" 165 W TGP options.
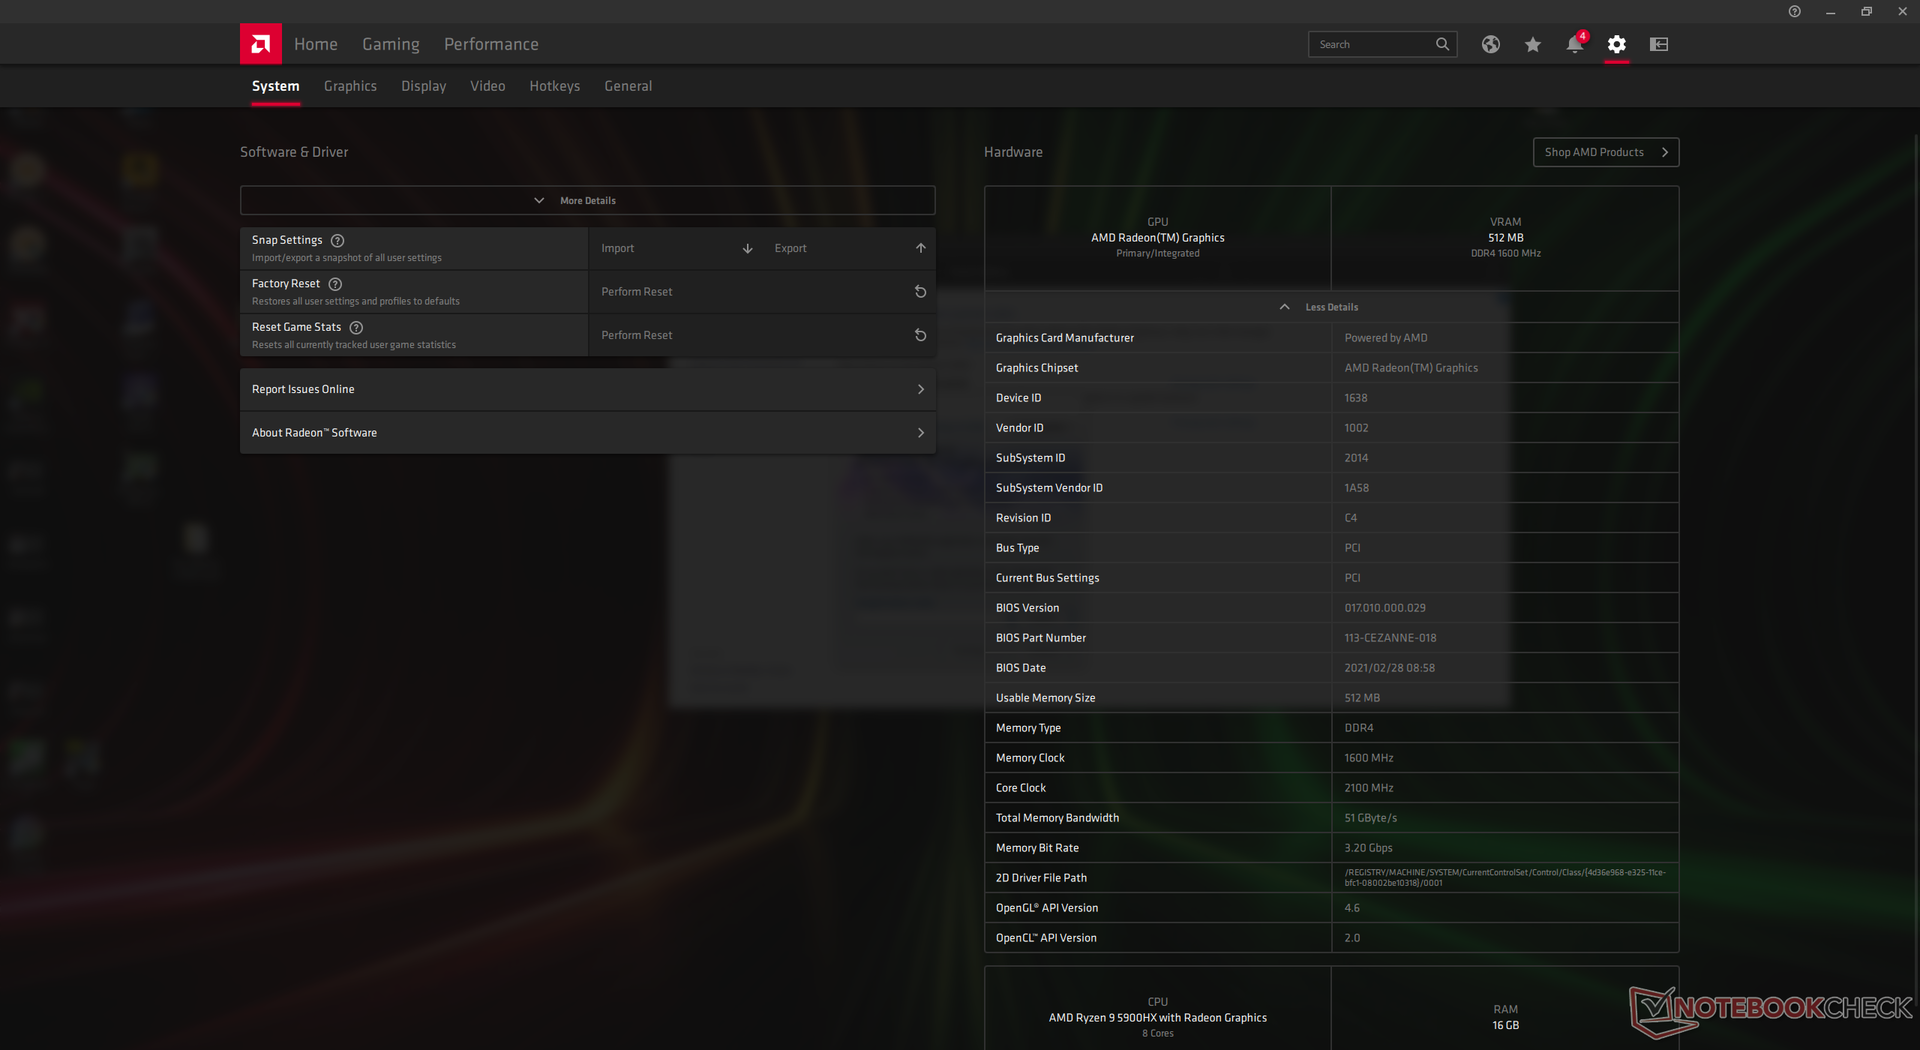
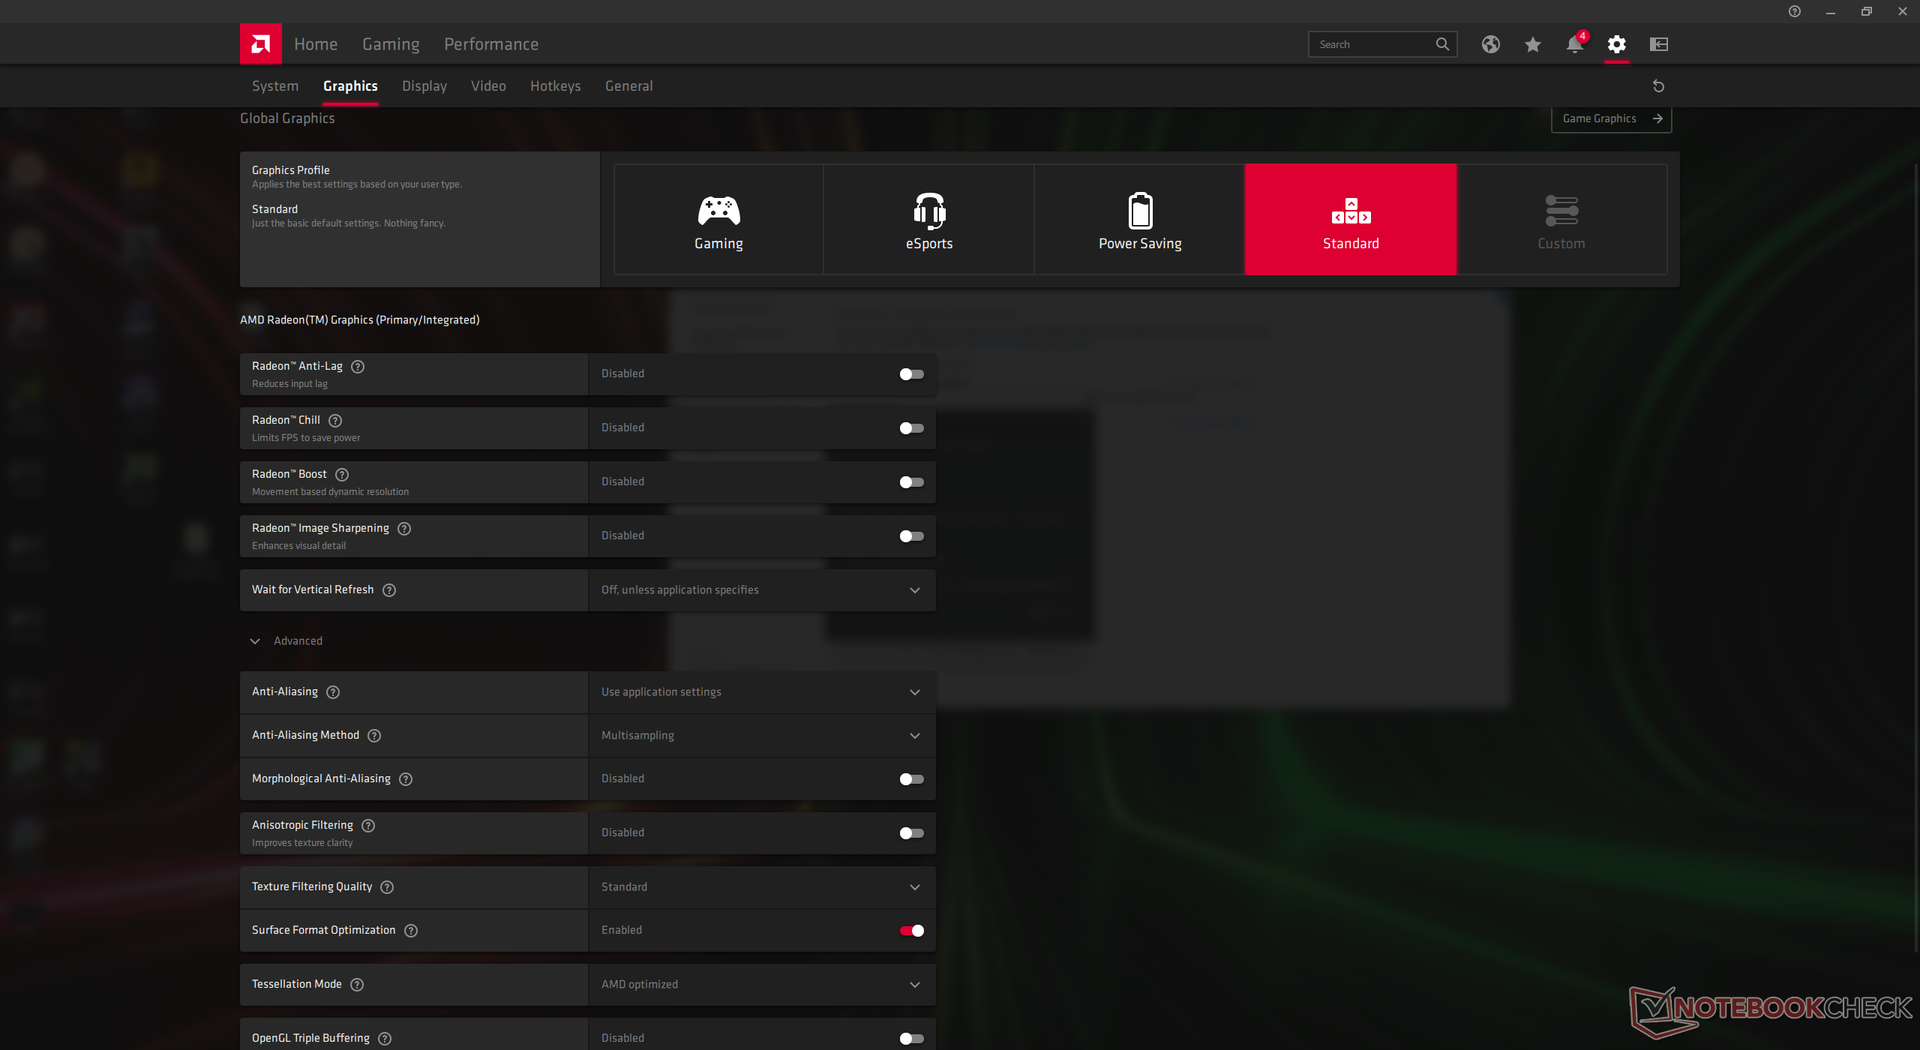
Our test unit was set to custom performance mode with the CPU and GPU on max power via Razer Synapse. We recommend owners become familiar with both Synapse and the Radeon applications as key features are toggled here.

Processor
Can an octa-core Ryzen 9 CPU actually perform in a tiny 14-inch laptop? The answer is yes — for the most part. Of the eight different laptops we've tested thus far with the same Ryzen 9 5900HX CPU, our Blade 14 is only behind by about 5 to 10 percent in Multi-thread-heavy benchmarks like CineBench. This delta can grow to 15 percent in single-threaded benchmarks like 7-Zip (-mmt1) which suggests that the CPU in the Blade 14 benefits from shorter maximum Turbo Boost potential than on other Ryzen 9 laptops.
The competing 11th gen Tiger Lake-H Intel Core i9-11900H is faster than our Ryzen 9 in single-threaded workloads by about 20 to 30 percent while being slightly slower in multi-threaded loads by up to 10 percent. A similar pattern can be observed between the Ryzen U-series and Core U-series CPUs as well.
Overall Turbo Boost sustainability is still very good nonetheless. Running CineBench R15 xT in a loop shows more consistent performance over long periods than on the Asus ROG Flow X13 or Zephyrus G14. This is easily one of the fastest 14-inch laptops you can find in terms of multi-thread processor performance — if not the fastest.
Cinebench R23: Multi Core | Single Core
Cinebench R15: CPU Multi 64Bit | CPU Single 64Bit
Blender: v2.79 BMW27 CPU
7-Zip 18.03: 7z b 4 -mmt1 | 7z b 4
Geekbench 5.5: Single-Core | Multi-Core
HWBOT x265 Benchmark v2.2: 4k Preset
LibreOffice : 20 Documents To PDF
R Benchmark 2.5: Overall mean
Cinebench R23: Multi Core | Single Core
Cinebench R15: CPU Multi 64Bit | CPU Single 64Bit
Blender: v2.79 BMW27 CPU
7-Zip 18.03: 7z b 4 -mmt1 | 7z b 4
Geekbench 5.5: Single-Core | Multi-Core
HWBOT x265 Benchmark v2.2: 4k Preset
LibreOffice : 20 Documents To PDF
R Benchmark 2.5: Overall mean
* ... smaller is better
System Performance
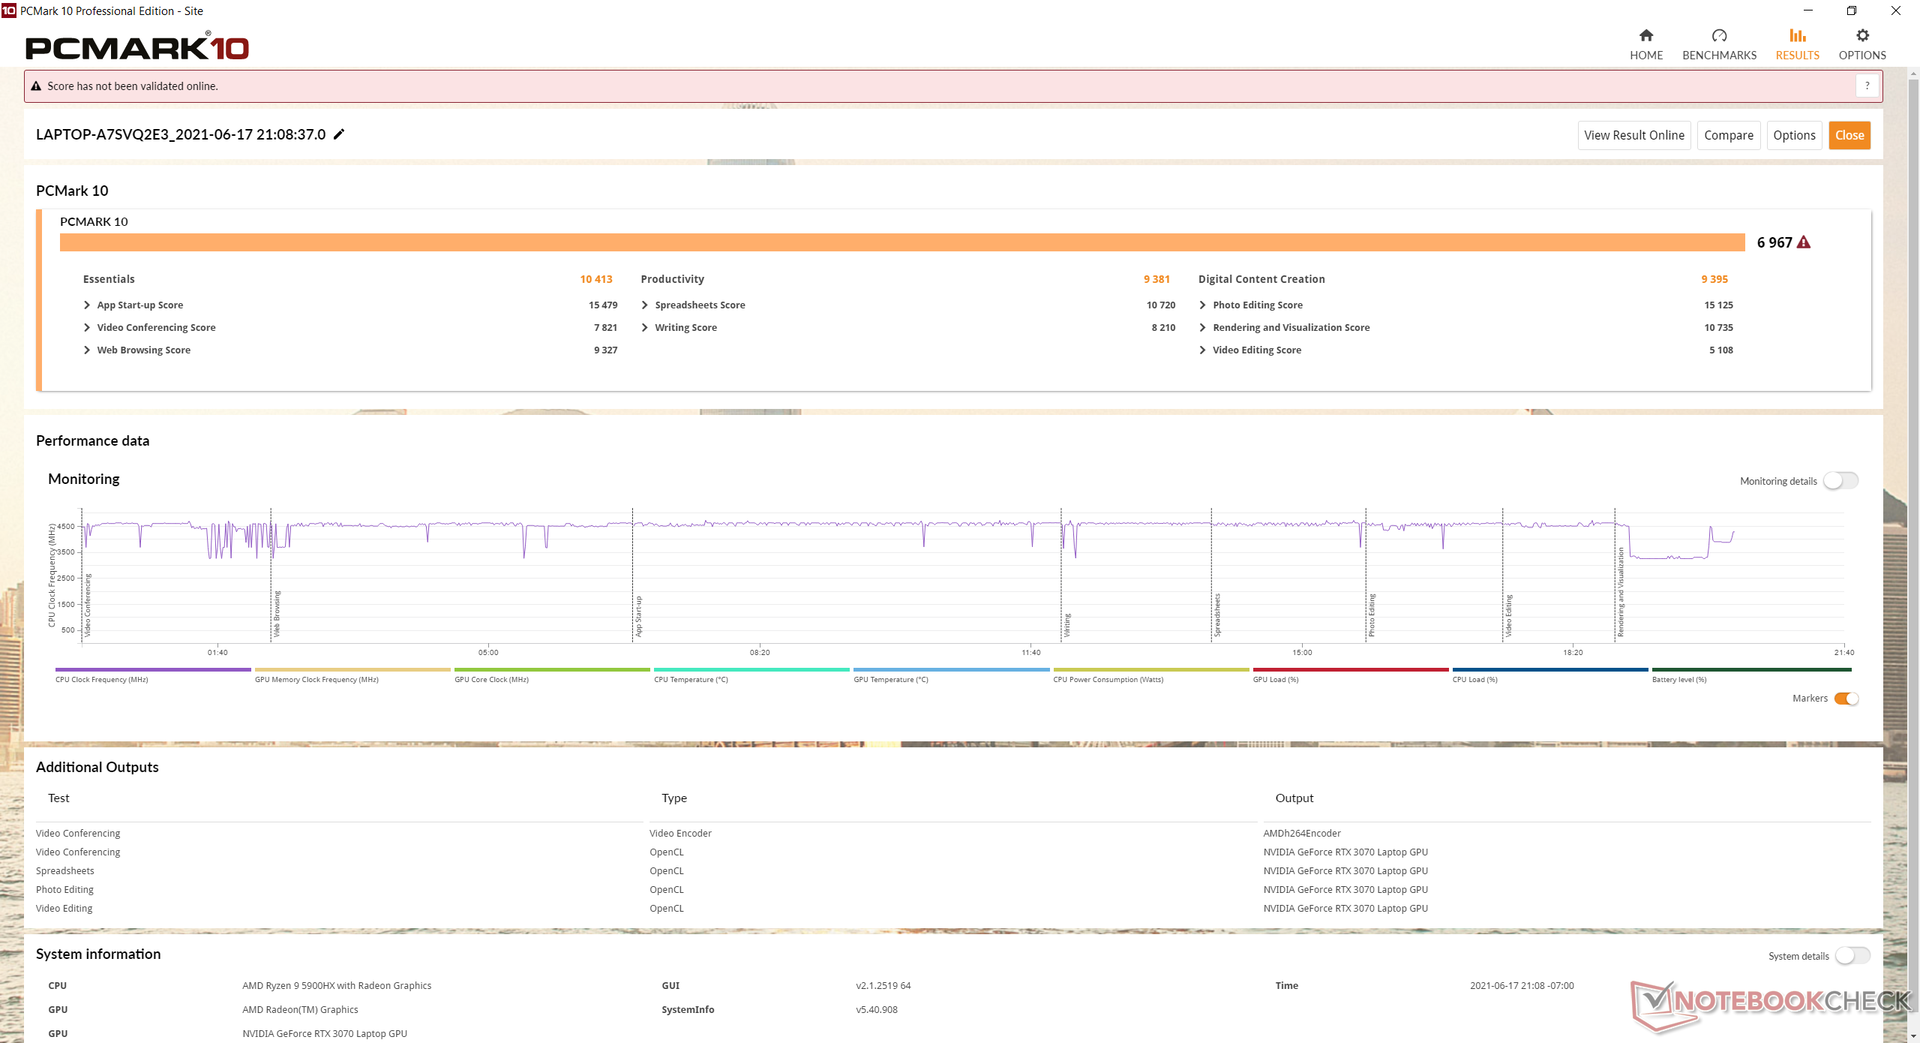
PCMark scores are consistently higher than any existing Blade laptop in the market including the fully equipped 17.3-inch Razer Blade Pro with GeForce RTX 3080 graphics. The Ryzen 9 5900HX is definitely leaving its mark in this particular category.
| PCMark 10 / Score | |
| Razer Blade 14 Ryzen 9 RTX 3070 | |
| Average AMD Ryzen 9 5900HX, NVIDIA GeForce RTX 3070 Laptop GPU (6875 - 6967, n=4) | |
| Razer Blade 15 Advanced Model Early 2021 | |
| MSI GS66 Stealth 10UG | |
| Asus ROG Flow X13 GV301QH | |
| Asus Zephyrus G14 GA401IV | |
| Dell XPS 15 9500 Core i7 4K UHD | |
| PCMark 10 / Essentials | |
| Razer Blade 14 Ryzen 9 RTX 3070 | |
| Average AMD Ryzen 9 5900HX, NVIDIA GeForce RTX 3070 Laptop GPU (9991 - 10413, n=3) | |
| Asus Zephyrus G14 GA401IV | |
| Dell XPS 15 9500 Core i7 4K UHD | |
| Asus ROG Flow X13 GV301QH | |
| MSI GS66 Stealth 10UG | |
| Razer Blade 15 Advanced Model Early 2021 | |
| PCMark 10 / Productivity | |
| Razer Blade 14 Ryzen 9 RTX 3070 | |
| Average AMD Ryzen 9 5900HX, NVIDIA GeForce RTX 3070 Laptop GPU (9301 - 9381, n=3) | |
| Asus ROG Flow X13 GV301QH | |
| Razer Blade 15 Advanced Model Early 2021 | |
| Dell XPS 15 9500 Core i7 4K UHD | |
| MSI GS66 Stealth 10UG | |
| Asus Zephyrus G14 GA401IV | |
| PCMark 10 / Digital Content Creation | |
| Average AMD Ryzen 9 5900HX, NVIDIA GeForce RTX 3070 Laptop GPU (9383 - 9561, n=3) | |
| Razer Blade 14 Ryzen 9 RTX 3070 | |
| MSI GS66 Stealth 10UG | |
| Razer Blade 15 Advanced Model Early 2021 | |
| Asus ROG Flow X13 GV301QH | |
| Asus Zephyrus G14 GA401IV | |
| Dell XPS 15 9500 Core i7 4K UHD | |
| PCMark 10 Score | 6967 points | |
Help | ||
DPC Latency
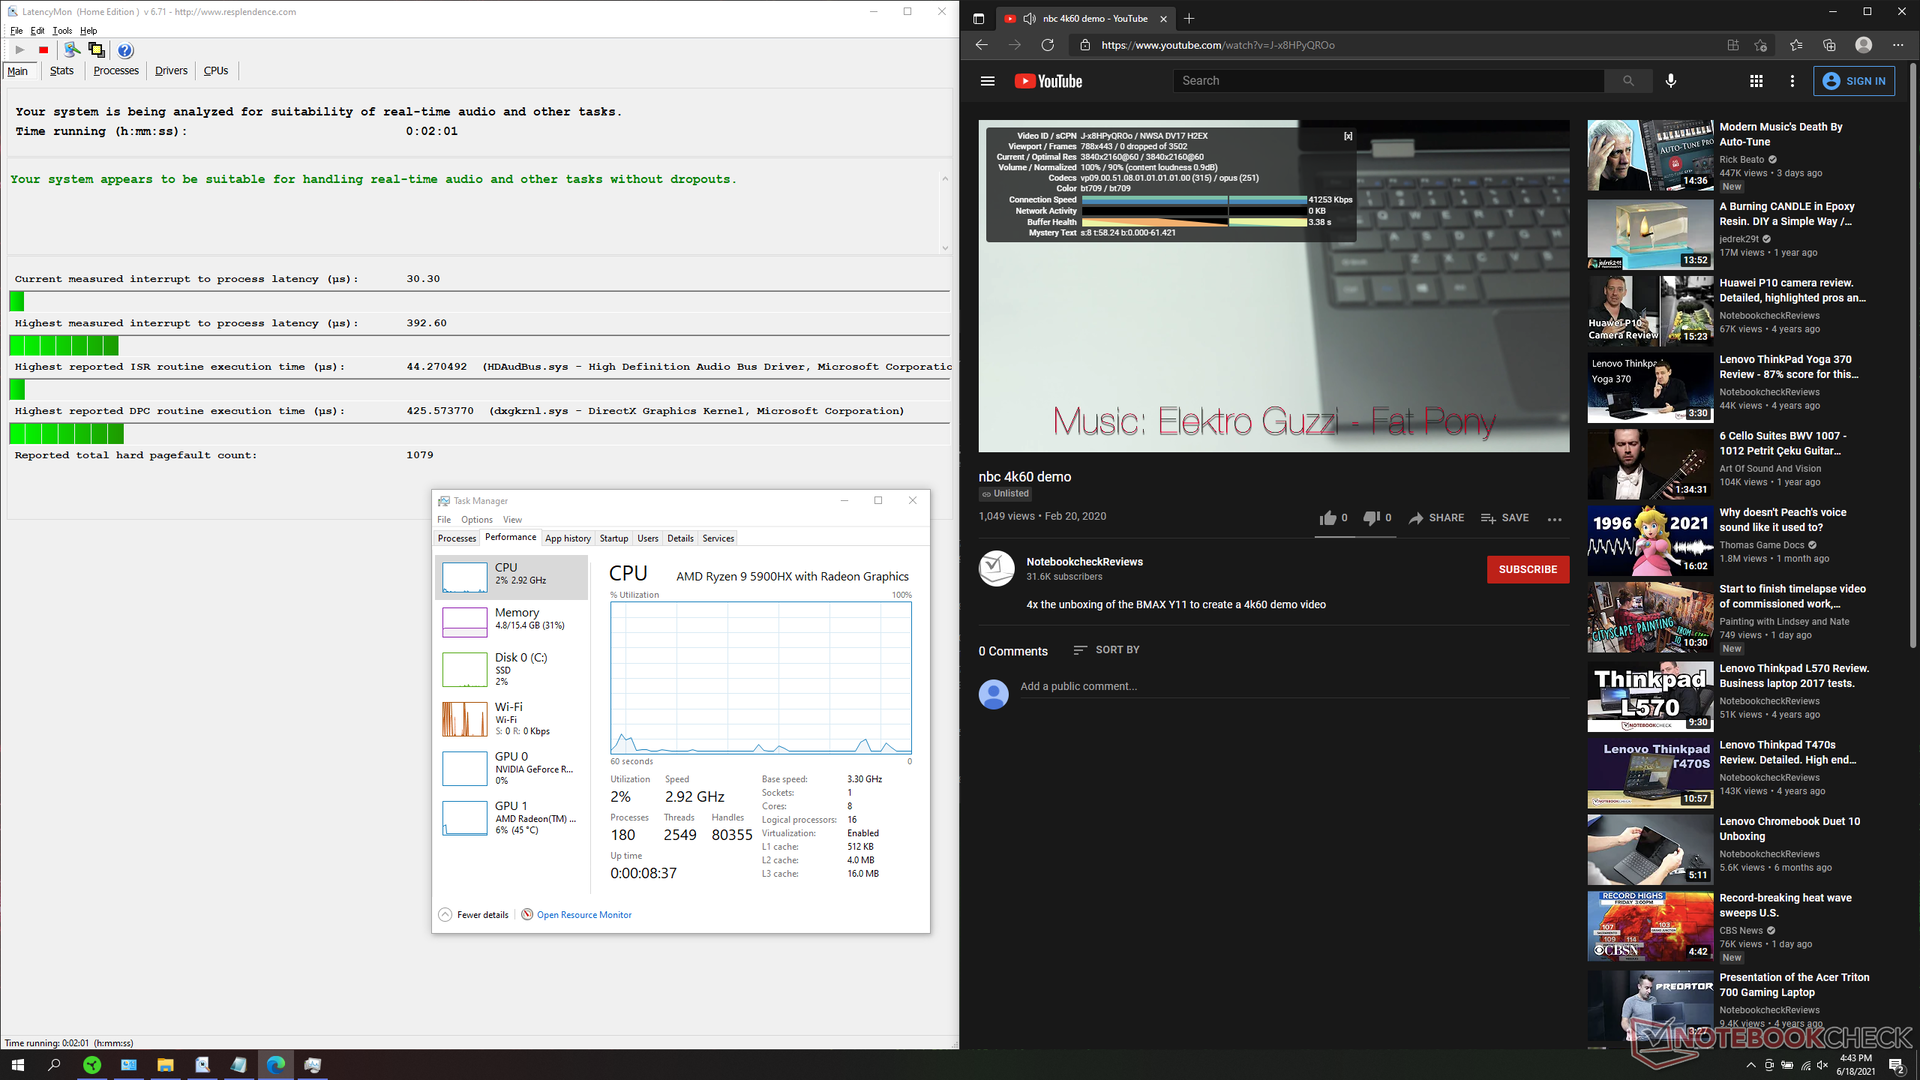
Impressively, LatencyMon shows no DPC latency issues when browsing the web and opening multiple tabs on our home page. 4K video playback at 60 FPS is smooth and with no dropped frames as well. CPU and iGPU utilization would sit at just 2 percent and 6 percent, respectively, compared to 7 percent and 31 percent on most Intel laptops powered by Core i7 Tiger Lake-U CPUs.

| DPC Latencies / LatencyMon - interrupt to process latency (max), Web, Youtube, Prime95 | |
| Dell XPS 15 9500 Core i7 4K UHD | |
| Asus ROG Flow X13 GV301QH | |
| Asus Zephyrus G14 GA401IV | |
| MSI GS66 Stealth 10UG | |
| Razer Blade 15 Advanced Model Early 2021 | |
| Razer Blade 14 Ryzen 9 RTX 3070 | |
* ... smaller is better
Storage Devices — Just One Internal Drive
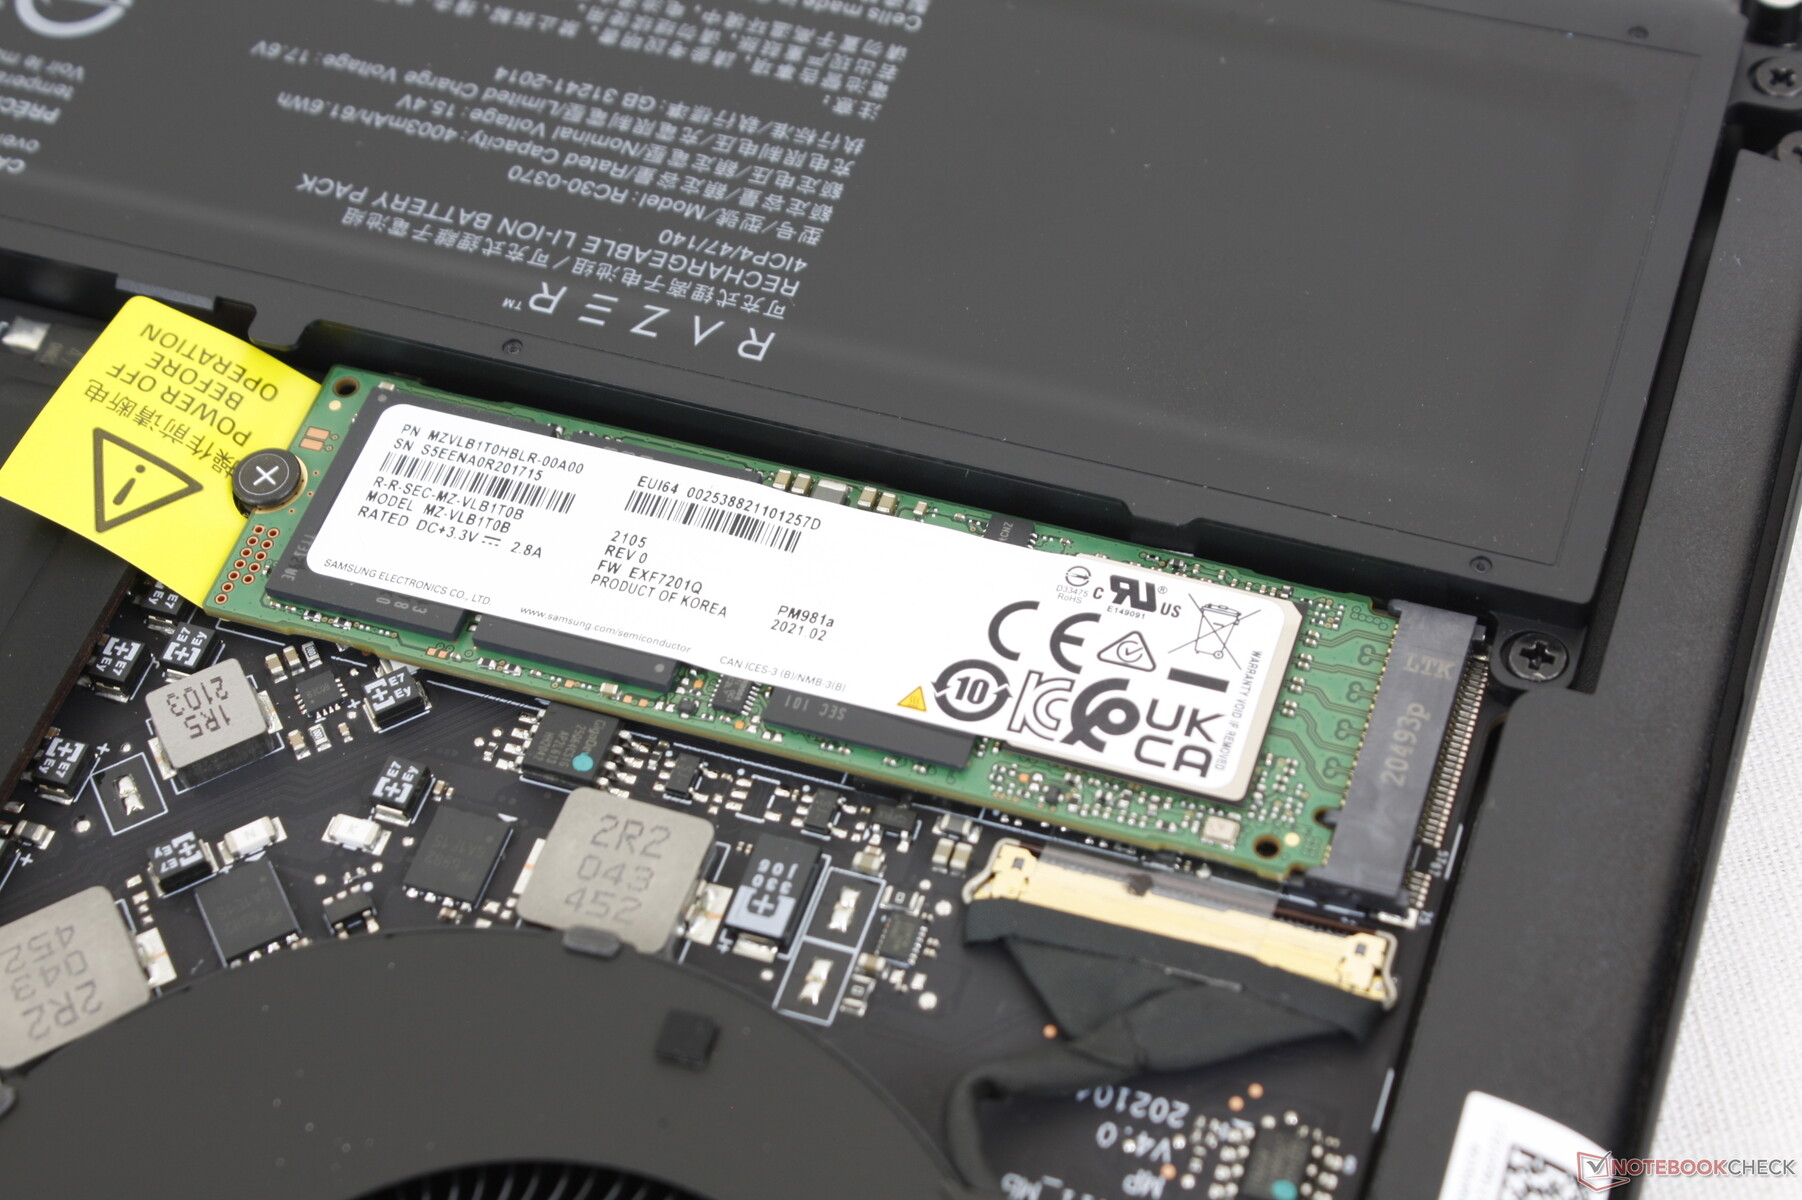
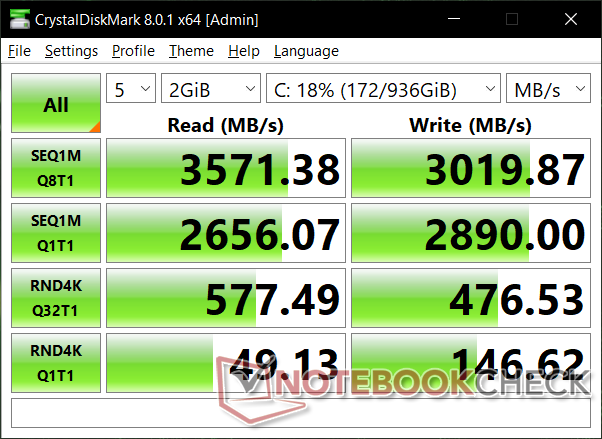
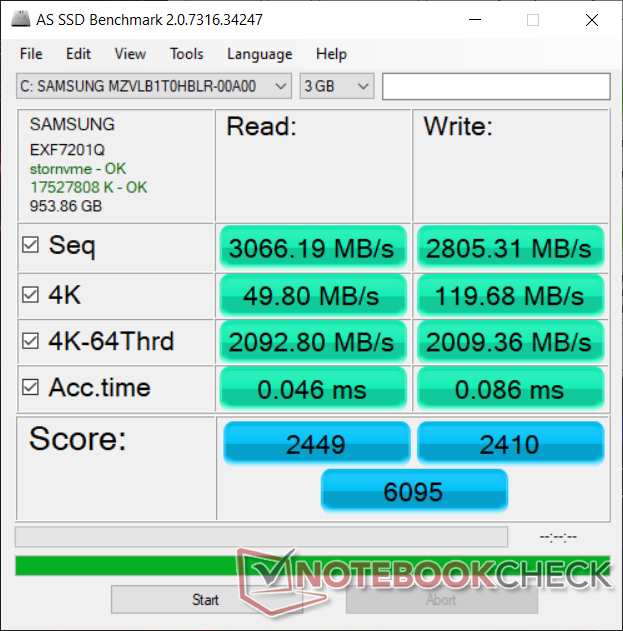
The majority of Razer Blade laptops come with Samsung PM981 A NVMe SSDs and the Blade 14 continues this trend. It's somewhat disappointing to see no PCIe 4.0 support, however, but that can be partly blamed on AMD and its Zen 3 architecture. A small handful of 14-inch Ultrabooks like the Vaio Z are already shipping with PCIe 4.0 drives.
| Razer Blade 14 Ryzen 9 RTX 3070 Samsung PM981a MZVLB1T0HBLR | Razer Blade 15 Advanced Model Early 2021 Samsung PM981a MZVLB1T0HBLR | Asus Zephyrus G14 GA401IV Intel SSD 660p 1TB SSDPEKNW010T8 | Asus ROG Flow X13 GV301QH WDC PC SN530 SDBPNPZ-1T00 | Dell XPS 15 9500 Core i7 4K UHD SK Hynix PC611 512GB | |
|---|---|---|---|---|---|
| AS SSD | -8% | -32% | -15% | -32% | |
| Seq Read | 3066 | 2112 -31% | 1278 -58% | 2137 -30% | 2072 -32% |
| Seq Write | 2805 | 2024 -28% | 1624 -42% | 1334 -52% | 1486 -47% |
| 4K Read | 49.8 | 46.53 -7% | 57.8 16% | 45.37 -9% | 47.41 -5% |
| 4K Write | 119.7 | 89.7 -25% | 163 36% | 179.3 50% | 117.6 -2% |
| 4K-64 Read | 2093 | 1747 -17% | 582 -72% | 1016 -51% | 967 -54% |
| 4K-64 Write | 2009 | 1962 -2% | 849 -58% | 1492 -26% | 715 -64% |
| Access Time Read * | 0.046 | 0.052 -13% | 0.036 22% | 0.033 28% | 0.057 -24% |
| Access Time Write * | 0.086 | 0.04 53% | 0.112 -30% | 0.043 50% | 0.096 -12% |
| Score Read | 2449 | 2004 -18% | 768 -69% | 1275 -48% | 1222 -50% |
| Score Write | 2410 | 2254 -6% | 1174 -51% | 1805 -25% | 981 -59% |
| Score Total | 6095 | 5280 -13% | 2372 -61% | 3700 -39% | 2809 -54% |
| Copy ISO MB/s | 1799 | 2128 18% | 1660 -8% | 1491 -17% | 1999 11% |
| Copy Program MB/s | 750 | 707 -6% | 443.5 -41% | 608 -19% | 627 -16% |
| Copy Game MB/s | 1830 | 1471 -20% | 1162 -37% | 1428 -22% | 1001 -45% |
* ... smaller is better

Disk Throttling: DiskSpd Read Loop, Queue Depth 8
GPU Performance — 100 W TGP GeForce RTX Graphics
Our 100 W GeForce RTX 3070 is roughly 4 to 8 percent slower than the 130 W RTX 3070 in the Asus ROG Strix G15 G513QR. When considering that the Blade 14 is just a fraction of the size of the Asus, many users may find the slight performance deficit an easy pill to swallow. Raw performance is still about 9 to 26 percent faster than the GeForce RTX 2080 Max-Q as found on most older (and larger) thin-and-light gaming laptops.
Upgrading to the RTX 3080 SKU will net users a relatively minor 10 to 13 percent gain in graphics performance while downgrading to the RTX 3060 SKU will cut performance by about 14 to 25 percent.
Real-world gaming performance is within just a few percentage points on average of a typical GeForce RTX 3070 laptop. Idling on Witcher 3 shows consistent frame rates over time with no major dips.
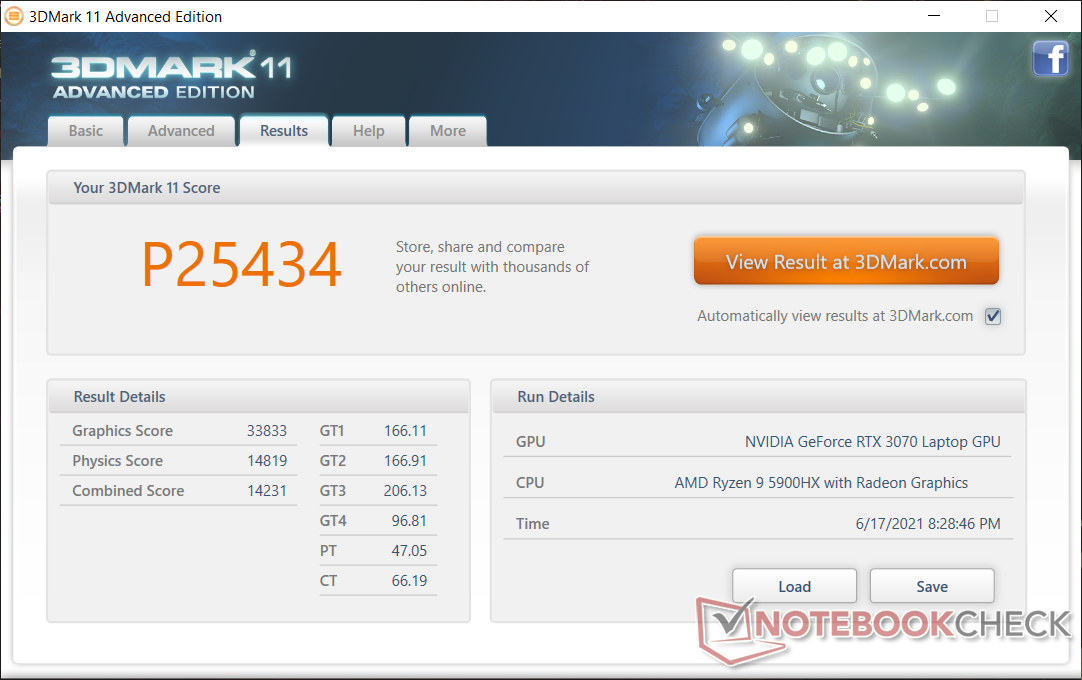
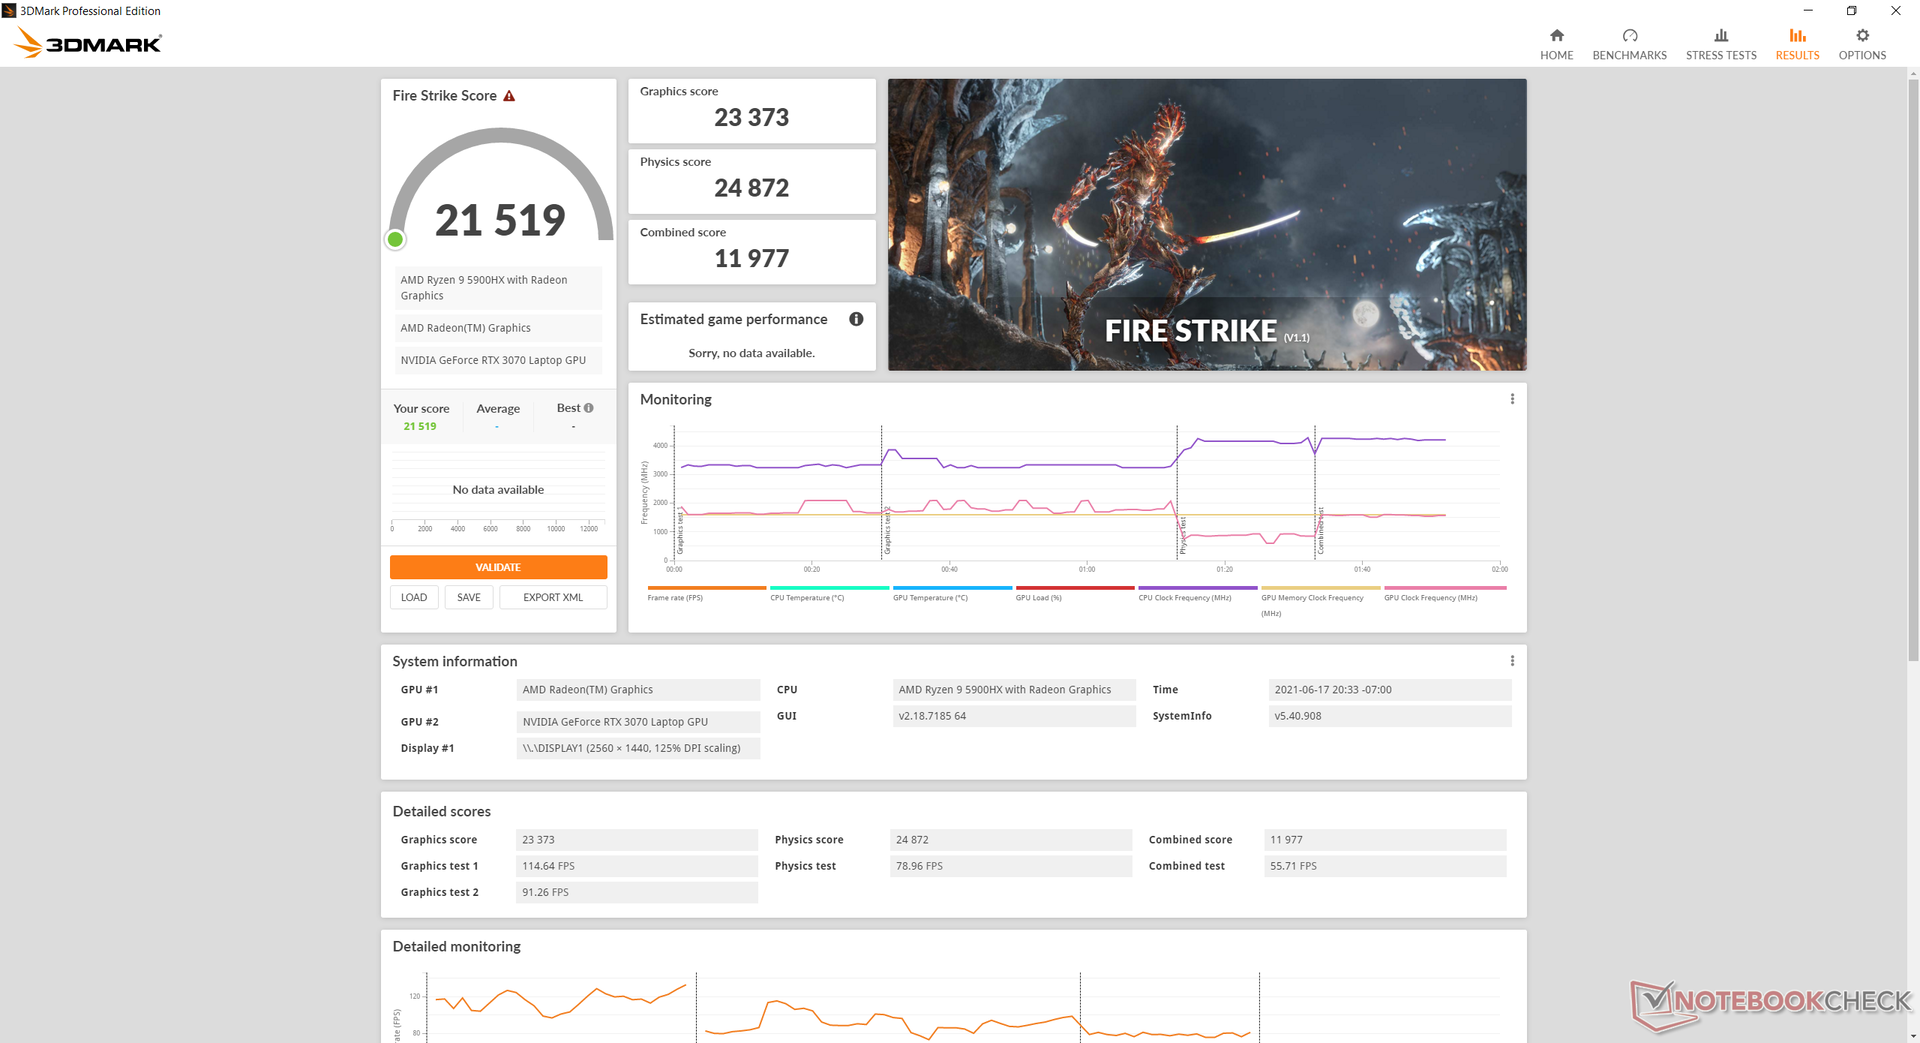
| 3DMark 11 Performance | 25434 points | |
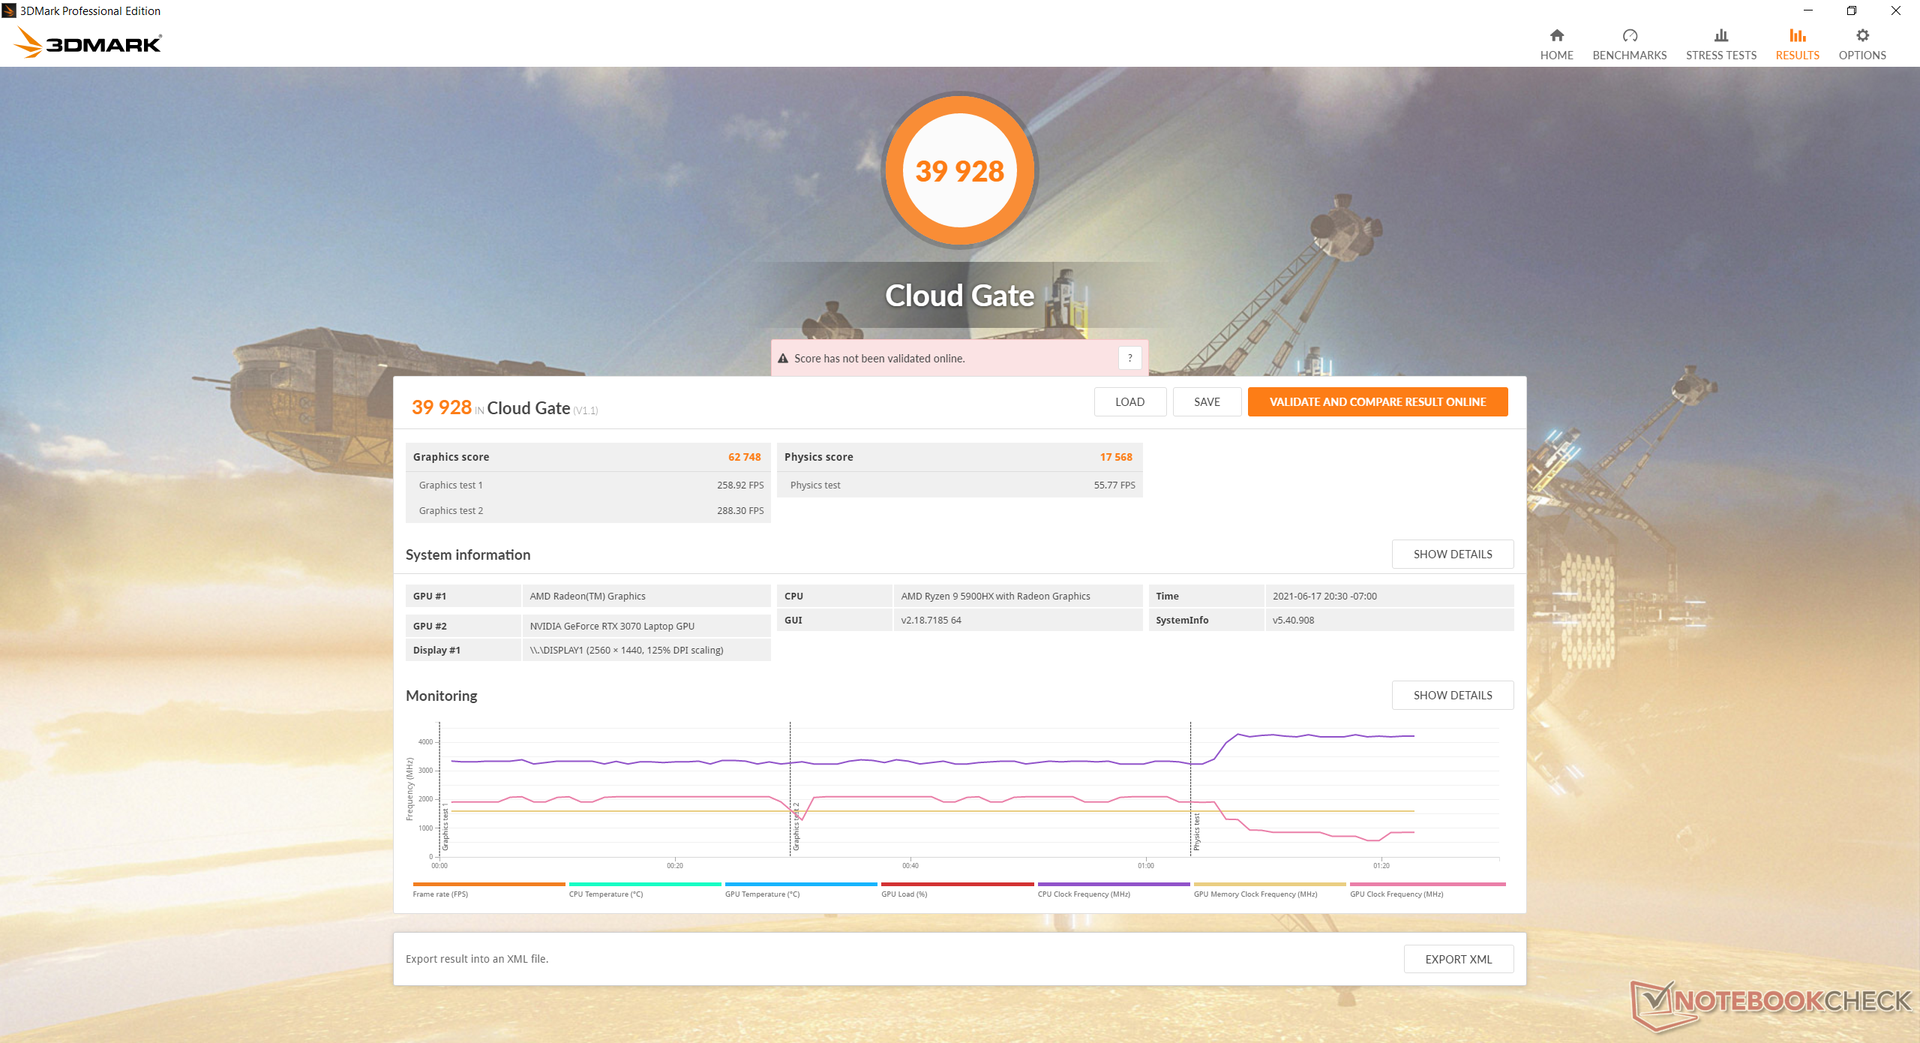
| 3DMark Cloud Gate Standard Score | 39928 points | |
| 3DMark Fire Strike Score | 21519 points | |
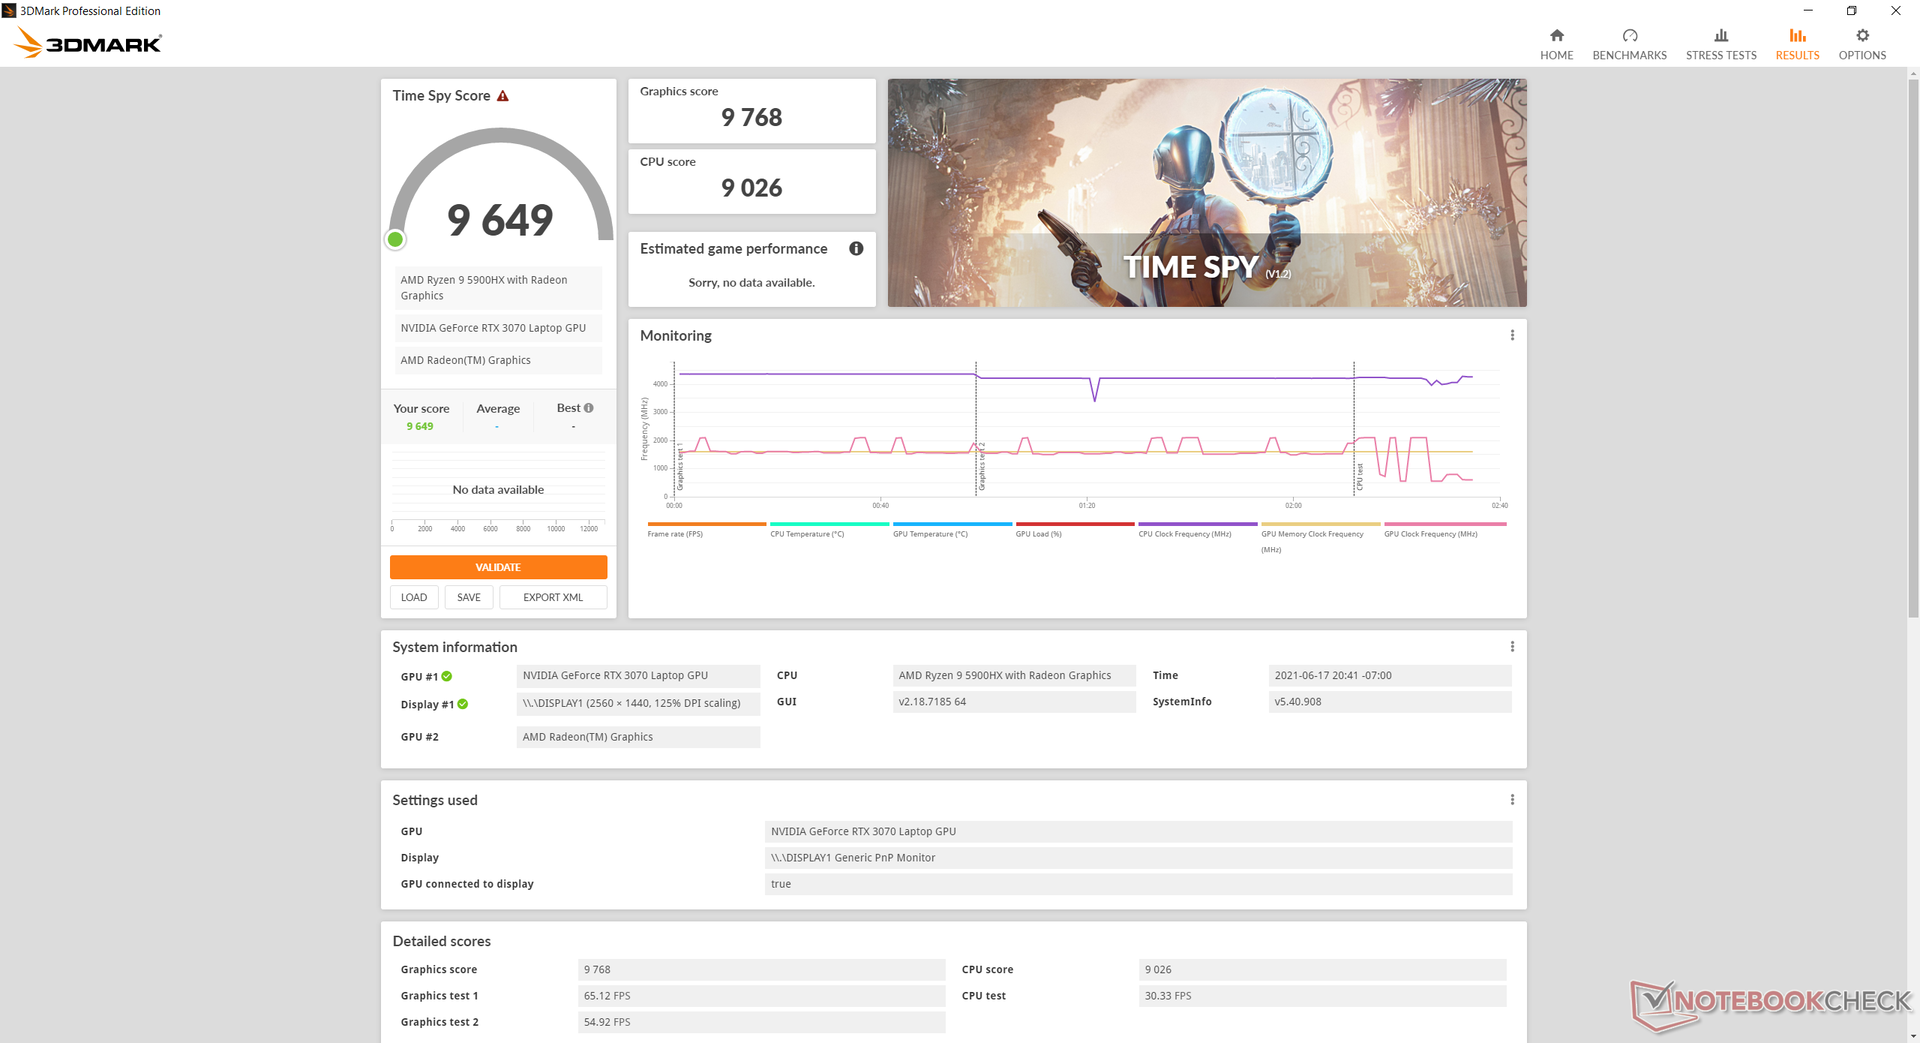
| 3DMark Time Spy Score | 9649 points | |
Help | ||
Witcher 3 FPS Chart
| low | med. | high | ultra | QHD | |
| GTA V (2015) | 169 | 132 | 79.6 | 72.7 | |
| The Witcher 3 (2015) | 288.3 | 164.2 | 88.6 | ||
| Dota 2 Reborn (2015) | 127 | 126 | 112 | 107 | |
| Final Fantasy XV Benchmark (2018) | 139 | 114 | 88 | 70.3 | |
| X-Plane 11.11 (2018) | 85 | 75.4 | 62.7 | ||
| Far Cry 5 (2018) | 133 | 110 | 105 | 99 | 86 |
| Strange Brigade (2018) | 285 | 178 | 163 | 154 | 119 |
| Assassin´s Creed Valhalla (2020) | 112 | 86 | 75 | 67 | 53 |
| Cyberpunk 2077 1.6 (2022) | 111.4 | 99.8 | 84.2 | 84 | 45.3 |
Emissions — Quiet When It Needs To Be
System Noise
Fan noise is tied closely to the Razer Synapse performance settings. When on Power Saver mode, the fans would typically settle at around 31 dB(A) or lower during simple tasks like browsing or streaming to be audible but not distracting. The fans may even idle during very low loads like word processing for a silent experience. These low-noise modes make it possible to use the Blade 14 in sensitive environments like classrooms or conferences just like any other Ultrabook.
Gaming on High Performance mode cranks up fan noise very quickly. We're able to record a steady noise of 44 dB(A) when running Witcher 3 up to almost 52 dB(A) when both the CPU and GPU are stressed even higher. These loud ranges are similar to most larger gaming laptops, however, and so the Blade 14 isn't necessarily louder than many of its larger peers — instead, its fans ramp up sooner and more sharply.
Razer does not utilize liquid metal cooling for its CPU unlike on every 2021 Asus ROG laptop currently in the market. We can't help but wonder how the technology could have changed the temperatures or fan noise of the Blade 14 over the usual silicone-based thermal paste.
| Razer Blade 14 Ryzen 9 RTX 3070 GeForce RTX 3070 Laptop GPU, R9 5900HX, Samsung PM981a MZVLB1T0HBLR | Razer Blade 15 Advanced Model Early 2021 GeForce RTX 3080 Laptop GPU, i7-10875H, Samsung PM981a MZVLB1T0HBLR | Asus Zephyrus G14 GA401IV GeForce RTX 2060 Max-Q, R9 4900HS, Intel SSD 660p 1TB SSDPEKNW010T8 | Asus ROG Flow X13 GV301QH GeForce GTX 1650 Max-Q, R9 5980HS, WDC PC SN530 SDBPNPZ-1T00 | Dell XPS 15 9500 Core i7 4K UHD GeForce GTX 1650 Ti Mobile, i7-10875H, SK Hynix PC611 512GB | MSI GS66 Stealth 10UG GeForce RTX 3070 Laptop GPU, i7-10870H, WDC PC SN730 SDBPNTY-1T00 | |
|---|---|---|---|---|---|---|
| Noise | -14% | -18% | -15% | -12% | -26% | |
| off / environment * | 25.1 | 24 4% | 28.1 -12% | 30.5 -22% | 28.4 -13% | 26.2 -4% |
| Idle Minimum * | 25.2 | 26 -3% | 30.4 -21% | 30.5 -21% | 28.4 -13% | 34 -35% |
| Idle Average * | 25.2 | 28 -11% | 31.5 -25% | 30.5 -21% | 28.4 -13% | 34 -35% |
| Idle Maximum * | 25.2 | 40 -59% | 33.7 -34% | 32.1 -27% | 28.4 -13% | 34 -35% |
| Load Average * | 31 | 45 -45% | 34.3 -11% | 43 -39% | 46 -48% | 47.2 -52% |
| Witcher 3 ultra * | 44 | 43 2% | 53.5 -22% | 42.8 3% | 42 5% | 46.3 -5% |
| Load Maximum * | 51.7 | 45 13% | 53.5 -3% | 41.3 20% | 47.1 9% | 58.2 -13% |
* ... smaller is better
Noise Level
| Idle |
| 25.2 / 25.2 / 25.2 dB(A) |
| Load |
| 31 / 51.7 dB(A) |
 | ||
30 dB silent 40 dB(A) audible 50 dB(A) loud |
||
min: | ||
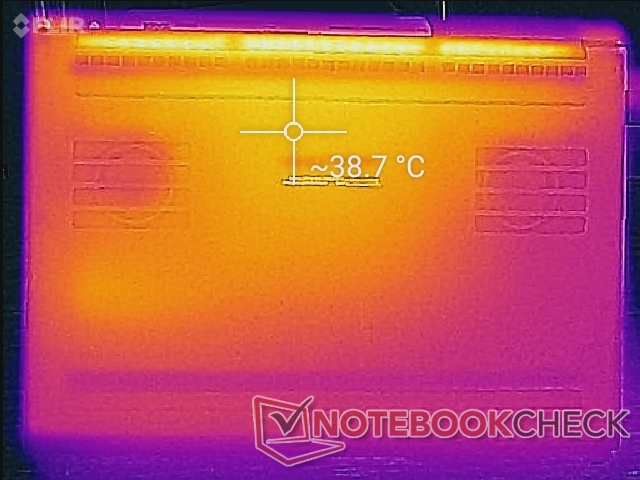
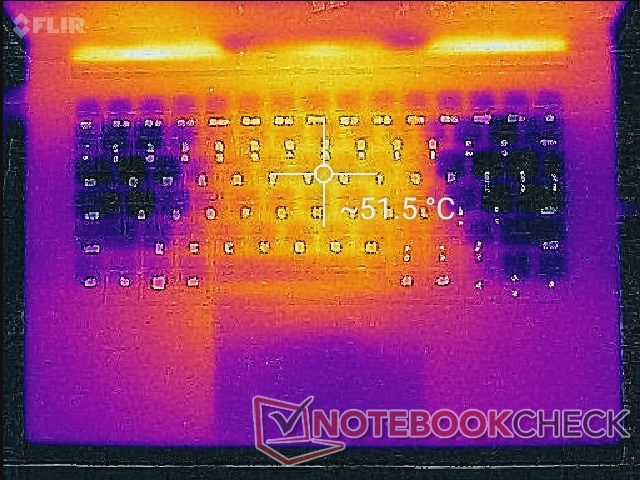
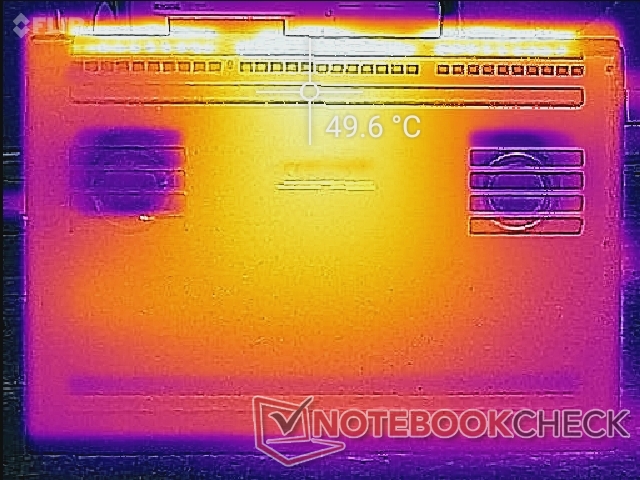
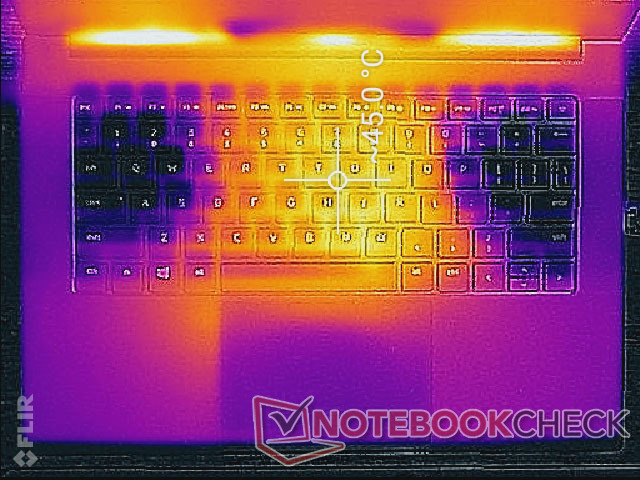
Temperature — Warm Almost All The Time
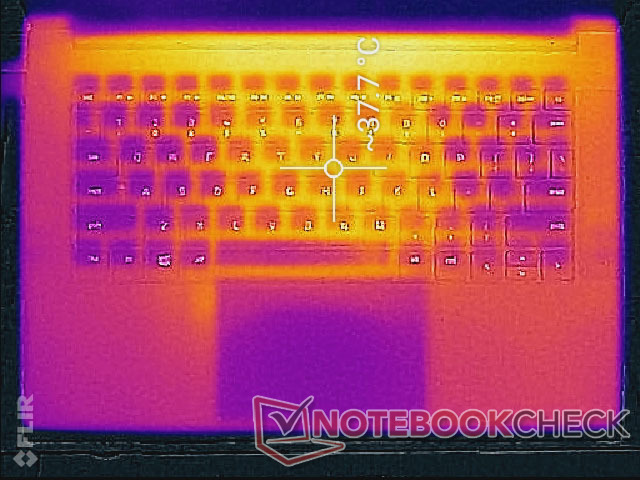
Surface temperatures are warmer than expected when idling on desktop because the fans tend to idle as mentioned above. In fact, the average surface temperature when idling is a full 10 C warmer than what we recorded on the Asus Zephyrus G14 when under similar conditions.
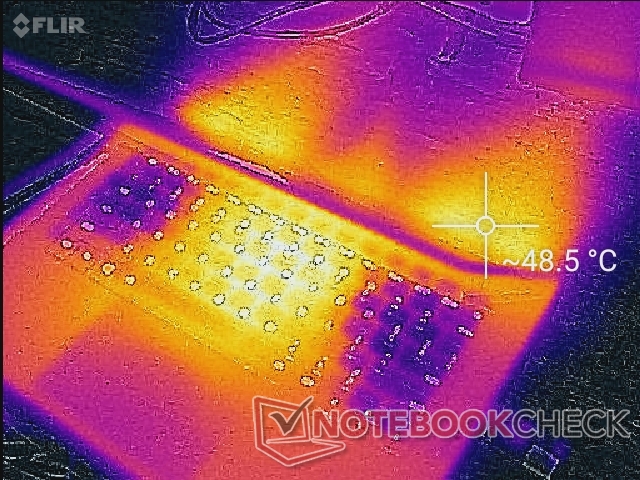
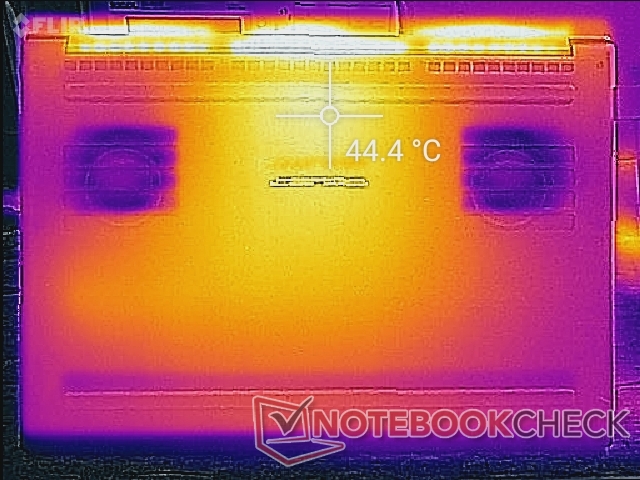
When running higher loads like games, the two fans draw cool air through the WASD and Enter keys as shown below for cooler fingers. The palm rests, however, will get much warmer at almost 40 C. It definitely feels a bit weird to have cool fingers on the WASD keys while the rest of the hand is a lot warmer. Average surface temperatures are warmer than what you'll find on other gaming laptops including on the Zephyrus G14 or MSI GS66 due in part to the denser unibody metal design of the Razer.

(±) The maximum temperature on the upper side is 45 °C / 113 F, compared to the average of 40.4 °C / 105 F, ranging from 21.2 to 68.8 °C for the class Gaming.
(±) The bottom heats up to a maximum of 44.4 °C / 112 F, compared to the average of 43.2 °C / 110 F
(±) In idle usage, the average temperature for the upper side is 35.4 °C / 96 F, compared to the device average of 33.8 °C / 93 F.
(-) Playing The Witcher 3, the average temperature for the upper side is 41.2 °C / 106 F, compared to the device average of 33.8 °C / 93 F.
(±) The palmrests and touchpad can get very hot to the touch with a maximum of 39.4 °C / 102.9 F.
(-) The average temperature of the palmrest area of similar devices was 28.9 °C / 84 F (-10.5 °C / -18.9 F).
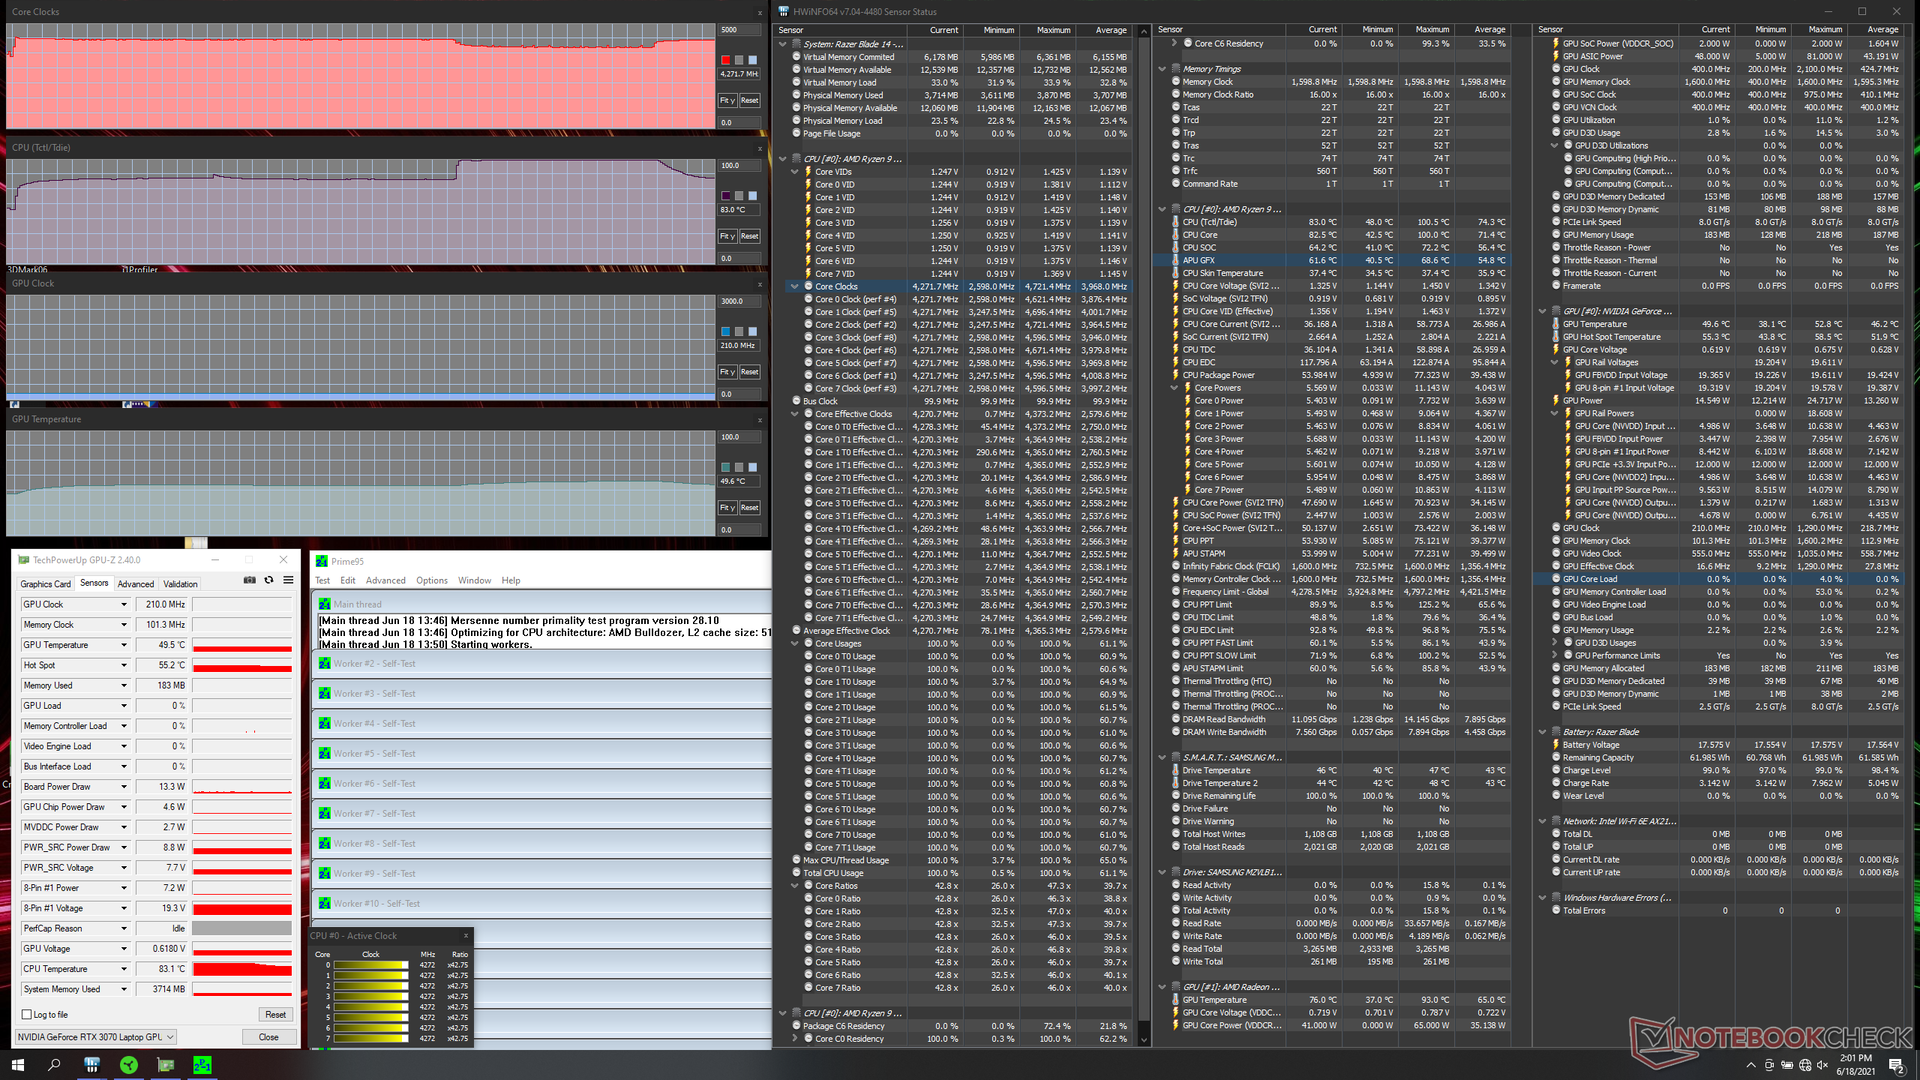
Stress Test
When running Prime95 to stress the CPU, clock rates can be observed boosting to and stabilizing at 4.3 GHz. Core temperature would also remain stable at around 83 C. Should the core ever reach 100 C, clock rates would dip to 3.8 GHz temporarily before boosting back up to 4.3 GHz as shown by the screenshot below. The highest stable CPU temperature we can record is 90 C when running both Prime95 and FurMark simultaneously on the machine.
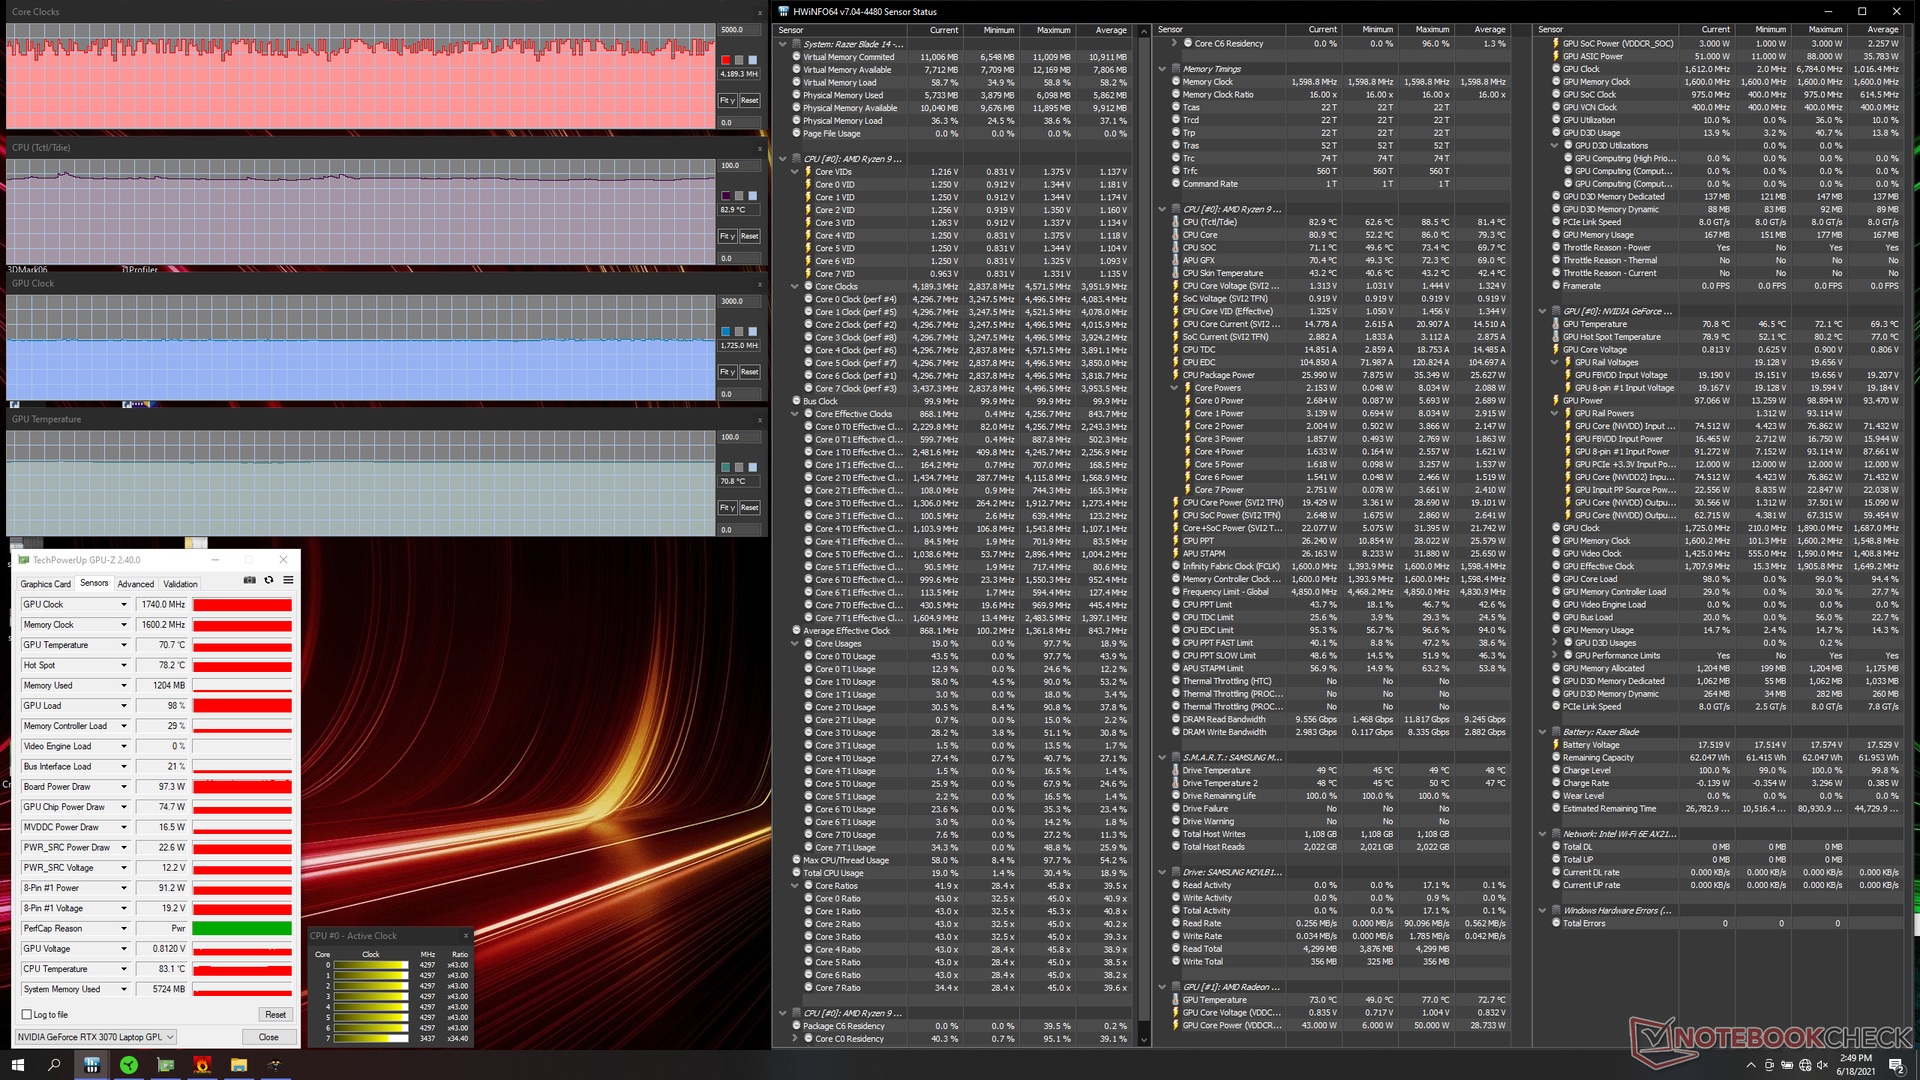
Running Witcher 3 is more representative of real-world gaming loads. The CPU and GPU would stabilize at 83 C and 71 C, respectively, compared to 79 C and 66 C on the Zephyrus G14 or 67 C and 75 C on the Blade 15 when under similar gaming conditions. The CPU is definitely running a bit warmer on the Blade 14 compared to what we've seen on most other gaming laptops.
GPU board draw would also hover around 97 W when running Witcher 3 which confirms Razer's claim of a 100 W TGP RTX 3070. The 15.6-inch Zephyrus Duo 15 SE is able to house more powerful 130 W TGP GPUs while offering the exact same CPU as our Blade 14.
Running on battery power will limit performance. A 3DMark 11 test on batteries would return Physics and Graphics scores of 11372 and 13071 points, respectively, compared to 14819 and 33833 points when on mains.
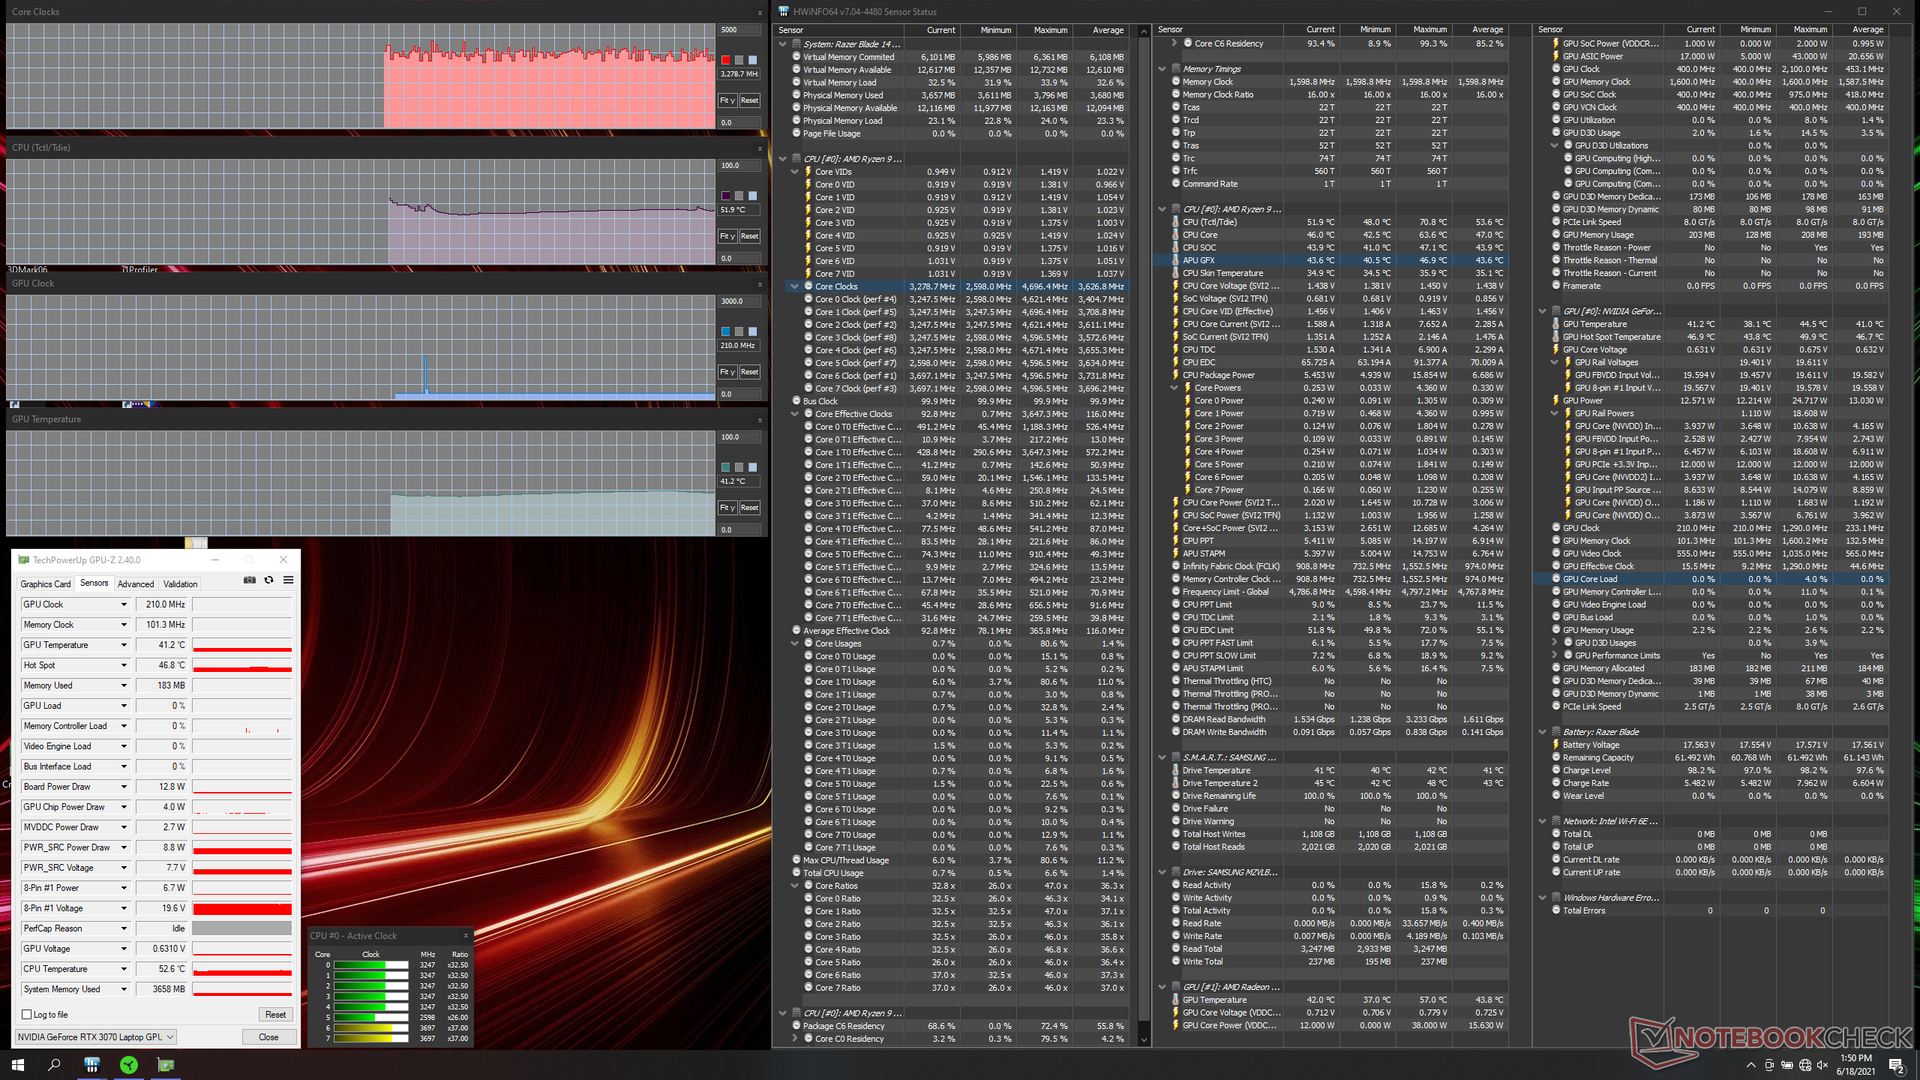
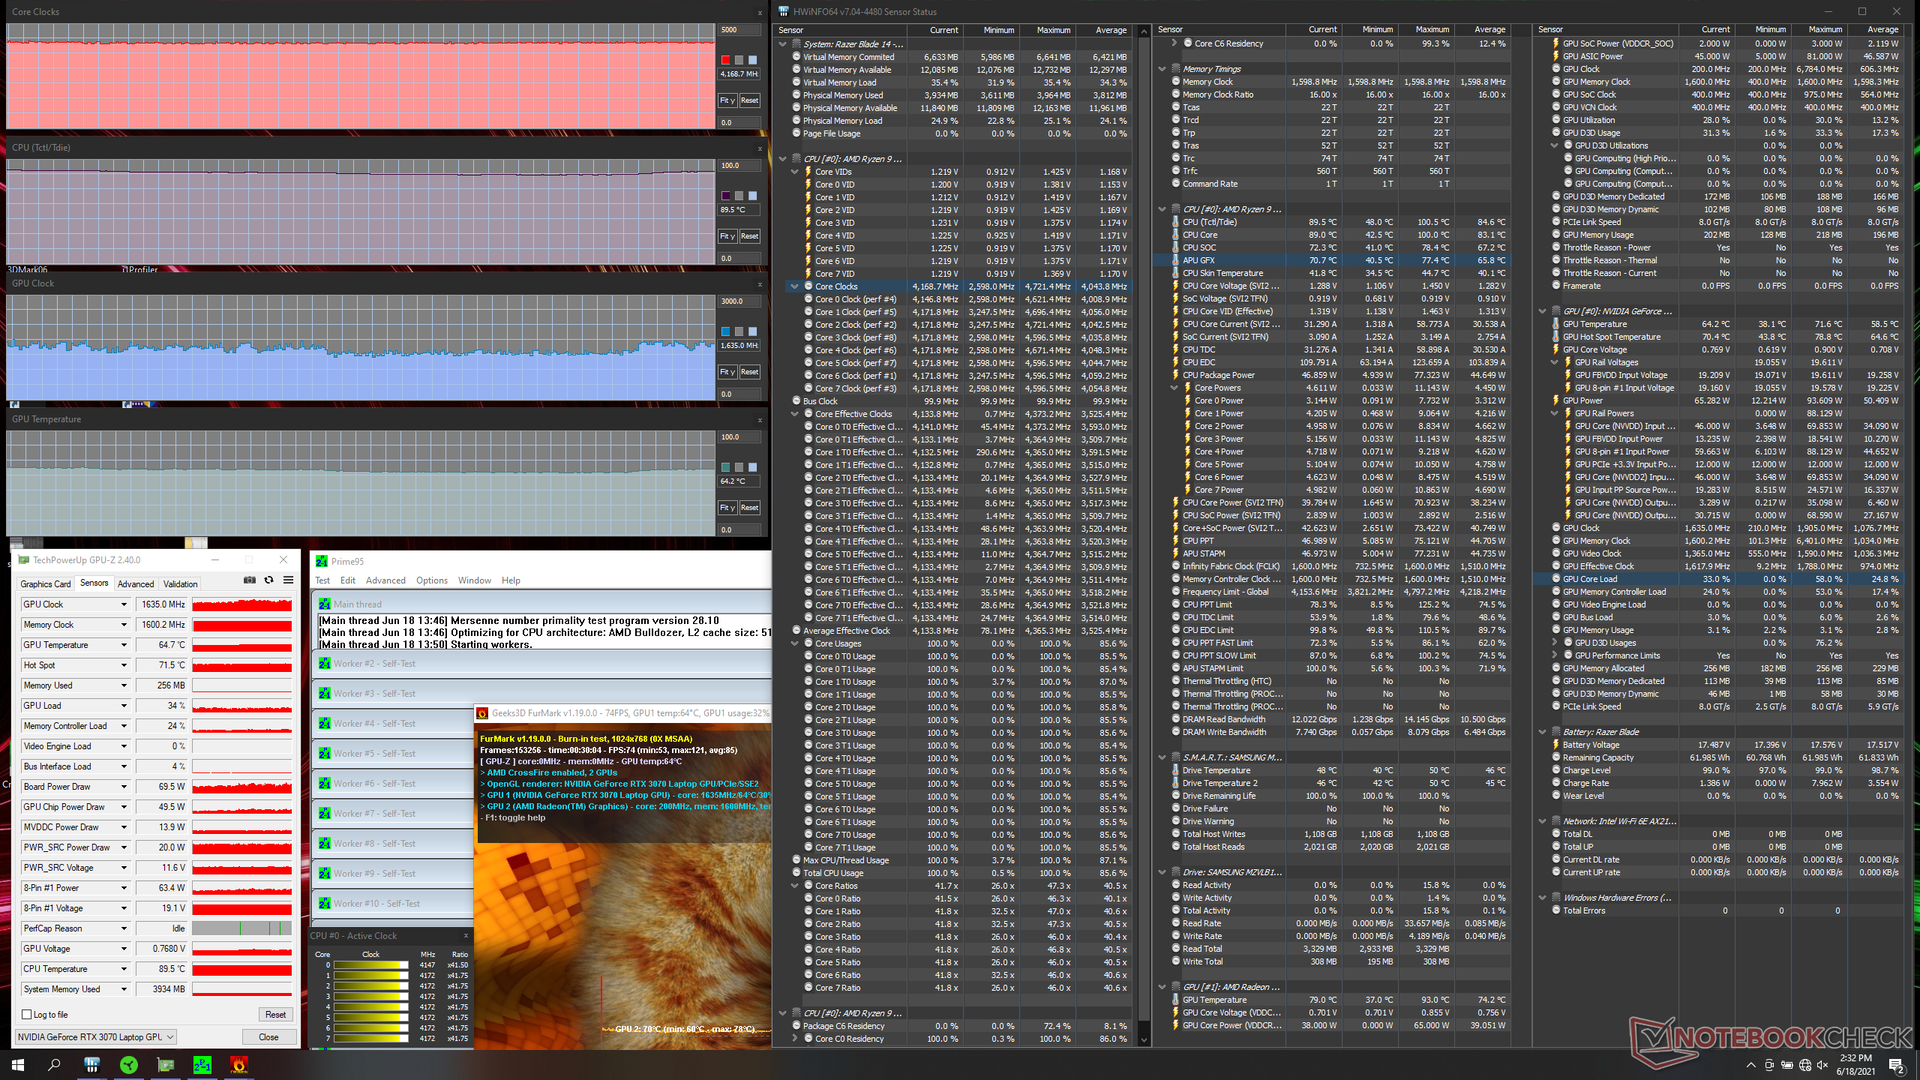
| CPU Clock (GHz) | GPU Clock (MHz) | Average CPU Temperature (°C) | Average GPU Temperature (°C) | |
| System Idle | -- | -- | 52 | 41 |
| Prime95 Stress | 3.9 - 4.3 | -- | 83 - 100 | 50 |
| Prime95 + FurMark Stress | 4.2 | ~1635 | 90 | 65 |
| Witcher 3 Stress | ~3.5 - 4.2 | 1740 | 83 | 71 |
Speakers
The stereo speakers are average and nothing special relative to the exciting hardware surrounding them. They could easily pass on a regular Ultrabook worth less than half the price of our Razer. You're likely going to want a good pair of headphones to drown out the fan noise when gaming, anyway.
The speaker grilles are along the sides of the keyboard much like on the Blade 15 despite the keyboard layout being identical to the Blade Stealth.
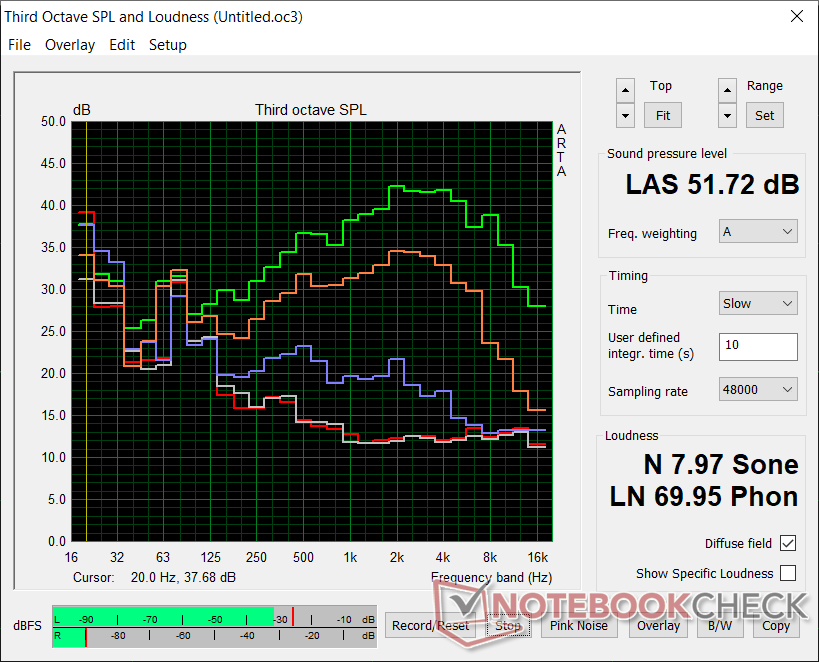
Razer Blade 14 Ryzen 9 RTX 3070 audio analysis
(±) | speaker loudness is average but good (78.1 dB)
Bass 100 - 315 Hz
(±) | reduced bass - on average 14.2% lower than median
(±) | linearity of bass is average (13.5% delta to prev. frequency)
Mids 400 - 2000 Hz
(±) | higher mids - on average 5.5% higher than median
(+) | mids are linear (6.6% delta to prev. frequency)
Highs 2 - 16 kHz
(+) | balanced highs - only 4.8% away from median
(±) | linearity of highs is average (8.9% delta to prev. frequency)
Overall 100 - 16.000 Hz
(±) | linearity of overall sound is average (18.6% difference to median)
Compared to same class
» 58% of all tested devices in this class were better, 9% similar, 34% worse
» The best had a delta of 6%, average was 18%, worst was 132%
Compared to all devices tested
» 37% of all tested devices were better, 8% similar, 56% worse
» The best had a delta of 4%, average was 25%, worst was 134%
Apple MacBook 12 (Early 2016) 1.1 GHz audio analysis
(+) | speakers can play relatively loud (83.6 dB)
Bass 100 - 315 Hz
(±) | reduced bass - on average 11.3% lower than median
(±) | linearity of bass is average (14.2% delta to prev. frequency)
Mids 400 - 2000 Hz
(+) | balanced mids - only 2.4% away from median
(+) | mids are linear (5.5% delta to prev. frequency)
Highs 2 - 16 kHz
(+) | balanced highs - only 2% away from median
(+) | highs are linear (4.5% delta to prev. frequency)
Overall 100 - 16.000 Hz
(+) | overall sound is linear (10.2% difference to median)
Compared to same class
» 5% of all tested devices in this class were better, 2% similar, 93% worse
» The best had a delta of 5%, average was 19%, worst was 53%
Compared to all devices tested
» 3% of all tested devices were better, 1% similar, 96% worse
» The best had a delta of 4%, average was 25%, worst was 134%
Energy Management
Power Consumption — High CPU Performance-Per-Watt
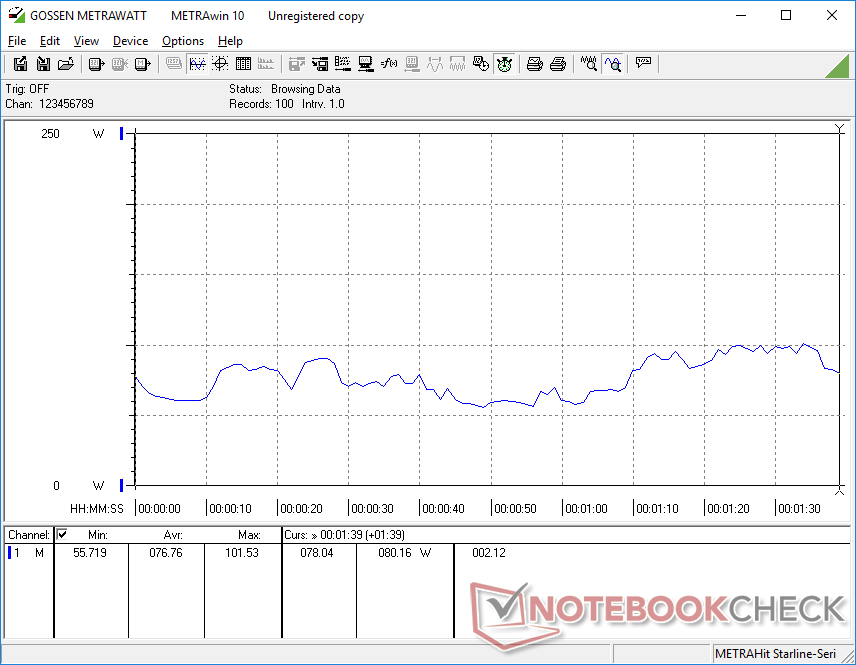
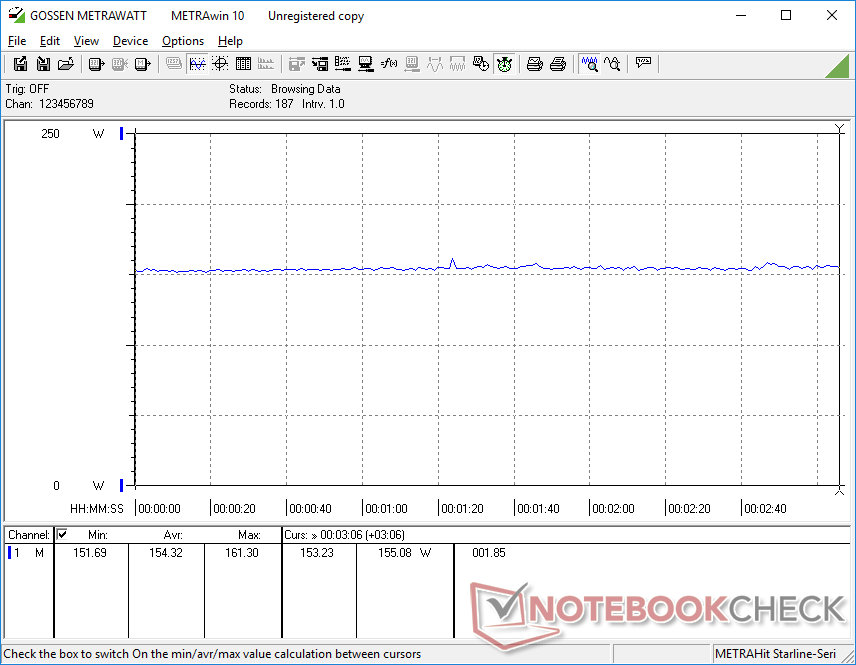
Power consumption when gaming is higher than what we recorded on the 2021 Blade 15 by about 22 percent. The Asus ROG Strix G15 G513QR with the same CPU and GPU as our Blade 14, however, would consume about 20 W to 40 W more when under the same gaming loads. The more demanding 130 W RTX 3070 in the Asus is at least partly responsible for this difference.
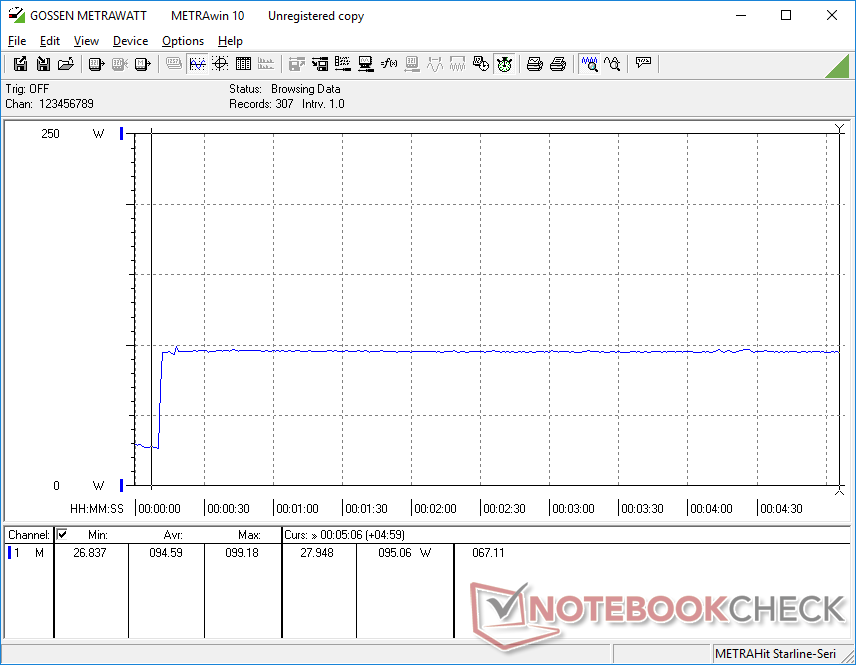
Running Prime95 would consume about 96 W compared to 122 W on the Blade Pro powered by the weaker Core i7-10875H. Thus, the Blade 14 is able to offer almost 40 percent faster multi-thread performance than the Core i7-10875H all while consuming 20 percent less power in the process.
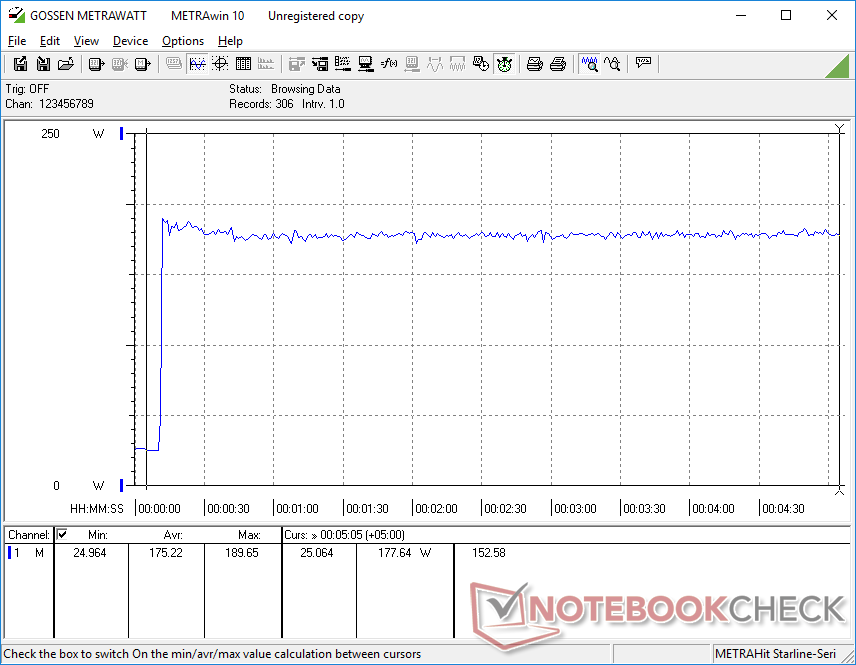
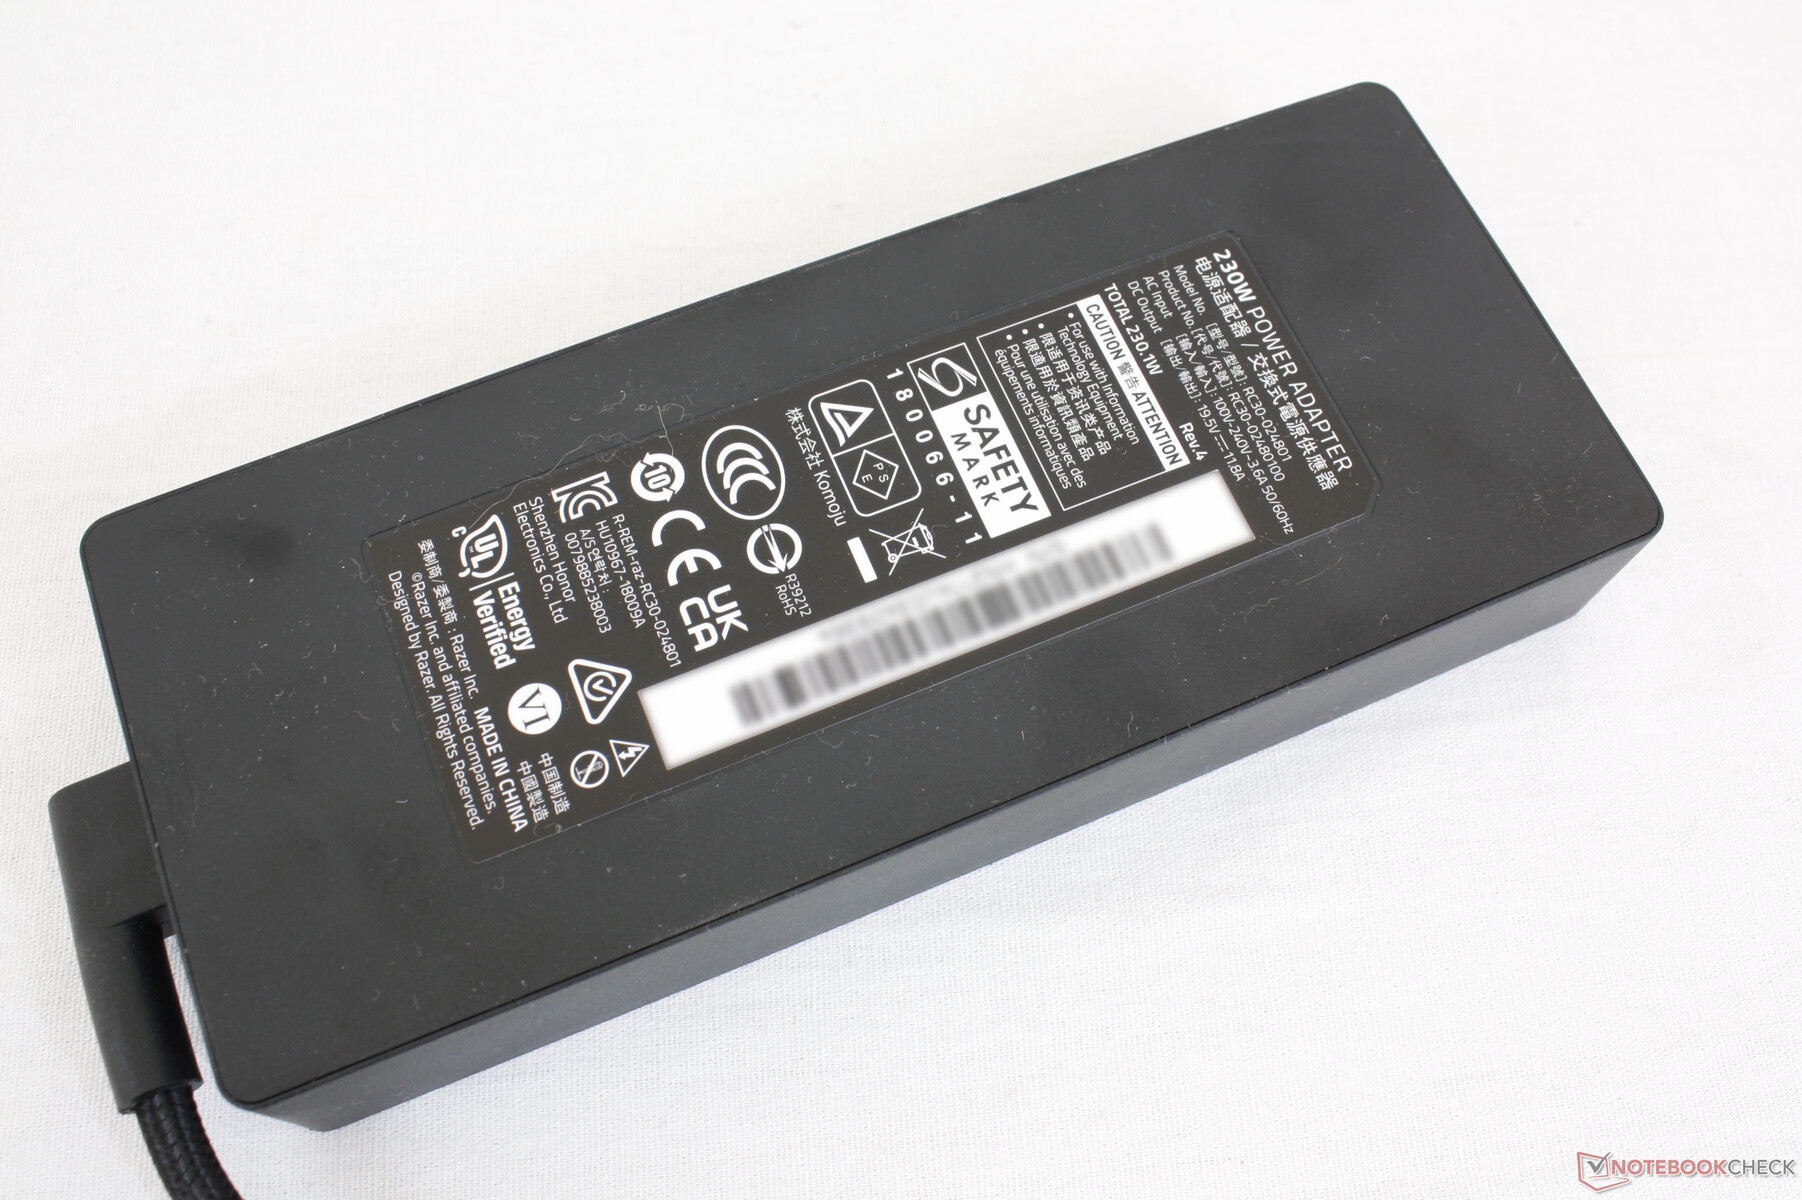
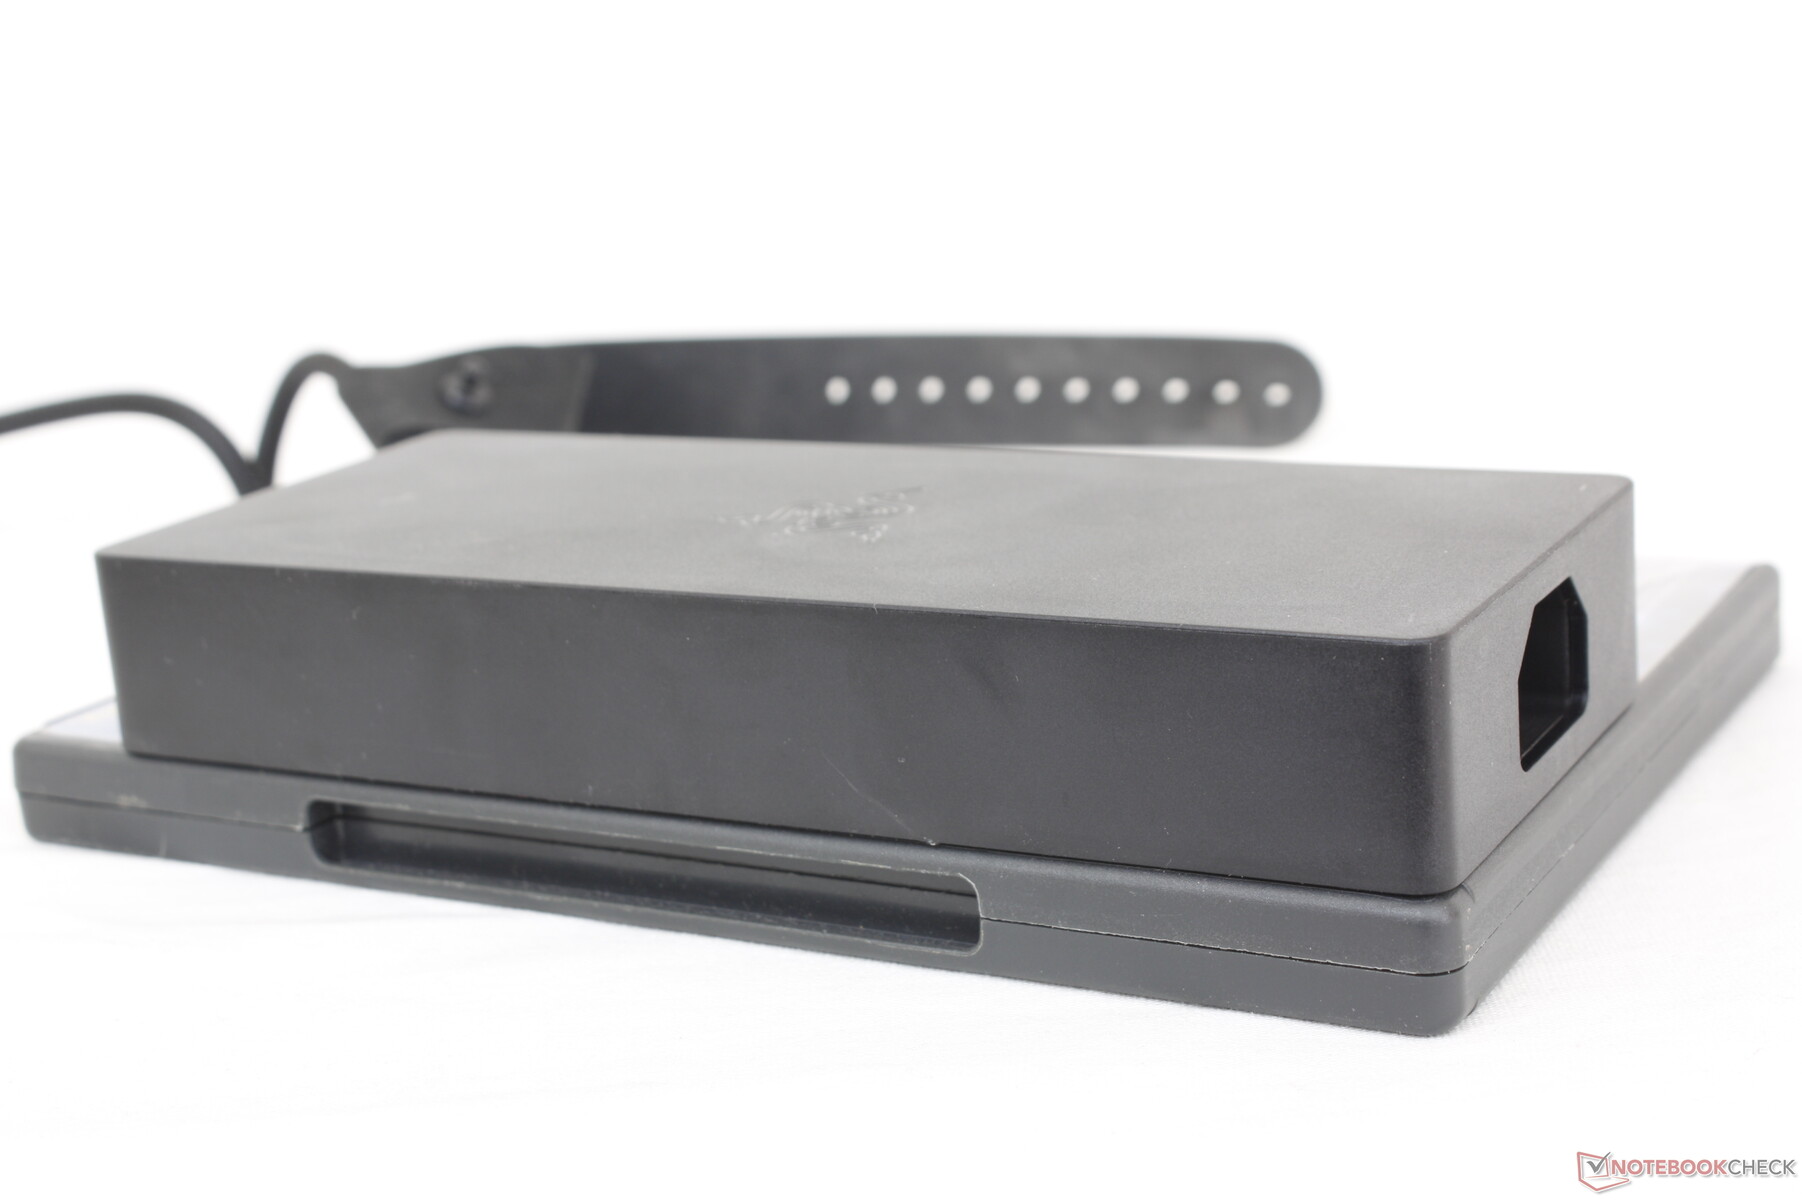
Running Prime95 and FurMark simultaneously draws a maximum of 190 W from the medium-sized (~17 x 7 x 2.5 cm) 230 W AC adapter. We appreciate the fact that all newer Blade models (excluding the Blade Stealth) share the same AC barrel charger for interchangeability and easy replacement if needed.
| Off / Standby | |
| Idle | |
| Load |
|
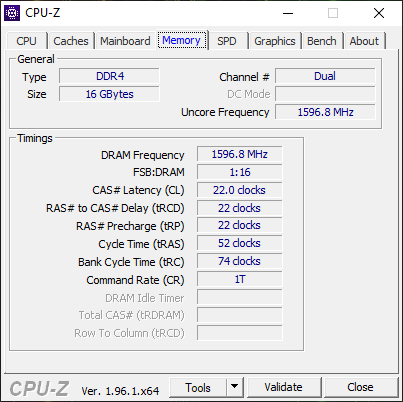
| Razer Blade 14 Ryzen 9 RTX 3070 R9 5900HX, GeForce RTX 3070 Laptop GPU, Samsung PM981a MZVLB1T0HBLR, IPS, 2560x1440, 14.00 | Razer Blade 15 Advanced Model Early 2021 i7-10875H, GeForce RTX 3080 Laptop GPU, Samsung PM981a MZVLB1T0HBLR, IPS, 1920x1080, 15.60 | Asus Zephyrus G14 GA401IV R9 4900HS, GeForce RTX 2060 Max-Q, Intel SSD 660p 1TB SSDPEKNW010T8, IPS, 1920x1080, 14.00 | Asus ROG Flow X13 GV301QH R9 5980HS, GeForce GTX 1650 Max-Q, WDC PC SN530 SDBPNPZ-1T00, IPS, 3840x2400, 13.40 | MSI GS66 Stealth 10UG i7-10870H, GeForce RTX 3070 Laptop GPU, WDC PC SN730 SDBPNTY-1T00, IPS, 1920x1080, 15.60 | |
|---|---|---|---|---|---|
| Power Consumption | -4% | 23% | 32% | -17% | |
| Idle Minimum * | 9.4 | 13 -38% | 5.5 41% | 7.4 21% | 12.9 -37% |
| Idle Average * | 15.8 | 15 5% | 9.3 41% | 10.3 35% | 15.4 3% |
| Idle Maximum * | 24.1 | 22 9% | 15.8 34% | 13.4 44% | 27.1 -12% |
| Load Average * | 76.8 | 98 -28% | 92.2 -20% | 75.9 1% | 98.2 -28% |
| Witcher 3 ultra * | 154 | 126 18% | 112.4 27% | 164.9 -7% | |
| Load Maximum * | 189.7 | 165 13% | 156.6 17% | 78 59% | 232.9 -23% |
* ... smaller is better
Battery Life — Long Runtimes
Battery capacity (62 Wh) is in between that of the Blade Stealth (53 Wh) and Blade 15 (80 Wh). Overall runtimes, however, are nonetheless shorter than either model by almost two hours. The 7-hour real-world WLAN runtime is still respectable and likely more than enough for the majority of users.
Charging from empty to full capacity is fast at just over 1.5 hours. Battery capacity will not drain over time if gaming and charging simultaneously unlike on some older Blade Stealth models. The charging rate, however, will be much slower.
| Razer Blade 14 Ryzen 9 RTX 3070 R9 5900HX, GeForce RTX 3070 Laptop GPU, 62 Wh | Razer Blade 15 Advanced Model Early 2021 i7-10875H, GeForce RTX 3080 Laptop GPU, 80 Wh | Asus Zephyrus G14 GA401IV R9 4900HS, GeForce RTX 2060 Max-Q, 76 Wh | Asus ROG Flow X13 GV301QH R9 5980HS, GeForce GTX 1650 Max-Q, 62 Wh | Dell XPS 15 9500 Core i7 4K UHD i7-10875H, GeForce GTX 1650 Ti Mobile, 86 Wh | MSI GS66 Stealth 10UG i7-10870H, GeForce RTX 3070 Laptop GPU, 99.9 Wh | Razer Blade Stealth i7-1165G7 GTX 1650 Ti Max-Q i7-1165G7, GeForce GTX 1650 Ti Max-Q, 53.1 Wh | |
|---|---|---|---|---|---|---|---|
| Battery Runtime | 27% | 36% | -4% | 48% | 13% | 36% | |
| Reader / Idle | 828 | 866 5% | 1140 38% | 623 -25% | 1382 67% | 649 -22% | 1235 49% |
| WiFi v1.3 | 439 | 538 23% | 577 31% | 347 -21% | 546 24% | 426 -3% | 541 23% |
| Load | 79 | 120 52% | 109 38% | 107 35% | 121 53% | 129 63% |
Pros
Cons
Verdict — Lives Up To All The Claims
Whenever we see a superthin laptop that promises Core i9-level performance with GeForce RTX 80 level graphics, we're always wondering what compromises had to be made behind users' backs. You just can't simply squeeze hardware designed for thick 17.3-inch form factors into a small 14-inch laptop without cutting some corners.
In Razer's case, the setbacks for the Blade 14 are remarkably minor relative to the savings in size and weight. The larger 15.6-inch Asus ROG Strix G15 G513QR, which comes with the exact same Ryzen 9 5900HX CPU and RTX 3070 GPU as our Razer test unit, is only just a few percentage points faster in raw benchmarks despite being 111 percent (!) larger in volume and 28 percent heavier. Even battery life isn't necessarily longer on the larger Asus model. The Blade 14 may be a hair slower, but the tremendous gains in portability and versatility will likely outweigh the tiny performance deficit between them for the target audience of traveling gamers or power-hungry students.
The Razer Blade 14 isn't just all looks as it has the real-world performance to back up all those impressive paper specifications.
If performance is comparable to larger 15.6-inch or 17.3-inch models, then the Blade 14 must be louder and warmer, right? In terms of noise, the system is generally on par with many of its larger alternatives when running games due to its oversized cooling solution. This leaves temperature as the one aspect where the Blade 14 could use some improvement. If you can deal with the very warm palm rests and lack of Thunderbolt support, then you'll find that the Blade 14 can actually deliver on all performance fronts.
Price and availability
The 2021 Razer Blade 14 is now widely available across major retailers including Razer's own online store. Walmart, Best Buy, and Amazon are each carrying our GeForce RTX 3070 configuration for $2199 USD.
Razer Blade 14 Ryzen 9 RTX 3070
-
06/22/2021 v7
Allen Ngo
More articles related to this device
Razer Blade 14 Ryzen 9 RTX 3070 (Blade 14 Series)Related Articles


Pricecompare
