 Deutsch
 English
 Español
 Français
 Italiano
 Nederlands
 Polski
 Português
 Русский
 Türkçe
 Svenska
 Chinese
 Magyar
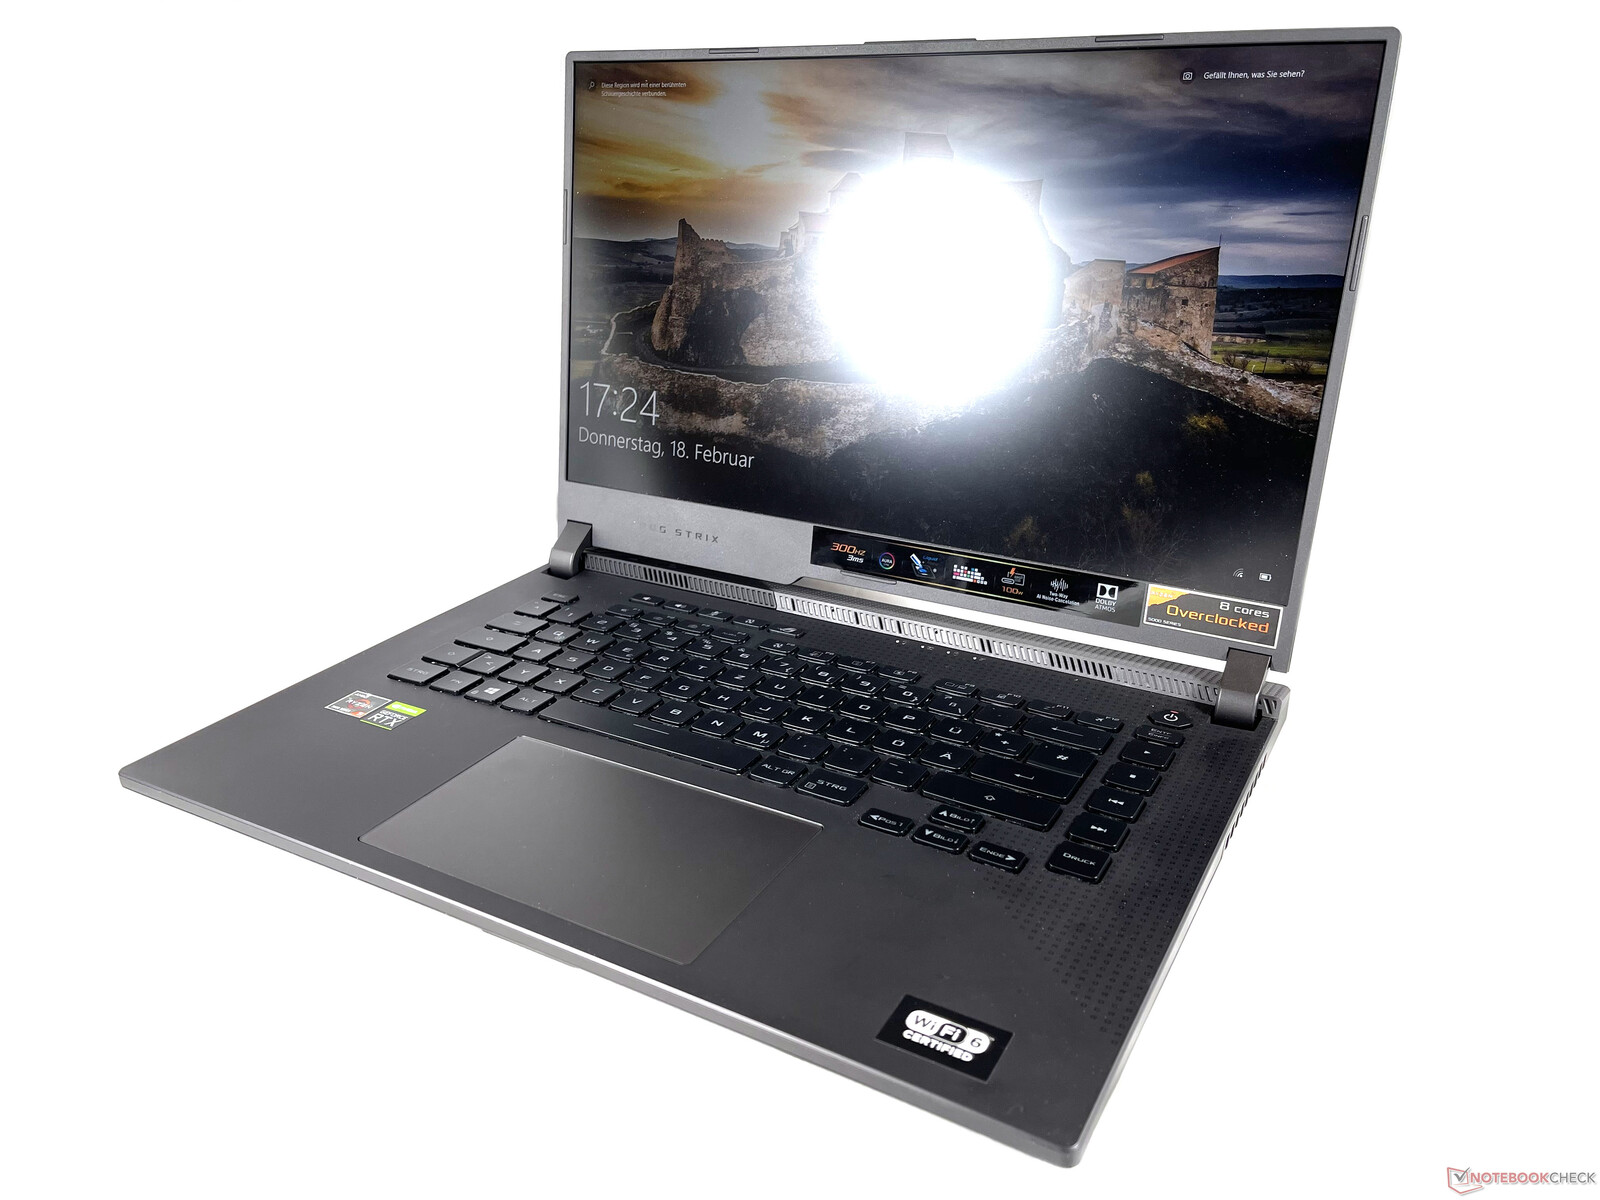
Asus ROG Strix G15 G513QR laptop review: AMD and Nvidia combined
Asus's ROG Strix lineup consists of powerful gaming laptops that rank just below the manufacturer's Strix SCAR flagship models. The ROG Strix G15 G513Q reviewed here is the 15-inch model that achieves a remarkable performance thanks to the currently popular combination of an AMD processor and an Nvidia graphics card. We want to find out how big the differences are compared to the predecessor, the Strix G15 G512LW, and whether the gaming laptop can also hold its own against the numerous competing models.
Possible contenders in comparison
Rating | Date | Model | Weight | Height | Size | Resolution | Best Price |
|---|---|---|---|---|---|---|---|
| 85 % | 02/2021 | Asus ROG Strix G15 G513QR R9 5900HX, GeForce RTX 3070 Laptop GPU | 2.3 kg | 27.2 mm | 15.60" | 1920x1080 | |
| 84 % | 02/2021 | MSI GS66 Stealth 10UG i7-10870H, GeForce RTX 3070 Laptop GPU | 2.1 kg | 19.8 mm | 15.60" | 1920x1080 | |
| 82.4 % | 02/2021 | Asus TUF Dash F15 FX516PR i7-11370H, GeForce RTX 3070 Laptop GPU | 2 kg | 20 mm | 15.60" | 1920x1080 | |
| 83.8 % | 02/2021 | Asus ROG Zephyrus G15 GA503Q R9 5900HS, GeForce RTX 3080 Laptop GPU | 2 kg | 20 mm | 15.60" | 2560x1440 | |
| 86.9 % | 08/2020 | Razer Blade 15 RTX 2070 Super Max-Q i7-10875H, GeForce RTX 2070 Super Max-Q | 2.1 kg | 17.8 mm | 15.60" | 1920x1080 | |
| 83.4 % | 11/2020 | Asus ROG Strix G15 G512LW i7-10750H, GeForce RTX 2070 Mobile | 2.3 kg | 25.8 mm | 15.60" | 1920x1080 |
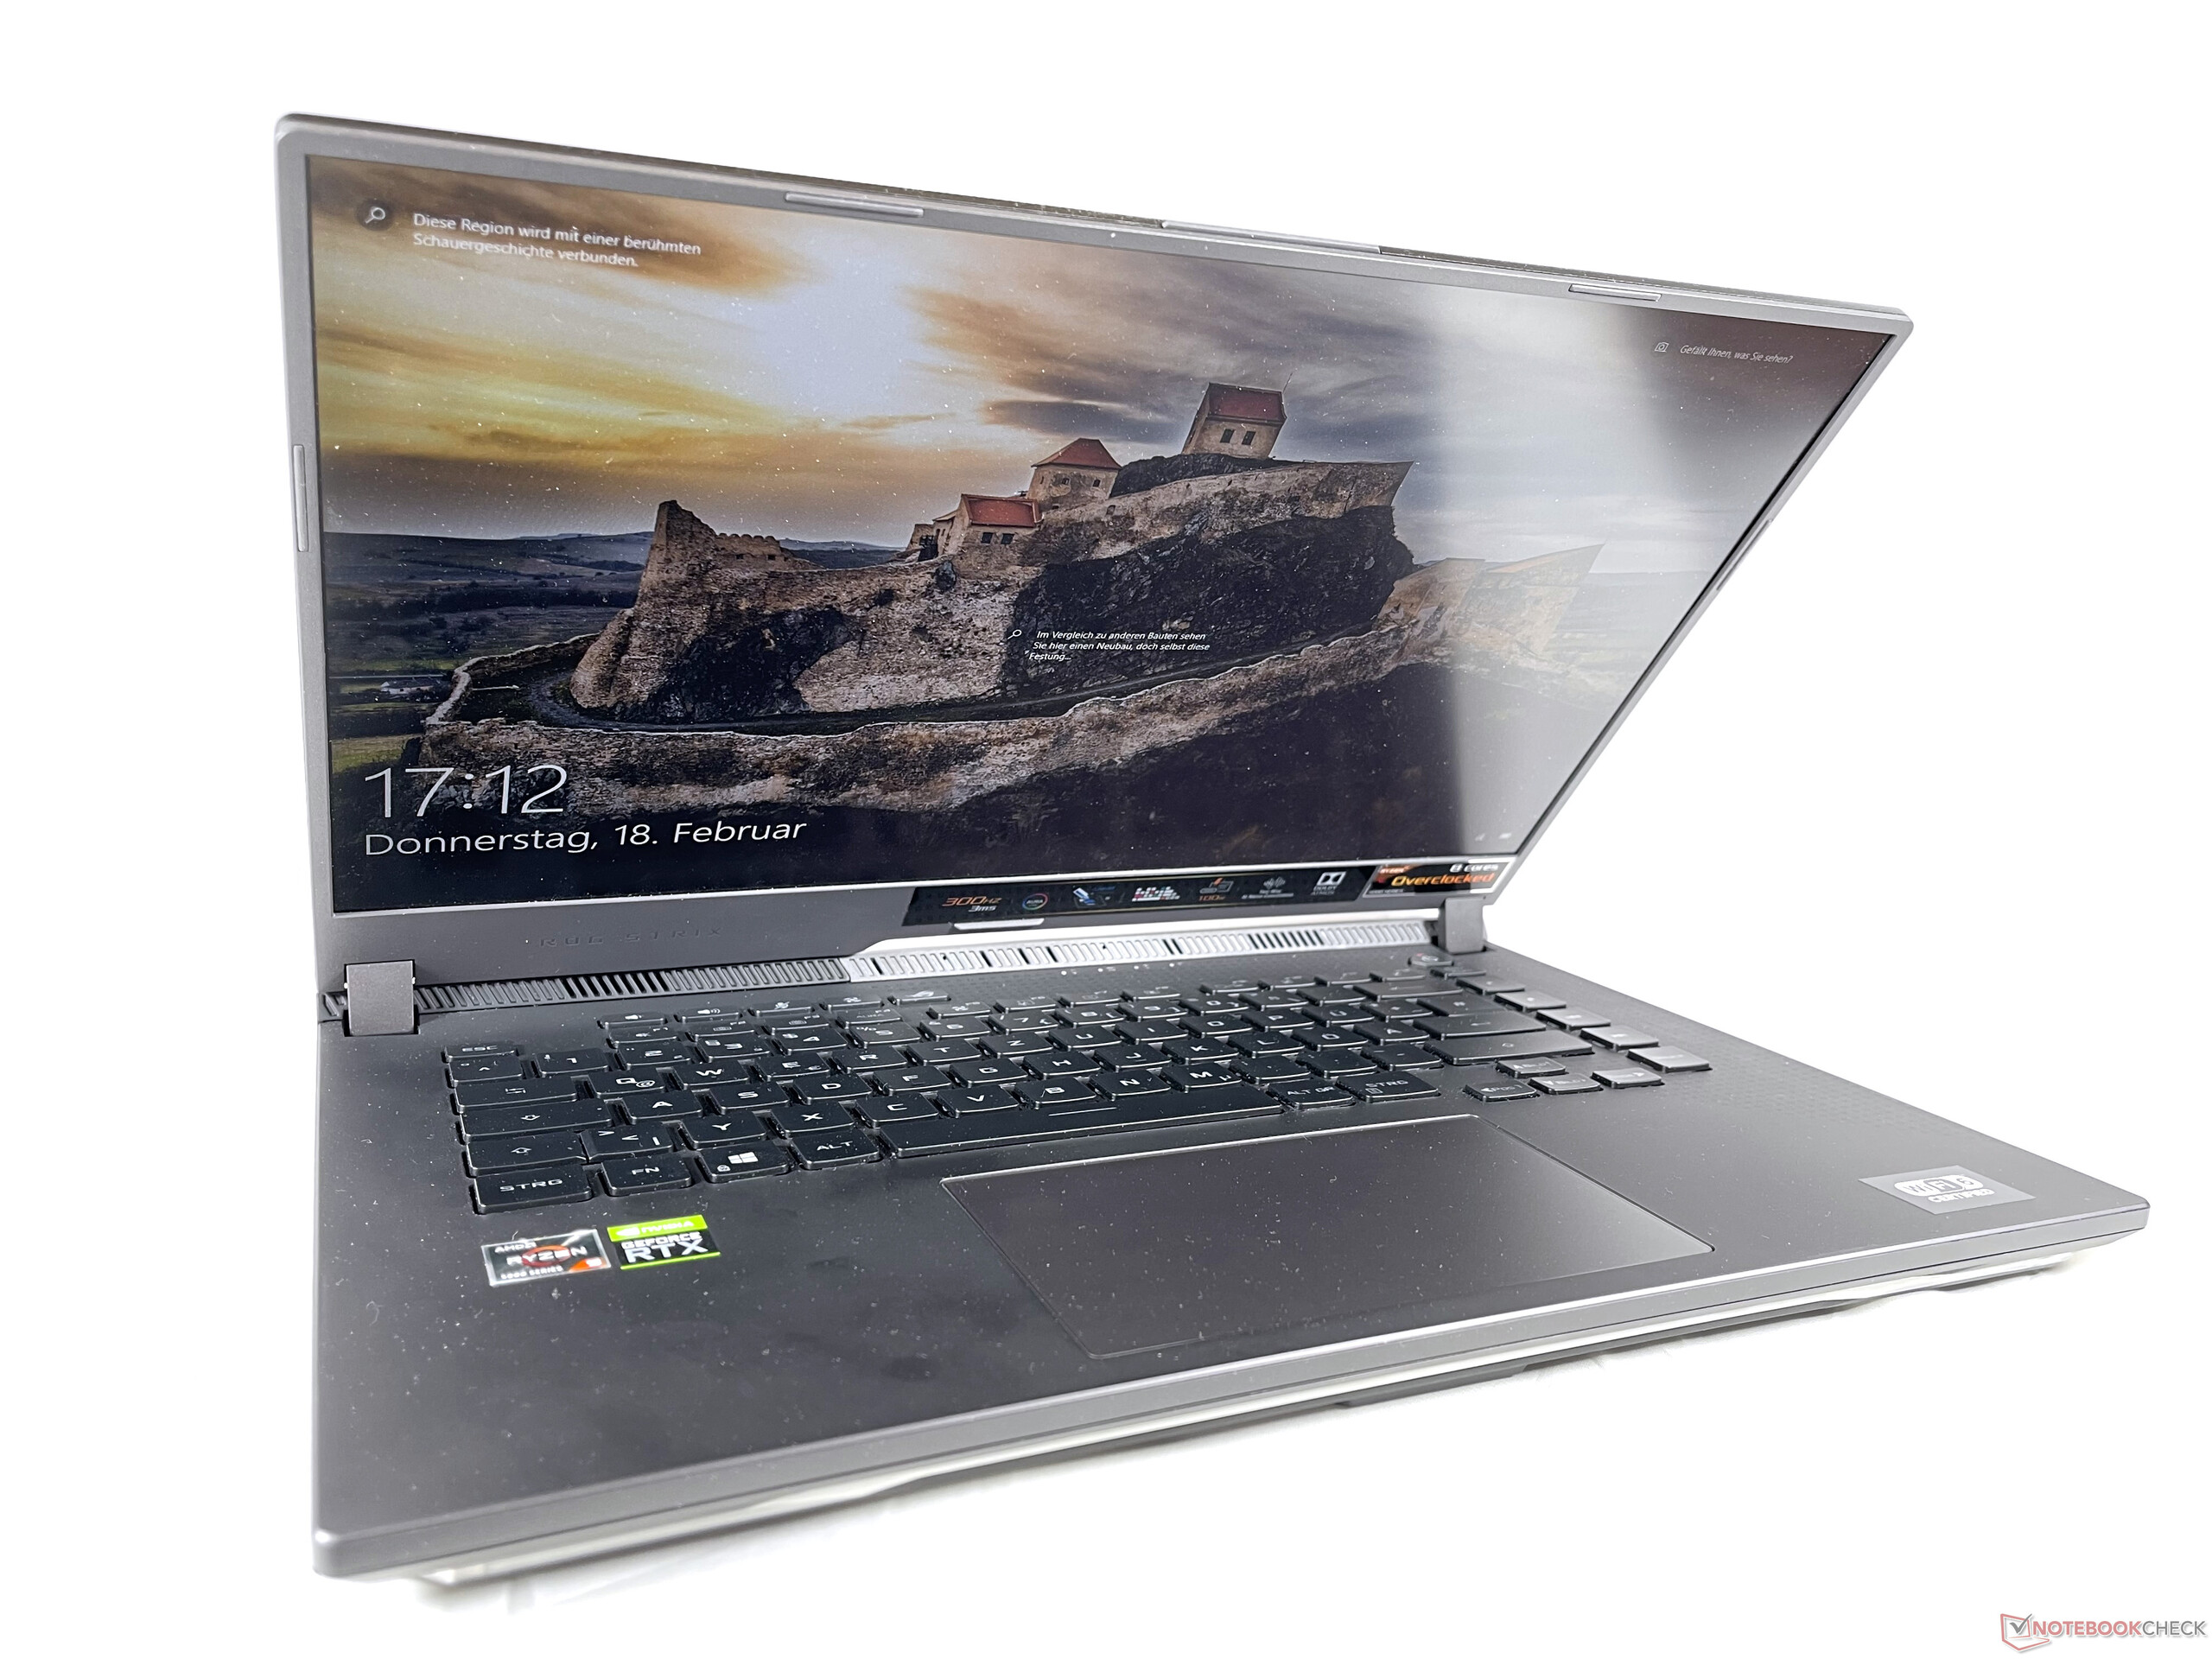
Case - Sophisticated design
The case is made of a blend of aluminum and gray, black, and transparent plastic. The build quality is excellent, and the gap dimensions don't give any reason for criticism. The protruding edge on the back houses some ports and promises better cooling performance, but at the same time, it restricts the opening angle of the hinges. The latter hold the screen firmly in every position and allow a comfortable one-handed opening - naturally, the sturdy base also contributes to this.
Not only does Asus use subtle color contrasts in the design but also angular contours. Together with the multiple RGB LEDs, the ROG Strix G15 is unmistakable as a gaming laptop. However, it still makes an elegant impression with deactivated (or discreet) lighting.


The footprint of the ROG Strix G15 G513 has shrunk a bit compared to its predecessor, making it closer to competing gaming laptops. Although it's the thickest laptop in the comparison, the difference isn't quite as great as the numbers would suggest, since the thickness decreases towards the front.
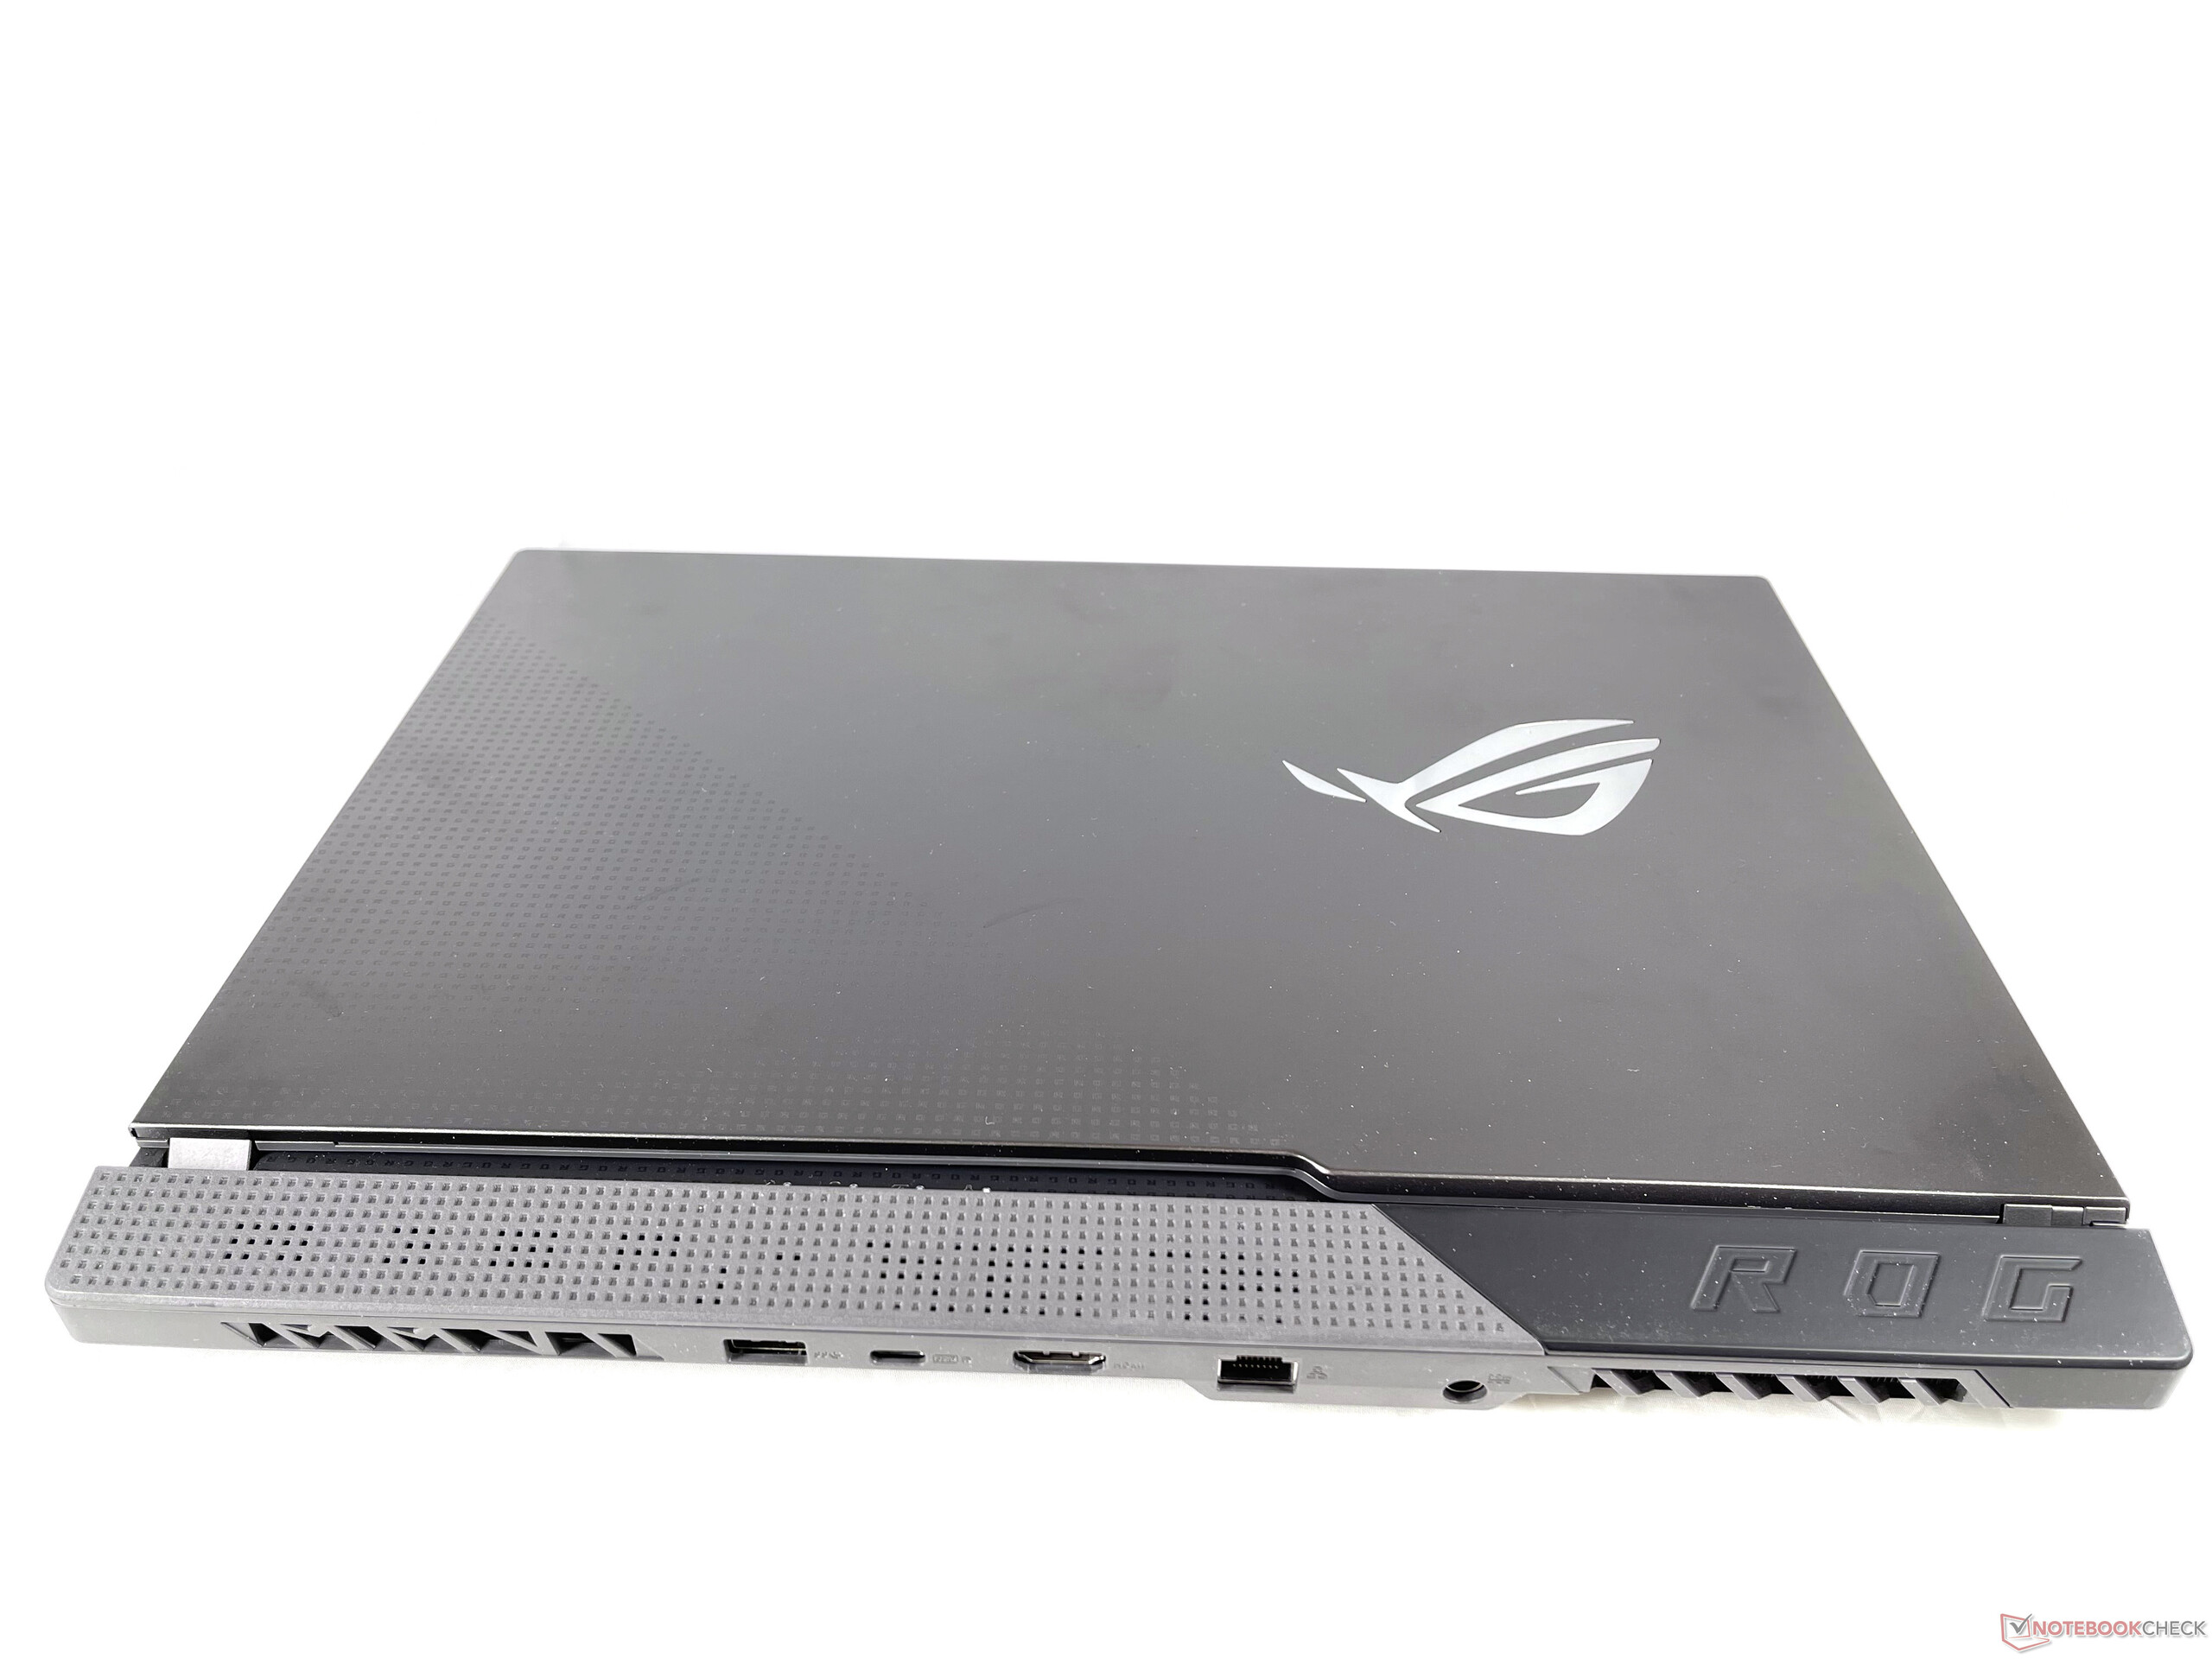
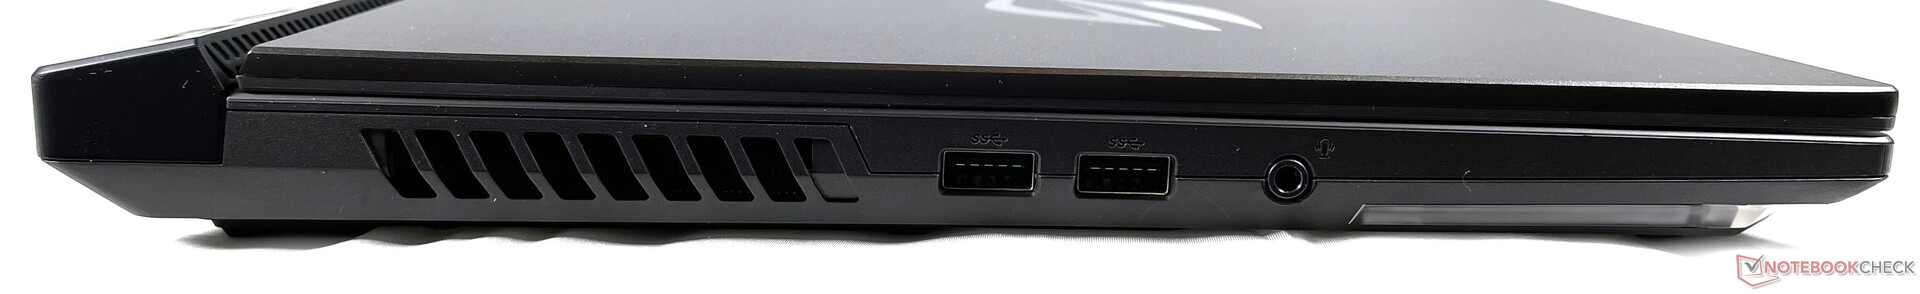
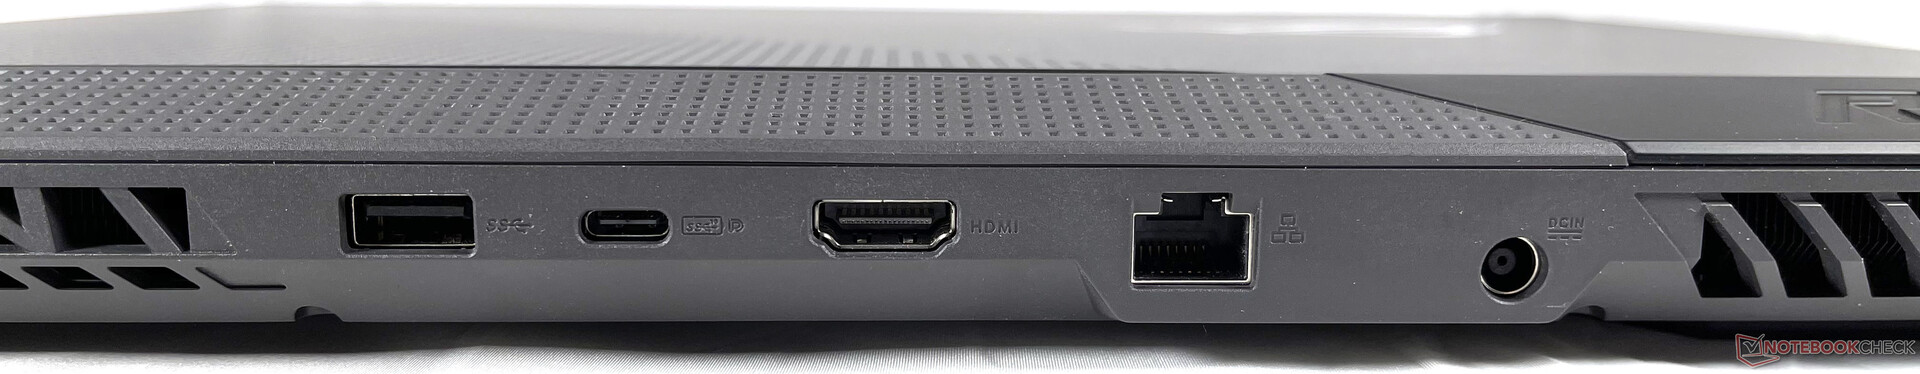
Connectivity - G15 with sparse connectivity
The port configuration is not exactly generous: With only one USB-C port, which can alternatively be used as a DisplayPort or charging port, there isn't much flexibility. In addition, you also have to do without a webcam and an SD card reader. Thunderbolt is not supported either due to the AMD processor. However, at least the ports are well distributed on the left side and the back with sufficient spacing between them, which is beneficial for right-handers.

Communication
Intel's AX200 WLAN module offers Wi-Fi 6 (802.11ax) and Bluetooth 5.x support. It achieves good WLAN transfer rates in the test, which are only slightly surpassed by the Razer Blade 15 in comparison. On the other hand, the signal strength is rather average.
Accessories
Except for the power adapter and some documents, there are no extras in the box. Asus offers carrying cases, backpacks, and various peripherals in its online store.
Maintenance
In principle, maintenance is very user-friendly. After loosening 11 cross-head screws, the bottom cover can be loosened on all sides and then removed. However, before you can completely place it aside, you have to carefully disconnect two small ribbon cables, which are responsible for the LED lighting, from the motherboard. Inside, you have direct access to both RAM and M.2 slots as well as the battery.

Warranty
The standard manufacturer's warranty is two years, and it can be extended with options after product registration or, for example, upgraded to include on-site service.
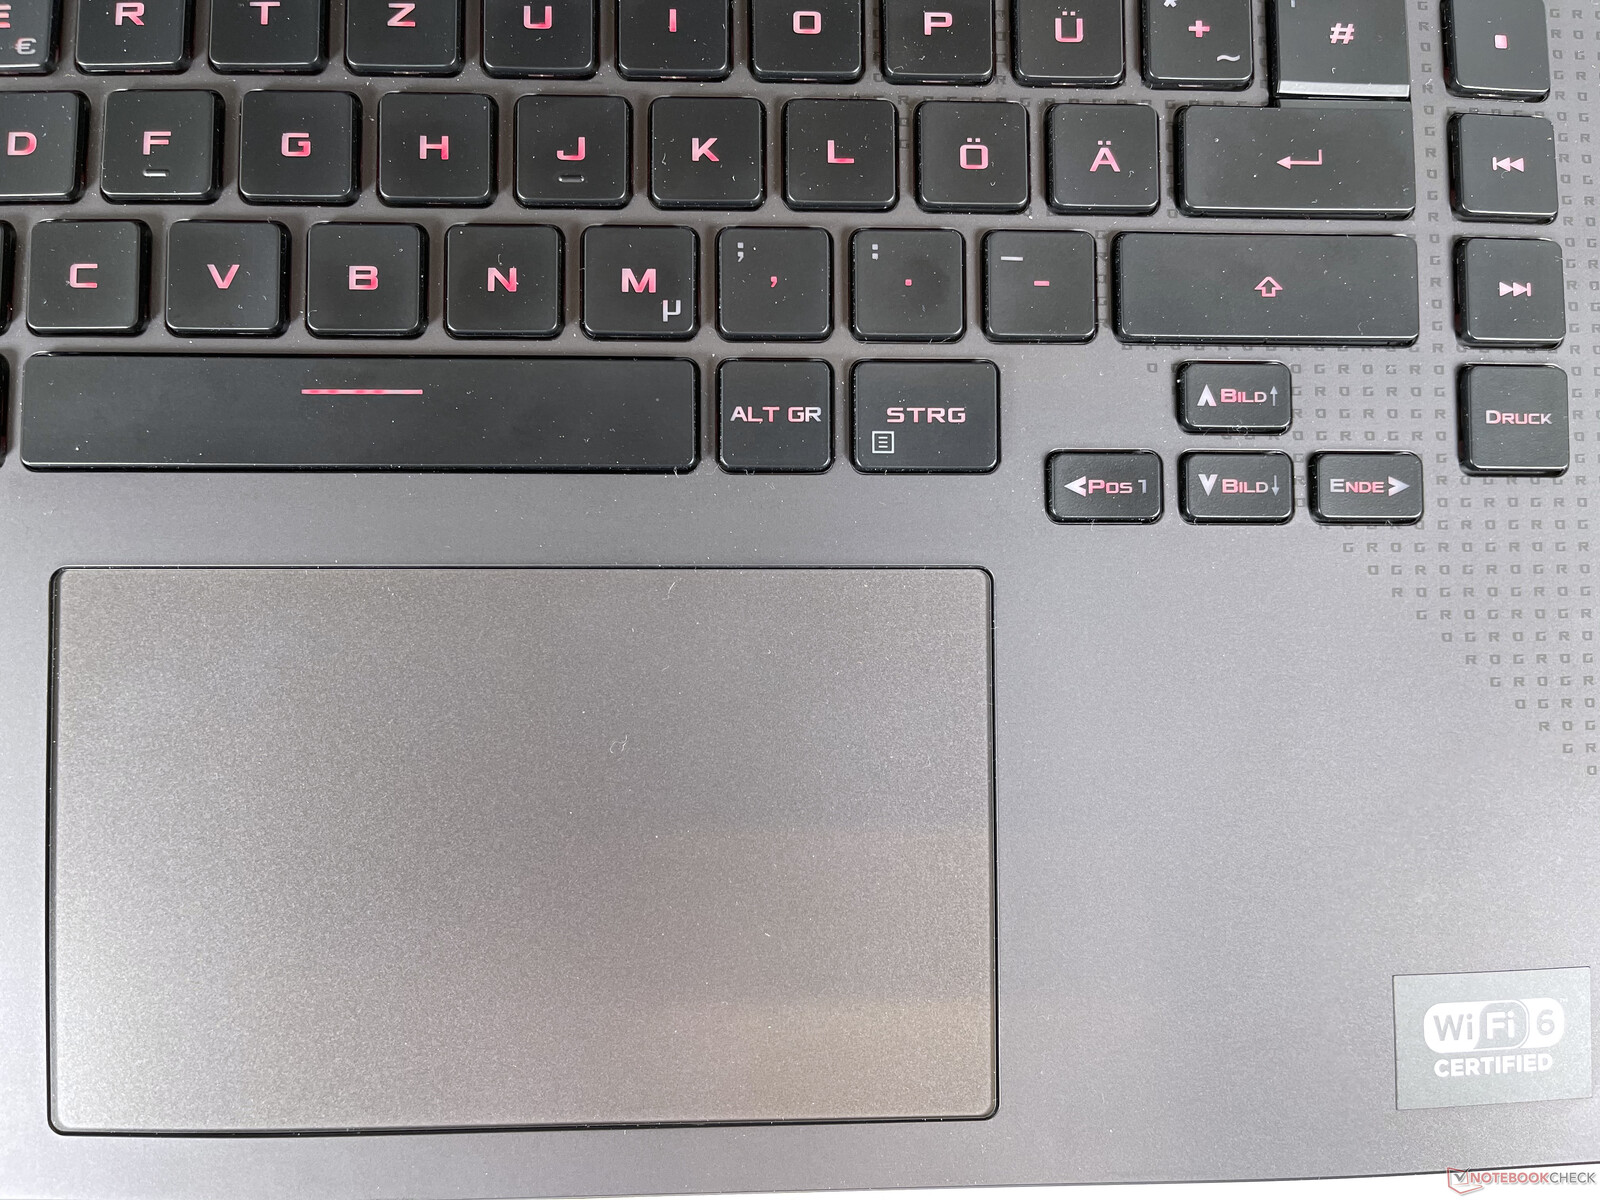
Input devices - Individual key backlighting and large touchpad
Keyboard
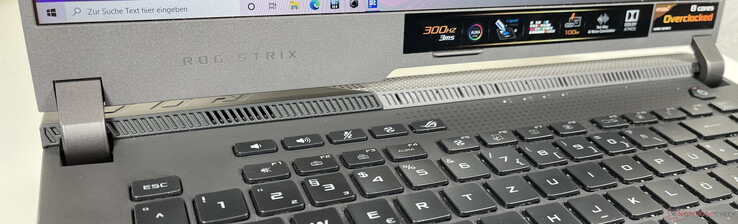
Asus uses a keyboard without a numeric keypad, but with extensive RGB lighting in return. Although there would have actually been enough space, the arrow keys are smaller than the rest of the keys. However, the latter are above-average by gaming laptop standards, and we especially liked the consistent key resistance. In addition, there are some multimedia control keys, which makes using the laptop easier. However, the keyboard doesn't come close to a classic mechanical keyboard. In return, the typing noise is relatively quiet.


Touchpad
With an area of 13 x 7.7 cm (~5.1 x 3.0 inches), the touchpad offers a very large surface. The surface is extremely smooth and enables precise pointer control. The integrated mouse buttons aren't as comfortable as their dedicated counterparts, but most users will probably connect an external mouse anyway. Beyond that, the ClickPad supports standard gestures like zooming, scrolling, and triggering right clicks with two fingers.
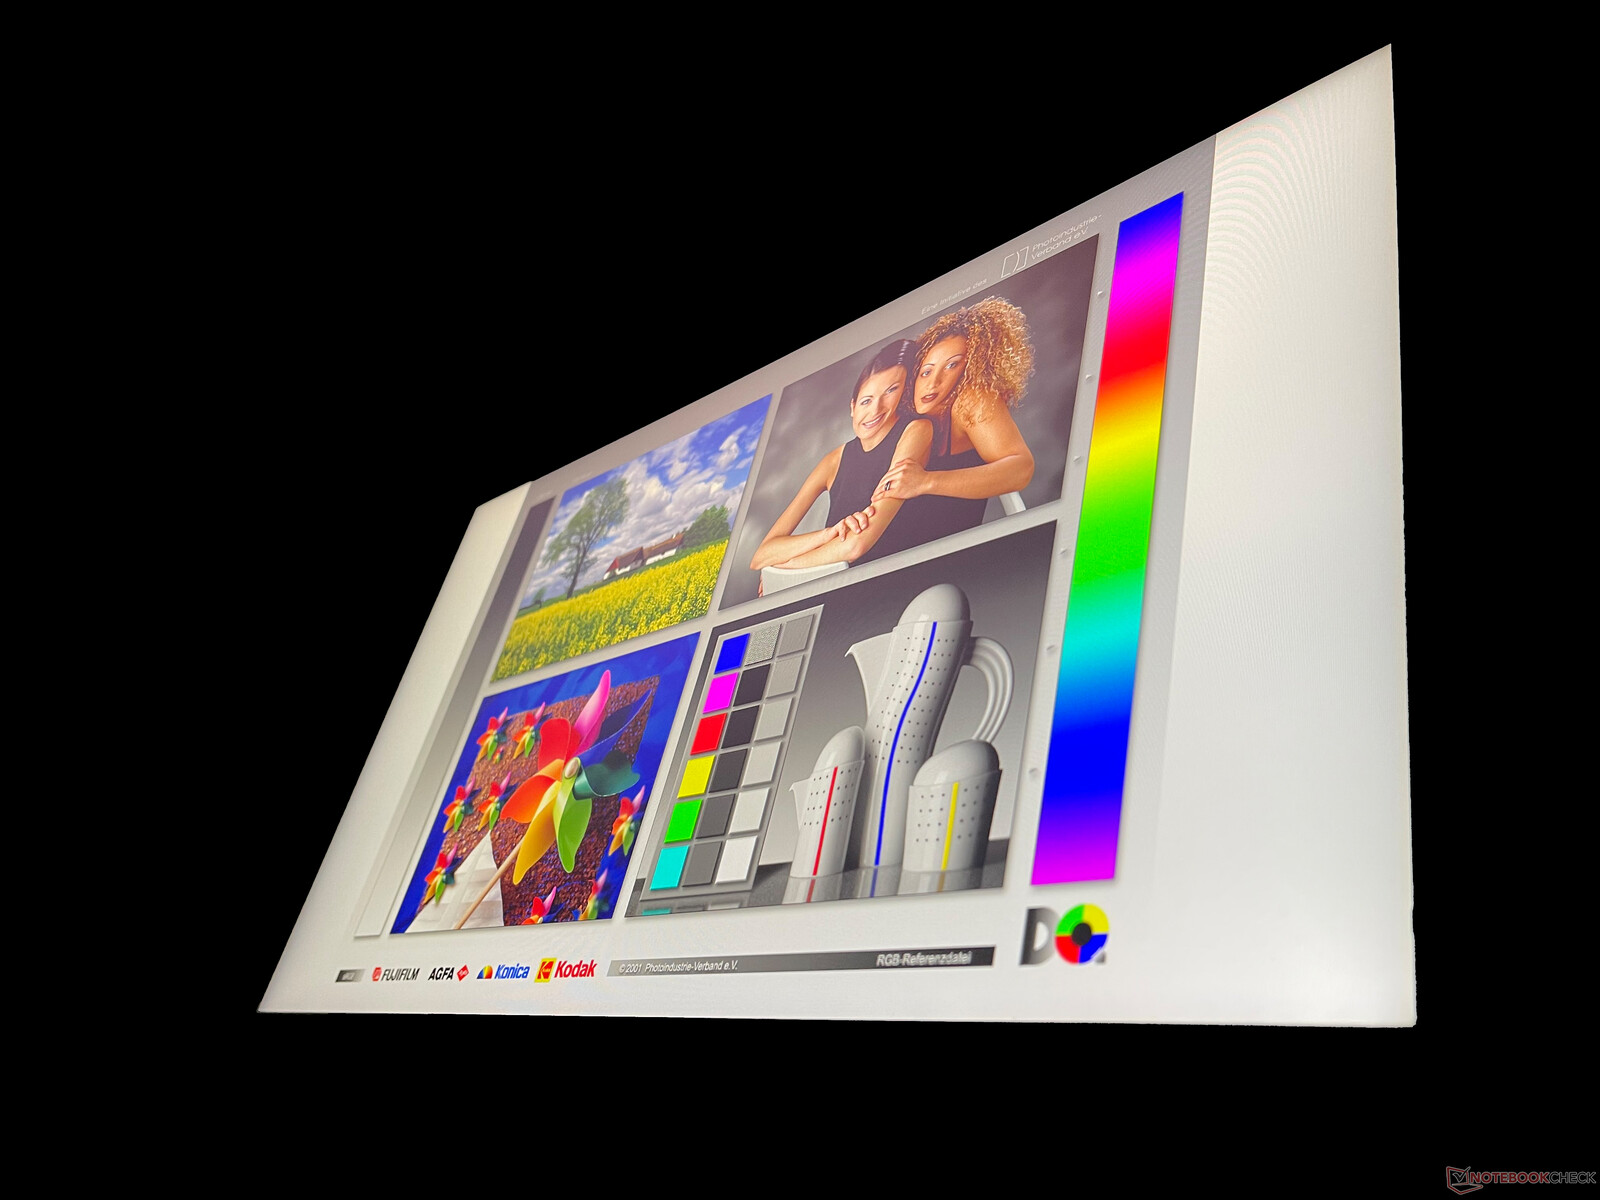
Display - 300 Hz or WQHD

Our configuration of the Strix G15 G513 is equipped with a matte Full HD IPS panel with a refresh rate of 300 Hz. Alternatively, a WQHD panel (2560x1440, also matte) at 165 Hz is also available. It's arguable whether this will result in recognizable advantages in terms of sharpness in a display size of only 15.6 inches, although the 300 Hz of the Full HD panel could be regarded in a similarly critical way outside of hectic shooter games. Furthermore, both panels support Adaptive Sync.
Our laptop is roughly in the midfield with a brightness of 288 cd/m² and doesn't resort to PWM for brightness control. We noticed minimal backlight bleeding on the lower left edge of the screen in the test.
| |||||||||||||||||||||||||
Brightness Distribution: 86 %
Center on Battery: 308 cd/m²
Contrast: 1339:1 (Black: 0.23 cd/m²)
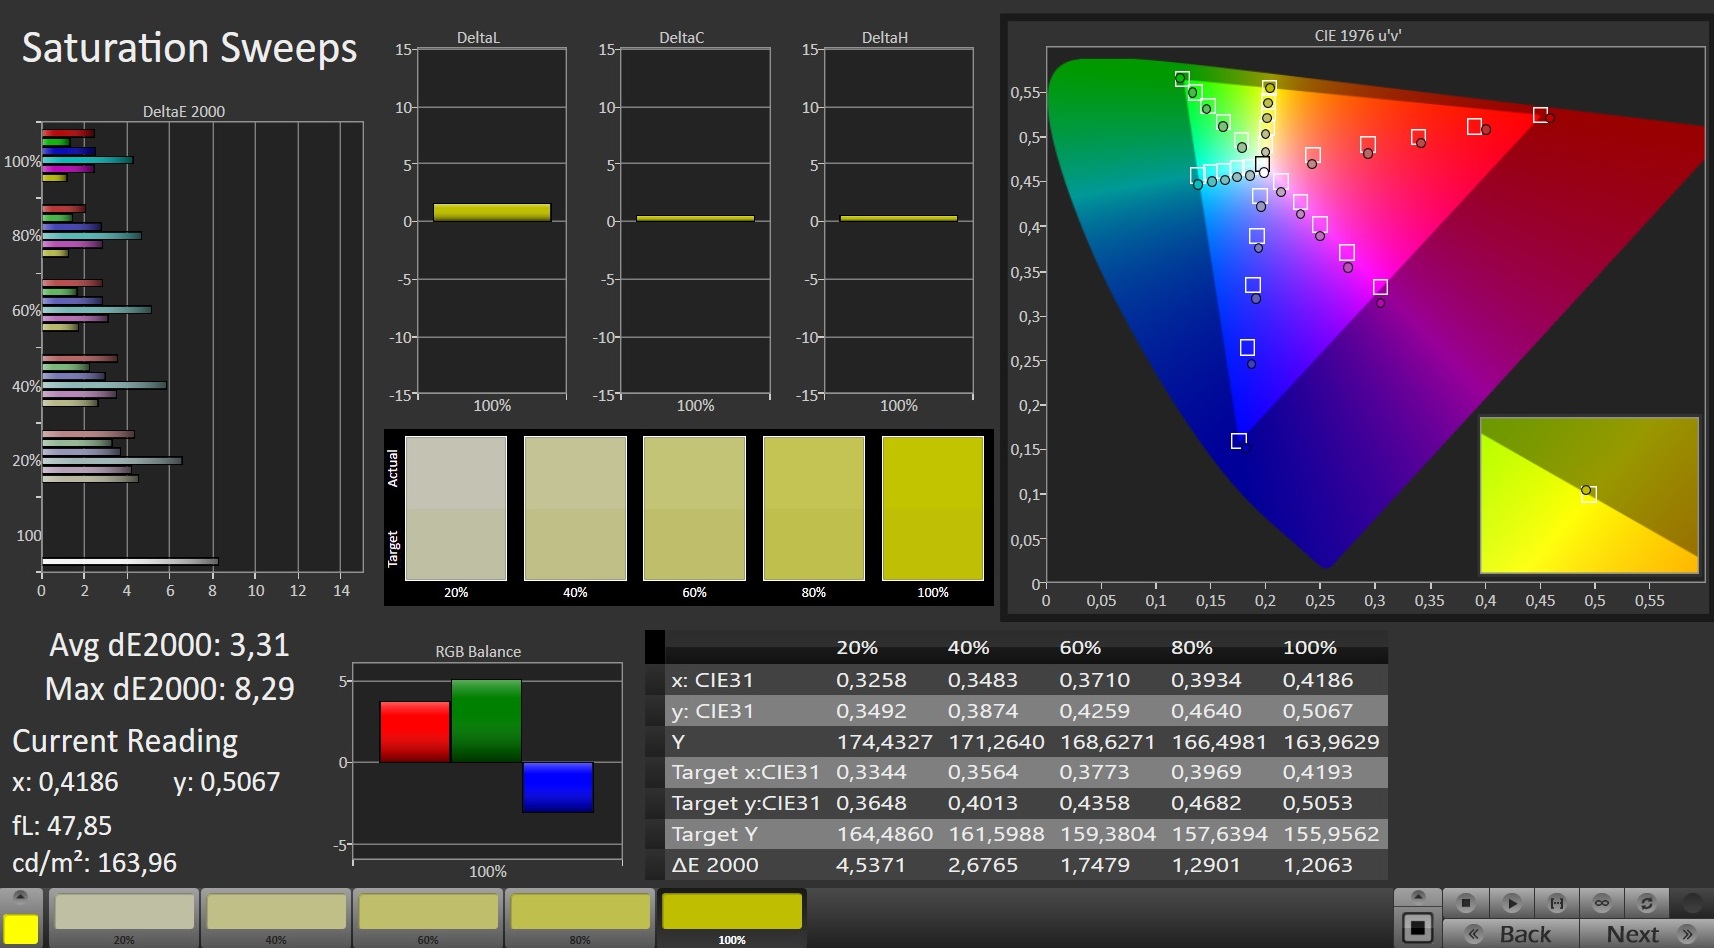
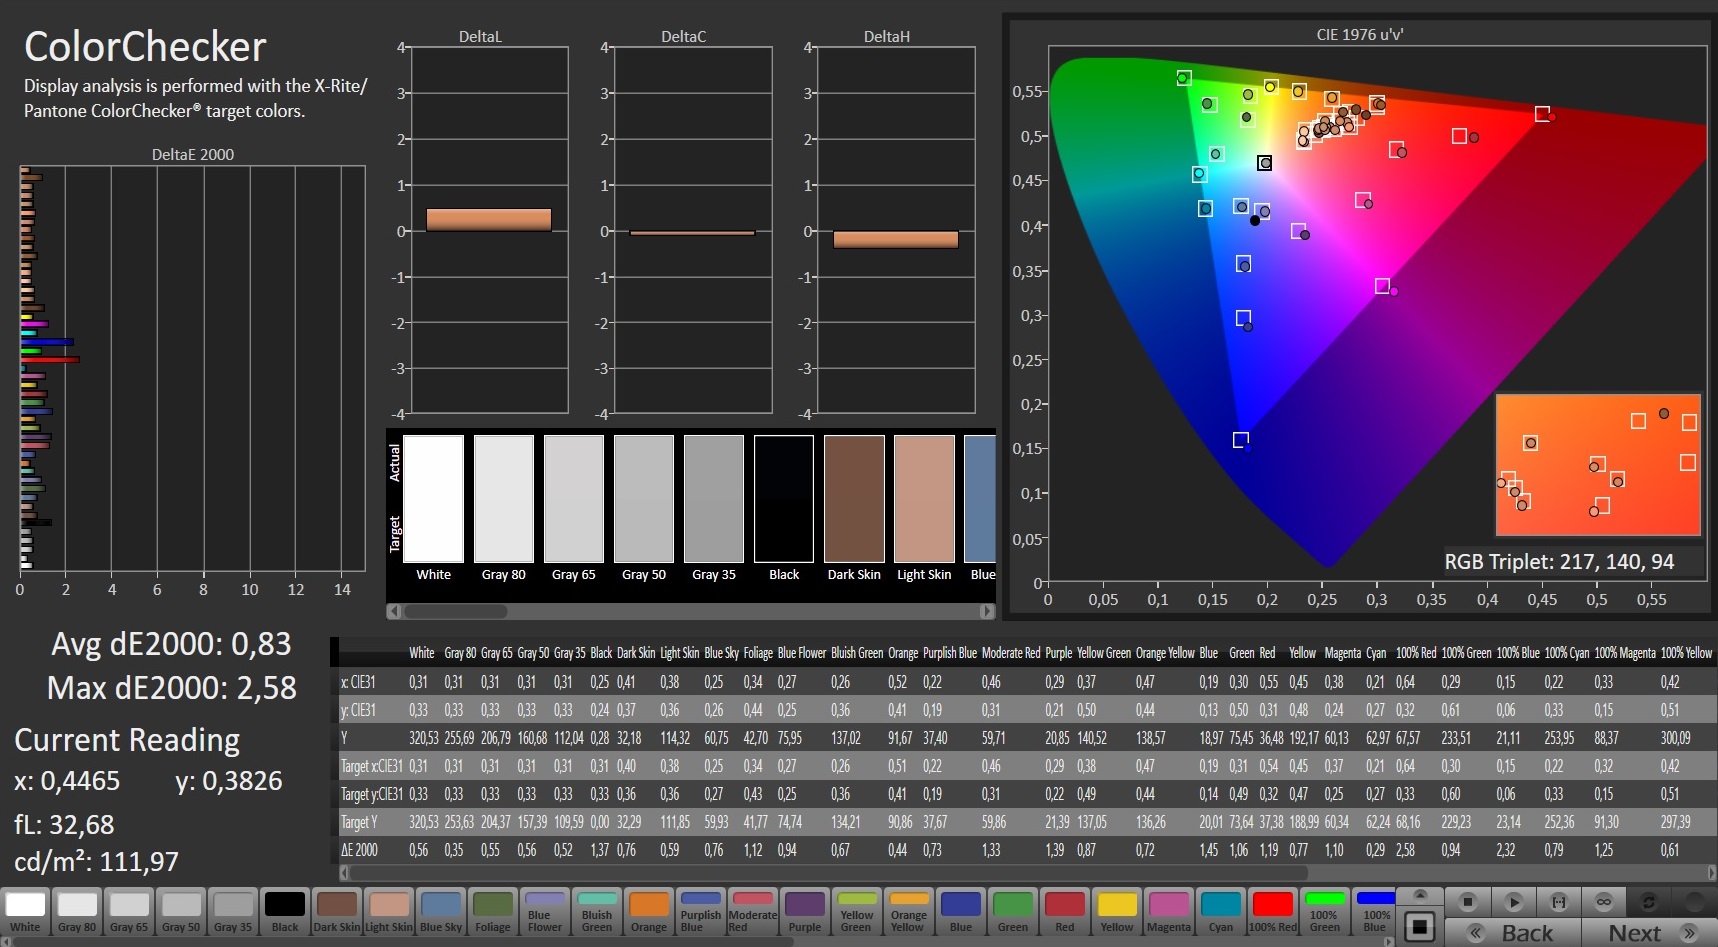
ΔE Color 3.28 | 0.5-29.43 Ø5, calibrated: 0.83
ΔE Greyscale 5 | 0.57-98 Ø5.3
90% sRGB (Argyll 1.6.3 3D)
68% AdobeRGB 1998 (Argyll 1.6.3 3D)
68.2% AdobeRGB 1998 (Argyll 2.2.0 3D)
94.3% sRGB (Argyll 2.2.0 3D)
67.7% Display P3 (Argyll 2.2.0 3D)
Gamma: 2.057
| Asus ROG Strix G15 G513QR LQ156M1JW25, IPS, 1920x1080, 15.60 | MSI GS66 Stealth 10UG AU Optronics B156HAN12.0, IPS, 1920x1080, 15.60 | Asus TUF Dash F15 FX516PR LQ156M1JW26 (SHP1532), IPS, 1920x1080, 15.60 | Asus ROG Zephyrus G15 GA503Q CMN N156KME-GNA (CMN152A), IPS-Level, 2560x1440, 15.60 | Razer Blade 15 RTX 2070 Super Max-Q AU Optronics B156HAN12.0, IPS, 1920x1080, 15.60 | Asus ROG Strix G15 G512LW Sharp LQ156M1JW09, IPS, 1920x1080, 15.60 | |
|---|---|---|---|---|---|---|
| Display | 2% | 1% | 25% | 4% | 1% | |
| Display P3 Coverage | 67.7 | 67.7 0% | 66.9 -1% | 97.3 44% | 69.4 3% | 67.8 0% |
| sRGB Coverage | 94.3 | 98.4 4% | 98.1 4% | 99.9 6% | 98.8 5% | 98.3 4% |
| AdobeRGB 1998 Coverage | 68.2 | 69.1 1% | 67.9 0% | 86.2 26% | 70.5 3% | 68.5 0% |
| Response Times | -51% | -28% | -15% | 37% | -54% | |
| Response Time Grey 50% / Grey 80% * | 8.2 ? | 14.4 ? -76% | 12 ? -46% | 8.8 ? -7% | 3.2 ? 61% | 16 ? -95% |
| Response Time Black / White * | 9.2 ? | 11.6 ? -26% | 10 ? -9% | 11.2 ? -22% | 8 ? 13% | 10.4 ? -13% |
| PWM Frequency | 23580 ? | 23580 ? | ||||
| Screen | -5% | 5% | -19% | -9% | -11% | |
| Brightness middle | 308 | 259.5 -16% | 286 -7% | 327 6% | 345.4 12% | 300.9 -2% |
| Brightness | 288 | 264 -8% | 275 -5% | 309 7% | 342 19% | 289 0% |
| Brightness Distribution | 86 | 90 5% | 91 6% | 89 3% | 90 5% | 92 7% |
| Black Level * | 0.23 | 0.25 -9% | 0.25 -9% | 0.33 -43% | 0.34 -48% | 0.31 -35% |
| Contrast | 1339 | 1038 -22% | 1144 -15% | 991 -26% | 1016 -24% | 971 -27% |
| Colorchecker dE 2000 * | 3.28 | 2.52 23% | 2.43 26% | 4.49 -37% | 3.18 3% | 3.54 -8% |
| Colorchecker dE 2000 max. * | 8.51 | 5.55 35% | 6.33 26% | 8.42 1% | 6.57 23% | 9.82 -15% |
| Colorchecker dE 2000 calibrated * | 0.83 | 1.93 -133% | 0.83 -0% | 2.27 -173% | 1.77 -113% | 1 -20% |
| Greyscale dE 2000 * | 5 | 1.7 66% | 3.5 30% | 4.2 16% | 3.8 24% | 5.9 -18% |
| Gamma | 2.057 107% | 2.04 108% | 2.32 95% | 2.173 101% | 2.15 102% | 2.37 93% |
| CCT | 7393 88% | 6414 101% | 7145 91% | 7014 93% | 7109 91% | 7456 87% |
| Color Space (Percent of AdobeRGB 1998) | 68 | 63.3 -7% | 68 0% | 86 26% | 64.3 -5% | 63.3 -7% |
| Color Space (Percent of sRGB) | 90 | 98.8 10% | 91 1% | 99 10% | 99 10% | 98.3 9% |
| Total Average (Program / Settings) | -18% /
-10% | -7% /
0% | -3% /
-10% | 11% /
-1% | -21% /
-14% |
* ... smaller is better
The panel of our Strix G15 G513 scores points with a black level of only 0.23 and a contrast ratio of 1,339:1. In comparison, both results are top values and ensure a good reproduction with rich colors and convincing dark scenes. In our configuration, the laptop covers 100% of the sRGB color space and 75.35% of the AdobeRGB color space according to Asus, while the WQHD model can even fully reproduce the larger DCI-P3 color space. In the lab, we were able to measure 90% and 68% for the sRGB and AdobeRGB color spaces on our model, respectively.


With a brightness of around 300 cd/m², the Strix G15 G513 is designed for indoor use, but as long as you stay in the shade or the sun is not too bright, the display is still legible outdoors.


Display Response Times
| ↔ Response Time Black to White | ||
|---|---|---|
| 9.2 ms ... rise ↗ and fall ↘ combined | ↗ 4.4 ms rise |  |
| ↘ 4.8 ms fall | ||
| The screen shows fast response rates in our tests and should be suited for gaming. In comparison, all tested devices range from 0.1 (minimum) to 240 (maximum) ms. » 20 % of all devices are better. This means that the measured response time is better than the average of all tested devices (21.5 ms). | ||
| ↔ Response Time 50% Grey to 80% Grey | ||
| 8.2 ms ... rise ↗ and fall ↘ combined | ↗ 2.6 ms rise | 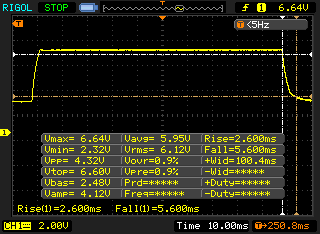 |
| ↘ 5.6 ms fall | ||
| The screen shows fast response rates in our tests and should be suited for gaming. In comparison, all tested devices range from 0.2 (minimum) to 636 (maximum) ms. » 17 % of all devices are better. This means that the measured response time is better than the average of all tested devices (33.7 ms). | ||
Screen Flickering / PWM (Pulse-Width Modulation)
| Screen flickering / PWM not detected |  | ||
In comparison: 53 % of all tested devices do not use PWM to dim the display. If PWM was detected, an average of 17853 (minimum: 5 - maximum: 3846000) Hz was measured. | |||
Viewing angles are excellent thanks to the IPS technology used, and the screen can, therefore, still be used without issues even when it's viewed from sharp angles.
Performance - Well-equipped Asus laptop
Our test device is equipped with an AMD Ryzen 9 5900HX, the laptop version of the Nvidia GeForce RTX 3070, and 16 GB of DDR4-3200 RAM in dual-channel mode. Potential buyers can alternatively choose models with a GeForce RTX 3060 Mobile GPU. The performance level of the series is very high thanks to the powerful hardware, and there's also enough power available for modern games. Naturally, with these components, the Strix G15 G513 also masters everyday tasks without problems.


Processor
The AMD Ryzen 9 5900HX is an octa-core processor based on AMD's current Zen 3 architecture. The cores clock at a frequency of 3.3 to 4.6 GHz and support two simultaneous threads each and, therefore, a total of 16 threads. So far, we only have the Asus Zephyrus Duo G15 available as a comparison device with the same CPU; it performed much more consistently and also between 5 to 10% better in the test. Even with the lowest score of 1,970 points, our test device is still far above the Intel competition in the Cinebench loop test, with the latter being at least 20% slower in the same test.
CPU performance is slightly limited on battery power. The Cinebench multi-thread scores are a good 10% lower on battery power than when plugged in.
In the application-based benchmarks, the Ryzen 9 5900HX always takes one of the front places in both the single and multi-core benchmarks and consequently meets the high expectations for a cutting-edge AMD processor.
Further technical information and benchmark comparisons can be found on our Ryzen 9 5900HX article.
* ... smaller is better
System performance
System performance is excellent thanks to the modern components and especially the fast NVMe SSD. In everyday use, the laptop responds almost instantaneously to inputs, programs are launched at lightning speed, and the ROG Strix G15 G513 doesn't break a sweat during multitasking either. Compared with the competition, it takes first place in this category, almost without exceptions.
| PCMark 8 Home Score Accelerated v2 | 6277 points | |
| PCMark 8 Creative Score Accelerated v2 | 10483 points | |
| PCMark 8 Work Score Accelerated v2 | 6808 points | |
| PCMark 10 Score | 6922 points | |
Help | ||
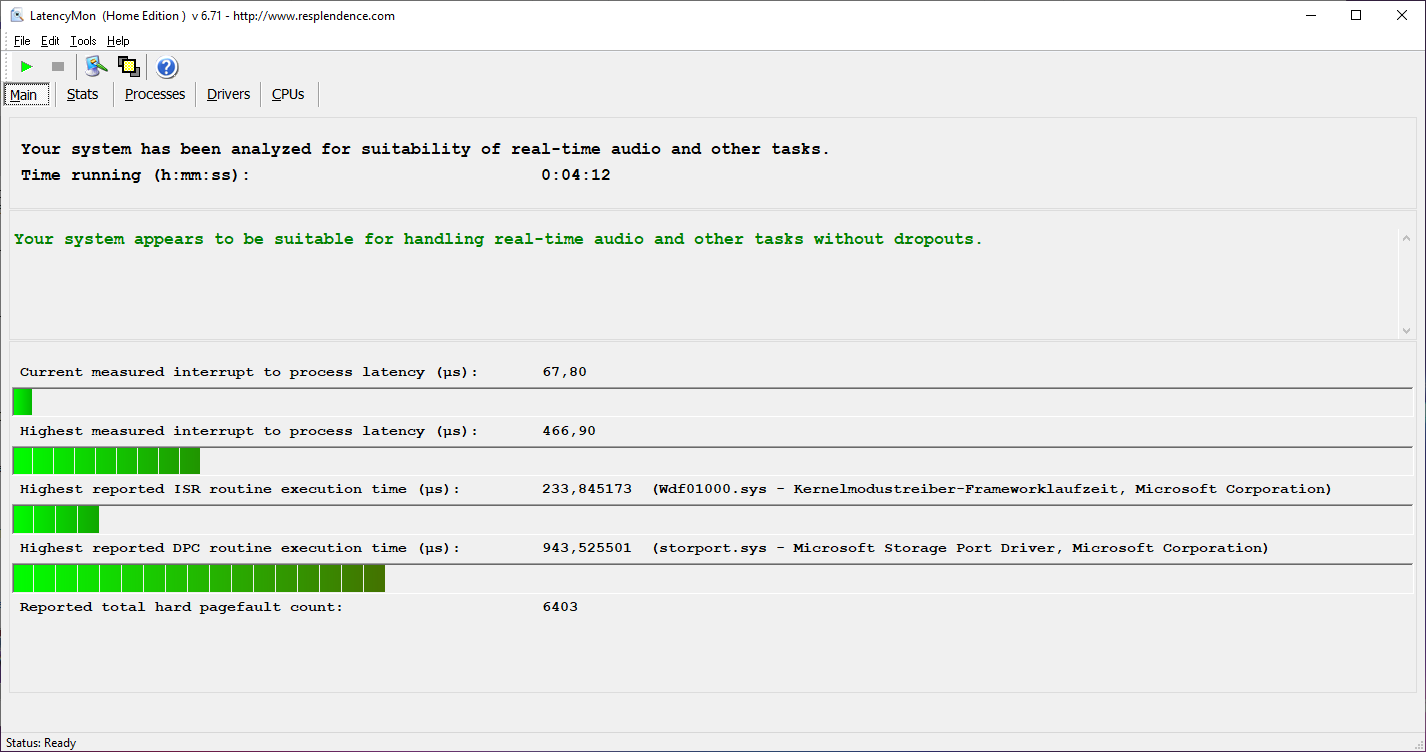
DPC latencies
Out of the box, the ROG Strix G15 may even be suitable for editing audio and video files in real time, since we didn't detect any increased DPC latencies in our test with LatencyMon.

| DPC Latencies / LatencyMon - interrupt to process latency (max), Web, Youtube, Prime95 | |
| Asus ROG Strix G15 G512LW | |
| Razer Blade 15 RTX 2070 Super Max-Q | |
| Asus TUF Dash F15 FX516PR | |
| MSI GS66 Stealth 10UG | |
| Asus ROG Strix G15 G513QR | |
| Asus ROG Zephyrus G15 GA503Q | |
* ... smaller is better
Storage
Our configuration is equipped with a 1 TB NVMe SSD from SK Hynix that achieves good results in the AS SSD benchmark and corresponds to the HFM001TD3JX013N model name. Although the SSDs of the competing models, such as the SN730 in the MSI GS66 Stealth 10UG, achieve higher scores at times with a sequential read performance that is higher by 65%, the drive installed here is overall one of the fastest in the comparison.
More information and benchmark comparisons can be found in our HDD/SSD Benchmarks article.
| Asus ROG Strix G15 G513QR SK Hynix HFM001TD3JX013N | MSI GS66 Stealth 10UG WDC PC SN730 SDBPNTY-1T00 | Asus TUF Dash F15 FX516PR SK Hynix HFM001TD3JX013N | Asus ROG Zephyrus G15 GA503Q SK Hynix HFM001TD3JX013N | Razer Blade 15 RTX 2070 Super Max-Q Samsung SSD PM981a MZVLB512HBJQ | Asus ROG Strix G15 G512LW Toshiba XG5-P KXG50PNV2T04 | |
|---|---|---|---|---|---|---|
| AS SSD | -3% | -29% | 1% | -17% | -42% | |
| Seq Read | 2881 | 2198 -24% | 2671 -7% | 2950 2% | 1957 -32% | 1933 -33% |
| Seq Write | 1570 | 2596 65% | 1501 -4% | 1600 2% | 2092 33% | 787 -50% |
| 4K Read | 52.4 | 43.81 -16% | 39.65 -24% | 53.6 2% | 50.2 -4% | 26.4 -50% |
| 4K Write | 124 | 115.5 -7% | 69 -44% | 126.8 2% | 96.5 -22% | 109.8 -11% |
| 4K-64 Read | 1334 | 1692 27% | 1209 -9% | 1429 7% | 1594 19% | 848 -36% |
| 4K-64 Write | 2189 | 2162 -1% | 1650 -25% | 2177 -1% | 2005 -8% | 923 -58% |
| Access Time Read * | 0.055 | 0.056 -2% | 0.093 -69% | 0.064 -16% | 0.057 -4% | 0.044 20% |
| Access Time Write * | 0.03 | 0.098 -227% | 0.055 -83% | 0.029 3% | 0.112 -273% | 0.158 -427% |
| Score Read | 1675 | 1956 17% | 1516 -9% | 1778 6% | 1840 10% | 1067 -36% |
| Score Write | 2470 | 2537 3% | 1869 -24% | 2464 0% | 2310 -6% | 1112 -55% |
| Score Total | 4943 | 5513 12% | 4105 -17% | 5090 3% | 5103 3% | 2669 -46% |
| Copy ISO MB/s | 1277 | 2236 75% | 1793 40% | 3210 151% | ||
| Copy Program MB/s | 575 | 690 20% | 573 0% | 728 27% | ||
| Copy Game MB/s | 1272 | 1546 22% | 1418 11% | 1499 18% |
* ... smaller is better

Continuous load read: DiskSpd Read Loop, Queue Depth 8
Graphics card

The laptop version of the Nvidia GeForce RTX 3070 is installed in our test device. Since the removal of the Max-Q branding, the TDP is what gives an indication of the GPU's actual performance now. In our model, the TDP is a maximum of 130 watts; this is relatively high, given that the Strix G15 is not a thin-and-light laptop with limited cooling capabilities.
As can be seen in the 3DMark benchmarks, the graphics card deploys its performance very well and places itself at the top in most benchmarks. This is no surprise, because the potential of the RTX 3070 in the MSI GS66 Stealth and the RTX 3080 in the ROG Zephyrus G15 is more limited due to their lower TDP. The fact that the 130-watt RTX 3080 in the Zephyrus Duo 15 SE tends to be slightly faster is also in line with our expectations.
Performance is severely limited on battery power. In a Time Spy run, the Strix G15 only achieves about 50% of the score that is possible when plugged in.
| 3DMark 11 Performance | 25508 points | |
| 3DMark Cloud Gate Standard Score | 47194 points | |
| 3DMark Fire Strike Score | 22758 points | |
| 3DMark Time Spy Score | 9933 points | |
Help | ||
Gaming performance
As expected, gaming performance is excellent. For the most part, the latest titles are smoothly playable at high frame rates on maximum settings. In the test with The Witcher 3, the ROG Strix G15 oddly achieves relatively low results on lower graphics settings, although it comes out on top in the native Full HD resolution on high and Ultra settings.
In our The Witcher 3 stability test, we register a small but somewhat unusual drop in frame rates of 16% after a few minutes. Apart from that, frame rates are relatively constant.
| low | med. | high | ultra | |
| GTA V (2015) | 171 | 158 | 130 | 78.6 |
| The Witcher 3 (2015) | 267 | 179.9 | 157 | 92.9 |
| Dota 2 Reborn (2015) | 136 | 129 | 112 | 107 |
| Final Fantasy XV Benchmark (2018) | 145 | 115 | 88.9 | |
| X-Plane 11.11 (2018) | 97.5 | 84 | 70.1 | |
| Far Cry 5 (2018) | 124 | 101 | 98 | 92 |
| Strange Brigade (2018) | 295 | 182 | 166 | 158 |
Emissions - Ryzen 9 and RTX 3070 generate a lot of heat
Noise emissions
During idle usage and low system load, the fans stand still to enable completely silent operation. In contrast, the fans need to quickly ramp up their speed under load in order to dissipate the high level of heat. Fortunately, the noise characteristics describe a monotonous noise that, although clearly audible, is not nearly as annoying as, for example, the fans of the MSI GS66 Stealth 10UG, which emit more high-frequency noise, as can clearly be seen in the diagram below. A less pleasing aspect is the audible coil whine that occurs, for example, when running The Witcher 3 in minimized mode or at very high frame rates. This is drowned out by the fans after a short time, but it's still a bit annoying.
Noise Level
| Idle |
| 25 / 31 / 33 dB(A) |
| Load |
| 45 / 50 dB(A) |
 | ||
30 dB silent 40 dB(A) audible 50 dB(A) loud |
||
min: | ||
Temperature
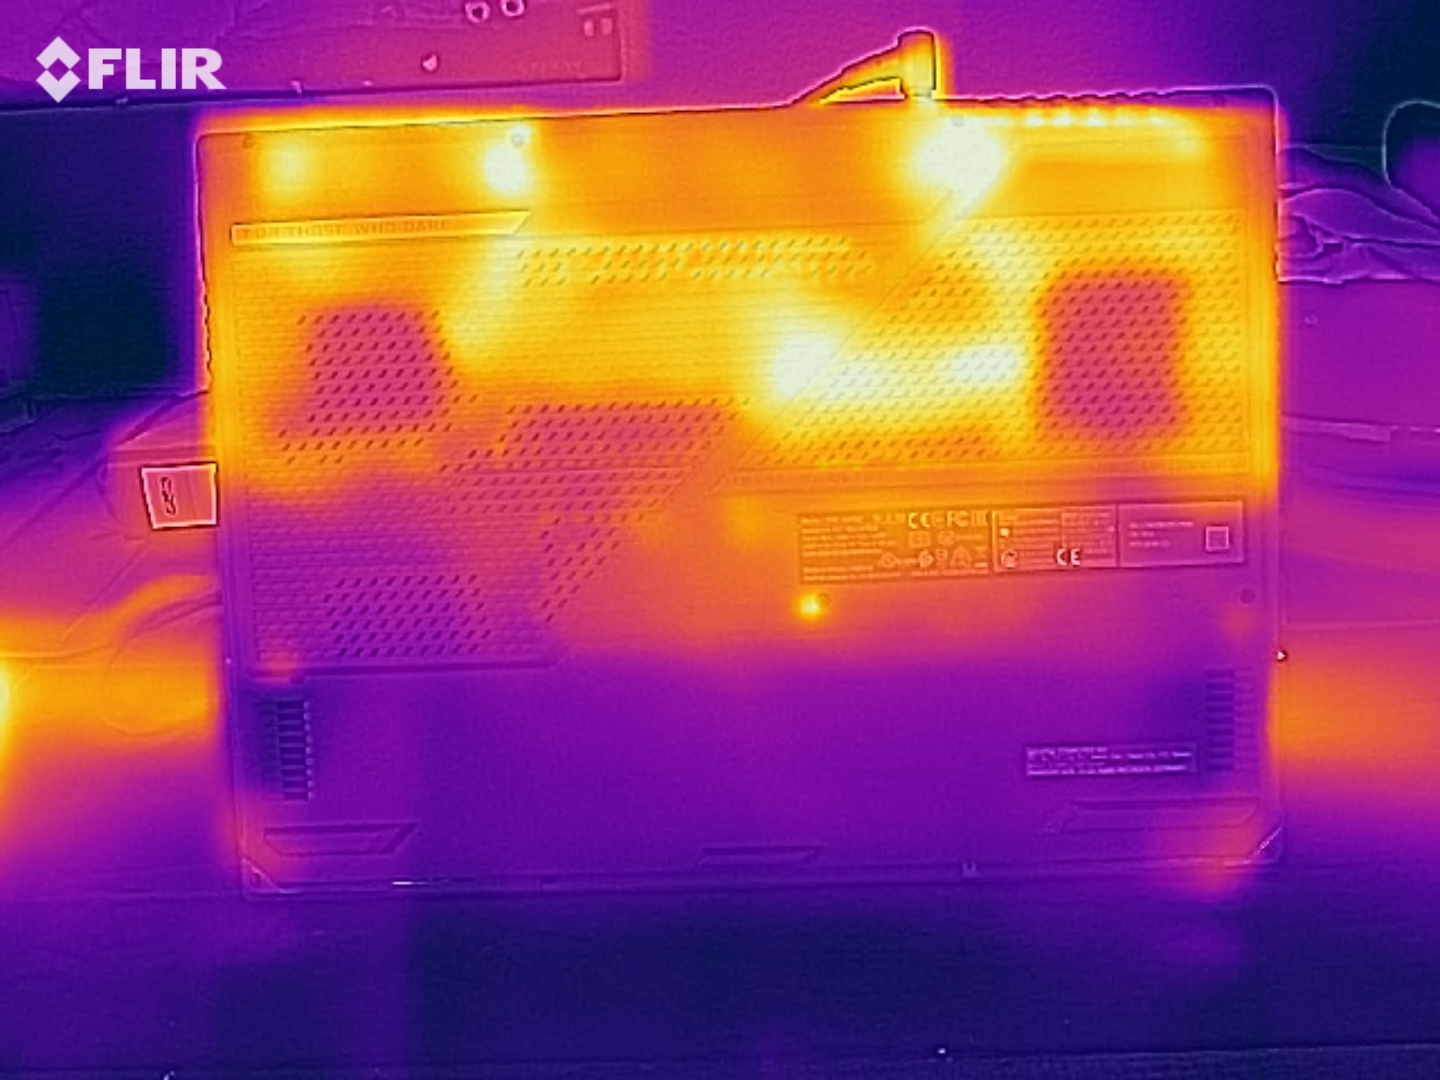
The temperatures reach a maximum of 33 °C (~91 °F) in idle usage and 49 °C (~120 °F) under load. Even when playing The Witcher 3, the maximum temperature of 44 °C (~111 °F) is too warm to use the device comfortably on the lap. Fortunately, the warmest spots are in the rear area, so that the palm rests remain cool even under load.
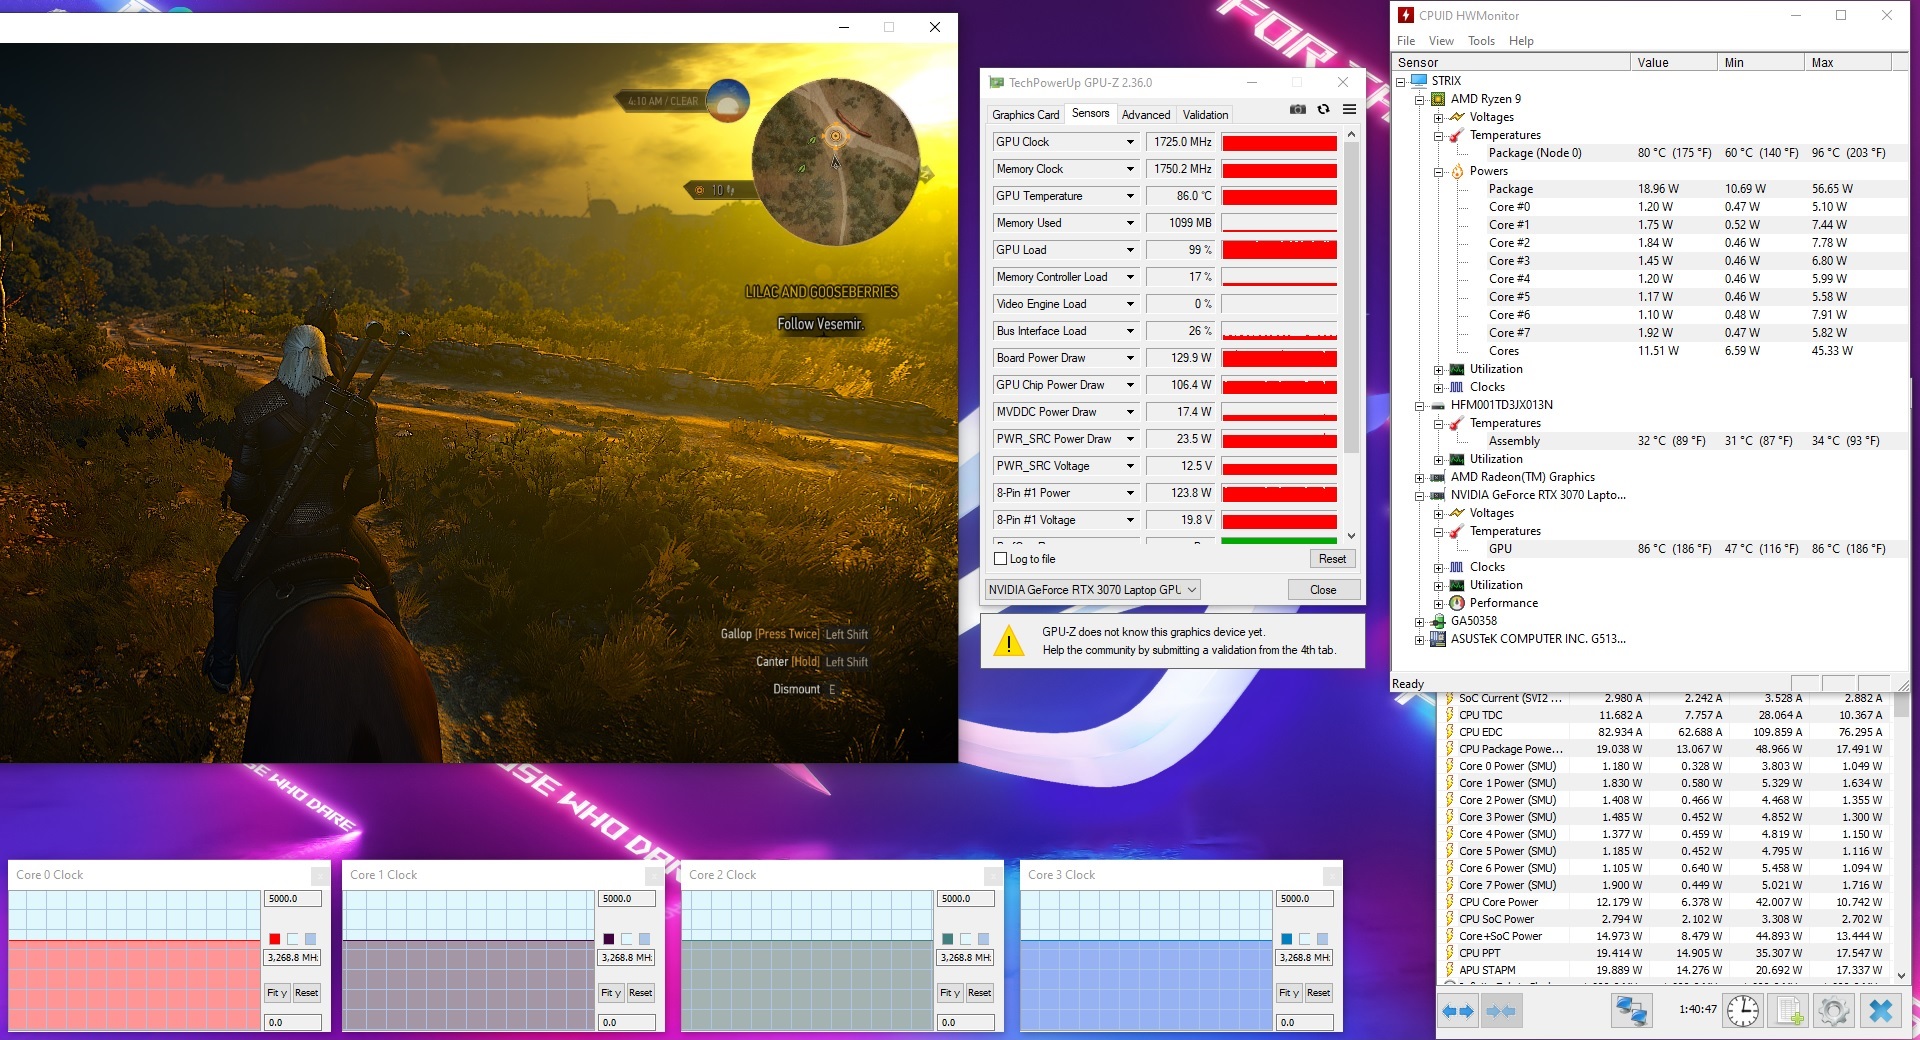


In the stress test, the clock rates of the CPU and GPU increase to 4.2 GHz and 1,560 MHz, respectively. The CPU reaches a core temperature of 97 °C (~207 °F) after a short time, after which the CPU clock speeds drop steadily until they finally stabilize at 2.8 GHz. Meanwhile, the GPU temperature rises to about 85 °C (~185 °F), which results in the graphics card lowering its clock rate to 1,395 MHz so as to prevent the core temperature from exceeding 85 °C (~185 °F). The CPU has to throttle below its base clock speed of 3.3 GHz in the stress test to keep the temperature in an acceptable range.
This is an extreme scenario that doesn't occur in everyday use. Therefore, you probably don't have to expect restrictions in here, even in more demanding games.
(-) The maximum temperature on the upper side is 49 °C / 120 F, compared to the average of 40.4 °C / 105 F, ranging from 21.2 to 68.8 °C for the class Gaming.
(-) The bottom heats up to a maximum of 48 °C / 118 F, compared to the average of 43.2 °C / 110 F
(+) In idle usage, the average temperature for the upper side is 28.1 °C / 83 F, compared to the device average of 33.8 °C / 93 F.
(±) Playing The Witcher 3, the average temperature for the upper side is 36.8 °C / 98 F, compared to the device average of 33.8 °C / 93 F.
(+) The palmrests and touchpad are cooler than skin temperature with a maximum of 30 °C / 86 F and are therefore cool to the touch.
(±) The average temperature of the palmrest area of similar devices was 28.9 °C / 84 F (-1.1 °C / -2 F).
Speakers
The built-in speakers sound exceptionally clear when it comes to mids and highs, but they can't produce a convincing bass. The maximum volume is sufficient to fill medium-sized rooms with sound. Voices are reproduced clearly and intelligibly. Furthermore, external audio devices can be connected via Bluetooth or the 3.5 mm audio jack.
Asus ROG Strix G15 G513QR audio analysis
(±) | speaker loudness is average but good (78 dB)
Bass 100 - 315 Hz
(±) | reduced bass - on average 5% lower than median
(±) | linearity of bass is average (7.3% delta to prev. frequency)
Mids 400 - 2000 Hz
(+) | balanced mids - only 3% away from median
(+) | mids are linear (3.4% delta to prev. frequency)
Highs 2 - 16 kHz
(+) | balanced highs - only 1.7% away from median
(+) | highs are linear (6.3% delta to prev. frequency)
Overall 100 - 16.000 Hz
(+) | overall sound is linear (8.3% difference to median)
Compared to same class
» 1% of all tested devices in this class were better, 1% similar, 98% worse
» The best had a delta of 6%, average was 18%, worst was 132%
Compared to all devices tested
» 1% of all tested devices were better, 1% similar, 98% worse
» The best had a delta of 4%, average was 25%, worst was 134%
MSI GS66 Stealth 10UG audio analysis
(±) | speaker loudness is average but good (81 dB)
Bass 100 - 315 Hz
(-) | nearly no bass - on average 18.9% lower than median
(±) | linearity of bass is average (13.6% delta to prev. frequency)
Mids 400 - 2000 Hz
(±) | higher mids - on average 6.1% higher than median
(+) | mids are linear (5.7% delta to prev. frequency)
Highs 2 - 16 kHz
(+) | balanced highs - only 2.4% away from median
(±) | linearity of highs is average (8% delta to prev. frequency)
Overall 100 - 16.000 Hz
(±) | linearity of overall sound is average (20.3% difference to median)
Compared to same class
» 69% of all tested devices in this class were better, 6% similar, 25% worse
» The best had a delta of 6%, average was 18%, worst was 132%
Compared to all devices tested
» 47% of all tested devices were better, 8% similar, 44% worse
» The best had a delta of 4%, average was 25%, worst was 134%
Energy management - Like a roller coaster
Energy management
With an idle power consumption of 4 to 9 watts, depending on the brightness level and performance profile, the ROG Strix G15 ranges from slightly to significantly more energy-efficient than the comparison devices. The picture reverses under load, as the fast graphics card and the powerful processor each take their toll here. However, there have been improvements compared to the predecessor here as well. Since we measured a maximum temporary consumption of 227 watts, the 240-watt power adapter also offers enough leeway for performance peaks.
| Off / Standby | |
| Idle | |
| Load |
|
| Asus ROG Strix G15 G513QR R9 5900HX, GeForce RTX 3070 Laptop GPU | MSI GS66 Stealth 10UG i7-10870H, GeForce RTX 3070 Laptop GPU | Asus TUF Dash F15 FX516PR i7-11370H, GeForce RTX 3070 Laptop GPU | Asus ROG Zephyrus G15 GA503Q R9 5900HS, GeForce RTX 3080 Laptop GPU | Razer Blade 15 RTX 2070 Super Max-Q i7-10875H, GeForce RTX 2070 Super Max-Q | Asus ROG Strix G15 G512LW i7-10750H, GeForce RTX 2070 Mobile | Average of class Gaming | |
|---|---|---|---|---|---|---|---|
| Power Consumption | -41% | -2% | -11% | -64% | -78% | -66% | |
| Idle Minimum * | 4 | 12.9 -223% | 9 -125% | 10 -150% | 14.3 -258% | 16.2 -305% | 13.9 ? -248% |
| Idle Average * | 9 | 15.4 -71% | 11 -22% | 12 -33% | 22.3 -148% | 24.1 -168% | 19.1 ? -112% |
| Idle Maximum * | 36 | 27.1 25% | 16 56% | 17 53% | 36.9 -3% | 30.8 14% | 26.9 ? 25% |
| Load Average * | 130 | 98.2 24% | 107 18% | 108 17% | 118.4 9% | 127.6 2% | 111.4 ? 14% |
| Witcher 3 ultra * | 174 | 164.9 5% | 121 30% | 123 29% | 153.7 12% | 187.5 -8% | |
| Load Maximum * | 227 | 232.9 -3% | 162 29% | 182 20% | 220.8 3% | 239 -5% | 251 ? -11% |
* ... smaller is better
Battery life
In our standardized WLAN test (150 cd/m², websites are periodically accessed using a script), our test device achieves a runtime of 7:21 hours; as a result, it ranks behind the Asus TUF Dash F15 and the ROG Zephyrus G15. In return, it beats the latter by 10 minutes in the load test, while the MSI GS66 Stealth 10UG lasts almost 30% longer here.
Overall, our review sample performs relatively well, especially considering that most of the rivals are based on more energy-efficient components. The battery capacity of 90 Wh is relatively high, even though the slimmer MSI GS66 Stealth with its 99.9 Wh battery shows that a little bit more can still be achieved.
| Asus ROG Strix G15 G513QR R9 5900HX, GeForce RTX 3070 Laptop GPU, 90 Wh | MSI GS66 Stealth 10UG i7-10870H, GeForce RTX 3070 Laptop GPU, 99.9 Wh | Asus TUF Dash F15 FX516PR i7-11370H, GeForce RTX 3070 Laptop GPU, 76 Wh | Asus ROG Zephyrus G15 GA503Q R9 5900HS, GeForce RTX 3080 Laptop GPU, 90 Wh | Razer Blade 15 RTX 2070 Super Max-Q i7-10875H, GeForce RTX 2070 Super Max-Q, 80 Wh | Asus ROG Strix G15 G512LW i7-10750H, GeForce RTX 2070 Mobile, 66 Wh | Average of class Gaming | |
|---|---|---|---|---|---|---|---|
| Battery Runtime | 13% | 23% | 9% | -14% | -13% | -28% | |
| H.264 | 809 | 397 ? -51% | |||||
| WiFi v1.3 | 441 | 426 -3% | 544 23% | 564 28% | 380 -14% | 385 -13% | 366 ? -17% |
| Load | 100 | 129 29% | 90 -10% | 83.9 ? -16% | |||
| Reader / Idle | 649 | 957 | 728 | 541 ? |
Pros
Cons
Verdict - Successful high-performance 15-inch laptop
The Asus ROG Strix impresses with an elaborate design and fast hardware. The latter can unleash its potential well in the large 15-inch case and achieve a decent performance boost compared to the previous generation. Especially the stunning 300 Hz display as well as the RTX 3070 and its generous TDP give gamers their money's worth. Asus didn't neglect seemingly small details, either, such as the keyboard and the maintenance options.
The ROG Strix G15 offers a lot of pure performance and excellent workmanship in a 15-inch format, but connectivity leaves something to be desired.
Our main point of criticism is the modest connectivity: With only one USB-C port that supports DisplayPort and Power Delivery and no webcam or SD card reader, it's pretty minimalistic - especially since no docking station can be connected due to the absence of a Thunderbolt port.
Users who can forego these features or who don't need them anyway will get a lot of performance for a reasonable price with the current Asus ROG Strix G15.
Price and availability
At the time of writing, it's a little bit hard to come by the latest version of the Asus ROG Strix G15. Adorama has it listed in our same configuration for $1,799.99 and also offers it with an RTX 3060 as a less expensive alternative.
Asus ROG Strix G15 G513QR
-
02/22/2021 v7
Marius Schell
More articles related to this device
Asus ROG Strix G15 G513QR (ROG Strix G15 G513 Series)Related Articles

Pricecompare

