

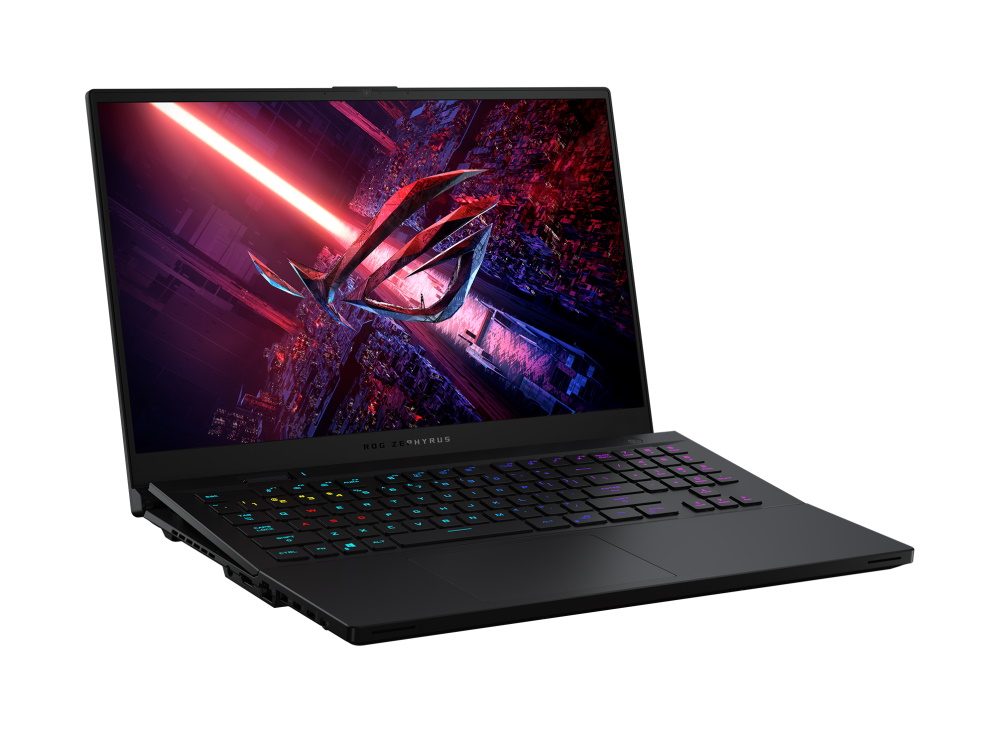
Asus ROG Zephyrus S17 laptop review: Gaming device case opens up to provide more fresh air. Cool - but is it safe?
Last year's Zephyrus S17 was quite an unusual 17-inch gaming device. When opened, the case also opened up a bit on the underside, which was supposed to provide a better air supply. So as not to compromise stability, the position of the touchpad and keyboard was shifted in an unusual way.
This year, Asus is launching the completely redesigned new edition of the S17. In addition to hardware updates (Tiger Lake and RTX 30), the case has also been modified entirely. Once again, a gap opens when you open the laptop, but it's not at the bottom anymore; instead, the keyboard is raised.
Among the competition, we include the two Gigabyte models Aorus 17G and Aero 17 HDR, the Schenker XMG Ultra 17 and the MSI GE76 Raider 10UH. In addition, we will naturally compare it with the predecessor.
Possible contenders in comparison
Rating | Date | Model | Weight | Height | Size | Resolution | Price |
|---|---|---|---|---|---|---|---|
| 90.1 % v7 (old) | 07 / 2021 | Asus ROG Zephyrus S17 GX703HSD i9-11900H, GeForce RTX 3080 Laptop GPU | 2.8 kg | 19.9 mm | 17.30" | 2560x1440 | |
| 82.4 % v7 (old) | 08 / 2020 | Asus Zephyrus S17 GX701LXS i7-10875H, GeForce RTX 2080 Super Max-Q | 2.6 kg | 18.7 mm | 17.30" | 1920x1080 | |
| 86 % v7 (old) | 06 / 2021 | Aorus 17G YD i7-11800H, GeForce RTX 3080 Laptop GPU | 2.8 kg | 26 mm | 17.30" | 1920x1080 | |
| 88 % v7 (old) | 05 / 2021 | Gigabyte Aero 17 HDR YD i9-11980HK, GeForce RTX 3080 Laptop GPU | 2.8 kg | 22 mm | 17.30" | 3840x2160 | |
| 84.9 % v7 (old) | 04 / 2021 | Schenker XMG Ultra 17 Rocket Lake i9-11900K, GeForce RTX 3080 Laptop GPU | 4.7 kg | 43.5 mm | 17.30" | 1920x1080 | |
| 87.1 % v7 (old) | 03 / 2021 | MSI GE76 Raider 10UH i7-10870H, GeForce RTX 3080 Laptop GPU | 3 kg | 27.4 mm | 17.30" | 1920x1080 |
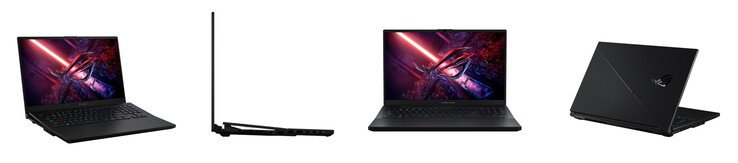
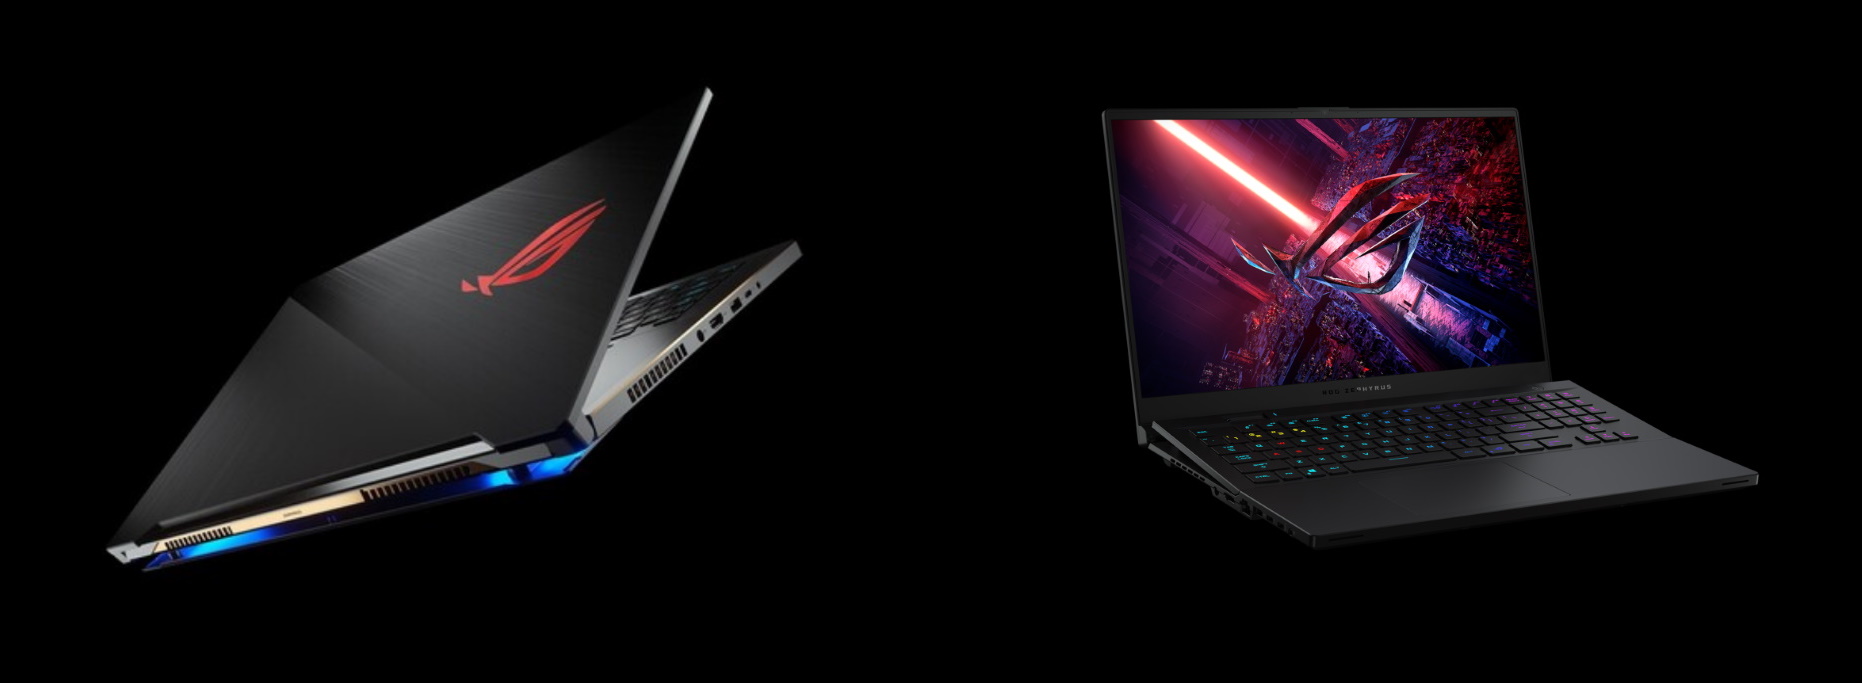
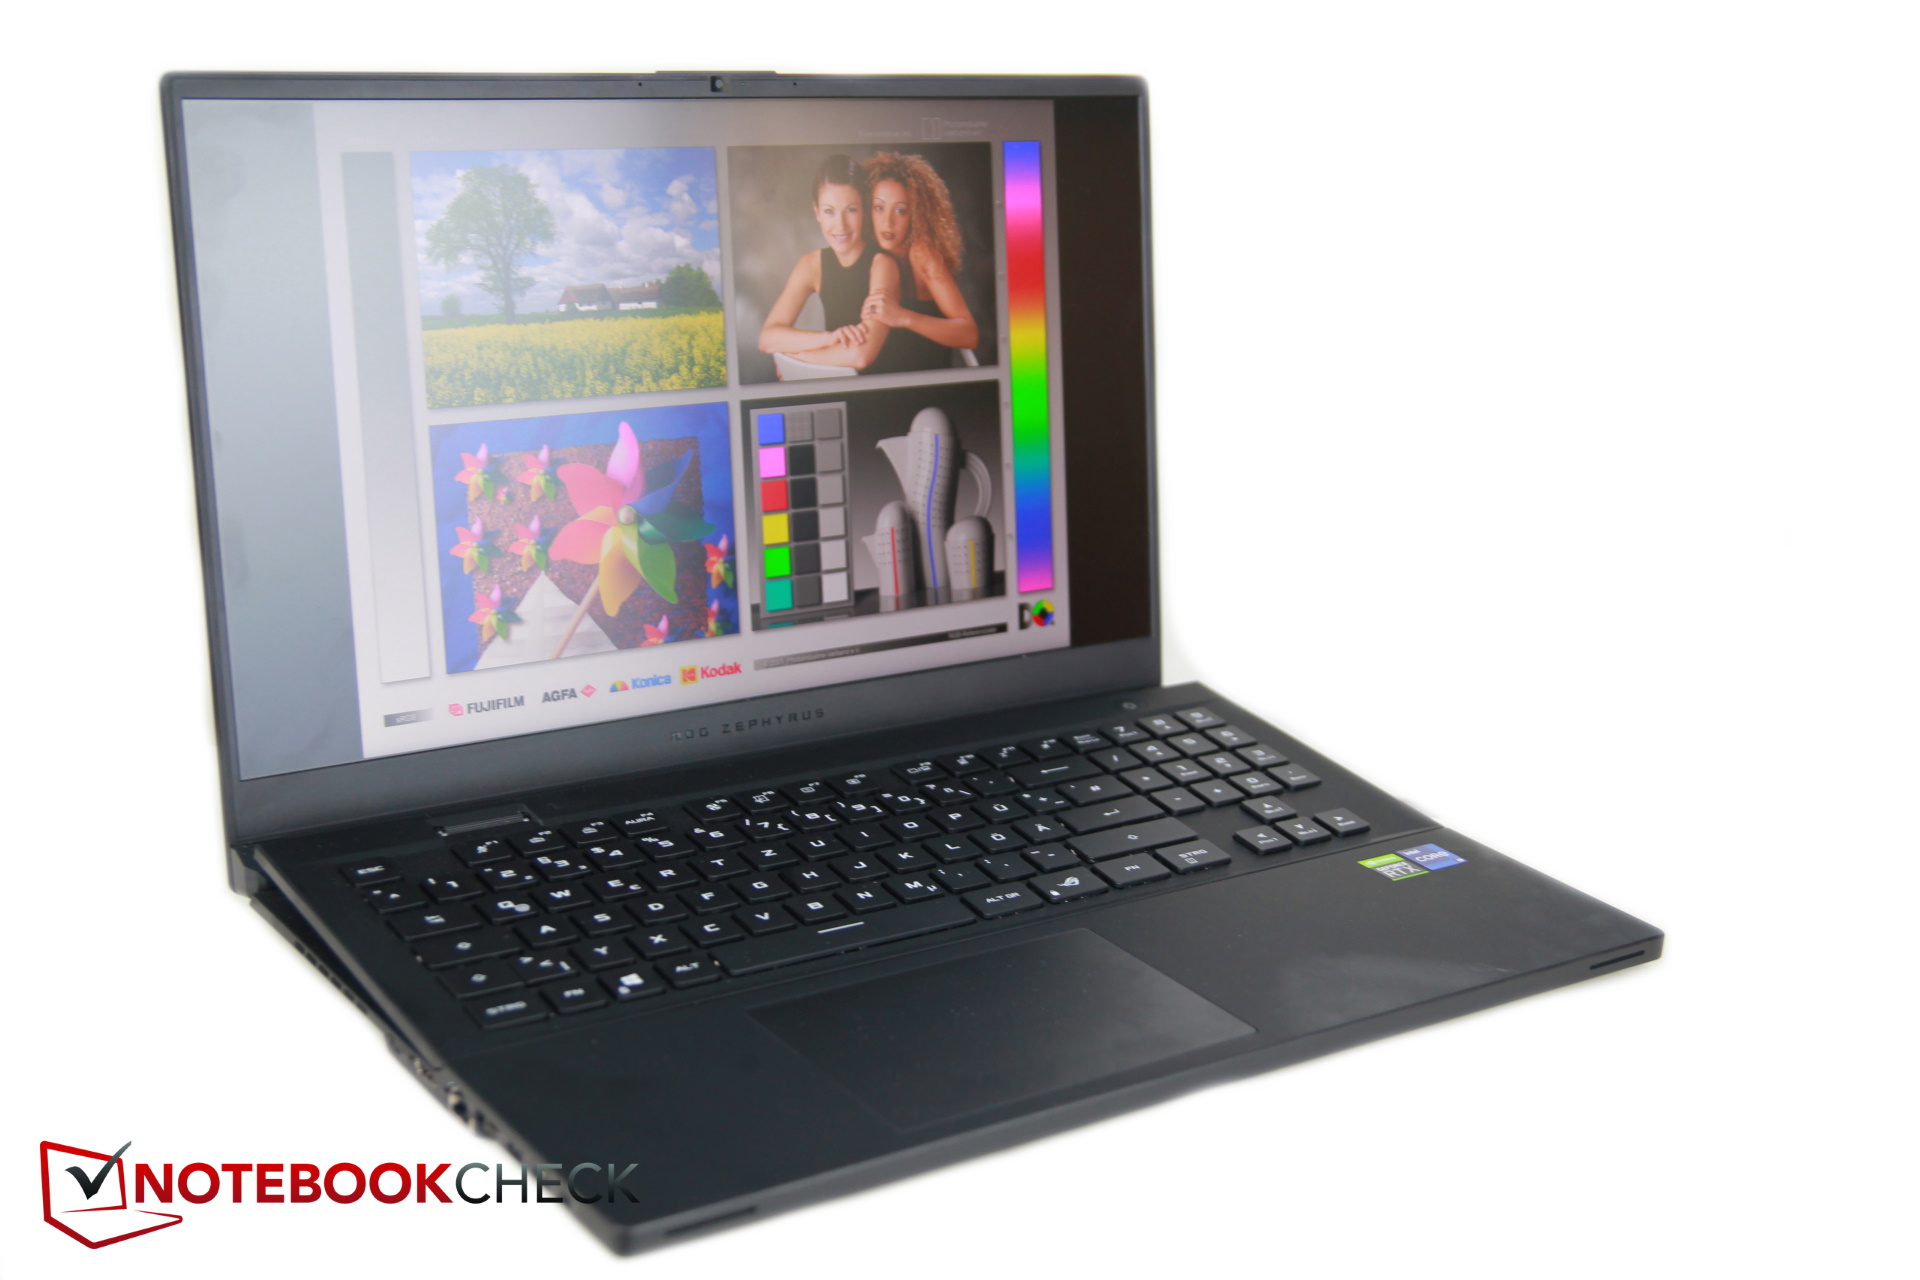
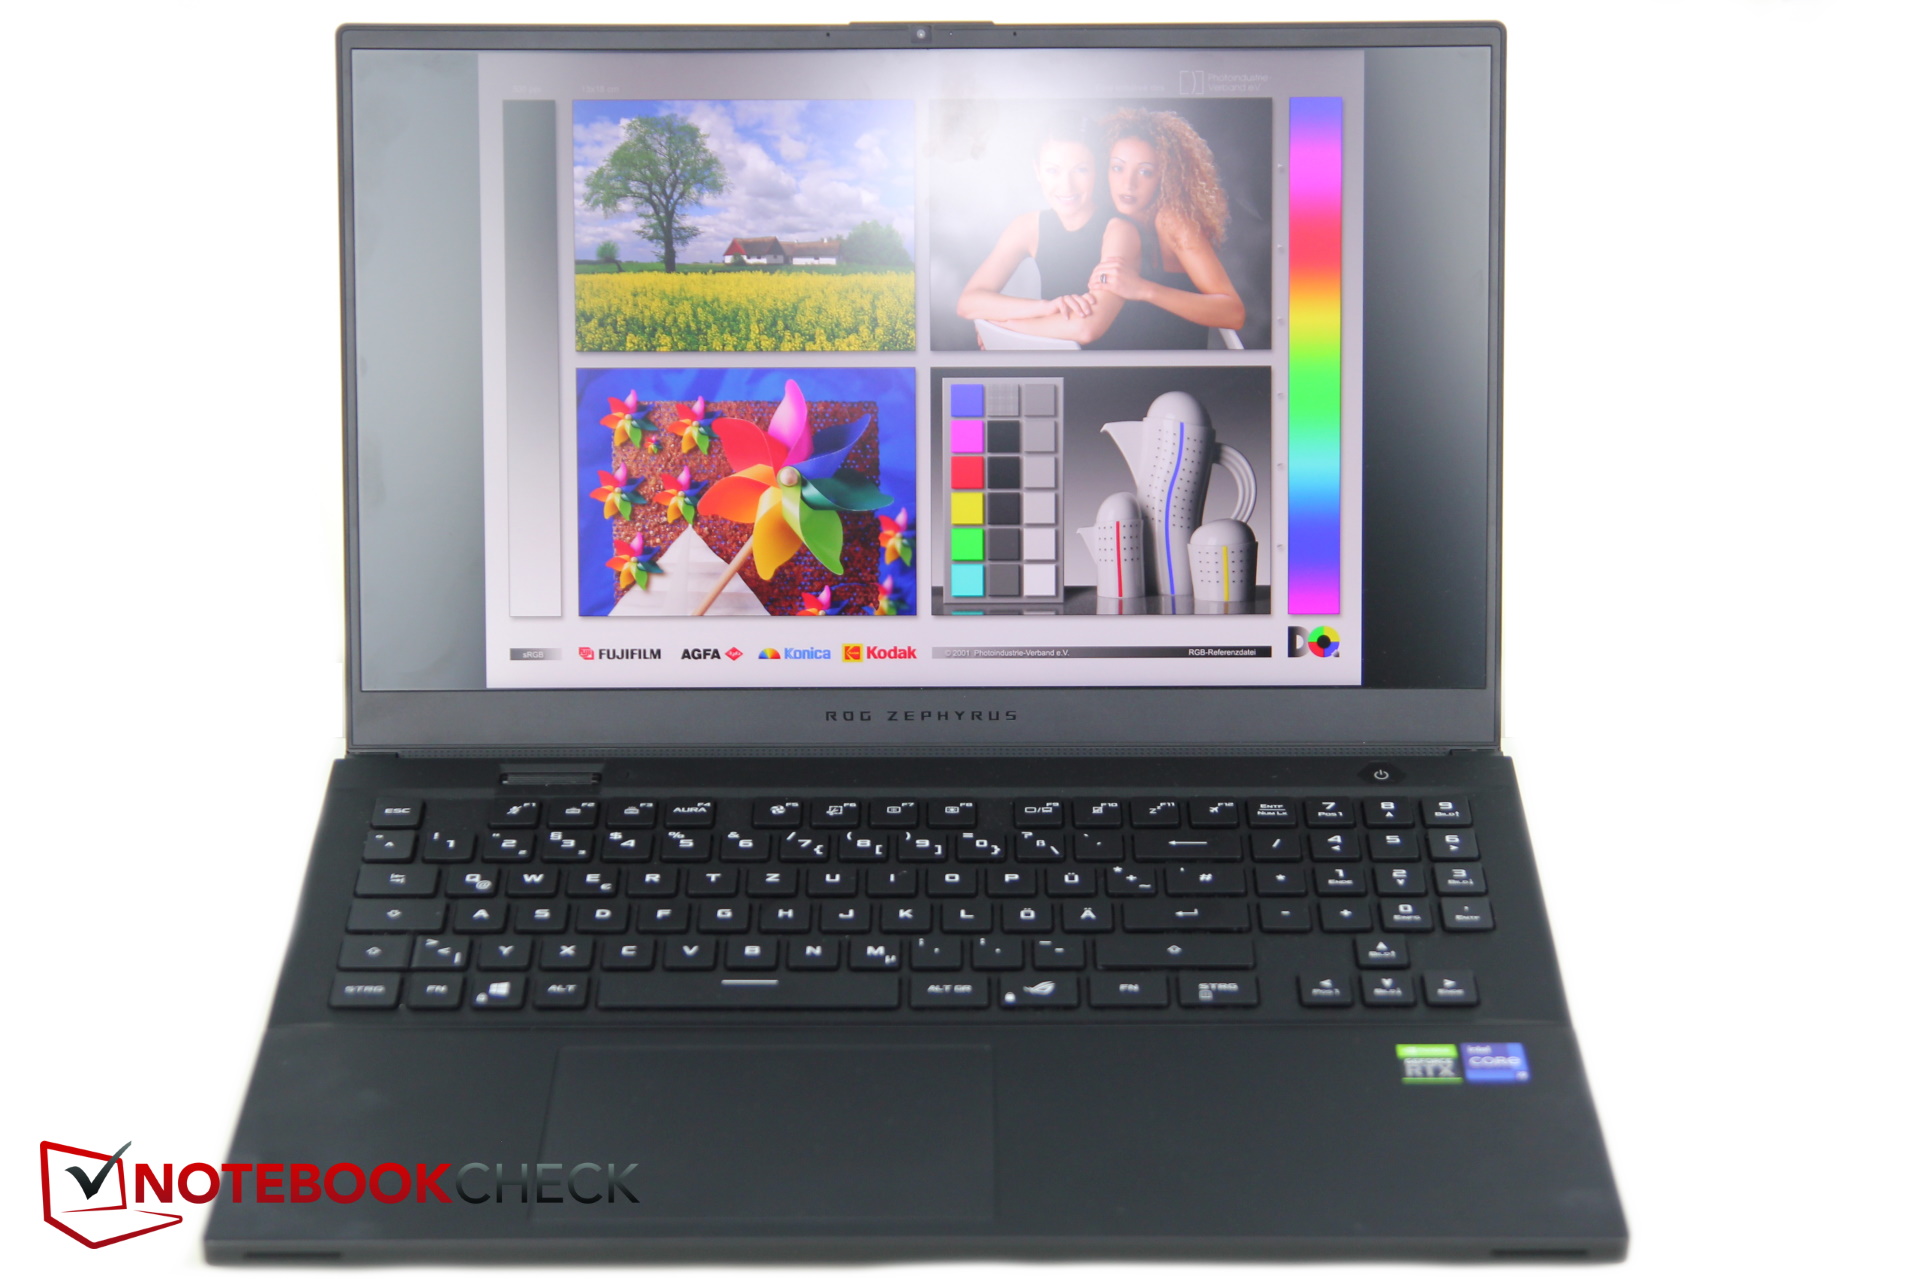
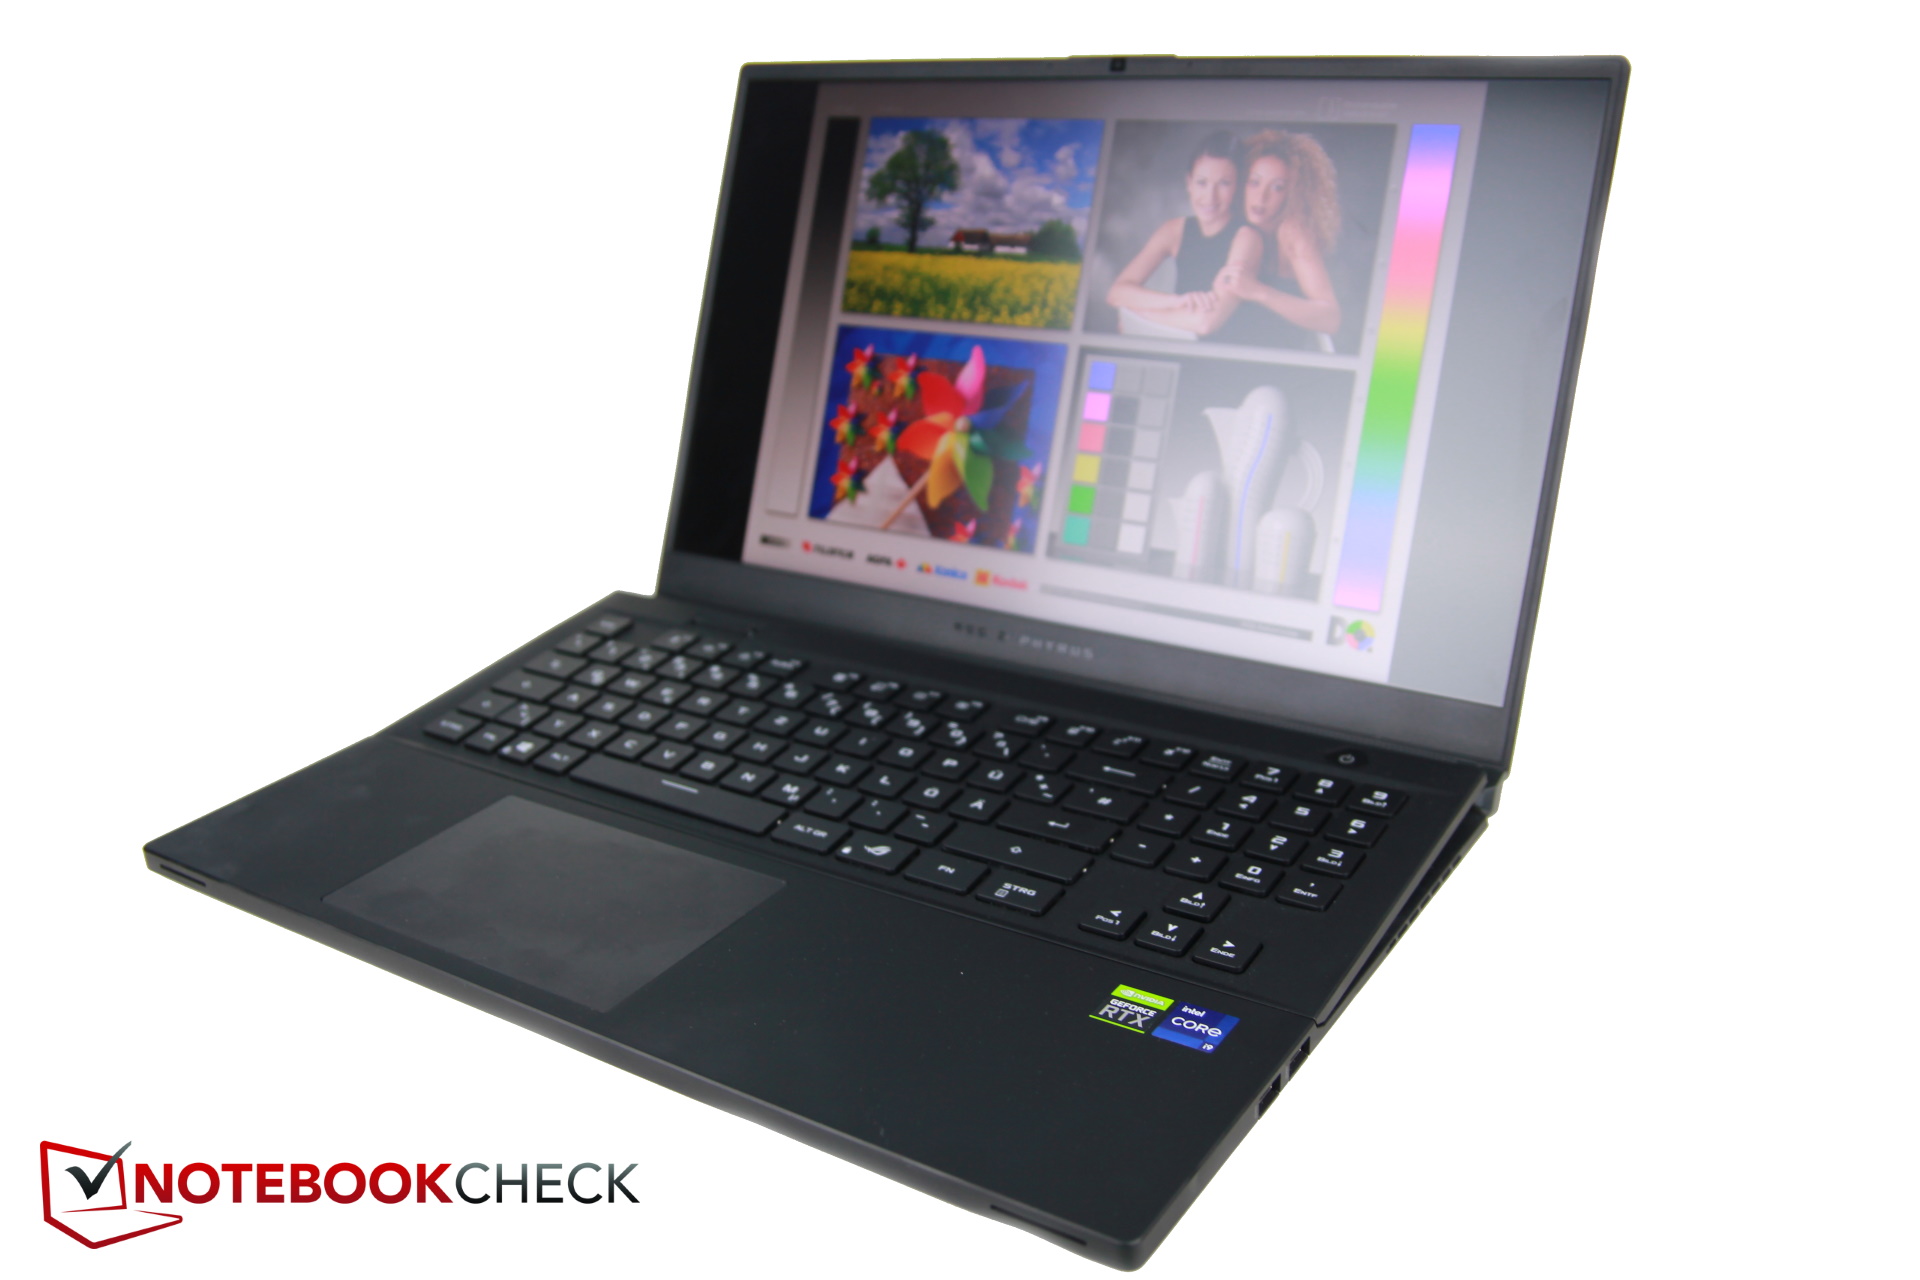
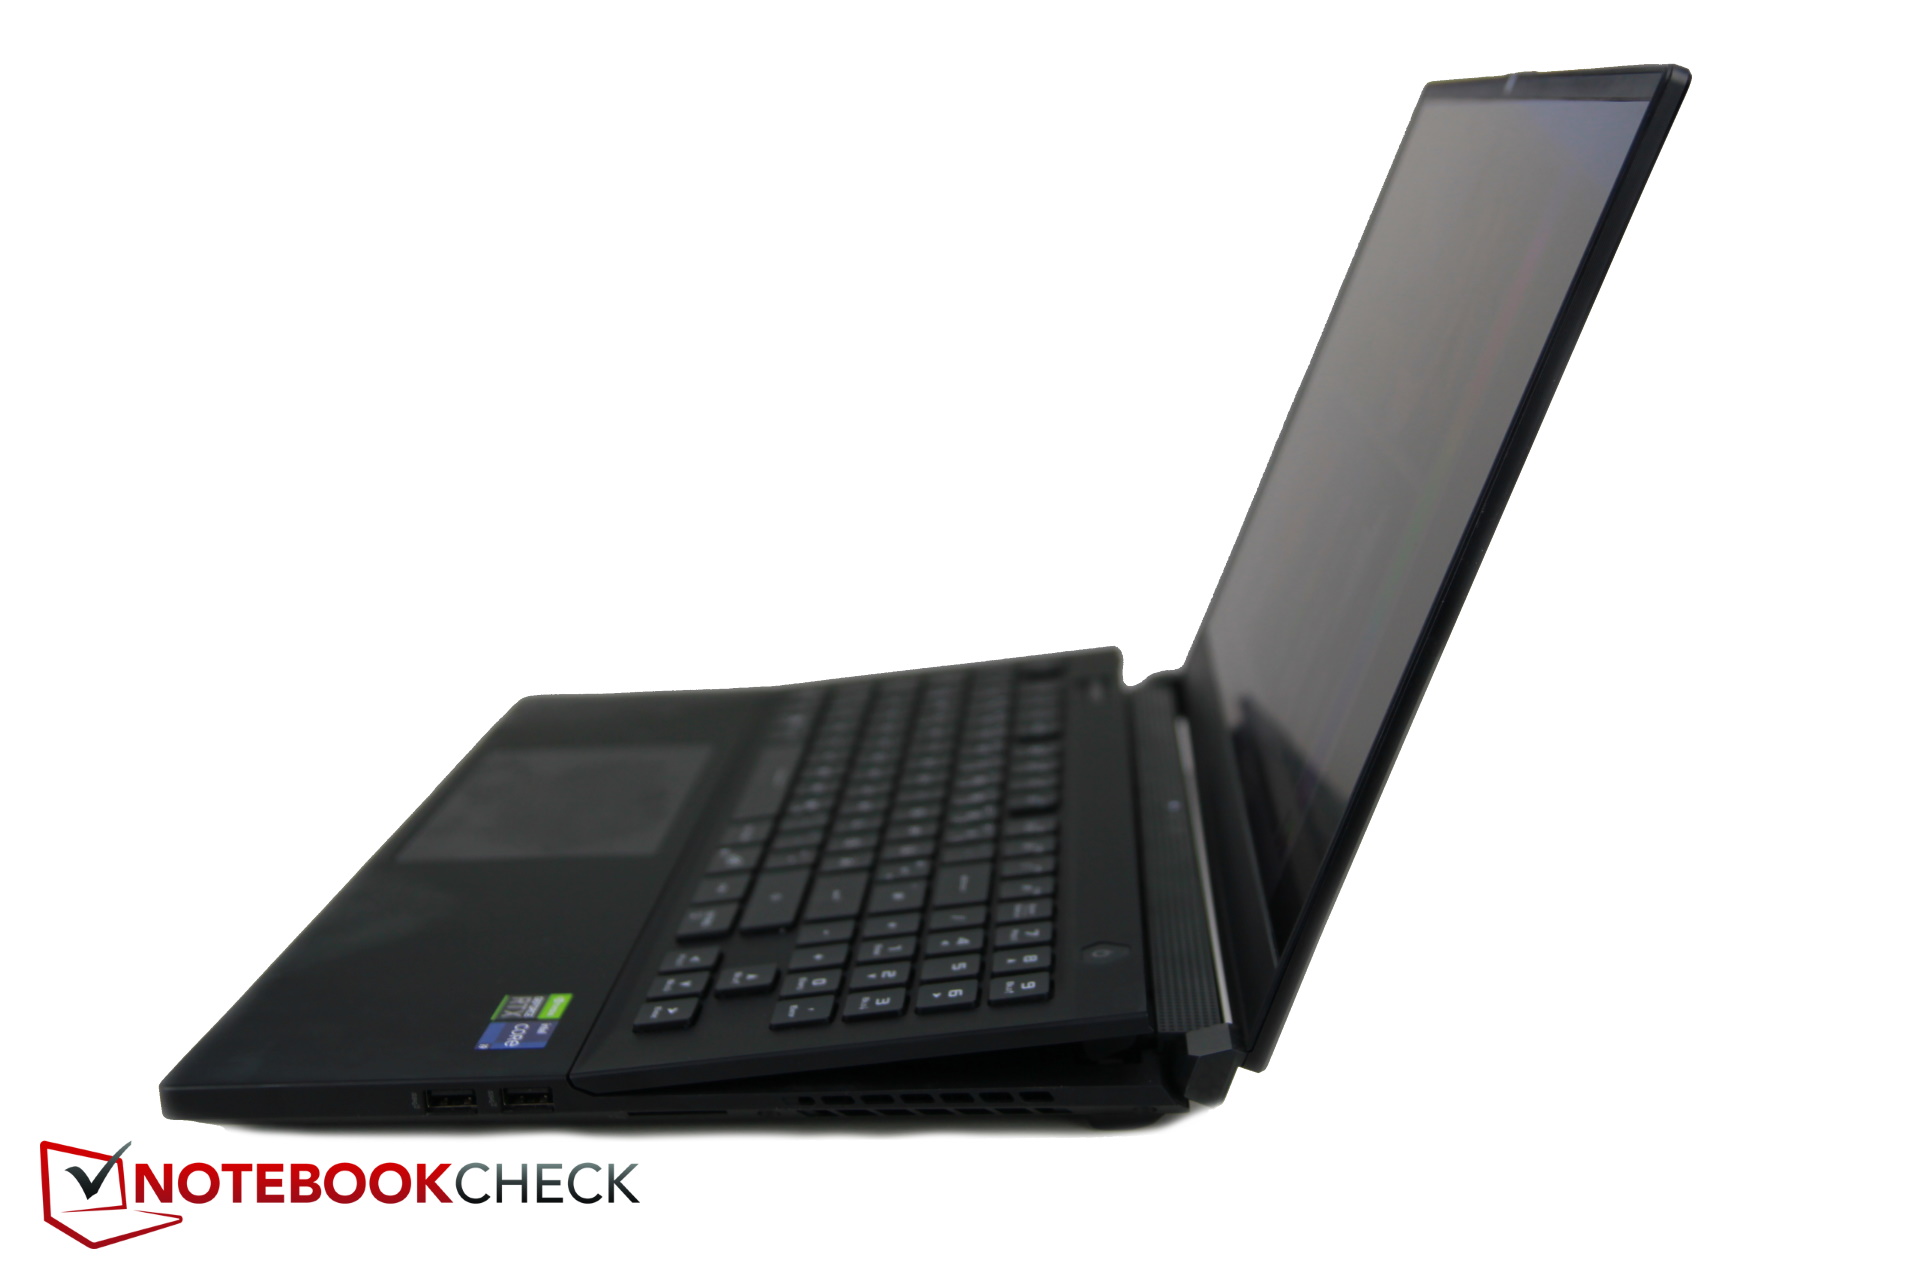
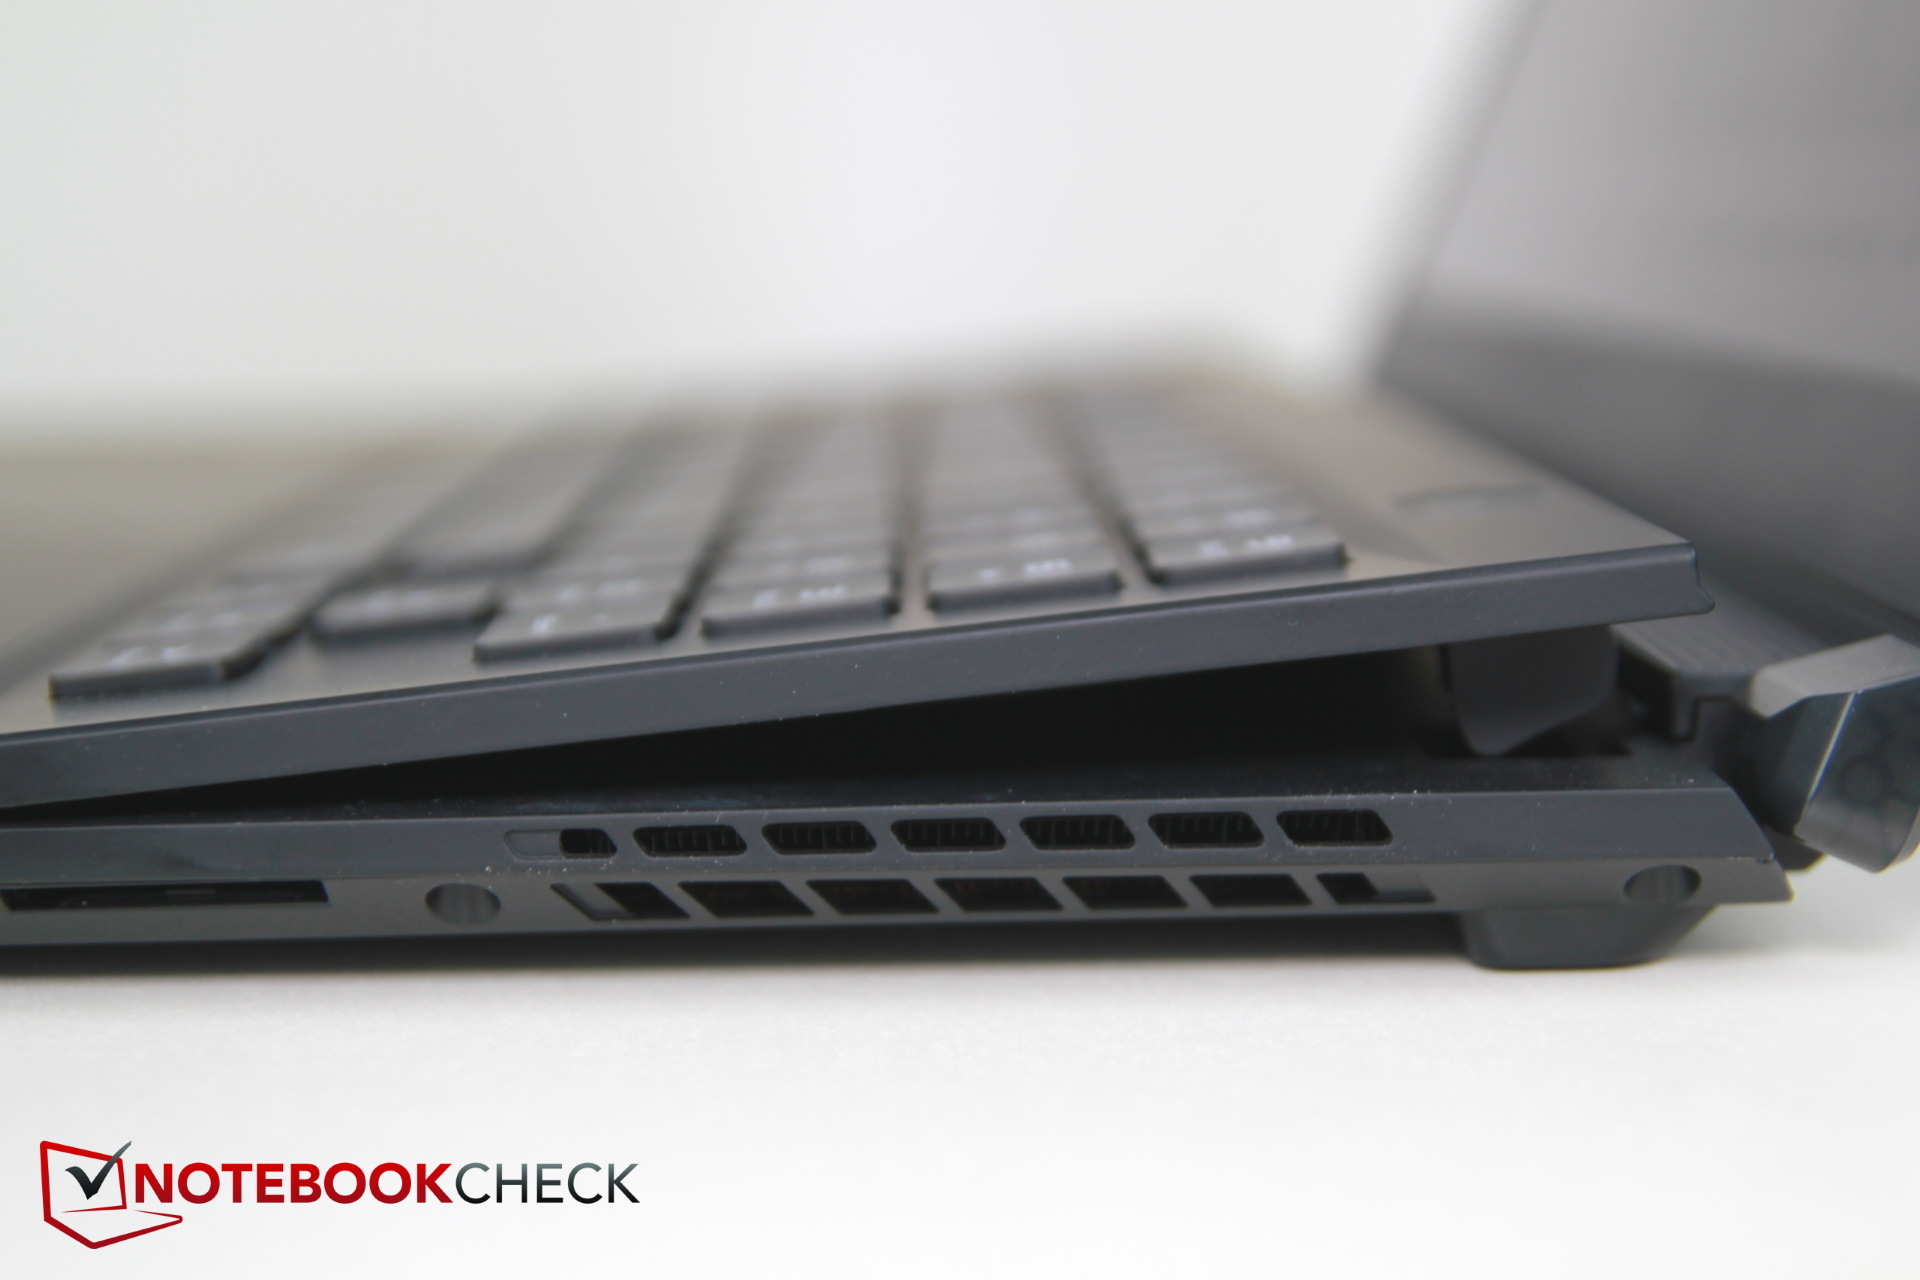
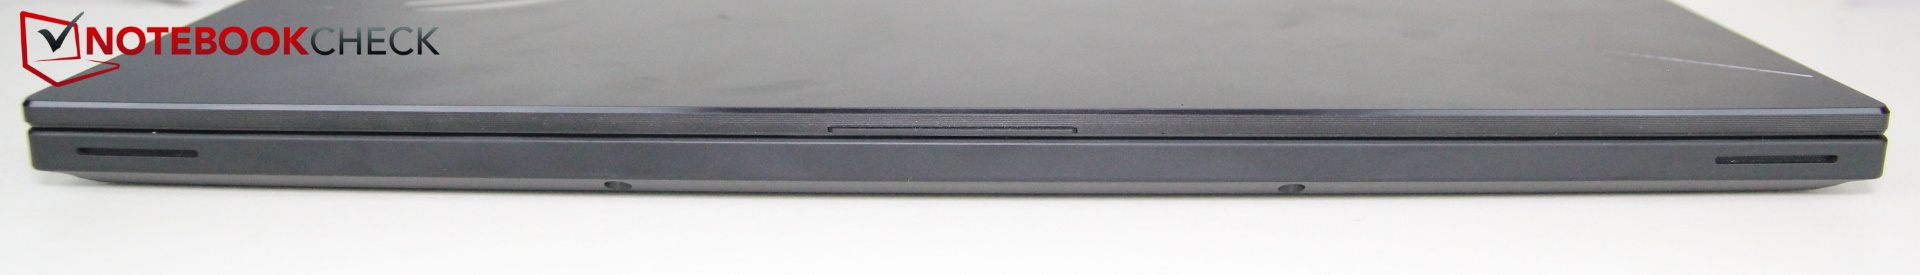
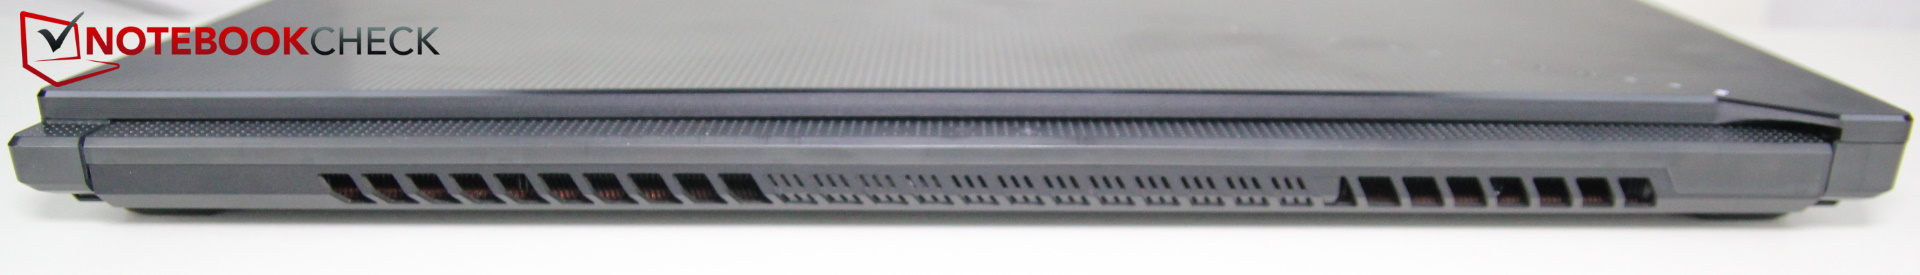
Case - Lifts to reveal a gap
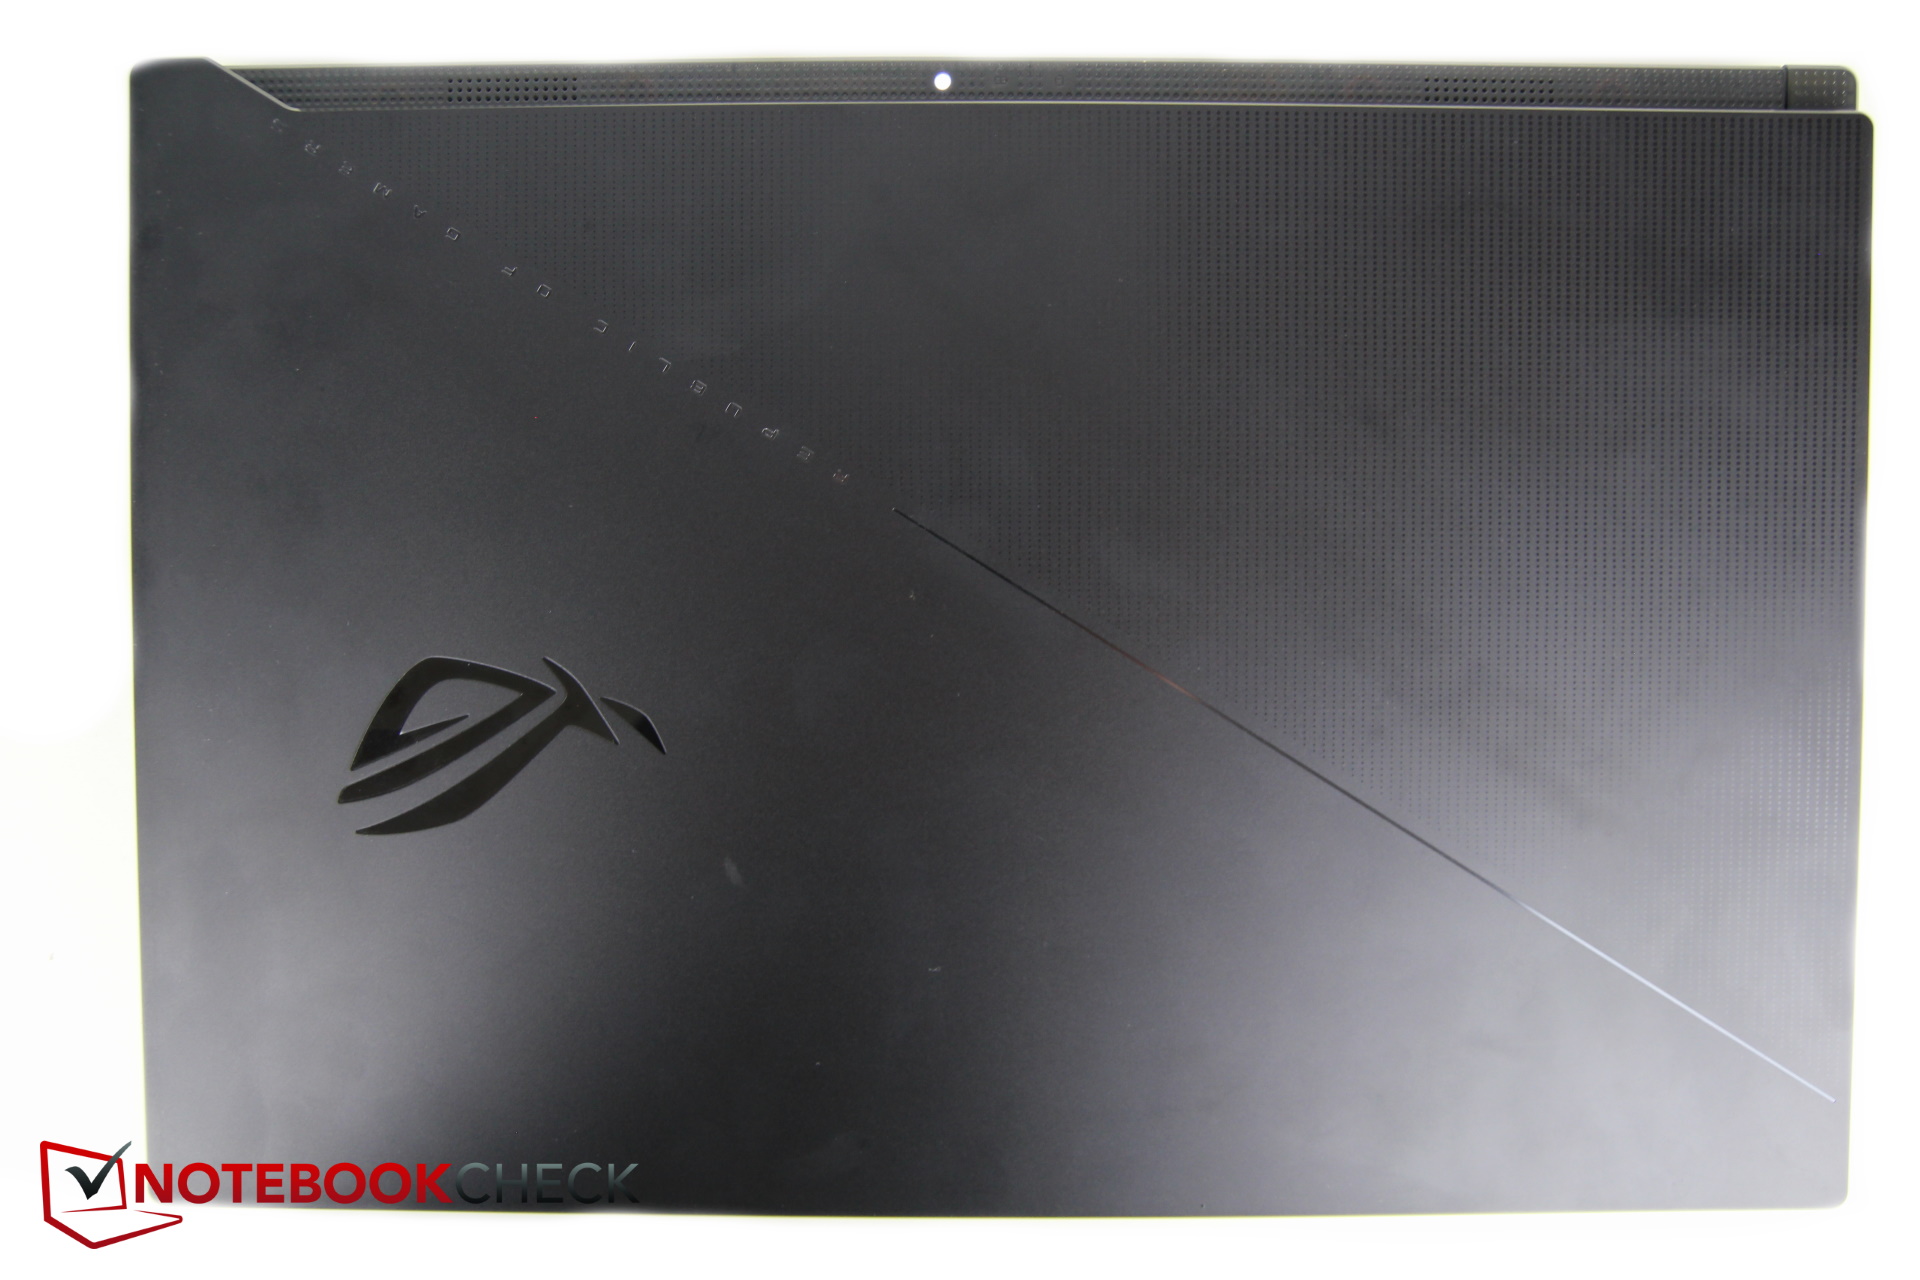
The black case, which is quite thin for a 17-incher, is made of sturdy metal, and the palm rests on the inside are rubberized.
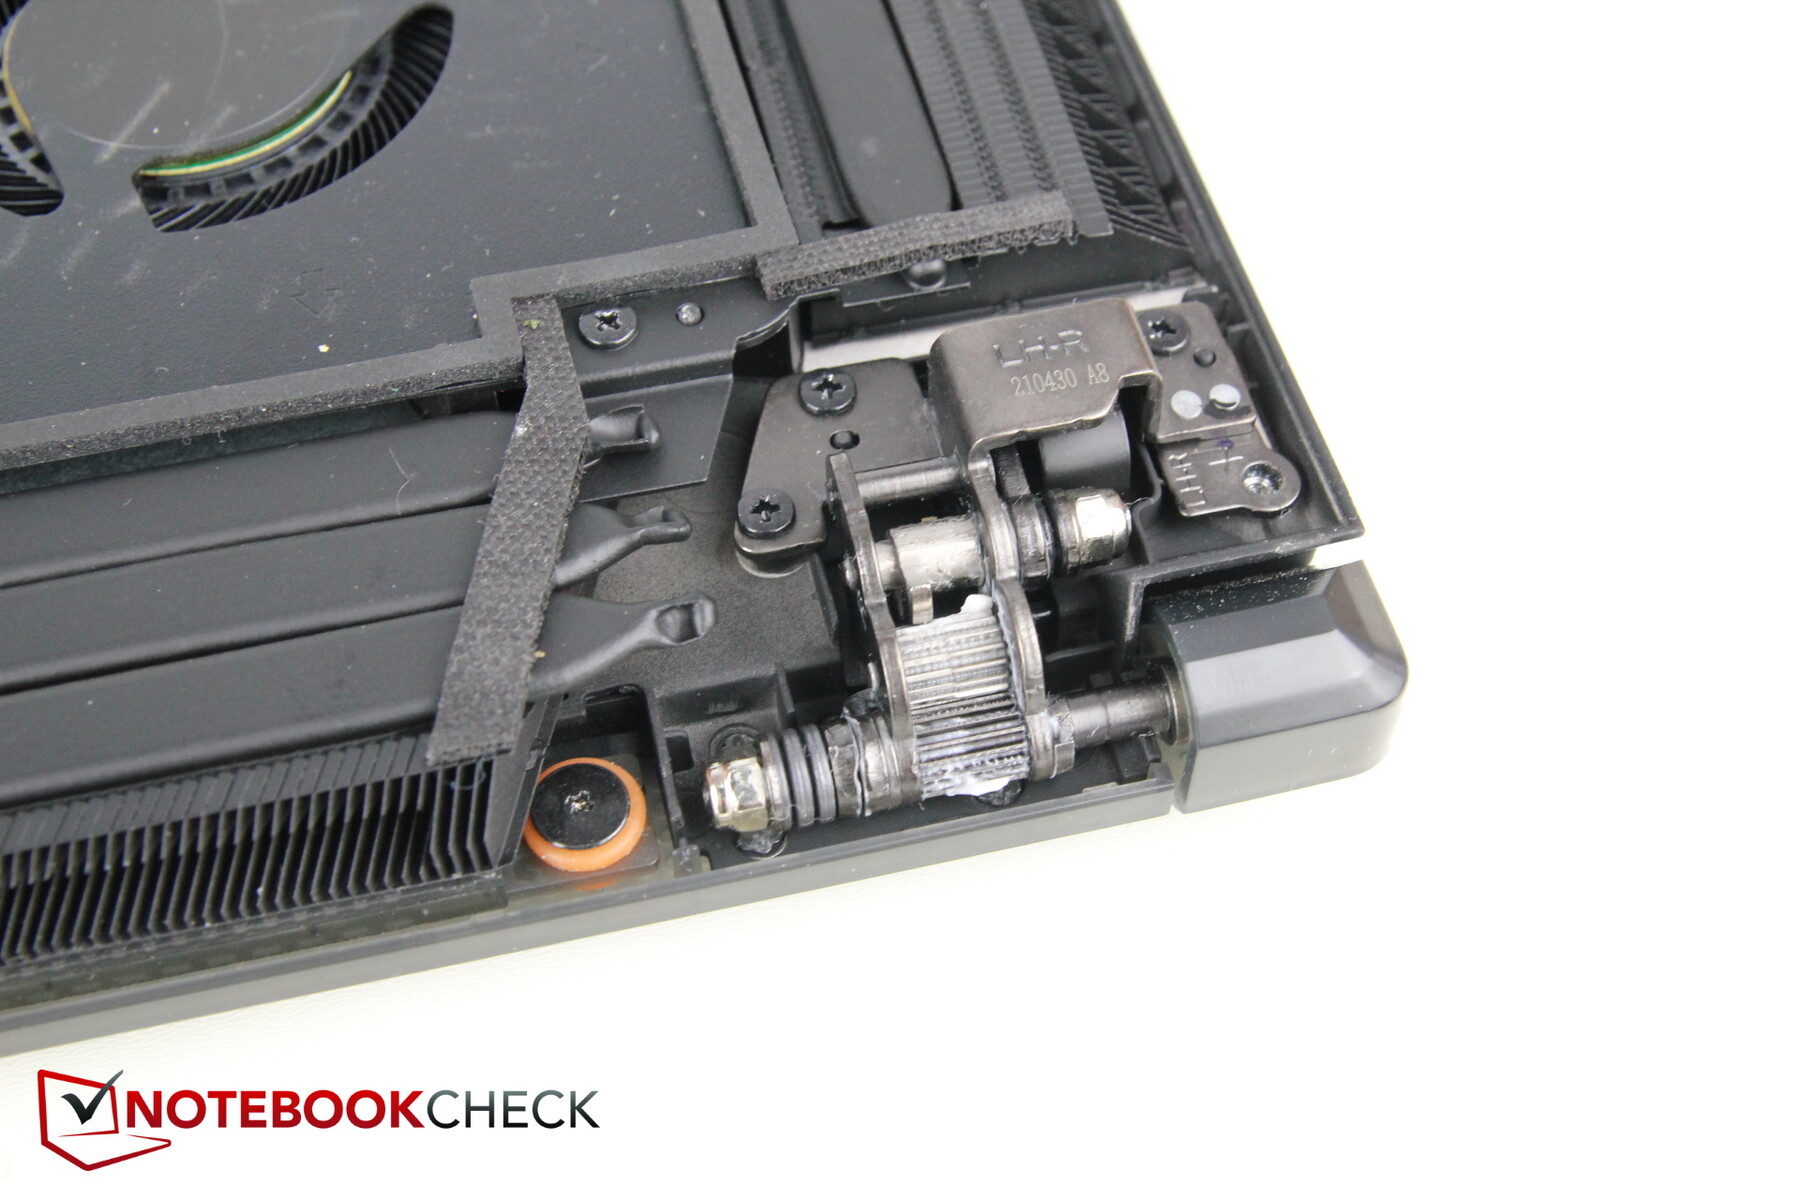
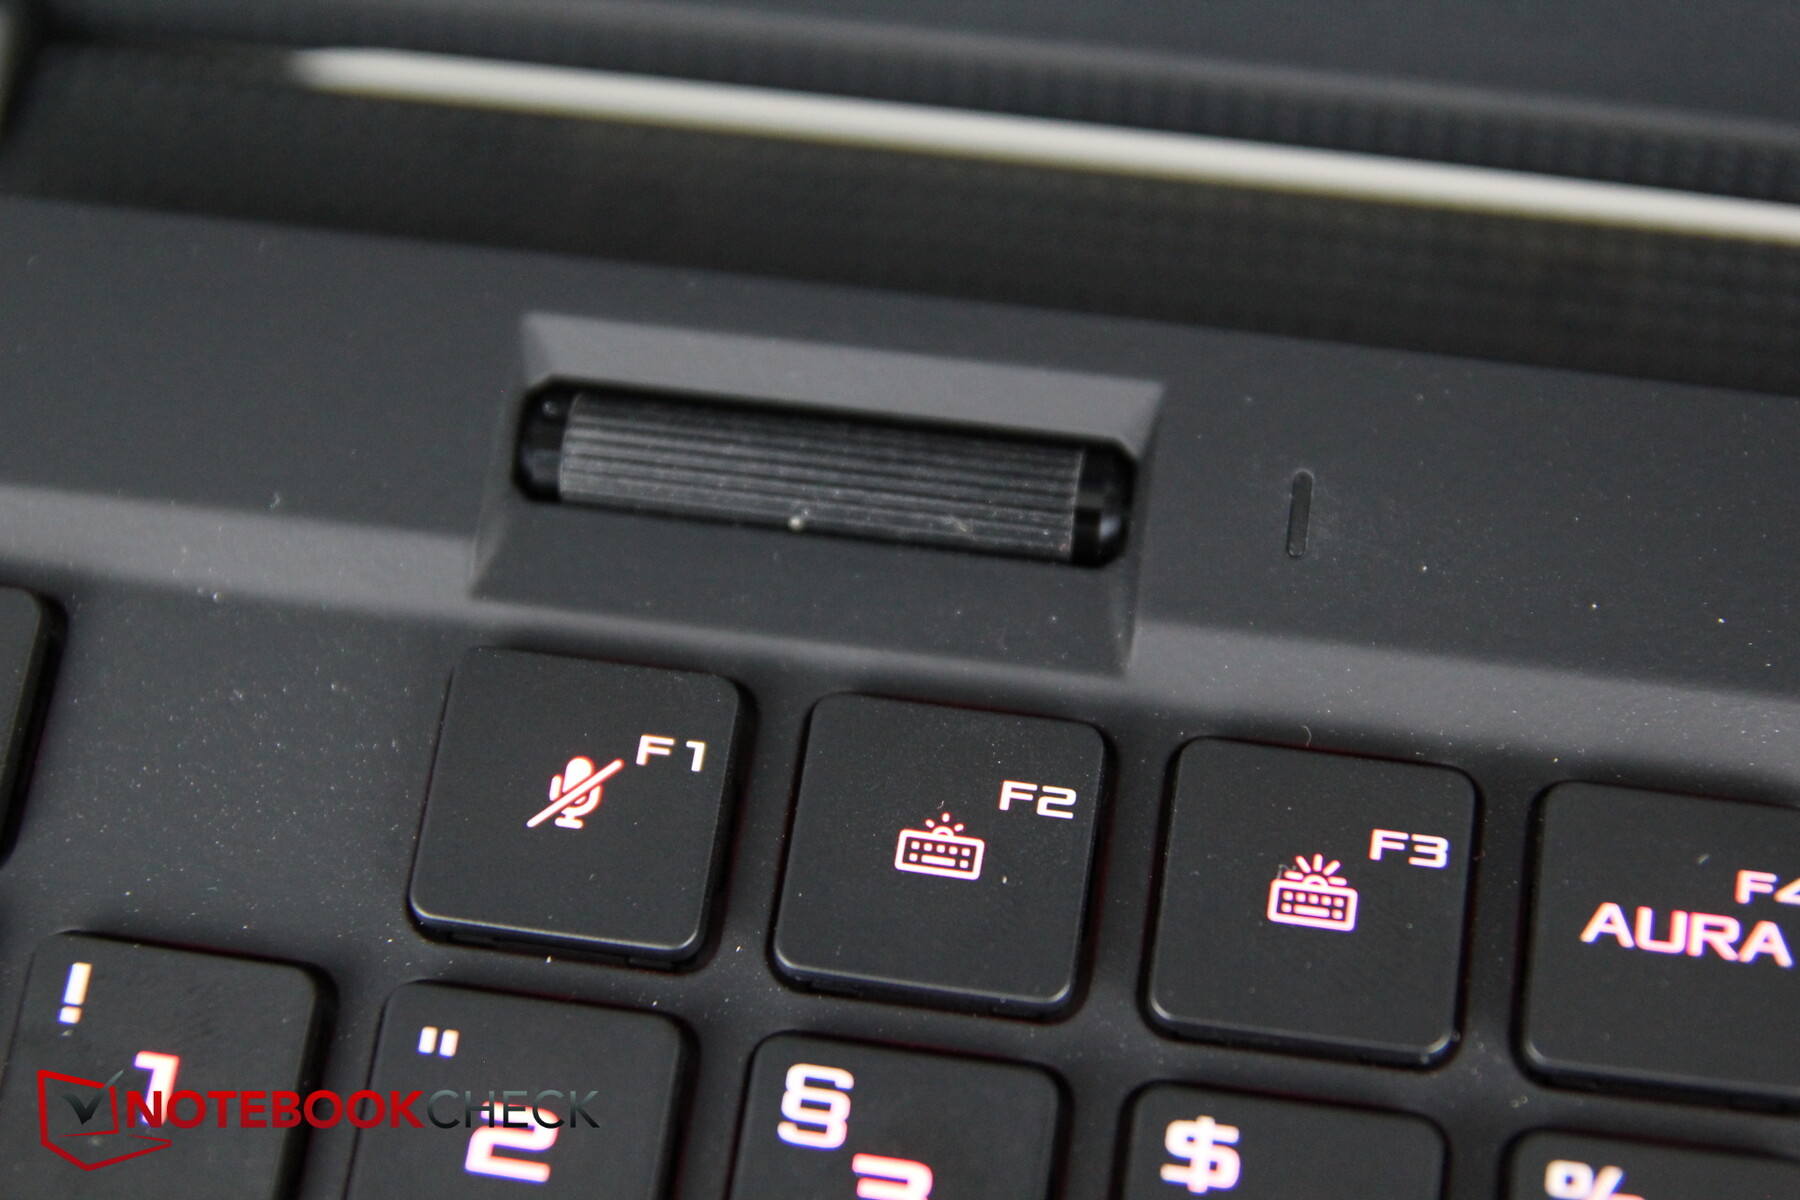
When you open the lid, the sturdy hinges simultaneously lift the thin keyboard unit, so that a narrow gap opens up in the case. This is meant to take in more air, and at the same time, it also puts the keyboard in a more ergonomic position.
Due to the metal used, this mechanism makes quite a stable impression, and even the keyboard unit doesn't flex. However, it can be moved slightly, which results in audible noises. At the same time, dust can penetrate more into the interior, not to mention crumbs and other dirt particles.
You can't see any electronic components through the narrow gap, though; they might be especially covered to prevent dirt from penetrating.
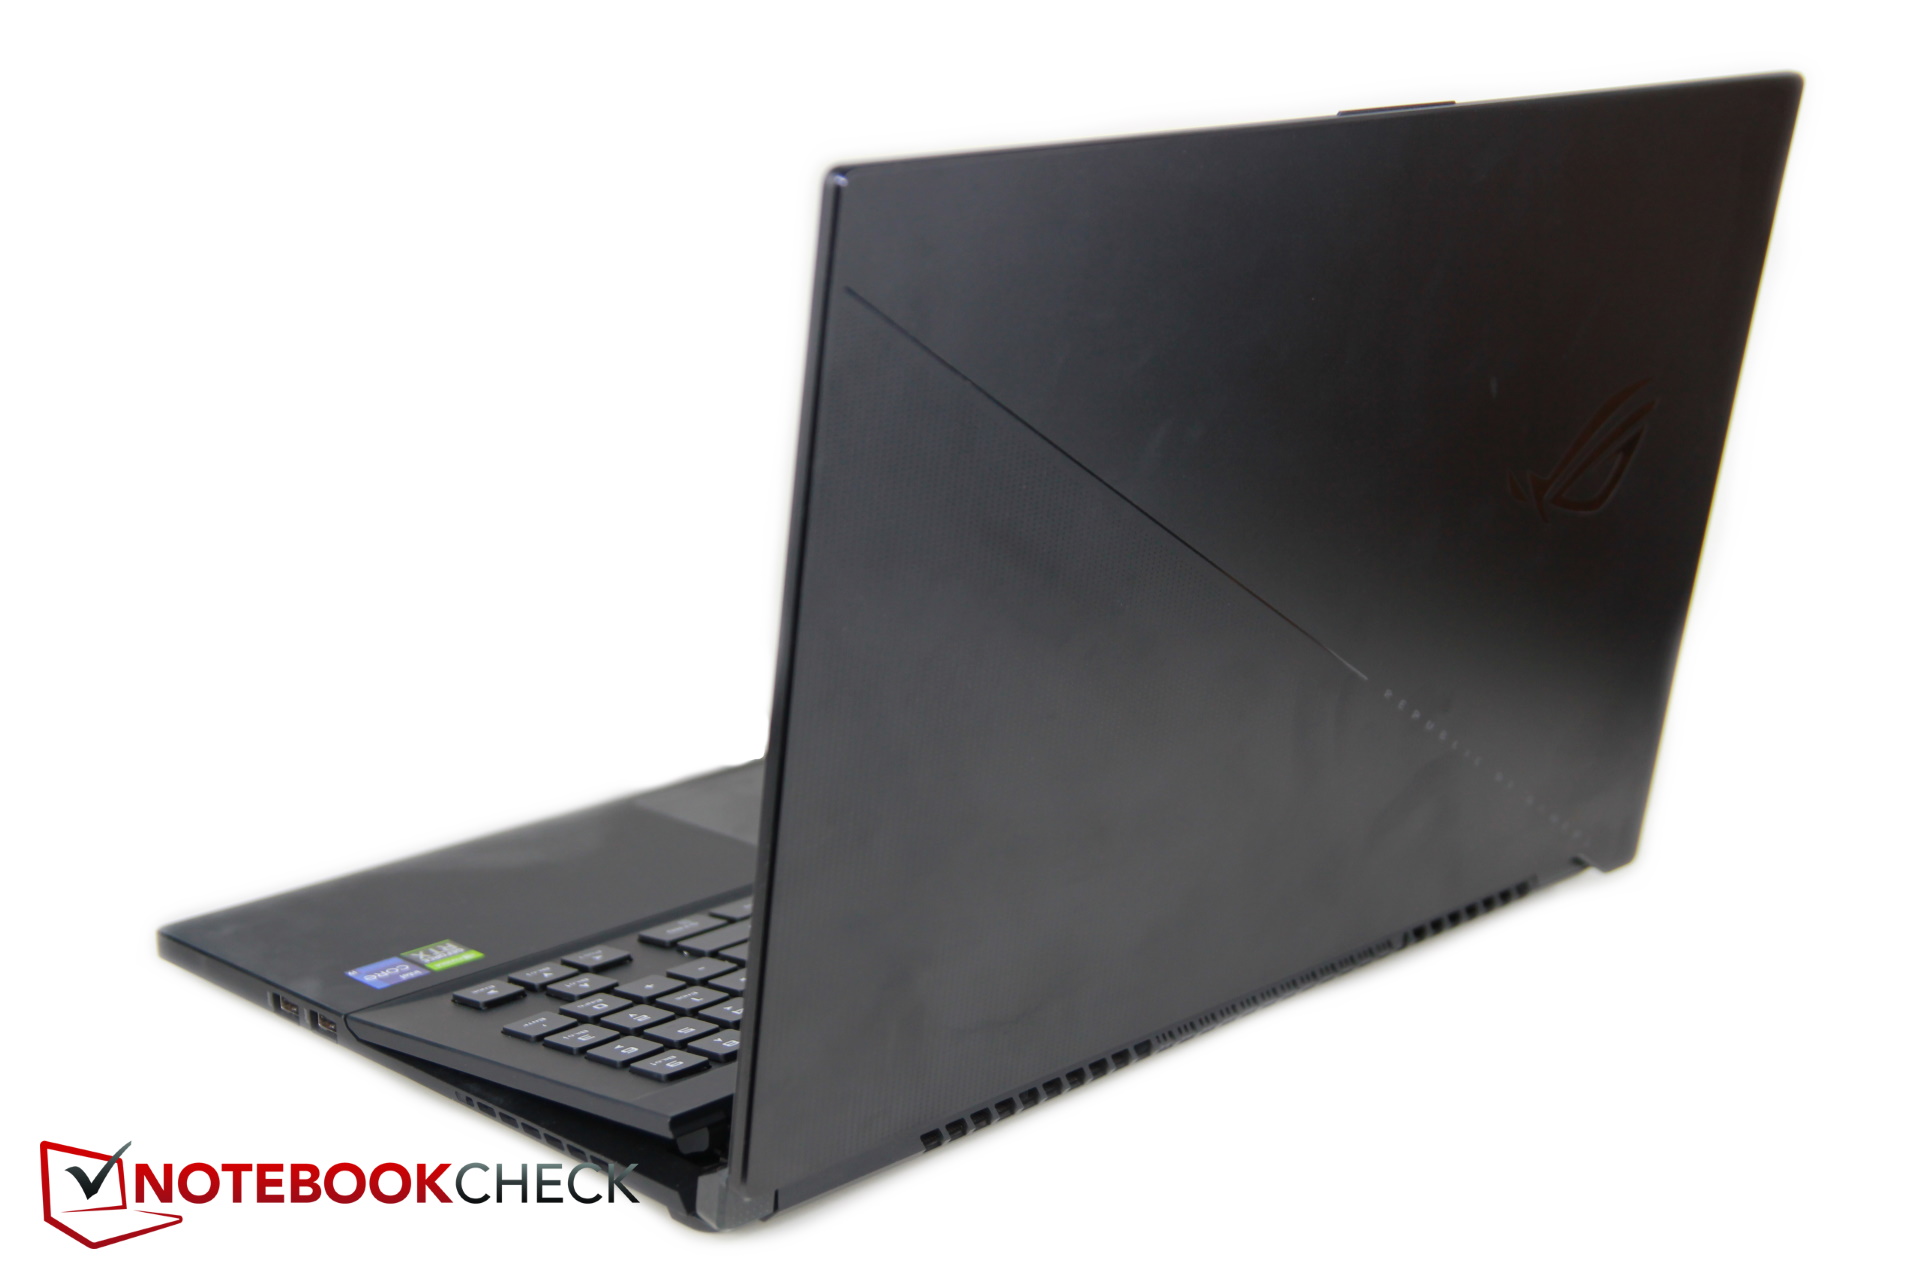
Asus has reduced the length and width by a few millimeters with the redesign, but the new model is about 1 mm (~0.04 inches) thicker in return.
The remaining 17-inch competition is a bit larger and also thicker. Therefore, the Zephyrus is one of the thinner and smaller 17-inch gaming devices. At under 2.8 kg (~6.2 lb), it's also one of the lighter ones in direct comparison; the two Gigabyte models are about the same weight.
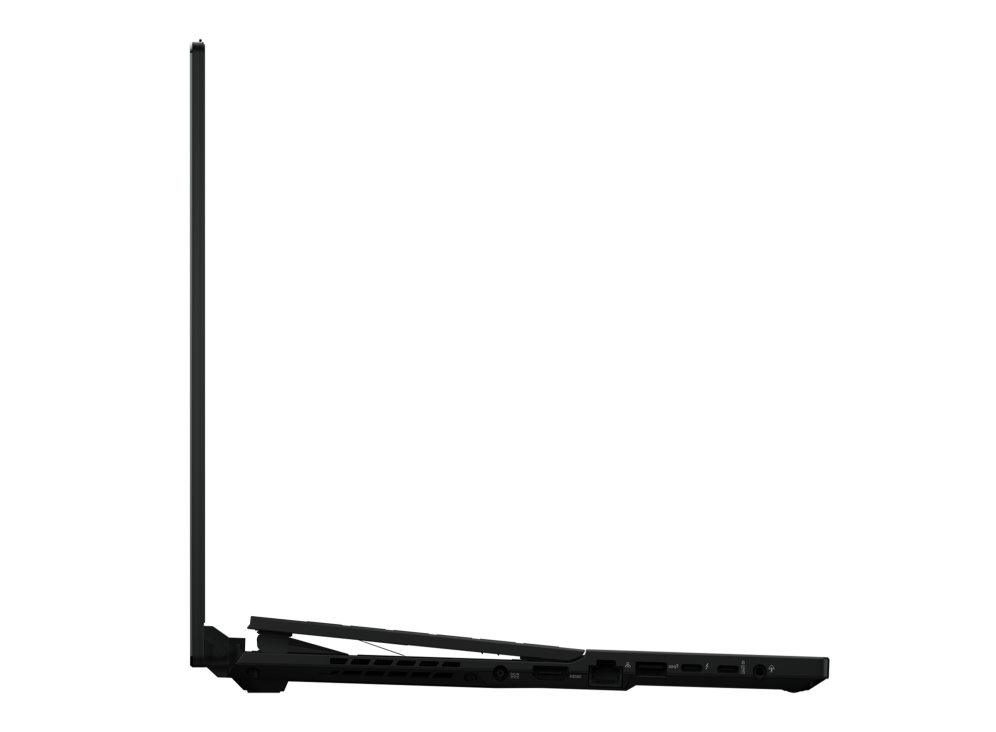
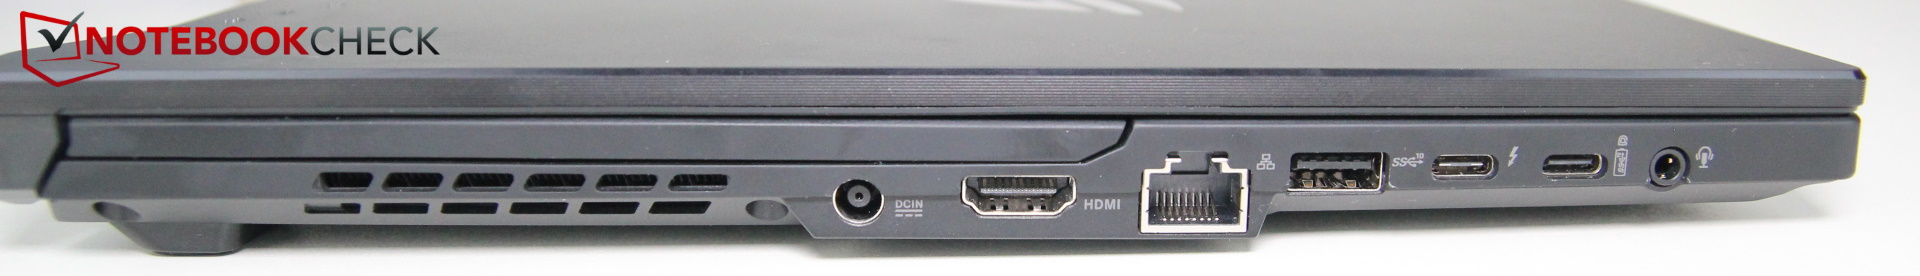
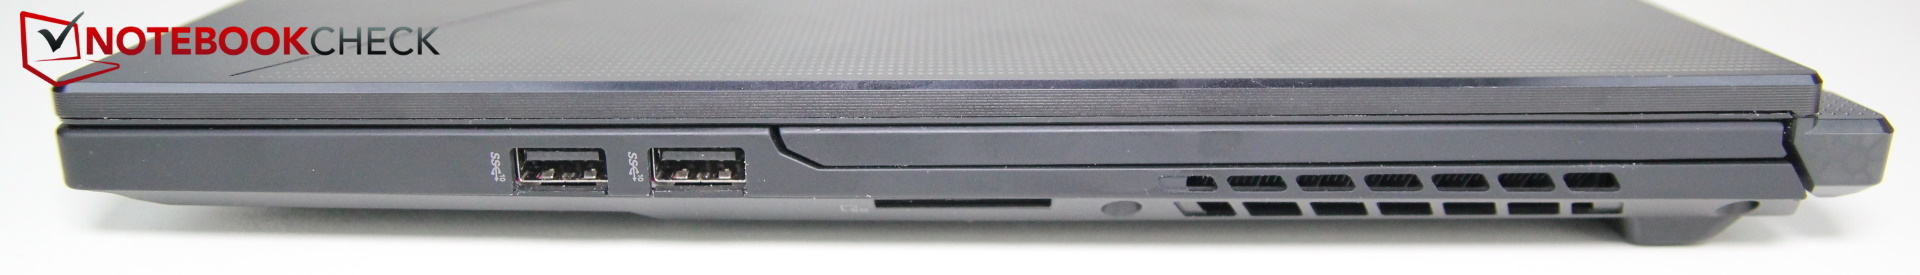
Connectivity - Generous amount of ports, slow WLAN
The S17 has five fast USB 3.2 Gen 2 ports. The two USB-C ports also support charging via USB, and one of the two supports Thunderbolt 4.
Most of the ports are located on the left, which is convenient for right-handed users. SD cards can be inserted into the reader with a click, and they don't protrude from the case - very good. On the other hand, the numerous ports are quite close to each other on the left, but they shouldn't interfere with each other thanks to the clever arrangement of potentially thick cables next to rather thin cables (e.g. HDMI next to LAN, USB-A next to USB-C).
SD card reader
According to Asus, the SD card reader supports the UHS-II standard at up to 312 MB/s. In our copying test of 1 GB of image content from our 128 GB AV PRO V60 microSD to the desktop, the reader achieves a value of 183 MB/s and is therefore on par with the competition. The read rate in AS SSD of 256 MB/s is at the top in this class.
| SD Card Reader | |
| average JPG Copy Test (av. of 3 runs) | |
| Schenker XMG Ultra 17 Rocket Lake | |
| MSI GE76 Raider 10UH (Toshiba Exceria Pro SDXC 64 GB UHS-II) | |
| Aorus 17G YD (AV PRO microSD 128 GB V60) | |
| Gigabyte Aero 17 HDR YD (AV PRO microSD 128 GB V60) | |
| Asus ROG Zephyrus S17 GX703HSD | |
| Average of class Gaming (20 - 210, n=65, last 2 years) | |
| maximum AS SSD Seq Read Test (1GB) | |
| Asus ROG Zephyrus S17 GX703HSD | |
| Schenker XMG Ultra 17 Rocket Lake (AV PRO microSD 128 GB V60) | |
| MSI GE76 Raider 10UH (Toshiba Exceria Pro SDXC 64 GB UHS-II) | |
| Aorus 17G YD (AV PRO microSD 128 GB V60) | |
| Gigabyte Aero 17 HDR YD (AV PRO microSD 128 GB V60) | |
| Average of class Gaming (25.8 - 261, n=62, last 2 years) | |
Communication
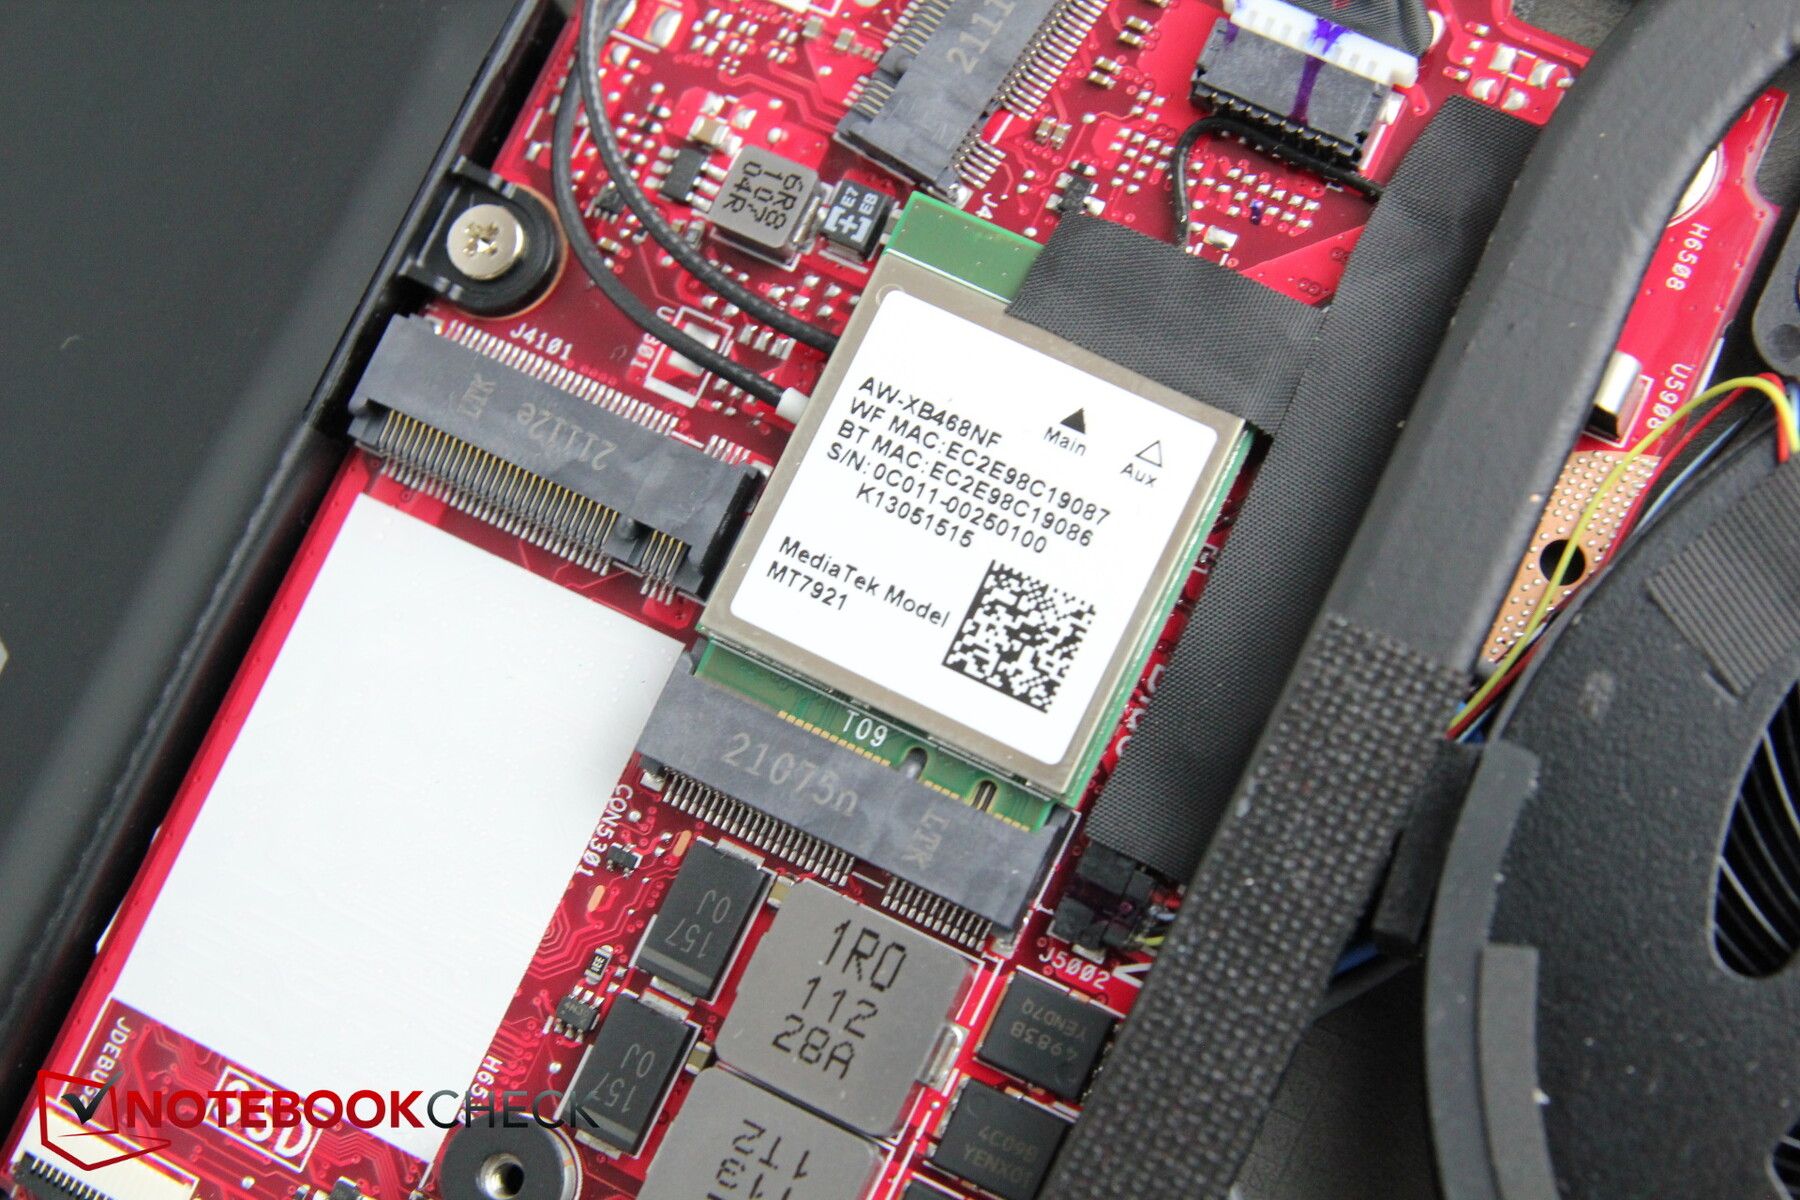
The Zephyrus S17 does support Wi-Fi 6 (802.11ax) and Bluetooth 5.2, but unfortunately, the built-in MediaTek MT7921 lags behind the Intel modules of the competition. The direct predecessor with the Intel AX201 was twice as fast here - an inexplicable downgrade.
Webcam

Unlike the predecessor, a webcam including dual microphones is now installed at the top edge. Unfortunately, there's no shutter, and its quality corresponds to the current standard, which is still very low despite the coronavirus and home office.


Security
Needless to say, TPM 2.0 is supported, but there is no slot for a Kensington lock.
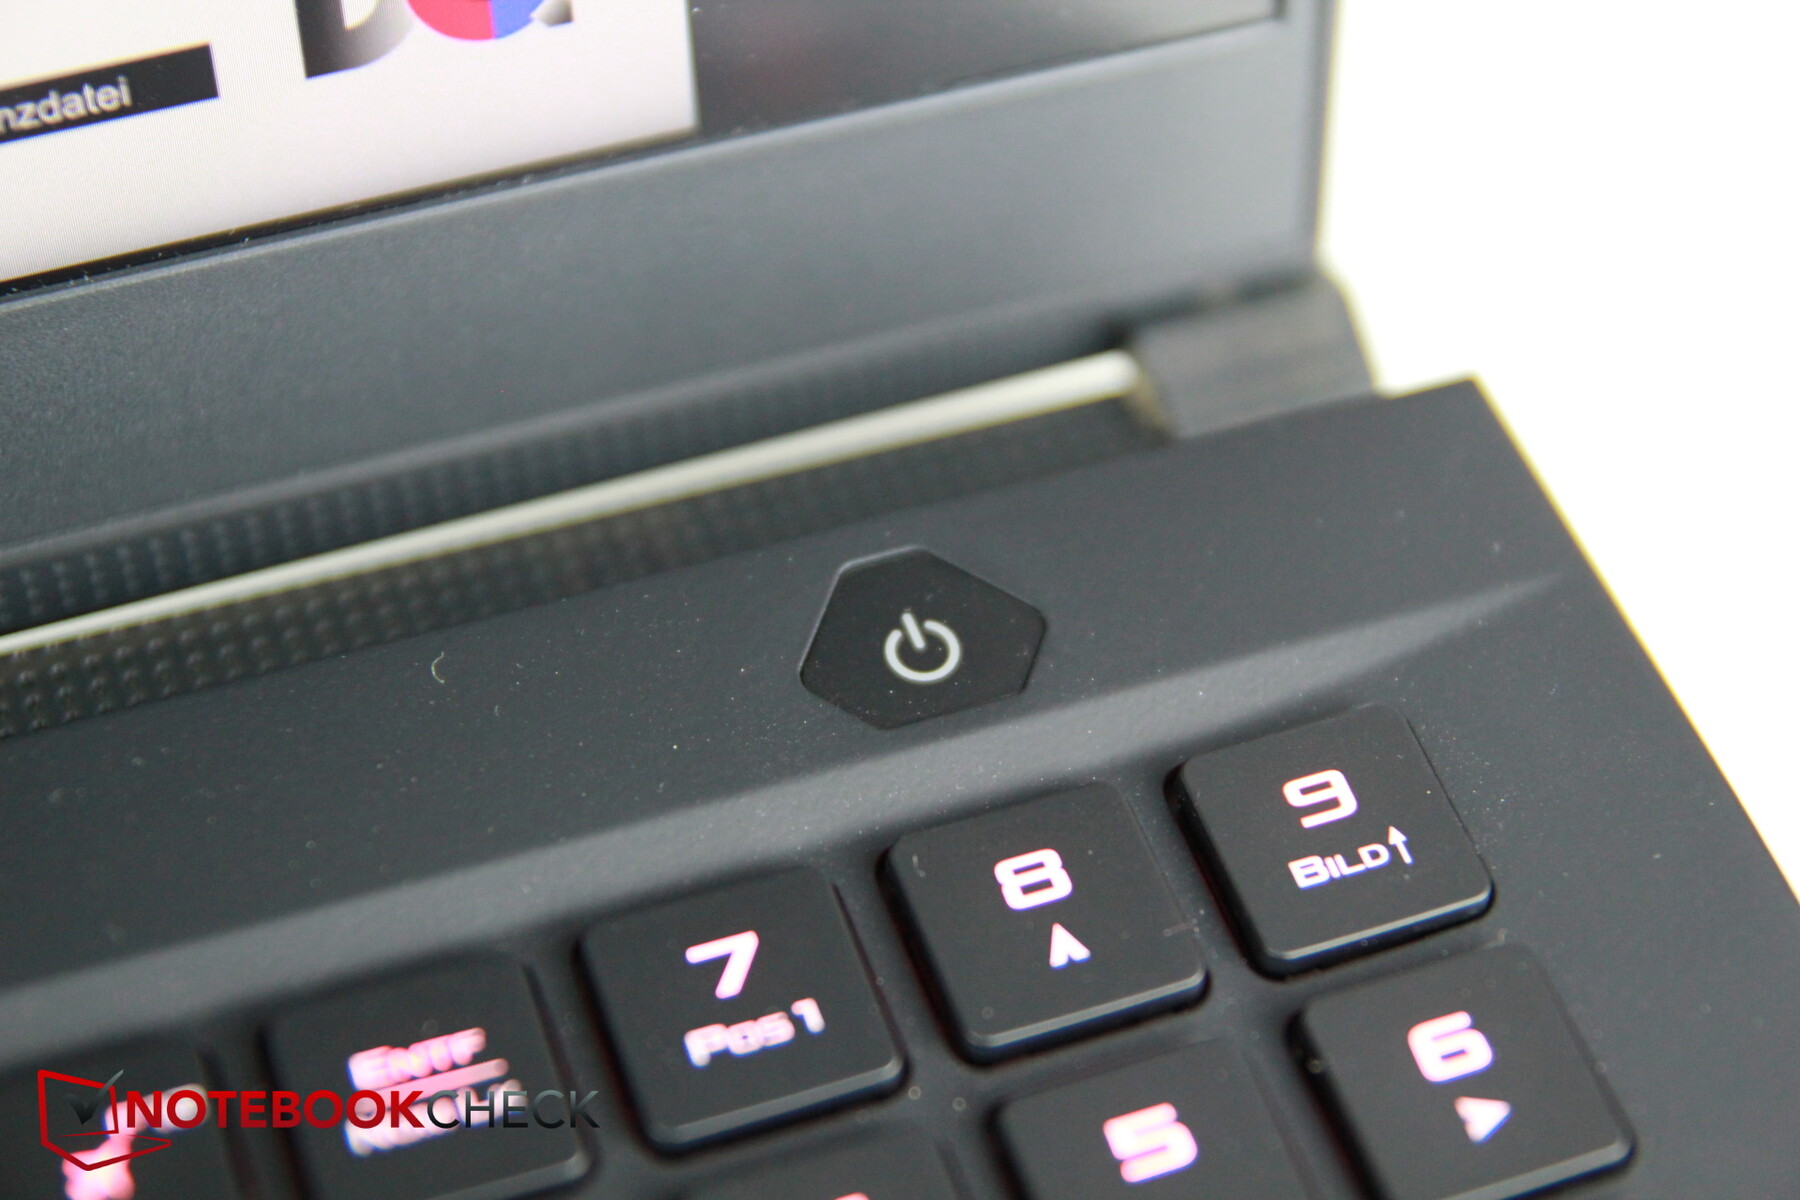
However, there's a fingerprint sensor in return that is integrated into the power button. It can be set up easily for logging in via Windows Hello.
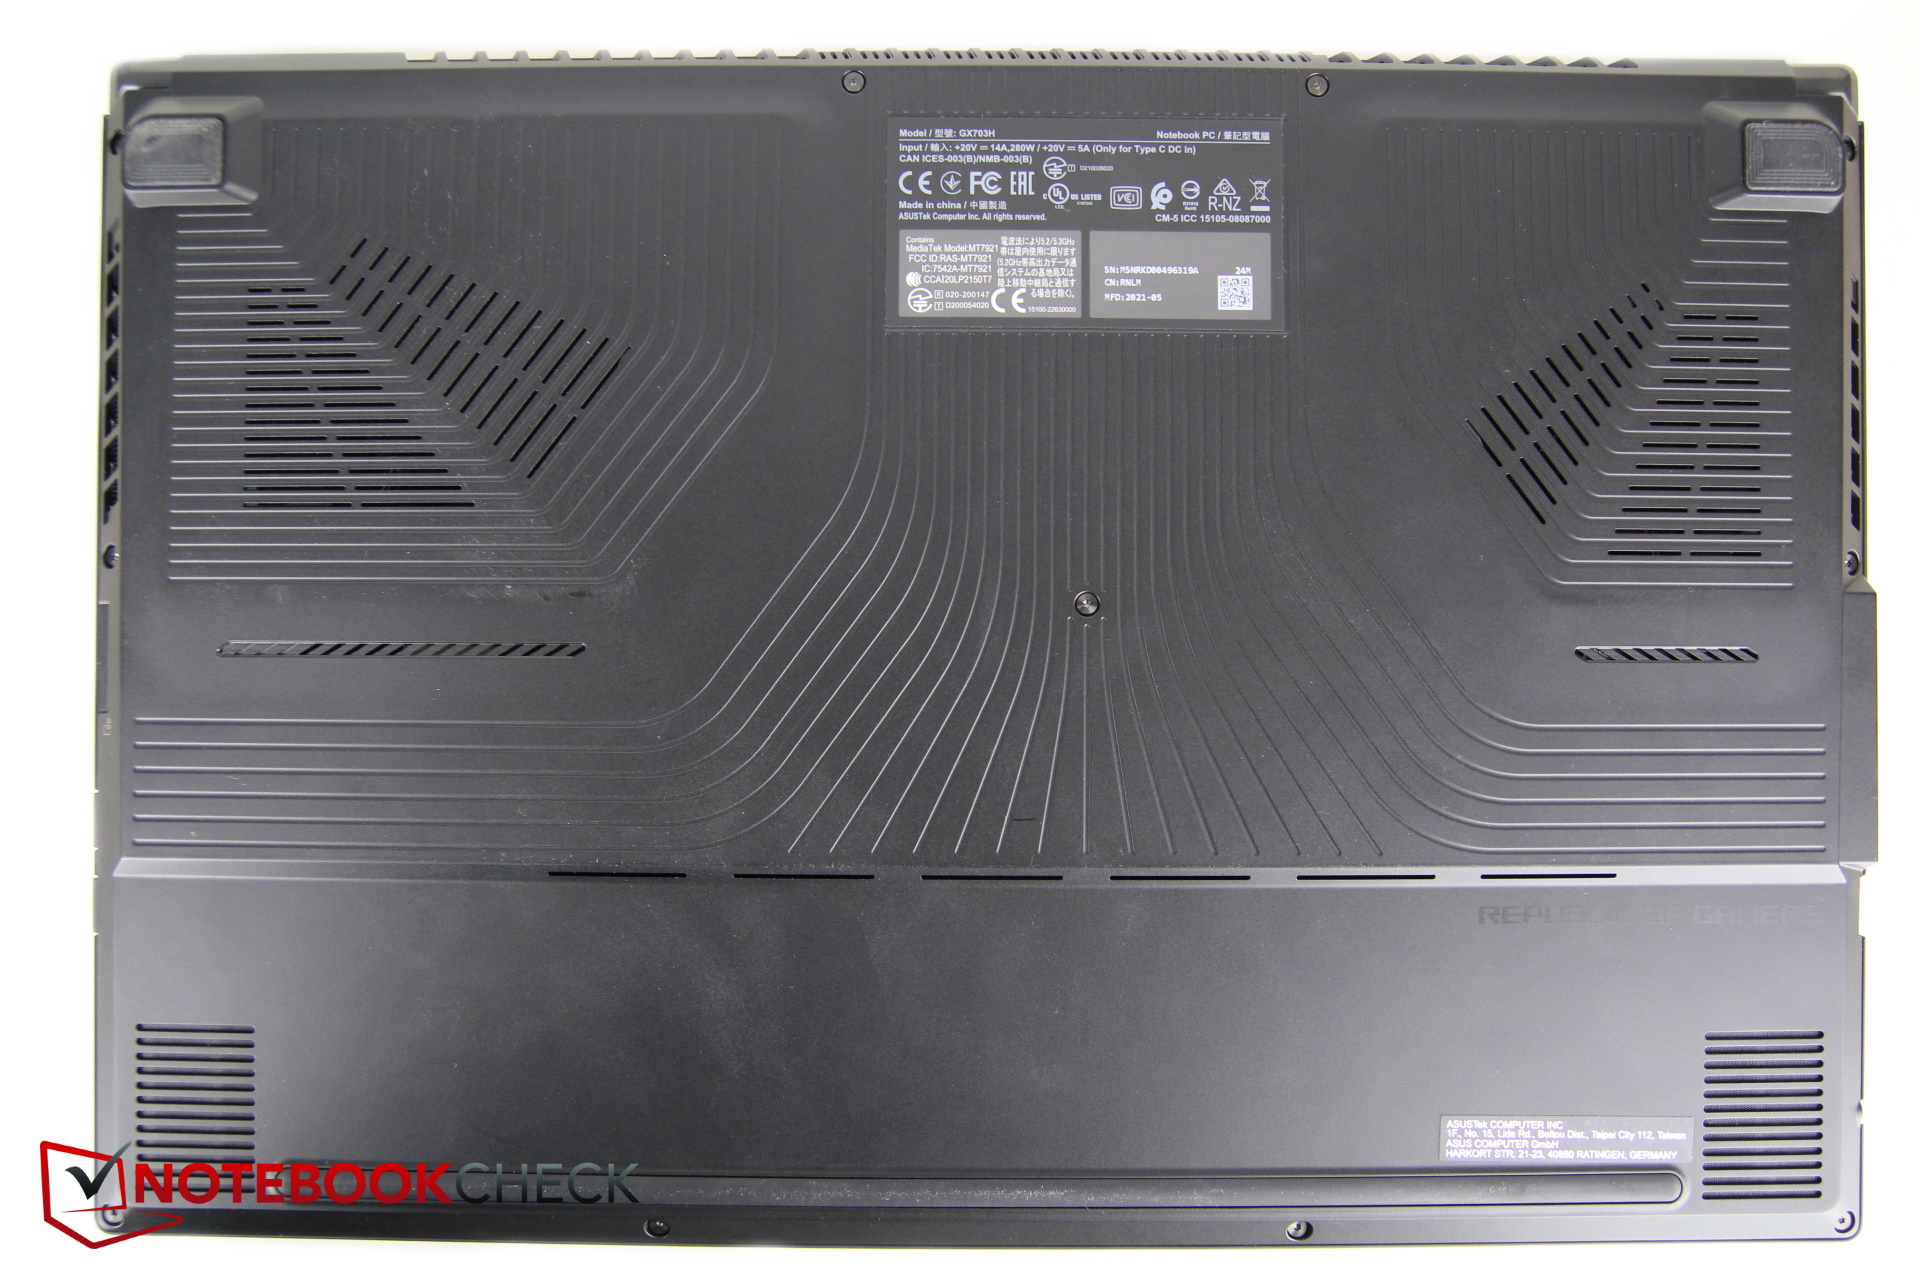
Maintenance
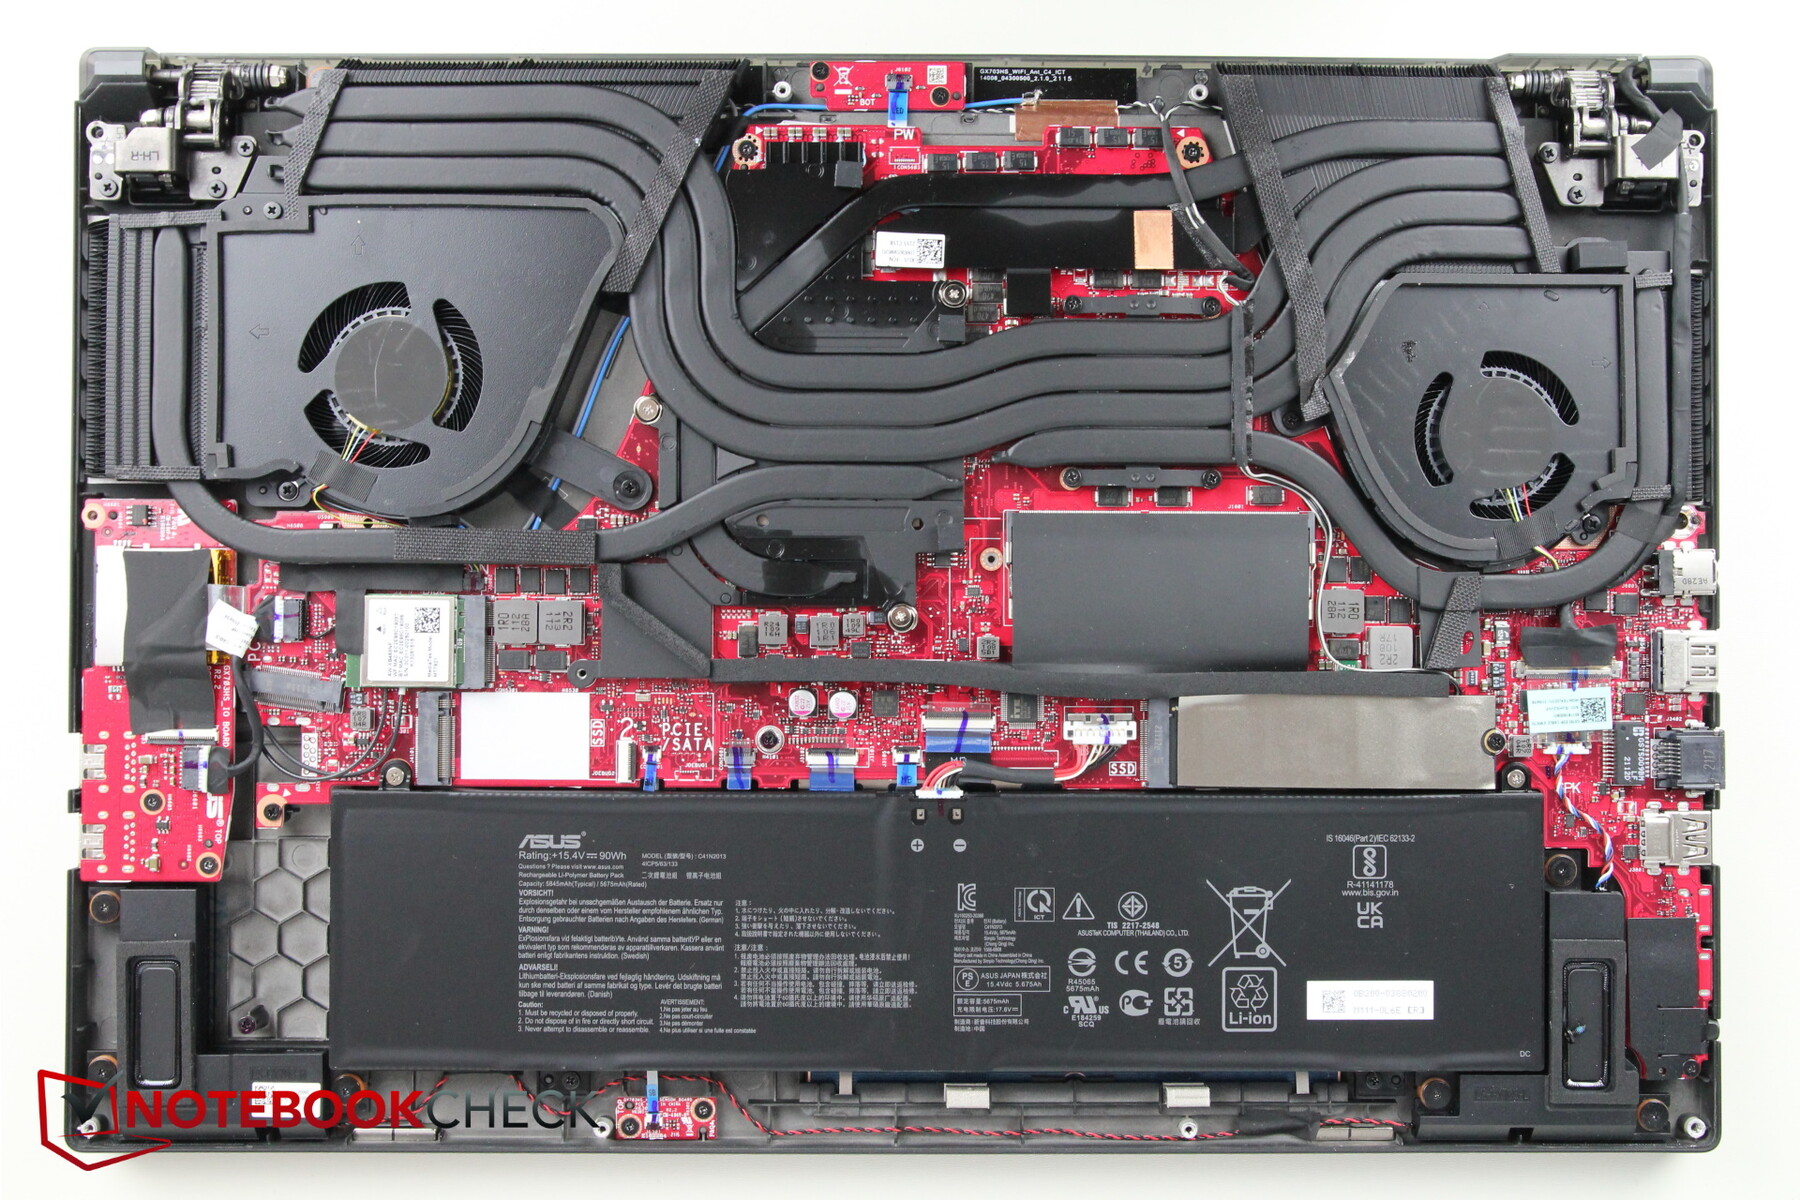
Last year, the complicated opening mechanism prevented an easy maintenance. Fortunately, this is different this year thanks to the redesign: 11 Torx screws secure the bottom cover, which can be removed very easily afterwards. Underneath, you finally get simple access to the SSD slots (one occupied), the RAM (one slot replaceable, the other one soldered), the MediaTek WLAN module, the battery, and the fans - very good!
Accessories and warranty
Apart from the usual paperwork, Asus doesn't include any other accessories in the box. The manufacturer grants a 24-month warranty.
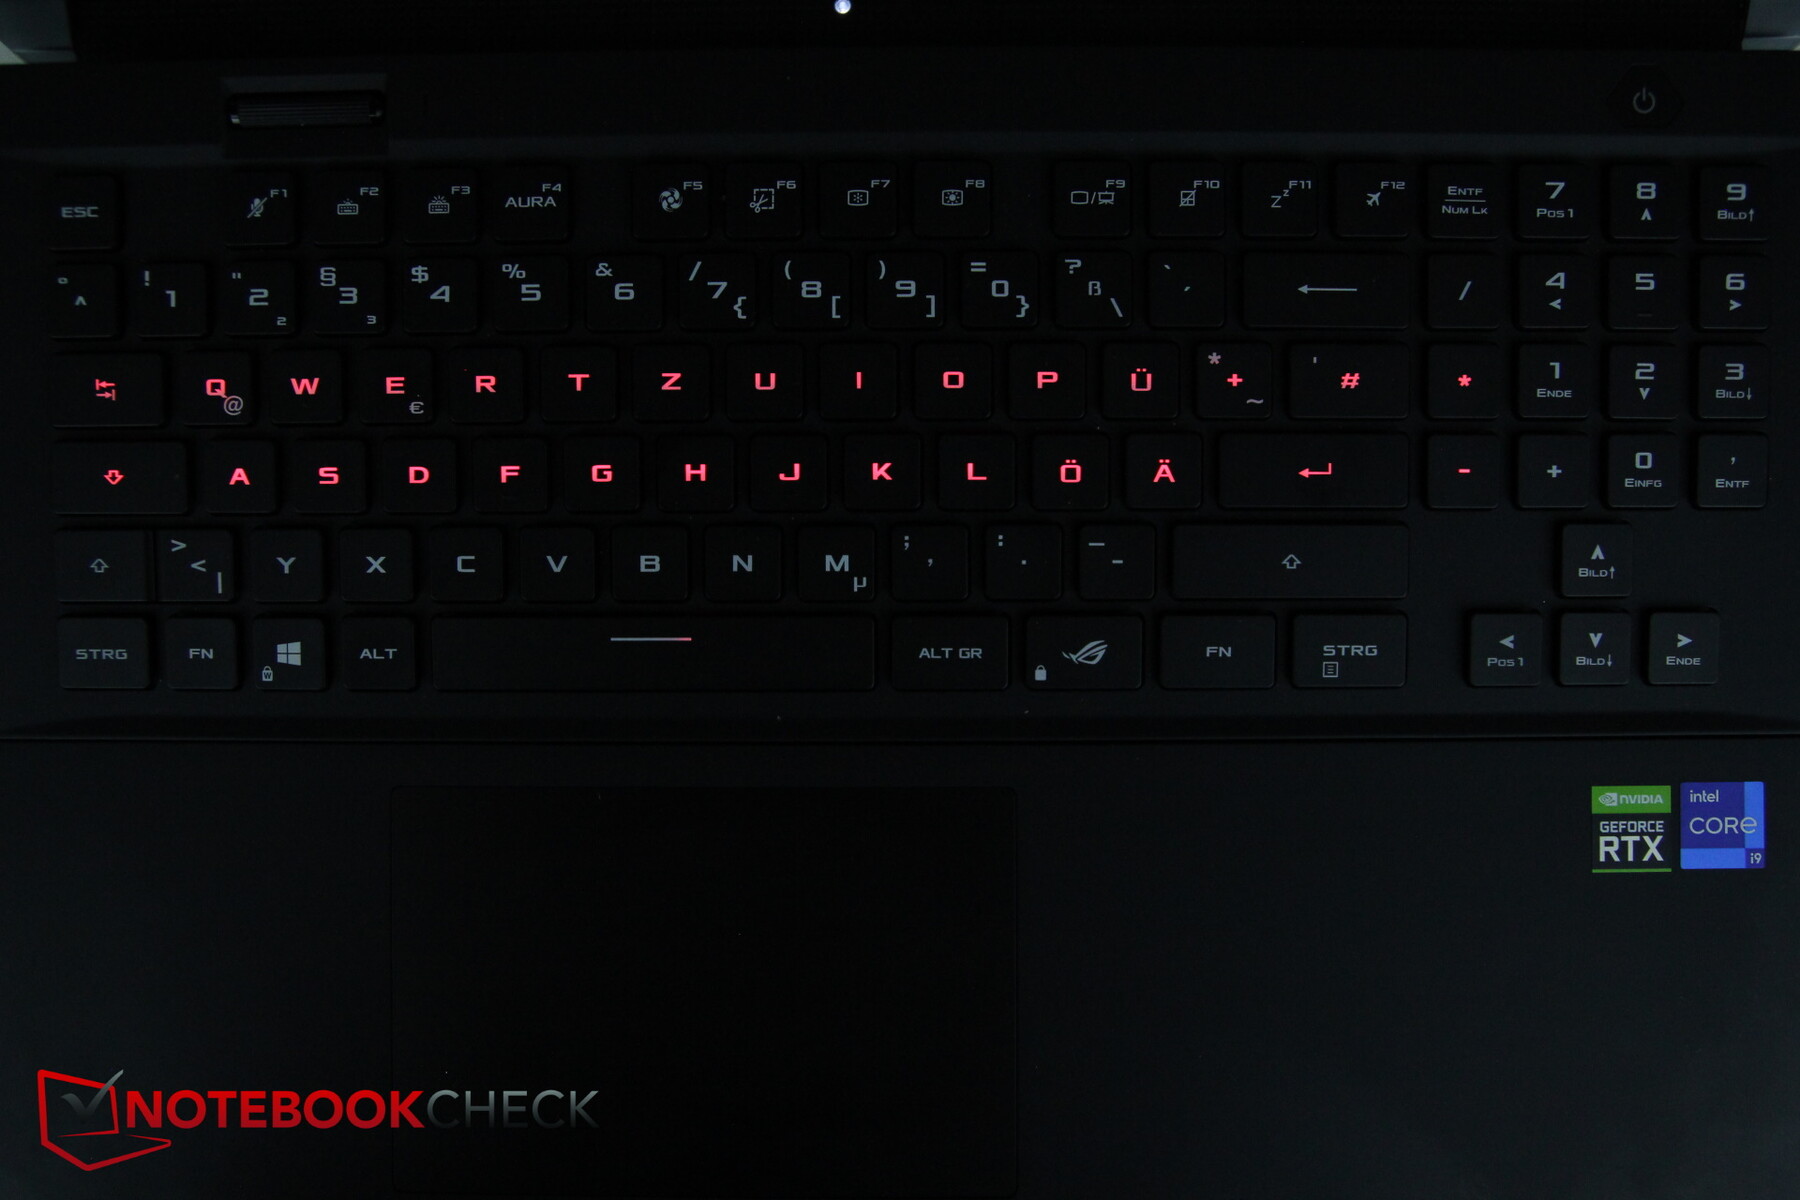
Input devices - Optical-mechanical switches
Keyboard
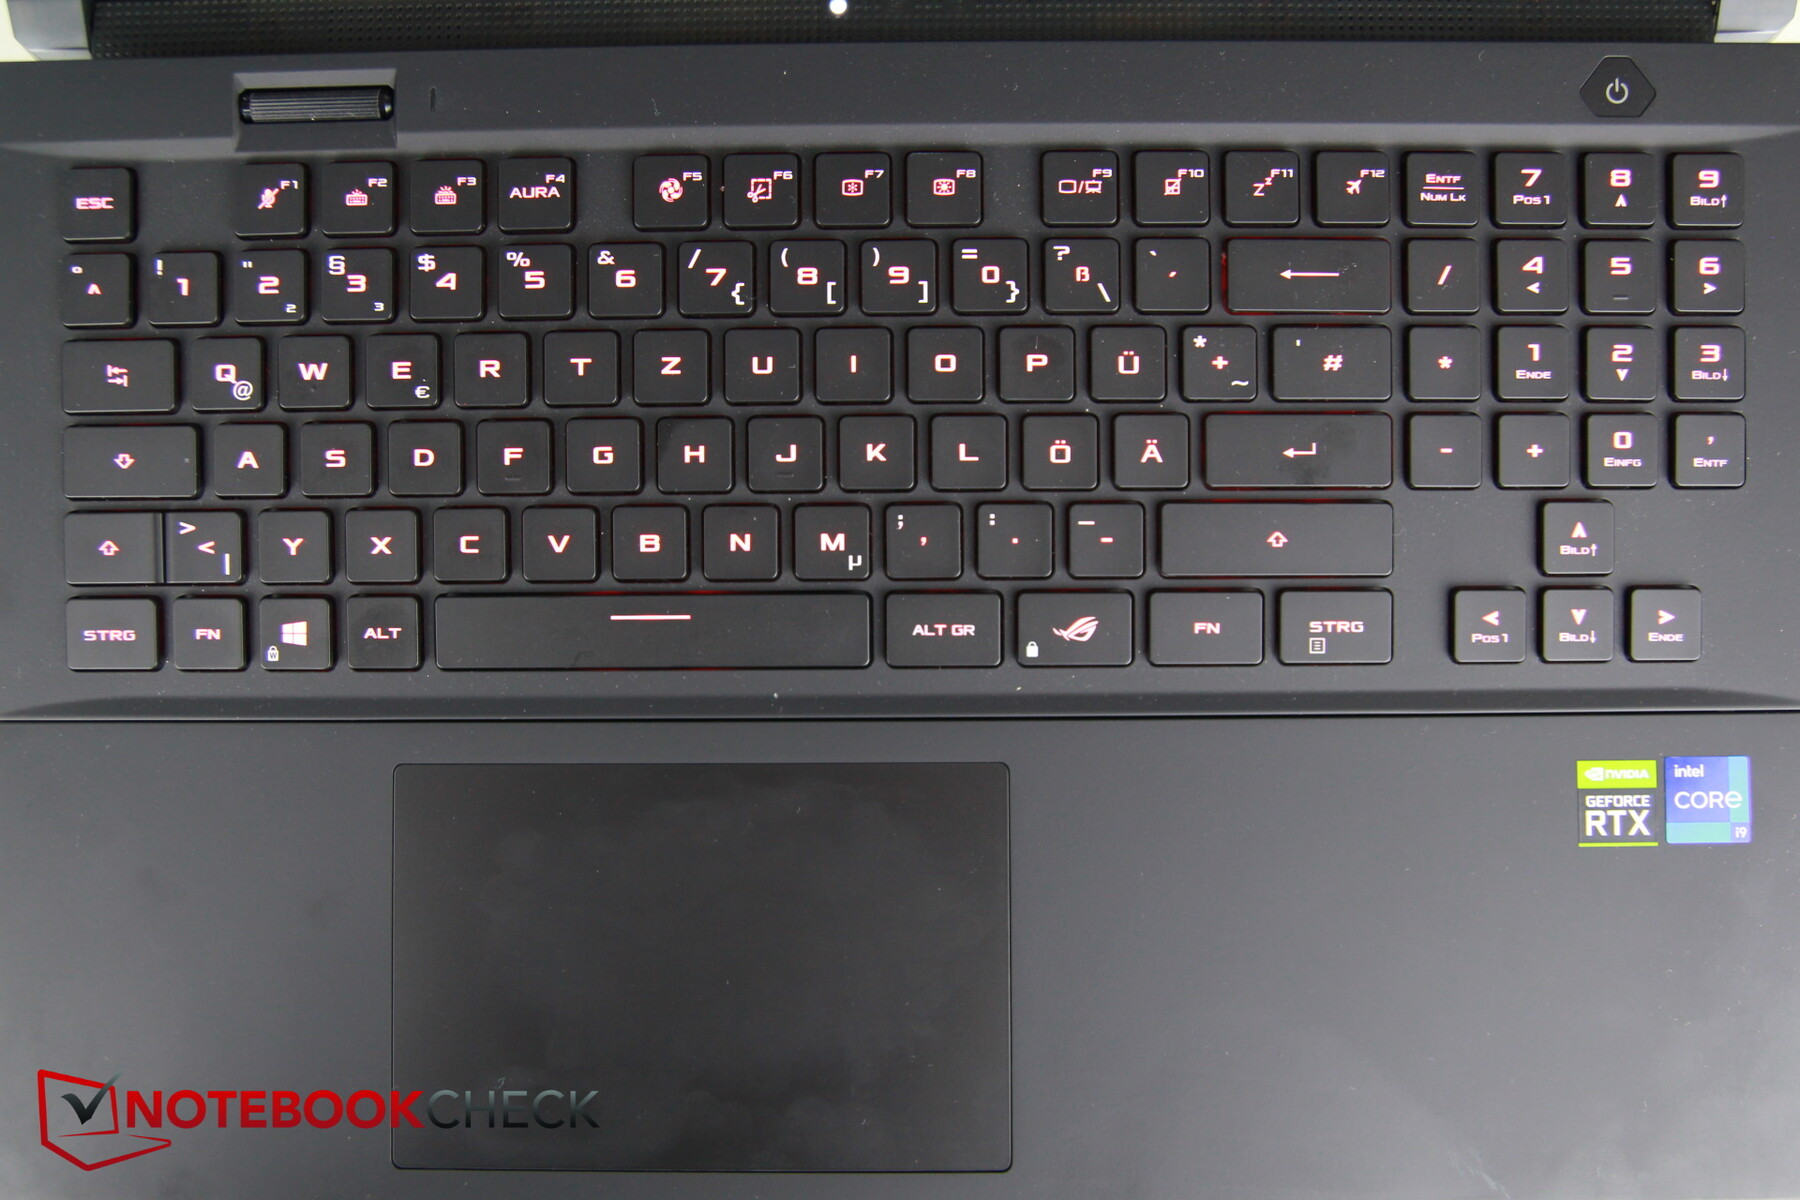
The RGB-lit keys emit a clearly perceptible clicking noise. The travel feels flatter than it actually is (1.9 mm/~0.08 in), which makes the keyboard feel a bit mushy despite its mechanical switches. Nevertheless, typing is quite fast, but it doesn't feel particularly satisfying. When it comes to gaming, though, the keys are probably better suited, as they respond quite quickly. In exchange, the WASD keys start a proper click frenzy in shooters and the like due to the quite high-pitched mechanical triggering noise.
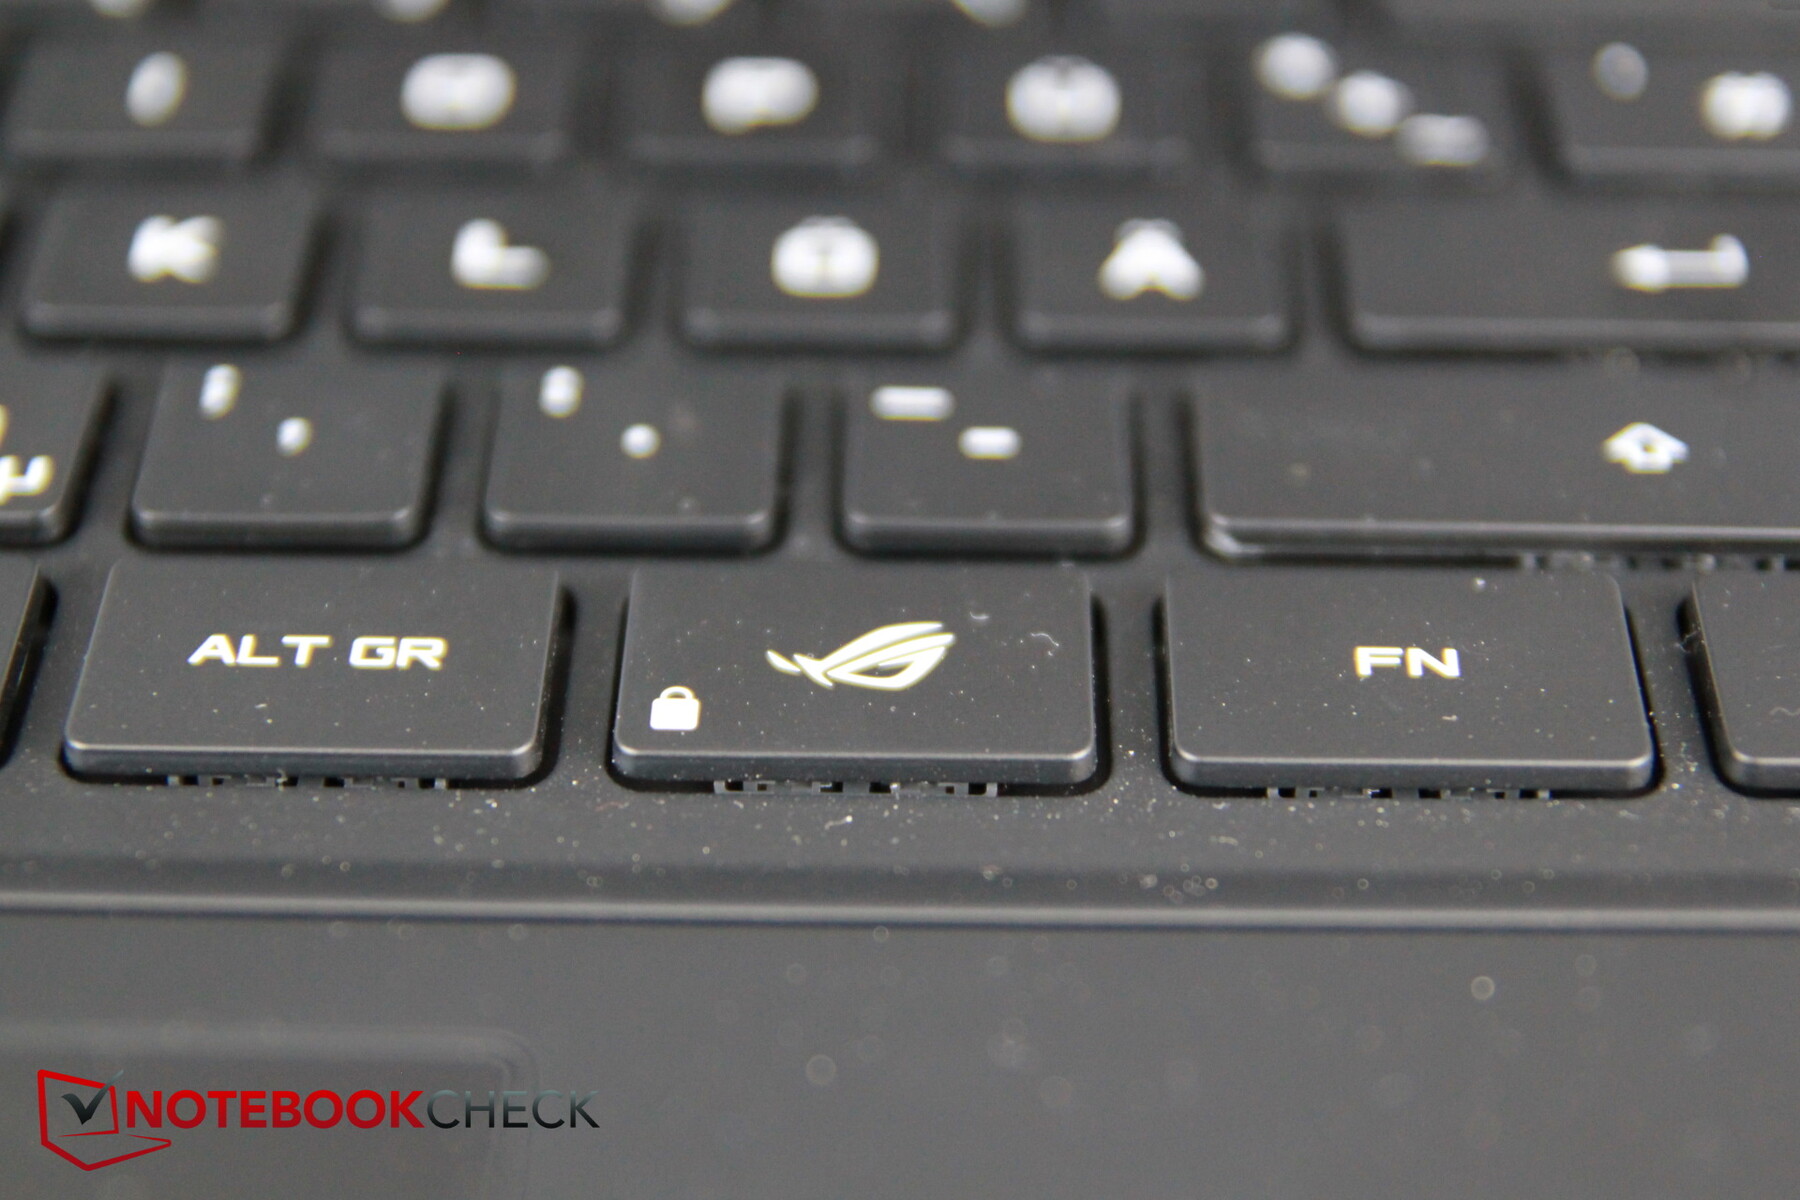
Unlike in the predecessor, the layout is more in line with the standard. Only the numpad on the right is a bit smaller, and the arrow keys are located underneath, so they have extra space and are full-size as a result. The multiwheel, a rotating wheel that can be configured individually so that various functions like volume or brightness can be adjusted, is located on the upper left.
The keys protrude minimally above the base, which means that the gaps that result could be a gateway for crumb invasions. The RGB backlight can be adjusted in three brightness levels.
Touchpad
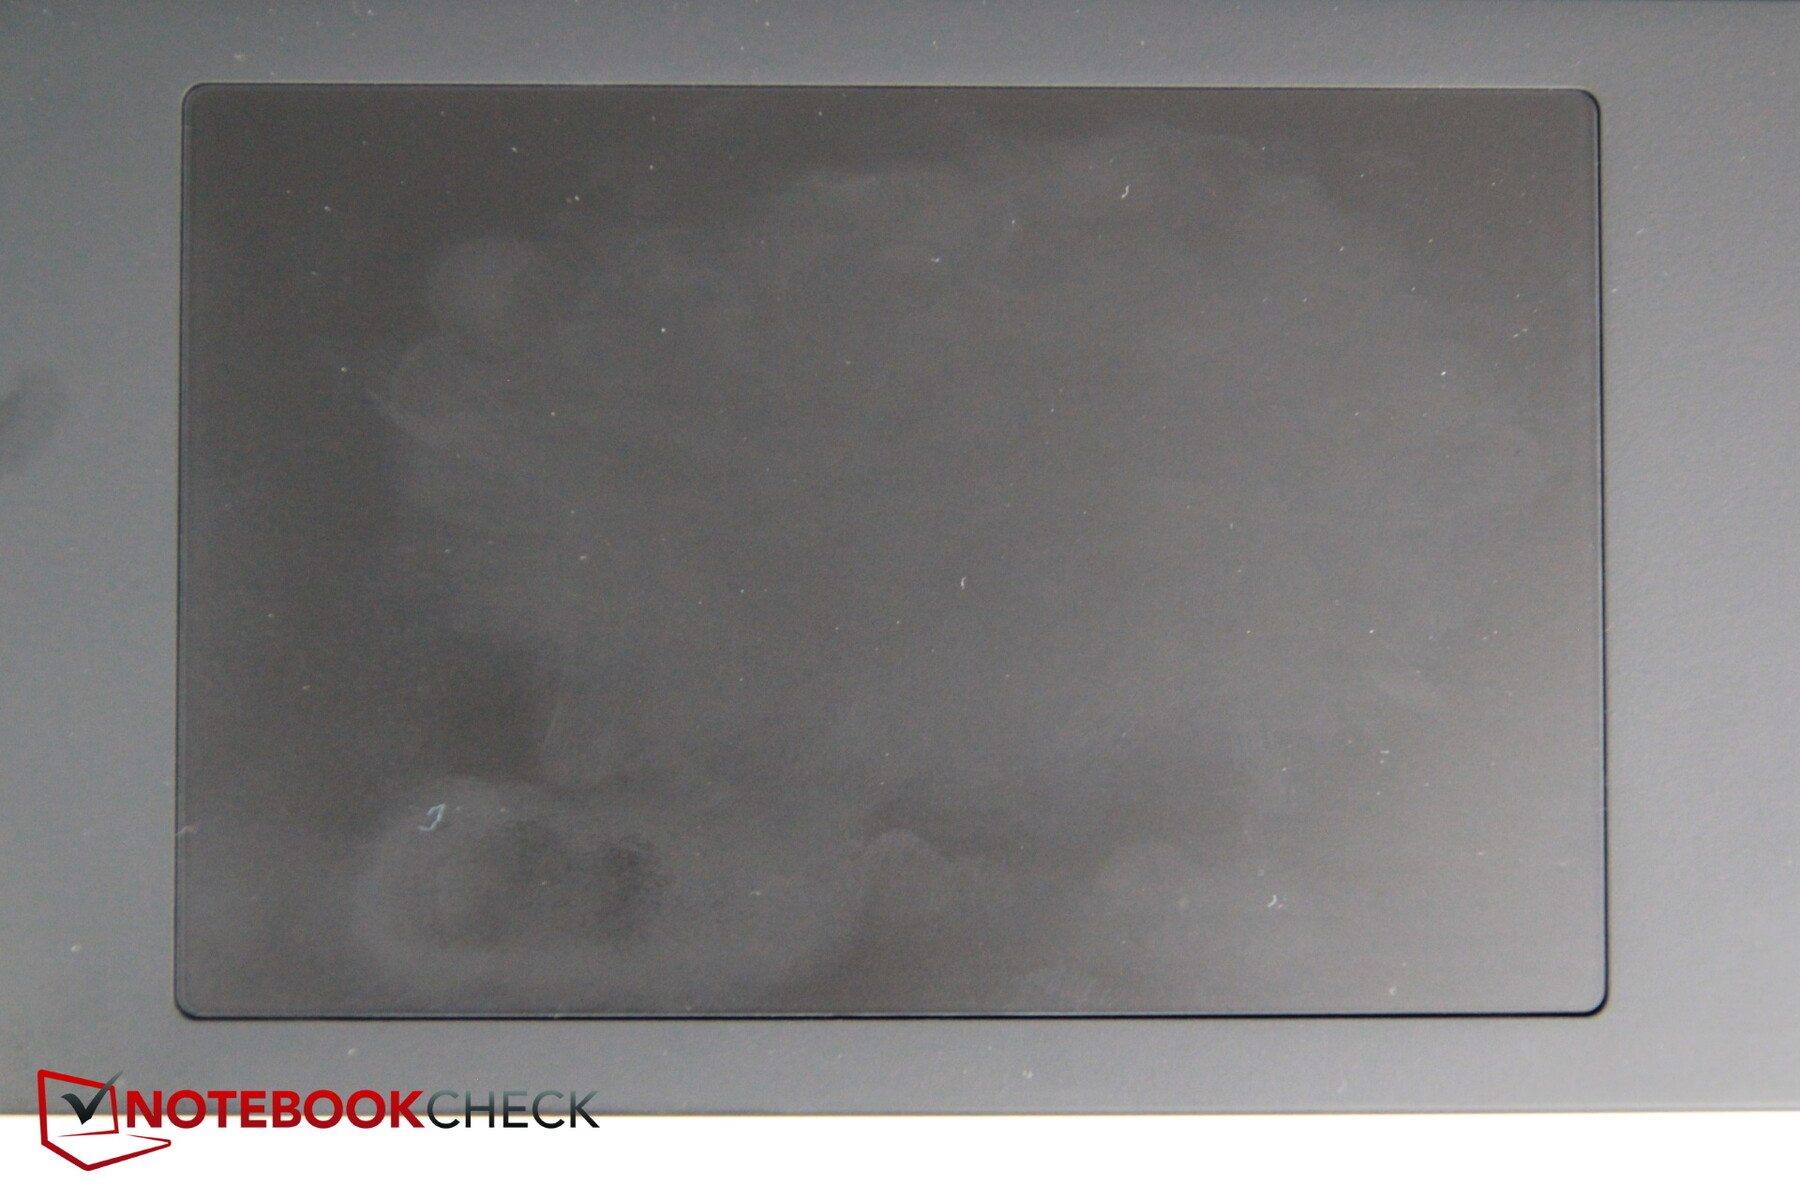
The touchpad has become even larger, very large in fact (~13 x 8.5 cm/~5.1 x 3.4 in). However, the dedicated mouse buttons are gone as a result. There's a small space between the touchpad's surface and the case edge, where small crumbs can quickly build up as well.
The gliding properties are good, and the trackpad is precise even during slow movements and in the corners.
The integrated mouse buttons have a very short pressure point, but a clear click feedback in return.
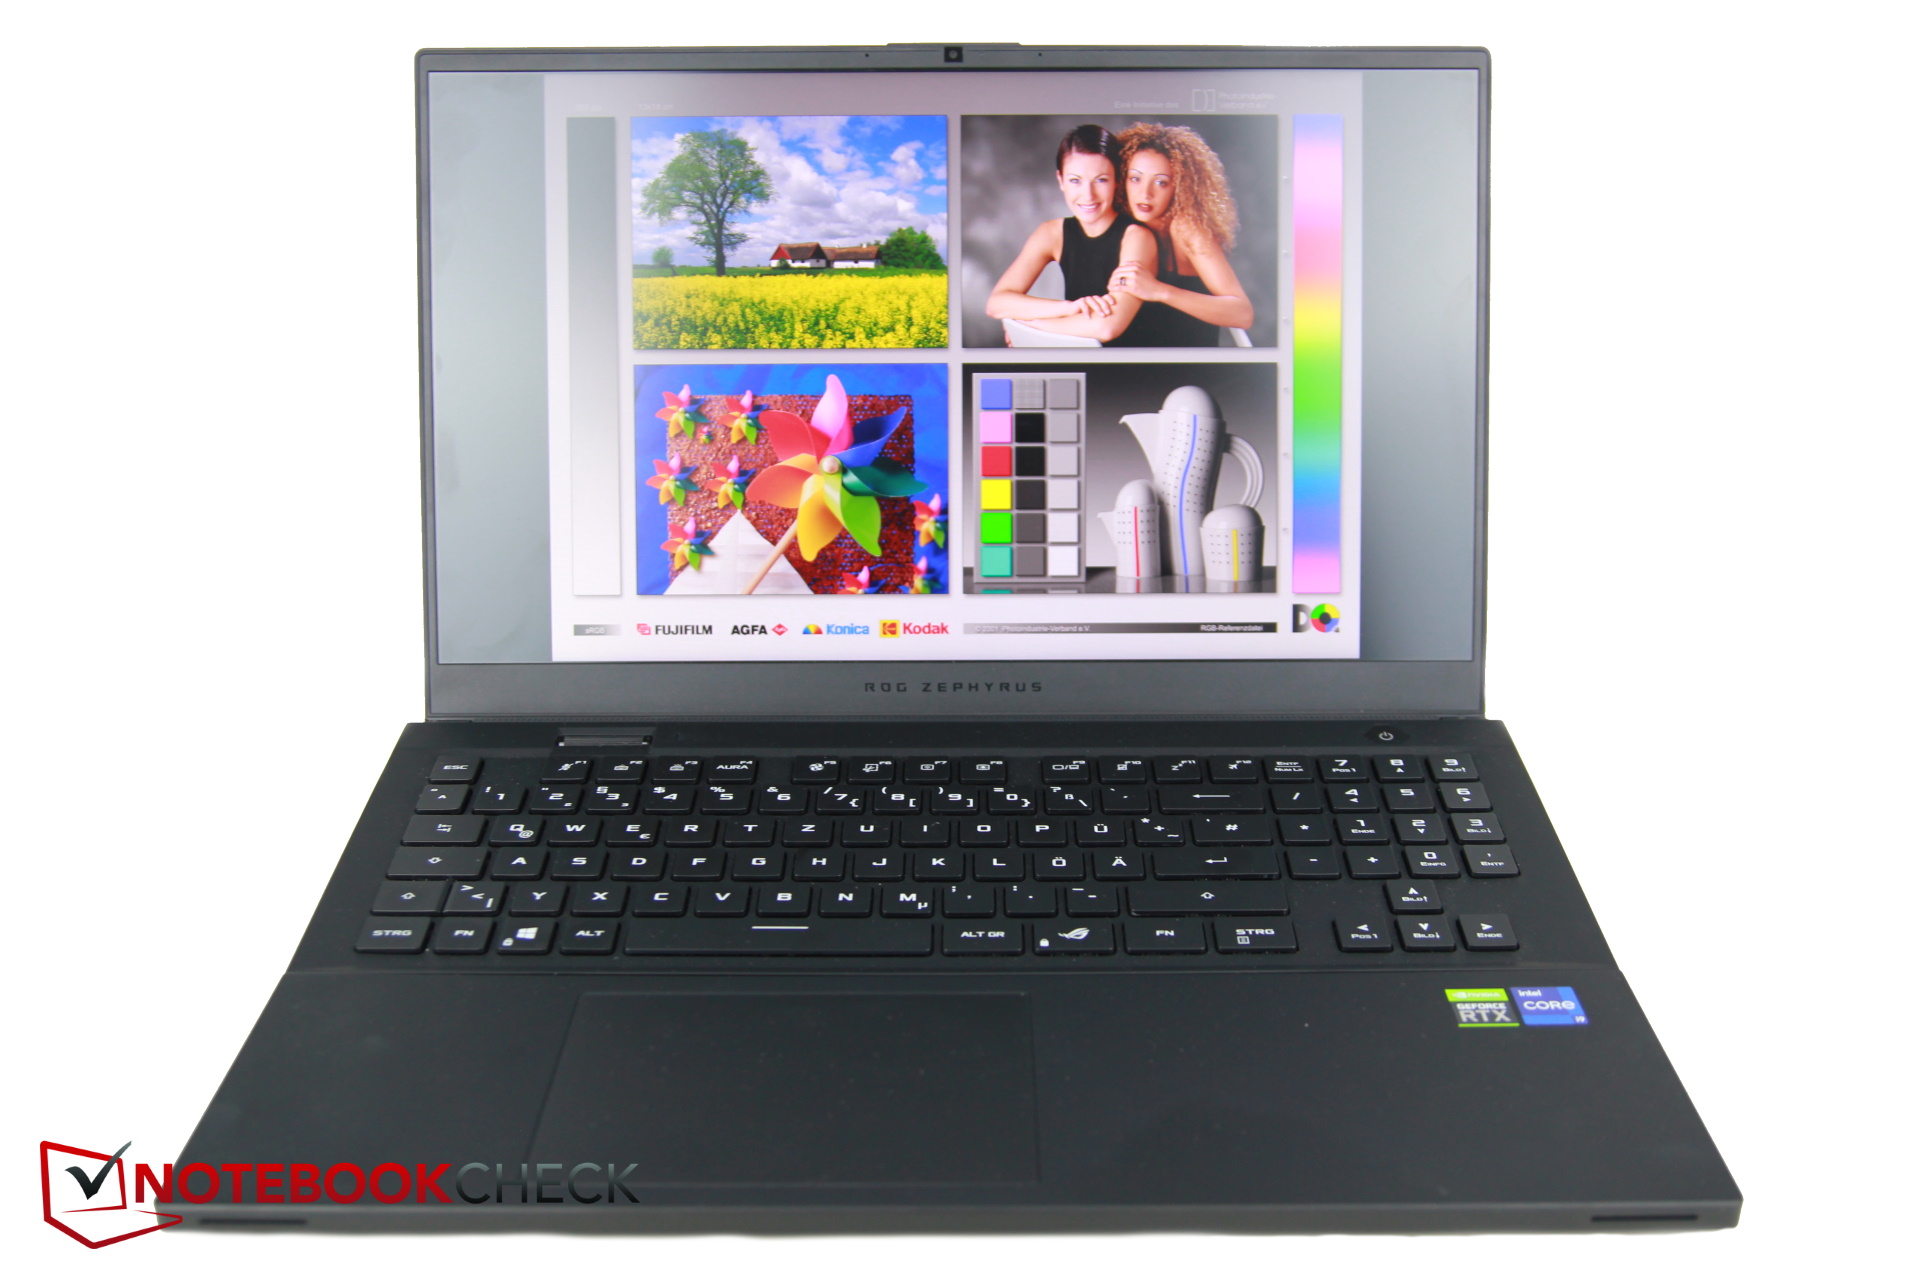
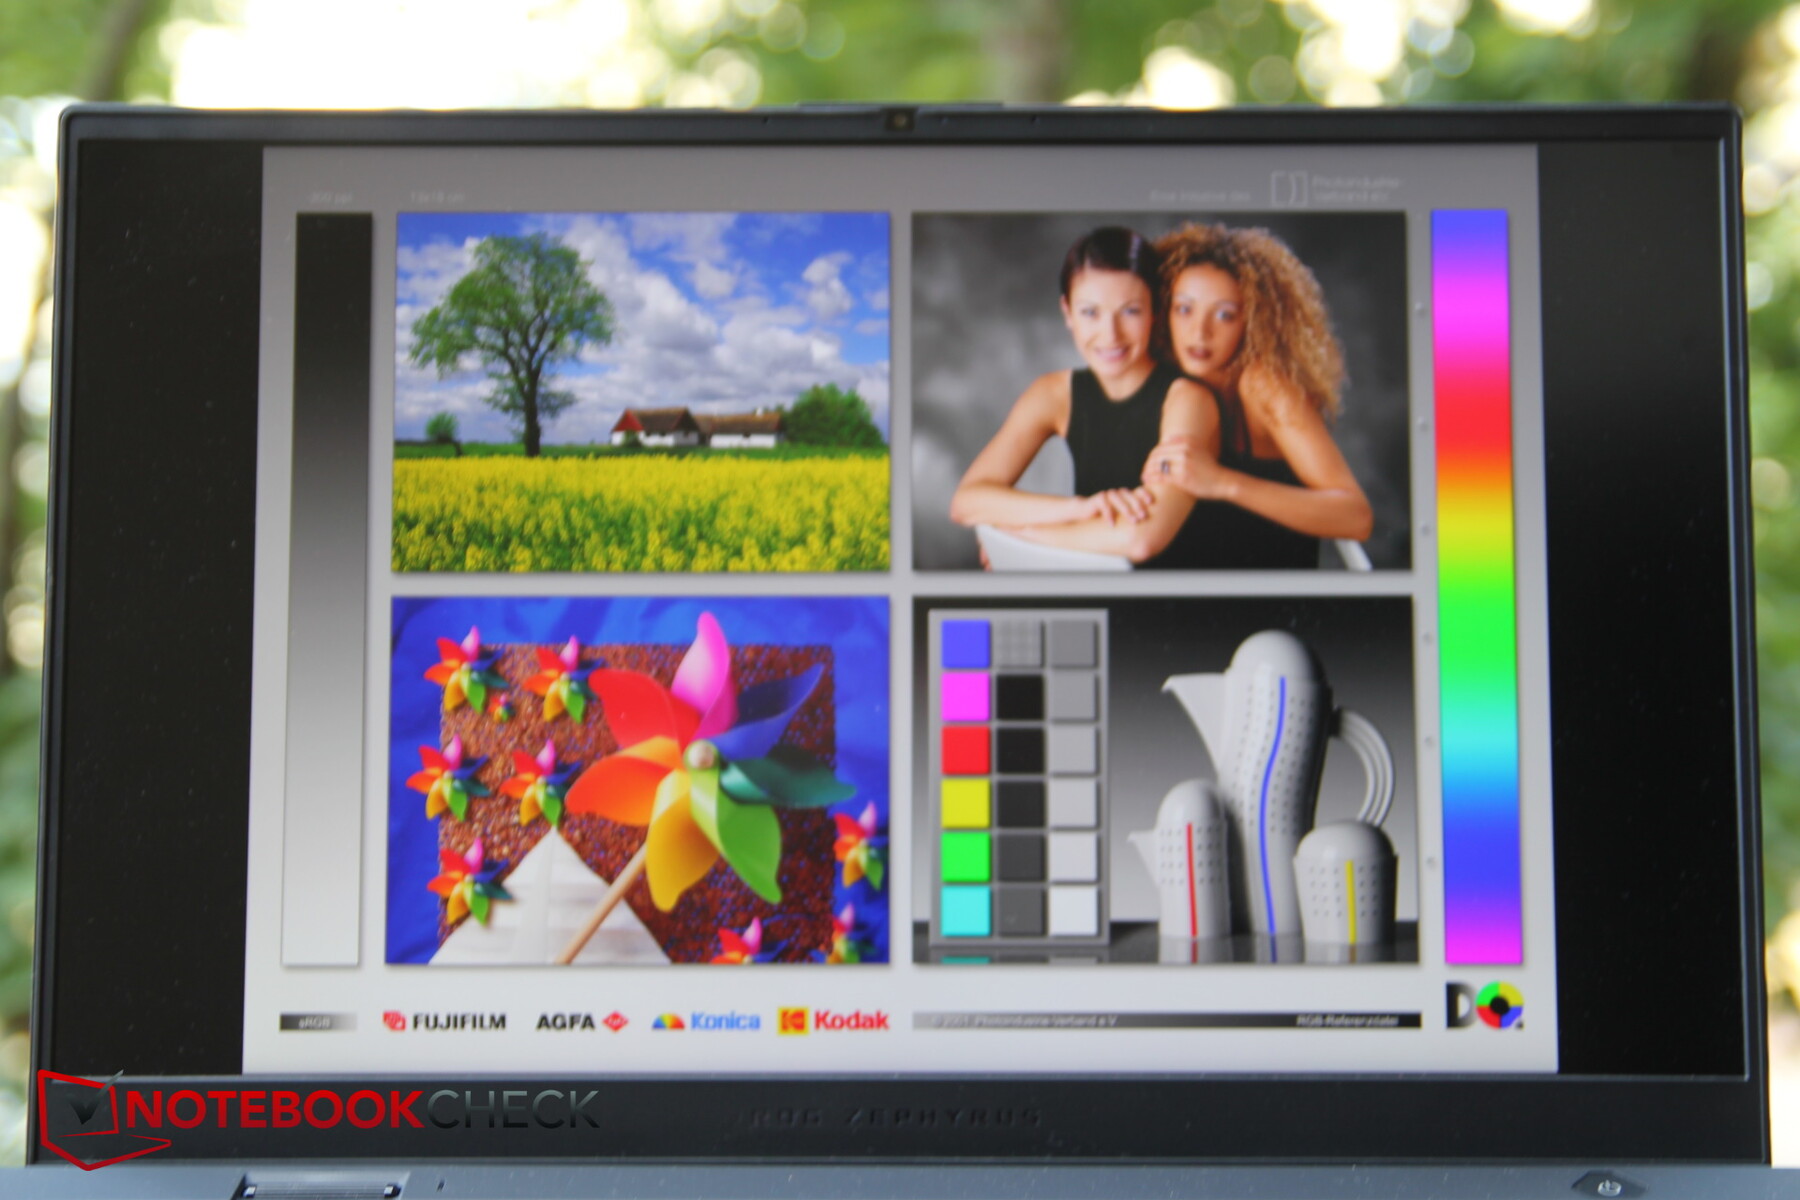
Display - WQHD and many features
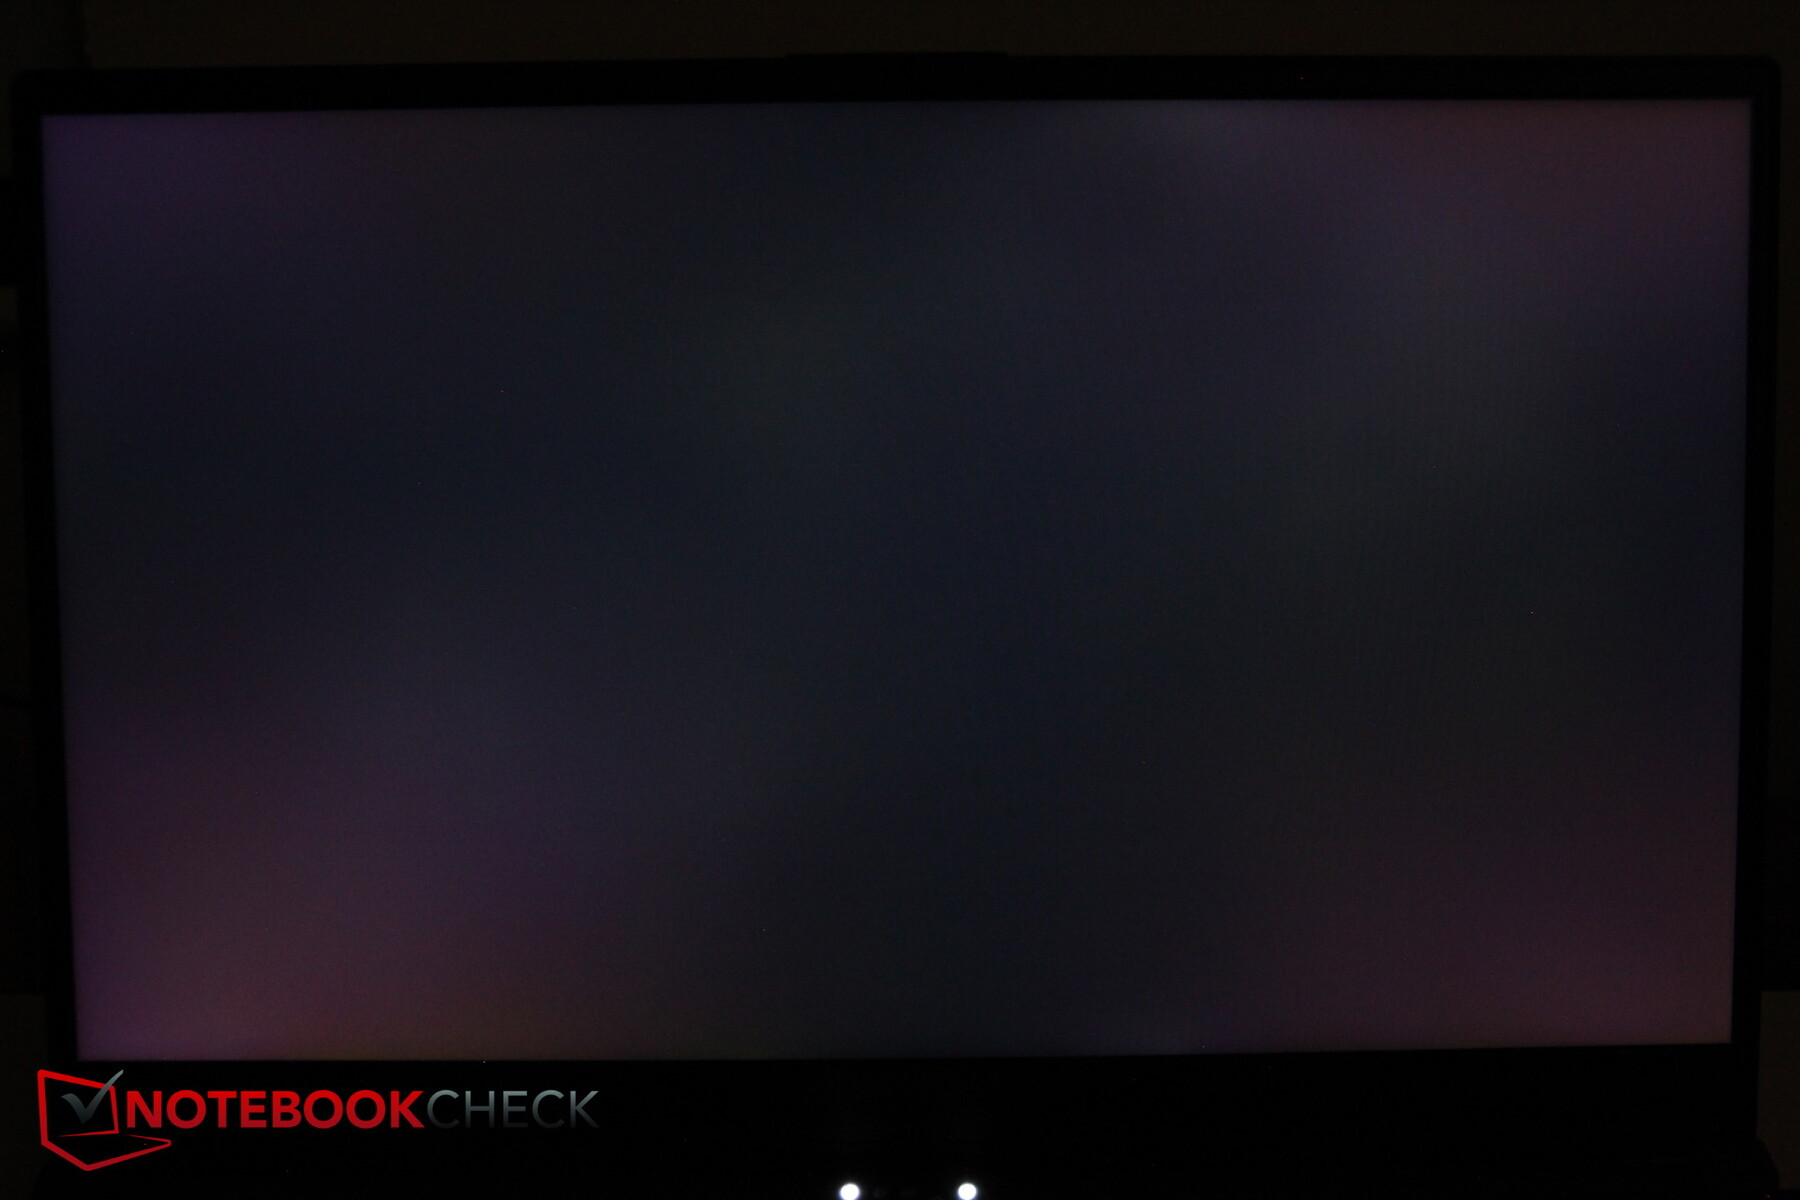
The 17.3-inch IPS display from BOE is equipped with Adaptive Sync and NVIDIA Advanced Optimus; it has a WQHD resolution (2560x1440) and supports 165 Hz. This makes the image look noticeably sharper than Full HD models. Alternatively, a 144 Hz 4K model is supposed to be available as well.
The average brightness of an acceptable 288 nits is on par with the Aorus 17G, while the Aero is much brighter - the S17 would be, too, if the brightness distribution wasn't so uneven; we can observe a decrease in brightness especially towards the lower right corner. We didn't notice any PWM.
Response times are fast as it should be for a gaming device.
| |||||||||||||||||||||||||
Brightness Distribution: 72 %
Center on Battery: 296 cd/m²
Contrast: 1073:1 (Black: 0.3 cd/m²)
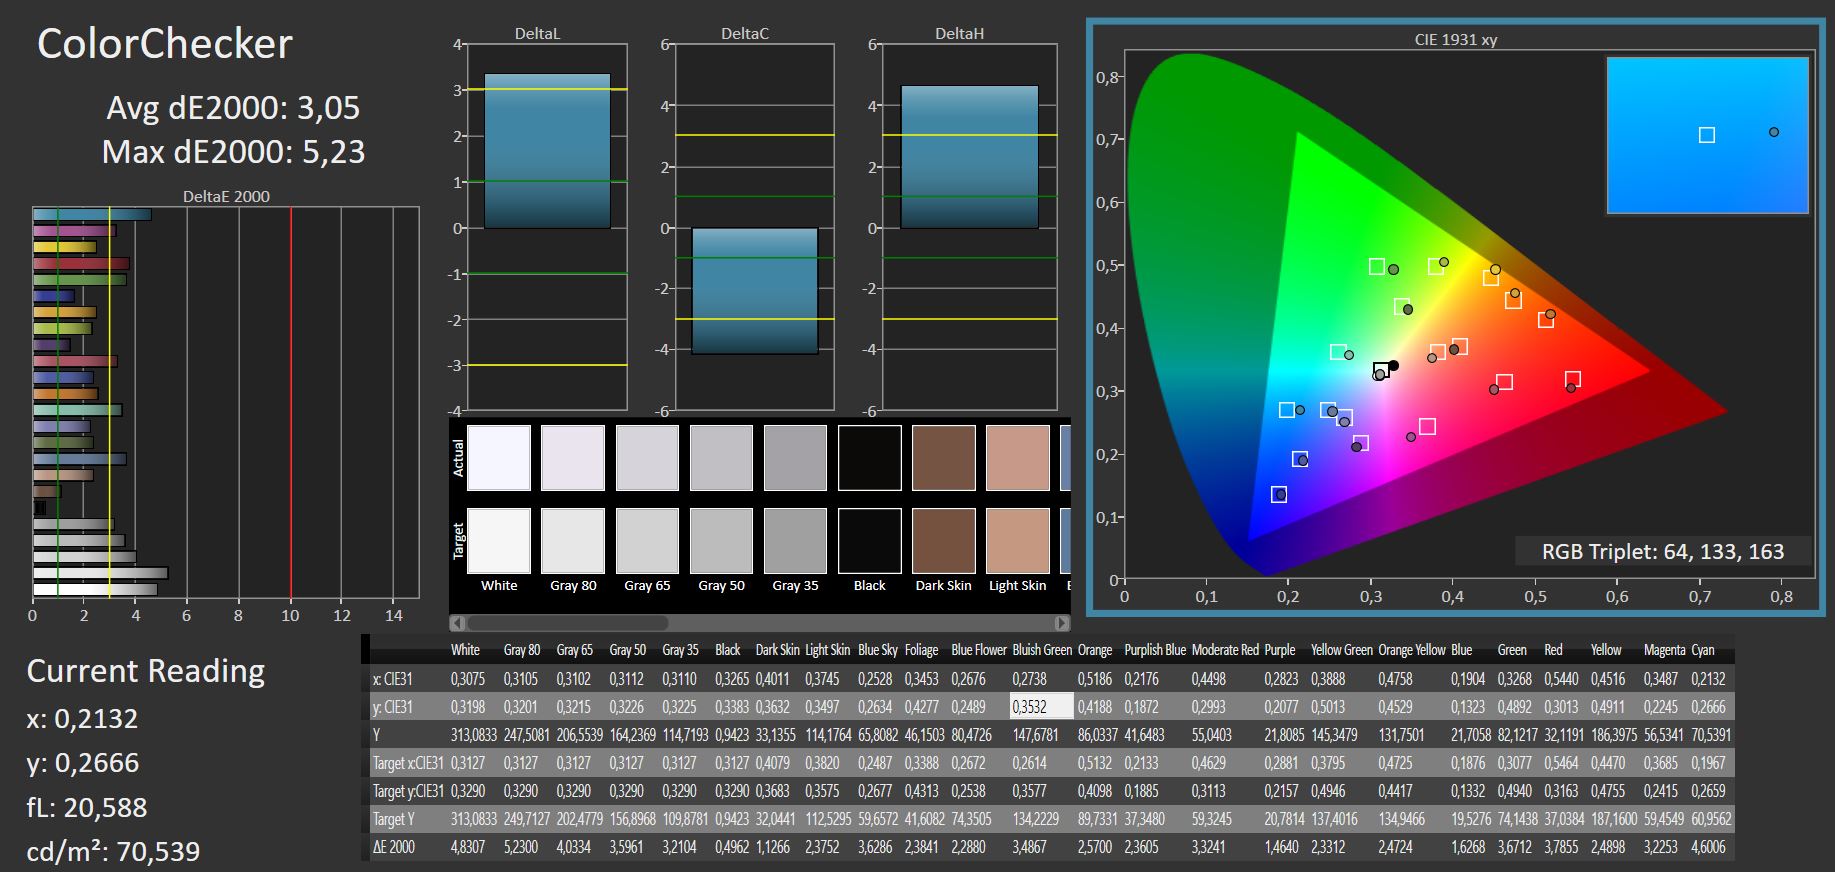
ΔE ColorChecker Calman: 3.05 | ∀{0.5-29.43 Ø4.78}
calibrated: 1.92
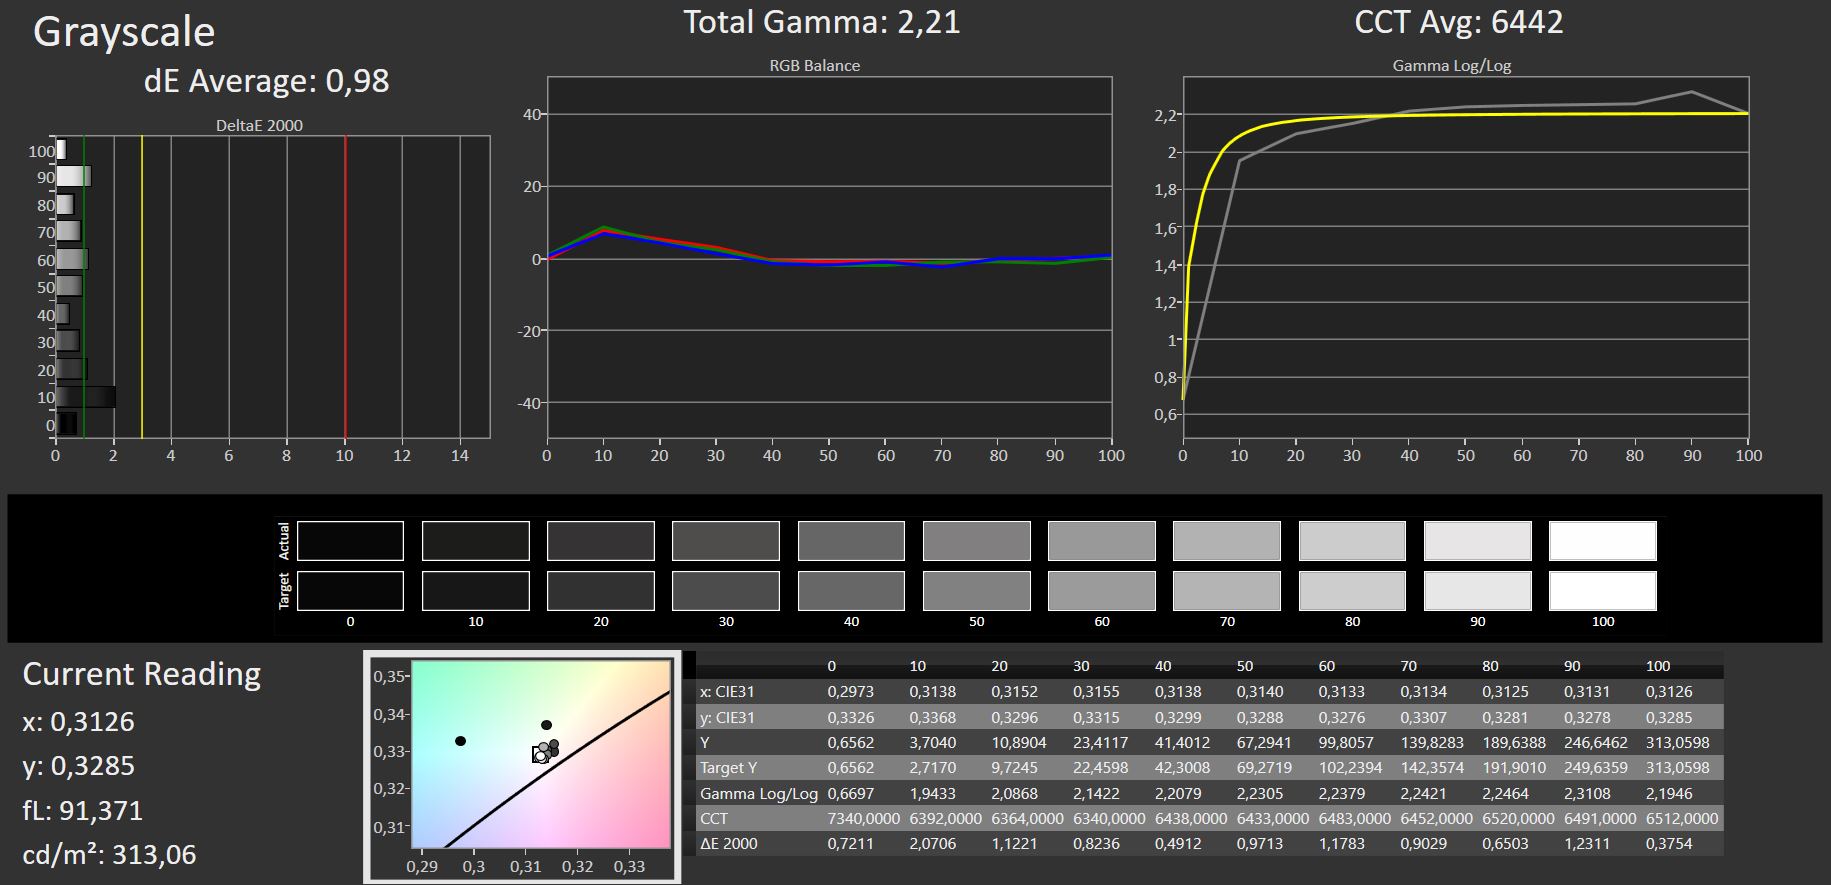
ΔE Greyscale Calman: 3.11 | ∀{0.09-98 Ø5}
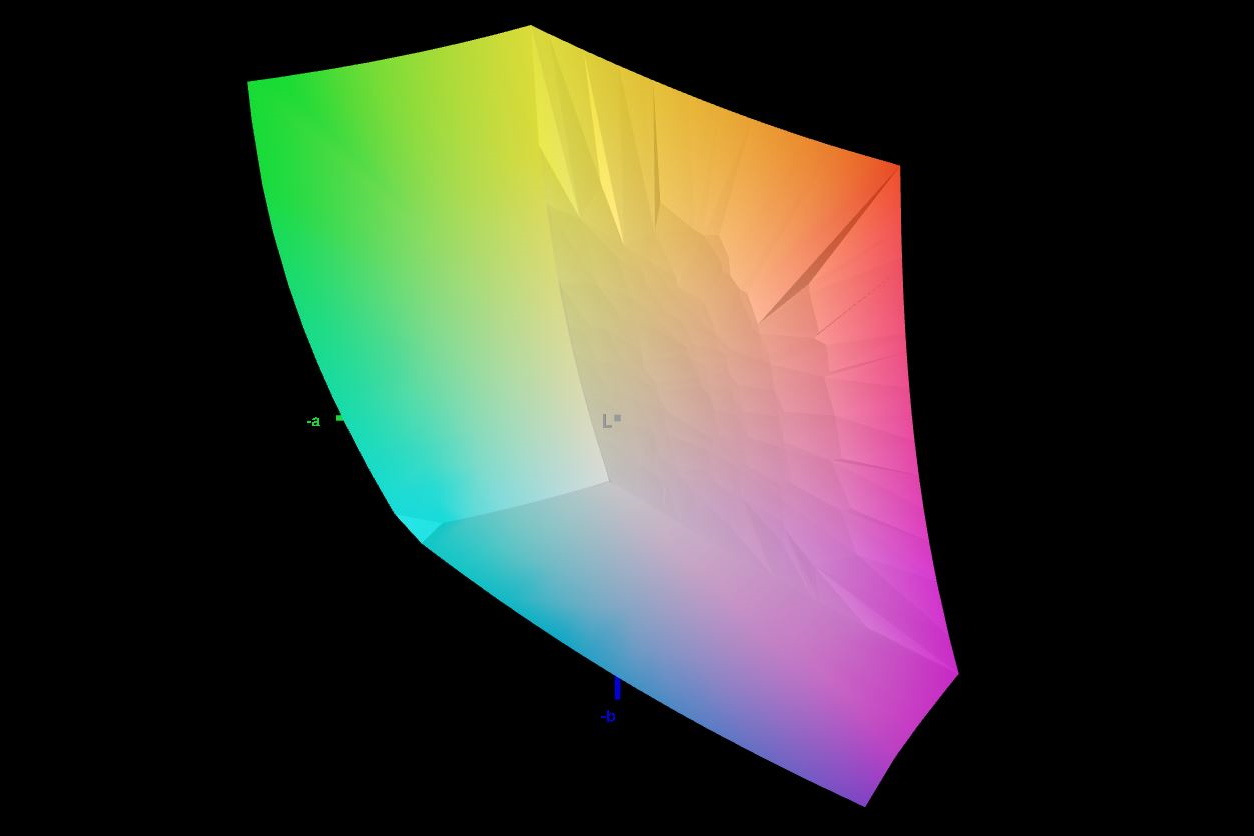
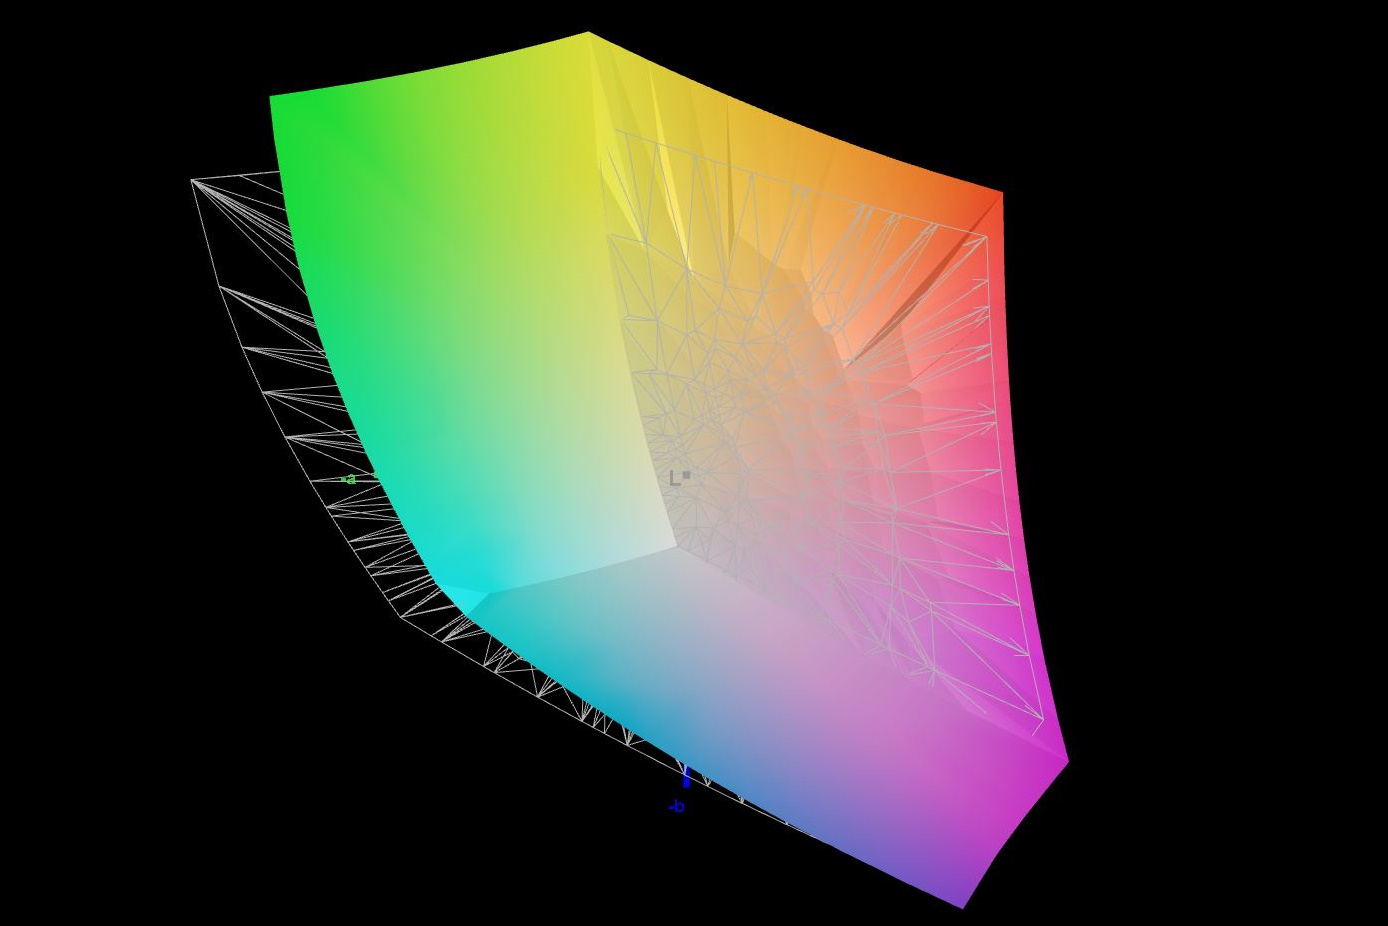
99% sRGB (Argyll 1.6.3 3D)
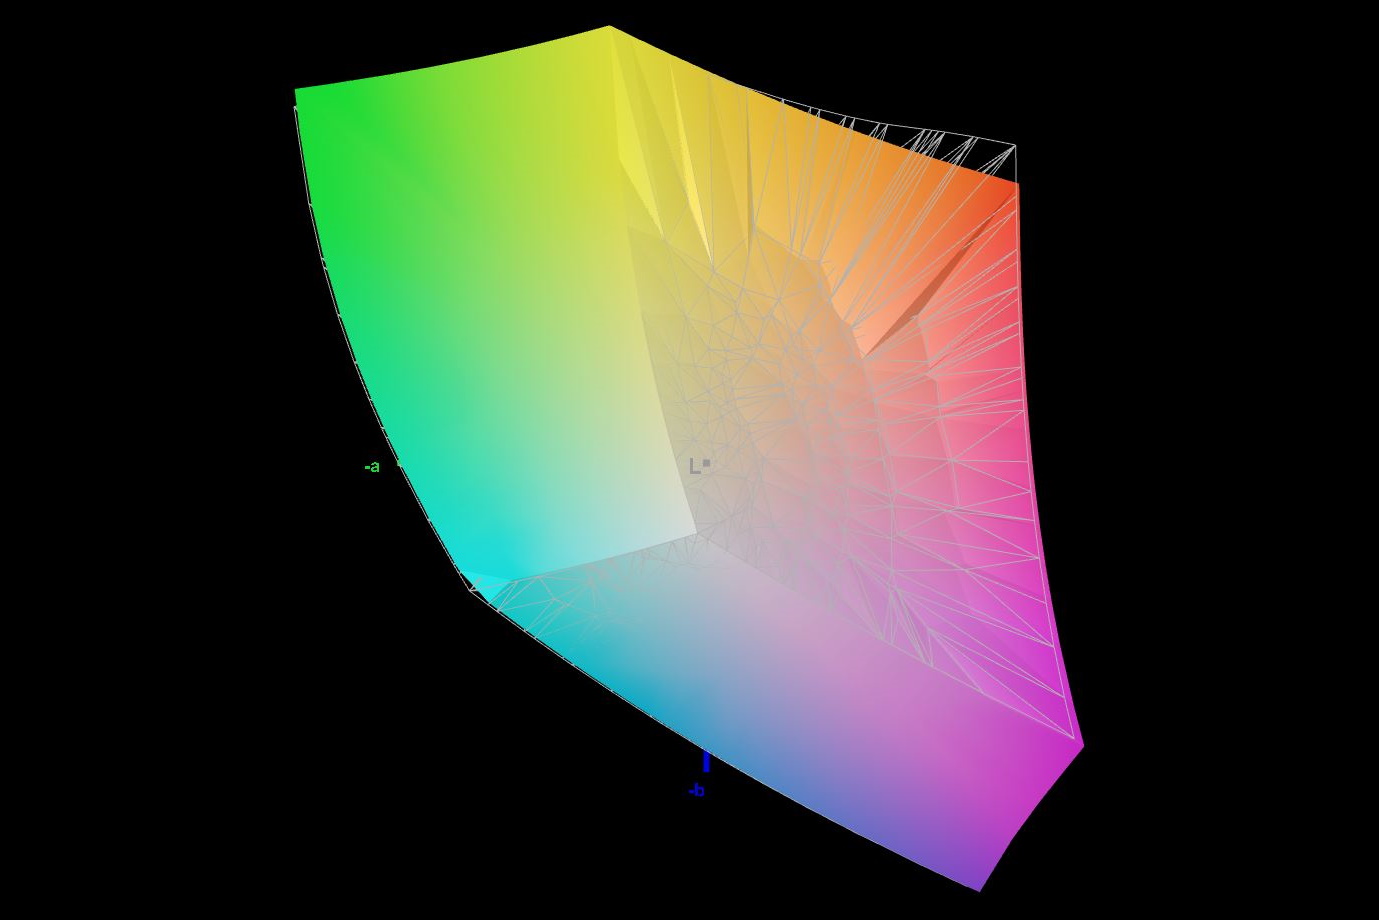
84% AdobeRGB 1998 (Argyll 1.6.3 3D)
84.4% AdobeRGB 1998 (Argyll 3D)
98.7% sRGB (Argyll 3D)
94.2% Display P3 (Argyll 3D)
Gamma: 2.13
CCT: 6553 K
| Asus ROG Zephyrus S17 GX703HSD BOE099D (BOE CQ NE173QHM-NY3), IPS, 2560x1440, 17.3" | Asus Zephyrus S17 GX701LXS Sharp SHP14DC, IPS, 1920x1080, 17.3" | Aorus 17G YD Sharp LQ173M1JW04, IPS, 1920x1080, 17.3" | Gigabyte Aero 17 HDR YD AU Optronics AUO329B, IPS, 3840x2160, 17.3" | Schenker XMG Ultra 17 Rocket Lake AU Optronics B173HAN05.1, IPS, 1920x1080, 17.3" | MSI GE76 Raider 10UH AU Optronics B173HAN05.1, IPS, 1920x1080, 17.3" | |
|---|---|---|---|---|---|---|
| Display | -11% | -12% | 4% | -14% | -12% | |
| Display P3 Coverage (%) | 94.2 | 73.6 -22% | 72.3 -23% | 86.9 -8% | 69.8 -26% | 71.8 -24% |
| sRGB Coverage (%) | 98.7 | 99.7 1% | 100 1% | 100 1% | 97.2 -2% | 98.1 -1% |
| AdobeRGB 1998 Coverage (%) | 84.4 | 73.7 -13% | 73.7 -13% | 99.6 18% | 72 -15% | 73.9 -12% |
| Response Times | -2% | -99% | -604% | -16% | -175% | |
| Response Time Grey 50% / Grey 80% * (ms) | 4.8 | 5 ? -4% | 13.6 ? -183% | 52 ? -983% | 5.6 ? -17% | 20.4 ? -325% |
| Response Time Black / White * (ms) | 8 | 8 ? -0% | 9.2 ? -15% | 26 ? -225% | 9.2 ? -15% | 10 ? -25% |
| PWM Frequency (Hz) | 151500 | |||||
| Screen | 10% | 3% | 36% | 16% | -15% | |
| Brightness middle (cd/m²) | 322 | 308 -4% | 286 -11% | 488 52% | 306 -5% | 324.6 1% |
| Brightness (cd/m²) | 288 | 310 8% | 282 -2% | 467 62% | 299 4% | 312 8% |
| Brightness Distribution (%) | 72 | 76 6% | 73 1% | 86 19% | 93 29% | 87 21% |
| Black Level * (cd/m²) | 0.3 | 0.34 -13% | 0.24 20% | 0.33 -10% | 0.22 27% | 0.28 7% |
| Contrast (:1) | 1073 | 906 -16% | 1192 11% | 1479 38% | 1391 30% | 1159 8% |
| Colorchecker dE 2000 * | 3.05 | 1.49 51% | 2.79 9% | 1.23 60% | 1.92 37% | 3.87 -27% |
| Colorchecker dE 2000 max. * | 5.23 | 3.97 24% | 6.23 -19% | 2.94 44% | 4.78 9% | 9.35 -79% |
| Colorchecker dE 2000 calibrated * | 1.92 | 0.99 48% | 0.82 57% | 0.77 60% | 1.34 30% | 1.42 26% |
| Greyscale dE 2000 * | 3.11 | 2.3 26% | 3.5 -13% | 1.5 52% | 2 36% | 6.5 -109% |
| Gamma | 2.13 103% | 2.193 100% | 2.358 93% | 2.169 101% | 2.153 102% | 2.23 99% |
| CCT | 6553 99% | 6981 93% | 6147 106% | 6614 98% | 6738 96% | 5702 114% |
| Color Space (Percent of AdobeRGB 1998) (%) | 84 | 74 -12% | 74 -12% | 99 18% | 72 -14% | 66.3 -21% |
| Color Space (Percent of sRGB) (%) | 99 | 96 -3% | 96 -3% | 99 0% | 93 -6% | 98 -1% |
| Total Average (Program / Settings) | -1% /
5% | -36% /
-12% | -188% /
-50% | -5% /
6% | -67% /
-35% |
* ... smaller is better
The contrast and black level are okay, but the 4K Aero is obviously better again, although so is the Schenker Ultra.
The panel seems to be well calibrated out of the box; the color deviations are already low, and they can even be reduced a bit further through manual calibration.
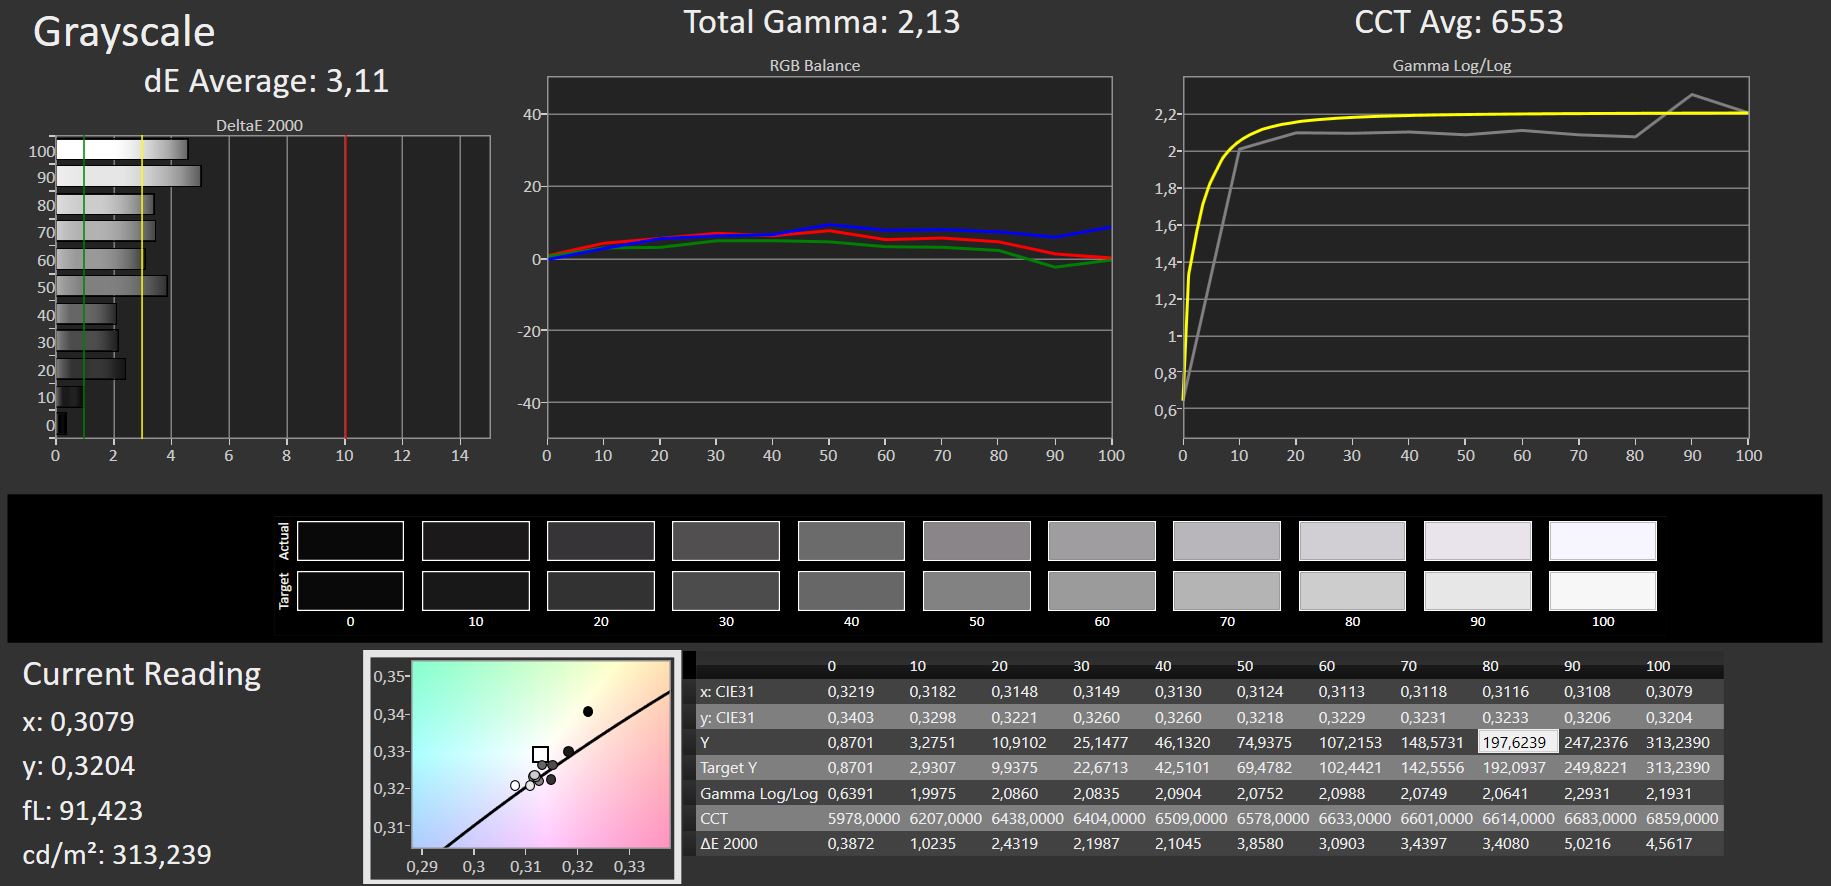
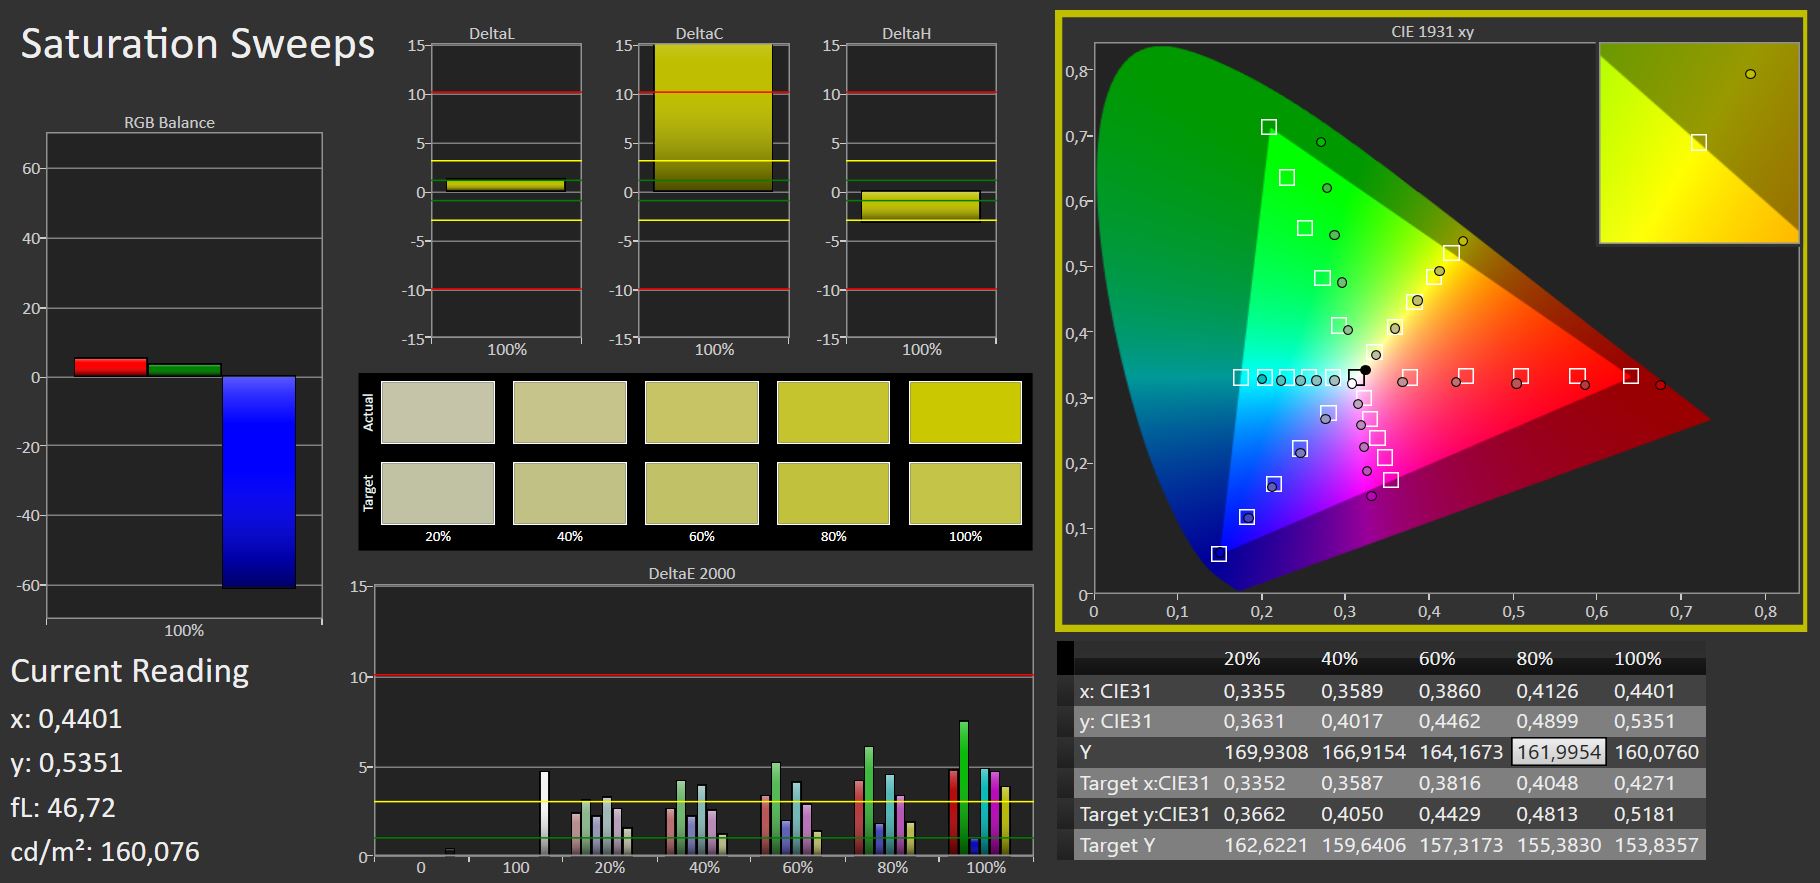
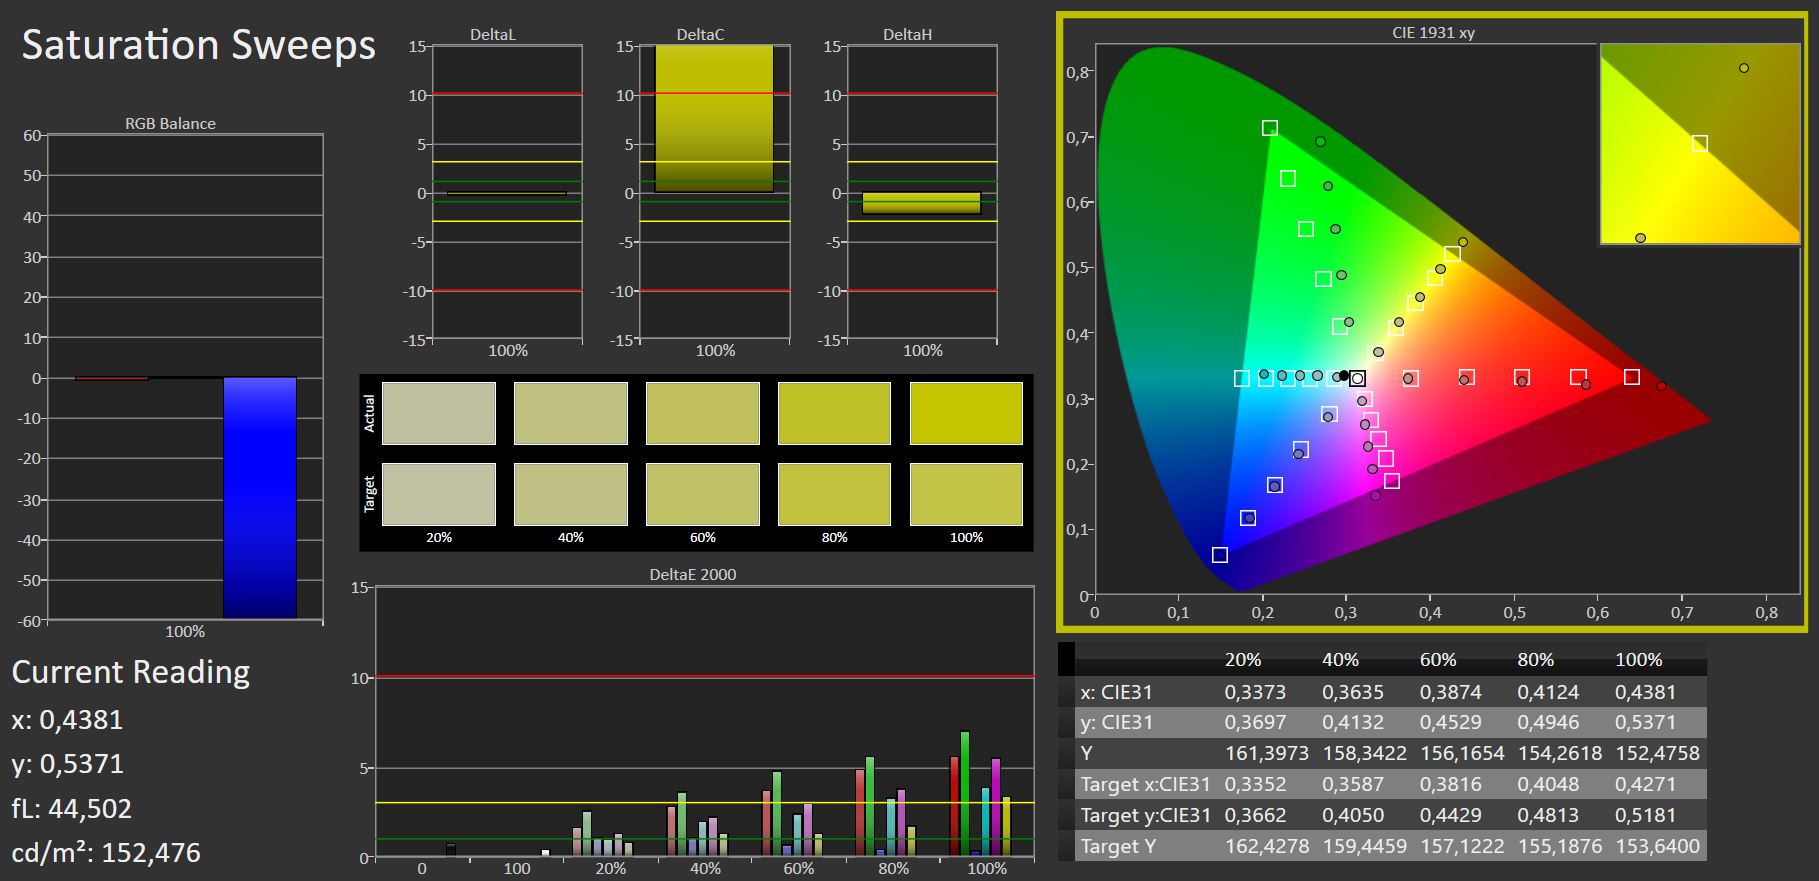
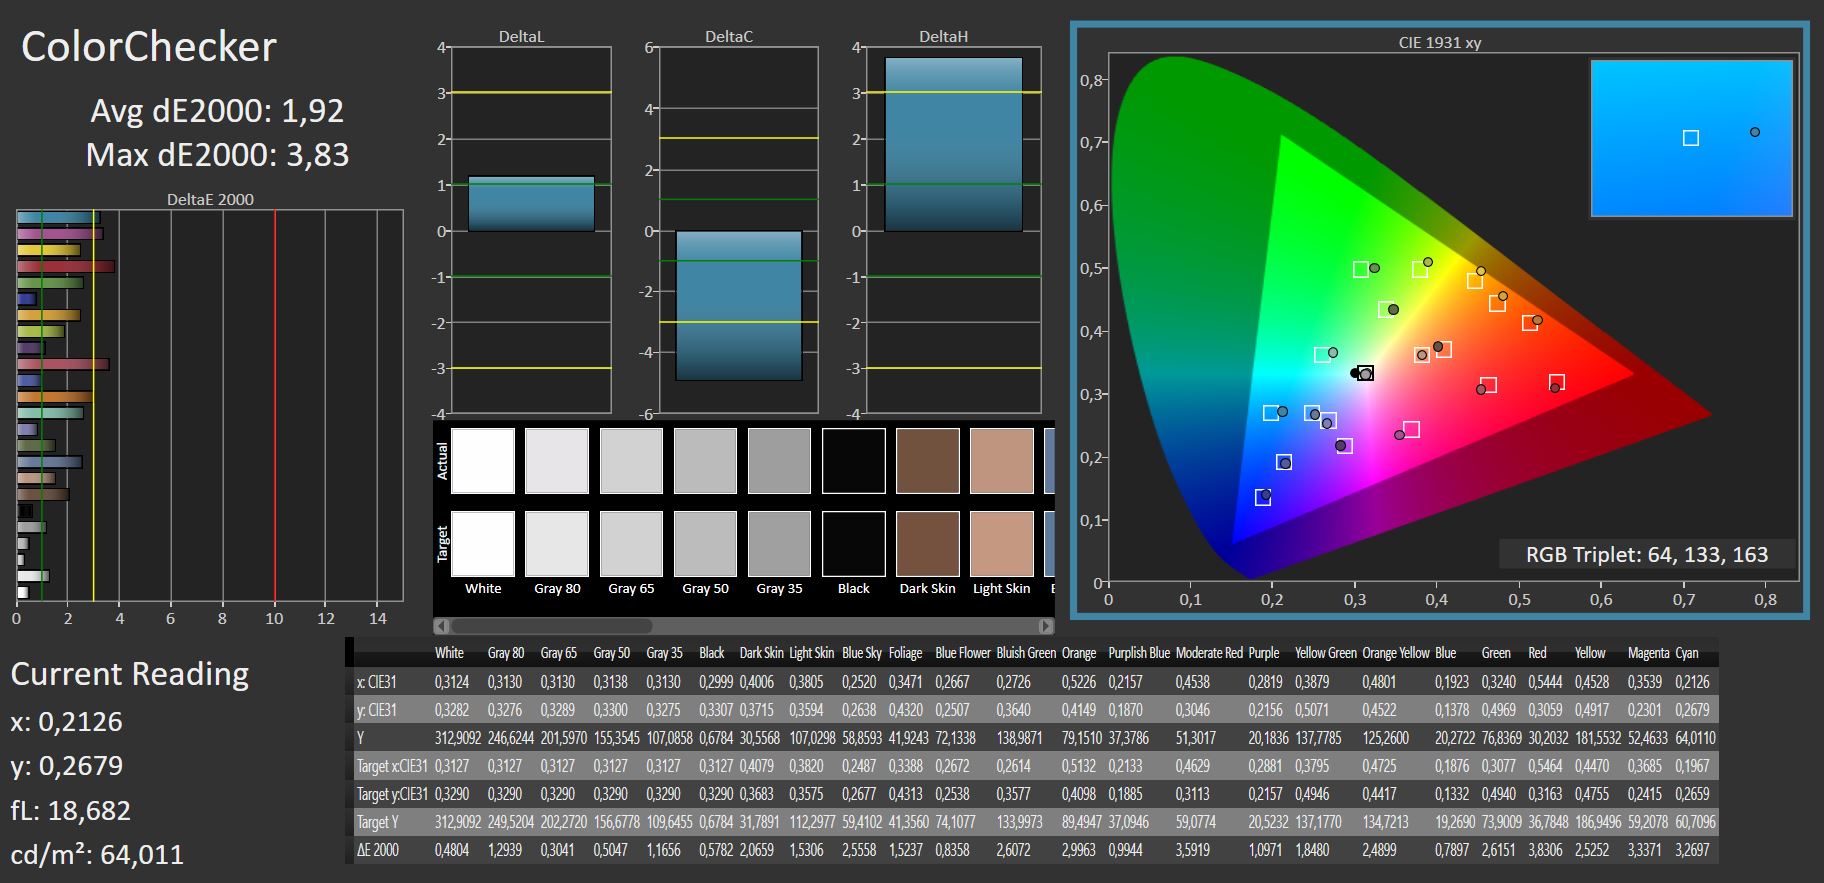
Asus states that DCI-P3 is covered by 100%, which is almost confirmed by our measurements (94%). The smaller sRGB color space is nearly completely covered, and AdobeRGB is still covered by 84%.
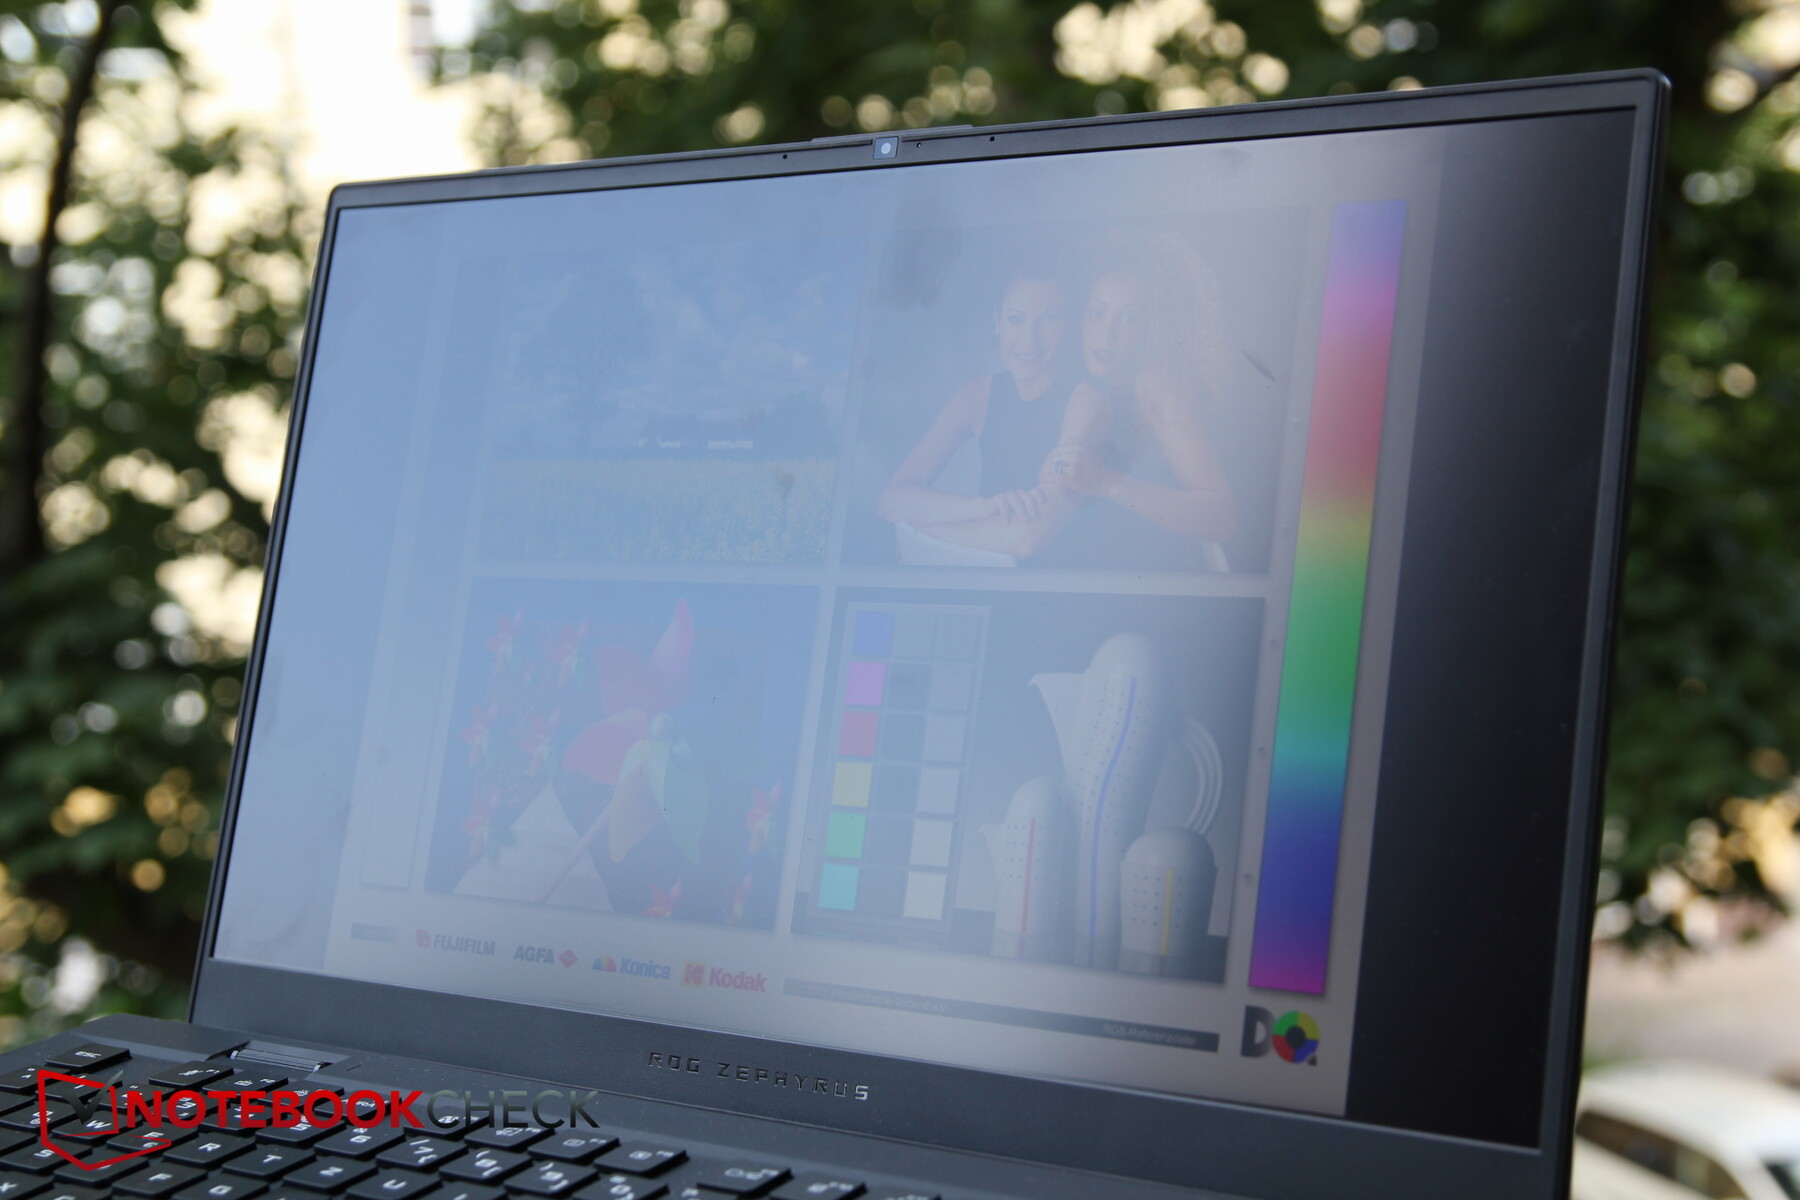
When looking at the panel from an oblique angle, the content is quickly covered by a whitish veil. Furthermore, the display could be brighter, so outdoor use is predominantly recommended in areas in the shade and with a direct overhead view.
Display Response Times
| ↔ Response Time Black to White | ||
|---|---|---|
| 8 ms ... rise ↗ and fall ↘ combined | ↗ ms rise | |
| ↘ ms fall | ||
| The screen shows fast response rates in our tests and should be suited for gaming. In comparison, all tested devices range from 0.1 (minimum) to 240 (maximum) ms. » 21 % of all devices are better. This means that the measured response time is better than the average of all tested devices (20.2 ms). | ||
| ↔ Response Time 50% Grey to 80% Grey | ||
| 4.8 ms ... rise ↗ and fall ↘ combined | ↗ ms rise | |
| ↘ ms fall | ||
| The screen shows very fast response rates in our tests and should be very well suited for fast-paced gaming. In comparison, all tested devices range from 0.165 (minimum) to 636 (maximum) ms. » 15 % of all devices are better. This means that the measured response time is better than the average of all tested devices (31.6 ms). | ||
Screen Flickering / PWM (Pulse-Width Modulation)
| Screen flickering / PWM not detected |  | ||
In comparison: 53 % of all tested devices do not use PWM to dim the display. If PWM was detected, an average of 8111 (minimum: 5 - maximum: 343500) Hz was measured. | |||
The display is quite viewing-angle stable in dark environments, and only little brightness is lost when it is viewed from extreme angles.

Performance - Great, but it deteriorates strongly on battery power
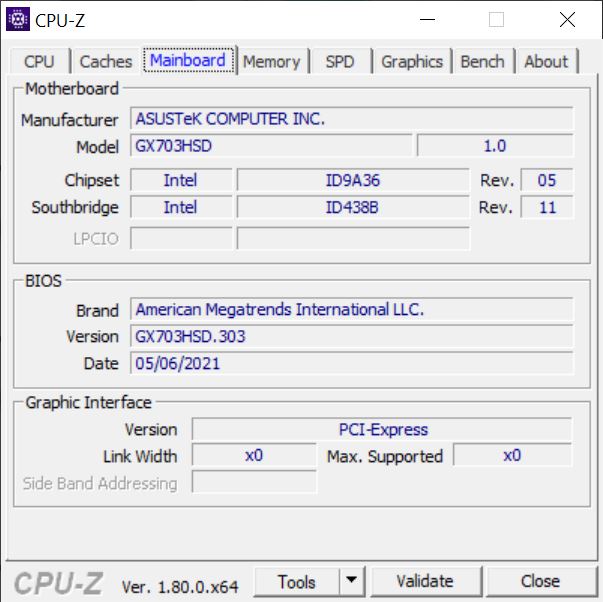
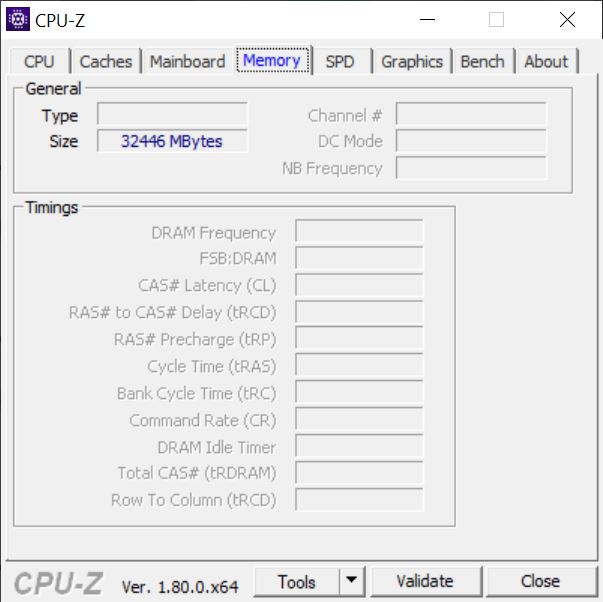
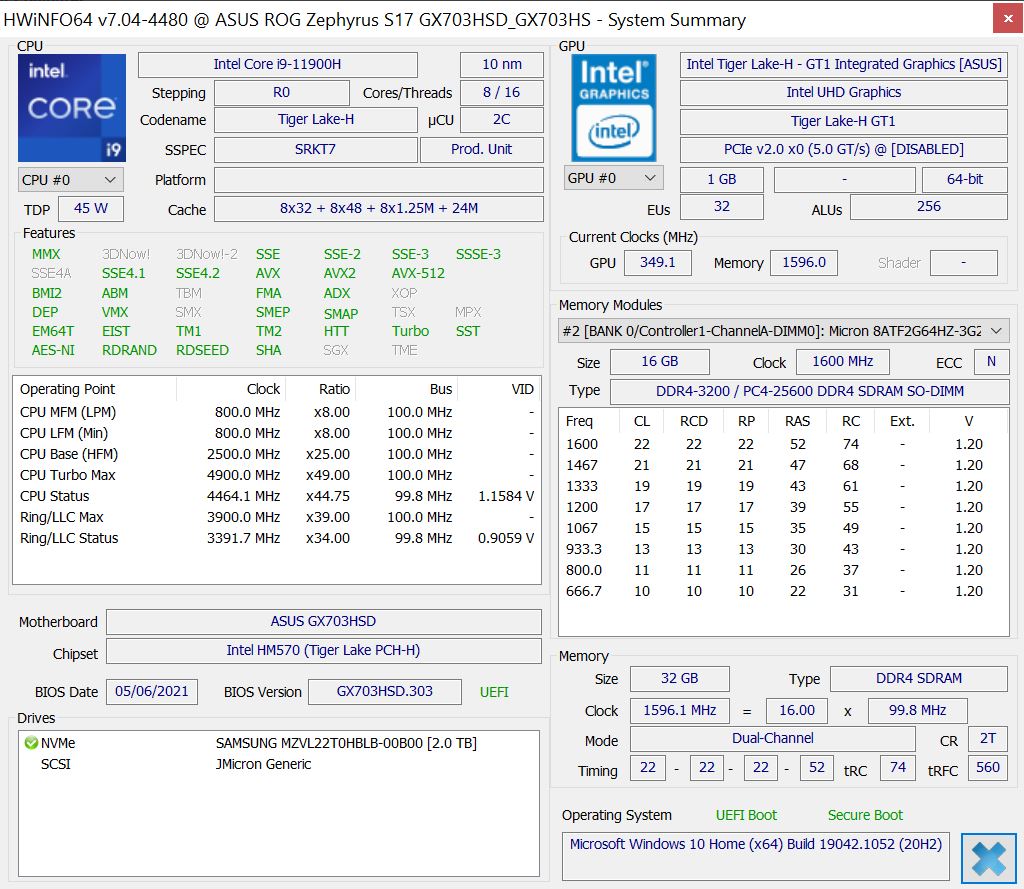
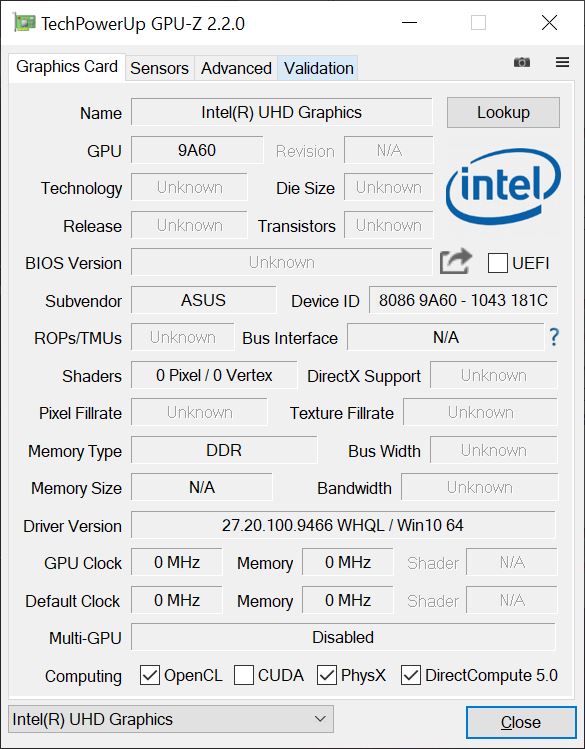
The Zephyrus S17 is equipped with strong gaming hardware: The Intel Core i9-11900H Tiger Lake processor, the NVIDIA GeForce RTX 3080 laptop GPU, the 2 TB of SSD storage, and the 32 GB of RAM in dual-channel mode, 16 GB of which are soldered, leave little to be desired. Moreover, we didn't detect any PWM.
In the Asus Armoury Crate software, where all the relevant performance settings are located alongside My Asus, we set the slider to "Windows" for our tests, making the OS settings crucial. For the measurements, we use the High Performance mode found in the taskbar.
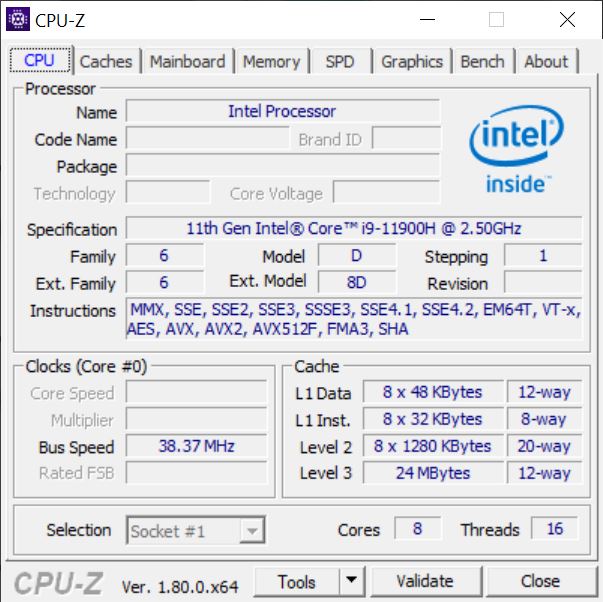
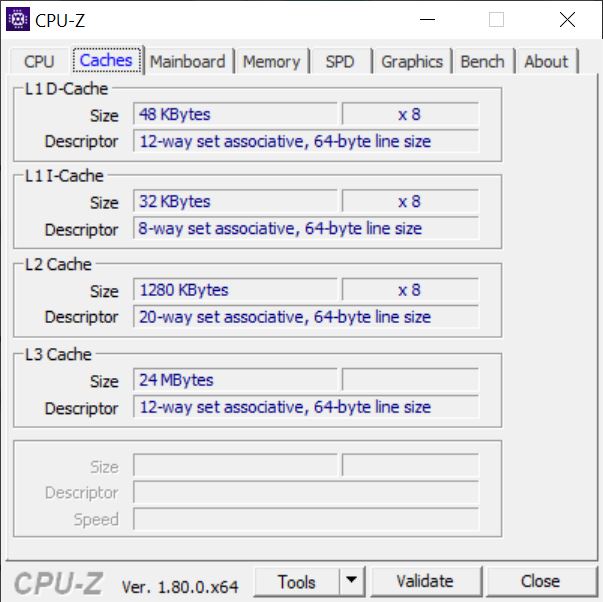
Processor
The Intel Core i9-11900H is a 45-watt octa-core CPU with cores that clock from 2.5 to 4.9 GHz (4.4 GHz in Turbo mode with all cores running simultaneously).
The Cinebench R15 loop reveals a consistently high performance that even surpasses that of the Schenker XMG Ultra on a sustained basis, despite the fact that the latter's output is slightly higher. The Comet Lake CPU in the predecessor is outperformed by over 30% in the multithread test.
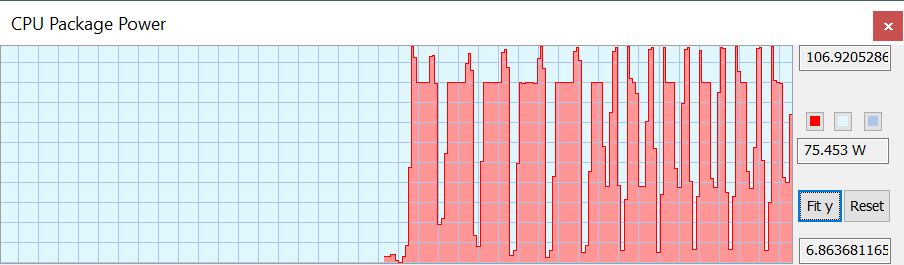
During a single run, the TDP fluctuates constantly between 107 watts and 90 watts. Oddly, the tests often start at 90 watts and end at 107 watts, whereas the opposite is usually the case. In subsequent iterations, however, there are also short performance drops during a run, where the TDP briefly drops to 42 watts.
The CPU performance decreases considerably on battery power. From the initial 2,184 points in the Cinebench R15 multi test, only 802 points remain, which corresponds to a drop of 63%!
Cinebench R20: CPU (Single Core) | CPU (Multi Core)
Cinebench R15: CPU Single 64Bit | CPU Multi 64Bit
Blender: v2.79 BMW27 CPU
7-Zip 18.03: 7z b 4 -mmt1 | 7z b 4
Geekbench 5.5: Single-Core | Multi-Core
HWBOT x265 Benchmark v2.2: 4k Preset
LibreOffice : 20 Documents To PDF
R Benchmark 2.5: Overall mean
| Cinebench R23 / Single Core | |
| Average of class Gaming (1136 - 2267, n=145, last 2 years) | |
| Schenker XMG Ultra 17 Rocket Lake | |
| Asus ROG Zephyrus S17 GX703HSD | |
| Average Intel Core i9-11900H (1574 - 1605, n=4) | |
| Aorus 17G YD | |
| MSI GE76 Raider 10UH | |
| Cinebench R23 / Multi Core | |
| Average of class Gaming (5668 - 40970, n=145, last 2 years) | |
| Schenker XMG Ultra 17 Rocket Lake | |
| Aorus 17G YD | |
| Asus ROG Zephyrus S17 GX703HSD | |
| Average Intel Core i9-11900H (11135 - 13012, n=4) | |
| MSI GE76 Raider 10UH | |
| Cinebench R20 / CPU (Single Core) | |
| Average of class Gaming (439 - 870, n=144, last 2 years) | |
| Schenker XMG Ultra 17 Rocket Lake | |
| Asus ROG Zephyrus S17 GX703HSD | |
| Average Intel Core i9-11900H (600 - 615, n=5) | |
| Gigabyte Aero 17 HDR YD | |
| Aorus 17G YD | |
| MSI GE76 Raider 10UH | |
| Asus Zephyrus S17 GX701LXS | |
| Cinebench R20 / CPU (Multi Core) | |
| Average of class Gaming (2179 - 16108, n=144, last 2 years) | |
| Gigabyte Aero 17 HDR YD | |
| Schenker XMG Ultra 17 Rocket Lake | |
| Asus ROG Zephyrus S17 GX703HSD | |
| Aorus 17G YD | |
| Average Intel Core i9-11900H (4324 - 5160, n=5) | |
| MSI GE76 Raider 10UH | |
| Asus Zephyrus S17 GX701LXS | |
| Cinebench R15 / CPU Single 64Bit | |
| Average of class Gaming (188.8 - 343, n=143, last 2 years) | |
| Schenker XMG Ultra 17 Rocket Lake | |
| Asus ROG Zephyrus S17 GX703HSD | |
| Average Intel Core i9-11900H (236 - 243, n=5) | |
| Gigabyte Aero 17 HDR YD | |
| Aorus 17G YD | |
| Asus Zephyrus S17 GX701LXS | |
| MSI GE76 Raider 10UH | |
| Cinebench R15 / CPU Multi 64Bit | |
| Average of class Gaming (1537 - 6271, n=144, last 2 years) | |
| Schenker XMG Ultra 17 Rocket Lake | |
| Asus ROG Zephyrus S17 GX703HSD | |
| Aorus 17G YD | |
| Average Intel Core i9-11900H (1770 - 2211, n=5) | |
| Gigabyte Aero 17 HDR YD | |
| MSI GE76 Raider 10UH | |
| Asus Zephyrus S17 GX701LXS | |
| Blender / v2.79 BMW27 CPU | |
| Aorus 17G YD | |
| Asus Zephyrus S17 GX701LXS | |
| MSI GE76 Raider 10UH | |
| Average Intel Core i9-11900H (231 - 270, n=5) | |
| Gigabyte Aero 17 HDR YD | |
| Asus ROG Zephyrus S17 GX703HSD | |
| Schenker XMG Ultra 17 Rocket Lake | |
| Average of class Gaming (80 - 517, n=140, last 2 years) | |
| 7-Zip 18.03 / 7z b 4 -mmt1 | |
| Average of class Gaming (4199 - 7508, n=142, last 2 years) | |
| Schenker XMG Ultra 17 Rocket Lake | |
| Asus ROG Zephyrus S17 GX703HSD | |
| Average Intel Core i9-11900H (5582 - 6018, n=5) | |
| Gigabyte Aero 17 HDR YD | |
| Aorus 17G YD | |
| Asus Zephyrus S17 GX701LXS | |
| Asus Zephyrus S17 GX701LXS | |
| MSI GE76 Raider 10UH | |
| 7-Zip 18.03 / 7z b 4 | |
| Average of class Gaming (23795 - 148086, n=142, last 2 years) | |
| Schenker XMG Ultra 17 Rocket Lake | |
| Asus ROG Zephyrus S17 GX703HSD | |
| Gigabyte Aero 17 HDR YD | |
| Average Intel Core i9-11900H (49486 - 57263, n=5) | |
| Aorus 17G YD | |
| MSI GE76 Raider 10UH | |
| Asus Zephyrus S17 GX701LXS | |
| Asus Zephyrus S17 GX701LXS | |
| Geekbench 5.5 / Single-Core | |
| Average of class Gaming (986 - 2423, n=141, last 2 years) | |
| Schenker XMG Ultra 17 Rocket Lake | |
| Asus ROG Zephyrus S17 GX703HSD | |
| Average Intel Core i9-11900H (1576 - 1692, n=5) | |
| Gigabyte Aero 17 HDR YD | |
| Aorus 17G YD | |
| Asus Zephyrus S17 GX701LXS | |
| MSI GE76 Raider 10UH | |
| Geekbench 5.5 / Multi-Core | |
| Average of class Gaming (4557 - 27010, n=141, last 2 years) | |
| Schenker XMG Ultra 17 Rocket Lake | |
| Gigabyte Aero 17 HDR YD | |
| Asus ROG Zephyrus S17 GX703HSD | |
| Aorus 17G YD | |
| Average Intel Core i9-11900H (7725 - 9856, n=5) | |
| MSI GE76 Raider 10UH | |
| Asus Zephyrus S17 GX701LXS | |
| HWBOT x265 Benchmark v2.2 / 4k Preset | |
| Average of class Gaming (7.7 - 44.3, n=142, last 2 years) | |
| Schenker XMG Ultra 17 Rocket Lake | |
| Asus ROG Zephyrus S17 GX703HSD | |
| Gigabyte Aero 17 HDR YD | |
| Aorus 17G YD | |
| Average Intel Core i9-11900H (13.6 - 16.7, n=5) | |
| MSI GE76 Raider 10UH | |
| Asus Zephyrus S17 GX701LXS | |
| LibreOffice / 20 Documents To PDF | |
| MSI GE76 Raider 10UH | |
| Asus Zephyrus S17 GX701LXS | |
| Average of class Gaming (19 - 88.8, n=141, last 2 years) | |
| Average Intel Core i9-11900H (40.5 - 49.3, n=5) | |
| Asus ROG Zephyrus S17 GX703HSD | |
| Gigabyte Aero 17 HDR YD | |
| Schenker XMG Ultra 17 Rocket Lake | |
| Aorus 17G YD | |
| R Benchmark 2.5 / Overall mean | |
| MSI GE76 Raider 10UH | |
| Asus Zephyrus S17 GX701LXS | |
| Aorus 17G YD | |
| Gigabyte Aero 17 HDR YD | |
| Average Intel Core i9-11900H (0.52 - 0.544, n=5) | |
| Asus ROG Zephyrus S17 GX703HSD | |
| Schenker XMG Ultra 17 Rocket Lake | |
| Average of class Gaming (0.3551 - 0.759, n=143, last 2 years) | |
* ... smaller is better
System performance
The system performance is outstanding. Although the XMG Ultra is always a few percentage points ahead, our Zephyrus usually comes in second, while the Aero and the Aorus are marginally slower.
There was a blue screen once during the test as we tried to run 3DMark 06.
| PCMark 10 / Score | |
| Average of class Gaming (5776 - 9647, n=119, last 2 years) | |
| Schenker XMG Ultra 17 Rocket Lake | |
| Asus ROG Zephyrus S17 GX703HSD | |
| Gigabyte Aero 17 HDR YD | |
| Aorus 17G YD | |
| Average Intel Core i9-11900H, NVIDIA GeForce RTX 3080 Laptop GPU (6822 - 7245, n=2) | |
| MSI GE76 Raider 10UH | |
| Asus Zephyrus S17 GX701LXS | |
| PCMark 10 / Essentials | |
| Schenker XMG Ultra 17 Rocket Lake | |
| Average of class Gaming (8840 - 12600, n=123, last 2 years) | |
| Asus ROG Zephyrus S17 GX703HSD | |
| Aorus 17G YD | |
| Gigabyte Aero 17 HDR YD | |
| Average Intel Core i9-11900H, NVIDIA GeForce RTX 3080 Laptop GPU (9690 - 10630, n=2) | |
| MSI GE76 Raider 10UH | |
| Asus Zephyrus S17 GX701LXS | |
| PCMark 10 / Productivity | |
| Schenker XMG Ultra 17 Rocket Lake | |
| Average of class Gaming (6662 - 14612, n=119, last 2 years) | |
| Aorus 17G YD | |
| Asus ROG Zephyrus S17 GX703HSD | |
| Gigabyte Aero 17 HDR YD | |
| Average Intel Core i9-11900H, NVIDIA GeForce RTX 3080 Laptop GPU (8882 - 9182, n=2) | |
| Asus Zephyrus S17 GX701LXS | |
| MSI GE76 Raider 10UH | |
| PCMark 10 / Digital Content Creation | |
| Average of class Gaming (7440 - 19351, n=119, last 2 years) | |
| Schenker XMG Ultra 17 Rocket Lake | |
| Asus ROG Zephyrus S17 GX703HSD | |
| Gigabyte Aero 17 HDR YD | |
| MSI GE76 Raider 10UH | |
| Average Intel Core i9-11900H, NVIDIA GeForce RTX 3080 Laptop GPU (10014 - 10573, n=2) | |
| Aorus 17G YD | |
| Asus Zephyrus S17 GX701LXS | |
| PCMark 10 Score | 7245 points | |
Help | ||
DPC latencies
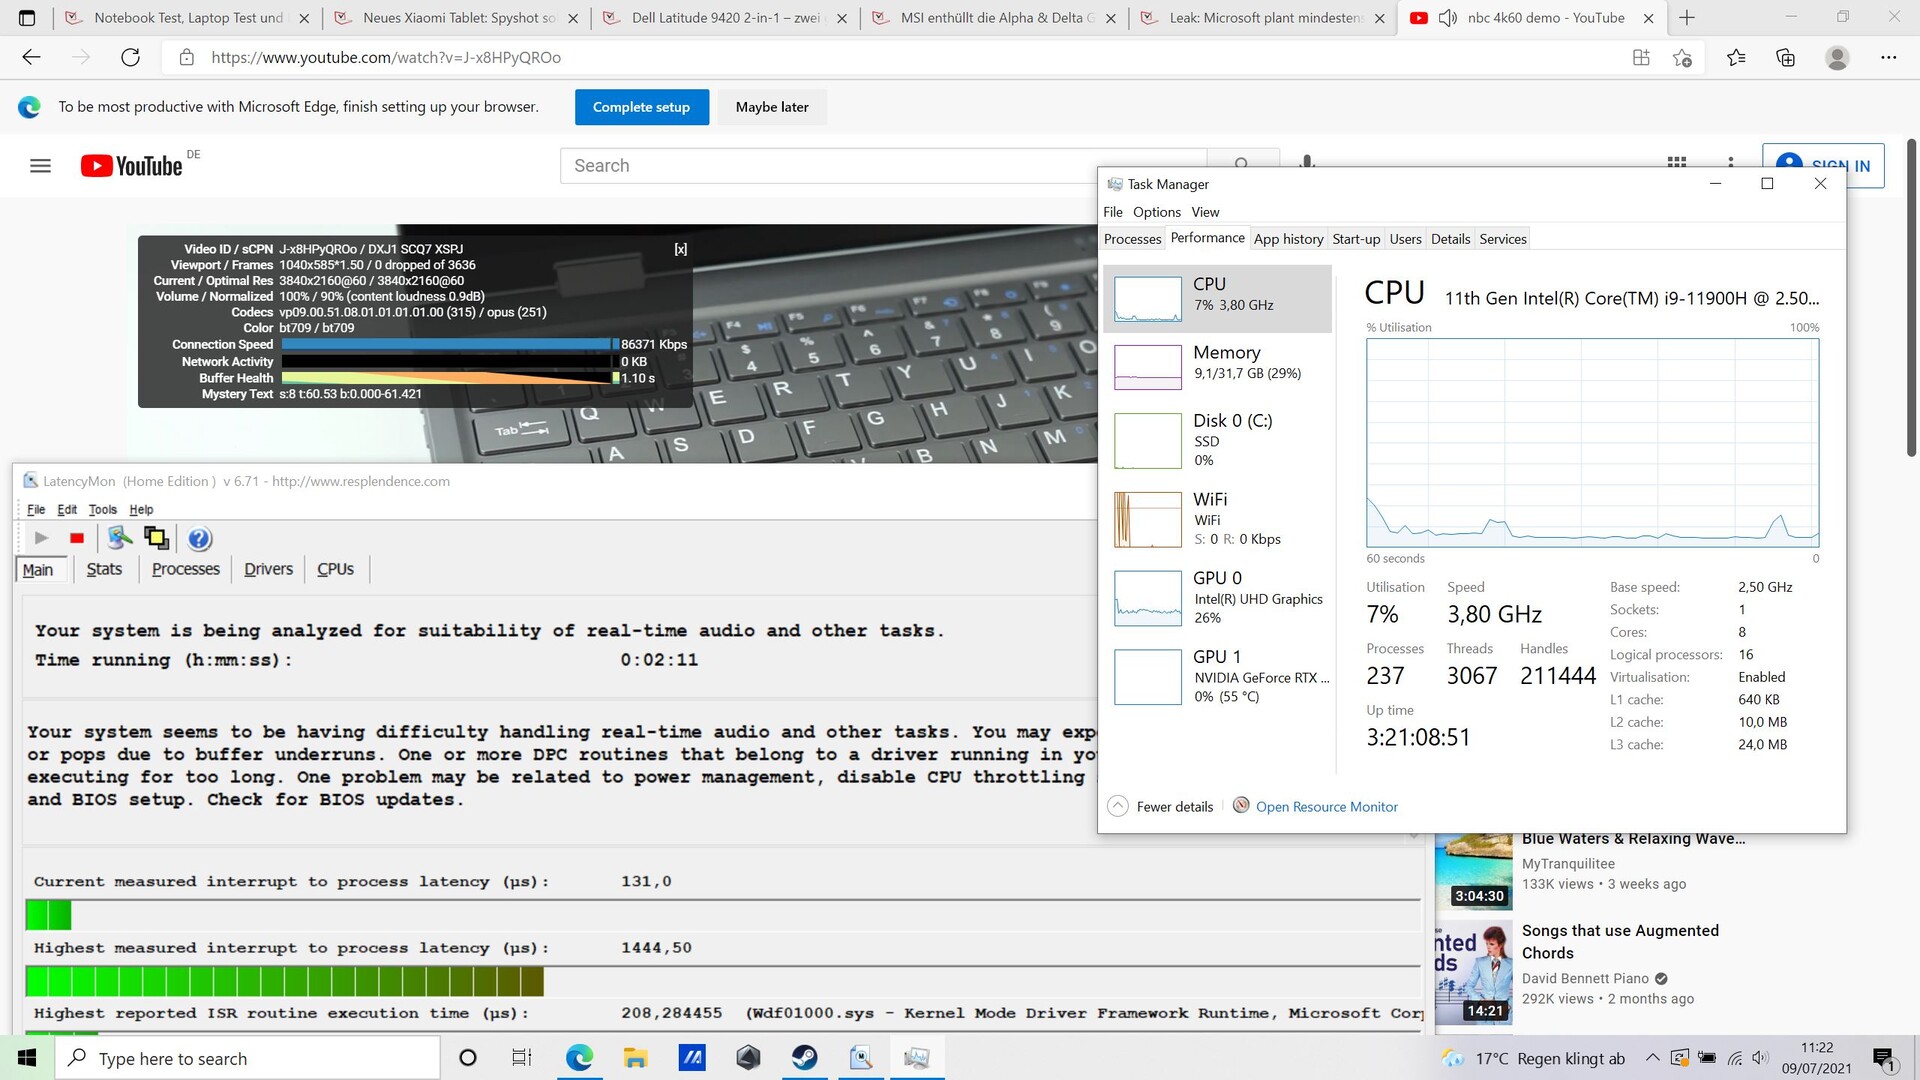
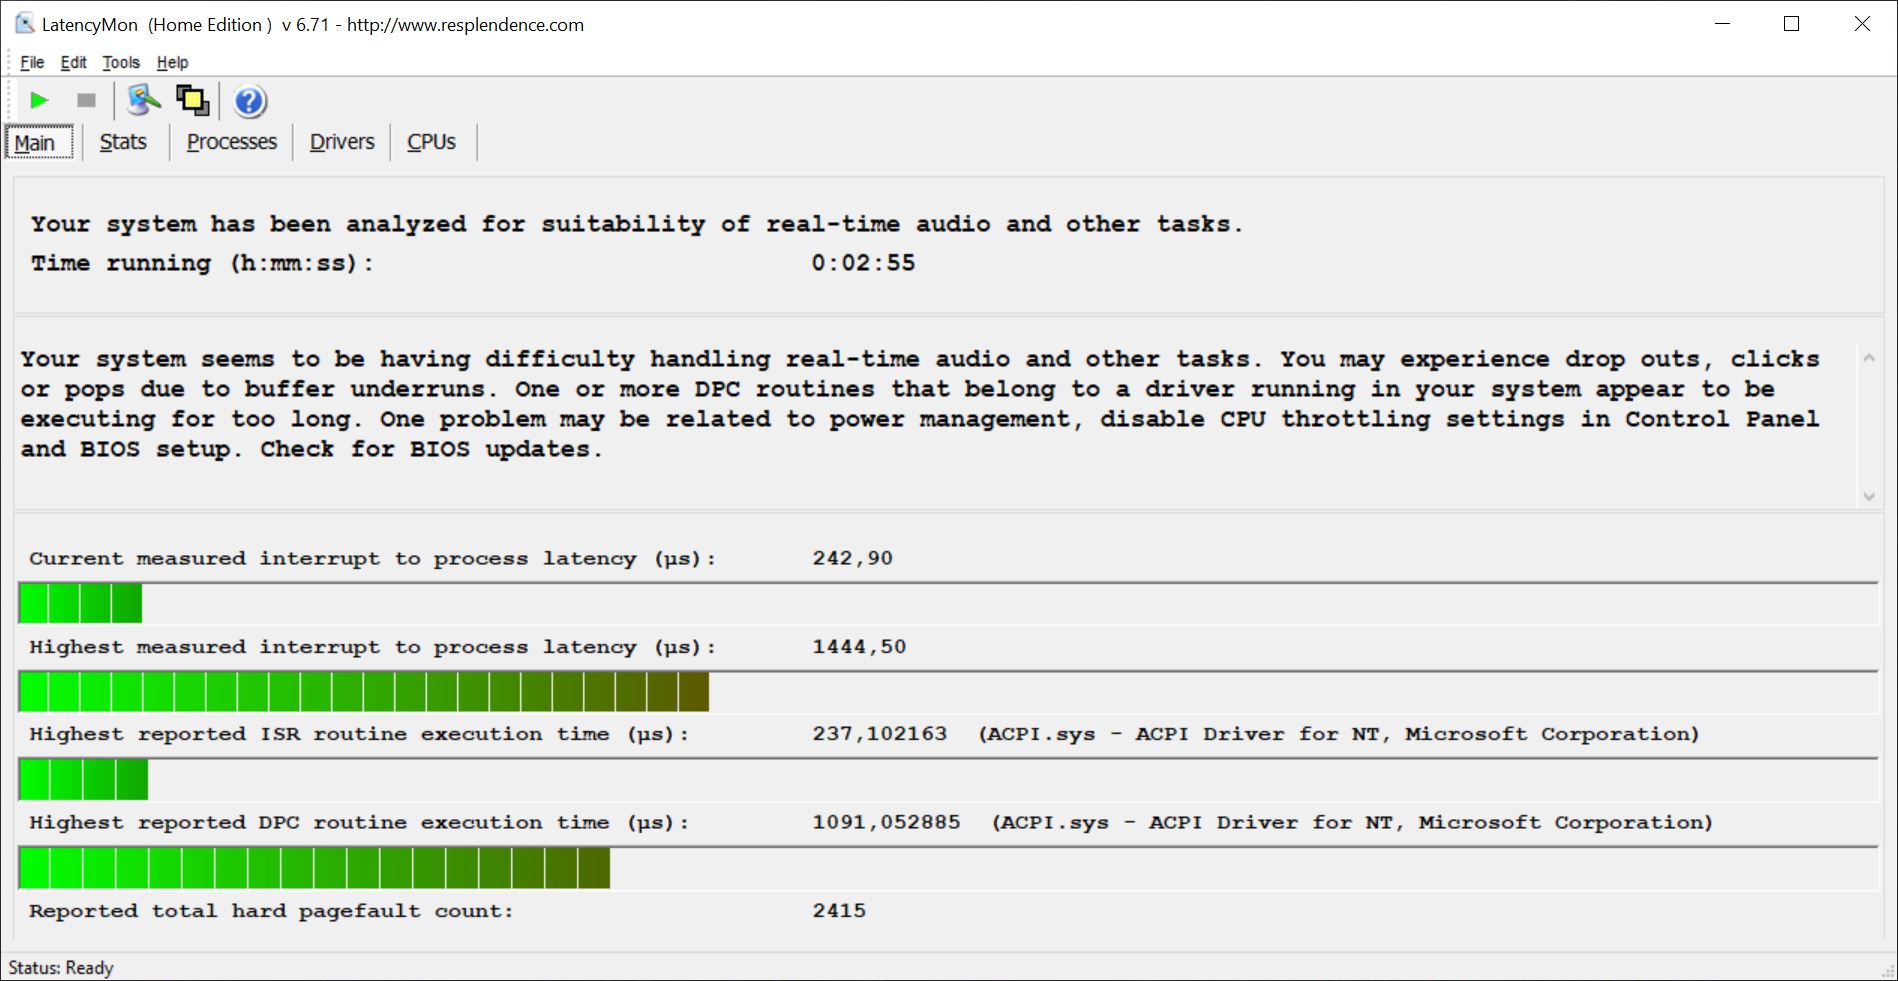
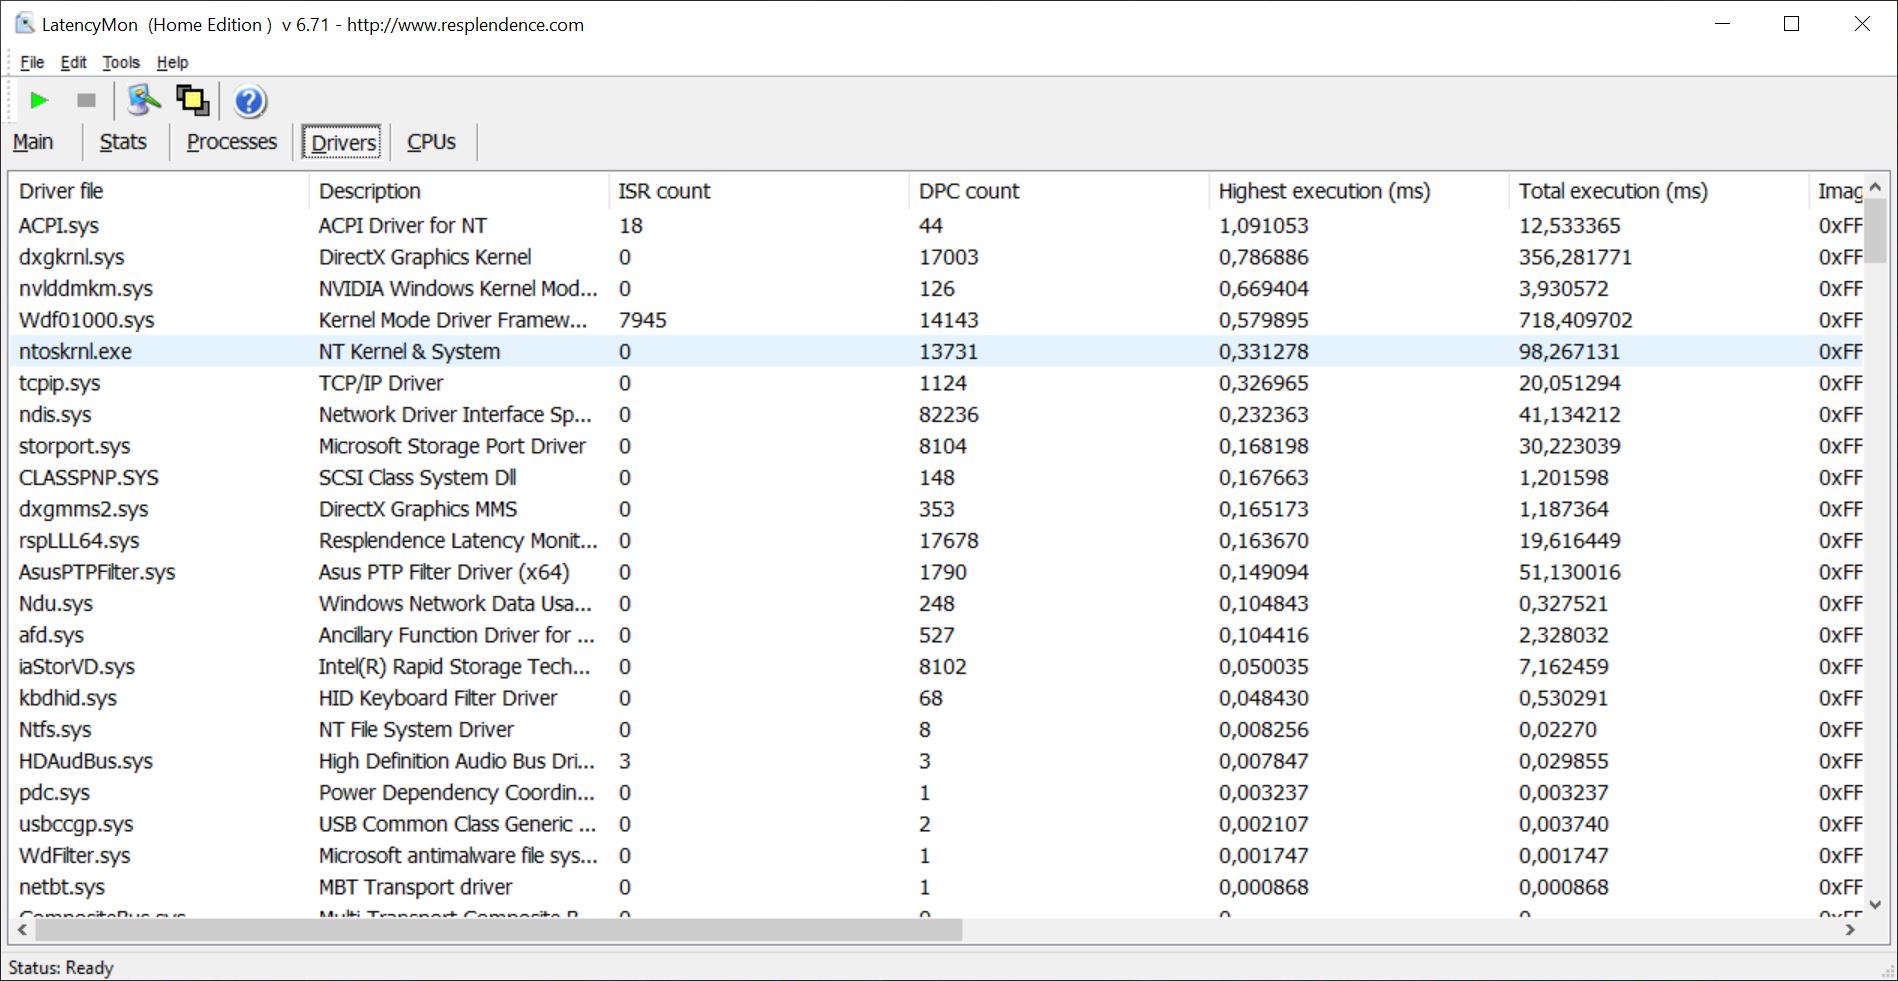
While opening several browser tabs doesn't cause any issues for the S17, the reproduction of our 4K/60 fps YouTube video on the other hand does, according to LatencyMon, even though the test is completed with 0 dropped frames. Problems are caused by the ACPI.sys driver as well as a DirectX and an NVIDIA graphics driver.
| DPC Latencies / LatencyMon - interrupt to process latency (max), Web, Youtube, Prime95 | |
| MSI GE76 Raider 10UH | |
| Gigabyte Aero 17 HDR YD | |
| Asus ROG Zephyrus S17 GX703HSD | |
| Aorus 17G YD | |
| Schenker XMG Ultra 17 Rocket Lake | |
| Asus Zephyrus S17 GX701LXS | |
* ... smaller is better
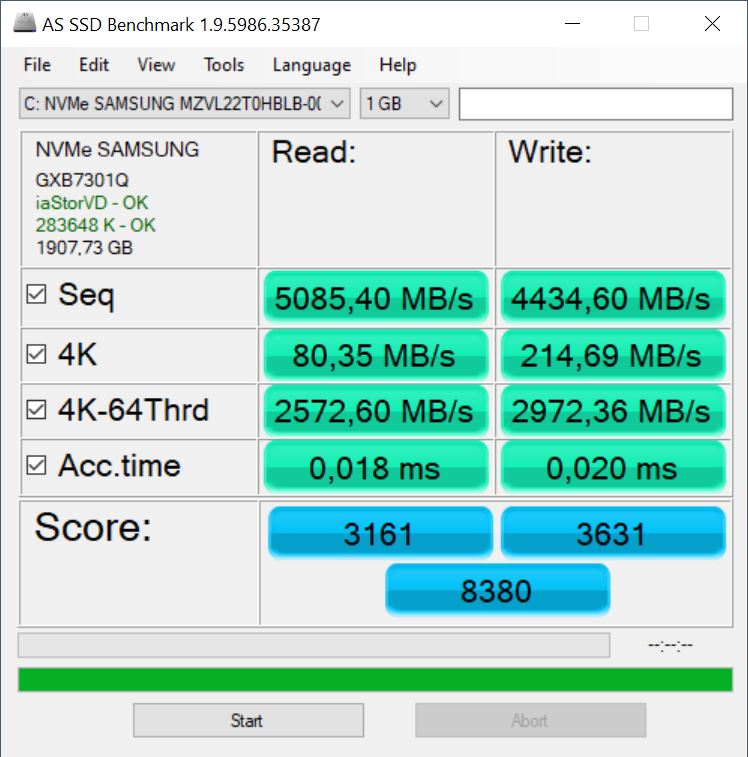
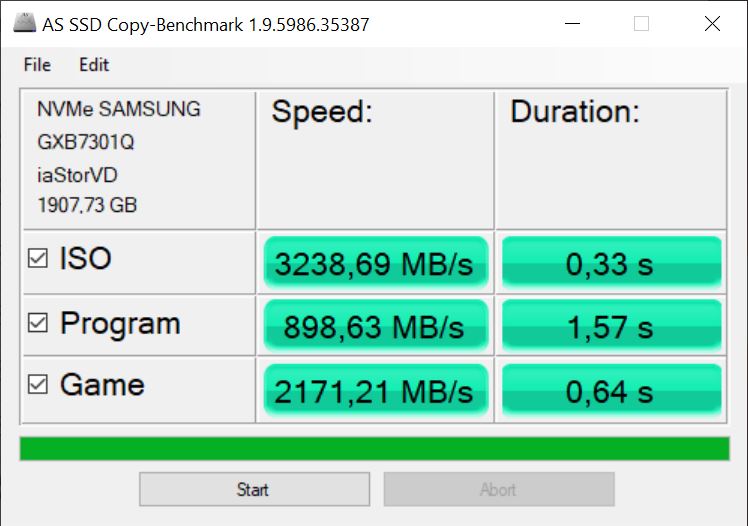
Storage
Samsung's generous 2 TB NVMe SSD ranks 6th in our HDD/SSD Benchmarks article, making it one of the fastest models available. Since the SSD in the Zephyrus also performs 10% above its average counterpart in our database, it even surpasses the competition with other Samsung models, which is good as well.
| Asus ROG Zephyrus S17 GX703HSD Samsung PM9A1 MZVL22T0HBLB | Asus Zephyrus S17 GX701LXS Samsung PM981a MZVLB1T0HBLR | Aorus 17G YD Samsung PM9A1 MZVL2512HCJQ | Gigabyte Aero 17 HDR YD Samsung PM9A1 MZVL2512HCJQ | Schenker XMG Ultra 17 Rocket Lake Samsung SSD 980 Pro 2TB MZ-V8P2T0 | MSI GE76 Raider 10UH WDC PC SN730 SDBPNTY-1T00 | Average Samsung PM9A1 MZVL22T0HBLB | |
|---|---|---|---|---|---|---|---|
| CrystalDiskMark 5.2 / 6 | -46% | -11% | 2% | 5% | -38% | -9% | |
| Write 4K (MB/s) | 244.2 | 120 -51% | 227.4 -7% | 230.4 -6% | 240 -2% | 157.1 -36% | 215 ? -12% |
| Read 4K (MB/s) | 89.8 | 45.24 -50% | 91.3 2% | 91.6 2% | 87.8 -2% | 46.3 -48% | 78.7 ? -12% |
| Write Seq (MB/s) | 2090 | 2241 | 4216 | 4281 | 2396 | 3657 ? | |
| Read Seq (MB/s) | 2246 | 4496 | 4543 | 4228 | 2245 | 3821 ? | |
| Write 4K Q32T1 (MB/s) | 607 | 392.5 -35% | 661 9% | 667 10% | 696 15% | 436.1 -28% | 572 ? -6% |
| Read 4K Q32T1 (MB/s) | 658 | 348.4 -47% | 712 8% | 728 11% | 778 18% | 524 -20% | 712 ? 8% |
| Write Seq Q32T1 (MB/s) | 5270 | 3015 -43% | 1540 -71% | 5043 -4% | 5195 -1% | 3086 -41% | 5359 ? 2% |
| Read Seq Q32T1 (MB/s) | 7091 | 3445 -51% | 6806 -4% | 6821 -4% | 7099 0% | 3363 -53% | 6846 ? -3% |
| Write 4K Q8T8 (MB/s) | 2270 | 1625 ? -28% | |||||
| Read 4K Q8T8 (MB/s) | 2490 | 2020 ? -19% | |||||
| AS SSD | -70% | -37% | -24% | -22% | -100% | -21% | |
| Seq Read (MB/s) | 5085 | 2744 -46% | 5150 1% | 5438 7% | 5010 -1% | 2967 -42% | 5454 ? 7% |
| Seq Write (MB/s) | 4434 | 1351 -70% | 3920 -12% | 3904 -12% | 3974 -10% | 2604 -41% | 3968 ? -11% |
| 4K Read (MB/s) | 80.3 | 47.24 -41% | 46.6 -42% | 56.2 -30% | 51.9 -35% | 42.97 -46% | 72 ? -10% |
| 4K Write (MB/s) | 214.7 | 109.1 -49% | 145.8 -32% | 165.8 -23% | 156.8 -27% | 107.8 -50% | 195.9 ? -9% |
| 4K-64 Read (MB/s) | 2573 | 1118 -57% | 2071 -20% | 2489 -3% | 2611 1% | 1684 -35% | 1998 ? -22% |
| 4K-64 Write (MB/s) | 2972 | 1926 -35% | 3267 10% | 3480 17% | 3859 30% | 2164 -27% | 2700 ? -9% |
| Access Time Read * (ms) | 0.018 | 0.064 -256% | 0.078 -333% | 0.054 -200% | 0.072 -300% | 0.116 -544% | 0.03461 ? -92% |
| Access Time Write * (ms) | 0.02 | 0.034 -70% | 0.029 -45% | 0.026 -30% | 0.026 -30% | 0.106 -430% | 0.03473 ? -74% |
| Score Read (Points) | 3161 | 1439 -54% | 2633 -17% | 3089 -2% | 3164 0% | 2023 -36% | 2615 ? -17% |
| Score Write (Points) | 3631 | 2170 -40% | 2805 -23% | 4036 11% | 4414 22% | 2532 -30% | 3292 ? -9% |
| Score Total (Points) | 8380 | 4283 -49% | 7716 -8% | 8620 3% | 9134 9% | 5571 -34% | 7177 ? -14% |
| Copy ISO MB/s (MB/s) | 3239 | 3190 -2% | 3424 6% | 2106 -35% | 3150 ? -3% | ||
| Copy Program MB/s (MB/s) | 899 | 987 10% | 1091 21% | 687 -24% | 747 ? -17% | ||
| Copy Game MB/s (MB/s) | 2171 | 2096 -3% | 2365 9% | 1590 -27% | 1803 ? -17% | ||
| Total Average (Program / Settings) | -58% /
-61% | -24% /
-29% | -11% /
-15% | -9% /
-14% | -69% /
-81% | -15% /
-17% |
* ... smaller is better

Continuous load read: DiskSpd Read Loop, Queue Depth 8
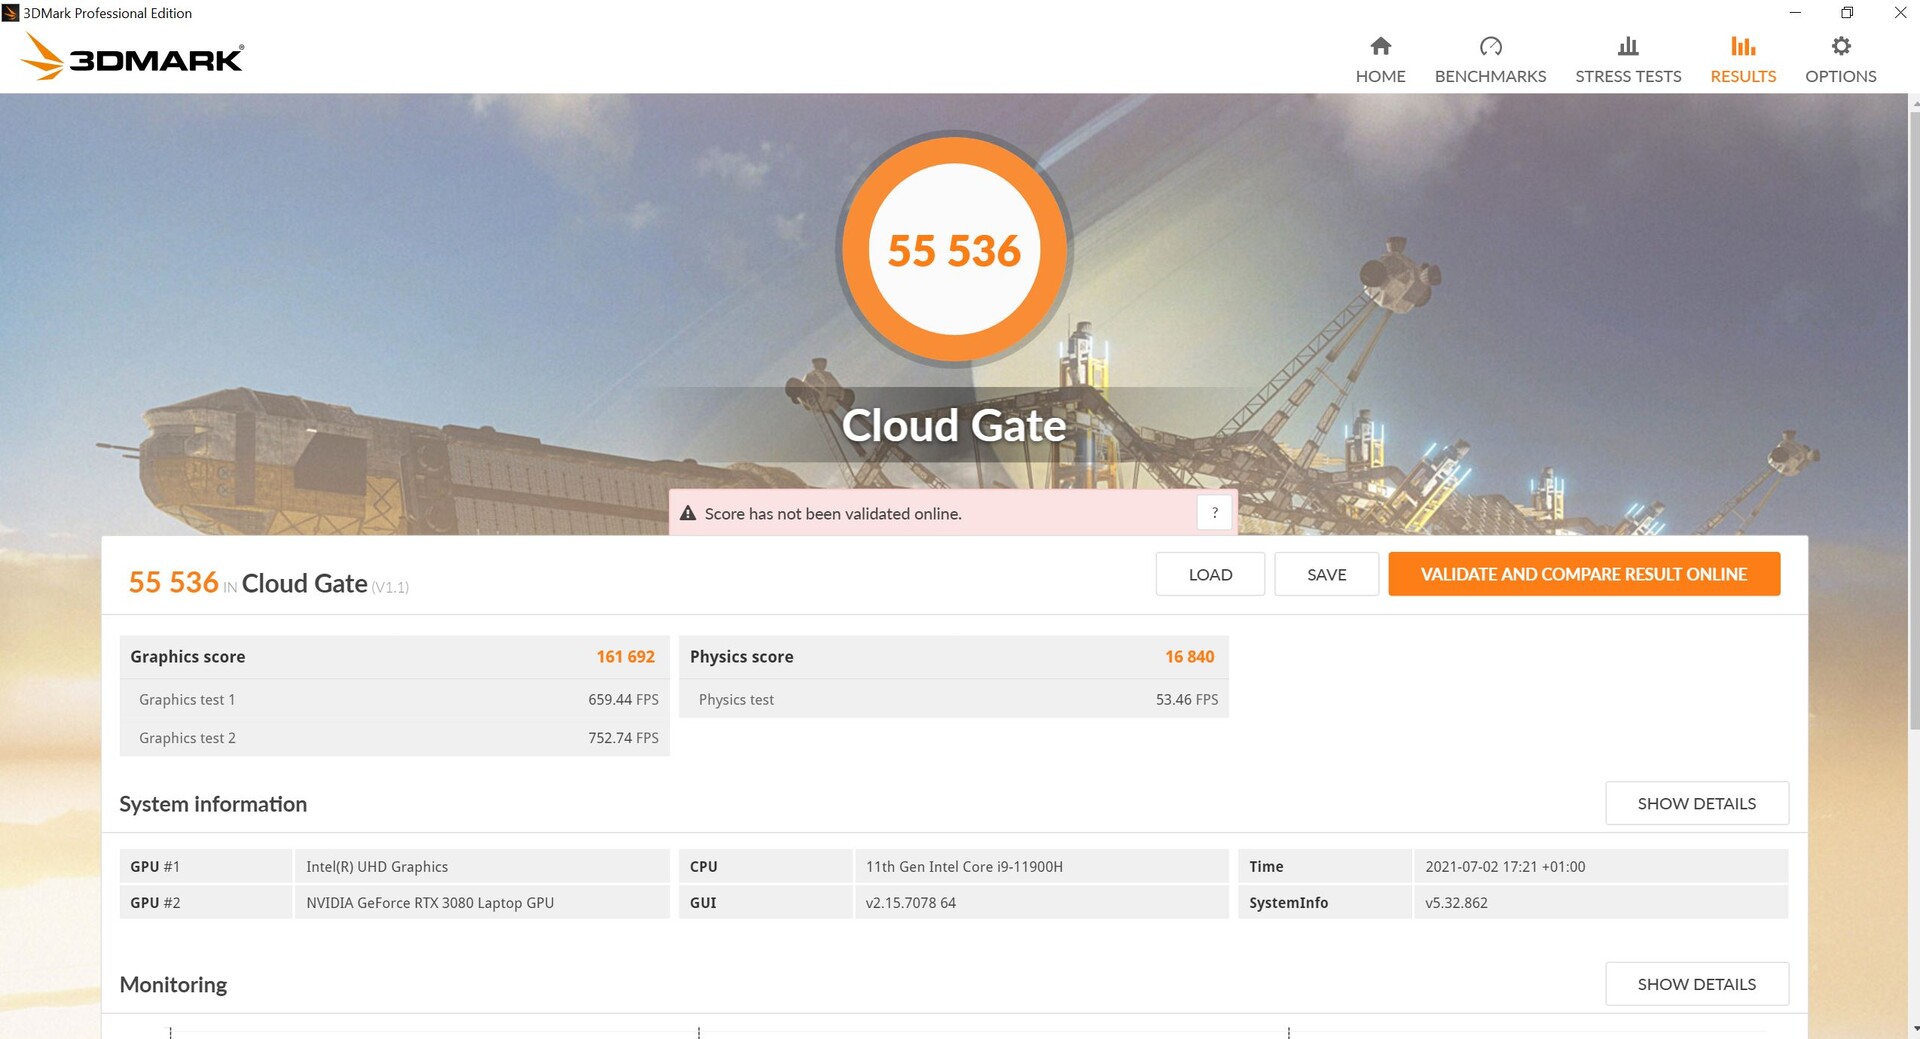
Graphics card
An RTX 3080 laptop GPU can run at a maximum of 165 watts, but Asus "only" allows 140 watts in the S17.
In the synthetic 3DMark benchmarks, the GPU in the S17 performs close to the expected level, perhaps marginally better.
On battery power, 3D performance drops sharply as well, but this isn't unusual for gaming devices. Instead of around 38,000 points in 3DMark 11, we only get 16,164 points on the go.
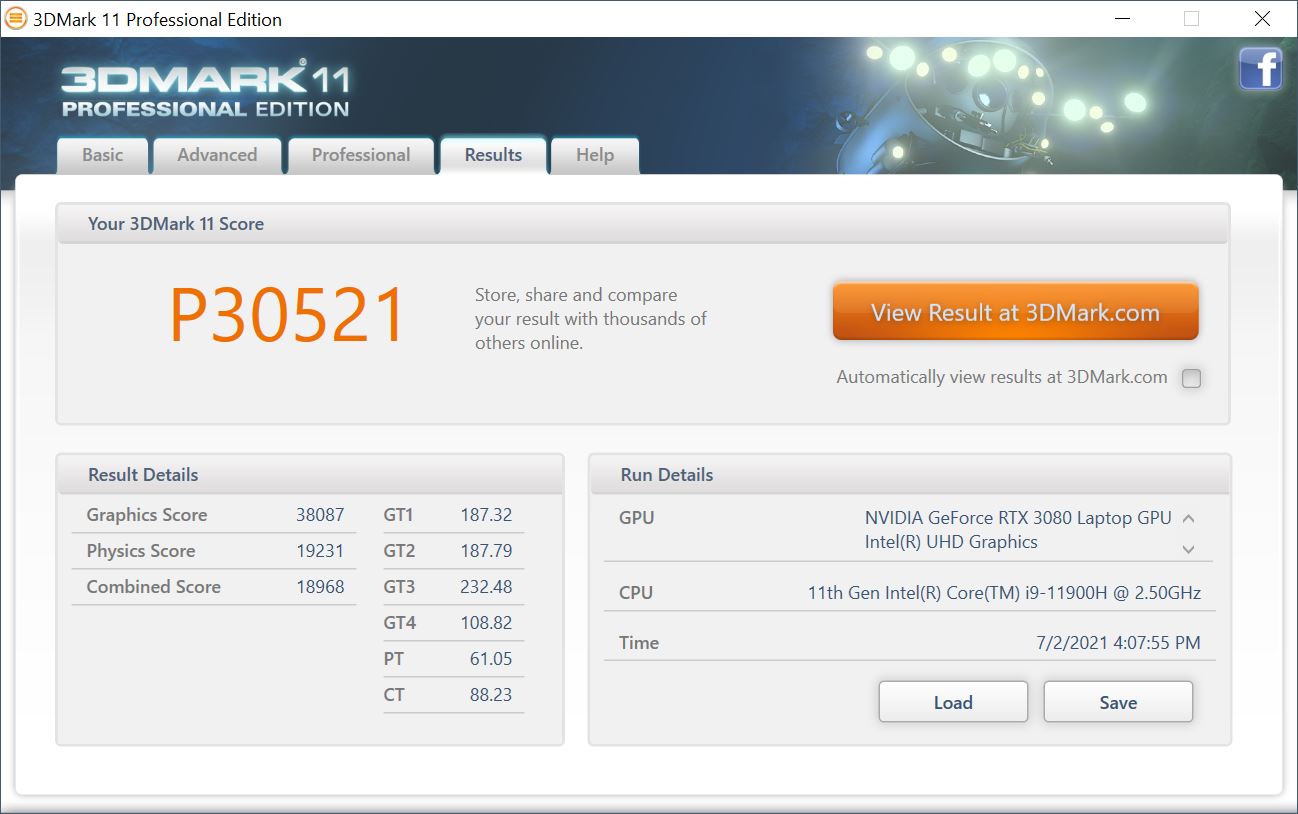
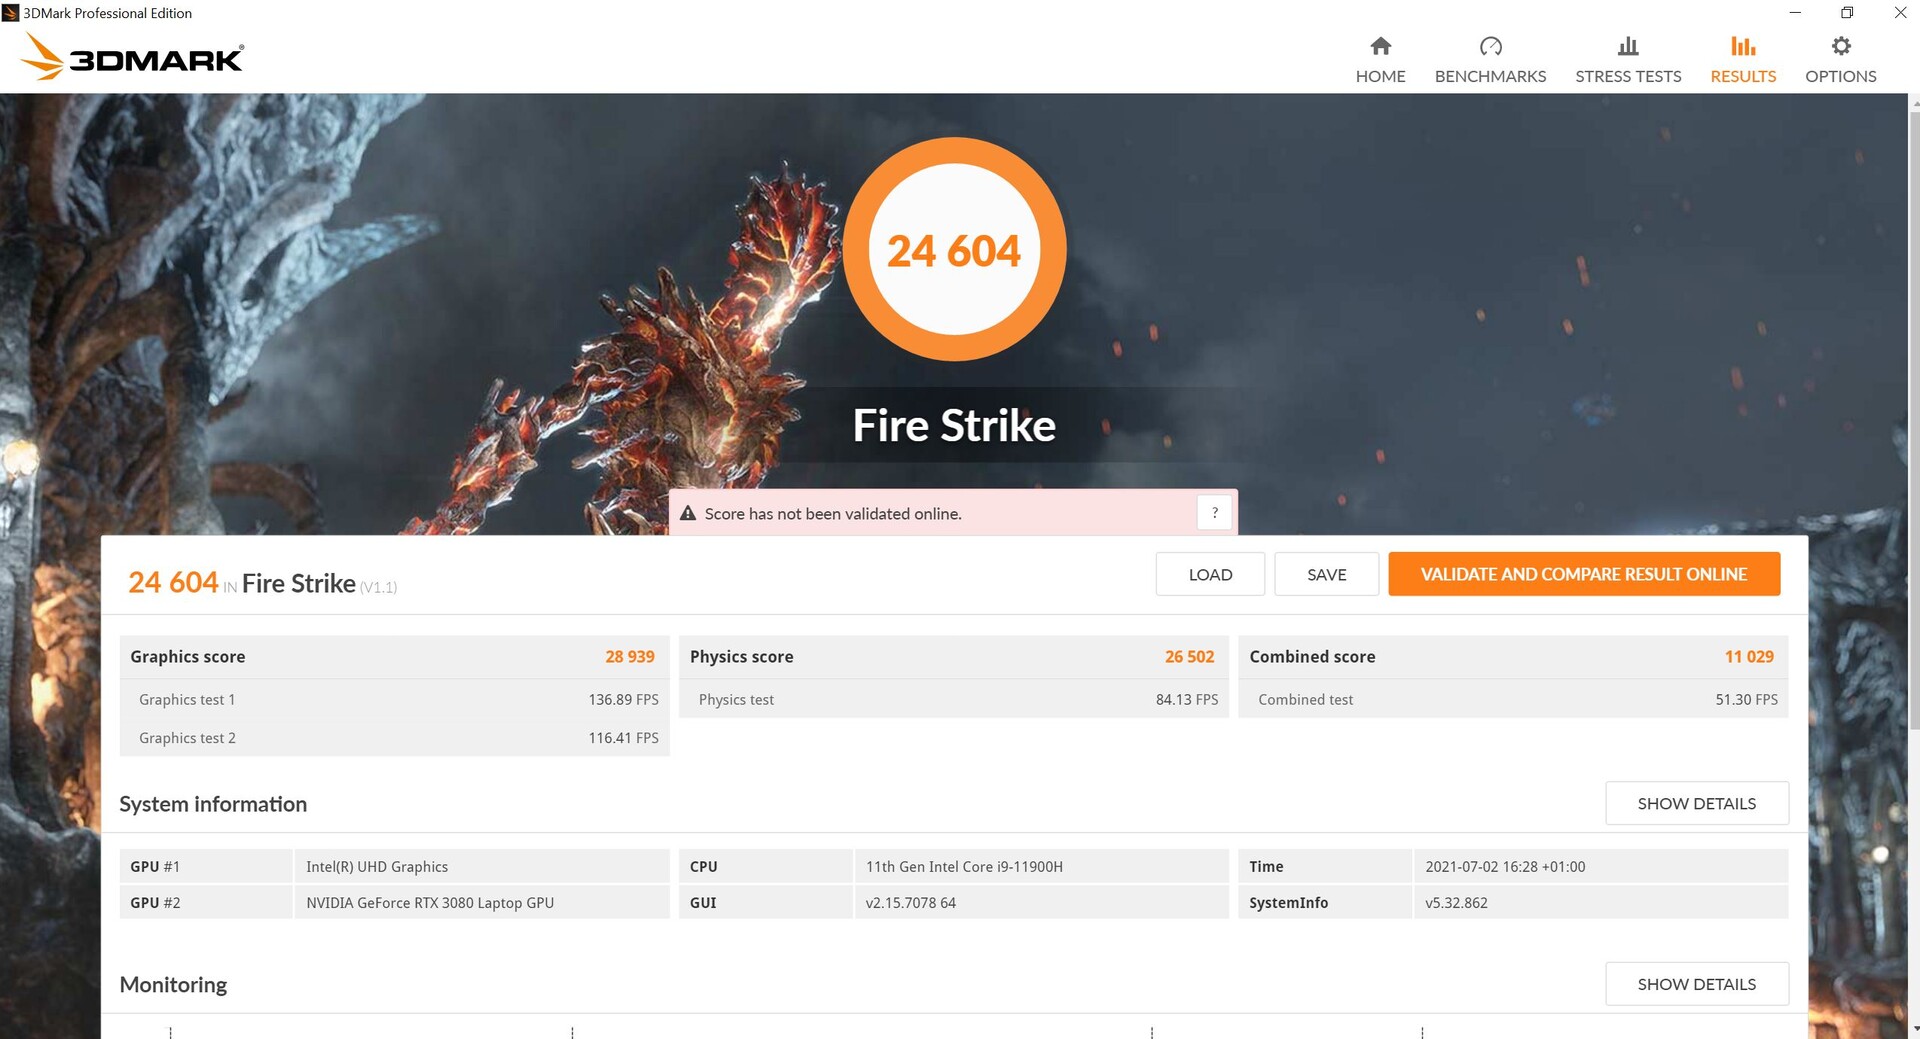
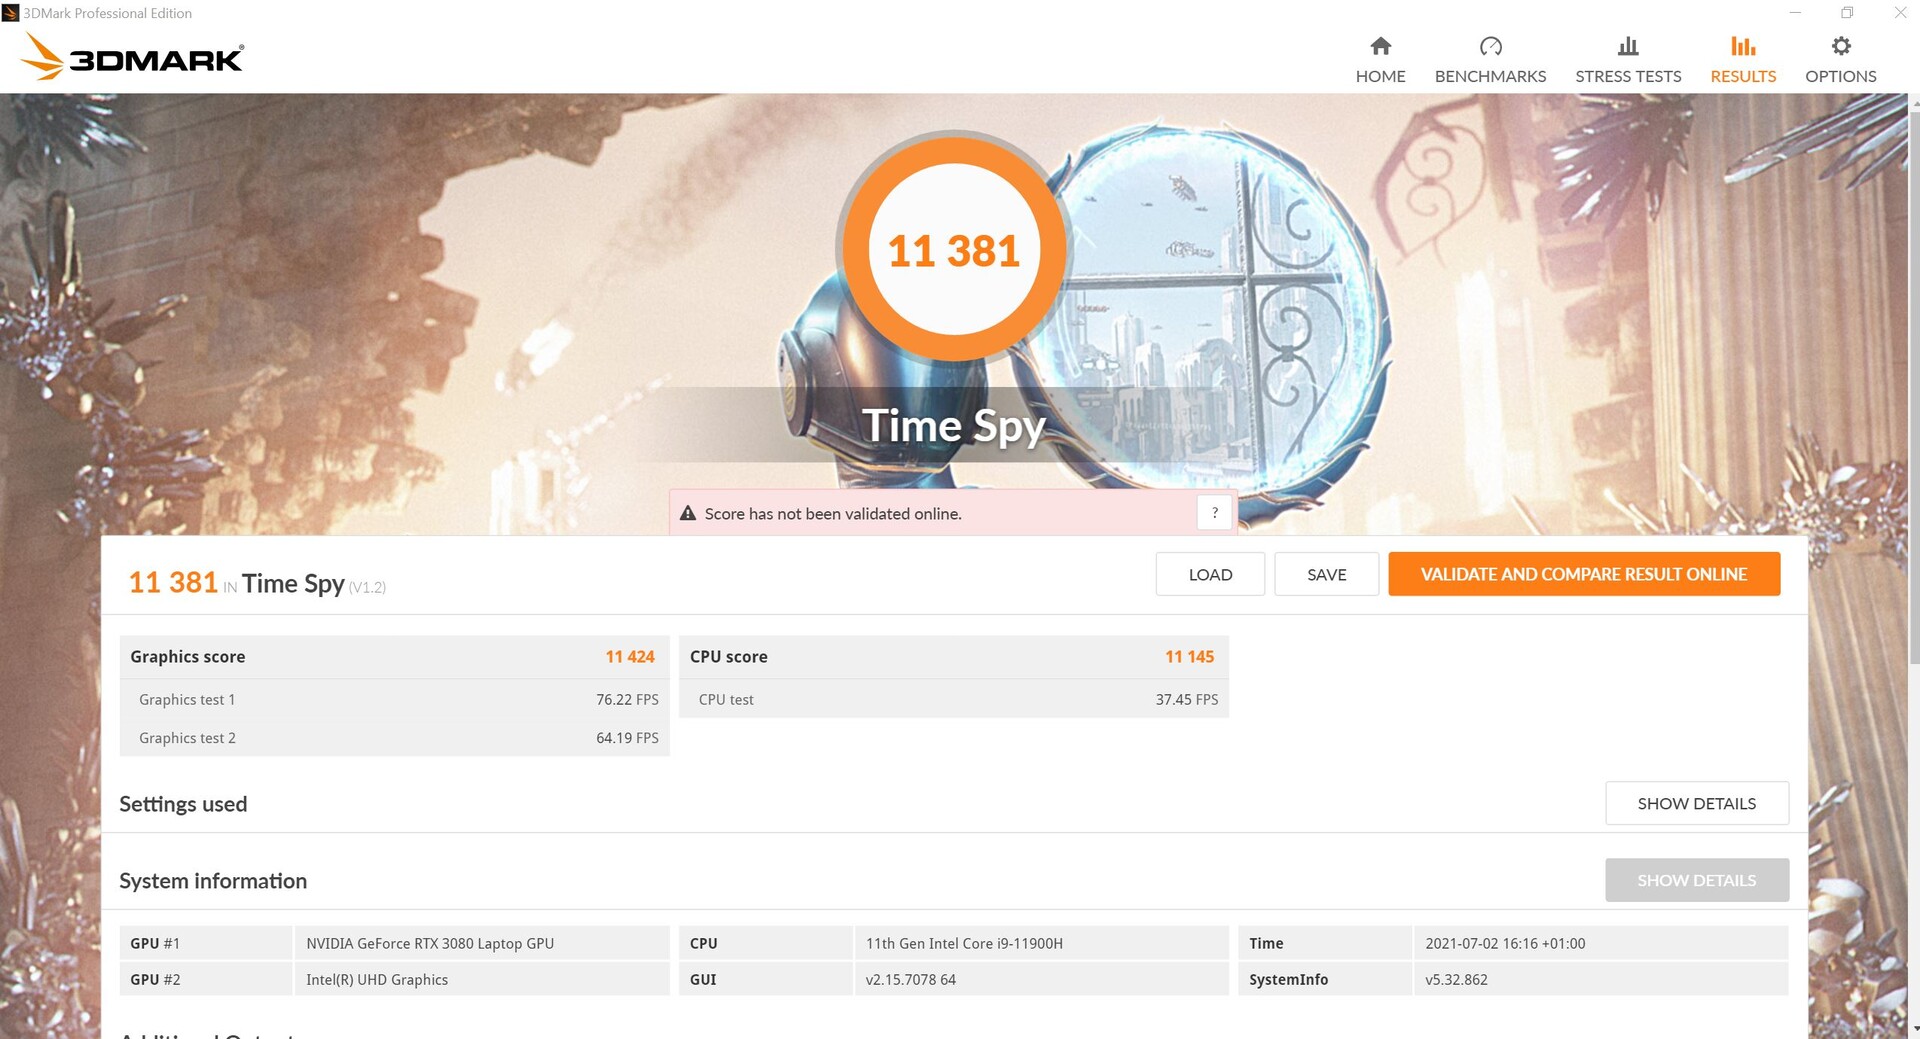
| 3DMark 11 Performance | 30521 points | |
| 3DMark Cloud Gate Standard Score | 55536 points | |
| 3DMark Fire Strike Score | 24604 points | |
| 3DMark Time Spy Score | 11381 points | |
Help | ||
Gaming performance
At Full HD, for example, The Witcher 3 runs consistently at over 100 fps even in Ultra settings, and 76 fps is still reached in the native WQHD resolution.
While the XMG Ultra 17 is faster, the Zephyrus goes head-to-head with the MSI and its 155-watt RTX 3080. The MSI is mostly ahead in The Witcher 3, but the S17 is about 5% faster in Far Cry 5.
| Shadow of the Tomb Raider | |
| 1920x1080 Lowest Preset | |
| Schenker XMG Ultra 17 Rocket Lake | |
| Average NVIDIA GeForce RTX 3080 Laptop GPU (117 - 178.7, n=8) | |
| Asus ROG Zephyrus S17 GX703HSD | |
| 1920x1080 Medium Preset | |
| Schenker XMG Ultra 17 Rocket Lake | |
| Asus ROG Zephyrus S17 GX703HSD | |
| Average NVIDIA GeForce RTX 3080 Laptop GPU (81.6 - 164, n=12) | |
| 1920x1080 High Preset AA:SM | |
| Schenker XMG Ultra 17 Rocket Lake | |
| Average of class Gaming (n=1last 2 years) | |
| Asus ROG Zephyrus S17 GX703HSD | |
| Average NVIDIA GeForce RTX 3080 Laptop GPU (79.4 - 160, n=13) | |
| 1920x1080 Highest Preset AA:T | |
| Average of class Gaming (131 - 212, n=2, last 2 years) | |
| Schenker XMG Ultra 17 Rocket Lake | |
| Asus ROG Zephyrus S17 GX703HSD | |
| Average NVIDIA GeForce RTX 3080 Laptop GPU (76.6 - 151, n=13) | |
The Zephyrus runs through our The Witcher 3 loop for an hour with a constantly high frame rate without any issues. Throttling isn't noticeable during this period.
The Witcher 3 FPS diagram
| low | med. | high | ultra | QHD | |
|---|---|---|---|---|---|
| GTA V (2015) | 186 | 181 | 176 | 112 | |
| The Witcher 3 (2015) | 398.5 | 293.2 | 197.1 | 112 | |
| Dota 2 Reborn (2015) | 176 | 82.7 | 148 | 138 | |
| Final Fantasy XV Benchmark (2018) | 144 | ||||
| X-Plane 11.11 (2018) | 142 | 132 | 102 | ||
| Far Cry 5 (2018) | 174 | 139 | 134 | 125 | 103 |
| Strange Brigade (2018) | 471 | 253 | 210 | 186 | |
| Shadow of the Tomb Raider (2018) | 159 | 141 | 138 | 128 | 98 |
Emissions - Quiet, but with background noise
The emissions should show whether the case opening is beneficial: Does the unusual design keep the S17 quieter and cooler than other gaming laptops with the same hardware?
Noise emissions
As a matter of fact, the fans usually remain silent in idle usage, even in High Performance mode and at full brightness. The competition is usually audibly louder here. Under average load, the rivals are only slightly louder than the Zephyrus S17, but our test model remains significantly quieter than most competitors in The Witcher 3 or in the stress test. Only the MSI can keep up in terms of noise across all conditions - even without the case opening, and with comparable performance.
When the laptop switches from idle usage to average load, the fans tend to throb. For example, the fans are still quiet at the beginning of 3DMark 06. Due to the load, they start spinning after about a minute, but not in a uniform manner with a slight increase over time; instead, the number of revolutions pulsates annoyingly in a multi-second interval. Only after a while do the fans finally rotate constantly.
What's really annoying, however, is the electronic noise that plagues users of the Zephyrus and varies based on the applied load. Mostly, this manifests itself in buzzing sounds that are by no means quiet; at times, they are low, but most of the time, they are high-pitched. There's no buzzing during light office work, and the SSD doesn't seem to be affected. The irritating noise under load might be caused by the graphics card.
Noise level
| Idle |
| 23 / 23 / 23 dB(A) |
| Load |
| 41 / 52 dB(A) |
 | ||
30 dB silent 40 dB(A) audible 50 dB(A) loud |
||
min: | ||
| Asus ROG Zephyrus S17 GX703HSD GeForce RTX 3080 Laptop GPU, i9-11900H, Samsung PM9A1 MZVL22T0HBLB | Asus Zephyrus S17 GX701LXS GeForce RTX 2080 Super Max-Q, i7-10875H, Samsung PM981a MZVLB1T0HBLR | Aorus 17G YD GeForce RTX 3080 Laptop GPU, i7-11800H, Samsung PM9A1 MZVL2512HCJQ | Gigabyte Aero 17 HDR YD GeForce RTX 3080 Laptop GPU, i9-11980HK, Samsung PM9A1 MZVL2512HCJQ | Schenker XMG Ultra 17 Rocket Lake GeForce RTX 3080 Laptop GPU, i9-11900K, Samsung SSD 980 Pro 2TB MZ-V8P2T0 | MSI GE76 Raider 10UH GeForce RTX 3080 Laptop GPU, i7-10870H, WDC PC SN730 SDBPNTY-1T00 | |
|---|---|---|---|---|---|---|
| Noise | -25% | -28% | -27% | -47% | -4% | |
| off / environment * (dB) | 23 | 25 -9% | 25 -9% | 25 -9% | 24 -4% | 25.3 -10% |
| Idle Minimum * (dB) | 23 | 32 -39% | 32 -39% | 30 -30% | 30 -30% | 26.1 -13% |
| Idle Average * (dB) | 23 | 35 -52% | 33 -43% | 32 -39% | 31 -35% | 26.1 -13% |
| Idle Maximum * (dB) | 23 | 43 -87% | 39 -70% | 41 -78% | 57 -148% | 26.1 -13% |
| Load Average * (dB) | 41 | 44 -7% | 43 -5% | 43 -5% | 63 -54% | 37.2 9% |
| Witcher 3 ultra * (dB) | 45 | 41 9% | 52 -16% | 51 -13% | 61 -36% | 36.8 18% |
| Load Maximum * (dB) | 52 | 45 13% | 61 -17% | 59 -13% | 63 -21% | 56.9 -9% |
* ... smaller is better
Temperature
So is the S17 cooler than the competition? Not really! It's hardly surprising that the laptop heats up a bit more than the competition in idle usage, considering that the fans are mostly inactive here. However, the S17 can't really demonstrate its supposed design advantages under load, even with fully active fans. Although the fans remain quieter than those of the competition (except for MSI), the temperatures tend to be a bit higher in return.
At the top, the hotspots are mainly towards the display, where hot air is emitted. Here, the LED control bar between the base unit and the display heats up to 59 °C (~138 °F). However, the surface at the keyboard remains cooler (about 53 °C (~127 °F)). A maximum of 53 °C (~127 °F) is reached at the bottom, but this isn't outdone by the competition, either. The palm rests already get noticeably warm in idle mode at 30 °C (~86 °F) due to the inactive fans. Under full load, though, the temperature in these areas is kept within limits, and the WASD key area remains within an acceptable range as well.
(-) The maximum temperature on the upper side is 59 °C / 138 F, compared to the average of 40.4 °C / 105 F, ranging from 21.2 to 68.8 °C for the class Gaming.
(-) The bottom heats up to a maximum of 53 °C / 127 F, compared to the average of 43.3 °C / 110 F
(±) In idle usage, the average temperature for the upper side is 32.4 °C / 90 F, compared to the device average of 33.9 °C / 93 F.
(-) Playing The Witcher 3, the average temperature for the upper side is 41.8 °C / 107 F, compared to the device average of 33.9 °C / 93 F.
(±) The palmrests and touchpad can get very hot to the touch with a maximum of 39 °C / 102.2 F.
(-) The average temperature of the palmrest area of similar devices was 28.9 °C / 84 F (-10.1 °C / -18.2 F).
| Asus ROG Zephyrus S17 GX703HSD GeForce RTX 3080 Laptop GPU, i9-11900H, Samsung PM9A1 MZVL22T0HBLB | Asus Zephyrus S17 GX701LXS GeForce RTX 2080 Super Max-Q, i7-10875H, Samsung PM981a MZVLB1T0HBLR | Aorus 17G YD GeForce RTX 3080 Laptop GPU, i7-11800H, Samsung PM9A1 MZVL2512HCJQ | Gigabyte Aero 17 HDR YD GeForce RTX 3080 Laptop GPU, i9-11980HK, Samsung PM9A1 MZVL2512HCJQ | Schenker XMG Ultra 17 Rocket Lake GeForce RTX 3080 Laptop GPU, i9-11900K, Samsung SSD 980 Pro 2TB MZ-V8P2T0 | MSI GE76 Raider 10UH GeForce RTX 3080 Laptop GPU, i7-10870H, WDC PC SN730 SDBPNTY-1T00 | |
|---|---|---|---|---|---|---|
| Heat | 12% | 16% | 7% | 10% | 11% | |
| Maximum Upper Side * (°C) | 59 | 57 3% | 36 39% | 44 25% | 34 42% | 41 31% |
| Maximum Bottom * (°C) | 53 | 51 4% | 52 2% | 56 -6% | 43 19% | 48.8 8% |
| Idle Upper Side * (°C) | 35 | 28 20% | 29 17% | 32 9% | 38 -9% | 31.8 9% |
| Idle Bottom * (°C) | 35 | 28 20% | 33 6% | 35 -0% | 39 -11% | 36 -3% |
* ... smaller is better
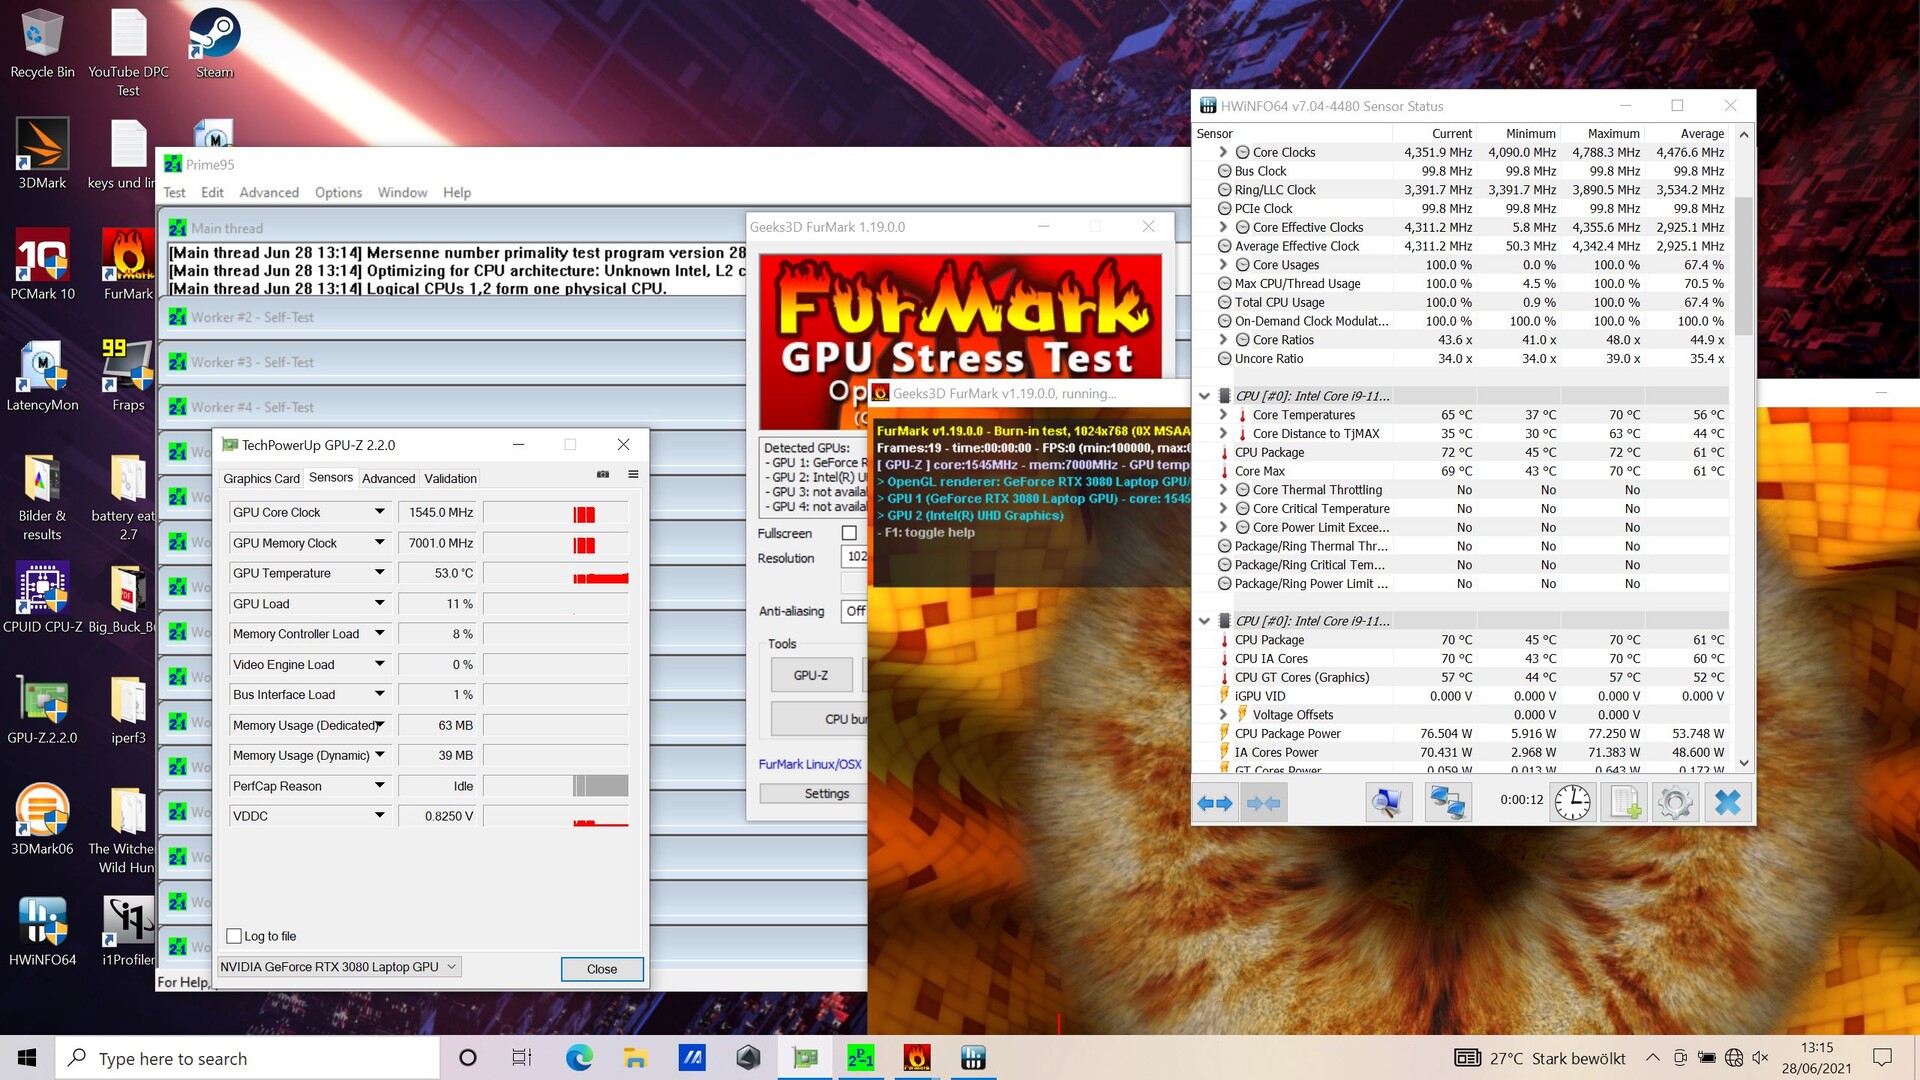
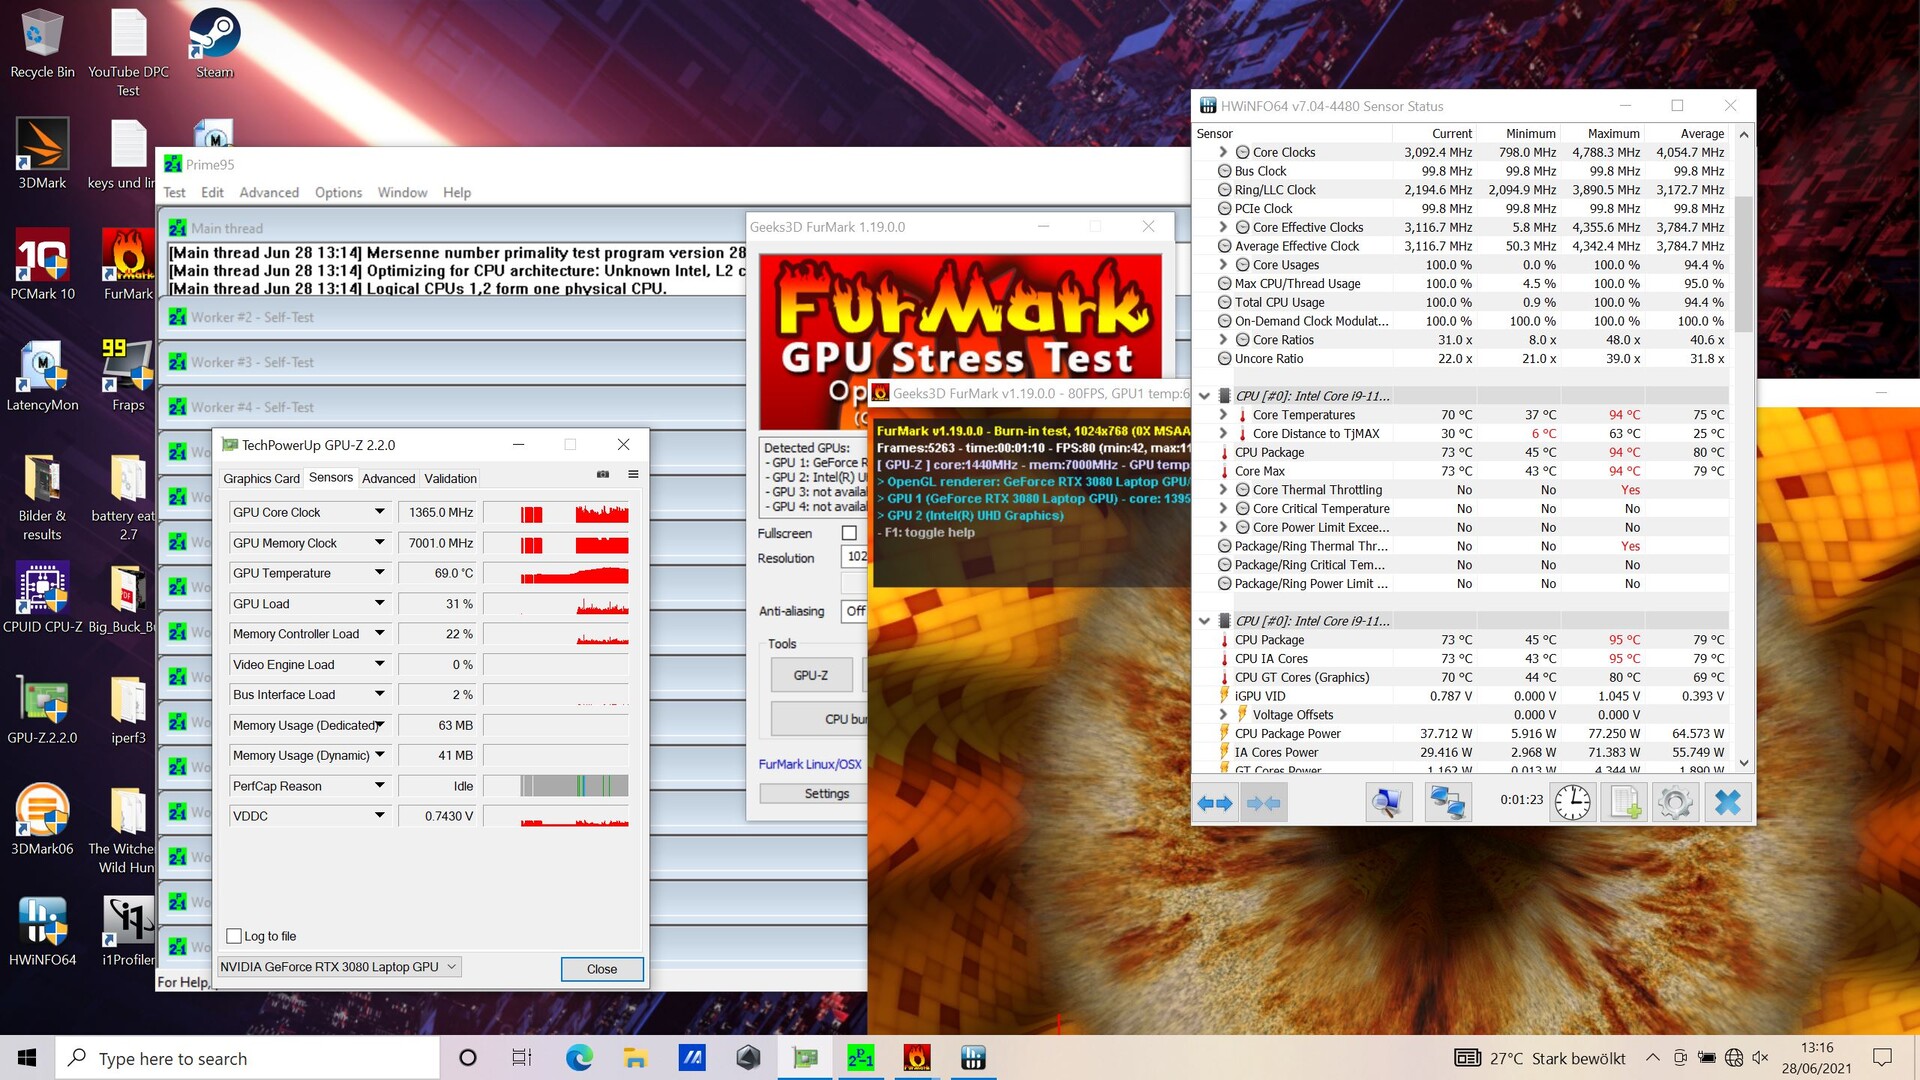
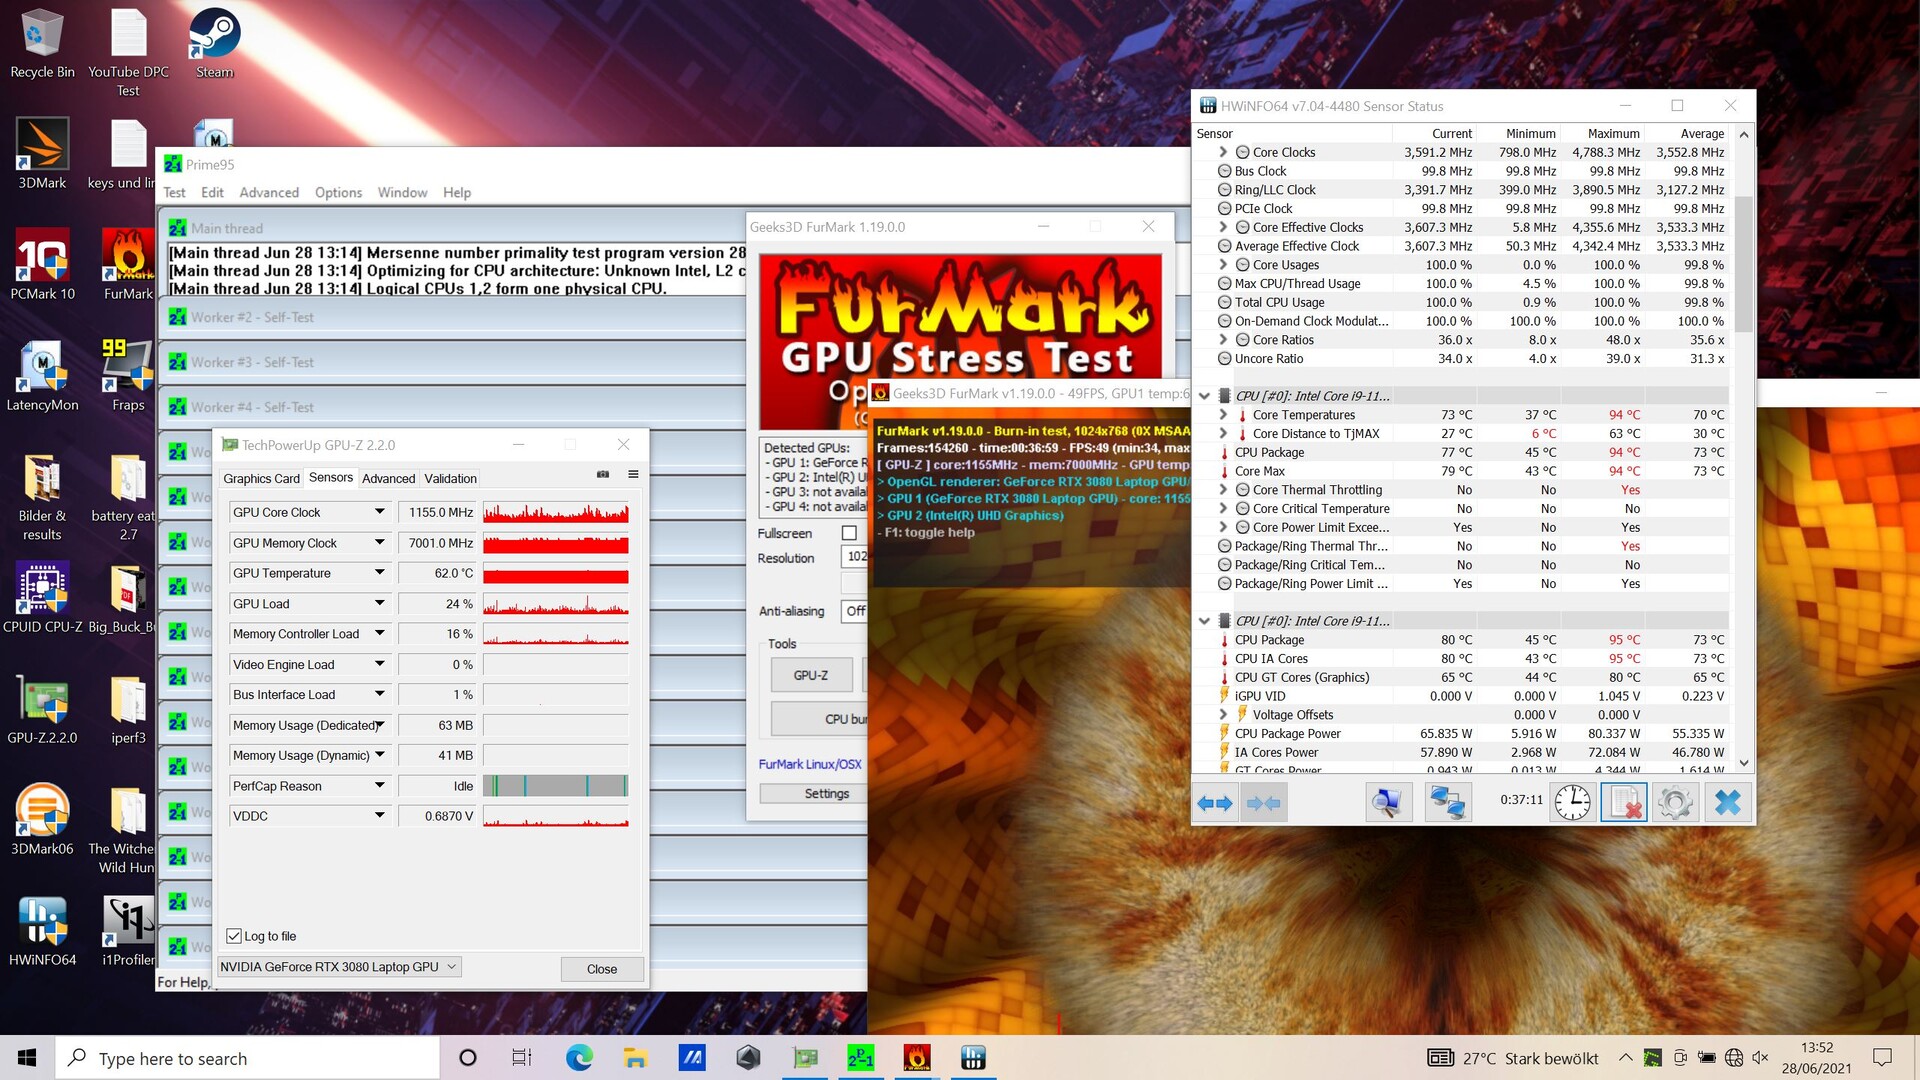
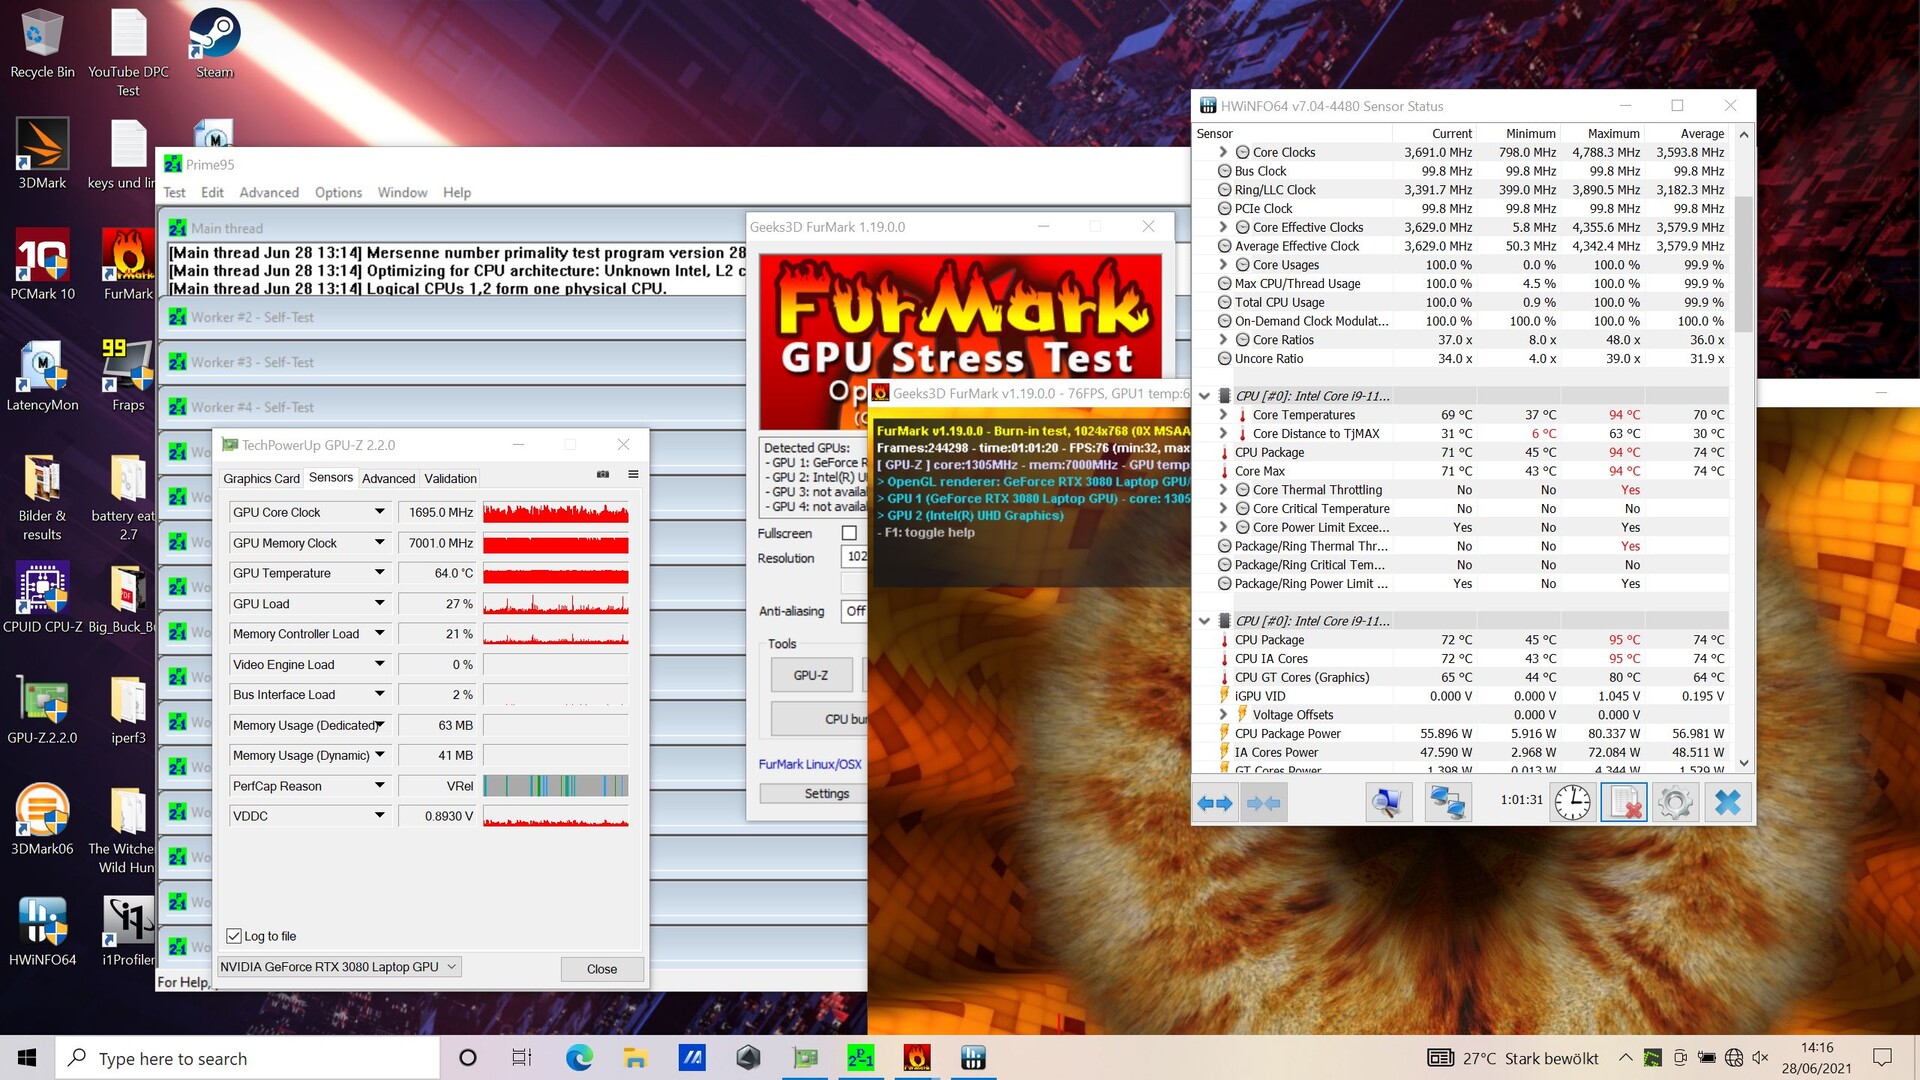
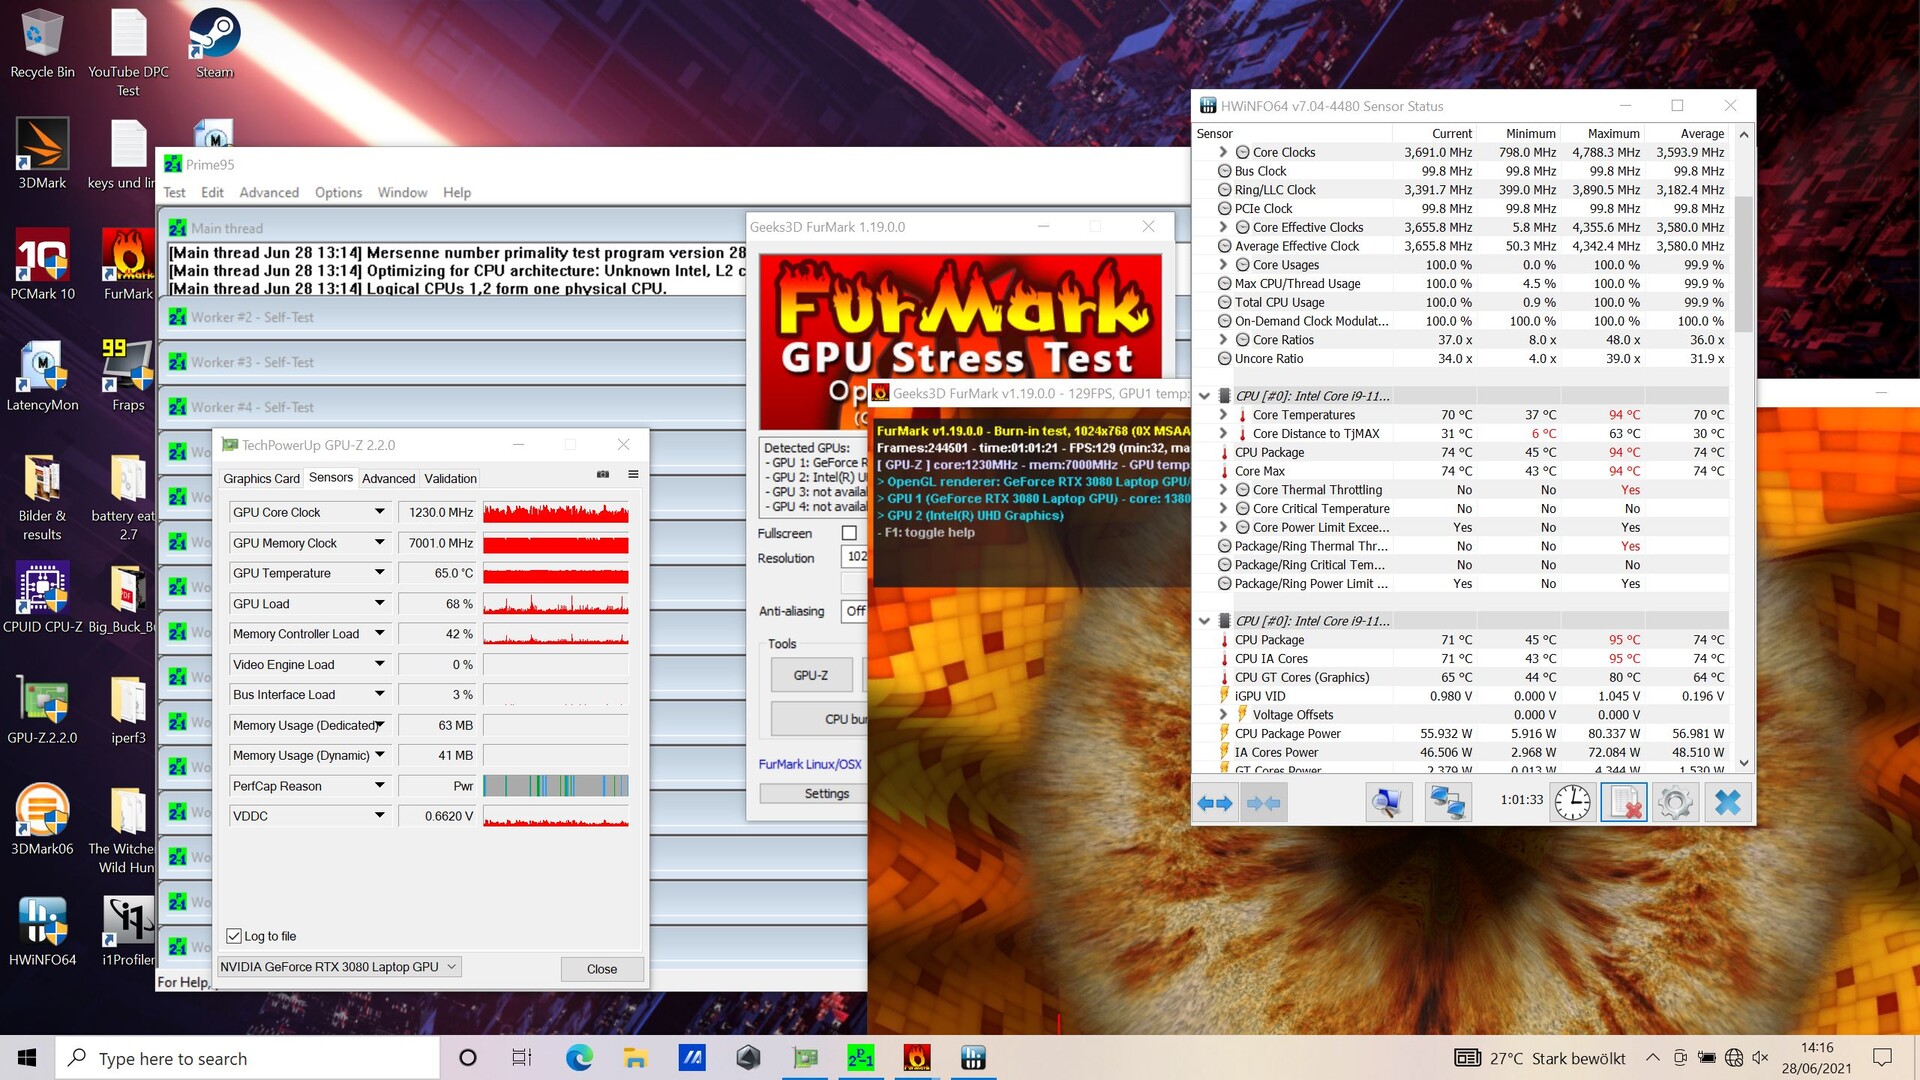
The Zephyrus starts our one-hour stress test at around 4.3 to 4.4 GHz on all cores, which corresponds to the maximum Turbo clock speed. However, the core temperatures rise quite quickly to over 90 °C (~194 °F), after which the clock rates are throttled and consequently drop. At the same time, the clock rate never drops below 3 GHZ, but it oscillates in the range of 3 to 3.6 GHz afterwards.
The GPU clock speed fluctuates even more sharply. It starts at around 1.7 GHz, but it decreases very quickly and then oscillates extremely between 960 MHz and 1.6 GHz.

Speakers
The speakers in the S17 could gladly be a bit louder, but otherwise, though, they offer well-balanced mids and trebles. In addition, unlike in most other laptops, bass is definitely present, making the speakers sound pretty good and balanced overall. External audio devices can be connected via the headset jack.
Asus ROG Zephyrus S17 GX703HSD audio analysis
(±) | speaker loudness is average but good (74.2 dB)
Bass 100 - 315 Hz
(+) | good bass - only 3.6% away from median
(±) | linearity of bass is average (7.3% delta to prev. frequency)
Mids 400 - 2000 Hz
(+) | balanced mids - only 1.1% away from median
(+) | mids are linear (2.6% delta to prev. frequency)
Highs 2 - 16 kHz
(+) | balanced highs - only 3.3% away from median
(+) | highs are linear (4% delta to prev. frequency)
Overall 100 - 16.000 Hz
(+) | overall sound is linear (8.1% difference to median)
Compared to same class
» 1% of all tested devices in this class were better, 1% similar, 98% worse
» The best had a delta of 6%, average was 18%, worst was 132%
Compared to all devices tested
» 1% of all tested devices were better, 1% similar, 98% worse
» The best had a delta of 4%, average was 24%, worst was 134%
MSI GE76 Raider 10UH audio analysis
(+) | speakers can play relatively loud (85.6 dB)
Bass 100 - 315 Hz
(-) | nearly no bass - on average 15.6% lower than median
(±) | linearity of bass is average (10.7% delta to prev. frequency)
Mids 400 - 2000 Hz
(+) | balanced mids - only 3.6% away from median
(+) | mids are linear (2.7% delta to prev. frequency)
Highs 2 - 16 kHz
(+) | balanced highs - only 3.7% away from median
(+) | highs are linear (5.4% delta to prev. frequency)
Overall 100 - 16.000 Hz
(+) | overall sound is linear (12.3% difference to median)
Compared to same class
» 13% of all tested devices in this class were better, 4% similar, 82% worse
» The best had a delta of 6%, average was 18%, worst was 132%
Compared to all devices tested
» 10% of all tested devices were better, 2% similar, 88% worse
» The best had a delta of 4%, average was 24%, worst was 134%
Energy management - Great battery life
Energy consumption
There are hardly any surprises in terms of energy consumption, which is in line with the class average. Due to the higher-resolution display, the S17 consumes more than its predecessor in idle usage, but that isn't necessarily the case under load, despite the more powerful hardware.
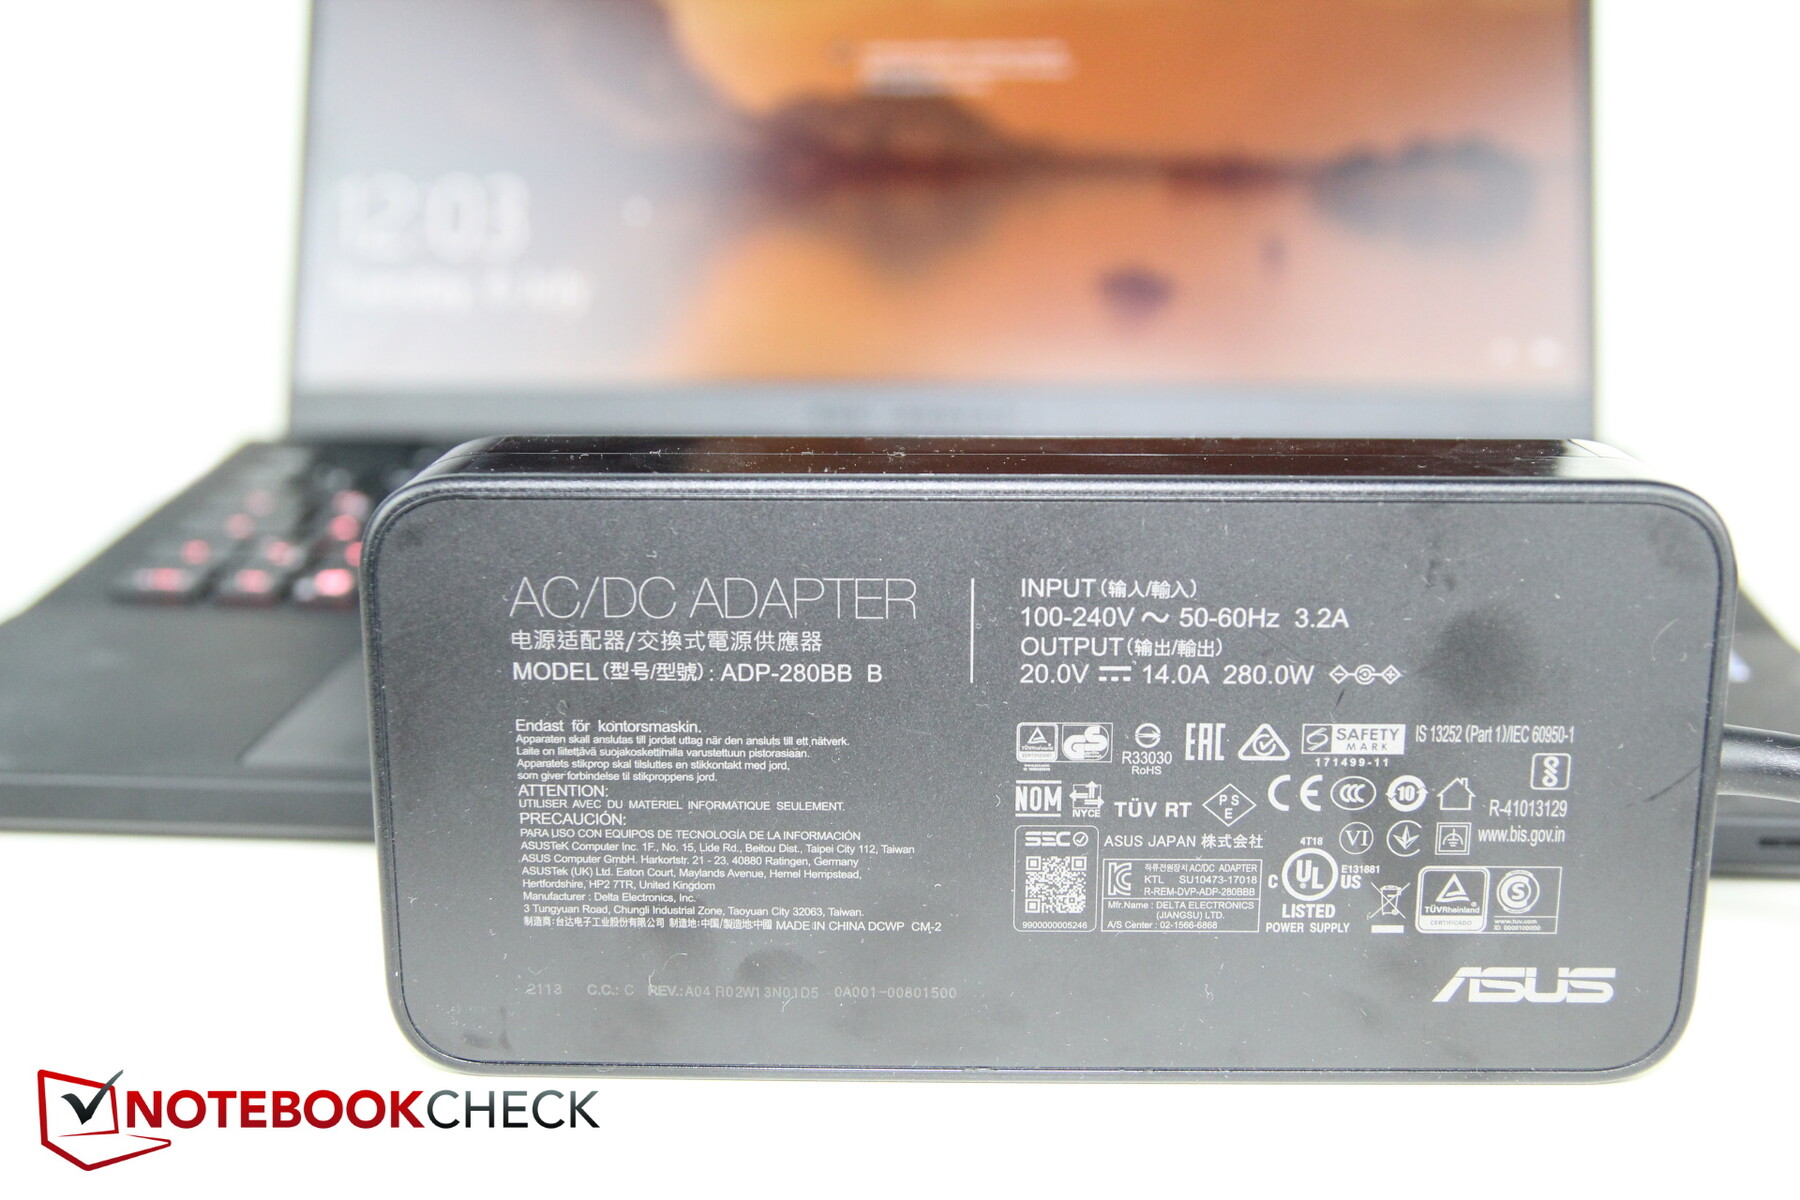
We measure a maximum consumption of 210 watts, which should be handled easily by the rather bulky 280-watt power adapter (~18 x 8.5 x 3.5 cm/~7.1 x 3.4 x 1.4 in).
| Off / Standby | |
| Idle | |
| Load |
|
Key:
min: | |
| Asus ROG Zephyrus S17 GX703HSD i9-11900H, GeForce RTX 3080 Laptop GPU, Samsung PM9A1 MZVL22T0HBLB, IPS, 2560x1440, 17.3" | Asus Zephyrus S17 GX701LXS i7-10875H, GeForce RTX 2080 Super Max-Q, Samsung PM981a MZVLB1T0HBLR, IPS, 1920x1080, 17.3" | Aorus 17G YD i7-11800H, GeForce RTX 3080 Laptop GPU, Samsung PM9A1 MZVL2512HCJQ, IPS, 1920x1080, 17.3" | Gigabyte Aero 17 HDR YD i9-11980HK, GeForce RTX 3080 Laptop GPU, Samsung PM9A1 MZVL2512HCJQ, IPS, 3840x2160, 17.3" | Schenker XMG Ultra 17 Rocket Lake i9-11900K, GeForce RTX 3080 Laptop GPU, Samsung SSD 980 Pro 2TB MZ-V8P2T0, IPS, 1920x1080, 17.3" | MSI GE76 Raider 10UH i7-10870H, GeForce RTX 3080 Laptop GPU, WDC PC SN730 SDBPNTY-1T00, IPS, 1920x1080, 17.3" | Average NVIDIA GeForce RTX 3080 Laptop GPU | Average of class Gaming | |
|---|---|---|---|---|---|---|---|---|
| Power Consumption | 17% | -2% | -8% | -105% | -2% | 2% | 12% | |
| Idle Minimum * (Watt) | 21.7 | 10 54% | 24 -11% | 25 -15% | 62 -186% | 15.5 29% | 19.8 ? 9% | 13.6 ? 37% |
| Idle Average * (Watt) | 27 | 16 41% | 26 4% | 28 -4% | 64 -137% | 31.3 -16% | 24.3 ? 10% | 19.5 ? 28% |
| Idle Maximum * (Watt) | 33 | 29 12% | 38 -15% | 40 -21% | 69 -109% | 31.7 4% | 33.3 ? -1% | 26.1 ? 21% |
| Load Average * (Watt) | 108 | 143 -32% | 101 6% | 114 -6% | 183 -69% | 93.6 13% | 108.1 ? -0% | 110.9 ? -3% |
| Witcher 3 ultra * (Watt) | 195 | 146 25% | 164 16% | 176 10% | 297 -52% | 233 -19% | ||
| Load Maximum * (Watt) | 210 | 205 2% | 230 -10% | 236 -12% | 368 -75% | 260.3 -24% | 230 ? -10% | 262 ? -25% |
* ... smaller is better
Battery life
The battery in the S17 has a capacity of 90 Wh, while the competition has even bigger batteries. Nevertheless, our S17 lasts longer in most tests. Depending on the brightness level, it lasts between 6.5 and 7.5 hours in the Wi-Fi test. Video playback time can also be estimated at just over 7 hours; the competition is worse without exception here.
| Asus ROG Zephyrus S17 GX703HSD i9-11900H, GeForce RTX 3080 Laptop GPU, 90 Wh | Asus Zephyrus S17 GX701LXS i7-10875H, GeForce RTX 2080 Super Max-Q, 76 Wh | Aorus 17G YD i7-11800H, GeForce RTX 3080 Laptop GPU, 99 Wh | Gigabyte Aero 17 HDR YD i9-11980HK, GeForce RTX 3080 Laptop GPU, 99 Wh | Schenker XMG Ultra 17 Rocket Lake i9-11900K, GeForce RTX 3080 Laptop GPU, 97 Wh | MSI GE76 Raider 10UH i7-10870H, GeForce RTX 3080 Laptop GPU, 99.9 Wh | Average of class Gaming | |
|---|---|---|---|---|---|---|---|
| Battery runtime | -54% | -25% | -41% | -70% | -27% | -12% | |
| H.264 (h) | 7.2 | 6.2 -14% | 1.9 -74% | 8.1 ? 13% | |||
| WiFi v1.3 (h) | 7.5 | 2.8 -63% | 6 -20% | 5.6 -25% | 1.8 -76% | 6.3 -16% | 6.71 ? -11% |
| Witcher 3 ultra (h) | 1 | 0.958 ? -4% | |||||
| Load (h) | 2.7 | 1.5 -44% | 1.6 -41% | 1.2 -56% | 1.1 -59% | 1.7 -37% | 1.435 ? -47% |
| Reader / Idle (h) | 3.5 | 9 | 3 | 8.2 | 9.99 ? |
Pros
Cons
Verdict - Good gaming laptop with uncertain future
In conclusion, it still remains difficult to assess what the unusual opening in the case ultimately accomplishes. The Zephyrus is usually a bit quieter than the competition but not exactly cooler. On the other hand, there's also the questionable aspect of longevity, even though the lifted keyboard unit makes a very stable impression. Nonetheless, there's an additional vulnerability here.
Asus has a very good gaming laptop in store here, but we can't really decide whether the lifting case is a cool feature or more of a disadvantage. Asus should do a better job with the bothersome noises too.
If we evaluate pure gaming performance, the ROG Zephyrus leaves nothing to be desired. Both the raw CPU and GPU performance are unchallenged. The 140-watt GPU is even on par with the 155-watt GPU in the MSI GE76 Raider 10UH.
It's only on battery power that CPU performance in particular drops more than expected. However, Asus deserves some serious criticism for the annoying noise, the suboptimal fan behavior, and the slow WLAN module.
Otherwise, this is nitpicking, and the positive impressions clearly prevail. These include performance, the very good port configuration, the very good battery life, the comparatively quiet operation, the fast SSD, and so on.
Price and availability
Asus ROG Zephyrus S17 GX703HSD
- 07/12/2021 v7 (old)
Christian Hintze
Price comparison

