

Gigabyte Aero 17 HDR YD laptop review: 4K HDR meets RTX 3080

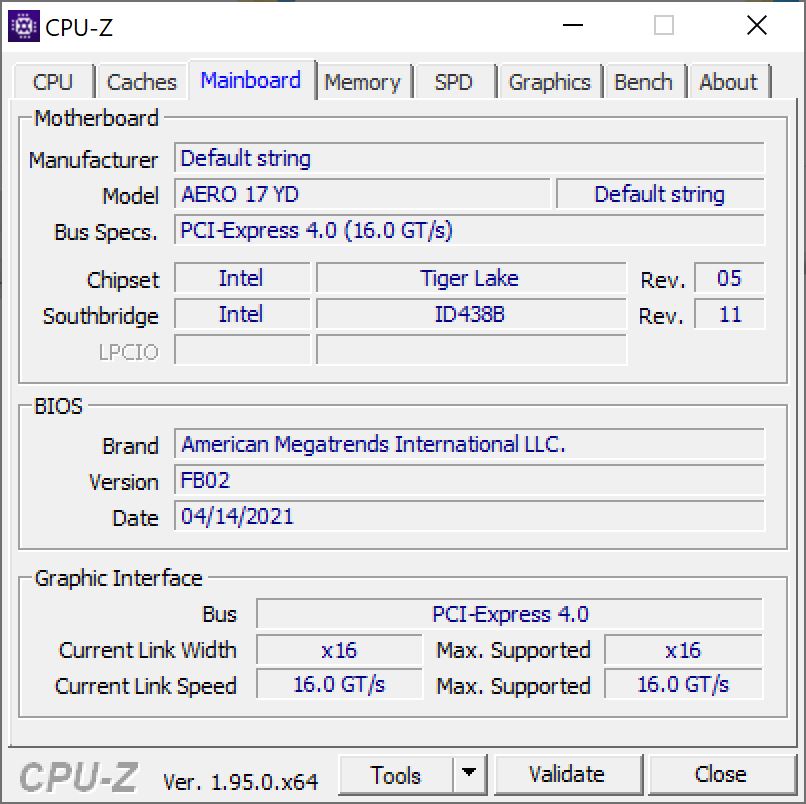
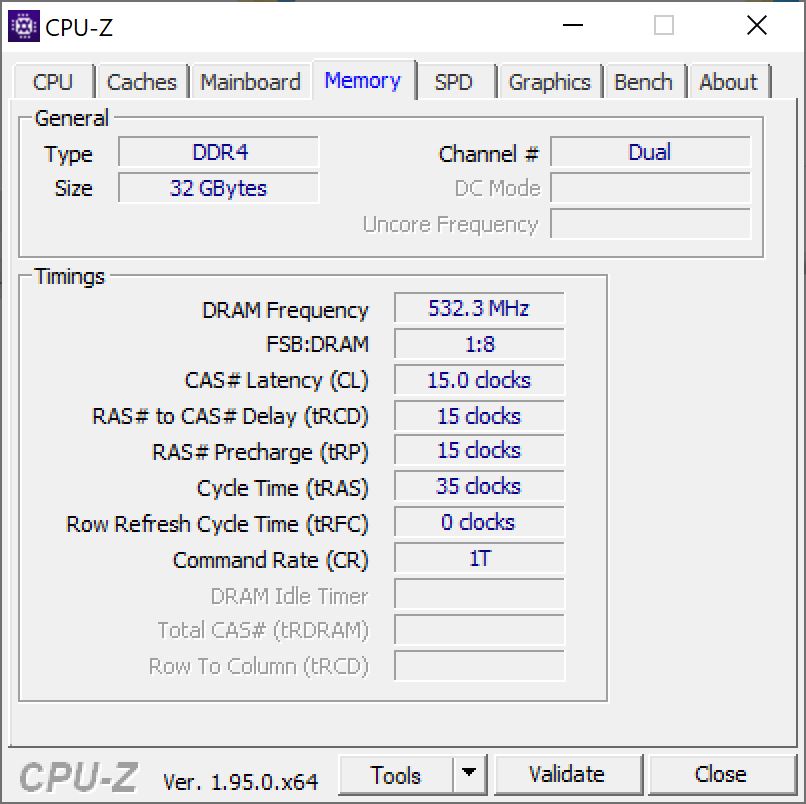
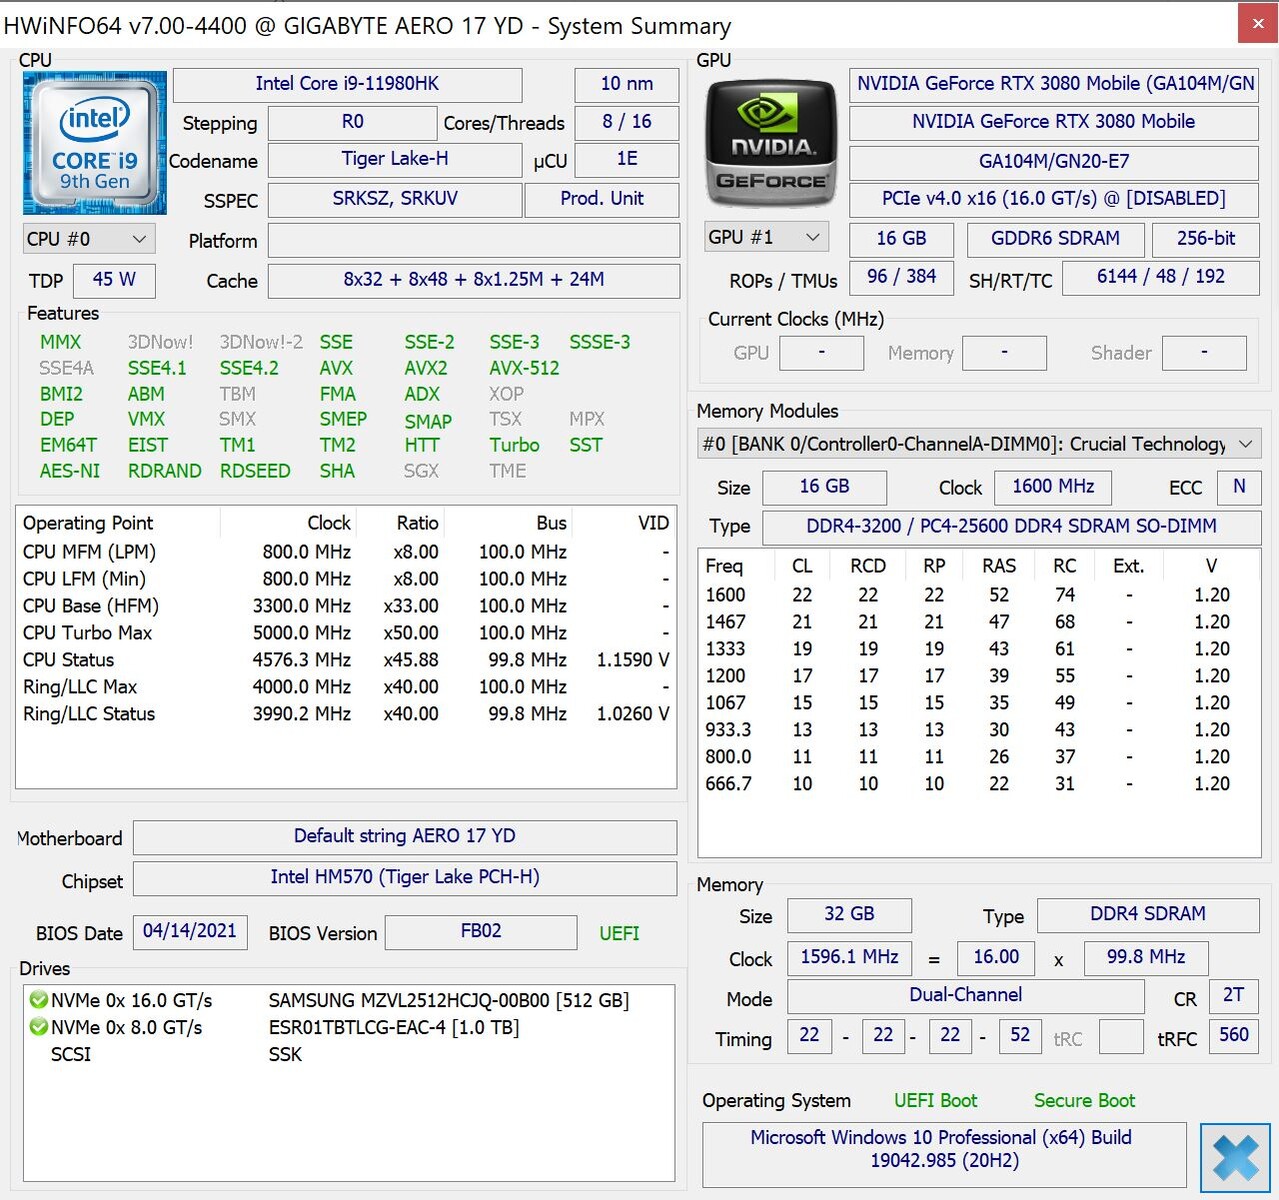
Compared to the Aero 17 HDR YC we tested in January, in the spec sheet only the CPU and working memory are changed. The Aero 17 HRD YD is run by an Intel Core i9-11980HK that is accompanied by 32 GB of working memory. The system is installed on a 512 GB SSD from Samsung, and a second 1-TB SSD is available for storing larger amounts of data. An Nvidia GeForce RTX 3080 is responsible for the display of the image contents.
This configuration costs about 3900 Euros (~$4751), and we compare it with the competing devices listed below. Below each of the sections, you can also add more notebooks to the comparison from our database. Since not much has changed visually or in terms of the equipment, we refer to our reviews of the Aero 17 XA HDR and Aero 17 HDR YC for more detailed descriptions of these sections.
Possible Competitors for Comparison
Rating | Date | Model | Weight | Height | Size | Resolution | Price |
|---|---|---|---|---|---|---|---|
| 88 % v7 (old) | 05 / 2021 | Gigabyte Aero 17 HDR YD i9-11980HK, GeForce RTX 3080 Laptop GPU | 2.8 kg | 22 mm | 17.30" | 3840x2160 | |
| 87.6 % v7 (old) | 01 / 2021 | Gigabyte Aero 17 HDR YC i9-10980HK, GeForce RTX 3080 Laptop GPU | 2.8 kg | 21.4 mm | 17.30" | 3840x2160 | |
| 87.8 % v7 (old) | 02 / 2021 | Razer Blade Pro 17 2021 (QHD Touch) i7-10875H, GeForce RTX 3080 Laptop GPU | 3 kg | 19.9 mm | 17.30" | 3840x2160 | |
| 85.3 % v7 (old) | 04 / 2021 | Alienware m17 R4 i9-10980HK, GeForce RTX 3080 Laptop GPU | 3 kg | 22 mm | 17.30" | 1920x1080 |
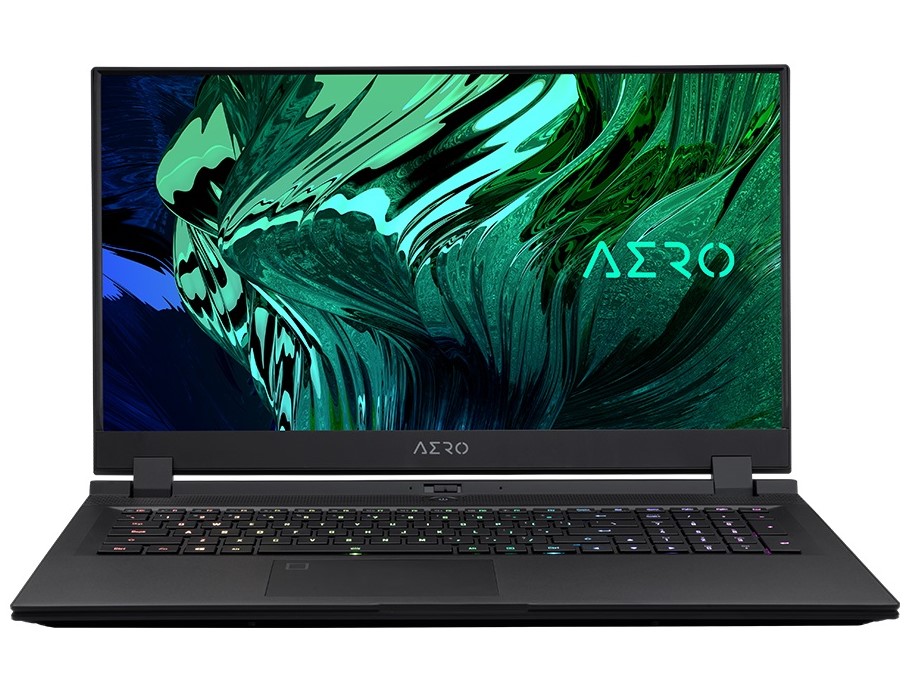
Case - A slim 17-inch gaming laptop
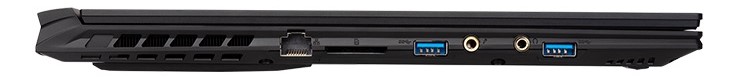
Connections - The Aero 17 HDR with Thunderbolt 4 and fast WLAN

SD Card Reader
| SD Card Reader | |
| average JPG Copy Test (av. of 3 runs) | |
| Razer Blade Pro 17 2021 (QHD Touch) (Toshiba Exceria Pro SDXC 64 GB UHS-II) | |
| Gigabyte Aero 17 HDR YC (Toshiba Exceria Pro SDXC 64 GB UHS-II) | |
| Alienware m17 R4 (AV PRO microSD 128 GB V60) | |
| Gigabyte Aero 17 HDR YD (AV PRO microSD 128 GB V60) | |
| Average of class Gaming (20 - 210, n=66, last 2 years) | |
| maximum AS SSD Seq Read Test (1GB) | |
| Alienware m17 R4 (AV PRO microSD 128 GB V60) | |
| Gigabyte Aero 17 HDR YC (Toshiba Exceria Pro SDXC 64 GB UHS-II) | |
| Razer Blade Pro 17 2021 (QHD Touch) (Toshiba Exceria Pro SDXC 64 GB UHS-II) | |
| Gigabyte Aero 17 HDR YD (AV PRO microSD 128 GB V60) | |
| Average of class Gaming (25.8 - 261, n=63, last 2 years) | |
Communication
Webcam


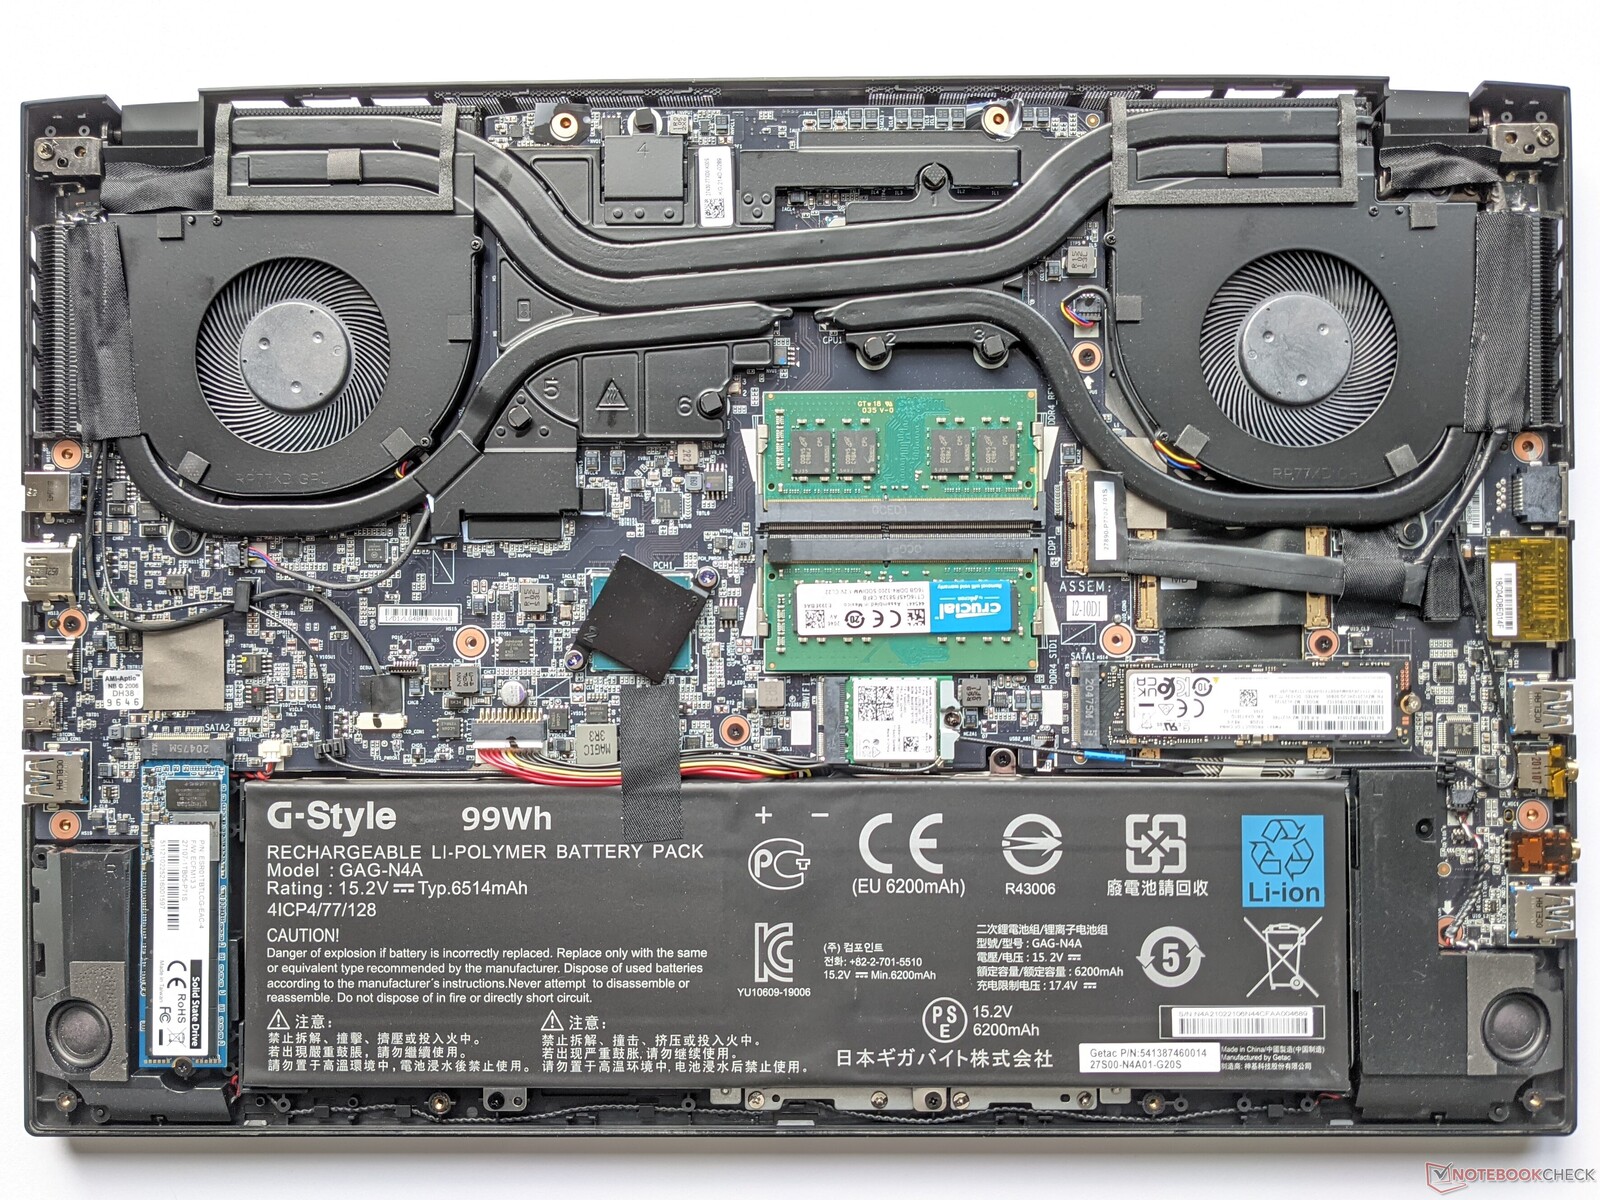
Maintenance
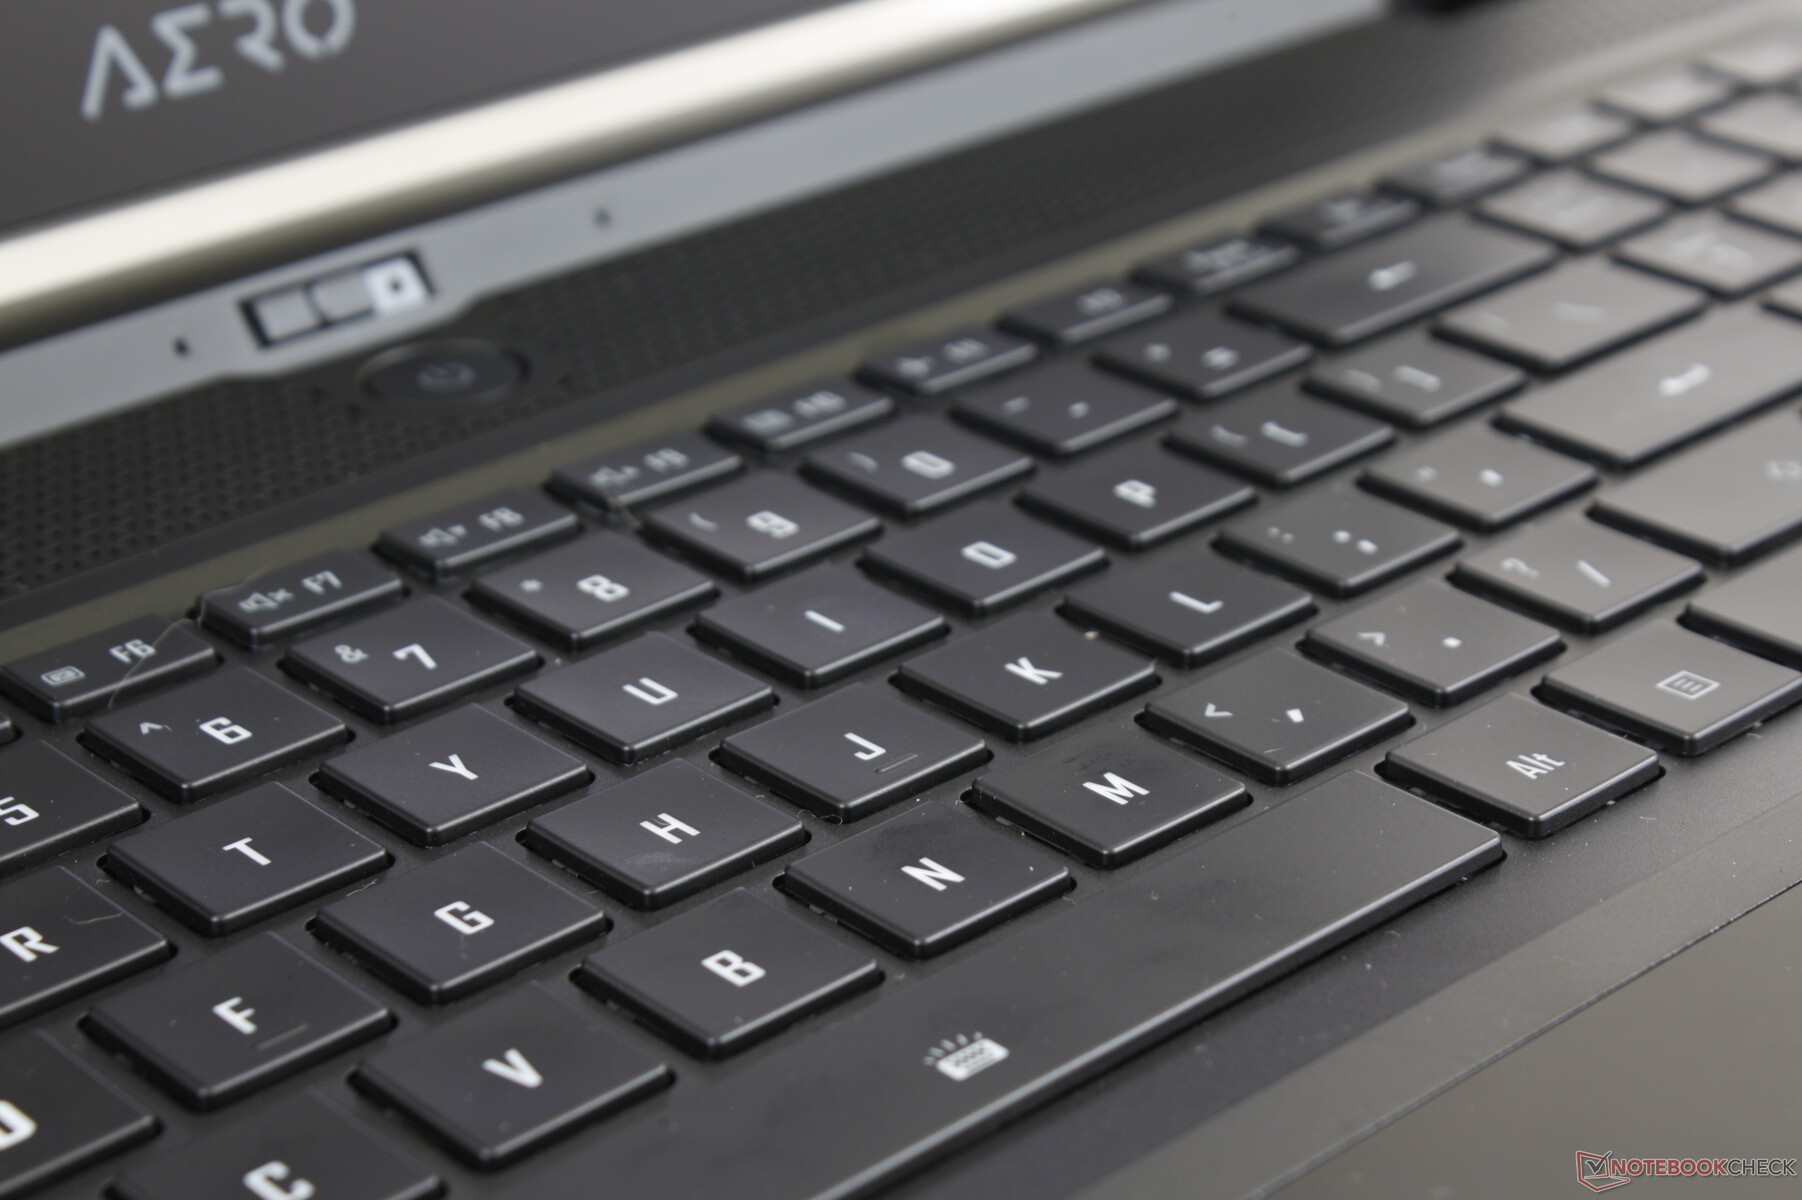
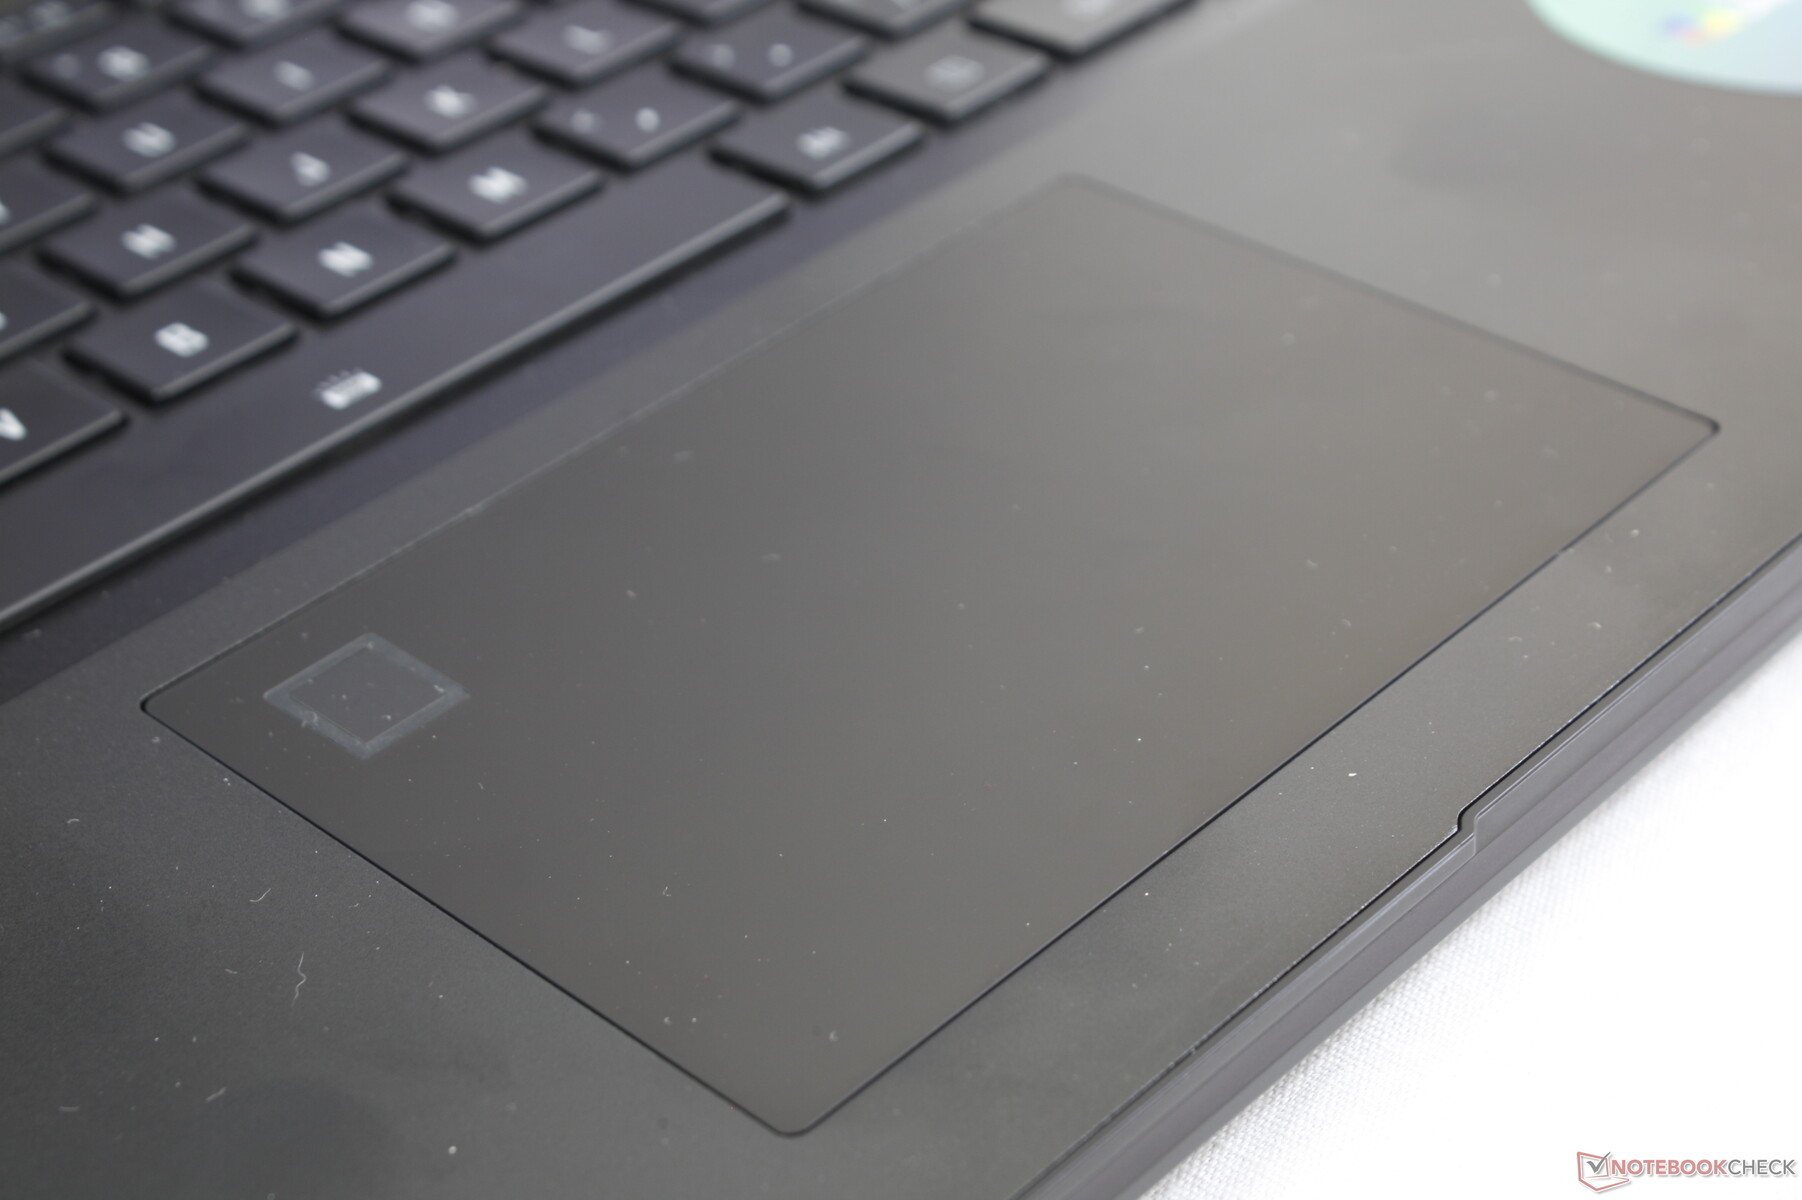
Input Devices - Powerful RGB illumination
You can find a detailed description of the input devices in our review of the Gigabyte Aero 17 XA HDR.
Display - A very good image thanks to HDR and 4K
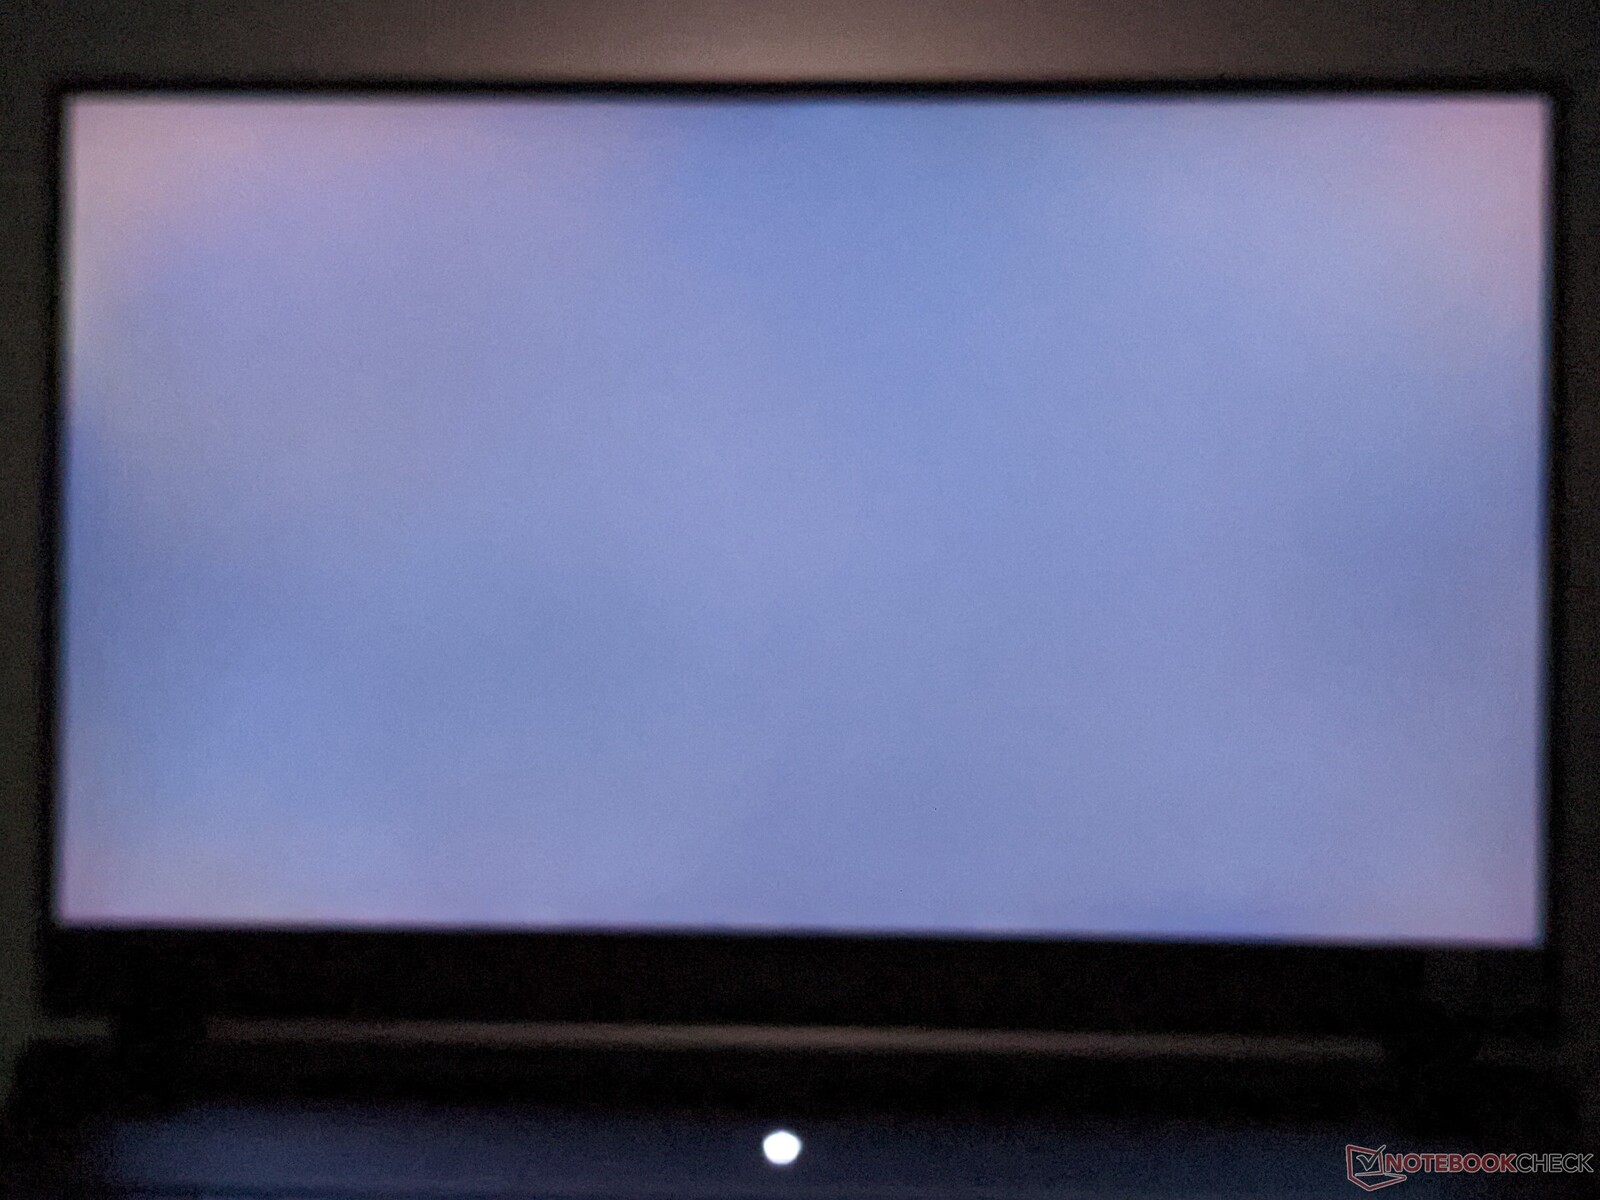
The display of the Aero 17 HDR YD consists of a 17-inch IPS panel that offers a resolution of 3840 x 2160 pixels. At an average of 467 cd/m², the maximum brightness is only slightly higher than that of the Aero 17 HDR YC and significantly lower than in the Aero 17 XA HDR. At 86%, the brightness distribution is also the lowest in our test field.
Since PWM is not used for brightness control, there should not be any problems for users with sensitive eyes.
| |||||||||||||||||||||||||
Brightness Distribution: 86 %
Center on Battery: 488 cd/m²
Contrast: 1479:1 (Black: 0.33 cd/m²)
ΔE ColorChecker Calman: 1.23 | ∀{0.5-29.43 Ø4.78}
calibrated: 0.77
ΔE Greyscale Calman: 1.5 | ∀{0.09-98 Ø5}
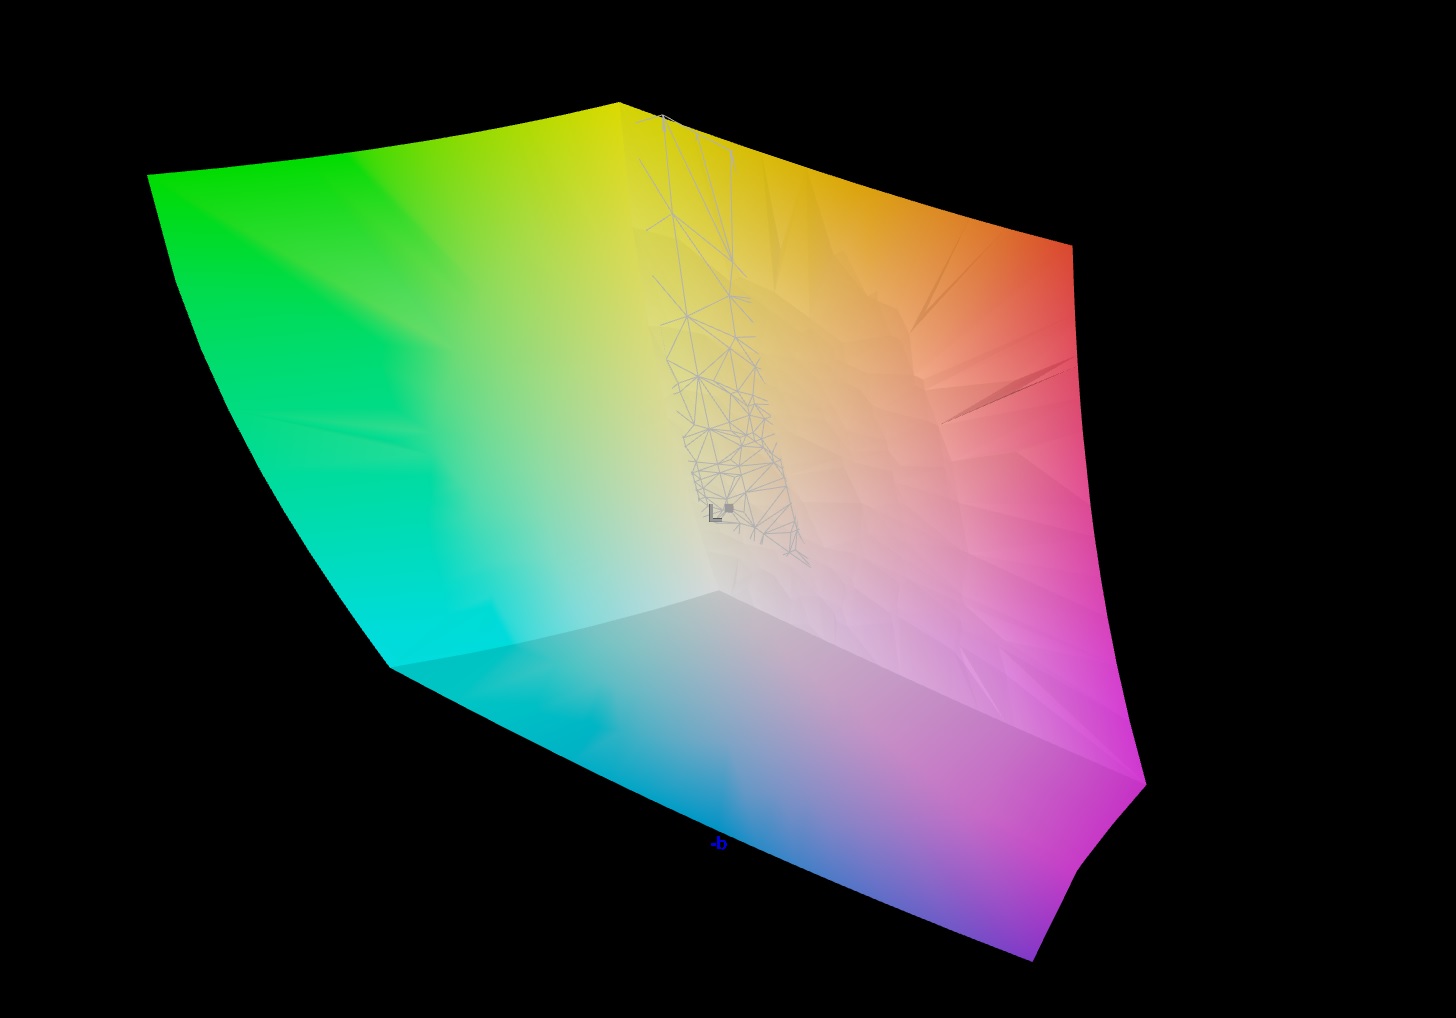
99% sRGB (Argyll 1.6.3 3D)
99% AdobeRGB 1998 (Argyll 1.6.3 3D)
99.6% AdobeRGB 1998 (Argyll 3D)
100% sRGB (Argyll 3D)
86.9% Display P3 (Argyll 3D)
Gamma: 2.169
CCT: 6614 K
| Gigabyte Aero 17 HDR YD AU Optronics AUO329B, IPS, 3840x2160, 17.3" | Gigabyte Aero 17 HDR YC AUO B173ZAN03.2 (AUO329B), IPS-Level, 3840x2160, 17.3" | Razer Blade Pro 17 2021 (QHD Touch) AU Optronics B173ZAN03.3, IPS, 3840x2160, 17.3" | Alienware m17 R4 AU Optronics AUOEC91, IPS, 1920x1080, 17.3" | |
|---|---|---|---|---|
| Display | 0% | 1% | -16% | |
| Display P3 Coverage (%) | 86.9 | 87.3 0% | 88.6 2% | 69.8 -20% |
| sRGB Coverage (%) | 100 | 100 0% | 100 0% | 99.7 0% |
| AdobeRGB 1998 Coverage (%) | 99.6 | 99.9 0% | 99.9 0% | 71.6 -28% |
| Response Times | 3% | 63% | 70% | |
| Response Time Grey 50% / Grey 80% * (ms) | 52 ? | 51.6 ? 1% | 15.2 ? 71% | 13.2 ? 75% |
| Response Time Black / White * (ms) | 26 ? | 24.8 ? 5% | 12 ? 54% | 9.2 ? 65% |
| PWM Frequency (Hz) | ||||
| Screen | -5% | -157% | -9% | |
| Brightness middle (cd/m²) | 488 | 458 -6% | 407.2 -17% | 305 -37% |
| Brightness (cd/m²) | 467 | 446 -4% | 403 -14% | 301 -36% |
| Brightness Distribution (%) | 86 | 92 7% | 90 5% | 93 8% |
| Black Level * (cd/m²) | 0.33 | 0.37 -12% | 0.42 -27% | 0.19 42% |
| Contrast (:1) | 1479 | 1238 -16% | 970 -34% | 1605 9% |
| Colorchecker dE 2000 * | 1.23 | 1.52 -24% | 7.25 -489% | 1.31 -7% |
| Colorchecker dE 2000 max. * | 2.94 | 2.51 15% | 12.51 -326% | 2.32 21% |
| Colorchecker dE 2000 calibrated * | 0.77 | 0.66 14% | 3.62 -370% | 0.91 -18% |
| Greyscale dE 2000 * | 1.5 | 1.9 -27% | 8.1 -440% | 2.3 -53% |
| Gamma | 2.169 101% | 2.145 103% | 2.24 98% | 2.281 96% |
| CCT | 6614 98% | 6534 99% | 5925 110% | 6449 101% |
| Color Space (Percent of AdobeRGB 1998) (%) | 99 | 100 1% | 88.1 -11% | 72 -27% |
| Color Space (Percent of sRGB) (%) | 99 | 100 1% | 100 1% | 94 -5% |
| Total Average (Program / Settings) | -1% /
-3% | -31% /
-100% | 15% /
-1% |
* ... smaller is better
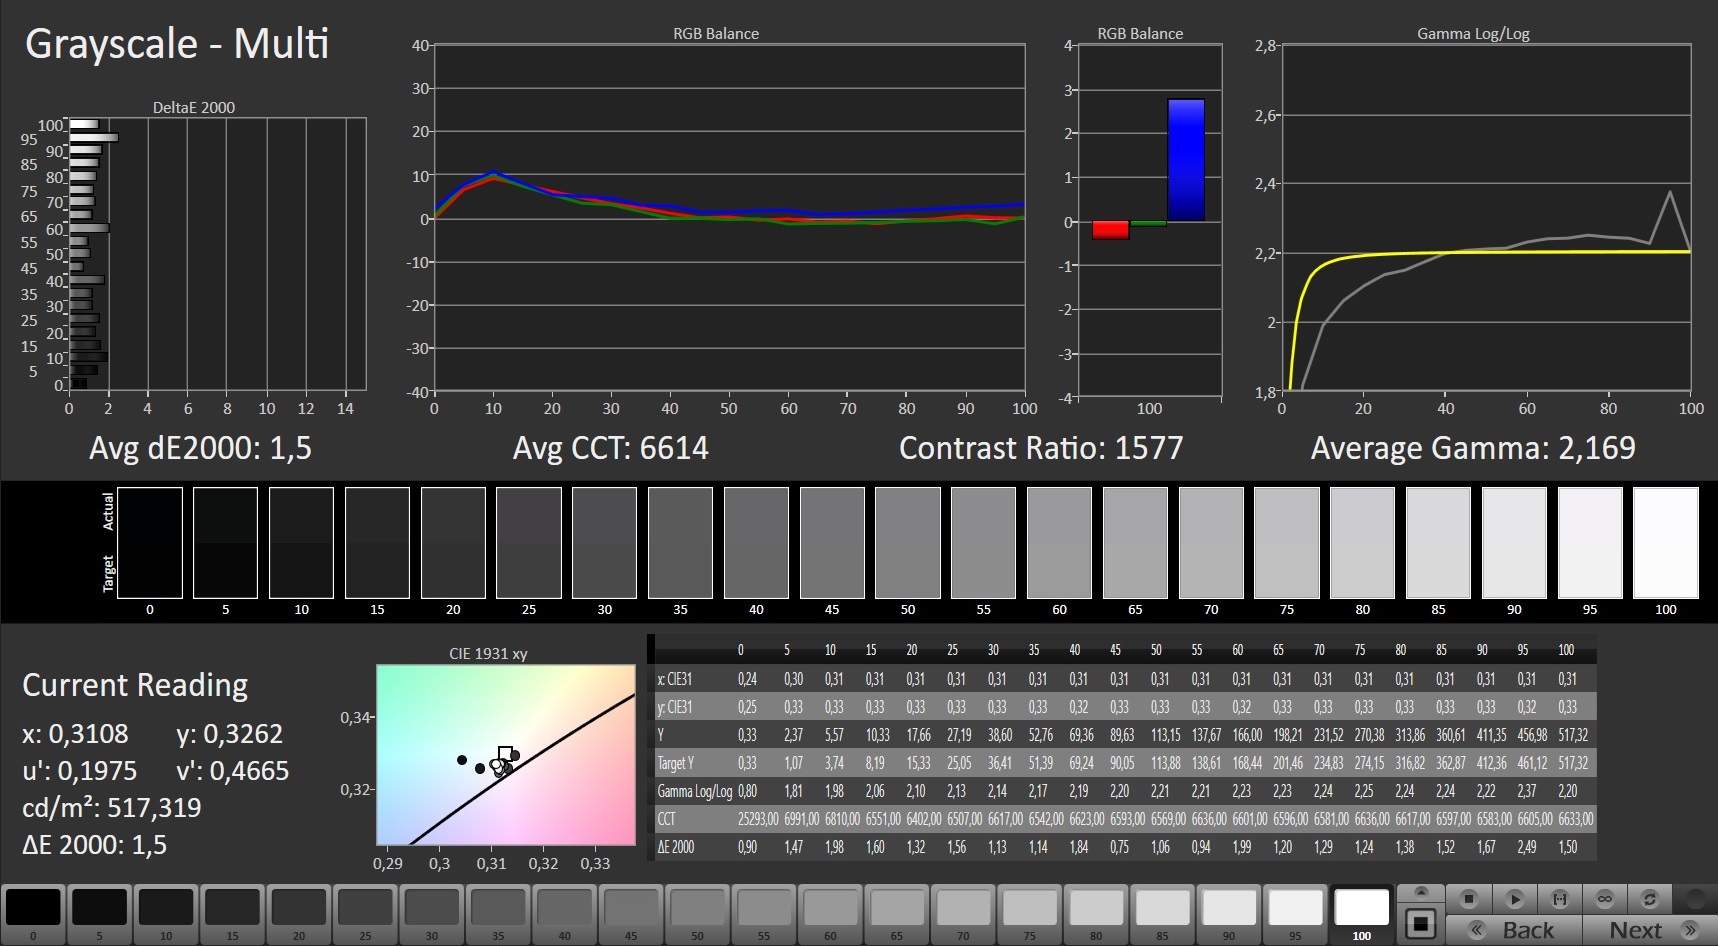
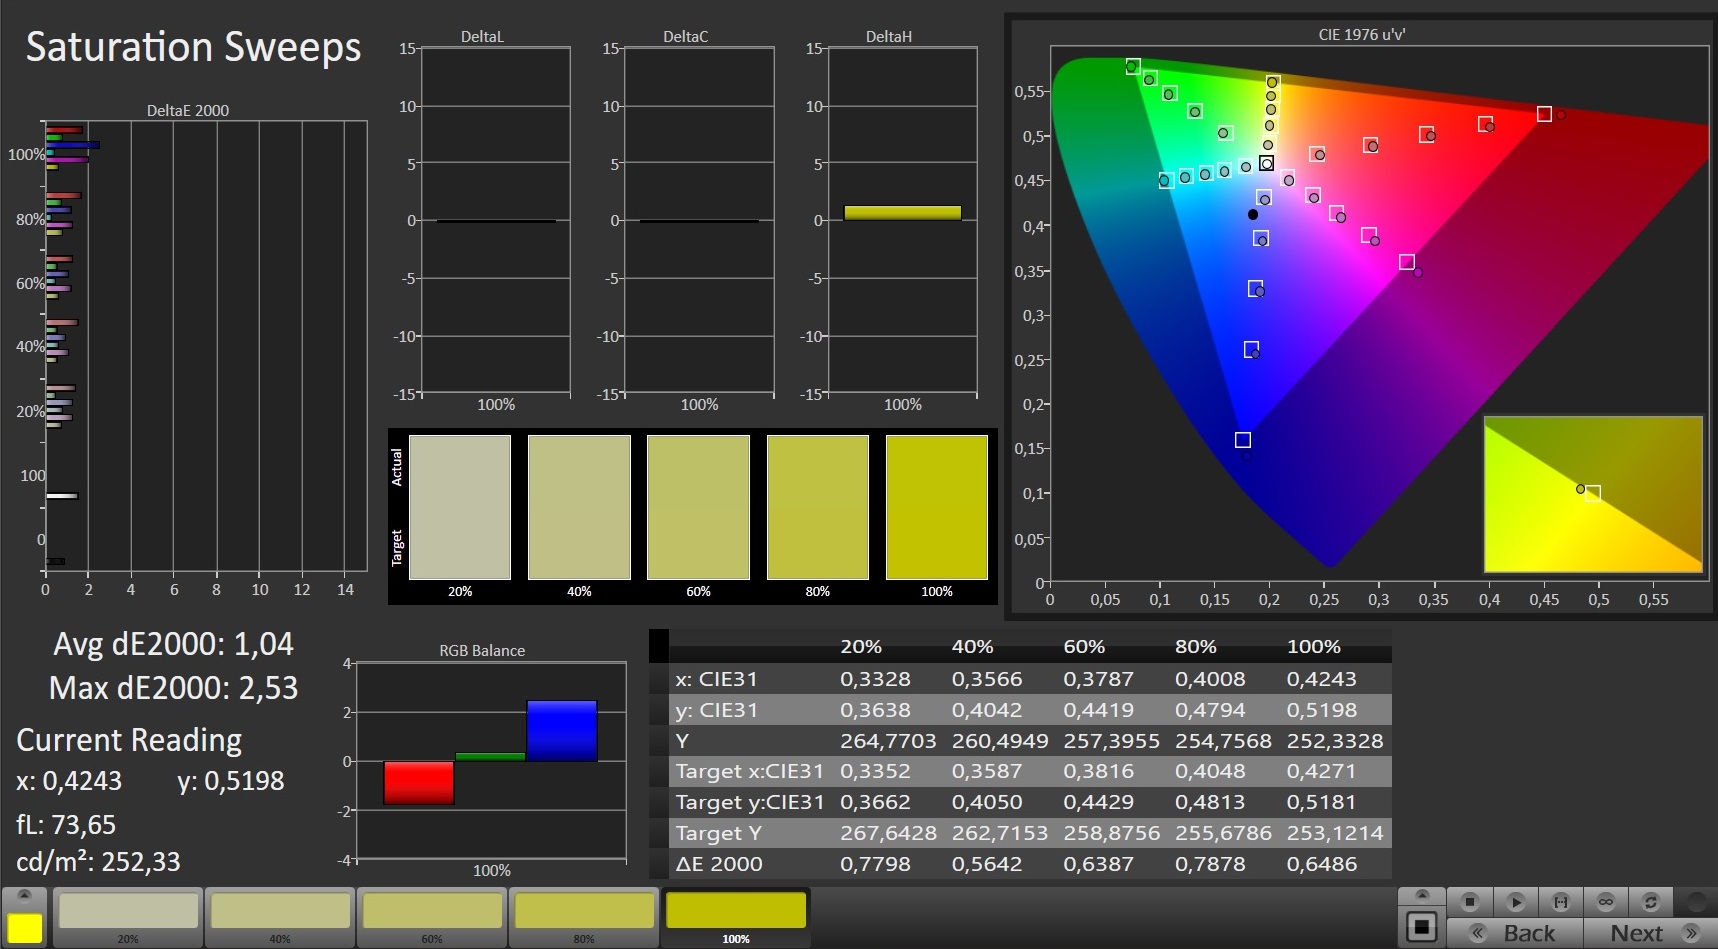
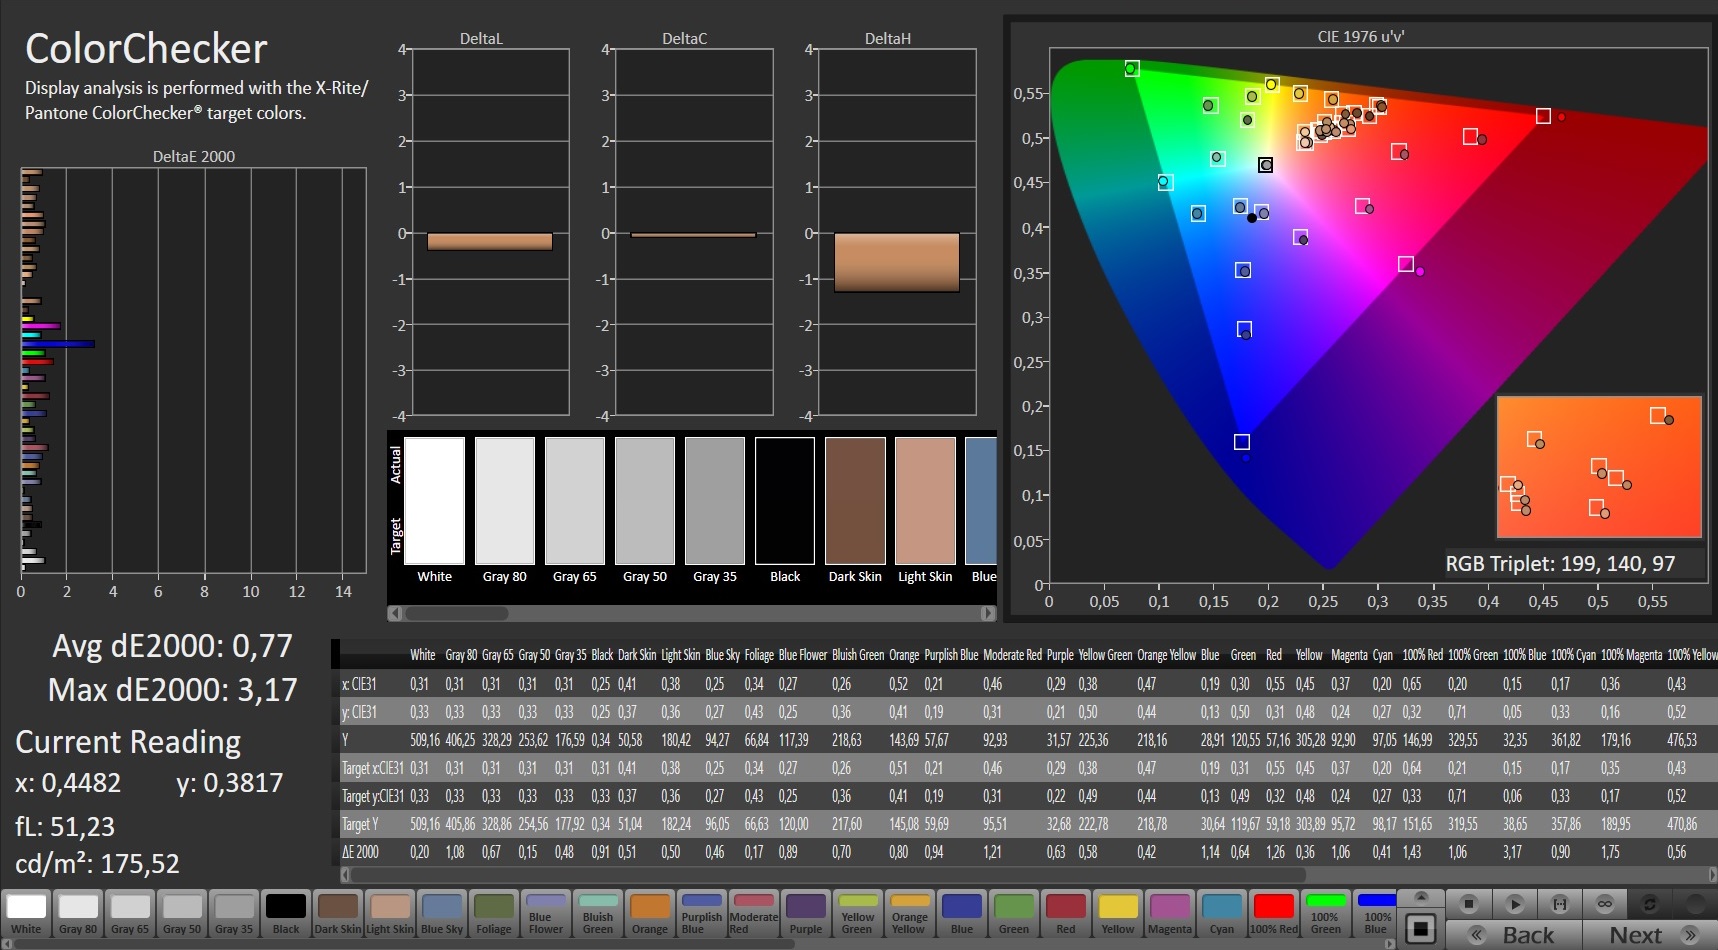
The contrast ratio turns out very good at 1479:1, and the black value is also only slightly elevated at 0.33 cd/m². In addition, the color space coverage of 99% for both the sRGB and AdobeRGB color spaces is excellent. Gigabyte advertises the display of the Aero 17 HDR YD with a calibration in the state of delivery that was validated by Pantone and that can be selected in the various modes of the Control Center corresponding to the current usage scenario.
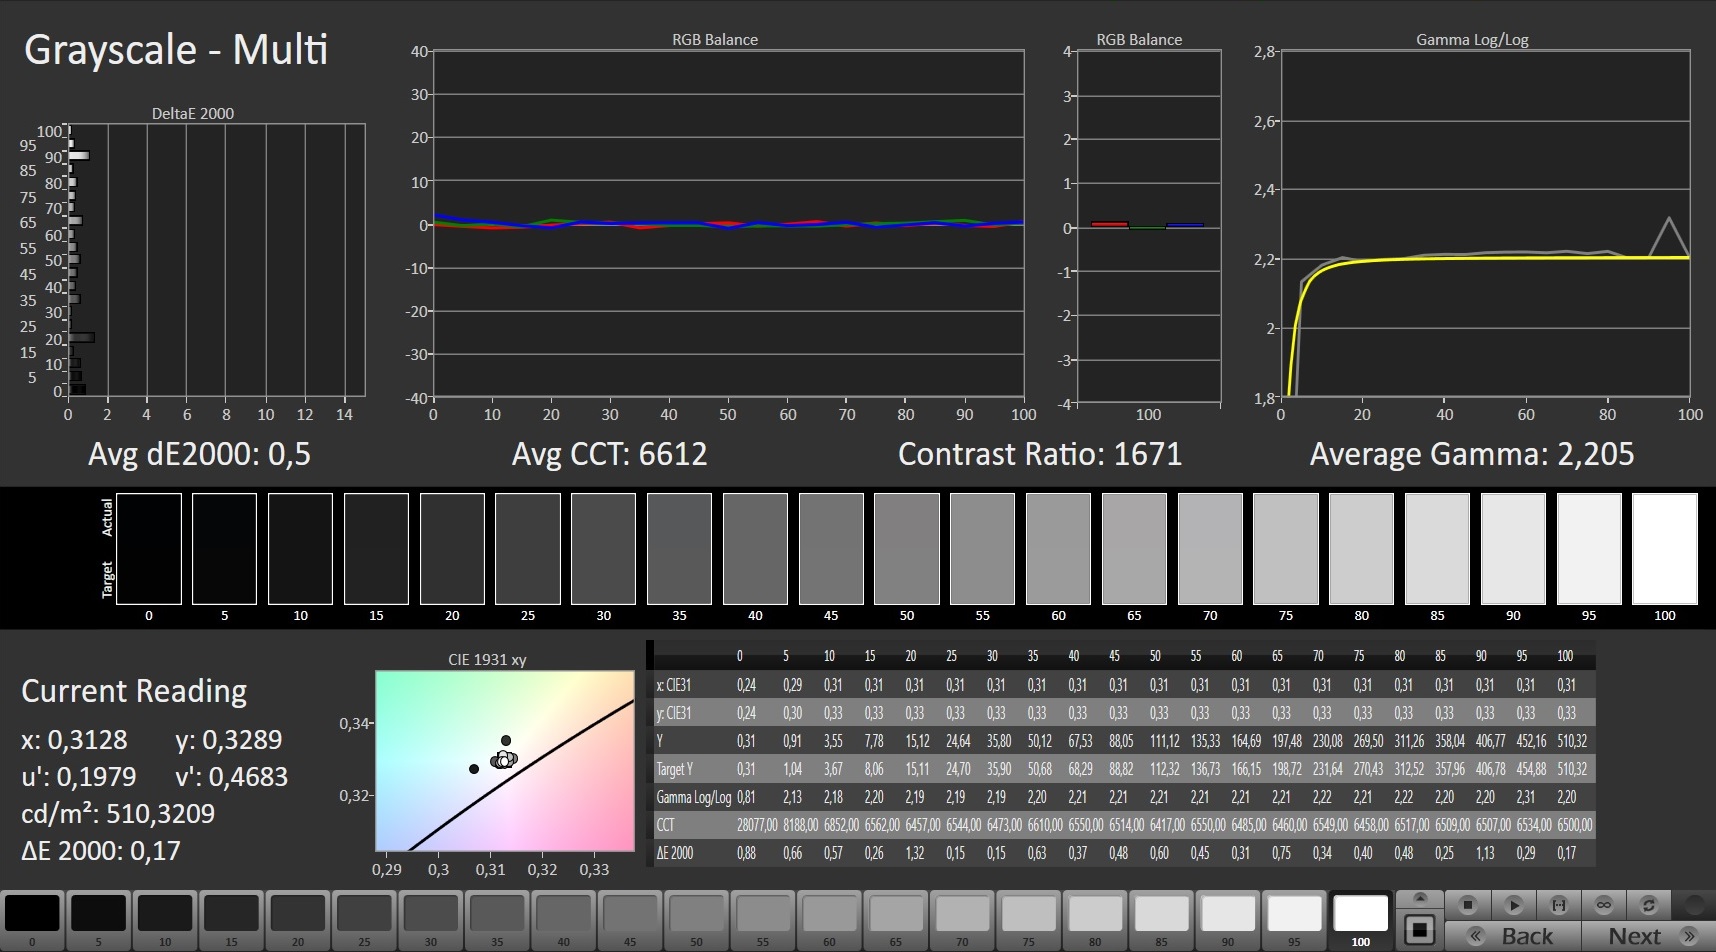
Accordingly, the CalMAN analysis also shows a DeltaE2000 deviation that is correspondingly low. Another calibration will only bring a small improvement from 1.5 to 0.5. You can download the corresponding ICC file from the link in the frame above, to the right of the schematic on the brightness distribution.


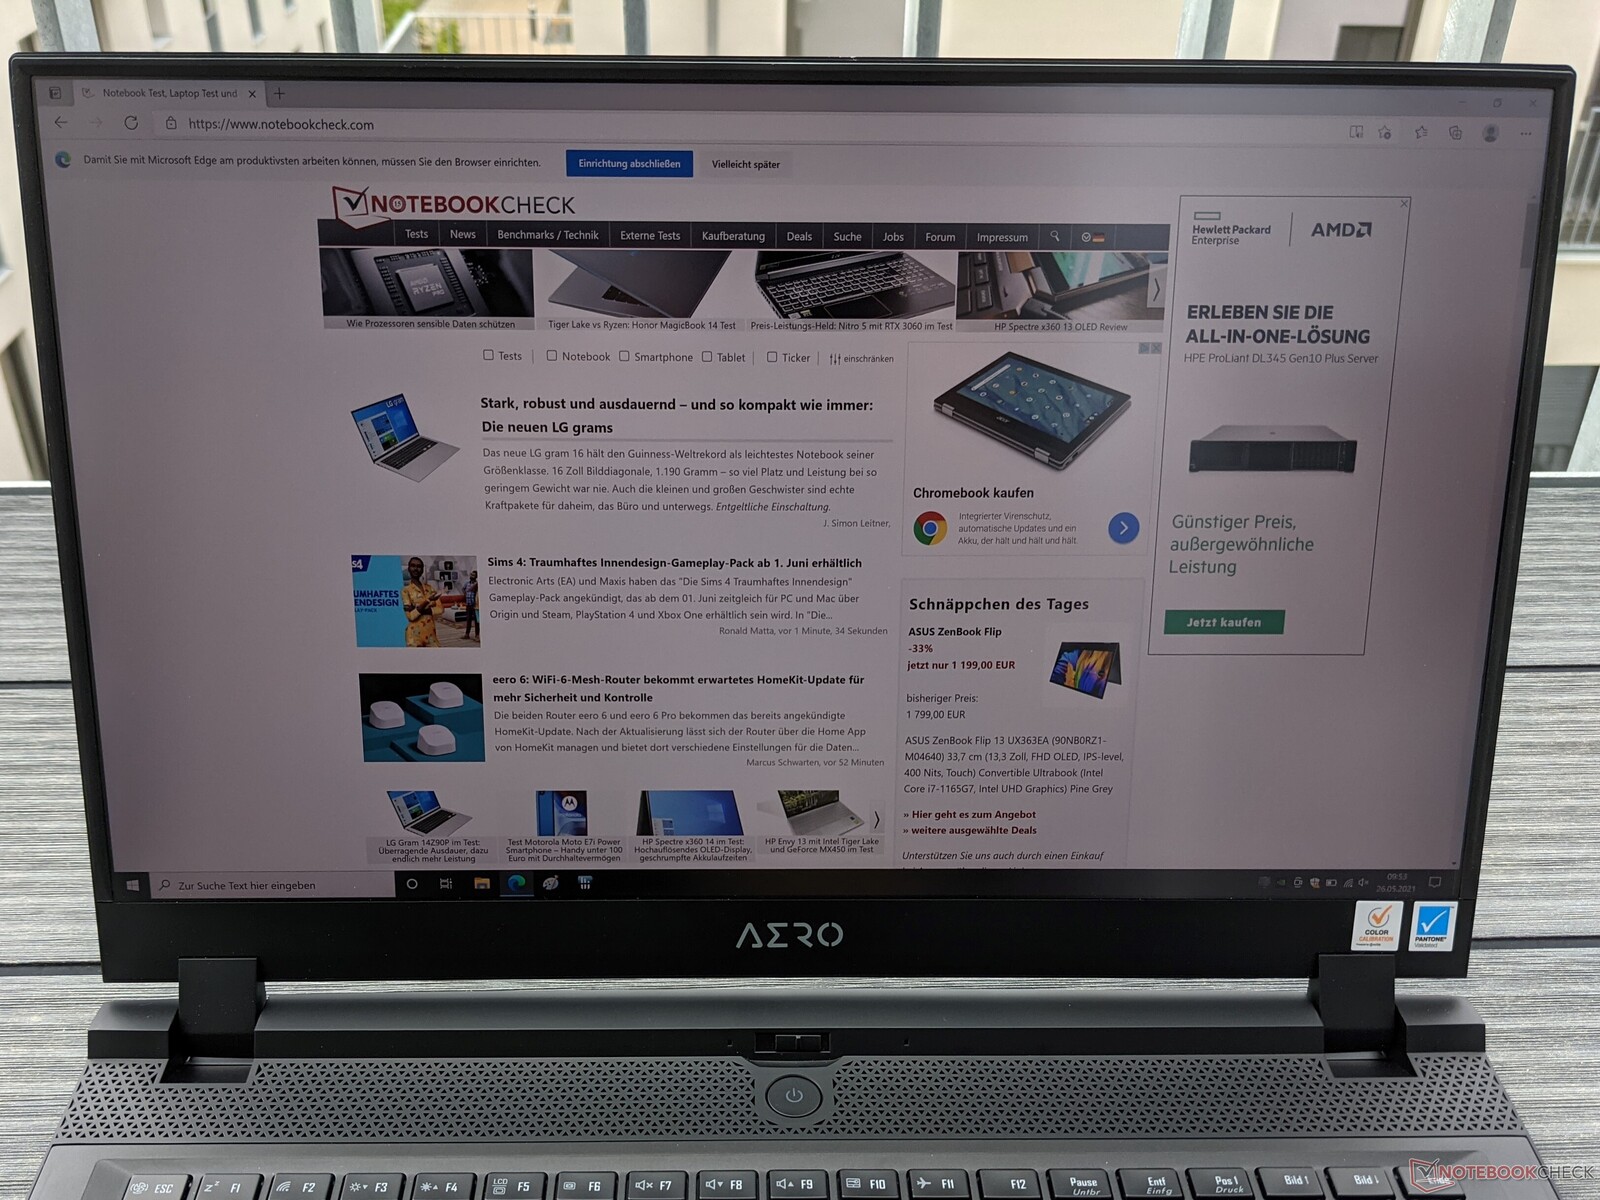
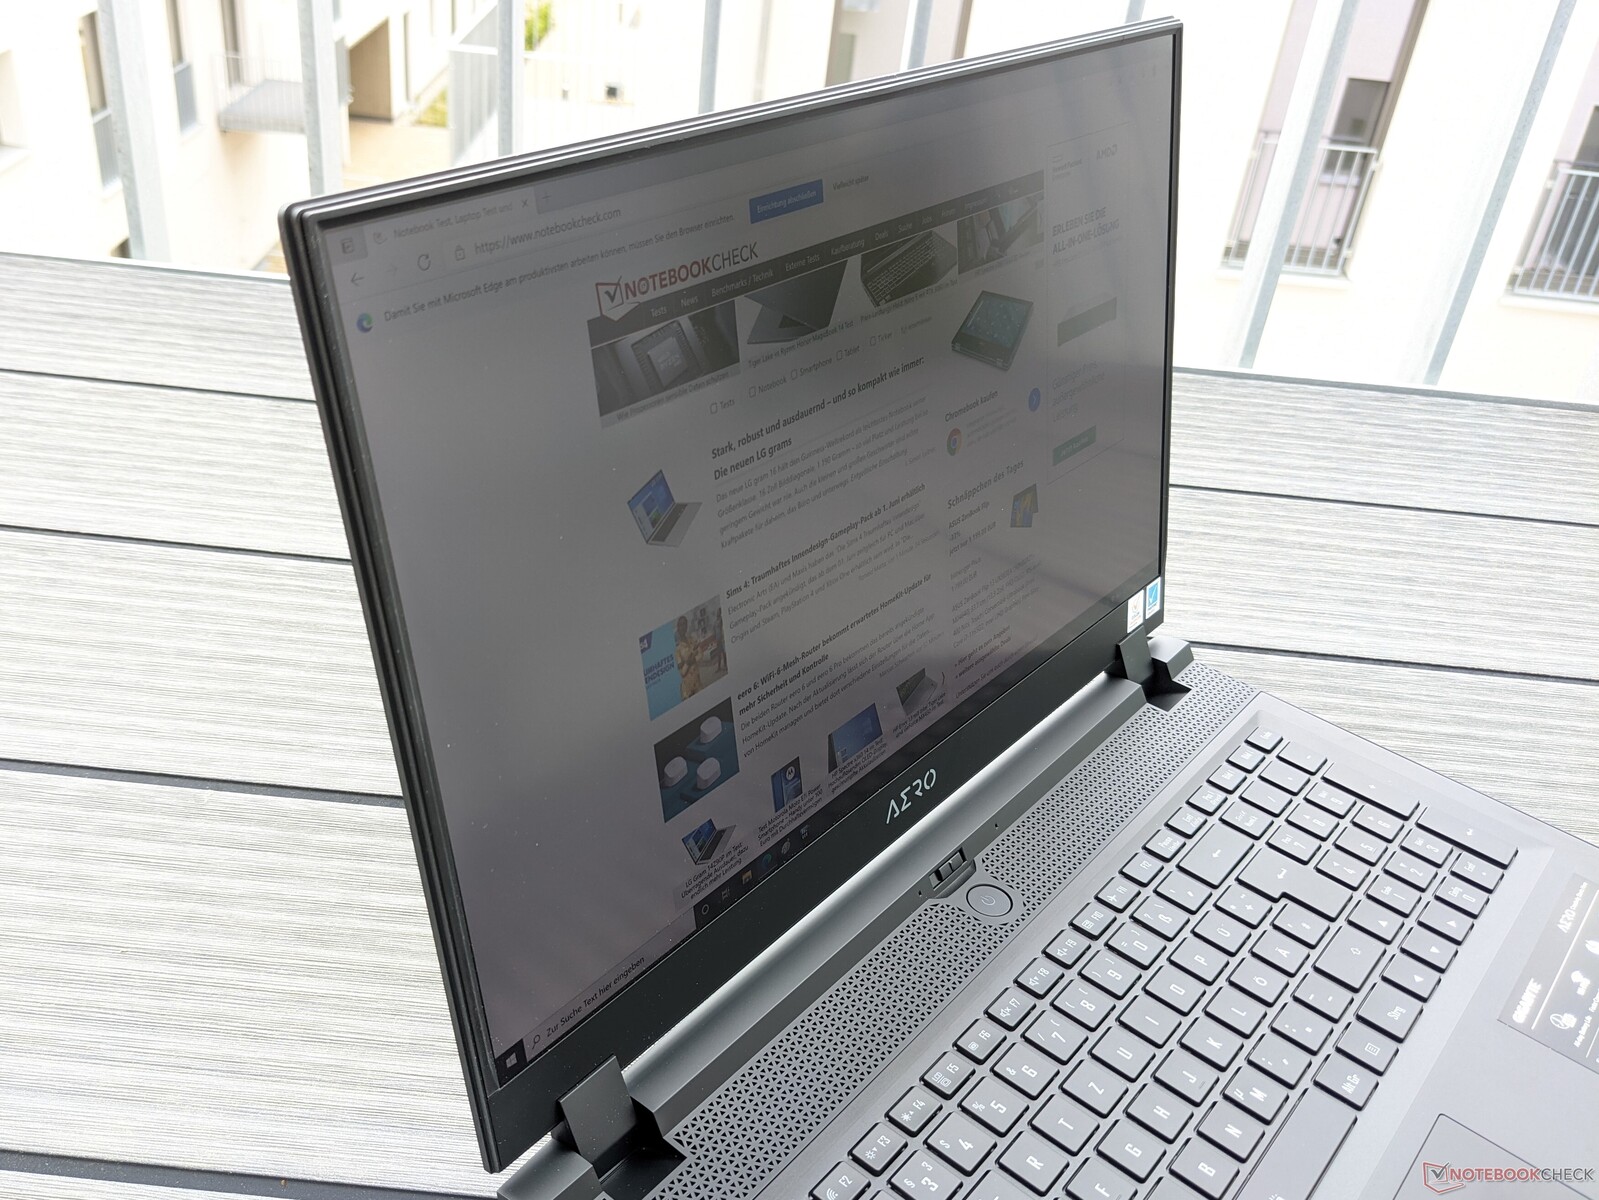
The display brightness of the Aero 17 HDR YD is sufficient to show the image contents easily readable on cloudy days. While the matte display will prevent reflections in direct sunlight, reading the display contents will then still be harder.

Display Response Times
| ↔ Response Time Black to White | ||
|---|---|---|
| 26 ms ... rise ↗ and fall ↘ combined | ↗ 10 ms rise | 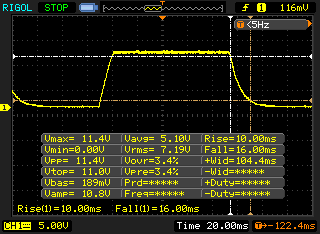 |
| ↘ 16 ms fall | ||
| The screen shows relatively slow response rates in our tests and may be too slow for gamers. In comparison, all tested devices range from 0.1 (minimum) to 240 (maximum) ms. » 61 % of all devices are better. This means that the measured response time is worse than the average of all tested devices (20.2 ms). | ||
| ↔ Response Time 50% Grey to 80% Grey | ||
| 52 ms ... rise ↗ and fall ↘ combined | ↗ 25.2 ms rise | 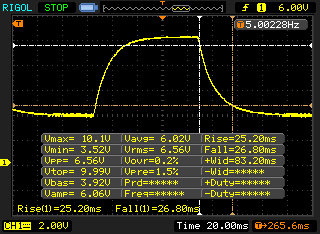 |
| ↘ 26.8 ms fall | ||
| The screen shows slow response rates in our tests and will be unsatisfactory for gamers. In comparison, all tested devices range from 0.165 (minimum) to 636 (maximum) ms. » 88 % of all devices are better. This means that the measured response time is worse than the average of all tested devices (31.6 ms). | ||
Screen Flickering / PWM (Pulse-Width Modulation)
| Screen flickering / PWM not detected | 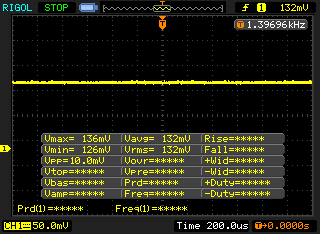 | ||
In comparison: 53 % of all tested devices do not use PWM to dim the display. If PWM was detected, an average of 8108 (minimum: 5 - maximum: 343500) Hz was measured. | |||
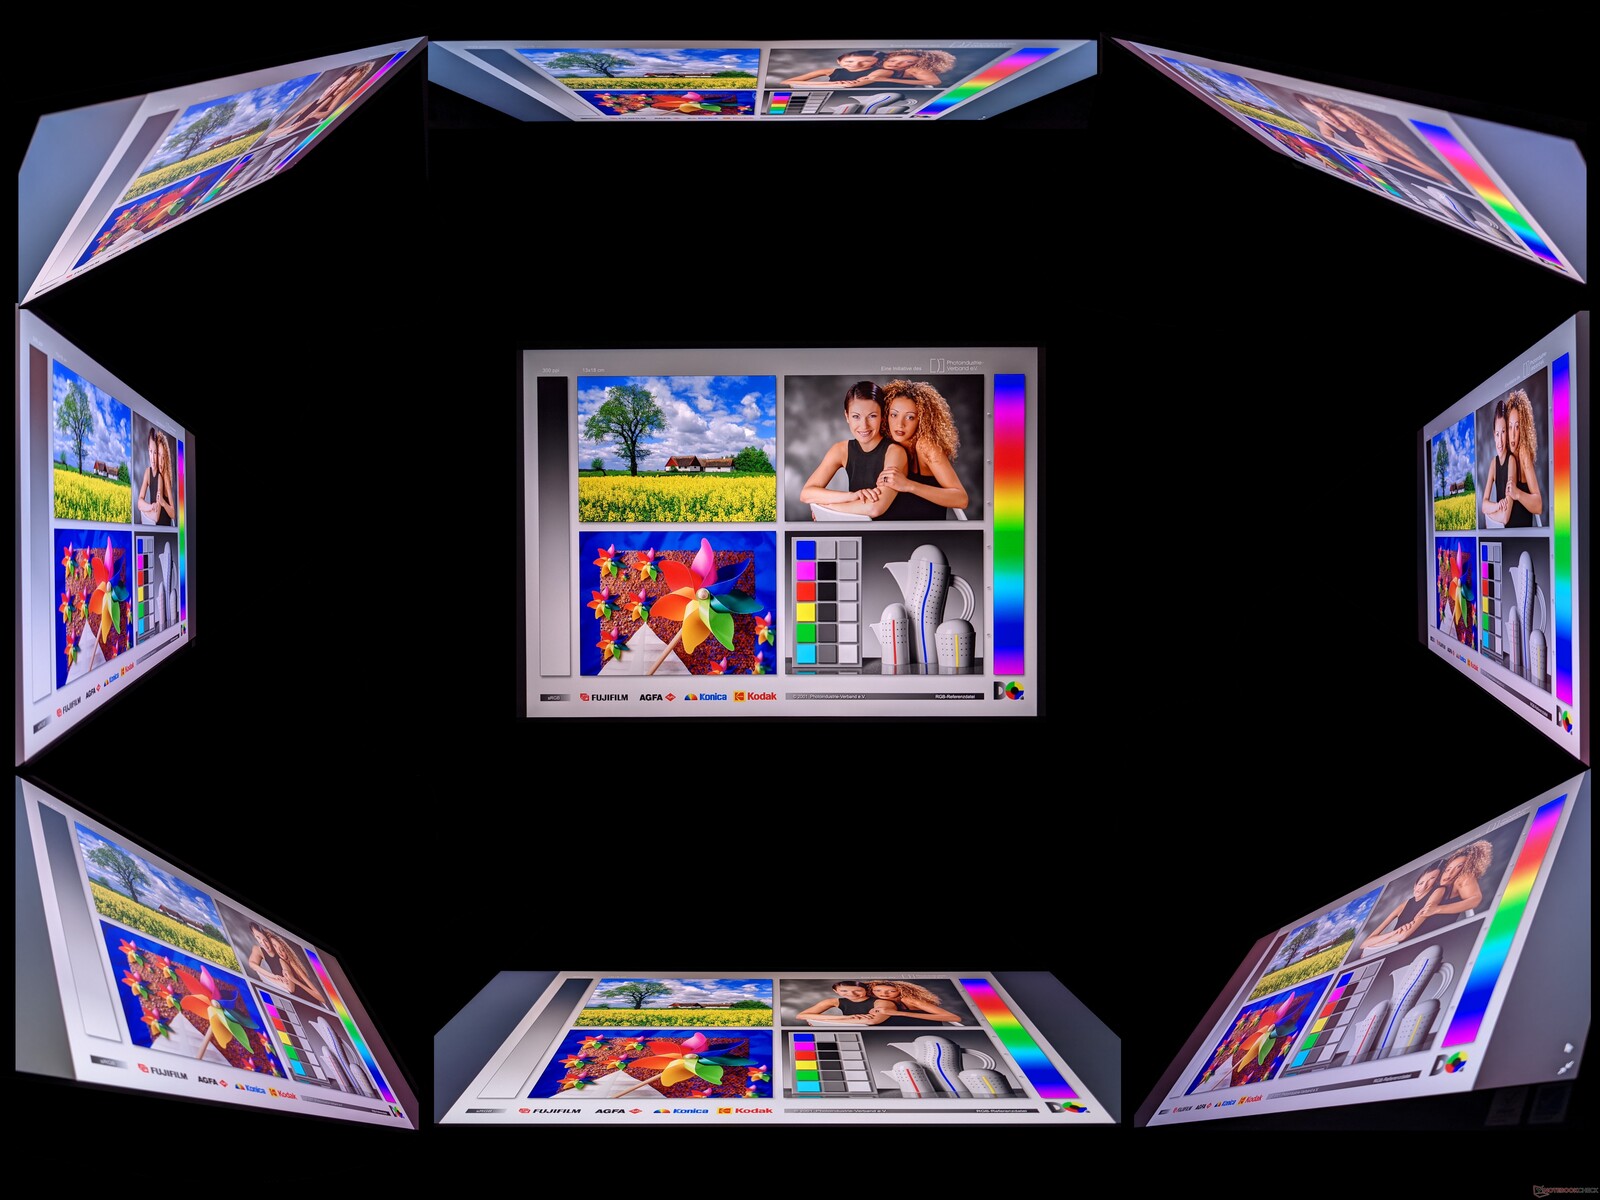
The viewing angles of the Aero 17 HDR YD display are very stable, and the contents can be viewed from almost any angle without the colors or image becoming distorted.
Performance - Increased CPU performance
With the Aero 17 HDR YD, Gigabyte targets content creators and gamers who need a powerful laptop with a very good display. In addition to the configuration tested here, the HDR YD is also available with an Intel Core i7-11800H and Nvidia GeForce RTX 3080 with 8 GB of video storage. As "Aero 17 HDR XD," the laptop comes with an Intel Core i7-11800H and Nvidia GeForce RTX 3070 with 8 GB of video storage.
All the following benchmarks were run with the "Turbo" system setting.
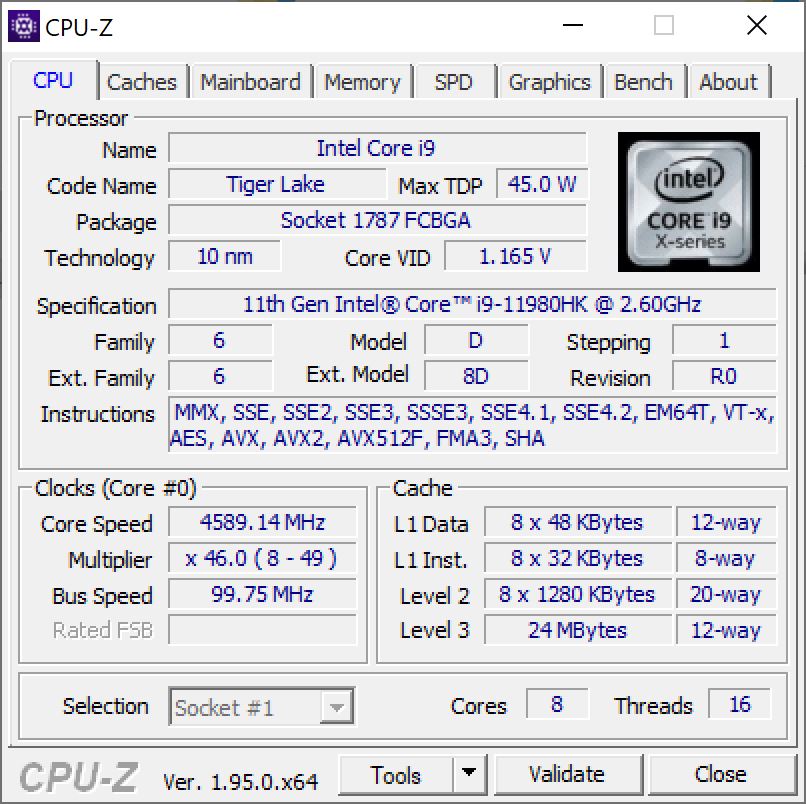
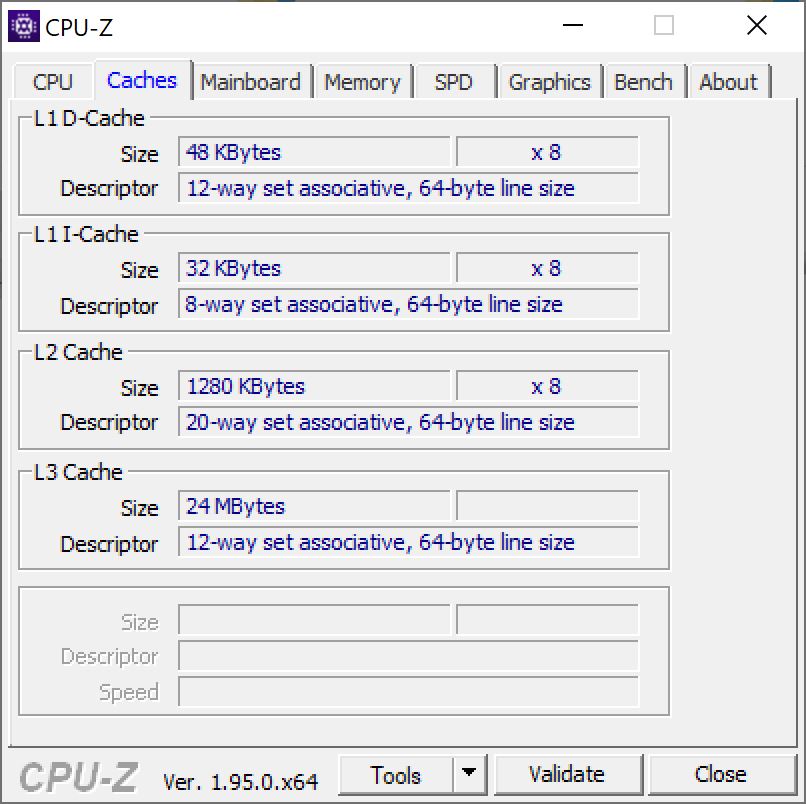
Processor
The Intel Core i9-11980HK used here is an octa-core processor, which can operate on up to 16 threads simultaneously. The clock speeds fall between 2.6 and 5 GHz, with the configured TDP playing an important role in determining the performance. Gigabyte has configured this as a PL1 of 70 watts and PL2 of 109 watts. With this, the maximum possible of 65 watts is even slightly exceeded, and the Aero 17 HDR YD is able to lead our test field in the benchmarks.
In our Cinebech R15 constant load test, the CPU is also able to maintain its performance for a longer time period, and it is able to quickly recover from smaller drops of about 9% in the performance.
* ... smaller is better
System Performance
In the PCMark 10 test to evaluate the system performance, the Gigabyte Aero 17 HDR YD places first in our test field. This goes for the overall evaluation as well as all the single disciplines. In everyday operation, the laptop runs very smoothly without showing any micro stutters or similar delays.
You can find out what performance you can expect from other devices in comparison in our CPU benchmark list.
| PCMark 10 Score | 7088 points | |
Help | ||
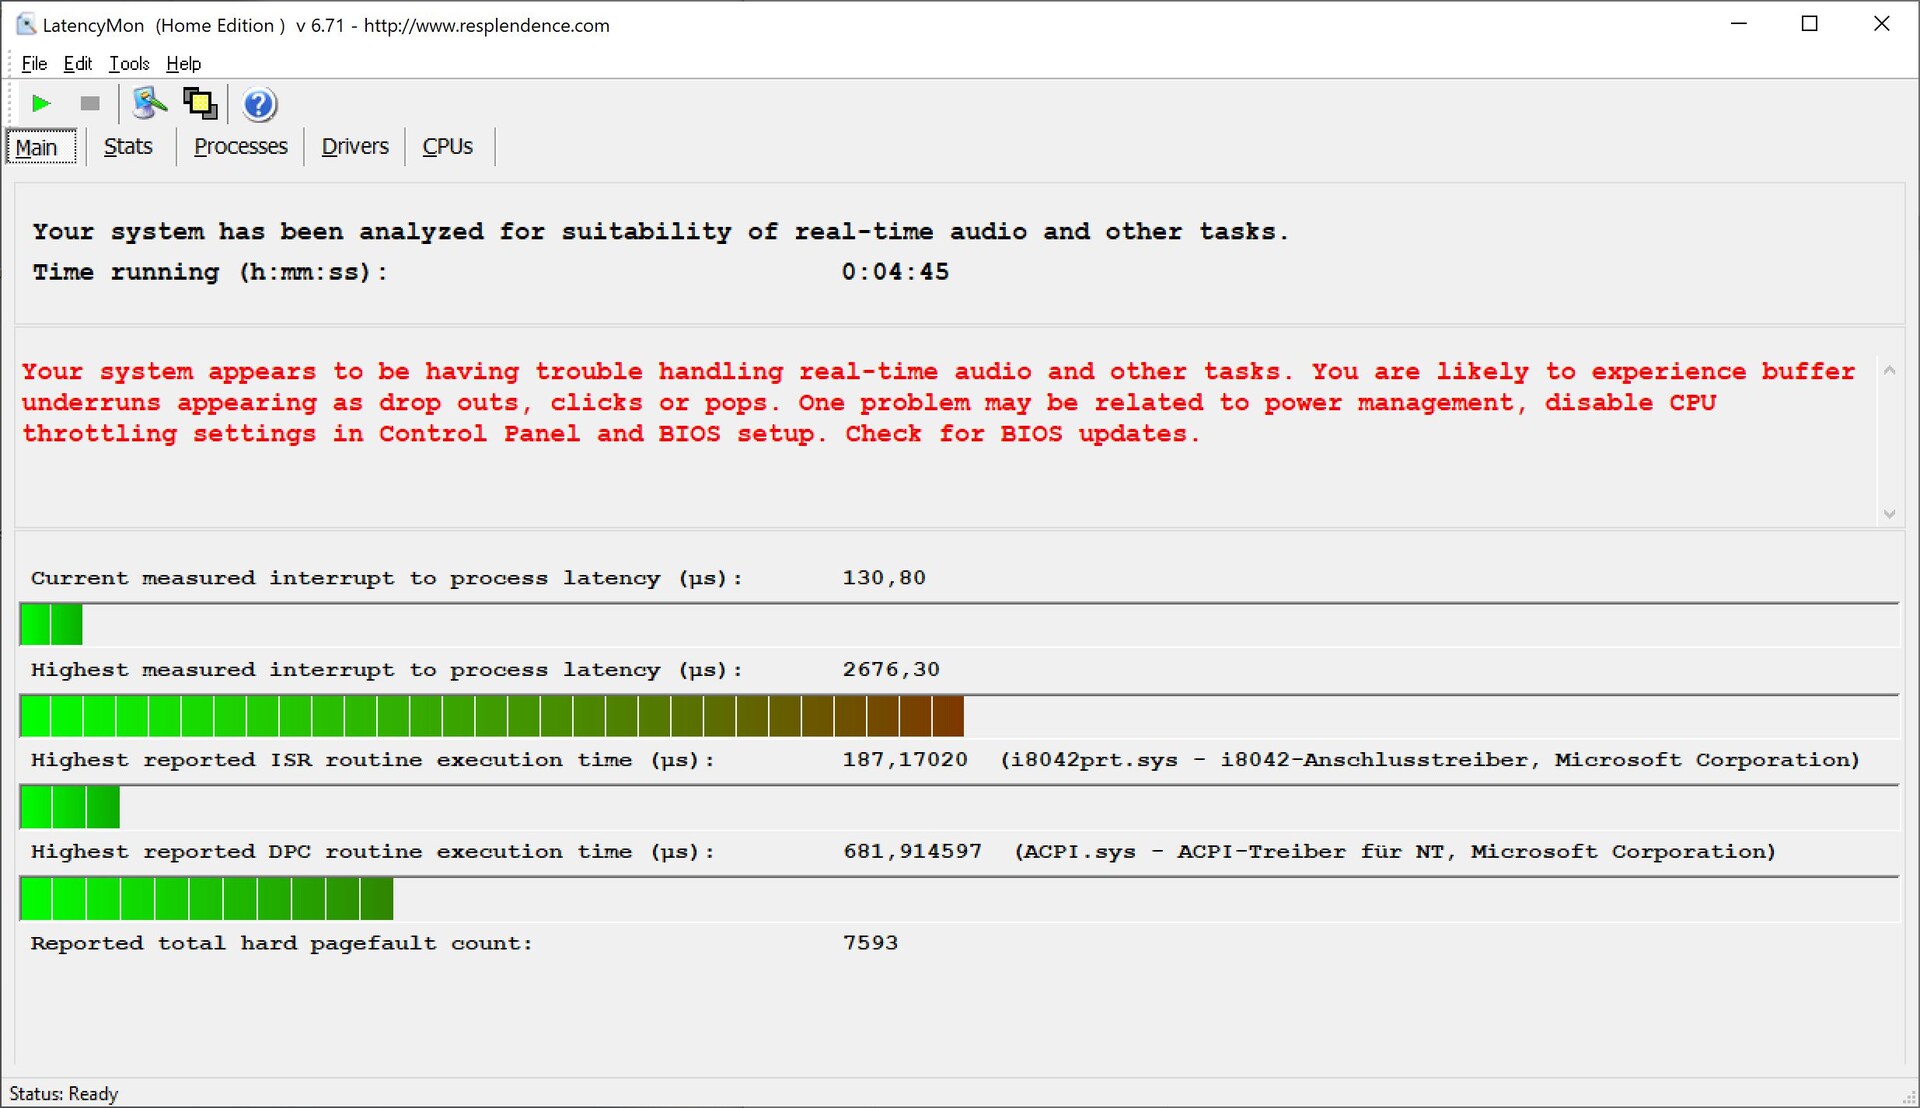
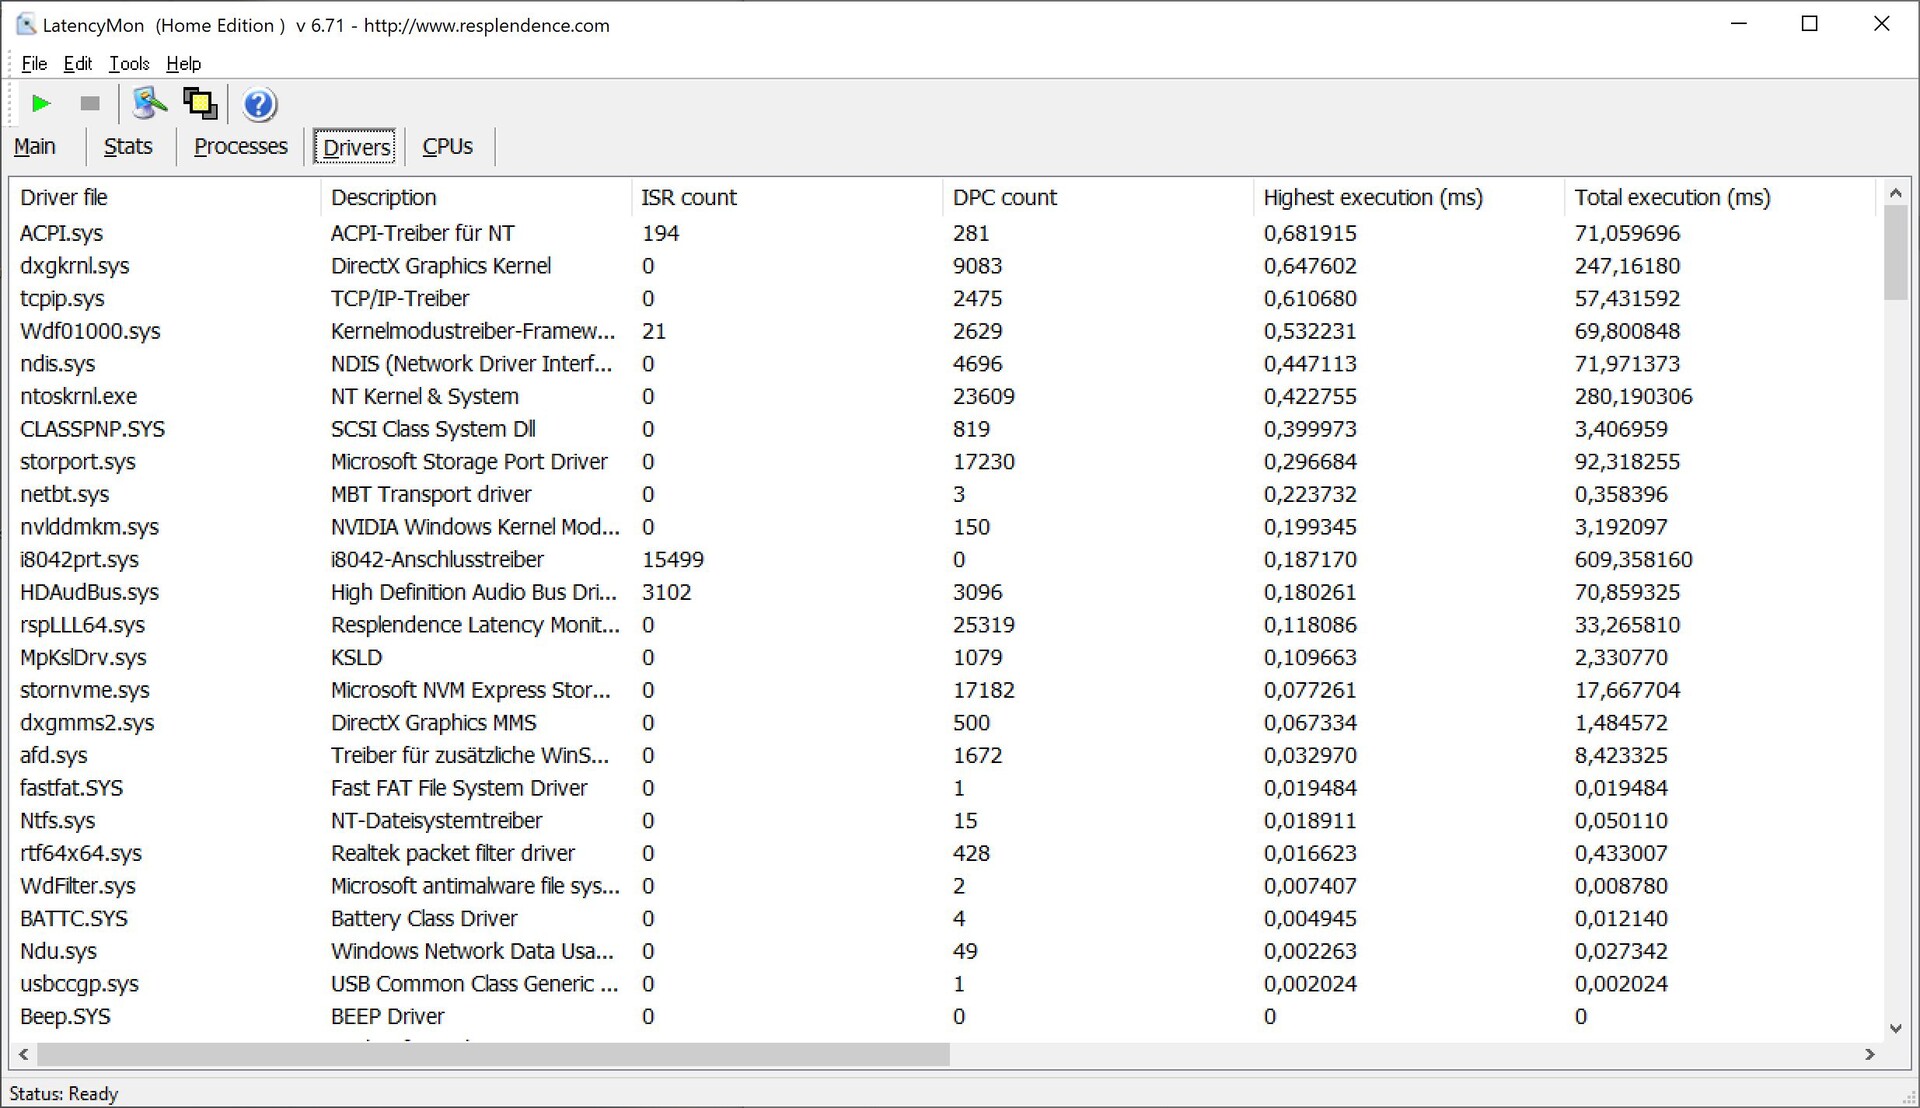
DPC Latencies
In the test with LatencyMon, the Aero 17 HDR YD shows increased latencies, and it is therefore not suited for applications with real-time processing.
| DPC Latencies / LatencyMon - interrupt to process latency (max), Web, Youtube, Prime95 | |
| Gigabyte Aero 17 HDR YC | |
| Gigabyte Aero 17 HDR YD | |
| Razer Blade Pro 17 2021 (QHD Touch) | |
| Alienware m17 R4 | |
* ... smaller is better
Storage Solution
In our test configuration, Gigabyte uses a 512 GB SSD from Samsung that achieves very good read and write rates in the storage benchmark. In addition, there is also a 1-TB SSD as it is also used in the Aero 17 HDR YC, offering similar speeds.
You can find out what performance to expect from other storage solutions in our HDD/SSD benchmark list.
| Gigabyte Aero 17 HDR YD Samsung PM9A1 MZVL2512HCJQ | Gigabyte Aero 17 HDR YC ESR01TBTLCG-EAC-4 | Razer Blade Pro 17 2021 (QHD Touch) Samsung PM981a MZVLB1T0HBLR | Alienware m17 R4 2x Micron 2300 512 GB (RAID 0) | Average Samsung PM9A1 MZVL2512HCJQ | |
|---|---|---|---|---|---|
| CrystalDiskMark 5.2 / 6 | -38% | -45% | -41% | -20% | |
| Write 4K (MB/s) | 230.4 | 141.2 -39% | 123.5 -46% | 93.1 -60% | 180.8 ? -22% |
| Read 4K (MB/s) | 91.6 | 46.48 -49% | 45.96 -50% | 46.79 -49% | 76.7 ? -16% |
| Write Seq (MB/s) | 4216 | 2433 -42% | 1861 -56% | 2853 -32% | 3103 ? -26% |
| Read Seq (MB/s) | 4543 | 1742 -62% | 1584 -65% | 2556 -44% | 3370 ? -26% |
| Write 4K Q32T1 (MB/s) | 667 | 565 -15% | 466.4 -30% | 475 -29% | 459 ? -31% |
| Read 4K Q32T1 (MB/s) | 728 | 655 -10% | 566 -22% | 529 -27% | 562 ? -23% |
| Write Seq Q32T1 (MB/s) | 5043 | 3028 -40% | 2981 -41% | 3331 -34% | 4450 ? -12% |
| Read Seq Q32T1 (MB/s) | 6821 | 3424 -50% | 3260 -52% | 3319 -51% | 6347 ? -7% |
| AS SSD | -33% | -67% | -66% | -19% | |
| Seq Read (MB/s) | 5438 | 2674 -51% | 2068 -62% | 2733 -50% | 4665 ? -14% |
| Seq Write (MB/s) | 3904 | 2458 -37% | 2047 -48% | 2822 -28% | 2769 ? -29% |
| 4K Read (MB/s) | 56.2 | 52.1 -7% | 47.85 -15% | 45.04 -20% | 67.7 ? 20% |
| 4K Write (MB/s) | 165.8 | 113.4 -32% | 87.4 -47% | 88.4 -47% | 174 ? 5% |
| 4K-64 Read (MB/s) | 2489 | 1881 -24% | 1932 -22% | 1388 -44% | 1543 ? -38% |
| 4K-64 Write (MB/s) | 3480 | 2849 -18% | 2017 -42% | 1227 -65% | 2390 ? -31% |
| Access Time Read * (ms) | 0.054 | 0.102 -89% | 0.055 -2% | 0.079 -46% | 0.04816 ? 11% |
| Access Time Write * (ms) | 0.026 | 0.033 -27% | 0.128 -392% | 0.095 -265% | 0.03505 ? -35% |
| Score Read (Points) | 3089 | 2201 -29% | 2187 -29% | 1706 -45% | 2077 ? -33% |
| Score Write (Points) | 4036 | 3208 -21% | 2309 -43% | 1598 -60% | 2815 ? -30% |
| Score Total (Points) | 8620 | 6524 -24% | 5612 -35% | 4184 -51% | 5895 ? -32% |
| Total Average (Program / Settings) | -36% /
-35% | -56% /
-58% | -54% /
-55% | -20% /
-19% |
* ... smaller is better

Constant Performance Reads: DiskSpd Read Loop, Queue Depth 8
Graphics Card
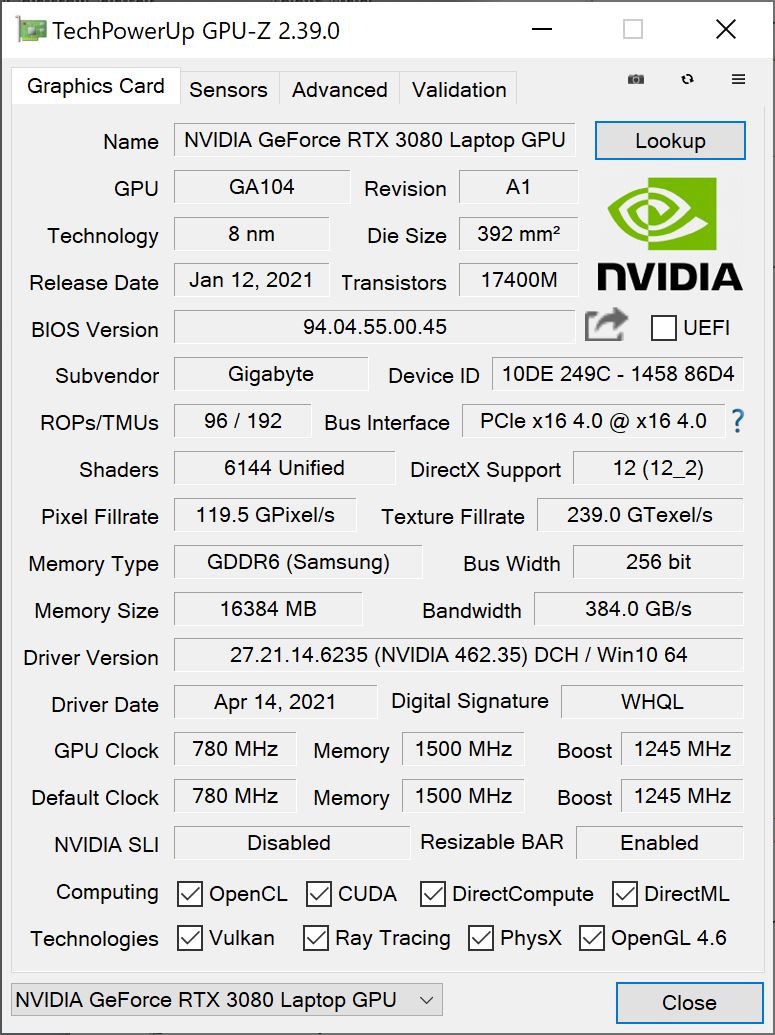
The Nvidia GeForce RTX 3080 used here is currently one of the most powerful graphics cards in mobile devices. However, the actual performance depends on the configured TGP, which can be up to 165 watts. Gigabyte specifies this value as 105 watts, resulting in slightly lower but still very good results in the 3DMark benchmarks.
Our GPU benchmark list shows how other graphics cards fare in comparison.
| 3DMark 11 Performance | 29248 points | |
| 3DMark Cloud Gate Standard Score | 34027 points | |
| 3DMark Fire Strike Score | 22142 points | |
| 3DMark Time Spy Score | 9800 points | |
Help | ||
Gaming Performance
The Nvidia GeForce RTX 3080 used here is able to play all the current games smoothly and at high frame rates. Only in very demanding games, the frame rates can go down to values below 30 fps in 4K resolution and at high detail levels.
Our GPU games list shows the performance you can expect in various games.
| The Witcher 3 - 1920x1080 Ultra Graphics & Postprocessing (HBAO+) | |
| Average of class Gaming (18.4 - 240, n=55, last 2 years) | |
| Alienware m17 R4 | |
| Razer Blade Pro 17 2021 (QHD Touch) | |
| Average NVIDIA GeForce RTX 3080 Laptop GPU (85.1 - 123, n=40) | |
| Gigabyte Aero 17 HDR YC | |
| Gigabyte Aero 17 HDR YD | |
| Cyberpunk 2077 1.0 | |
| 3840x2160 Ultra Preset | |
| Gigabyte Aero 17 HDR YD | |
| Average NVIDIA GeForce RTX 3080 Laptop GPU (19.7 - 27.9, n=3) | |
| Gigabyte Aero 17 HDR YC | |
| 2560x1440 Ultra Preset | |
| Average NVIDIA GeForce RTX 3080 Laptop GPU (39.8 - 49.7, n=5) | |
| Gigabyte Aero 17 HDR YD | |
| Gigabyte Aero 17 HDR YC | |
| 1920x1080 Ultra Preset | |
| Alienware m17 R4 | |
| Average NVIDIA GeForce RTX 3080 Laptop GPU (52.9 - 84.3, n=9) | |
| Gigabyte Aero 17 HDR YC | |
| Gigabyte Aero 17 HDR YD | |
| GTA V - 1920x1080 Highest AA:4xMSAA + FX AF:16x | |
| Average of class Gaming (12.1 - 186.9, n=128, last 2 years) | |
| Gigabyte Aero 17 HDR YD | |
| Razer Blade Pro 17 2021 (QHD Touch) | |
| Average NVIDIA GeForce RTX 3080 Laptop GPU (68.6 - 114.6, n=34) | |
| Alienware m17 R4 | |
| Gigabyte Aero 17 HDR YC | |
In our The Witcher 3 constant load test, the Aero 17 HDR YD does not show any drop in performance. You therefore do not have to expect any limitations in the gaming performance even after longer periods of playing.
| low | med. | high | ultra | QHD | 4K | |
|---|---|---|---|---|---|---|
| GTA V (2015) | 185 | 178 | 166 | 103 | ||
| The Witcher 3 (2015) | 93.4 | |||||
| Dota 2 Reborn (2015) | 172.8 | 156.1 | 145.7 | 138.4 | 112.6 | |
| Final Fantasy XV Benchmark (2018) | 193 | 127 | 99 | 75.9 | 45.4 | |
| X-Plane 11.11 (2018) | 129 | 110 | 89.3 | 62.2 | ||
| Far Cry 5 (2018) | 118 | 96 | 54 | |||
| Strange Brigade (2018) | 442 | 236 | 193 | 172 | 129 | 77 |
| Cyberpunk 2077 1.0 (2020) | 74.8 | 52.9 | 42.8 | 27.9 |
Emissions - Quiet operation is possible
The emissions were measured with active AI and the "Normal" fan adjustment.
Noise Emissions
The Aero 17 HDR YD can be very quiet in everyday operation. When using office and browser applications, the fans will only rarely rev up slightly. During gaming, the laptop operation will be clearly noticeable, depending on the load. During high load, the noise levels will reach up to 59 dB(A). This makes the fans annoyingly loud.
Noise level
| Idle |
| 30 / 32 / 41 dB(A) |
| Load |
| 43 / 59 dB(A) |
 | ||
30 dB silent 40 dB(A) audible 50 dB(A) loud |
||
min: | ||
Temperatures
Under load, the surfaces of the Aero 17 HDR YD reach temperatures of up to 56 °C (133 °F). The warmest spots are at the bottom towards the back, but the palm rests will always remain at moderate temperatures. With this, you will still be able to use the laptop on your lap, but just barely.
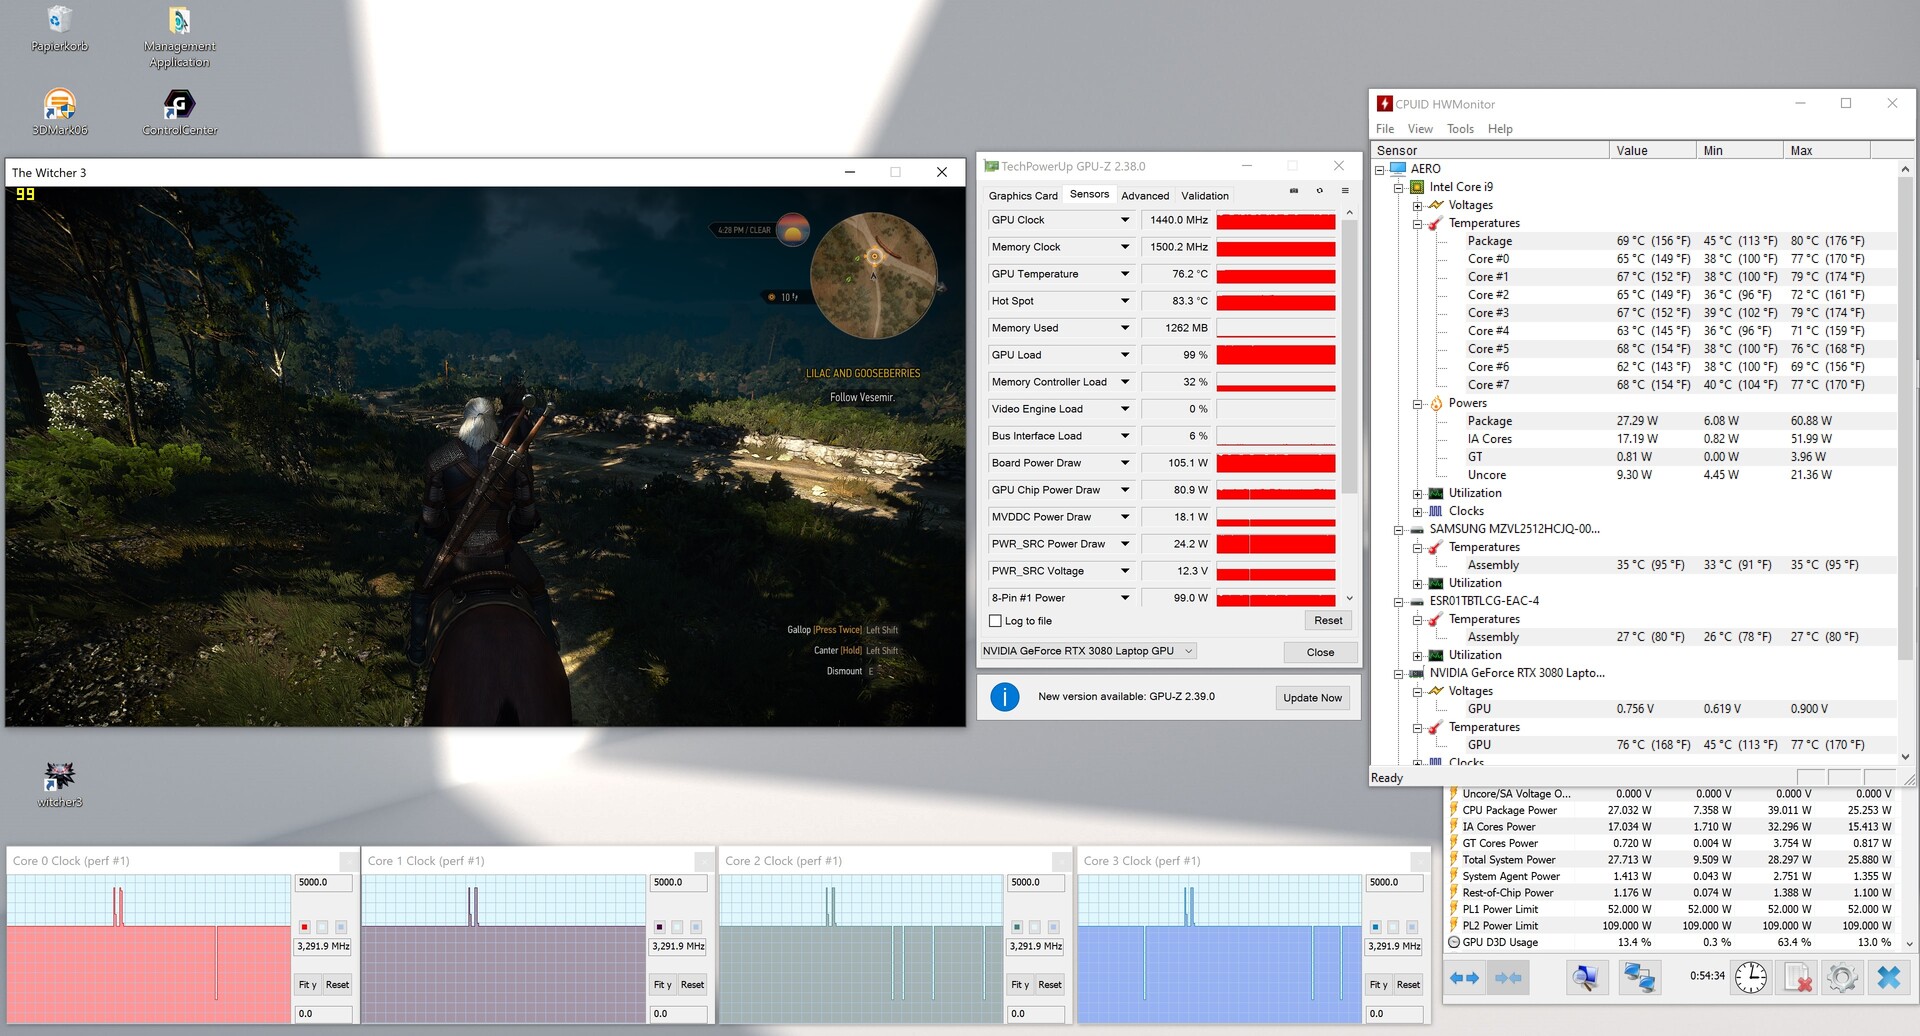


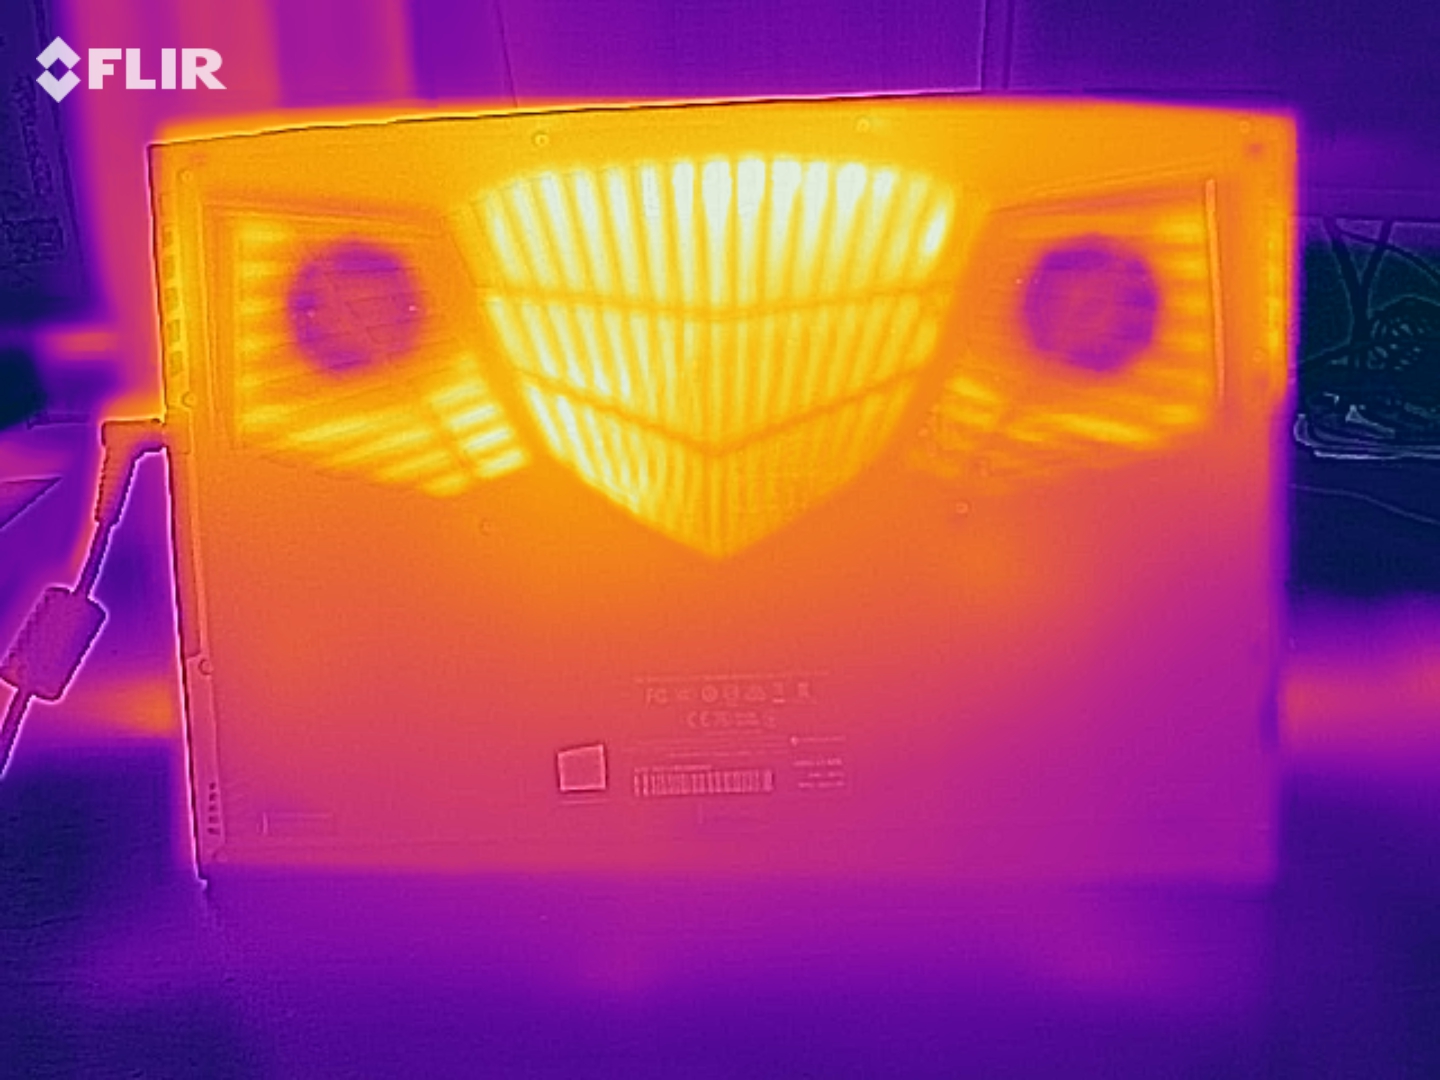
During our constant load test, the temperatures inside the Gigabyte laptop rise up to 93 °C (199 °F). At 2.9 GHz during this time, the clock speeds remain above the basic clock speed, and according to HWInfo, the CPU runs stably at 70 watts. The same behavior is shown during our The Witcher 3 constant load test, with the temperatures remaining slightly lower at a maximum of 80 °C (176 °F). While operating the laptop under constant load, you should therefore not have to expect any limitations due to temperatures being too high.
(±) The maximum temperature on the upper side is 44 °C / 111 F, compared to the average of 40.4 °C / 105 F, ranging from 21.2 to 68.8 °C for the class Gaming.
(-) The bottom heats up to a maximum of 56 °C / 133 F, compared to the average of 43.3 °C / 110 F
(+) In idle usage, the average temperature for the upper side is 29.1 °C / 84 F, compared to the device average of 33.9 °C / 93 F.
(±) Playing The Witcher 3, the average temperature for the upper side is 37.9 °C / 100 F, compared to the device average of 33.9 °C / 93 F.
(+) The palmrests and touchpad are reaching skin temperature as a maximum (35 °C / 95 F) and are therefore not hot.
(-) The average temperature of the palmrest area of similar devices was 28.9 °C / 84 F (-6.1 °C / -11 F).
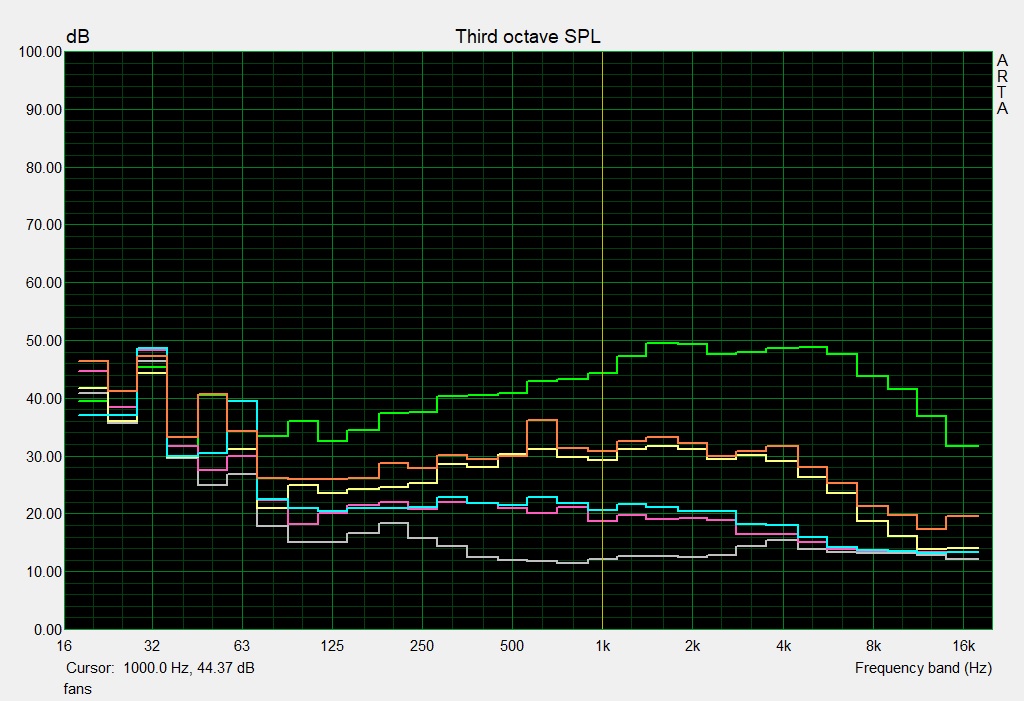
Speakers
The speakers of the Aero 17 YD produce a fairly high volume and relatively broad sound spectrum that drops steeply below the mid-level frequencies, however. While this will allow you to occasionally reproduce voice contents, for listening to music or playing games, external speakers or headphones would be preferable.
Gigabyte Aero 17 HDR YD audio analysis
(+) | speakers can play relatively loud (88 dB)
Bass 100 - 315 Hz
(-) | nearly no bass - on average 33.9% lower than median
(±) | linearity of bass is average (9.6% delta to prev. frequency)
Mids 400 - 2000 Hz
(+) | balanced mids - only 2.9% away from median
(+) | mids are linear (6.5% delta to prev. frequency)
Highs 2 - 16 kHz
(±) | higher highs - on average 5.1% higher than median
(+) | highs are linear (4.7% delta to prev. frequency)
Overall 100 - 16.000 Hz
(±) | linearity of overall sound is average (19.8% difference to median)
Compared to same class
» 69% of all tested devices in this class were better, 6% similar, 25% worse
» The best had a delta of 6%, average was 18%, worst was 132%
Compared to all devices tested
» 50% of all tested devices were better, 7% similar, 43% worse
» The best had a delta of 4%, average was 24%, worst was 134%
Apple MacBook 12 (Early 2016) 1.1 GHz audio analysis
(+) | speakers can play relatively loud (83.6 dB)
Bass 100 - 315 Hz
(±) | reduced bass - on average 11.3% lower than median
(±) | linearity of bass is average (14.2% delta to prev. frequency)
Mids 400 - 2000 Hz
(+) | balanced mids - only 2.4% away from median
(+) | mids are linear (5.5% delta to prev. frequency)
Highs 2 - 16 kHz
(+) | balanced highs - only 2% away from median
(+) | highs are linear (4.5% delta to prev. frequency)
Overall 100 - 16.000 Hz
(+) | overall sound is linear (10.2% difference to median)
Compared to same class
» 7% of all tested devices in this class were better, 2% similar, 91% worse
» The best had a delta of 5%, average was 18%, worst was 53%
Compared to all devices tested
» 4% of all tested devices were better, 1% similar, 94% worse
» The best had a delta of 4%, average was 24%, worst was 134%
Power Management - The battery life has dropped a bit
Power Consumption
Under load, the Aero 17 with the RTX 3080 has a power consumption up to 236 watts. With this, it is at the level of comparable devices under load, and we only measure a slightly higher power consumption than in other devices during idle operation.
The output of the included power supply is rated at 230 watts.
| Off / Standby | |
| Idle | |
| Load |
|
Key:
min: | |
| Gigabyte Aero 17 HDR YD i9-11980HK, GeForce RTX 3080 Laptop GPU | Gigabyte Aero 17 HDR YC i9-10980HK, GeForce RTX 3080 Laptop GPU | Razer Blade Pro 17 2021 (QHD Touch) i7-10875H, GeForce RTX 3080 Laptop GPU | Alienware m17 R4 i9-10980HK, GeForce RTX 3080 Laptop GPU | Average NVIDIA GeForce RTX 3080 Laptop GPU | Average of class Gaming | |
|---|---|---|---|---|---|---|
| Power Consumption | 14% | 15% | -43% | 12% | 21% | |
| Idle Minimum * (Watt) | 25 | 17 32% | 15.2 39% | 42 -68% | 19.8 ? 21% | 13.6 ? 46% |
| Idle Average * (Watt) | 28 | 21 25% | 20.3 27% | 48 -71% | 24.3 ? 13% | 19.5 ? 30% |
| Idle Maximum * (Watt) | 40 | 33 17% | 37.3 7% | 58 -45% | 33.3 ? 17% | 26.1 ? 35% |
| Load Average * (Watt) | 114 | 113 1% | 114.9 -1% | 124 -9% | 108.1 ? 5% | 110.9 ? 3% |
| Witcher 3 ultra * (Watt) | 176 | 157 11% | 158.4 10% | 219 -24% | ||
| Load Maximum * (Watt) | 236 | 237 -0% | 223.7 5% | 337 -43% | 230 ? 3% | 262 ? -11% |
* ... smaller is better
Battery Life
In our realistic WLAN test, the Gigabyte Aero 17 HDR YD achieves a battery life of 5.5 hours. With this, its battery life is about 20 minutes shorter than that of the Aero 17 HDR YC predecessor model, but still longer than that of the Alienware m17 R4.
| Gigabyte Aero 17 HDR YD i9-11980HK, GeForce RTX 3080 Laptop GPU, 99 Wh | Gigabyte Aero 17 HDR YC i9-10980HK, GeForce RTX 3080 Laptop GPU, 99 Wh | Razer Blade Pro 17 2021 (QHD Touch) i7-10875H, GeForce RTX 3080 Laptop GPU, 70.5 Wh | Alienware m17 R4 i9-10980HK, GeForce RTX 3080 Laptop GPU, 86 Wh | Average of class Gaming | |
|---|---|---|---|---|---|
| Battery runtime | 15% | 11% | -29% | 21% | |
| WiFi v1.3 (h) | 5.6 | 5.9 5% | 5.9 5% | 2.4 -57% | 6.76 ? 21% |
| Load (h) | 1.2 | 1.5 25% | 1.4 17% | 1.2 0% | 1.435 ? 20% |
Pros
Cons
Verdict - A better performance thanks to i9 Tiger Lake
Not only is the Aero 17 HDR YD a very good laptop for gamers but also for content creators.
With the upgrade to the Intel Core i9-11980HK, Gigabyte particularly improved the system performance.
In addition, the hardware package is rounded by the extremely fast SSD and 32 GB of working memory in dual-channel mode. Compared to the predecessor, the battery life is reduced only moderately, and the 4K display also basically keeps its good qualities.
For gaming, the Nvidia GeForce RTX 3080 continues to be the most powerful graphics unit for laptops that is currently available. The 3D performance is correspondingly good, even if the Aero 17 HDR YD is only at the same level as the competitors here. With the corresponding system settings, you can also limit the noise level, making the Gigabyte laptop well suited for gaming even without headphones.
Price and Availability
Currently the Aero 17 HDR YD is not available yet. Avadirect currently lists it as available in June starting at $3699.
Gigabyte Aero 17 HDR YD
- 05/28/2021 v7 (old)
Mike Wobker
Price comparison

