 Deutsch
 English
 Español
 Français
 Italiano
 Nederlands
 Polski
 Português
 Русский
 Türkçe
 Svenska
 Chinese
 Magyar
Alienware m17 R4 laptop review: Burning up into the atmosphere
The Alienware M17 R4 is the 17-inch model from Dell's Alienware lineup. The RGB-backlit laptops are known for their striking design and have earned a certain image in the world of gaming laptops as a result. The two other models in Alienware's portfolio are the 15-inch variant of our test device, which goes by the name of Alienware M15 R4, and the Alienware Area-51M R2. In contrast to the latter, the Alienware M17 R4 is still relatively compact, as far as you can still speak of that when it comes to a 17-inch laptop in this performance class. The Alienware M17 R4 is an updated version of the Alienware M17 R3, which we previously examined. In the following review, we'll take a look at how well the slim case copes with the new hardware and how the lightning-fast 360 Hz display performs.
Possible contenders in comparison
Rating | Date | Model | Weight | Height | Size | Resolution | Best Price |
|---|---|---|---|---|---|---|---|
| 85.3 % | 04/2021 | Alienware m17 R4 i9-10980HK, GeForce RTX 3080 Laptop GPU | 3 kg | 22 mm | 17.30" | 1920x1080 | |
| 87.1 % | 03/2021 | MSI GE76 Raider 10UH i7-10870H, GeForce RTX 3080 Laptop GPU | 3 kg | 27.4 mm | 17.30" | 1920x1080 | |
| 87.8 % | 02/2021 | Razer Blade Pro 17 2021 (QHD Touch) i7-10875H, GeForce RTX 3080 Laptop GPU | 3 kg | 19.9 mm | 17.30" | 3840x2160 | |
| 87.6 % | 01/2021 | Gigabyte Aero 17 HDR YC i9-10980HK, GeForce RTX 3080 Laptop GPU | 2.8 kg | 21.4 mm | 17.30" | 3840x2160 | |
| 85.1 % | 01/2021 | SCHENKER XMG Neo 17 (Early 2021, RTX 3070, 5800H) R7 5800H, GeForce RTX 3070 Laptop GPU | 2.5 kg | 27 mm | 17.30" | 2560x1440 | |
| 85.3 % | 09/2020 | Alienware m17 R3 P45E i9-10980HK, GeForce RTX 2080 Super Mobile | 3 kg | 20.7 mm | 17.30" | 1920x1080 |
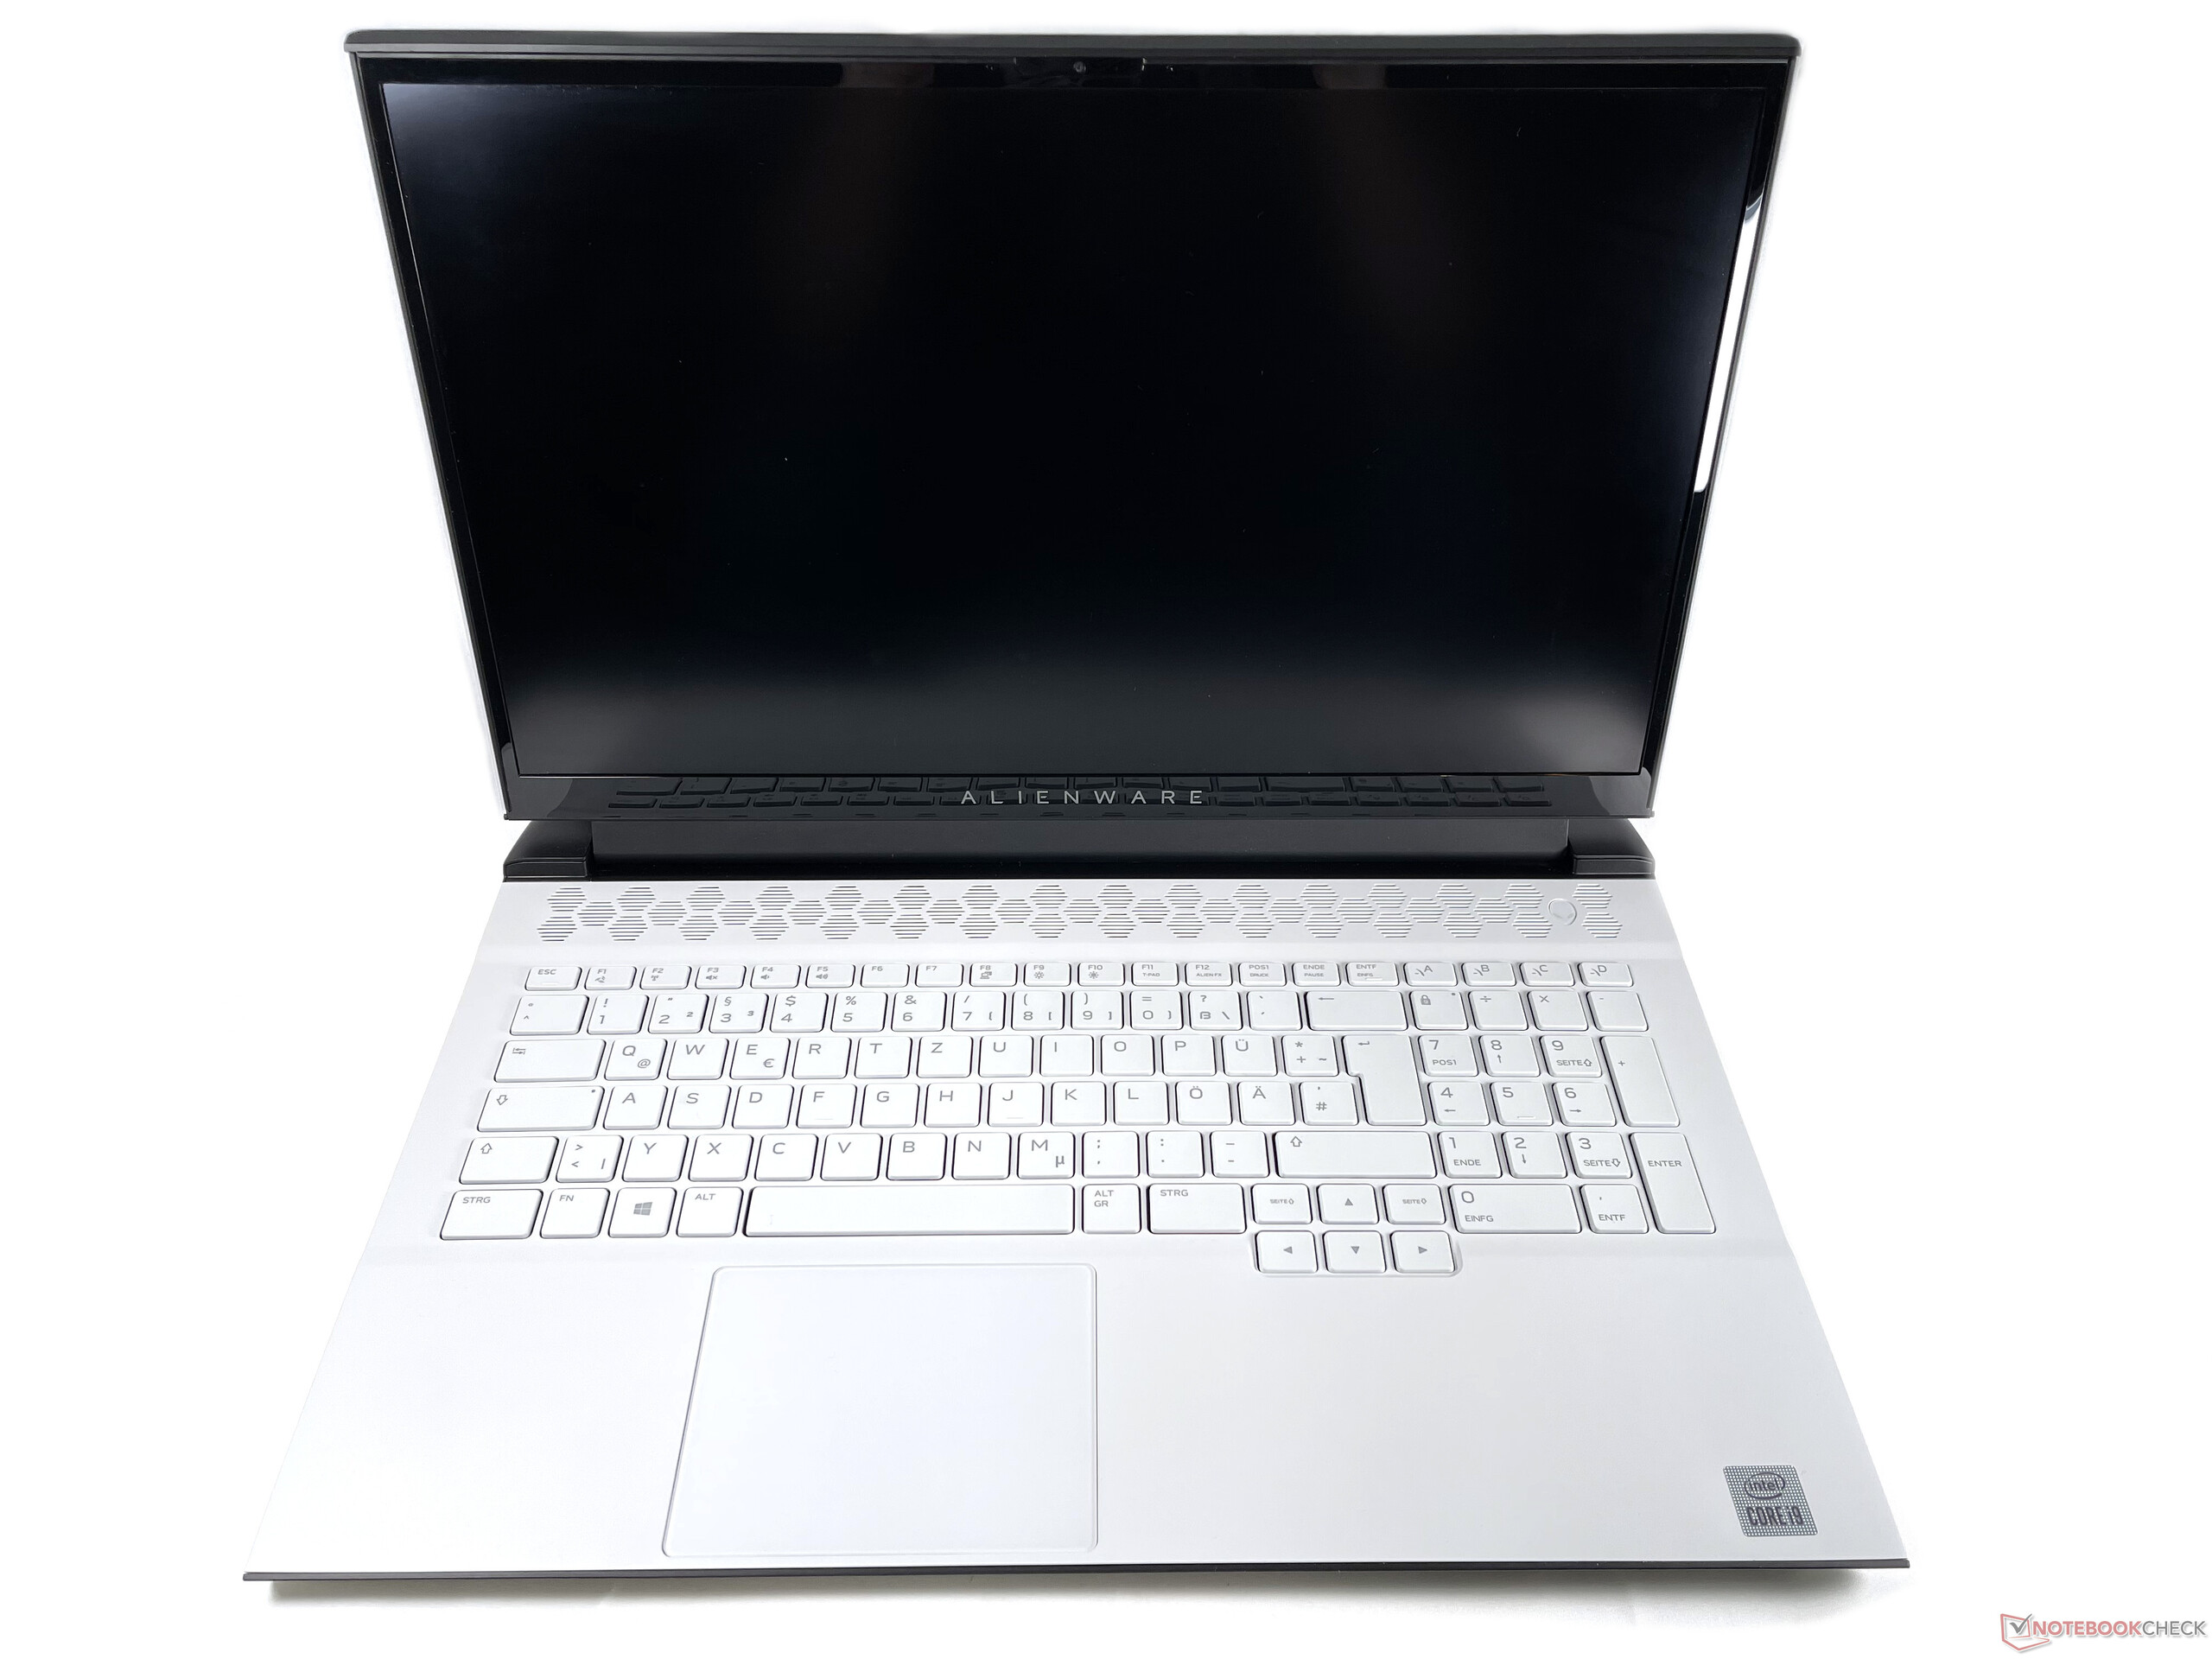
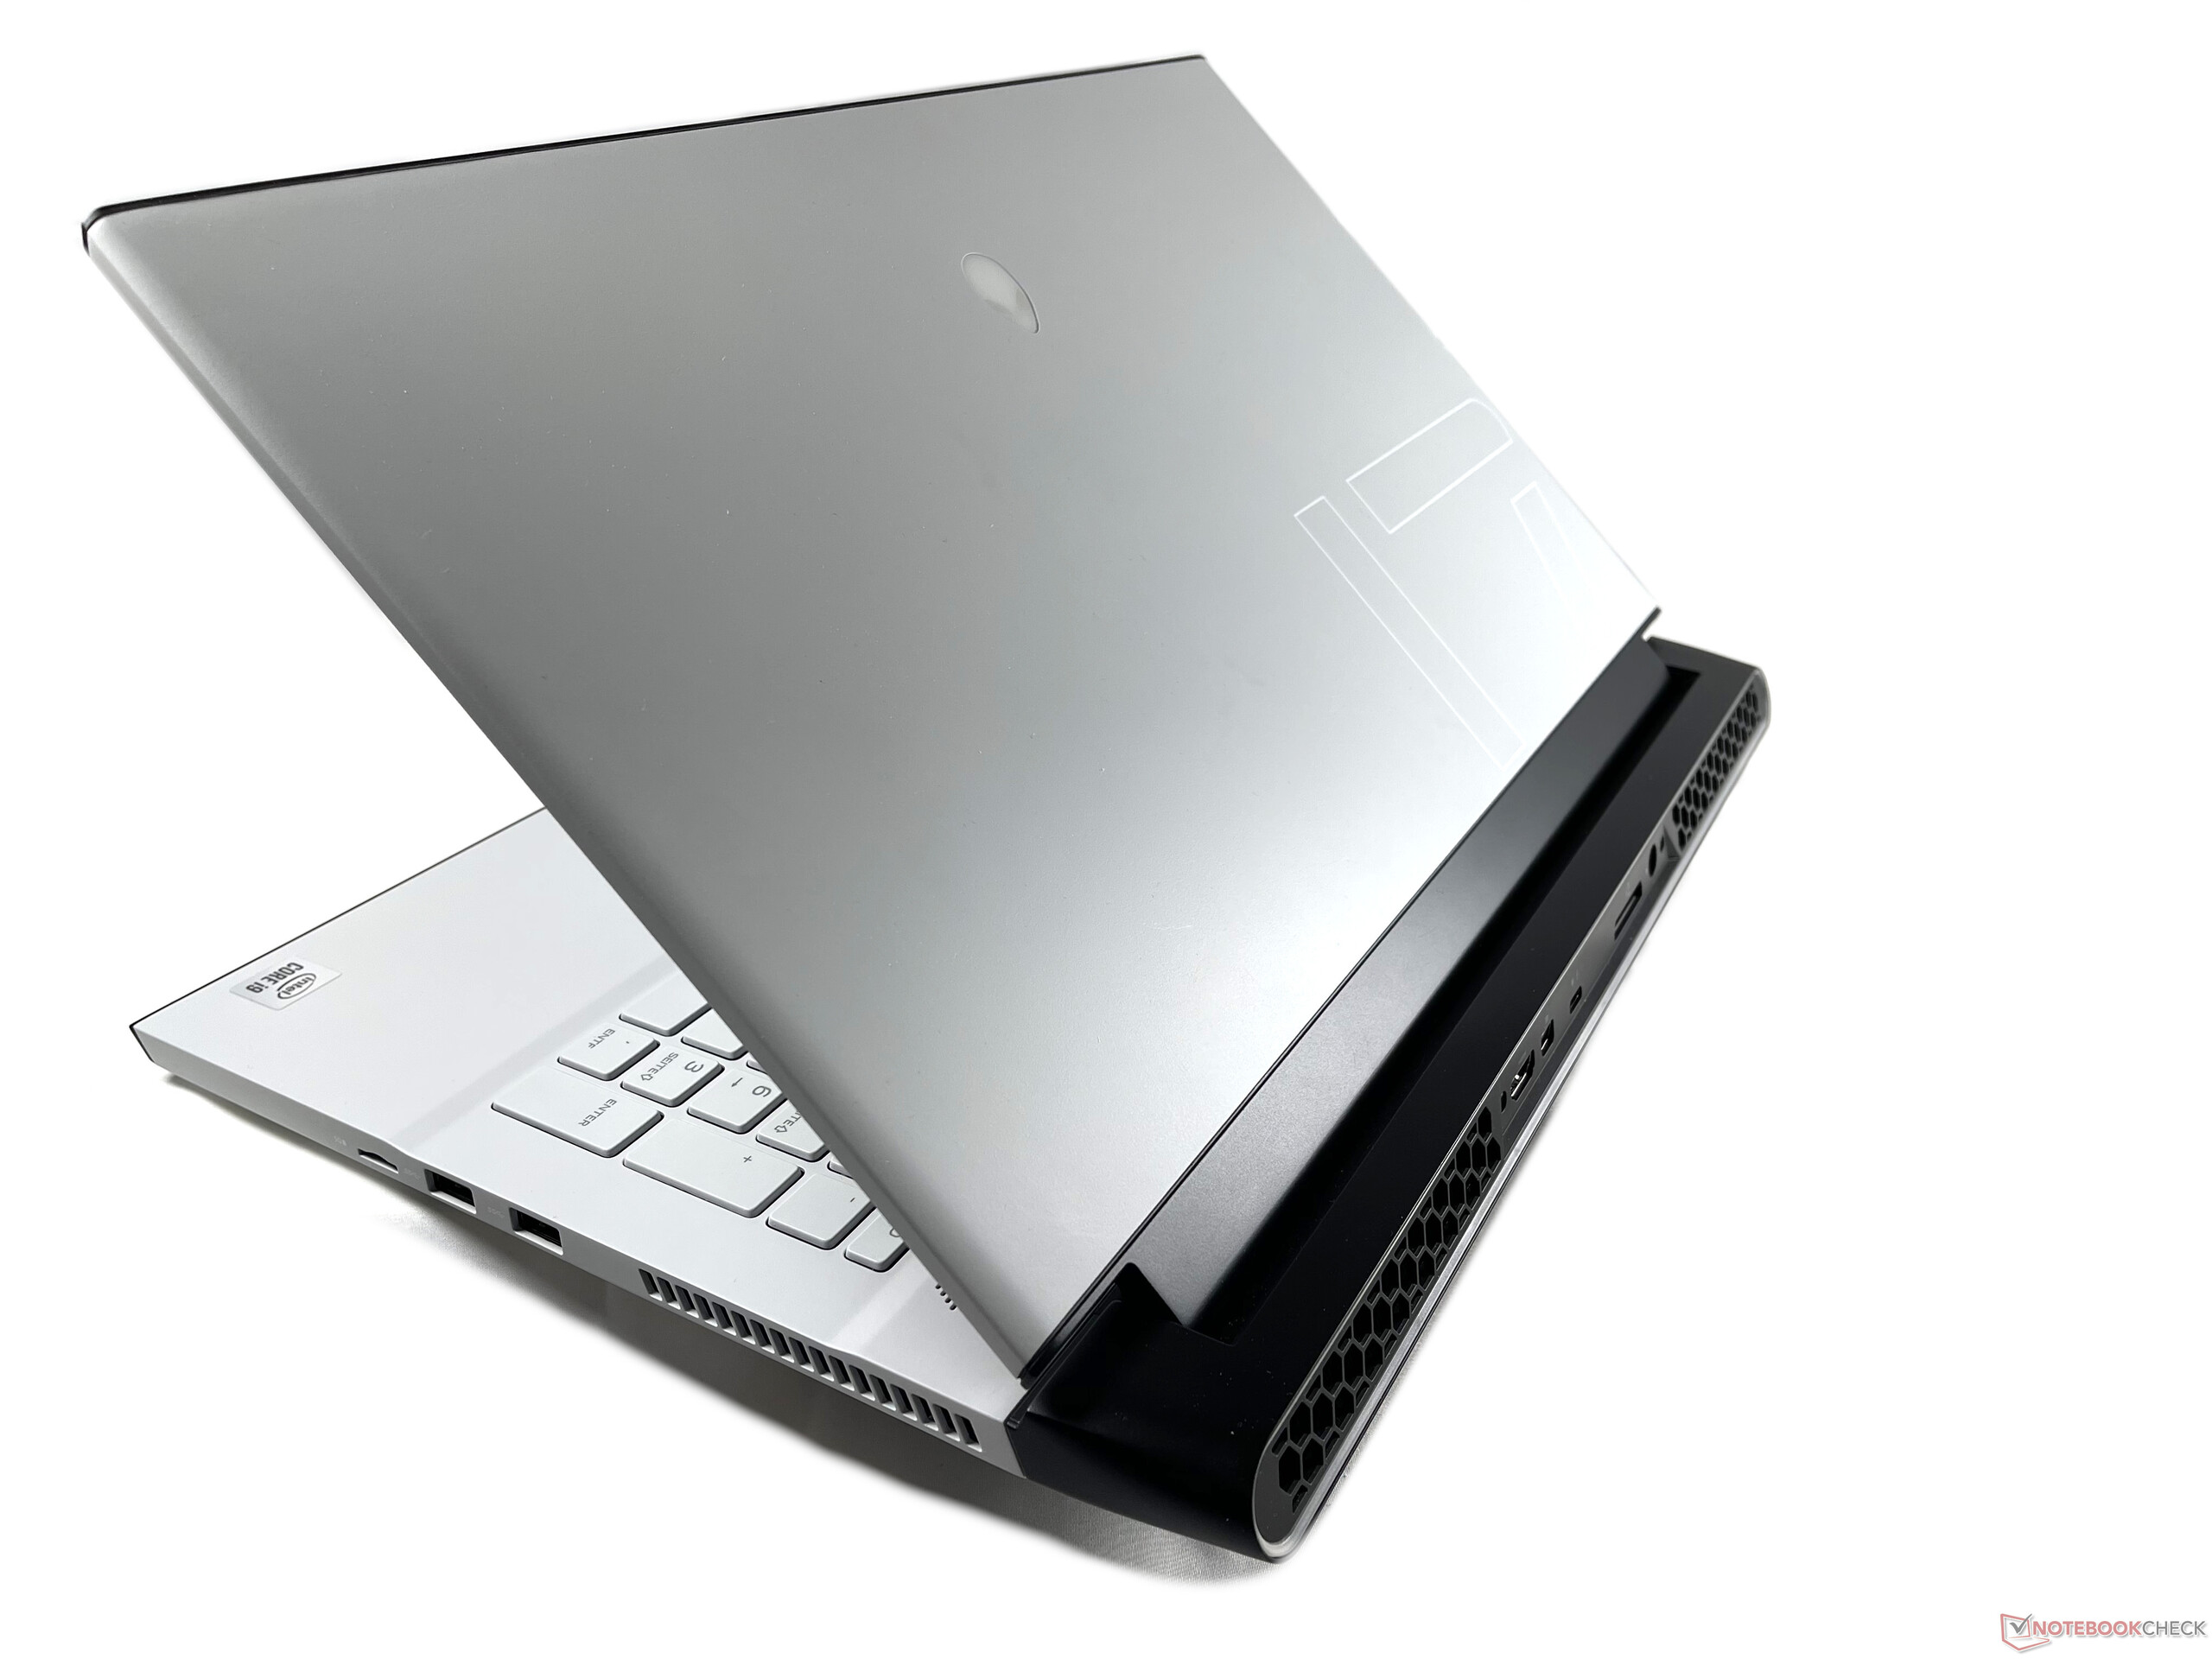
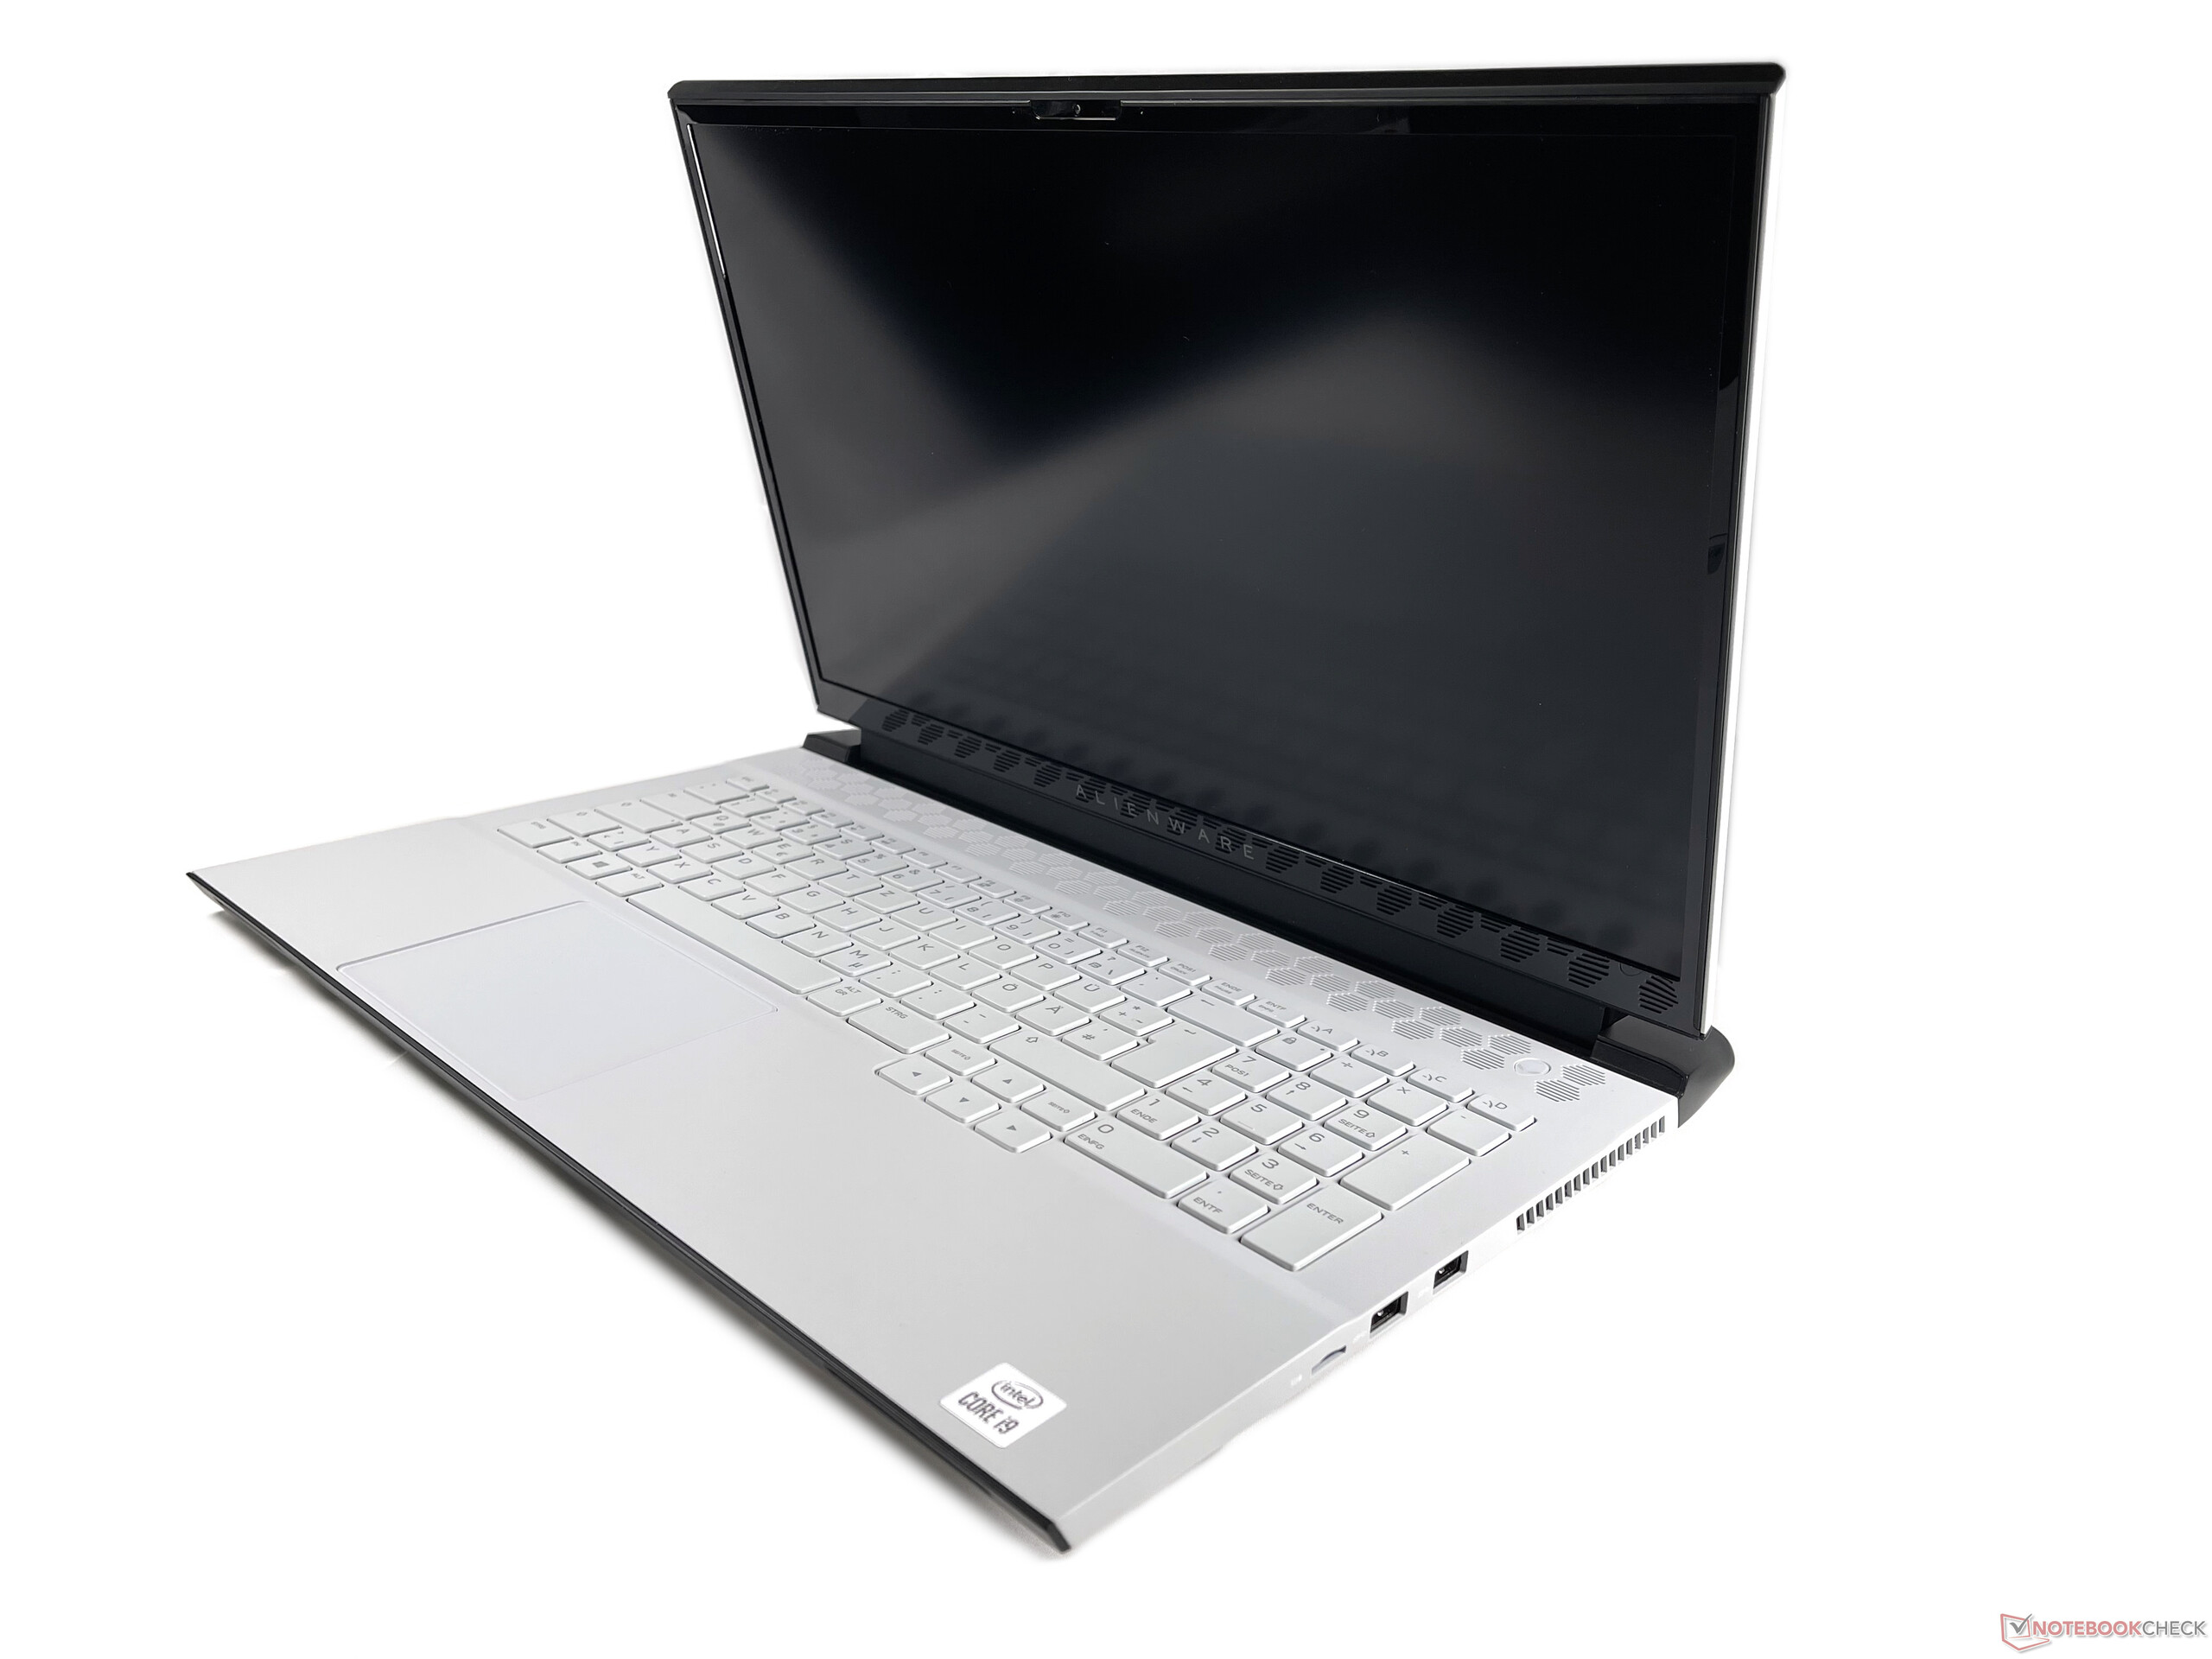
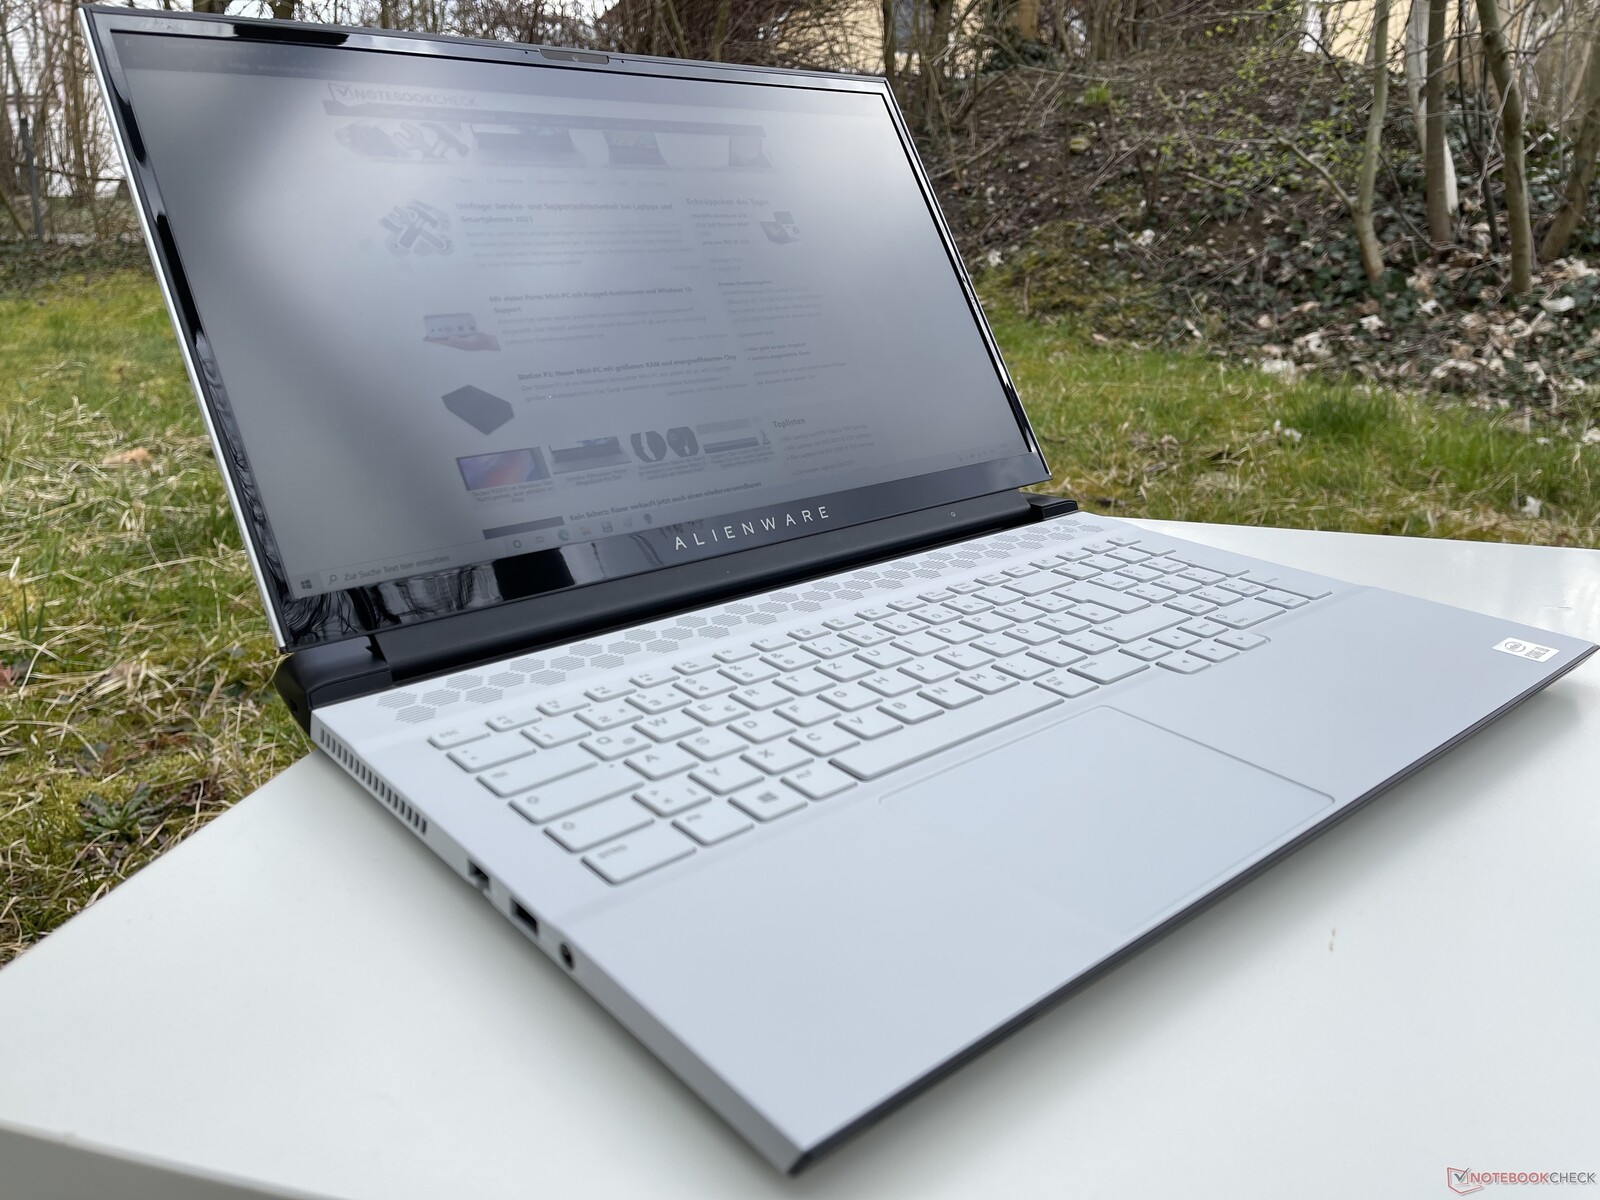
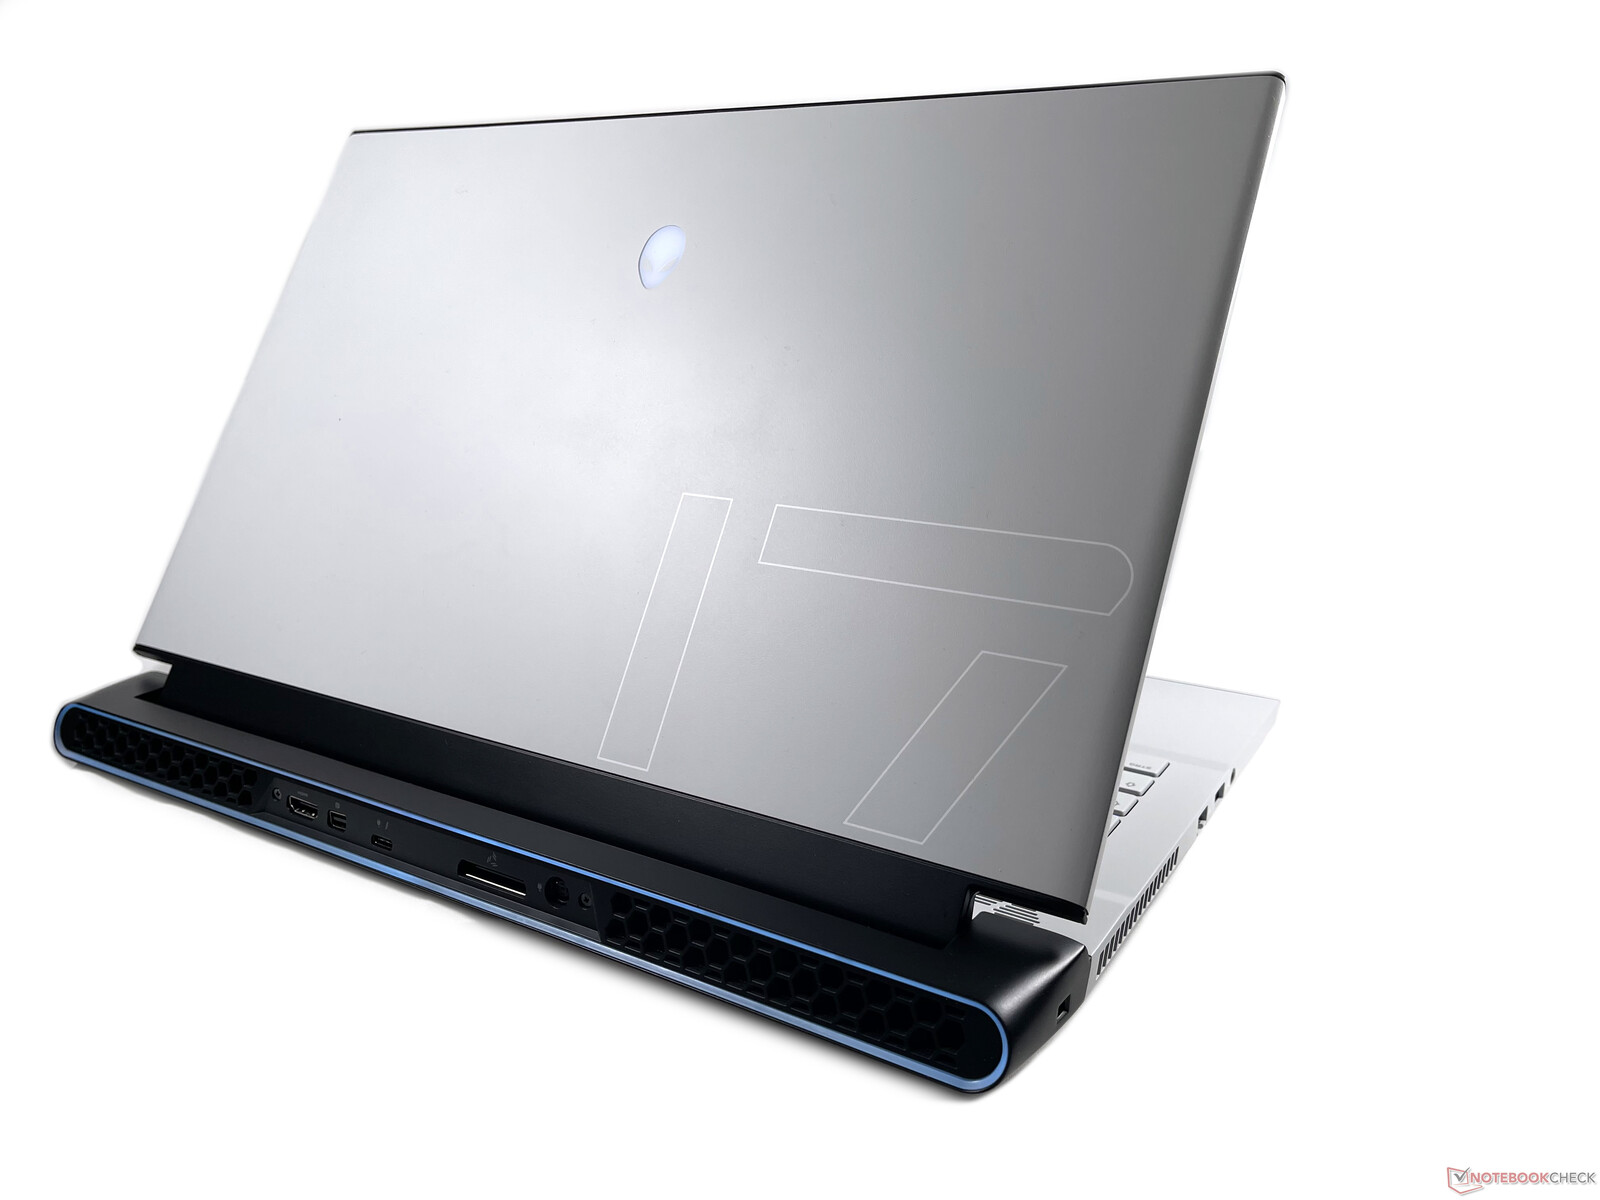
Case - Alienware laptop dressed in white
The case is made of a white magnesium alloy with black plastic elements. The gap dimensions are even, and the build quality is very high. This is also noticeable in the high rigidity of the construction. The design hasn't changed compared to the predecessor.
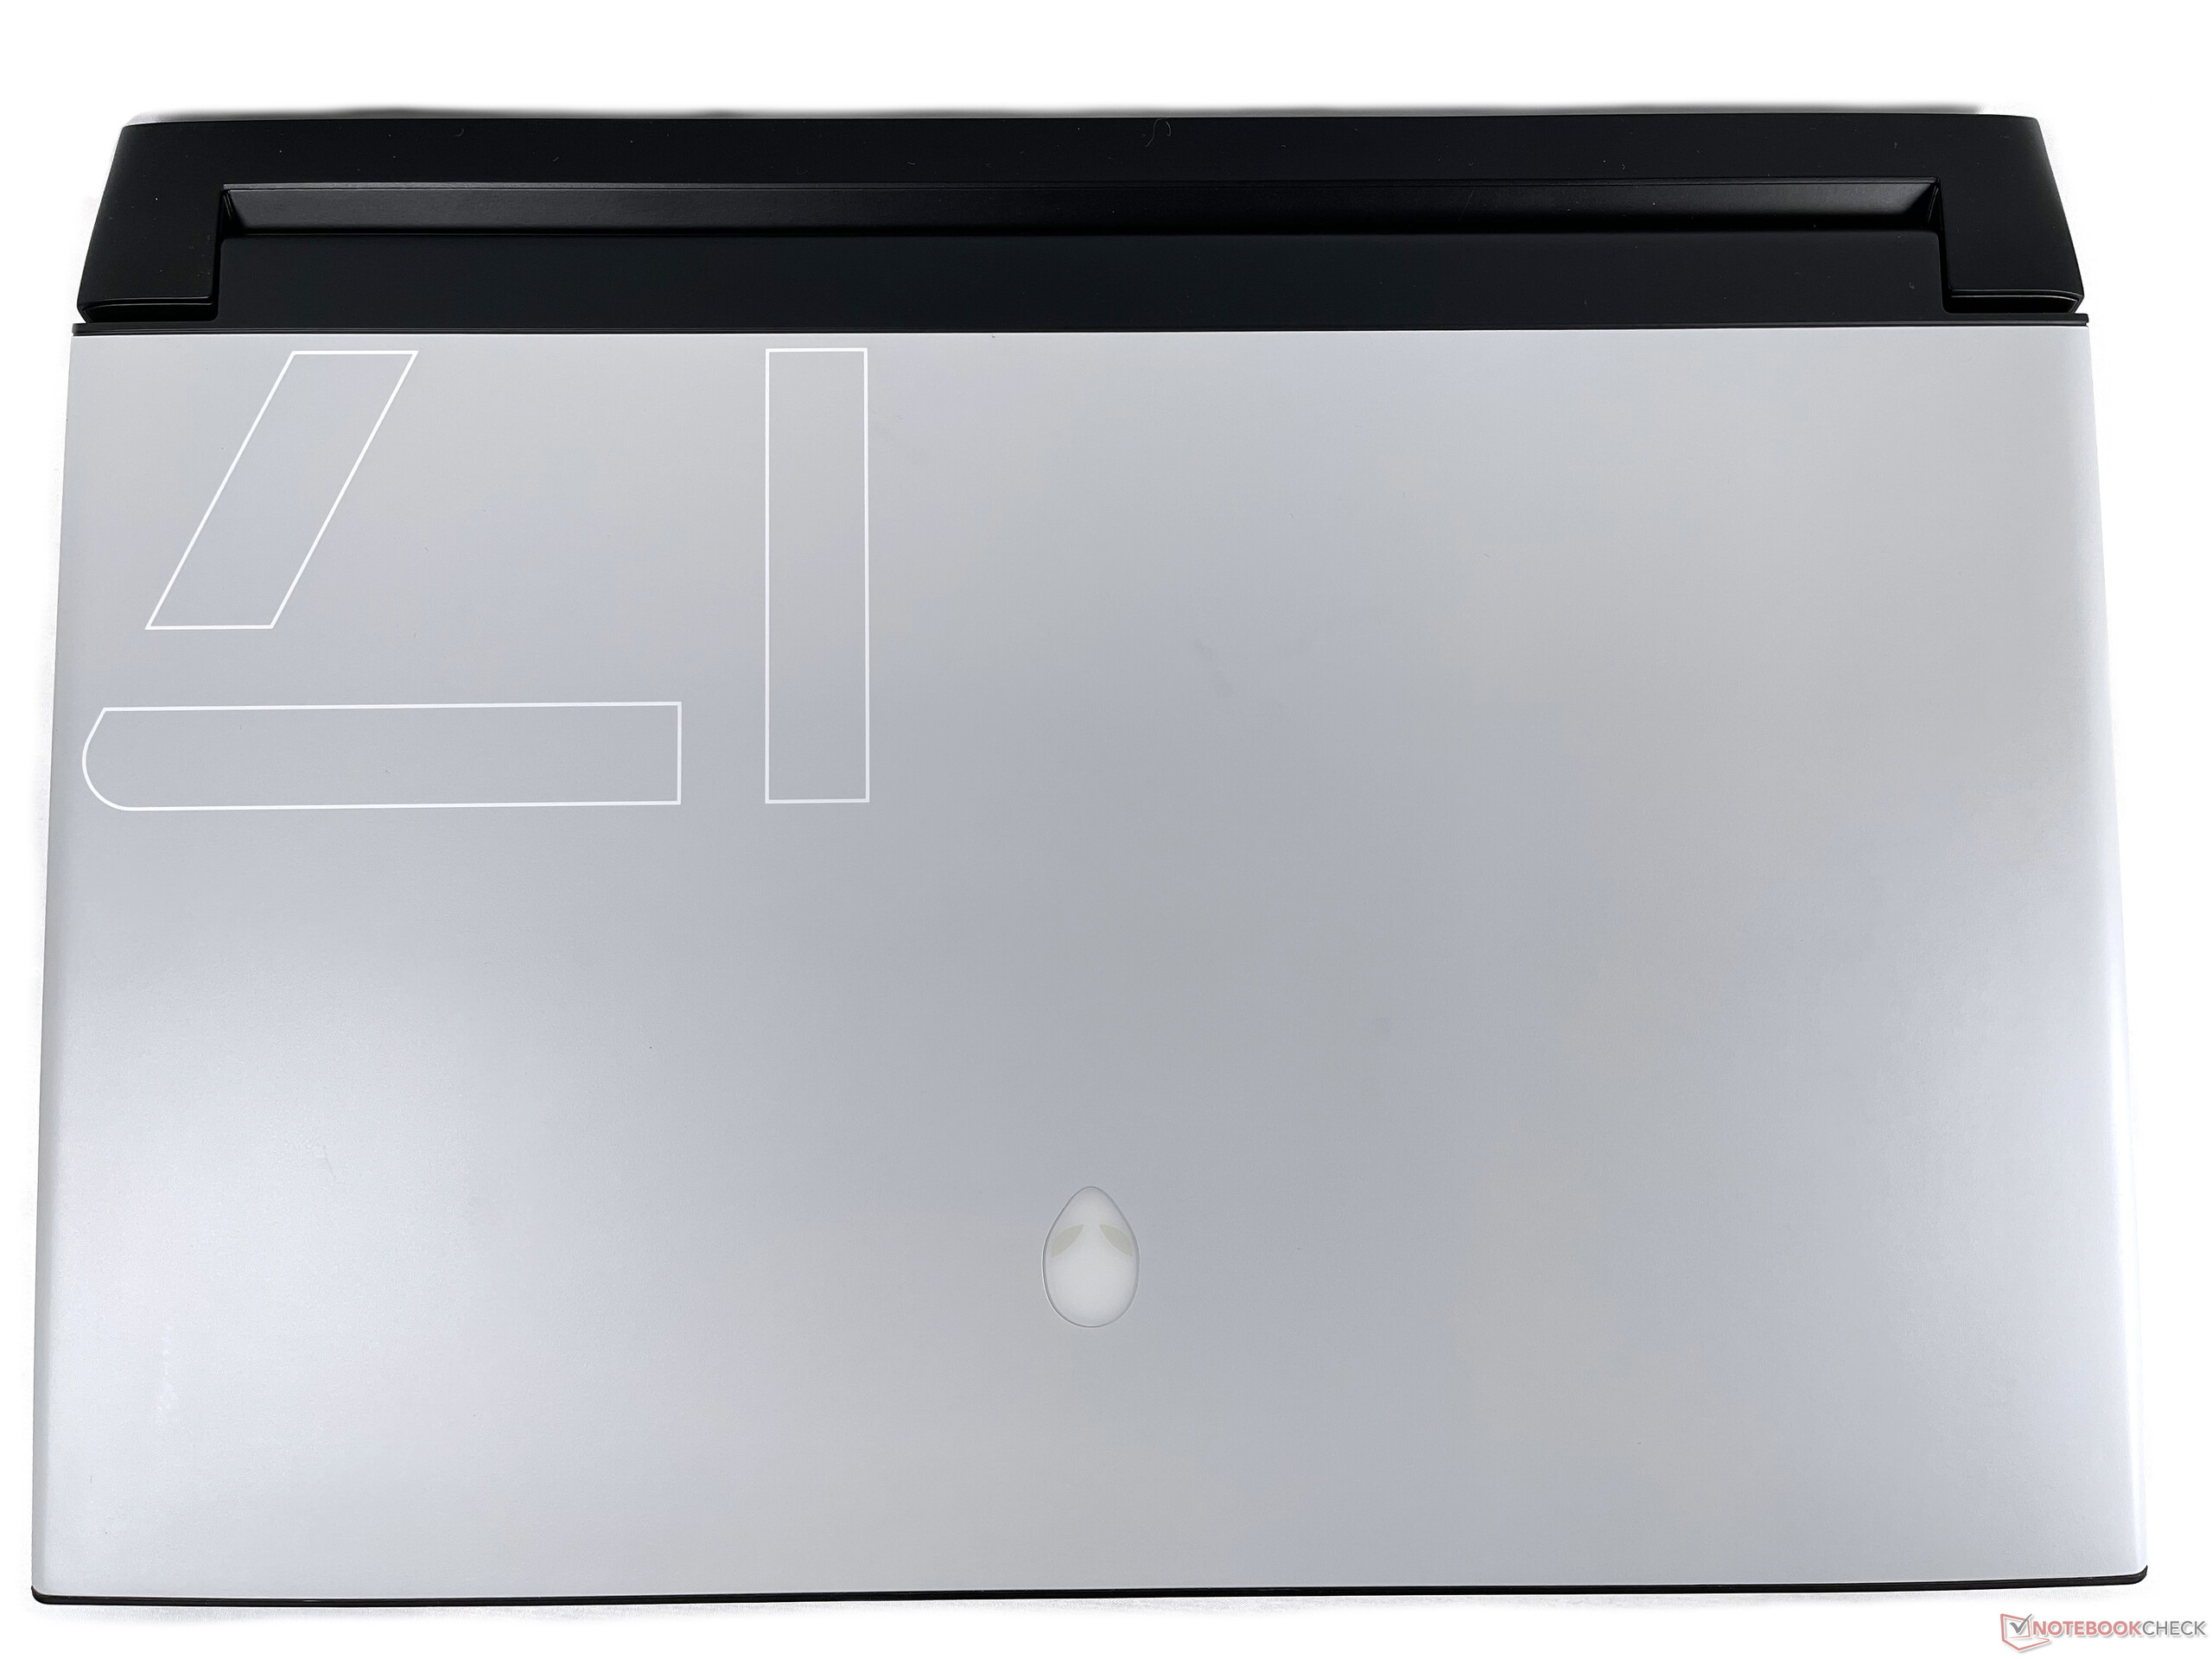
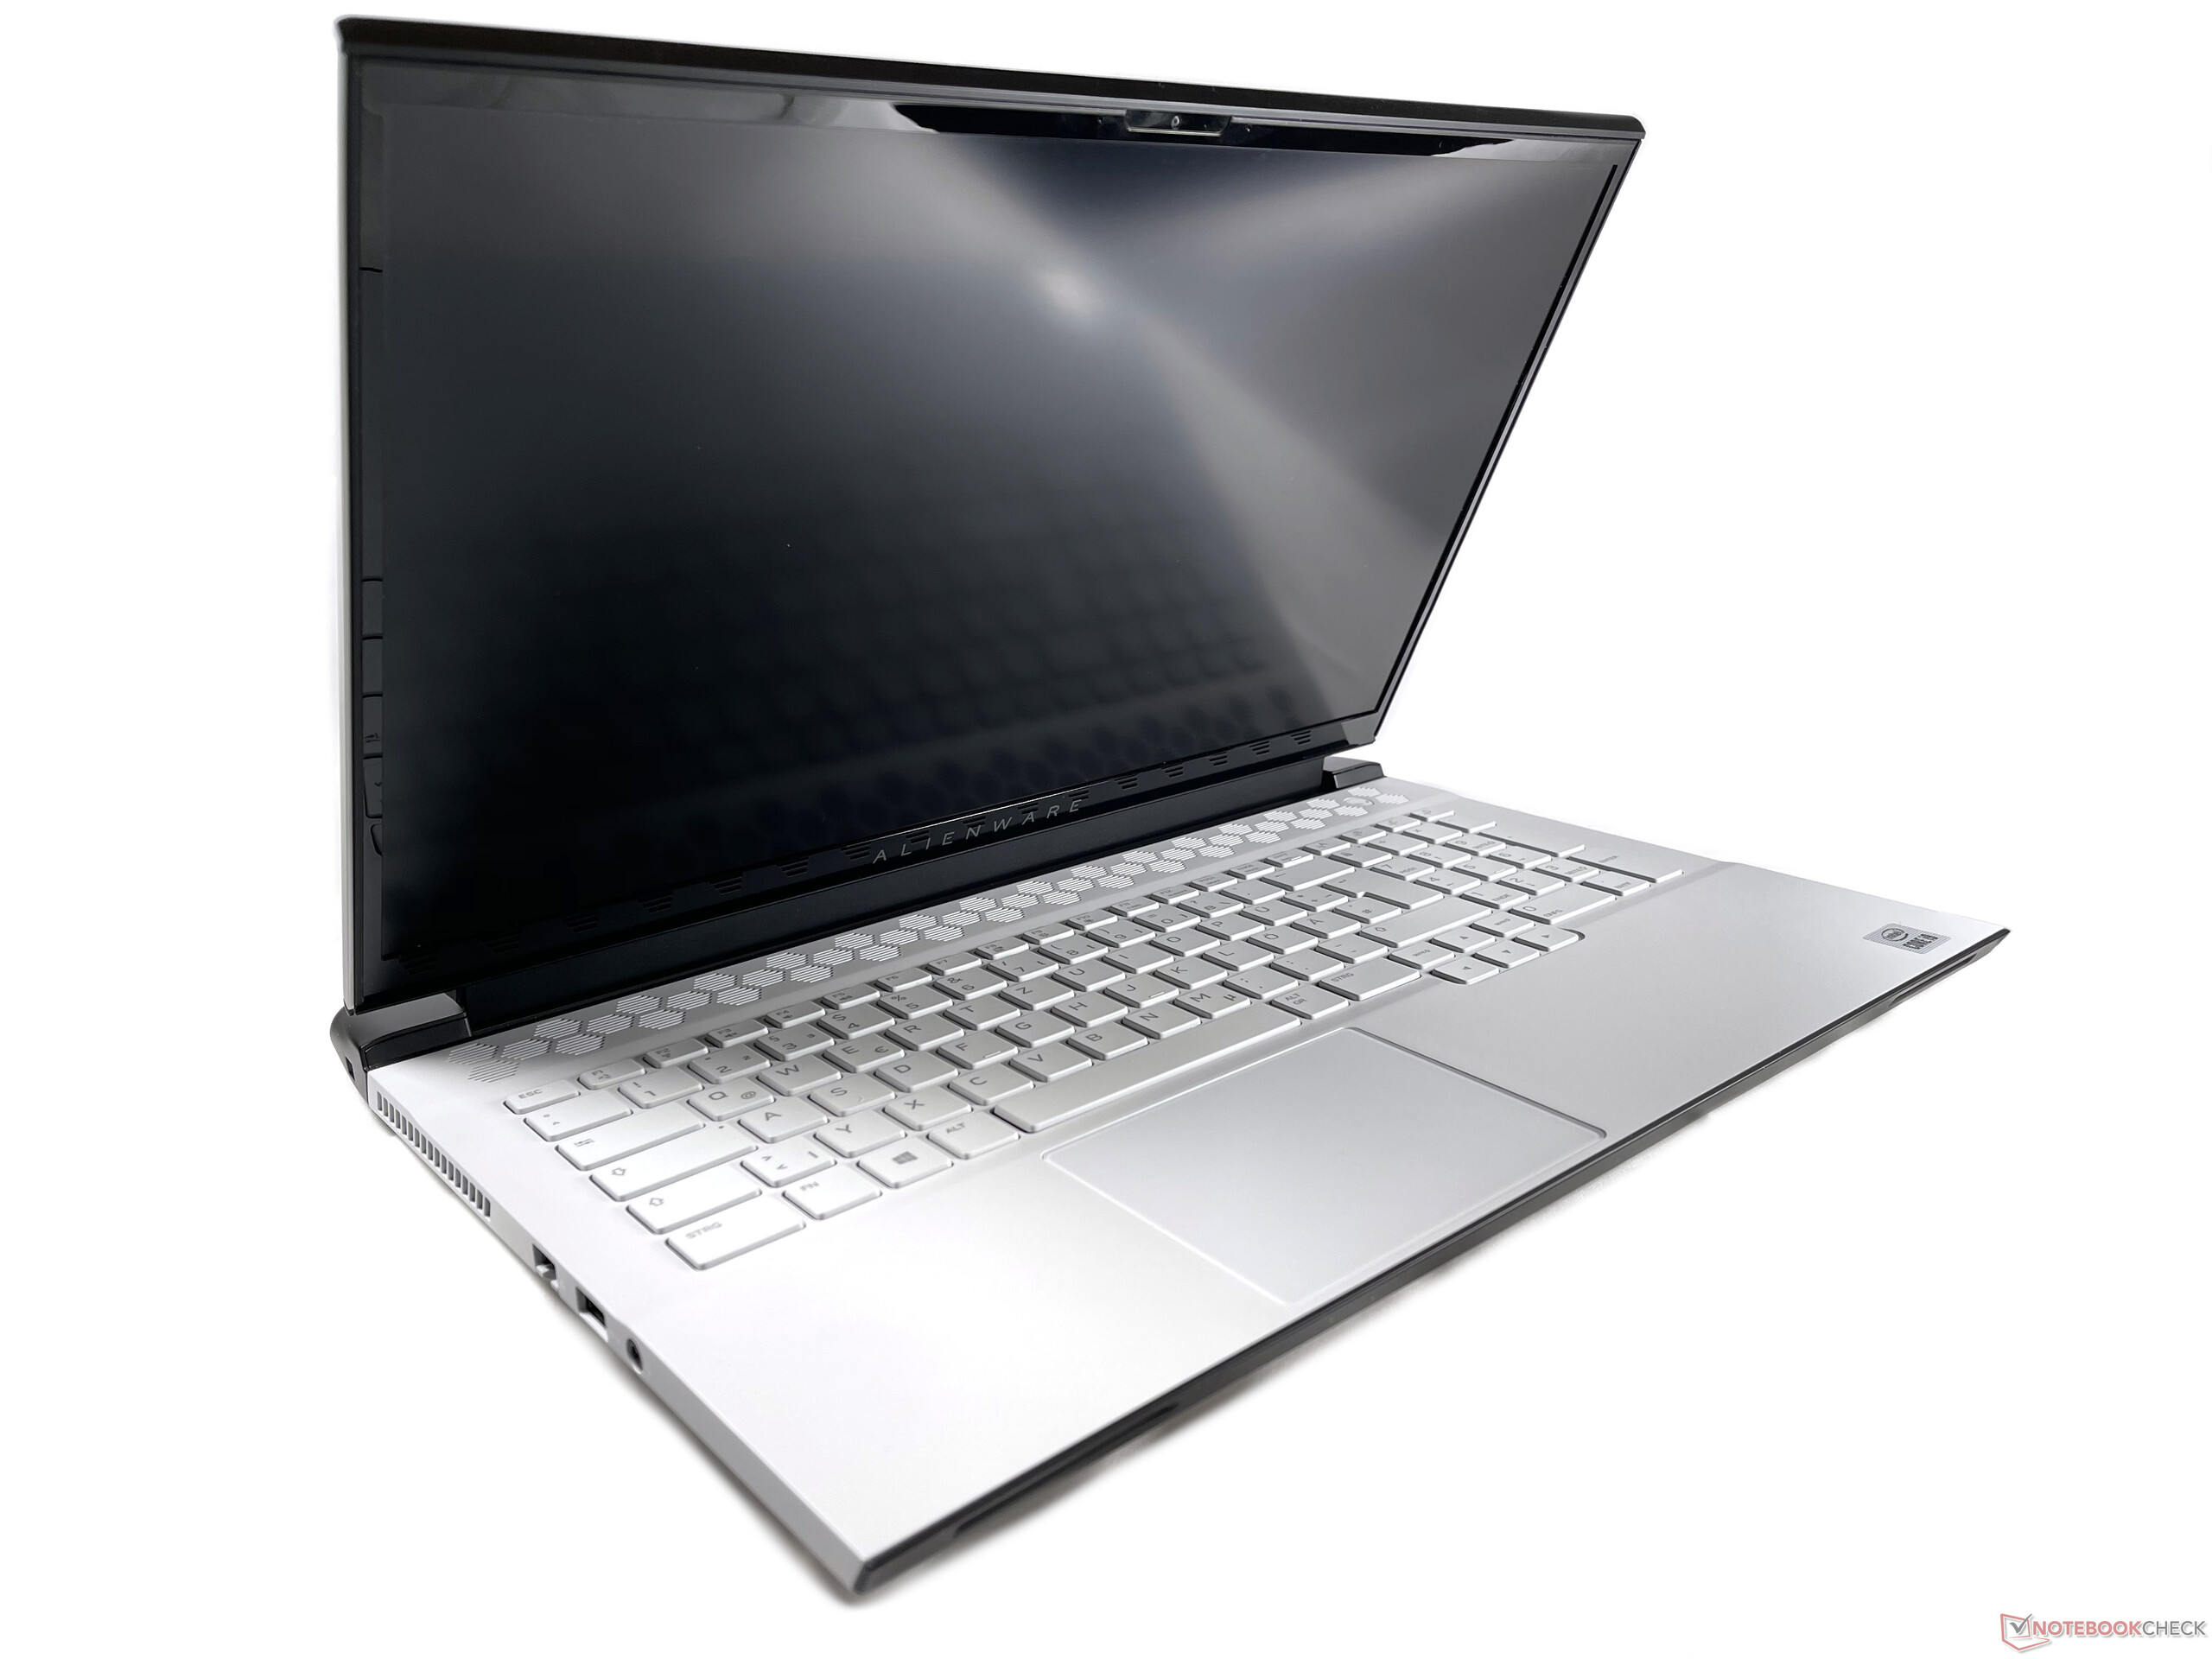
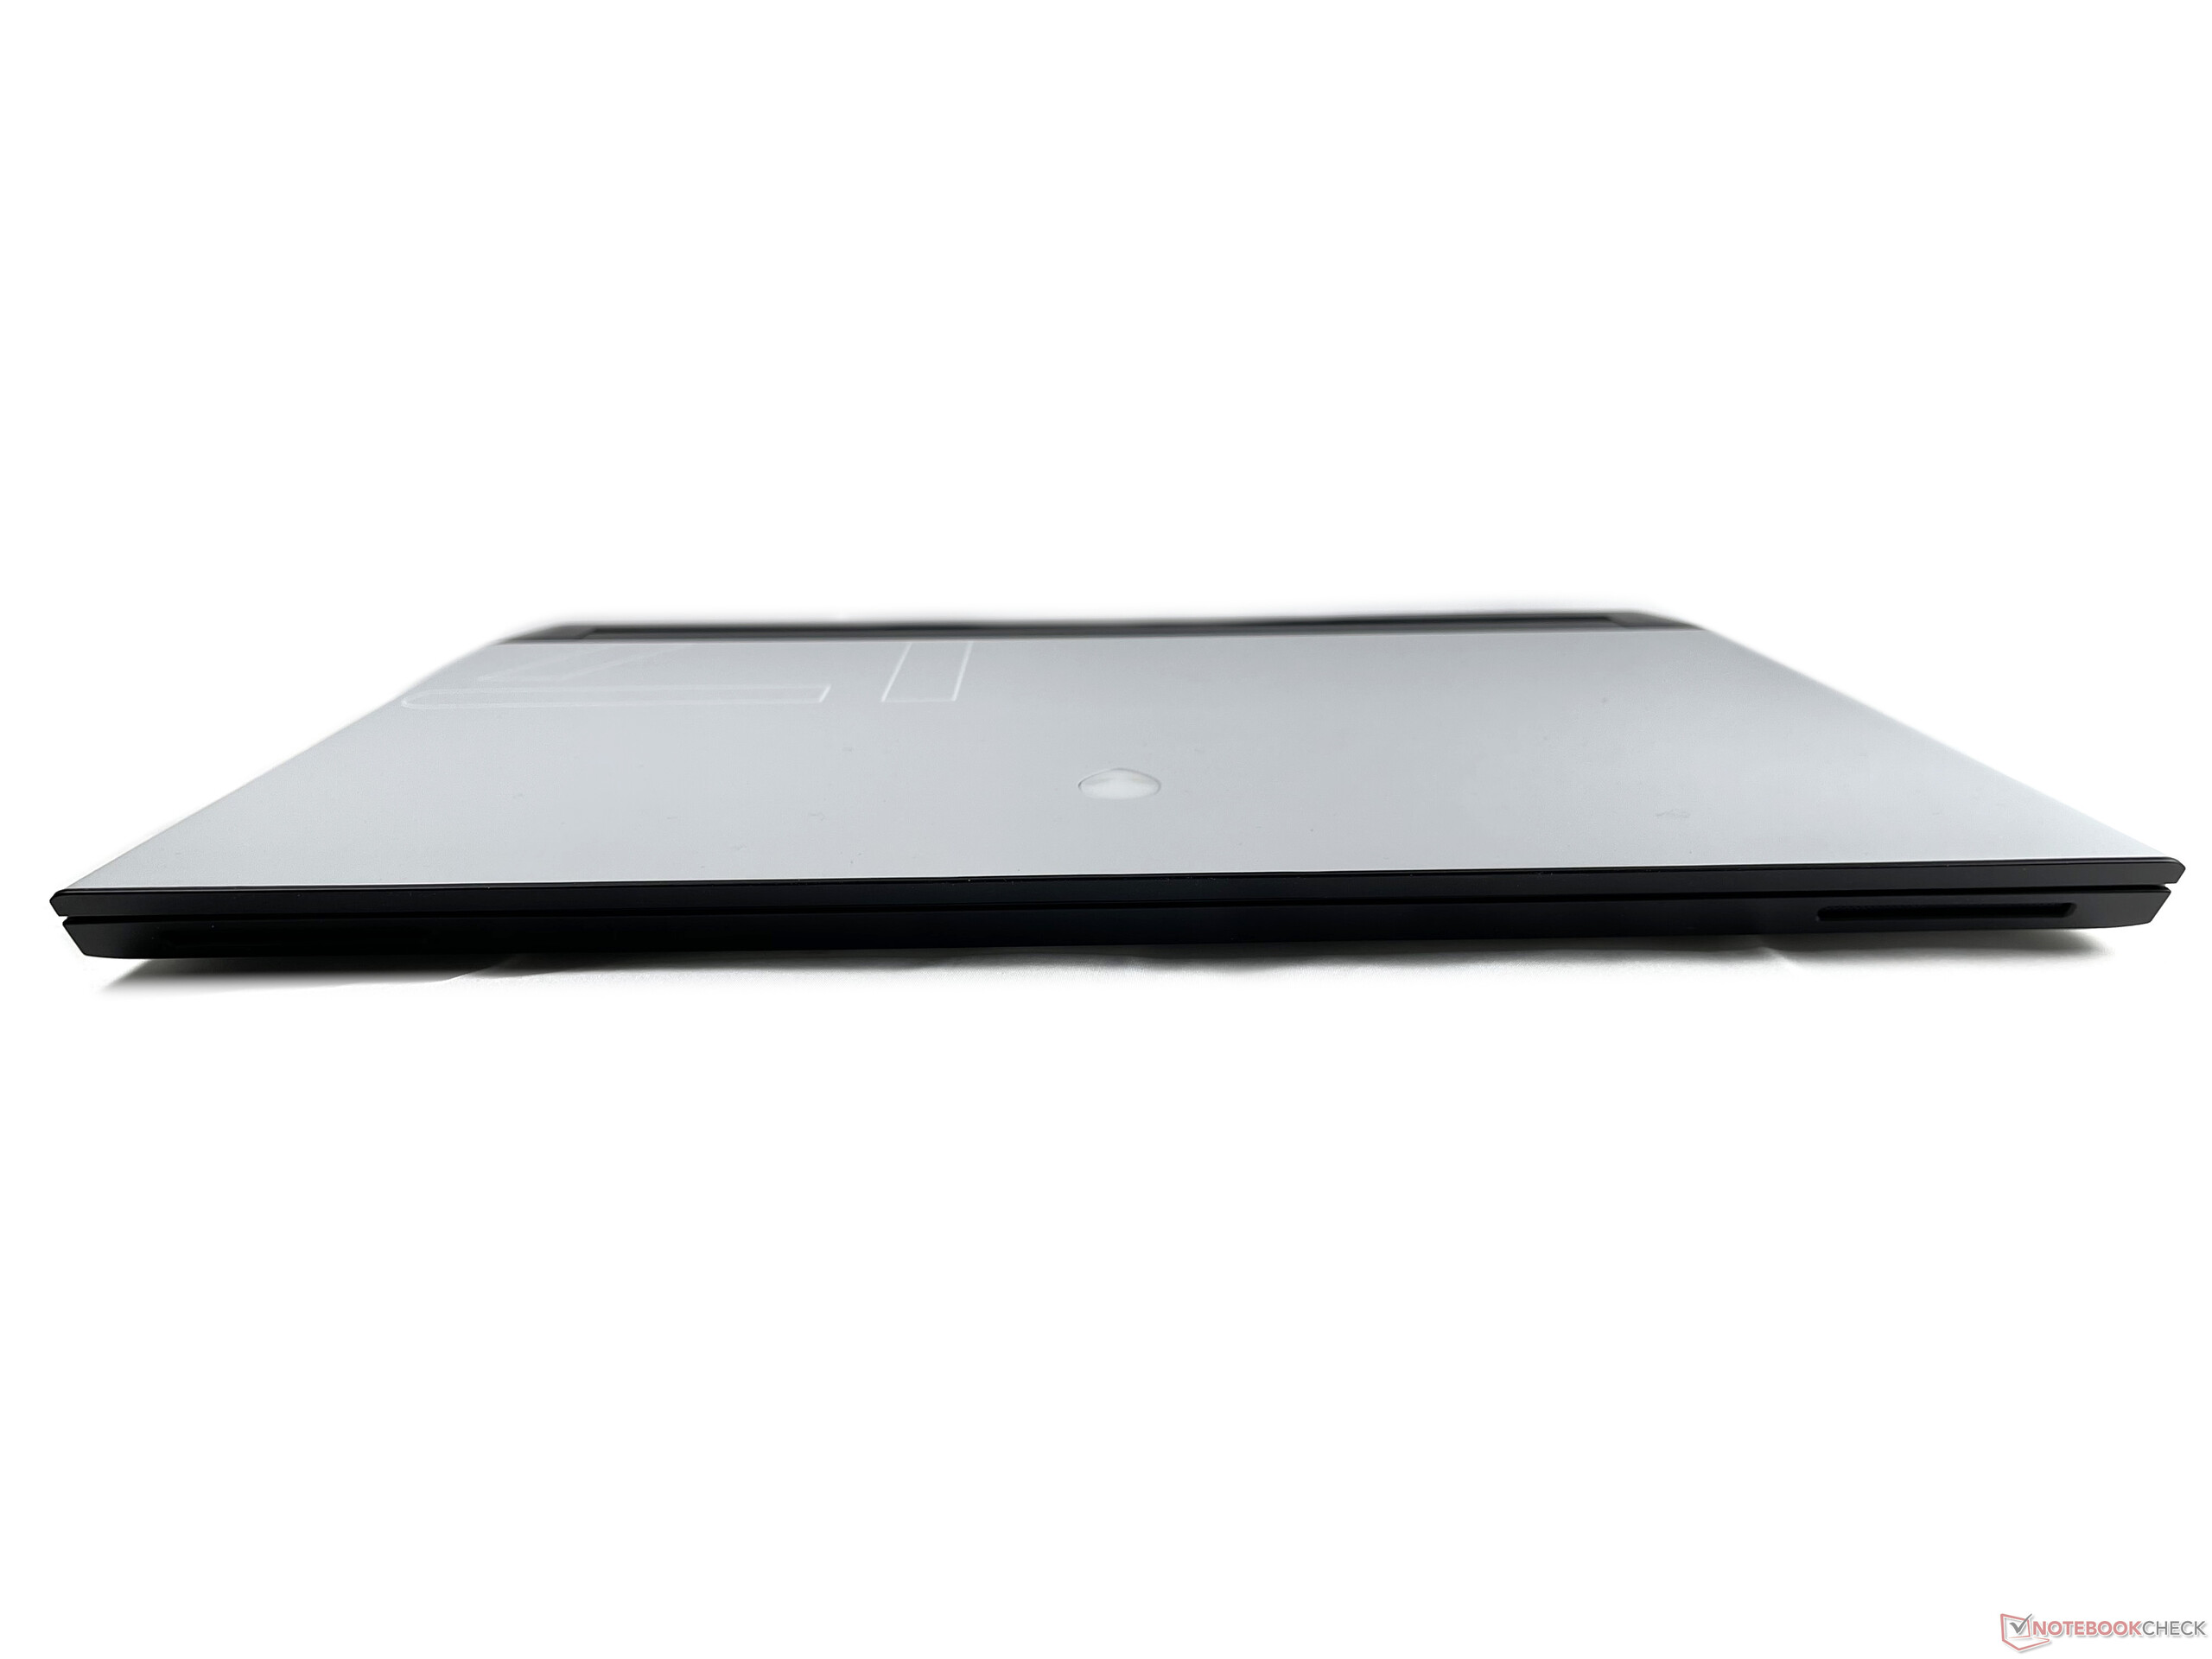
Since the dimensions and weight of the Alienware m17 R4 are virtually the same as those of the m17 R3, the new model is also one of the large and heavy contenders in the 17-inch class. In return, it's a good bit thinner than the Schenker XMG Neo 17 and the MSI GE76 Raider UH.
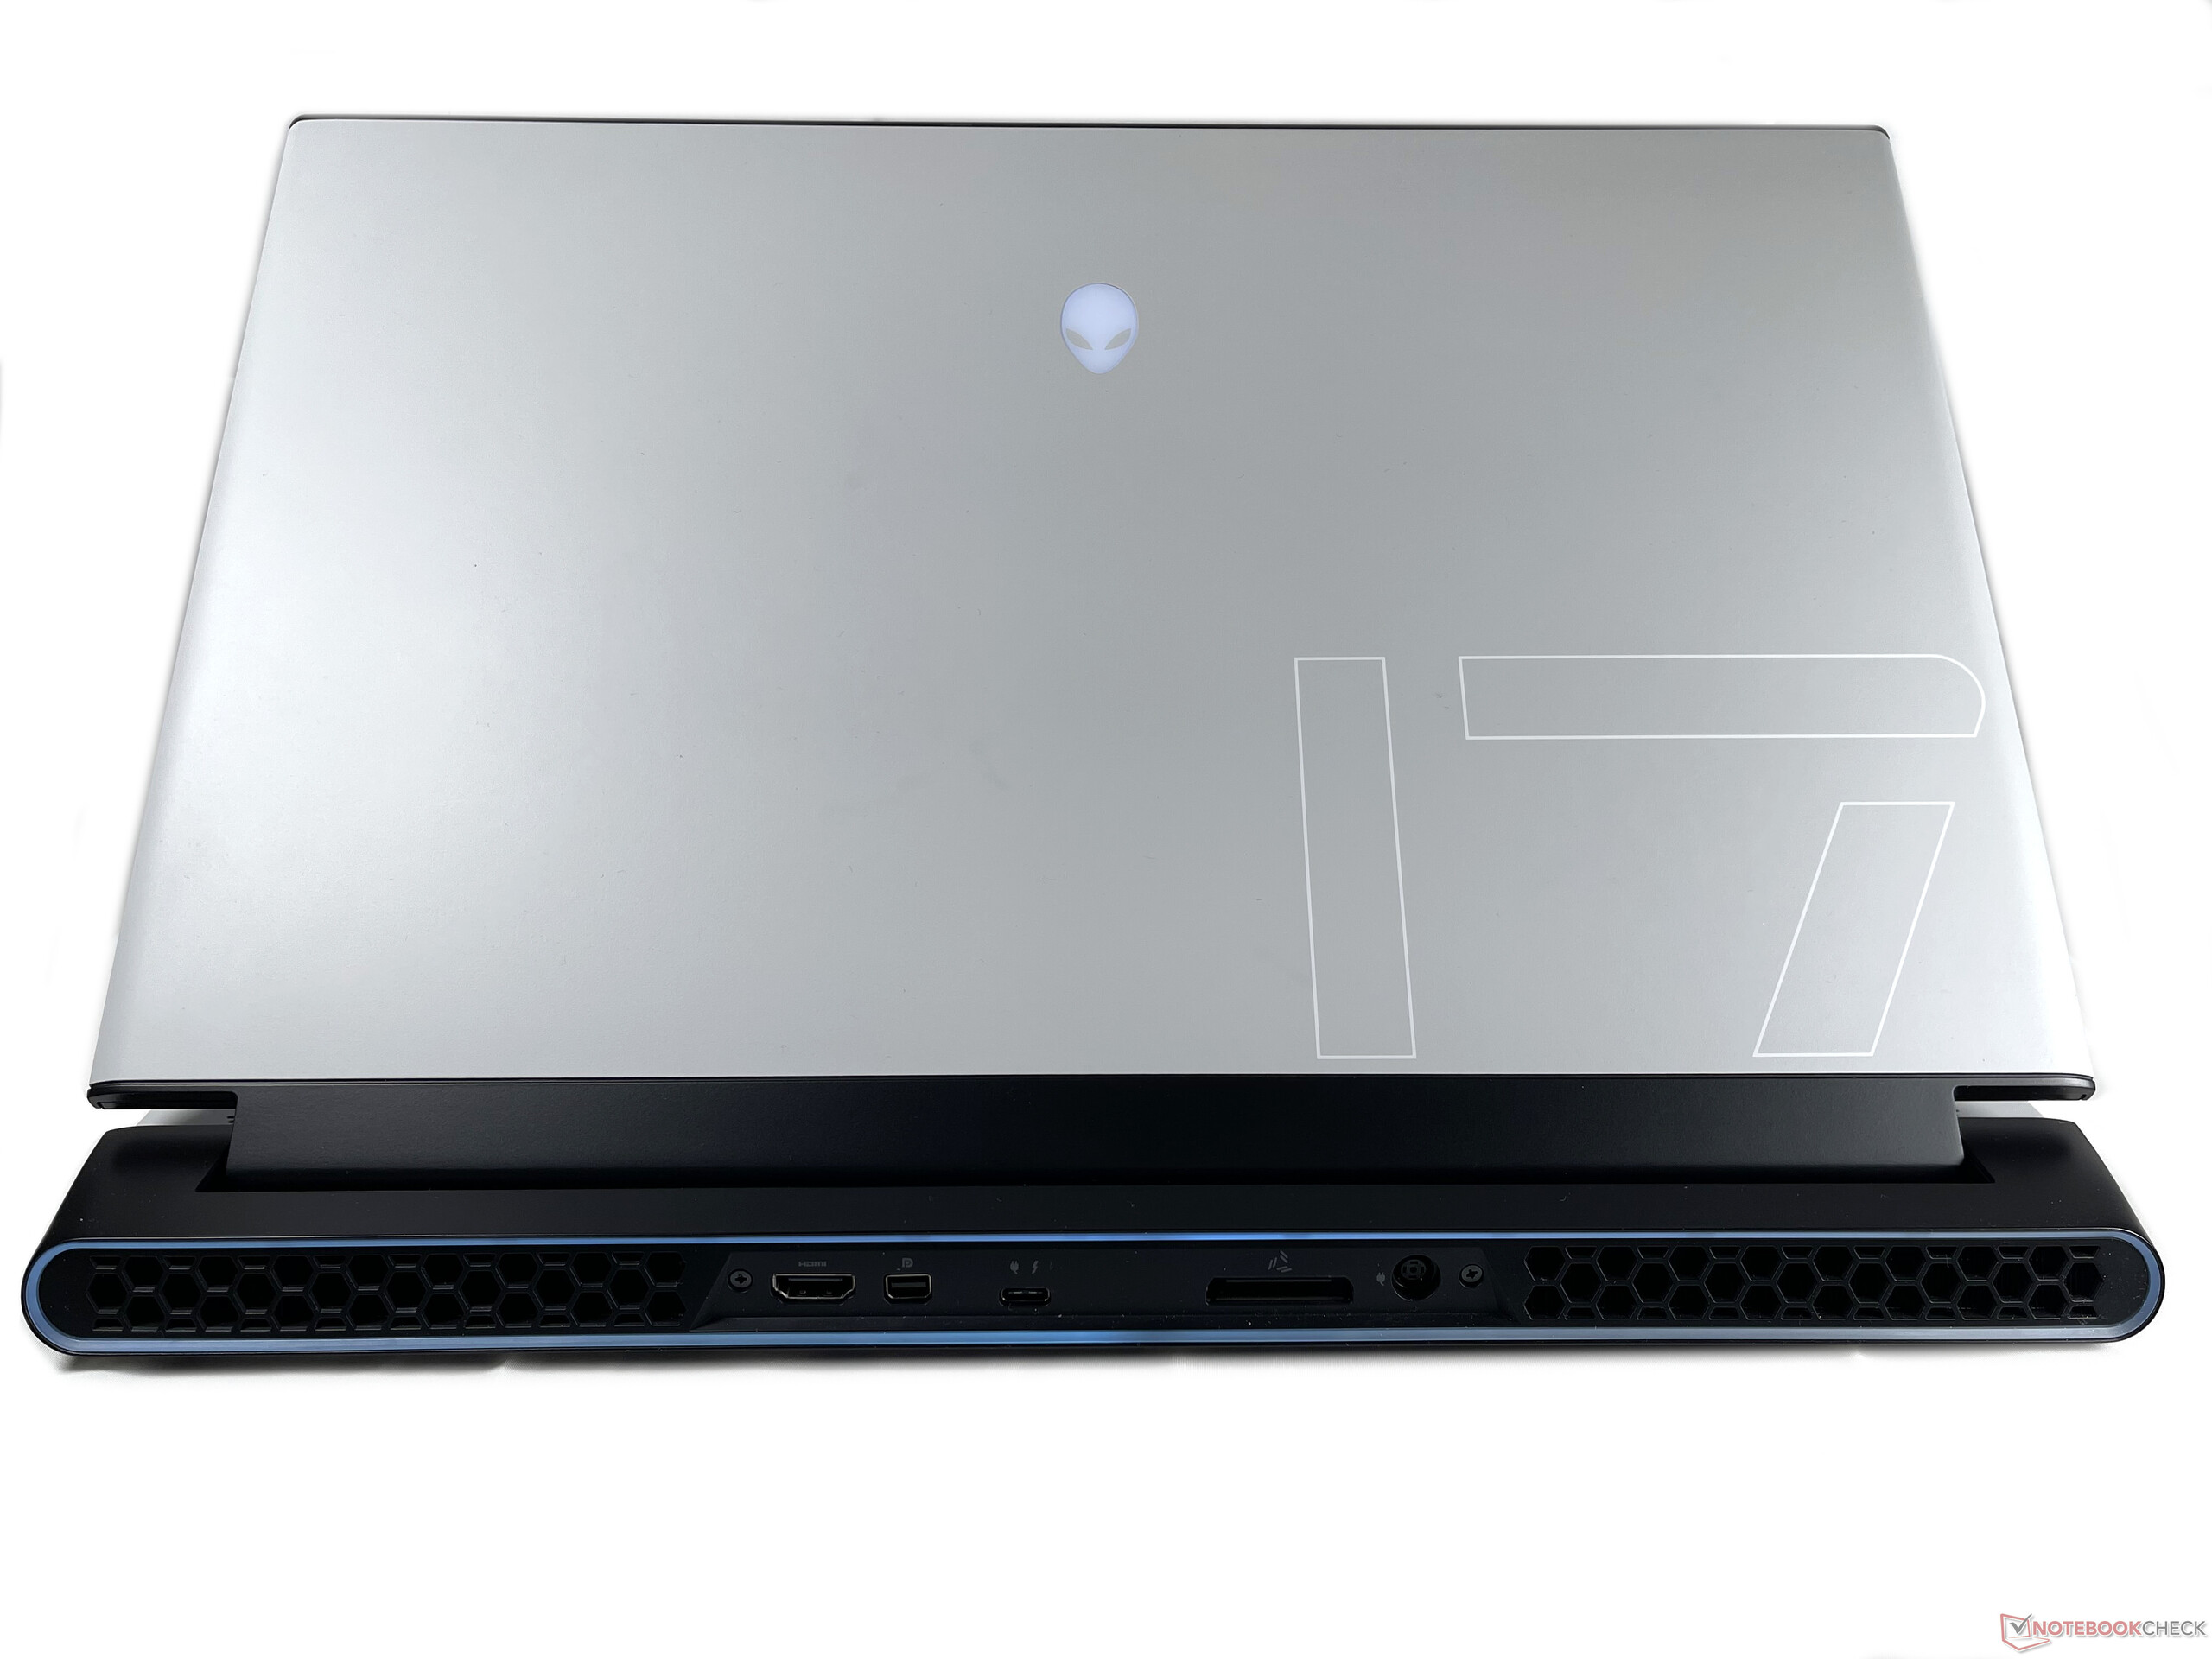
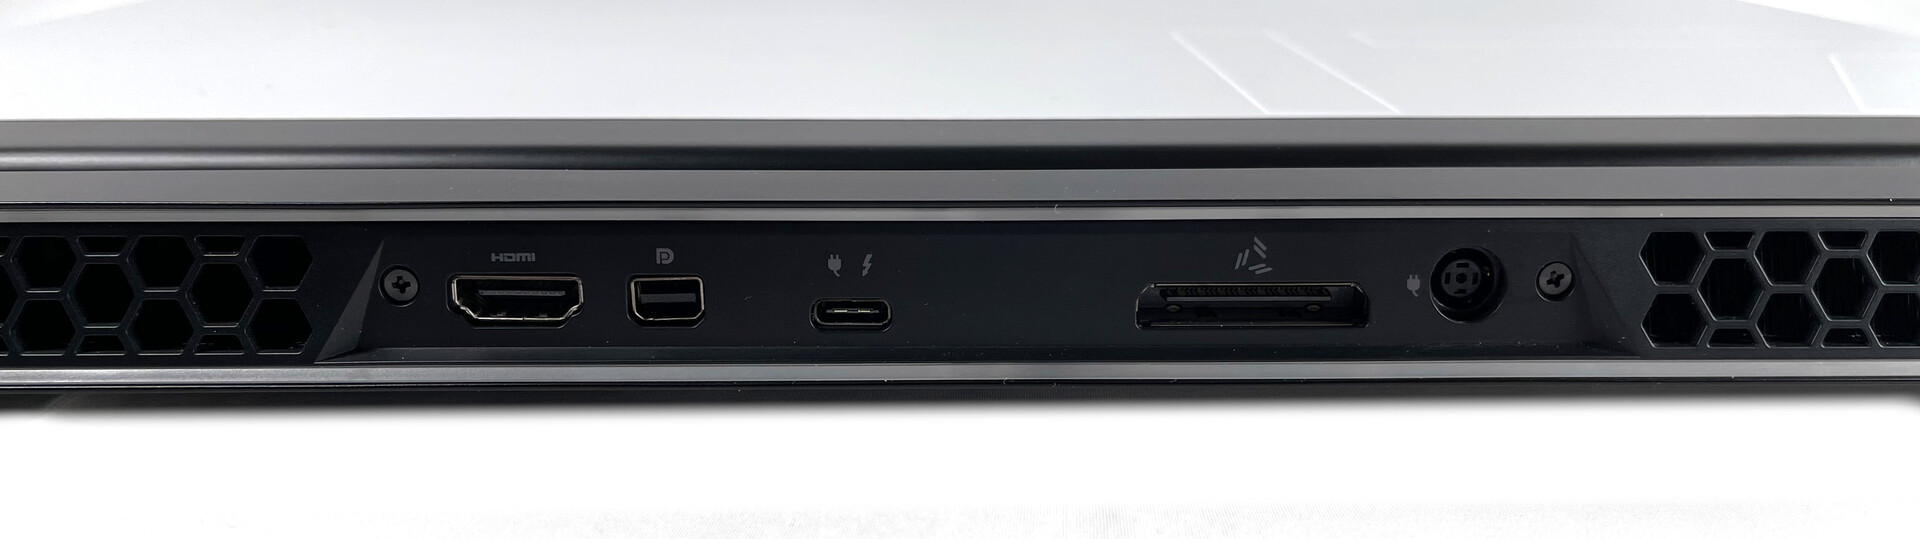
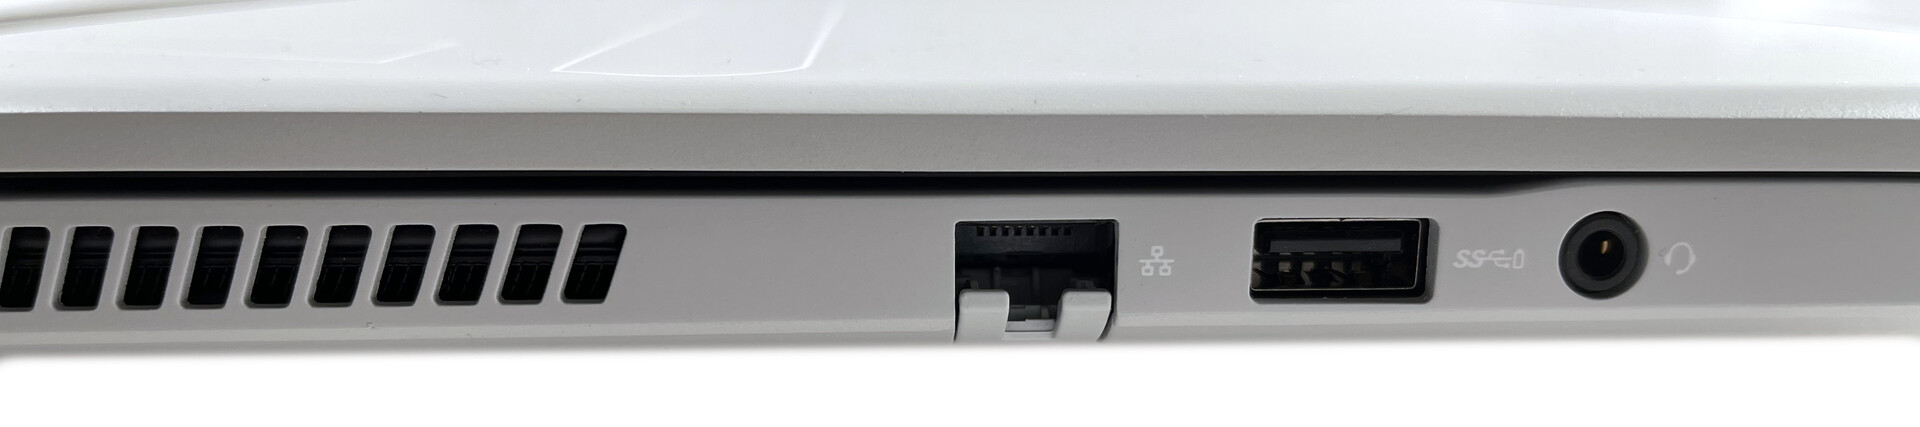
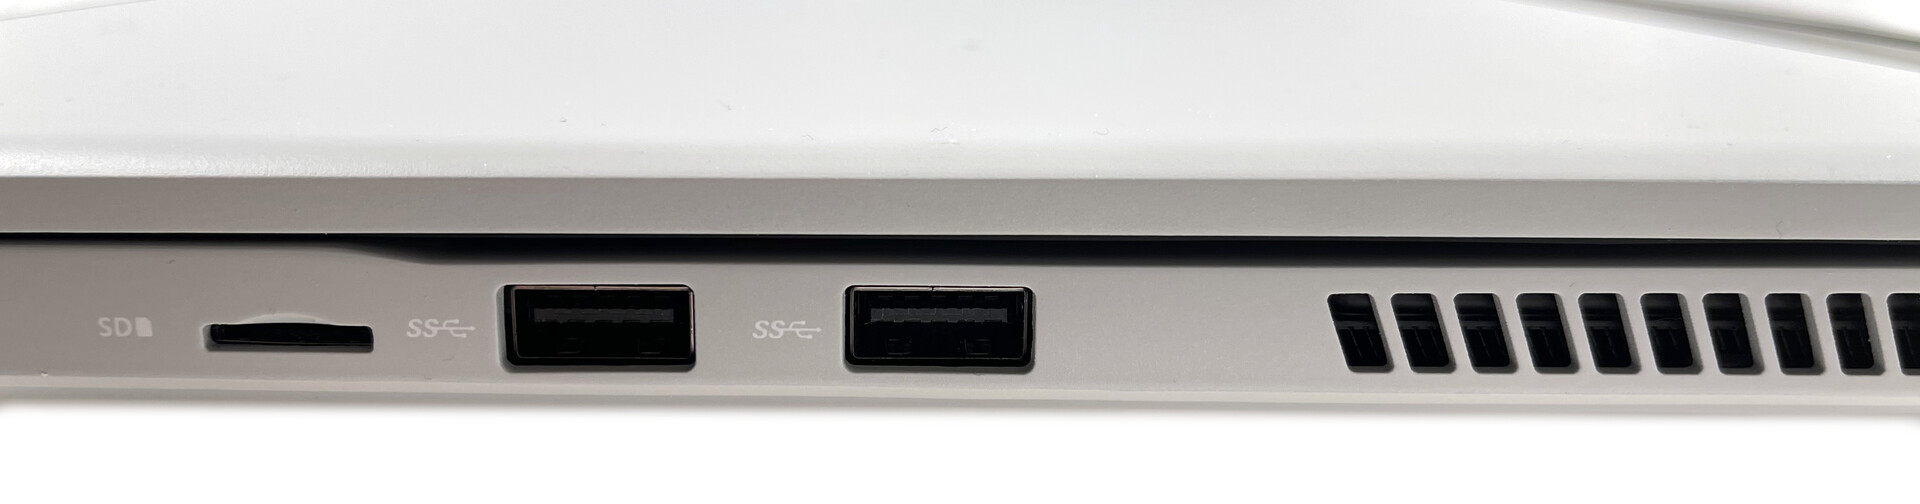
Connectivity - Thunderbolt 3 and 2.5 Gb/s LAN
| SD Card Reader | |
| average JPG Copy Test (av. of 3 runs) | |
| Alienware m17 R3 P45E (Toshiba Exceria Pro M501 UHS-II) | |
| Razer Blade Pro 17 2021 (QHD Touch) (Toshiba Exceria Pro SDXC 64 GB UHS-II) | |
| Gigabyte Aero 17 HDR YC (Toshiba Exceria Pro SDXC 64 GB UHS-II) | |
| MSI GE76 Raider 10UH (Toshiba Exceria Pro SDXC 64 GB UHS-II) | |
| Alienware m17 R4 (AV PRO microSD 128 GB V60) | |
| Average of class Gaming (19 - 202, n=99, last 2 years) | |
| SCHENKER XMG Neo 17 (Early 2021, RTX 3070, 5800H) (Toshiba Exceria Pro SDXC 64 GB UHS-II) | |
| maximum AS SSD Seq Read Test (1GB) | |
| Alienware m17 R4 (AV PRO microSD 128 GB V60) | |
| Alienware m17 R3 P45E (Toshiba Exceria Pro M501 UHS-II) | |
| Gigabyte Aero 17 HDR YC (Toshiba Exceria Pro SDXC 64 GB UHS-II) | |
| MSI GE76 Raider 10UH (Toshiba Exceria Pro SDXC 64 GB UHS-II) | |
| Razer Blade Pro 17 2021 (QHD Touch) (Toshiba Exceria Pro SDXC 64 GB UHS-II) | |
| Average of class Gaming (26 - 269, n=92, last 2 years) | |
| SCHENKER XMG Neo 17 (Early 2021, RTX 3070, 5800H) (Toshiba Exceria Pro SDXC 64 GB UHS-II) | |
Communication
The Intel-based Killer AX1650 WLAN module is responsible for wireless connectivity and offers Wi-Fi 6 and Bluetooth 5.1. The transfer speeds that we measured are above the average of the WLAN chip and also above those of the predecessor, which is also equipped with the AX1650.
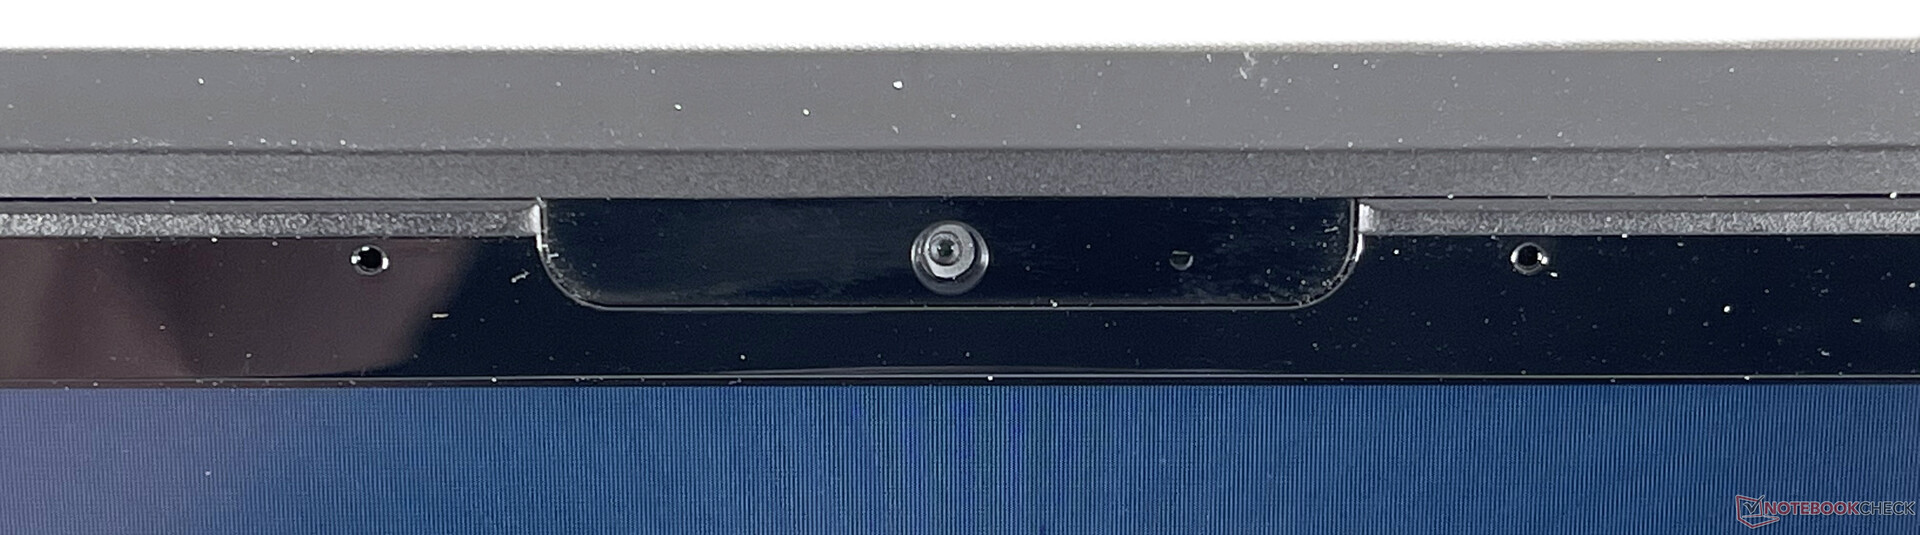
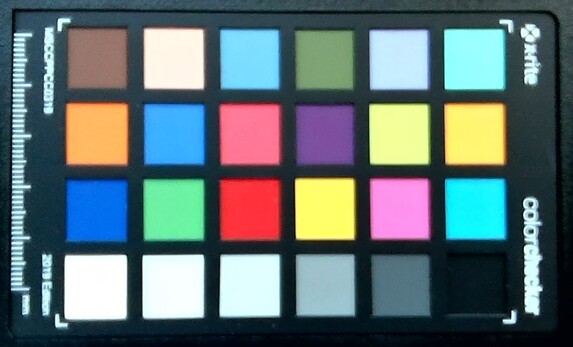
Webcam
")
")
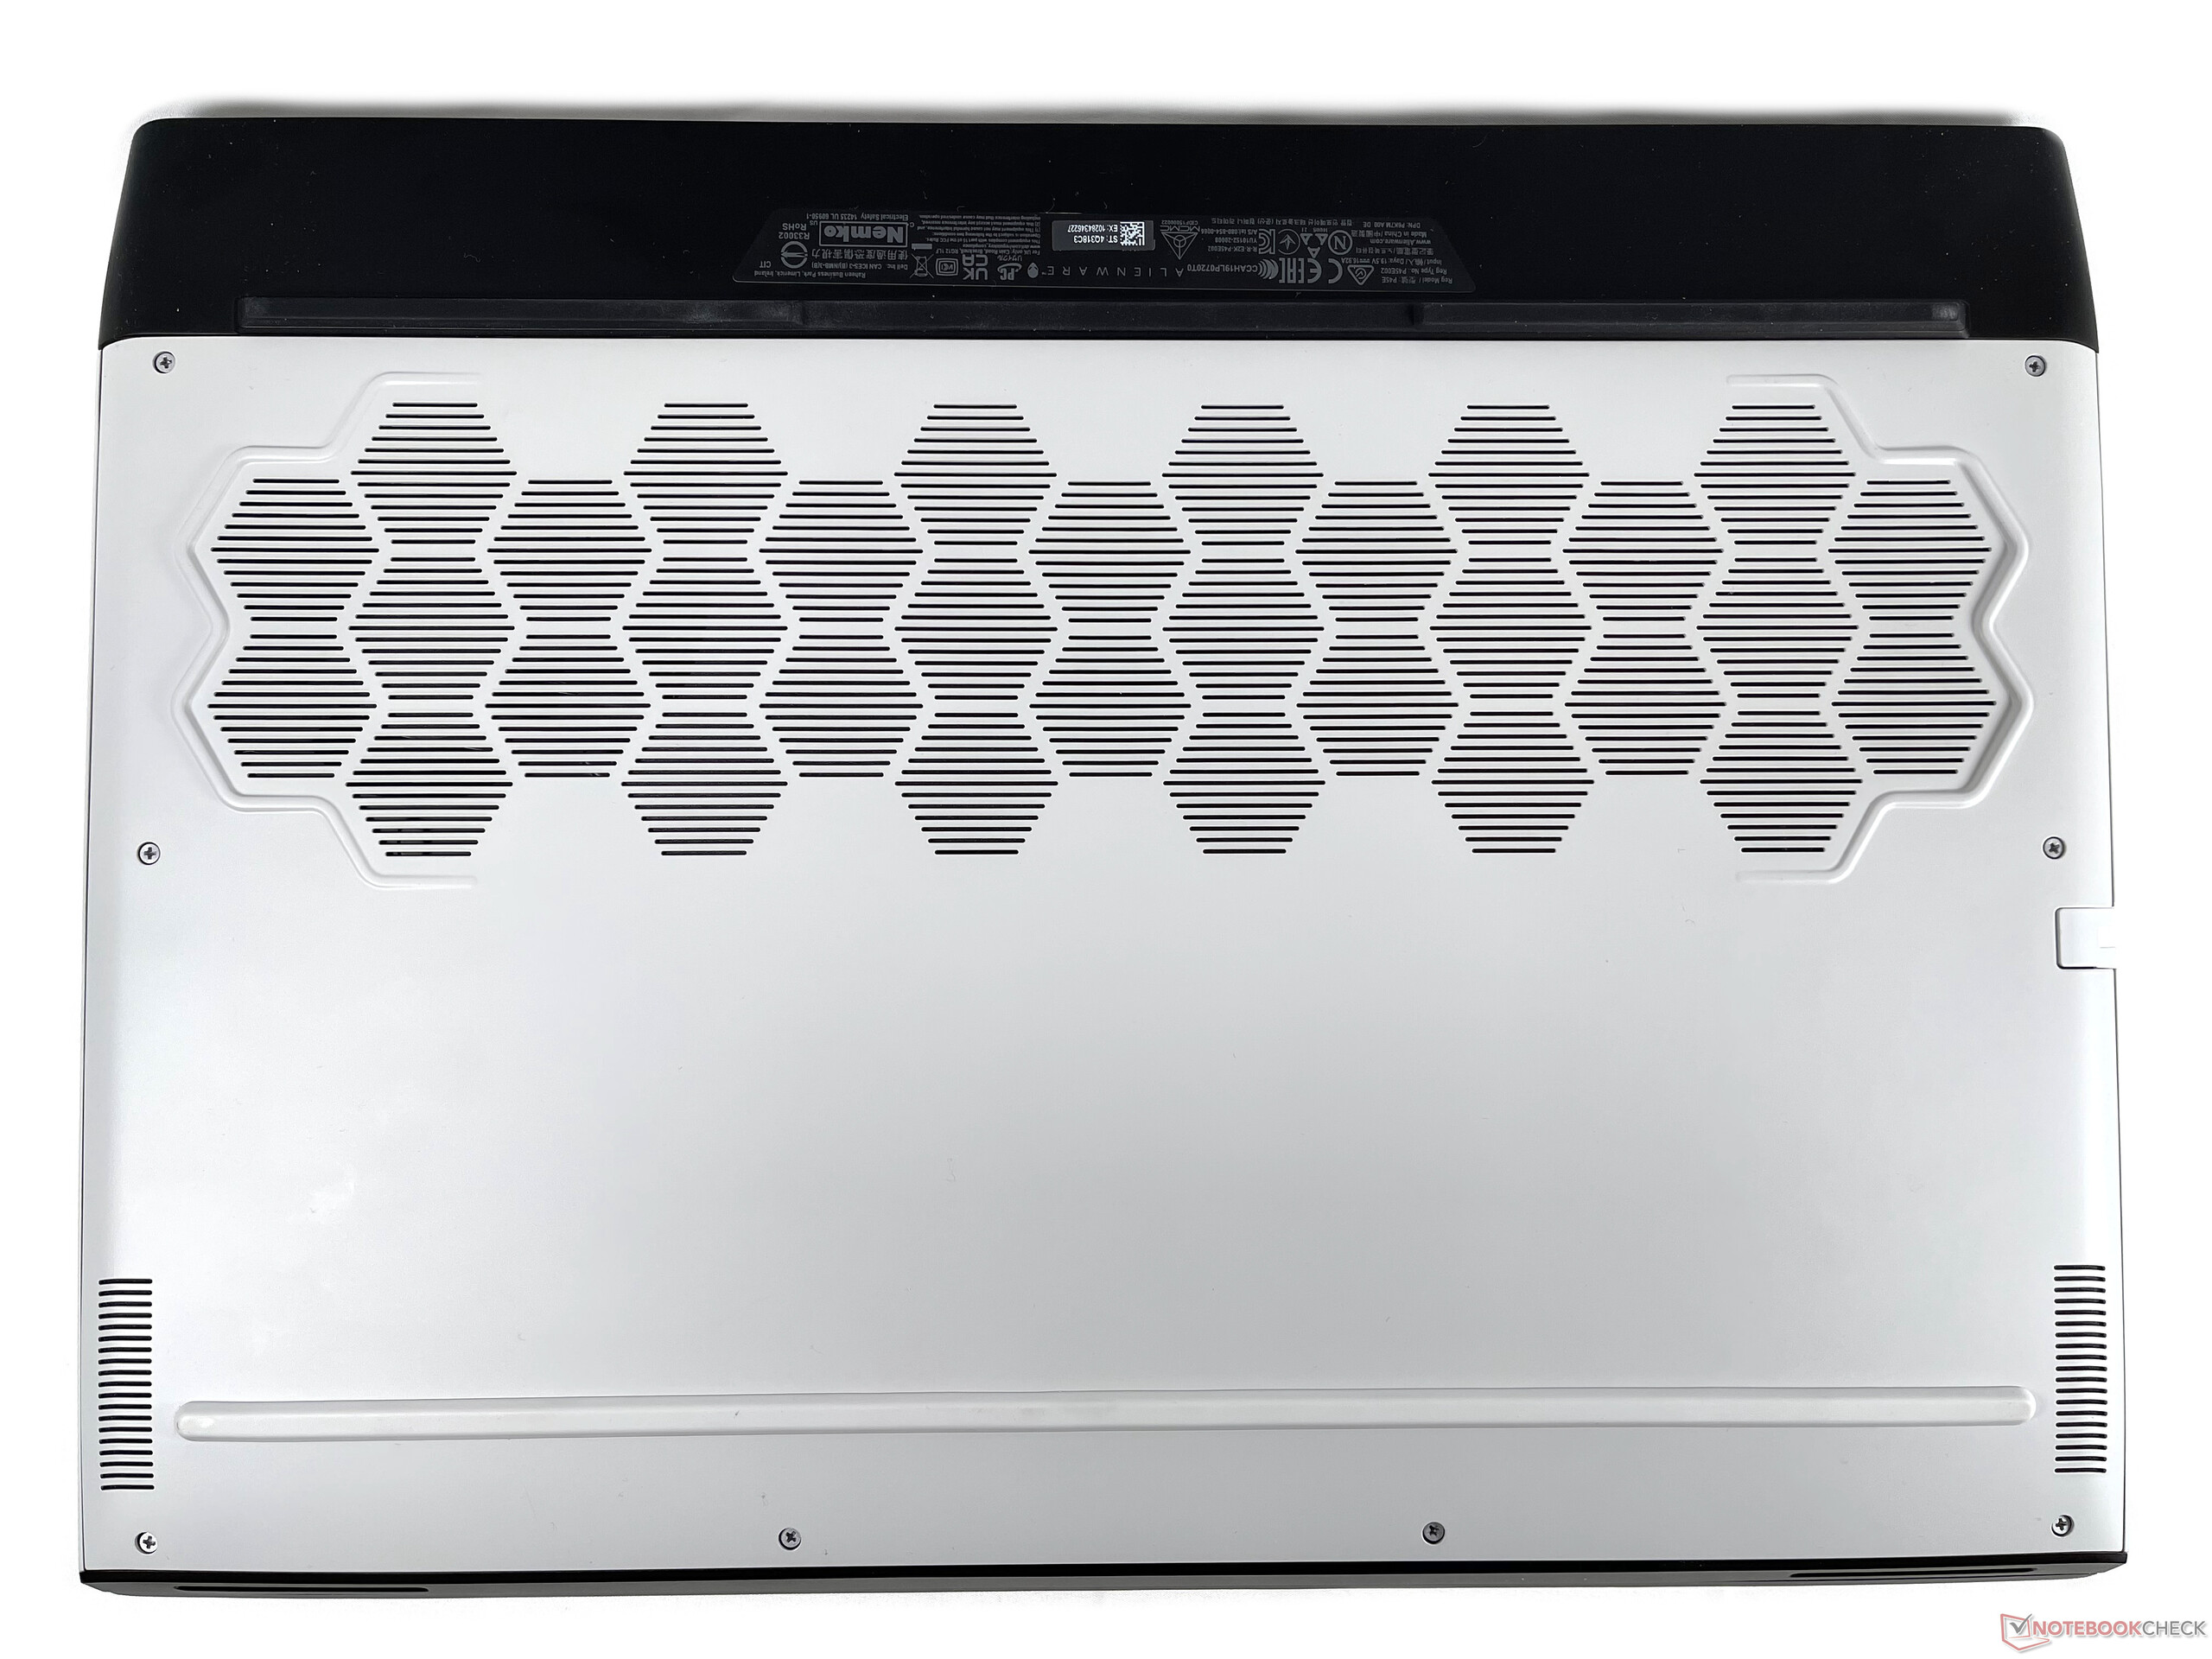
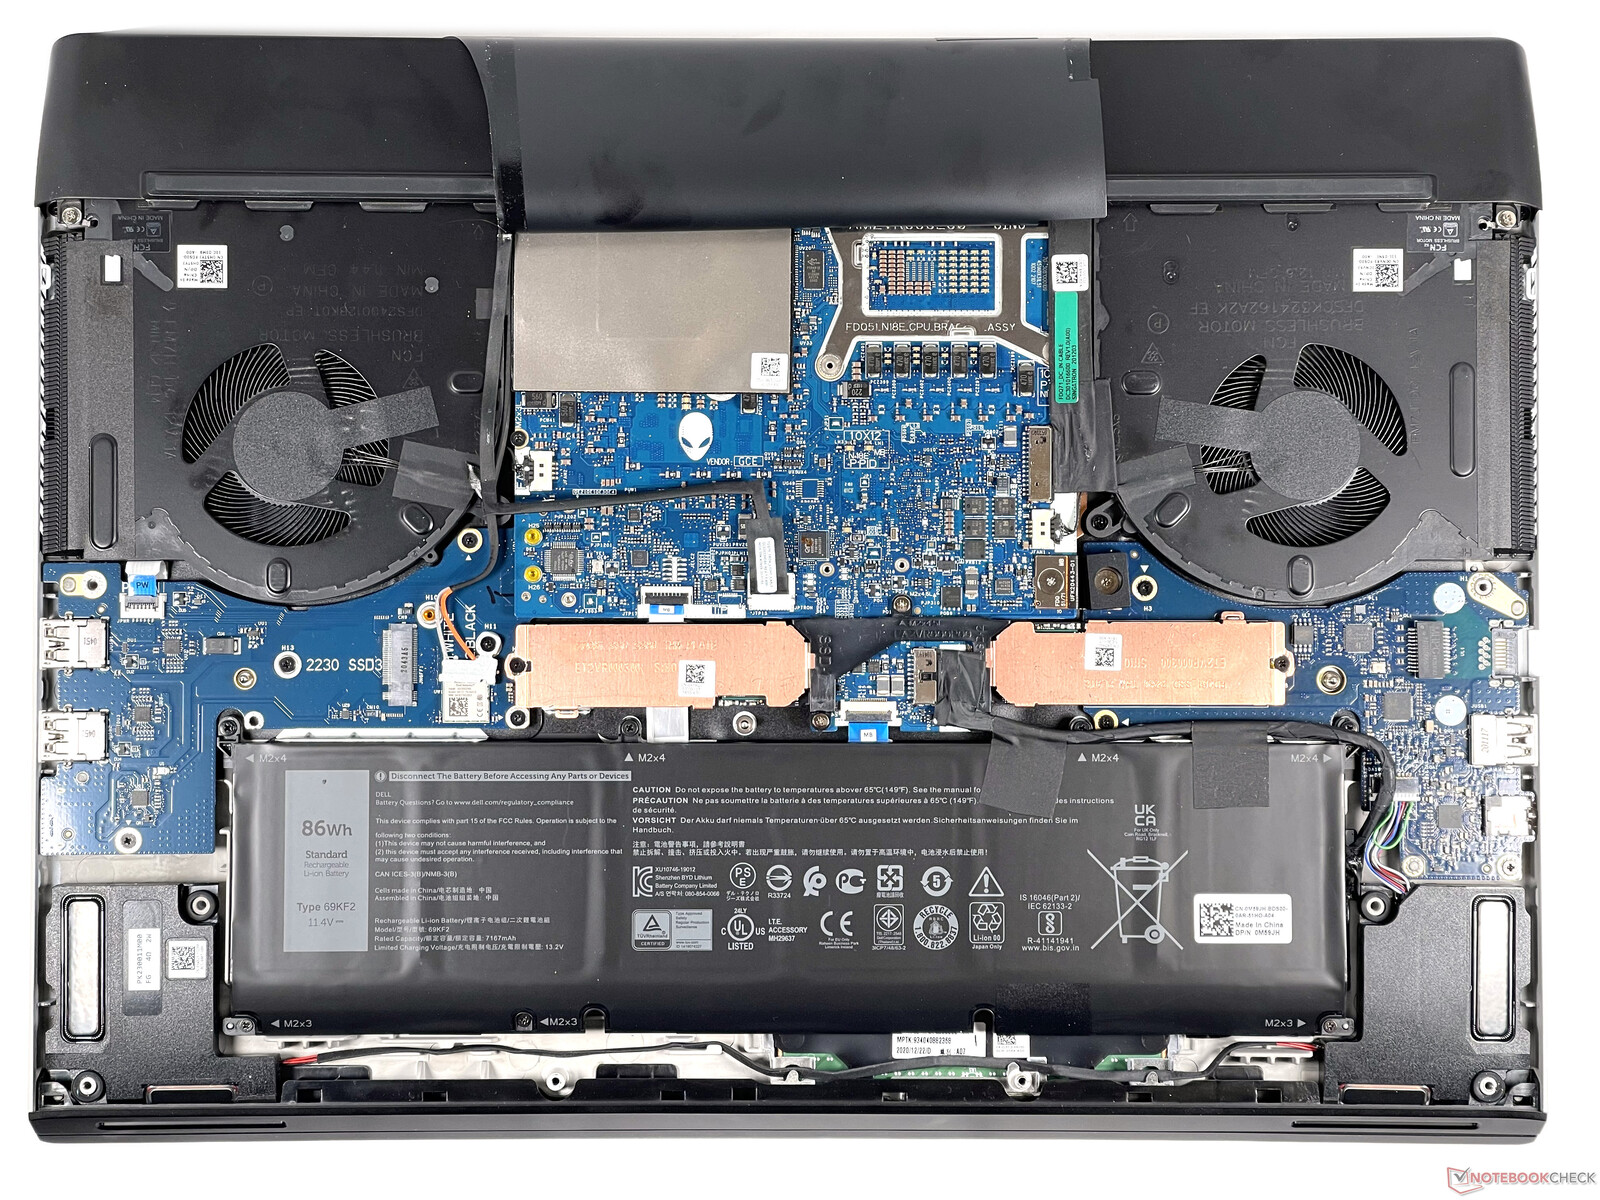
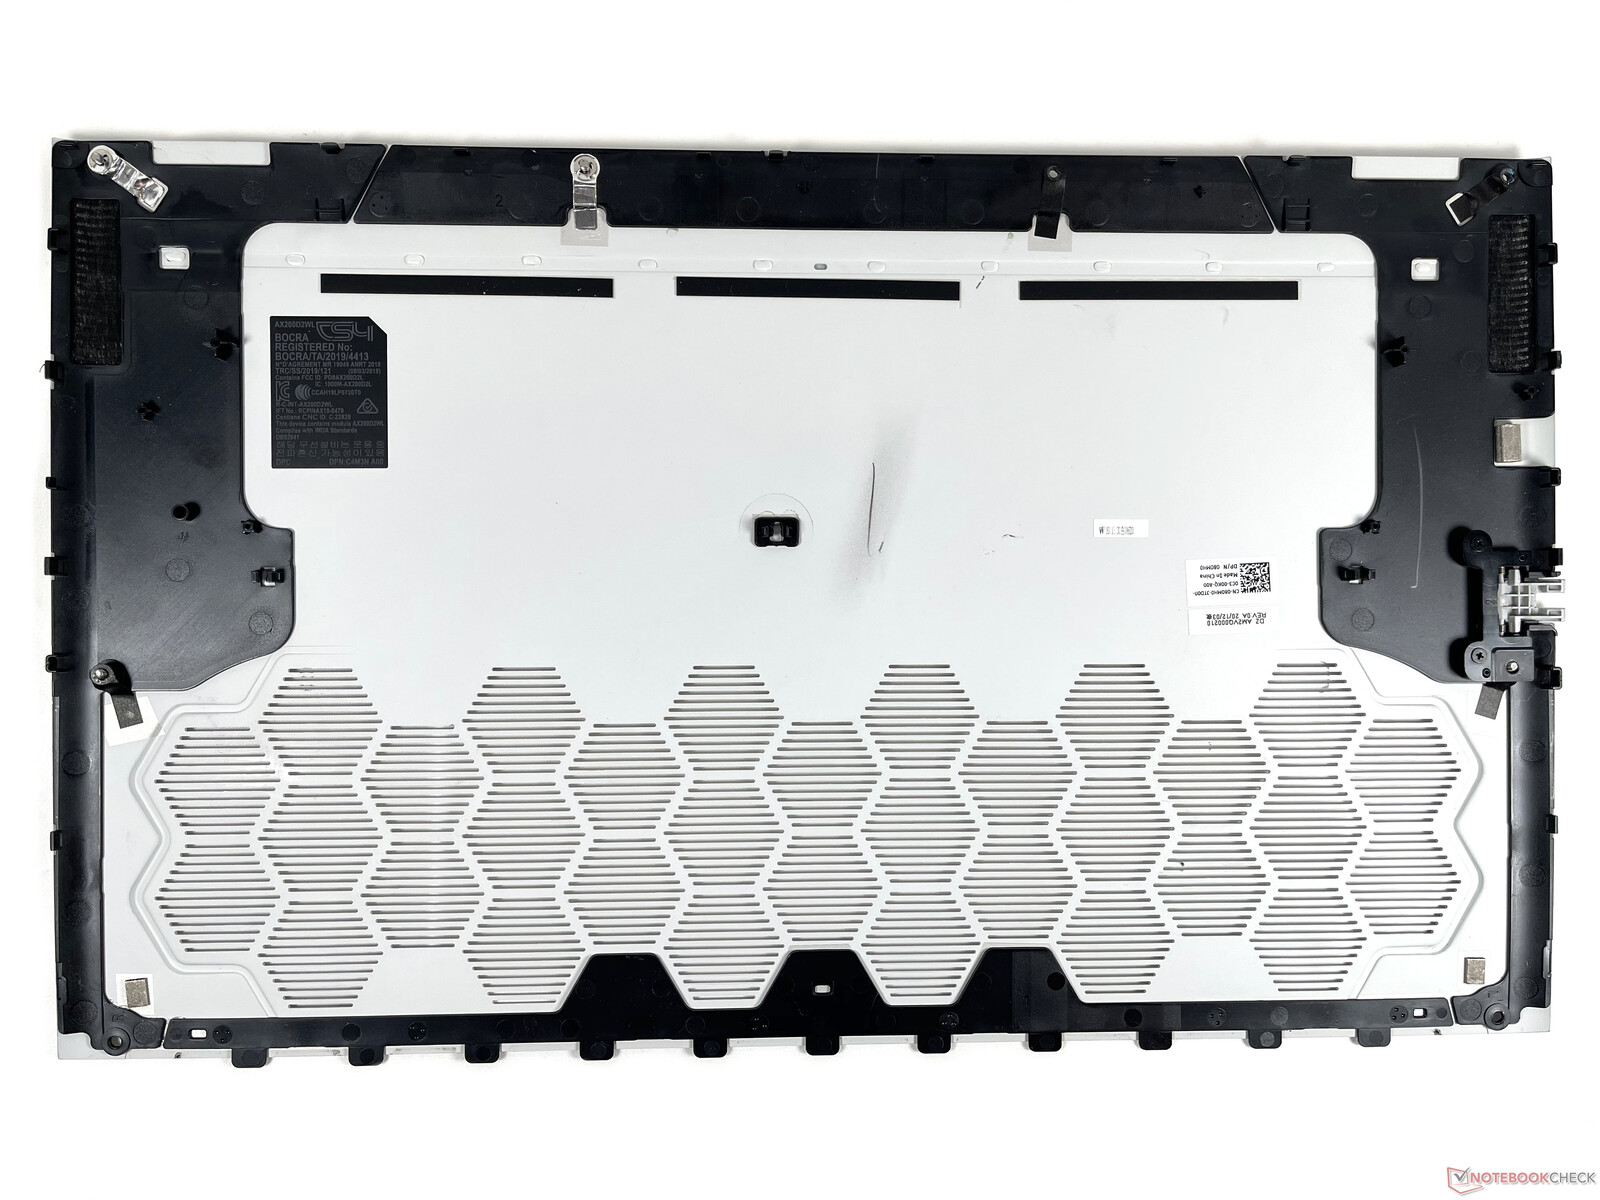
Maintenance
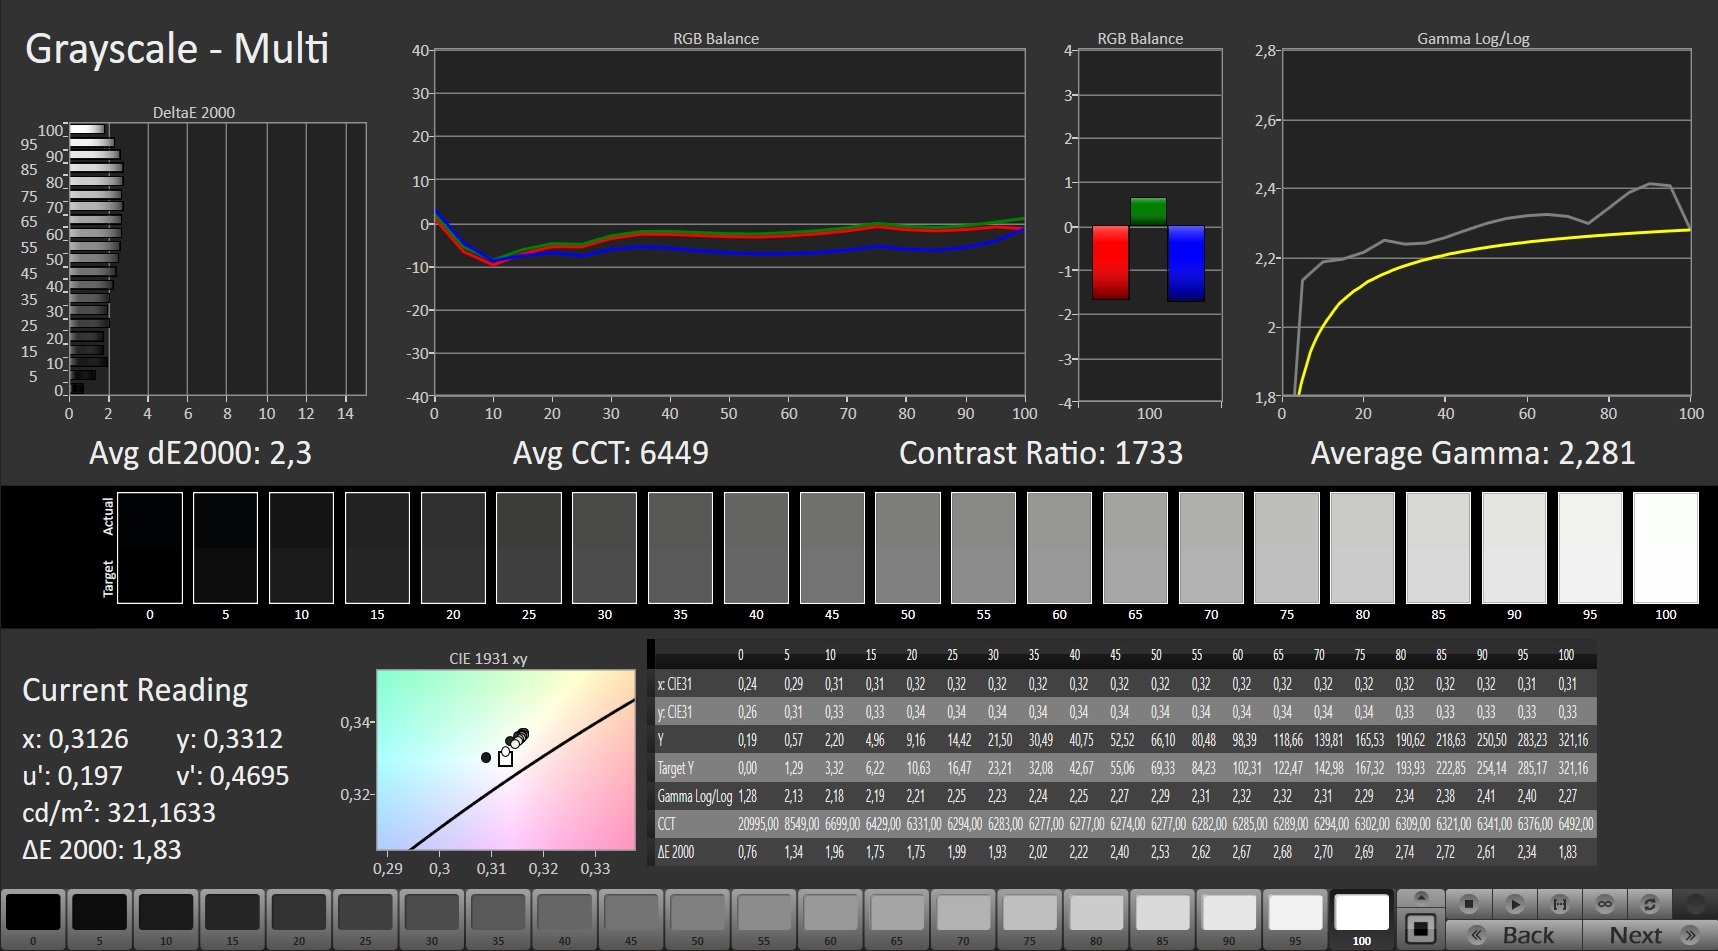
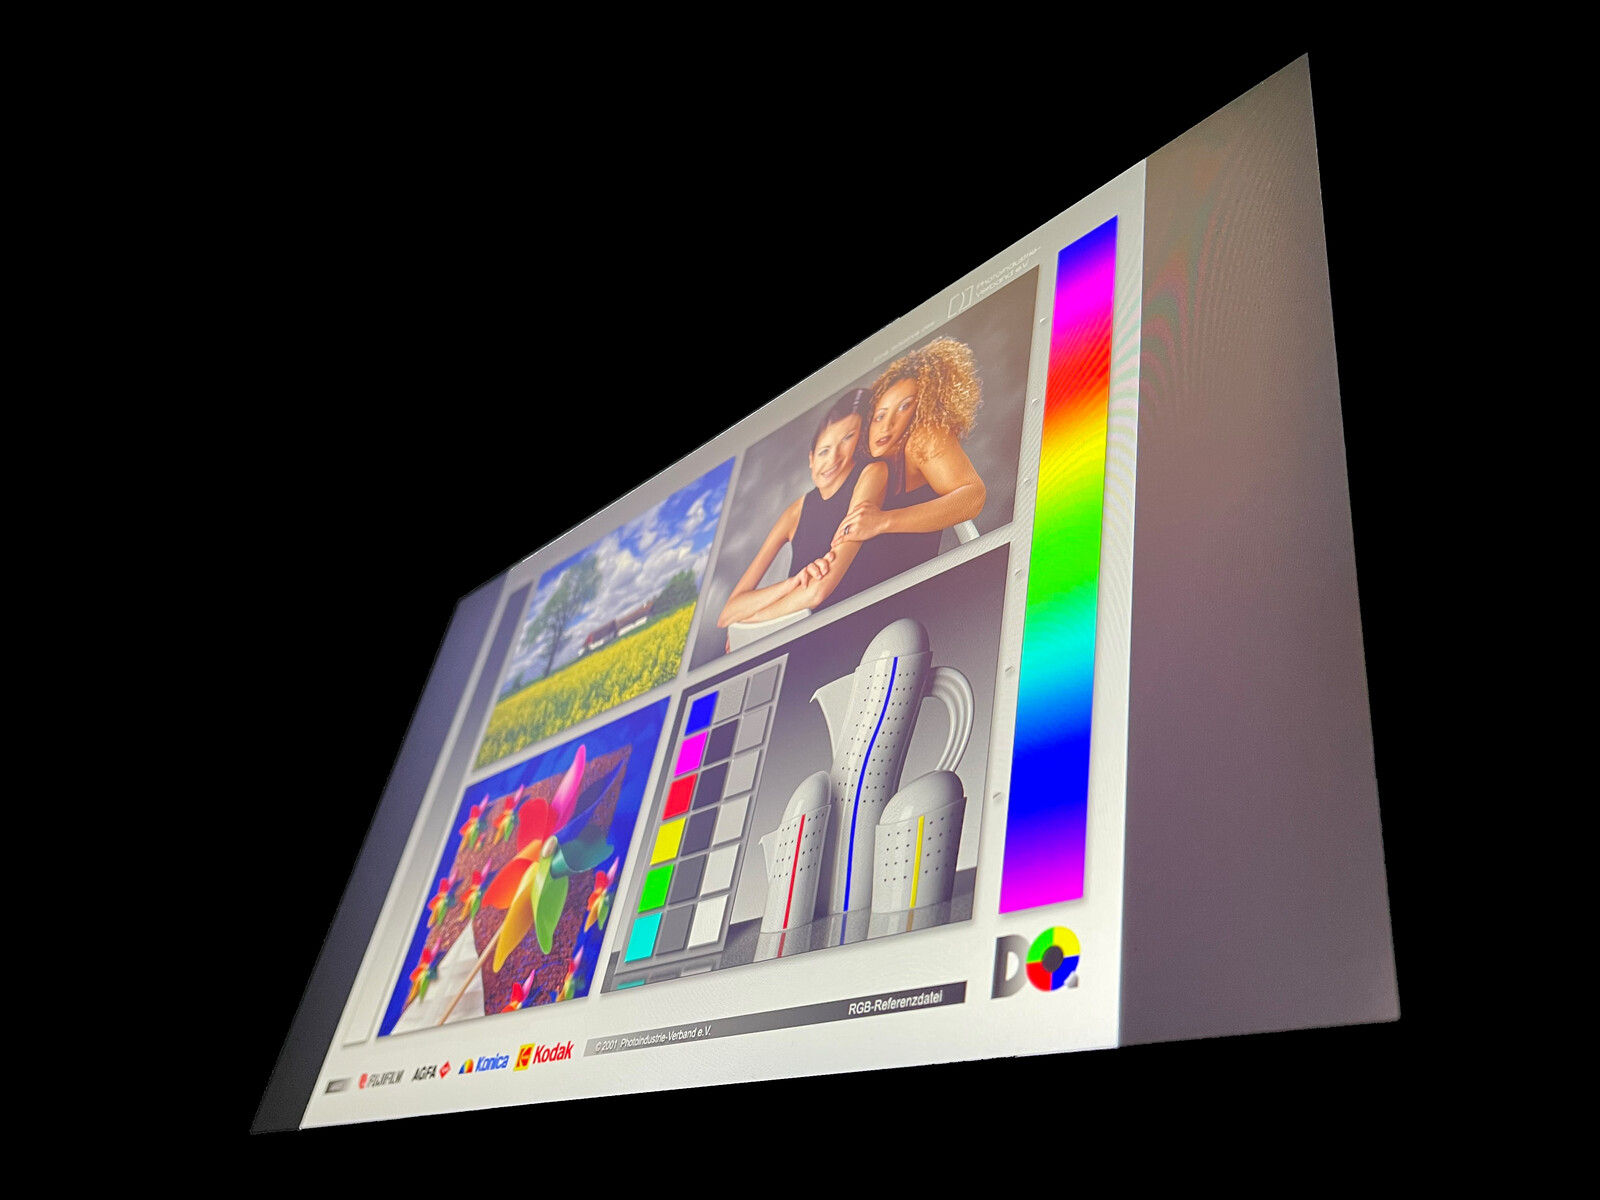
Display - Alienware m17 R4 with high-contrast 360 Hz display
The matte 17.3-inch IPS display has a native resolution of 1920x1080 pixels (Full HD) and a refresh rate of 360 Hz. The panel covers the sRGB color space almost completely and supports Nvidia G-Sync. The latter is also true for the alternatively available Full HD 144 Hz configuration, which covers 72% of the NTSC color spectrum according to the manufacturer's specifications. A 4K variant, where you exchange the high refresh rate for higher resolution, higher brightness, 100% coverage of the AdobeRGB color spectrum, and Tobii eye tracking, is also available, but it comes with a hefty additional price.
The manufacturer's specified value of 300 cd/m² is achieved by the display in our independent measurement, and although the gap is small, the brightness distribution of 93% is the highest in our comparison field. We have also included the new Alienware m15 R4 in the table, because the comparison with the fast Full HD displays makes more sense than the comparison with the 4K panels of the Gigabyte Aero 17 YC or the Razer Blade Pro 17.
| |||||||||||||||||||||||||
Brightness Distribution: 93 %
Center on Battery: 305 cd/m²
Contrast: 1605:1 (Black: 0.19 cd/m²)
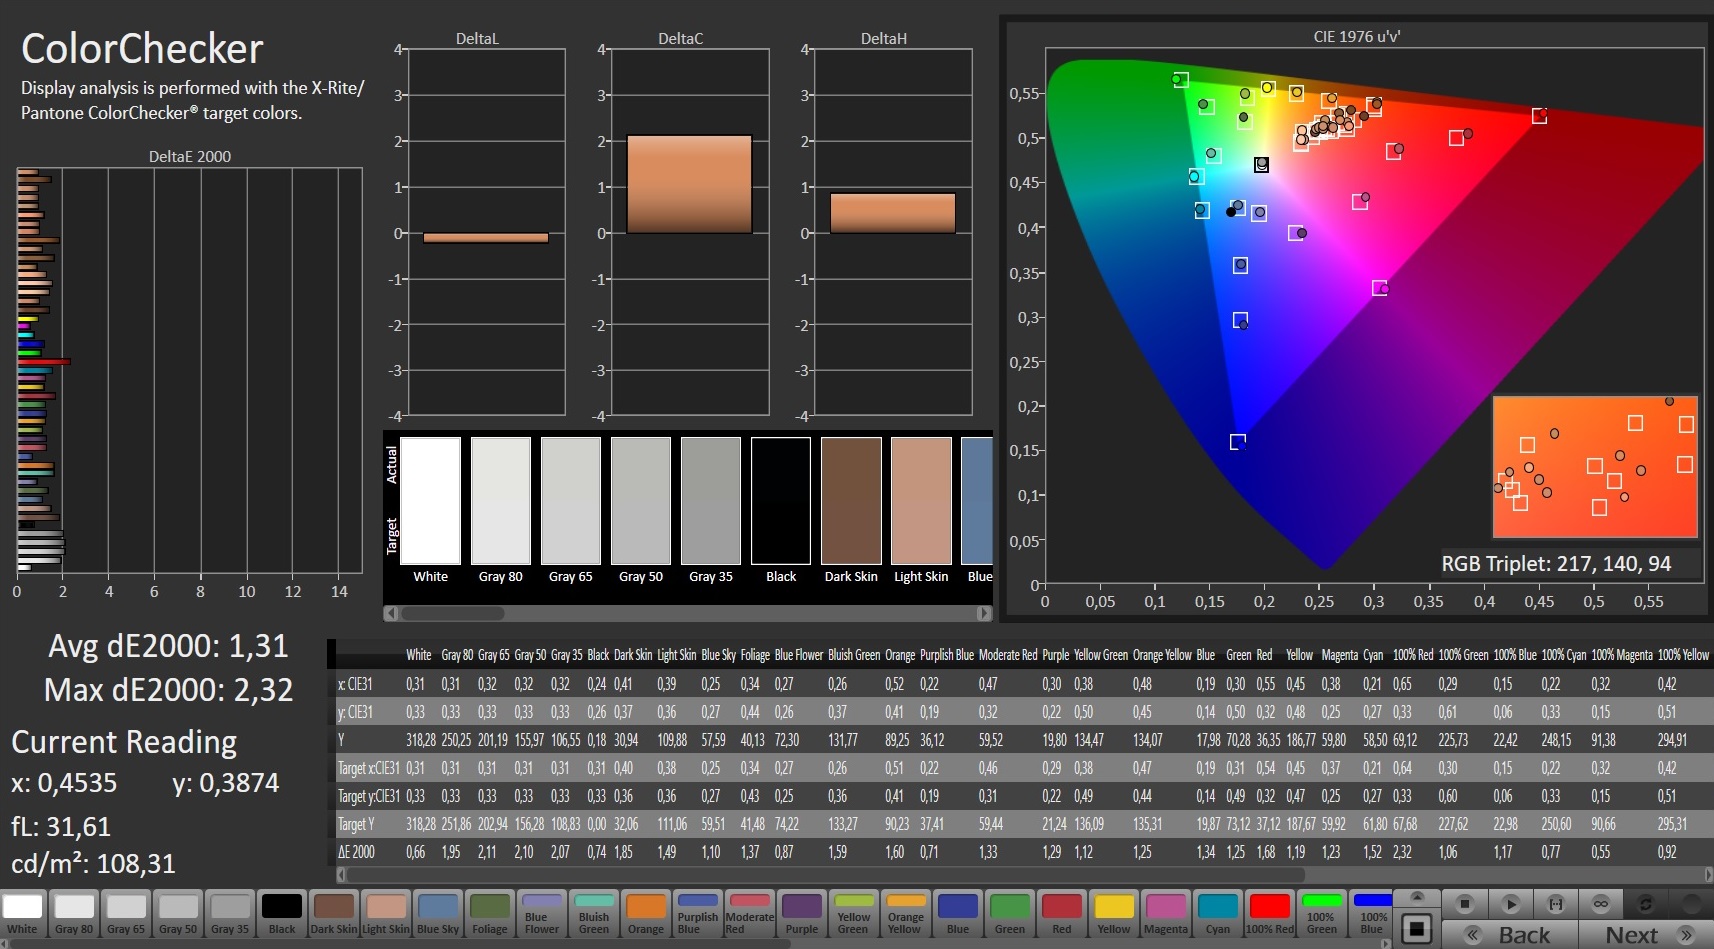
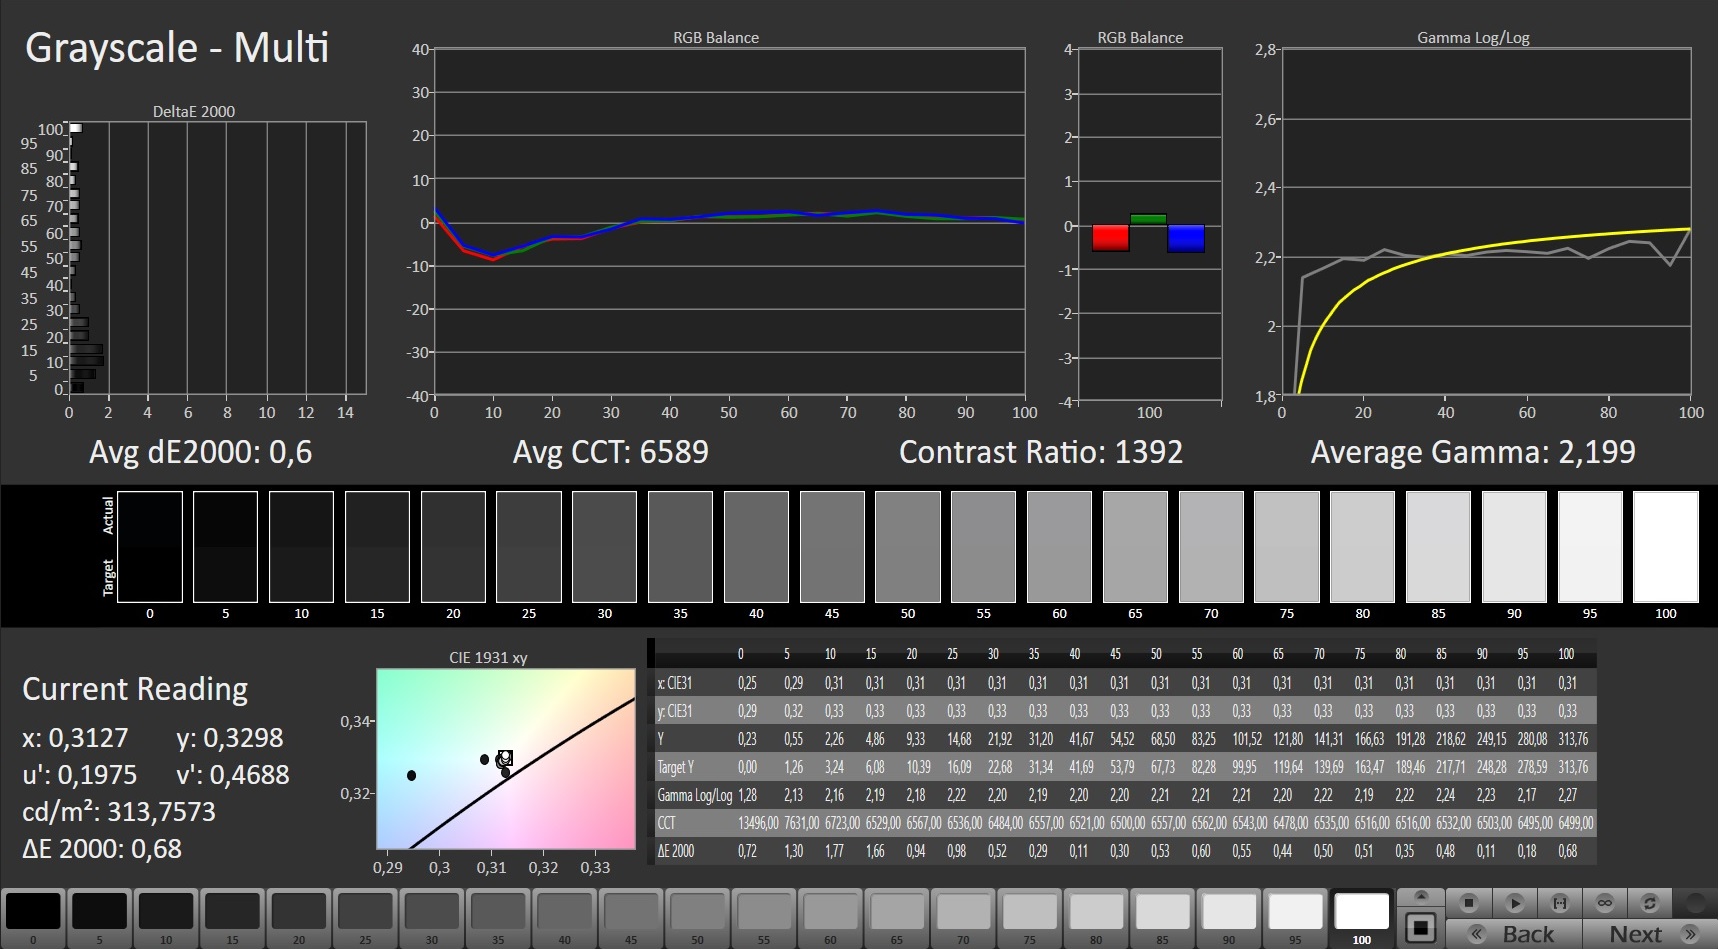
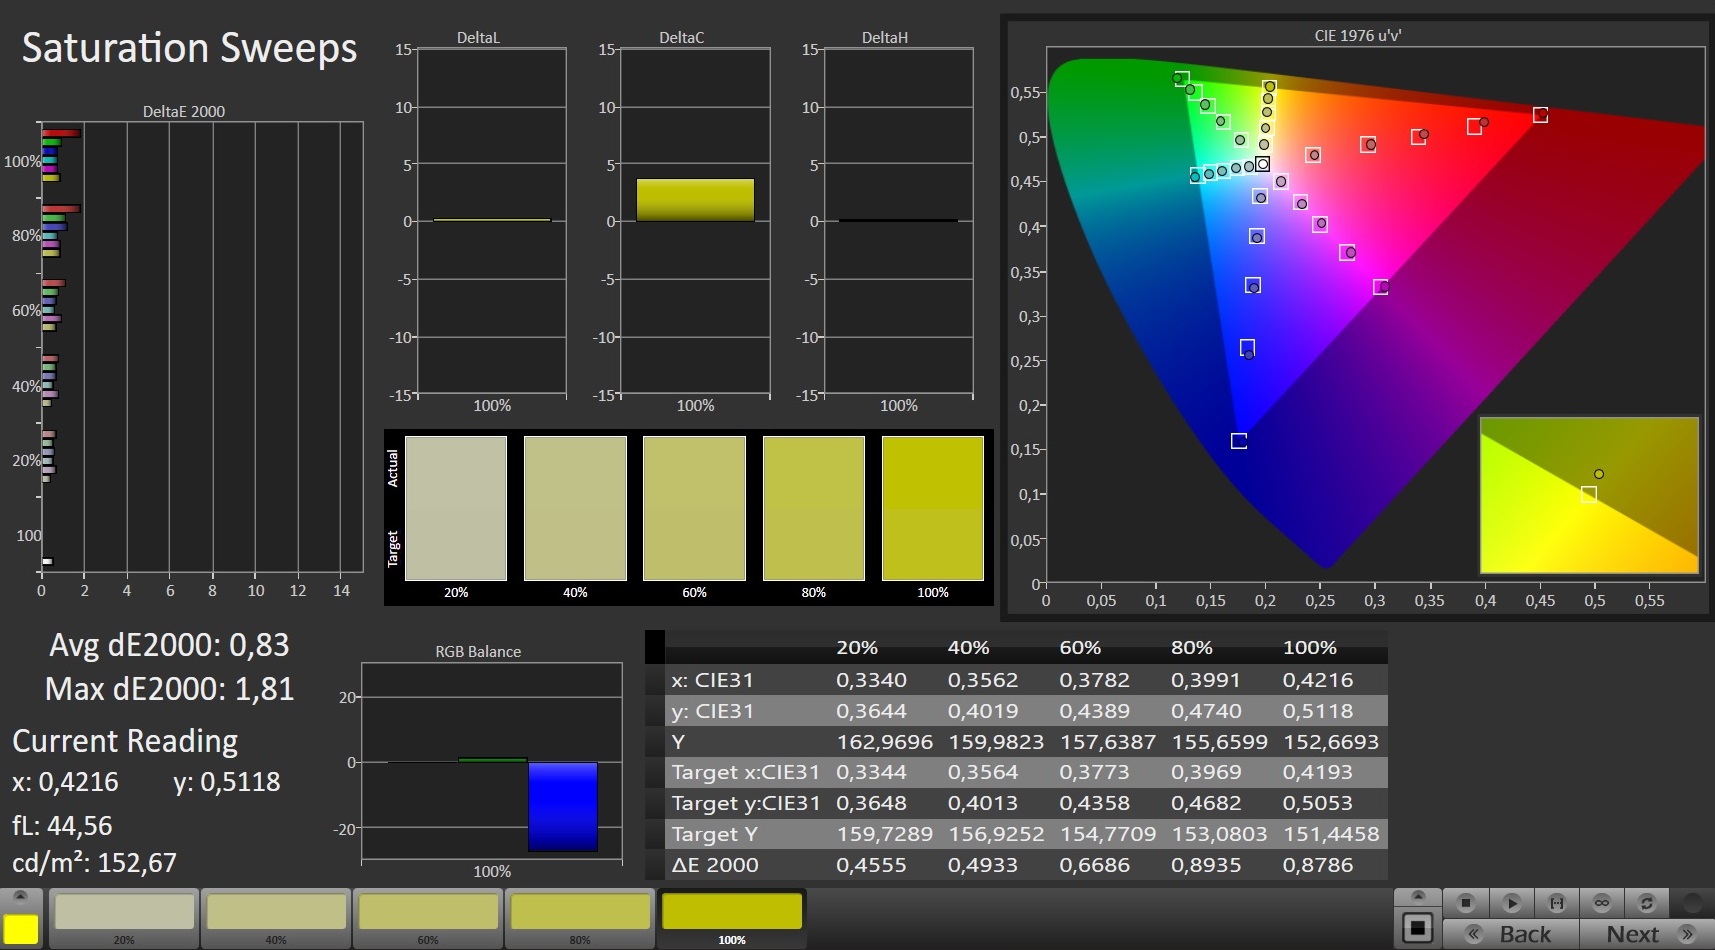
ΔE Color 1.31 | 0.5-29.43 Ø5, calibrated: 0.91
ΔE Greyscale 2.3 | 0.57-98 Ø5.3
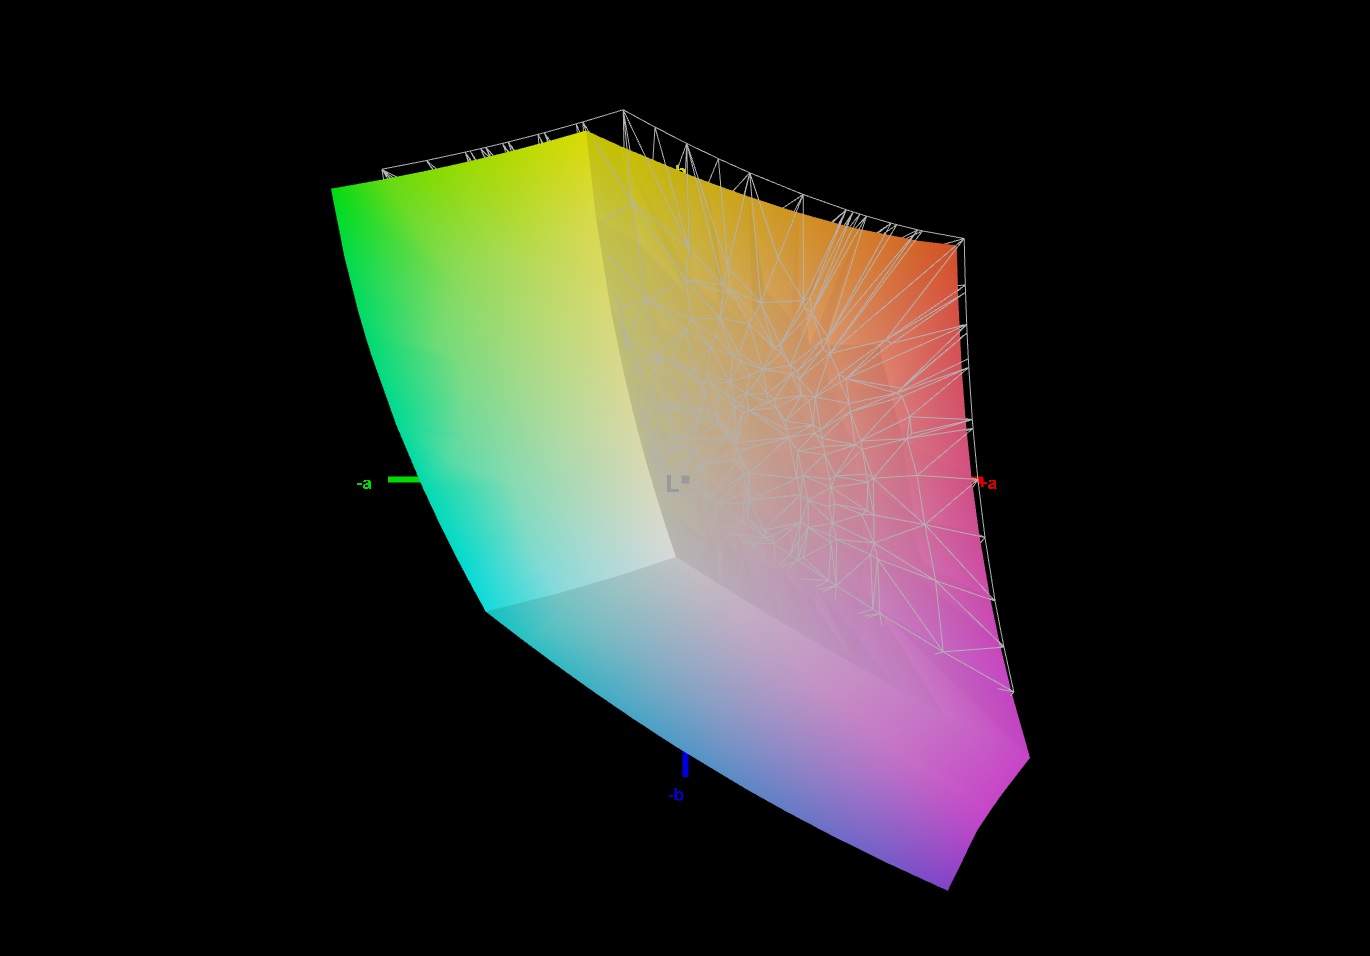
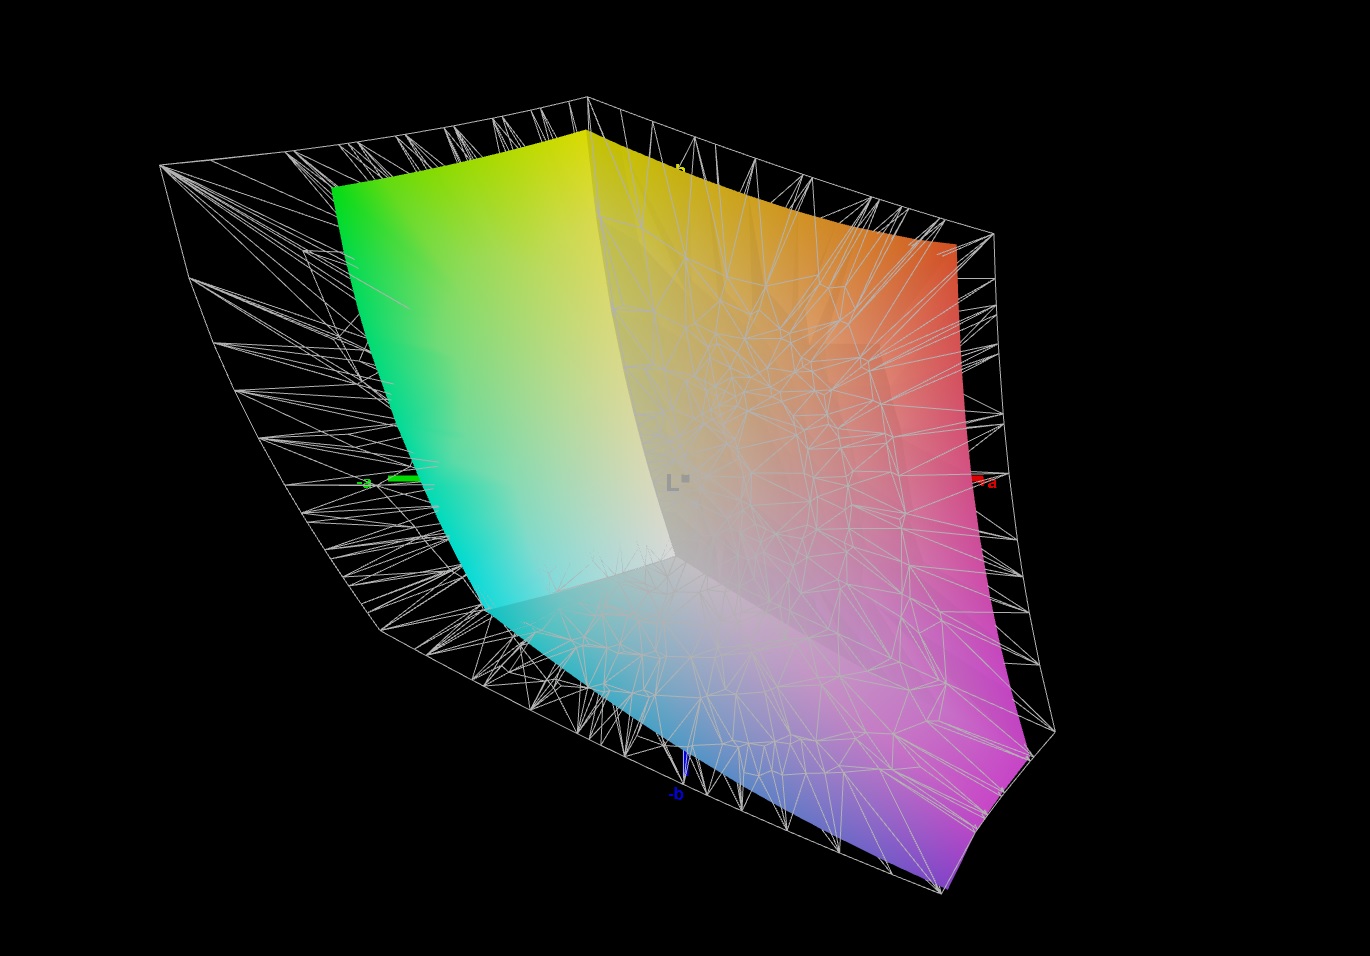
94% sRGB (Argyll 1.6.3 3D)
72% AdobeRGB 1998 (Argyll 1.6.3 3D)
71.6% AdobeRGB 1998 (Argyll 2.2.0 3D)
99.7% sRGB (Argyll 2.2.0 3D)
69.8% Display P3 (Argyll 2.2.0 3D)
Gamma: 2.281
| Alienware m17 R4 AU Optronics AUOEC91, IPS, 1920x1080, 17.30 | MSI GE76 Raider 10UH AU Optronics B173HAN05.1, IPS, 1920x1080, 17.30 | SCHENKER XMG Neo 17 (Early 2021, RTX 3070, 5800H) BOE NE173QHM-NY2 (BOE0977), IPS, 2560x1440, 17.30 | Alienware m17 R3 P45E AU Optronics B173HAN, IPS, 1920x1080, 17.30 | Alienware m15 R4 LG Philips LGD066E, IPS, 1920x1080, 15.60 | |
|---|---|---|---|---|---|
| Display | 1% | 0% | -1% | -1% | |
| Display P3 Coverage | 69.8 | 71.8 3% | 70.5 1% | 69.2 -1% | 69.4 -1% |
| sRGB Coverage | 99.7 | 98.1 -2% | 99.5 0% | 97.9 -2% | 99 -1% |
| AdobeRGB 1998 Coverage | 71.6 | 73.9 3% | 71.8 0% | 71.4 0% | 70.5 -2% |
| Response Times | -32% | -18% | -40% | 18% | |
| Response Time Grey 50% / Grey 80% * | 13.2 ? | 20.4 ? -55% | 16.8 ? -27% | 16.8 ? -27% | 7.4 ? 44% |
| Response Time Black / White * | 9.2 ? | 10 ? -9% | 10 ? -9% | 14 ? -52% | 10 ? -9% |
| PWM Frequency | 151500 | ||||
| Screen | -74% | -31% | -17% | -20% | |
| Brightness middle | 305 | 324.6 6% | 410 34% | 338.3 11% | 333 9% |
| Brightness | 301 | 312 4% | 381 27% | 325 8% | 303 1% |
| Brightness Distribution | 93 | 87 -6% | 88 -5% | 91 -2% | 86 -8% |
| Black Level * | 0.19 | 0.28 -47% | 0.37 -95% | 0.27 -42% | 0.29 -53% |
| Contrast | 1605 | 1159 -28% | 1108 -31% | 1253 -22% | 1148 -28% |
| Colorchecker dE 2000 * | 1.31 | 3.87 -195% | 2.55 -95% | 1.88 -44% | 1.8 -37% |
| Colorchecker dE 2000 max. * | 2.32 | 9.35 -303% | 4.33 -87% | 3.23 -39% | 4.49 -94% |
| Colorchecker dE 2000 calibrated * | 0.91 | 1.42 -56% | 1.28 -41% | 1.32 -45% | 1.13 -24% |
| Greyscale dE 2000 * | 2.3 | 6.5 -183% | 3.4 -48% | 2.4 -4% | 1.9 17% |
| Gamma | 2.281 96% | 2.23 99% | 2.275 97% | 2.39 92% | 2.265 97% |
| CCT | 6449 101% | 5702 114% | 6637 98% | 6572 99% | 6840 95% |
| Color Space (Percent of AdobeRGB 1998) | 72 | 66.3 -8% | 72 0% | 64.7 -10% | 71 -1% |
| Color Space (Percent of sRGB) | 94 | 98 4% | 95 1% | 97.8 4% | 93 -1% |
| Total Average (Program / Settings) | -35% /
-55% | -16% /
-23% | -19% /
-17% | -1% /
-12% |
* ... smaller is better
Thanks to the very good black level of only 0.19, the contrast of 1,605:1 is about 30% higher than in the comparison devices. The Delta E color deviation and grayscale values of 1.31 and 2.3 respectively are excellent even before calibration, and they're also in the optimal range (Delta E < 3). According to our independent measurement, the display covers 94% and 72% of the sRGB and AdobeRGB color spaces, respectively.


For the most part, the brightness is too low for outdoor use, but the matte layer helps keep the display content legible, at least in the shade or in darker conditions.
Display Response Times
| ↔ Response Time Black to White | ||
|---|---|---|
| 9.2 ms ... rise ↗ and fall ↘ combined | ↗ 4.8 ms rise | 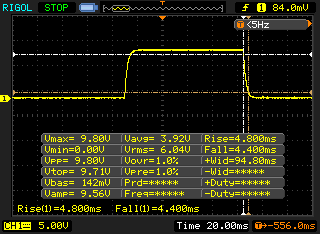 |
| ↘ 4.4 ms fall | ||
| The screen shows fast response rates in our tests and should be suited for gaming. In comparison, all tested devices range from 0.1 (minimum) to 240 (maximum) ms. » 20 % of all devices are better. This means that the measured response time is better than the average of all tested devices (21.5 ms). | ||
| ↔ Response Time 50% Grey to 80% Grey | ||
| 13.2 ms ... rise ↗ and fall ↘ combined | ↗ 6.4 ms rise | 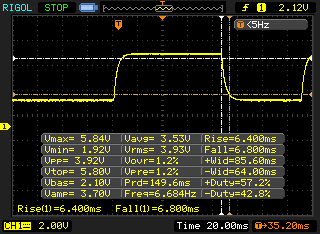 |
| ↘ 6.8 ms fall | ||
| The screen shows good response rates in our tests, but may be too slow for competitive gamers. In comparison, all tested devices range from 0.2 (minimum) to 636 (maximum) ms. » 21 % of all devices are better. This means that the measured response time is better than the average of all tested devices (33.8 ms). | ||
Screen Flickering / PWM (Pulse-Width Modulation)
| Screen flickering / PWM not detected | 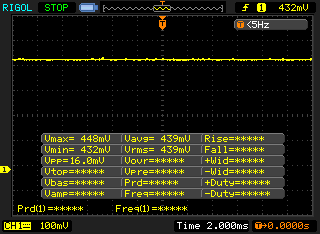 | ||
In comparison: 53 % of all tested devices do not use PWM to dim the display. If PWM was detected, an average of 17933 (minimum: 5 - maximum: 3846000) Hz was measured. | |||
Thanks to the underlying IPS technology, the viewing angles of the display are good. Even when viewing it from extremely steep angles, the contrast and brightness hardly change.
Performance - Alienware m17 R4 with high CPU and GPU performance
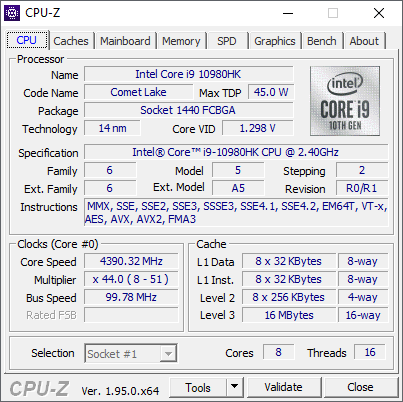
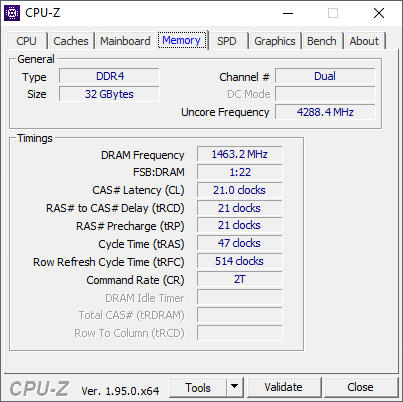
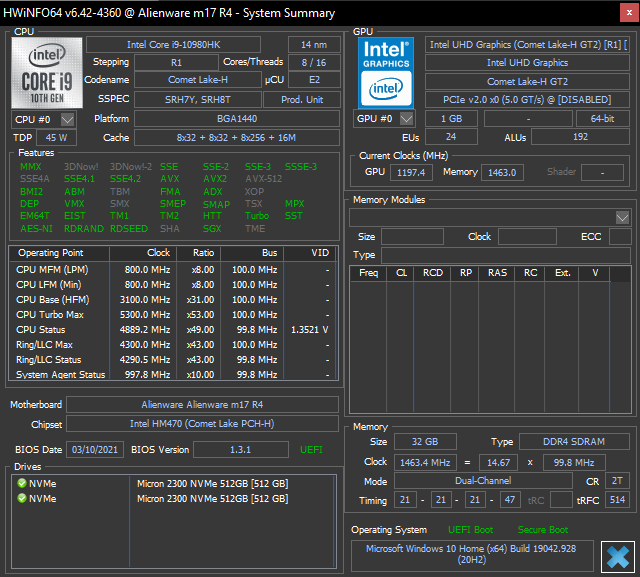
Our configuration of the Alienware m17 R4 is equipped with an Intel Core i9-10980HK and a mobile Nvidia GeForce RTX 3080. The powerful duo is supported by 32 GB of soldered dual-channel DDR4 RAM running at 2,933 MHz as well as by two 512 GB NVMe SSDs in a RAID 0 setup. As for the processor, you have the choice between the aforementioned Core i9 and the Core i7-10870H. In our Cinebench R15 loop test, the latter is about 9% slower than the processor in our test model. The base configuration features a mobile Nvidia GeForce RTX 3070, 16 GB of DDR4 RAM, and a single 512 GB SSD.
Processor
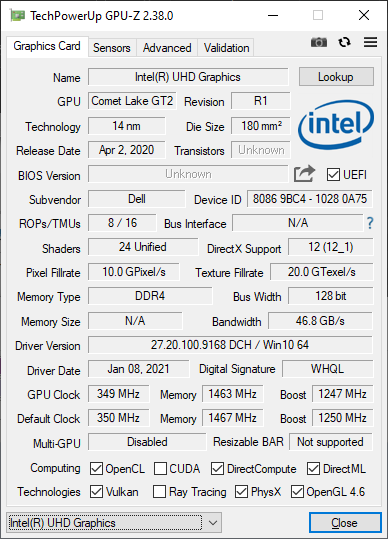
The Intel Core i9-10980HK is an octa-core processor for laptops that also offers an integrated GPU. The CPU is based on the Comet Lake architecture, and it was used in some of the predecessor's models as well. The chip clocks at 2.4-5.2 GHz or 2.4-5.3 GHz, whereby 5.3 GHz is unlikely to be reached in practice, since the CPU temperature can't exceed 65 °C (~149 °F) for this clock rate. The "K" in the name indicates that the CPU can theoretically be overclocked. The Intel UHD Graphics 630 integrated into the processor takes over graphics processing in low-load scenarios, which saves power and reduces heat development.
Turbo mode is used to a high extent and is maintained steadily throughout the entire test period in the Cinebench R15 loop test. CPU performance is limited in battery mode: A Cinebench R15 run produces a score of about 1,820 when plugged in, while only around 1,500 points are reached on battery power.
As with the predecessor, the CPU performance is also at a high level compared to rivals with the same CPU, since the Core i9-10980HK unfolds its performance excellently here as well. Nevertheless, the Schenker XMG Neo 17, for example, beats all Intel rivals and is also more efficient, despite "only" being equipped with the Ryzen 7 5800H instead of the AMD Ryzen 9 5900HX.
* ... smaller is better
System performance
In the PCMark benchmarks, our m17 R4 achieves slightly above-average scores for the CPU-GPU combination. Overall, the system performance level is consequently in the upper midfield, while the Schenker XMG Neo 17 is able to claim most benchmarks in its favor. In everyday use, the system consistently responds to inputs without delays, but we encountered a small display bug with the Alienware Command Center.
| PCMark 8 Home Score Accelerated v2 | 6224 points | |
| PCMark 8 Work Score Accelerated v2 | 5555 points | |
| PCMark 10 Score | 6684 points | |
Help | ||
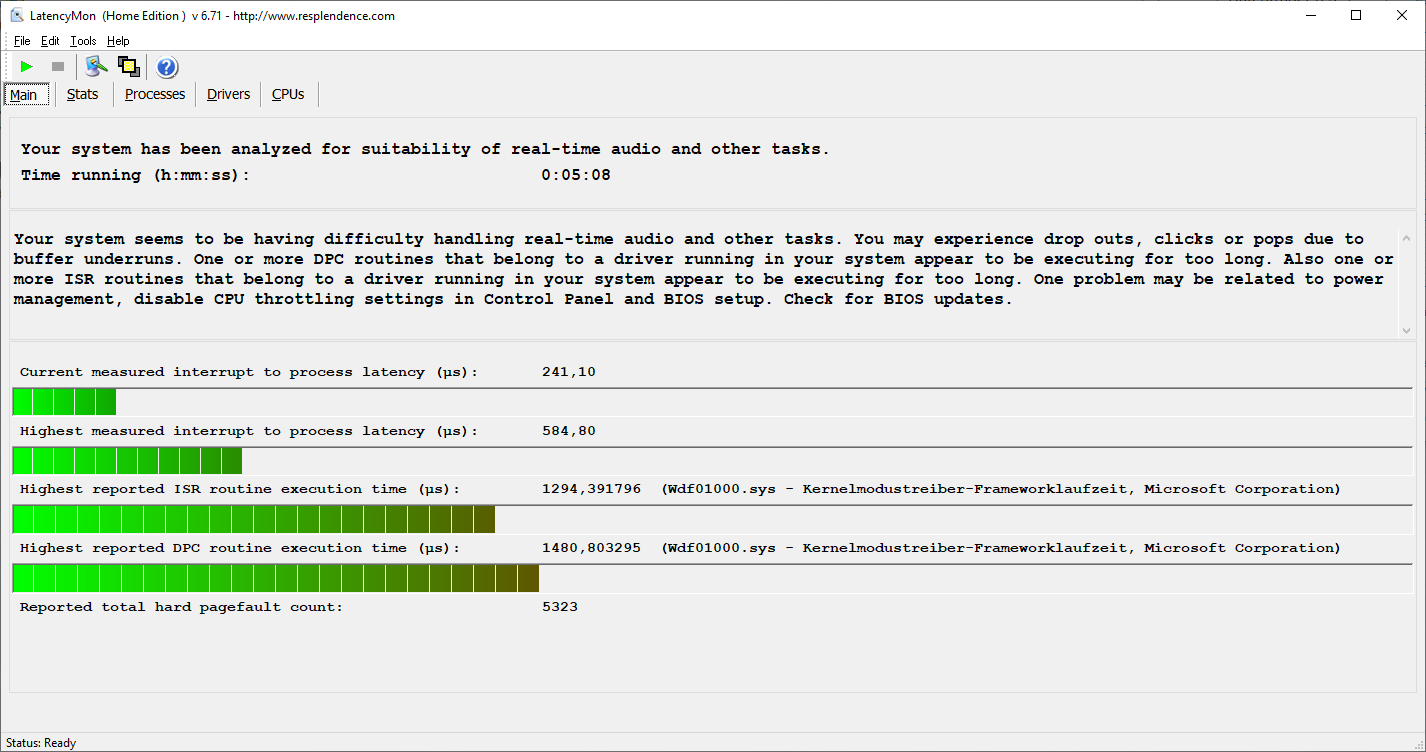
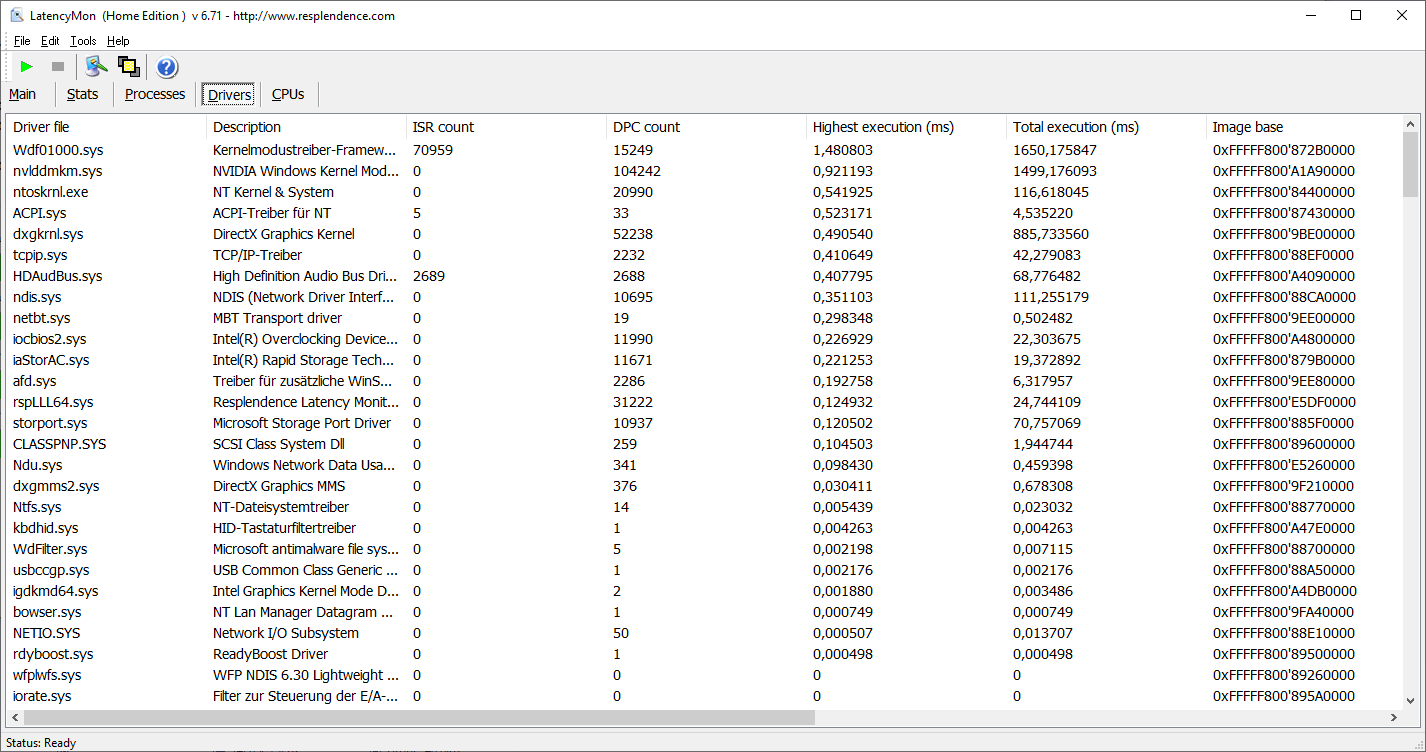
DPC latencies
The DPC latencies are lower than in all other comparison devices, but they're still possibly not suitable for editing video and audio files in real time out of the box.
| DPC Latencies / LatencyMon - interrupt to process latency (max), Web, Youtube, Prime95 | |
| MSI GE76 Raider 10UH | |
| Gigabyte Aero 17 HDR YC | |
| SCHENKER XMG Neo 17 (Early 2021, RTX 3070, 5800H) | |
| Razer Blade Pro 17 2021 (QHD Touch) | |
| Alienware m17 R3 P45E | |
| Alienware m17 R4 | |
* ... smaller is better
Storage
In our case, a RAID 0 setup consisting of two Micron 2300 NVMe SSDs serves as the storage solution. The low 4K write performance is a natural consequence of the RAID array, but the 4K read performance is partly even lower than in drive solutions with a single SSD. Nevertheless, performance tends to be a good bit higher than with the Micron 2200S RAID 0 configuration of the predecessor.
More information can be found in our HDD/SSD Benchmarks article.
| Alienware m17 R4 2x Micron 2300 512 GB (RAID 0) | MSI GE76 Raider 10UH WDC PC SN730 SDBPNTY-1T00 | Razer Blade Pro 17 2021 (QHD Touch) Samsung PM981a MZVLB1T0HBLR | Gigabyte Aero 17 HDR YC ESR01TBTLCG-EAC-4 | SCHENKER XMG Neo 17 (Early 2021, RTX 3070, 5800H) Samsung SSD 970 EVO Plus 500GB | Alienware m17 R3 P45E 2x Micron 2200S 512 GB (RAID 0) | |
|---|---|---|---|---|---|---|
| CrystalDiskMark 5.2 / 6 | 3% | -6% | 5% | 22% | -12% | |
| Write 4K | 93.1 | 157.1 69% | 123.5 33% | 141.2 52% | 206.1 121% | 68 -27% |
| Read 4K | 46.79 | 46.3 -1% | 45.96 -2% | 46.48 -1% | 53 13% | 42.04 -10% |
| Write Seq | 2853 | 2396 -16% | 1861 -35% | 2433 -15% | 3018 6% | 2221 -22% |
| Read Seq | 2556 | 2245 -12% | 1584 -38% | 1742 -32% | 2575 1% | 2202 -14% |
| Write 4K Q32T1 | 475 | 436.1 -8% | 466.4 -2% | 565 19% | 535 13% | 494.5 4% |
| Read 4K Q32T1 | 529 | 524 -1% | 566 7% | 655 24% | 608 15% | 540 2% |
| Write Seq Q32T1 | 3331 | 3086 -7% | 2981 -11% | 3028 -9% | 3242 -3% | 2623 -21% |
| Read Seq Q32T1 | 3319 | 3363 1% | 3260 -2% | 3424 3% | 3617 9% | 3159 -5% |
| AS SSD | 7% | 8% | 38% | 41% | -35% | |
| Seq Read | 2733 | 2967 9% | 2068 -24% | 2674 -2% | 3020 11% | 2060 -25% |
| Seq Write | 2822 | 2604 -8% | 2047 -27% | 2458 -13% | 2631 -7% | 2297 -19% |
| 4K Read | 45.04 | 42.97 -5% | 47.85 6% | 52.1 16% | 60.3 34% | 35.39 -21% |
| 4K Write | 88.4 | 107.8 22% | 87.4 -1% | 113.4 28% | 171.6 94% | 63.1 -29% |
| 4K-64 Read | 1388 | 1684 21% | 1932 39% | 1881 36% | 1410 2% | 1337 -4% |
| 4K-64 Write | 1227 | 2164 76% | 2017 64% | 2849 132% | 2324 89% | 1307 7% |
| Access Time Read * | 0.079 | 0.116 -47% | 0.055 30% | 0.102 -29% | 0.045 43% | 0.057 28% |
| Access Time Write * | 0.095 | 0.106 -12% | 0.128 -35% | 0.033 65% | 0.024 75% | 0.411 -333% |
| Score Read | 1706 | 2023 19% | 2187 28% | 2201 29% | 1773 4% | 1578 -8% |
| Score Write | 1598 | 2532 58% | 2309 44% | 3208 101% | 2759 73% | 1600 0% |
| Score Total | 4184 | 5571 33% | 5612 34% | 6524 56% | 5429 30% | 3997 -4% |
| Copy ISO MB/s | 2414 | 2106 -13% | 2400 -1% | 1728 -28% | ||
| Copy Program MB/s | 1030 | 687 -33% | 684 -34% | 727 -29% | ||
| Copy Game MB/s | 1991 | 1590 -20% | 1629 -18% | 1585 -20% | ||
| Total Average (Program / Settings) | 5% /
6% | 1% /
3% | 22% /
24% | 32% /
33% | -24% /
-26% |
* ... smaller is better

Continuous load read: DiskSpd Read Loop, Queue Depth 8
Graphics card
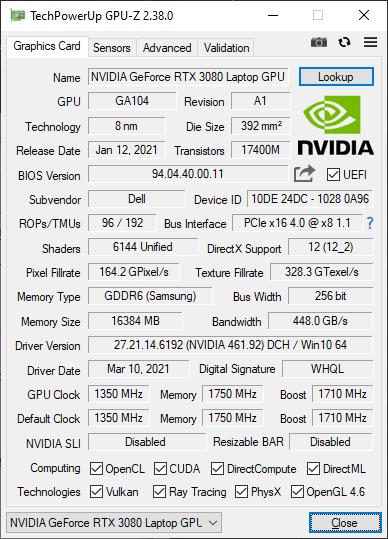
The mobile Nvidia GeForce RTX 3080 is currently the fastest laptop gaming graphics card, and it has access to a generous TDP of 165 watts (including Dynamic Boost) and 16 GB of video memory. Graphics performance is roughly on par with that of a desktop GeForce RTX 3060 Ti.
The effects of the high energy budget can be seen in the 3DMark benchmarks, which are led by the Alienware m17 R4 without exception. At the same time, you can see from the results that the new model shows an advantage of about 20% over the m17 R3. The scores show that the GeForce RTX 3080 can unleash its performance excellently in the Alienware laptop and already suggest an excellent gaming performance as well.
Graphics performance is limited on battery power. A Fire Strike run delivers physics and graphics scores of 18,713 and 6,900, respectively, on battery power, while 22,147 and 32,536 are achieved when plugged in.
| 3DMark 11 Performance | 29711 points | |
| 3DMark Cloud Gate Standard Score | 57555 points | |
| 3DMark Fire Strike Score | 24937 points | |
| 3DMark Time Spy Score | 12224 points | |
Help | ||
Gaming performance
In the practical gaming tests, our review sample performs extremely well, and even the latest games, such as Cyberpunk 2077, can be played smoothly at the highest graphics settings. Unfortunately, the display doesn't seem to cope well with some situations, because the image flickers from time to time.
More information can be found in our benchmarks list.
In our The Witcher 3 test, during which the game character is not moved for the entire period, the frame rates drop slightly several times, which could possibly be due to interfering background activity or thermal throttling.
| low | med. | high | ultra | |
| GTA V (2015) | 180 | 176 | 160 | 93.9 |
| The Witcher 3 (2015) | 334 | 236 | 211 | 115 |
| Dota 2 Reborn (2015) | 164 | 145 | 140 | 132 |
| Final Fantasy XV Benchmark (2018) | 166 | 139 | 98.2 | |
| X-Plane 11.11 (2018) | 118 | 105 | 88 | |
| Far Cry 5 (2018) | 154 | 135 | 126 | 121 |
| Strange Brigade (2018) | 390 | 287 | 240 | 212 |
| Cyberpunk 2077 1.0 (2020) | 113 | 104 | 92.4 | 80.6 |
Emissions - Temperatures at the upper limit
Noise emissions
The fans can be controlled via the Alienware Command Center software, and they behave very dynamically under the "Balanced" profile. For instance, while they stand still when browsing and working on the desktop, they spin at maximum speed under high load. They quickly become clearly audible when gaming and then remain at this high noise level for the duration of the game. Afterwards, however, they usually return to silent operation after just a few seconds of idle usage. We didn't detect any coil whine or other noteworthy electronic noises in our test device.
Noise Level
| Idle |
| 24 / 25 / 36 dB(A) |
| Load |
| 45 / 50 dB(A) |
 | ||
30 dB silent 40 dB(A) audible 50 dB(A) loud |
||
min: | ||
Temperature
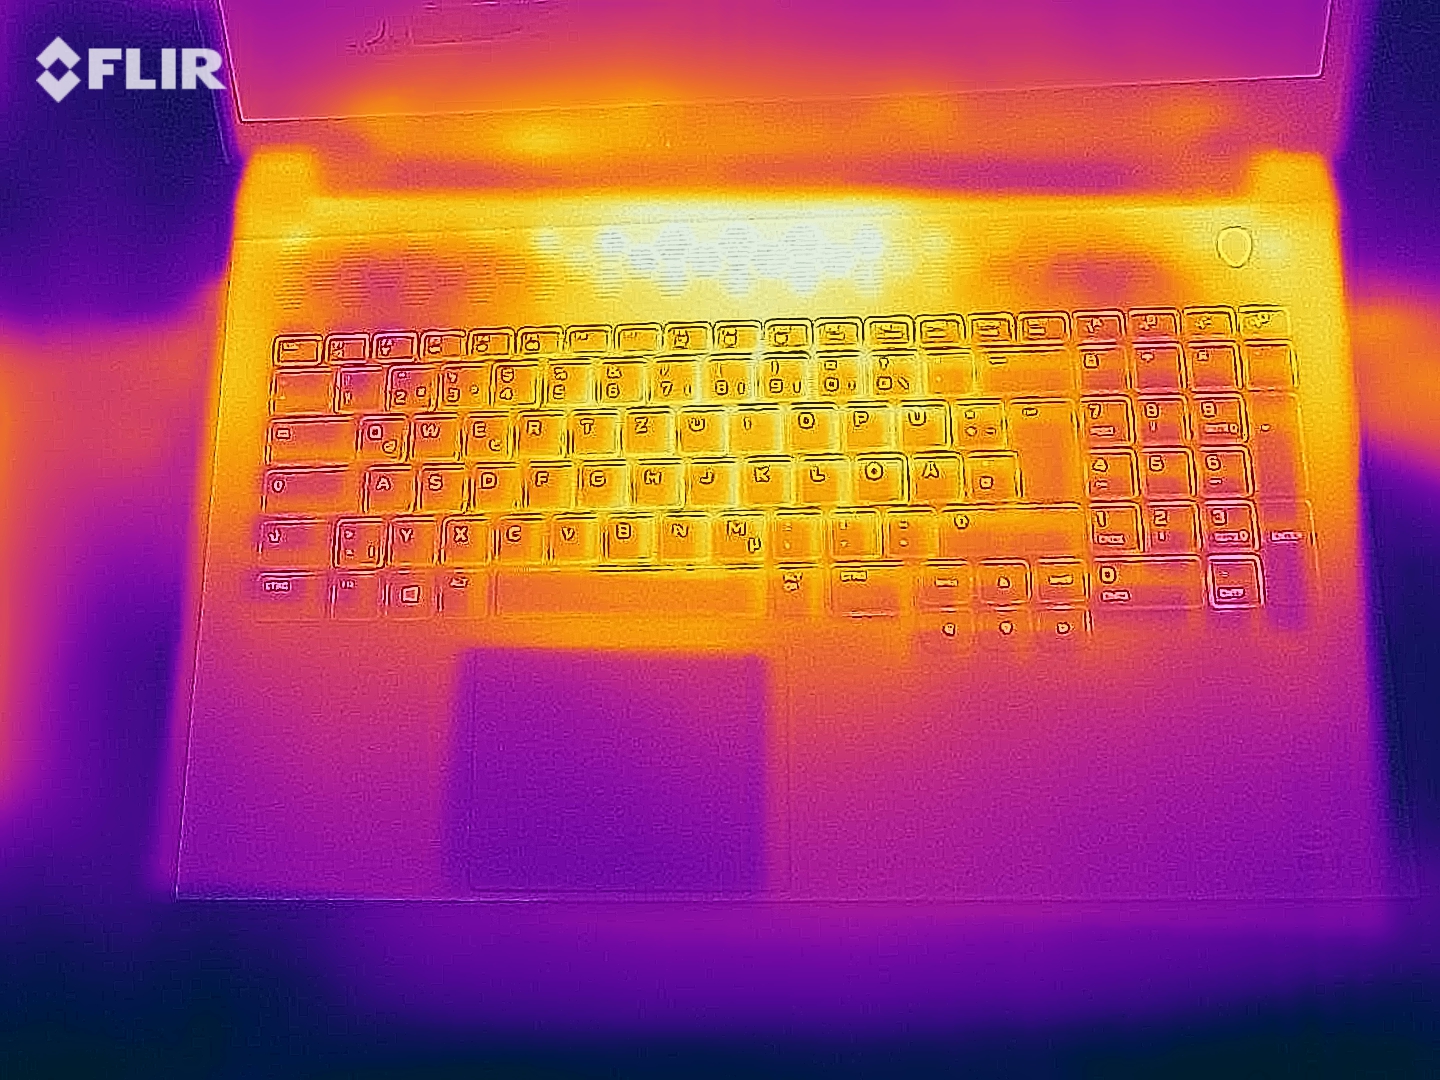
Due to the sometimes extremely high operating temperatures, certain areas on the surface also get very warm. Temperatures of up to 60 °C (~140 °F) and 58 °C (~ 136 °F), respectively, are reached in the base unit's rear area while gaming and during the stress test. The palm rests also get especially warm at up to 44 °C (~111 °F), which can be uncomfortable when gaming.
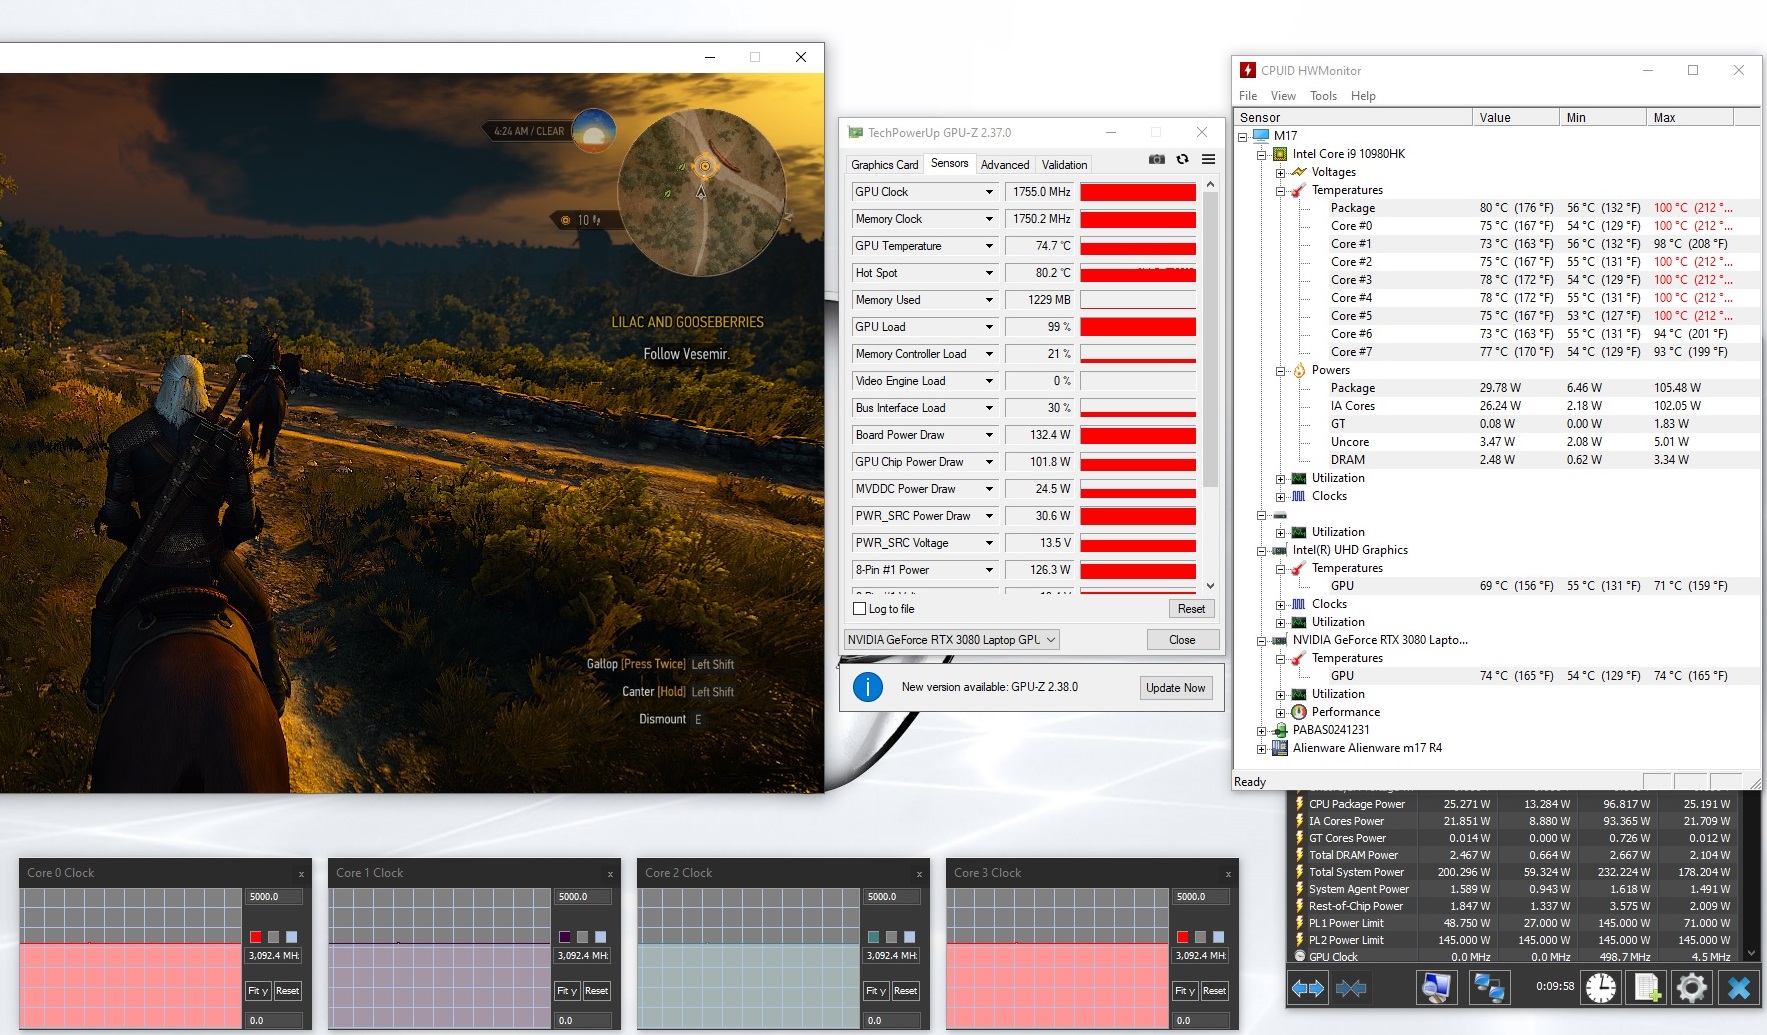
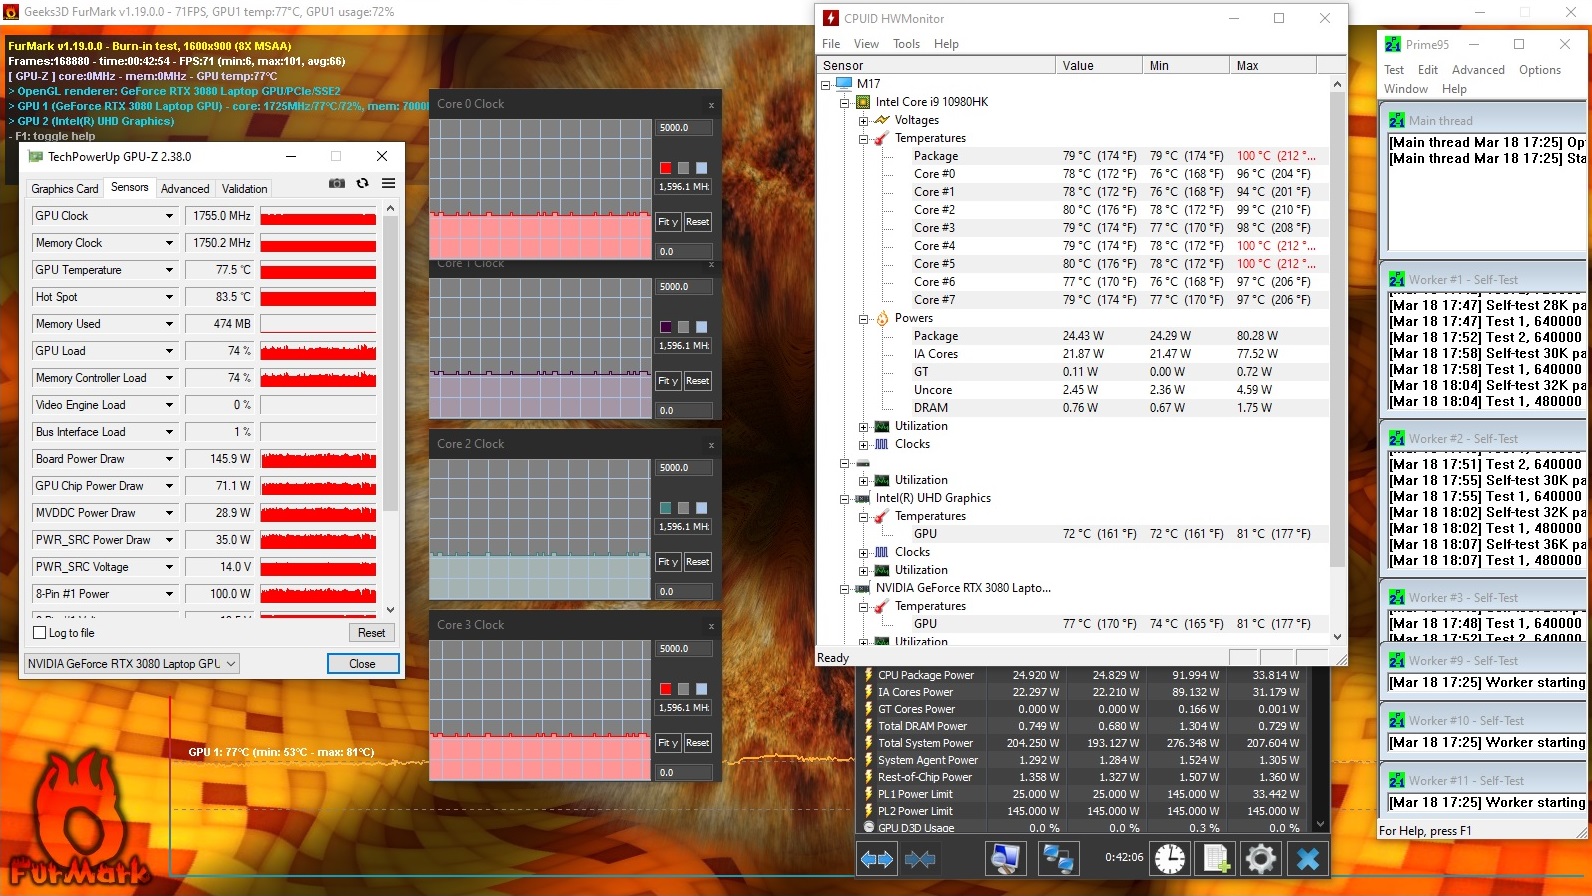
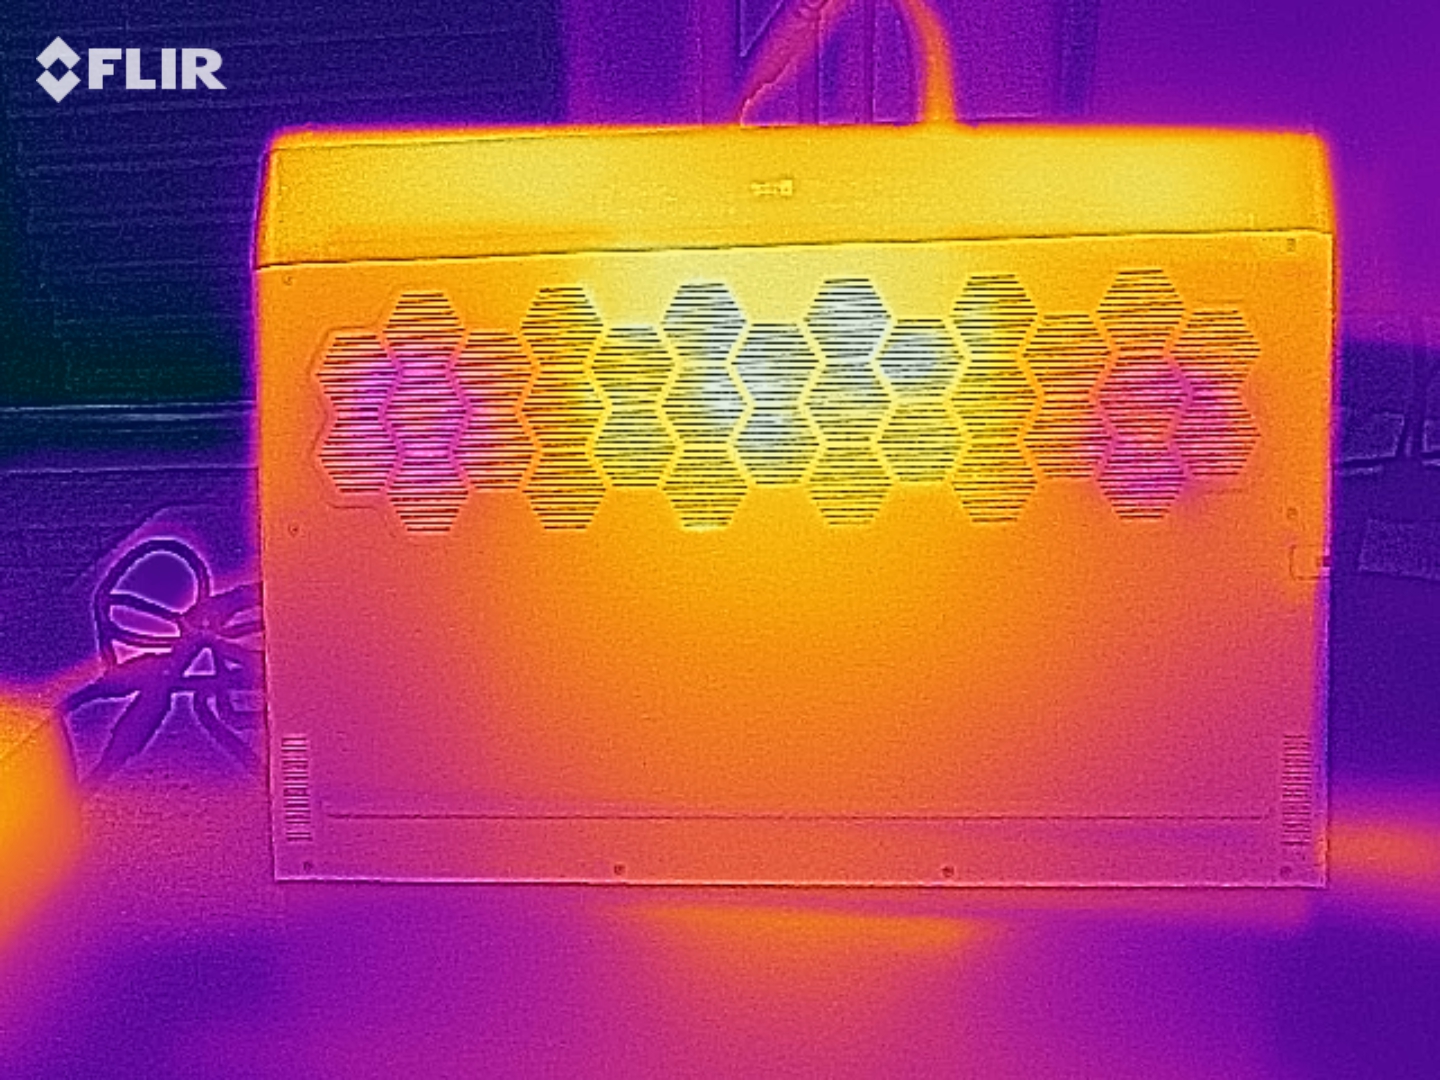
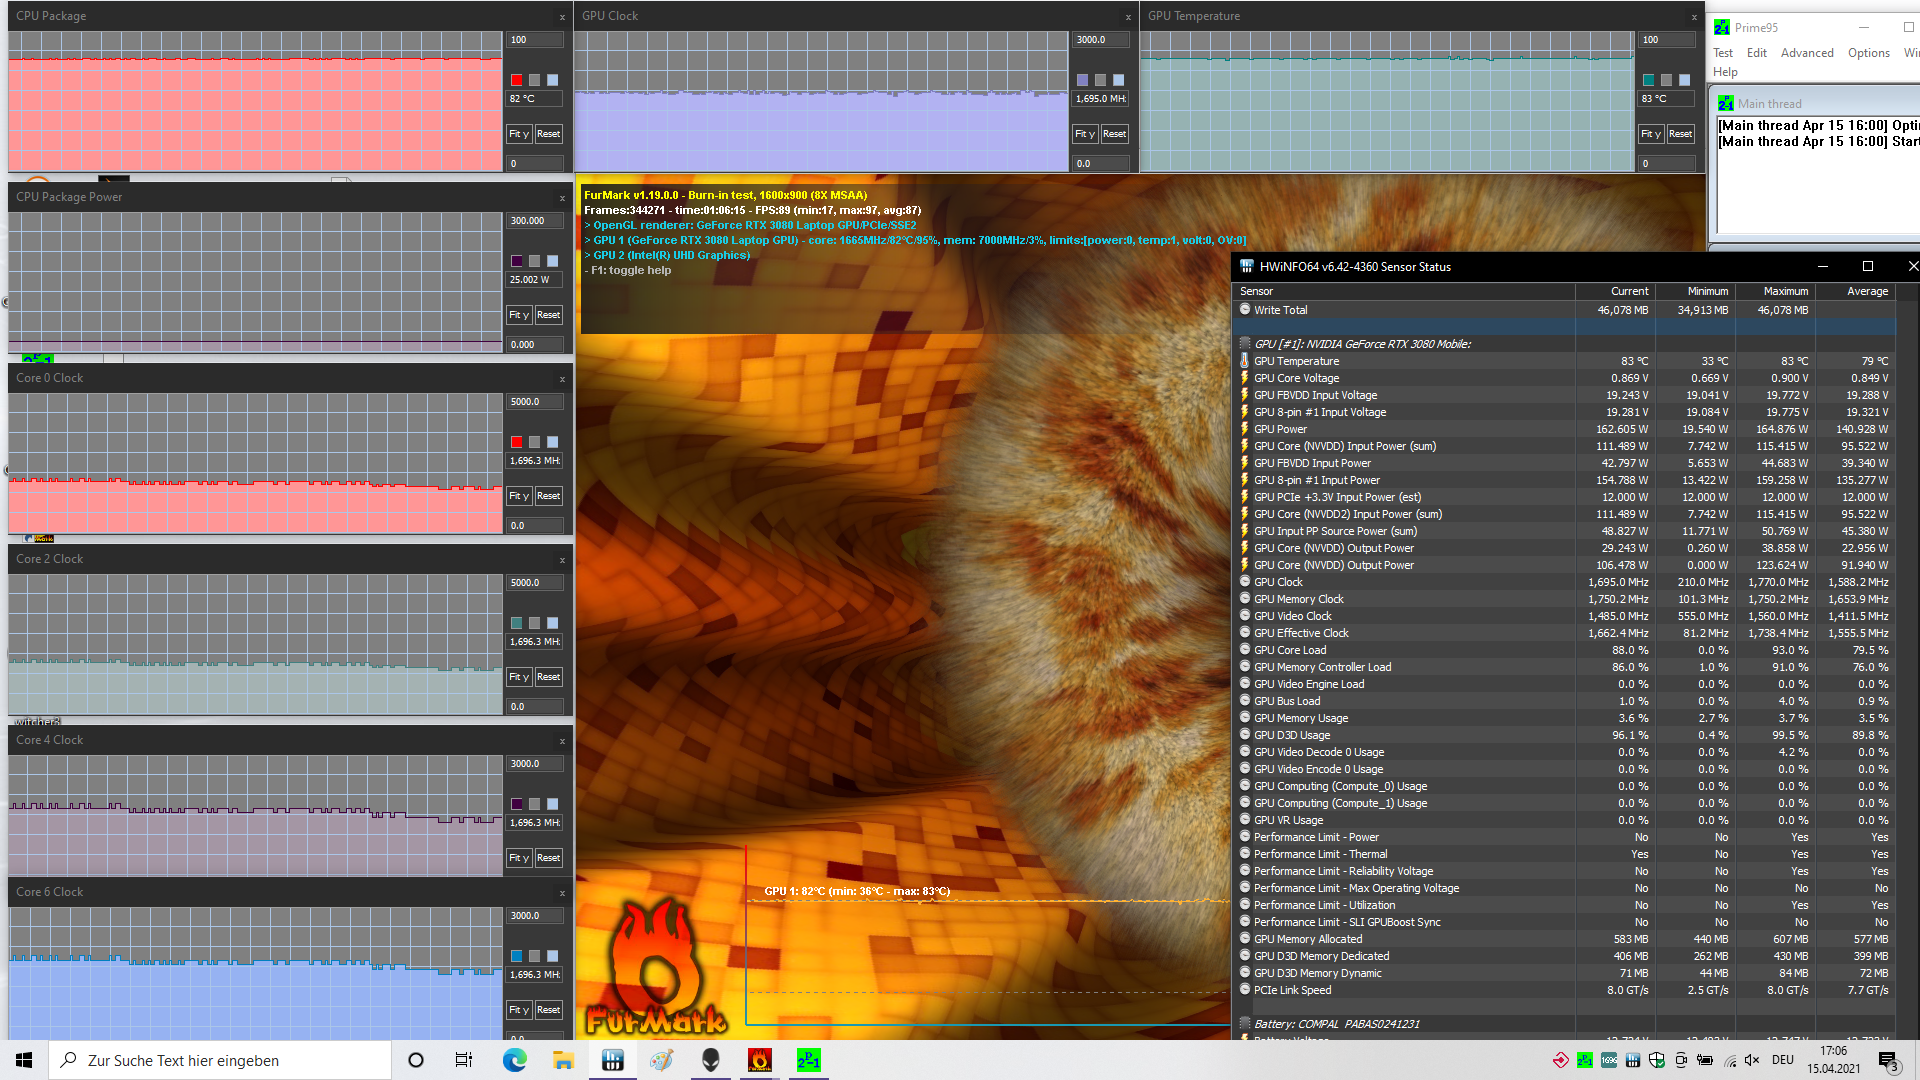
In the stress test, the CPU and GPU initially clock at a frequency of 5.1 GHz and 1,755 MHz, respectively. The CPU then reaches a peak temperature of 105 °C (~126 °F) and begins to reduce its clock frequency after a short time until it finally stabilizes at around 1.7 GHz and a temperature of 80 °C (~176 °F). Unlike the CPU, the GPU doesn't need to throttle, but it does reduce its clock frequency when it reaches 83 °C (~181 °F) and settles at a respectable 1,695 MHz over time. Significant screen flickering was seen during the stress test, which could be a sign of overheated components.
(-) The maximum temperature on the upper side is 58 °C / 136 F, compared to the average of 40.4 °C / 105 F, ranging from 21.2 to 68.8 °C for the class Gaming.
(-) The bottom heats up to a maximum of 46 °C / 115 F, compared to the average of 43.2 °C / 110 F
(-) In idle usage, the average temperature for the upper side is 40.8 °C / 105 F, compared to the device average of 33.8 °C / 93 F.
(-) Playing The Witcher 3, the average temperature for the upper side is 49.2 °C / 121 F, compared to the device average of 33.8 °C / 93 F.
(-) The palmrests and touchpad can get very hot to the touch with a maximum of 44 °C / 111.2 F.
(-) The average temperature of the palmrest area of similar devices was 28.9 °C / 84 F (-15.1 °C / -27.2 F).
Alienware m17 R4 audio analysis
(+) | speakers can play relatively loud (87 dB)
Bass 100 - 315 Hz
(-) | nearly no bass - on average 16.4% lower than median
(±) | linearity of bass is average (8.8% delta to prev. frequency)
Mids 400 - 2000 Hz
(+) | balanced mids - only 4.7% away from median
(+) | mids are linear (5% delta to prev. frequency)
Highs 2 - 16 kHz
(±) | higher highs - on average 7.7% higher than median
(±) | linearity of highs is average (7% delta to prev. frequency)
Overall 100 - 16.000 Hz
(±) | linearity of overall sound is average (16.1% difference to median)
Compared to same class
» 36% of all tested devices in this class were better, 7% similar, 57% worse
» The best had a delta of 6%, average was 18%, worst was 132%
Compared to all devices tested
» 21% of all tested devices were better, 5% similar, 74% worse
» The best had a delta of 4%, average was 25%, worst was 134%
Razer Blade Pro 17 2021 (QHD Touch) audio analysis
(+) | speakers can play relatively loud (86.2 dB)
Bass 100 - 315 Hz
(-) | nearly no bass - on average 19.5% lower than median
(±) | linearity of bass is average (11.2% delta to prev. frequency)
Mids 400 - 2000 Hz
(+) | balanced mids - only 3.4% away from median
(+) | mids are linear (3.6% delta to prev. frequency)
Highs 2 - 16 kHz
(+) | balanced highs - only 2.8% away from median
(+) | highs are linear (5.2% delta to prev. frequency)
Overall 100 - 16.000 Hz
(+) | overall sound is linear (13.6% difference to median)
Compared to same class
» 19% of all tested devices in this class were better, 6% similar, 75% worse
» The best had a delta of 6%, average was 18%, worst was 132%
Compared to all devices tested
» 11% of all tested devices were better, 4% similar, 85% worse
» The best had a delta of 4%, average was 25%, worst was 134%
Energy management - Alienware laptop with high consumption in idle usage
Energy consumption
Even in idle desktop use, power consumption is very high at an average of 48 watts. The Schenker XMG Neo 17, for example, only requires 16 watts in this scenario. Under maximum load, we were able to measure a temporary peak consumption of 337 watts; in our real-world gaming test, it amounted to 219 watts. The huge 330-watt power adapter has sufficient capacity to supply the laptop with energy even under heavy system load.
| Off / Standby | |
| Idle | |
| Load |
|
| Alienware m17 R4 i9-10980HK, GeForce RTX 3080 Laptop GPU | MSI GE76 Raider 10UH i7-10870H, GeForce RTX 3080 Laptop GPU | Razer Blade Pro 17 2021 (QHD Touch) i7-10875H, GeForce RTX 3080 Laptop GPU | Gigabyte Aero 17 HDR YC i9-10980HK, GeForce RTX 3080 Laptop GPU | SCHENKER XMG Neo 17 (Early 2021, RTX 3070, 5800H) R7 5800H, GeForce RTX 3070 Laptop GPU | Alienware m17 R3 P45E i9-10980HK, GeForce RTX 2080 Super Mobile | Average of class Gaming | |
|---|---|---|---|---|---|---|---|
| Power Consumption | 31% | 38% | 38% | 38% | 2% | 44% | |
| Idle Minimum * | 42 | 15.5 63% | 15.2 64% | 17 60% | 13 69% | 33.6 20% | 13.7 ? 67% |
| Idle Average * | 48 | 31.3 35% | 20.3 58% | 21 56% | 16 67% | 43.9 9% | 19.1 ? 60% |
| Idle Maximum * | 58 | 31.7 45% | 37.3 36% | 33 43% | 26 55% | 59 -2% | 26.8 ? 54% |
| Load Average * | 124 | 93.6 25% | 114.9 7% | 113 9% | 125 -1% | 134.9 -9% | 110.9 ? 11% |
| Witcher 3 ultra * | 219 | 233 -6% | 158.4 28% | 157 28% | 187 15% | 242 -11% | |
| Load Maximum * | 337 | 260.3 23% | 223.7 34% | 237 30% | 259 23% | 320 5% | 250 ? 26% |
* ... smaller is better
Battery life
Even for a powerful gaming laptop, battery life is extremely poor. Runtimes like 2:21 hours in our standardized Wi-Fi test ( 250 cd/m² brightness, web-browsing script) or 2:13 hours in our video test with the short film Big Buck Bunny are no surprise considering the high idle consumption. The battery capacity of 86 Wh ranks in the midfield, and the Razer Blade Pro 17 achieves higher runtimes even with its smaller 70.5 Wh battery.
| Alienware m17 R4 i9-10980HK, GeForce RTX 3080 Laptop GPU, 86 Wh | MSI GE76 Raider 10UH i7-10870H, GeForce RTX 3080 Laptop GPU, 99.9 Wh | Razer Blade Pro 17 2021 (QHD Touch) i7-10875H, GeForce RTX 3080 Laptop GPU, 70.5 Wh | Gigabyte Aero 17 HDR YC i9-10980HK, GeForce RTX 3080 Laptop GPU, 99 Wh | SCHENKER XMG Neo 17 (Early 2021, RTX 3070, 5800H) R7 5800H, GeForce RTX 3070 Laptop GPU, 62 Wh | Alienware m17 R3 P45E i9-10980HK, GeForce RTX 2080 Super Mobile, 86 Wh | Average of class Gaming | |
|---|---|---|---|---|---|---|---|
| Battery Runtime | 101% | 84% | 88% | 4% | -4% | 125% | |
| H.264 | 133 | 399 ? 200% | |||||
| WiFi v1.3 | 141 | 375 166% | 356 152% | 354 151% | 208 48% | 191 35% | 368 ? 161% |
| Load | 74 | 101 36% | 86 16% | 92 24% | 44 -41% | 43 -42% | 84.2 ? 14% |
| Reader / Idle | 494 | 593 | 620 | 281 | 221 | 544 ? |
Pros
Cons
Verdict - m17 R4 with wasted potential
The first impression of the Alienware m17 R4 is great. The case has a stylish design that is enhanced by many RGB LEDs and accompanied by an excellent build quality. The keyboard is decent, and the manufacturer doesn't seem to have skimped on the touchpad either. The display also cuts a fine figure in the test: It outperforms similarly fast panels with a lower black level and a higher contrast.
Our main point of criticism is the high operating temperatures, since the CPU in particular reaches up to 105 °C (~221 °F) in the stress test. This might also be the reason for the screen flickering, which was unfortunately not only observed during stress tests but also when gaming. In addition, the surfaces get warmer than on most competitors, which reduces comfort while gaming.
The Alienware m17 R4 delivers tremendous graphics performance, but it's unable to dissipate the overall system heat adequately, which results in screen flickering and very warm surfaces.
In view of this, choosing an Intel CPU is also questionable, as it's less efficient and more difficult to cool than its current AMD Ryzen counterparts. However, the graphics performance achieved by the mobile GeForce RTX 3080 is remarkable. Hardly any competitor can keep up here, since Dell grants the GPU a particularly generous TDP. Very high frame rates are achieved in modern games, and they come into their own on the fast display.
Although the Alienware m17 R4 offers very good build quality and looks, the high premium compared to gaming laptops with a better price-performance ratio is currently not justified in our opinion. However, this could change quickly once the screen flickering is fixed and if the price is reduced or even if an AMD version is released.
Price and availability
You can find the Alienware m17 R4 on Amazon in several configurations such as the following:
Alienware m17 R4
-
04/17/2021 v7
Marius Schell

Pricecompare

