Alienware x17 R1 RTX 3080 laptop review: A new beginning

The 17.3-inch Alienware laptop series has had an avalanche of changes these past few years. Dell introduced a brand new Alienware m17 R1 chassis in 2019 only to replace it with a fully redesigned m17 R2 chassis just a year later in 2020. For 2021, the manufacturer has introduced yet another full chassis redesign to replace the m17 series altogether called the Alienware x17.
Our test unit is a higher-end configuration equipped with the Core i7-11800H CPU, GeForce RTX 3080 GPU, 120 Hz 4K UHD display, CherryMX mechanical keys, and 32 GB of RAM for approximately $3200 USD. Lesser and higher options are available with the RTX 3060 or Core i9-11980HK, respectively. Perhaps the most important feature of the new chassis is its redesigned cooling solution that includes more fans than before and a new gallium-silicone-based thermal paste over the CPU. A 15.6-inch version is also available called the Alienware x15 R1.
Competitors to the Alienware x17 R1 include other ultra-thin 17.3-inch gaming laptops like the MSI GS76, Razer Blade 17, Asus ROG Zephyrus S17, and the Tongfang-based Maingear Vector Pro.
More Dell reviews:
potential competitors in comparison
Rating | Date | Model | Weight | Height | Size | Resolution | Price |
|---|---|---|---|---|---|---|---|
| 89 % v7 (old) | 09 / 2021 | Alienware x17 RTX 3080 P48E i7-11800H, GeForce RTX 3080 Laptop GPU | 3.2 kg | 21.4 mm | 17.30" | 3840x2160 | |
| 85.3 % v7 (old) | 04 / 2021 | Alienware m17 R4 i9-10980HK, GeForce RTX 3080 Laptop GPU | 3 kg | 22 mm | 17.30" | 1920x1080 | |
| 89.4 % v7 (old) | 09 / 2021 | Razer Blade 17 RTX 3070 i7-11800H, GeForce RTX 3070 Laptop GPU | 2.8 kg | 19.9 mm | 17.30" | 1920x1080 | |
| 90.1 % v7 (old) | 07 / 2021 | Asus ROG Zephyrus S17 GX703HSD i9-11900H, GeForce RTX 3080 Laptop GPU | 2.8 kg | 19.9 mm | 17.30" | 2560x1440 | |
| 86.2 % v7 (old) | 09 / 2021 | MSI GS76 Stealth 11UH i9-11900H, GeForce RTX 3080 Laptop GPU | 2.4 kg | 20 mm | 17.30" | 3840x2160 | |
| 88 % v7 (old) | 05 / 2021 | Gigabyte Aero 17 HDR YD i9-11980HK, GeForce RTX 3080 Laptop GPU | 2.8 kg | 22 mm | 17.30" | 3840x2160 |
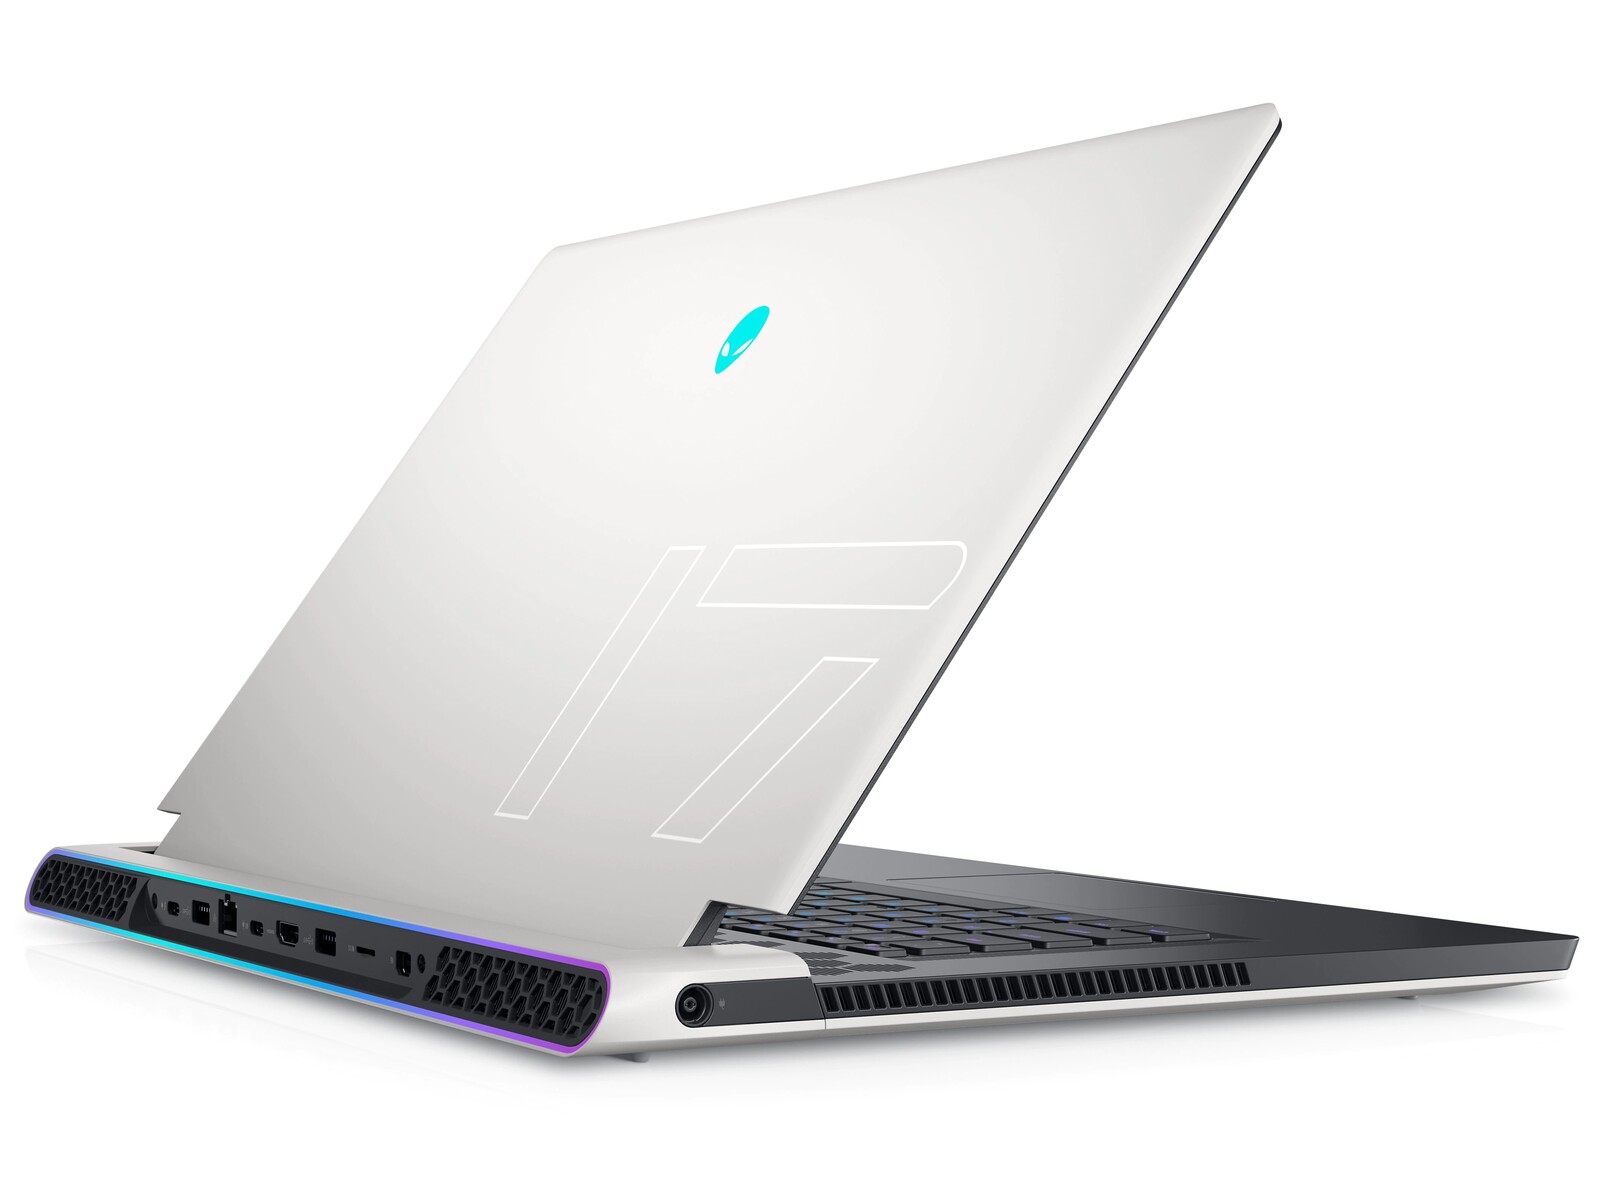
Case — Legend Reborn
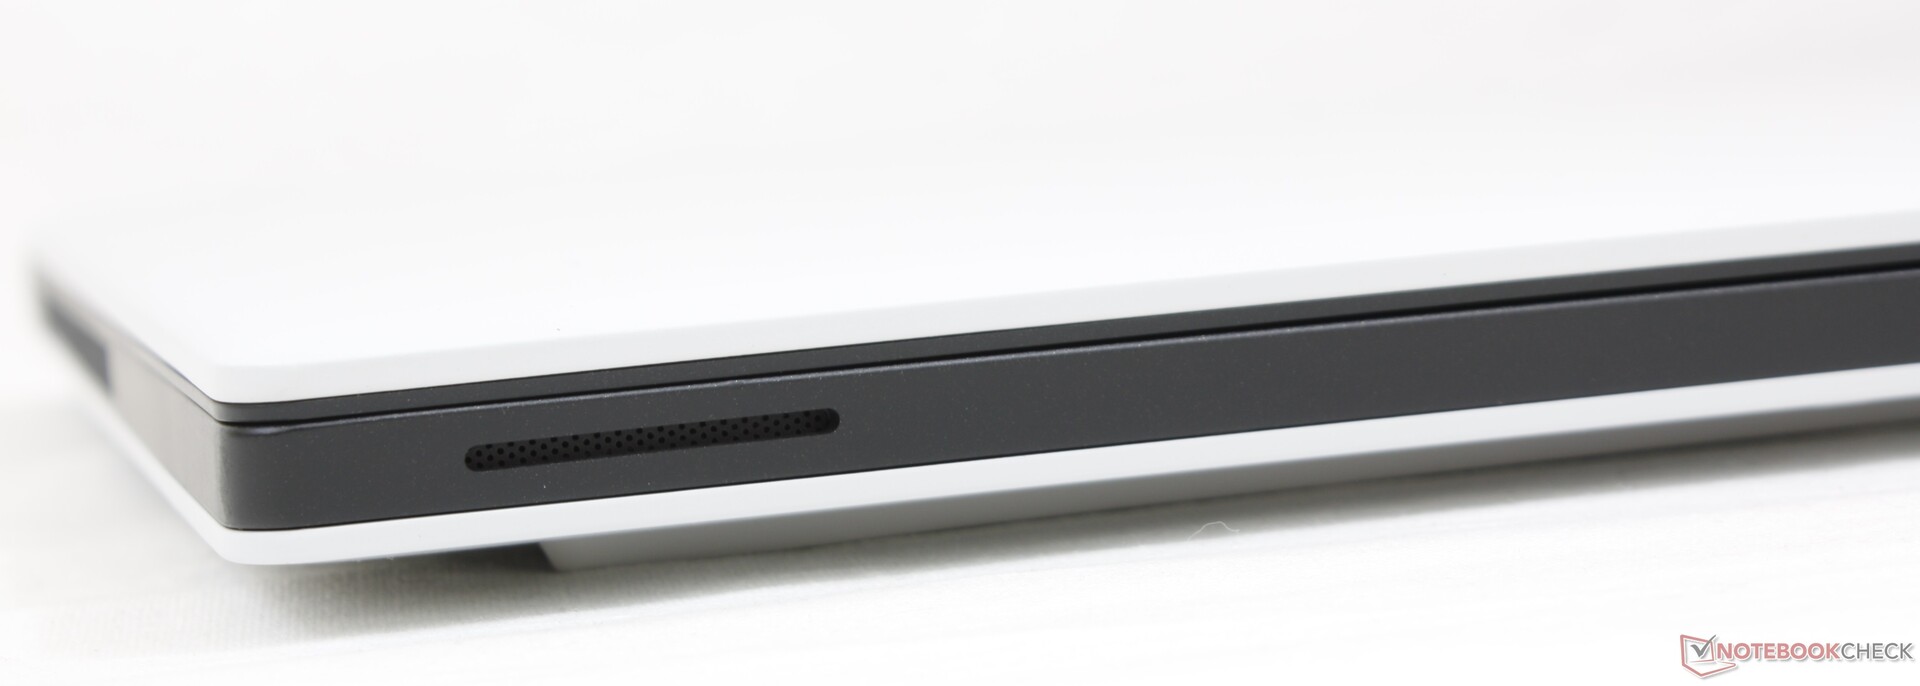
The revamped "Legend" chassis design utilizes similar soft-touch plastics as on the m17 R2 but in different and generally flatter proportions to accentuate a thinner look. The white outer lid and honeycomb grilles all remain, for example, while the keyboard deck is now black and sharper around the edges. Rigidity is still excellent especially around the base with very little warping and no creaking to speak of.
The lid flexes more than the lid on the Blade 17 but not as much as on the MSI GS75. It also has some of the thickest bezels along the bottom edge for any 17.3-inch gaming laptop we've seen which are partly responsible for the extra-large footprint.

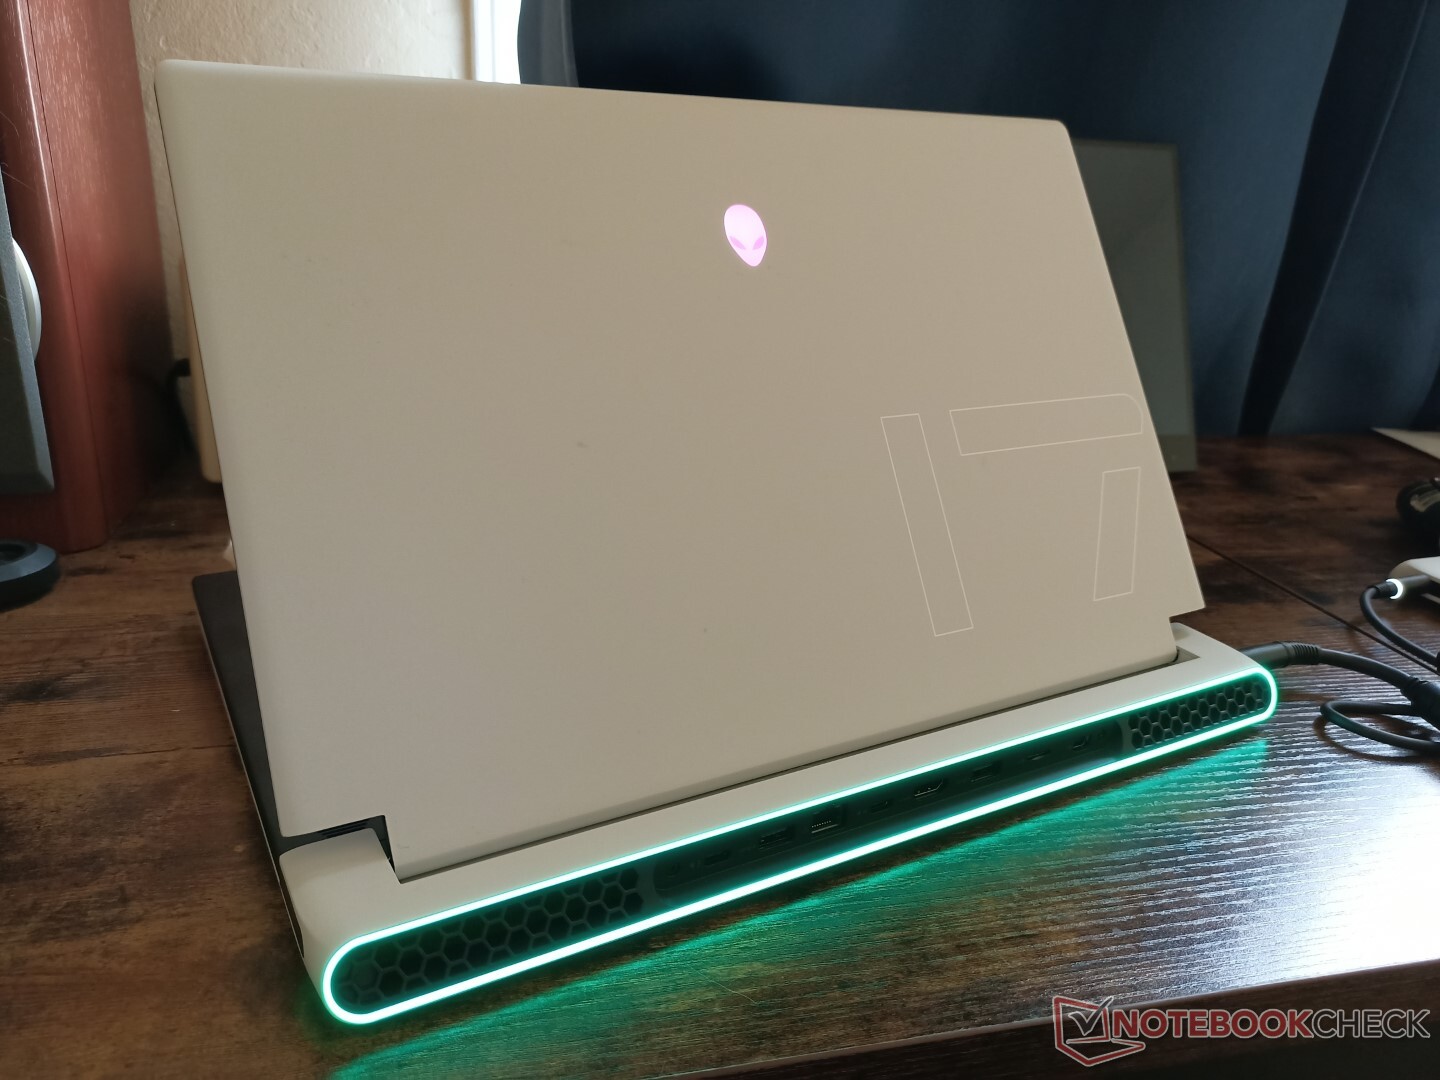
Alienware laptops aren't afraid to be big and the x17 R1 is still a big system regardless of how "thin" Dell likes to market the model. The truth is that the system is noticeably bigger and heavier than most competing models like the MSI GS76, Blade 17, or Zephyrus S17. Even the older Alienware m17 R4 is lighter than the x17 R1 by about 200 grams despite their nearly identical volumes. The added weight contributes to a stronger and stiffer base, however.

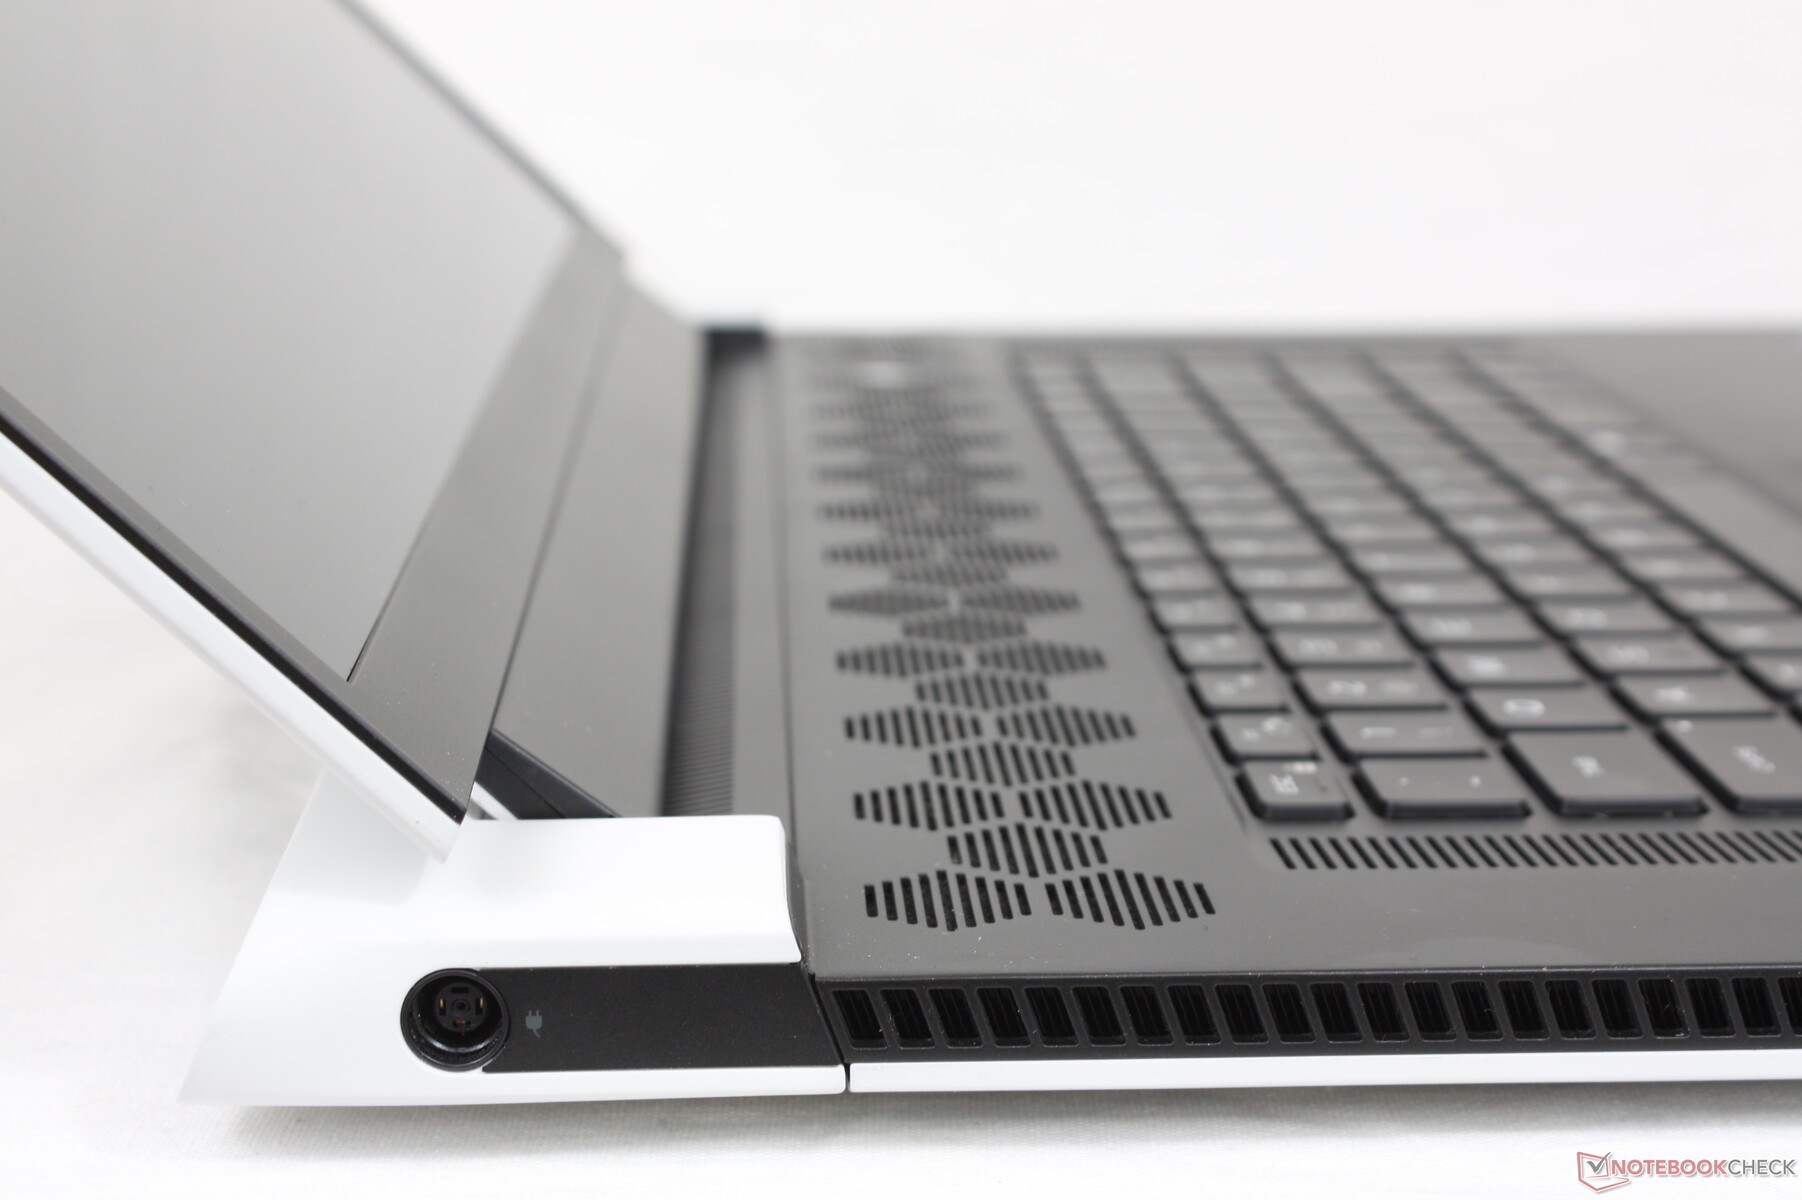


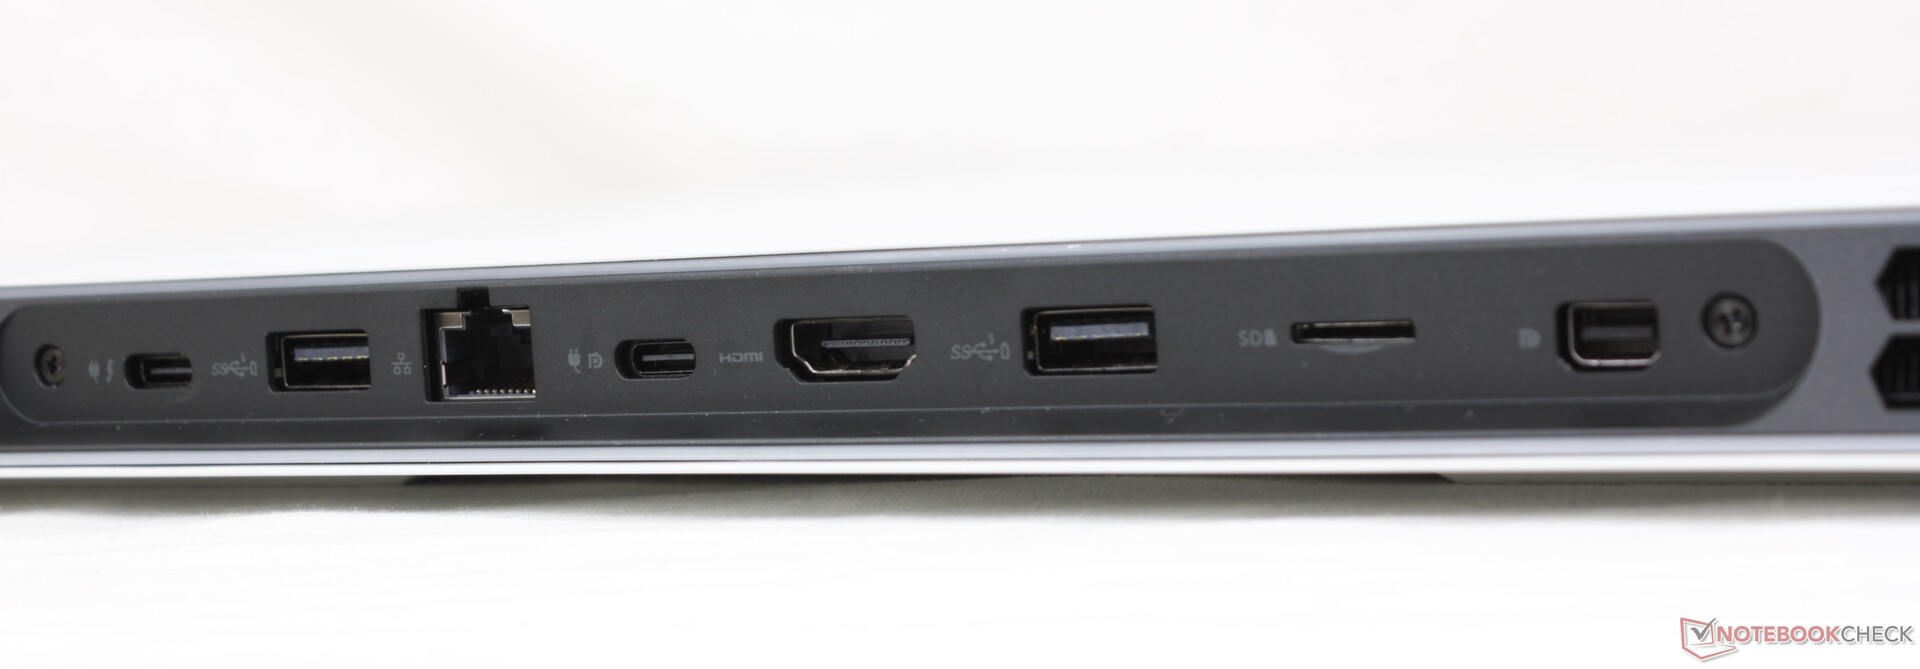
Connectivity — All Along the Back
Port options are mostly the same as on last year's Alienware m17 R4 but with a few important changes. The rarely used proprietary Graphics Amplifier port, for example, has been dropped in favor of a more handy second USB-C port. There is also one less USB-A port to work with this time around. Otherwise, all other ports have returned albeit rearranged along the rear of the chassis to be generally harder to reach and see than on most other laptops.
Note that both USB-C ports support DisplayPort and Power Delivery but only one is actually compatible with Thunderbolt 4.

SD Card Reader
Transfer rates from the integrated MicroSD reader are very fast at nearly 250 MB/s with our UHS-II test card. The slot is a bit difficult to access since it's along the rear, but it definitely beats not having one at all.

| SD Card Reader | |
| average JPG Copy Test (av. of 3 runs) | |
| Razer Blade 17 RTX 3070 (AV Pro V60) | |
| MSI GS76 Stealth 11UH (AV PRO microSD 128 GB V60) | |
| Alienware m17 R4 (AV PRO microSD 128 GB V60) | |
| Gigabyte Aero 17 HDR YD (AV PRO microSD 128 GB V60) | |
| Asus ROG Zephyrus S17 GX703HSD | |
| Alienware x17 RTX 3080 P48E (AV Pro V60) | |
| maximum AS SSD Seq Read Test (1GB) | |
| Asus ROG Zephyrus S17 GX703HSD | |
| Alienware x17 RTX 3080 P48E (AV Pro V60) | |
| Alienware m17 R4 (AV PRO microSD 128 GB V60) | |
| MSI GS76 Stealth 11UH (AV PRO microSD 128 GB V60) | |
| Razer Blade 17 RTX 3070 (AV Pro V60) | |
| Gigabyte Aero 17 HDR YD (AV PRO microSD 128 GB V60) | |
Communication
The Wi-Fi 6E-enabled Killer AX1675x module comes soldered much like how it was on the last generation m17 design. Interestingly, the WLAN module is removable on the Alienware x15 even though it's a smaller 15.6-inch form factor.

Webcam — IR, but no Shutter
Camera quality has not really improved gen-to-gen as the system only comes with a 720p sensor. A few other laptops like the Razer Blade 17 have since upgraded to 1080p. A webcam shutter is missing as well.

")
")
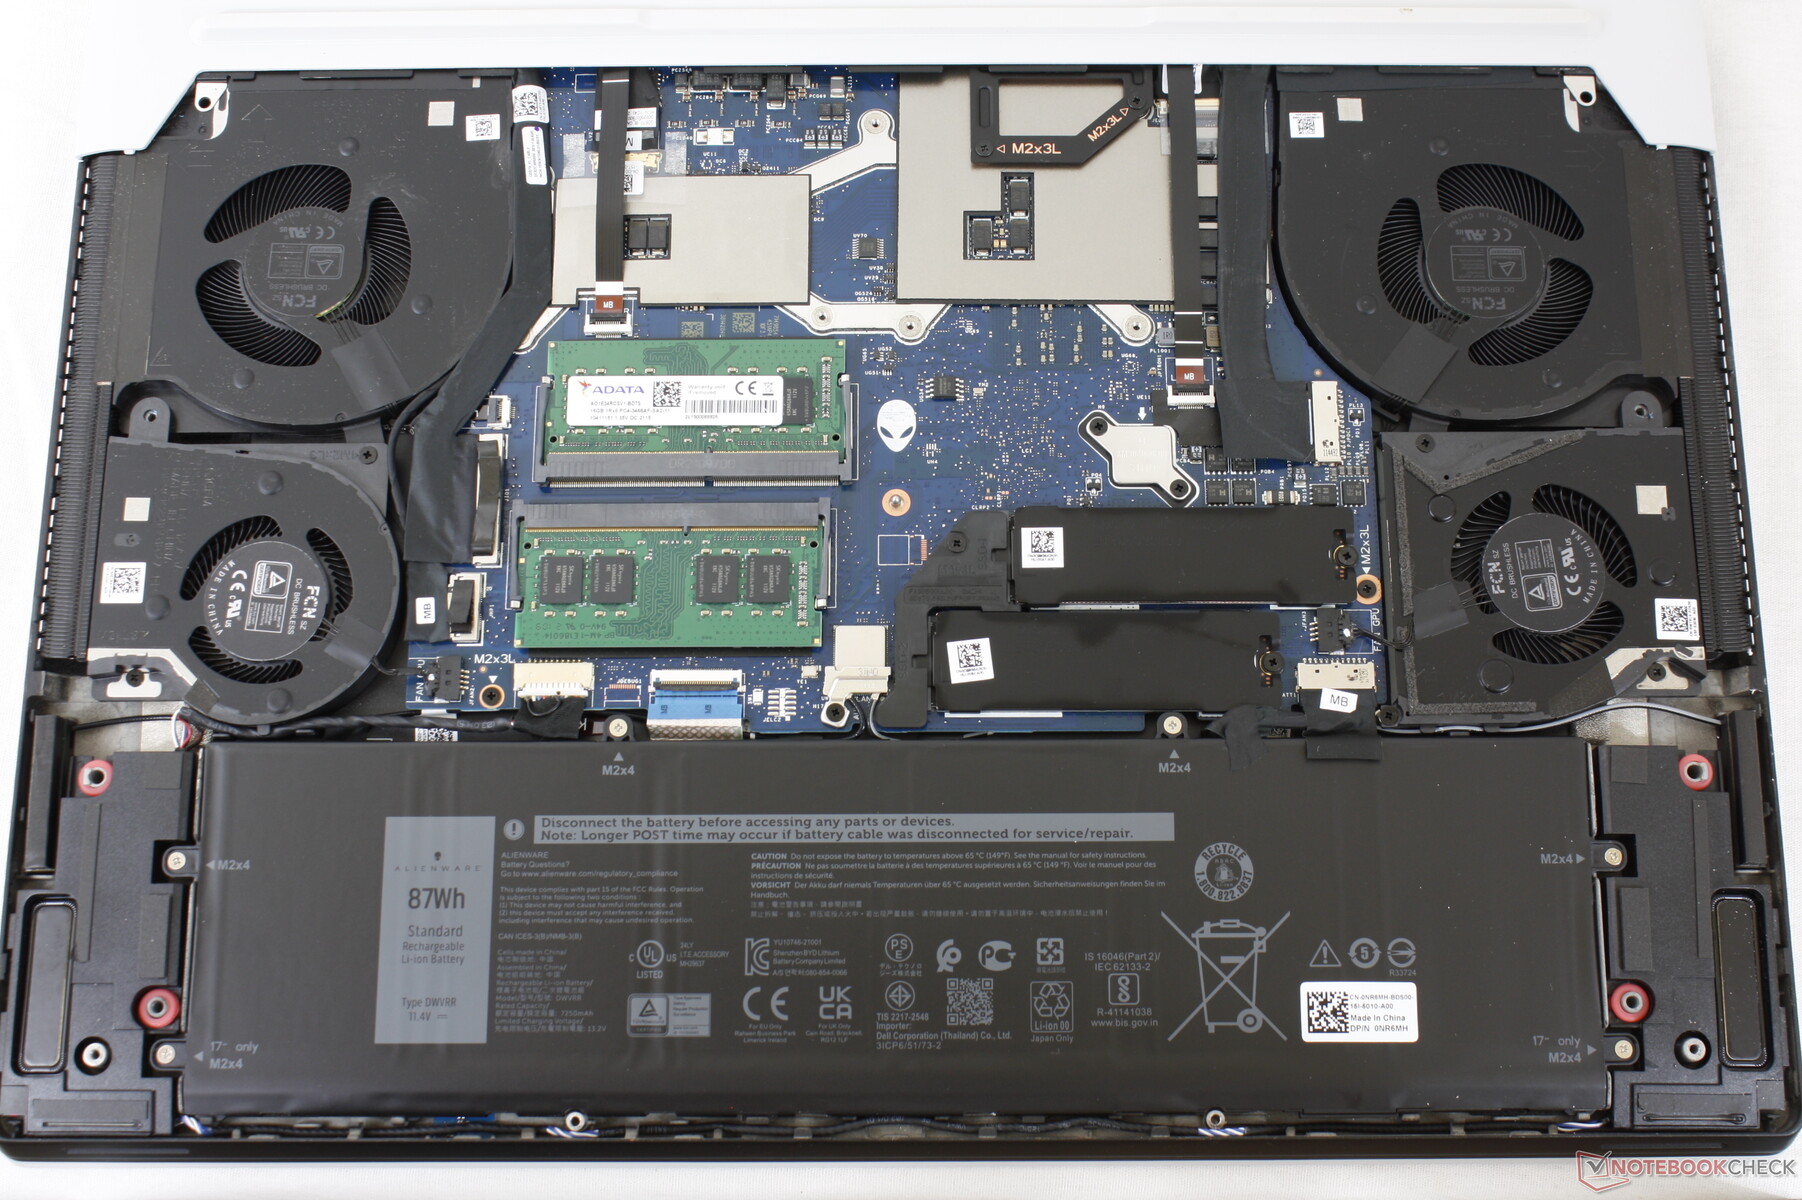
Maintenance
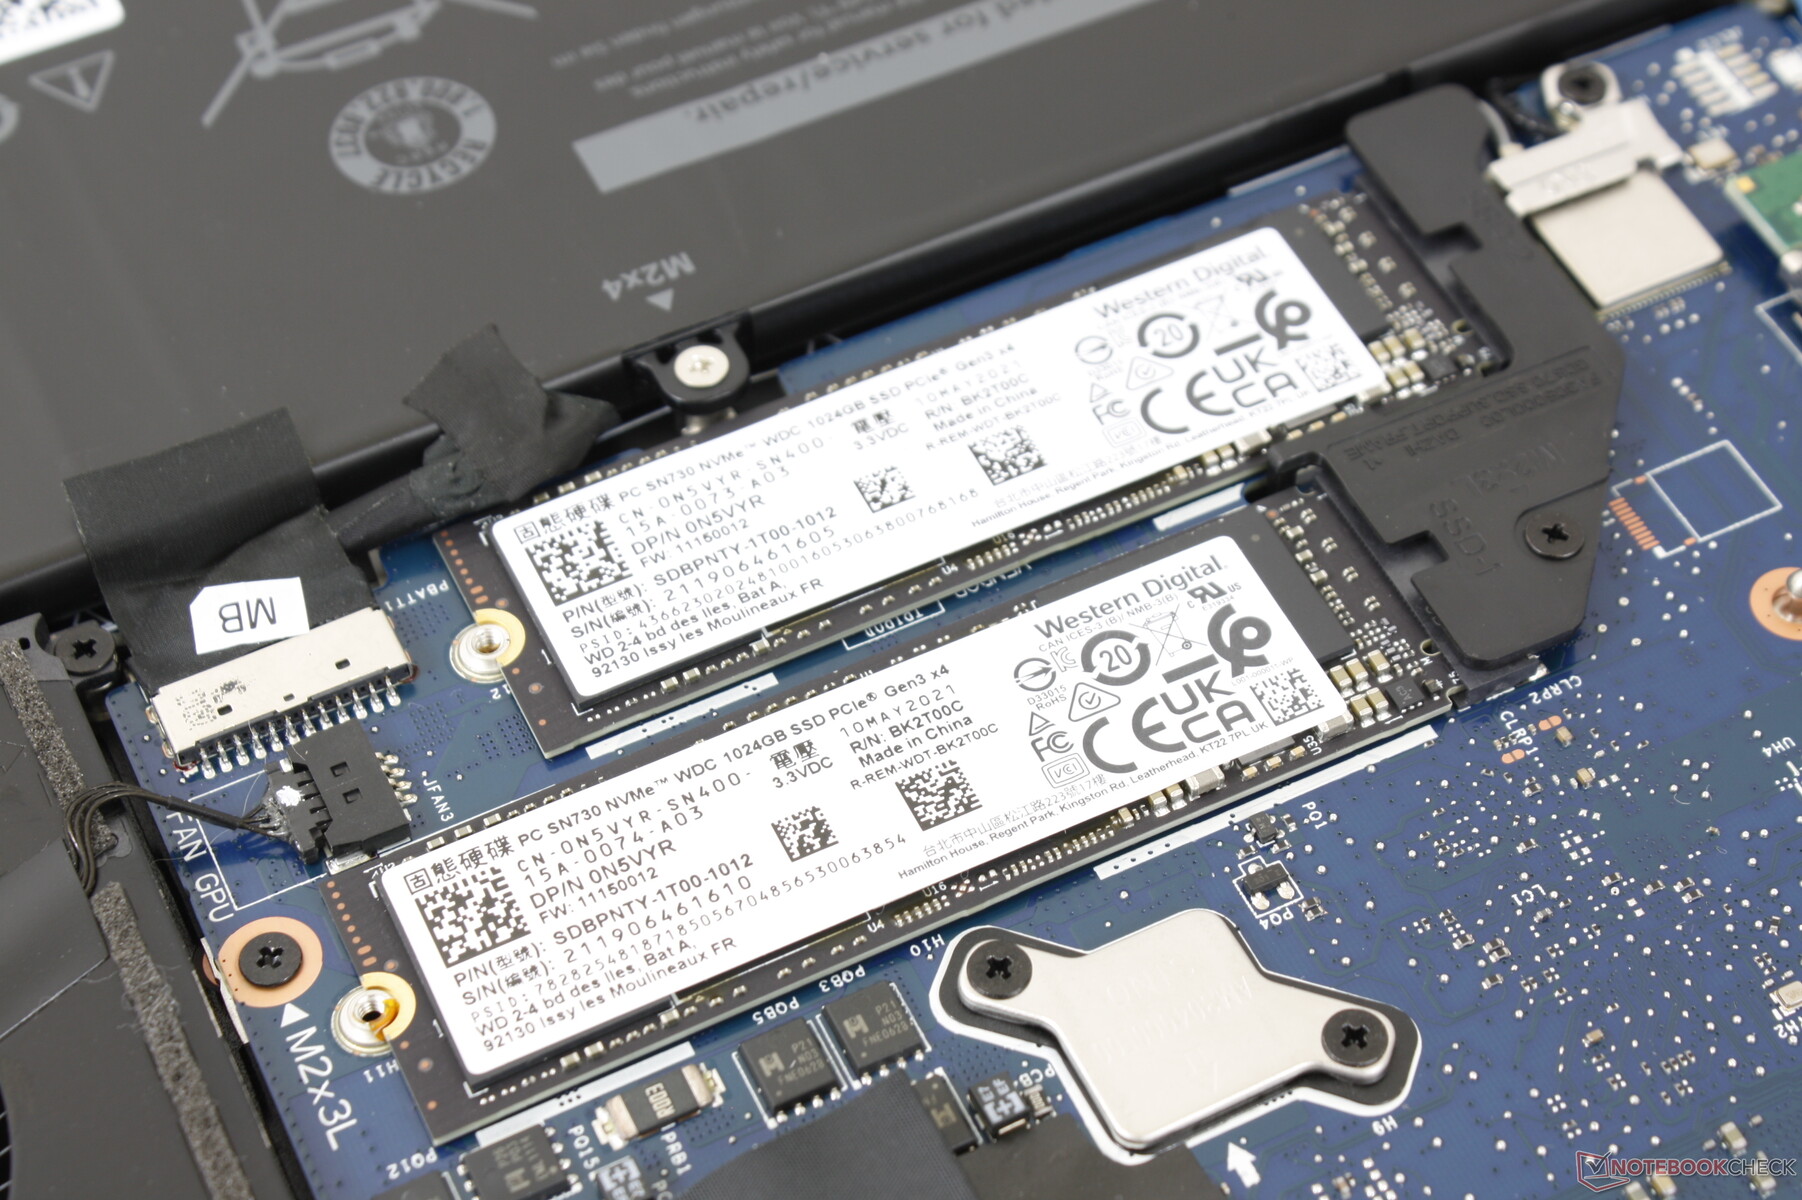
The bottom panel pops off easily with just a Philips screwdriver and sharp edge. RAM is now expandable via 2x SODIMM slots whereas they are soldered on the older m17 R2 design.
Accessories and Warranty
There are no extras in the box outside of the AC adapter and paperwork. The standard one-year limited warranty applies with extension options if purchased directly from Dell.
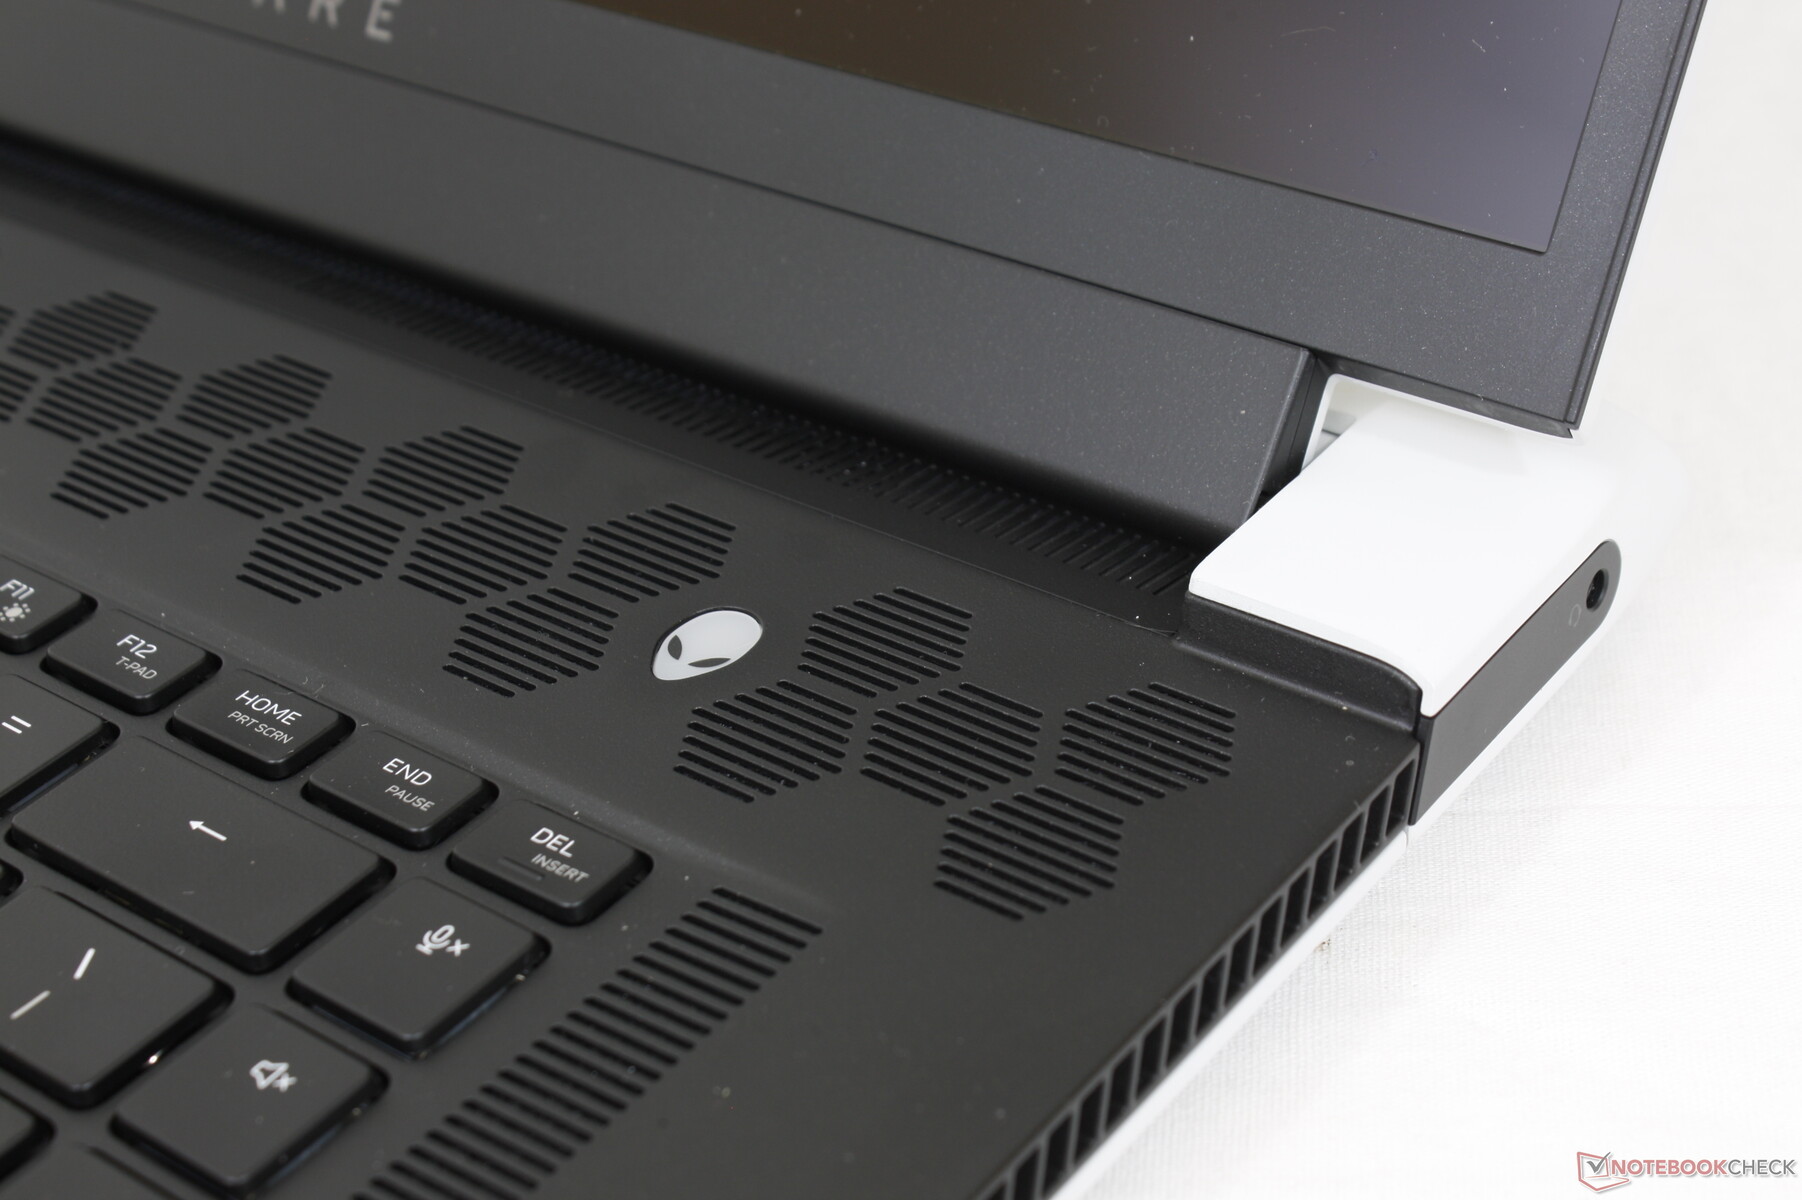
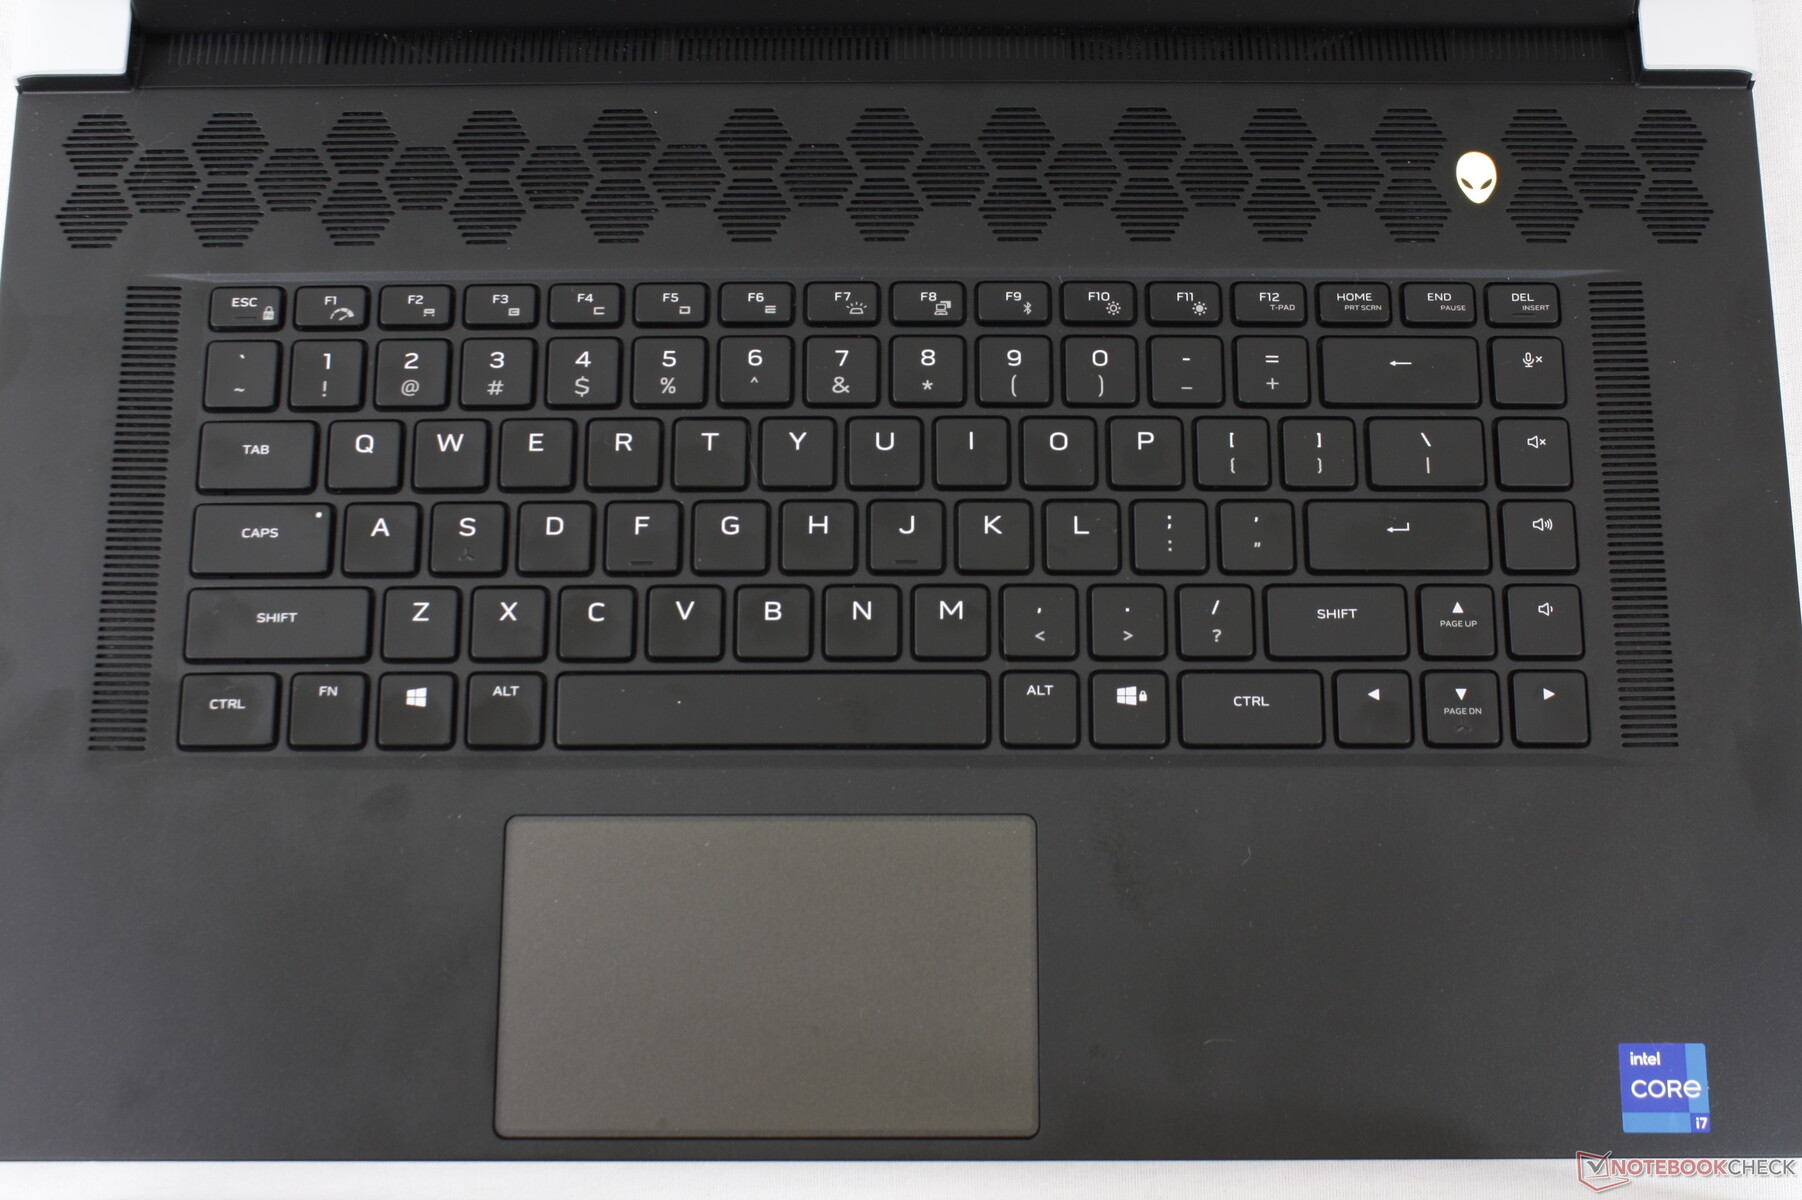
Input Devices — CherryMX to the Rescue
Keyboard
Introduced on last year's Alienware m17 R4, the ultra-low profile CherryMX mechanical keys have returned on the x17 R1 as an optional feature. We were initially hesitant about the keys since mechanical or optical switches have been mostly misses on laptops like the MSI GT80 Titan, 2019 Razer Blade 15, or Lenovo Legion Y920. These new CherryMX keys, however, are quickly becoming our favorite on any gaming laptop. Feedback is uniform, crisper, and with both deeper travel and a more satisfying click when compared to laptops like the Razer Blade 17 or MSI GS76. The per-key RGB keys work well for both word processing and gaming albeit at the cost of loud high-pitched clatter that roommates or classmates may not appreciate. In these scenarios, we recommend opting for the SKUs with traditional membrane-based switches instead.
Perhaps our biggest gripe with the keyboard is that the secondary symbols on most keys are not backlit. Thus, the keys for brightness control, Print Screen, Pause, Insert, and more are almost impossible to see if working or gaming under dim ambient lighting. All keys and symbols are lit on the Blade 17 in comparison. Note that the first row of function keys are not mechanical, either.

Touchpad
The Precision clickpad is relatively small at 11.3 x 6.8 cm compared to 14 x 6.5 cm on the MSI GS75. Its surface is otherwise smooth when gliding at medium speeds with only a bit of sticking at slower speeds for more accurate clicks. Travel is very shallow and feedback is on the softer side when pressing down. Though a larger surface area would have made for easier multi-touch inputs, at least the clickpad isn't as spongy as the one on the Razer Blade series.
Dell offers an RGB backlight for the clickpad on certain SKUs which is a returning superficial option from older Alienware laptops. This feature is not available on the smaller 15.6-inch Alienware x15 R1.


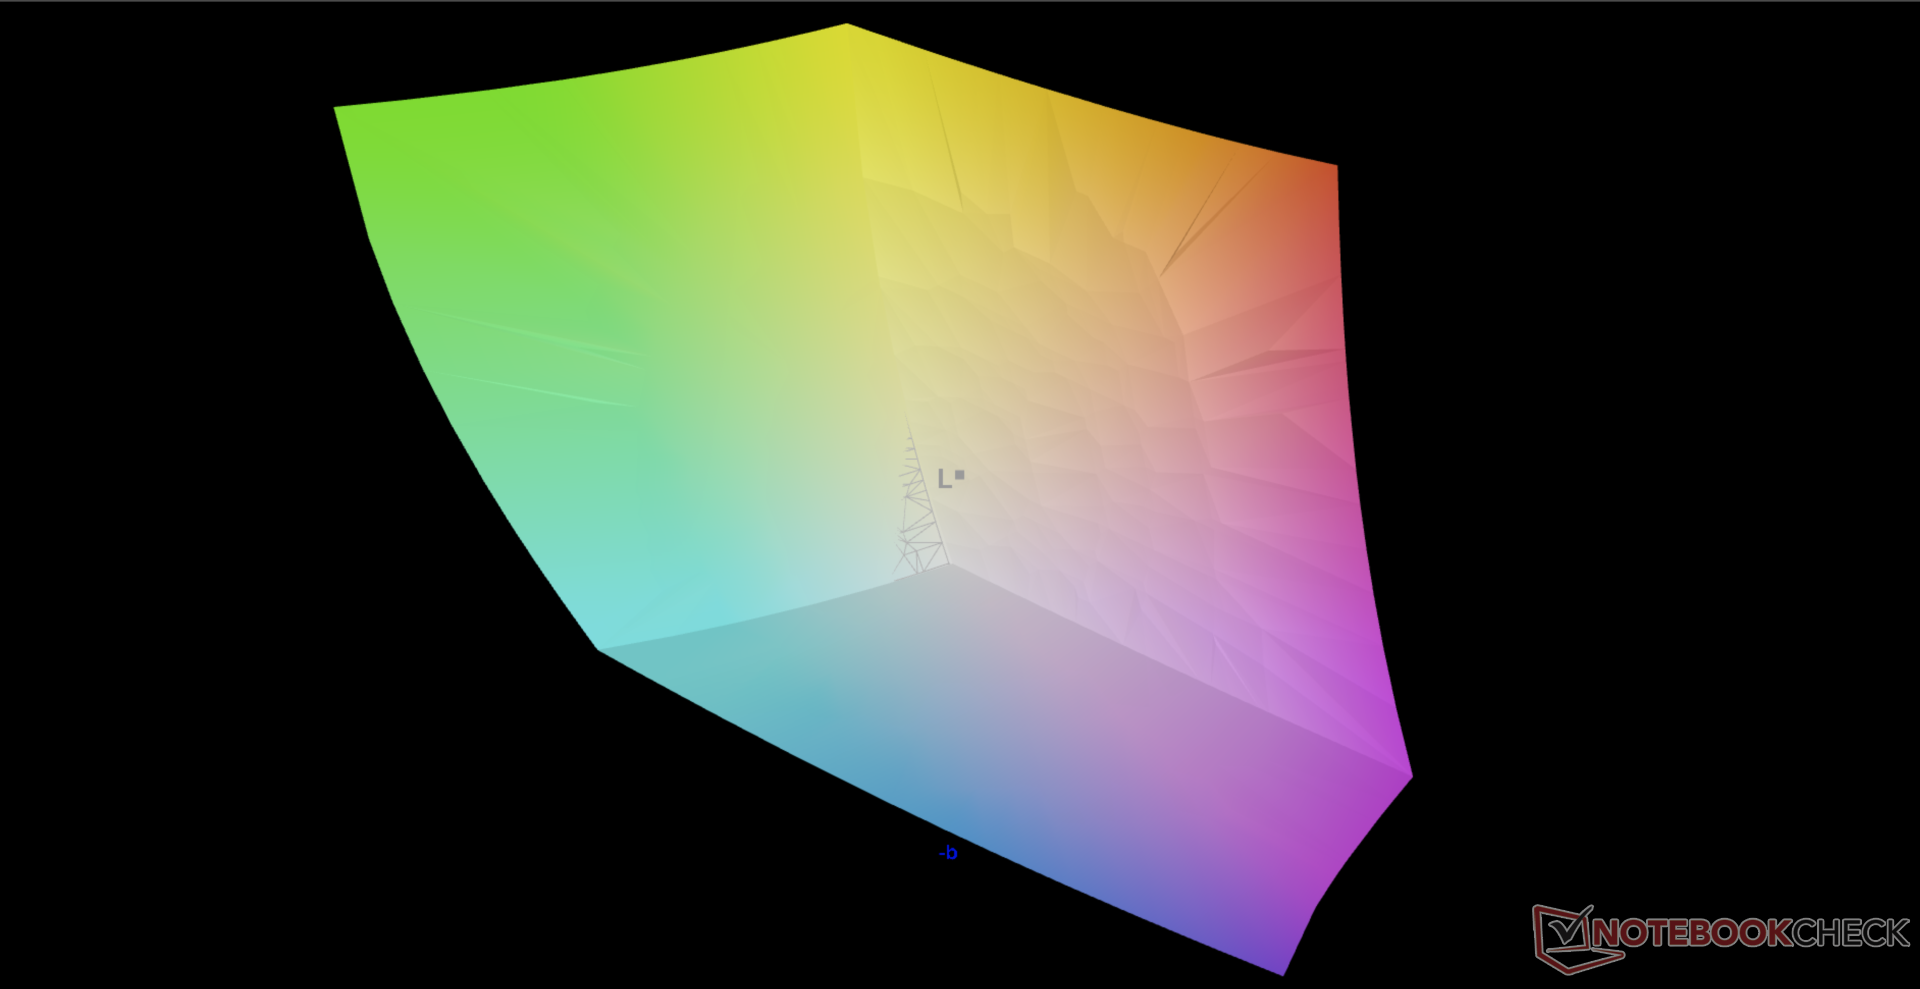
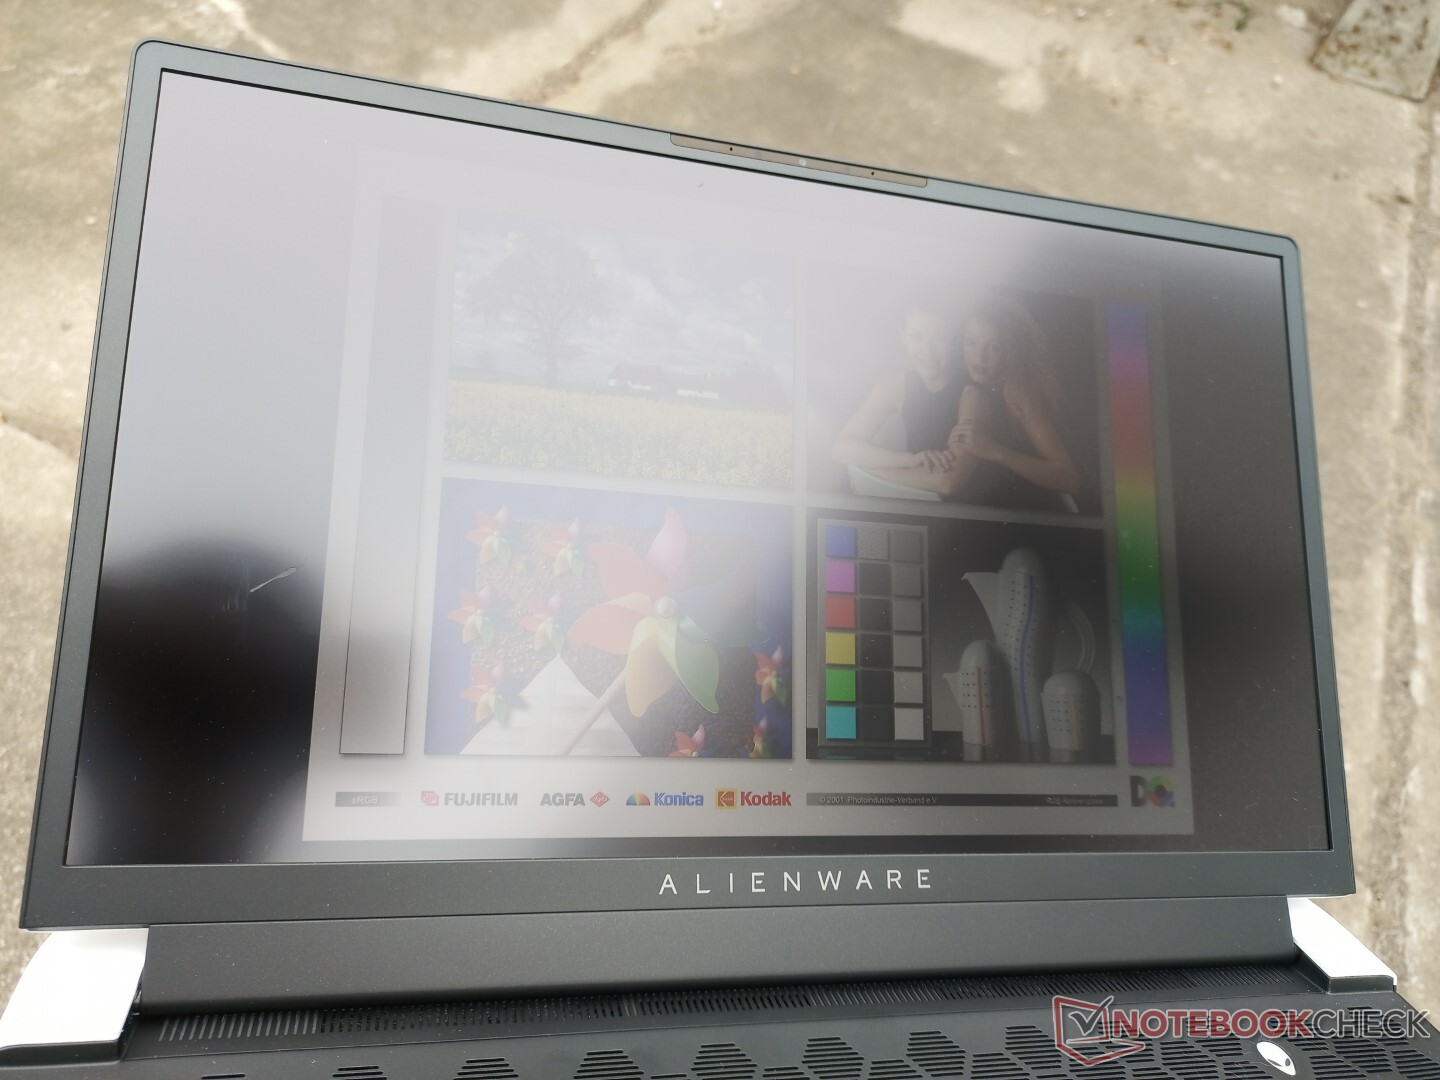
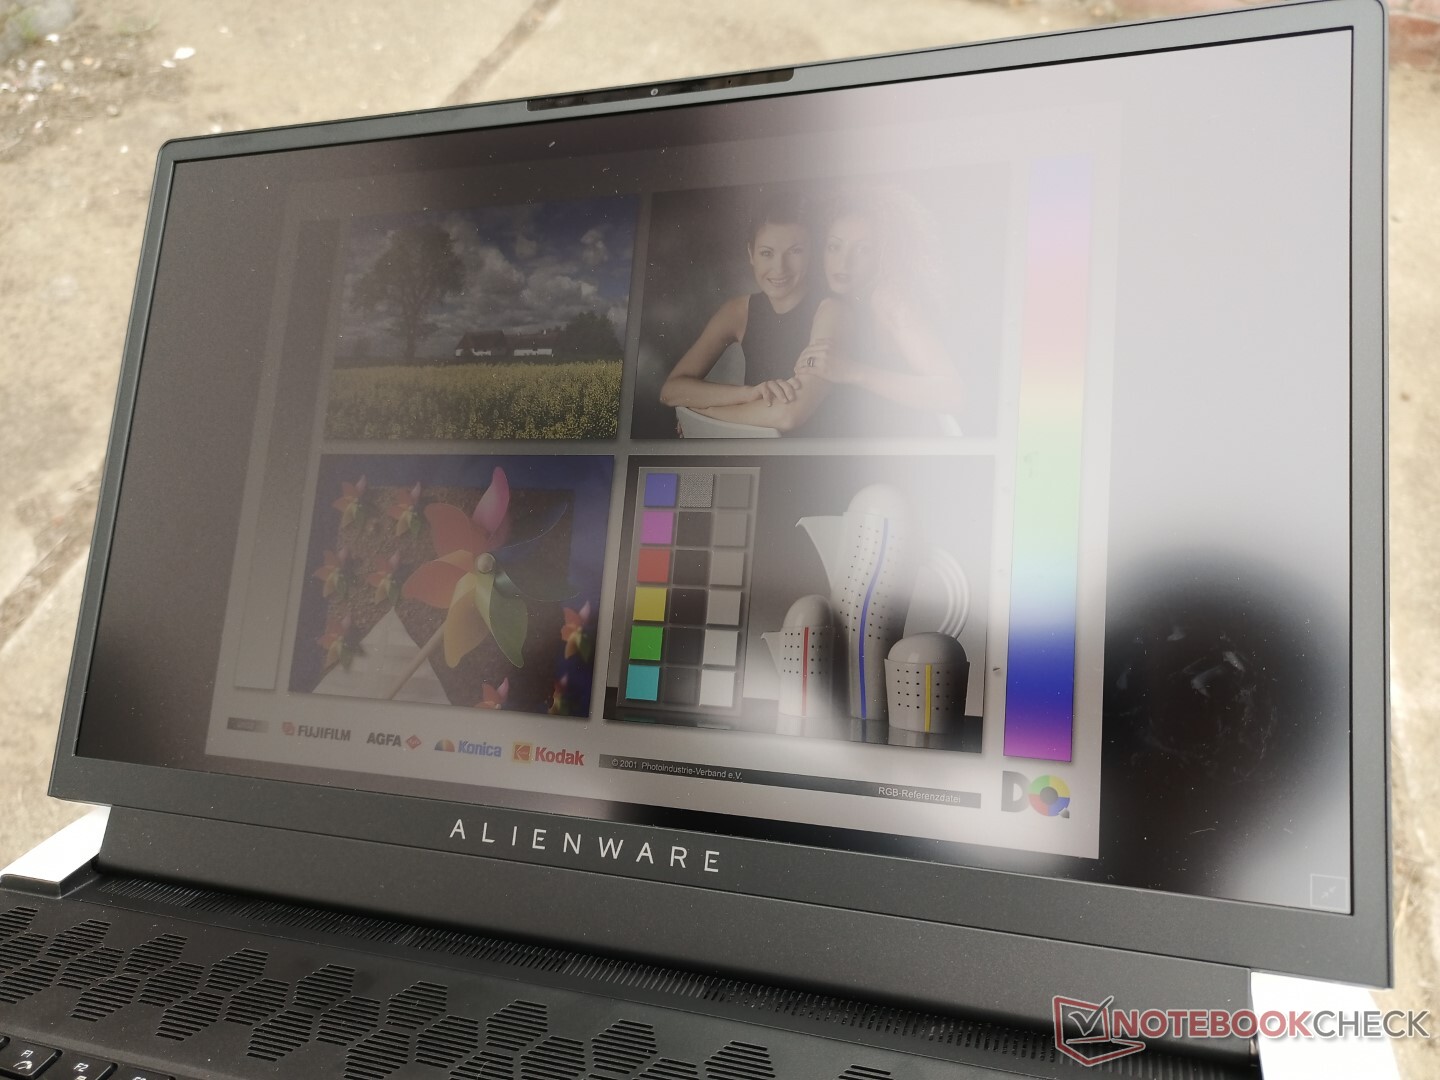
Display — 4K, 120 Hz, 100% AdobeRGB, 5 ms
While the AU Optronics B173ZAN panel can be found on other laptops like the Schenker XMG Ultra 17, the one on our Alienware has a native refresh rate of 120 Hz instead of 60 Hz. Furthermore, black-white and gray-gray response times are very fast in the one-digit ranges and maximum brightness is also noticeably brighter than on most other gaming laptops. The MSI GS76 carries a similar 4K panel with even faster response times than our Alienware albeit at the cost of a narrower gamut. This makes the Alienware display one of the very few we've seen that seemingly checks all the boxes in regards to refresh rate, resolution, response times, color coverage, and brightness.
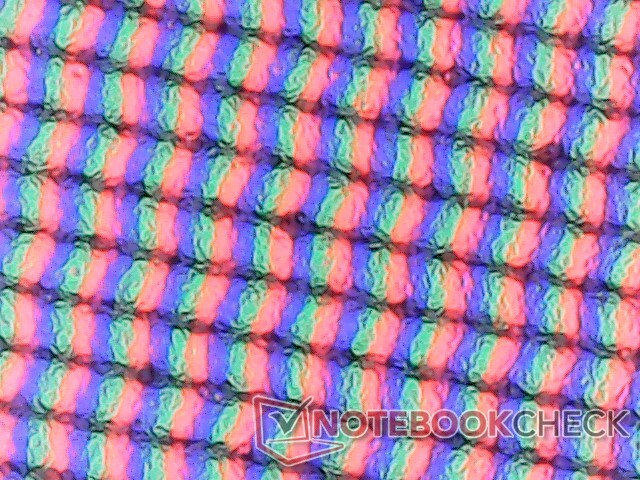
The matte overlay is slightly grainier than a glossy alternative and backlight bleeding could have been better on our specific unit. Our measurements below reflect only the 4K 120 Hz panel and not any of the other display options available for the Alienware x17 which are expected to have different attributes.
Note that Advanced Optimus is only available on FHD 360 Hz SKUs. Other SKUs like ours have Optimus 1.0 with a manual discrete GPU option in the BIOS.


| |||||||||||||||||||||||||
Brightness Distribution: 91 %
Center on Battery: 438.7 cd/m²
Contrast: 914:1 (Black: 0.48 cd/m²)
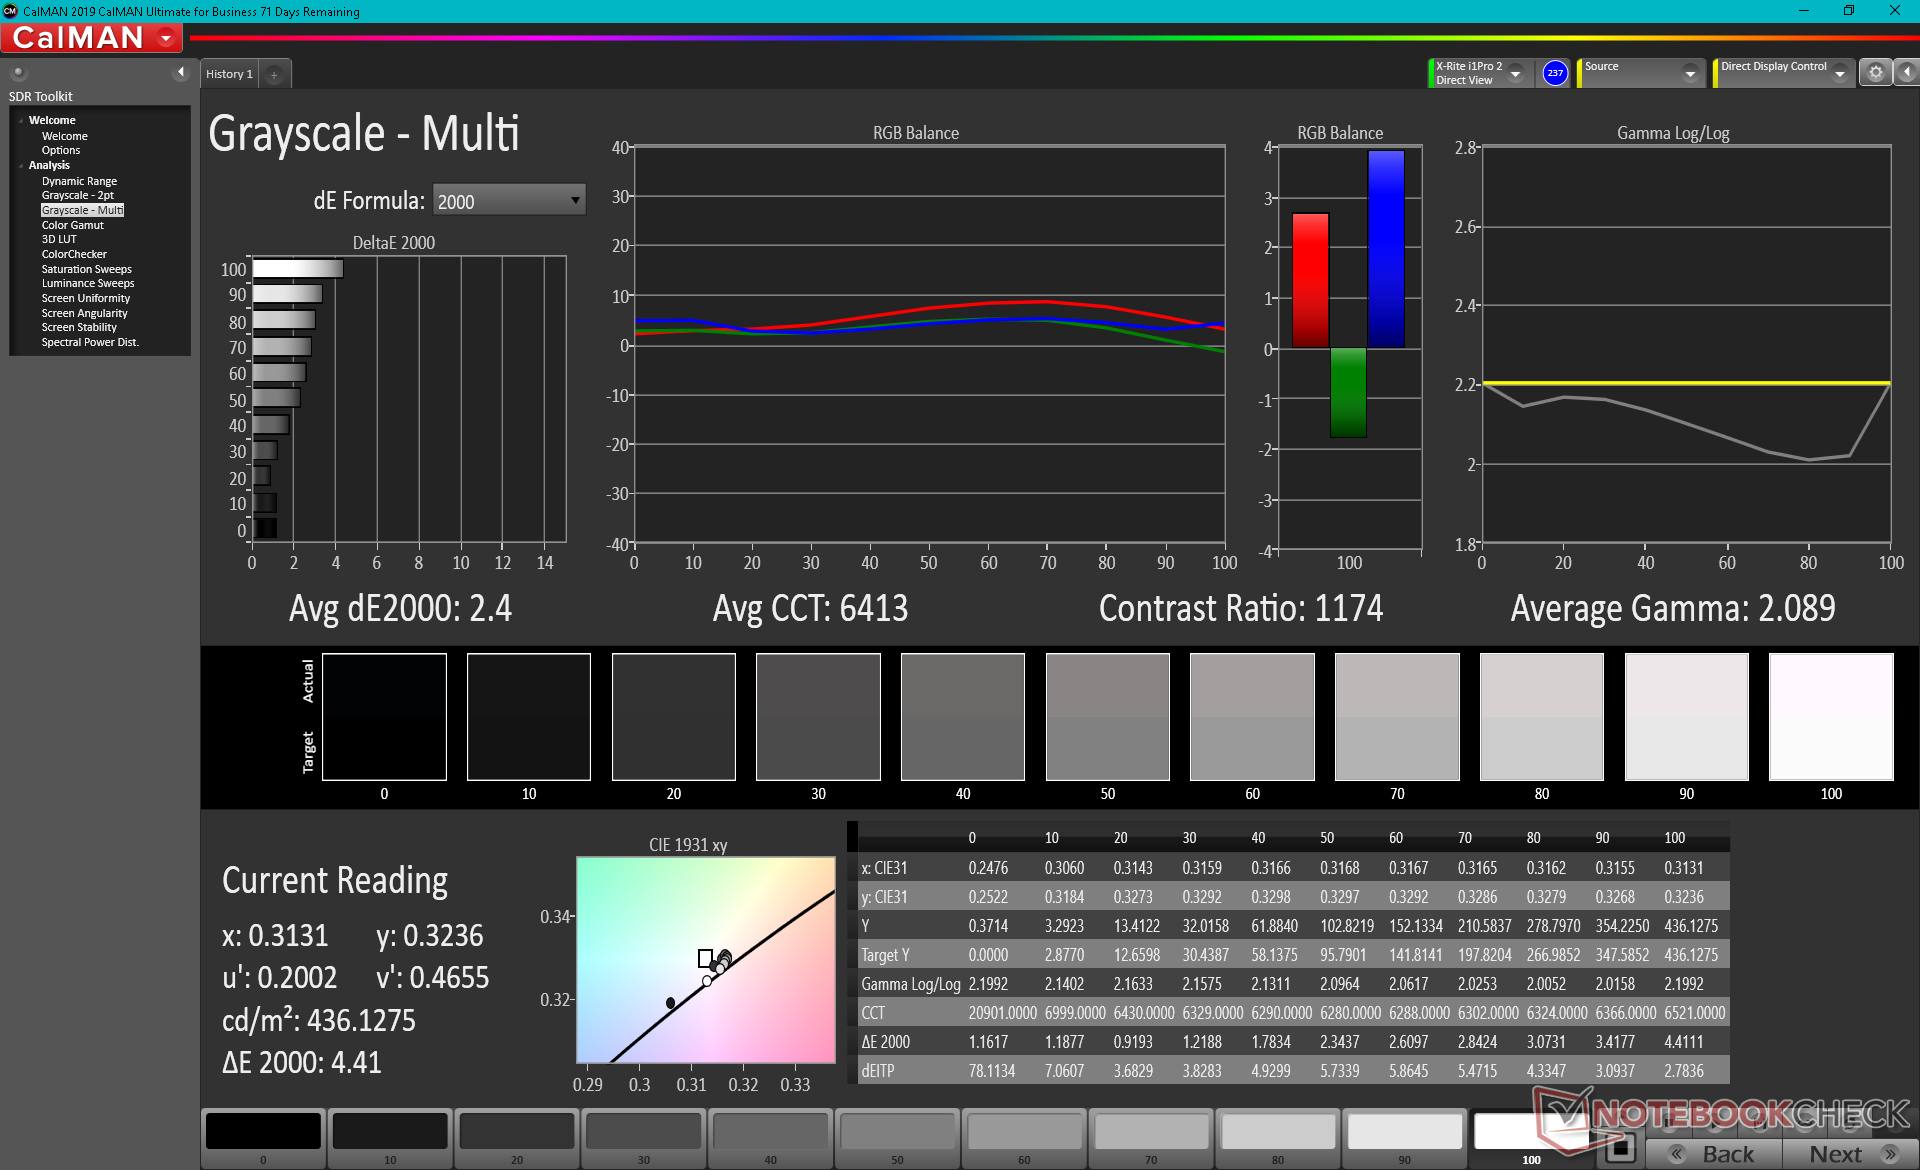
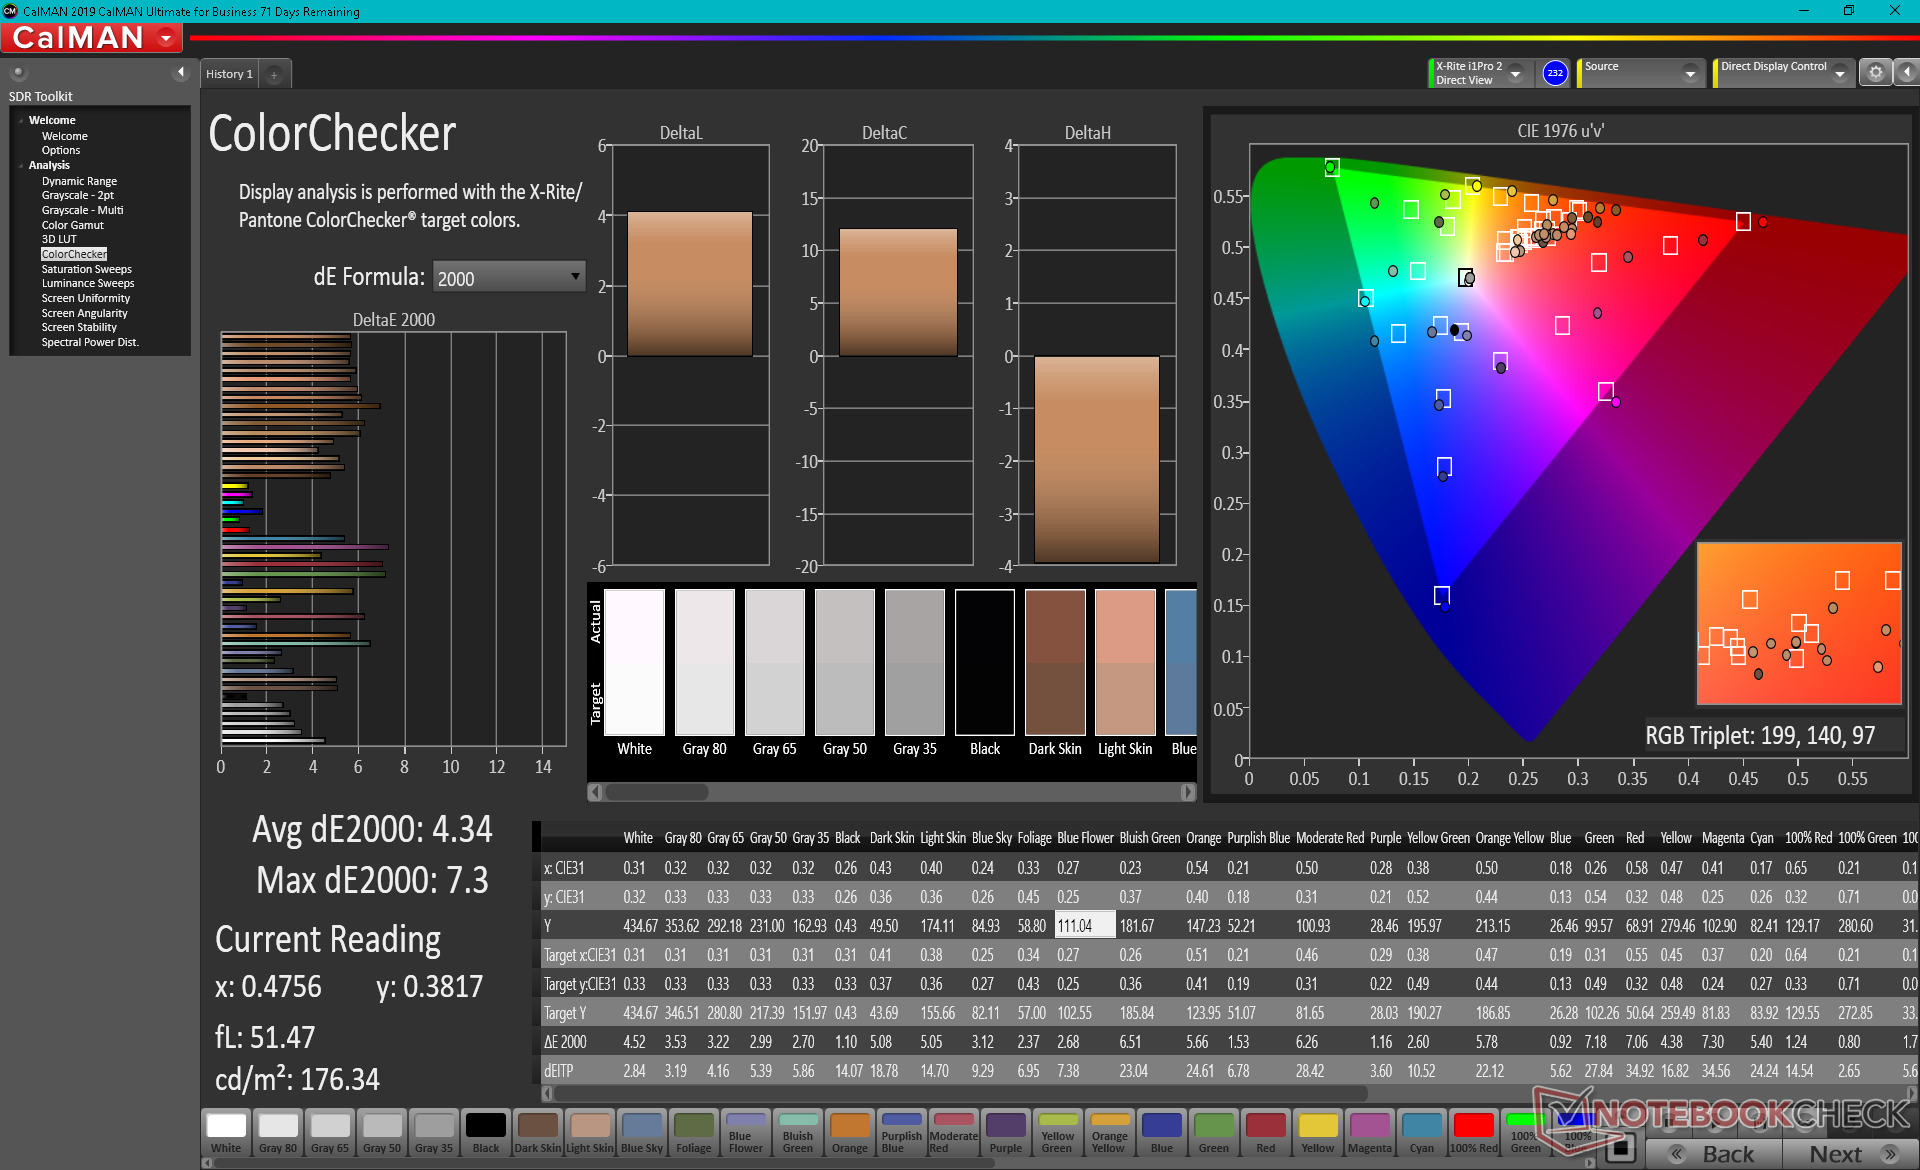
ΔE ColorChecker Calman: 4.34 | ∀{0.5-29.43 Ø4.71}
calibrated: 0.72
ΔE Greyscale Calman: 2.4 | ∀{0.09-98 Ø4.96}
100% AdobeRGB 1998 (Argyll 3D)
100% sRGB (Argyll 3D)
88.3% Display P3 (Argyll 3D)
Gamma: 2.09
CCT: 6413 K
| Alienware x17 RTX 3080 P48E AU Optronics B173ZAN, IPS, 17.3", 3840x2160 | Alienware m17 R4 AU Optronics AUOEC91, IPS, 17.3", 1920x1080 | Razer Blade 17 RTX 3070 AU Optronics B173HAN05.4, IPS, 17.3", 1920x1080 | Asus ROG Zephyrus S17 GX703HSD BOE099D (BOE CQ NE173QHM-NY3), IPS, 17.3", 2560x1440 | MSI GS76 Stealth 11UH AUO B173ZAN06.1 (AUODE95), IPS, 17.3", 3840x2160 | Gigabyte Aero 17 HDR YD AU Optronics AUO329B, IPS, 17.3", 3840x2160 | |
|---|---|---|---|---|---|---|
| Display | -16% | -15% | -3% | -23% | -1% | |
| Display P3 Coverage (%) | 88.3 | 69.8 -21% | 71.7 -19% | 94.2 7% | 63 -29% | 86.9 -2% |
| sRGB Coverage (%) | 100 | 99.7 0% | 98.8 -1% | 98.7 -1% | 94.8 -5% | 100 0% |
| AdobeRGB 1998 Coverage (%) | 100 | 71.6 -28% | 73.6 -26% | 84.4 -16% | 65 -35% | 99.6 0% |
| Response Times | 10% | 43% | 45% | 39% | -206% | |
| Response Time Grey 50% / Grey 80% * (ms) | 14.4 ? | 13.2 ? 8% | 4.2 ? 71% | 4.8 67% | 8.8 ? 39% | 52 ? -261% |
| Response Time Black / White * (ms) | 10.4 ? | 9.2 ? 12% | 8.8 ? 15% | 8 23% | 6.4 ? 38% | 26 ? -150% |
| PWM Frequency (Hz) | ||||||
| Screen | 21% | -44% | -19% | 9% | 30% | |
| Brightness middle (cd/m²) | 438.7 | 305 -30% | 323.3 -26% | 322 -27% | 474 8% | 488 11% |
| Brightness (cd/m²) | 435 | 301 -31% | 315 -28% | 288 -34% | 454 4% | 467 7% |
| Brightness Distribution (%) | 91 | 93 2% | 91 0% | 72 -21% | 88 -3% | 86 -5% |
| Black Level * (cd/m²) | 0.48 | 0.19 60% | 0.33 31% | 0.3 37% | 0.46 4% | 0.33 31% |
| Contrast (:1) | 914 | 1605 76% | 980 7% | 1073 17% | 1030 13% | 1479 62% |
| Colorchecker dE 2000 * | 4.34 | 1.31 70% | 4.59 -6% | 3.05 30% | 1.5 65% | 1.23 72% |
| Colorchecker dE 2000 max. * | 7.3 | 2.32 68% | 10.82 -48% | 5.23 28% | 5.59 23% | 2.94 60% |
| Colorchecker dE 2000 calibrated * | 0.72 | 0.91 -26% | 1.4 -94% | 1.92 -167% | 0.86 -19% | 0.77 -7% |
| Greyscale dE 2000 * | 2.4 | 2.3 4% | 7.9 -229% | 3.11 -30% | 2.8 -17% | 1.5 37% |
| Gamma | 2.09 105% | 2.281 96% | 2.28 96% | 2.13 103% | 2.158 102% | 2.169 101% |
| CCT | 6413 101% | 6449 101% | 5941 109% | 6553 99% | 6597 99% | 6614 98% |
| Color Space (Percent of AdobeRGB 1998) (%) | 72 | 84 | 99 | |||
| Color Space (Percent of sRGB) (%) | 94 | 99 | 99 | |||
| Total Average (Program / Settings) | 5% /
12% | -5% /
-25% | 8% /
-6% | 8% /
6% | -59% /
-10% |
* ... smaller is better
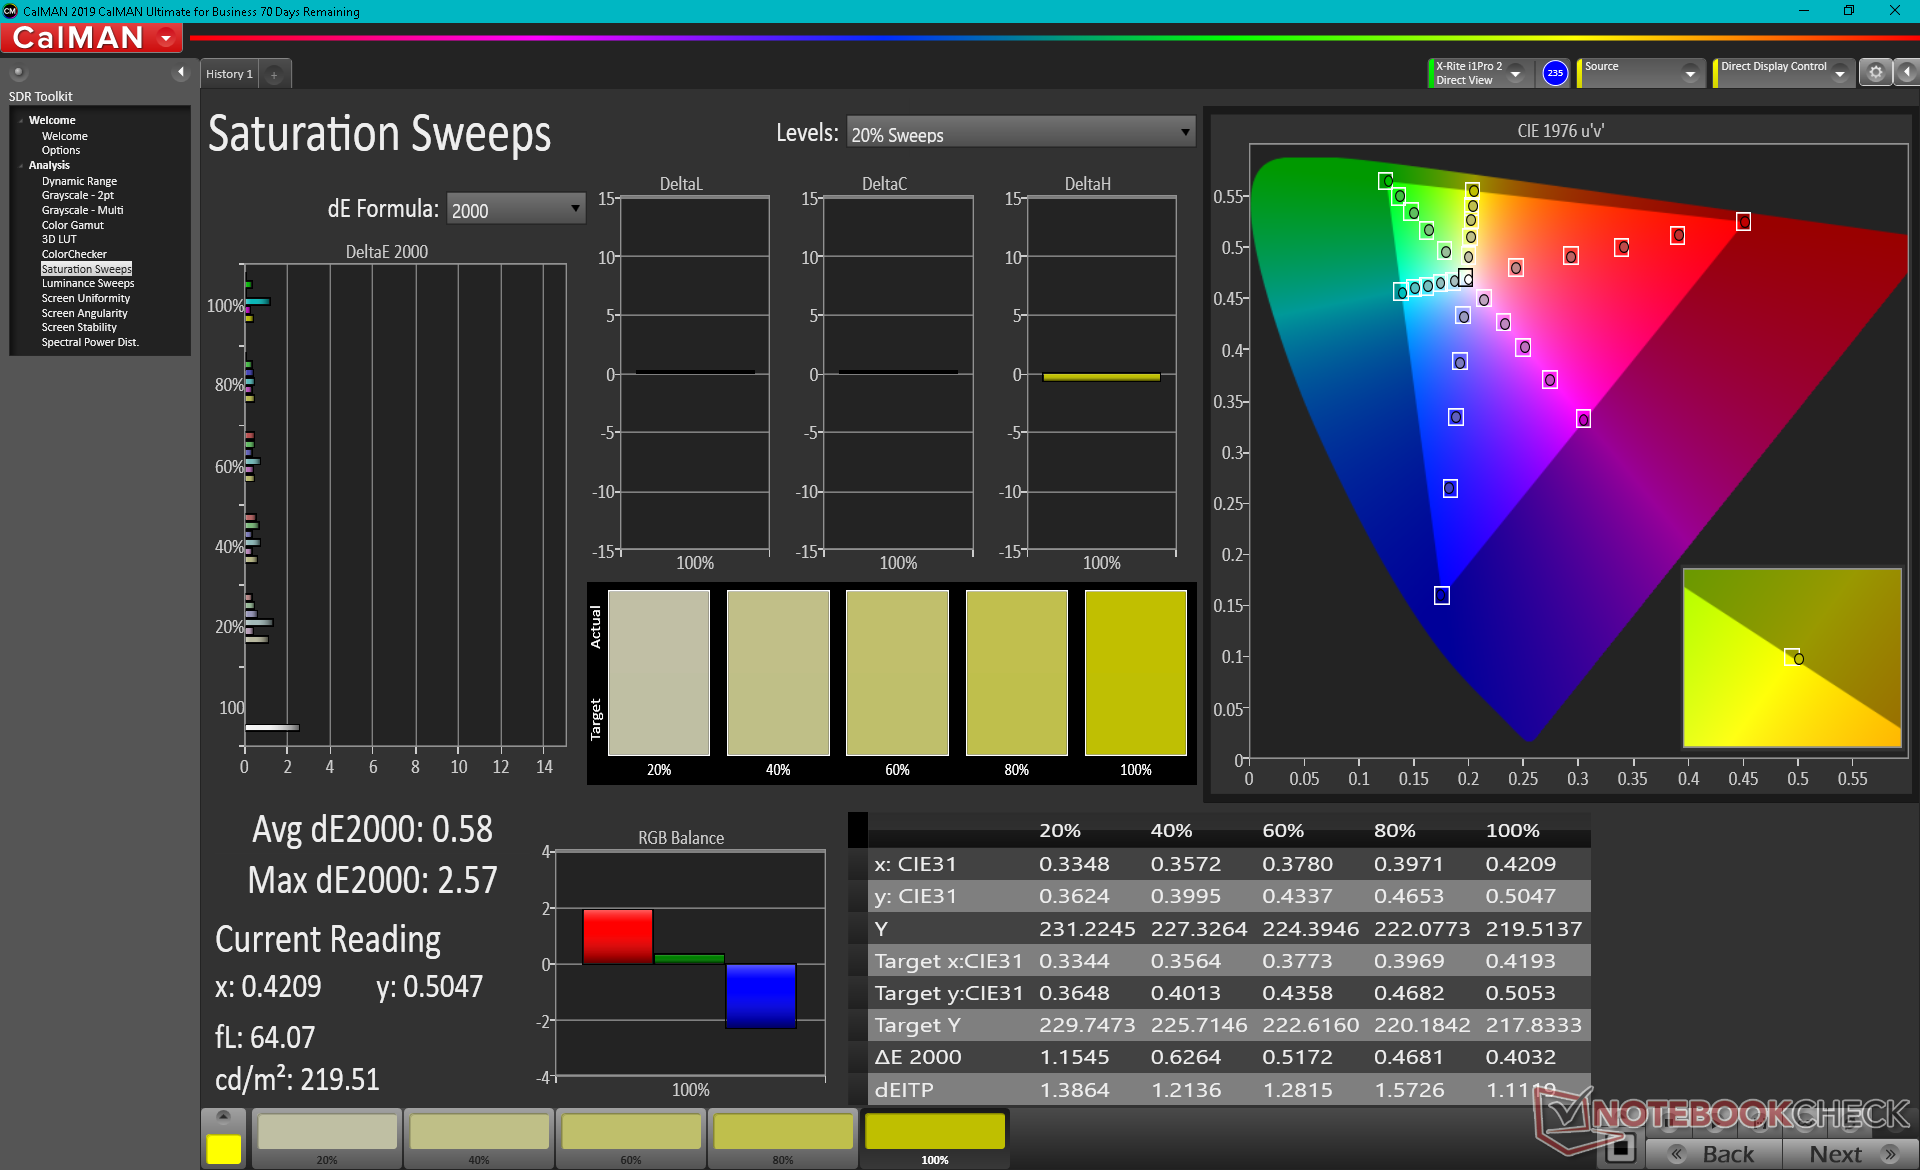
Color space encompasses all of sRGB and AdobeRGB as advertised by the manufacturer while DCI-P3 coverage is approximately 88 percent. The deep colors, fast response times, and fast refresh rate all make this 4K panel suitable for both gaming and graphics editing.

X-Rite colorimeter measurements show that the display is decently calibrated out of the box with average grayscale and color DeltaE values of just 2.4 and 4.34, respectively, when compared against the AdobeRGB standard. Setting the display to sRGB and then calibrating its colors would result in excellent DeltaE values of less than 2 across the board.


Display Response Times
| ↔ Response Time Black to White | ||
|---|---|---|
| 10.4 ms ... rise ↗ and fall ↘ combined | ↗ 5.2 ms rise |  |
| ↘ 5.2 ms fall | ||
| The screen shows good response rates in our tests, but may be too slow for competitive gamers. In comparison, all tested devices range from 0.1 (minimum) to 240 (maximum) ms. » 28 % of all devices are better. This means that the measured response time is better than the average of all tested devices (19.8 ms). | ||
| ↔ Response Time 50% Grey to 80% Grey | ||
| 14.4 ms ... rise ↗ and fall ↘ combined | ↗ 7.6 ms rise | 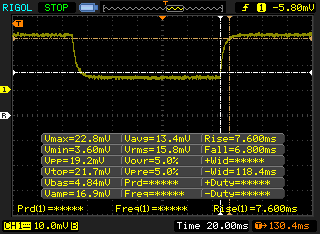 |
| ↘ 6.8 ms fall | ||
| The screen shows good response rates in our tests, but may be too slow for competitive gamers. In comparison, all tested devices range from 0.165 (minimum) to 636 (maximum) ms. » 29 % of all devices are better. This means that the measured response time is better than the average of all tested devices (30.9 ms). | ||
Screen Flickering / PWM (Pulse-Width Modulation)
| Screen flickering / PWM not detected | 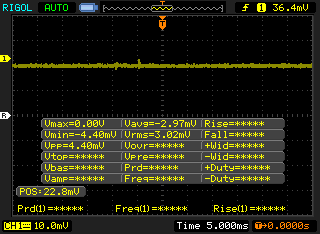 | ||
In comparison: 52 % of all tested devices do not use PWM to dim the display. If PWM was detected, an average of 7741 (minimum: 5 - maximum: 343500) Hz was measured. | |||
Outdoor visibility is slightly better than on many other 17.3-inch gaming laptops since the 400-nit matte display is brighter than the typical 300-nit target. The heavy weight and size are difficult to ignore, however, and so you'll likely want to work on a flat desk regardless of the environment.


Performance — Impressive Processor Clock Rates
Two CPU options (Core i7-11800H, Core i9-11980HK) and three GeForce graphics options (RTX 3060, RTX 3070, RTX 3080) are available. We don't expect big differences between the two CPUs since our i7-11800H is already running well above 90 C when under load, but the three GPUs are each running at different TGP targets of 130 W, 140 W, and 165 W, respectively. In comparison, the RTX 3080 in the Razer Blade 17 targets "only" 130 W.
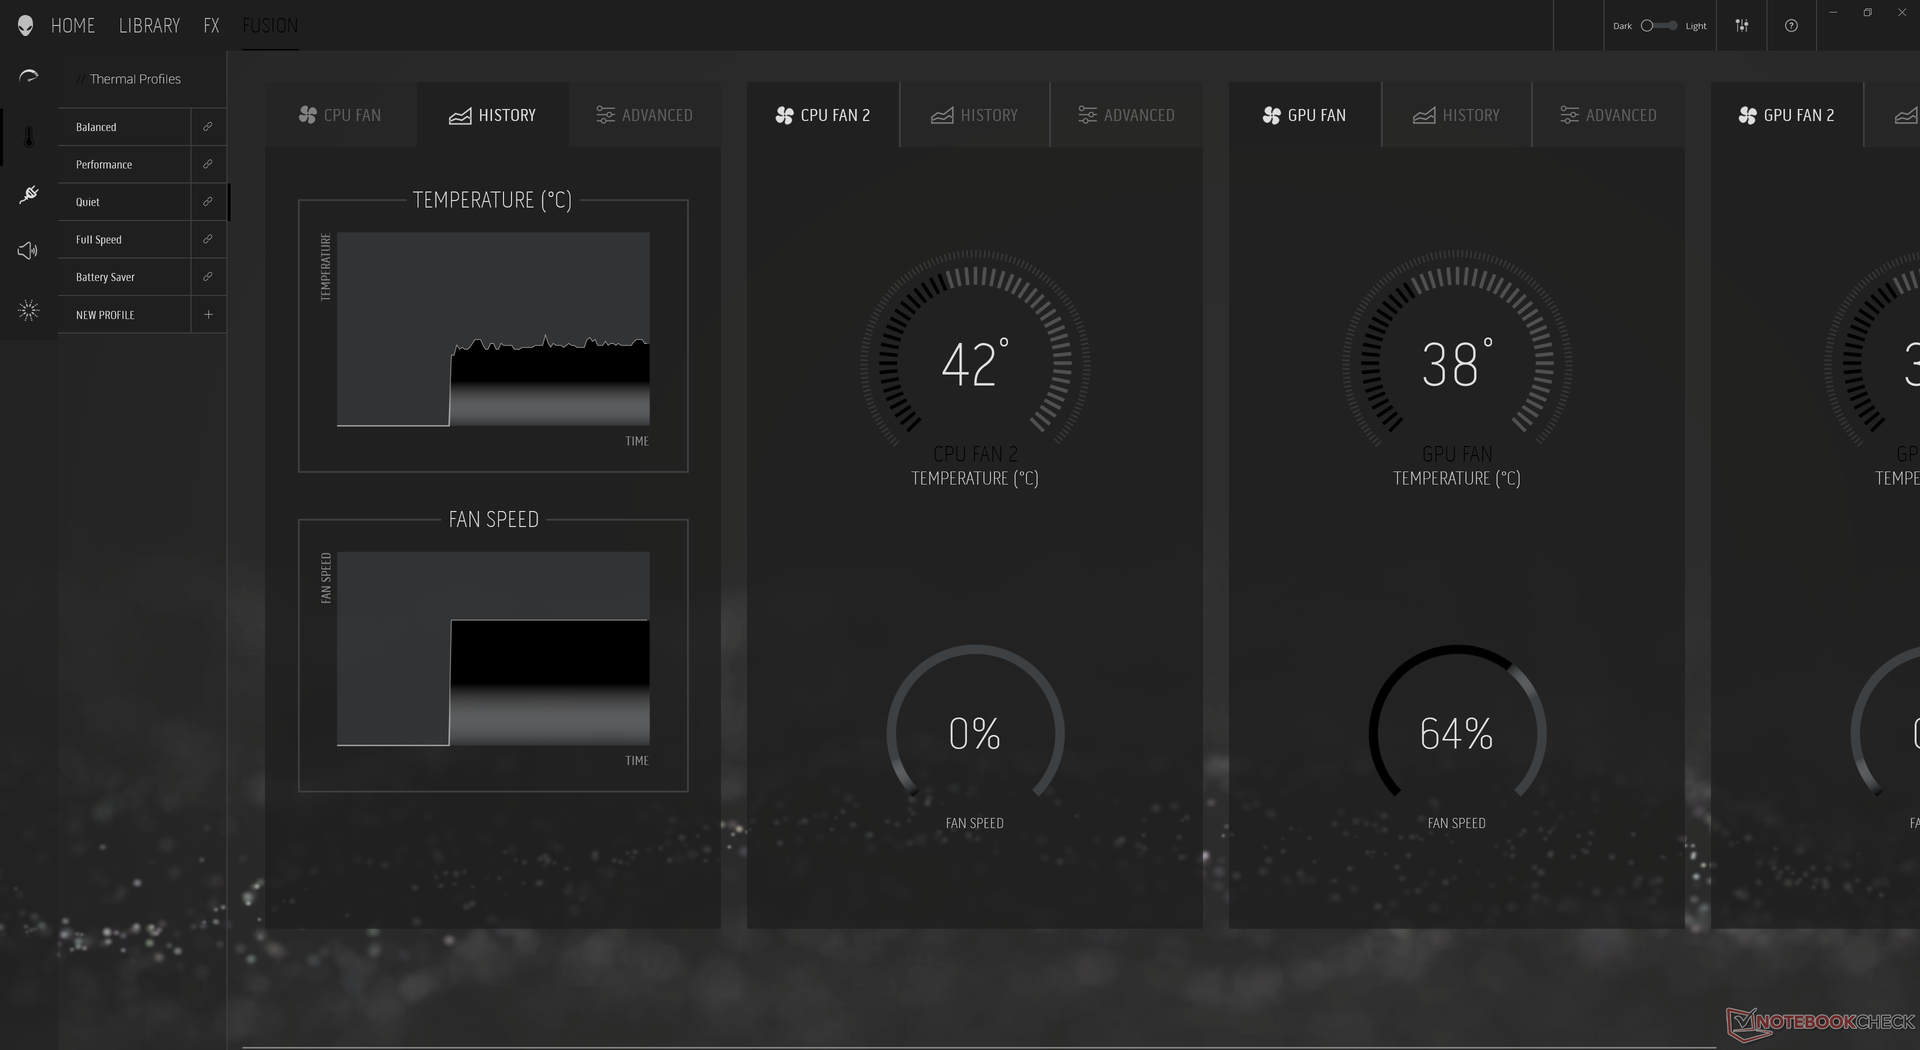
Our system was set to High Performance mode via the Alienware Command Center software prior to running our benchmarks below for the highest possible scores. We recommend users become familiar with this software as all lighting and performance features are found here. Additionally, users can set the system to Optimus or discrete GPU mode via the BIOS.
Advanced Optimus and thus G-Sync are only supported on the 360 Hz FHD SKUs.


Processor
CPU performance is outstanding with CineBench xT scores that are up to 20 percent faster than the average laptop in our database with the same Core i7-11800H CPU. In fact, the Alienware x17 is one of the fastest laptops you can get in the market with this specific processor. The faster-than-expected performance of our system actually puts it slightly ahead of the Ryzen 9 5900HX or Core i9-11900K in multi-threaded loads even though the i7-11800H is generally behind on most other laptops.
The high CPU performance of the Alienware can be attributed to the very high PL1 and PL2 targets of 165 W each (with a real-world sustainability of 98 W to 108 W) compared to 65 W and 90 W, respectively, on other laptops like the Razer Blade 17. The system is also excellent at maintaining high Turbo Boost clock rates over extended periods as shown by our CineBench R15 xT loop test below. Such lofty performance results don't come free, however, as our Stress Test and Power Consumption sections below will show.
Cinebench R15 Multi Loop
Cinebench R23: Multi Core | Single Core
Cinebench R15: CPU Multi 64Bit | CPU Single 64Bit
Blender: v2.79 BMW27 CPU
7-Zip 18.03: 7z b 4 -mmt1 | 7z b 4
Geekbench 5.5: Single-Core | Multi-Core
HWBOT x265 Benchmark v2.2: 4k Preset
LibreOffice : 20 Documents To PDF
R Benchmark 2.5: Overall mean
| Cinebench R23 / Multi Core | |
| Schenker XMG Ultra 17 Rocket Lake | |
| Alienware x17 RTX 3080 P48E | |
| Asus Strix Scar 17 G733QSA-XS99 | |
| MSI GS76 Stealth 11UH | |
| Asus ROG Strix G17 G713QE-RB74 | |
| Average Intel Core i7-11800H (6508 - 14088, n=48) | |
| Alienware m17 R4 | |
| Medion Erazer Beast X20 | |
| Cinebench R23 / Single Core | |
| Schenker XMG Ultra 17 Rocket Lake | |
| MSI GS76 Stealth 11UH | |
| Alienware x17 RTX 3080 P48E | |
| Asus Strix Scar 17 G733QSA-XS99 | |
| Average Intel Core i7-11800H (1386 - 1522, n=45) | |
| Asus ROG Strix G17 G713QE-RB74 | |
| Alienware m17 R4 | |
| Medion Erazer Beast X20 | |
| Geekbench 5.5 / Single-Core | |
| Schenker XMG Ultra 17 Rocket Lake | |
| MSI GS76 Stealth 11UH | |
| Average Intel Core i7-11800H (1429 - 1625, n=40) | |
| Asus Strix Scar 17 G733QSA-XS99 | |
| Alienware m17 R4 | |
| MSI GS75 10SF-609US | |
| Medion Erazer Beast X20 | |
| Eluktronics RP-17 | |
| Schenker XMG Pro 17 PB71RD-G | |
| Lenovo Legion 5 17IMH05 | |
| Geekbench 5.5 / Multi-Core | |
| Schenker XMG Ultra 17 Rocket Lake | |
| MSI GS76 Stealth 11UH | |
| Asus Strix Scar 17 G733QSA-XS99 | |
| Average Intel Core i7-11800H (4655 - 9851, n=40) | |
| MSI GS75 10SF-609US | |
| Alienware m17 R4 | |
| Eluktronics RP-17 | |
| Medion Erazer Beast X20 | |
| Schenker XMG Pro 17 PB71RD-G | |
| Lenovo Legion 5 17IMH05 | |
| LibreOffice / 20 Documents To PDF | |
| Lenovo Legion 5 17IMH05 | |
| Eluktronics RP-17 | |
| Asus ROG Strix G17 G713QE-RB74 | |
| Medion Erazer Beast X20 | |
| Alienware m17 R4 | |
| MSI GS75 10SF-609US | |
| MSI GS76 Stealth 11UH | |
| Alienware x17 RTX 3080 P48E | |
| Average Intel Core i7-11800H (38.6 - 59.9, n=45) | |
| Asus Strix Scar 17 G733QSA-XS99 | |
| Schenker XMG Ultra 17 Rocket Lake | |
* ... smaller is better
System Performance
PCMark scores are where we expect them to be relative to other high-performance gaming laptops. Overall results just slightly edge out the Razer Blade 17 equipped with the same CPU and GPU.

| PCMark 10 / Score | |
| Alienware x17 RTX 3080 P48E | |
| Razer Blade 17 RTX 3070 | |
| Asus ROG Zephyrus S17 GX703HSD | |
| Average Intel Core i7-11800H, NVIDIA GeForce RTX 3080 Laptop GPU (6673 - 7470, n=11) | |
| Gigabyte Aero 17 HDR YD | |
| MSI GS76 Stealth 11UH | |
| Alienware m17 R4 | |
| PCMark 10 / Essentials | |
| Razer Blade 17 RTX 3070 | |
| Asus ROG Zephyrus S17 GX703HSD | |
| Average Intel Core i7-11800H, NVIDIA GeForce RTX 3080 Laptop GPU (9862 - 11064, n=11) | |
| Gigabyte Aero 17 HDR YD | |
| Alienware x17 RTX 3080 P48E | |
| MSI GS76 Stealth 11UH | |
| Alienware m17 R4 | |
| PCMark 10 / Productivity | |
| Alienware x17 RTX 3080 P48E | |
| Asus ROG Zephyrus S17 GX703HSD | |
| Razer Blade 17 RTX 3070 | |
| Average Intel Core i7-11800H, NVIDIA GeForce RTX 3080 Laptop GPU (8278 - 9803, n=11) | |
| Gigabyte Aero 17 HDR YD | |
| MSI GS76 Stealth 11UH | |
| Alienware m17 R4 | |
| PCMark 10 / Digital Content Creation | |
| Alienware x17 RTX 3080 P48E | |
| Razer Blade 17 RTX 3070 | |
| Asus ROG Zephyrus S17 GX703HSD | |
| Average Intel Core i7-11800H, NVIDIA GeForce RTX 3080 Laptop GPU (9881 - 11323, n=11) | |
| Gigabyte Aero 17 HDR YD | |
| MSI GS76 Stealth 11UH | |
| Alienware m17 R4 | |
| PCMark 10 Score | 7470 points | |
Help | ||
DPC Latency
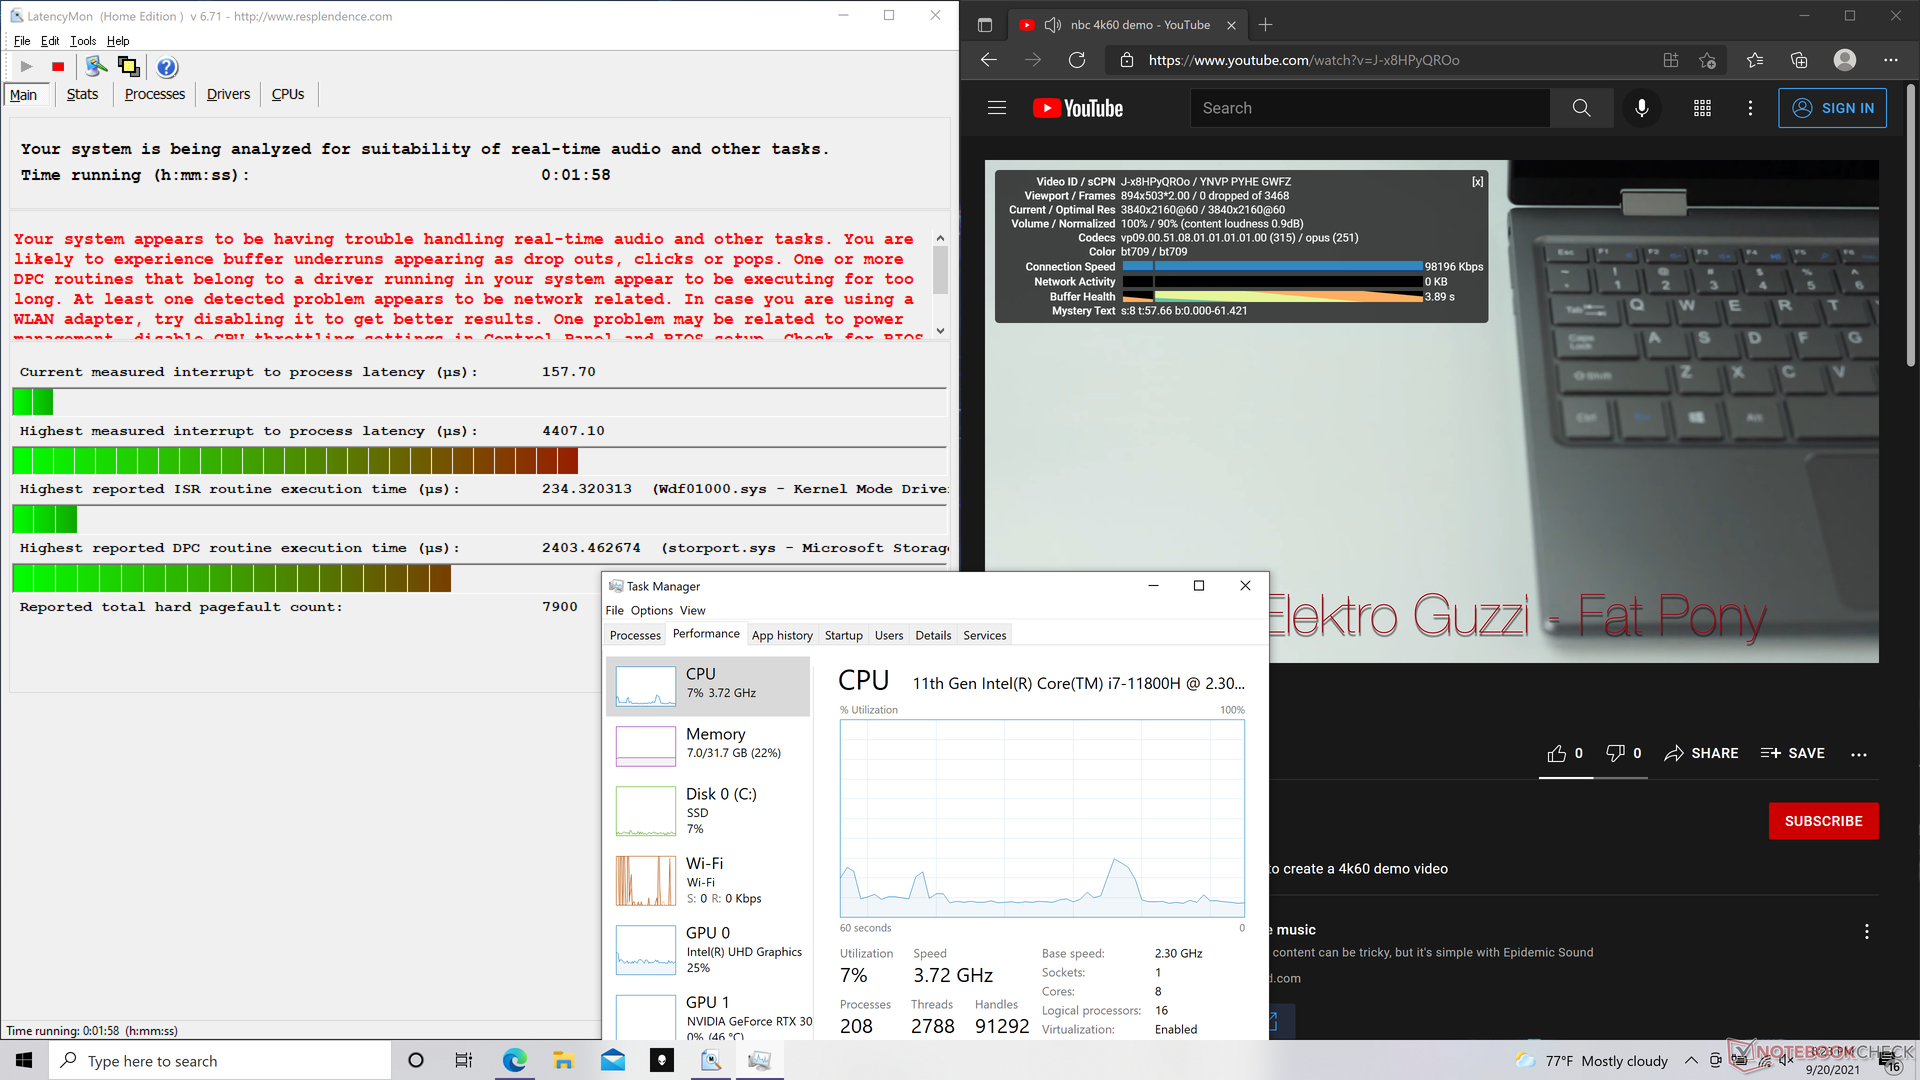
LatencyMon reveals DPC latency issues when opening multiple browser tabs on our homepage and when running Prime95 stress. 4K video playback at 60 FPS is otherwise perfect with no dropped frames.

| DPC Latencies / LatencyMon - interrupt to process latency (max), Web, Youtube, Prime95 | |
| Alienware x17 RTX 3080 P48E | |
| Gigabyte Aero 17 HDR YD | |
| Asus ROG Zephyrus S17 GX703HSD | |
| MSI GS76 Stealth 11UH | |
| Alienware m17 R4 | |
| Razer Blade 17 RTX 3070 | |
* ... smaller is better
Storage Devices — One PCIe4 and one PCIe3
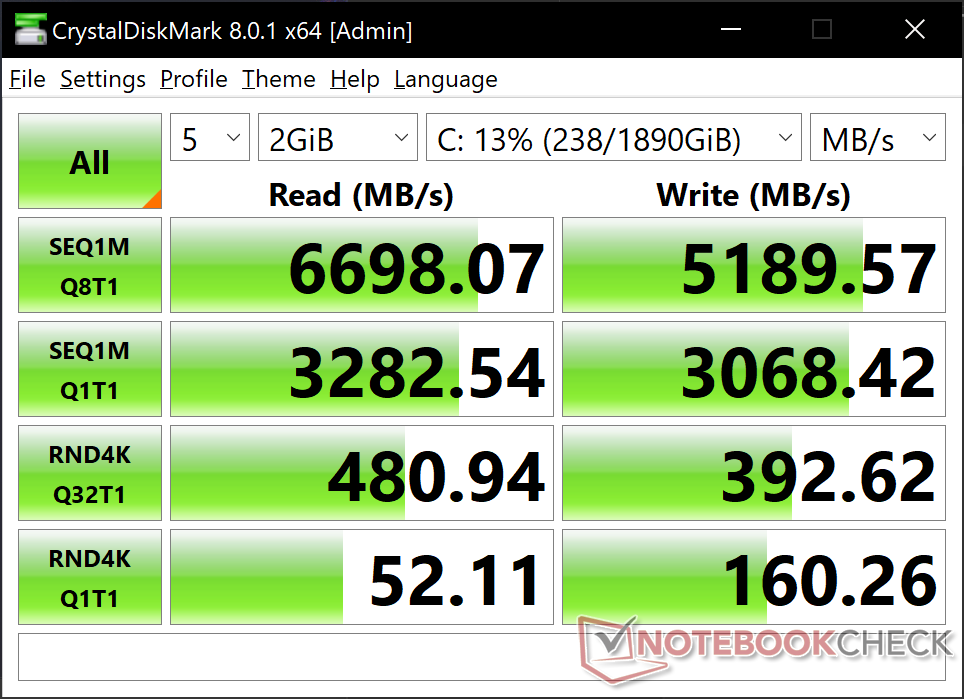
Our test unit comes with two 1 TB WD SN730 NVMe SSDs in RAID 0 for sequential read and write rates of up to 6700 MB/s and 4300 MB/s, respectively, to be faster than any single PCIe3 SSD available. Nonetheless, a single Samsung PM9A1 PCIe4 SSD will still outperform our PCIe3 RAID 0 setup. Dell says the system can support up to one PCIe4 SSD if users want to install one themselves.

| Alienware x17 RTX 3080 P48E 2x WDC PC SN730 SDBPNTY-1T00 (RAID 0) | Alienware m17 R4 2x Micron 2300 512 GB (RAID 0) | Razer Blade 17 RTX 3070 Samsung PM9A1 MZVL21T0HCLR | Asus ROG Zephyrus S17 GX703HSD Samsung PM9A1 MZVL22T0HBLB | MSI GS76 Stealth 11UH Samsung PM9A1 MZVL22T0HBLB | Gigabyte Aero 17 HDR YD Samsung PM9A1 MZVL2512HCJQ | |
|---|---|---|---|---|---|---|
| AS SSD | -12% | 52% | 67% | 68% | 66% | |
| Seq Read (MB/s) | 4978 | 2733 -45% | 5302 7% | 5085 2% | 5408 9% | 5438 9% |
| Seq Write (MB/s) | 2058 | 2822 37% | 3977 93% | 4434 115% | 3863 88% | 3904 90% |
| 4K Read (MB/s) | 43.4 | 45.04 4% | 55 27% | 80.3 85% | 52.7 21% | 56.2 29% |
| 4K Write (MB/s) | 146.9 | 88.4 -40% | 148.7 1% | 214.7 46% | 153.1 4% | 165.8 13% |
| 4K-64 Read (MB/s) | 1260 | 1388 10% | 2715 115% | 2573 104% | 2692 114% | 2489 98% |
| 4K-64 Write (MB/s) | 1385 | 1227 -11% | 3416 147% | 2972 115% | 3414 146% | 3480 151% |
| Access Time Read * (ms) | 0.039 | 0.079 -103% | 0.044 -13% | 0.018 54% | 0.046 -18% | 0.054 -38% |
| Access Time Write * (ms) | 0.074 | 0.095 -28% | 0.085 -15% | 0.02 73% | 0.027 64% | 0.026 65% |
| Score Read (Points) | 1801 | 1706 -5% | 3300 83% | 3161 76% | 3285 82% | 3089 72% |
| Score Write (Points) | 1737 | 1598 -8% | 3963 128% | 3631 109% | 3953 128% | 4036 132% |
| Score Total (Points) | 4314 | 4184 -3% | 8874 106% | 8380 94% | 8830 105% | 8620 100% |
| Copy ISO MB/s (MB/s) | 2009 | 2414 20% | 2710 35% | 3239 61% | ||
| Copy Program MB/s (MB/s) | 1099 | 1030 -6% | 1114 1% | 899 -18% | ||
| Copy Game MB/s (MB/s) | 1881 | 1991 6% | 2095 11% | 2171 15% | ||
| CrystalDiskMark 5.2 / 6 | -16% | 38% | 41% | 39% | 42% | |
| Write 4K (MB/s) | 159.2 | 93.1 -42% | 233.5 47% | 244.2 53% | 230.7 45% | 230.4 45% |
| Read 4K (MB/s) | 51.9 | 46.79 -10% | 90.1 74% | 89.8 73% | 87.9 69% | 91.6 76% |
| Write Seq (MB/s) | 3115 | 2853 -8% | 4263 37% | 4300 38% | 4216 35% | |
| Read Seq (MB/s) | 3298 | 2556 -22% | 4468 35% | 4392 33% | 4543 38% | |
| Write 4K Q32T1 (MB/s) | 392.6 | 475 21% | 538 37% | 607 55% | 582 48% | 667 70% |
| Read 4K Q32T1 (MB/s) | 474.7 | 529 11% | 703 48% | 658 39% | 730 54% | 728 53% |
| Write Seq Q32T1 (MB/s) | 4331 | 3331 -23% | 5097 18% | 5270 22% | 5152 19% | 5043 16% |
| Read Seq Q32T1 (MB/s) | 6746 | 3319 -51% | 7065 5% | 7091 5% | 7094 5% | 6821 1% |
| Write 4K Q8T8 (MB/s) | 2270 | |||||
| Read 4K Q8T8 (MB/s) | 2490 | |||||
| Total Average (Program / Settings) | -14% /
-13% | 45% /
47% | 54% /
59% | 54% /
55% | 54% /
56% |
* ... smaller is better

Disk Throttling: DiskSpd Read Loop, Queue Depth 8
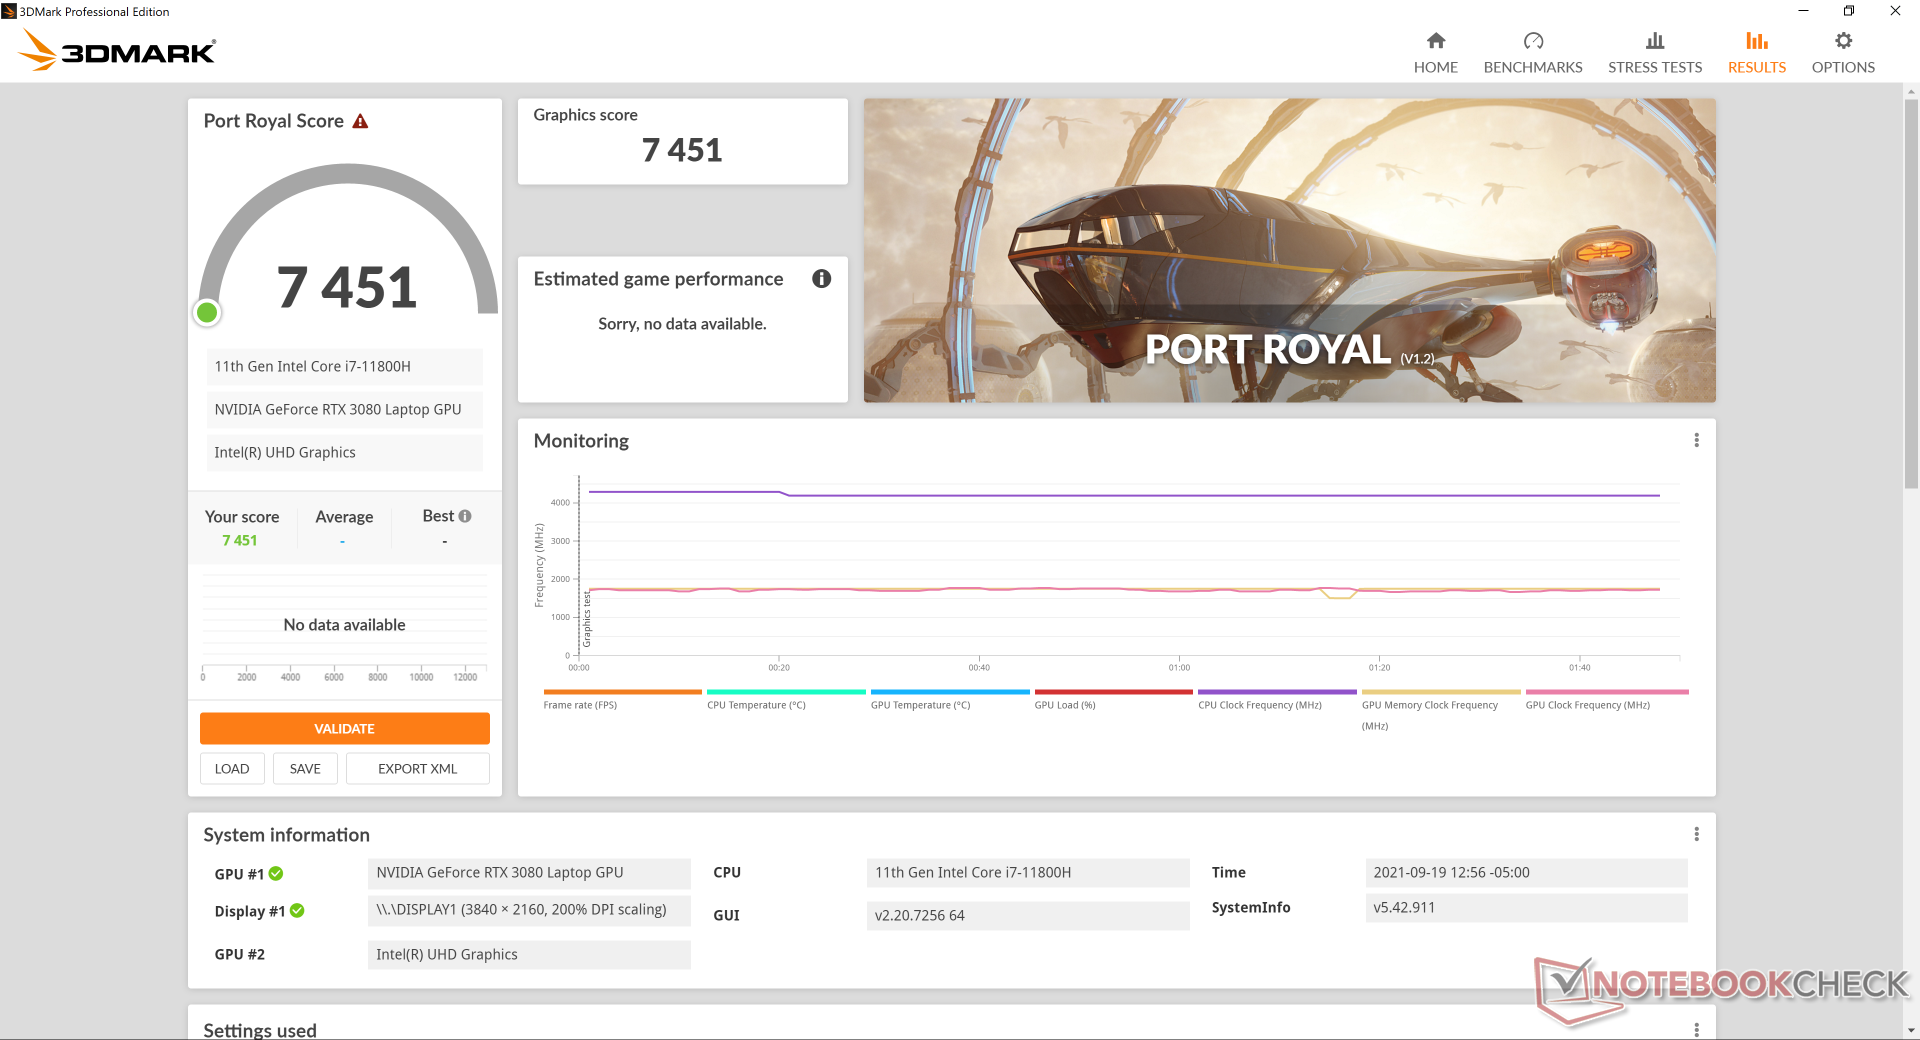
GPU Performance — Just a Bit Higher than Average
Despite the 165 W RTX 3080 graphics, raw performance is only 2 to 9 percent faster than the average RTX 3080 laptop in our database likely due to diminishing returns at higher TGP targets. The minor advantage can also be seen when running games as frame rates are again only a few percentage points higher on average. However, the performance difference becomes more pronounced when compared to the 90 W RTX 3080 in the MSI GS76 where our Alienware can be roughly 15 to 30 percent faster in certain titles. A desktop PC with RTX 3080 graphics will still outperform any RTX 3080 laptop by about 40 to 45 percent.
Idling on Witcher 3 for over an hour shows stable frame rates with no random drops to suggest no interrupting background activity when gaming in contrast to what we observed on some older Alienware m15 models.
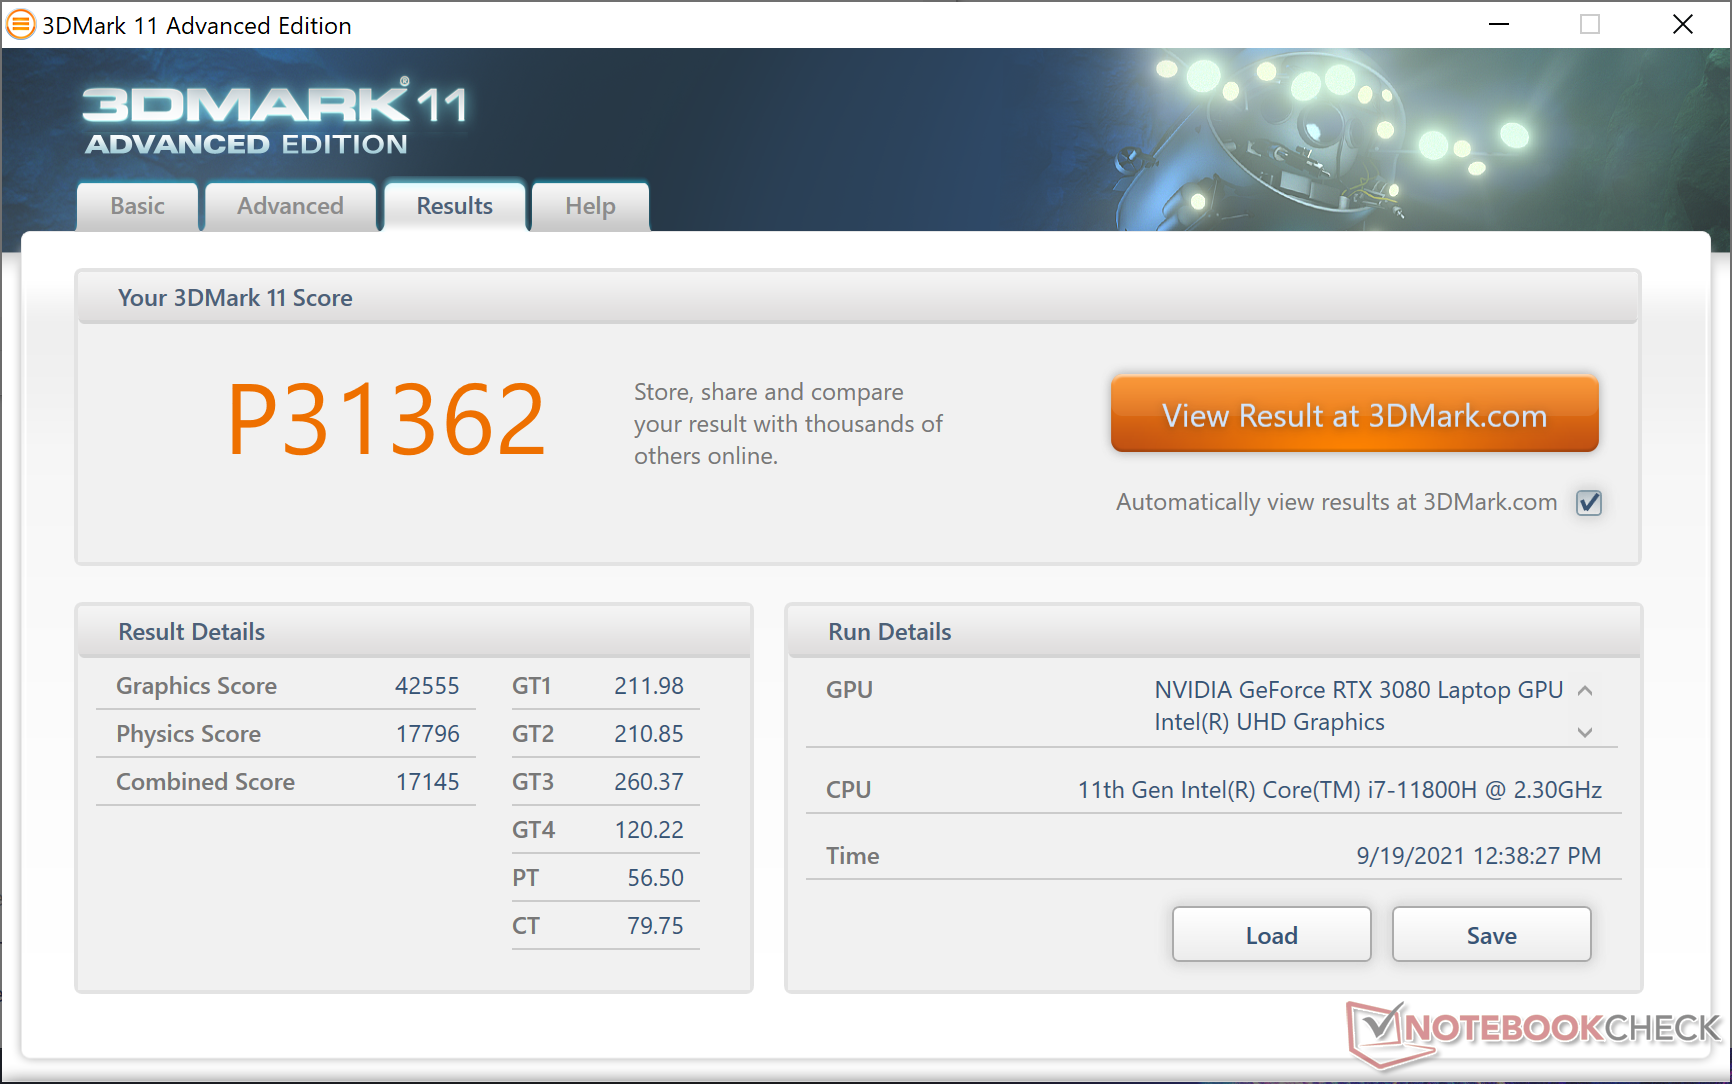
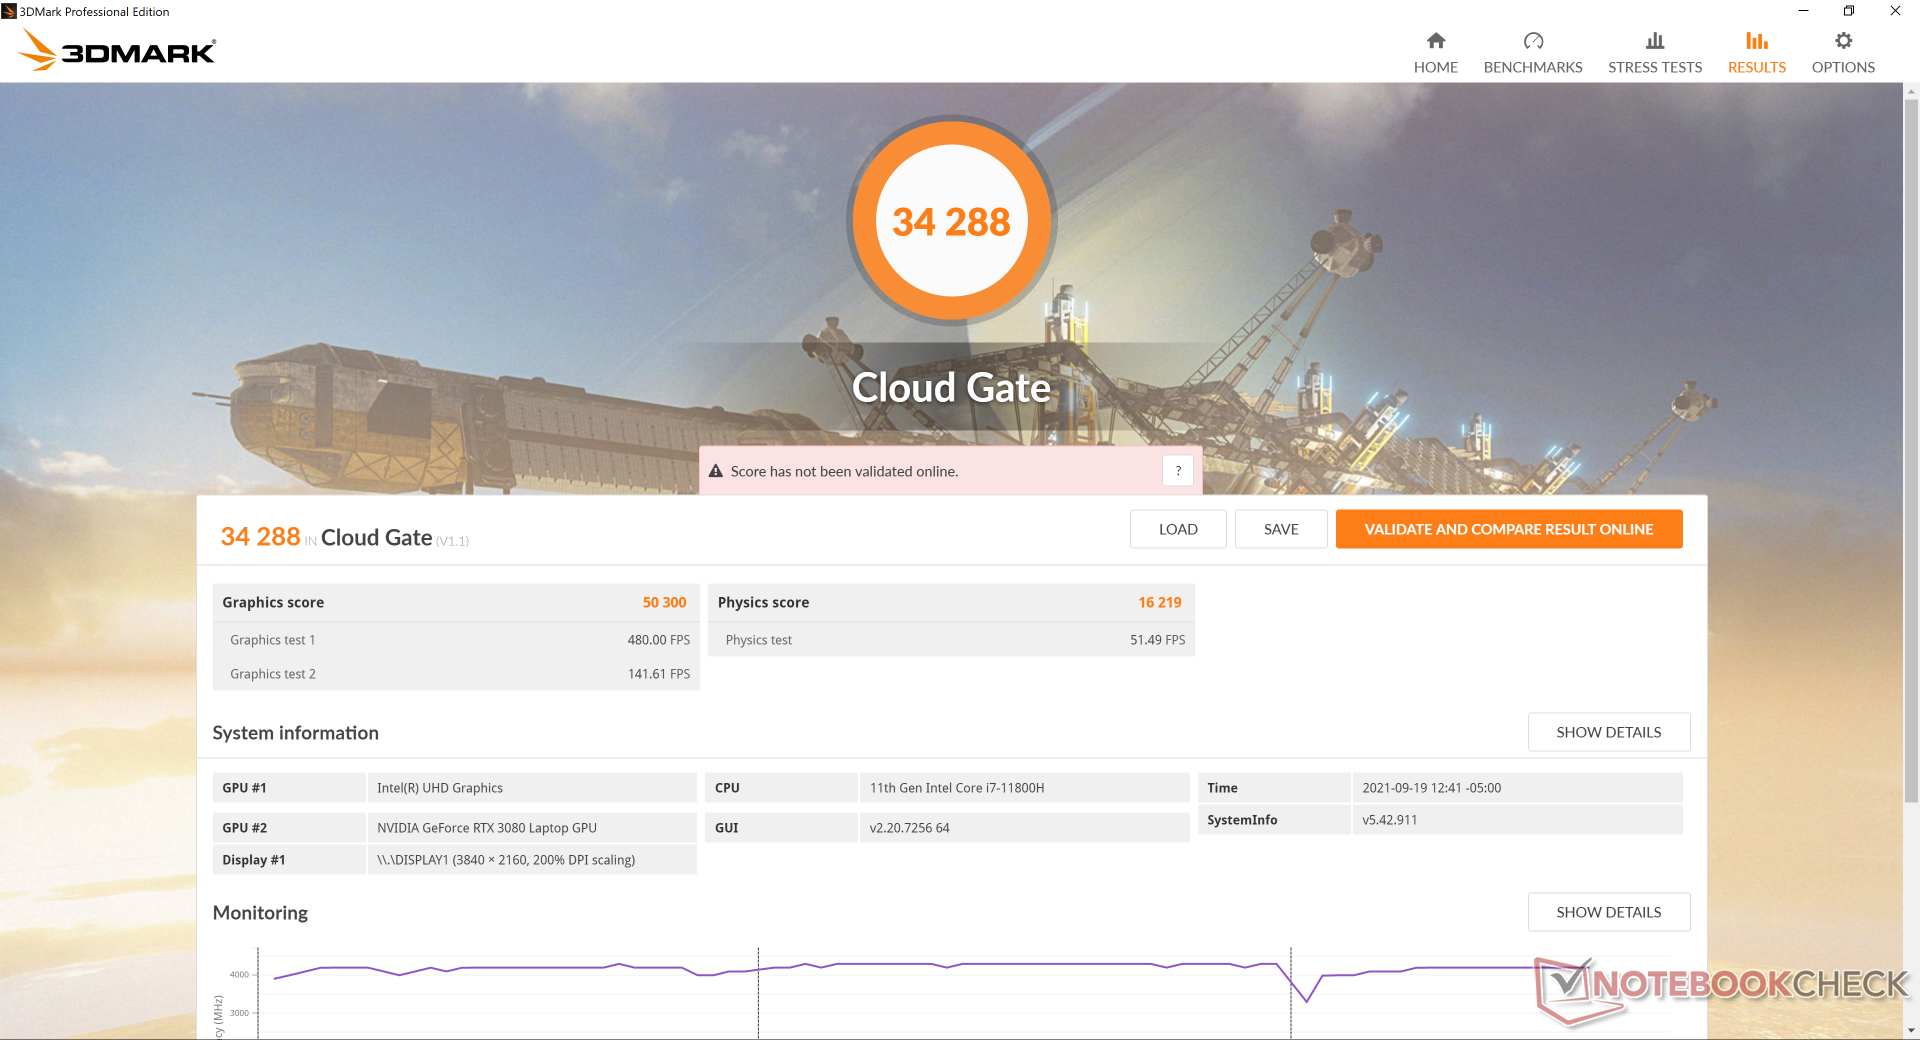


| 3DMark 11 Performance | 31362 points | |
| 3DMark Cloud Gate Standard Score | 34288 points | |
| 3DMark Fire Strike Score | 23159 points | |
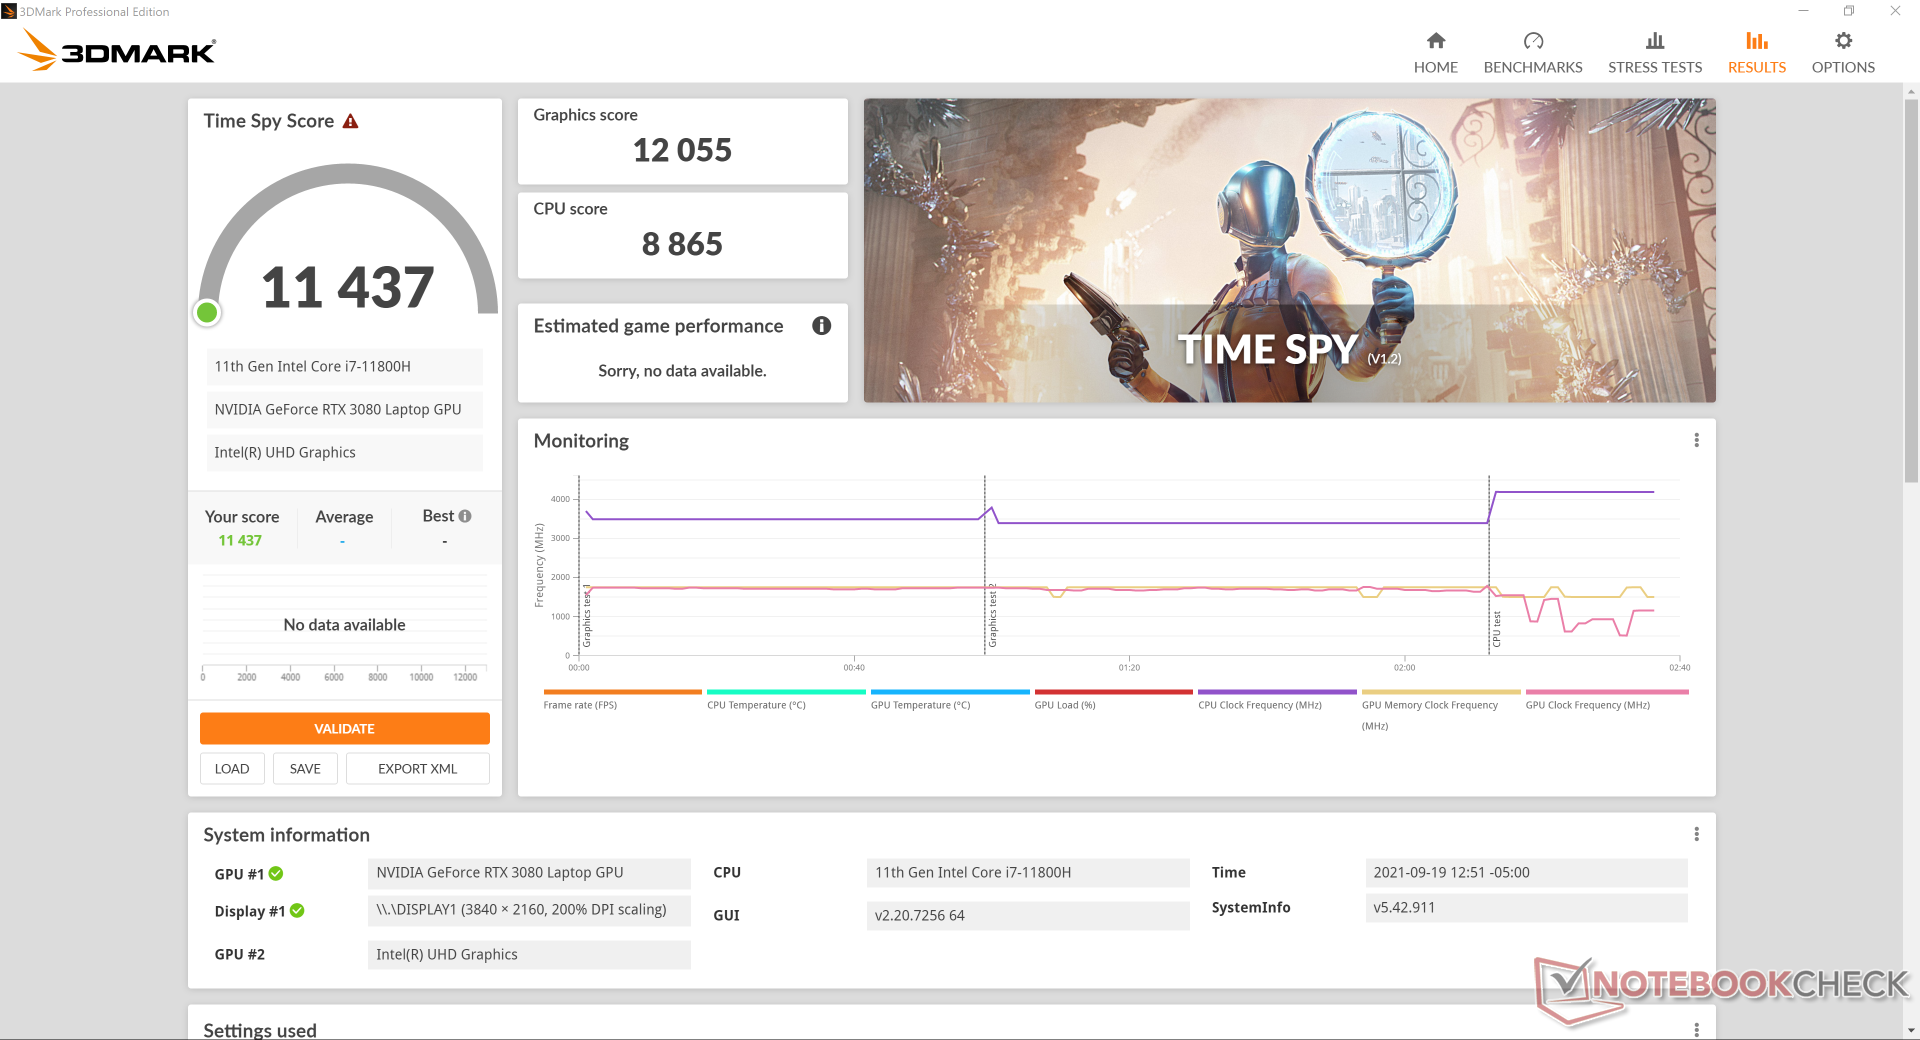
| 3DMark Time Spy Score | 11437 points | |
Help | ||
Witcher 3 FPS Chart
| low | med. | high | ultra | QHD | 4K | |
|---|---|---|---|---|---|---|
| GTA V (2015) | 183 | 176 | 163 | 98.1 | 89.2 | 98.1 |
| The Witcher 3 (2015) | 370.2 | 294 | 192 | 105.2 | 80.2 | |
| Dota 2 Reborn (2015) | 164 | 148 | 143 | 135 | 111 | |
| Final Fantasy XV Benchmark (2018) | 181 | 134 | 106 | 81.8 | 50.8 | |
| X-Plane 11.11 (2018) | 118 | 99.3 | 79.7 | 56.9 | ||
| Far Cry 5 (2018) | 144 | 125 | 120 | 112 | 98 | 63 |
| Strange Brigade (2018) | 456 | 269 | 225 | 199 | 152 | 91.6 |
Emissions
System Noise — Vapor Chamber + Gallium-silicone Thermal Paste
Fan noise is highly dependent on the Alienware Command Center settings (Quiet, Performance, and Full Speed). Despite having two times more fans than on most other gaming laptops, the Alienware x17 is generally very quiet during low loads like browsing or video streaming even when set to Performance mode. We're able to record a fan noise of just 31.3 dB(A) against a background of 24.9 dB(A) when running 3DMark 06 for 90 seconds. Any longer, however, and fan noise would eventually rise to 43.8 dB(A) which is similar to what we've recorded on other gaming laptops.
Running Witcher 3 on Performance mode would result in a steady fan noise of 49.7 dB(A). Interestingly, this level would remain the same even when on Balanced mode and so gamers should set the system to Performance mode whenever possible. Setting the fans to Full Speed mode will increase fan noise to as high as 55 dB(A) no matter the onscreen load. The Alienware x17 is generally quieter than the Gigabyte Aero 17 or last generation m17 R4 during low loads, but they almost about the same once higher loads are introduced.


| Alienware x17 RTX 3080 P48E GeForce RTX 3080 Laptop GPU, i7-11800H, 2x WDC PC SN730 SDBPNTY-1T00 (RAID 0) | Alienware m17 R4 GeForce RTX 3080 Laptop GPU, i9-10980HK, 2x Micron 2300 512 GB (RAID 0) | Razer Blade 17 RTX 3070 GeForce RTX 3070 Laptop GPU, i7-11800H, Samsung PM9A1 MZVL21T0HCLR | Asus ROG Zephyrus S17 GX703HSD GeForce RTX 3080 Laptop GPU, i9-11900H, Samsung PM9A1 MZVL22T0HBLB | MSI GS76 Stealth 11UH GeForce RTX 3080 Laptop GPU, i9-11900H, Samsung PM9A1 MZVL22T0HBLB | Gigabyte Aero 17 HDR YD GeForce RTX 3080 Laptop GPU, i9-11980HK, Samsung PM9A1 MZVL2512HCJQ | |
|---|---|---|---|---|---|---|
| Noise | -6% | -3% | 4% | -10% | -20% | |
| off / environment * (dB) | 24.9 | 24 4% | 24.2 3% | 23 8% | 24 4% | 25 -0% |
| Idle Minimum * (dB) | 24.9 | 24 4% | 24.7 1% | 23 8% | 24 4% | 30 -20% |
| Idle Average * (dB) | 24.9 | 25 -0% | 24.7 1% | 23 8% | 25 -0% | 32 -29% |
| Idle Maximum * (dB) | 29.6 | 36 -22% | 24.7 17% | 23 22% | 42 -42% | 41 -39% |
| Load Average * (dB) | 31.1 | 45 -45% | 44.3 -42% | 41 -32% | 46 -48% | 43 -38% |
| Witcher 3 ultra * (dB) | 49.7 | 47 5% | 56.3 -13% | 45 9% | 48 3% | 51 -3% |
| Load Maximum * (dB) | 54.8 | 50 9% | 47.7 13% | 52 5% | 48 12% | 59 -8% |
* ... smaller is better
Noise level
| Idle |
| 24.9 / 24.9 / 29.6 dB(A) |
| Load |
| 31.1 / 54.8 dB(A) |
 | ||
30 dB silent 40 dB(A) audible 50 dB(A) loud |
||
min: | ||
Temperature
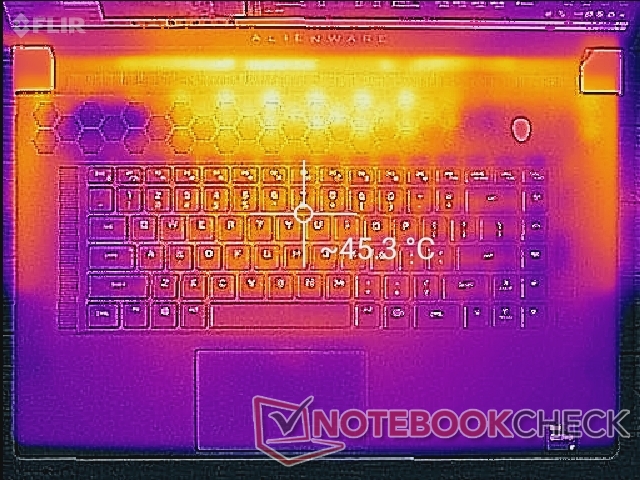
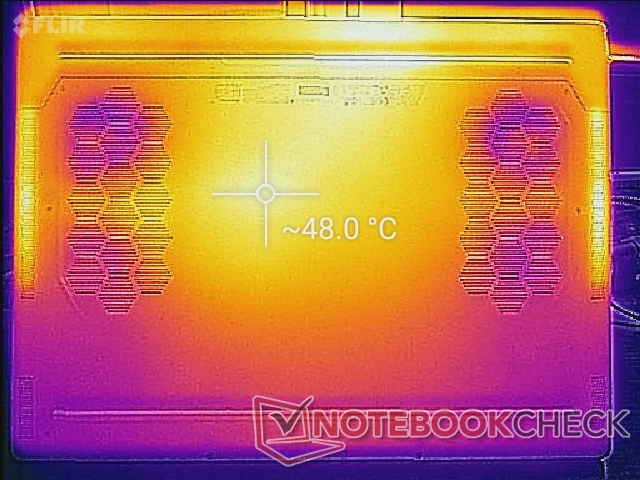
Surface temperatures when idling are relatively cool on the palm rests while the keyboard center and bottom can be noticeably warmer at about 33 C each since the fans are on low speed. When gaming, hot spots can become as warm as 59 C and 52 C on the top and bottom, respectively, or even 39 C along the side edges of the keyboard. These hot spots are generally away from users' palms and fingers as to be less distracting during gameplay, but it's definitely recommended to not block any of the several ventilation grilles all around the system.
Overall temperatures are actually cooler than what we observed on the Asus Zephyrus S17 likely due to the thicker and larger size of our Alienware chassis.

(-) The maximum temperature on the upper side is 58.4 °C / 137 F, compared to the average of 40.4 °C / 105 F, ranging from 21.2 to 68.8 °C for the class Gaming.
(-) The bottom heats up to a maximum of 49 °C / 120 F, compared to the average of 43.2 °C / 110 F
(+) In idle usage, the average temperature for the upper side is 29.5 °C / 85 F, compared to the device average of 33.9 °C / 93 F.
(-) Playing The Witcher 3, the average temperature for the upper side is 41.4 °C / 107 F, compared to the device average of 33.9 °C / 93 F.
(+) The palmrests and touchpad are reaching skin temperature as a maximum (32.4 °C / 90.3 F) and are therefore not hot.
(-) The average temperature of the palmrest area of similar devices was 28.8 °C / 83.8 F (-3.6 °C / -6.5 F).


Stress Test

When stressed with Prime95, CPU clock rates and temperature would cycle between 3.8 GHz to 4.2 GHz and 85 C to 100 C every couple of minutes which are very high values all around. For comparison, the Razer Blade 17 comes with the exact same Core i7-11800H processor and yet it would stabilize at only 2.8 GHz and 78 C when subjected to the same conditions. Both CPU and GPU clock rates will throttle when each are at 100 percent utilization via Prime95 and FurMark.
Running Witcher 3 on High Performance mode causes the CPU and GPU to stabilize at 3.5 GHz and 1785 MHz, respectively, with a steady GPU board power draw of around 145 W. If on Balanced mode, CPU clock rates would drop to just 2.5 GHz while GPU clock rates may dip slightly to 1680 MHz and a power draw of ~135 W. If you're gaming and want the most of your laptop, then be sure to enable High performance mode via the Alienware software. GPU clock rates are faster than expected either way when compared to most other laptops with the same GPU like the Maingear Vector Pro.
Running on battery power will limit graphics performance. A Fire Strike test on batteries would return Physics and Graphics scores of 24602 and 13281 points, respectively, compared to 22907 and 29194 points when on mains.


| CPU Clock (GHz) | GPU Clock (MHz) | Average CPU Temperature (°C) | Average GPU Temperature (°C) | |
| System Idle | -- | -- | 36 | 32 |
| Prime95 Stress (High Performance mode) | 3.8 - 4.2 | -- | 85 - 100 | 55 |
| Prime95 + FurMark Stress (High Performance mode) | 1.9 - 3.4 | 300 - 1785 | 71 - 86 | 65 - 79 |
| Witcher 3 Stress (Balanced mode) | 2.5 | 1785 | 68 | 79 |
| Witcher 3 Stress (High Performance mode) | 3.5 | 1785 | 75 | 84 |
Speakers


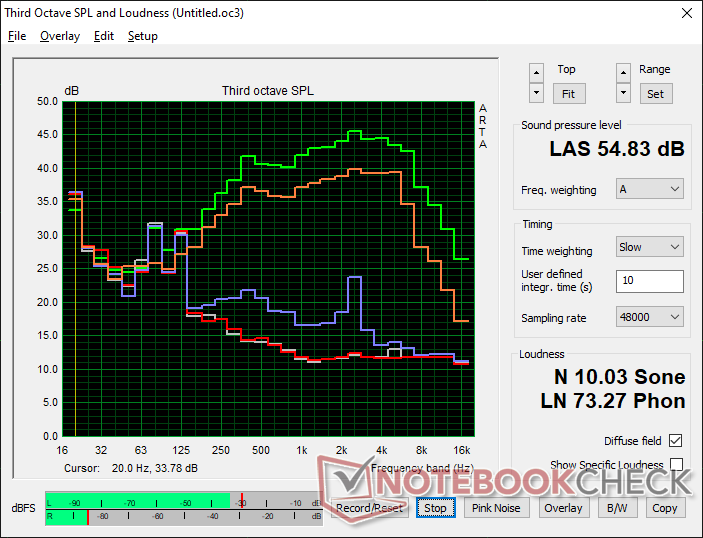
Alienware x17 RTX 3080 P48E audio analysis
(+) | speakers can play relatively loud (88 dB)
Bass 100 - 315 Hz
(-) | nearly no bass - on average 23% lower than median
(±) | linearity of bass is average (9.8% delta to prev. frequency)
Mids 400 - 2000 Hz
(+) | balanced mids - only 2.7% away from median
(+) | mids are linear (4% delta to prev. frequency)
Highs 2 - 16 kHz
(+) | balanced highs - only 4.4% away from median
(±) | linearity of highs is average (7% delta to prev. frequency)
Overall 100 - 16.000 Hz
(±) | linearity of overall sound is average (17.3% difference to median)
Compared to same class
» 47% of all tested devices in this class were better, 12% similar, 41% worse
» The best had a delta of 6%, average was 18%, worst was 132%
Compared to all devices tested
» 33% of all tested devices were better, 8% similar, 59% worse
» The best had a delta of 4%, average was 23%, worst was 134%
Apple MacBook 12 (Early 2016) 1.1 GHz audio analysis
(+) | speakers can play relatively loud (83.6 dB)
Bass 100 - 315 Hz
(±) | reduced bass - on average 11.3% lower than median
(±) | linearity of bass is average (14.2% delta to prev. frequency)
Mids 400 - 2000 Hz
(+) | balanced mids - only 2.4% away from median
(+) | mids are linear (5.5% delta to prev. frequency)
Highs 2 - 16 kHz
(+) | balanced highs - only 2% away from median
(+) | highs are linear (4.5% delta to prev. frequency)
Overall 100 - 16.000 Hz
(+) | overall sound is linear (10.2% difference to median)
Compared to same class
» 7% of all tested devices in this class were better, 2% similar, 90% worse
» The best had a delta of 5%, average was 18%, worst was 53%
Compared to all devices tested
» 5% of all tested devices were better, 1% similar, 94% worse
» The best had a delta of 4%, average was 23%, worst was 134%
Energy Management
Power Consumption — High Energy Bills
Dell has improved the power consumption of the system during low loads when compared to the m17 R4 which may explain the overall longer battery life in our next section. Our system would draw as little as 10 W when idling on desktop at the minimum brightness setting to be 4x more efficient than what we recorded on last year's m17 R4.
Power consumption when gaming remains higher than usual much like what we discovered on the m17 series. Running Witcher 3 would consume an average of 249 W compared to only 195 W or 156 W on the Asus ROG Zephyrus S17 or MSI GS76, respectively. The higher CPU TDP and GPU TGP targets of the Alienware system are likely responsible for its higher power demands.
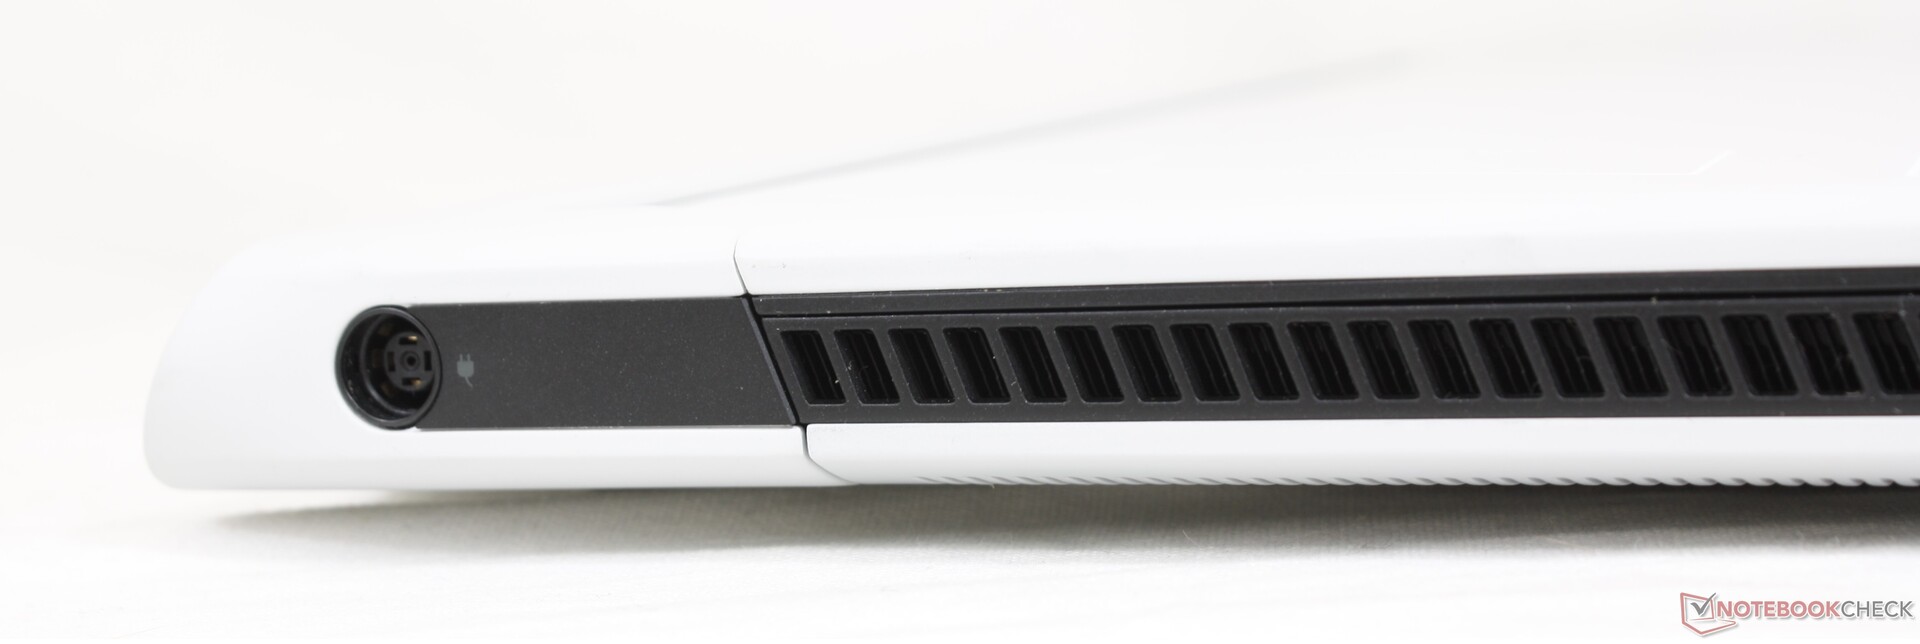
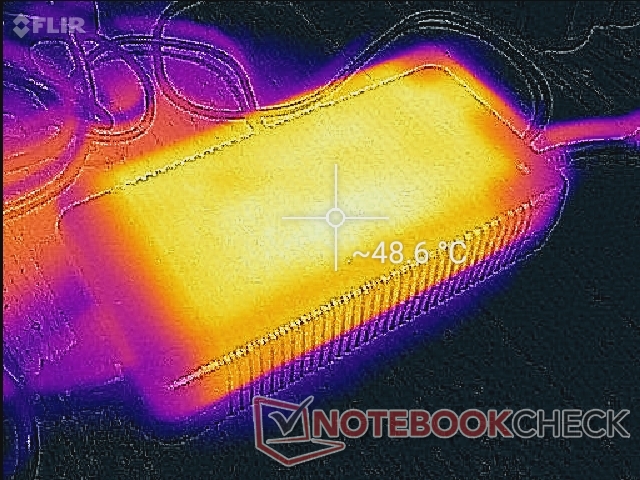
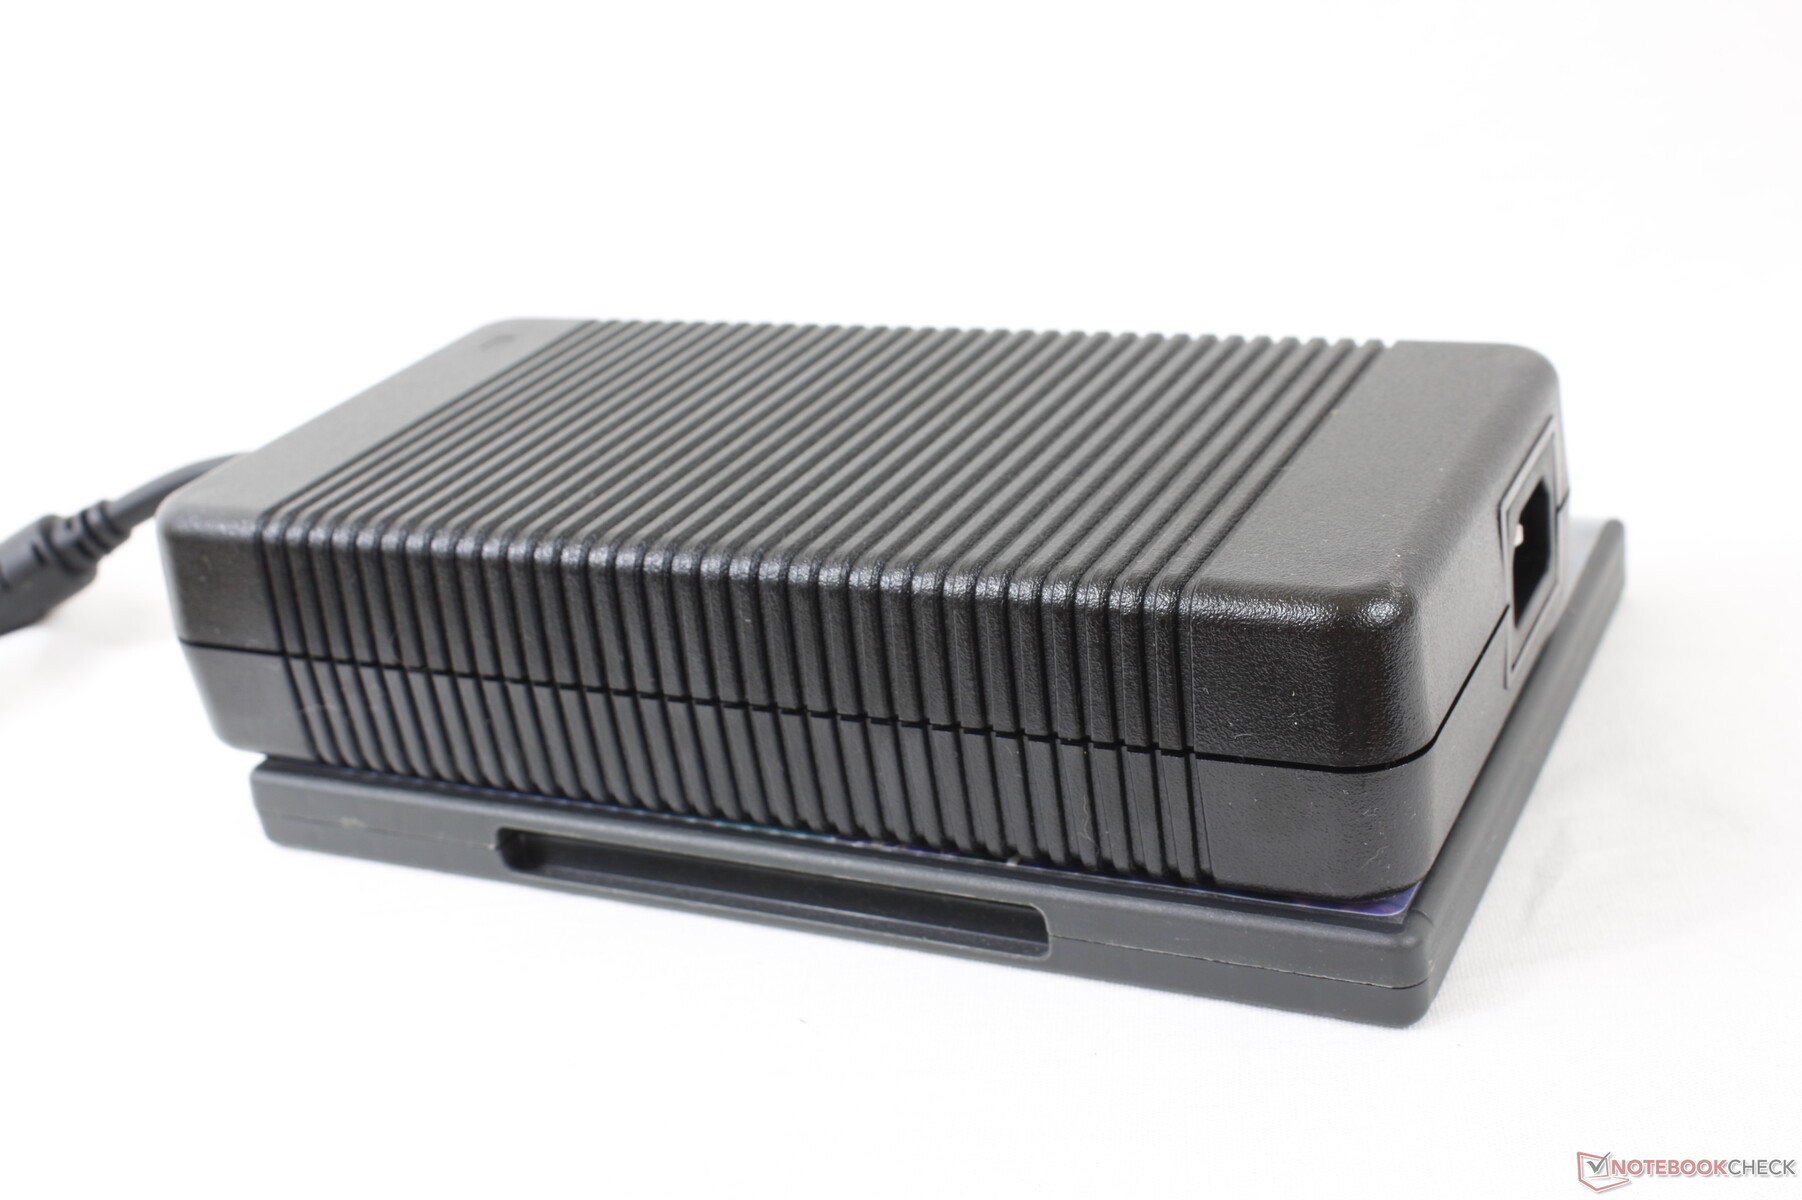
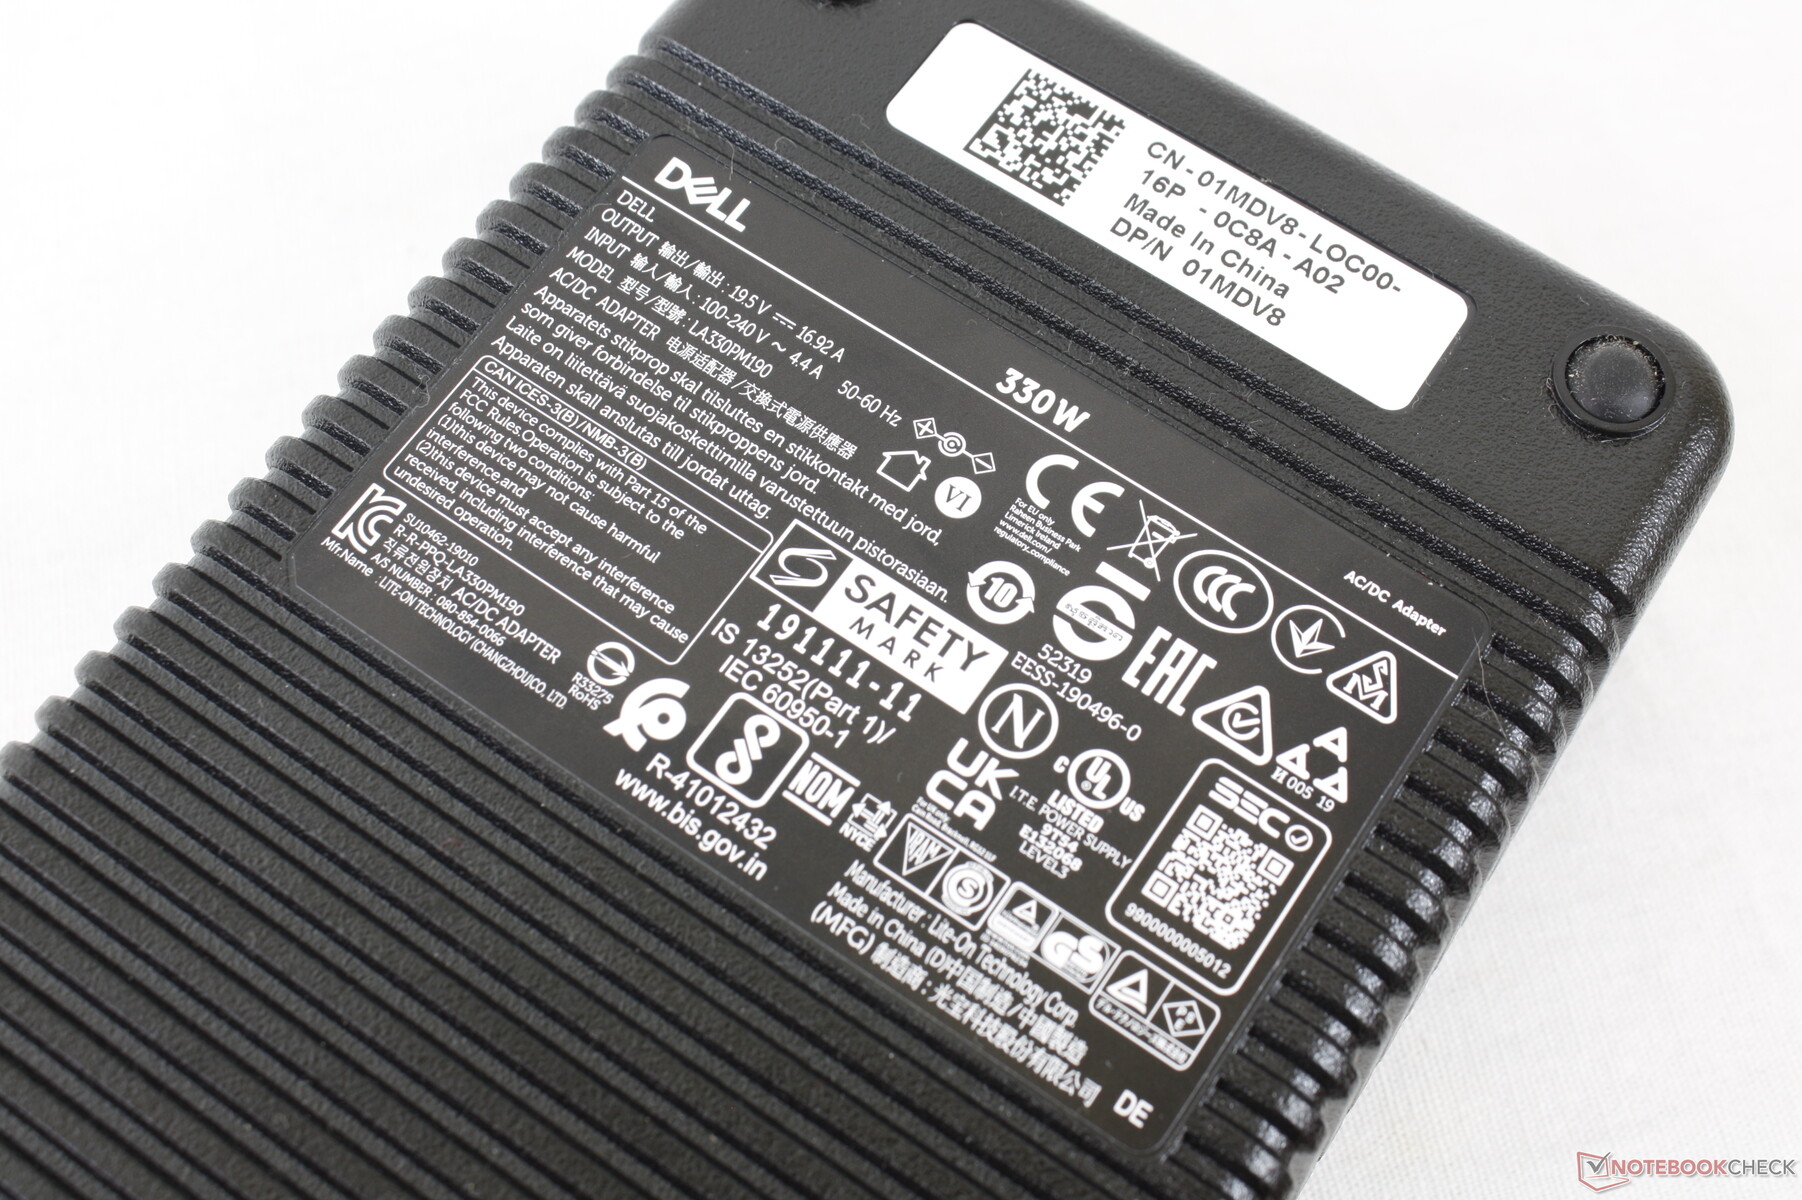
Our test unit ships with a large and heavy (~20 x 9.9 x 4.3 cm, 1.5 kg) 330 W AC adapter compared to the smaller 280 W or 230 W AC adapters of the ROG Zephyrus S17 or Razer Blade 17, respectively. We suspect that the oversized AC adapter is to better support the aforementioned higher TDP and TGP targets of the system as well as the battery charging rate when gaming. Dell offers a smaller 240 W AC adapter for the lesser RTX 3060 SKUs.


| Off / Standby | |
| Idle | |
| Load |
|
Key:
min: | |
| Alienware x17 RTX 3080 P48E i7-11800H, GeForce RTX 3080 Laptop GPU, 2x WDC PC SN730 SDBPNTY-1T00 (RAID 0), IPS, 3840x2160, 17.3" | Alienware m17 R4 i9-10980HK, GeForce RTX 3080 Laptop GPU, 2x Micron 2300 512 GB (RAID 0), IPS, 1920x1080, 17.3" | Razer Blade 17 RTX 3070 i7-11800H, GeForce RTX 3070 Laptop GPU, Samsung PM9A1 MZVL21T0HCLR, IPS, 1920x1080, 17.3" | Asus ROG Zephyrus S17 GX703HSD i9-11900H, GeForce RTX 3080 Laptop GPU, Samsung PM9A1 MZVL22T0HBLB, IPS, 2560x1440, 17.3" | MSI GS76 Stealth 11UH i9-11900H, GeForce RTX 3080 Laptop GPU, Samsung PM9A1 MZVL22T0HBLB, IPS, 3840x2160, 17.3" | Gigabyte Aero 17 HDR YD i9-11980HK, GeForce RTX 3080 Laptop GPU, Samsung PM9A1 MZVL2512HCJQ, IPS, 3840x2160, 17.3" | |
|---|---|---|---|---|---|---|
| Power Consumption | -80% | -11% | -10% | 13% | -20% | |
| Idle Minimum * (Watt) | 10.2 | 42 -312% | 20.9 -105% | 21.7 -113% | 14 -37% | 25 -145% |
| Idle Average * (Watt) | 21.2 | 48 -126% | 25.1 -18% | 27 -27% | 19 10% | 28 -32% |
| Idle Maximum * (Watt) | 48.4 | 58 -20% | 45 7% | 33 32% | 31 36% | 40 17% |
| Load Average * (Watt) | 118.7 | 124 -4% | 102 14% | 108 9% | 97 18% | 114 4% |
| Witcher 3 ultra * (Watt) | 249 | 219 12% | 189 24% | 195 22% | 156 37% | 176 29% |
| Load Maximum * (Watt) | 262 | 337 -29% | 234.8 10% | 210 20% | 231 12% | 236 10% |
* ... smaller is better
Power Consumption Witcher 3 / Stresstest
Battery Life — Not Bad for the Size
Runtimes were terrible on the last generation m17 series even when all performance settings were set to minimum. Thankfully, battery life has improved significantly on the x17 without needing to up battery capacity. Users can now expect just under 6 hours of real-world WLAN use compared to ~2.5 hours on the m17 R4 which is decent for a high-performance gaming laptop. Results are generally comparable to the MSI GS76 or Gigabyte Aero 17 which come with larger 99 Wh batteries.
Charging from empty to full capacity is very fast at around 75 minutes with the included AC barrel adapter.
| Alienware x17 RTX 3080 P48E i7-11800H, GeForce RTX 3080 Laptop GPU, 87 Wh | Alienware m17 R4 i9-10980HK, GeForce RTX 3080 Laptop GPU, 86 Wh | Razer Blade 17 RTX 3070 i7-11800H, GeForce RTX 3070 Laptop GPU, 70 Wh | Asus ROG Zephyrus S17 GX703HSD i9-11900H, GeForce RTX 3080 Laptop GPU, 90 Wh | MSI GS76 Stealth 11UH i9-11900H, GeForce RTX 3080 Laptop GPU, 99.9 Wh | Gigabyte Aero 17 HDR YD i9-11980HK, GeForce RTX 3080 Laptop GPU, 99 Wh | |
|---|---|---|---|---|---|---|
| Battery runtime | -5% | 24% | 133% | 37% | 23% | |
| Reader / Idle (h) | 7 | 6.7 -4% | 9.9 41% | |||
| WiFi v1.3 (h) | 5.9 | 2.4 -59% | 5.2 -12% | 7.5 27% | 6.4 8% | 5.6 -5% |
| Load (h) | 0.8 | 1.2 50% | 1.5 88% | 2.7 238% | 1.3 63% | 1.2 50% |
| Witcher 3 ultra (h) | 1 |
Pros
Cons
Verdict — Larger and Heavier for all the Right Reasons
The most compelling features of the Alienware x17 are its processor performance and CherryMX mechanical keys. The Core i7-11800H CPU here runs noticeably faster than on other laptops equipped with the exact same chip while the clicky mechanical keys are some of the most comfortable we've used on any gaming laptop.
Dell's Alienware x17 isn't afraid to maximize performance even if it means being slightly bigger and heavier than the rest.
All that performance comes at the cost of core temperature, power consumption, size, and weight as alternative models like the Razer Blade 17, MSI GS76 Stealth, or Asus ROG Zephyrus S17 are all smaller, lighter, and more power efficient while offering similar Intel and Nvidia options. These systems tend to run a bit slower, however, and so it'll be up to users to balance performance with their personal portability preferences. If you're content with RTX 3060-level performance, then the lighter Razer or MSI may be the better option while RTX 3080 performance hunters can squeeze out much more from the Alienware x17 and its comparatively larger cooling system.
Price and availability
Different configurations of the Alienware x17 R1 are now available at Best Buy and Newegg starting at $2399 USD at the time of writing. Alternatively, users can order directly from Dell who will naturally have more SKUs and options.
Alienware x17 RTX 3080 P48E
- 09/24/2021 v7 (old)
Allen Ngo
Price comparison
