 Deutsch
 English
 Español
 Français
 Italiano
 Nederlands
 Polski
 Português
 Русский
 Türkçe
 Svenska
 Chinese
 Magyar
Alienware m17 (i9-8950HK, RTX 2080 Max-Q, 4K UHD) Laptop Review
When Dell retired the long-running Alienware 17 series, its legacy would continue to live on through the new Alienware Area-51m desktop replacement and thinner Alienware m17. The unit we're checking out today is the latter equipped to the brim with the Core i9-8950HK CPU, RTX 2080 Max-Q GPU, and 4K UHD display for about $3300 USD retail. Users who wish to configure with "only" the Core i7-8750H, RTX 2060, and FHD panel can find the model for less than half the price of our test unit.
As Dell's first Alienware laptop targeting the ultra-thin gaming market, the Alienware m17 competes against other ultra-thin 17.3-inch alternatives including the MSI GS75, Asus Zephyrus S GX701, Acer Predator Triton 700, Lenovo Legion Y740-17ICH, and the Walmart Overpowered 17. How well does the thin Alienware stack up against the competition and its older Alienware 17 brother?
More Alienware reviews:
Case
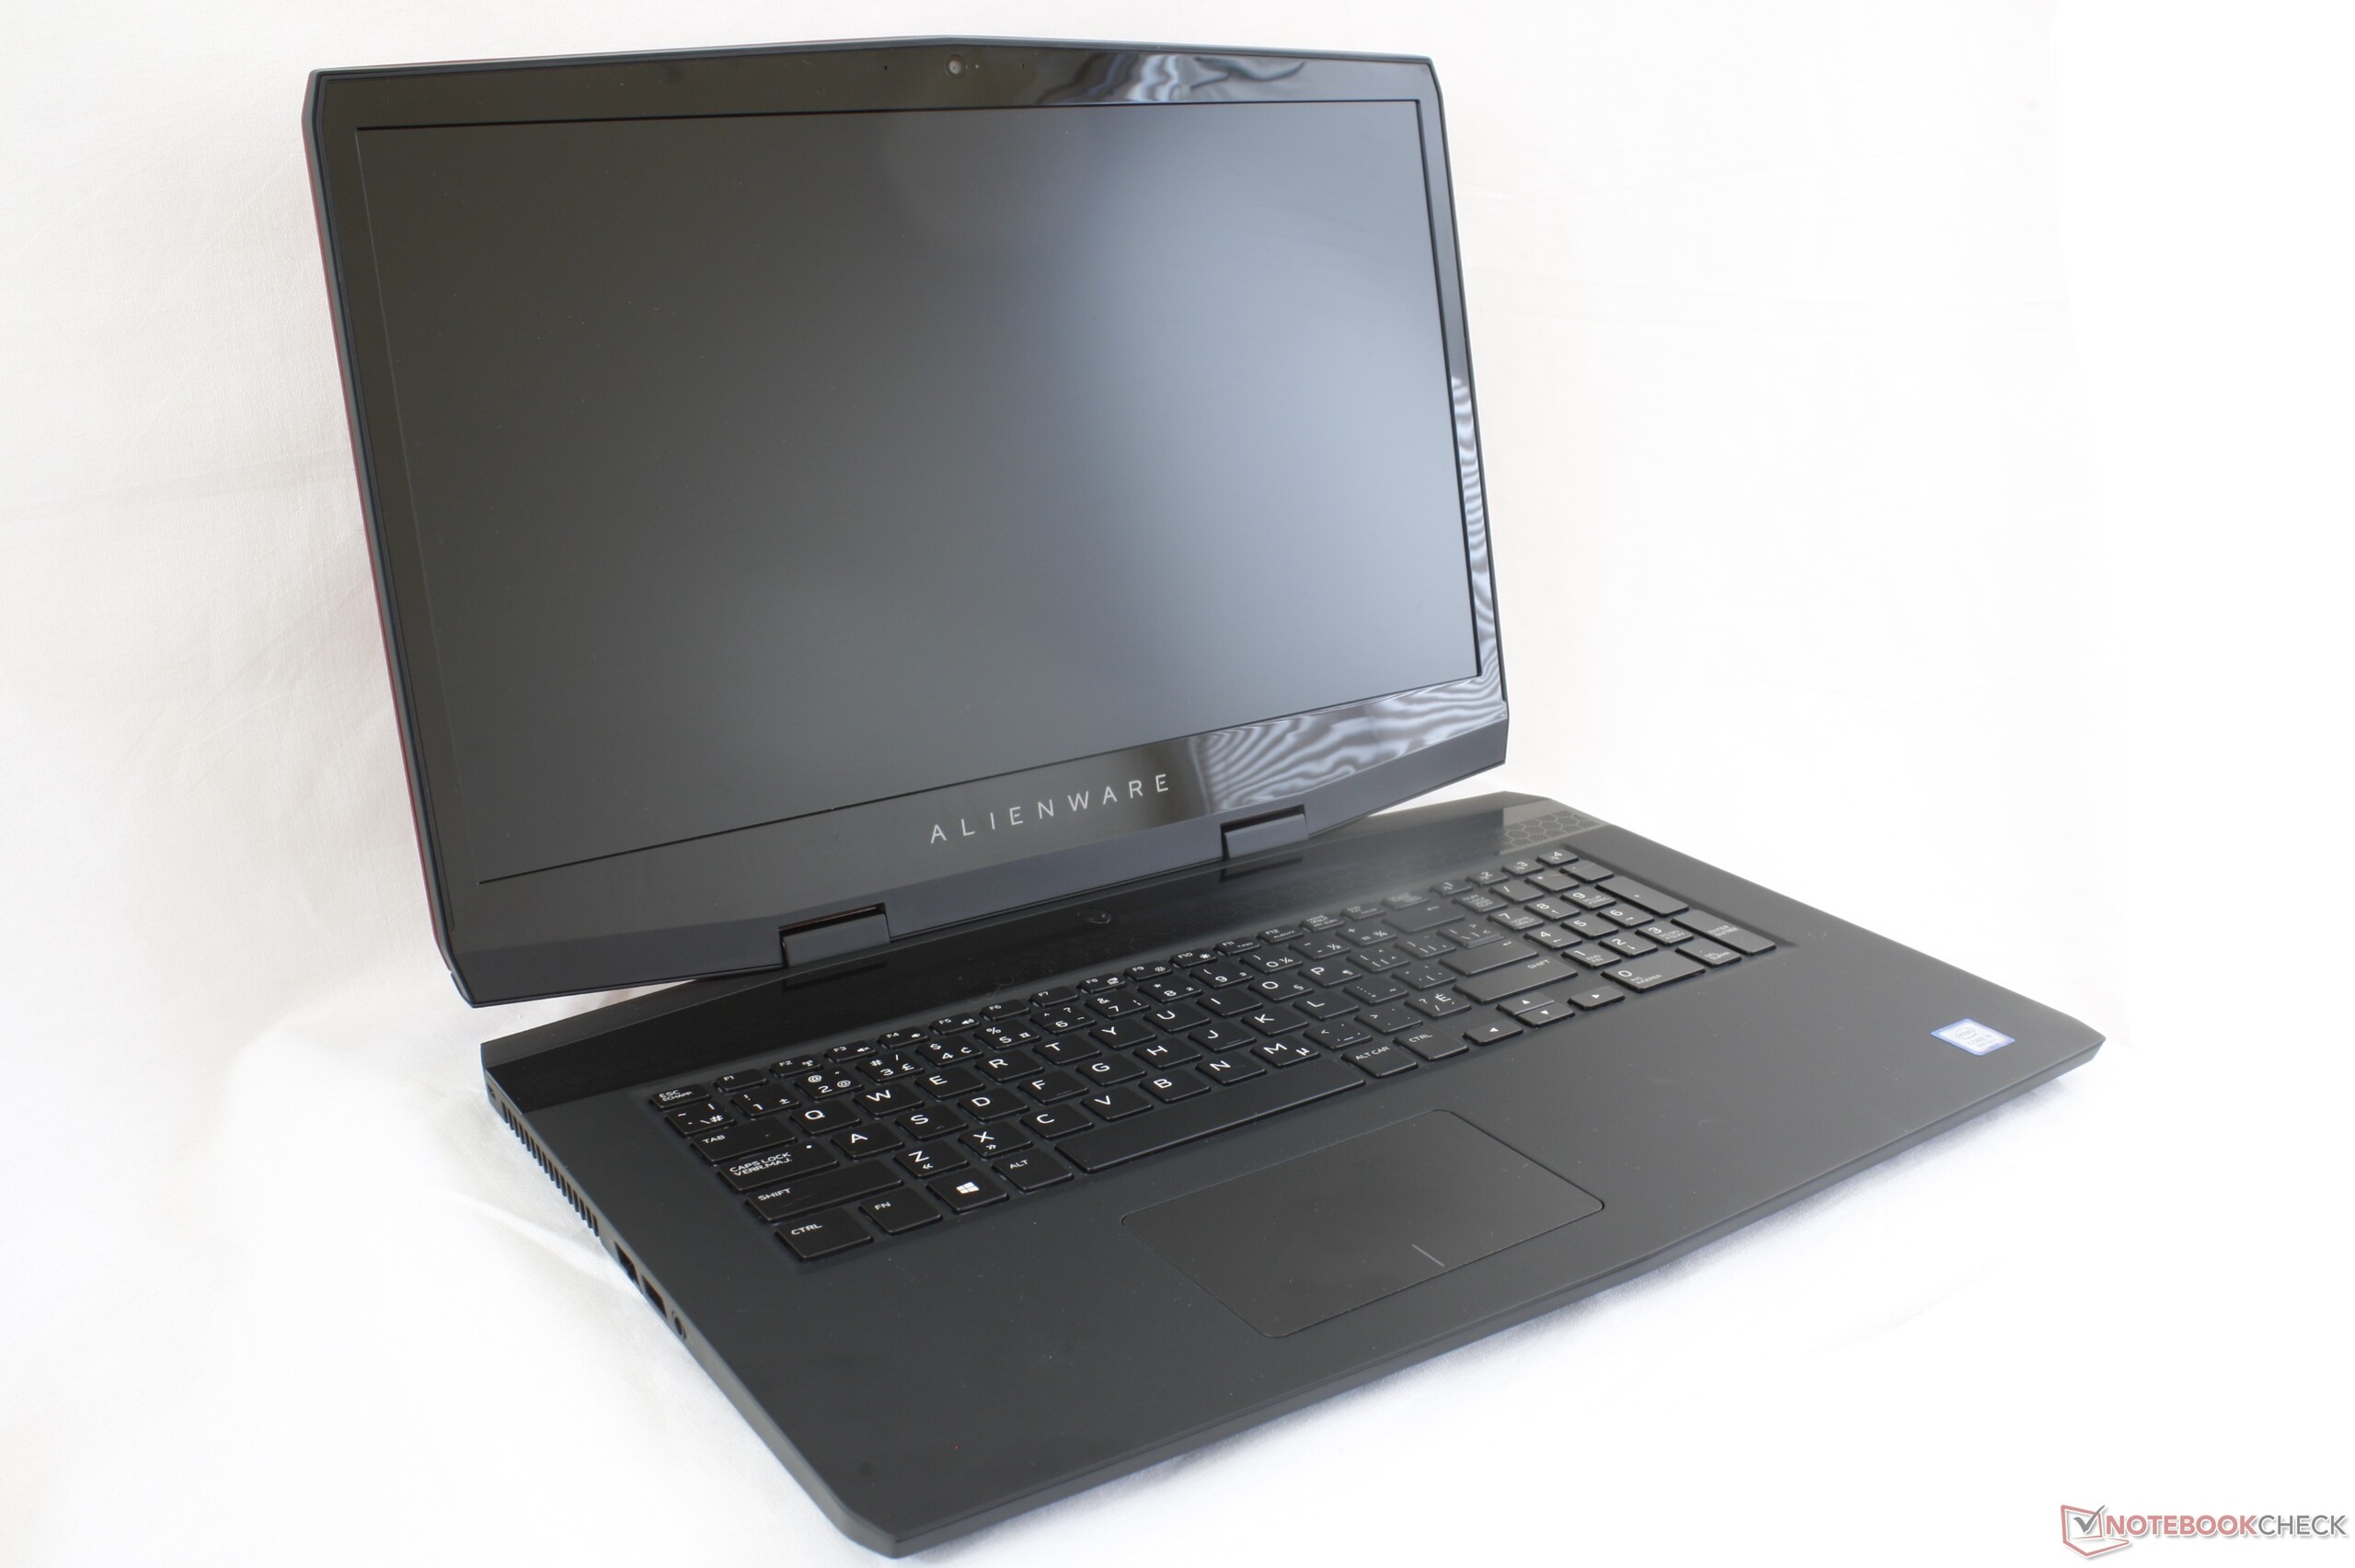
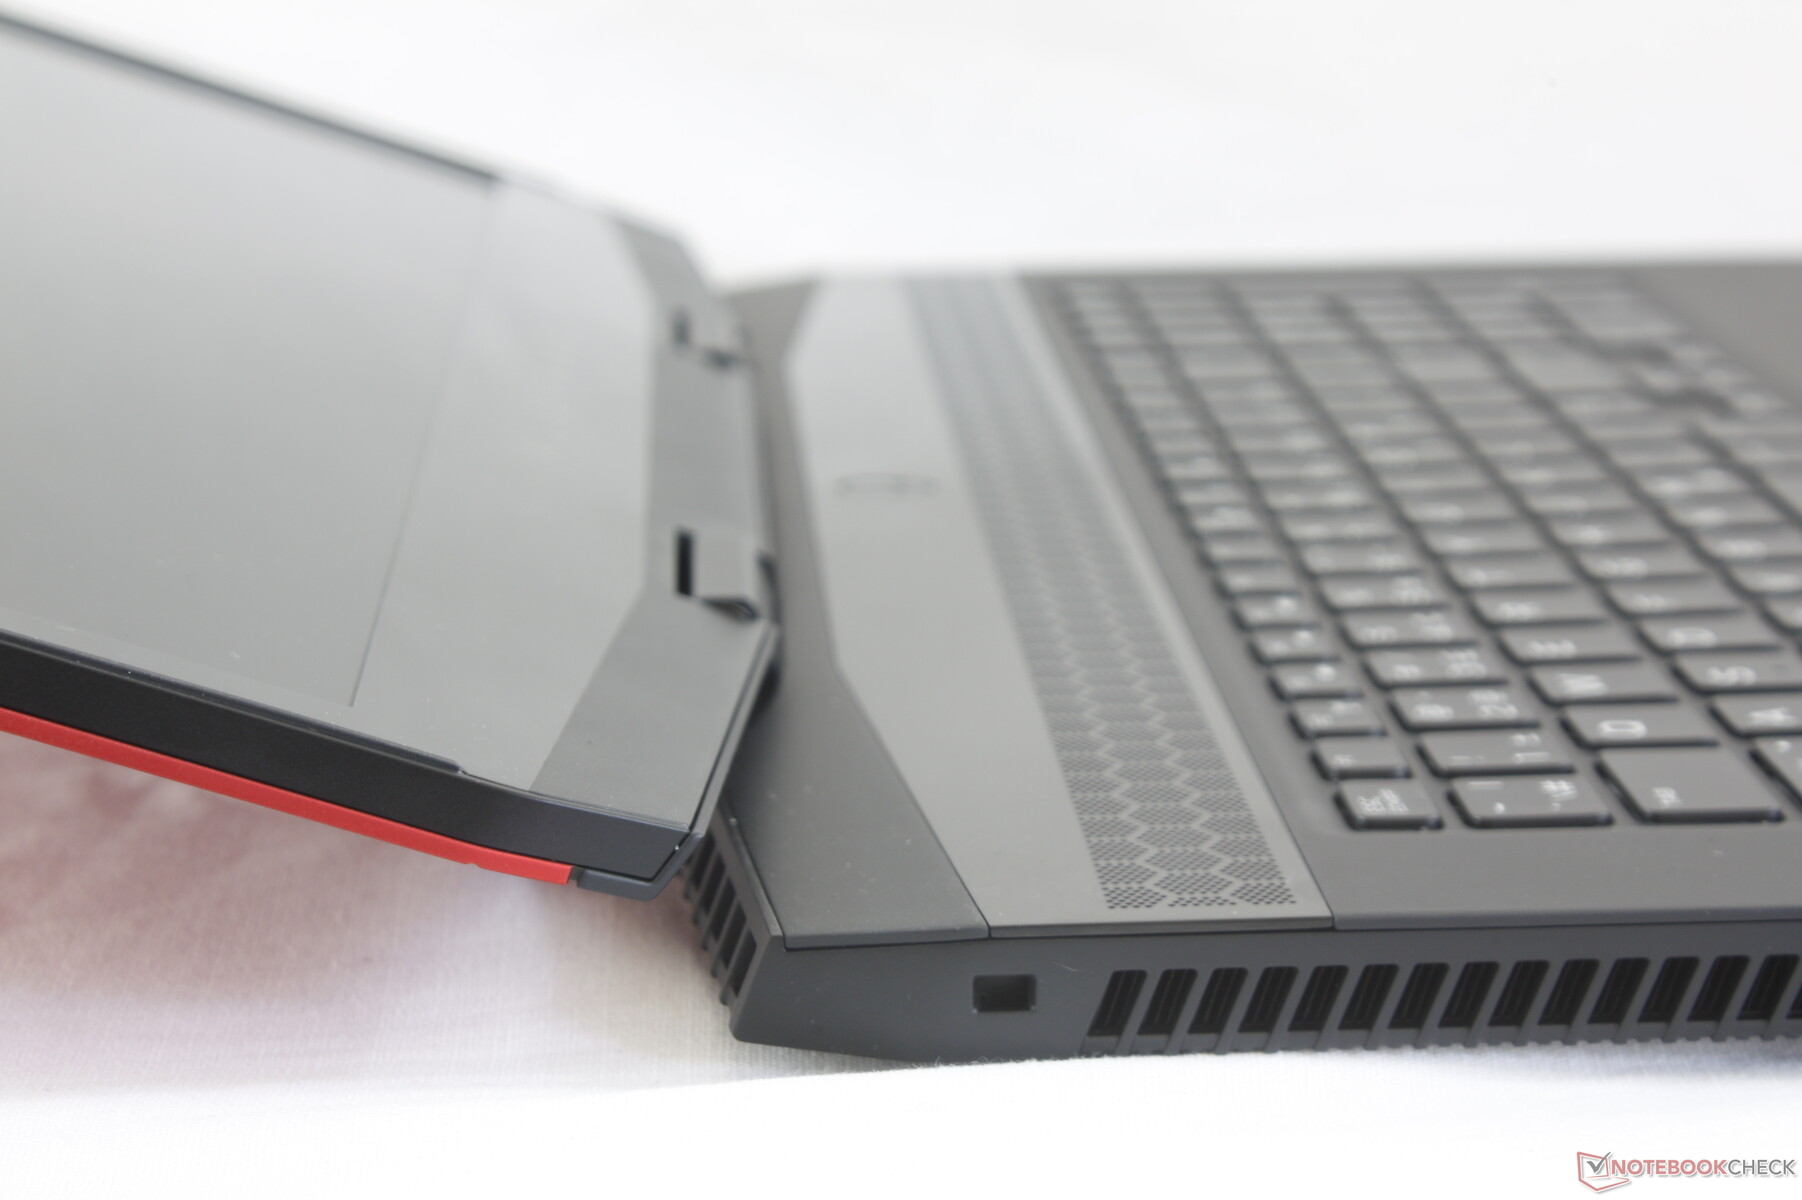
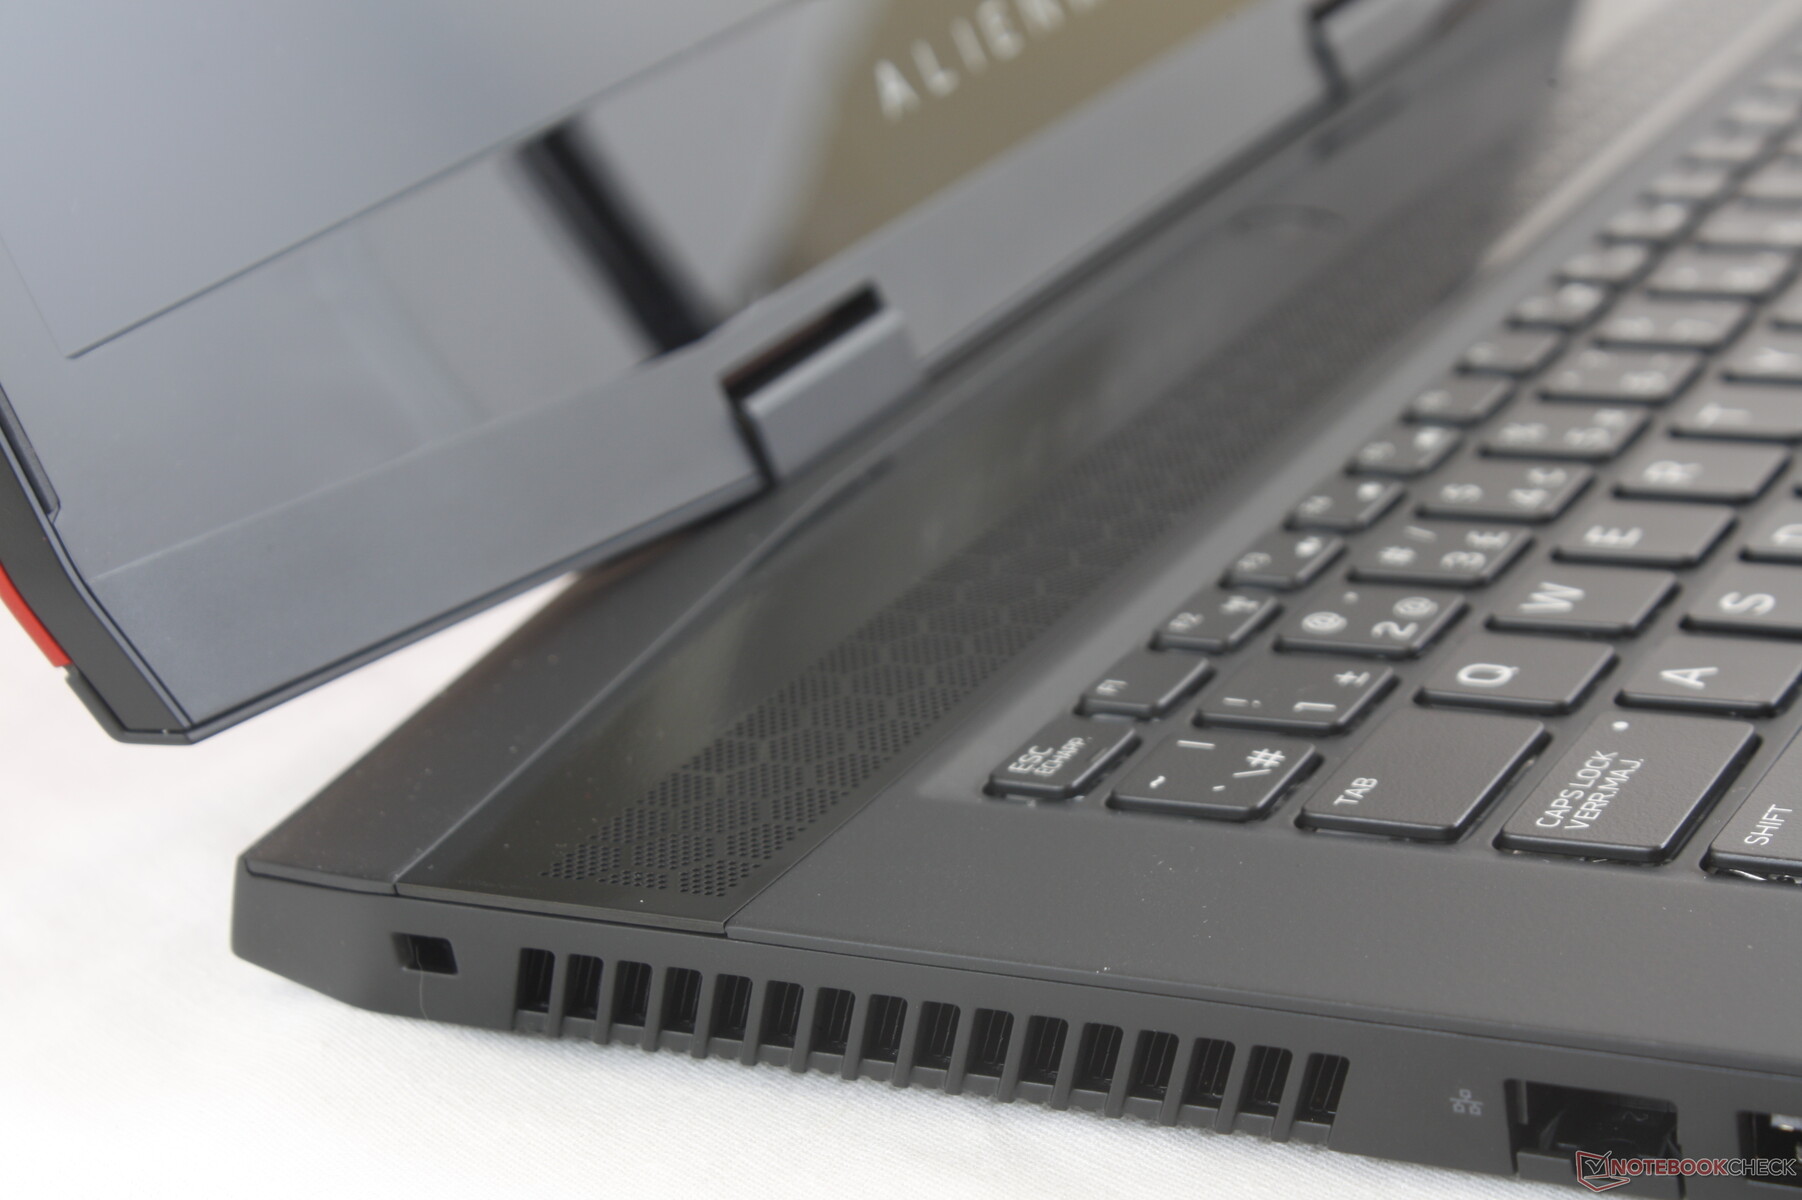
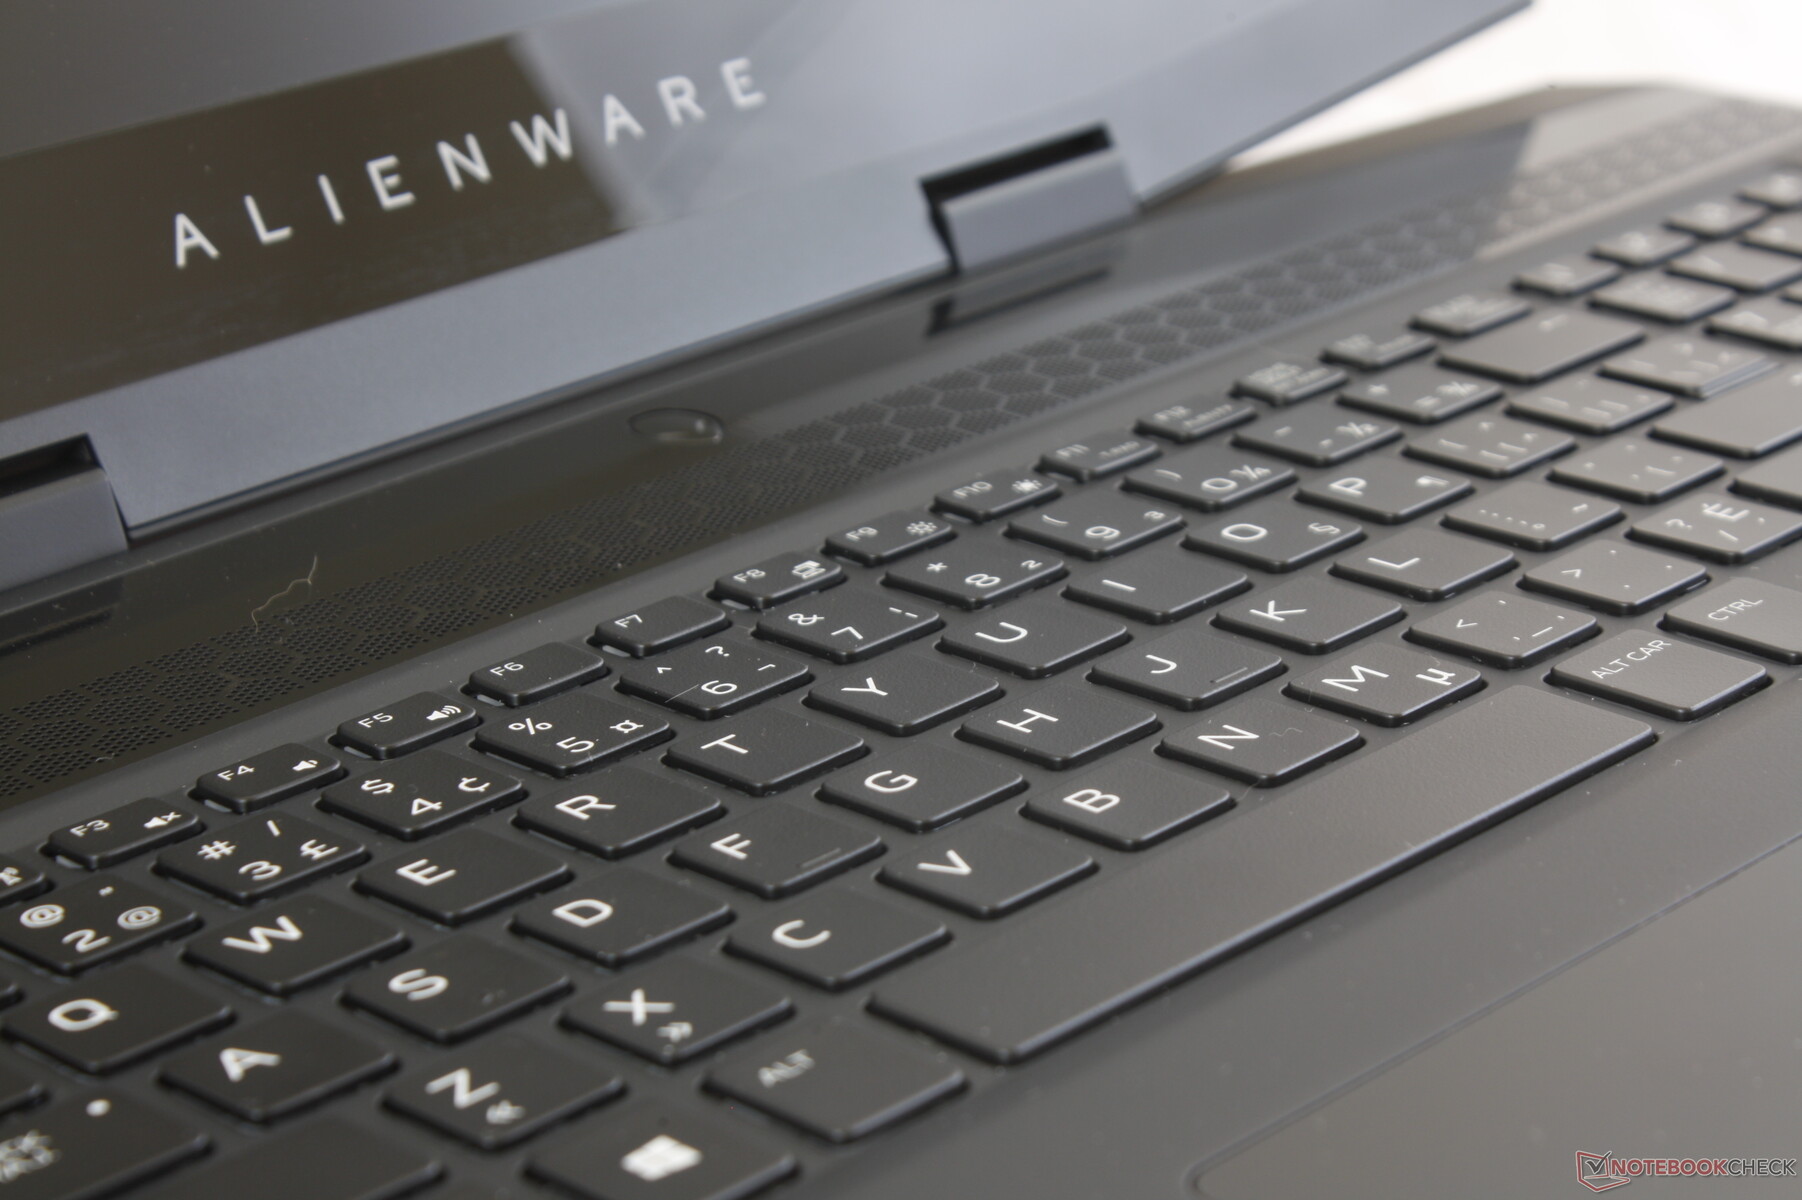
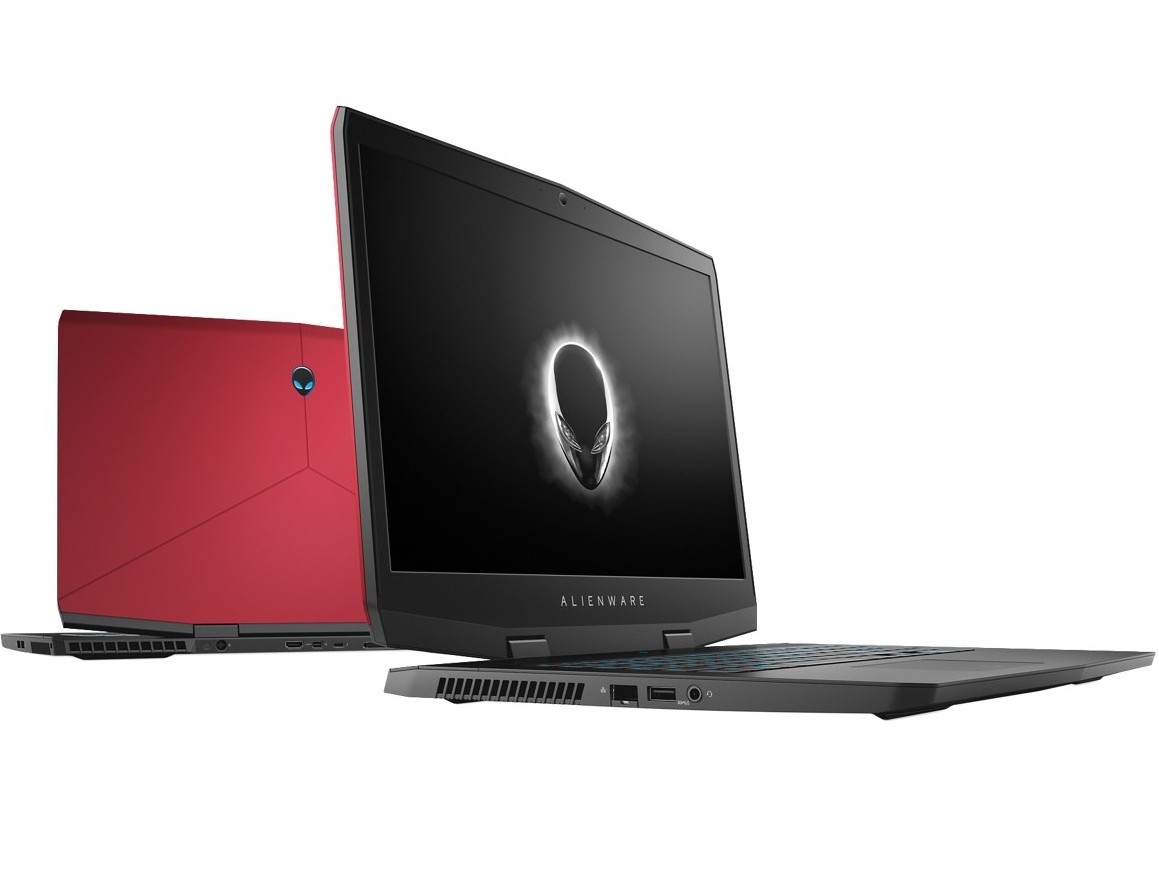
The Alienware m15 and m17 both share the same chassis design and materials. Thus, all our existing comments about the 15.6-inch Alienware m15 still apply here for the m17. In fact, this works in Dell's favor as we find that the chassis scales better to the larger 17-inch form factor when compared to competitors. The MSI GS75 and Asus Zephyrus GX701, for example, are 17-inch versions of the 15-inch GS65 and Zephyrus GX501. The larger versions are noticeably more flexible than their 15-inch counterparts while the same can't be said between the Alienware m15 and m17. The base remains tough with no creaking, the center of the keyboard is very resistant to yielding, and the hinges feel firmer than on both the GS75 or GX701. Its lid is especially more rigid for a stronger impression overall that comes close to what the thicker Alienware 17 offered.
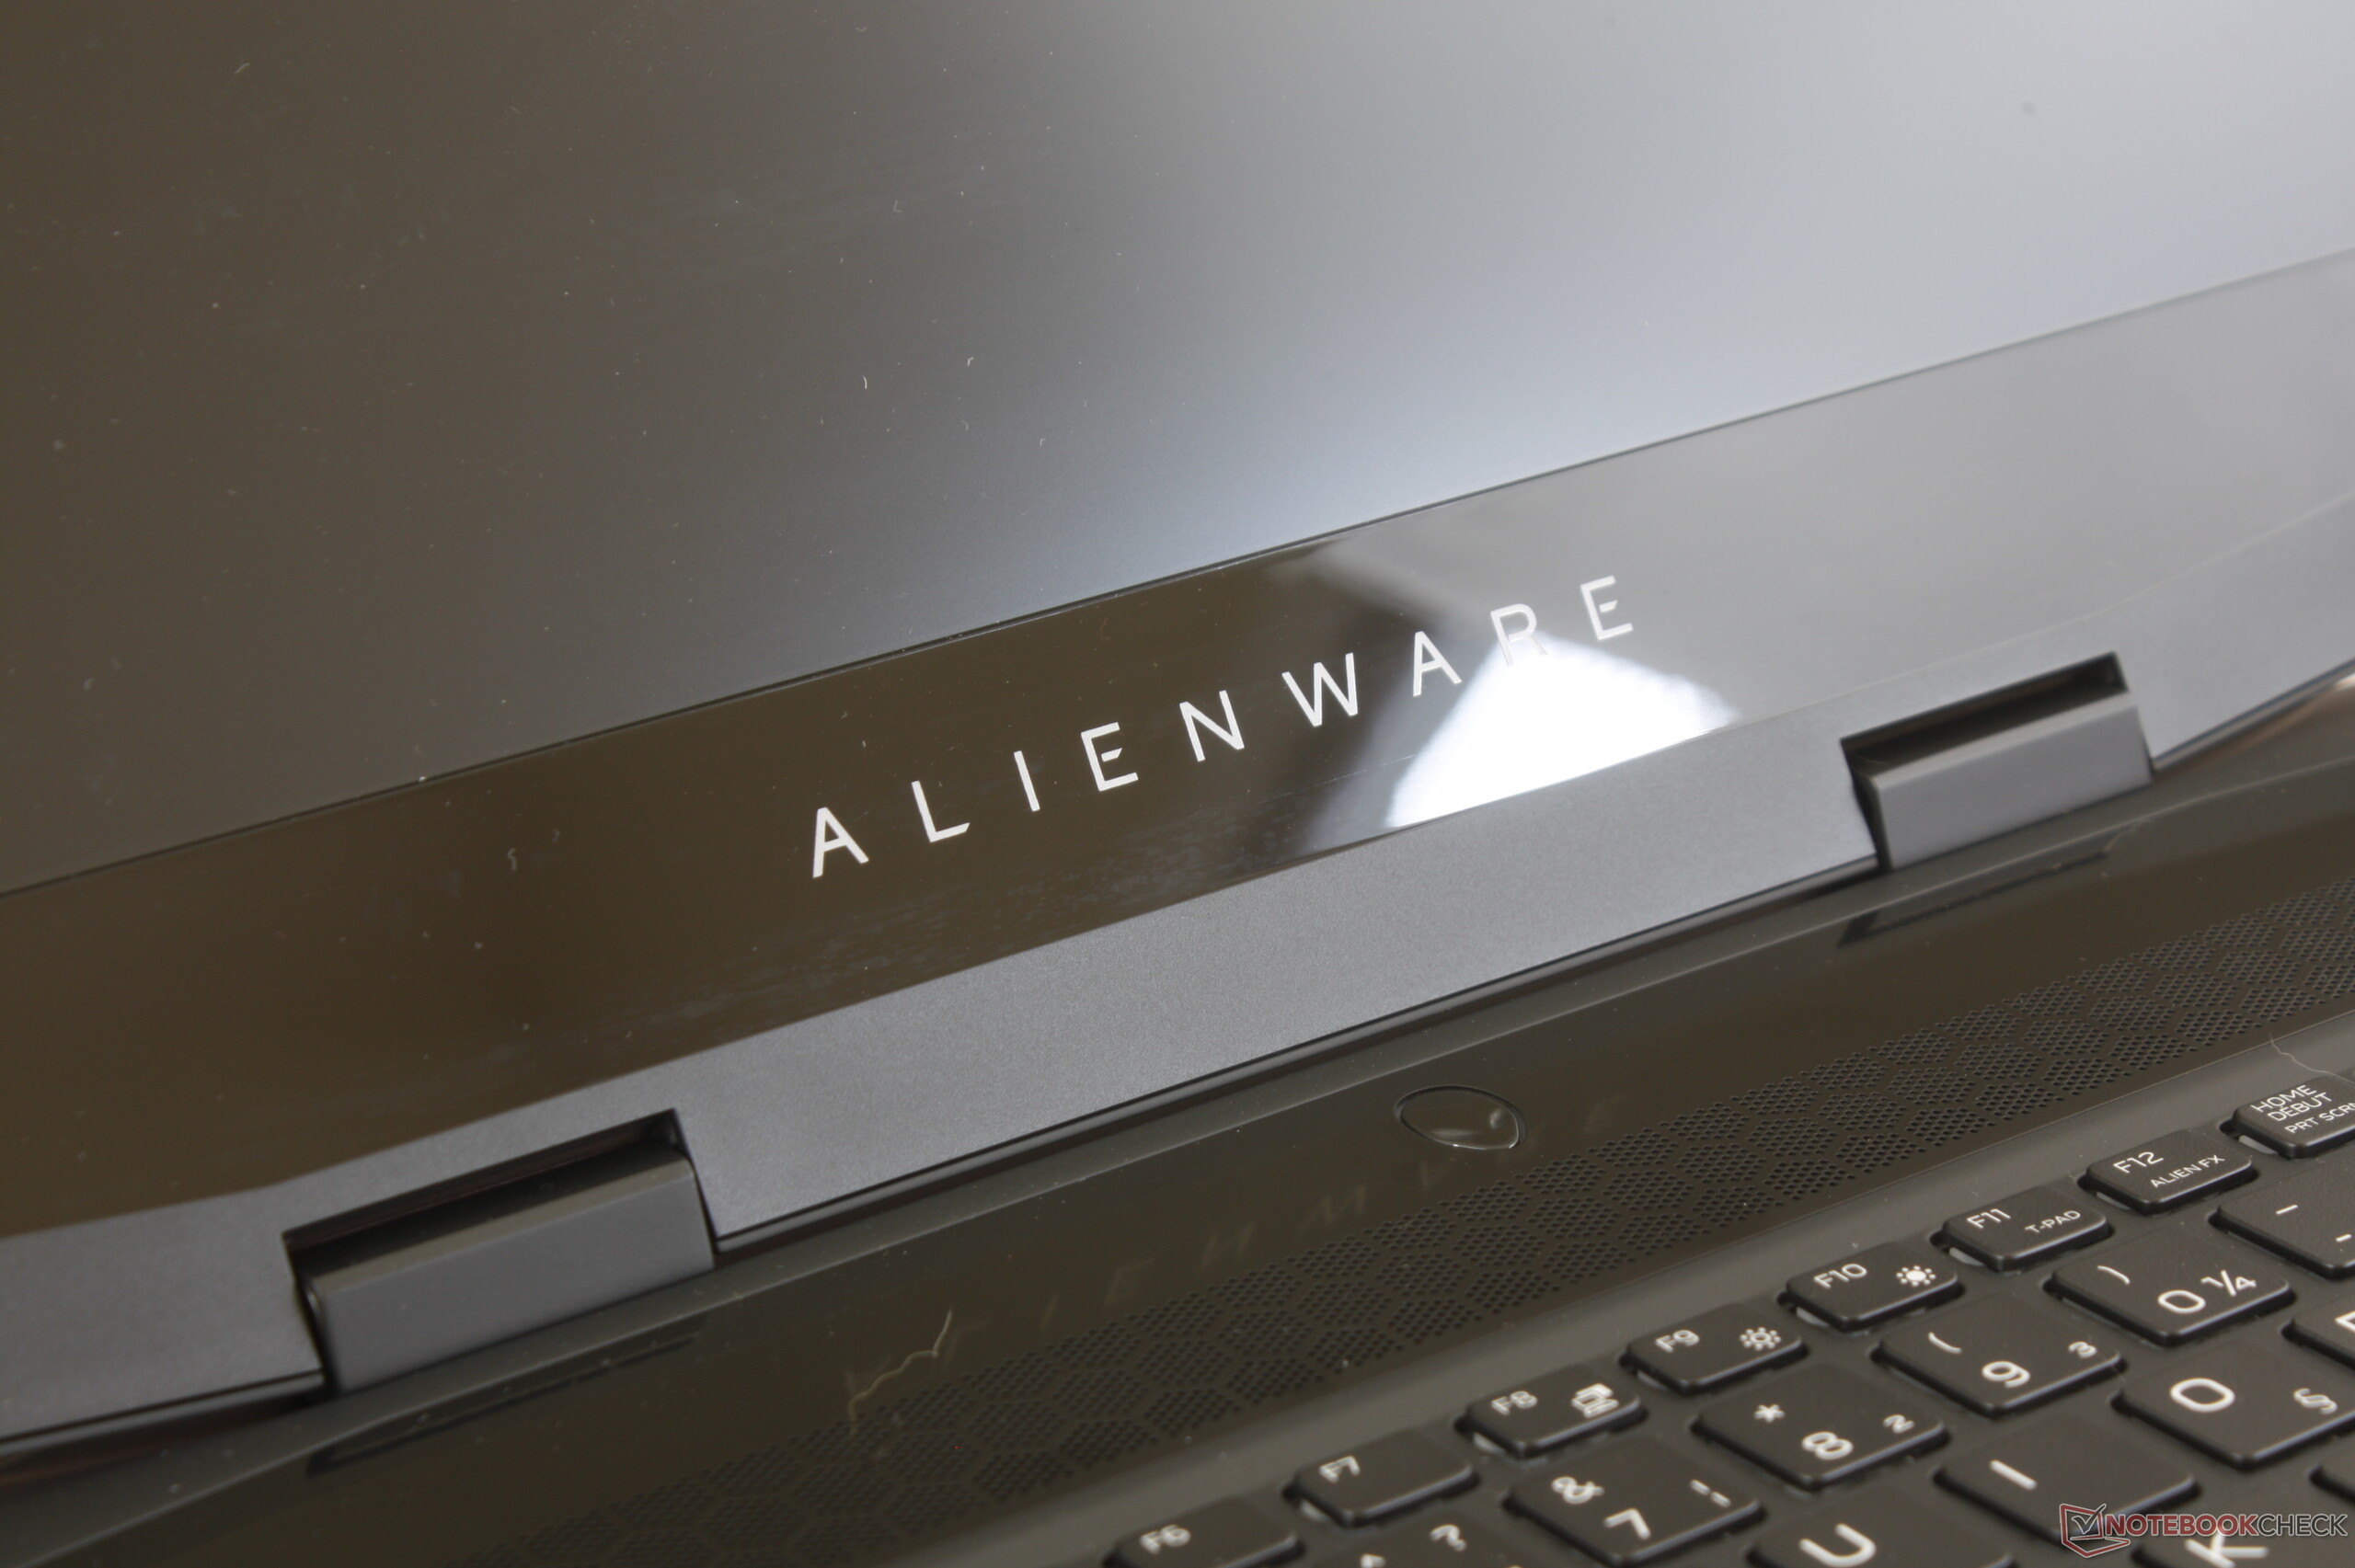
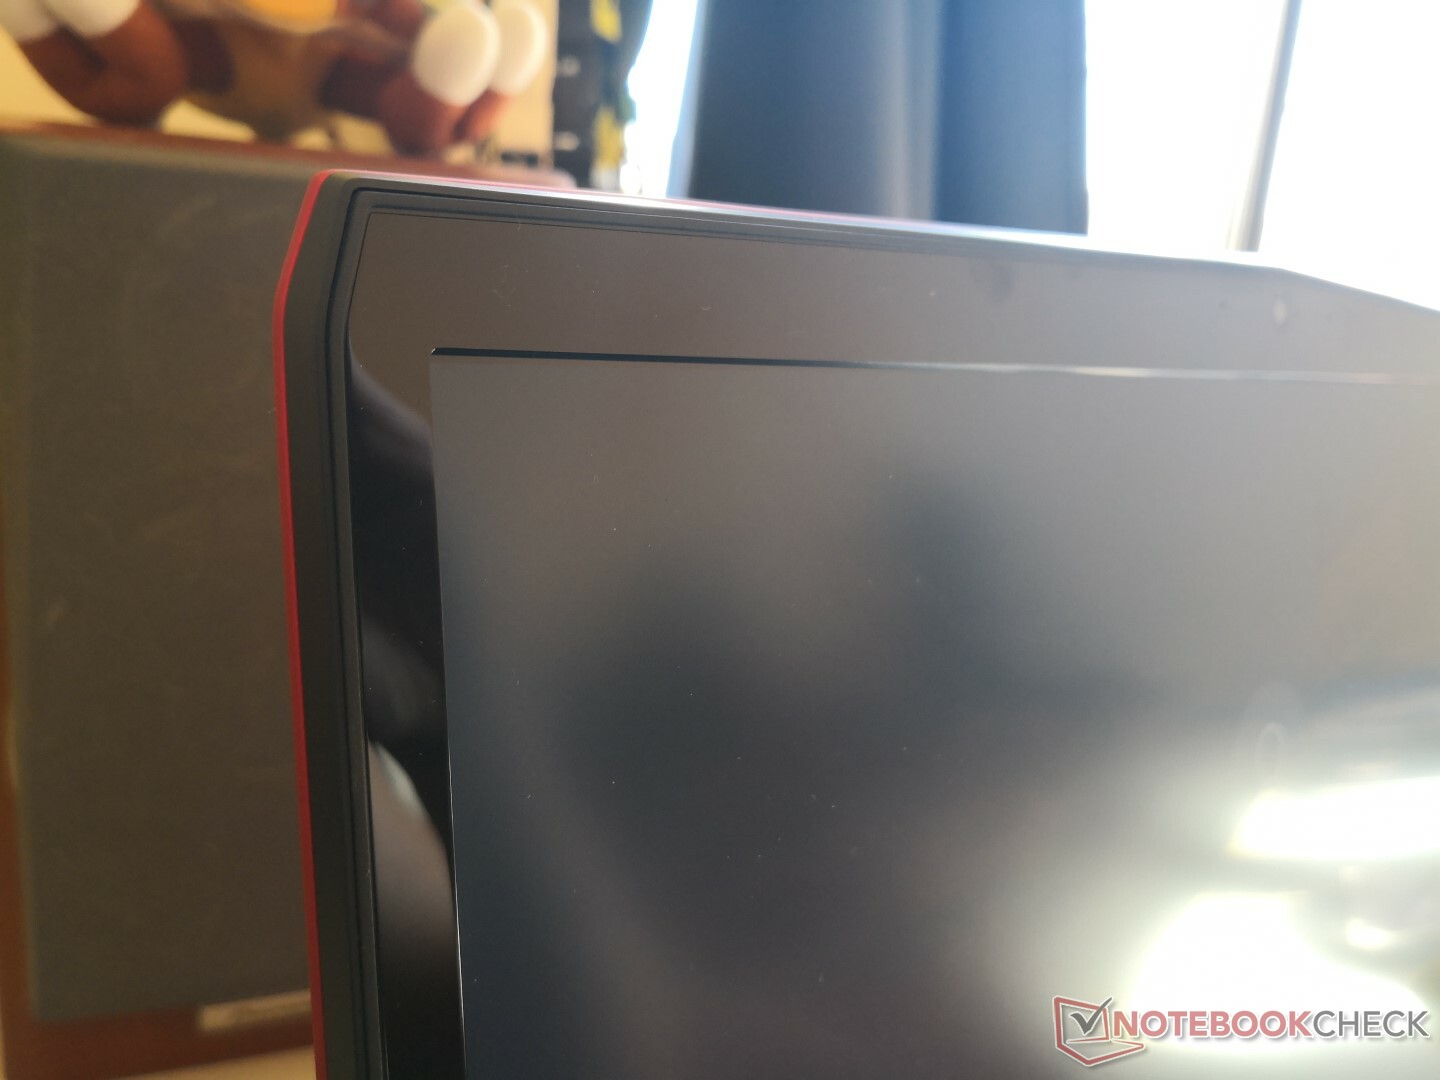
Our biggest complaint about the chassis is largely superficial. The rubberized palm rests and trackpad collect unsightly grease like no tomorrow while the reflective plastic inner bezel, which was not present on the older Alienware 17, does not flow well with the otherwise all-matte look.
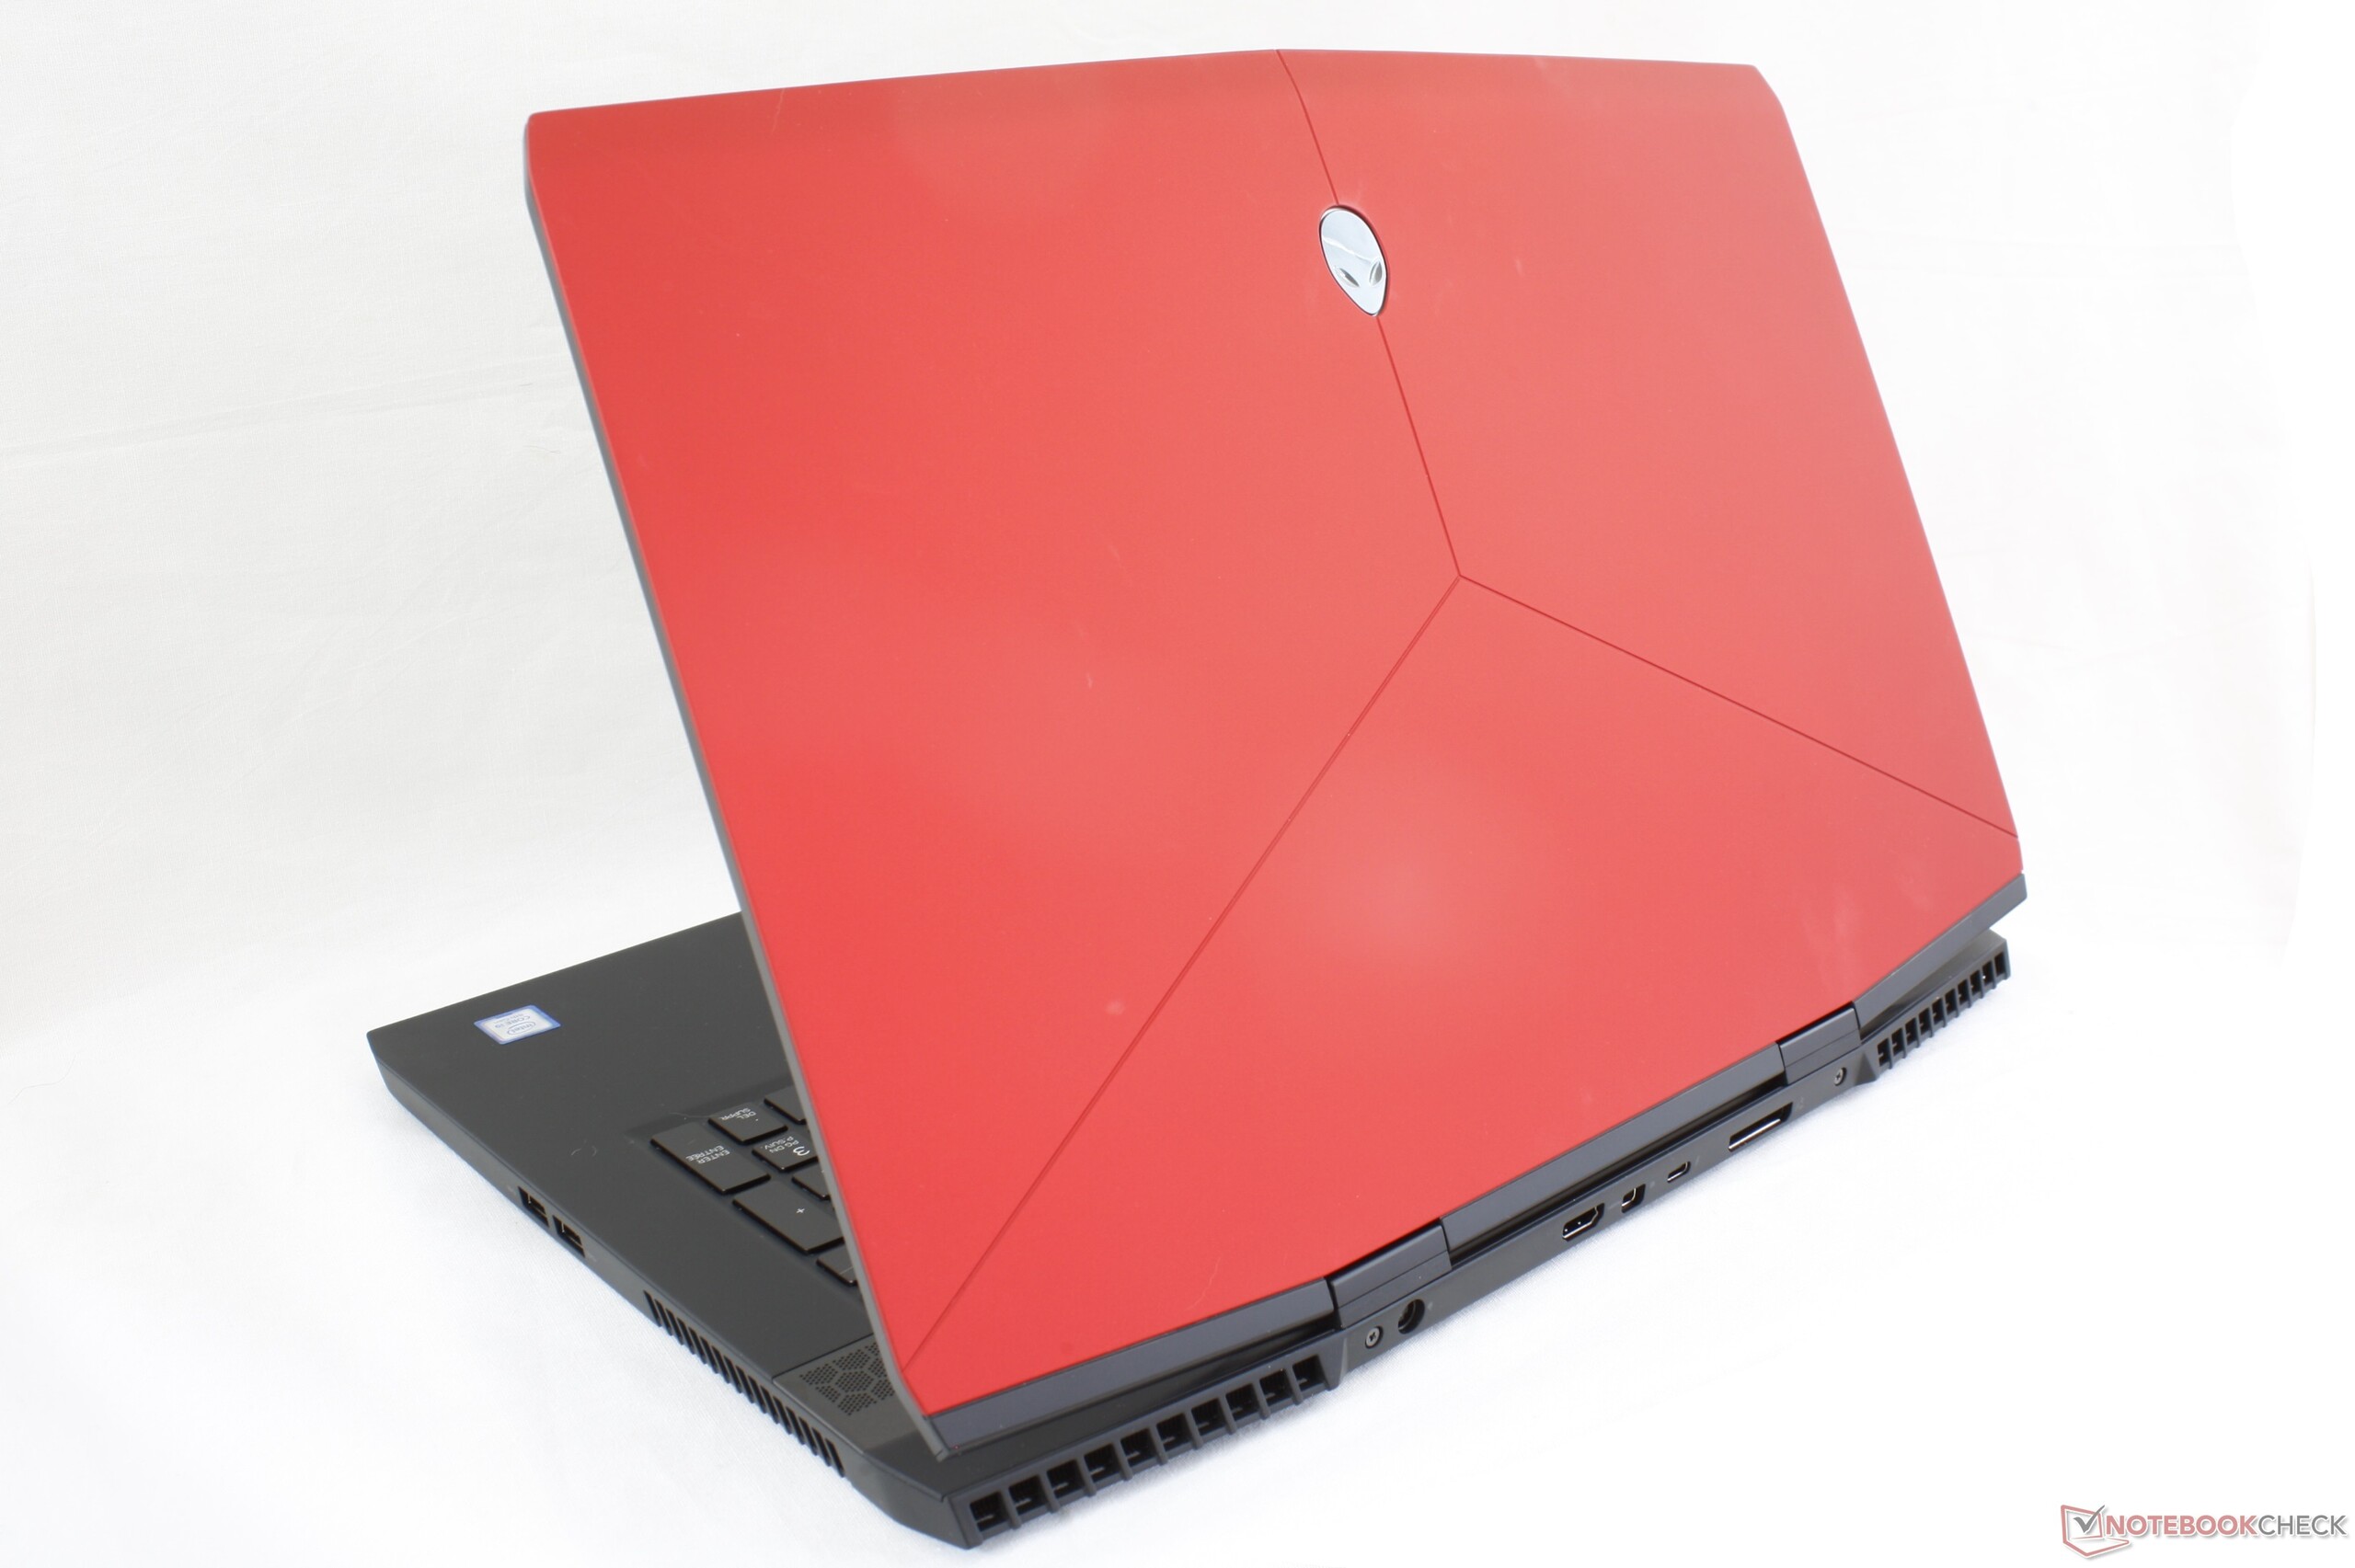
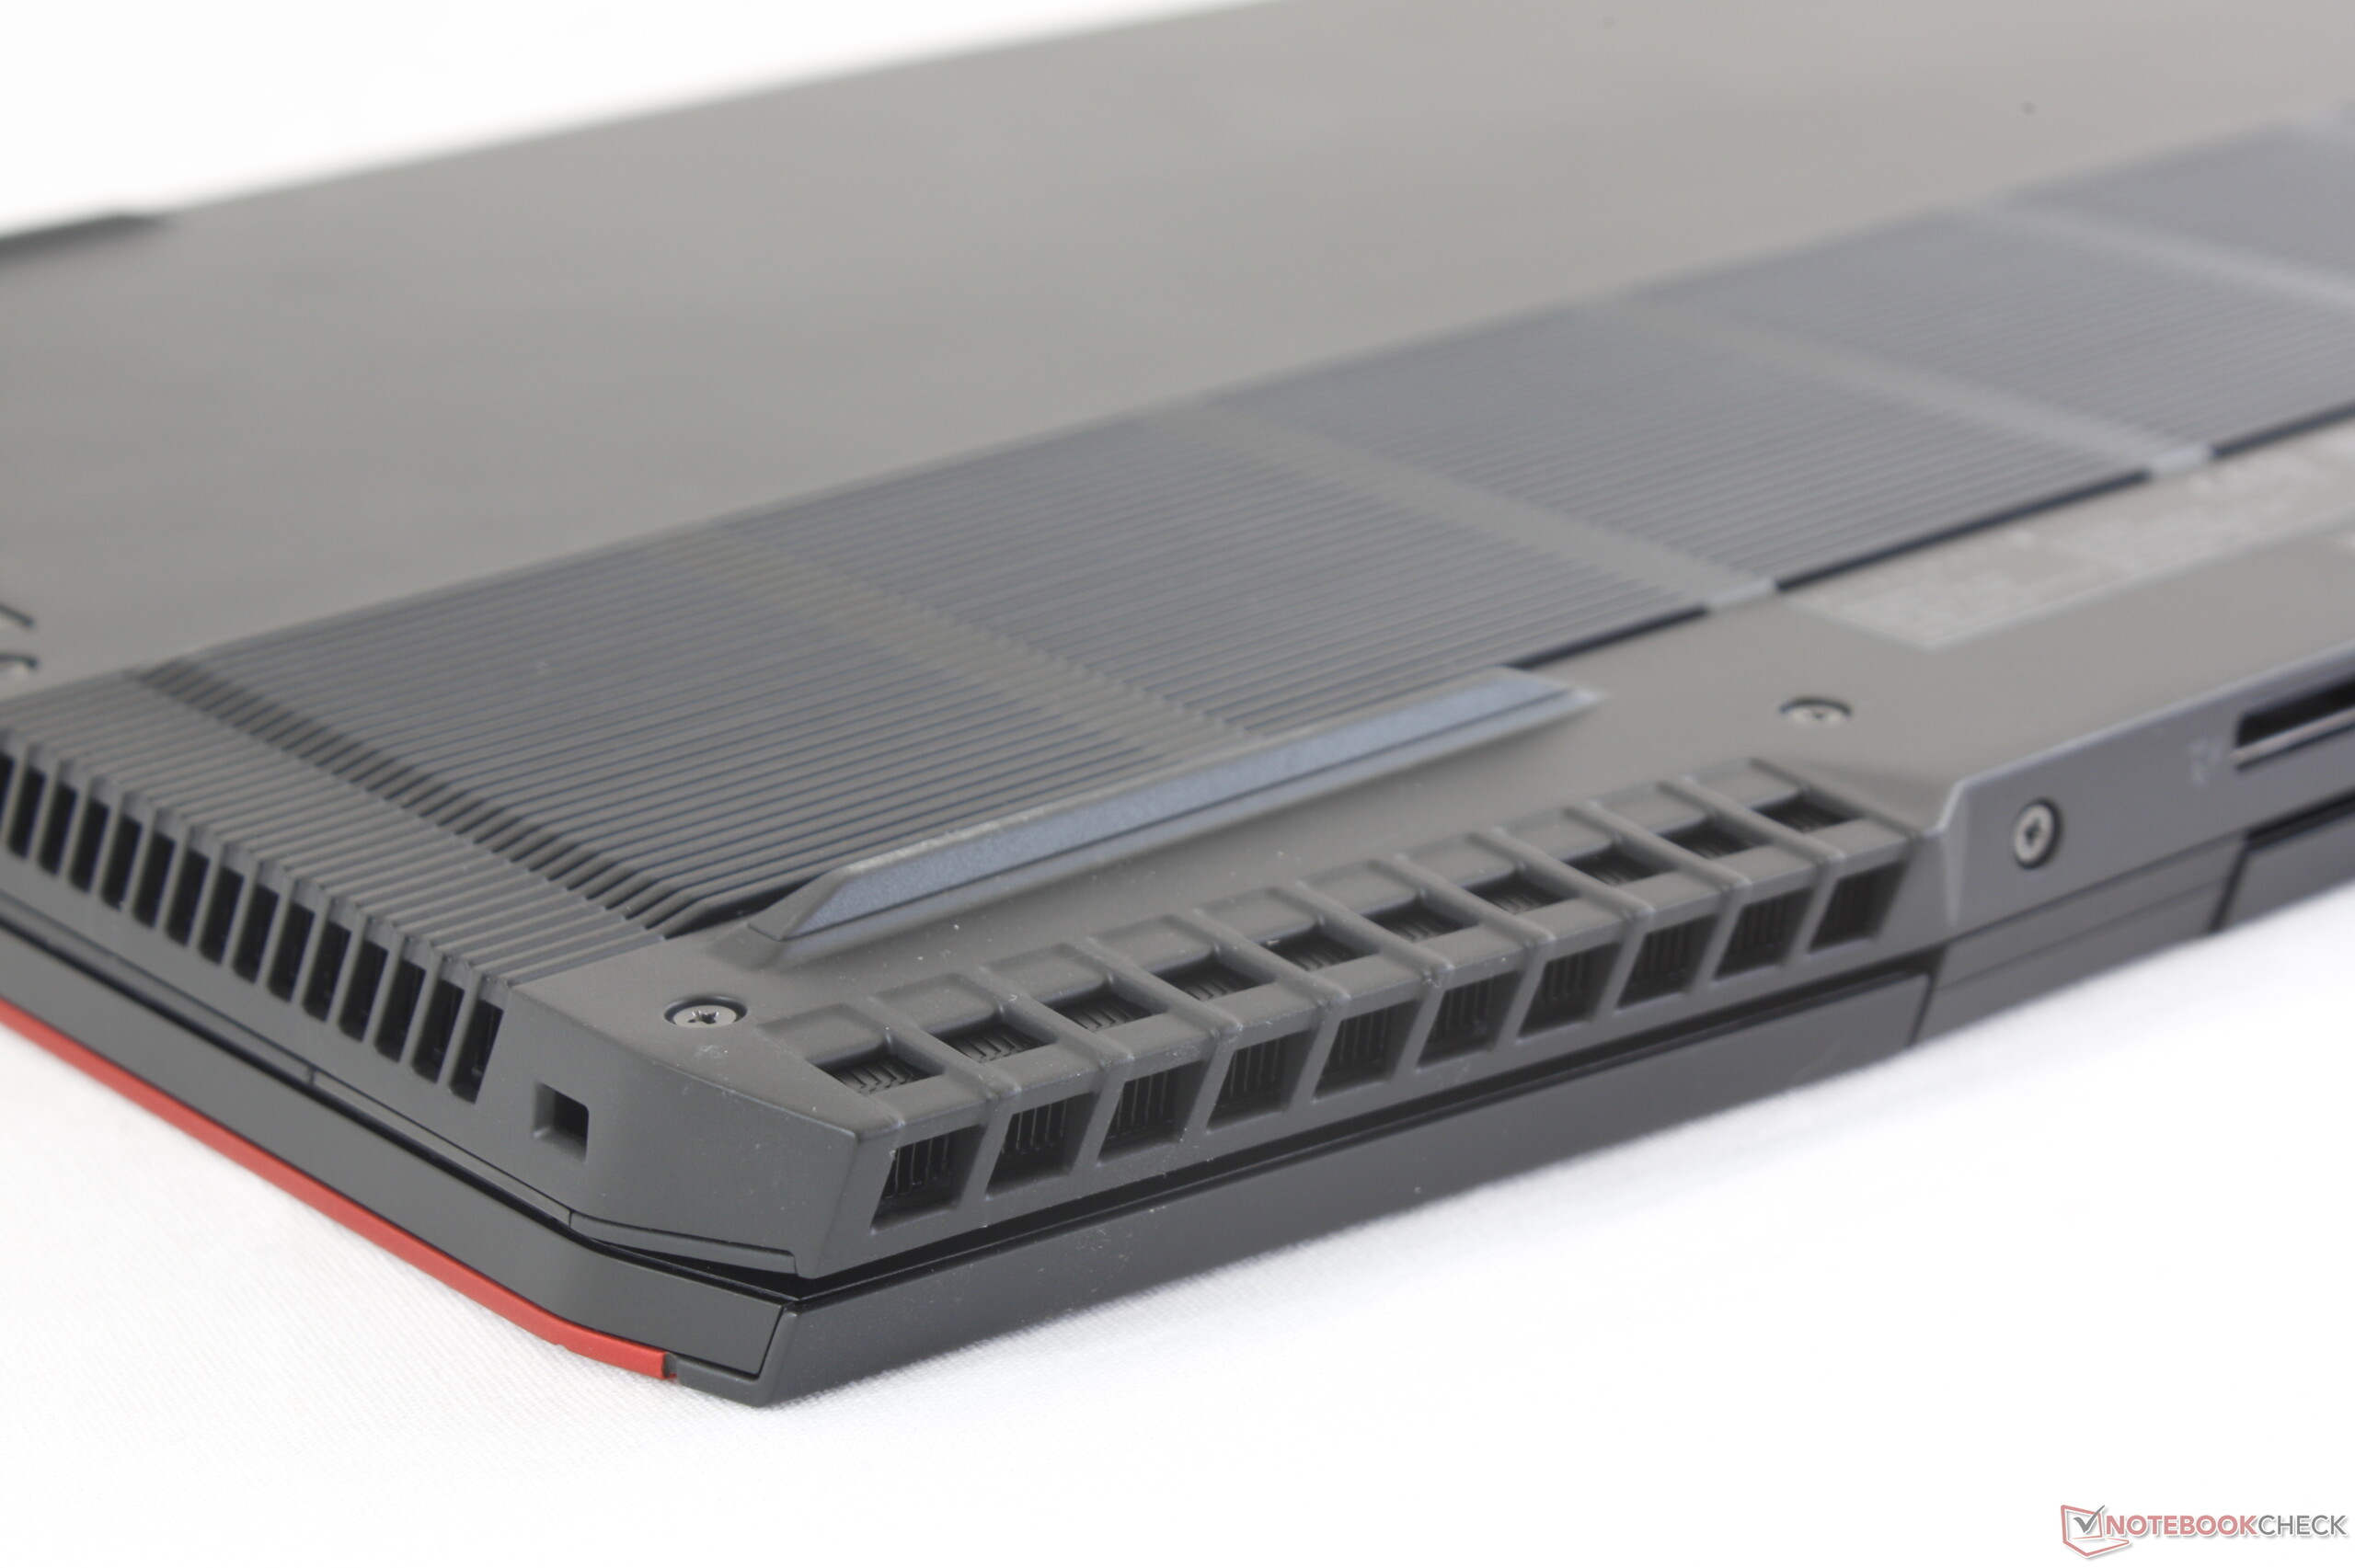
The structurally sound chassis comes at the cost of size and weight. Despite being significantly smaller and lighter than the now-outdated Alienware 17, the Alienware m17 is noticeably thicker and heavier than other ultra-thin laptops. The Acer Predator Triton 700, for example, is lighter by about 200 grams while the MSI GS75 is smaller in all three dimensions. As a result, the Alienware m17 is more of a medium-sized solution for gamers who may want something more rigid than an MSI GS75 without being oversized like the Asus ROG G703.
Connectivity
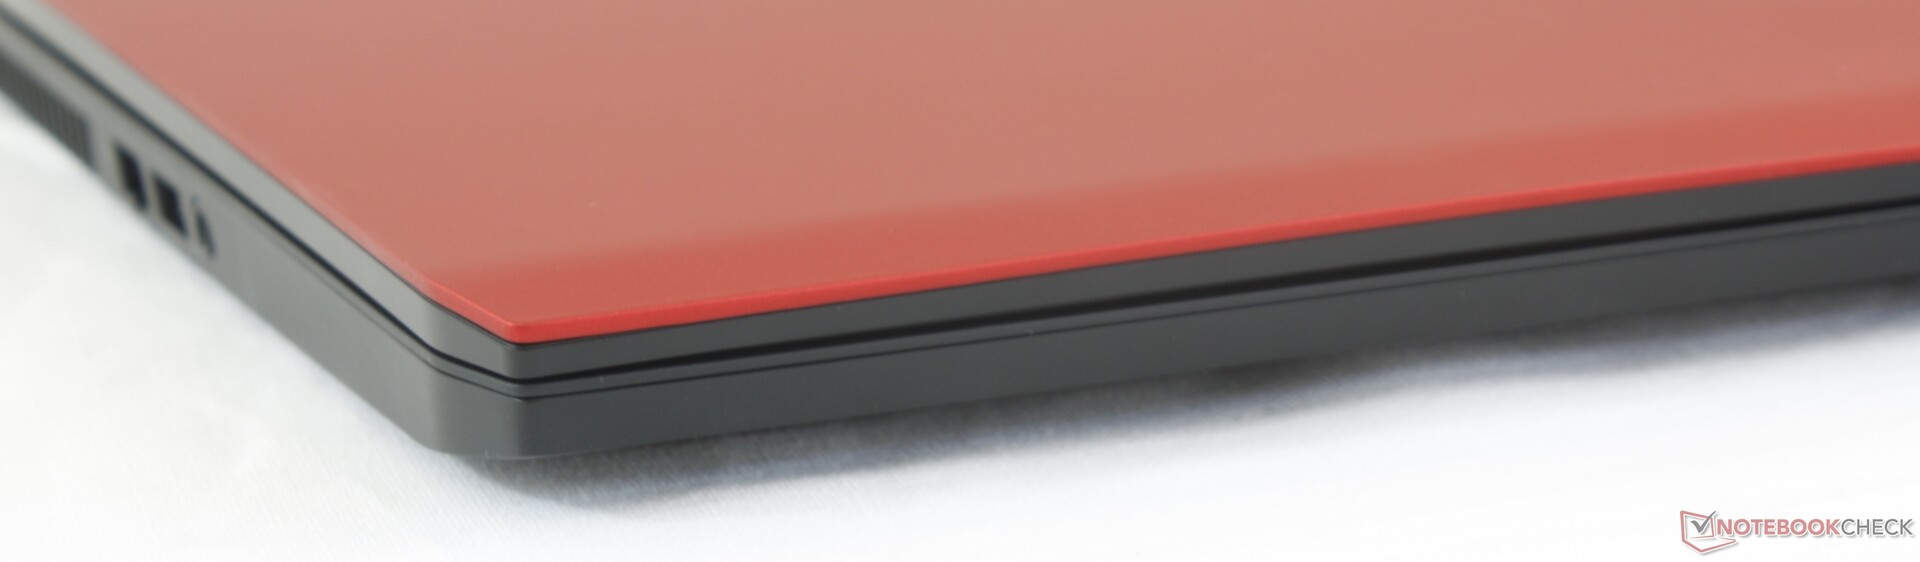
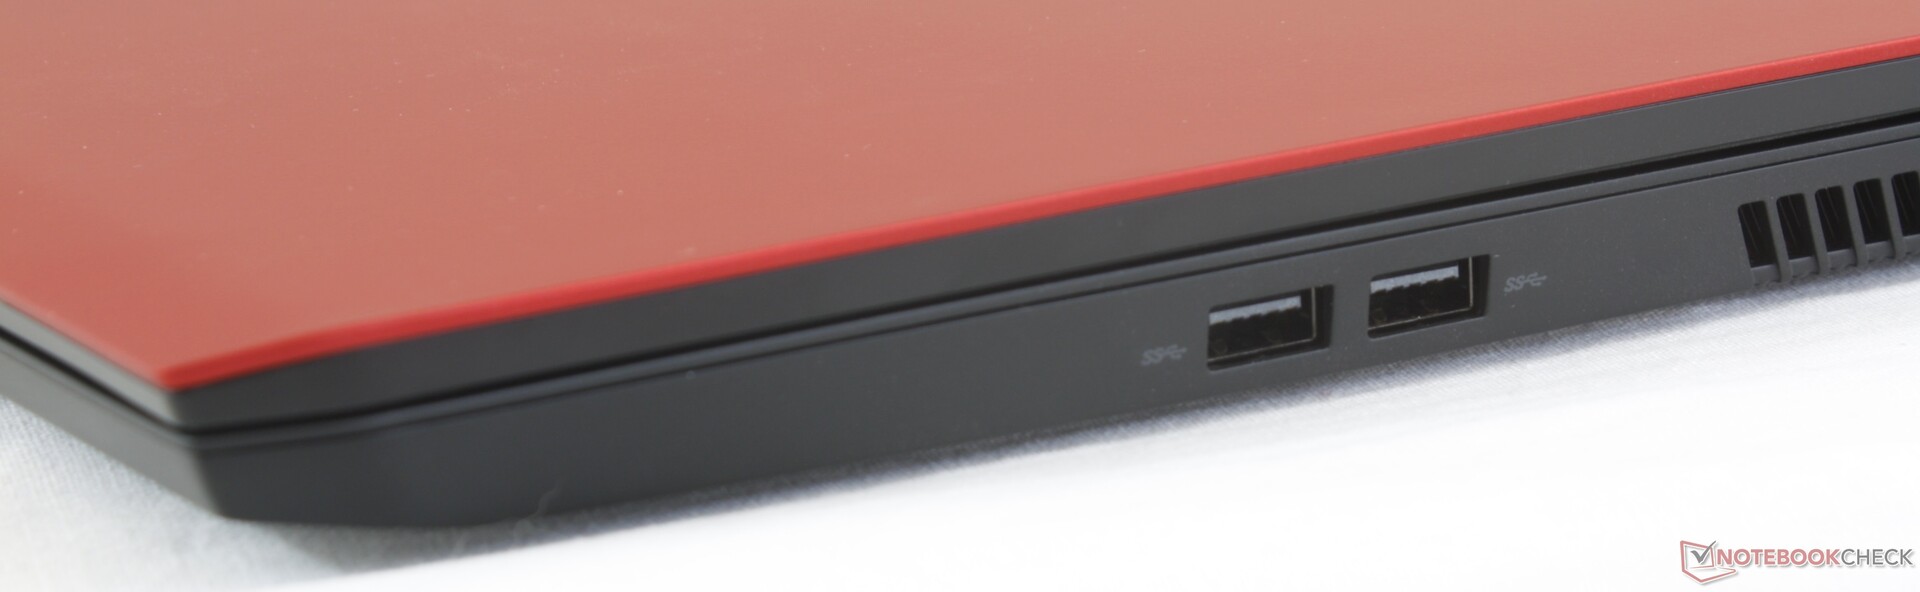
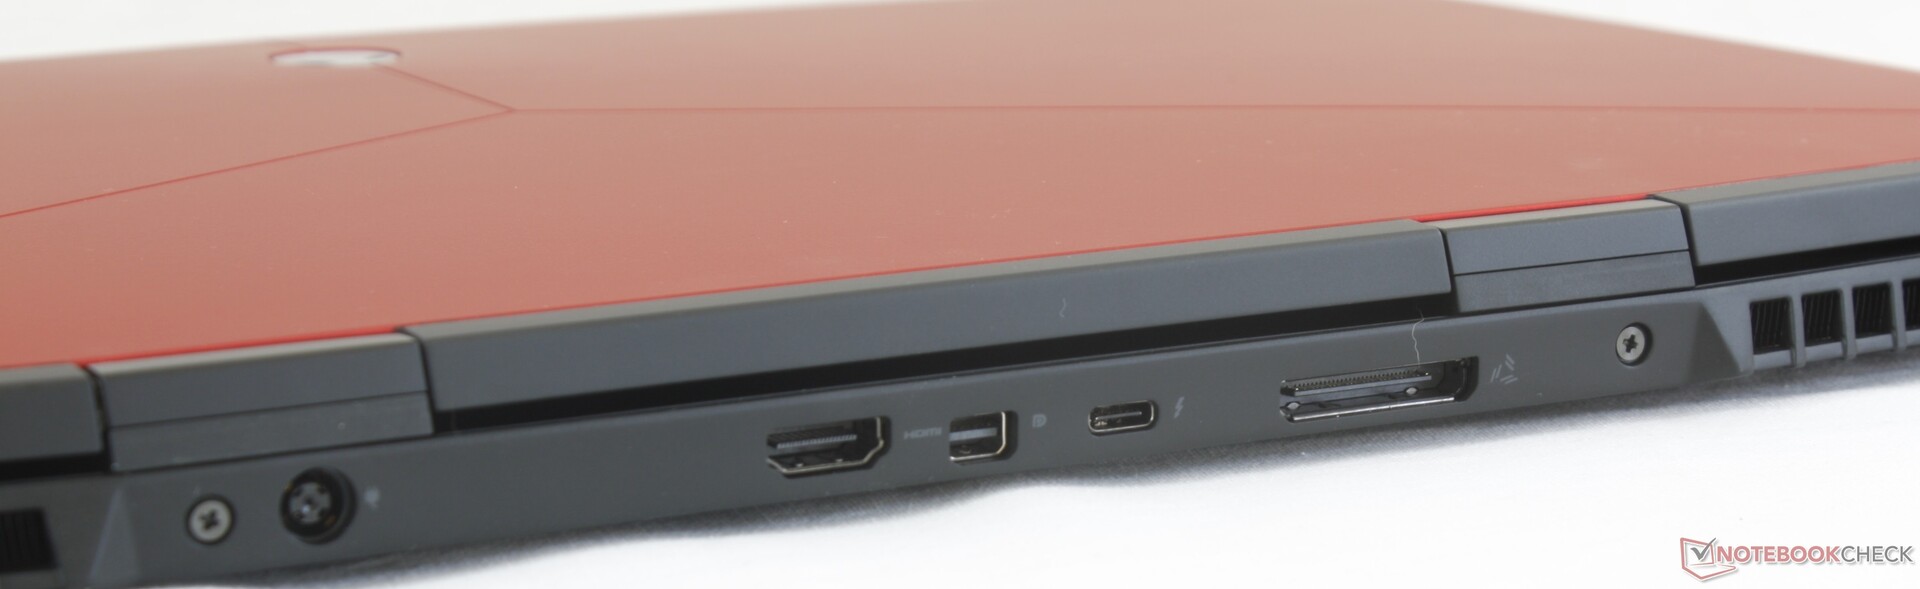
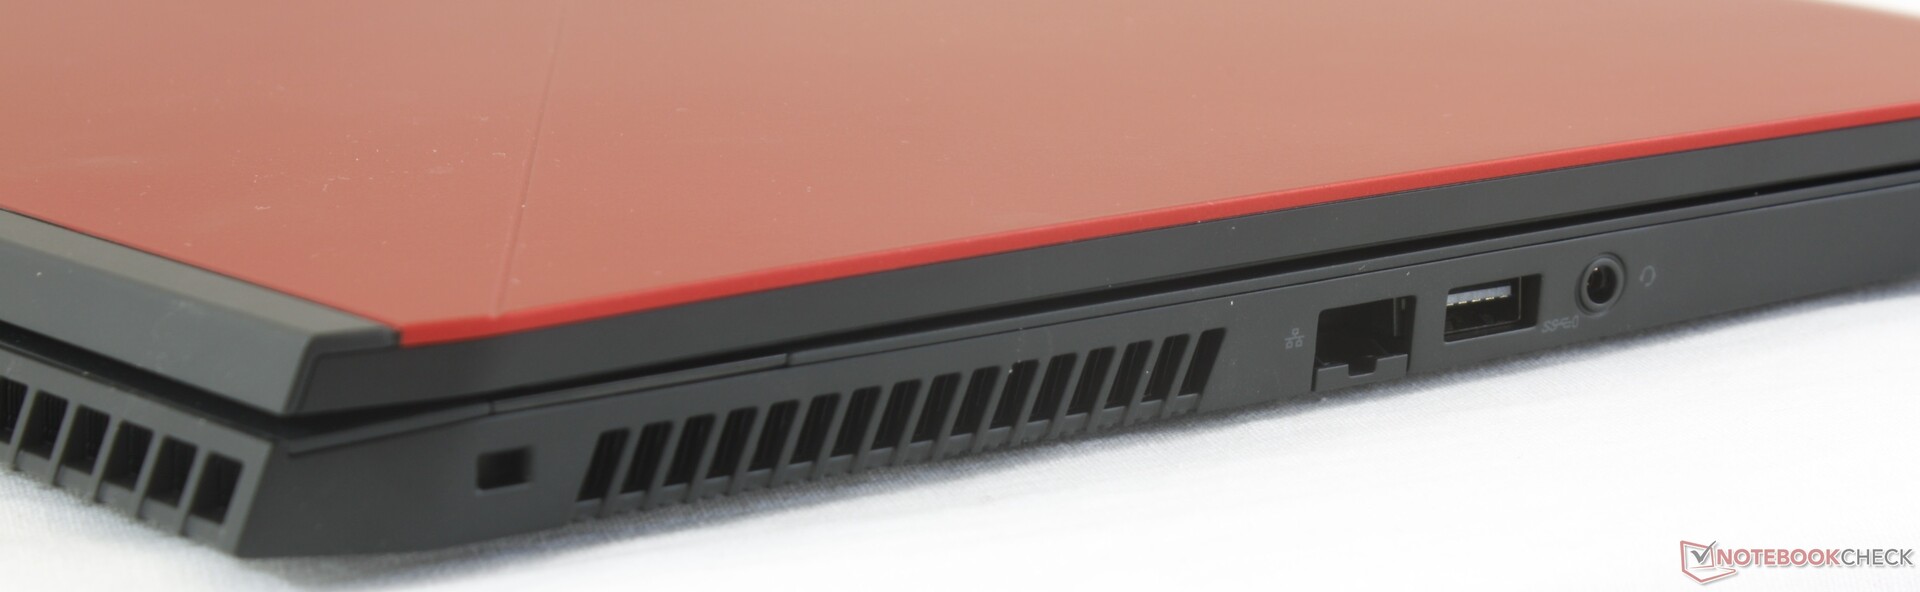
Port options and positioning are identical to the Alienware m15 even though the m17 is larger. Most ports from the Alienware 17 R5 have returned with the exception of a second USB Type-C port and a dedicated 3.5 mm microphone line. We're a bit disappointed to see no integrated card reader on the Alienware laptop series.
Unlike most Ultrabooks, the Thunderbolt 3 port is positioned along the rear instead of the side edges. We subsequently find it more cumbersome to connect USB Type-C devices since the small port is more difficult to reach.
Communication
Users can configure with either the Qualcomm QCA6174A with Bluetooth 4.2 or Killer 1550 with Bluetooth 5. The Killer 1550 includes all the gaming-centric features as found on the Killer 1535 but with support for significantly faster transfer rates of up to 1.73 Gbps. Raw performance is otherwise identical to the Intel 9560 as found on many newer Ultrabooks.
Our server setup is limited by a 1 Gbps line and so real world results can be faster than what we've recorded below.
Accessories
The system includes no extras in the box other than the AC adapter and warranty card. We would have liked a velvet cleaning cloth at the very least since the matte rubberized surfaces of the chassis will accumulate fingerprints very quickly. Optional accessories include an Alienware backpack designed specifically to fit 17-inch gaming laptops and the Alienware Amplifier eGPU docking station.
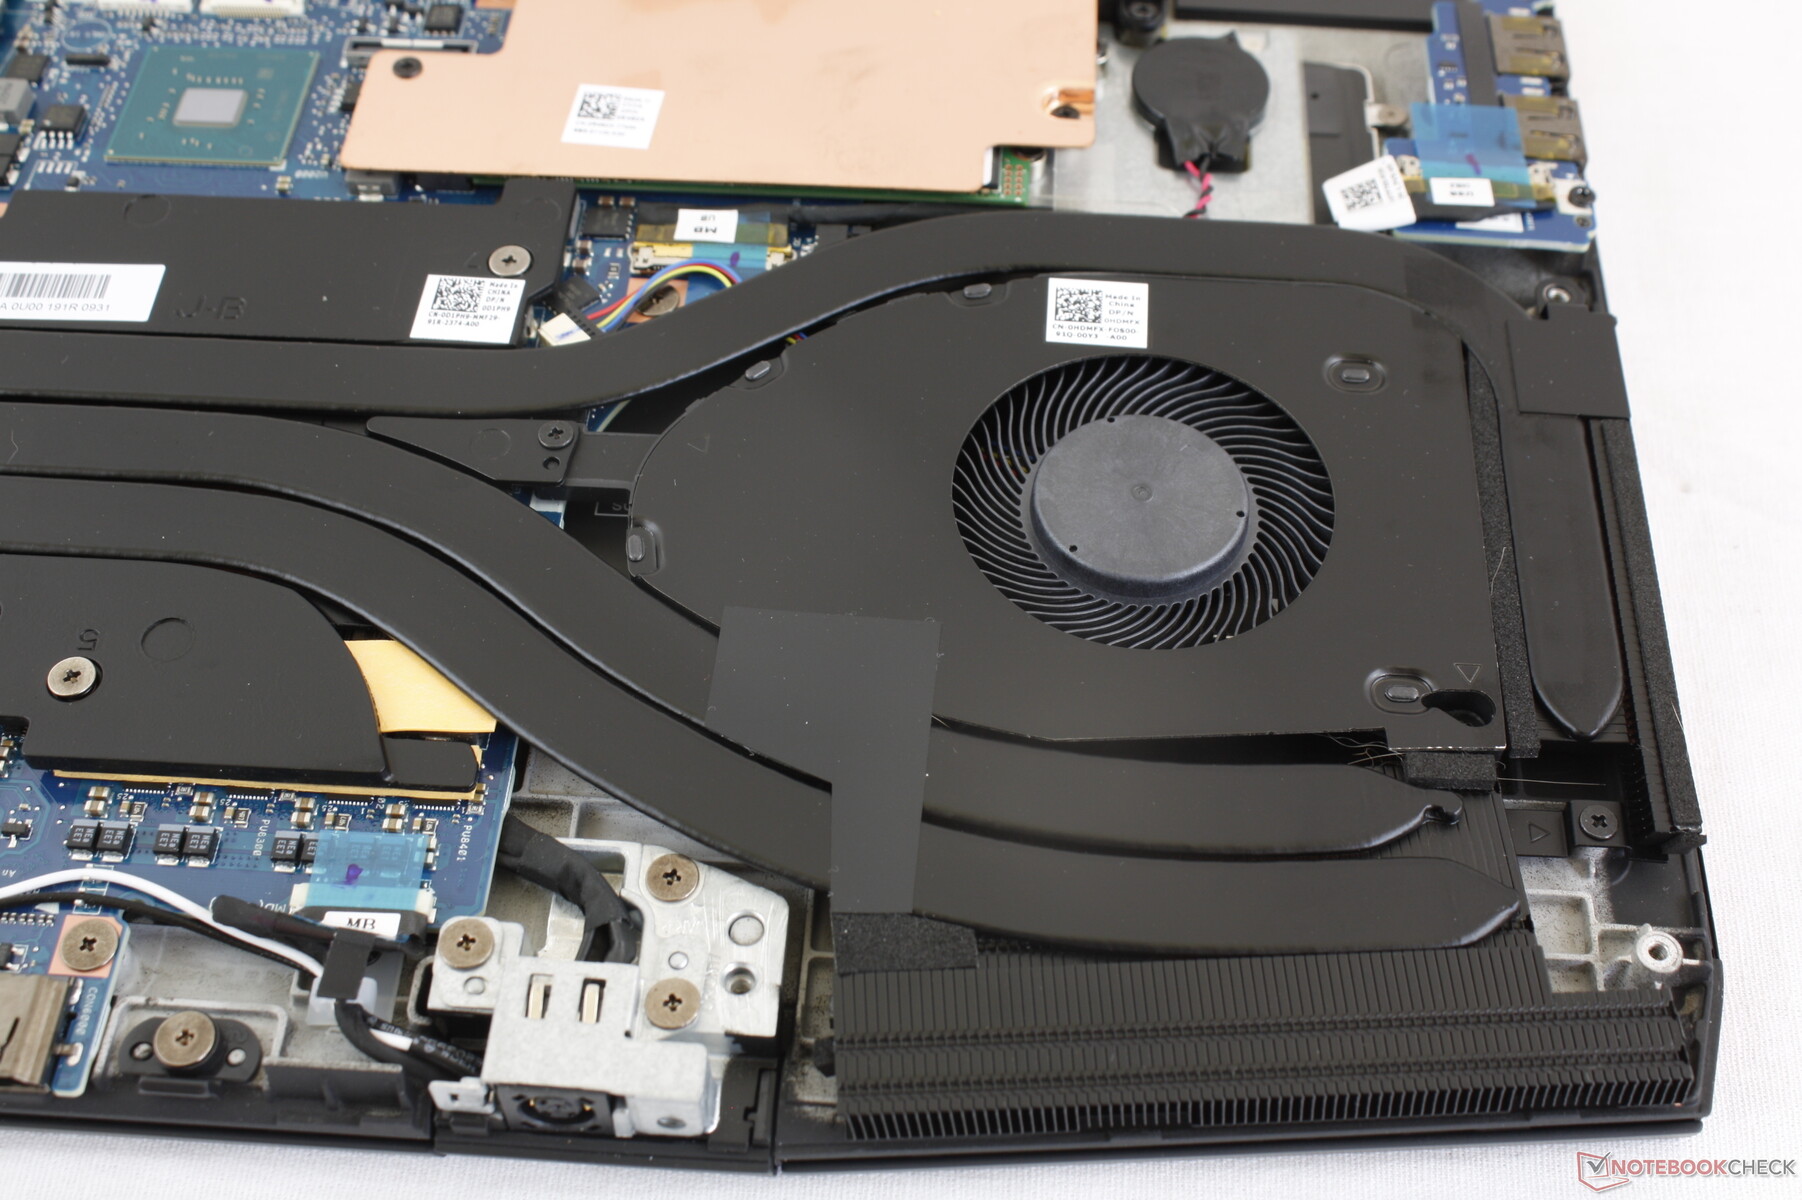
Maintenance
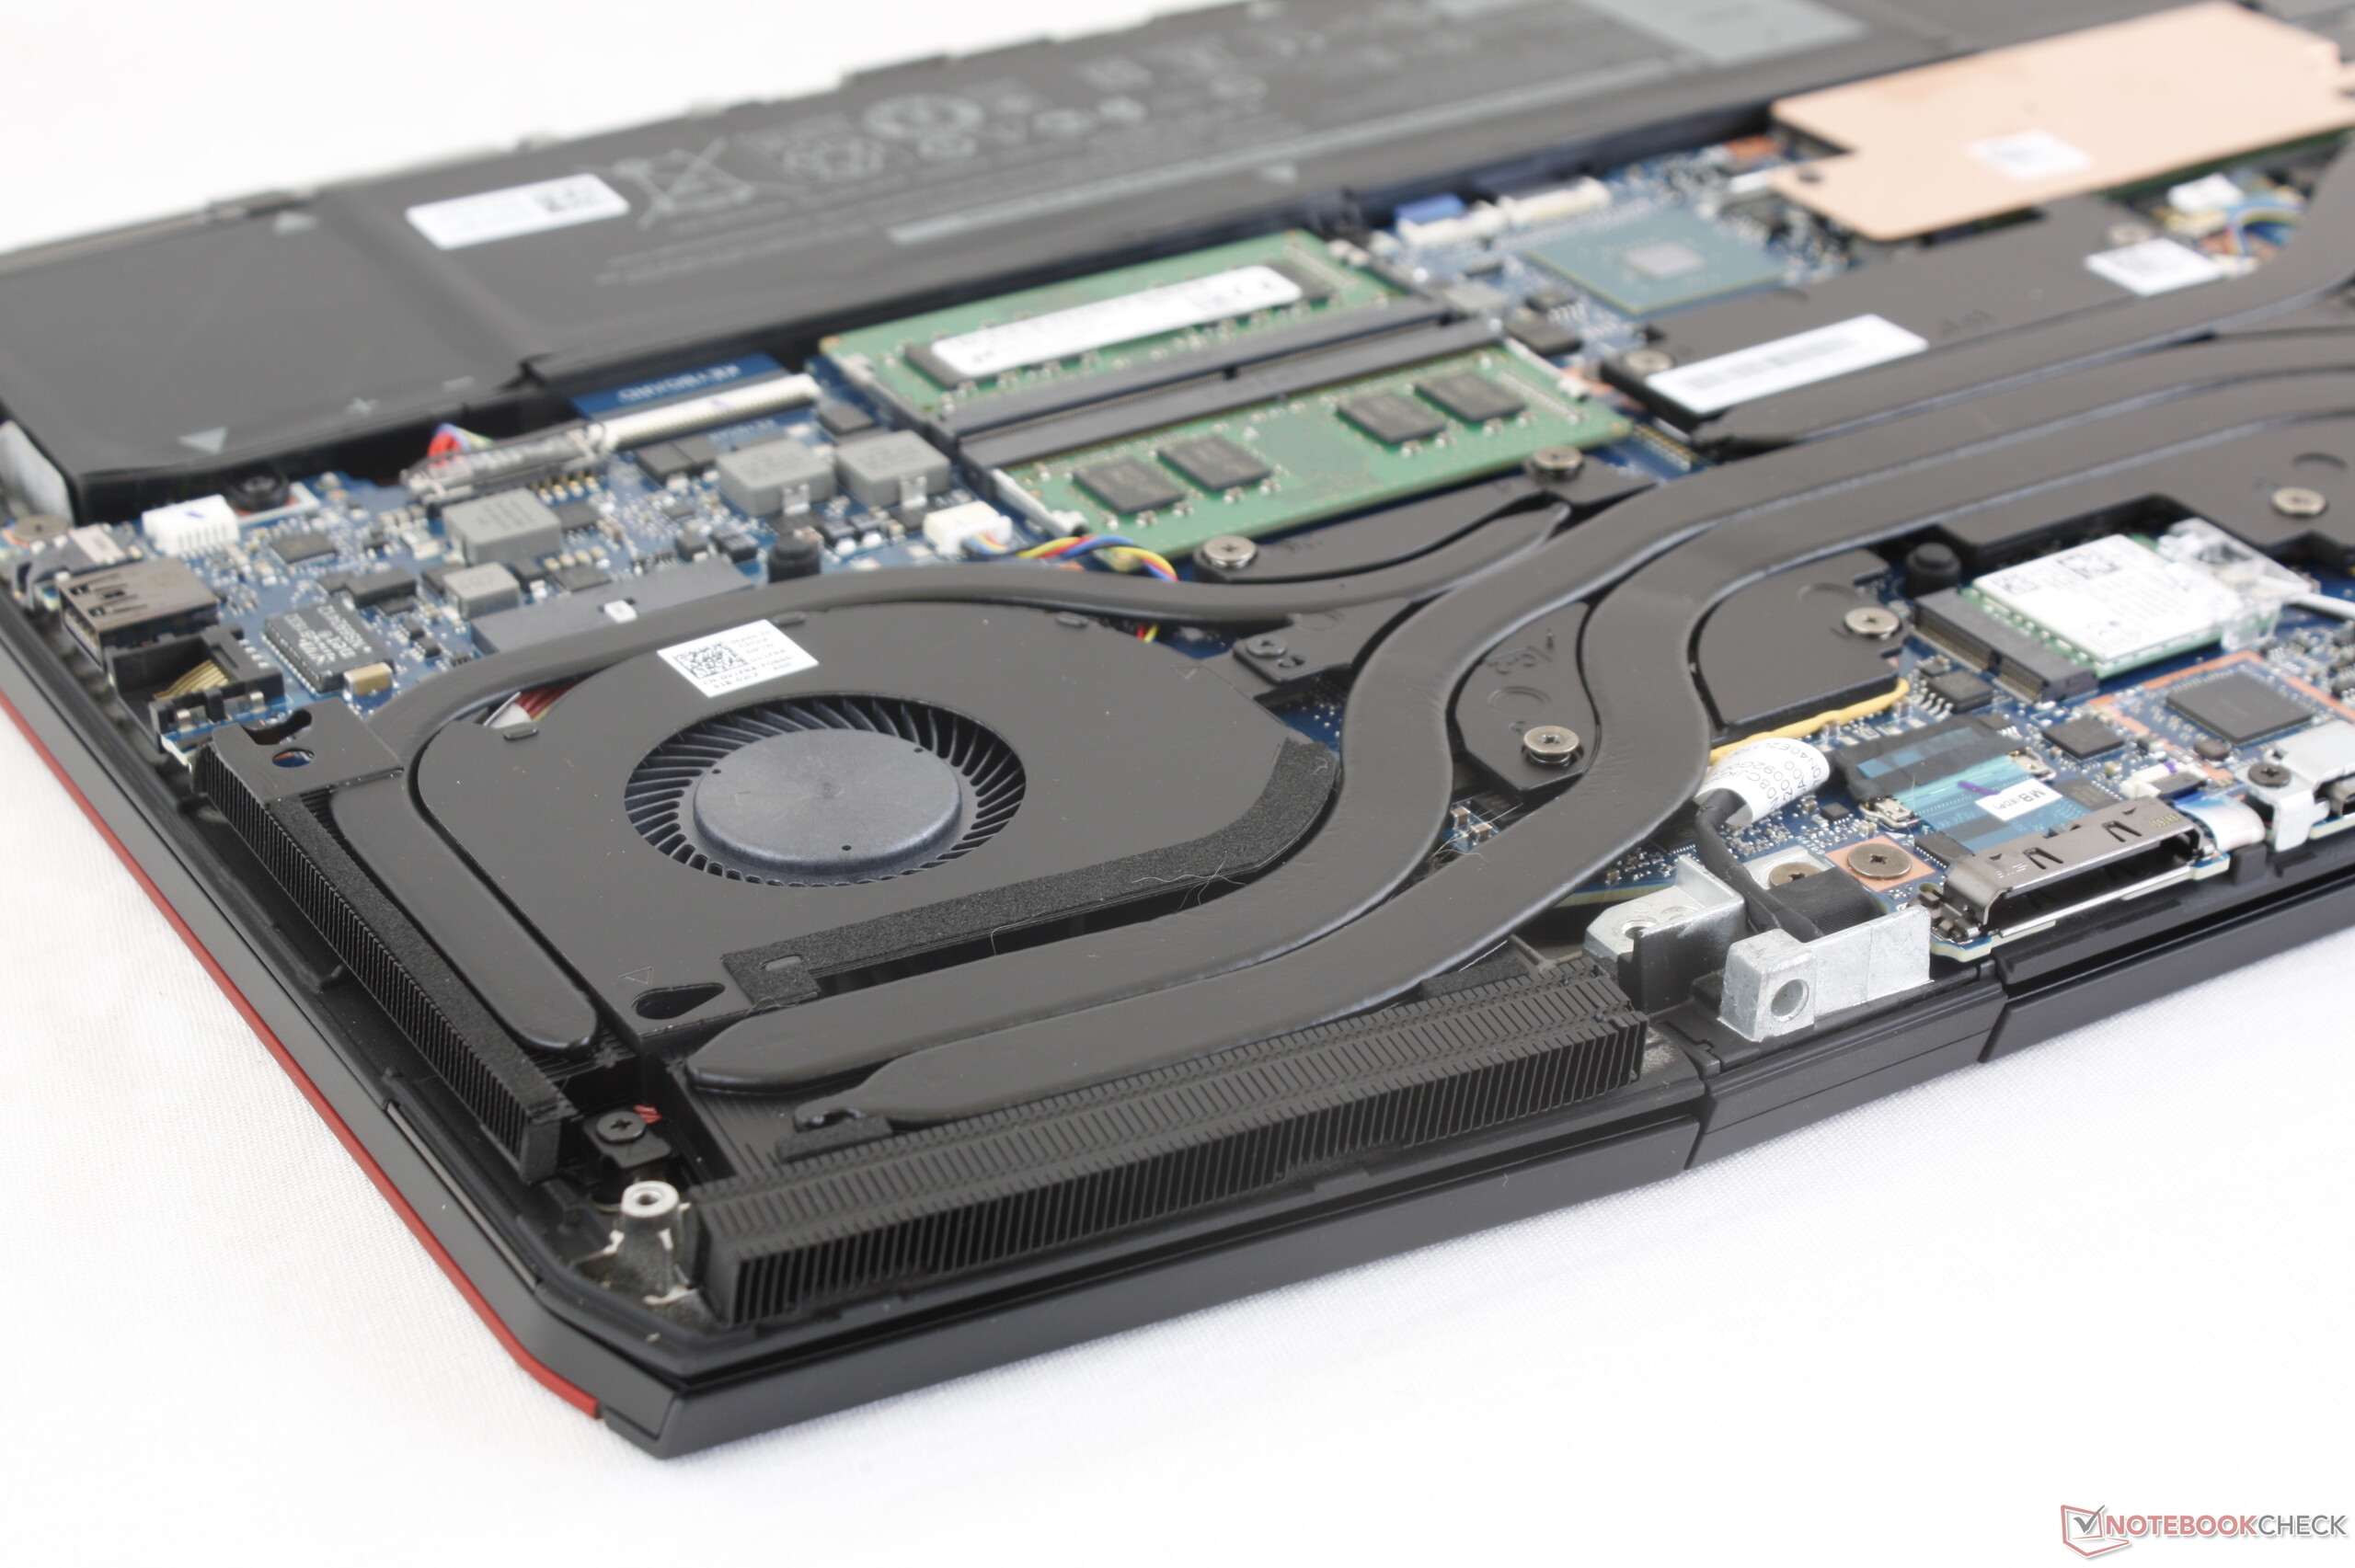
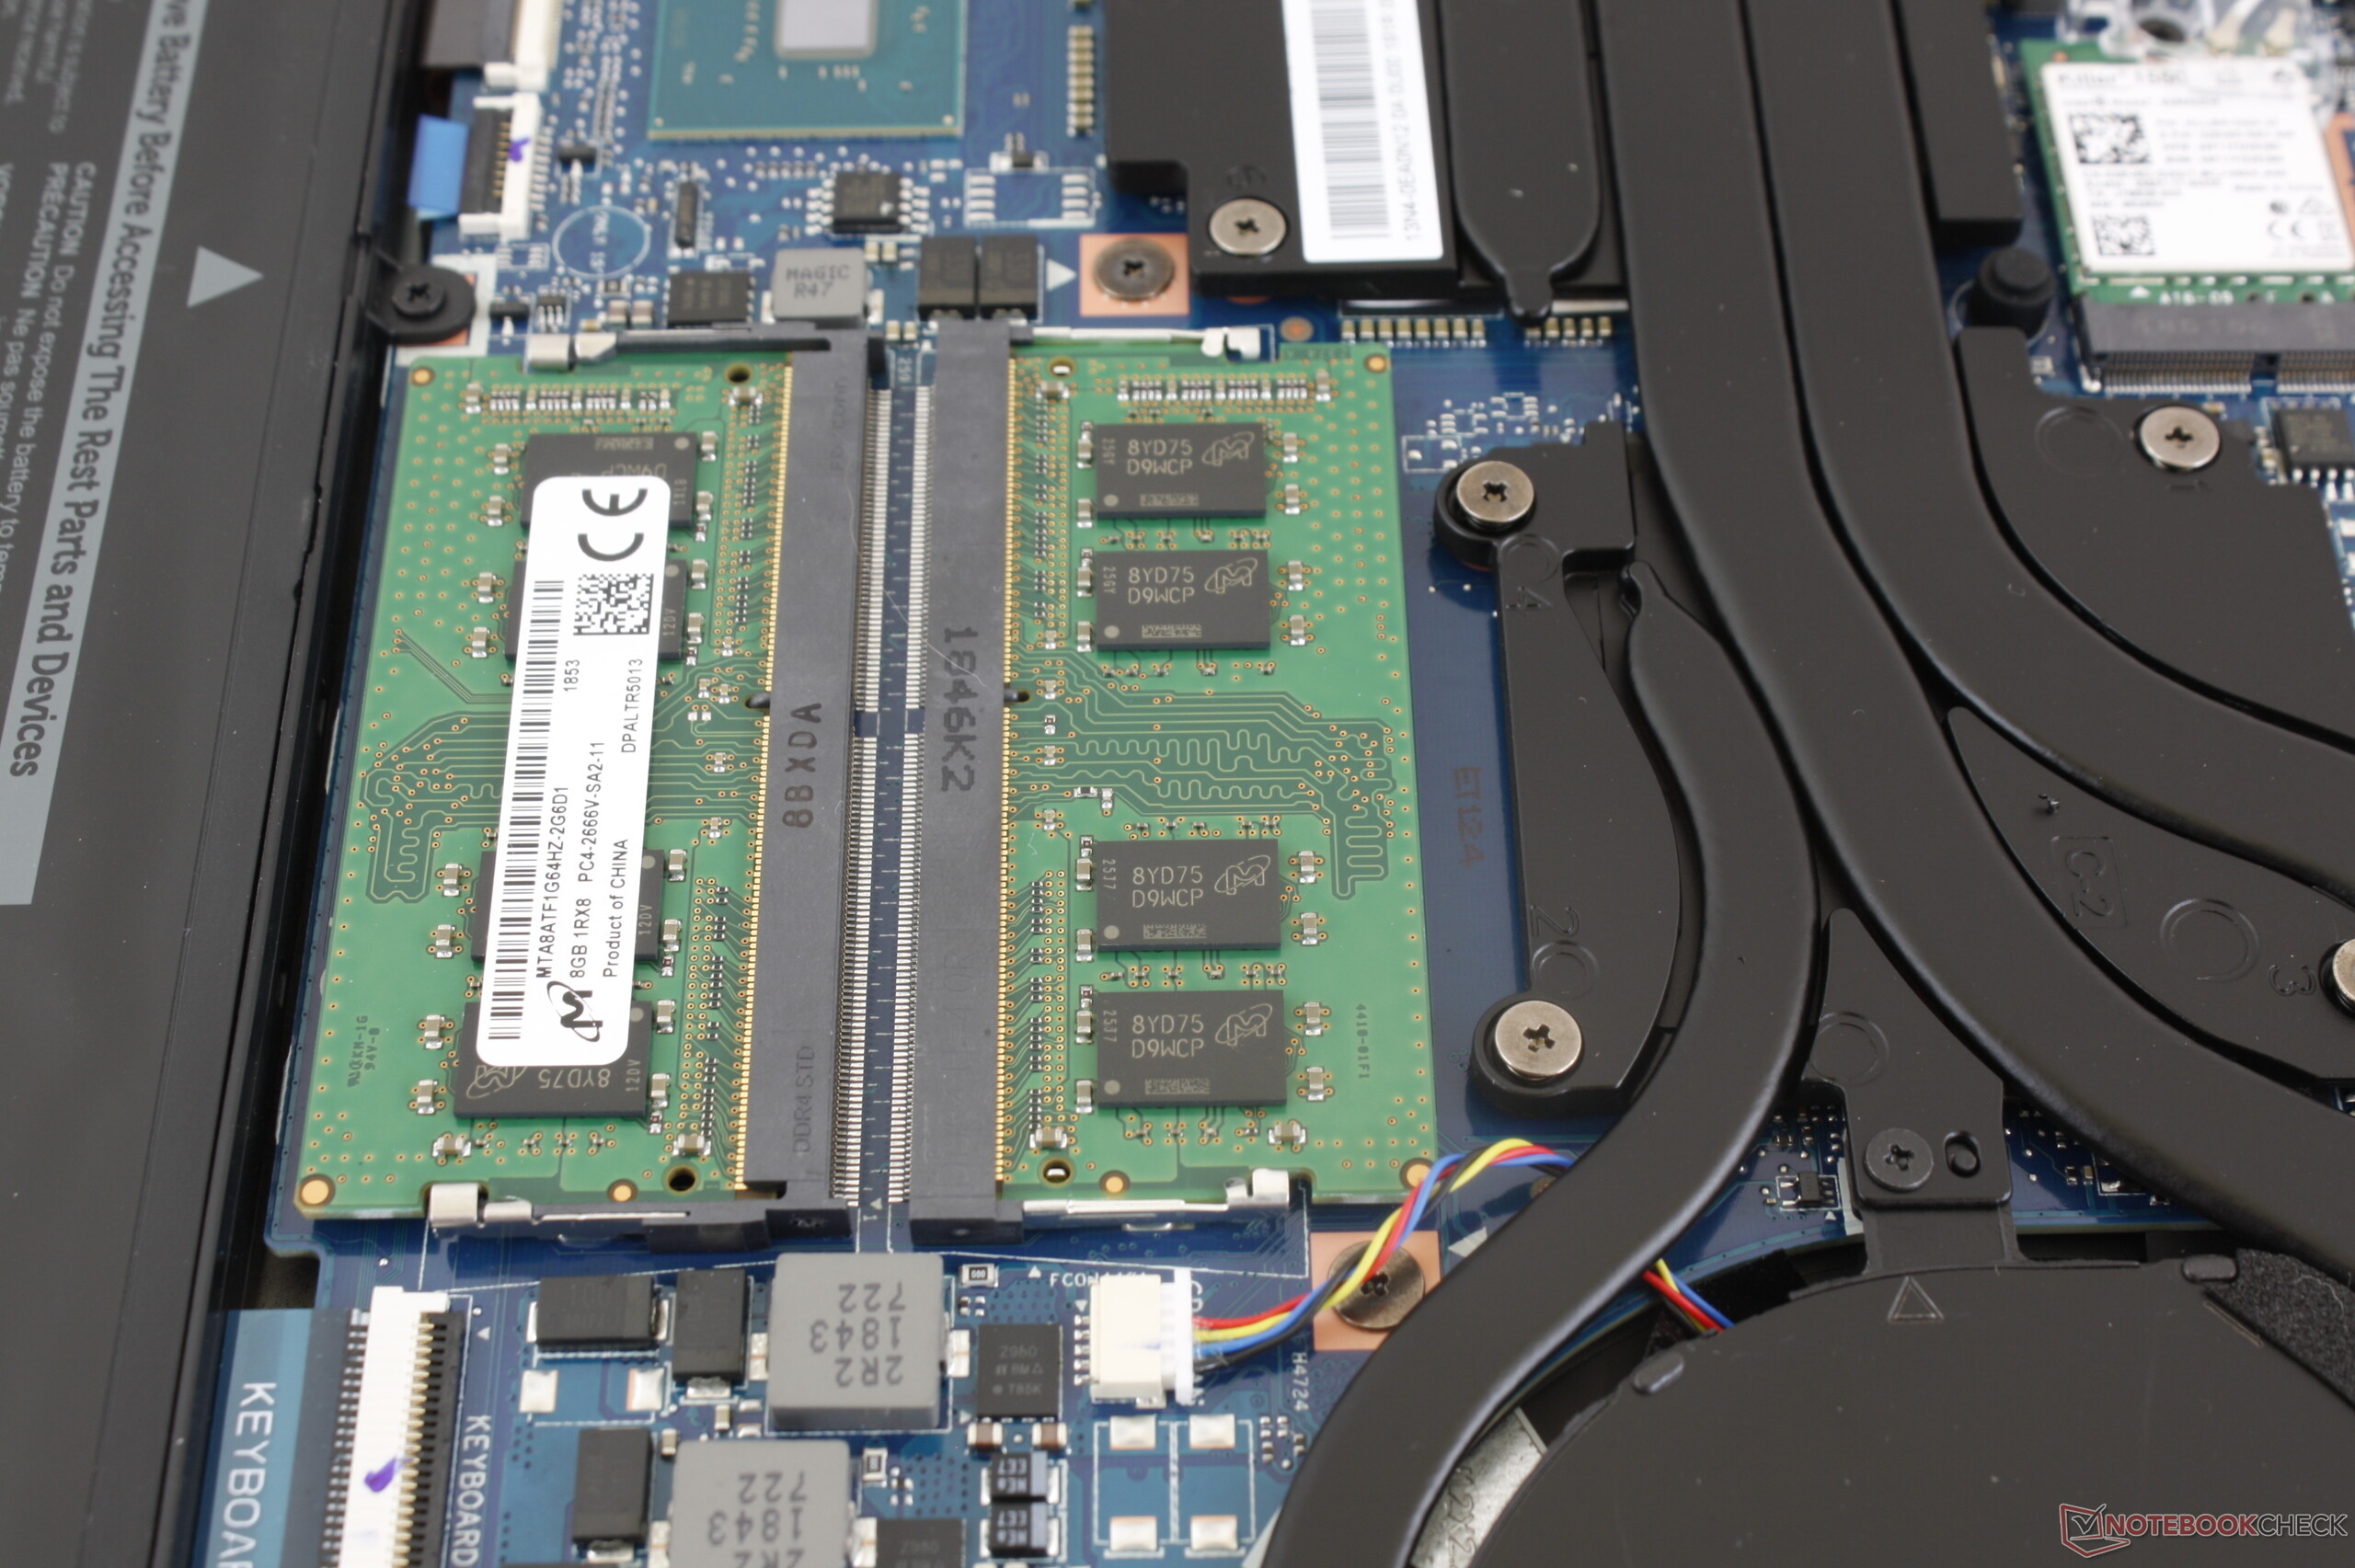
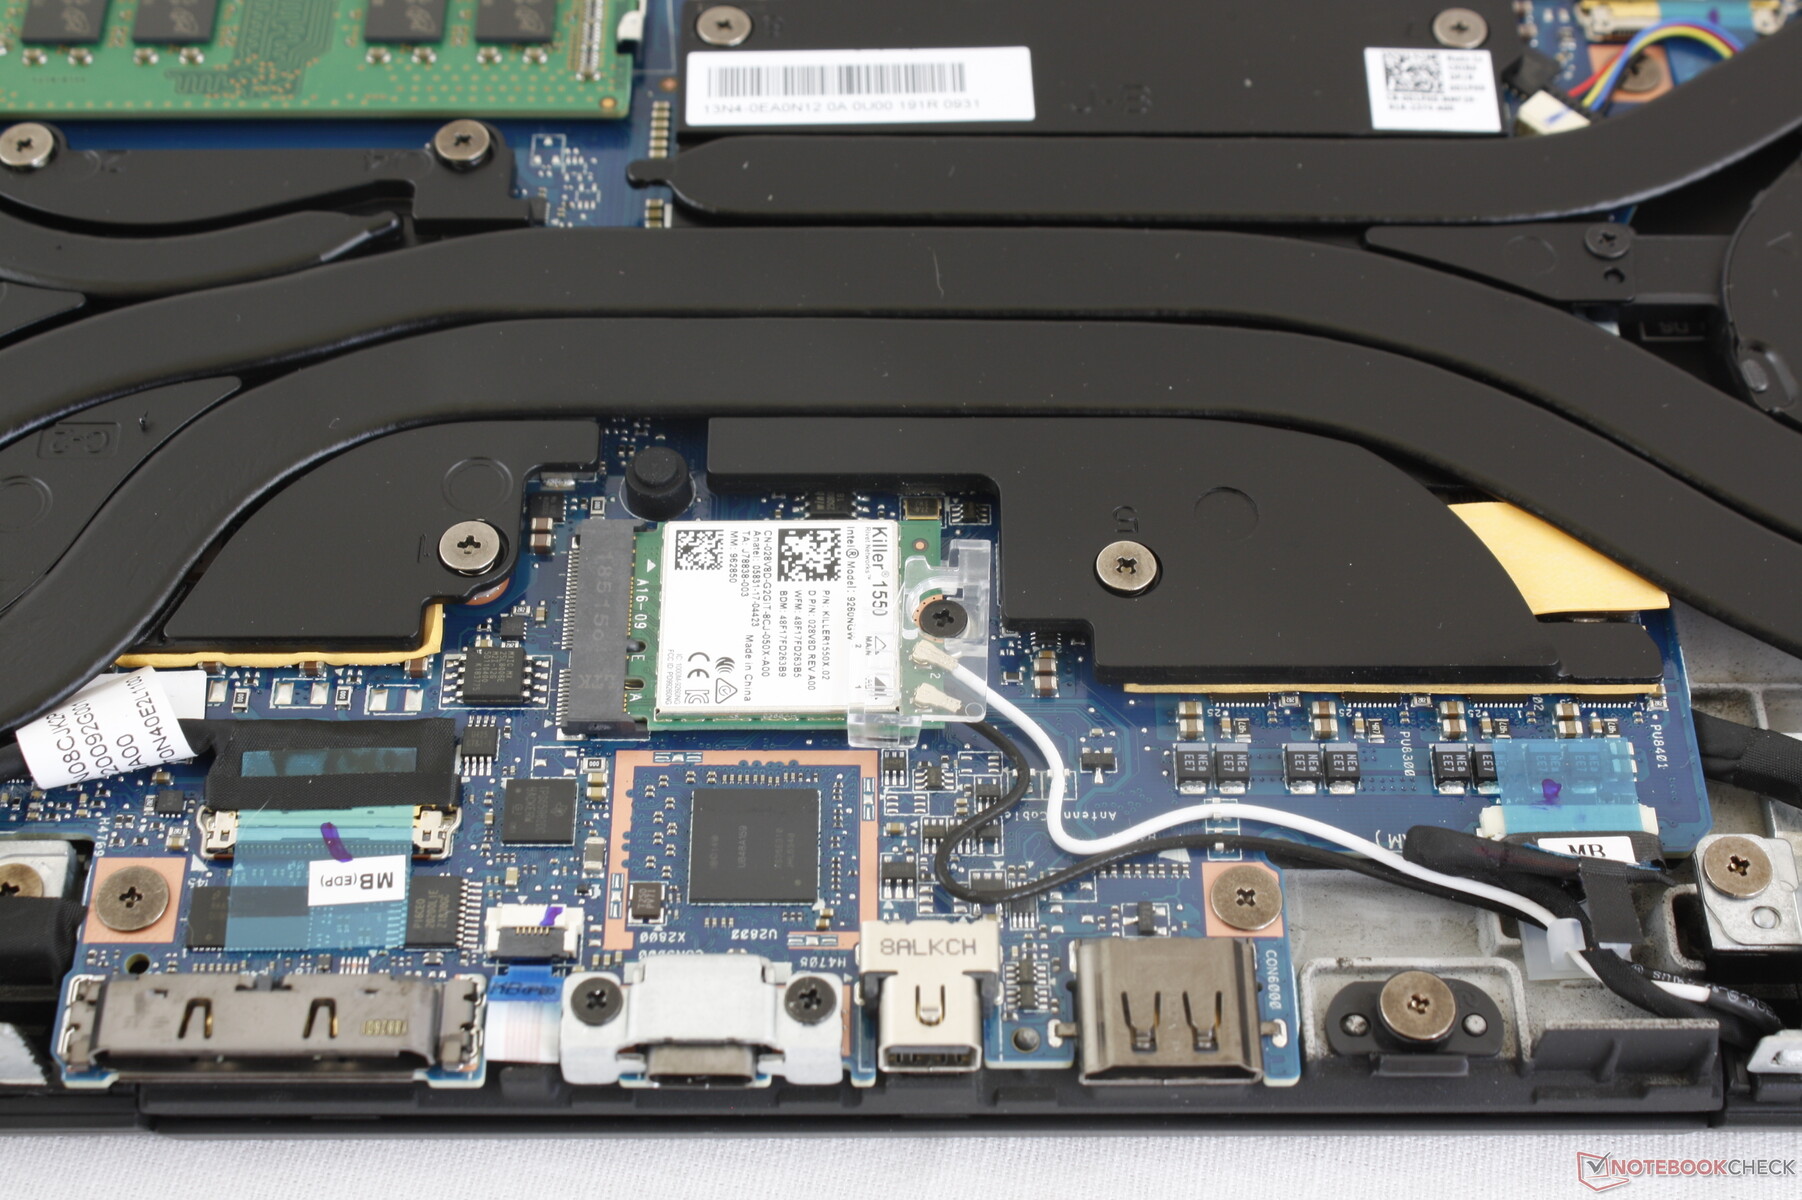
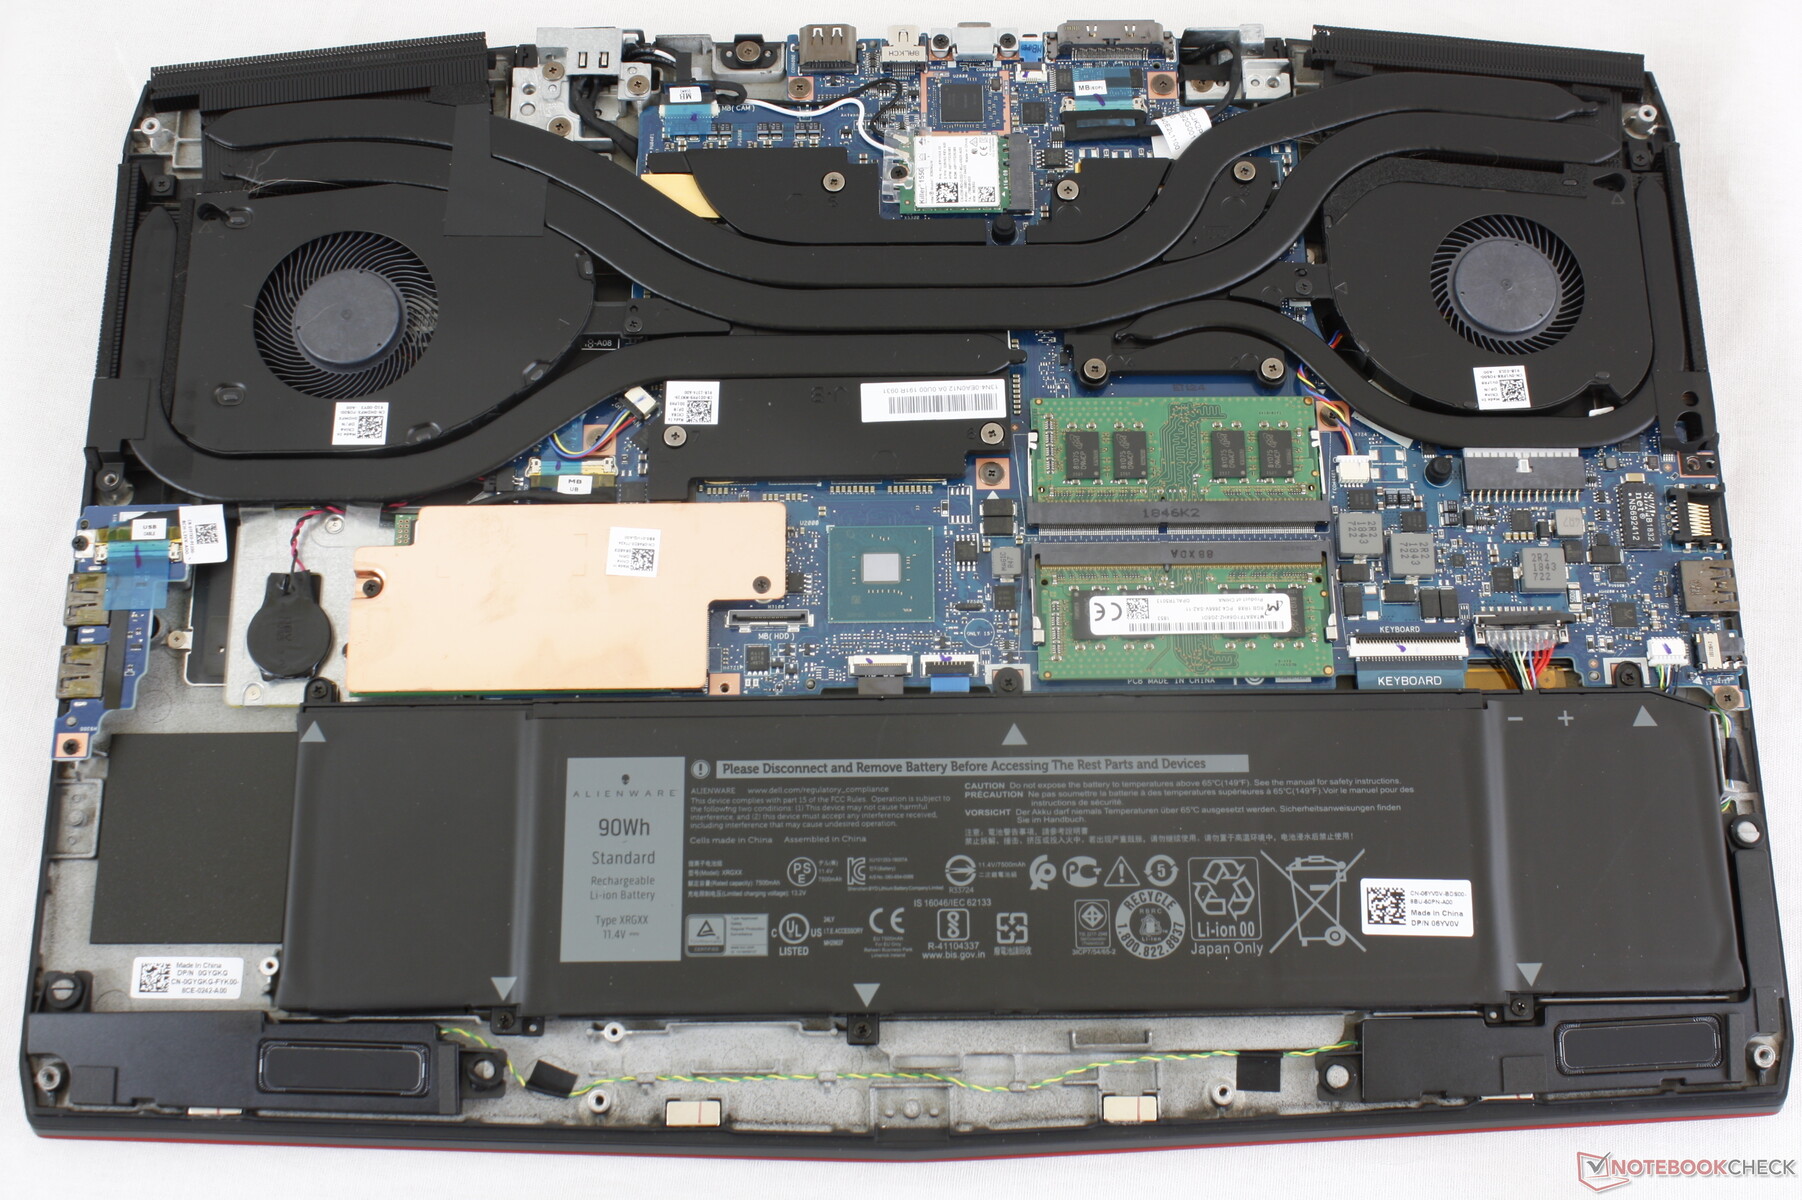
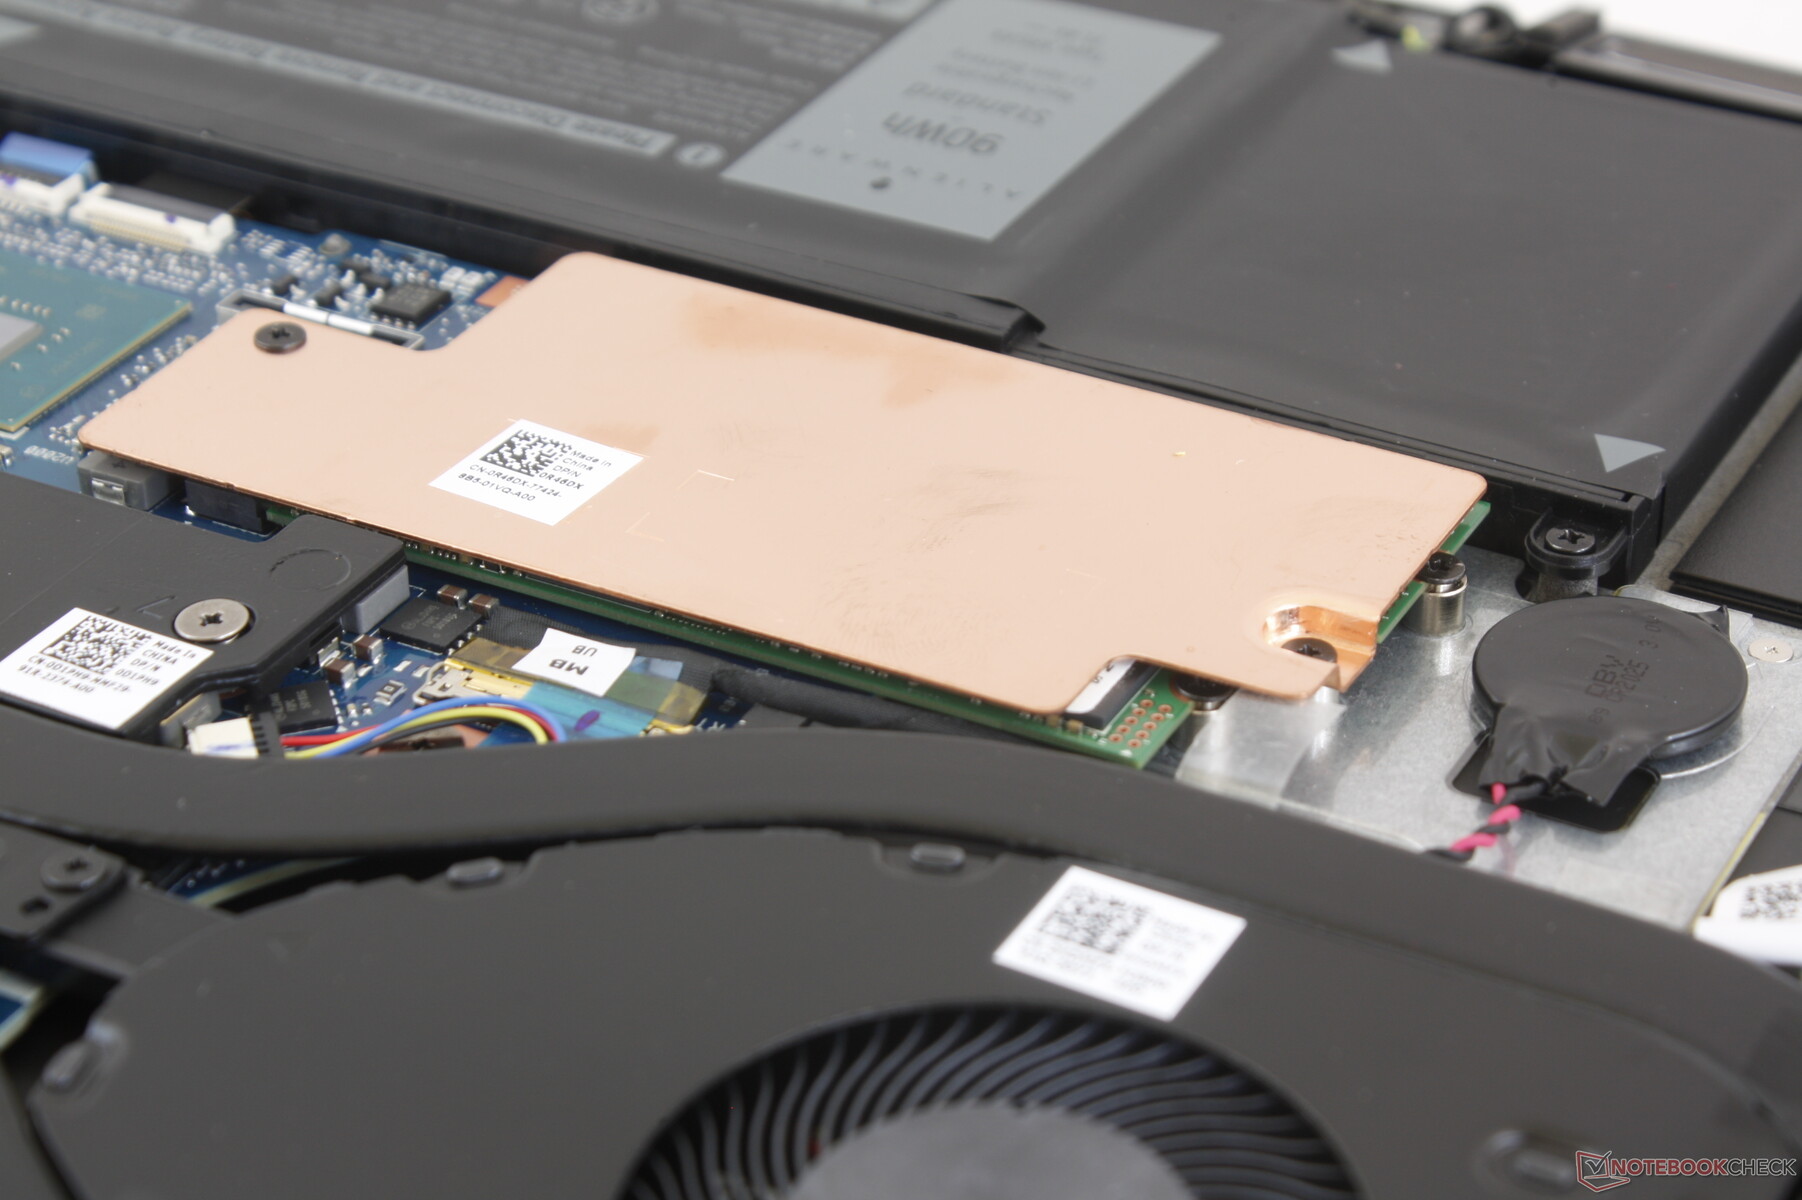
The bottom panel requires only a Philips screwdriver to remove. With a dozen screws to remove, however, it definitely takes some patience. Users have direct access to the WLAN module, internal battery, both DDR4 SODIMM slots, BIOS battery, and both M.2 2280 slots underneath the bottom protector. If users have the 60 Wh battery SKU, then a 2.5-inch SATA III bay will be available.
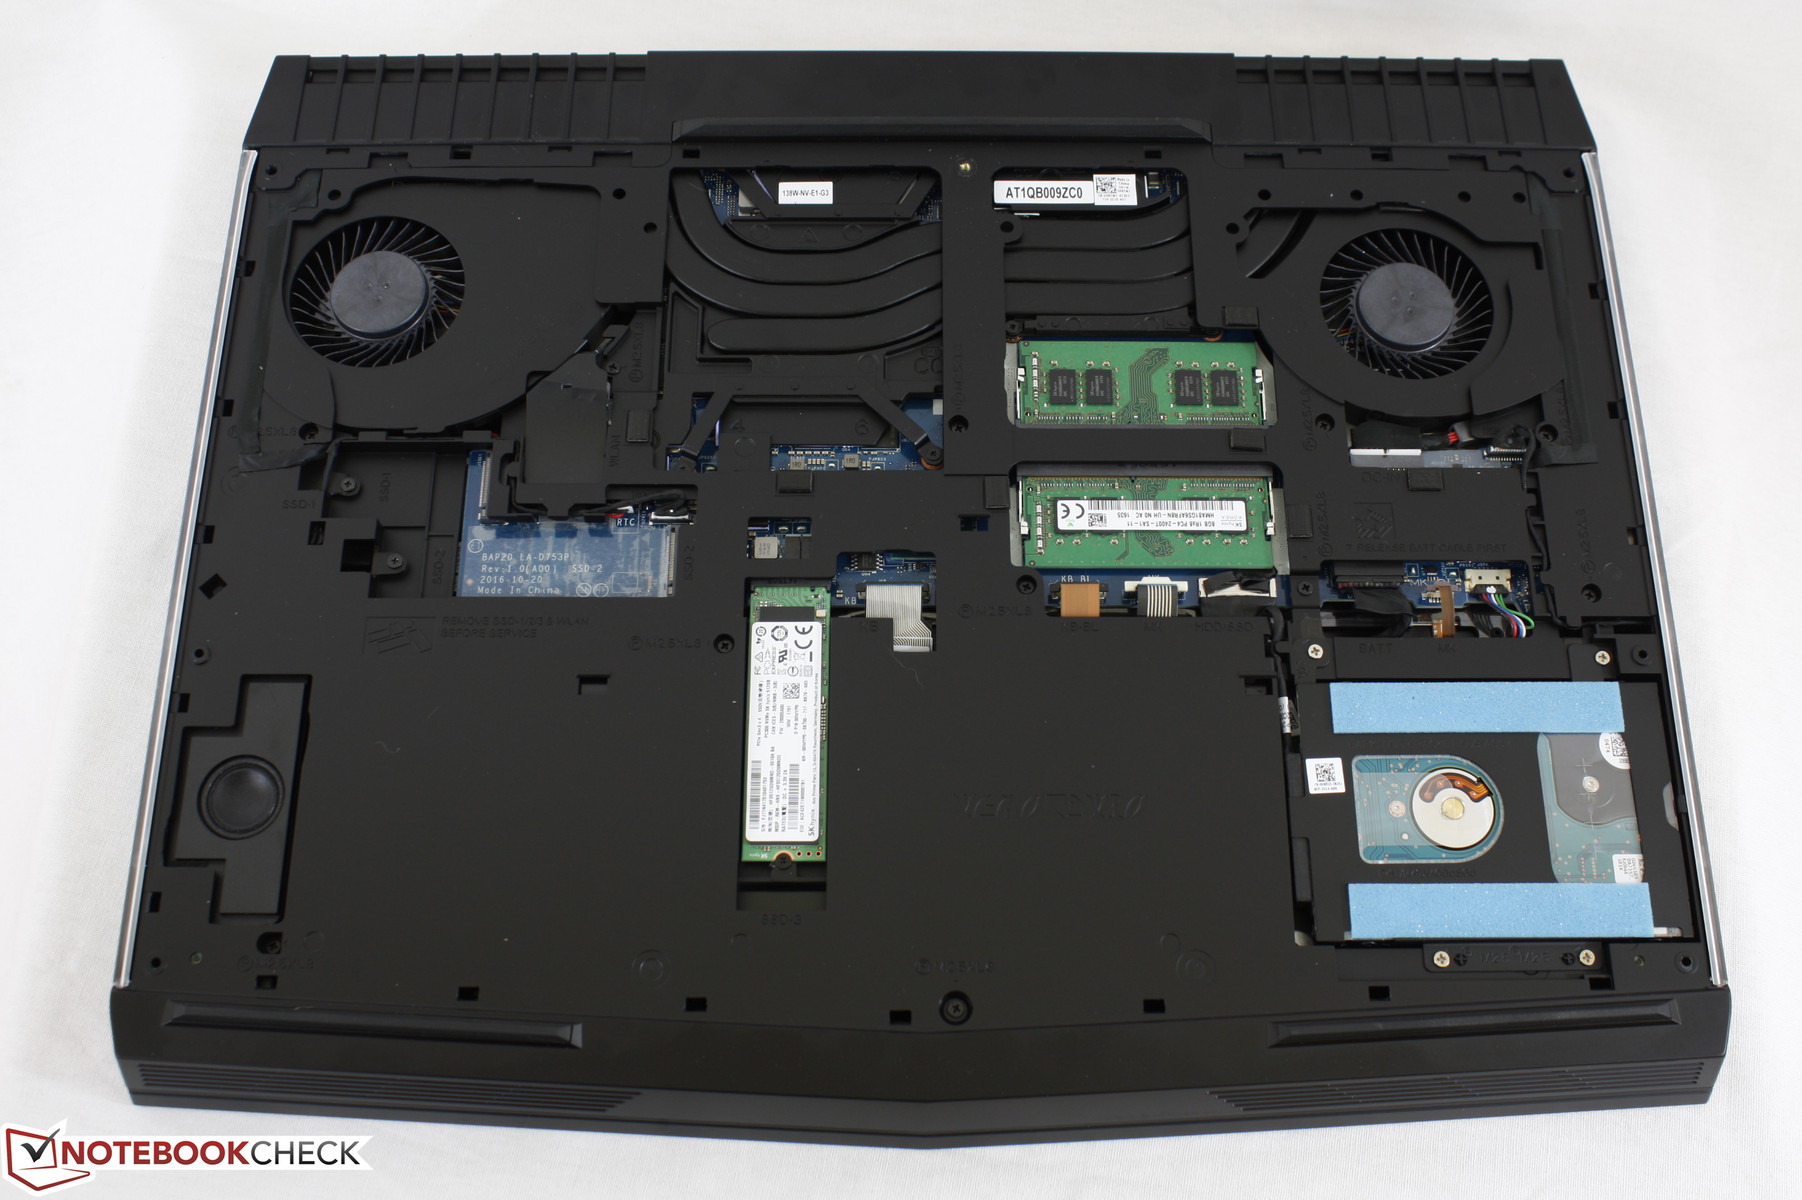
When compared to the Alienware 17, the m17 lacks the internal skeletal reinforcement as shown below. The m17 is not as rigid as its predecessor as a result, but that is the price to pay for having such a thinner and lighter design.
Warranty
The standard one-year limited manufacturer warranty applies. While not as long as Gigabyte's two-year global warranty, Dell offers a wider range of protection options for up to five years with accidental damage service if desired.
Input Devices
Keyboard and Touchpad
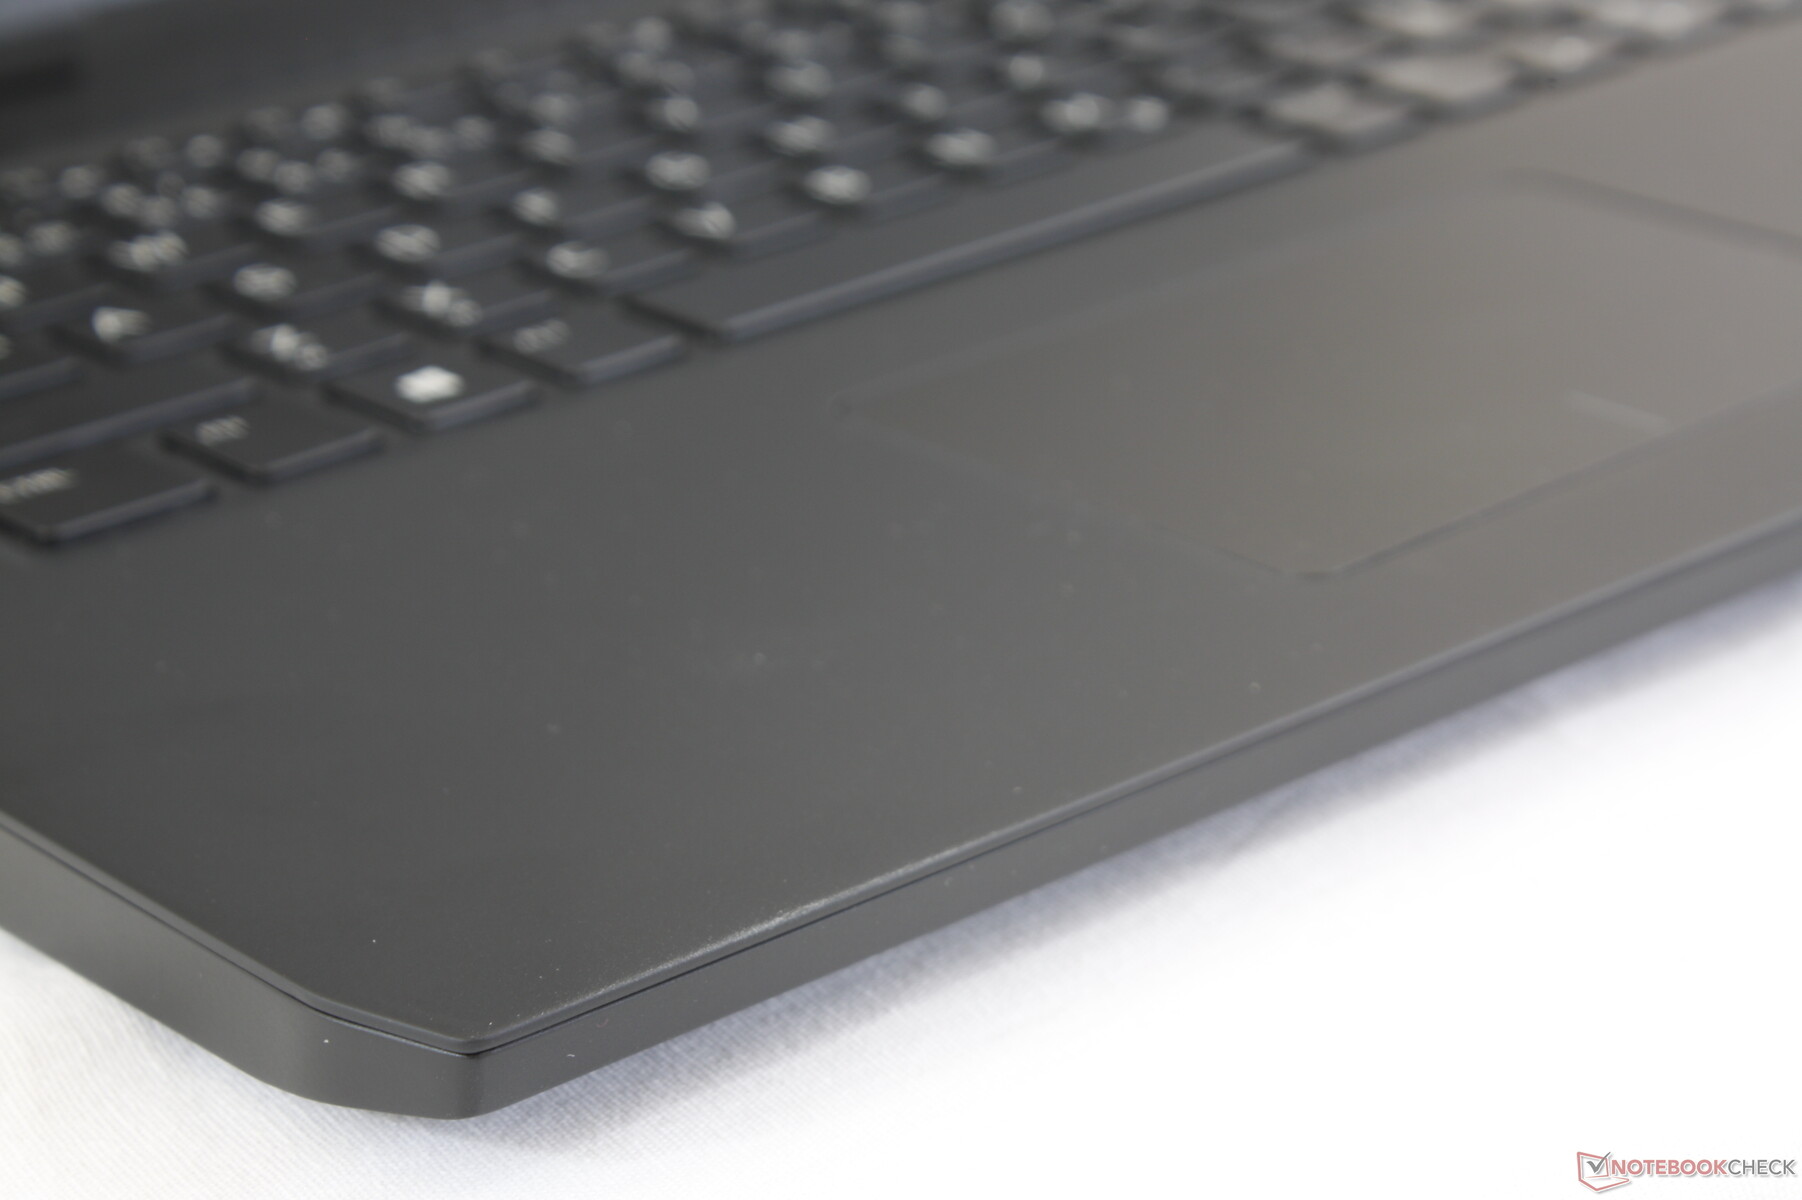
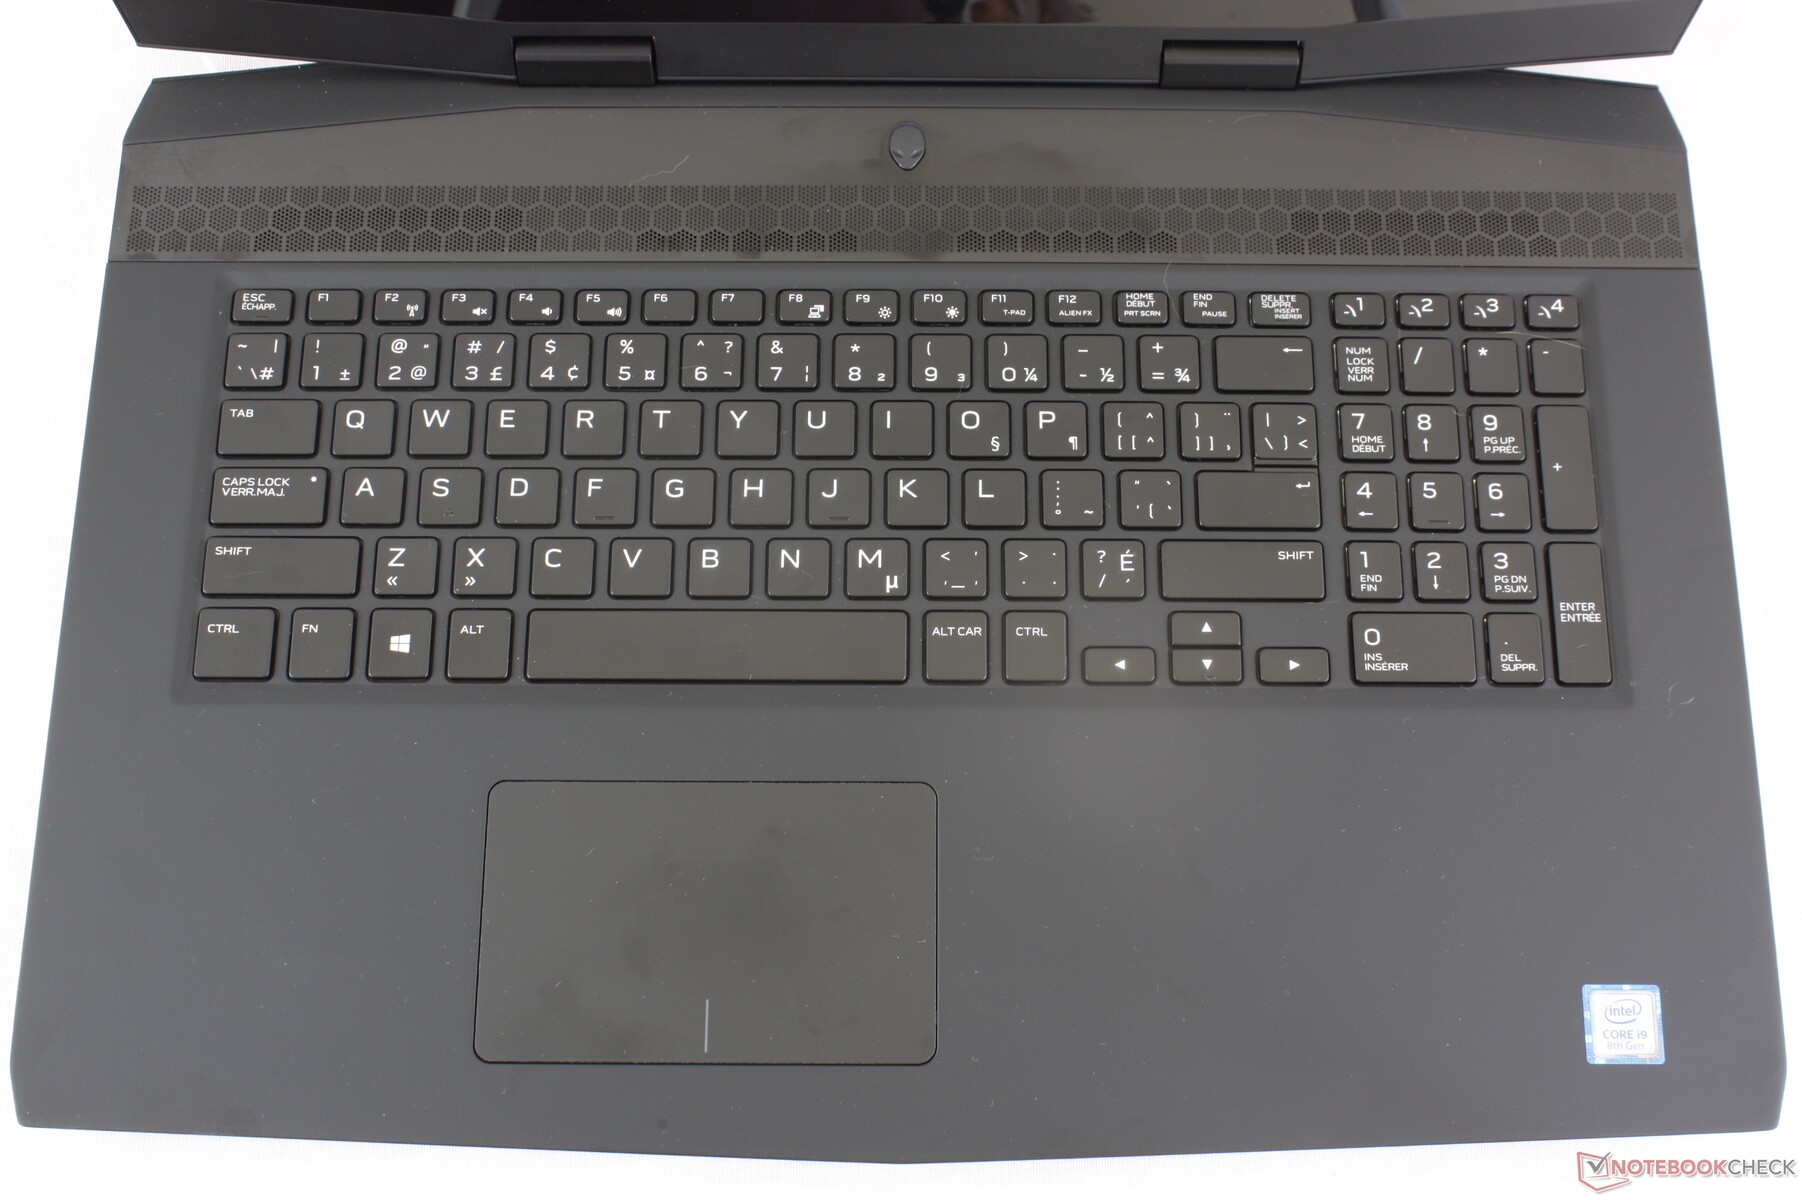
The keyboard and trackpad are identical to the ones on the Alienware m15. Even the surface area of the trackpads are the same. Thus, our existing comments on the Alienware m15 still apply here. Since the firm underlying base barely yields to pressure, the keys and trackpad are quiet albeit not as firm or deep as the keyboards on the Area-51m or last generation Alienware 17. It's also a bit disappointing that the NumPad keys are physically narrower than the main qwerty keys despite the extra unused space along the edges of the keyboard. Fans of the last generation Alienware 17 will likely need some time to adjust to the Ultrabook-like feedback of the new keyboard and trackpad.
Meanwhile, Dell has dropped the dedicated mouse keys on the Alienware 17 in favor of a larger clickpad (10.5 x 6.5 cm vs. 10 x 5.5 cm) for the m17. While multi-touch gestures are now easier and roomier, the integrated mouse clicks are soft and with moderate clatter. Whether or not this is any better than the trackpad on the Alienware 17 comes down to personal preference and usage scenario. Users who click frequently, for example, may prefer the older model.
A four-zone RGB keyboard backlight is available is lieu of per-key RGB lighting. Dell is reserving this feature for its larger Area-51m instead.
Display
Display options include 1080p 60 Hz IPS, 1440p 120 Hz TN, or 2160p 60 Hz IPS. An OLED option will be coming to the smaller Alienware m15 with no announcements yet for the m17. Our test model houses the pricier 4K UHD panel and so our measurements below do not reflect the FHD or QHD SKUs. There are no G-Sync options as of this writing.
The 4K AU Optronics B173ZAN01.0 panel on our Alienware unit is common on many other flagship 17.3-inch laptops including the Acer Predator 17, Clevo-based Schenker XMG U727, and the MSI GT73VR. Thus, the Alienware m17 shares many of the same display characteristics as these competing alternatives including the wide color gamut and excellent contrast ratio of ~1000:1. Response times, however, are nowhere near as fast as the latest FHD panels with 3 ms or 5 ms timings and so ghosting will be more noticeable on the native 4K UHD option.
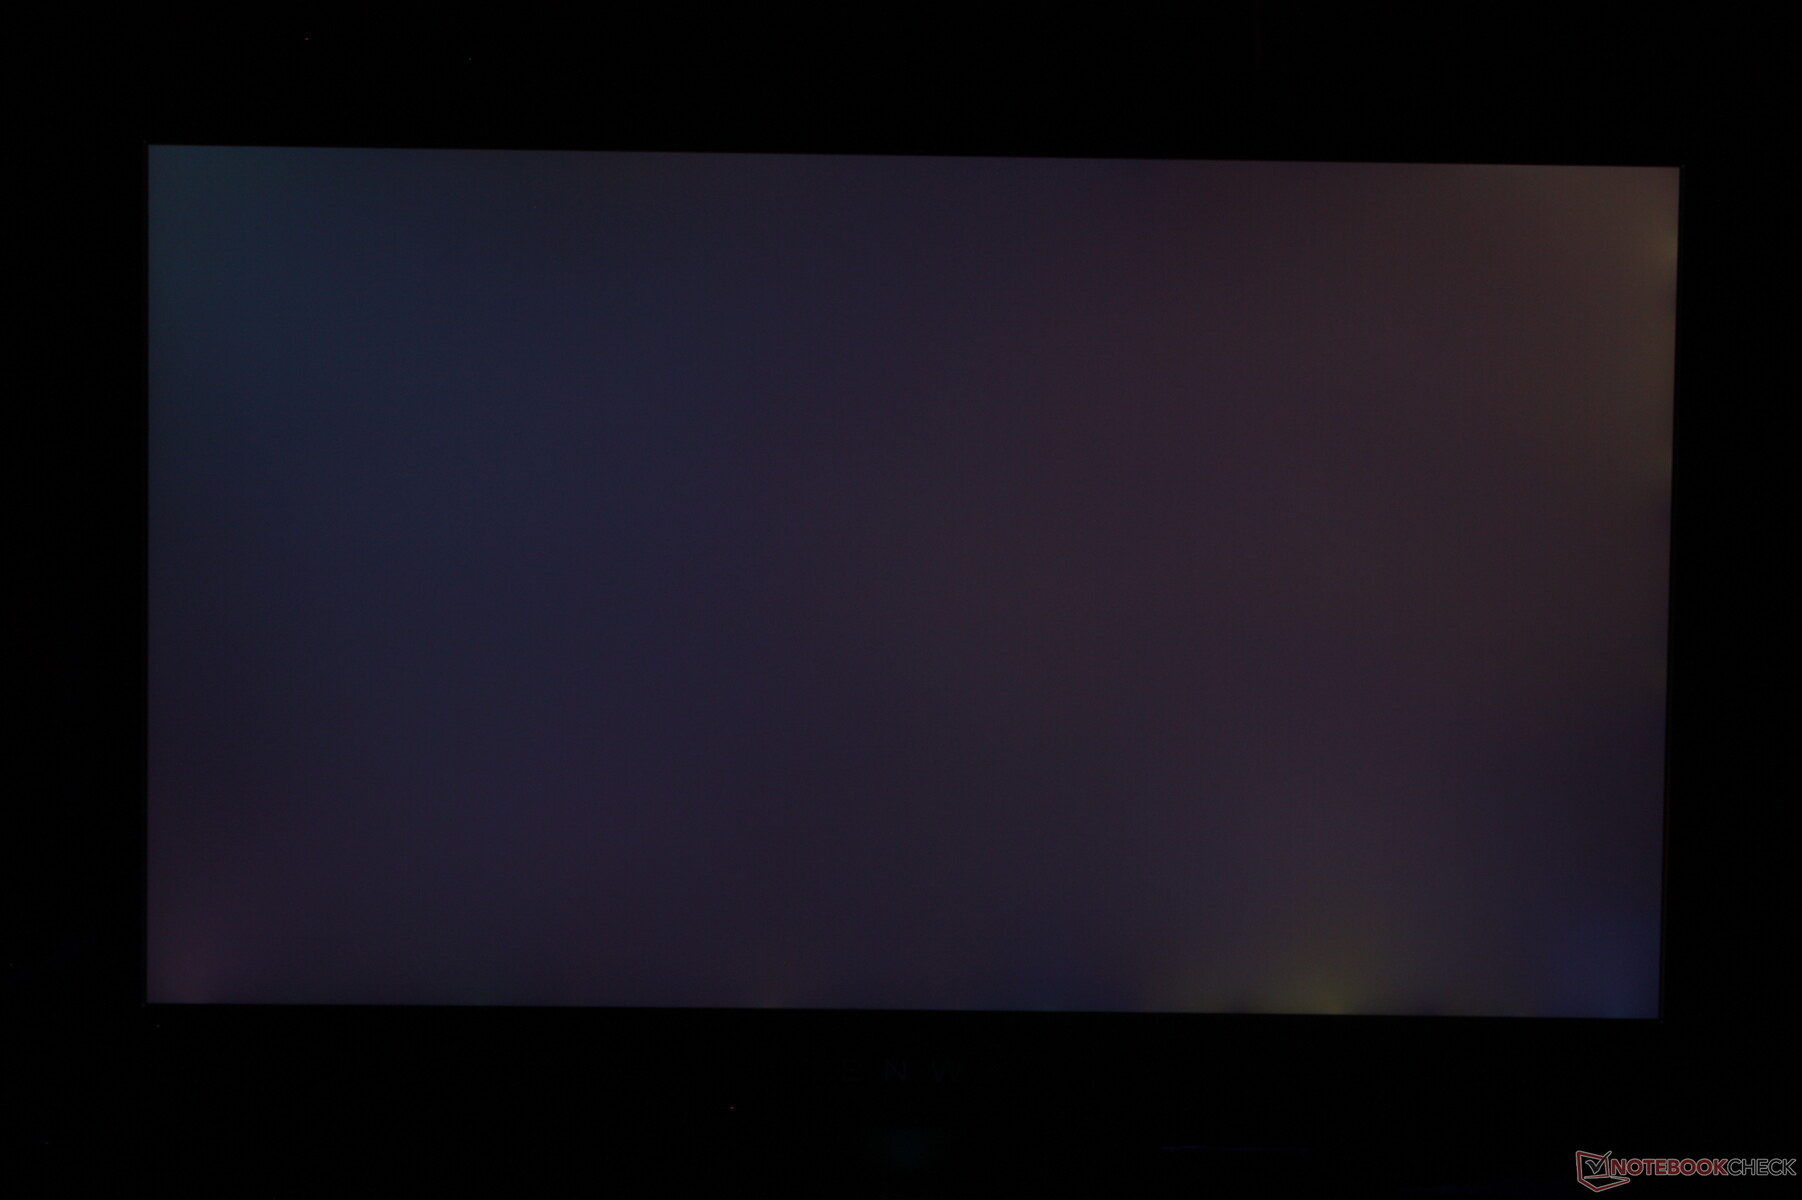
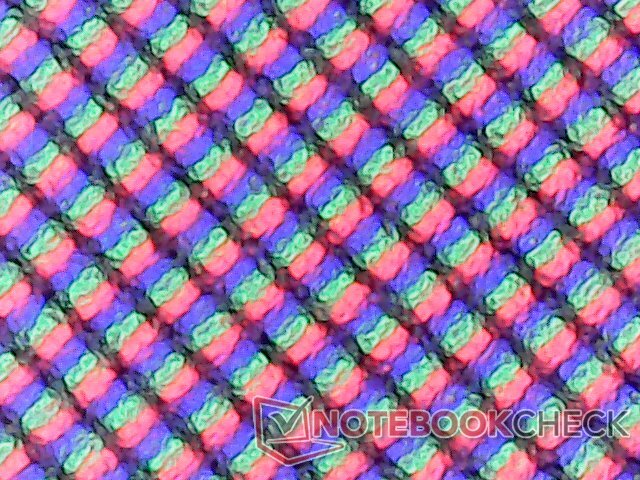
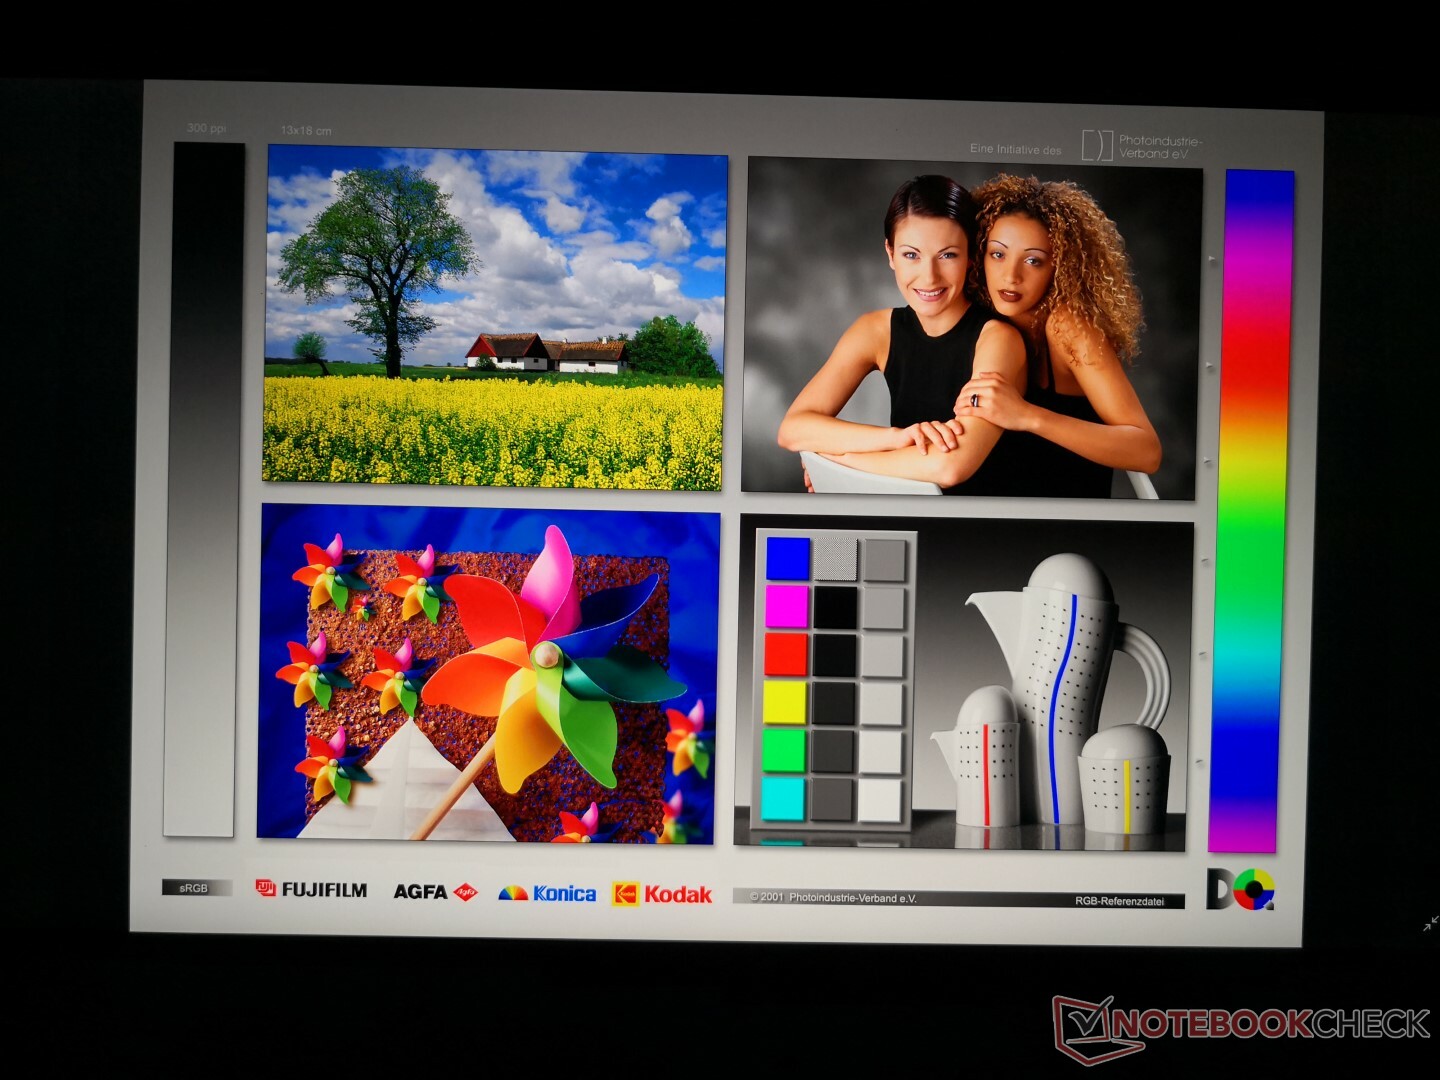
The matte screen is noticeably grainier than a glossy alternative. This becomes more apparent when viewing a solid white image where color grains are easier to see. Using a microscope to focus on the individual subpixels shows the classic "blurry" overlay common on many matte screens. While not distracting, it's nonetheless noticeable especially when sitting side-by-side to a glossy screen.
Our unit exhibits only minor uneven backlight bleeding along the edges. It's thankfully unnoticeable when gaming or watching movies.
| |||||||||||||||||||||||||
Brightness Distribution: 94 %
Center on Battery: 357.9 cd/m²
Contrast: 1085:1 (Black: 0.33 cd/m²)
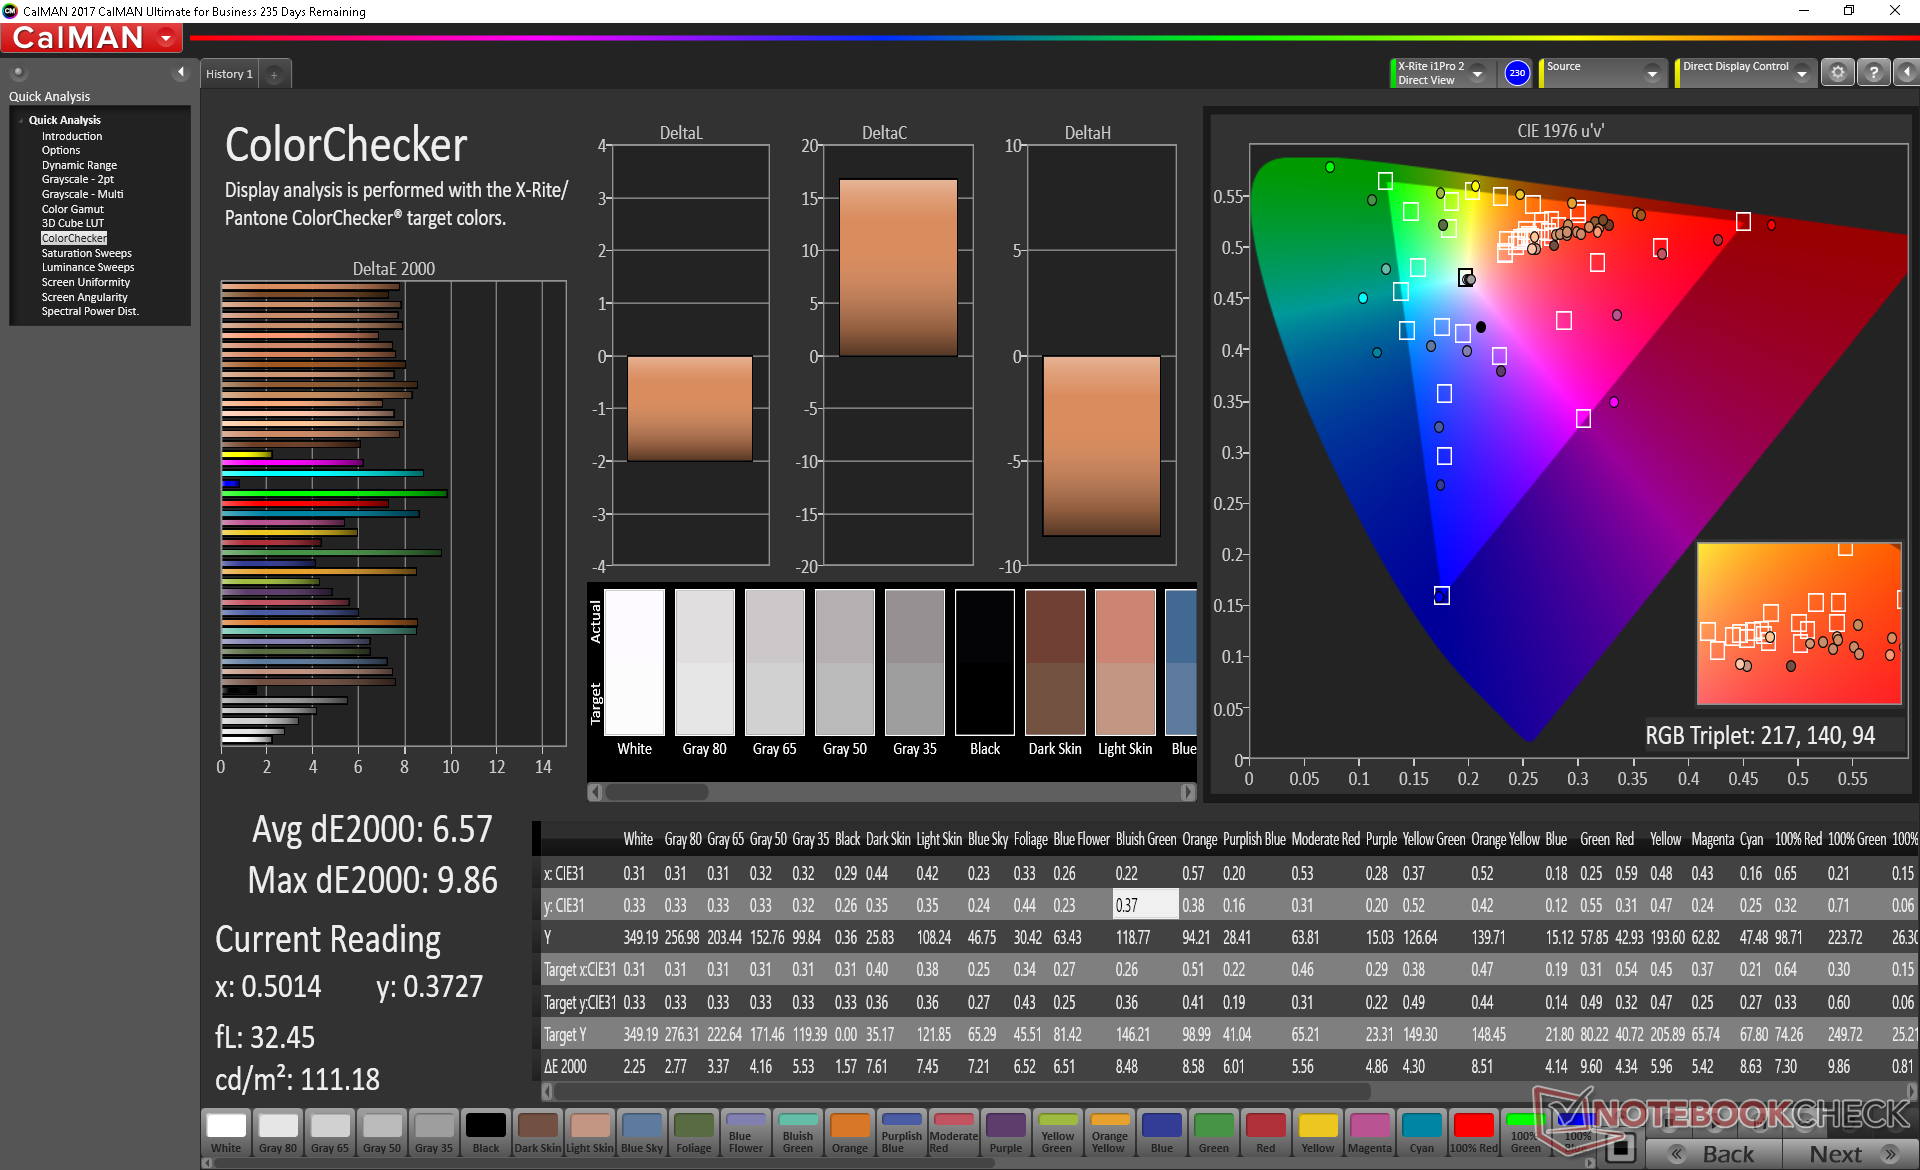
ΔE Color 6.57 | 0.5-29.43 Ø5, calibrated: 6.74
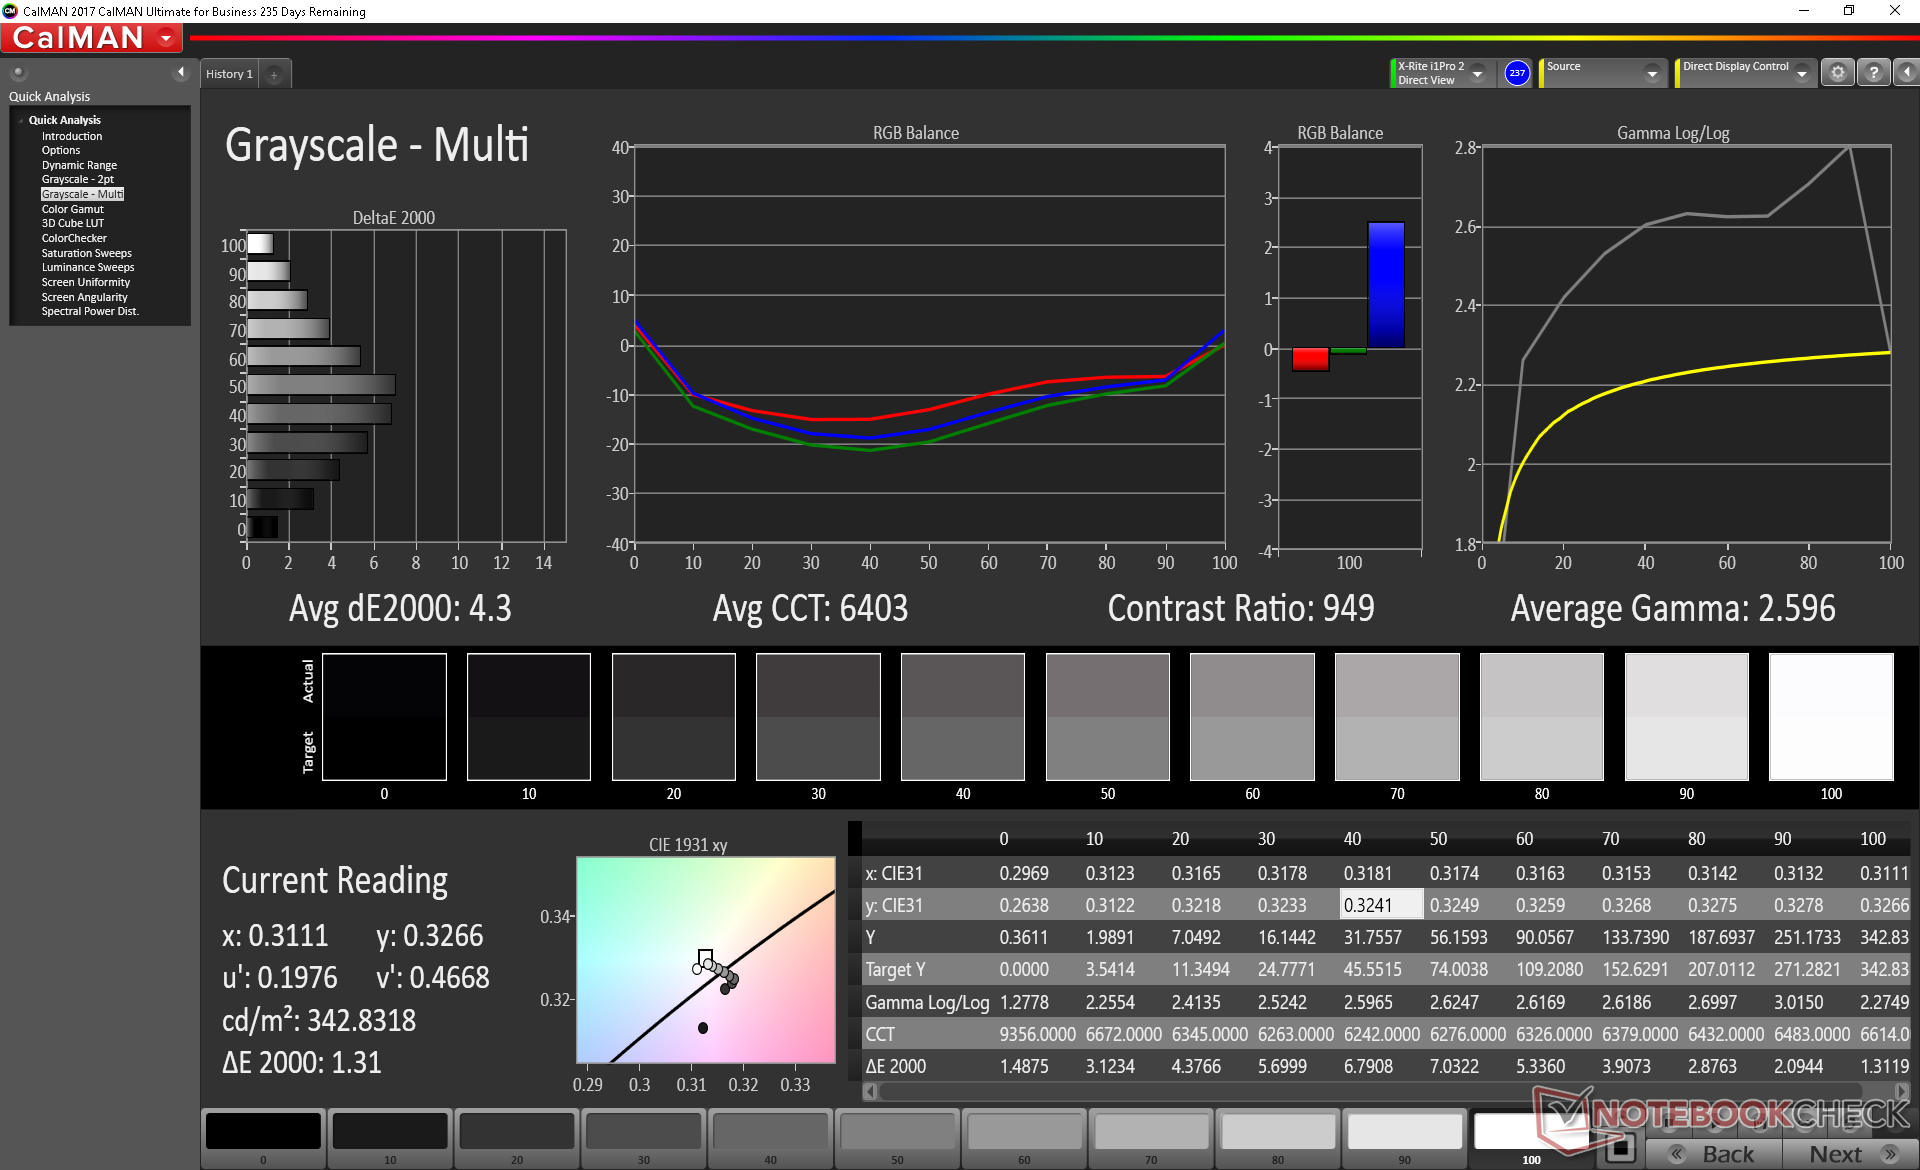
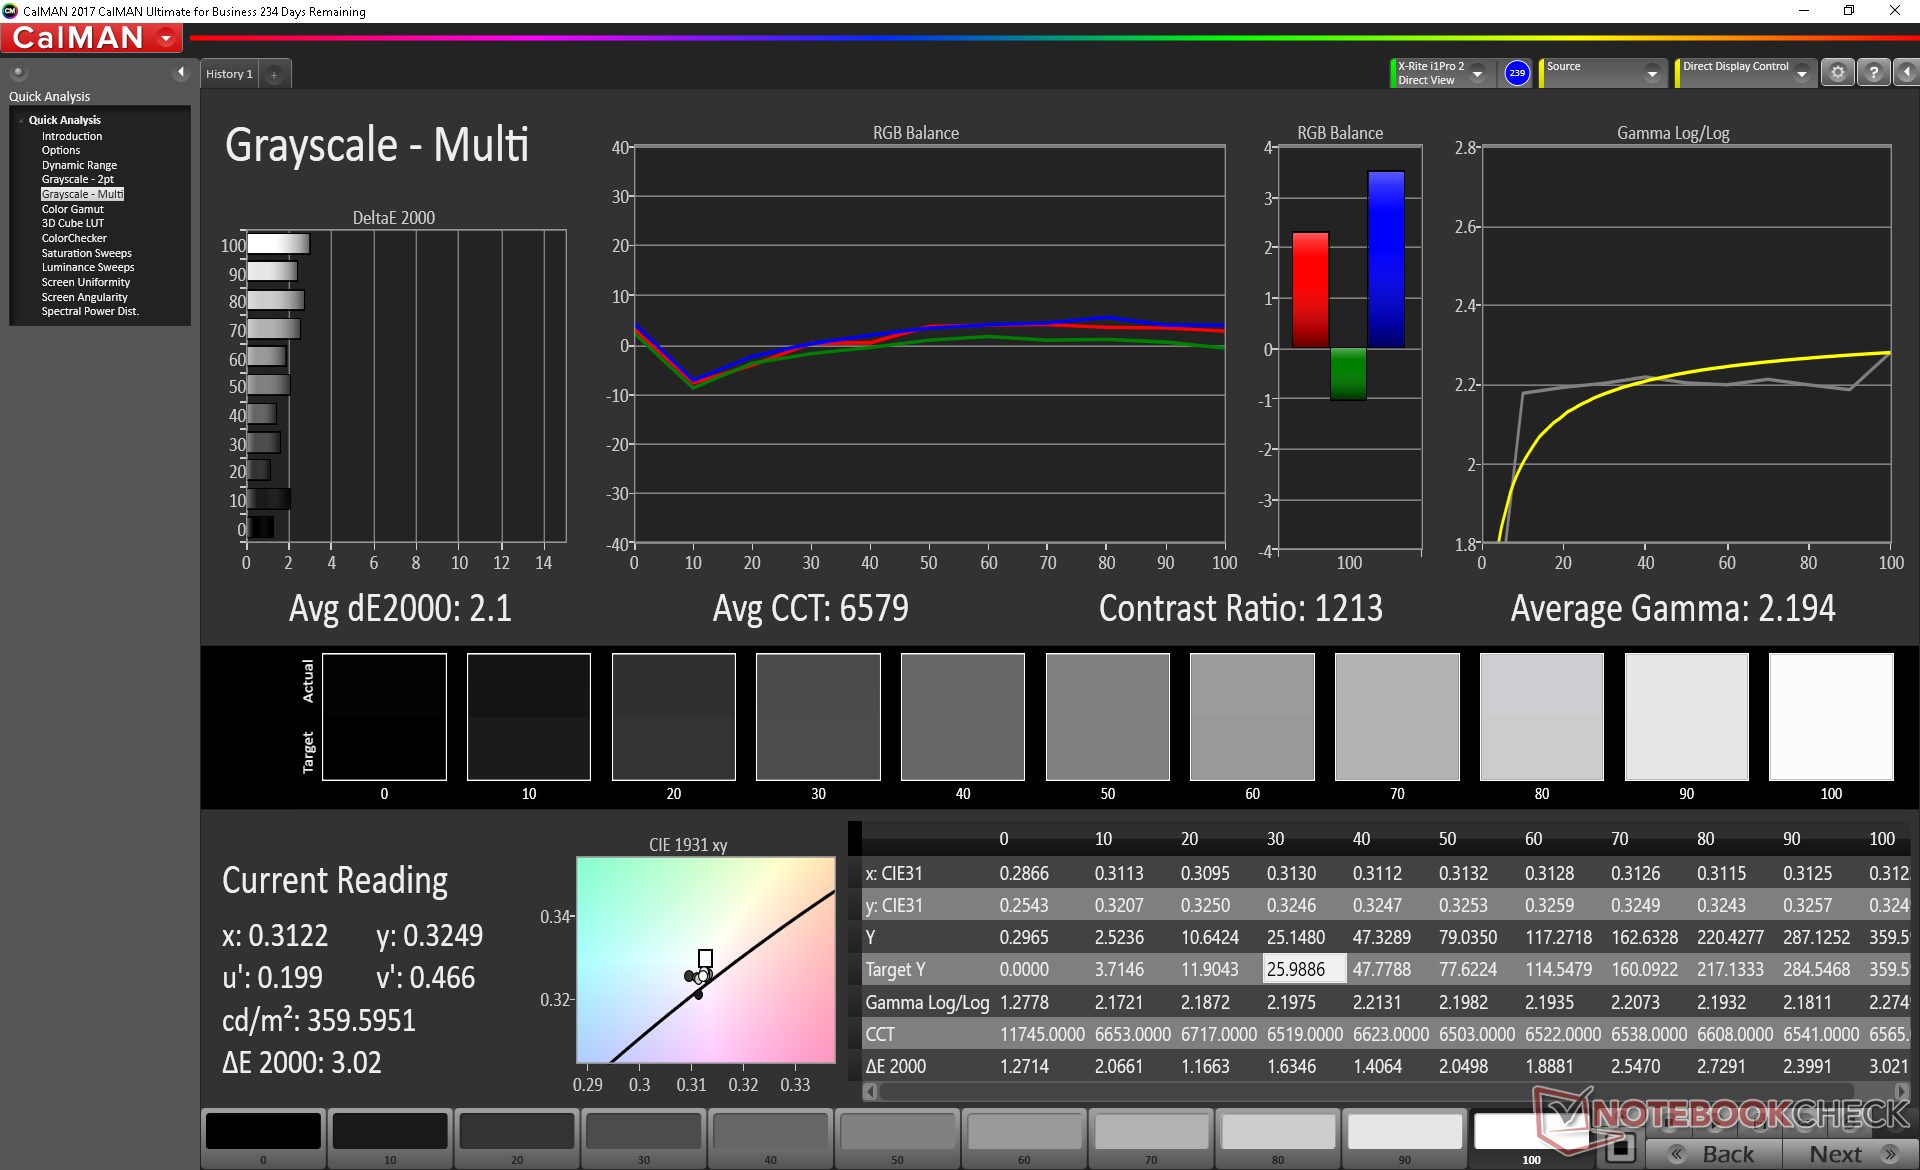
ΔE Greyscale 4.3 | 0.57-98 Ø5.3
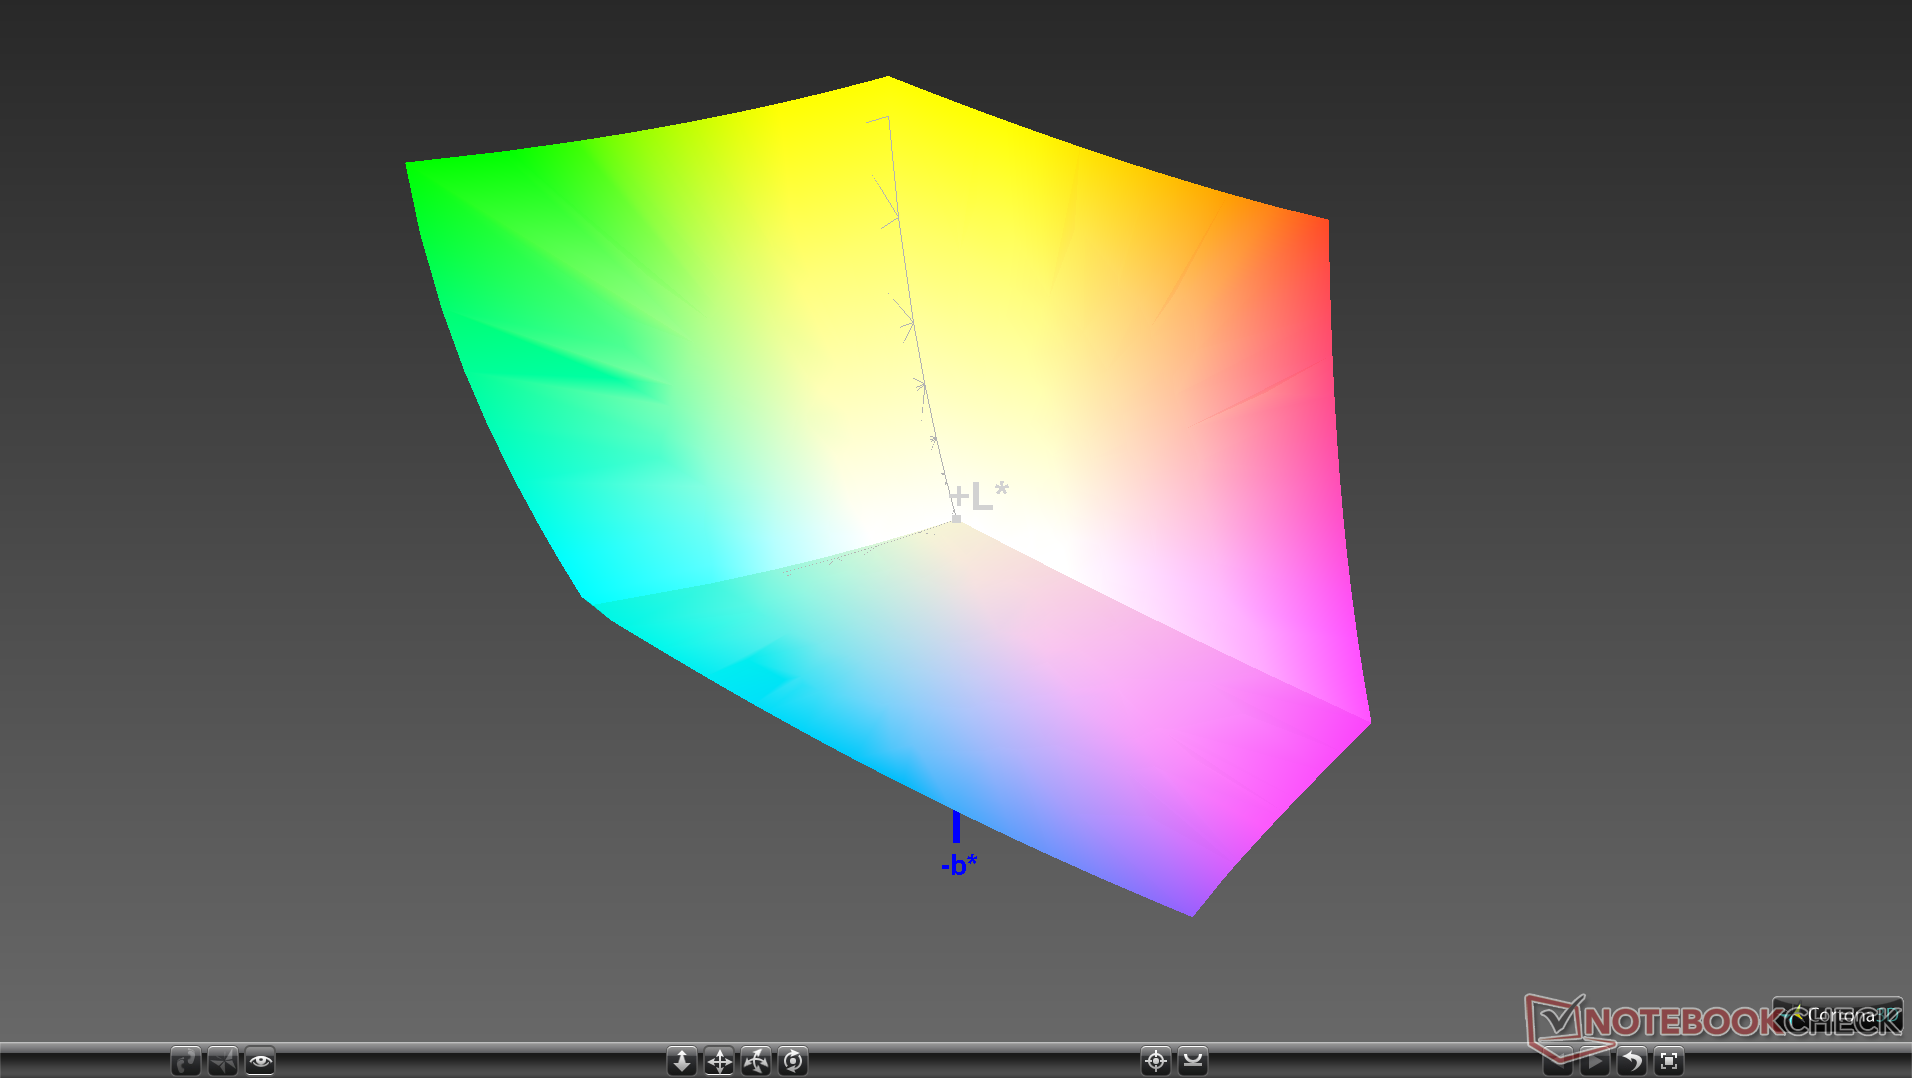
100% sRGB (Argyll 1.6.3 3D)
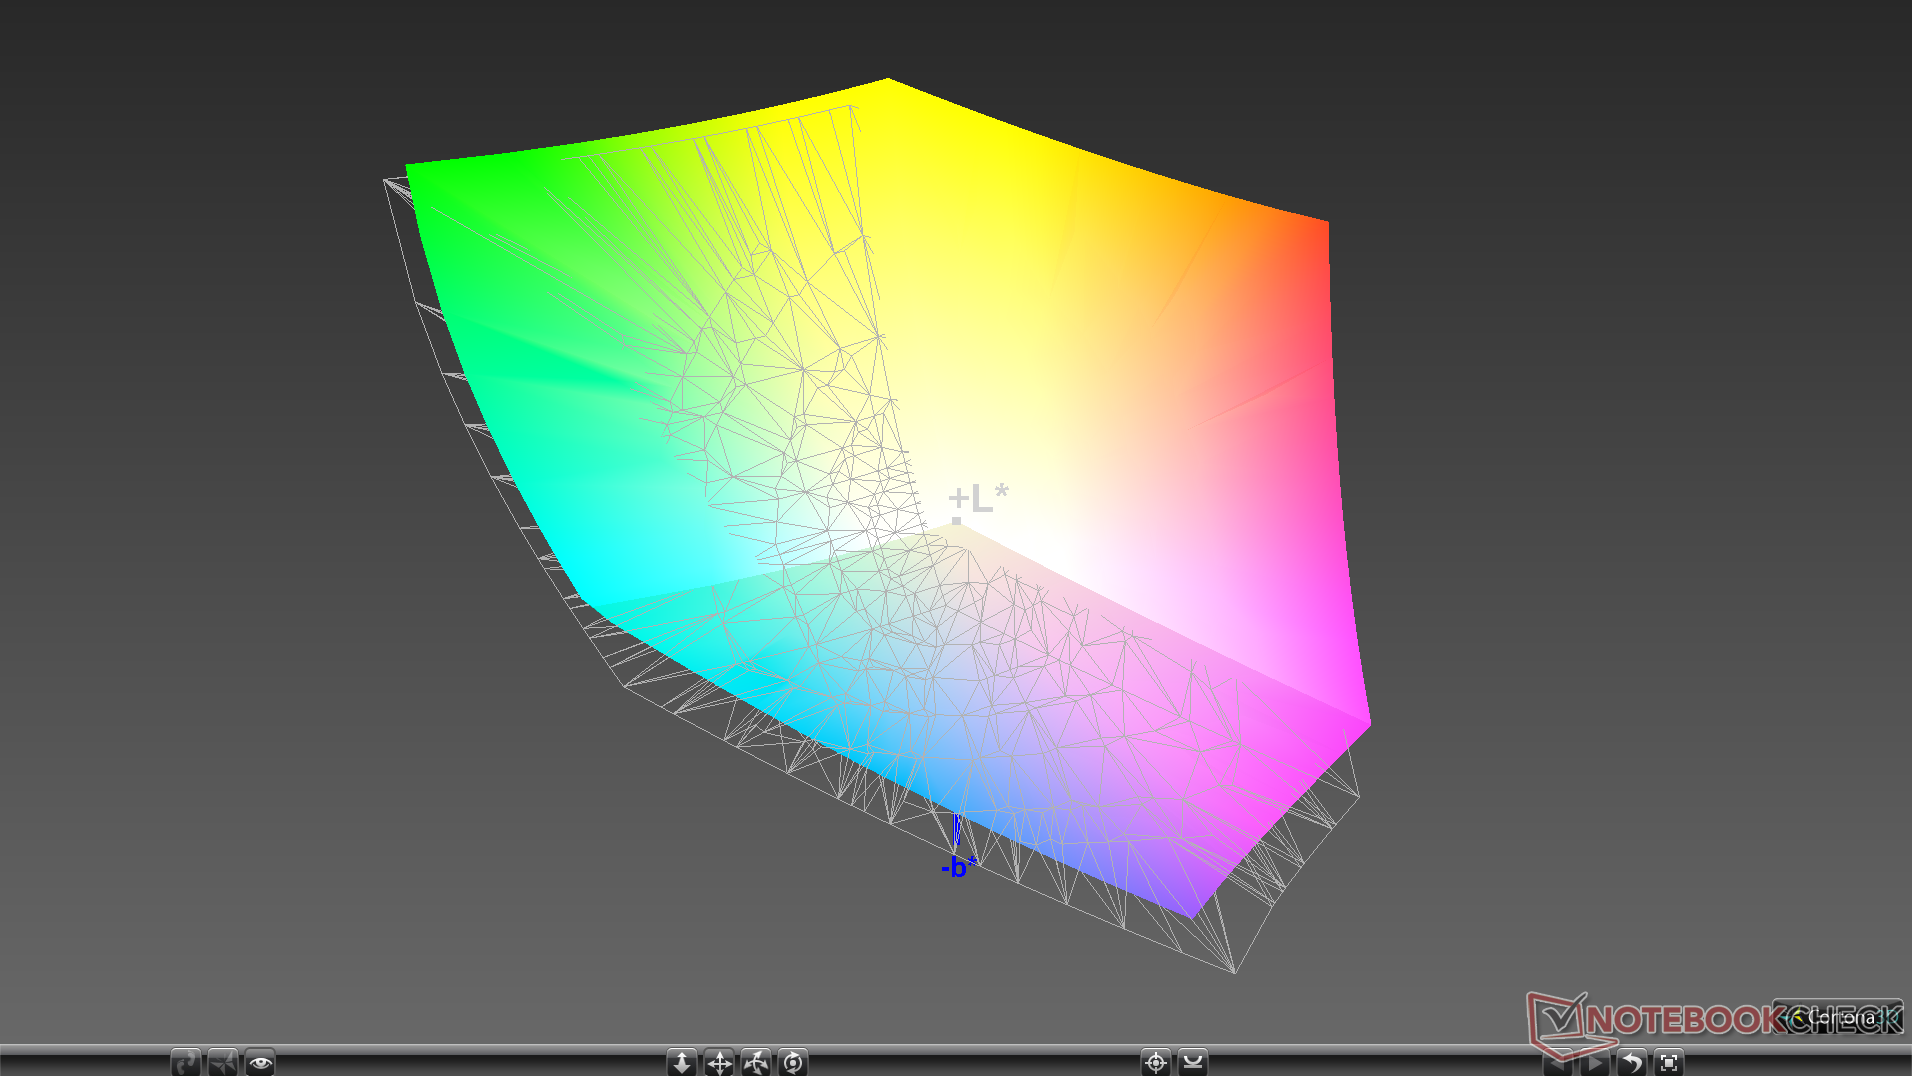
88.4% AdobeRGB 1998 (Argyll 1.6.3 3D)
99.1% AdobeRGB 1998 (Argyll 2.2.0 3D)
99.9% sRGB (Argyll 2.2.0 3D)
86.4% Display P3 (Argyll 2.2.0 3D)
Gamma: 2.6
| Alienware m17 P37E AU Optronics B173ZAN01.0, IPS, 17.30, 3840x2160 | Alienware 17 R5 JYWWF_B173QTN (AUO1496), TN, 17.30, 2560x1440 | Asus ROG Strix Scar II GL704GW B173HAN04.0 (AUO409D), AHVA, 17.30, 1920x1080 | MSI GS75 8SG Stealth N173HCE-G33 (CMN175C), IPS, 17.30, 1920x1080 | Razer Blade Pro 2017 Sharp LQ173D1JW33 (SHP145A), IGZO, 17.30, 3840x2160 | Acer Predator Triton 700 AUO B156HAN04.2 (AUO42ED), IPS, 15.60, 1920x1080 | |
|---|---|---|---|---|---|---|
| Display | -26% | -25% | -22% | 1% | -25% | |
| Display P3 Coverage | 86.4 | 63.4 -27% | 62.9 -27% | 63.6 -26% | 88.9 3% | 62.5 -28% |
| sRGB Coverage | 99.9 | 86.1 -14% | 87.1 -13% | 95.4 -5% | 100 0% | 88.7 -11% |
| AdobeRGB 1998 Coverage | 99.1 | 62.9 -37% | 63.7 -36% | 65.5 -34% | 99.7 1% | 63.5 -36% |
| Response Times | 61% | 56% | 73% | -54% | -16% | |
| Response Time Grey 50% / Grey 80% * | 35.6 ? | 20.8 ? 42% | 17.6 ? 51% | 7.6 ? 79% | 60.8 ? -71% | 44.8 ? -26% |
| Response Time Black / White * | 28 ? | 6 ? 79% | 11.2 ? 60% | 9.6 ? 66% | 38.4 ? -37% | 29.6 ? -6% |
| PWM Frequency | 25510 ? | 204.9 ? | ||||
| Screen | -7% | 14% | 25% | -4% | -9% | |
| Brightness middle | 357.9 | 398 11% | 295 -18% | 355 -1% | 230 -36% | 291 -19% |
| Brightness | 347 | 367 6% | 291 -16% | 327 -6% | 207 -40% | 277 -20% |
| Brightness Distribution | 94 | 86 -9% | 96 2% | 85 -10% | 83 -12% | 84 -11% |
| Black Level * | 0.33 | 0.51 -55% | 0.24 27% | 0.26 21% | 0.2 39% | 0.22 33% |
| Contrast | 1085 | 780 -28% | 1229 13% | 1365 26% | 1150 6% | 1323 22% |
| Colorchecker dE 2000 * | 6.57 | 5.45 17% | 3.2 51% | 1.54 77% | 5.62 14% | 5.52 16% |
| Colorchecker dE 2000 max. * | 9.86 | 10.36 -5% | 6.64 33% | 3 70% | 10.24 -4% | 10.72 -9% |
| Colorchecker dE 2000 calibrated * | 6.74 | 2.56 62% | 2.52 63% | 0.77 89% | ||
| Greyscale dE 2000 * | 4.3 | 5.4 -26% | 2.16 50% | 2.19 49% | 4.54 -6% | 6.59 -53% |
| Gamma | 2.6 85% | 2.4 92% | 2.46 89% | 2.42 91% | 2.36 93% | 2.44 90% |
| CCT | 6403 102% | 7453 87% | 6872 95% | 6893 94% | 6625 98% | 7816 83% |
| Color Space (Percent of AdobeRGB 1998) | 88.4 | 56 -37% | 57 -36% | 61 -31% | 88 0% | 58 -34% |
| Color Space (Percent of sRGB) | 100 | 86 -14% | 87 -13% | 95 -5% | 100 0% | 89 -11% |
| Total Average (Program / Settings) | 9% /
-2% | 15% /
12% | 25% /
22% | -19% /
-10% | -17% /
-13% |
* ... smaller is better
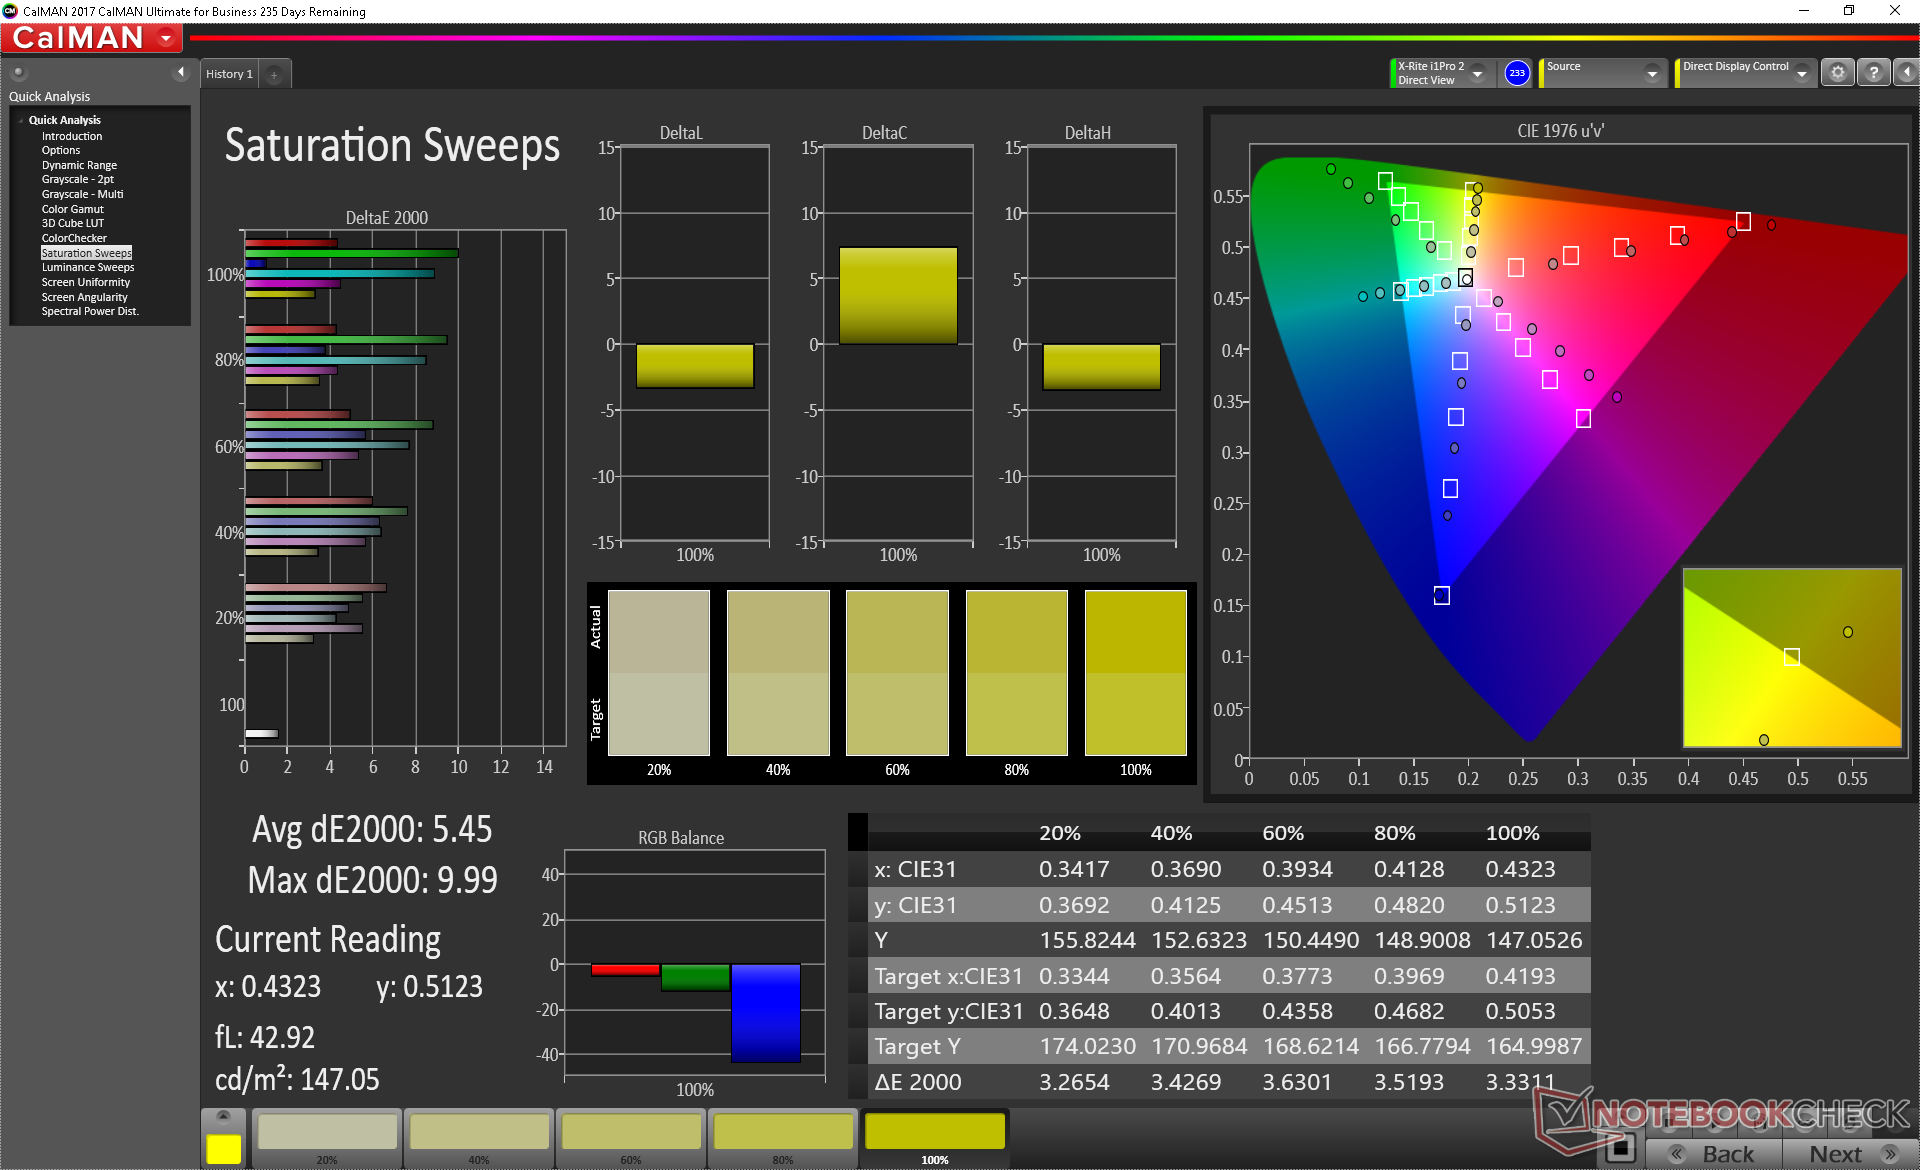
Gamut covers the entirety of sRGB and about 90 percent of AdobeRGB not unlike the Sharp LQ173D1JW33 IGZO panel on the Razer Blade Pro. Color space is measurably wider than the 1440p AUO1496 panel on the last generation Alienware 17 R5.
Though the panel is capable of reproducing the AdobeRGB standard accurately, we can't seem to be able to adjust the colors to sRGB even through the usual Windows display color settings. Thus, our CalMAN results below show the display to be more inaccurate than it really is both before and after calibration. More finicking through Dell's pre-installed software may be needed to fine tune the colors.


Display Response Times
| ↔ Response Time Black to White | ||
|---|---|---|
| 28 ms ... rise ↗ and fall ↘ combined | ↗ 16 ms rise | 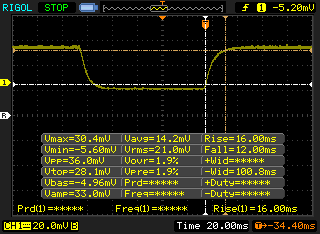 |
| ↘ 12 ms fall | ||
| The screen shows relatively slow response rates in our tests and may be too slow for gamers. In comparison, all tested devices range from 0.1 (minimum) to 240 (maximum) ms. » 67 % of all devices are better. This means that the measured response time is worse than the average of all tested devices (21.5 ms). | ||
| ↔ Response Time 50% Grey to 80% Grey | ||
| 35.6 ms ... rise ↗ and fall ↘ combined | ↗ 19.6 ms rise | 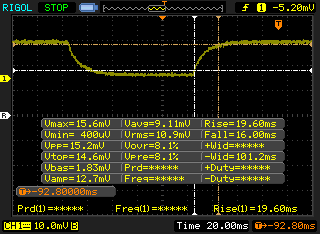 |
| ↘ 16 ms fall | ||
| The screen shows slow response rates in our tests and will be unsatisfactory for gamers. In comparison, all tested devices range from 0.2 (minimum) to 636 (maximum) ms. » 43 % of all devices are better. This means that the measured response time is similar to the average of all tested devices (33.8 ms). | ||
Screen Flickering / PWM (Pulse-Width Modulation)
| Screen flickering / PWM not detected | 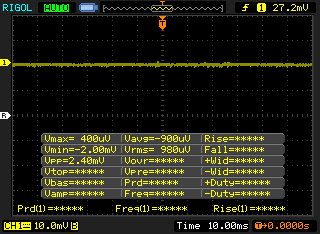 | ||
In comparison: 53 % of all tested devices do not use PWM to dim the display. If PWM was detected, an average of 17933 (minimum: 5 - maximum: 3846000) Hz was measured. | |||
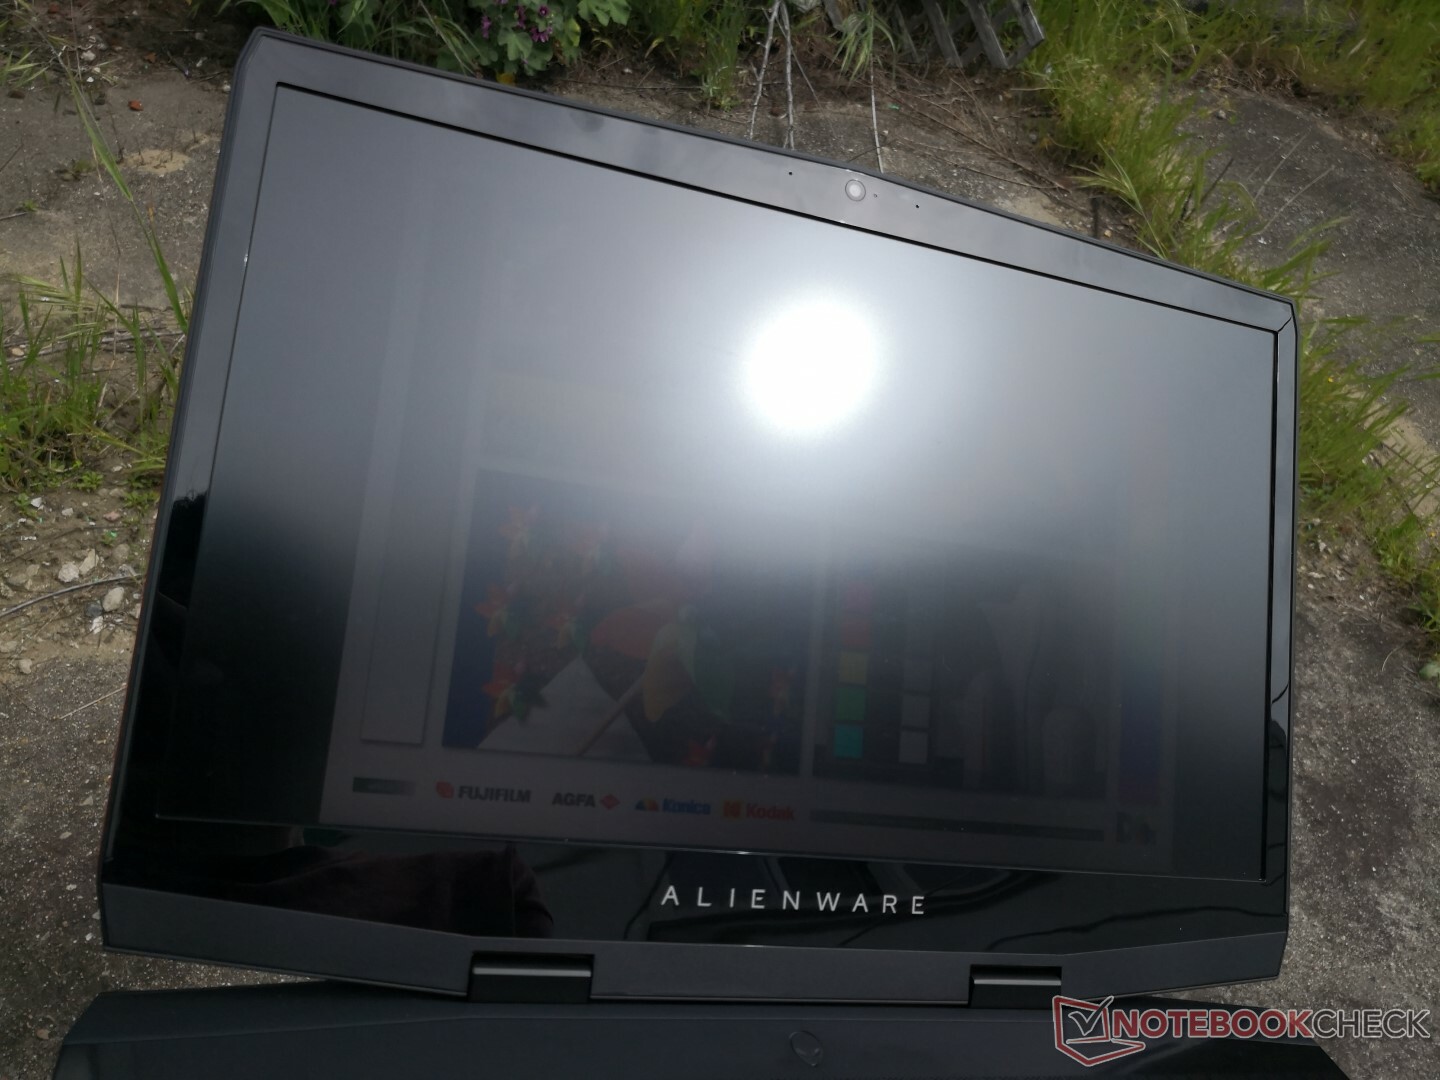
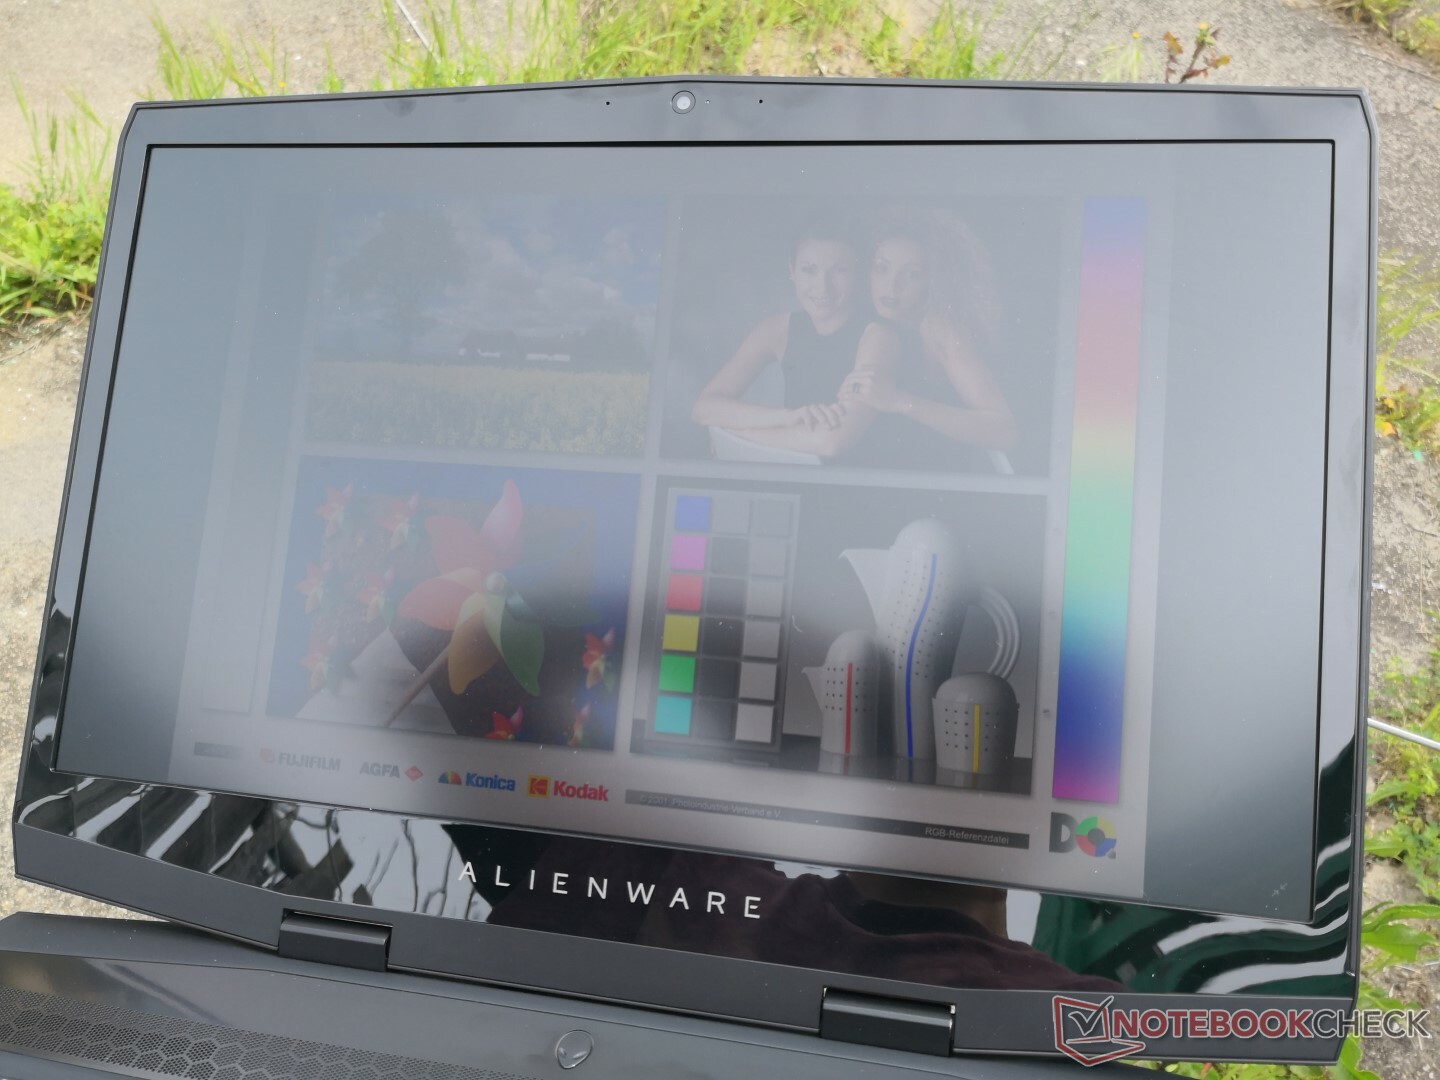
Outdoor visibility is about the same as on the last generation Alienware 17 if not slightly worse since the display is slightly dimmer. The 4K UHD resolution works against the laptop in this regard as the smaller text becomes even more difficult to read if text scaling is off. Some glare and washed out colors are inevitable despite the matte overlay.
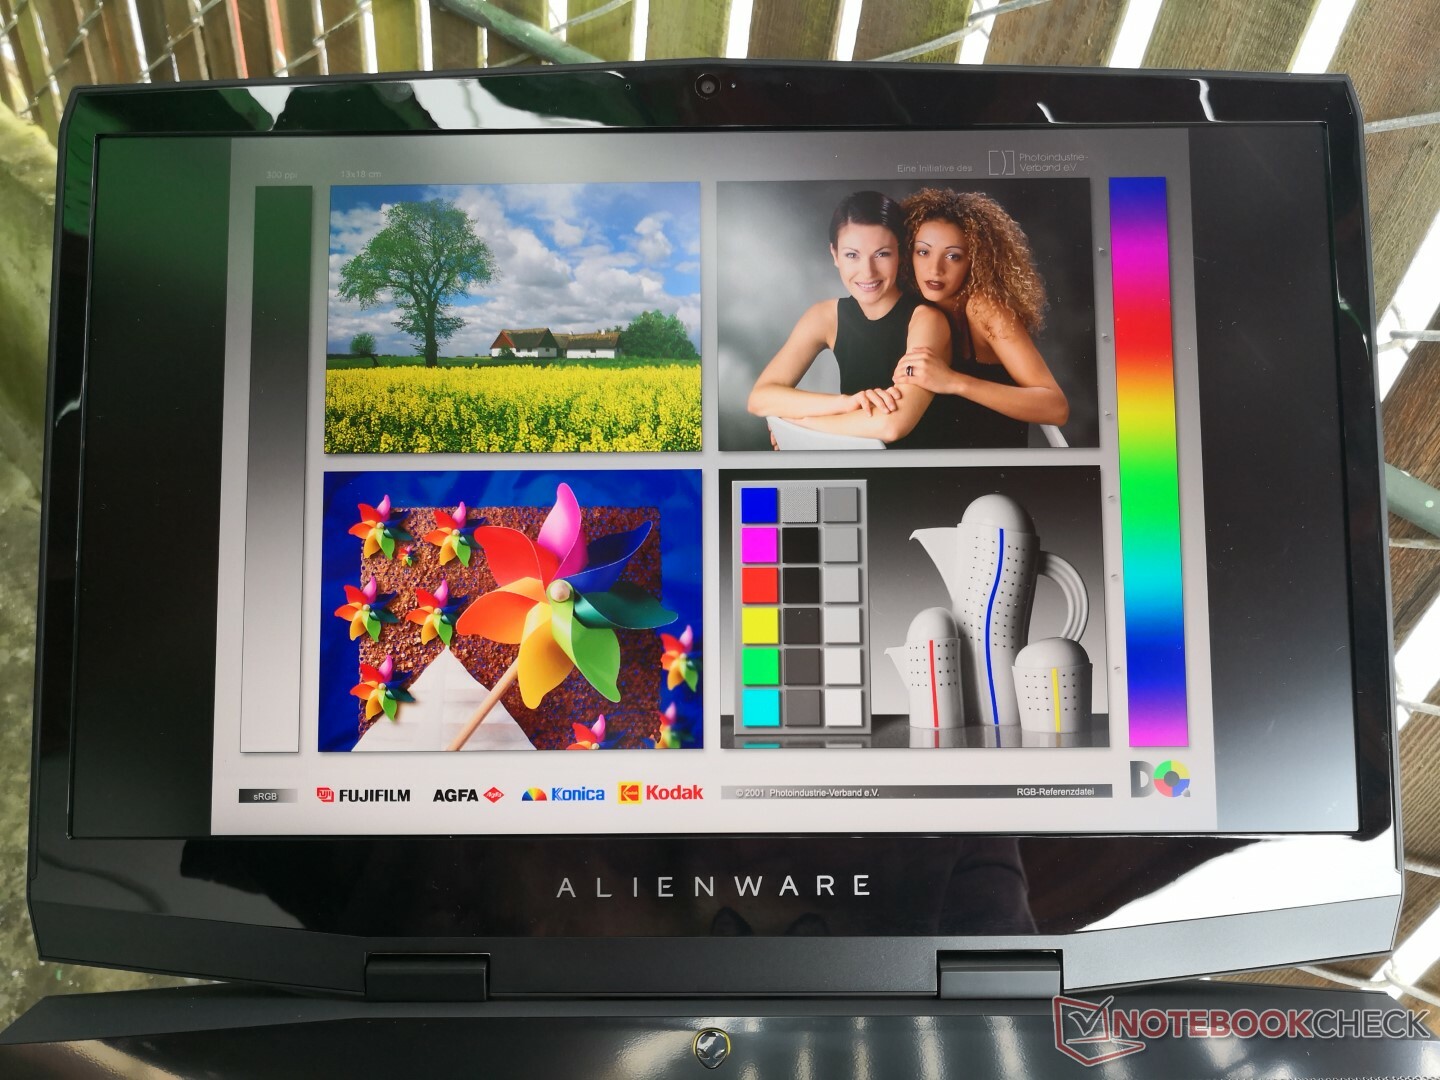
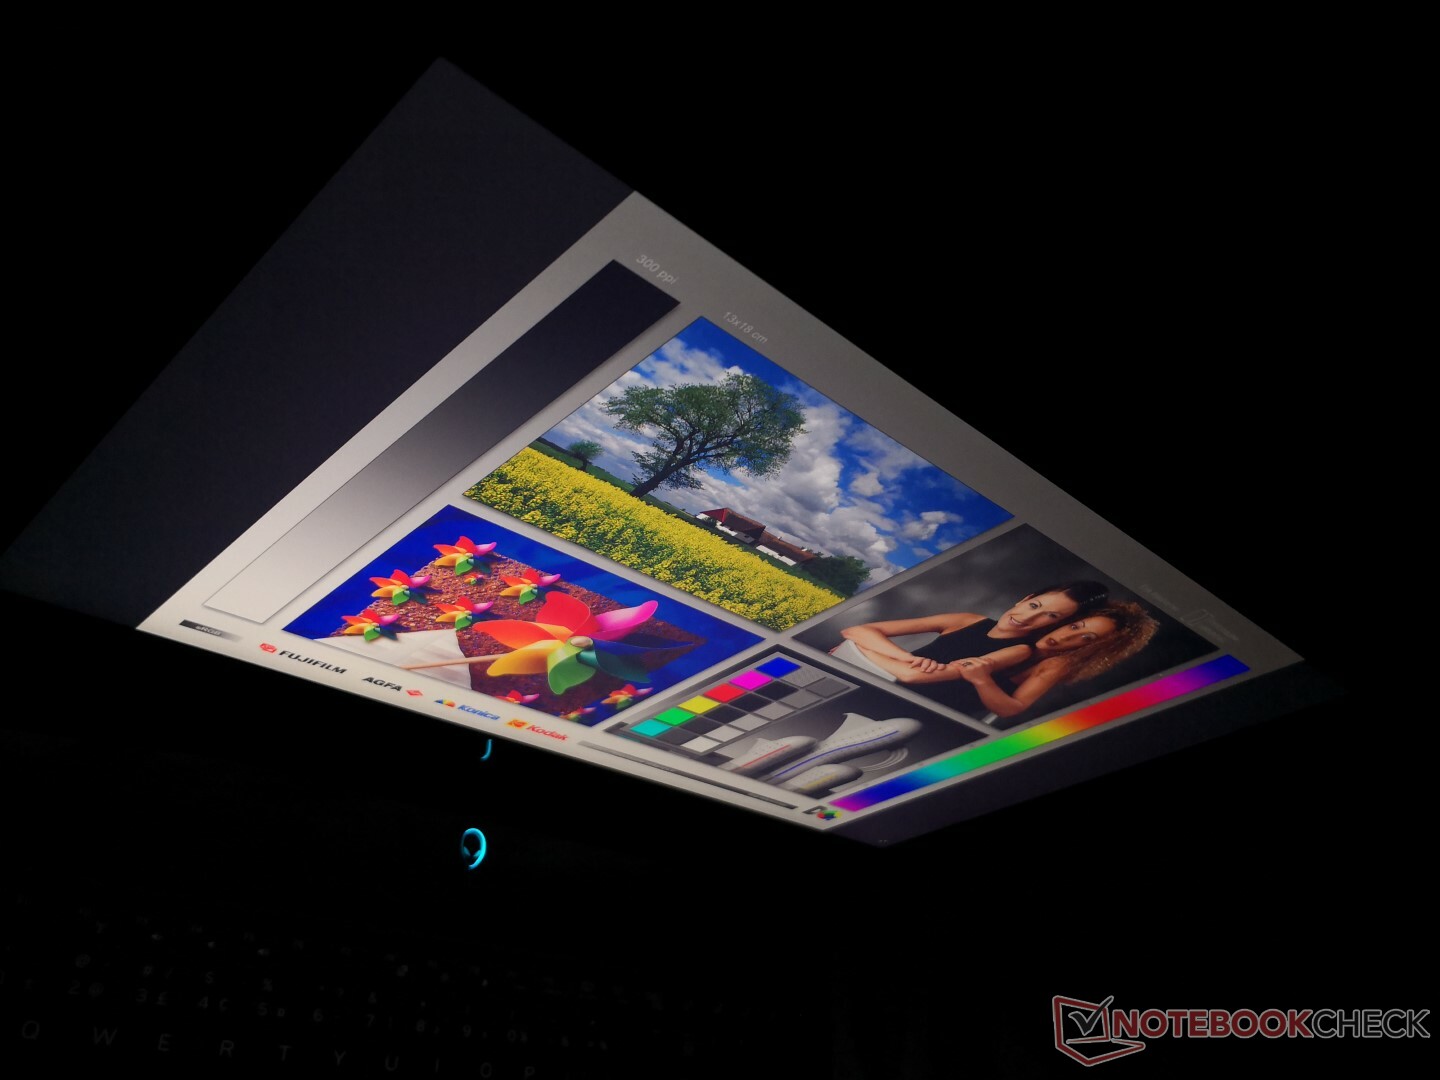
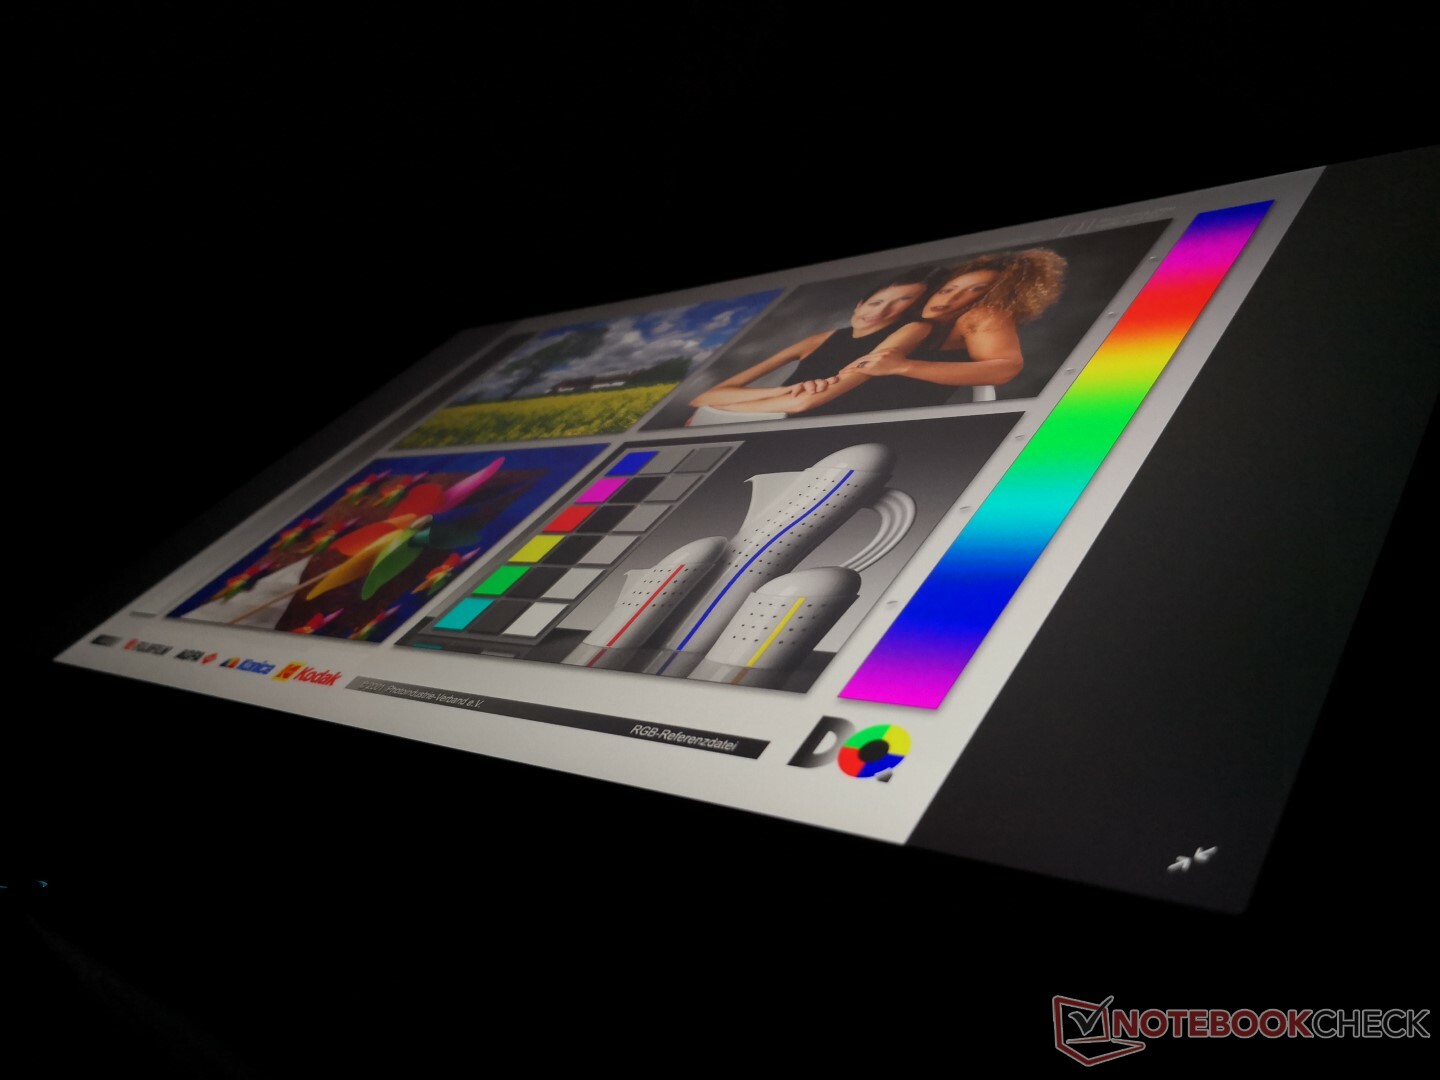
Viewing angles are otherwise very wide with only minimal changes to colors and contrast if viewing from obtuse angles.
Performance
Dell offers only Core i7 or Core i9 options for its Alienware m17 series. Users who want the cheaper Core i5 CPU instead ought to consider the every-level Dell G Series. The GPU range for the m17 also consists of high-end SKUs only from the RTX 2060 up to the RTX 2080 Max-Q. This is in contrast to the larger Alienware Area-51m which comes equipped with desktop CPU and full-power (Max-P) RTX 2080 configurations.
The pre-installed Alienware Command Center software is almost exactly as it appears on the Alienware 17 and Area-51m.
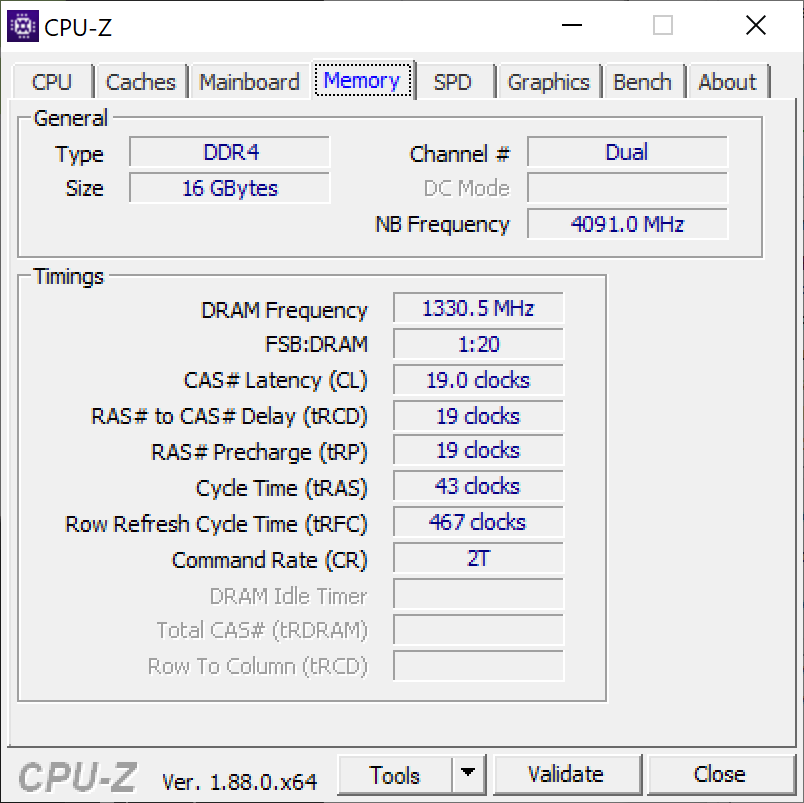
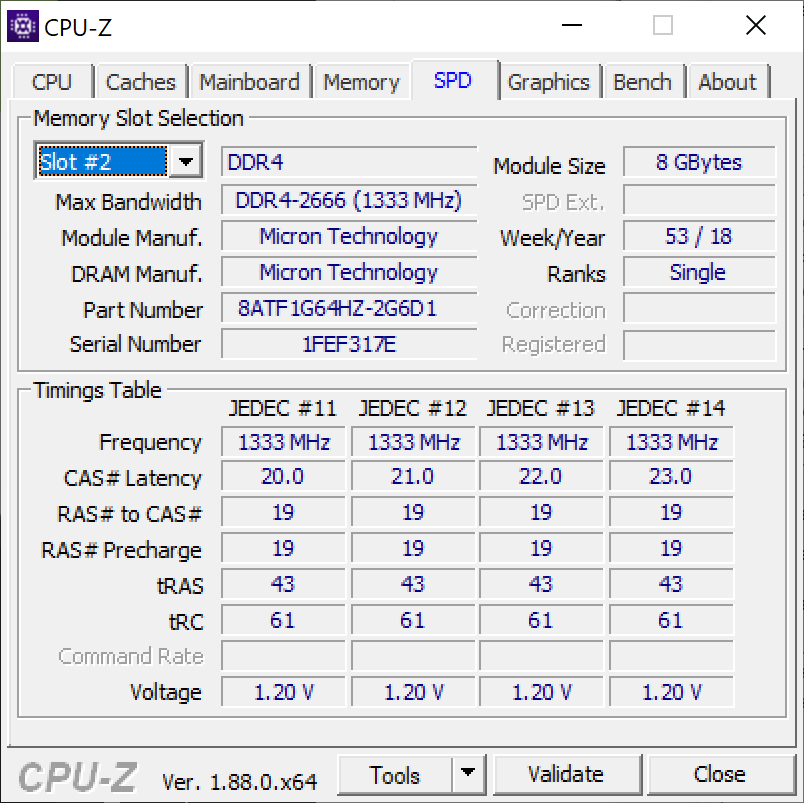
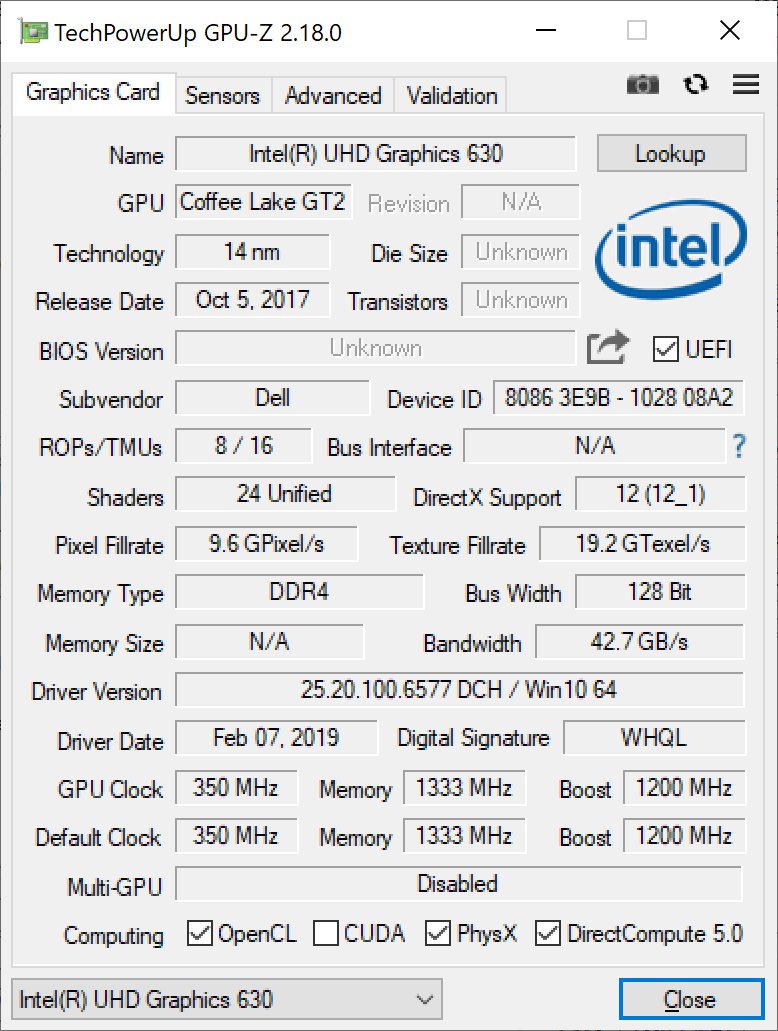
RAM is configurable up to 32 GB across the two accessible SODIMM slots. Optimus comes standard for automatic graphics switching.
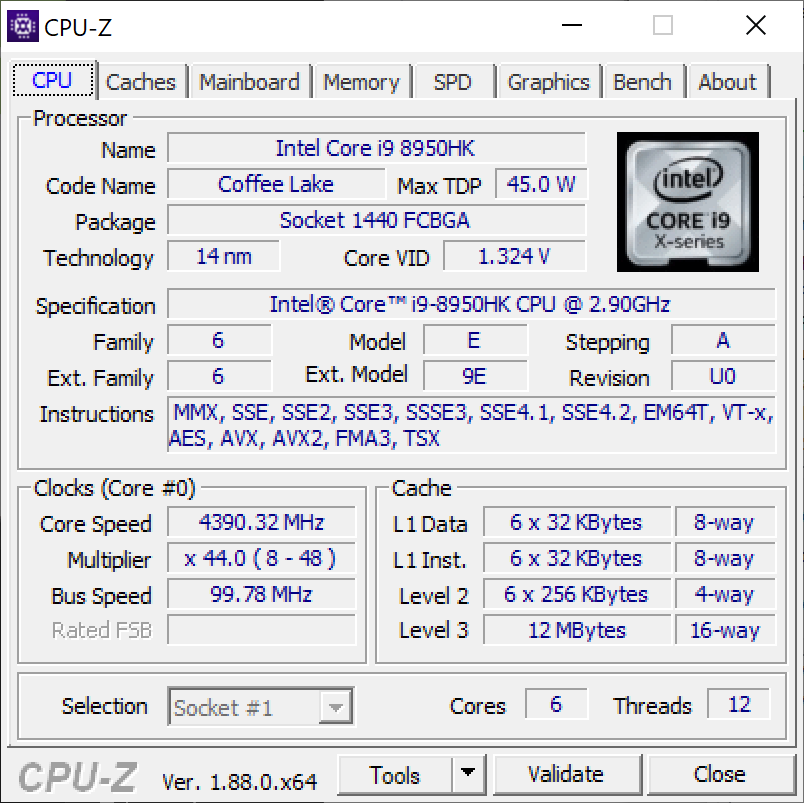
Processor
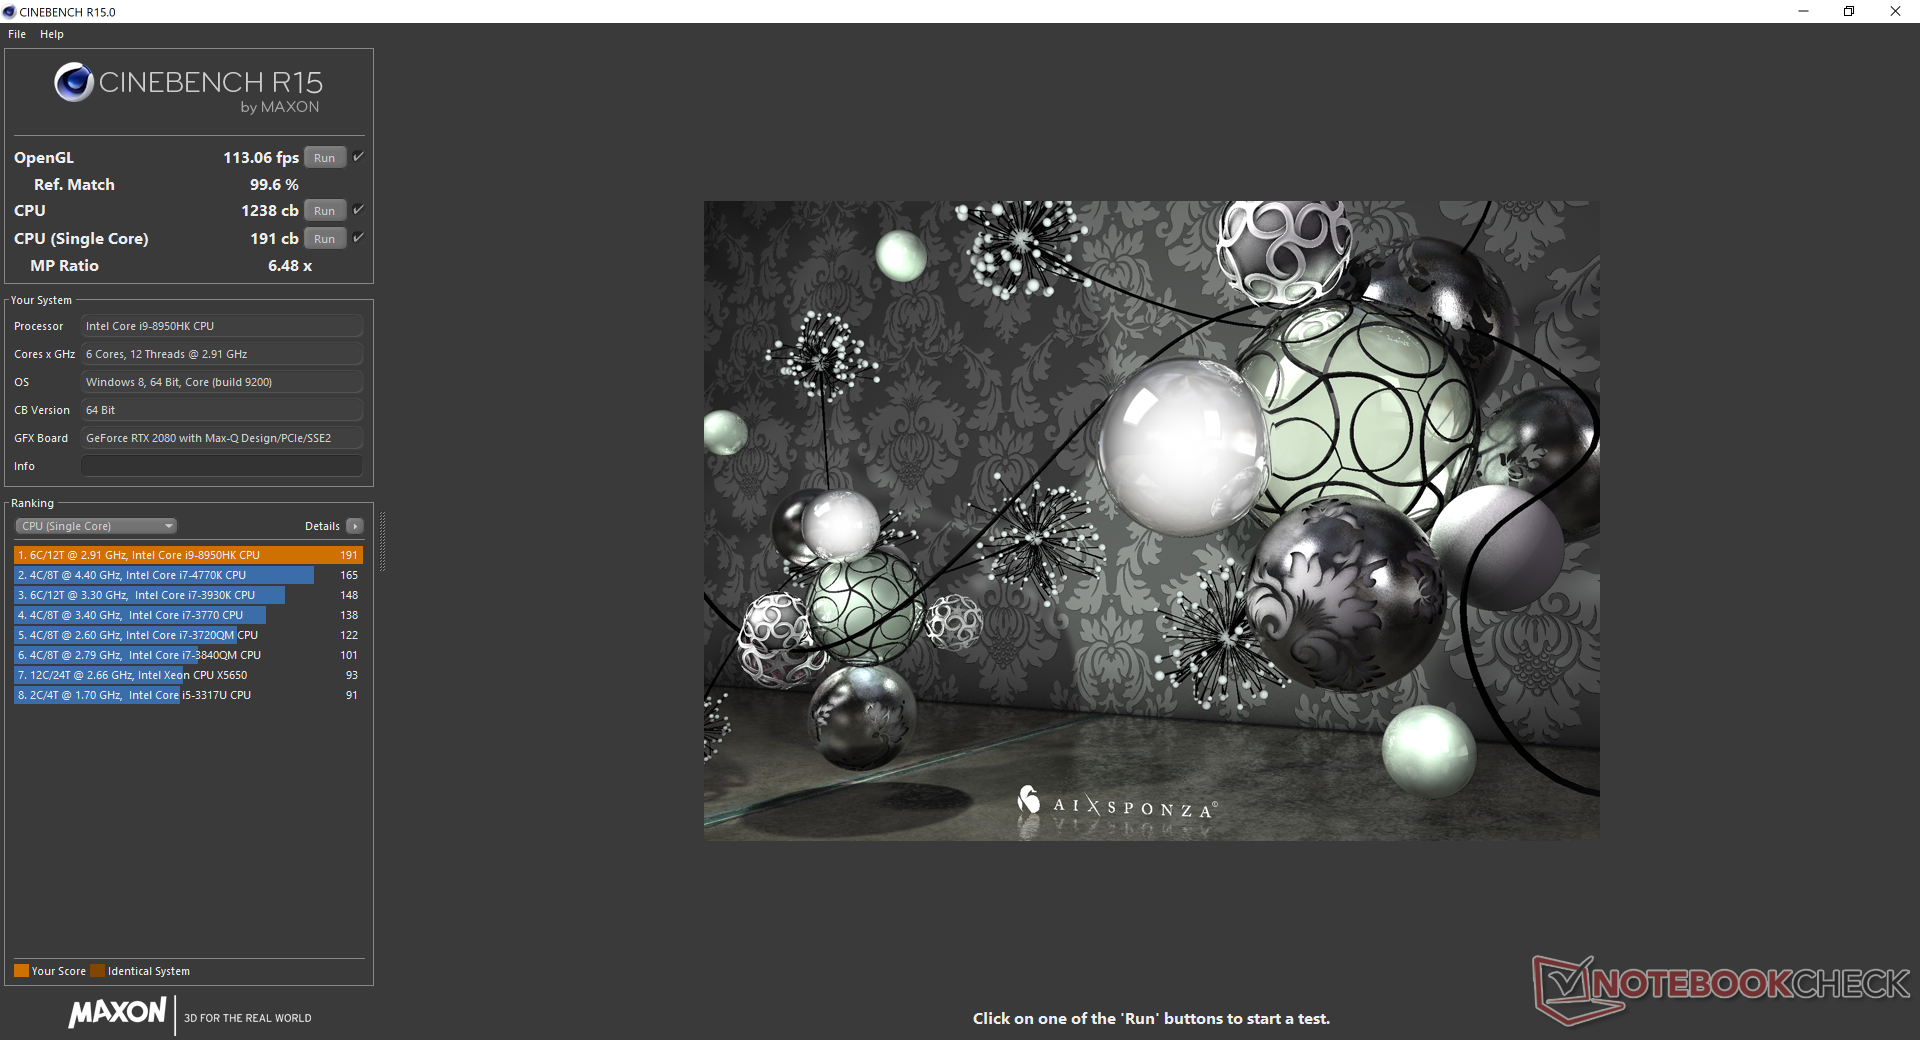
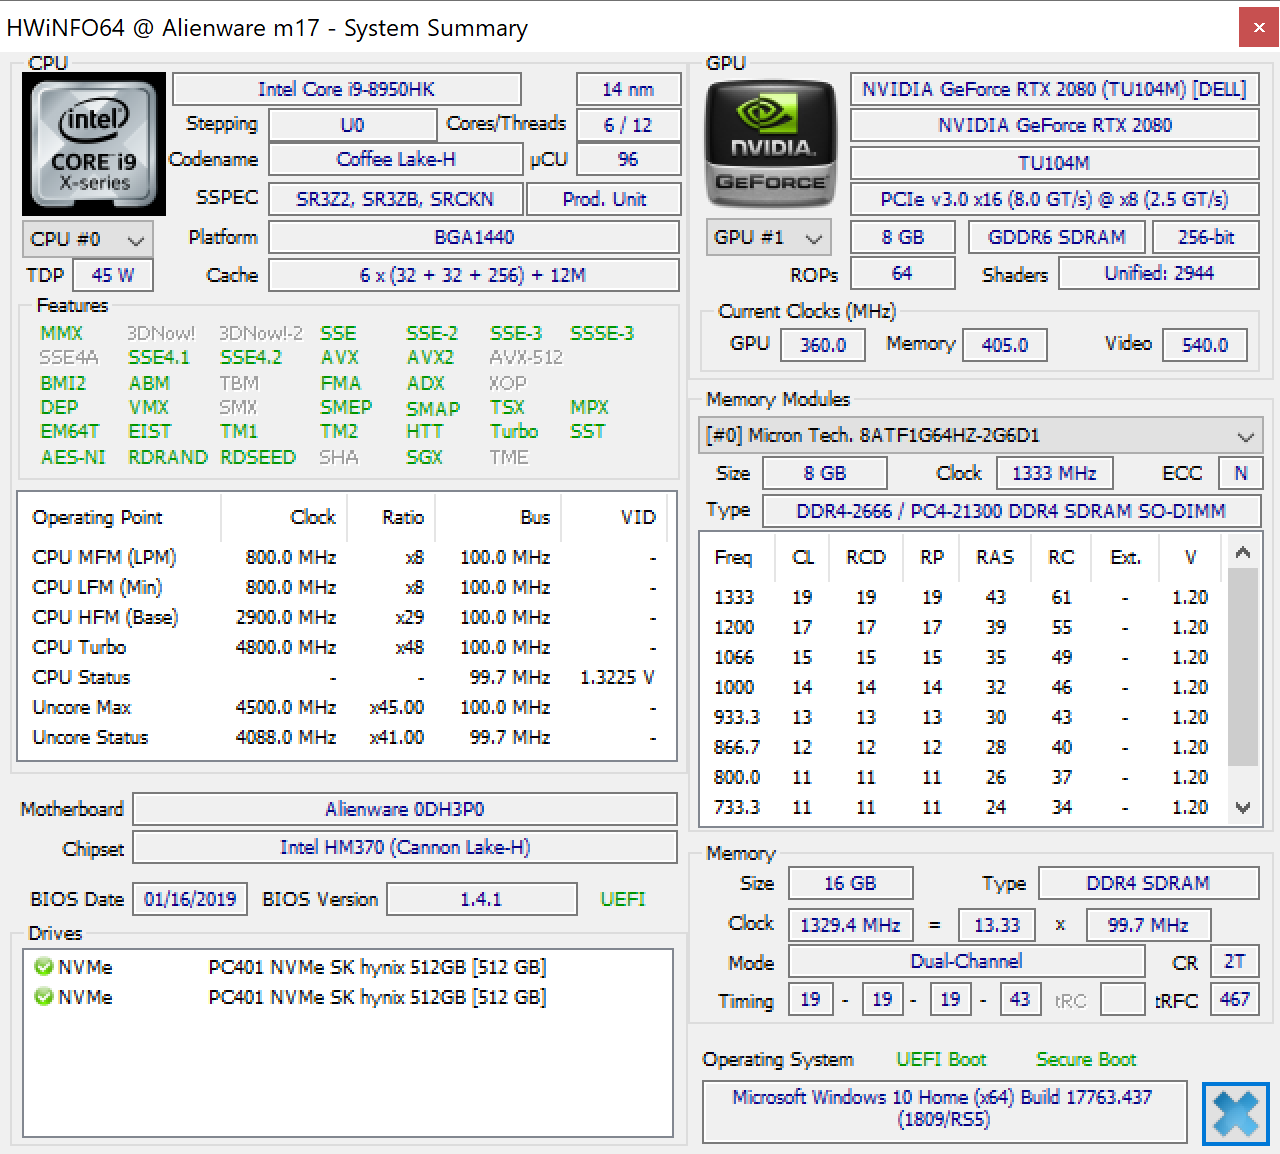
We've already made our opinion clear about the Core i9-8950HK and our stance remains unmoved. When the Core i9 SKU costs hundreds of dollars more than the Core i7 SKU without offering any substantial gains in performance, then it becomes difficult for us to recommend the pricier Core i9 option. The less expensive i7-8750H in the Alienware m15, for example, performs within 2 to 3 percent of our i9-8950HK according to CineBench R15 benchmarks. Nonetheless, users upgrading from the older Kaby Lake i7-7700HQ generation will still see a substantial boost in CPU performance.
Turbo Boost sustainability is better than on both the Gigabyte Aero 15 and Dell XPS 15 equipped with the same Core i9 processor. By running CineBench R15 Multi-Thread in a loop, we can observe that the Alienware m17 averages about 5 to 11 percent faster than the Gigabyte and XPS 15 after long periods of CPU stress as shown by our comparison graph below.
Users who want "true" Core i9 performance should consider the Area-51m with the full-fledged Core i9-9900K instead. The desktop CPU offers a substantial 65 percent boost in multi-thread performance over the Core i9-8950HK.
See our dedicated page on the Core i9-8950HK for more technical information and benchmark comparisons.
System Performance
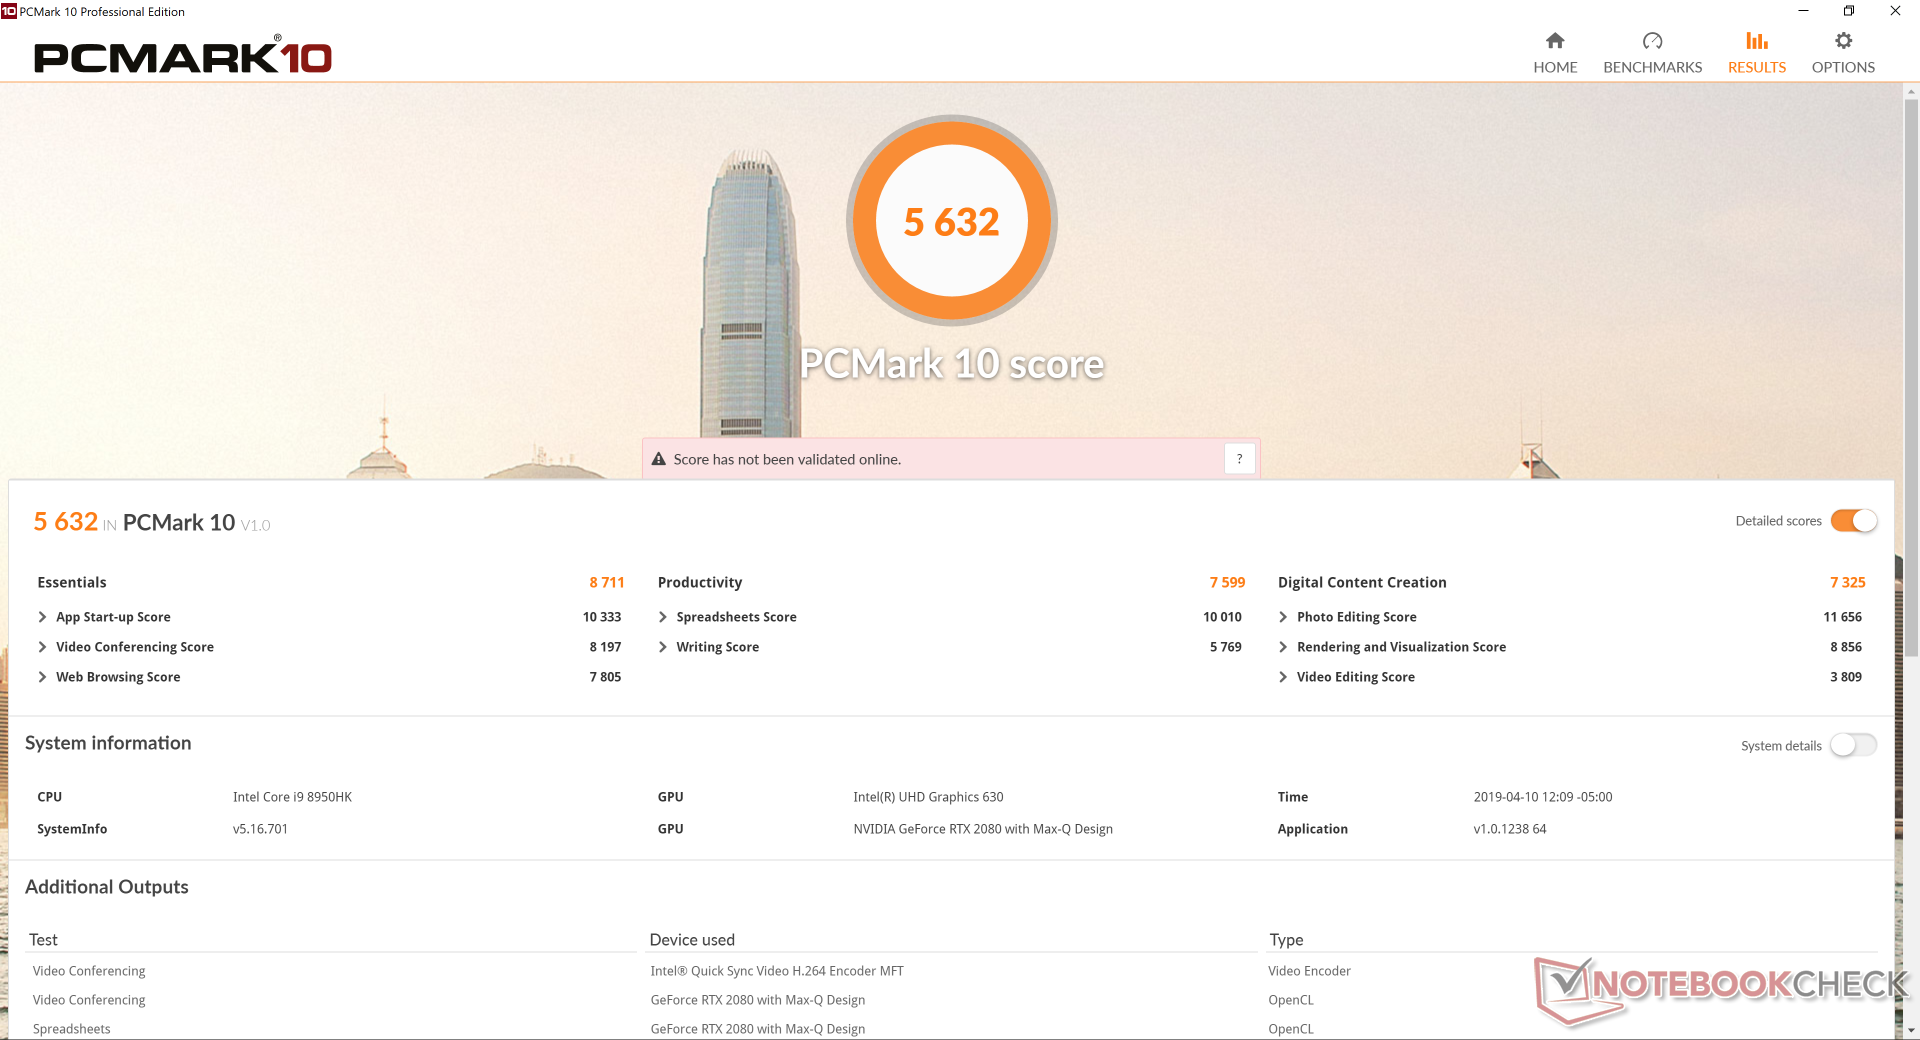
PCMark benchmarks are within single-digit percentages of the older Alienware 17 R5. Thus, the m17 isn't necessarily any faster than its larger predecessor when it comes to day-to-day office loads or general editing tasks. The Alienware Area-51m is able to handily outclass our Alienware m17 especially in video or image editing where GPU performance becomes vital.
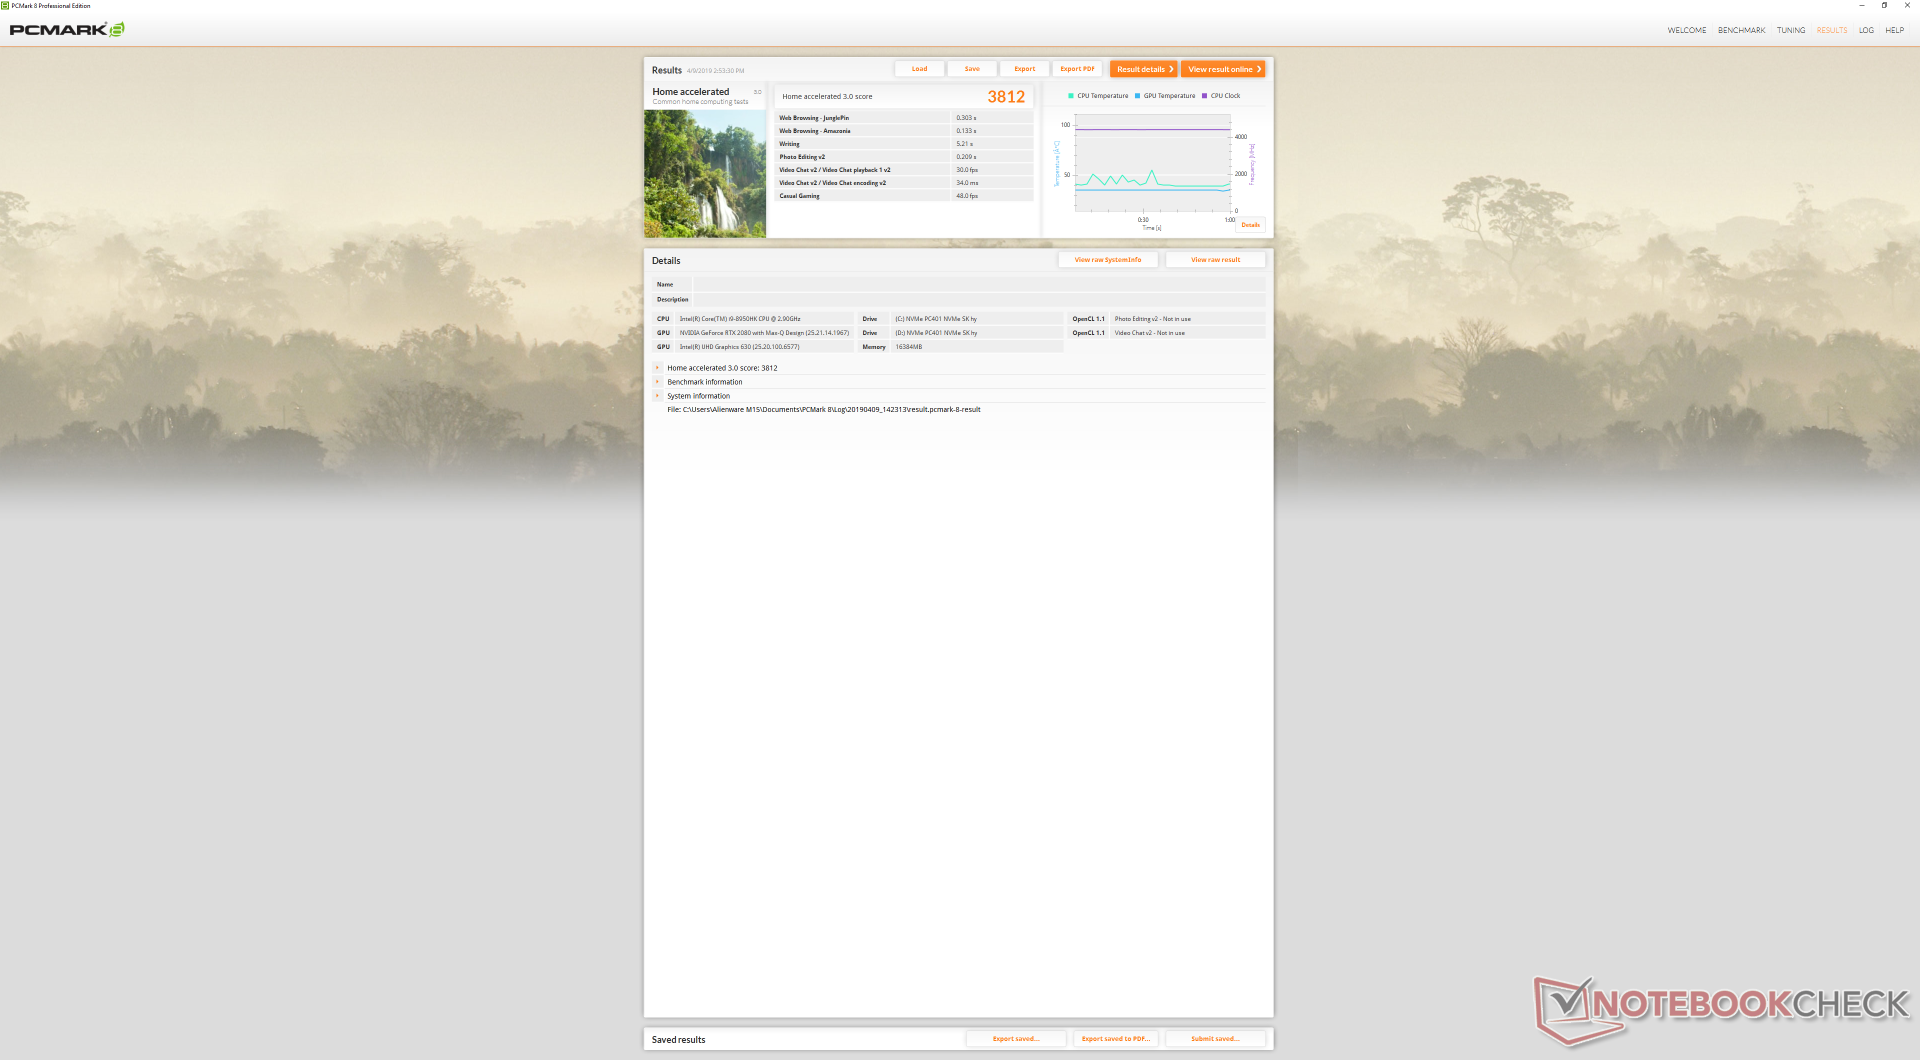

| PCMark 8 Home Score Accelerated v2 | 3812 points | |
| PCMark 8 Work Score Accelerated v2 | 4765 points | |
| PCMark 10 Score | 5632 points | |
Help | ||
Storage Devices
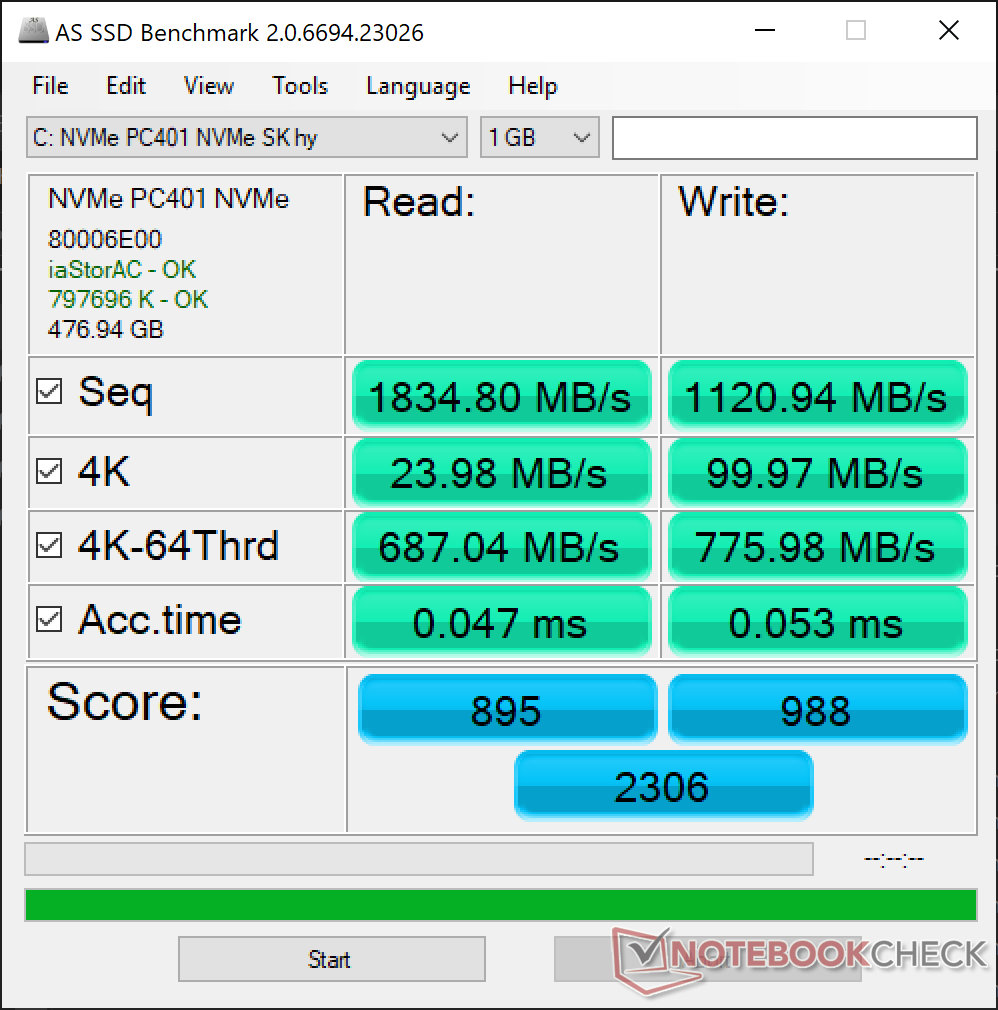
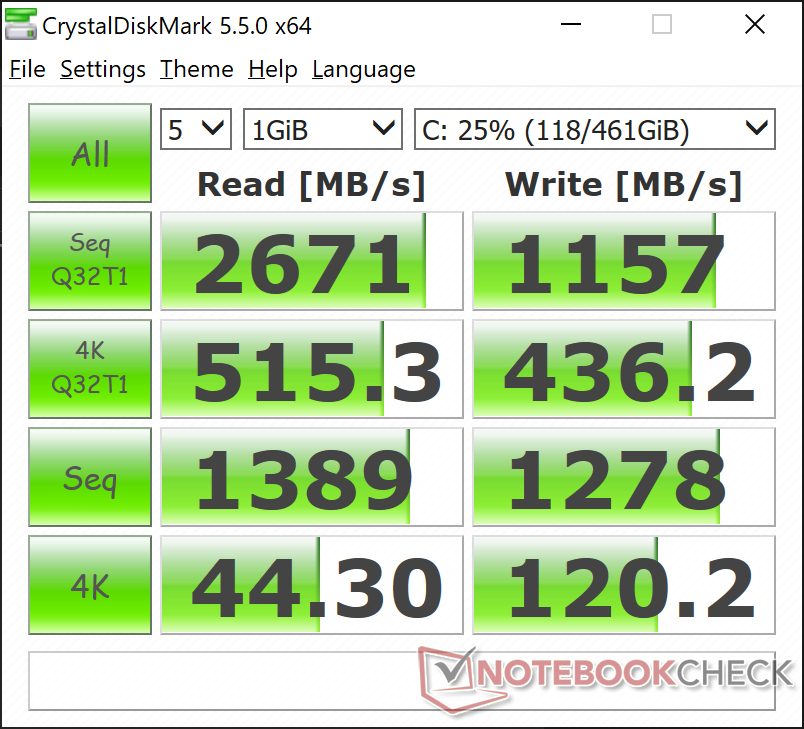
Dell seems content with sourcing SK Hynix M.2 SSDs for its Alienware series and the Alienware m17 is no different. Our test unit is equipped with two SK Hynix PC401 NVMe SSDs in RAID 0 for sequential read and write rates of about 1800 MB/s and 1100 MB/s, respectively, according to AS SSD. It's too bad that the Alienware isn't equipped with the Samsung SSD PM981 or SK Hynix Canvas SC300 instead as these offer even faster transfer rates than our PC401.
Internal storage options include 2x M.2 2280 or 2x M.2 2280 + 1x 2.5-inch SATA III. Users who want the 2.5-inch SATA bay will have to accept a smaller 60 Wh internal battery due to space constraints.
See our table of SSDs and HDDs for more benchmark comparisons.
| Alienware m17 P37E SK Hynix PC401 512GB M.2 (HFS512GD9TNG) | Alienware 17 R5 SK hynix PC401 HFS256GD9TNG | Asus ROG Strix Scar II GL704GW Intel SSD 660p SSDPEKNW512G8 | MSI GS75 8SG Stealth 2x Samsung SSD PM981 MZVLB512HAJQ (RAID 0) | Razer Blade Pro 2017 2x Samsung SSD PM951 MZVLV256HCHP (RAID 0) | Acer Predator Triton 700 2x SK Hynix Canvas SC300 512GB M.2 (HFS512G39MND) (RAID 0) | |
|---|---|---|---|---|---|---|
| AS SSD | -28% | -14% | 60% | 14% | 36% | |
| Seq Read | 1835 | 2203 20% | 1315 -28% | 3005 64% | 2599 42% | 2517 37% |
| Seq Write | 1121 | 559 -50% | 927 -17% | 2668 138% | 588 -48% | 2372 112% |
| 4K Read | 23.98 | 38.74 62% | 52.4 119% | 40.89 71% | 37.57 57% | 41.47 73% |
| 4K Write | 100 | 92.7 -7% | 122.8 23% | 94.4 -6% | 104.4 4% | 93 -7% |
| 4K-64 Read | 687 | 447.2 -35% | 326.5 -52% | 1366 99% | 1116 62% | 1057 54% |
| 4K-64 Write | 776 | 279.1 -64% | 727 -6% | 1197 54% | 513 -34% | 913 18% |
| Access Time Read * | 0.047 | 0.091 -94% | 0.11 -134% | 0.055 -17% | 0.051 -9% | 0.062 -32% |
| Access Time Write * | 0.053 | 0.065 -23% | 0.045 15% | 0.039 26% | 0.036 32% | 0.041 23% |
| Score Read | 895 | 706 -21% | 510 -43% | 1708 91% | 1414 58% | 1350 51% |
| Score Write | 988 | 428 -57% | 942 -5% | 1558 58% | 676 -32% | 1243 26% |
| Score Total | 2306 | 1424 -38% | 1715 -26% | 4123 79% | 2715 18% | 3282 42% |
| Copy ISO MB/s | 773 | |||||
| Copy Program MB/s | 493 | |||||
| Copy Game MB/s | 647 |
* ... smaller is better

GPU Performance
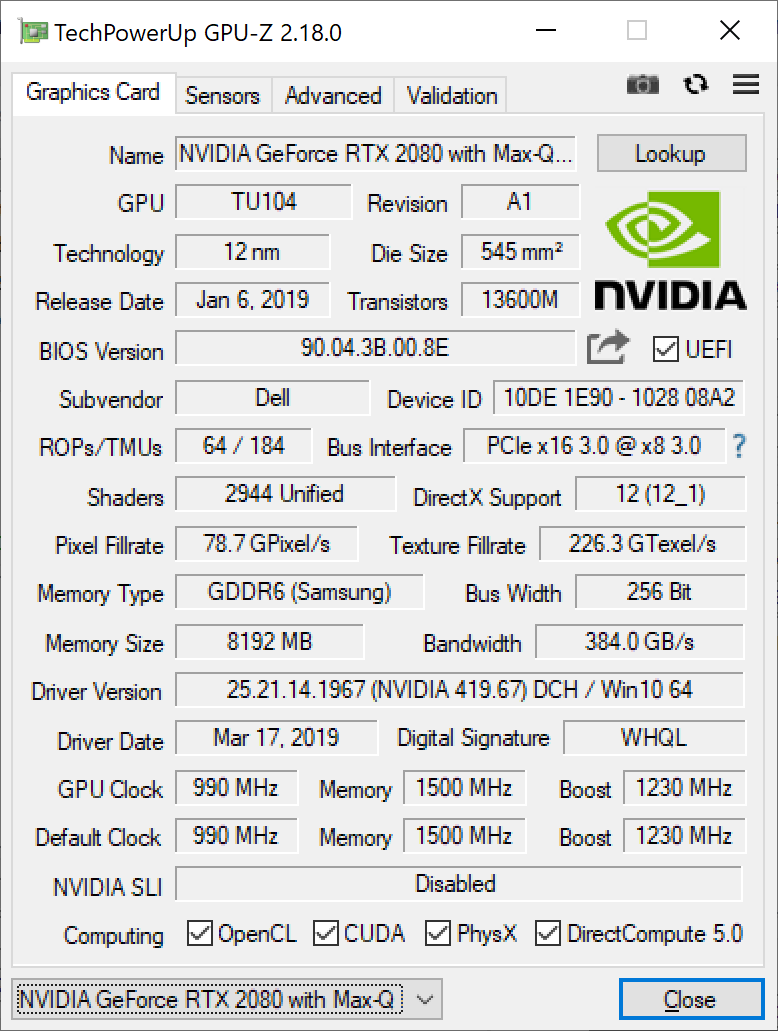
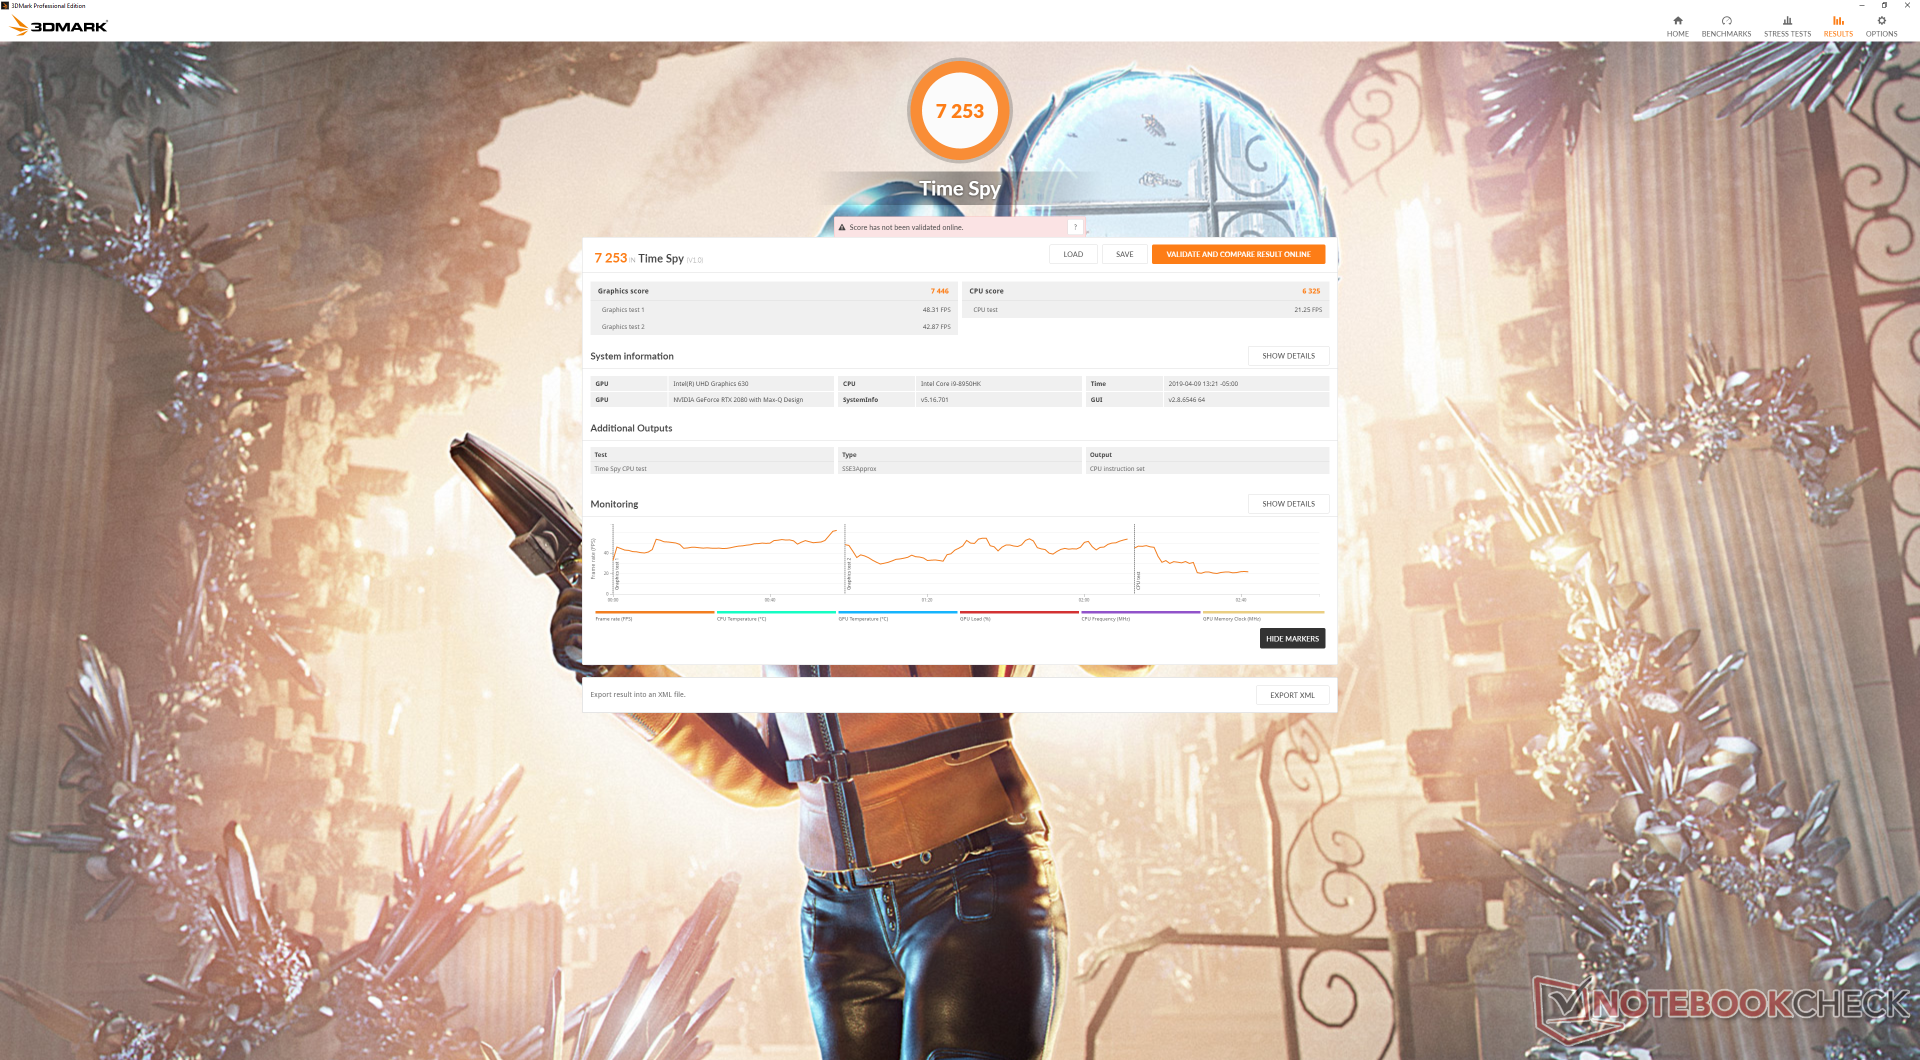
GPU-Z reveals a GPU Boost clock rate of 1230 MHz compared to 1095 MHz on the MSI GS75 with the same RTX 2080 Max-Q GPU. Nonetheless, 3DMark results between these two laptops are nearly identical. The Asus Zephyrus S GX701GX continues to be the fastest RTX 2080 Max-Q laptop in our database with results up to 14 percent higher than our Alienware. Overall GPU performance is within 7 to 10 percent of the mobile GTX 1080 and about 20 to 30 percent slower than the RTX 2080 as found on the Area-51m. Users upgrading from the RTX 2060 option will see a 30 to 45 percent increase in graphics power.
The latest PC titles are playable at the native 4K UHD resolution on High or better settings. For stable 60 FPS, however, be ready to tune most settings down to Medium or lower. Users who opt for the native 1080p display configuration can aim for a stable 120 FPS instead.
See our review on the mobile Turing series for more technical information and our dedicated page on the RTX 2080 Max-Q for more benchmark comparisons.
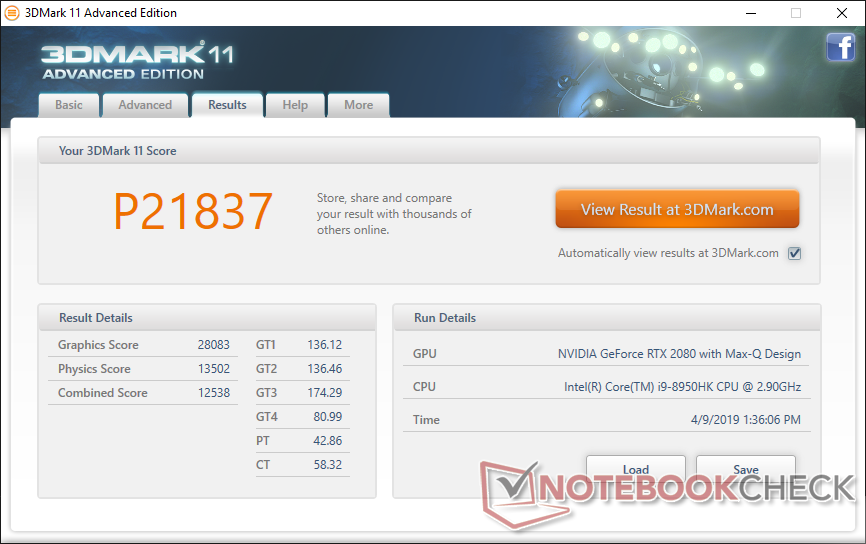

| 3DMark 11 Performance | 21837 points | |
| 3DMark Cloud Gate Standard Score | 25513 points | |
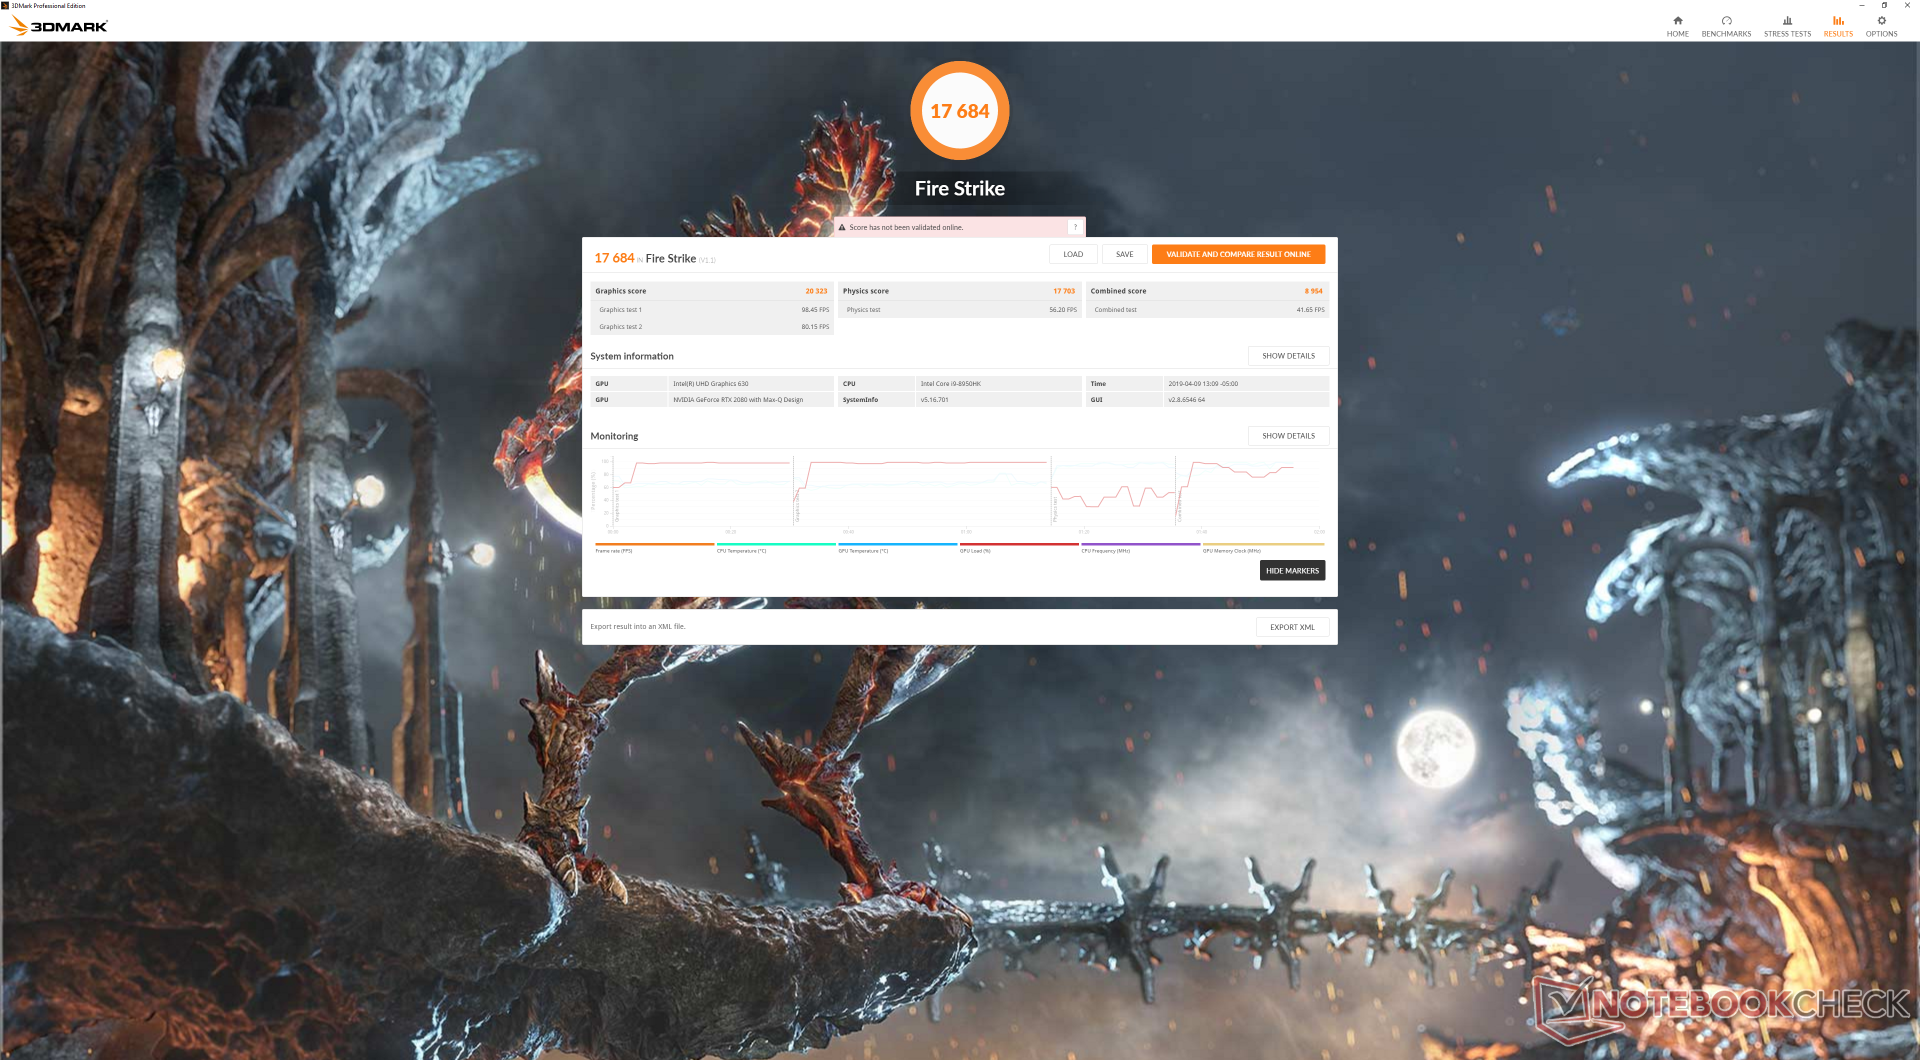
| 3DMark Fire Strike Score | 17684 points | |
| 3DMark Time Spy Score | 7253 points | |
Help | ||
| low | med. | high | ultra | 4K | |
| BioShock Infinite (2013) | 312.6 | 271 | 252.1 | 164.7 | |
| The Witcher 3 (2015) | 277.6 | 221.1 | 138.2 | 75.7 | 53 |
| Rise of the Tomb Raider (2016) | 196.4 | 165.7 | 131.9 | 113.1 | 52.4 |
Emissions
System Noise
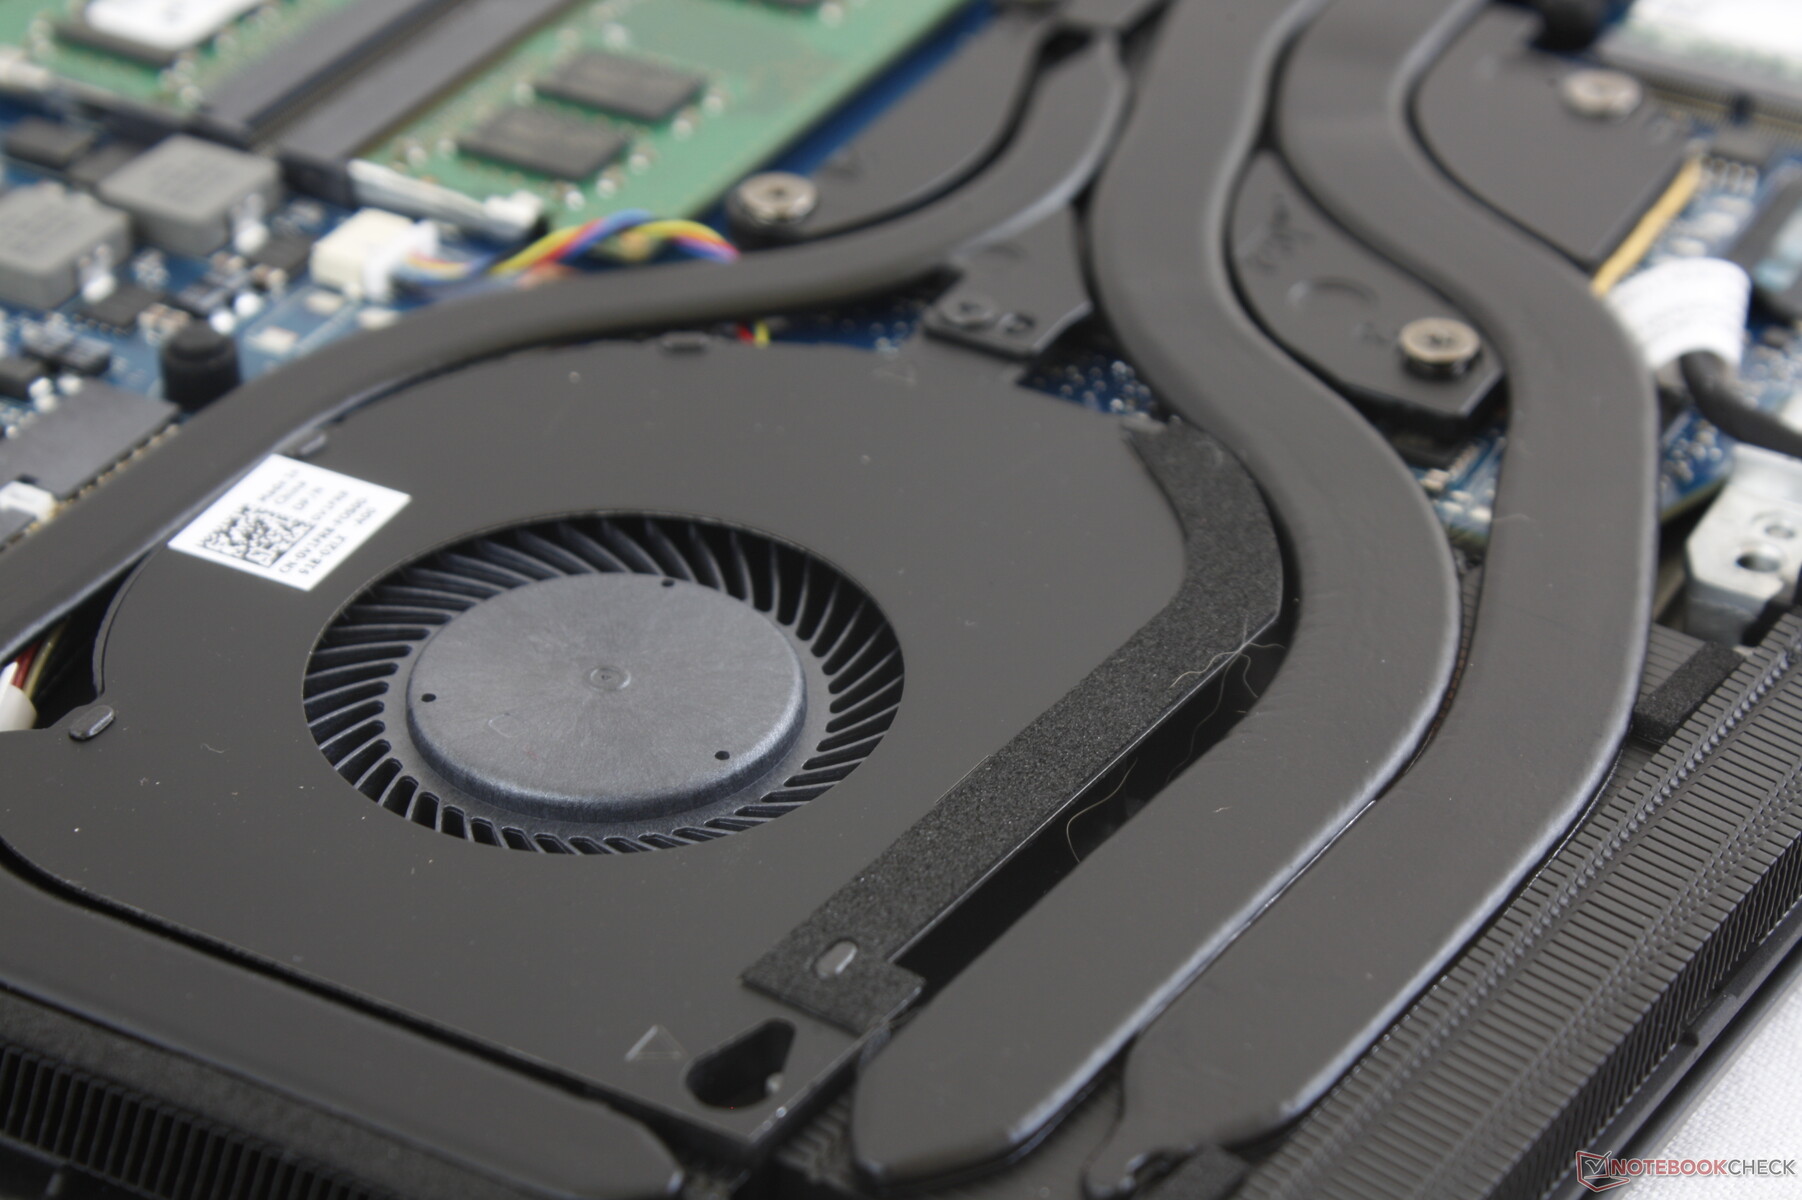
The cooling solution is essentially identical to the Alienware m15 even though the m17 chassis is larger. The same "Quiet", "Balanced", and "High Performance" Alienware Command Center power settings are available once again that directly affect fan behavior.
When set to Quiet mode, the system fans will idle during low loads for a silent experience. Low-medium loads like prolonged browsing or video streaming, however, will eventually cause the fans to start running. Even so, fan noise remains low at the 31 to 33 dB(A) range.
When set to Balanced mode, the fan RPM ceiling is lifted and fan noise can be as loud as 50.8 dB(A) when gaming or about 35.1 dB(A) when running medium loads. Fan pulsing occurs frequently in this mode.
When set to High Performance mode, fan noise becomes permanent at 50.8 dB(A) no matter the system load. The low 50 dB(A) range is common amongst ultra-thin gaming laptops including the MSI GS75 and Asus GL704, so it's a bit disappointing that the Alienware can't offer a quieter gaming experience. Much like on the Area-51m, we recommend running on Quiet mode if maximum performance is not required and Balanced or High Performance mode only when gaming.
Our test unit suffers from slight coil whine that is only noticeable when set to Quiet mode and in a completely silent room.
| Alienware m17 P37E GeForce RTX 2080 Max-Q, i9-8950HK, SK Hynix PC401 512GB M.2 (HFS512GD9TNG) | Alienware 17 R5 GeForce GTX 1070 Mobile, i7-8750H, SK hynix PC401 HFS256GD9TNG | Asus ROG Strix Scar II GL704GW GeForce RTX 2070 Mobile, i7-8750H, Intel SSD 660p SSDPEKNW512G8 | MSI GS75 8SG Stealth GeForce RTX 2080 Max-Q, i7-8750H, 2x Samsung SSD PM981 MZVLB512HAJQ (RAID 0) | Razer Blade Pro 2017 GeForce GTX 1080 Mobile, i7-7820HK, 2x Samsung SSD PM951 MZVLV256HCHP (RAID 0) | Acer Predator Triton 700 GeForce GTX 1080 Max-Q, i7-7700HQ, 2x SK Hynix Canvas SC300 512GB M.2 (HFS512G39MND) (RAID 0) | |
|---|---|---|---|---|---|---|
| Noise | -4% | -6% | -6% | -5% | -5% | |
| off / environment * | 28.2 | 30 -6% | 29 -3% | 30 -6% | 30 -6% | 31 -10% |
| Idle Minimum * | 28.2 | 32 -13% | 29 -3% | 31 -10% | 30 -6% | 33 -17% |
| Idle Average * | 28.2 | 33 -17% | 32 -13% | 32 -13% | 31 -10% | 34 -21% |
| Idle Maximum * | 31 | 34 -10% | 40 -29% | 41 -32% | 33 -6% | 40 -29% |
| Load Average * | 50.8 | 43 15% | 46 9% | 47 7% | 43 15% | 41 19% |
| Witcher 3 ultra * | 50.8 | 51 -0% | 51 -0% | 47 7% | 55 -8% | 43 15% |
| Load Maximum * | 50.8 | 51 -0% | 52 -2% | 48 6% | 58 -14% | 48 6% |
* ... smaller is better
Noise Level
| Idle |
| 28.2 / 28.2 / 31 dB(A) |
| Load |
| 50.8 / 50.8 dB(A) |
 | ||
30 dB silent 40 dB(A) audible 50 dB(A) loud |
||
min: | ||
Temperature
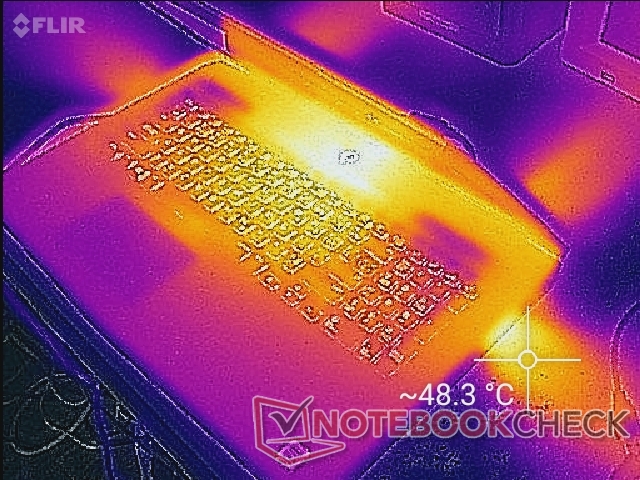
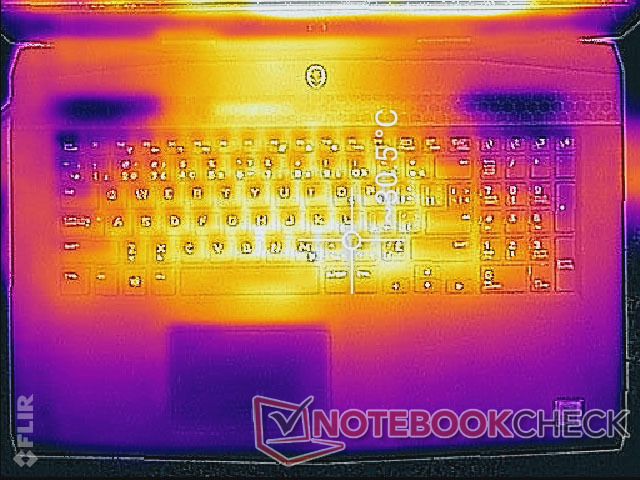
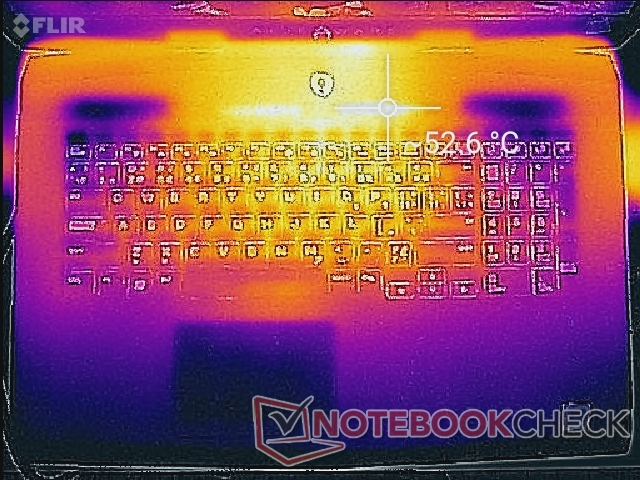
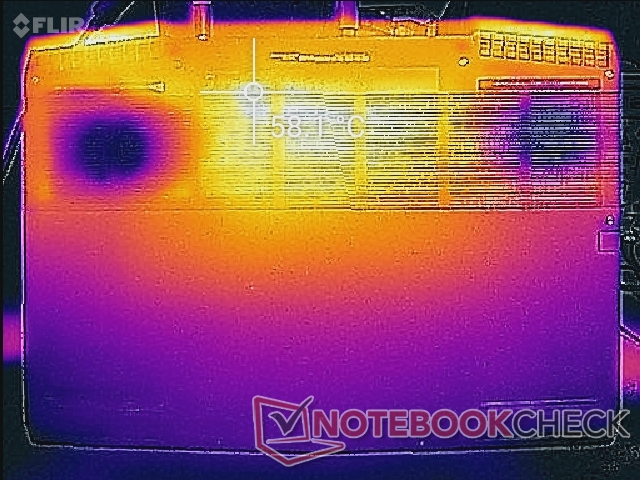
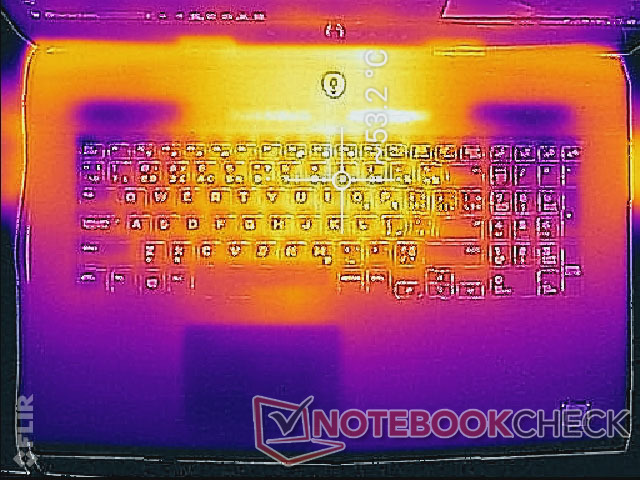
Surface temperatures are generally warmer on the Alienware m17 when compared to the thicker last generation Alienware 17. When running Witcher 3, for example, the center of the keyboard can become as warm as 45 C compared to 41 C on the last generation model. This is an expected consequence of having to maintain core performance in a thinner form factor.
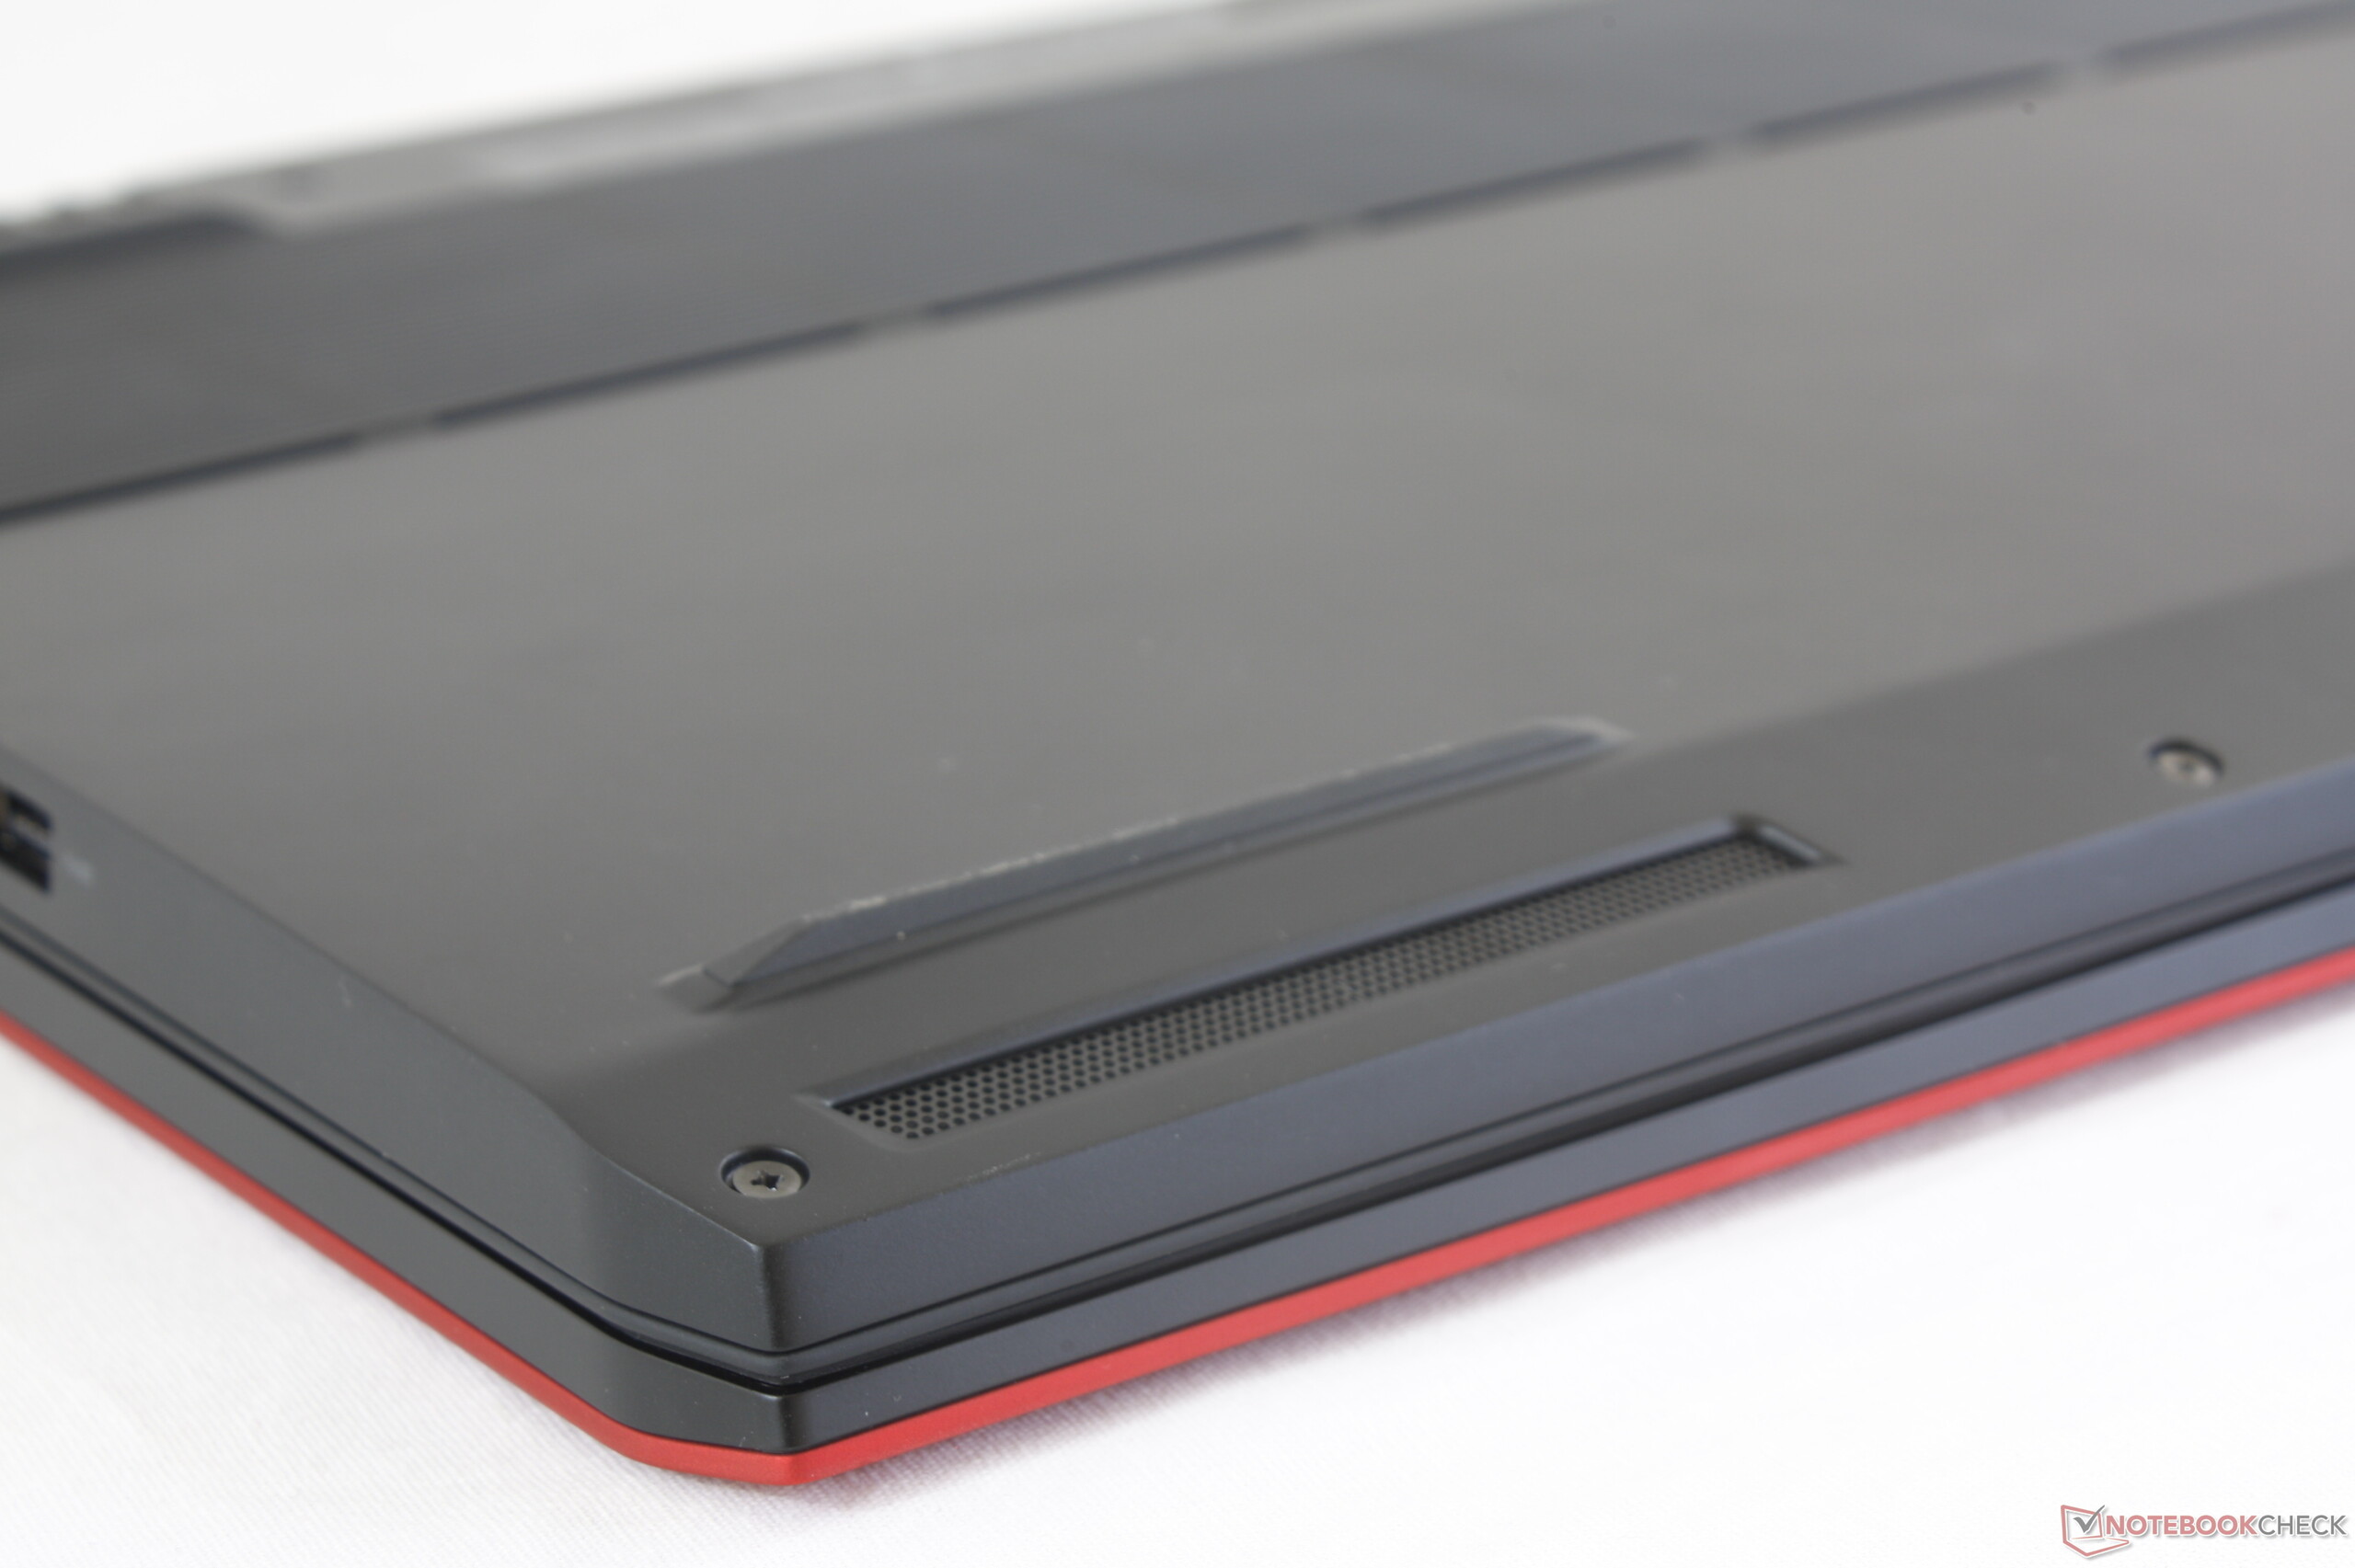
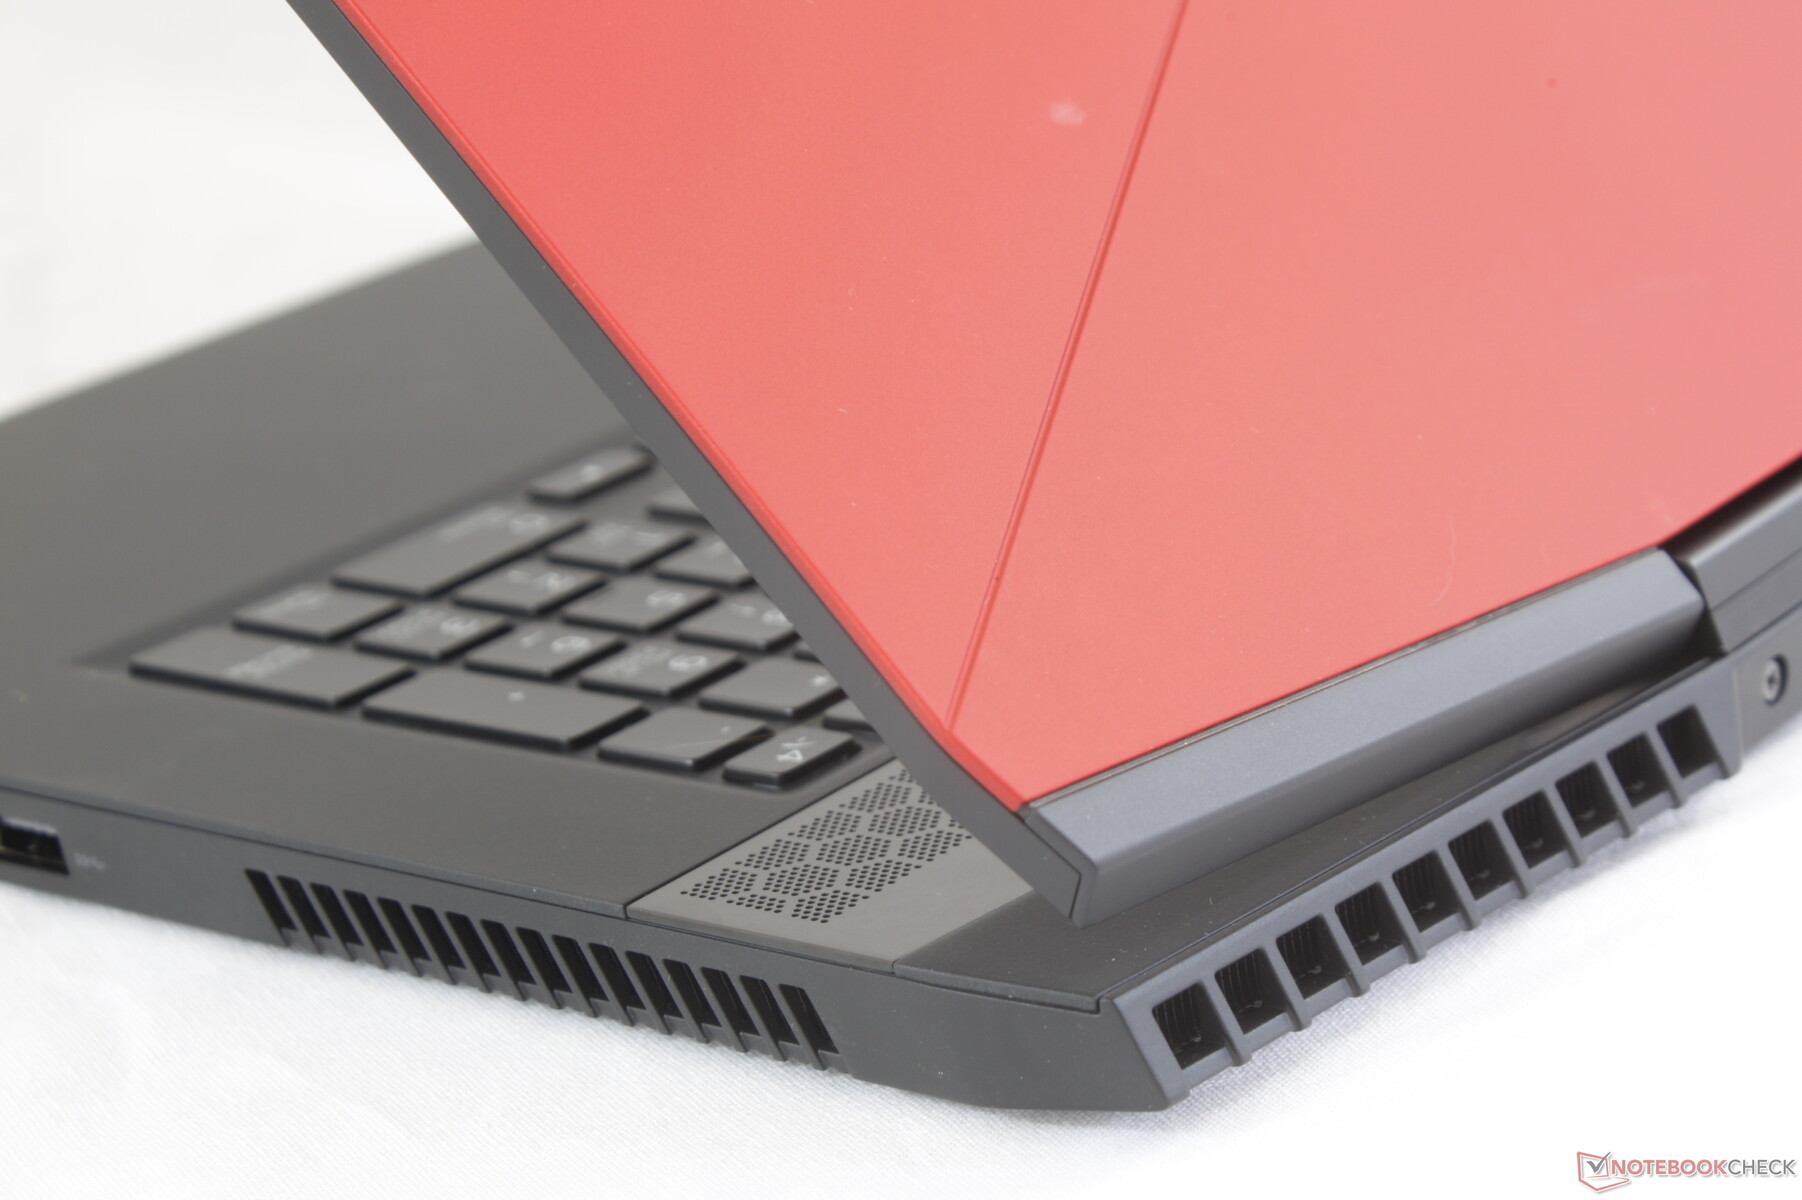
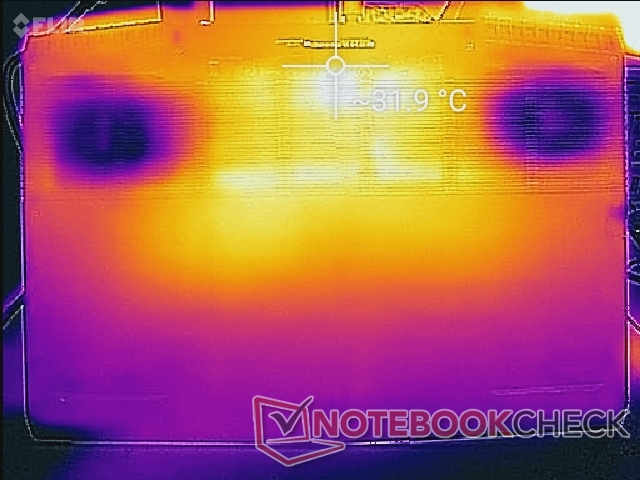
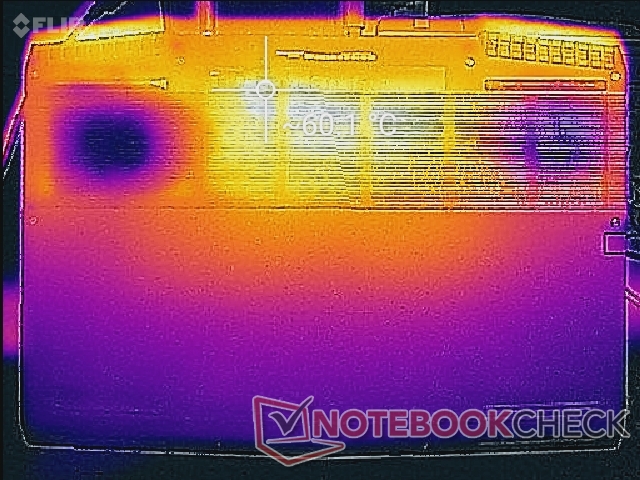
For its size class, however, the m17 runs a bit cooler on average than other ultra-thin competitors. The Razer Blade Pro and MSI GS75 have much warmer palm rests by several degrees to impact the user experience when gaming. Be careful to not block any of the large ventilation grilles around the bottom and edges.
Note that surface temperatures will actually be slightly warmer by up to a few degrees when idling on Quiet mode as opposed to Balanced or High Performance mode. This is because the fans tend to idle in Quiet mode for reduced noise and cooling.
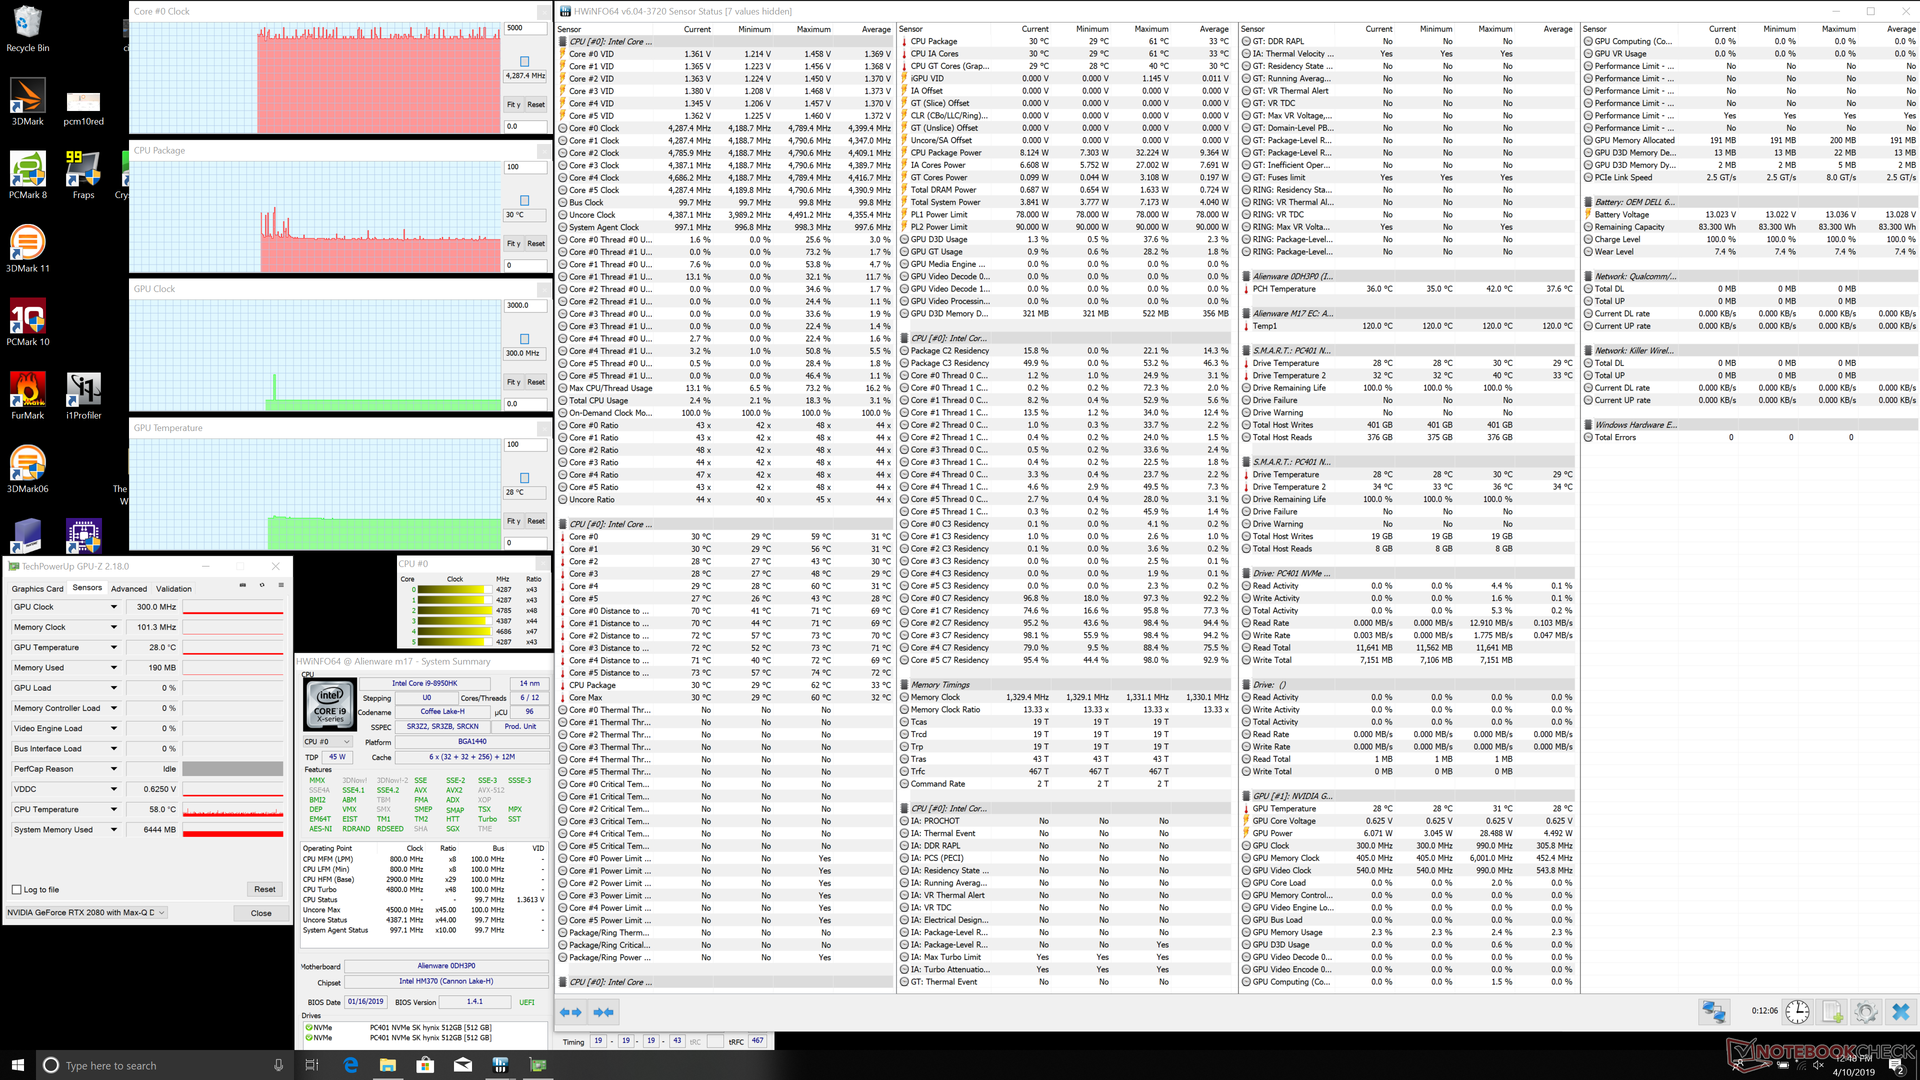
Stress Test
On paper, the Core i9-8950HK can run as fast as 4.3 GHz on all six cores compared to "only" 3.9 GHz on the Core i7-8750H. Most Core i9 laptops, however, are unable to maintain 4.3 GHz and so real-world performance will be much closer to the Core i7 as a result. The Alienware m17 is no exception and we can observe this behavior when running Prime95 to stress the processor. CPU clock rate will be 4.3 GHz for only 5 to 10 seconds before falling and stabilizing at the 3.4 to 3.6 GHz range. Core temperature averages at an alarming 98 C to explain why the processor refuses to run at faster clock rates for extended periods of time. Overclocking, while available, is not recommended.
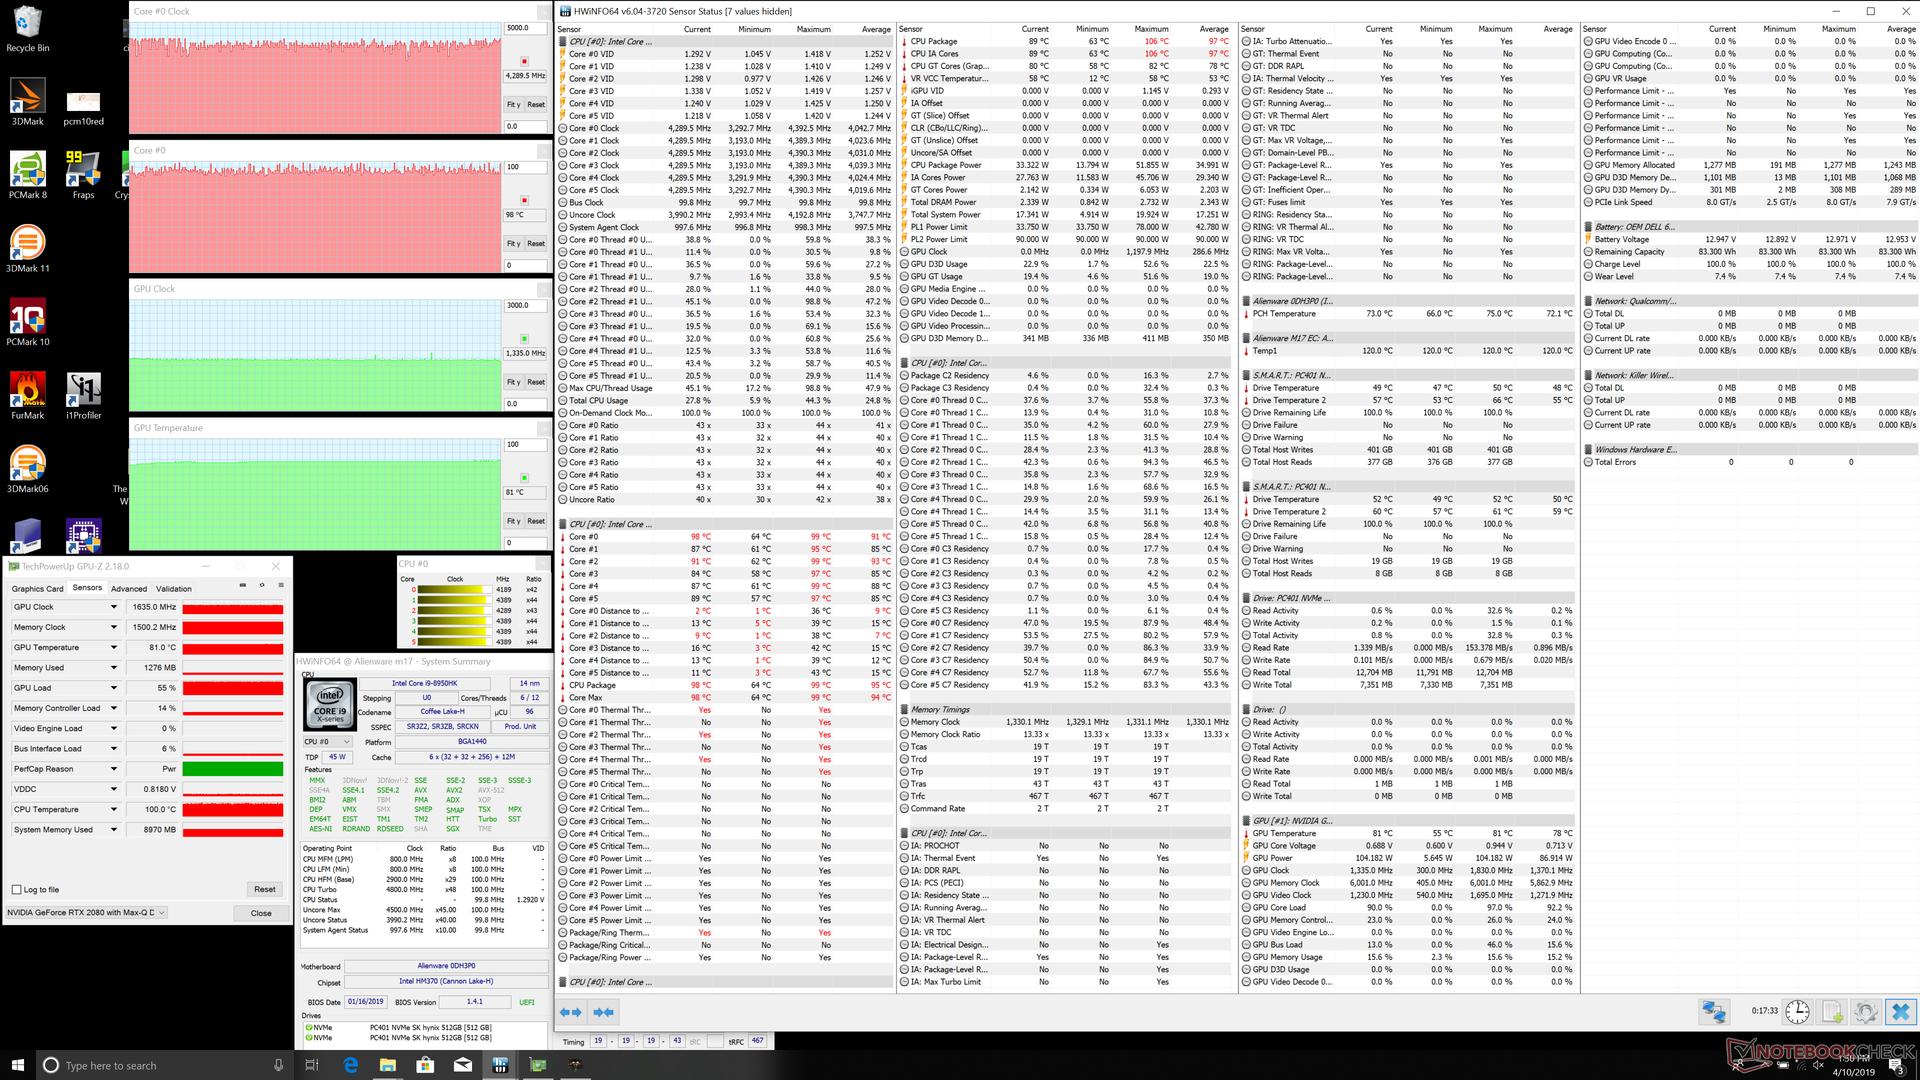
CPU and GPU temperatures when running Witcher 3 stabilize at 98 C and 81 C, respectively. While not unsafe, gaming with such high core temperatures is generally undesirable. Results are much warmer than most other gaming laptops including the MSI GS75 where core temperatures stabilize in the 73 C to 80 C range when under similar loads.
Strangely, GPU-Z and HWiNFO report very different GPU clock rates of 1635 MHz and 1335 MHz, respectively, when running Witcher 3.
Running on battery power will impact both CPU and GPU performance. A Fire Strike run on batteries returns Physics and Graphics scores of 14885 and 4900 points, respectively, compared to 17703 and 20323 points when on mains.
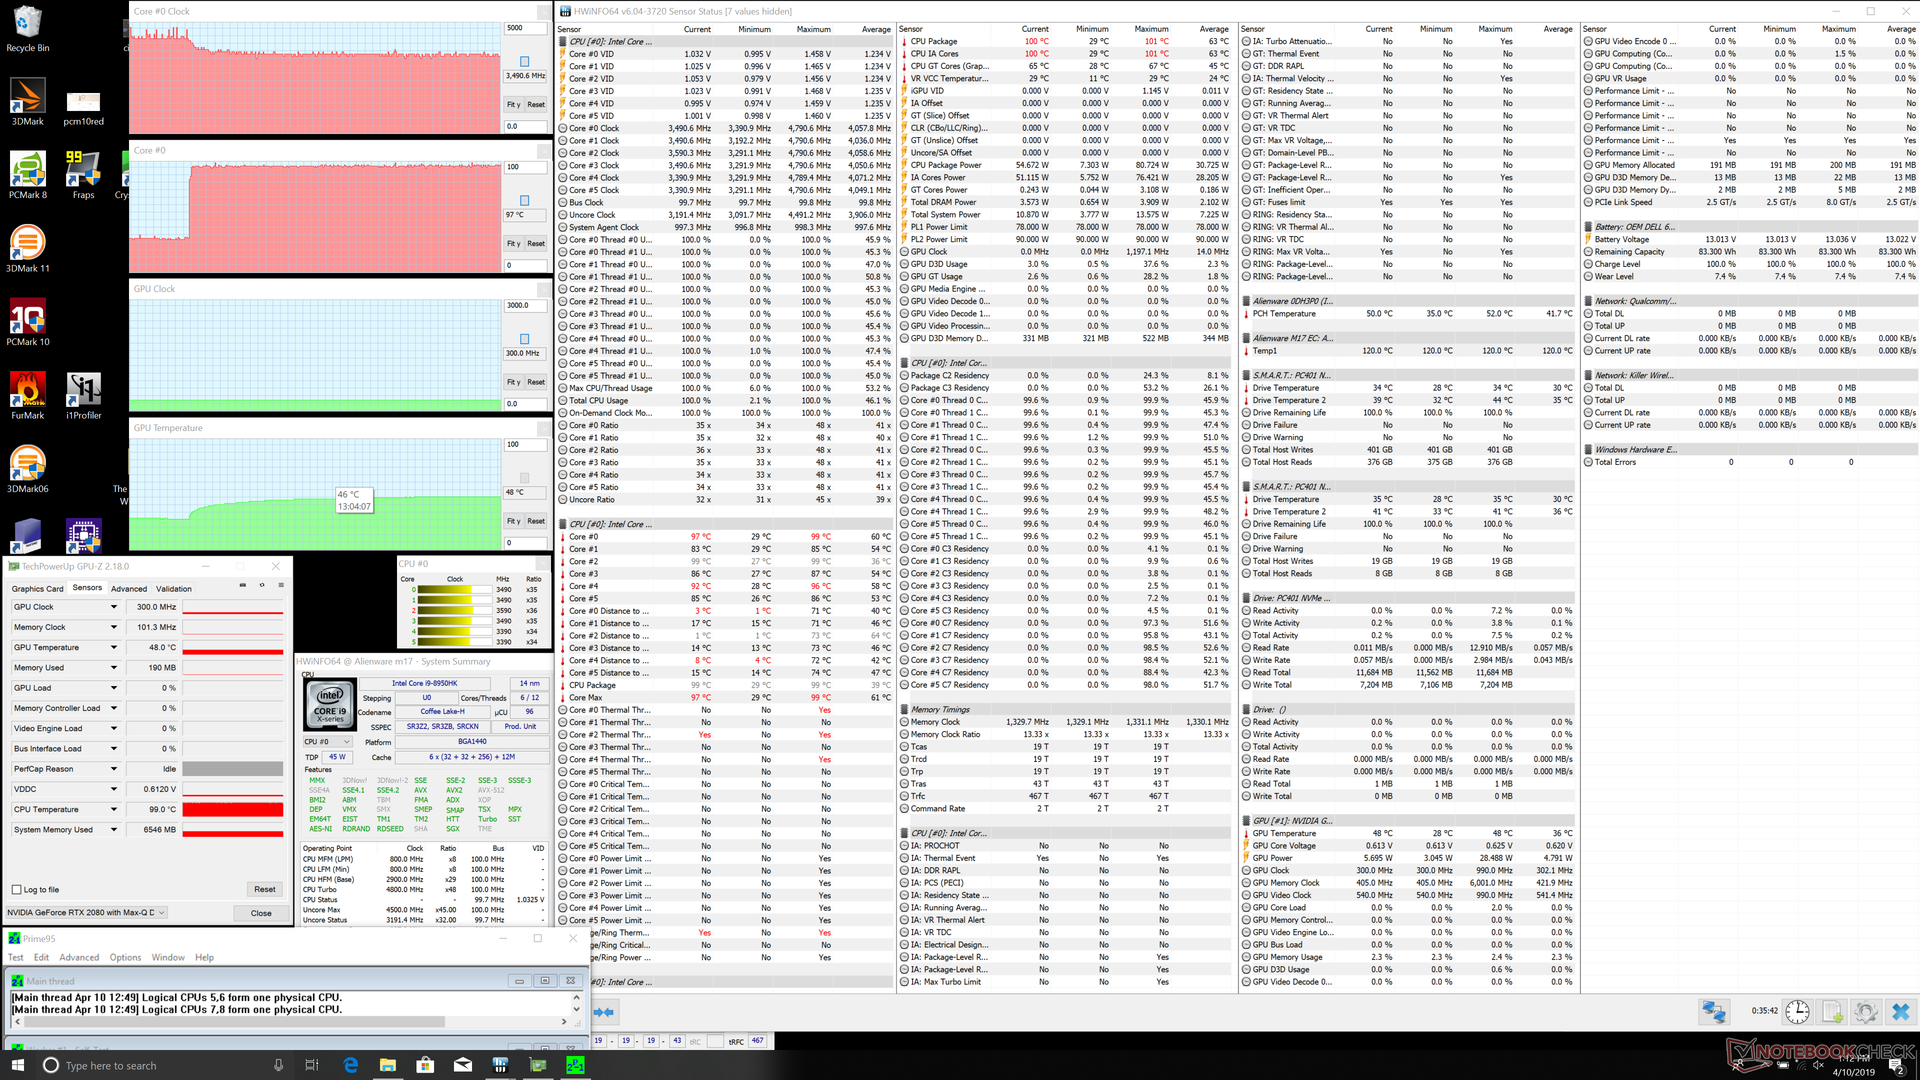
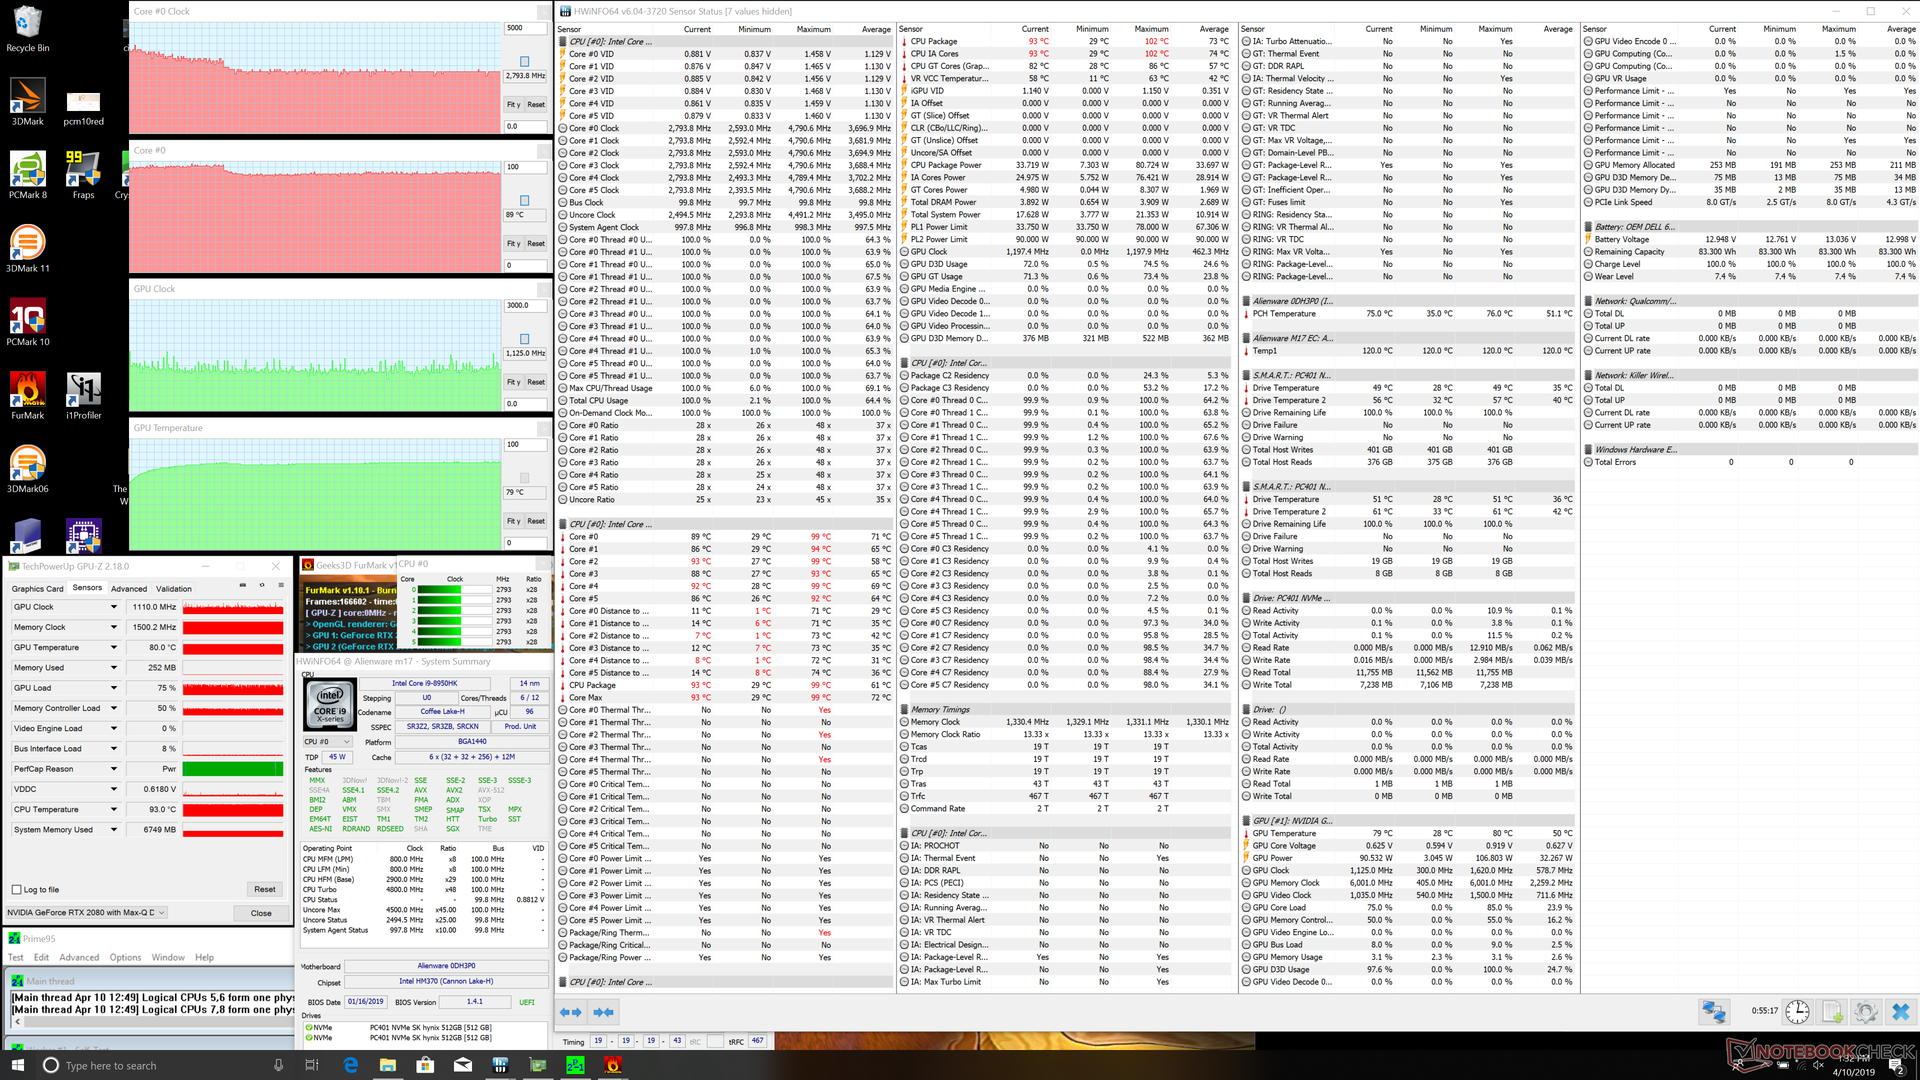
| CPU Clock (GHz) | GPU Clock (MHz) | Average CPU Temperature (°C) | Average GPU Temperature (°C) | |
| System Idle | -- | -- | 30 | 28 |
| Prime95 Stress | 3.4 - 3.6 | -- | 98 | 48 |
| Prime95 + FurMark Stress | 2.8 | 1110 | 89 | 79 |
| Witcher 3 Stress | 4.3 | 1335 | 98 | 81 |
(-) The maximum temperature on the upper side is 55 °C / 131 F, compared to the average of 40.4 °C / 105 F, ranging from 21.2 to 68.8 °C for the class Gaming.
(-) The bottom heats up to a maximum of 60 °C / 140 F, compared to the average of 43.2 °C / 110 F
(+) In idle usage, the average temperature for the upper side is 27.3 °C / 81 F, compared to the device average of 33.8 °C / 93 F.
(±) Playing The Witcher 3, the average temperature for the upper side is 37.4 °C / 99 F, compared to the device average of 33.8 °C / 93 F.
(+) The palmrests and touchpad are reaching skin temperature as a maximum (32.2 °C / 90 F) and are therefore not hot.
(-) The average temperature of the palmrest area of similar devices was 28.9 °C / 84 F (-3.3 °C / -6 F).
Speakers
The m17 drops the dedicated subwoofer of the last generation Alienware 17 for a more common 2.0 setup. Audio is still loud but not as full as many other 17-inch gaming laptops including the MSI GT75. Maximum volume will vibrate the palm rests more noticeably than on the Alienware 17. Overall quality is acceptable if not underwhelming based on what we've come to expect from the Alienware brand.


Alienware m17 P37E audio analysis
(±) | speaker loudness is average but good (80.4 dB)
Bass 100 - 315 Hz
(±) | reduced bass - on average 11.4% lower than median
(±) | linearity of bass is average (12.4% delta to prev. frequency)
Mids 400 - 2000 Hz
(+) | balanced mids - only 3% away from median
(+) | mids are linear (6.1% delta to prev. frequency)
Highs 2 - 16 kHz
(+) | balanced highs - only 4.3% away from median
(+) | highs are linear (5.2% delta to prev. frequency)
Overall 100 - 16.000 Hz
(+) | overall sound is linear (13.8% difference to median)
Compared to same class
» 20% of all tested devices in this class were better, 6% similar, 74% worse
» The best had a delta of 6%, average was 18%, worst was 132%
Compared to all devices tested
» 12% of all tested devices were better, 3% similar, 85% worse
» The best had a delta of 4%, average was 25%, worst was 134%
Apple MacBook 12 (Early 2016) 1.1 GHz audio analysis
(+) | speakers can play relatively loud (83.6 dB)
Bass 100 - 315 Hz
(±) | reduced bass - on average 11.3% lower than median
(±) | linearity of bass is average (14.2% delta to prev. frequency)
Mids 400 - 2000 Hz
(+) | balanced mids - only 2.4% away from median
(+) | mids are linear (5.5% delta to prev. frequency)
Highs 2 - 16 kHz
(+) | balanced highs - only 2% away from median
(+) | highs are linear (4.5% delta to prev. frequency)
Overall 100 - 16.000 Hz
(+) | overall sound is linear (10.2% difference to median)
Compared to same class
» 5% of all tested devices in this class were better, 2% similar, 93% worse
» The best had a delta of 5%, average was 19%, worst was 53%
Compared to all devices tested
» 3% of all tested devices were better, 1% similar, 96% worse
» The best had a delta of 4%, average was 25%, worst was 134%
Energy Management
Power Consumption
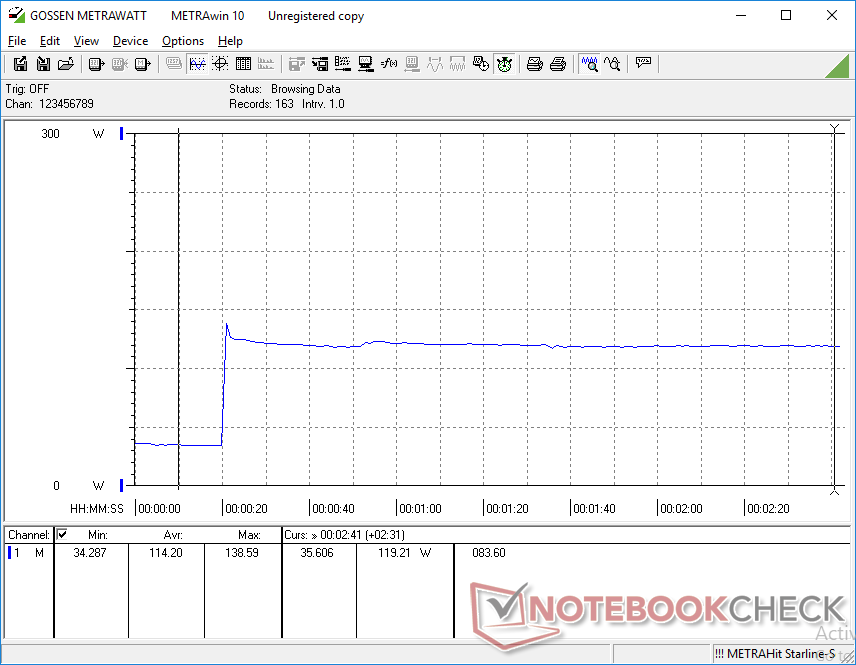
The system draws anywhere between 21 W to 34 W simply from idling on desktop depending on the brightness level and power profile setting. While over twice as demanding when compared to most Ultrabooks, this range is not uncommon for a 17.3-inch gaming laptop.
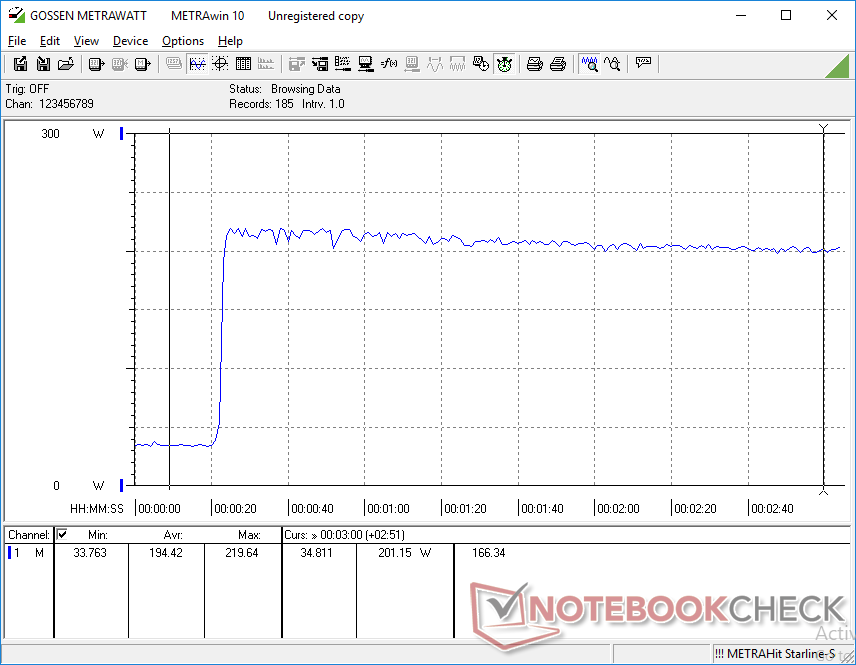
Interestingly, the Alienware m17 is noticeably more demanding than the MSI GS75 despite the fact that both are equipped with 45 W CPUs and the same RTX 2080 Max-Q GPU. Running Witcher 3, for example, draws about 178 W compared to just 147 W on the MSI even though the Alienware offers no major CPU or GPU performance advantages. On the other hand, power consumption is at least 8 percent lower than the outgoing Alienware 17 GTX 1070 while offering 14 to 31 percent faster graphics performance for improved performance-per-Watt.
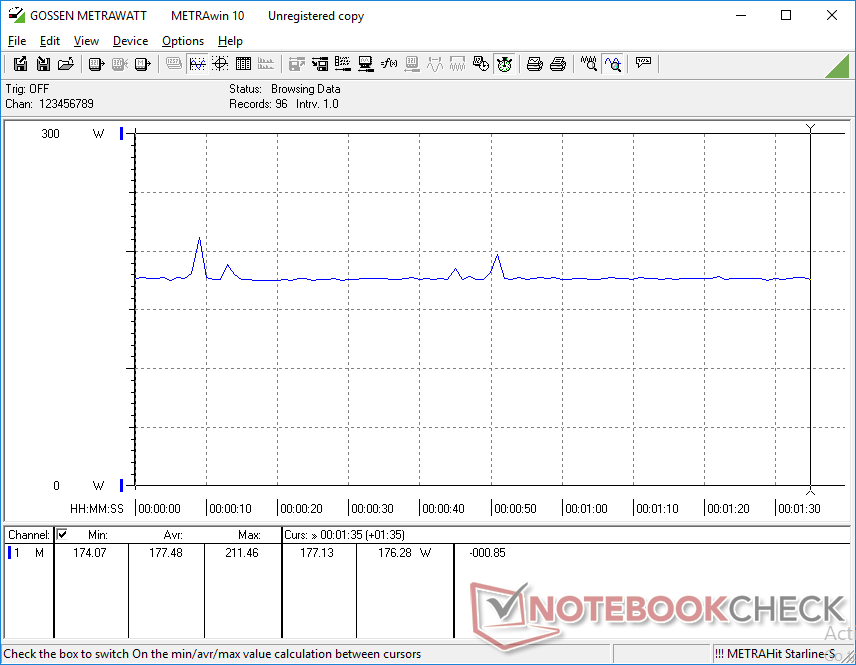
We're able to record a maximum draw of 219.7 W from the relatively large (~19.8 x 9.8 x 2.6 cm) 240 W AC adapter. Dell ships the same 240 W AC adapter across all current SKUs of the Alienware m17.
| Off / Standby | |
| Idle | |
| Load |
|
| Alienware m17 P37E i9-8950HK, GeForce RTX 2080 Max-Q, SK Hynix PC401 512GB M.2 (HFS512GD9TNG), IPS, 3840x2160, 17.30 | Alienware 17 R5 i7-8750H, GeForce GTX 1070 Mobile, SK hynix PC401 HFS256GD9TNG, TN, 2560x1440, 17.30 | Asus ROG Strix Scar II GL704GW i7-8750H, GeForce RTX 2070 Mobile, Intel SSD 660p SSDPEKNW512G8, AHVA, 1920x1080, 17.30 | MSI GS75 8SG Stealth i7-8750H, GeForce RTX 2080 Max-Q, 2x Samsung SSD PM981 MZVLB512HAJQ (RAID 0), IPS, 1920x1080, 17.30 | Razer Blade Pro 2017 i7-7820HK, GeForce GTX 1080 Mobile, 2x Samsung SSD PM951 MZVLV256HCHP (RAID 0), IGZO, 3840x2160, 17.30 | Acer Predator Triton 700 i7-7700HQ, GeForce GTX 1080 Max-Q, 2x SK Hynix Canvas SC300 512GB M.2 (HFS512G39MND) (RAID 0), IPS, 1920x1080, 15.60 | |
|---|---|---|---|---|---|---|
| Power Consumption | -8% | 10% | 27% | -19% | -5% | |
| Idle Minimum * | 21.2 | 28 -32% | 19 10% | 13 39% | 31 -46% | 28 -32% |
| Idle Average * | 29.6 | 32 -8% | 22 26% | 17 43% | 36 -22% | 33 -11% |
| Idle Maximum * | 34 | 37 -9% | 29 15% | 23 32% | 44 -29% | 41 -21% |
| Load Average * | 130.9 | 112 14% | 102 22% | 90 31% | 107 18% | 94 28% |
| Witcher 3 ultra * | 177.5 | 192 -8% | 190 -7% | 147 17% | 212 -19% | 160 10% |
| Load Maximum * | 219.7 | 231 -5% | 231 -5% | 215 2% | 258 -17% | 222 -1% |
* ... smaller is better
Battery Life
We're able to record a real-world WLAN runtime of just under 5 hours when set to the Balanced power profile through the Alienware Command Center software. The presence of Nvidia Optimus, which was missing on the last generation Alienware 17, helps the m17 achieve longer battery life than the original Alienware 17 (296 min. vs. 218 min.) despite its smaller internal battery (90 Wh vs. 99 Wh). Longer runtimes can be achieved if on the Power Saver profile.
As mentioned earlier, the Alienware m17 has 60 Wh and 90 Wh SKUs much like on some older XPS 15 configurations. Runtimes on the 60 Wh SKUs will likely be two-thirds of what we've recorded here.
Charging from empty to full capacity takes about 1.5 to 2 hours.
| Alienware m17 P37E i9-8950HK, GeForce RTX 2080 Max-Q, 90 Wh | Alienware 17 R5 i7-8750H, GeForce GTX 1070 Mobile, 99 Wh | Asus ROG Strix Scar II GL704GW i7-8750H, GeForce RTX 2070 Mobile, 66 Wh | MSI GS75 8SG Stealth i7-8750H, GeForce RTX 2080 Max-Q, 80.25 Wh | Razer Blade Pro 2017 i7-7820HK, GeForce GTX 1080 Mobile, 99 Wh | Acer Predator Triton 700 i7-7700HQ, GeForce GTX 1080 Max-Q, 54 Wh | |
|---|---|---|---|---|---|---|
| Battery Runtime | -15% | -5% | 1% | -7% | -27% | |
| Reader / Idle | 543 | 268 -51% | 372 -31% | 464 -15% | 253 -53% | 150 -72% |
| WiFi v1.3 | 296 | 218 -26% | 235 -21% | 316 7% | 197 -33% | 144 -51% |
| Load | 49 | 64 31% | 67 37% | 54 10% | 81 65% | 70 43% |
| Witcher 3 ultra | 52 |
Pros
Cons
Verdict
Dell smartly split its Alienware 17 series into two very distinct versions: the Alienware m17 and Alienware Area-51m. While the thinner m17 has been stripped of features when compared to the original 17 series, the larger and fully packed Area-51m has picked up the slack. The once bulky 17-inch Alienware series can now appeal to gamers who prefer leaner and thinner laptops as well gamers who want as much power as possible from a laptop form factor.
Because the m17 is essentially an "Alienware 17 lite", however, fans of the original series will lament the fact that it sacrifices a handful of classic Alienware features all in the name of being thinner and lighter. It still doesn't manage to be nearly as thin or light as the latest models from MSI, Asus, or Acer and so the m17 is more of a middle-ground solution between ultrathin and thick and heavy. On the other hand, the extra girth makes the m17 chassis more unyielding than many of its superthin alternatives especially in regard to the lid.
Our biggest complaints relate to core temperatures, fan noise, and the keyboard. Reaching core temperatures of 98 C even with the fans running at their loudest when gaming can be hard to swallow for many. Meanwhile, the soft key feedback would have been more appropriate on a thin Ultrabook rather than on an enthusiast gaming laptop like the m17. The SteelSeries keyboards on MSI and Clevo laptops offer firmer key feedback for a tighter gaming experience. The beveled keyboard layout on both the Area-51m and older Alienware 17 feel better for gaming as well.
The Alienware m17 offers massive weight and size savings over the Alienware 17. The downsides, however, are noticeable including the omission of many hardware features and the move to Max-Q GPUs. Luckily, users who want a more classic Alienware experience can opt for the Area-51m while newcomers to the brand will like the m17 for its strong chassis design compared to other ultrathin alternatives.
Alienware m17 P37E
-
04/14/2019 v6(old)
Allen Ngo


Pricecompare
