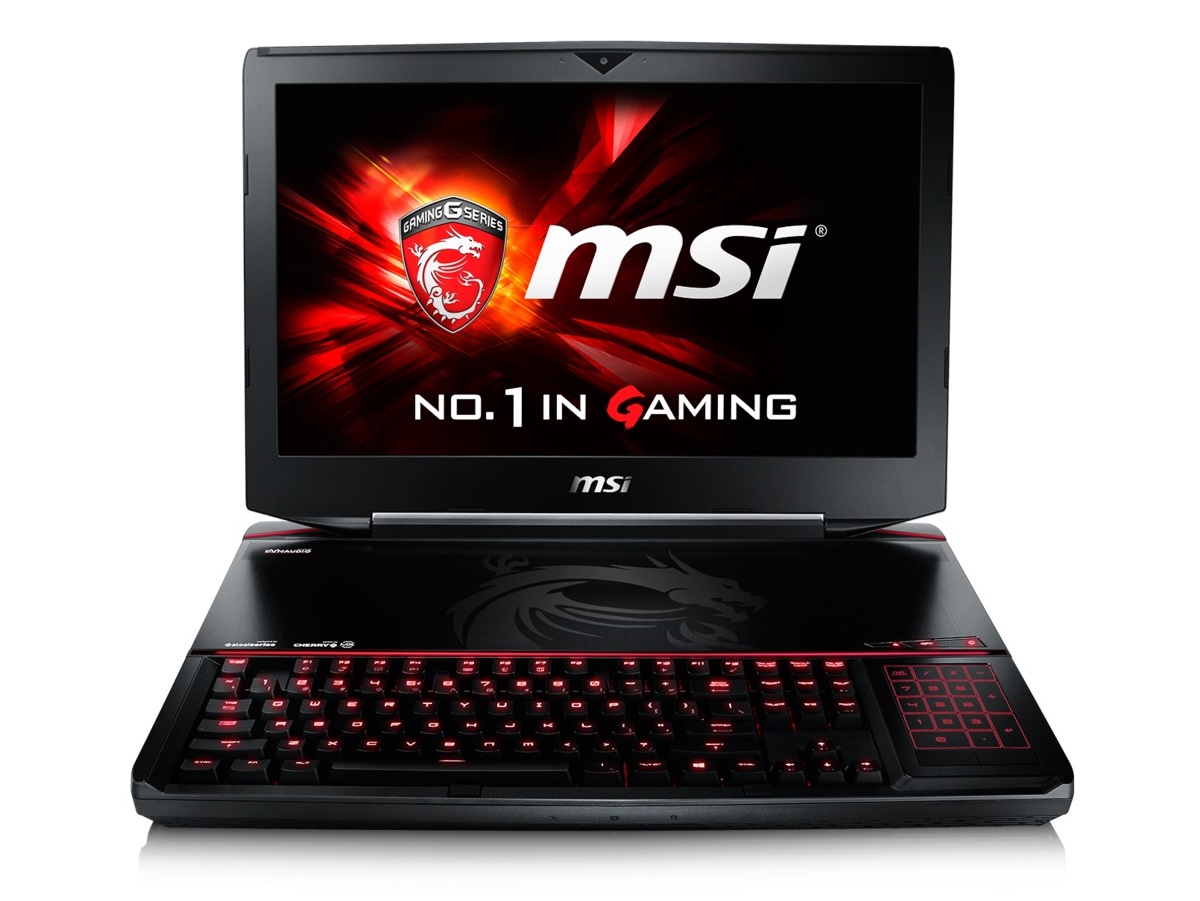
MSI GT80S 6QF Titan SLI Notebook Review
For the original German review, see here.
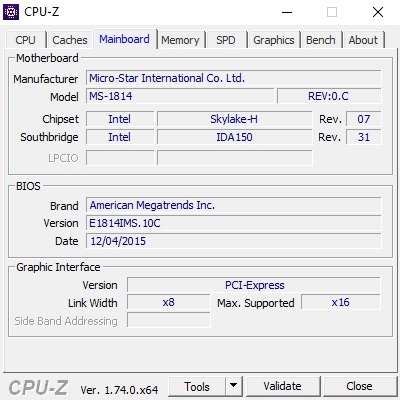
Five months after the review of the GT80 2QD (Core i7-5700HQ), MSI has launched the successor to the throne, which is just as exclusive. Instead of a CPU from Intel’s Broadwell generation, you now get the modern Skylake architecture. Depending on the model, the device uses a Core i7-6700HQ (2.6 to 3.5 GHz), a Core i7-6920HQ (2.9 to 3.8 GHz) or a Core i7-6820HK (2.7 to 3.6 GHz). The latter does not have the highest clocks, but a free multiplier in return, which improves overclocking.
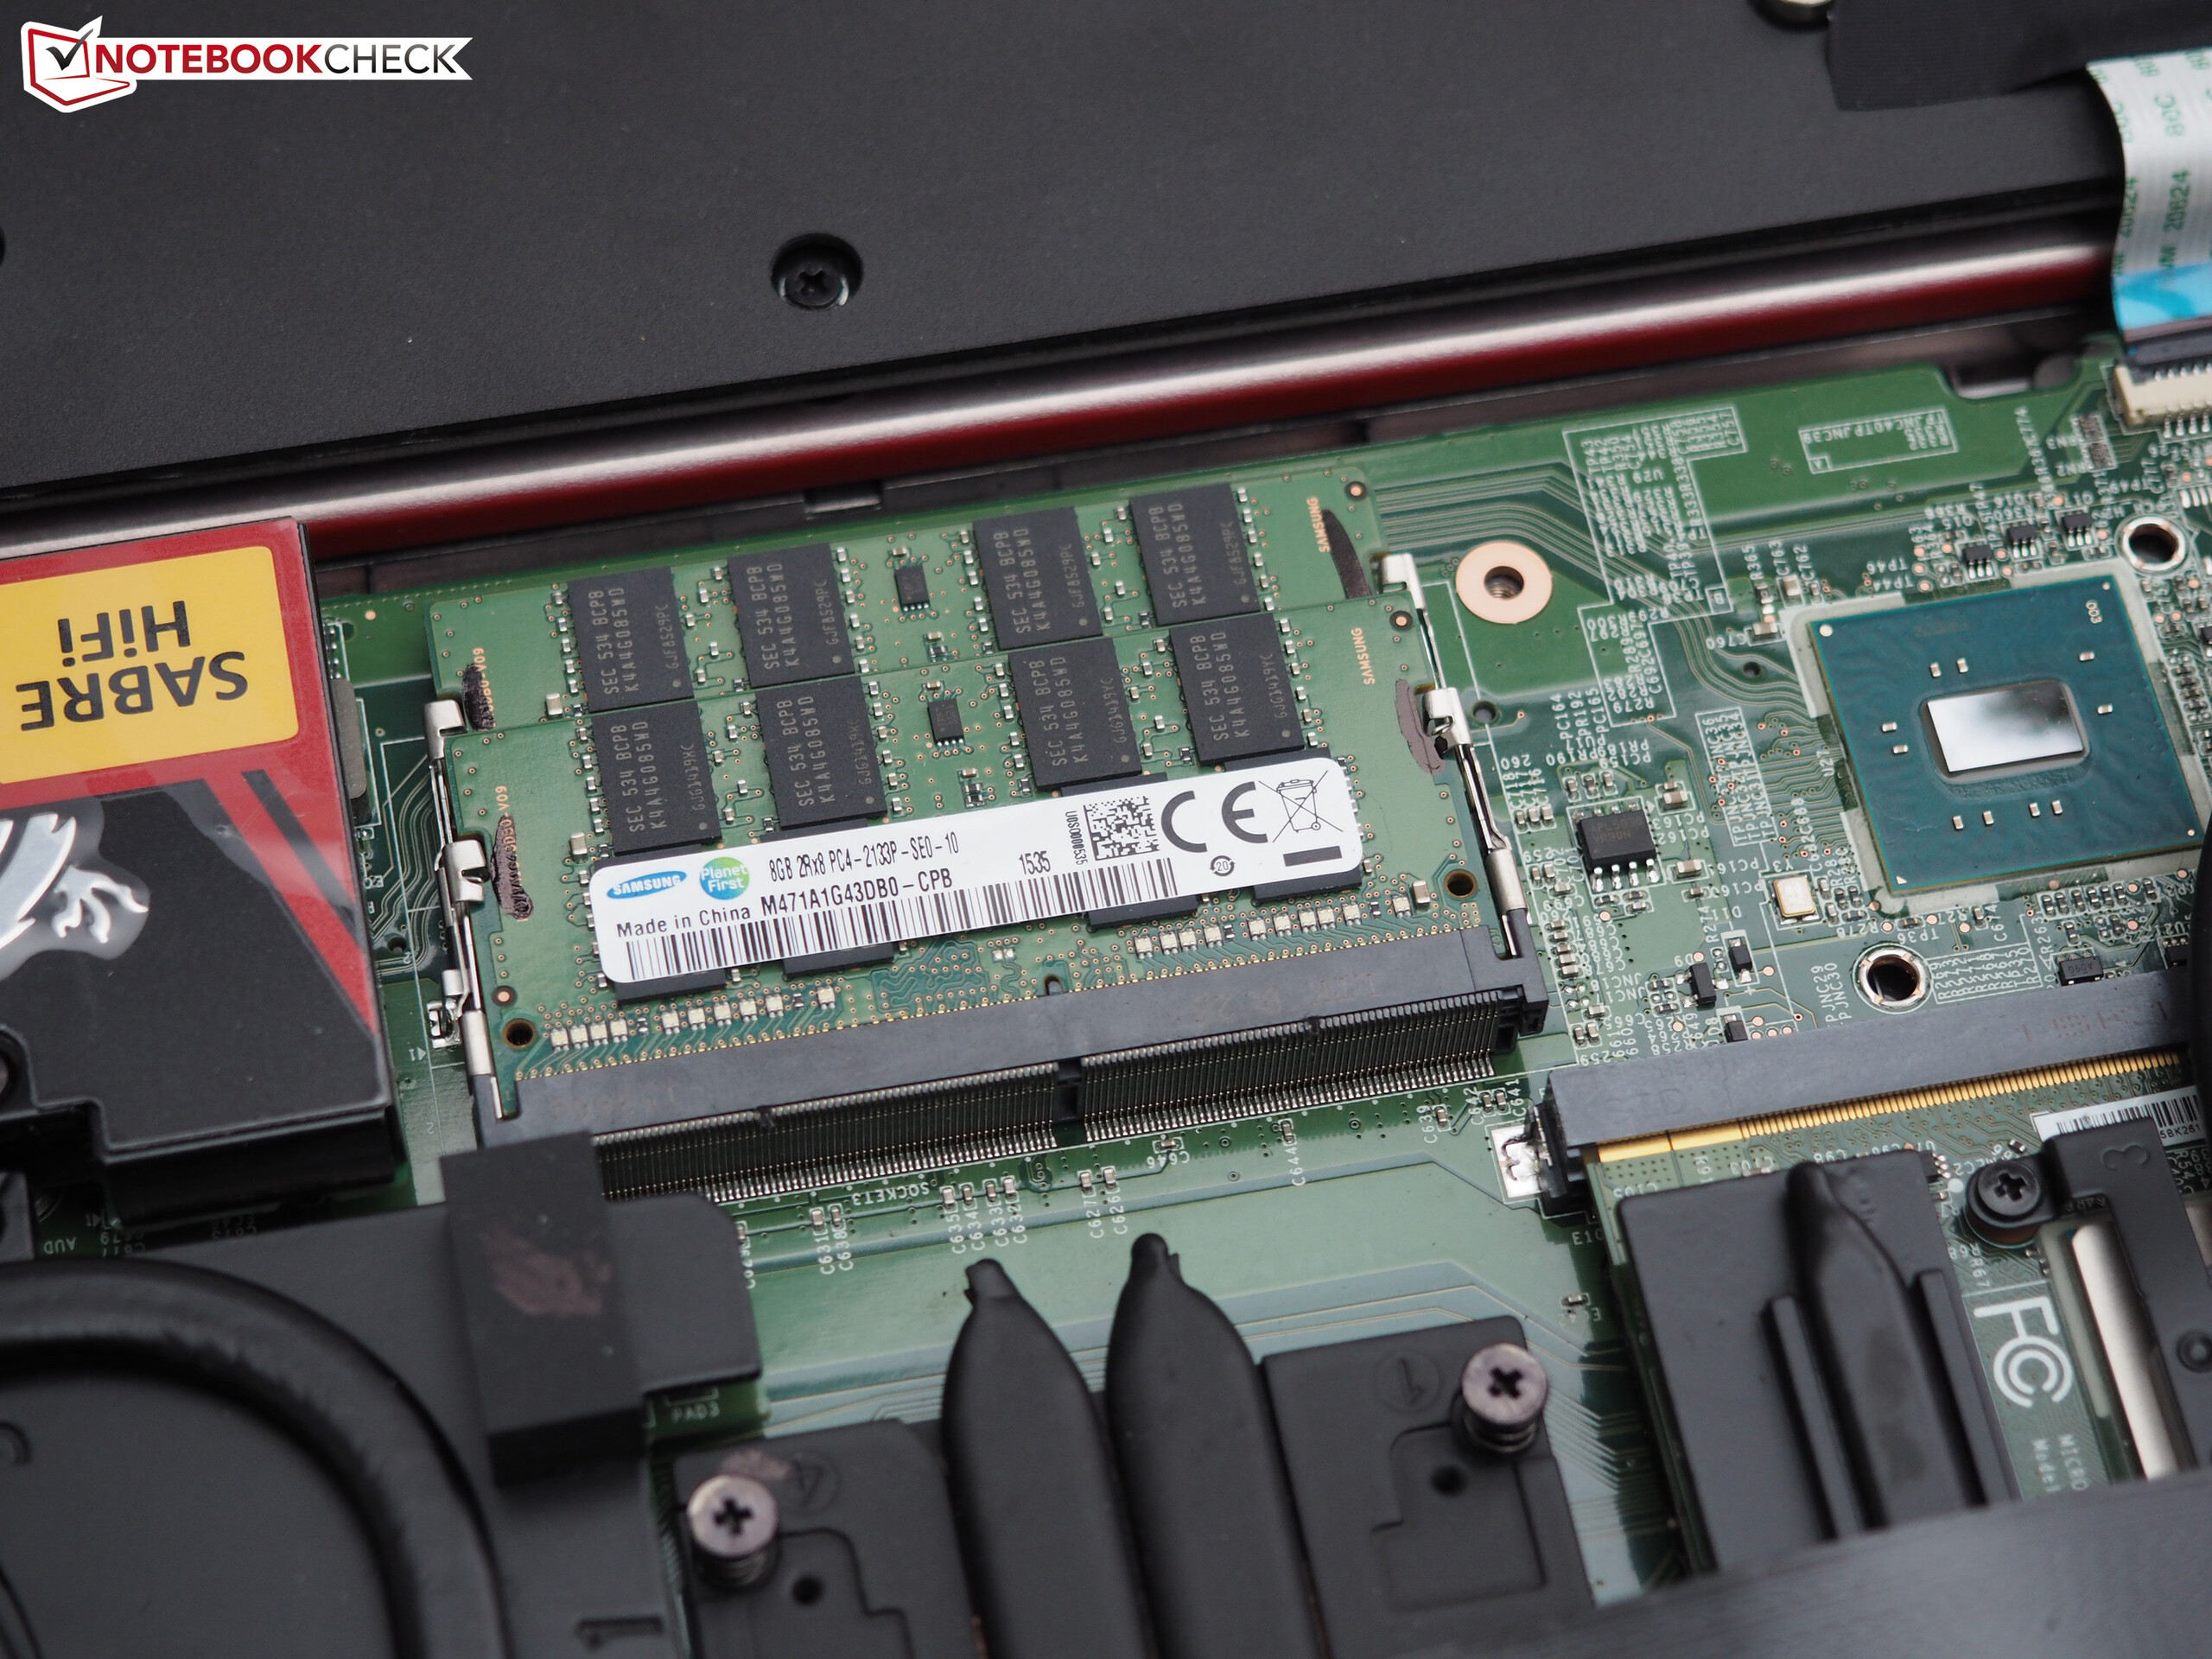
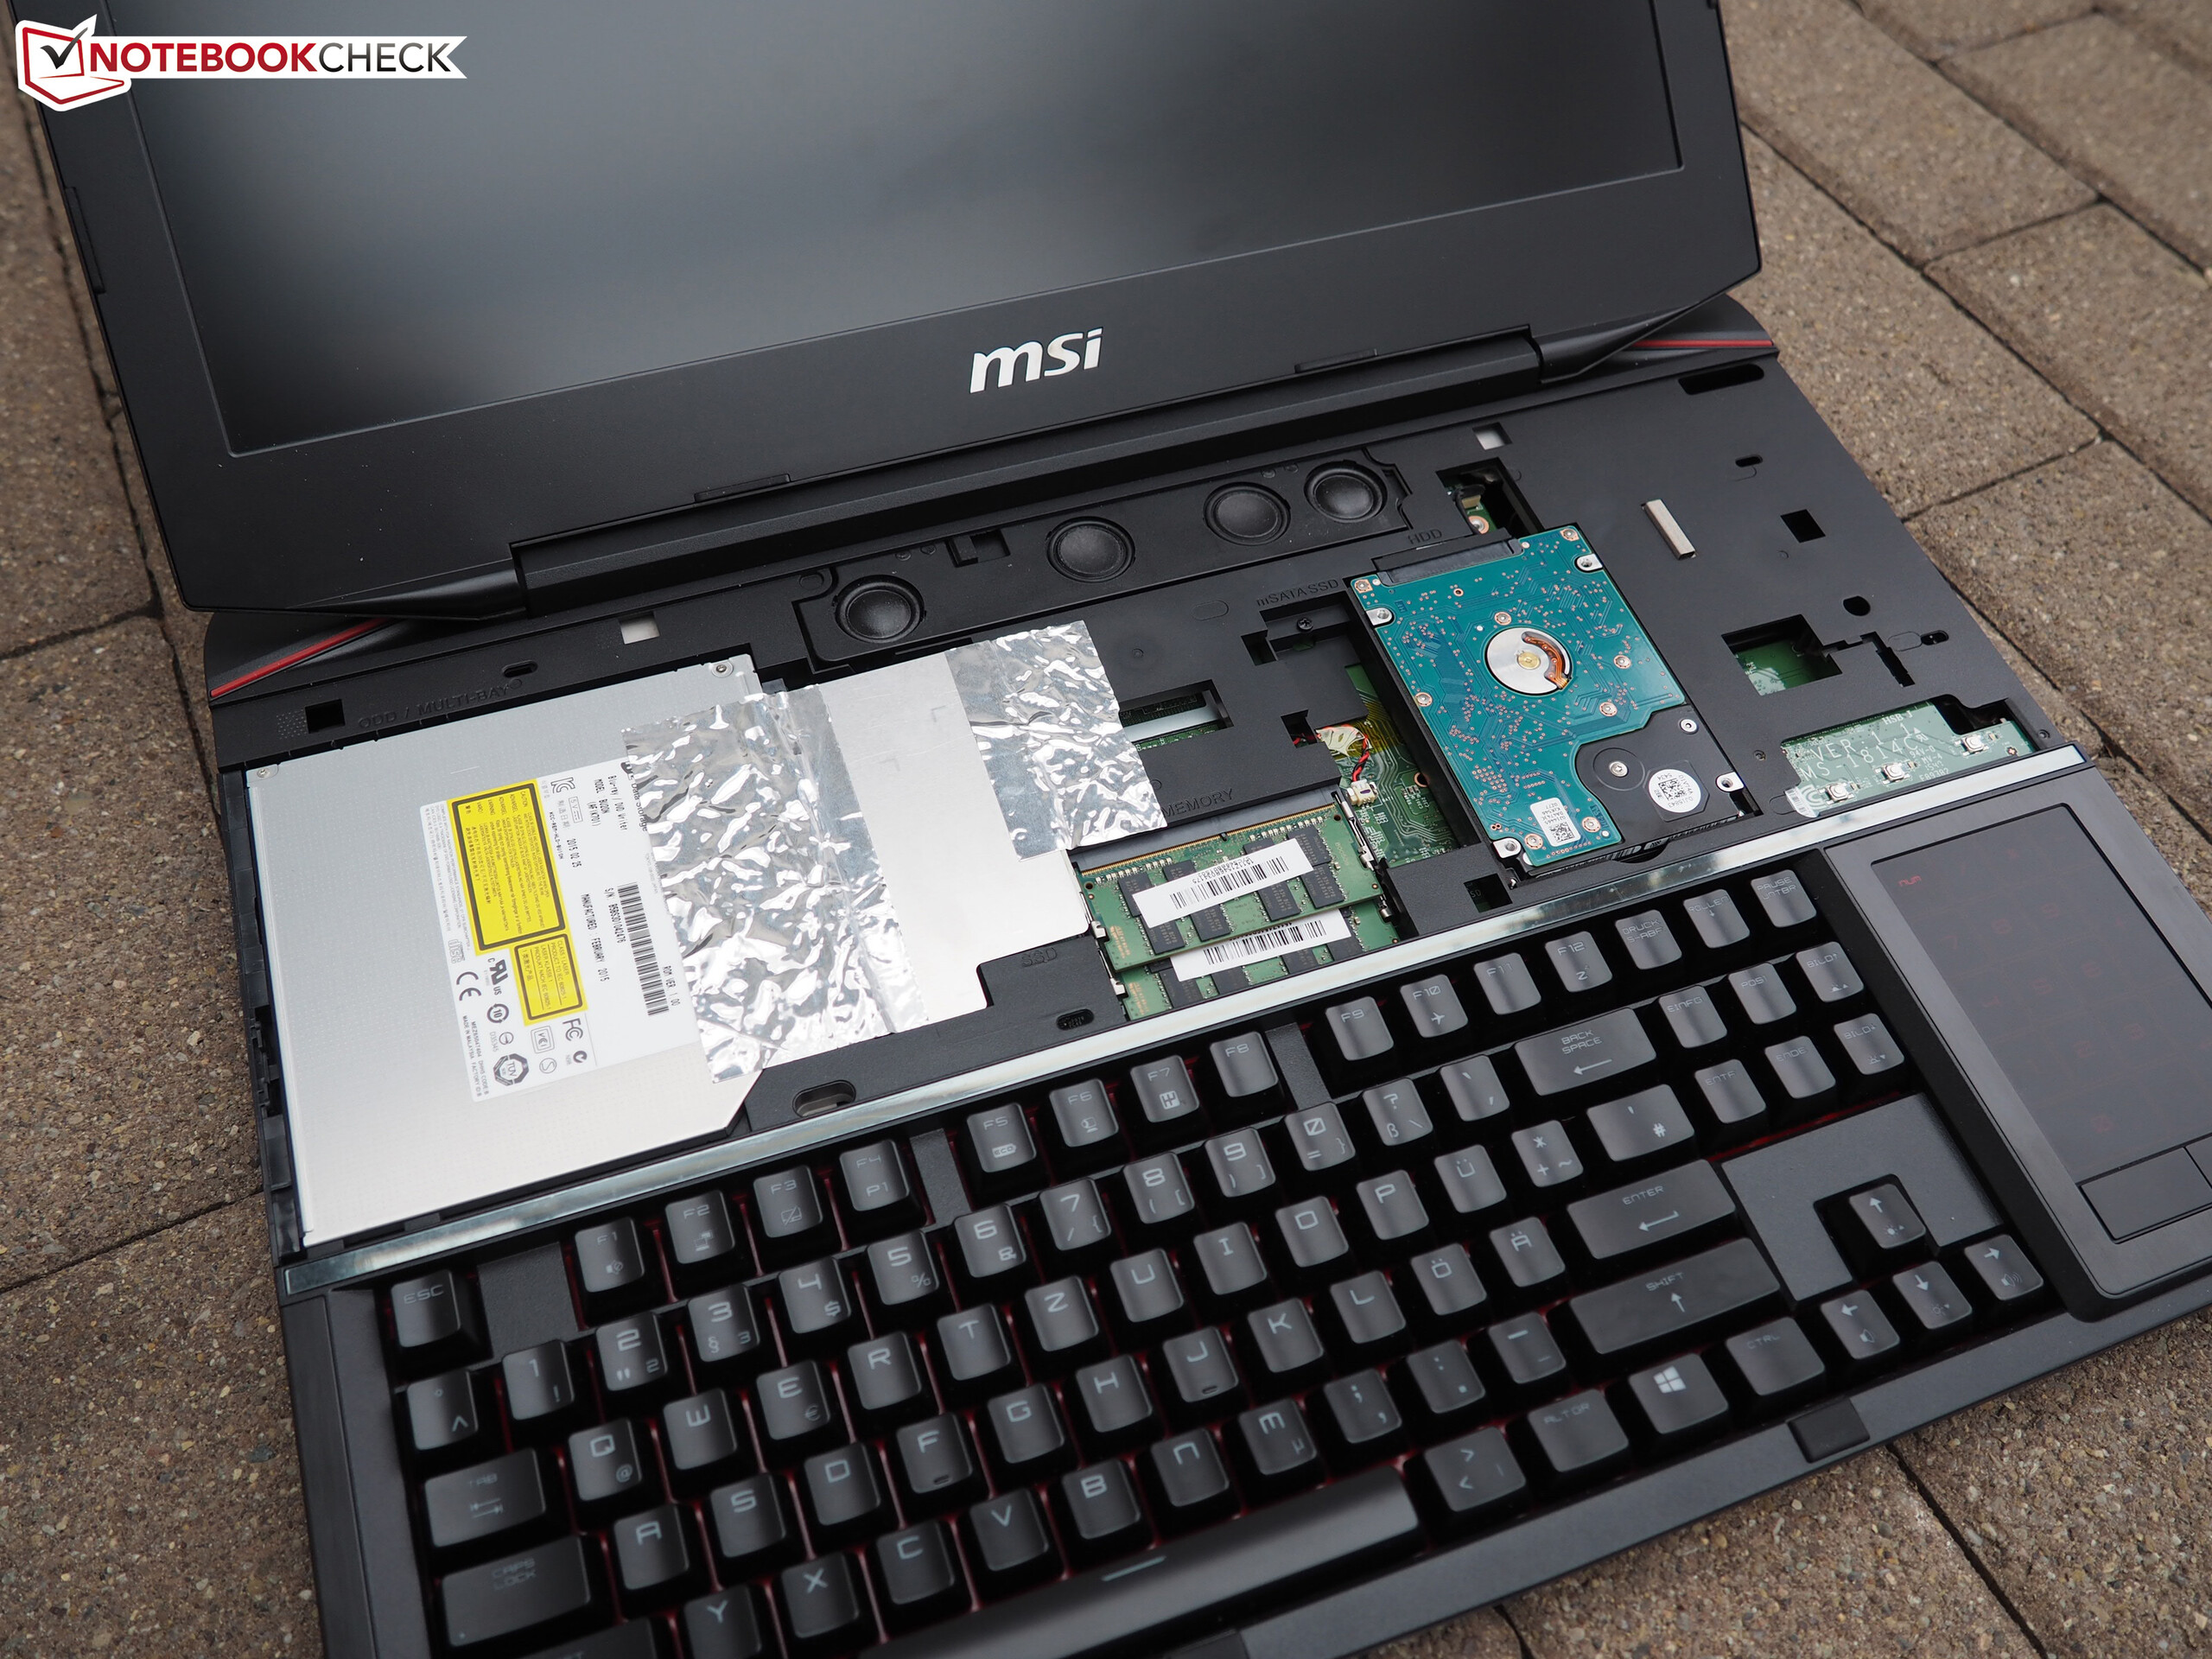
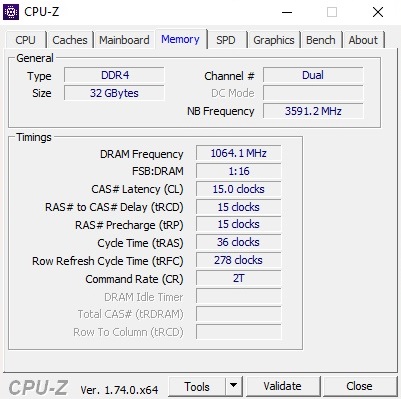
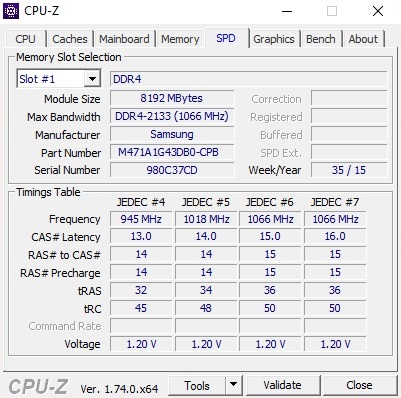
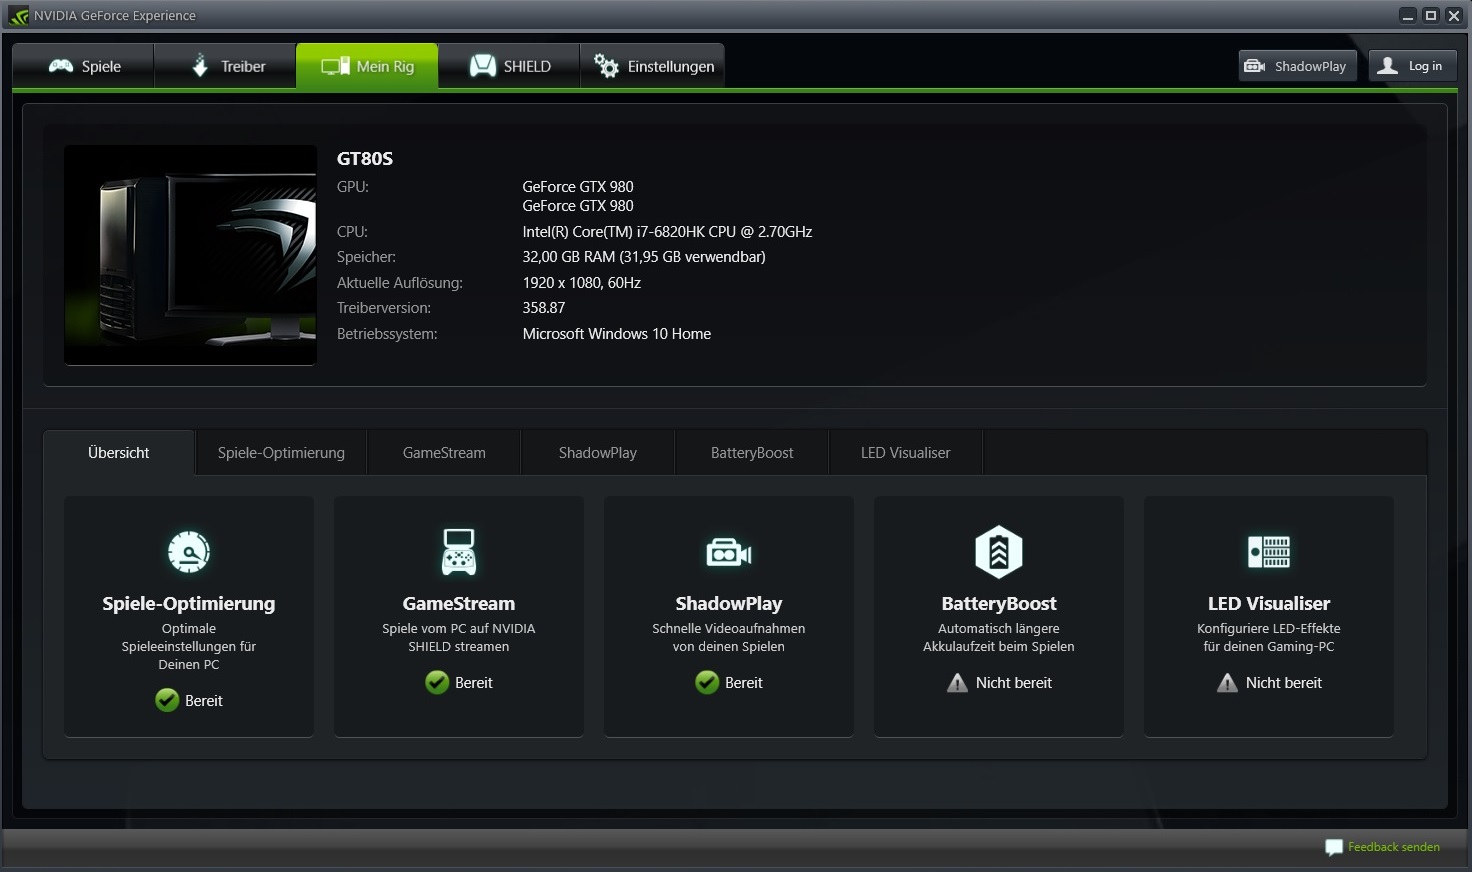
The graphics cards are also different: While the model for 3000 Euros (~$3255) is equipped with two GTX 970M, the configurations for more than 4000 Euros (~$4340) get a combination of two GTX 980M chips. The top model GT80S 6QF, which is also our review configuration, even gets two GTX 980 chips in an SLI configuration. The situation is similarly luxurious in terms of RAM. 32 GB DDR4 memory should not become a bottleneck any time soon. The same applies to the storage devices. Our model uses two 256 GB SSD in a RAID-0 array, which is accompanied by a 1 TB HDD.
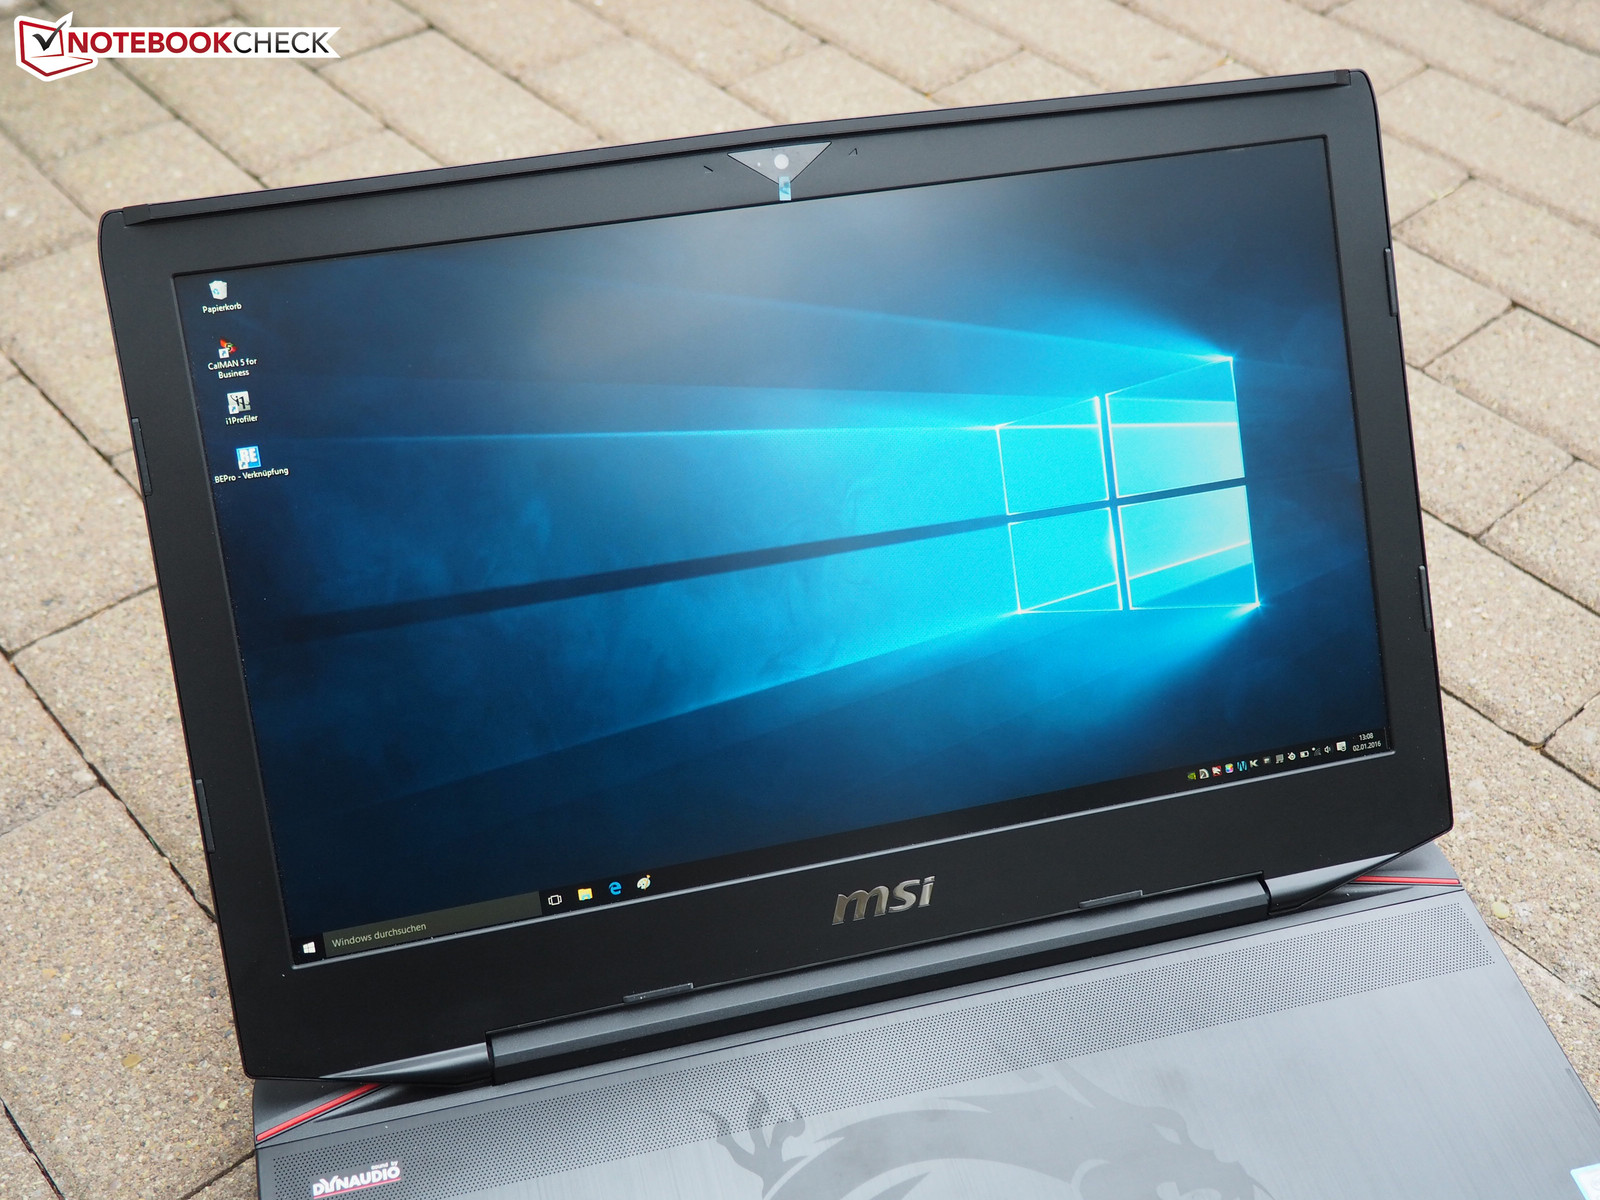
The display cannot quite meet the leading role. Despite the large screen size, MSI only integrates a Full HD panel with 1920x1080 pixels. The reason: According to the manufacturer, there is currently no suitable 18-inch 4K panel. At least you get a wide-view display with Super-PLS technology (variety of IPS).
New Features
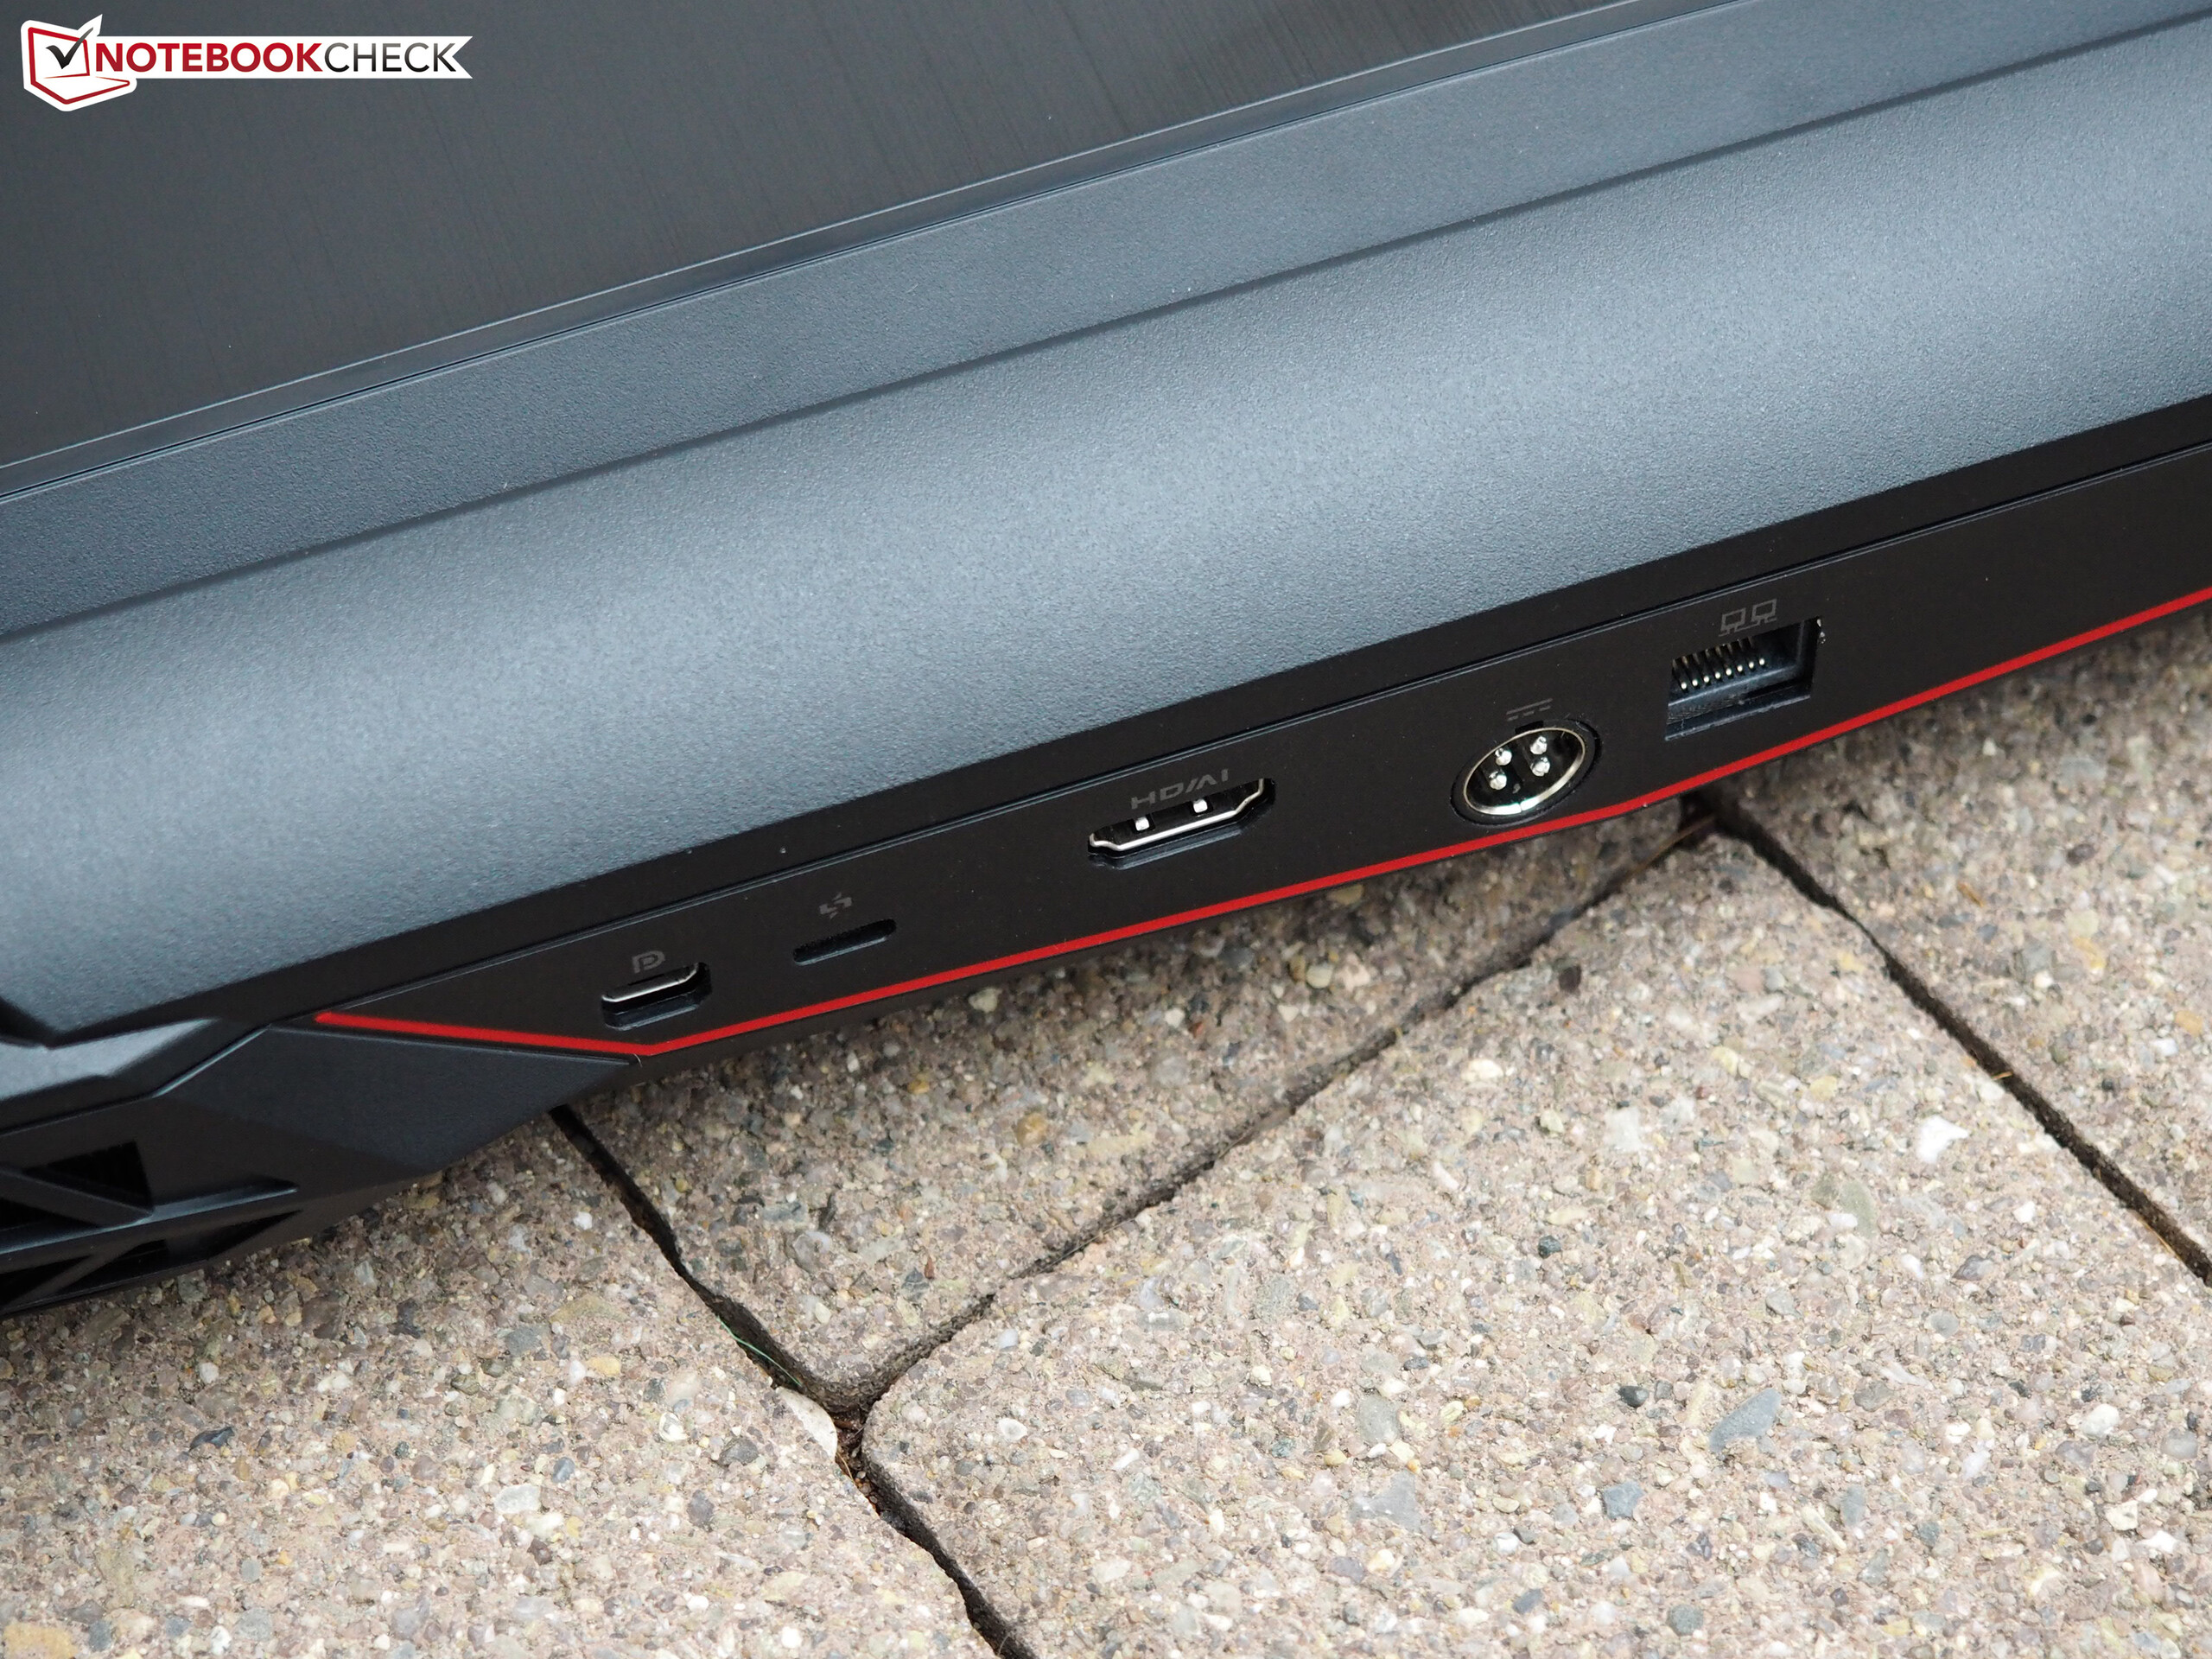
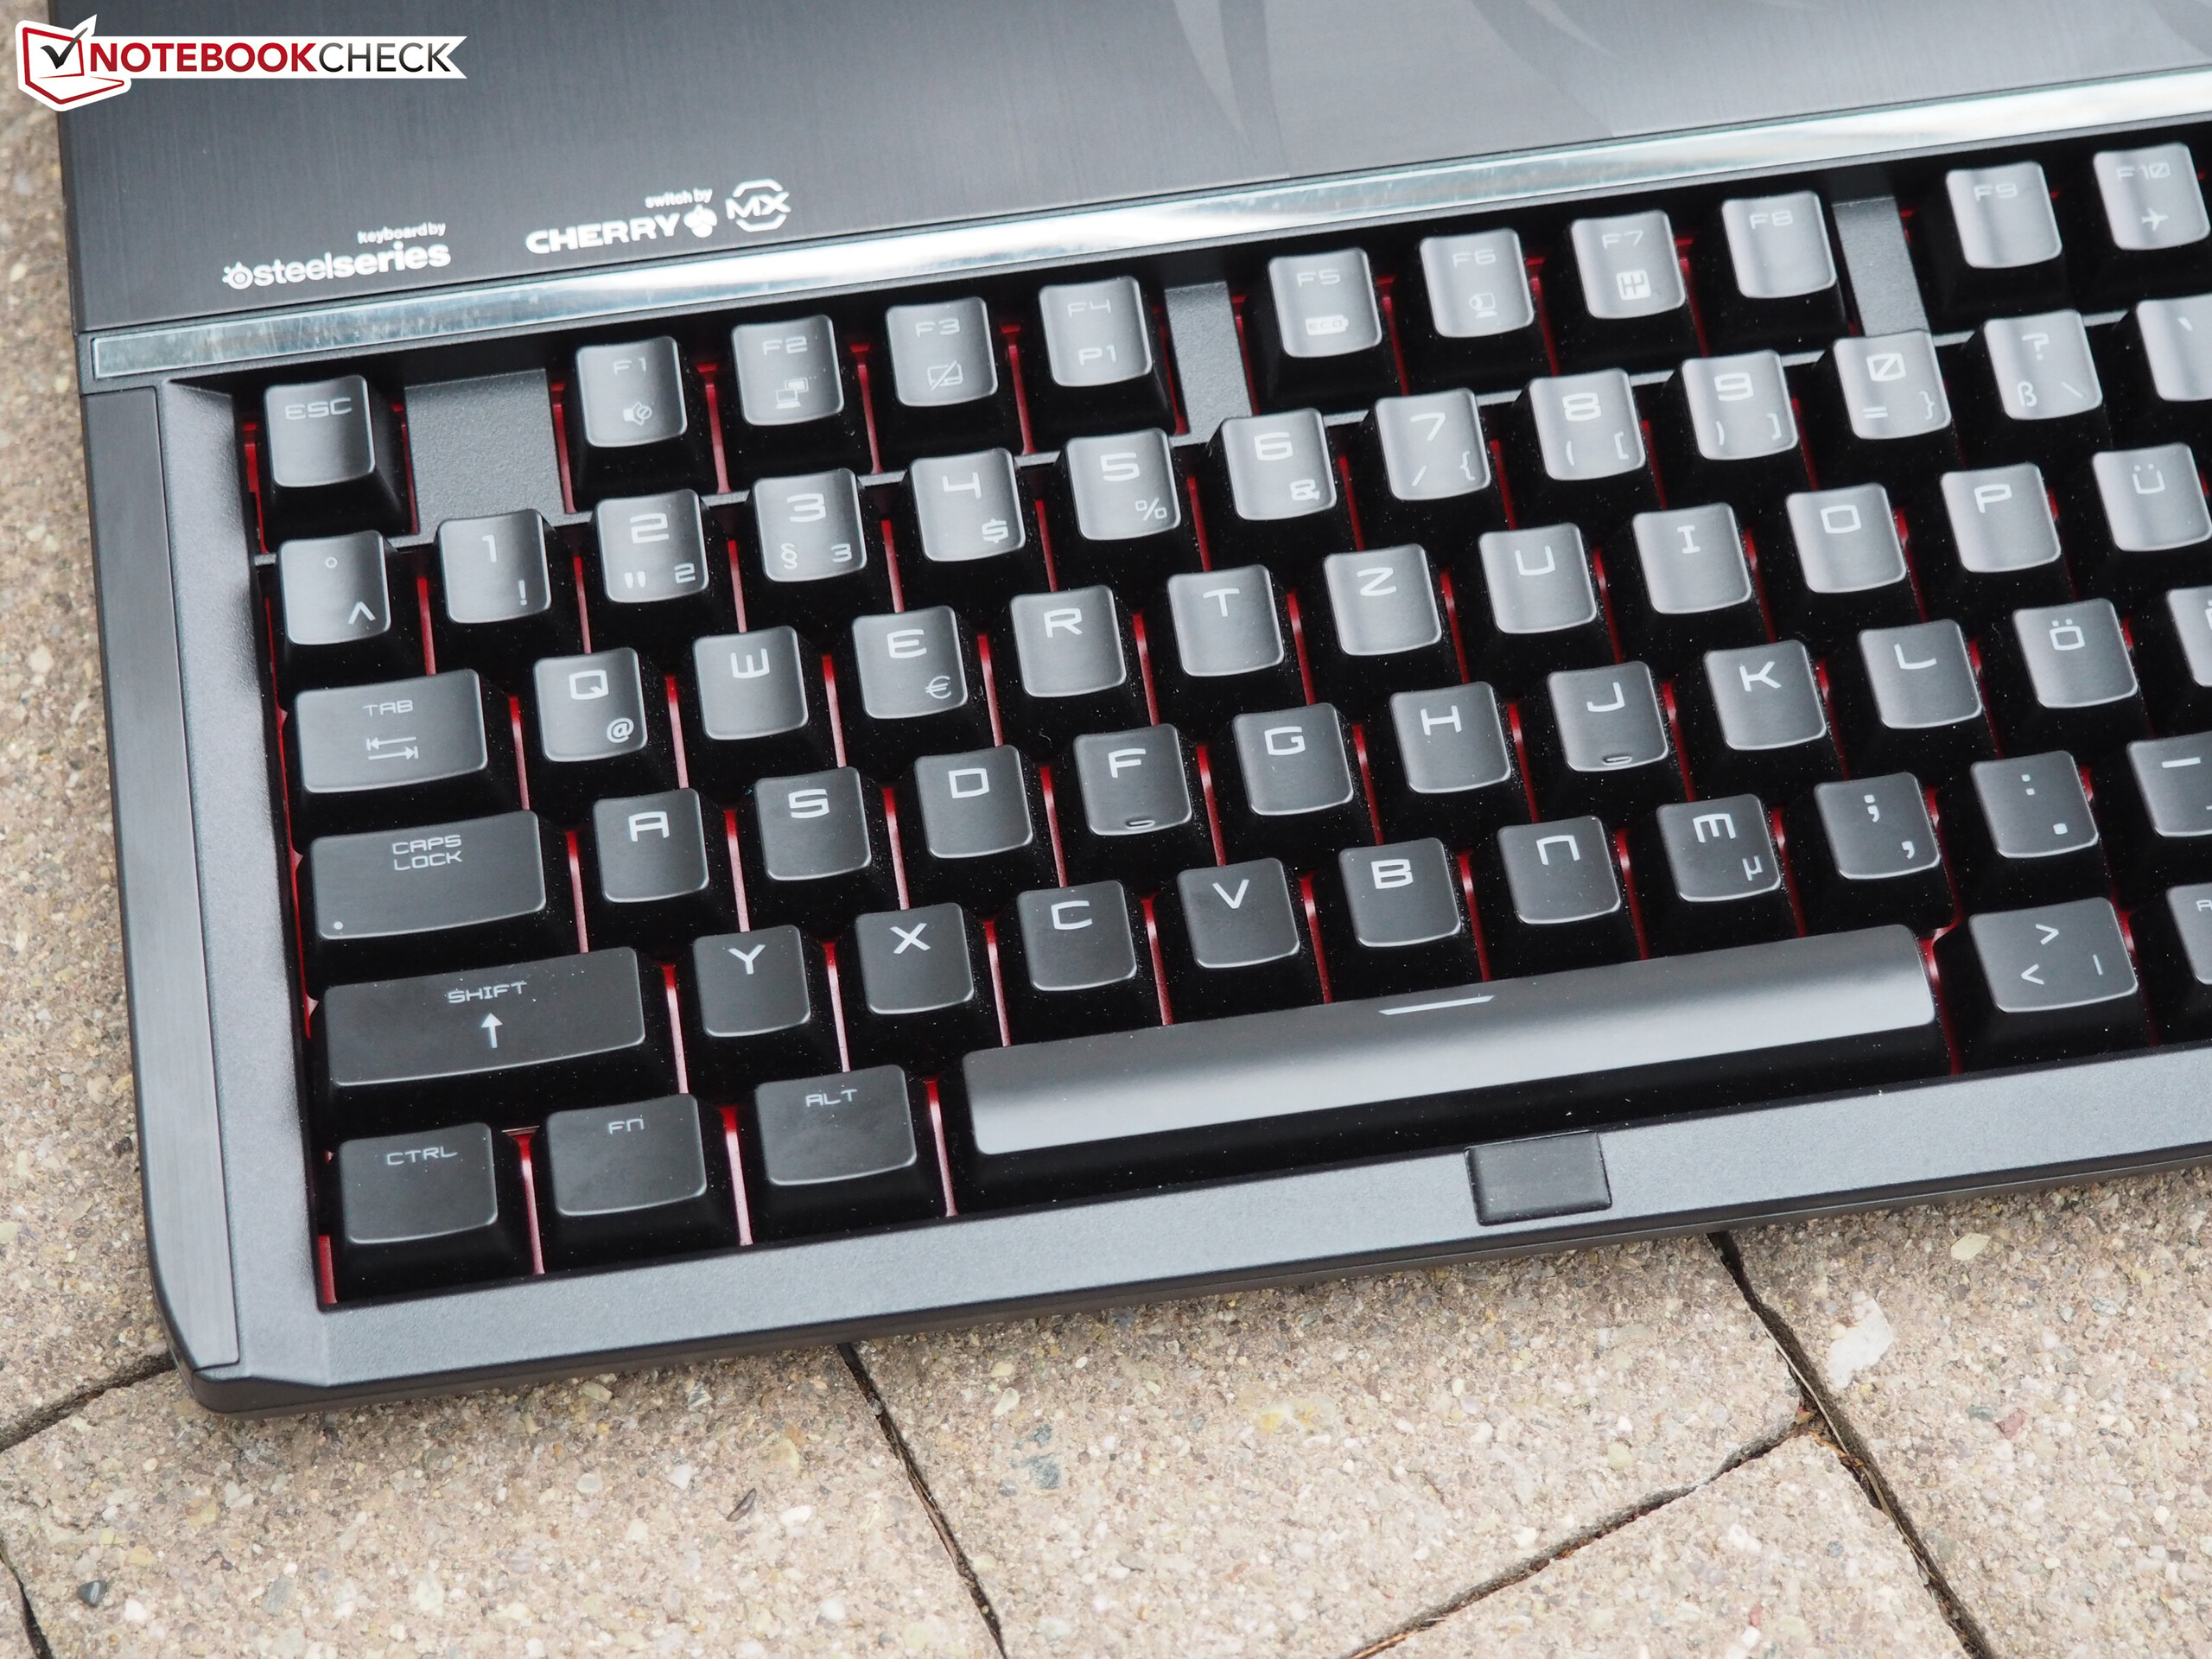
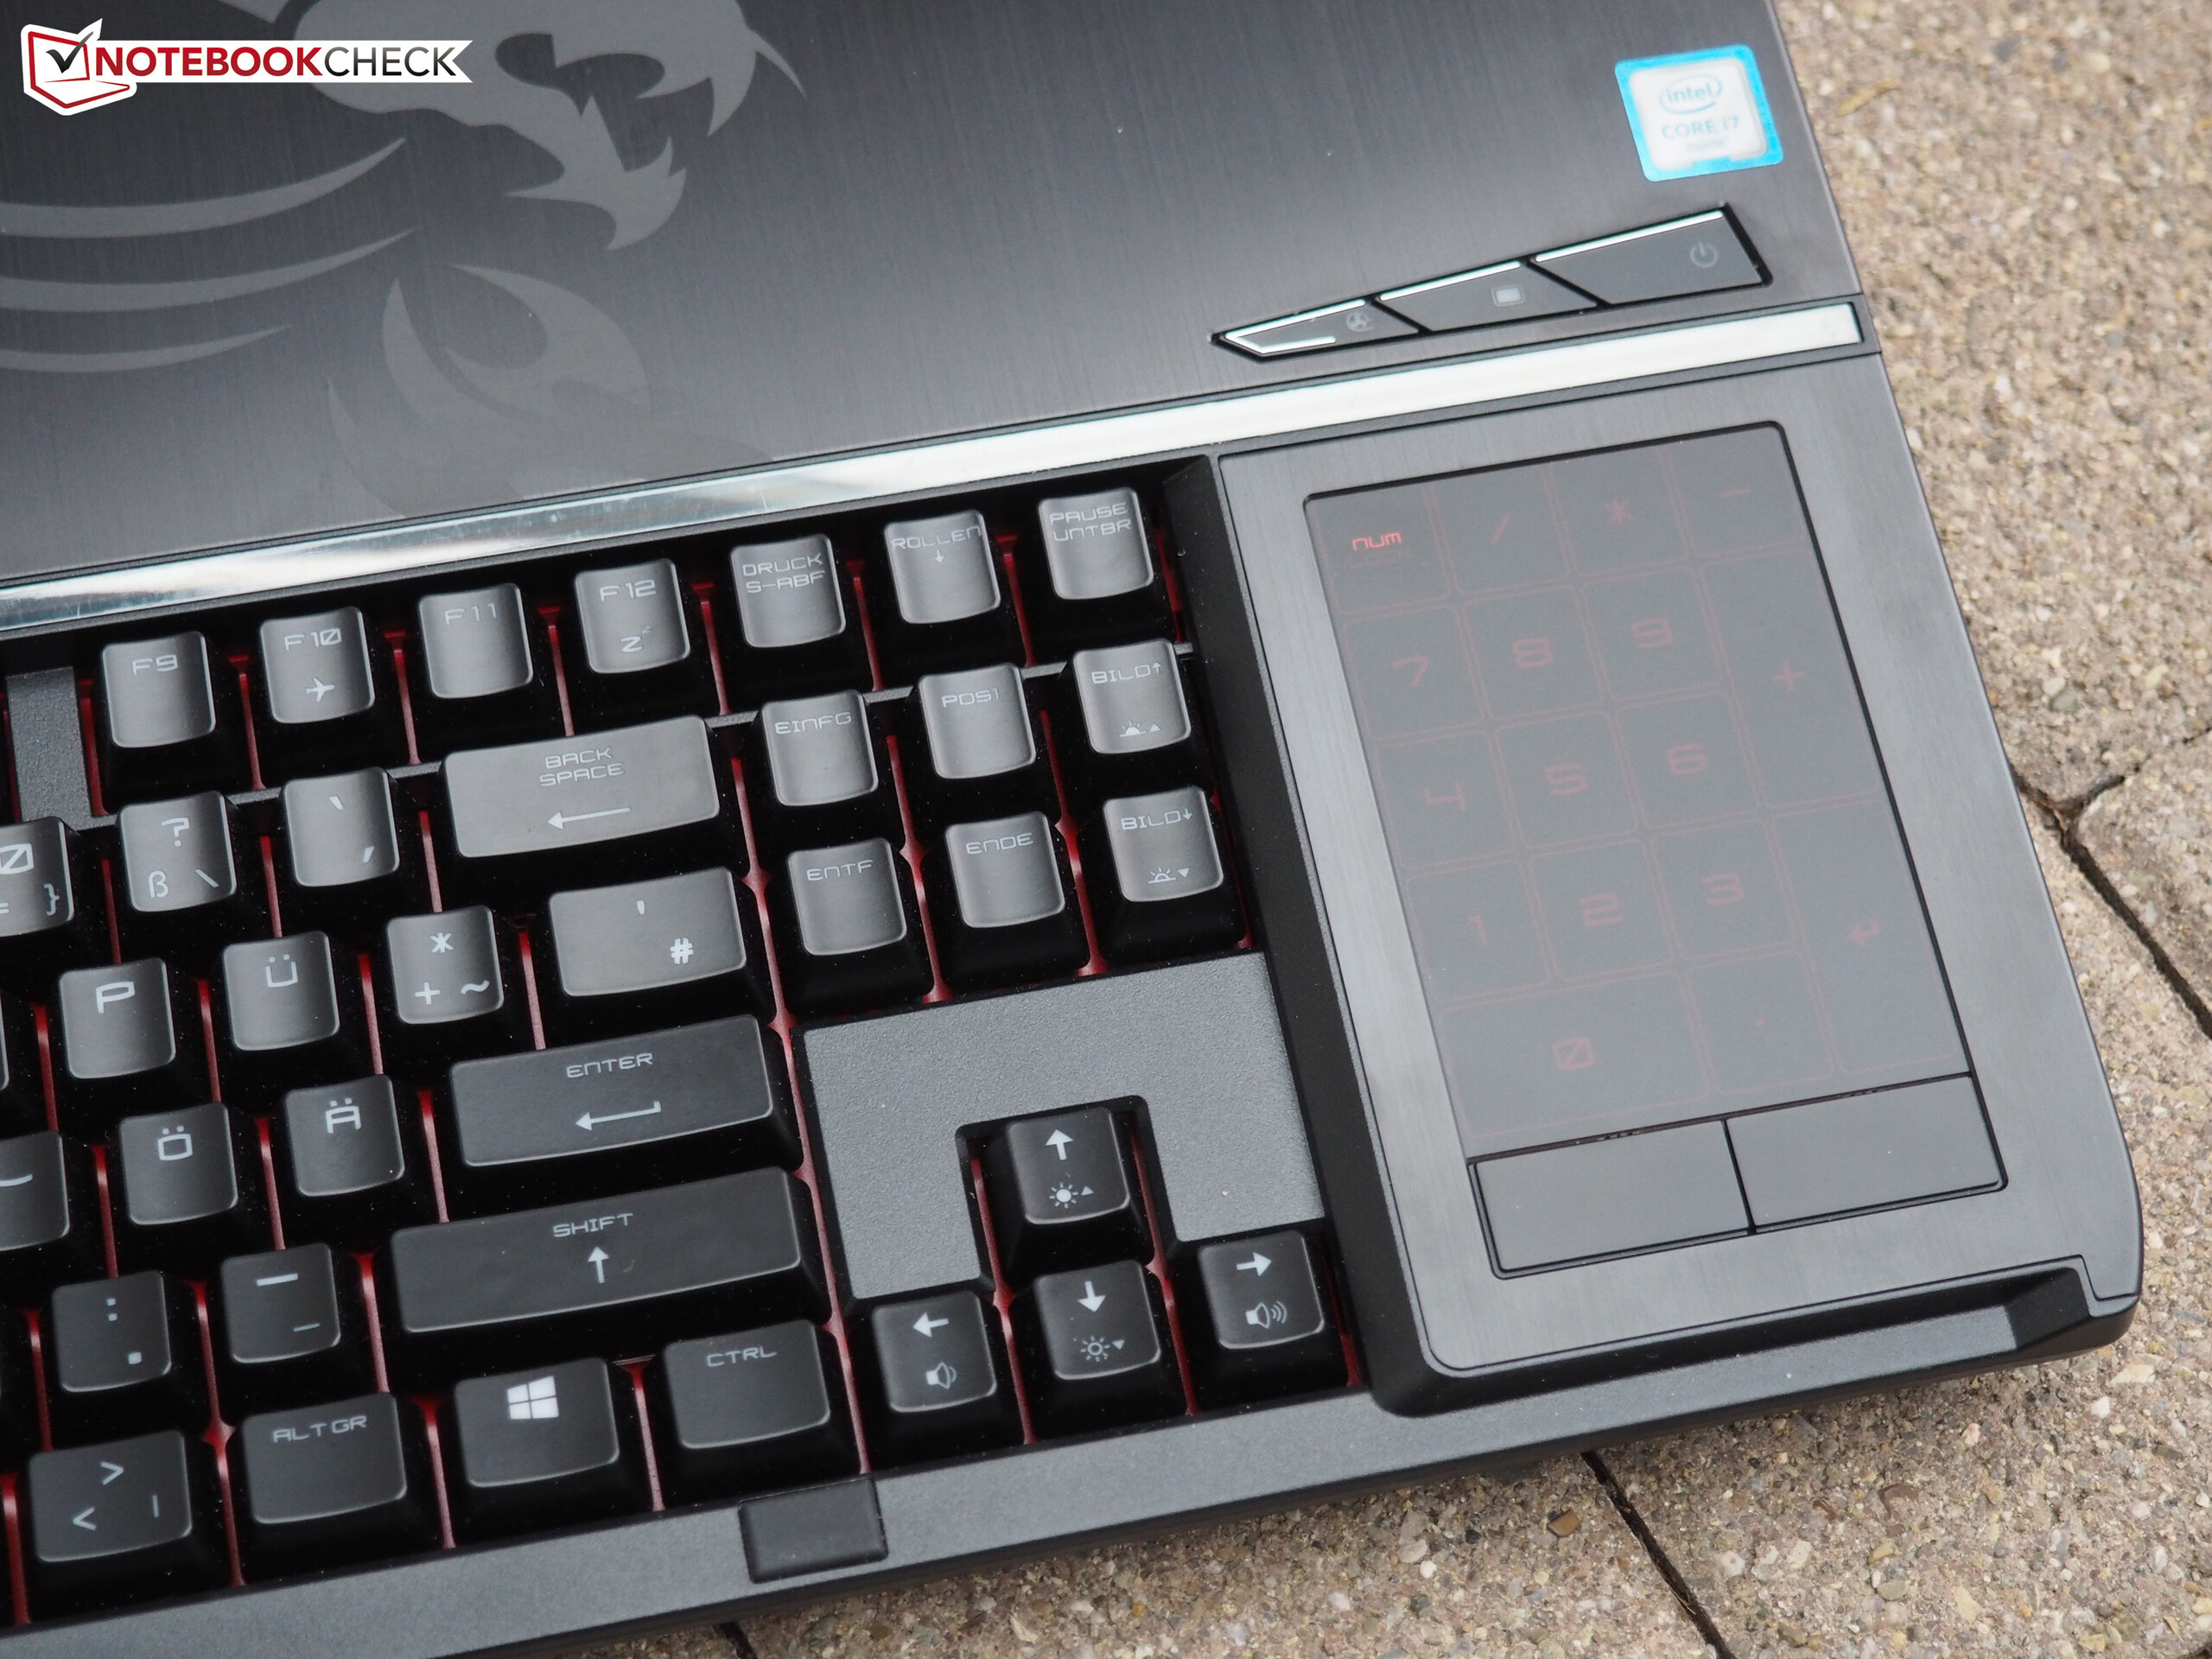
Even though at a first glance the GT80S looks a lot like its predecessor, there are actually many updated details. We start with the ports: To make sure that the 18-inch device is fit for the future, MSI has replaced one of the two Mini-DisplayPorts with a so called Super Port, which combines USB 3.1 Type-C and Thunderbolt 3 for additional connectivity options.
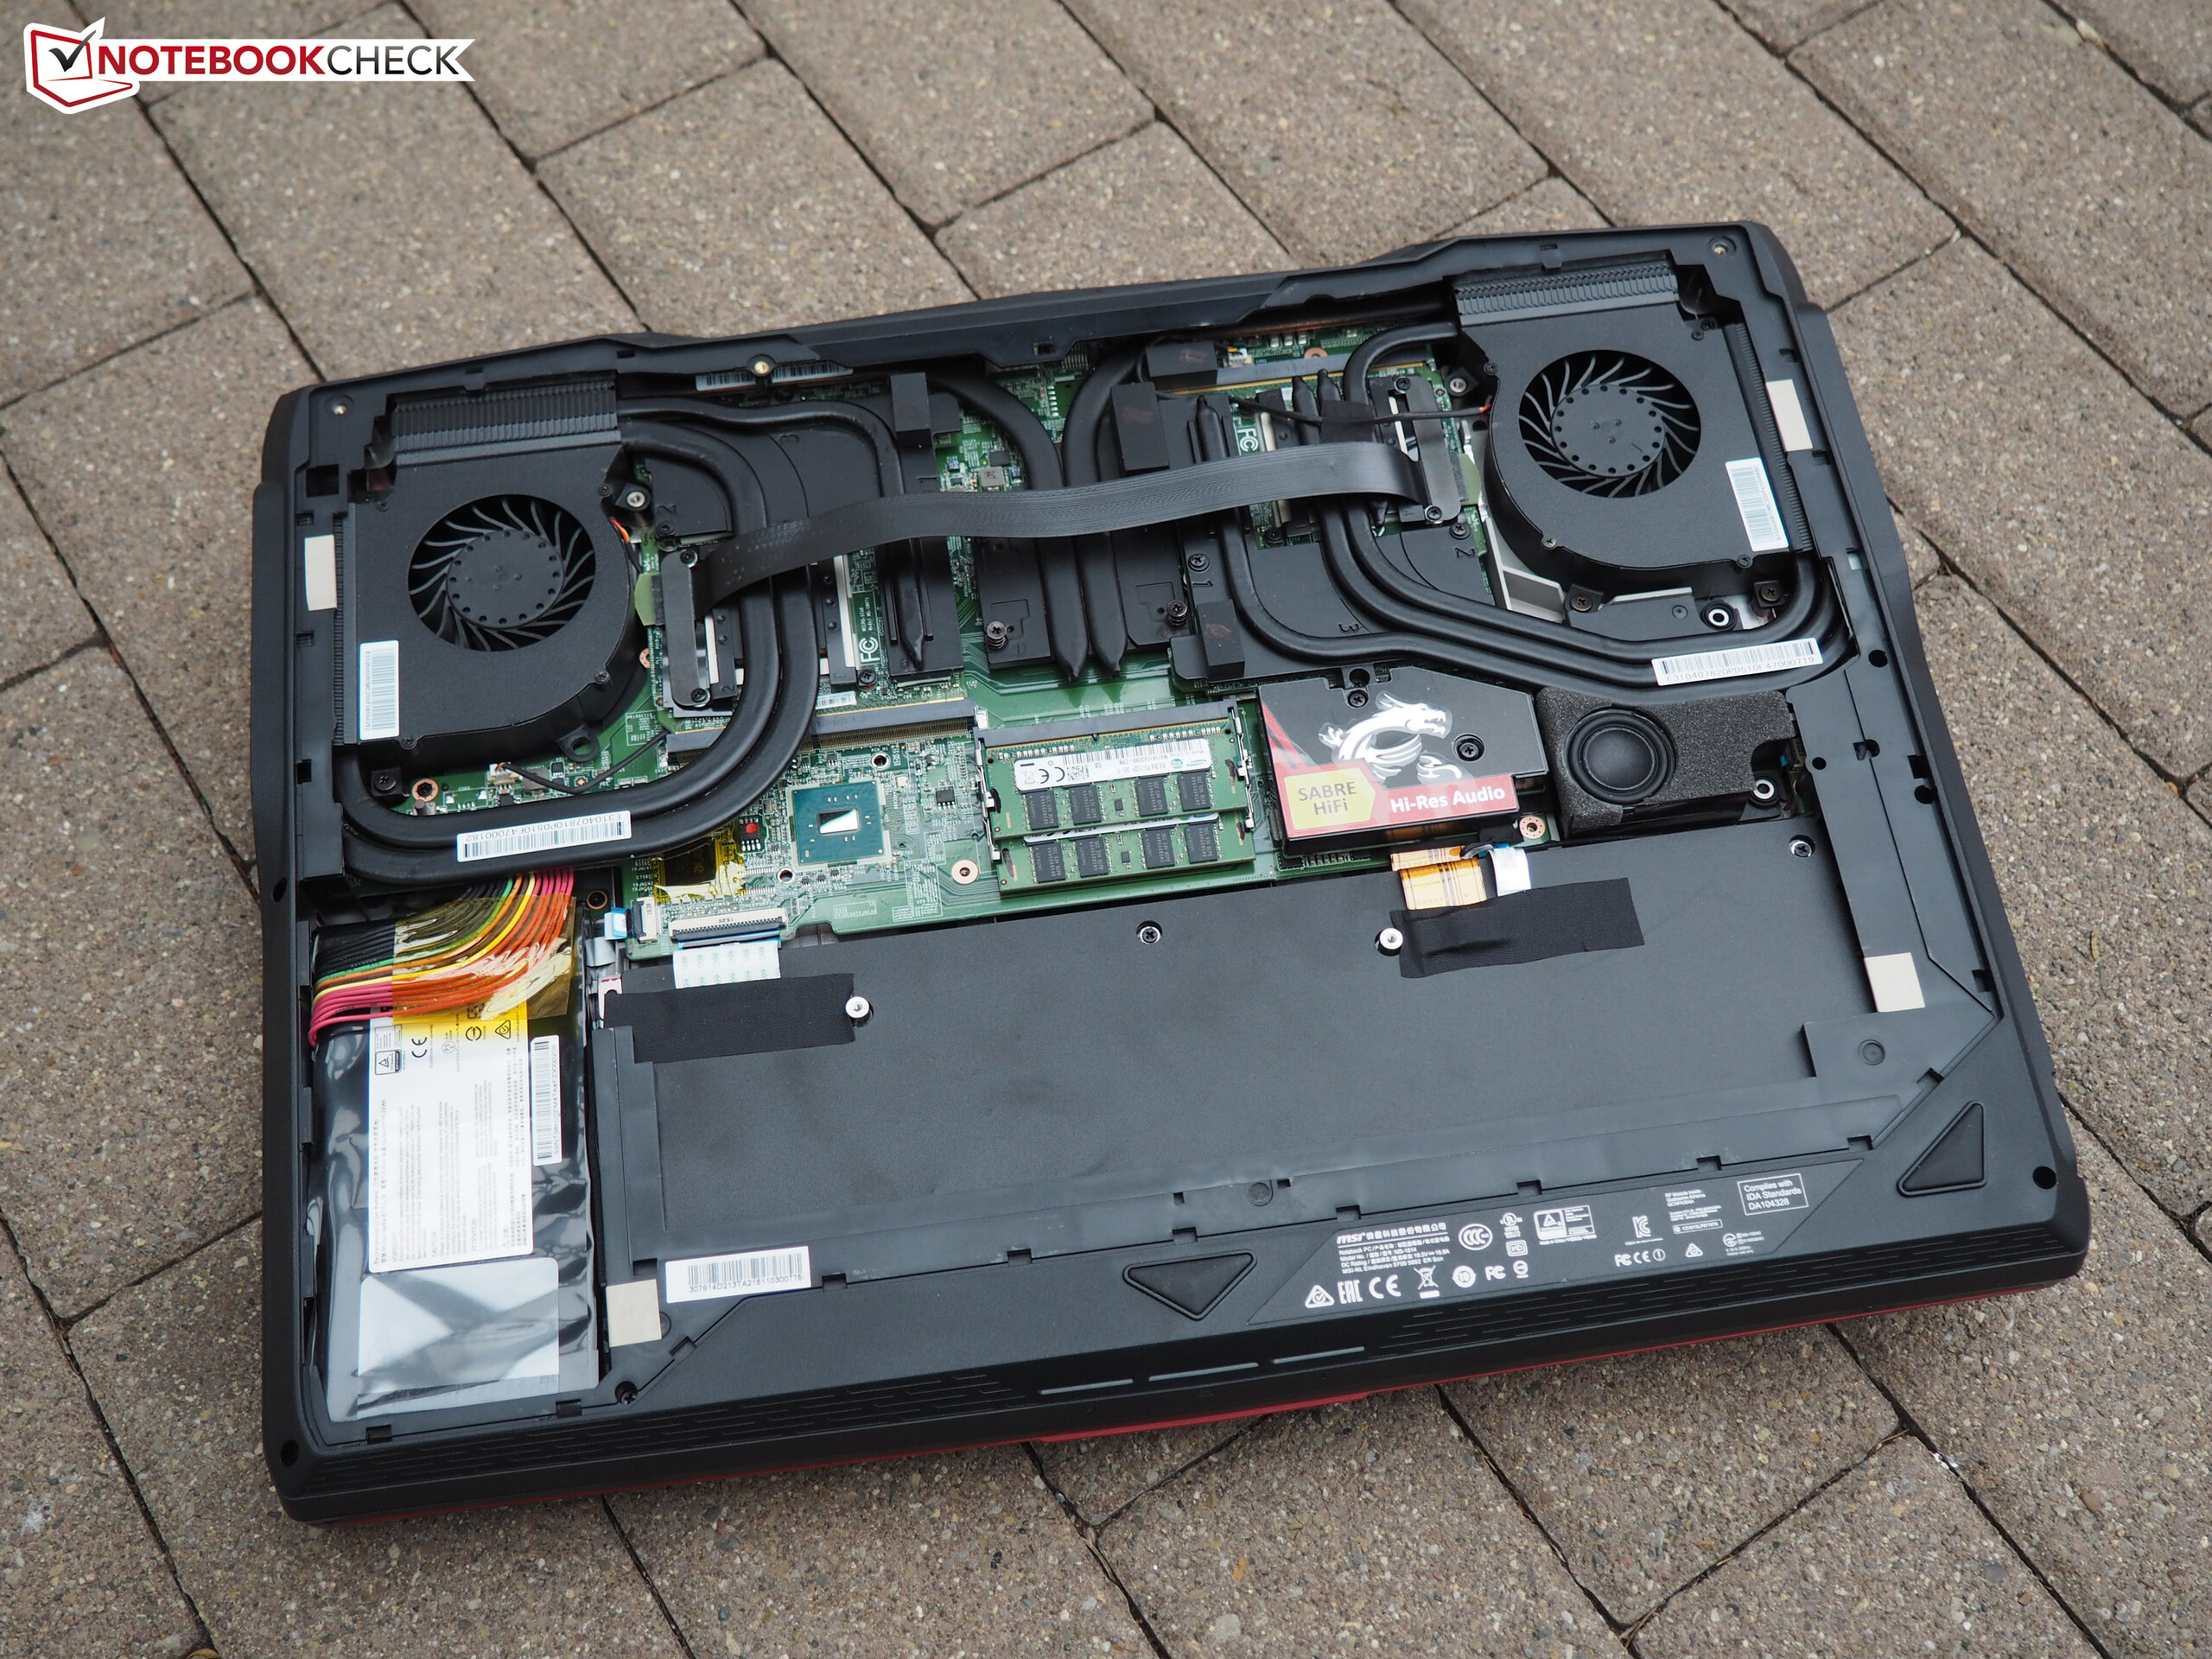
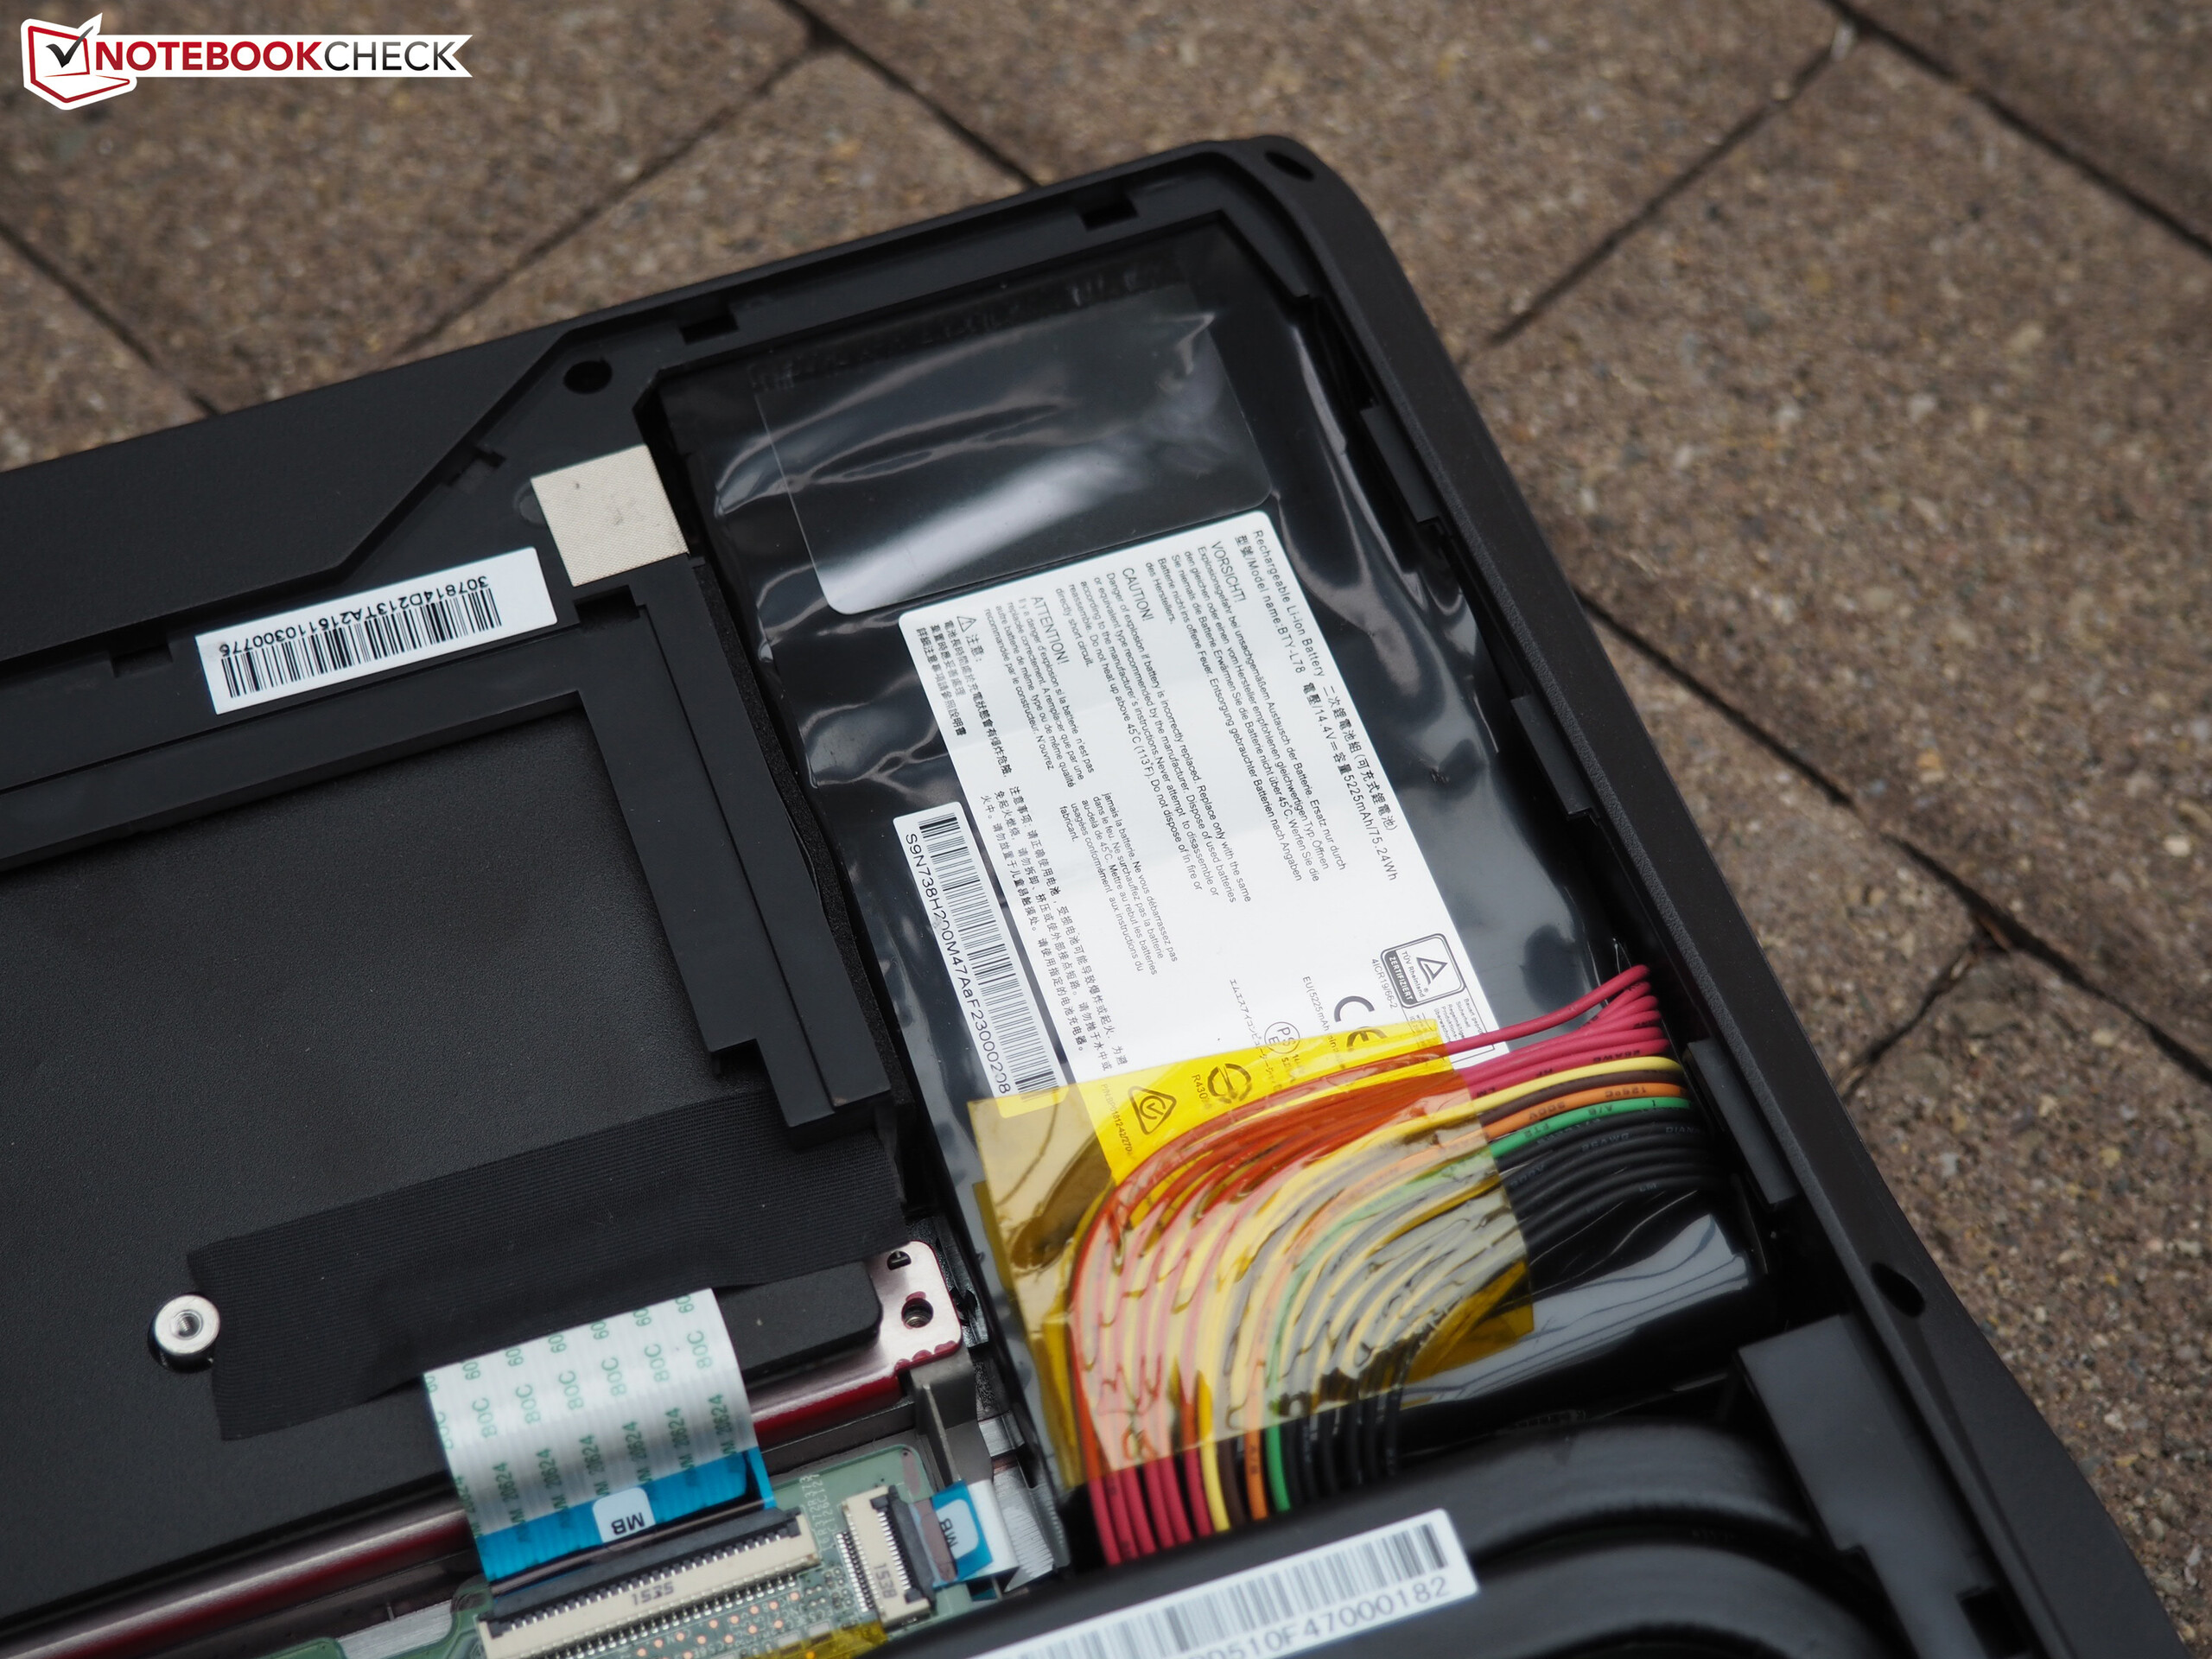
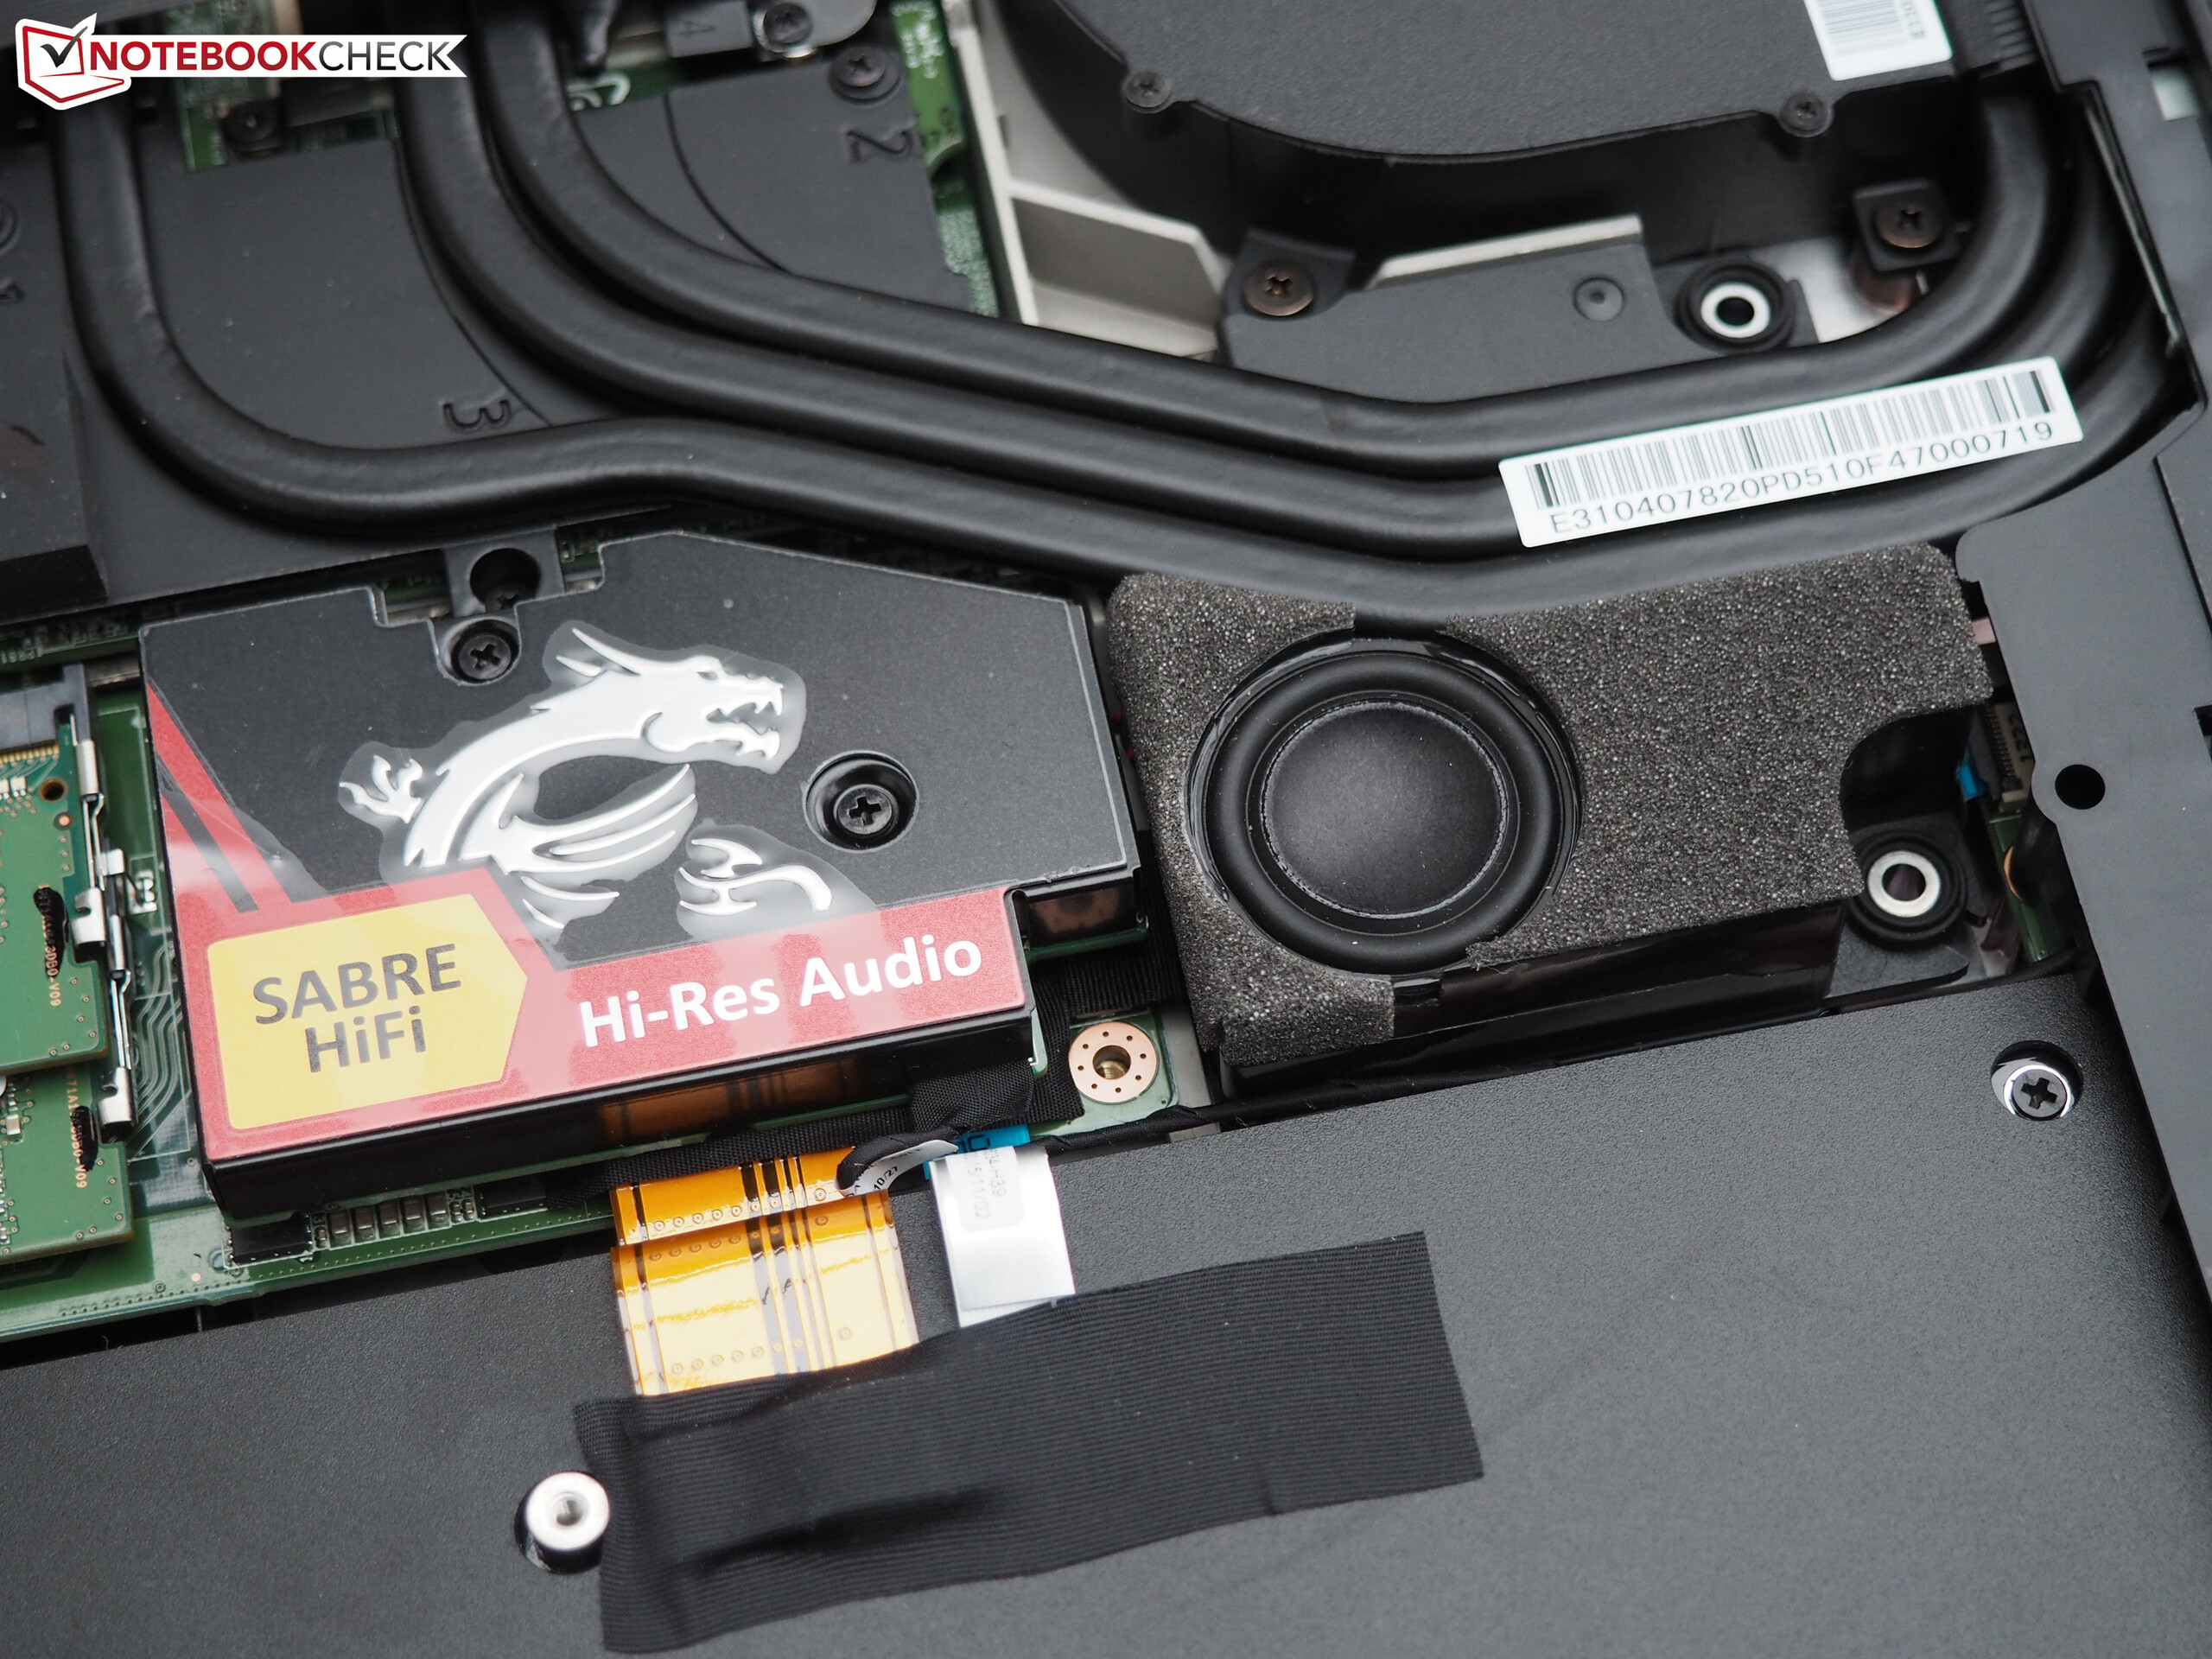
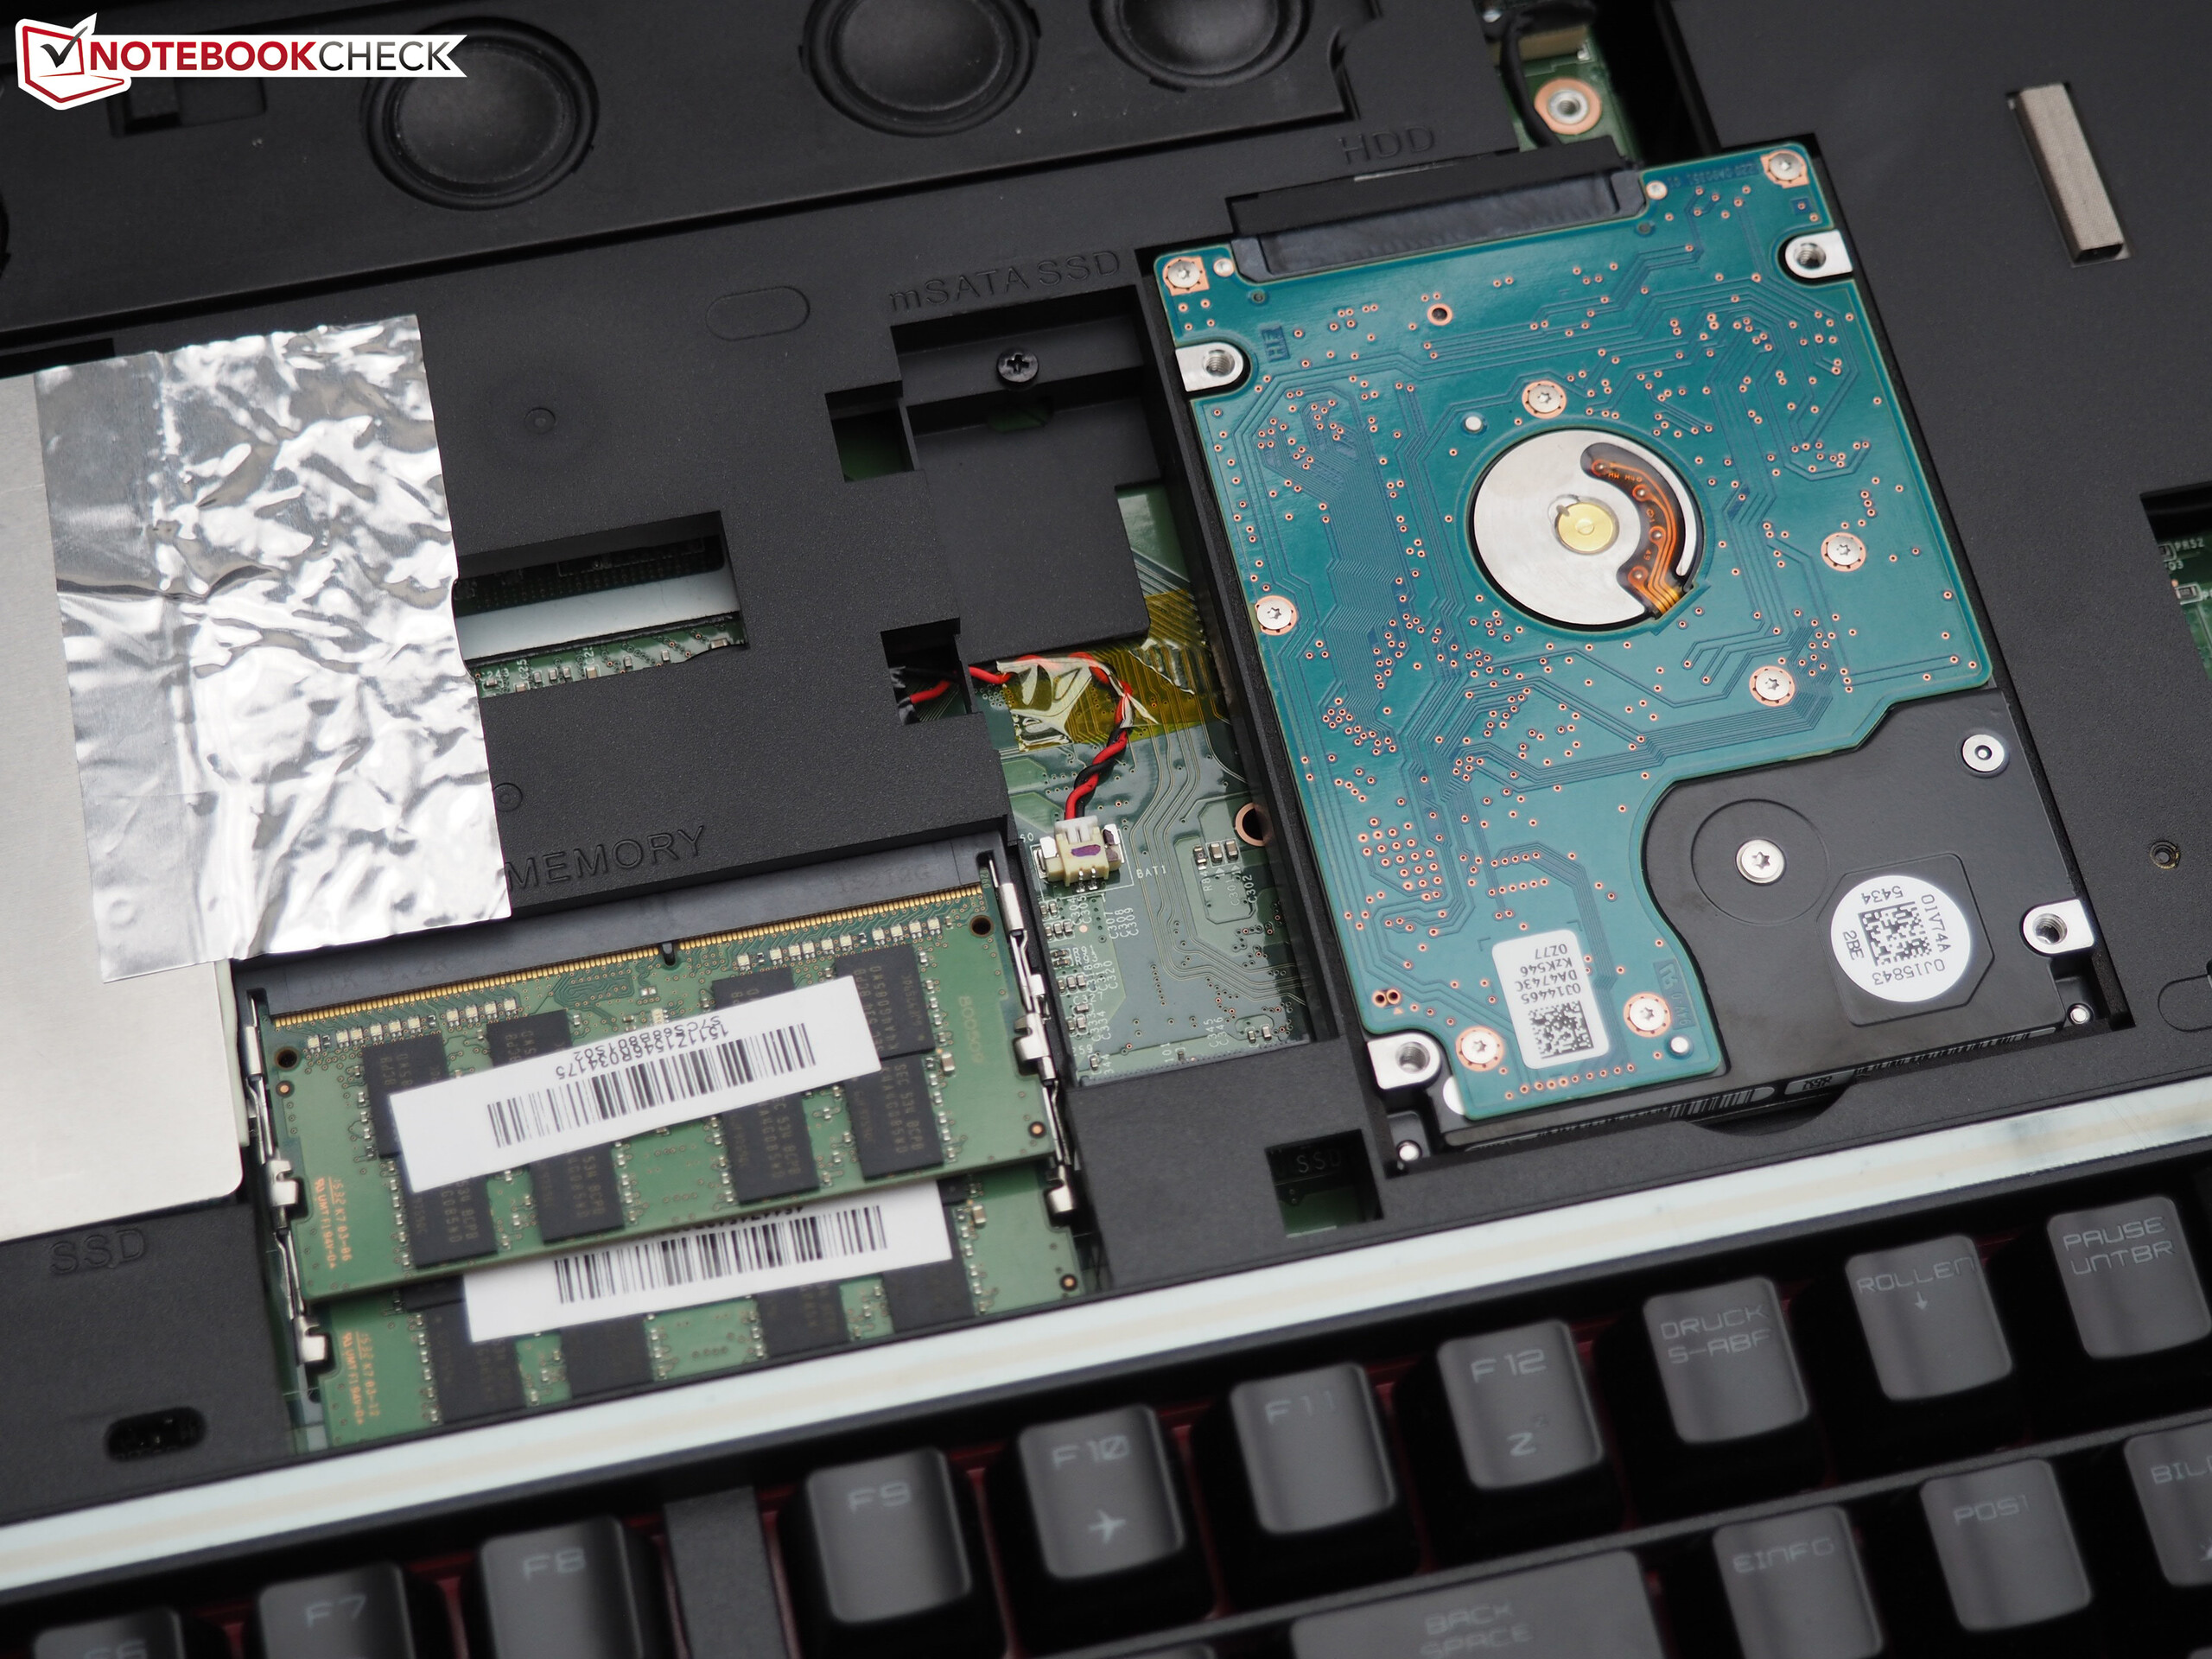
MSI is particularly proud about the sound quality of the GT80S. Thanks to a new Hi-Fi output and the huge audio chip (ESS Sabre Hi-Res Audio), external sound systems and headphones are supposed to get a perfect sound signal. The storage device has also been updated. Instead of four SATA-III SSDs, the new model gets only two solid-state drives. This may look like a downgrade, but we think it makes sense. MSI now uses M.2 SSDs based on the PCIe and NVMe technology, respectively, which are not limited by the SATA-III interface (500 to 550 MB/s) anymore and can manage much higher transfer rates in a RAID array.
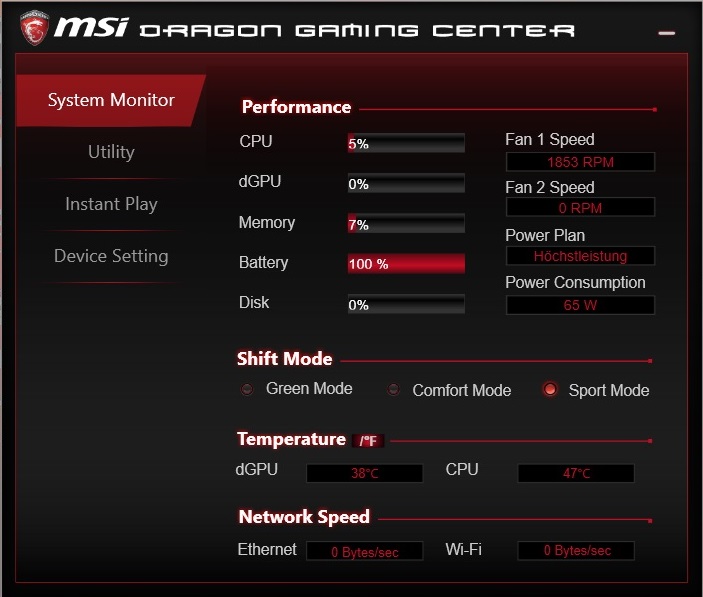
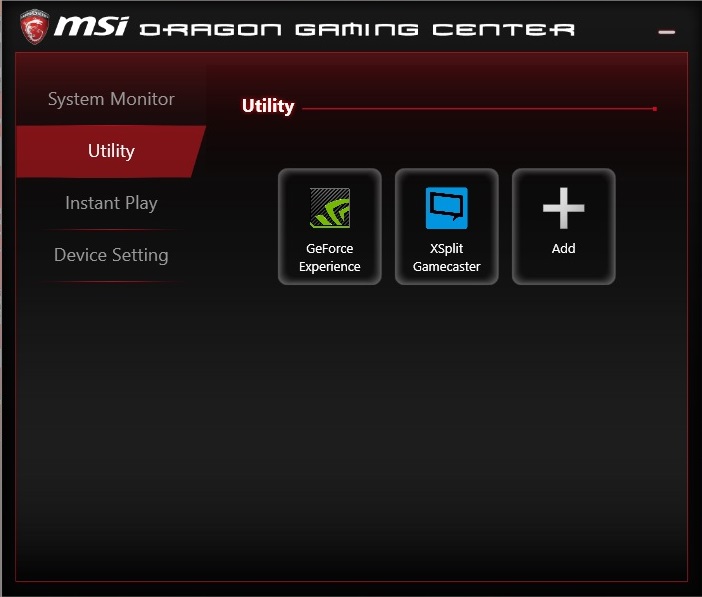
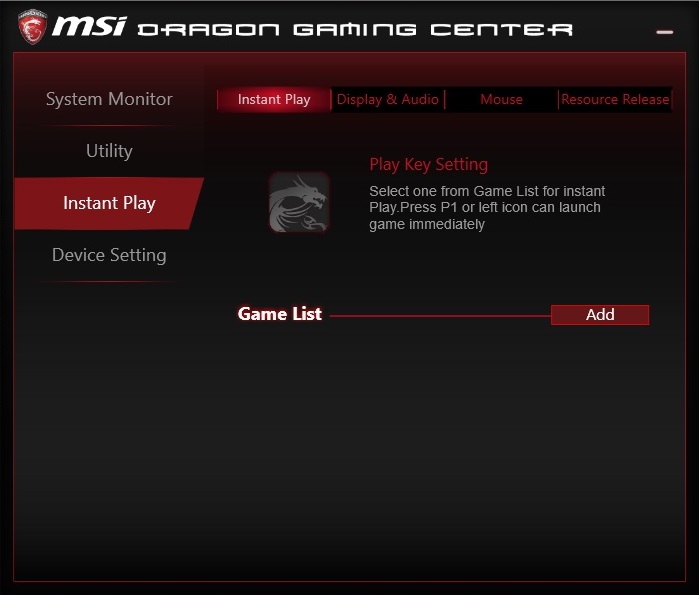
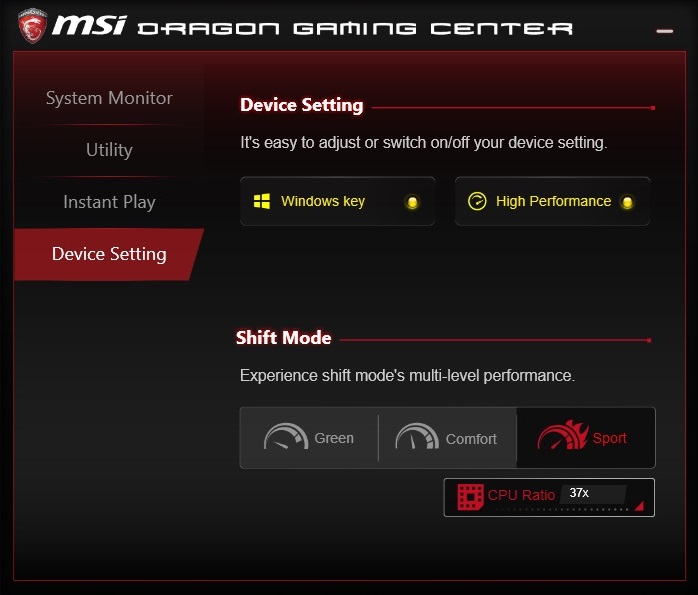
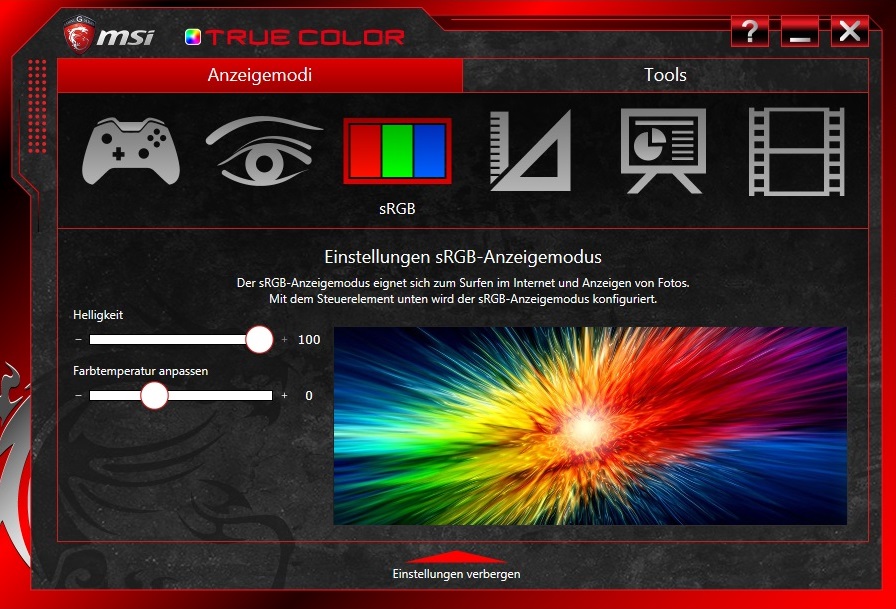
The software has improved as well: The True-Color technology optimizes the color reproduction of the display. MSI has also implemented new functions for the Dragon Gaming Center. If you select the Shift mode "Sport", you can increase the CPU multiplier from 37x to 41x (3.7 vs. 4.1 GHz). The benchmarks and all the other 3D tests (system noise, power consumption) were performed in the Sport mode with full overclocking and activated SLI. However, the Cooler Boost feature, which increases the fan speed in favor of the temperatures, has been deactivated.
More information about the sections Case, Connectivity and Input Devices is available in the review of the GT80 2QE.
Display
As expected, the GT80S is equipped with the same FHD panel as its predecessors. The Samsung 184HL does not have to hide behind the 17-inch competition with a contrast ratio of around 850:1 and a black value of 0.35 cd/m².
| |||||||||||||||||||||||||
Brightness Distribution: 78 %
Center on Battery: 298 cd/m²
Contrast: 851:1 (Black: 0.35 cd/m²)
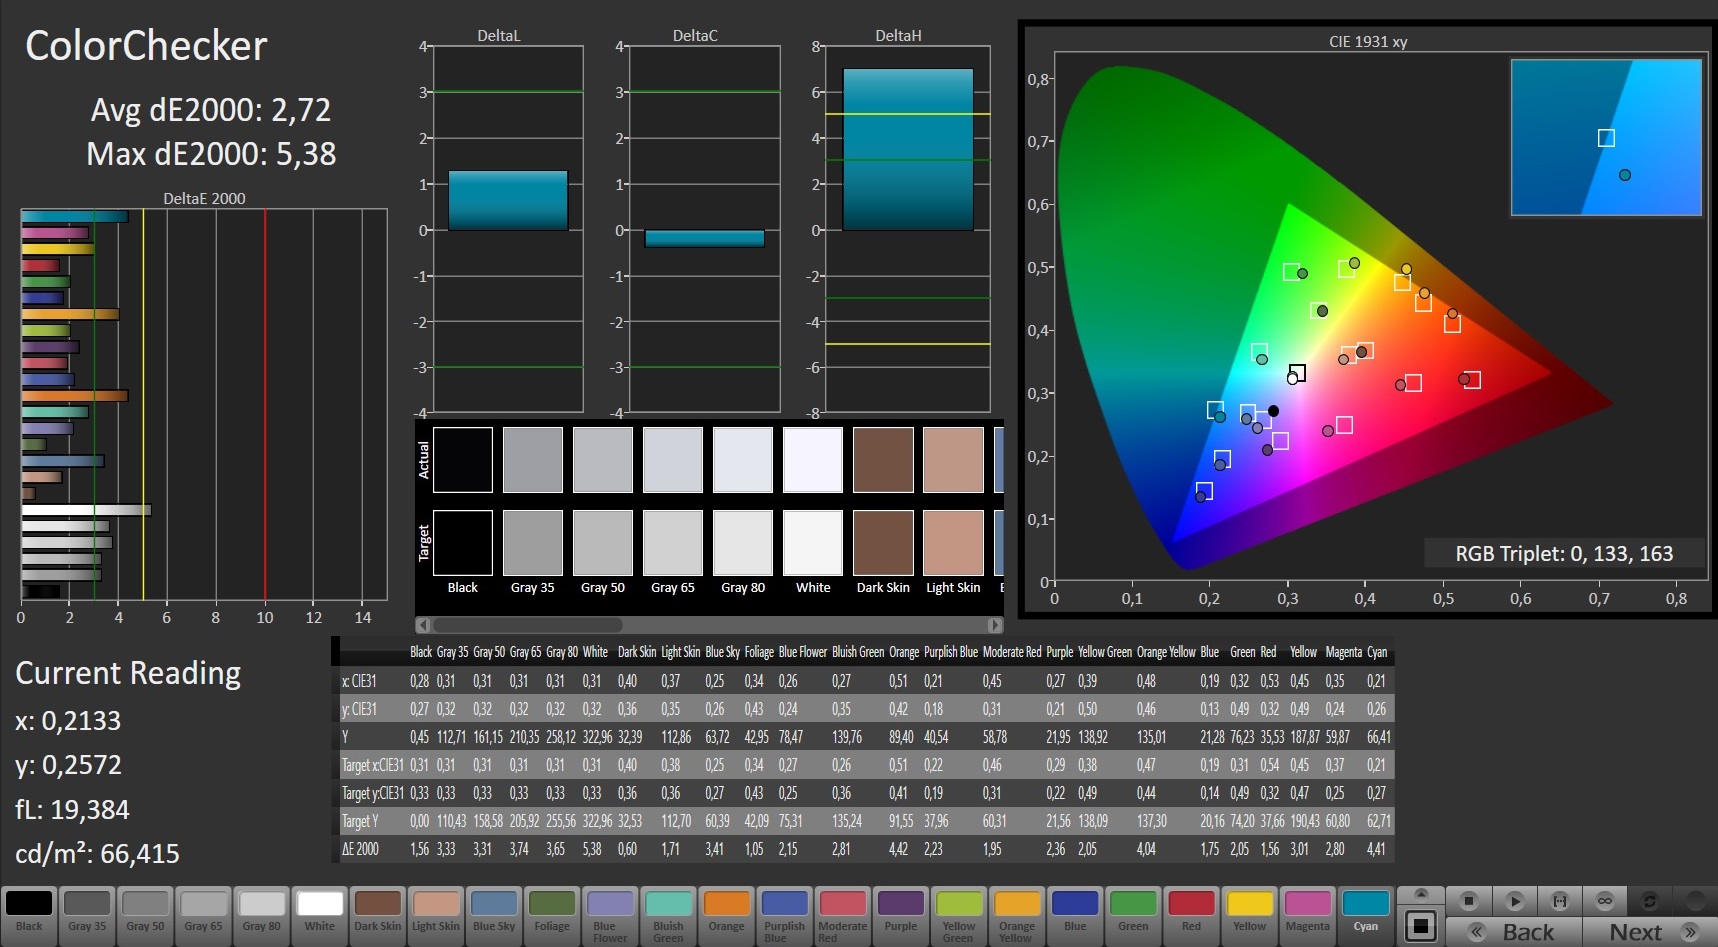
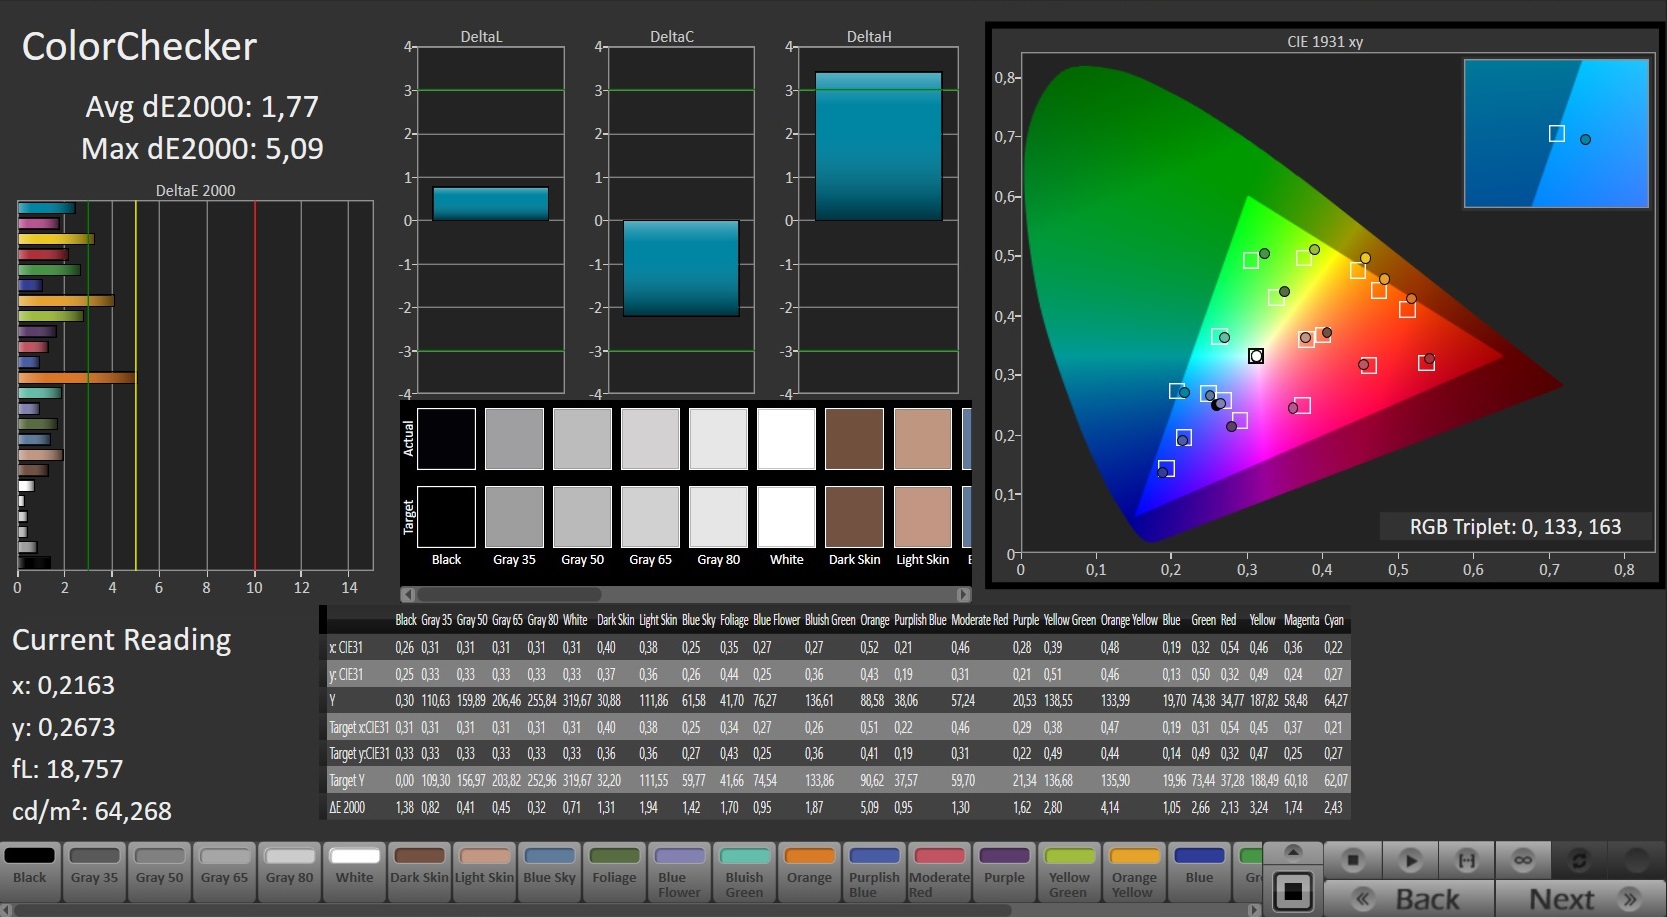
ΔE ColorChecker Calman: 2.72 | ∀{0.5-29.43 Ø4.72}
ΔE Greyscale Calman: 3 | ∀{0.09-98 Ø4.97}
89% sRGB (Argyll 1.6.3 3D)
58% AdobeRGB 1998 (Argyll 1.6.3 3D)
65.2% AdobeRGB 1998 (Argyll 3D)
89.2% sRGB (Argyll 3D)
65.5% Display P3 (Argyll 3D)
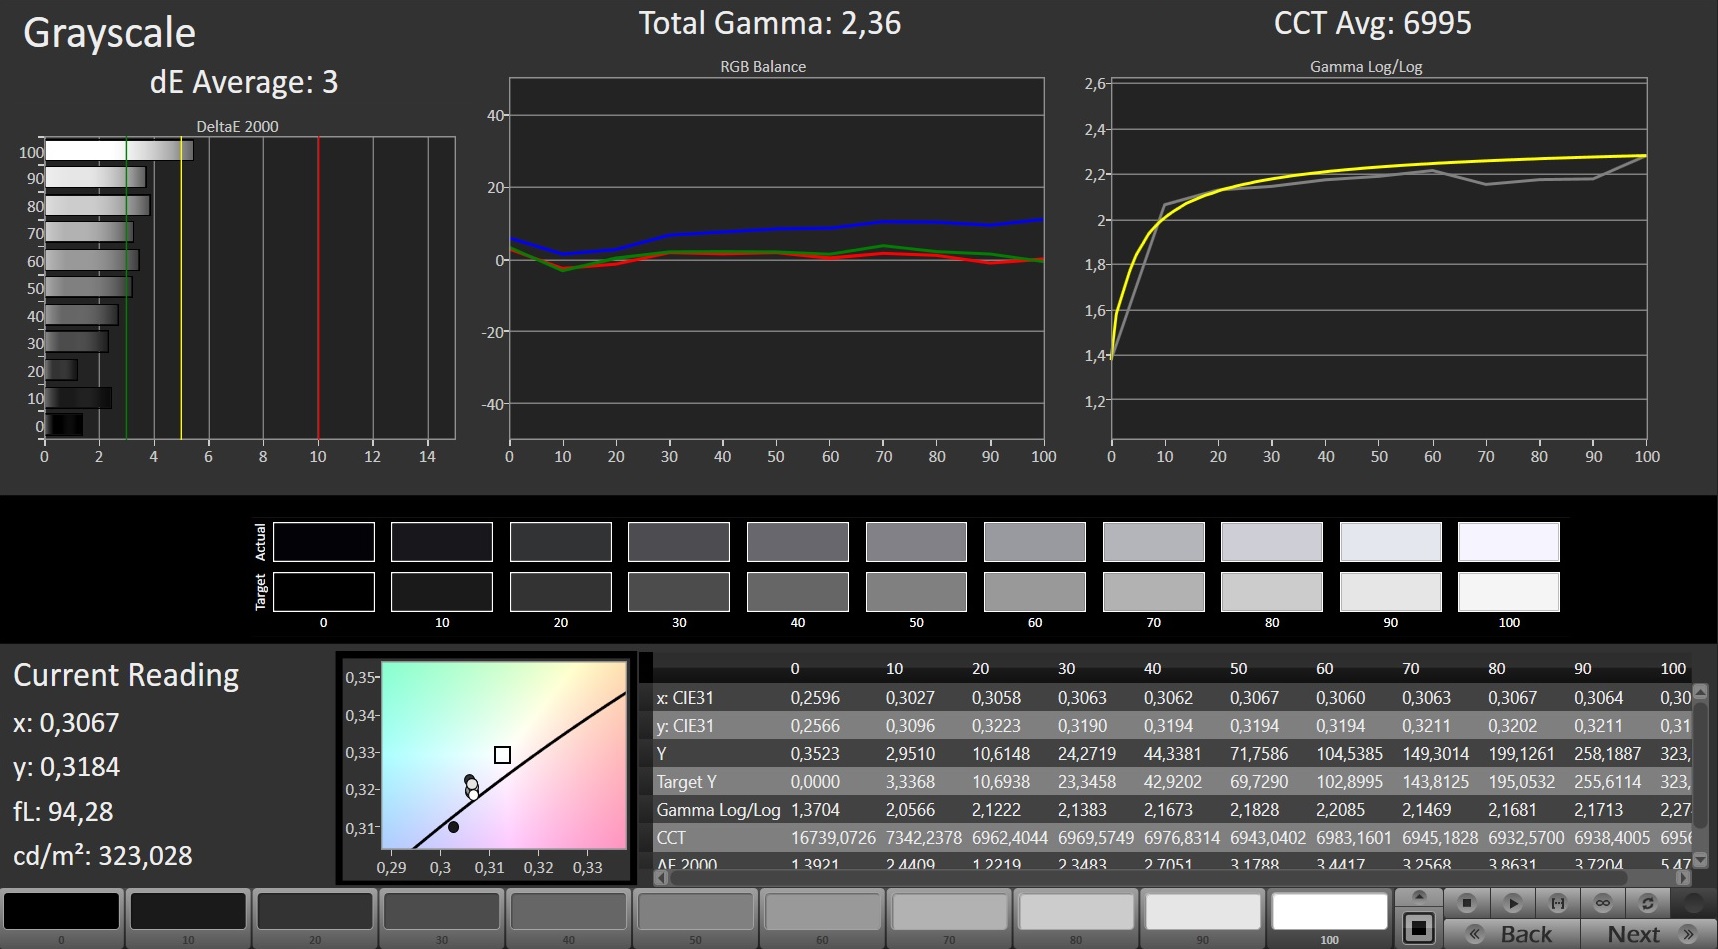
Gamma: 2.36
CCT: 6995 K
| MSI GT80S 6QF Samsung 184HL (SDC4C48), 1920x1080 | MSI GT80-2QES32SR311BW XJY7J_184HL (SDC4C48), 1920x1080 | MSI GT72S 6QF Name: LG Philips LP173WF4-SPF1, ID: LGD0469, 1920x1080 | Asus GX700 LP173WF4-SPF3 (LGD04E8), 1920x1080 | Schenker XMG U726 AU B173ZAN01.0 (AUO109B), 3840x2160 | Schenker XMG U716 AU B173ZAN01.0 (AUO109B), 3840x2160 | |
|---|---|---|---|---|---|---|
| Display | -7% | -1% | -3% | 32% | 32% | |
| Display P3 Coverage (%) | 65.5 | 60.7 -7% | 67.6 3% | 66.7 2% | 87 33% | 86.5 32% |
| sRGB Coverage (%) | 89.2 | 82.8 -7% | 86.1 -3% | 84.9 -5% | 100 12% | 100 12% |
| AdobeRGB 1998 Coverage (%) | 65.2 | 60.6 -7% | 63 -3% | 62.1 -5% | 98.9 52% | 99 52% |
| Response Times | -34% | -8% | -35% | |||
| Response Time Grey 50% / Grey 80% * (ms) | 35 ? | 43 ? -23% | 37 ? -6% | 45 ? -29% | ||
| Response Time Black / White * (ms) | 20 ? | 29 ? -45% | 22 ? -10% | 28 ? -40% | ||
| PWM Frequency (Hz) | 250 ? | |||||
| Screen | -20% | 9% | -17% | 7% | -3% | |
| Brightness middle (cd/m²) | 298 | 341 14% | 356.7 20% | 332 11% | 330 11% | 374 26% |
| Brightness (cd/m²) | 265 | 305 15% | 326 23% | 319 20% | 327 23% | 356 34% |
| Brightness Distribution (%) | 78 | 77 -1% | 85 9% | 93 19% | 86 10% | 88 13% |
| Black Level * (cd/m²) | 0.35 | 0.34 3% | 0.282 19% | 0.34 3% | 0.38 -9% | 0.4 -14% |
| Contrast (:1) | 851 | 1003 18% | 1265 49% | 976 15% | 868 2% | 935 10% |
| Colorchecker dE 2000 * | 2.72 | 5.15 -89% | 4.16 -53% | 5.35 -97% | 3 -10% | 4.23 -56% |
| Colorchecker dE 2000 max. * | 5.4 | 5.3 2% | 6.7 -24% | |||
| Greyscale dE 2000 * | 3 | 6.34 -111% | 2.47 18% | 6.45 -115% | 3.81 -27% | 5.48 -83% |
| Gamma | 2.36 93% | 2.35 94% | 2.29 96% | 2.34 94% | 2.52 87% | 2.35 94% |
| CCT | 6995 93% | 6895 94% | 6860 95% | 7048 92% | 6306 103% | 6686 97% |
| Color Space (Percent of AdobeRGB 1998) (%) | 58 | 53 -9% | 56 -3% | 56 -3% | 88 52% | 88 52% |
| Color Space (Percent of sRGB) (%) | 89 | 85 -4% | 85 -4% | 100 12% | 100 12% | |
| Total Average (Program / Settings) | -14% /
-16% | -9% /
1% | -9% /
-13% | 20% /
13% | -2% /
-0% |
* ... smaller is better
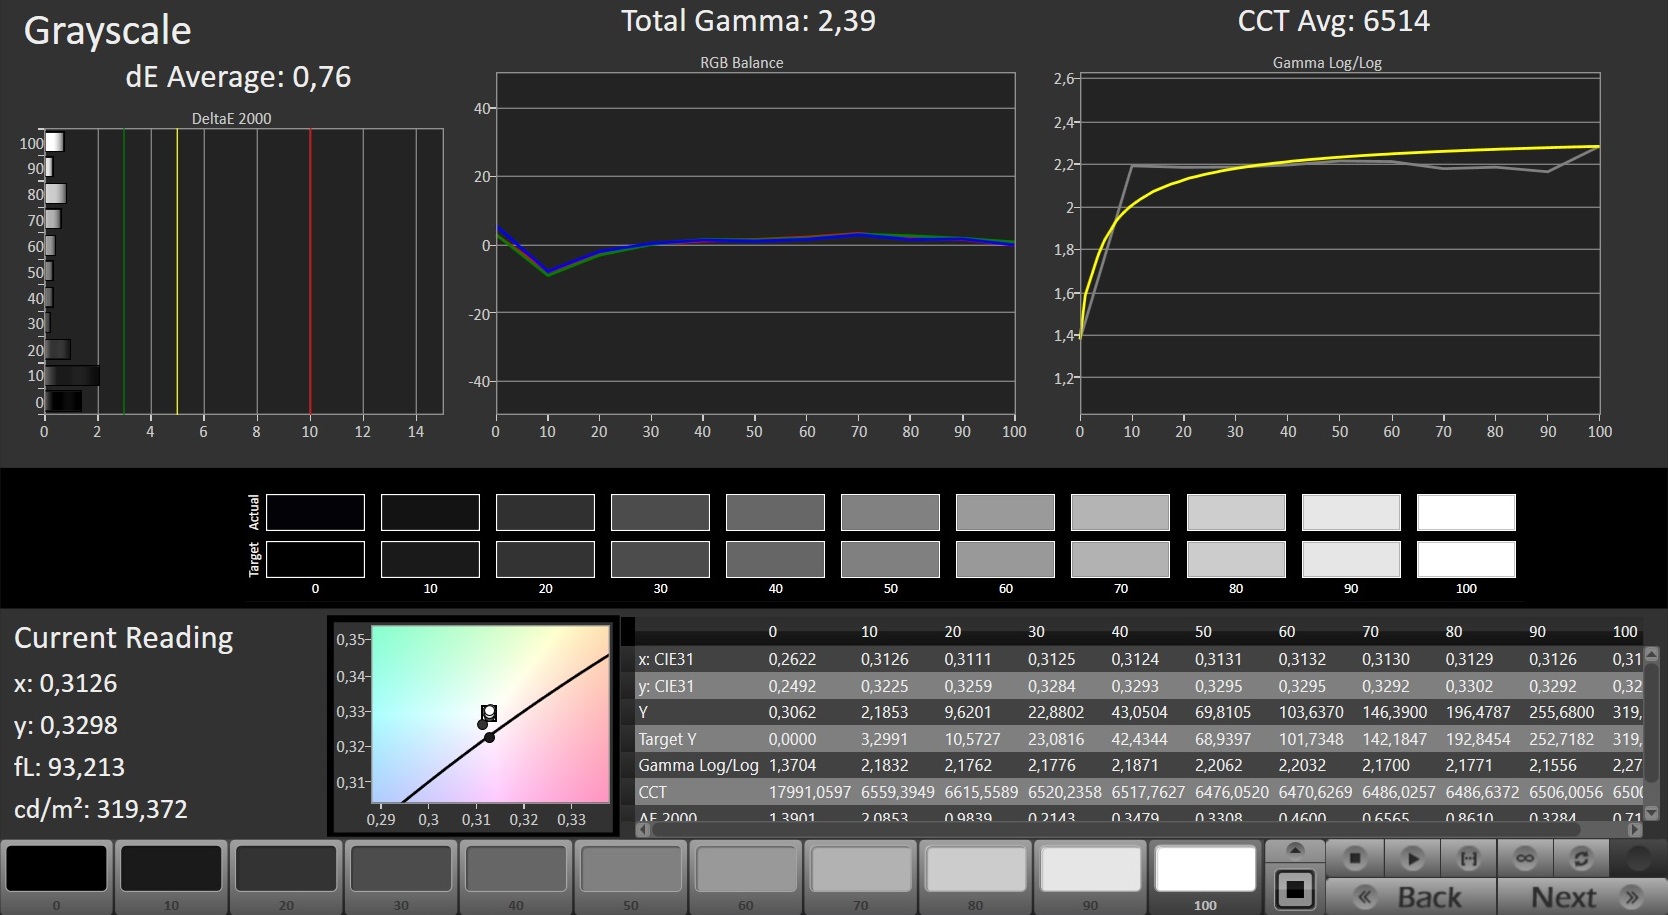
If anyone asks why the luminance is lower compared to the GT80 2QD or 2QE, respectively: The adjustments to the True Color software result in a significantly lower brightness, but the new device impresses with much more accurate colors. Neither the DeltaE2000 value for the grayscale (3 vs. 6.34) or the colors (2.72 vs. 5.15) no longer give cause for criticism.
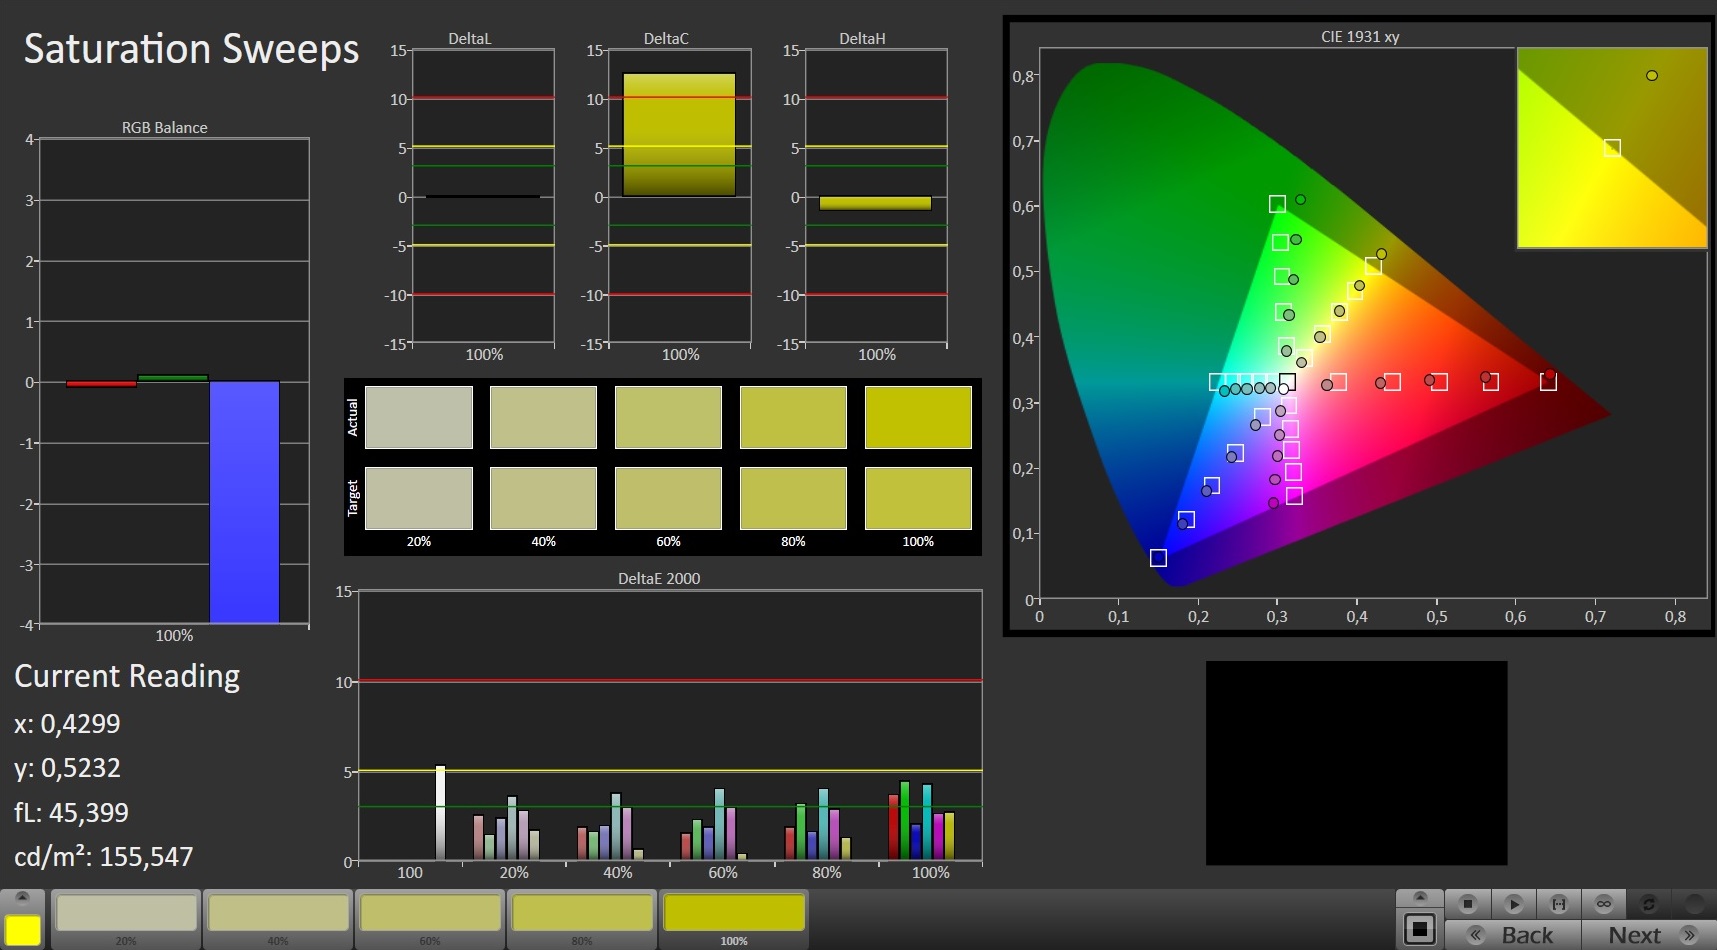
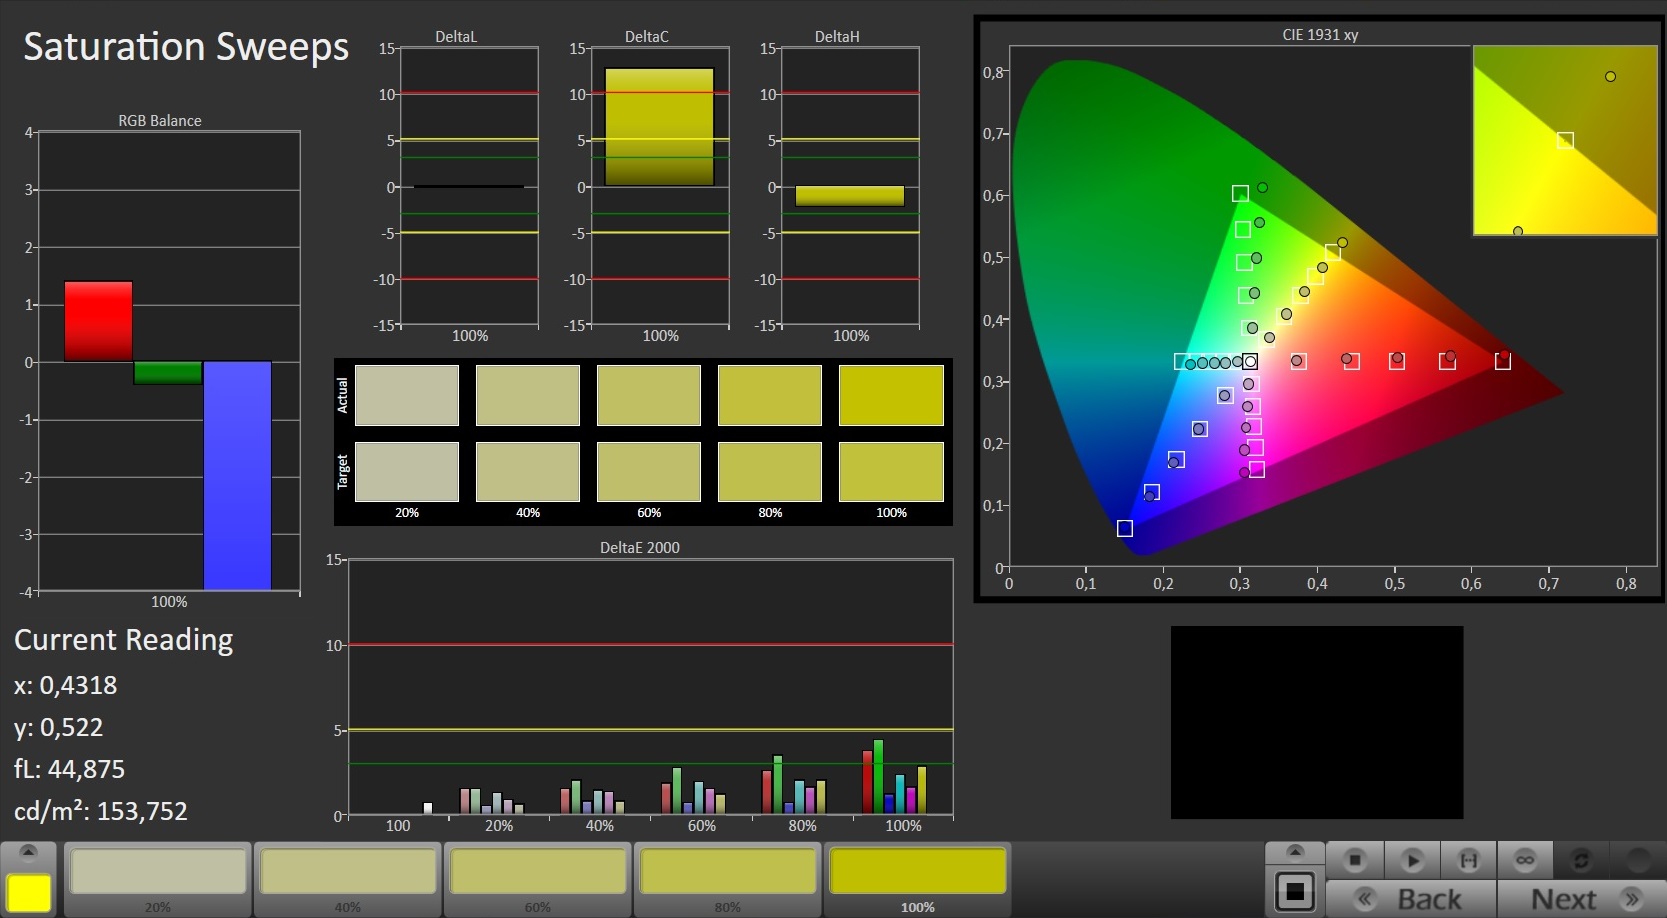

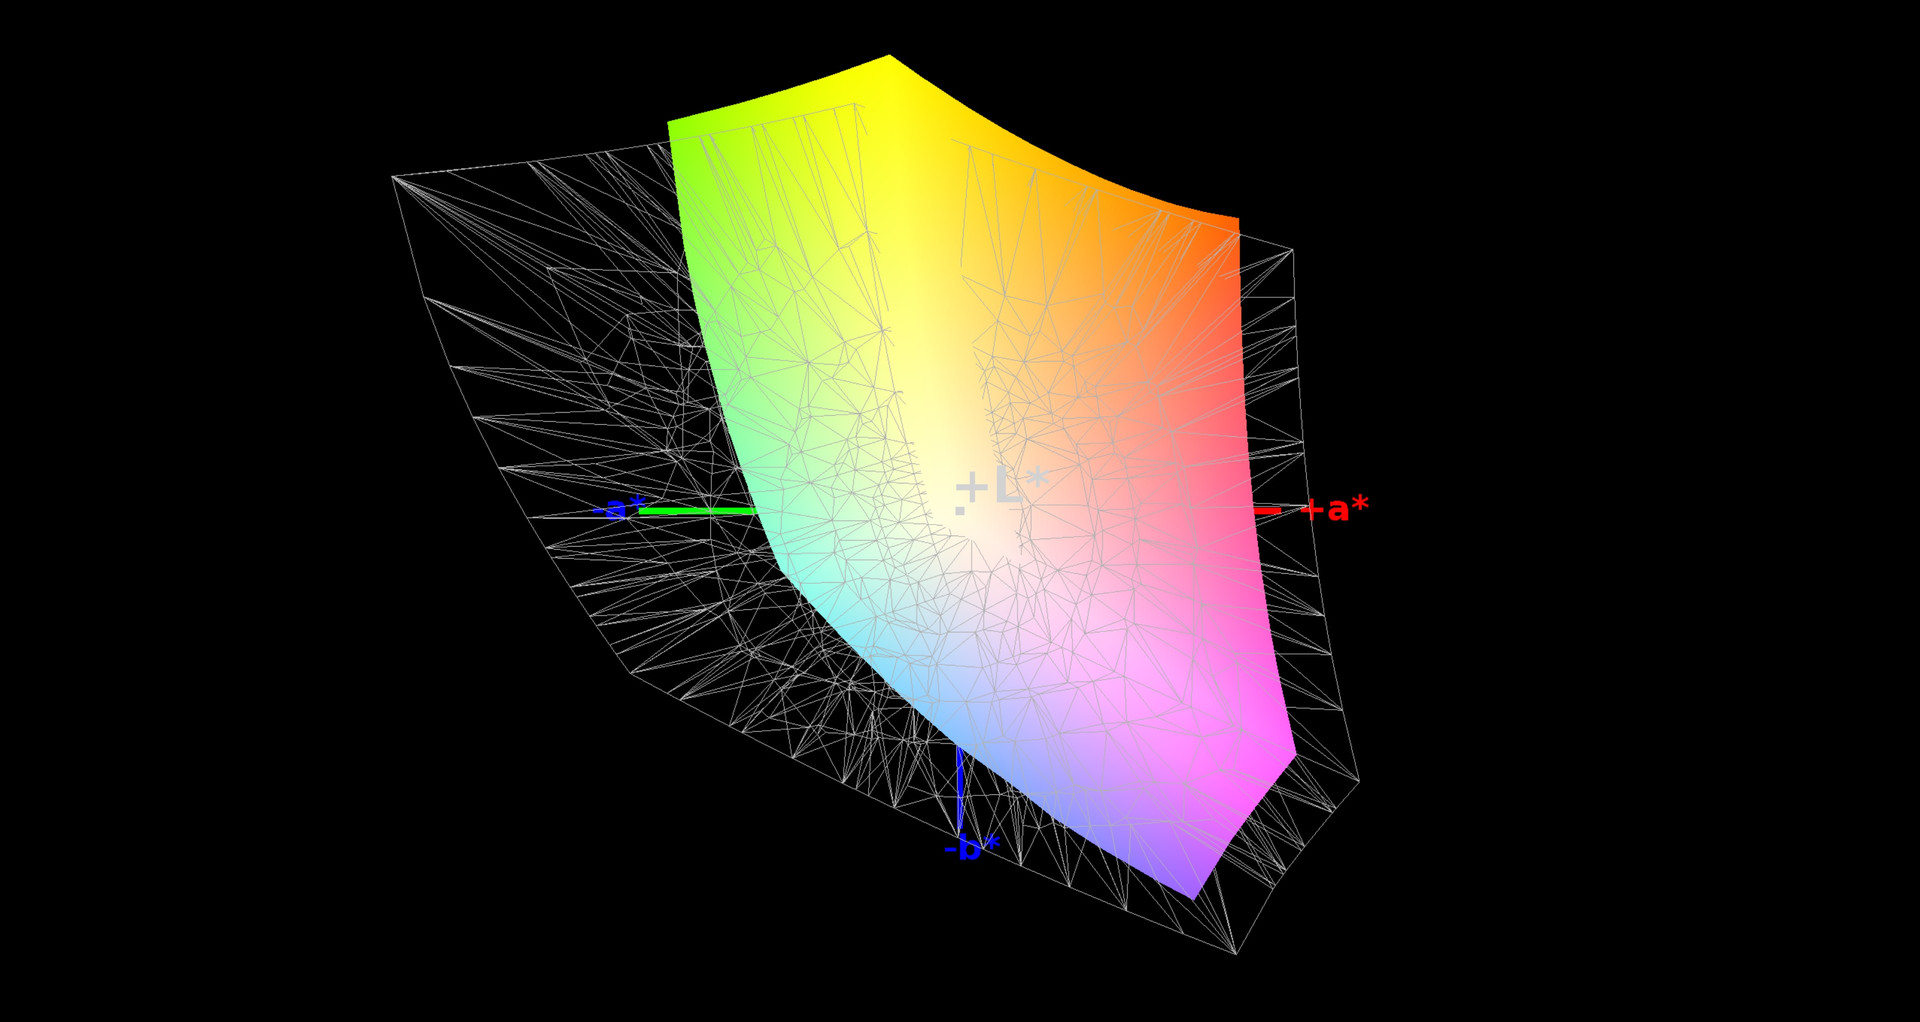
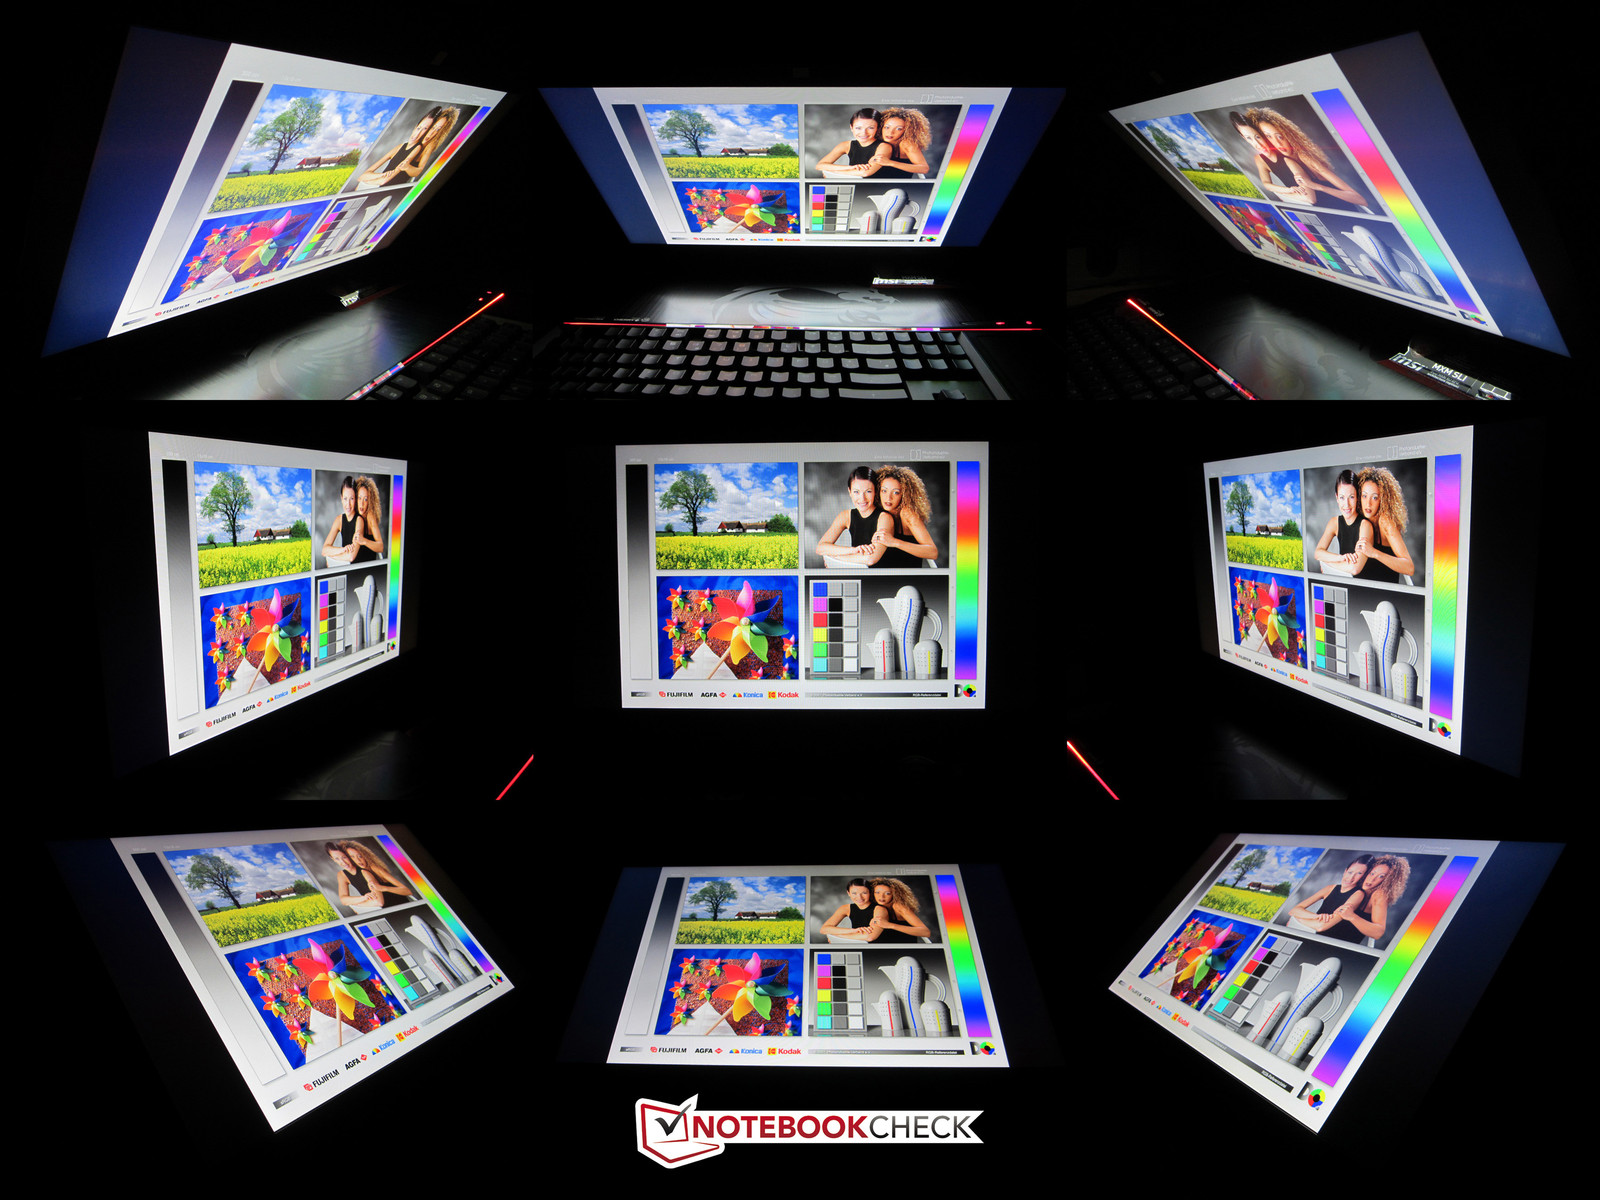
Viewing angles and brightness distribution have not changed compared to the previous generation. The picture looks very homogenous and still quite natural even from wider angles. The color space coverage is also decent for a high-end notebook. 89% sRGB and 58% AdobeRGB ensure an accurate presentation for games.
The Samsung 184HL performs better than most IPS panels in terms of reaction times. 20 ms (black-white) and 35 ms (gray-to-gray) might be high on paper, but we could not determine tearing in our tests. Panel flickering at a reduced brightness level (0 to 80%) is a drawback. This is probably caused by PWM and might scare off sensitive users.
Display Response Times
| ↔ Response Time Black to White | ||
|---|---|---|
| 20 ms ... rise ↗ and fall ↘ combined | ↗ 5 ms rise | 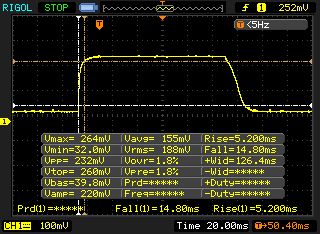 |
| ↘ 15 ms fall | ||
| The screen shows good response rates in our tests, but may be too slow for competitive gamers. In comparison, all tested devices range from 0.1 (minimum) to 240 (maximum) ms. » 44 % of all devices are better. This means that the measured response time is similar to the average of all tested devices (19.8 ms). | ||
| ↔ Response Time 50% Grey to 80% Grey | ||
| 35 ms ... rise ↗ and fall ↘ combined | ↗ 14 ms rise | 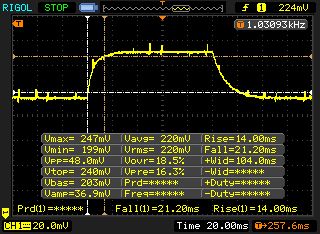 |
| ↘ 21 ms fall | ||
| The screen shows slow response rates in our tests and will be unsatisfactory for gamers. In comparison, all tested devices range from 0.165 (minimum) to 636 (maximum) ms. » 49 % of all devices are better. This means that the measured response time is worse than the average of all tested devices (31 ms). | ||
Screen Flickering / PWM (Pulse-Width Modulation)
| Screen flickering / PWM detected | 250 Hz | ≤ 80 % brightness setting | 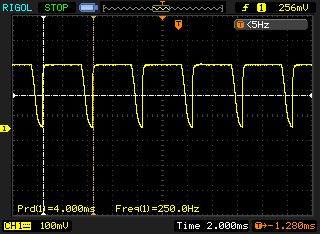 |
The display backlight flickers at 250 Hz (worst case, e.g., utilizing PWM) Flickering detected at a brightness setting of 80 % and below. There should be no flickering or PWM above this brightness setting. The frequency of 250 Hz is relatively low, so sensitive users will likely notice flickering and experience eyestrain at the stated brightness setting and below. In comparison: 52 % of all tested devices do not use PWM to dim the display. If PWM was detected, an average of 7747 (minimum: 5 - maximum: 343500) Hz was measured. | |||
Performance
The MSI GT80 6QD is the perfect device for wealthy gamers that are looking for the maximum performance, but do not want a desktop or mini PC. It does not matter if you look at the memory, hard drive, CPU or GPU performance: The 18-inch system aims to be the fastest device in every category. Our benchmarks will show if this is true.
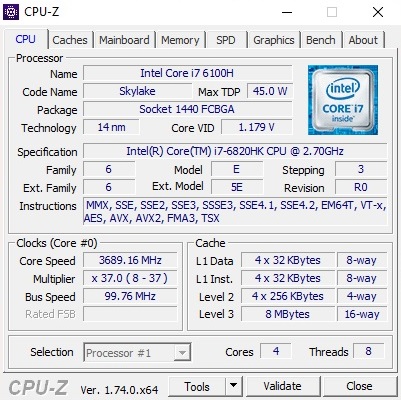

Processor
The processor is a quad-core chip from Intel’s Skylake generation. The Core i7-6820HK of our review unit has a nominal clock of 2.7 GHz, but can reach up to 3.6 GHz via Turbo Boost. MSI even goes a step further and allows overclocking to 4.1 GHz via Sport mode. This means that the GT80S even beats the GX700 from Asus, which reached 4.0 GHz with the water-cooling.

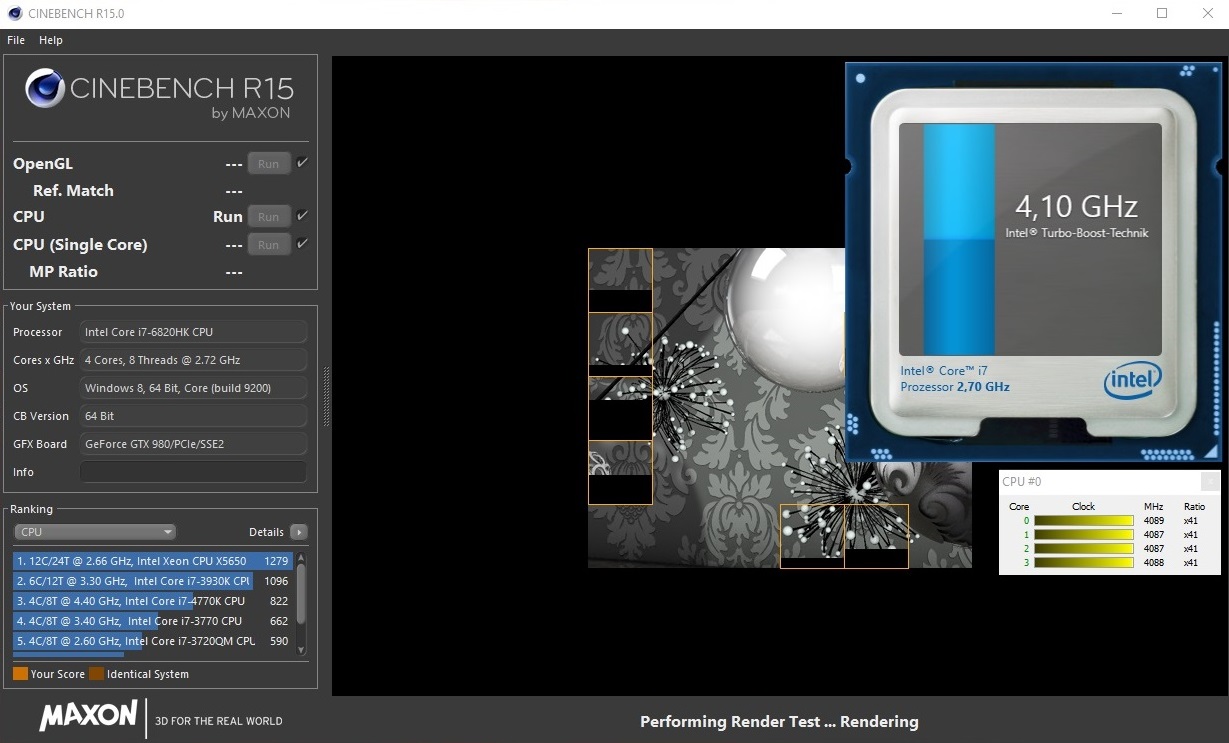
The CPU benchmarks determine an excellent performance for the 18-inch notebook that is on par with desktop systems. 888 points in the Multi-Core test of Cinebench R15 is just as huge as the 174 points in the Single-Core test (875 & 173 @Asus GX 700). A Core i7-6820HK without additional overclocking falls behind by 20%. The MSI GT72S 6QF, for example, managed only 703 and 138 points. The Core i7-4980HQ of the GT80 2QE is also up to 20% slower.
The GTX 980 rivals Schenker XMG U726 and XMG U716, which were equipped with a Core i7-6700, cannot keep up with the GT80S, either (see table). However, subjectively, there is not a big difference – at least in terms of gaming performance.
System Performance
It is not really surprising that the 18-inch notebook manages top results in the system benchmarks. 7386 points in PCMark 7 only result in the second place behind the Asus GX700 (7933 points), but the GT80S can beat all the other rivals.
| PCMark 7 Score | 7386 points | |
Help | ||
Storage Devices
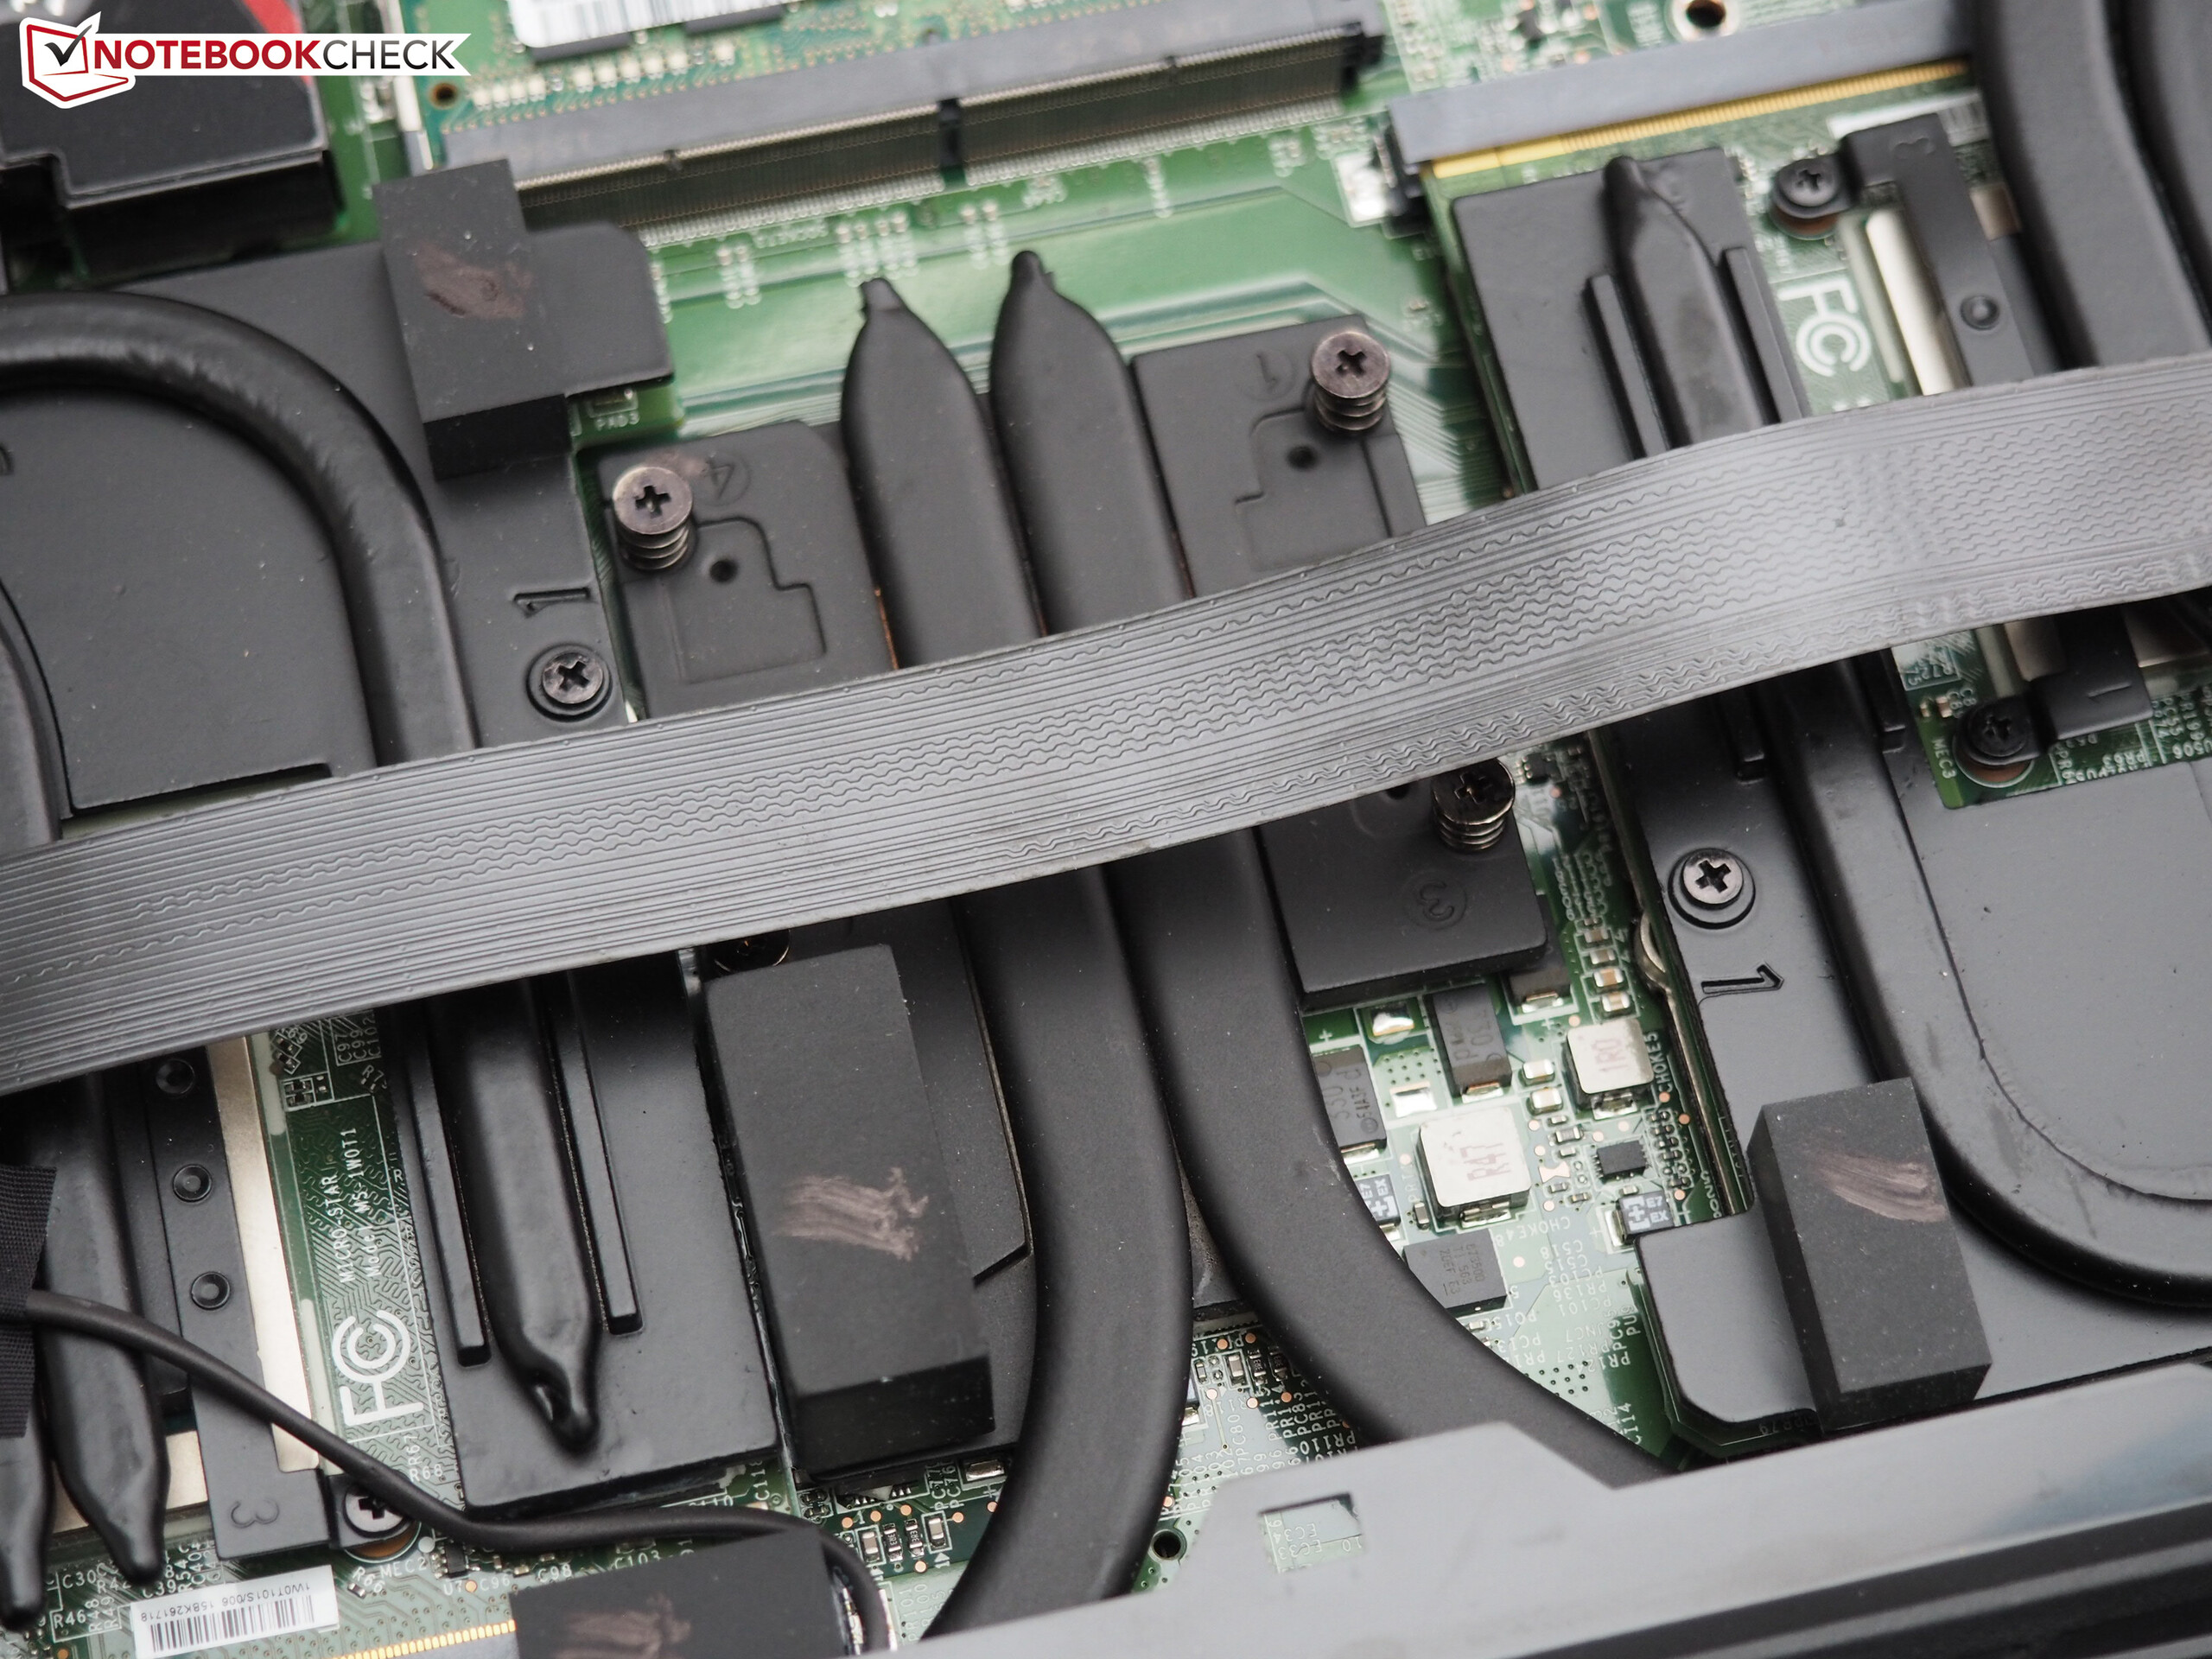
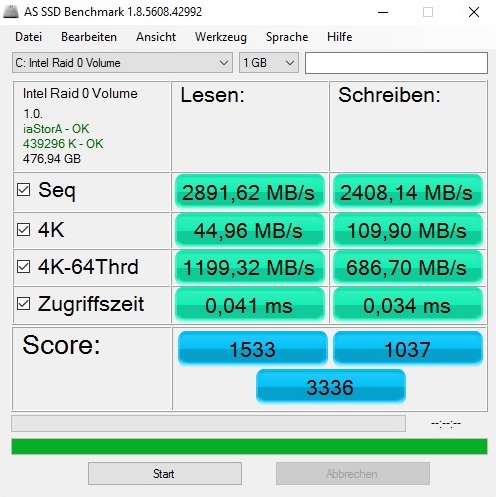
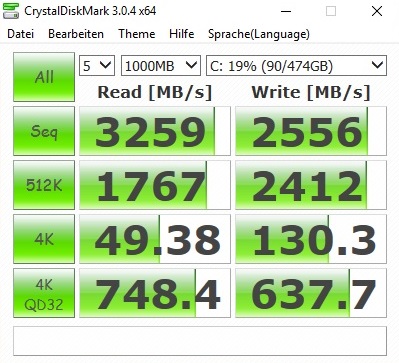
We also want to praise the switch to PCIe and NVMe, respectively. While typical SATA-III SSDs – as mentioned previously – are restricted to around 500 to 550 MB/s, modern solid-state drives can manage sequential speeds of more than 1000 MB/s even without RAID arrays.
MSI is still not satisfied with just one drive and has equipped the GT80S with two M.2 models from Samsung (SM951), which manage up to 2891 MB/s (read) and 2408 MB/s (write) in the AS SSD benchmark. These values are not just excellent, they are among the best we have ever come across. Only the much larger RAID array of the Asus GX700 (total capacity of 1024 instead of 512 GB) is slightly ahead. The SSD interface is not that important for smaller files, so the normal Windows operation does not always benefit from PCIe.
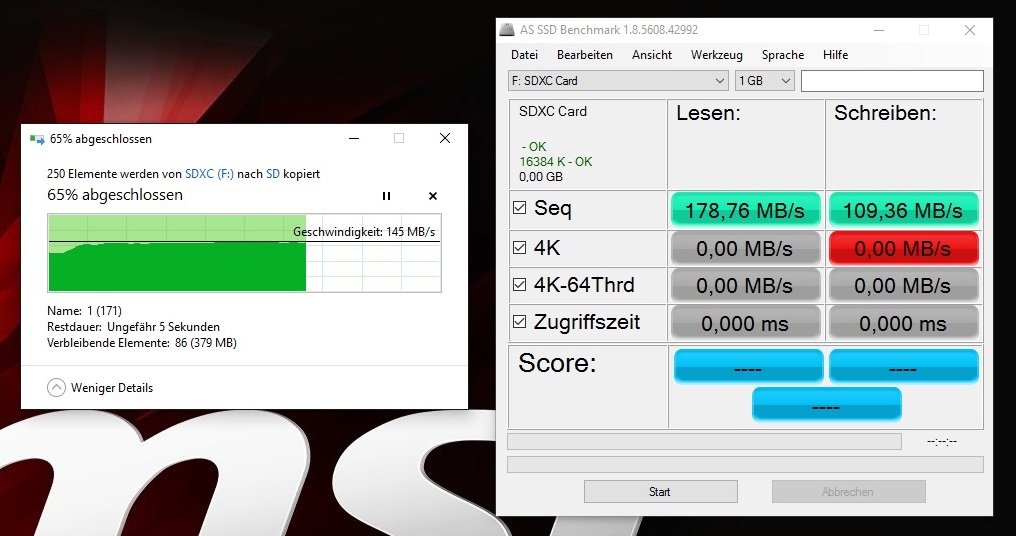
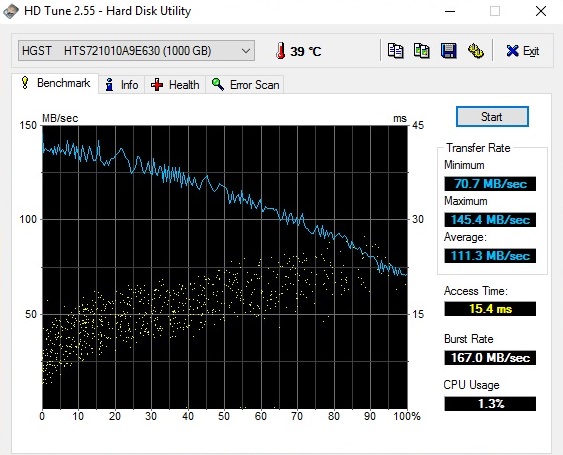
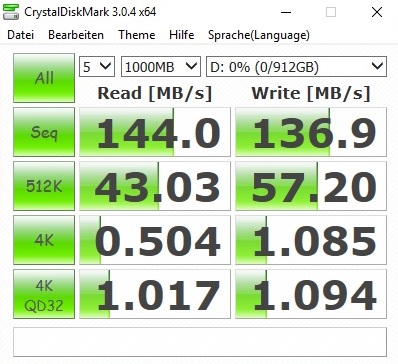
MSI has also integrated a conventional HDD to ensure sufficient storage capacity for the user. The 1000 GB version of the HGST Travelstar 7K1000 manages around 140 MB/s according to the sequential test of CrystalDiskMark – a great result for a 7200 rpm drive.

| MSI GT80S 6QF 2x Samsung SM951 MZVPV256HDGL (RAID 0) | MSI GT80-2QES32SR311BW 4x Toshiba HG6 THNSNJ256G8NU (RAID 0) | MSI GT72S 6QF 2x Micron M600 MTFDDAV128MBF NVMe (RAID 0) | Asus GX700 2x Samsung SM951 MZVPV512HDGL (RAID 0) | Schenker XMG U726 Samsung SM951 MZHPV512HDGL m.2 PCI-e | Schenker XMG U716 Samsung SM951 MZHPV512HDGL m.2 PCI-e | |
|---|---|---|---|---|---|---|
| AS SSD | -46% | -19% | 6% | -26% | -26% | |
| Seq Read (MB/s) | 2892 | 1529 -47% | 2544 -12% | 2964 2% | 1943 -33% | 1942 -33% |
| Seq Write (MB/s) | 2408 | 1142 -53% | 1279 -47% | 2525 5% | 1500 -38% | 1516 -37% |
| 4K Read (MB/s) | 44.96 | 21.09 -53% | 42.98 -4% | 46.43 3% | 40.45 -10% | 40.86 -9% |
| 4K Write (MB/s) | 109.9 | 64.1 -42% | 97.8 -11% | 119.6 9% | 103.6 -6% | 102.8 -6% |
| Score Total (Points) | 3336 | 2109 -37% | 2568 -23% | 3655 10% | 1930 -42% | 1910 -43% |
Graphics Card
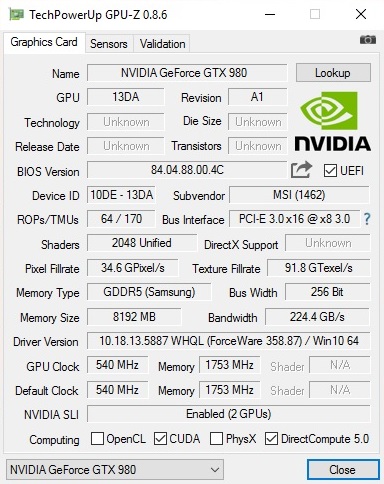
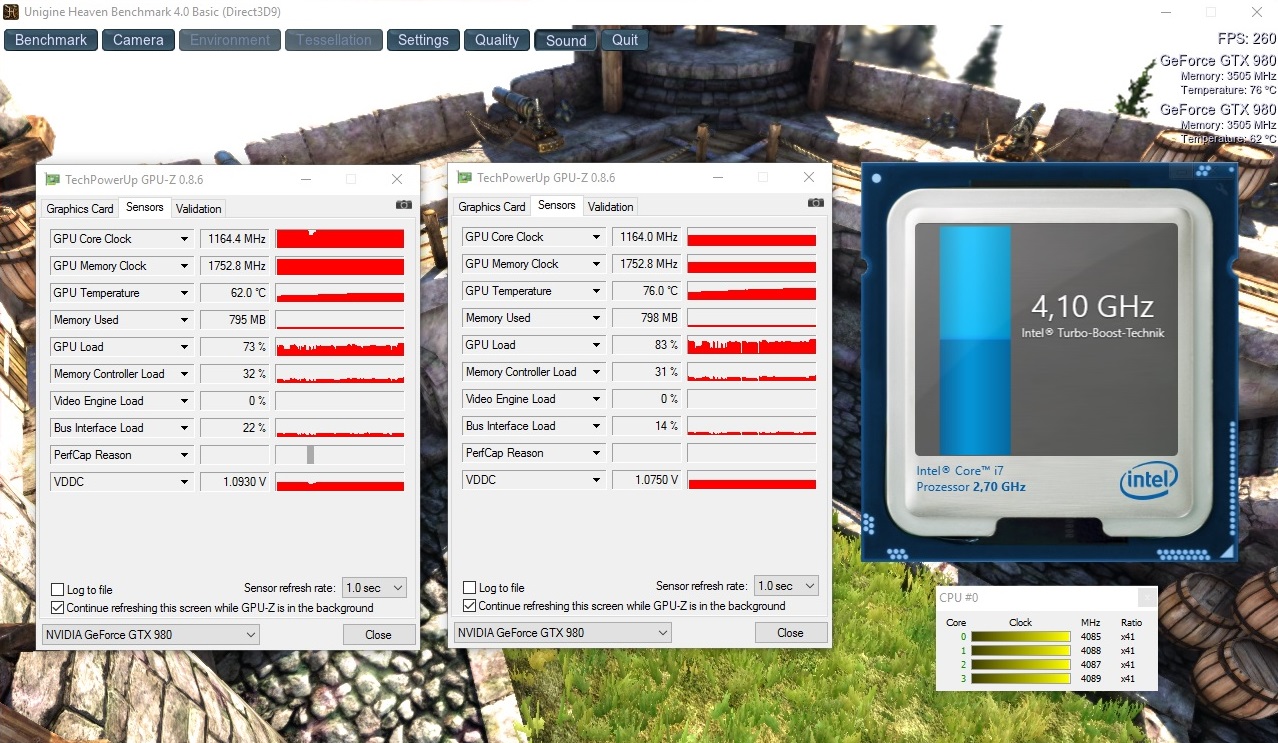
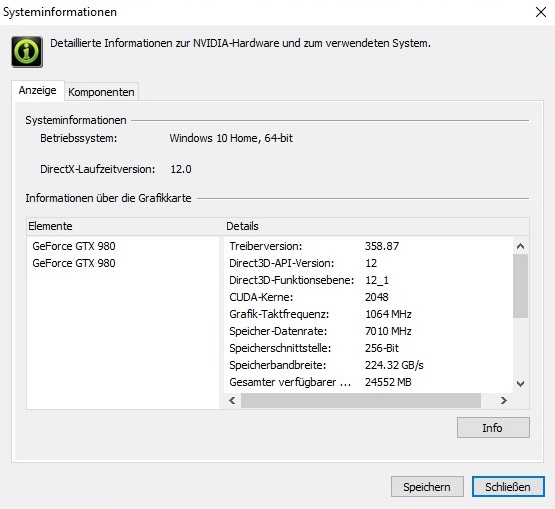
This is not the first time that we have reviewed the GeForce GTX 980, so we will just focus on the most important aspects at this point. 2048 shaders and a memory clock of 3500 MHz surpass the old top model GeForce GTX 980M (1536 shaders, 2500 MHz). Great: Thanks to the MXM technology, the GPUs can be replaced if necessary.
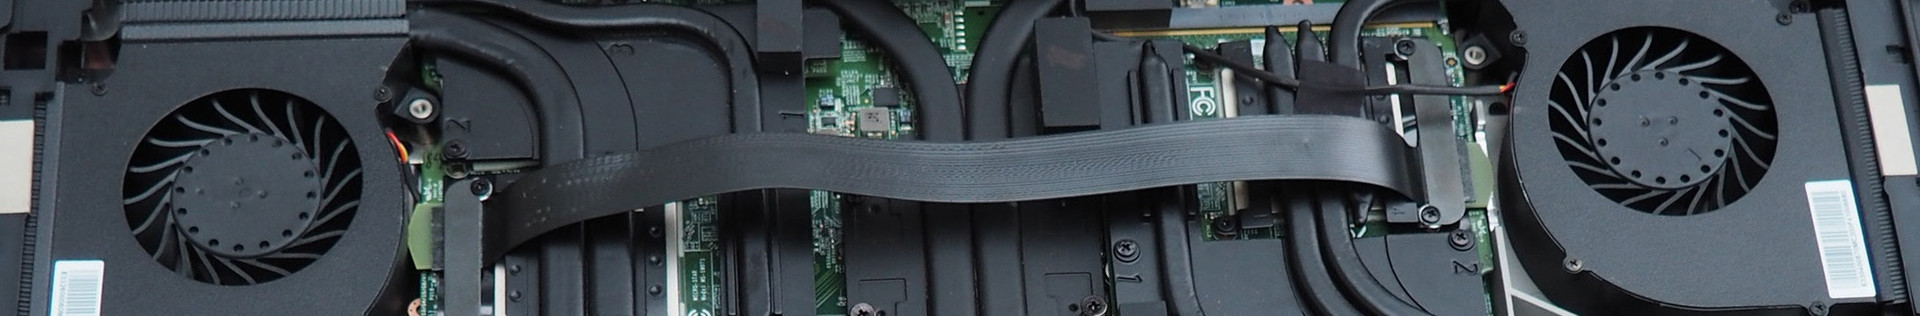
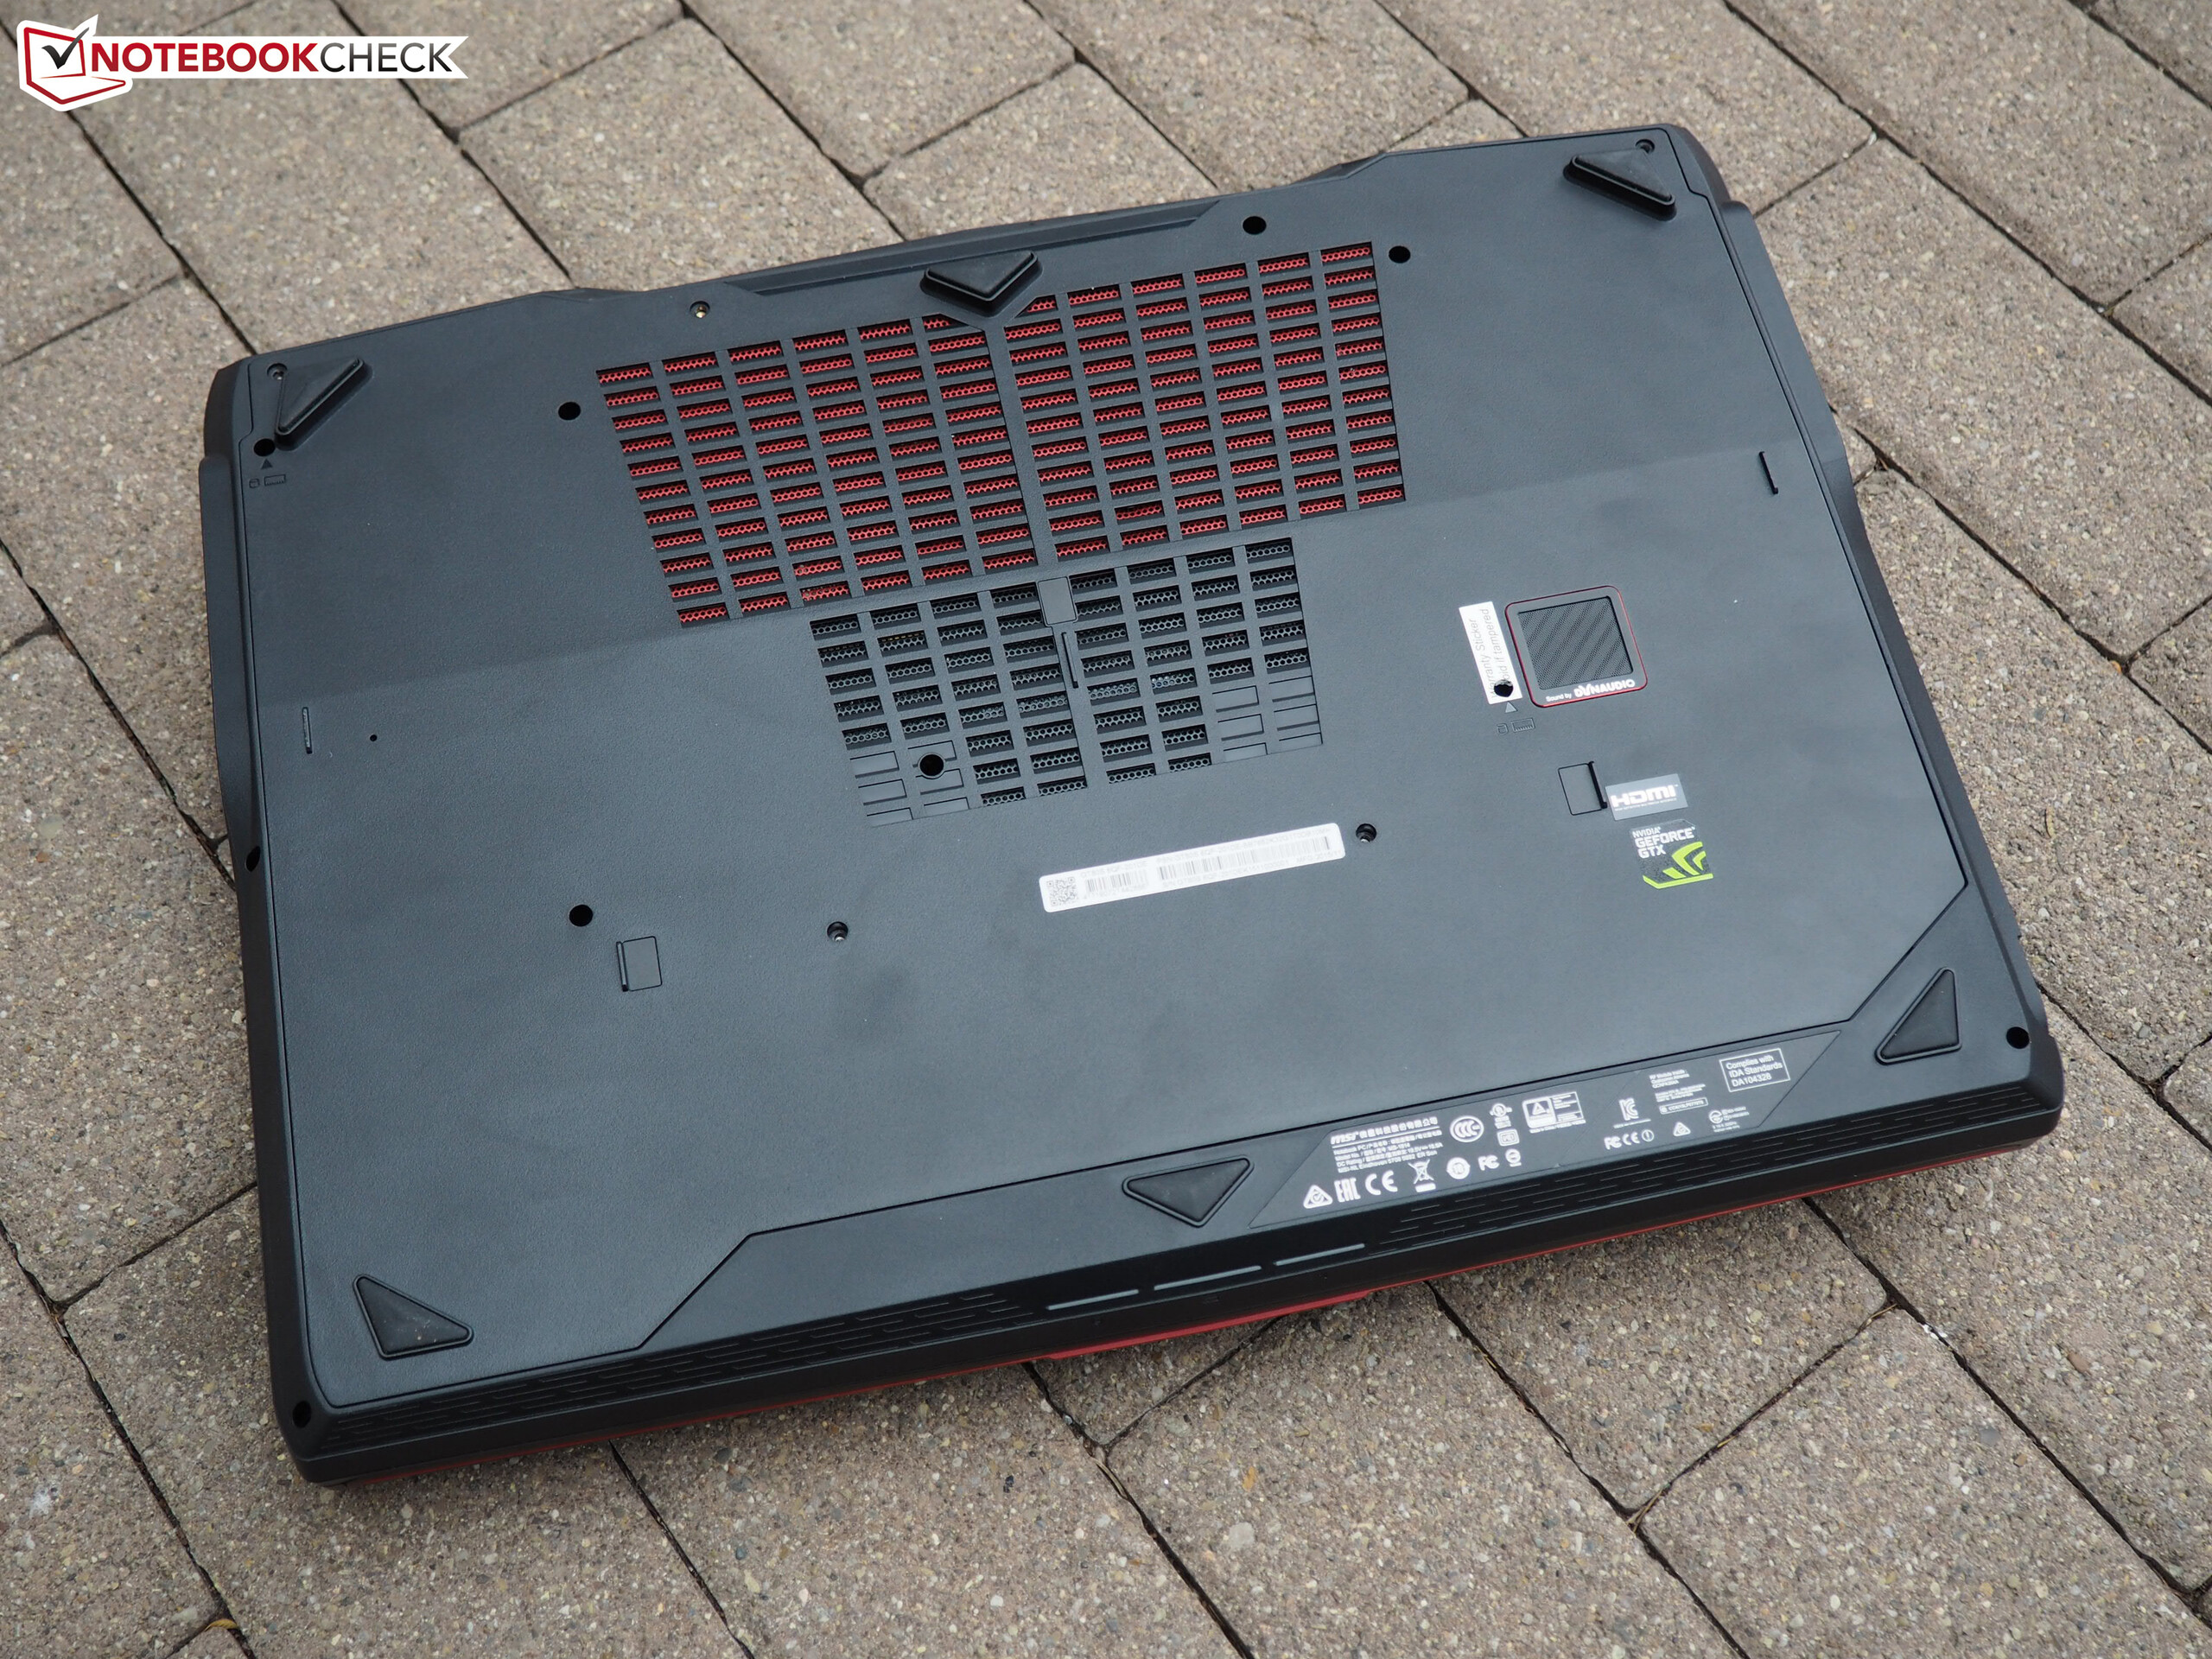
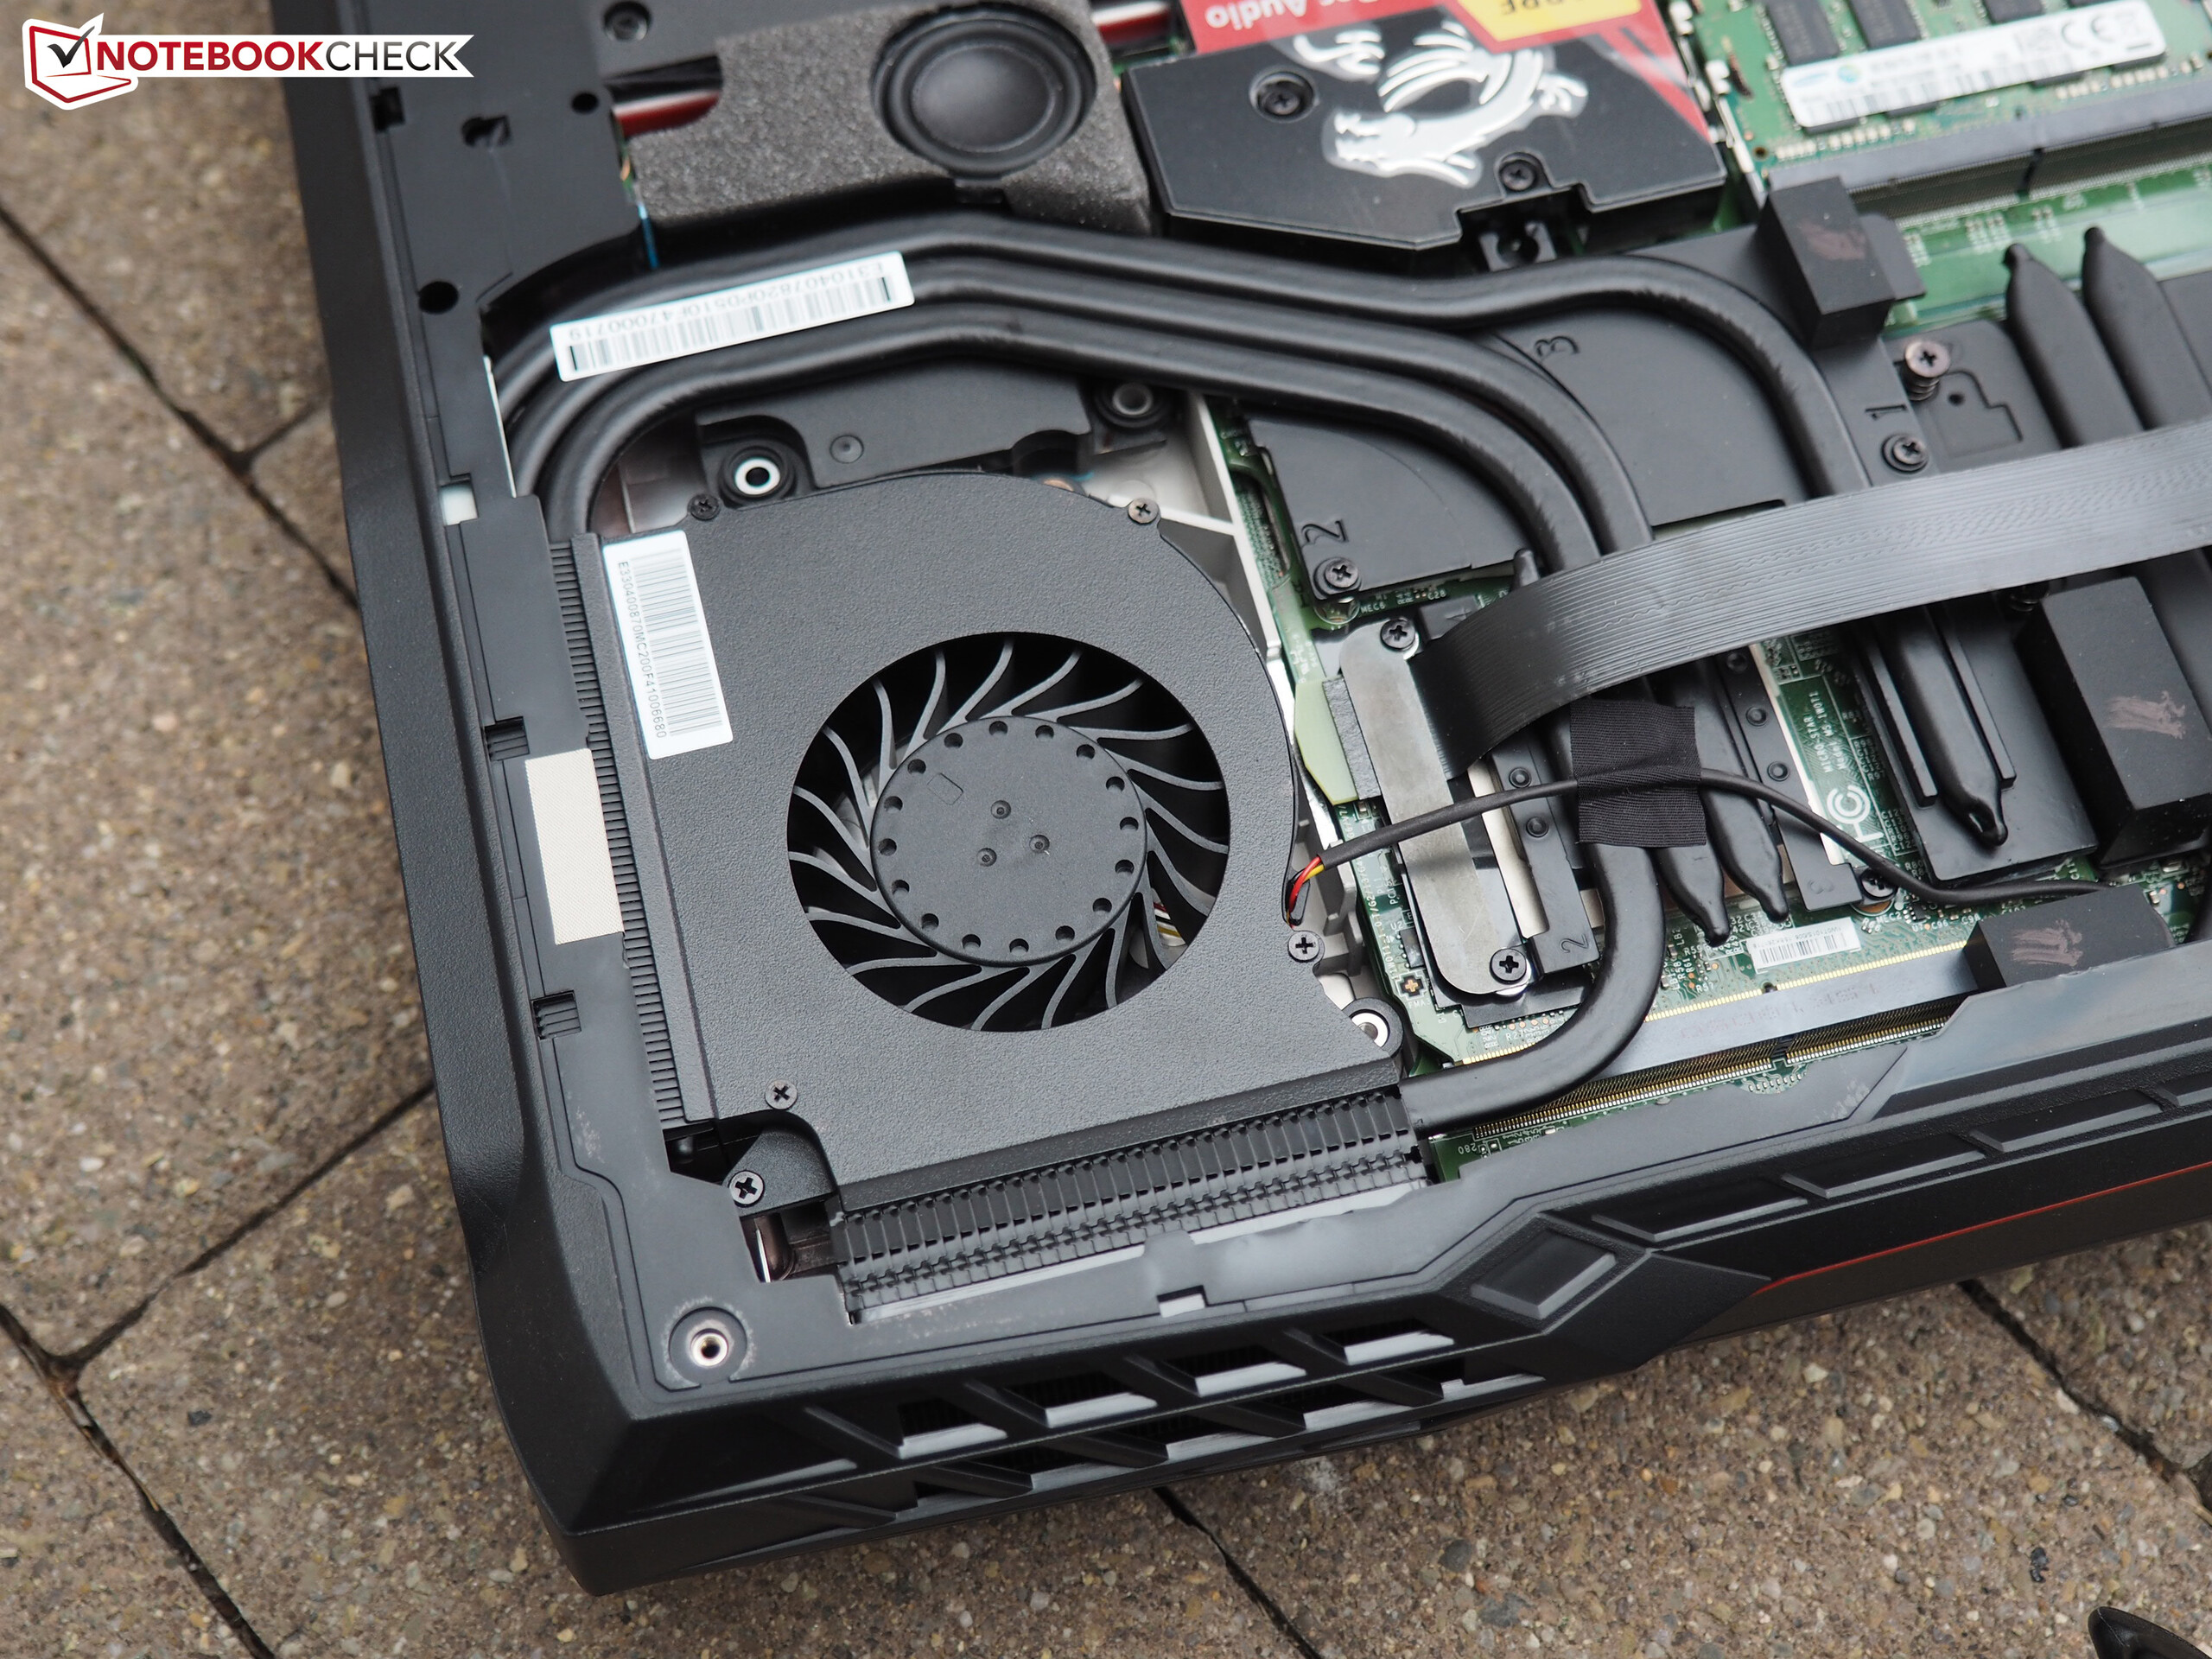
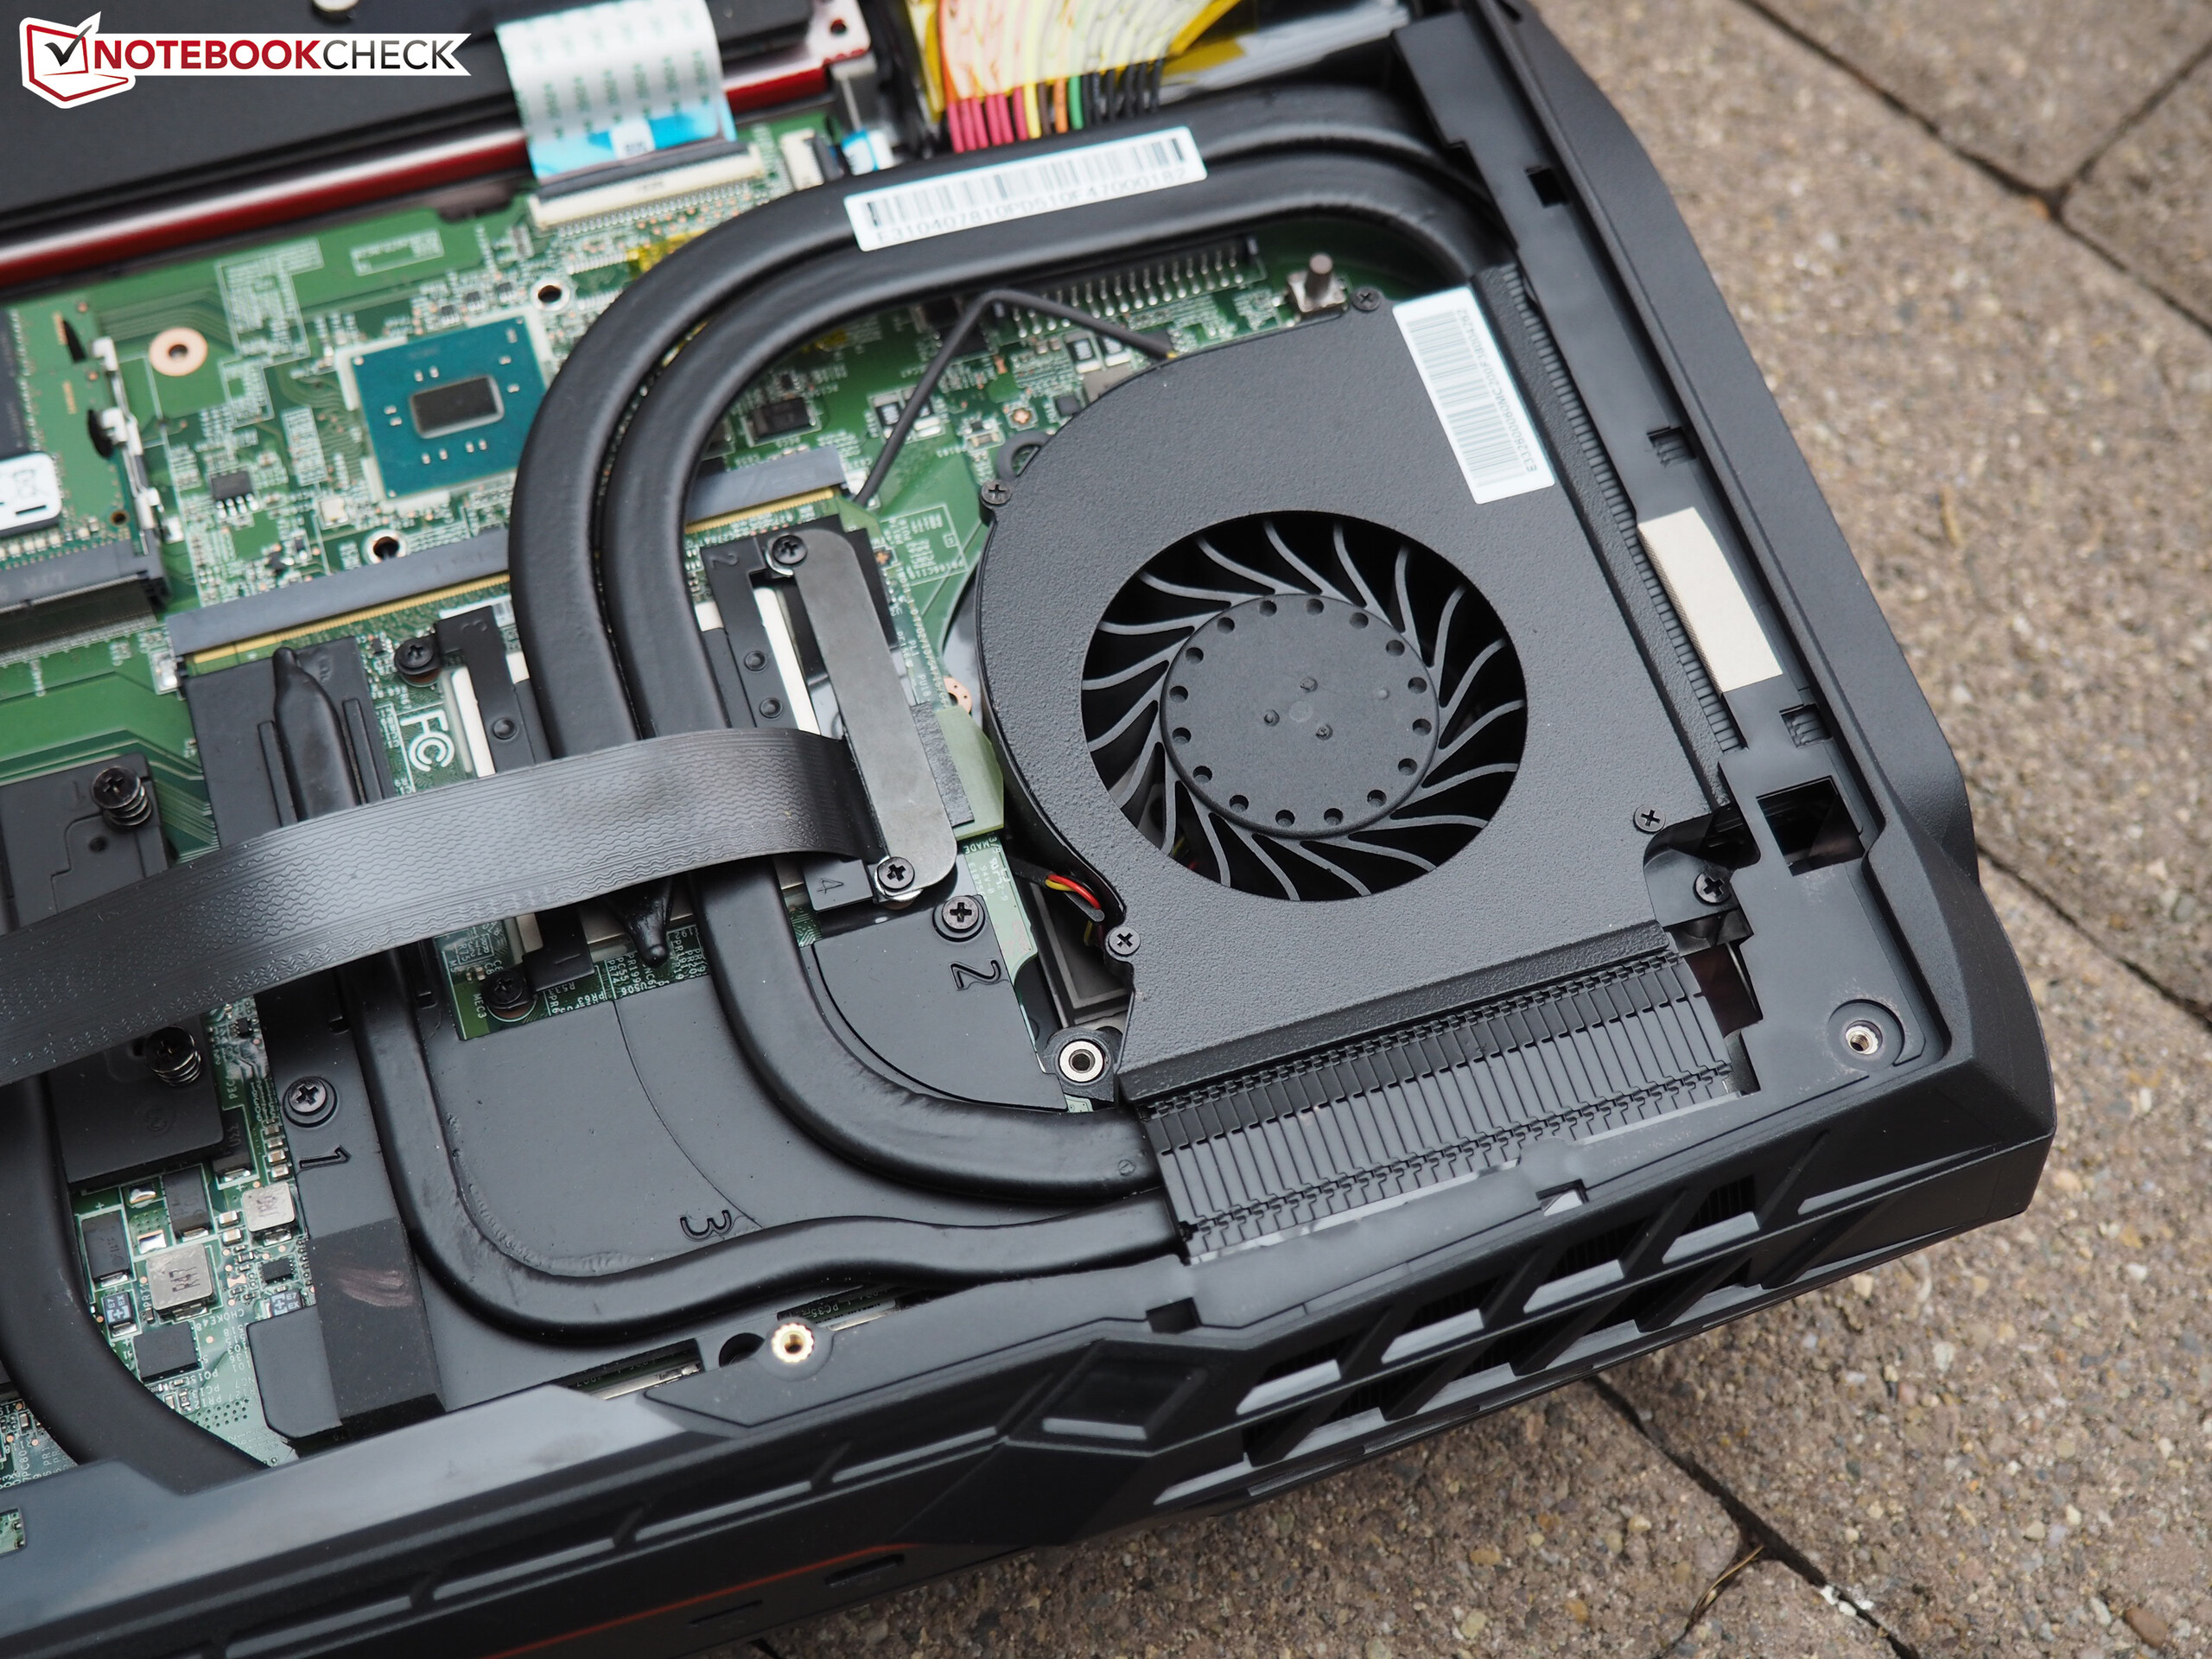
The amount of memory deserves respect as well: 2x 8GB GDDR5-VRAM (256-bit interface) ensure that even demanding games are not a problem. The dual-GPU operation on the other hand is not without its flaws. Micro stutters are not usually an issue for the GT80S due to the massive performance, but the second GPU has a big negative impact on the temperatures, the power consumption and the noise development. It is no accident that MSI puts the hardware in a 5 kg (~11 lb) chassis that is almost 5 centimeters (~2 in) high.
| 3DMark 06 Standard Score | 35639 points | |
| 3DMark Vantage P Result | 47704 points | |
| 3DMark 11 Performance | 20055 points | |
| 3DMark Ice Storm Standard Score | 184803 points | |
| 3DMark Cloud Gate Standard Score | 32522 points | |
| 3DMark Fire Strike Score | 17165 points | |
Help | ||
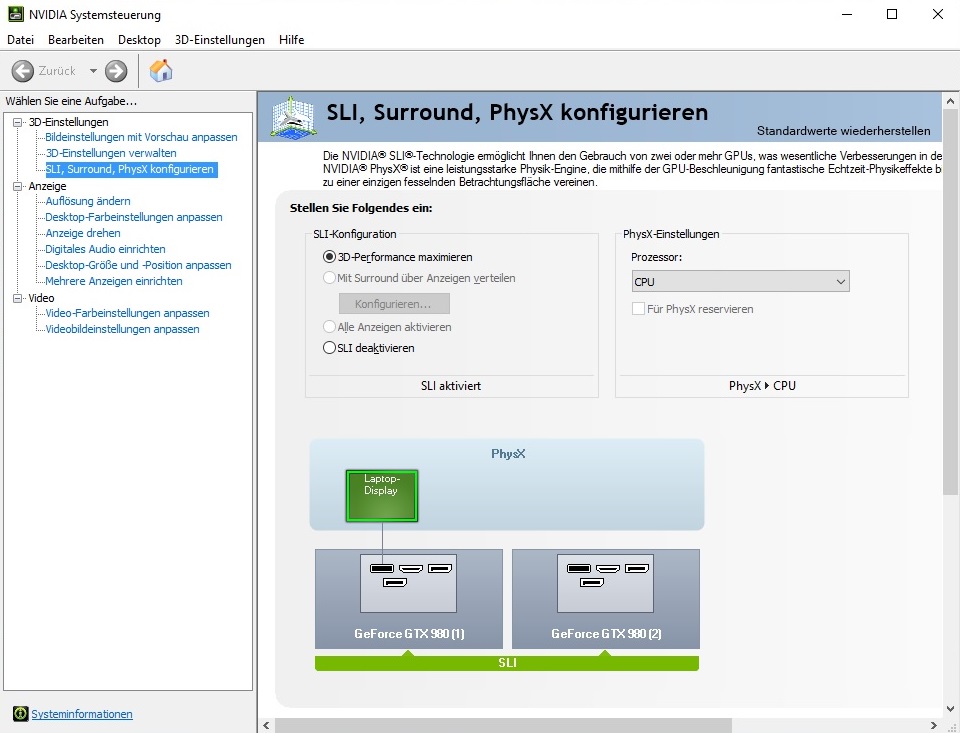
The performance of the SLI system is very impressive. 17165 points in the 3DMark 13 Fire Strike test is 50 to 60% ahead of a single GTX 980. Two GTX 980M, like in the GT80 2QE, are 20% slower. Unlike the predecessor, you cannot use the integrated GPU of the processor in the case of the GT80S 6QF. The previous GPU button is now used to turn off the display. There is no support for Optimus and Nvidia's G-Sync, either.
| 3DMark | |
| 1920x1080 Fire Strike Score (sort by value) | |
| MSI GT80S 6QF | |
| MSI GT80-2QES32SR311BW | |
| MSI GT72S 6QF | |
| Asus GX700 | |
| Schenker XMG U726 | |
| Schenker XMG U716 | |
| 3840x2160 Fire Strike Ultra Score (sort by value) | |
| MSI GT80S 6QF | |
| Asus GX700 | |
| Schenker XMG U726 | |
| Schenker XMG U716 | |
| 3DMark 11 - 1280x720 Performance (sort by value) | |
| MSI GT80S 6QF | |
| MSI GT80-2QES32SR311BW | |
| MSI GT72S 6QF | |
| Asus GX700 | |
| Schenker XMG U726 | |
| Schenker XMG U716 | |
| Unigine Heaven 4.0 - Extreme Preset DX11 (sort by value) | |
| MSI GT80S 6QF | |
| Asus GX700 | |
| Schenker XMG U726 | |
| Schenker XMG U716 | |
Gaming Performance
Even though the GT80S can take the gaming crown, we were a bit disappointed with the overall results. Yes, the performance can be 50 to 90% better compared to a single GTX 980 (“Battlefield 4”, “BF Hardline”, “Fallout 4”, “Call of Duty Black Ops 3”, “Mad Max”, “The Witcher 3”, “Dragon Age Inquisition”, “Evolve”, “Shadow of Mordor”, “Tomb Raider”, “Crysis 3”), but there are also games where the second chip does not help at all. These include “Rainbow Six Siege”, “Anno 2205”, “The Sims 4”, “GRID Autosport” or “Watch Dogs”. It is either the fault of the GPU driver (no suitable SLI profile yet) or the game cannot handle a secondary GPU very well.
Some games (“Just Cause 3”, “Batman Arkham Knight” & “FIFA 16”) even perform worse compared to a single GTX 980 notebook. Settings lower than 1920x1080 and (Ultra) High settings are not listed in the comparison table, because the CPU is often the limiting factor in these cases.
| Battlefield 4 | |
| 3840x2160 High Preset (sort by value) | |
| MSI GT80S 6QF | |
| Schenker XMG U716 | |
| Schenker W504 | |
| Schenker W504 | |
| 1920x1080 Ultra Preset AA:4x MS (sort by value) | |
| MSI GT80S 6QF | |
| MSI GT80-2QES32SR311BW | |
| Schenker XMG U716 | |
| MSI GT72-2QE32SR311BW | |
| Schenker XMG P505 | |
| Just Cause 3 - 1920x1080 Very High / On AA:SM AF:16x (sort by value) | |
| MSI GT80S 6QF | |
| Schenker W504 | |
| Schenker W504 | |
| Rainbow Six Siege | |
| 3840x2160 High Preset AA:T AF:4x (sort by value) | |
| MSI GT80S 6QF | |
| Schenker W504 | |
| Schenker W504 | |
| 1920x1080 Ultra Preset AA:T AF:16x (sort by value) | |
| MSI GT80S 6QF | |
| Schenker W504 | |
| Schenker W504 | |
| Assassin's Creed Syndicate | |
| 3840x2160 High Preset AA:FX (sort by value) | |
| MSI GT80S 6QF | |
| Schenker XMG U716 | |
| Schenker W504 | |
| Schenker W504 | |
| 1920x1080 Ultra High Preset AA:4x MSAA + FX (sort by value) | |
| MSI GT80S 6QF | |
| Schenker XMG U716 | |
| Schenker W504 | |
| Schenker W504 | |
| Star Wars Battlefront | |
| 3840x2160 High Preset AA:FX (sort by value) | |
| MSI GT80S 6QF | |
| Schenker XMG U716 | |
| Schenker W504 | |
| Schenker W504 | |
| 1920x1080 Ultra Preset AA:FX (sort by value) | |
| MSI GT80S 6QF | |
| Schenker XMG U716 | |
| Schenker W504 | |
| Schenker W504 | |
| Fallout 4 | |
| 3840x2160 High Preset AA:T AF:16x (sort by value) | |
| MSI GT80S 6QF | |
| Schenker XMG U716 | |
| Schenker W504 | |
| Schenker W504 | |
| 1920x1080 Ultra Preset AA:T AF:16x (sort by value) | |
| MSI GT80S 6QF | |
| Schenker XMG U716 | |
| Schenker W504 | |
| Schenker W504 | |
| Call of Duty: Black Ops 3 | |
| 3840x2160 High / On AA:FX (sort by value) | |
| MSI GT80S 6QF | |
| Schenker XMG U716 | |
| Schenker W504 | |
| Schenker W504 | |
| 1920x1080 Extra / On AA:T2x SM (sort by value) | |
| MSI GT80S 6QF | |
| Schenker XMG U716 | |
| Schenker W504 | |
| Schenker W504 | |
| Anno 2205 | |
| 3840x2160 High Preset AA:4x (sort by value) | |
| MSI GT80S 6QF | |
| Schenker XMG U716 | |
| Schenker W504 | |
| Schenker W504 | |
| 1920x1080 Ultra High Preset AA:8x (sort by value) | |
| MSI GT80S 6QF | |
| Schenker XMG U716 | |
| Schenker W504 | |
| Schenker W504 | |
| FIFA 16 | |
| 3840x2160 High Preset AA:2x MS (sort by value) | |
| MSI GT80S 6QF | |
| Schenker XMG U716 | |
| Schenker W504 | |
| Schenker W504 | |
| 1920x1080 High Preset AA:4x MS (sort by value) | |
| MSI GT80S 6QF | |
| Schenker XMG U716 | |
| Schenker W504 | |
| Schenker W504 | |
| Mad Max - 1920x1080 Very High Preset AF:12x (sort by value) | |
| MSI GT80S 6QF | |
| Schenker XMG U716 | |
| Schenker W504 | |
| Schenker W504 | |
| Batman: Arkham Knight | |
| 3840x2160 High / On (Interactive Smoke & Paper Debris Off) AA:SM AF:8x (sort by value) | |
| MSI GT80S 6QF | |
| Schenker XMG U716 | |
| Schenker W504 | |
| Schenker W504 | |
| 1920x1080 High / On AA:SM AF:16x (sort by value) | |
| MSI GT80S 6QF | |
| MSI GT80 Titan SLI | |
| Schenker XMG U716 | |
| Schenker W504 | |
| Schenker W504 | |
| The Witcher 3 | |
| 3840x2160 High Graphics & Postprocessing (Nvidia HairWorks Off) (sort by value) | |
| MSI GT80S 6QF | |
| Schenker XMG U716 | |
| Schenker W504 | |
| Schenker W504 | |
| 1920x1080 Ultra Graphics & Postprocessing (HBAO+) (sort by value) | |
| MSI GT80S 6QF | |
| Schenker XMG U716 | |
| Schenker W504 | |
| Schenker W504 | |
| Dirt Rally | |
| 3840x2160 High Preset (sort by value) | |
| MSI GT80S 6QF | |
| Schenker XMG U716 | |
| Schenker W504 | |
| Schenker W504 | |
| 1920x1080 Ultra Preset AA:4x MS (sort by value) | |
| MSI GT80S 6QF | |
| Schenker XMG U716 | |
| Schenker W504 | |
| Schenker W504 | |
| Battlefield Hardline - 1920x1080 Ultra Graphics Quality (DX11) AA:4x MS (sort by value) | |
| MSI GT80S 6QF | |
| MSI GT80 Titan SLI | |
| Schenker XMG U716 | |
| Schenker W504 | |
| Schenker W504 | |
| Evolve - 1920x1080 Very High Graphics Quality AA:1TX SM (sort by value) | |
| MSI GT80S 6QF | |
| Schenker XMG U716 | |
| Schenker W504 | |
| Schenker W504 | |
| Dragon Age: Inquisition - 1920x1080 Ultra Graphics Quality AA:2x MS (sort by value) | |
| MSI GT80S 6QF | |
| MSI GT80-2QES32SR311BW | |
| MSI GT80 Titan SLI | |
| Schenker XMG U716 | |
| Far Cry 4 - 1920x1080 Ultra Graphics Quality AA:SM (sort by value) | |
| MSI GT80S 6QF | |
| MSI GT80-2QES32SR311BW | |
| Schenker XMG U716 | |
| Alien: Isolation - 1920x1080 Ultra, On, Shadow Map 2048, HDAO AA:2x SM AF:16x (sort by value) | |
| MSI GT80S 6QF | |
| MSI GT80-2QES32SR311BW | |
| Schenker XMG U716 | |
| MSI GT72-2QE32SR311BW | |
| Schenker XMG P505 | |
| Middle-earth: Shadow of Mordor - 1920x1080 Ultra Preset (HD Package) (sort by value) | |
| MSI GT80S 6QF | |
| MSI GT80-2QES32SR311BW | |
| MSI GT80 Titan SLI | |
| Schenker XMG U716 | |
| MSI GT72-2QE32SR311BW | |
| Schenker XMG P505 | |
| Sims 4 - 1920x1080 Ultra Preset (sort by value) | |
| MSI GT80S 6QF | |
| MSI GT80-2QES32SR311BW | |
| Schenker XMG U716 | |
| MSI GT72-2QE32SR311BW | |
| Schenker XMG P505 | |
| GRID: Autosport - 1920x1080 Ultra Preset AA:4x MS (sort by value) | |
| MSI GT80S 6QF | |
| MSI GT80-2QES32SR311BW | |
| Schenker XMG U716 | |
| MSI GT72-2QE32SR311BW | |
| Schenker XMG P505 | |
| Watch Dogs - 1920x1080 Ultra Overall Quality, Ultra Textures AA:4x MS (sort by value) | |
| MSI GT80S 6QF | |
| MSI GT80-2QES32SR311BW | |
| Schenker XMG U716 | |
| MSI GT72-2QE32SR311BW | |
| Schenker XMG P505 | |
| Thief - 1920x1080 Very High Preset AA:FXAA & High SS AF:8x (sort by value) | |
| MSI GT80S 6QF | |
| MSI GT80-2QES32SR311BW | |
| MSI GT80 Titan SLI | |
| Schenker XMG U716 | |
| MSI GT72-2QE32SR311BW | |
| Schenker XMG P505 | |
| Metro: Last Light - 1920x1080 Very High (DX11) AF:16x (sort by value) | |
| MSI GT80S 6QF | |
| MSI GT80-2QES32SR311BW | |
| MSI GT80 Titan SLI | |
| Schenker XMG U716 | |
| MSI GT72-2QE32SR311BW | |
| Schenker XMG P505 | |
| BioShock Infinite - 1920x1080 Ultra Preset, DX11 (DDOF) (sort by value) | |
| MSI GT80S 6QF | |
| MSI GT80-2QES32SR311BW | |
| MSI GT80 Titan SLI | |
| Schenker XMG U716 | |
| MSI GT72-2QE32SR311BW | |
| Schenker XMG P505 | |
| Tomb Raider - 1920x1080 Ultra Preset AA:FX AF:16x (sort by value) | |
| MSI GT80S 6QF | |
| MSI GT80-2QES32SR311BW | |
| MSI GT80 Titan SLI | |
| Schenker XMG U716 | |
| MSI GT72-2QE32SR311BW | |
| Schenker XMG P505 | |
| Crysis 3 - 1920x1080 Very High Preset AA:2xSM AF:16x (sort by value) | |
| MSI GT80S 6QF | |
| MSI GT80-2QES32SR311BW | |
| Schenker XMG U716 | |
| MSI GT72-2QE32SR311BW | |
| Schenker XMG P505 | |
Unfortunately, we encountered several issues over the course of the tests. Despite the updated driver (ForceWare 358.87 has been replaced by ForceWare 359.23 on request from MSI), some games had issues in the 4K benchmarks. “Just Cause 3” (loading problems), “Mad Max” (crashed) and “Dirt rally” (fps-drops) did not really work on the external display Asus PB287Q.
The fact that the picture sometimes freezes for a fraction of a second (independent of the game, no micro stutters) is also annoying. Speaking of freezes: We cannot explain why, but the desktop background is sometimes temporarily burnt into the display. We had already noticed this problem during several notebook reviews in the past and the problem was usually fixed by a driver update.
Taking all FHD and 4K benchmarks into account, you get the following ranking:
GPU |
Overall performance GeForce GTX 980 SLI |
Base GeForce GTX 980M SLI |
-17% GeForce GTX 980 |
-26% GeForce GTX 970M SLI |
-33% GeForce GTX 980M |
-46% GeForce GTX 970M |
-57% |
|---|
| low | med. | high | ultra | 4K | |
|---|---|---|---|---|---|
| Crysis 3 (2013) | 163.7 | 147.9 | 128 | 91.7 | |
| Tomb Raider (2013) | 548 | 521 | 507 | 276.9 | |
| BioShock Infinite (2013) | 293.3 | 259.7 | 241.6 | 178.1 | |
| Metro: Last Light (2013) | 155.9 | 151.2 | 143.8 | 111.9 | |
| Battlefield 4 (2013) | 199.6 | 199.5 | 198.9 | 176.8 | 91.6 |
| Thief (2014) | 131.9 | 130.8 | 130.3 | 113.8 | |
| Watch Dogs (2014) | 106 | 94.3 | 78.5 | 69.3 | |
| GRID: Autosport (2014) | 342 | 191.3 | 155.2 | 142.9 | |
| Sims 4 (2014) | 191.7 | 172.7 | 144.3 | 138.4 | |
| Middle-earth: Shadow of Mordor (2014) | 227.8 | 203 | 186.1 | 160.9 | |
| Alien: Isolation (2014) | 284.6 | 269.1 | 238.7 | 185.4 | |
| Far Cry 4 (2014) | 137.9 | 136.9 | 120.4 | 113.6 | |
| Dragon Age: Inquisition (2014) | 197.8 | 187.7 | 159.2 | 123.5 | |
| Evolve (2015) | 274.8 | 225.7 | 199 | 177.8 | |
| Battlefield Hardline (2015) | 198.4 | 197.9 | 195.4 | 176.1 | |
| Dirt Rally (2015) | 394 | 178.9 | 137.3 | 124.4 | 85.6 |
| The Witcher 3 (2015) | 270.3 | 203.4 | 131.9 | 74 | 51.2 |
| Batman: Arkham Knight (2015) | 160 | 148 | 96 | 64 | 32 |
| Mad Max (2015) | 277 | 244.9 | 230.8 | ||
| FIFA 16 (2015) | 357.3 | 319.8 | 266.4 | 118.6 | |
| Anno 2205 (2015) | 170.1 | 157.1 | 88 | 31.5 | 35.4 |
| Call of Duty: Black Ops 3 (2015) | 175.3 | 169.2 | 152.8 | 152.7 | 60.8 |
| Fallout 4 (2015) | 189.2 | 183.8 | 149.4 | 129.9 | 55.6 |
| Star Wars Battlefront (2015) | 161.7 | 150.6 | 114.4 | 110.4 | 62.6 |
| Assassin's Creed Syndicate (2015) | 94.9 | 93.4 | 85.3 | 34.8 | 37.7 |
| Rainbow Six Siege (2015) | 279.8 | 232.2 | 150.9 | 136.4 | 50.2 |
| Just Cause 3 (2015) | 158 | 147.7 | 92.7 | 79.3 |
Emissions
System Noise
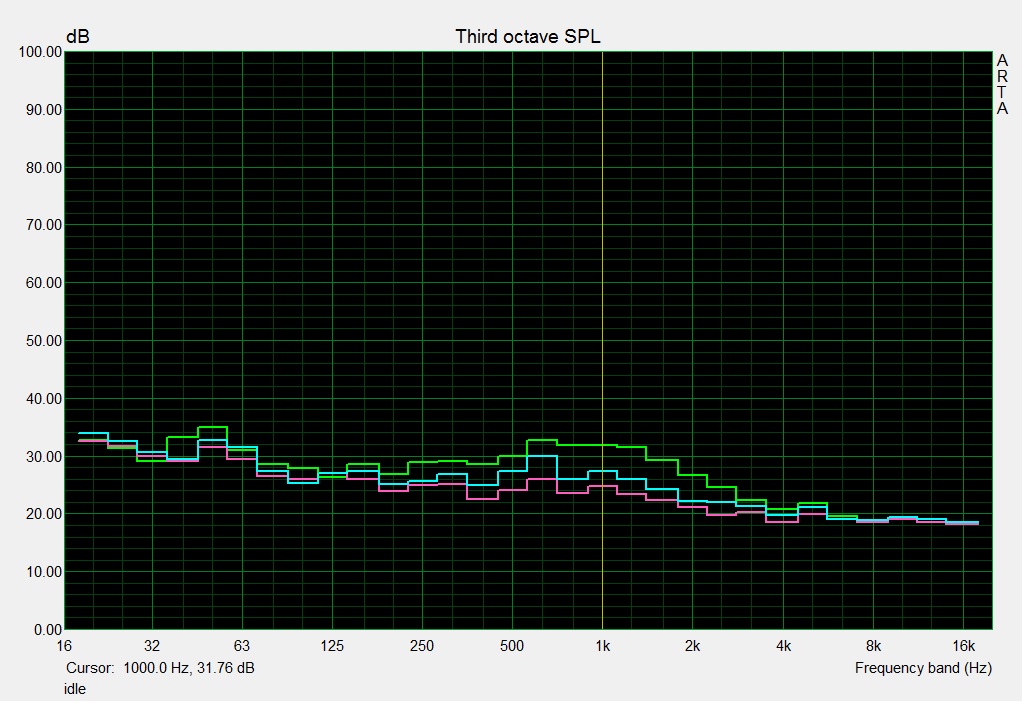
One of the biggest issues of the GT80S is the noise development. While idle values of 34 to 36 dB(A) (short speed increase towards 40 dB(A)) are still perfectly reasonable, we can measure 46 to 53 dB(A) with an average of 51 dB(A) in 3D scenarios. This means that the 18-inch notebook is one of the loudest notebooks in general. Even powerful single GPU laptops like the MSI GT72S 6QF, the Asus GX700, the Schenker XMG U716 or the Schenker XMG U726 usually remain below 50 dB(A). If this mark is exceeded, it is only under maximum load.
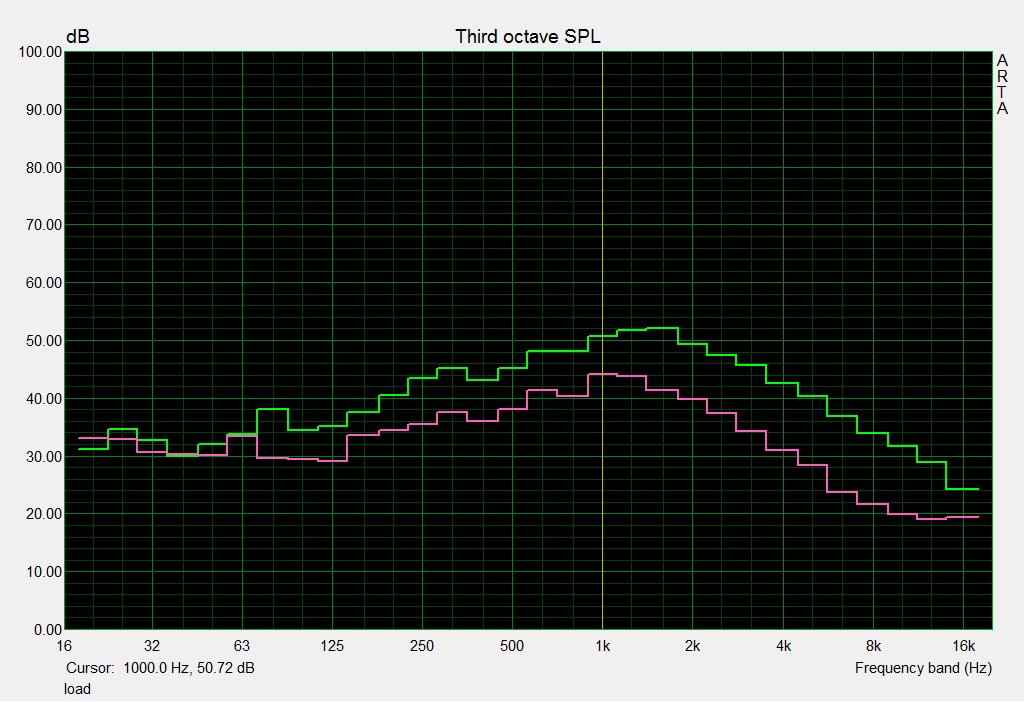
The pre-predecessor GT80 2QE was also much quieter in some situations. The two 18-inch systems are only similarly loud in the stress test with the tools FurMark and Prime95. 60 dB(A) is deafeningly loud for a notebook and can hardly be tolerated without a headset. Note: Our review unit suffers from some kind of coil whining, which would annoy many users.
Noise level
| Idle |
| 34 / 36 / 40 dB(A) |
| DVD |
| 36 / dB(A) |
| Load |
| 51 / 60 dB(A) |
 | ||
30 dB silent 40 dB(A) audible 50 dB(A) loud |
||
min: | ||
| MSI GT80S 6QF GeForce GTX 980 SLI (Laptop), 6820HK | MSI GT80-2QES32SR311BW GeForce GTX 980M SLI, 4980HQ | MSI GT72S 6QF GeForce GTX 980 (Laptop), 6820HK | Asus GX700 GeForce GTX 980 (Laptop), 6820HK | Schenker XMG U726 GeForce GTX 980 (Laptop), 6700 | Schenker XMG U716 GeForce GTX 980 (Laptop), 6700 | |
|---|---|---|---|---|---|---|
| Noise | 2% | 11% | 6% | 12% | 9% | |
| Idle Minimum * (dB) | 34 | 34.2 -1% | 33.1 3% | 33 3% | 33 3% | 33 3% |
| Idle Average * (dB) | 36 | 36.2 -1% | 33.3 7% | 35 3% | 34 6% | 35 3% |
| Idle Maximum * (dB) | 40 | 37.8 5% | 37 7% | 42 -5% | 35 12% | 38 5% |
| Load Average * (dB) | 51 | 47.6 7% | 39 24% | 46 10% | 42 18% | 45 12% |
| Load Maximum * (dB) | 60 | 59.8 -0% | 52.2 13% | 48 20% | 46 23% | 48 20% |
* ... smaller is better
Temperature
We have to criticize the temperatures as well. The palm rest is always conveniently cool at 27 °C (~81 °F), but we can measure up to 61 °C (~140 °F) under maximum load at the bottom. However, hardly any user will ever use the 5 kg (~11 lb) monster on their lap. The temperature development while idling reminds us of the Schenker XMG U716 and XMG U726, respectively. Average results of 32 to 33 °C (~90 to ~91 °F) are decent.
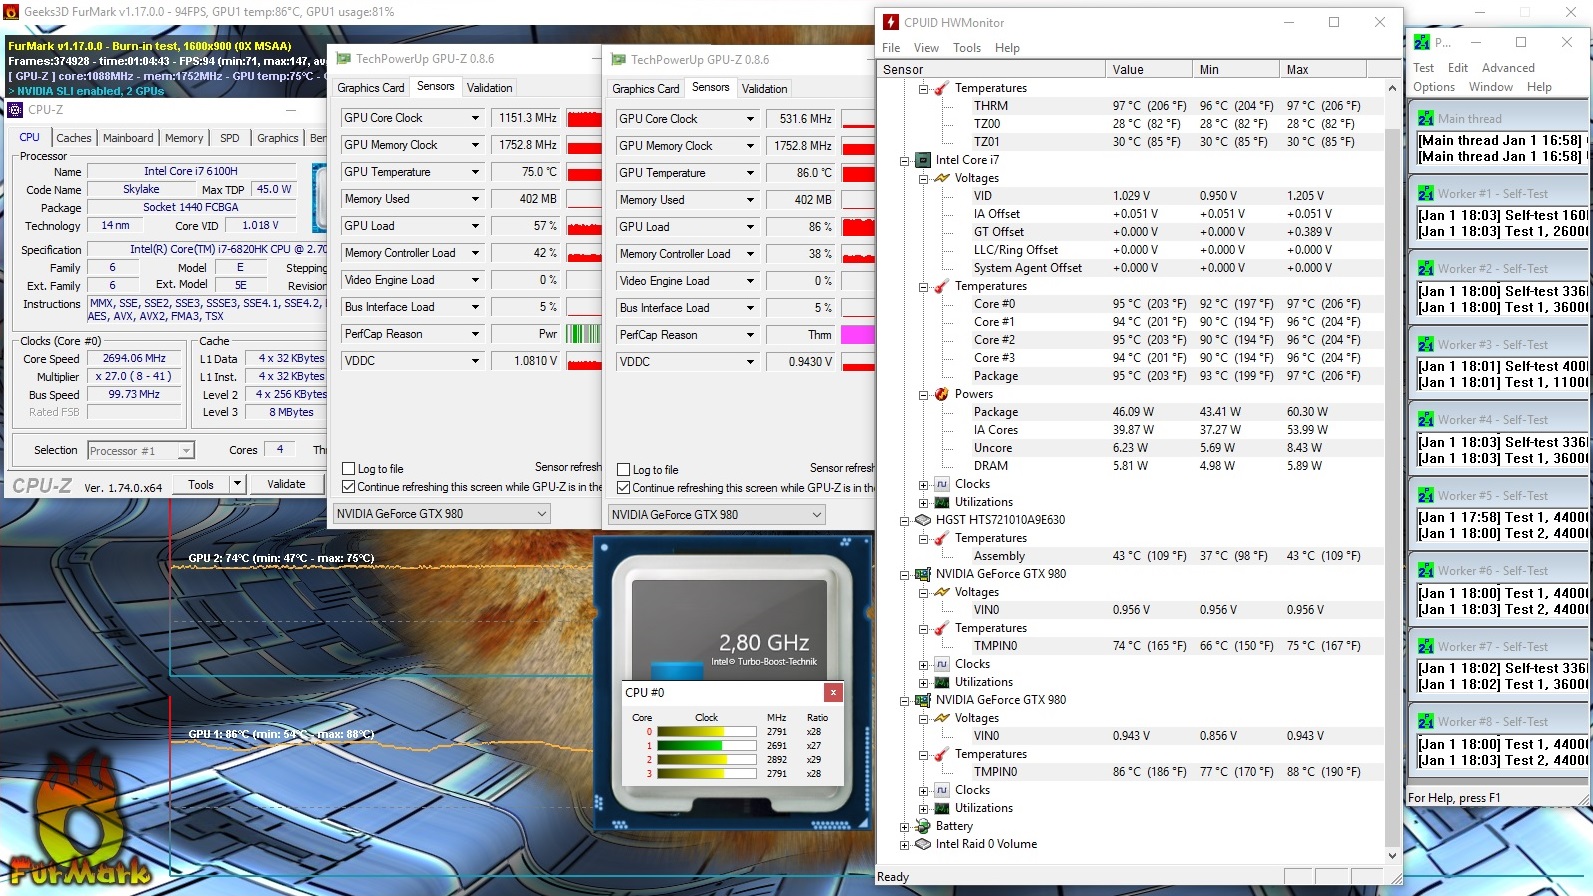
The adjective extraordinary describes the components pretty well. The CPU does not throttle in the stress test, but up to 97 °C (~207 °F; according to HWMonitor) are pretty high. The GPUs start to sweat as well: One chip is decent at 75 °C (~167 °F), but the other GTX 980 reaches – despite throttling to 400 to 600 MHz – up to 88 °C (~190 °F).
(-) The maximum temperature on the upper side is 45.7 °C / 114 F, compared to the average of 40.4 °C / 105 F, ranging from 21.2 to 68.8 °C for the class Gaming.
(-) The bottom heats up to a maximum of 61 °C / 142 F, compared to the average of 43.2 °C / 110 F
(±) In idle usage, the average temperature for the upper side is 32.4 °C / 90 F, compared to the device average of 33.9 °C / 93 F.
(+) The palmrests and touchpad are cooler than skin temperature with a maximum of 27.2 °C / 81 F and are therefore cool to the touch.
(±) The average temperature of the palmrest area of similar devices was 28.8 °C / 83.8 F (+1.6 °C / 2.8 F).
| MSI GT80S 6QF GeForce GTX 980 SLI (Laptop), 6820HK | MSI GT80-2QES32SR311BW GeForce GTX 980M SLI, 4980HQ | MSI GT72S 6QF GeForce GTX 980 (Laptop), 6820HK | Asus GX700 GeForce GTX 980 (Laptop), 6820HK | Schenker XMG U726 GeForce GTX 980 (Laptop), 6700 | Schenker XMG U716 GeForce GTX 980 (Laptop), 6700 | |
|---|---|---|---|---|---|---|
| Heat | 11% | 23% | 3% | -2% | 2% | |
| Maximum Upper Side * (°C) | 45.7 | 43.8 4% | 39.8 13% | 48.7 -7% | 46.9 -3% | 48.8 -7% |
| Maximum Bottom * (°C) | 61 | 63 -3% | 49 20% | 61 -0% | 55.8 9% | |
| Idle Upper Side * (°C) | 36.4 | 29.6 19% | 27.8 24% | 32 12% | 36.3 -0% | 36.7 -1% |
| Idle Bottom * (°C) | 39.2 | 30.4 22% | 26 34% | 40.8 -4% | 37.3 5% |
* ... smaller is better
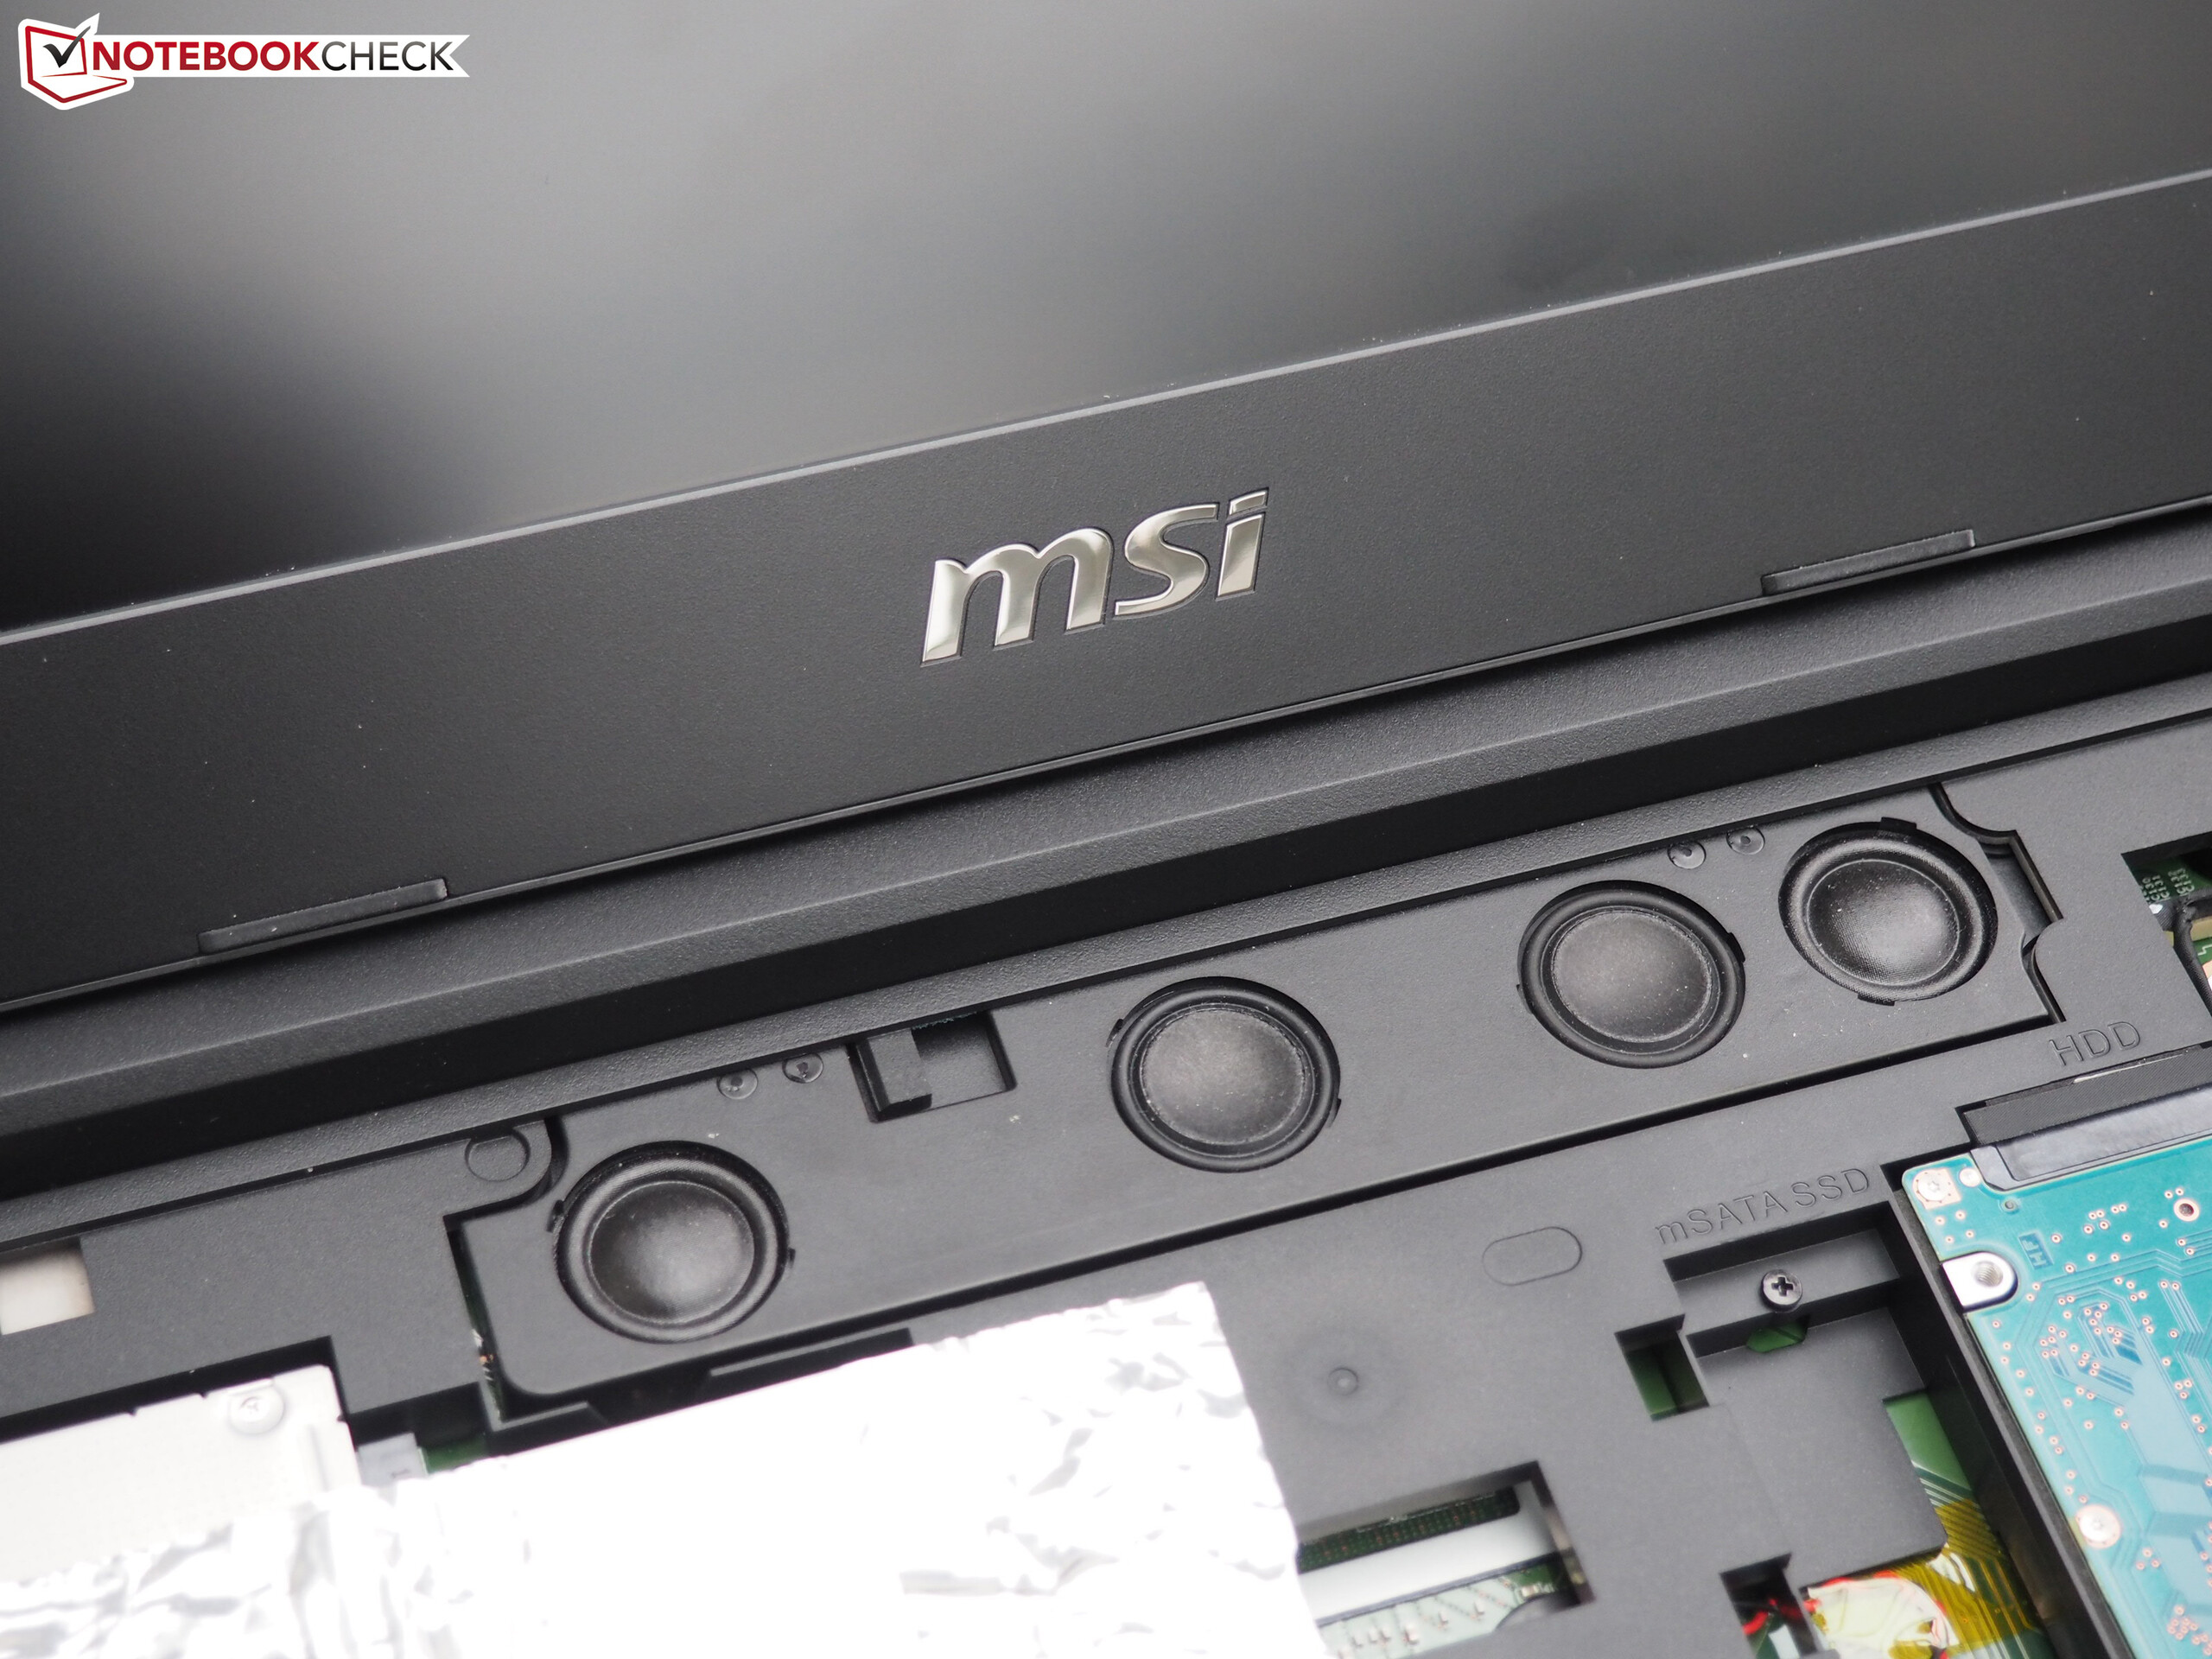
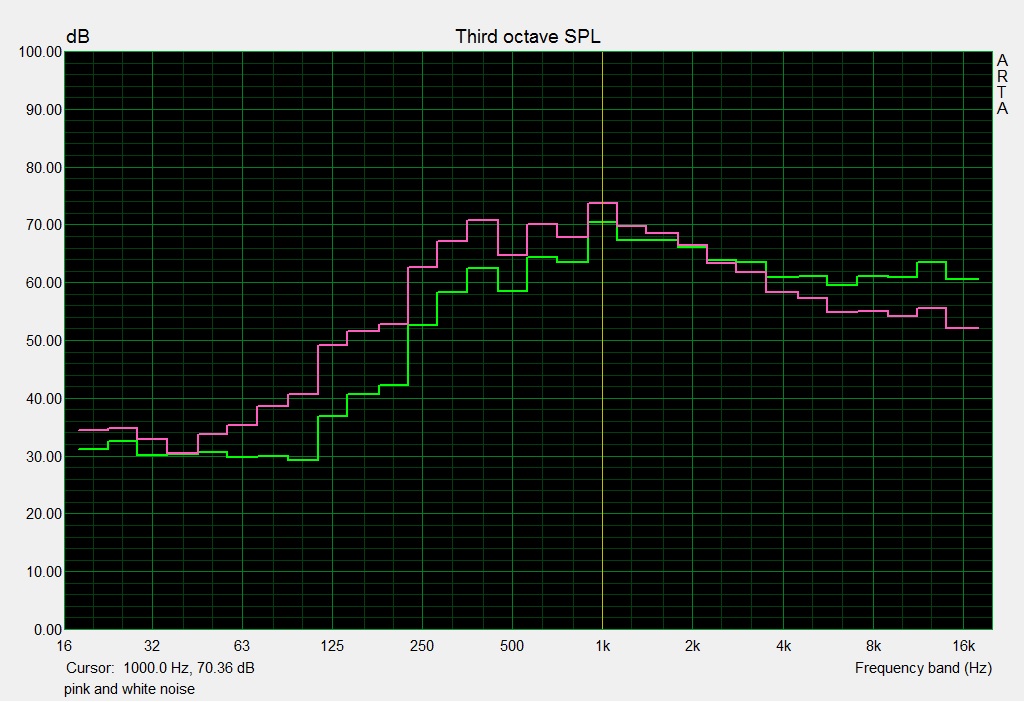
Speakers
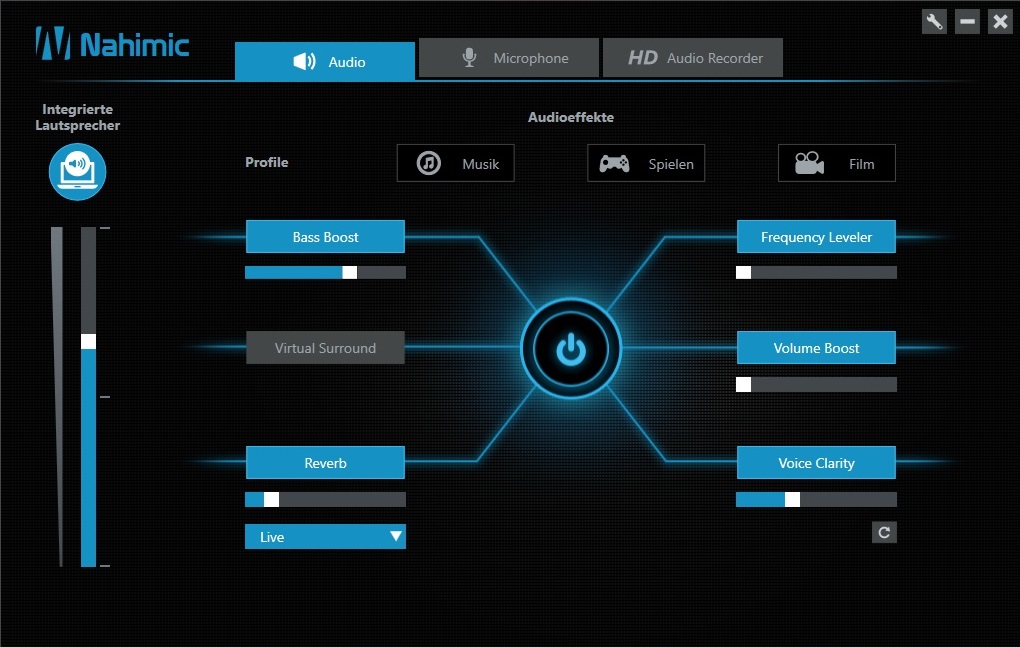
The 4.1 system from Dynaudio has a new software. The sound is now handled by the Nahimic Audio Enhancer instead of the Sound Blaster Cinema 2 (GT80 2QE). Subjectively, there is no difference between the two, so we refrain from any further comments at this point and refer to the old review instead.
Energy Management
Power Consumption
Users that want to save power should stay well clear of the GT80S. With 44 to 62 watts, the 18-inch device consumes around 10 to 25% more power than the competition from Asus and Schenker while idling, although those devices are equipped with only one GPU (34 to 49 watts @MSI GT80 2QE). The differences are similar in 3D scenarios.
We are worried about the maximum consumption in particular. More than 400 watts suggest either a bad efficiency of the power adapter or that it is not powerful enough. 330 watts are borderline for such a fast system, especially since the battery discharges under higher loads, and even single GTX 980 notebooks are shipped with a 330-watt module. In short: in our opinion 400 watts would be better for the GT80S 6QF.
| Off / Standby | |
| Idle | |
| Load |
|
Key:
min: | |
| MSI GT80S 6QF GeForce GTX 980 SLI (Laptop), 6820HK | MSI GT80-2QES32SR311BW GeForce GTX 980M SLI, 4980HQ | MSI GT72S 6QF GeForce GTX 980 (Laptop), 6820HK | Asus GX700 GeForce GTX 980 (Laptop), 6820HK | Schenker XMG U726 GeForce GTX 980 (Laptop), 6700 | Schenker XMG U716 GeForce GTX 980 (Laptop), 6700 | |
|---|---|---|---|---|---|---|
| Power Consumption | 19% | 15% | 18% | 20% | ||
| Idle Minimum * (Watt) | 44 | 34.3 22% | 40 9% | 36 18% | 35 20% | |
| Idle Average * (Watt) | 53 | 41.9 21% | 45 15% | 45 15% | 44 17% | |
| Idle Maximum * (Watt) | 62 | 49.3 20% | 51 18% | 53 15% | 51 18% | |
| Load Average * (Watt) | 163 | 140.2 14% | 149 9% | 139 15% | 134 18% | |
| Load Maximum * (Watt) | 411 | 328.6 20% | 313 24% | 306 26% | 298 27% |
* ... smaller is better
Battery Runtime
If you plan to use the 18-inch device on battery power: More than 2.5 hours are not possible with the activated SLI. However, we should mention that the competition also does not sell any runtime wonders. The two Schenker notebooks XMG U716 and XMG U726 do not last three hours, either. Only MSI's own GT72S 6QF is an option for longer road trips (up to 6.5 hours).
| MSI GT80S 6QF GeForce GTX 980 SLI (Laptop), 6820HK | MSI GT80-2QES32SR311BW GeForce GTX 980M SLI, 4980HQ | MSI GT72S 6QF GeForce GTX 980 (Laptop), 6820HK | Asus GX700 GeForce GTX 980 (Laptop), 6820HK | Schenker XMG U726 GeForce GTX 980 (Laptop), 6700 | Schenker XMG U716 GeForce GTX 980 (Laptop), 6700 | |
|---|---|---|---|---|---|---|
| Battery runtime | 4% | 105% | 43% | 36% | 27% | |
| Reader / Idle (h) | 2.5 | 3.2 28% | 6.5 160% | 3.4 36% | 2.8 12% | 2.6 4% |
| Load (h) | 1 | 0.8 -20% | 1.5 50% | 1.5 50% | 1.6 60% | 1.5 50% |
Pros
Cons
Verdict
5500 Euros (~$5968): What sounds like the price of a used car, is MSI's answer to the mobile gaming reference notebook. The implementation of two GTX 980 chips in an SLI configuration is not only extremely expensive, but also pretty bold.
Because of the heavy weight and the enormous temperature development, the GT80S 6QF is not suitable for frequent travellers or noise-sensitive users.
50-60 dB(A) in 3D scenarios prevents a "very good" rating for the high-end device, which was possible considering the brilliant gaming performance.
Smaller and bigger bugs associated with SLI or the driver (like a heavy stutter in “Star Wars Battlefront” & display flickering in “Evolve”) also affect the overall impression slightly. MSI should also fix the coil whining while idling.
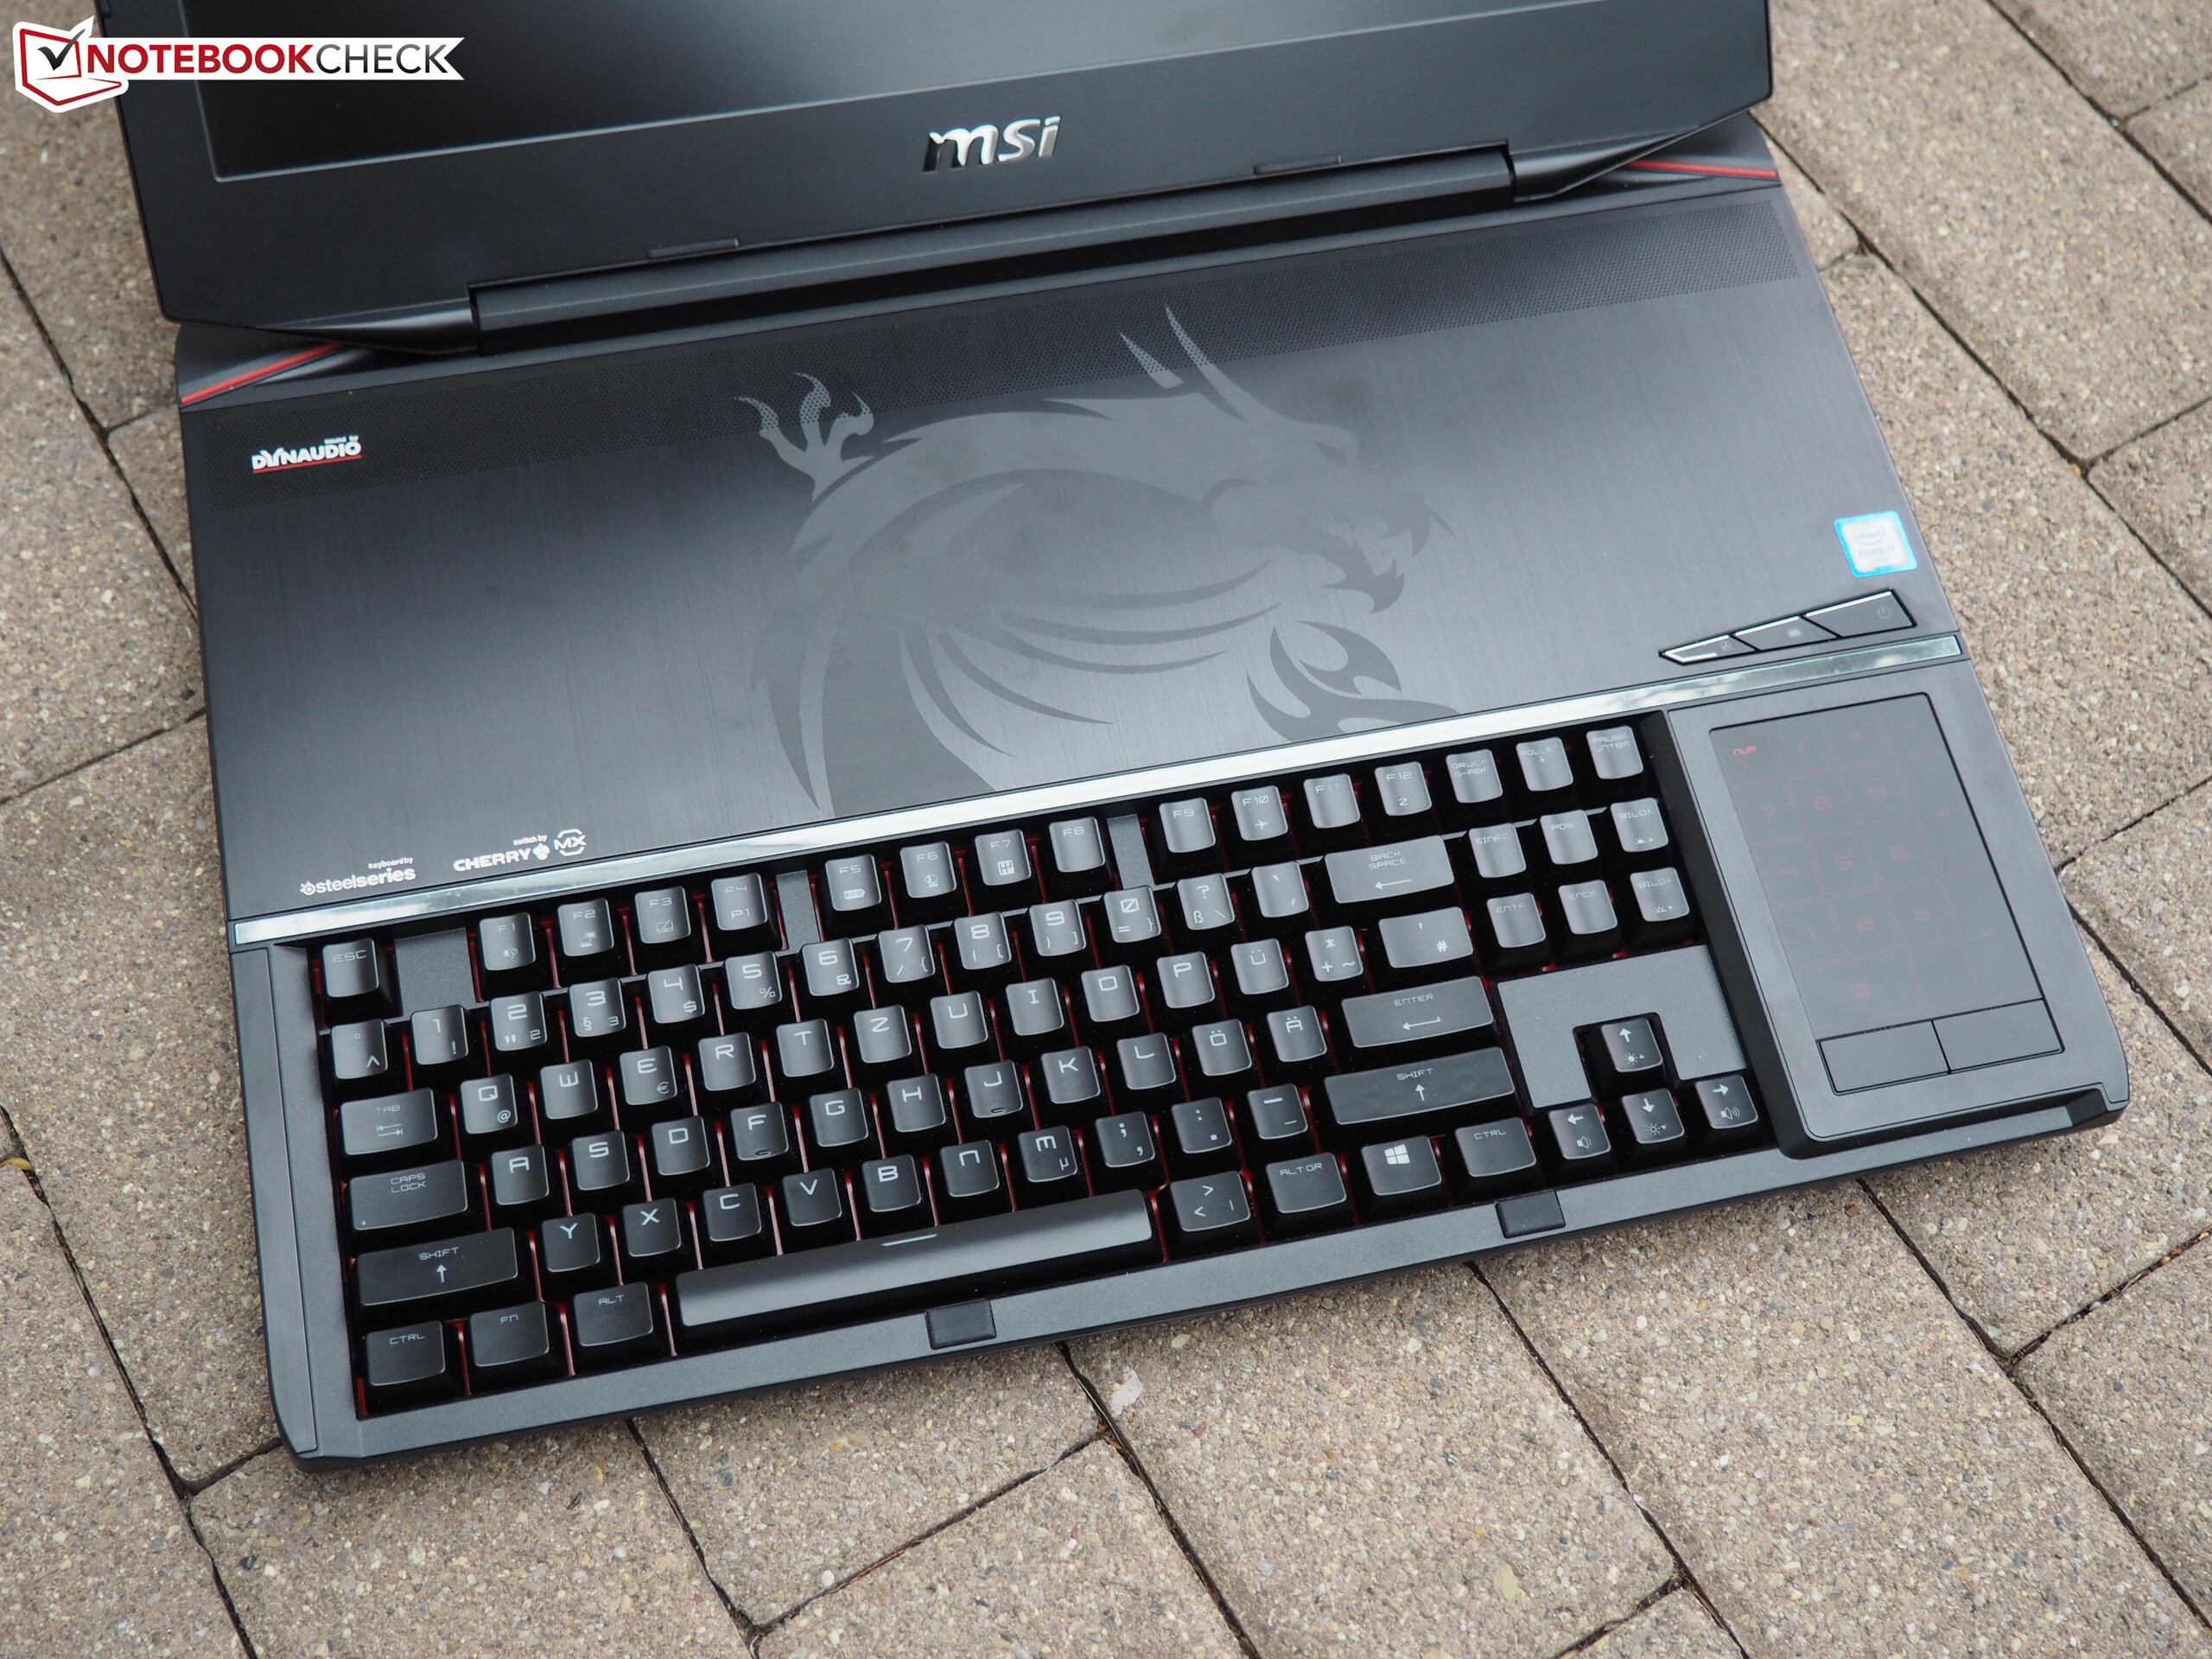
Otherwise, there is not much to criticize: Build quality, touchpad, ports, picture and sound quality do not leave anything to be desired. The typing experience of the mechanical keyboard is currently not beaten by any competitor.
MSI GT80S 6QF
- 02/24/2016 v5 (old)
Florian Glaser
Price comparison

