 Deutsch
 English
 Español
 Français
 Italiano
 Nederlands
 Polski
 Português
 Русский
 Türkçe
 Svenska
 Chinese
 Magyar
Evolve Benchmarked
For the original German article, see here.
Technology
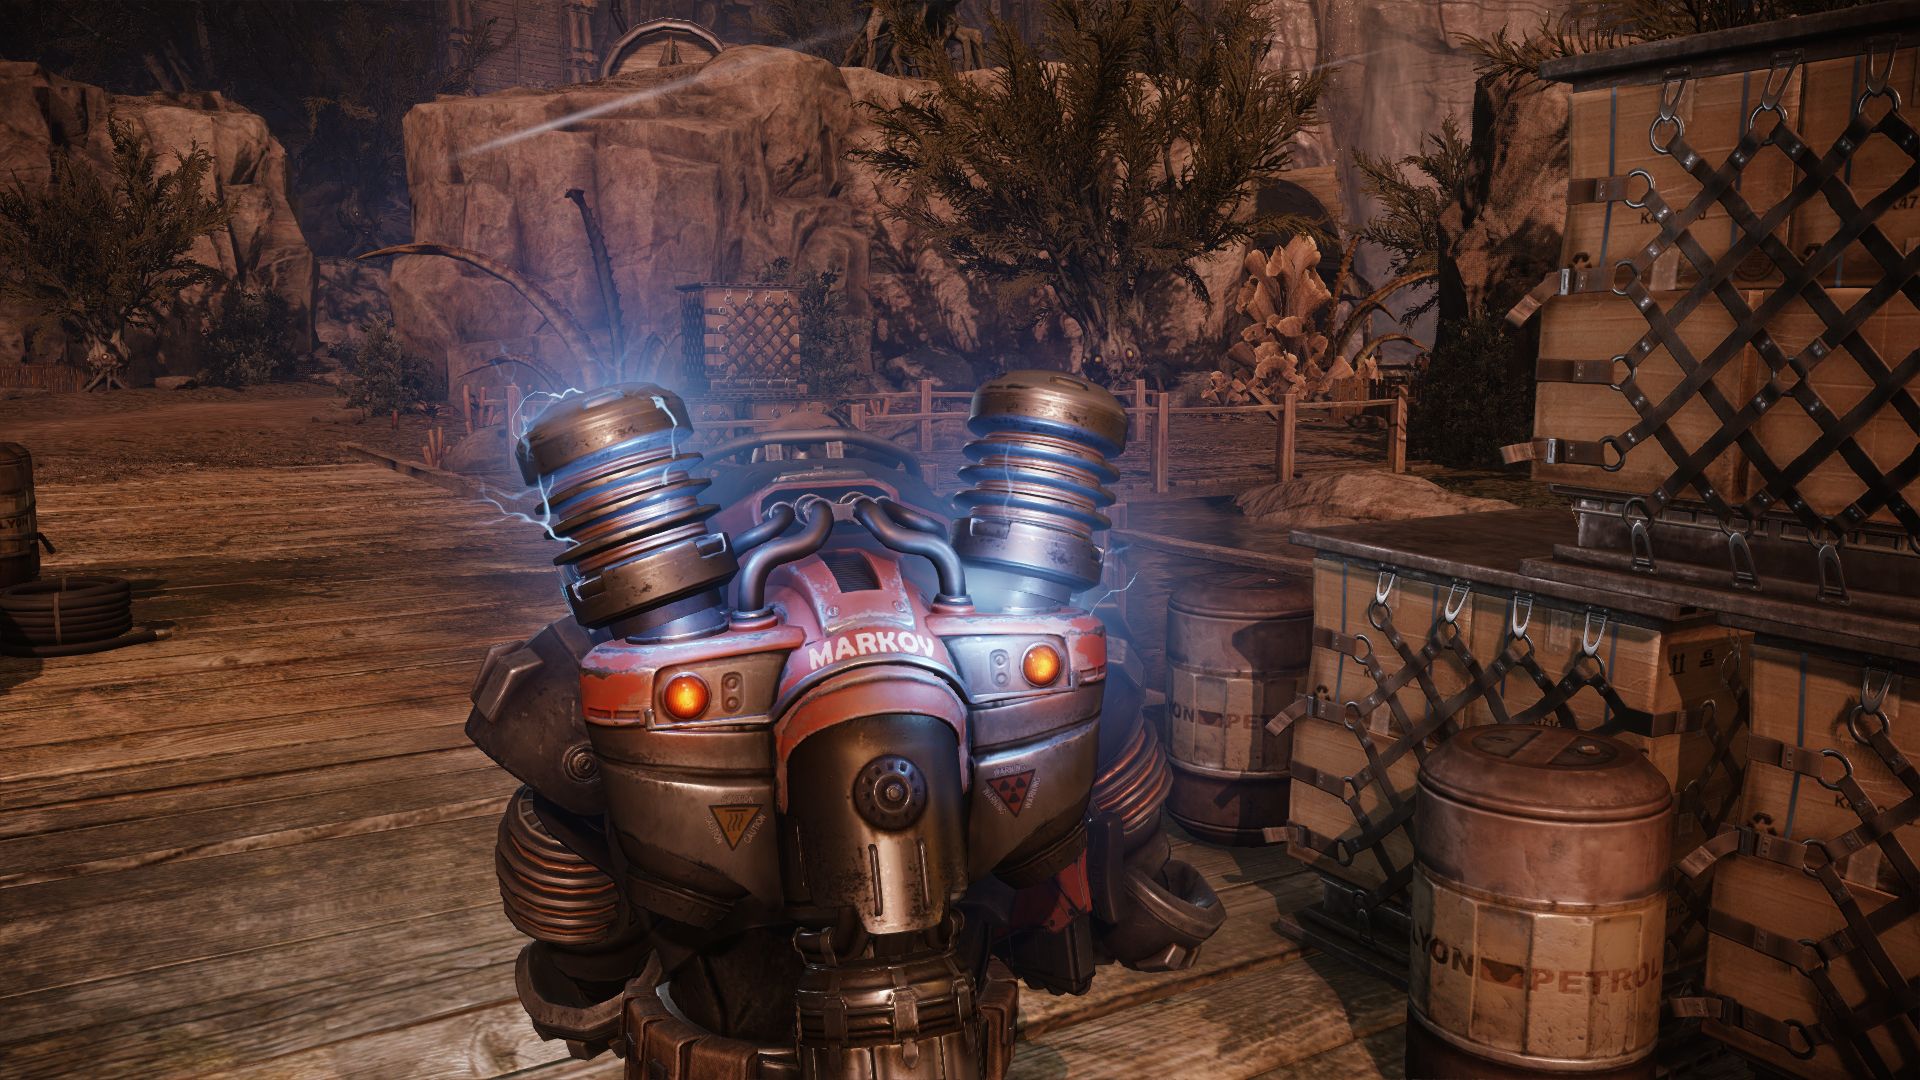
Unlike Crysis 3, Evolve is based on the fourth generation instead of the third generation of the CryEngine, which, for example, shows its muscles in Ryse: Son of Rome. Compared to the previous big project of the developers, graphics improved tremendously.

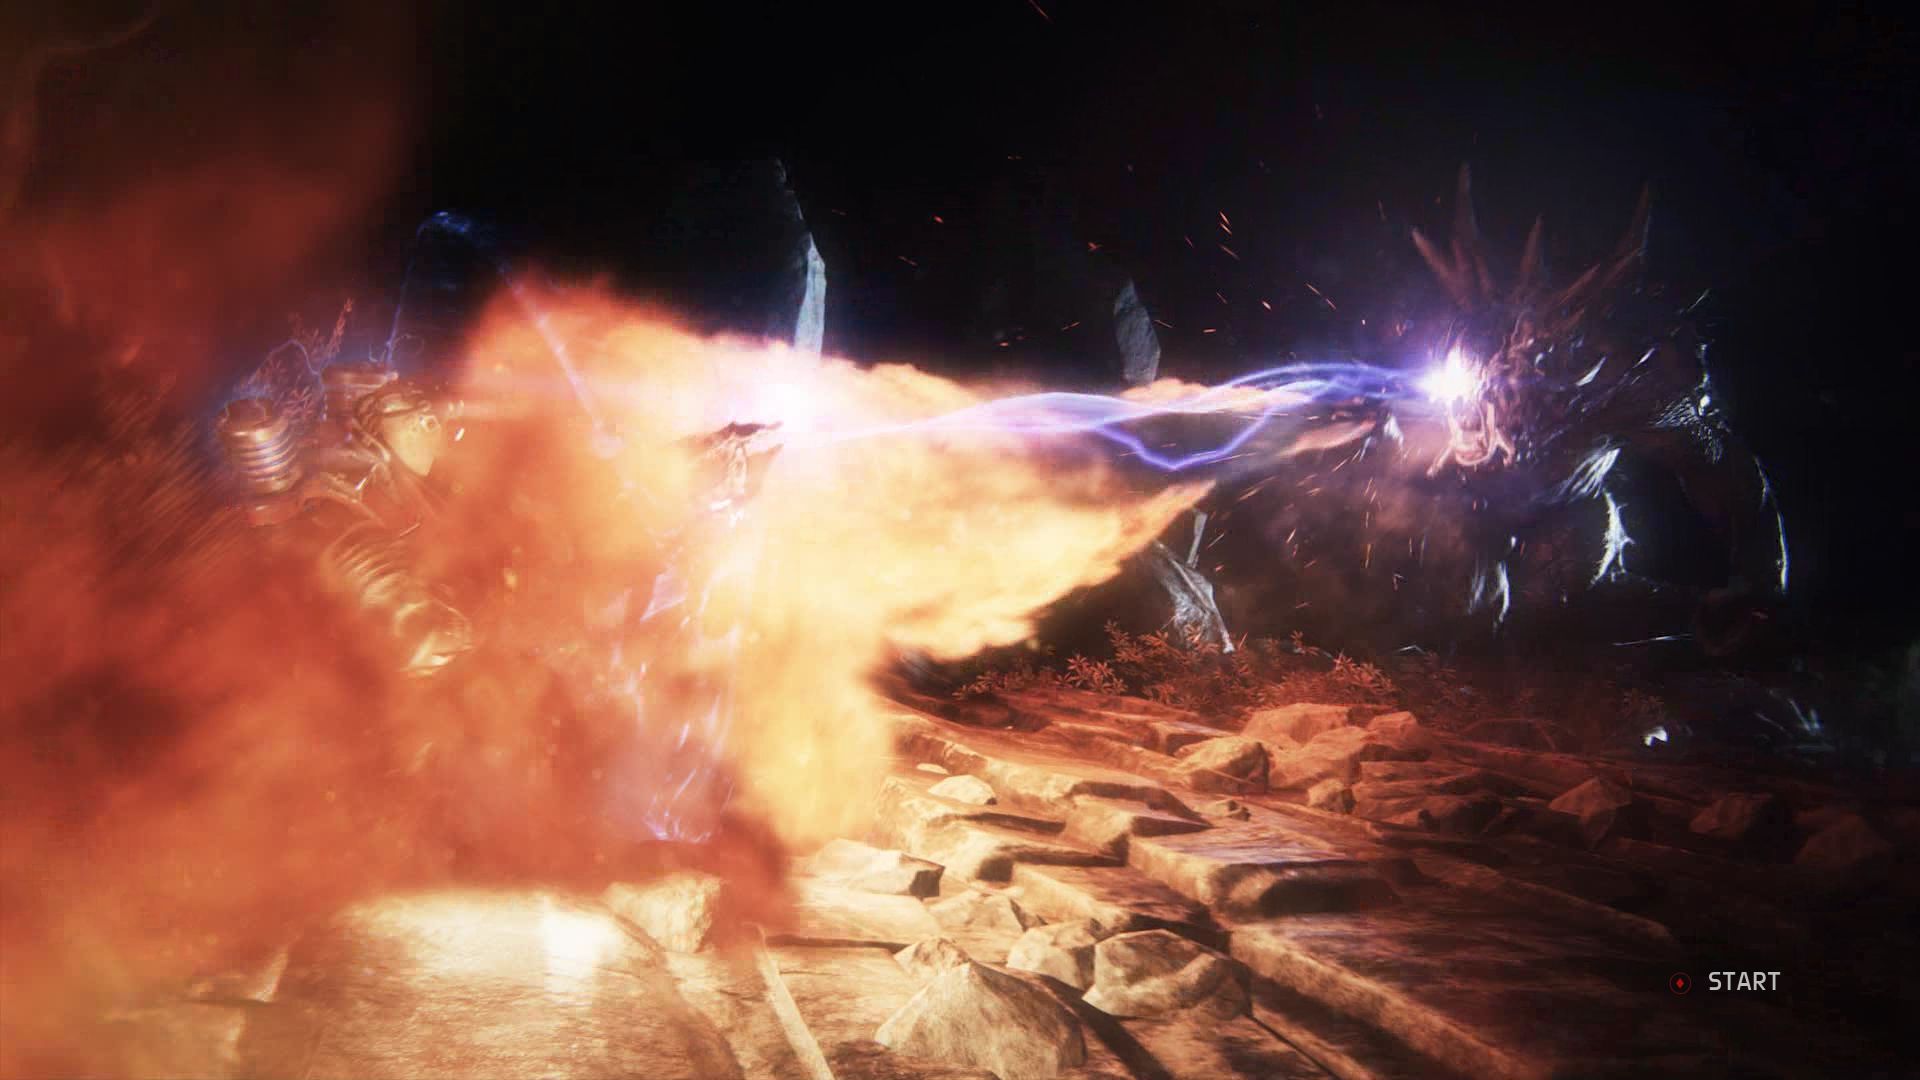


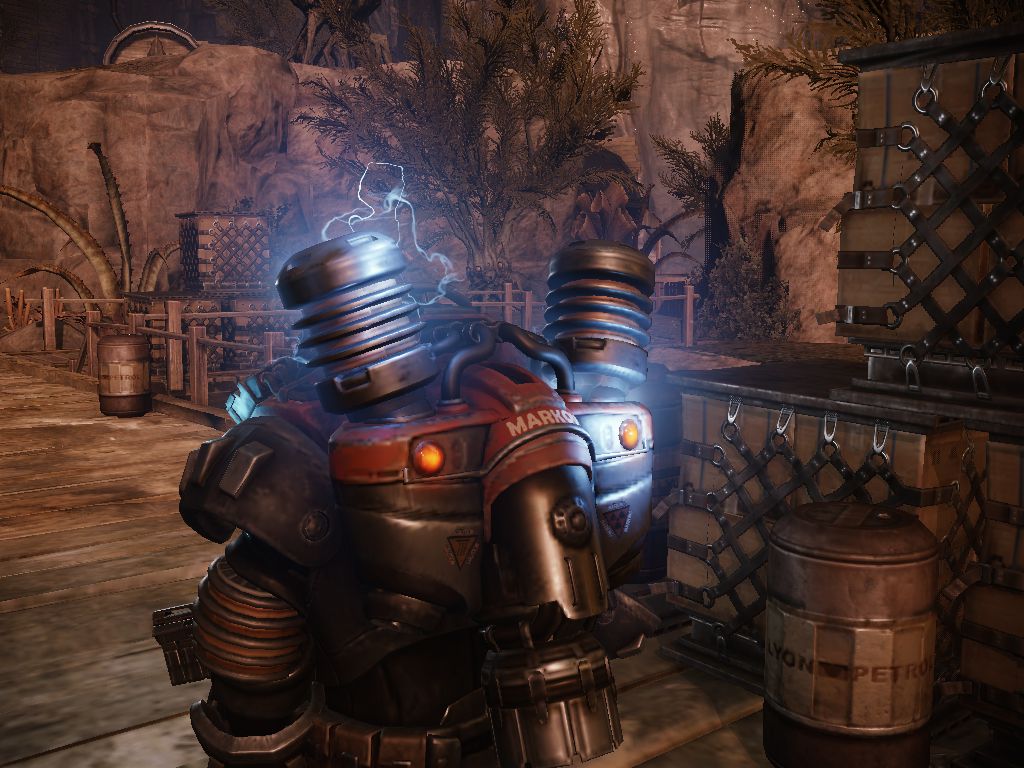
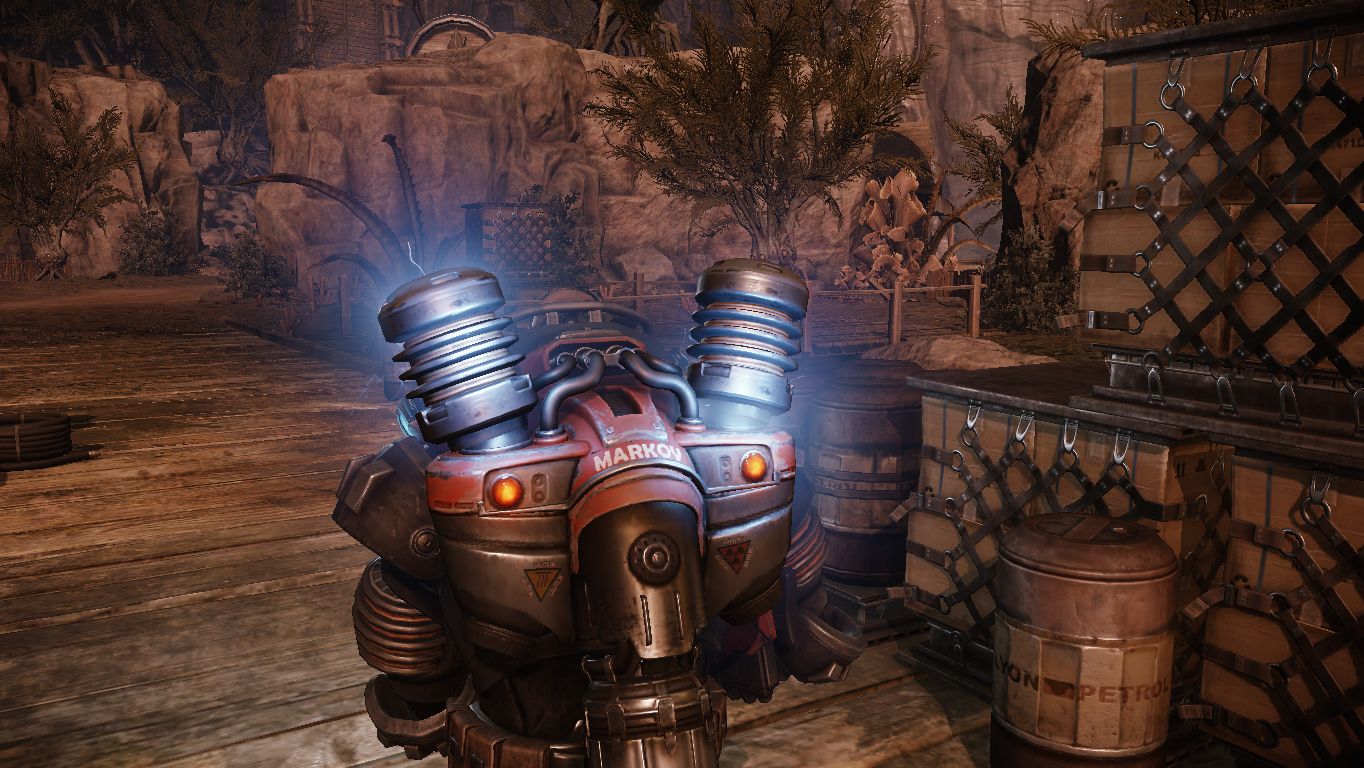
While textures and polygon count are rather adequate in Left 4 Dead, Evolve is much more hardware-intensive. Apart from the sharpness of objects, the quality of the effects, including smoke, fire, light, or other particles (energy rays, etc.) is particularly convincing. The characters appear more detailed and more lovingly designed, too. The level of Battlefield 4 or Crysis 3 is not completely reached, but the performance is very good for a game designed for multi-player fights. Points of critique are only the level design and the color choice, which is slightly too monotonous or dull over time.


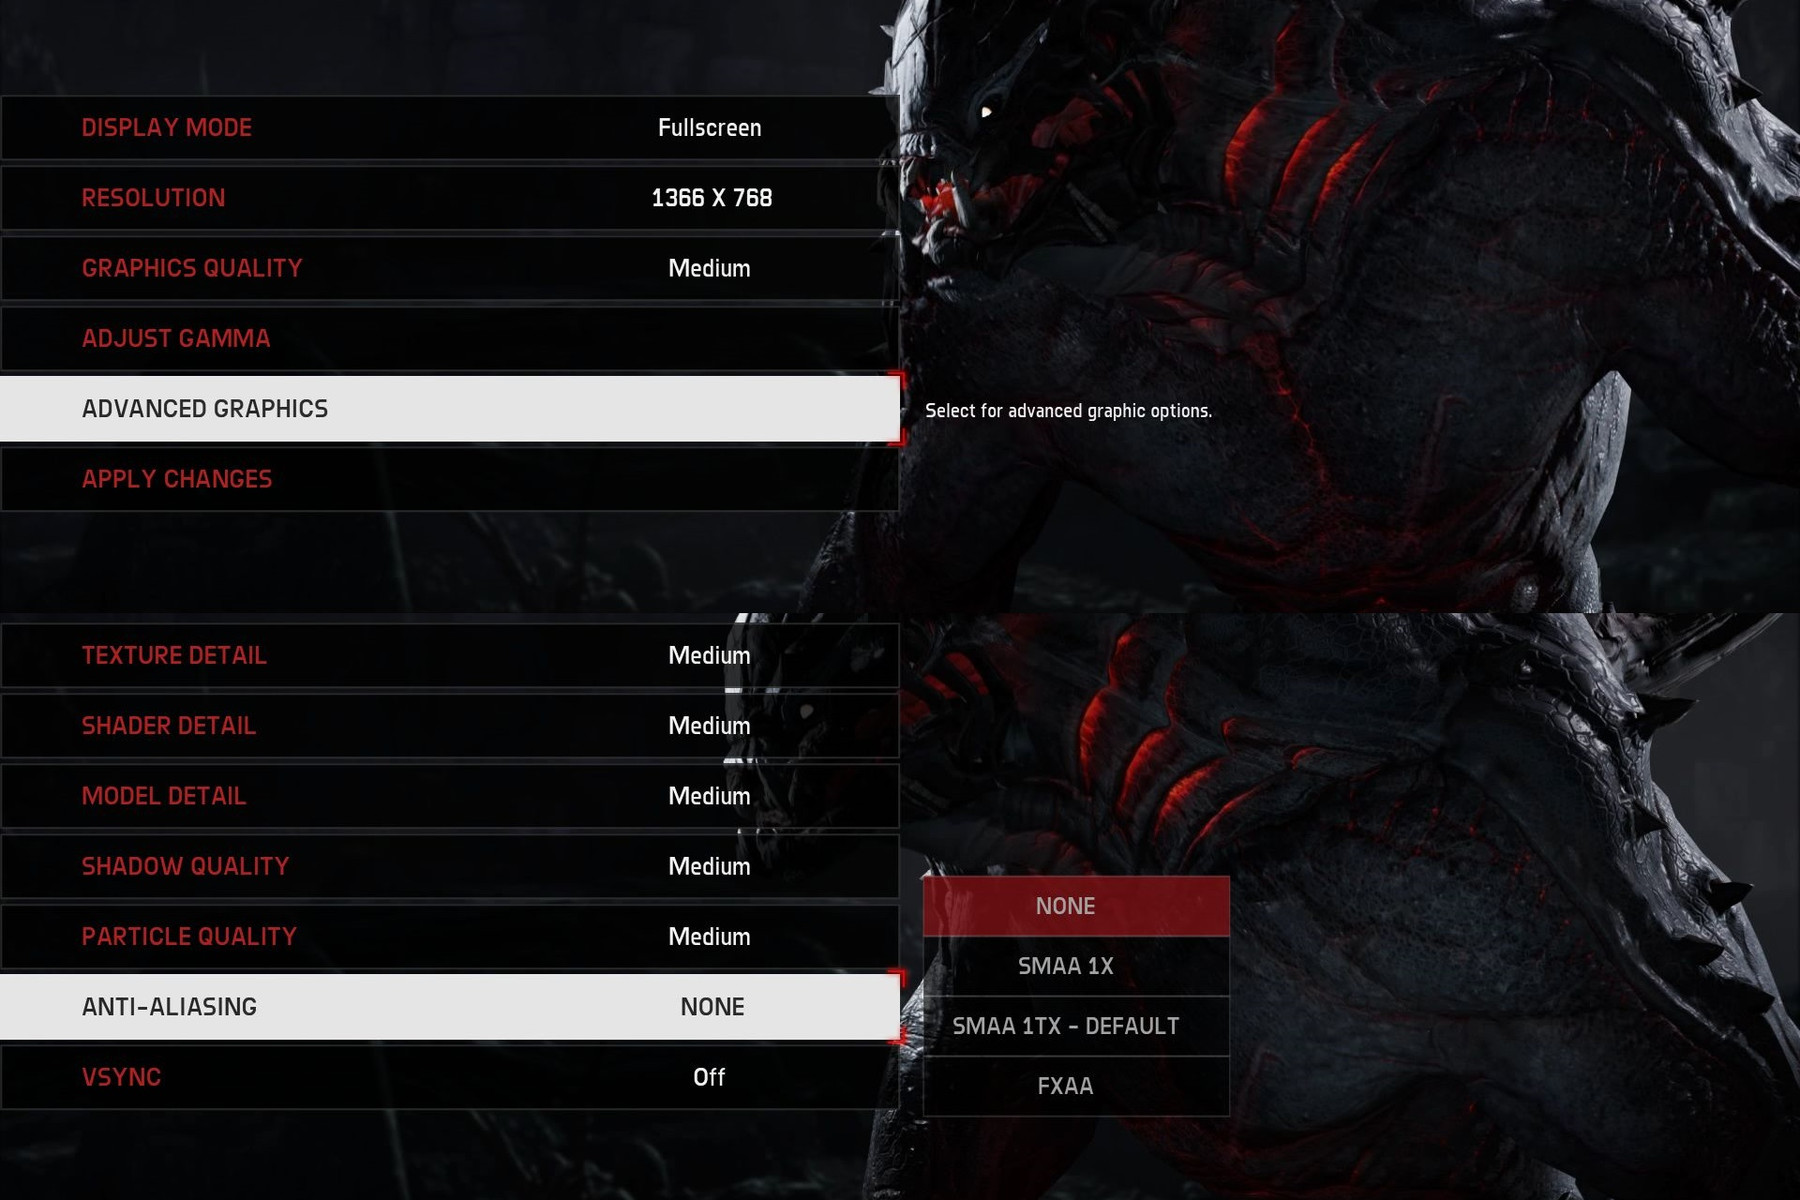
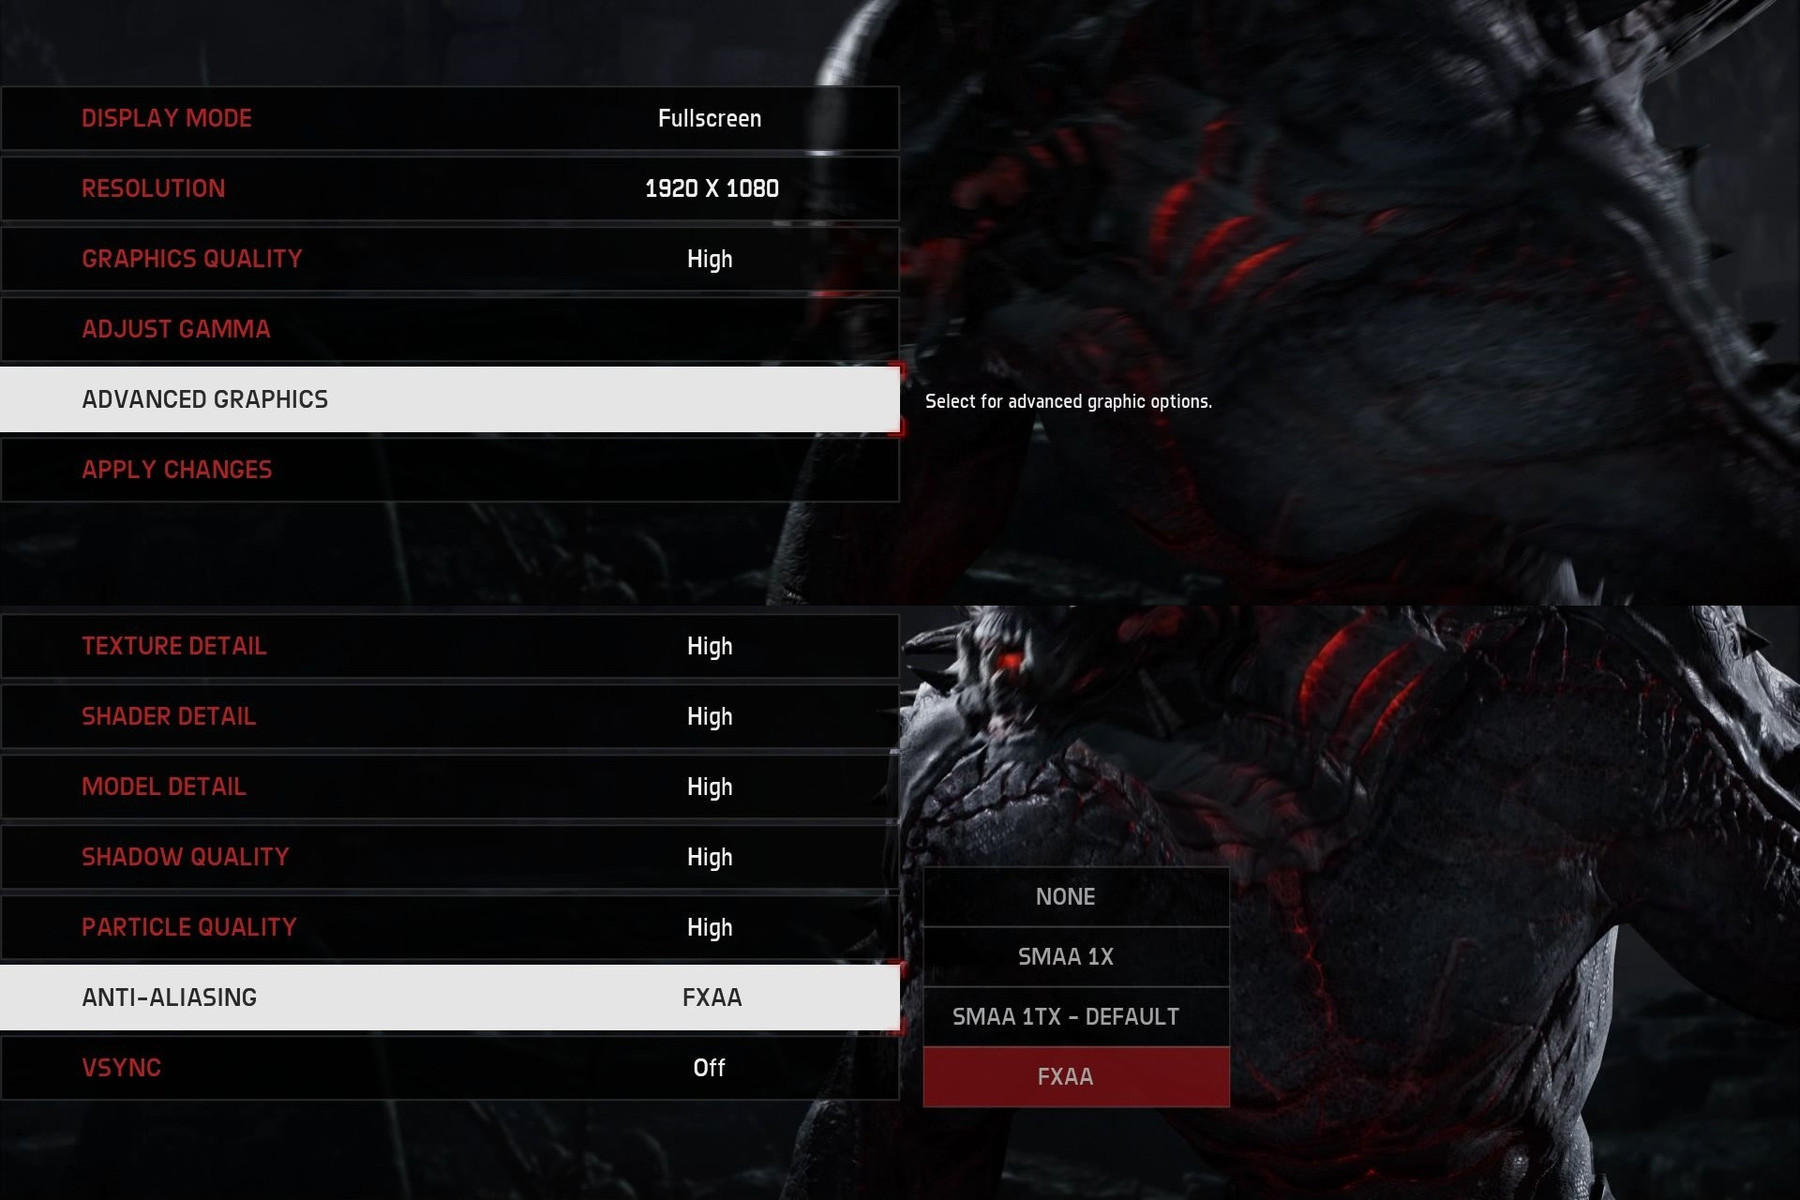
We appreciate that changing the graphics settings does not require restarting the game (not all settings can be changed when a game is running). Speaking about settings: The video menu has just three options. Apart from the display mode, you can only change resolution, gamma value and the overall quality (four presets). The advanced graphics menu offers more options, including five detail or quality controls, vertical synchronization, and various anti-aliasing modes. Those owning an Nvidia notebook can select the significantly better TXAA instead of SMAA, SMAA 1TX or FXAA.


We were not completely satisfied with Evolve in terms of technology. For example, the frame rate sometimes falls by above 50% during effect-intensive fights. Many systems generally suffered from stuttering, although their performance was sufficient on paper (especially with low and medium settings). In addition, loading and game starts should be bit faster. Hence, the developers should spend a little more time on optimization. So far, the title does not run completely smoothly.


Benchmark
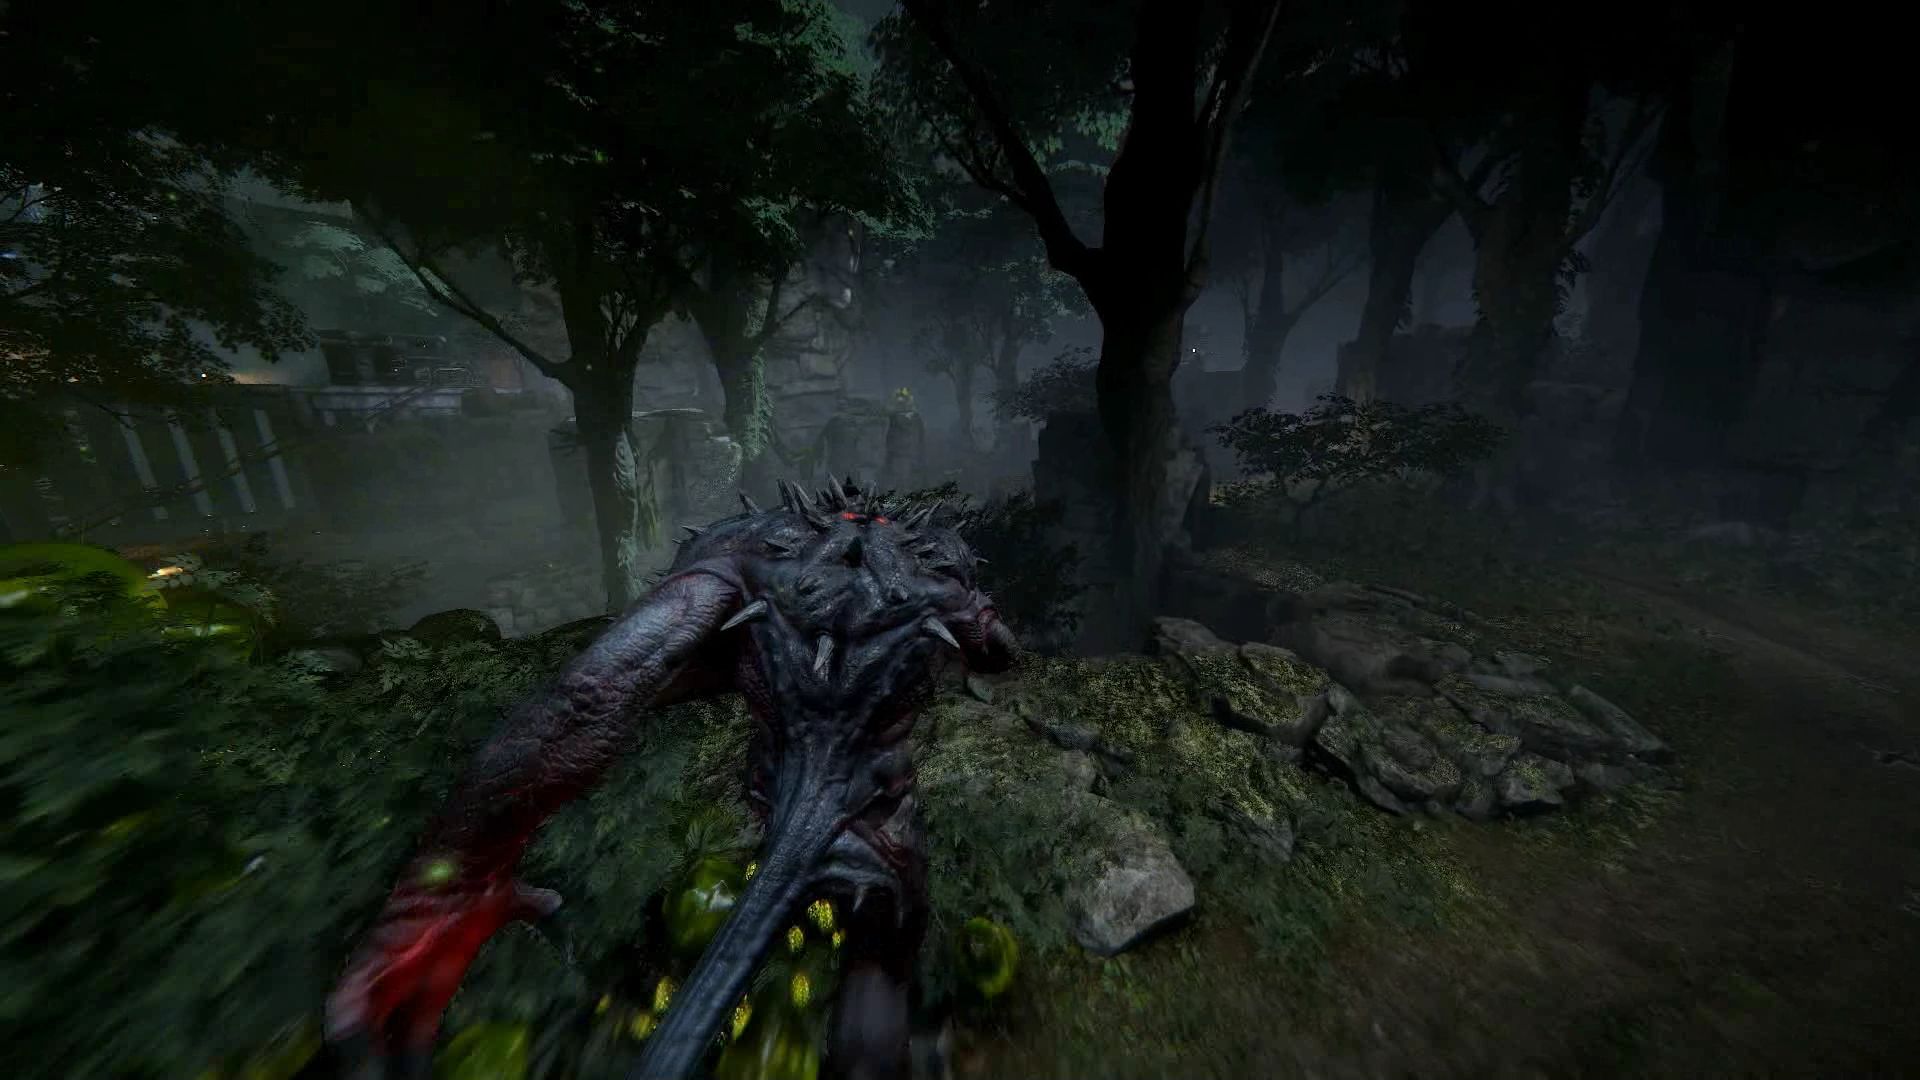
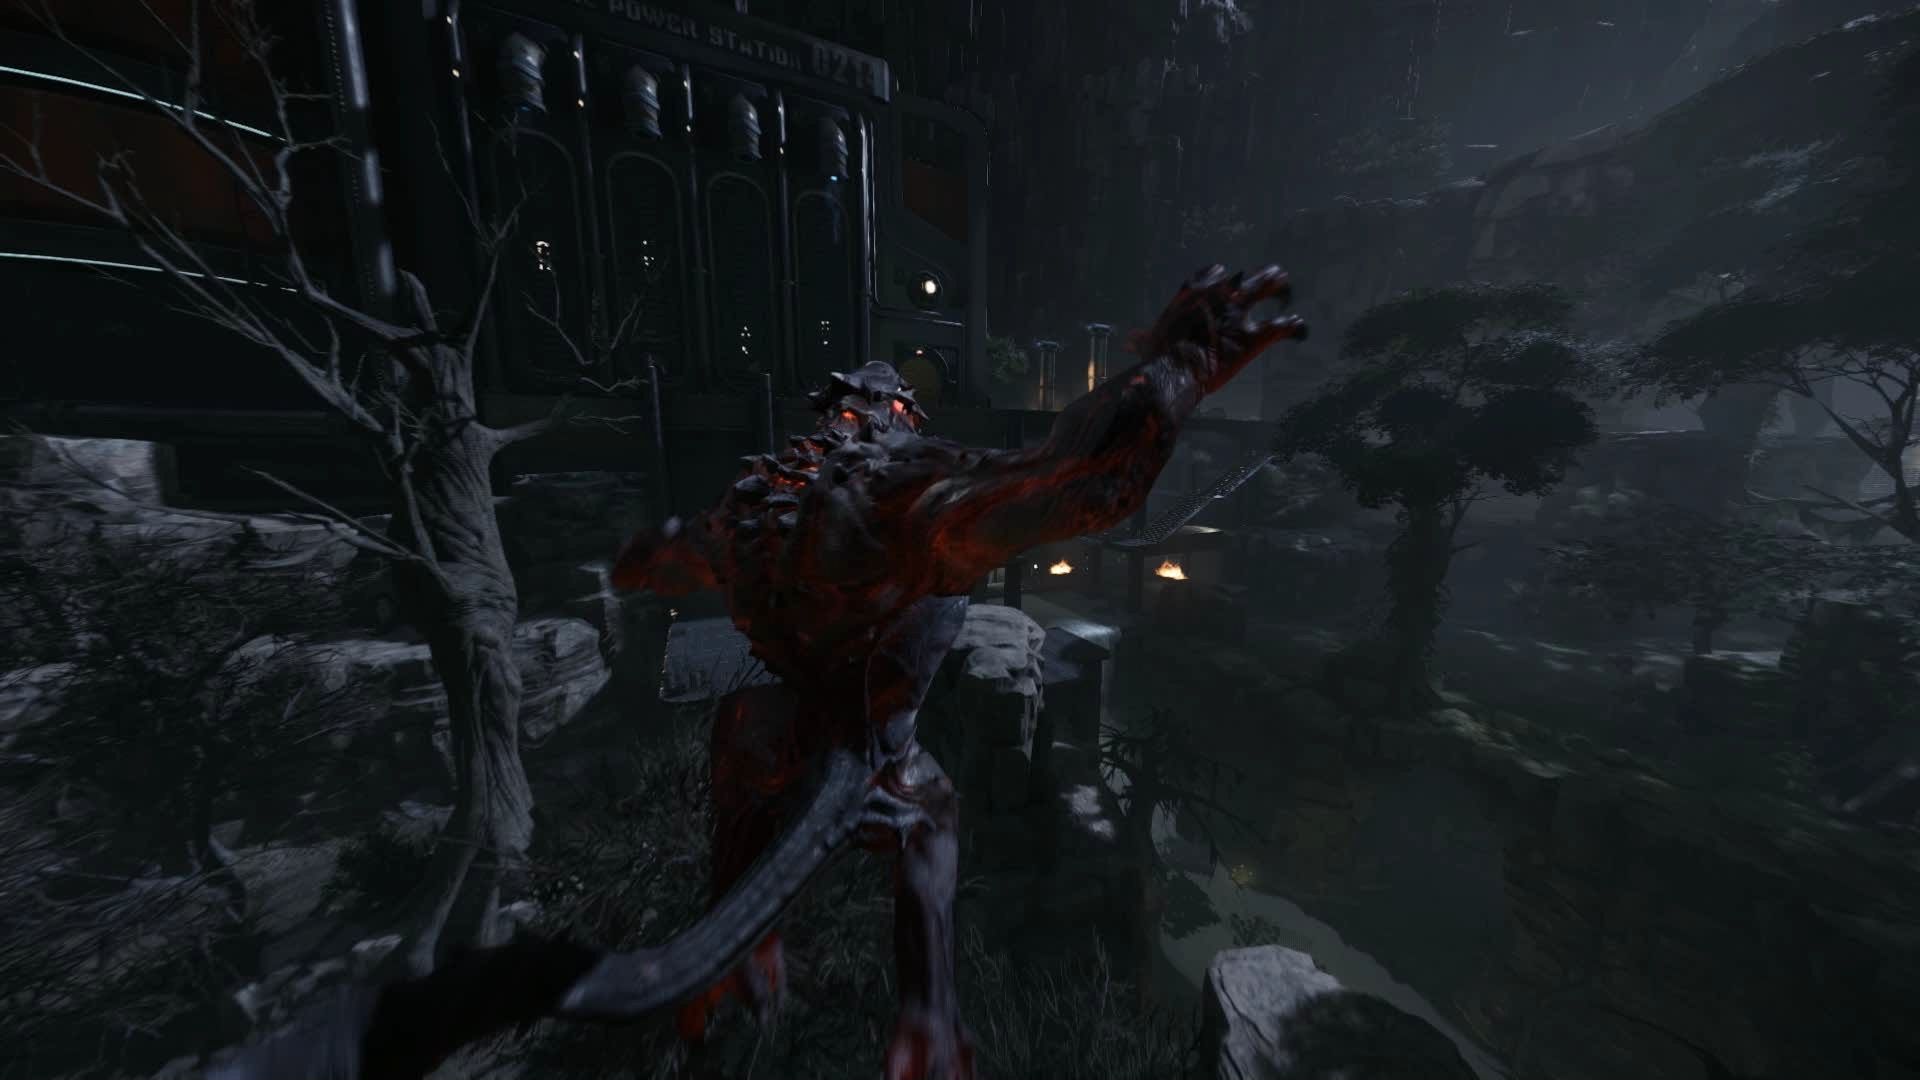
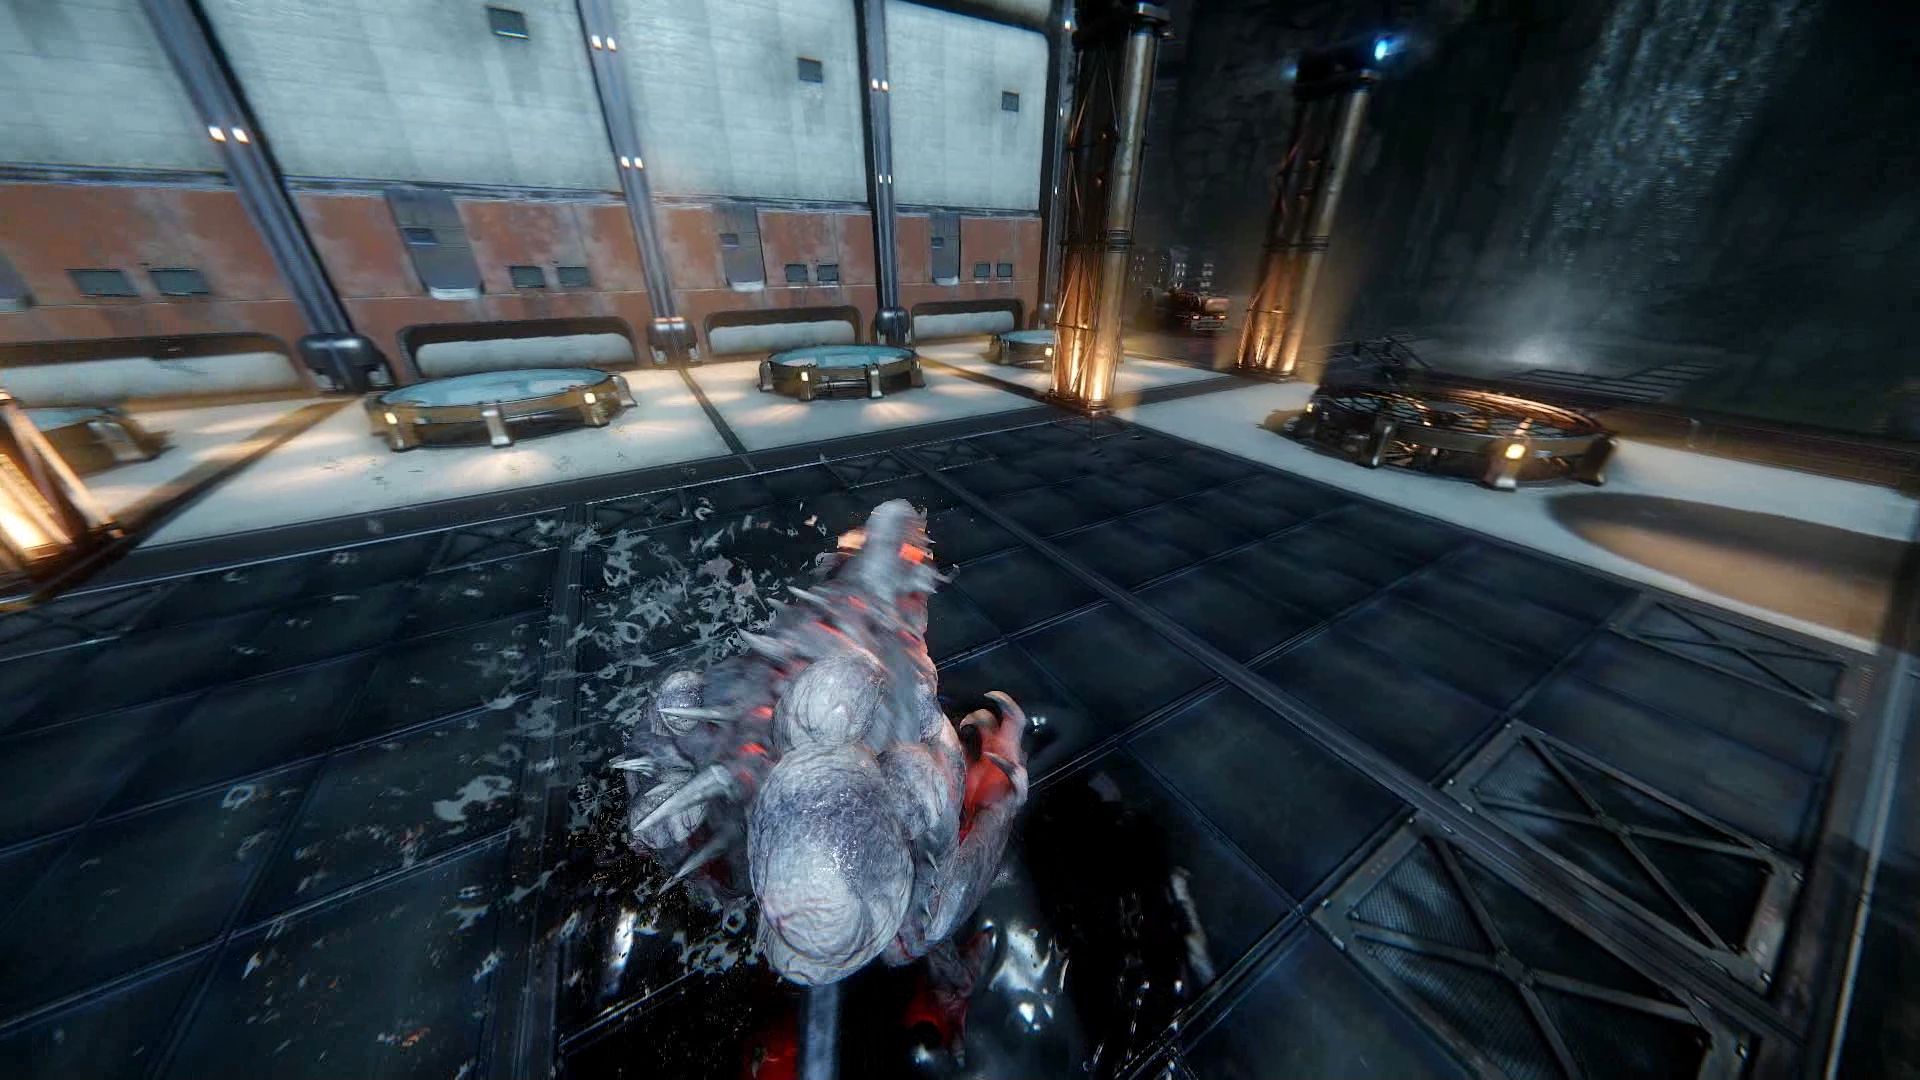
We use the beginning of the monster tutorial as the benchmark sequence. After a short camera movement, "Goliath" runs, jumps and climbs through quite a linear jungle. As soon as the monster reaches a higher plateau, we stop recording with the Fraps tool and record minimum and average fps. The latter roughly corresponds to what you can expect from the game. The sequence is neither undemanding nor particularly computationally intensive. Comfortable gameplay should be possible with a benchmark result of 35+.
Results
Since the graphics quality can only be reduced to some extent (even the low preset still looks acceptable), the hardware requirements are steep. Entry-level or older mid-range GPUs like the HD Graphics 4600 or the GeForce GT 740M are generally too weak for the title. At least a GeForce GT 750M is required for low details and a resolution of 1024x768 pixels. If you want to enjoy medium settings and 1366x768 to 1600x900 pixels, you'll have to own a powerful all-round chip like the GeForce GTX 850M. 1920x1080 pixels and the (very) high preset won't run smoothly with weaker graphics cards than a GeForce GTX 780M or GTX 870M.
Unfortunately, we could not test the Radeon R9 M290X, since the driver installation was messed up and not even a system restore could resolve this problem. In the coming weeks, the results from other AMD chips will follow (most of them low-end and mid-range). All benchmarks considered, Evolve is very demanding and definitely calls for a real gaming notebook with higher settings.
| Evolve | |
| 1920x1080 Very High Graphics Quality AA:1TX SM 1920x1080 High Graphics Quality AA:FX 1366x768 Medium Graphics Quality 1024x768 Low Graphics Quality | |
| NVIDIA GeForce GTX 980, 3770K | |
| AMD Radeon R9 290X, 4790K | |
| AMD Radeon R9 280X, 3770K | |
| NVIDIA GeForce GTX 980M, 4700MQ | |
| NVIDIA GeForce GTX 970M, 4700MQ | |
| NVIDIA GeForce GTX 880M, 4700MQ | |
| NVIDIA GeForce GTX 780M, 4700MQ | |
| NVIDIA GeForce GTX 870M, 4700MQ | |
| NVIDIA GeForce GTX 770M, 4700MQ | |
| NVIDIA GeForce GTX 860M, 4700MQ | |
| NVIDIA GeForce GTX 850M, 4340M | |
| NVIDIA GeForce GTX 765M, 4700MQ | |
| NVIDIA GeForce GT 750M, 4702MQ | |
| AMD Radeon R7 512 Cores (Kaveri Desktop), A10-7850K | |
| Intel Iris Pro Graphics 5200, 4750HQ | |
| NVIDIA GeForce GT 640M, 2637M | |
| NVIDIA GeForce GT 740M, 4200M | |
| NVIDIA GeForce GT 720M, 4200M | |
| AMD Radeon HD 8650G, A10-5750M | |
| NVIDIA GeForce GT 630M, 3720QM | |
| Intel HD Graphics 4600, 4700MQ | |
| Intel Iris Graphics 5100, 4258U | |
Test Systems
Four of our test devices stem from Schenker Technologies (mysn.de):
- W504 (Core i7-4700MQ, 8 GB DDR3, GeForce GTX 860M, GTX 870M, GTX 880M, GTX 970M, GTX 980M, Radeon R9 M290X)
- W503 (Core i7-4700MQ, 8 GB DDR3, GeForce GTX 765M, GTX 770M, GTX 780M)
- M504 (Core i5-4340M, 8 GB DDR3, GeForce GTX 850M)
- M503 (Core i7-4702MQ, 8 GB DDR3, GeForce GT 750M)
Each of these notebooks has Windows 7 64-bit installed.
Nvidia provided us with further test devices:
- HP Envy 15-j011sg (Core i5-4200M, 12 GB DDR3, GeForce GT 740M)
- MSI CX61-i572M281BW7 (Core i5-4200M, 8 GB DDR3, GeForce GT 720M)
- Acer Aspire Timeline Ultra M3-581TG (Core i7-2637M, 4GB DDR3, GeForce GT 640M)
In addition, Intel provided us with the:
- Schenker S413 (Core i7-4750HQ, 8 GB DDR3, Iris Pro Graphics 5200)
The desktop computers house CPUs/APUs from Intel and AMD, SSDs from Micron, Intel, and Samsung, motherboards from Intel and Asus and graphics cards from Nvidia and AMD.
Used GPU driver: Nvidia 347.52, AMD 14.12, Intel 15.36.14.64.4080
Overview
