 Deutsch
 English
 Español
 Français
 Italiano
 Nederlands
 Polski
 Português
 Русский
 Türkçe
 Svenska
 Chinese
 Magyar
Ryse: Son of Rome Benchmarked
For the original German article, see here.
Graphics
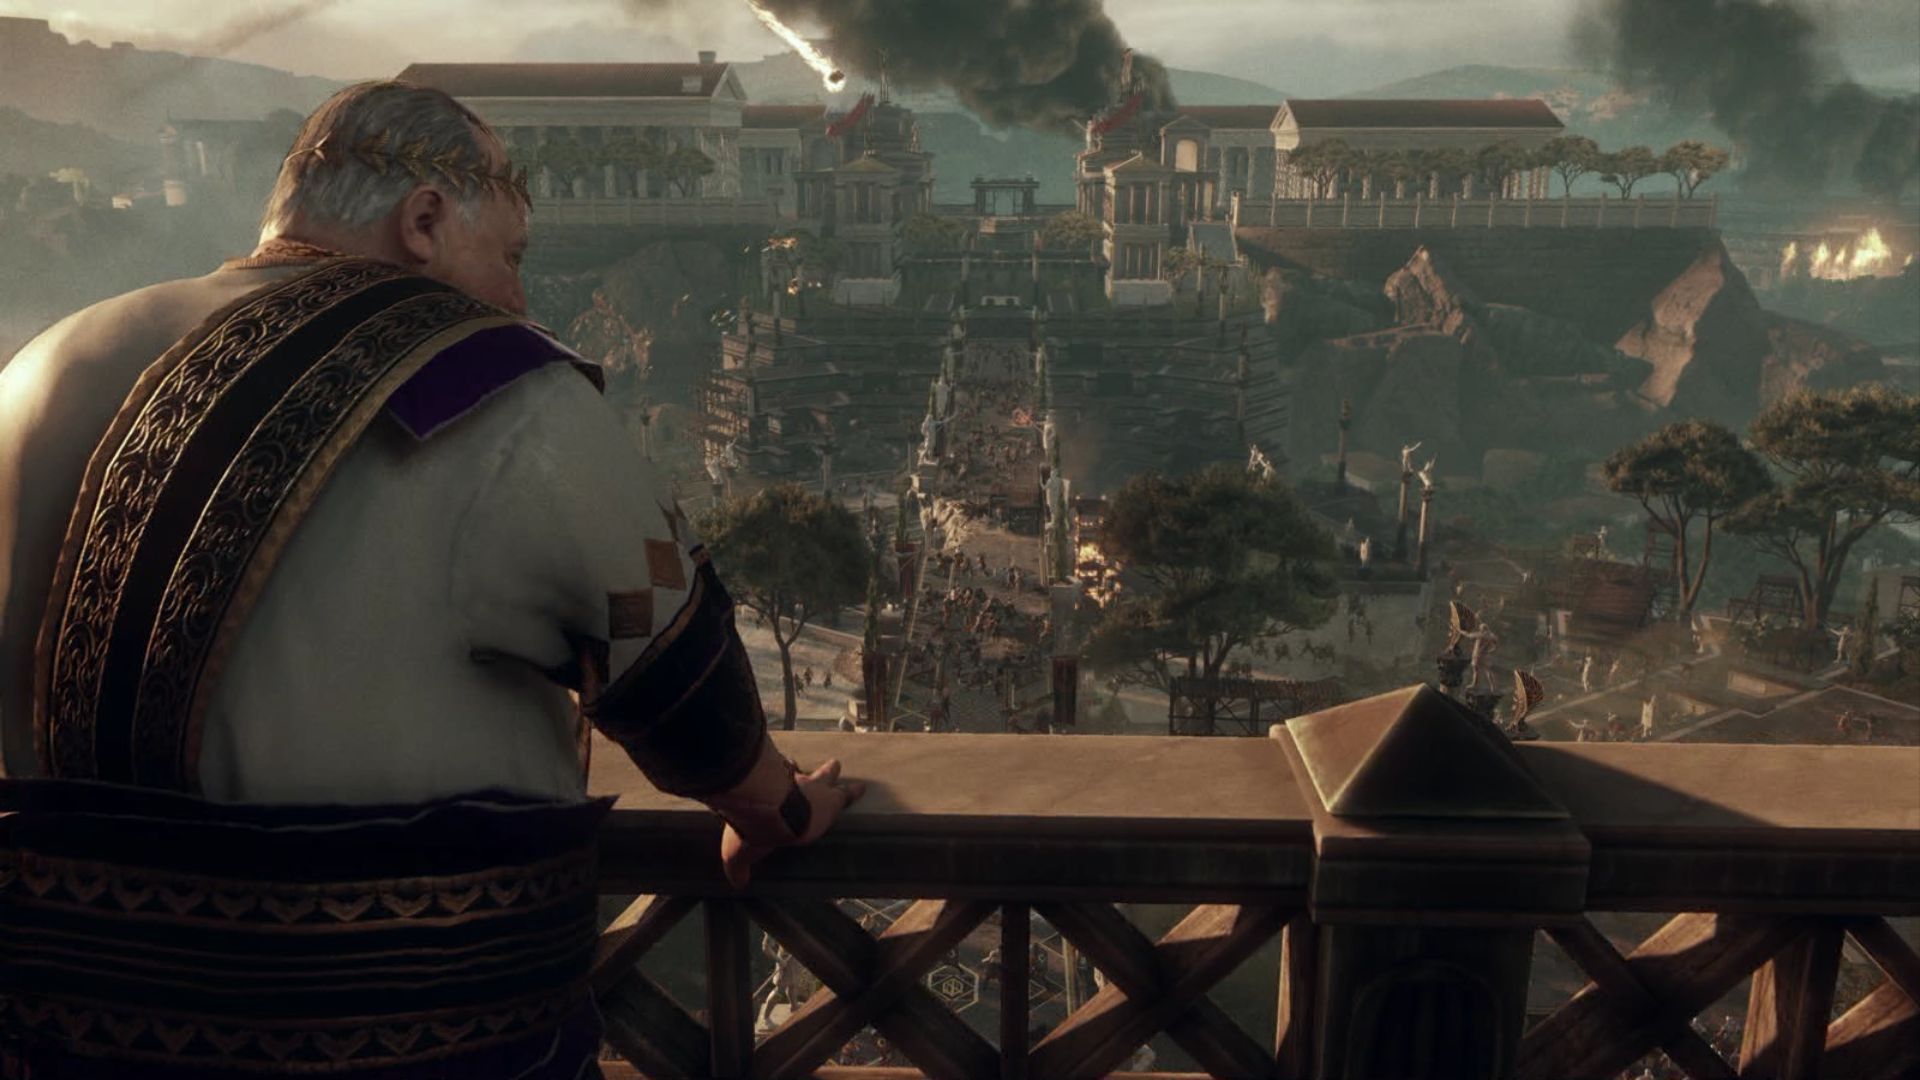
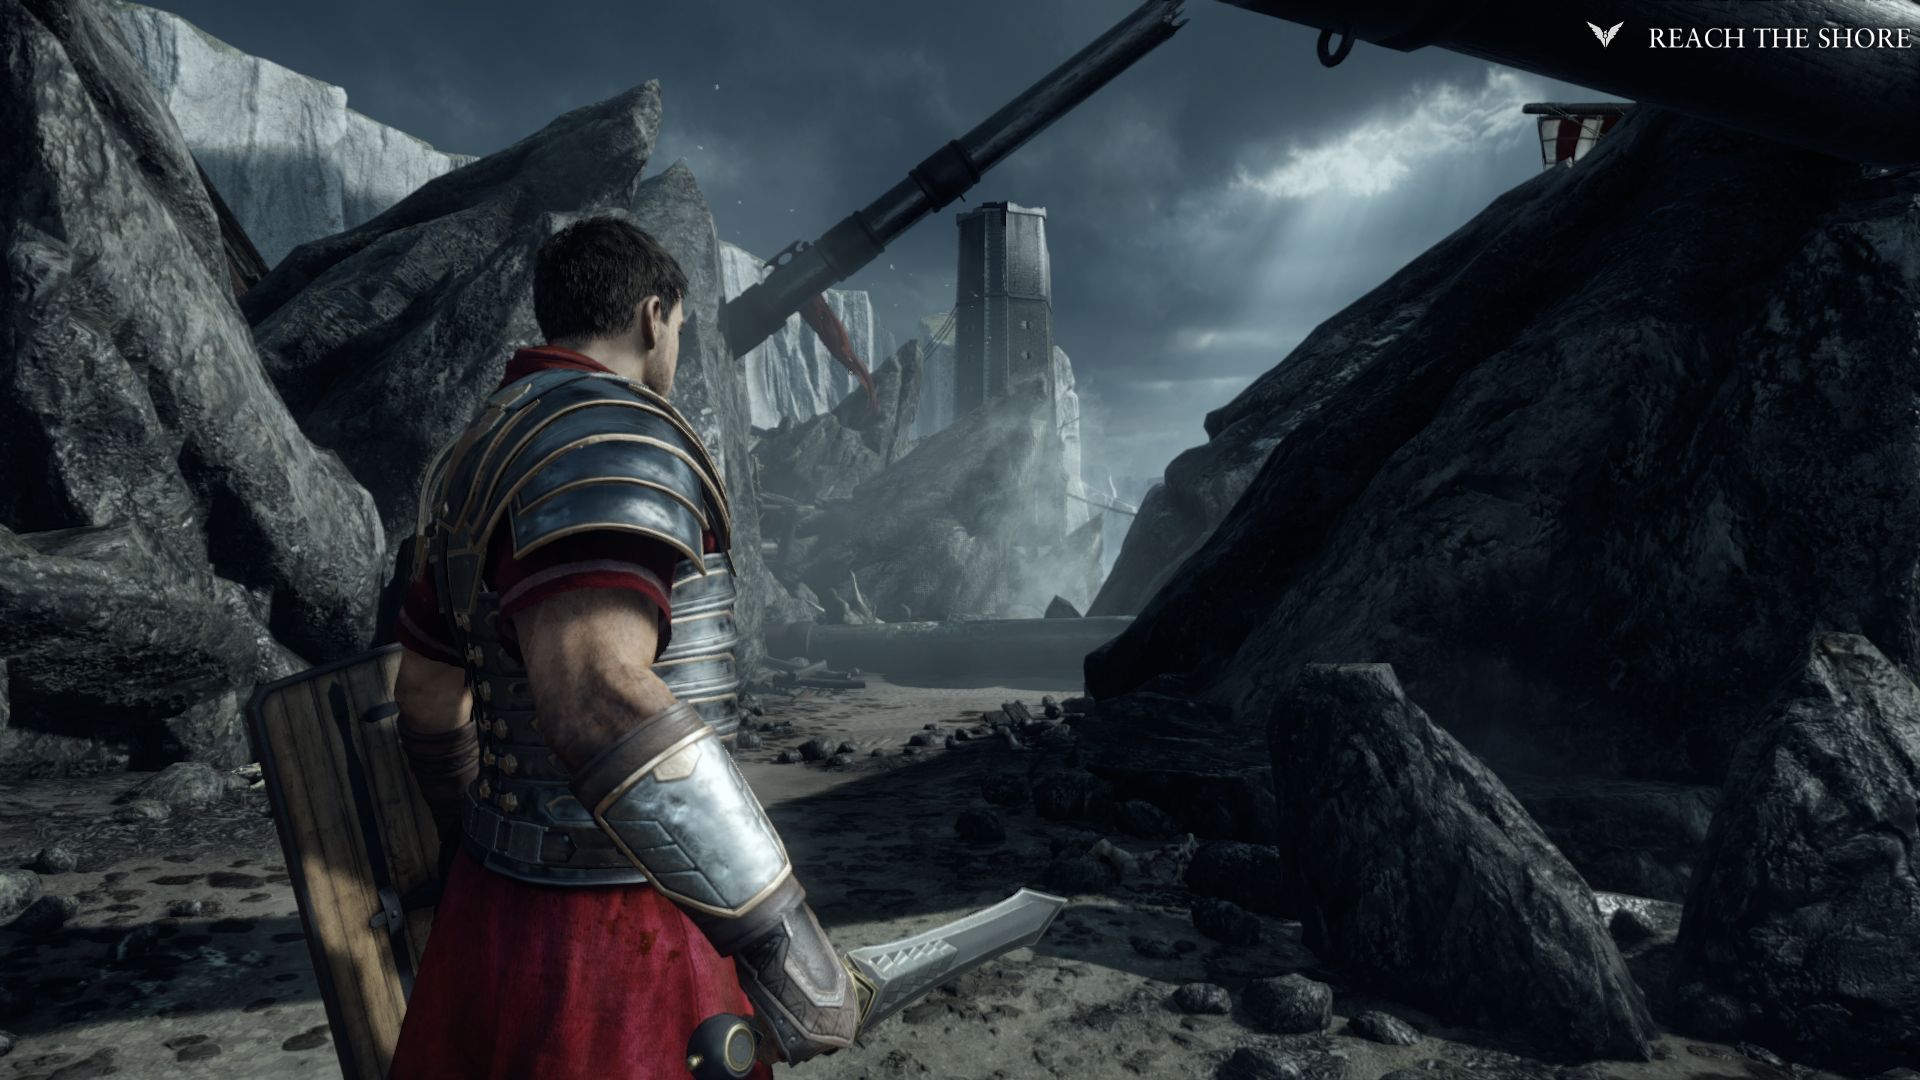
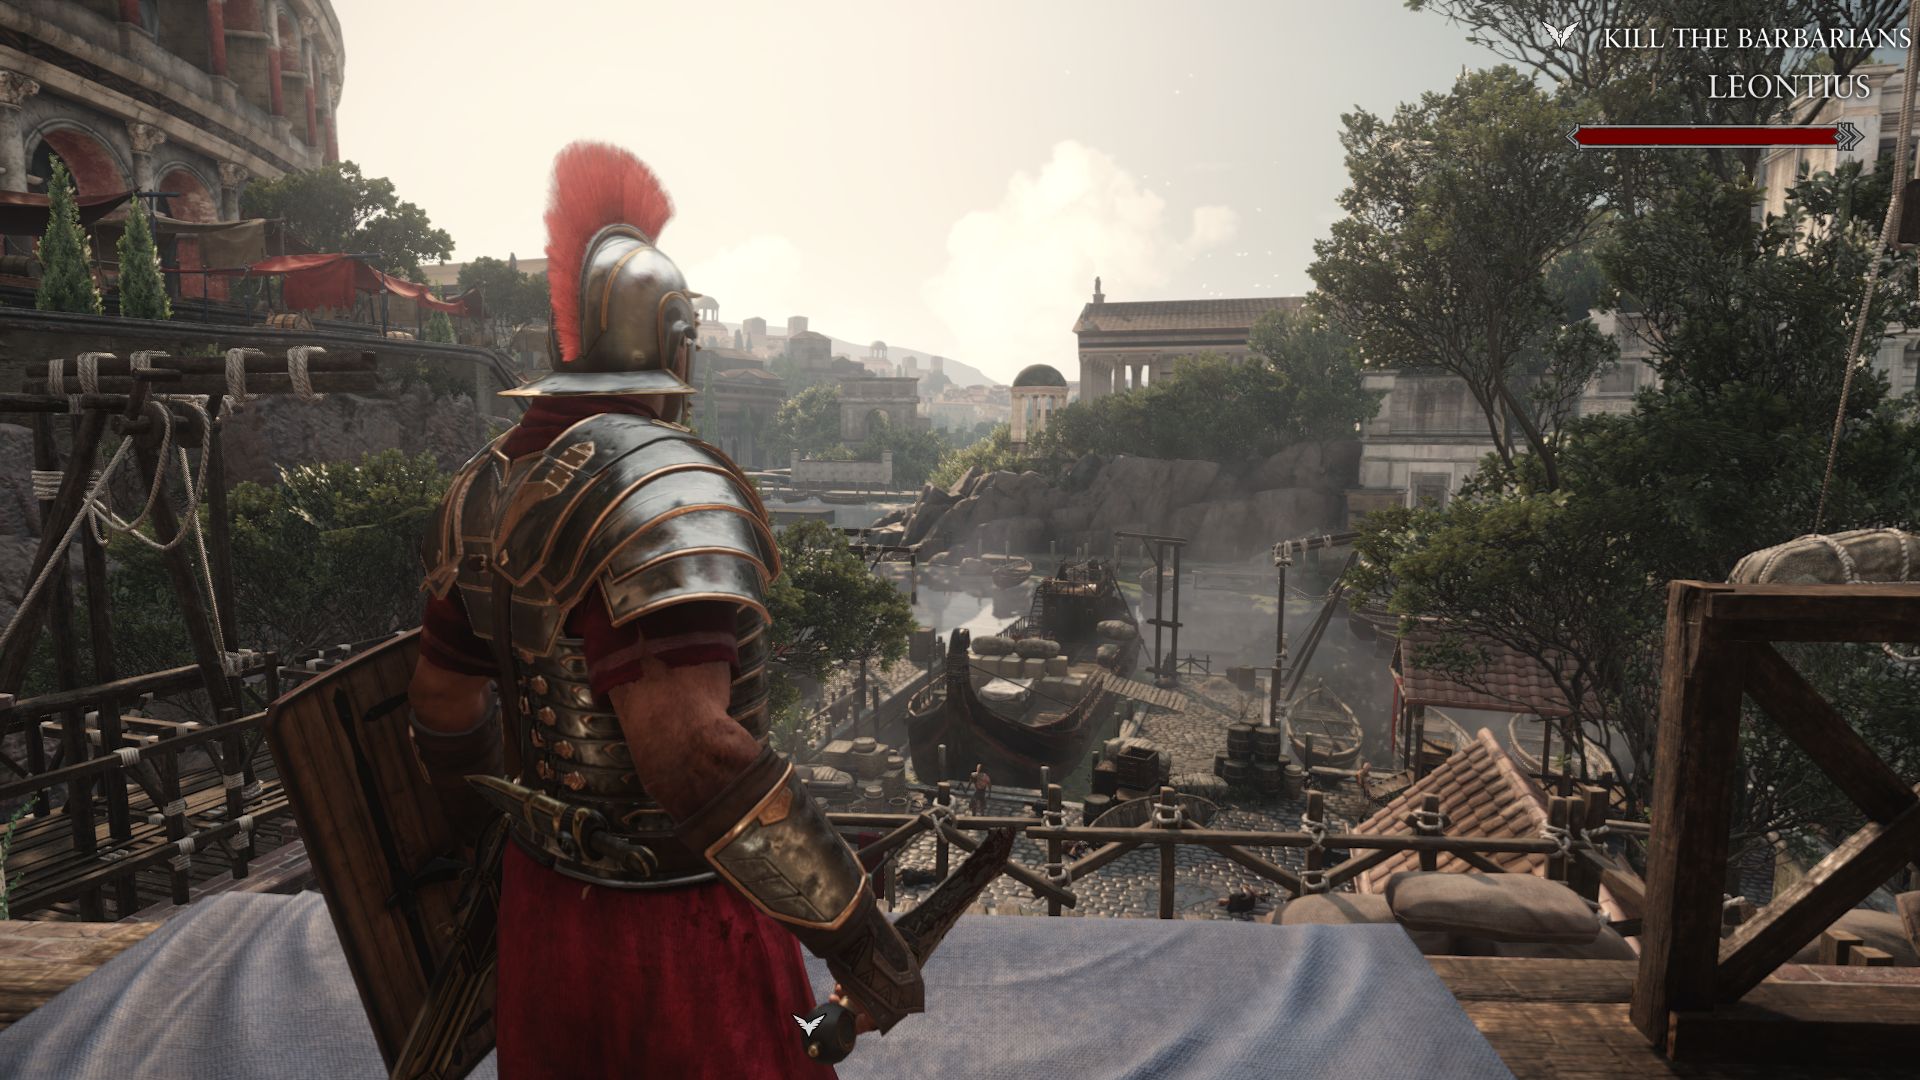
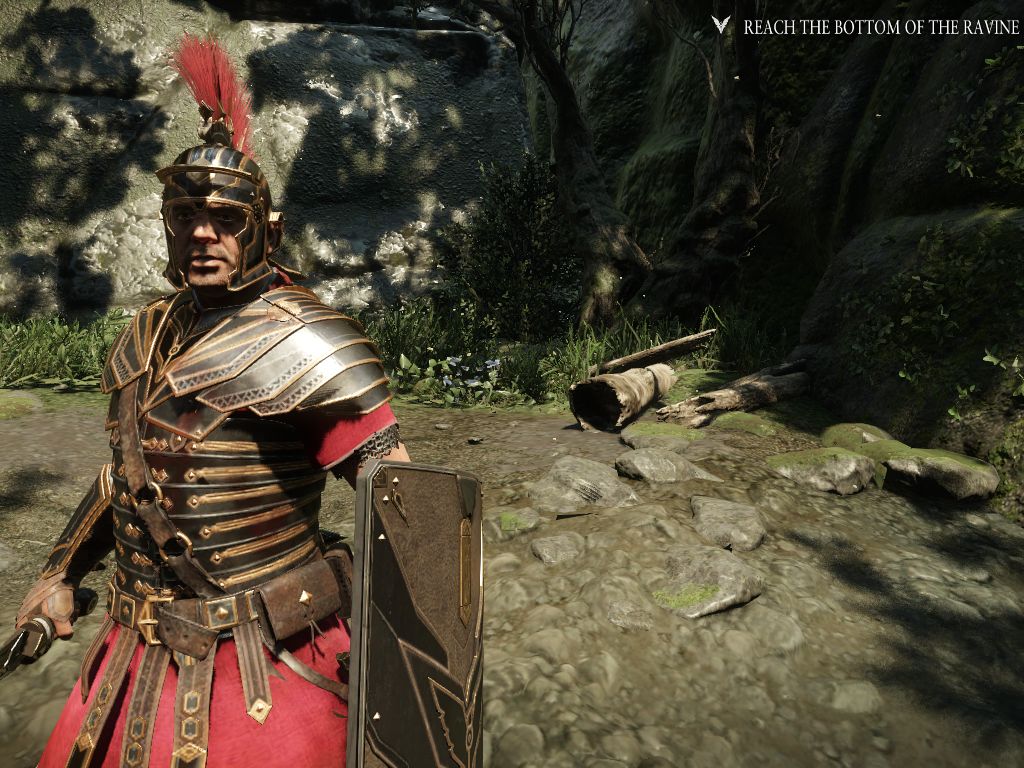
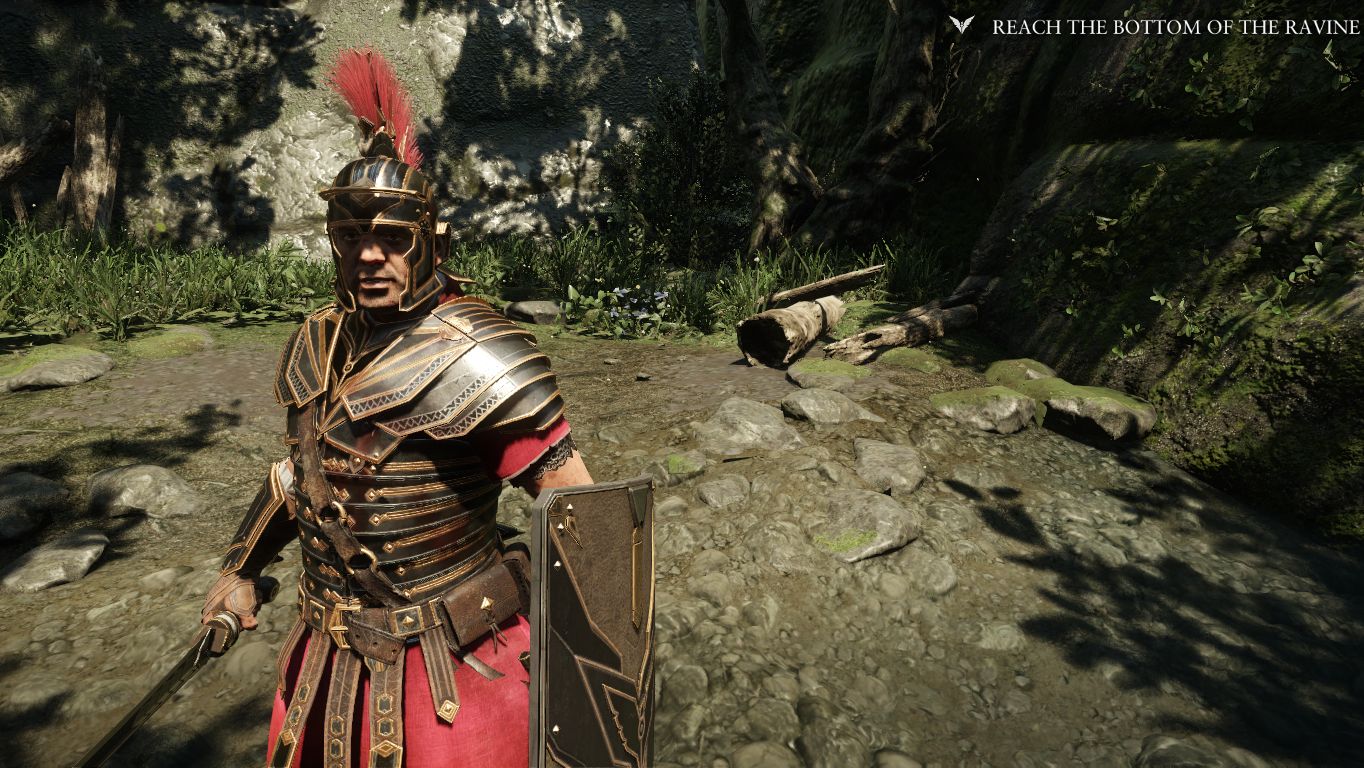
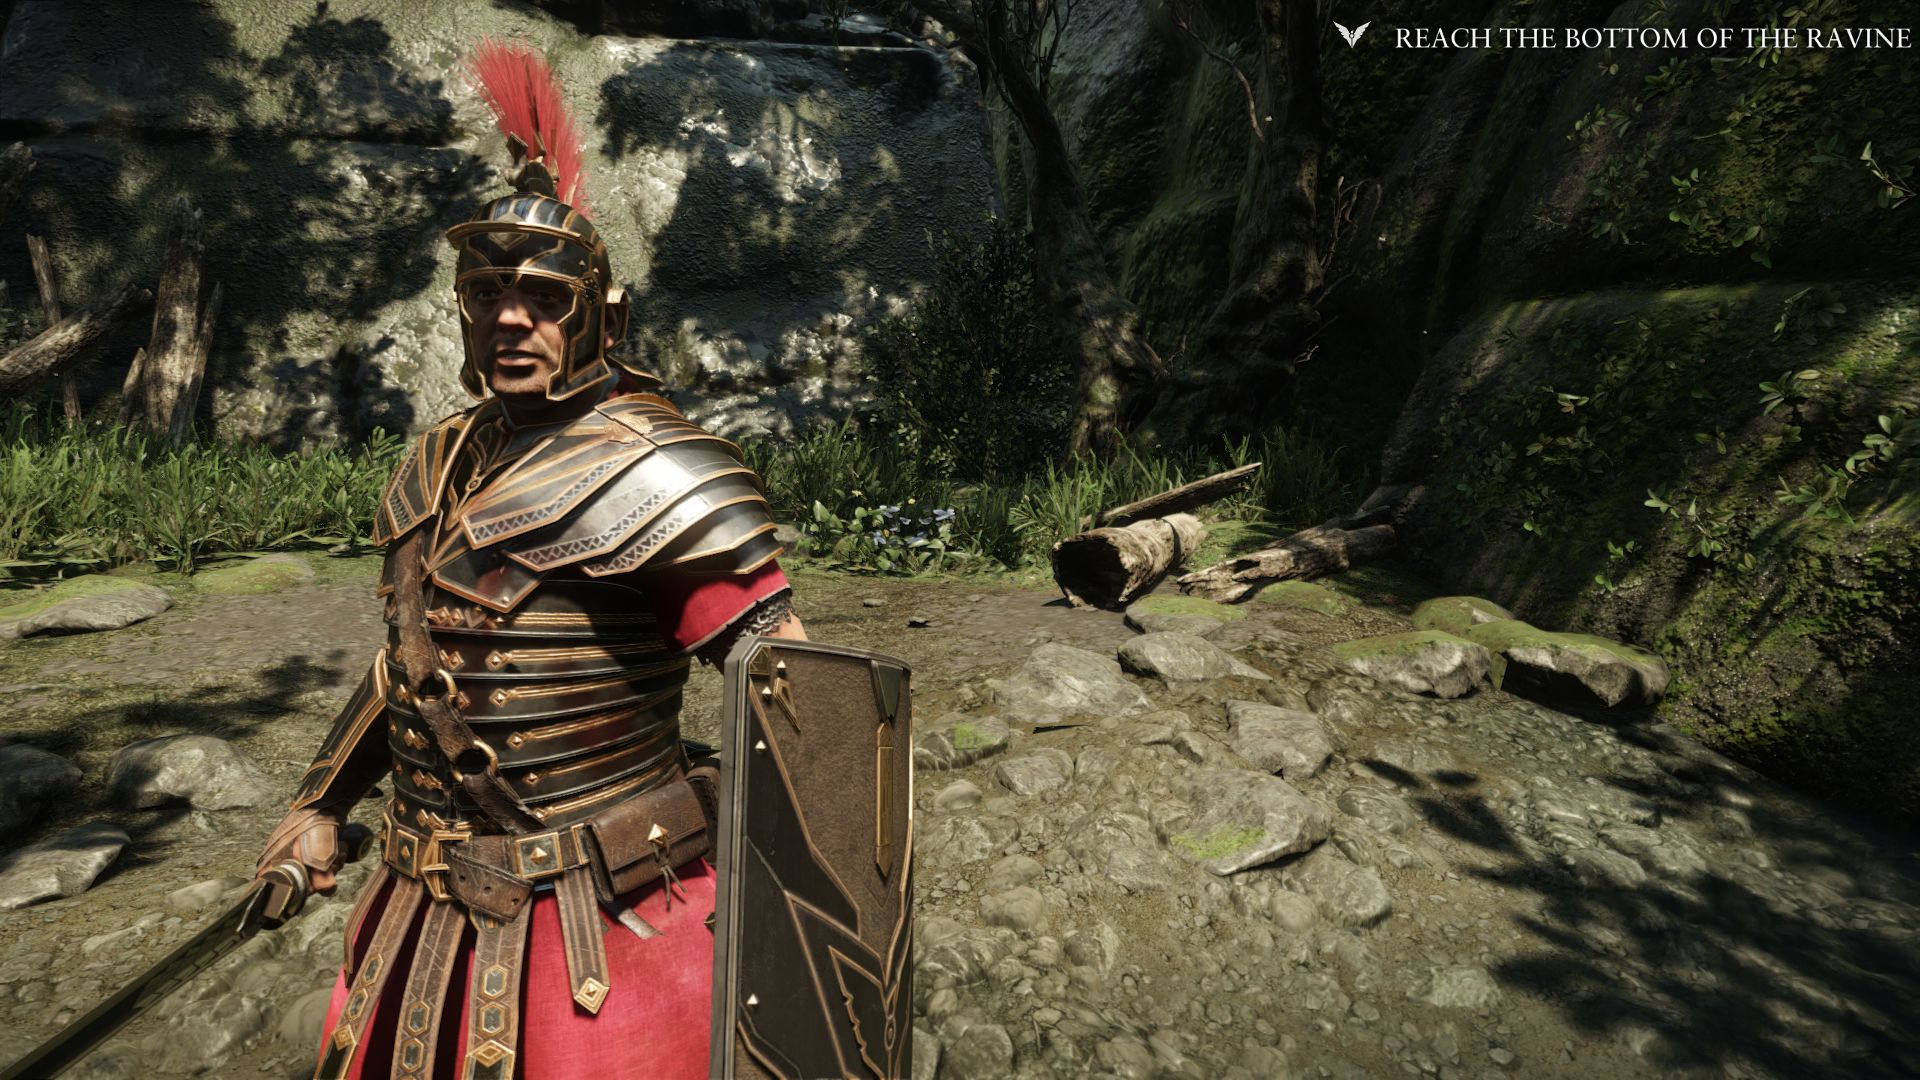
After creating the stunning visuals that sweep through Crysis 3, Crytek went the extra mile once again for their PC version of Ryse: Son of Rome. Whether the topic of discussion is texture sharpness, polygon count or the quality of effects, the third-person title is definitely one of the most impressive PC games of all time. With all its exemplary graphics-related features, we would even call it a new gold standard. Even though the levels are programmed rather narrowly and linearly, the scenery often feels spacious.
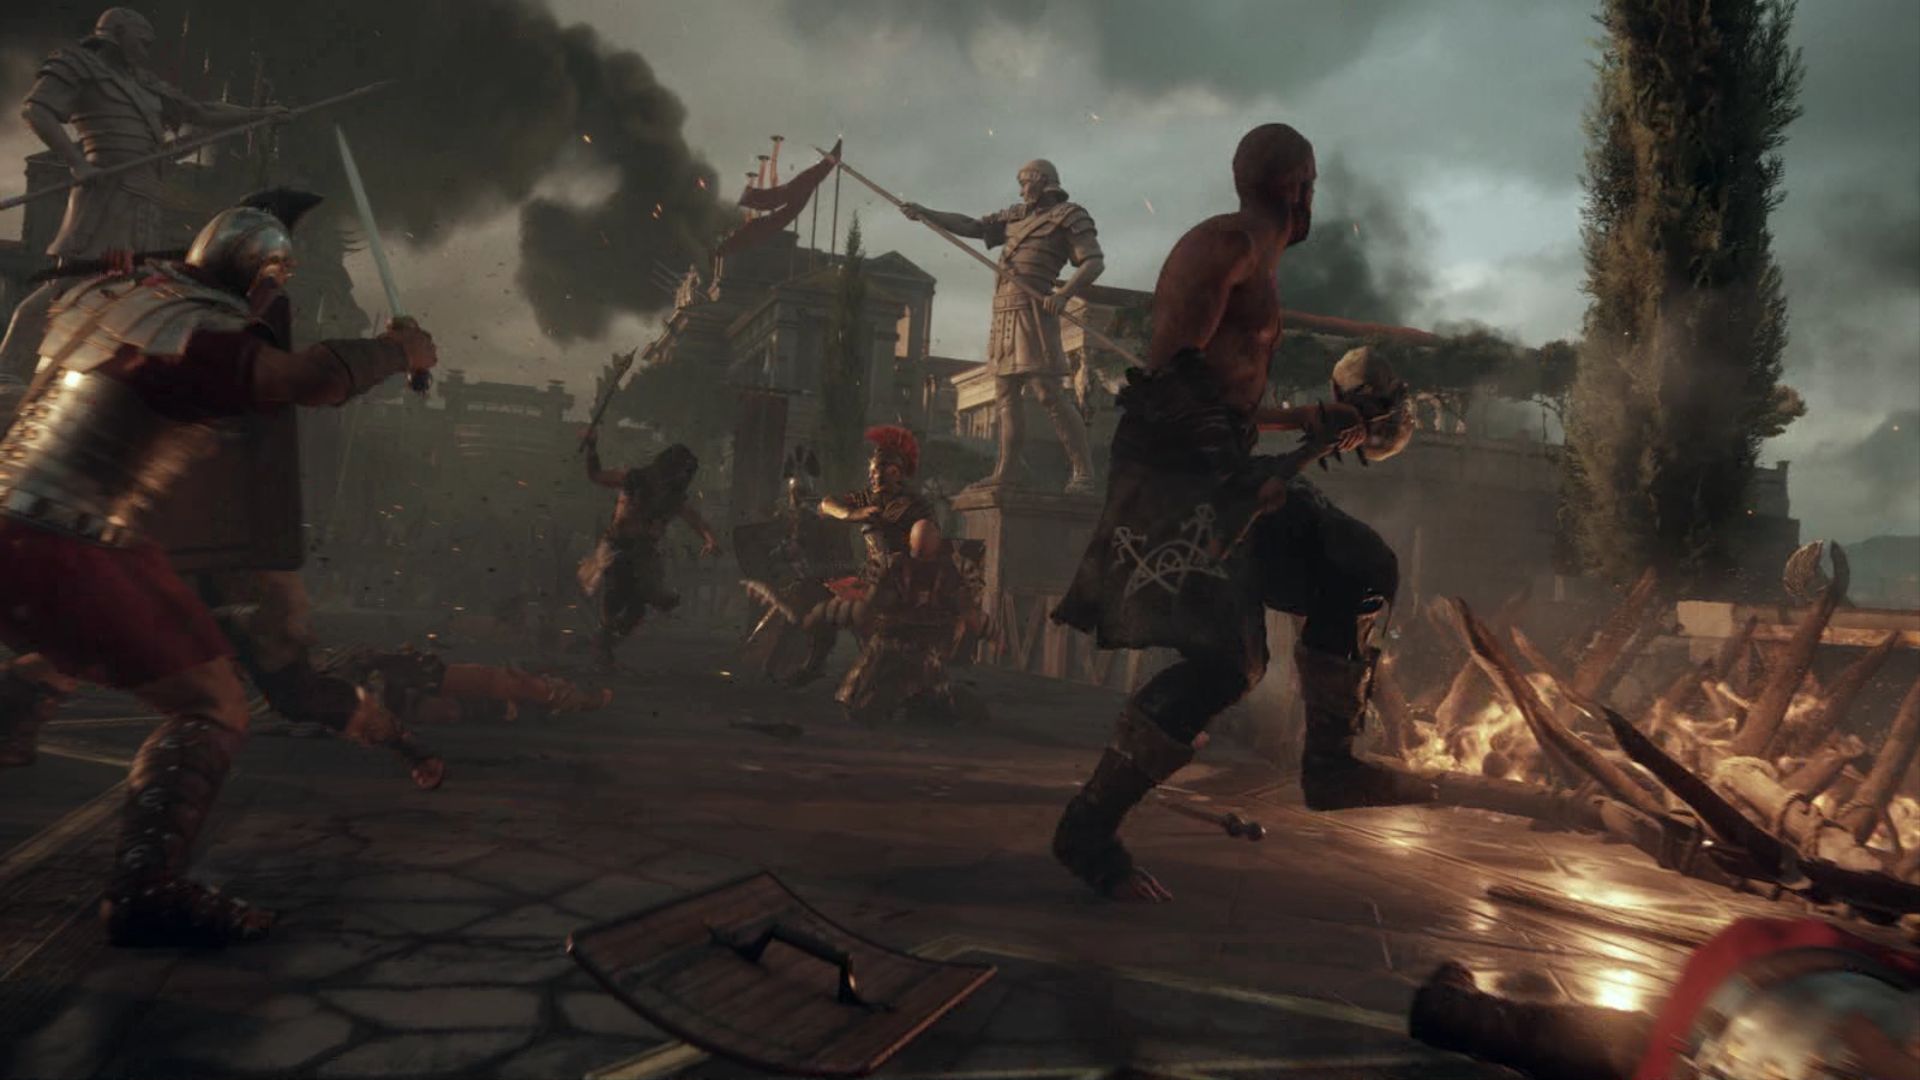
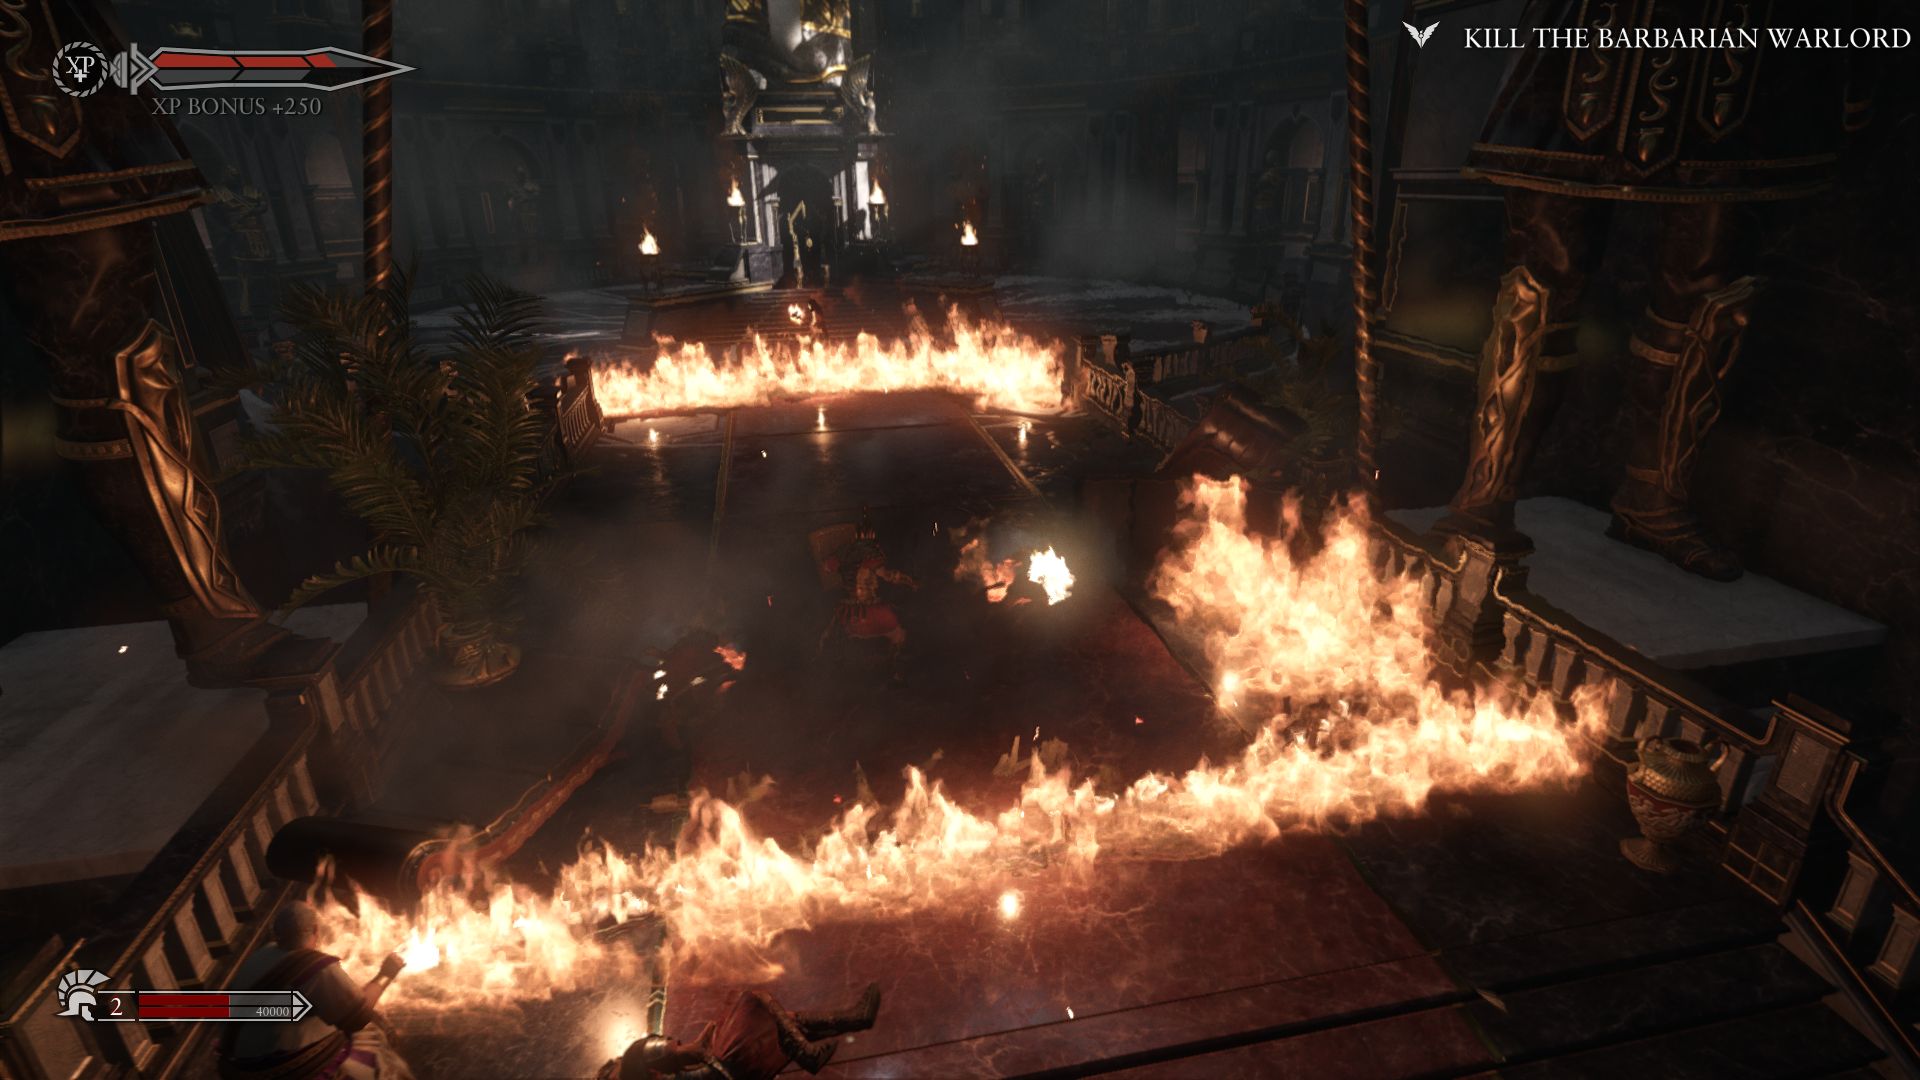
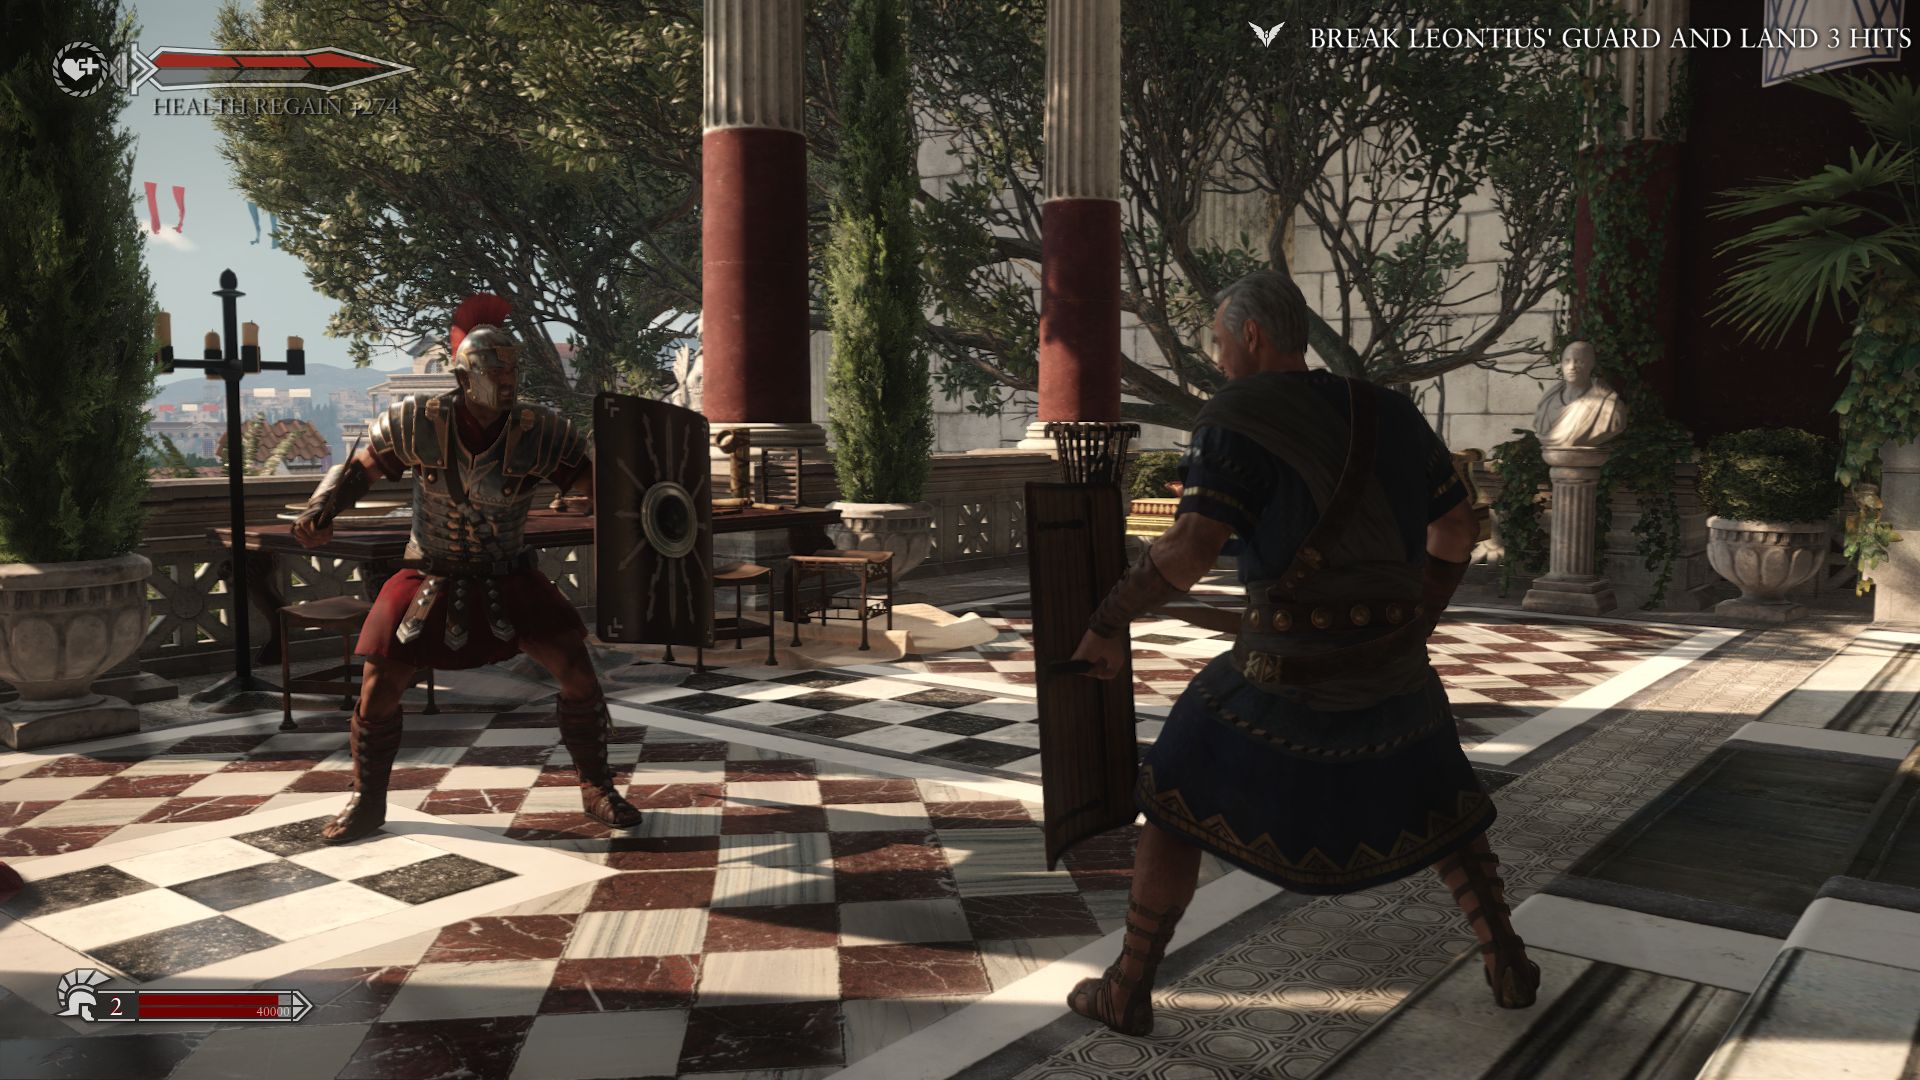
As well as the pretty and attractively illuminated panoramas, the characters' rich physical detail is also very appealing. Yes, here and there the animations could be a little more believable (in the action genre, Battlefield 4 takes the lead); but it would hardly be possible to find fault with the facial expressions and finishing moves. In general, whether in the well-executed video sequences or in the game scenes, the incredibly realistic nature of the faces is captivating. A veritable torrent of effects (smoke, explosions, falling objects, etc.) intensifies the atmosphere of the battles.
Speaking of battles: Just in terms of gameplay, Ryse failed to sweep us off our feet. Like in the olden days, back when hack-and-slash was popular, the player simply slaughters hordes of dim-witted clones to reach the next mission. Ryse almost never offers any variety. True, depending on the level of difficulty, the combat can certainly be challenging, but in the long run it just is not exciting. The stylistic choreography fails to help much here. The same goes for the unlockable upgrades. Overall, the game feels very repetitive, and except in the Roman settings, somewhat discouraging. It is not without reason that Ryse has been mockingly referred to as a "graphics demo" in the past.

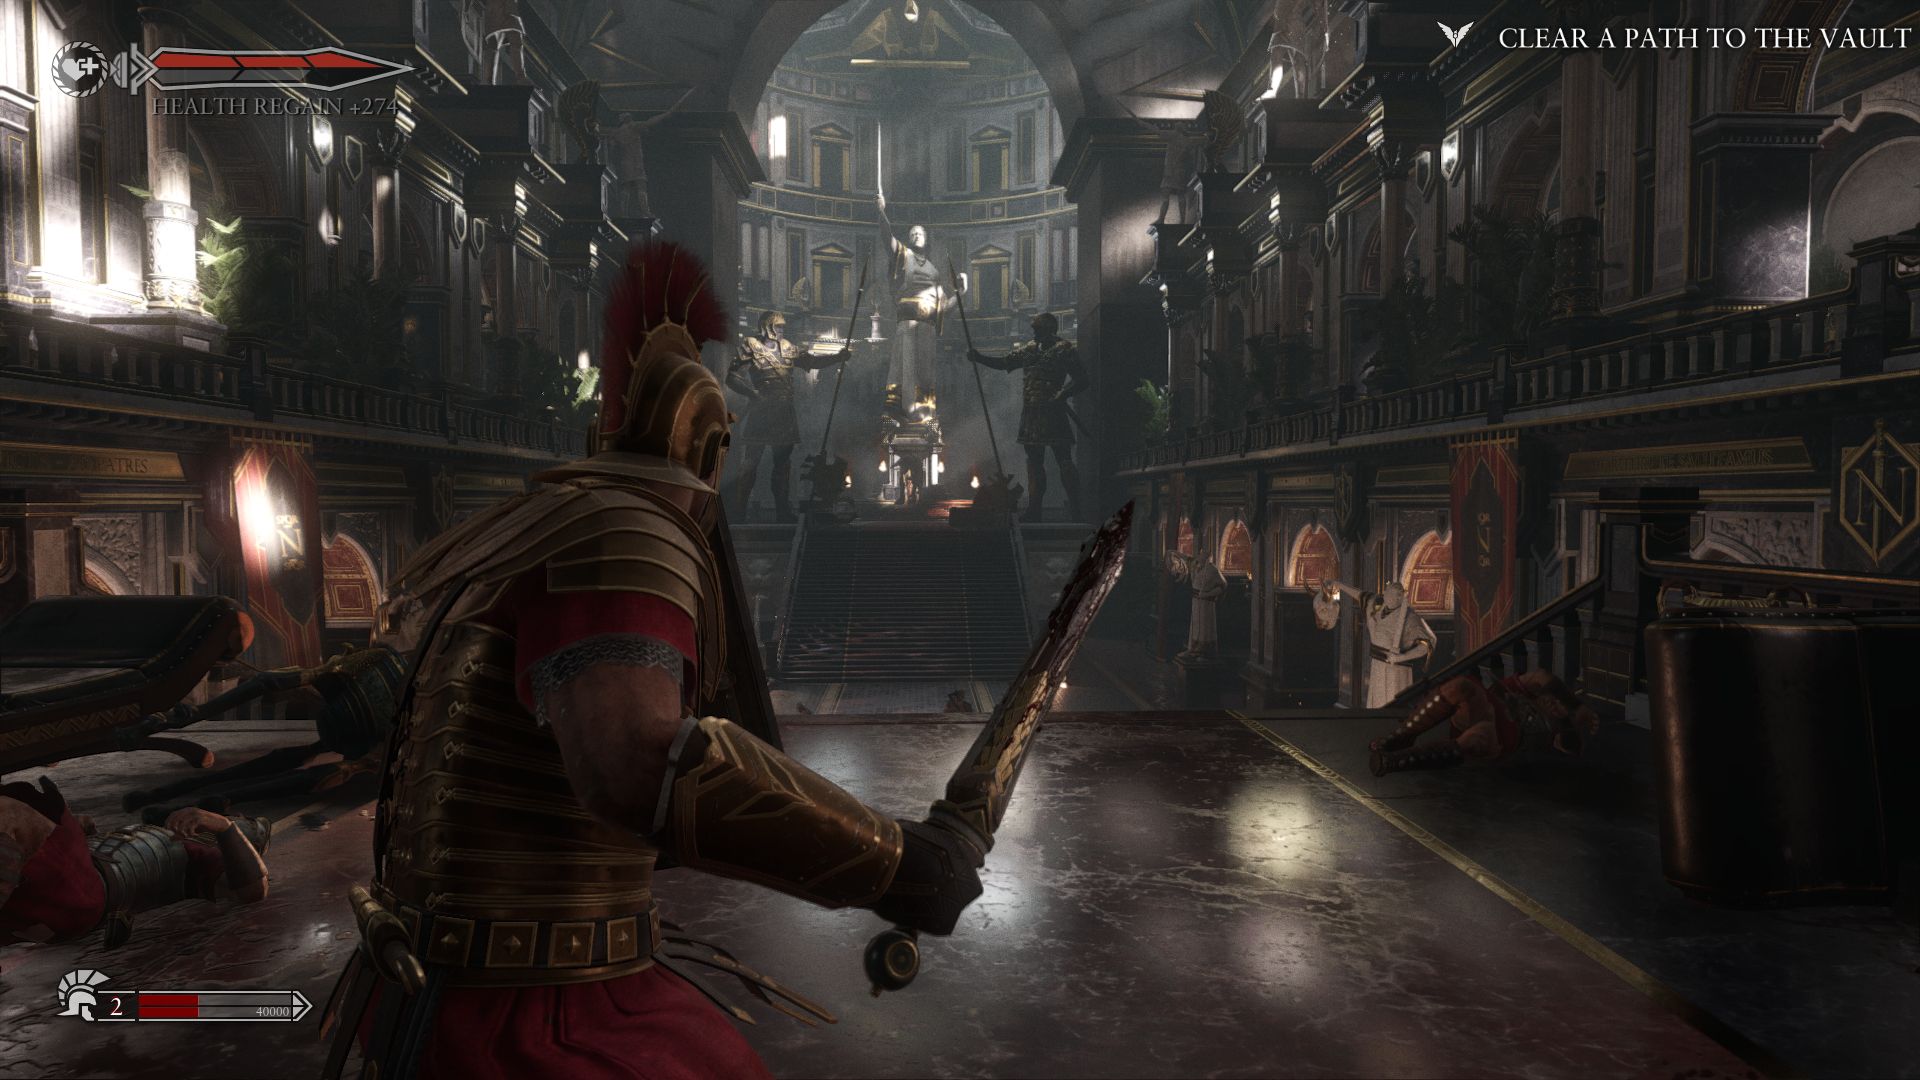
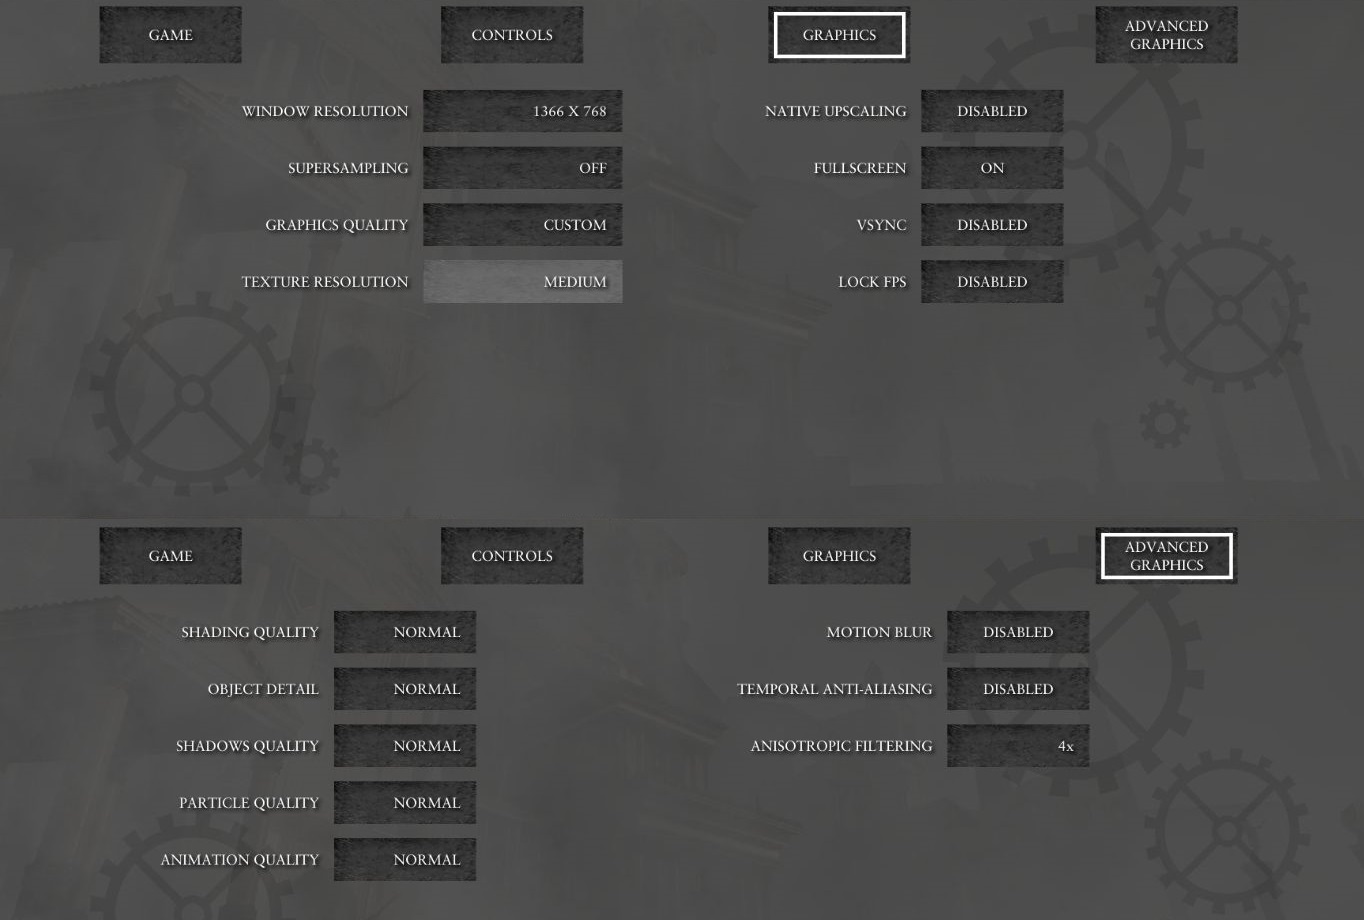
Regardless of that shortcoming, Crytek did a good job converting the game for PC. Overlooking the relatively high load times (HDD) and the not quite perfect controls, there remains little room for criticism. The only thing we do not quite comprehend is the fact that (currently) the texture resolution nearly fills up the video memory - think Watch Dogs, Middle Earth: Shadow of Mordor and Wolfenstein: The New Order. While Ryse chooses to use 1024 MB for low details, medium texture settings already hit 1536 MB. High settings here require 2.0 GB VRAM, and the game can only function at maximum details with 3.0 GB.
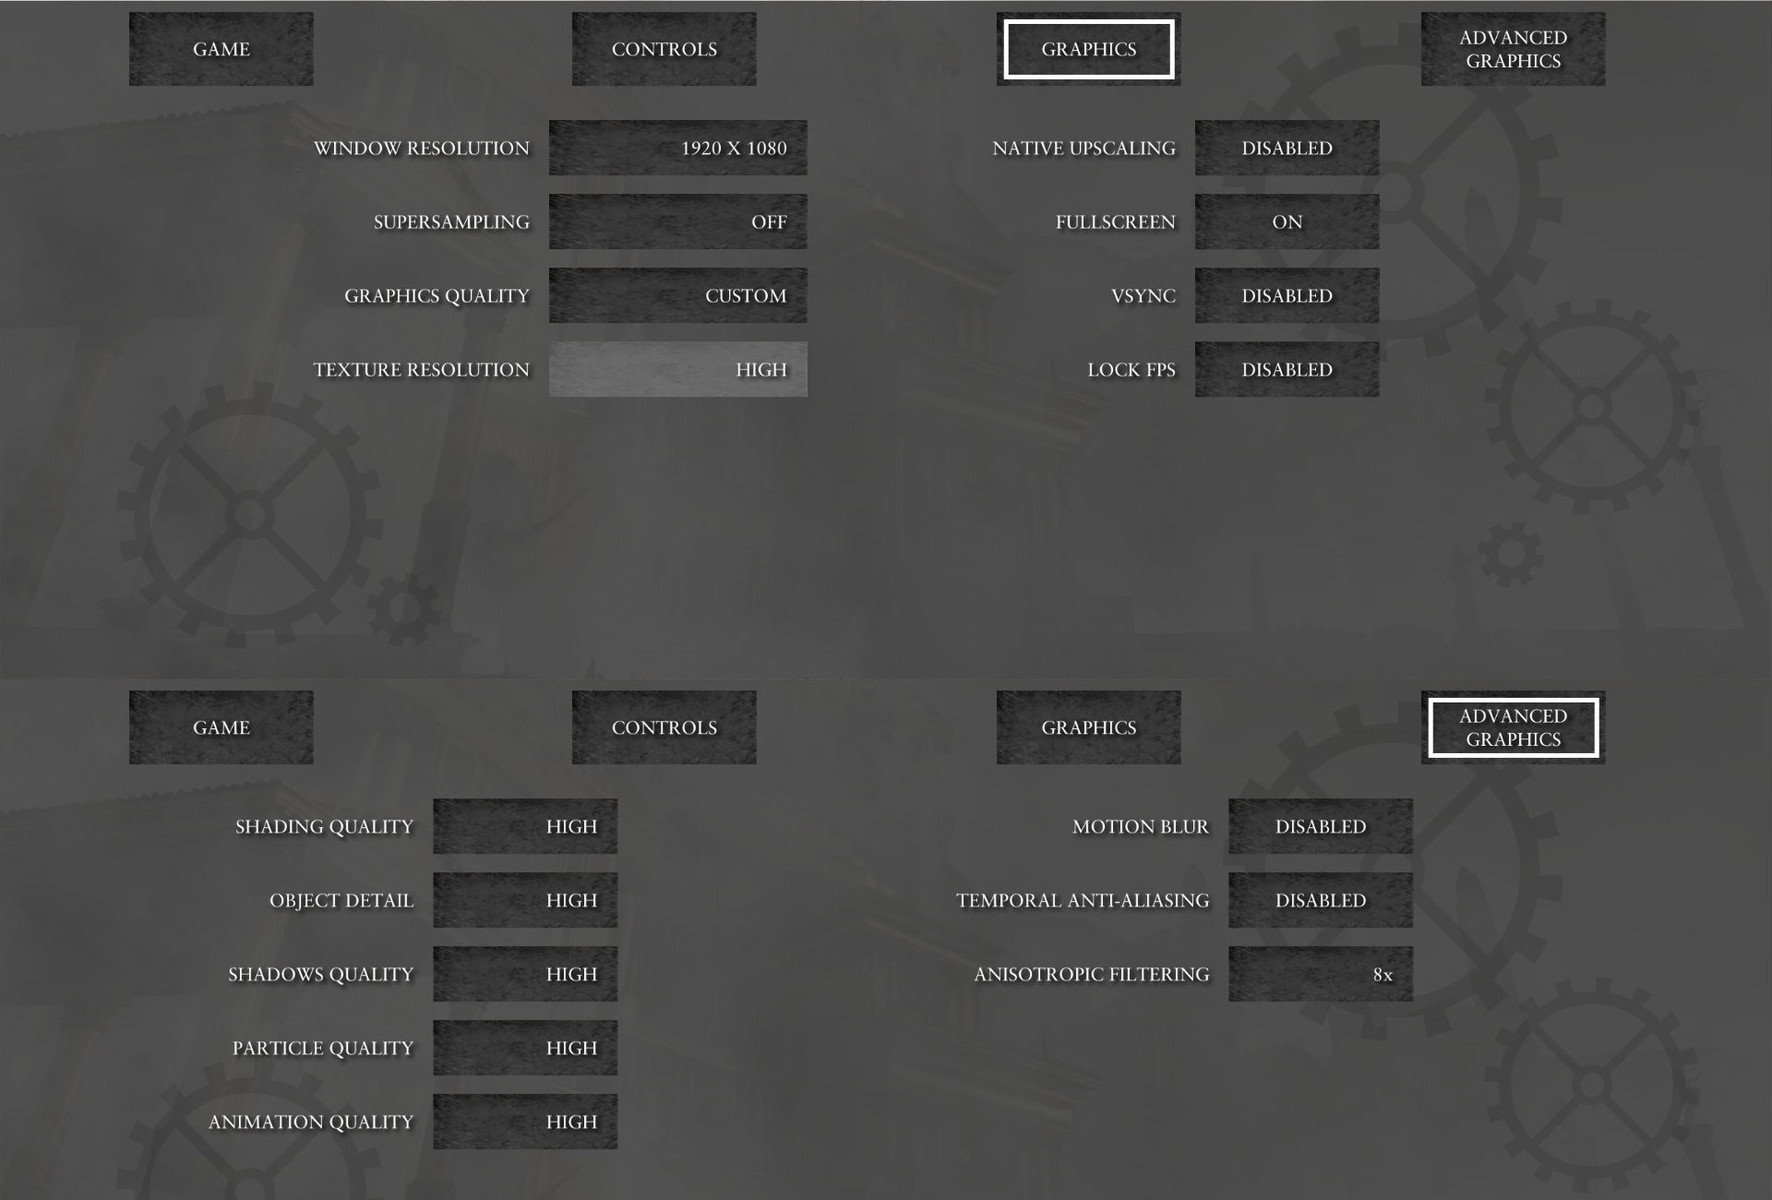
At least in theory, this is true. Using a cheat, it is possible to set the game to a manual texture quality. Those who wish to make their own decision can open the system.cfg with the editor (Steam\SteamApps\common\Ryse Son of Rome) and add the line sys_spec_TextureResolution = X. The X represents the texture quality level (1 for "Low", 2 for "Medium", 3 for "High" and 4 for "Very High"). The changes were correctly applied in our tests.
Fortunately, Crytek lets the user make his or her own decisions everywhere else. Via the "Graphics Quality" menu item, advanced graphics options can be altered in one go. Since the game is already activated on "Low", temporal anti-aliasing, we modified the presets a little (we deactivated AA for every setting except "Ultra"). Ryse also offers SSAA anti-aliasing, but this option demands an awful lot from the graphics card and brings most notebooks to their knees.


Graphics-lovers will be excited about the upscaling option. VSync and frame lock are also on board. Surprisingly, many settings hardly have an effect on the visuals or the performance. It almost makes no difference whether the player runs Ryse in high or very high texture quality. The difference is similarly negligible when it comes to temporal anti-aliasing. It does smooth the edges perceptibly, but it also makes the image a little more spongy.
Because Ryse was optimized for the Xbox One hardware, currently AMD cards do somewhat better. For example: The Radeon R9 M290X, which normally lies about 25% under the GeForce GTX 880M, sprints 5% ahead of its competitor on the ultra-setting (39.2 vs. 37.4 fps). According to Nvidia, a driver update is soon to be released that should improve their cards' performance. In general, owners of weaker notebooks will not be able to enjoy the Roman epic. Since the CryEngine (version 4) hardly offers any genuinely low settings, the game requires a certain level of performance power that not all GPUs possess.


Benchmark
For our benchmarks, we used the forests-and-meadows scenario in the fourth mission ("The King"). With its thick vegetation, this section demands a fair amount of power from the hardware. The recording with the Fraps tool starts almost as soon as the mission begins and ends after about 50 seconds, right before the first confrontation with an opponent. Because more graphics-intensive scenes do exist and the gameplay is rather quick for a third-person title, a given GPU will need to render at least 35-40 fps in the benchmark to run the game fluidly. As the table below shows, we recorded not only the average fps, but also the minimum fps.
If your results are considerably worse than ours, that might have to do with the graphics switching. At least when Ryse was first released, the Nvidia driver 344.11 could not recognize the game and we had to manually select "High Performance Processor" in the 3D settings.
Results
We have mentioned several times the game demands a lot of performance from the GPU. Inexpensive all-round GPUs on the level of the GeForce GT 740M are just as slow as the graphics chips in Intel CPUs (HD Graphics 3000/4000/4600). Even mid-range cards falter at low settings and a resolution of 1024x768. The GeForce GT 750M only managed a just barely playable 34 fps.
For normal details and 1366x768 pixels, you will need an upper mid-range graphics chip (GTX 850M @ 40 fps) or something from the lower high-end sector (GTX 765M @ 38 fps). 1920x1080 pixels and "High" setting demands a deluxe model like the GeForce GTX 780M to run fluidly. For maximum settings with activated anti-aliasing, we recommend at least a Radeon R9 M290X or a GeForce GTX 880M.
| Ryse: Son of Rome | |
| 1920x1080 Very High Texture Res. + High Graphics Quality (Motion Blur & Temporal AA On, Rest Off/Disabled) AF:8x 1920x1080 High Texture Res. + High Graphics Quality (Rest Off/Disabled) AF:8x 1366x768 Medium Texture Res. + Normal Graphics Quality (Rest Off/Disabled) AF:4x 1024x768 Low Texture Res. + Low Graphics Quality (Rest Off/Disabled) AF:2x | |
| Radeon R9 290X, 2600K, Samsung SSD 840 Pro 256GB MZ7PD256HAFV-0Z000 | |
| GeForce GTX 780 Ti, 3770K | |
| Radeon R9 280X, 3770K | |
| Radeon R9 M290X, 4700MQ | |
| GeForce GTX 880M, 4700MQ | |
| GeForce GTX 760, 3770K | |
| GeForce GTX 780M, 4700MQ | |
| GeForce GTX 870M, 4700MQ | |
| GeForce GTX 750 Ti, 3770K | |
| GeForce GTX 770M, 4700MQ | |
| GeForce GTX 860M, 4700MQ | |
| GeForce GTX 850M, 4340M | |
| GeForce GTX 765M, 4700MQ | |
| Radeon R7 512 Cores (Kaveri Desktop), A10-7850K, Samsung SSD 470 Series MZ-5PA256/EU | |
| GeForce GT 750M, 4702MQ | |
| GeForce GT 640M, 2637M, Lite-On LMT-256M3M | |
| GeForce GT 740M, 4200M | |
| GeForce GT 720M, 4200M, WDC Scorpio Blue WD10JPVX-22JC3T0 | |
| GeForce GT 630M, 3720QM, Seagate Momentus 7200.5 ST9750420AS | |
| Iris Pro Graphics 5200, 4750HQ, Intel SSD 525 Series SSDMCEAC180B3 | |
| HD Graphics 4600, 4700MQ | |
| Radeon HD 8650G, A10-5750M, Samsung SSD 470 Series MZ-5PA256/EU | |
| HD Graphics 4000, 3720QM | |
Test Systems
Four of our test devices are courtesy of Schenker Technologies (mysn.de):
- W504 (Core i7-4700MQ, 8 GB DDR3, GeForce GTX 860M, GTX 870M, GTX 880M, Radeon R9 M290X)
- W503 (Core i7-4700MQ, 8 GB DDR3, GeForce GTX 765M, GTX 770M, GTX 780M)
- M504 (Core i5-4340M, 8 GB DDR3, GeForce GTX 850M)
- M503 (Core i7-4702MQ, 8 GB DDR3, GeForce GT 750M)
Windows 7 (64-bit) is installed on each of these notebooks. A further thank you goes to Micron for the 480 GB Crucial M500.
Another test device is courtesy of Nvidia:
- HP Envy 15-j011sg (Core i5-4200M, 12 GB DDR3, GeForce GT 740M)
GPU drivers used: Nvidia 344.11, AMD 14.9, Intel 10.18.10.3907
There are also benchmarks from other notebooks, possibly with different drivers.
Overview
