Review Schenker W503 (Clevo P150SM) Notebook
For the original German review, see here.
Schenker made the W503 pre-sample available to us at the same time as the XMG P703. The gaming notebook is the successor of the successful 15-inch XMG P502, which achieved a decent rating of 86% in our test.
Alike other Schenker devices, the W503 can be individually configured on the homepage of the manufacturer (mysn.de). Graphics card, processor, RAM, hard drive, Wi-Fi adapter or operating system: The customer can adapt nearly all components to their needs. Accordingly, the price can vary greatly and easily exceeds 2,000 Euros (~$2598) if you select a powerful configuration.
In contrast to the previous notebook generation, the W503 no longer features an Ivy Bridge processor, it has a Haswell processor (HM87 chipset). As mentioned above, the graphics card stems from Nvidia's 700 series and no longer from the 600 series. In order to test all new graphics cards, we configured the W503 with a GeForce GTX 765M, an entry-level high-end graphics card.
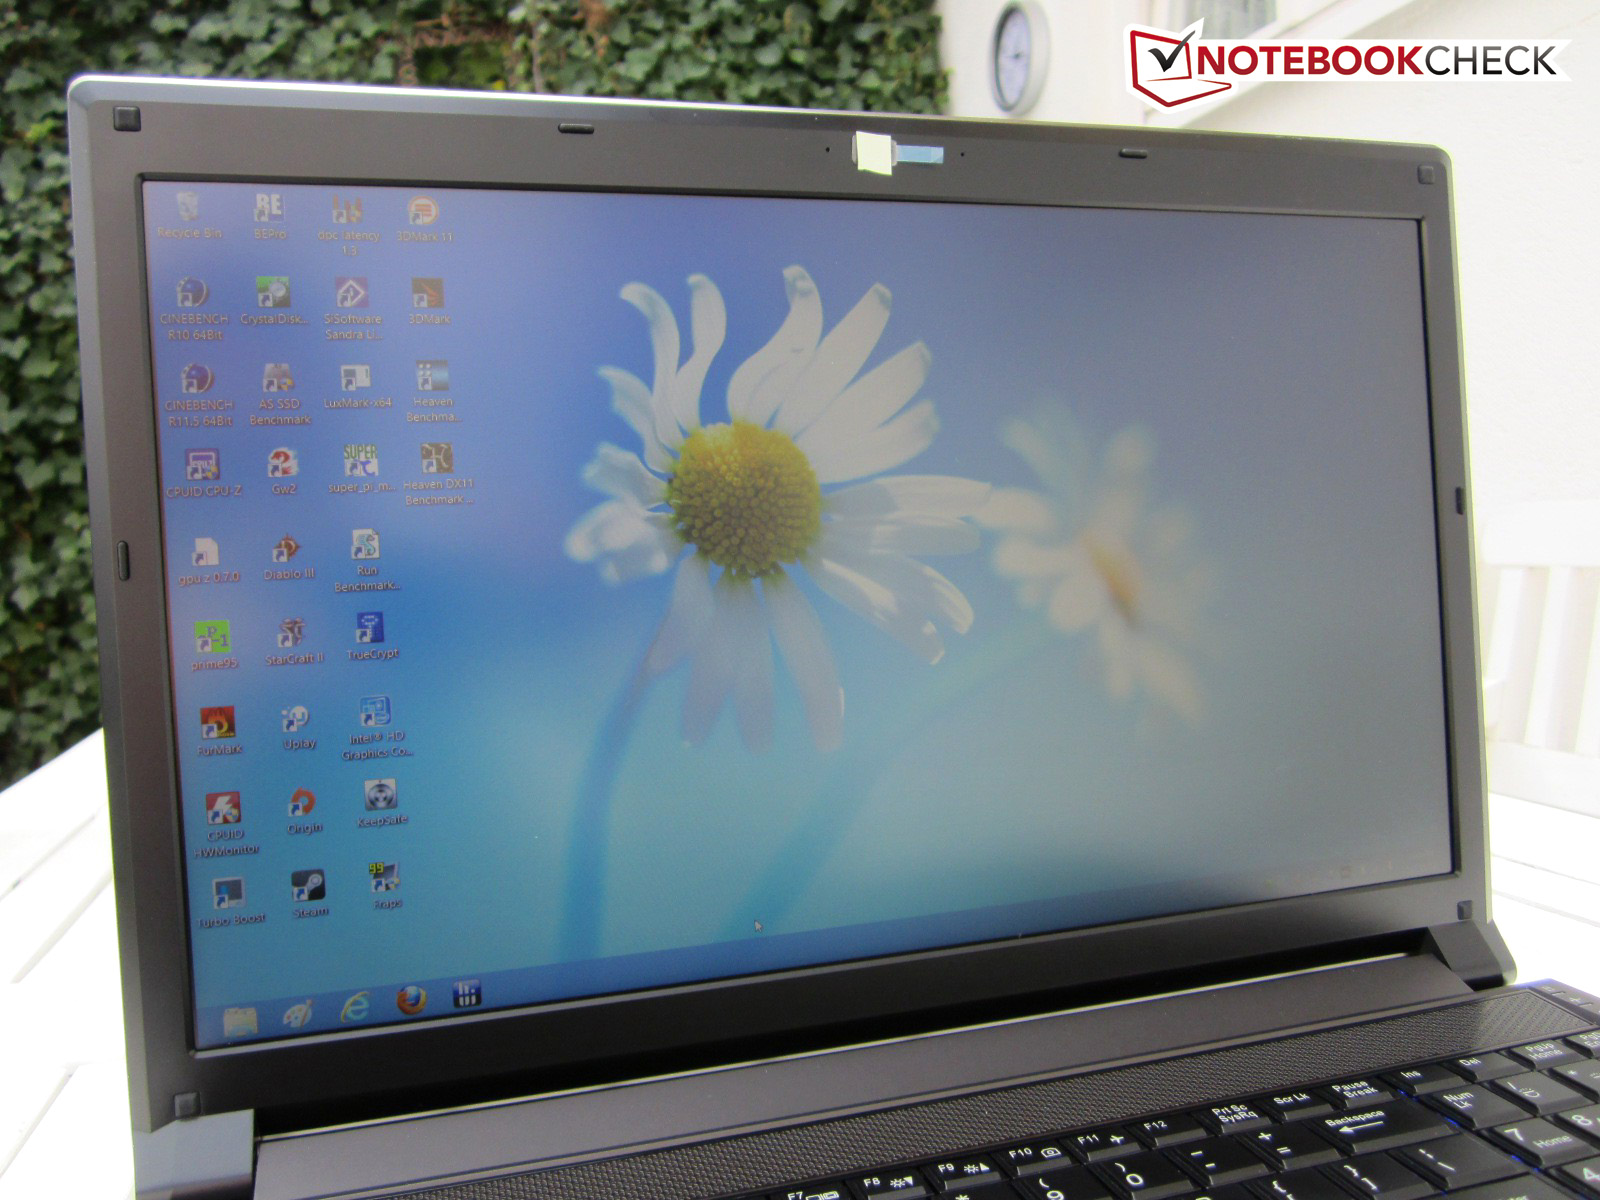
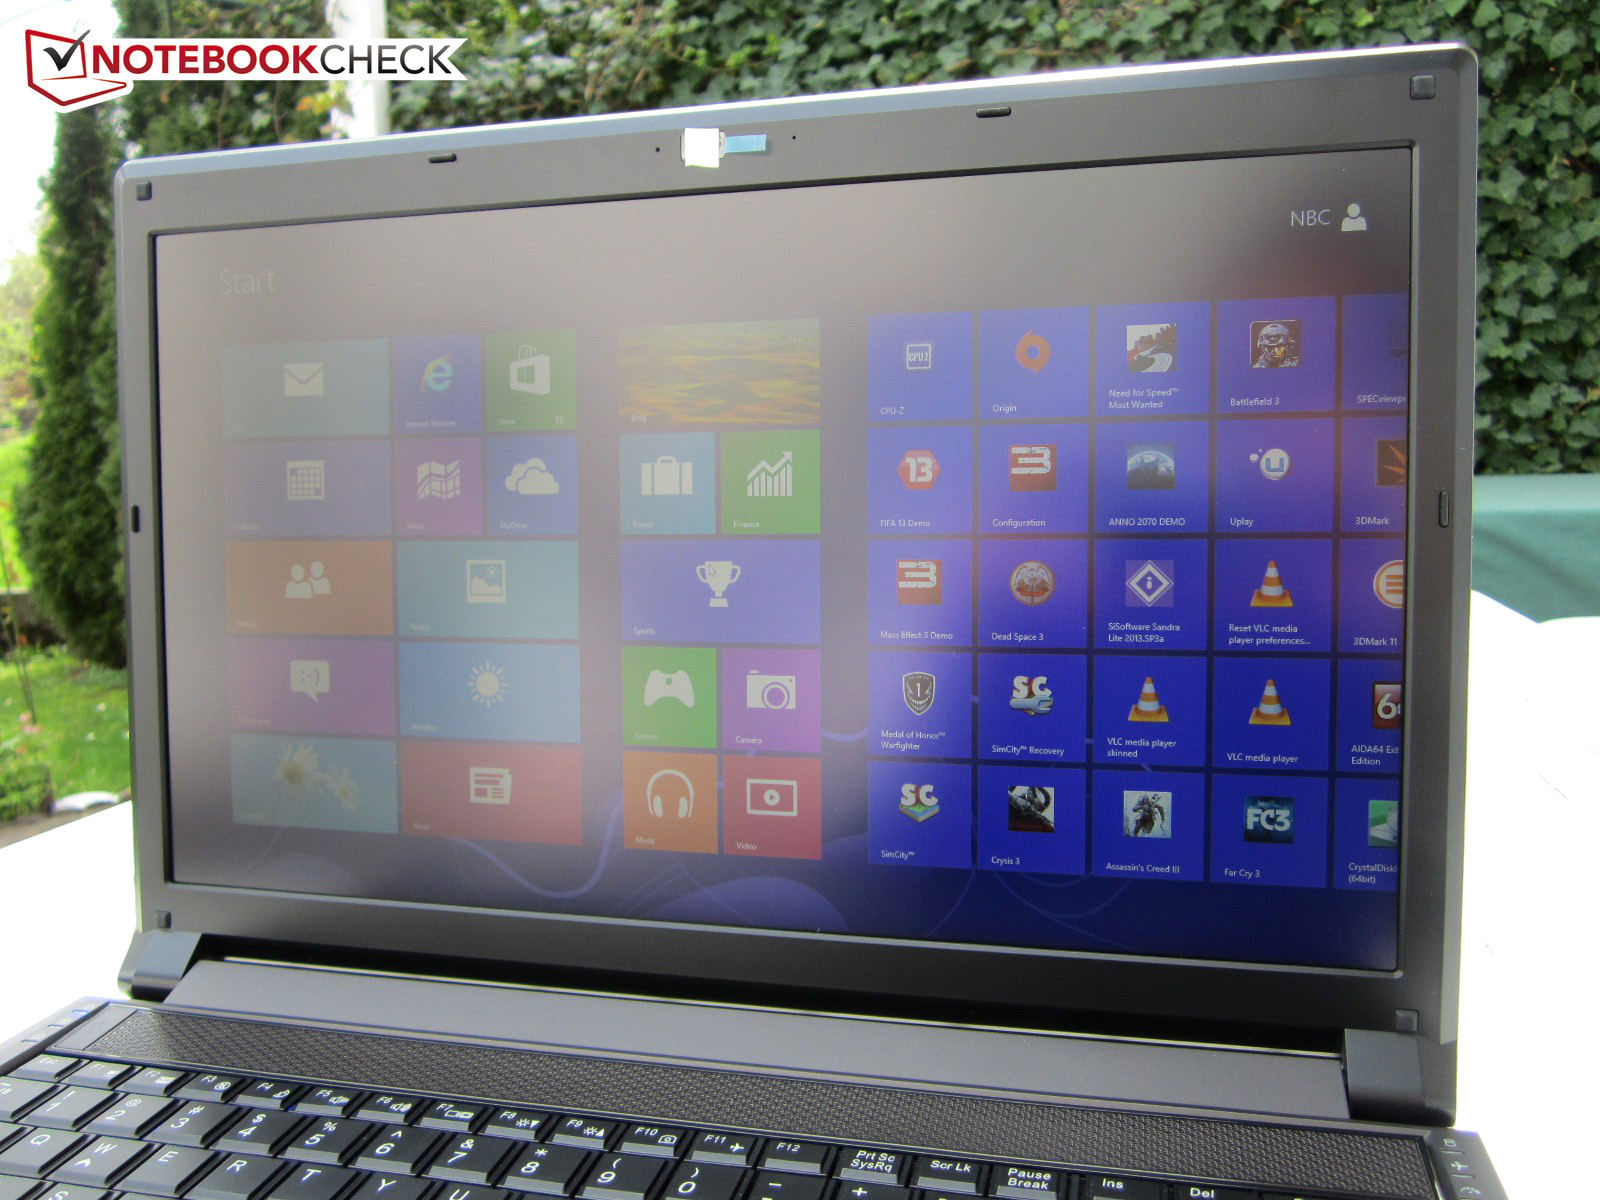
Note: As we tested a pre-sample, driver, BIOS, and fan control might be different in the final model. However, the device already appears very final. Windows 7 was not yet finally supported at the time of the test. The manufacturer currently focuses on Windows 8.
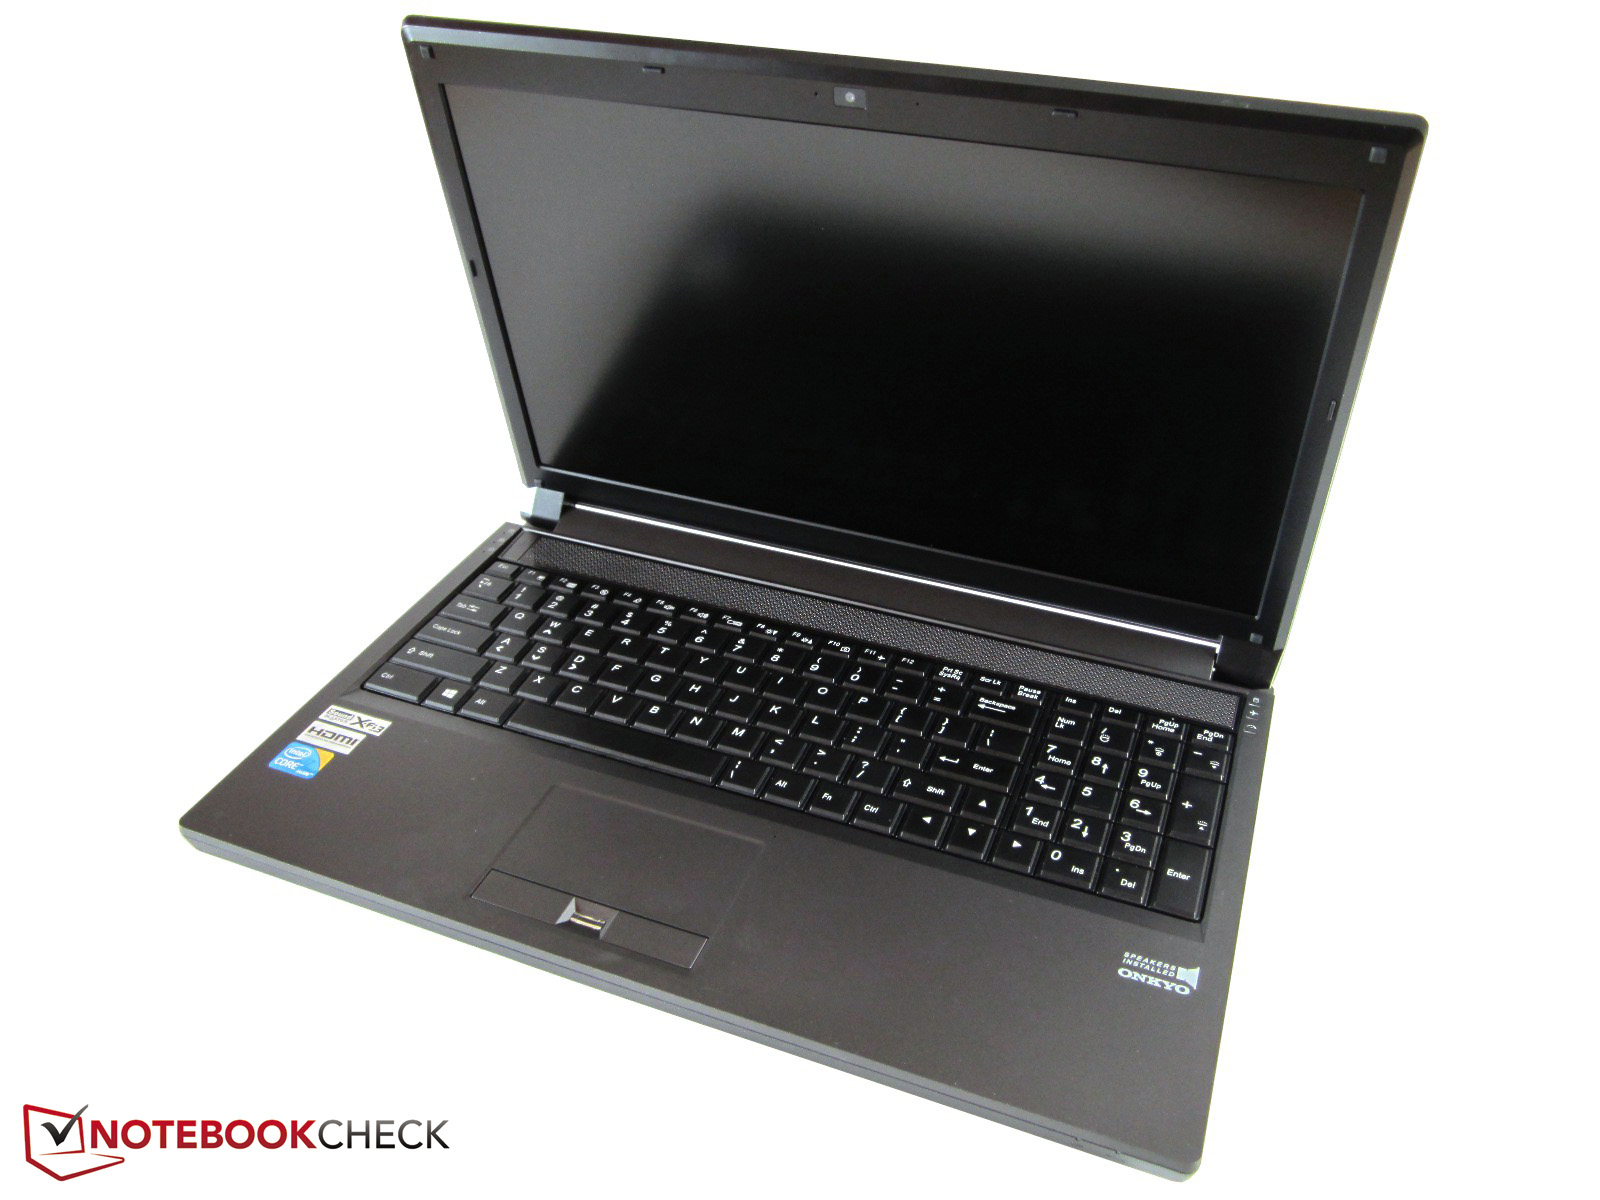
Case

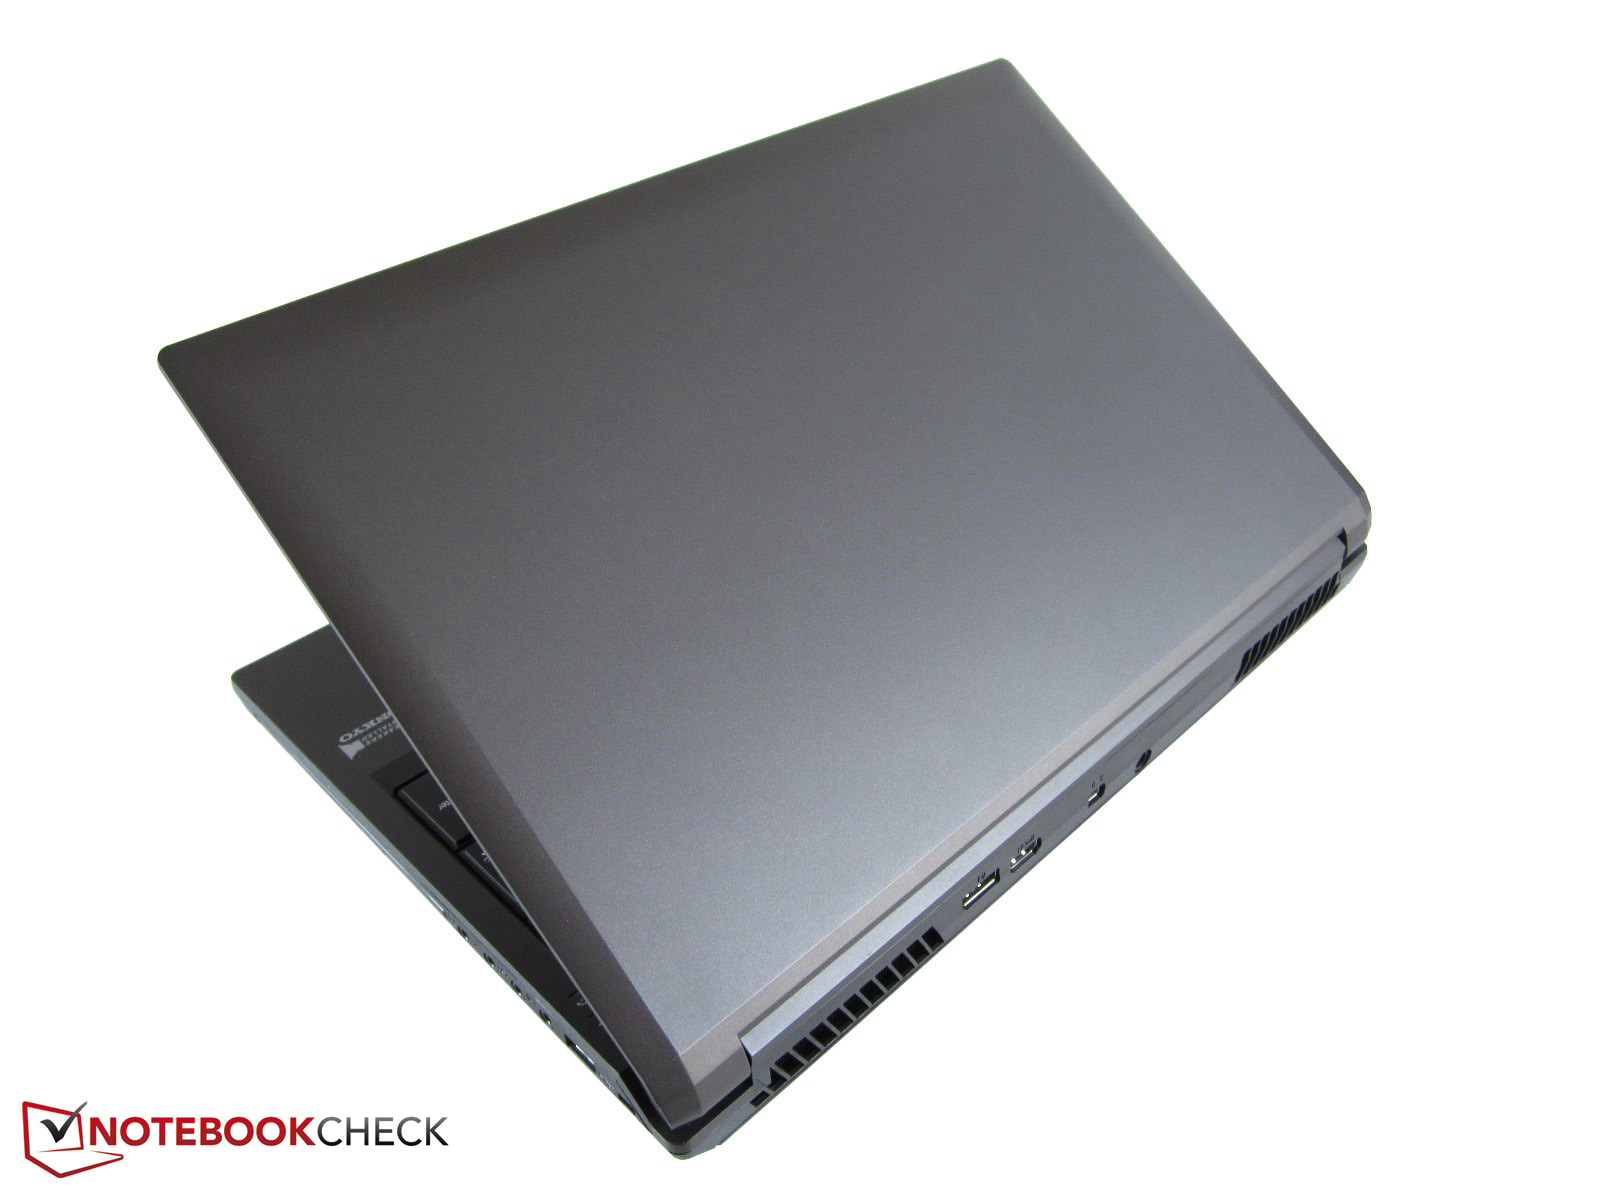
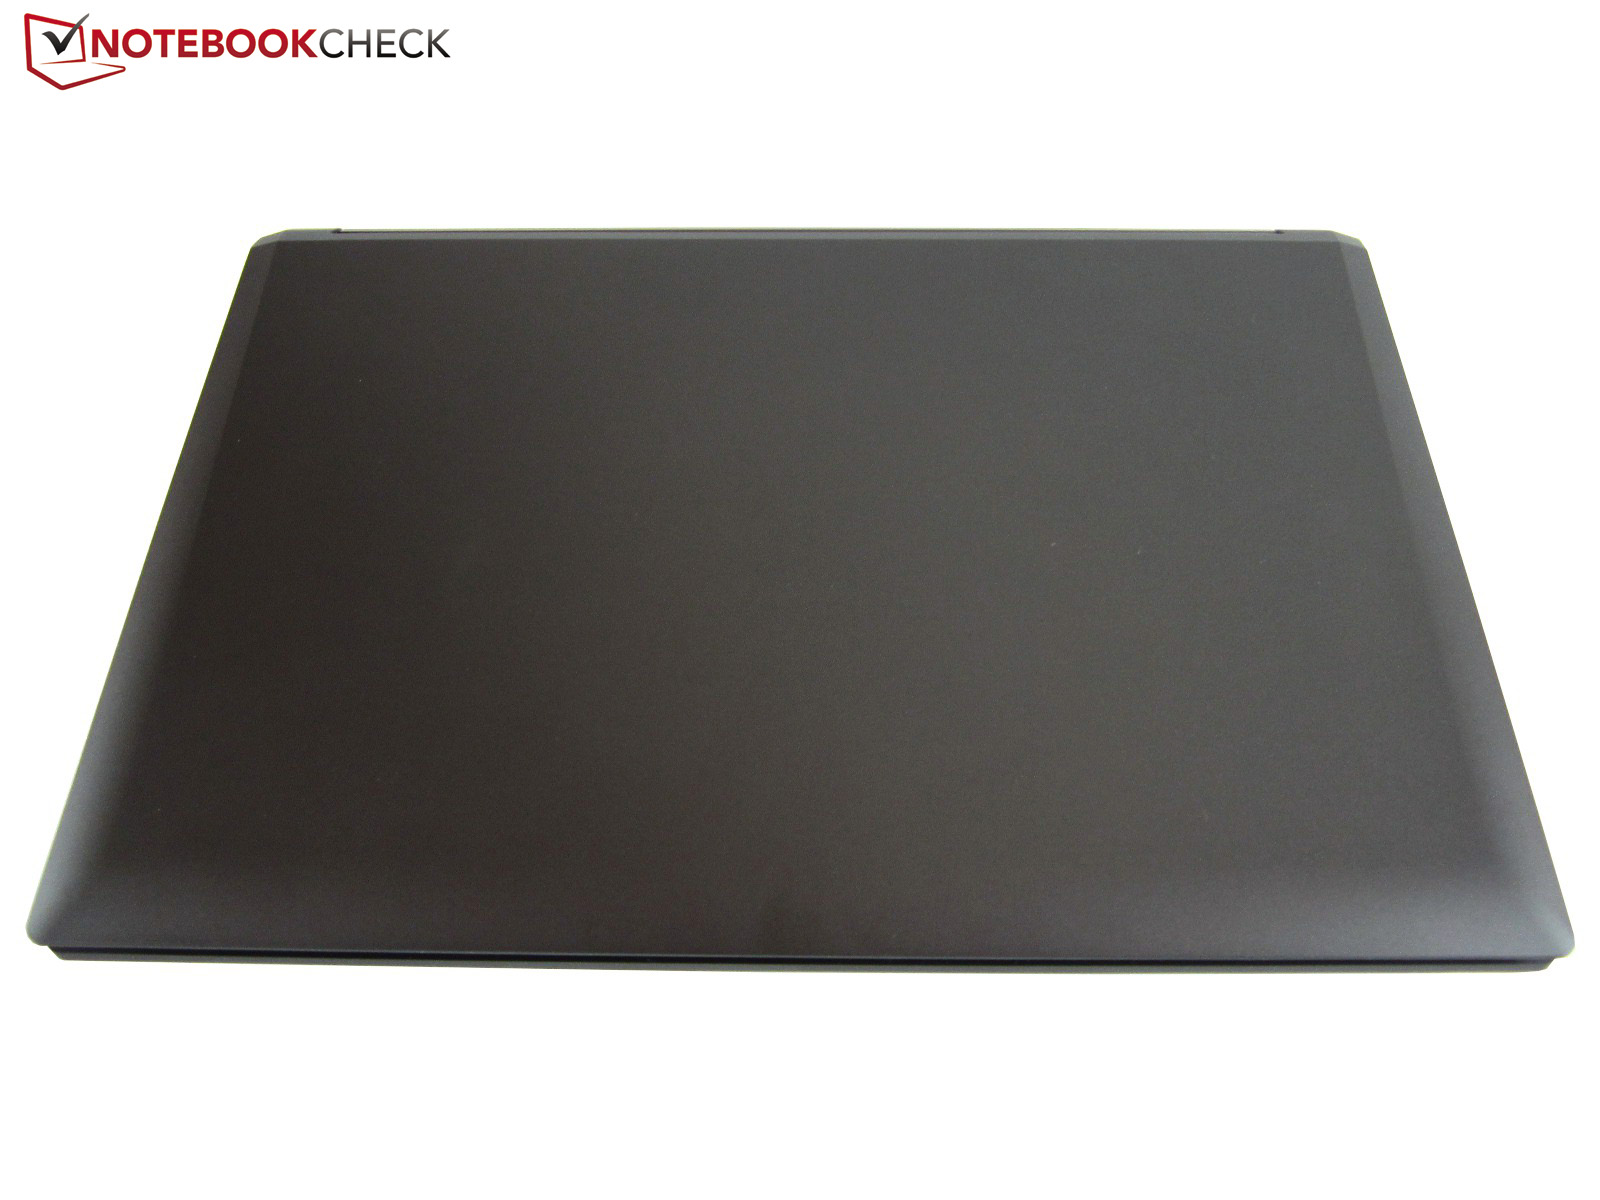
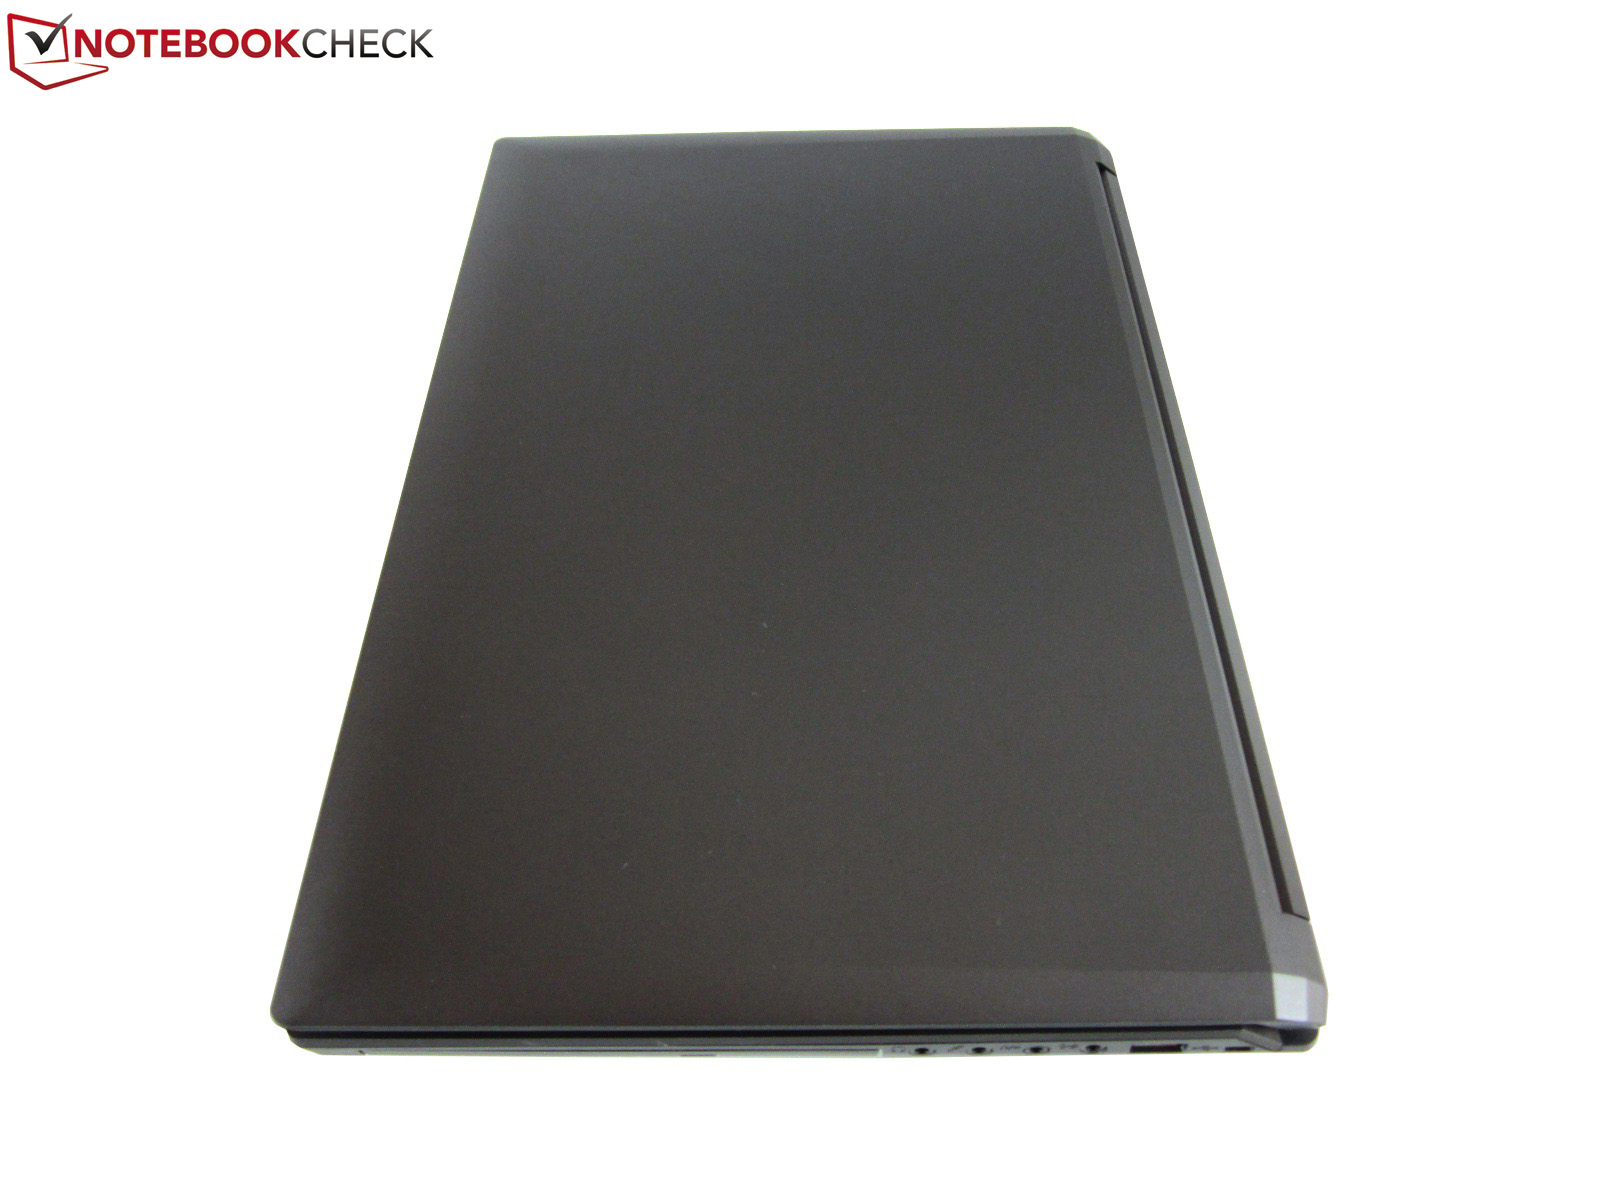
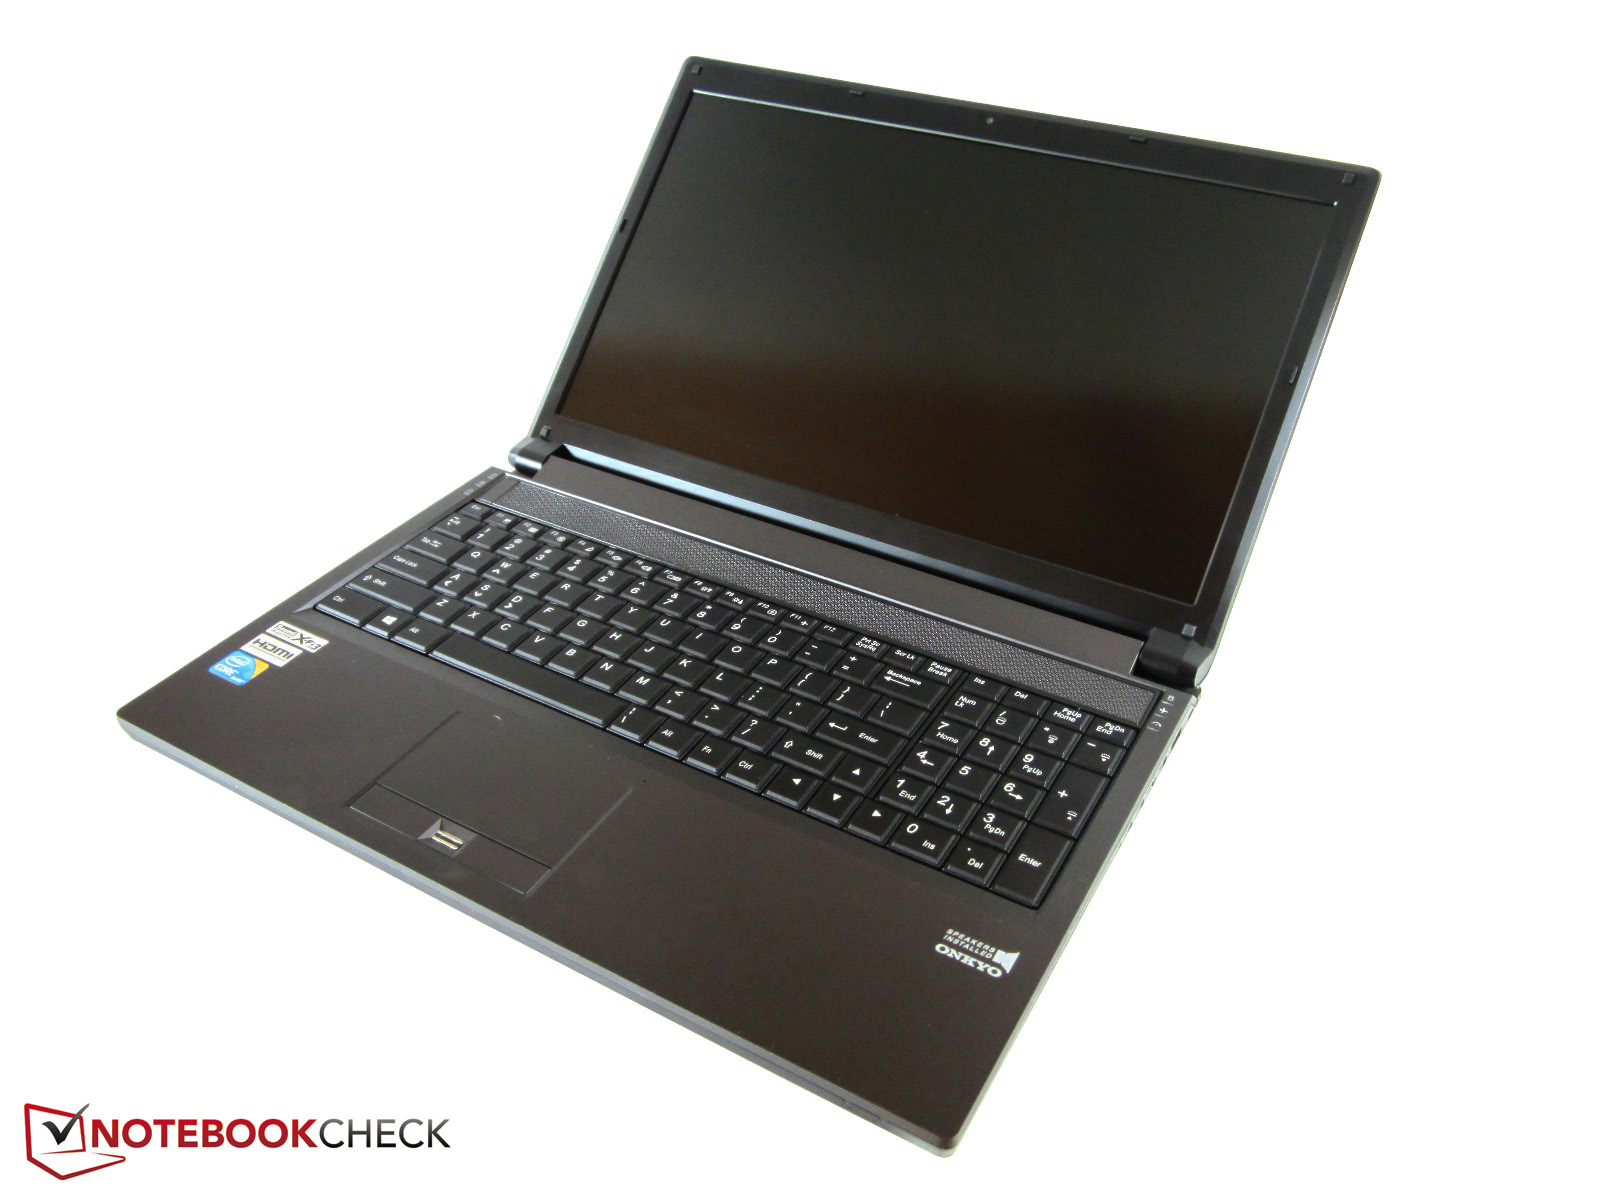
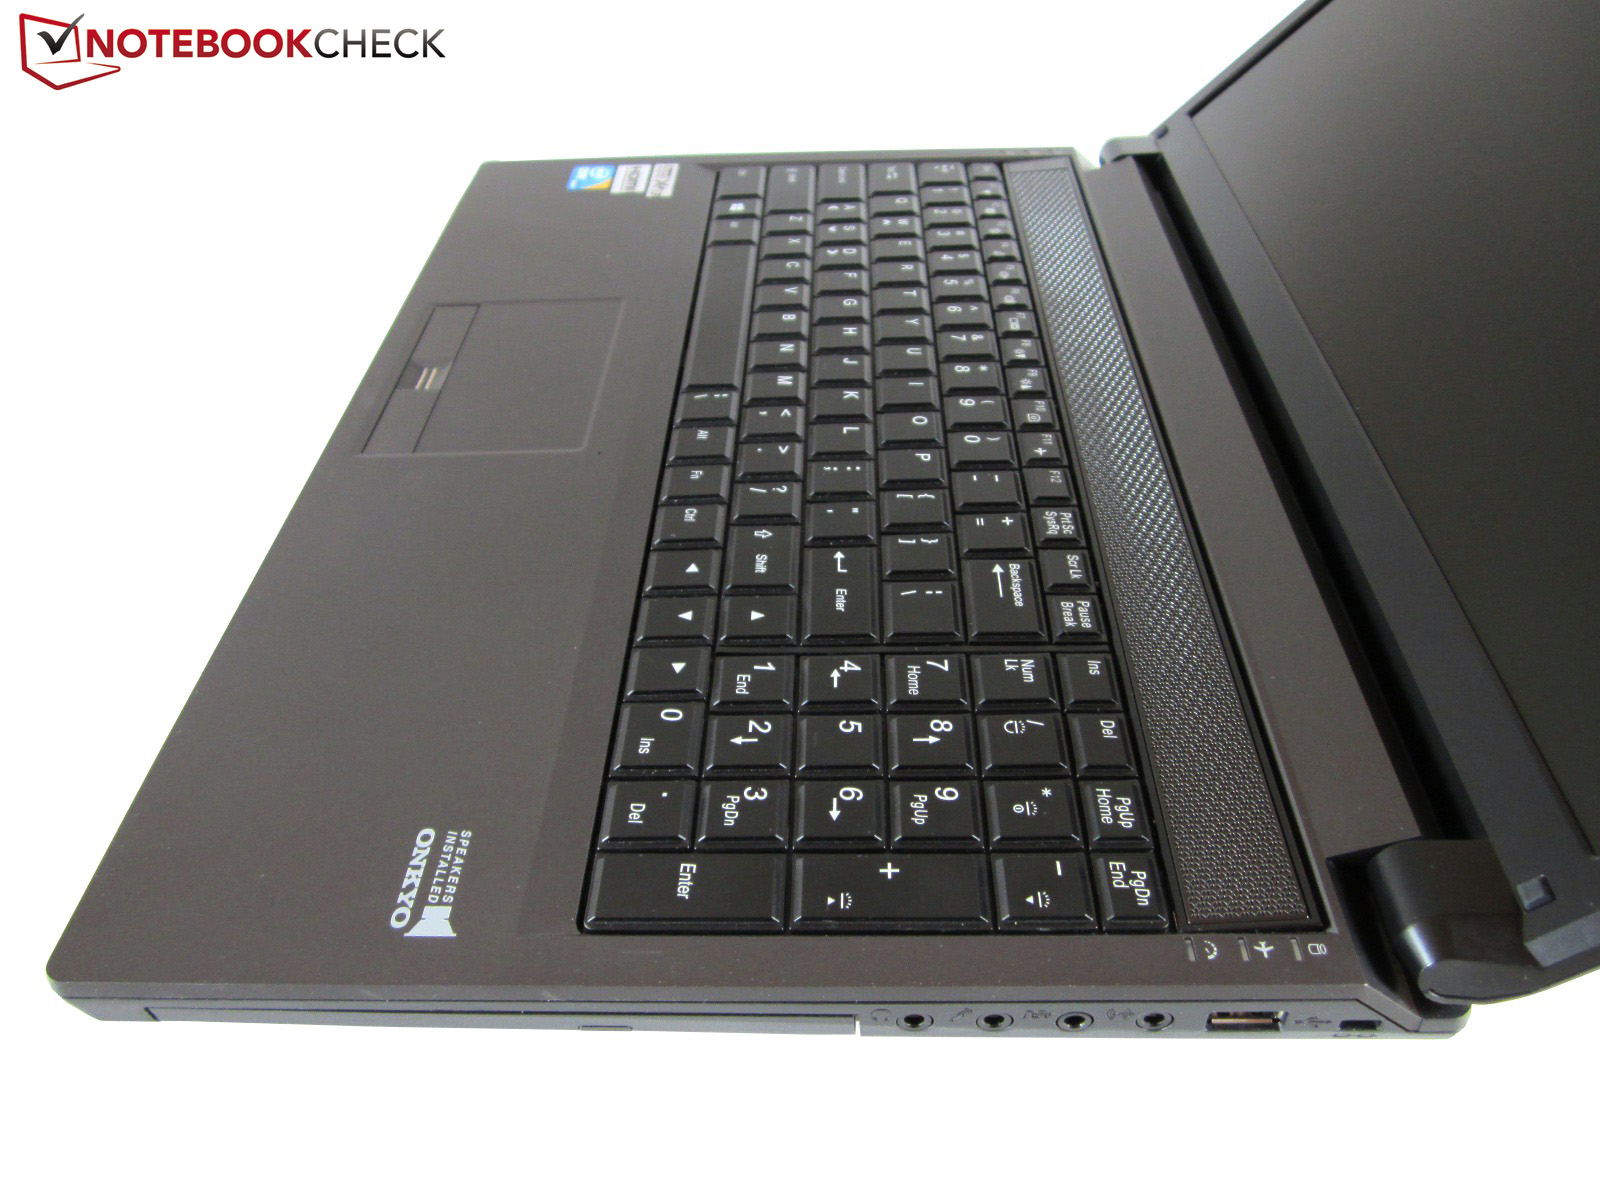
The dark gray case is based on the Clevo P150SM barebone, which looks - apart from a few smaller details - like the old P150EM (Schenker XMG P502).
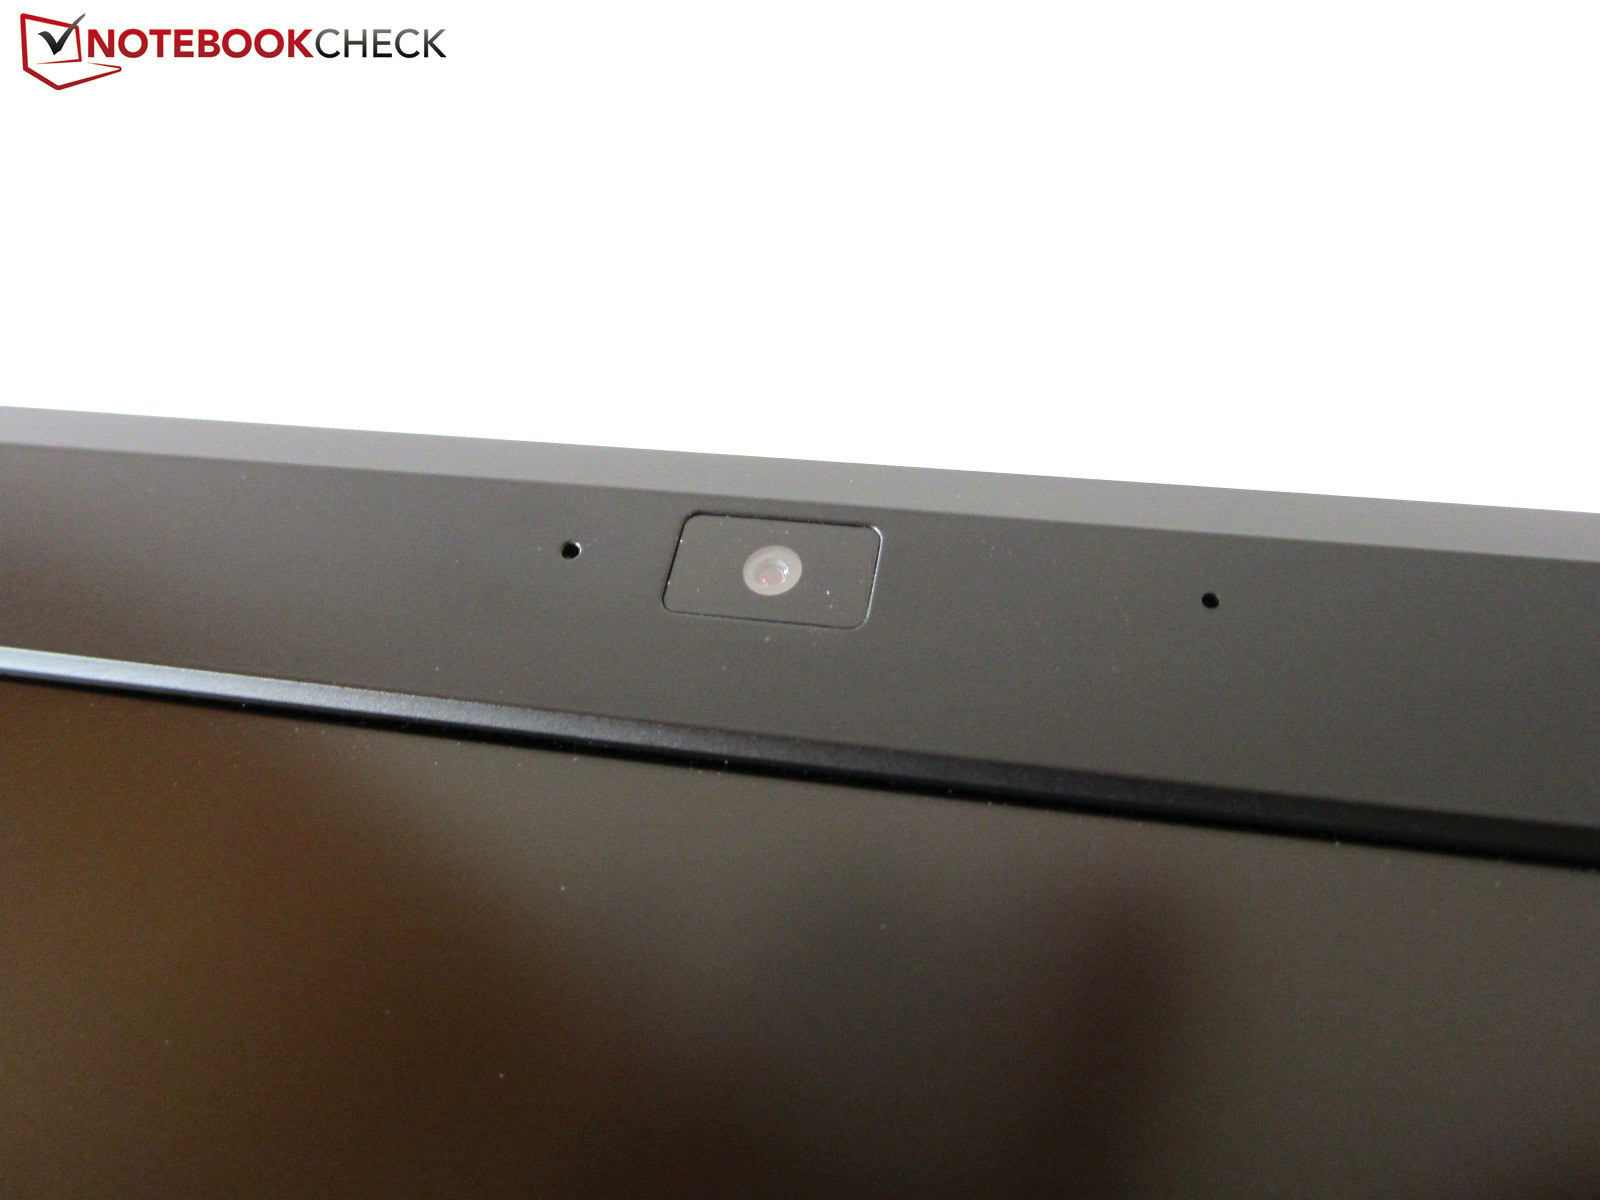
Apart from the connectivity, Clevo only changed the position of the Fn key and the display bezel. After years of critique, the glossy bezel, extremely susceptible to scratching, was finally replaced by a matte one.
The lid and palm rests are again rubberized and feel nice to the touch. If you do not touch the case with greasy fingers, it does not get too dirty. Glossy devices like the DevilTech Devil 6700 are definitely bigger fingerprint magnets.
The build quality of the P150SM barebone is decent. Although the 15-incher cannot completely keep up with Asus's G55VW or the Alienware M14x, it also does not fail. Most of the plastic parts connect neatly to each other.
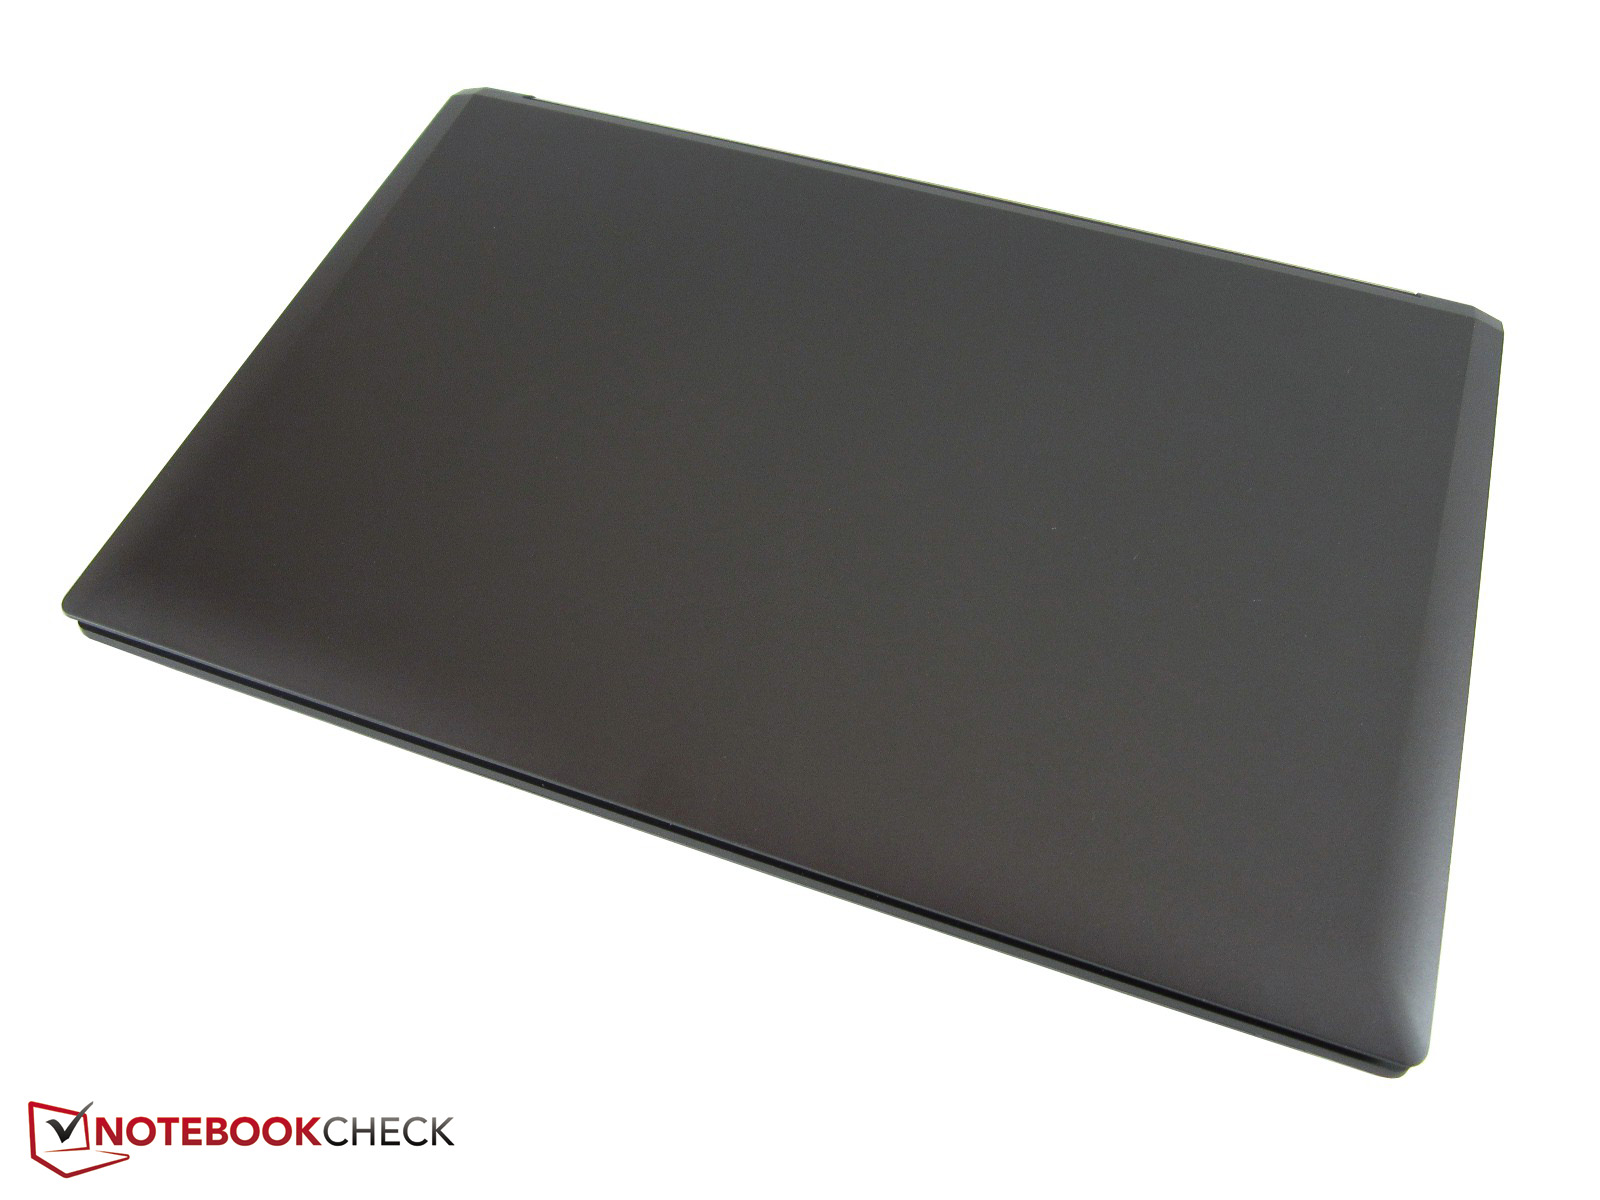
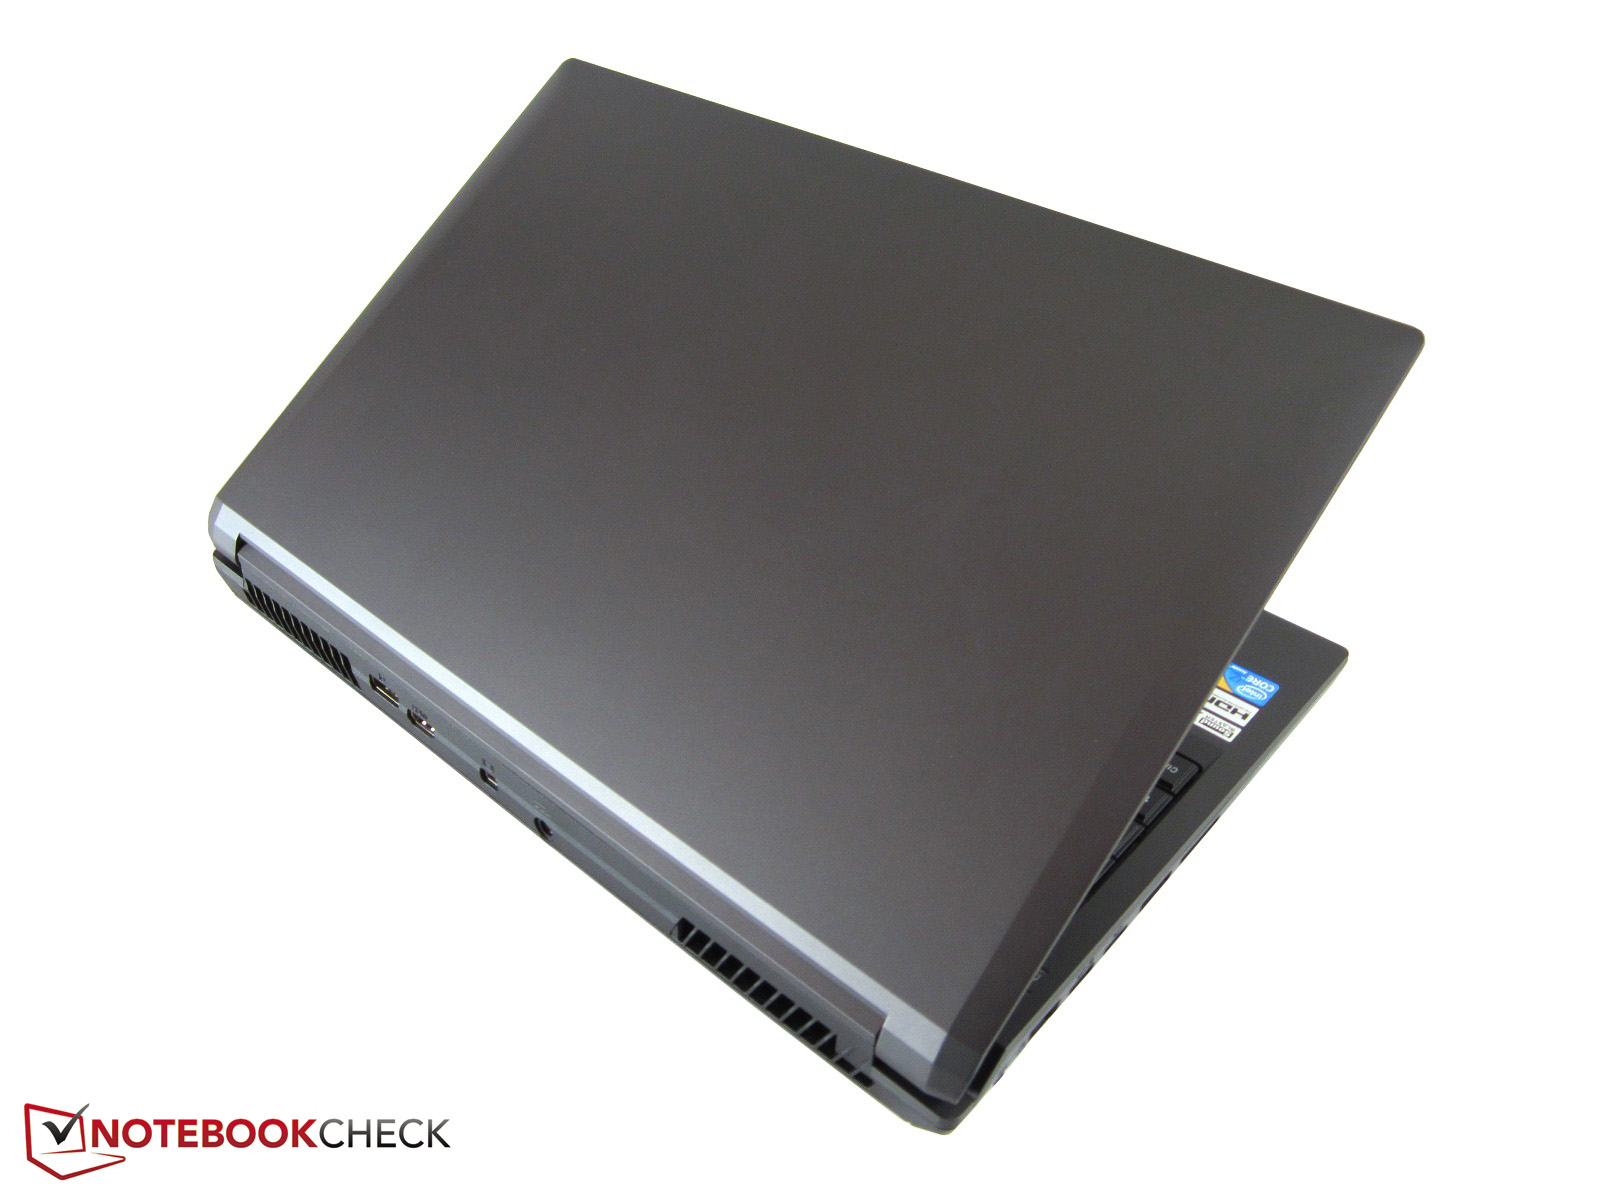
The stability is on a similar high level. If you ignore that the lid wobbles a little bit (a typical notebook problem), the case is rather flexural rigid even if stronger pressure is applied. Users who are not too demanding should be satisfied with the quality experience. We especially liked the simple and timeless design, which might appear conservative to some. The 15-inch laptop is miles away from the cheap "bling" look of MSI notebooks (e.g. see the GT60).
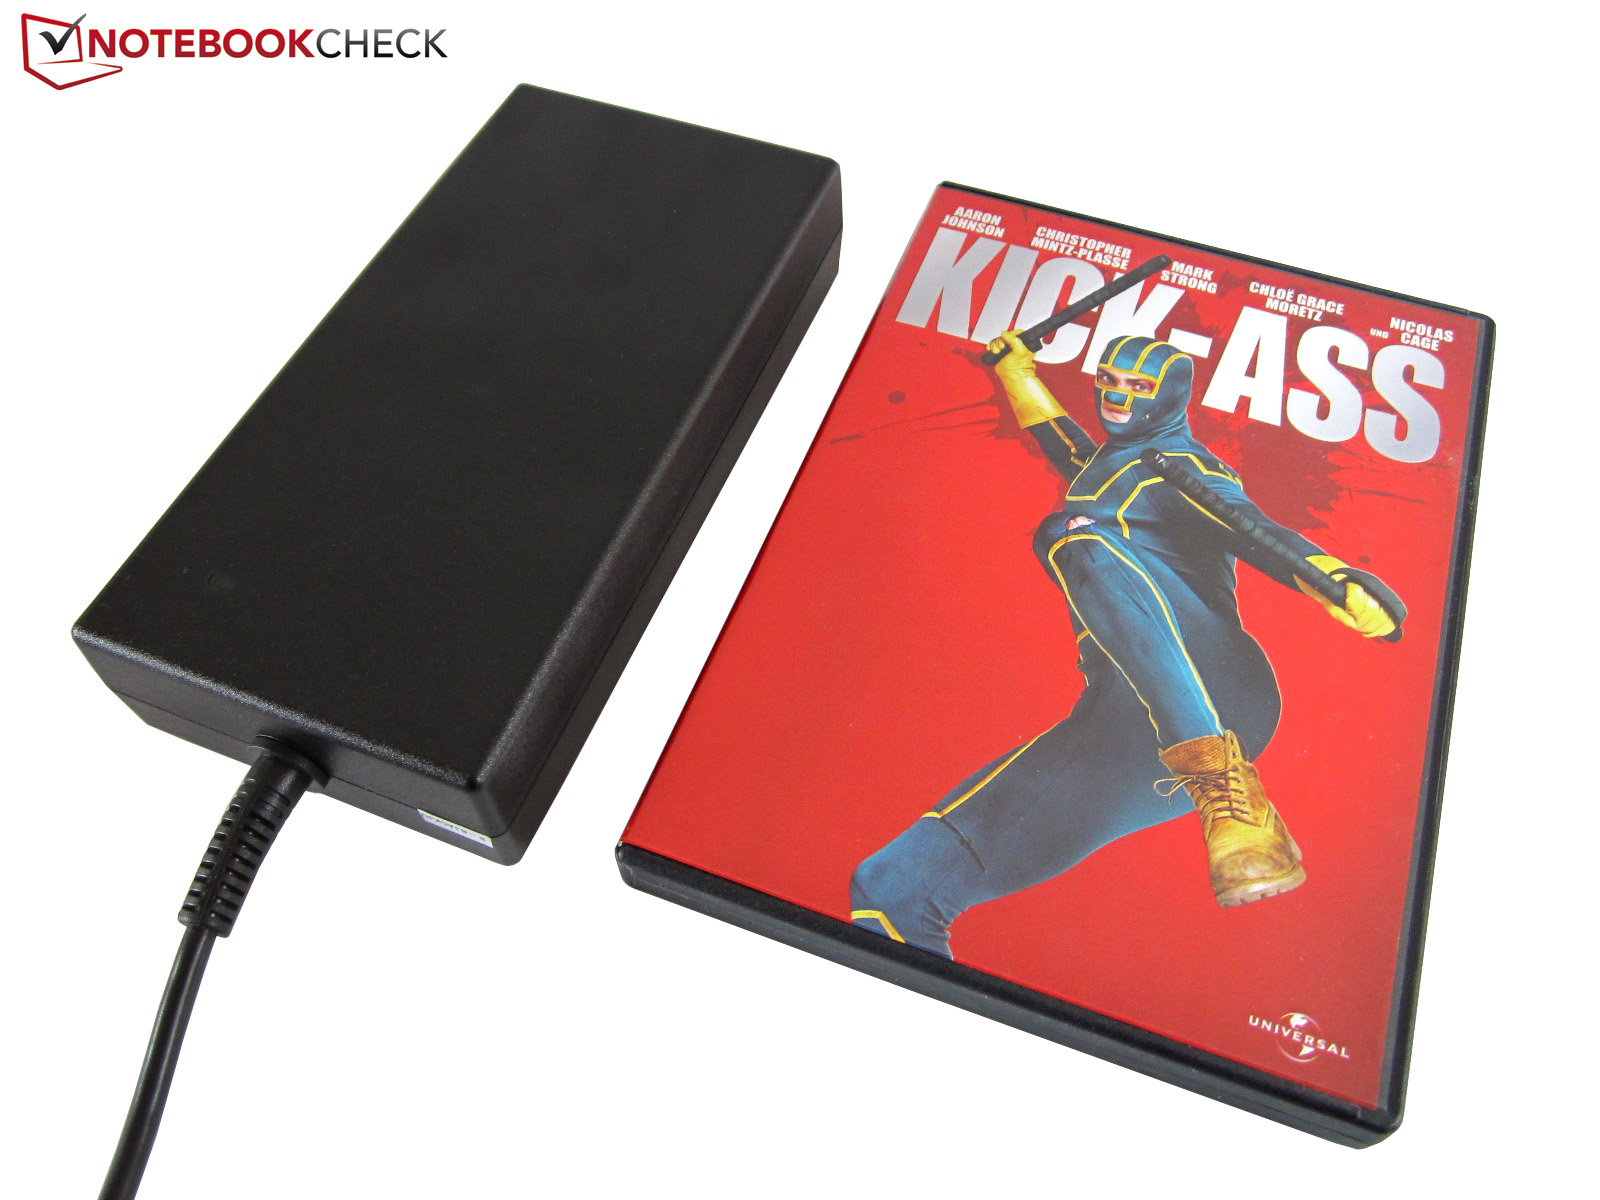
With a size of 376 x 256 x 49 mm and a weight of just under 3.2 kg, the Schenker W503 does not belong with the slimmest and lightest notebooks. Nevertheless, it can be properly transported if you do not mind the 850 g, 168 x 83 x 35 mm power adapter.
Connectivity
Interfaces
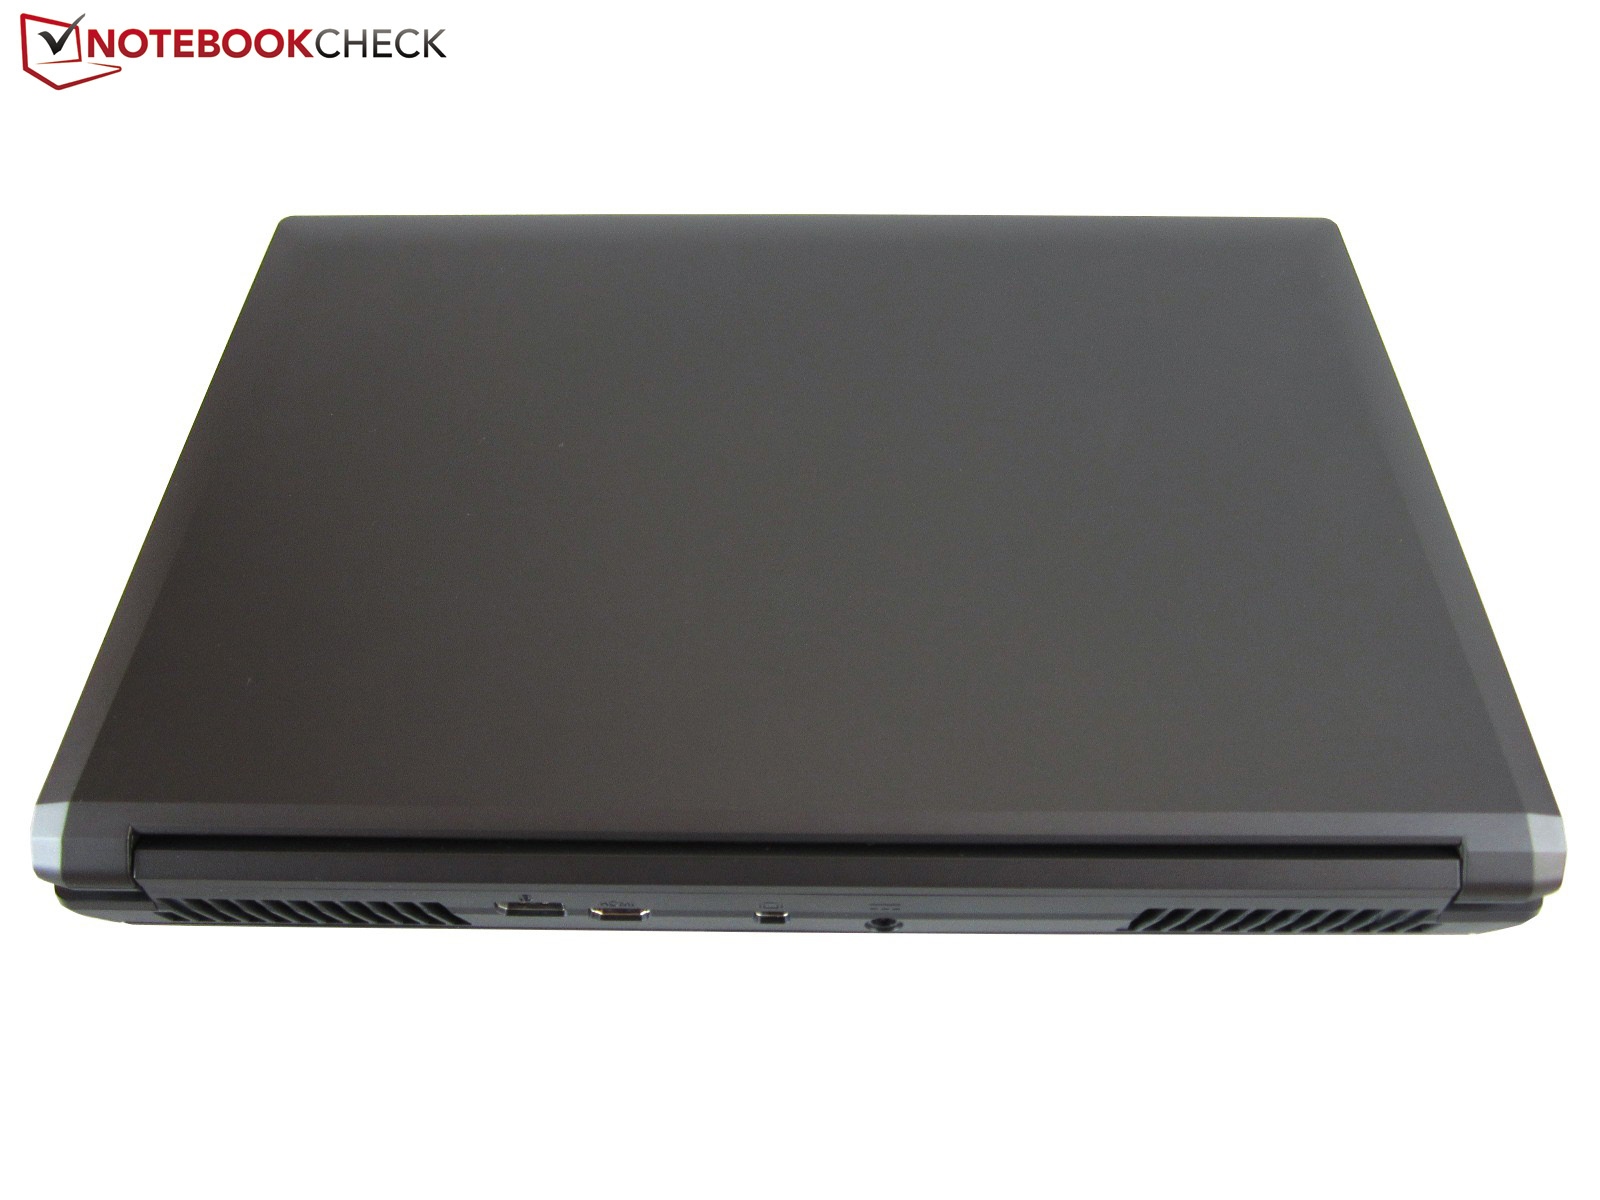
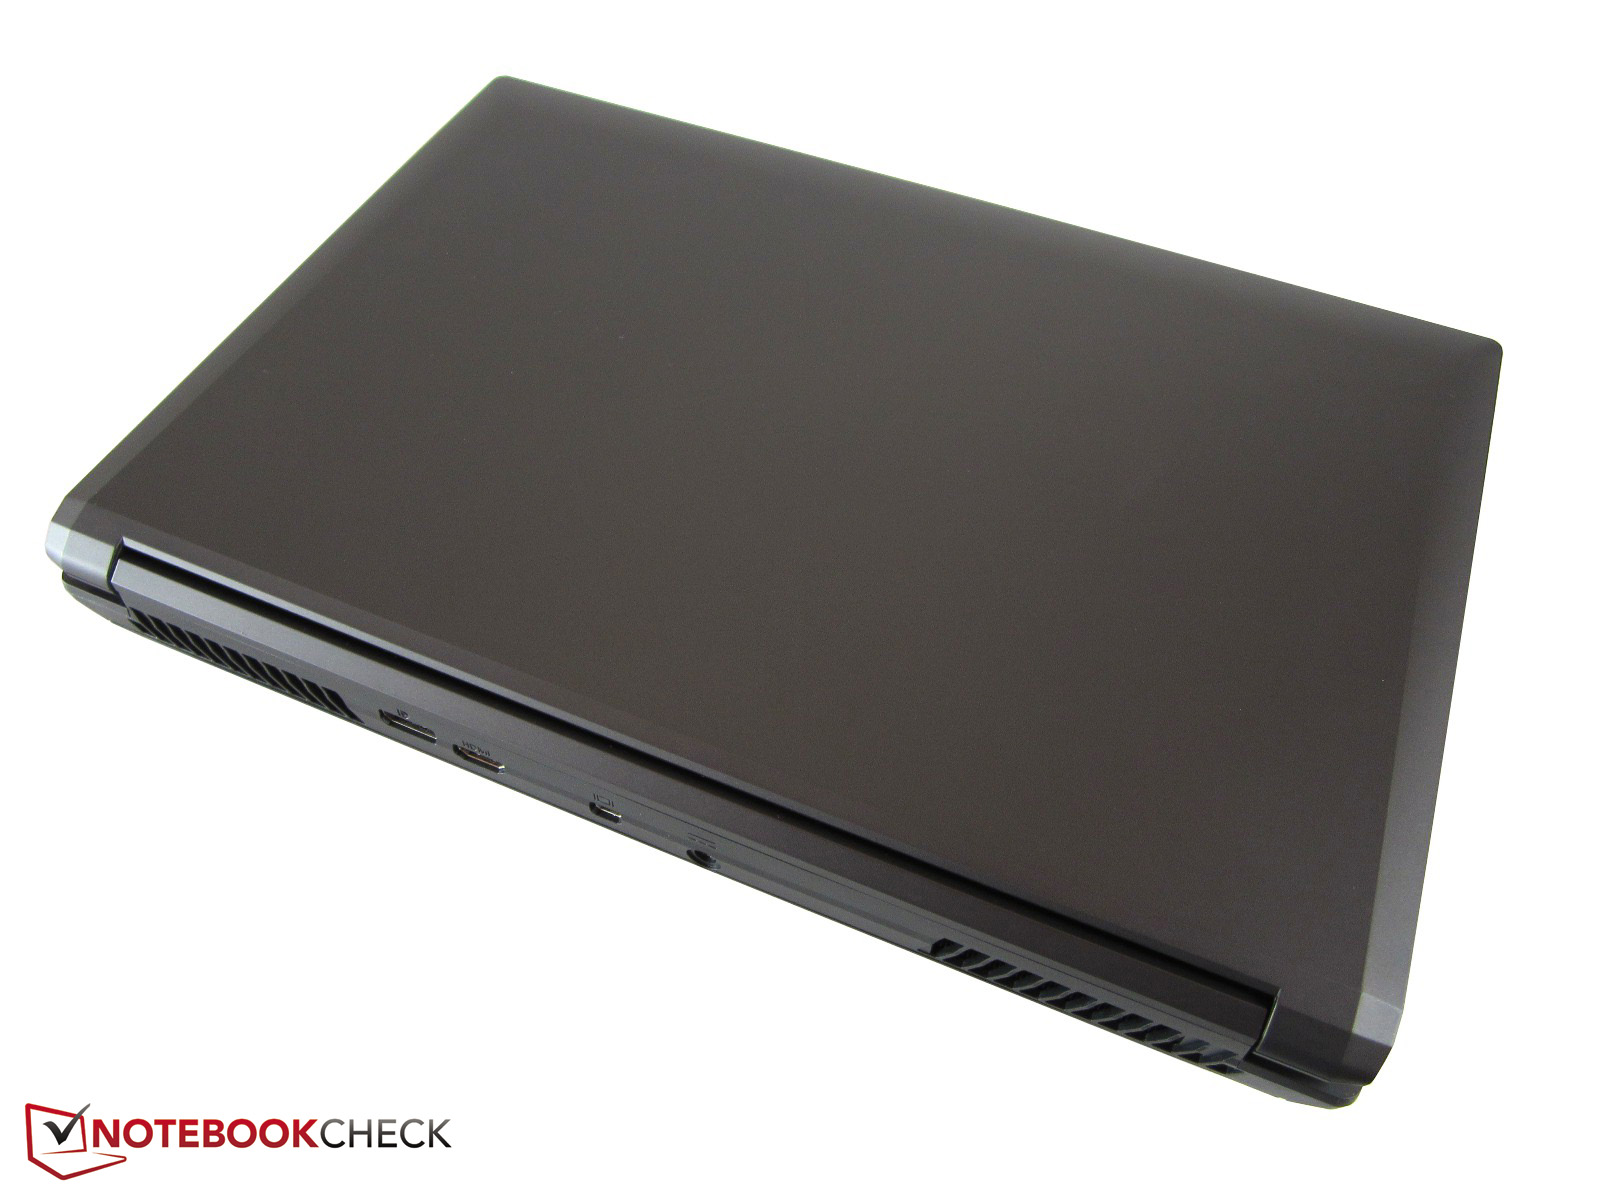
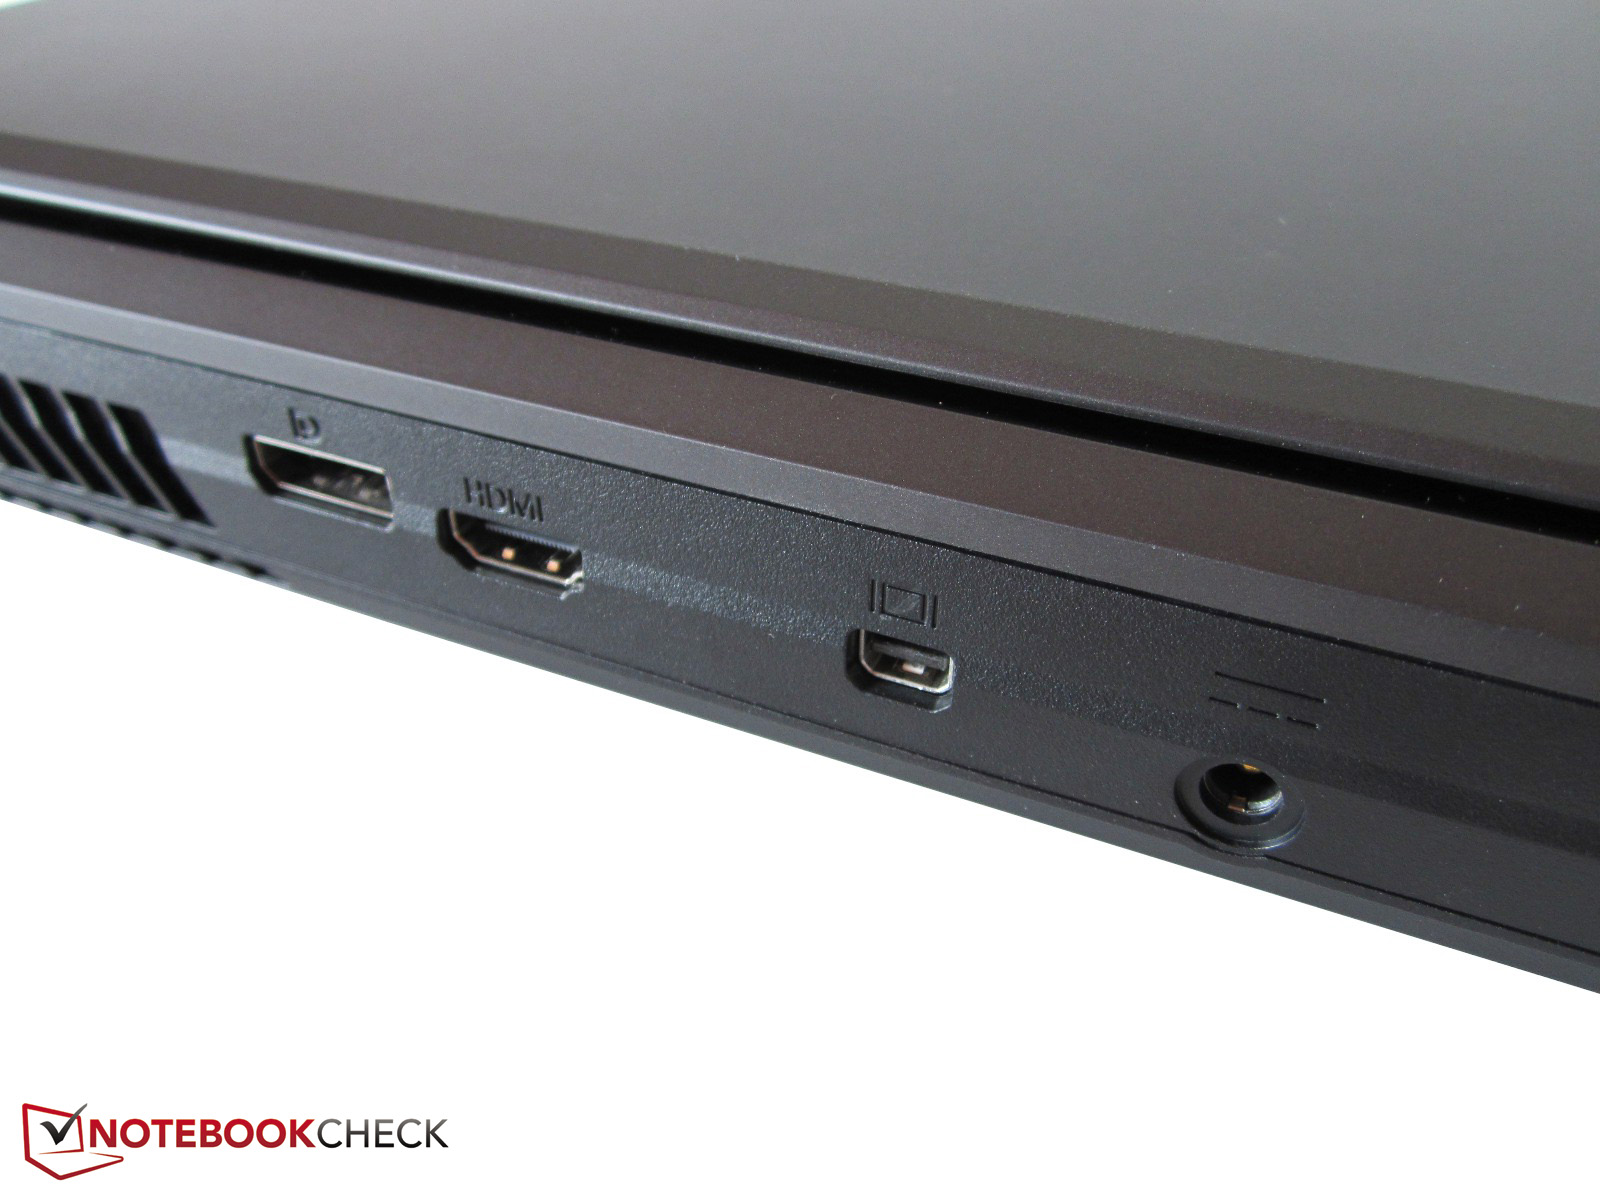
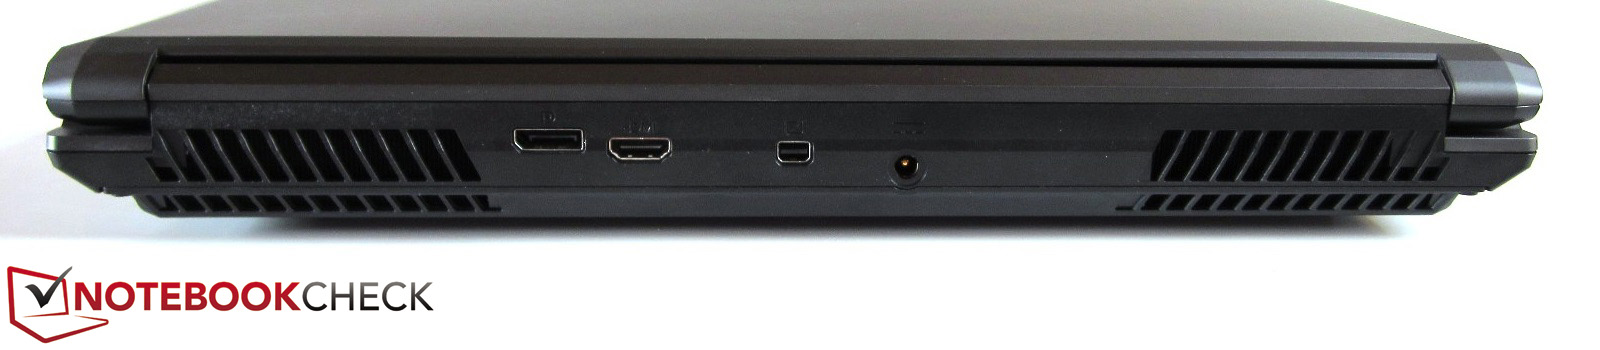
The connectivity is very similar to the XMG P502. The rear side houses the power-in, an HDMI-out, a DisplayPort and a mini DisplayPort (once DVI). Three digital video outs are quite a lot and not all competitors deliver that many.
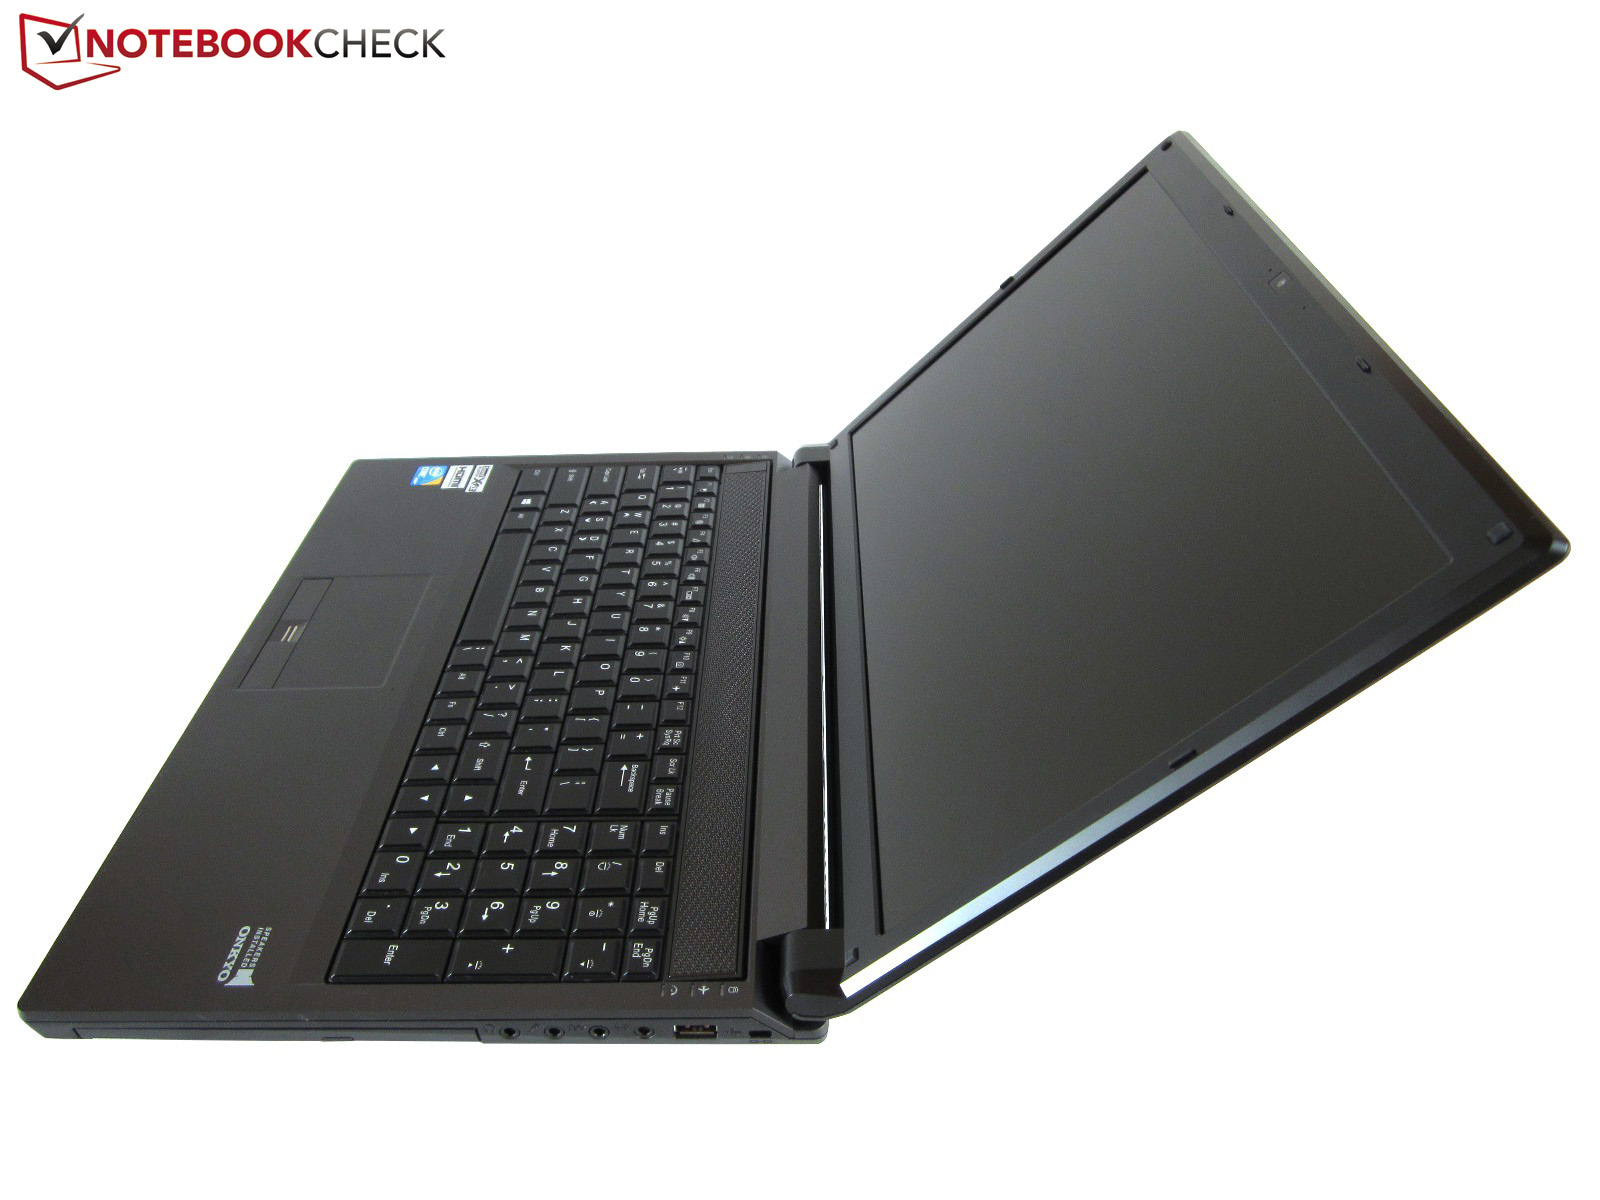
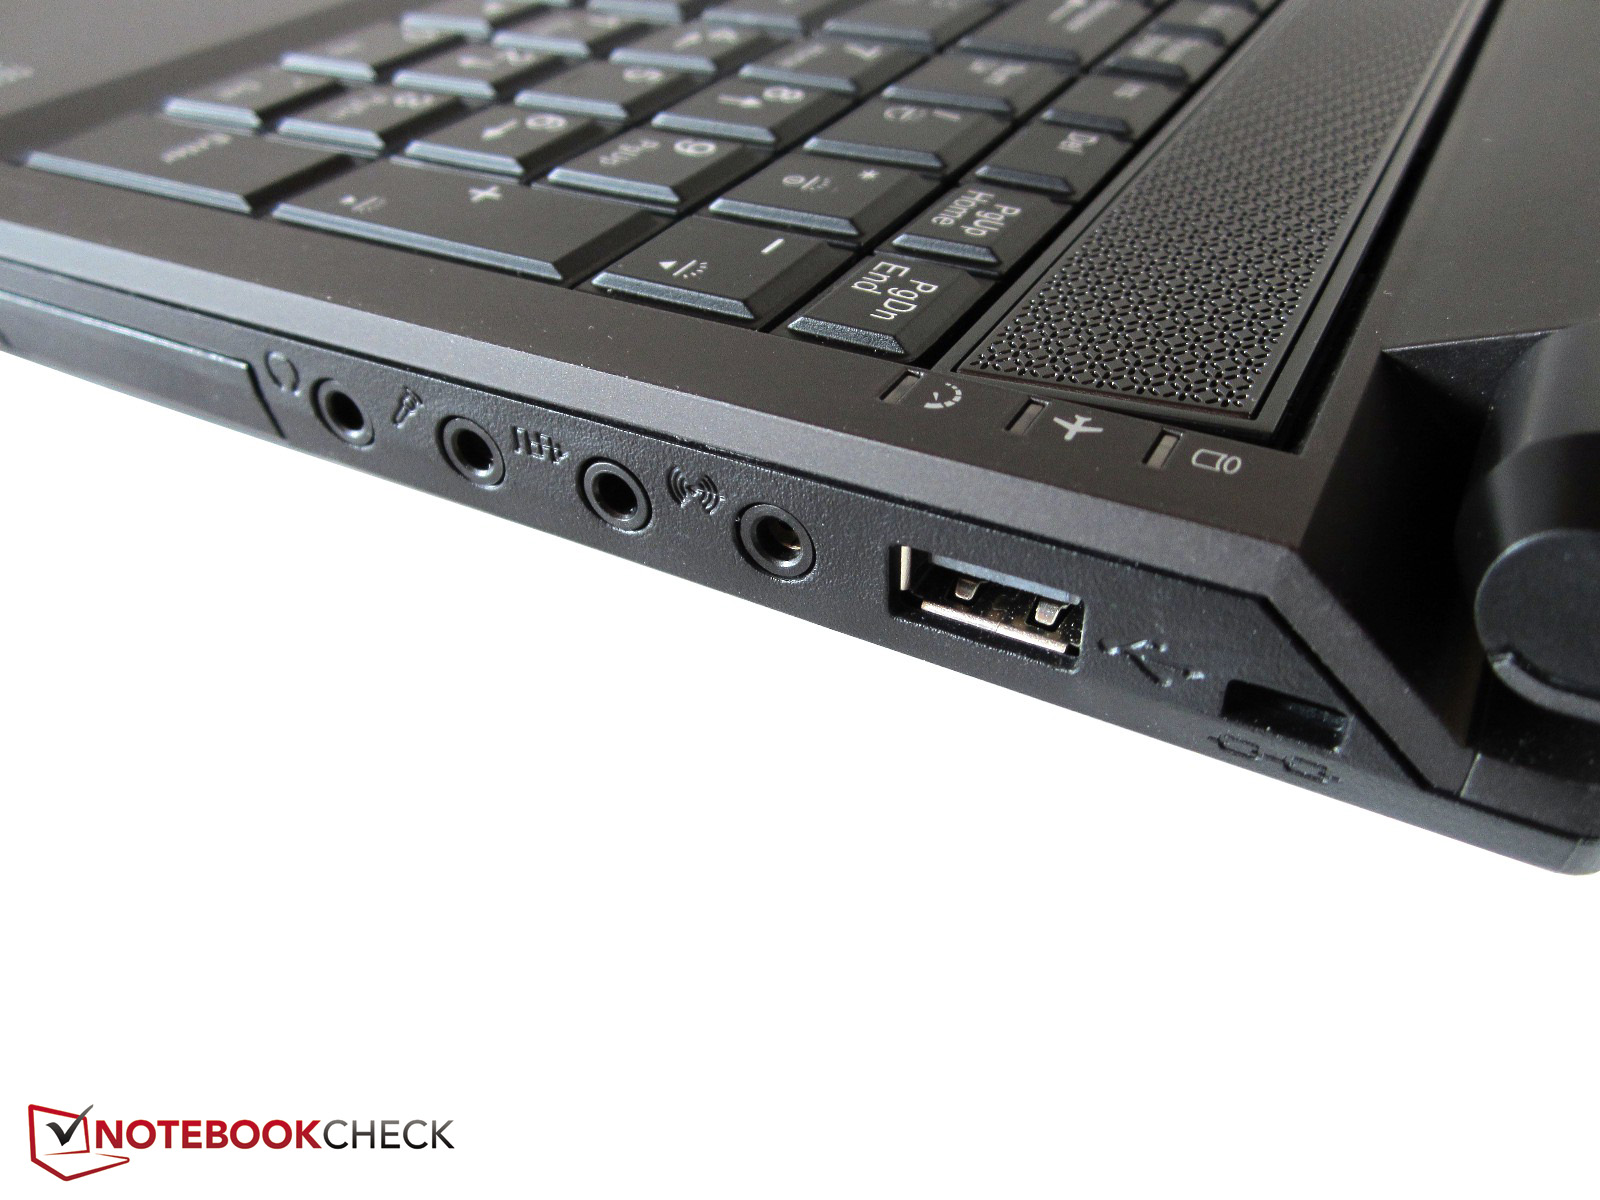
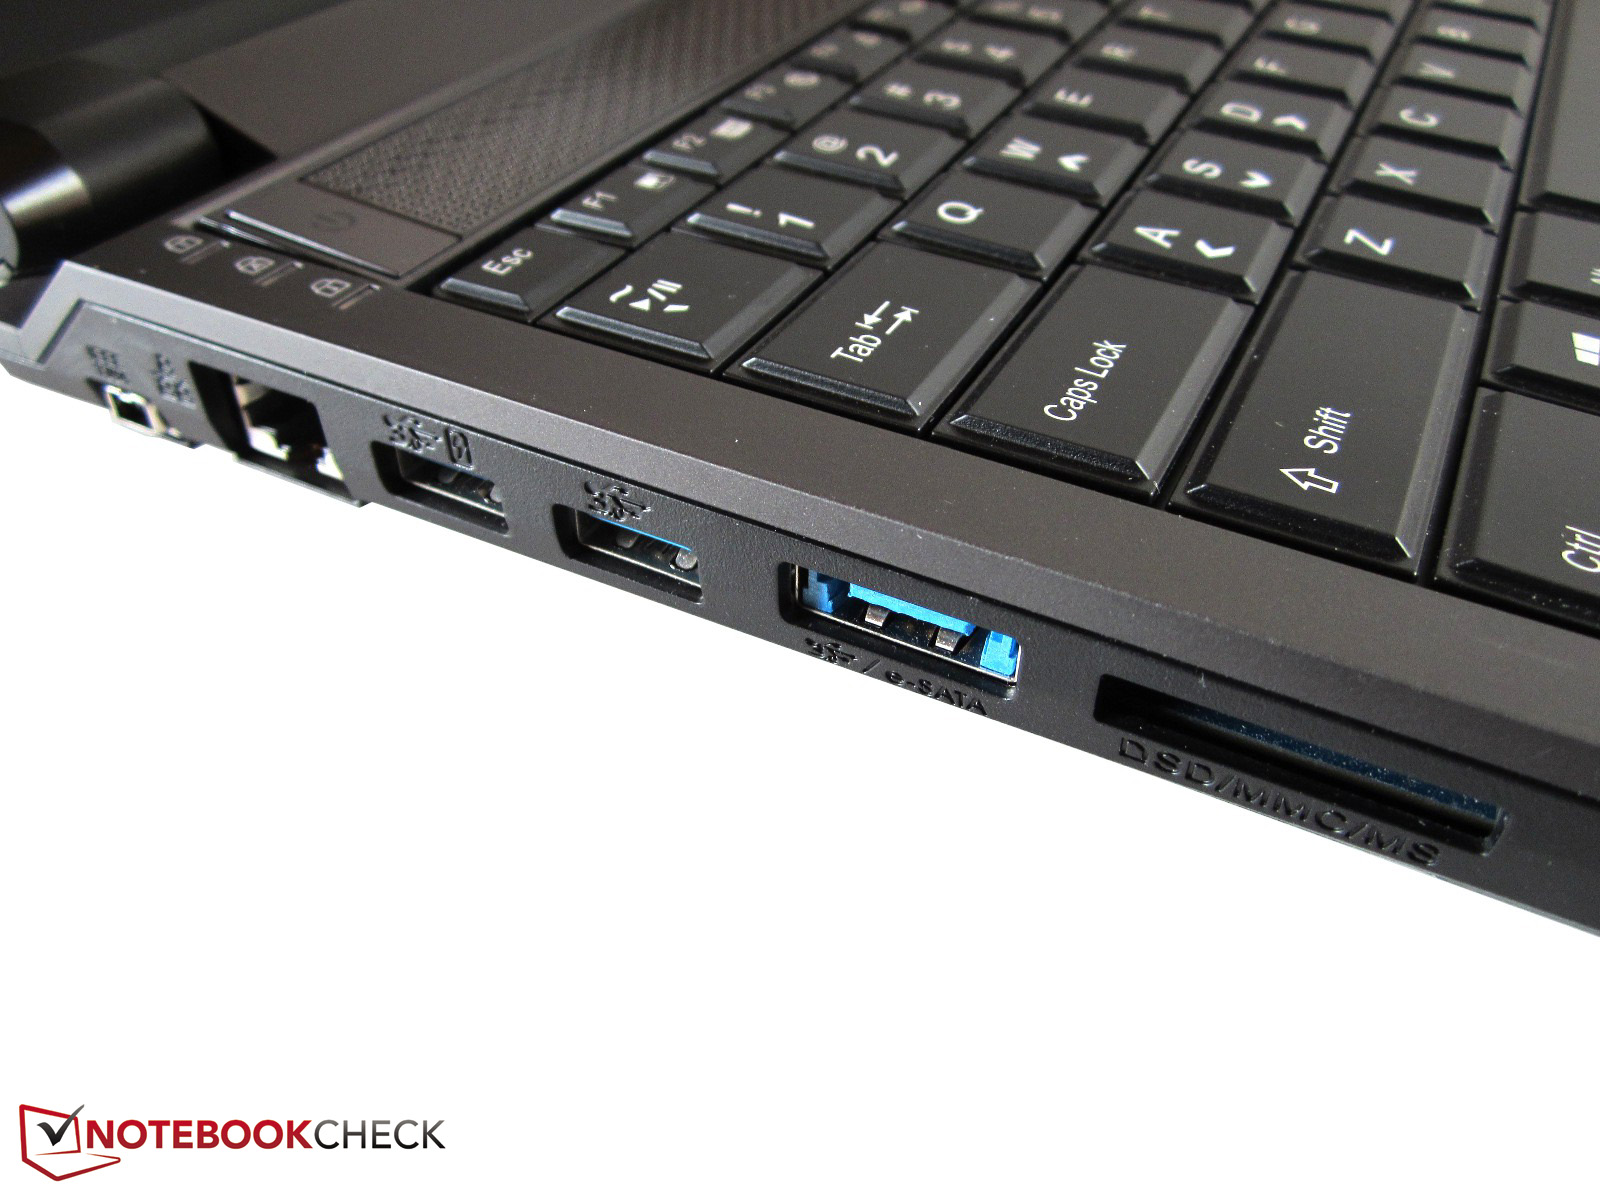
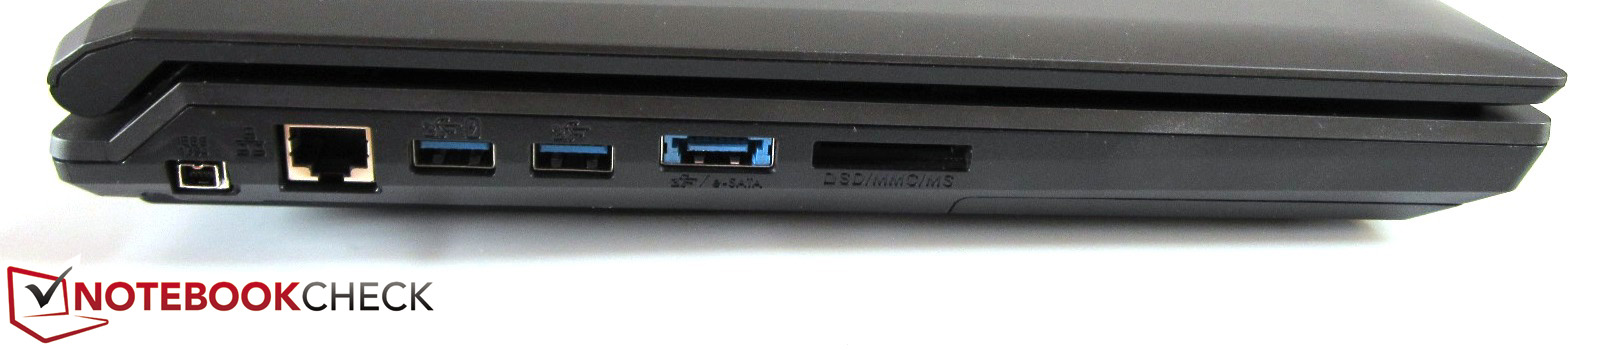
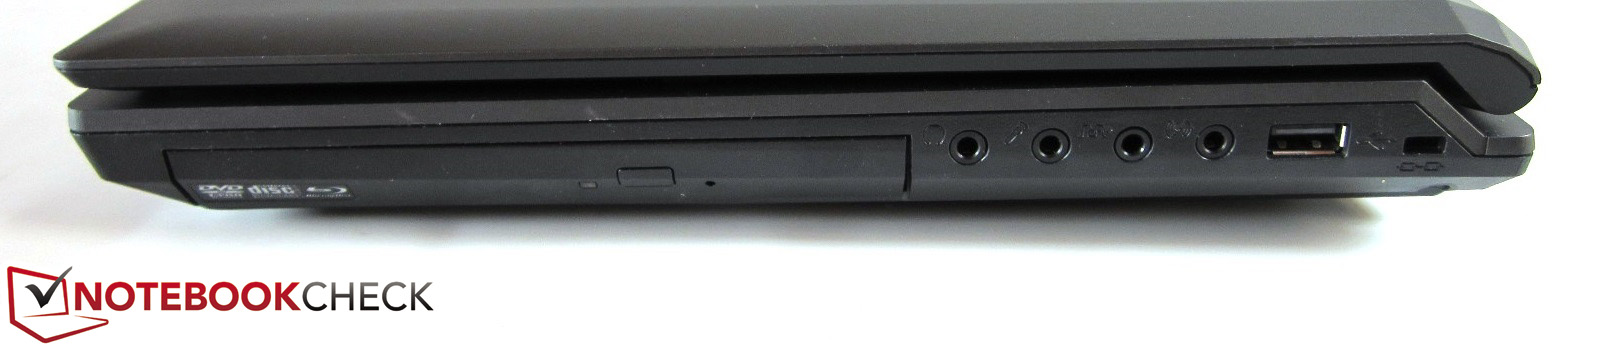
The right side provides a Kensington Lock, a USB 2.0 port and four audio jacks for connecting a surround sound system (7.1 sound). On the left side there is a card reader (nine formats), an eSATA/USB 3.0 combi-port, two further USB 3.0 ports, an RJ-45 Gigabit LAN interface, and a mini FireWire port. Some users might be disappointed that Clevo does not include a Thunderbolt interface.
The interface layout is alright. The interfaces are positioned towards the back, ensuring the workspace left and right of the notebook is kept largely free from cables, even if many are connected. When you use an external mouse, you will appreciate this.
Other features
The Clevo comes with a Full HD webcam with 2.0 MP, an integrated microphone, and a fingerprint reader between the touchpad buttons.
Wireless communication
The test device features an Intel Centrino Advanced-N 6235 combi-adapter, which supports WLAN 802.11 a/b/g/n and Bluetooth 4.0. In contrast to the cheaper Centrino Wireless-N 2230, the 6235 can also handle the 5 GHz frequency (maximum: 300 Mbit/s). According to our experiences, the range is mid-range.
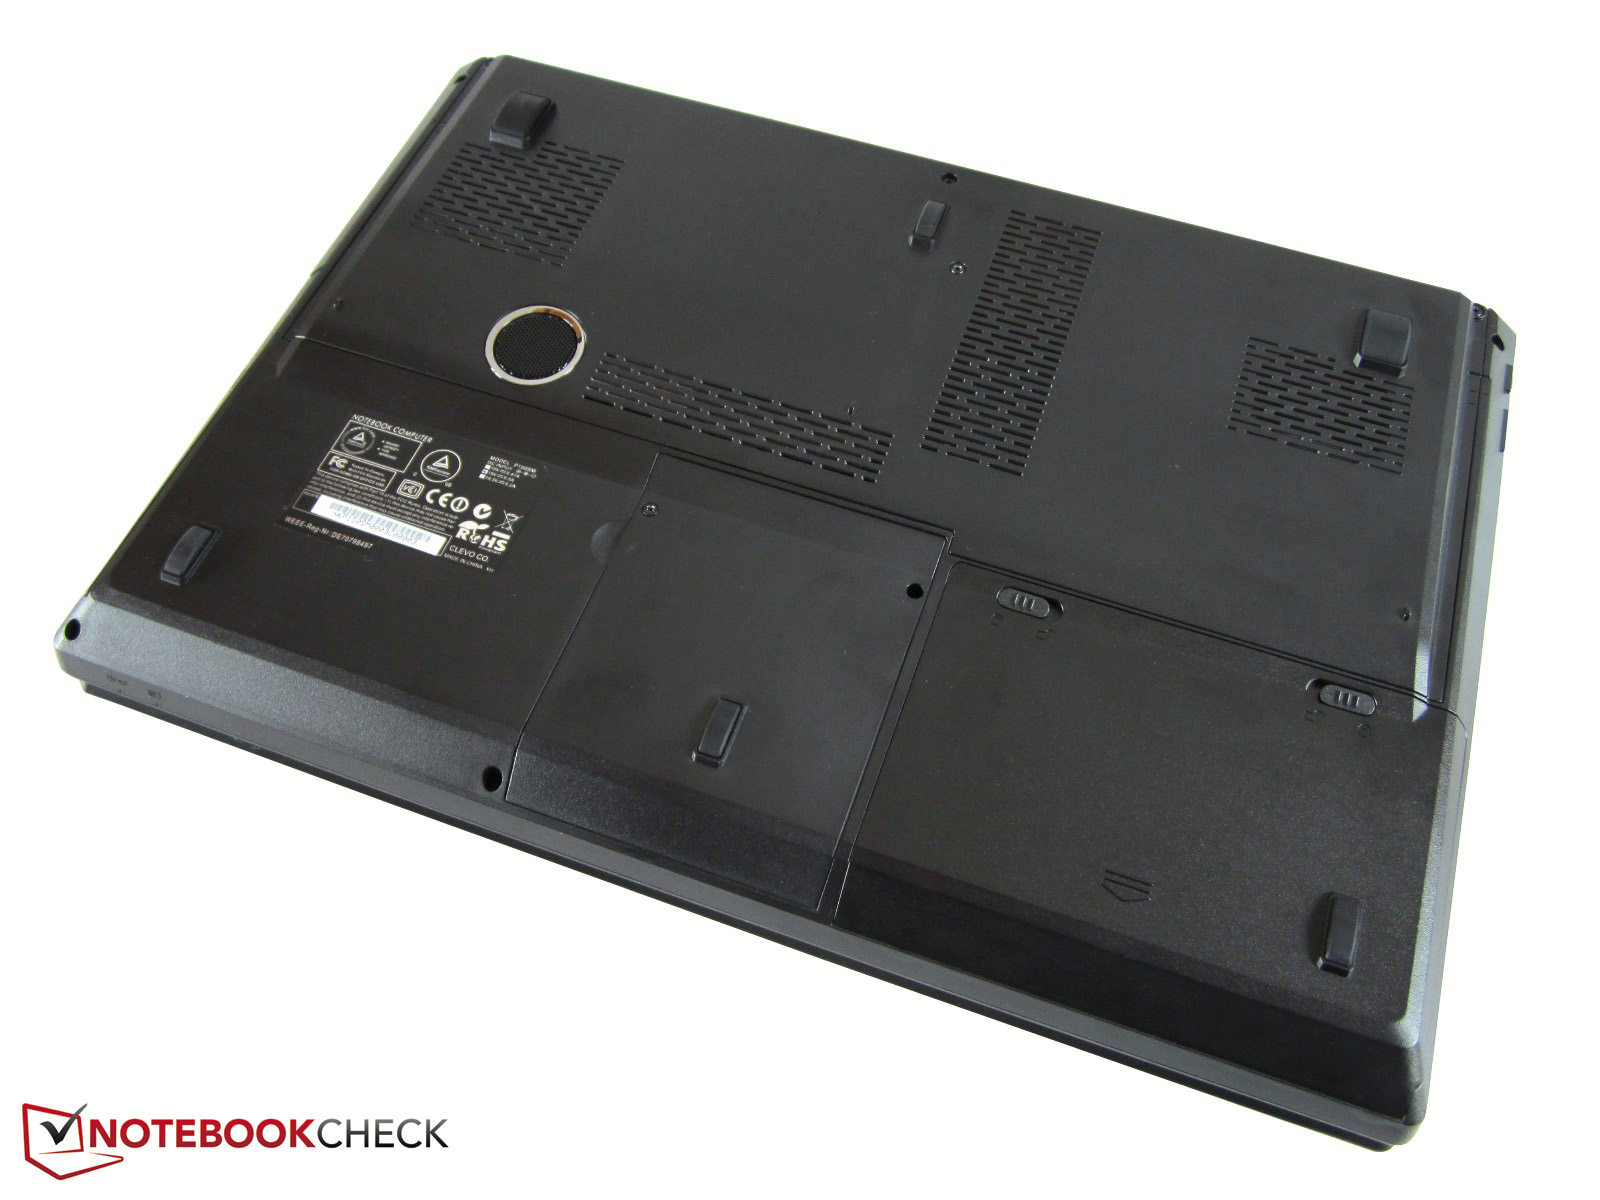
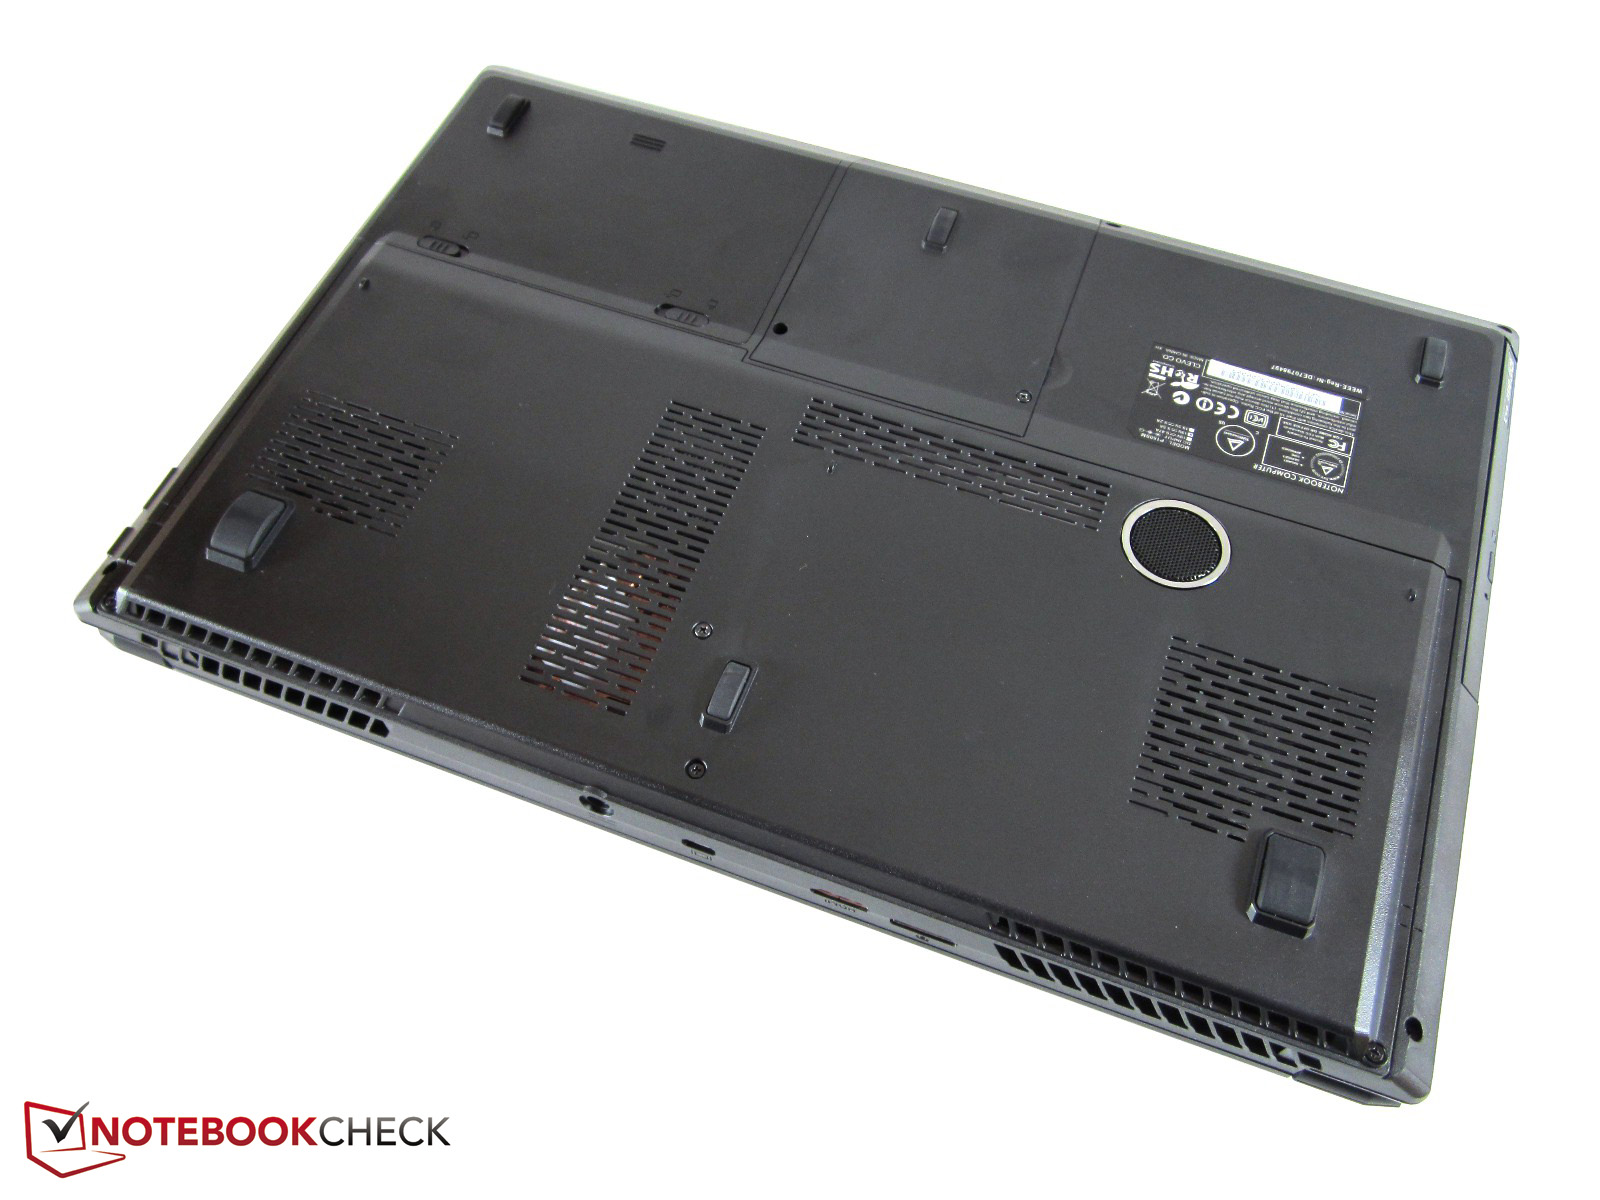
Maintenance
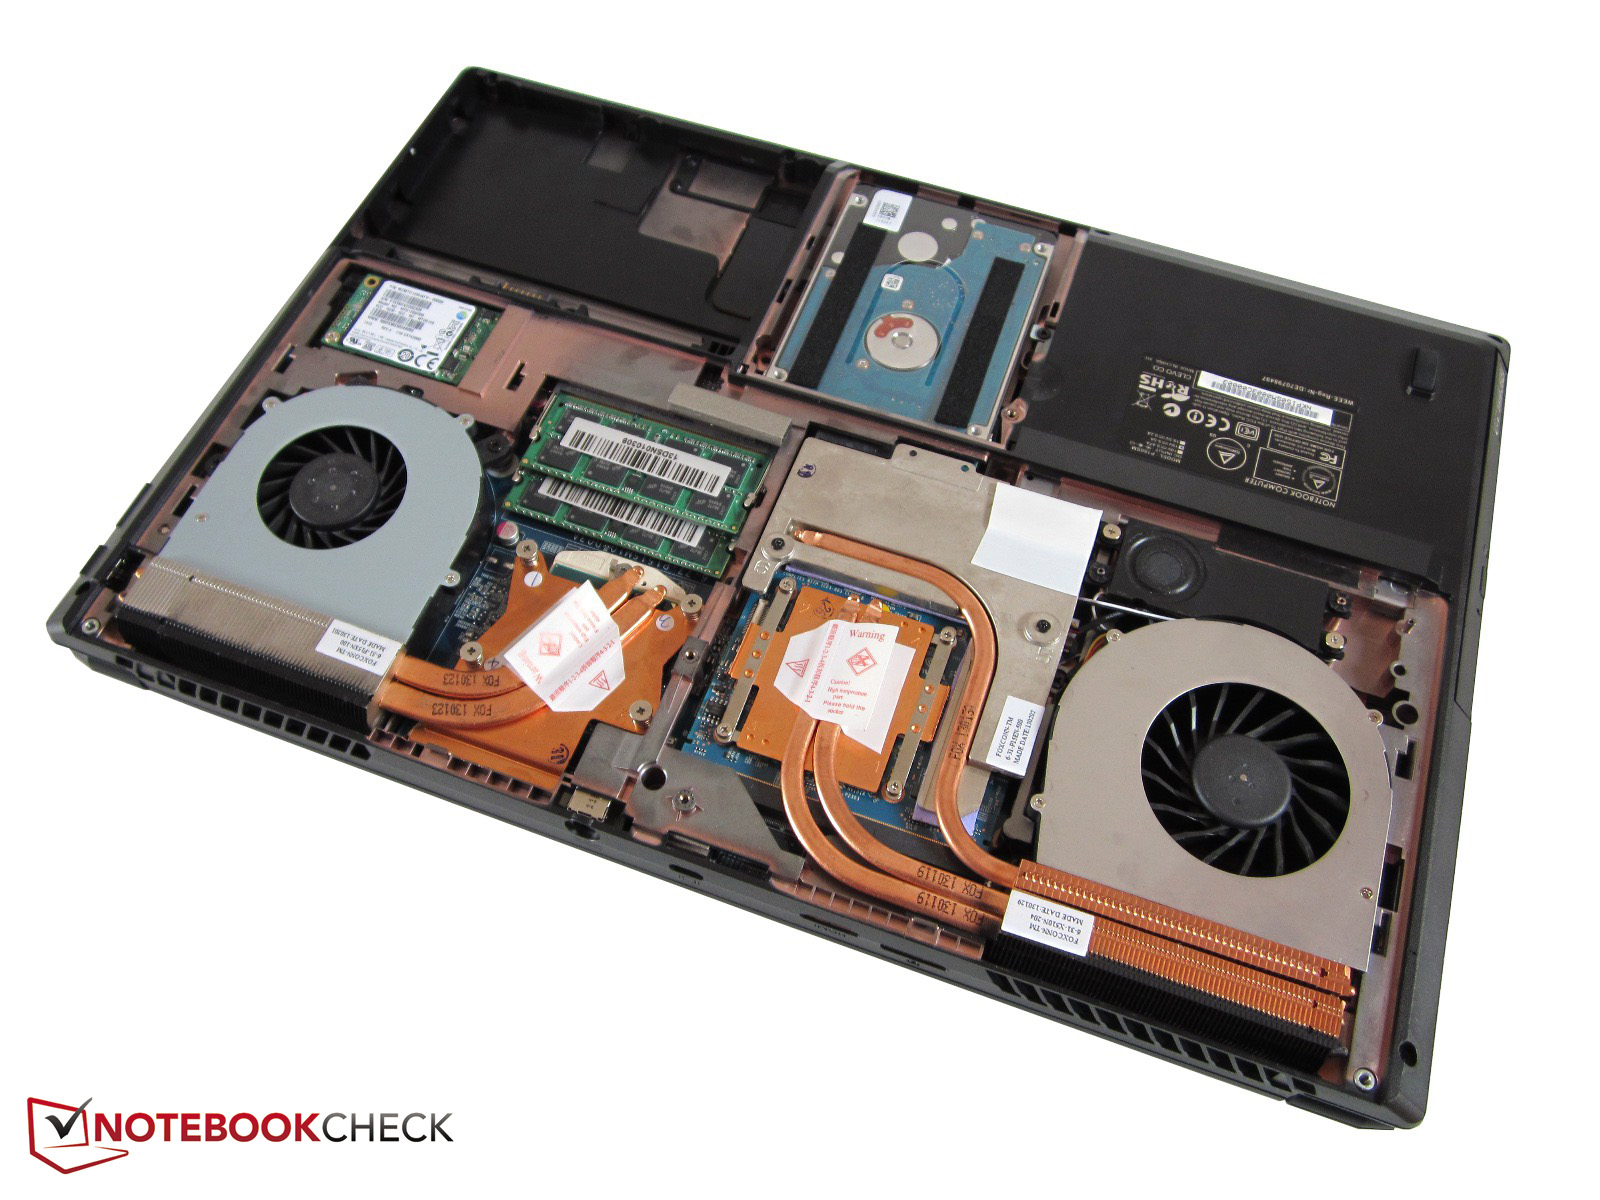
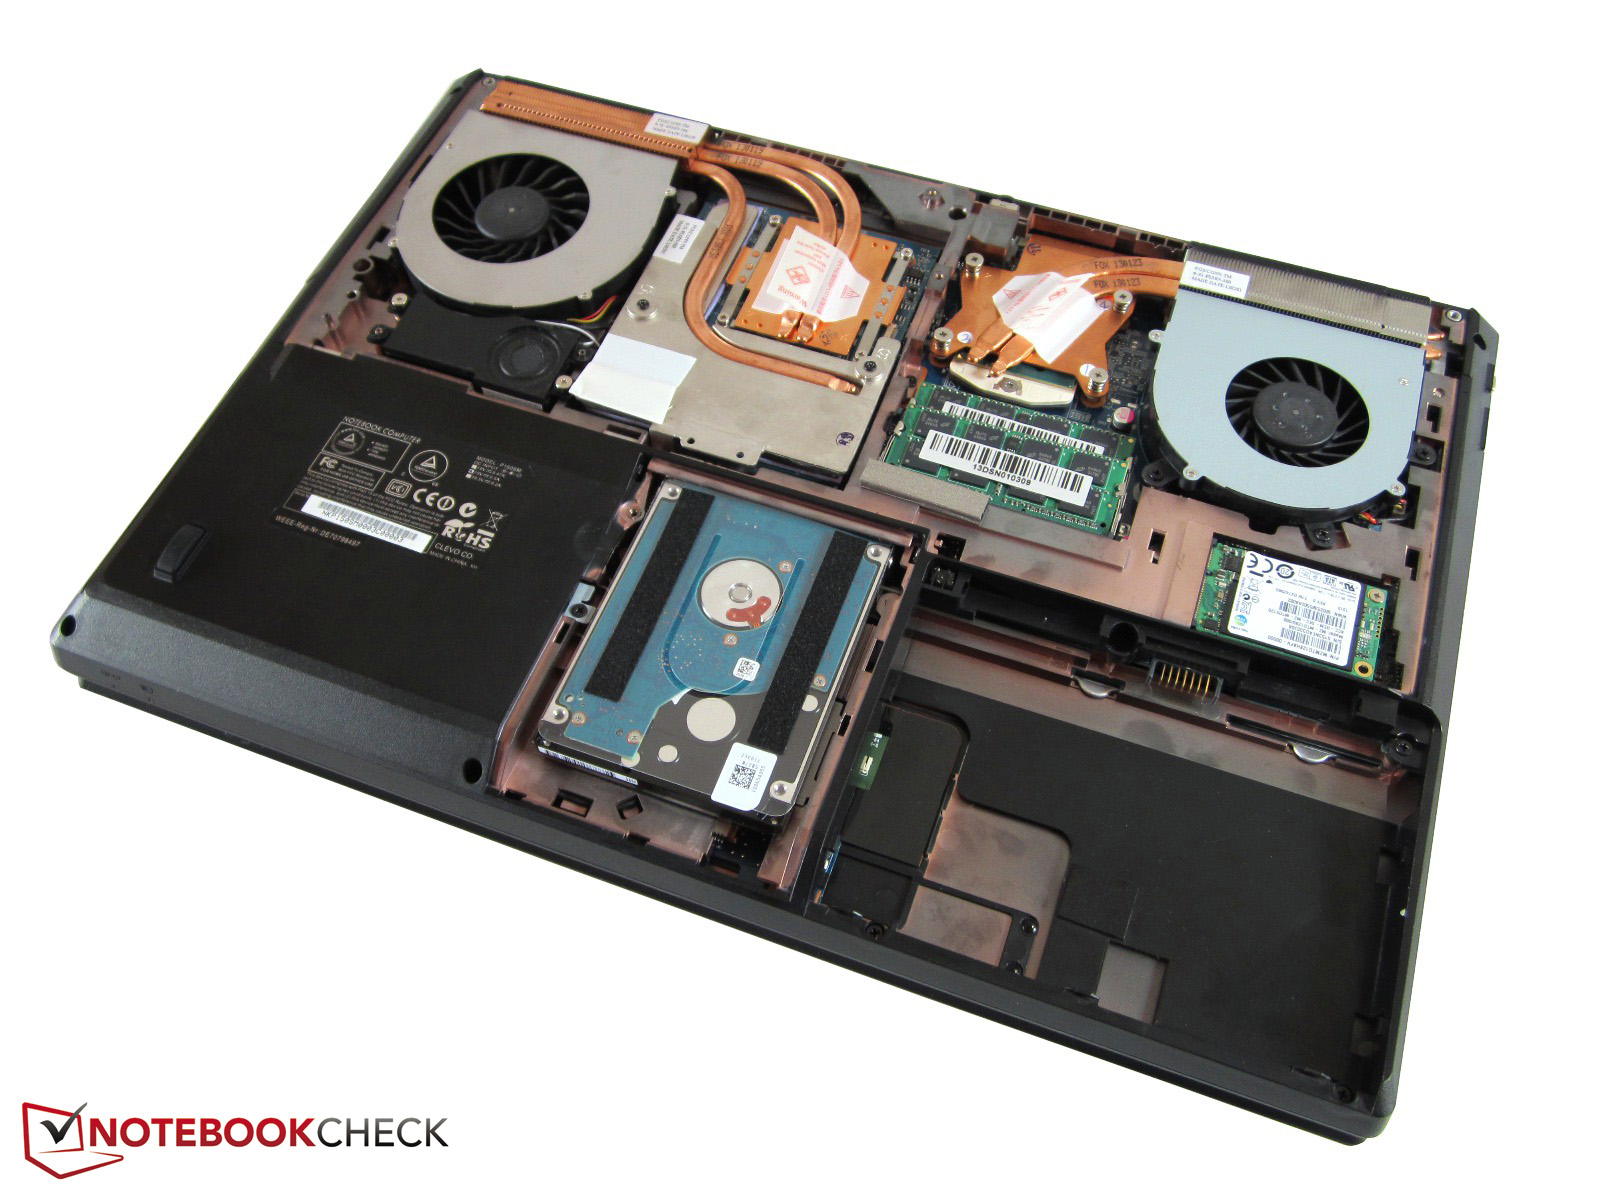
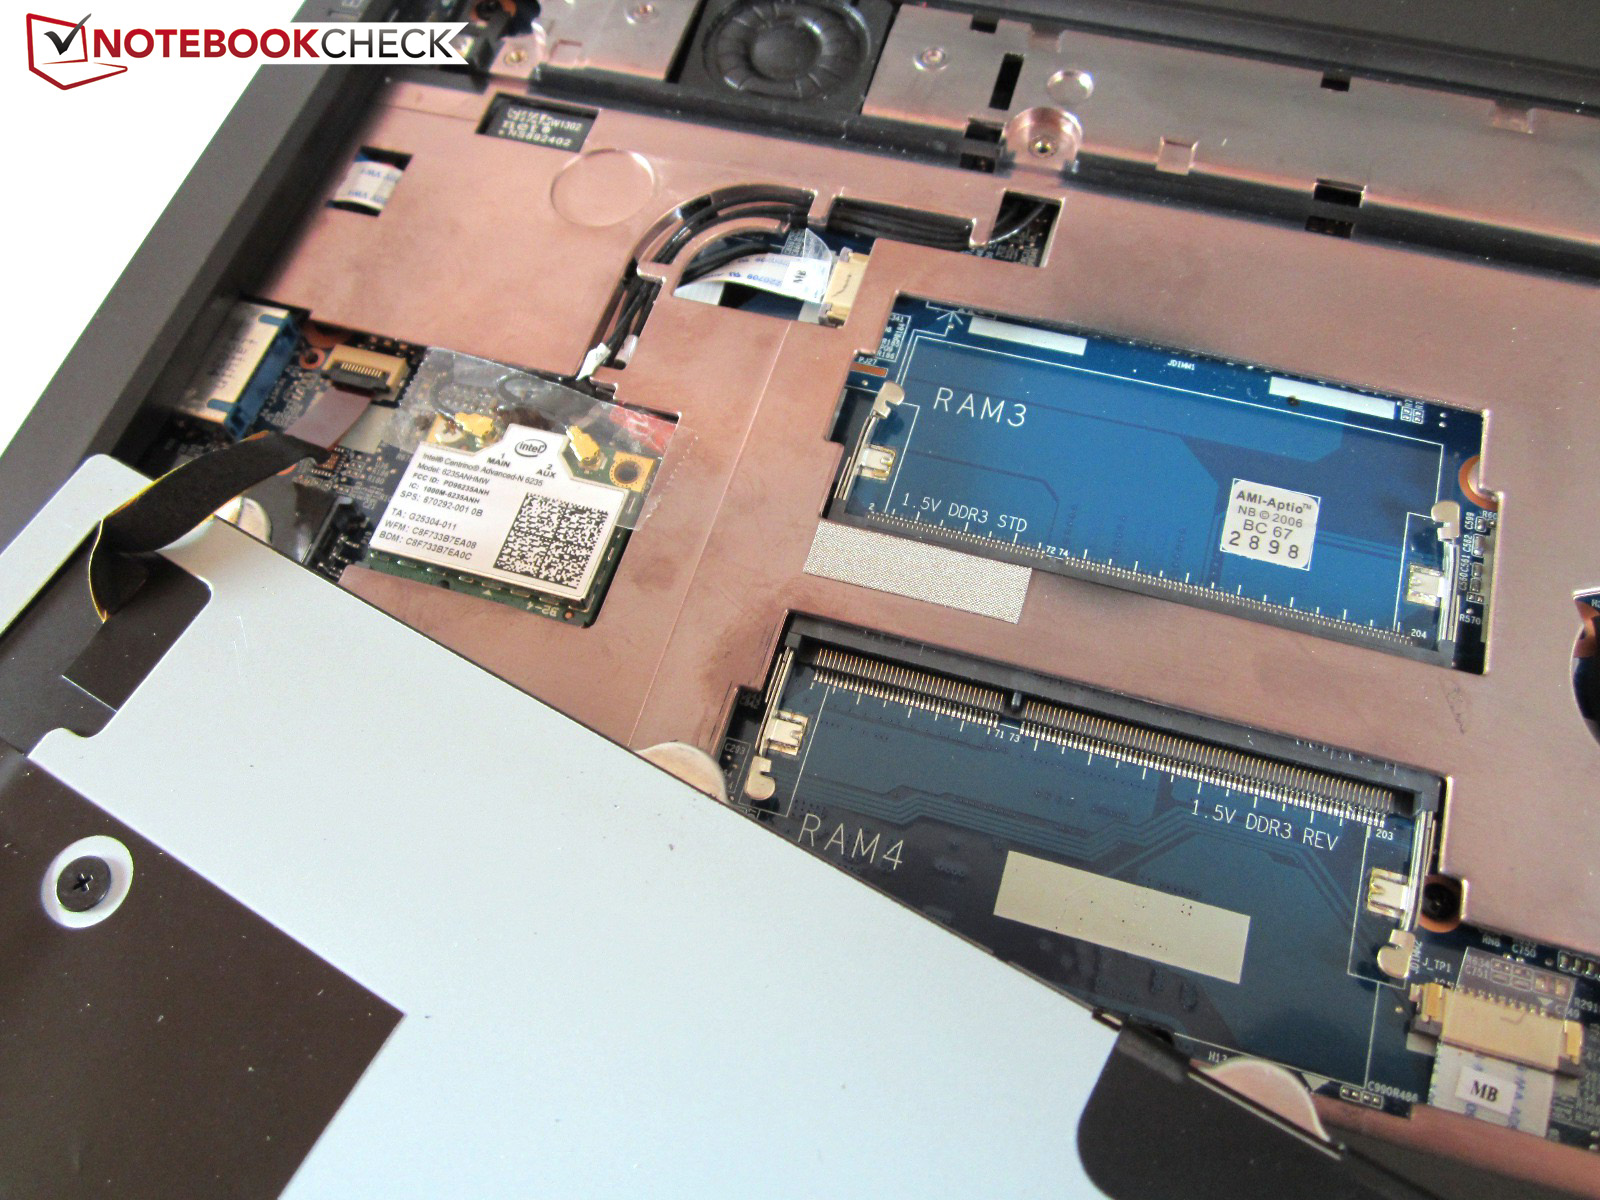
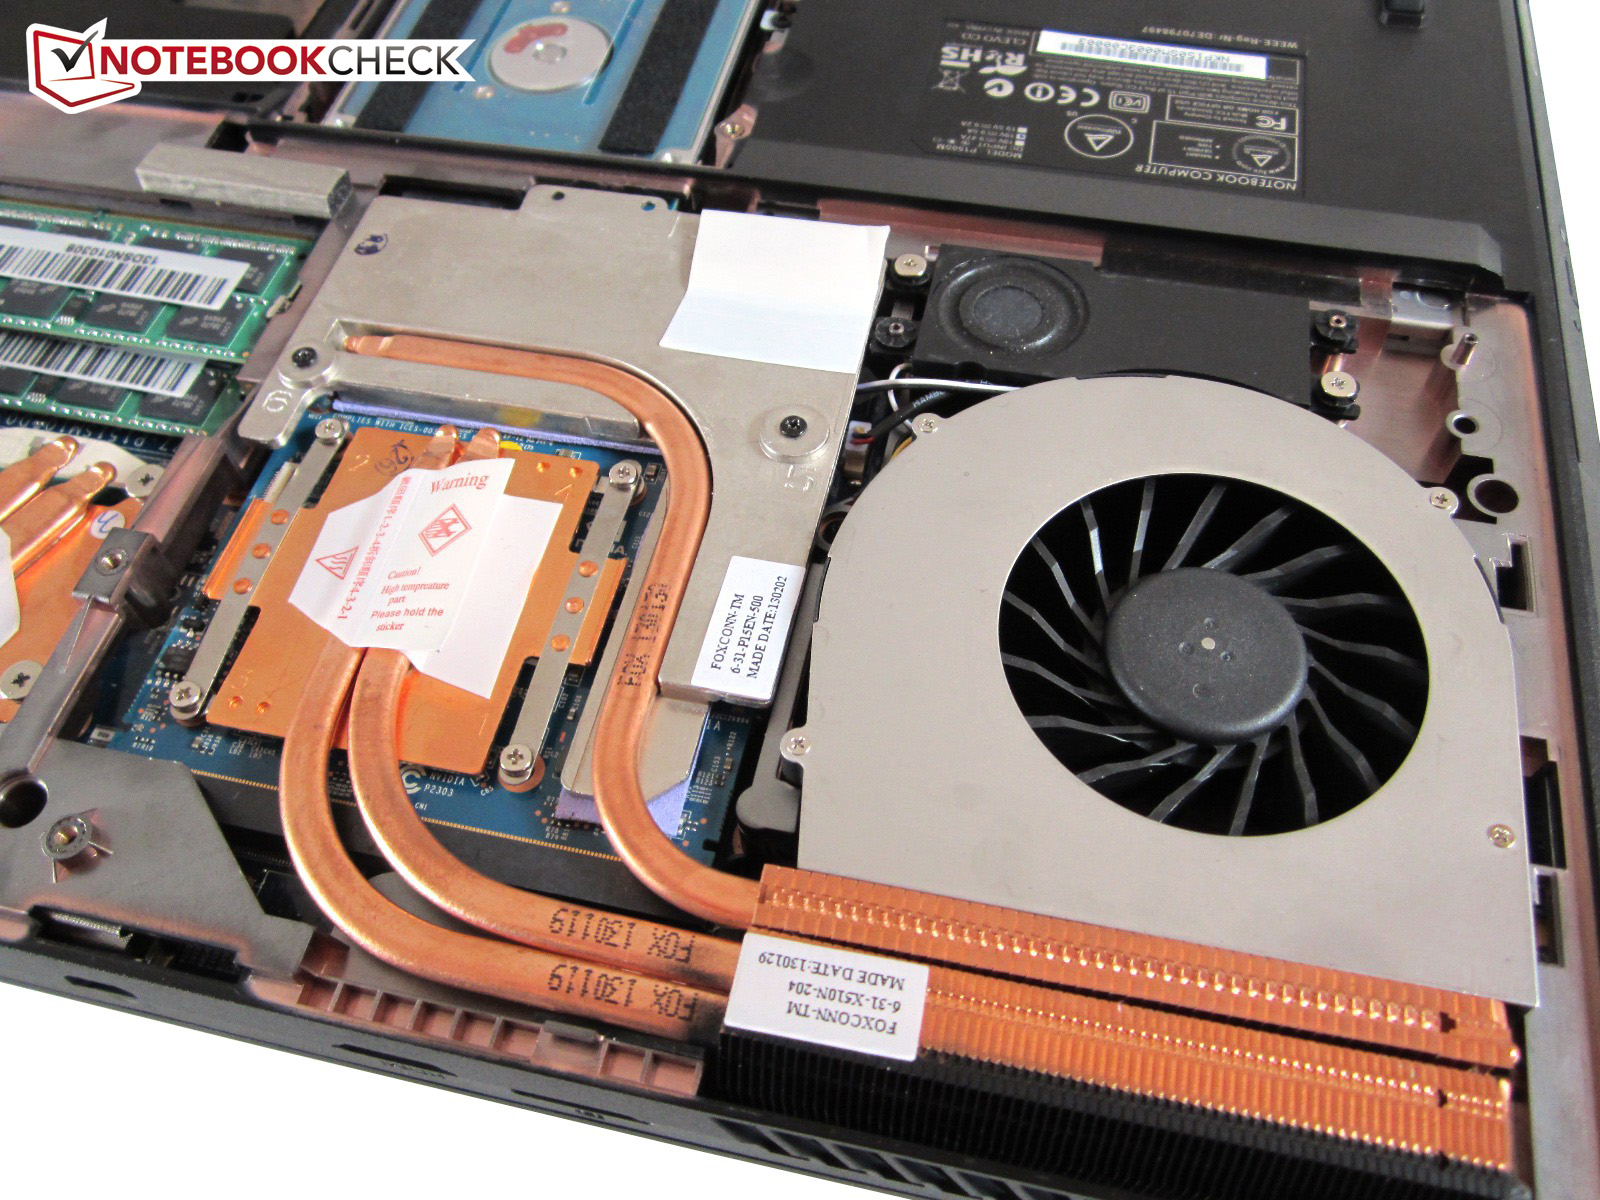
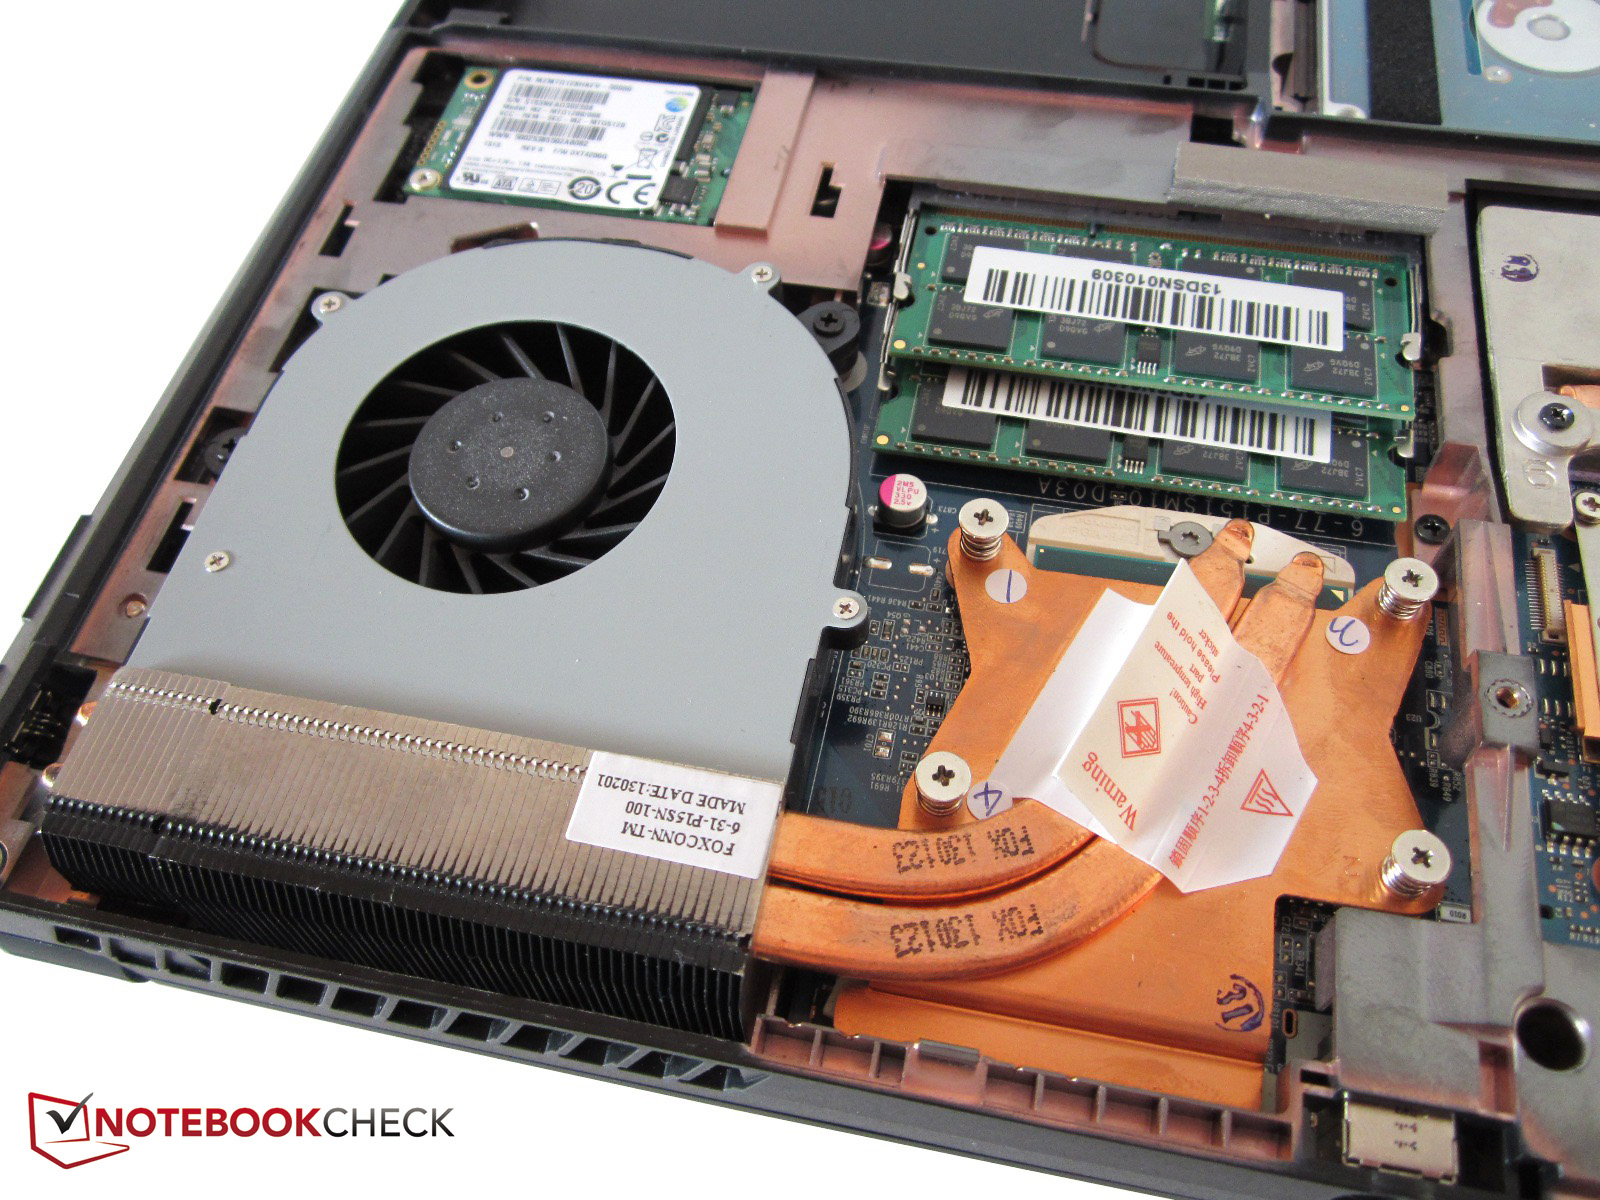
One of the biggest advantages of the Schenker W503 is its ease of maintenance. Both maintenance flaps can be quickly removed with a standard screwdriver. While the smaller one covers a 2.5-inch slot and the mSATA slot, there are the primary RAM slots, the fan, the cooling systems and a second mSATA slot beneath the bigger one. Best of all: Graphics card and processor can be replaced if needed (but not arbitrarily).
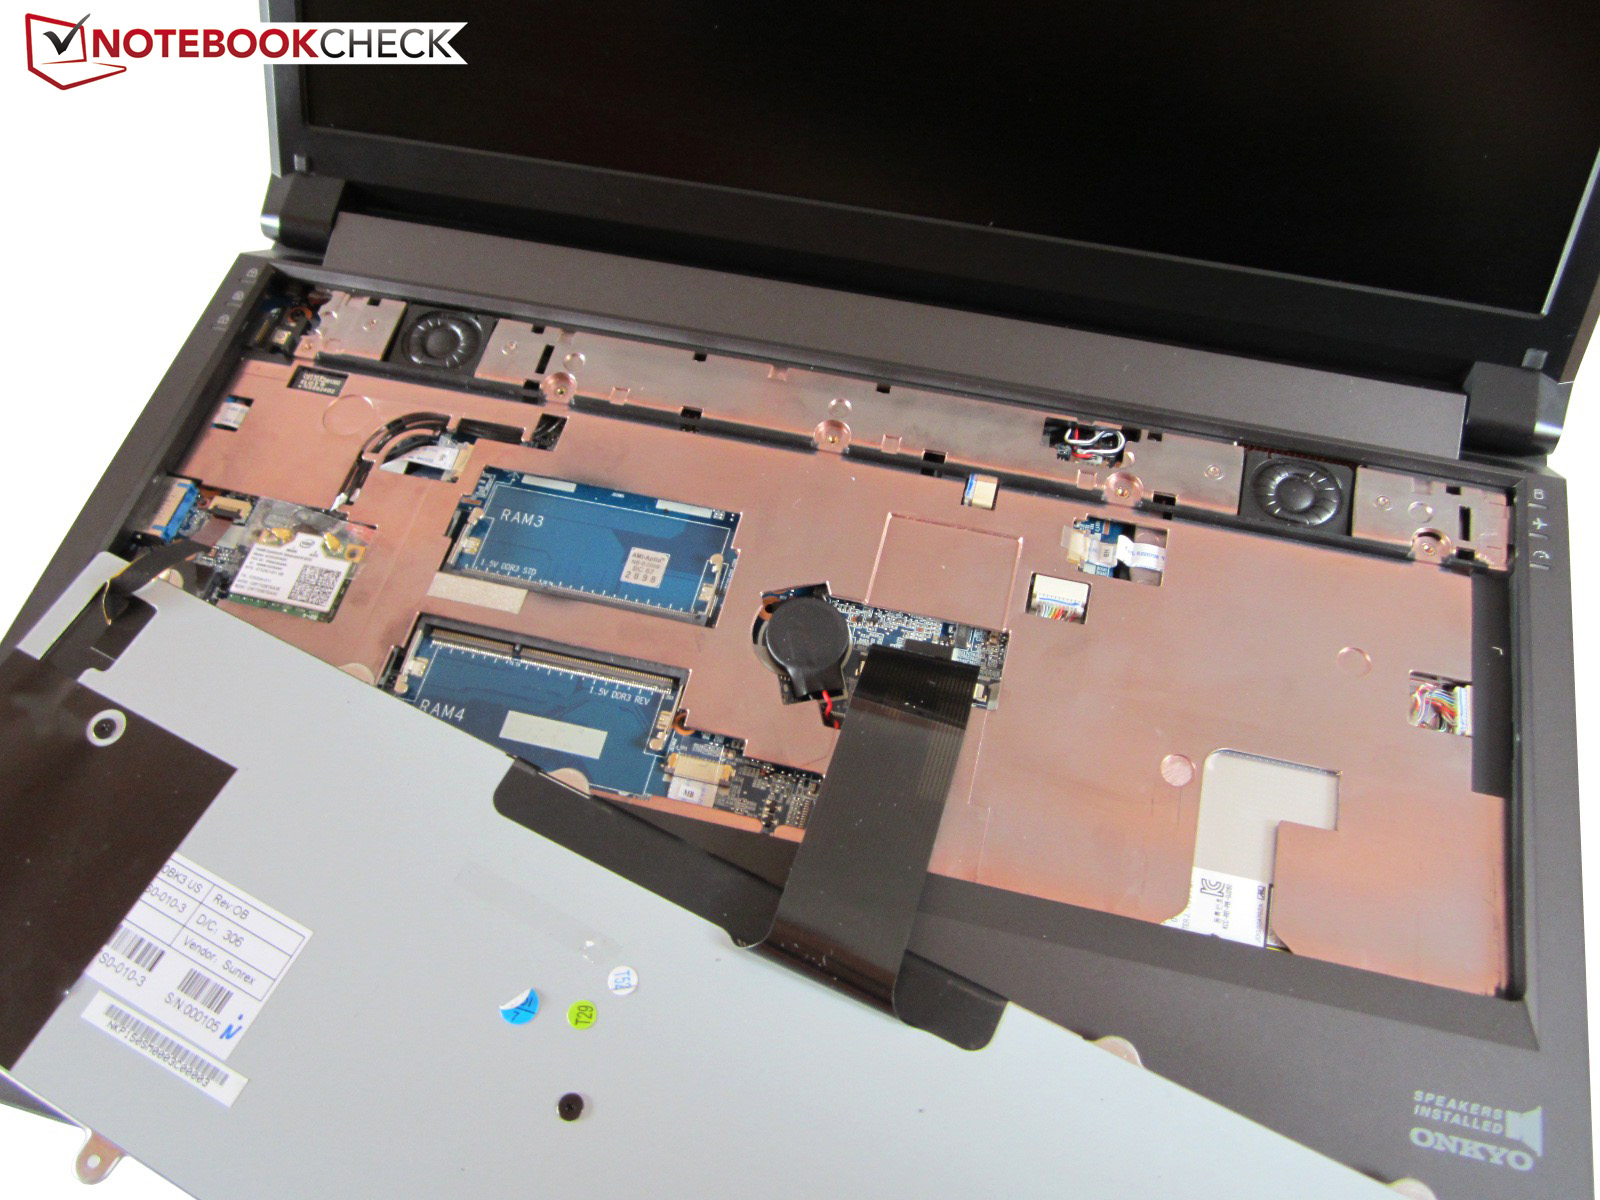
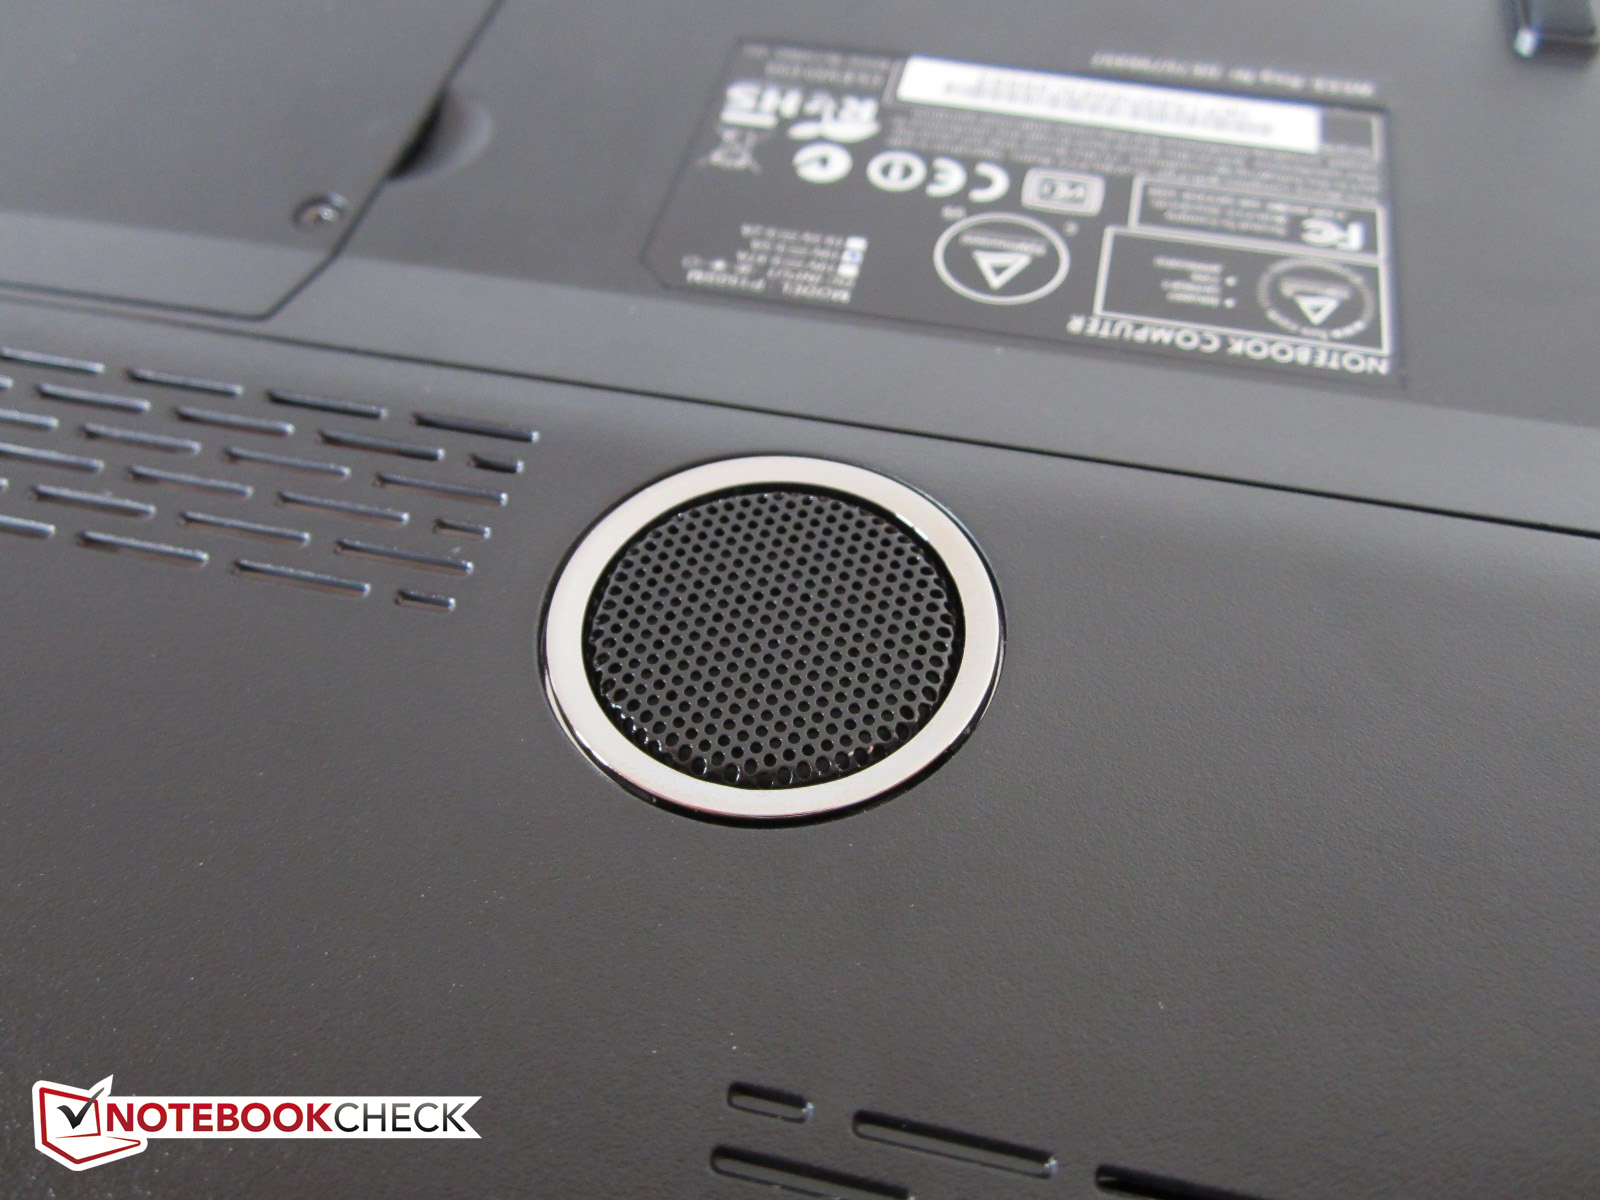
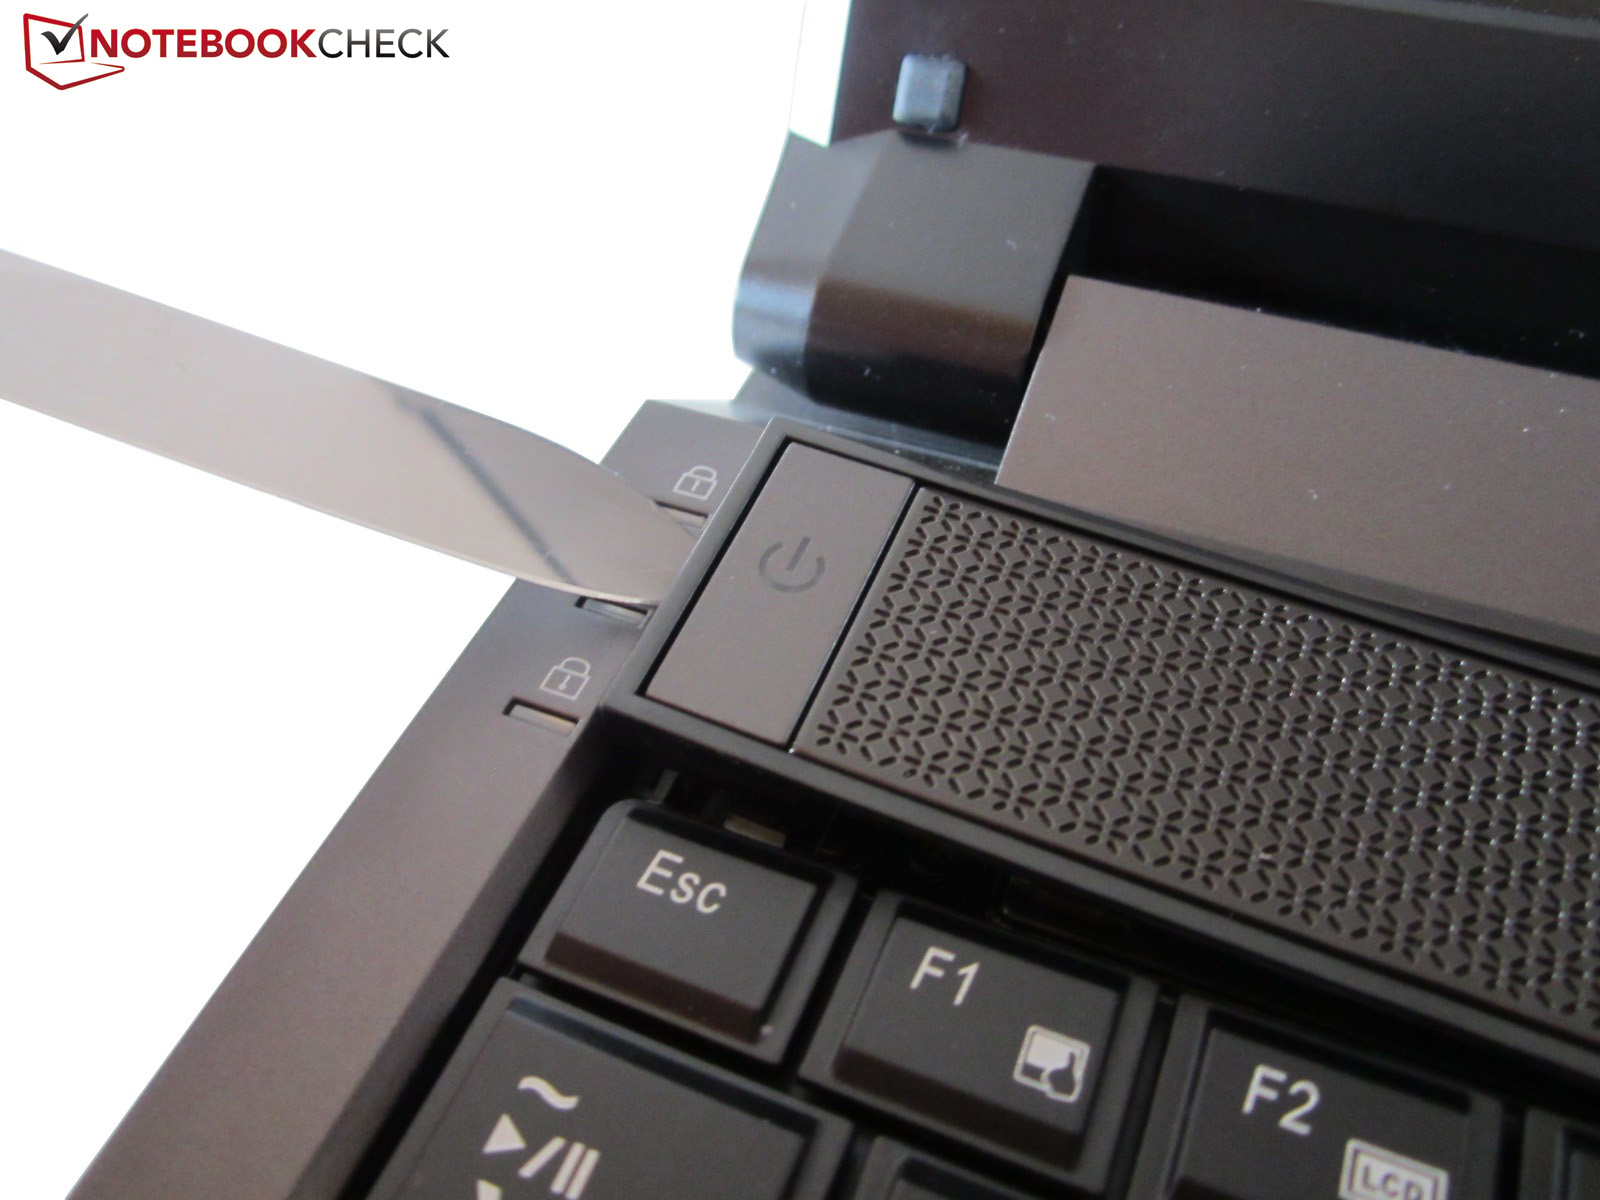
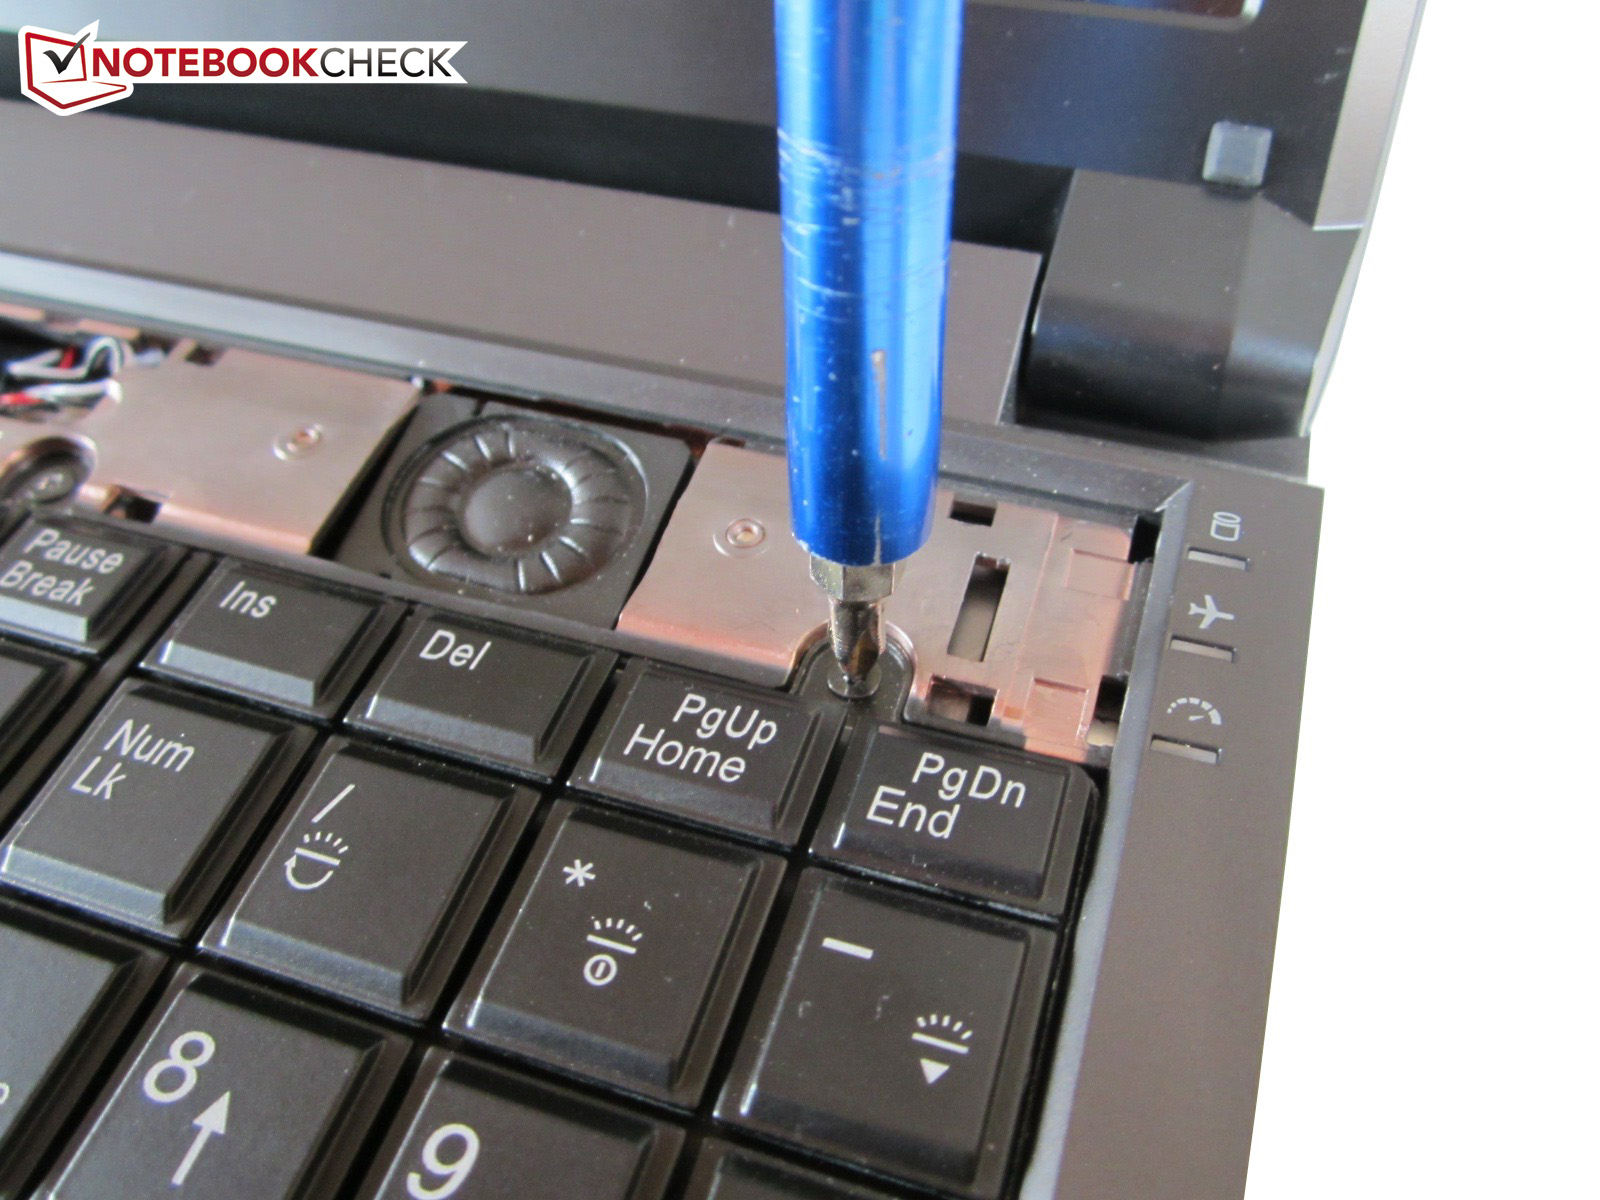
There are several components beneath the keyboard. After prying out the speaker grille with a pointed object, you can also remove the keyboard with a screwdriver (attention: two cables!). As can be seen in a photo in the right hand column, the upper side of the motherboard houses the Wi-Fi module and the third and fourth RAM slot. Quad-core CPUs support up to 32 GB DDR3 RAM (4x 8192 MB).


Software
The manufacturer deserves praise for a clean Windows installation without annoying bloatware. Our test device only had just under 20 drivers and tools preinstalled. This is exemplary and bigger notebook manufacturers like Toshiba and Asus, who often install a lot of unnecessary programs, should learn from it.
Accessories
Apart from a 180 Watt power adapter and the 77 Wh lithium-ion battery (420 grams) only a driver DVD is included. We assume that the production model will also come with a multi-lingual user guide. If you order an operating system from Schenker, you will also get an original Windows media. In 2013, this is no longer standard.
Warranty
Input devices
Keyboard
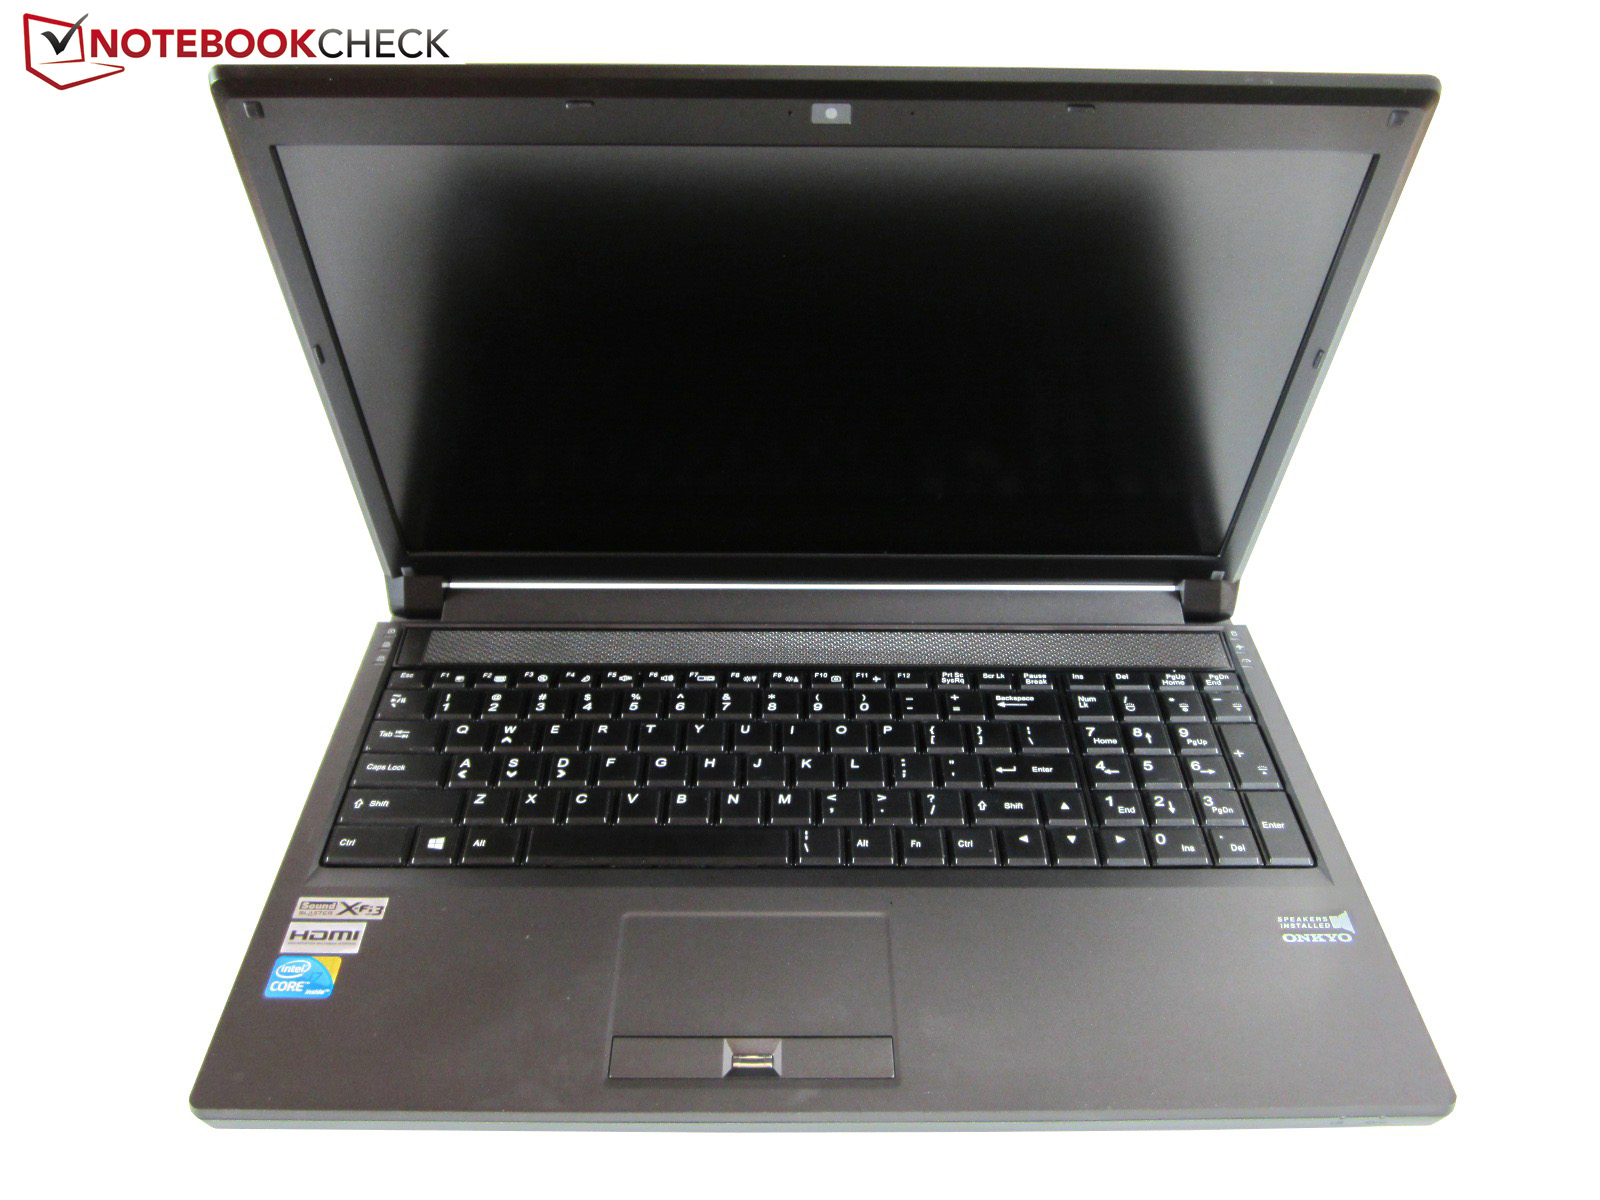
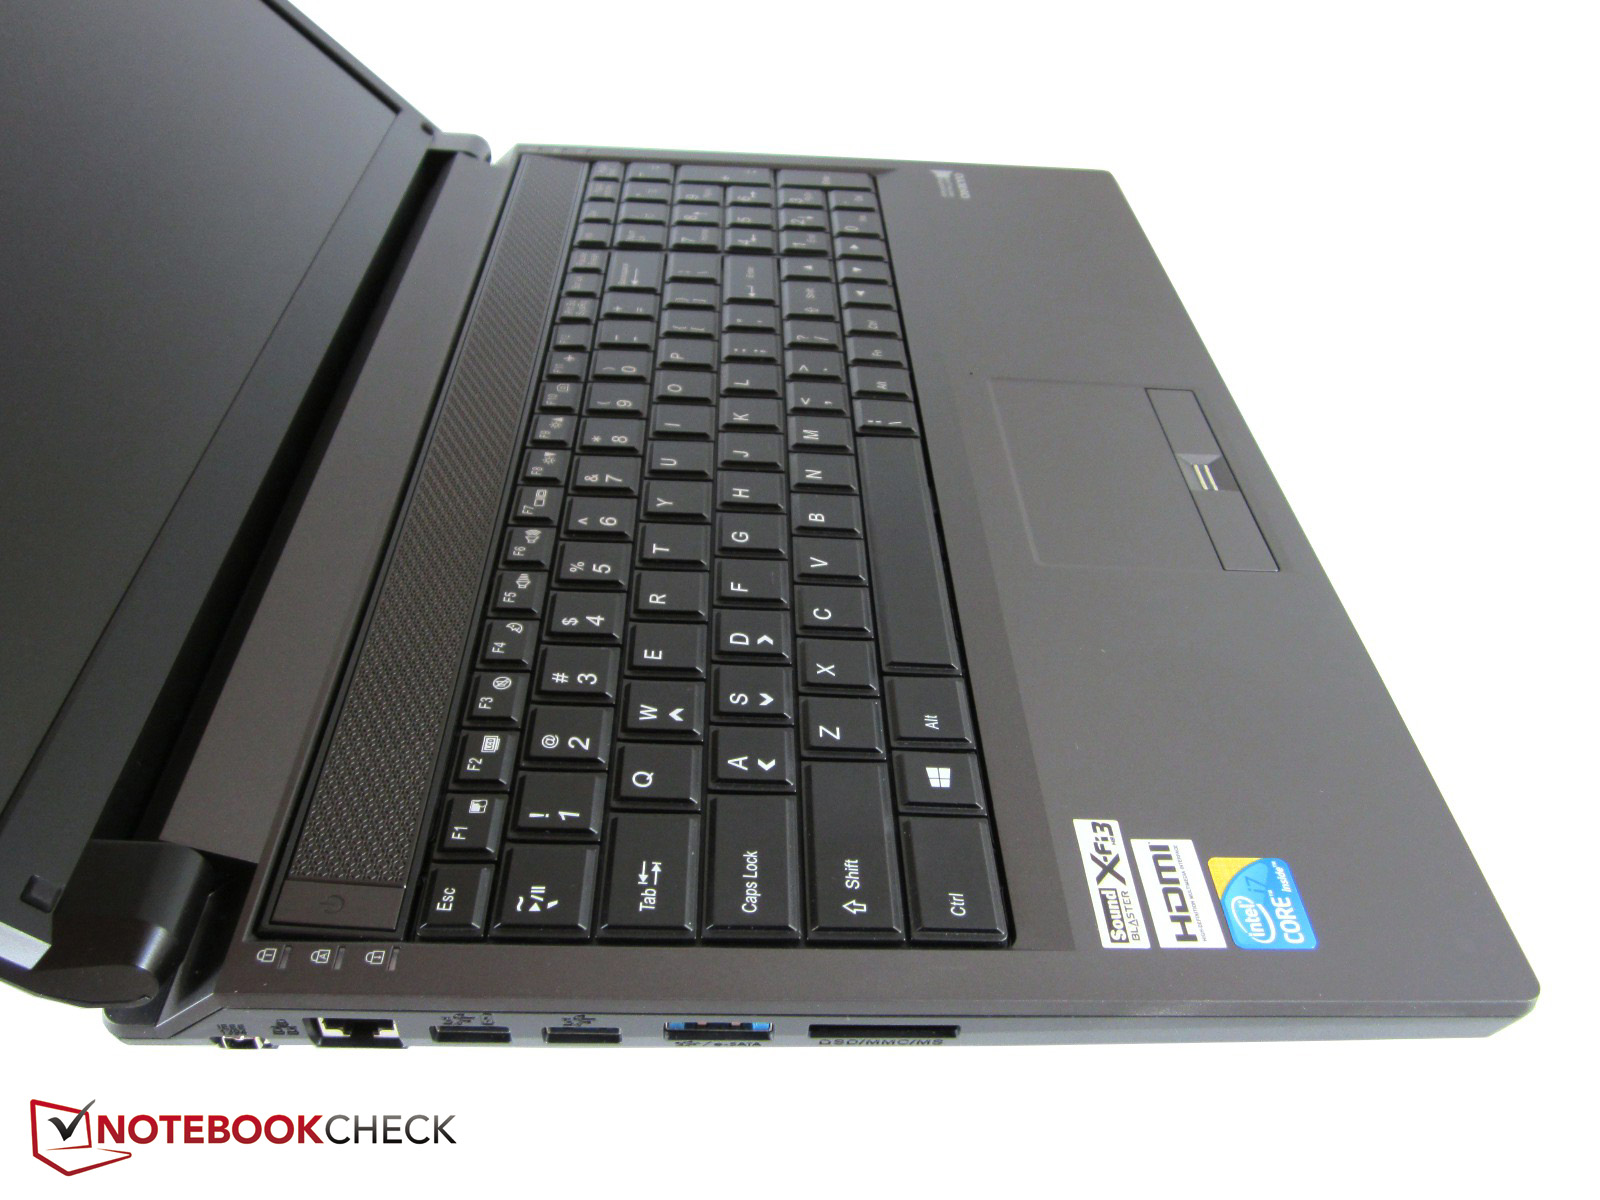
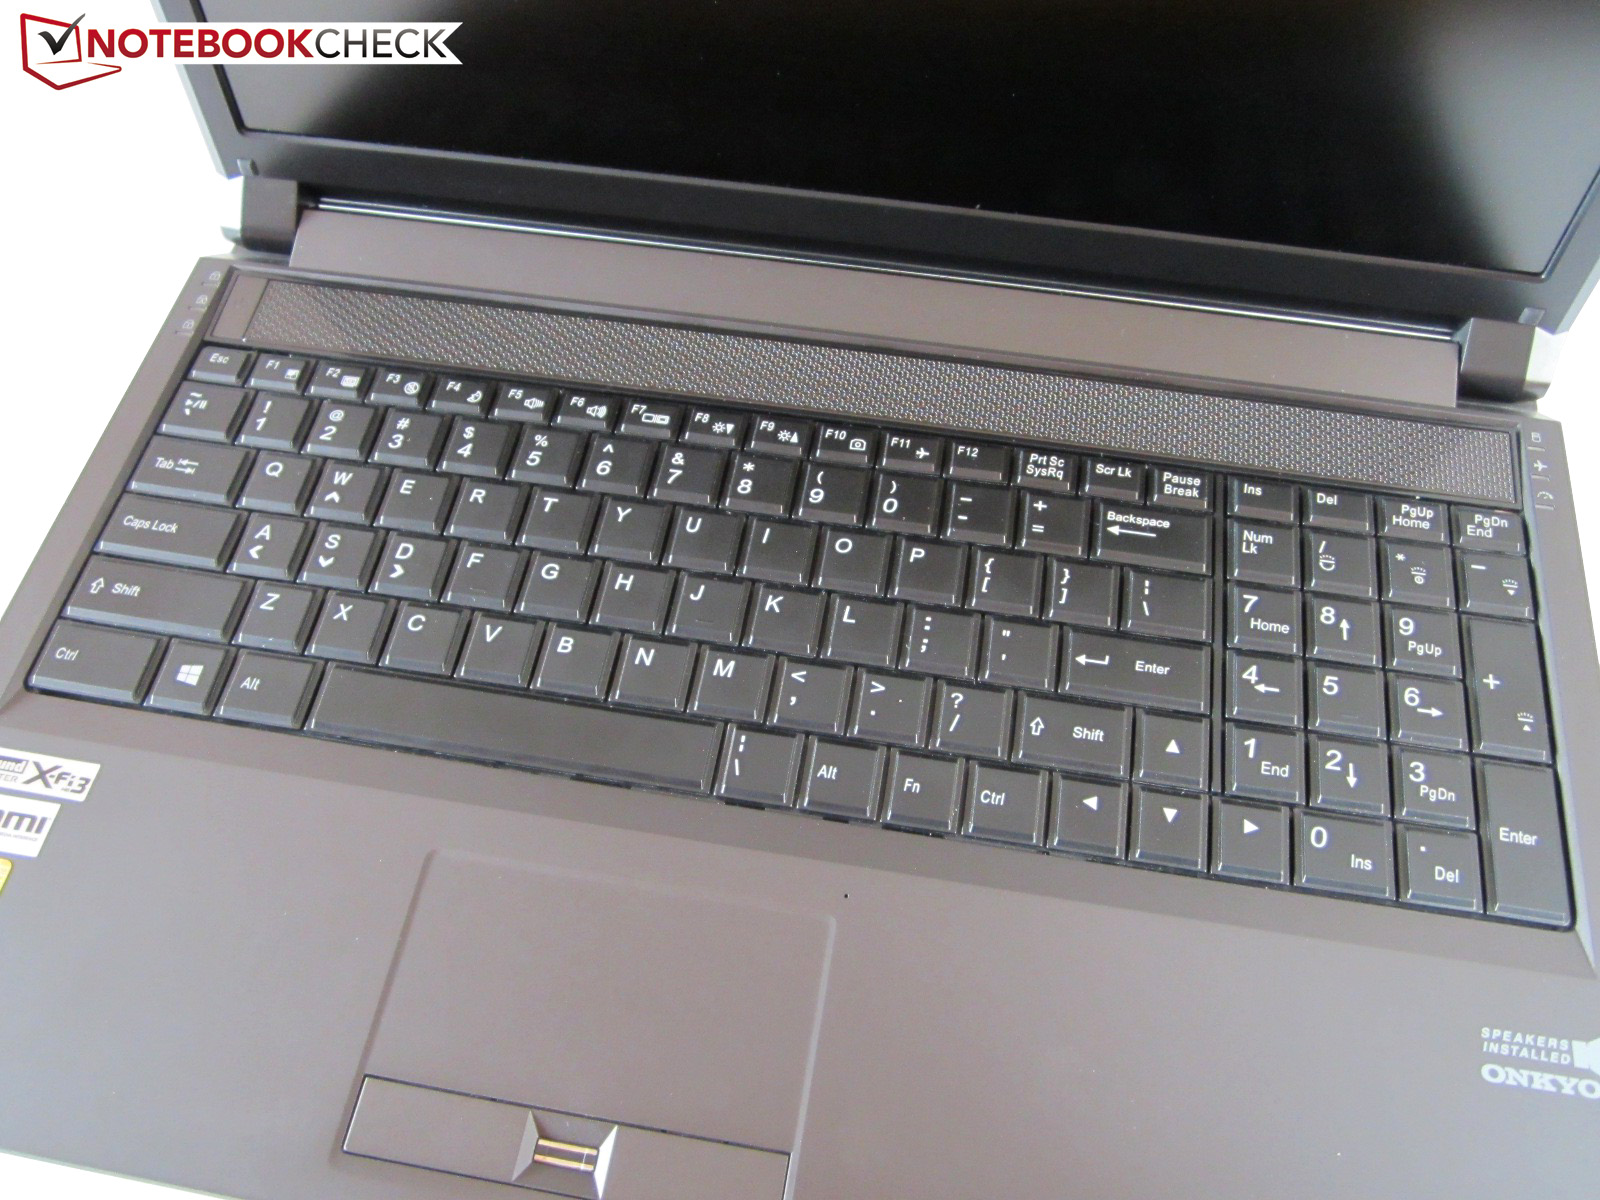
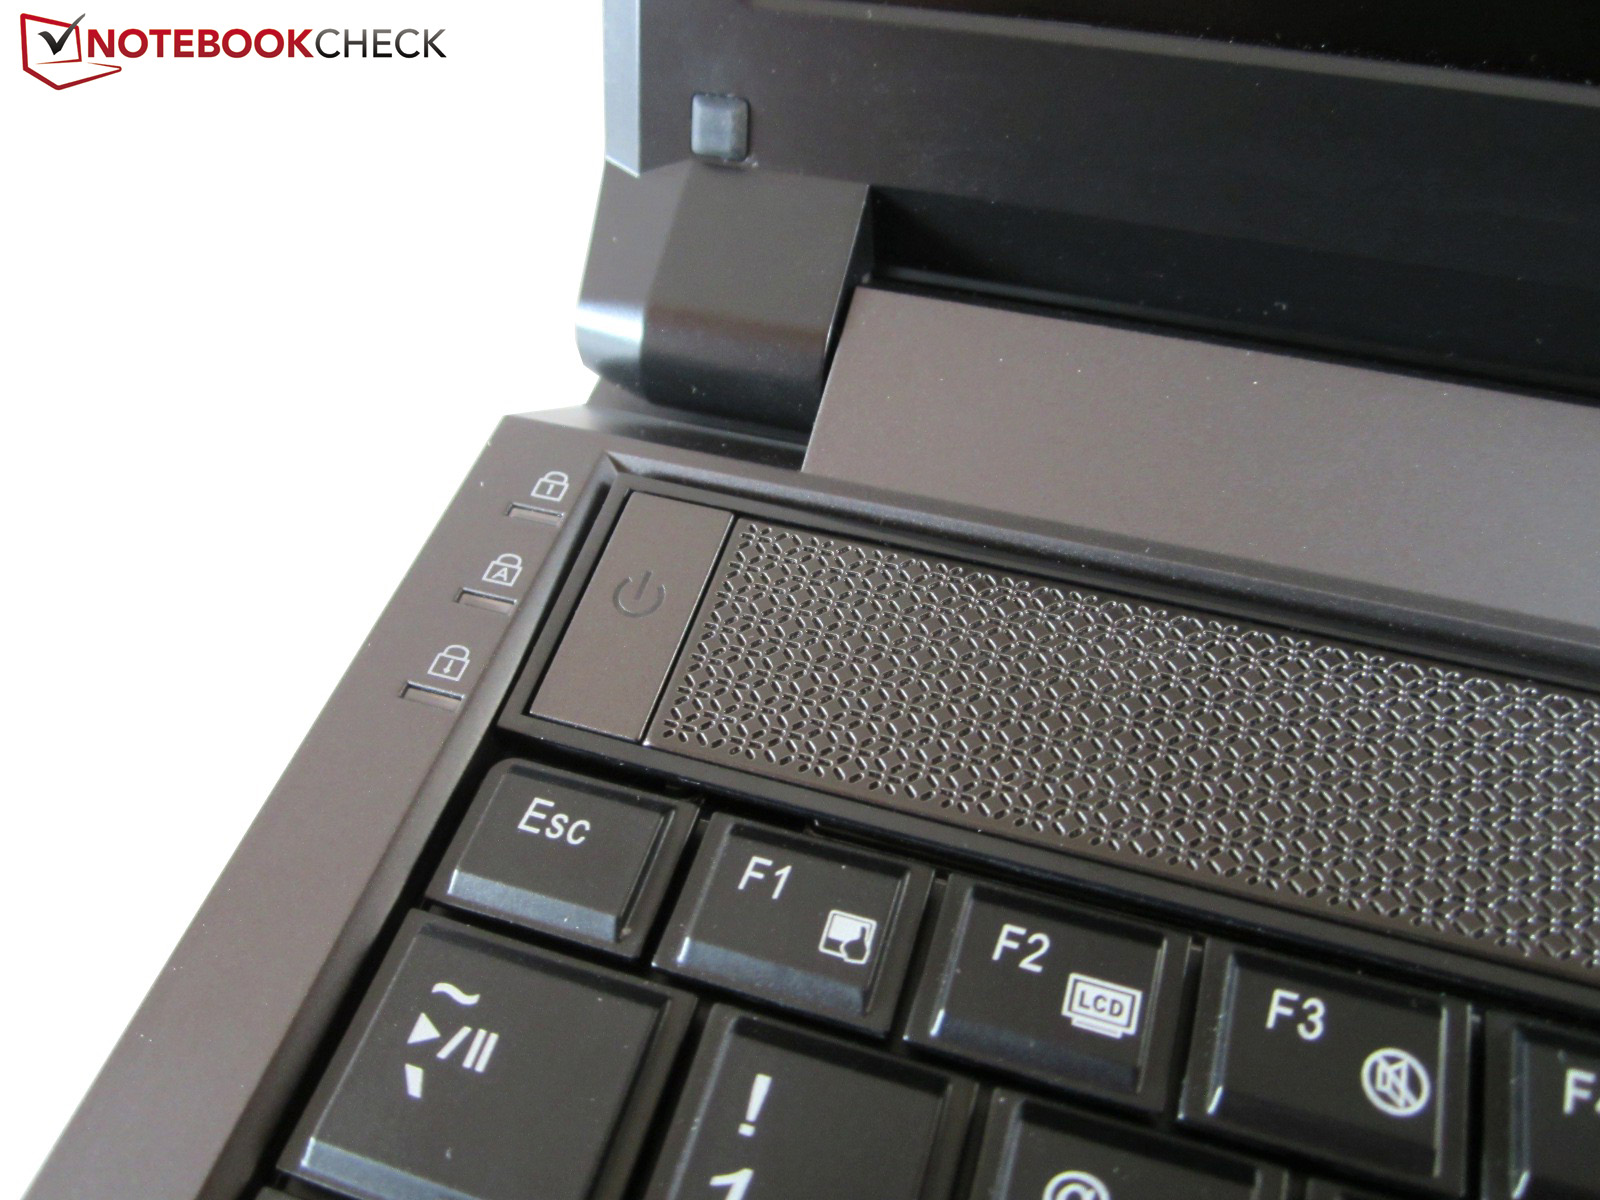
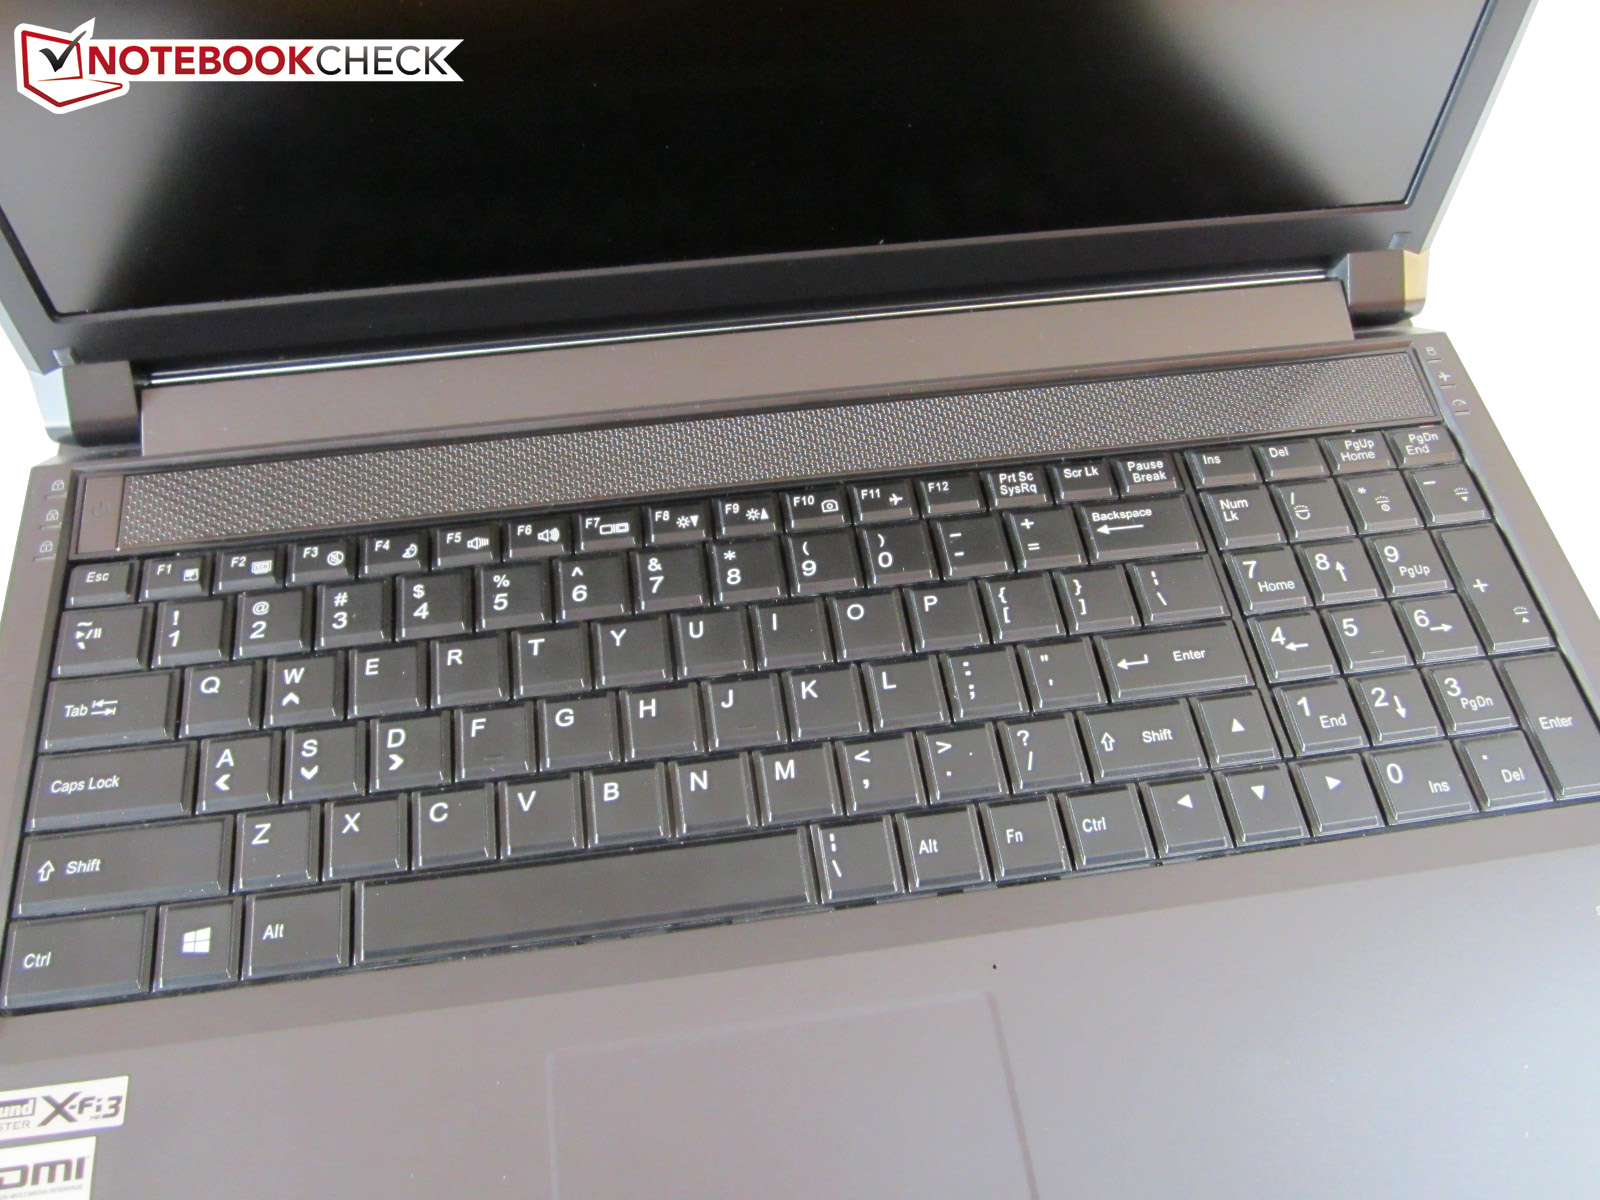
While the P150HM barebone was equipped with a chiclet keyboard without backlight, the P150EM featured such components and so does the P150SM.
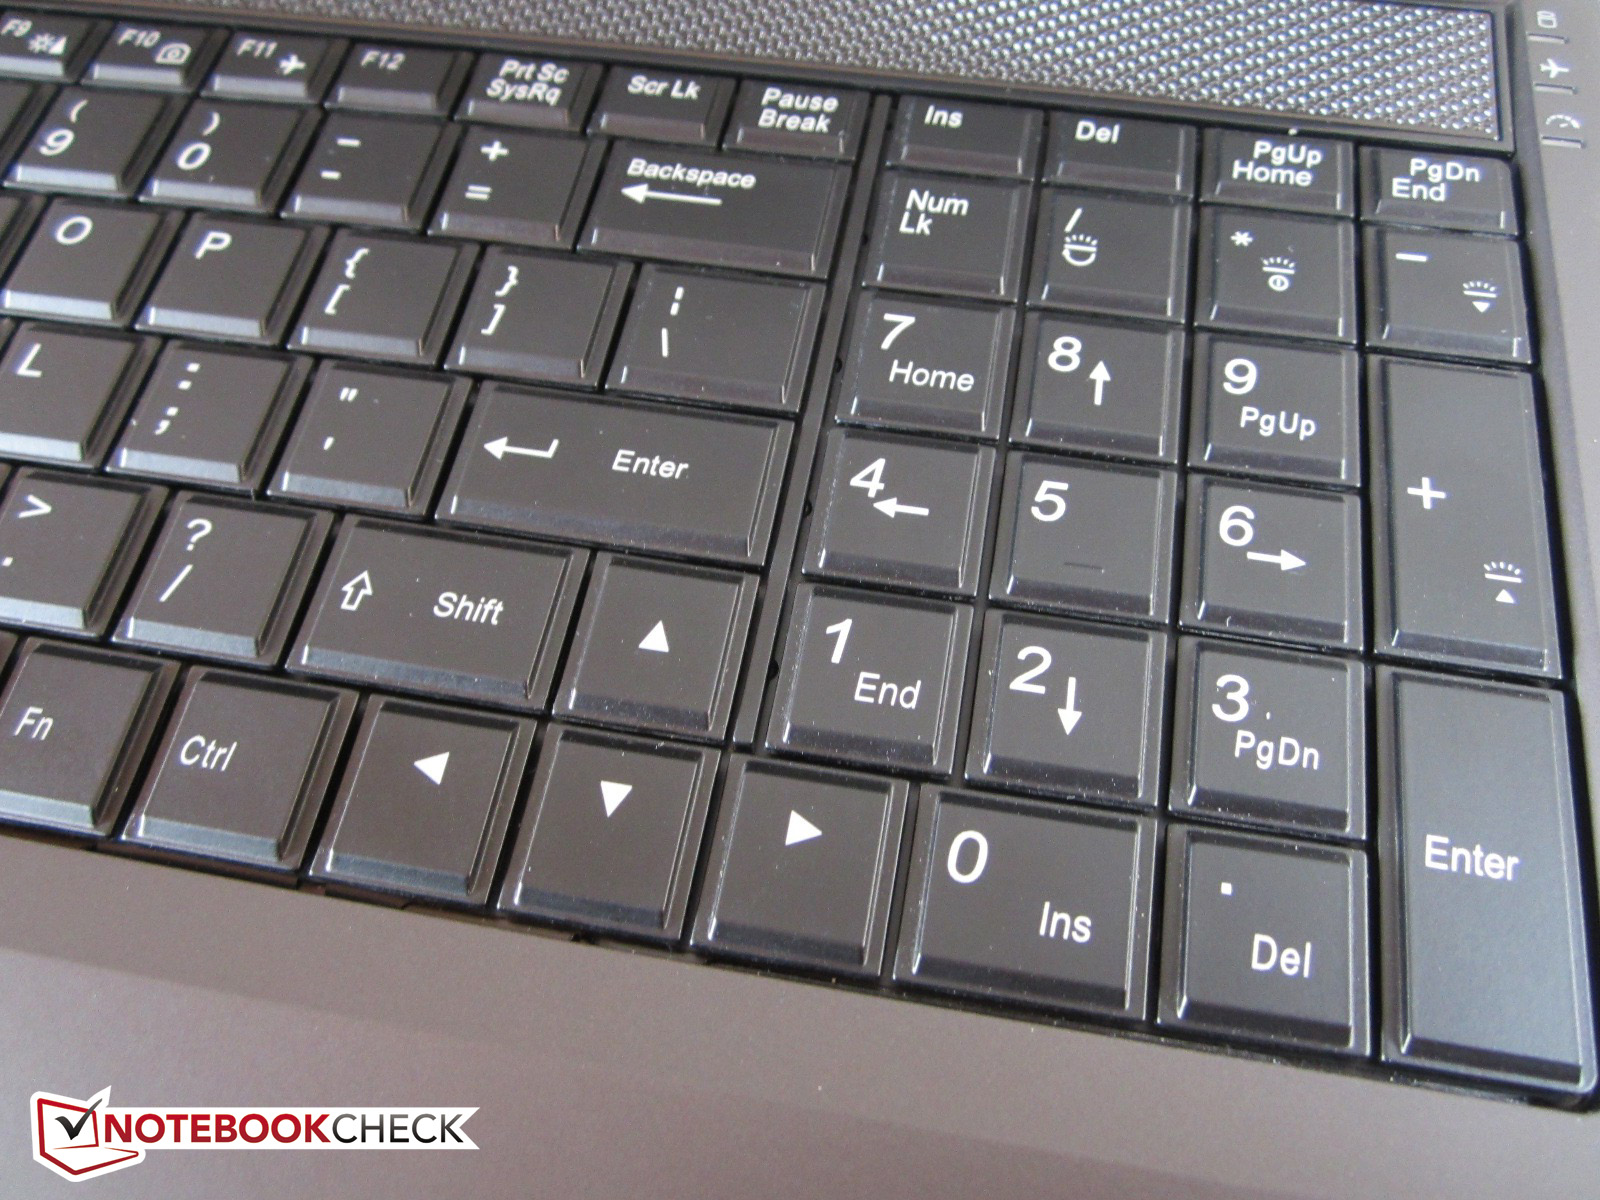
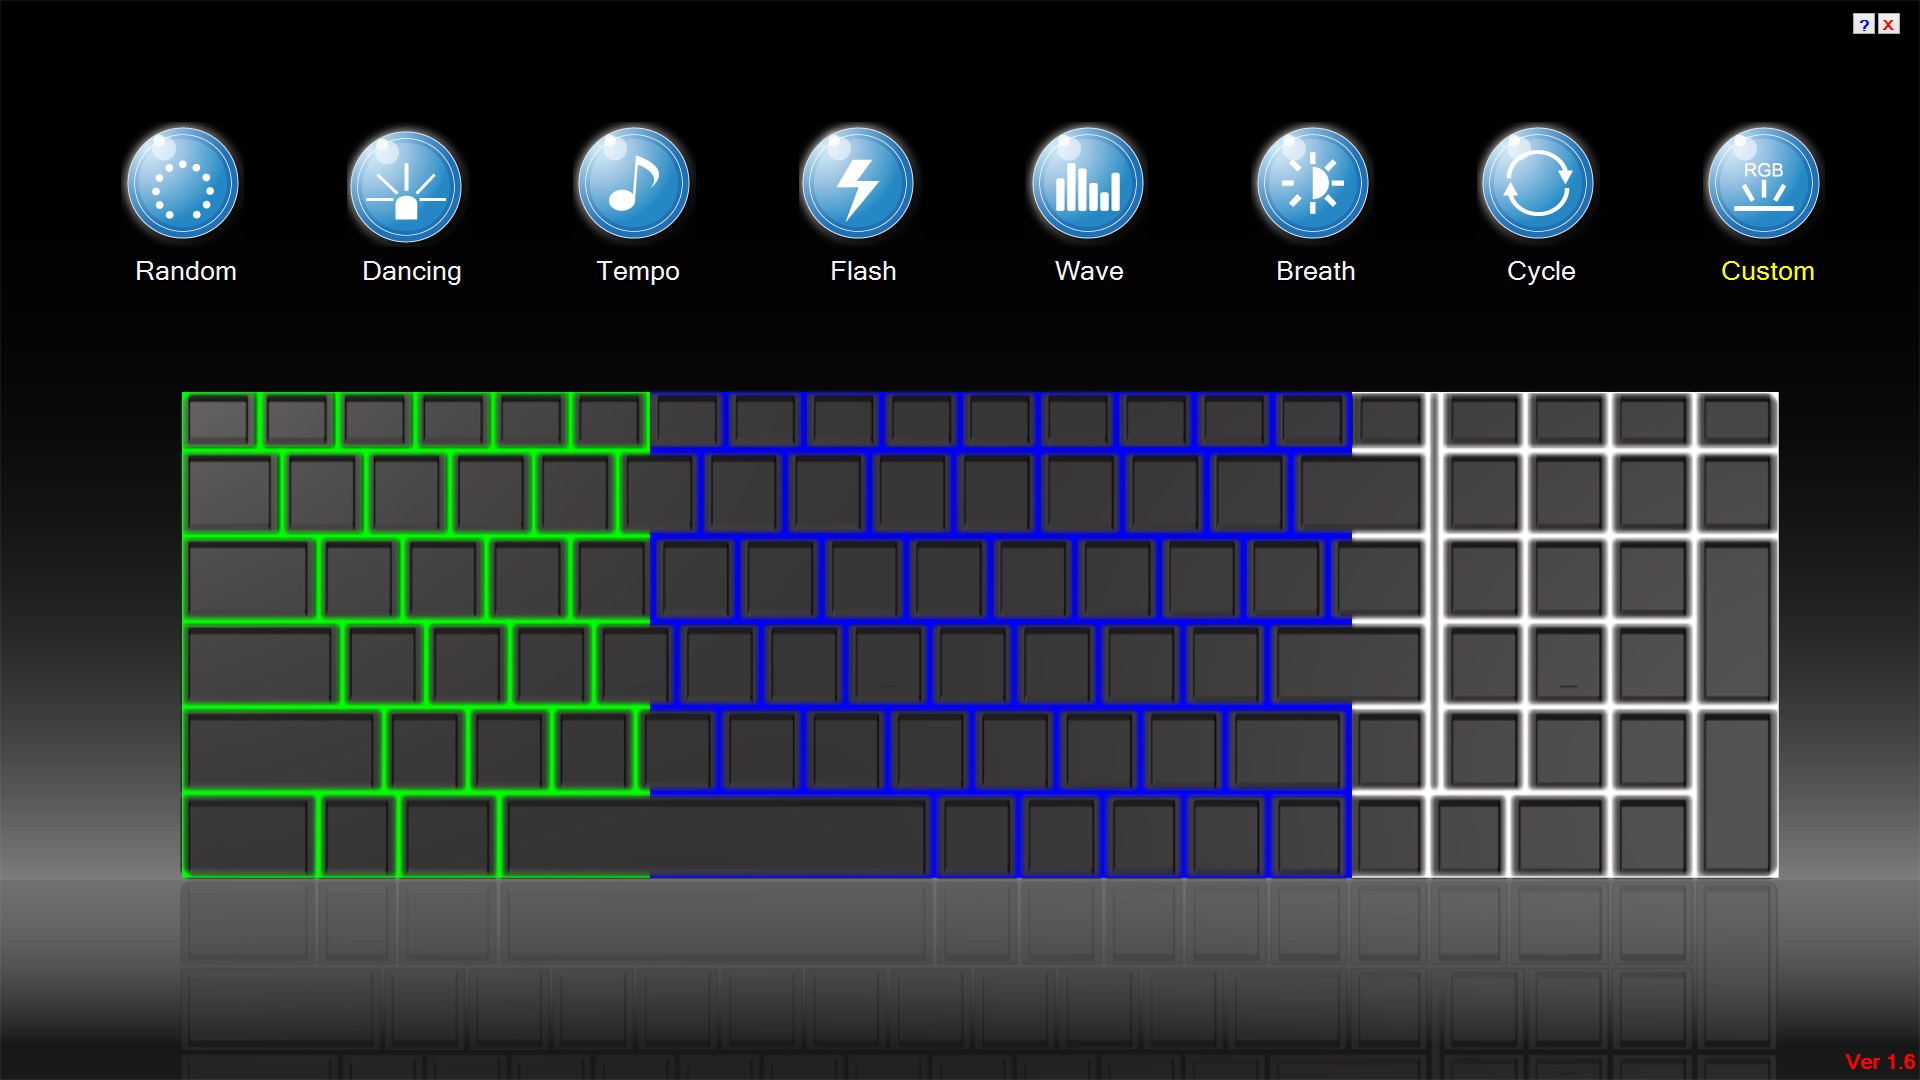
The keys of just under 17 x 17 mm (13 x 13 mm effective) can be lit in several colors and brightness levels. The user-friendly software also supports several special modes (Tempo, Breath, Cycle etc.), which turn the 15-incher into a mini disco. You can even configure three zones.
The typing experience is decent. Pressure point and stroke are well defined. Because of the unusual layout (displaced ><|-key, one-row enter key) a longer training time is required. Pros are sufficiently big cursor keys and the four column number pad.
The special features are advantageous. Apart from brightness and volume you can also control touchpad and display, webcam, and Wi-Fi module via the F-keys. Typing is neither especially quiet nor very loud.
Touchpad
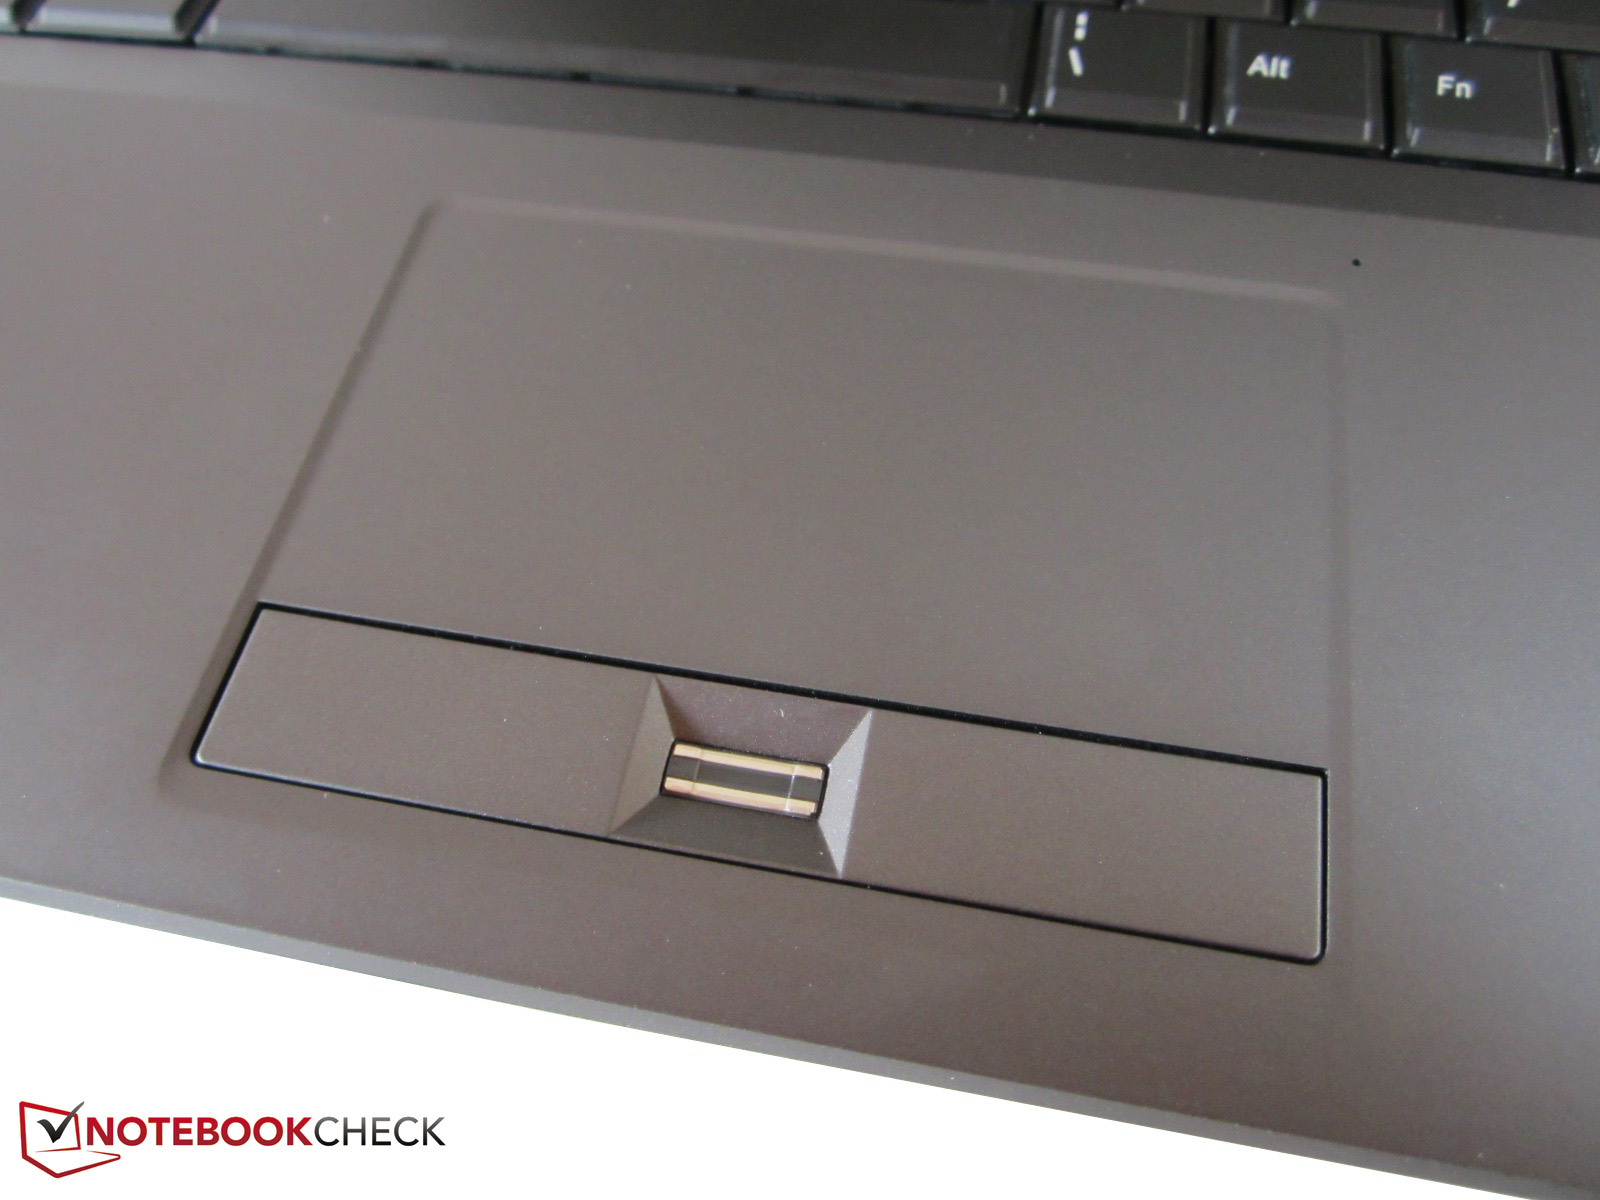
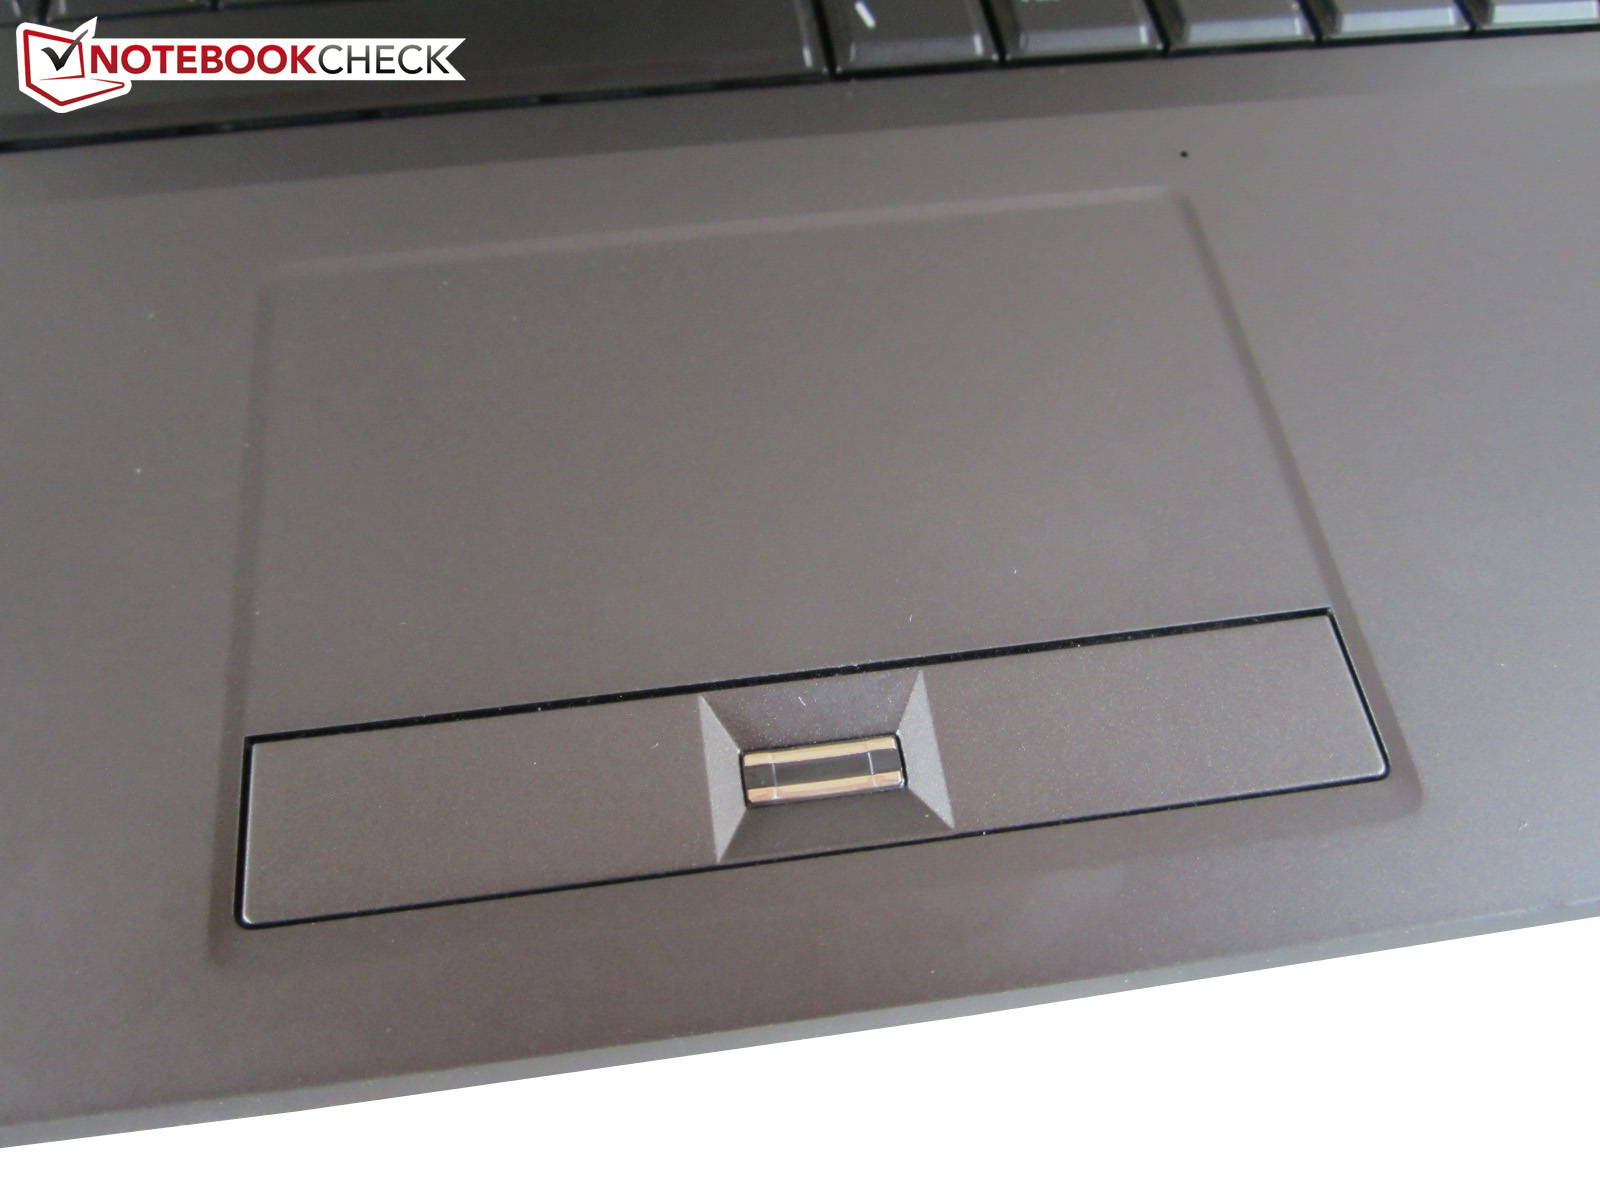
The popular Synaptics Touchpad V7.2 is used as mouse replacement. It supports several multi-touch gestures. As expected these include zooming, scrolling, and rotation. Standard scrolling via scroll areas on the right and bottom edge is also possible. During the test, the gestures were mostly reliably recognized. The precision can also hardly be criticized.
However, we wonder why the touchpad was rubberized. The gliding traits of the "sticky" surface are modest. In addition, the size of 88 x 47 mm is not particularly big. While the dedicated mouse buttons (single bar) are easily accessible, they sound somewhat rickety. The touchpad is slightly sunk into the palm rests to compensate the fact that it lacks a light.
Display
The 15.6-inch non-glare screen features a resolution of 1920x1080 pixels. Users used to HD or HD+ displays might be unaccustomed to such a high resolution at the beginning, but high-end notebooks are expected to support Full HD. When you work with many windows simultaneously, you will appreciate the advantages of 1920x1080 pixels. Of course, the enormous calculation requirements are a big disadvantage. Even gaming graphics cards like the GeForce GTX 765M are sometimes too slow for maximum details.
| |||||||||||||||||||||||||
Brightness Distribution: 85 %
Center on Battery: 125 cd/m²
Contrast: 656:1 (Black: 0.43 cd/m²)
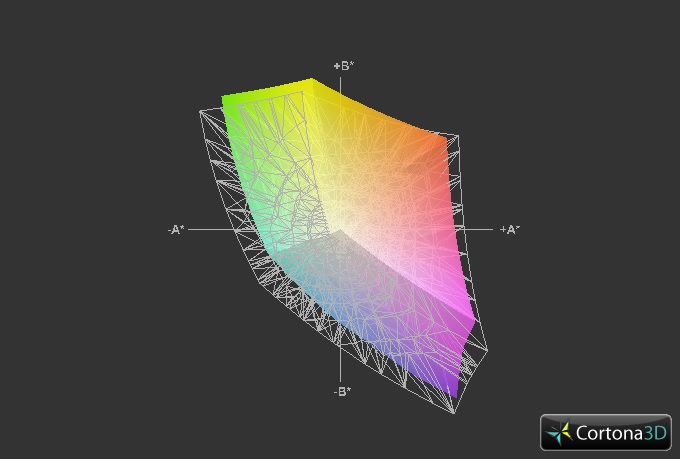
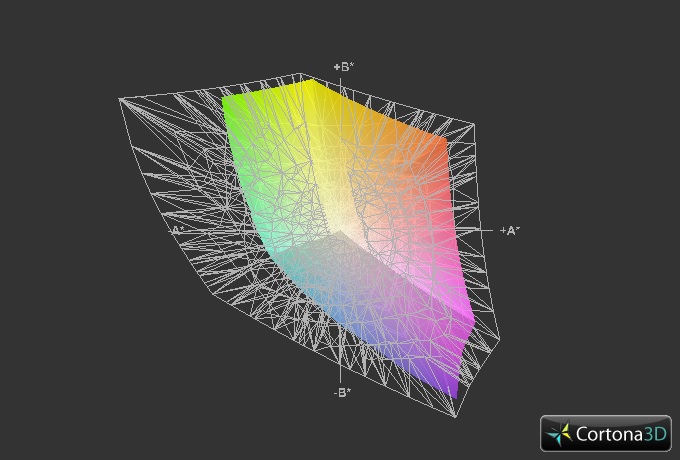
61.1% AdobeRGB 1998 (Argyll 3D)
88.8% sRGB (Argyll 3D)
59.4% Display P3 (Argyll 3D)
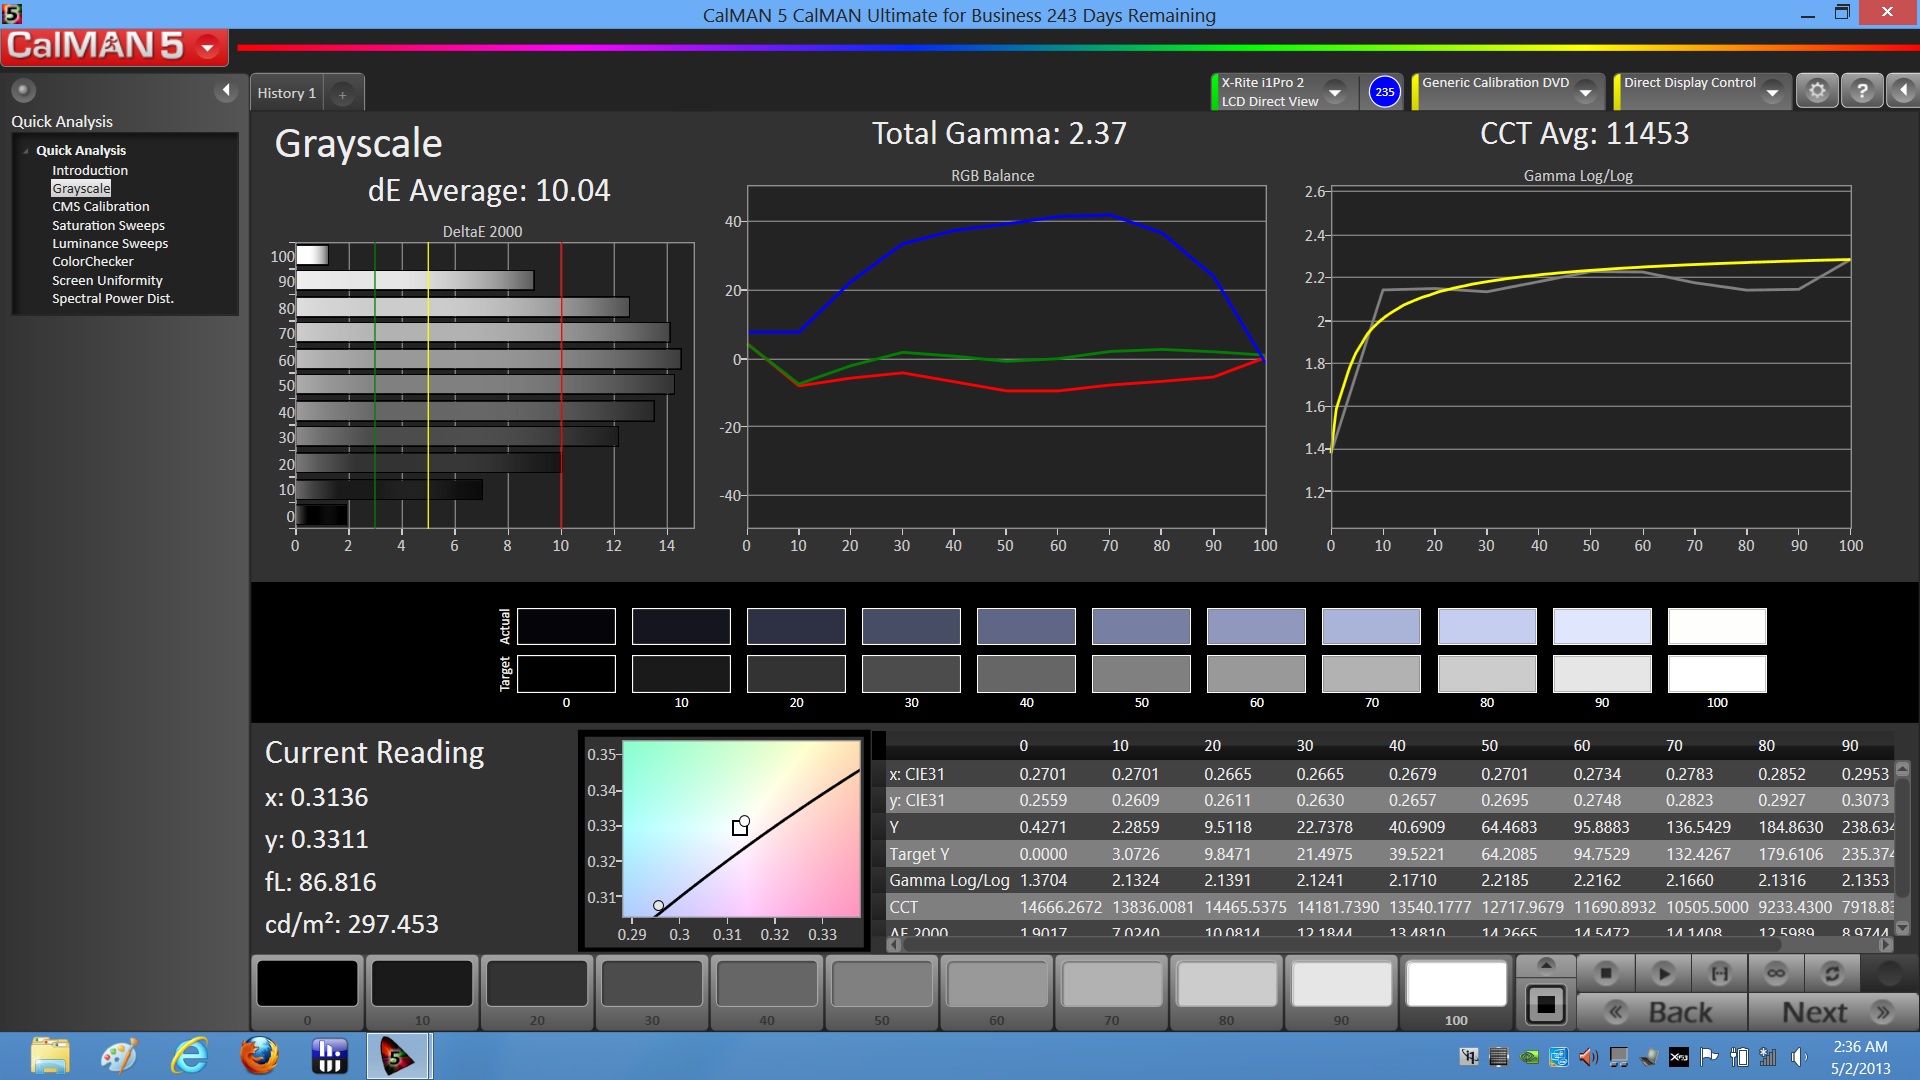
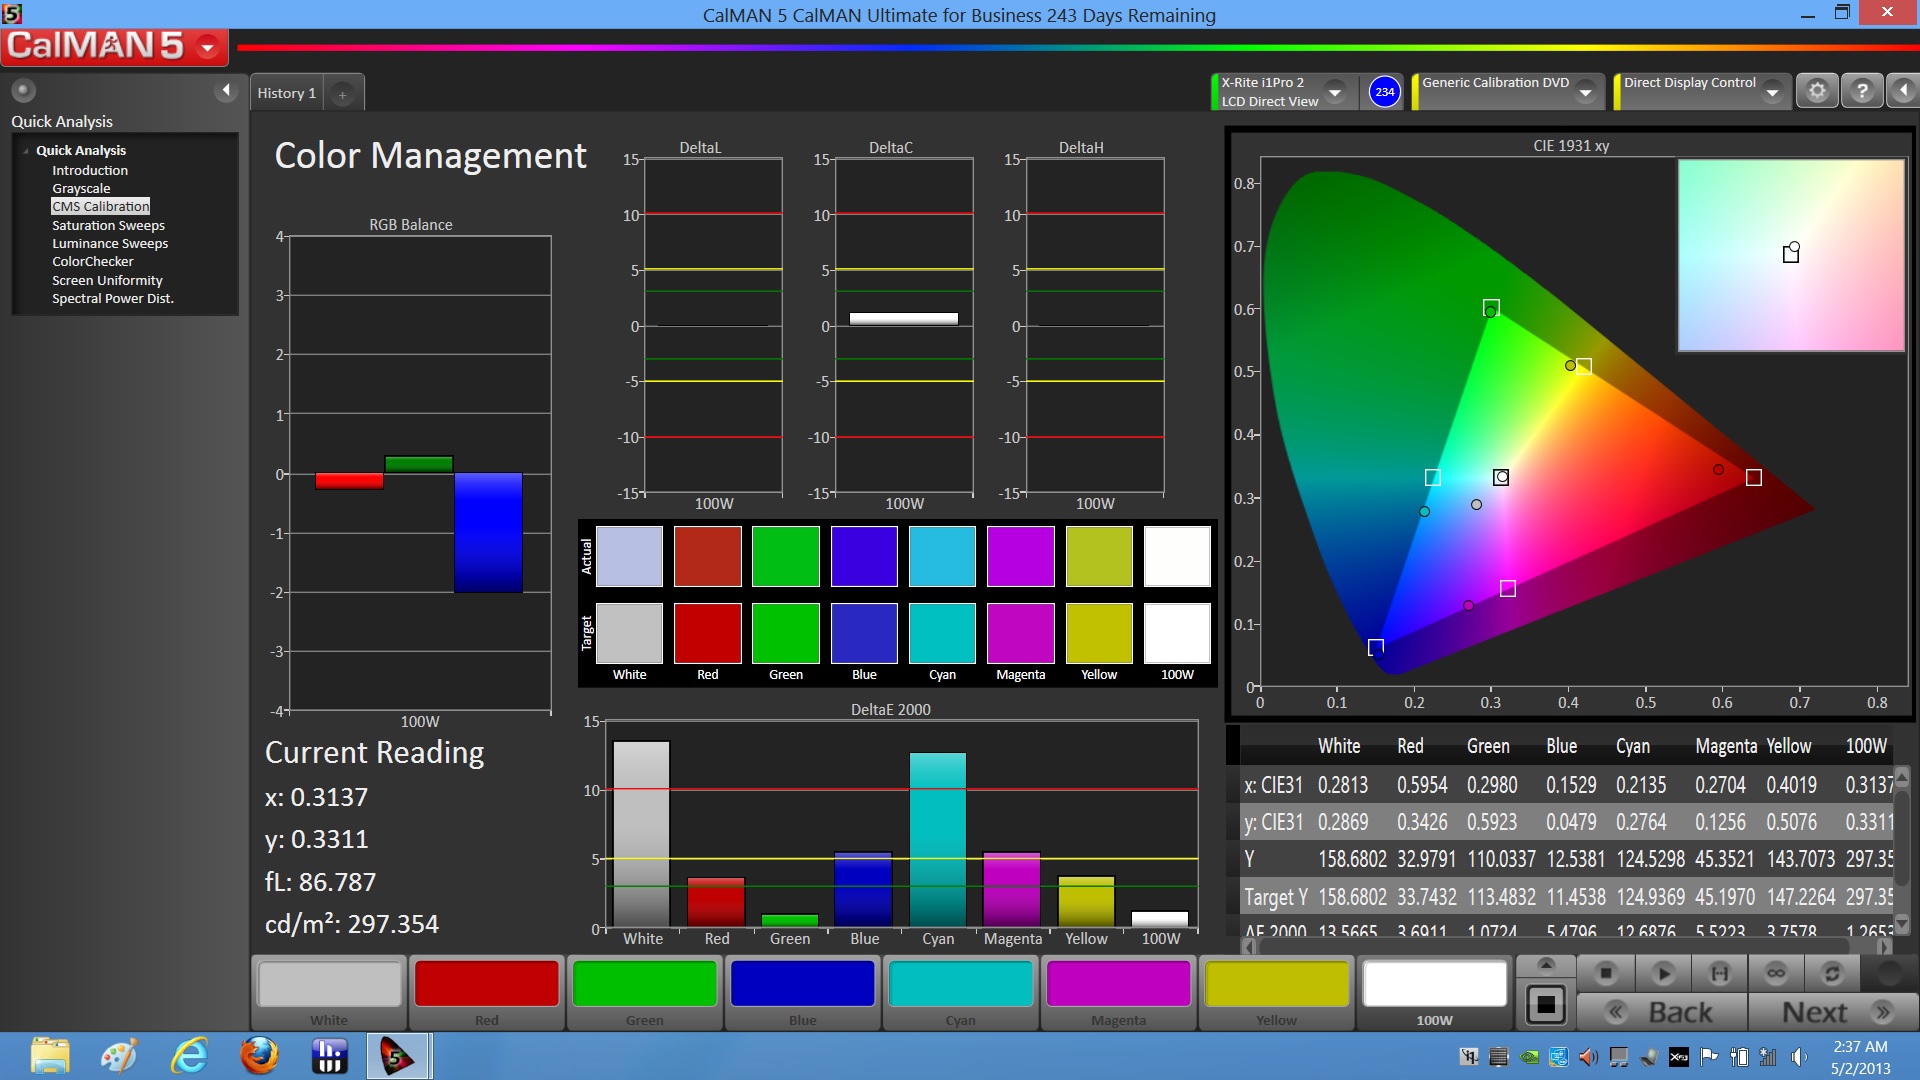
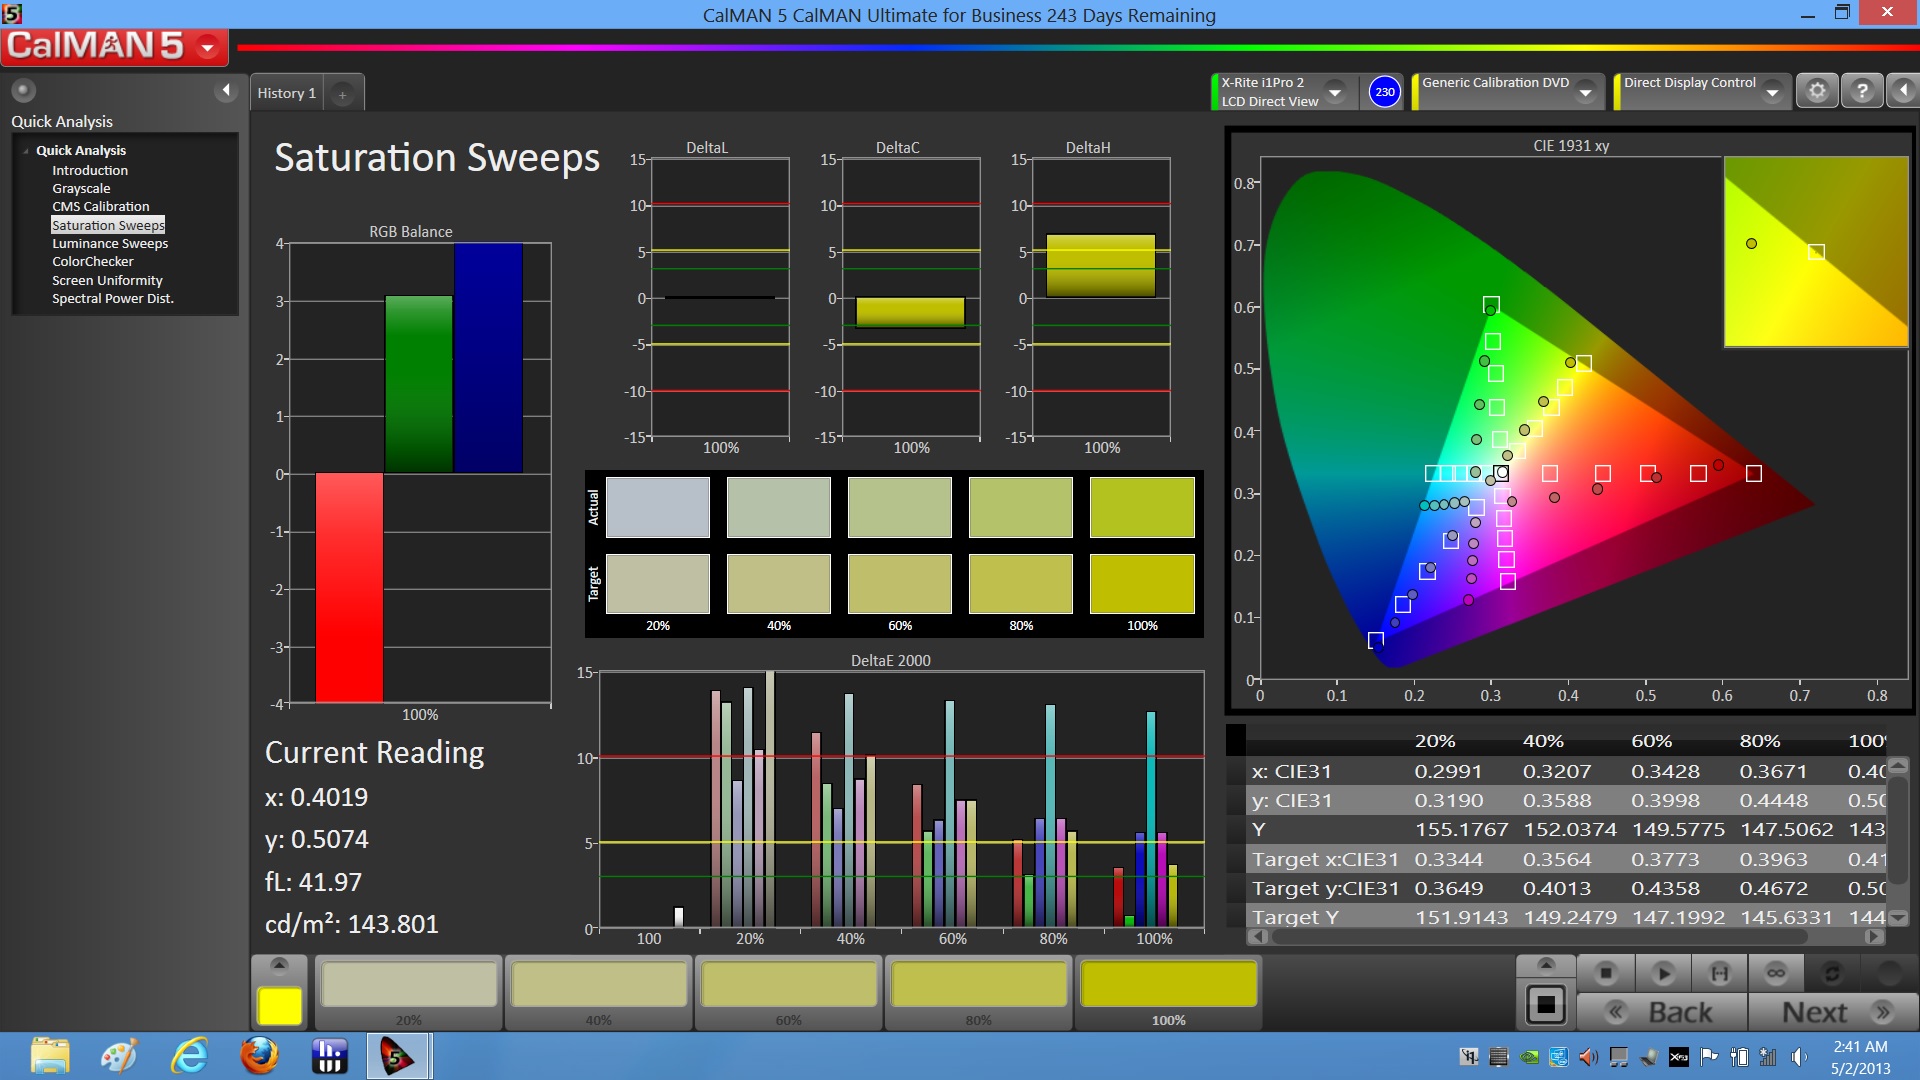
Clevo chose an excellent screen. The LG Philips LP156WF1-TLF3 already demonstrated its strengths in other high-end notebooks like the MSI GX60, the Schenker XMG A522, or the DevilTech Fire DTX.
The brightness of about 260 cd/m² exceeds the usual level (200-250 cd/m²). The black level of 0.43 cd/m² is rather low, but dark film and gaming scenes still look slightly grayish. However, many TN competitors perform significantly worse here.
To summarize, our test sample achieved a contrast of about 650:1. So, the panel ranges in between ordinary displays and absolute top screens. Despite the not extraordinary big color coverage, the colors will appear vivid and natural to most users.

Thanks to the matte finish and the decent brightness, outdoor usage is comfortable. The image is easily legible under normal lightning conditions. Annoying reflections known from glare-type models (Alienware M17x R4) are scarce. As the brightness drops by more than 50% on battery, you should connect the power adapter outdoors.
The viewing angles are more than decent. In a horizontal direction, the image hardly changes at acute angles. Although, you will face the usual weaknesses of a TN screen in a vertical direction, the LG Philips LP156WF1-TLF3 performs better than most of its competitors.

Performance
Processor
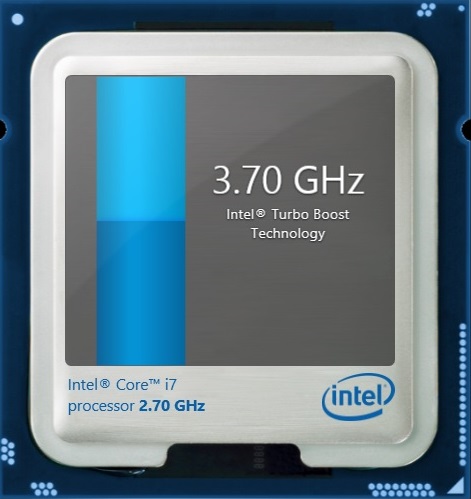
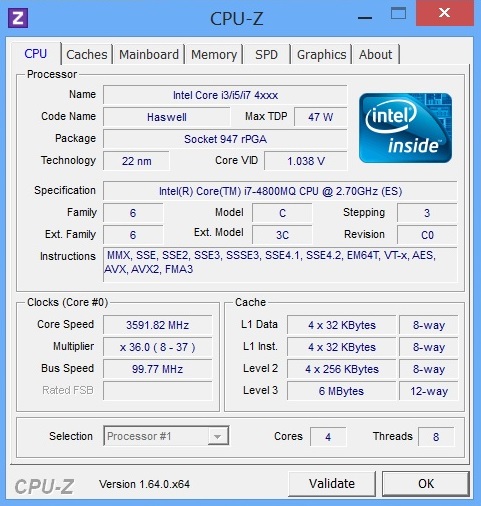
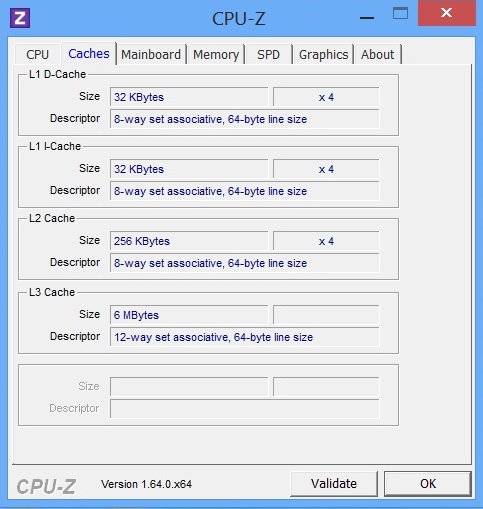
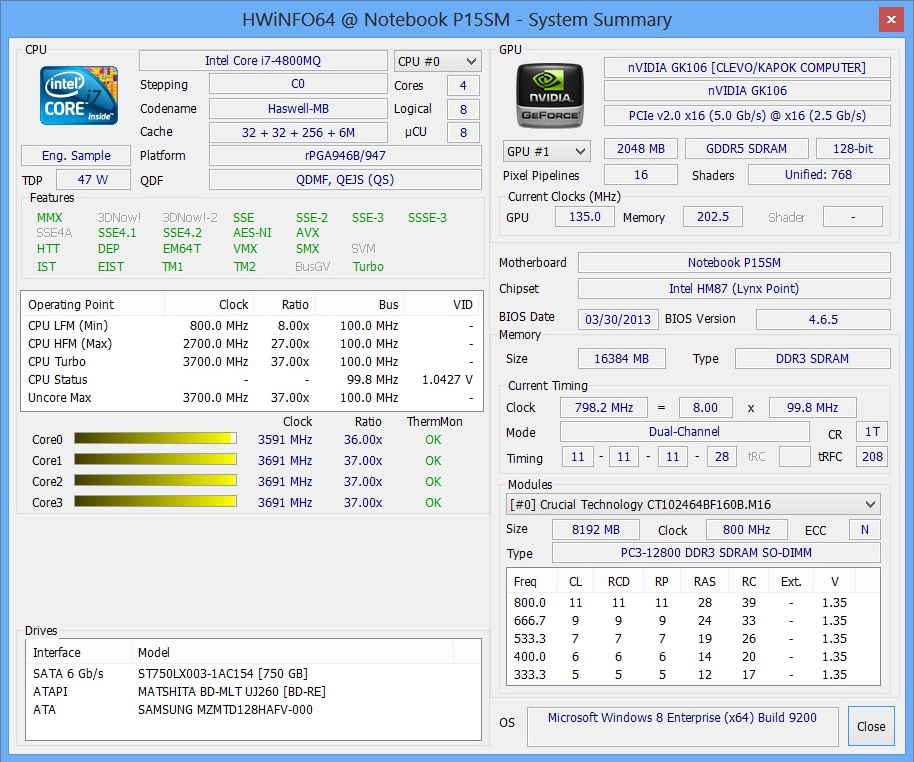
The P150SM barebone can be equipped with a dual or quad-core processor from Intel's current Haswell generation. Our test sample features a 2.7-3.7 GHz Core i7-4800MQ with four cores and 6 MB L3 cache.
Like its Ivy Bridge predecessor, the Core i7-3740QM, the Haswell chip is also processed in 22 nm lithography. Because of the integrated voltage converter Intel slightly increased the TDP from the 45 Watt of previous generation quad-core CPUs to 47 Watt.
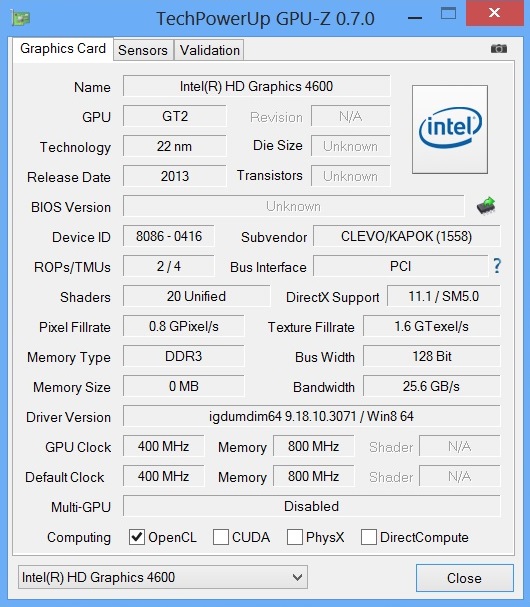
While the CPU performance increased only slightly, the integrated HD Graphics 4600 graphics chip is significantly faster than the HD Graphics 4000. Hyperthreading technology, which adds a virtual core to each real one, is already well known. However, only few users will profit from eight parallel threads.
Thanks to Nvidia's Optimus technology, the Schenker W503 can dynamically switch between the integrated and dedicated graphics solution.

Turbo Boost
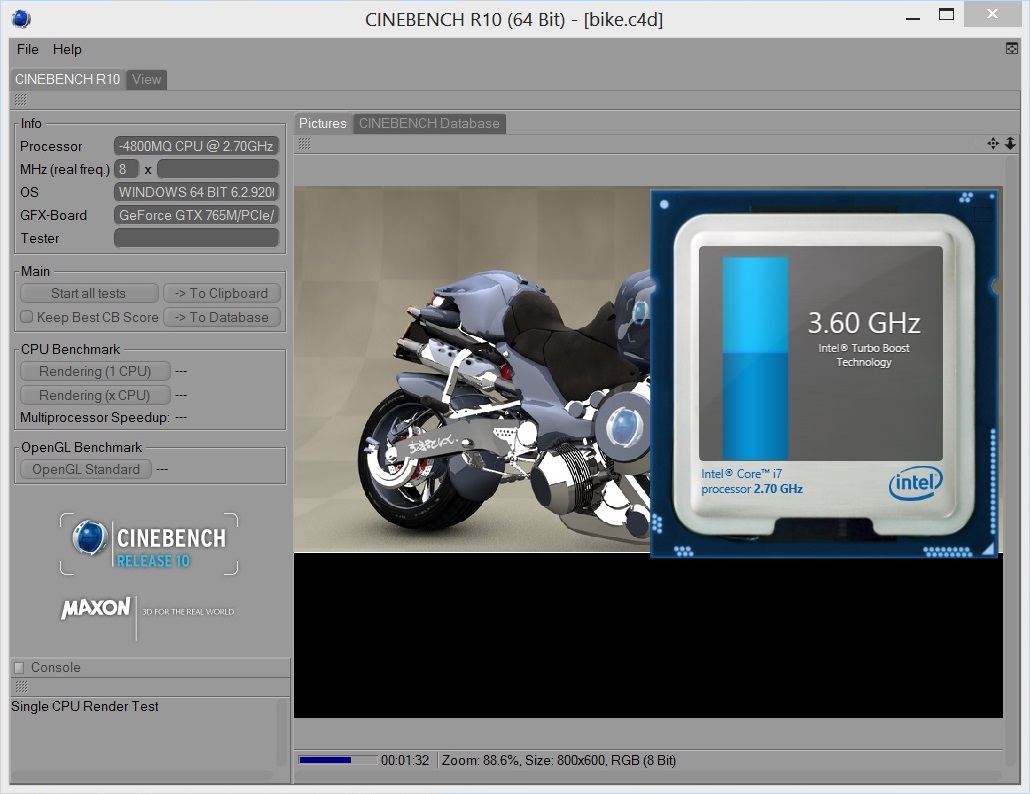
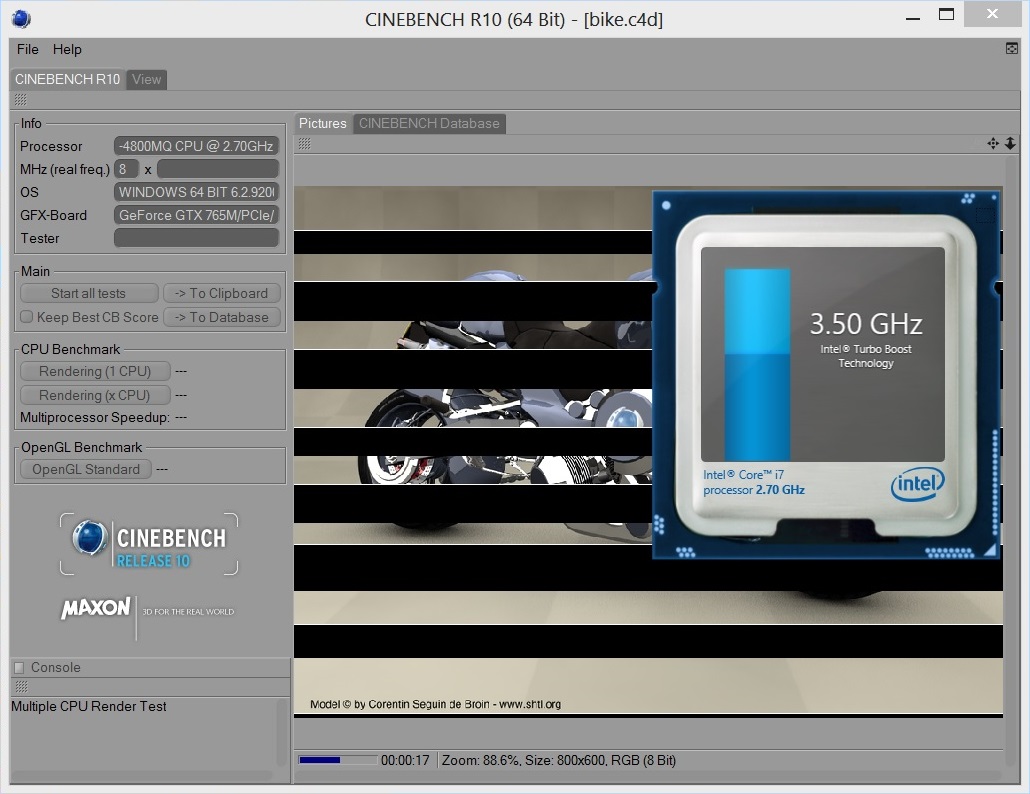
The CPU turbo works flawlessly. 3.6-3.7 GHz during single core load and 3.5 GHz during multi-core load hint at an adequate cooling system. Even under full load, automatic overclocking remains active (~3.0 GHz). But, these results depend on the hardware configuration.
CPU performance
According to our performance measurements, Haswell is rather an evolution than a revolution. With 1.68 points, the Core i7-4800MQ is exactly 10% faster than the Core i7-3740QM (1.53 points @ One M73-2N) in the single-core test of Cinebench R11.5. It even outperforms the most popular quad-core CPU so far, the Core i7-3630QM (1.42 points @ Asus G75VX-T4020H), by just under 20%.
The performance gain is similar in multi-core rendering: 7.61 points, i.e. 10% faster than the Core i7-3740QM (6.93 points). The Core i7-3630QM is about 16% slower (6.42 points).
Note: All benchmarks were run on an engineering sample.
| Cinebench R10 | |
| Rendering Single CPUs 64Bit (sort by value) | |
| Core i7-4800MQ | |
| Core i7-3630QM | |
| Core i7-3740QM | |
| Rendering Multiple CPUs 64Bit (sort by value) | |
| Core i7-4800MQ | |
| Core i7-3630QM | |
| Core i7-3740QM | |
Graphics card

Although the name suggests something different, the GeForce 700 is not a completely new series with new architecture, but a tuned Kepler model.
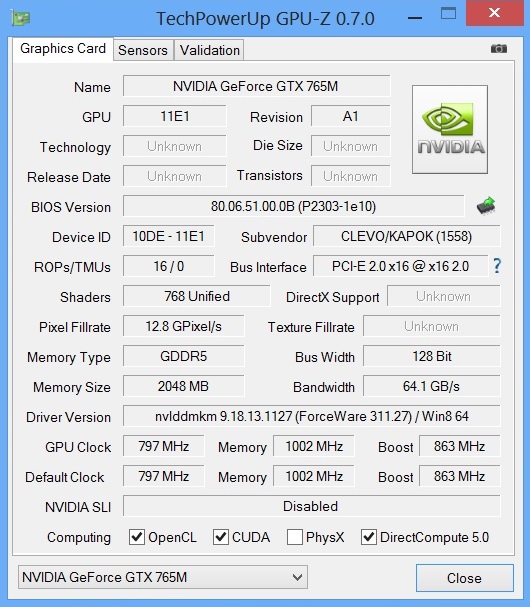
With 768 unified shaders and 2.048 MB GDDR5 video memory (128-bit interface) the GeForce GTX 765M is a halved GeForce GTX 780M. Nvidia's current top model features 1,536 shaders and double the VRAM (256-bit interface).
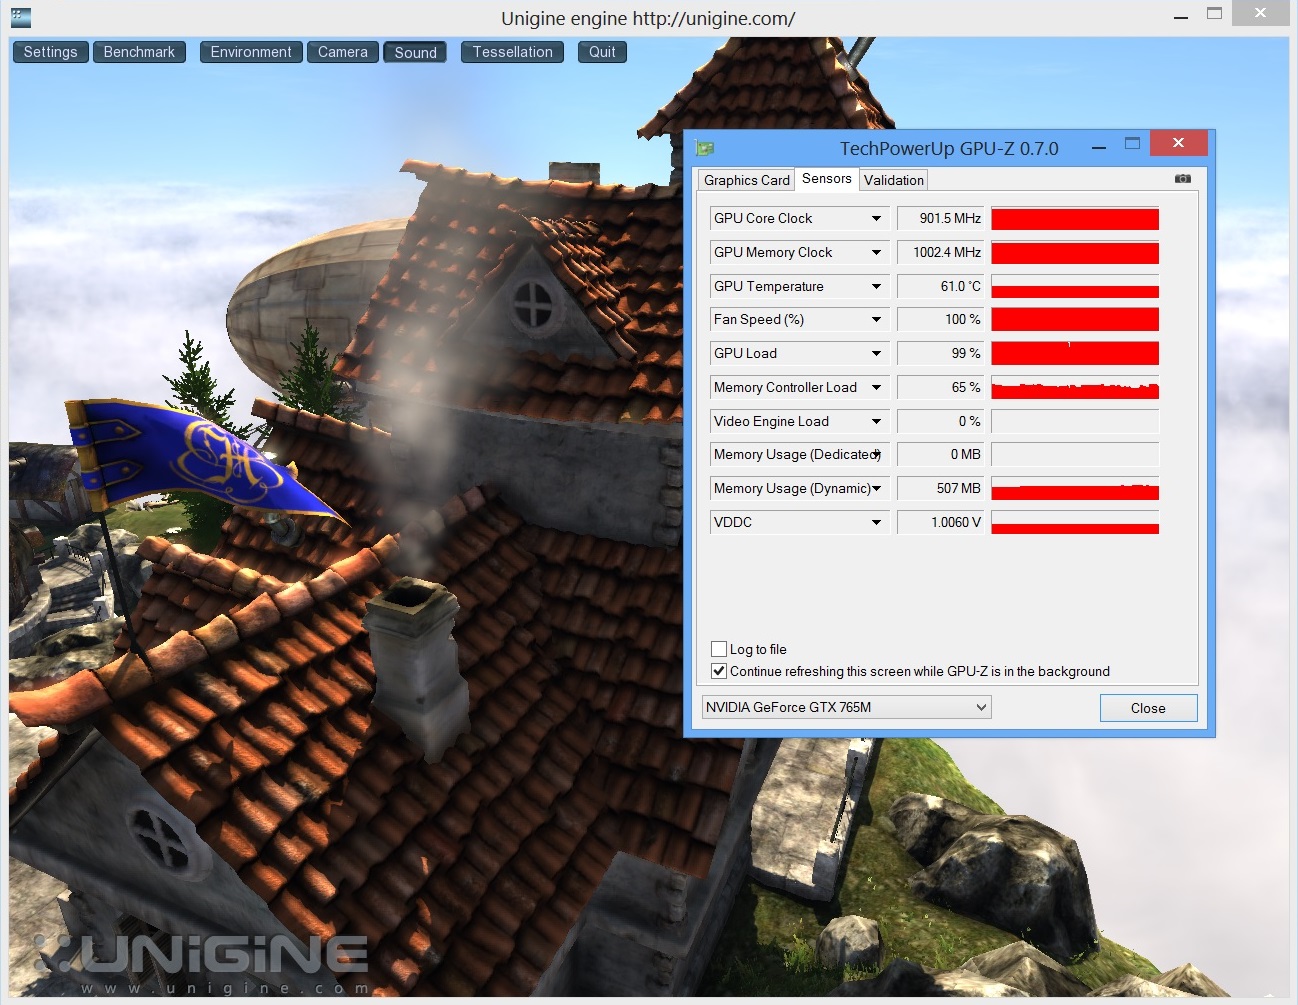
The GeForce GTX 765M also has a lower memory clock: 2,004 MHz is 20% slower than the GTX 780M's 2,500 MHz. But, the core clock of the GTX 765M is slightly higher (850 vs. 823 MHz). Thanks to GPU Boost the graphics card can automatically overclock. According to GPU-Z it clocks with up to 902 MHz (see screenshot) during the Unigine Heaven benchmark.
According to the specs, the GeForce GTX 765M is akin to the GeForce GTX 670MX. The Kepler model features 25% more unified shaders (960) and a 50% wider memory interface (192-bit), but clocks with 600 and 1,400 MHz (core/memory) significantly lower.
As the GeForce GTX 765M was not yet supported by official Nvidia drivers, we had to use the somewhat older ForceWare 311.27.
GPU performance
Despite a partly weaker specification, the GeForce GTX 765M is mostly faster than its Kepler counterpart. For example, the DirectX 11 GPU achieves a GPU score of 2,479 points in 3DMark 2013 and is about 5% faster than the GTX 670MX (2,371 points @ Schenker XMG P502). The main competitor from AMD, the Radeon HD 8870M, is just under 15% slower (2,169 points @ Samsung 770Z7E). The GeForce GTX 780M performs significantly better: 5,234 points (Schenker XMG P703) is about double the performance.
In the Unigine Heaven 3.0 benchmark (1920x1080, high, tessellation normal) the GeForce GTX 765M is significantly slower with 36.0 vs. 76.0 fps. The Radeon HD 8870M is even slower (26.7 fps) here. The GeForce GTX 670MX achieves 34.1 fps and is only marginally slower than its brother device.
| 3DMark 11 - 1280x720 Performance GPU (sort by value) | |
| GeForce GTX 765M | |
| Radeon HD 8870M | |
| GeForce GTX 670MX | |
| GeForce GTX 675MX | |
| GeForce GTX 770M | |
| GeForce GTX 780M | |
| Unigine Heaven 2.1 - 1280x1024 high, Tesselation (normal), DirectX11 AA:off AF:1x (sort by value) | |
| GeForce GTX 765M | |
| Radeon HD 8870M | |
| GeForce GTX 670MX | |
| GeForce GTX 675MX | |
| GeForce GTX 770M | |
| GeForce GTX 780M | |
| 3DMark 06 Standard Score | 21003 points | |
| 3DMark Vantage P Result | 15486 points | |
| 3DMark 11 Performance | 4318 points | |
| 3DMark Ice Storm Standard Score | 87332 points | |
| 3DMark Cloud Gate Standard Score | 13312 points | |
| 3DMark Fire Strike Score | 2345 points | |
Help | ||
Storage solution
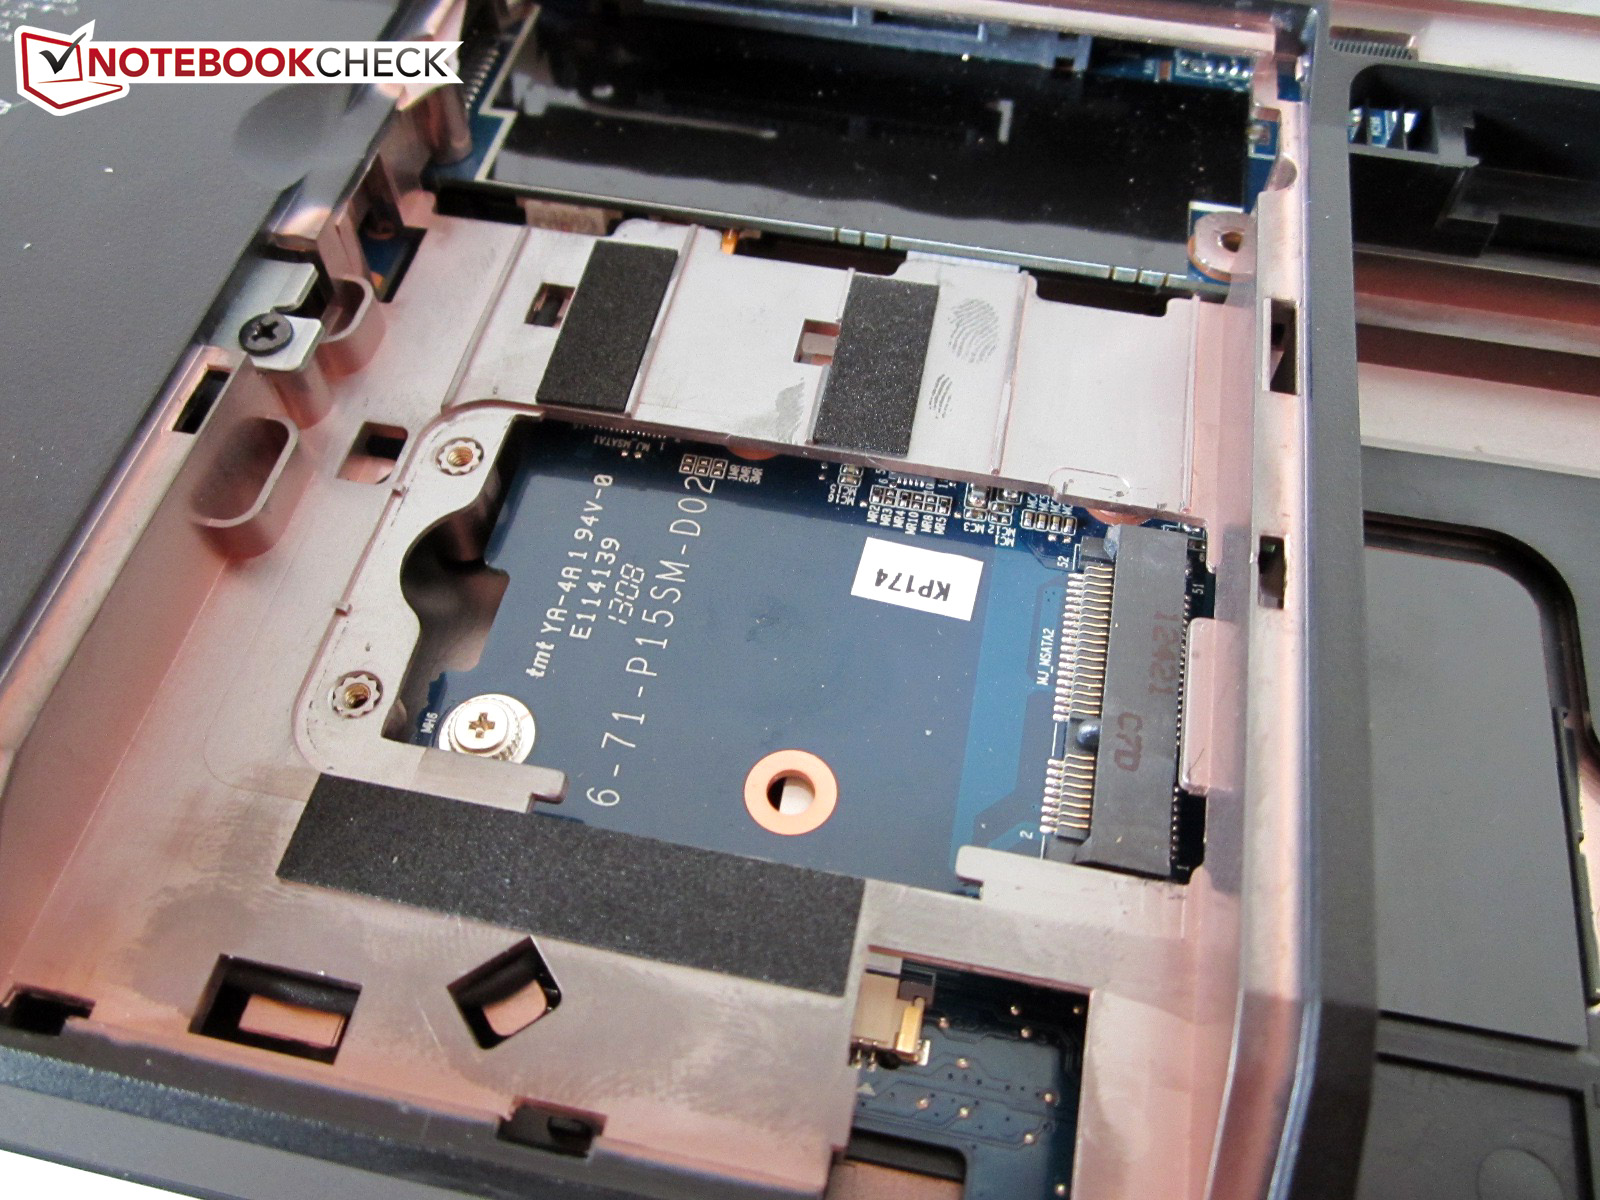
Apart from HDDs and SSDs you can also configure hybrid models on Schenker's homepage. Thanks to the two mSATA slots and the 2.5-inch slot the P150SM barebone can house a maximum of three hard drives (the P150EM only featured a single mSATA slot).
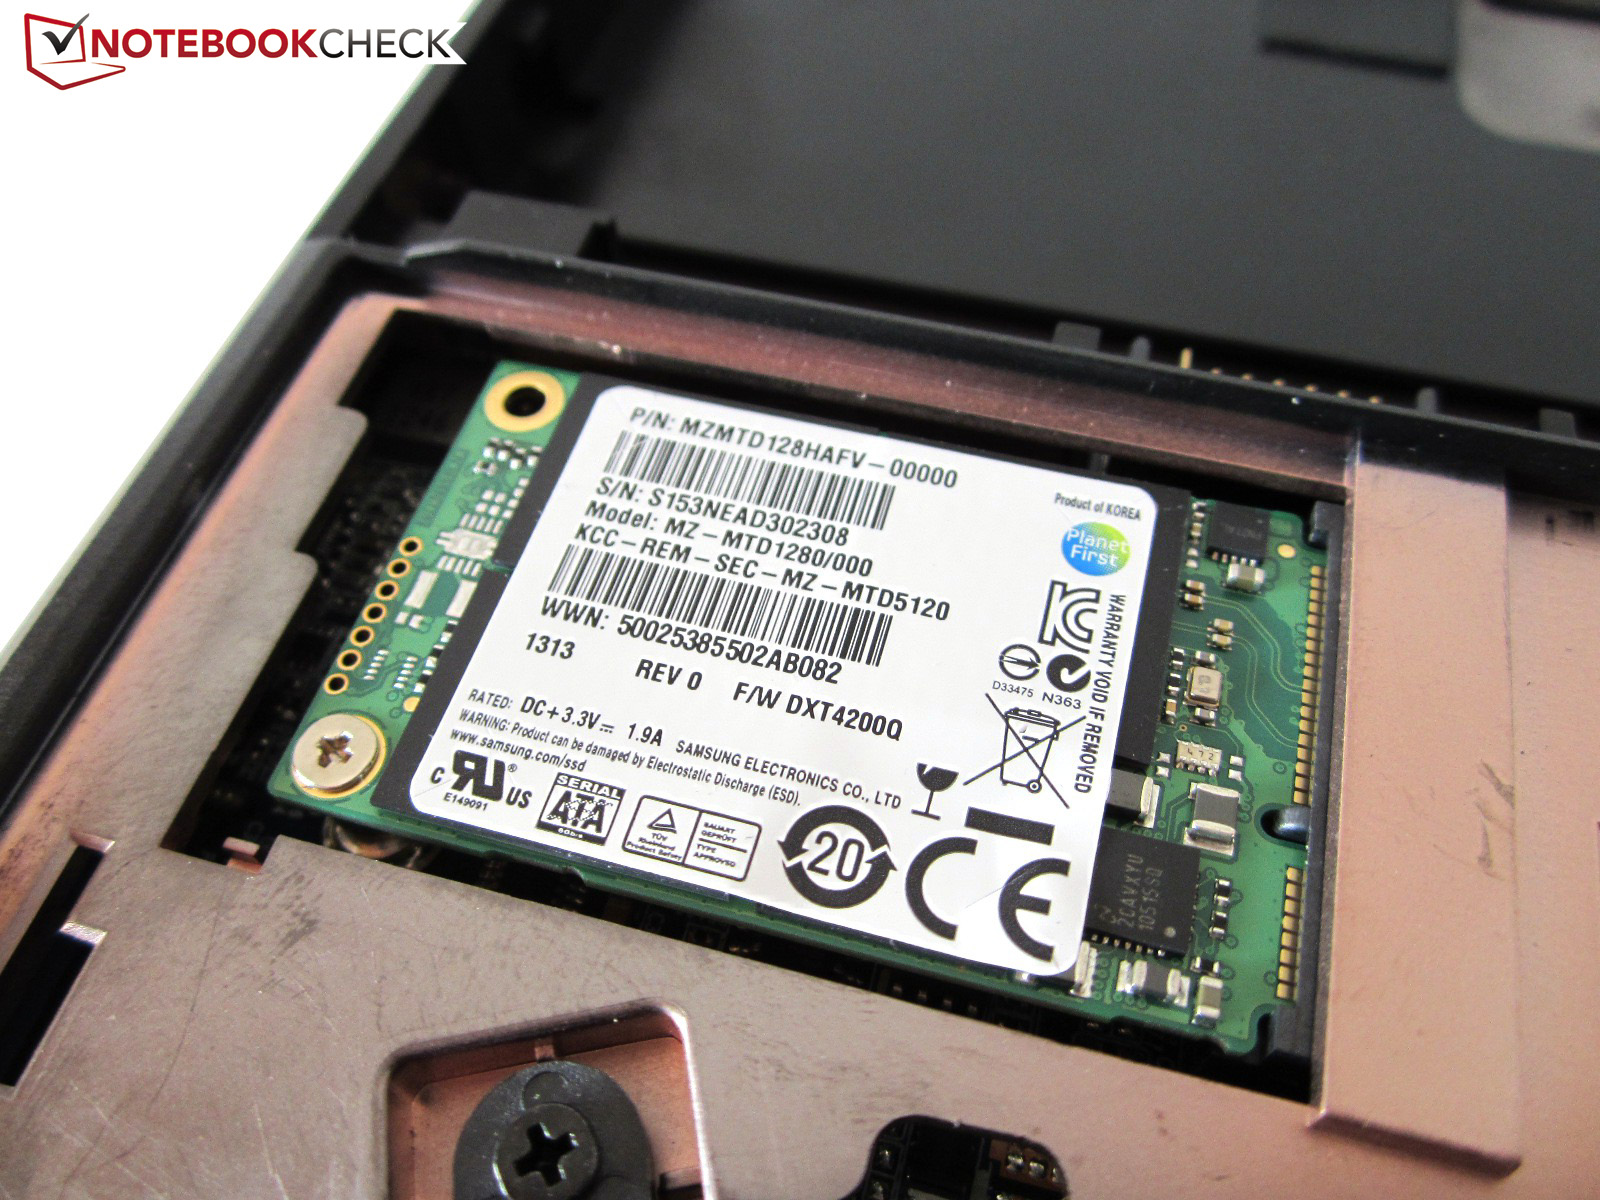
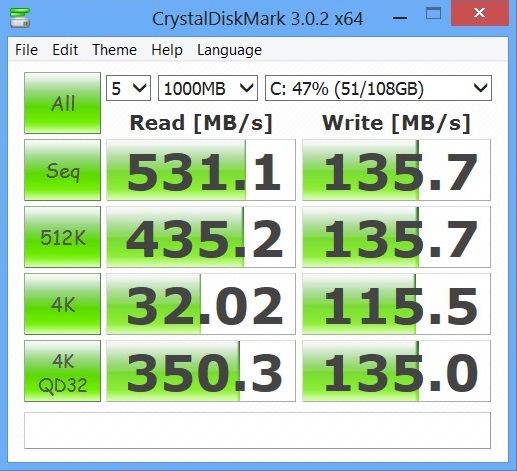
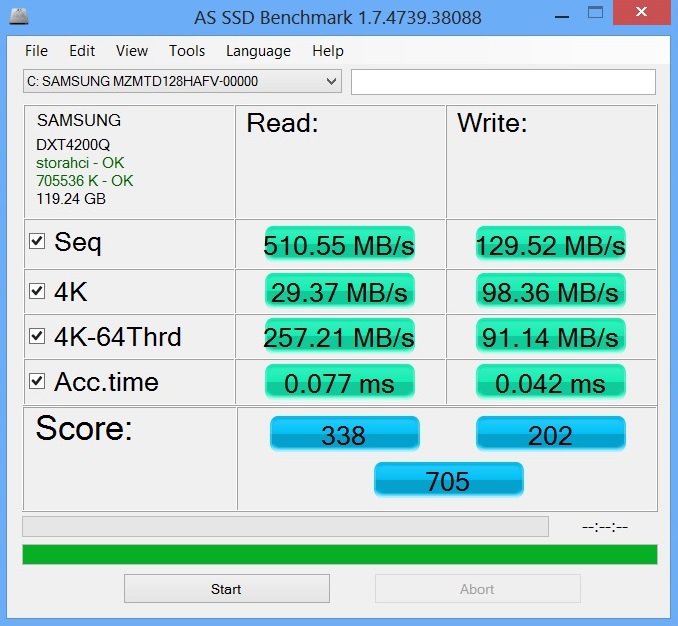
We think that a combination of a small mSATA SSD and a big HDD would be most attractive. The 128 GB model of the Samsung SSD PM841 (MZMTD128HAFV) is definitely a good choice.
With a sequential read rate of 511 MB/s, a sequential write rate of just under 130 MB/s and an access time lower than 0.1 ms, it can keep up with the 120 GB Samsung SSD 840 (MZ-7TD120) model. The 2.5-inch model achieved very similar results in the DevilTech HellMachine. E.g. the 256 GB model of the Samsung SSD PM841 is more than 100 MB/s faster in sequential writing (see Schenker XMG P703).
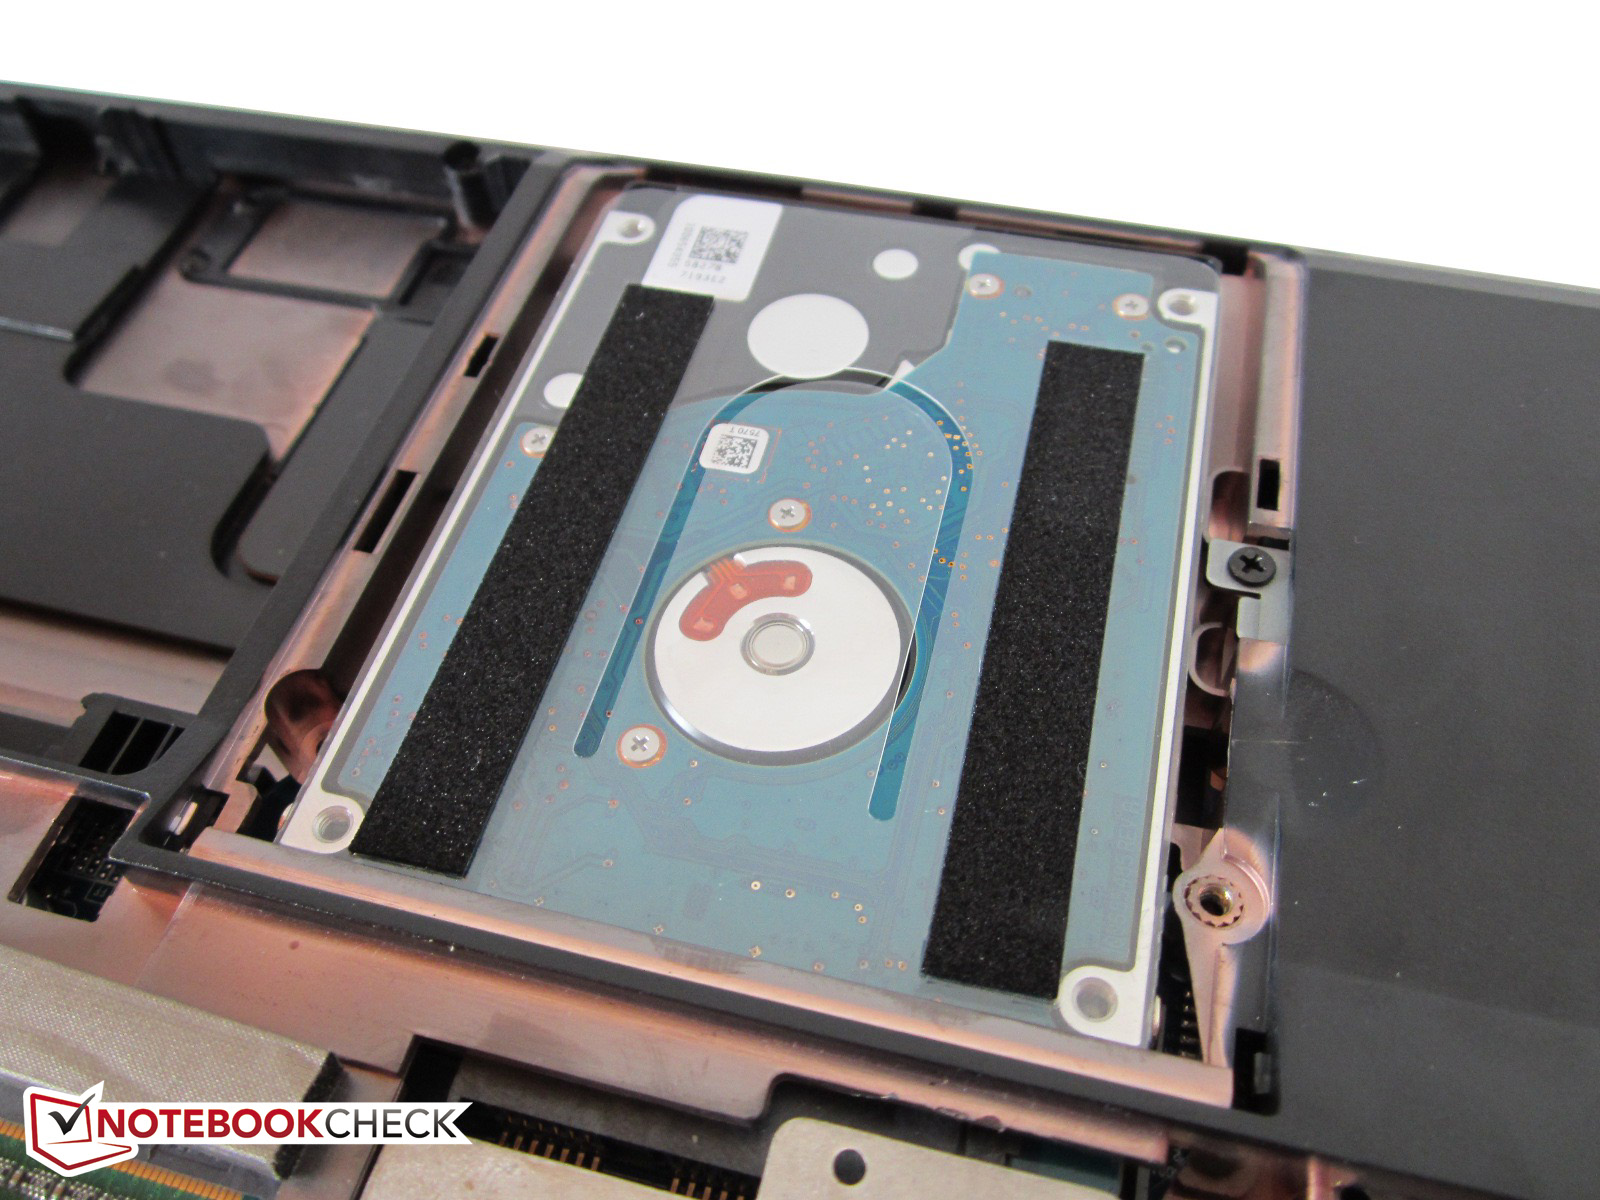
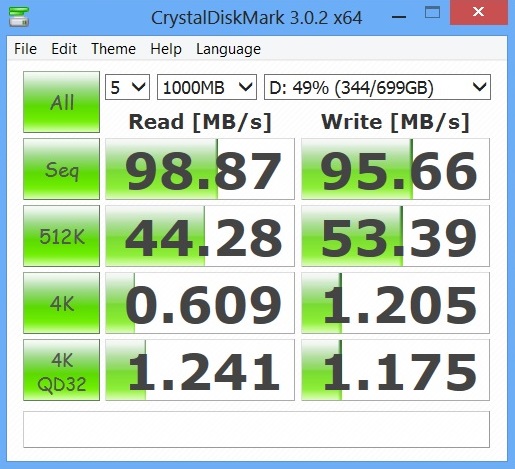
In addition to the mSATA SSD, the Clevo comes with a 750 GB hybrid hard drive. The 7,200 rpm Seagate Momentus XT 7200.1 (ST750LX003) with 8 MB flash memory outperforms nearly all competitors. It achieves an excellent 100 MB/s in CrystalDiskMark. While there are 7200 rpm models, e.g. the 1,000 GB Hitachi Travelstar 7K1000 (HTS721010A9E630) available, which are faster on paper, the advantages of the hybrid technology should not be underestimated.
Overall, the sequential rates are on par with the Samsung SpinPoint M8 HN-M101MBB, the Seagate Momentus ST1000LM024, and the Toshiba MQ01ABD100, which have a capacity of 1,000 GB and a revolution speed of 5,400 rpm.

System performance
The system performance is beyond any doubt. So far, hardly any device achieved more than 22000 points in PCMark Vantage. Only dual GPU notebooks, like the Schenker XMG P722 (GeForce GTX 680M SLI) and the Alienware M18x R2 (Radeon HD 7970M CF) could perform better in the past.
| PCMark Vantage Result | 22008 points | |
| PCMark 7 Score | 6152 points | |
Help | ||
Gaming Performance

Our gaming tests verified the results in synthetic graphics benchmarks. All results considered, the GeForce GTX 765M ranks in between the GeForce GTX 670MX and the GeForce GTX 675MX. The latter is about 20% faster, but the GeForce 700 series is still young and does not have up-to-date drivers so far.
However, the 28 nm GPU does not stand a chance against the GeForce GTX 780M. Nvidia's top model is about 100% faster. But, the enormous performance difference also results in a significantly higher price. The Radeon HD 7770 would be the closest competing desktop model.
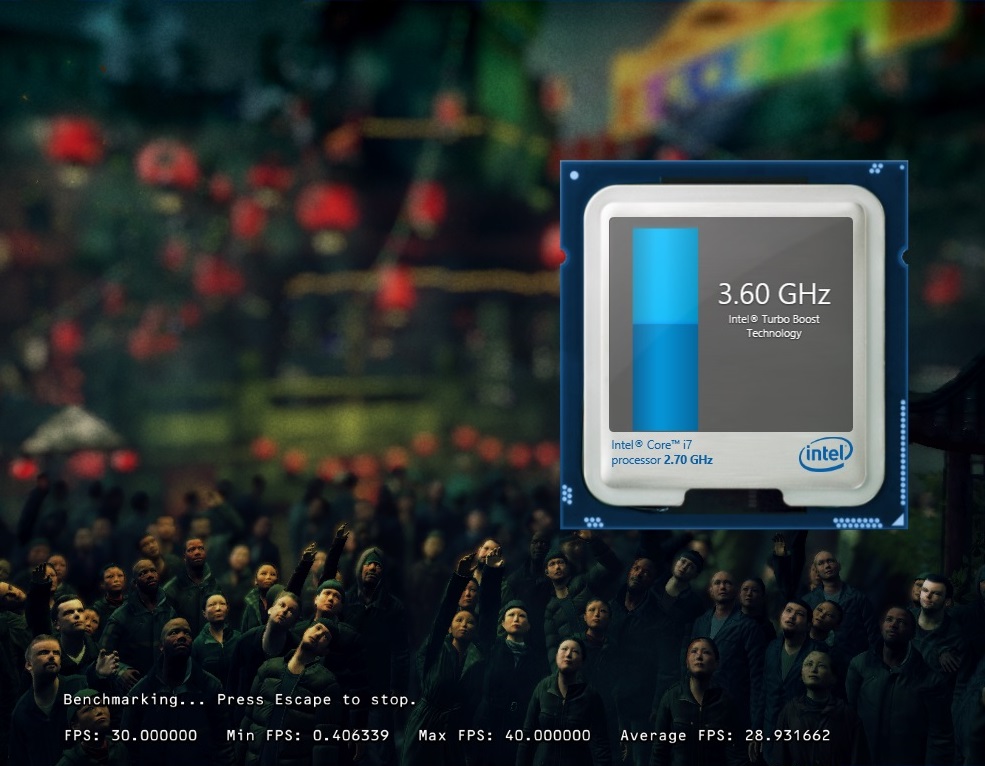
The GeForce GTX 765M can run modern games fairly well. However, the performance is not always sufficient for maximum graphics options and 4x anti aliasing while most games run smoothly with high details and 2x anti aliasing. Only some special cases, like Crysis 3 or Hitman: Absolution force the user to configure medium settings or reduce the resolution (1600x900 pixels).
Verdict: Gaming enthusiasts should at least select a GeForce GT 765M or even a GeForce GTX 770M. Despite its impressive performance, the GeForce GTX 780M might be far too expensive for most gamers.
| Graphics card | total performance |
|---|---|
| GeForce GTX 780M | +94 % |
| GeForce GTX 770M | +36 % |
| GeForce GTX 675MX | +18 % |
| GeForce GTX 765M | base (average of 30 games) |
| GeForce GTX 670MX | -8 % |
| Radeon HD 8870M | -26 % |
| low | med. | high | ultra | |
|---|---|---|---|---|
| Battlefield 3 (2011) | 109.1 | 78.7 | 61 | 22.1 |
| CoD: Modern Warfare 3 (2011) | 142.8 | 140.2 | 113.6 | 63.6 |
| The Elder Scrolls V: Skyrim (2011) | 85.9 | 63.2 | 35.4 | |
| Anno 2070 (2011) | 200.4 | 110.1 | 70.6 | 36.1 |
| Alan Wake (2012) | 83.6 | 48.4 | 24.1 | |
| Mass Effect 3 (2012) | 59.9 | 59.9 | 58.7 | |
| Risen 2: Dark Waters (2012) | 93.2 | 62.3 | 50.5 | 24.3 |
| Diablo III (2012) | 216.4 | 196.6 | 177.4 | 104.3 |
| Dirt Showdown (2012) | 122 | 93.5 | 88.7 | 34.9 |
| Max Payne 3 (2012) | 80.9 | 78.1 | 39.1 | 29.6 |
| Darksiders II (2012) | 112.4 | 66.4 | ||
| Sleeping Dogs (2012) | 151.2 | 108.9 | 53.8 | 14.2 |
| Counter-Strike: GO (2012) | 267.2 | 249.1 | 187.4 | 106.9 |
| Guild Wars 2 (2012) | 99.3 | 59 | 21.8 | |
| F1 2012 (2012) | 182 | 140 | 127 | 57 |
| Borderlands 2 (2012) | 117.3 | 93.4 | 75.4 | 47.7 |
| Fifa 13 (2012) | 464 | 375.1 | 359 | 237.4 |
| Dishonored (2012) | 128.2 | 127.7 | 122.4 | 80 |
| Medal of Honor: Warfighter (2012) | 125.4 | 83.1 | 66.7 | 24.7 |
| Need for Speed: Most Wanted (2012) | 59.9 | 59.9 | 58.1 | 38.3 |
| Call of Duty: Black Ops 2 (2012) | 172.9 | 134 | 79.7 | 50 |
| Hitman: Absolution (2012) | 81.5 | 65 | 34.2 | 13.4 |
| Assassin´s Creed III (2012) | 76.4 | 66.9 | 22.8 | |
| Far Cry 3 (2012) | 83.8 | 77.8 | 45.4 | 14.4 |
| Dead Space 3 (2013) | 262.1 | 153.8 | 119.4 | 70.4 |
| Crysis 3 (2013) | 91.8 | 52.6 | 36.8 | 14.2 |
| Tomb Raider (2013) | 216.5 | 115.2 | 72.6 | 31.7 |
| SimCity (2013) | 92.7 | 46.5 | 38.7 | 23.9 |
| BioShock Infinite (2013) | 168.2 | 95.8 | 80.8 | 23.6 |
Emissions
System noise
Unfortunately, one of the biggest disadvantages of the predecessor notebooks did not improve: the high system noise. In 3D mode, the fans do not get particularly loud with about 42 dB, but they are also not at all quiet. Under full load the W503 reaches an extremely loud 54 dB. As in the past, we feel that there are too few steps. The rotation speed of the fan jumps abruptly and without any reason. But, the GTX 765M laptop is quieter than models equipped with the GeForce GTX 780M.
The fans are also rather loud during simple tasks like office or internet: Just under 36 dB is above average and might annoy sensitive users in the long run. The MSI GT60 was quieter in our test. The 15-incher is only comfortably quiet after a longer idle period with medium to maximum energy saving settings. In order to avoid an unnecessary noise increase, it is recommended to activate VSync in games.
Noise level
| Idle |
| 35.6 / 35.8 / 36.4 dB(A) |
| DVD |
| 40.3 / dB(A) |
| Load |
| 41.8 / 53.9 dB(A) |
 | ||
30 dB silent 40 dB(A) audible 50 dB(A) loud |
||
min: | ||
Temperature
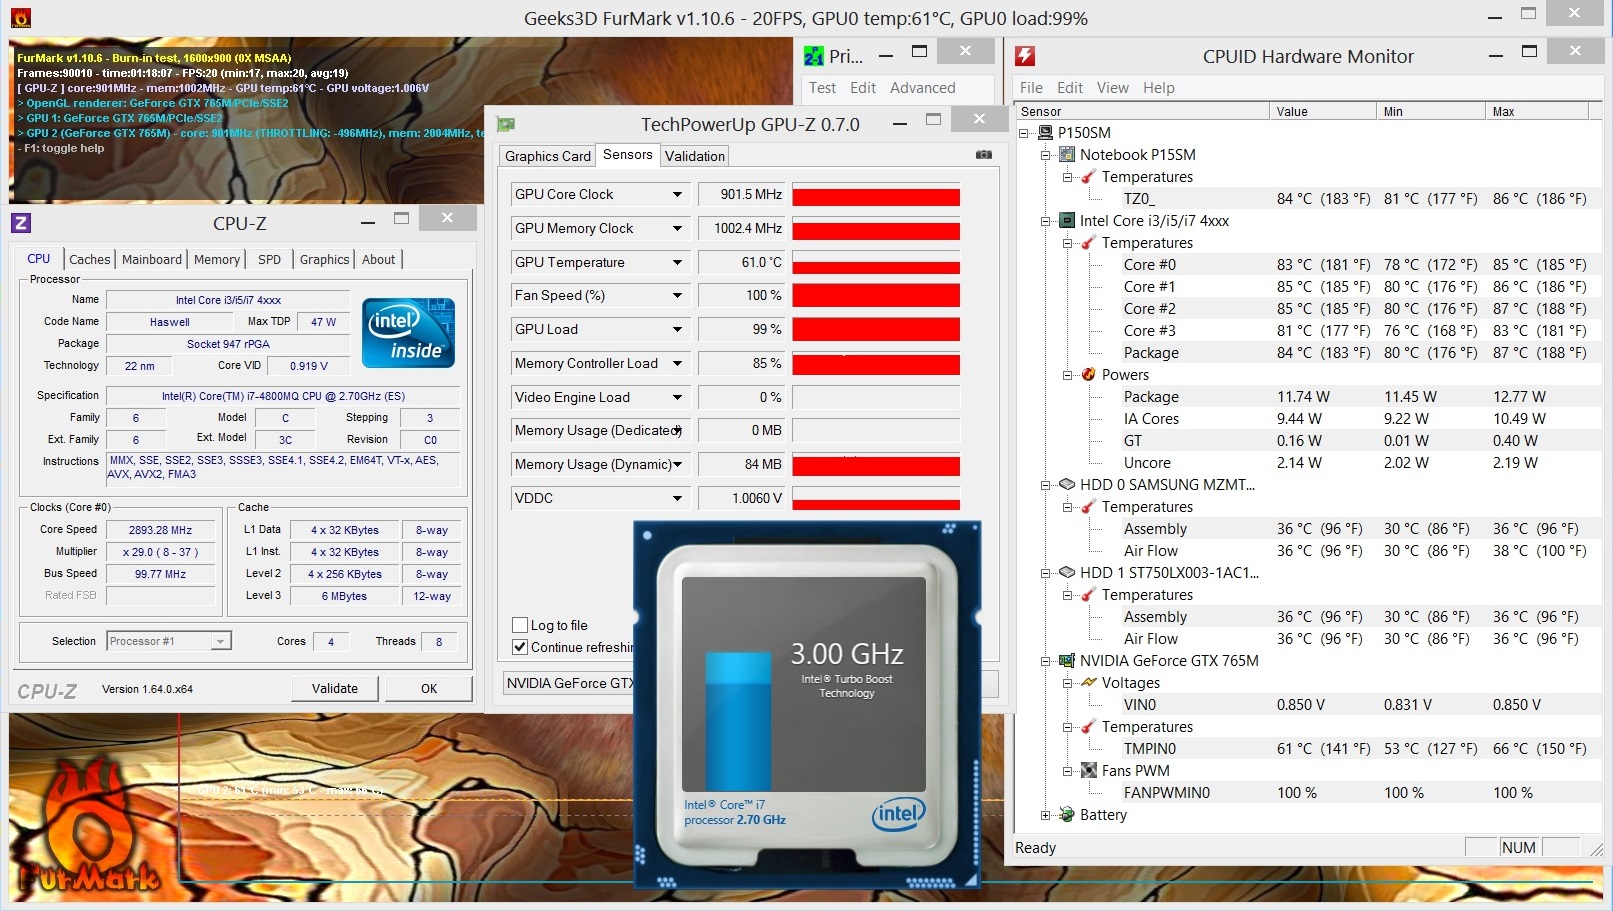
The temperatures are alright. Even under full load the GeForce GTX 765M only hovers around 61 °C and the maximum GPU boost remains available. While the CPU gets significantly warmer according to the CPUID hardware monitor, just under 85 °C is still absolutely acceptable.
The surface temperatures are also acceptable: Given the components, an average of 27 °C while idle and of 32 °C after one hour stress test with Furmark and Prime are more than acceptable. Other 15-inch gamers, e.g. the Lenovo IdeaPad Y500 and the Schenker XMG A522, get significantly warmer. The W503 might get warmer with a faster graphics card.
(+) The maximum temperature on the upper side is 34.5 °C / 94 F, compared to the average of 40.5 °C / 105 F, ranging from 21.2 to 68.8 °C for the class Gaming.
(±) The bottom heats up to a maximum of 40.5 °C / 105 F, compared to the average of 43.3 °C / 110 F
(+) In idle usage, the average temperature for the upper side is 26.4 °C / 80 F, compared to the device average of 33.9 °C / 93 F.
(+) The palmrests and touchpad are cooler than skin temperature with a maximum of 28 °C / 82.4 F and are therefore cool to the touch.
(±) The average temperature of the palmrest area of similar devices was 28.9 °C / 84 F (+0.9 °C / 1.6 F).
Speakers
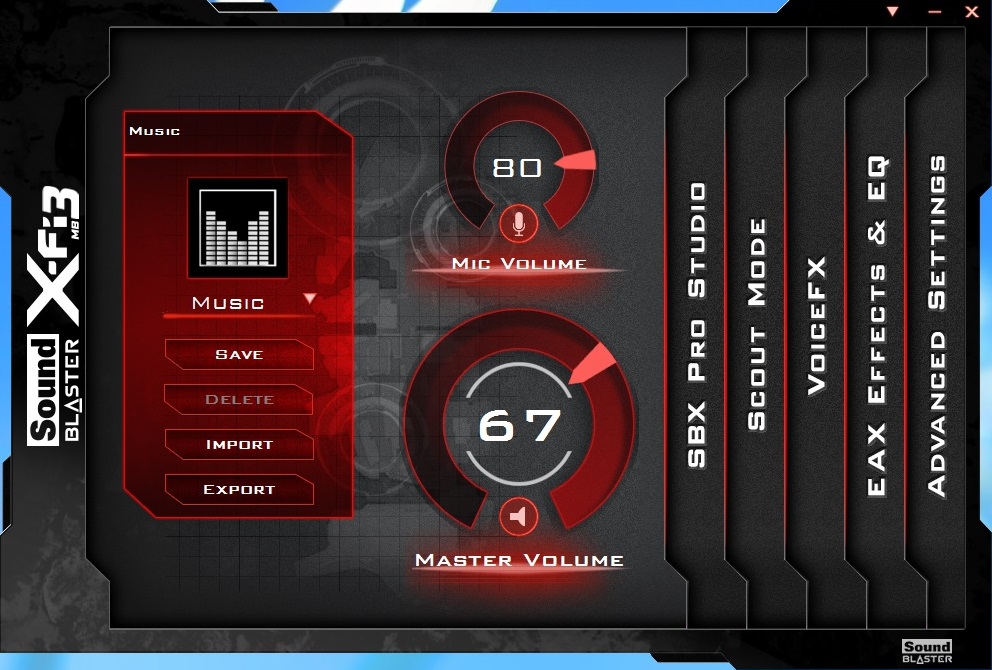
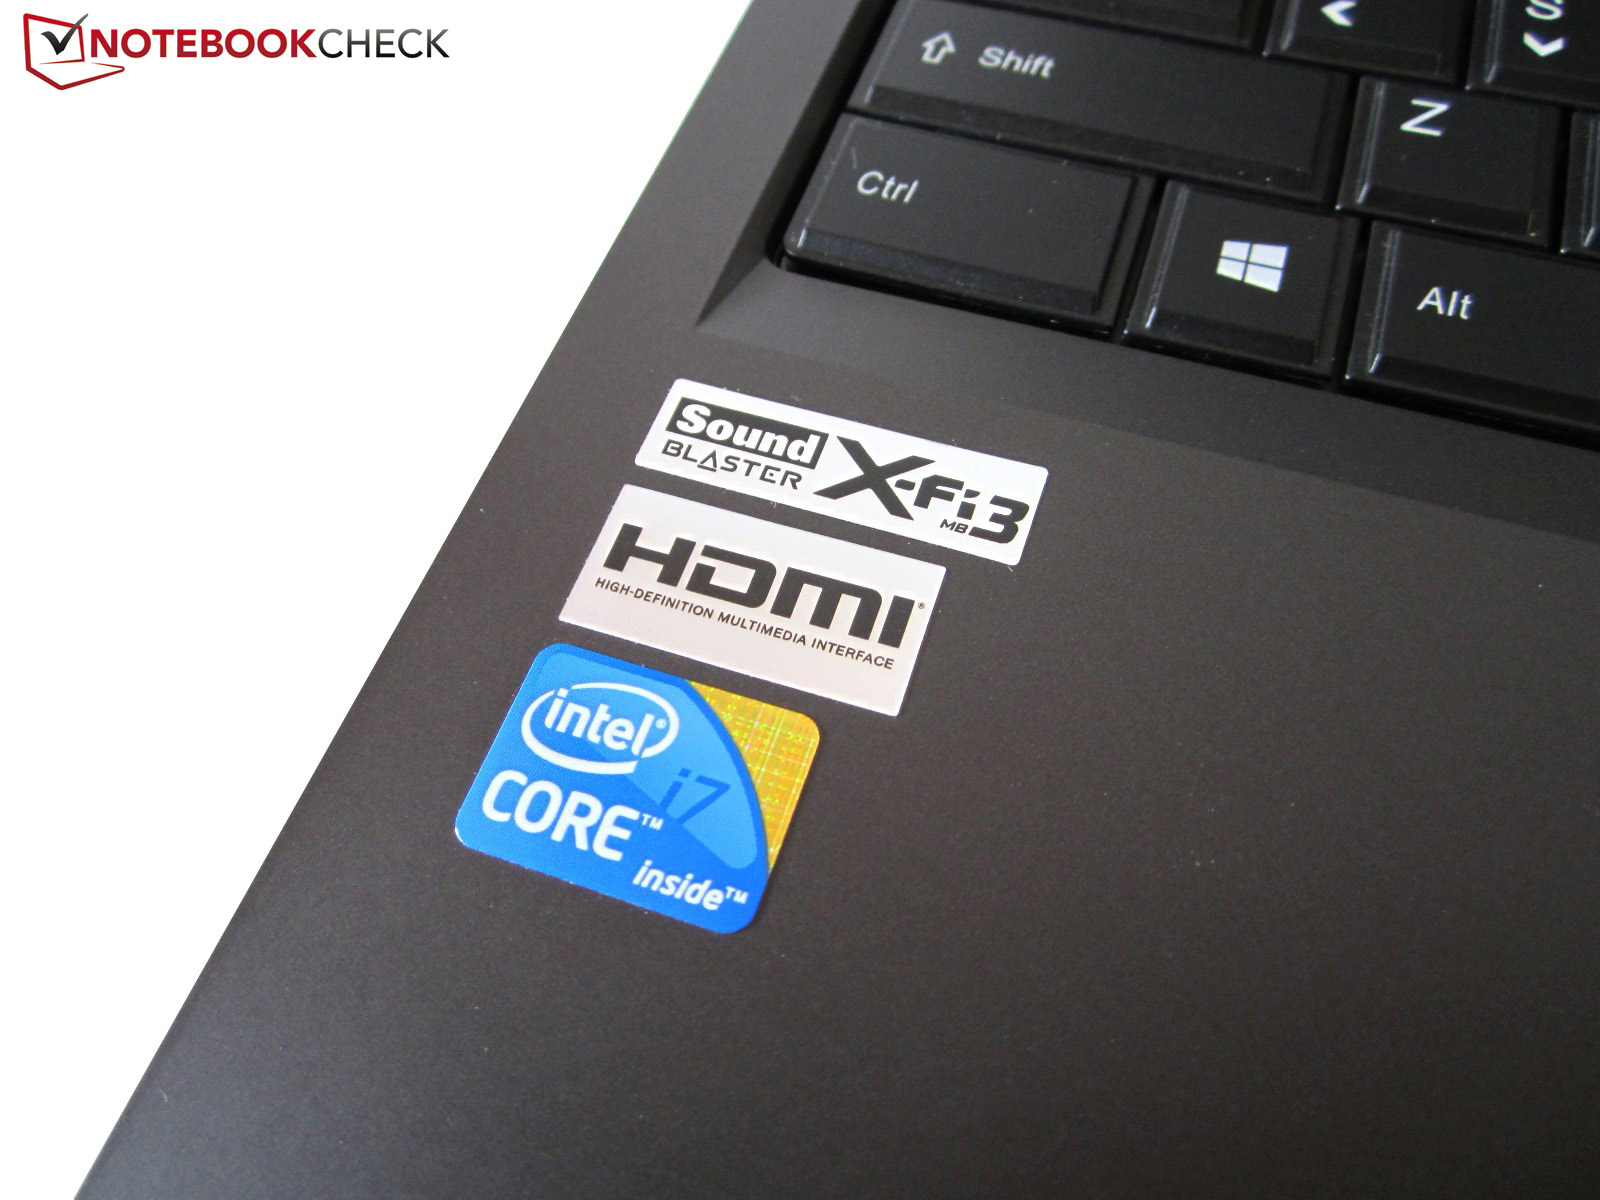
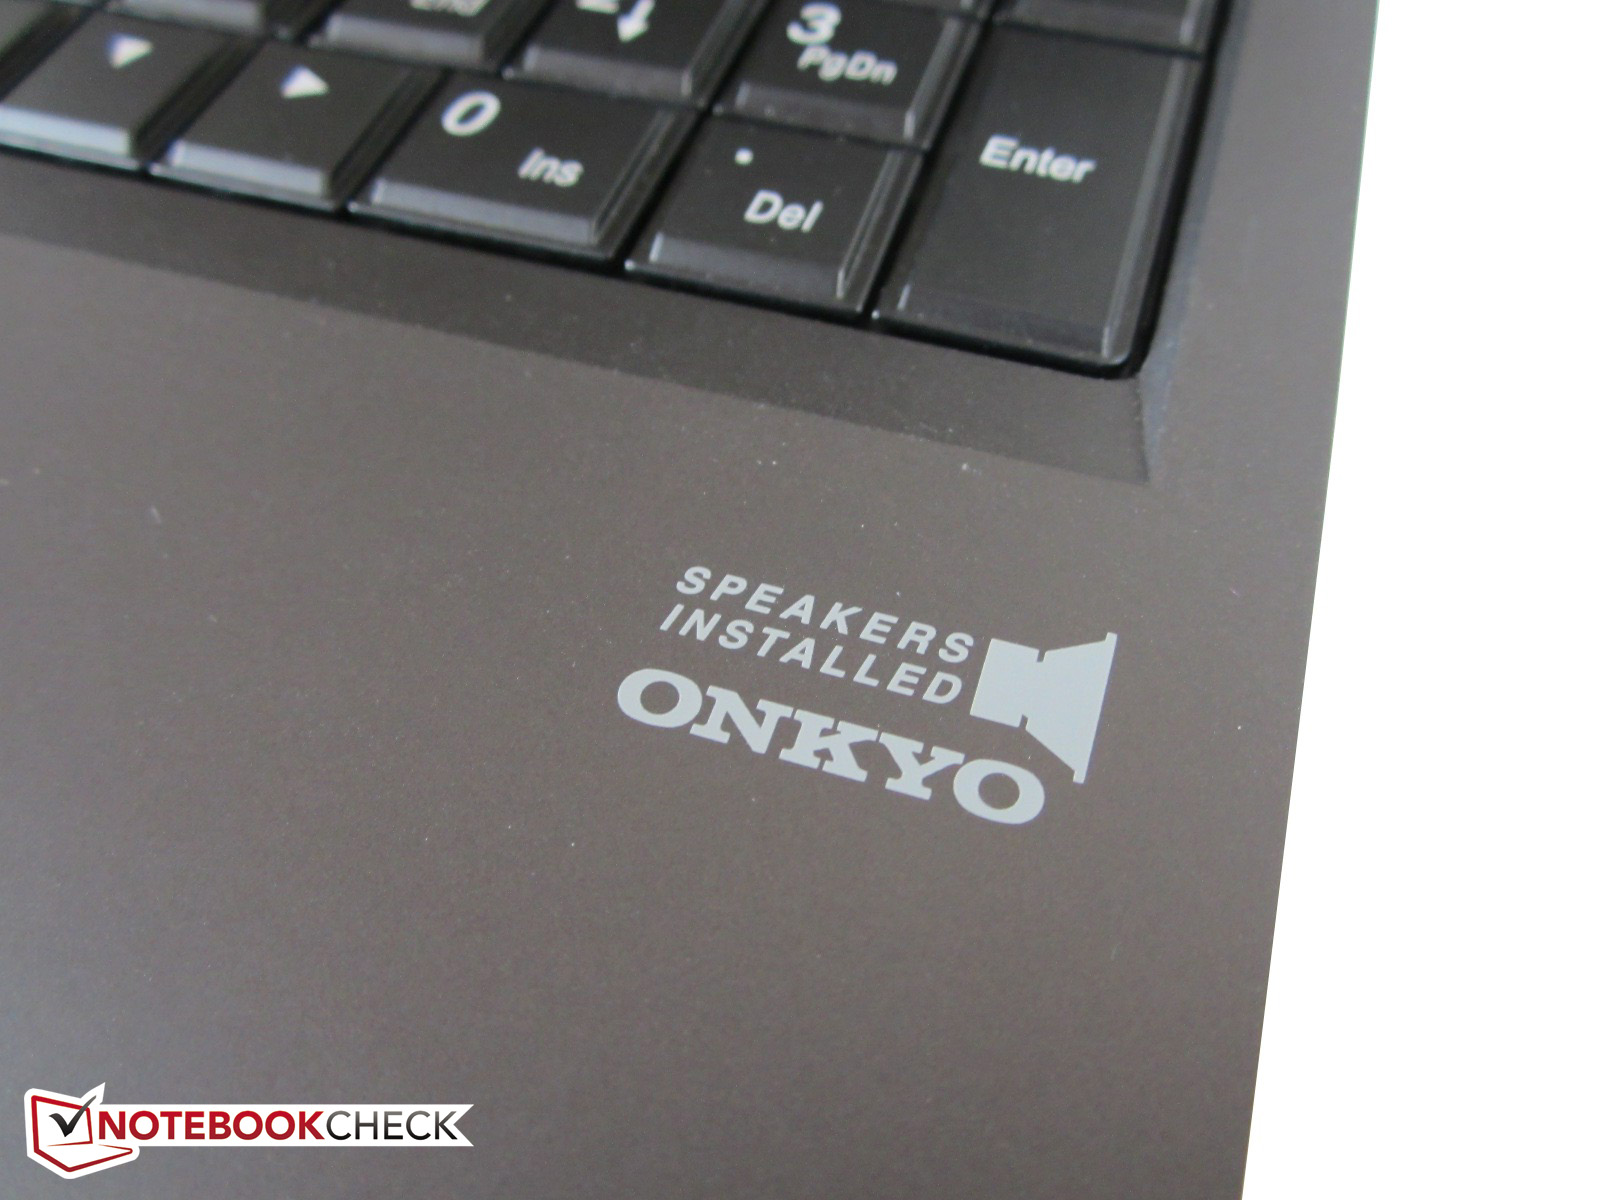
The modest sound is one of the most striking disadvantages of the P150EM barebone, although it comes with Onkyo speakers and THX TruStudio Pro. Despite Sound Blaster X-Fi MB3 technology, which also stems from Creative and significantly improves the sound, the sound can overall not really convince.
Compared to the MSI GT60, which features high-end Dynaudio speakers, the 15-incher sounds less precise, voluminous, and balanced. Also, the good maximum volume and the integrated subwoofer cannot really improve this. If you frequently run PC games or watch videos, you should connect a headset or external speakers.
It's a pity that Clevo does not use a similar sound system as in the P177SM or P370EM. The 17-inch brother devices sound significantly better. At least it shows some improvement compared to the XMG P502.
Energy management
Power consumption
While idle the 15-incher demands slightly more power than other gaming notebooks. With 17-28 Watt the power consumption is just under 50% faster than the reviewed One M73-2N (10-19 Watt) with Core i7-3740QM and GeForce GTX 675MX. Under load it is the other way round. While the Schenker W503 needs about 102 Watt during 3DMark 06, the One M73-2N requires 113 Watt. Under full load the power consumption is, with 156 vs. 186 Watt, significantly lower.
| Off / Standby | |
| Idle | |
| Load |
|
Key:
min: | |
Battery life
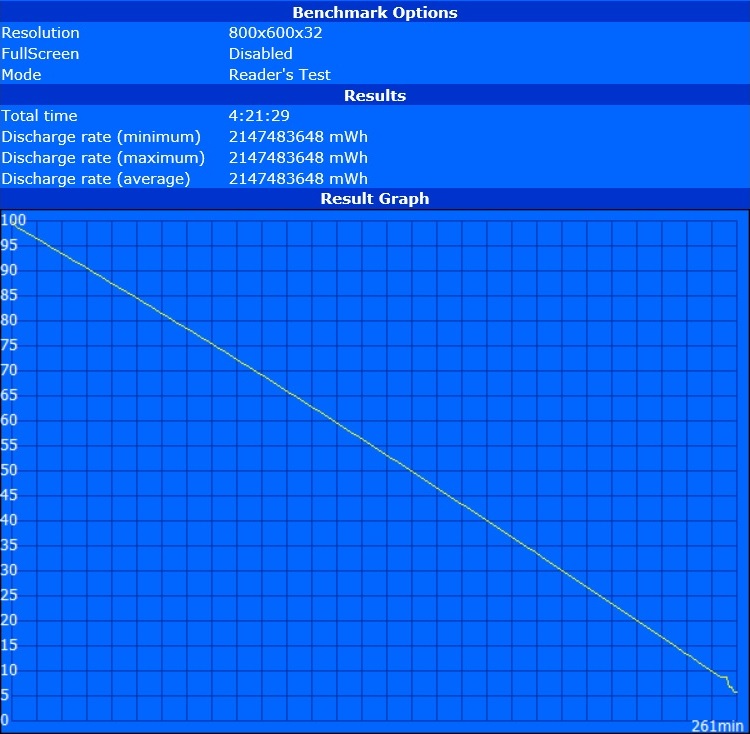

The battery life is not outstanding. For a gaming notebook, 100 minutes in the Classic Test of the Battery Eater tool (maximum brightness) and just under 4.5 hours in the Reader's Test (minimum brightness) are not bad.
In our standardized WLAN test (average energy saving), the 15-incher shuts down after 3.5 hours. You can enjoy videos from DVD for just under three hours on battery. Overall, the results remind us of the XMG P703.
Great: The GeForce GTX 765M is only 10% slower on battery.
Verdict
Clevo did not risk much in regard to the look of the P150SM barebone. Apart from a slightly different connectivity and a matte display bezel the 15-inch laptop looks very much like the old P150EM barebone.
However, a lot was changed inside. Besides an additional mSATA slot, the cutting-edge motherboard has to be mentioned. Intel's Haswell processors are the new mobile top models. The performance of the GeForce GTX 765M is also noteworthy. High graphics settings do usually not pose a problem. Those who want even faster performance can configure a more expensive GPU model.
Speaking of configuration: The excellent maintenance and upgrade possibilities belong to the biggest advantages of the P150SM barebone. The 15-incher is very user-friendly. Its matte Full HD screen, the vast connectivity and the uniform keyboard light also contribute to a positive overall impression. In general, the case scores points with a simple design, a good build quality, and a decent stability. We also liked the rubberized surfaces and the inconspicuous temperature increase.
However, we have to criticize the high system noise. The Schenker W503 is not a device for everyone. Sound and touchpad could also be better. As there are far more advantages than disadvantages, gaming enthusiasts can nevertheless safely buy it.
In comparison
| BioShock Infinite - 1920x1080 Ultra Preset, DX11 (DDOF) (sort by value) | |
| GeForce GTX 765M / Core i7-4800MQ | |
| GeForce GTX 670MX / Core i7-3610QM | |
| GeForce GTX 675MX / Core i7-3610QM | |
| GeForce GTX 770M / Core i7-4800MQ | |
| GeForce GTX 780M / Core i7- 4900MQ | |
| SimCity - 1920x1080 Ultra / High AA:on (sort by value) | |
| GeForce GTX 765M / Core i7-4800MQ | |
| GeForce GTX 670MX / Core i7-3610QM | |
| GeForce GTX 675MX / Core i7-3610QM | |
| GeForce GTX 770M / Core i7-4800MQ | |
| GeForce GTX 780M / Core i7- 4900MQ | |
| Tomb Raider - 1920x1080 Ultra Preset AA:FX AF:16x (sort by value) | |
| GeForce GTX 765M / Core i7-4800MQ | |
| Radeon HD 8870M / Core i7-3635QM | |
| GeForce GTX 670MX / Core i7-3610QM | |
| GeForce GTX 675MX / Core i7-3610QM | |
| GeForce GTX 770M / Core i7-4800MQ | |
| GeForce GTX 780M / Core i7- 4900MQ | |
| Crysis 3 - 1920x1080 Very High Preset AA:2xSM AF:16x (sort by value) | |
| GeForce GTX 765M / Core i7-4800MQ | |
| Radeon HD 8870M / Core i7-3635QM | |
| GeForce GTX 670MX / Core i7-3610QM | |
| GeForce GTX 675MX / Core i7-3610QM | |
| GeForce GTX 770M / Core i7-4800MQ | |
| GeForce GTX 780M / Core i7- 4900MQ | |
| Dead Space 3 - 1920x1080 Very High Preset (sort by value) | |
| GeForce GTX 765M / Core i7-4800MQ | |
| Radeon HD 8870M / Core i7-3635QM | |
| GeForce GTX 670MX / Core i7-3610QM | |
| GeForce GTX 675MX / Core i7-3610QM | |
| GeForce GTX 770M / Core i7-4800MQ | |
| GeForce GTX 780M / Core i7- 4900MQ | |
| Far Cry 3 - 1920x1080 DX11 Ultra Preset (HDAO, Enhanced Alpha To Coverage) AA:4x MS (sort by value) | |
| GeForce GTX 765M / Core i7-4800MQ | |
| Radeon HD 8870M / Core i7-3635QM | |
| GeForce GTX 670MX / Core i7-3630QM | |
| GeForce GTX 675MX / Core i7-3610QM | |
| GeForce GTX 770M / Core i7-4800MQ | |
| GeForce GTX 780M / Core i7- 4900MQ | |
| Assassin´s Creed III - 1920x1080 Very High (sort by value) | |
| GeForce GTX 765M / Core i7-4800MQ | |
| Radeon HD 8870M / Core i7-3635QM | |
| GeForce GTX 670MX / Core i7-3630QM | |
| GeForce GTX 675MX / Core i7-3610QM | |
| GeForce GTX 770M / Core i7-4800MQ | |
| GeForce GTX 780M / Core i7- 4900MQ | |
| Hitman: Absolution - 1920x1080 Ultra Preset AA:4xMS AF:16x (sort by value) | |
| GeForce GTX 765M / Core i7-4800MQ | |
| Radeon HD 8870M / Core i7-3635QM | |
| GeForce GTX 670MX / Core i7-3630QM | |
| GeForce GTX 675MX / Core i7-3610QM | |
| GeForce GTX 770M / Core i7-4800MQ | |
| GeForce GTX 780M / Core i7- 4900MQ | |
| Call of Duty: Black Ops 2 - 1920x1080 (Extra) High / On, FXAA AA:4xMS (sort by value) | |
| GeForce GTX 765M / Core i7-4800MQ | |
| Radeon HD 8870M / Core i7-3635QM | |
| GeForce GTX 670MX / Core i7-3630QM | |
| GeForce GTX 675MX / Core i7-3610QM | |
| GeForce GTX 770M / Core i7-4800MQ | |
| GeForce GTX 780M / Core i7- 4900MQ | |
| Need for Speed: Most Wanted - 1920x1080 High / On (sort by value) | |
| GeForce GTX 765M / Core i7-4800MQ | |
| Radeon HD 8870M / Core i7-3635QM | |
| GeForce GTX 670MX / Core i7-3630QM | |
| GeForce GTX 675MX / Core i7-3610QM | |
| GeForce GTX 770M / Core i7-4800MQ | |
| GeForce GTX 780M / Core i7- 4900MQ | |
| Medal of Honor: Warfighter - 1920x1080 Ultra Preset AA:4xMS AF:16x (sort by value) | |
| GeForce GTX 765M / Core i7-4800MQ | |
| Radeon HD 8870M / Core i7-3635QM | |
| GeForce GTX 670MX / Core i7-3630QM | |
| GeForce GTX 675MX / Core i7-3610QM | |
| GeForce GTX 770M / Core i7-4800MQ | |
| GeForce GTX 780M / Core i7- 4900MQ | |
| Dishonored - 1920x1080 High / On, FOV: 75 AA:FX (sort by value) | |
| GeForce GTX 765M / Core i7-4800MQ | |
| Radeon HD 8870M / Core i7-3635QM | |
| GeForce GTX 670MX / Core i7-3630QM | |
| GeForce GTX 675MX / Core i7-3740QM | |
| GeForce GTX 770M / Core i7-4800MQ | |
| GeForce GTX 780M / Core i7- 4900MQ | |
| Fifa 13 - 1920x1080 High AA:4xMS (sort by value) | |
| GeForce GTX 765M / Core i7-4800MQ | |
| Radeon HD 8870M / Core i7-3635QM | |
| GeForce GTX 670MX / Core i7-3630QM | |
| GeForce GTX 675MX / Core i7-3740QM | |
| GeForce GTX 770M / Core i7-4800MQ | |
| GeForce GTX 780M / Core i7- 4900MQ | |
| Borderlands 2 - 1920x1080 (Ultra) High / On (PhysX low) AA:FX AF:8x (sort by value) | |
| GeForce GTX 765M / Core i7-4800MQ | |
| Radeon HD 8870M / Core i7-3635QM | |
| GeForce GTX 670MX / Core i7-3630QM | |
| GeForce GTX 675MX / Core i7-3740QM | |
| GeForce GTX 770M / Core i7-4800MQ | |
| GeForce GTX 780M / Core i7- 4900MQ | |
| F1 2012 - 1920x1080 Ultra Preset AA:4xMS (sort by value) | |
| GeForce GTX 765M / Core i7-4800MQ | |
| GeForce GTX 670MX / Core i7-3630QM | |
| GeForce GTX 675MX / Core i7-3740QM | |
| GeForce GTX 770M / Core i7-4800MQ | |
| GeForce GTX 780M / Core i7- 4900MQ | |
| Guild Wars 2 - 1920x1080 All Maximum / On AA:FX (sort by value) | |
| GeForce GTX 765M / Core i7-4800MQ | |
| Radeon HD 8870M / Core i7-3635QM | |
| GeForce GTX 670MX / Core i7-3630QM | |
| GeForce GTX 675MX / Core i7-3740QM | |
| GeForce GTX 770M / Core i7-4800MQ | |
| GeForce GTX 780M / Core i7- 4900MQ | |
| Counter-Strike: GO - 1920x1080 (Very) High, FXAA AA:4x MS AF:8x (sort by value) | |
| GeForce GTX 765M / Core i7-4800MQ | |
| Radeon HD 8870M / Core i7-3635QM | |
| GeForce GTX 670MX / Core i7-3630QM | |
| GeForce GTX 675MX / Core i7-3740QM | |
| GeForce GTX 770M / Core i7-4800MQ | |
| GeForce GTX 780M / Core i7- 4900MQ | |
| Sleeping Dogs - 1920x1080 Extreme Preset AA:Extreme (sort by value) | |
| GeForce GTX 765M / Core i7-4800MQ | |
| Radeon HD 8870M / Core i7-3635QM | |
| GeForce GTX 670MX / Core i7-3630QM | |
| GeForce GTX 675MX / Core i7-3740QM | |
| GeForce GTX 770M / Core i7-4800MQ | |
| GeForce GTX 780M / Core i7- 4900MQ | |
| Darksiders II - 1920x1080 2/4 Shadows, No Ambient Occlusion, AA:Low (sort by value) | |
| GeForce GTX 765M / Core i7-4800MQ | |
| Radeon HD 8870M / Core i7-3635QM | |
| GeForce GTX 670MX / Core i7-3630QM | |
| GeForce GTX 675MX / Core i7-3740QM | |
| GeForce GTX 770M / Core i7-4800MQ | |
| GeForce GTX 780M / Core i7- 4900MQ | |
| Max Payne 3 - 1920x1080 Very High, DX11 AA:Very High FX AF:8x (sort by value) | |
| GeForce GTX 765M / Core i7-4800MQ | |
| Radeon HD 8870M / Core i7-3635QM | |
| GeForce GTX 670MX / Core i7-3630QM | |
| GeForce GTX 675MX / Core i7-3740QM | |
| GeForce GTX 770M / Core i7-4800MQ | |
| GeForce GTX 780M / Core i7- 4900MQ | |
| Dirt Showdown - 1920x1080 Ultra Preset AA:4xMS (sort by value) | |
| GeForce GTX 765M / Core i7-4800MQ | |
| Radeon HD 8870M / Core i7-3635QM | |
| GeForce GTX 670MX / Core i7-3630QM | |
| GeForce GTX 675MX / Core i7-3740QM | |
| GeForce GTX 770M / Core i7-4800MQ | |
| GeForce GTX 780M / Core i7- 4900MQ | |
| Diablo III - 1920x1080 High AA:on (sort by value) | |
| GeForce GTX 765M / Core i7-4800MQ | |
| Radeon HD 8870M / Core i7-3635QM | |
| GeForce GTX 670MX / Core i7-3630QM | |
| GeForce GTX 675MX / Core i7-3740QM | |
| GeForce GTX 770M / Core i7-4800MQ | |
| GeForce GTX 780M / Core i7- 4900MQ | |
| Risen 2: Dark Waters - 1920x1080 Ultra / on AA:on AF:8x (sort by value) | |
| GeForce GTX 765M / Core i7-4800MQ | |
| Radeon HD 8870M / Core i7-3635QM | |
| GeForce GTX 670MX / Core i7-3630QM | |
| GeForce GTX 675MX / Core i7-3740QM | |
| GeForce GTX 770M / Core i7-4800MQ | |
| GeForce GTX 780M / Core i7- 4900MQ | |
| Alan Wake - 1920x1080 High Preset AA:4x AF:8x (sort by value) | |
| GeForce GTX 765M / Core i7-4800MQ | |
| Radeon HD 8870M / Core i7-3635QM | |
| GeForce GTX 670MX / Core i7-3630QM | |
| GeForce GTX 675MX / Core i7-3740QM | |
| GeForce GTX 770M / Core i7-4800MQ | |
| GeForce GTX 780M / Core i7- 4900MQ | |
| Anno 2070 - 1920x1080 Very High Preset AA:on AF:4x (sort by value) | |
| GeForce GTX 765M / Core i7-4800MQ | |
| Radeon HD 8870M / Core i7-3635QM | |
| GeForce GTX 670MX / Core i7-3630QM | |
| GeForce GTX 675MX / Core i7-3740QM | |
| GeForce GTX 770M / Core i7-4800MQ | |
| GeForce GTX 780M / Core i7- 4900MQ | |
| The Elder Scrolls V: Skyrim - 1920x1080 Ultra Preset AA:8x AF:16x (sort by value) | |
| GeForce GTX 765M / Core i7-4800MQ | |
| Radeon HD 8870M / Core i7-3635QM | |
| GeForce GTX 670MX / Core i7-3630QM | |
| GeForce GTX 675MX / Core i7-3740QM | |
| GeForce GTX 770M / Core i7-4800MQ | |
| GeForce GTX 780M / Core i7- 4900MQ | |
| CoD: Modern Warfare 3 - 1920x1080 Extra, all on, Image Quality: Native AA:4x (sort by value) | |
| GeForce GTX 765M / Core i7-4800MQ | |
| Radeon HD 8870M / Core i7-3635QM | |
| GeForce GTX 670MX / Core i7-3630QM | |
| GeForce GTX 675MX / Core i7-3740QM | |
| GeForce GTX 770M / Core i7-4800MQ | |
| GeForce GTX 780M / Core i7- 4900MQ | |
| Battlefield 3 - 1920x1080 ultra AA:4x MS AF:16x (sort by value) | |
| GeForce GTX 765M / Core i7-4800MQ | |
| Radeon HD 8870M / Core i7-3635QM | |
| GeForce GTX 670MX / Core i7-3630QM | |
| GeForce GTX 675MX / Core i7-3740QM | |
| GeForce GTX 770M / Core i7-4800MQ | |
| GeForce GTX 780M / Core i7- 4900MQ | |