

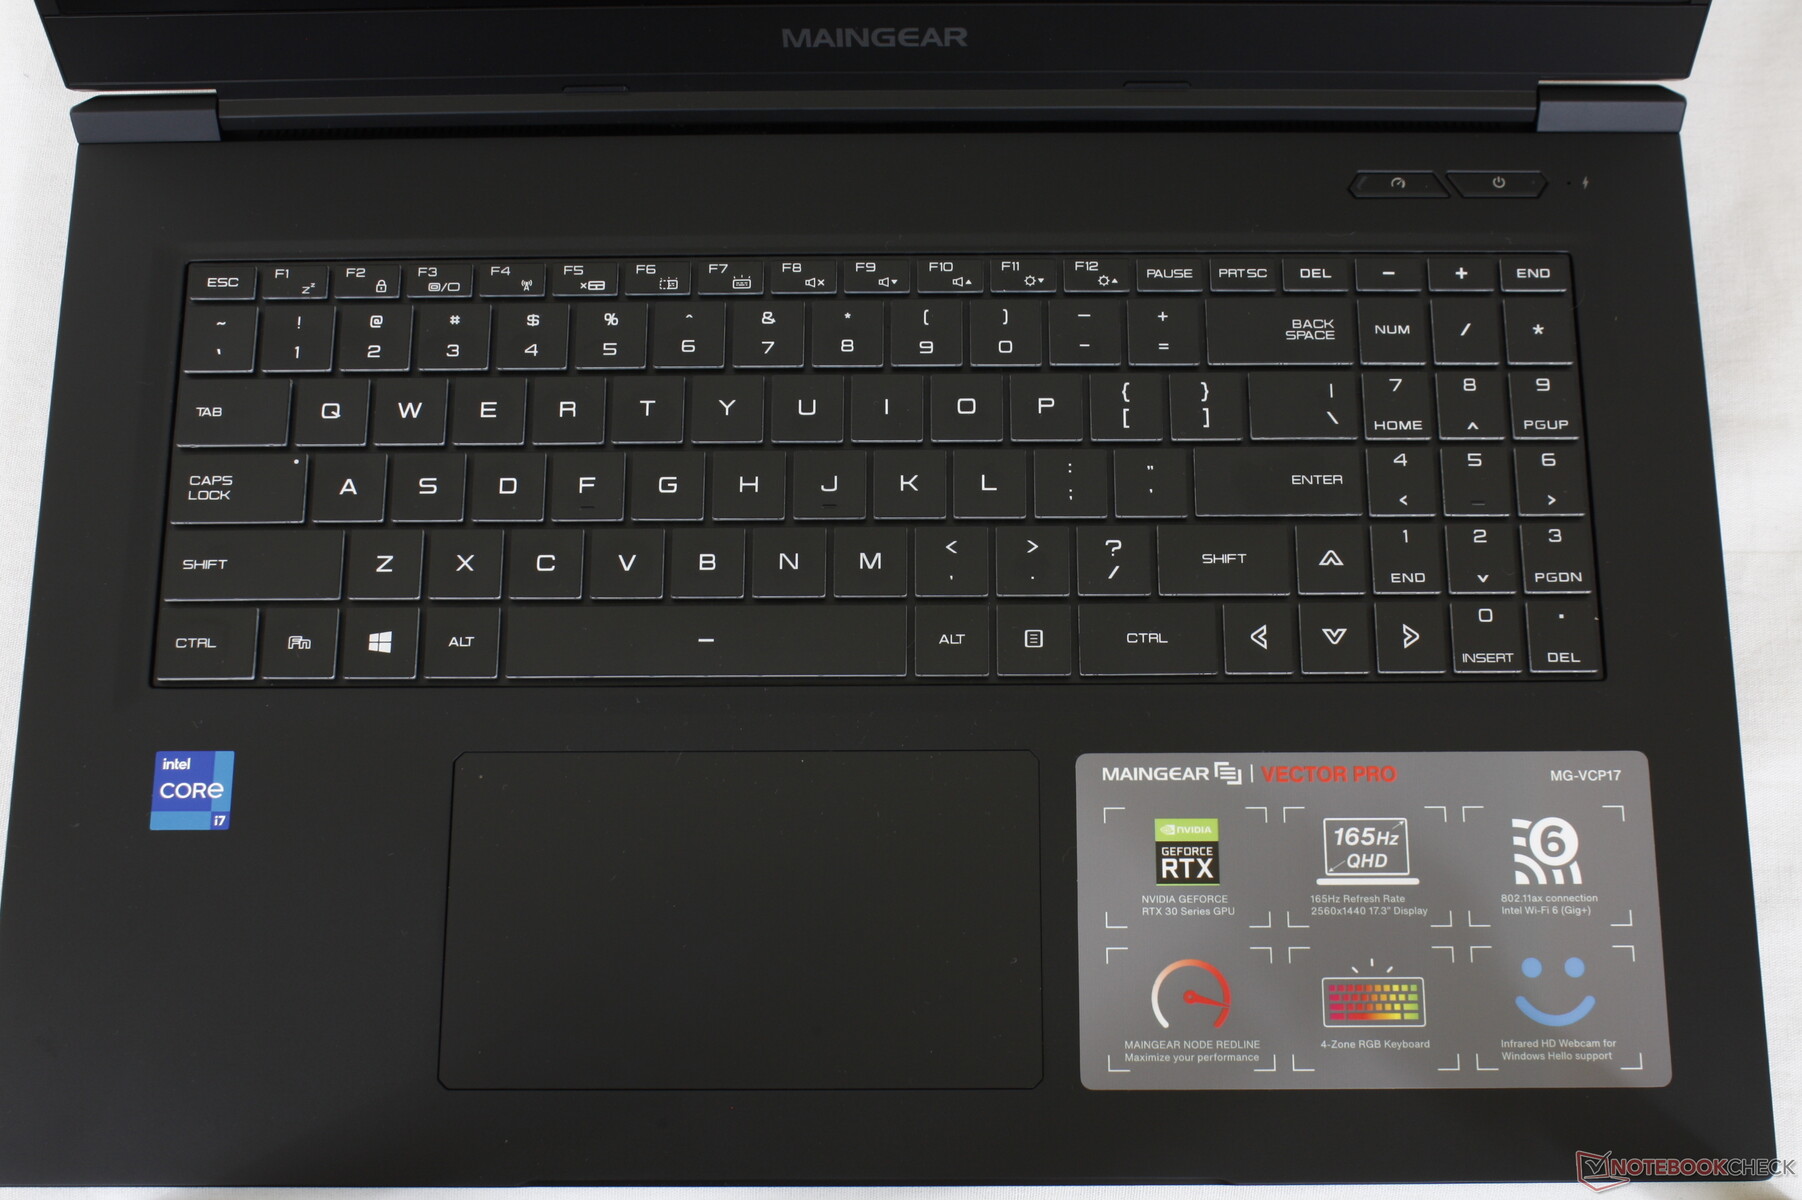
Maingear Vector Pro MG-VCP17 laptop review: 165 W GeForce RTX 3080 for ultrathin size
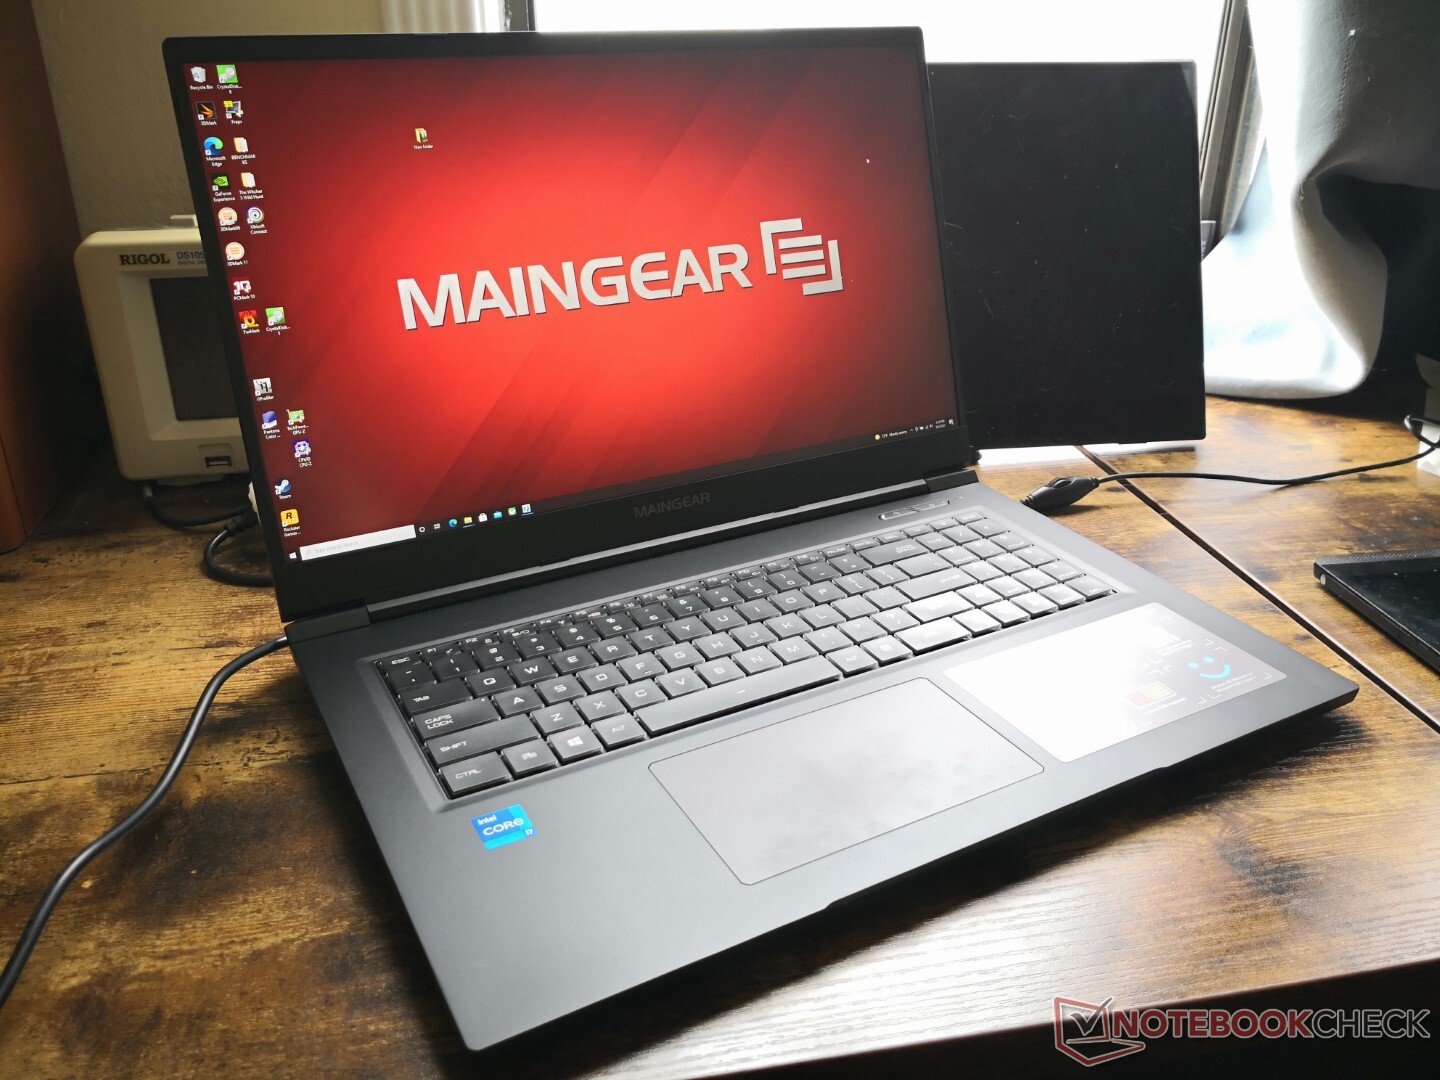
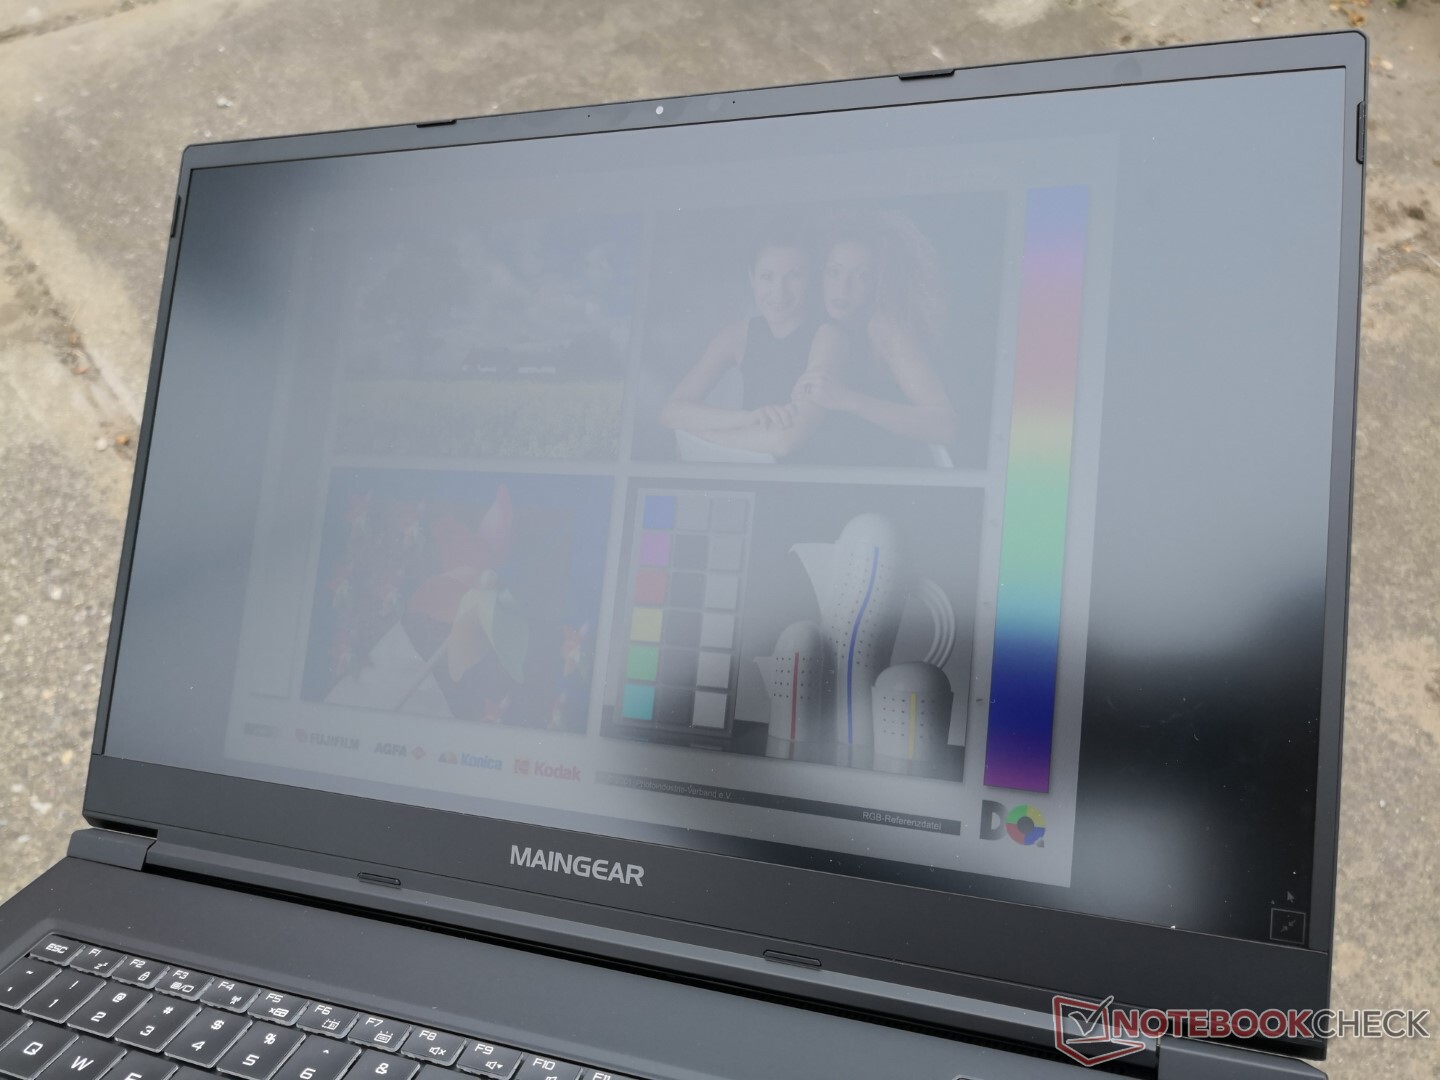
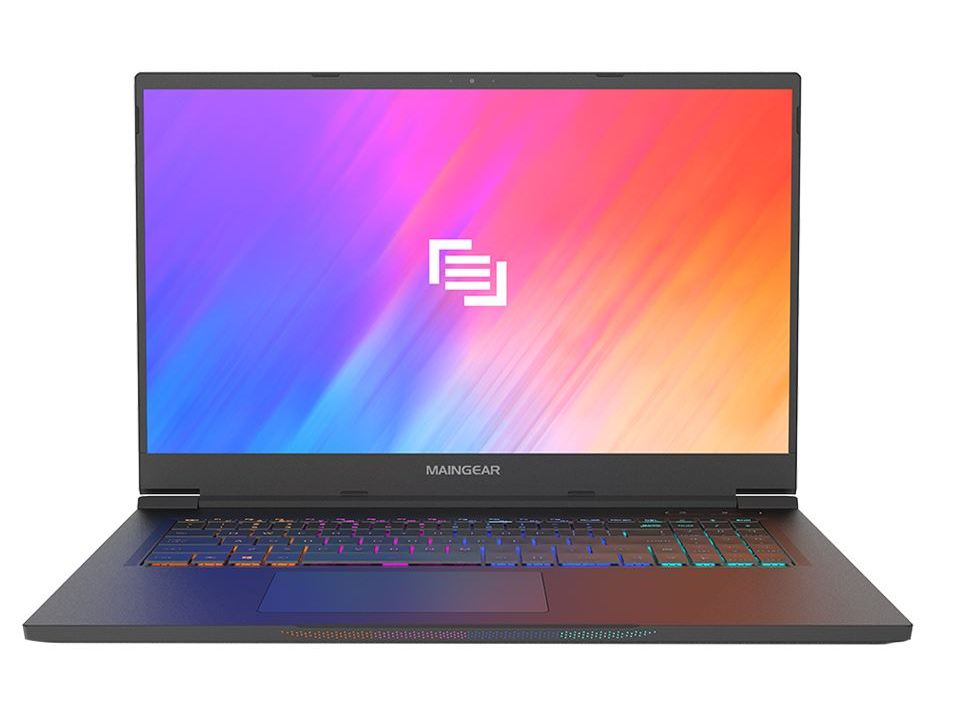
The Vector Pro is an ultra-thin 17.3-inch gaming laptop from the custom PC builder Maingear. It's an ultrathin high-performance system in the same vein as the MSI GS75, Razer Blade Pro, Asus Zephyrus S17, or Dell Alienware x17 series.
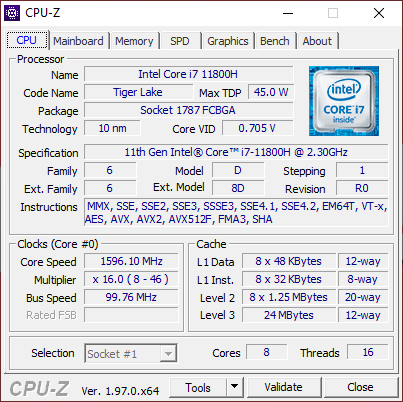
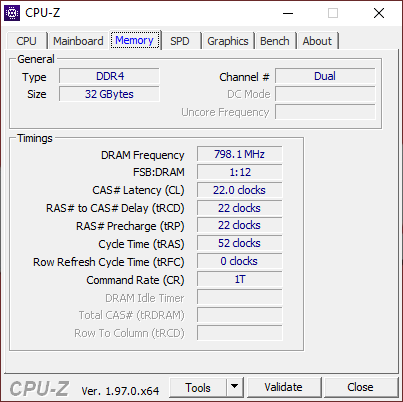
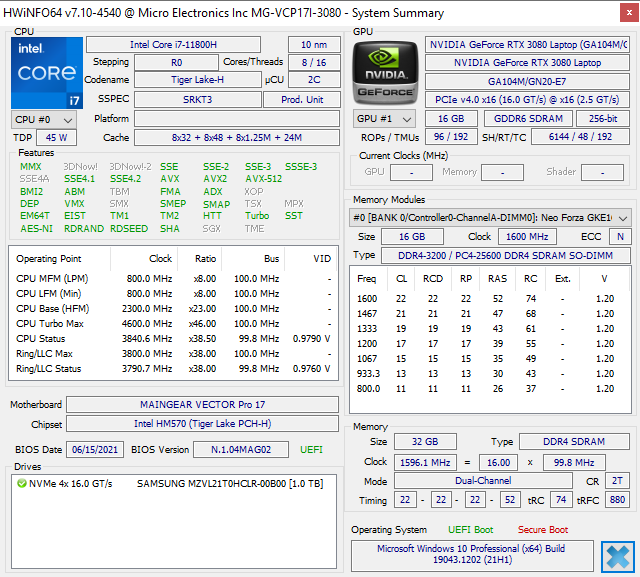
Our test unit has been fully configured with the 11th gen Core i7-11800H CPU, 165 W GeForce RTX 3080 GPU, and 165 Hz 1440p IPS display for approximately $2500 USD retail. Lesser SKUs to be made available with the RTX 3070 for lower starting prices.
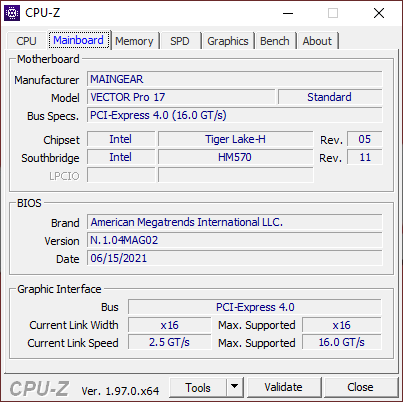
It's worth mentioning that the Vector Pro utilizes a white label Tongfang chassis. Thus, users can find very similar designs and features from other resellers (Eluktronics, CyberPowerPC, Schenker, etc.) including the Schenker XMG Neo 17 or XMG Core 17.
potential competitors in comparison
Rating | Date | Model | Weight | Height | Size | Resolution | Price |
|---|---|---|---|---|---|---|---|
| 87.8 % v7 (old) | 09 / 2021 | Maingear Vector Pro MG-VCP17 i7-11800H, GeForce RTX 3080 Laptop GPU | 2.3 kg | 19.81 mm | 17.30" | 2560x1440 | |
| 90.1 % v7 (old) | 07 / 2021 | Asus ROG Zephyrus S17 GX703HSD i9-11900H, GeForce RTX 3080 Laptop GPU | 2.8 kg | 19.9 mm | 17.30" | 2560x1440 | |
| 83.9 % v7 (old) | 06 / 2021 | Schenker XMG Core 17 (Early 2021) i7-10870H, GeForce RTX 3060 Laptop GPU | 2.5 kg | 30.05 mm | 17.30" | 2560x1440 | |
| 85.1 % v7 (old) | 01 / 2021 | Schenker XMG Neo 17 (Early 2021, RTX 3070, 5800H) R7 5800H, GeForce RTX 3070 Laptop GPU | 2.5 kg | 27 mm | 17.30" | 2560x1440 | |
| 84 % v7 (old) | 12 / 2020 | Schenker Compact 17 i7-10875H, GeForce RTX 2070 Super Mobile | 2.9 kg | 29.9 mm | 17.30" | 3840x2160 | |
| 83.7 % v7 (old) | 07 / 2020 | MSI GS75 10SF-609US i7-10875H, GeForce RTX 2070 Max-Q | 2.3 kg | 18.9 mm | 17.30" | 1920x1080 |
Case
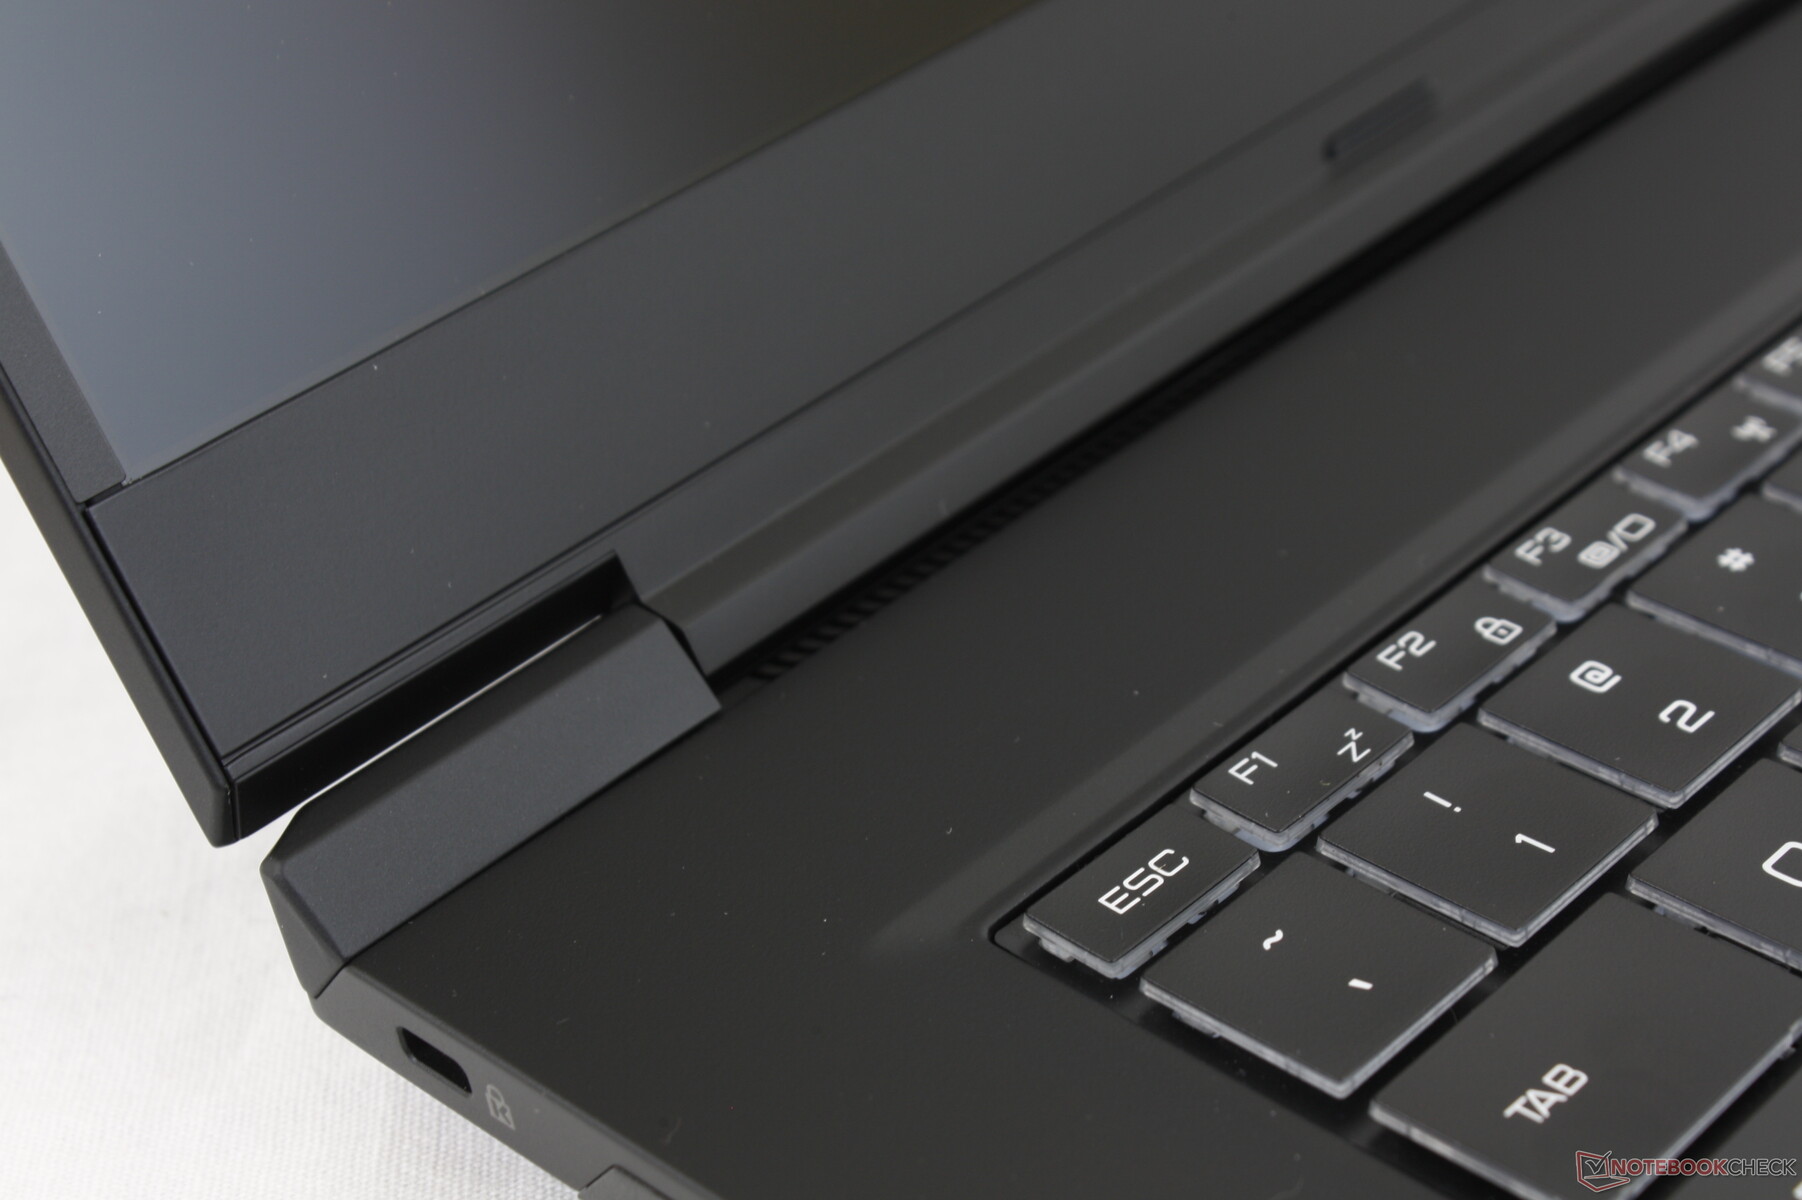
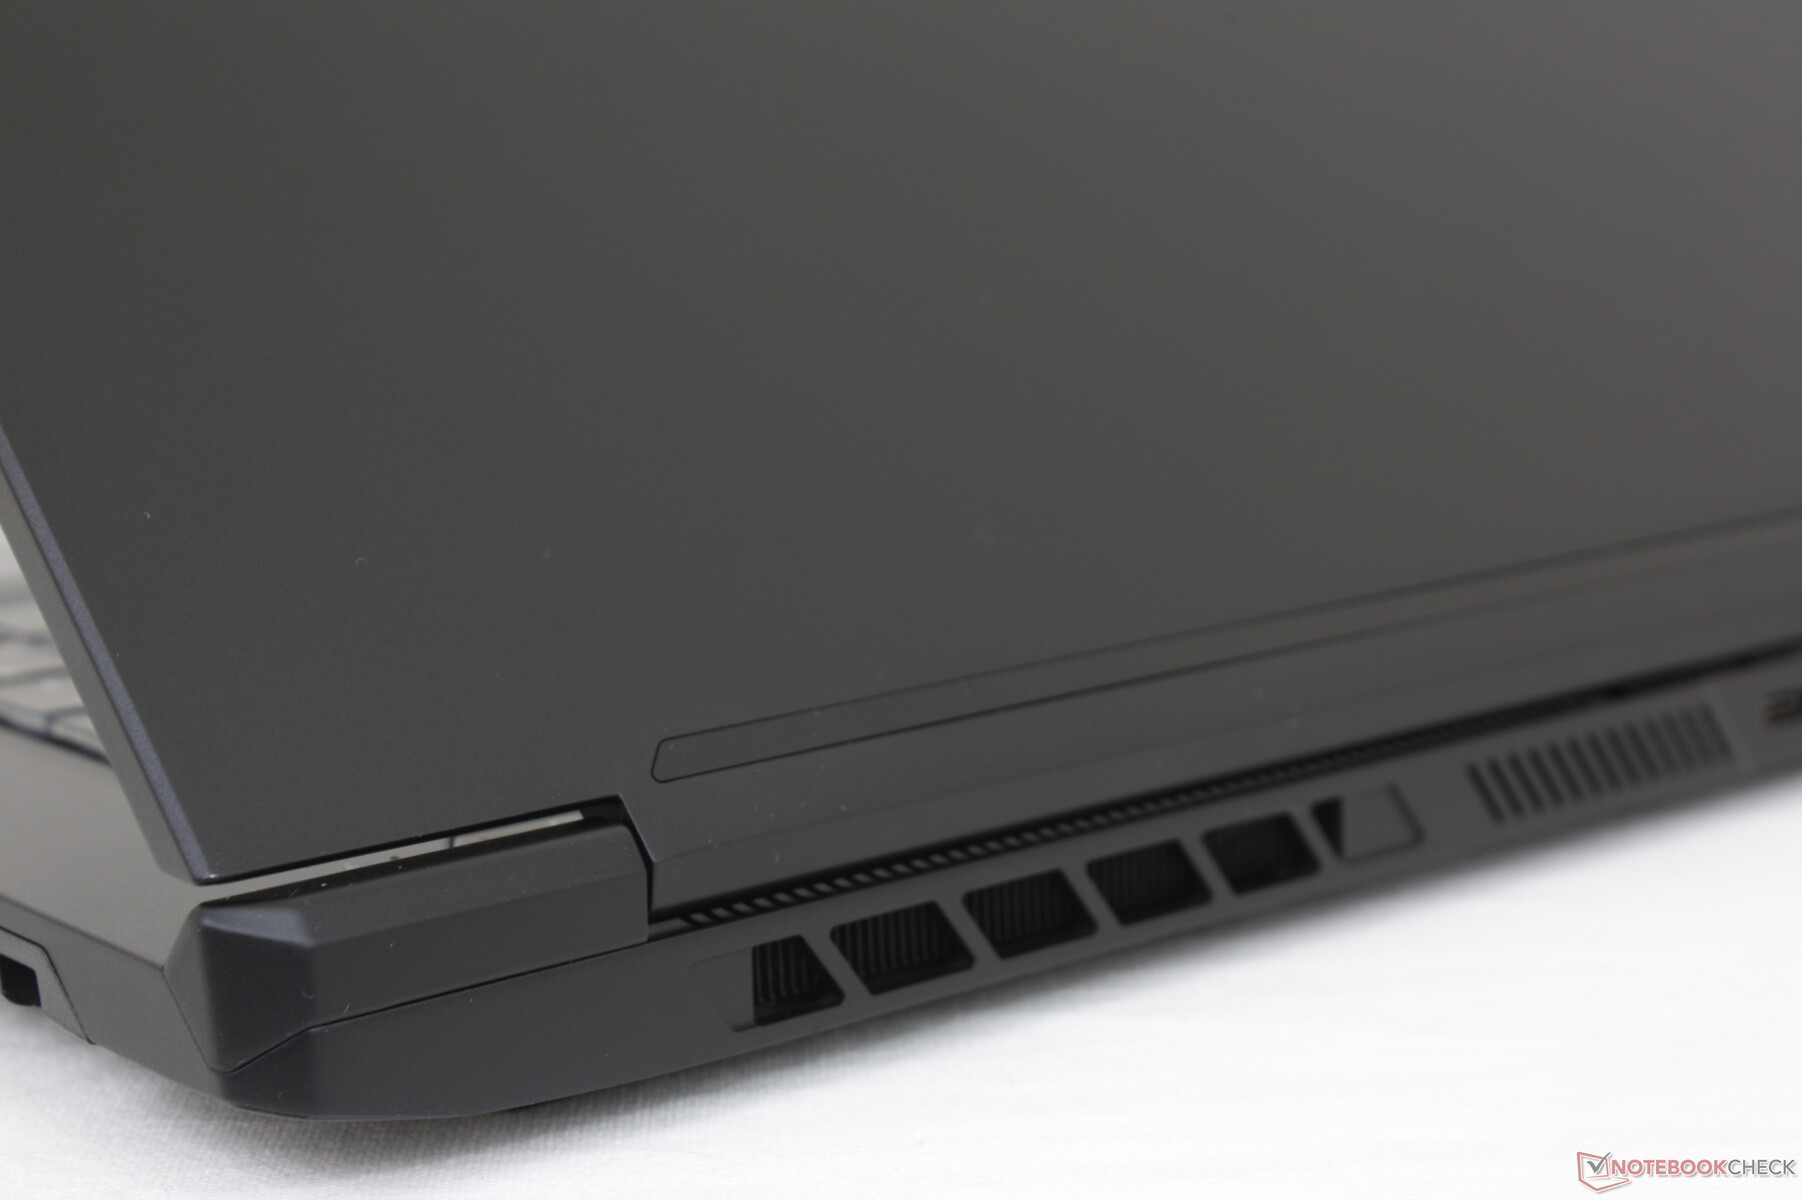
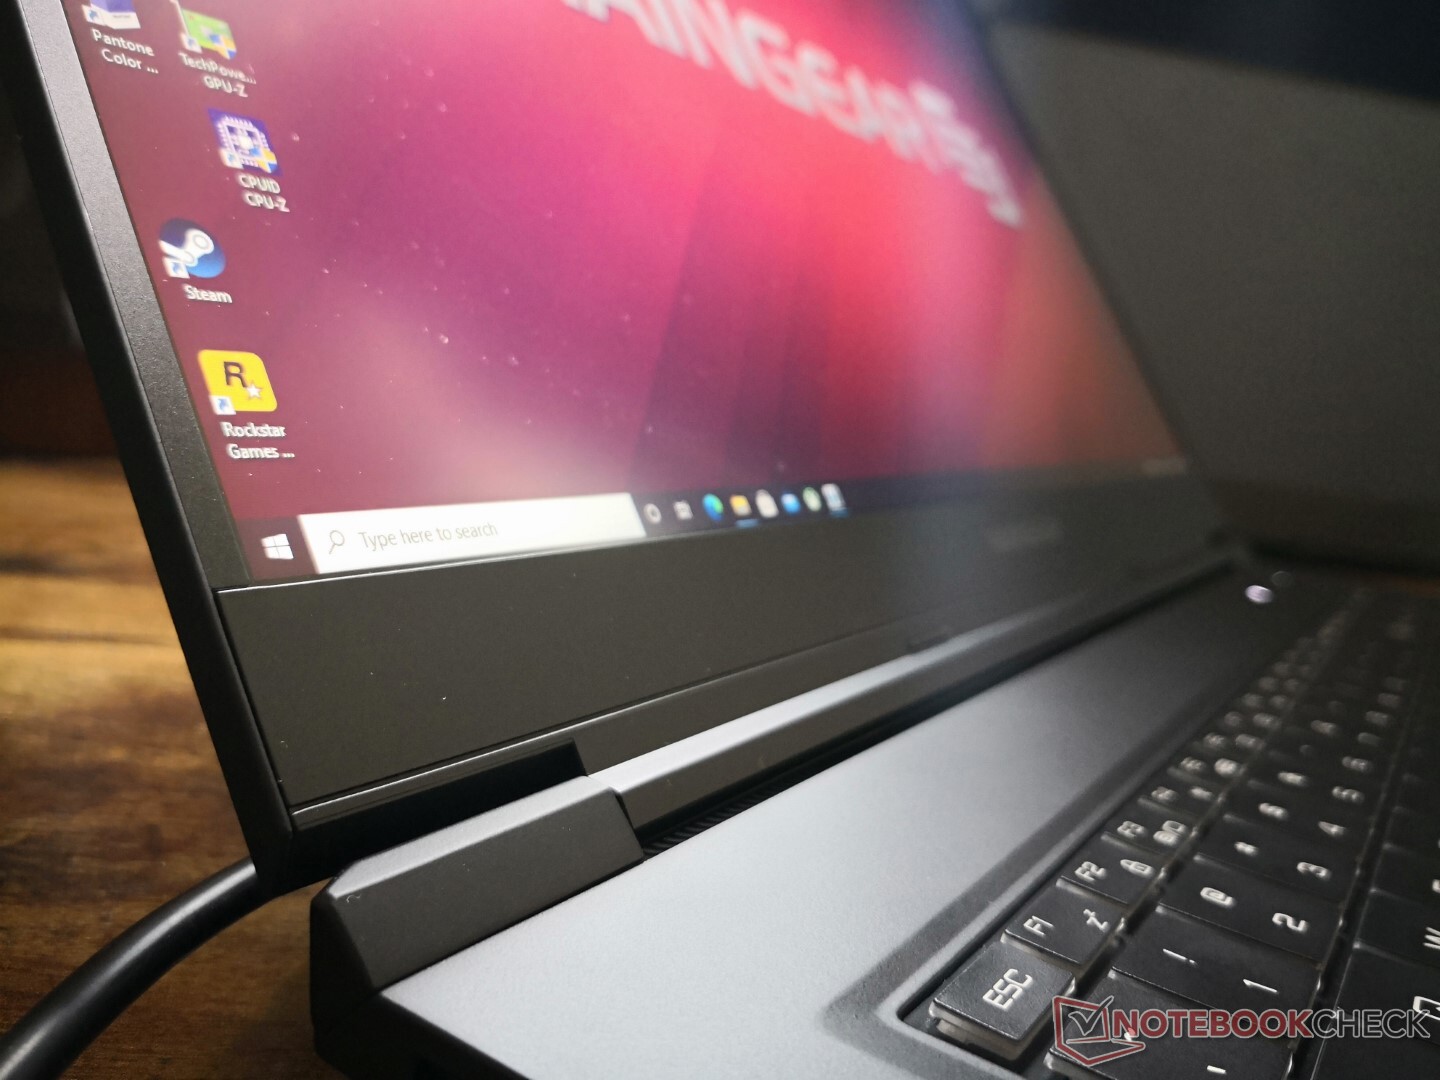
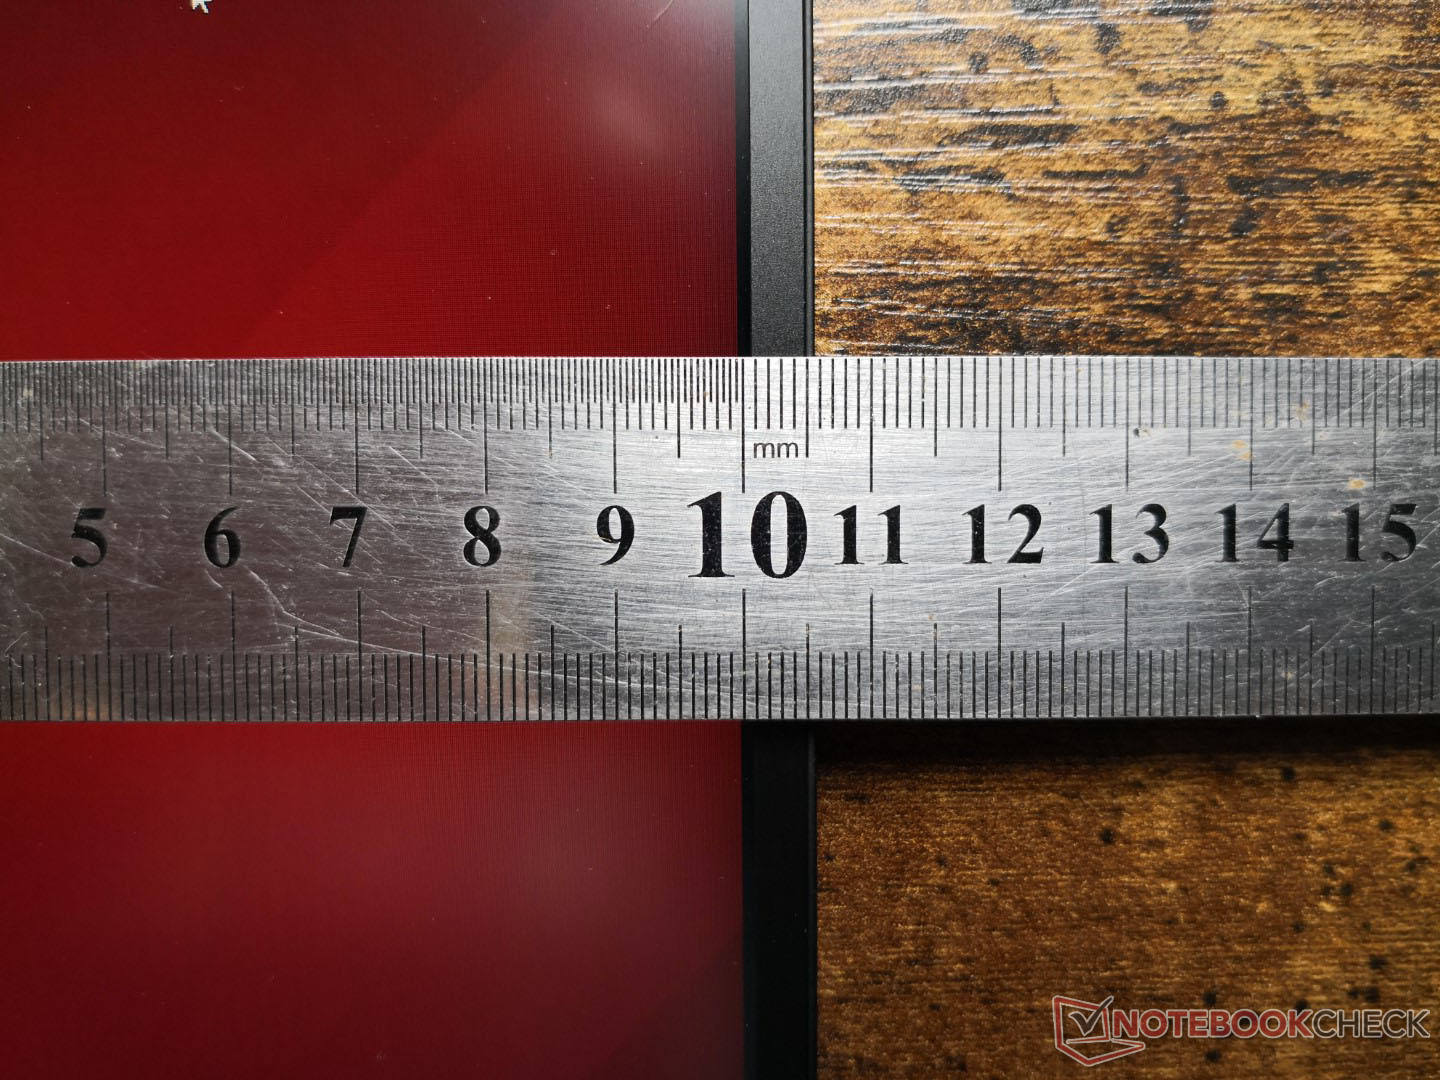
The chassis may not be as flashy as an Asus Zephyrus S or MSI GS75, but it certainly feels stronger and more rigid. The base doesn't yield or creak when attempting to twist its corners for strong first impressions. The lid and hinges, however, could have been stiffer to reduce teetering when adjusting angles. The thicker Asus ROG Strix laptops have larger hinges for a better sense of longevity.
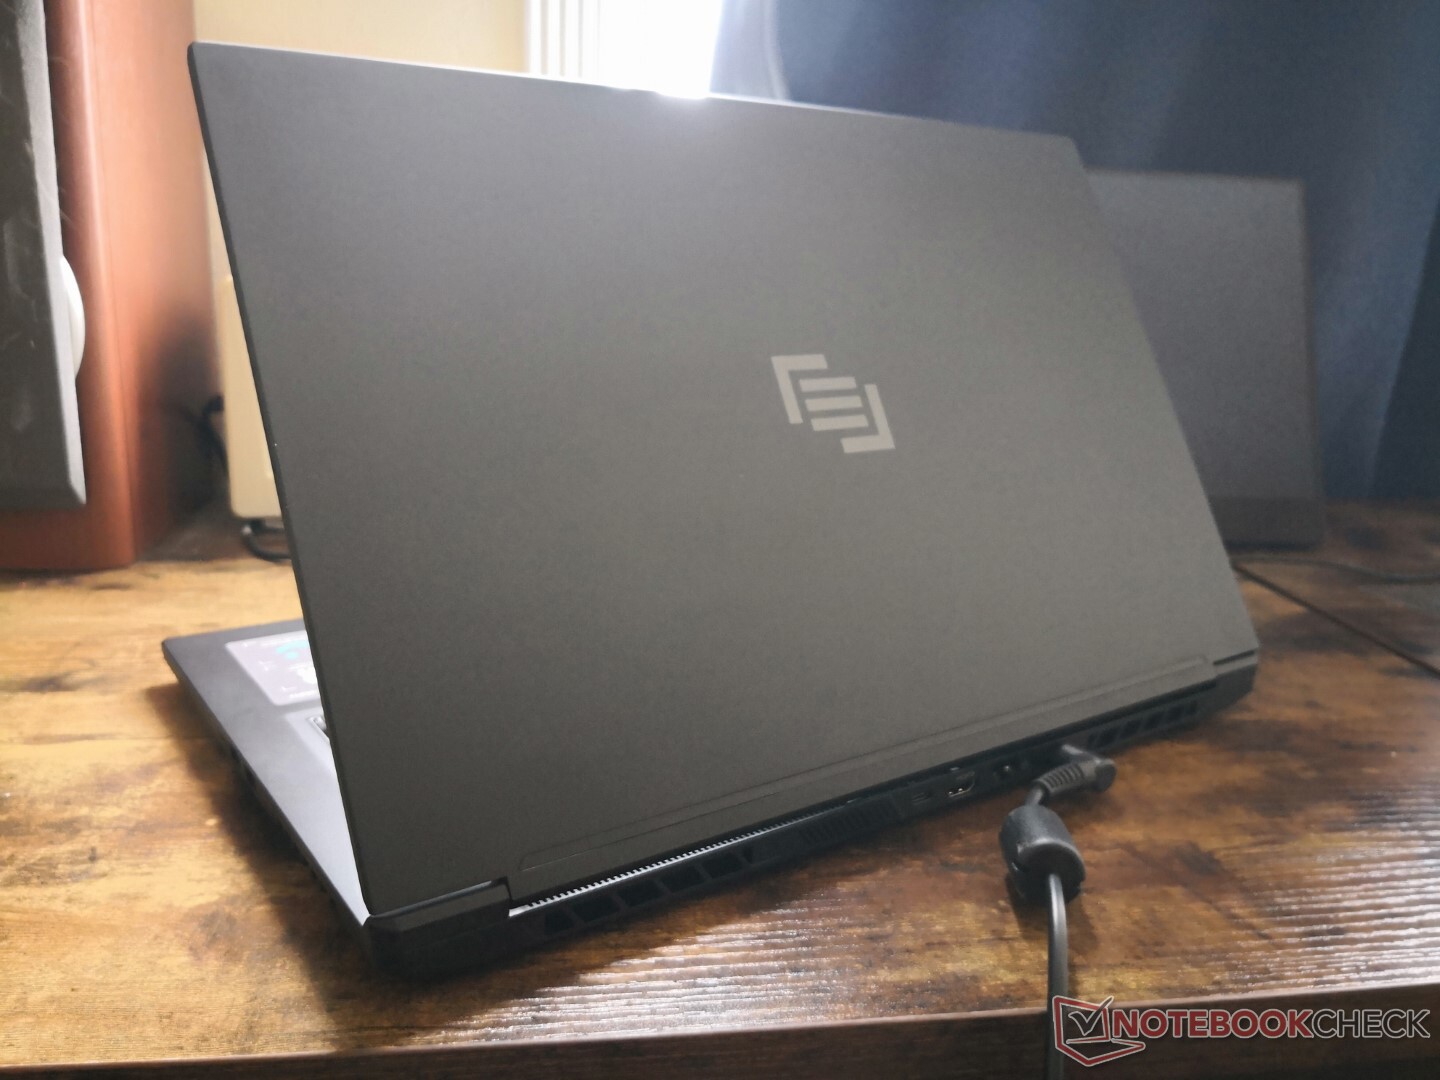
Dimensions are nearly identical to the Razer Blade Pro. Weight, however, is almost half a kilogram lighter in favor of the Maingear. The lack of a vapor chamber cooler in the Maingear is likely responsible for the lighter weight.
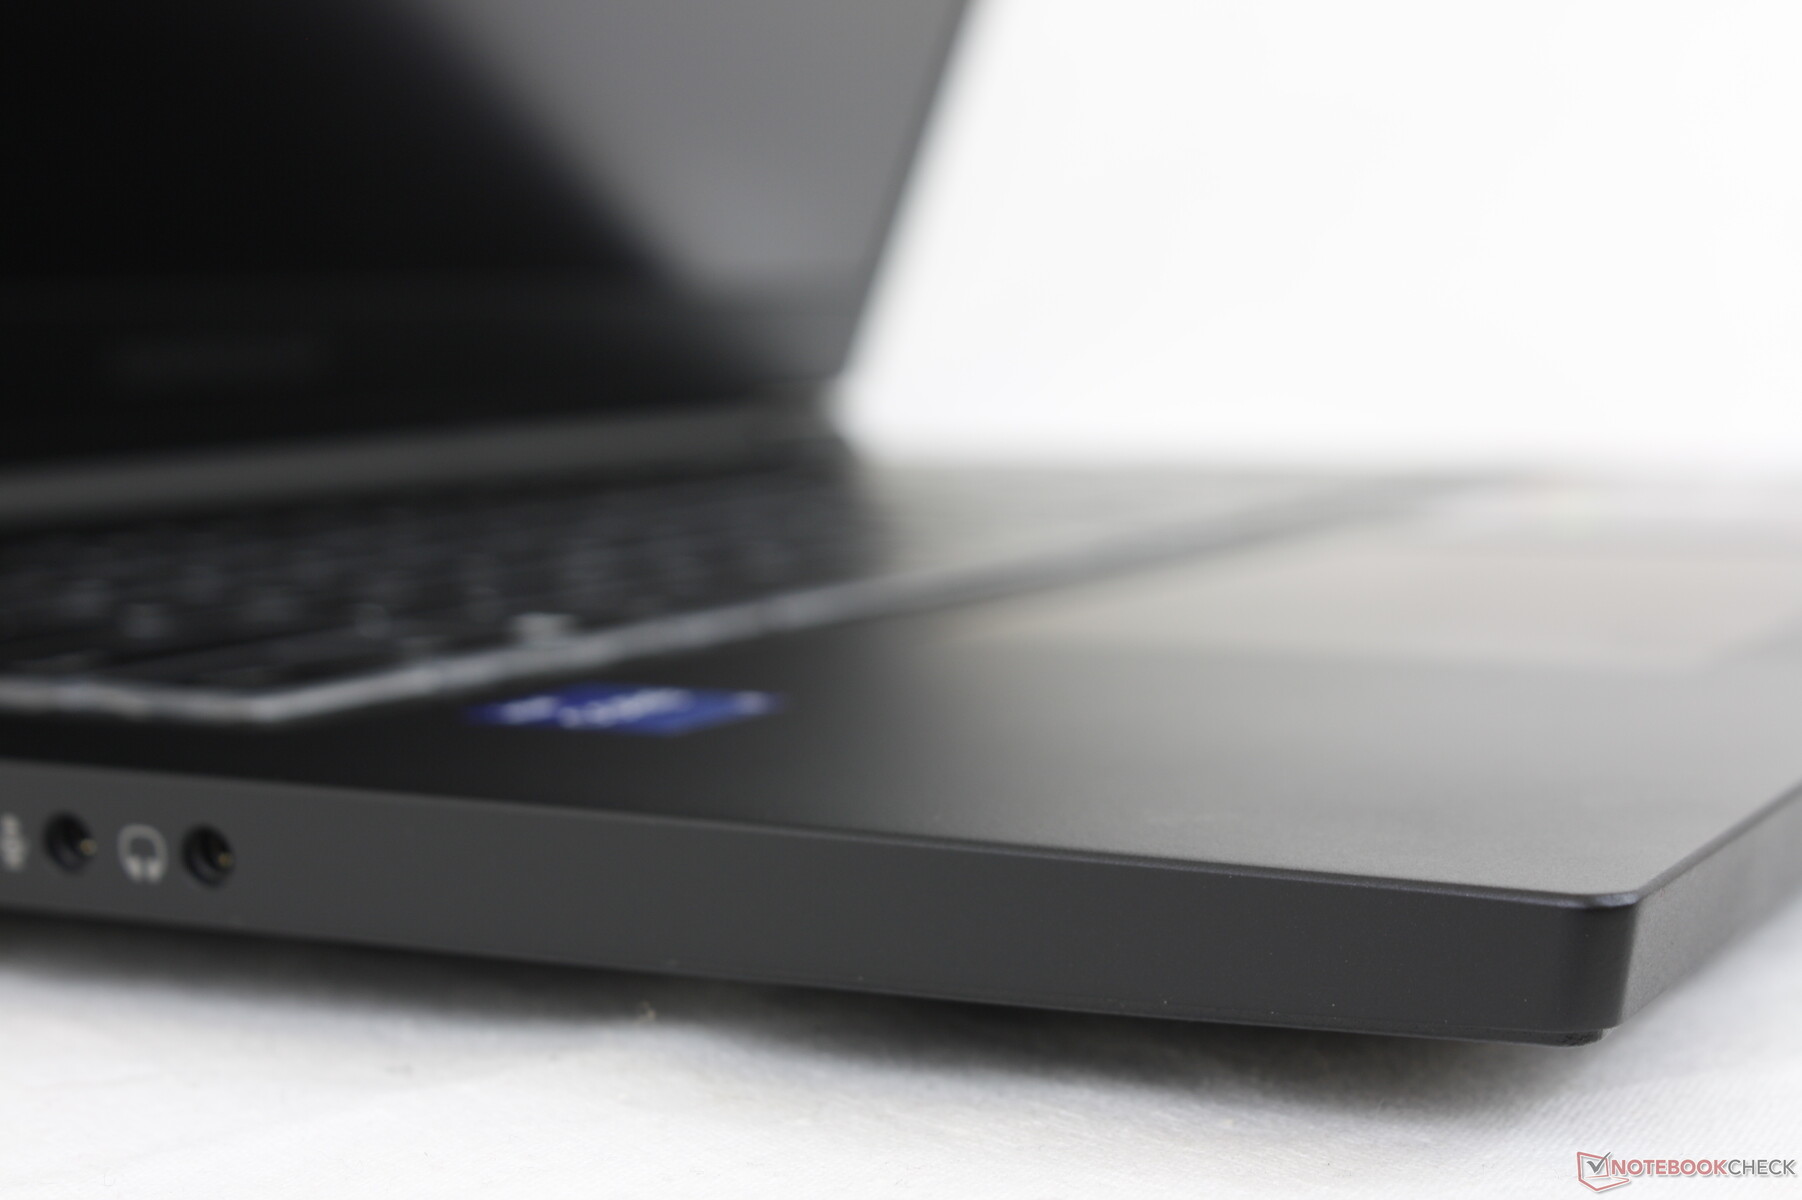
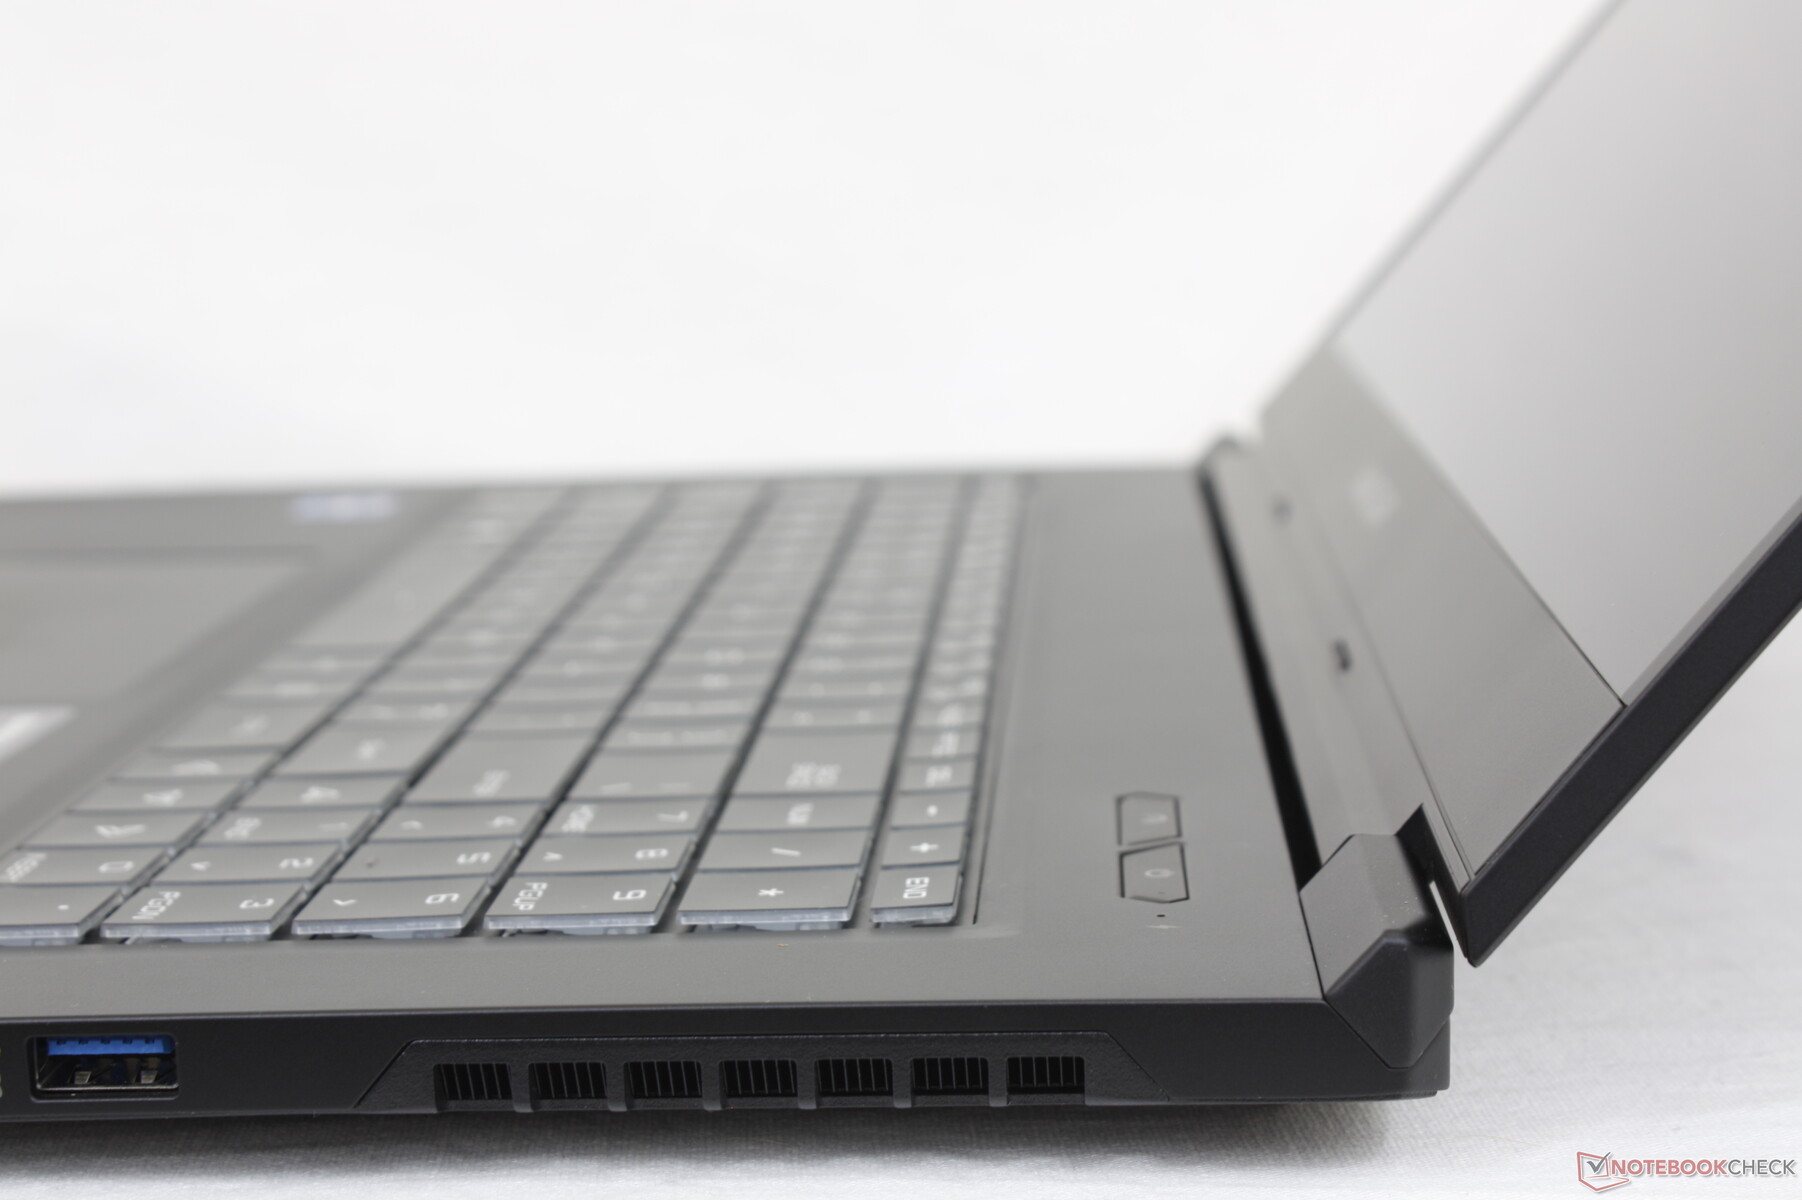
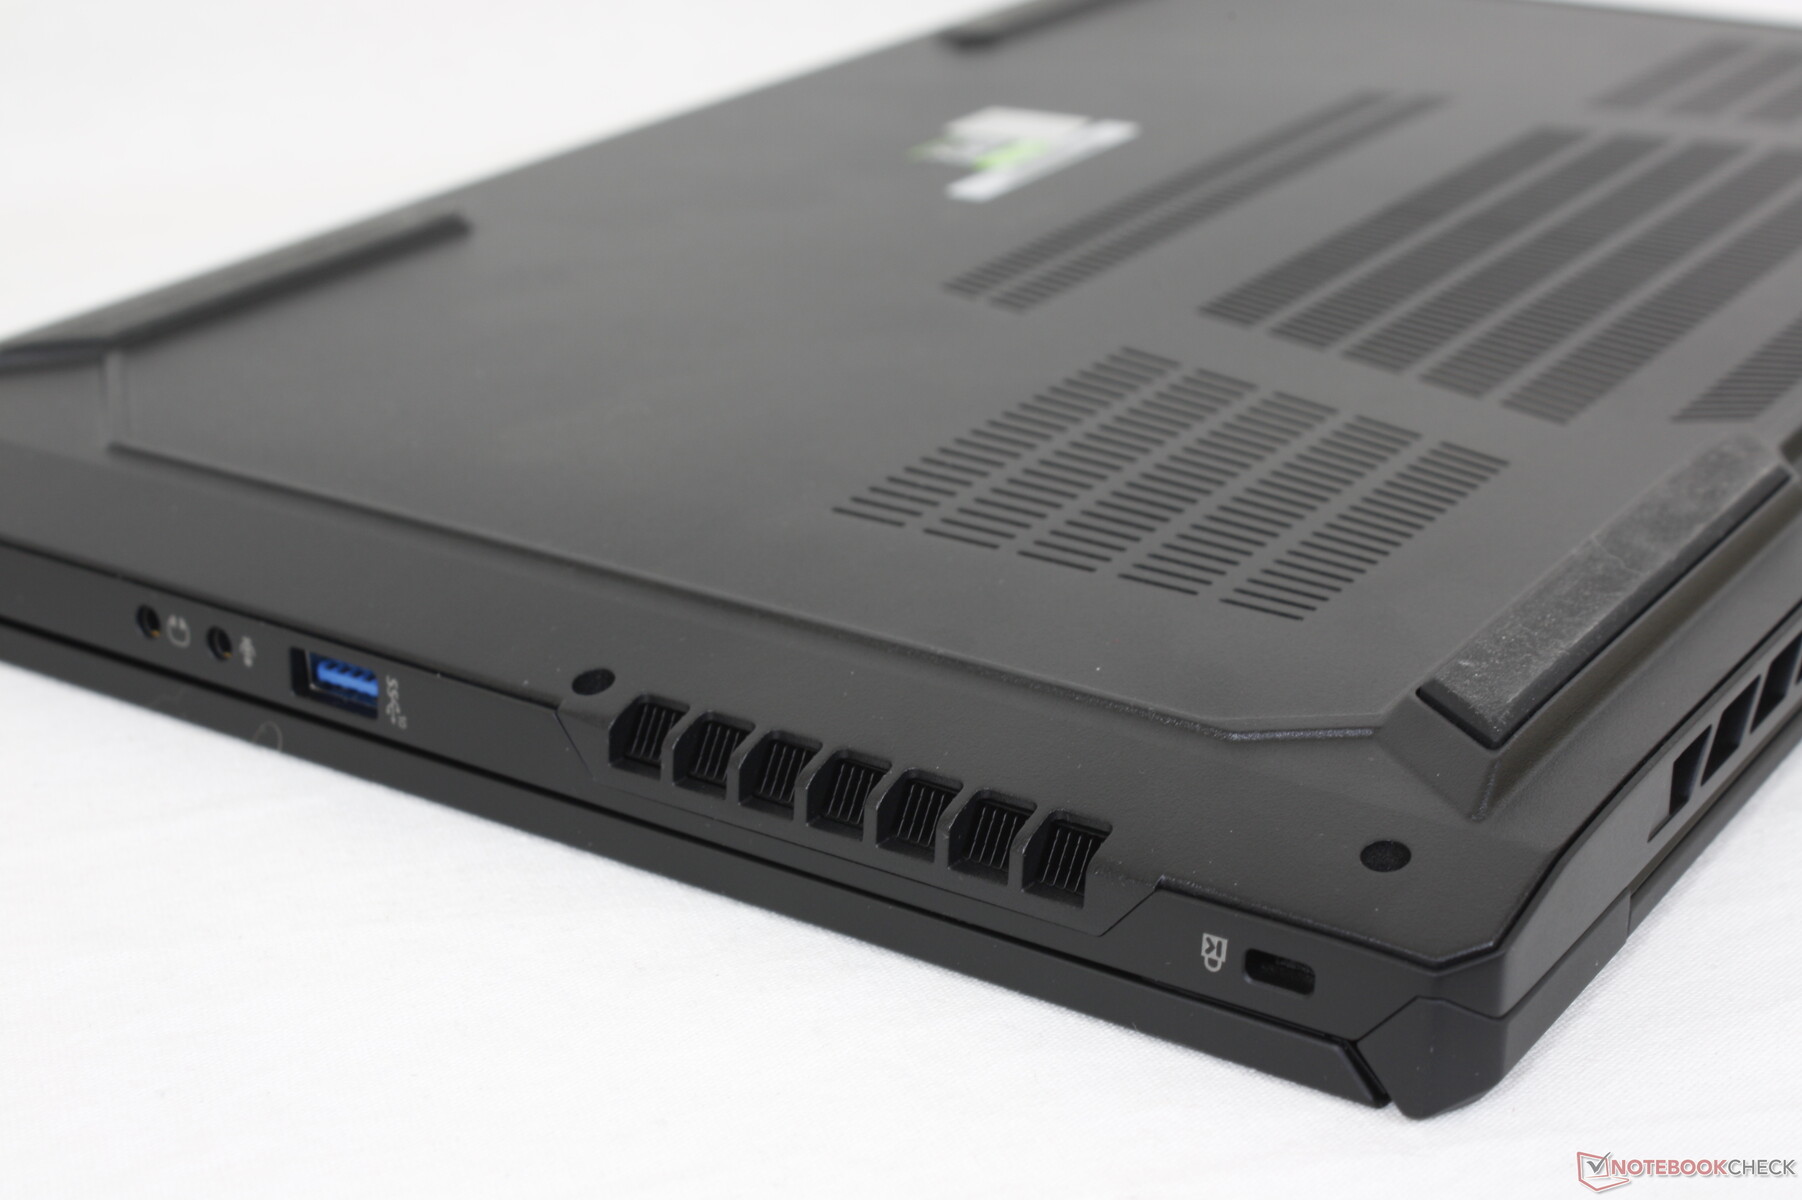
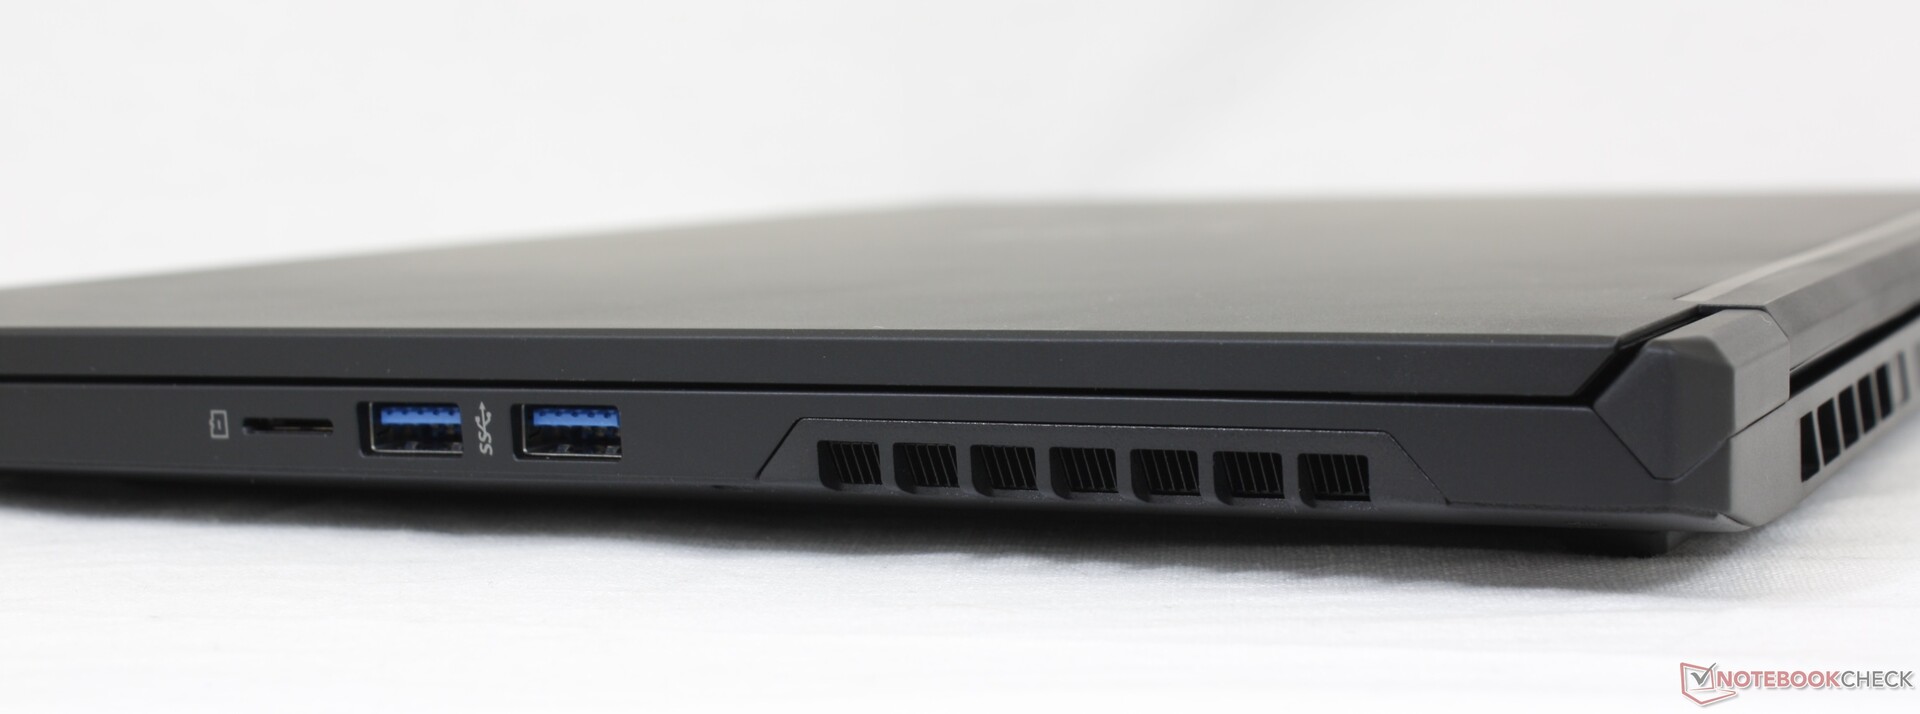
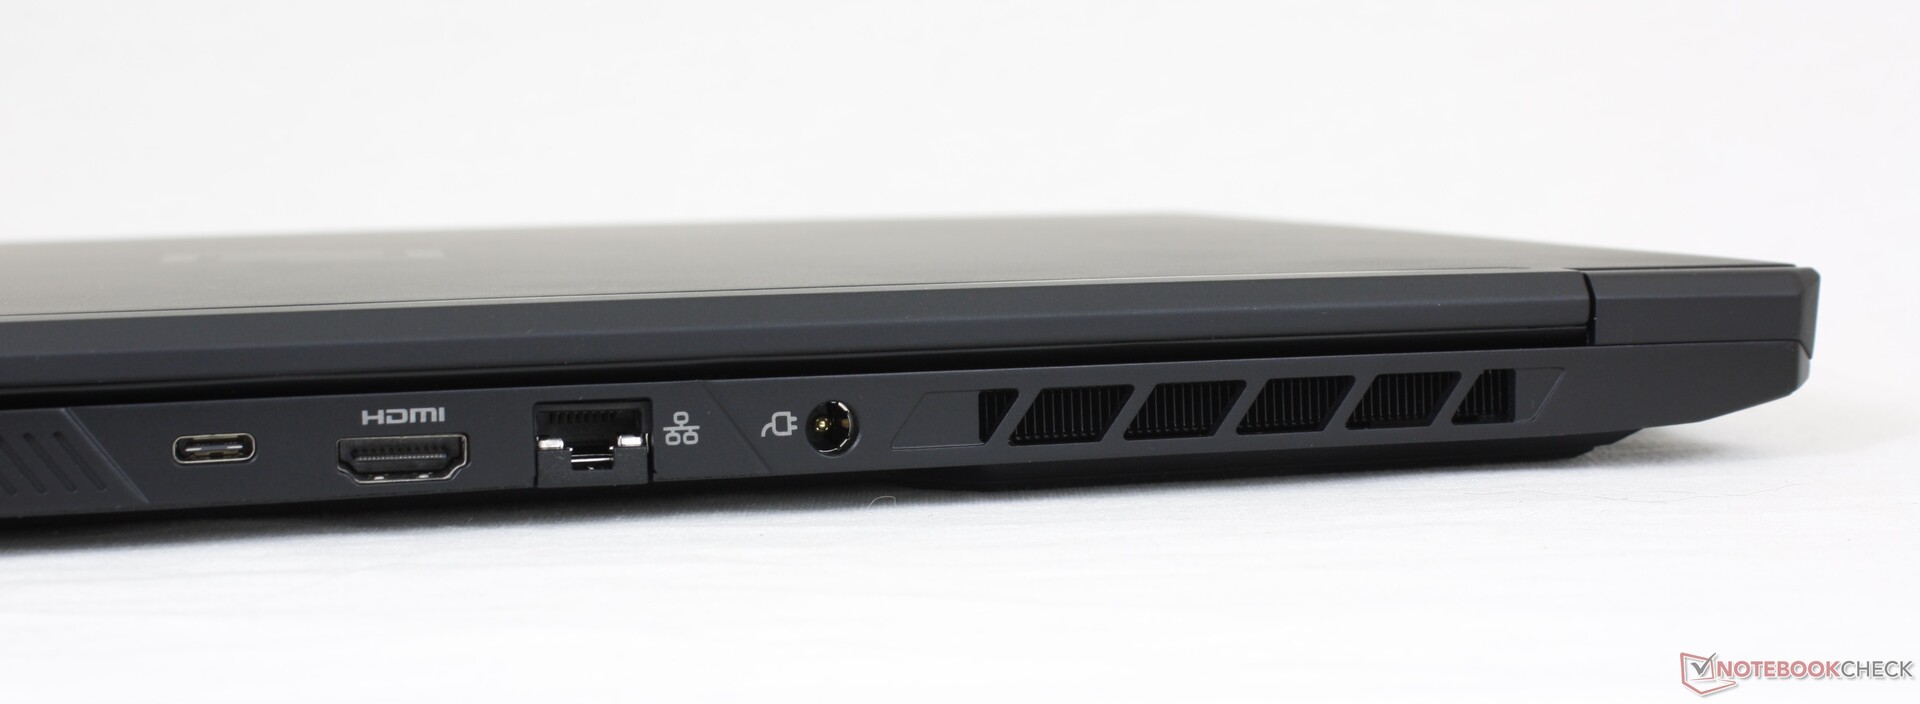
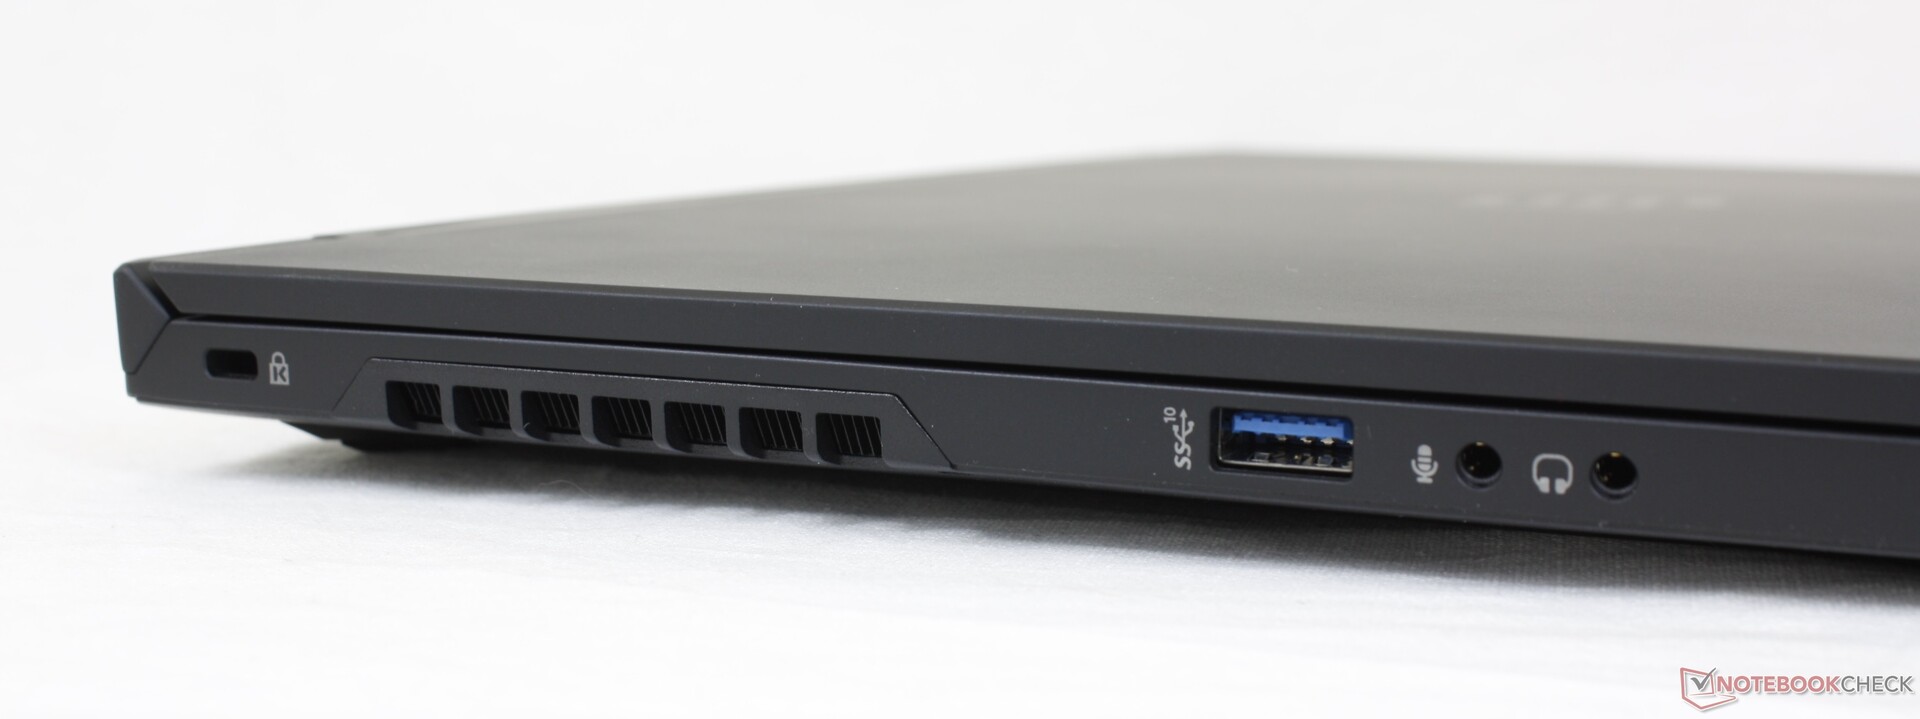
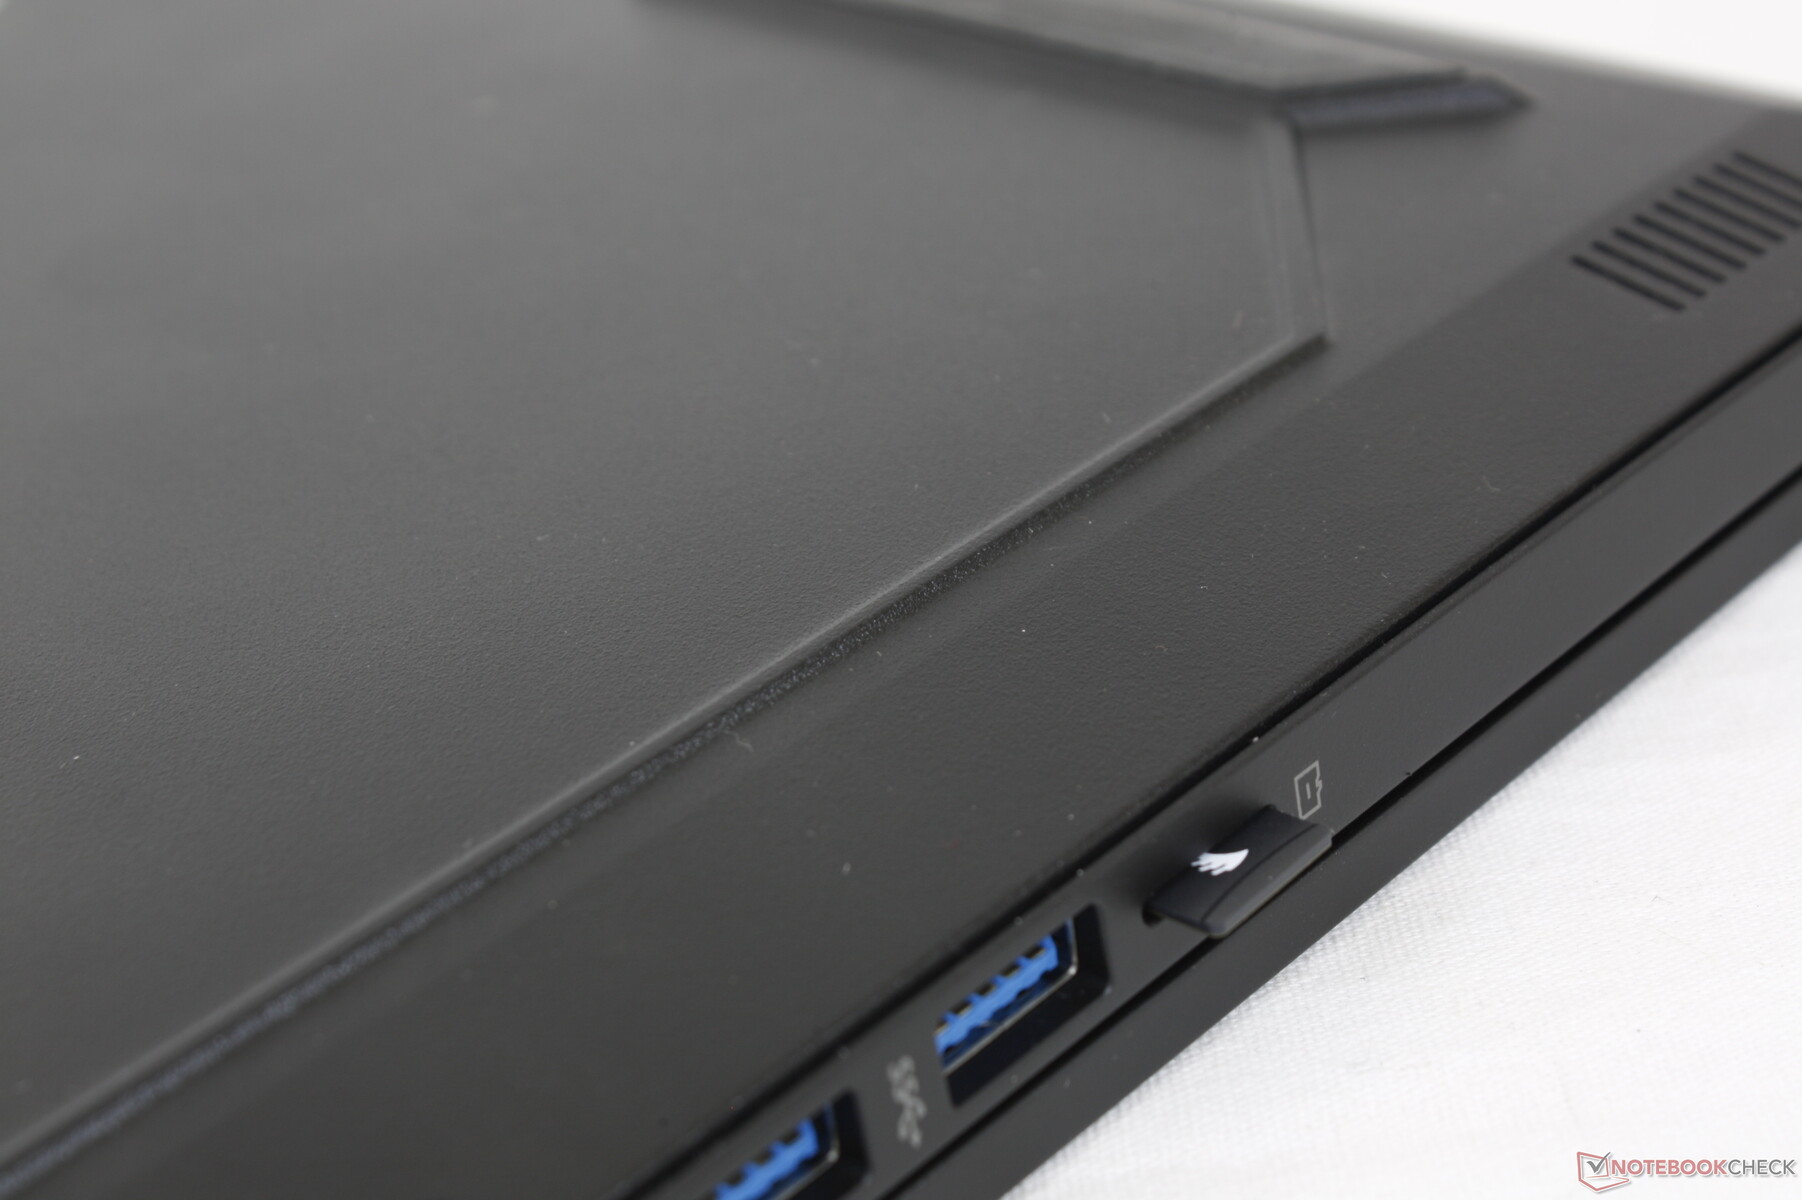
Connectivity
Port options are nearly identical to the Tongfang GM7ZG7S or GM7MG0R but with one notable exception: our Maingear chassis integrates a MicroSD reader instead of a full-size one. Thunderbolt 4 is natively supported via the Intel chipset unlike on AMD-powered laptops.
Unfortunately, the laptop cannot be recharged via USB-C even after testing out multiple USB-C adapters.
SD Card Reader
Transfer rates are average from the integrated MicroSD reader. Moving 1 GB of pictures from our UHS-II test card to desktop takes about 14 seconds compared to less than half that on the MSI GS75.
| SD Card Reader | |
| average JPG Copy Test (av. of 3 runs) | |
| MSI GS75 10SF-609US (Toshiba Exceria Pro M501 UHS-II) | |
| Asus ROG Zephyrus S17 GX703HSD | |
| Schenker Compact 17 (Toshiba Exceria Pro SDXC 64 GB UHS-II) | |
| Schenker XMG Neo 17 (Early 2021, RTX 3070, 5800H) (Toshiba Exceria Pro SDXC 64 GB UHS-II) | |
| Maingear Vector Pro MG-VCP17 (AV Pro V60) | |
| Schenker XMG Core 17 (Early 2021) (AV PRO microSD 128 GB V60) | |
| maximum AS SSD Seq Read Test (1GB) | |
| Asus ROG Zephyrus S17 GX703HSD | |
| MSI GS75 10SF-609US (Toshiba Exceria Pro M501 UHS-II) | |
| Schenker Compact 17 (Toshiba Exceria Pro SDXC 64 GB UHS-II) | |
| Schenker XMG Neo 17 (Early 2021, RTX 3070, 5800H) (Toshiba Exceria Pro SDXC 64 GB UHS-II) | |
| Maingear Vector Pro MG-VCP17 (AV Pro V60) | |
| Schenker XMG Core 17 (Early 2021) (AV PRO microSD 128 GB V60) | |
Communication
Webcam
While there is IR for Windows Hello compatibility, the 720p webcam integrates no privacy shutter.


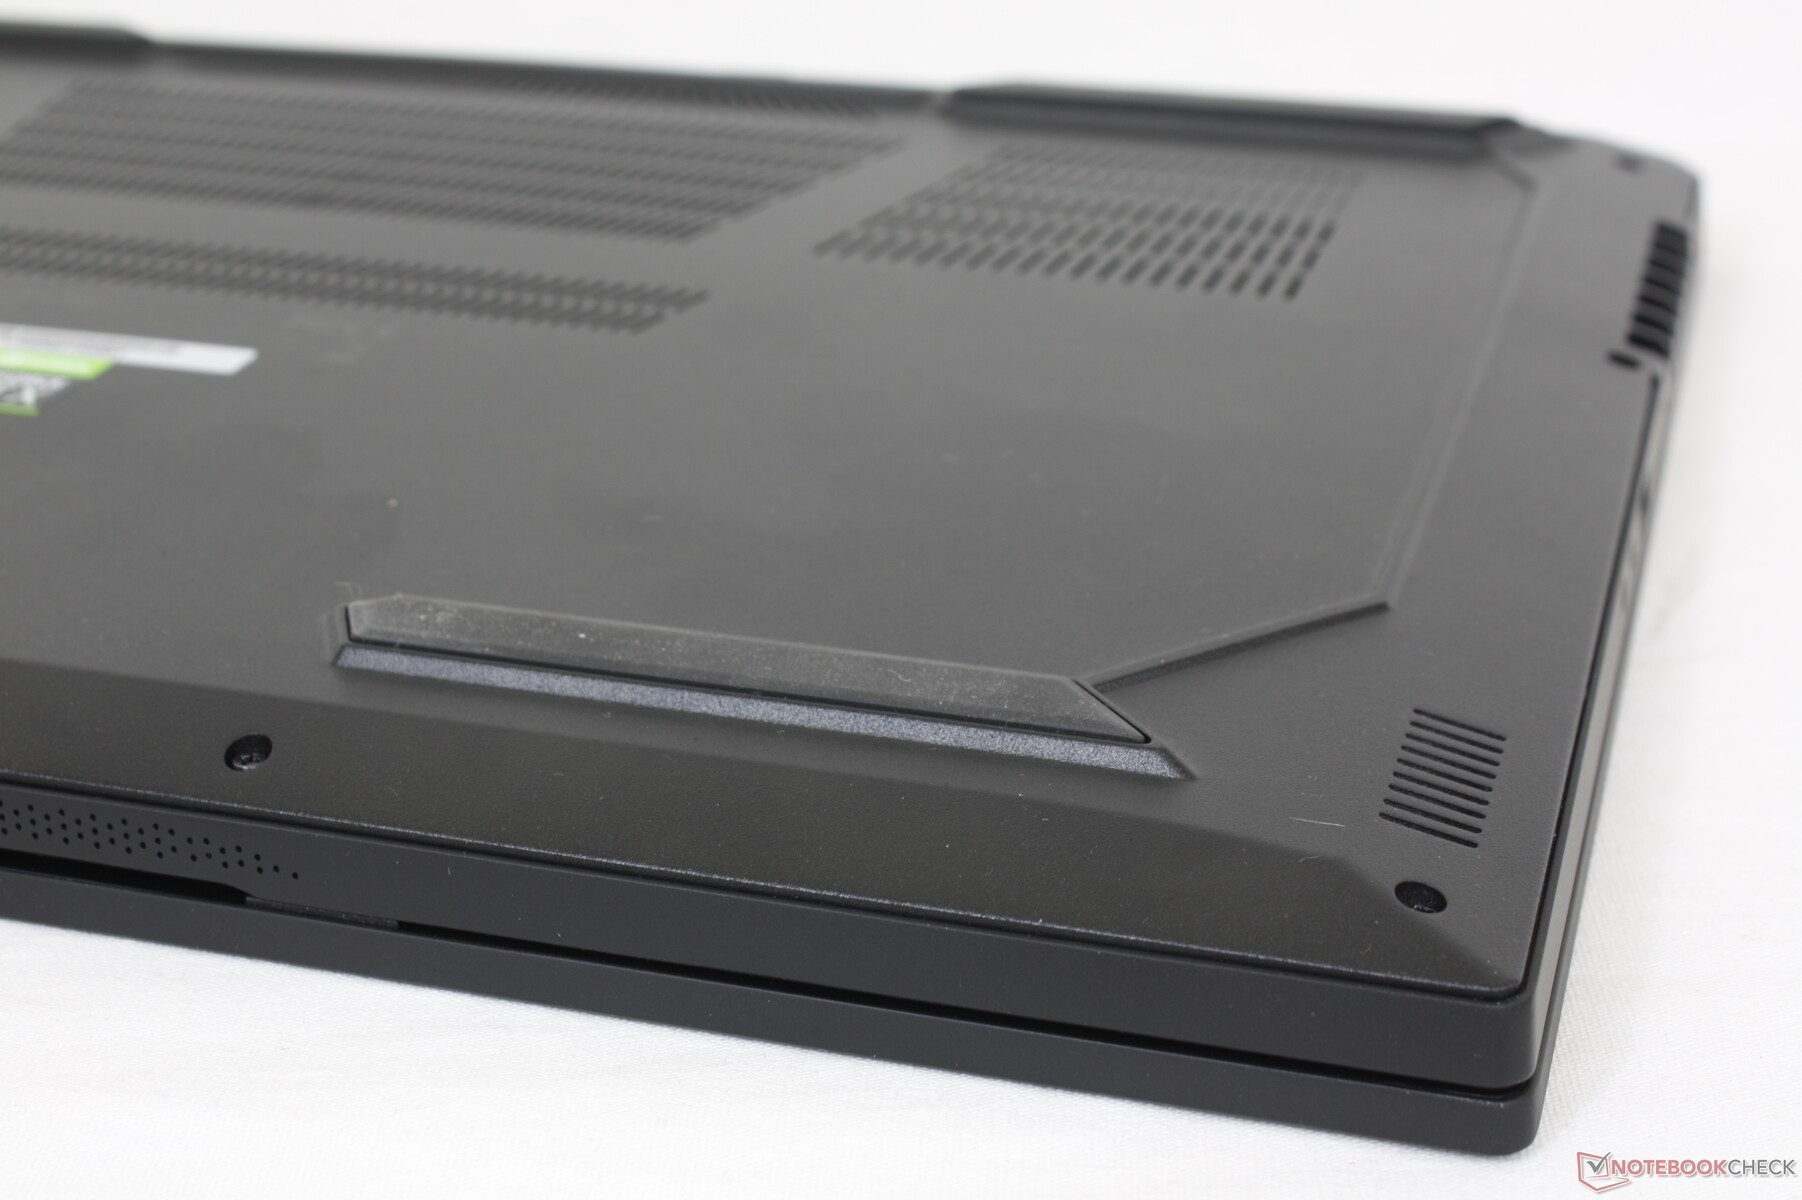
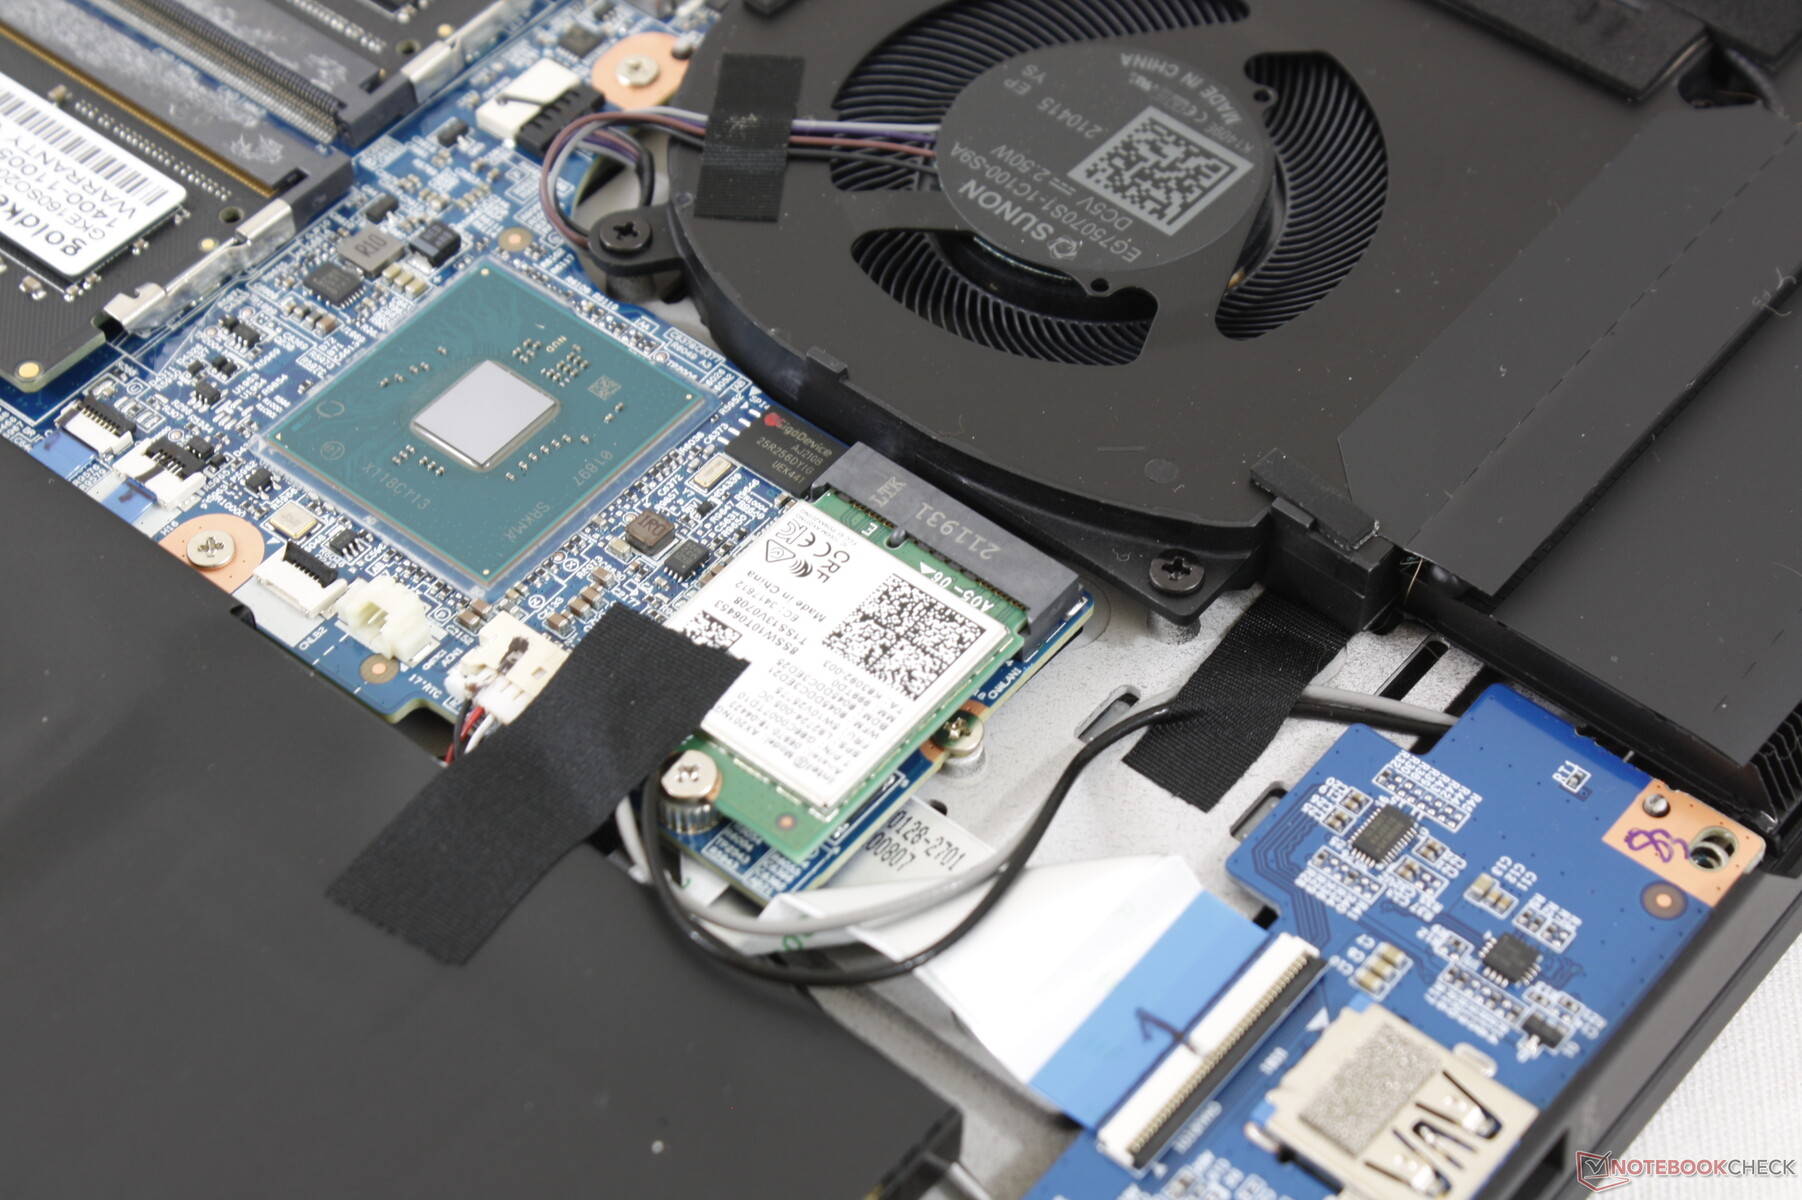
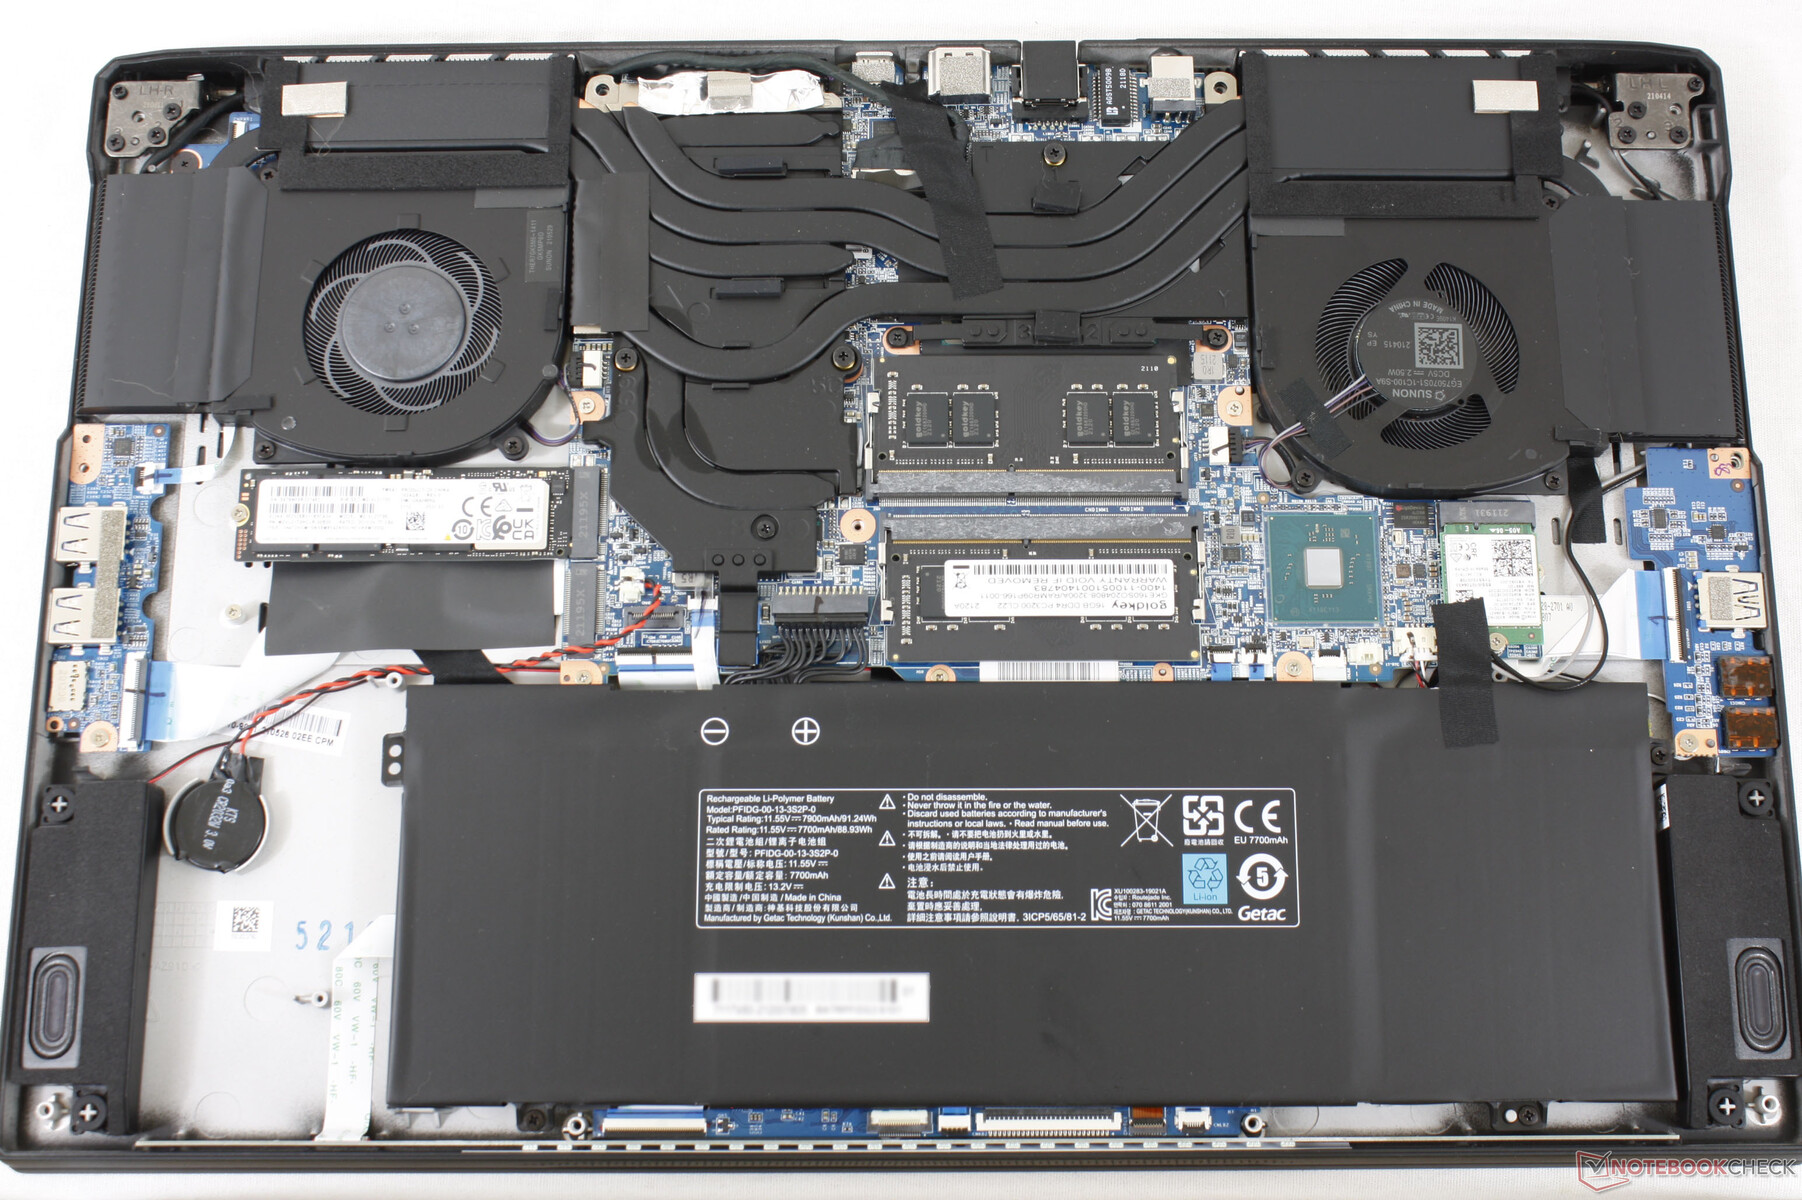
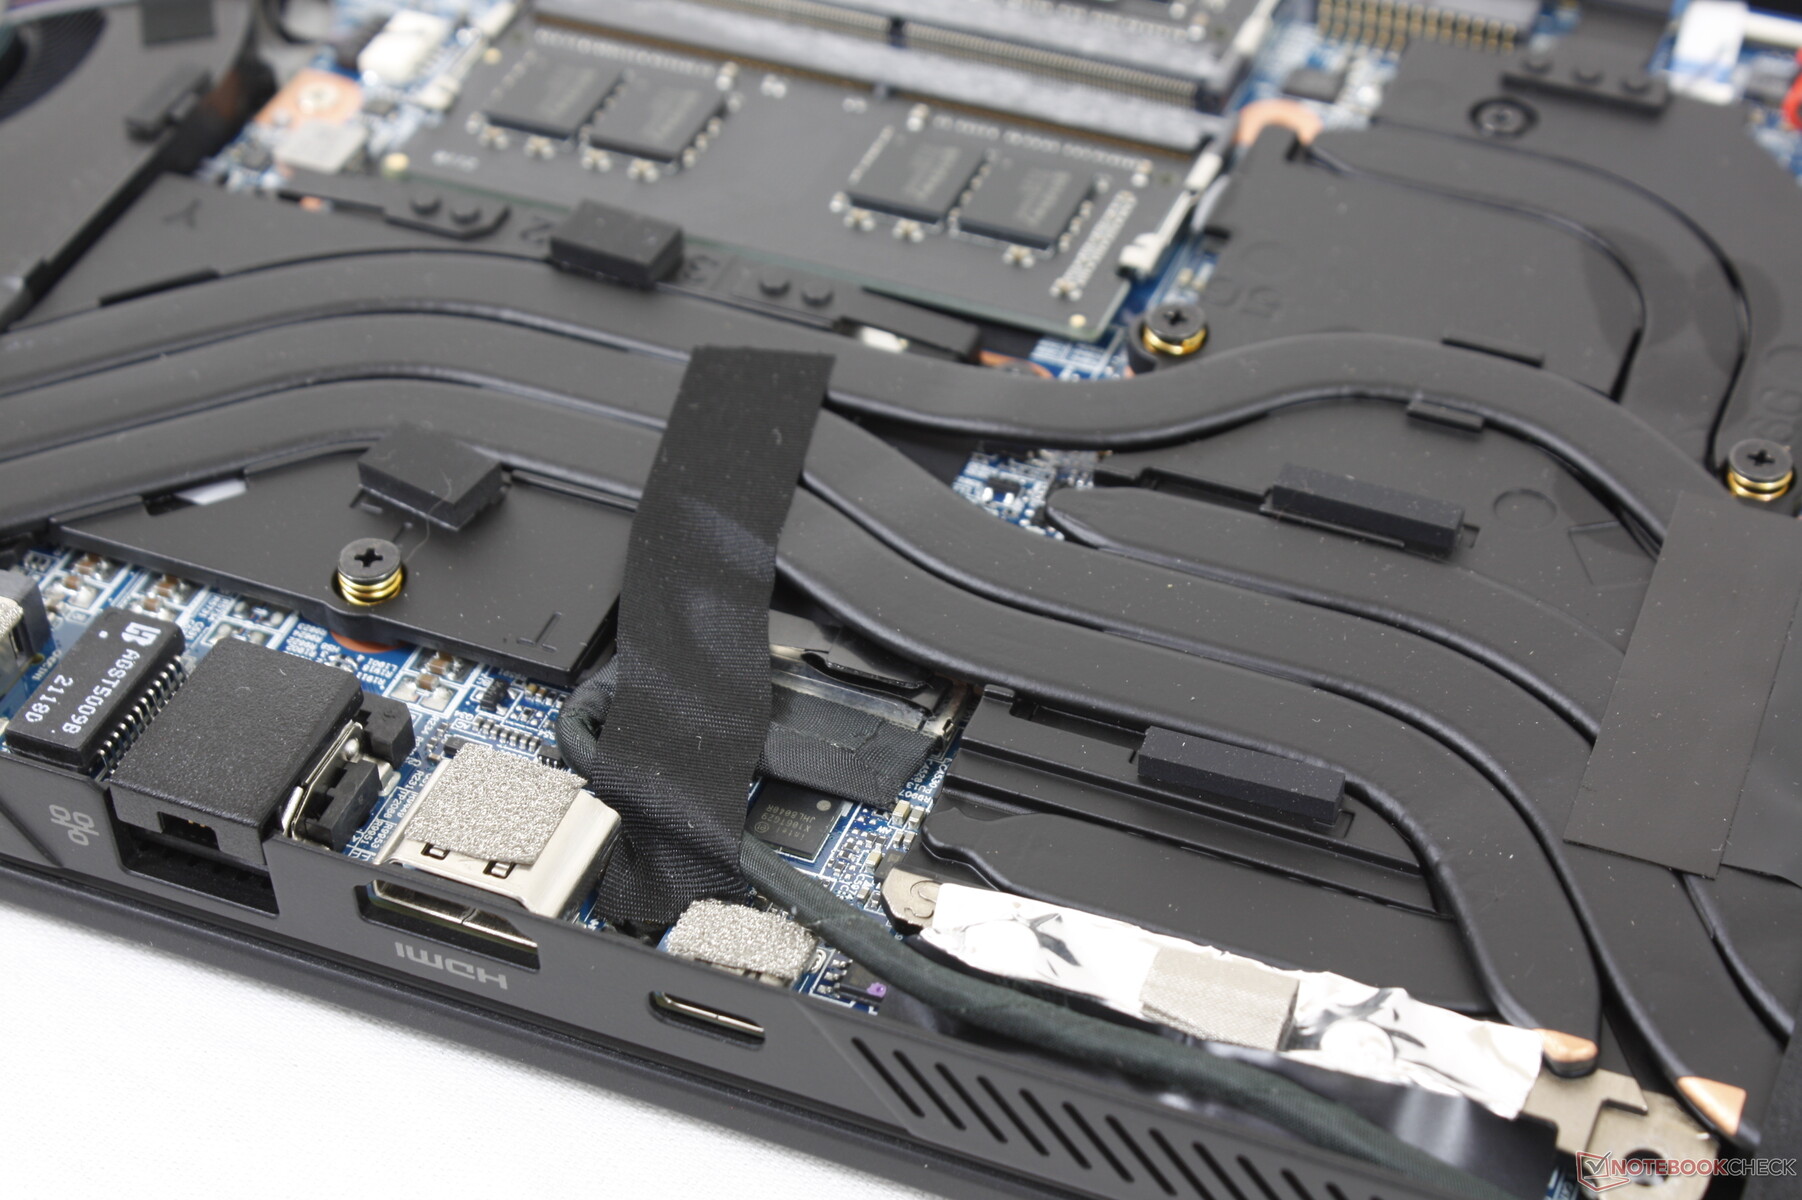
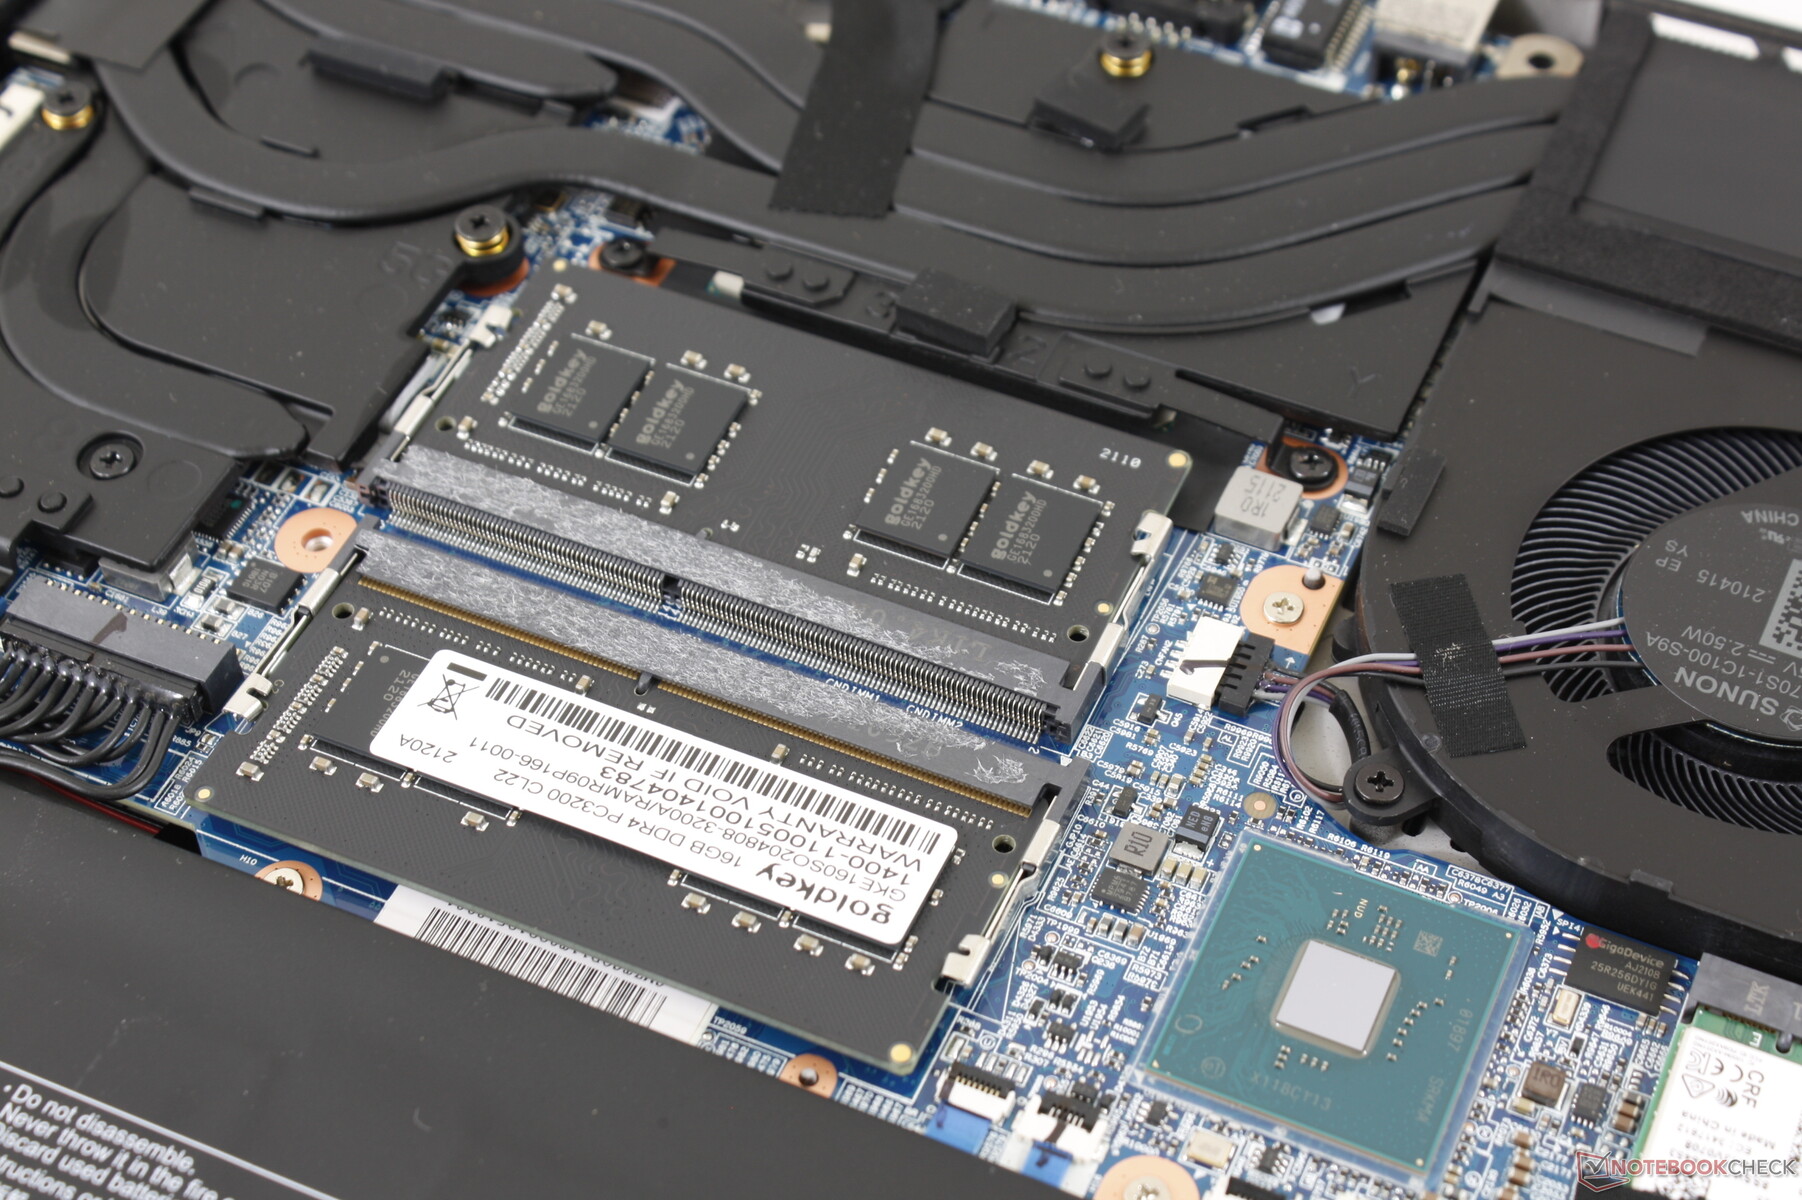
Maintenance
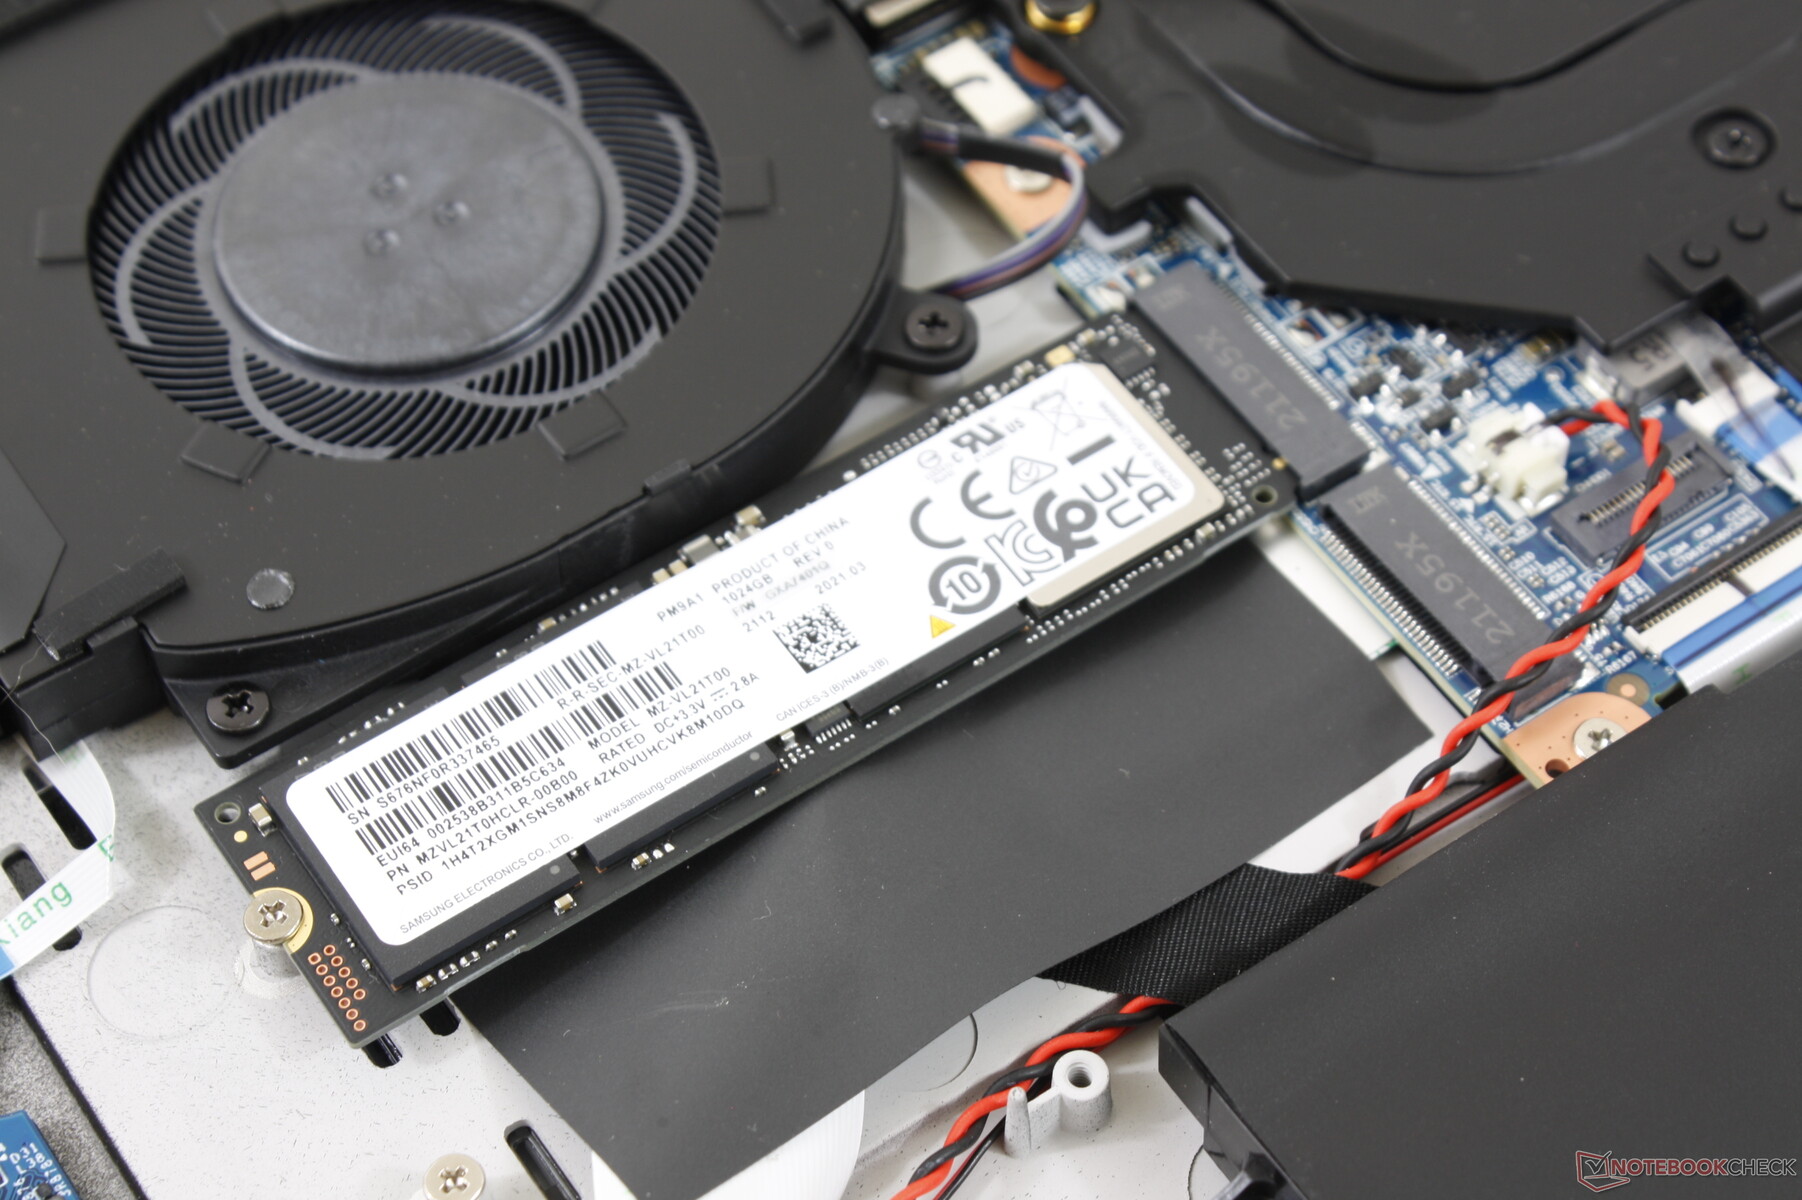
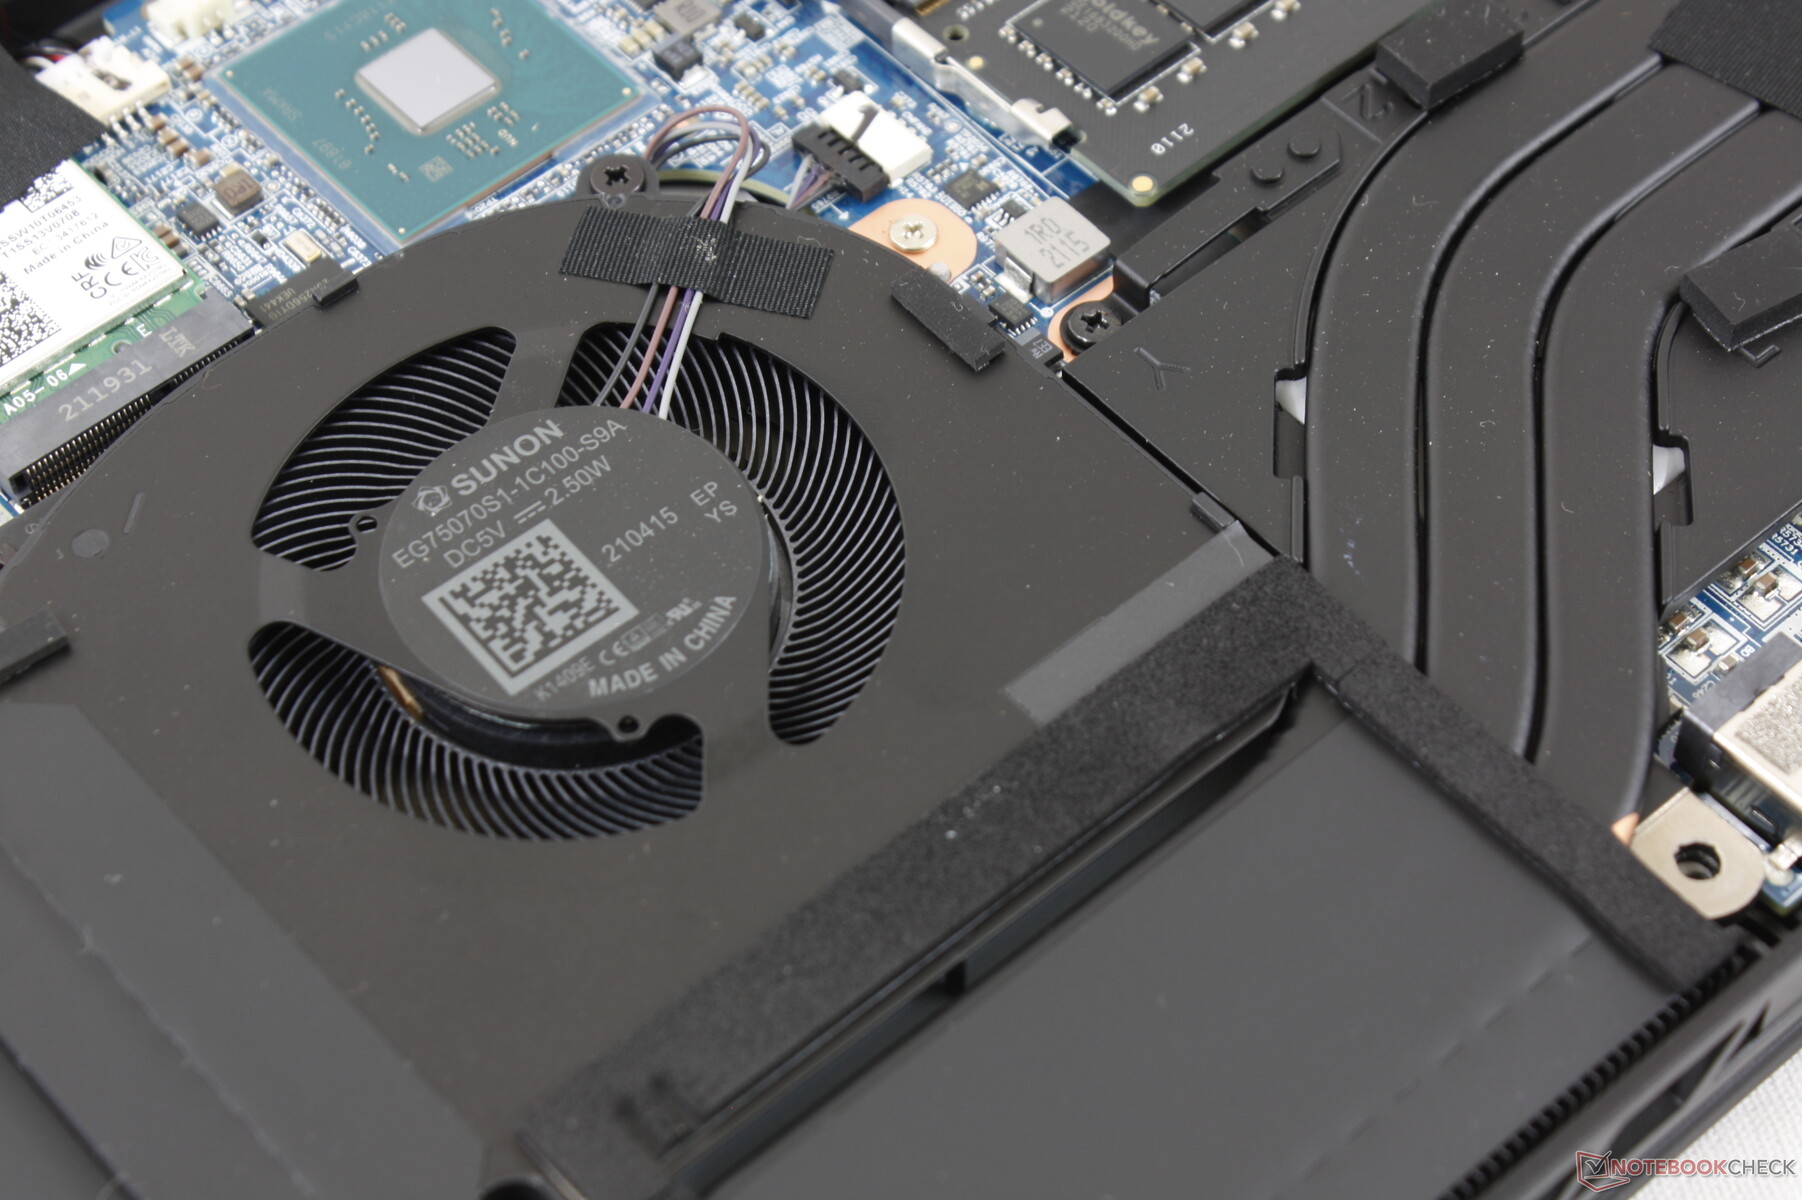
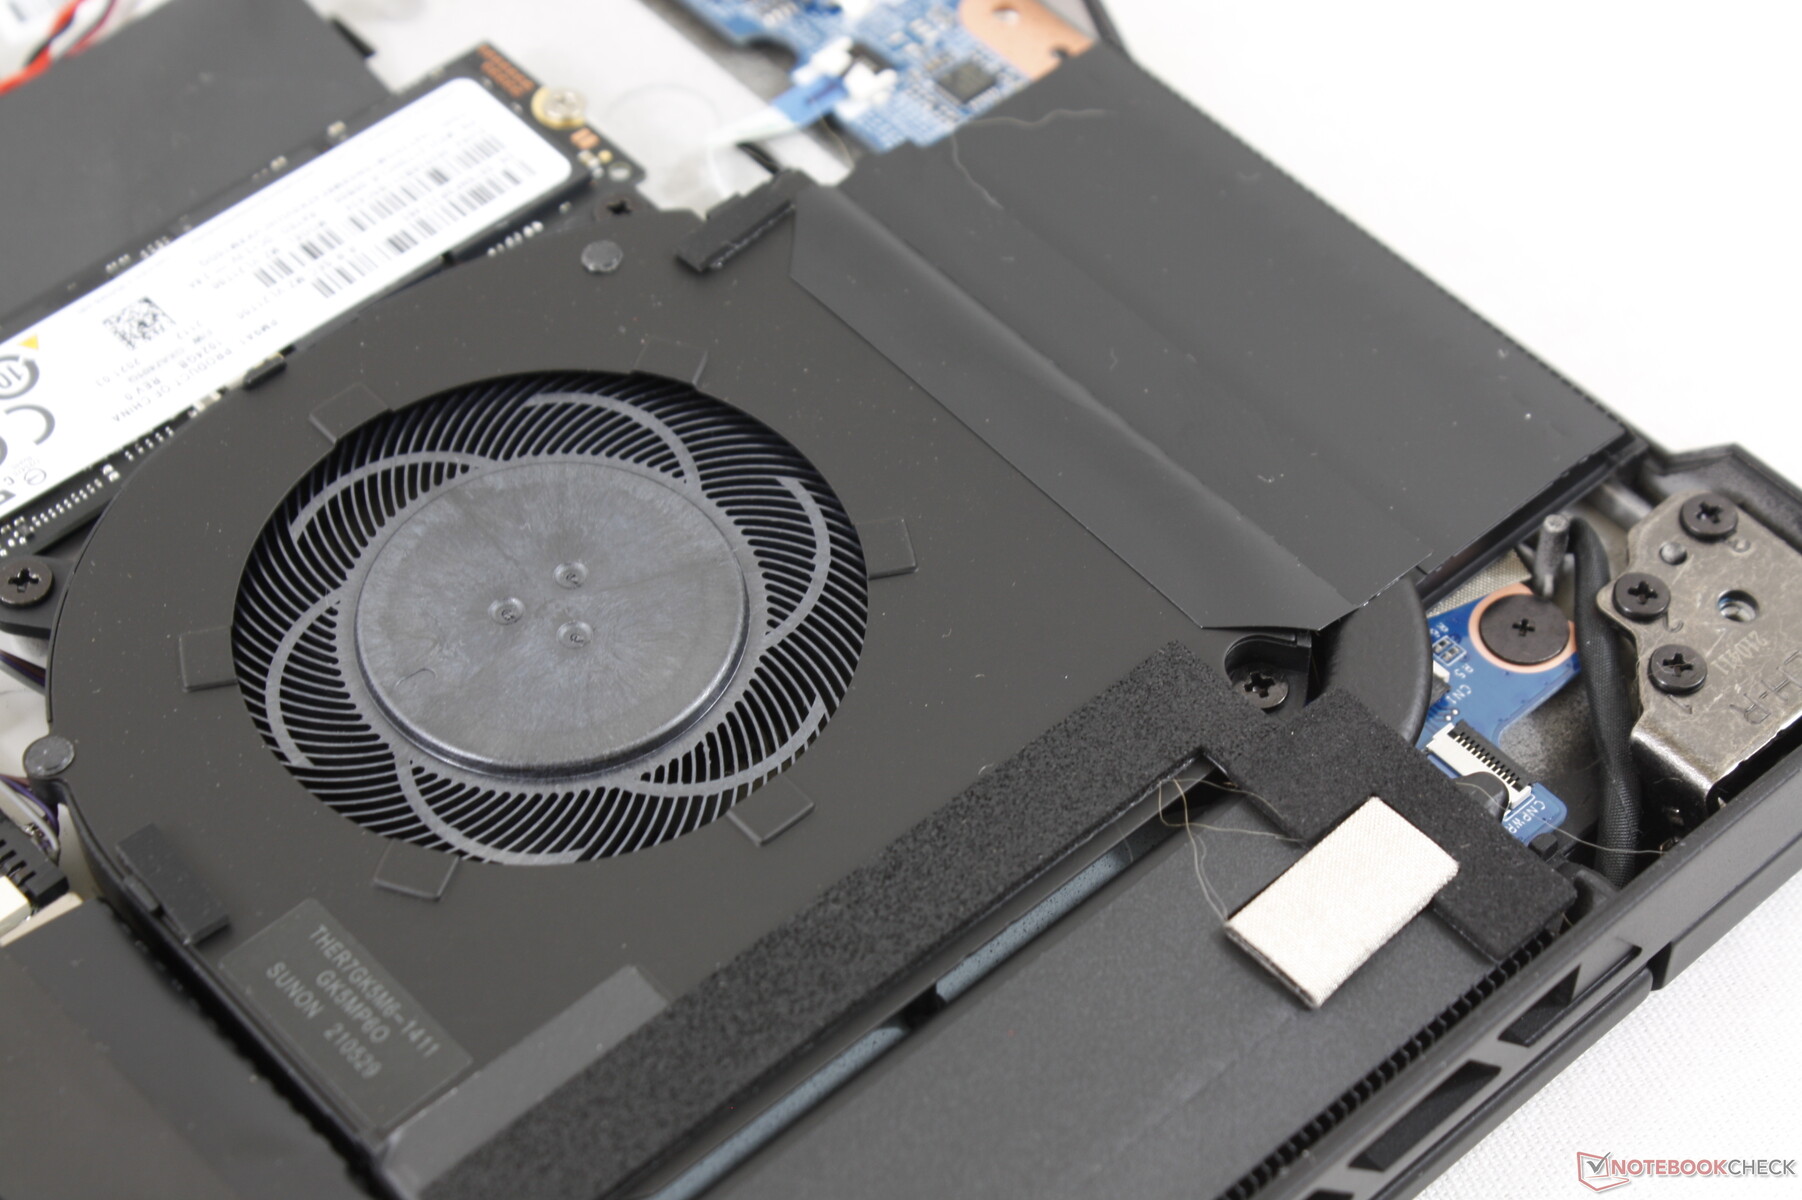
The bottom panel pops off fairly easily after removing the ten Philips screws underneath. Owners have direct access to the battery, both M.2 2280 slots, both RAM slots, and the WLAN module.
Accessories and Warranty
There are no extras in the retail box other than the AC adapter, paperwork, and a couple of Maingear logo stickers. The standard one-year limited warranty applies with extension options from Maingear.
Input Devices
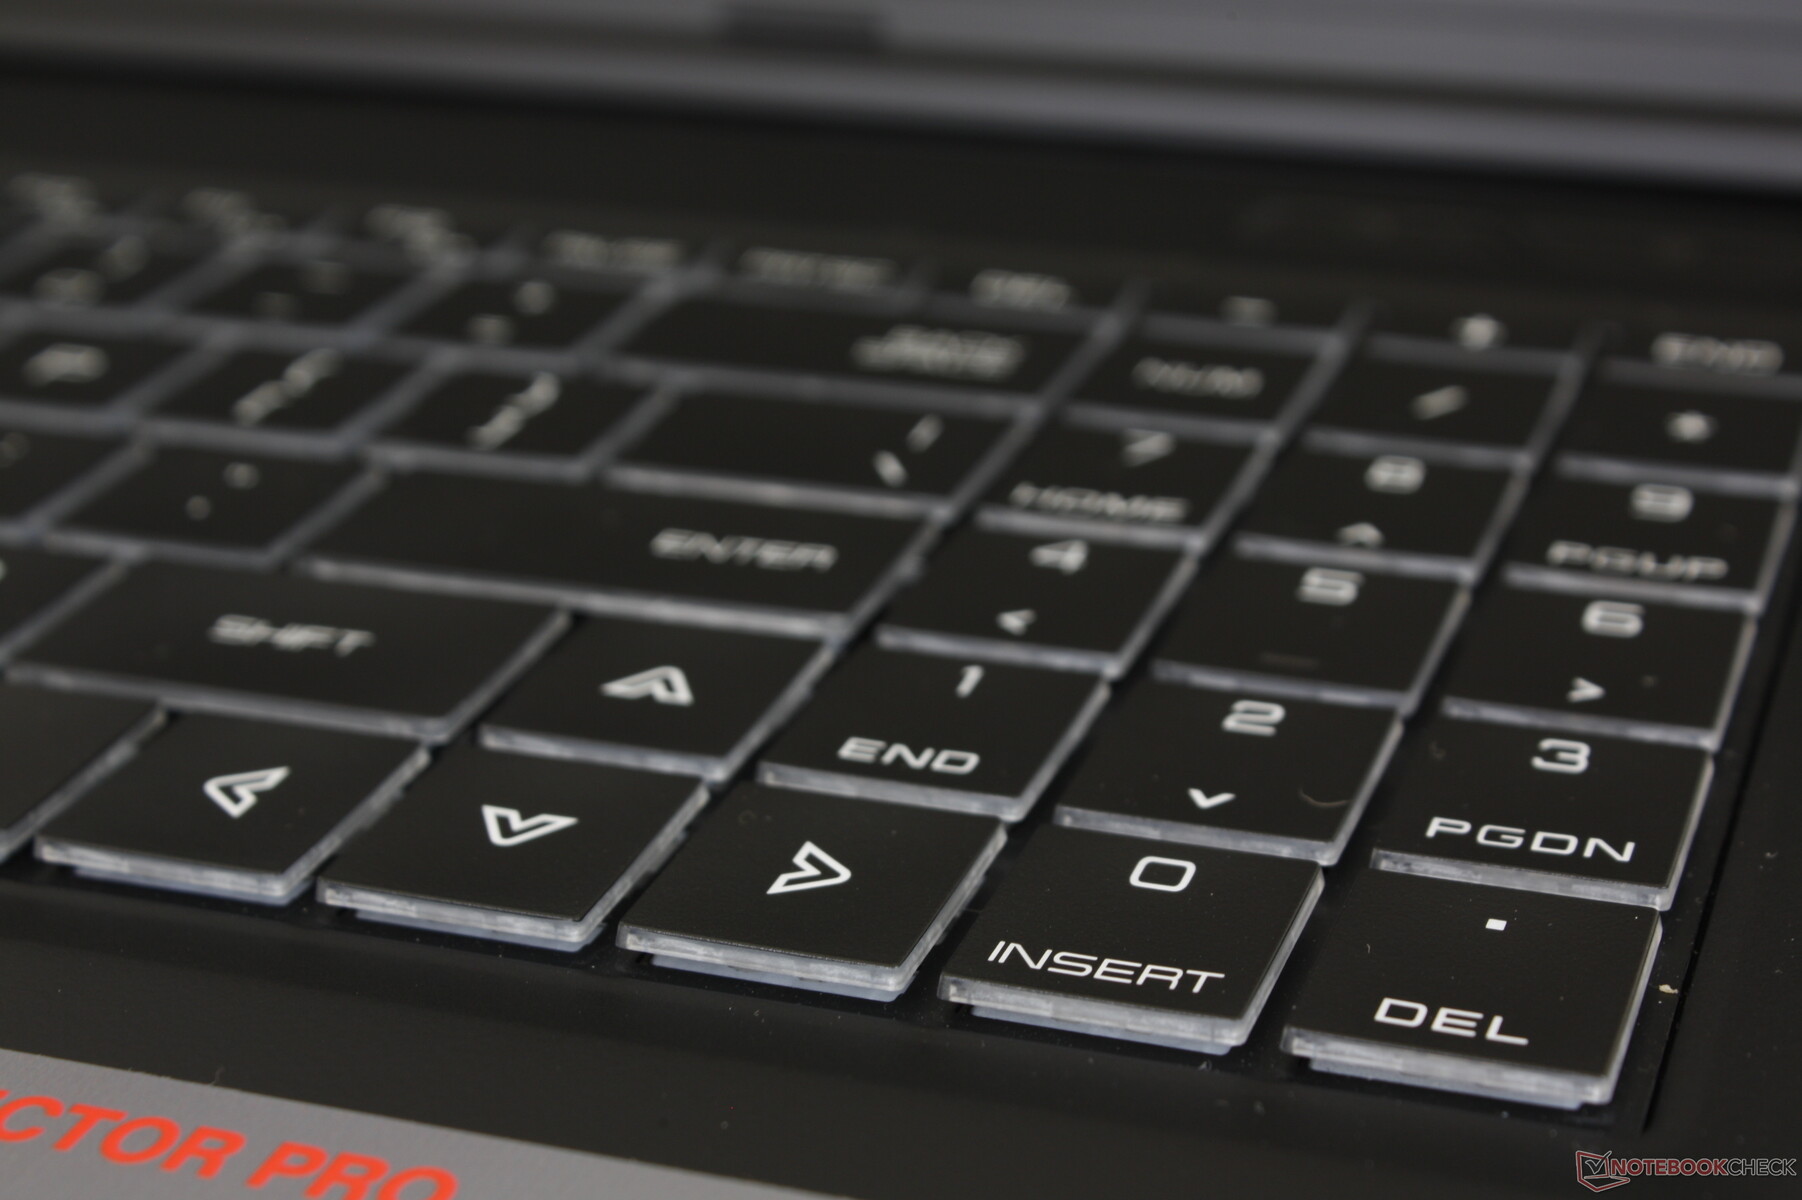
Keyboard
Key feedback and travel could have been firmer and deeper especially for a gaming laptop. Though not as light or shallow as a cheap Asus VivoBook, more give on the keys could have improved the gaming and typing experience. Feedback is more comparable to an Asus Zephyrus than on an MSI GT or GS model.
Touchpad
The clickpad is a bit smaller than the one on the Razer Blade Pro (13.3 x 7.5 cm vs. 13 x 8 cm). Feedback, however, is stronger and not as spongy on the Maingear.

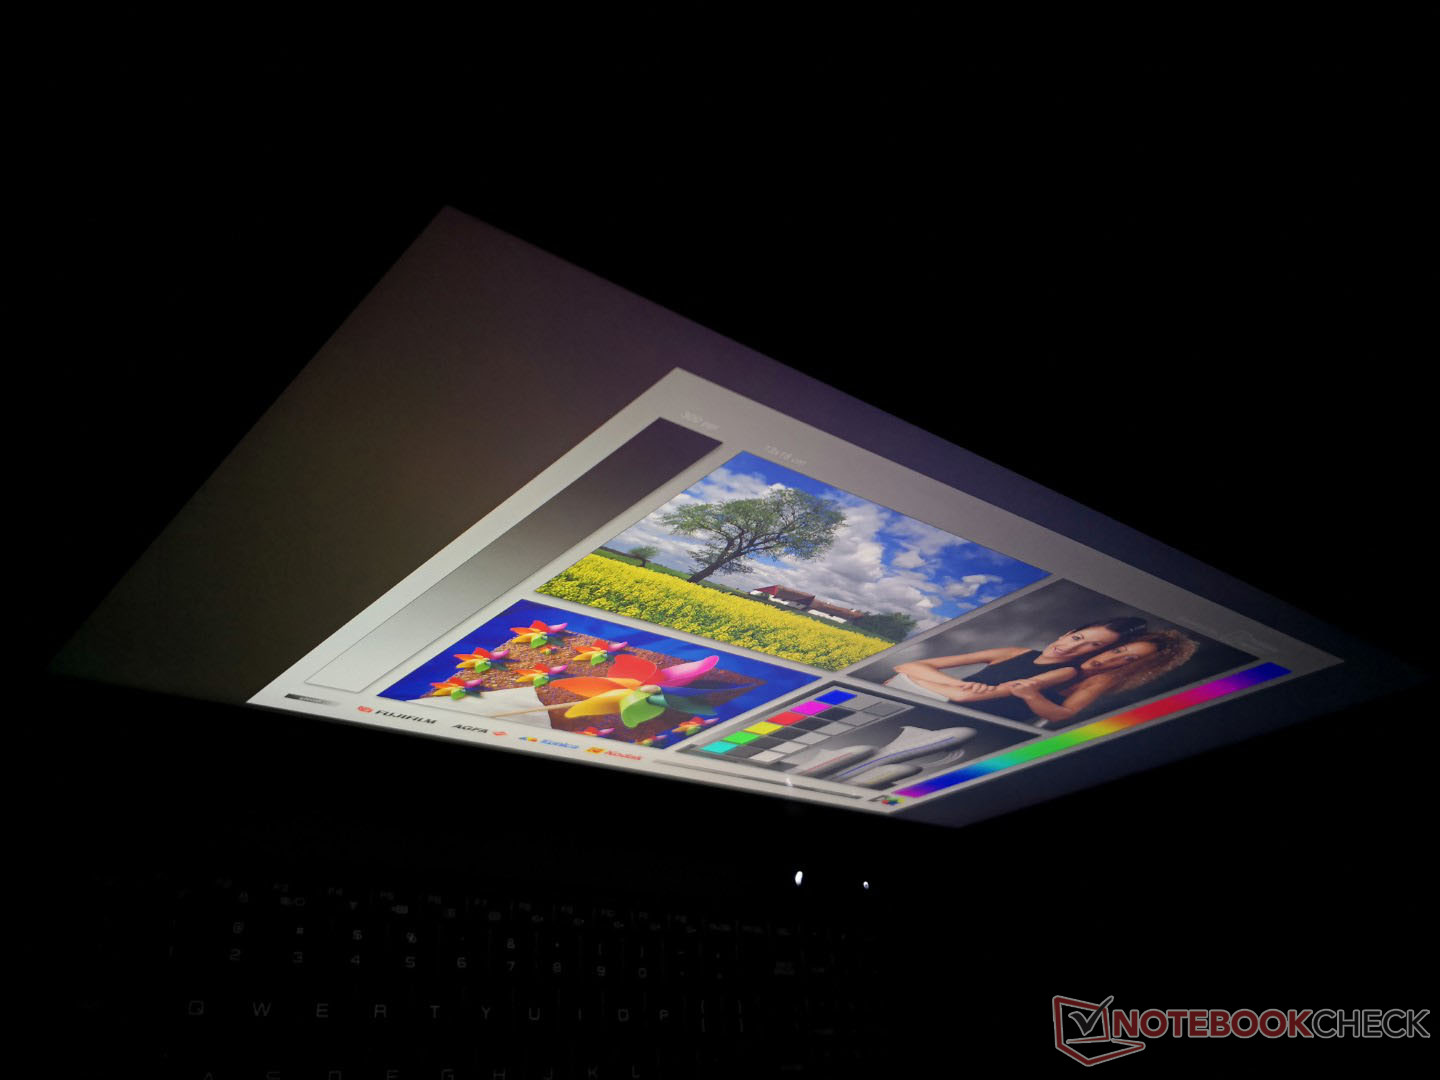
Display
Our Vector Pro uses the same NE173QHM-NY2 IPS panel from BOE as found on the Schenker XMG Core 17 meaning both laptops share similar display attributes. Response times are fast with good brightness, contrast levels, and refresh rates to represent a high-end 1440p panel designed for gaming. BOE has a newer NE173QHM-NY3 panel with even faster response times and better colors as found on the Asus ROG Zephyrus S17 GX703 and so it's a bit disappointing that our Maingear is using an older version.

| |||||||||||||||||||||||||
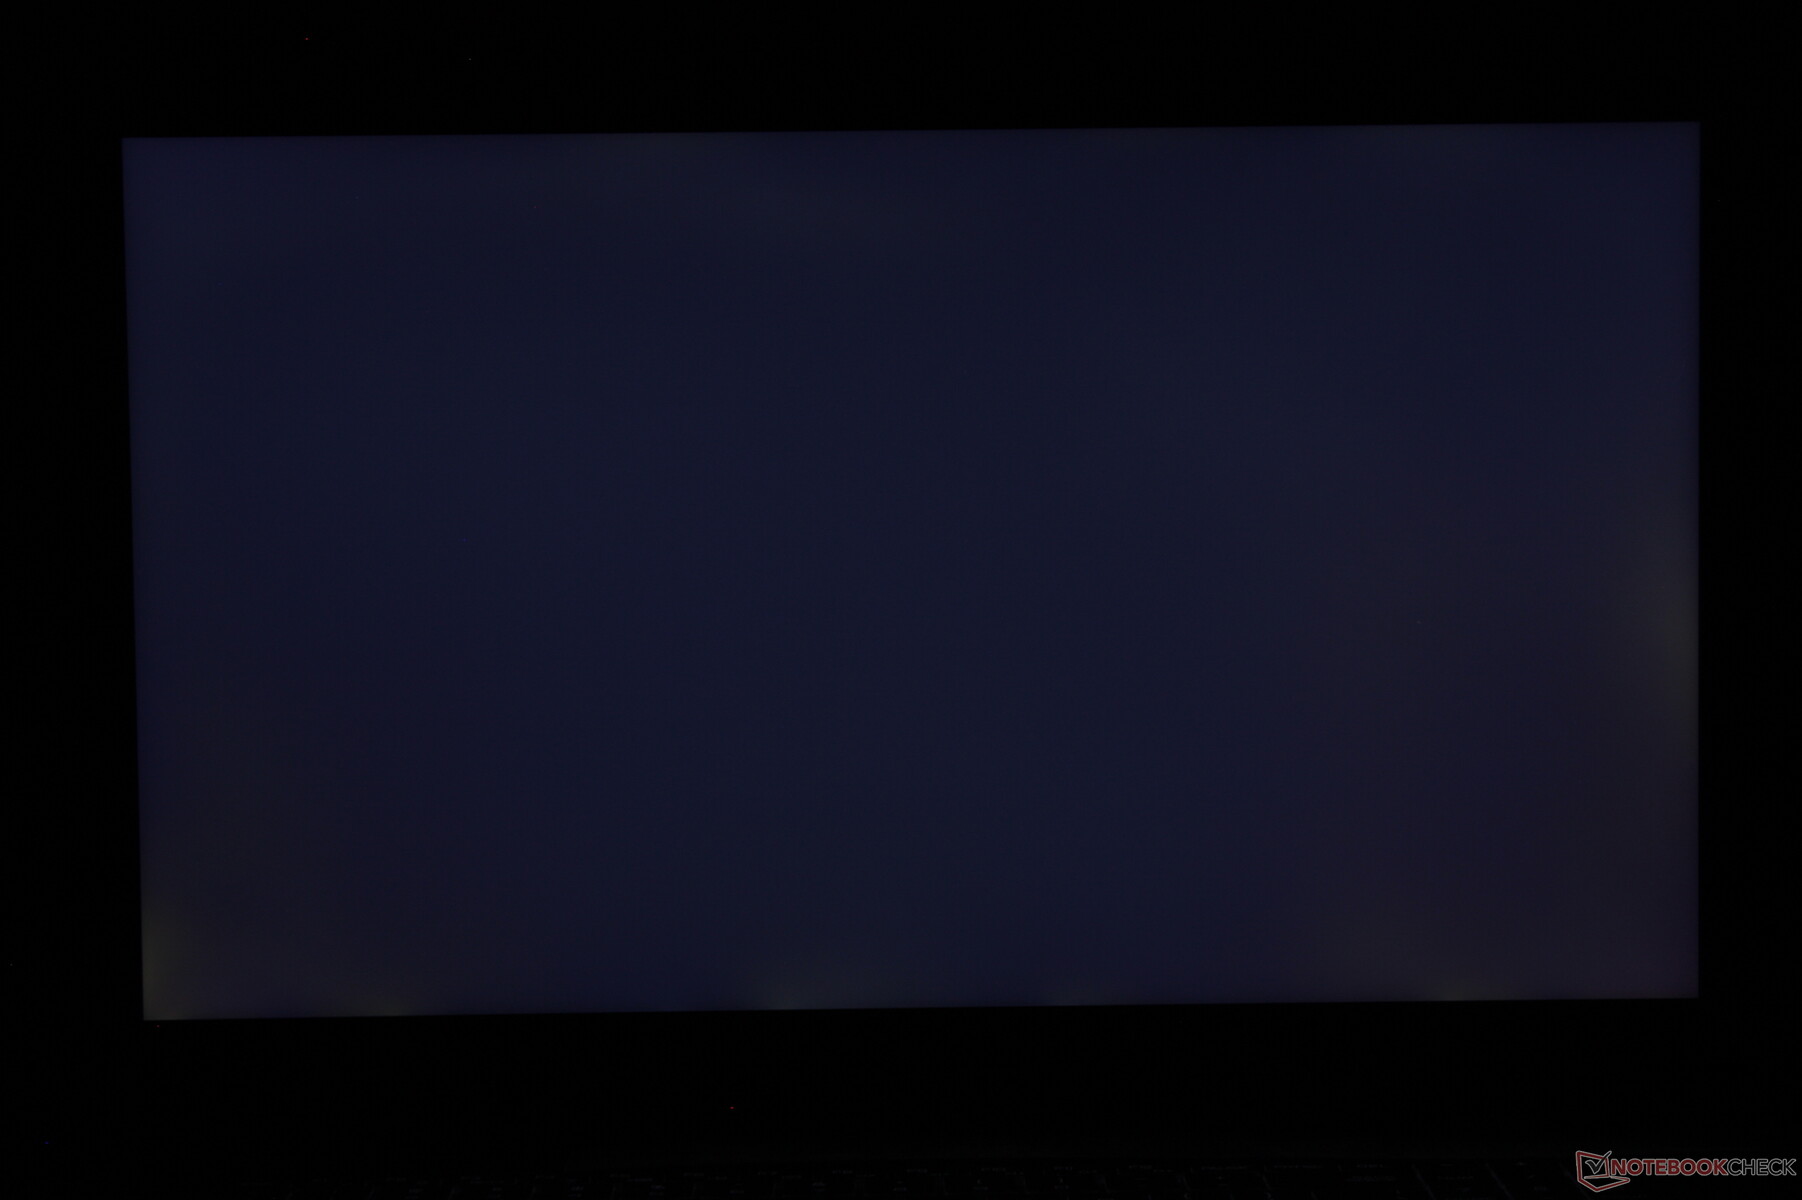
Brightness Distribution: 84 %
Center on Battery: 389.7 cd/m²
Contrast: 829:1 (Black: 0.47 cd/m²)
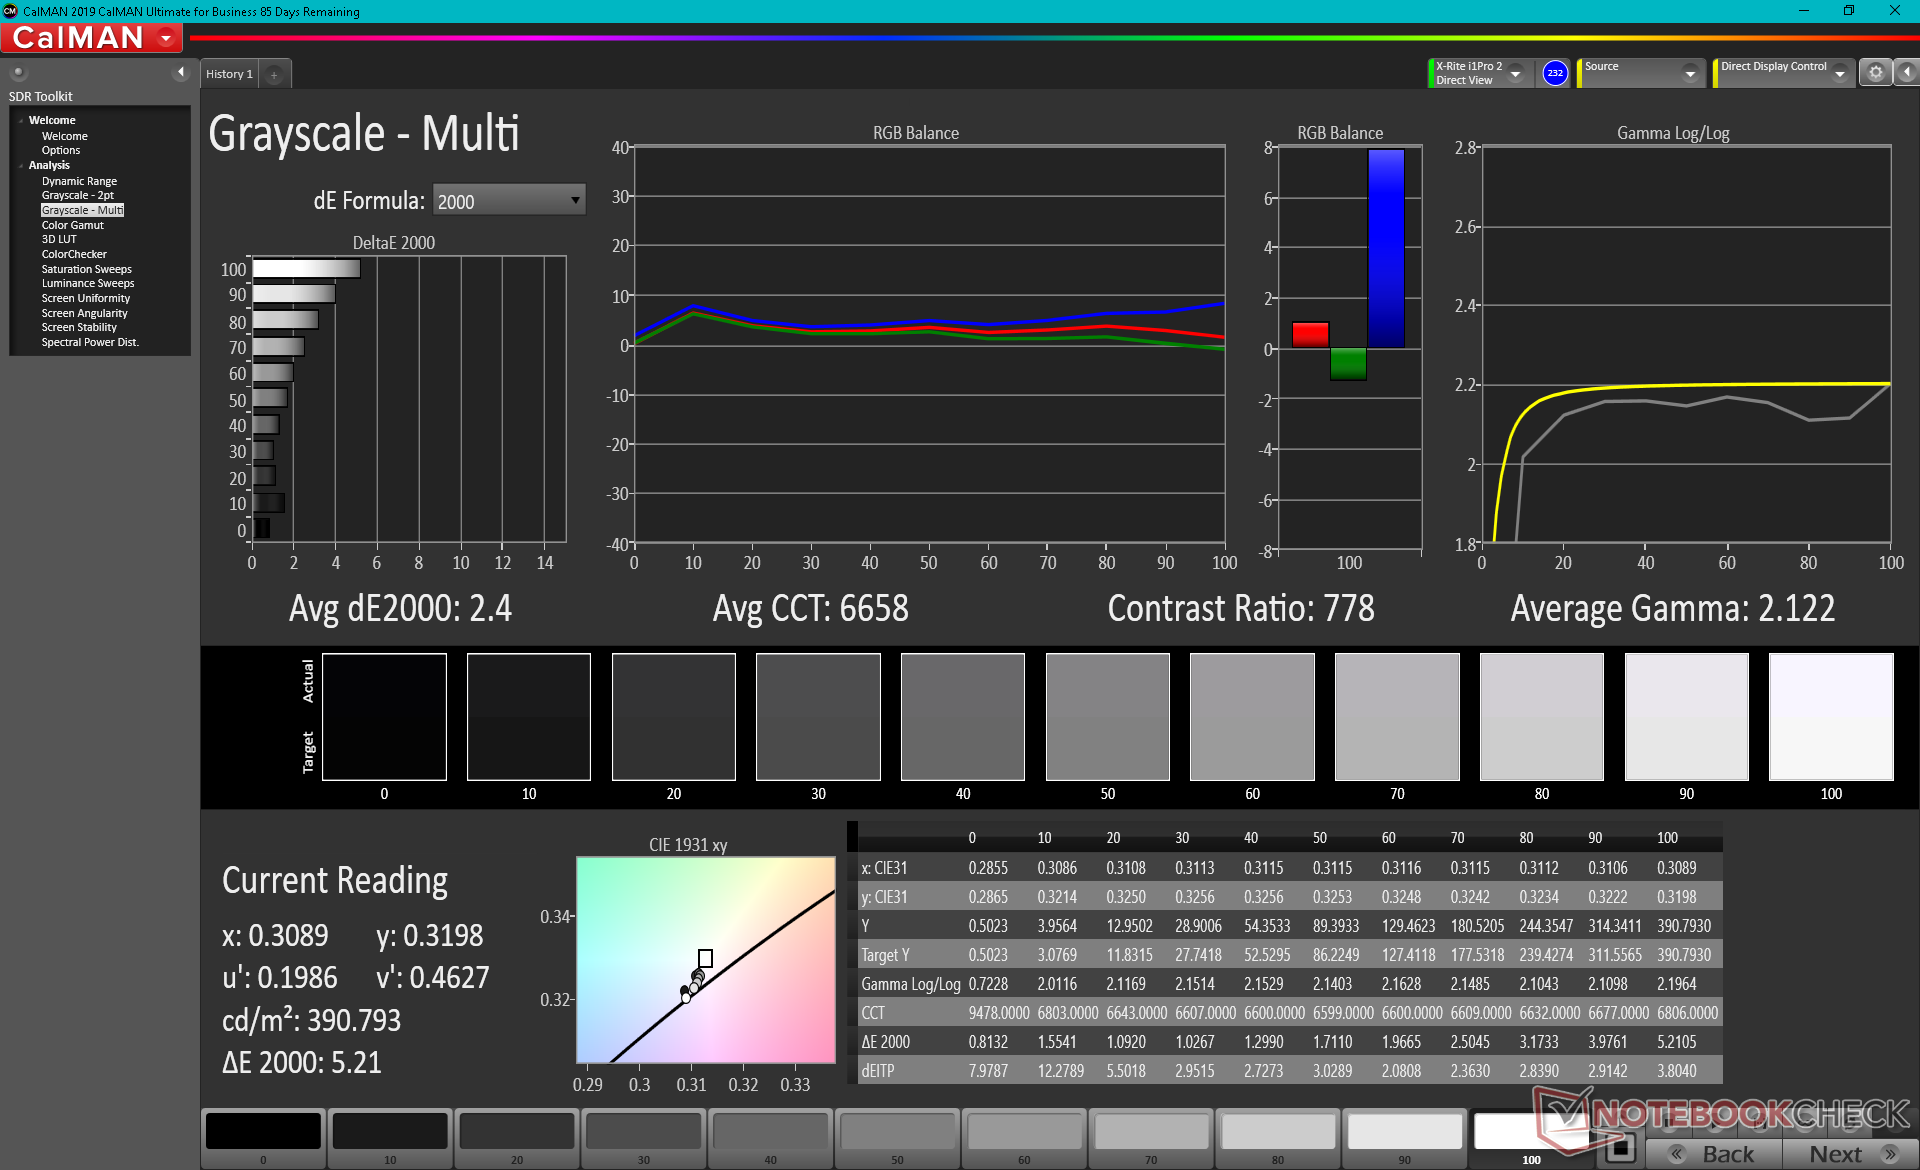
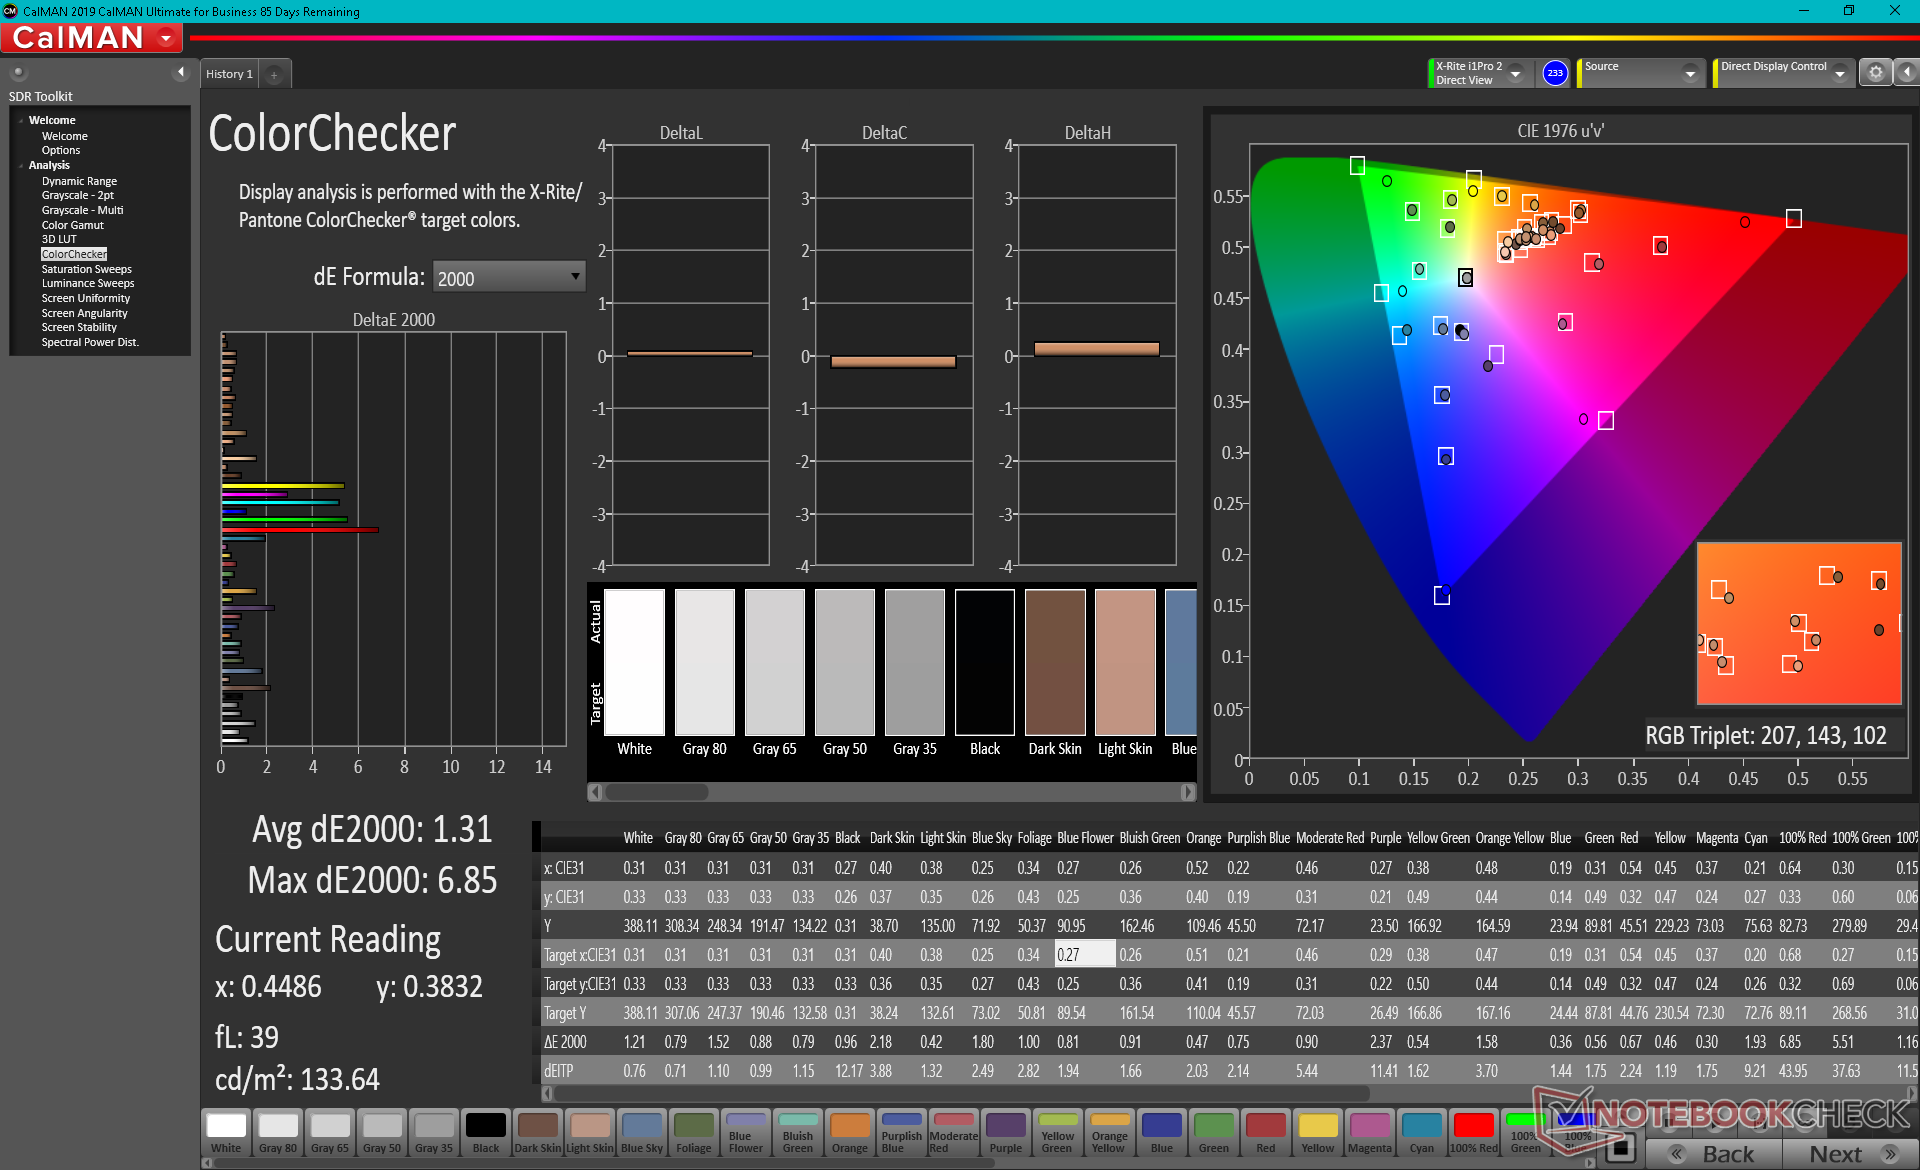
ΔE ColorChecker Calman: 1.93 | ∀{0.5-29.43 Ø4.77}
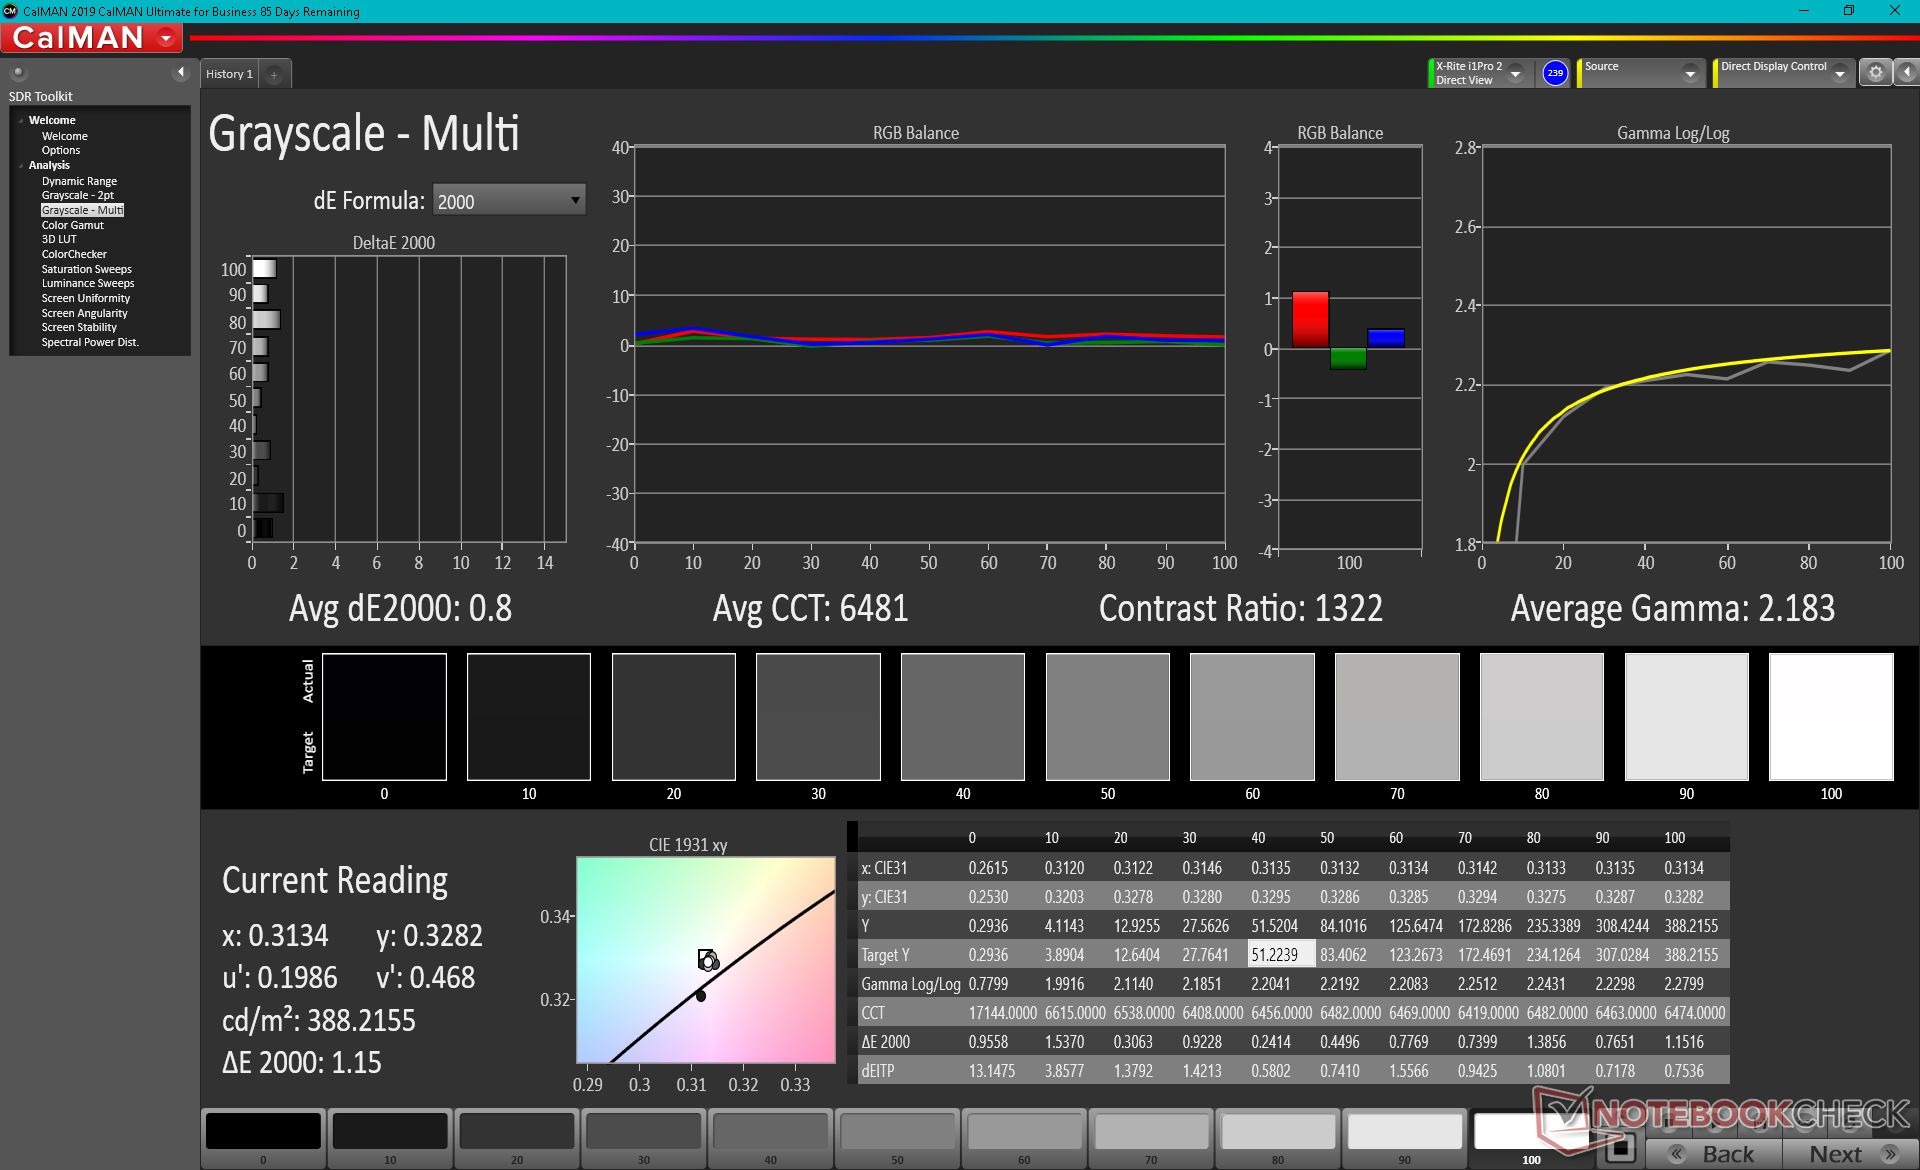
calibrated: 1.31
ΔE Greyscale Calman: 2.4 | ∀{0.09-98 Ø5}
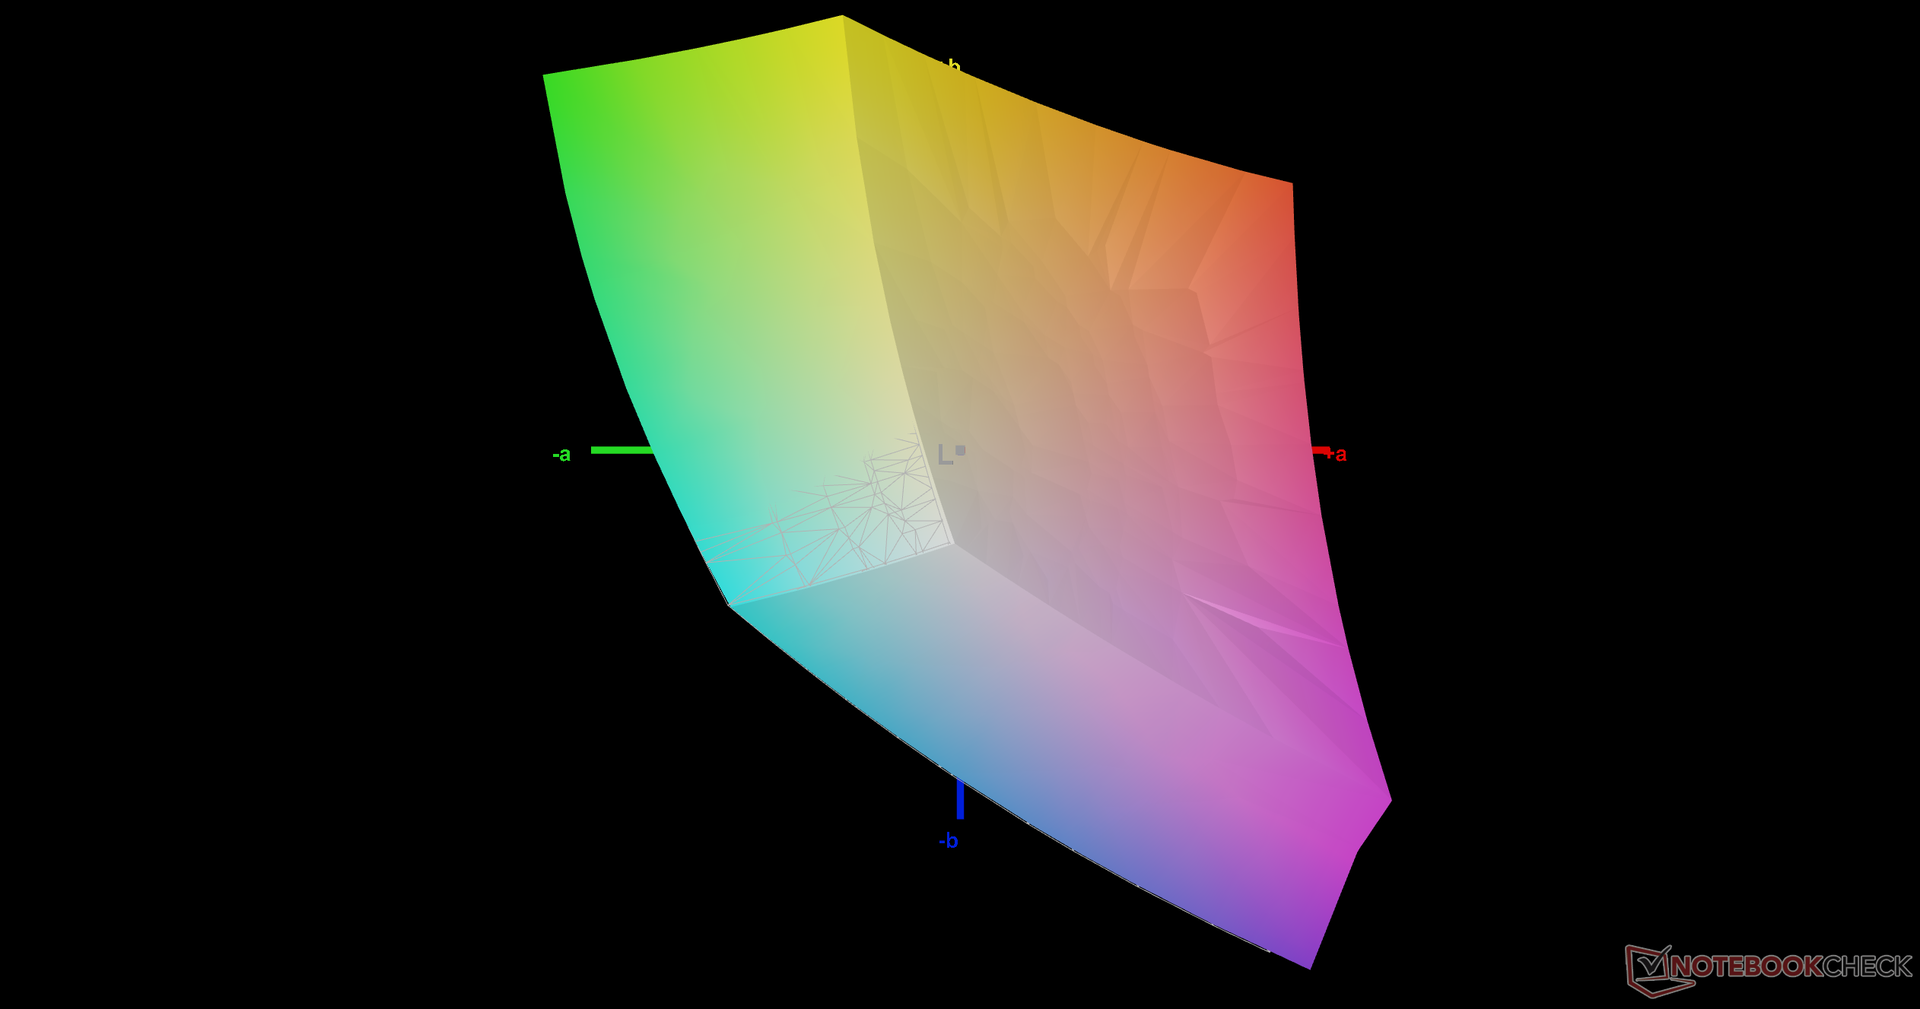
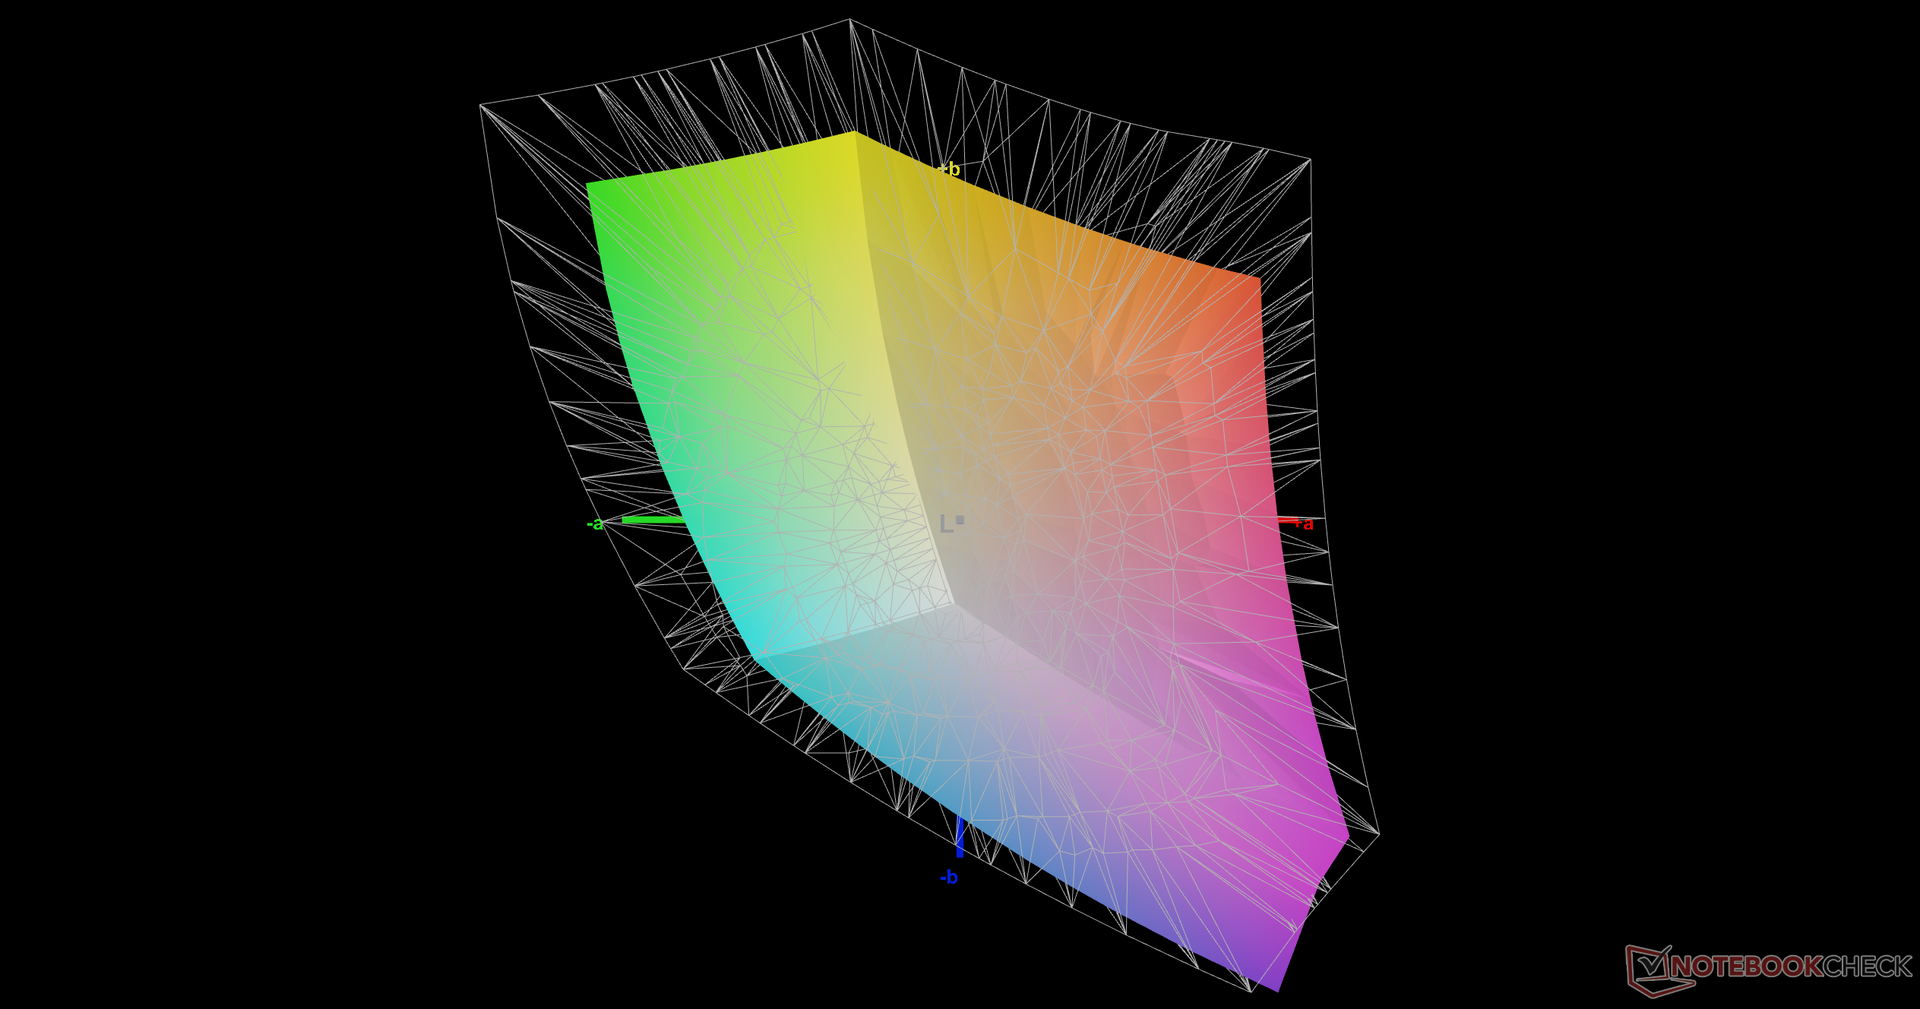
71.7% AdobeRGB 1998 (Argyll 3D)
99.4% sRGB (Argyll 3D)
70.7% Display P3 (Argyll 3D)
Gamma: 2.12
CCT: 6658 K
| Maingear Vector Pro MG-VCP17 BOE NE173QHM-NY2, IPS, 17.3", 2560x1440 | Asus ROG Zephyrus S17 GX703HSD BOE099D (BOE CQ NE173QHM-NY3), IPS, 17.3", 2560x1440 | Schenker XMG Core 17 (Early 2021) BOE CQ NE173QHM-NY2, IPS, 17.3", 2560x1440 | Schenker XMG Neo 17 (Early 2021, RTX 3070, 5800H) BOE NE173QHM-NY2 (BOE0977), IPS, 17.3", 2560x1440 | Schenker Compact 17 AU Optronics B173ZAN03.0, IPS, 17.3", 3840x2160 | MSI GS75 10SF-609US Sharp LQ173M1JW05, IPS, 17.3", 1920x1080 | |
|---|---|---|---|---|---|---|
| Display | 17% | -3% | 0% | 19% | 4% | |
| Display P3 Coverage (%) | 70.7 | 94.2 33% | 68.1 -4% | 70.5 0% | 84.4 19% | 75.6 7% |
| sRGB Coverage (%) | 99.4 | 98.7 -1% | 98.5 -1% | 99.5 0% | 99.9 1% | 99.8 0% |
| AdobeRGB 1998 Coverage (%) | 71.7 | 84.4 18% | 69.3 -3% | 71.8 0% | 98 37% | 75.1 5% |
| Response Times | 51% | 5% | 5% | -197% | 57% | |
| Response Time Grey 50% / Grey 80% * (ms) | 15.6 ? | 4.8 69% | 16.8 ? -8% | 16.8 ? -8% | 51 ? -227% | 5 ? 68% |
| Response Time Black / White * (ms) | 12 ? | 8 33% | 10 ? 17% | 10 ? 17% | 32 ? -167% | 6.6 ? 45% |
| PWM Frequency (Hz) | ||||||
| Screen | -11% | -7% | 4% | -40% | 3% | |
| Brightness middle (cd/m²) | 389.7 | 322 -17% | 370 -5% | 410 5% | 437 12% | 299.4 -23% |
| Brightness (cd/m²) | 363 | 288 -21% | 333 -8% | 381 5% | 413 14% | 299 -18% |
| Brightness Distribution (%) | 84 | 72 -14% | 84 0% | 88 5% | 88 5% | 84 0% |
| Black Level * (cd/m²) | 0.47 | 0.3 36% | 0.38 19% | 0.37 21% | 0.6 -28% | 0.31 34% |
| Contrast (:1) | 829 | 1073 29% | 974 17% | 1108 34% | 728 -12% | 966 17% |
| Colorchecker dE 2000 * | 1.93 | 3.05 -58% | 2.41 -25% | 2.55 -32% | 4.28 -122% | 1.82 6% |
| Colorchecker dE 2000 max. * | 6.84 | 5.23 24% | 7.32 -7% | 4.33 37% | 7.65 -12% | 3.91 43% |
| Colorchecker dE 2000 calibrated * | 1.31 | 1.92 -47% | 1.19 9% | 1.28 2% | 3.41 -160% | 1.59 -21% |
| Greyscale dE 2000 * | 2.4 | 3.11 -30% | 3.9 -63% | 3.4 -42% | 3.8 -58% | 2.7 -13% |
| Gamma | 2.12 104% | 2.13 103% | 2.287 96% | 2.275 97% | 2.49 88% | 2.18 101% |
| CCT | 6658 98% | 6553 99% | 7302 89% | 6637 98% | 7363 88% | 6837 95% |
| Color Space (Percent of AdobeRGB 1998) (%) | 84 | 69 | 72 | 87 | 67.1 | |
| Color Space (Percent of sRGB) (%) | 99 | 93 | 95 | 100 | 99.8 | |
| Total Average (Program / Settings) | 19% /
4% | -2% /
-4% | 3% /
3% | -73% /
-50% | 21% /
11% |
* ... smaller is better
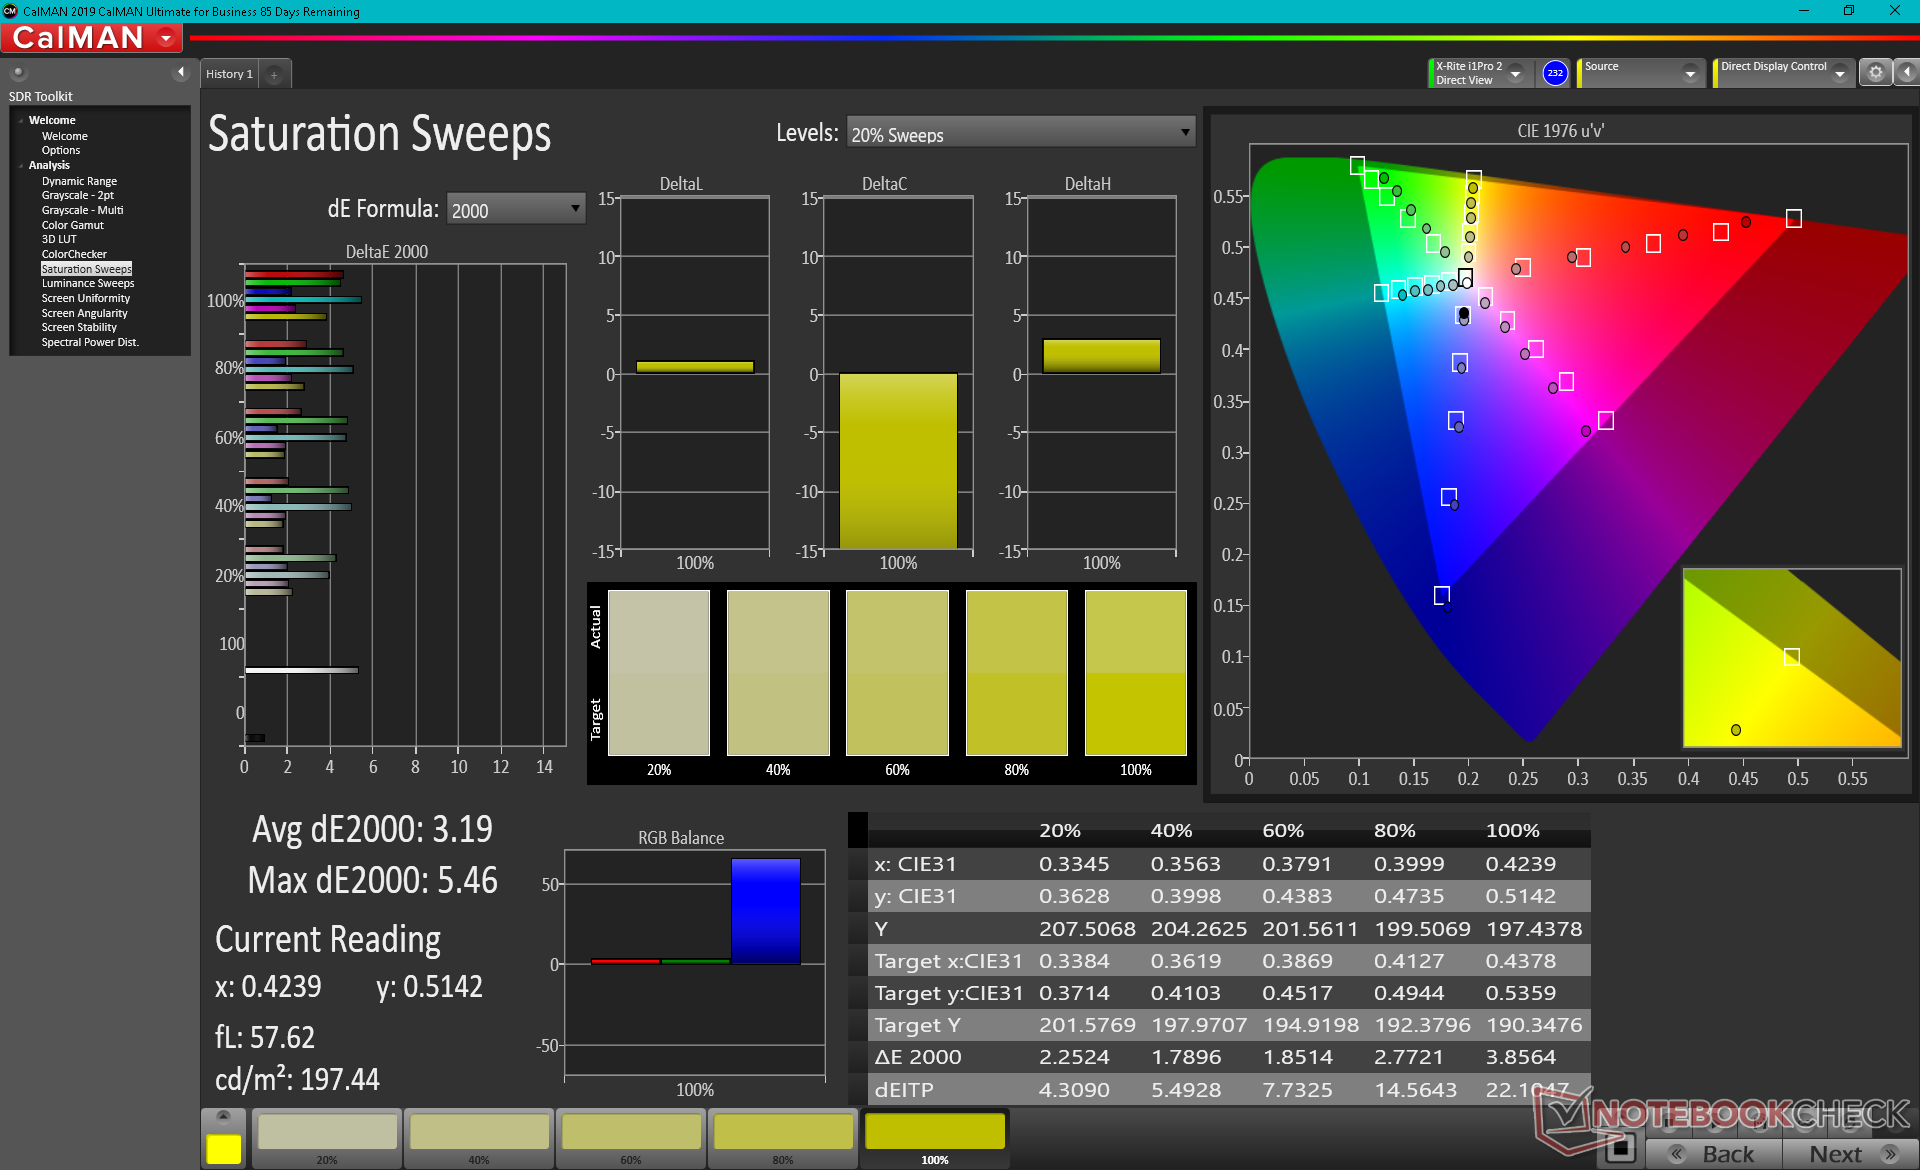
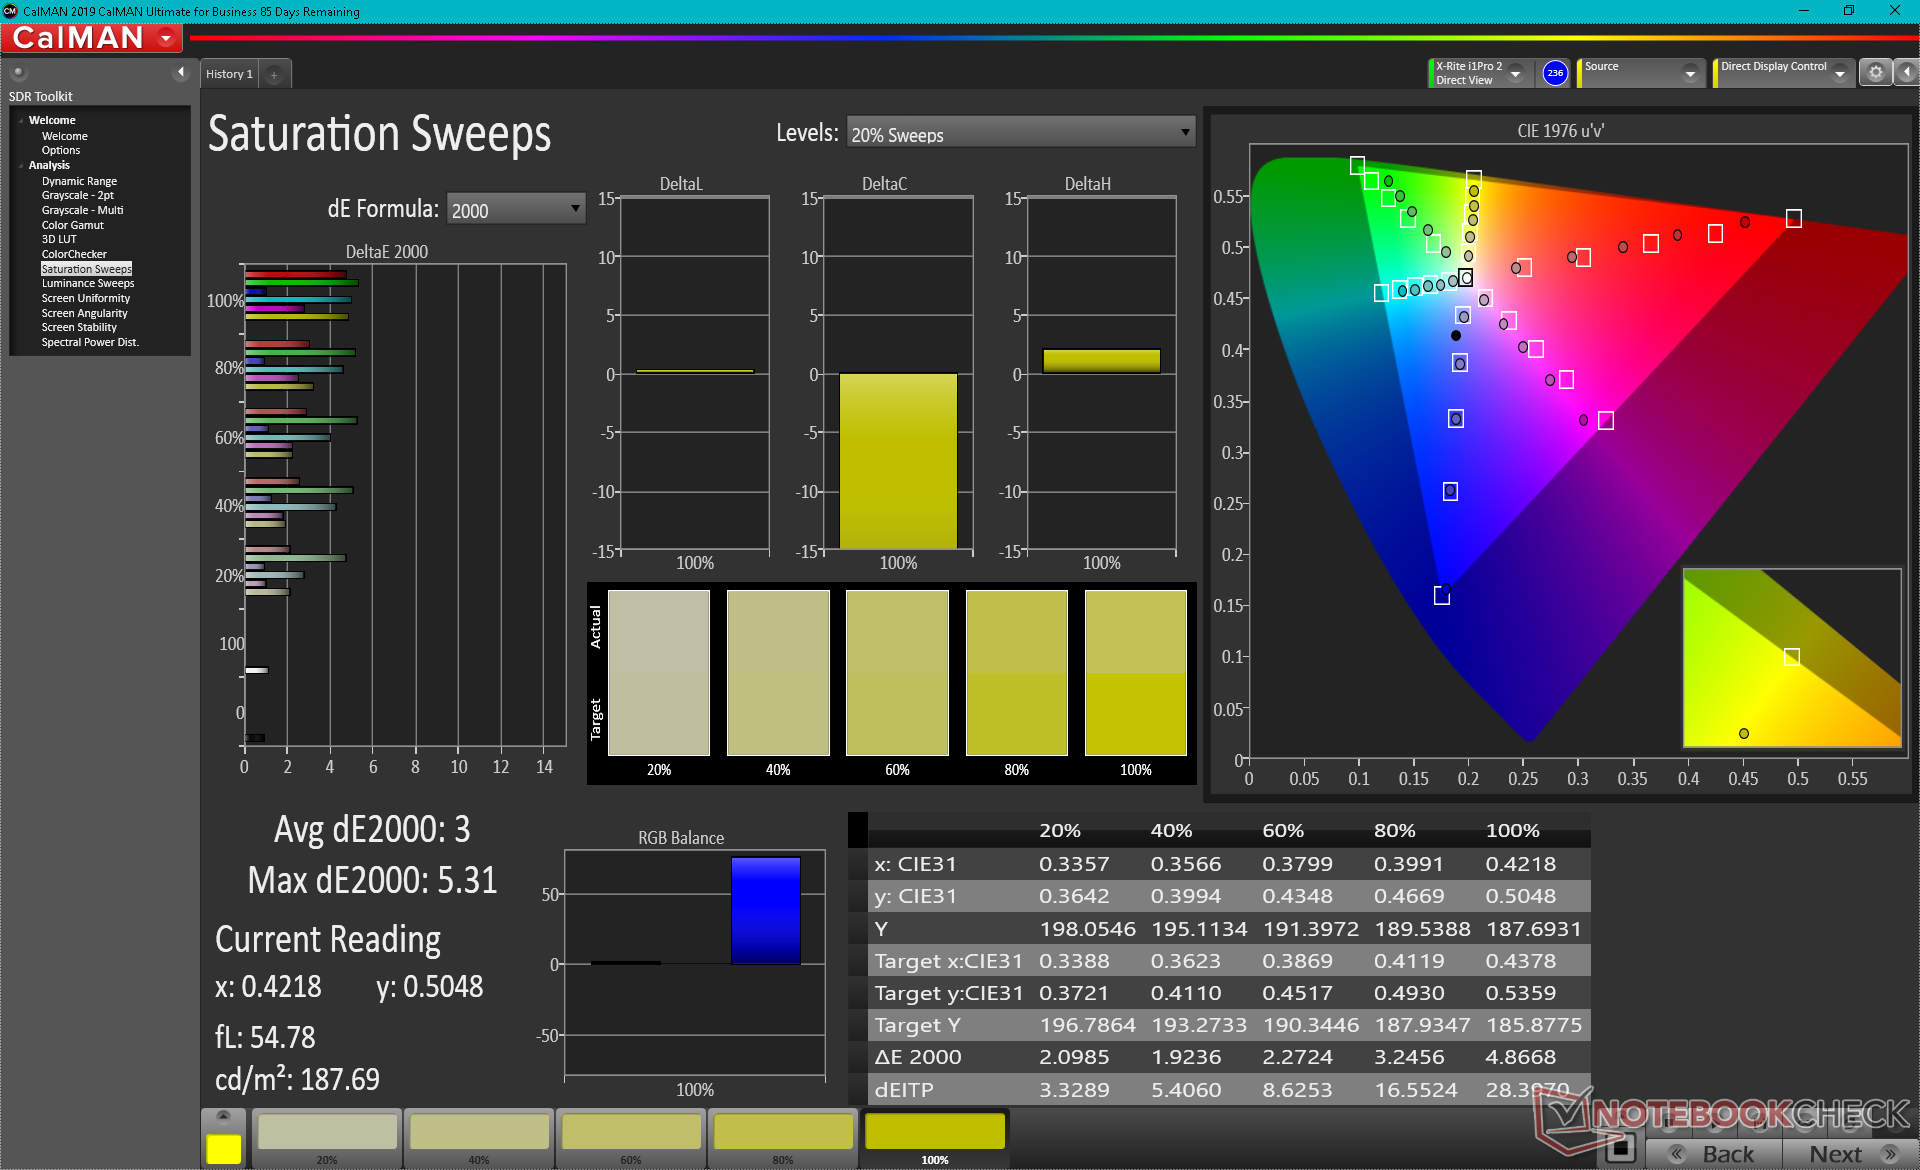
Color space covers sRGB entirely and approximately 72 percent of AdobeRGB. Higher resolution 4K IPS panels tend to offer deeper colors albeit at the cost of slower refresh rates and response times.
Colors and grayscale are fairly accurate out of the box suggesting no end-user tinkering is really necessary. Nonetheless, our own calibration with an X-Rite colorimeter would improve average grayscale values just slightly across the board.

Display Response Times
| ↔ Response Time Black to White | ||
|---|---|---|
| 12 ms ... rise ↗ and fall ↘ combined | ↗ 6.8 ms rise | 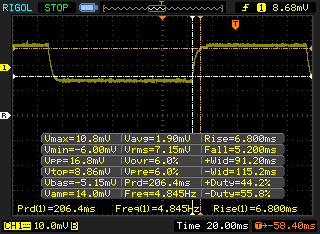 |
| ↘ 5.2 ms fall | ||
| The screen shows good response rates in our tests, but may be too slow for competitive gamers. In comparison, all tested devices range from 0.1 (minimum) to 240 (maximum) ms. » 30 % of all devices are better. This means that the measured response time is better than the average of all tested devices (20.2 ms). | ||
| ↔ Response Time 50% Grey to 80% Grey | ||
| 15.6 ms ... rise ↗ and fall ↘ combined | ↗ 8.4 ms rise | 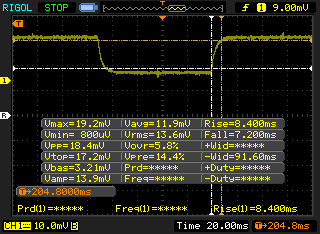 |
| ↘ 7.2 ms fall | ||
| The screen shows good response rates in our tests, but may be too slow for competitive gamers. In comparison, all tested devices range from 0.165 (minimum) to 636 (maximum) ms. » 29 % of all devices are better. This means that the measured response time is better than the average of all tested devices (31.6 ms). | ||
Screen Flickering / PWM (Pulse-Width Modulation)
| Screen flickering / PWM not detected | 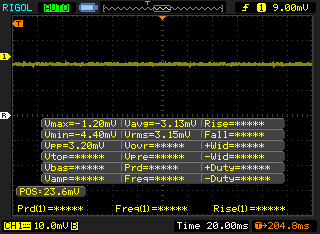 | ||
In comparison: 53 % of all tested devices do not use PWM to dim the display. If PWM was detected, an average of 8084 (minimum: 5 - maximum: 343500) Hz was measured. | |||
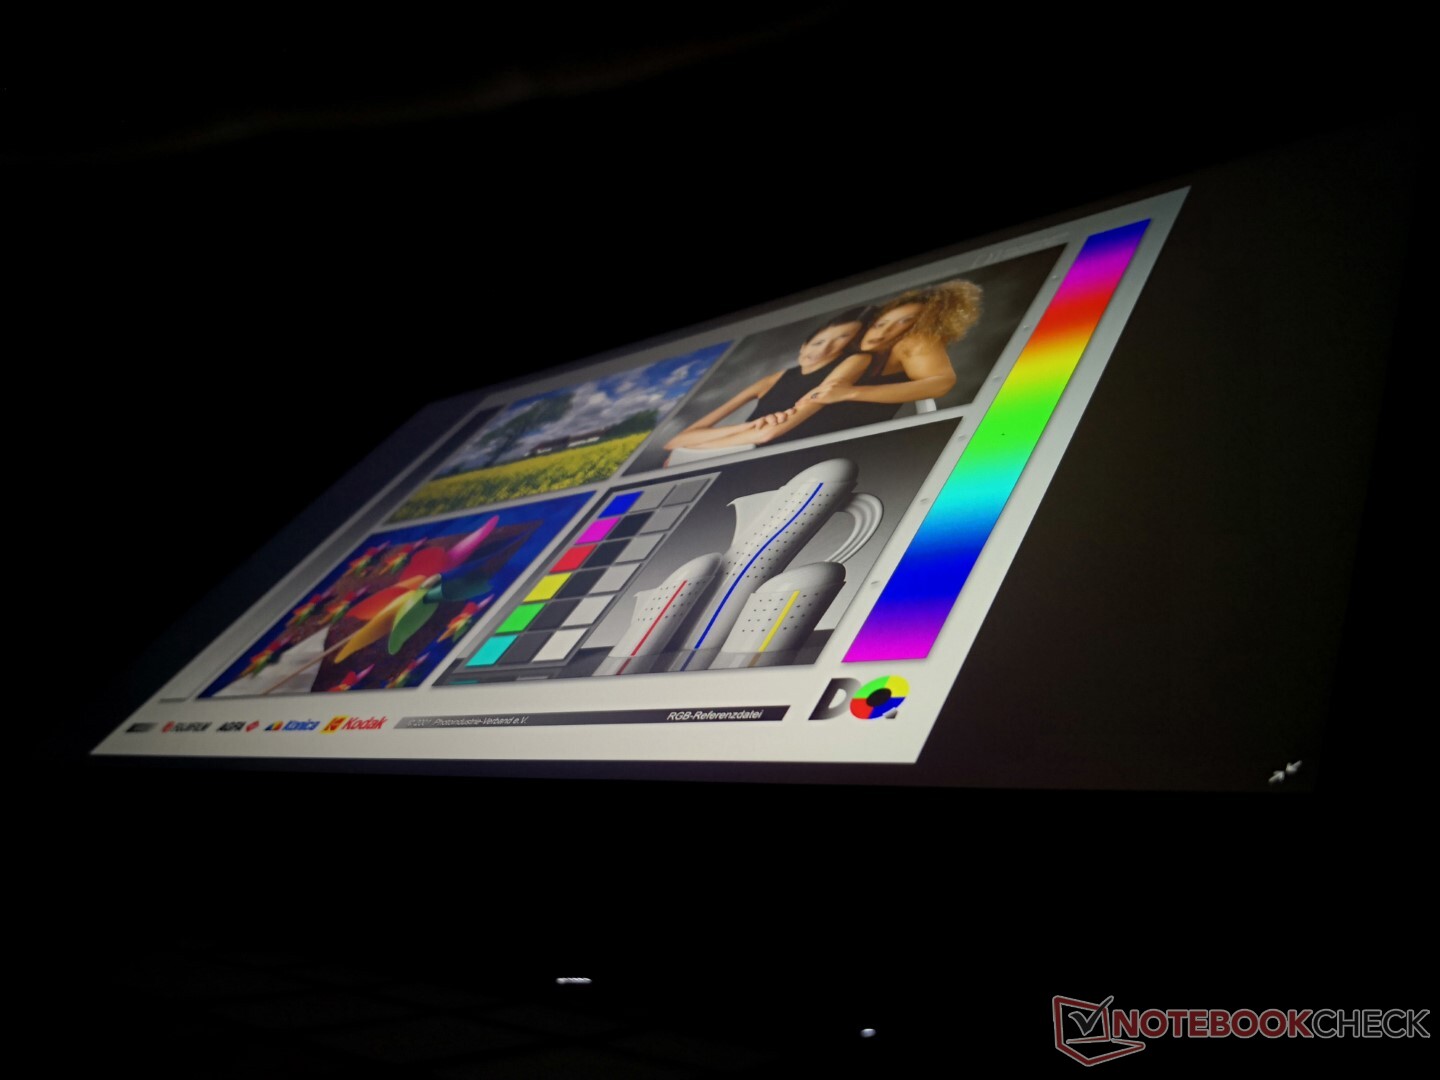
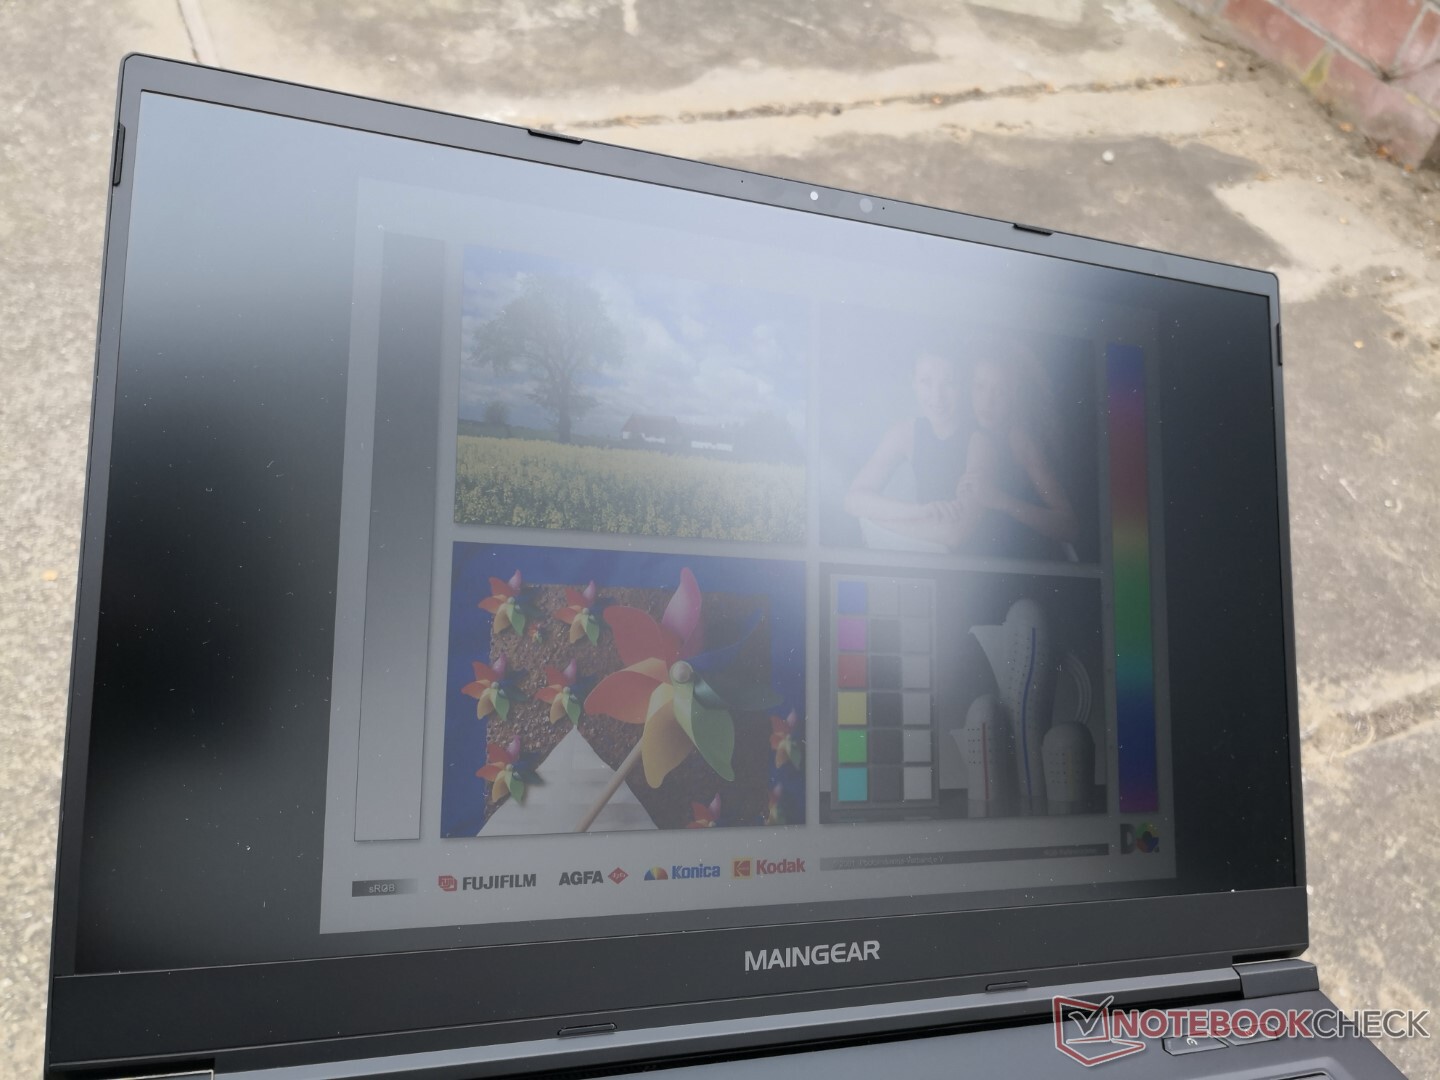
Outdoor visibility is better than on most 17.3-inch gaming laptops since maximum brightness is closer to 400 nits instead of the usual 300 nits. You'll still want to avoid direct sunlight, however, or else the screen will wash out.

Performance
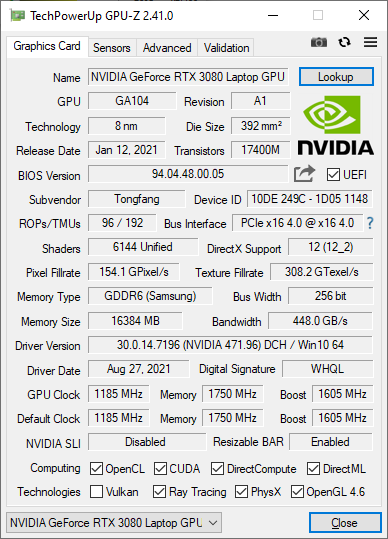
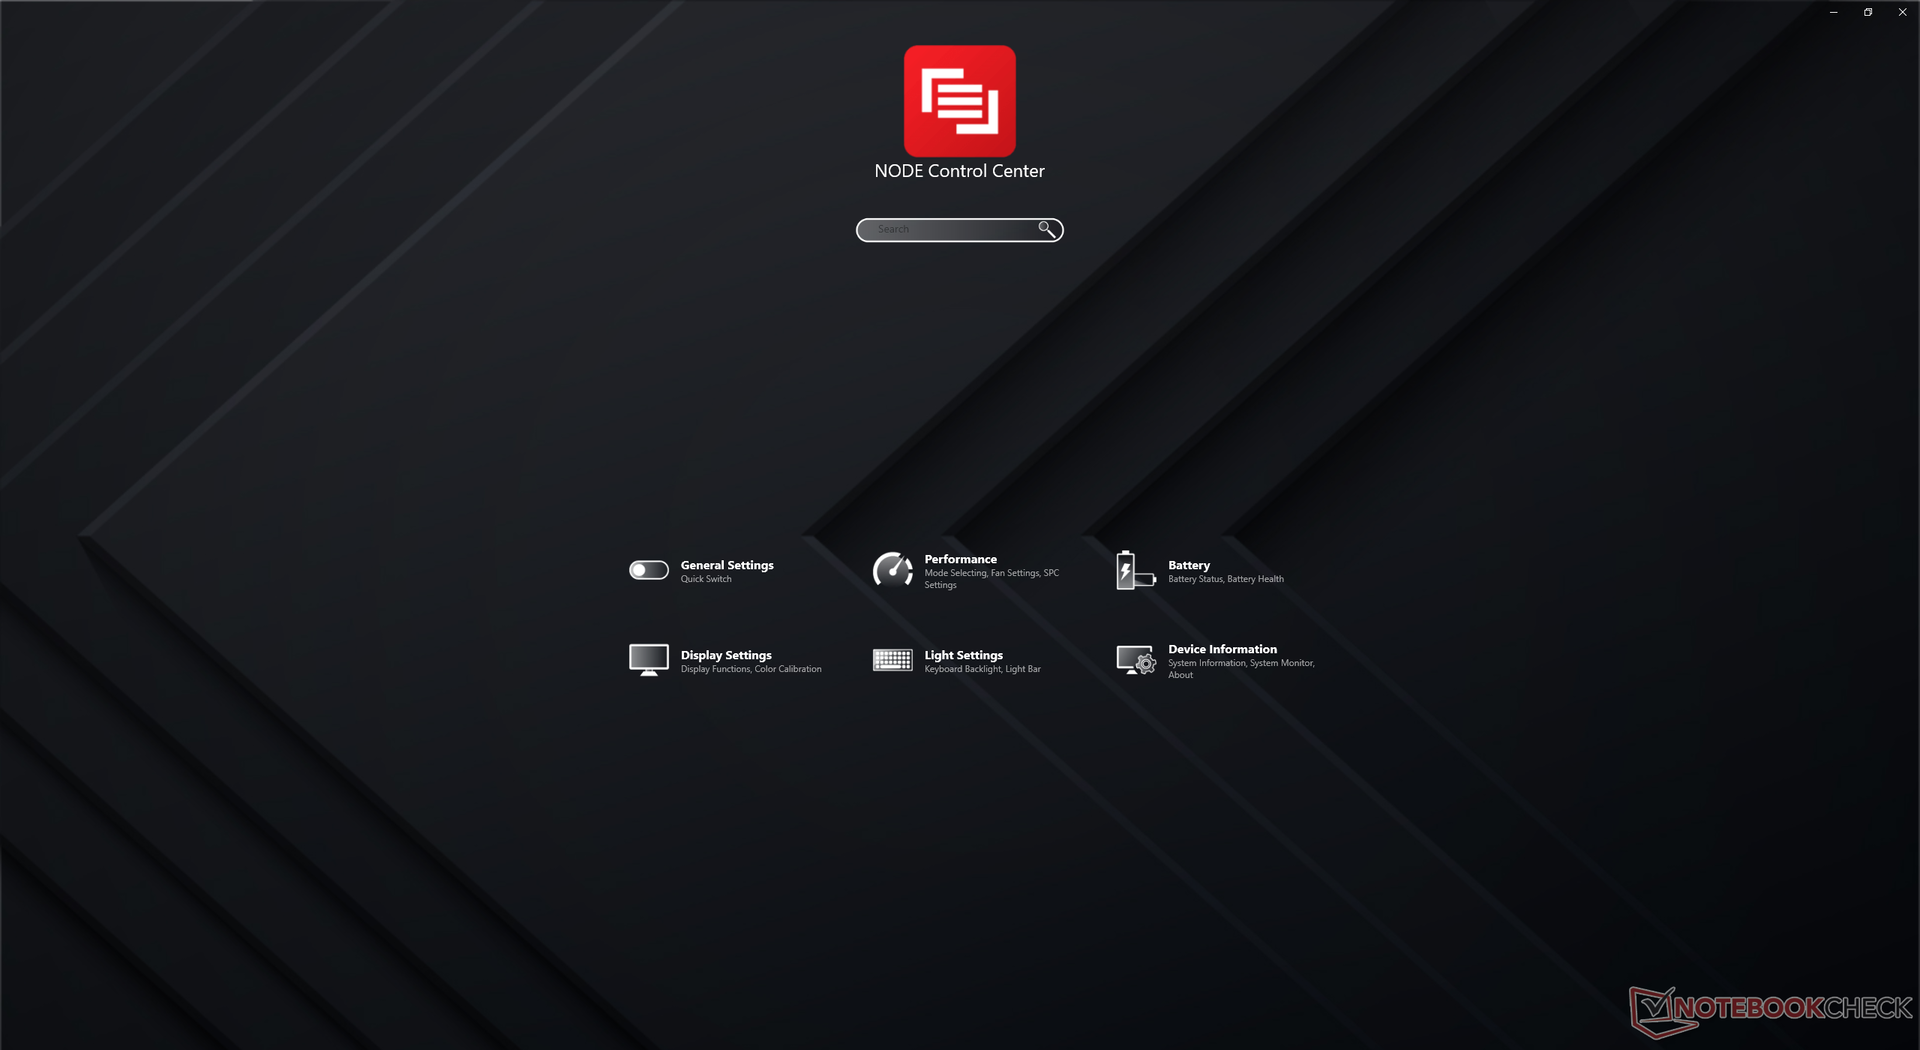
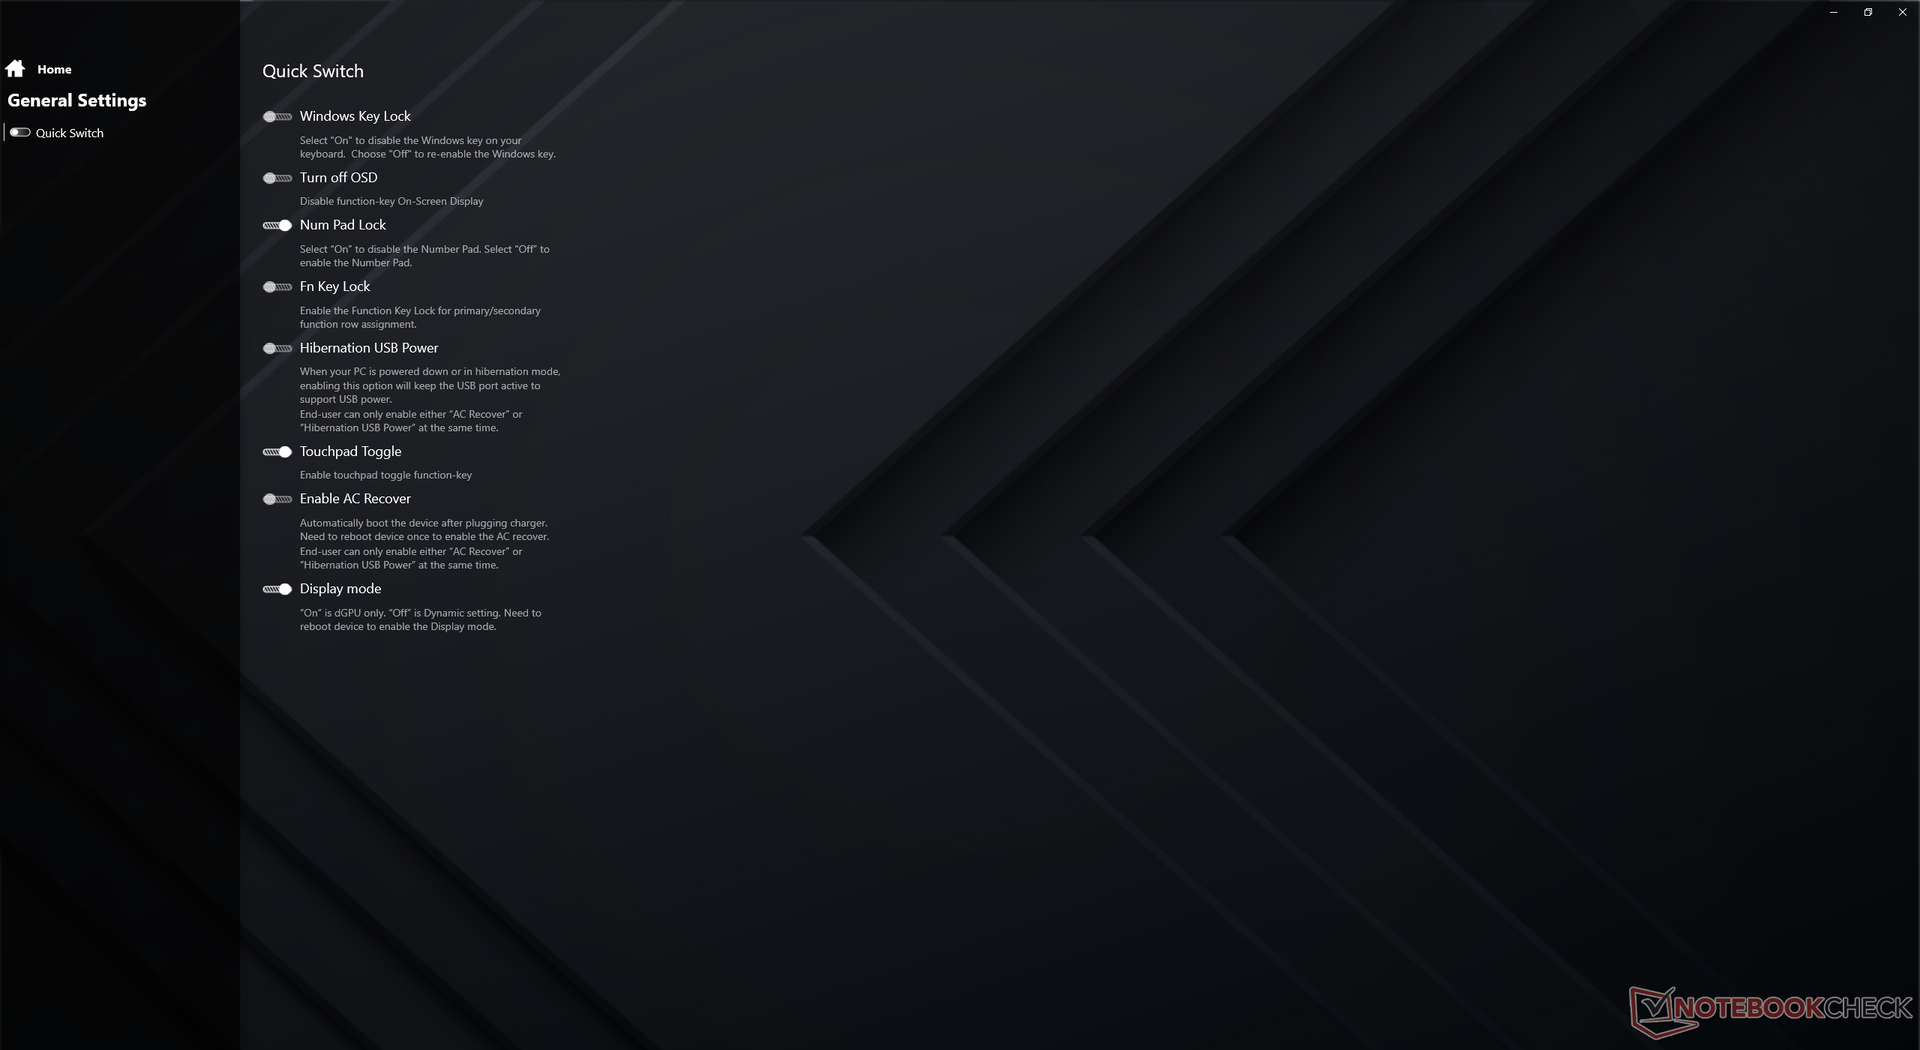
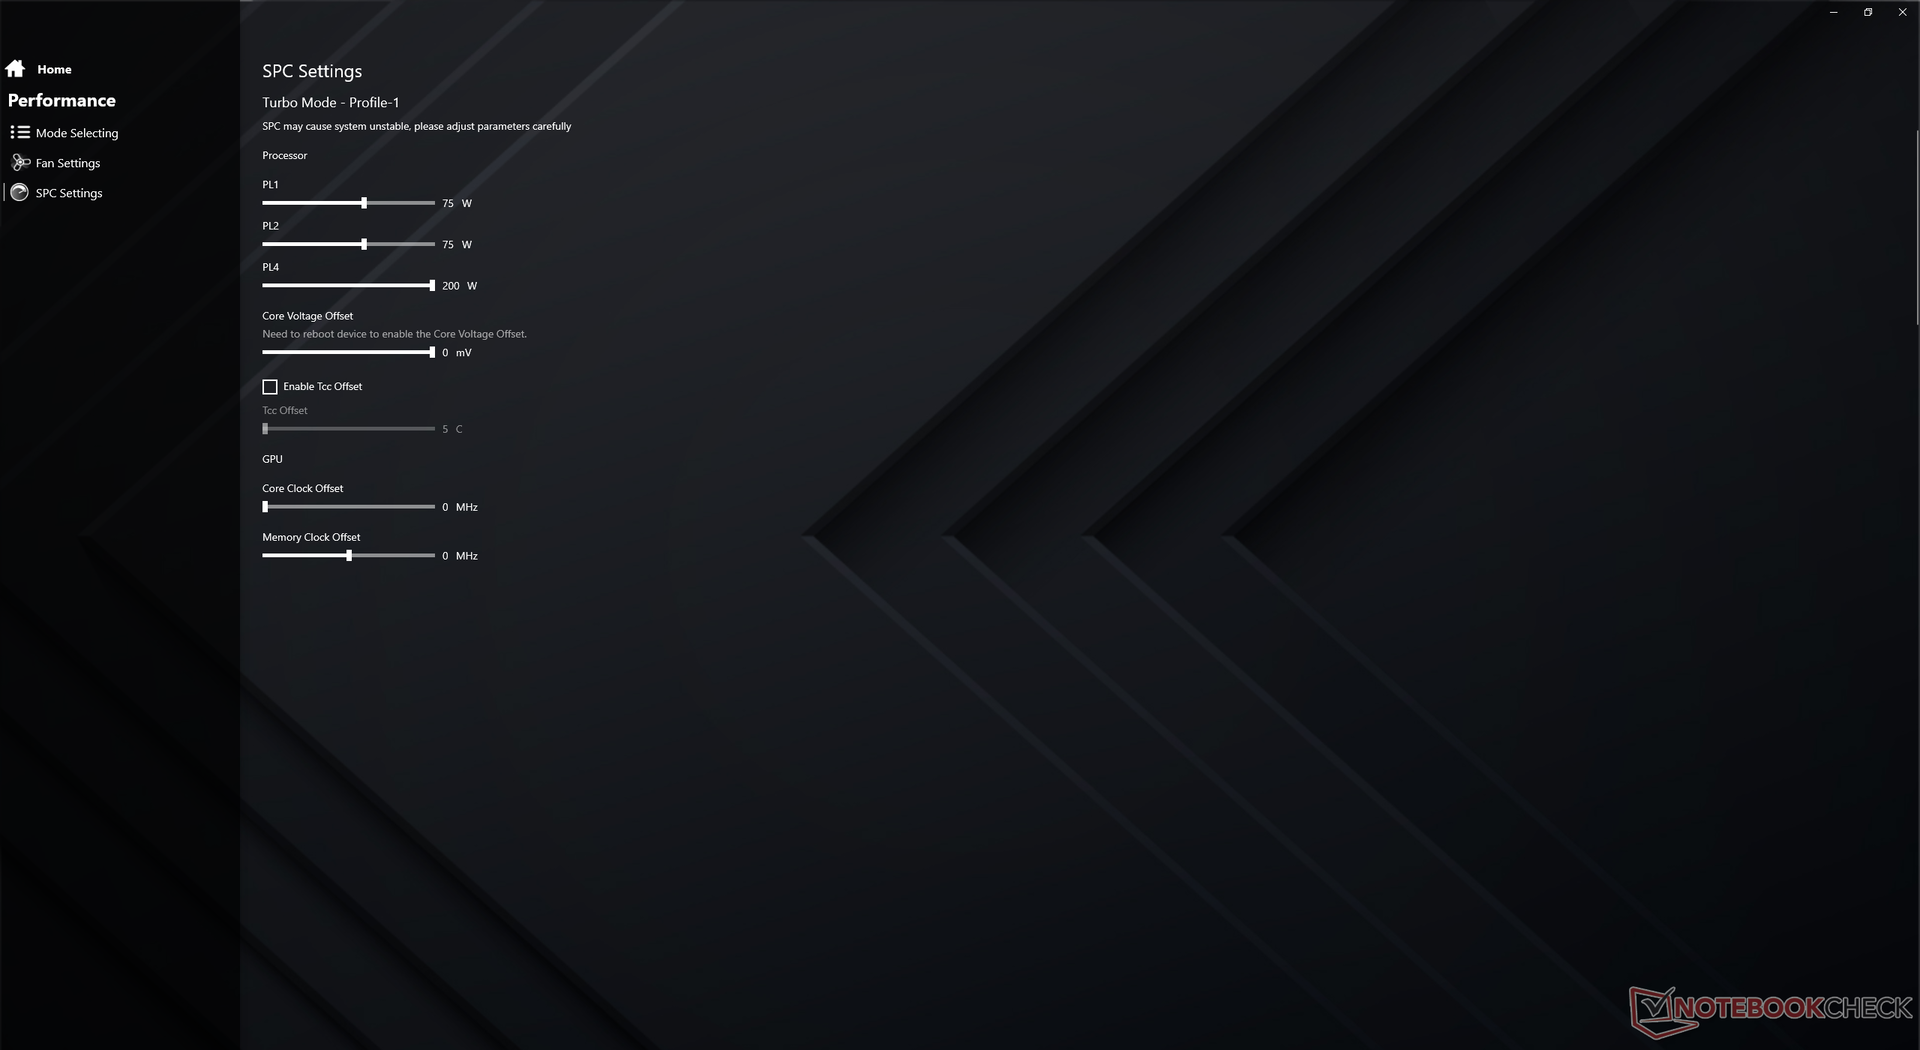
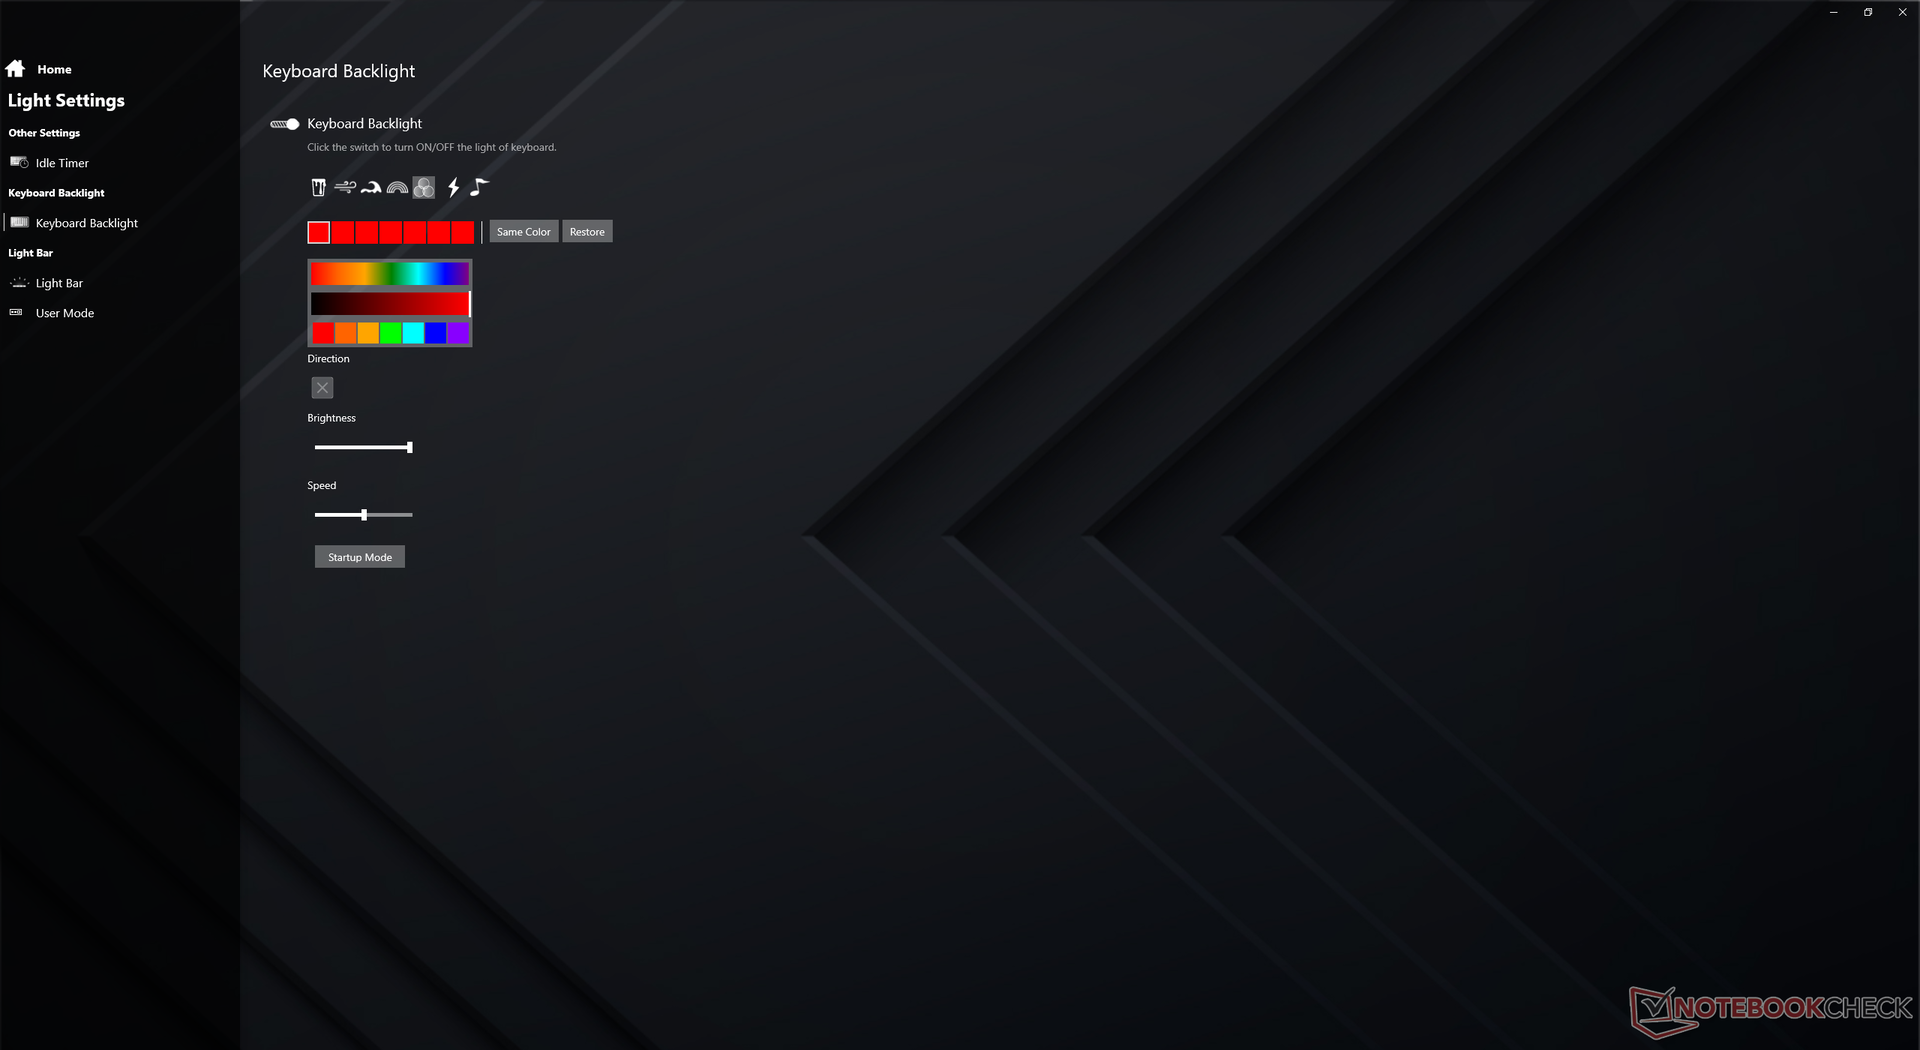
The Maingear squeezes in a 165 W GeForce RTX 3080 GPU despite its compact design to be similar to the GPU as found on the thicker Schenker XMG Ultra 17 in terms of target TGP. Resizable Bar, Dynamic Boost 2.0, and WhisperMode 2.0 are all supported while Advanced Optimus and internal G-Sync are not. Thus, a manual switch is available via the Maingear NODE Control Center software to toggle between dGPU mode (i.e., full GPU performance mode) or Optimus mode. We recommend users become familiar with this software as many system-specific settings and LED features are toggled here.
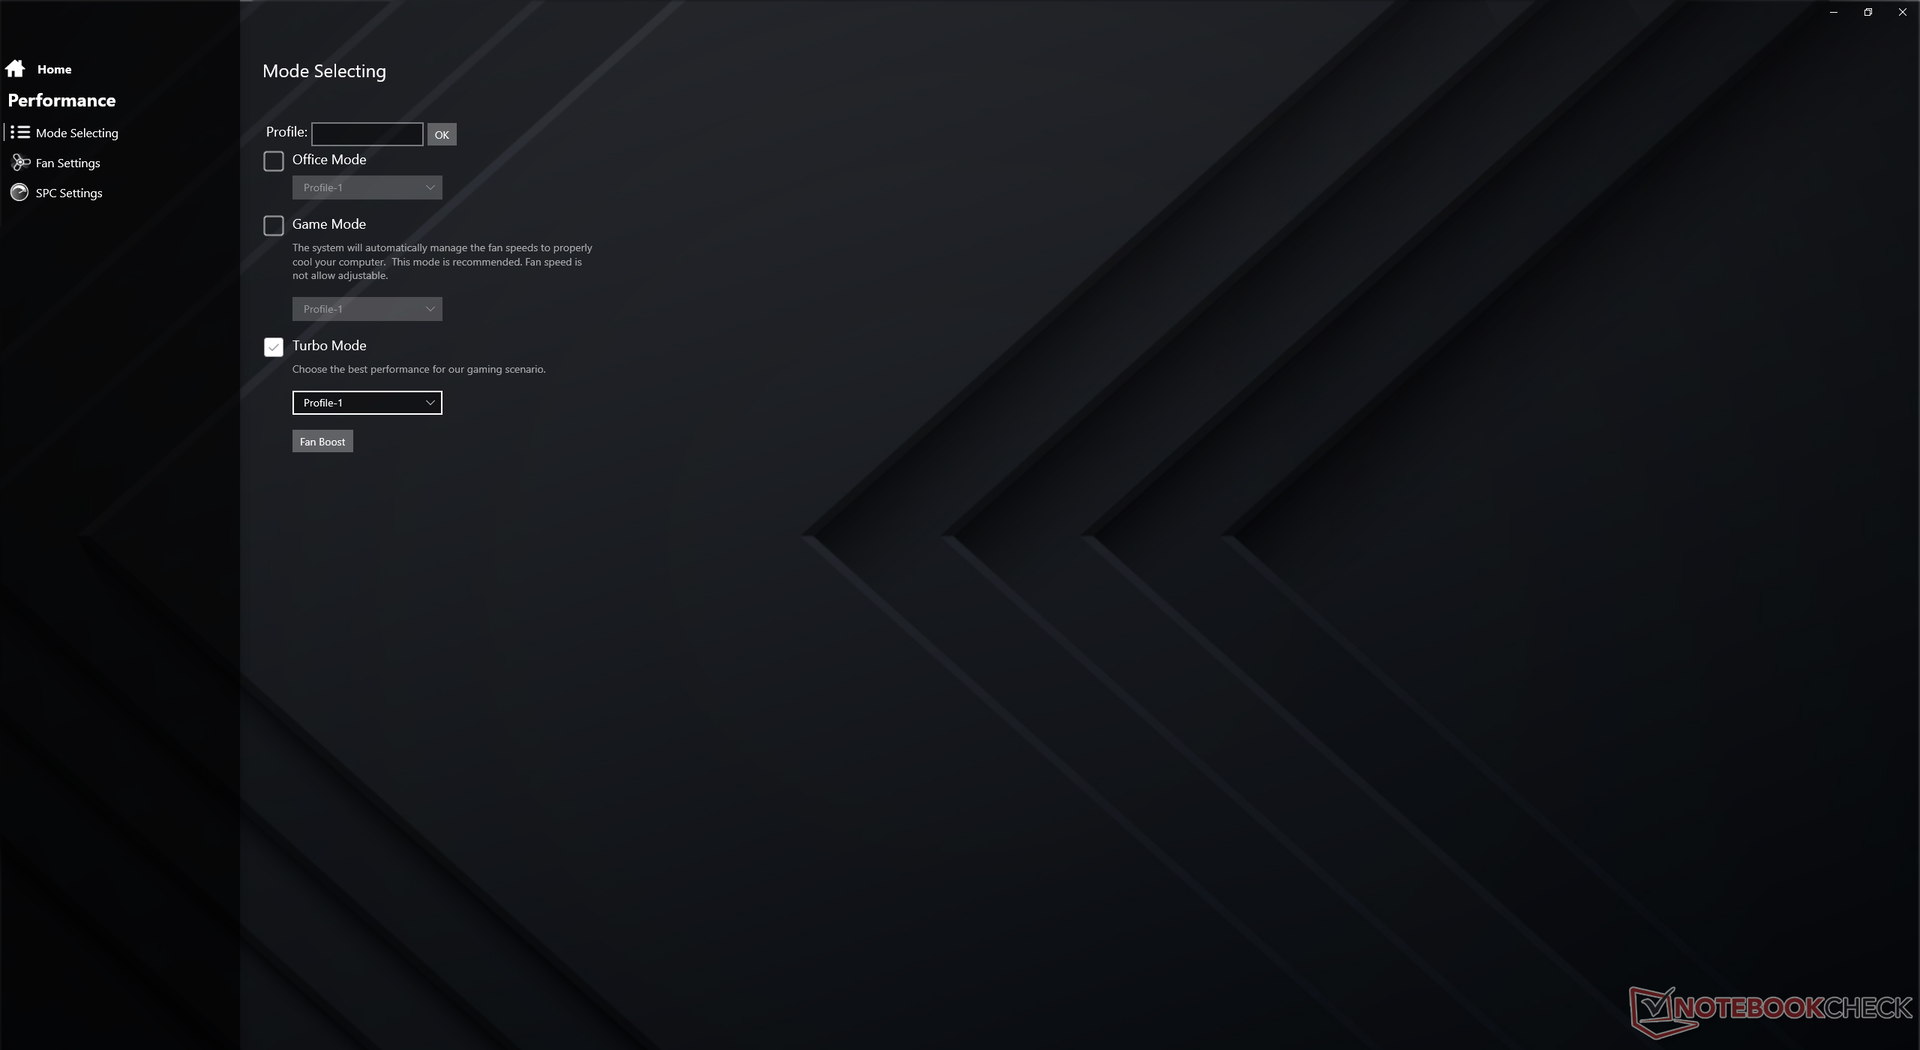
Our system was set to Turbo mode and dGPU mode prior to running any performance benchmarks below for the highest possible scores.
Processor
CPU performance is excellent and where we expect it to be relative to other laptops equipped with the same processor. Users upgrading from an older Core i7-10750H or Core i7-10875H laptop will see a performance boost of roughly 40 percent and 20 percent, respectively. The competing Ryzen 7 5800H is slightly faster in multi-threaded loads while being slightly slower in single-threaded loads than our Core i7-11800H.
Cinebench R15 Multi Loop
Cinebench R23: Multi Core | Single Core
Cinebench R15: CPU Multi 64Bit | CPU Single 64Bit
Blender: v2.79 BMW27 CPU
7-Zip 18.03: 7z b 4 -mmt1 | 7z b 4
Geekbench 5.5: Single-Core | Multi-Core
HWBOT x265 Benchmark v2.2: 4k Preset
LibreOffice : 20 Documents To PDF
R Benchmark 2.5: Overall mean
* ... smaller is better
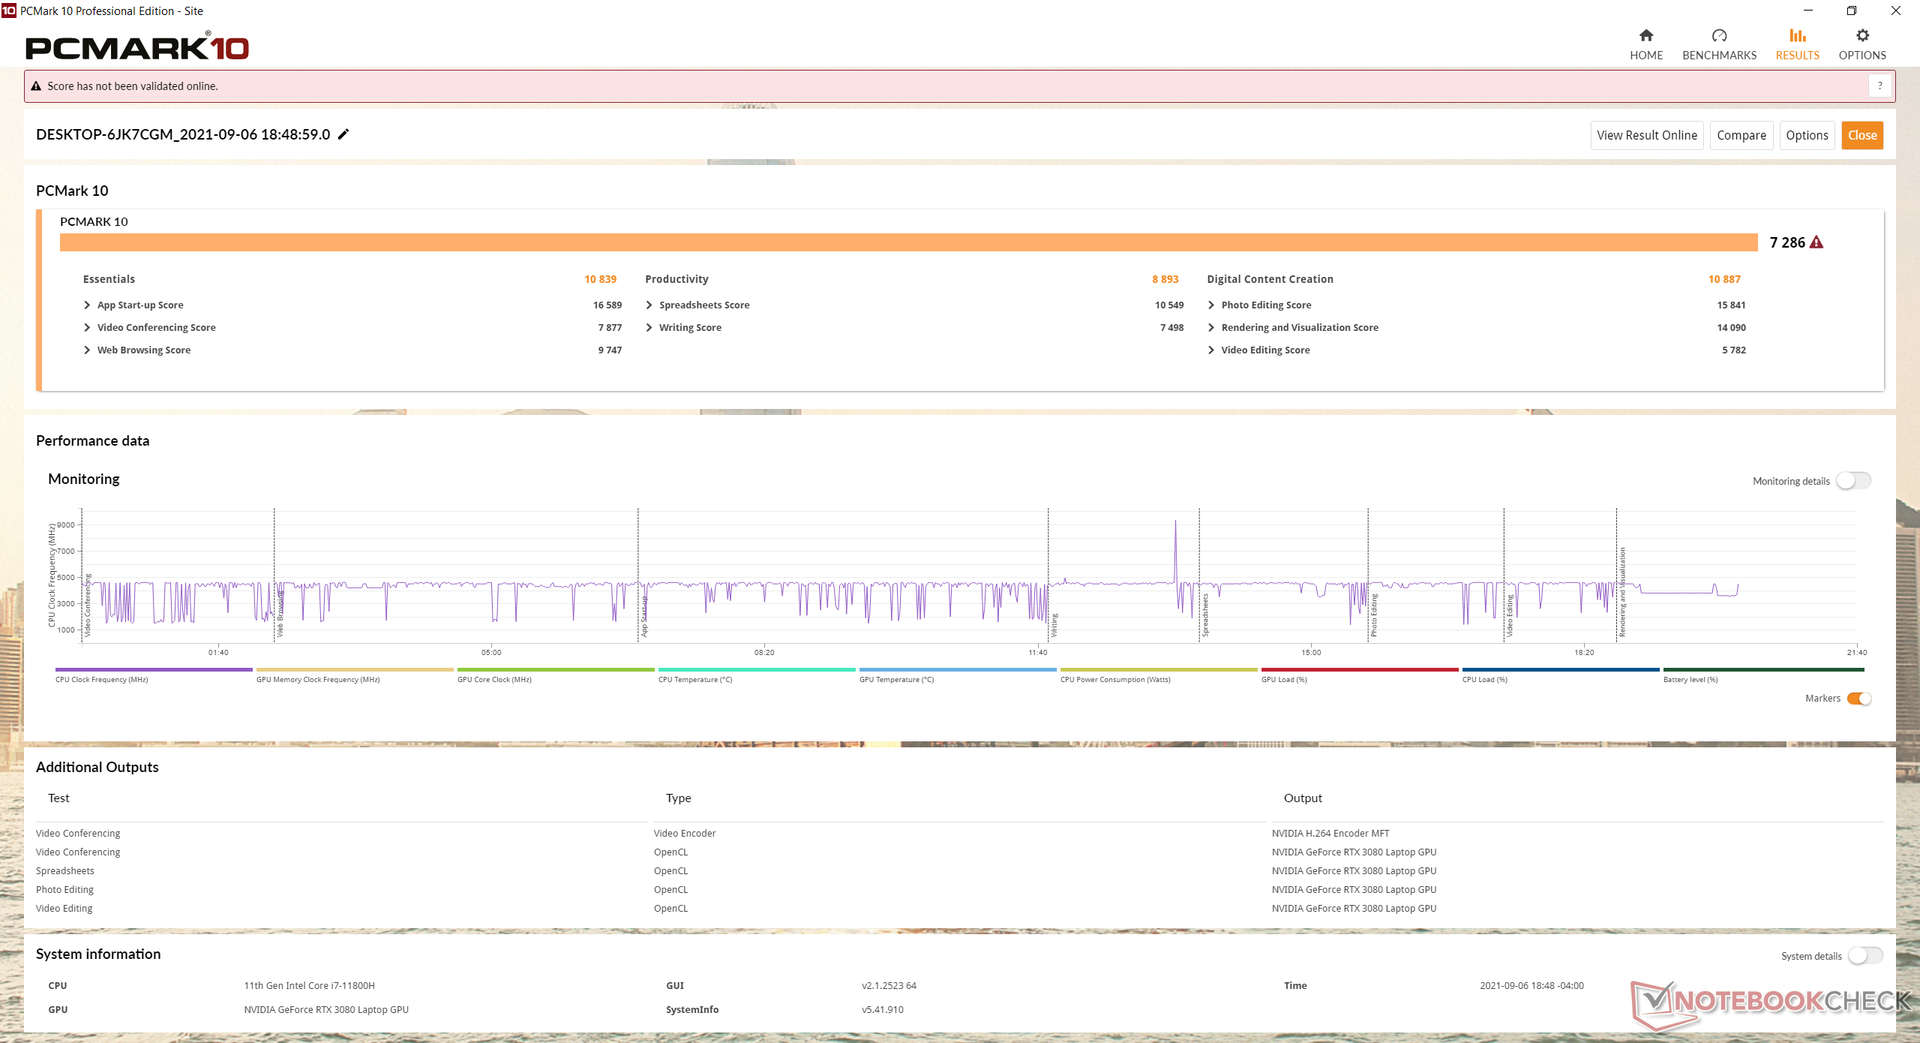
System Performance
| PCMark 10 / Score | |
| Maingear Vector Pro MG-VCP17 | |
| Asus ROG Zephyrus S17 GX703HSD | |
| Average Intel Core i7-11800H, NVIDIA GeForce RTX 3080 Laptop GPU (6673 - 7470, n=11) | |
| Schenker XMG Neo 17 (Early 2021, RTX 3070, 5800H) | |
| MSI GS75 10SF-609US | |
| Schenker Compact 17 | |
| Schenker XMG Core 17 (Early 2021) | |
| PCMark 10 / Essentials | |
| Maingear Vector Pro MG-VCP17 | |
| Asus ROG Zephyrus S17 GX703HSD | |
| Average Intel Core i7-11800H, NVIDIA GeForce RTX 3080 Laptop GPU (9862 - 11064, n=11) | |
| MSI GS75 10SF-609US | |
| Schenker XMG Neo 17 (Early 2021, RTX 3070, 5800H) | |
| Schenker Compact 17 | |
| Schenker XMG Core 17 (Early 2021) | |
| PCMark 10 / Productivity | |
| Asus ROG Zephyrus S17 GX703HSD | |
| Average Intel Core i7-11800H, NVIDIA GeForce RTX 3080 Laptop GPU (8278 - 9803, n=11) | |
| Maingear Vector Pro MG-VCP17 | |
| Schenker XMG Neo 17 (Early 2021, RTX 3070, 5800H) | |
| Schenker Compact 17 | |
| MSI GS75 10SF-609US | |
| Schenker XMG Core 17 (Early 2021) | |
| PCMark 10 / Digital Content Creation | |
| Maingear Vector Pro MG-VCP17 | |
| Asus ROG Zephyrus S17 GX703HSD | |
| Average Intel Core i7-11800H, NVIDIA GeForce RTX 3080 Laptop GPU (9881 - 11323, n=11) | |
| Schenker XMG Neo 17 (Early 2021, RTX 3070, 5800H) | |
| MSI GS75 10SF-609US | |
| Schenker Compact 17 | |
| Schenker XMG Core 17 (Early 2021) | |
| PCMark 10 Score | 7286 points | |
Help | ||
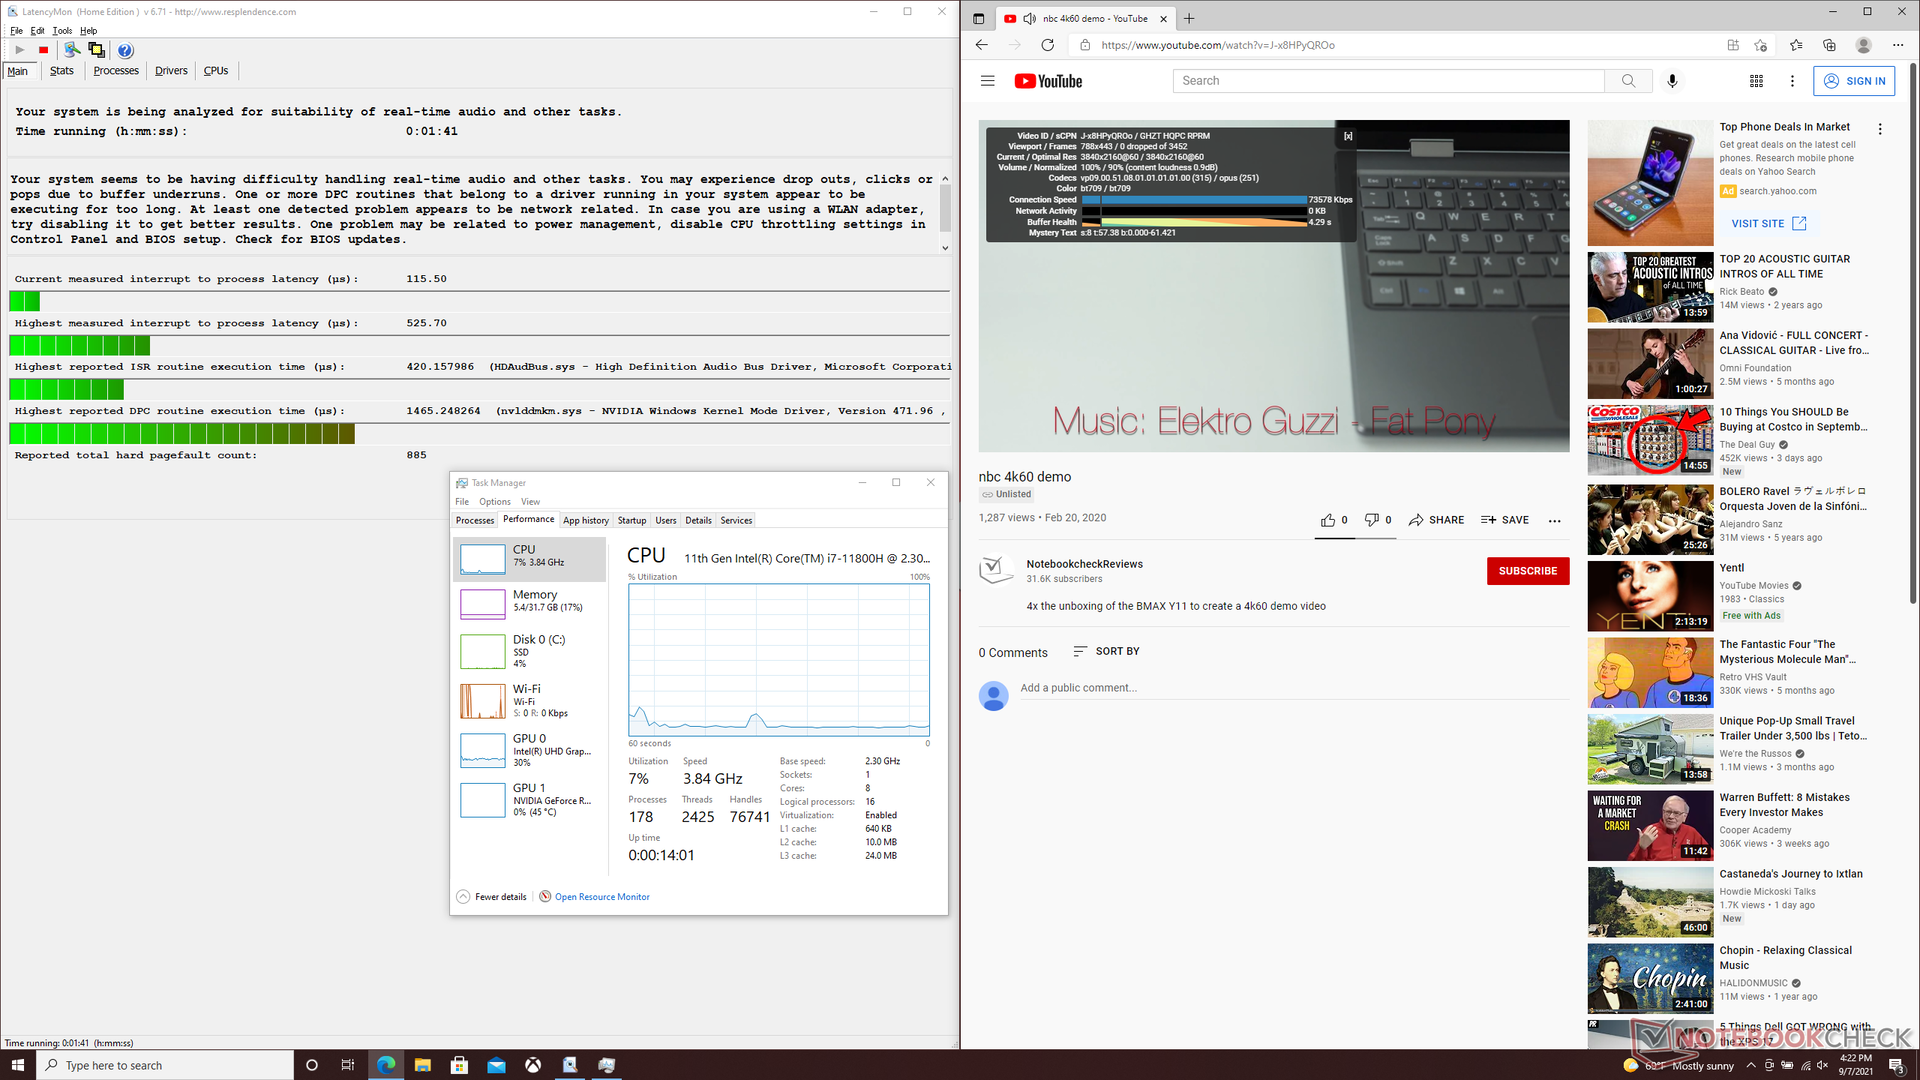
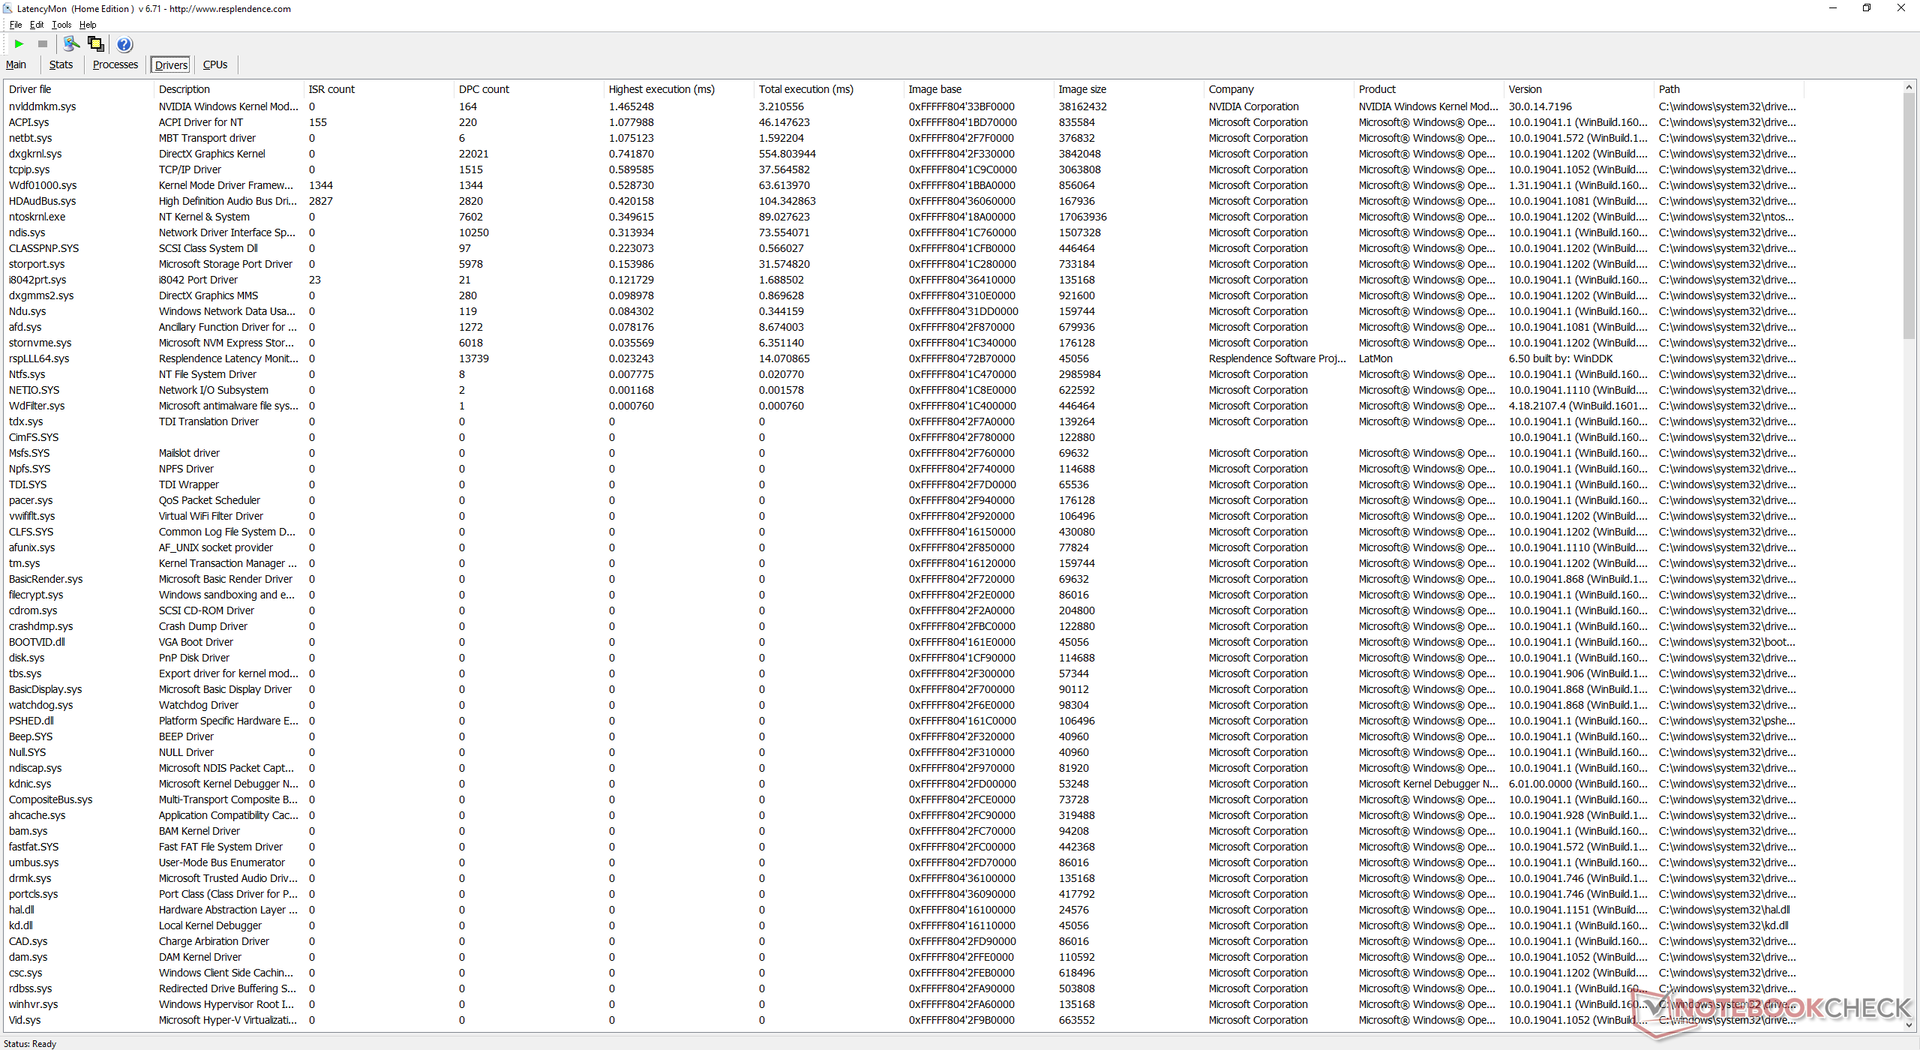
DPC Latency
LatencyMon shows minor DPC latency issues when opening multiple browser tabs on our homepage. 4K video playback at 60 FPS is otherwise smooth and with no dropped frames.
| DPC Latencies / LatencyMon - interrupt to process latency (max), Web, Youtube, Prime95 | |
| Schenker XMG Neo 17 (Early 2021, RTX 3070, 5800H) | |
| Asus ROG Zephyrus S17 GX703HSD | |
| Schenker XMG Core 17 (Early 2021) | |
| Schenker Compact 17 | |
| Maingear Vector Pro MG-VCP17 | |
| MSI GS75 10SF-609US | |
* ... smaller is better
Storage Devices
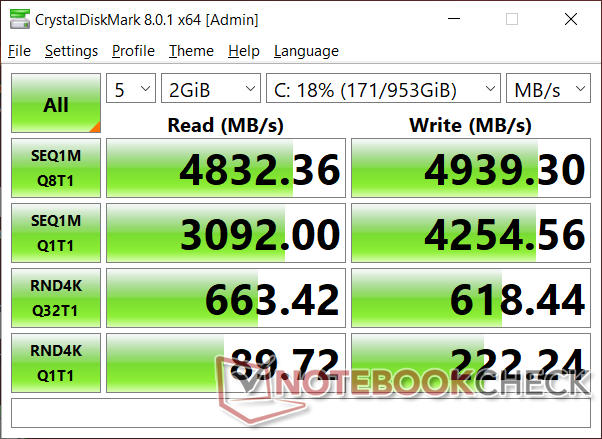
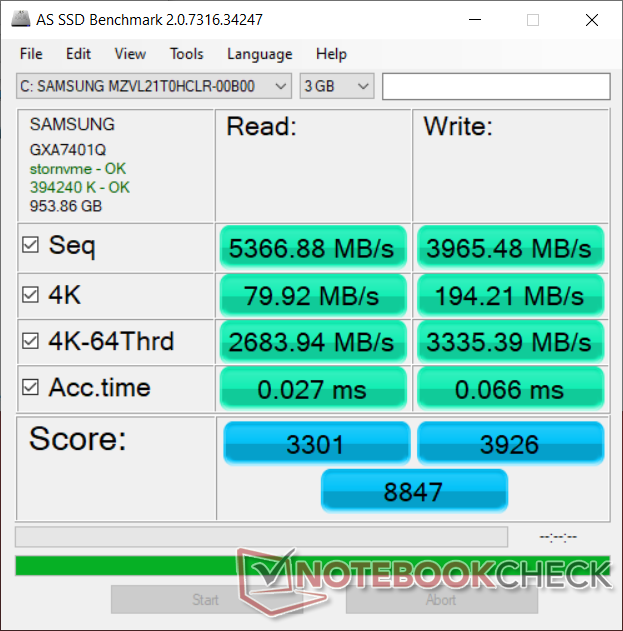
Our test unit comes with a Samsung PM9A1 which is the manufacturer's premier PCIe Gen4 NVMe SSD for consumers. Sequential read and write rates approach 7000 MB/s and 5200 MB/s, respectively, to be about 2x faster than on the Samsung PM981a series commonly found on previous generation flagship laptops.
| Maingear Vector Pro MG-VCP17 Samsung PM9A1 MZVL21T0HCLR | Asus ROG Zephyrus S17 GX703HSD Samsung PM9A1 MZVL22T0HBLB | Schenker XMG Core 17 (Early 2021) Samsung SSD 970 EVO Plus 1TB | Schenker XMG Neo 17 (Early 2021, RTX 3070, 5800H) Samsung SSD 970 EVO Plus 500GB | Schenker Compact 17 Samsung SSD 970 EVO Plus 1TB | MSI GS75 10SF-609US WDC PC SN730 SDBPNTY-512G | |
|---|---|---|---|---|---|---|
| AS SSD | 7% | -38% | -28% | -28% | -50% | |
| Seq Read (MB/s) | 5367 | 5085 -5% | 2876 -46% | 3020 -44% | 2879 -46% | 2327 -57% |
| Seq Write (MB/s) | 3965 | 4434 12% | 2803 -29% | 2631 -34% | 2842 -28% | 2479 -37% |
| 4K Read (MB/s) | 79.9 | 80.3 1% | 55.3 -31% | 60.3 -25% | 51.6 -35% | 45.46 -43% |
| 4K Write (MB/s) | 194.2 | 214.7 11% | 106.9 -45% | 171.6 -12% | 142.5 -27% | 157.4 -19% |
| 4K-64 Read (MB/s) | 2684 | 2573 -4% | 1662 -38% | 1410 -47% | 1672 -38% | 1050 -61% |
| 4K-64 Write (MB/s) | 3335 | 2972 -11% | 2101 -37% | 2324 -30% | 2293 -31% | 938 -72% |
| Access Time Read * (ms) | 0.027 | 0.018 33% | 0.067 -148% | 0.045 -67% | 0.034 -26% | 0.076 -181% |
| Access Time Write * (ms) | 0.066 | 0.02 70% | 0.037 44% | 0.024 64% | 0.027 59% | 0.071 -8% |
| Score Read (Points) | 3301 | 3161 -4% | 2005 -39% | 1773 -46% | 2012 -39% | 1328 -60% |
| Score Write (Points) | 3926 | 3631 -8% | 2488 -37% | 2759 -30% | 2719 -31% | 1343 -66% |
| Score Total (Points) | 8847 | 8380 -5% | 5520 -38% | 5429 -39% | 5760 -35% | 3366 -62% |
| Copy ISO MB/s (MB/s) | 2579 | 3239 26% | 2029 -21% | 2383 -8% | 3092 20% | |
| Copy Program MB/s (MB/s) | 1133 | 899 -21% | 691 -39% | 603 -47% | 733 -35% | |
| Copy Game MB/s (MB/s) | 2161 | 2171 0% | 1513 -30% | 873 -60% | 1683 -22% | |
| CrystalDiskMark 5.2 / 6 | 1% | -32% | -28% | -31% | -37% | |
| Write 4K (MB/s) | 227.2 | 244.2 7% | 145.7 -36% | 206.1 -9% | 167.8 -26% | 177.9 -22% |
| Read 4K (MB/s) | 89 | 89.8 1% | 51.3 -42% | 53 -40% | 53.5 -40% | 47.42 -47% |
| Write Seq (MB/s) | 4256 | 3036 -29% | 3018 -29% | 3073 -28% | 2707 -36% | |
| Read Seq (MB/s) | 4364 | 2837 -35% | 2575 -41% | 2488 -43% | 2369 -46% | |
| Write 4K Q32T1 (MB/s) | 614 | 607 -1% | 511 -17% | 535 -13% | 524 -15% | 427.8 -30% |
| Read 4K Q32T1 (MB/s) | 659 | 658 0% | 582 -12% | 608 -8% | 595 -10% | 543 -18% |
| Write Seq Q32T1 (MB/s) | 5216 | 5270 1% | 3294 -37% | 3242 -38% | 3324 -36% | 2703 -48% |
| Read Seq Q32T1 (MB/s) | 7073 | 7091 0% | 3522 -50% | 3617 -49% | 3564 -50% | 3387 -52% |
| Write 4K Q8T8 (MB/s) | 2270 | |||||
| Read 4K Q8T8 (MB/s) | 2490 | |||||
| Total Average (Program / Settings) | 4% /
5% | -35% /
-36% | -28% /
-28% | -30% /
-29% | -44% /
-46% |
* ... smaller is better

Disk Throttling: DiskSpd Read Loop, Queue Depth 8
GPU Performance
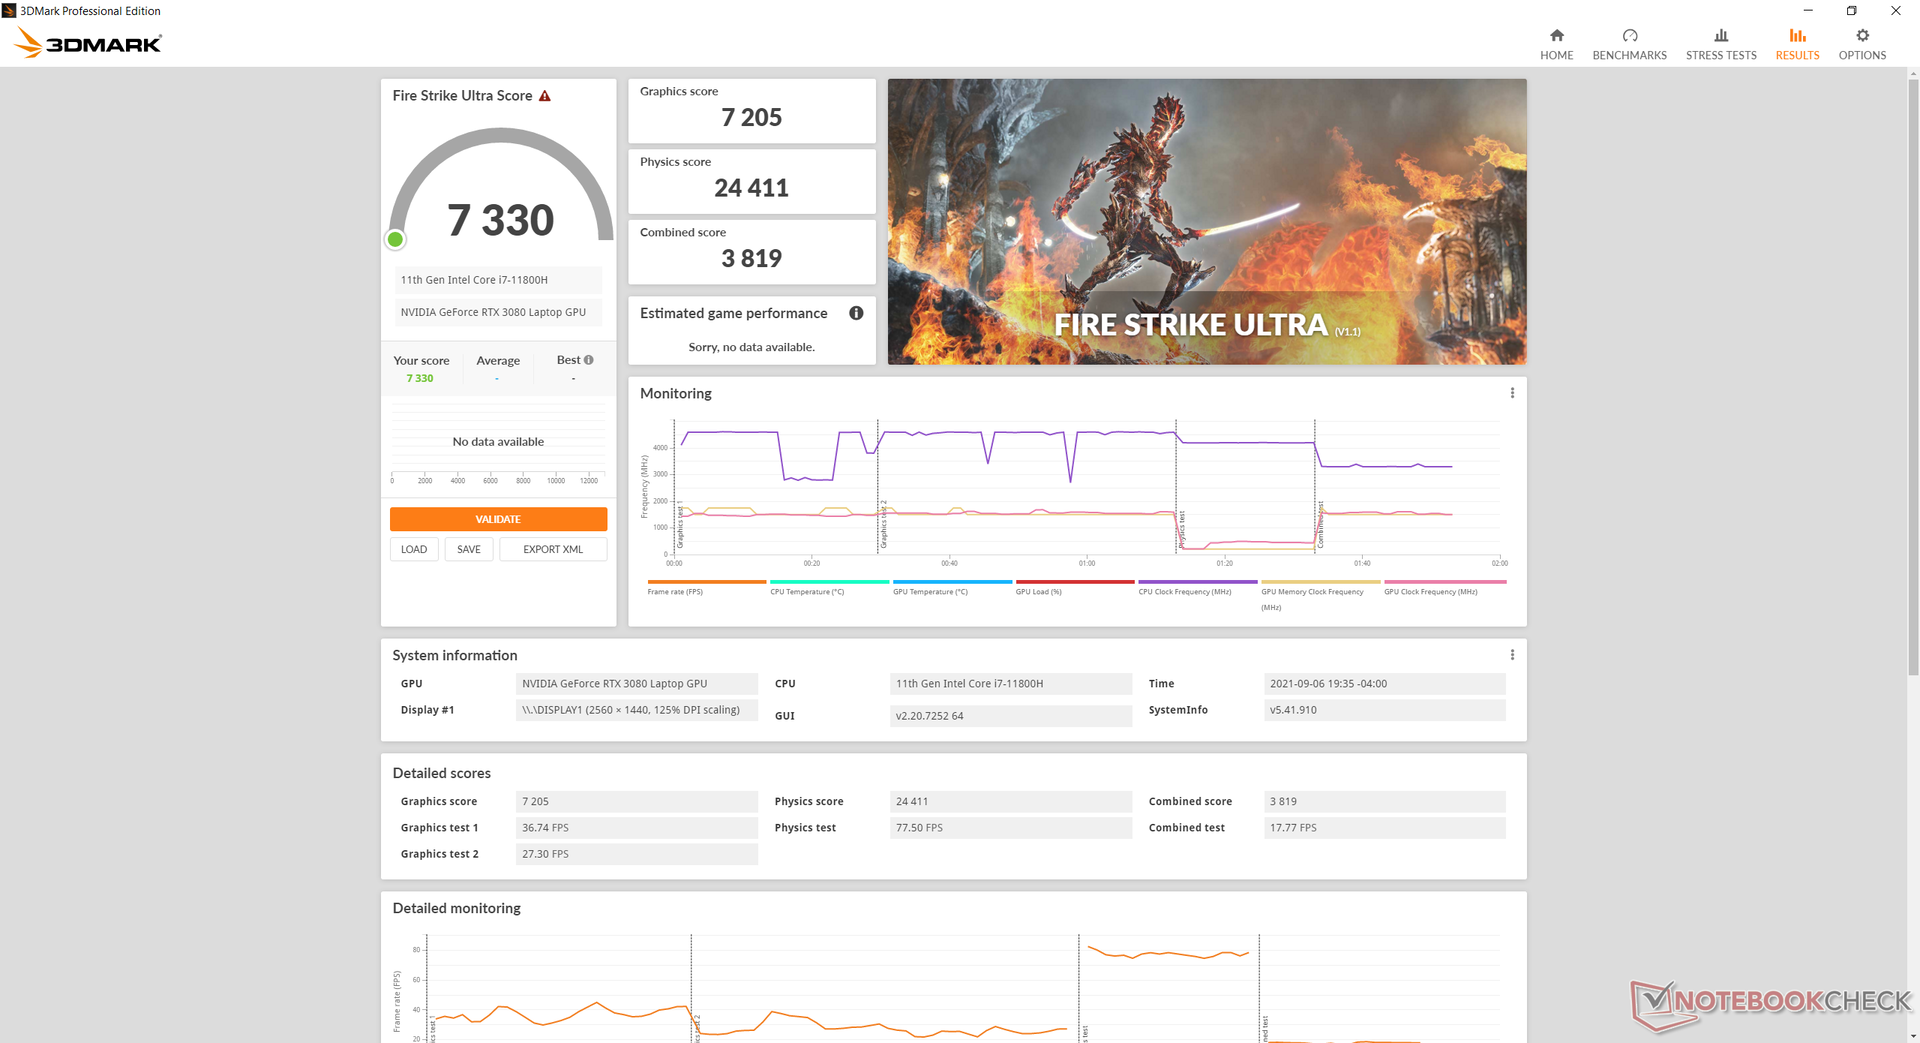
Graphics performance falls short by around 15 percent when compared to the Schenker Ultra 17 even though each system comes with a 165 W TGP GeForce RTX 3080. A "proper" desktop RTX 3080 can perform anywhere between 40 to 60 percent faster than our mobile version. Even so, our GPU is about where we expect it to be after testing over 30 RTX 3080 laptops thus far.
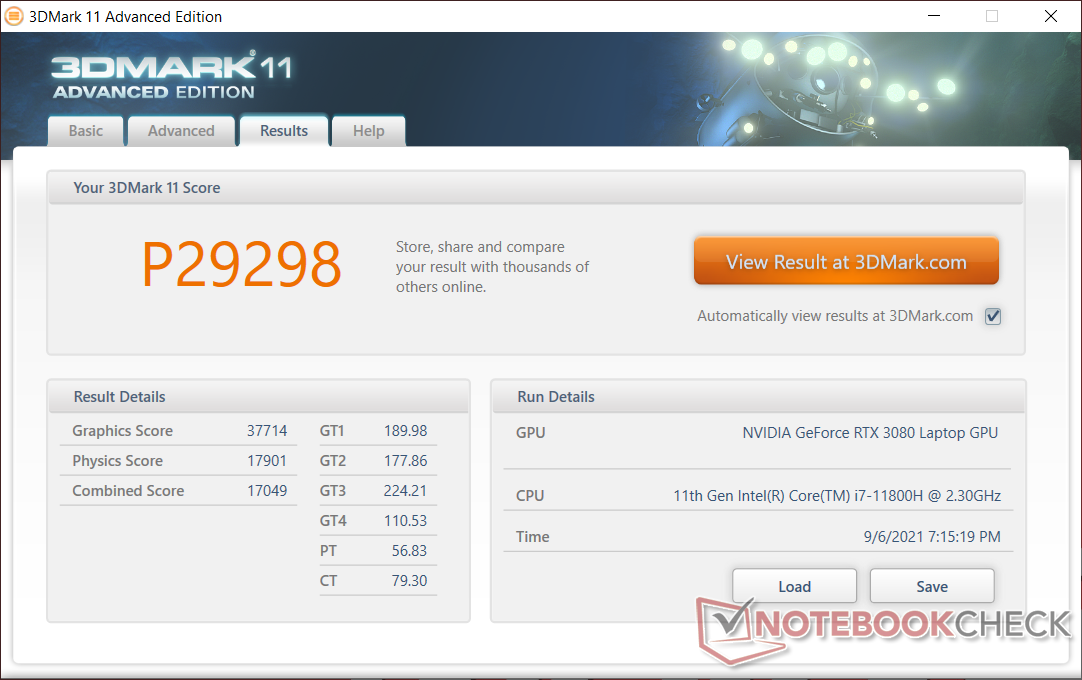
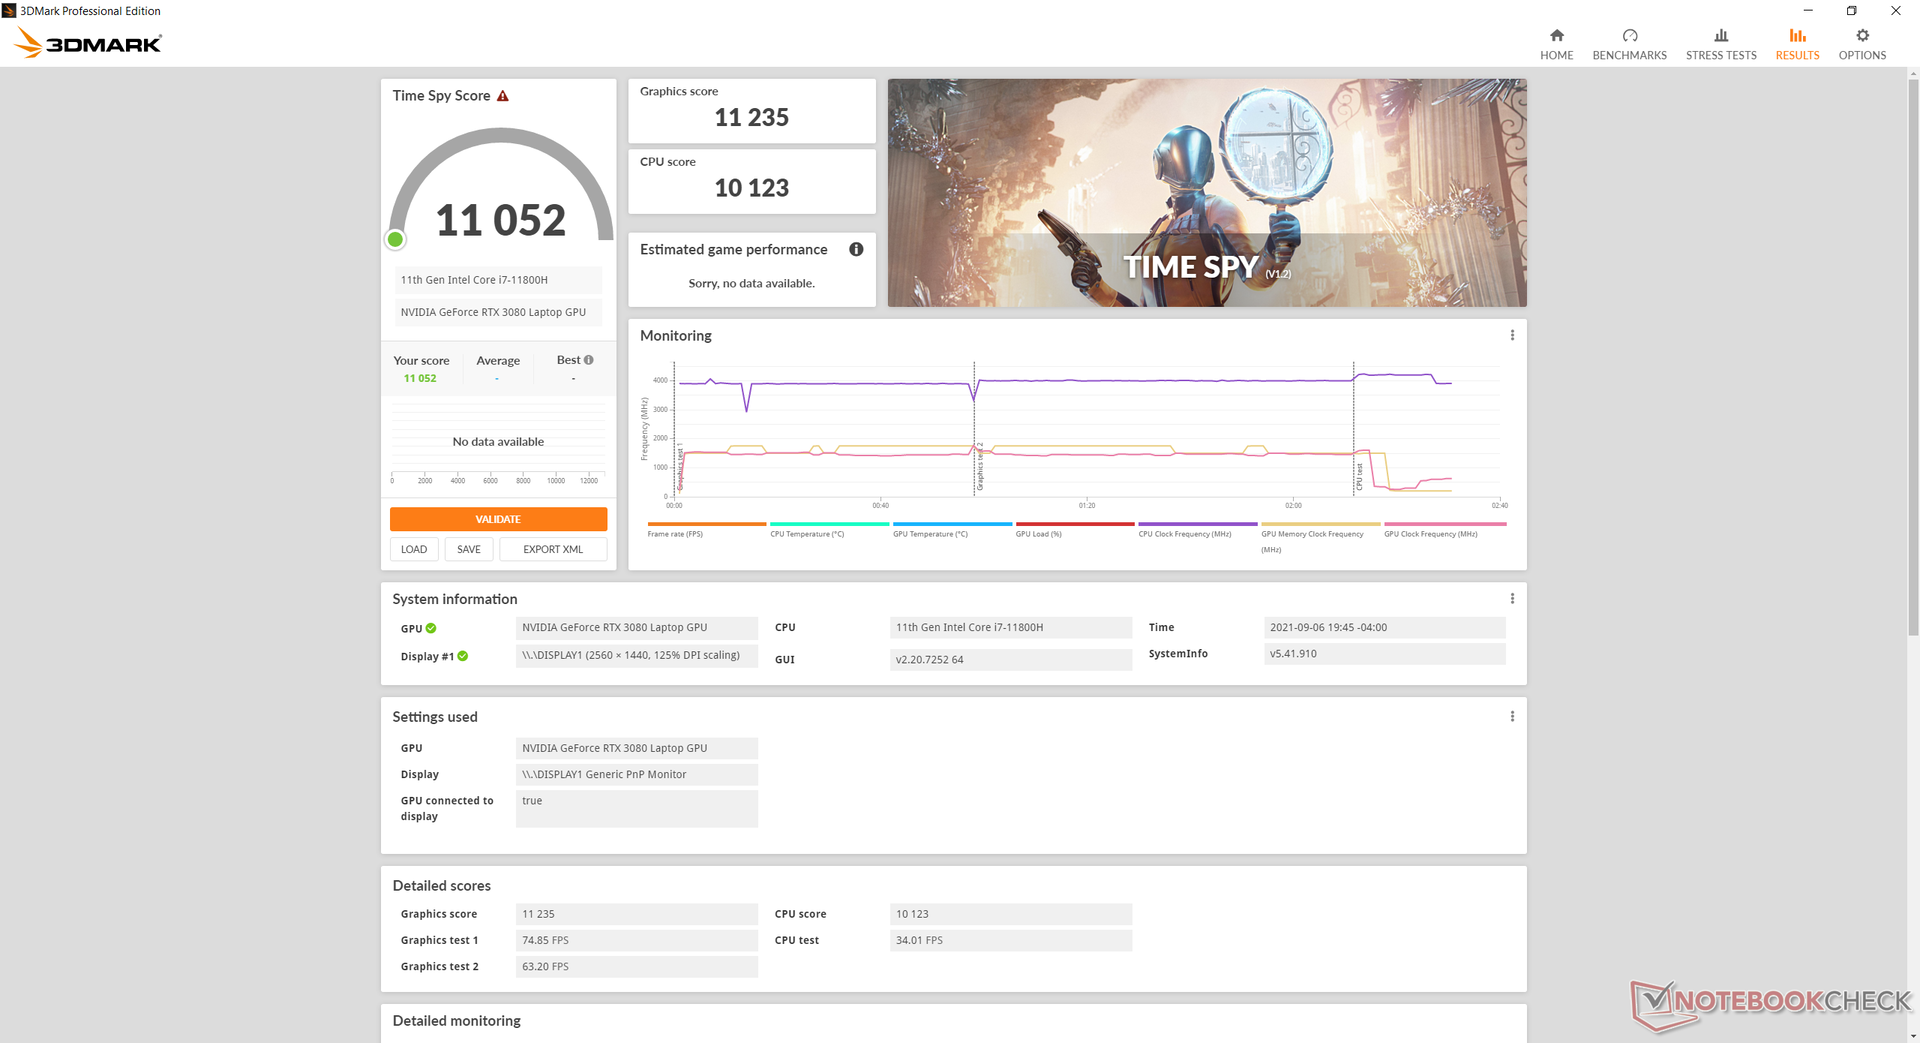
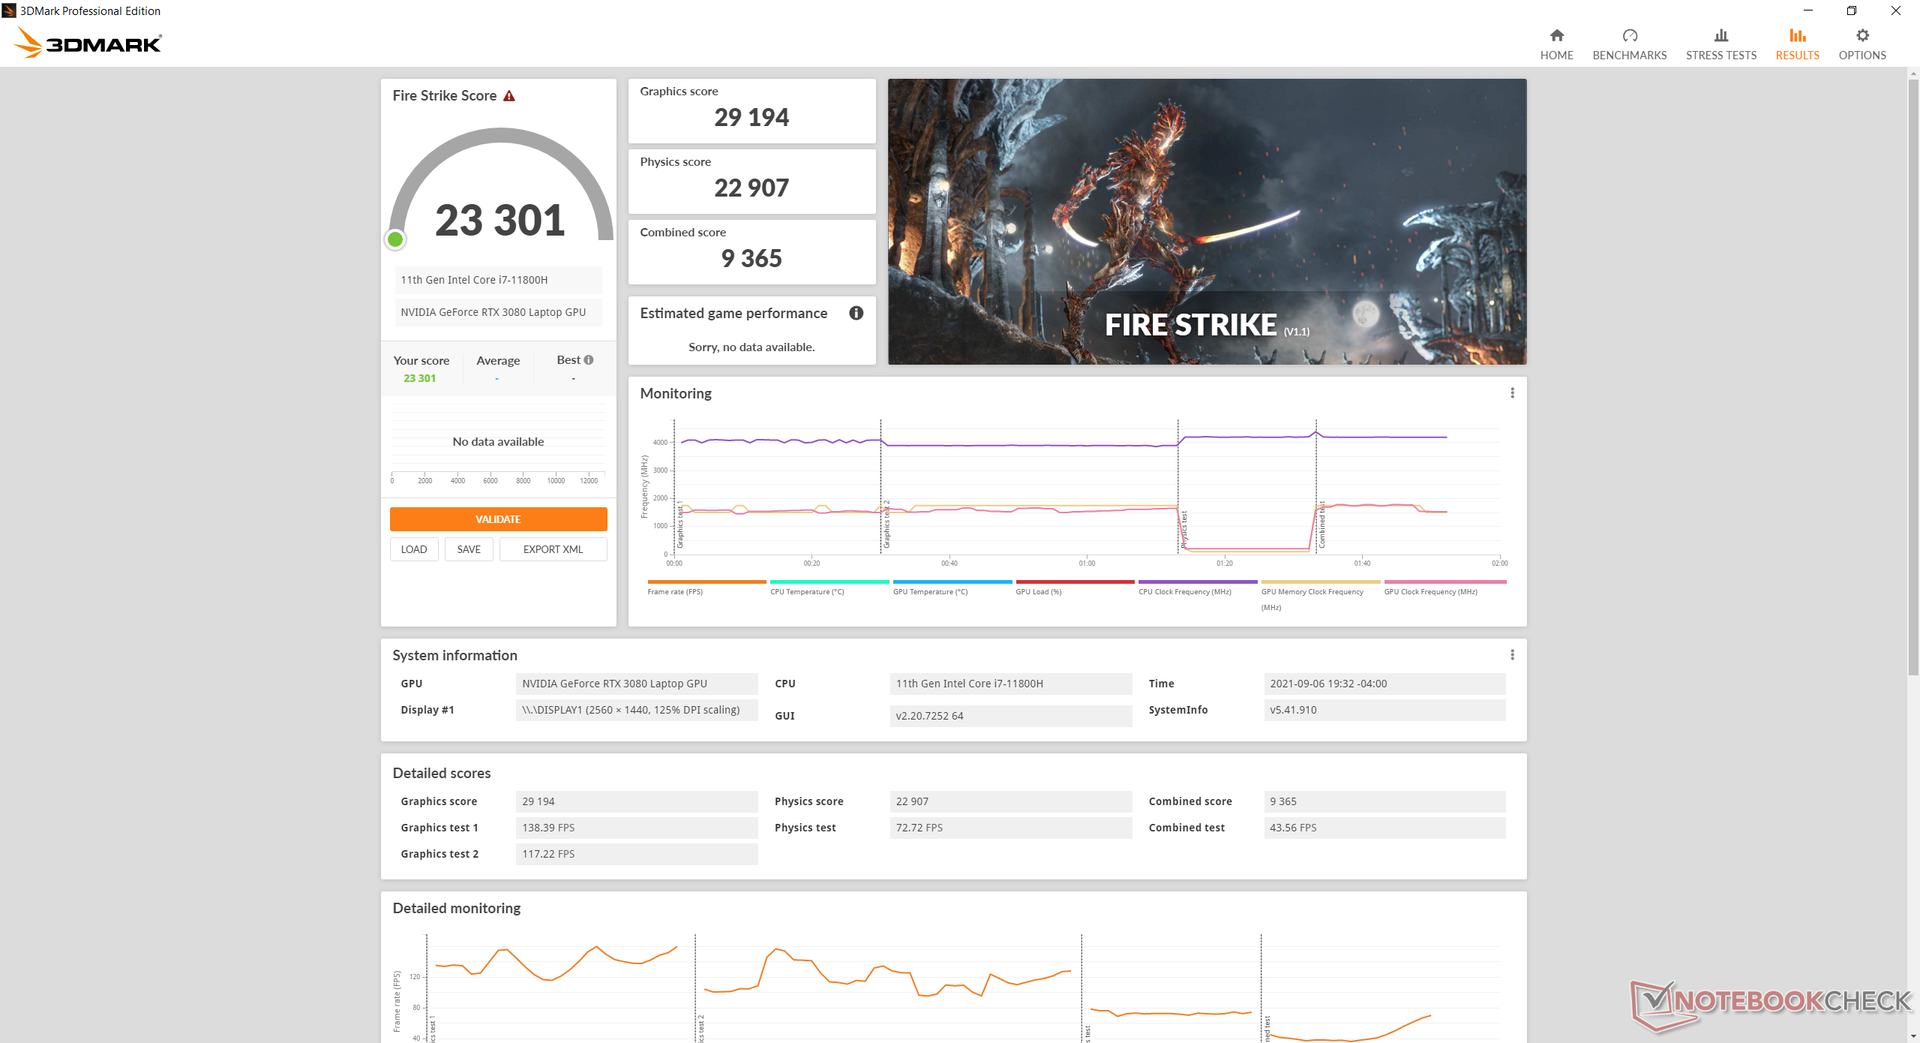
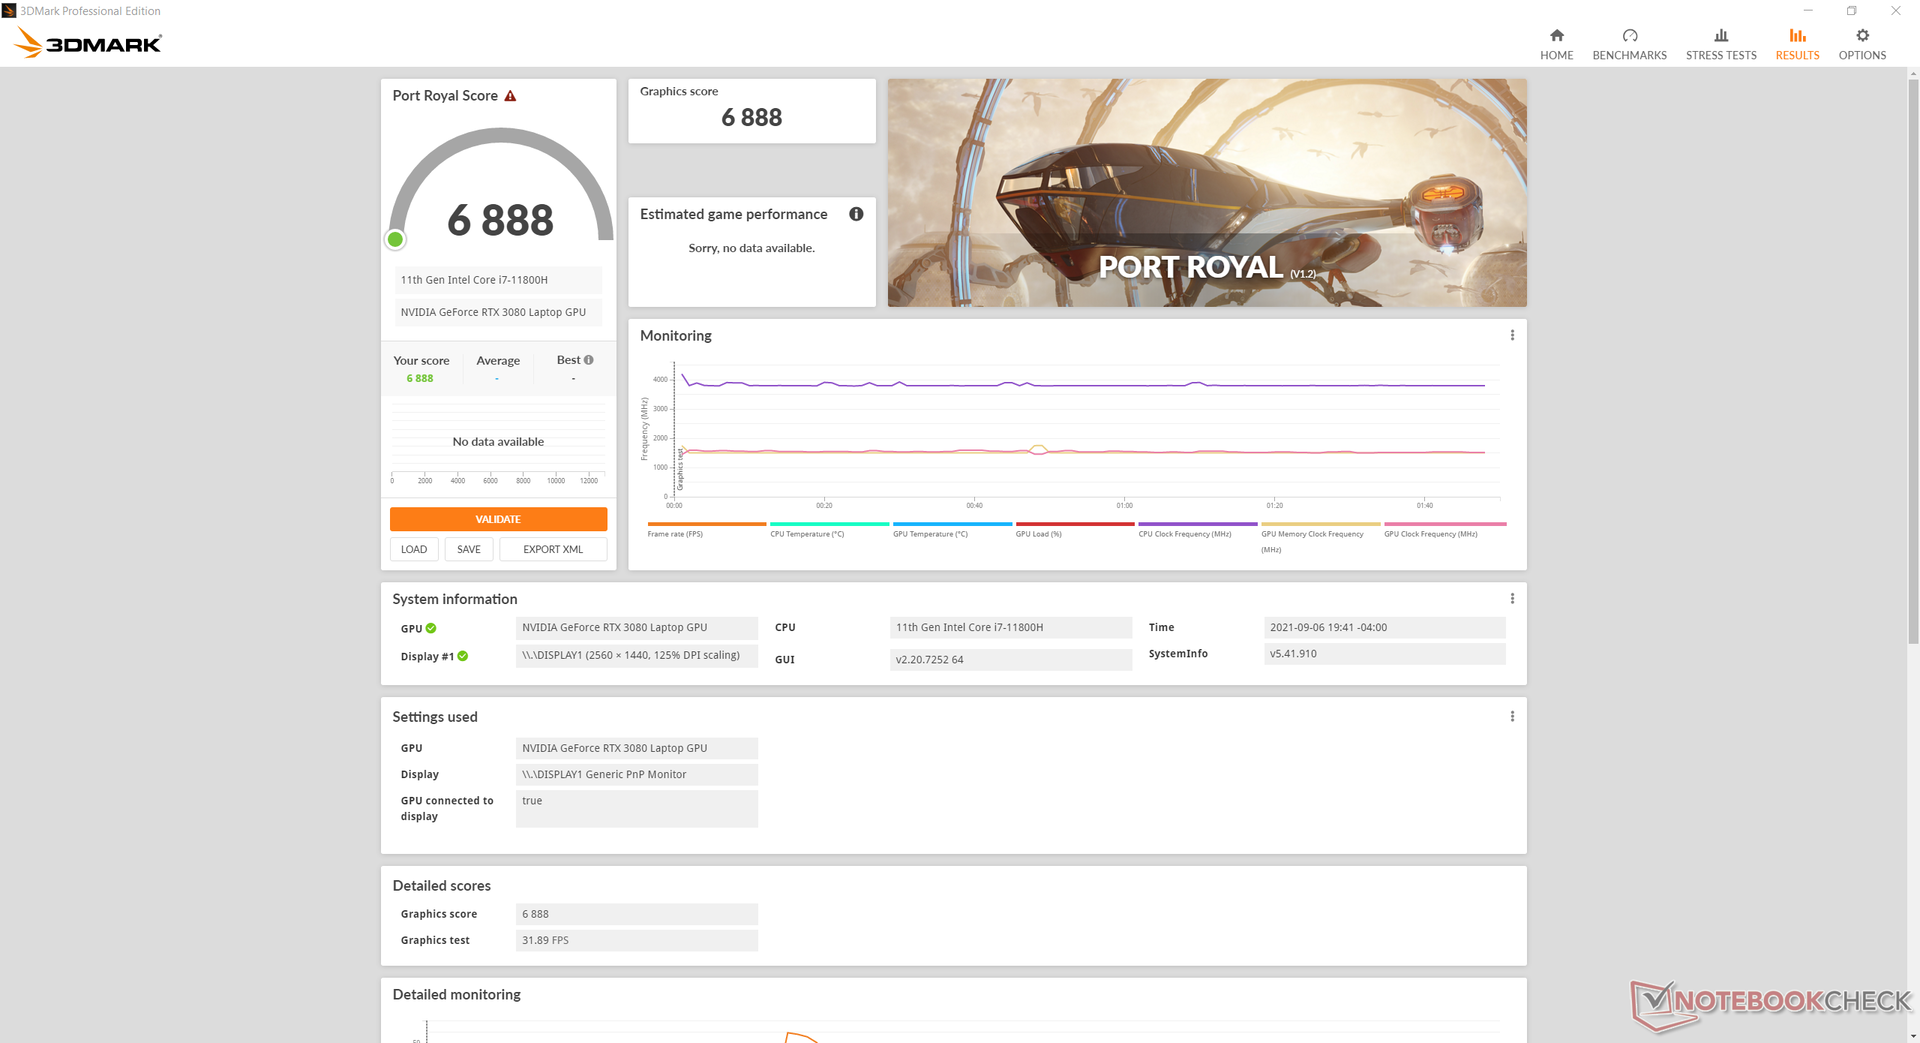
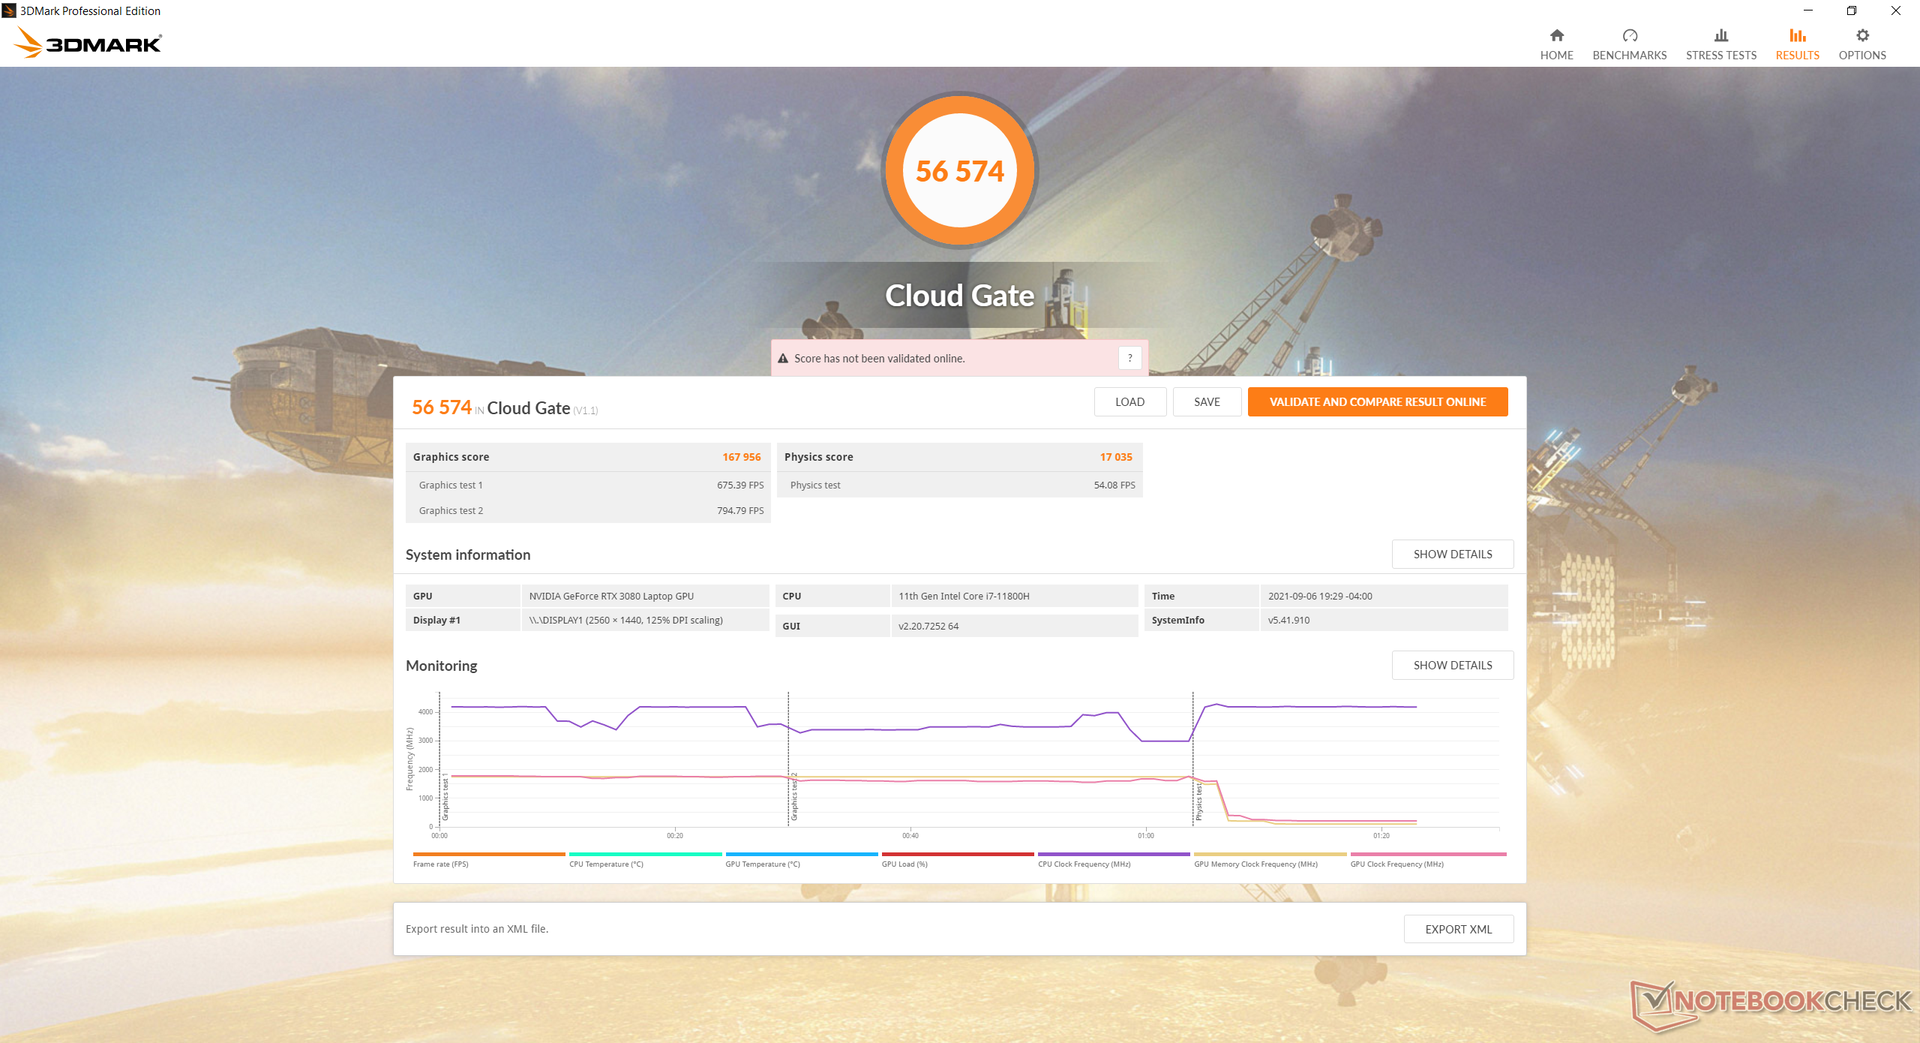
| 3DMark 11 Performance | 29298 points | |
| 3DMark Cloud Gate Standard Score | 56574 points | |
| 3DMark Fire Strike Score | 23301 points | |
| 3DMark Time Spy Score | 11052 points | |
Help | ||
Witcher 3 FPS Chart
| low | med. | high | ultra | QHD | |
|---|---|---|---|---|---|
| GTA V (2015) | 184 | 179 | 173 | 109 | 99.1 |
| The Witcher 3 (2015) | 439.6 | 321.2 | 212.9 | 108.6 | |
| Dota 2 Reborn (2015) | 164 | 145 | 142 | 127 | |
| Final Fantasy XV Benchmark (2018) | 184 | 144 | 108 | 83.5 | |
| X-Plane 11.11 (2018) | 126 | 114 | 85.7 | ||
| Far Cry 5 (2018) | 162 | 140 | 134 | 124 | 110 |
| Strange Brigade (2018) | 521 | 289 | 233 | 204 | 151 |
Emissions
System Noise
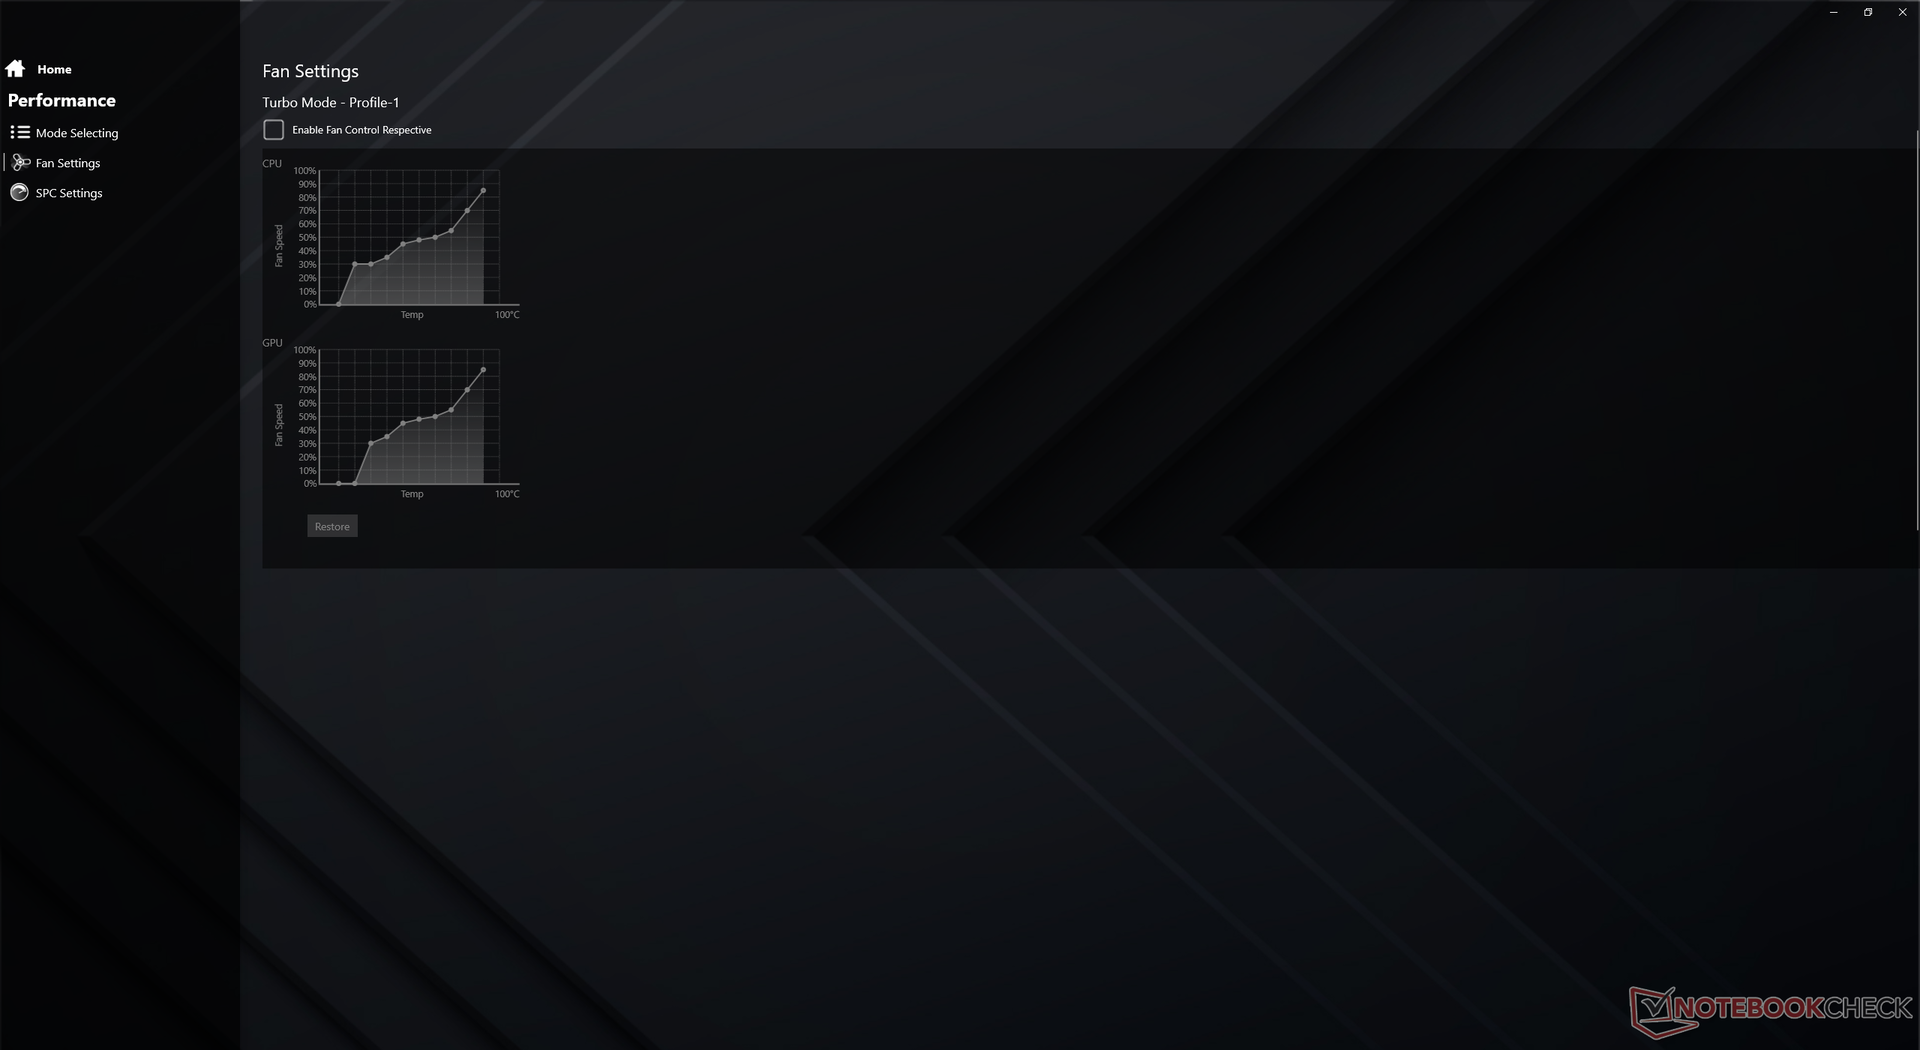
Fan noise is a mixed bag. When idling on desktop or web browsing, fan noise is generally quiet topping out at only 28.7 dB(A) against a silent background of 23.8 dB(A). When running the first benchmark scene of 3DMark 06, however, fan noise would boost to as high as 38 dB(A) in the middle of the scene before falling back down to 28.7 dB(A) towards the end. It's recommended to run on Office mode instead of Turbo mode to keep the fans from pulsing as frequently.
Fan noise when gaming is very loud at almost 56 dB(A) to be distracting if not wearing headphones. Enabling Fan Boost will set the fans to their maximum of 56 dB(A) regardless of processing load, but users will reach this ceiling anyway when gaming regardless of the Fan Boost setting.
| Maingear Vector Pro MG-VCP17 GeForce RTX 3080 Laptop GPU, i7-11800H, Samsung PM9A1 MZVL21T0HCLR | Asus ROG Zephyrus S17 GX703HSD GeForce RTX 3080 Laptop GPU, i9-11900H, Samsung PM9A1 MZVL22T0HBLB | Schenker XMG Core 17 (Early 2021) GeForce RTX 3060 Laptop GPU, i7-10870H, Samsung SSD 970 EVO Plus 1TB | Schenker XMG Neo 17 (Early 2021, RTX 3070, 5800H) GeForce RTX 3070 Laptop GPU, R7 5800H, Samsung SSD 970 EVO Plus 500GB | Schenker Compact 17 GeForce RTX 2070 Super Mobile, i7-10875H, Samsung SSD 970 EVO Plus 1TB | MSI GS75 10SF-609US GeForce RTX 2070 Max-Q, i7-10875H, WDC PC SN730 SDBPNTY-512G | |
|---|---|---|---|---|---|---|
| Noise | 5% | -20% | -20% | -21% | -21% | |
| off / environment * (dB) | 23.8 | 23 3% | 25 -5% | 24 -1% | 25.4 -7% | 26.2 -10% |
| Idle Minimum * (dB) | 23.9 | 23 4% | 30 -26% | 29 -21% | 25.4 -6% | 31.2 -31% |
| Idle Average * (dB) | 23.9 | 23 4% | 32 -34% | 32 -34% | 25.4 -6% | 31.4 -31% |
| Idle Maximum * (dB) | 23.9 | 23 4% | 36 -51% | 38 -59% | 40 -67% | 34 -42% |
| Load Average * (dB) | 38 | 41 -8% | 53 -39% | 49 -29% | 54.6 -44% | 49.5 -30% |
| Witcher 3 ultra * (dB) | 55.9 | 45 19% | 51 9% | 53 5% | 50.6 9% | |
| Load Maximum * (dB) | 55.9 | 52 7% | 54 3% | 55 2% | 54.6 2% | 60.7 -9% |
* ... smaller is better
Noise level
| Idle |
| 23.9 / 23.9 / 23.9 dB(A) |
| Load |
| 38 / 55.9 dB(A) |
 | ||
30 dB silent 40 dB(A) audible 50 dB(A) loud |
||
min: | ||
Temperature
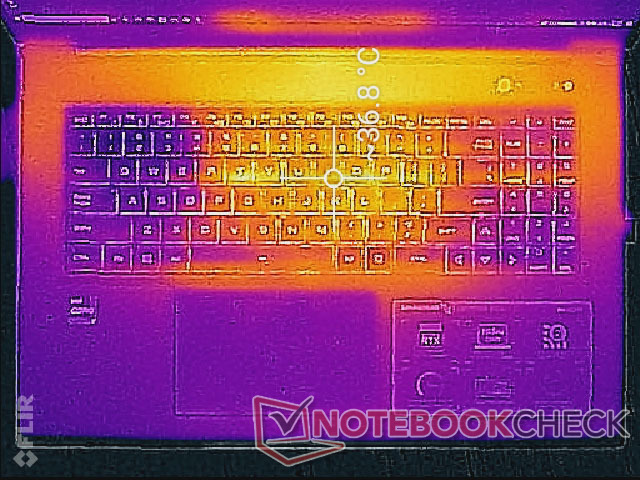
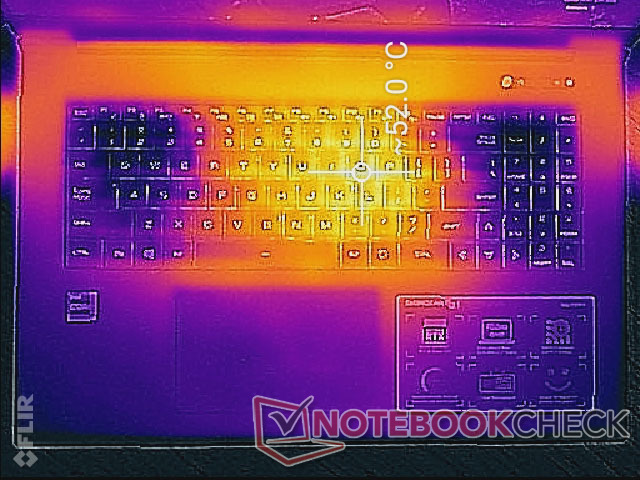
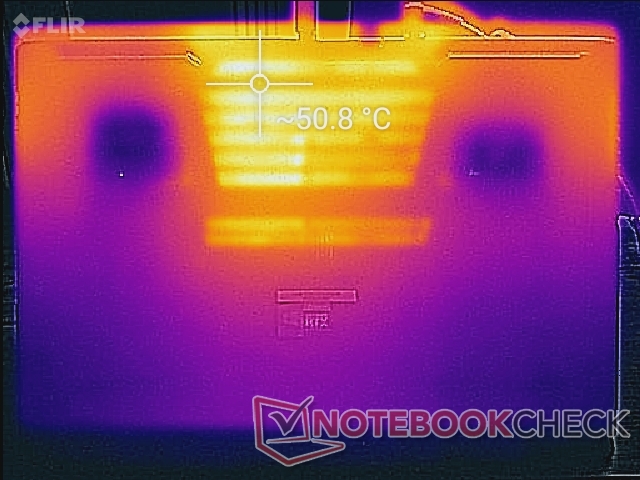
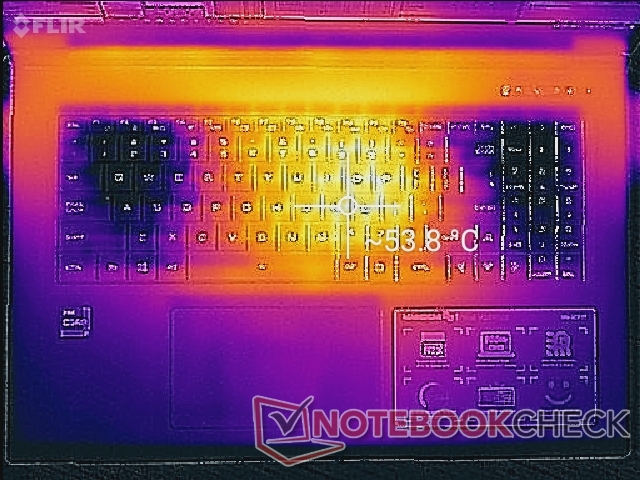
Surface temperatures are warmest toward the center of the keyboard while being much cooler on the WASD keys, numpad, and palm rests. Such a distribution is desirable when gaming since fingers and palms are more likely to rest on these cooler areas than anywhere on the keyboard center. We're able to measure a hot spot of over 53 C on the "J" key when gaming compared to just 26 C on the "W" key where cool air is being pulled in.
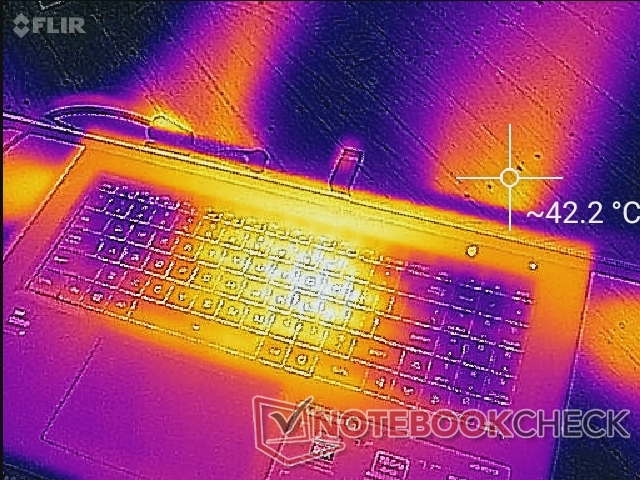
(-) The maximum temperature on the upper side is 54.2 °C / 130 F, compared to the average of 40.4 °C / 105 F, ranging from 21.2 to 68.8 °C for the class Gaming.
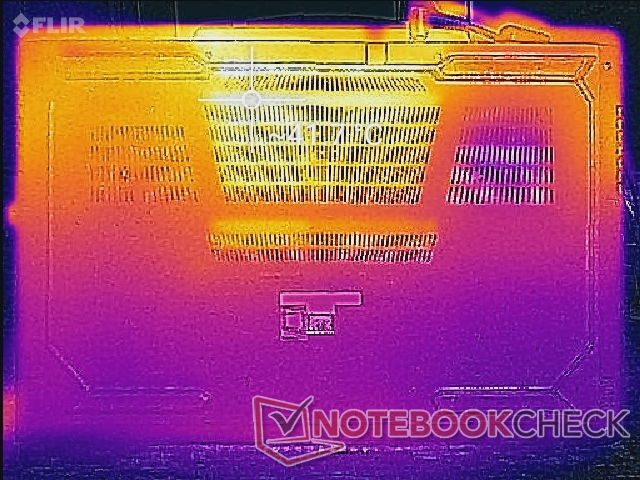
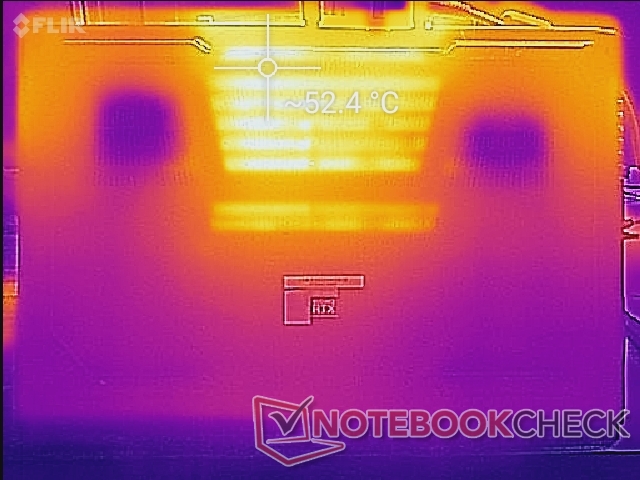
(-) The bottom heats up to a maximum of 52.2 °C / 126 F, compared to the average of 43.3 °C / 110 F
(+) In idle usage, the average temperature for the upper side is 31.5 °C / 89 F, compared to the device average of 33.9 °C / 93 F.
(±) Playing The Witcher 3, the average temperature for the upper side is 36.1 °C / 97 F, compared to the device average of 33.9 °C / 93 F.
(+) The palmrests and touchpad are reaching skin temperature as a maximum (32.6 °C / 90.7 F) and are therefore not hot.
(-) The average temperature of the palmrest area of similar devices was 28.8 °C / 83.8 F (-3.8 °C / -6.9 F).
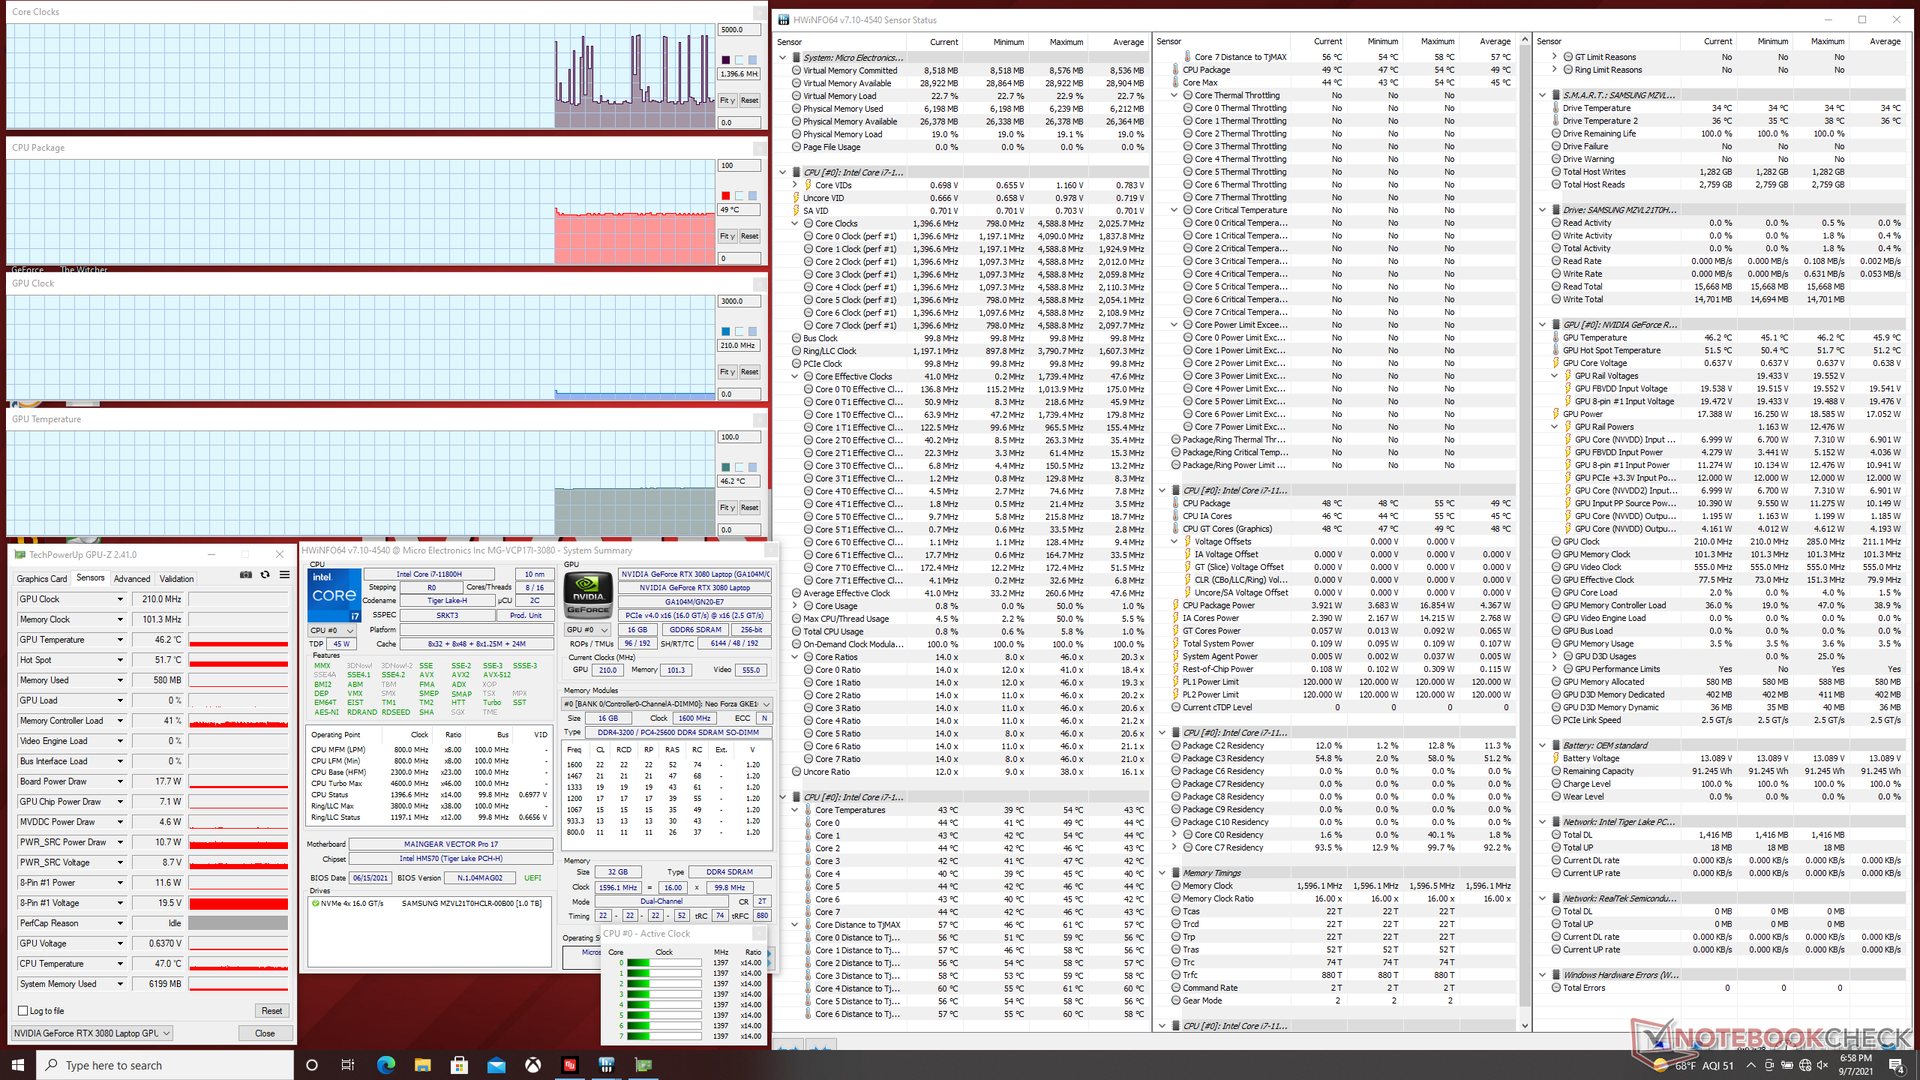
Stress Test
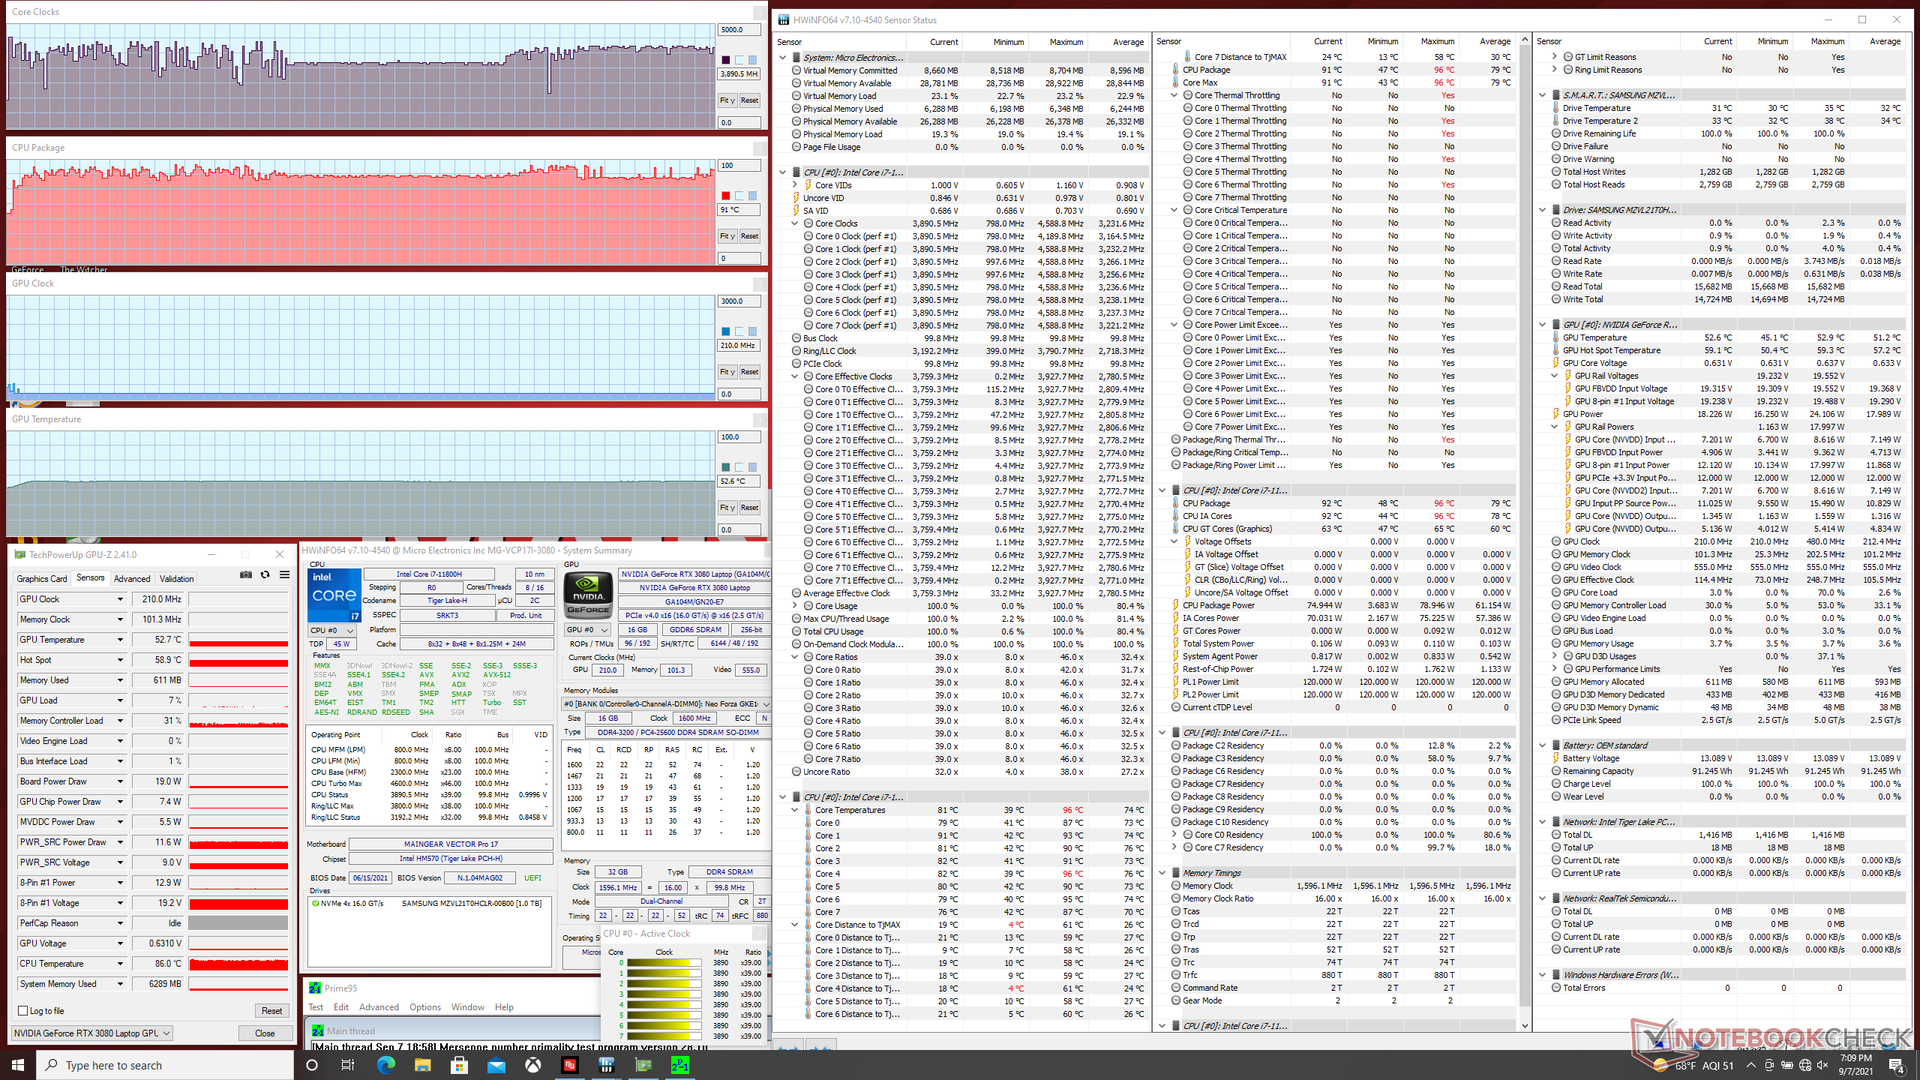
When stressed with Prime95, the CPU would boost to 4.1 GHz for the first few seconds before dropping and eventually fluctuating in the 3.2 GHz to 3.8 GHz range. Core temperature would reach just over 90 C compared to just 76 C on the Ryzen 7-powered Asus ROG Strix G17 G713QE when under similar conditions.
Running Witcher 3 is more representative of real-world gaming stress. Our CPU and GPU would stabilize at 80 C each with a stable TGP draw of 130 W instead of the target 165 W. This deficit could explain why our Maingear is behind the Schenker Ultra 17 even though both are equipped with 165 W RTX 3080 GPUs. Enabling Fan Boost mode does not appear to improve graphics performance or temperatures at all as the mode simply sets the fan RPM to maximum regardless of processing load.
Running on battery power will severely limit performance even when set to Turbo mode. A Fire Strike test on batteries would return Physics and Graphics scores of just 6513 and 2345 points, respectively, compared to 22907 and 29194 points when on mains.
| CPU Clock (GHz) | GPU Clock (MHz) | Average CPU Temperature (°C) | Average GPU Temperature (°C) | |
| System Idle | -- | -- | 49 | 46 |
| Prime95 Stress | 3.2 - 3.8 | -- | 91 | 53 |
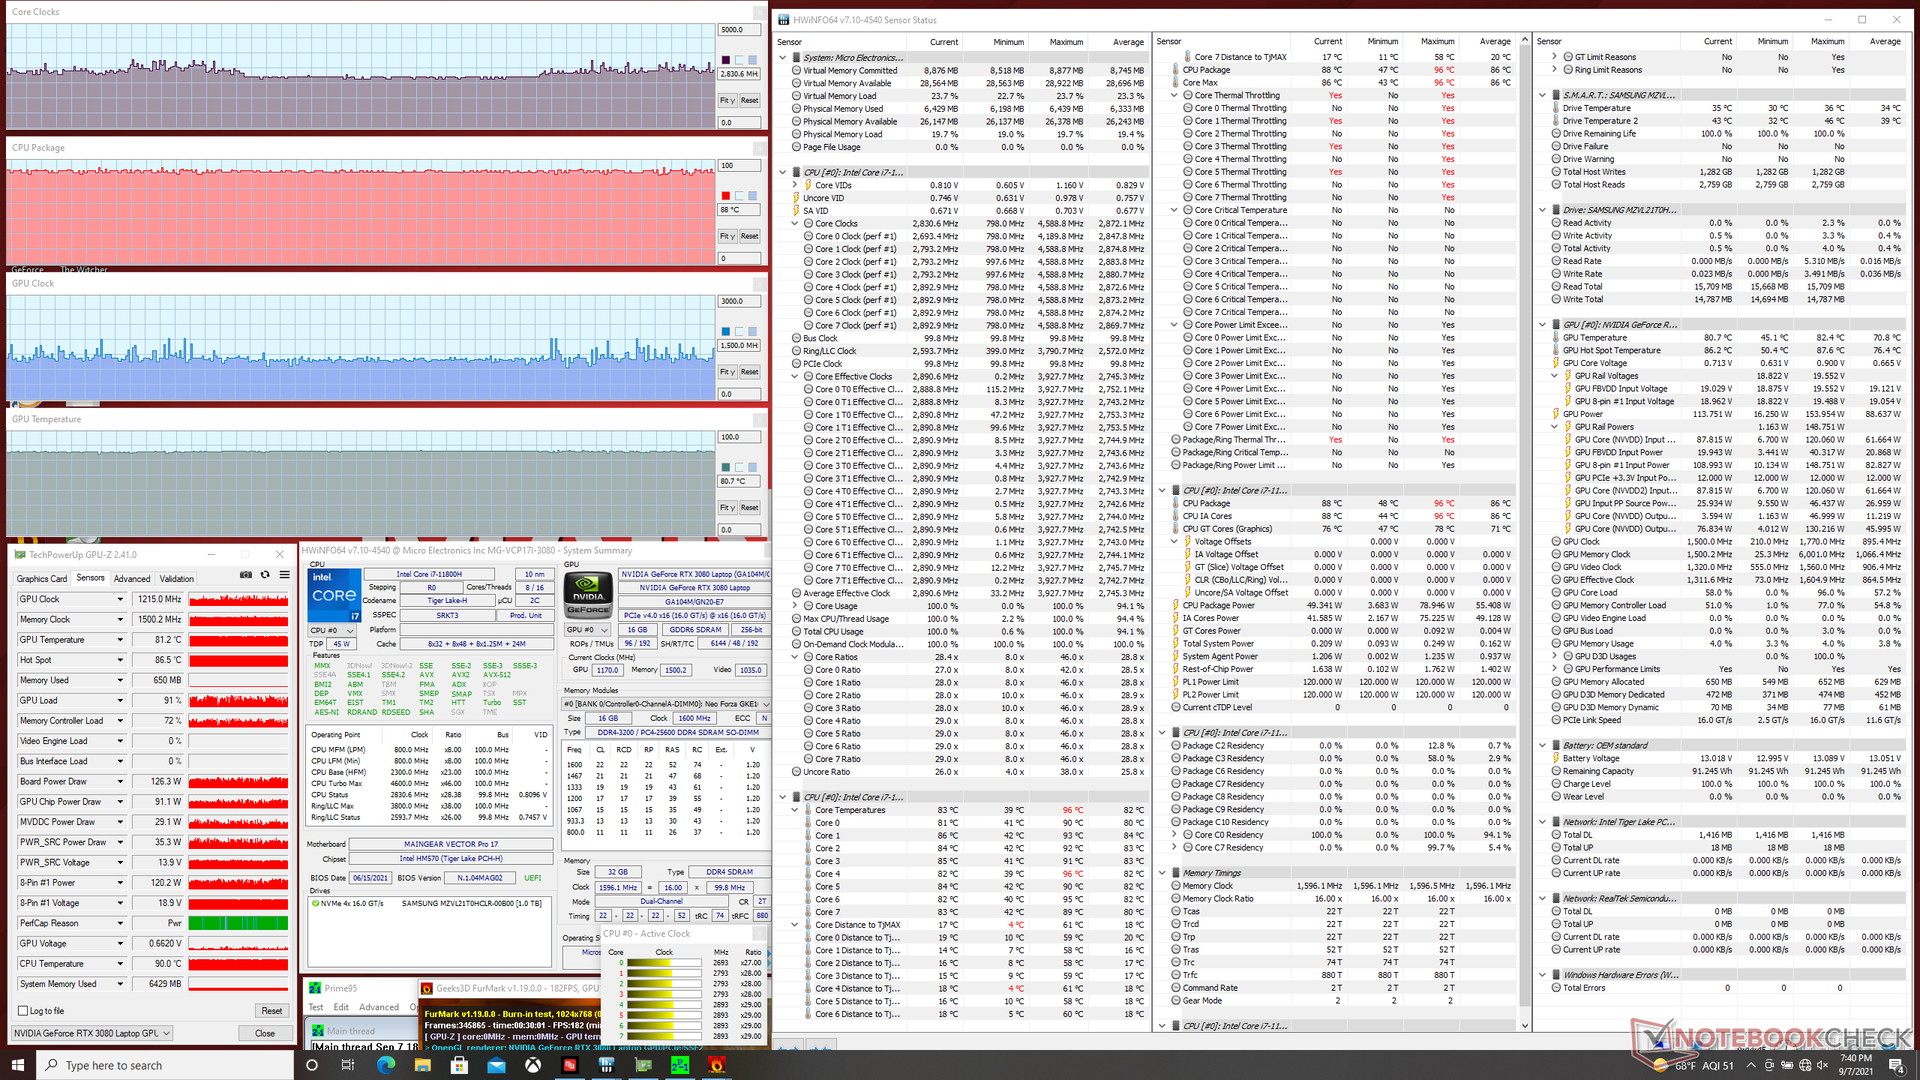
| Prime95 + FurMark Stress | 2.8 - 3.2 | 1100 - 1770 | 88 | 81 |
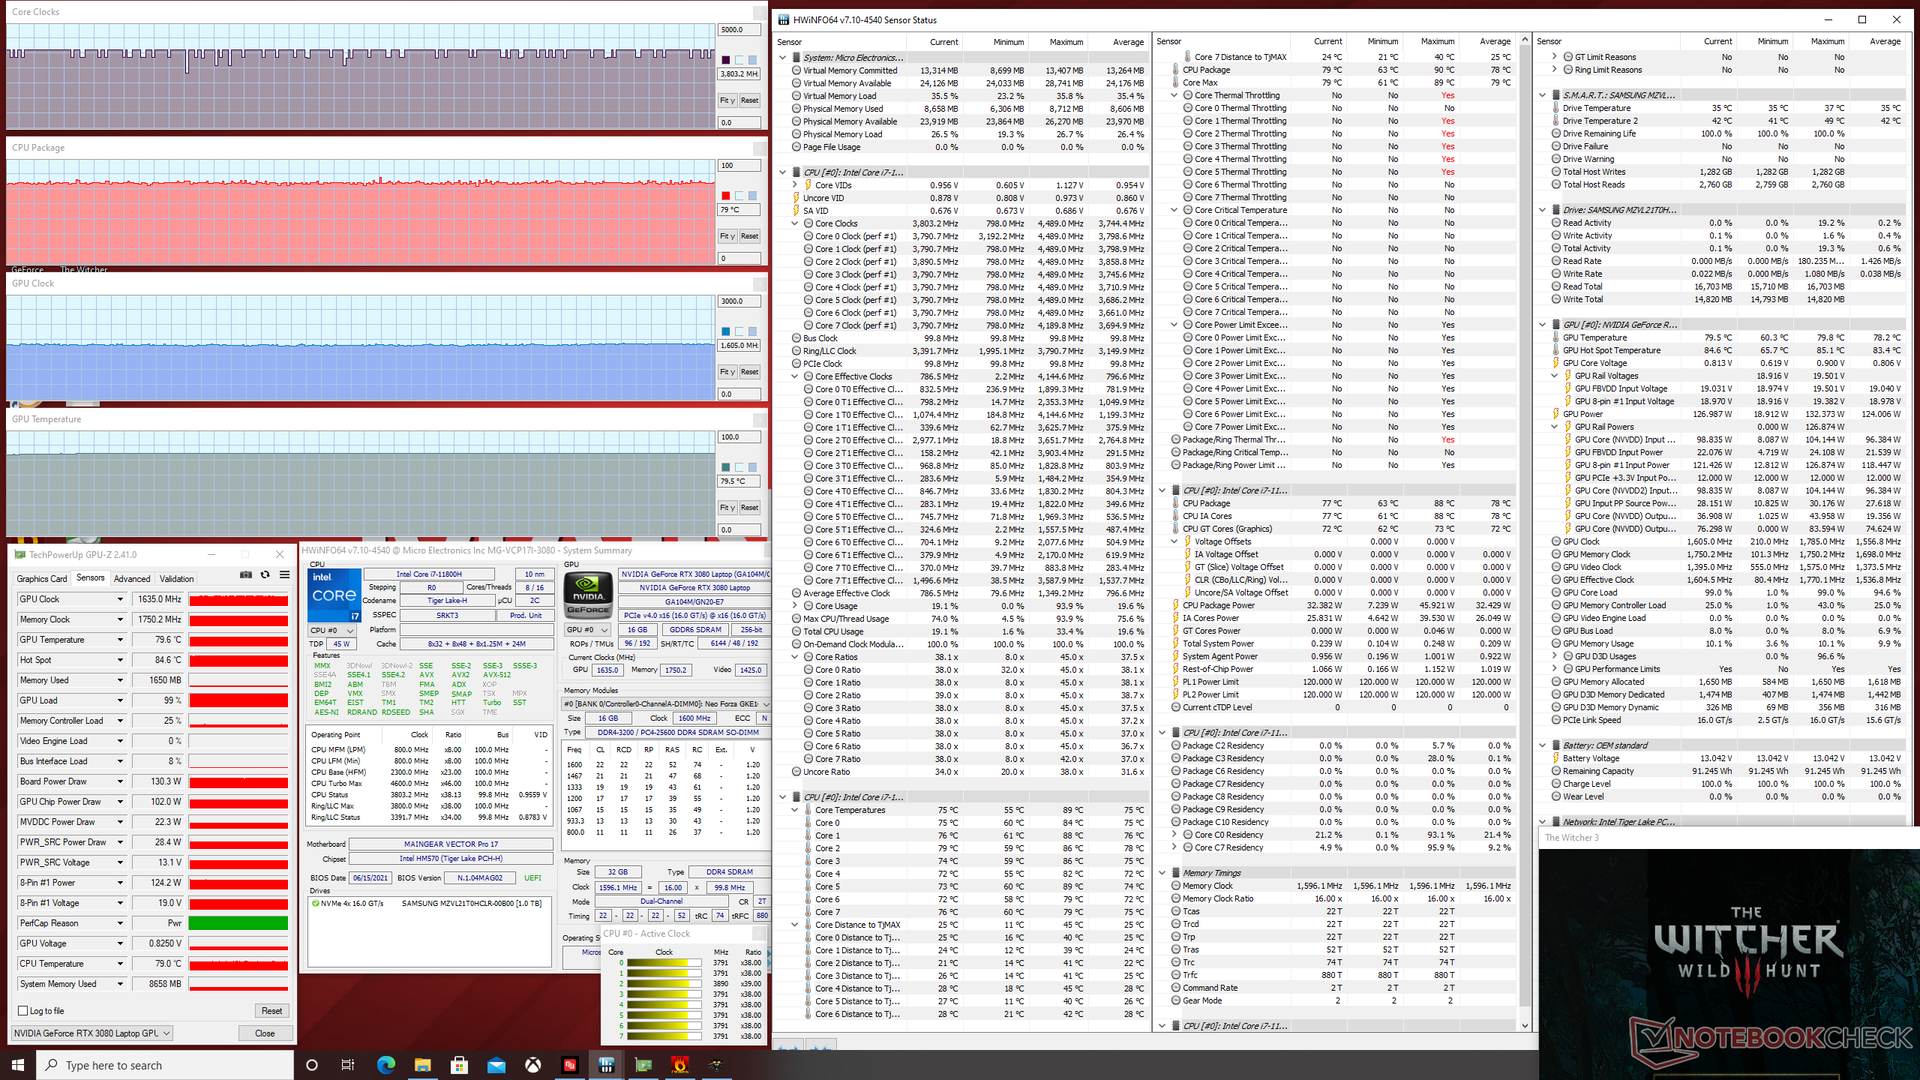
| Witcher 3 Stress | 3.4 - 3.8 | 1635 | 79 | 80 |
Speakers


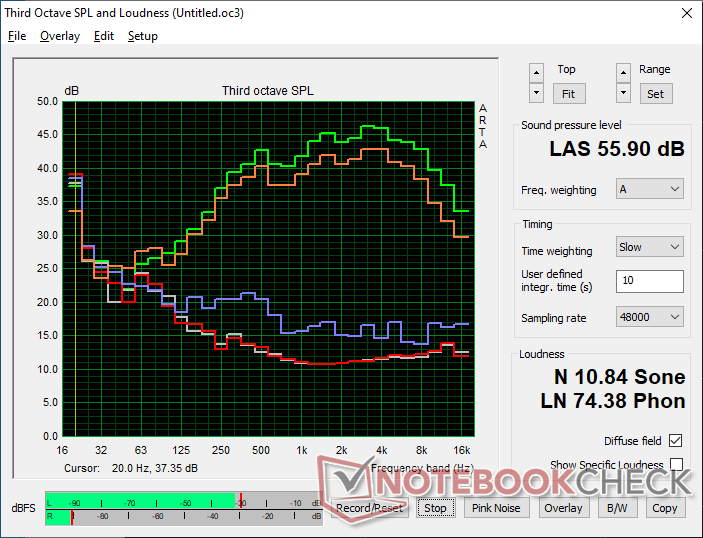
Maingear Vector Pro MG-VCP17 audio analysis
(±) | speaker loudness is average but good (75.5 dB)
Bass 100 - 315 Hz
(-) | nearly no bass - on average 19.3% lower than median
(±) | linearity of bass is average (11.7% delta to prev. frequency)
Mids 400 - 2000 Hz
(+) | balanced mids - only 2.1% away from median
(+) | mids are linear (4.5% delta to prev. frequency)
Highs 2 - 16 kHz
(+) | balanced highs - only 3.4% away from median
(+) | highs are linear (6.6% delta to prev. frequency)
Overall 100 - 16.000 Hz
(±) | linearity of overall sound is average (17.5% difference to median)
Compared to same class
» 48% of all tested devices in this class were better, 12% similar, 40% worse
» The best had a delta of 6%, average was 18%, worst was 132%
Compared to all devices tested
» 33% of all tested devices were better, 8% similar, 59% worse
» The best had a delta of 4%, average was 24%, worst was 134%
Apple MacBook 12 (Early 2016) 1.1 GHz audio analysis
(+) | speakers can play relatively loud (83.6 dB)
Bass 100 - 315 Hz
(±) | reduced bass - on average 11.3% lower than median
(±) | linearity of bass is average (14.2% delta to prev. frequency)
Mids 400 - 2000 Hz
(+) | balanced mids - only 2.4% away from median
(+) | mids are linear (5.5% delta to prev. frequency)
Highs 2 - 16 kHz
(+) | balanced highs - only 2% away from median
(+) | highs are linear (4.5% delta to prev. frequency)
Overall 100 - 16.000 Hz
(+) | overall sound is linear (10.2% difference to median)
Compared to same class
» 7% of all tested devices in this class were better, 2% similar, 91% worse
» The best had a delta of 5%, average was 18%, worst was 53%
Compared to all devices tested
» 4% of all tested devices were better, 1% similar, 94% worse
» The best had a delta of 4%, average was 24%, worst was 134%
Energy Management
Power Consumption
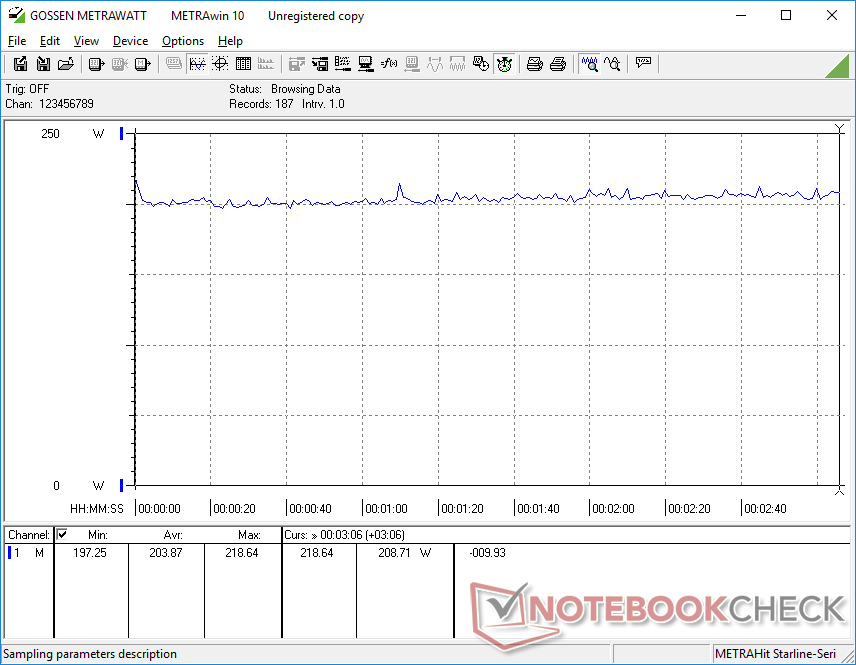
Idling on desktop on Turbo mode and with the dGPU active can consume as much as 34 W compared to just 16 W when on Optimus mode. Thus, it's worth turning down the performance level if the extra power isn't needed.
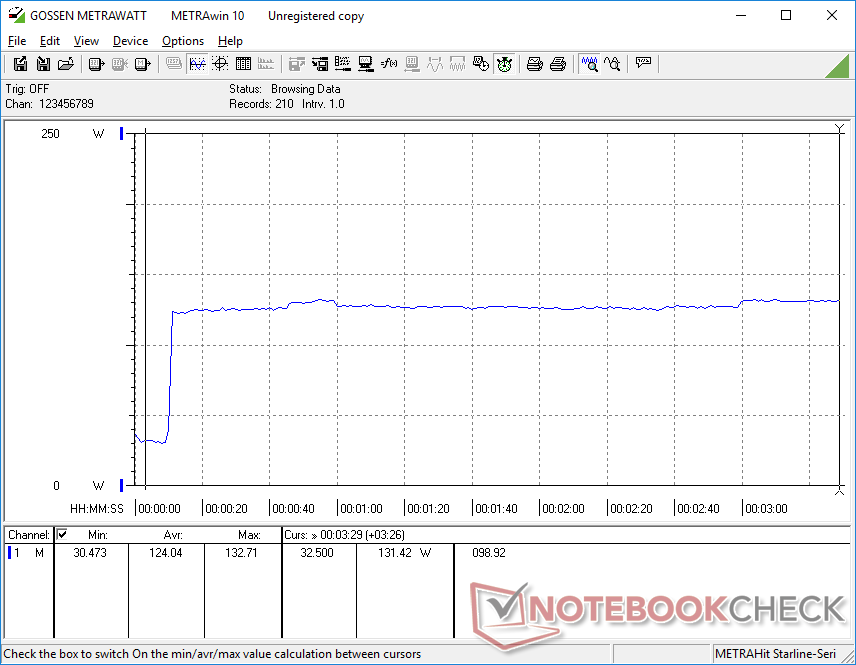
Running Witcher 3 consumes slightly more power than on most other 17.3-inch GeForce RTX laptops to correlate with the faster graphics performance of our RTX 3080-powered Maingear. The Schenker XMG Core 17 with RTX 3060 graphics, for example, consumes about 15 percent less power while offering 25 percent slower graphics performance than our RTX 3080.
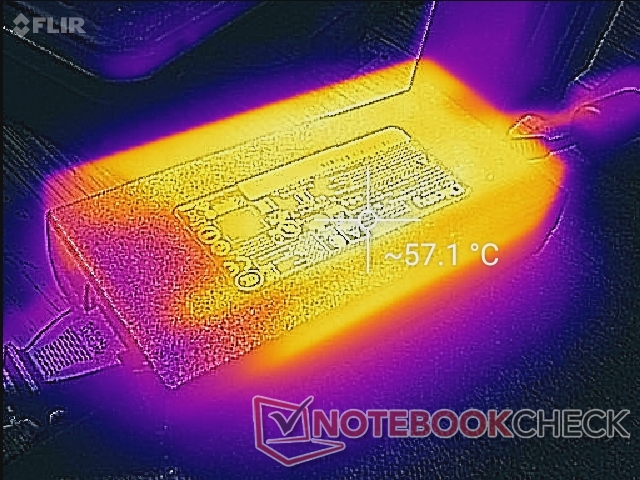
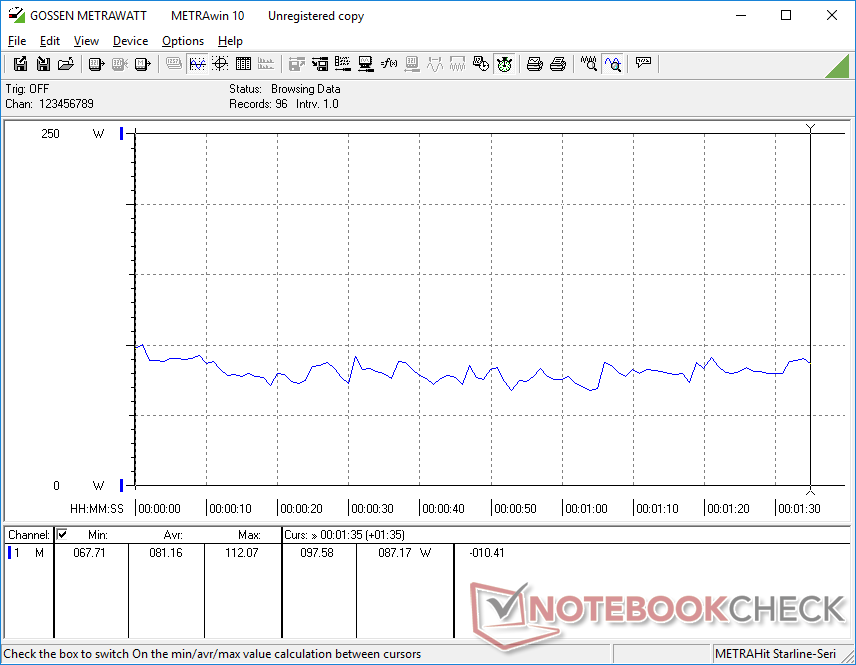
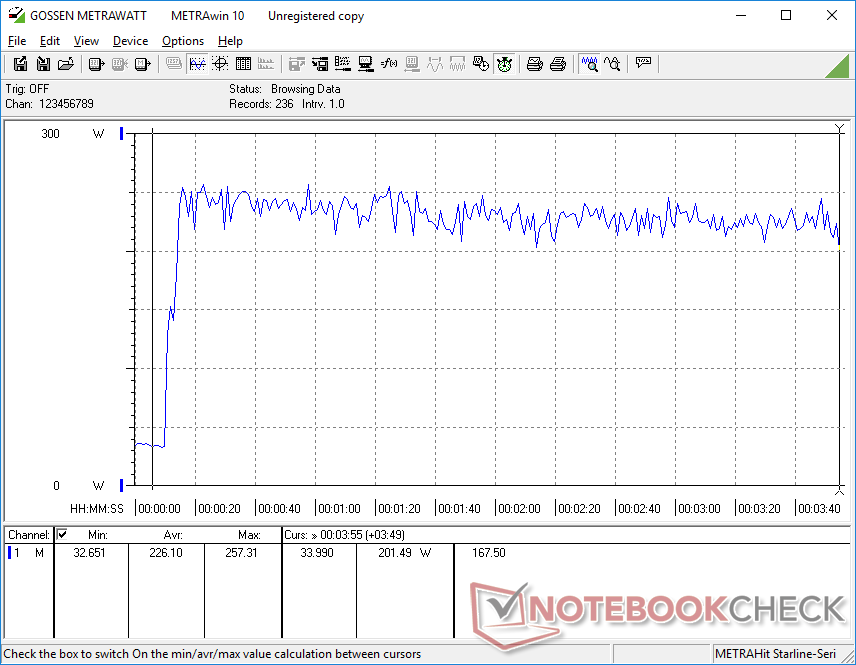
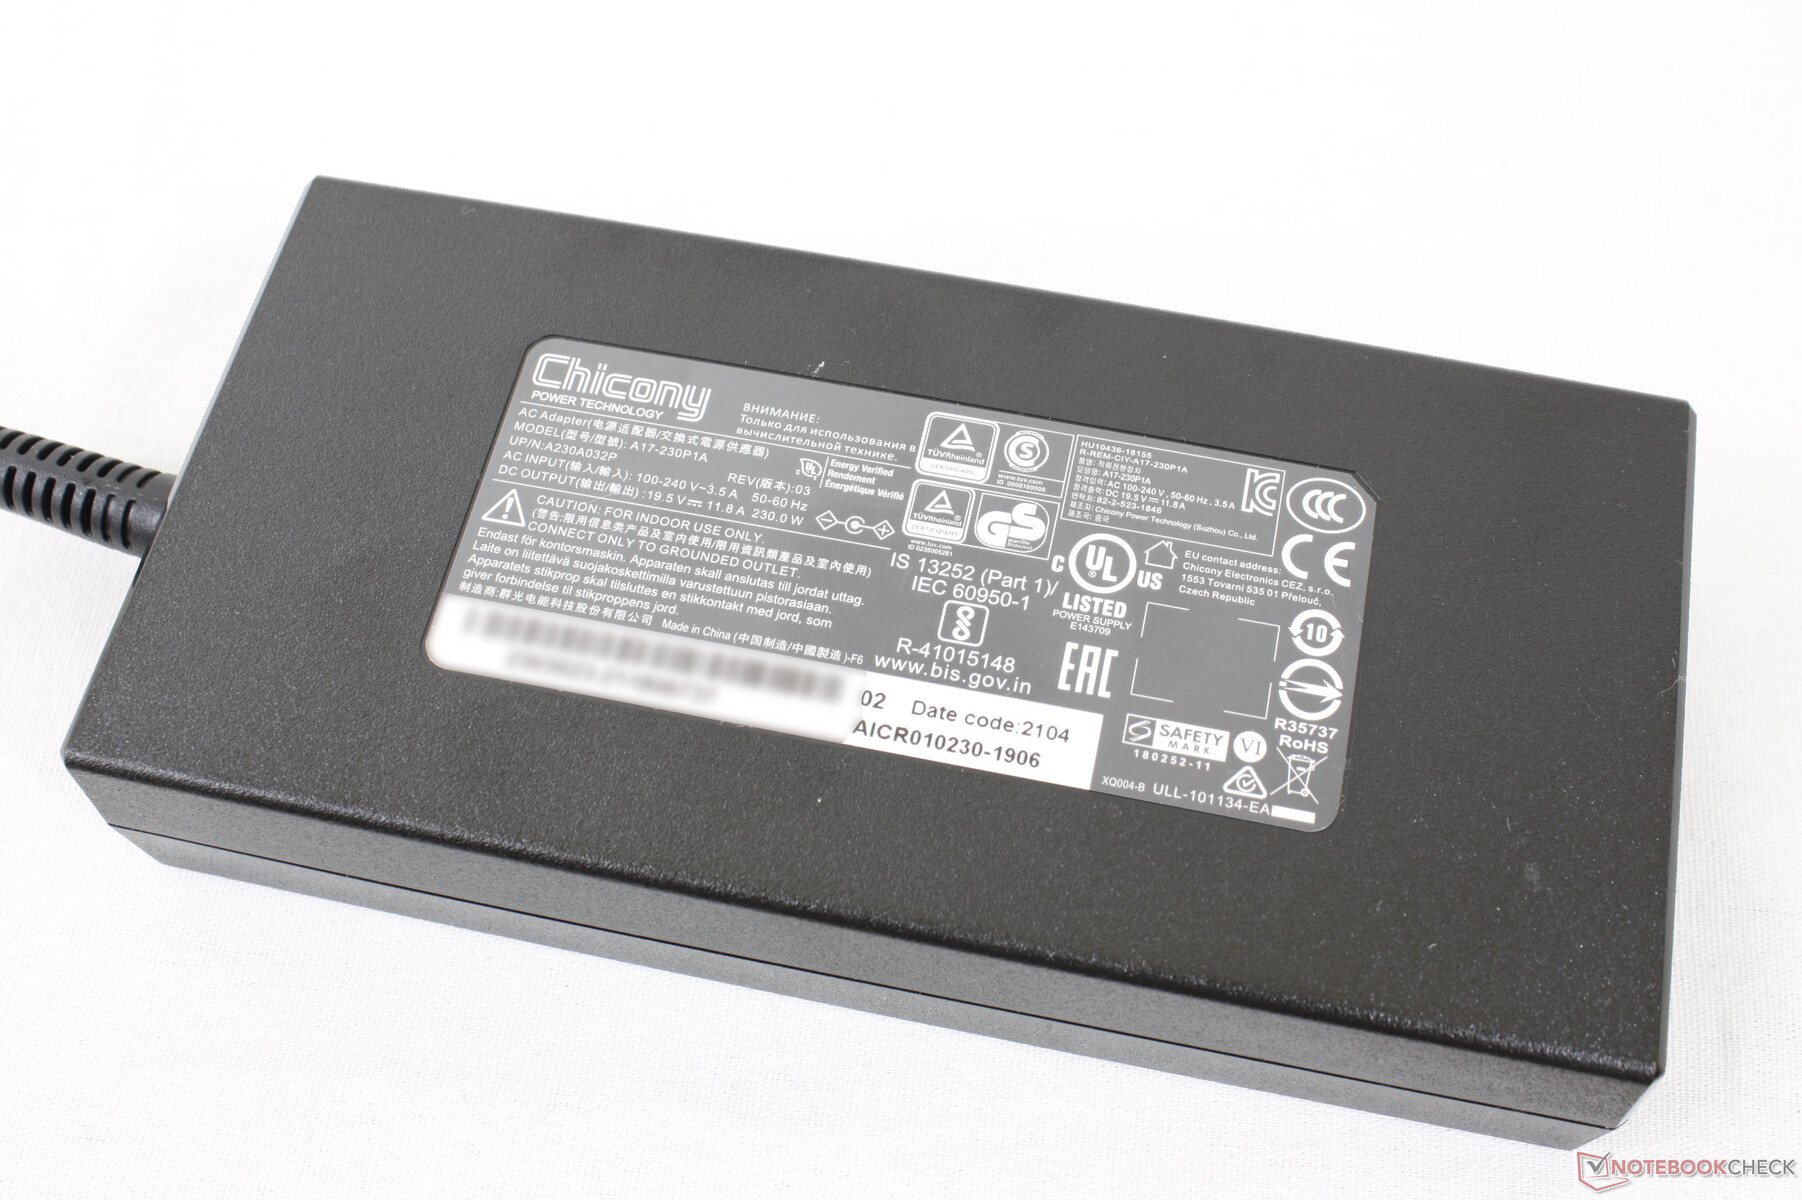
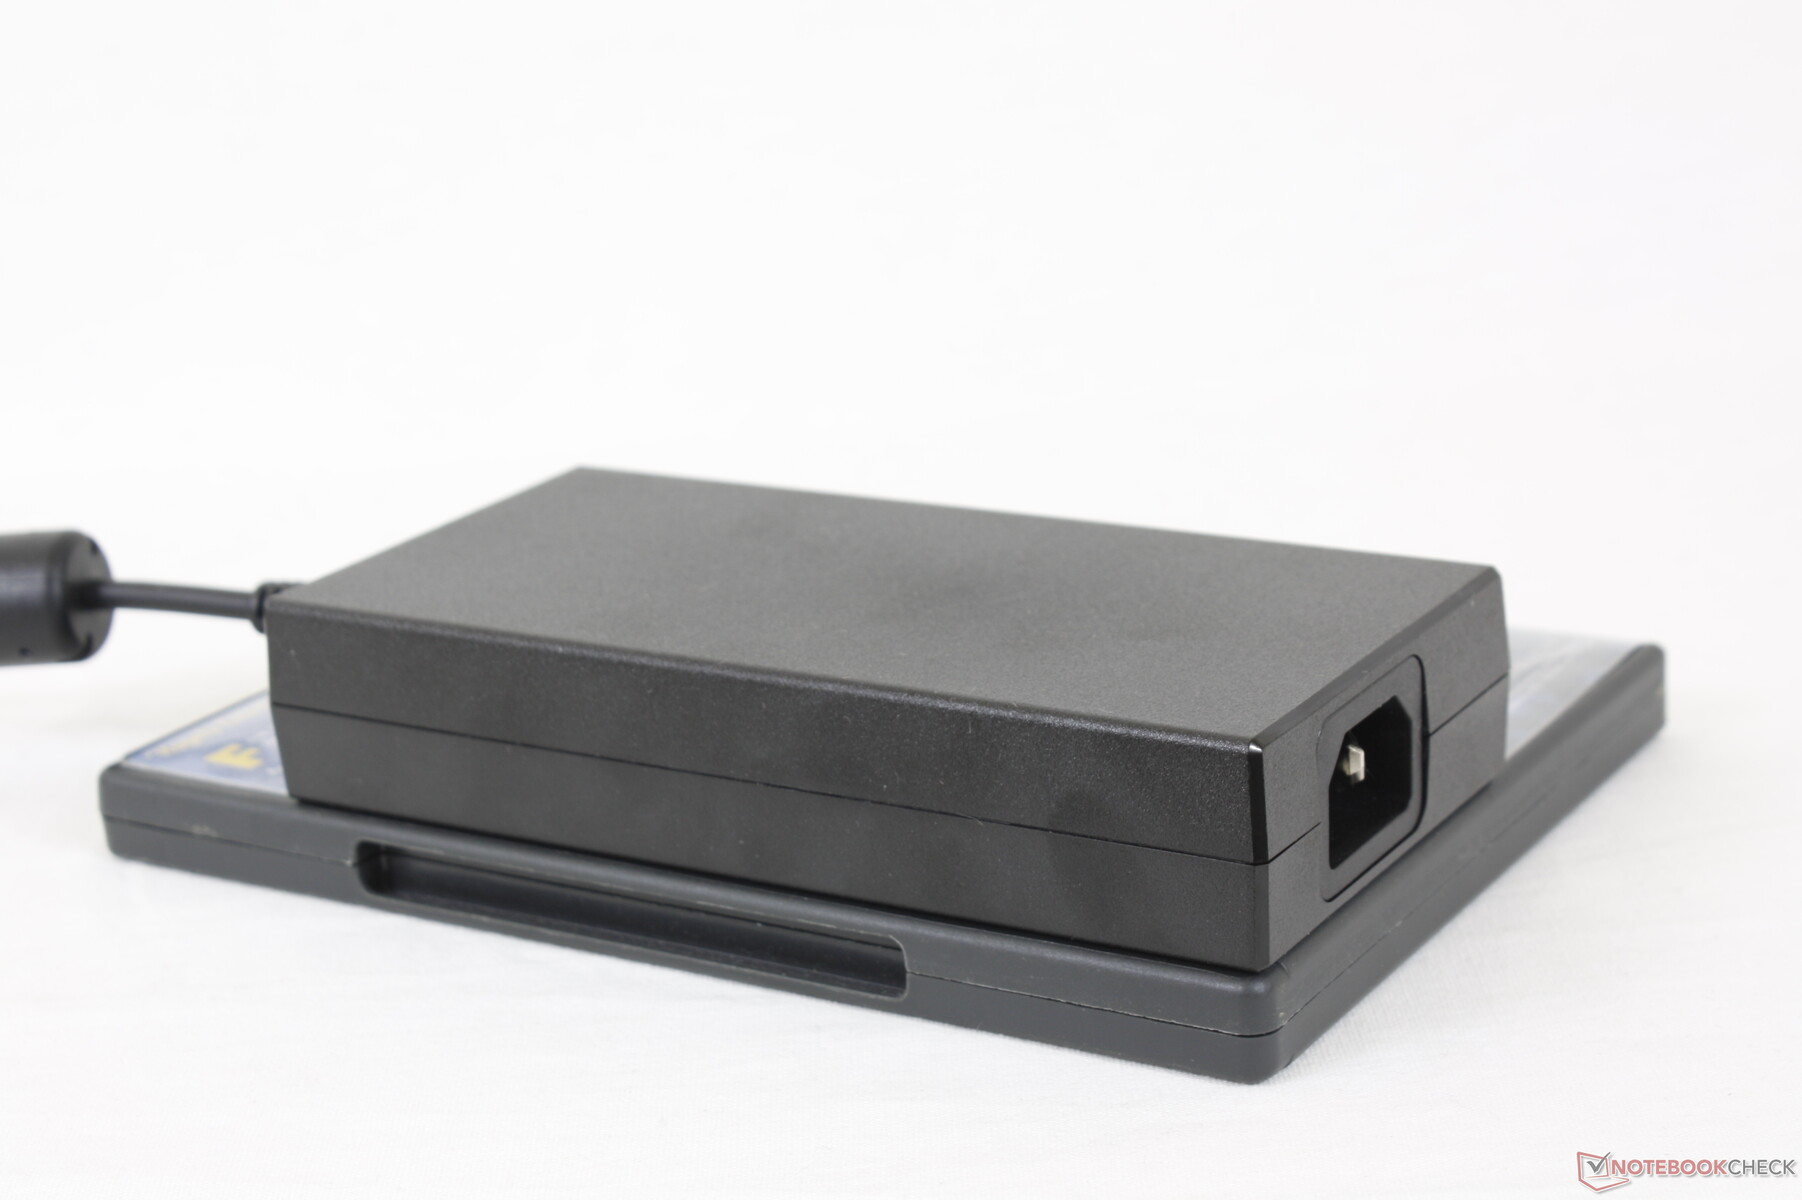
We're able to record a maximum draw of 257 W from the medium-sized (~15.3 x 7.4 x 3 cm) 240 W AC adapter when running Prime95 and FurMark simultaneously. Thus, the system could have potentially benefitted from a larger AC adapter with a higher power rating. Running games will thankfully not drain the battery when connected to an outlet unlike on some early Dell XPS 17 models.
| Off / Standby | |
| Idle | |
| Load |
|
Key:
min: | |
| Maingear Vector Pro MG-VCP17 i7-11800H, GeForce RTX 3080 Laptop GPU, Samsung PM9A1 MZVL21T0HCLR, IPS, 2560x1440, 17.3" | Asus ROG Zephyrus S17 GX703HSD i9-11900H, GeForce RTX 3080 Laptop GPU, Samsung PM9A1 MZVL22T0HBLB, IPS, 2560x1440, 17.3" | Schenker XMG Core 17 (Early 2021) i7-10870H, GeForce RTX 3060 Laptop GPU, Samsung SSD 970 EVO Plus 1TB, IPS, 2560x1440, 17.3" | Schenker XMG Neo 17 (Early 2021, RTX 3070, 5800H) R7 5800H, GeForce RTX 3070 Laptop GPU, Samsung SSD 970 EVO Plus 500GB, IPS, 2560x1440, 17.3" | Schenker Compact 17 i7-10875H, GeForce RTX 2070 Super Mobile, Samsung SSD 970 EVO Plus 1TB, IPS, 3840x2160, 17.3" | MSI GS75 10SF-609US i7-10875H, GeForce RTX 2070 Max-Q, WDC PC SN730 SDBPNTY-512G, IPS, 1920x1080, 17.3" | |
|---|---|---|---|---|---|---|
| Power Consumption | -30% | 1% | -7% | -9% | -21% | |
| Idle Minimum * (Watt) | 11 | 21.7 -97% | 13 -18% | 13 -18% | 13.6 -24% | 19.2 -75% |
| Idle Average * (Watt) | 15.6 | 27 -73% | 16 -3% | 16 -3% | 19.8 -27% | 22.4 -44% |
| Idle Maximum * (Watt) | 34 | 33 3% | 29 15% | 26 24% | 23.5 31% | 34.7 -2% |
| Load Average * (Watt) | 81.2 | 108 -33% | 100 -23% | 125 -54% | 105 -29% | 106.7 -31% |
| Witcher 3 ultra * (Watt) | 204 | 195 4% | 173 15% | 187 8% | 160.5 21% | |
| Load Maximum * (Watt) | 257.3 | 210 18% | 213 17% | 259 -1% | 243 6% | 248.7 3% |
* ... smaller is better
Power Consumption Witcher 3 / Stresstest
Battery Life
Battery capacity is large at 91 Wh despite the thin chassis design. We're able to squeeze almost 7 hours of real-world WLAN use on a full charge when the system is set to iGPU mode.
Charging from empty to full capacity takes just under 2 hours.
| Maingear Vector Pro MG-VCP17 i7-11800H, GeForce RTX 3080 Laptop GPU, 91 Wh | Asus ROG Zephyrus S17 GX703HSD i9-11900H, GeForce RTX 3080 Laptop GPU, 90 Wh | Schenker XMG Core 17 (Early 2021) i7-10870H, GeForce RTX 3060 Laptop GPU, 62 Wh | Schenker XMG Neo 17 (Early 2021, RTX 3070, 5800H) R7 5800H, GeForce RTX 3070 Laptop GPU, 62 Wh | Schenker Compact 17 i7-10875H, GeForce RTX 2070 Super Mobile, 62 Wh | MSI GS75 10SF-609US i7-10875H, GeForce RTX 2070 Max-Q, 80.25 Wh | |
|---|---|---|---|---|---|---|
| Battery runtime | 9% | -29% | -49% | -32% | -29% | |
| WiFi v1.3 (h) | 6.9 | 7.5 9% | 4.9 -29% | 3.5 -49% | 4.7 -32% | 4.9 -29% |
| Witcher 3 ultra (h) | 1 | |||||
| Load (h) | 2.7 | 1.3 | 0.7 | 4.1 | ||
| Reader / Idle (h) | 7.7 | 4.7 | 8.6 |
Pros
Cons
Verdict — Excellent Balance of Weight and Performance
Can you really run a 165 W TGP GPU in a chassis the size of a Razer Blade Pro while weighing 500 grams less? Our tests show that the GPU in the Maingear will hover around 130 W instead when gaming which is about average when taking into account other RTX 3080 laptops currently in the market. If you want to maximize RTX 3080 performance, then you'll still have to consider bulkier laptops like the Schenker XMG Ultra 17.
The Maingear system could also use some improvements in regard to hinge rigidity. While its base feels sturdier than an Asus Zephyrus S, its hinges could have been stiffer for a better sense of longevity and quality. The fans are also very loud when gaming, but that is a trait shared between other ultrathin gaming laptops and so we can't uniquely fault the Vector Pro for its noise.
Powerful and surprisingly lightweight for the size. Some minor features have been omitted, but the core system, display, performance, and expandability are solid.
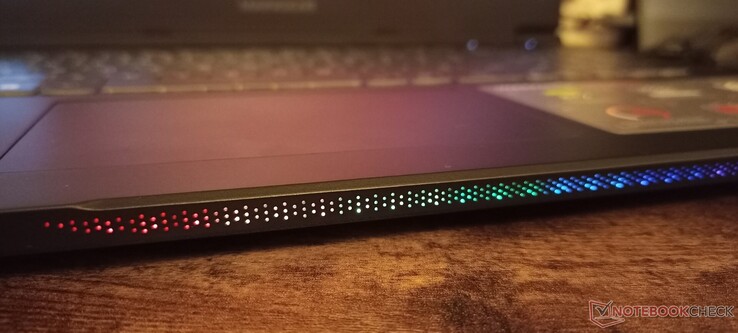
The long battery life and easy upgrades are worthy mentions for an ultrathin gaming laptop. For future models, we would love to see per-key RGB lighting, USB-C PD, louder speakers, and a webcam shutter all of which are becoming standard on higher-end models.
Price and availability
Our exact configuration can currently be found on Amazon for $2499 USD while the lesser RTX 3070 SKU is retailing for $2099.
Maingear Vector Pro MG-VCP17
- 09/10/2021 v7 (old)
Allen Ngo
Price comparison
