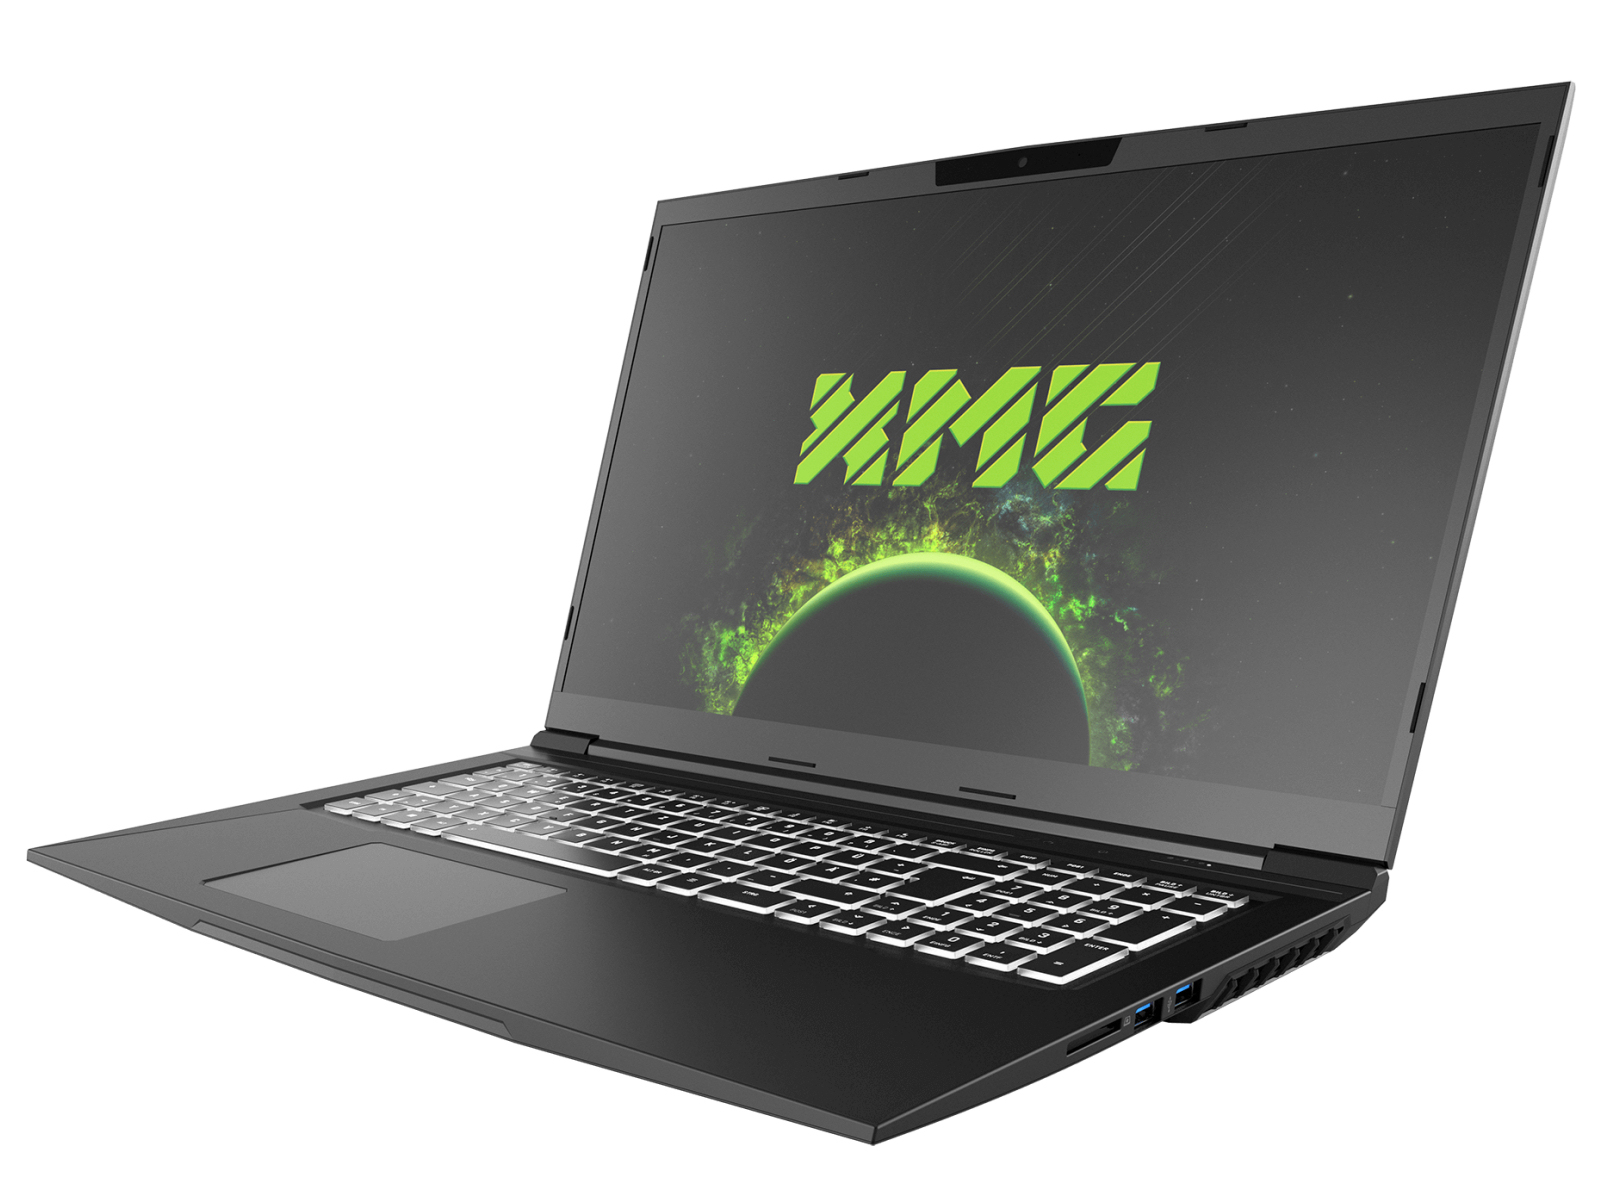
Schenker XMG Core 17 (Tongfang GM7MG0R) review: Configurable gaming laptop with a WQHD display

With the XMG Core 17 (Early 2021) Schenker is adding a gaming laptop of the upper mid-range to its offerings. The test unit provided to us is run by a Core i7-10870H processor and a GeForce RTX-3060 laptop GPU. The competitors include devices such as the MSI Alpha 17 A4DEK, the Acer Predator Helios 300 PH317-54, and the Medion Erazer Beast X10.
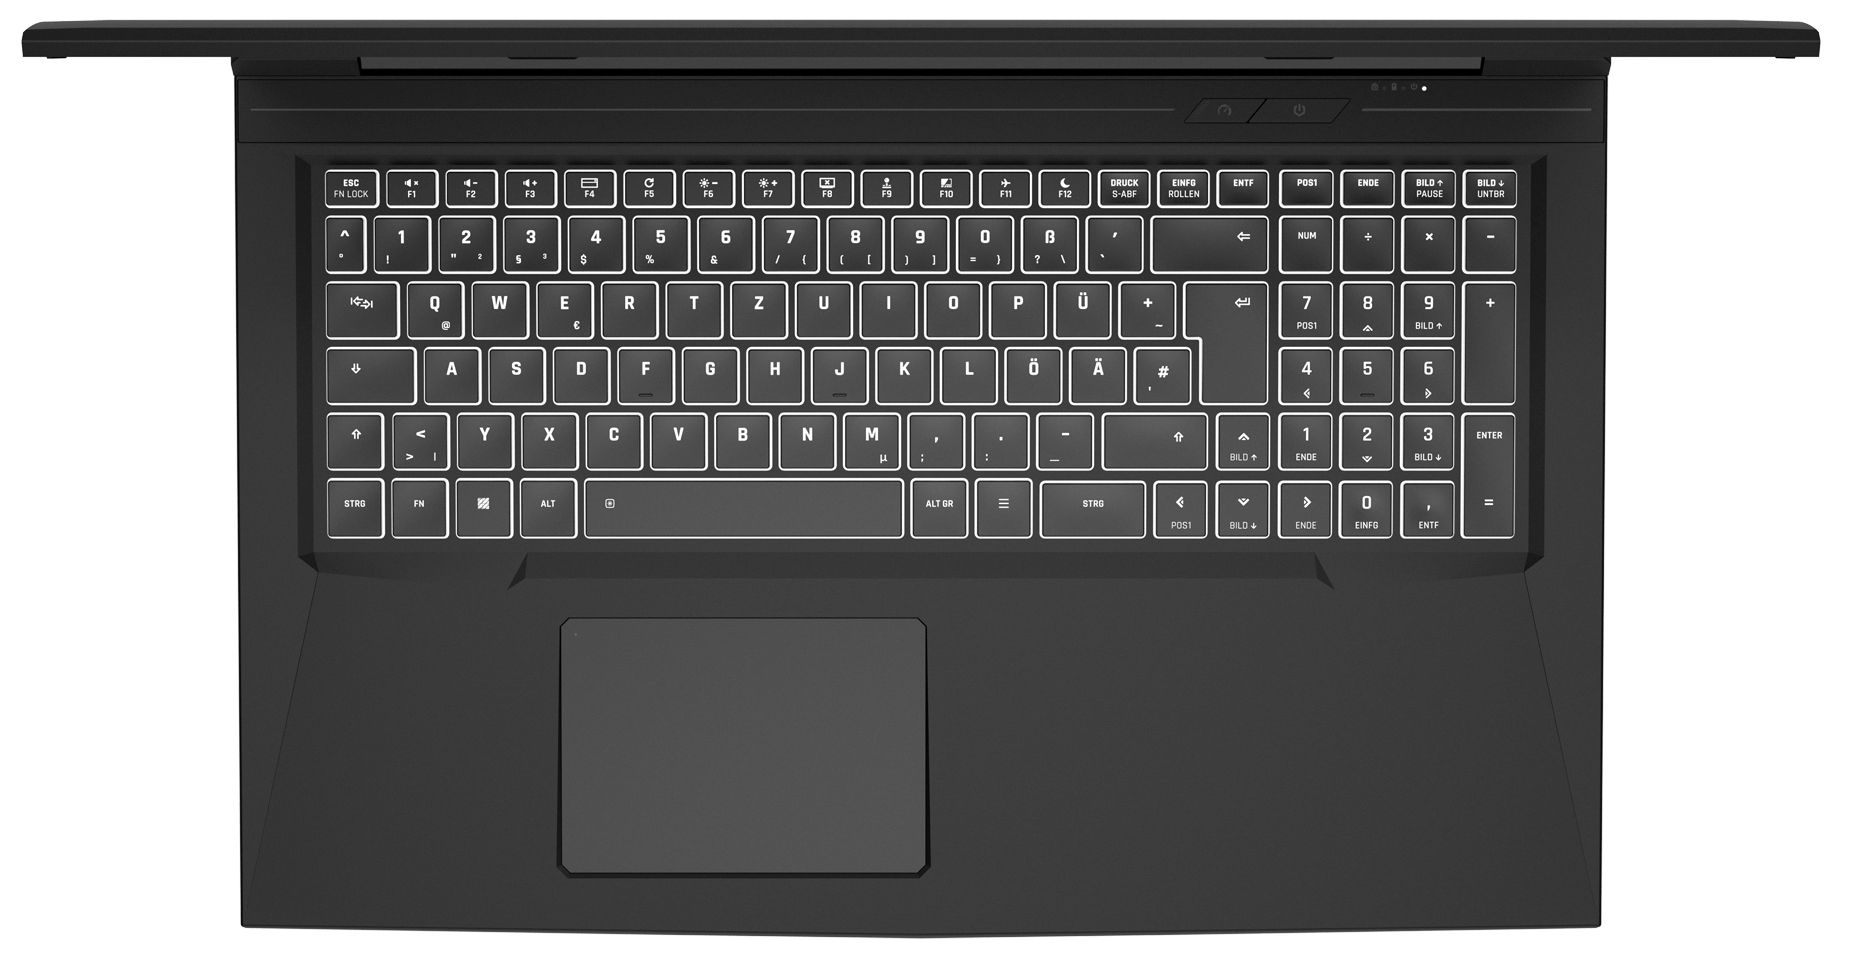
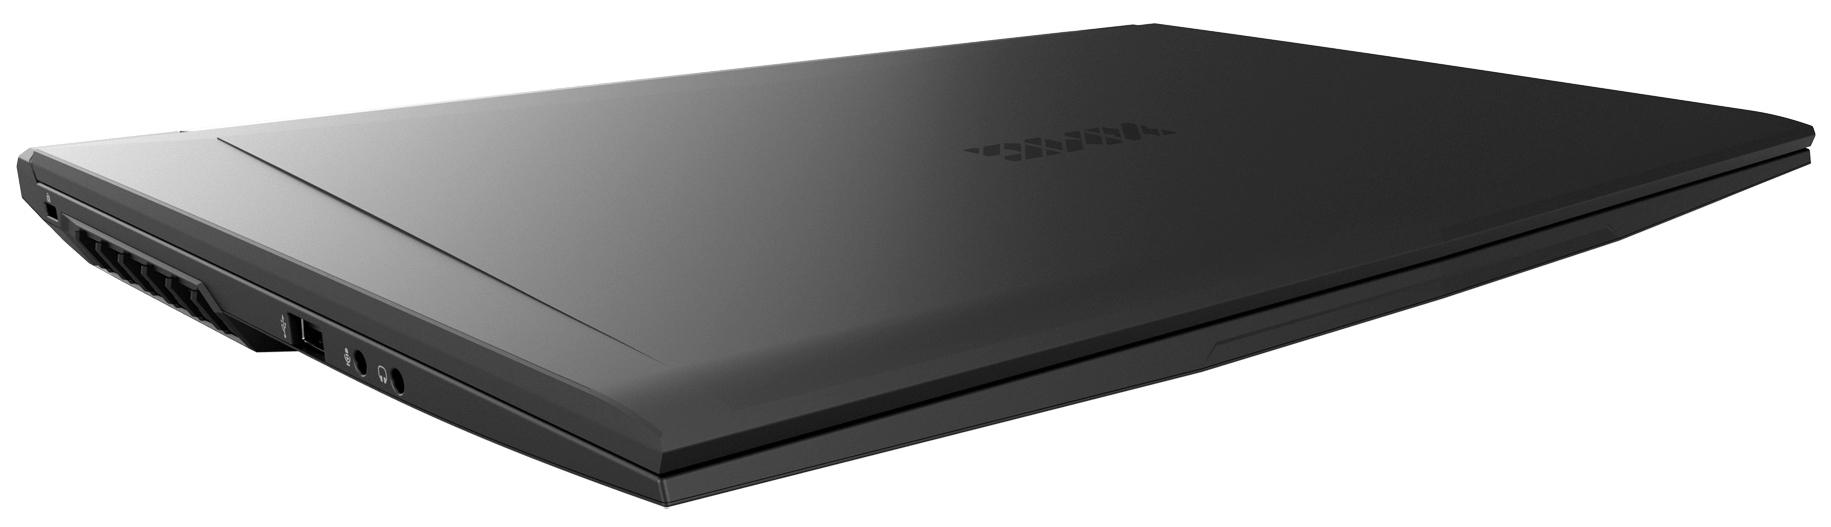
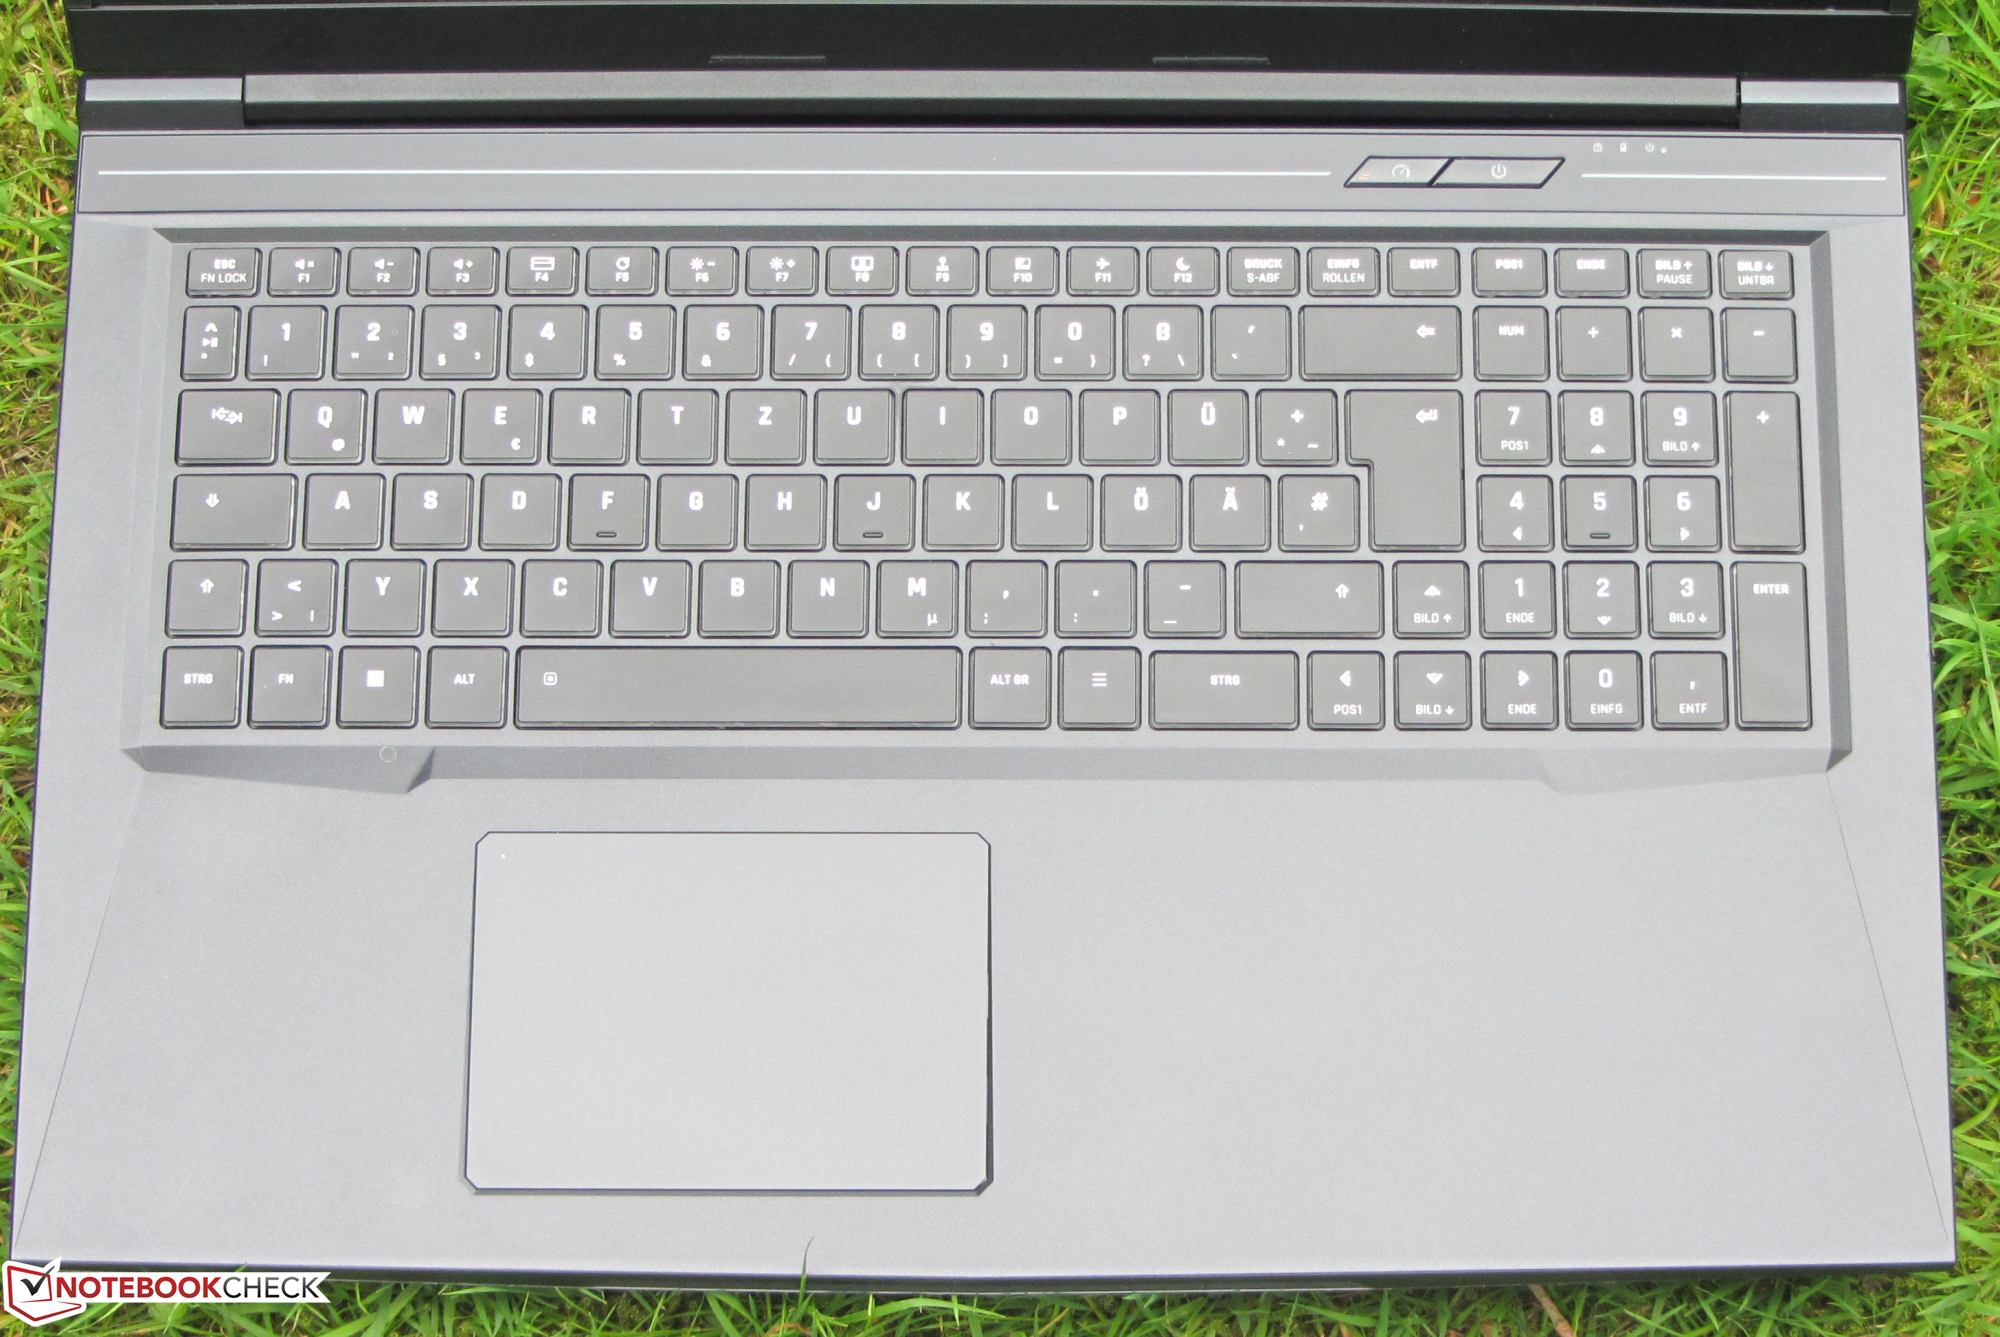
Since the build of the laptop is to a large extent identical to that of its two predecessors, we won't discuss the case, connection equipment, input devices, and speakers, except where there are differences. You can find the corresponding information on these features in our review of the XMG Core 17 (2019).
Possible Competitors in the Comparison
Rating | Date | Model | Weight | Height | Size | Resolution | Price |
|---|---|---|---|---|---|---|---|
| 83.9 % v7 (old) | 06 / 2021 | Schenker XMG Core 17 (Early 2021) i7-10870H, GeForce RTX 3060 Laptop GPU | 2.5 kg | 30.05 mm | 17.30" | 2560x1440 | |
| 83.3 % v7 (old) | 02 / 2021 | MSI Alpha 17 A4DEK R7 4800H, Radeon RX 5600M | 2.6 kg | 28 mm | 17.30" | 1920x1080 | |
| 83.6 % v7 (old) | 10 / 2020 | Acer Predator Helios 300 PH317-54-75G8 i7-10750H, GeForce RTX 2060 Mobile | 2.8 kg | 25 mm | 17.30" | 1920x1080 | |
| 84.7 % v7 (old) | 11 / 2020 | Medion Erazer Beast X10 MD61804 i7-10750H, GeForce RTX 2070 Super Max-Q | 2.3 kg | 24.6 mm | 17.30" | 1920x1080 |

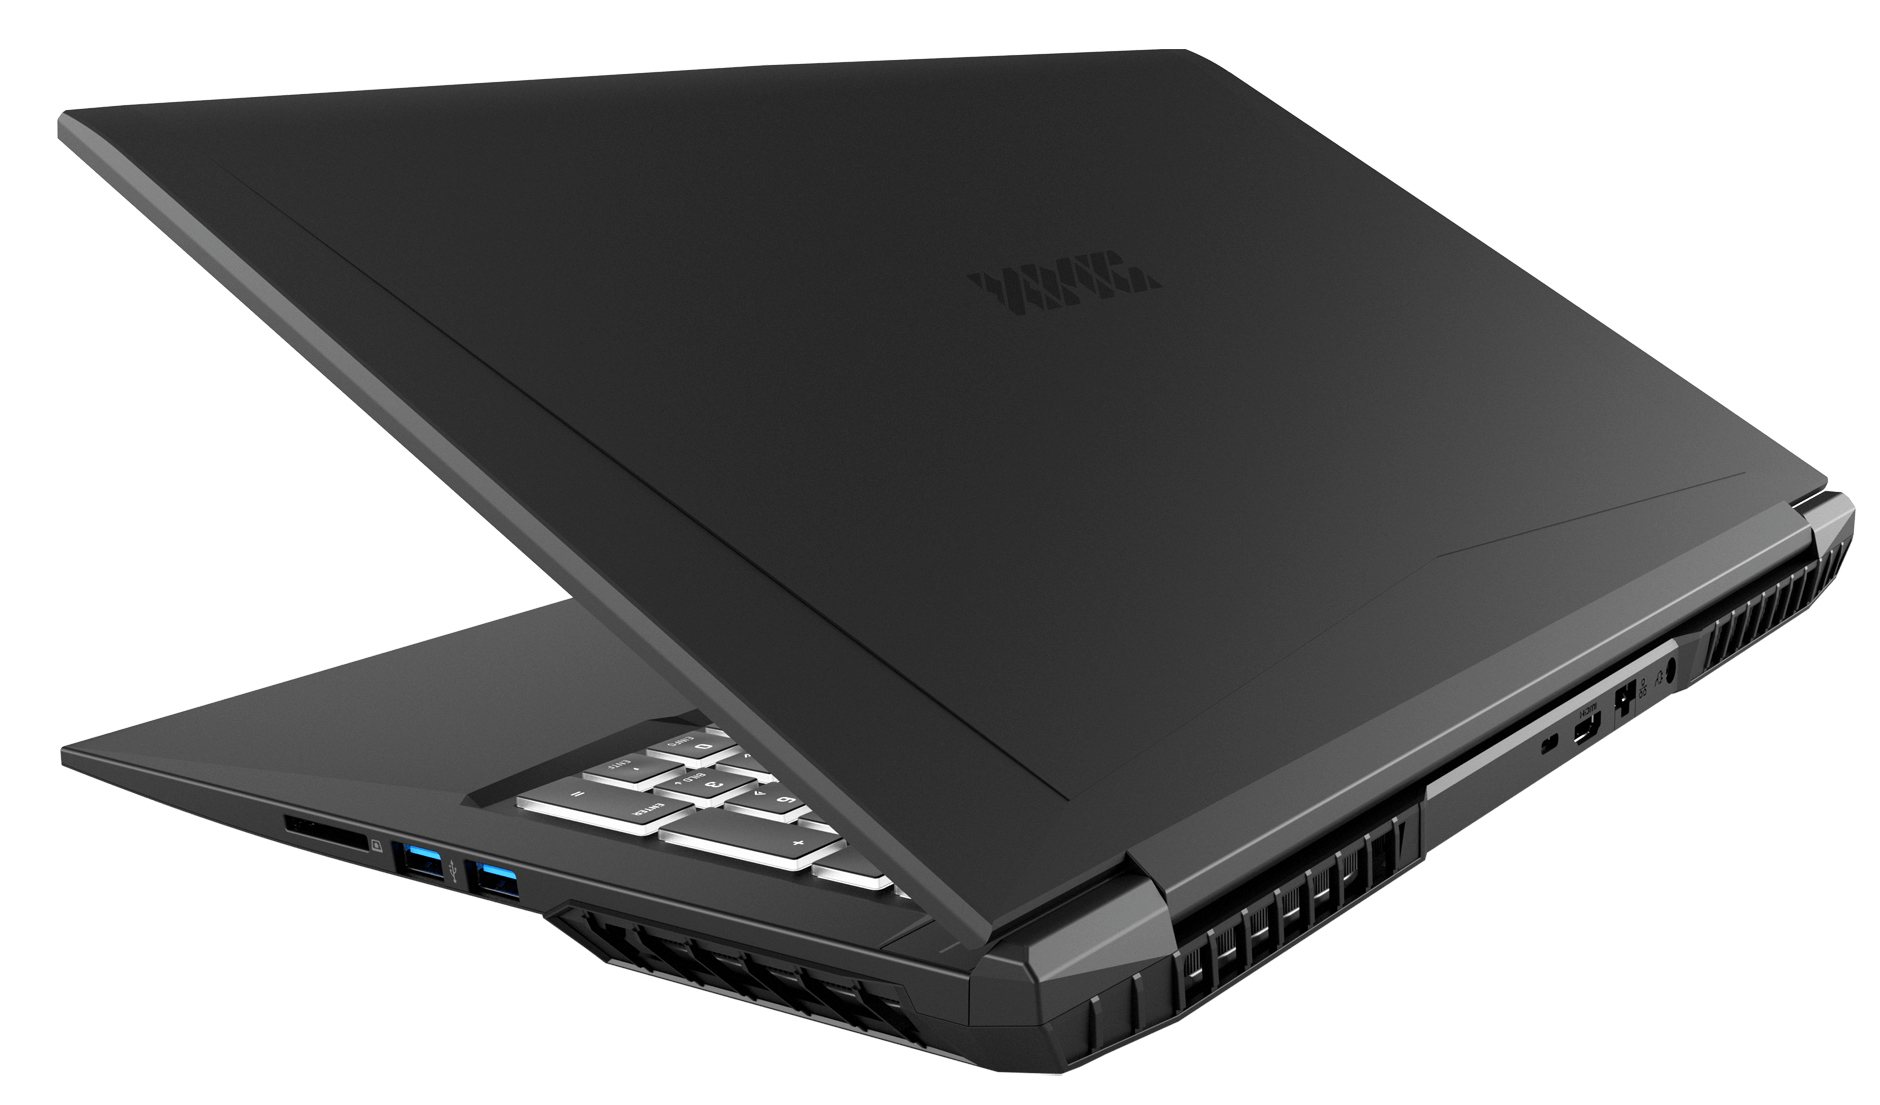
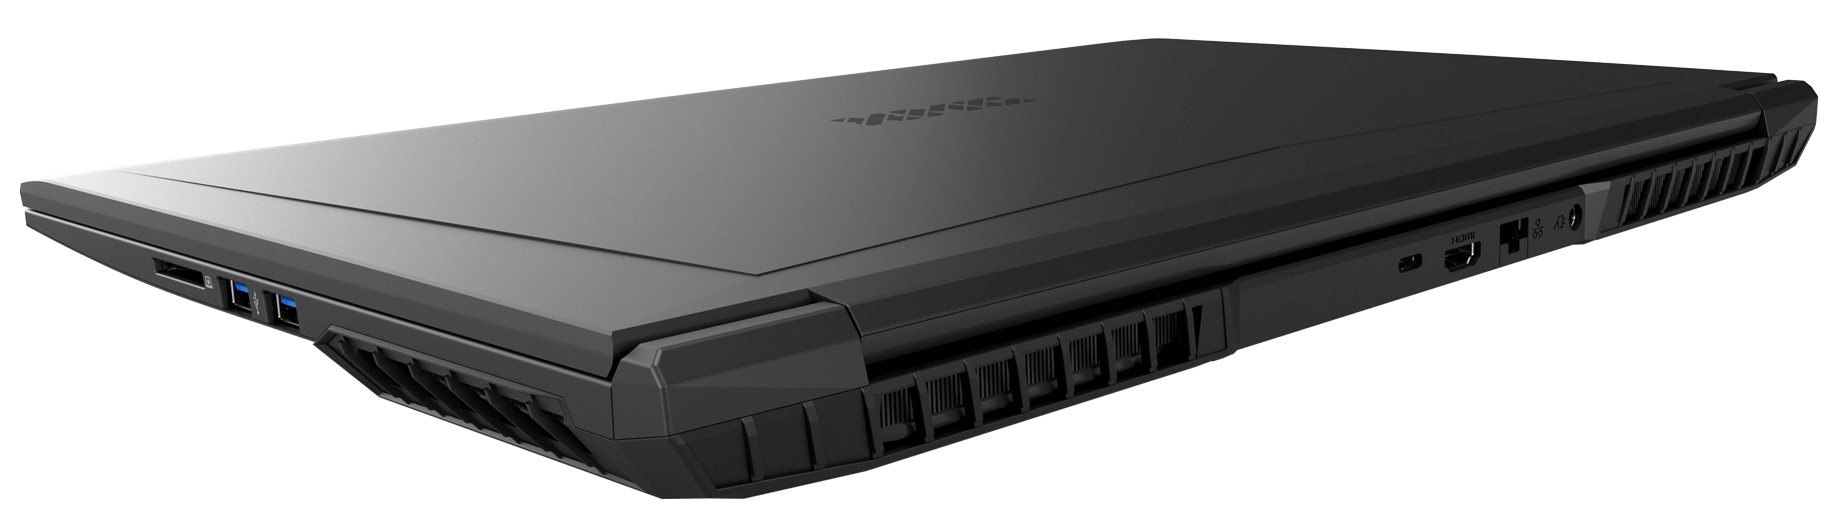

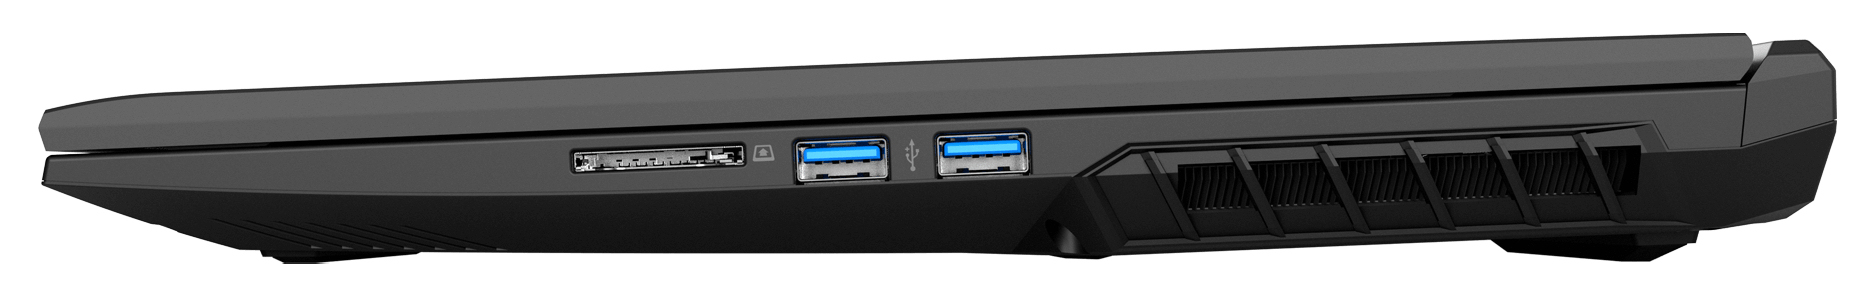
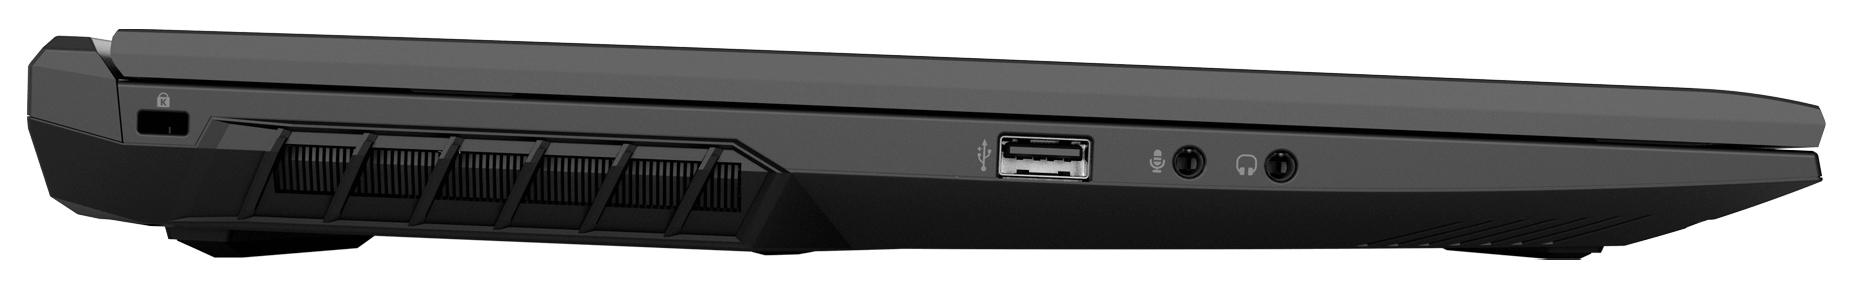
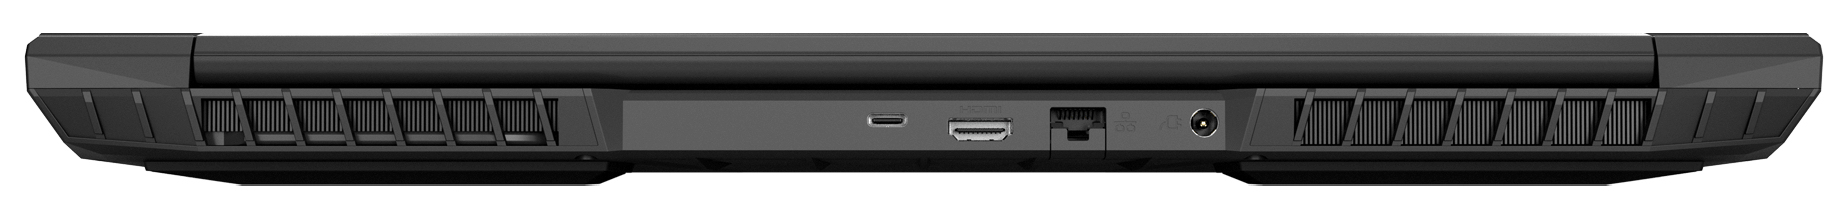
Connections - The Schenker laptop does not offer Thunderbolt
In terms of the connections, something has changed compared to the predecessors: The two Mini-DisplayPort connections were removed, and the USB-C port now supports the USB 3.2 Gen 2 standard (before: USB 3.2 Gen 1) and also DisplayPort via USB-C.
| SD Card Reader | |
| average JPG Copy Test (av. of 3 runs) | |
| Average of class Gaming (20 - 210, n=64, last 2 years) | |
| MSI Alpha 17 A4DEK (Toshiba Exceria Pro SDXC 64 GB UHS-II) | |
| Schenker XMG Core 17 (Toshiba Exceria Pro SDXC 64 GB UHS-II) | |
| Schenker XMG Core 17 Comet Lake (Toshiba Exceria Pro SDXC 64 GB UHS-II) | |
| Schenker XMG Core 17 (Early 2021) (AV PRO microSD 128 GB V60) | |
| maximum AS SSD Seq Read Test (1GB) | |
| Average of class Gaming (25.5 - 261, n=61, last 2 years) | |
| MSI Alpha 17 A4DEK (Toshiba Exceria Pro SDXC 64 GB UHS-II) | |
| Schenker XMG Core 17 (Toshiba Exceria Pro SDXC 64 GB UHS-II) | |
| Schenker XMG Core 17 Comet Lake (Toshiba Exceria Pro SDXC 64 GB UHS-II) | |
| Schenker XMG Core 17 (Early 2021) (AV PRO microSD 128 GB V60) | |
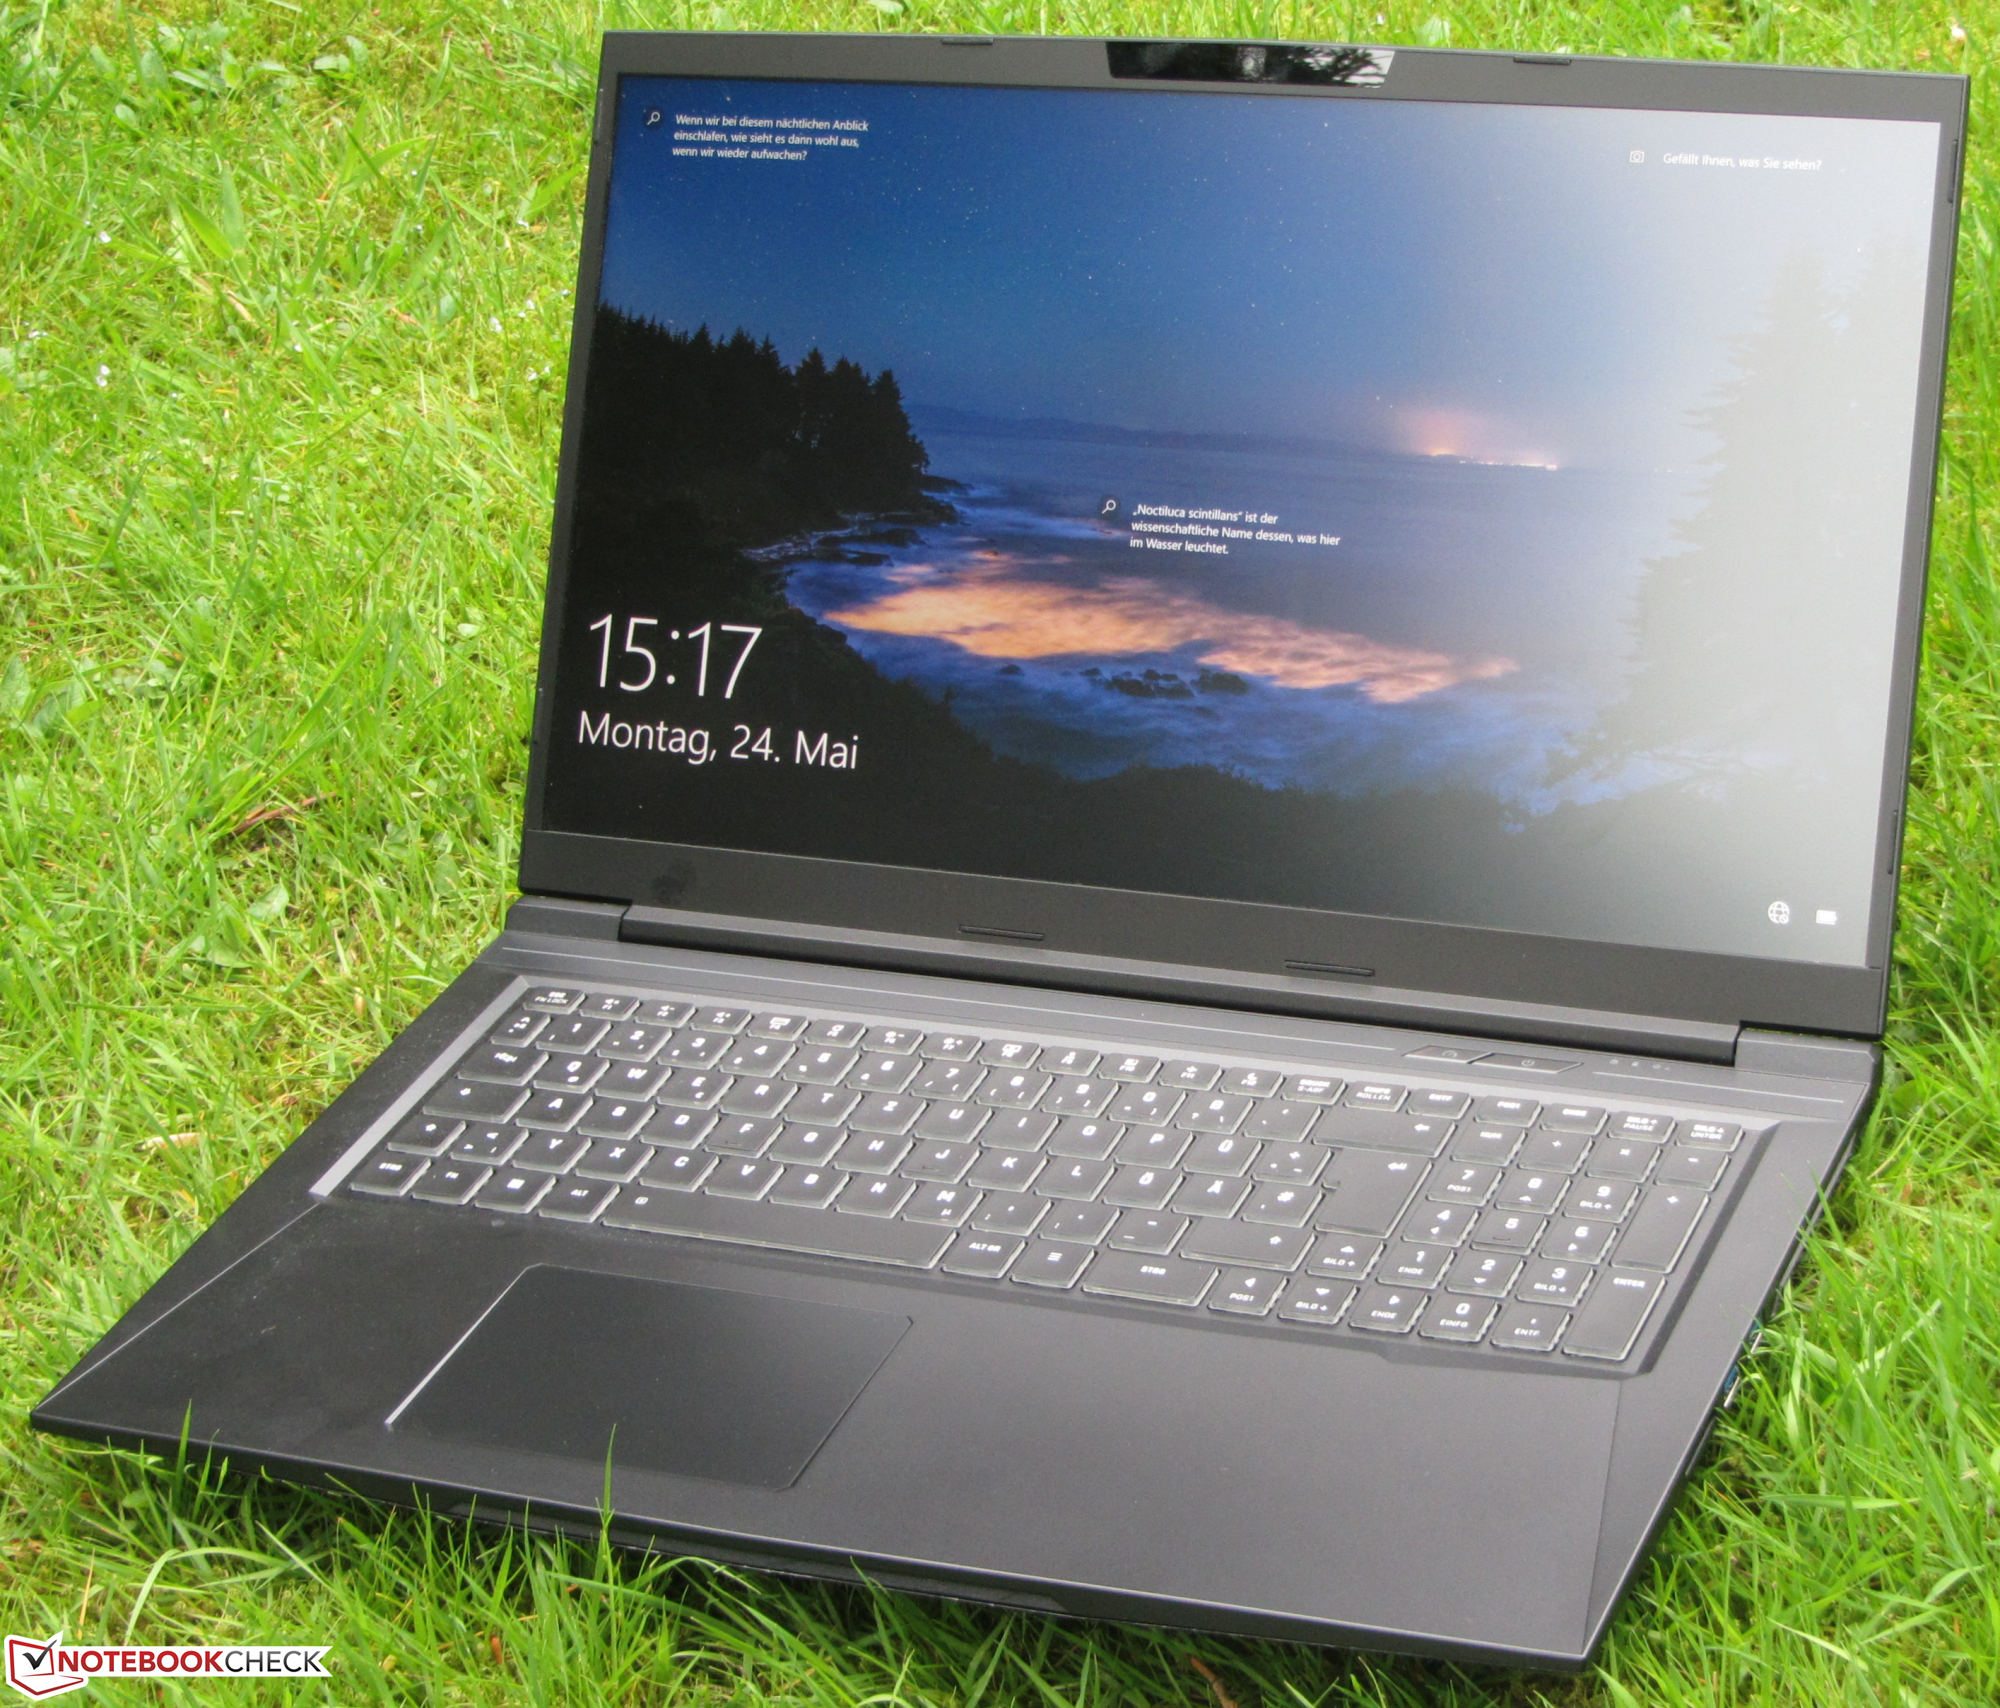
Display - 165 Hz WQHD IPS
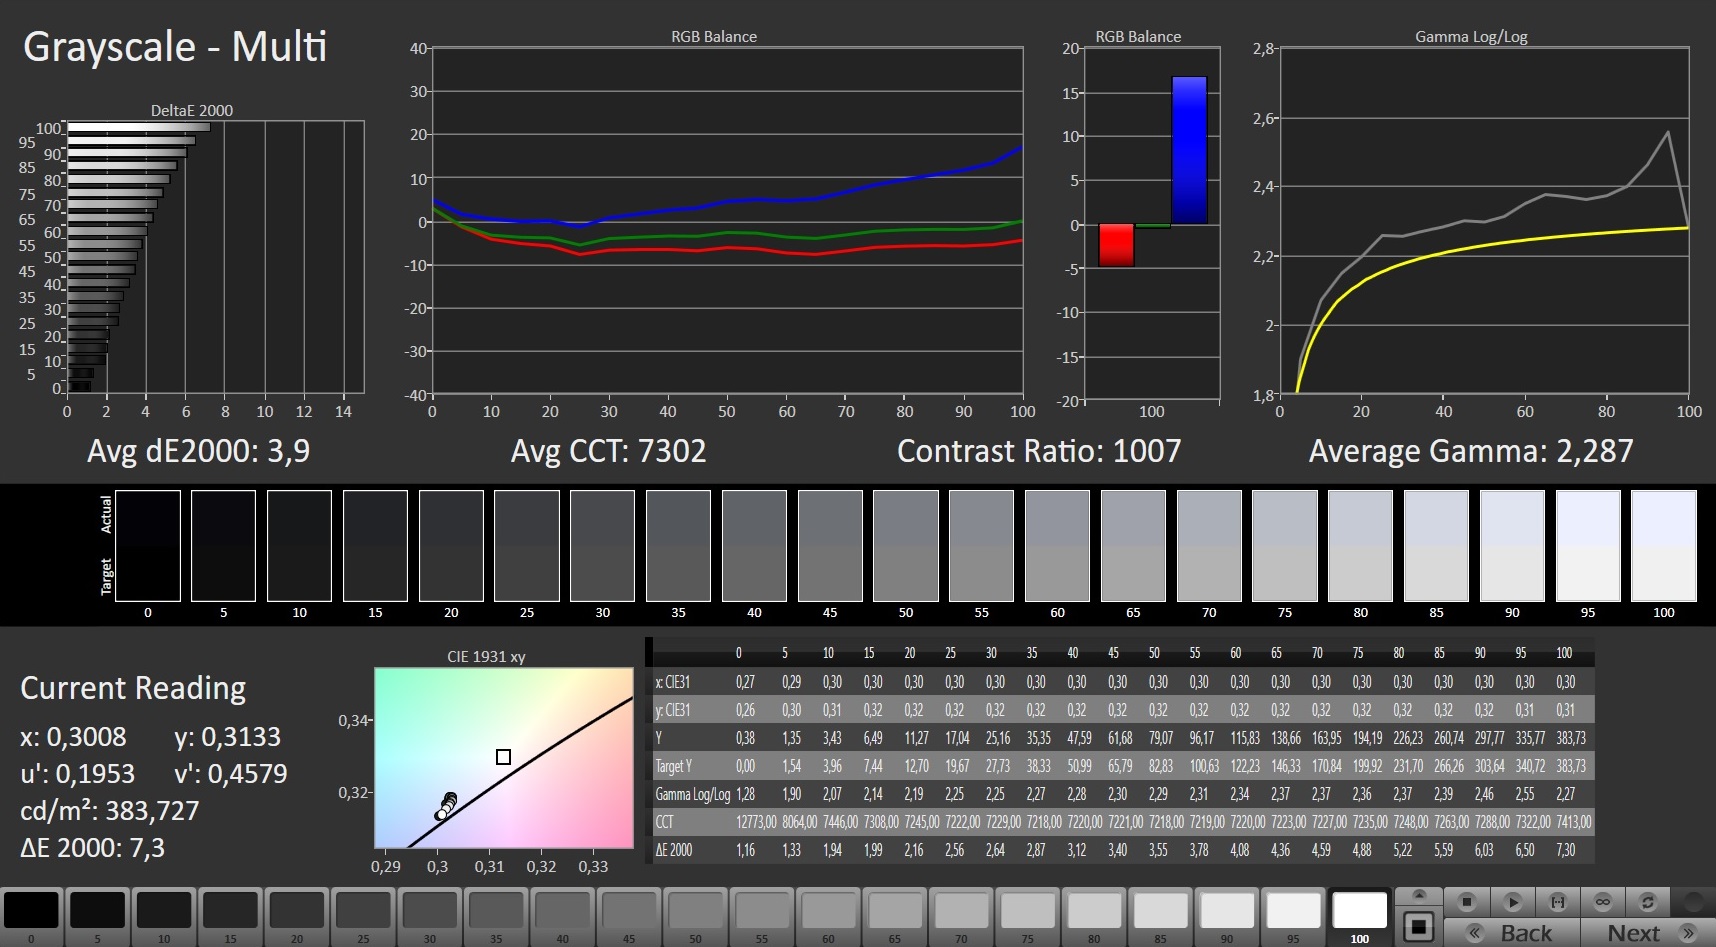
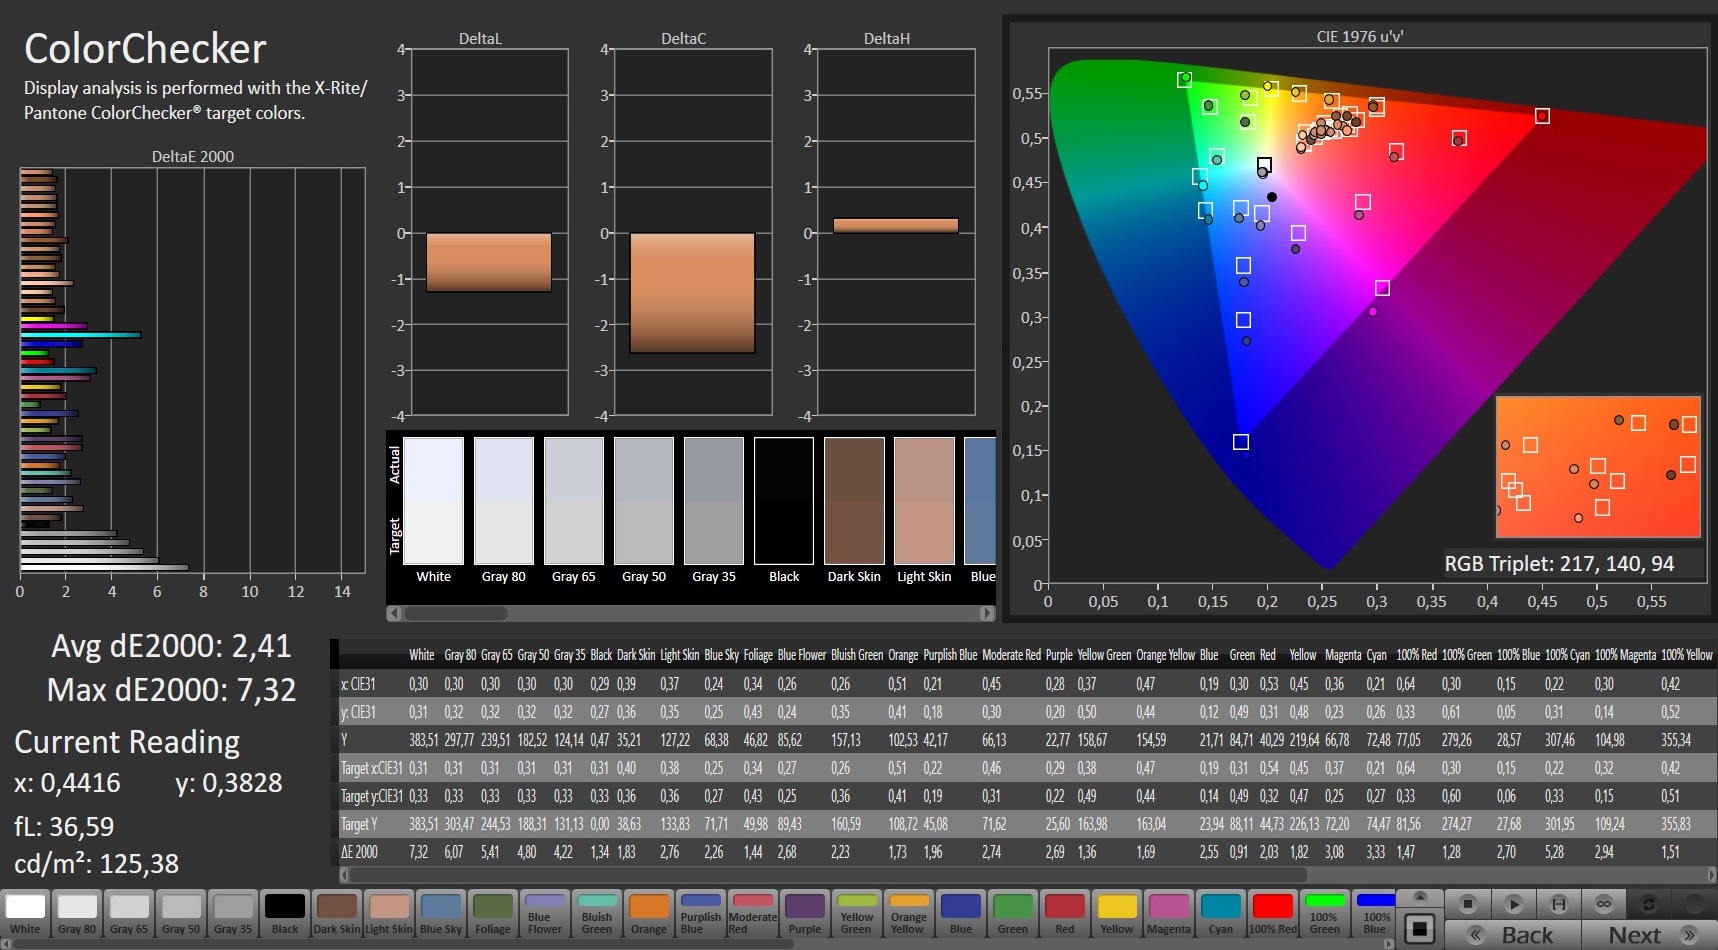
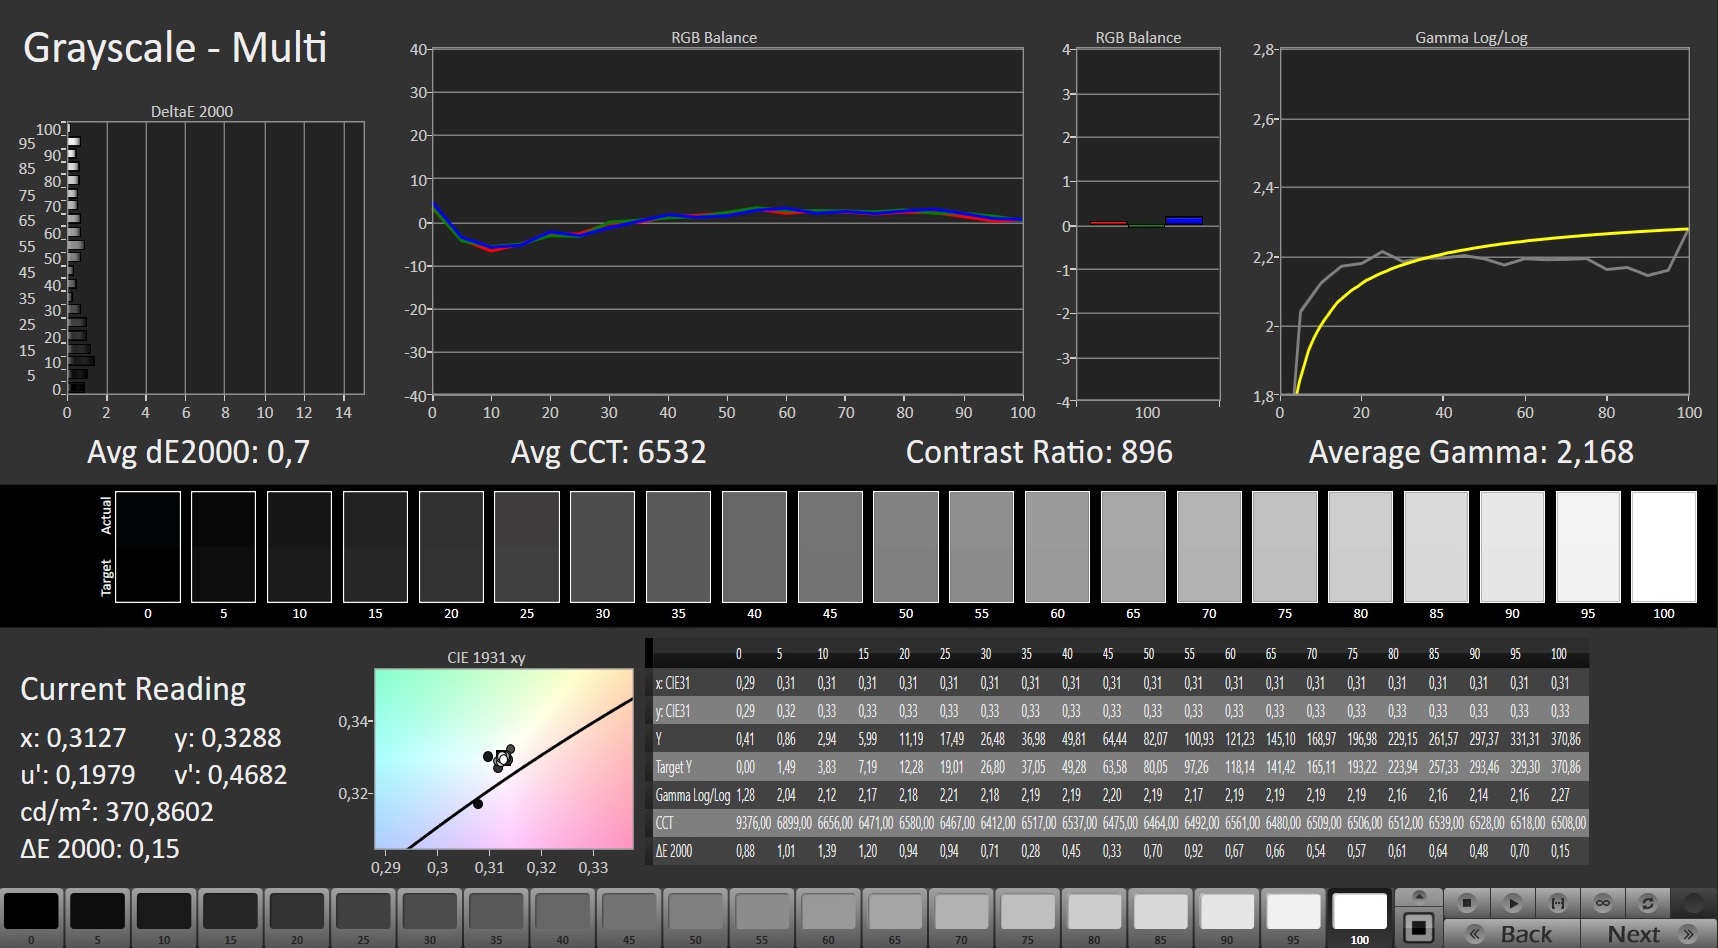
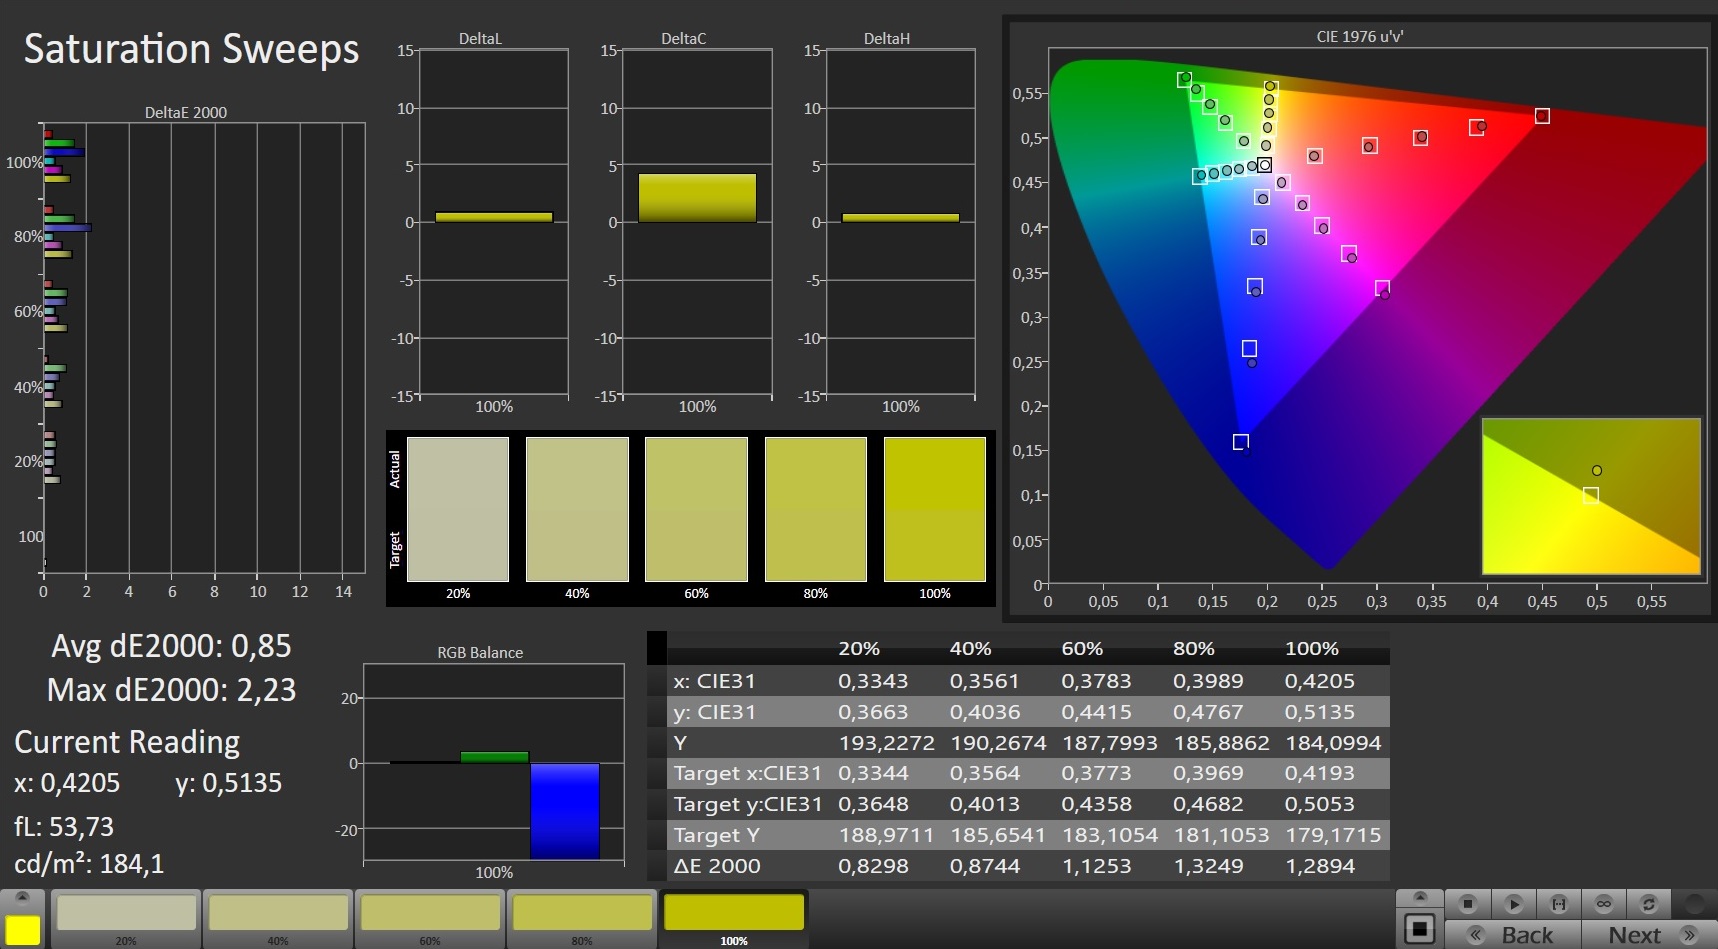
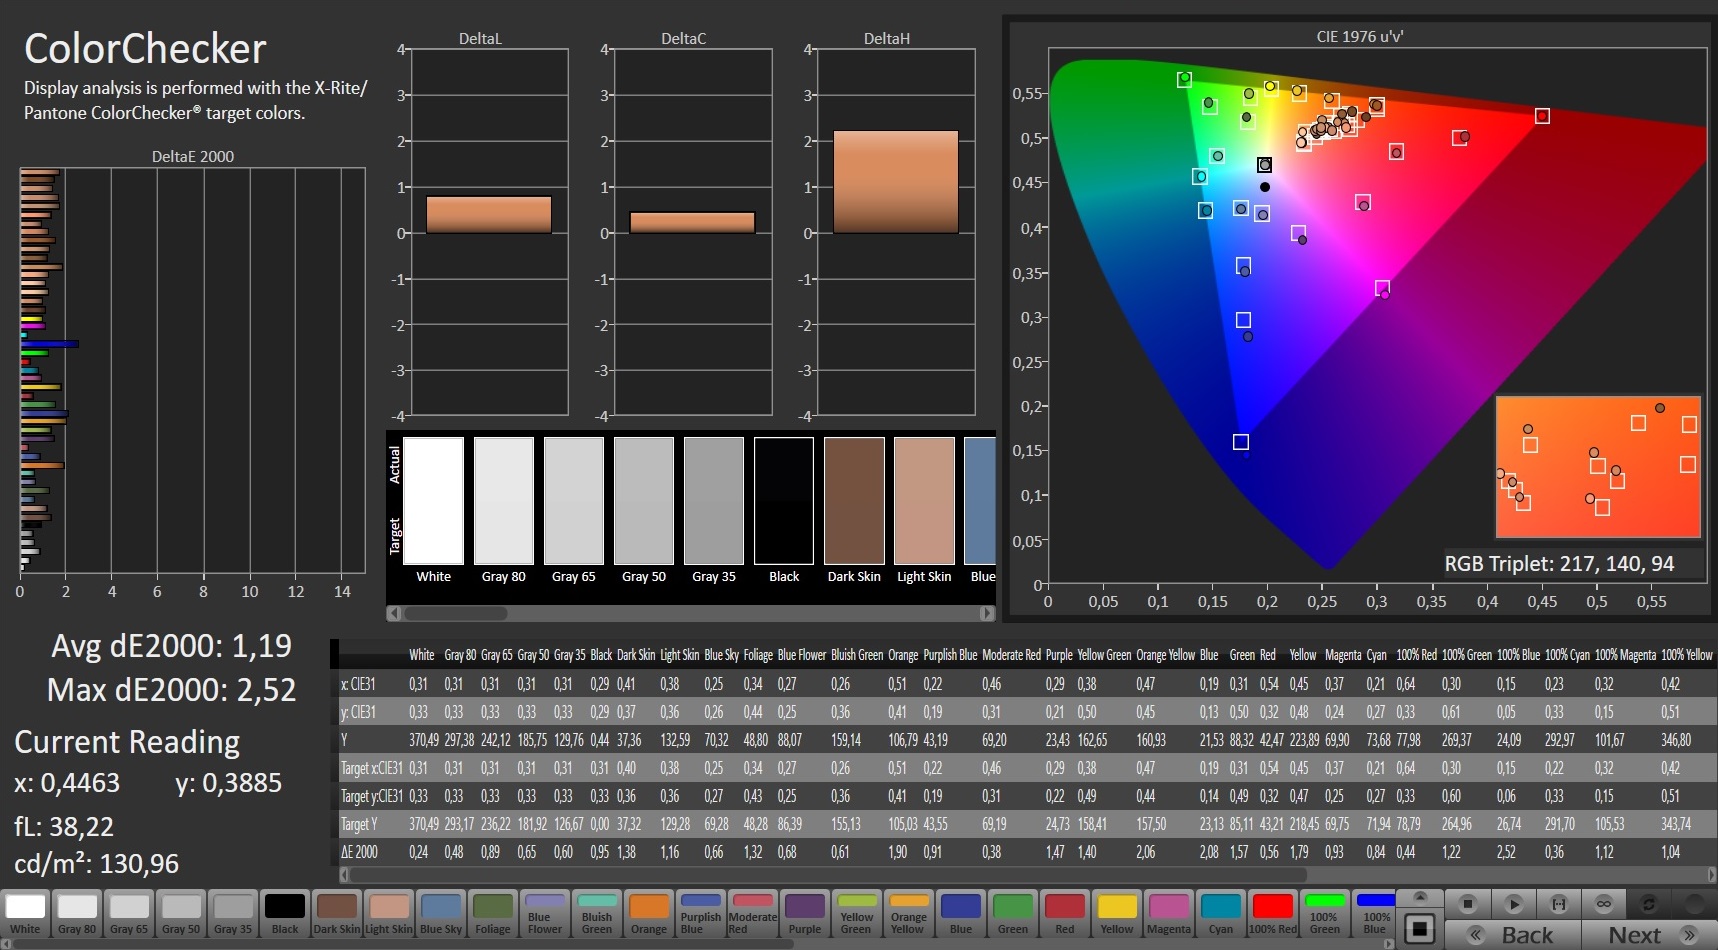
While the brightness value (332.7 cd/m²) of the matte 17.3-inch display (2560 x 1440 pixels) turns out good, the contrast (974:1) could use some improvement, barely missing the target (> 1000:1). The 165-Hz panel offers quick response times and does not produce any PWM flickering. Alternatively, Schenker also offers the option for an FHD display (IPS, 144 Hz).
| |||||||||||||||||||||||||
Brightness Distribution: 84 %
Center on Battery: 370 cd/m²
Contrast: 974:1 (Black: 0.38 cd/m²)
ΔE ColorChecker Calman: 2.41 | ∀{0.5-29.43 Ø4.76}
calibrated: 1.19
ΔE Greyscale Calman: 3.9 | ∀{0.09-98 Ø5}
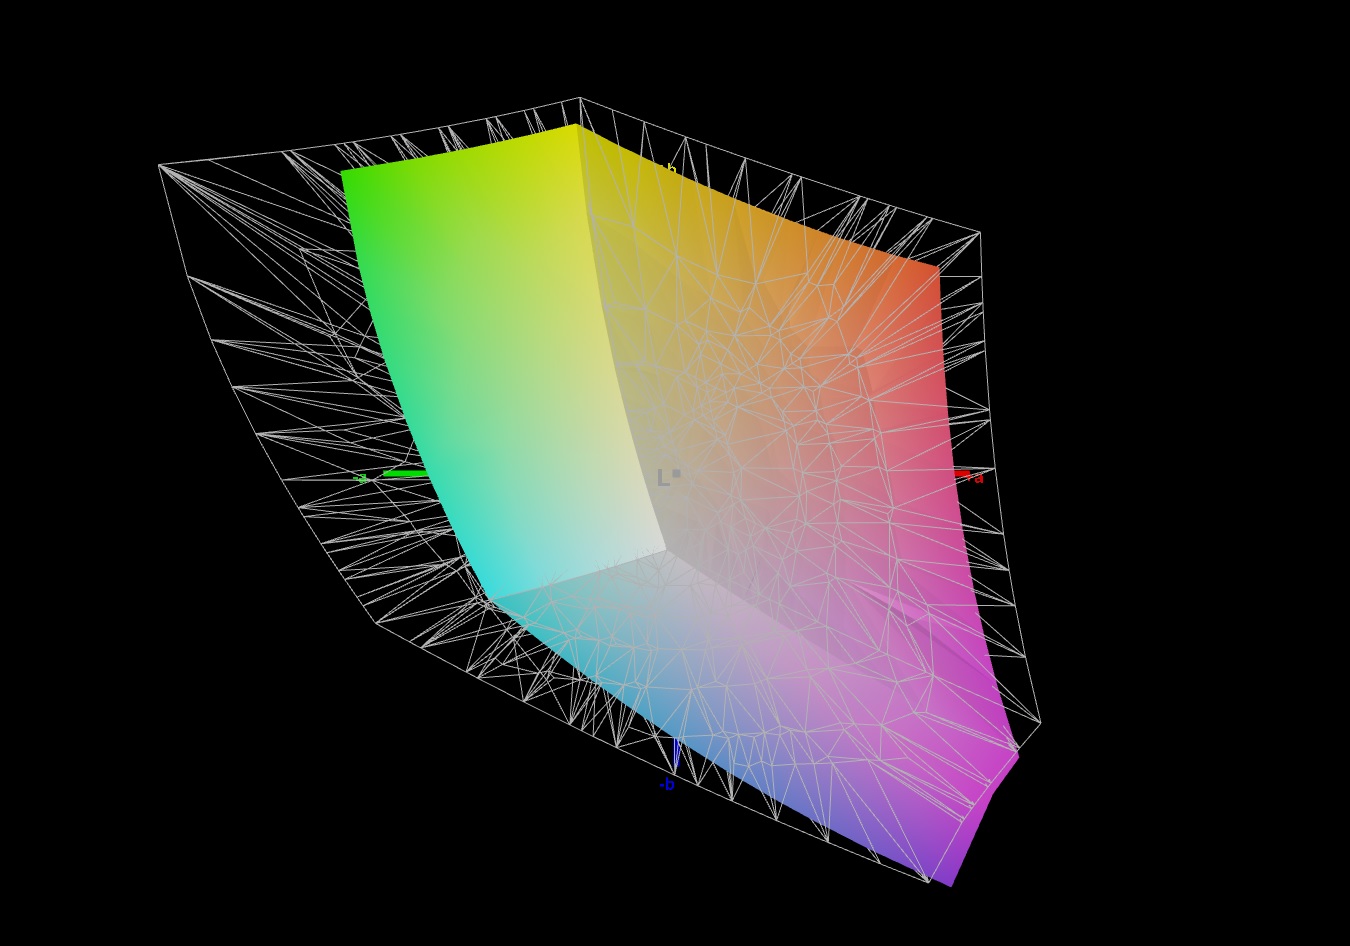
93% sRGB (Argyll 1.6.3 3D)
69% AdobeRGB 1998 (Argyll 1.6.3 3D)
69.3% AdobeRGB 1998 (Argyll 3D)
98.5% sRGB (Argyll 3D)
68.1% Display P3 (Argyll 3D)
Gamma: 2.287
CCT: 7302 K
| Schenker XMG Core 17 (Early 2021) BOE CQ NE173QHM-NY2, IPS, 2560x1440, 17.3" | MSI Alpha 17 A4DEK AU Optronics AUO978F, IPS, 1920x1080, 17.3" | Acer Predator Helios 300 PH317-54-75G8 Chi Mei N173HCE-G33, IPS, 1920x1080, 17.3" | Medion Erazer Beast X10 MD61804 LG Phillips LP173WFG-SPB3, IPS, 1920x1080, 17.3" | Schenker XMG Core 17 LG Philips LP173WFG-SPB1 (LGD0615), IPS, 1920x1080, 17.3" | Schenker XMG Core 17 Comet Lake BOE HF NV173FHM-N44, IPS, 1920x1080, 17.3" | |
|---|---|---|---|---|---|---|
| Display | -41% | -6% | -4% | -4% | -5% | |
| Display P3 Coverage (%) | 68.1 | 39.55 -42% | 62.6 -8% | 64.5 -5% | 64.4 -5% | 65.3 -4% |
| sRGB Coverage (%) | 98.5 | 59.2 -40% | 94.3 -4% | 95.6 -3% | 95.6 -3% | 92.6 -6% |
| AdobeRGB 1998 Coverage (%) | 69.3 | 40.86 -41% | 64.7 -7% | 65.6 -5% | 65.6 -5% | 66.5 -4% |
| Response Times | -165% | -3% | 7% | 9% | -3% | |
| Response Time Grey 50% / Grey 80% * (ms) | 16.8 ? | 40 ? -138% | 16.4 ? 2% | 14.4 ? 14% | 14.4 ? 14% | 17.6 ? -5% |
| Response Time Black / White * (ms) | 10 ? | 29.2 ? -192% | 10.8 ? -8% | 10 ? -0% | 9.6 ? 4% | 10 ? -0% |
| PWM Frequency (Hz) | 24510 ? | 1000 ? | ||||
| Screen | -46% | 27% | -5% | 1% | -16% | |
| Brightness middle (cd/m²) | 370 | 254 -31% | 322 -13% | 313 -15% | 329 -11% | 315 -15% |
| Brightness (cd/m²) | 333 | 254 -24% | 308 -8% | 297 -11% | 286 -14% | 298 -11% |
| Brightness Distribution (%) | 84 | 93 11% | 92 10% | 88 5% | 79 -6% | 88 5% |
| Black Level * (cd/m²) | 0.38 | 0.23 39% | 0.18 53% | 0.27 29% | 0.3 21% | 0.29 24% |
| Contrast (:1) | 974 | 1104 13% | 1789 84% | 1159 19% | 1097 13% | 1086 11% |
| Colorchecker dE 2000 * | 2.41 | 4.12 -71% | 1.53 37% | 2.96 -23% | 2.52 -5% | 4.3 -78% |
| Colorchecker dE 2000 max. * | 7.32 | 19.66 -169% | 3.14 57% | 9.83 -34% | 6.9 6% | 7.3 -0% |
| Colorchecker dE 2000 calibrated * | 1.19 | 3.78 -218% | 0.74 38% | 1.03 13% | 1.31 -10% | 2.29 -92% |
| Greyscale dE 2000 * | 3.9 | 3.2 18% | 1.9 51% | 4.9 -26% | 2.98 24% | 4.3 -10% |
| Gamma | 2.287 96% | 2.179 101% | 2.144 103% | 2.187 101% | 2.38 92% | 2.084 106% |
| CCT | 7302 89% | 6754 96% | 6809 95% | 7559 86% | 6738 96% | 7434 87% |
| Color Space (Percent of AdobeRGB 1998) (%) | 69 | 41 -41% | 65 -6% | 66 -4% | 60 -13% | 66 -4% |
| Color Space (Percent of sRGB) (%) | 93 | 59 -37% | 87 -6% | 89 -4% | 95 2% | 92 -1% |
| Total Average (Program / Settings) | -84% /
-60% | 6% /
17% | -1% /
-3% | 2% /
1% | -8% /
-12% |
* ... smaller is better
In the state of delivery, the display offers a good color reproduction, meeting the target (Delta E < 3) with a color deviation of 2.41. The display does not suffer from a blue tint. Via calibration, you can achieve some improvements, with the color deviation dropping to 1.19 and the Grayscale display becoming more balanced. The AdobeRGB (69%) and sRGB (93%) color spaces are not fully covered.
Display Response Times
| ↔ Response Time Black to White | ||
|---|---|---|
| 10 ms ... rise ↗ and fall ↘ combined | ↗ 4.8 ms rise |  |
| ↘ 5.2 ms fall | ||
| The screen shows good response rates in our tests, but may be too slow for competitive gamers. In comparison, all tested devices range from 0.1 (minimum) to 240 (maximum) ms. » 26 % of all devices are better. This means that the measured response time is better than the average of all tested devices (20.1 ms). | ||
| ↔ Response Time 50% Grey to 80% Grey | ||
| 16.8 ms ... rise ↗ and fall ↘ combined | ↗ 8.4 ms rise | 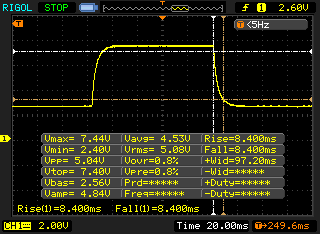 |
| ↘ 8.4 ms fall | ||
| The screen shows good response rates in our tests, but may be too slow for competitive gamers. In comparison, all tested devices range from 0.165 (minimum) to 636 (maximum) ms. » 30 % of all devices are better. This means that the measured response time is better than the average of all tested devices (31.5 ms). | ||
Screen Flickering / PWM (Pulse-Width Modulation)
| Screen flickering / PWM not detected |  | ||
In comparison: 53 % of all tested devices do not use PWM to dim the display. If PWM was detected, an average of 8082 (minimum: 5 - maximum: 343500) Hz was measured. | |||
The viewing angles of the IPS panel are stable and the display contents can be read from any position. Outdoors, the display contents can be read if the sun isn't too bright.


Performance - Sufficient for the next few years
The XMG Core 17 is able to bring every current game to the screen smoothly and also strikes a good figure in all the other application areas.

Test Conditions
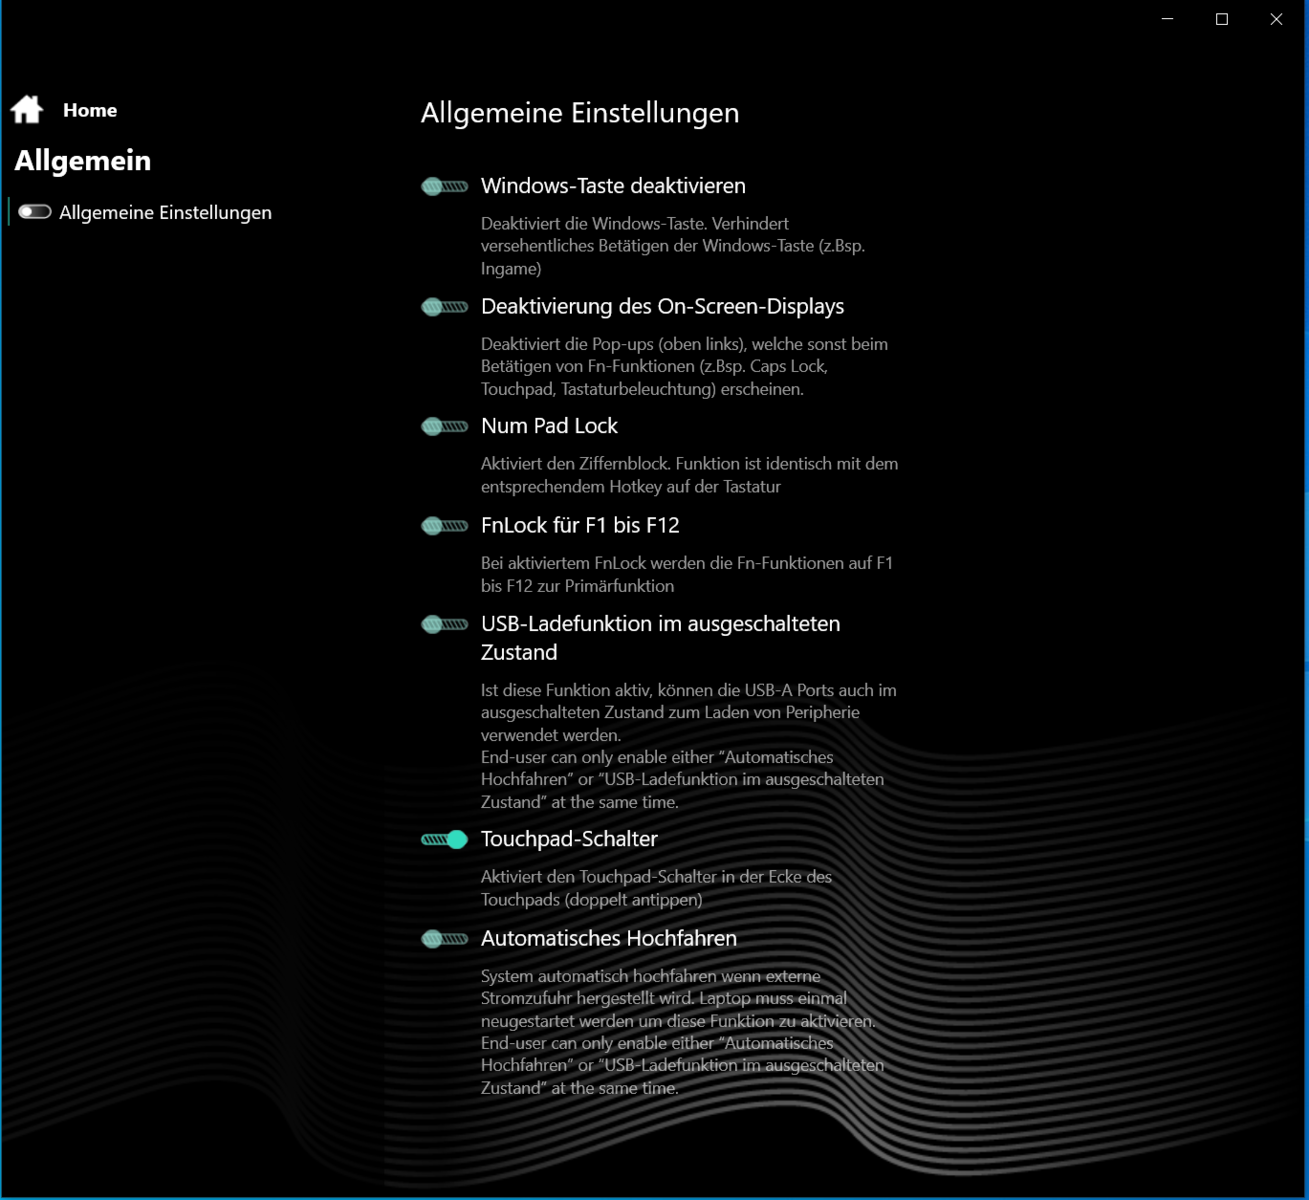
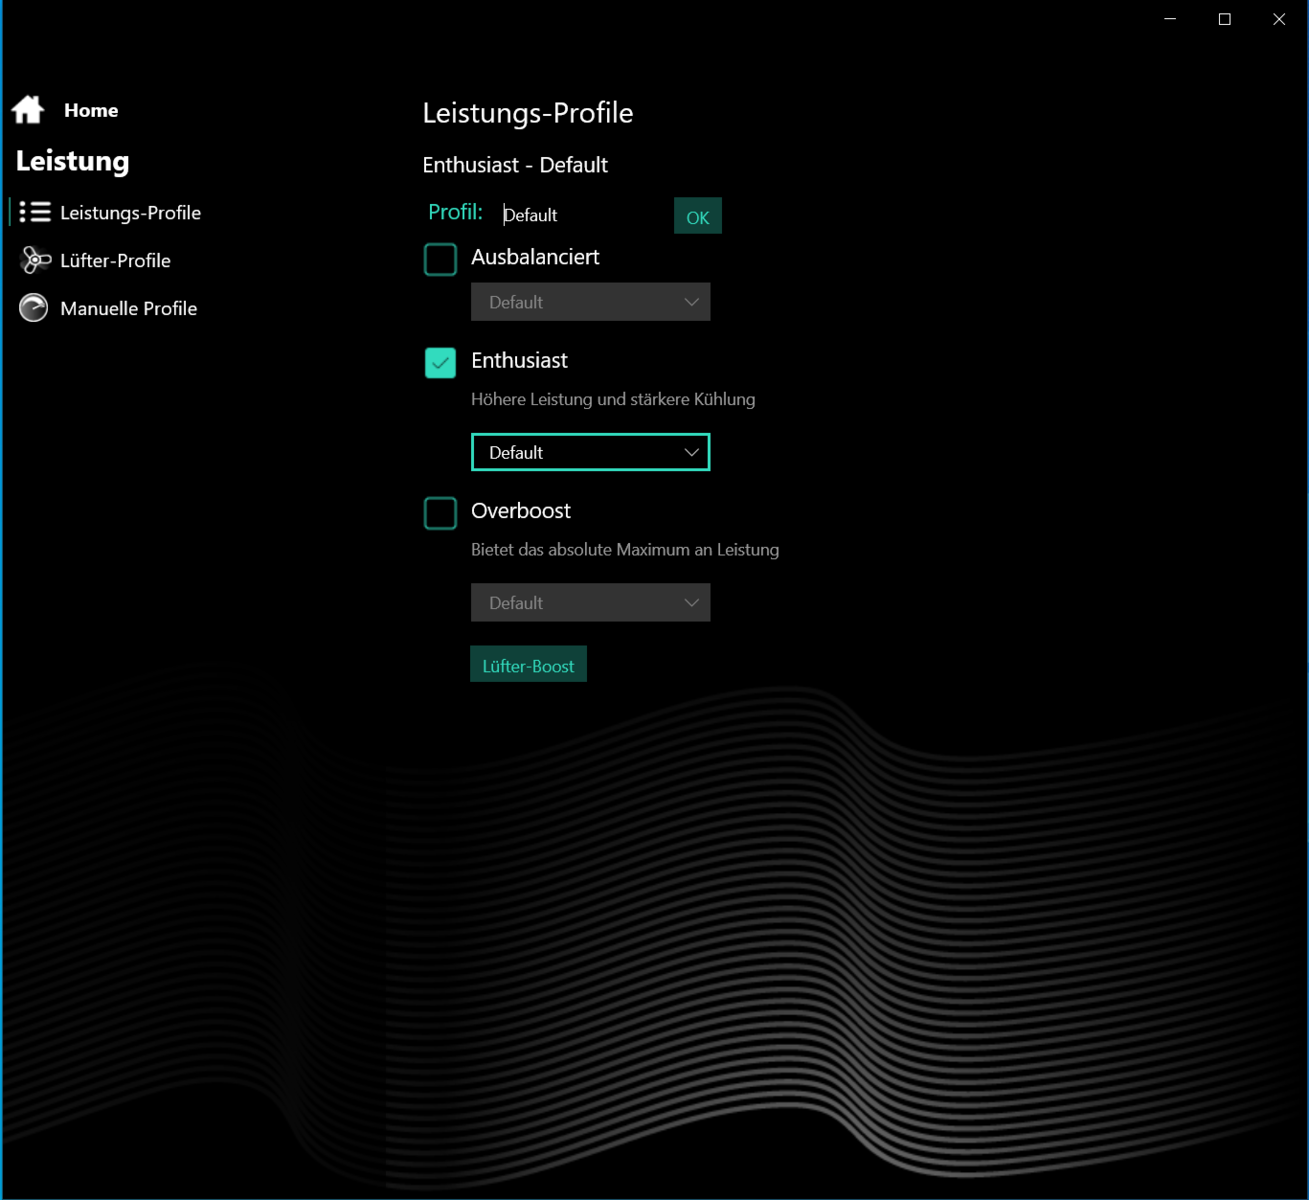
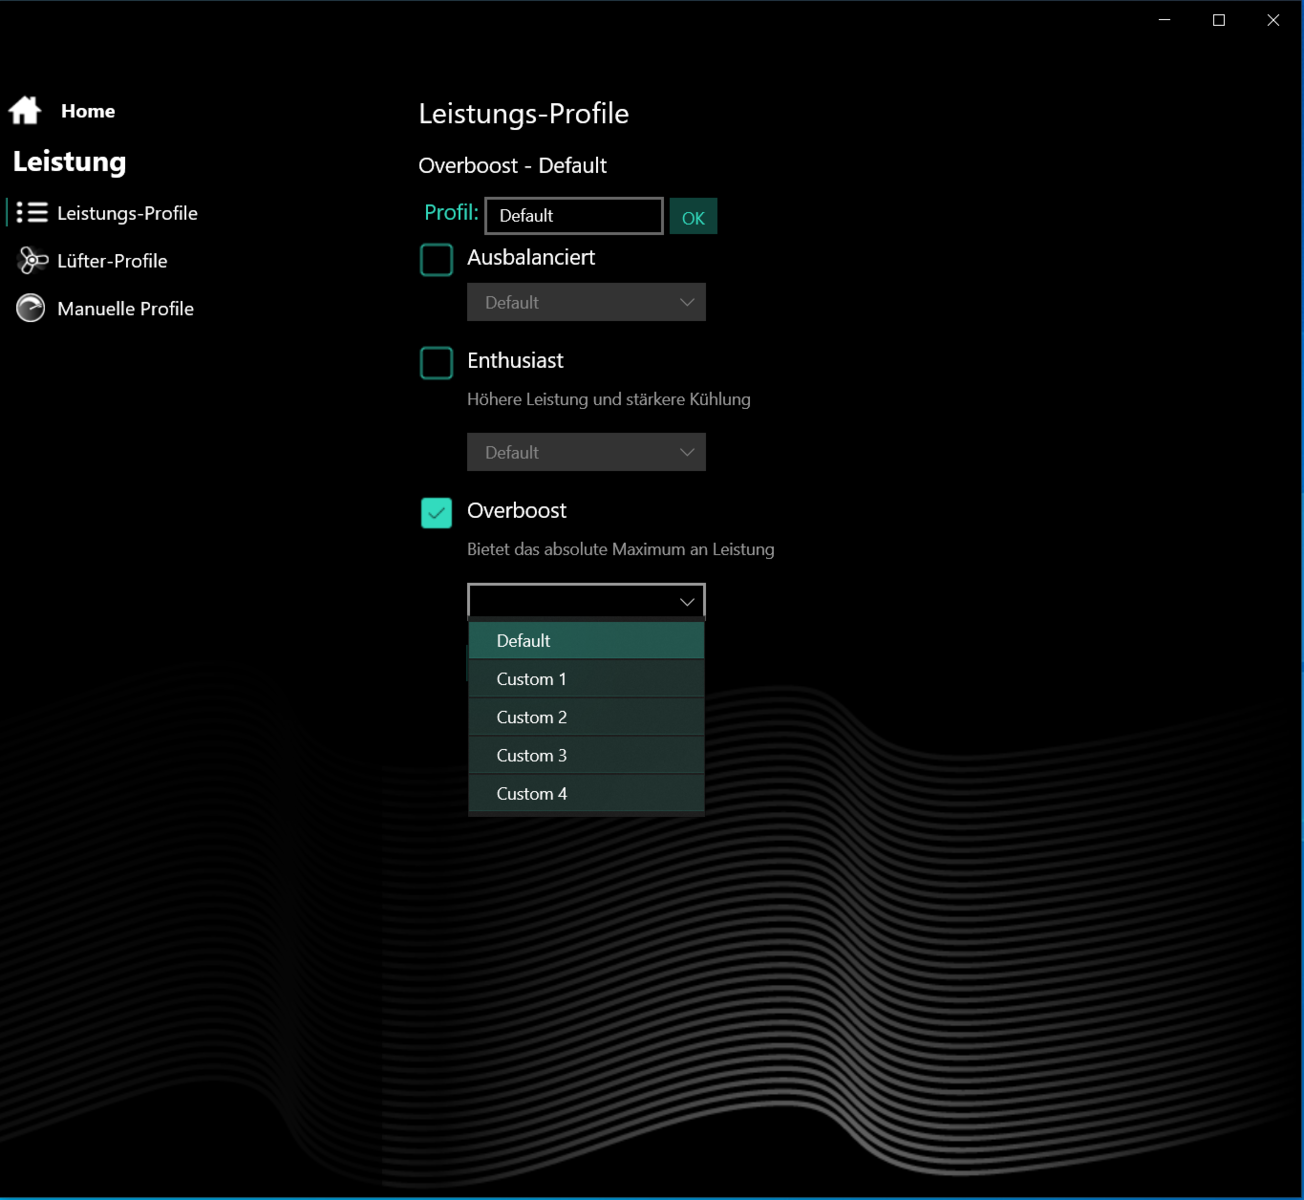
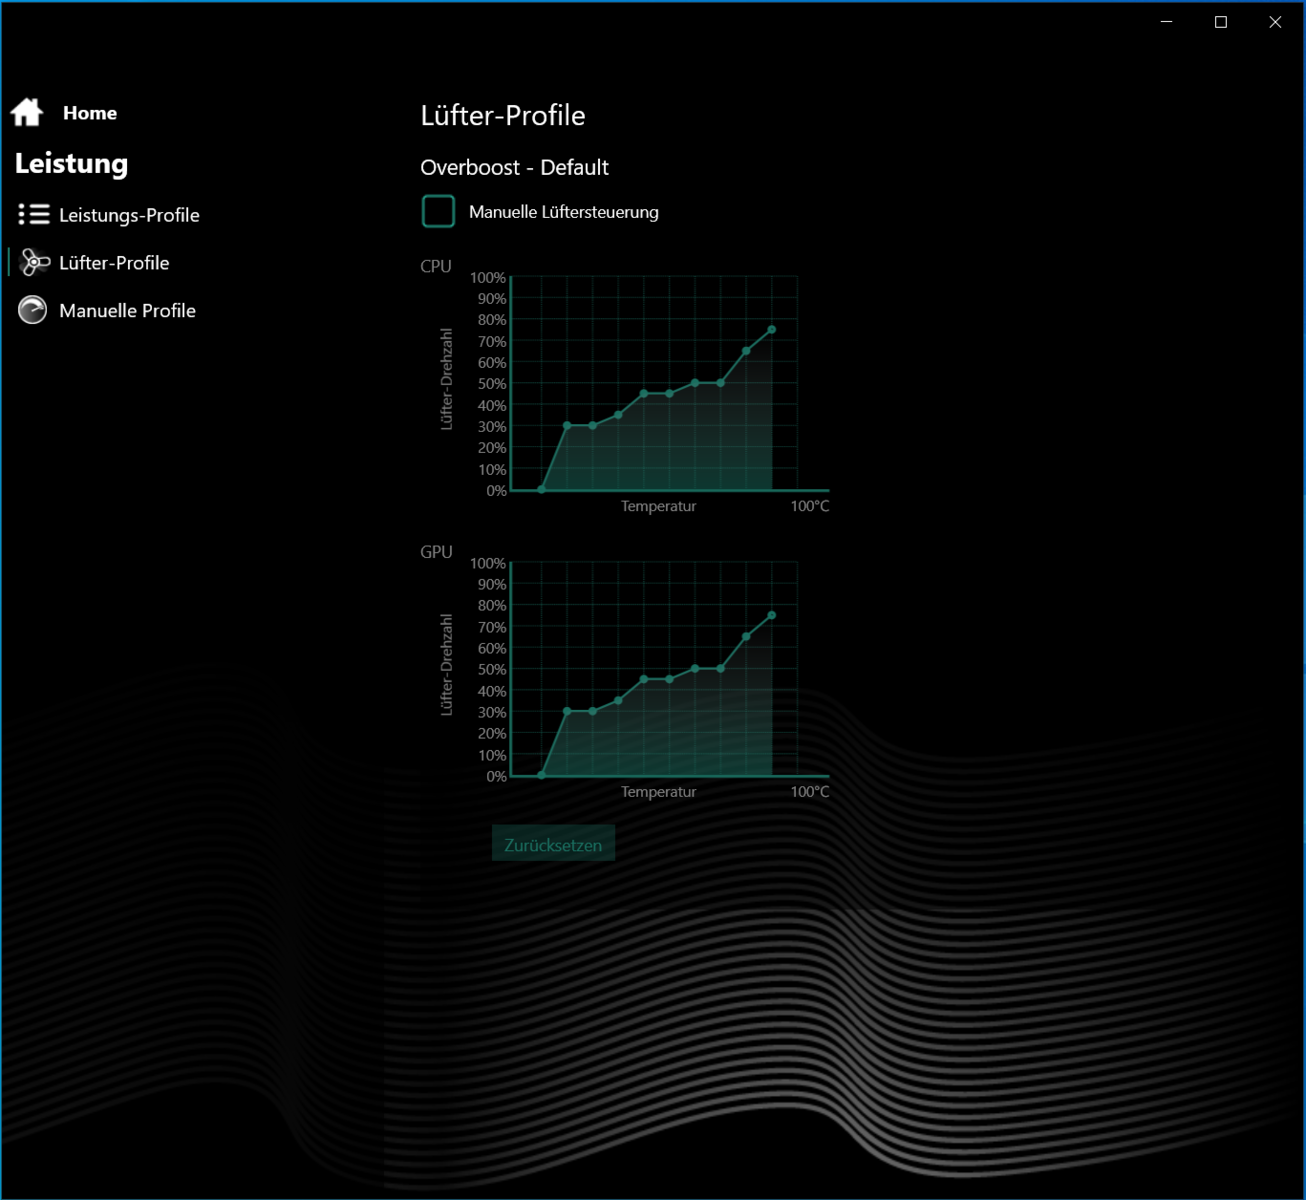
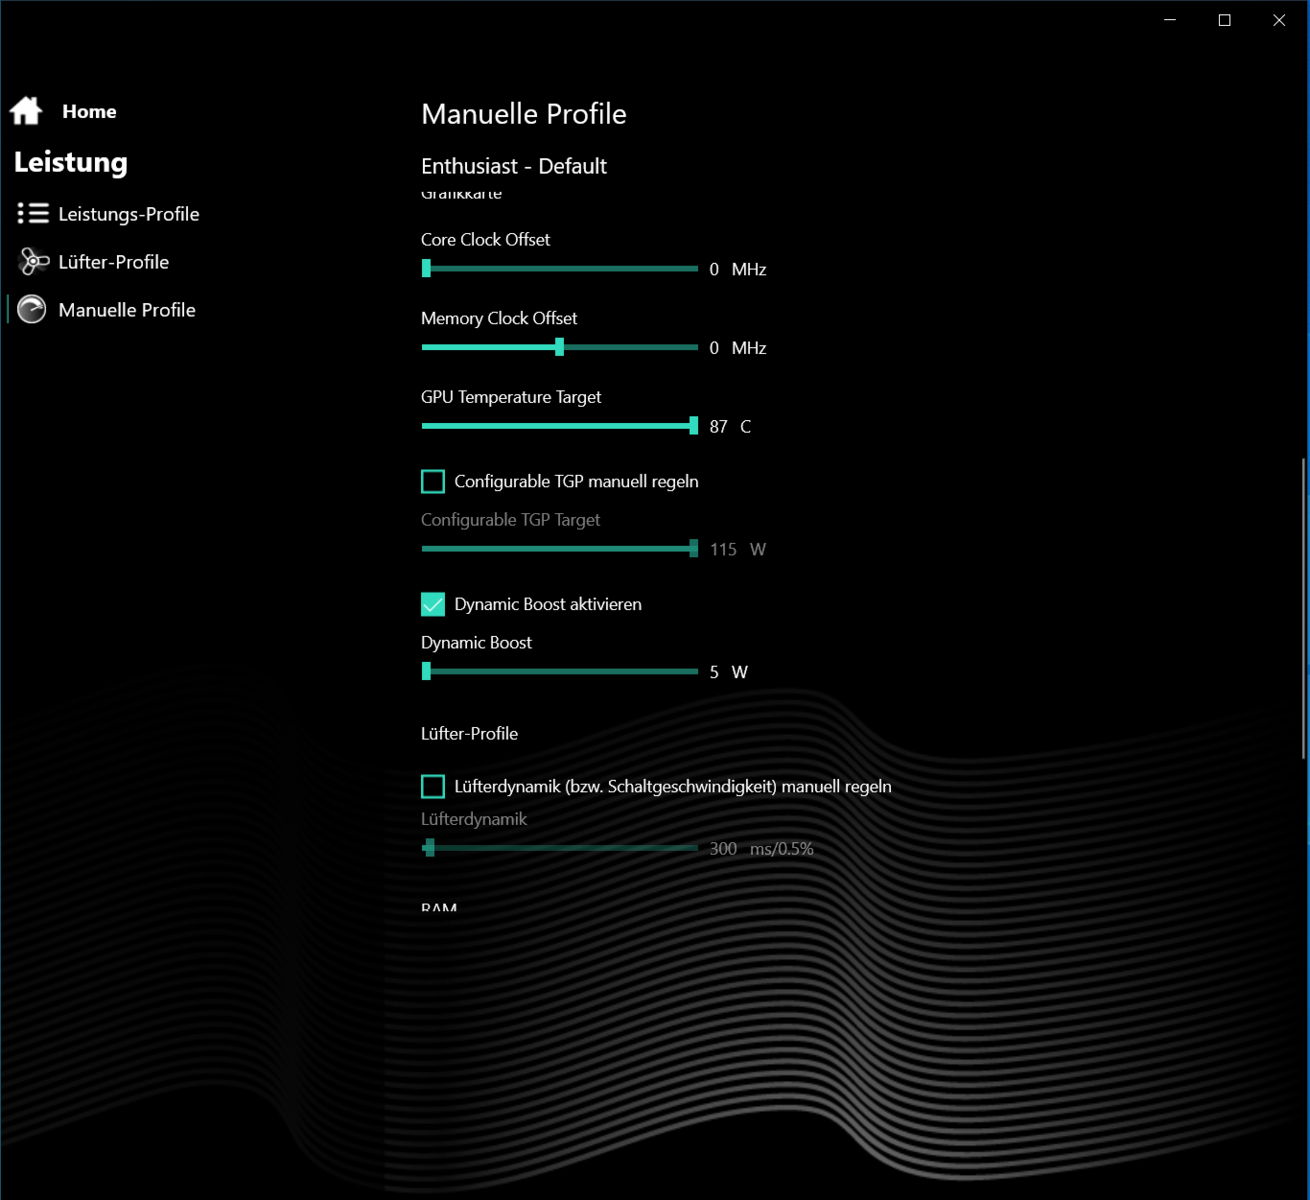
You can switch between the three performance profiles "Balanced," "Enthusiast," and "Overboost" via the preinstalled Control Center or the profile switching key (next to the power button). For our test, we used the "Enthusiast" profile (PL1/PL2: 60 watts) and the automatic fan control. Several benchmarks were also run with the "Overboost" profile (PL1/PL2: 75 watts) activated. During the battery tests, we used the "Balanced" profile (PL1/PL2: 35 watts).
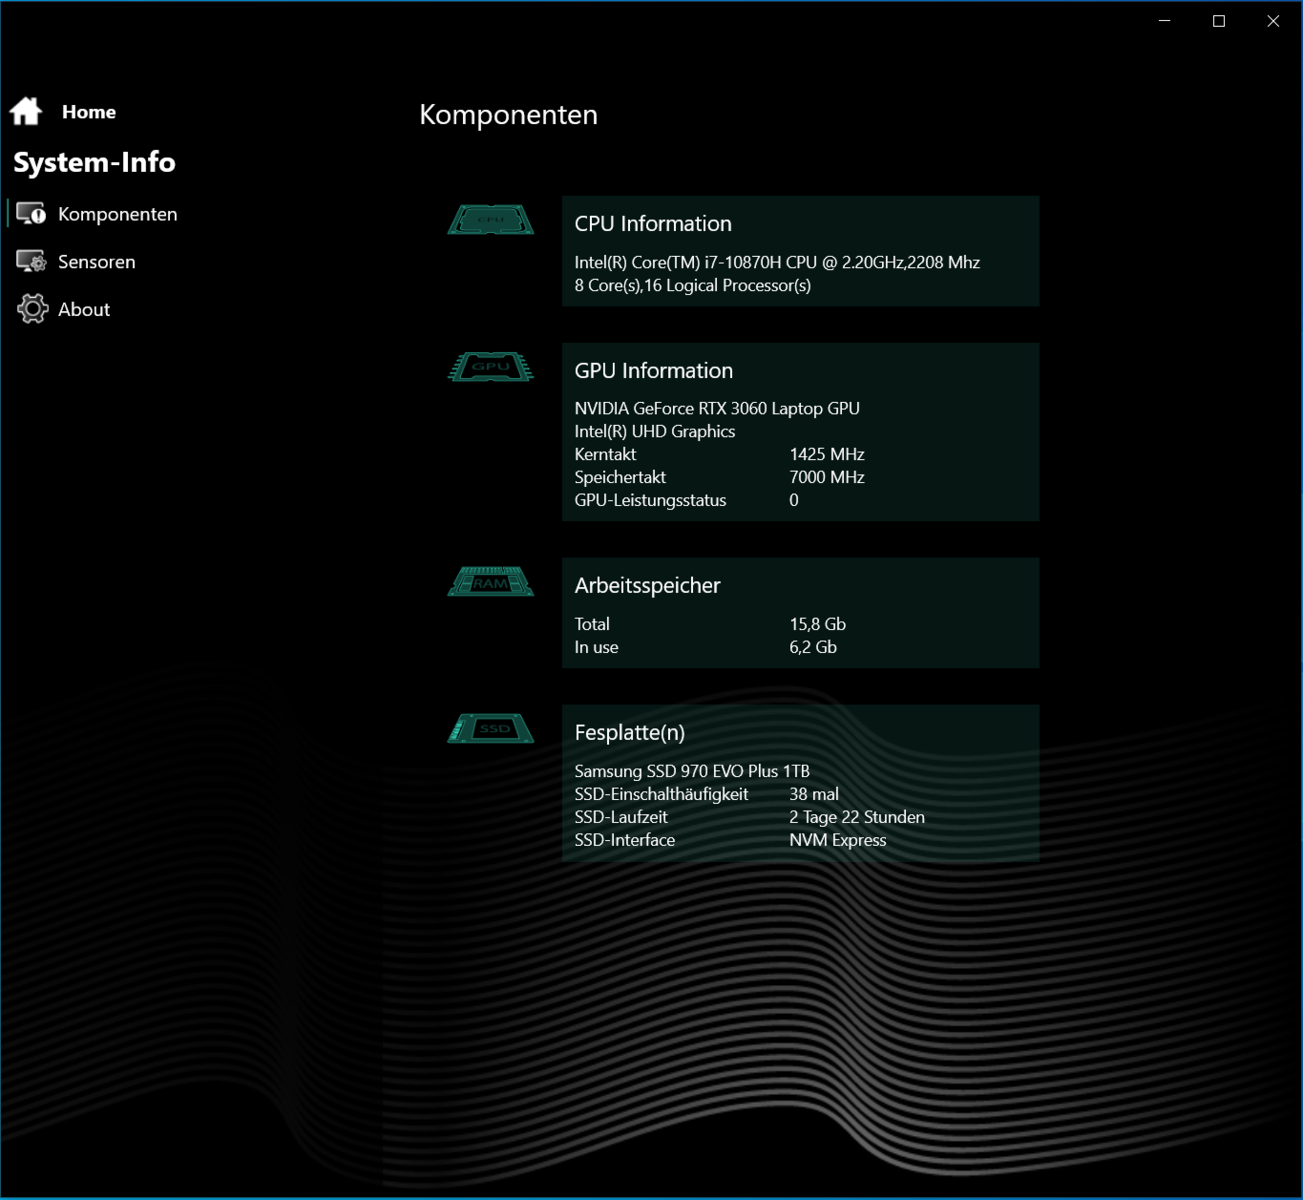
Processor
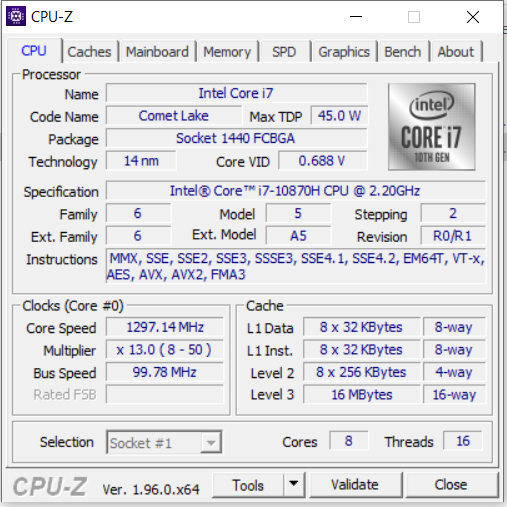
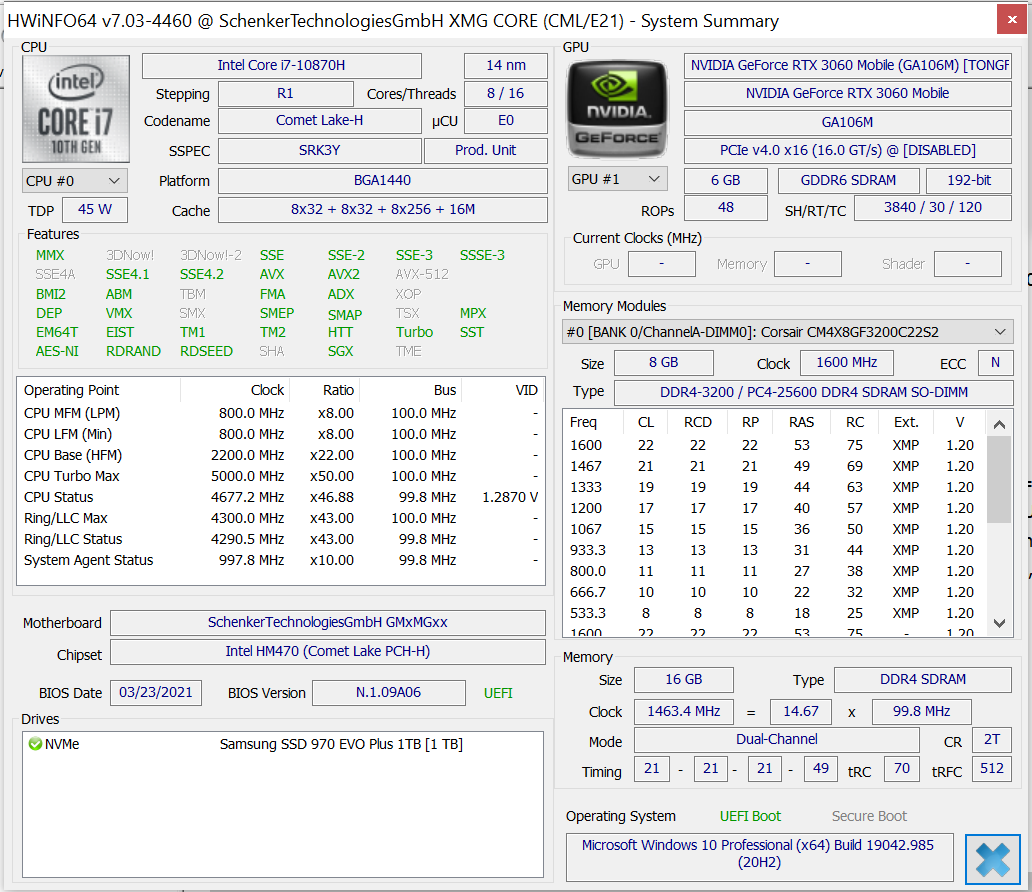
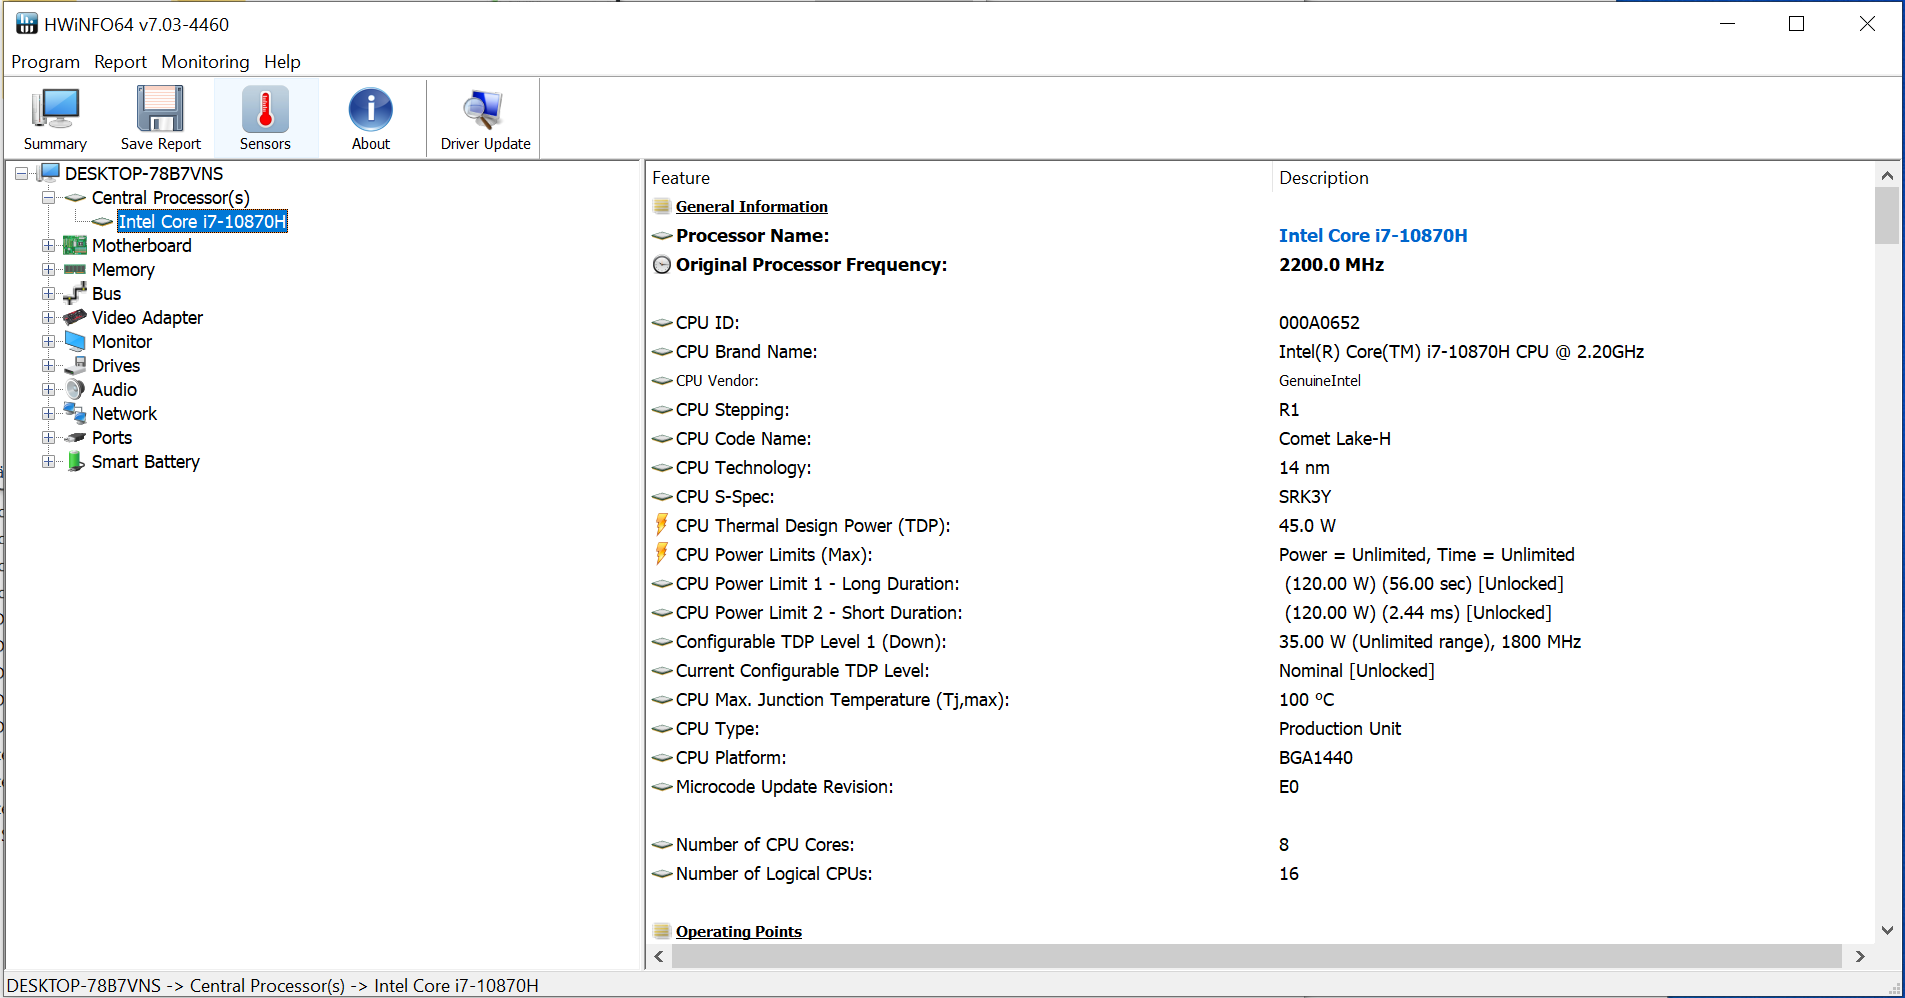
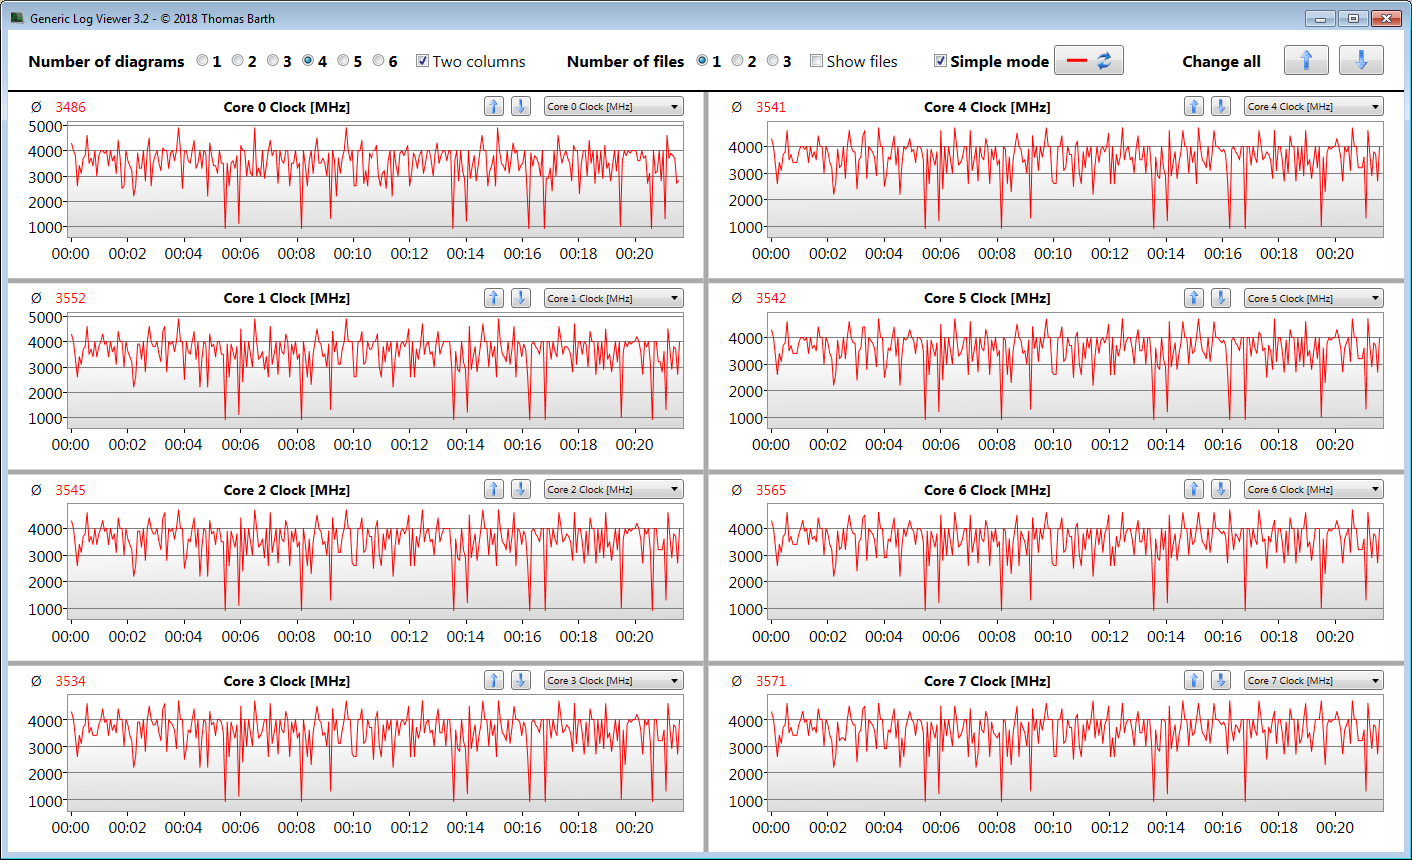
The Core i7-10870H octa-core processor (Comet Lake) runs at a basic clock speed of 2.2 GHz. Via Turbo, this can be increased up to a maximum of 4.2 GHz (eight cores) and 5 GHz (single core). Hyperthreading (two threads per core) is supported.
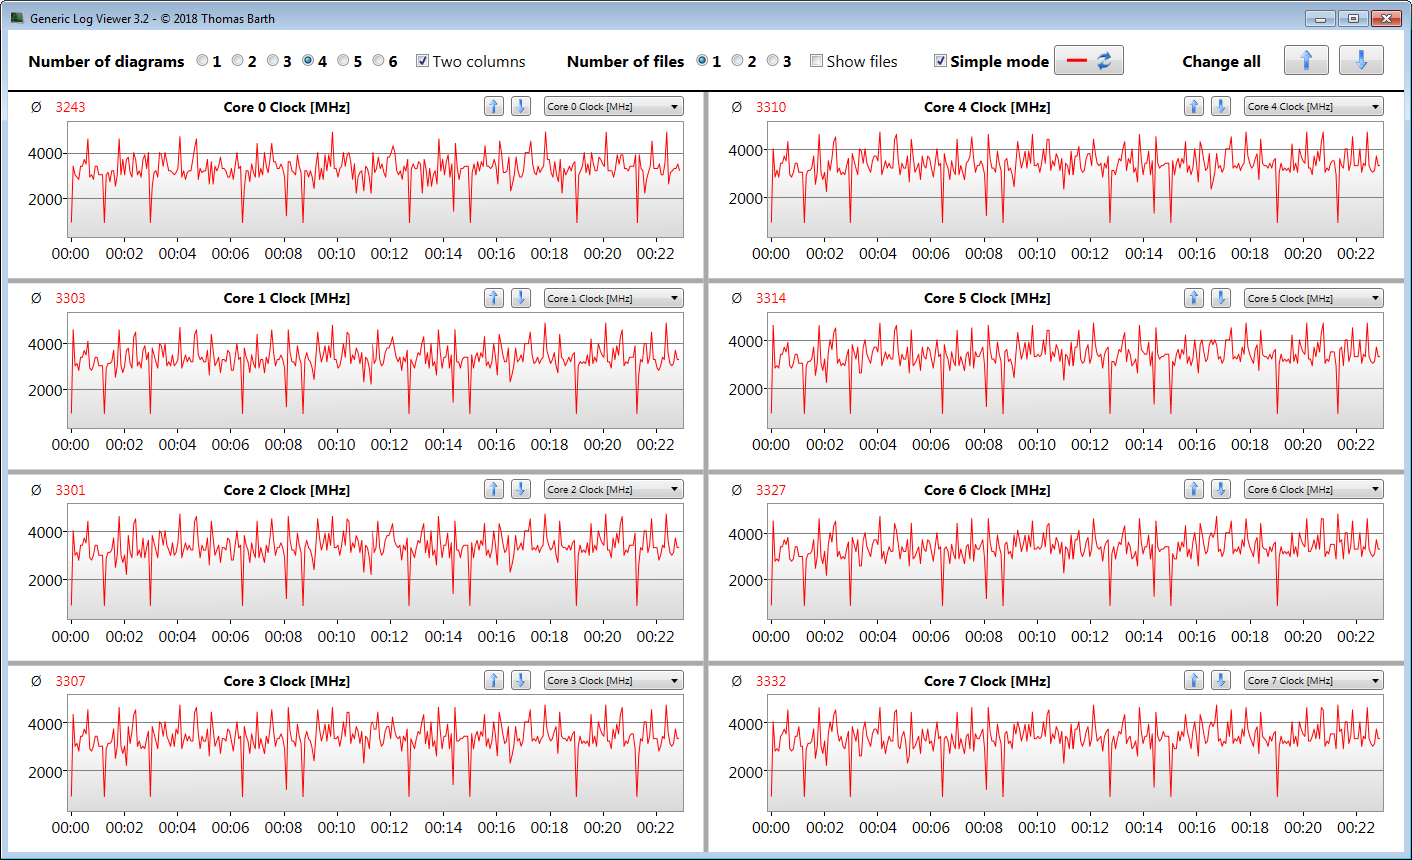
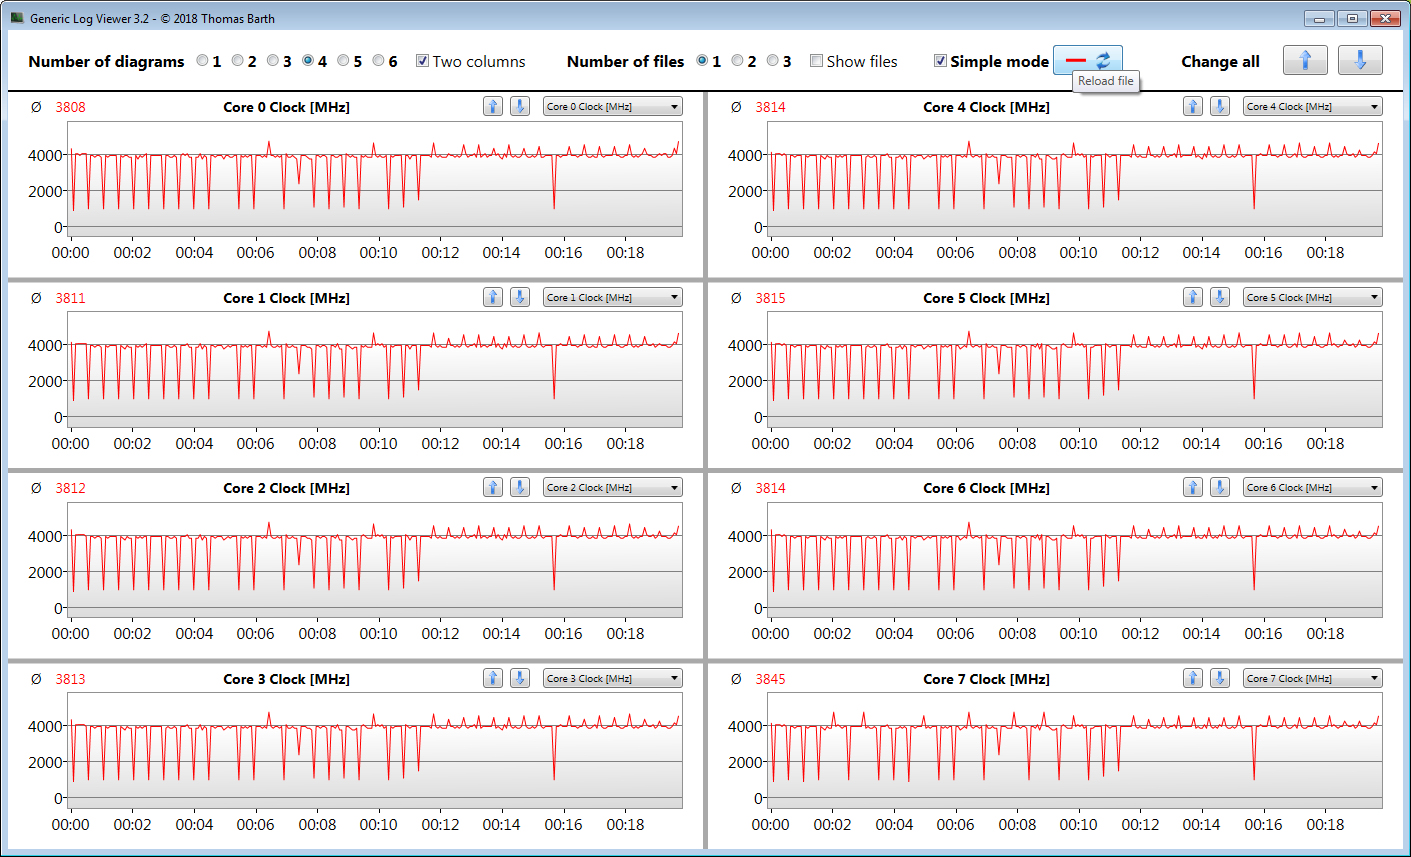
The processor runs through the CPU tests of the Cinebench R15 benchmark at 3 to 3.8 GHz (multi-thread) and 4 to 4.8 GHz (single thread). In battery operation, the CPU operates at clock speeds between 2.6 and 2.9 GHz (multi-thread) and between 2.4 and 4.2 GHz (single thread).
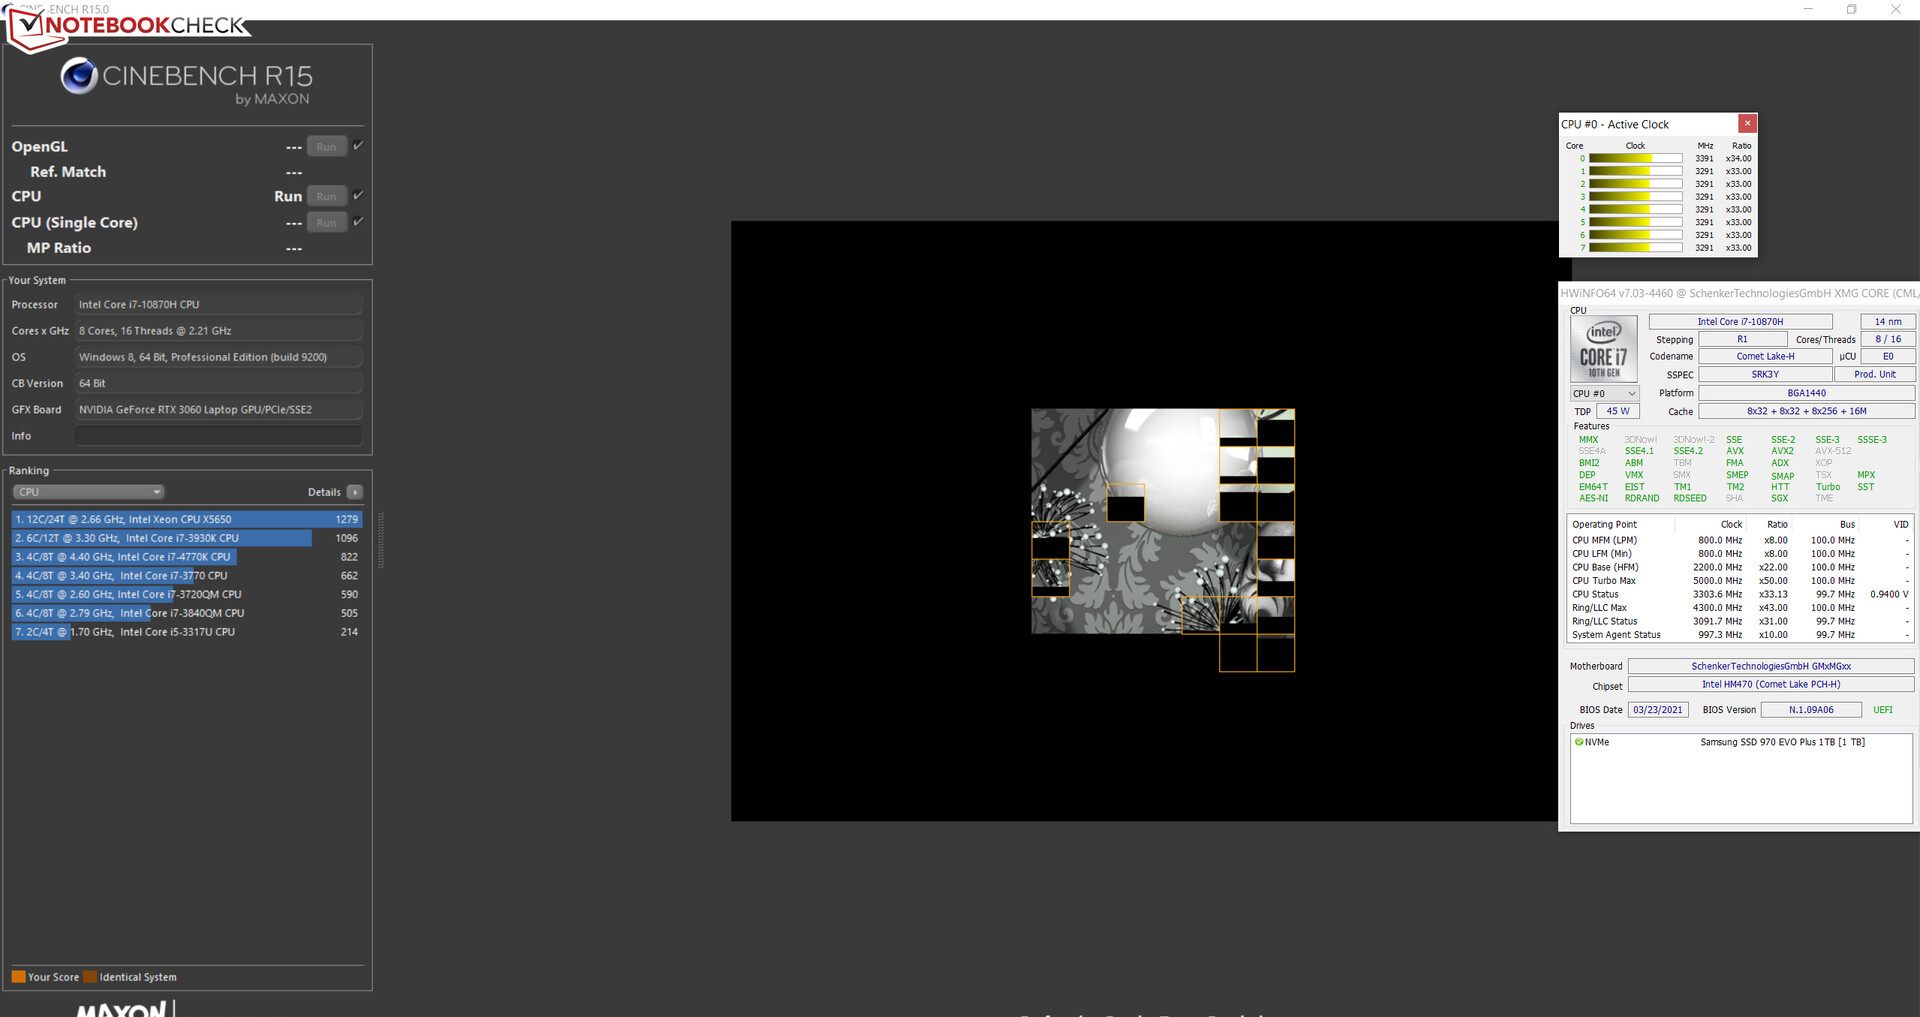
We evaluate whether the CPU Turbo is also used constantly in mains operation by running the multi-thread test of the Cinebench R15 benchmark for at least 30 minutes in a constant loop. The Turbo is used at a medium level. The "Overboost" performance profile only causes the clock speed to increase slightly.
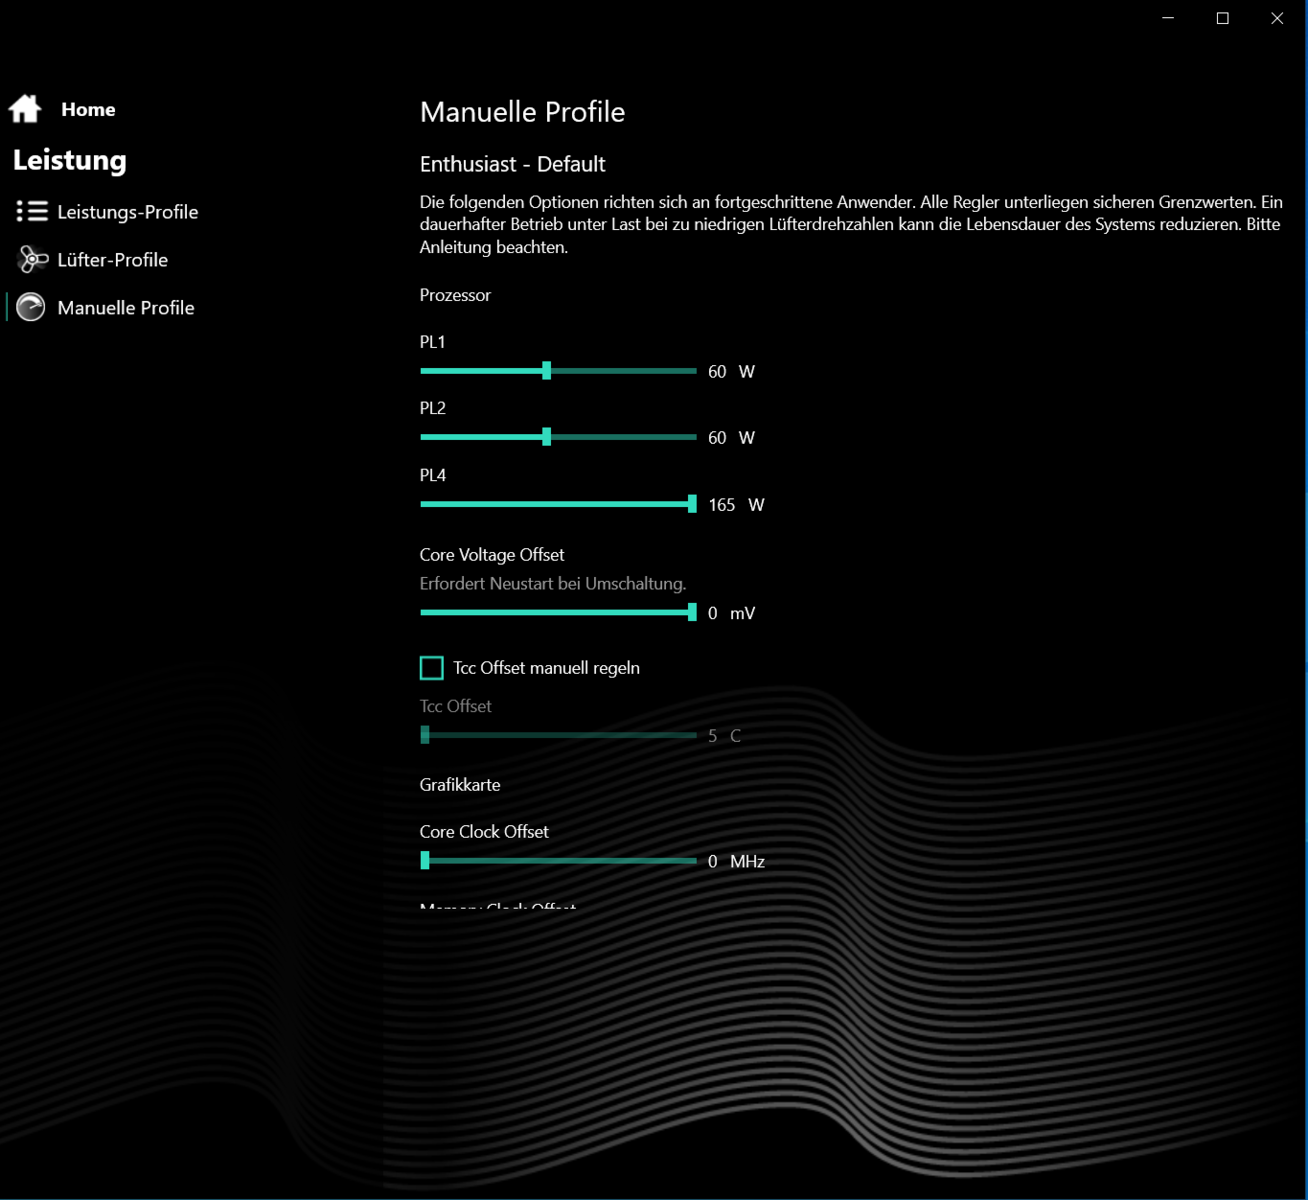
Overall, the Core i7 does not fully make use of its capabilities in the multi-thread benchmarks. In order to get more performance from it, the power limits of the CPU would need to be raised, which would be possible via the preinstalled Control Center, where the maximum configurable would be 120 watts (PL1/PL2). We also ran the CB15 loop with this performance setting in order to test this - without running into any problems.
* ... smaller is better
System Performance
The fast and smoothly running system will also offer sufficient performance for the next few years for demanding application areas such as gaming and video and image processing. The PC-Mark results are good as well.
| PCMark 8 Home Score Accelerated v2 | 4073 points | |
| PCMark 8 Creative Score Accelerated v2 | 5816 points | |
| PCMark 8 Work Score Accelerated v2 | 5375 points | |
| PCMark 10 Score | 5685 points | |
Help | ||
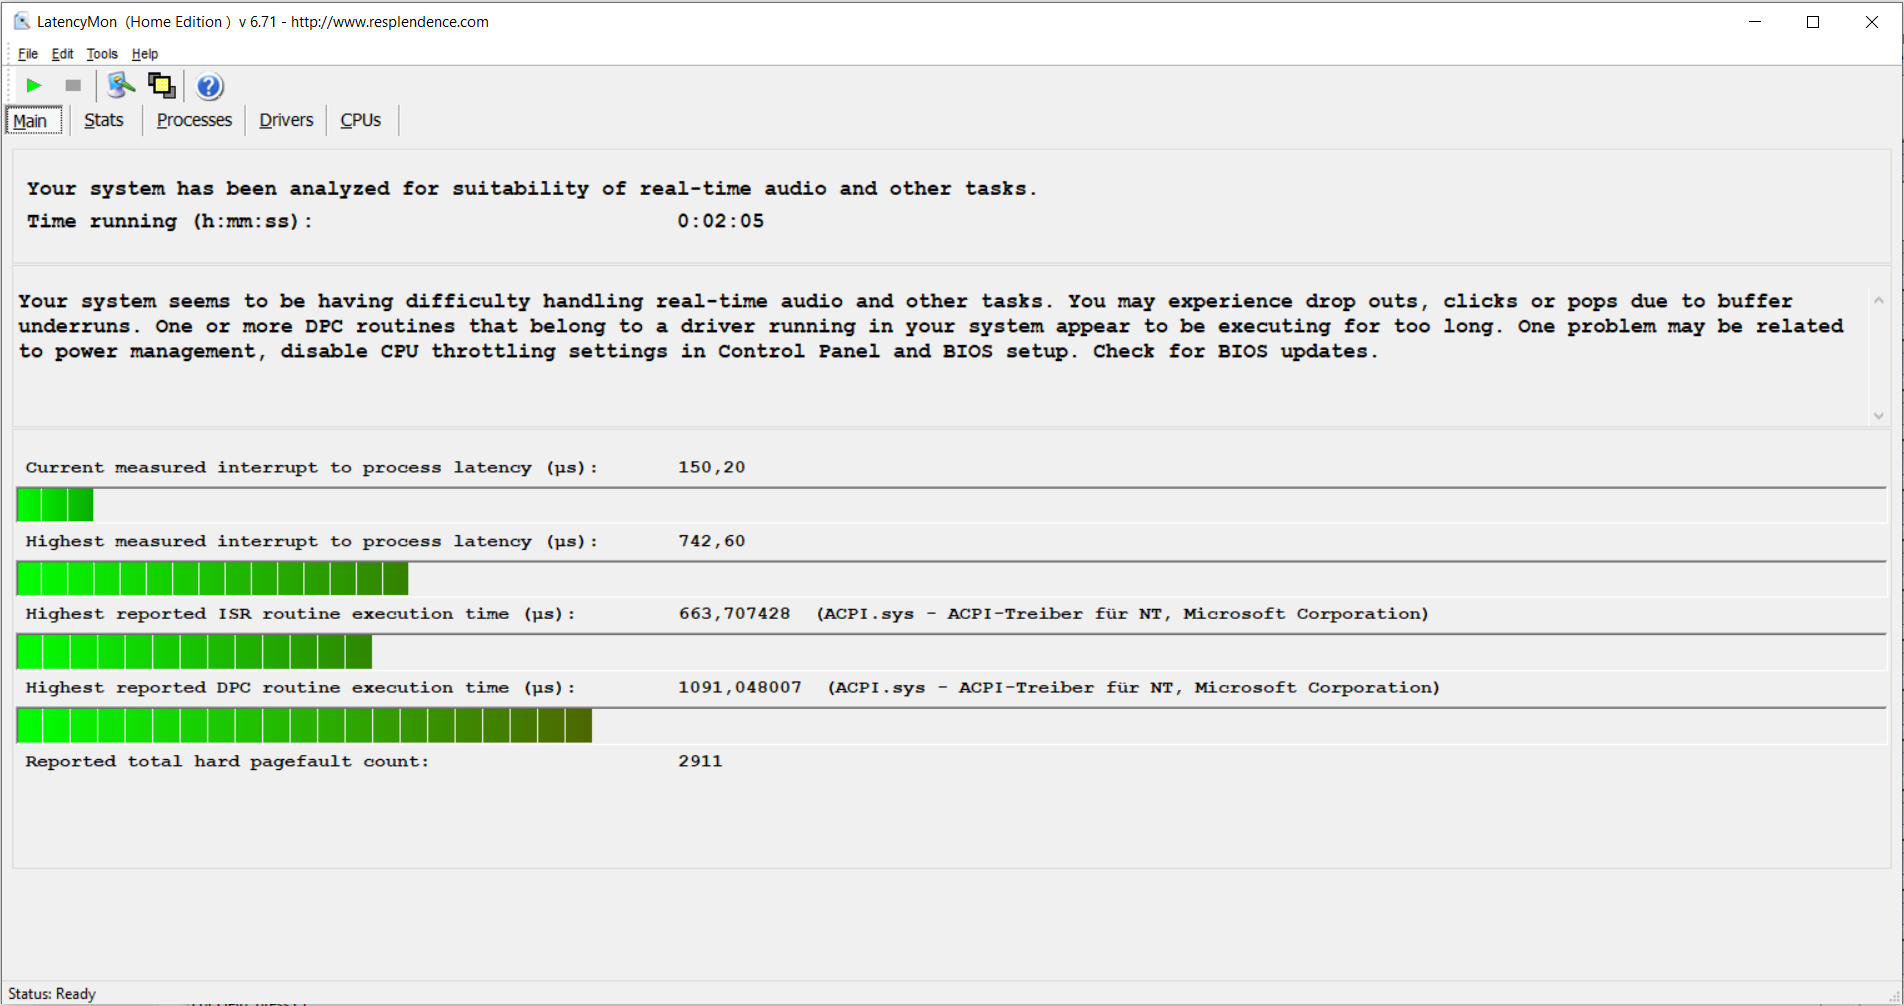
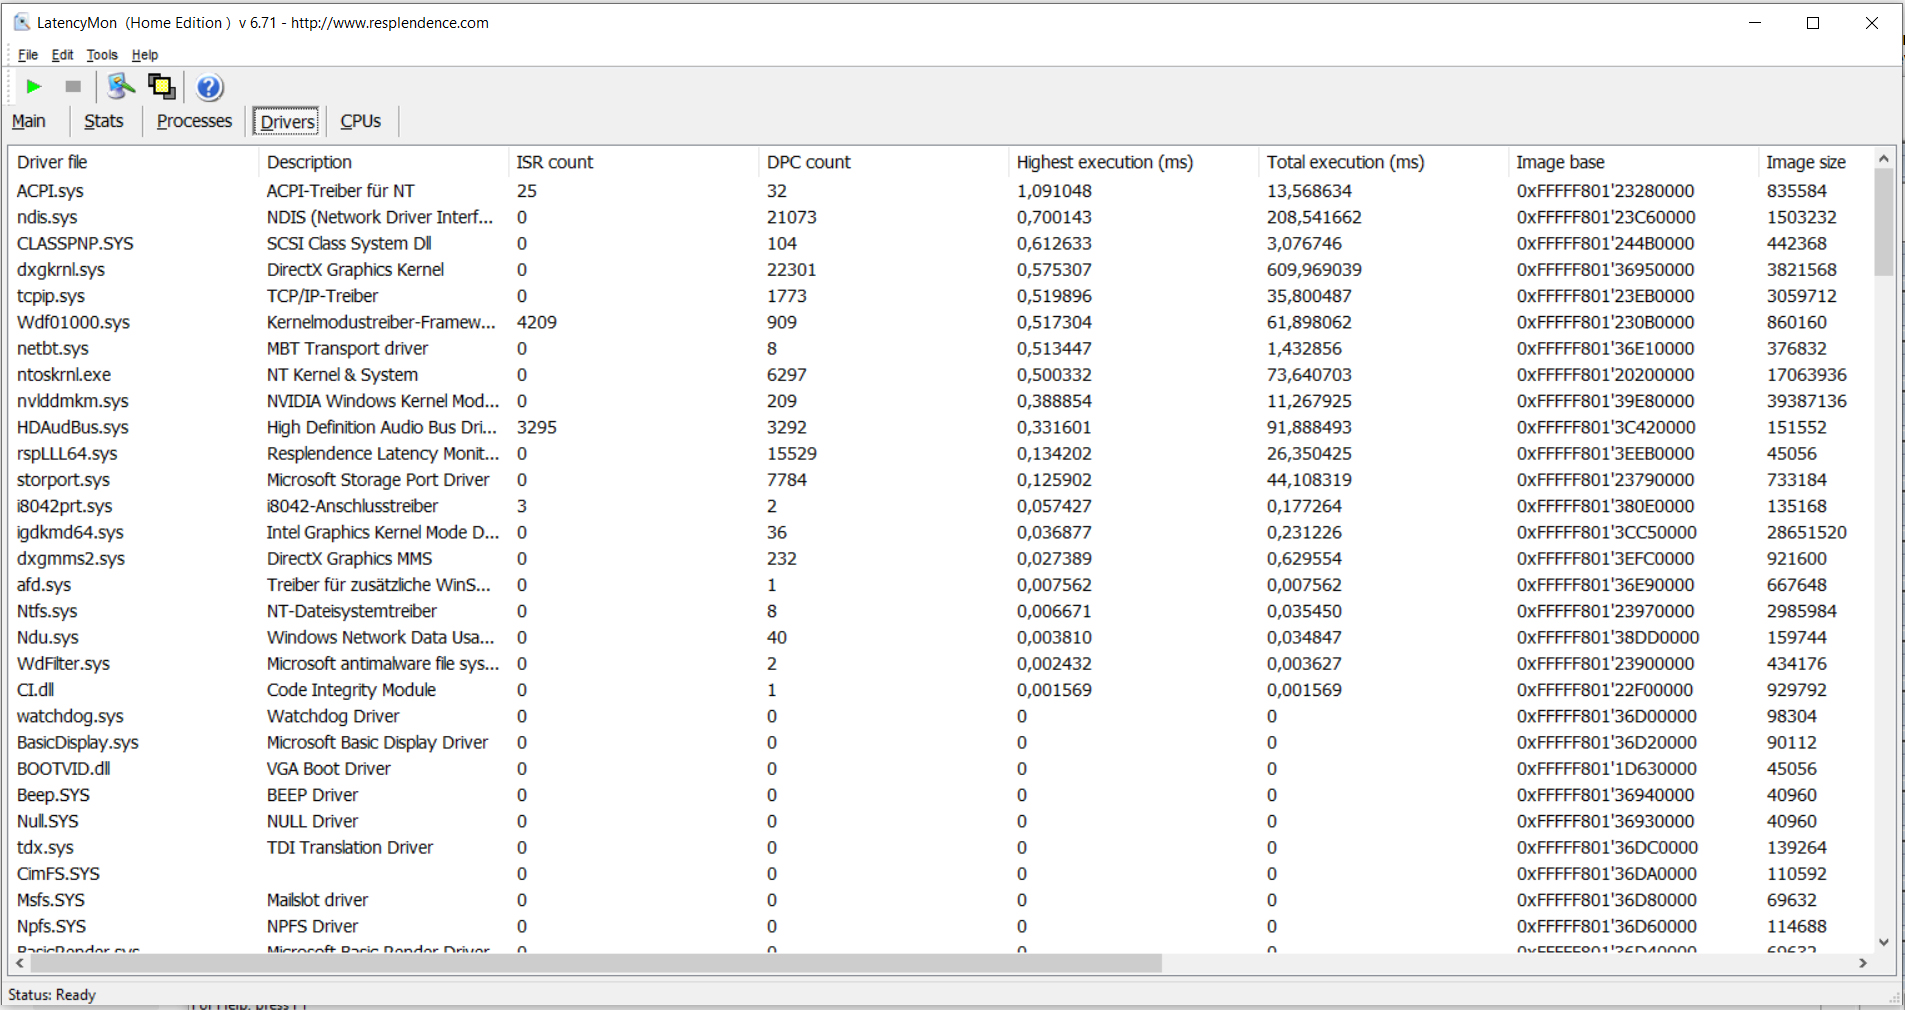
DPC Latencies
In our standardized Latency Monitor test (web surfing, 4K video reproduction, Prime95 high load), we were able to observe some conspicuous behavior in terms of the DPC latencies. This means that the system does not appear to be suitable for real-time video and audio processing.
| DPC Latencies / LatencyMon - interrupt to process latency (max), Web, Youtube, Prime95 | |
| MSI Alpha 17 A4DEK | |
| Schenker XMG Core 17 Comet Lake | |
| Medion Erazer Beast X10 MD61804 | |
| Schenker XMG Core 17 (Early 2021) | |
| Acer Predator Helios 300 PH317-54-75G8 | |
* ... smaller is better
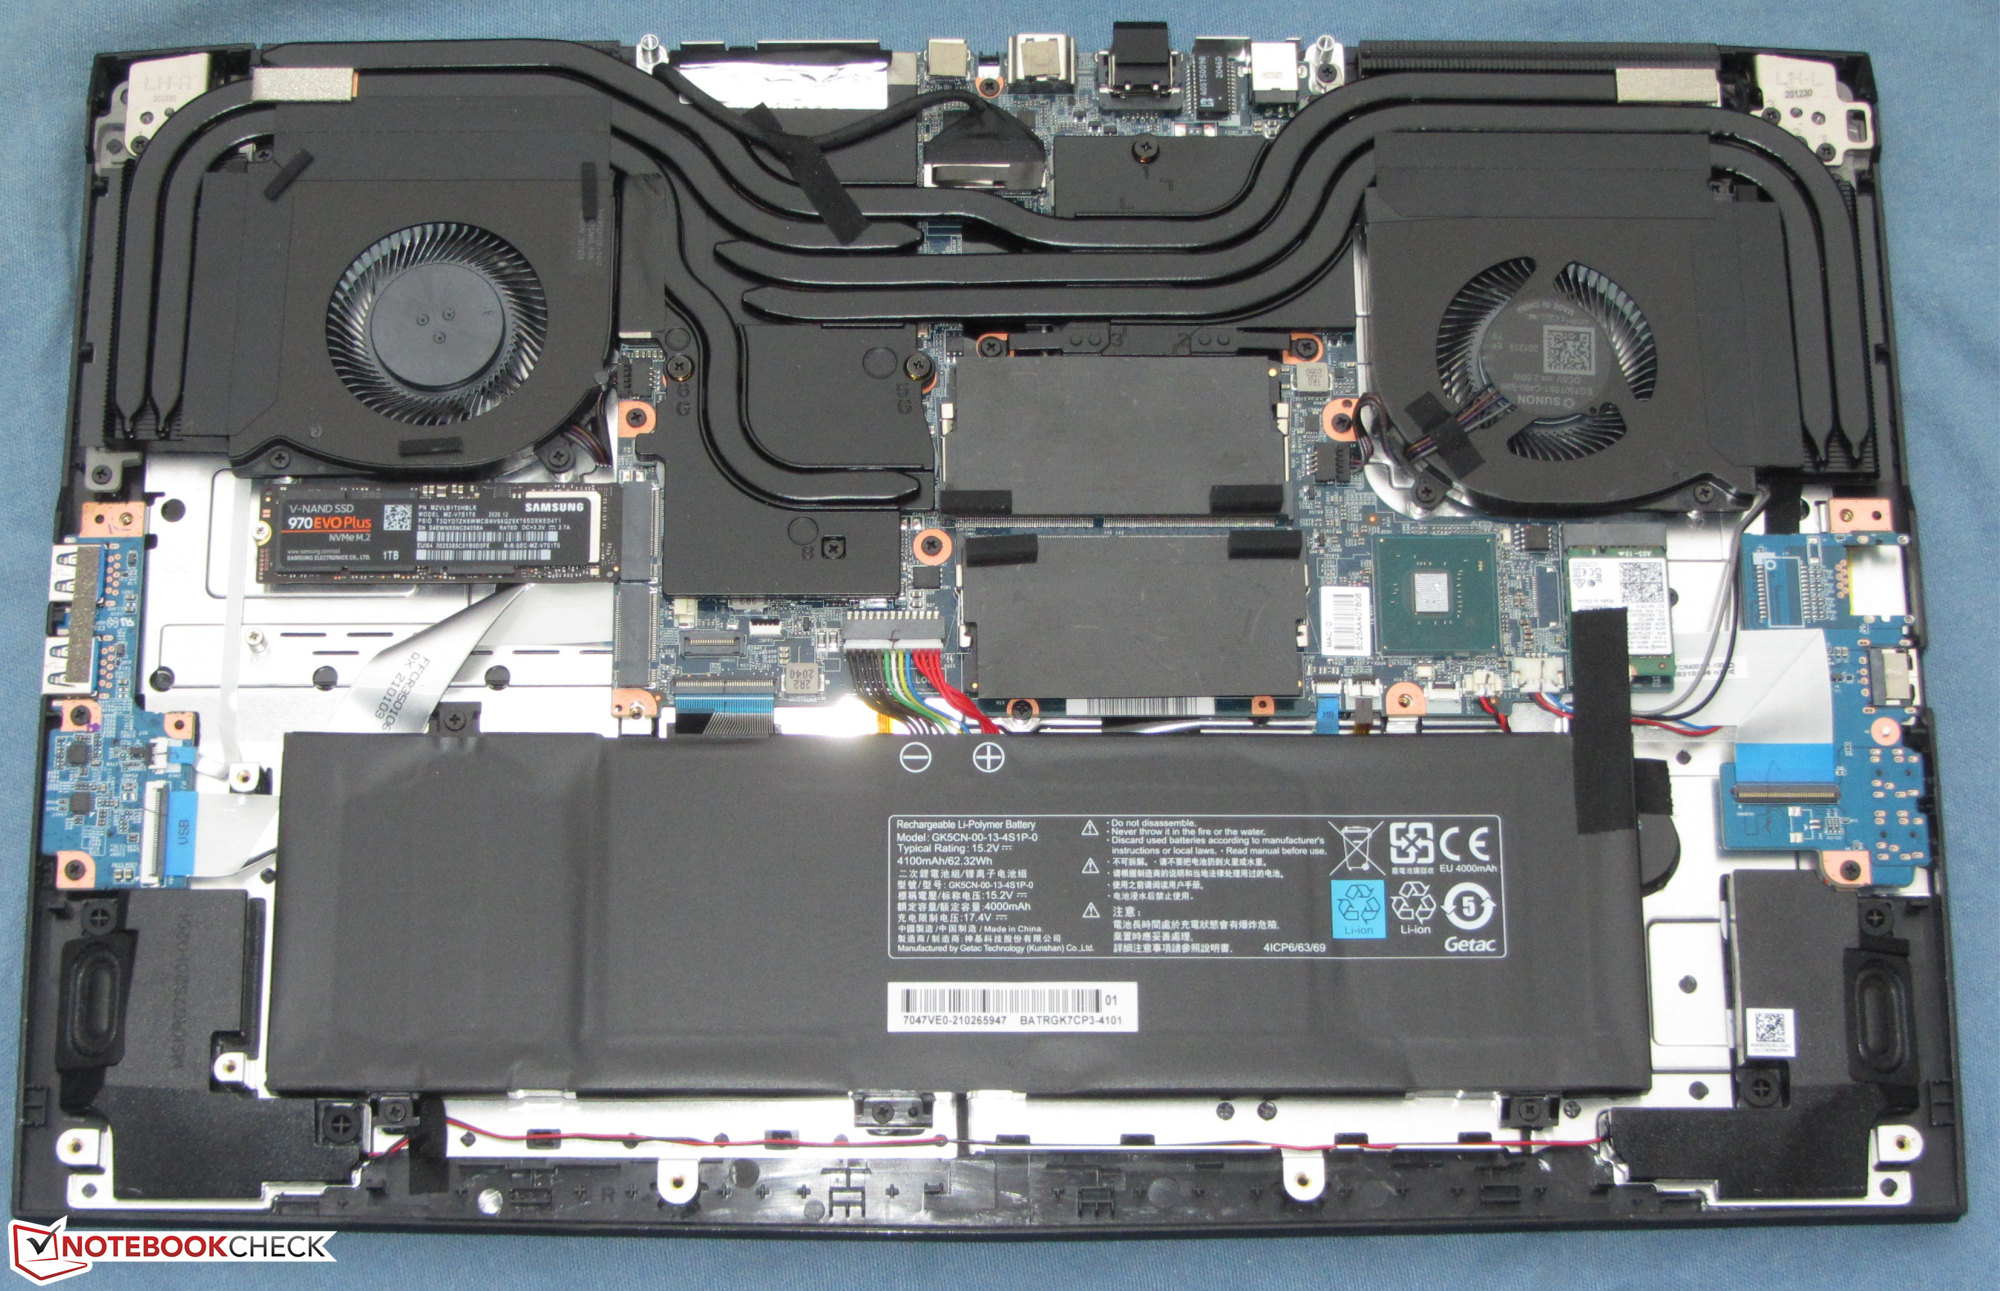
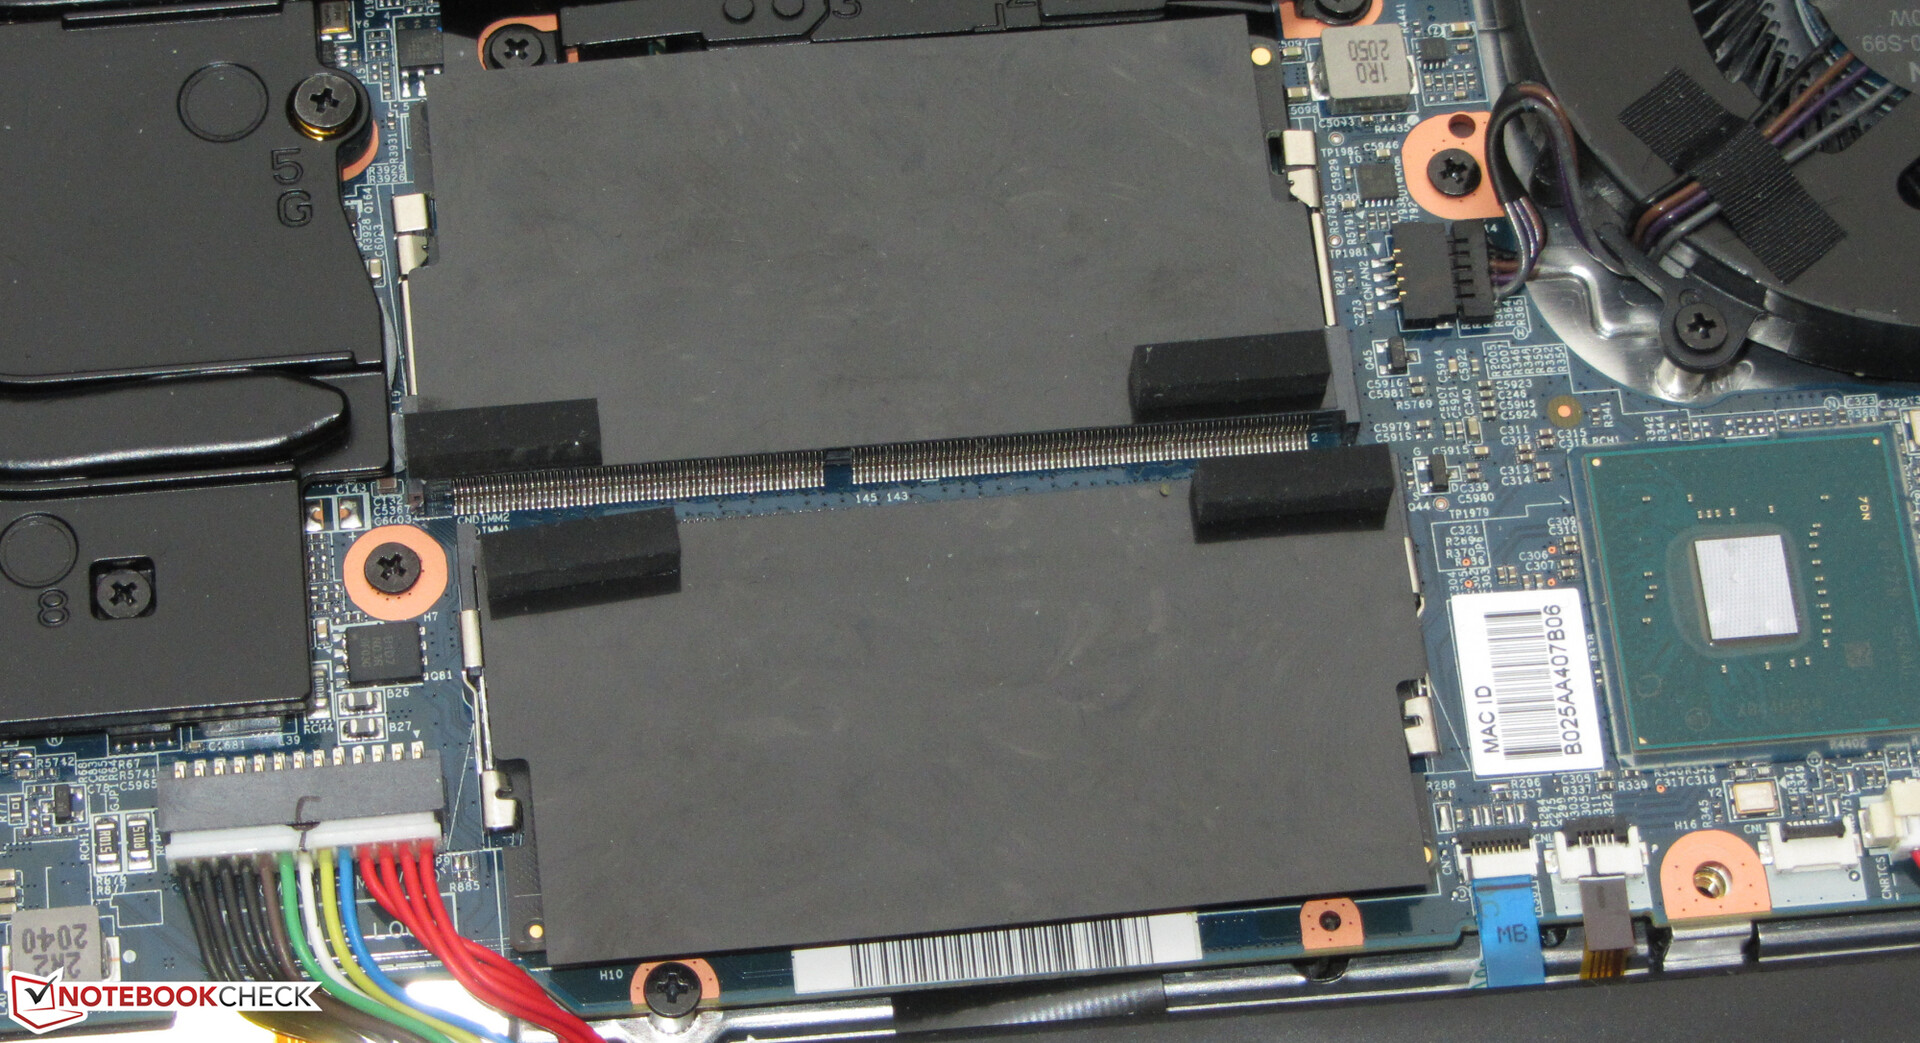
Storage Solution
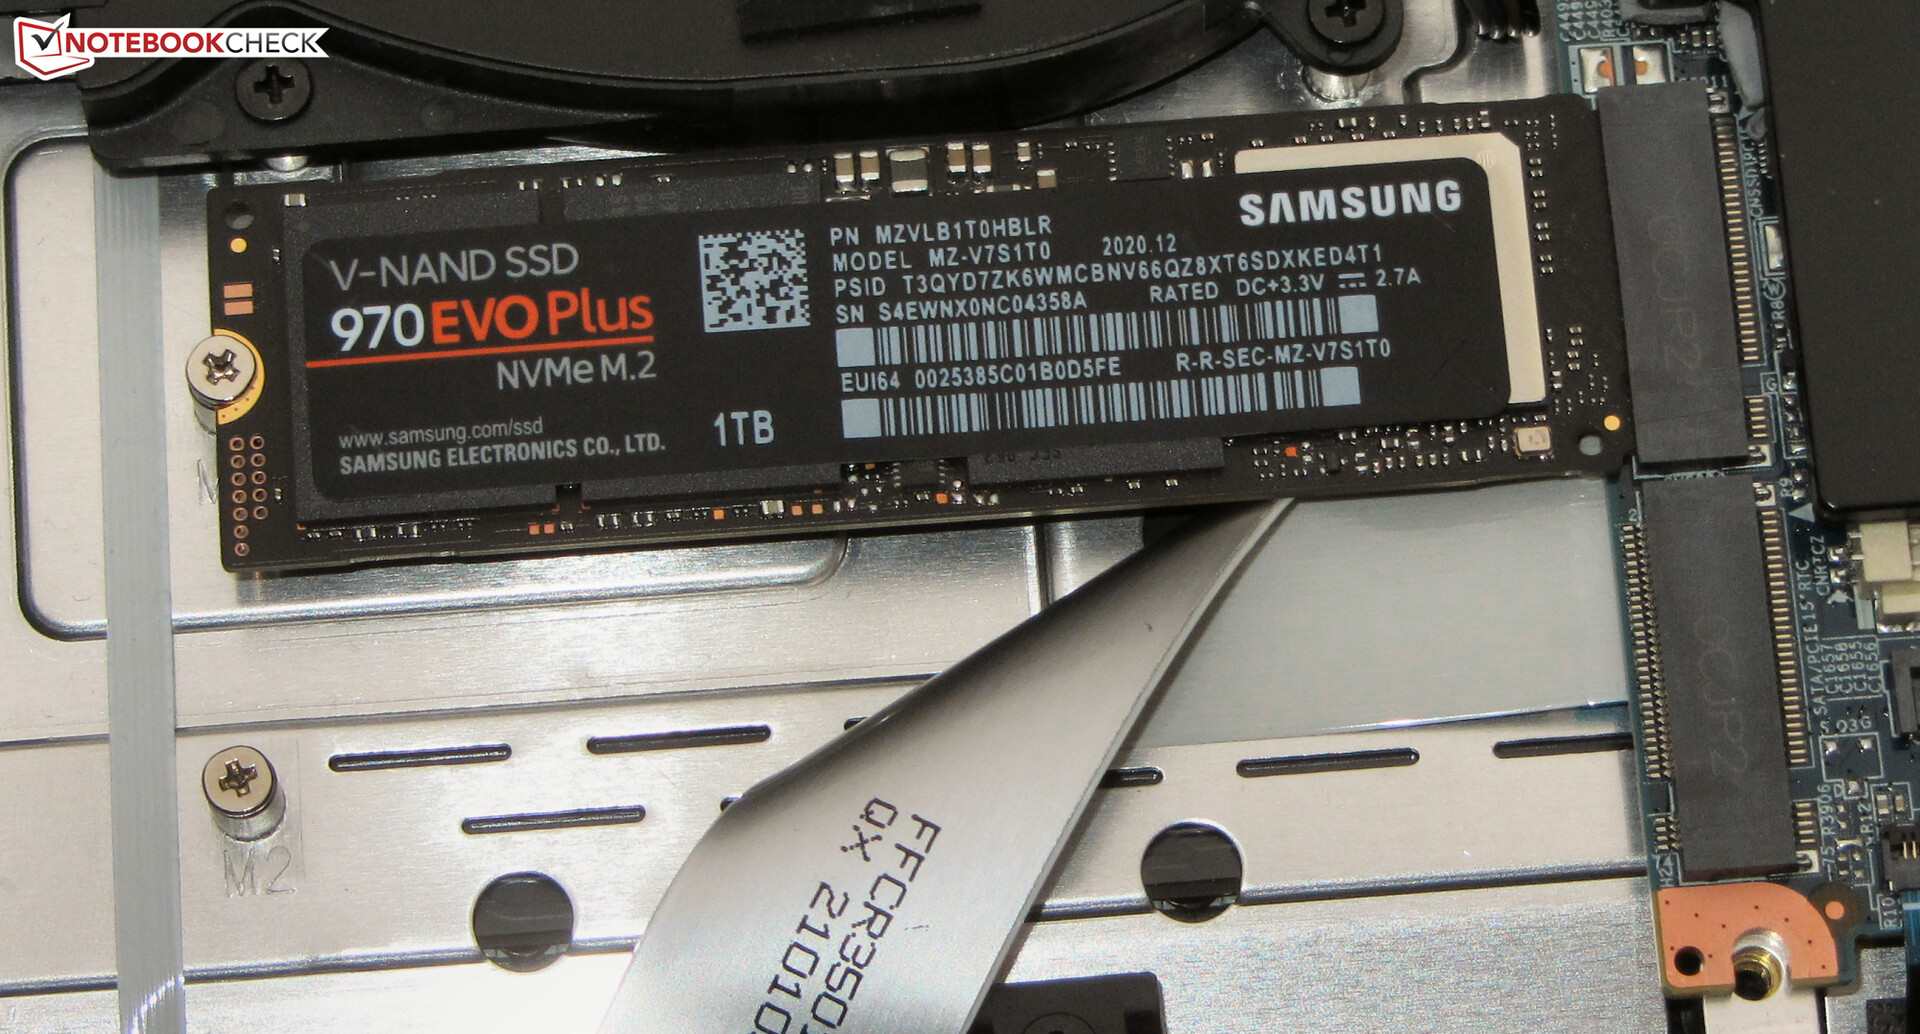
An NVMe SSD (M.2-2280) from Samsung serves as the system drive. It offers 1 TB of storage and delivers good transfer rates. The laptop is able to accept a total of two NVMe SSDs, and RAID-0 is supported.

| Schenker XMG Core 17 (Early 2021) Samsung SSD 970 EVO Plus 1TB | MSI Alpha 17 A4DEK Kingston OM8PCP3512F-AB | Acer Predator Helios 300 PH317-54-75G8 WDC PC SN730 SDBQNTY-1T00 | Medion Erazer Beast X10 MD61804 Samsung PM981a MZVLB1T0HBLR | Schenker XMG Core 17 Samsung SSD 970 EVO Plus 500GB | Schenker XMG Core 17 Comet Lake Samsung SSD 970 EVO Plus 1TB | |
|---|---|---|---|---|---|---|
| CrystalDiskMark 5.2 / 6 | -31% | -12% | -17% | -29% | 4% | |
| Write 4K (MB/s) | 145.7 | 204.7 40% | 141.9 -3% | 151 4% | 99.3 -32% | 169.5 16% |
| Read 4K (MB/s) | 51.3 | 50.4 -2% | 48.75 -5% | 49.29 -4% | 38.47 -25% | 51.5 0% |
| Write Seq (MB/s) | 3036 | 985 -68% | 2734 -10% | 1109 -63% | 1449 -52% | 3009 -1% |
| Read Seq (MB/s) | 2837 | 1193 -58% | 1921 -32% | 1049 -63% | 1237 -56% | 2959 4% |
| Write 4K Q32T1 (MB/s) | 511 | 537 5% | 422.6 -17% | 494.4 -3% | 364.4 -29% | 536 5% |
| Read 4K Q32T1 (MB/s) | 582 | 300 -48% | 509 -13% | 569 -2% | 421.9 -28% | 621 7% |
| Write Seq Q32T1 (MB/s) | 3294 | 982 -70% | 3055 -7% | 3017 -8% | 3276 -1% | 3339 1% |
| Read Seq Q32T1 (MB/s) | 3522 | 1985 -44% | 3257 -8% | 3542 1% | 3338 -5% | 3561 1% |
| AS SSD | -43% | -11% | -3% | -20% | 11% | |
| Seq Read (MB/s) | 2876 | 251.9 -91% | 2828 -2% | 2470 -14% | 2283 -21% | 2937 2% |
| Seq Write (MB/s) | 2803 | 925 -67% | 2677 -4% | 2473 -12% | 2779 -1% | 2858 2% |
| 4K Read (MB/s) | 55.3 | 58.2 5% | 39.94 -28% | 50.2 -9% | 29.99 -46% | 50.3 -9% |
| 4K Write (MB/s) | 106.9 | 98 -8% | 100.9 -6% | 124.4 16% | 99.1 -7% | 130.6 22% |
| 4K-64 Read (MB/s) | 1662 | 461.4 -72% | 1562 -6% | 1711 3% | 1156 -30% | 1710 3% |
| 4K-64 Write (MB/s) | 2101 | 924 -56% | 1867 -11% | 1848 -12% | 2333 11% | 2355 12% |
| Access Time Read * (ms) | 0.067 | 0.09 -34% | 0.039 42% | 0.092 -37% | 0.037 45% | |
| Access Time Write * (ms) | 0.037 | 0.022 41% | 0.037 -0% | 0.029 22% | 0.037 -0% | 0.028 24% |
| Score Read (Points) | 2005 | 545 -73% | 1885 -6% | 2008 0% | 1414 -29% | 2054 2% |
| Score Write (Points) | 2488 | 1114 -55% | 2236 -10% | 2220 -11% | 2710 9% | 2771 11% |
| Score Total (Points) | 5520 | 1994 -64% | 5076 -8% | 5257 -5% | 4871 -12% | 5873 6% |
| Copy ISO MB/s (MB/s) | 2029 | 1870 -8% | 1909 -6% | 1394 -31% | 2225 10% | |
| Copy Program MB/s (MB/s) | 691 | 545 -21% | 588 -15% | 379.8 -45% | 779 13% | |
| Copy Game MB/s (MB/s) | 1513 | 1083 -28% | 975 -36% | 976 -35% | 1590 5% | |
| Total Average (Program / Settings) | -37% /
-38% | -12% /
-11% | -10% /
-8% | -25% /
-23% | 8% /
8% |
* ... smaller is better
Constant Performance Reads: DiskSpd Read Loop, Queue Depth 8
Graphics Card
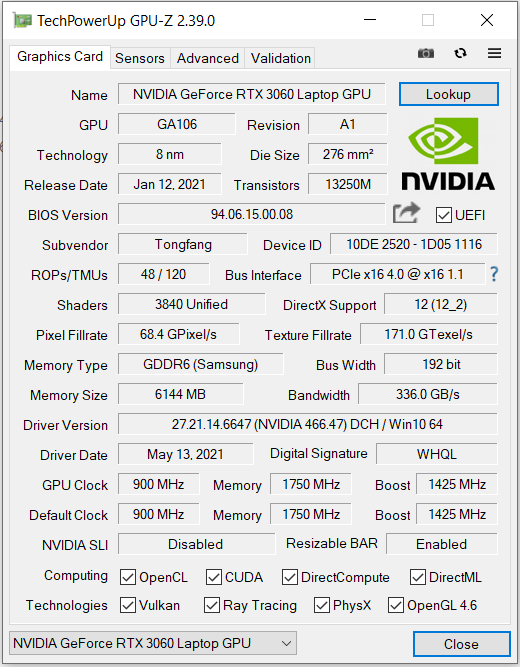
The GeForce RTX-3060 laptop graphics core represents Nvidia's current entry-level model into the GPU high end. The GPU is able to use fast GDDR6 graphics storage (6144 MB). The UHD Graphics-630 graphics core integrated into the processor is active, and the laptop uses Nvidia's Optimus graphics switching solution. The GeForce GPU can be deactivated in the BIOS.
Laptop manufacturers are able to configure the TGP and with that the maximum available computing performance of a RTX 3000 graphics core fairly freely as long as they stay within the limits defined by Nvidia (Overview of all RTX 3060 laptops including their TGPs). Schenker extends this option to the users, allowing them to freely adjust the TGP up to the maximum of 130 watts (115 watts + 15 watts Dynamic Boost).
However, at a high TGP the performance increase turns out to be limited: Even though the "Overboost" profile (115 watts + 5 watts Dynamic Boost) uses a TGP that is about 26% higher than the "Enthusiast" profile (90 watts + 5 watts Dynamic Boost), the achieved test results are only up to 10% higher. This goes for the GPU tests as well as the gaming benchmarks.
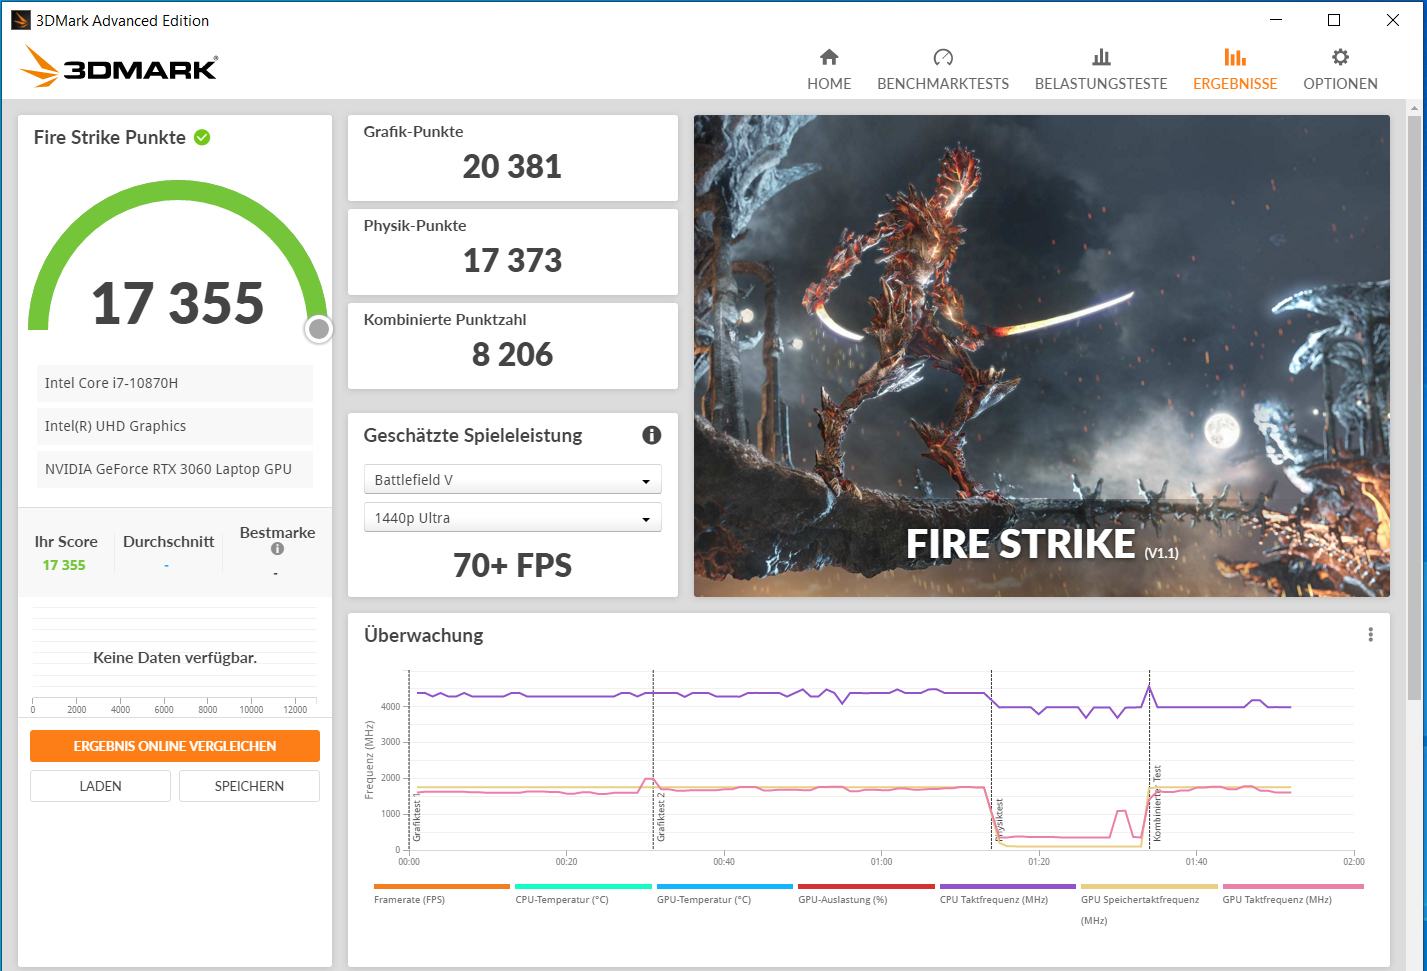
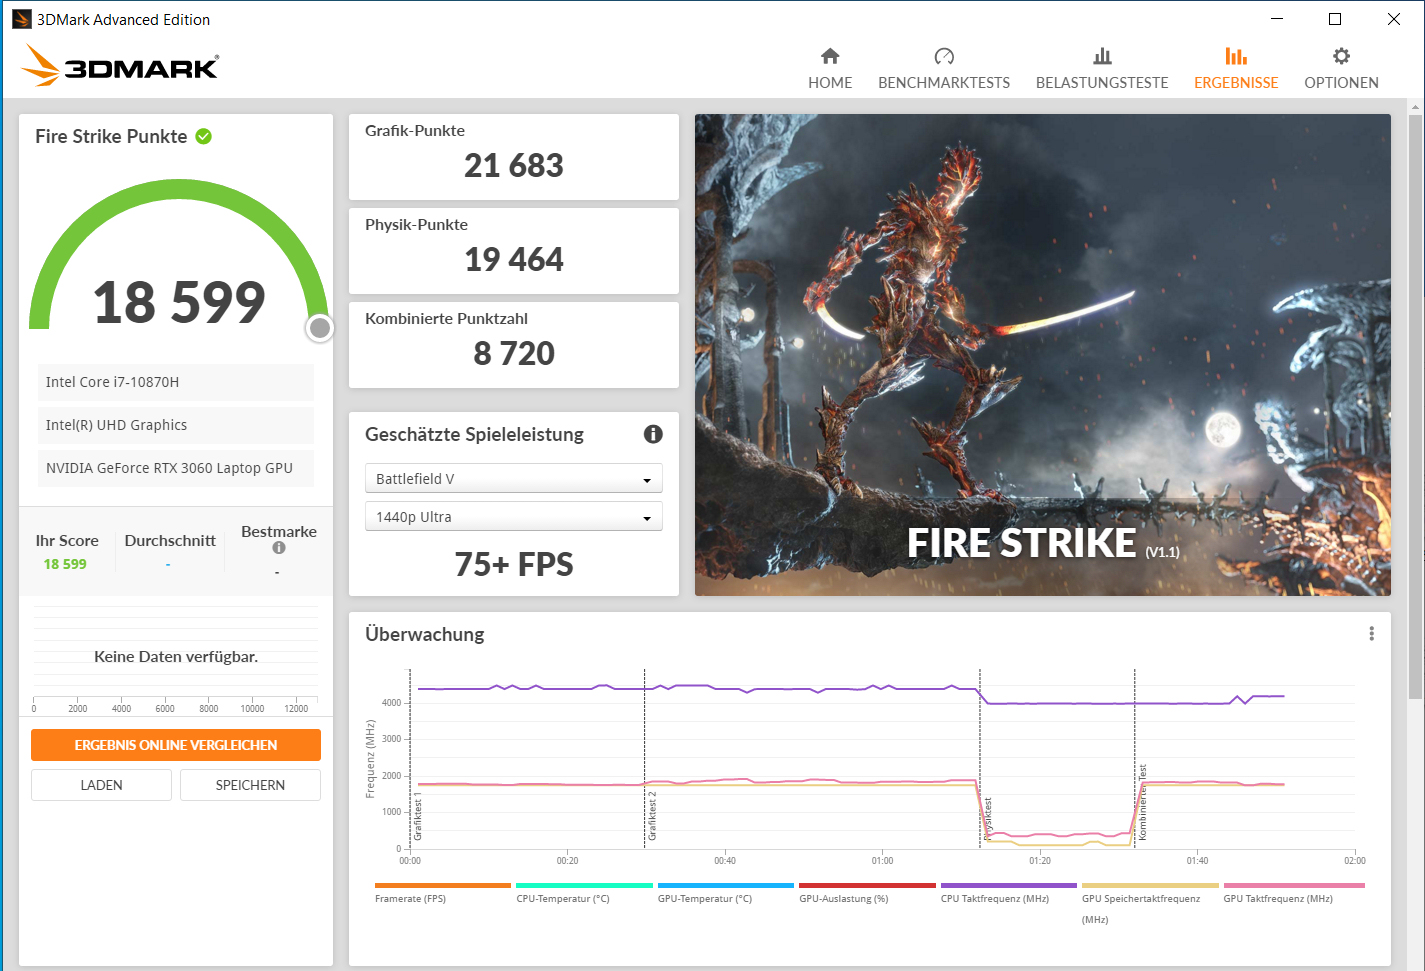
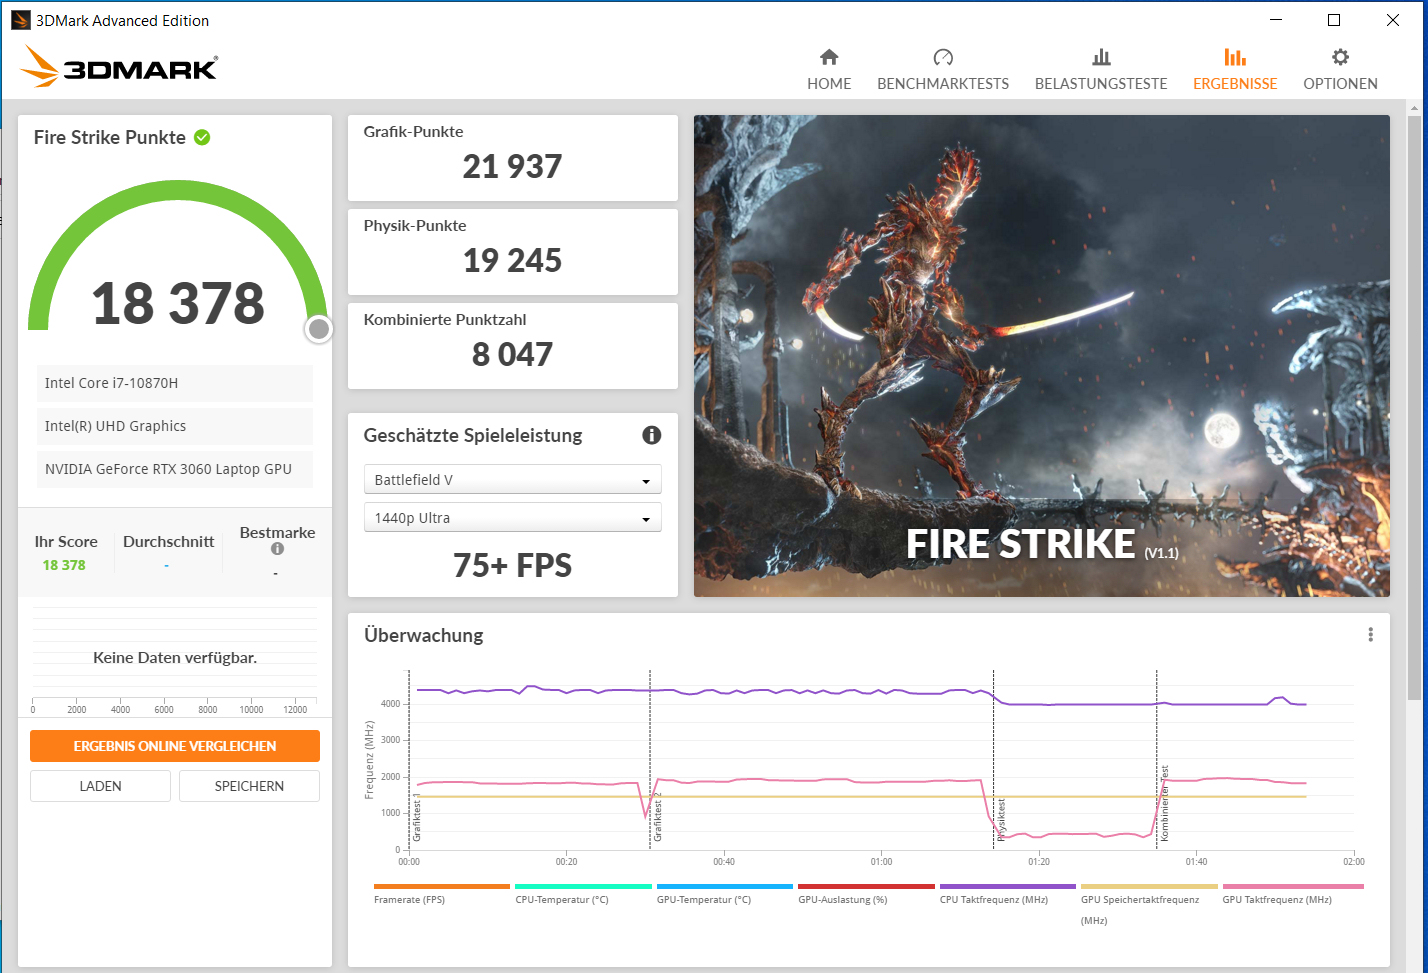

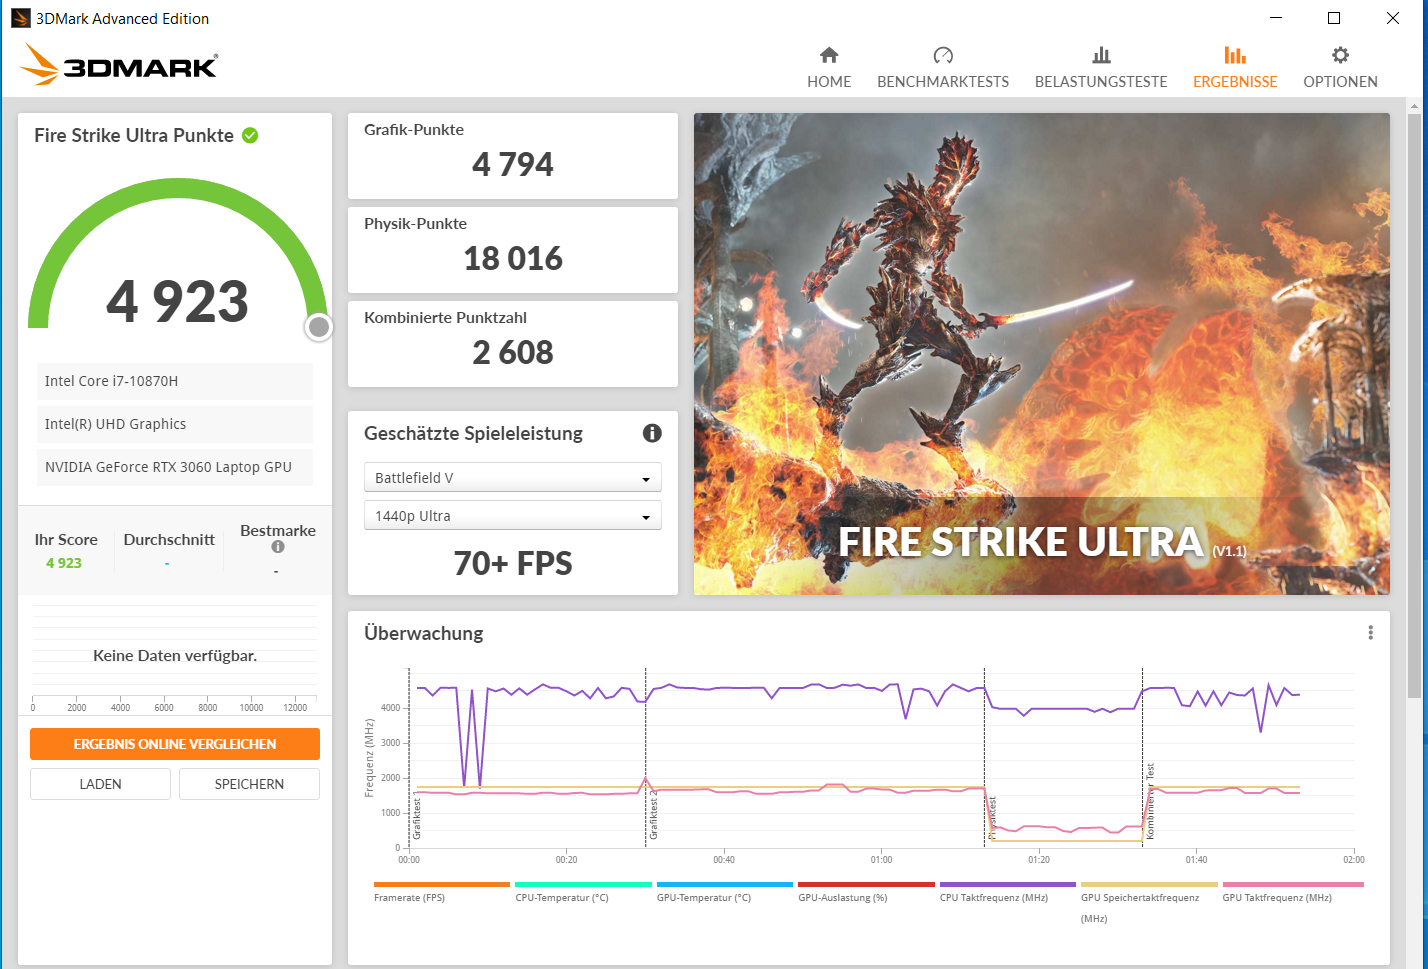
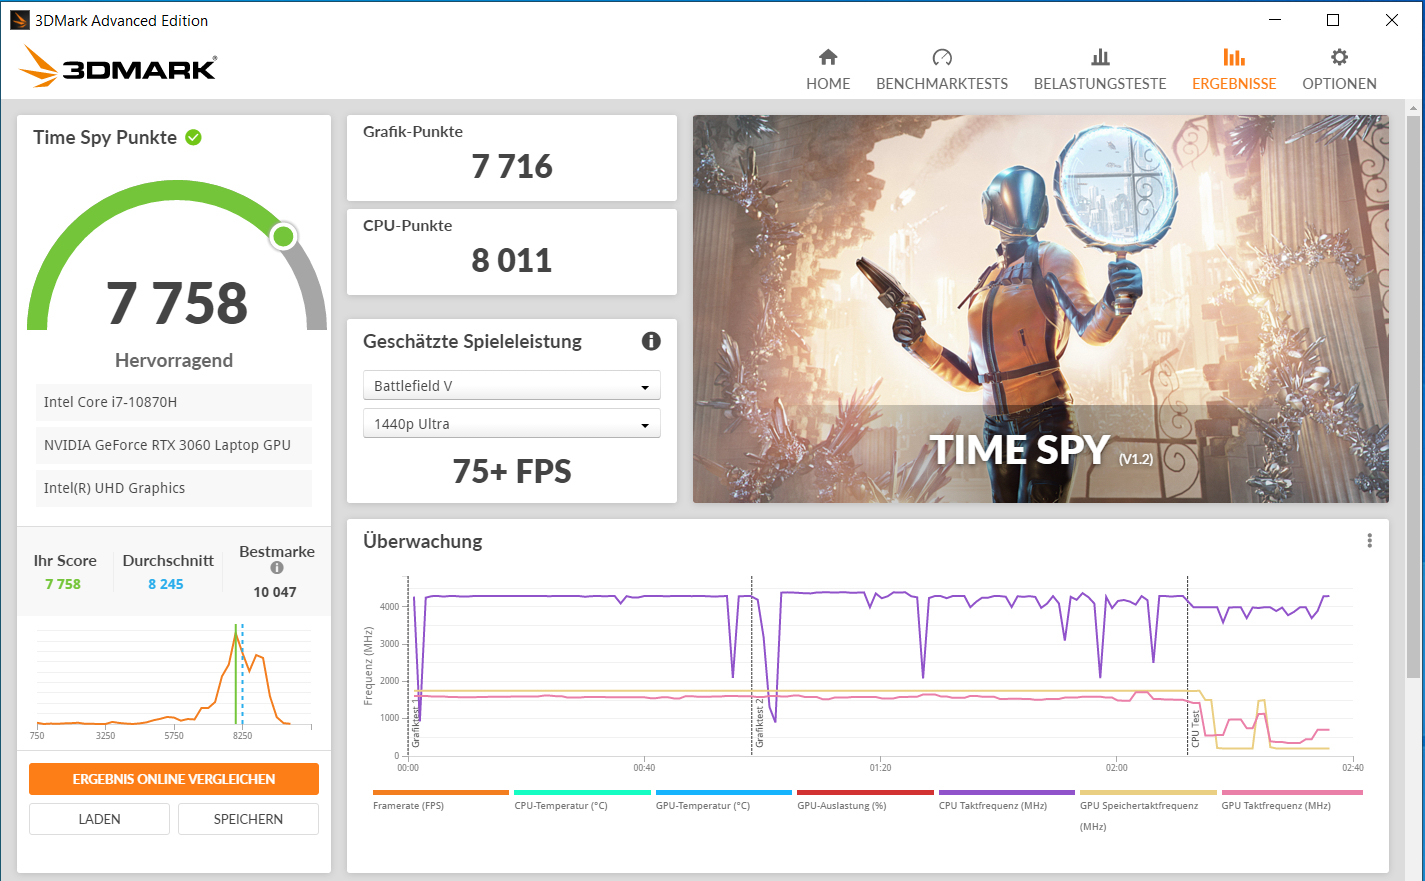


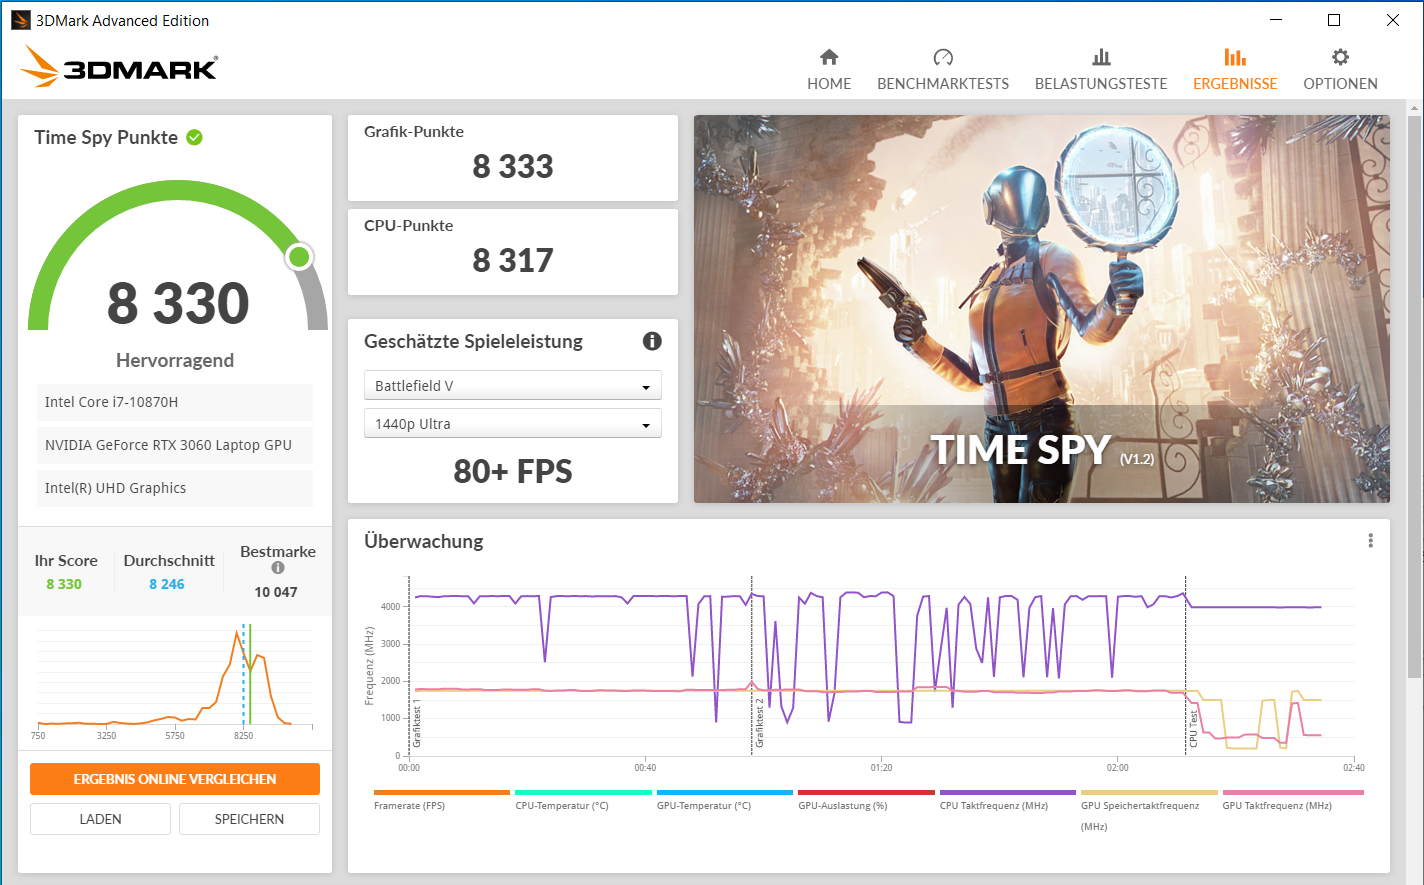
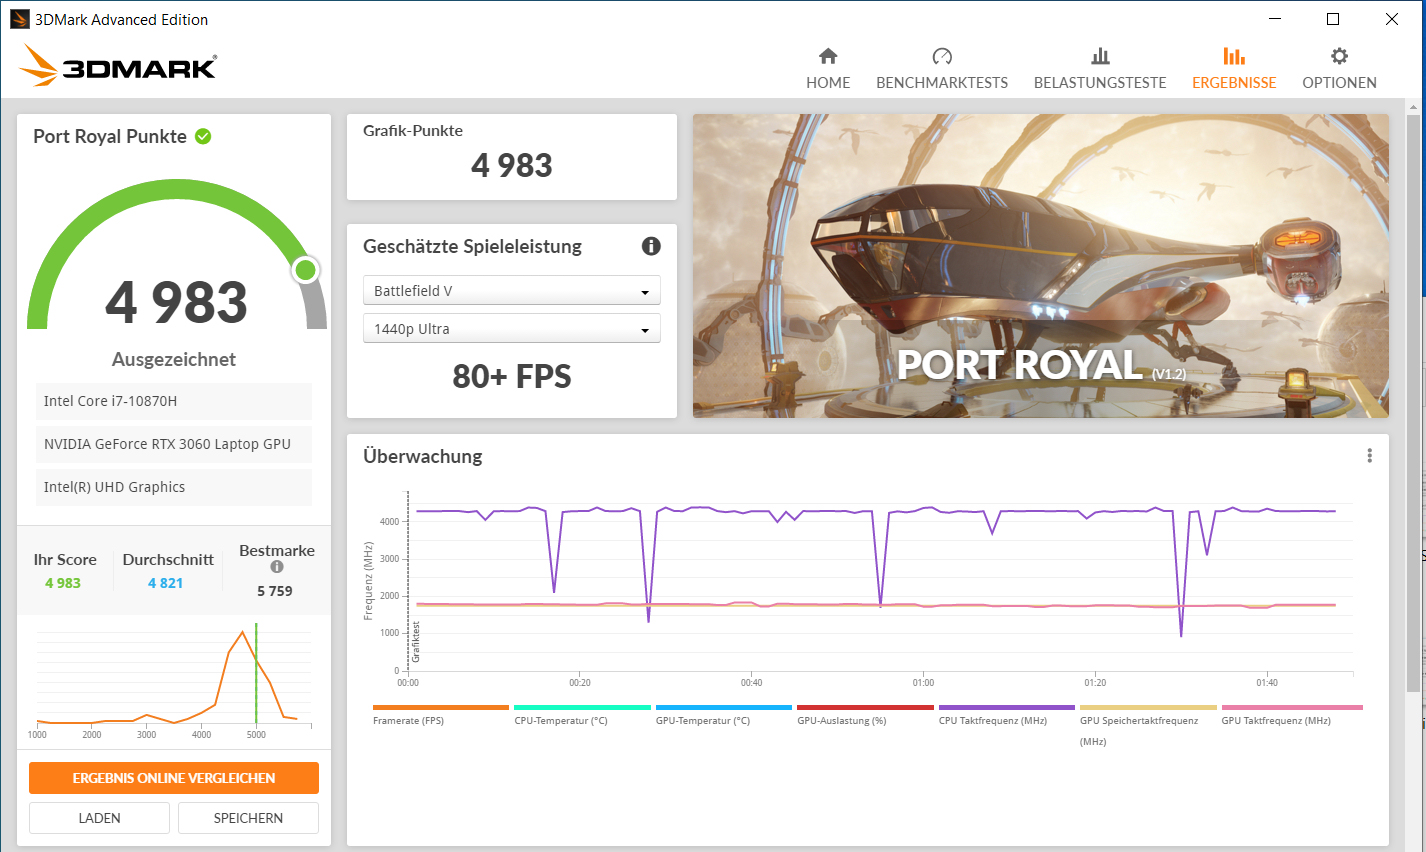
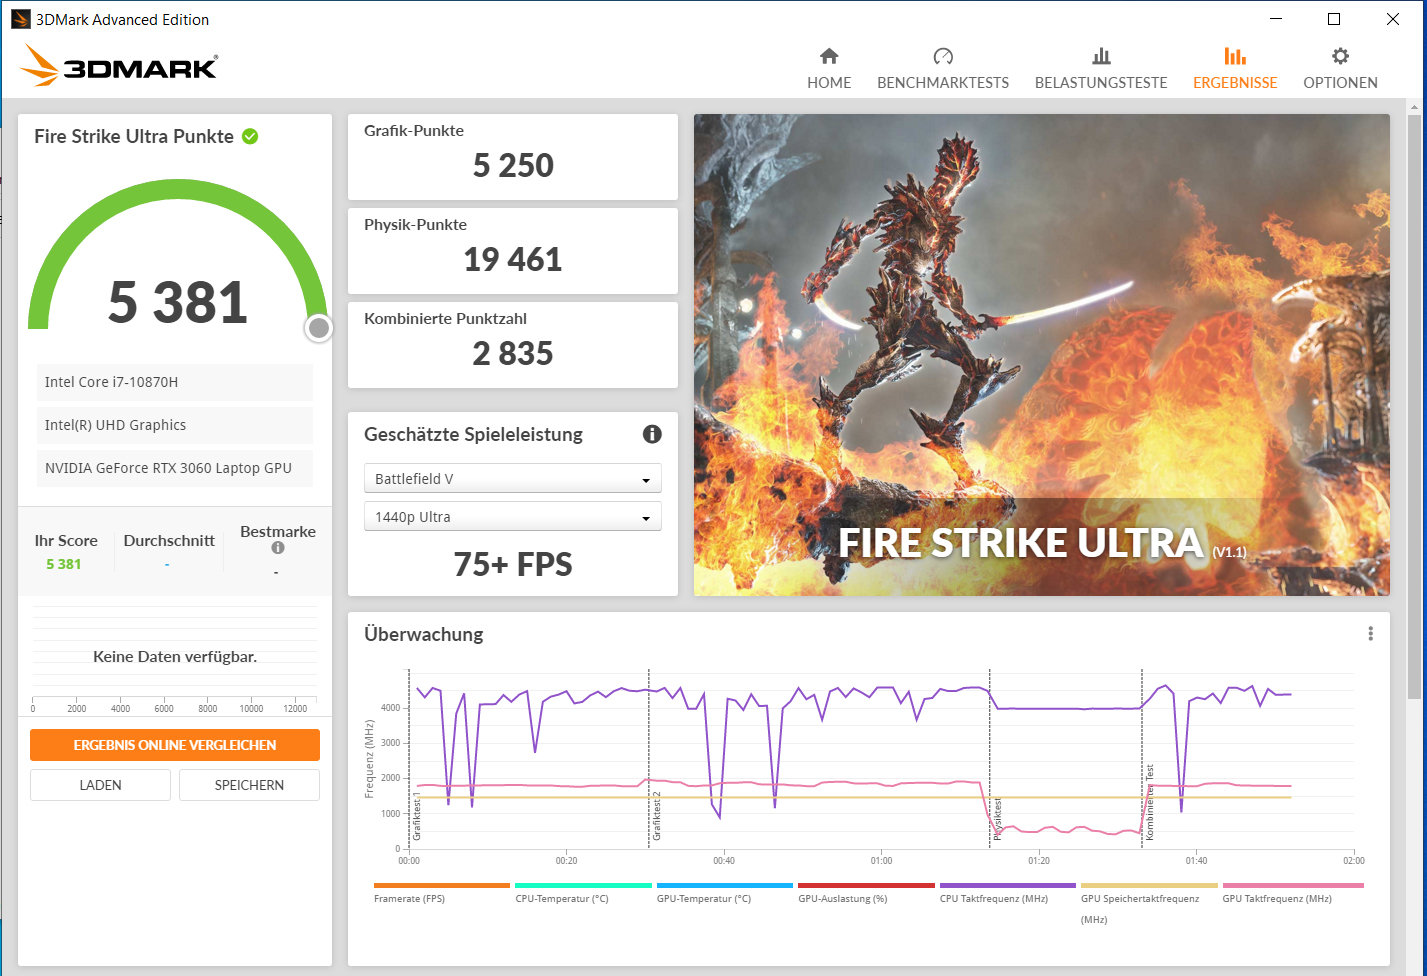
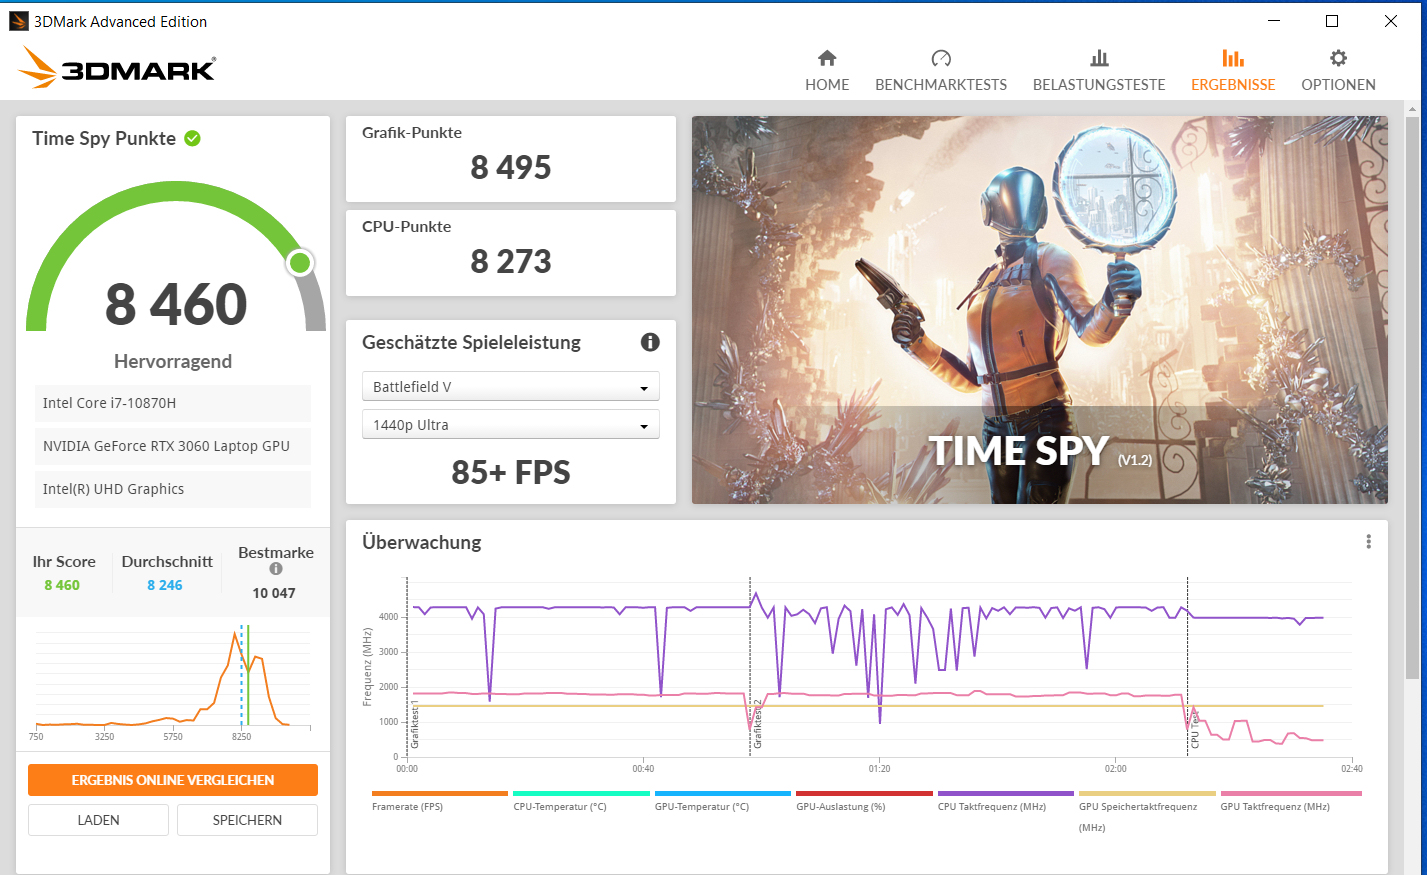
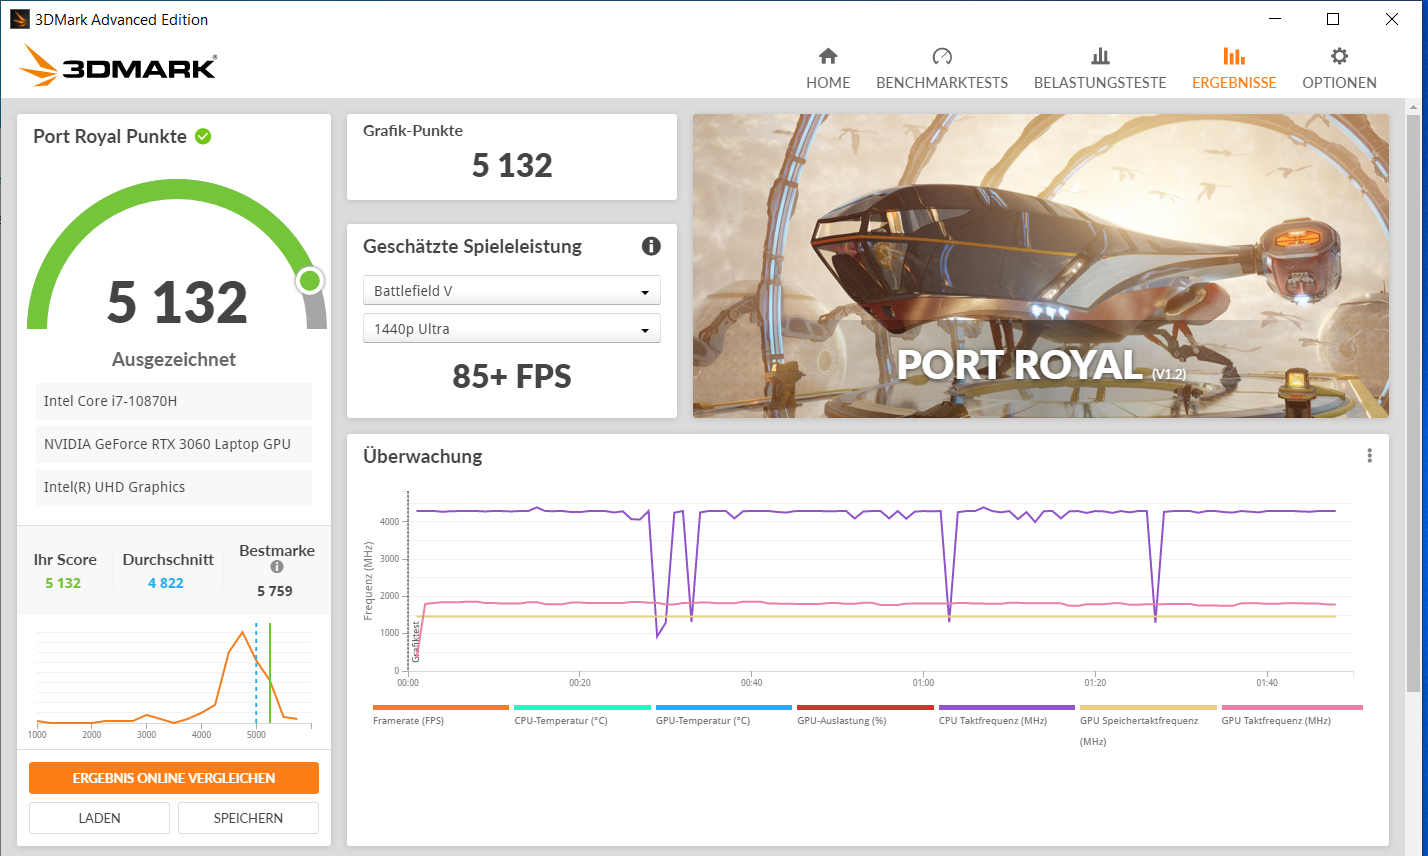
| 3DMark 11 Performance | 21813 points | |
| 3DMark Cloud Gate Standard Score | 41707 points | |
| 3DMark Fire Strike Score | 17355 points | |
| 3DMark Time Spy Score | 7758 points | |
Help | ||
| 3DMark | |
| 1920x1080 Fire Strike Graphics | |
| Average of class Gaming (12242 - 62849, n=139, last 2 years) | |
| Schenker XMG Core 17 (Early 2021) (Overboost, TGP: 130 Watt) | |
| Schenker XMG Core 17 (Early 2021) (Overboost) | |
| Medion Erazer Beast X10 MD61804 | |
| Average NVIDIA GeForce RTX 3060 Laptop GPU (16354 - 23109, n=49) | |
| Schenker XMG Core 17 (Early 2021) | |
| MSI Alpha 17 A4DEK | |
| Acer Predator Helios 300 PH317-54-75G8 | |
| Schenker XMG Core 17 | |
| Schenker XMG Core 17 Comet Lake | |
| 2560x1440 Time Spy Graphics | |
| Average of class Gaming (4310 - 25984, n=136, last 2 years) | |
| Schenker XMG Core 17 (Early 2021) (Overboost, TGP: 130 Watt) | |
| Schenker XMG Core 17 (Early 2021) (Overboost) | |
| Average NVIDIA GeForce RTX 3060 Laptop GPU (6285 - 9235, n=49) | |
| Medion Erazer Beast X10 MD61804 | |
| Schenker XMG Core 17 (Early 2021) | |
| Acer Predator Helios 300 PH317-54-75G8 | |
| MSI Alpha 17 A4DEK | |
| Schenker XMG Core 17 | |
| Schenker XMG Core 17 Comet Lake | |
Gaming Performance
The hardware is able to bring all the current games to the screen smoothly. Generally, you can use the full resolution of the display (2560 x 1440 pixels, WQHD) and high to maximum quality settings while gaming. The FHD resolution would allow for a maximum quality level throughout.
Compared to all the RTX 3060 laptops that we have tested until now, the Core 17 does very well. Generally the differences in the frame rates between the devices do not turn out too large, despite the different TGP configurations. As the results of the Core 17 show, even a significant increase of the TGP value will only lead to a slight increase in the frame rates.
| The Witcher 3 - 1920x1080 Ultra Graphics & Postprocessing (HBAO+) | |
| Average of class Gaming (80.2 - 240, n=36, last 2 years) | |
| Medion Erazer Beast X10 MD61804 | |
| Schenker XMG Core 15 Ampere | |
| Schenker XMG Core 17 (Early 2021) (Overboost) | |
| Razer Blade 15 Base Edition 2021, i7-10750H RTX 3060 | |
| Schenker XMG Core 17 (Early 2021) | |
| Schenker XMG Core 17 (Early 2021, RTX 3060, 5800H) | |
| Average NVIDIA GeForce RTX 3060 Laptop GPU (58.2 - 91.5, n=48) | |
| Acer Aspire Nitro 5 AN515-55-57GF | |
| MSI GF65 Thin 10UE | |
| Acer Predator Helios 300 PH317-54-75G8 | |
| MSI Alpha 17 A4DEK | |
| Schenker XMG Core 17 | |
| Schenker XMG Core 17 Comet Lake | |
| Dota 2 Reborn - 1920x1080 ultra (3/3) best looking | |
| Average of class Gaming (65.1 - 248, n=133, last 2 years) | |
| Average NVIDIA GeForce RTX 3060 Laptop GPU (90.7 - 154.8, n=49) | |
| Schenker XMG Core 17 (Early 2021, RTX 3060, 5800H) | |
| Razer Blade 15 Base Edition 2021, i7-10750H RTX 3060 | |
| Schenker XMG Core 17 (Early 2021) | |
| Acer Aspire Nitro 5 AN515-55-57GF | |
| Schenker XMG Core 17 Comet Lake | |
| Schenker XMG Core 17 (Early 2021) (Overboost) | |
| MSI Alpha 17 A4DEK | |
| Schenker XMG Core 15 Ampere | |
| MSI GF65 Thin 10UE | |
| X-Plane 11.11 - 1920x1080 high (fps_test=3) | |
| Average of class Gaming (33.4 - 150.2, n=136, last 2 years) | |
| Average NVIDIA GeForce RTX 3060 Laptop GPU (61.9 - 109.3, n=48) | |
| Razer Blade 15 Base Edition 2021, i7-10750H RTX 3060 | |
| Schenker XMG Core 17 (Early 2021, RTX 3060, 5800H) | |
| Schenker XMG Core 17 Comet Lake | |
| Schenker XMG Core 17 (Early 2021) (Overboost) | |
| Schenker XMG Core 17 (Early 2021) | |
| Acer Aspire Nitro 5 AN515-55-57GF | |
| Schenker XMG Core 15 Ampere | |
| MSI GF65 Thin 10UE | |
| MSI Alpha 17 A4DEK | |
| Final Fantasy XV Benchmark | |
| 2560x1440 High Quality | |
| Average of class Gaming (32.5 - 184.3, n=103, last 2 years) | |
| Schenker XMG Core 17 (Early 2021) (1.3, Overboost, TGP: 130 Watt) | |
| Schenker XMG Core 17 (Early 2021) (1.3, Overboost) | |
| Schenker XMG Core 17 (Early 2021) (1.3) | |
| Average NVIDIA GeForce RTX 3060 Laptop GPU (41.1 - 73.7, n=25) | |
| MSI GF65 Thin 10UE (1.3) | |
| 1920x1080 High Quality | |
| Average of class Gaming (37.9 - 215, n=126, last 2 years) | |
| Schenker XMG Core 17 (Early 2021) (1.3, Overboost, TGP: 130 Watt) | |
| Schenker XMG Core 17 (Early 2021) (1.3, Overboost) | |
| Razer Blade 15 Base Edition 2021, i7-10750H RTX 3060 (1.3) | |
| Schenker XMG Core 17 (Early 2021) (1.3) | |
| Average NVIDIA GeForce RTX 3060 Laptop GPU (55 - 100.9, n=42) | |
| Acer Aspire Nitro 5 AN515-55-57GF (1.3) | |
| MSI GF65 Thin 10UE (1.3) | |
| Schenker XMG Core 17 | |
| MSI Alpha 17 A4DEK | |
| Strange Brigade | |
| 2560x1440 ultra AA:ultra AF:16 | |
| Average of class Gaming (52.8 - 350, n=94, last 2 years) | |
| Schenker XMG Core 17 (Early 2021) (1.47.22.14 D3D12, Overboost) | |
| Schenker XMG Core 17 (Early 2021) (1.47.22.14 D3D12, Overboost, TGP: 130 Watt) | |
| Schenker XMG Core 17 (Early 2021) (1.47.22.14 D3D12) | |
| Average NVIDIA GeForce RTX 3060 Laptop GPU (75.4 - 118.4, n=17) | |
| 1920x1080 ultra AA:ultra AF:16 | |
| Average of class Gaming (76.3 - 456, n=116, last 2 years) | |
| Schenker XMG Core 17 (Early 2021) (1.47.22.14 D3D12, Overboost, TGP: 130 Watt) | |
| Schenker XMG Core 17 (Early 2021) (1.47.22.14 D3D12, Overboost) | |
| Razer Blade 15 Base Edition 2021, i7-10750H RTX 3060 (1.47.22.14 D3D12) | |
| Average NVIDIA GeForce RTX 3060 Laptop GPU (102.2 - 166.3, n=43) | |
| Schenker XMG Core 17 (Early 2021) (1.47.22.14 D3D12) | |
| Acer Aspire Nitro 5 AN515-55-57GF (1.47.22.14 D3D12) | |
| MSI GF65 Thin 10UE (1.47.22.14 D3D12) | |
| Shadow of the Tomb Raider | |
| 1920x1080 Highest Preset AA:T | |
| Average of class Gaming (131 - 212, n=2, last 2 years) | |
| Schenker XMG Core 17 (Early 2021) | |
| Average NVIDIA GeForce RTX 3060 Laptop GPU (84 - 95, n=4) | |
| Schenker XMG Core 17 (Early 2021, RTX 3060, 5800H) | |
| Schenker XMG Core 15 Ampere | |
| Acer Predator Helios 300 PH317-54-75G8 | |
| 2560x1440 Highest Preset AA:T | |
| Average of class Gaming (86 - 176, n=2, last 2 years) | |
| Schenker XMG Core 15 Ampere | |
| Average NVIDIA GeForce RTX 3060 Laptop GPU (66 - 71, n=3) | |
| Schenker XMG Core 17 (Early 2021, RTX 3060, 5800H) | |
| Schenker XMG Core 17 (Early 2021) | |
| Far Cry 5 | |
| 1920x1080 Ultra Preset AA:T | |
| Average of class Gaming (70 - 174, n=33, last 2 years) | |
| Schenker XMG Core 17 (Early 2021) (Overboost, TGP: 130 Watt) | |
| Schenker XMG Core 17 (Early 2021) | |
| Average NVIDIA GeForce RTX 3060 Laptop GPU (80 - 120, n=31) | |
| Schenker XMG Core 17 (Early 2021) (Overboost) | |
| Schenker XMG Core 15 Ampere | |
| MSI GF65 Thin 10UE | |
| Acer Aspire Nitro 5 AN515-55-57GF | |
| Schenker XMG Core 17 | |
| 2560x1440 Ultra Preset AA:T | |
| Average of class Gaming (80 - 171, n=29, last 2 years) | |
| Schenker XMG Core 17 (Early 2021) (Overboost, TGP: 130 Watt) | |
| Schenker XMG Core 15 Ampere | |
| Schenker XMG Core 17 (Early 2021) (Overboost) | |
| Schenker XMG Core 17 (Early 2021) | |
| Average NVIDIA GeForce RTX 3060 Laptop GPU (58 - 92, n=12) | |
| GTA V | |
| 1920x1080 Highest AA:4xMSAA + FX AF:16x | |
| Average of class Gaming (47.9 - 186.9, n=118, last 2 years) | |
| Schenker XMG Core 17 (Early 2021, RTX 3060, 5800H) | |
| Schenker XMG Core 17 (Early 2021) (Overboost) | |
| Average NVIDIA GeForce RTX 3060 Laptop GPU (69.2 - 109.8, n=46) | |
| Schenker XMG Core 17 (Early 2021) (Overboost, TGP: 130 Watt) | |
| Schenker XMG Core 17 (Early 2021) | |
| Razer Blade 15 Base Edition 2021, i7-10750H RTX 3060 | |
| Acer Aspire Nitro 5 AN515-55-57GF | |
| MSI GF65 Thin 10UE | |
| 2560x1440 Highest AA:4xMSAA + FX AF:16x | |
| Average of class Gaming (36.9 - 183.9, n=87, last 2 years) | |
| Schenker XMG Core 17 (Early 2021) (Overboost, TGP: 130 Watt) | |
| Schenker XMG Core 17 (Early 2021) (Overboost) | |
| Schenker XMG Core 17 (Early 2021) | |
| Average NVIDIA GeForce RTX 3060 Laptop GPU (52 - 86.5, n=23) | |
| Performance rating - Percent | |
| Average of class Gaming | |
| Razer Blade 15 Base Edition 2021, i7-10750H RTX 3060 -7! | |
| Schenker XMG Core 17 (Early 2021, RTX 3060, 5800H) -7! | |
| Schenker XMG Core 17 (Early 2021) -5! | |
| Schenker XMG Core 17 (Early 2021) -2! | |
| Medion Erazer Beast X10 MD61804 -12! | |
| Schenker XMG Core 15 Ampere -6! | |
| Average NVIDIA GeForce RTX 3060 Laptop GPU | |
| Schenker XMG Core 17 (Early 2021) | |
| Acer Aspire Nitro 5 AN515-55-57GF -6! | |
| Schenker XMG Core 17 Comet Lake -10! | |
| MSI GF65 Thin 10UE -5! | |
| Schenker XMG Core 17 -10! | |
| Acer Predator Helios 300 PH317-54-75G8 -11! | |
| MSI Alpha 17 A4DEK -9! | |
| The Witcher 3 - 1920x1080 Ultra Graphics & Postprocessing (HBAO+) | |
| Average of class Gaming (80.2 - 240, n=36, last 2 years) | |
| Medion Erazer Beast X10 MD61804 | |
| Schenker XMG Core 15 Ampere | |
| Schenker XMG Core 17 (Early 2021) (Overboost) | |
| Razer Blade 15 Base Edition 2021, i7-10750H RTX 3060 | |
| Schenker XMG Core 17 (Early 2021) | |
| Schenker XMG Core 17 (Early 2021, RTX 3060, 5800H) | |
| Average NVIDIA GeForce RTX 3060 Laptop GPU (58.2 - 91.5, n=48) | |
| Acer Aspire Nitro 5 AN515-55-57GF | |
| MSI GF65 Thin 10UE | |
| Acer Predator Helios 300 PH317-54-75G8 | |
| MSI Alpha 17 A4DEK | |
| Schenker XMG Core 17 | |
| Schenker XMG Core 17 Comet Lake | |
| Dota 2 Reborn - 1920x1080 ultra (3/3) best looking | |
| Average of class Gaming (65.1 - 248, n=133, last 2 years) | |
| Average NVIDIA GeForce RTX 3060 Laptop GPU (90.7 - 154.8, n=49) | |
| Schenker XMG Core 17 (Early 2021, RTX 3060, 5800H) | |
| Razer Blade 15 Base Edition 2021, i7-10750H RTX 3060 | |
| Schenker XMG Core 17 (Early 2021) | |
| Acer Aspire Nitro 5 AN515-55-57GF | |
| Schenker XMG Core 17 Comet Lake | |
| Schenker XMG Core 17 (Early 2021) (Overboost) | |
| MSI Alpha 17 A4DEK | |
| Schenker XMG Core 15 Ampere | |
| MSI GF65 Thin 10UE | |
| X-Plane 11.11 - 1920x1080 high (fps_test=3) | |
| Average of class Gaming (33.4 - 150.2, n=136, last 2 years) | |
| Average NVIDIA GeForce RTX 3060 Laptop GPU (61.9 - 109.3, n=48) | |
| Razer Blade 15 Base Edition 2021, i7-10750H RTX 3060 | |
| Schenker XMG Core 17 (Early 2021, RTX 3060, 5800H) | |
| Schenker XMG Core 17 Comet Lake | |
| Schenker XMG Core 17 (Early 2021) (Overboost) | |
| Schenker XMG Core 17 (Early 2021) | |
| Acer Aspire Nitro 5 AN515-55-57GF | |
| Schenker XMG Core 15 Ampere | |
| MSI GF65 Thin 10UE | |
| MSI Alpha 17 A4DEK | |
| Final Fantasy XV Benchmark | |
| 2560x1440 High Quality | |
| Average of class Gaming (32.5 - 184.3, n=103, last 2 years) | |
| Schenker XMG Core 17 (Early 2021) (1.3, Overboost, TGP: 130 Watt) | |
| Schenker XMG Core 17 (Early 2021) (1.3, Overboost) | |
| Schenker XMG Core 17 (Early 2021) (1.3) | |
| Average NVIDIA GeForce RTX 3060 Laptop GPU (41.1 - 73.7, n=25) | |
| MSI GF65 Thin 10UE (1.3) | |
| 1920x1080 High Quality | |
| Average of class Gaming (37.9 - 215, n=126, last 2 years) | |
| Schenker XMG Core 17 (Early 2021) (1.3, Overboost, TGP: 130 Watt) | |
| Schenker XMG Core 17 (Early 2021) (1.3, Overboost) | |
| Razer Blade 15 Base Edition 2021, i7-10750H RTX 3060 (1.3) | |
| Schenker XMG Core 17 (Early 2021) (1.3) | |
| Average NVIDIA GeForce RTX 3060 Laptop GPU (55 - 100.9, n=42) | |
| Acer Aspire Nitro 5 AN515-55-57GF (1.3) | |
| MSI GF65 Thin 10UE (1.3) | |
| Schenker XMG Core 17 | |
| MSI Alpha 17 A4DEK | |
| Strange Brigade | |
| 2560x1440 ultra AA:ultra AF:16 | |
| Average of class Gaming (52.8 - 350, n=94, last 2 years) | |
| Schenker XMG Core 17 (Early 2021) (1.47.22.14 D3D12, Overboost) | |
| Schenker XMG Core 17 (Early 2021) (1.47.22.14 D3D12, Overboost, TGP: 130 Watt) | |
| Schenker XMG Core 17 (Early 2021) (1.47.22.14 D3D12) | |
| Average NVIDIA GeForce RTX 3060 Laptop GPU (75.4 - 118.4, n=17) | |
| 1920x1080 ultra AA:ultra AF:16 | |
| Average of class Gaming (76.3 - 456, n=116, last 2 years) | |
| Schenker XMG Core 17 (Early 2021) (1.47.22.14 D3D12, Overboost, TGP: 130 Watt) | |
| Schenker XMG Core 17 (Early 2021) (1.47.22.14 D3D12, Overboost) | |
| Razer Blade 15 Base Edition 2021, i7-10750H RTX 3060 (1.47.22.14 D3D12) | |
| Average NVIDIA GeForce RTX 3060 Laptop GPU (102.2 - 166.3, n=43) | |
| Schenker XMG Core 17 (Early 2021) (1.47.22.14 D3D12) | |
| Acer Aspire Nitro 5 AN515-55-57GF (1.47.22.14 D3D12) | |
| MSI GF65 Thin 10UE (1.47.22.14 D3D12) | |
| Shadow of the Tomb Raider | |
| 1920x1080 Highest Preset AA:T | |
| Average of class Gaming (131 - 212, n=2, last 2 years) | |
| Schenker XMG Core 17 (Early 2021) | |
| Average NVIDIA GeForce RTX 3060 Laptop GPU (84 - 95, n=4) | |
| Schenker XMG Core 17 (Early 2021, RTX 3060, 5800H) | |
| Schenker XMG Core 15 Ampere | |
| Acer Predator Helios 300 PH317-54-75G8 | |
| 2560x1440 Highest Preset AA:T | |
| Average of class Gaming (86 - 176, n=2, last 2 years) | |
| Schenker XMG Core 15 Ampere | |
| Average NVIDIA GeForce RTX 3060 Laptop GPU (66 - 71, n=3) | |
| Schenker XMG Core 17 (Early 2021, RTX 3060, 5800H) | |
| Schenker XMG Core 17 (Early 2021) | |
| Far Cry 5 | |
| 1920x1080 Ultra Preset AA:T | |
| Average of class Gaming (70 - 174, n=33, last 2 years) | |
| Schenker XMG Core 17 (Early 2021) (Overboost, TGP: 130 Watt) | |
| Schenker XMG Core 17 (Early 2021) | |
| Average NVIDIA GeForce RTX 3060 Laptop GPU (80 - 120, n=31) | |
| Schenker XMG Core 17 (Early 2021) (Overboost) | |
| Schenker XMG Core 15 Ampere | |
| MSI GF65 Thin 10UE | |
| Acer Aspire Nitro 5 AN515-55-57GF | |
| Schenker XMG Core 17 | |
| 2560x1440 Ultra Preset AA:T | |
| Average of class Gaming (80 - 171, n=29, last 2 years) | |
| Schenker XMG Core 17 (Early 2021) (Overboost, TGP: 130 Watt) | |
| Schenker XMG Core 15 Ampere | |
| Schenker XMG Core 17 (Early 2021) (Overboost) | |
| Schenker XMG Core 17 (Early 2021) | |
| Average NVIDIA GeForce RTX 3060 Laptop GPU (58 - 92, n=12) | |
| GTA V | |
| 1920x1080 Highest AA:4xMSAA + FX AF:16x | |
| Average of class Gaming (47.9 - 186.9, n=118, last 2 years) | |
| Schenker XMG Core 17 (Early 2021, RTX 3060, 5800H) | |
| Schenker XMG Core 17 (Early 2021) (Overboost) | |
| Average NVIDIA GeForce RTX 3060 Laptop GPU (69.2 - 109.8, n=46) | |
| Schenker XMG Core 17 (Early 2021) (Overboost, TGP: 130 Watt) | |
| Schenker XMG Core 17 (Early 2021) | |
| Razer Blade 15 Base Edition 2021, i7-10750H RTX 3060 | |
| Acer Aspire Nitro 5 AN515-55-57GF | |
| MSI GF65 Thin 10UE | |
| 2560x1440 Highest AA:4xMSAA + FX AF:16x | |
| Average of class Gaming (36.9 - 183.9, n=87, last 2 years) | |
| Schenker XMG Core 17 (Early 2021) (Overboost, TGP: 130 Watt) | |
| Schenker XMG Core 17 (Early 2021) (Overboost) | |
| Schenker XMG Core 17 (Early 2021) | |
| Average NVIDIA GeForce RTX 3060 Laptop GPU (52 - 86.5, n=23) | |
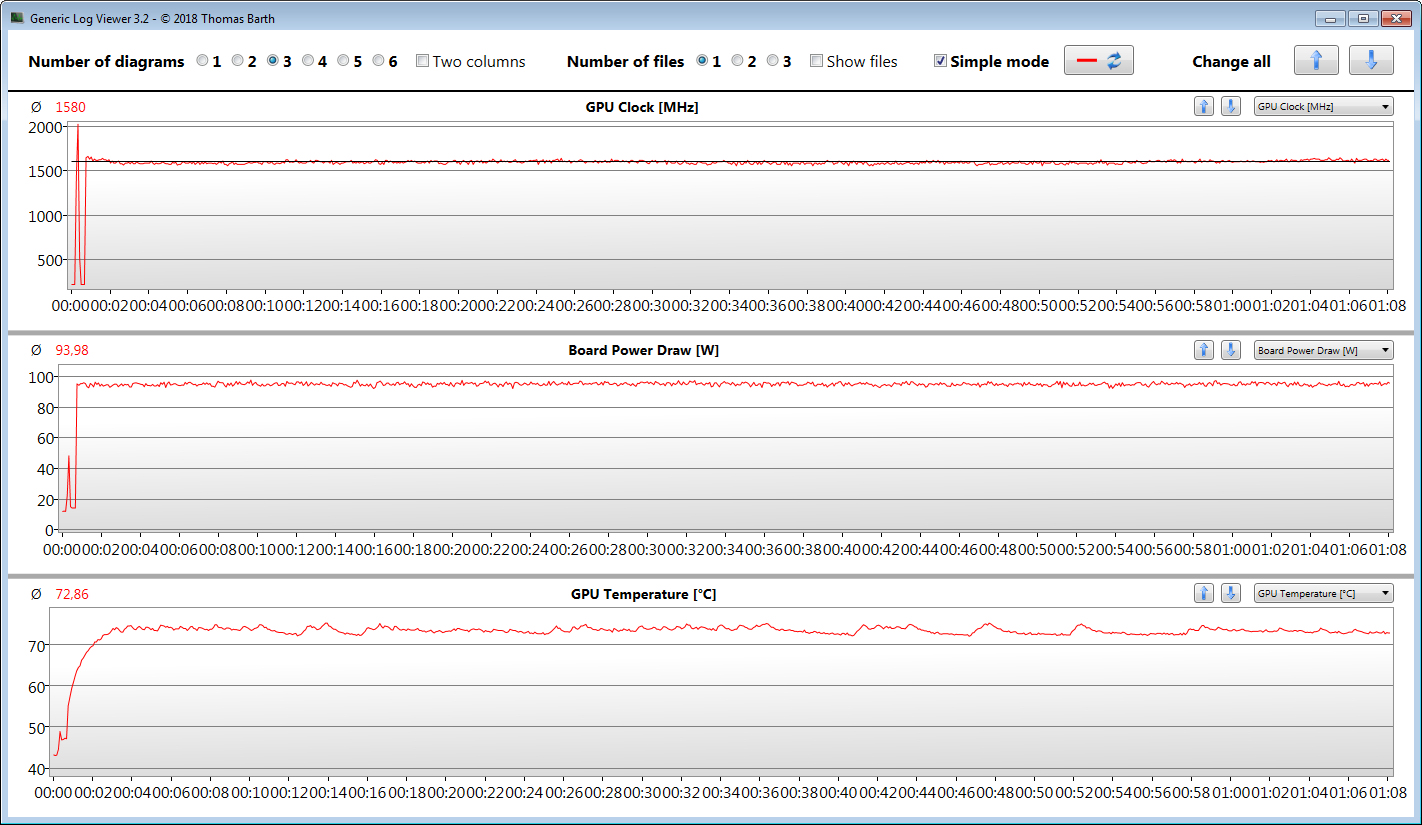
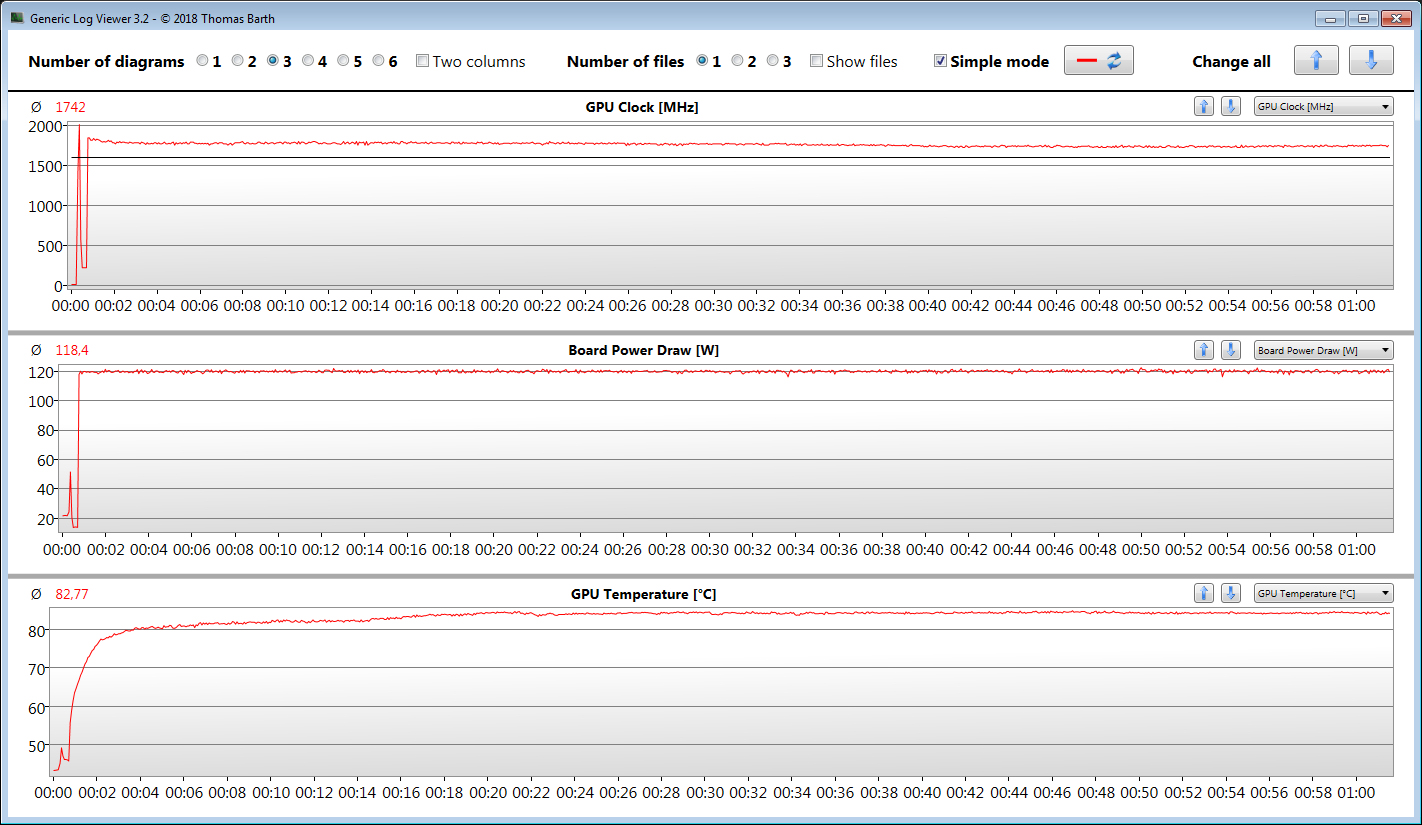
In order to evaluate whether the frame rates also remain mostly constant over a longer time period, we run the game "The Witcher 3" for about 60 minutes at Full-HD resolution and maximum quality settings, without moving the gaming character. We do not notice any drop in the frame rates.
| low | med. | high | ultra | QHD | |
|---|---|---|---|---|---|
| GTA V (2015) | 179 | 172 | 150 | 86.9 | 74.3 |
| The Witcher 3 (2015) | 302 | 229 | 144 | 79.5 | |
| Dota 2 Reborn (2015) | 146 | 136 | 124 | 118 | |
| Final Fantasy XV Benchmark (2018) | 141 | 105 | 79.9 | 59.6 | |
| X-Plane 11.11 (2018) | 89.5 | 81.7 | 68.7 | ||
| Far Cry 5 (2018) | 145 | 113 | 108 | 102 | 82 |
| Strange Brigade (2018) | 345 | 191 | 154 | 134 | 101 |
| Shadow of the Tomb Raider (2018) | 113 | 106 | 102 | 95 | 66 |
| Watch Dogs Legion (2020) | 82.1 | 77 | 70.7 | 50.8 | 33.9 |
| Dirt 5 (2020) | 140 | 102 | 89.1 | 71.5 | 56.1 |
| Yakuza Like a Dragon (2020) | 127 | 106 | 105 | 92.2 | 61.8 |
| Outriders (2021) | 122 | 103 | 98.9 | 90.1 | 65.1 |
| Resident Evil Village (2021) | 160 | 140 | 136 | 121 | 81.6 |
| Mass Effect Legendary Edition (2021) | 109 | 92.9 | 91.9 | ||
| Days Gone (2021) | 173 | 121 | 107 | 81.1 | 58.9 |
Emissions - The Schenker computer can produce a lot of noise
Noise Emissions
During idle operation and under low loads, the noise development remains within limits. The fans then generally run at low speeds. Under load, they will rev up, and we register a maximum noise level of 54 dB(A) (stress test) and 51 dB(A) ("The Witcher 3" test), which makes using a headset almost a requirement.
Noise level
| Idle |
| 30 / 32 / 36 dB(A) |
| Load |
| 53 / 54 dB(A) |
 | ||
30 dB silent 40 dB(A) audible 50 dB(A) loud |
||
min: | ||
| Schenker XMG Core 17 (Early 2021) i7-10870H, GeForce RTX 3060 Laptop GPU | MSI Alpha 17 A4DEK R7 4800H, Radeon RX 5600M | Acer Predator Helios 300 PH317-54-75G8 i7-10750H, GeForce RTX 2060 Mobile | Medion Erazer Beast X10 MD61804 i7-10750H, GeForce RTX 2070 Super Max-Q | Schenker XMG Core 17 i7-9750H, GeForce GTX 1660 Ti Mobile | Schenker XMG Core 17 Comet Lake i7-10750H, GeForce GTX 1650 Ti Mobile | Average of class Gaming | |
|---|---|---|---|---|---|---|---|
| Noise | 6% | 6% | 3% | 1% | 9% | 11% | |
| off / environment * (dB) | 25 | 25 -0% | 24 4% | 25 -0% | 30 -20% | 25 -0% | 24.2 ? 3% |
| Idle Minimum * (dB) | 30 | 31 -3% | 25 17% | 26 13% | 30 -0% | 25 17% | 26 ? 13% |
| Idle Average * (dB) | 32 | 32 -0% | 30 6% | 29 9% | 32 -0% | 31 3% | 27.6 ? 14% |
| Idle Maximum * (dB) | 36 | 33 8% | 37 -3% | 35 3% | 35 3% | 32 11% | 30.2 ? 16% |
| Load Average * (dB) | 53 | 38 28% | 48 9% | 52 2% | 47 11% | 48 9% | 43.1 ? 19% |
| Witcher 3 ultra * (dB) | 51 | 46 10% | 50 2% | 53 -4% | 48 6% | 44 14% | |
| Load Maximum * (dB) | 54 | 54 -0% | 52 4% | 55 -2% | 51 6% | 51 6% | 53.9 ? -0% |
* ... smaller is better
Temperatures
The CPU and GPU run through our stress test (Prime95 and Furmark running for at least one hour) at 3.2 GHz and 1327 MHz respectively. The stress test represents an extreme scenario, and we use this test to evaluate whether the system also remains stable under full load.
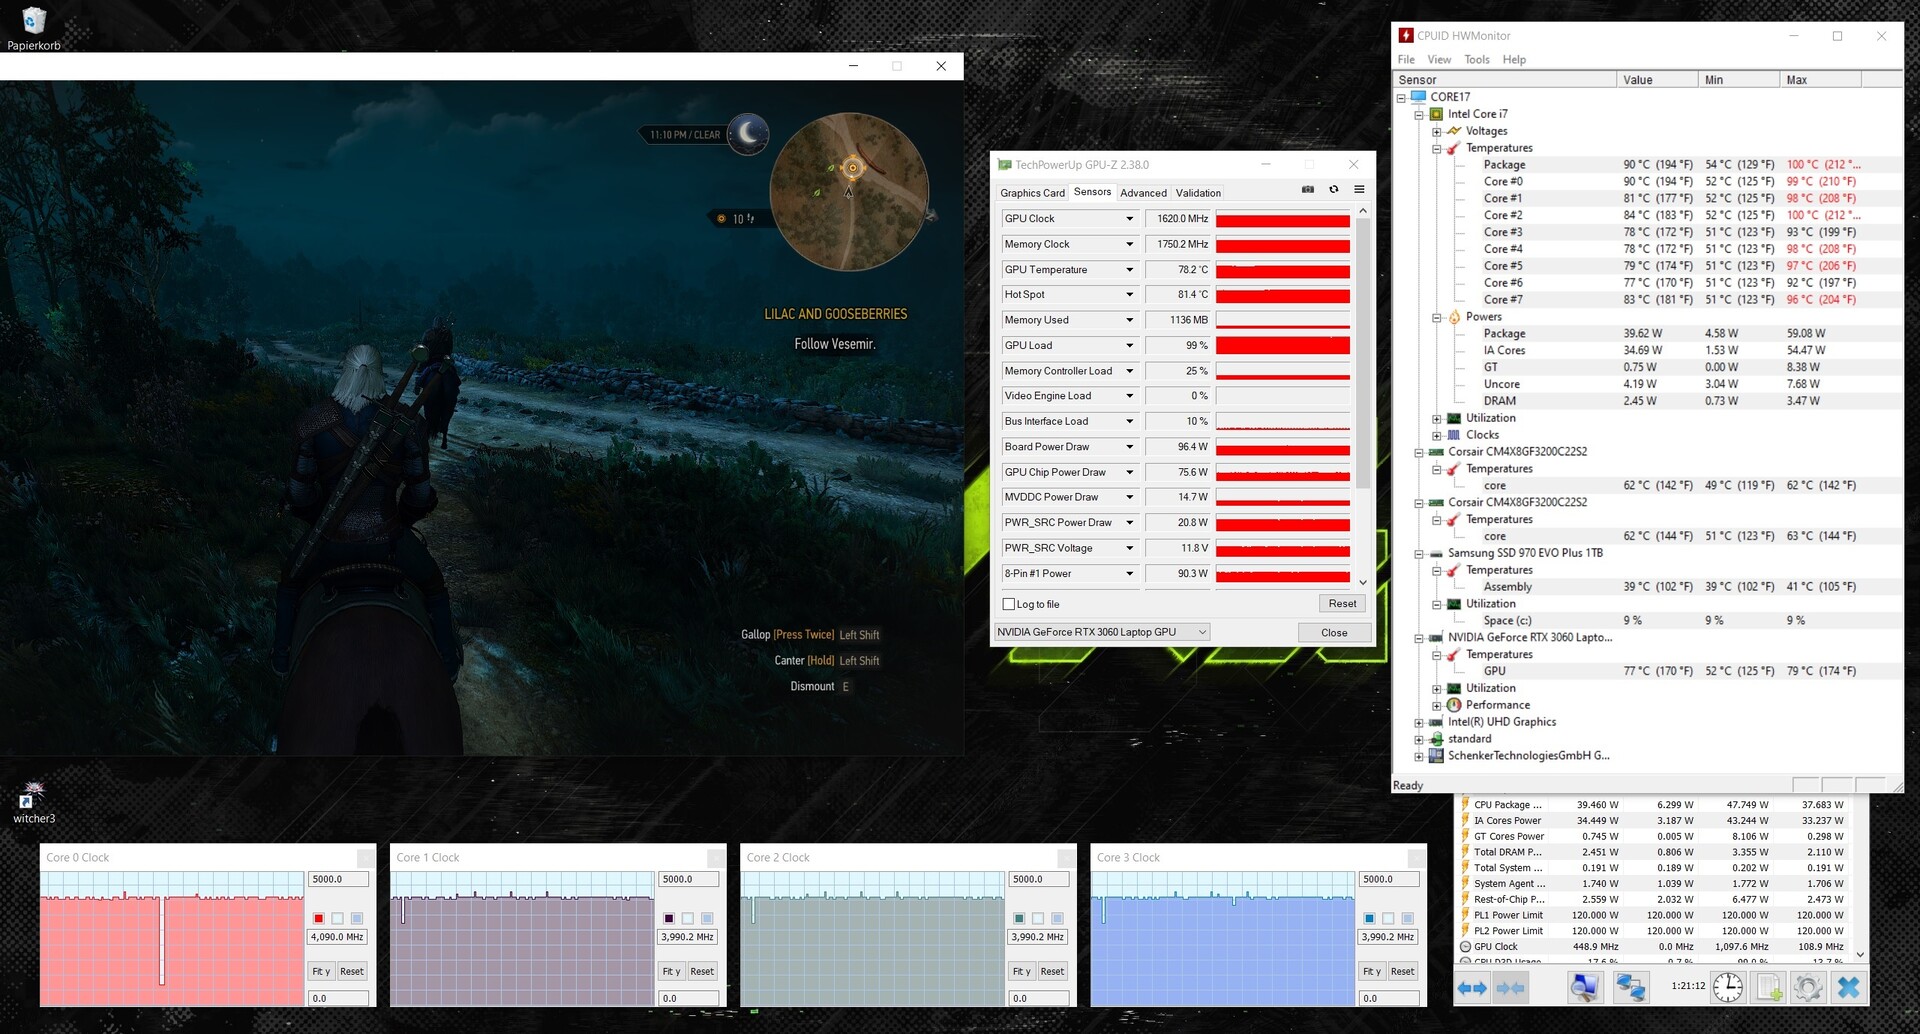
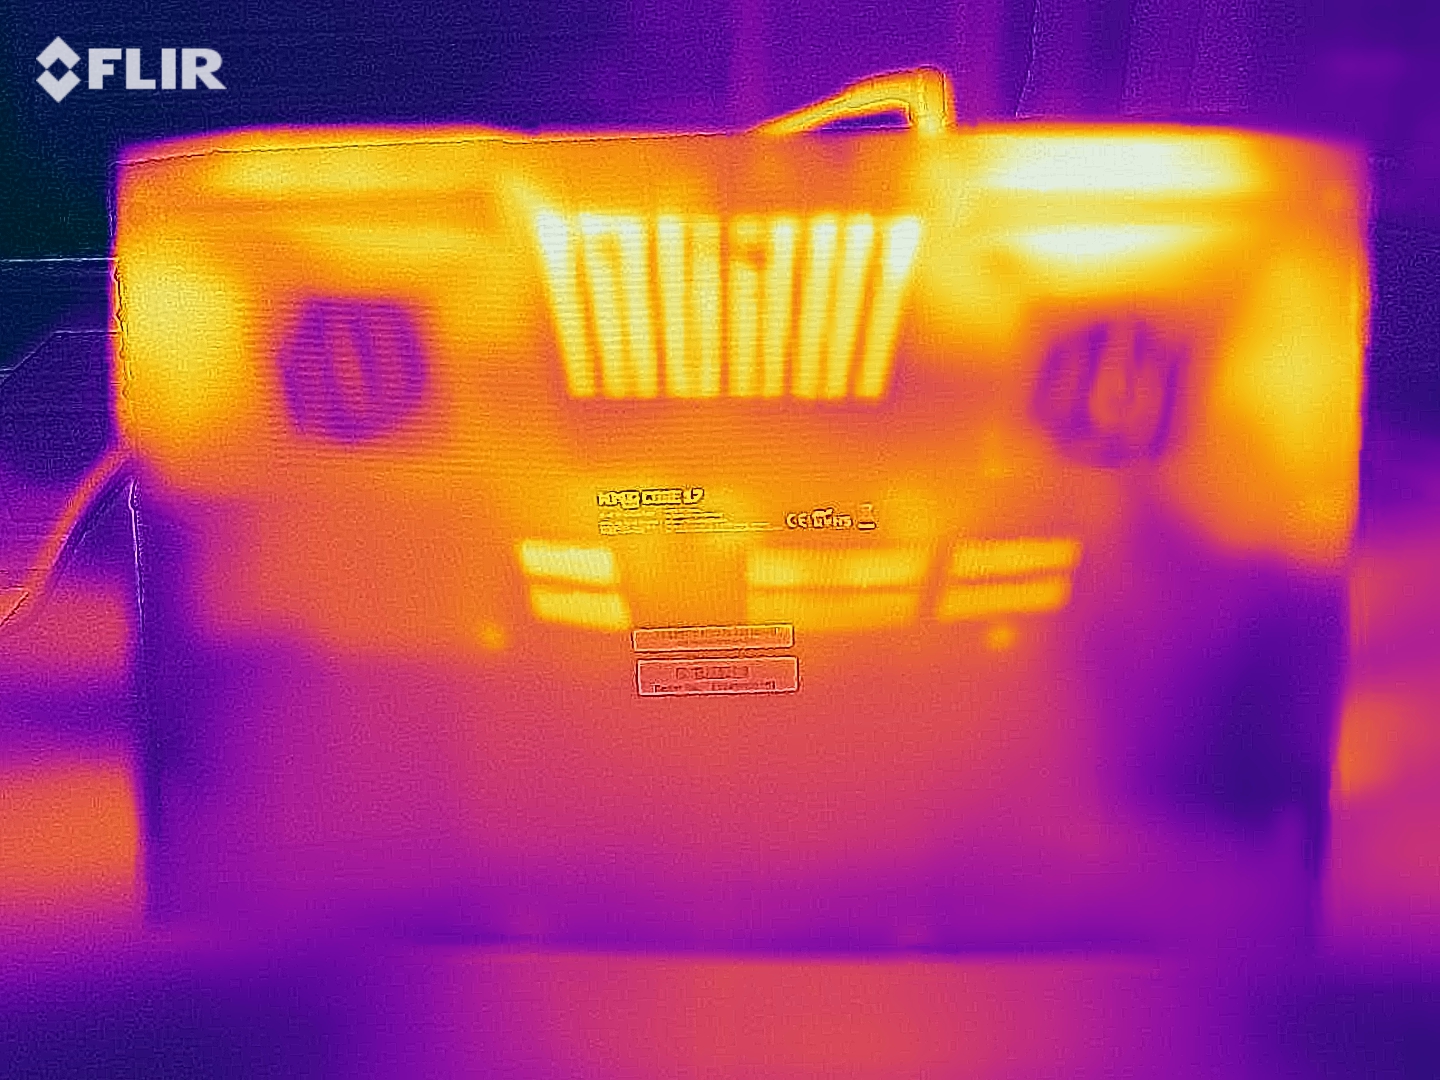
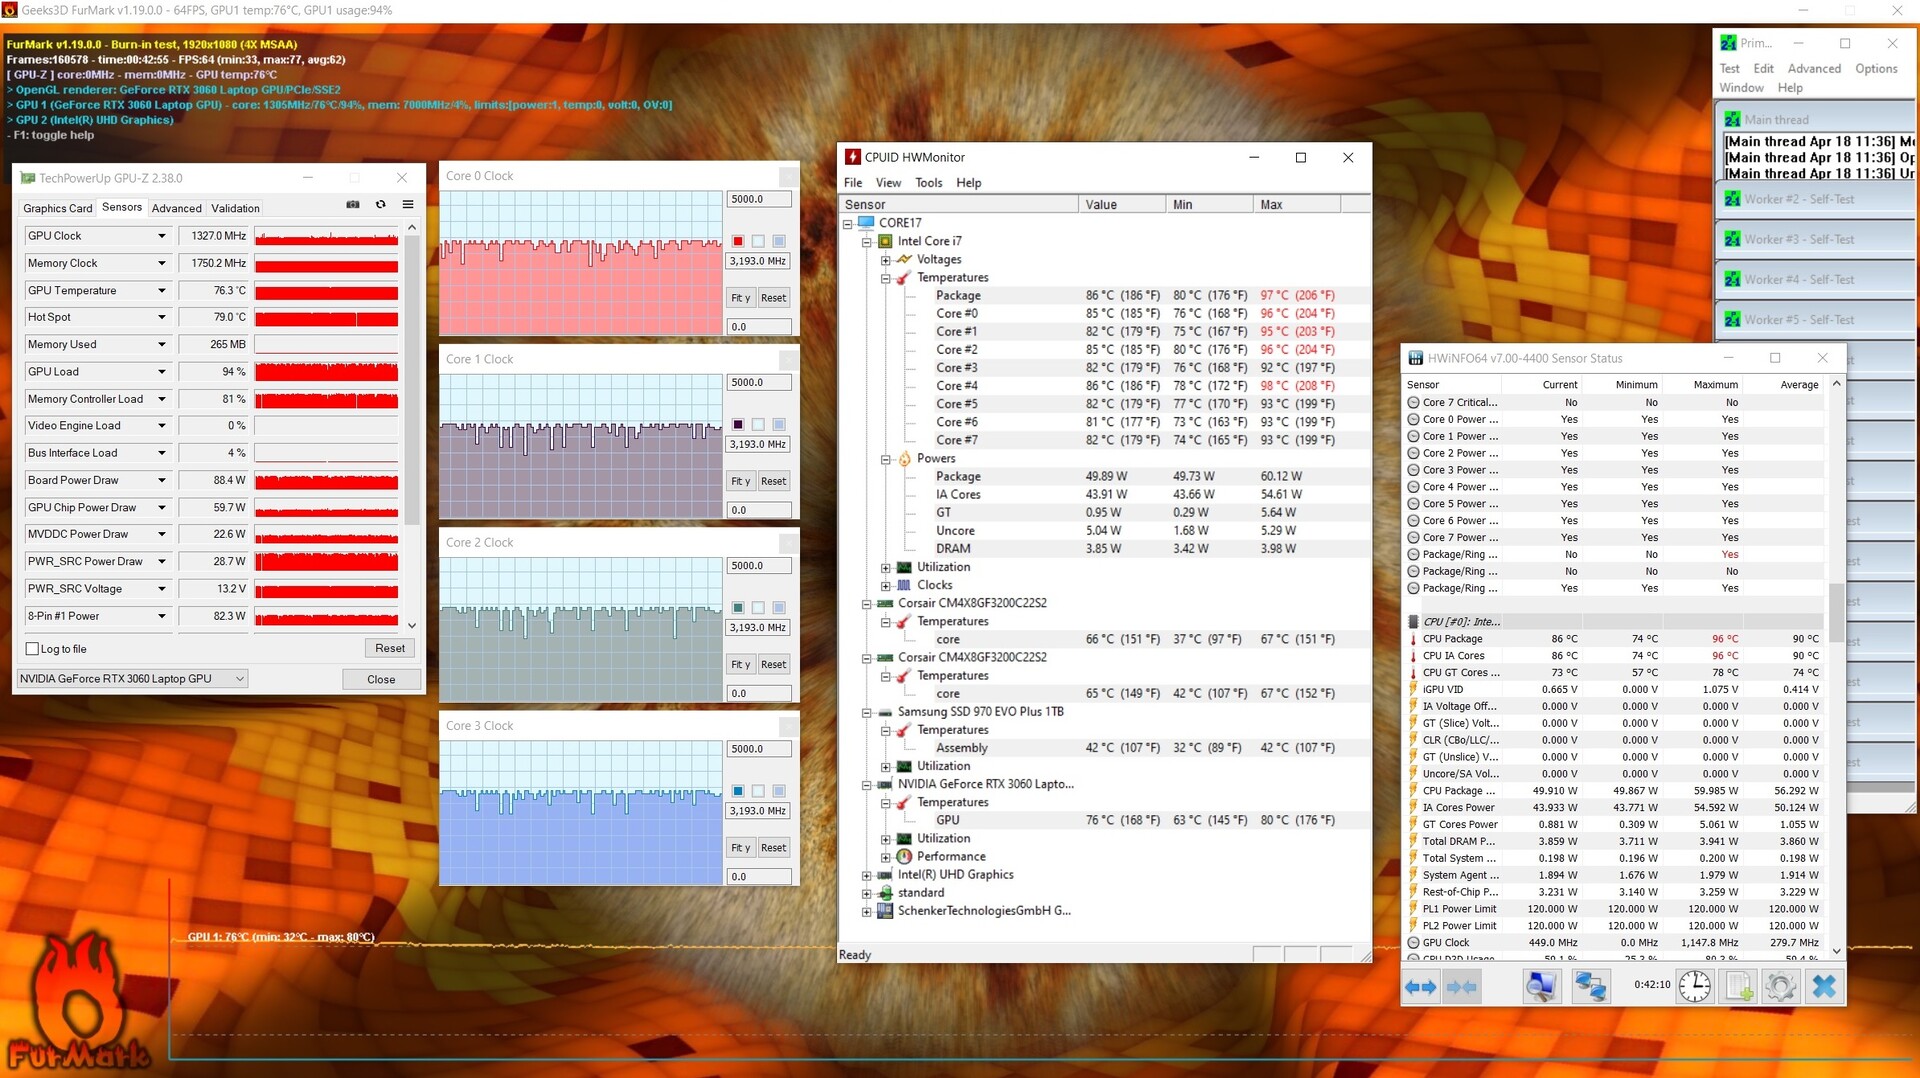
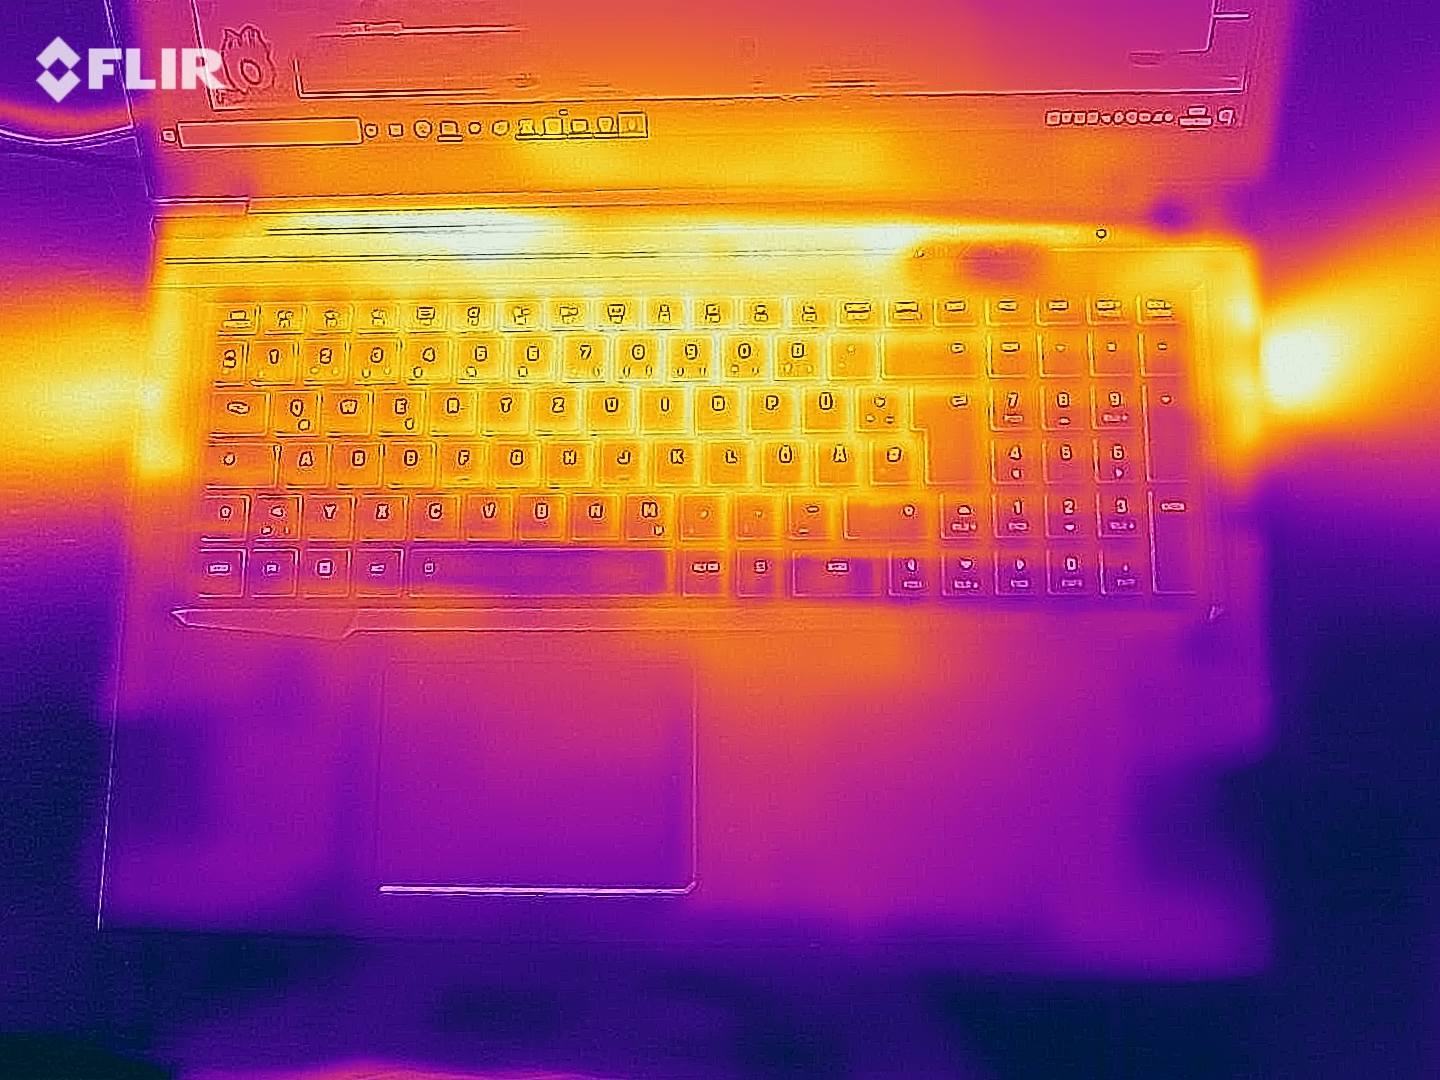
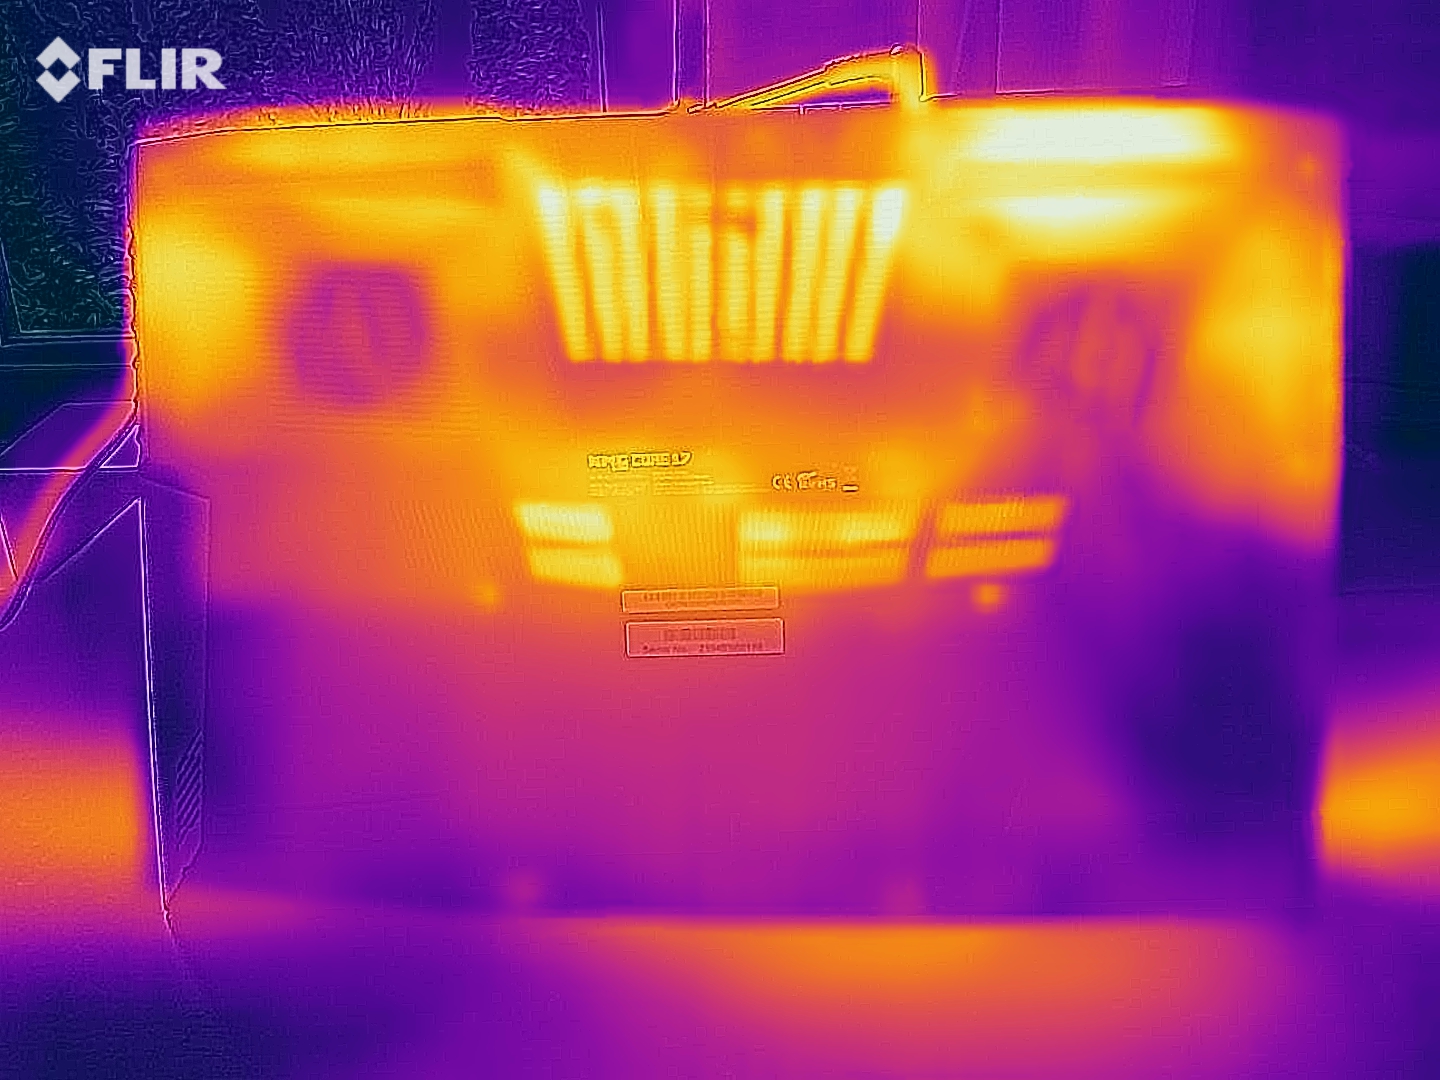
Considering the hardware inside the laptop, it does not heat up too much during the stress test. The heat development turns out minimally higher when running our "The Witcher 3" test. In both cases, you should not run the laptop in your lap.
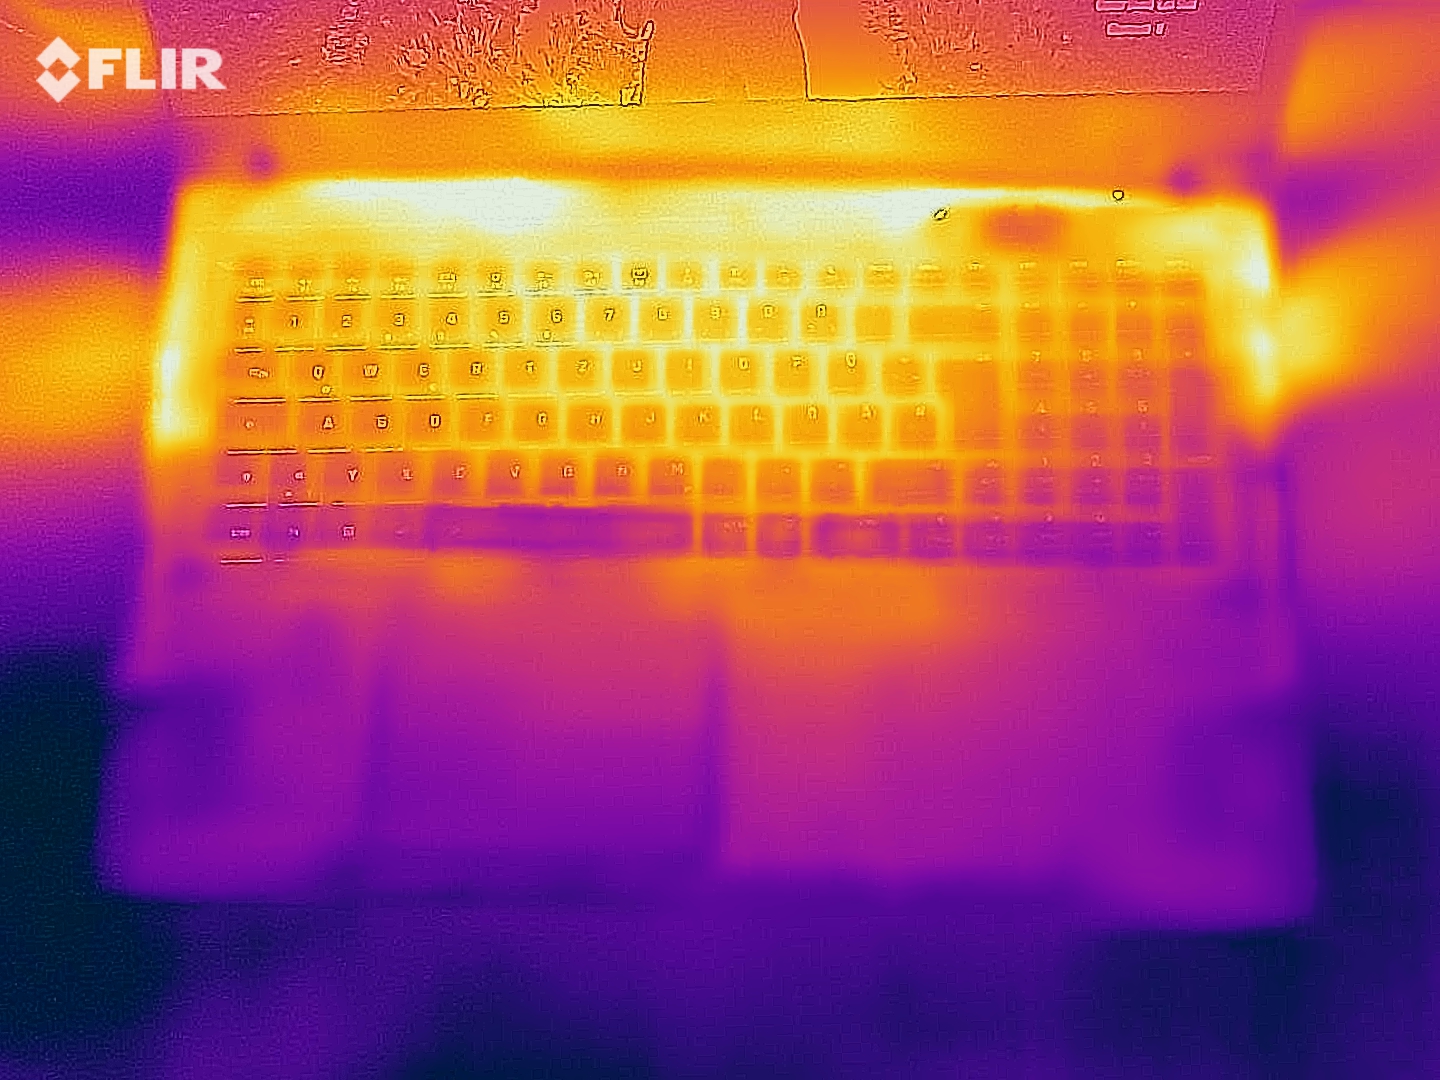
(±) The maximum temperature on the upper side is 44 °C / 111 F, compared to the average of 40.4 °C / 105 F, ranging from 21.2 to 68.8 °C for the class Gaming.
(-) The bottom heats up to a maximum of 50 °C / 122 F, compared to the average of 43.3 °C / 110 F
(+) In idle usage, the average temperature for the upper side is 28.9 °C / 84 F, compared to the device average of 33.9 °C / 93 F.
(±) Playing The Witcher 3, the average temperature for the upper side is 37.3 °C / 99 F, compared to the device average of 33.9 °C / 93 F.
(+) The palmrests and touchpad are reaching skin temperature as a maximum (32 °C / 89.6 F) and are therefore not hot.
(-) The average temperature of the palmrest area of similar devices was 28.8 °C / 83.8 F (-3.2 °C / -5.8 F).
| Schenker XMG Core 17 (Early 2021) i7-10870H, GeForce RTX 3060 Laptop GPU | MSI Alpha 17 A4DEK R7 4800H, Radeon RX 5600M | Acer Predator Helios 300 PH317-54-75G8 i7-10750H, GeForce RTX 2060 Mobile | Medion Erazer Beast X10 MD61804 i7-10750H, GeForce RTX 2070 Super Max-Q | Schenker XMG Core 17 i7-9750H, GeForce GTX 1660 Ti Mobile | Schenker XMG Core 17 Comet Lake i7-10750H, GeForce GTX 1650 Ti Mobile | Average of class Gaming | |
|---|---|---|---|---|---|---|---|
| Heat | 16% | -6% | -4% | -2% | 7% | -1% | |
| Maximum Upper Side * (°C) | 44 | 44 -0% | 53 -20% | 51 -16% | 47 -7% | 45 -2% | 45.7 ? -4% |
| Maximum Bottom * (°C) | 50 | 43 14% | 59 -18% | 56 -12% | 50 -0% | 48 4% | 48.5 ? 3% |
| Idle Upper Side * (°C) | 30 | 25 17% | 29 3% | 31 -3% | 34 -13% | 27 10% | 31.5 ? -5% |
| Idle Bottom * (°C) | 36 | 24 33% | 32 11% | 30 17% | 32 11% | 30 17% | 34.6 ? 4% |
* ... smaller is better
Speakers
Schenker XMG Core 17 (Early 2021) audio analysis
(+) | speakers can play relatively loud (82 dB)
Bass 100 - 315 Hz
(-) | nearly no bass - on average 27.5% lower than median
(±) | linearity of bass is average (12.8% delta to prev. frequency)
Mids 400 - 2000 Hz
(+) | balanced mids - only 2.3% away from median
(+) | mids are linear (5.4% delta to prev. frequency)
Highs 2 - 16 kHz
(+) | balanced highs - only 3.5% away from median
(±) | linearity of highs is average (9.9% delta to prev. frequency)
Overall 100 - 16.000 Hz
(±) | linearity of overall sound is average (17.5% difference to median)
Compared to same class
» 48% of all tested devices in this class were better, 12% similar, 40% worse
» The best had a delta of 6%, average was 18%, worst was 132%
Compared to all devices tested
» 33% of all tested devices were better, 8% similar, 58% worse
» The best had a delta of 4%, average was 24%, worst was 134%
Power Management - The Core 17 delivers an acceptable battery life
Power Consumption
There is nothing conspicuous in terms of the power consumption. Across the whole range of loads, the values remain at a normal level for the hardware used here. The power supply is rated at 180 watts.
| Off / Standby | |
| Idle | |
| Load |
|
Key:
min: | |
| Schenker XMG Core 17 (Early 2021) i7-10870H, GeForce RTX 3060 Laptop GPU | MSI Alpha 17 A4DEK R7 4800H, Radeon RX 5600M | Acer Predator Helios 300 PH317-54-75G8 i7-10750H, GeForce RTX 2060 Mobile | Medion Erazer Beast X10 MD61804 i7-10750H, GeForce RTX 2070 Super Max-Q | Schenker XMG Core 17 i7-9750H, GeForce GTX 1660 Ti Mobile | Schenker XMG Core 17 Comet Lake i7-10750H, GeForce GTX 1650 Ti Mobile | Average of class Gaming | |
|---|---|---|---|---|---|---|---|
| Power Consumption | 23% | 25% | -23% | 21% | 16% | -10% | |
| Idle Minimum * (Watt) | 13 | 9 31% | 6 54% | 19 -46% | 10 23% | 12 8% | 13.8 ? -6% |
| Idle Average * (Watt) | 16 | 12 25% | 11 31% | 22 -38% | 13 19% | 15 6% | 19.6 ? -23% |
| Idle Maximum * (Watt) | 29 | 18 38% | 19 34% | 30 -3% | 21 28% | 24 17% | 25.8 ? 11% |
| Load Average * (Watt) | 100 | 76 24% | 96 4% | 118 -18% | 89 11% | 105 -5% | 110.4 ? -10% |
| Witcher 3 ultra * (Watt) | 173 | 136 21% | 144 17% | 176 -2% | 128 26% | 93 46% | |
| Load Maximum * (Watt) | 213 | 222 -4% | 197 8% | 274 -29% | 177 17% | 168 21% | 258 ? -21% |
* ... smaller is better
Battery Life
In the WLAN test (loading websites via a script) and video test (short film Big Buck Bunny running in a loop; H.264 coding, FHD), the Core 17 lasts for 4:53 hours and 4:43 hours respectively. During both of the tests, the power saving functions of the laptop are deactivated, and the display brightness is reduced to about 150 cd/m². While running the video test, the communication modules were also turned off.
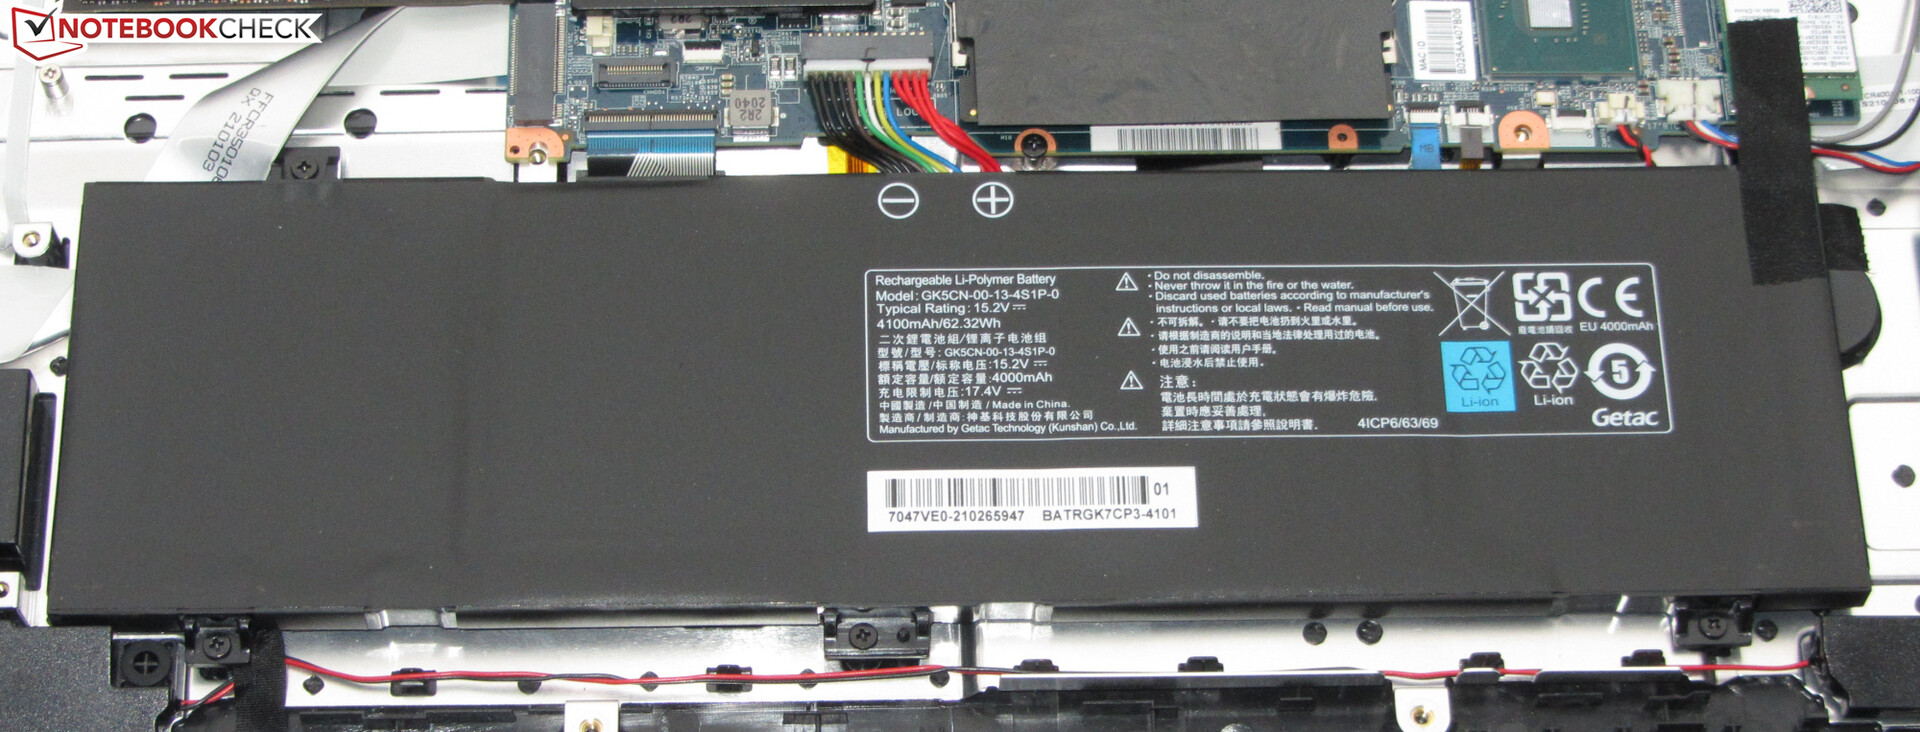
| Schenker XMG Core 17 (Early 2021) i7-10870H, GeForce RTX 3060 Laptop GPU, 62 Wh | MSI Alpha 17 A4DEK R7 4800H, Radeon RX 5600M, 65 Wh | Acer Predator Helios 300 PH317-54-75G8 i7-10750H, GeForce RTX 2060 Mobile, 59 Wh | Medion Erazer Beast X10 MD61804 i7-10750H, GeForce RTX 2070 Super Max-Q, 91.2 Wh | Schenker XMG Core 17 i7-9750H, GeForce GTX 1660 Ti Mobile, 46.74 Wh | Schenker XMG Core 17 Comet Lake i7-10750H, GeForce GTX 1650 Ti Mobile, 62.3 Wh | Average of class Gaming | |
|---|---|---|---|---|---|---|---|
| Battery runtime | 33% | 26% | 56% | 4% | 4% | 35% | |
| Reader / Idle (h) | 7.7 | 10.5 36% | 8.2 6% | 11.4 48% | 8.1 5% | 9.23 ? 20% | |
| H.264 (h) | 4.7 | 5.9 26% | 8.5 81% | 5.3 13% | 7.93 ? 69% | ||
| WiFi v1.3 (h) | 4.9 | 7.3 49% | 5.1 4% | 6.8 39% | 4.7 -4% | 5.1 4% | 6.73 ? 37% |
| Load (h) | 1.3 | 1.5 15% | 2.2 69% | 2 54% | 1.3 0% | 1.472 ? 13% |
Pros
Cons
Verdict
The Core i7-10870H CPU (maxPL1/2: 120 watts) and GeForce RTX-3060 laptop GPU (maxTGP: 130 watts) bring all the current games to the screen smoothly. You won't have to worry about throttling, and the CPU and GPU are always able to maintain their constant performance.
With the XMG Core 17 (Early 2021), Schenker delivers a well-rounded mid-range gaming laptop.
While the automatic fan control makes the laptop very loud under load, you can make some adjustments here, and the Control Center offers manual control of the fan curves. Particularly during gaming ("The Witcher 3" test), there is still some potential for optimization compared to other RTX 3060 laptops.
The display (WQHD, IPS, 165 Hz) offers a good brightness value, stable viewing angles, short response times, a good color reproduction, and a very decent color space coverage. However, the contrast could be higher, and the battery life is not very inspiring to anyone either.
Note that some of the valuations of the single categories are different than those of the Core 17 from 2019, since we have updated the valuation system. This means that the valuations of both Core 17 models are not comparable.
Price and Availability
The Schenker XMG Core 17 (Early 2021) can be configured individually at the Schenker (Bestware) online shop starting from about 1450 Euros (~$1773). The equipment configuration provided to us for testing is available for about 1840 Euros (~$2250).
Schenker XMG Core 17 (Early 2021)
- 05/31/2021 v7 (old)
Sascha Mölck
Price comparison

