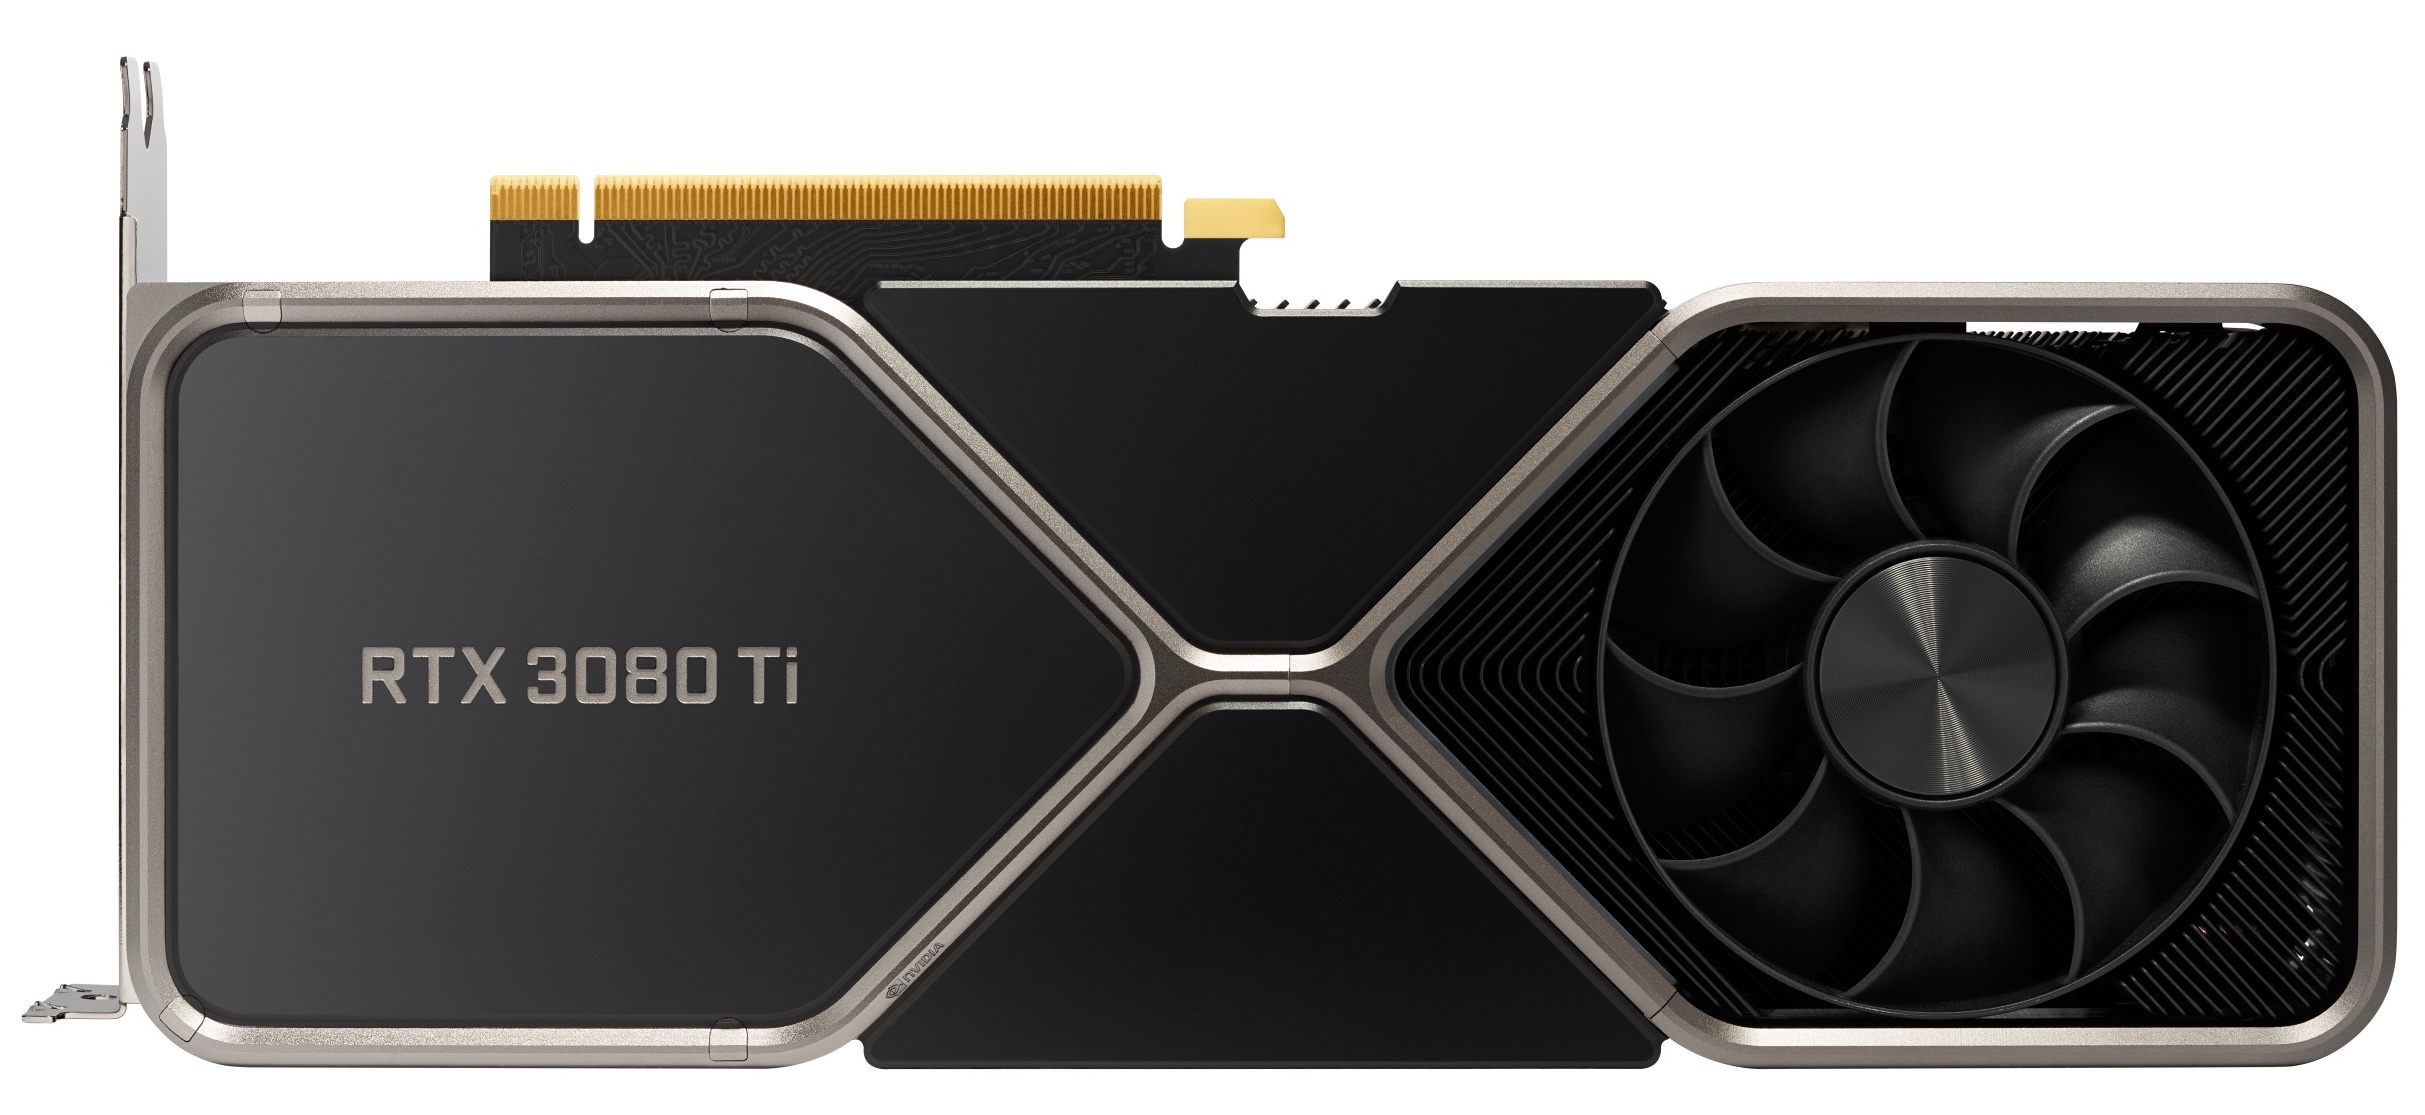
NVIDIA GeForce RTX 3080 Ti
The Nvidia GeForce RTX 3080 Ti is high-end desktop graphics card based on the Ampere generation. It uses the big GA102 chip and offers 10,210 shaders and 12 GB GDDR6X graphics memory. The main difference to the expensive RTX 3090 is the reduced VRAM (12 vs. 24 GB and a slight reduction in the shader count (-256 shaders).
Therefore, the gaming performance is quite similar to the RTX 3090 and best suited for 4K gaming with maximum detail settings.
As the RTX 3090, the RTX 3080 Ti is specified with a 350 Watt TDP and therefore quite power hungry (750 Watt power supply recommended).
GeForce RTX 3000 Series Codename Ampere GA102 Architecture Ampere Pipelines 10240 - unified Core Speed 1370 - 1667 (Boost) MHz Memory Speed 19000 MHz Memory Bus Width 384 Bit Memory Type GDDR6X Max. Amount of Memory 12 GB Shared Memory no API DirectX 12_2, Shader 6.7, OpenGL 4.6 Power Consumption 350 Watt Transistor Count 28 Billion technology 8 nm Date of Announcement 24.09.2020 Link to Manufacturer Page www.nvidia.com
Benchmarks Performance Rating - 3DMark 11 + Fire Strike + Time Spy
21.5 pt (65%)
...
NVIDIA GeForce RTX 3080 Ti
...
3DMark - 3DMark Time Spy Score
min: 17433 avg: 18566 median: 18903.5 (55%) max: 19025 Points
GPU TDP ? TDP 350 W 96% 100%
...
NVIDIA GeForce RTX 3080 Ti
...
3DMark - 3DMark Time Spy Graphics
min: 19041 avg: 19237 median: 19224 (51%) max: 19460 Points
GPU TDP ? TDP 350 W 100% 100%
...
NVIDIA GeForce RTX 3080 Ti
...
3DMark - 3DMark Ice Storm Unlimited Graphics
min: 750291 avg: 779661 median: 785365 (89%) max: 803326 Points
GPU TDP ? TDP 350 W 100% 96%
...
NVIDIA GeForce RTX 3080 Ti
3DMark - 3DMark Ice Storm Extreme Graphics
min: 572351 avg: 592563 median: 593730 (76%) max: 611608 Points
GPU TDP ? TDP 350 W 100% 100%
...
NVIDIA GeForce RTX 3080 Ti
3DMark - 3DMark Cloud Gate Score
min: 76027 avg: 81917 median: 81921 (88%) max: 87802 Points
GPU TDP ? TDP 350 W 100% 90%
...
NVIDIA GeForce RTX 3080 Ti
...
3DMark - 3DMark Cloud Gate Graphics
min: 161798 avg: 209614 median: 218185 (57%) max: 248858 Points
GPU TDP ? TDP 350 W 100% 76%
...
NVIDIA GeForce RTX 3080 Ti
...
3DMark - 3DMark Fire Strike Standard Score
min: 32491 avg: 38344 median: 38628.5 (68%) max: 43628 Points
GPU TDP ? TDP 350 W 99% 100%
...
NVIDIA GeForce RTX 3080 Ti
...
3DMark - 3DMark Fire Strike Standard Graphics
min: 45785 avg: 47180 median: 47113 (53%) max: 48709 Points
GPU TDP ? TDP 350 W 100% 100%
...
NVIDIA GeForce RTX 3080 Ti
...
3DMark - 3DMark Ice Storm Graphics
min: 648792 avg: 672558 median: 682810 (82%) max: 686073 Points
GPU TDP ? TDP 350 W 95% 100%
...
NVIDIA GeForce RTX 3080 Ti
3DMark - 3DMark Wild Life Unlimited
114111 Points (57%)
...
NVIDIA GeForce RTX 3080 Ti
3DMark - 3DMark Night Raid
min: 82972 avg: 86531 median: 86530.5 (82%) max: 90089 Points
...
NVIDIA GeForce RTX 3080 Ti
3DMark - 3DMark Night Raid Graphics Score
min: 180232 avg: 189351 median: 189351 (73%) max: 198470 Points
...
NVIDIA GeForce RTX 3080 Ti
3DMark 11 - 3DM11 Performance Score
min: 41396 avg: 46617 median: 46988 (65%) max: 51094 Points
GPU TDP ? TDP 350 W 98% 100%
...
NVIDIA GeForce RTX 3080 Ti
...
3DMark 11 - 3DM11 Performance GPU
min: 59799 avg: 60987 median: 60980 (52%) max: 62189 Points
GPU TDP ? TDP 350 W 100% 98%
...
NVIDIA GeForce RTX 3080 Ti
...
3DMark Vantage + 3DMark Vantage - 3DM Vant. Perf. total
min: 118753 avg: 123725 median: 120236 (35%) max: 132187 Points
GPU TDP ? TDP 350 W 100% 90%
...
NVIDIA GeForce RTX 3080 Ti
...
3DM Vant. Perf. GPU no PhysX + 3DMark Vantage - 3DM Vant. Perf. GPU no PhysX
min: 130100 avg: 136576 median: 135271 (77%) max: 144357 Points
GPU TDP ? TDP 350 W 100% 92%
...
NVIDIA GeForce RTX 3080 Ti
...
3DMark 05 - 3DMark 05 - Standard
min: 63621 avg: 77313 median: 82816 (91%) max: 85501 Points
GPU TDP ? TDP 350 W 100% 86%
...
Intel Arc A580
NVIDIA GeForce RTX 3080 Ti
...
3DMark 06 3DMark 06 - Standard 1280x1024 +
min: 66161 avg: 68191 median: 66856 (88%) max: 71555 Points
GPU TDP ? TDP 350 W 97% 100%
...
NVIDIA GeForce RTX 3080 Ti
Unigine Valley 1.0 - Unigine Valley 1.0 DX
min: 206 avg: 228.3 median: 233.3 (76%) max: 240.4 fps
GPU TDP ? TDP 350 W 94% 100%
...
NVIDIA GeForce RTX 3080 Ti
Blender - Blender 3.3 Classroom CUDA *
min: 21 avg: 21.5 median: 21.5 (3%) max: 22 Seconds
GPU TDP ? TDP 350 W 100% 100%
NVIDIA GeForce RTX 3080 Ti
...
Blender - Blender 3.3 Classroom OPTIX *
min: 14 avg: 14.5 median: 14.5 (5%) max: 15 Seconds
GPU TDP ? TDP 350 W 100% 100%
...
NVIDIA GeForce RTX 3080 Ti
...
SPECviewperf 12 + SPECviewperf 12 - specvp12 sw-03
min: 100 avg: 103.7 median: 105 (26%) max: 106 fps
GPU TDP ? TDP 350 W 100% 97%
...
NVIDIA GeForce RTX 3080 Ti
...
specvp12 snx-02 + SPECviewperf 12 - specvp12 snx-02
min: 16.5 avg: 16.7 median: 16.6 (2%) max: 17.1 fps
GPU TDP ? TDP 350 W 99% 100%
...
NVIDIA GeForce RTX 3080 Ti
...
specvp12 showcase-01 + SPECviewperf 12 - specvp12 showcase-01
min: 252 avg: 256 median: 252 (55%) max: 264 fps
GPU TDP ? TDP 350 W 98% 100%
...
NVIDIA GeForce RTX 3080 Ti
specvp12 mediacal-01 + SPECviewperf 12 - specvp12 mediacal-01
min: 89.4 avg: 124.8 median: 142 (36%) max: 143 fps
GPU TDP ? TDP 350 W 100% 82%
...
NVIDIA GeForce RTX 3080 Ti
...
specvp12 maya-04 + SPECviewperf 12 - specvp12 maya-04
min: 283 avg: 294 median: 297 (81%) max: 302 fps
GPU TDP ? TDP 350 W 100% 96%
...
NVIDIA GeForce RTX 3080 Ti
specvp12 energy-01 + SPECviewperf 12 - specvp12 energy-01
min: 24.9 avg: 26.7 median: 27.5 (25%) max: 27.6 fps
GPU TDP ? TDP 350 W 100% 95%
...
NVIDIA GeForce RTX 3080 Ti
...
specvp12 creo-01 + SPECviewperf 12 - specvp12 creo-01
min: 94.3 avg: 96.3 median: 94.7 (38%) max: 100 fps
GPU TDP ? TDP 350 W 97% 100%
...
NVIDIA GeForce RTX 3080 Ti
...
specvp12 catia-04 + SPECviewperf 12 - specvp12 catia-04
min: 167 avg: 172 median: 171 (28%) max: 178 fps
GPU TDP ? TDP 350 W 99% 100%
...
Intel Arc A580
NVIDIA GeForce RTX 3080 Ti
...
specvp12 3dsmax-05 + SPECviewperf 12 - specvp12 3dsmax-05
min: 363 avg: 373.3 median: 372 (65%) max: 385 fps
GPU TDP ? TDP 350 W 100% 95%
...
NVIDIA GeForce RTX 3080 Ti
...
SPECviewperf 13 specvp13 sw-04 + SPECviewperf 13 - specvp13 sw-04
min: 146 avg: 150.7 median: 153 (41%) max: 153 fps
GPU TDP ? TDP 350 W 100% 98%
...
NVIDIA GeForce RTX 3080 Ti
...
specvp13 snx-03 + SPECviewperf 13 - specvp13 snx-03
min: 29.6 avg: 30.1 median: 29.9 (3%) max: 30.8 fps
GPU TDP ? TDP 350 W 99% 100%
...
NVIDIA GeForce RTX 3080 Ti
...
specvp13 showcase-02 + SPECviewperf 13 - specvp13 showcase-02
min: 252 avg: 256.7 median: 254 (55%) max: 264 fps
GPU TDP ? TDP 350 W 97% 100%
...
NVIDIA GeForce RTX 3080 Ti
...
specvp13 medical-02 + SPECviewperf 13 - specvp13 medical-02
min: 106 avg: 106.3 median: 106 (22%) max: 107 fps
GPU TDP ? TDP 350 W 100% 99%
...
NVIDIA GeForce RTX 3080 Ti
...
specvp13 maya-05 + SPECviewperf 13 - specvp13 maya-05
min: 567 avg: 574 median: 569 (65%) max: 586 fps
GPU TDP ? TDP 350 W 99% 100%
...
NVIDIA GeForce RTX 3080 Ti
...
specvp13 energy-02 + SPECviewperf 13 - specvp13 energy-02
min: 35.8 avg: 41.4 median: 44.1 (14%) max: 44.2 fps
GPU TDP ? TDP 350 W 100% 91%
...
NVIDIA GeForce RTX 3080 Ti
...
specvp13 creo-02 + SPECviewperf 13 - specvp13 creo-02
min: 389 avg: 398 median: 402 (59%) max: 403 fps
GPU TDP ? TDP 350 W 100% 99%
...
NVIDIA GeForce RTX 3080 Ti
...
specvp13 catia-05 + SPECviewperf 13 - specvp13 catia-05
min: 241 avg: 251.3 median: 255 (28%) max: 258 fps
GPU TDP ? TDP 350 W 100% 96%
...
Intel Arc A580
NVIDIA GeForce RTX 3080 Ti
...
specvp13 3dsmax-06 + SPECviewperf 13 - specvp13 3dsmax-06
min: 364 avg: 372.3 median: 371 (65%) max: 382 fps
GPU TDP ? TDP 350 W 100% 96%
...
NVIDIA GeForce RTX 3080 Ti
...
SPECviewperf 2020 specvp2020 solidworks-05 4k + SPECviewperf 2020 - specvp2020 solidworks-05 4k
184 fps (54%)
...
NVIDIA GeForce RTX 3080 Ti
...
specvp2020 snx-04 4k + SPECviewperf 2020 - specvp2020 snx-04 4k
min: 24.7 avg: 25.2 median: 24.9 (3%) max: 25.9 fps
GPU TDP ? TDP 350 W 98% 100%
...
NVIDIA GeForce RTX 3080 Ti
...
specvp2020 medical-03 4k + SPECviewperf 2020 - specvp2020 medical-03 4k
min: 19.8 avg: 21.8 median: 22.7 (22%) max: 22.9 fps
GPU TDP ? TDP 350 W 100% 93%
...
NVIDIA GeForce RTX 3080 Ti
...
specvp2020 maya-06 4k + SPECviewperf 2020 - specvp2020 maya-06 4k
min: 351 avg: 356.3 median: 352 (57%) max: 366 fps
GPU TDP ? TDP 350 W 100% 96%
...
NVIDIA GeForce RTX 3080 Ti
...
specvp2020 energy-03 4k + SPECviewperf 2020 - specvp2020 energy-03 4k
min: 38.9 avg: 64.3 median: 57.5 (13%) max: 96.4 fps
GPU TDP ? TDP 350 W 85% 100%
...
NVIDIA GeForce RTX 3080 Ti
...
specvp2020 creo-03 4k + SPECviewperf 2020 - specvp2020 creo-03 4k
min: 108 avg: 113 median: 114 (54%) max: 117 fps
GPU TDP ? TDP 350 W 100% 99%
...
NVIDIA GeForce RTX 3080 Ti
...
specvp2020 catia-06 4k + SPECviewperf 2020 - specvp2020 catia-06 4k
min: 58.4 avg: 59.6 median: 59.9 (39%) max: 60.4 fps
GPU TDP ? TDP 350 W 100% 99%
...
NVIDIA GeForce RTX 3080 Ti
...
specvp2020 3dsmax-07 4k + SPECviewperf 2020 - specvp2020 3dsmax-07 4k
min: 139 avg: 139.3 median: 139 (58%) max: 140 fps
GPU TDP ? TDP 350 W 100% 100%
...
NVIDIA GeForce RTX 3080 Ti
...
Cinebench R10 Cinebench R10 Shading (32bit) + Cinebench R10 - Cinebench R10 Shading (32bit)
min: 6828 avg: 6829 median: 6829 (5%) max: 6830 points
...
NVIDIA GeForce RTX 3080 Ti
...
Cinebench R11.5 Cinebench R11.5 OpenGL 64 Bit + Cinebench R11.5 - Cinebench R11.5 OpenGL 64 Bit
min: 198.8 avg: 208.9 median: 208.9 (72%) max: 218.92 fps
...
NVIDIA GeForce RTX 3080 Ti
Cinebench R15 + Cinebench R15 - Cinebench R15 OpenGL 64 Bit
min: 312.84 avg: 326.4 median: 326.4 (19%) max: 339.9 fps
...
NVIDIA GeForce RTX 3080 Ti
Cinebench R15 OpenGL Ref. Match 64 Bit + Cinebench R15 - Cinebench R15 OpenGL Ref. Match 64 Bit
99.6 % (100%)
...
NVIDIA GeForce RTX 3080 Ti
...
LuxMark v2.0 64Bit - LuxMark v2.0 Room GPU
min: 5772 avg: 6138 median: 6158.5 (28%) max: 6464 Samples/s
GPU TDP ? TDP 350 W 90% 100%
...
NVIDIA GeForce RTX 3080 Ti
...
LuxMark v2.0 64Bit - LuxMark v2.0 Sala GPU
min: 14871 avg: 15612 median: 15570 (27%) max: 16438 Samples/s
GPU TDP ? TDP 350 W 92% 100%
...
NVIDIA GeForce RTX 3080 Ti
...
ComputeMark v2.1 - ComputeMark v2.1 Result
min: 47377 avg: 48266 median: 48398 (52%) max: 48892 points
GPU TDP ? TDP 350 W 99% 100%
...
NVIDIA GeForce RTX 3080 Ti
Power Consumption - Furmark Stress Test Power Consumption - external Monitor *
min: 427 avg: 464.3 median: 453 (64%) max: 513 Watt
GPU TDP ? TDP 350 W 100% 138%
...
NVIDIA GeForce RTX 3080 Ti
...
0 30 60 90 120 150 180 210 240 270 300 330 360 390 420 450 480 510 Tooltip Intel NUC13 Raptor Canyon: Ø427 (410-454)
Corsair One i300: Ø453 (421-486)
ASUS TUF Gaming GeForce RTX 3080 Ti OC: Ø513 (500-527)
Power Consumption - The Witcher 3 Power Consumption - external Monitor *
min: 490 avg: 506 median: 499 (70%) max: 528 Watt
GPU TDP ? TDP 350 W 100% 118%
...
NVIDIA GeForce RTX 3080 Ti
0 30 60 90 120 150 180 210 240 270 300 330 360 390 420 450 480 510 540 Tooltip Corsair One i300: Ø490 (482-544)
Intel NUC13 Raptor Canyon: Ø499 (487-544)
ASUS TUF Gaming GeForce RTX 3080 Ti OC: Ø528 (511-549)
Power Consumption - Witcher 3 ultra Power Efficiency - external Monitor
min: 0.3496 avg: 0.4 median: 0.4 (30%) max: 0.3735 fps per Watt
GPU TDP ? TDP 350 W 95% 100%
...
NVIDIA GeForce RTX 3080 Ti
...
- Range of benchmark values for this graphics card
- Average benchmark values for this graphics card
* Smaller numbers mean a higher performance
Game Benchmarks The following benchmarks stem from our benchmarks of review laptops. The performance depends on the used graphics memory, clock rate, processor, system settings, drivers, and operating systems. So the results don't have to be representative for all laptops with this GPU. For detailed information on the benchmark results, click on the fps number.
...
NVIDIA GeForce RTX 3080 Ti
...
...
NVIDIA GeForce RTX 3080 Ti
...
...
NVIDIA GeForce RTX 3080 Ti
...
...
NVIDIA GeForce RTX 3080 Ti
...
NVIDIA GeForce RTX 3080 Ti
...
...
NVIDIA GeForce RTX 3080 Ti
...
» With all tested laptops playable in detail settings ultra.
Additional Benchmarks
Low Preset (without FSR Upscaling) 1280x720
235 [X] AMD Ryzen 9 7950X 4.5GHz
NVIDIA GeForce RTX 3080 Ti
Ultra Preset (without FSR Upscaling) + Full Ray-Tracing 1920x1080
76 [X] AMD Ryzen 9 7950X 4.5GHz
NVIDIA GeForce RTX 3080 Ti
...
NVIDIA GeForce RTX 3080 Ti
...
NVIDIA GeForce RTX 3080 Ti
...
...
NVIDIA GeForce RTX 3080 Ti
...
NVIDIA GeForce RTX 3080 Ti
...
NVIDIA GeForce RTX 3080 Ti
...
...
NVIDIA GeForce RTX 3080 Ti
» With all tested laptops playable in detail settings ultra.
Additional Benchmarks
Low Preset 1280x720
188.3 [X] AMD Ryzen 9 7950X 4.5GHz
NVIDIA GeForce RTX 3080 Ti
min:
88.2 fps, P0.1:
114.8 fps, P1:
143.6 fps, max:
237 fps
...
NVIDIA GeForce RTX 3080 Ti
...
NVIDIA GeForce RTX 3080 Ti
...
NVIDIA GeForce RTX 3080 Ti
...
NVIDIA GeForce RTX 3080 Ti
...
NVIDIA GeForce RTX 3080 Ti
...
NVIDIA GeForce RTX 3080 Ti
» With all tested laptops playable in detail settings ultra.
Additional Benchmarks
Very Low Preset 1280x720
208 [X] AMD Ryzen 9 7950X 4.5GHz
NVIDIA GeForce RTX 3080 Ti
min:
66.2 fps, P0.1:
104 fps, P1:
142.1 fps, max:
262 fps
Very High Preset + Ray-Tracing TAA 1920x0180
93.9 [X] AMD Ryzen 9 7950X 4.5GHz
NVIDIA GeForce RTX 3080 Ti
min:
66.7 fps, P0.1:
73.8 fps, P1:
79.2 fps, max:
160.1 fps
...
NVIDIA GeForce RTX 3080 Ti
...
...
NVIDIA GeForce RTX 3080 Ti
...
...
NVIDIA GeForce RTX 3080 Ti
...
...
NVIDIA GeForce RTX 3080 Ti
...
...
NVIDIA GeForce RTX 3080 Ti
...
NVIDIA GeForce RTX 3080 Ti
...
NVIDIA GeForce RTX 3080 Ti
» With all tested laptops playable in detail settings ultra.
Additional Benchmarks
Basic Quality Preset T2X SMAA 1280x720
222 [X] AMD Ryzen 9 7950X 4.5GHz
NVIDIA GeForce RTX 3080 Ti
0 100 200 300 400 500 600 700 Tooltip
...
NVIDIA GeForce RTX 3080 Ti
...
...
NVIDIA GeForce RTX 3080 Ti
...
...
NVIDIA GeForce RTX 3080 Ti
...
...
NVIDIA GeForce RTX 3080 Ti
...
...
NVIDIA GeForce RTX 3080 Ti
...
...
NVIDIA GeForce RTX 3080 Ti
» With all tested laptops playable in detail settings ultra.
Additional Benchmarks
Low Preset 1280x720
125.6 [X] AMD Ryzen 9 7950X 4.5GHz
NVIDIA GeForce RTX 3080 Ti
min:
42.8 fps, P0.1:
64.2 fps, P1:
104.8 fps, max:
165.5 fps
...
NVIDIA GeForce RTX 3080 Ti
...
NVIDIA GeForce RTX 3080 Ti
...
NVIDIA GeForce RTX 3080 Ti
...
...
NVIDIA GeForce RTX 3080 Ti
...
NVIDIA GeForce RTX 3080 Ti
...
NVIDIA GeForce RTX 3080 Ti
» With all tested laptops playable in detail settings ultra.
Additional Benchmarks
Low Preset 1280x720
182.8 [X] AMD Ryzen 9 7950X 4.5GHz
NVIDIA GeForce RTX 3080 Ti
min:
38.3 fps, P0.1:
91.2 fps, P1:
137.6 fps, max:
239 fps
...
NVIDIA GeForce RTX 3080 Ti
...
...
NVIDIA GeForce RTX 3080 Ti
...
...
NVIDIA GeForce RTX 3080 Ti
...
...
NVIDIA GeForce RTX 3080 Ti
...
...
NVIDIA GeForce RTX 3080 Ti
...
...
NVIDIA GeForce RTX 3080 Ti
» With all tested laptops playable in detail settings ultra.
Additional Benchmarks
Low Rendering Quality 1280x720
267 [X] AMD Ryzen 9 7950X 4.5GHz
NVIDIA GeForce RTX 3080 Ti
min:
81.9 fps, P0.1:
191.7 fps, P1:
212 fps, max:
334 fps
...
NVIDIA GeForce RTX 3080 Ti
...
NVIDIA GeForce RTX 3080 Ti
...
...
NVIDIA GeForce RTX 3080 Ti
...
...
NVIDIA GeForce RTX 3080 Ti
...
...
NVIDIA GeForce RTX 3080 Ti
...
NVIDIA GeForce RTX 3080 Ti
» With all tested laptops playable in detail settings ultra.
Additional Benchmarks
Low Preset 1280x720
361 [X] AMD Ryzen 9 7950X 4.5GHz
NVIDIA GeForce RTX 3080 Ti
min:
22.6 fps, P0.1:
124.5 fps, P1:
255 fps, max:
583 fps
...
NVIDIA GeForce RTX 3080 Ti
...
...
NVIDIA GeForce RTX 3080 Ti
...
...
NVIDIA GeForce RTX 3080 Ti
...
NVIDIA GeForce RTX 3080 Ti
...
...
NVIDIA GeForce RTX 3080 Ti
...
...
NVIDIA GeForce RTX 3080 Ti
...
» With all tested laptops playable in detail settings ultra.
Additional Benchmarks
Ultra Low Preset 16xAF TAA 1280x720
539 [X] AMD Ryzen 9 7950X 4.5GHz
NVIDIA GeForce RTX 3080 Ti
min:
384 fps, P1:
332 fps, max:
622 fps
0 100 200 300 400 500 600 700 Tooltip
...
NVIDIA GeForce RTX 3080 Ti
...
NVIDIA GeForce RTX 3080 Ti
...
NVIDIA GeForce RTX 3080 Ti
...
NVIDIA GeForce RTX 3080 Ti
...
NVIDIA GeForce RTX 3080 Ti
...
NVIDIA GeForce RTX 3080 Ti
» With all tested laptops playable in detail settings ultra.
Additional Benchmarks
Low Preset 1280x720
523 [X] AMD Ryzen 9 7950X 4.5GHz
NVIDIA GeForce RTX 3080 Ti
min:
24.7 fps, P0.1:
182.7 fps, P1:
359 fps, max:
834 fps
...
NVIDIA GeForce RTX 3080 Ti
...
NVIDIA GeForce RTX 3080 Ti
0 100 200 300 400 500 600 700 800 Tooltip
...
NVIDIA GeForce RTX 3080 Ti
...
...
NVIDIA GeForce RTX 3080 Ti
...
...
NVIDIA GeForce RTX 3080 Ti
...
0 100 200 300 400 500 600 700 800 900 1000 1100 1200 1300 1400 1500 1600 1700 1800 1900 2000 2100 2200 2300 2400 2500 2600 2700 2800 2900 3000 3100 3200 3300 3400 3500 3600 3700 3800 3900 4000 4100 4200 4300 4400 4500 4600 4700 4800 4900 5000 5100 5200 5300 5400 5500 5600 5700 5800 5900 6000 6100 6200 6300 6400 6500 6600 6700 6800 6900 7000 7100 7200 7300 7400 7500 7600 7700 7800 7900 8000 8100 8200 8300 8400 8500 8600 8700 8800 8900 9000 9100 9200 9300 9400 9500 9600 9700 9800 9900 Tooltip
...
NVIDIA GeForce RTX 3080 Ti
» With all tested laptops playable in detail settings ultra.
Additional Benchmarks
Lowest Settings 1280x720
307 [X] AMD Ryzen 9 7950X 4.5GHz
NVIDIA GeForce RTX 3080 Ti
min:
59.8 fps, P0.1:
151.9 fps, P1:
223 fps, max:
403 fps
Highest Settings + Maximum Ray Tracing 1920x1080
119.9 [X] AMD Ryzen 9 7950X 4.5GHz
NVIDIA GeForce RTX 3080 Ti
min:
39.2 fps, P0.1:
61.9 fps, P1:
80.9 fps, max:
230 fps
...
NVIDIA GeForce RTX 3080 Ti
...
...
NVIDIA GeForce RTX 3080 Ti
...
NVIDIA GeForce RTX 3080 Ti
...
NVIDIA GeForce RTX 3080 Ti
...
NVIDIA GeForce RTX 3080 Ti
...
...
NVIDIA GeForce RTX 3080 Ti
» With all tested laptops playable in detail settings ultra.
Additional Benchmarks
Lowest Preset (DX12) 1280x720
434 [X] AMD Ryzen 9 7950X 4.5GHz
NVIDIA GeForce RTX 3080 Ti
...
NVIDIA GeForce RTX 3080 Ti
...
NVIDIA GeForce RTX 3080 Ti
...
NVIDIA GeForce RTX 3080 Ti
...
NVIDIA GeForce RTX 3080 Ti
...
...
NVIDIA GeForce RTX 3080 Ti
...
NVIDIA GeForce RTX 3080 Ti
» With all tested laptops playable in detail settings ultra.
Additional Benchmarks
Low Preset 1280x720
224 [X] AMD Ryzen 9 7950X 4.5GHz
NVIDIA GeForce RTX 3080 Ti
min:
69.3 fps, max:
302 fps
Ray Tracing Ultra Preset (DLSS off) 1920x1080
69.1 [X] AMD Ryzen 9 7950X 4.5GHz
NVIDIA GeForce RTX 3080 Ti
min:
53.3 fps, max:
89.8 fps
Ray Tracing Ultra Preset (DLSS off) 3840x2160
18.6 [X] AMD Ryzen 9 7950X 4.5GHz
NVIDIA GeForce RTX 3080 Ti
min:
9.13 fps, max:
27.1 fps
...
NVIDIA GeForce RTX 3080 Ti
...
NVIDIA GeForce RTX 3080 Ti
...
NVIDIA GeForce RTX 3080 Ti
...
NVIDIA GeForce RTX 3080 Ti
...
NVIDIA GeForce RTX 3080 Ti
...
NVIDIA GeForce RTX 3080 Ti
...
» With all tested laptops playable in detail settings ultra.
Additional Benchmarks
Low Preset 1280x720
319 [X] AMD Ryzen 9 7950X 4.5GHz
NVIDIA GeForce RTX 3080 Ti
min:
59.6 fps, max:
436 fps
0 100 200 Tooltip One i300: Ø191.1 (181.015-219)
...
NVIDIA GeForce RTX 3080 Ti
0 100 200 Tooltip One i300: Ø170.7 (159.578-219.1)
...
NVIDIA GeForce RTX 3080 Ti
0 100 Tooltip One i300: Ø150.7 (144.584-162.27)
...
NVIDIA GeForce RTX 3080 Ti
0 100 Tooltip One i300: Ø110.4 (105.615-119.209)
...
NVIDIA GeForce RTX 3080 Ti
0 100 Tooltip One i300: Ø69.7 (58.48-163)
...
NVIDIA GeForce RTX 3080 Ti
» With all tested laptops playable in detail settings high.
Additional Benchmarks
Low Quality 1280x720
258 [X] Corsair One i300 Intel Core i9-12900K 3.2GHz
NVIDIA GeForce RTX 3080 Ti
min:
109 fps, P0.1:
197 fps, P1:
233 fps, max:
302 fps
High Quality Raytracing 1920x1080
83.5 [X] Corsair One i300 Intel Core i9-12900K 3.2GHz
NVIDIA GeForce RTX 3080 Ti
min:
7.17 fps, P0.1:
15.7 fps, P1:
44.9 fps, max:
237 fps
...
NVIDIA GeForce RTX 3080 Ti
...
NVIDIA GeForce RTX 3080 Ti
...
NVIDIA GeForce RTX 3080 Ti
...
NVIDIA GeForce RTX 3080 Ti
...
NVIDIA GeForce RTX 3080 Ti
...
NVIDIA GeForce RTX 3080 Ti
» With all tested laptops playable in detail settings ultra.
Additional Benchmarks
Ultra Low Preset (with Fixed Resolution Quality) 1280x720
0 100 200 300 400 500 600 700 800 900 1000 1100 1200 1300 1400 1500 1600 1700 1800 1900 2000 2100 2200 2300 2400 2500 2600 2700 2800 2900 3000 3100 3200 3300 3400 3500 3600 3700 3800 3900 4000 4100 4200 4300 4400 4500 4600 4700 4800 4900 5000 5100 5200 5300 5400 5500 5600 5700 5800 5900 6000 6100 6200 6300 6400 6500 6600 6700 6800 6900 7000 7100 7200 7300 7400 7500 7600 7700 7800 7900 8000 Tooltip One i300: Ø212 (193.13-241)
: Ø491 (200.28-8034)
NUC13 Raptor Canyon: Ø230 (214.119-247.47)
...
NVIDIA GeForce RTX 3080 Ti
0 100 200 300 400 500 600 700 Tooltip One i300: Ø191.8 (179.008-306)
NUC13 Raptor Canyon: Ø226 (190.28-790)
...
NVIDIA GeForce RTX 3080 Ti
...
0 100 200 300 400 Tooltip One i300: Ø170.8 (156.139-307)
NUC13 Raptor Canyon: Ø180.3 (158.834-480)
: Ø174.9 (164.086-187.34)
...
NVIDIA GeForce RTX 3080 Ti
...
0 100 Tooltip One i300: Ø121.6 (105.558-164.7)
NUC13 Raptor Canyon: Ø125.4 (111.325-183.5)
: Ø126.9 (110.162-147.9)
...
NVIDIA GeForce RTX 3080 Ti
...
0 100 Tooltip One i300: Ø101.8 (93.396-123)
NUC13 Raptor Canyon: Ø108.4 (94.602-129.2)
: Ø114.2 (97.179-196)
...
NVIDIA GeForce RTX 3080 Ti
0 100 200 Tooltip One i300: Ø72.9 (60.102-207)
NUC13 Raptor Canyon: Ø79.2 (71.262-86.62)
: Ø83.7 (73.207-122.2)
...
NVIDIA GeForce RTX 3080 Ti
» With all tested laptops playable in detail settings ultra.
Additional Benchmarks
Low Preset 1280x720
209 [X] Corsair One i300 Intel Core i9-12900K 3.2GHz
NVIDIA GeForce RTX 3080 Ti
min:
97.5 fps, P0.1:
113 fps, P1:
131 fps, max:
533 fps
248 [X] AMD Ryzen 9 7950X 4.5GHz
NVIDIA GeForce RTX 3080 Ti
min:
67.8 fps, P0.1:
115.9 fps, P1:
197.2 fps, max:
537 fps
0 100 200 Tooltip One i300: Ø232 (211.14-255.662)
...
NVIDIA GeForce RTX 3080 Ti
0 100 200 300 Tooltip One i300: Ø206 (179.536-327)
...
NVIDIA GeForce RTX 3080 Ti
0 100 200 Tooltip One i300: Ø191.4 (171.197-226.4)
...
NVIDIA GeForce RTX 3080 Ti
0 100 Tooltip One i300: Ø146 (130.083-164.6)
...
NVIDIA GeForce RTX 3080 Ti
0 100 Tooltip One i300: Ø87.2 (71.292-113.9)
...
NVIDIA GeForce RTX 3080 Ti
» With all tested laptops playable in detail settings ultra.
Additional Benchmarks
Low Preset 1920x1080
264 [X] Corsair One i300 Intel Core i9-12900K 3.2GHz
NVIDIA GeForce RTX 3080 Ti
min:
64.9 fps, P0.1:
152 fps, P1:
187 fps, max:
462 fps
0 100 200 300 400 Tooltip One i300: Ø357 (320.273-450)
...
NVIDIA GeForce RTX 3080 Ti
Intel Arc A580
0 100 200 300 400 500 600 700 800 900 1000 1100 1200 1300 Tooltip One i300: Ø303 (252.251-1385)
...
Intel Arc A580
NVIDIA GeForce RTX 3080 Ti
0 100 200 300 400 500 600 700 800 900 1000 1100 1200 1300 1400 Tooltip One i300: Ø265 (204.11-1428)
...
NVIDIA GeForce RTX 3080 Ti
0 100 200 300 Tooltip One i300: Ø209 (192.564-333)
...
NVIDIA GeForce RTX 3080 Ti
0 100 200 Tooltip One i300: Ø204 (191.39-219.05)
...
NVIDIA GeForce RTX 3080 Ti
0 100 200 300 400 500 600 700 800 900 1000 1100 1200 1300 1400 1500 1600 1700 1800 1900 2000 2100 2200 2300 2400 2500 2600 2700 2800 2900 3000 3100 3200 3300 3400 3500 3600 3700 3800 3900 4000 4100 4200 4300 4400 4500 4600 4700 4800 4900 5000 5100 5200 5300 5400 5500 5600 5700 5800 5900 6000 6100 6200 6300 6400 6500 6600 6700 6800 6900 7000 7100 7200 7300 7400 7500 7600 7700 7800 7900 8000 8100 8200 8300 8400 8500 8600 8700 8800 8900 9000 9100 9200 9300 9400 9500 9600 9700 9800 9900 Tooltip One i300: Ø511 (140.029-13089)
...
NVIDIA GeForce RTX 3080 Ti
» With all tested laptops playable in detail settings ultra.
Additional Benchmarks
Low Preset 1920x1080
345 [X] Corsair One i300 Intel Core i9-12900K 3.2GHz
NVIDIA GeForce RTX 3080 Ti
min:
64.3 fps, P0.1:
153 fps, P1:
211 fps, max:
445 fps
0 100 200 Tooltip One i300: Ø220 (171.056-245.6)
...
NVIDIA GeForce RTX 3080 Ti
0 100 200 Tooltip One i300: Ø198.8 (175.275-254.6)
...
NVIDIA GeForce RTX 3080 Ti
0 100 200 Tooltip One i300: Ø172.3 (147.027-217.9)
...
NVIDIA GeForce RTX 3080 Ti
0 100 200 300 400 Tooltip One i300: Ø164.9 (126.11-458)
...
NVIDIA GeForce RTX 3080 Ti
0 100 Tooltip One i300: Ø128.2 (100.75-197.5)
...
NVIDIA GeForce RTX 3080 Ti
0 100 200 Tooltip One i300: Ø91.8 (61.834-249)
...
NVIDIA GeForce RTX 3080 Ti
» With all tested laptops playable in detail settings ultra.
Additional Benchmarks
Low Preset 1920x1080
208 [X] Corsair One i300 Intel Core i9-12900K 3.2GHz
NVIDIA GeForce RTX 3080 Ti
min:
16.7 fps, P0.1:
86.5 fps, P1:
146 fps, max:
263 fps
Ultra Preset + Ray Tracing 1920x1080
117 [X] Corsair One i300 Intel Core i9-12900K 3.2GHz
NVIDIA GeForce RTX 3080 Ti
min:
10.8 fps, P0.1:
26.9 fps, P1:
84.6 fps, max:
162 fps
...
NVIDIA GeForce RTX 3080 Ti
...
...
NVIDIA GeForce RTX 3080 Ti
...
...
NVIDIA GeForce RTX 3080 Ti
...
NVIDIA GeForce RTX 3080 Ti
...
...
NVIDIA GeForce RTX 3080 Ti
...
NVIDIA GeForce RTX 3080 Ti
» With all tested laptops playable in detail settings ultra.
Additional Benchmarks
Low Preset 1920x1080
239 [X] AMD Ryzen 9 7950X 4.5GHz
NVIDIA GeForce RTX 3080 Ti
...
NVIDIA GeForce RTX 3080 Ti
...
NVIDIA GeForce RTX 3080 Ti
...
NVIDIA GeForce RTX 3080 Ti
...
NVIDIA GeForce RTX 3080 Ti
...
NVIDIA GeForce RTX 3080 Ti
...
NVIDIA GeForce RTX 3080 Ti
» With all tested laptops playable in detail settings ultra.
Additional Benchmarks
Low Preset 1920x1080
...
NVIDIA GeForce RTX 3080 Ti
...
...
NVIDIA GeForce RTX 3080 Ti
...
...
NVIDIA GeForce RTX 3080 Ti
...
NVIDIA GeForce RTX 3080 Ti
...
...
NVIDIA GeForce RTX 3080 Ti
...
...
NVIDIA GeForce RTX 3080 Ti
» With all tested laptops playable in detail settings ultra.
Additional Benchmarks
Low Preset 1920x1080
Ultra Preset + Ultra Ray-Tracing 1920x1080
0 100 200 Tooltip One i300: Ø200 (170-263)
NUC13 Raptor Canyon: Ø211 (178-284)
: Ø216 (172-277)
...
NVIDIA GeForce RTX 3080 Ti
...
0 100 200 Tooltip One i300: Ø176 (147-211)
NUC13 Raptor Canyon: Ø180.4 (148-235)
: Ø188 (148-229)
...
NVIDIA GeForce RTX 3080 Ti
...
0 100 200 Tooltip One i300: Ø155 (127-193)
NUC13 Raptor Canyon: Ø160.6 (128-206)
: Ø167.6 (128-217)
...
NVIDIA GeForce RTX 3080 Ti
...
0 100 Tooltip NUC13 Raptor Canyon: Ø120.7 (100-164)
One i300: Ø148.5 (125-185)
: Ø159.6 (123-198)
...
NVIDIA GeForce RTX 3080 Ti
...
0 100 Tooltip One i300: Ø128.9 (113-145)
NUC13 Raptor Canyon: Ø136 (120-151)
: Ø136.9 (116-152)
...
NVIDIA GeForce RTX 3080 Ti
...
0 Tooltip One i300: Ø81.6 (74-88)
NUC13 Raptor Canyon: Ø86 (77-93)
: Ø86.2 (79-93)
...
NVIDIA GeForce RTX 3080 Ti
...
» With all tested laptops playable in detail settings ultra.
Additional Benchmarks
Low Graphics Quality 1920x1080
208 [X] AMD Ryzen 9 7950X 4.5GHz
NVIDIA GeForce RTX 3080 Ti
min:
166 fps, max:
257 fps
Ultra Graphics Quality + HD Textures + DXR TAA 1920x1080
128.6 [X] AMD Ryzen 9 7950X 4.5GHz
NVIDIA GeForce RTX 3080 Ti
min:
109 fps, max:
170 fps
0 100 200 Tooltip One i300: Ø195 (152.4-265.04)
...
NVIDIA GeForce RTX 3080 Ti
0 100 200 Tooltip One i300: Ø166.5 (119.582-252.26)
...
NVIDIA GeForce RTX 3080 Ti
0 100 200 Tooltip One i300: Ø154.8 (112.278-238.069)
...
NVIDIA GeForce RTX 3080 Ti
0 100 200 Tooltip One i300: Ø144.9 (105.332-241.5)
...
NVIDIA GeForce RTX 3080 Ti
0 100 200 300 400 500 600 700 800 900 1000 1100 Tooltip One i300: Ø174 (99.036-1104)
...
NVIDIA GeForce RTX 3080 Ti
0 100 200 300 400 500 600 700 800 900 1000 1100 1200 1300 1400 1500 1600 1700 1800 1900 2000 2100 2200 2300 2400 2500 2600 2700 2800 Tooltip One i300: Ø143.8 (65.7-2816)
...
NVIDIA GeForce RTX 3080 Ti
» With all tested laptops playable in detail settings ultra.
...
NVIDIA GeForce RTX 3080 Ti
...
...
NVIDIA GeForce RTX 3080 Ti
...
...
NVIDIA GeForce RTX 3080 Ti
...
...
NVIDIA GeForce RTX 3080 Ti
...
NVIDIA GeForce RTX 3080 Ti
...
NVIDIA GeForce RTX 3080 Ti
» With all tested laptops playable in detail settings ultra.
0 100 200 300 Tooltip GeForce RTX 3080 Ti Founders Edition: Ø185.9 (165.243-363)
...
NVIDIA GeForce RTX 3080 Ti
0 100 Tooltip GeForce RTX 3080 Ti Founders Edition: Ø140 (127.282-193.8)
...
NVIDIA GeForce RTX 3080 Ti
0 100 Tooltip GeForce RTX 3080 Ti Founders Edition: Ø88 (78.04-199)
...
NVIDIA GeForce RTX 3080 Ti
» With all tested laptops playable in detail settings ultra.
0 100 200 Tooltip GeForce RTX 3080 Ti Founders Edition: Ø238 (188.9-297.8)
...
NVIDIA GeForce RTX 3080 Ti
0 100 200 Tooltip GeForce RTX 3080 Ti Founders Edition: Ø203 (173.082-249.3)
...
NVIDIA GeForce RTX 3080 Ti
0 100 200 Tooltip GeForce RTX 3080 Ti Founders Edition: Ø117.9 (103.61-208.3)
...
NVIDIA GeForce RTX 3080 Ti
» With all tested laptops playable in detail settings ultra.
Additional Benchmarks
Ray Tracing Preset 1920x1080
0 100 200 Tooltip GeForce RTX 3080 Ti Founders Edition: Ø155 (96.521-289)
...
NVIDIA GeForce RTX 3080 Ti
0 100 Tooltip GeForce RTX 3080 Ti Founders Edition: Ø156.6 (108.67-198)
...
NVIDIA GeForce RTX 3080 Ti
0 100 200 300 400 500 600 700 800 900 1000 1100 1200 1300 1400 1500 1600 1700 1800 1900 2000 2100 2200 2300 2400 2500 2600 2700 2800 2900 3000 3100 3200 3300 3400 3500 3600 3700 3800 3900 4000 4100 4200 4300 4400 4500 4600 4700 4800 4900 5000 5100 5200 5300 5400 5500 5600 5700 5800 5900 6000 6100 6200 6300 6400 6500 6600 6700 6800 6900 7000 7100 7200 7300 7400 7500 7600 7700 7800 7900 8000 8100 8200 8300 8400 Tooltip GeForce RTX 3080 Ti Founders Edition: Ø297 (75.105-8477)
...
NVIDIA GeForce RTX 3080 Ti
» With all tested laptops playable in detail settings ultra.
...
NVIDIA GeForce RTX 3080 Ti
...
NVIDIA GeForce RTX 3080 Ti
...
NVIDIA GeForce RTX 3080 Ti
» With all tested laptops playable in detail settings ultra.
0 100 Tooltip GeForce RTX 3080 Ti Founders Edition: Ø127.7 (111.04-138.1)
...
NVIDIA GeForce RTX 3080 Ti
0 Tooltip GeForce RTX 3080 Ti Founders Edition: Ø86.4 (78.08-92.47)
...
NVIDIA GeForce RTX 3080 Ti
0 Tooltip GeForce RTX 3080 Ti Founders Edition: Ø45 (41.266-58.4)
...
NVIDIA GeForce RTX 3080 Ti
...
» With all tested laptops playable in detail settings ultra.
Additional Benchmarks
Ray Tracing Ultra Preset (DLSS off) 1920x1080
Ray Tracing Ultra Preset (DLSS off) 3840x2160
0 100 Tooltip GeForce RTX 3080 Ti Founders Edition: Ø164.3 (145.184-188.186)
...
NVIDIA GeForce RTX 3080 Ti
0 100 Tooltip GeForce RTX 3080 Ti Founders Edition: Ø133.1 (118.07-159.3)
...
NVIDIA GeForce RTX 3080 Ti
0 100 200 300 400 500 600 700 800 900 Tooltip GeForce RTX 3080 Ti Founders Edition: Ø99 (68.846-919)
...
NVIDIA GeForce RTX 3080 Ti
» With all tested laptops playable in detail settings ultra.
Additional Benchmarks
Highest Settings + Ultra Ray Tracing 1920x1080
...
NVIDIA GeForce RTX 3080 Ti
...
...
NVIDIA GeForce RTX 3080 Ti
...
...
NVIDIA GeForce RTX 3080 Ti
» With all tested laptops playable in detail settings ultra.
...
NVIDIA GeForce RTX 3080 Ti
...
NVIDIA GeForce RTX 3080 Ti
...
NVIDIA GeForce RTX 3080 Ti
» With all tested laptops playable in detail settings ultra.
0 100 Tooltip GeForce RTX 3080 Ti Founders Edition: Ø98.3 (45-141)
...
NVIDIA GeForce RTX 3080 Ti
...
0 100 Tooltip GeForce RTX 3080 Ti Founders Edition: Ø88.8 (56-120)
...
NVIDIA GeForce RTX 3080 Ti
...
0 100 Tooltip GeForce RTX 3080 Ti Founders Edition: Ø58.6 (19-104)
...
NVIDIA GeForce RTX 3080 Ti
» With all tested laptops playable in detail settings ultra.
Additional Benchmarks
Ultra Preset + Ultra Ray Tracing (DX12) 1920x1080
0 100 200 Tooltip GeForce RTX 3080 Ti Founders Edition: Ø164 (116.776-208.268)
...
NVIDIA GeForce RTX 3080 Ti
...
0 100 Tooltip GeForce RTX 3080 Ti Founders Edition: Ø144.6 (128.606-163.33)
...
NVIDIA GeForce RTX 3080 Ti
0 100 Tooltip GeForce RTX 3080 Ti Founders Edition: Ø90 (82.074-118.9)
...
NVIDIA GeForce RTX 3080 Ti
» With all tested laptops playable in detail settings high.
...
NVIDIA GeForce RTX 3080 Ti
...
...
NVIDIA GeForce RTX 3080 Ti
...
...
NVIDIA GeForce RTX 3080 Ti
...
...
NVIDIA GeForce RTX 3080 Ti
...
NVIDIA GeForce RTX 3080 Ti
...
...
NVIDIA GeForce RTX 3080 Ti
» With all tested laptops playable in detail settings ultra.
...
NVIDIA GeForce RTX 3080 Ti
...
NVIDIA GeForce RTX 3080 Ti
...
NVIDIA GeForce RTX 3080 Ti
» With all tested laptops playable in detail settings ultra.
0 100 200 300 400 Tooltip GeForce RTX 3080 Ti Founders Edition: Ø390 (236.355-434.17)
...
NVIDIA GeForce RTX 3080 Ti
0 100 200 300 Tooltip GeForce RTX 3080 Ti Founders Edition: Ø317 (215.64-347.3)
...
NVIDIA GeForce RTX 3080 Ti
0 100 200 Tooltip GeForce RTX 3080 Ti Founders Edition: Ø194.9 (172.753-225.4)
...
NVIDIA GeForce RTX 3080 Ti
» With all tested laptops playable in detail settings ultra.
...
NVIDIA GeForce RTX 3080 Ti
...
NVIDIA GeForce RTX 3080 Ti
...
...
NVIDIA GeForce RTX 3080 Ti
...
» With all tested laptops playable in detail settings ultra.
...
NVIDIA GeForce RTX 3080 Ti
...
...
NVIDIA GeForce RTX 3080 Ti
...
...
NVIDIA GeForce RTX 3080 Ti
...
...
NVIDIA GeForce RTX 3080 Ti
...
...
NVIDIA GeForce RTX 3080 Ti
...
...
NVIDIA GeForce RTX 3080 Ti
» With all tested laptops playable in detail settings ultra.
Additional Benchmarks
Very Low Overall Quality (DX11) 1920x1080
238 [X] AMD Ryzen 9 7950X 4.5GHz
NVIDIA GeForce RTX 3080 Ti
0 100 200 300 400 500 600 Tooltip One i300: Ø259 (239.03-628)
: Ø269 (239.001-689)
...
NVIDIA GeForce RTX 3080 Ti
0 100 200 300 400 500 600 700 800 900 Tooltip One i300: Ø262 (215.065-995)
: Ø245 (227.574-278.9)
...
NVIDIA GeForce RTX 3080 Ti
...
0 100 200 Tooltip GeForce RTX 3080 Ti Founders Edition: Ø183.7 (163.206-213.1)
One i300: Ø192.5 (166.174-267.2)
: Ø194.5 (169.992-249.7)
...
NVIDIA GeForce RTX 3080 Ti
...
0 100 200 Tooltip GeForce RTX 3080 Ti Founders Edition: Ø126.7 (111.58-205.4)
One i300: Ø134 (112.02-219.6)
: Ø130.2 (113.17-153)
...
NVIDIA GeForce RTX 3080 Ti
0 100 Tooltip One i300: Ø70.1 (57.05-196)
: Ø69.3 (57.173-109.2)
GeForce RTX 3080 Ti Founders Edition: Ø67.4 (59.207-83.3)
...
NVIDIA GeForce RTX 3080 Ti
» With all tested laptops playable in detail settings high.
Additional Benchmarks
High Quality Preset & High Ray Tracing Preset (DX12) 1920x1080
111 [X] Corsair One i300 Intel Core i9-12900K 3.2GHz
NVIDIA GeForce RTX 3080 Ti
min:
6.44 fps, P0.1:
53.3 fps, P1:
92.8 fps, max:
171 fps
120.6 [X] AMD Ryzen 9 7950X 4.5GHz
NVIDIA GeForce RTX 3080 Ti
min:
6.57 fps, P0.1:
82.4 fps, P1:
100.1 fps, max:
224 fps
...
NVIDIA GeForce RTX 3080 Ti
...
NVIDIA GeForce RTX 3080 Ti
...
NVIDIA GeForce RTX 3080 Ti
» With all tested laptops playable in detail settings ultra.
0 100 200 Tooltip One i300: Ø168 (148.045-300)
...
NVIDIA GeForce RTX 3080 Ti
Intel Arc A580
0 100 Tooltip One i300: Ø165.5 (151.286-189.805)
...
Intel Arc A580
NVIDIA GeForce RTX 3080 Ti
0 100 Tooltip One i300: Ø126.2 (111.309-144.65)
...
Intel Arc A580
NVIDIA GeForce RTX 3080 Ti
0 100 Tooltip One i300: Ø73.4 (60.341-113)
...
NVIDIA GeForce RTX 3080 Ti
Intel Arc A580
0 100 Tooltip One i300: Ø71.1 (57.105-155.9)
...
Intel Arc A580
NVIDIA GeForce RTX 3080 Ti
0 100 Tooltip One i300: Ø64.2 (53.077-196)
...
Intel Arc A580
NVIDIA GeForce RTX 3080 Ti
...
» With all tested laptops playable in detail settings ultra.
0 100 200 Tooltip GeForce RTX 3080 Ti Founders Edition: Ø70 (0-230)
...
NVIDIA GeForce RTX 3080 Ti
...
0 100 200 Tooltip GeForce RTX 3080 Ti Founders Edition: Ø82.5 (0-231)
...
NVIDIA GeForce RTX 3080 Ti
...
0 100 200 Tooltip GeForce RTX 3080 Ti Founders Edition: Ø130.6 (0-272)
...
NVIDIA GeForce RTX 3080 Ti
» With all tested laptops playable in detail settings ultra.
0 100 200 Tooltip One i300: Ø189.7 (144-282)
: Ø198.6 (134-298)
NUC13 Raptor Canyon: Ø200 (122-297)
...
Intel Arc A580
NVIDIA GeForce RTX 3080 Ti
0 100 200 Tooltip One i300: Ø164.8 (129-250)
NUC13 Raptor Canyon: Ø173.8 (120-262)
: Ø174.5 (135-268)
...
NVIDIA GeForce RTX 3080 Ti
0 100 200 Tooltip One i300: Ø156.8 (122-235)
NUC13 Raptor Canyon: Ø166.9 (129-250)
: Ø169 (131-261)
...
NVIDIA GeForce RTX 3080 Ti
0 100 200 Tooltip GeForce RTX 3080 Ti Founders Edition: Ø121.5 (67-203)
One i300: Ø141.3 (98-229)
NUC13 Raptor Canyon: Ø150.2 (106-242)
: Ø152.9 (104-256)
...
NVIDIA GeForce RTX 3080 Ti
0 100 200 Tooltip GeForce RTX 3080 Ti Founders Edition: Ø118.4 (80-196)
One i300: Ø137.2 (97-205)
NUC13 Raptor Canyon: Ø144 (105-211)
: Ø145.7 (103-216)
...
NVIDIA GeForce RTX 3080 Ti
0 100 Tooltip GeForce RTX 3080 Ti Founders Edition: Ø100.3 (78-126)
One i300: Ø106.7 (85-127)
NUC13 Raptor Canyon: Ø109.1 (93-130)
: Ø109.8 (85-131)
...
NVIDIA GeForce RTX 3080 Ti
...
» With all tested laptops playable in detail settings ultra.
...
Intel Arc A580
NVIDIA GeForce RTX 3080 Ti
...
...
NVIDIA GeForce RTX 3080 Ti
...
...
NVIDIA GeForce RTX 3080 Ti
...
...
NVIDIA GeForce RTX 3080 Ti
...
...
NVIDIA GeForce RTX 3080 Ti
...
...
NVIDIA GeForce RTX 3080 Ti
...
» With all tested laptops playable in detail settings ultra.
Additional Benchmarks
Ultra Quality DXR 16xAF 1920x1080
121.2 [X] AMD Ryzen 9 7950X 4.5GHz
NVIDIA GeForce RTX 3080 Ti
min:
66.05 fps, max:
193.46 fps
0 100 200 Tooltip GeForce RTX 3080 Ti Founders Edition: Ø203 (179.027-284.5)
...
NVIDIA GeForce RTX 3080 Ti
0 100 200 300 400 500 600 700 800 900 Tooltip GeForce RTX 3080 Ti Founders Edition: Ø218 (179.25-912)
...
NVIDIA GeForce RTX 3080 Ti
0 100 200 Tooltip GeForce RTX 3080 Ti Founders Edition: Ø141.7 (113.208-206.9)
...
NVIDIA GeForce RTX 3080 Ti
» With all tested laptops playable in detail settings ultra.
Additional Benchmarks
Ultra Preset DXR 1920x1080
...
Intel Arc A580
NVIDIA GeForce RTX 3080 Ti
...
...
NVIDIA GeForce RTX 3080 Ti
...
...
NVIDIA GeForce RTX 3080 Ti
...
...
NVIDIA GeForce RTX 3080 Ti
...
...
NVIDIA GeForce RTX 3080 Ti
...
...
NVIDIA GeForce RTX 3080 Ti
...
» With all tested laptops playable in detail settings ultra.
Additional Benchmarks
Lowest Preset 1920x1080
323 [X] AMD Ryzen 9 7950X 4.5GHz
NVIDIA GeForce RTX 3080 Ti
max:
497 fps
613 667 [X] Corsair One i300 1.47.22.14 D3D12
Intel Core i9-12900K 3.2GHz
NVIDIA GeForce RTX 3080 Ti
min:
61.1 fps, P1:
507 fps, max:
980 fps
692 [X] 1.47.22.14 D3D12
AMD Ryzen 9 7950X 4.5GHz
NVIDIA GeForce RTX 3080 Ti
min:
60.2 fps, P1:
551 fps, max:
930 fps
~ 657 fps
+ Compare
- Hide Comparison
...
NVIDIA GeForce RTX 3080 Ti
...
484 [X] Corsair One i300 1.47.22.14 D3D12
Intel Core i9-12900K 3.2GHz
NVIDIA GeForce RTX 3080 Ti
min:
59.9 fps, P1:
383 fps, max:
668 fps
489 523 [X] 1.47.22.14 D3D12
AMD Ryzen 9 7950X 4.5GHz
NVIDIA GeForce RTX 3080 Ti
min:
60.3 fps, P1:
425 fps, max:
718 fps
~ 499 fps
+ Compare
- Hide Comparison
...
NVIDIA GeForce RTX 3080 Ti
392 [X] Corsair One i300 1.47.22.14 D3D12
Intel Core i9-12900K 3.2GHz
NVIDIA GeForce RTX 3080 Ti
min:
59.7 fps, P1:
282 fps, max:
602 fps
407 415 [X] 1.47.22.14 D3D12
AMD Ryzen 9 7950X 4.5GHz
NVIDIA GeForce RTX 3080 Ti
min:
60 fps, P1:
296 fps, max:
642 fps
~ 405 fps
+ Compare
- Hide Comparison
...
NVIDIA GeForce RTX 3080 Ti
345 [X] Corsair One i300 1.47.22.14 D3D12
Intel Core i9-12900K 3.2GHz
NVIDIA GeForce RTX 3080 Ti
min:
60 fps, P1:
254 fps, max:
551 fps
359 360 [X] 1.47.22.14 D3D12
AMD Ryzen 9 7950X 4.5GHz
NVIDIA GeForce RTX 3080 Ti
min:
59.5 fps, P1:
263 fps, max:
584 fps
~ 355 fps
+ Compare
- Hide Comparison
...
NVIDIA GeForce RTX 3080 Ti
...
260 [X] Corsair One i300 1.47.22.14 D3D12
Intel Core i9-12900K 3.2GHz
NVIDIA GeForce RTX 3080 Ti
min:
59.9 fps, P1:
200 fps, max:
554 fps
269 270 [X] 1.47.22.14 D3D12
AMD Ryzen 9 7950X 4.5GHz
NVIDIA GeForce RTX 3080 Ti
min:
59 fps, P1:
208 fps, max:
613 fps
~ 266 fps
+ Compare
- Hide Comparison
...
NVIDIA GeForce RTX 3080 Ti
...
156 [X] Corsair One i300 1.47.22.14 D3D12
Intel Core i9-12900K 3.2GHz
NVIDIA GeForce RTX 3080 Ti
min:
33.2 fps, P1:
132 fps, max:
403 fps
161 [X] Intel NUC13 Raptor Canyon 1.47.22.14 D3D12
Intel Core i9-13900K 3GHz
NVIDIA GeForce RTX 3080 Ti
min:
123.3 fps, P1:
134.5 fps, max:
336 fps
161.8 [X] 1.47.22.14 D3D12
AMD Ryzen 9 7950X 4.5GHz
NVIDIA GeForce RTX 3080 Ti
min:
38.7 fps, P1:
135.9 fps, max:
423 fps
~ 160 fps
+ Compare
- Hide Comparison
...
NVIDIA GeForce RTX 3080 Ti
» With all tested laptops playable in detail settings ultra.
0 100 200 300 Tooltip One i300: Ø230 (148-313)
NUC13 Raptor Canyon: Ø239 (168-301)
: Ø242 (186-329)
...
NVIDIA GeForce RTX 3080 Ti
0 100 200 300 Tooltip One i300: Ø200 (149-274)
NUC13 Raptor Canyon: Ø208 (144-274)
: Ø212 (165-304)
...
NVIDIA GeForce RTX 3080 Ti
0 100 200 Tooltip One i300: Ø190 (145-262)
NUC13 Raptor Canyon: Ø198.5 (154-263)
: Ø204 (156-288)
...
NVIDIA GeForce RTX 3080 Ti
0 100 200 Tooltip One i300: Ø175.4 (134-238)
NUC13 Raptor Canyon: Ø185.6 (141-254)
: Ø188.4 (137-271)
...
NVIDIA GeForce RTX 3080 Ti
0 100 200 Tooltip One i300: Ø167.9 (134-213)
NUC13 Raptor Canyon: Ø175.8 (139-216)
: Ø176.8 (143-216)
...
NVIDIA GeForce RTX 3080 Ti
0 100 Tooltip One i300: Ø108.3 (97-128)
: Ø109.2 (98-128)
NUC13 Raptor Canyon: Ø109.1 (98-129)
...
NVIDIA GeForce RTX 3080 Ti
...
» With all tested laptops playable in detail settings ultra.
Additional Benchmarks
Low Preset TAA 1920x1080
236 [X] AMD Ryzen 9 7950X 4.5GHz
NVIDIA GeForce RTX 3080 Ti
min:
176 fps, max:
321 fps
...
NVIDIA GeForce RTX 3080 Ti
...
NVIDIA GeForce RTX 3080 Ti
...
...
NVIDIA GeForce RTX 3080 Ti
...
...
NVIDIA GeForce RTX 3080 Ti
...
» With all tested laptops playable in detail settings high.
...
NVIDIA GeForce RTX 3080 Ti
...
...
NVIDIA GeForce RTX 3080 Ti
...
NVIDIA GeForce RTX 3080 Ti
...
...
NVIDIA GeForce RTX 3080 Ti
...
...
NVIDIA GeForce RTX 3080 Ti
...
» With all tested laptops playable in detail settings high.
0 100 200 300 400 500 Tooltip One i300: Ø492 (478.198-515.2)
: Ø491 (483.033-523.3)
...
NVIDIA GeForce RTX 3080 Ti
0 100 200 300 400 Tooltip One i300: Ø346 (331.67-405.1)
: Ø390 (370.878-421.28)
...
NVIDIA GeForce RTX 3080 Ti
0 100 200 300 Tooltip One i300: Ø263 (238.112-314.1)
: Ø288 (269.08-335.9)
...
NVIDIA GeForce RTX 3080 Ti
0 100 200 Tooltip One i300: Ø223 (201.401-244.4)
: Ø246 (225.6-295.4)
...
NVIDIA GeForce RTX 3080 Ti
0 100 Tooltip One i300: Ø116.2 (105.08-133.13)
: Ø122 (110.11-143.9)
...
NVIDIA GeForce RTX 3080 Ti
» With all tested laptops playable in detail settings ultra.
...
NVIDIA GeForce RTX 3080 Ti
...
...
NVIDIA GeForce RTX 3080 Ti
...
...
NVIDIA GeForce RTX 3080 Ti
...
...
NVIDIA GeForce RTX 3080 Ti
...
NVIDIA GeForce RTX 3080 Ti
» With all tested laptops playable in detail settings ultra.
0 100 200 300 400 500 600 700 800 900 1000 1100 Tooltip One i300: Ø691 (598.43-1196)
NUC13 Raptor Canyon: Ø706 (640.12-783.426)
: Ø786 (690.421-897.5)
...
NVIDIA GeForce RTX 3080 Ti
...
0 100 200 300 400 500 600 700 Tooltip One i300: Ø557 (491.92-648.284)
NUC13 Raptor Canyon: Ø573 (486.486-745.3)
: Ø591 (549.167-658.087)
...
NVIDIA GeForce RTX 3080 Ti
0 100 200 300 400 Tooltip One i300: Ø369 (341.108-417.9)
: Ø375 (345.079-420.91)
NUC13 Raptor Canyon: Ø379 (348.105-429.1)
...
NVIDIA GeForce RTX 3080 Ti
...
0 100 200 300 400 Tooltip GeForce RTX 3080 Ti Founders Edition: Ø169.6 (163-187)
NUC13 Raptor Canyon: Ø182.8 (167.216-211.2)
One i300: Ø189.1 (167.081-288)
: Ø192.6 (172.181-442)
...
NVIDIA GeForce RTX 3080 Ti
...
0 100 200 300 400 Tooltip GeForce RTX 3080 Ti Founders Edition: Ø148.8 (132-161)
One i300: Ø156.3 (138.66-437)
: Ø158.4 (143.133-196.2)
NUC13 Raptor Canyon: Ø161.8 (144.049-200.1)
...
NVIDIA GeForce RTX 3080 Ti
» With all tested laptops playable in detail settings ultra.
Additional Benchmarks
Ultra Graphics & Postprocessing (HBAO+) 3840x2160
93.1 [X] Corsair One i300 Intel Core i9-12900K 3.2GHz
NVIDIA GeForce RTX 3080 Ti
min:
37 fps, P0.1:
65.3 fps, P1:
80.3 fps, max:
372 fps
96.2 [X] AMD Ryzen 9 7950X 4.5GHz
NVIDIA GeForce RTX 3080 Ti
min:
54.6 fps, P0.1:
68.2 fps, P1:
85 fps, max:
266 fps
Medium Graphics & Postprocessing 1920x1080
445 [X] AMD Ryzen 9 7950X 4.5GHz
NVIDIA GeForce RTX 3080 Ti
min:
26.9 fps, P0.1:
213 fps, P1:
358 fps, max:
924 fps
...
Intel Arc A580
NVIDIA GeForce RTX 3080 Ti
...
NVIDIA GeForce RTX 3080 Ti
Intel Arc A380
...
...
NVIDIA GeForce RTX 3080 Ti
...
...
NVIDIA GeForce RTX 3080 Ti
...
...
NVIDIA GeForce RTX 3080 Ti
...
NVIDIA GeForce RTX 3080 Ti
» With all tested laptops playable in detail settings ultra.
Additional Benchmarks
Highest Settings possible 16xAF 4xMSAA + FXAA 3840x2160
93.9 [X] Corsair One i300 Intel Core i9-12900K 3.2GHz
NVIDIA GeForce RTX 3080 Ti
min:
4.79 fps, P1:
71.4 fps, max:
185 fps
95.6 [X] AMD Ryzen 9 7950X 4.5GHz
NVIDIA GeForce RTX 3080 Ti
min:
5.18 fps, P1:
66.7 fps, max:
271 fps
Normal/Off 4xAF 1920x1080
187 [X] Corsair One i300 Intel Core i9-12900K 3.2GHz
NVIDIA GeForce RTX 3080 Ti
min:
10.6 fps, P1:
200 fps, max:
498 fps
187.8 [X] AMD Ryzen 9 7950X 4.5GHz
NVIDIA GeForce RTX 3080 Ti
min:
3.28 fps, P1:
200 fps, max:
625 fps
Lowest Settings possible 1920x1080
187 [X] Corsair One i300 Intel Core i9-12900K 3.2GHz
NVIDIA GeForce RTX 3080 Ti
min:
2.54 fps, P1:
200 fps, max:
301 fps
188 [X] AMD Ryzen 9 7950X 4.5GHz
NVIDIA GeForce RTX 3080 Ti
min:
2.39 fps, P1:
200 fps, max:
735 fps
low med. high ultra QHD 4K The Callisto Protocol 223 192 136 135 102 63 Need for Speed Unbound 187.7 175.2 156.6 139.9 132.4 77.8 Spider-Man Miles Morales 203 186.1 174.8 168.9 134.6 82.1 Call of Duty Modern Warfare 2 2022 180 170 141 140 107 70 Uncharted Legacy of Thieves Collection 121.8 118.4 113.4 109.7 92.7 61.3 A Plague Tale Requiem 180 158.5 122.5 93.9 71.5 41.5 FIFA 23 250 247 243 242 234 165.1 The Quarry 285 219 181.5 149.1 106.9 60.3 F1 22 400 386 343 130 86 43 Vampire Bloodhunt 496 384 362 349 249 138.1 Ghostwire Tokyo 290 288 279 278 211 108.4 Tiny Tina's Wonderlands 363 295 213 170 124 70 Cyberpunk 2077 1.6 219 184.4 160.4 146.4 99.1 49.7 GRID Legends 317 289 254 223 185.1 130.3 Dying Light 2 189 164 149 109 61.5 Rainbow Six Extraction 365 353 348 282 194 104 God of War 217 188 168 120 104 73 Halo Infinite 229 198 188 142 83.1 Farming Simulator 22 349 270 226 203 201 157 Battlefield 2042 216 194 169 150 123 83 Forza Horizon 5 280 202 191 132 117 87 Riders Republic 284 220 188 176 136 80 Guardians of the Galaxy 194 196 191 191 186 110 Far Cry 6 209 181 161 143 134 85 New World 194 165 153 142 133 79.2 F1 2021 597 531 433 226 175 103 Days Gone 178 137 83.3 Resident Evil Village 234 199 114 Outriders 148 151 83.7 Hitman 3 267 210.4 119.6 Cyberpunk 2077 1.0 125 84.3 42.3 Call of Duty Black Ops Cold War 162 131 76.5 Assassin´s Creed Valhalla 100 86 61 Dirt 5 163 136 92.4 Watch Dogs Legion 97 88.5 58.7 Mafia Definitive Edition 163 142 86.6 F1 2020 517 430 416 307 238 145 Gears Tactics 141.1 147.5 88.3 Doom Eternal 388 316 191 Red Dead Redemption 2 112 92.5 62.7 Borderlands 3 226 196 179 151 124 73 Control 240 236 186 124 64 Total War: Three Kingdoms 151.2 103.4 51.4 Anno 1800 159 163 124 69.4 66.1 55.9 The Division 2 143 121 76.6 Far Cry New Dawn 196 171 164 142 136 107 Metro Exodus 267 213 172 135 114 76 Battlefield V 196 192 136 Shadow of the Tomb Raider 291 247 240 209 165 95 Strange Brigade 657 499 405 355 266 160 Far Cry 5 237 207 197 183 174 109 X-Plane 11.11 218 188 141 121 Final Fantasy XV Benchmark 234 229 181 140 85 Rise of the Tomb Raider 488 364 270 232 116 Dota 2 Reborn 275 241 234 216 208 The Witcher 3 722 568 370 180 152 GTA V 188 187 187 158 152 182 < 30 fps < 60 fps < 120 fps ≥ 120 fps 40 1 40 1 41 6 46 17 36 7 38 12
For more games that might be playable and a list of all games and graphics cards visit our Gaming List
v1.26
log 16. 08:37:43
#0 no ids found in url (should be separated by "_") +0s ... 0s
#1 not redirecting to Ajax server +0s ... 0s
#2 did not recreate cache, as it is less than 5 days old! Created at Tue, 16 Apr 2024 05:39:00 +0200 +0.001s ... 0.001s
#3 composed specs +0.047s ... 0.048s
#4 did output specs +0s ... 0.048s
#5 start showIntegratedCPUs +0s ... 0.048s
#6 getting avg benchmarks for device 10702 +0.037s ... 0.086s
#7 got single benchmarks 10702 +0.021s ... 0.107s
#8 got avg benchmarks for devices +0s ... 0.107s
#9 min, max, avg, median took s +1.018s ... 1.125s
#10 before gaming benchmark output +0s ... 1.125s
#11 Got 502 rows for game benchmarks. +0.164s ... 1.289s
#12 composed SQL query for gamebenchmarks +0s ... 1.289s
#13 got data and put it in $dataArray +0.051s ... 1.34s
#14 benchmarks composed for output. +2.457s ... 3.797s
#15 return log +0.051s ... 3.848s
Please share our article, every link counts!
» Comparison of GPUs
» Benchmark List
» Notebook Gaming List
Class 1 Arc A580
Class 2 Arc A380
Class 3 UHD Graphics 32EUs
UHD Graphics 750
Class 4 * Approximate position of the graphics adapter
Working For Notebookcheck
Are you a techie who knows how to translate? Then join our Team!
Details here
Top 10 Laptops Multimedia , Budget Multimedia , Gaming , Budget Gaming , Lightweight Gaming , Business , Budget Office , Workstation , Subnotebooks , Ultrabooks , Chromebooks
under 300 USD/Euros , under 500 USD/Euros , 1,000 USD/Euros , for University Students , Best Displays
Top 10 Smartphones Smartphones , Phablets , ≤6-inch , Camera Smartphones
Klaus Hinum (Update: 2021-07- 6)
 Deutsch
 English
 Español
 Français
 Italiano
 Nederlands
 Polski
 Português
 Русский
 Türkçe
 Svenska
 Chinese
 Magyar