 Deutsch
 English
 Español
 Français
 Italiano
 Nederlands
 Polski
 Português
 Русский
 Türkçe
 Svenska
 Chinese
 Magyar
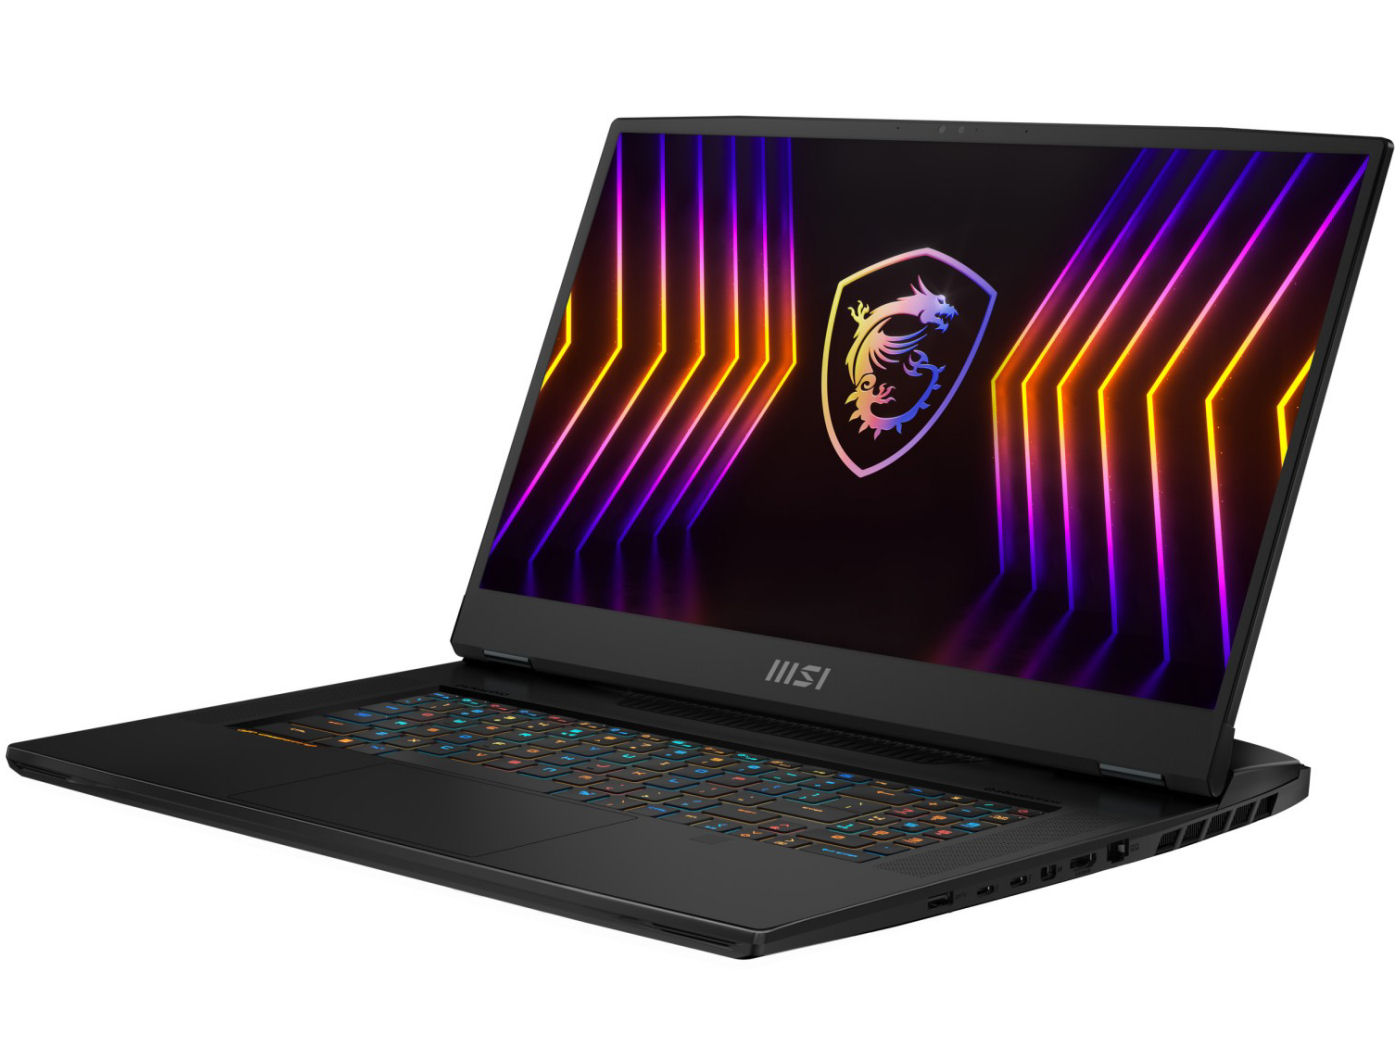
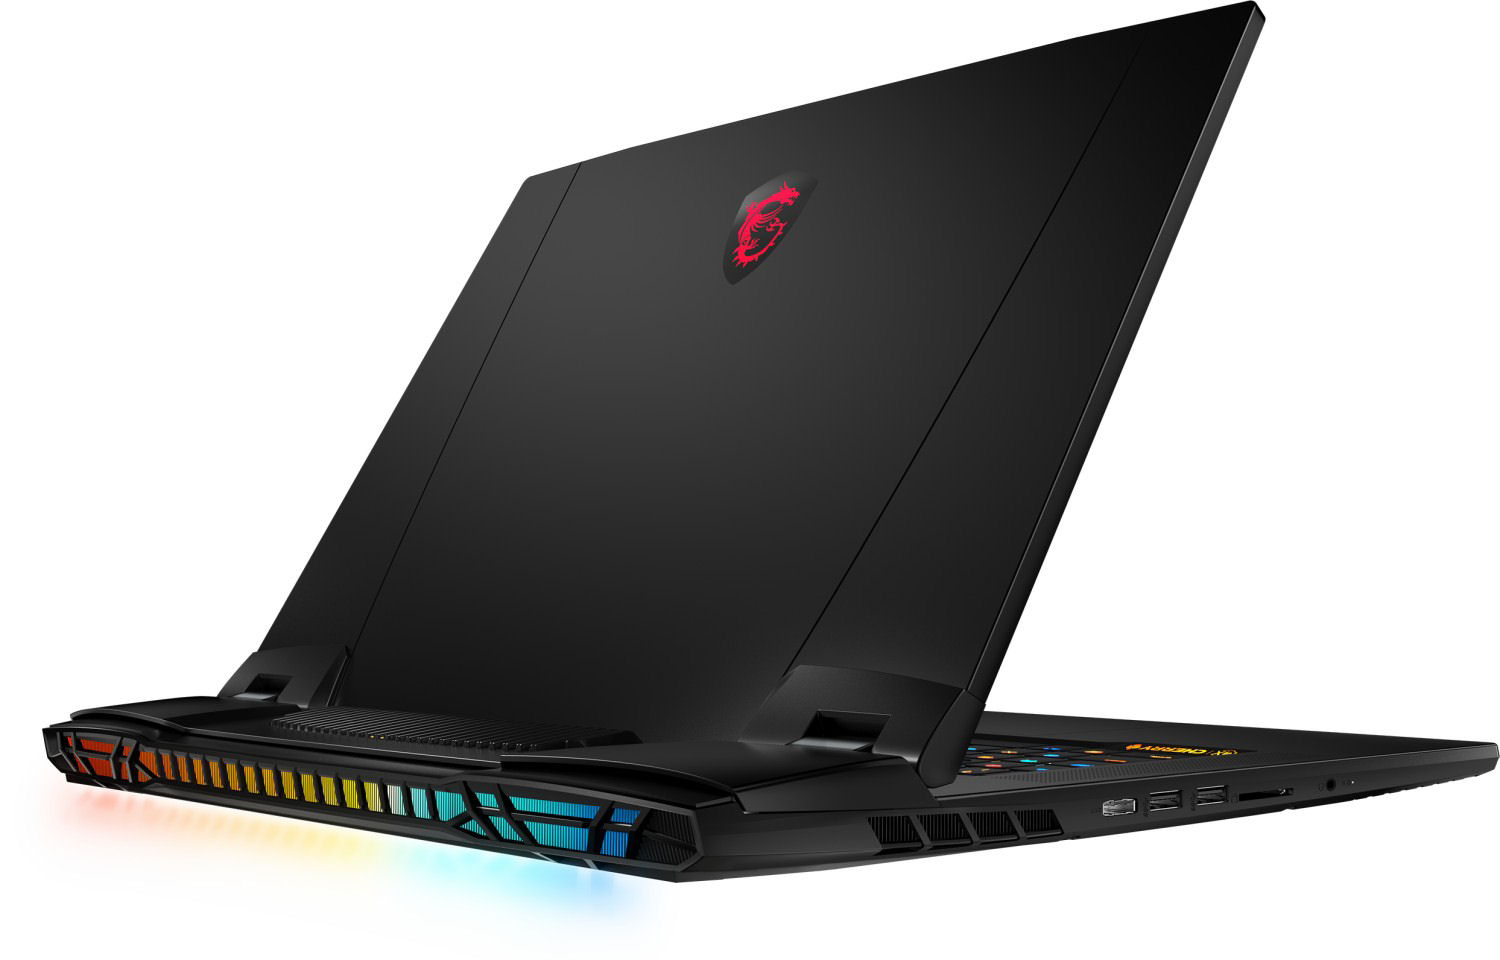
MSI Titan GT77 12UHS 4K review: Elite amongst UHD DTR laptops
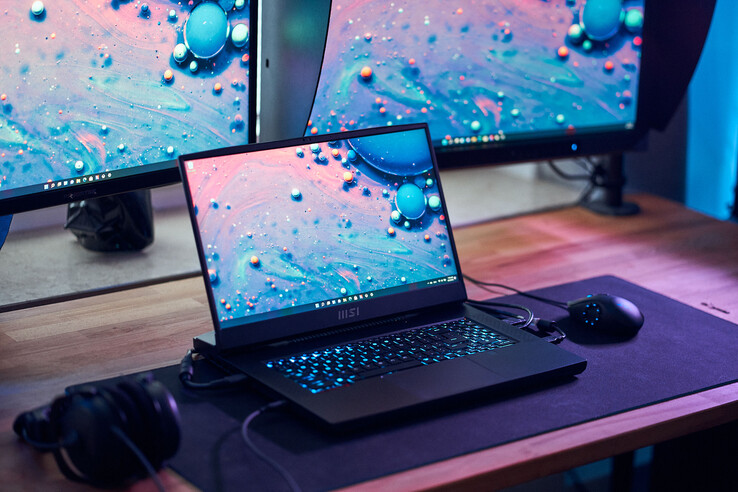
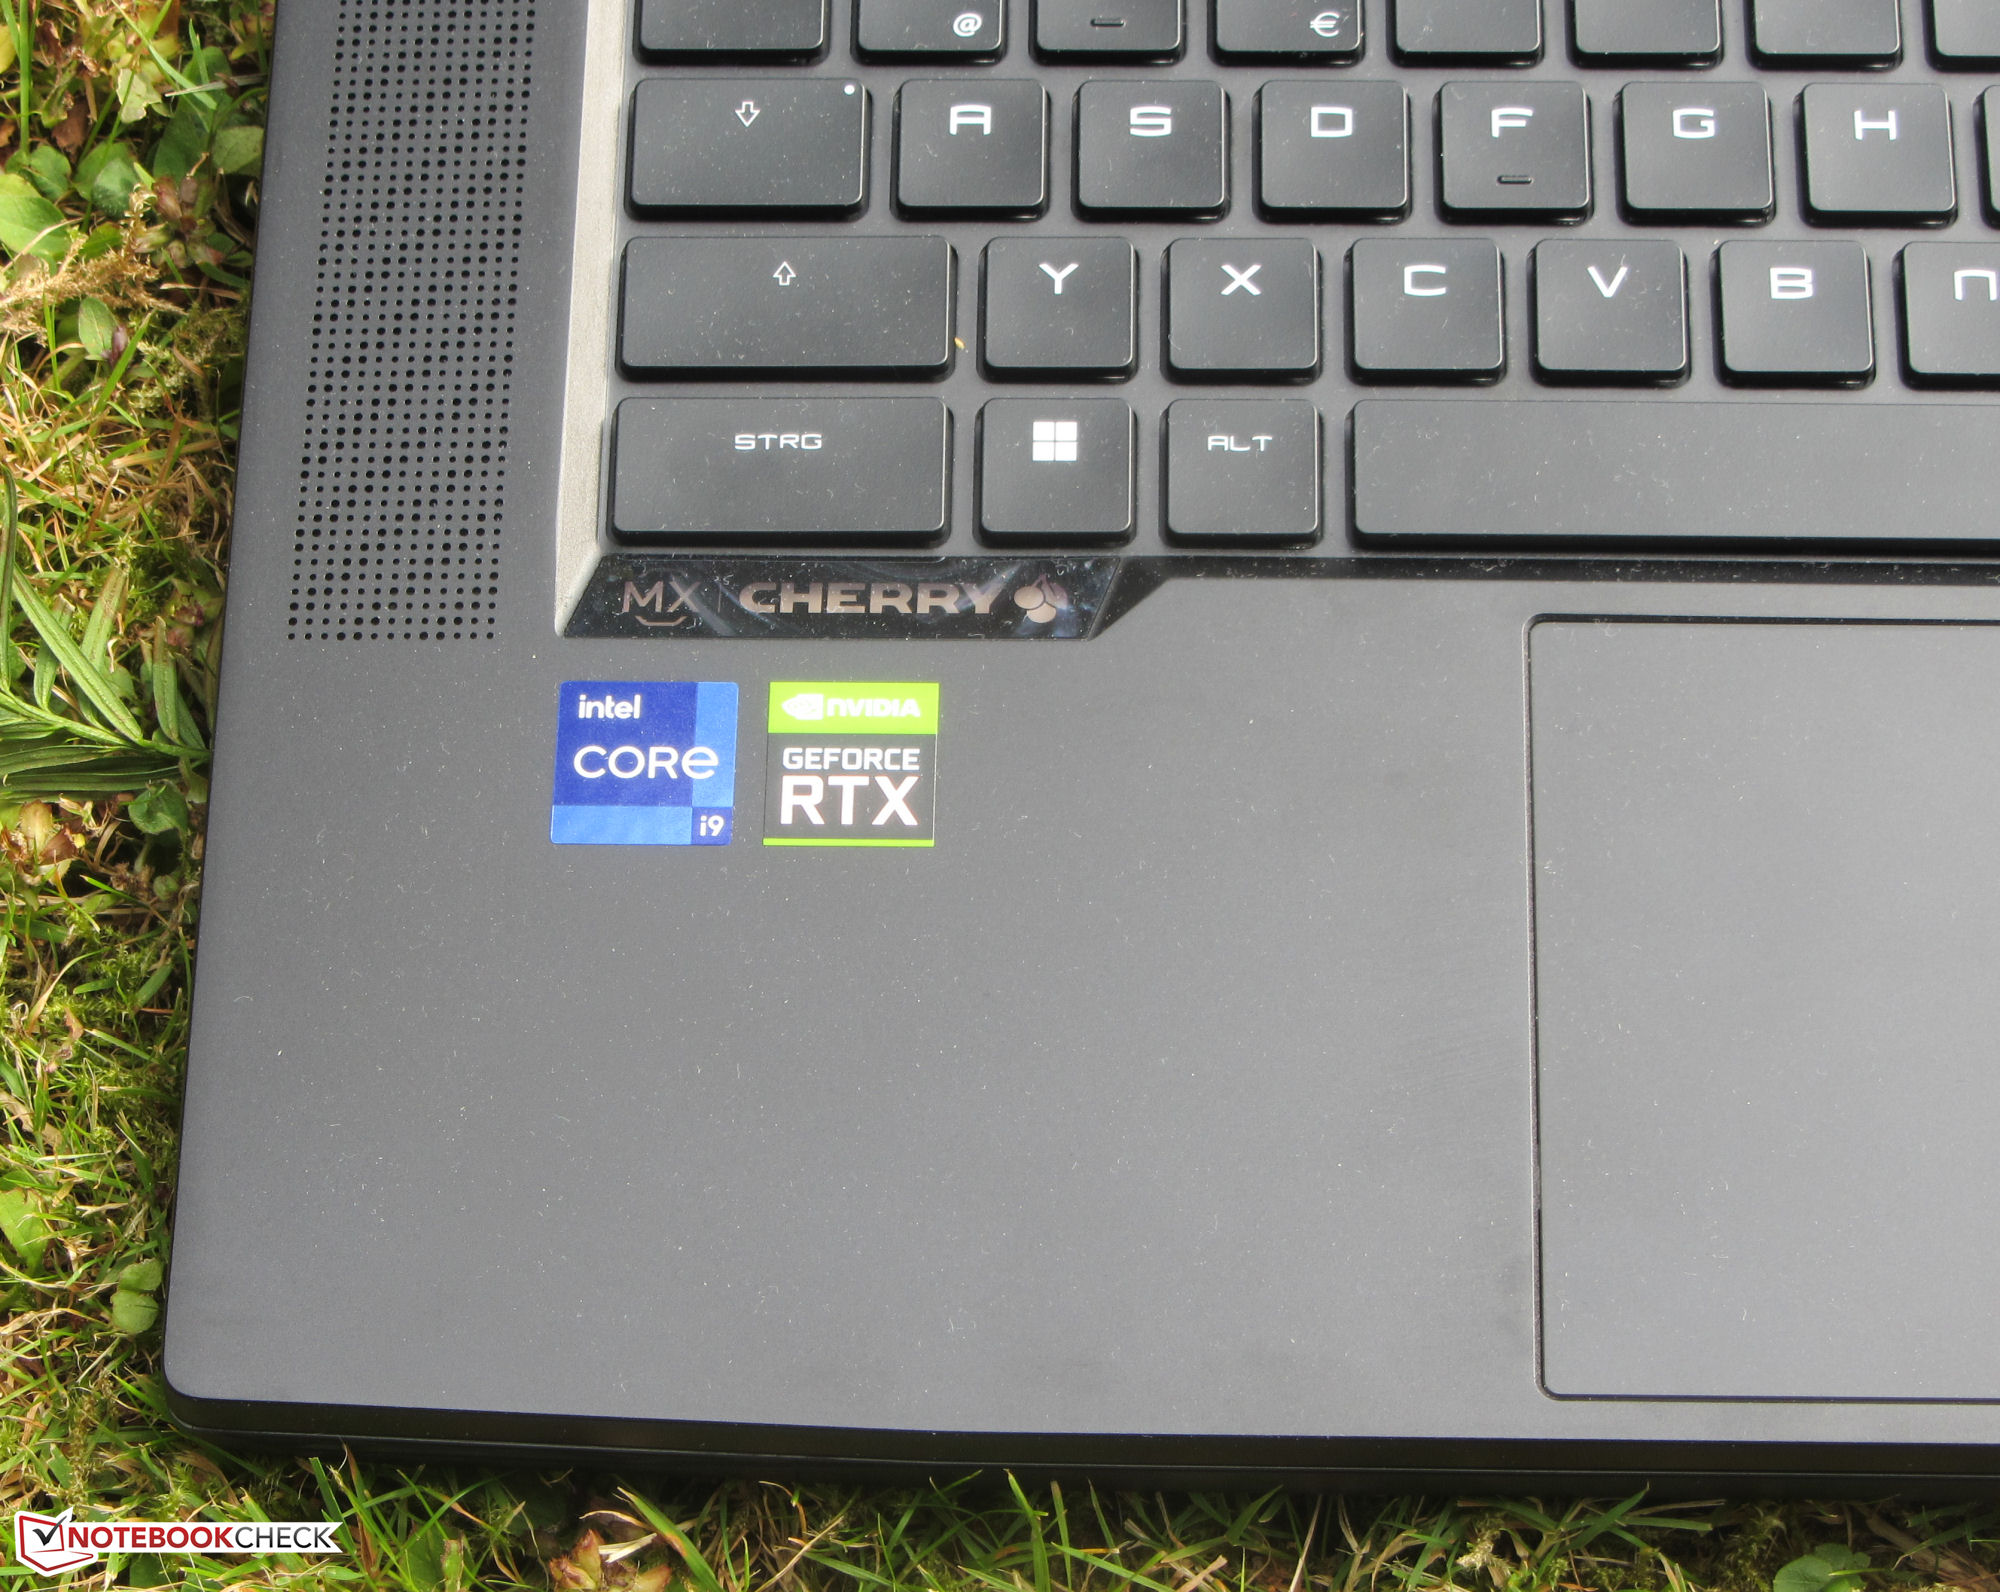
Gamers and creatives are both part of the target audience of the MSI Titan GT77 12UHS - a desktop replacement (DTR) laptop. The high-end specs (Core i9-12900HX, GeForce RTX 3080 Ti Laptop and 64 GB of RAM) push the laptop's price to around 5,600 Euro (US$5,980). The display is the main difference between this device and its FHD sibling model that we recently reviewed: the current review unit has a 4K panel on board. Some of its competitors include the Schenker XMG Ultra 17, the Razer Blade 17 and the Alienware x17 R2.
Because this device and its FHD counterpart are built identically, you can read our review of the MSI Titan GT77 12UHS (Core i9, FHD) for more information on the chassis, input devices and speakers.
Comparison of possible competitors
Rating | Date | Model | Weight | Height | Size | Resolution | Best Price |
|---|---|---|---|---|---|---|---|
| 87.8 % | 09/2022 | MSI Titan GT77 12UHS i9-12900HX, GeForce RTX 3080 Ti Laptop GPU | 3.4 kg | 23 mm | 17.30" | 3840x2160 | |
| 89.9 % | 07/2022 | Razer Blade 17 Early 2022 i9-12900H, GeForce RTX 3080 Ti Laptop GPU | 2.8 kg | 19.9 mm | 17.30" | 3840x2160 | |
| 89.2 % | 05/2022 | Alienware x17 R2 P48E i9-12900HK, GeForce RTX 3080 Ti Laptop GPU | 3.1 kg | 20.9 mm | 17.30" | 1920x1080 | |
| 84.9 % | 04/2021 | SCHENKER XMG Ultra 17 Rocket Lake i9-11900K, GeForce RTX 3080 Laptop GPU | 4.7 kg | 43.5 mm | 17.30" | 1920x1080 |


| SD Card Reader - average JPG Copy Test (av. of 3 runs) | |
| SCHENKER XMG Ultra 17 Rocket Lake | |
| Alienware x17 R2 P48E (AV Pro V60) | |
| Razer Blade 17 Early 2022 (AV PRO microSD 128 GB V60) | |
| Average of class Gaming (19 - 202, n=98, last 2 years) | |
| MSI Titan GT77 12UHS (AV PRO microSD 128 GB V60) | |
| MSI Titan GT77 12UHS 4k (AV PRO microSD 128 GB V60) | |


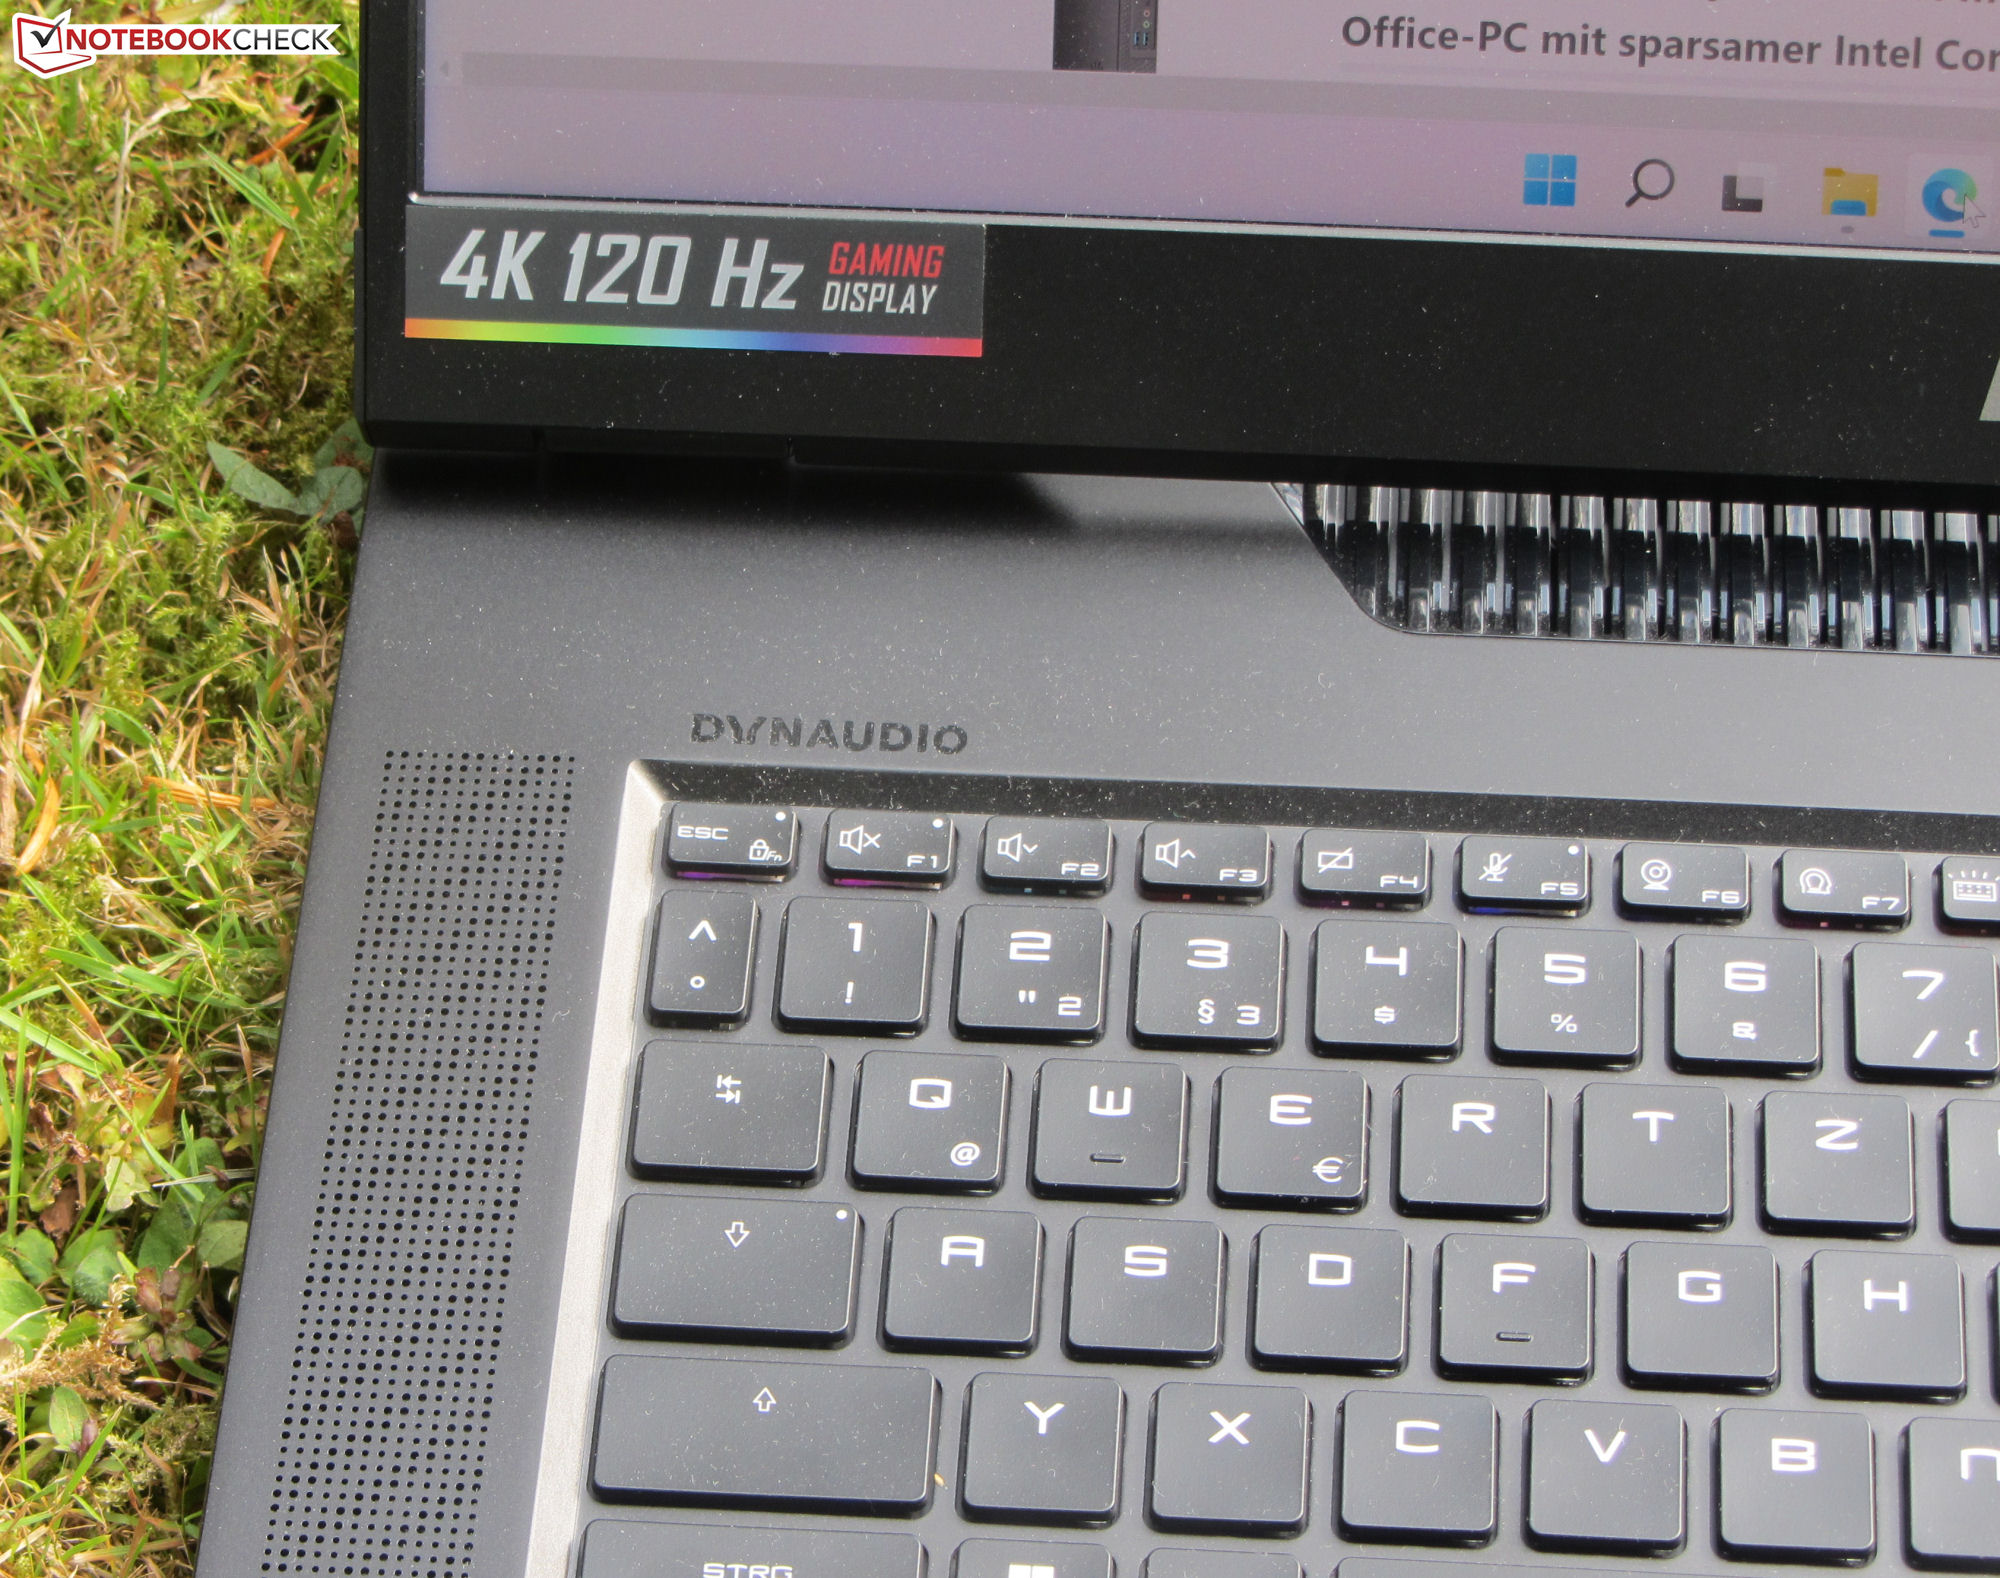
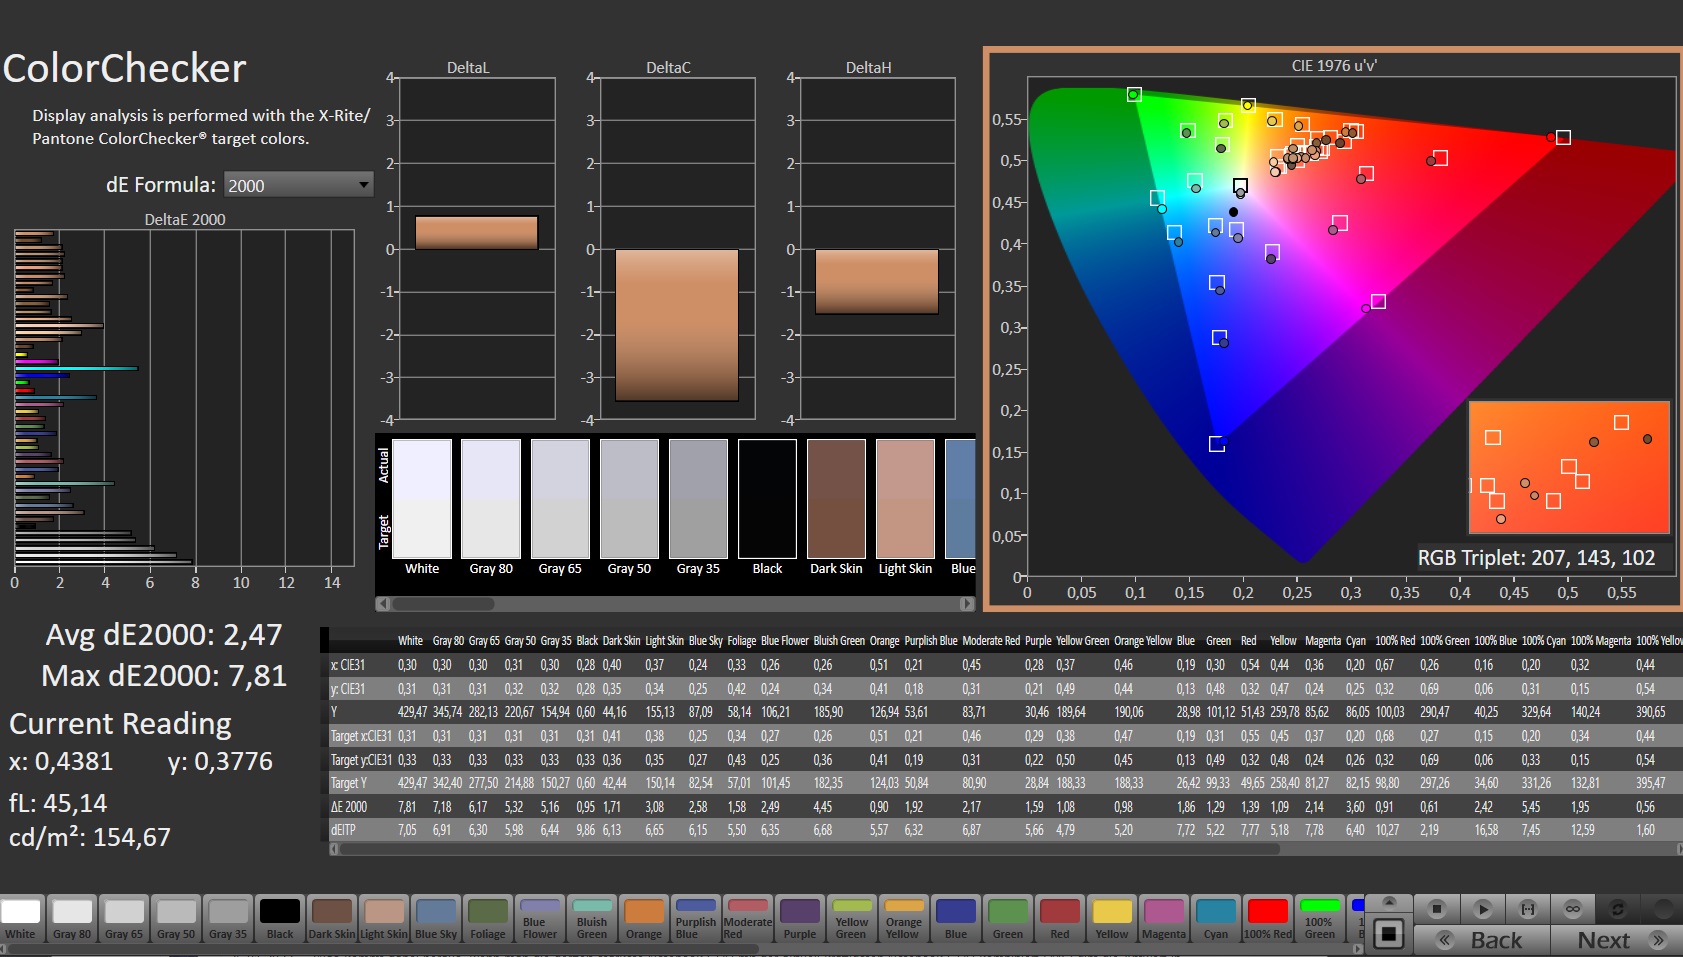
Display - Bright panel with high DCI-P3 coverage
The matt 4K panel (3,840 x 2,160 pixels) on the current review unit delivers significantly higher peak brightness than the FHD display on its sibling model (401 cd/m² vs. 275.1 cd/m²).
Nevertheless, there is still room for improvement in terms of contrast (871:1 vs. 700:1): both displays fall short of what we consider good values (> 1,000:1). Whilst the two panels are highly responsive, the FHD model offers a considerably higher refresh rate (120 Hz vs. 360 Hz). We didn't observe any PWM flicker during our measurements.
| |||||||||||||||||||||||||
Brightness Distribution: 91 %
Center on Battery: 418 cd/m²
Contrast: 871:1 (Black: 0.48 cd/m²)
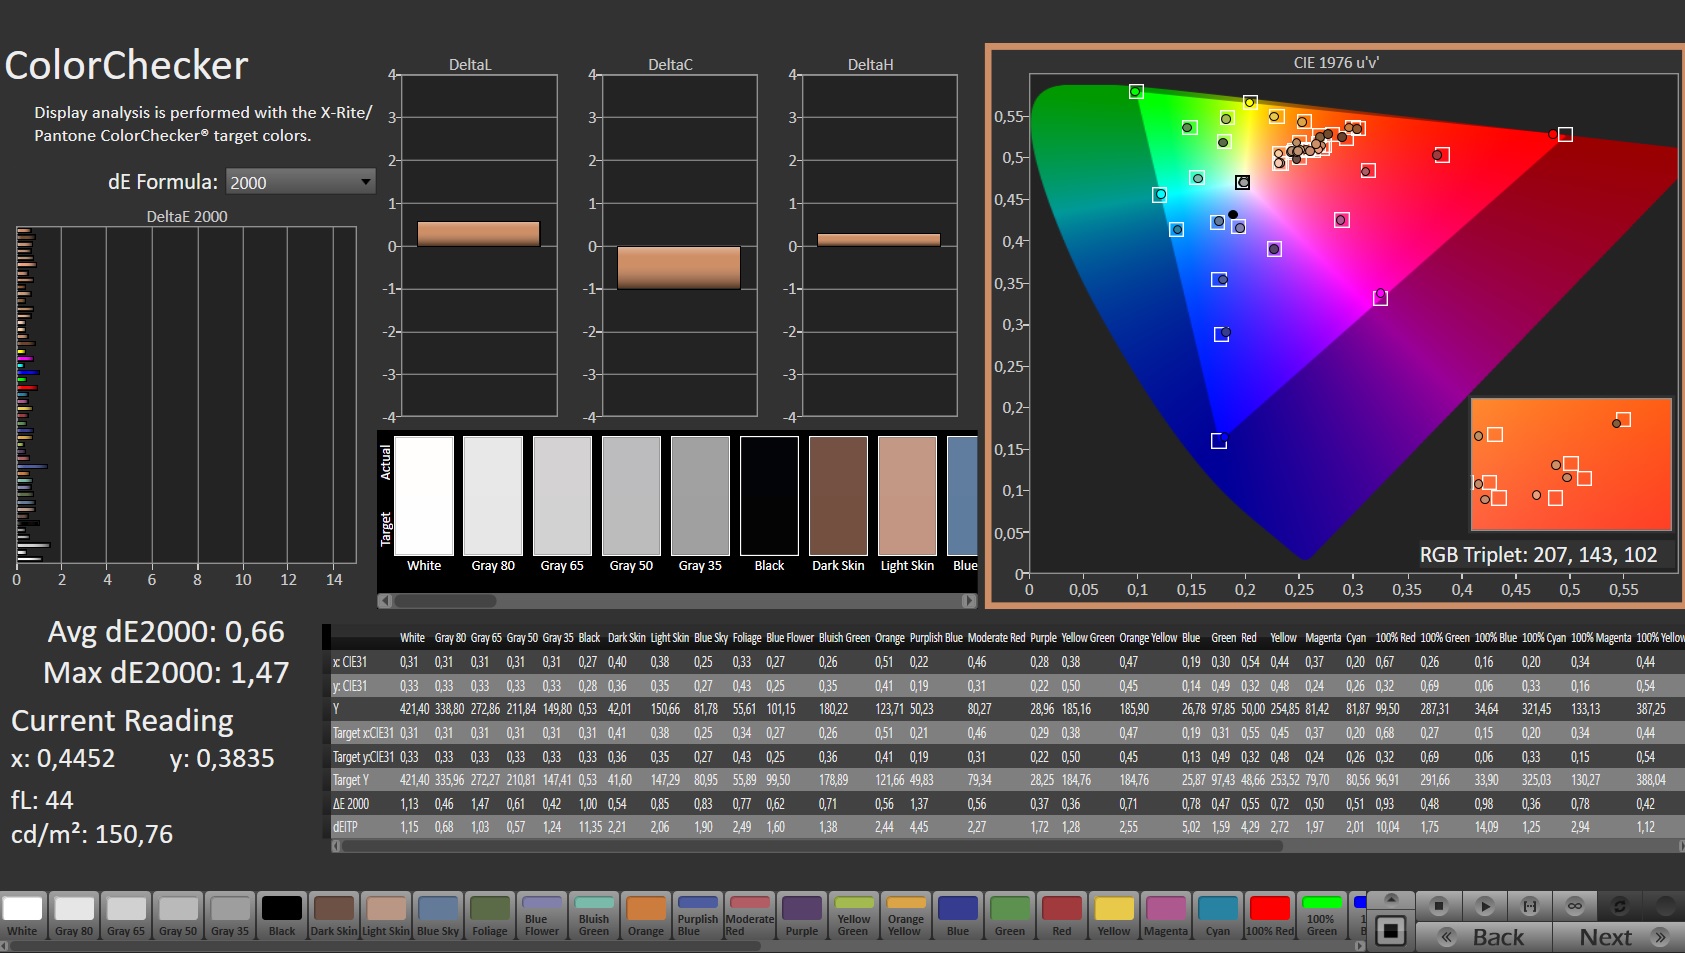
ΔE Color 2.47 | 0.5-29.43 Ø5, calibrated: 0.66
ΔE Greyscale 4.4 | 0.57-98 Ø5.3
86.2% AdobeRGB 1998 (Argyll 2.2.0 3D)
99.8% sRGB (Argyll 2.2.0 3D)
97% Display P3 (Argyll 2.2.0 3D)
Gamma: 2.129
| MSI Titan GT77 12UHS 4k AU Optronics B173ZAN06.1, IPS, 3840x2160, 17.30 | Razer Blade 17 Early 2022 AU Optronics B173ZAN06.9, IPS, 3840x2160, 17.30 | Alienware x17 R2 P48E AU Optronics B173HAN, IPS, 1920x1080, 17.30 | SCHENKER XMG Ultra 17 Rocket Lake AU Optronics B173HAN05.1, IPS, 1920x1080, 17.30 | MSI Titan GT77 12UHS Sharp SHP1544 LQ173M1JW08, IPS-Level, 1920x1080, 17.30 | |
|---|---|---|---|---|---|
| Display | 1% | -9% | -16% | -14% | |
| Display P3 Coverage | 97 | 99.4 2% | 79.2 -18% | 69.8 -28% | 70.8 -27% |
| sRGB Coverage | 99.8 | 100 0% | 99.8 0% | 97.2 -3% | 98.9 -1% |
| AdobeRGB 1998 Coverage | 86.2 | 87.3 1% | 79.6 -8% | 72 -16% | 73 -15% |
| Response Times | -27% | -109% | -44% | 19% | |
| Response Time Grey 50% / Grey 80% * | 5.2 ? | 7.5 ? -44% | 12.4 ? -138% | 5.6 ? -8% | 3.03 ? 42% |
| Response Time Black / White * | 5.1 ? | 5.6 ? -10% | 9.2 ? -80% | 9.2 ? -80% | 5.28 ? -4% |
| PWM Frequency | |||||
| Screen | 28% | 3% | 9% | -17% | |
| Brightness middle | 418 | 503 20% | 365.4 -13% | 306 -27% | 280 -33% |
| Brightness | 401 | 486 21% | 344 -14% | 299 -25% | 275 -31% |
| Brightness Distribution | 91 | 84 -8% | 85 -7% | 93 2% | 79 -13% |
| Black Level * | 0.48 | 0.44 8% | 0.29 40% | 0.22 54% | 0.4 17% |
| Contrast | 871 | 1143 31% | 1260 45% | 1391 60% | 700 -20% |
| Colorchecker dE 2000 * | 2.47 | 1.08 56% | 3.17 -28% | 1.92 22% | 2.1 15% |
| Colorchecker dE 2000 max. * | 7.81 | 4.54 42% | 7.69 2% | 4.78 39% | 5.83 25% |
| Colorchecker dE 2000 calibrated * | 0.66 | 0.6 9% | 0.51 23% | 1.34 -103% | 1.58 -139% |
| Greyscale dE 2000 * | 4.4 | 1.3 70% | 5.3 -20% | 2 55% | 3.3 25% |
| Gamma | 2.129 103% | 2.151 102% | 2.18 101% | 2.153 102% | 2.13 103% |
| CCT | 7197 90% | 6541 99% | 5879 111% | 6738 96% | 7060 92% |
| Color Space (Percent of AdobeRGB 1998) | 72 | ||||
| Color Space (Percent of sRGB) | 93 | ||||
| Total Average (Program / Settings) | 1% /
14% | -38% /
-15% | -17% /
-4% | -4% /
-11% |
* ... smaller is better
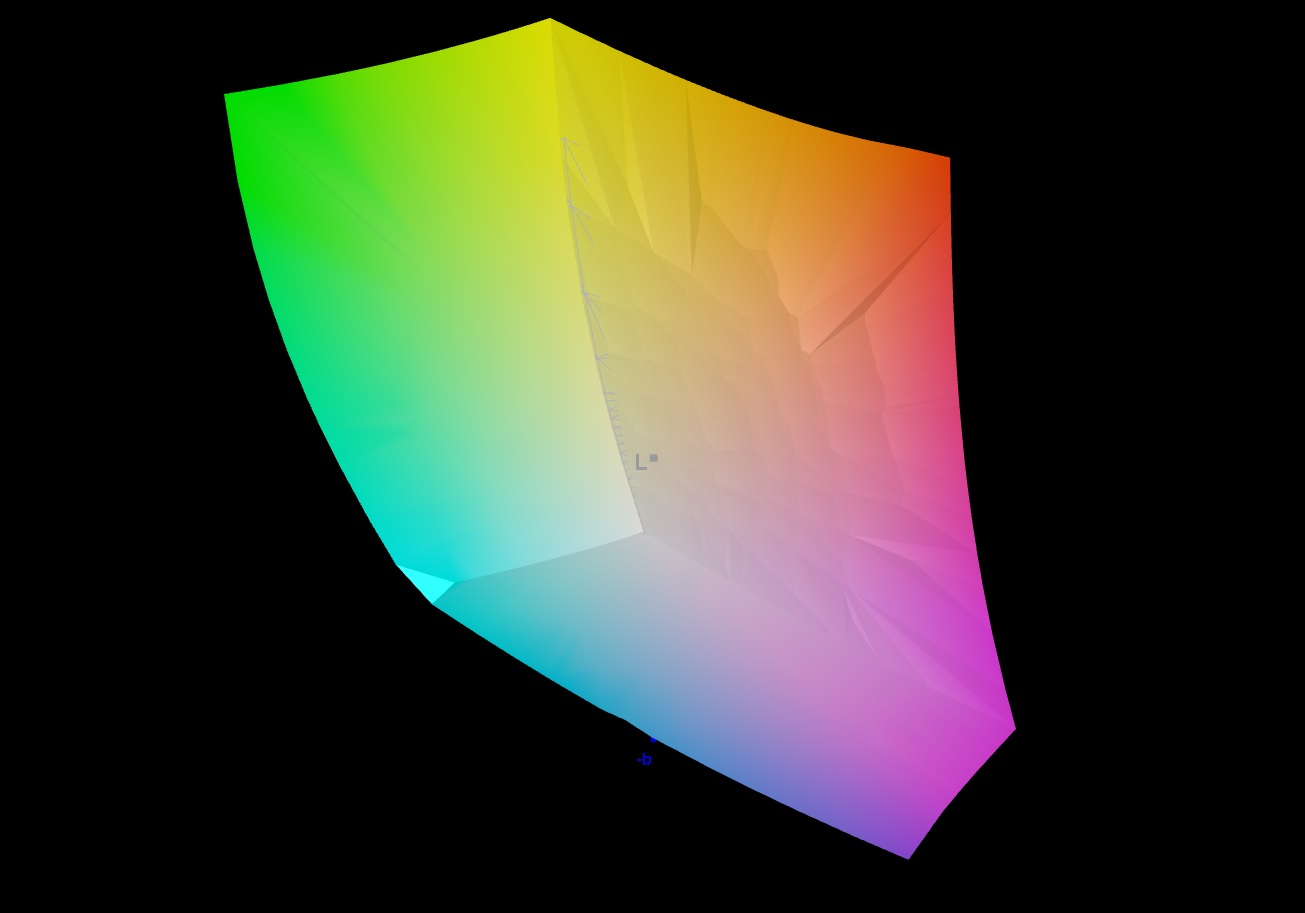
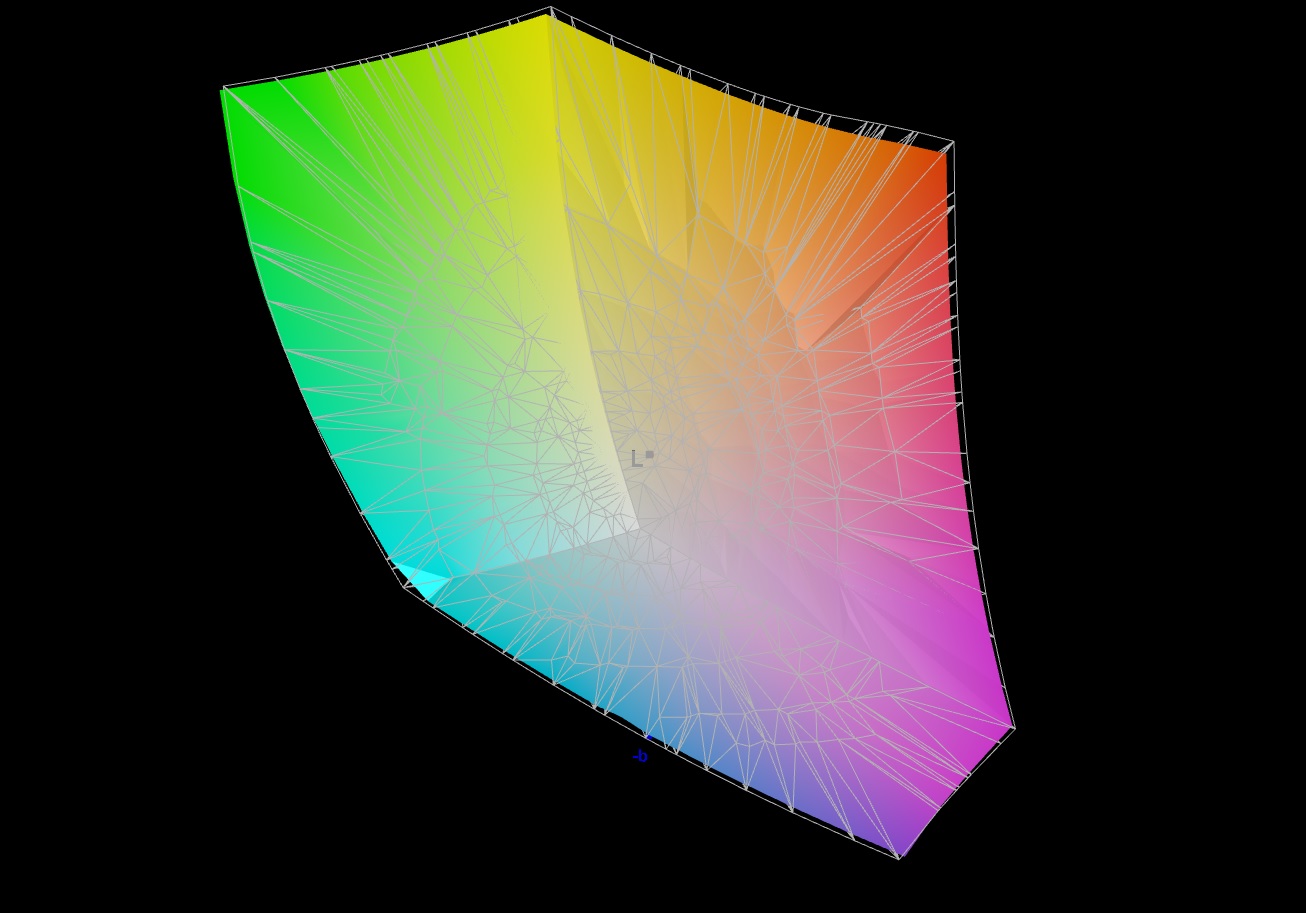
The 4K display covers almost the entire sRGB (99.8%) and DCI-P3 (97%) colour space and up to 86% of AdobeRGB. The FHD panel on the sibling model is unable to keep up in this regard (sRGB: 97%, AdobeRGB: 73%, DCI-P3: 71%). This means the 4K panel is the best option if colour accuracy is important to you.
The screens already have good colour reproduction right out of the box: the UHD and FHD displays meet the desired value (Delta E < 3) with their non-perceptible colour differences of 2.47 and 2.1 respectively. Calibrating the screens made their greyscale reproduction more balanced and decreased the colour differences to 0.66 and 1.58 respectively. In the infobox for each display, you can find a link to download the colour profiles created by us for free.
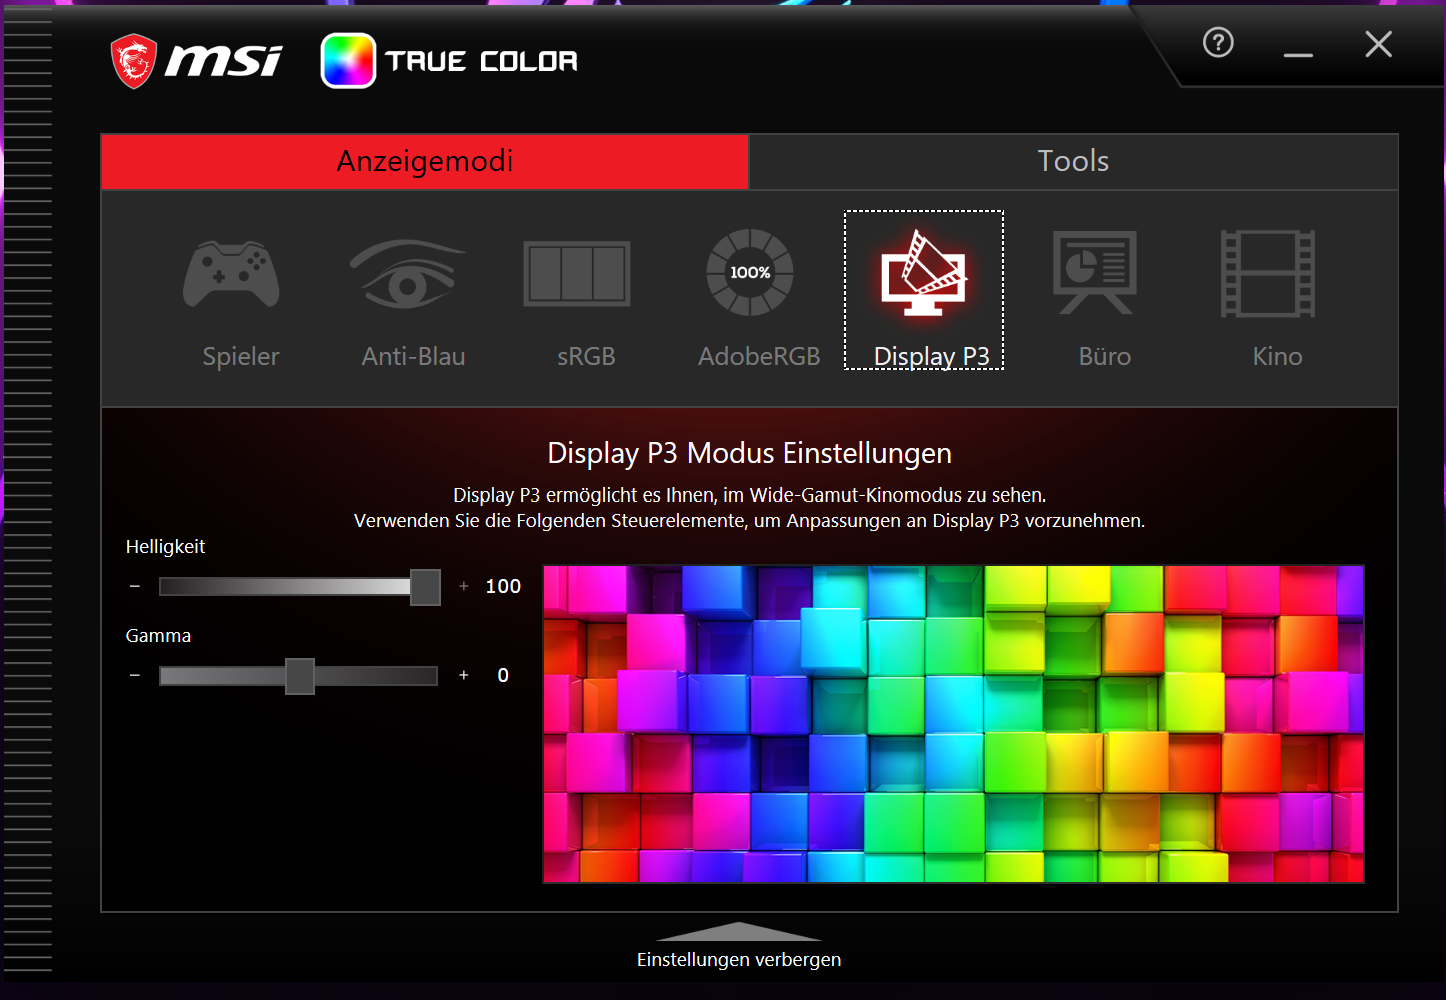
Note: The MSI True Color software allows you to adjust the colours to better suit a colour gamut or a defined usage scenario. We chose the preset "Display P3".


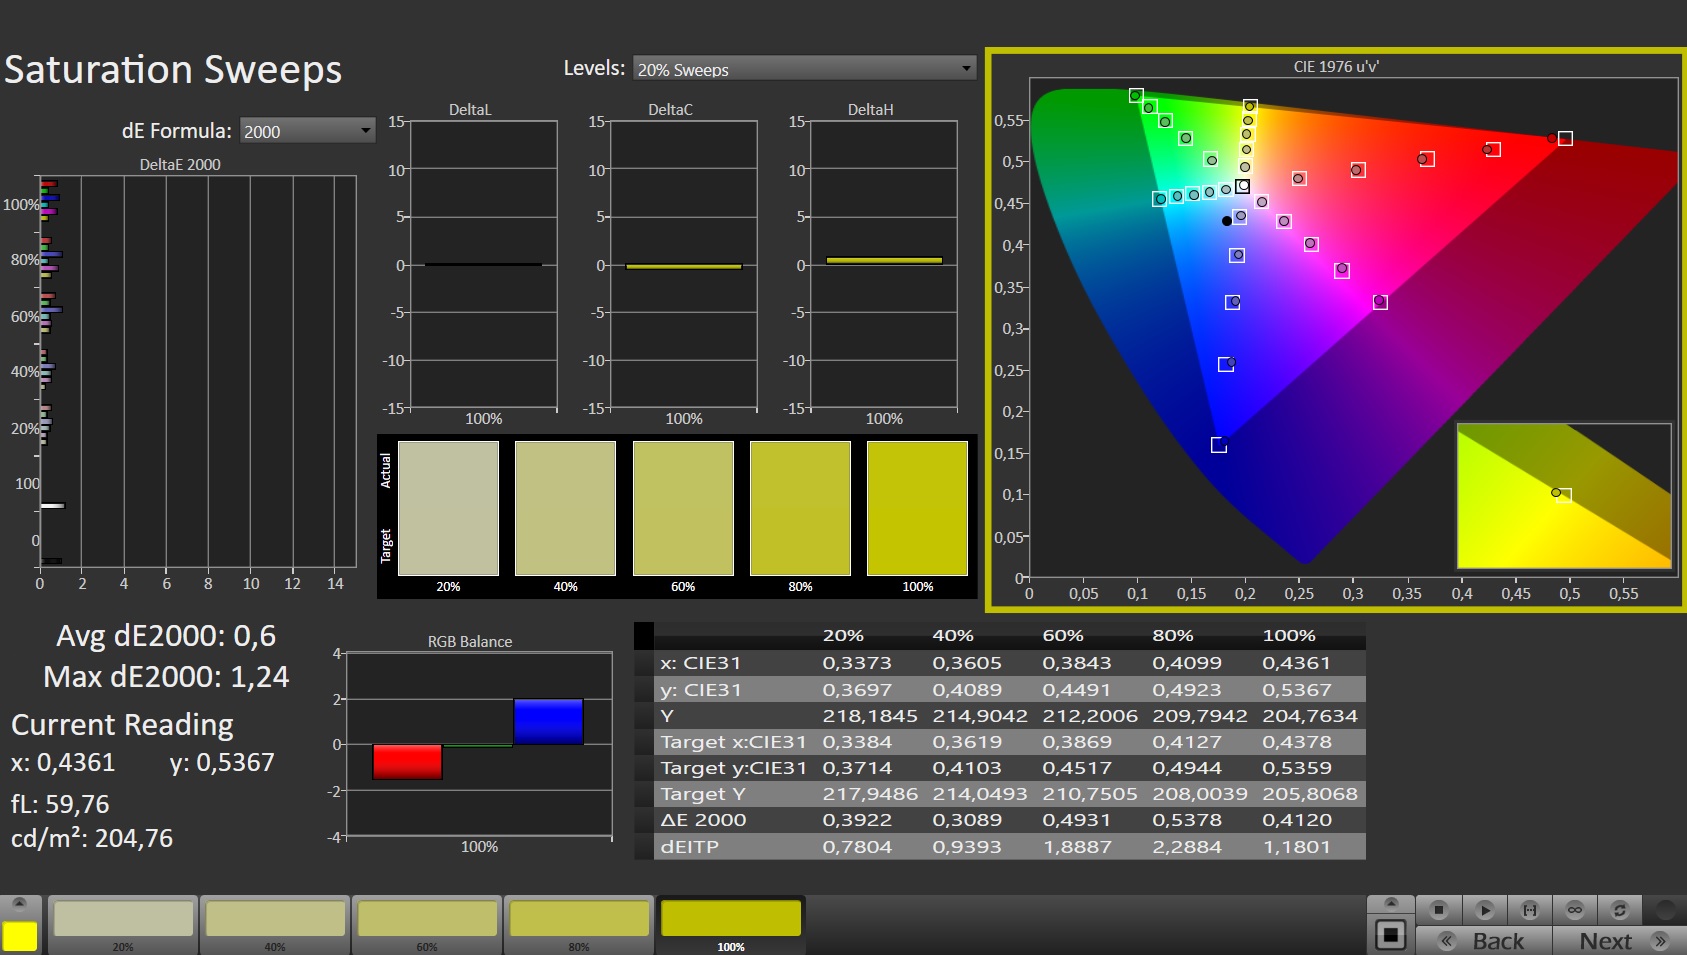


Display Response Times
| ↔ Response Time Black to White | ||
|---|---|---|
| 5.1 ms ... rise ↗ and fall ↘ combined | ↗ 1.5 ms rise | 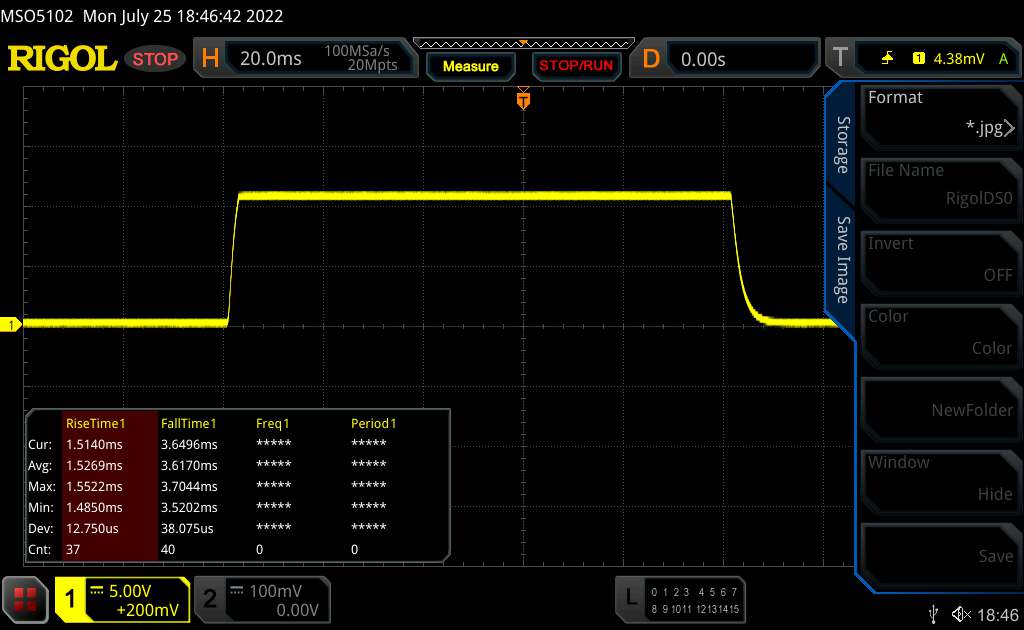 |
| ↘ 3.6 ms fall | ||
| The screen shows very fast response rates in our tests and should be very well suited for fast-paced gaming. In comparison, all tested devices range from 0.1 (minimum) to 240 (maximum) ms. » 12 % of all devices are better. This means that the measured response time is better than the average of all tested devices (21.4 ms). | ||
| ↔ Response Time 50% Grey to 80% Grey | ||
| 5.2 ms ... rise ↗ and fall ↘ combined | ↗ 1.2 ms rise |  |
| ↘ 4 ms fall | ||
| The screen shows very fast response rates in our tests and should be very well suited for fast-paced gaming. In comparison, all tested devices range from 0.2 (minimum) to 636 (maximum) ms. » 12 % of all devices are better. This means that the measured response time is better than the average of all tested devices (33.7 ms). | ||
Screen Flickering / PWM (Pulse-Width Modulation)
| Screen flickering / PWM not detected | 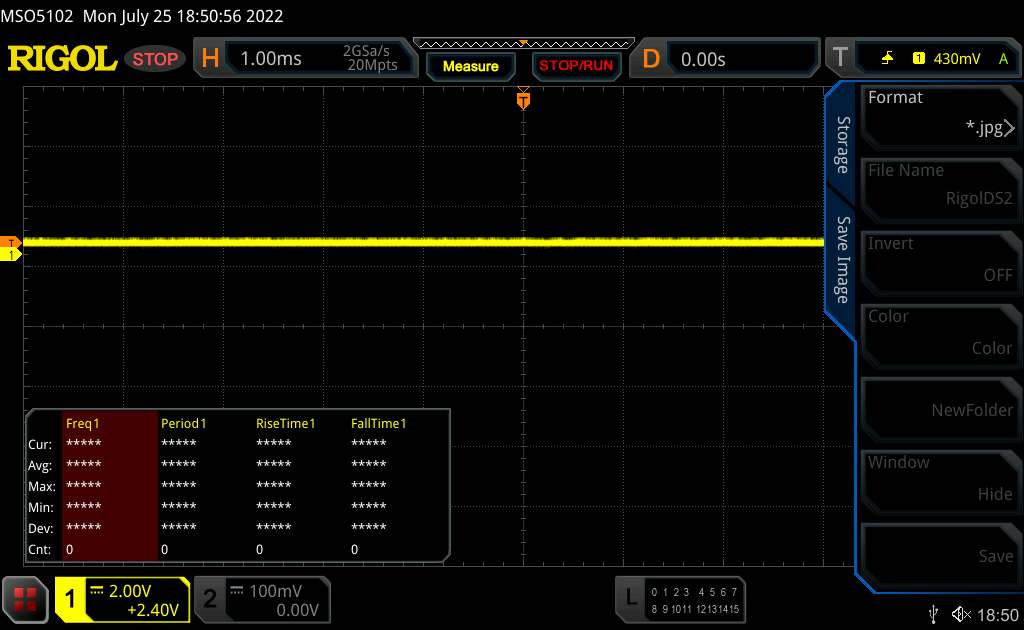 | ||
In comparison: 53 % of all tested devices do not use PWM to dim the display. If PWM was detected, an average of 17844 (minimum: 5 - maximum: 3846000) Hz was measured. | |||
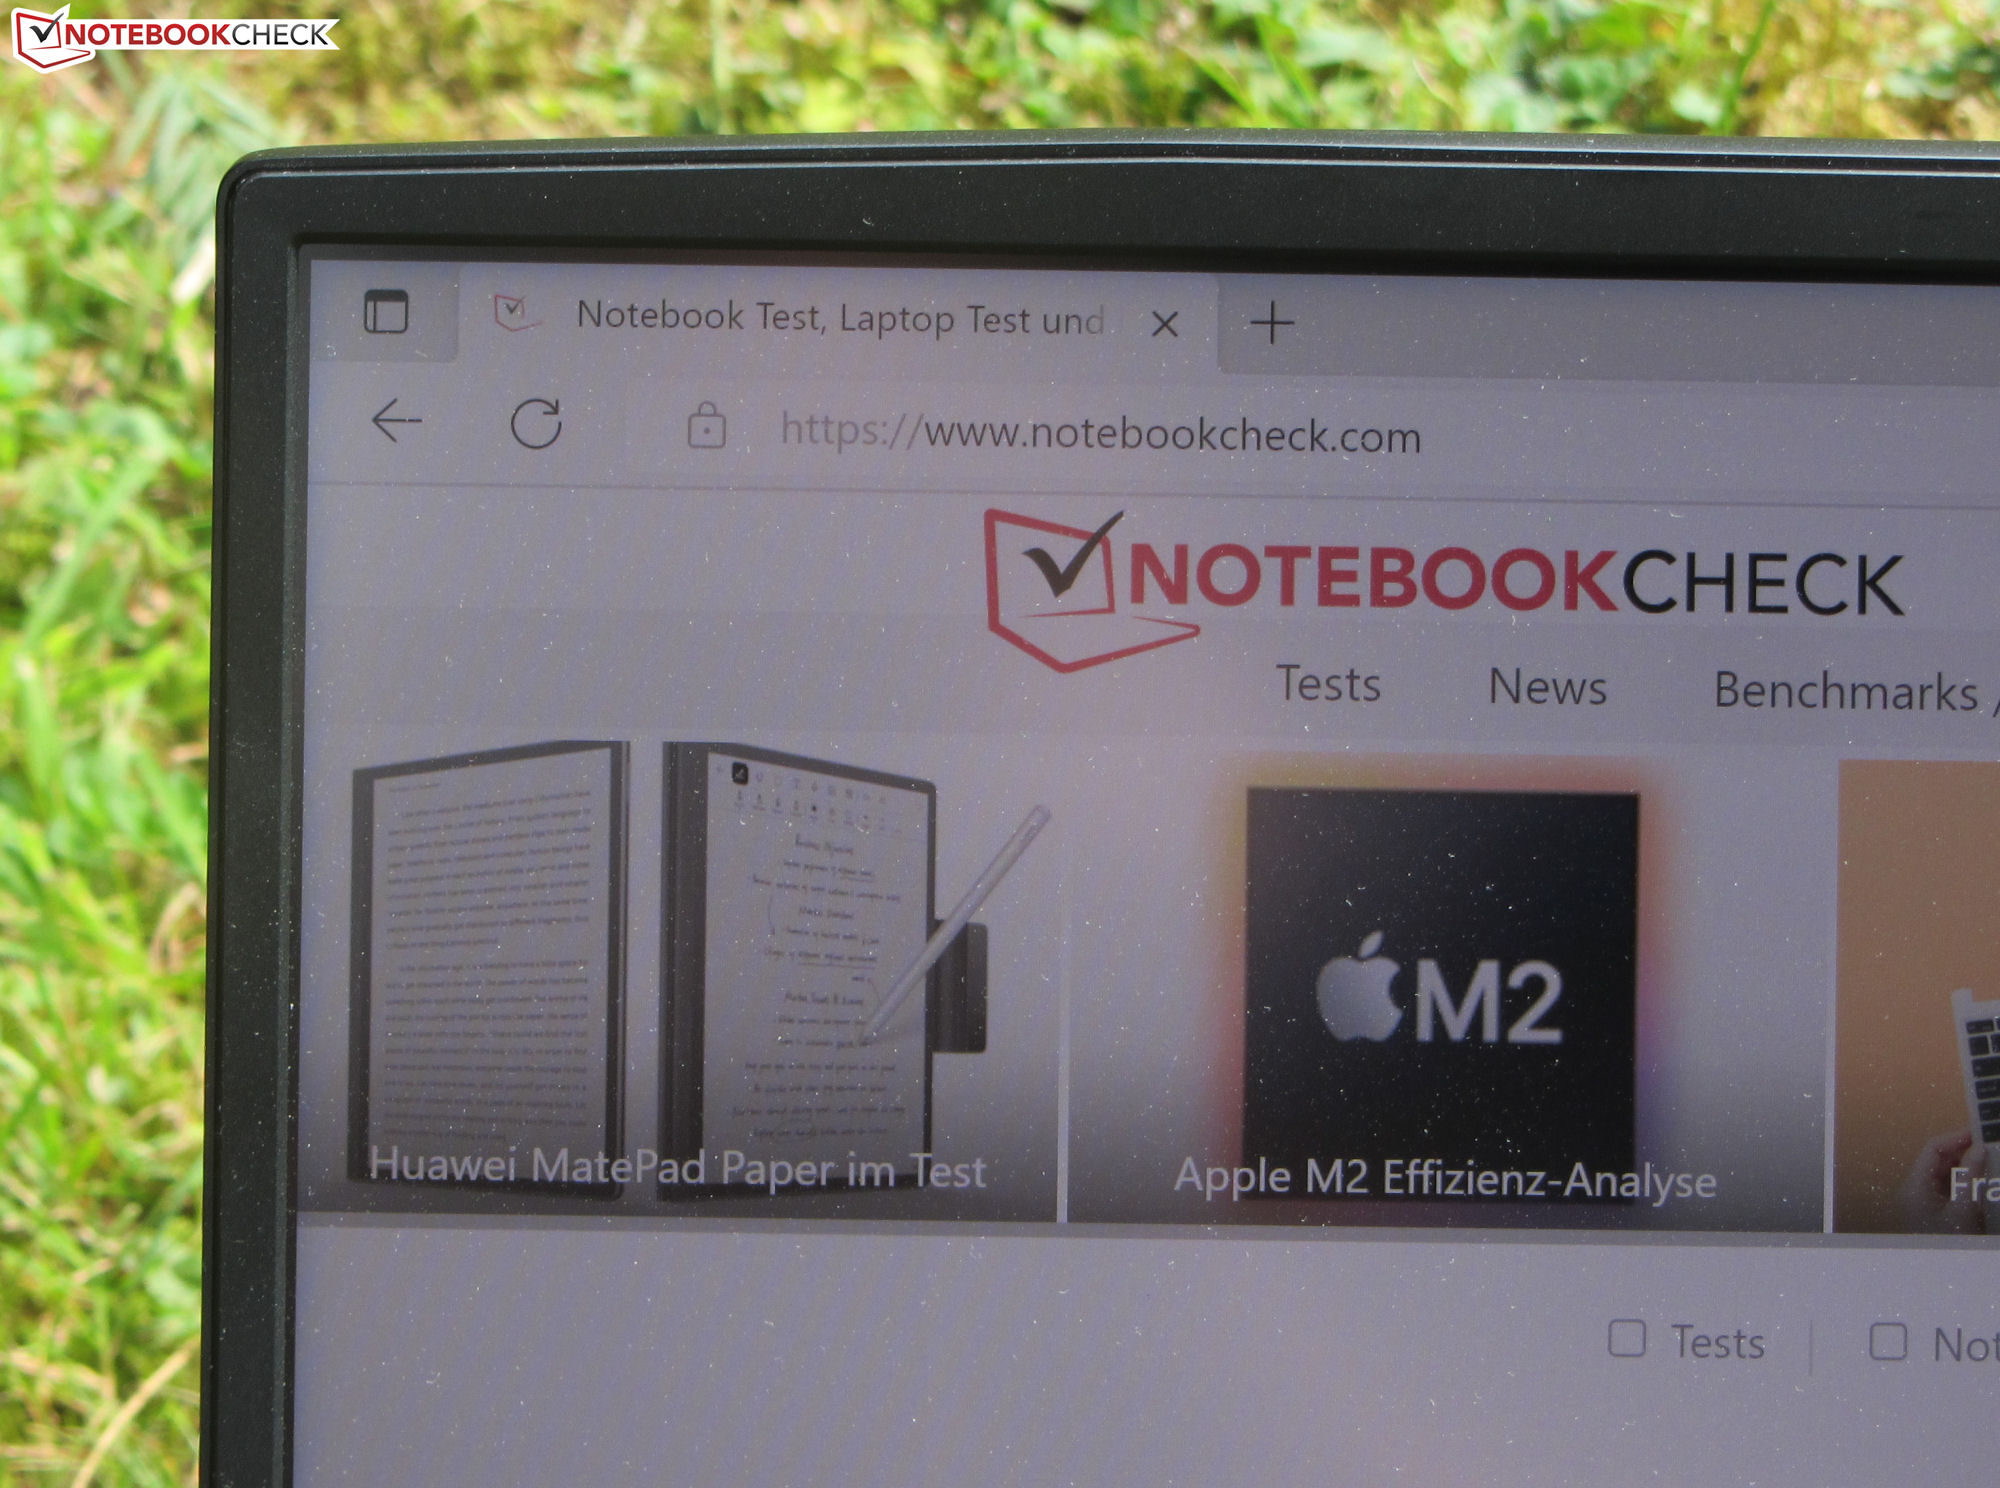
The IPS panel offers a stable viewing angle and thus can be easily view from any position. The display is also very readable outdoors.


Inaccurate colour reproduction due to software issues
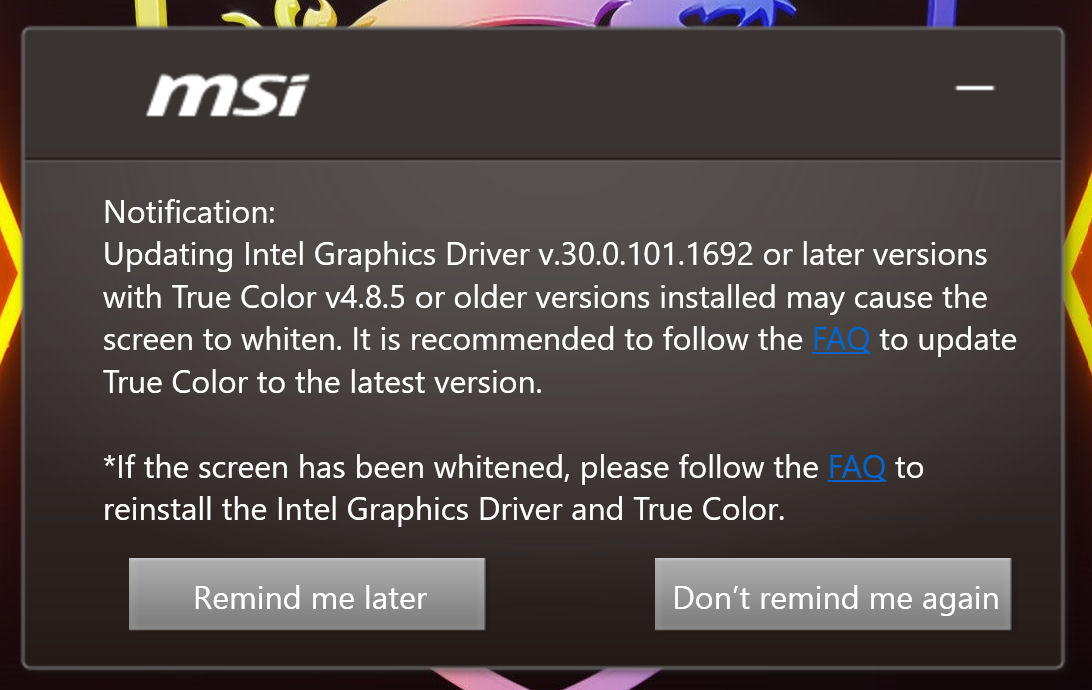
Certain combinations of True Color software and iGPU driver may lead to inaccurate reproduction of images. When this happens, all the colours shown will appear distorted and whitened. MSI recommends fully deinstalling and then reinstalling both components. After giving it a try, we found that this method solves the issue.
Performance - Ampere and Alder Lake provide lots of oomph.
With the Titan GT77 12UHS, MSI has a very powerful 17.3-inch laptop in its product range that performs well in all kinds of demanding usage scenarios.


Test conditions
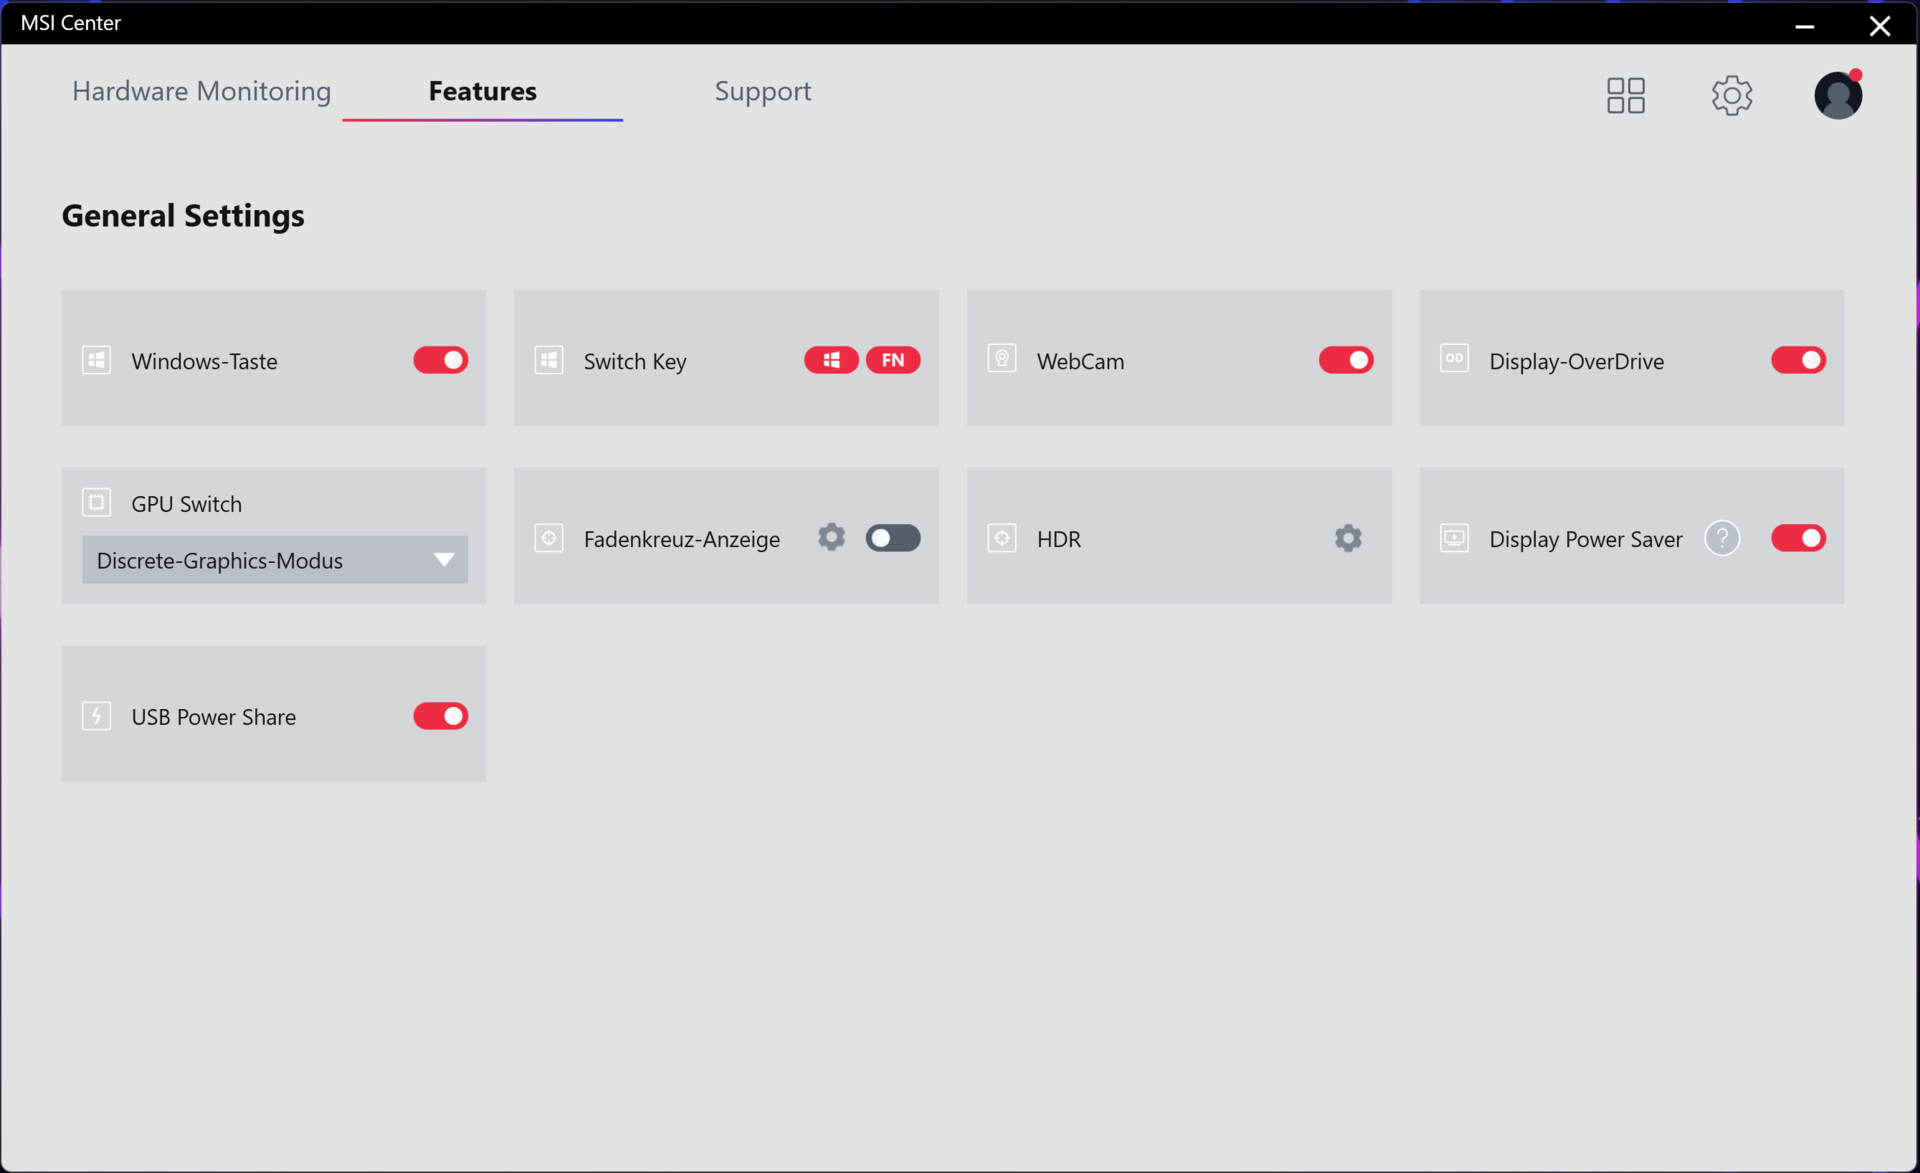
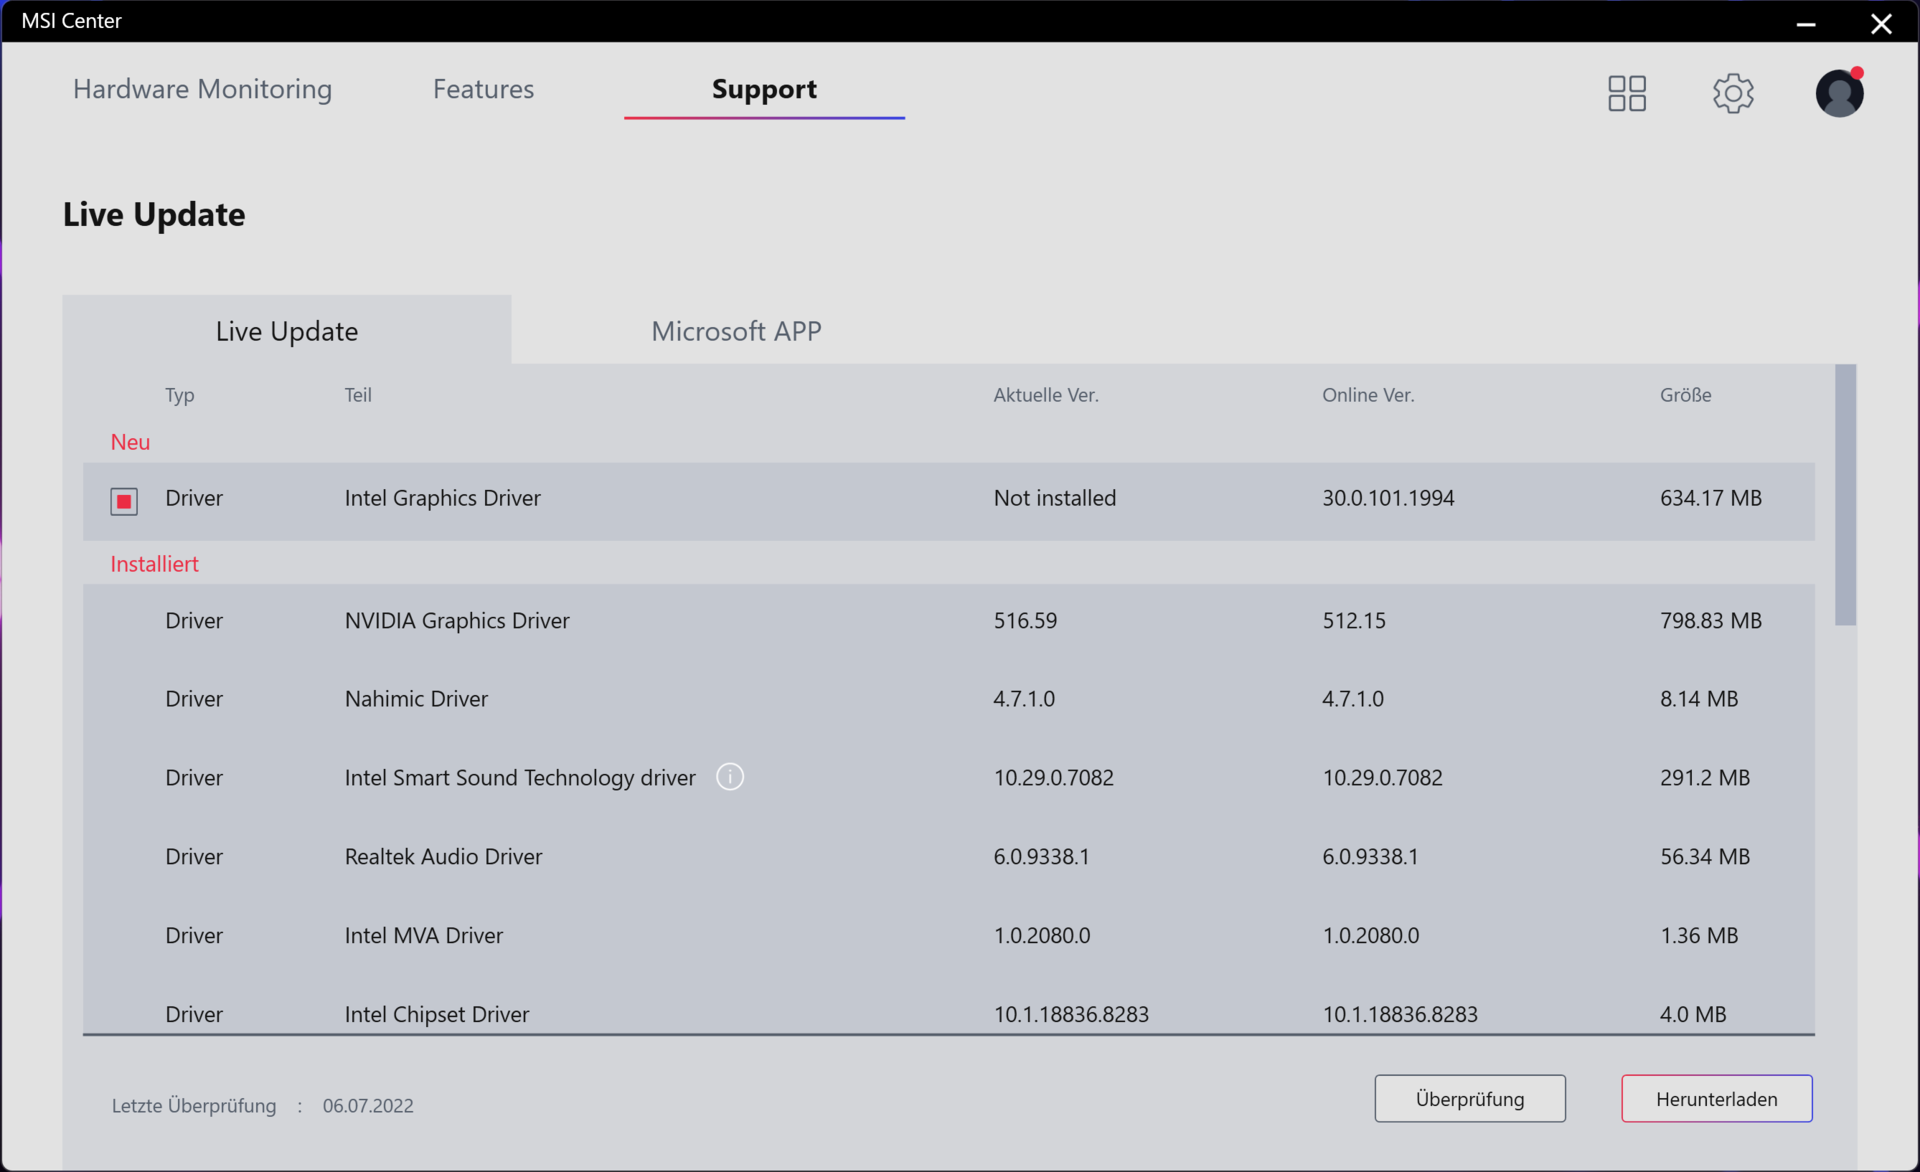
You can switch between four performance profiles using the preinstalled MSI Center (see pictures) or by pressing the key combination Fn+F7. If the higher-level, AI-based "Smart Auto" feature is activated (as in our case), the MSI Center will automatically choose the appropriate profile for the current situation.
We tested the FHD model with the dGPU mode active. In contrast, Nvidia Optimus was enabled during our review of the current device. Therefore, the measurement results may not always be directly comparable.


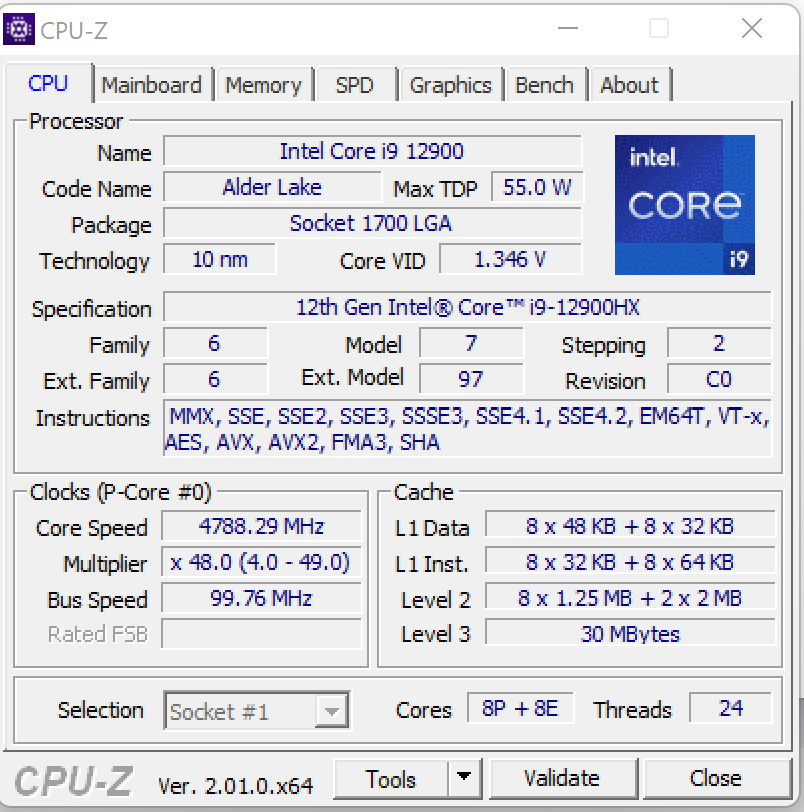
Processor
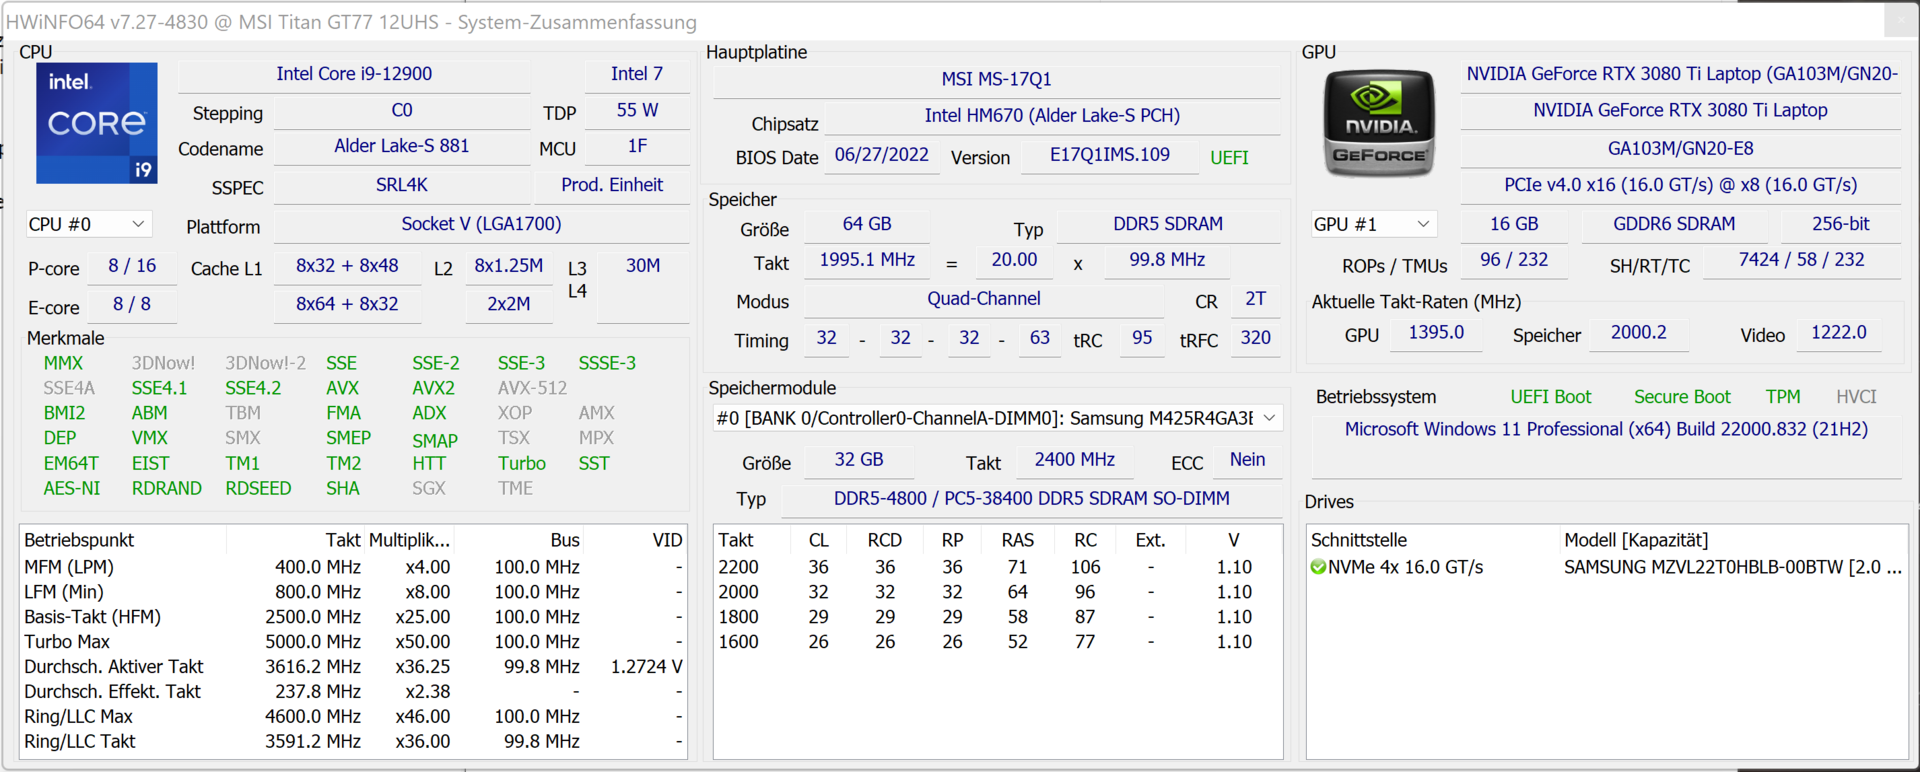
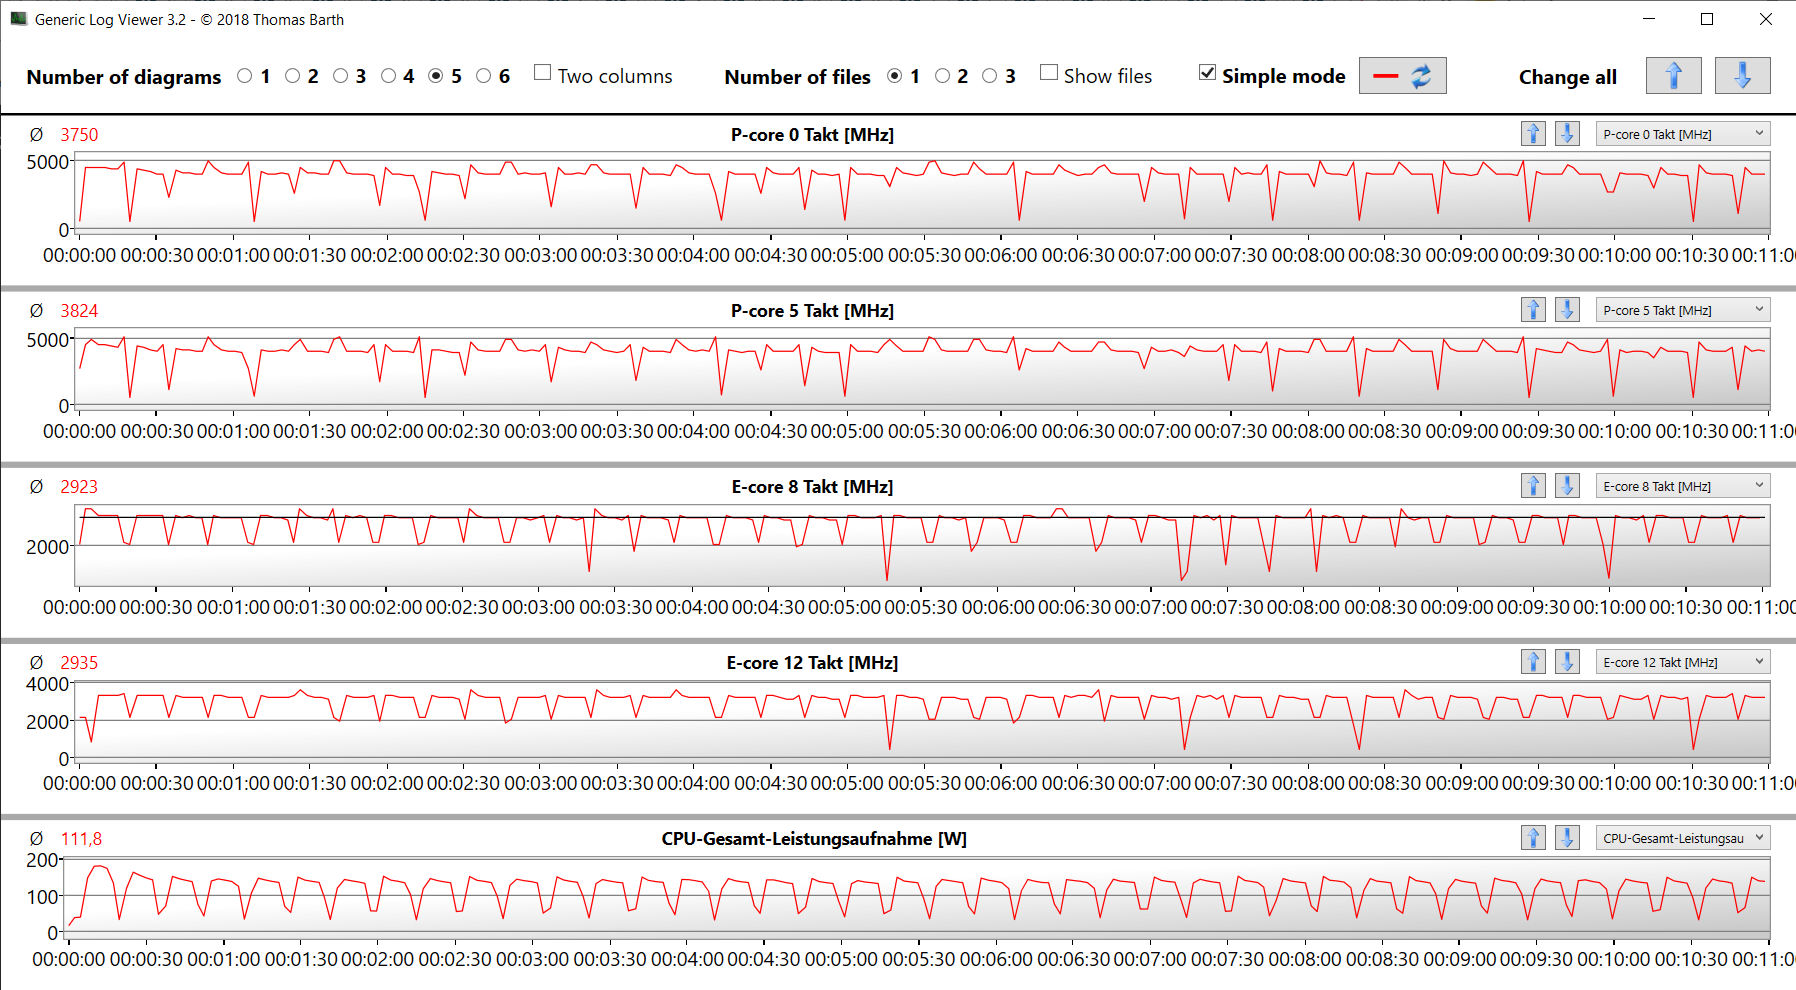
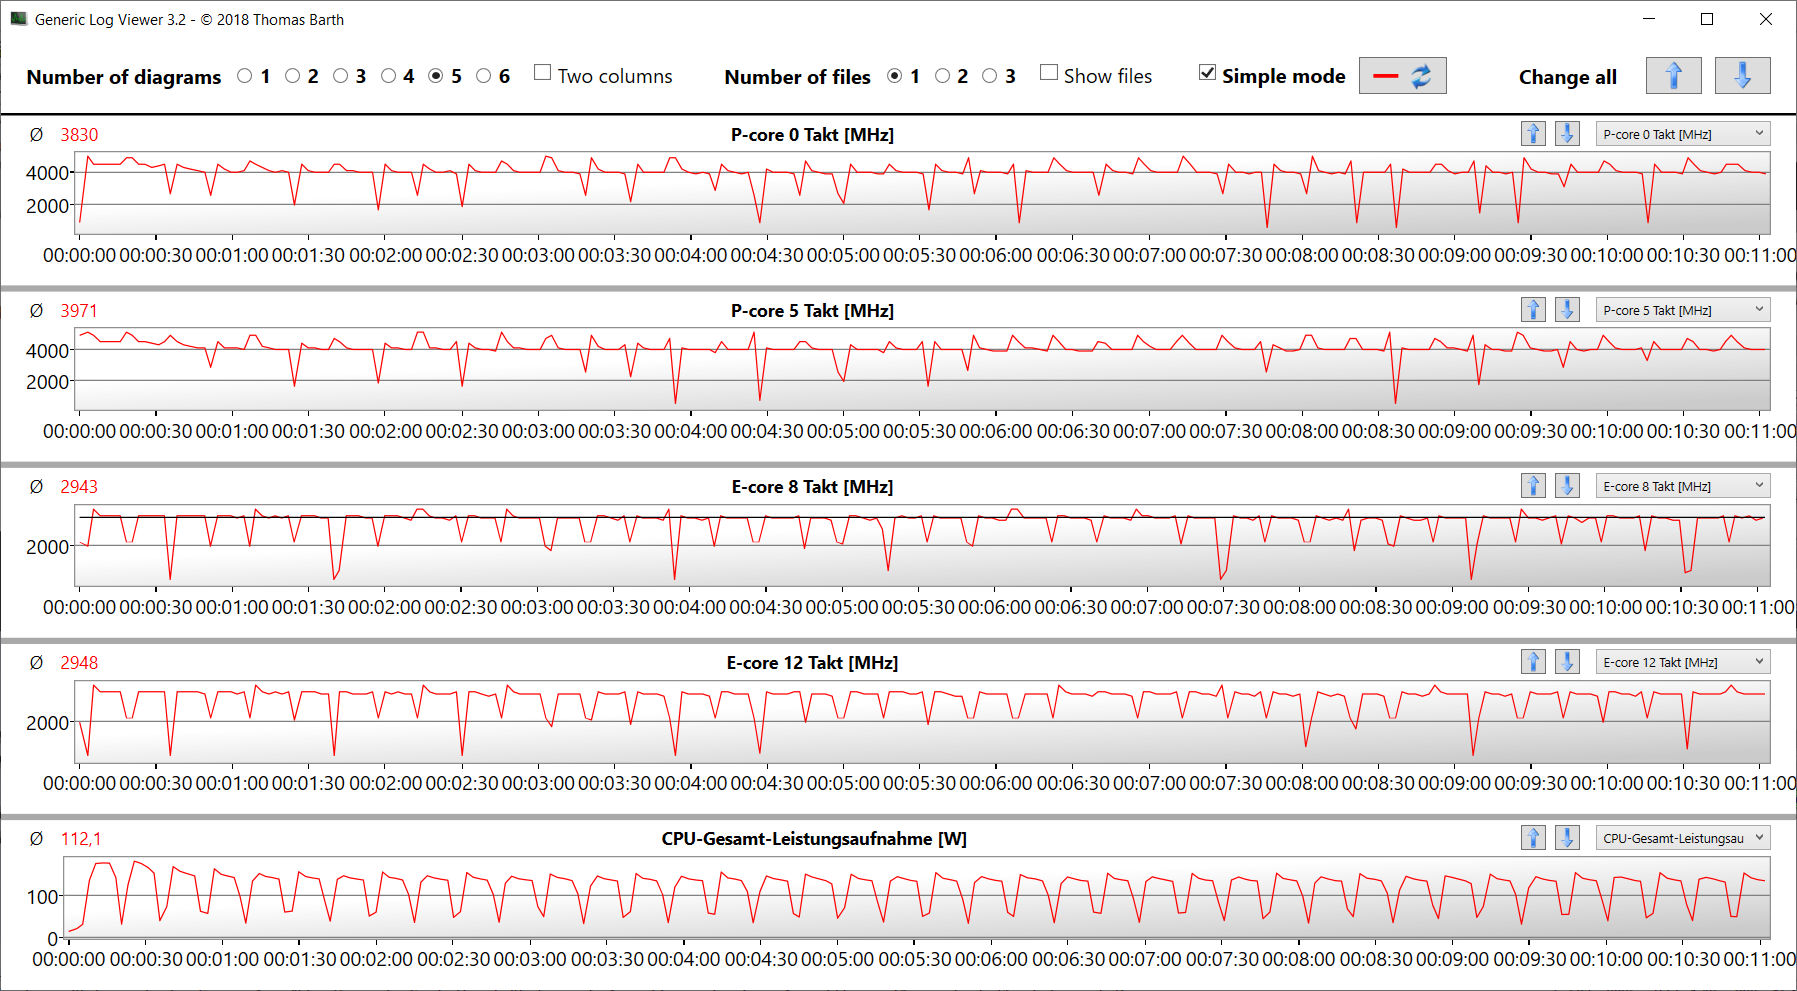
The Core i9-12900HX processor (Alder Lake) consists of eight performance cores (Hyper-Threading, 2.3 to 5 GHz) and eight efficiency cores (no Hyper-Threading, 1.7 to 3.6 GHz), giving a total of 24 threads.
In Cinebench R15, the CPU completed both the multi-thread test (P-cores: 4.4 GHz, E-cores: 3.3 GHz) and the single-thread test (P-cores: 500 MHz to 5 GHz, E-cores: 400 MHz to 3.6 GHz) at high clock speeds. It performed slightly slower on battery power.


The Cinebench 15 loop test revealed that the CPU is able to run at high clock speeds continuously. Using the "Extreme Performance" profile caused the performance to be marginally more stable.
Cinebench R15 Multi continuous test
| CPU Performance Rating - Percent | |
| MSI Titan GT77 12UHS 4k | |
| MSI Titan GT77 12UHS | |
| MSI Titan GT77 12UHS | |
| Average Intel Core i9-12900HX | |
| Alienware x17 R2 P48E | |
| Average of class Gaming | |
| SCHENKER XMG Ultra 17 Rocket Lake | |
| Razer Blade 17 Early 2022 | |
| Cinebench R23 | |
| Multi Core | |
| MSI Titan GT77 12UHS 4k | |
| MSI Titan GT77 12UHS (4k, Extreme Leistung, Cooler Boost) | |
| MSI Titan GT77 12UHS | |
| Average Intel Core i9-12900HX (18337 - 23482, n=8) | |
| Average of class Gaming (2435 - 34613, n=228, last 2 years) | |
| Alienware x17 R2 P48E | |
| SCHENKER XMG Ultra 17 Rocket Lake | |
| Razer Blade 17 Early 2022 | |
| Single Core | |
| MSI Titan GT77 12UHS 4k | |
| Average Intel Core i9-12900HX (1897 - 1936, n=8) | |
| MSI Titan GT77 12UHS | |
| MSI Titan GT77 12UHS (4k, Extreme Leistung, Cooler Boost) | |
| Razer Blade 17 Early 2022 | |
| Alienware x17 R2 P48E | |
| Average of class Gaming (527 - 2235, n=226, last 2 years) | |
| SCHENKER XMG Ultra 17 Rocket Lake | |
| Cinebench R20 | |
| CPU (Multi Core) | |
| MSI Titan GT77 12UHS 4k | |
| MSI Titan GT77 12UHS (4k, Extreme Leistung, Cooler Boost) | |
| MSI Titan GT77 12UHS | |
| Average Intel Core i9-12900HX (7037 - 9042, n=8) | |
| Average of class Gaming (930 - 13769, n=226, last 2 years) | |
| Alienware x17 R2 P48E | |
| SCHENKER XMG Ultra 17 Rocket Lake | |
| Razer Blade 17 Early 2022 | |
| CPU (Single Core) | |
| MSI Titan GT77 12UHS 4k | |
| MSI Titan GT77 12UHS | |
| Average Intel Core i9-12900HX (728 - 745, n=8) | |
| MSI Titan GT77 12UHS (4k, Extreme Leistung, Cooler Boost) | |
| Alienware x17 R2 P48E | |
| Average of class Gaming (169 - 855, n=226, last 2 years) | |
| Razer Blade 17 Early 2022 | |
| SCHENKER XMG Ultra 17 Rocket Lake | |
| Cinebench R15 | |
| CPU Multi 64Bit | |
| MSI Titan GT77 12UHS 4k | |
| MSI Titan GT77 12UHS (4k, Extreme Leistung, Cooler Boost) | |
| MSI Titan GT77 12UHS | |
| Average Intel Core i9-12900HX (2830 - 3652, n=8) | |
| Average of class Gaming (400 - 5663, n=230, last 2 years) | |
| Alienware x17 R2 P48E | |
| SCHENKER XMG Ultra 17 Rocket Lake | |
| Razer Blade 17 Early 2022 | |
| CPU Single 64Bit | |
| MSI Titan GT77 12UHS 4k | |
| MSI Titan GT77 12UHS | |
| MSI Titan GT77 12UHS (4k, Extreme Leistung, Cooler Boost) | |
| Average Intel Core i9-12900HX (274 - 282, n=8) | |
| Alienware x17 R2 P48E | |
| Average of class Gaming (79.2 - 318, n=229, last 2 years) | |
| Razer Blade 17 Early 2022 | |
| SCHENKER XMG Ultra 17 Rocket Lake | |
| Blender - v2.79 BMW27 CPU | |
| Razer Blade 17 Early 2022 | |
| SCHENKER XMG Ultra 17 Rocket Lake | |
| Average of class Gaming (87 - 1259, n=223, last 2 years) | |
| Alienware x17 R2 P48E | |
| Average Intel Core i9-12900HX (144 - 201, n=8) | |
| MSI Titan GT77 12UHS 4k | |
| MSI Titan GT77 12UHS | |
| MSI Titan GT77 12UHS (4k, Extreme Leistung, Cooler Boost) | |
| 7-Zip 18.03 | |
| 7z b 4 | |
| MSI Titan GT77 12UHS 4k | |
| MSI Titan GT77 12UHS (4k, Extreme Leistung, Cooler Boost) | |
| MSI Titan GT77 12UHS | |
| Average Intel Core i9-12900HX (69778 - 88128, n=7) | |
| Average of class Gaming (11386 - 140932, n=225, last 2 years) | |
| Alienware x17 R2 P48E | |
| SCHENKER XMG Ultra 17 Rocket Lake | |
| Razer Blade 17 Early 2022 | |
| 7z b 4 -mmt1 | |
| MSI Titan GT77 12UHS 4k | |
| Average Intel Core i9-12900HX (6165 - 6358, n=7) | |
| MSI Titan GT77 12UHS | |
| MSI Titan GT77 12UHS | |
| SCHENKER XMG Ultra 17 Rocket Lake | |
| Average of class Gaming (2685 - 7581, n=225, last 2 years) | |
| Razer Blade 17 Early 2022 | |
| Alienware x17 R2 P48E | |
| Geekbench 5.5 | |
| Multi-Core | |
| MSI Titan GT77 12UHS 4k | |
| MSI Titan GT77 12UHS (4k, Extreme Leistung, Cooler Boost) | |
| MSI Titan GT77 12UHS | |
| Average Intel Core i9-12900HX (15116 - 16925, n=8) | |
| Average of class Gaming (1946 - 22200, n=230, last 2 years) | |
| Alienware x17 R2 P48E | |
| SCHENKER XMG Ultra 17 Rocket Lake | |
| Razer Blade 17 Early 2022 | |
| Single-Core | |
| MSI Titan GT77 12UHS | |
| MSI Titan GT77 12UHS 4k | |
| MSI Titan GT77 12UHS (4k, Extreme Leistung, Cooler Boost) | |
| Average Intel Core i9-12900HX (1874 - 1949, n=8) | |
| Alienware x17 R2 P48E | |
| Average of class Gaming (158 - 2210, n=230, last 2 years) | |
| Razer Blade 17 Early 2022 | |
| SCHENKER XMG Ultra 17 Rocket Lake | |
| HWBOT x265 Benchmark v2.2 - 4k Preset | |
| MSI Titan GT77 12UHS 4k | |
| MSI Titan GT77 12UHS (4k, Extreme Leistung, Cooler Boost) | |
| MSI Titan GT77 12UHS | |
| Average Intel Core i9-12900HX (19.6 - 26.6, n=7) | |
| Alienware x17 R2 P48E | |
| Average of class Gaming (3 - 37.6, n=228, last 2 years) | |
| SCHENKER XMG Ultra 17 Rocket Lake | |
| Razer Blade 17 Early 2022 | |
| LibreOffice - 20 Documents To PDF | |
| Average of class Gaming (32.8 - 332, n=222, last 2 years) | |
| Alienware x17 R2 P48E | |
| SCHENKER XMG Ultra 17 Rocket Lake | |
| Razer Blade 17 Early 2022 | |
| MSI Titan GT77 12UHS | |
| MSI Titan GT77 12UHS 4k | |
| Average Intel Core i9-12900HX (33.6 - 42.4, n=7) | |
| MSI Titan GT77 12UHS (4k, Extreme Leistung, Cooler Boost) | |
| R Benchmark 2.5 - Overall mean | |
| SCHENKER XMG Ultra 17 Rocket Lake | |
| Average of class Gaming (0.3609 - 4.47, n=225, last 2 years) | |
| Razer Blade 17 Early 2022 | |
| Alienware x17 R2 P48E | |
| MSI Titan GT77 12UHS 4k | |
| MSI Titan GT77 12UHS (4k, Extreme Leistung, Cooler Boost) | |
| Average Intel Core i9-12900HX (0.4159 - 0.4242, n=7) | |
| MSI Titan GT77 12UHS | |
* ... smaller is better
AIDA64: FP32 Ray-Trace | FPU Julia | CPU SHA3 | CPU Queen | FPU SinJulia | FPU Mandel | CPU AES | CPU ZLib | FP64 Ray-Trace | CPU PhotoWorxx
| Performance Rating | |
| MSI Titan GT77 12UHS 4k | |
| MSI Titan GT77 12UHS | |
| MSI Titan GT77 12UHS | |
| Average Intel Core i9-12900HX | |
| Average of class Gaming | |
| SCHENKER XMG Ultra 17 Rocket Lake | |
| Alienware x17 R2 P48E | |
| Razer Blade 17 Early 2022 | |
| AIDA64 / FP32 Ray-Trace | |
| MSI Titan GT77 12UHS 4k (v6.70.6000) | |
| MSI Titan GT77 12UHS (v6.70.6000, 4k, Extreme Leistung, Cooler Boost) | |
| MSI Titan GT77 12UHS (v6.70.6000) | |
| Average Intel Core i9-12900HX (11535 - 22183, n=7) | |
| Average of class Gaming (3069 - 60169, n=221, last 2 years) | |
| SCHENKER XMG Ultra 17 Rocket Lake (v6.32.5600) | |
| Alienware x17 R2 P48E (v6.50.5800) | |
| Razer Blade 17 Early 2022 (v6.50.5800) | |
| AIDA64 / FPU Julia | |
| MSI Titan GT77 12UHS 4k (v6.70.6000) | |
| MSI Titan GT77 12UHS (v6.70.6000) | |
| MSI Titan GT77 12UHS (v6.70.6000, 4k, Extreme Leistung, Cooler Boost) | |
| Average Intel Core i9-12900HX (52916 - 110093, n=7) | |
| Average of class Gaming (18567 - 252486, n=221, last 2 years) | |
| SCHENKER XMG Ultra 17 Rocket Lake (v6.32.5600) | |
| Alienware x17 R2 P48E (v6.50.5800) | |
| Razer Blade 17 Early 2022 (v6.50.5800) | |
| AIDA64 / CPU SHA3 | |
| MSI Titan GT77 12UHS 4k (v6.70.6000) | |
| MSI Titan GT77 12UHS (v6.70.6000, 4k, Extreme Leistung, Cooler Boost) | |
| MSI Titan GT77 12UHS (v6.70.6000) | |
| SCHENKER XMG Ultra 17 Rocket Lake (v6.32.5600) | |
| Average Intel Core i9-12900HX (3559 - 5123, n=7) | |
| Average of class Gaming (629 - 10389, n=221, last 2 years) | |
| Alienware x17 R2 P48E (v6.50.5800) | |
| Razer Blade 17 Early 2022 (v6.50.5800) | |
| AIDA64 / CPU Queen | |
| Average of class Gaming (15371 - 200651, n=221, last 2 years) | |
| Alienware x17 R2 P48E (v6.50.5800) | |
| SCHENKER XMG Ultra 17 Rocket Lake (v6.32.5600) | |
| MSI Titan GT77 12UHS (v6.70.6000) | |
| MSI Titan GT77 12UHS 4k (v6.70.6000) | |
| MSI Titan GT77 12UHS (v6.70.6000, 4k, Extreme Leistung, Cooler Boost) | |
| Average Intel Core i9-12900HX (101029 - 104457, n=7) | |
| Razer Blade 17 Early 2022 (v6.50.5800) | |
| AIDA64 / FPU SinJulia | |
| MSI Titan GT77 12UHS 4k (v6.70.6000) | |
| MSI Titan GT77 12UHS (v6.70.6000, 4k, Extreme Leistung, Cooler Boost) | |
| MSI Titan GT77 12UHS (v6.70.6000) | |
| Average Intel Core i9-12900HX (10475 - 13062, n=7) | |
| Average of class Gaming (2137 - 32988, n=221, last 2 years) | |
| SCHENKER XMG Ultra 17 Rocket Lake (v6.32.5600) | |
| Alienware x17 R2 P48E (v6.50.5800) | |
| Razer Blade 17 Early 2022 (v6.50.5800) | |
| AIDA64 / FPU Mandel | |
| MSI Titan GT77 12UHS 4k (v6.70.6000) | |
| MSI Titan GT77 12UHS (v6.70.6000, 4k, Extreme Leistung, Cooler Boost) | |
| MSI Titan GT77 12UHS (v6.70.6000) | |
| Average of class Gaming (10291 - 134044, n=221, last 2 years) | |
| Average Intel Core i9-12900HX (31779 - 53628, n=7) | |
| SCHENKER XMG Ultra 17 Rocket Lake (v6.32.5600) | |
| Alienware x17 R2 P48E (v6.50.5800) | |
| Razer Blade 17 Early 2022 (v6.50.5800) | |
| AIDA64 / CPU AES | |
| MSI Titan GT77 12UHS (v6.70.6000, 4k, Extreme Leistung, Cooler Boost) | |
| MSI Titan GT77 12UHS | |
| MSI Titan GT77 12UHS 4k (v6.70.6000) | |
| Average Intel Core i9-12900HX (125268 - 183146, n=7) | |
| SCHENKER XMG Ultra 17 Rocket Lake (v6.32.5600) | |
| Average of class Gaming (19065 - 328679, n=221, last 2 years) | |
| Alienware x17 R2 P48E (v6.50.5800) | |
| Razer Blade 17 Early 2022 (v6.50.5800) | |
| AIDA64 / CPU ZLib | |
| MSI Titan GT77 12UHS 4k (v6.70.6000) | |
| MSI Titan GT77 12UHS (v6.70.6000, 4k, Extreme Leistung, Cooler Boost) | |
| MSI Titan GT77 12UHS (v6.70.6000) | |
| Average Intel Core i9-12900HX (990 - 1408, n=7) | |
| Average of class Gaming (150.9 - 2409, n=221, last 2 years) | |
| Alienware x17 R2 P48E (v6.50.5800) | |
| SCHENKER XMG Ultra 17 Rocket Lake (v6.32.5600) | |
| Razer Blade 17 Early 2022 (v6.50.5800) | |
| AIDA64 / FP64 Ray-Trace | |
| MSI Titan GT77 12UHS 4k (v6.70.6000) | |
| MSI Titan GT77 12UHS (v6.70.6000, 4k, Extreme Leistung, Cooler Boost) | |
| MSI Titan GT77 12UHS (v6.70.6000) | |
| Average Intel Core i9-12900HX (6663 - 11913, n=7) | |
| Average of class Gaming (1518 - 31796, n=221, last 2 years) | |
| SCHENKER XMG Ultra 17 Rocket Lake (v6.32.5600) | |
| Alienware x17 R2 P48E (v6.50.5800) | |
| Razer Blade 17 Early 2022 (v6.50.5800) | |
| AIDA64 / CPU PhotoWorxx | |
| Average Intel Core i9-12900HX (40239 - 47710, n=7) | |
| MSI Titan GT77 12UHS (v6.70.6000) | |
| MSI Titan GT77 12UHS 4k (v6.70.6000) | |
| MSI Titan GT77 12UHS (v6.70.6000, 4k, Extreme Leistung, Cooler Boost) | |
| Razer Blade 17 Early 2022 (v6.50.5800) | |
| Average of class Gaming (10805 - 60161, n=222, last 2 years) | |
| Alienware x17 R2 P48E (v6.50.5800) | |
| SCHENKER XMG Ultra 17 Rocket Lake (v6.32.5600) | |
System performance
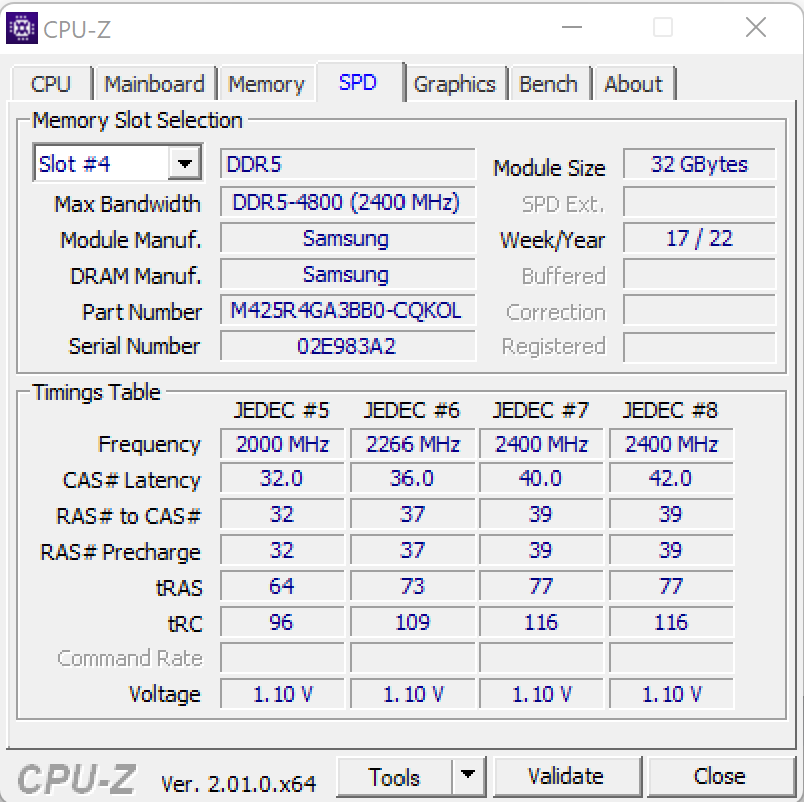
The GT77 doesn't lack computing power - this is immediately obvious just by looking at its specifications. The 17-inch laptop can handle gaming, rendering and much more with ease. The RAM transfer rates are in line with the usual performance level of DDR4-4800 memory. The system also obtained good results in PCMark.

CrossMark: Overall | Productivity | Creativity | Responsiveness
| PCMark 10 / Score | |
| MSI Titan GT77 12UHS (dGPU, Extreme Leistung) | |
| MSI Titan GT77 12UHS | |
| Alienware x17 R2 P48E | |
| Average Intel Core i9-12900HX, NVIDIA GeForce RTX 3080 Ti Laptop GPU (6812 - 8636, n=6) | |
| SCHENKER XMG Ultra 17 Rocket Lake | |
| Average of class Gaming (5235 - 9852, n=196, last 2 years) | |
| Razer Blade 17 Early 2022 | |
| MSI Titan GT77 12UHS 4k | |
| PCMark 10 / Essentials | |
| Alienware x17 R2 P48E | |
| MSI Titan GT77 12UHS (dGPU, Extreme Leistung) | |
| MSI Titan GT77 12UHS | |
| SCHENKER XMG Ultra 17 Rocket Lake | |
| Average of class Gaming (8300 - 12334, n=195, last 2 years) | |
| Average Intel Core i9-12900HX, NVIDIA GeForce RTX 3080 Ti Laptop GPU (9598 - 11192, n=6) | |
| Razer Blade 17 Early 2022 | |
| MSI Titan GT77 12UHS 4k | |
| PCMark 10 / Productivity | |
| MSI Titan GT77 12UHS (dGPU, Extreme Leistung) | |
| Average Intel Core i9-12900HX, NVIDIA GeForce RTX 3080 Ti Laptop GPU (9365 - 10932, n=6) | |
| MSI Titan GT77 12UHS | |
| Alienware x17 R2 P48E | |
| SCHENKER XMG Ultra 17 Rocket Lake | |
| Average of class Gaming (6662 - 11833, n=195, last 2 years) | |
| MSI Titan GT77 12UHS 4k | |
| Razer Blade 17 Early 2022 | |
| PCMark 10 / Digital Content Creation | |
| MSI Titan GT77 12UHS (dGPU, Extreme Leistung) | |
| MSI Titan GT77 12UHS | |
| Alienware x17 R2 P48E | |
| Average Intel Core i9-12900HX, NVIDIA GeForce RTX 3080 Ti Laptop GPU (9543 - 14291, n=6) | |
| SCHENKER XMG Ultra 17 Rocket Lake | |
| Average of class Gaming (6462 - 18475, n=195, last 2 years) | |
| Razer Blade 17 Early 2022 | |
| MSI Titan GT77 12UHS 4k | |
| CrossMark / Overall | |
| MSI Titan GT77 12UHS 4k | |
| Average Intel Core i9-12900HX, NVIDIA GeForce RTX 3080 Ti Laptop GPU (2108 - 2170, n=5) | |
| MSI Titan GT77 12UHS | |
| Alienware x17 R2 P48E | |
| Average of class Gaming (1247 - 2334, n=168, last 2 years) | |
| Razer Blade 17 Early 2022 | |
| CrossMark / Productivity | |
| MSI Titan GT77 12UHS 4k | |
| Average Intel Core i9-12900HX, NVIDIA GeForce RTX 3080 Ti Laptop GPU (1978 - 2047, n=5) | |
| MSI Titan GT77 12UHS | |
| Alienware x17 R2 P48E | |
| Average of class Gaming (1299 - 2204, n=168, last 2 years) | |
| Razer Blade 17 Early 2022 | |
| CrossMark / Creativity | |
| MSI Titan GT77 12UHS 4k | |
| Average Intel Core i9-12900HX, NVIDIA GeForce RTX 3080 Ti Laptop GPU (2288 - 2366, n=5) | |
| MSI Titan GT77 12UHS | |
| Alienware x17 R2 P48E | |
| Average of class Gaming (1275 - 2514, n=168, last 2 years) | |
| Razer Blade 17 Early 2022 | |
| CrossMark / Responsiveness | |
| MSI Titan GT77 12UHS 4k | |
| Average Intel Core i9-12900HX, NVIDIA GeForce RTX 3080 Ti Laptop GPU (1991 - 2090, n=5) | |
| MSI Titan GT77 12UHS | |
| Average of class Gaming (1030 - 2330, n=168, last 2 years) | |
| Alienware x17 R2 P48E | |
| Razer Blade 17 Early 2022 | |
| PCMark 8 Home Score Accelerated v2 | 4166 points | |
| PCMark 8 Creative Score Accelerated v2 | 6677 points | |
| PCMark 8 Work Score Accelerated v2 | 5165 points | |
| PCMark 10 Score | 6812 points | |
Help | ||
| AIDA64 / Memory Copy | |
| Average Intel Core i9-12900HX (62852 - 70863, n=7) | |
| MSI Titan GT77 12UHS | |
| MSI Titan GT77 12UHS 4k | |
| Razer Blade 17 Early 2022 | |
| Average of class Gaming (21842 - 92565, n=221, last 2 years) | |
| Alienware x17 R2 P48E | |
| SCHENKER XMG Ultra 17 Rocket Lake | |
| AIDA64 / Memory Read | |
| Average Intel Core i9-12900HX (62140 - 72930, n=7) | |
| Average of class Gaming (24879 - 90647, n=221, last 2 years) | |
| MSI Titan GT77 12UHS 4k | |
| Razer Blade 17 Early 2022 | |
| MSI Titan GT77 12UHS | |
| Alienware x17 R2 P48E | |
| SCHENKER XMG Ultra 17 Rocket Lake | |
| AIDA64 / Memory Write | |
| Average Intel Core i9-12900HX (60001 - 68782, n=7) | |
| Average of class Gaming (21619 - 103259, n=221, last 2 years) | |
| MSI Titan GT77 12UHS 4k | |
| MSI Titan GT77 12UHS | |
| Razer Blade 17 Early 2022 | |
| Alienware x17 R2 P48E | |
| SCHENKER XMG Ultra 17 Rocket Lake | |
| AIDA64 / Memory Latency | |
| Alienware x17 R2 P48E | |
| MSI Titan GT77 12UHS 4k | |
| MSI Titan GT77 12UHS | |
| Average Intel Core i9-12900HX (83.9 - 93.4, n=7) | |
| Average of class Gaming (59.5 - 152.5, n=218, last 2 years) | |
| SCHENKER XMG Ultra 17 Rocket Lake | |
* ... smaller is better
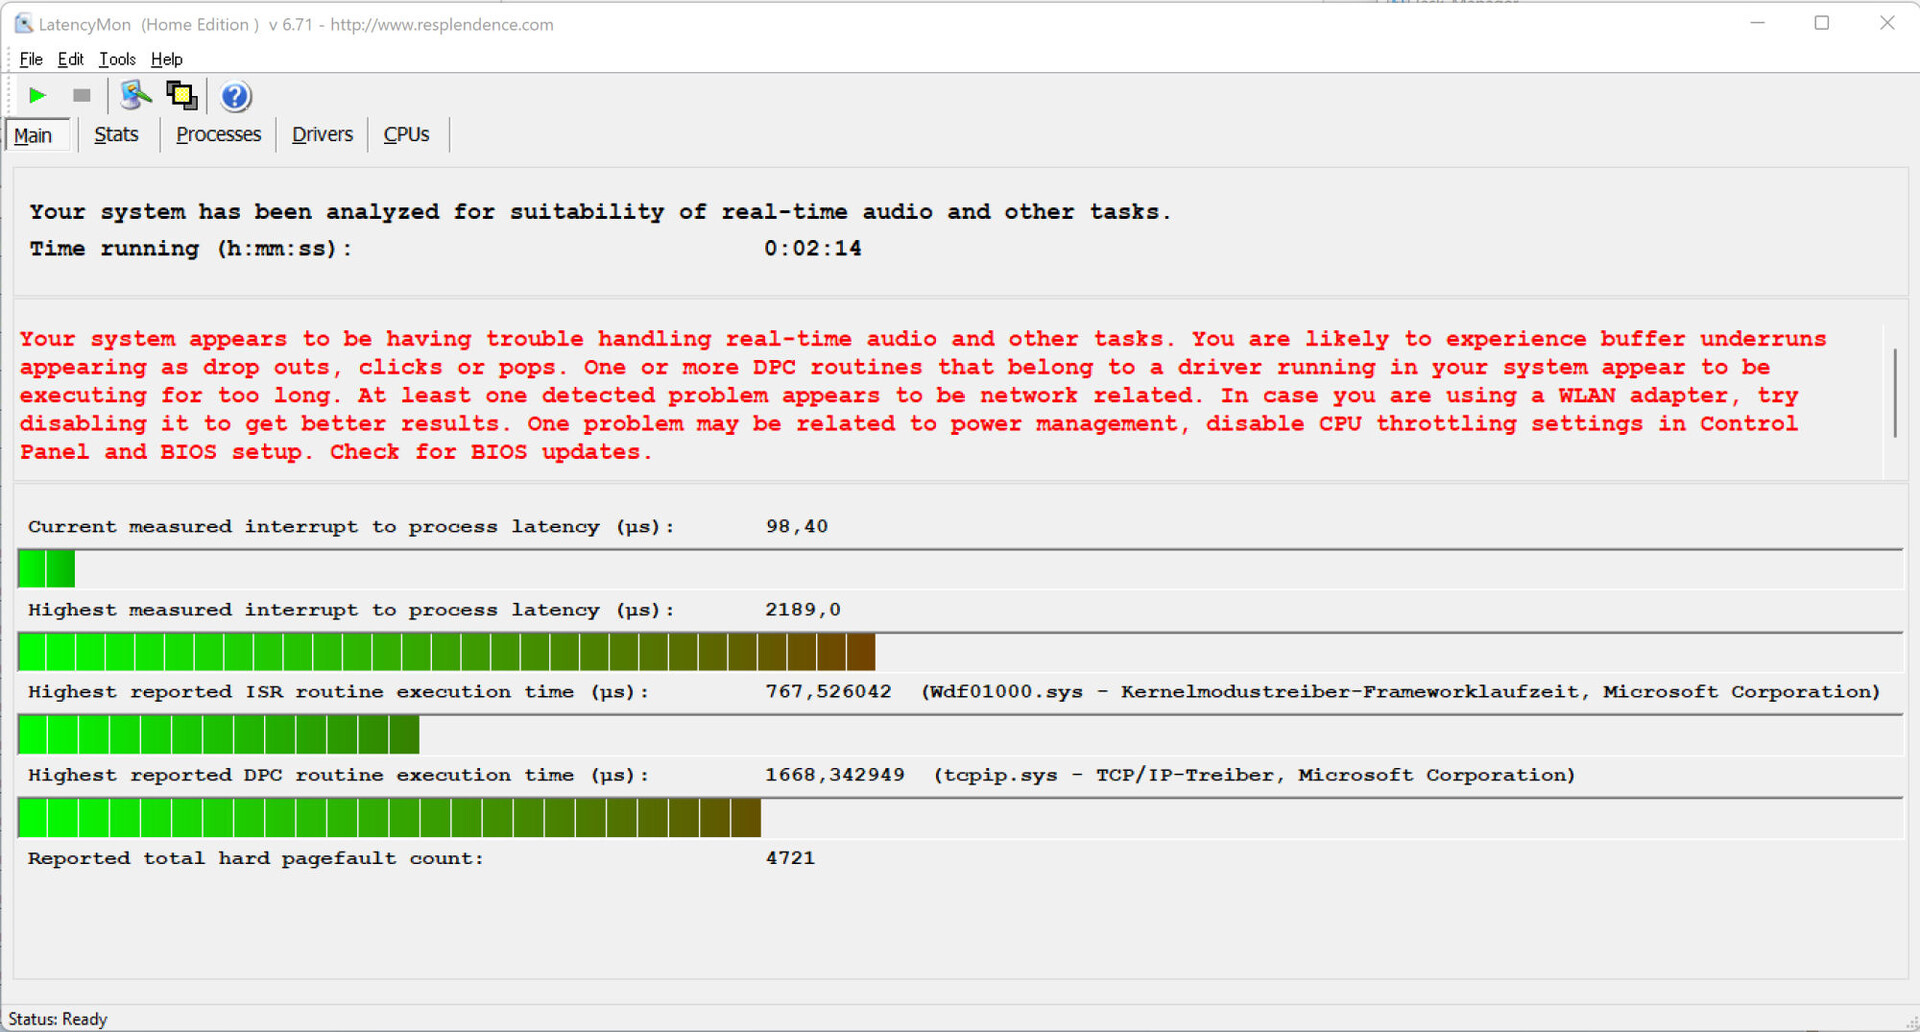
DPC latency
Our standardised latency monitoring test (Internet browsing, 4K video playback, Prime95 high load) revealed some issues with DPC latency. The system doesn't seem to be well-suited to real-time video and audio processing. Future software updates may improve or even worsen this problem.

| DPC Latencies / LatencyMon - interrupt to process latency (max), Web, Youtube, Prime95 | |
| MSI Titan GT77 12UHS | |
| MSI Titan GT77 12UHS | |
| MSI Titan GT77 12UHS 4k | |
| Alienware x17 R2 P48E | |
| SCHENKER XMG Ultra 17 Rocket Lake | |
| Razer Blade 17 Early 2022 | |
* ... smaller is better
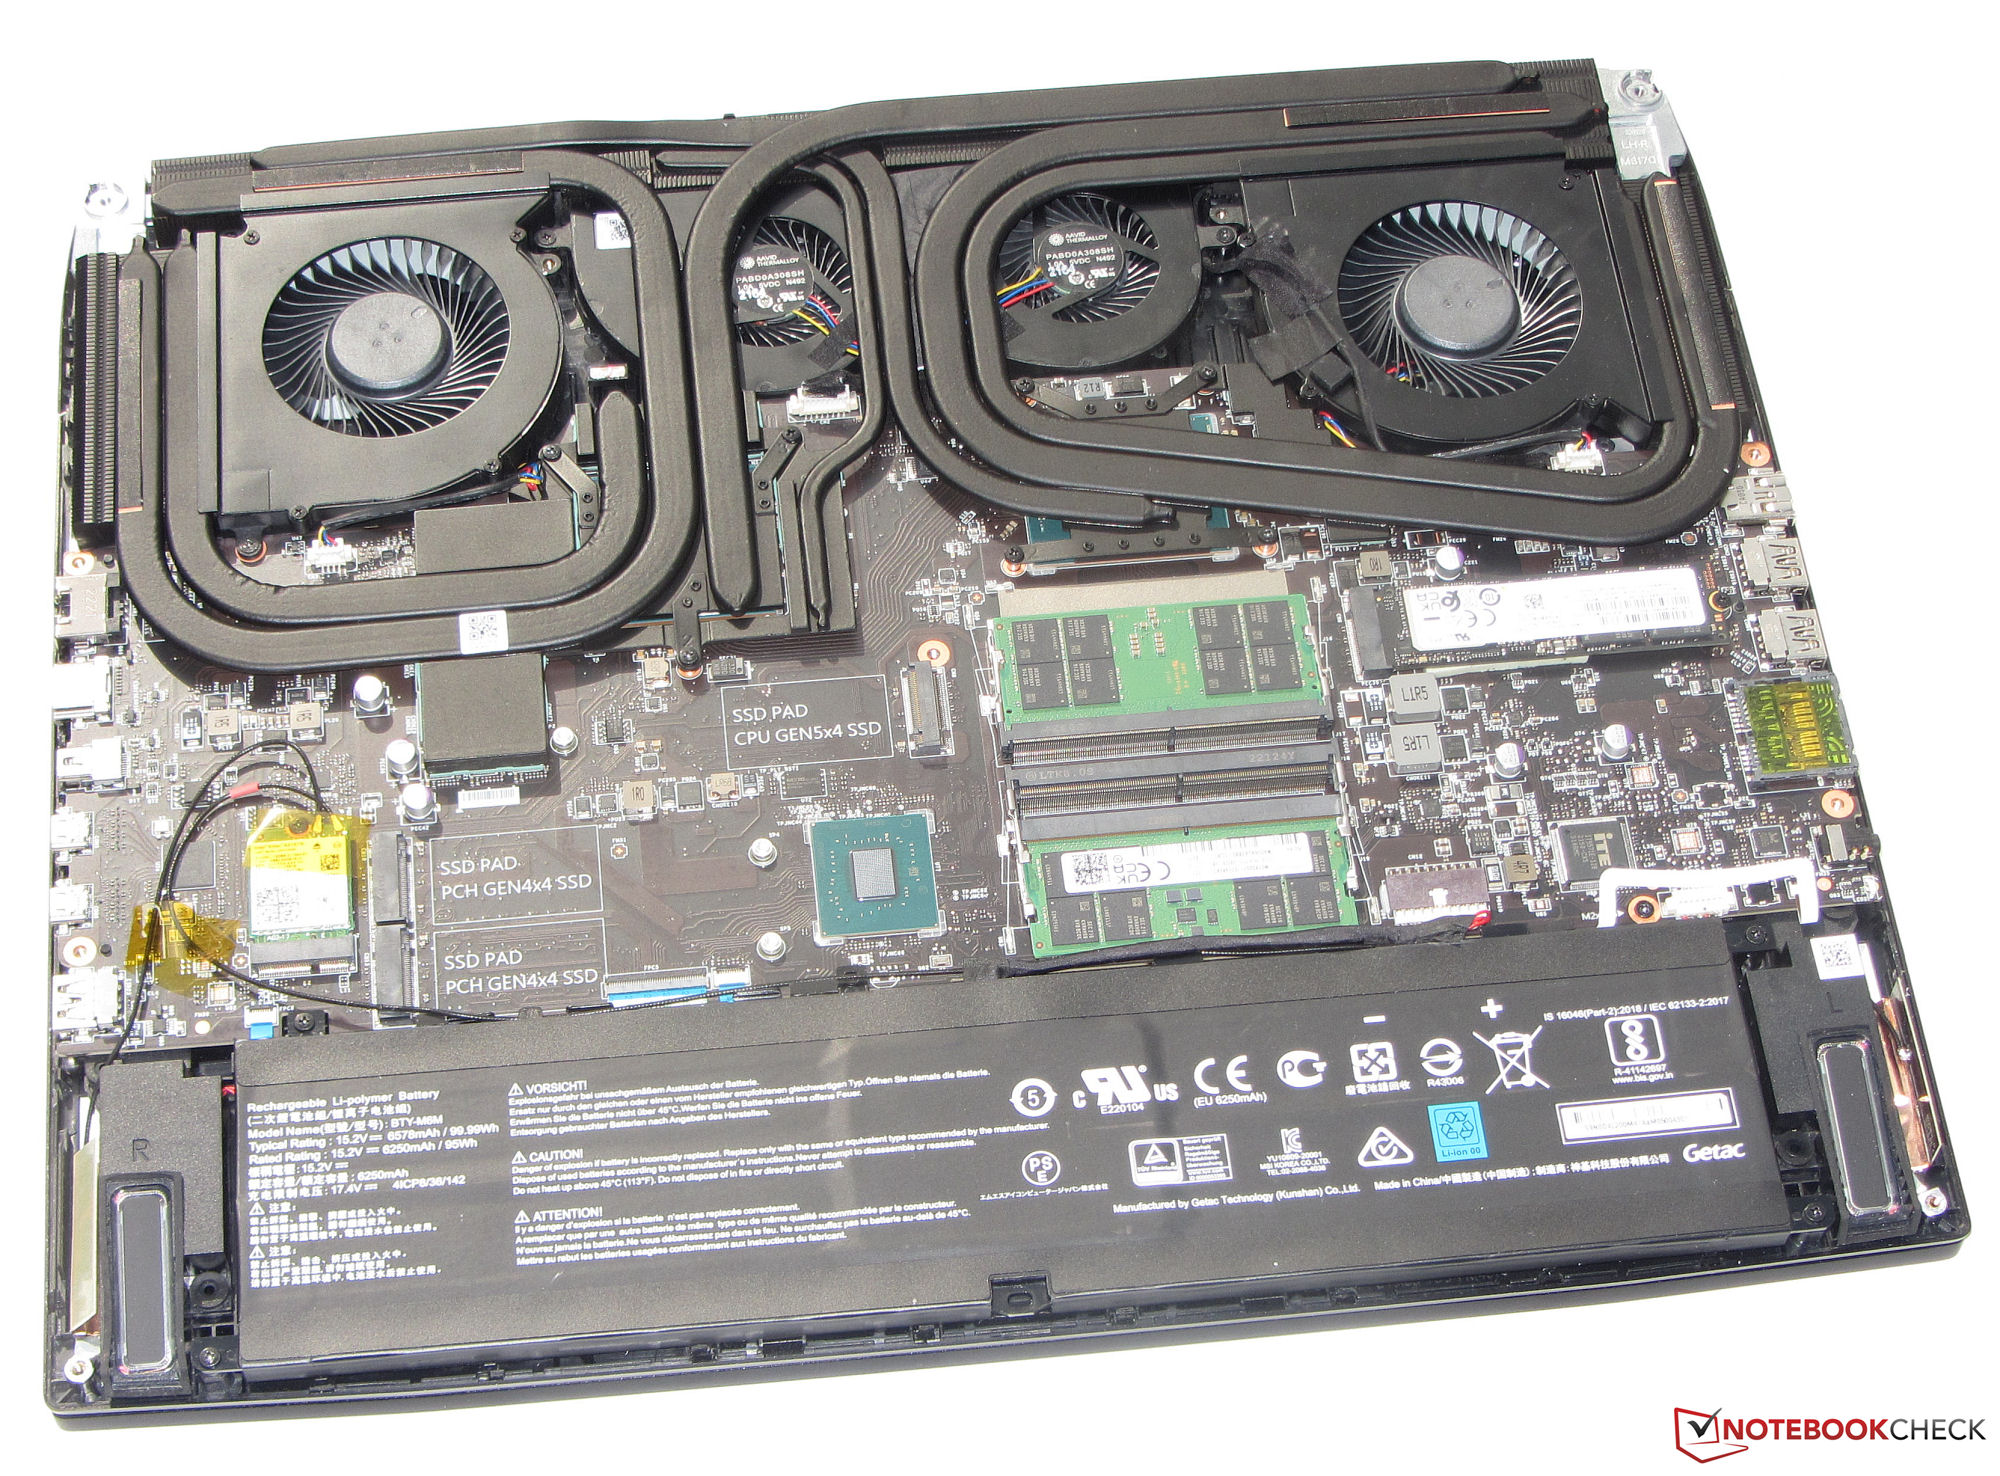
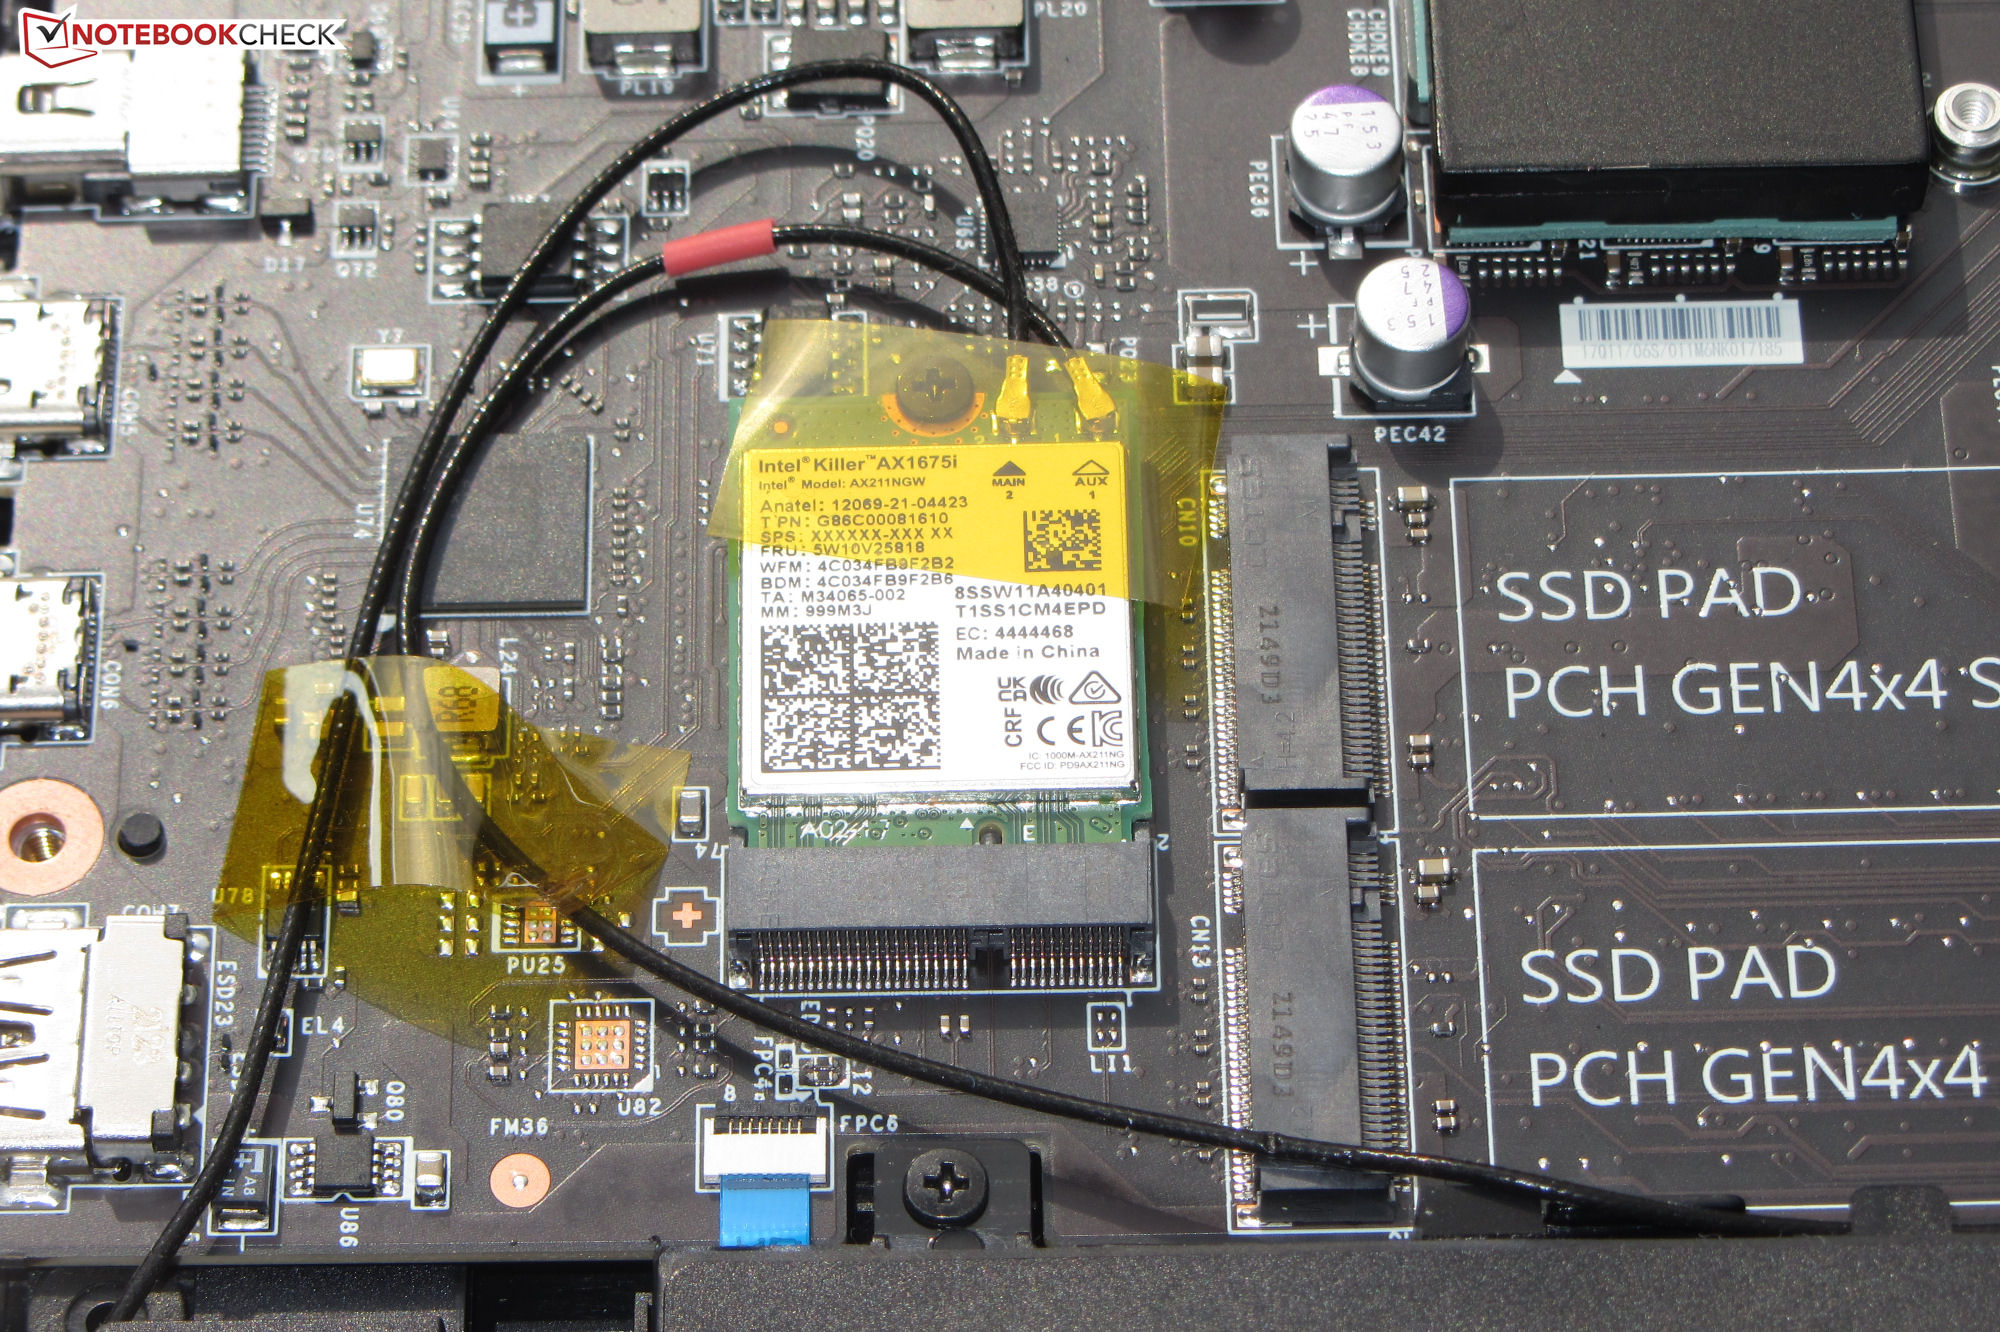
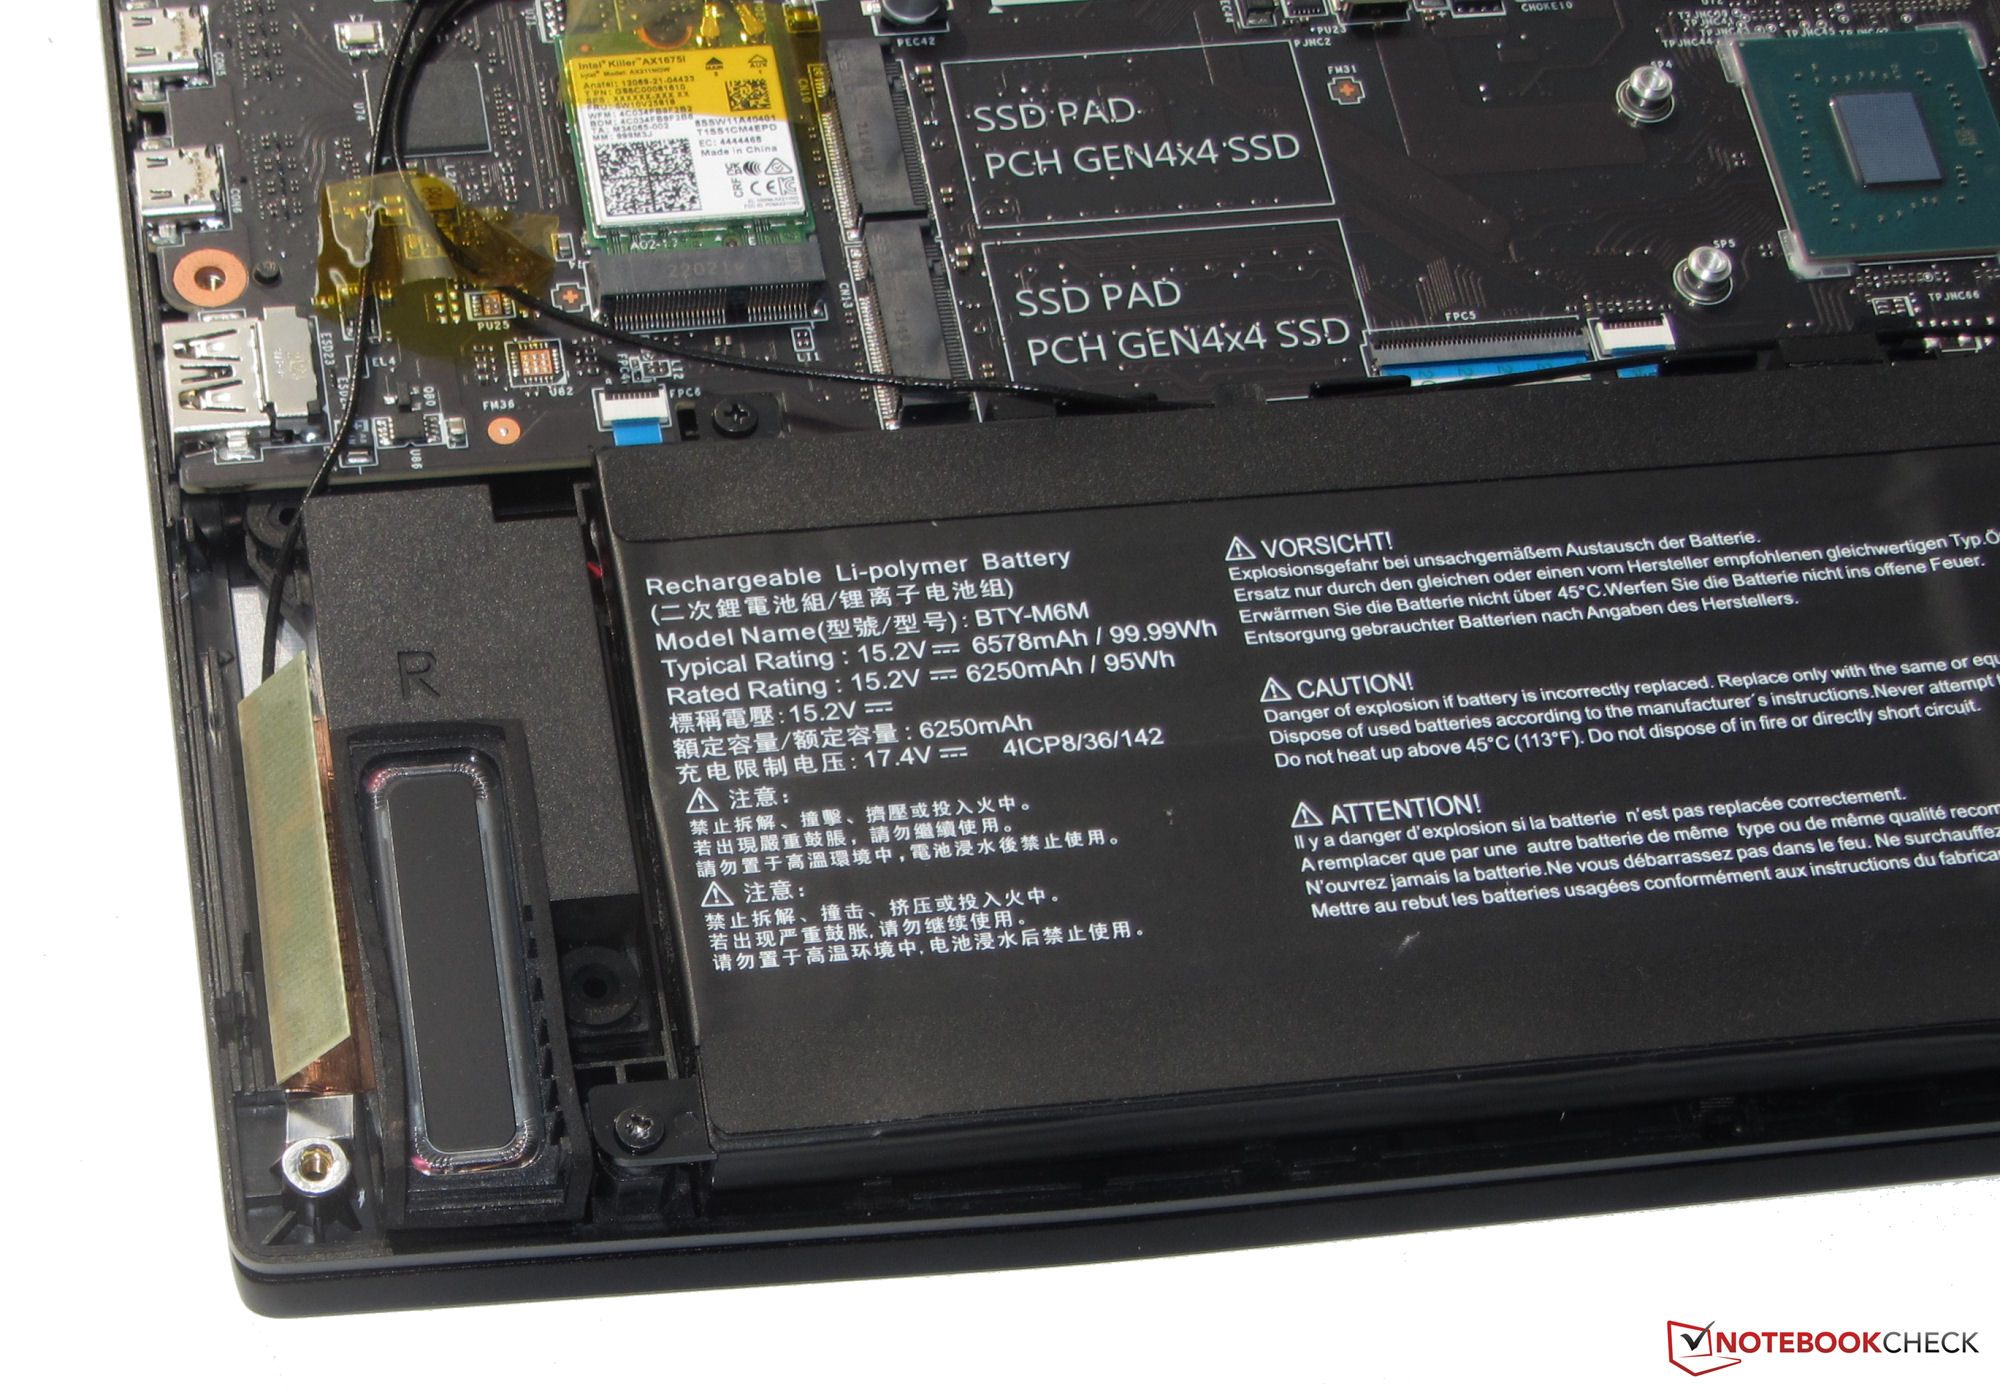
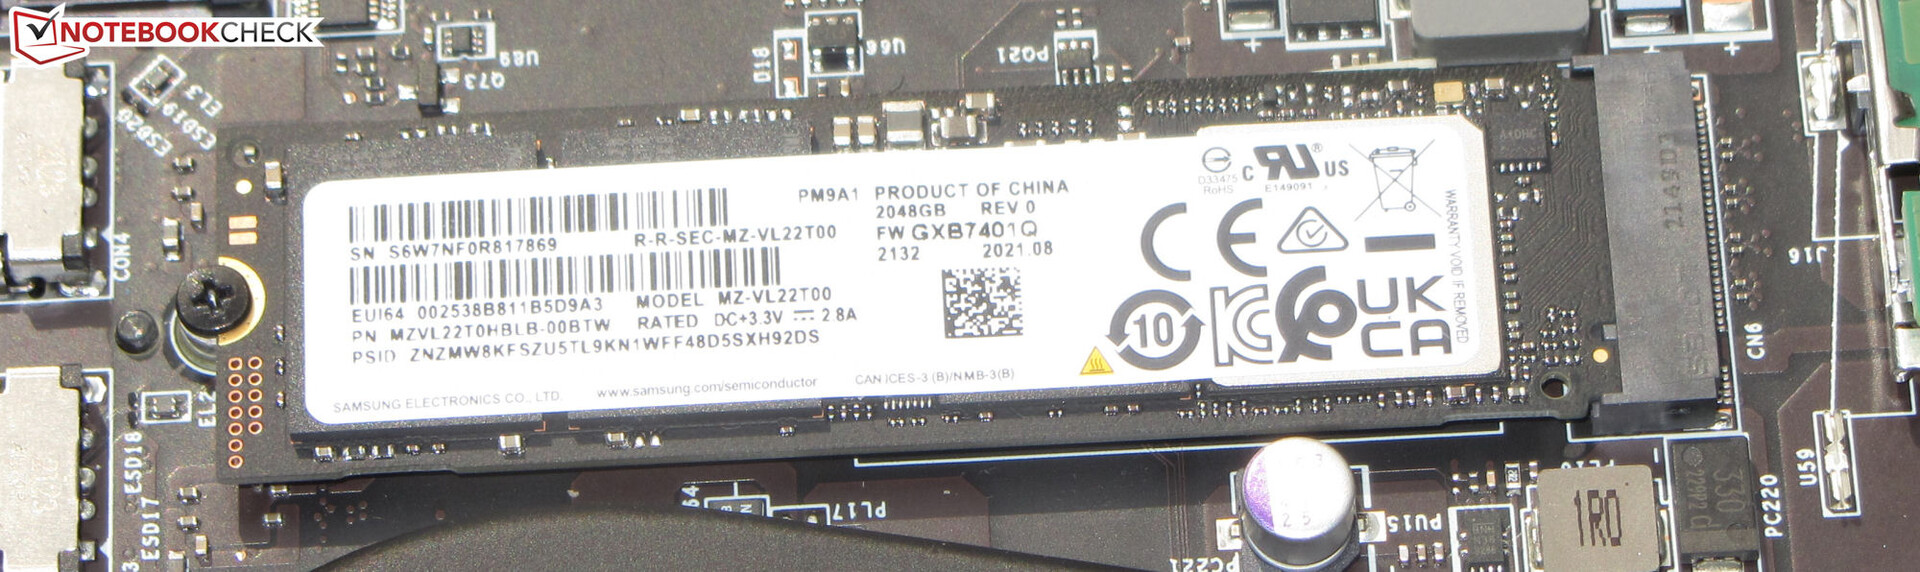
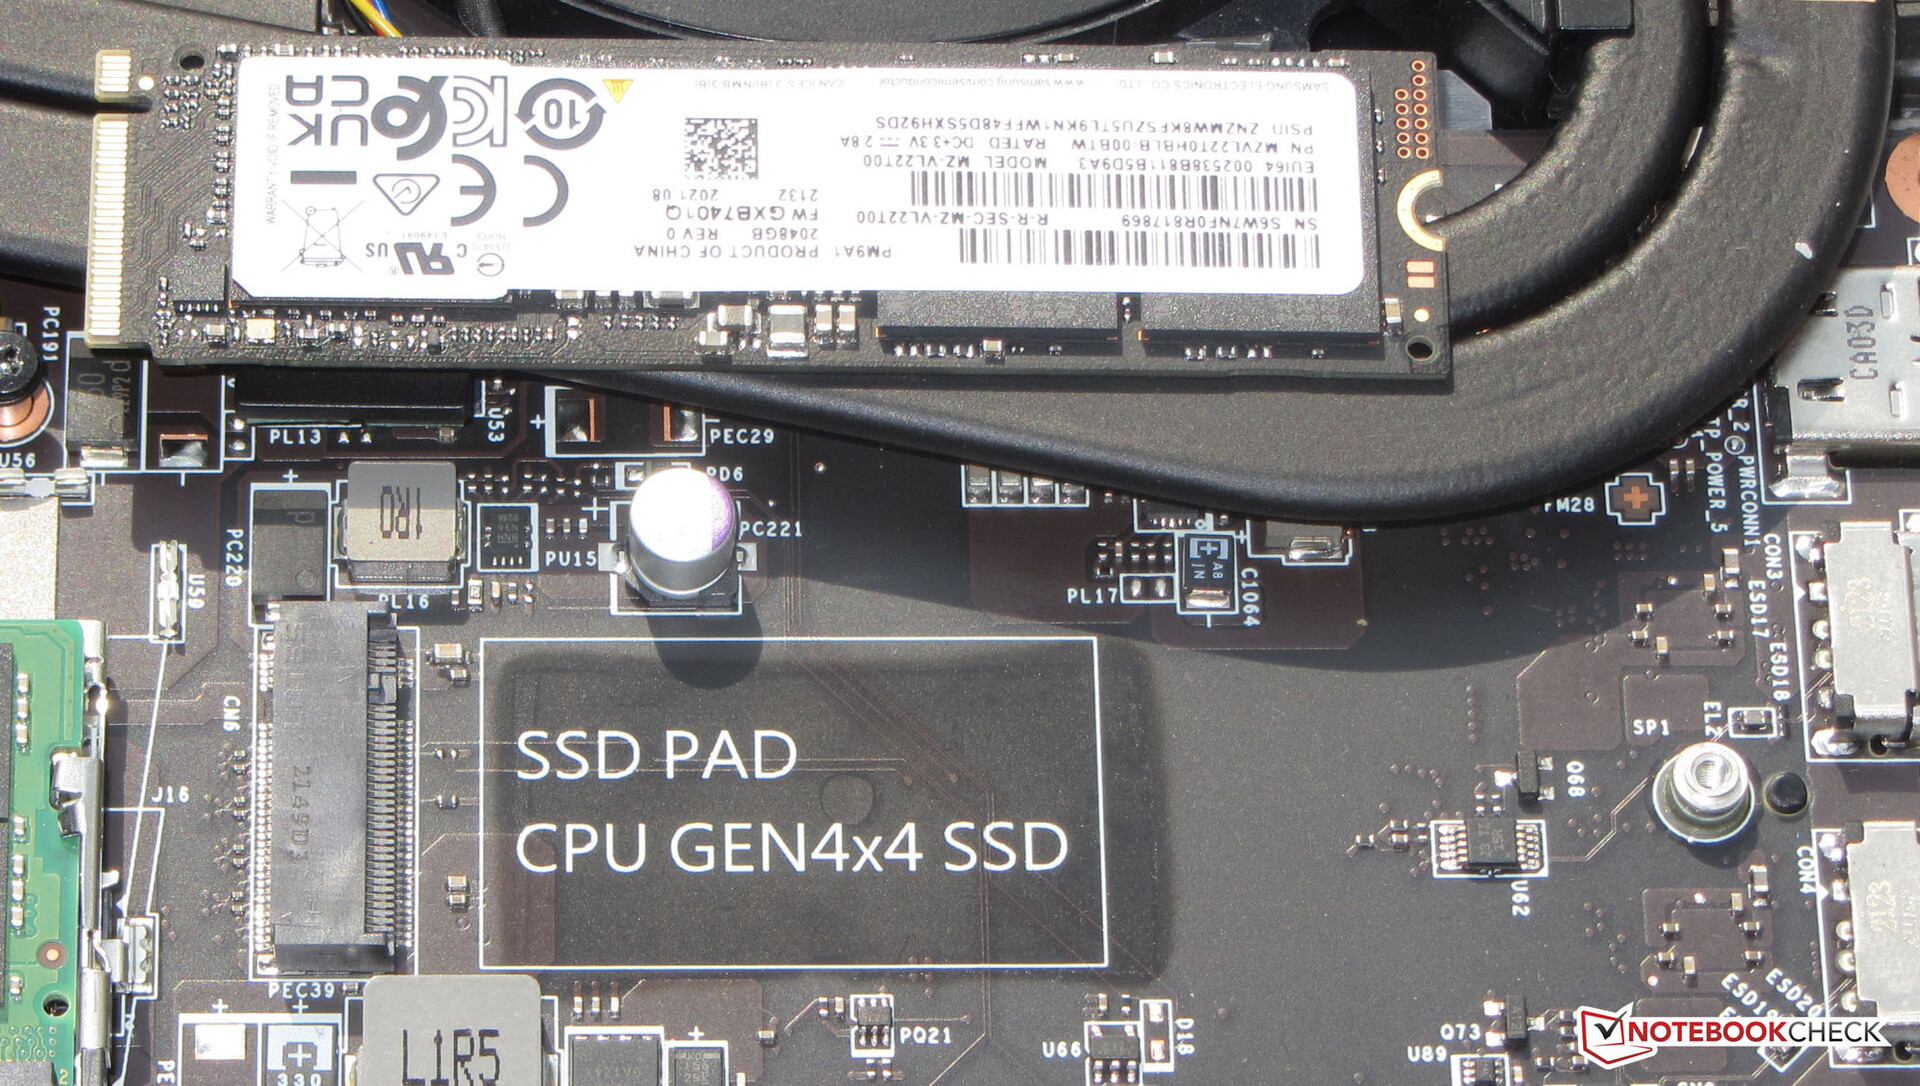
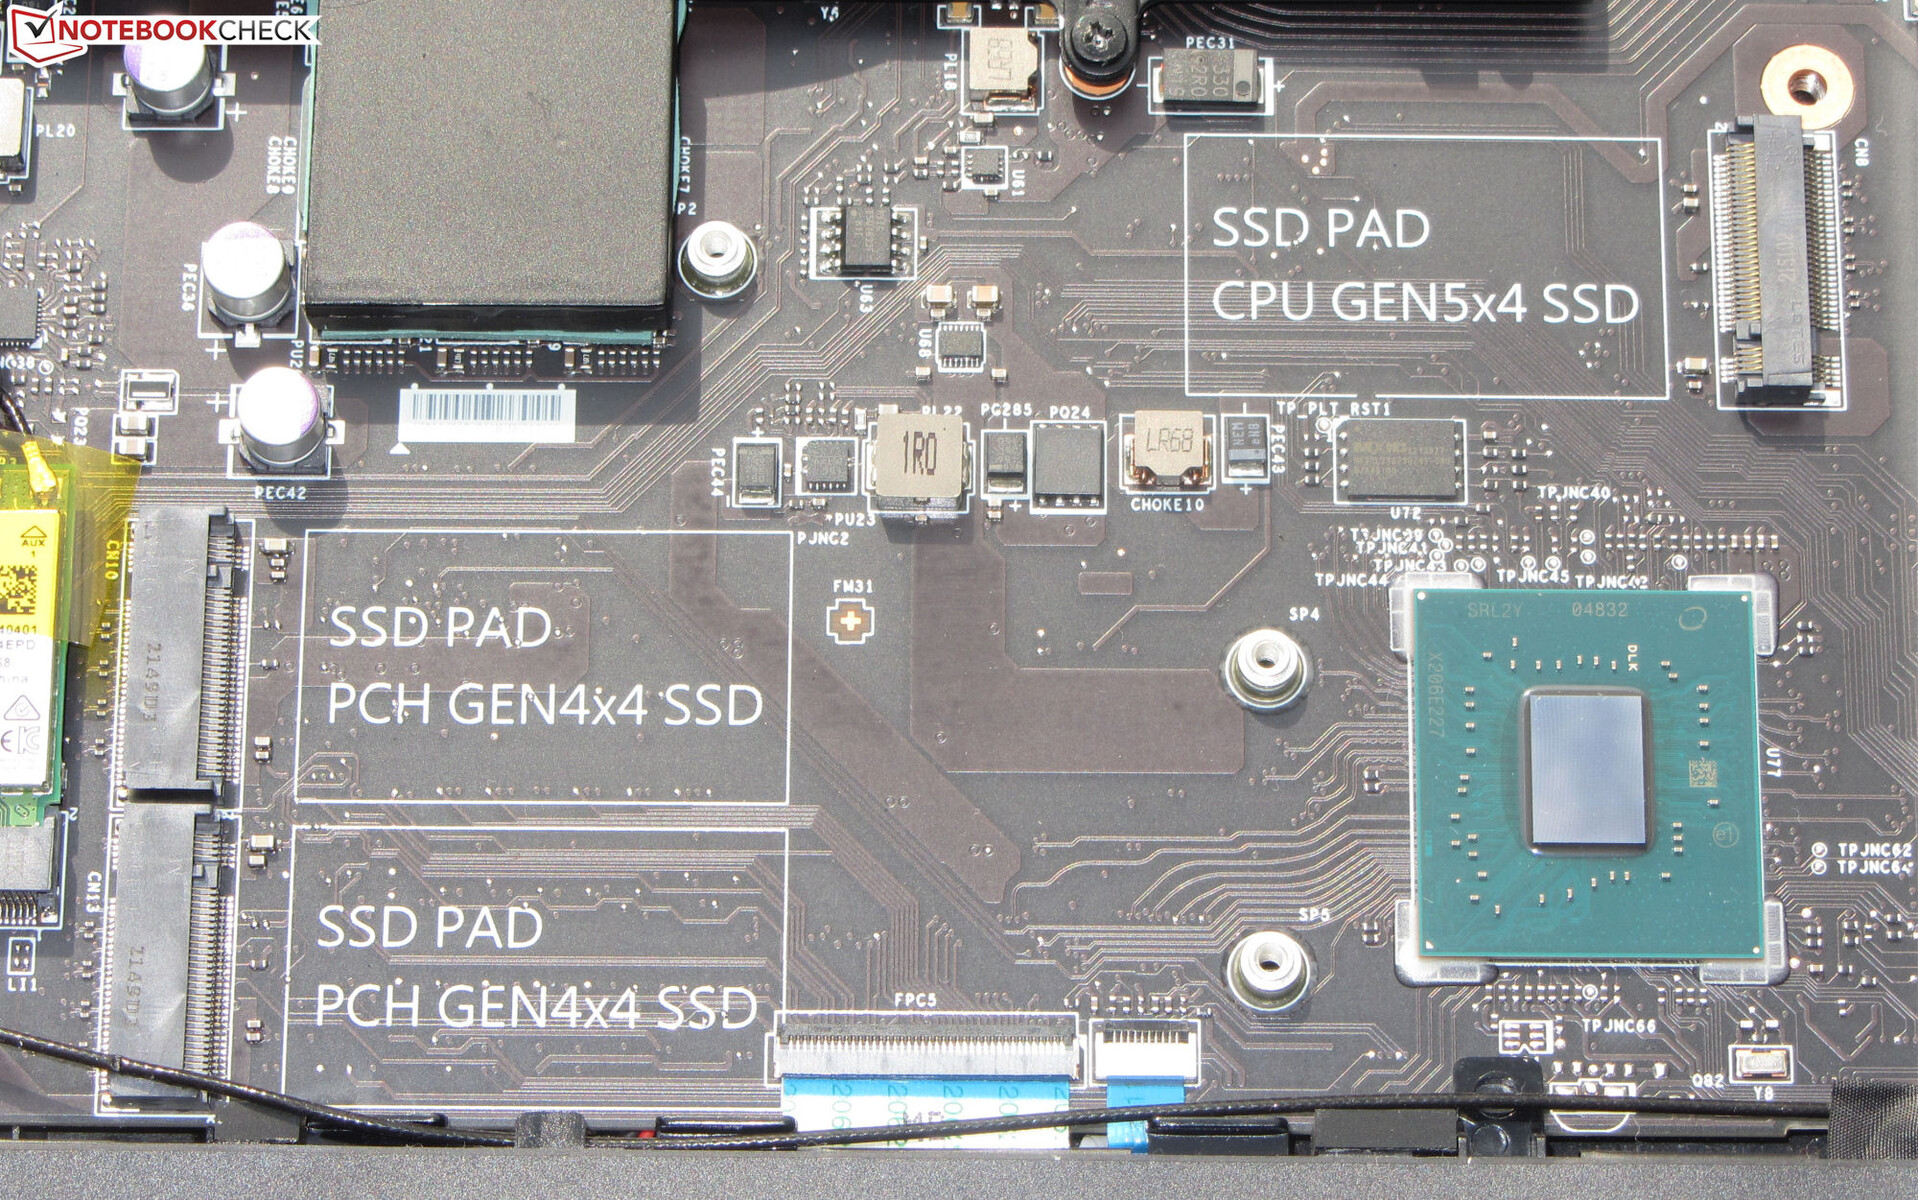
Mass storage
The Titan can hold up to four M.2 2280 SSDs (3x PCIe 4, 1x PCIe 5). The included 2 TB Samsung SSD (PCIe 4) is able to provide excellent transfer speeds.
In the FHD model, the SSD with the operating system (also made by Samsung) suffers from performance dips due to thermal throttling. Perhaps the three other SSDs installed in the laptop are preventing optimal airflow. The SSD in our current review unit doesn't exhibit any performance dips.

* ... smaller is better
Continuous read: DiskSpd Read Loop, Queue Depth 8
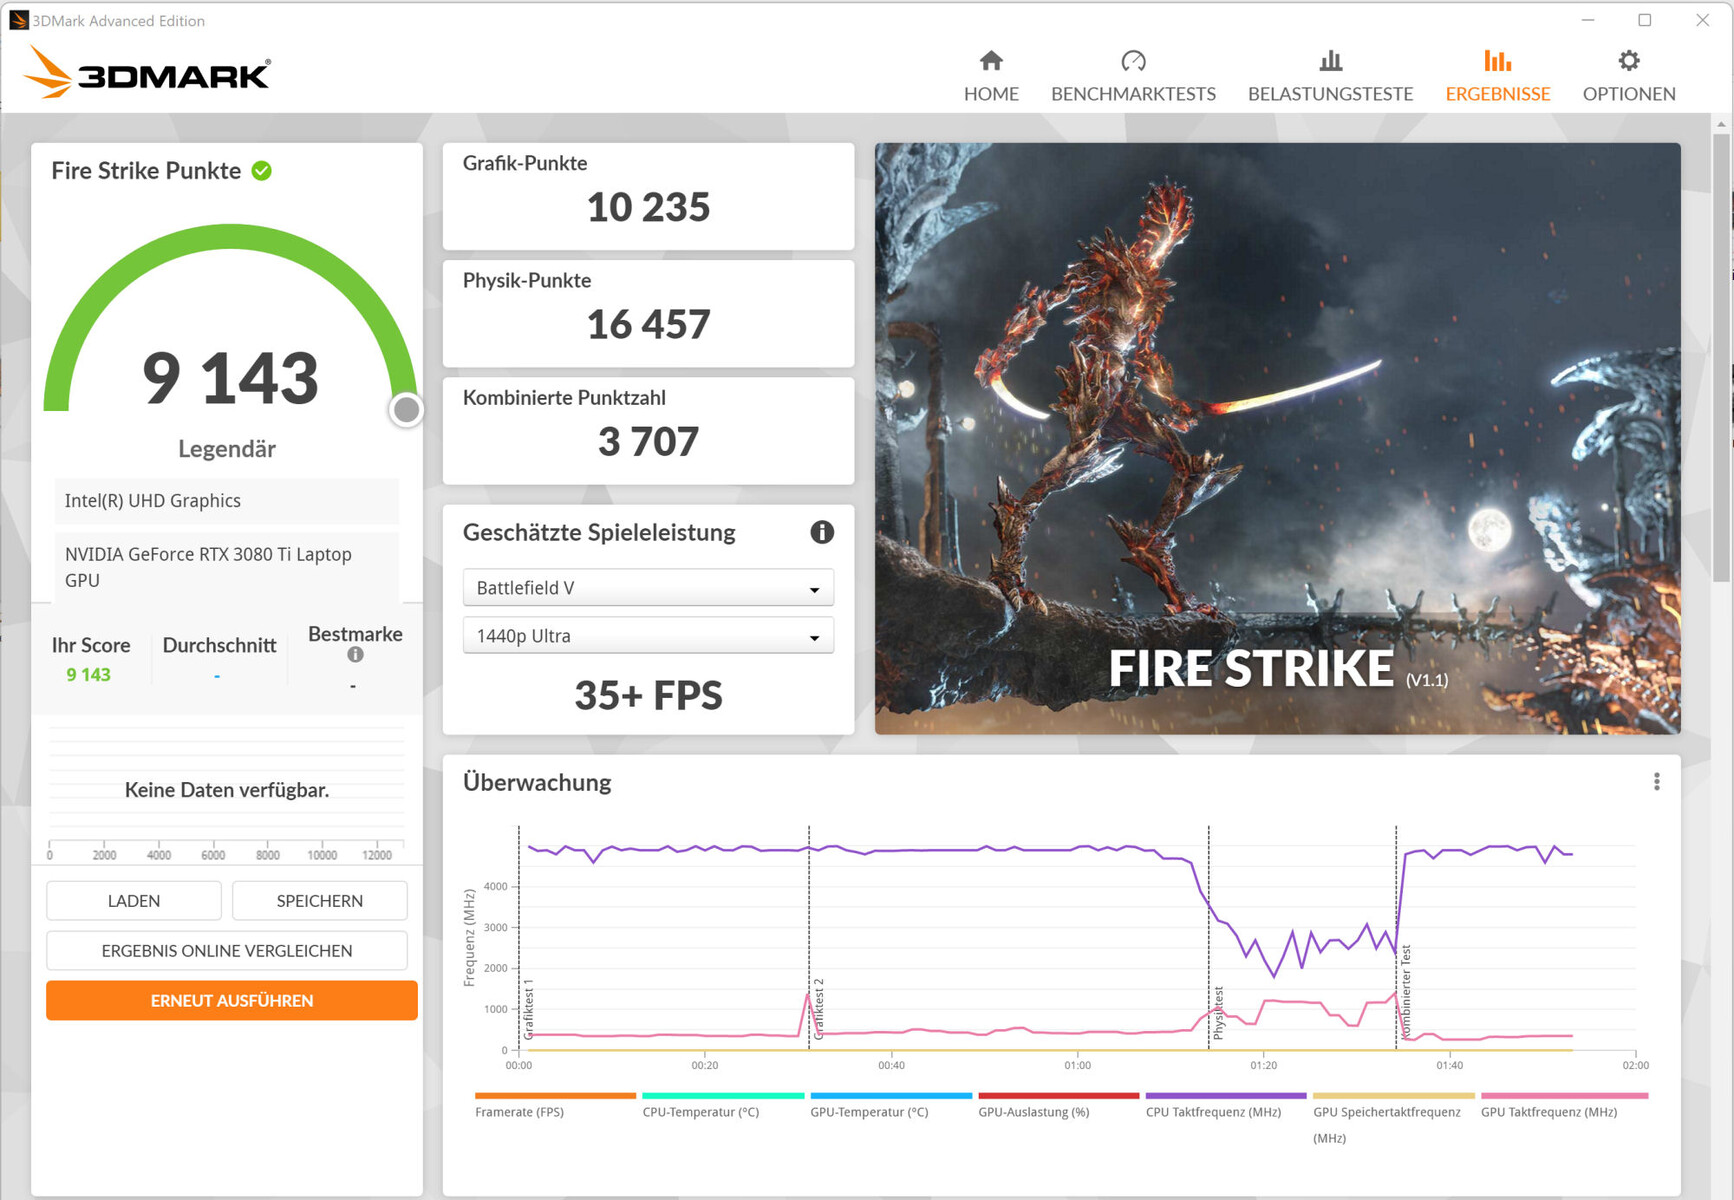
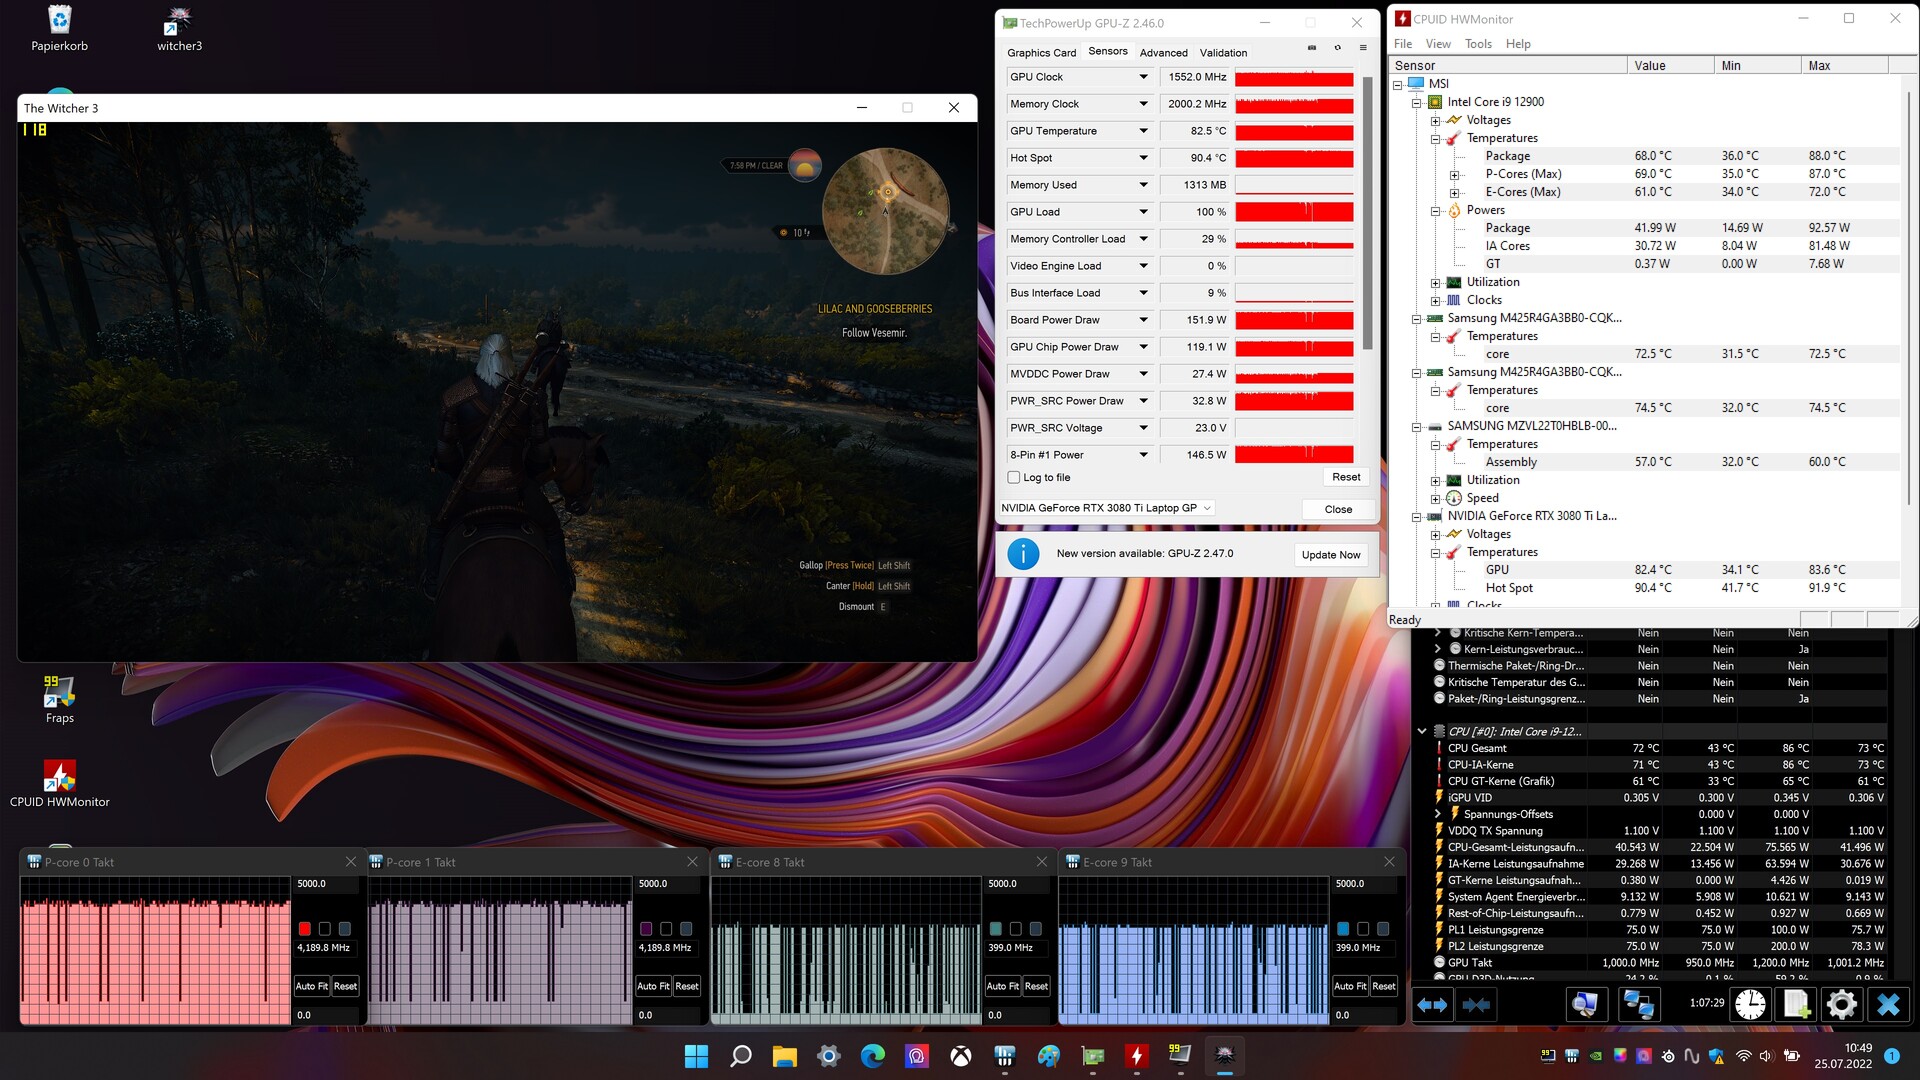
Graphics card
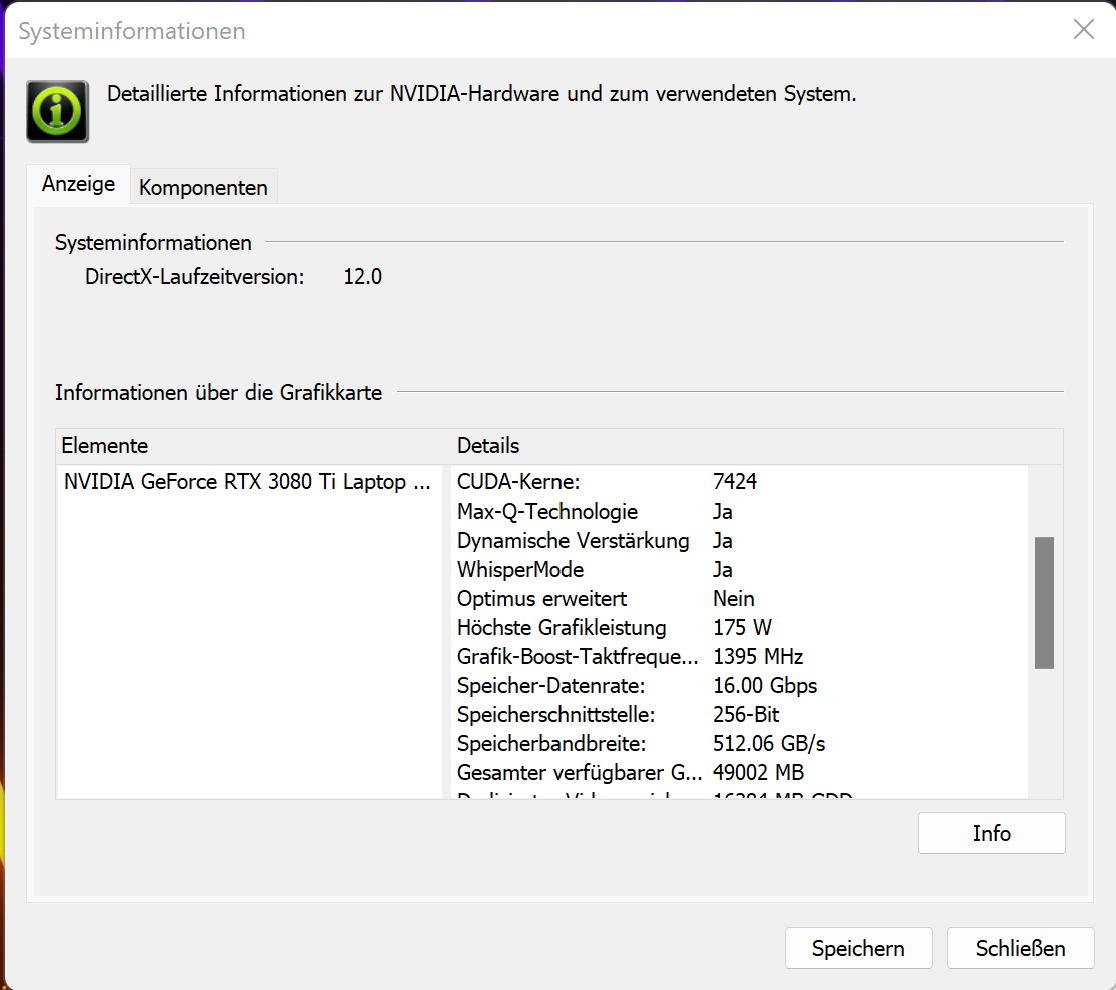
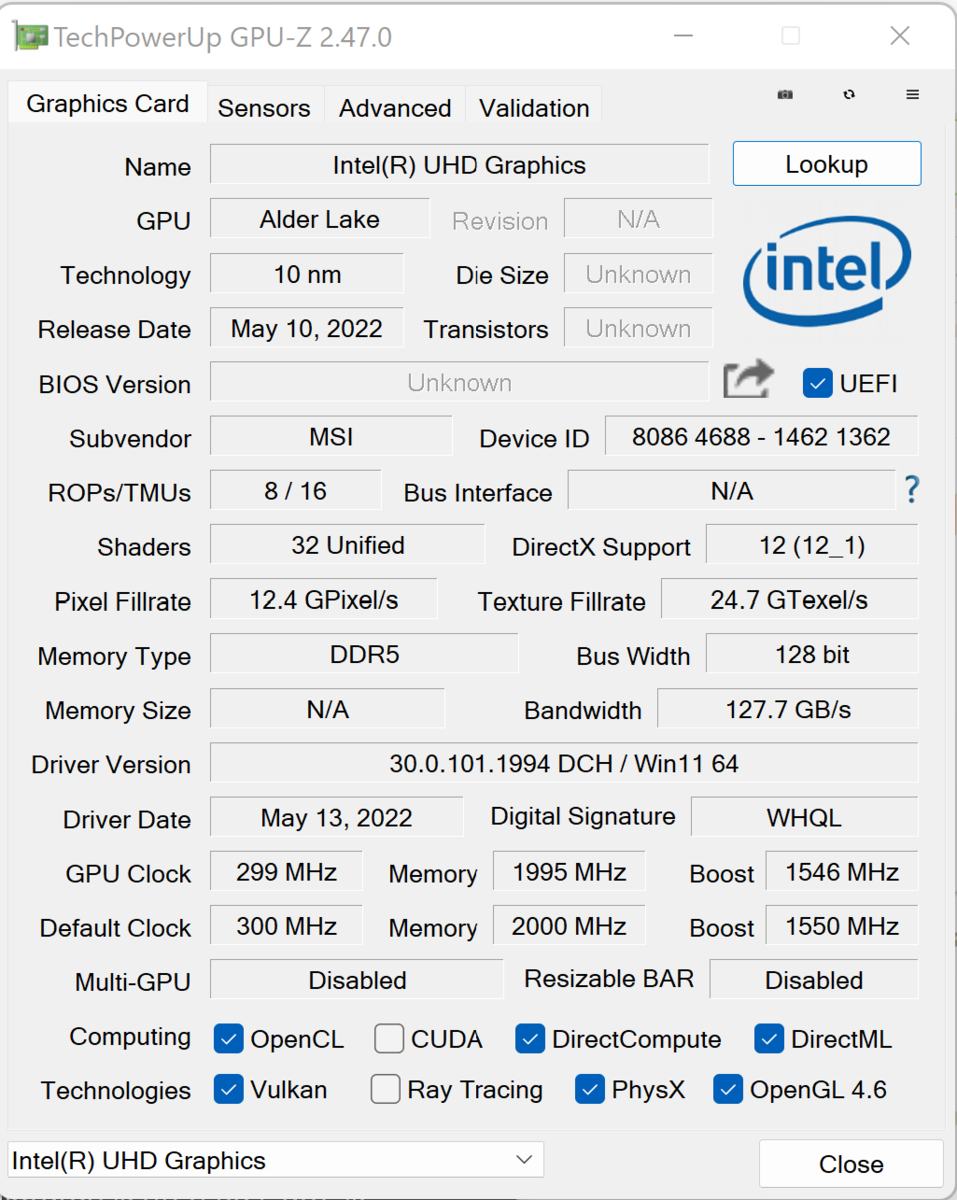
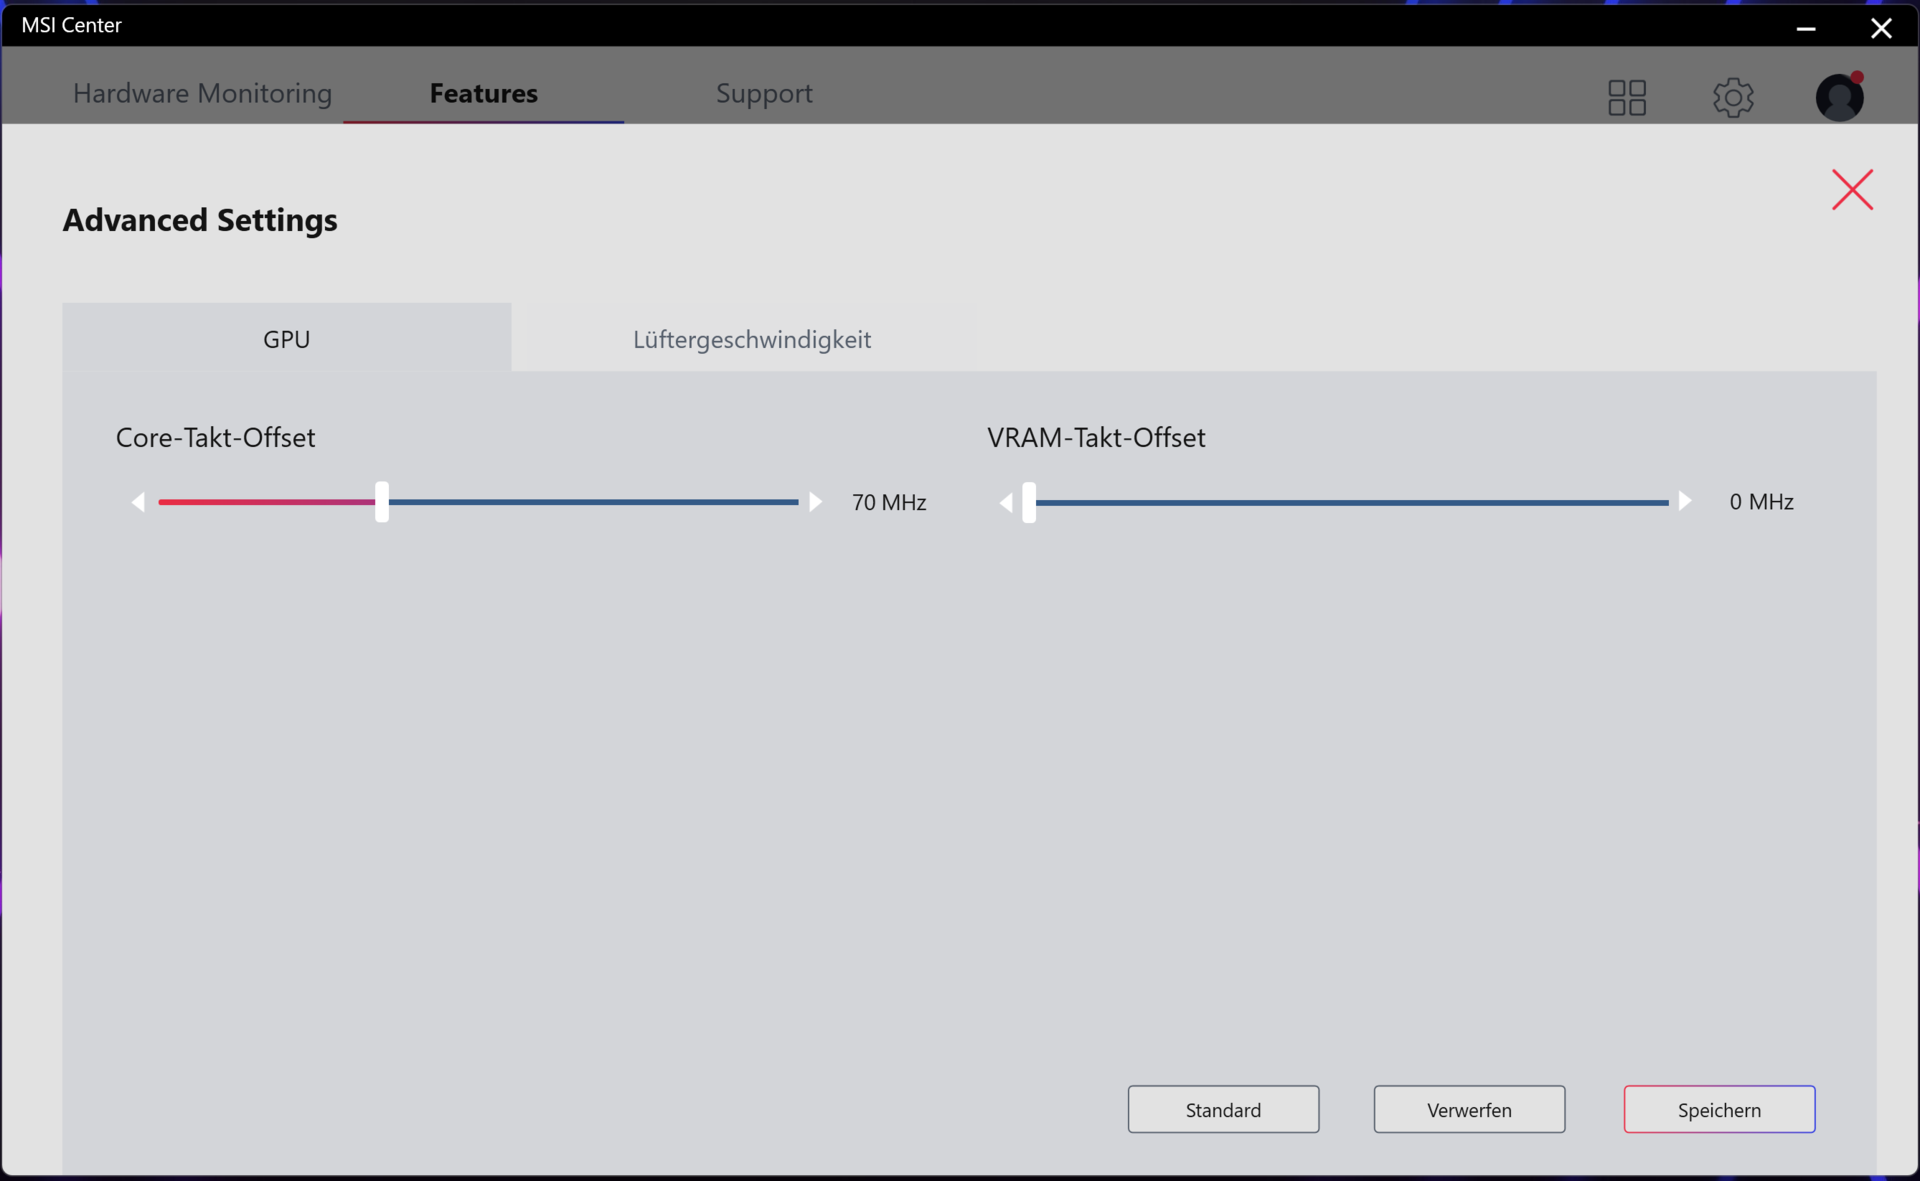
The GeForce RTX 3080 Ti Laptop (TGP: 175 watts, 16 GB of GDDR6 VRAM) in the MSI Titan GT77 produced some of the best scores we have seen from this GPU so far. However, the TGP is not being fully utilised, as shown by the Witcher 3 test. The "Extreme Performance" profile offers options for overclocking the GPU and graphics memory. Advanced Optimus is not supported. Switching between the dGPU and Optimus always requires the computer to be restarted.


| 3DMark Performance Rating - Percent | |
| MSI Titan GT77 12UHS | |
| Alienware x17 R2 P48E | |
| MSI Titan GT77 12UHS | |
| MSI Titan GT77 12UHS 4k -1! | |
| Razer Blade 17 Early 2022 | |
| SCHENKER XMG Ultra 17 Rocket Lake | |
| Average of class Gaming | |
| Average NVIDIA GeForce RTX 3080 Ti Laptop GPU | |
| 3DMark 11 - 1280x720 Performance GPU | |
| MSI Titan GT77 12UHS | |
| Alienware x17 R2 P48E | |
| MSI Titan GT77 12UHS 4k | |
| Razer Blade 17 Early 2022 | |
| MSI Titan GT77 12UHS (dGPU, Extreme Leistung) | |
| SCHENKER XMG Ultra 17 Rocket Lake | |
| Average of class Gaming (1029 - 72070, n=226, last 2 years) | |
| Average NVIDIA GeForce RTX 3080 Ti Laptop GPU (13920 - 45841, n=45) | |
| 3DMark | |
| 1920x1080 Fire Strike Graphics | |
| MSI Titan GT77 12UHS | |
| MSI Titan GT77 12UHS (dGPU, Extreme Leistung) | |
| Alienware x17 R2 P48E | |
| MSI Titan GT77 12UHS 4k | |
| Razer Blade 17 Early 2022 | |
| SCHENKER XMG Ultra 17 Rocket Lake | |
| Average of class Gaming (781 - 53059, n=231, last 2 years) | |
| Average NVIDIA GeForce RTX 3080 Ti Laptop GPU (6928 - 34439, n=43) | |
| 2560x1440 Time Spy Graphics | |
| MSI Titan GT77 12UHS | |
| Alienware x17 R2 P48E | |
| MSI Titan GT77 12UHS (dGPU, Extreme Leistung) | |
| SCHENKER XMG Ultra 17 Rocket Lake | |
| MSI Titan GT77 12UHS 4k | |
| Razer Blade 17 Early 2022 | |
| Average of class Gaming (224 - 22547, n=228, last 2 years) | |
| Average NVIDIA GeForce RTX 3080 Ti Laptop GPU (4921 - 13835, n=43) | |
| 2560x1440 Port Royal Graphics | |
| Alienware x17 R2 P48E | |
| MSI Titan GT77 12UHS | |
| MSI Titan GT77 12UHS (dGPU, Extreme Leistung) | |
| Razer Blade 17 Early 2022 | |
| SCHENKER XMG Ultra 17 Rocket Lake | |
| Average NVIDIA GeForce RTX 3080 Ti Laptop GPU (6423 - 8462, n=28) | |
| Average of class Gaming (280 - 14457, n=148, last 2 years) | |
| Geekbench 5.5 - OpenCL Score | |
| Alienware x17 R2 P48E | |
| MSI Titan GT77 12UHS (dGPU, Extreme Leistung) | |
| MSI Titan GT77 12UHS 4k | |
| Asus ROG Zephyrus Duo 16 GX650RX | |
| SCHENKER XMG Ultra 17 Rocket Lake | |
| Average NVIDIA GeForce RTX 3080 Ti Laptop GPU (88580 - 151633, n=41) | |
| MSI Titan GT77 12UHS | |
| Razer Blade 17 Early 2022 | |
| Gigabyte Aero 16 YE5 | |
| Average of class Gaming (5039 - 226512, n=229, last 2 years) | |
| V-Ray Benchmark Next 4.10 | |
| GPU | |
| Average of class Gaming (54 - 1334, n=184, last 2 years) | |
| MSI Titan GT77 12UHS (v4.10.07, dGPU, Extreme Leistung) | |
| MSI Titan GT77 12UHS (v4.10.07 ) | |
| Asus ROG Zephyrus Duo 16 GX650RX (v4.10.07 ) | |
| MSI Titan GT77 12UHS 4k (v4.10.07 ) | |
| Average NVIDIA GeForce RTX 3080 Ti Laptop GPU (311 - 552, n=35) | |
| Razer Blade 17 Early 2022 (v4.10.07 ) | |
| Gigabyte Aero 16 YE5 (v4.10.07 ) | |
| SCHENKER XMG Ultra 17 Rocket Lake (v4.10.07 ) | |
| CPU | |
| MSI Titan GT77 12UHS 4k (v4.10.07 ) | |
| MSI Titan GT77 12UHS (v4.10.07, dGPU, Extreme Leistung) | |
| MSI Titan GT77 12UHS (v4.10.07 ) | |
| Average of class Gaming (2741 - 37629, n=184, last 2 years) | |
| Average NVIDIA GeForce RTX 3080 Ti Laptop GPU (5564 - 23947, n=35) | |
| Gigabyte Aero 16 YE5 (v4.10.07 ) | |
| SCHENKER XMG Ultra 17 Rocket Lake (v4.10.07 ) | |
| Asus ROG Zephyrus Duo 16 GX650RX (v4.10.07 ) | |
| Razer Blade 17 Early 2022 (v4.10.07 ) | |
| Blender | |
| v3.3 Classroom CUDA | |
| Average of class Gaming (16 - 175, n=189, last 2 years) | |
| MSI Titan GT77 12UHS 4k | |
| MSI Titan GT77 12UHS (dGPU, Extreme Leistung) | |
| Average NVIDIA GeForce RTX 3080 Ti Laptop GPU (32 - 41, n=13) | |
| MSI Titan GT77 12UHS | |
| v3.3 Classroom OPTIX/RTX | |
| MSI Titan GT77 12UHS 4k | |
| Average NVIDIA GeForce RTX 3080 Ti Laptop GPU (20 - 28, n=13) | |
| Average of class Gaming (9 - 142, n=182, last 2 years) | |
| MSI Titan GT77 12UHS | |
| MSI Titan GT77 12UHS (dGPU, Extreme Leistung) | |
* ... smaller is better
| 3DMark 11 Performance | 35867 points | |
| 3DMark Cloud Gate Standard Score | 53629 points | |
| 3DMark Fire Strike Score | 27273 points | |
| 3DMark Fire Strike Extreme Score | 15613 points | |
| 3DMark Time Spy Score | 12865 points | |
Help | ||
Gaming performance
The hardware is designed for 4K gaming at high to max settings. Frame rates are above what an RTX 3080 Ti is capable of on average. When the GeForce GPU was driving the display directly, it often produced the best frame rates we have seen from an RTX 3080 Ti so far. In any case, as demonstrated by the Witcher 3 test, the laptop delivers good and stable results.
| The Witcher 3 | |
| 1920x1080 Ultra Graphics & Postprocessing (HBAO+) | |
| MSI Titan GT77 12UHS (dGPU, Extreme Leistung) | |
| MSI Titan GT77 12UHS | |
| Alienware x17 R2 P48E | |
| MSI Titan GT77 12UHS 4k | |
| SCHENKER XMG Ultra 17 Rocket Lake | |
| Razer Blade 17 Early 2022 | |
| Average of class Gaming (8.61 - 216, n=223, last 2 years) | |
| Average NVIDIA GeForce RTX 3080 Ti Laptop GPU (30 - 130.6, n=43) | |
| 3840x2160 Ultra Graphics & Postprocessing (HBAO+) | |
| Average of class Gaming (42.8 - 107.6, n=15, last 2 years) | |
| MSI Titan GT77 12UHS (dGPU, Extreme Leistung) | |
| MSI Titan GT77 12UHS 4k | |
| Razer Blade 17 Early 2022 | |
| Average NVIDIA GeForce RTX 3080 Ti Laptop GPU (44.8 - 62.7, n=5) | |
| Dota 2 Reborn | |
| 1920x1080 ultra (3/3) best looking | |
| MSI Titan GT77 12UHS | |
| MSI Titan GT77 12UHS (dGPU, Extreme Leistung) | |
| MSI Titan GT77 12UHS 4k | |
| Alienware x17 R2 P48E | |
| SCHENKER XMG Ultra 17 Rocket Lake | |
| Average of class Gaming (26.9 - 220, n=233, last 2 years) | |
| Average NVIDIA GeForce RTX 3080 Ti Laptop GPU (29.9 - 170.5, n=45) | |
| Razer Blade 17 Early 2022 | |
| 3840x2160 ultra (3/3) best looking | |
| MSI Titan GT77 12UHS (dGPU, Extreme Leistung) | |
| MSI Titan GT77 12UHS 4k | |
| Average of class Gaming (14.2 - 205, n=78, last 2 years) | |
| Average NVIDIA GeForce RTX 3080 Ti Laptop GPU (70.8 - 155.6, n=19) | |
| Razer Blade 17 Early 2022 | |
| X-Plane 11.11 | |
| 3840x2160 high (fps_test=3) | |
| MSI Titan GT77 12UHS (dGPU, Extreme Leistung) | |
| MSI Titan GT77 12UHS 4k | |
| Average of class Gaming (12 - 145.5, n=73, last 2 years) | |
| Average NVIDIA GeForce RTX 3080 Ti Laptop GPU (32.9 - 109.5, n=20) | |
| Razer Blade 17 Early 2022 | |
| 1920x1080 high (fps_test=3) | |
| MSI Titan GT77 12UHS | |
| MSI Titan GT77 12UHS (dGPU, Extreme Leistung) | |
| MSI Titan GT77 12UHS 4k | |
| SCHENKER XMG Ultra 17 Rocket Lake | |
| Alienware x17 R2 P48E | |
| Average of class Gaming (12.4 - 166.2, n=238, last 2 years) | |
| Average NVIDIA GeForce RTX 3080 Ti Laptop GPU (32.6 - 127, n=45) | |
| Razer Blade 17 Early 2022 | |
| Final Fantasy XV Benchmark | |
| 3840x2160 High Quality | |
| Average of class Gaming (32.2 - 94.7, n=64, last 2 years) | |
| MSI Titan GT77 12UHS (1.3, dGPU, Extreme Leistung) | |
| MSI Titan GT77 12UHS 4k (1.3) | |
| Razer Blade 17 Early 2022 (1.3) | |
| Average NVIDIA GeForce RTX 3080 Ti Laptop GPU (35.1 - 61.2, n=18) | |
| 1920x1080 High Quality | |
| MSI Titan GT77 12UHS (1.3, dGPU, Extreme Leistung) | |
| MSI Titan GT77 12UHS (1.3) | |
| MSI Titan GT77 12UHS 4k (1.3) | |
| Alienware x17 R2 P48E (1.3) | |
| Average NVIDIA GeForce RTX 3080 Ti Laptop GPU (30.7 - 140.6, n=42) | |
| Razer Blade 17 Early 2022 (1.3) | |
| Average of class Gaming (9.13 - 194.9, n=224, last 2 years) | |
| GTA V | |
| 3840x2160 Highest Settings possible AA:4xMSAA + FX AF:16x | |
| MSI Titan GT77 12UHS (dGPU, Extreme Leistung) | |
| MSI Titan GT77 12UHS 4k | |
| Average of class Gaming (33.6 - 90.9, n=47, last 2 years) | |
| Razer Blade 17 Early 2022 | |
| Average NVIDIA GeForce RTX 3080 Ti Laptop GPU (37.7 - 67.2, n=14) | |
| 1920x1080 Highest Settings possible AA:4xMSAA + FX AF:16x | |
| MSI Titan GT77 12UHS 4k | |
| MSI Titan GT77 12UHS (dGPU, Extreme Leistung) | |
| MSI Titan GT77 12UHS | |
| Alienware x17 R2 P48E | |
| Average NVIDIA GeForce RTX 3080 Ti Laptop GPU (30 - 139.2, n=42) | |
| Average of class Gaming (6.38 - 167.7, n=213, last 2 years) | |
| Razer Blade 17 Early 2022 | |
| Strange Brigade | |
| 3840x2160 ultra AA:ultra AF:16 | |
| Average of class Gaming (54.5 - 298, n=55, last 2 years) | |
| MSI Titan GT77 12UHS (1.47.22.14 D3D12, dGPU, Extreme Leistung) | |
| MSI Titan GT77 12UHS 4k (1.47.22.14 D3D12) | |
| Razer Blade 17 Early 2022 (1.47.22.14 D3D12) | |
| Average NVIDIA GeForce RTX 3080 Ti Laptop GPU (61.7 - 100.7, n=15) | |
| 1920x1080 ultra AA:ultra AF:16 | |
| MSI Titan GT77 12UHS (1.47.22.14 D3D12) | |
| MSI Titan GT77 12UHS (1.47.22.14 D3D12, dGPU, Extreme Leistung) | |
| Alienware x17 R2 P48E (1.47.22.14 D3D12) | |
| Average of class Gaming (14.6 - 421, n=221, last 2 years) | |
| MSI Titan GT77 12UHS 4k (1.47.22.14 D3D12) | |
| Razer Blade 17 Early 2022 (1.47.22.14 D3D12) | |
| Average NVIDIA GeForce RTX 3080 Ti Laptop GPU (42.3 - 224, n=41) | |
| F1 2021 | |
| 3840x2160 Ultra High Preset + Raytracing AA:T AF:16x | |
| Average of class Gaming (47.6 - 115.1, n=18, last 2 years) | |
| MSI Titan GT77 12UHS (874931, dGPU, Extreme Leistung) | |
| MSI Titan GT77 12UHS 4k (874931) | |
| Razer Blade 17 Early 2022 (874931) | |
| Average NVIDIA GeForce RTX 3080 Ti Laptop GPU (41.1 - 70.2, n=18) | |
| 1920x1080 Ultra High Preset + Raytracing AA:T AF:16x | |
| MSI Titan GT77 12UHS (874931) | |
| MSI Titan GT77 12UHS (874931, dGPU, Extreme Leistung) | |
| Razer Blade 17 Early 2022 (874931) | |
| MSI Titan GT77 12UHS 4k (874931) | |
| Average NVIDIA GeForce RTX 3080 Ti Laptop GPU (30.2 - 160.6, n=30) | |
| Average of class Gaming (13.5 - 271, n=58, last 2 years) | |
| Far Cry 5 | |
| 3840x2160 Ultra Preset AA:T | |
| Average of class Gaming (39 - 113, n=32, last 2 years) | |
| MSI Titan GT77 12UHS 4k | |
| MSI Titan GT77 12UHS (dGPU, Extreme Leistung) | |
| Razer Blade 17 Early 2022 | |
| Average NVIDIA GeForce RTX 3080 Ti Laptop GPU (45 - 76, n=9) | |
| 1920x1080 Ultra Preset AA:T | |
| MSI Titan GT77 12UHS (dGPU, Extreme Leistung) | |
| MSI Titan GT77 12UHS | |
| MSI Titan GT77 12UHS 4k | |
| SCHENKER XMG Ultra 17 Rocket Lake | |
| Average NVIDIA GeForce RTX 3080 Ti Laptop GPU (111 - 162, n=24) | |
| Average of class Gaming (14 - 218, n=125, last 2 years) | |
| Razer Blade 17 Early 2022 | |
Witcher 3 FPS graph

| low | med. | high | ultra | QHD | 4K | |
| GTA V (2015) | 187.3 | 186.6 | 182.3 | 134.4 | 117.8 | 121.7 |
| The Witcher 3 (2015) | 480 | 379 | 240 | 123.7 | 91.9 | |
| Dota 2 Reborn (2015) | 199.9 | 180.7 | 169.7 | 162.7 | 139.9 | |
| Final Fantasy XV Benchmark (2018) | 220 | 174.1 | 131 | 100.3 | 58.3 | |
| X-Plane 11.11 (2018) | 170.8 | 150.8 | 118.3 | 100.9 | ||
| Far Cry 5 (2018) | 199 | 169 | 161 | 151 | 134 | 76 |
| Strange Brigade (2018) | 519 | 286 | 233 | 206 | 156.2 | 93.7 |
| F1 2021 (2021) | 348 | 237 | 205 | 130.4 | 103.4 | 62.8 |
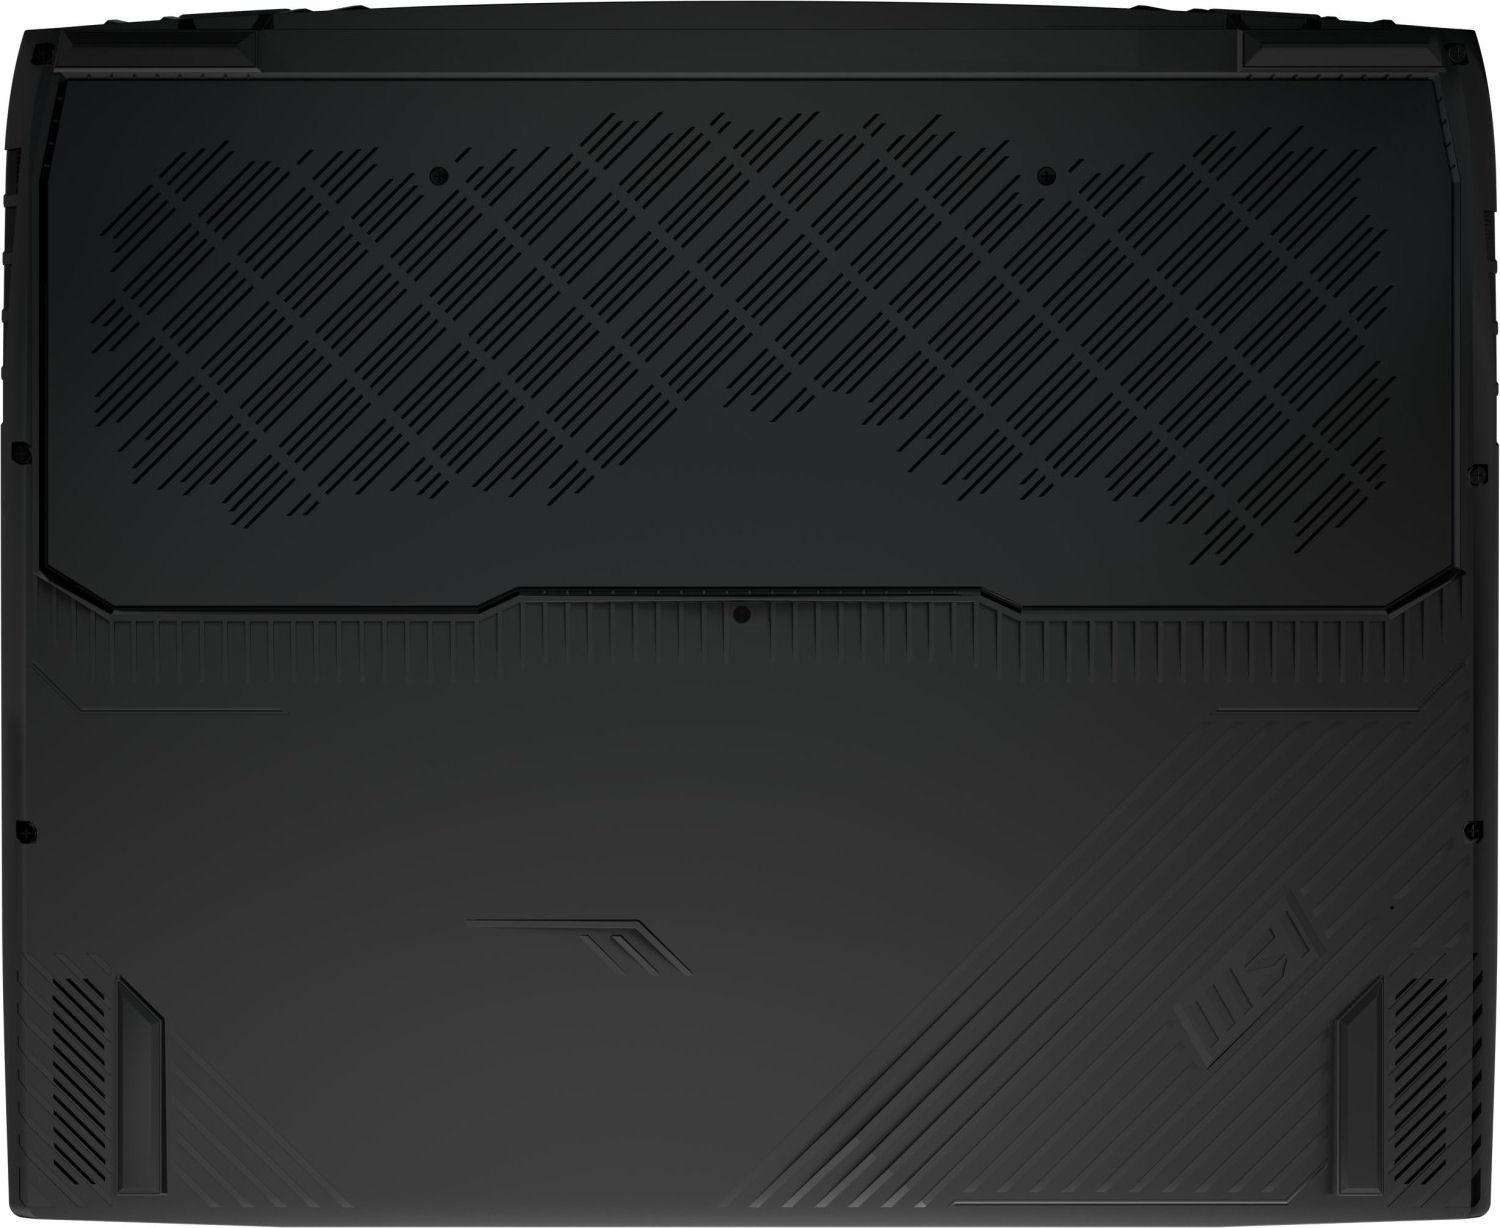
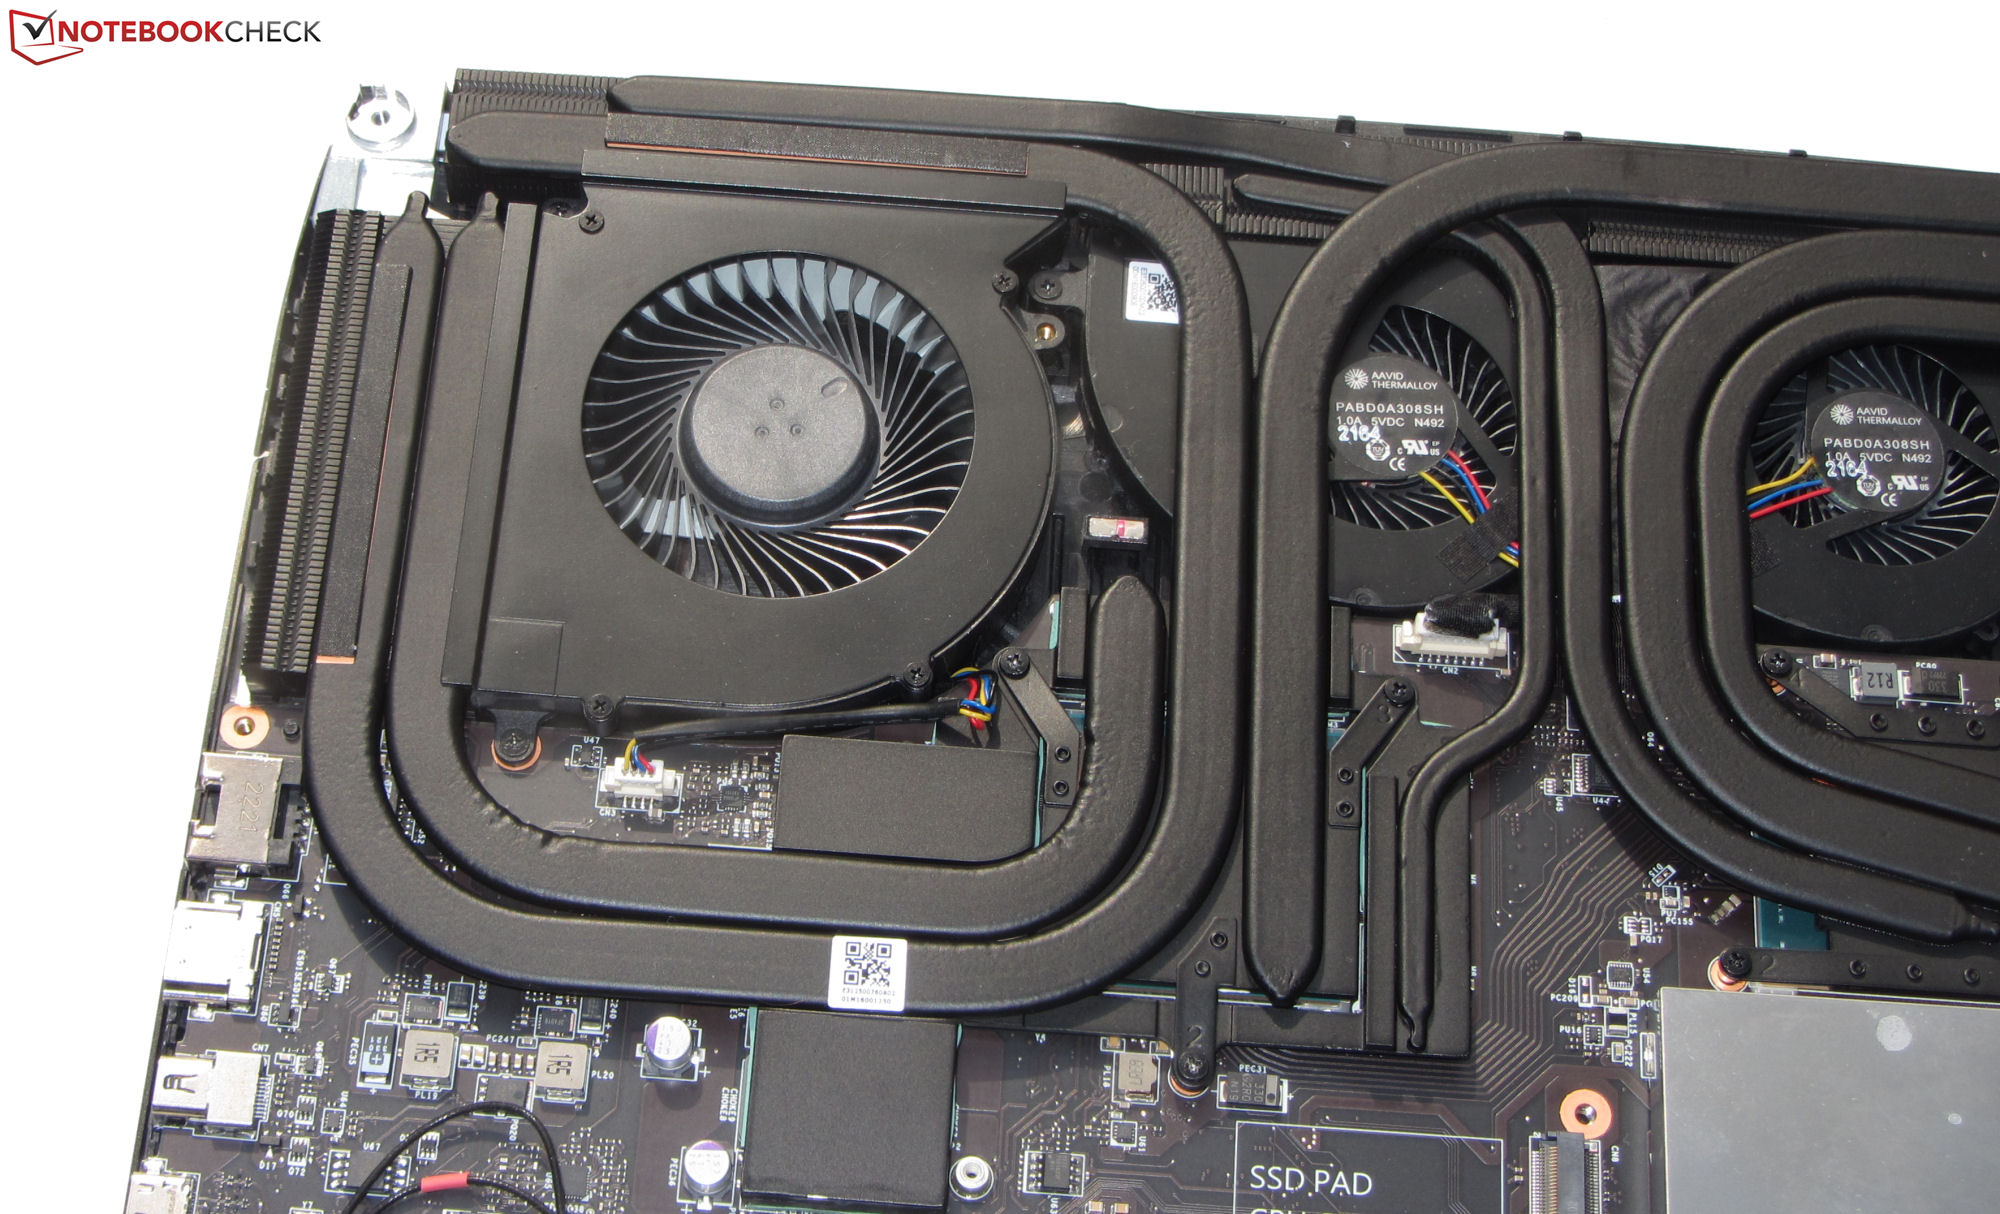
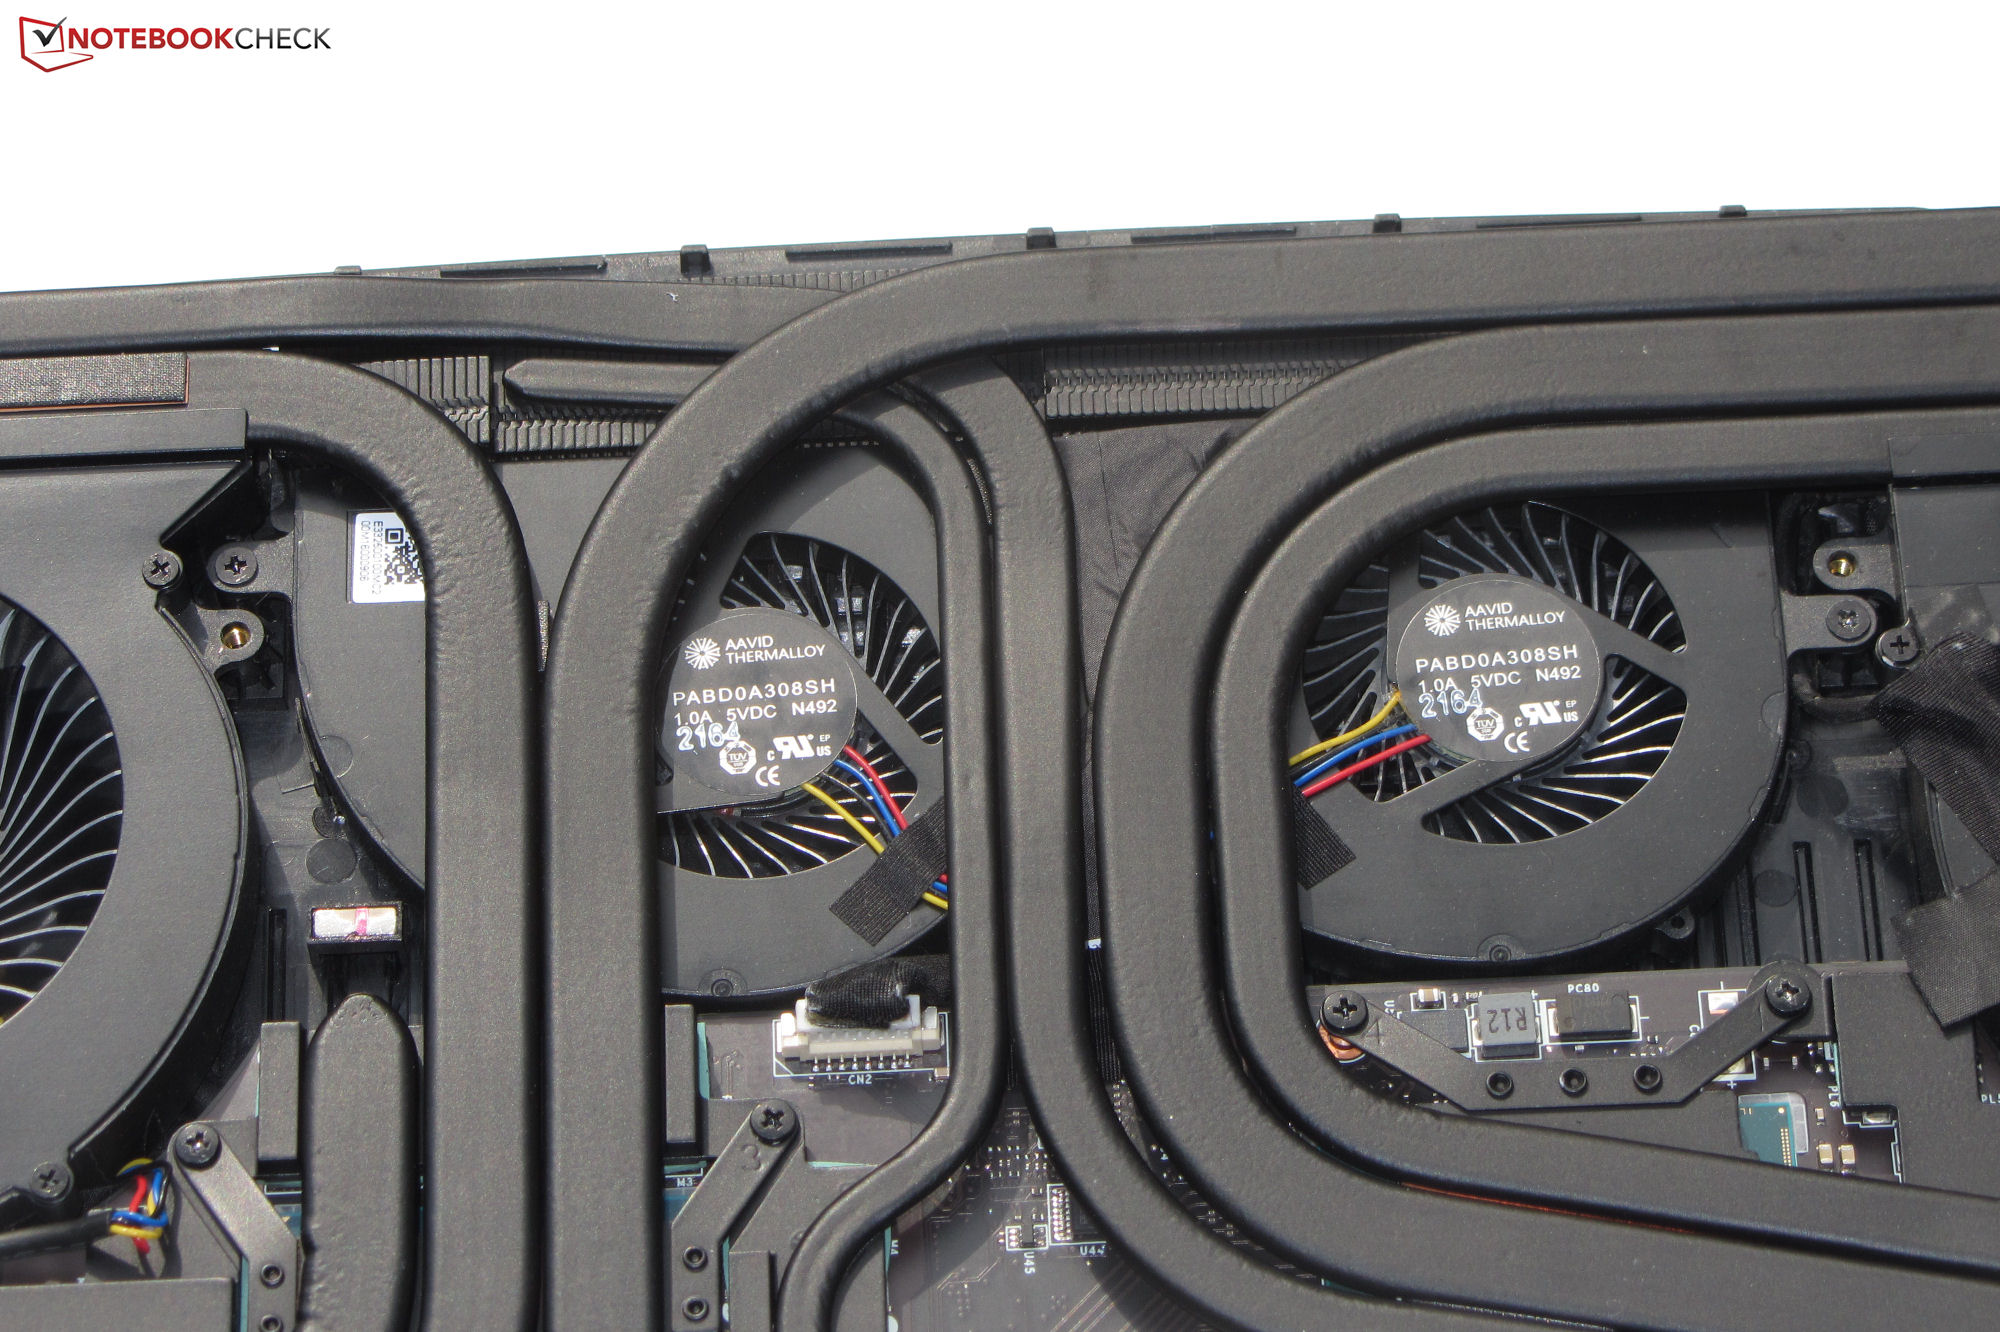
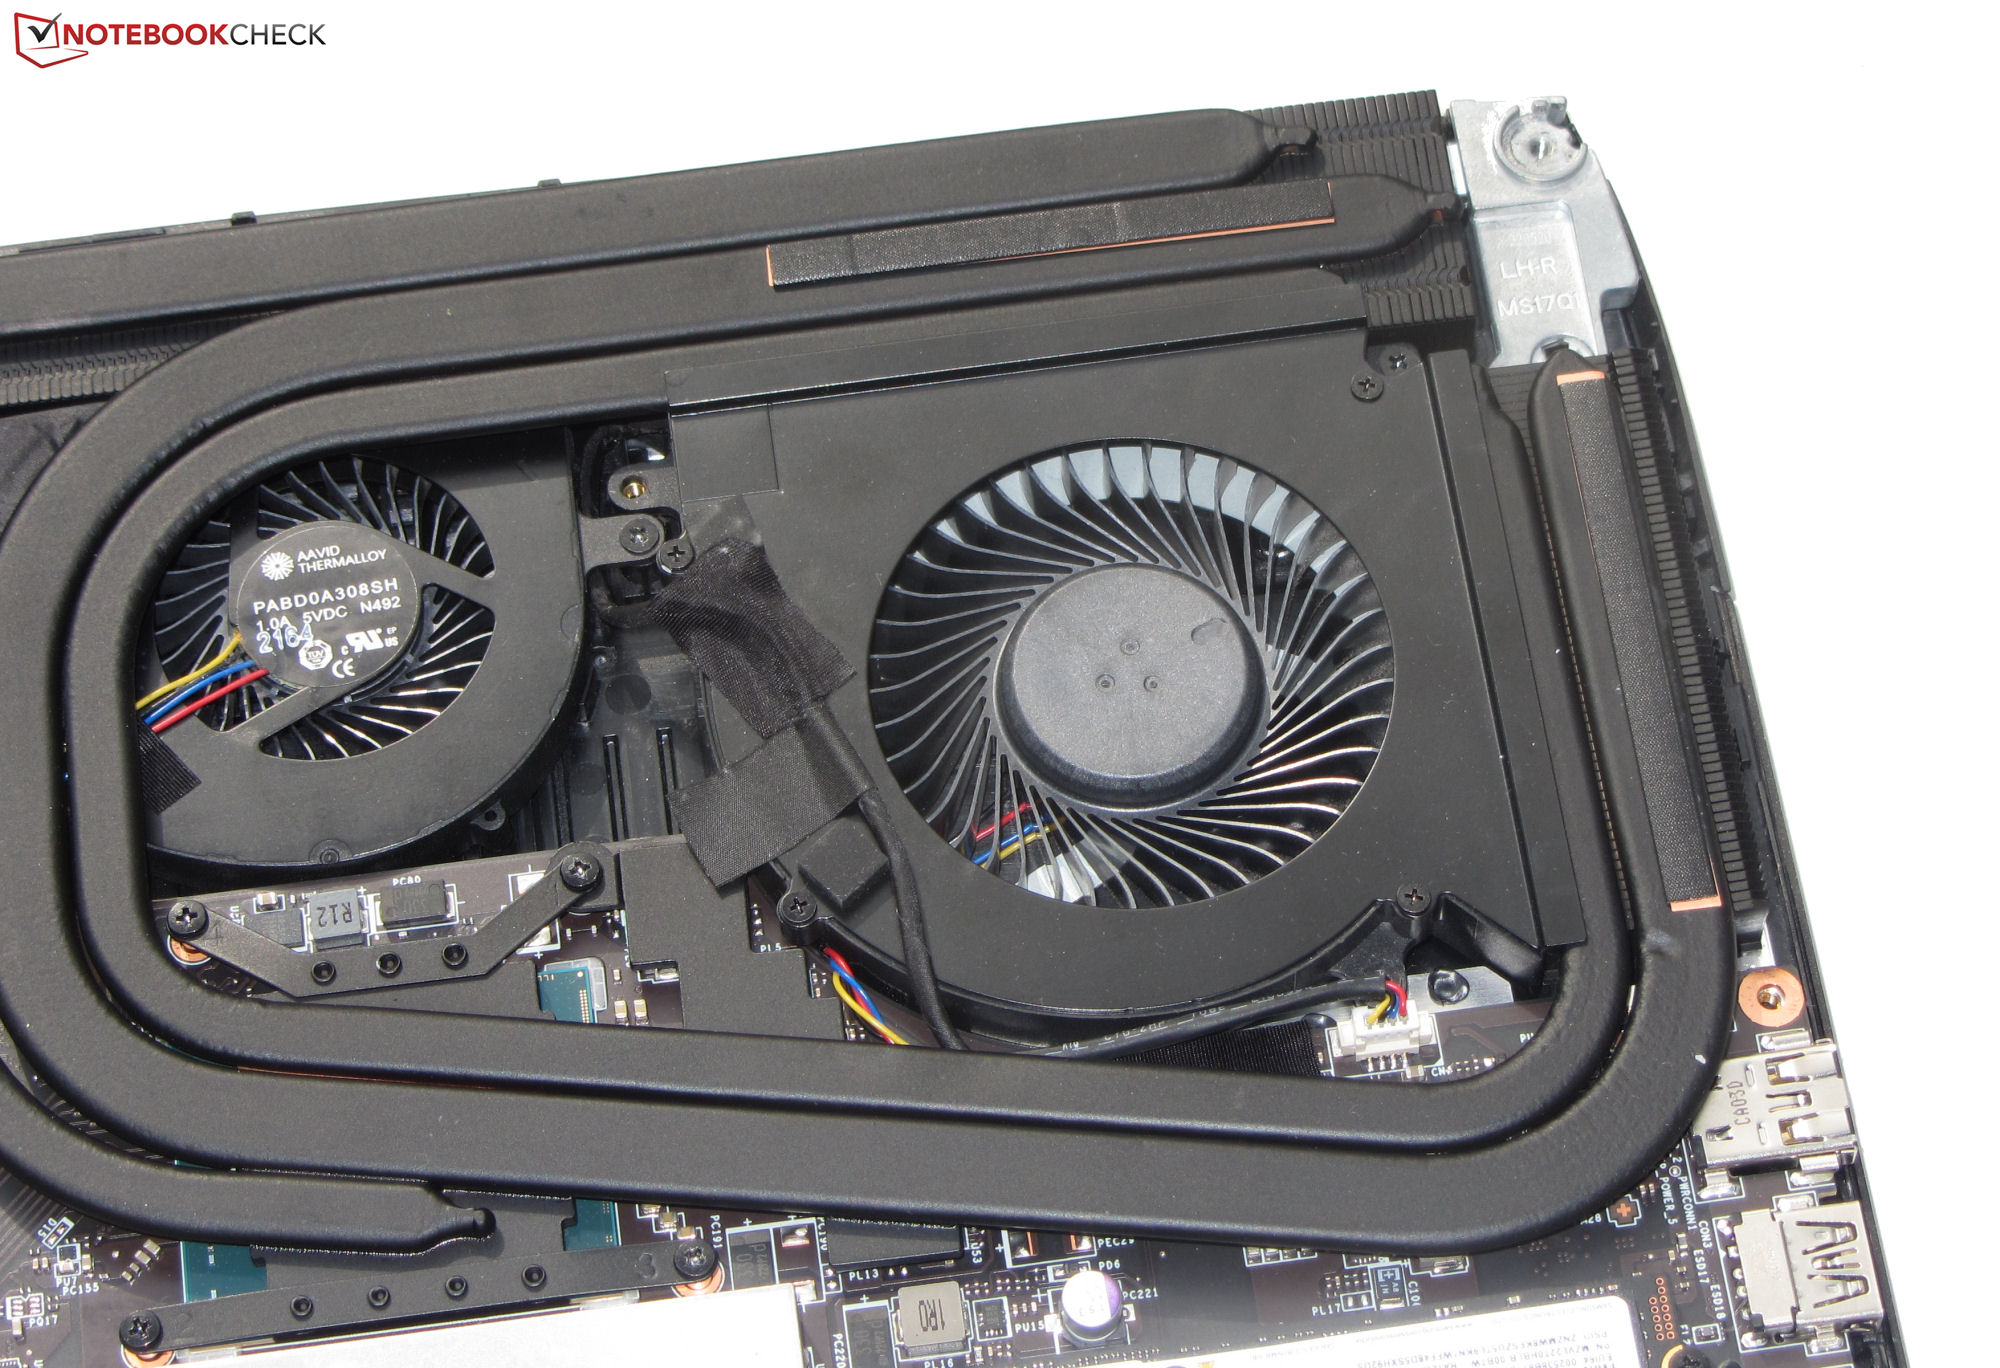
Emissions - The MSI GT77 has four fans
Noise emissions
The four fans can generate quite a bit of noise: under load, noise levels reached 53 dB(A) during the Witcher 3 test and 56 dB(A) during the stress test. At idle or under low load, at least one of the fans is usually spinning and fan noise can go up to 42 dB(A). However, the FHD Titan is not affect by this. One possible explanation is that the fan control on the 4K model could be somewhat more fidgety due to the active "Smart Auto" feature. The "Silent Mode" profile helps reduce the amount of noise when the system is running - at the expense of computing power.
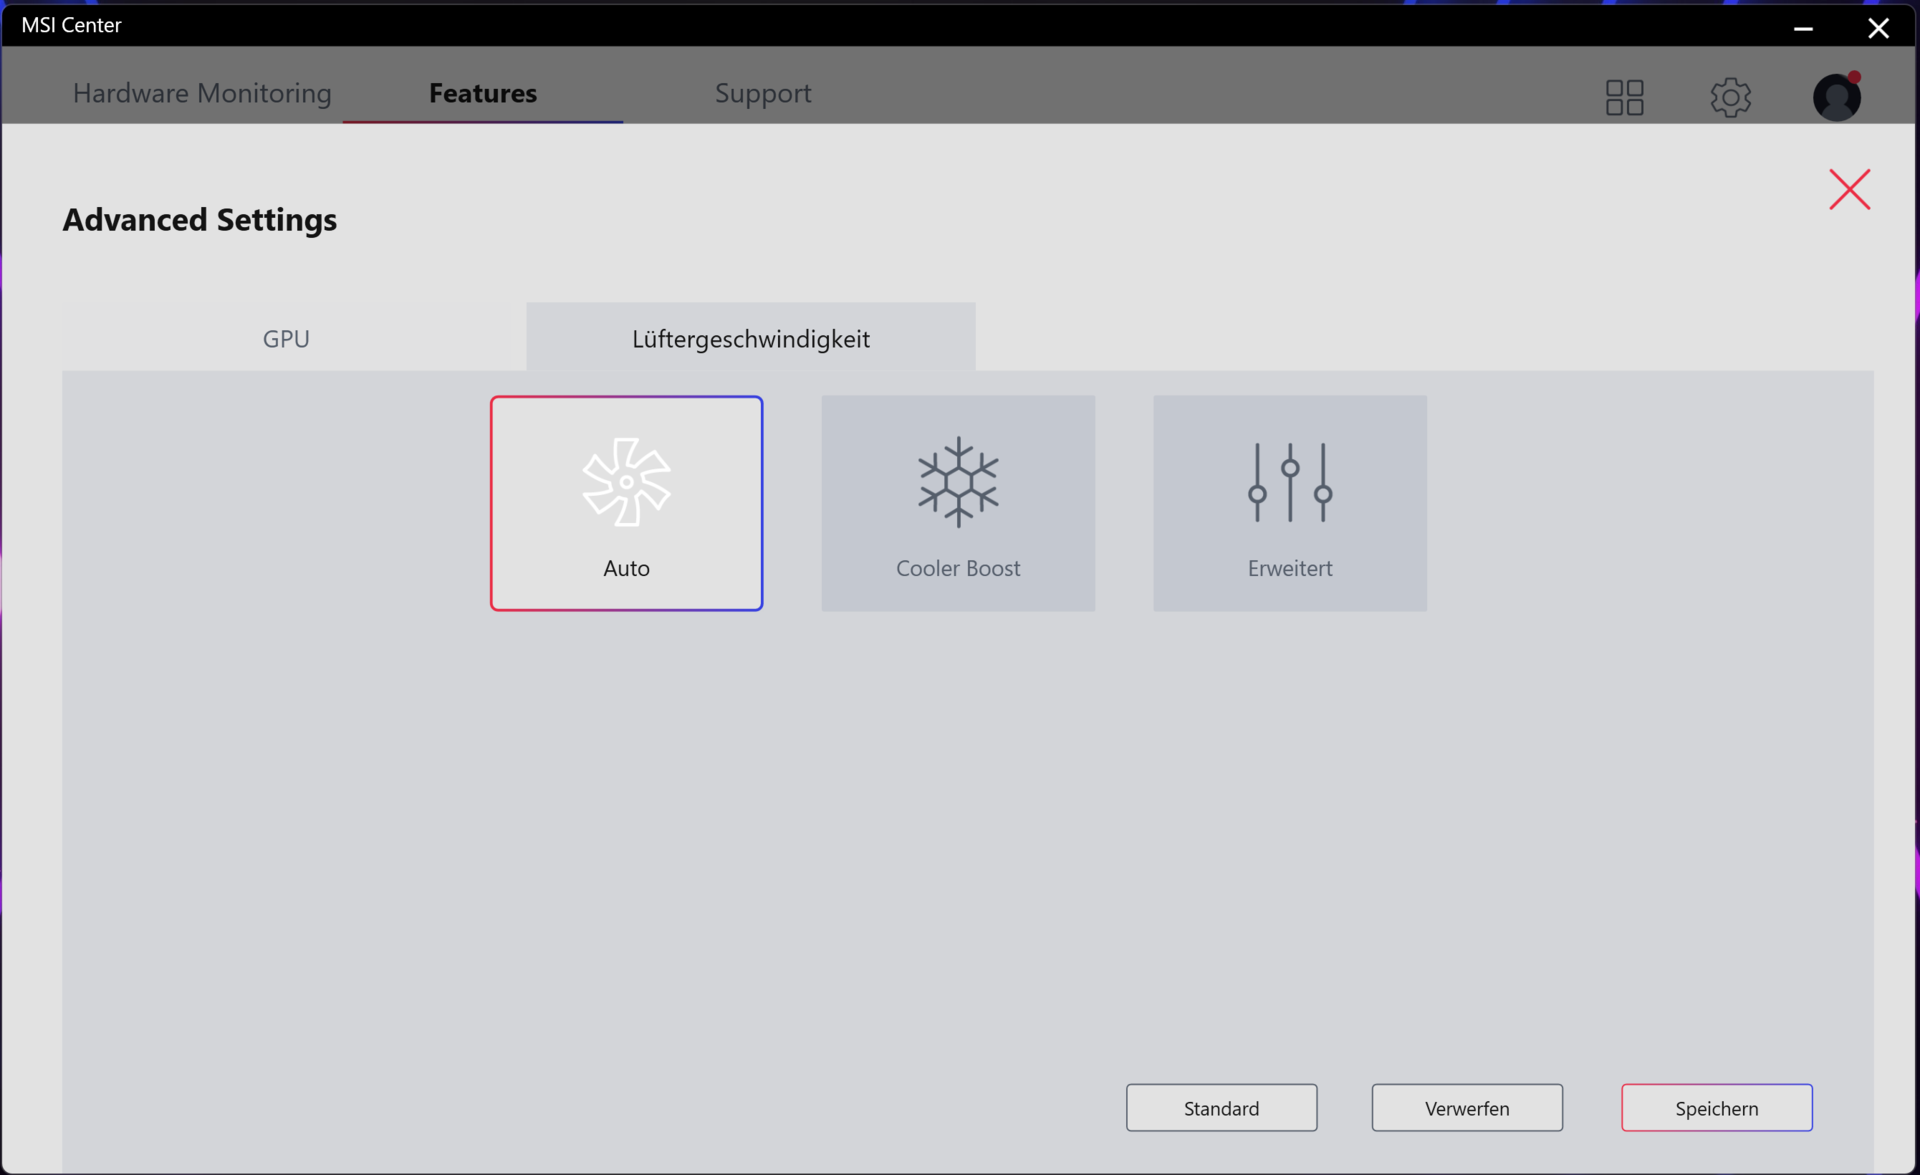
The "Extreme Performance" profile lets you modify the fan control. The options available include "Auto", "Cooler Boost" (fans run at max speed) and "Advanced" (customisation of fan curves).
Noise Level
| Idle |
| 29 / 30 / 42 dB(A) |
| Load |
| 54 / 56 dB(A) |
 | ||
30 dB silent 40 dB(A) audible 50 dB(A) loud |
||
min: | ||
| MSI Titan GT77 12UHS 4k i9-12900HX, GeForce RTX 3080 Ti Laptop GPU | Razer Blade 17 Early 2022 i9-12900H, GeForce RTX 3080 Ti Laptop GPU | Alienware x17 R2 P48E i9-12900HK, GeForce RTX 3080 Ti Laptop GPU | SCHENKER XMG Ultra 17 Rocket Lake i9-11900K, GeForce RTX 3080 Laptop GPU | MSI Titan GT77 12UHS i9-12900HX, GeForce RTX 3080 Ti Laptop GPU | |
|---|---|---|---|---|---|
| Noise | 9% | 21% | -12% | 14% | |
| off / environment * | 26 | 26 -0% | 22.7 13% | 24 8% | 21.9 16% |
| Idle Minimum * | 29 | 26 10% | 23.1 20% | 30 -3% | 24.53 15% |
| Idle Average * | 30 | 27 10% | 23.1 23% | 31 -3% | 24.53 18% |
| Idle Maximum * | 42 | 32 24% | 23.1 45% | 57 -36% | 24.53 42% |
| Load Average * | 54 | 50 7% | 31.9 41% | 63 -17% | 46.25 14% |
| Witcher 3 ultra * | 52 | 51 2% | 52.5 -1% | 61 -17% | 56.86 -9% |
| Load Maximum * | 56 | 51 9% | 52.5 6% | 63 -13% | 54.25 3% |
* ... smaller is better
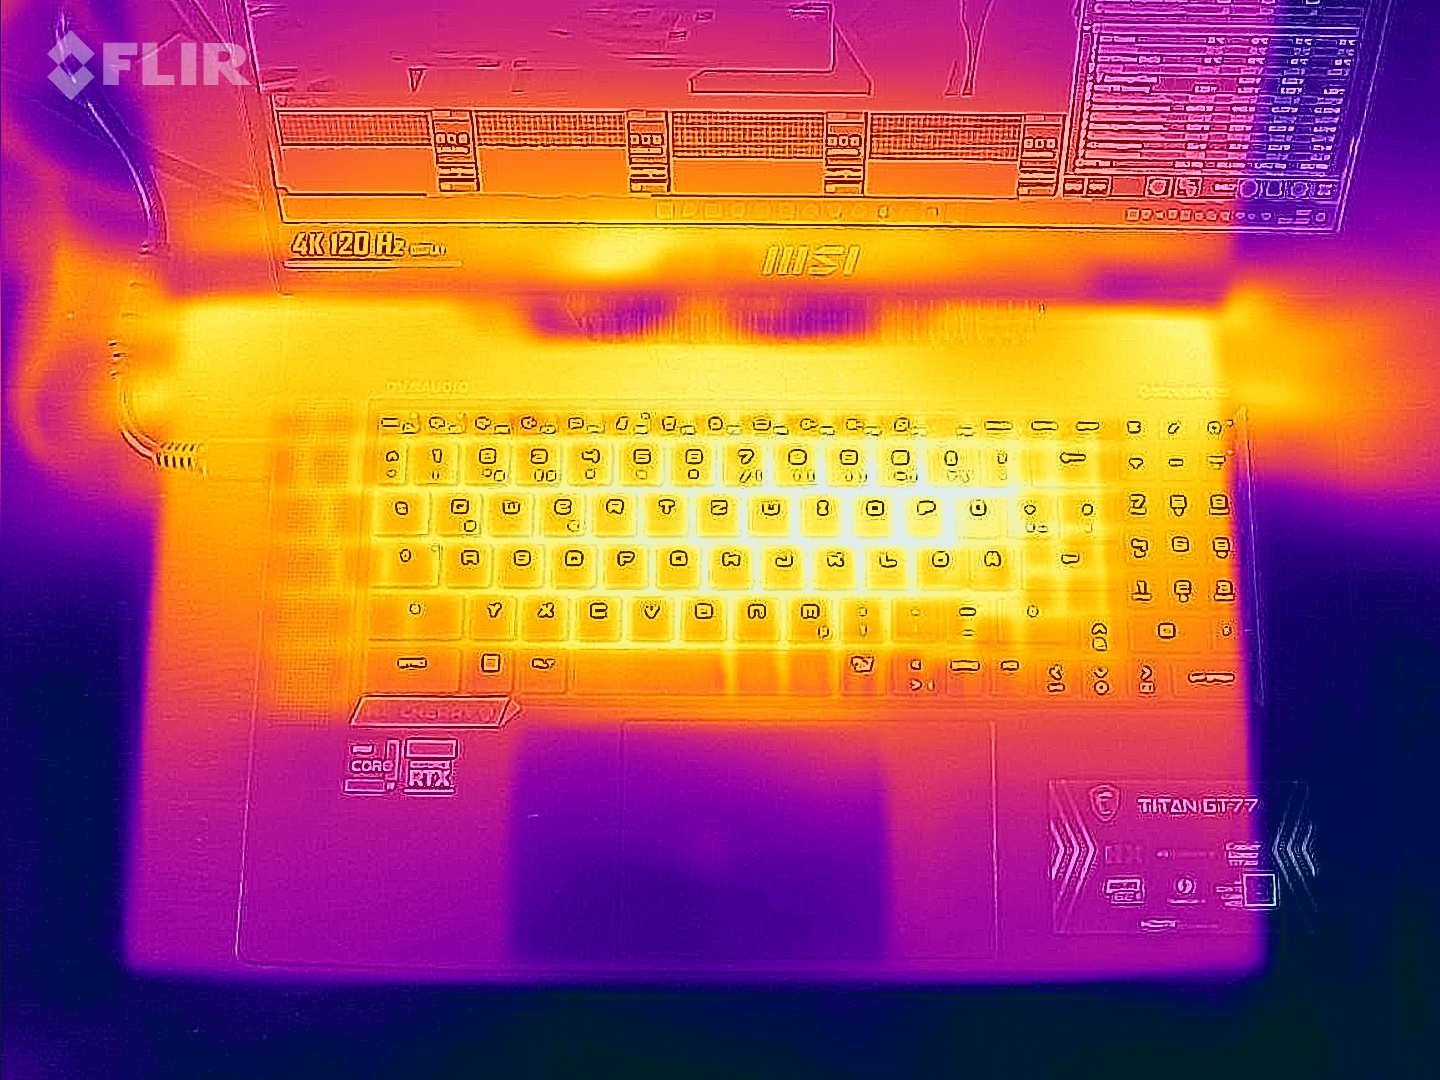
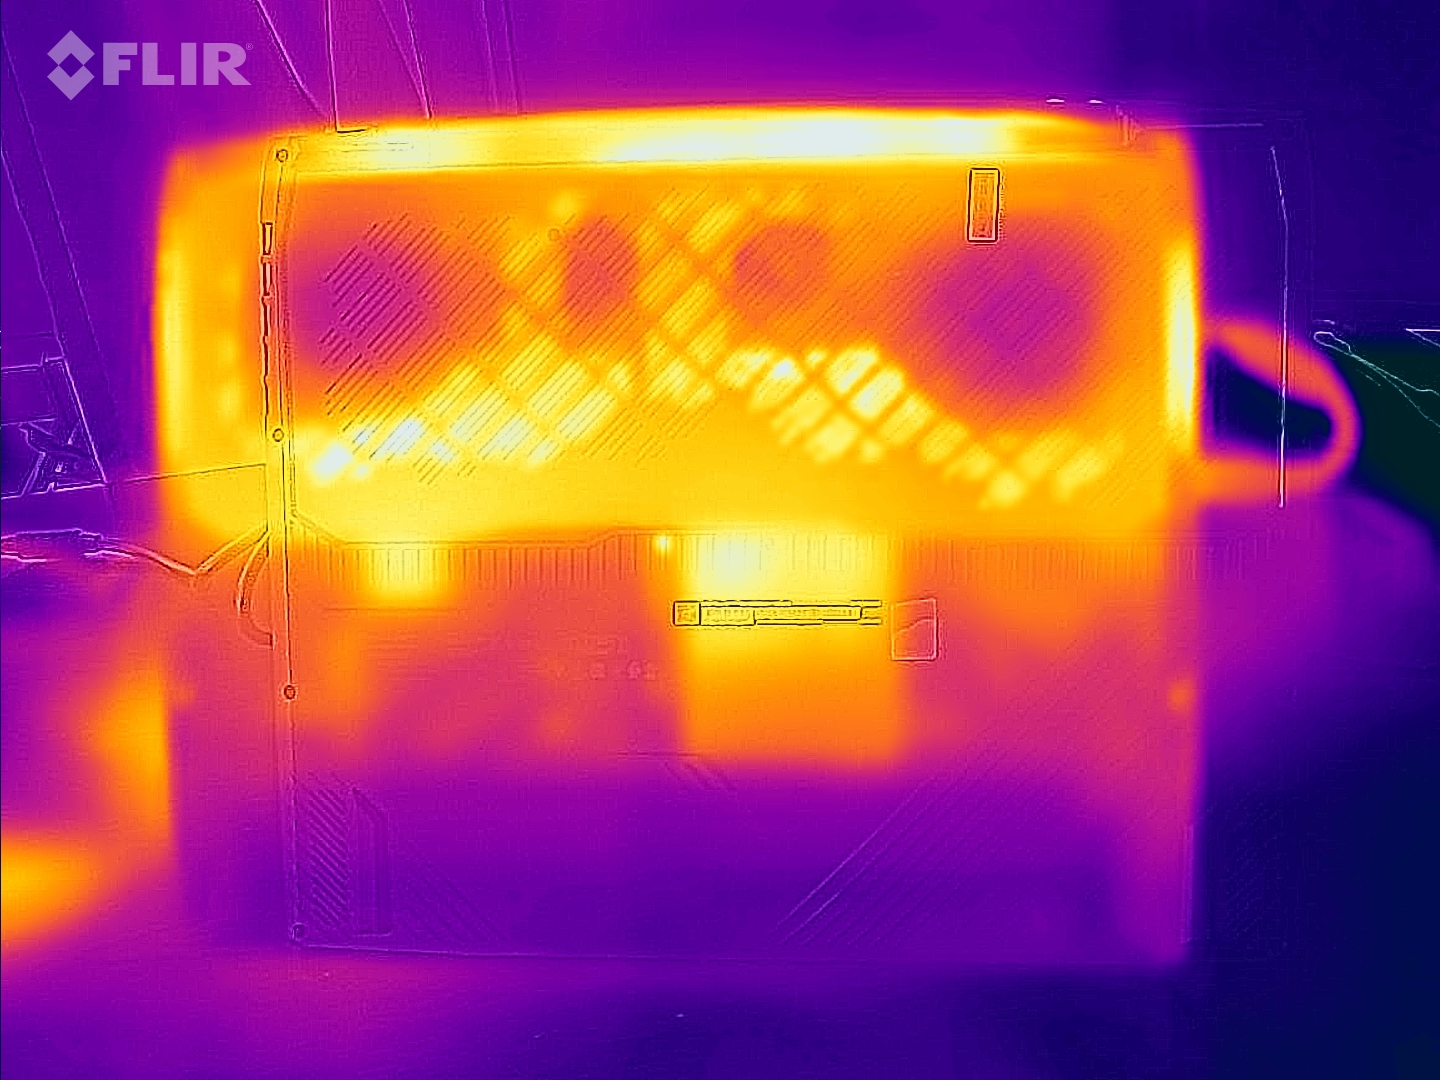
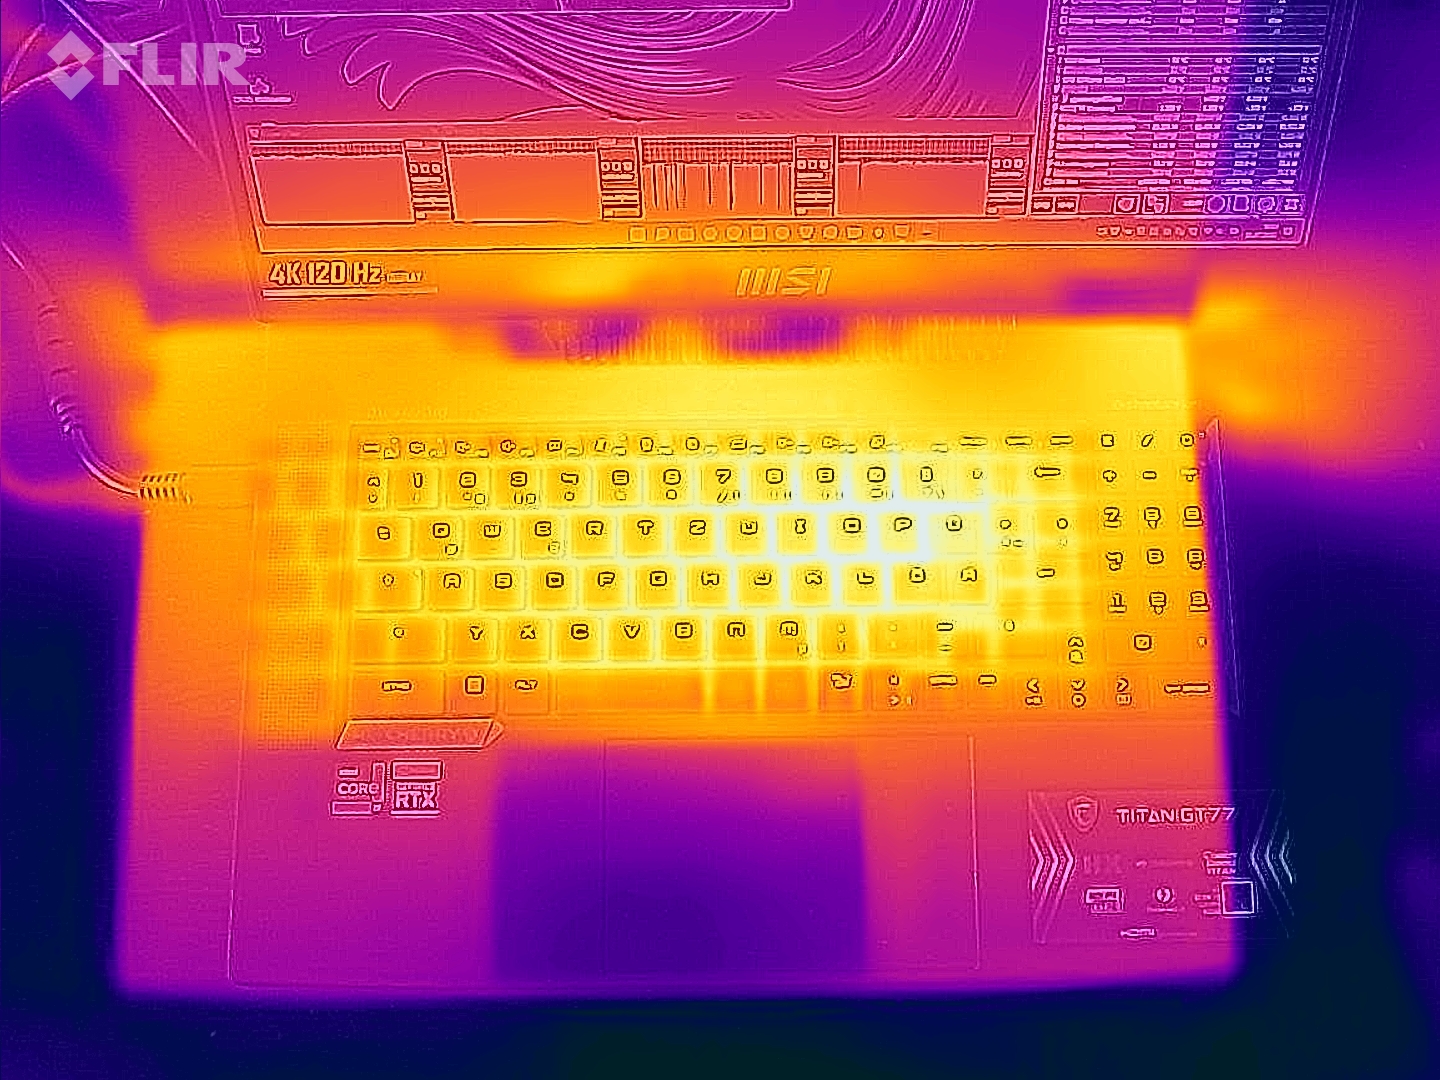
Temperature
In everyday use (office work, Internet browsing), the chassis' temperatures remained within an acceptable range. Under load (stress test, Witcher 3 test), the laptop became significantly warmer but not too hot. There is no cause for concern when it comes to CPU temperatures.
(-) The maximum temperature on the upper side is 49 °C / 120 F, compared to the average of 40.4 °C / 105 F, ranging from 21.2 to 68.8 °C for the class Gaming.
(-) The bottom heats up to a maximum of 50 °C / 122 F, compared to the average of 43.2 °C / 110 F
(±) In idle usage, the average temperature for the upper side is 33.2 °C / 92 F, compared to the device average of 33.8 °C / 93 F.
(-) Playing The Witcher 3, the average temperature for the upper side is 48.1 °C / 119 F, compared to the device average of 33.8 °C / 93 F.
(-) The palmrests and touchpad can get very hot to the touch with a maximum of 43 °C / 109.4 F.
(-) The average temperature of the palmrest area of similar devices was 28.9 °C / 84 F (-14.1 °C / -25.4 F).
| MSI Titan GT77 12UHS 4k Intel Core i9-12900HX, NVIDIA GeForce RTX 3080 Ti Laptop GPU | Razer Blade 17 Early 2022 Intel Core i9-12900H, NVIDIA GeForce RTX 3080 Ti Laptop GPU | Alienware x17 R2 P48E Intel Core i9-12900HK, NVIDIA GeForce RTX 3080 Ti Laptop GPU | SCHENKER XMG Ultra 17 Rocket Lake Intel Core i9-11900K, NVIDIA GeForce RTX 3080 Laptop GPU | MSI Titan GT77 12UHS Intel Core i9-12900HX, NVIDIA GeForce RTX 3080 Ti Laptop GPU | |
|---|---|---|---|---|---|
| Heat | -5% | 11% | 8% | 2% | |
| Maximum Upper Side * | 49 | 50 -2% | 49.6 -1% | 34 31% | 40.8 17% |
| Maximum Bottom * | 50 | 56 -12% | 42.4 15% | 43 14% | 52.4 -5% |
| Idle Upper Side * | 34 | 36 -6% | 29.2 14% | 38 -12% | 34.6 -2% |
| Idle Bottom * | 38 | 38 -0% | 32 16% | 39 -3% | 38.4 -1% |
* ... smaller is better
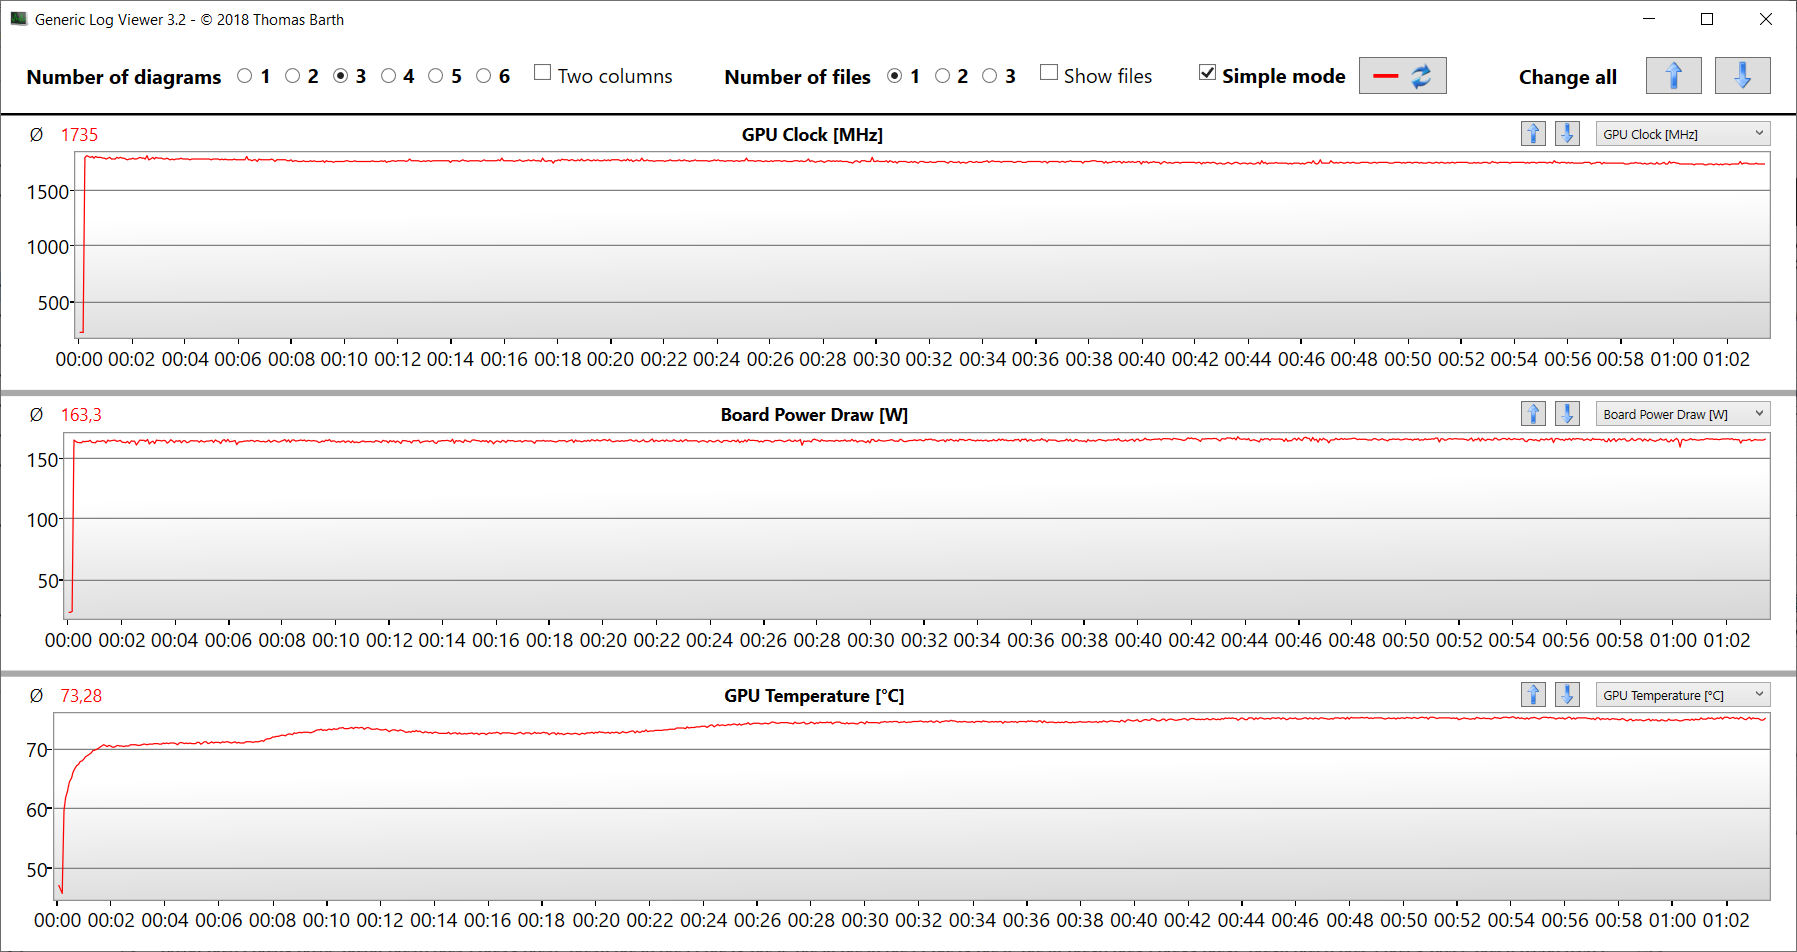
Stress test
The CPU completed the stress test (running Prime95 and FurMark for at least an hour) at medium processing speeds, whilst the GPU was able to hit its maximum clock speed. The stress test represents an extreme situation. We conduct this test to check whether the system is stable while running at full load.


Speakers
MSI Titan GT77 12UHS audio analysis
(+) | speakers can play relatively loud (91 dB)
Bass 100 - 315 Hz
(±) | reduced bass - on average 13.9% lower than median
(±) | linearity of bass is average (9.7% delta to prev. frequency)
Mids 400 - 2000 Hz
(+) | balanced mids - only 4% away from median
(+) | mids are linear (3.6% delta to prev. frequency)
Highs 2 - 16 kHz
(+) | balanced highs - only 1.8% away from median
(+) | highs are linear (3.9% delta to prev. frequency)
Overall 100 - 16.000 Hz
(+) | overall sound is linear (11.4% difference to median)
Compared to same class
» 8% of all tested devices in this class were better, 3% similar, 89% worse
» The best had a delta of 6%, average was 18%, worst was 132%
Compared to all devices tested
» 5% of all tested devices were better, 2% similar, 93% worse
» The best had a delta of 4%, average was 25%, worst was 134%
Alienware x17 R2 P48E audio analysis
(+) | speakers can play relatively loud (84.3 dB)
Bass 100 - 315 Hz
(±) | reduced bass - on average 9.7% lower than median
(+) | bass is linear (5.5% delta to prev. frequency)
Mids 400 - 2000 Hz
(+) | balanced mids - only 1.6% away from median
(+) | mids are linear (3% delta to prev. frequency)
Highs 2 - 16 kHz
(±) | higher highs - on average 5% higher than median
(±) | linearity of highs is average (7.6% delta to prev. frequency)
Overall 100 - 16.000 Hz
(+) | overall sound is linear (9.3% difference to median)
Compared to same class
» 2% of all tested devices in this class were better, 2% similar, 96% worse
» The best had a delta of 6%, average was 18%, worst was 132%
Compared to all devices tested
» 2% of all tested devices were better, 1% similar, 97% worse
» The best had a delta of 4%, average was 25%, worst was 134%
Power management - MSI laptop delivers decent battery life
Power consumption
The laptop's power consumption is within the normal range for the hardware inside it. During the Witcher 3 test and stress test, its power consumption increased to an average of 236 watts and a peak of 309 watts. The device used a constant amount of power during both tests.
Note: The FHD model was tested with the dGPU mode active. This explains why it consumed more power at idle.
| Off / Standby | |
| Idle | |
| Load |
|
| MSI Titan GT77 12UHS i9-12900HX, GeForce RTX 3080 Ti Laptop GPU | Razer Blade 17 Early 2022 i9-12900H, GeForce RTX 3080 Ti Laptop GPU | Alienware x17 R2 P48E i9-12900HK, GeForce RTX 3080 Ti Laptop GPU | SCHENKER XMG Ultra 17 Rocket Lake i9-11900K, GeForce RTX 3080 Laptop GPU | MSI Titan GT77 12UHS i9-12900HX, GeForce RTX 3080 Ti Laptop GPU | Average NVIDIA GeForce RTX 3080 Ti Laptop GPU | Average of class Gaming | |
|---|---|---|---|---|---|---|---|
| Power Consumption | -7% | -44% | -146% | -41% | -10% | 5% | |
| Idle Minimum * | 12 | 17 -42% | 24.1 -101% | 62 -417% | 30.21 -152% | 17.2 ? -43% | 13.9 ? -16% |
| Idle Average * | 18 | 23 -28% | 28.5 -58% | 64 -256% | 32.42 -80% | 23.3 ? -29% | 19.2 ? -7% |
| Idle Maximum * | 30 | 34 -13% | 60 -100% | 69 -130% | 33.7 -12% | 30.8 ? -3% | 26.9 ? 10% |
| Load Average * | 141 | 120 15% | 128.7 9% | 183 -30% | 125.09 11% | 121.2 ? 14% | 111.5 ? 21% |
| Witcher 3 ultra * | 236 | 229 3% | 254 -8% | 297 -26% | 256 -8% | ||
| Load Maximum * | 309 | 243 21% | 323 -5% | 368 -19% | 321.88 -4% | 276 ? 11% | 251 ? 19% |
* ... smaller is better
Power consumption Witcher 3 / stress test
Power consumption with external monitor
Battery life
For our Wi-Fi test (visiting websites automatically using a script) and video test (playing the short film Big Buck Bunny (H.264 encoding, FHD) in a loop), the 17.3-inch laptop managed to run for 5:52 hours and 6:50 hours respectively. The FHD sibling model lasted slightly longer due to its lower screen resolution.
| MSI Titan GT77 12UHS 4k i9-12900HX, GeForce RTX 3080 Ti Laptop GPU, 99.99 Wh | Razer Blade 17 Early 2022 i9-12900H, GeForce RTX 3080 Ti Laptop GPU, 82 Wh | Alienware x17 R2 P48E i9-12900HK, GeForce RTX 3080 Ti Laptop GPU, 87 Wh | SCHENKER XMG Ultra 17 Rocket Lake i9-11900K, GeForce RTX 3080 Laptop GPU, 97 Wh | MSI Titan GT77 12UHS i9-12900HX, GeForce RTX 3080 Ti Laptop GPU, 99.9 Wh | Average of class Gaming | |
|---|---|---|---|---|---|---|
| Battery Runtime | -15% | -56% | -58% | 5% | 2% | |
| Reader / Idle | 490 | 428 -13% | 234 -52% | 182 -63% | 543 ? 11% | |
| H.264 | 410 | 290 -29% | 115 -72% | 433 6% | 397 ? -3% | |
| WiFi v1.3 | 352 | 229 -35% | 117 -67% | 110 -69% | 412.1 17% | 368 ? 5% |
| Load | 89 | 103 16% | 46 -48% | 66 -26% | 82 -8% | 84.2 ? -5% |
| Witcher 3 ultra | 90 | 80.6 ? |
Pros
Cons
Verdict - Even better with a 4K display
With the Titan GT77, MSI is delivering one of the best-performing DTR laptops right now. It is designed for usage scenarios that require intense computing power and a large amount of RAM, such as rendering and gaming.
The MSI Titan GT77 - one of the best-performing laptops at the moment.
The Core i9-12900HX and GeForce RTX 3080 Ti Laptop (175 watts TGP, 16 GB of VRAM) are able to run consistently at high clock speeds. The laptop generates quite a bit of heat and noise, which is typical of this class of hardware. The two Thunderbolt 4 ports provide expansion options (e.g. external GPU, docking solutions). In addition, the laptop features a well-design mechanical keyboard and very decent battery life. These are all things that this current variant shares with its sibling model that we previously reviewed.
The display is the main difference between the two Titan models: the 4K panel (120 Hz) on the current review unit is superior to the FHD panel (360 Hz) on the other model in terms of resolution, peak brightness and colour coverage (almost 100% DCI-P3). It is therefore the best option if colour accuracy is important to you. The FHD display, on the other hand, offers a very high refresh rate and should be able to make many gamers happy. Unfortunately, both display are lacking in contrast.
The Alienware x17 R2 is a worthy alternative to the Titan when it comes to performance. However, it offers fewer expansion options and delivers poorer battery life.
Price and availability
The MSI Titan GT77 12UHS is available at retailers such as Amazon.com. The configuration we reviewed is priced at around 5,600 Euro (US$5,980).
MSI Titan GT77 12UHS
-
08/28/2022 v7
Sascha Mölck


Pricecompare

