

MSI Raider GE77 HX 12UHS in review: 4K gaming notebook with top performance

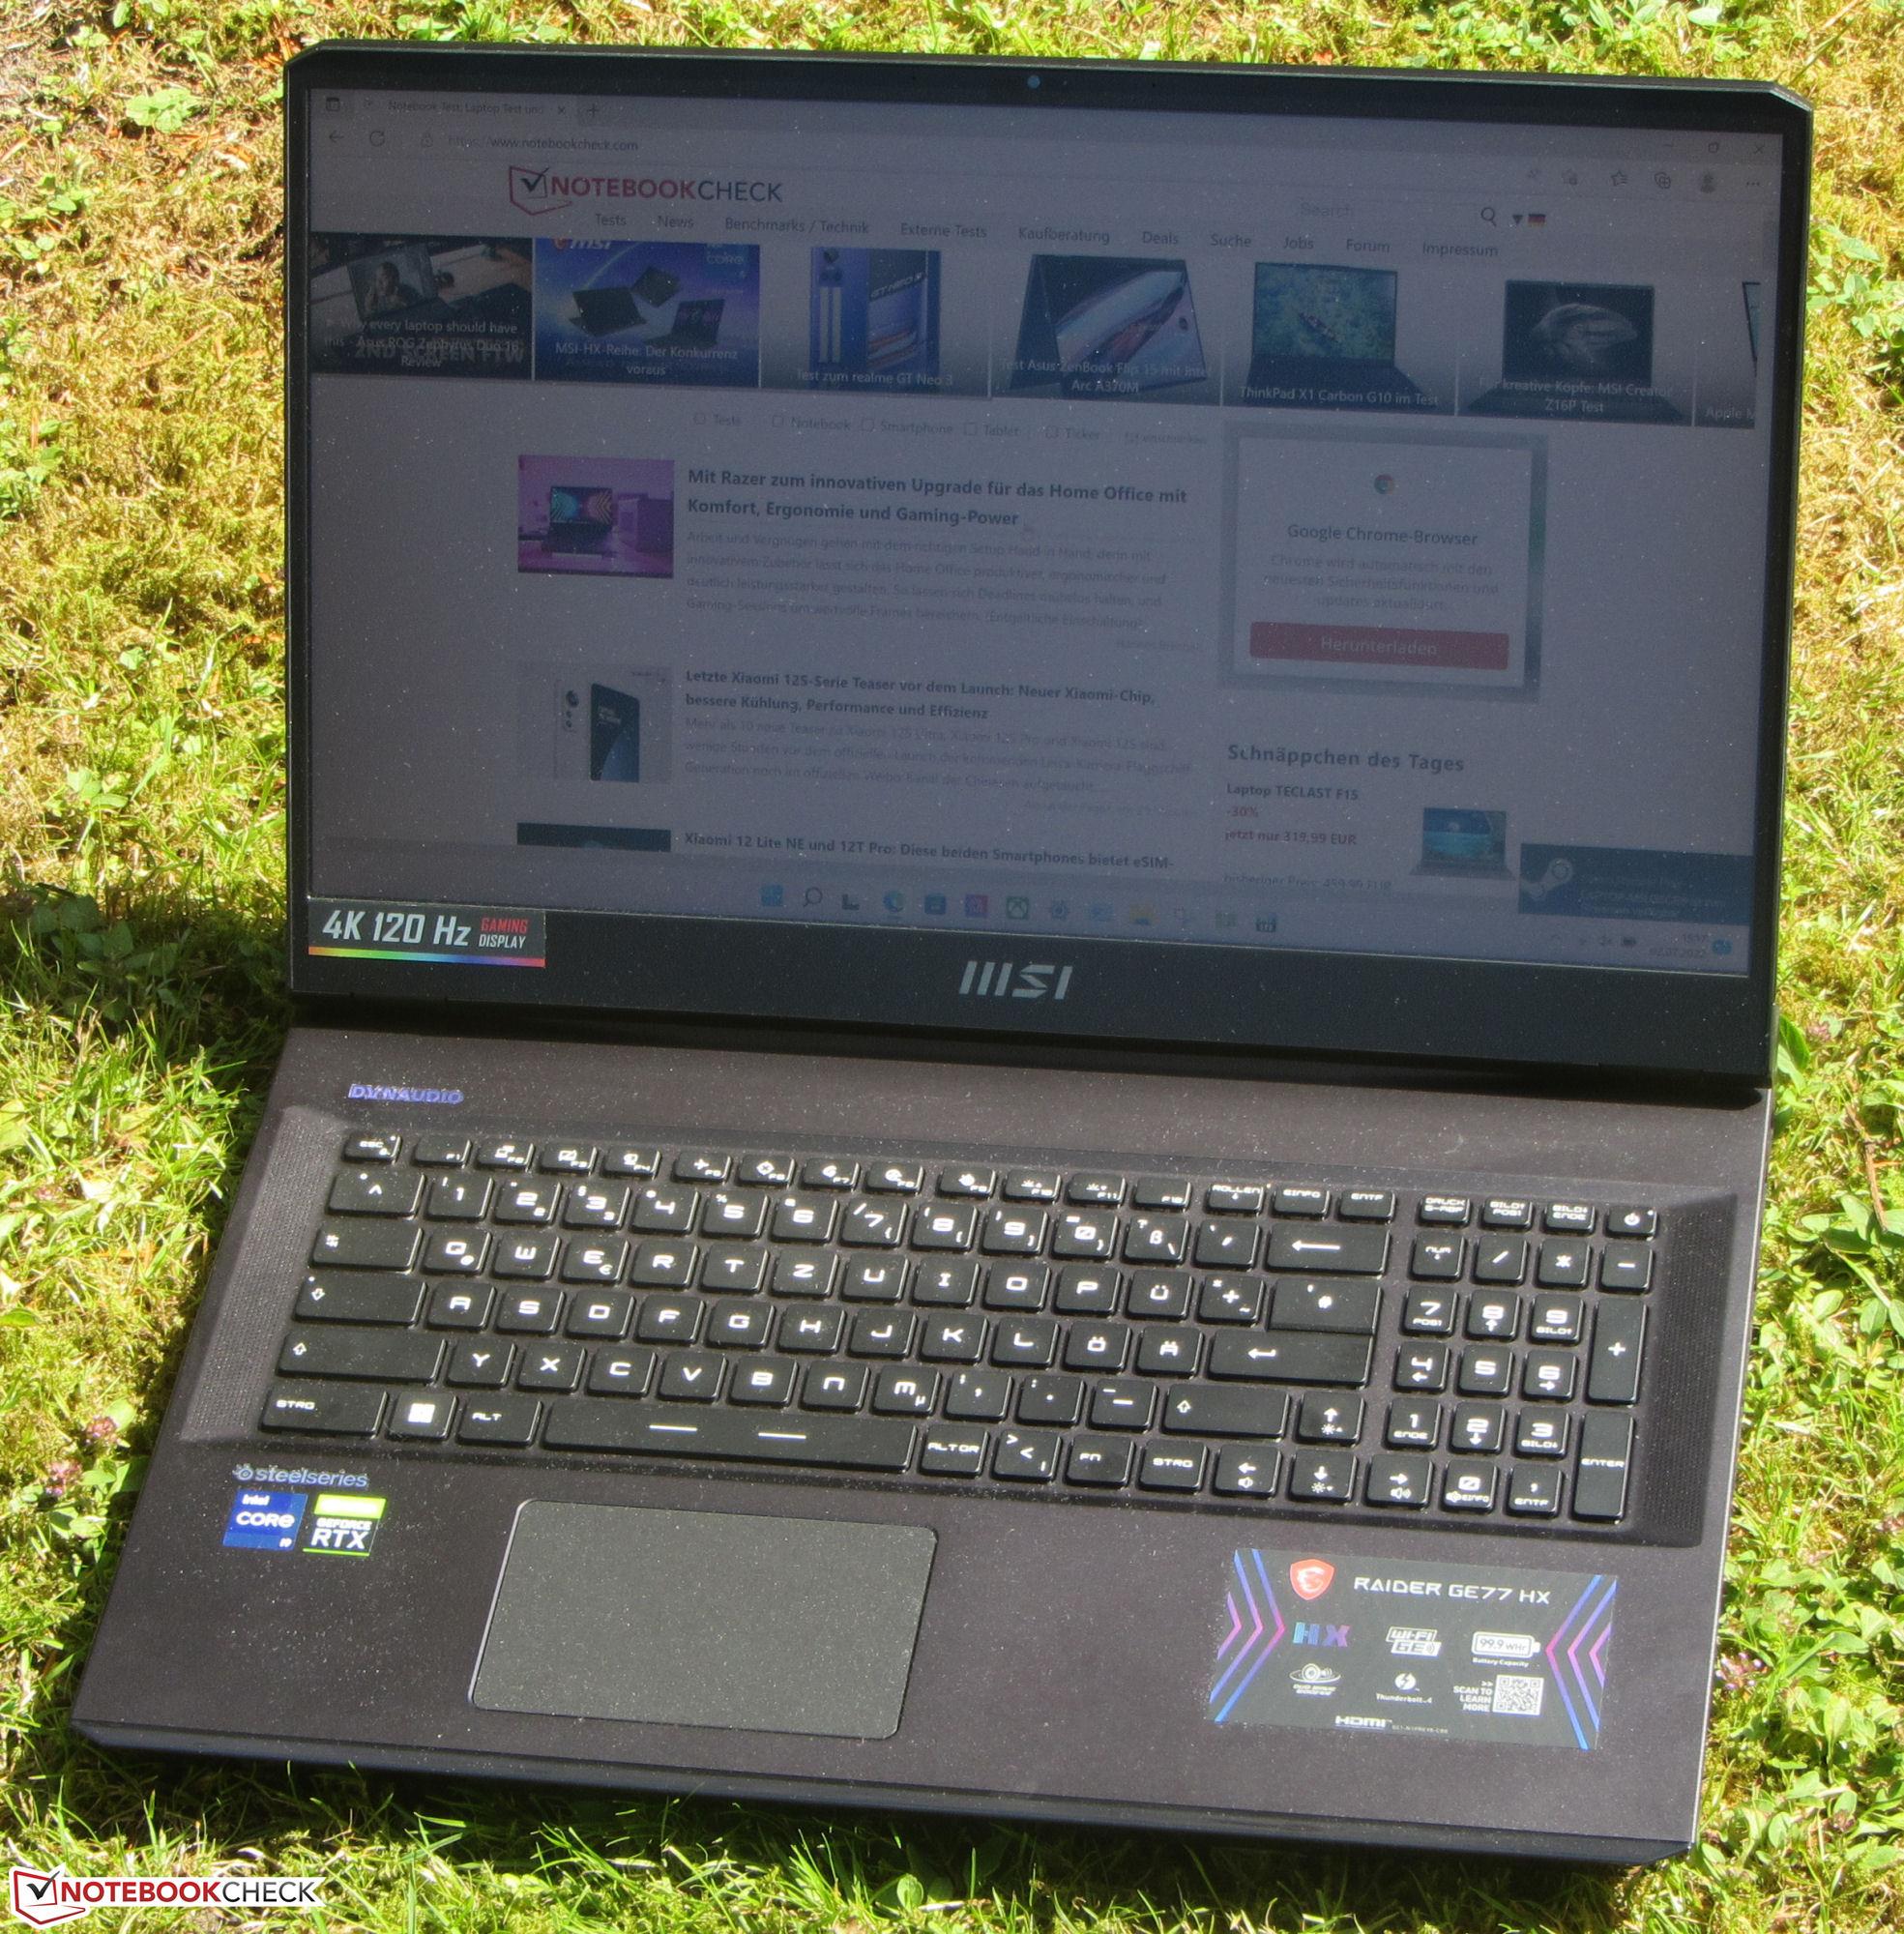
The MSI Raider GE77 HX 12UHS is aimed at gamers and creative users. Thus, our configuration is equipped with the latest and most powerful hardware: Core i9-12900HX CPU, GeForce RTX 3080 Ti Laptop GPU, 64 GB of RAM, and a 4K screen (17.3-inch). Our model costs about 5,200 USD. With the MSI Raider GE66 12UHS, we just recently reviewed the 15.6-inch version. The competition consists of similarly powerful (and expensive) laptops such as the Alienware x17 R2 P48E, Medion Erazer Beast X30, and the Razer Blade 17 (Early 2022).
Potential Competitors in Comparison
Rating | Date | Model | Weight | Height | Size | Resolution | Price |
|---|---|---|---|---|---|---|---|
| 86.8 % v7 (old) | 07 / 2022 | MSI Raider GE77 HX 12UHS i9-12900HX, GeForce RTX 3080 Ti Laptop GPU | 3.1 kg | 25.9 mm | 17.30" | 3840x2160 | |
| 89.9 % v7 (old) | 07 / 2022 | Razer Blade 17 Early 2022 i9-12900H, GeForce RTX 3080 Ti Laptop GPU | 2.8 kg | 19.9 mm | 17.30" | 3840x2160 | |
| 89.2 % v7 (old) | 05 / 2022 | Alienware x17 R2 P48E i9-12900HK, GeForce RTX 3080 Ti Laptop GPU | 3.1 kg | 20.9 mm | 17.30" | 1920x1080 | |
| 86.7 % v7 (old) | 05 / 2022 | Medion Erazer Beast X30 i9-12900HK, GeForce RTX 3080 Ti Laptop GPU | 2.2 kg | 23 mm | 17.30" | 2560x1440 |
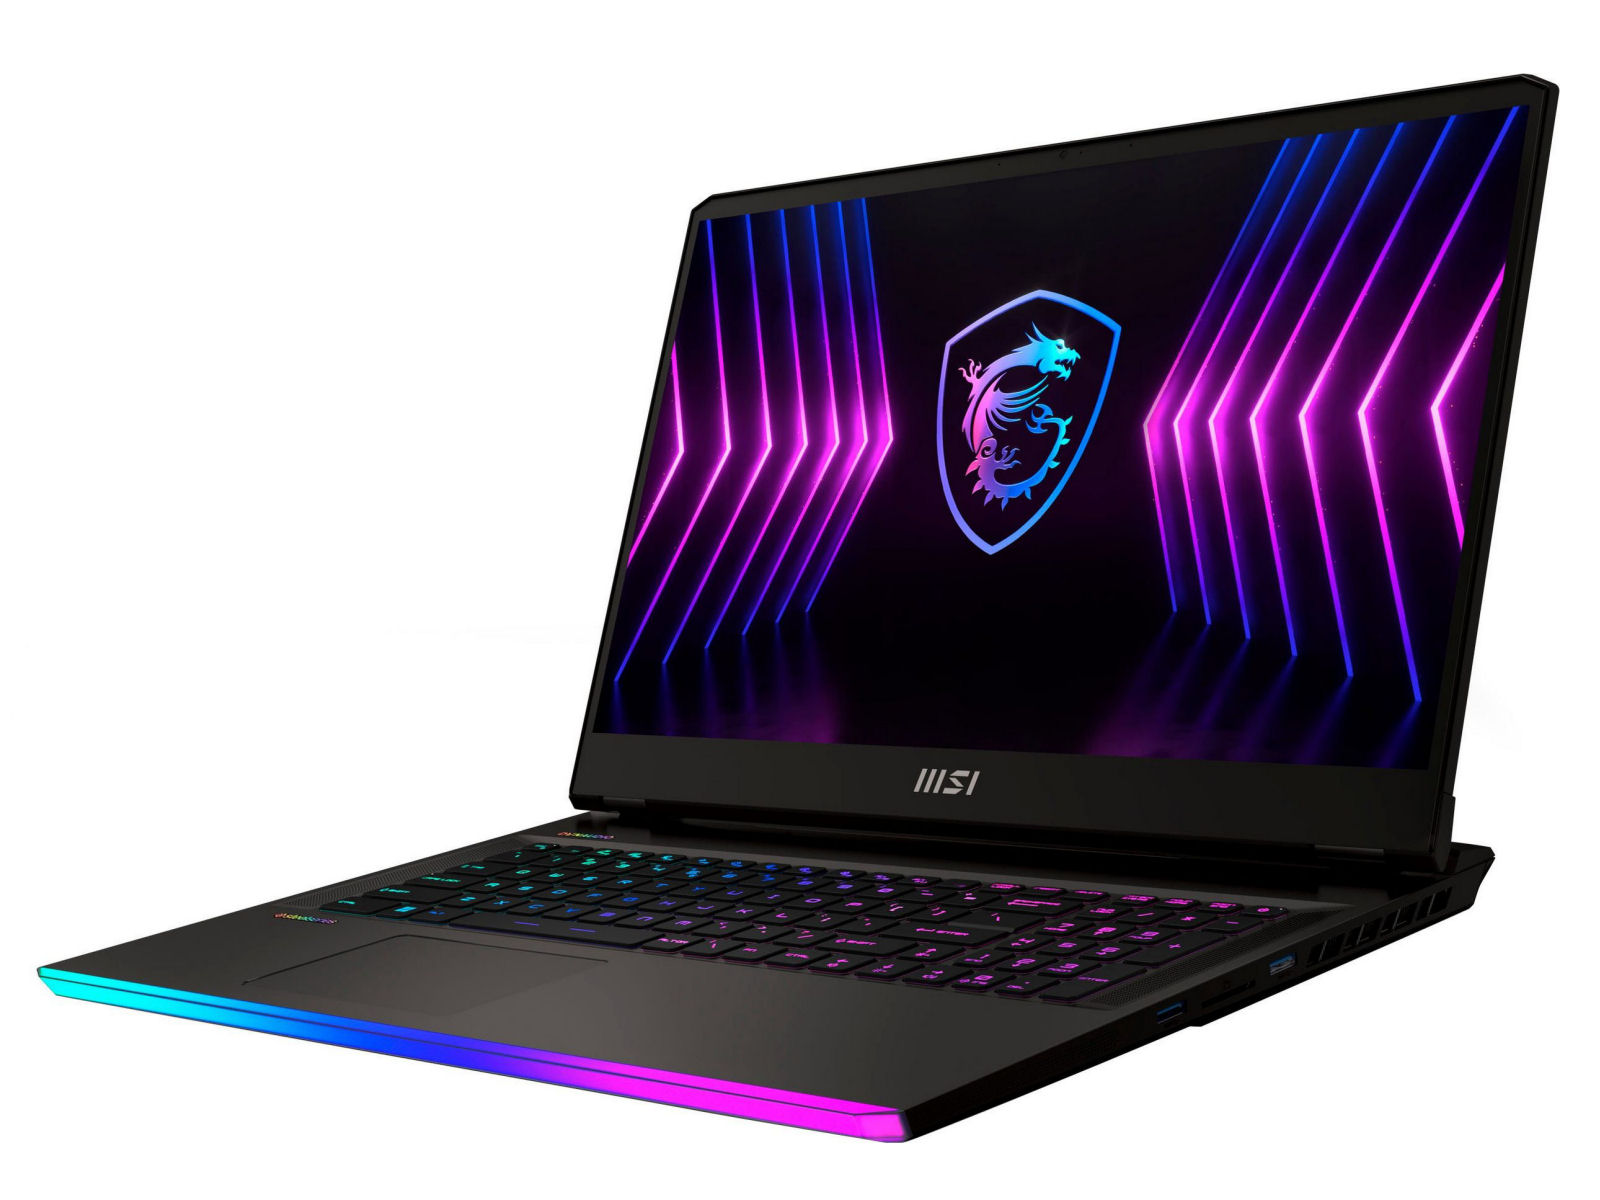
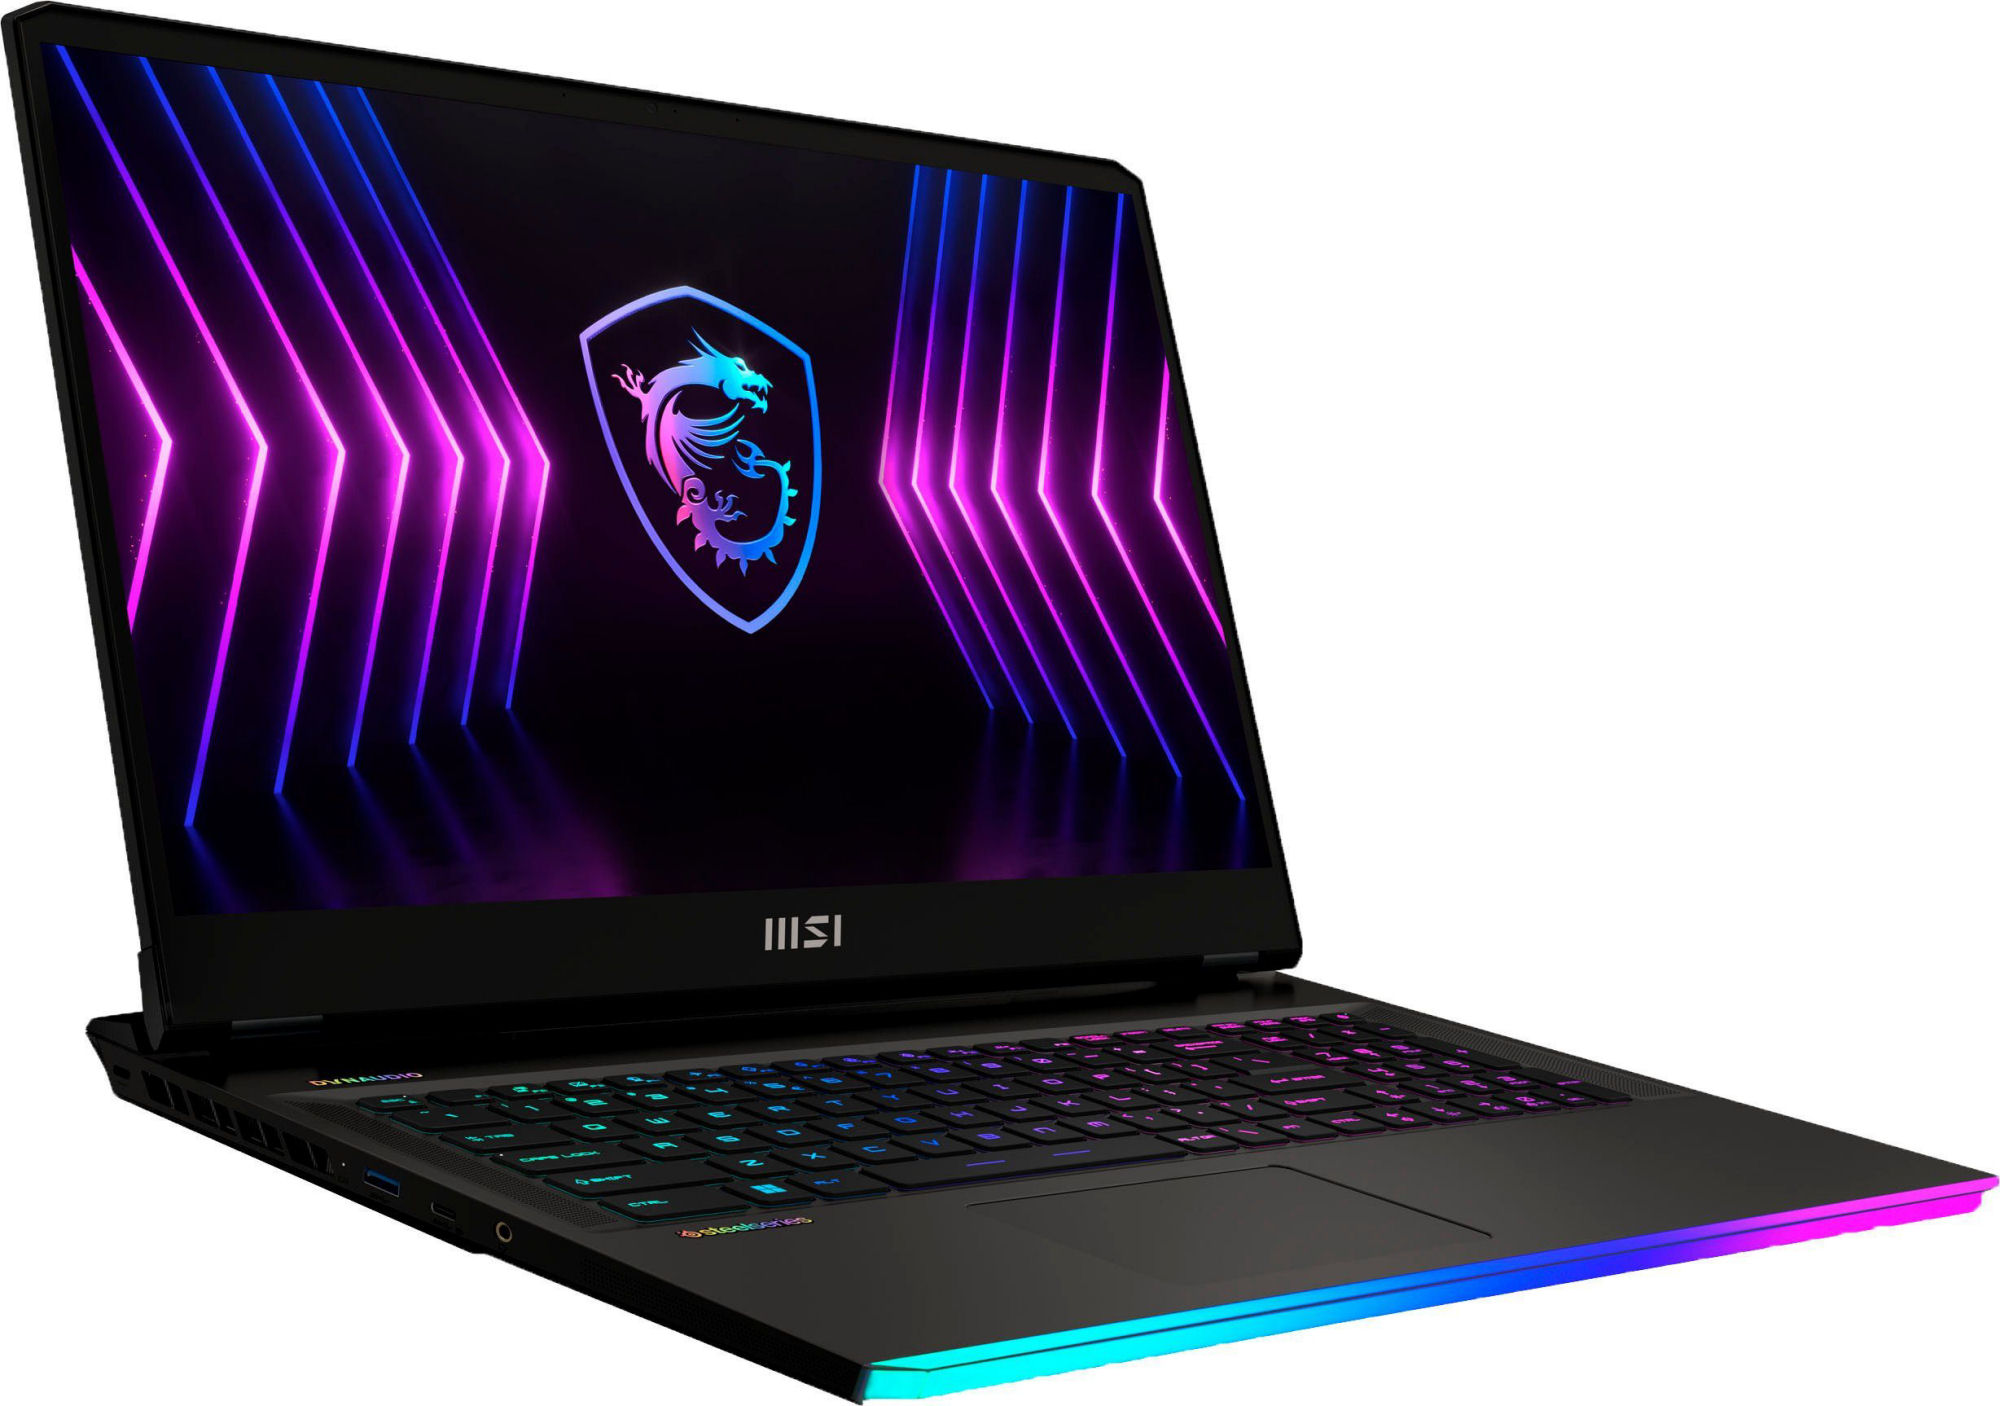
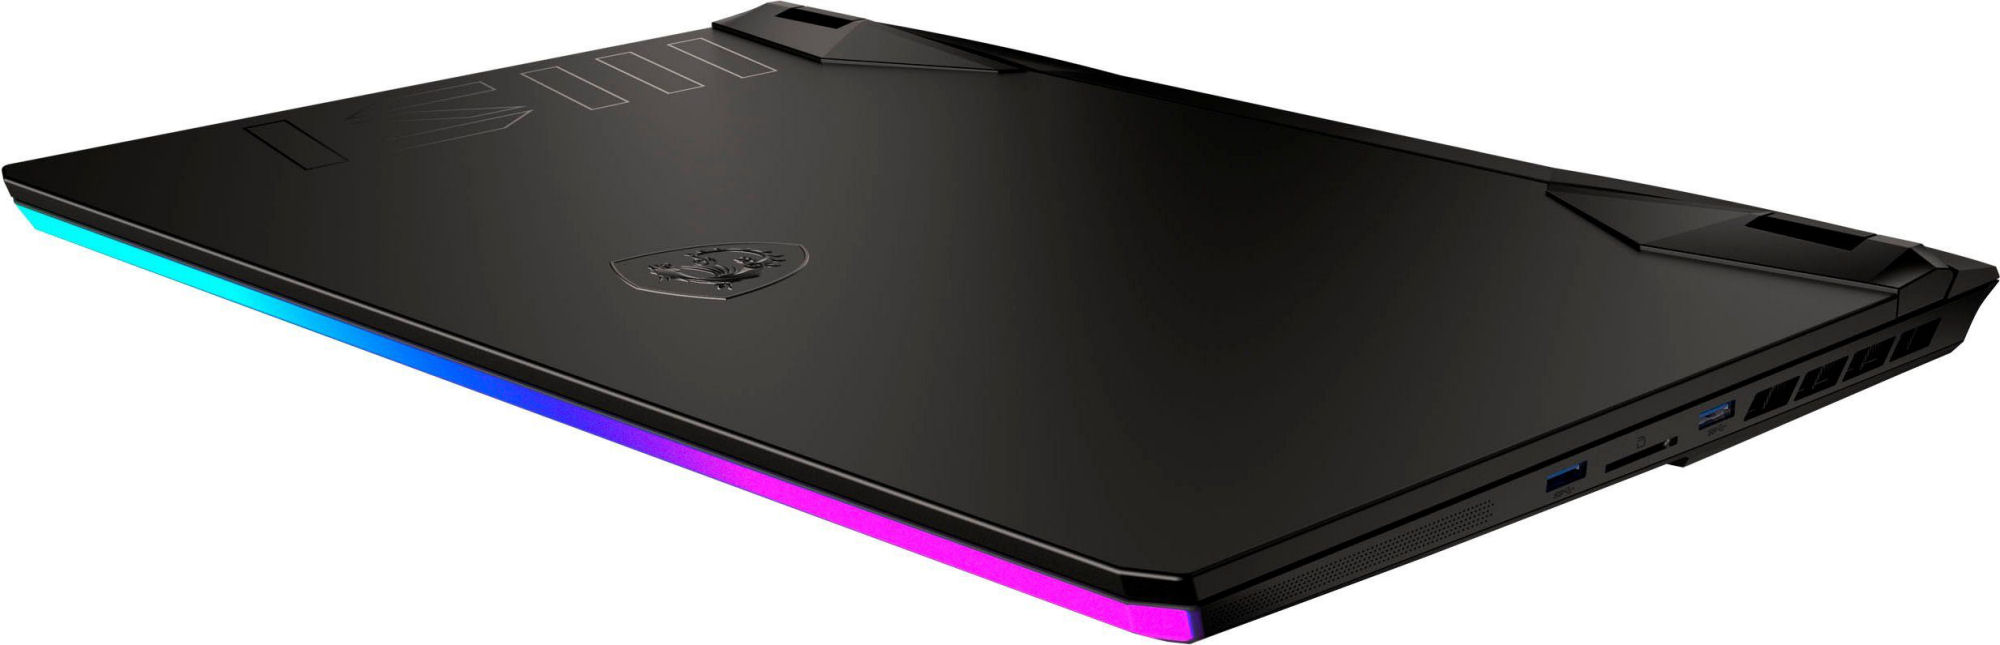
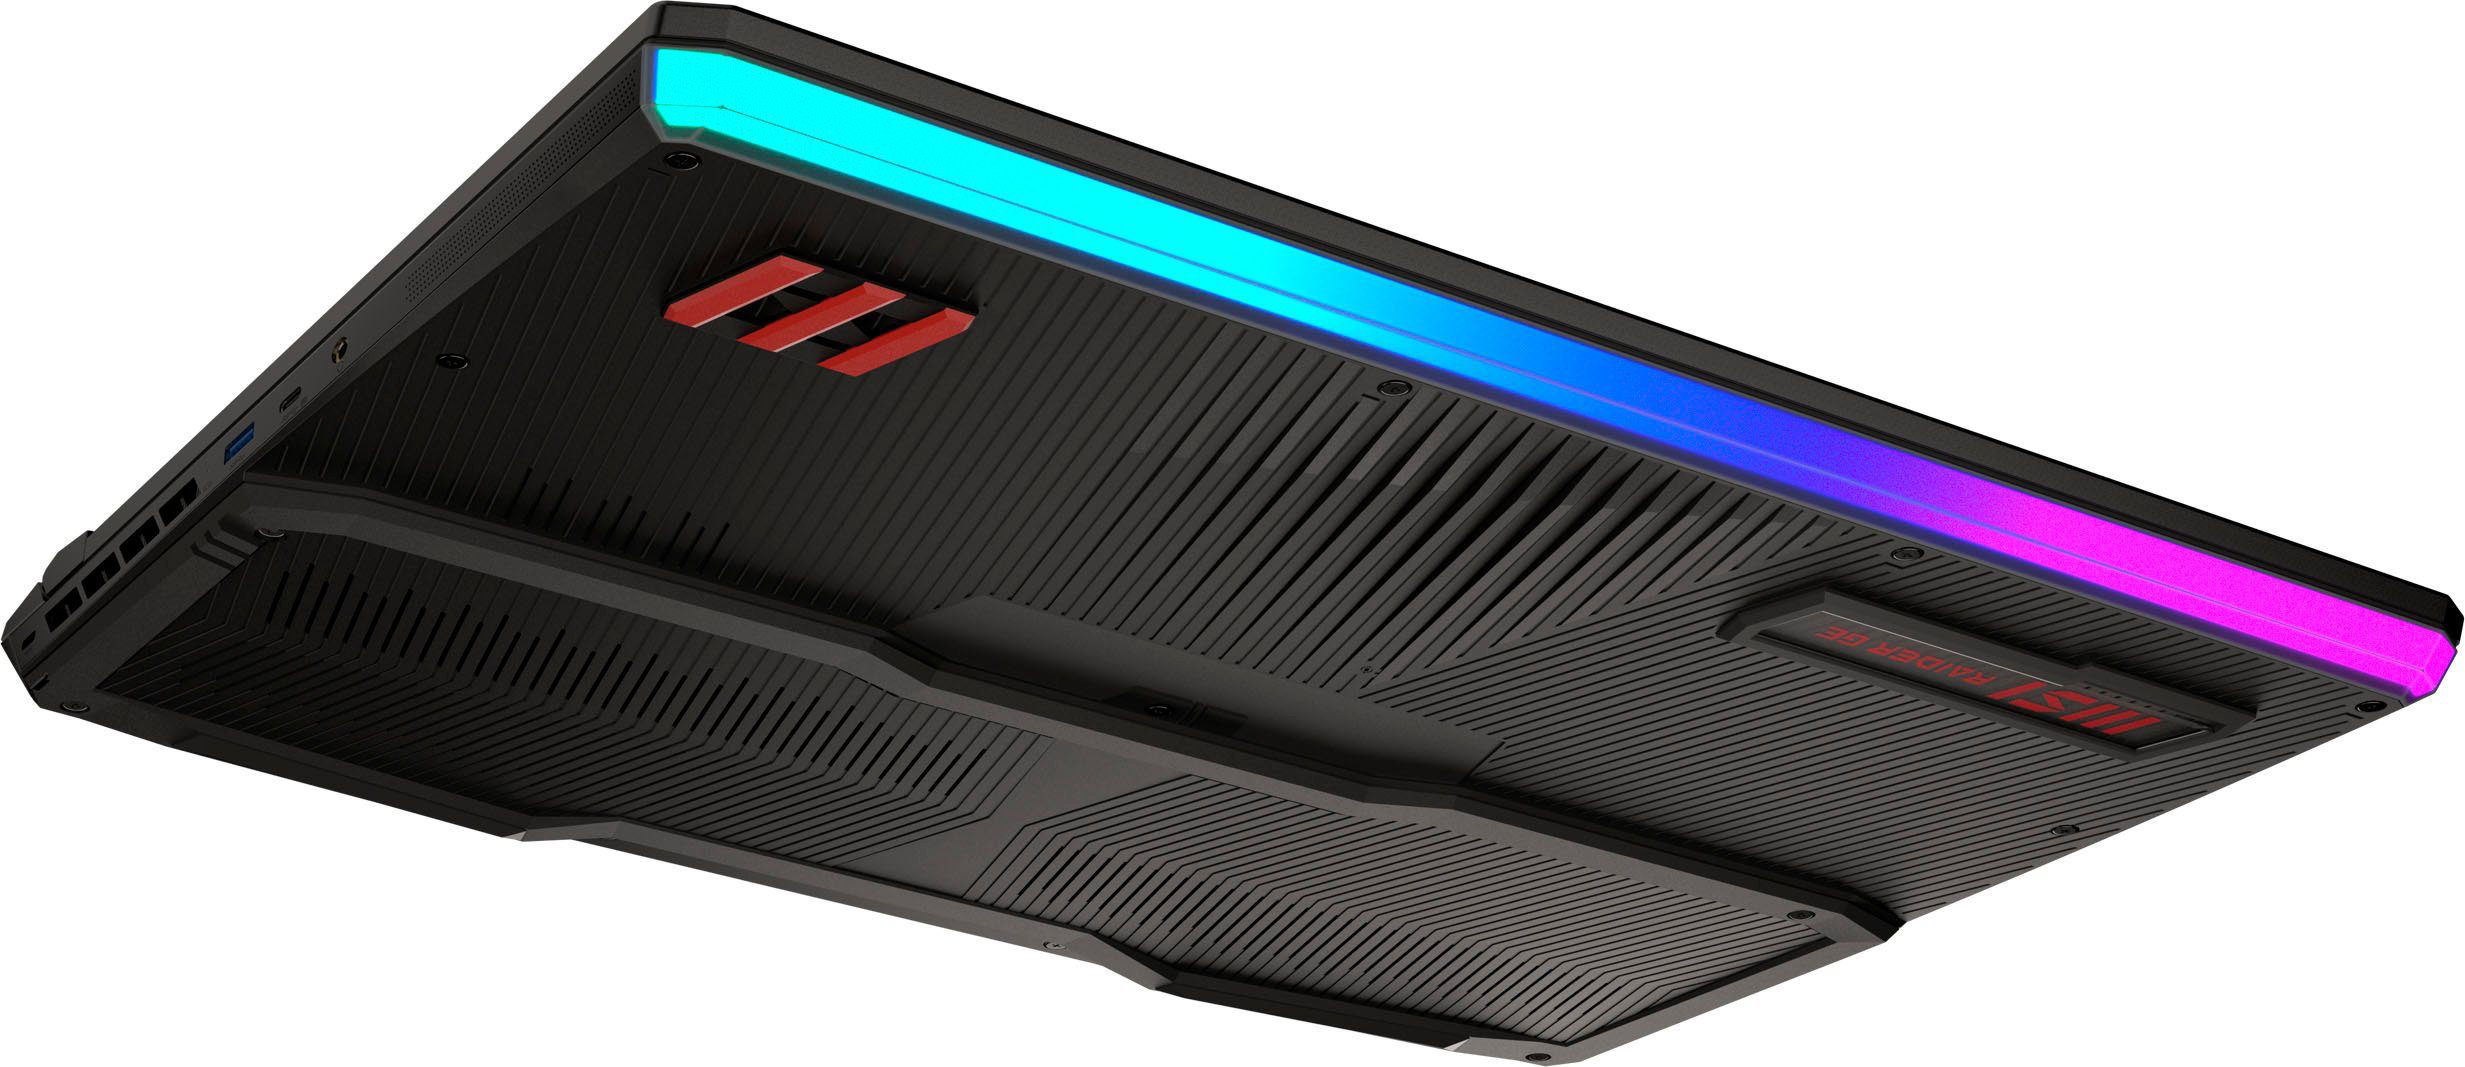
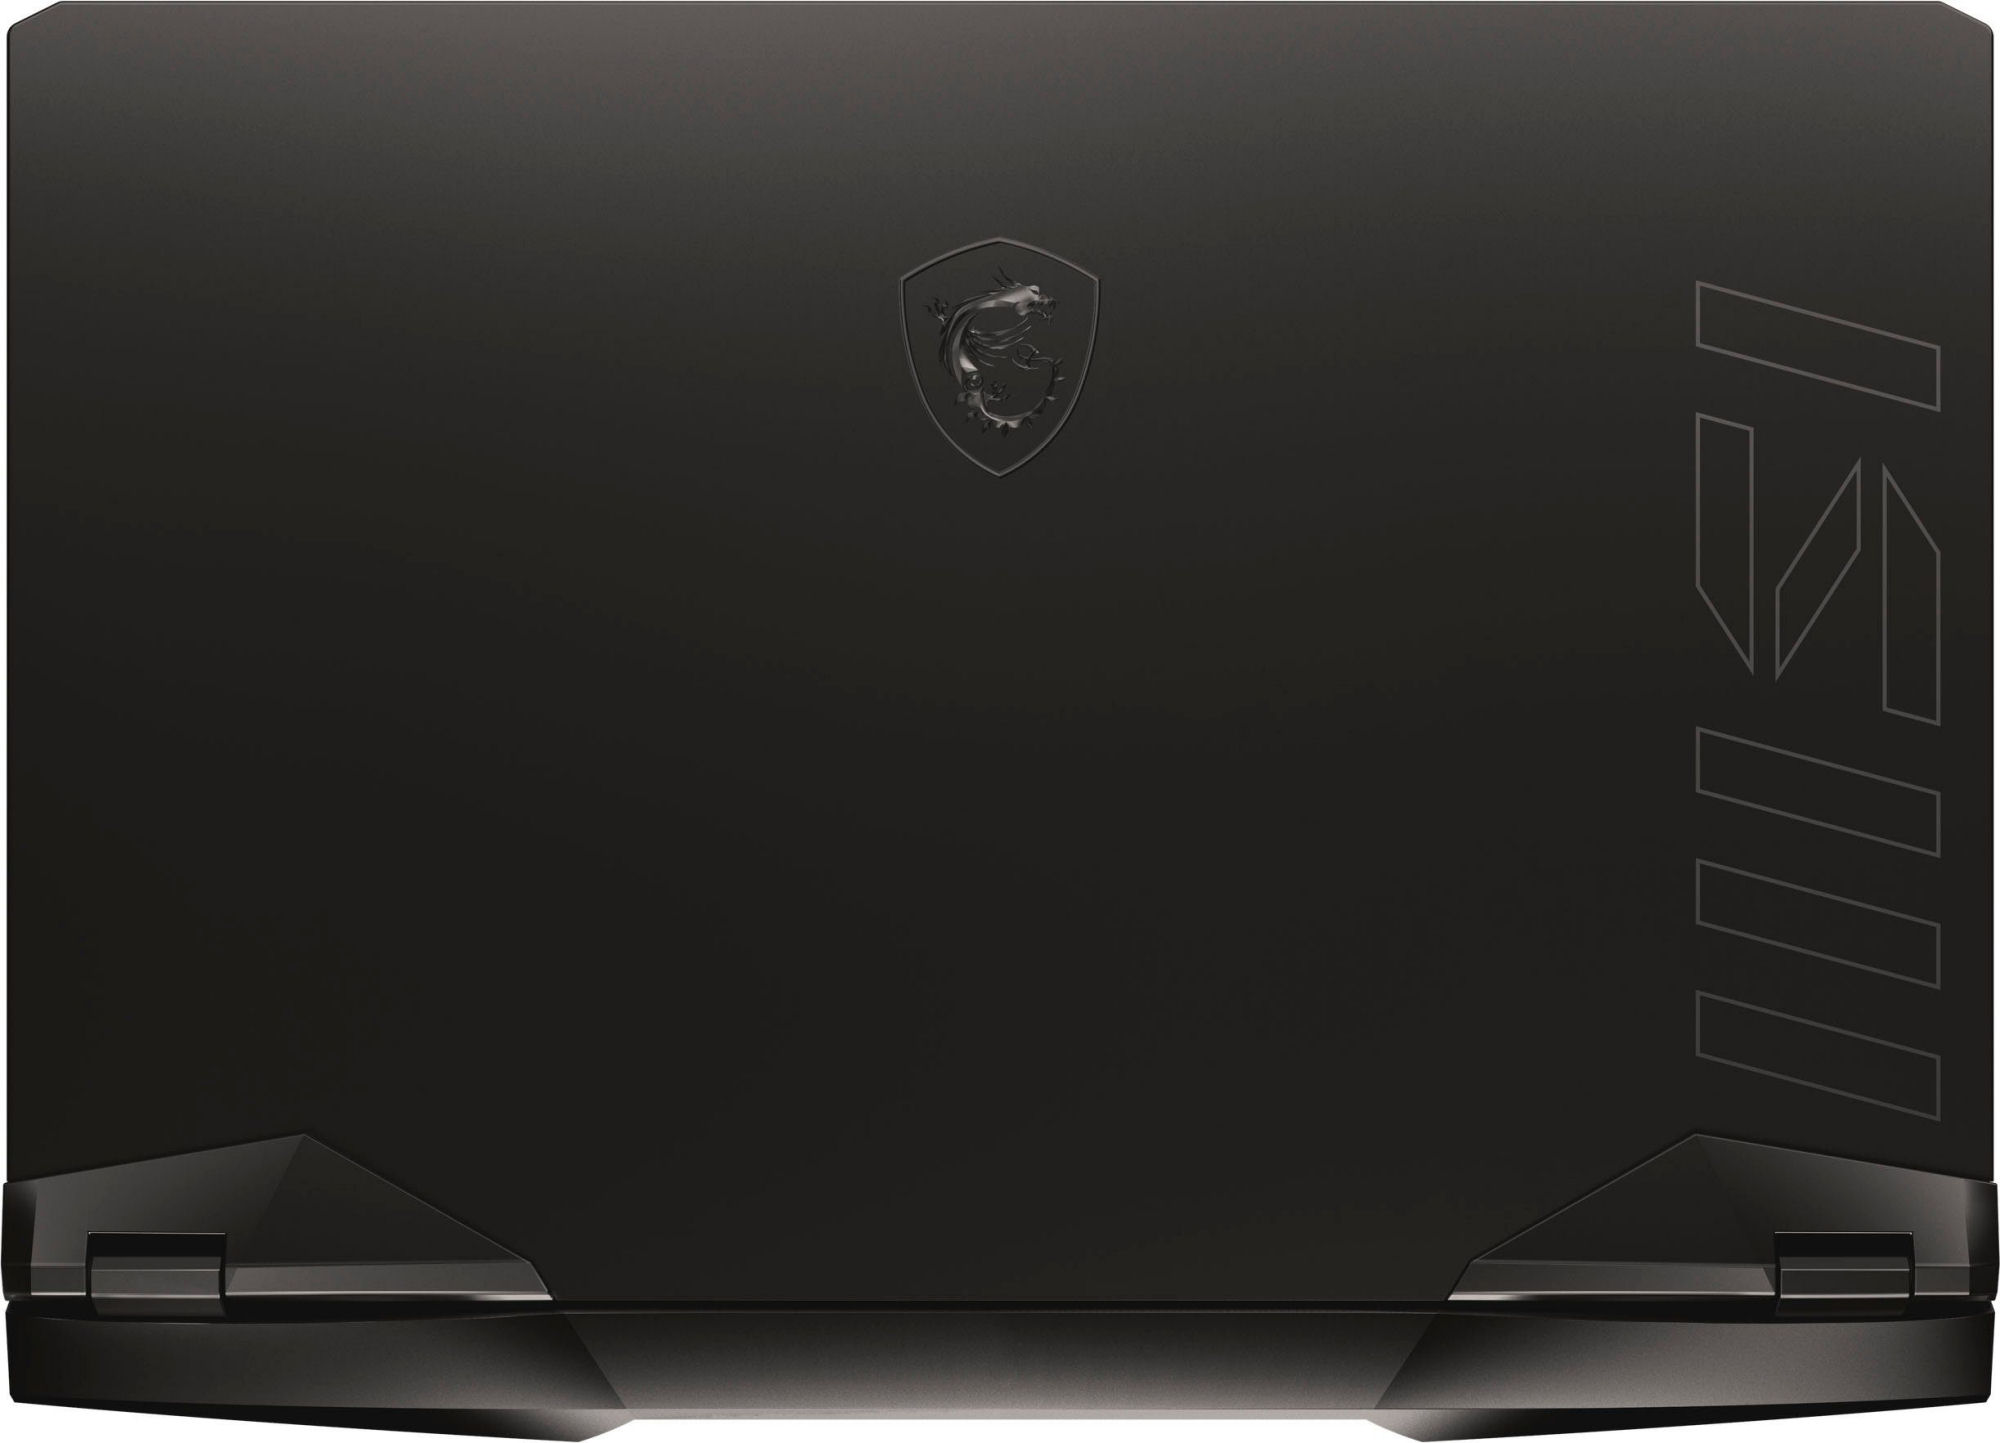
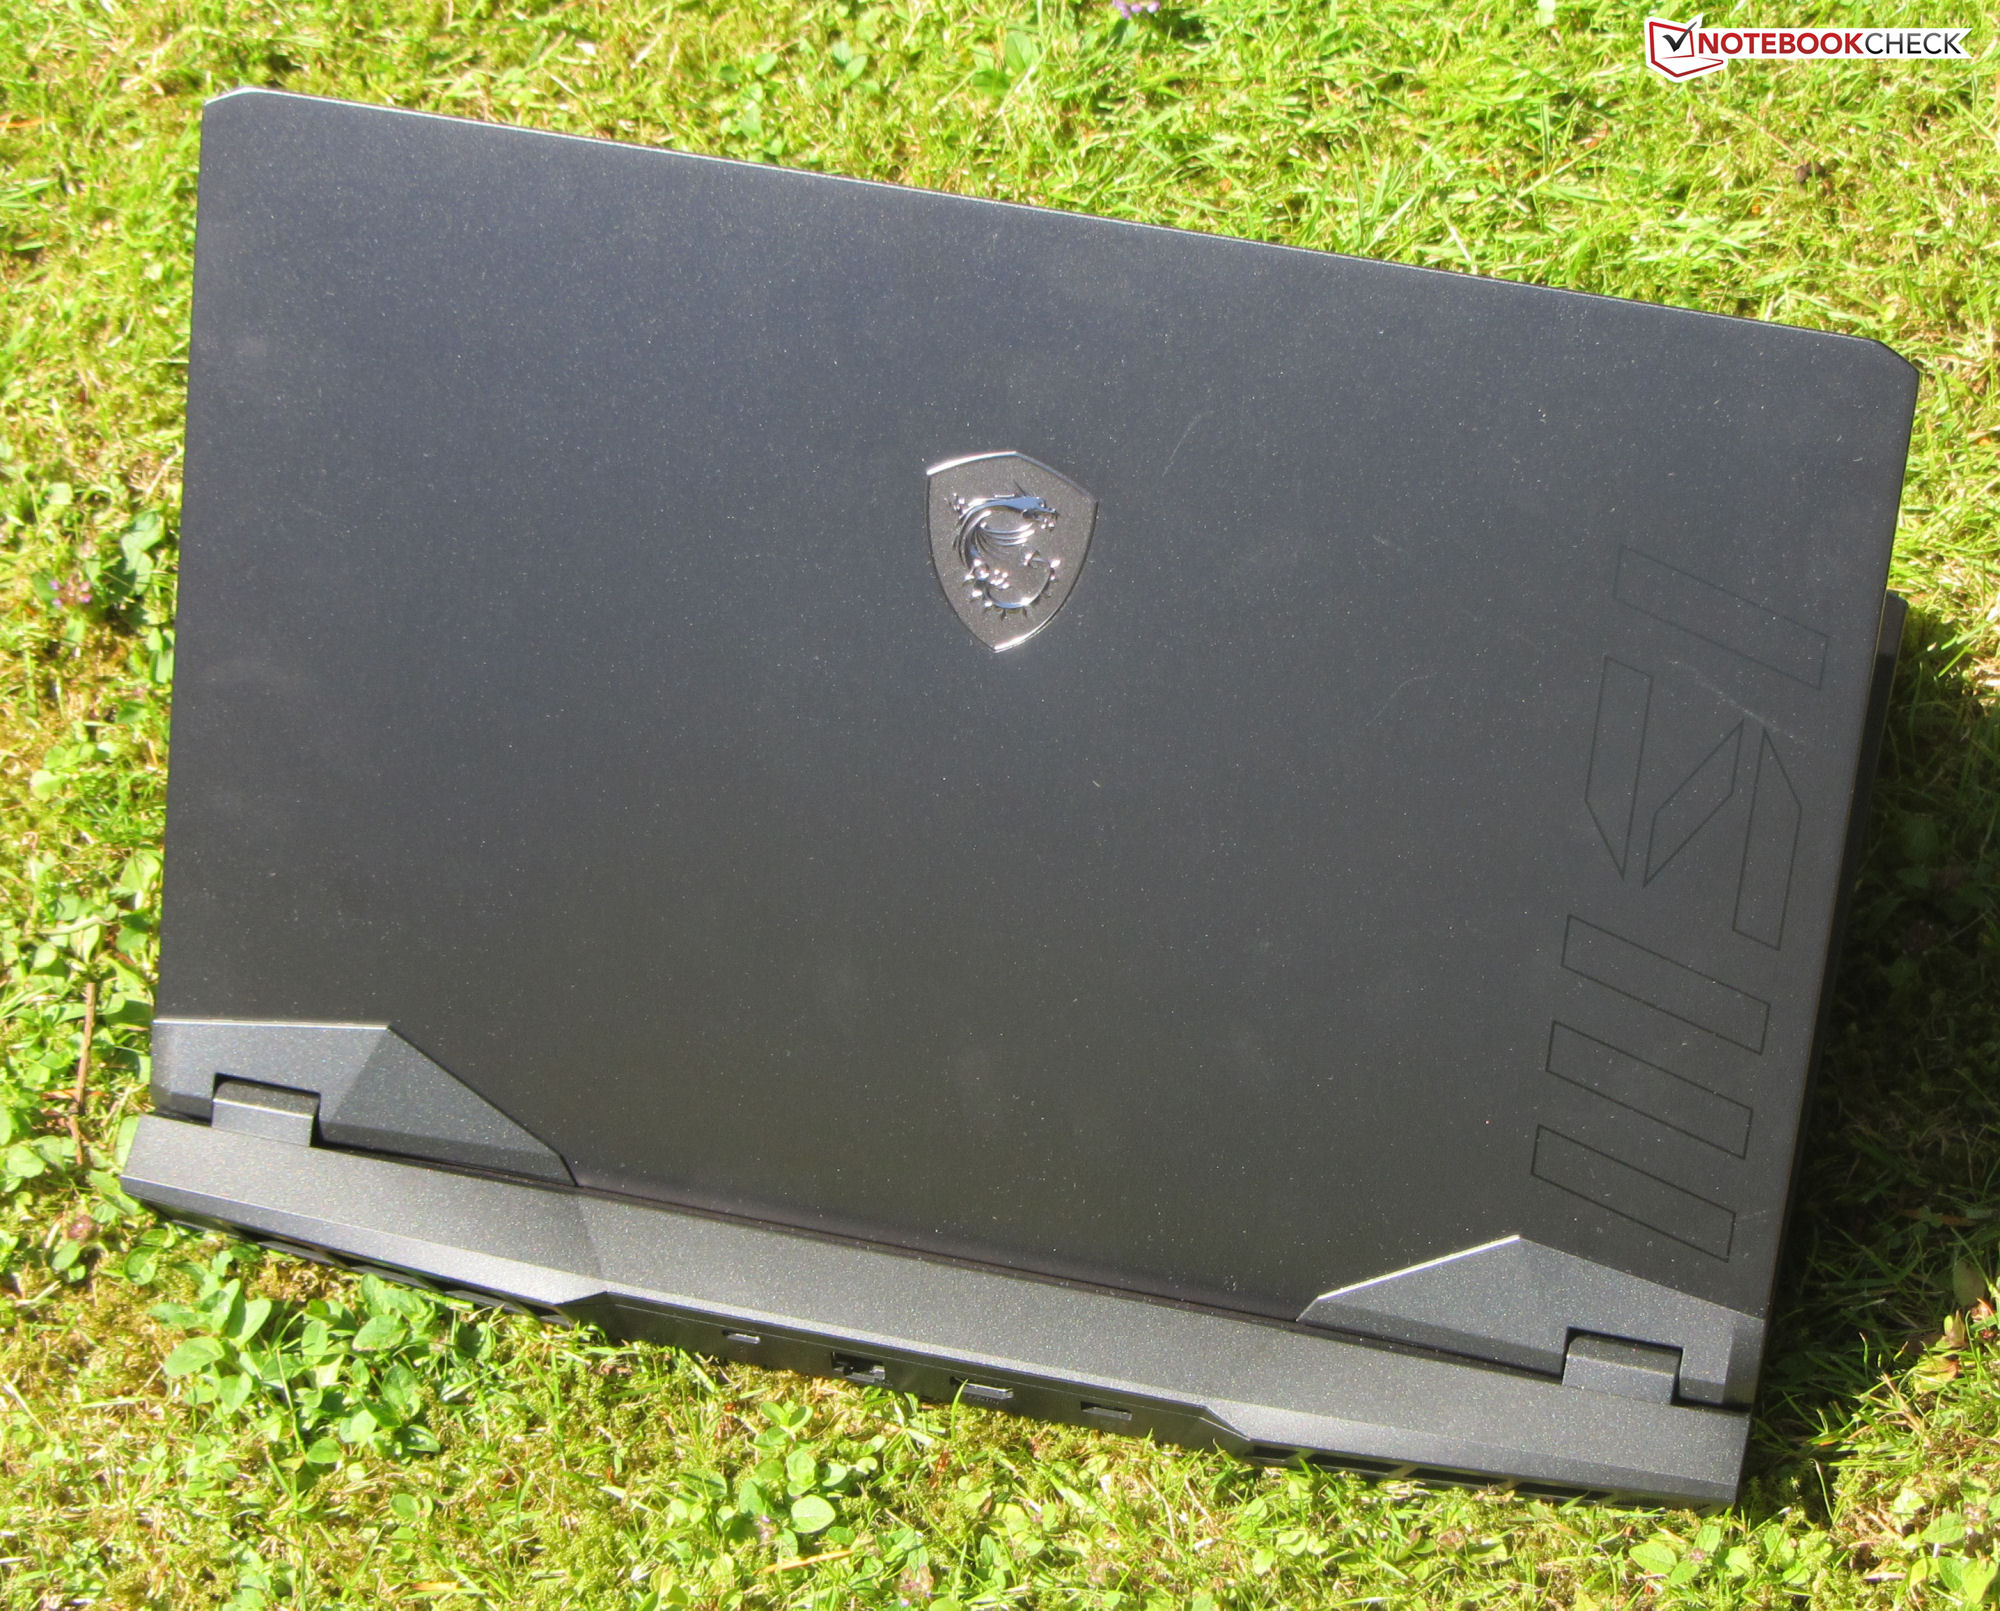
Case - GE77 with a subtle metal chassis
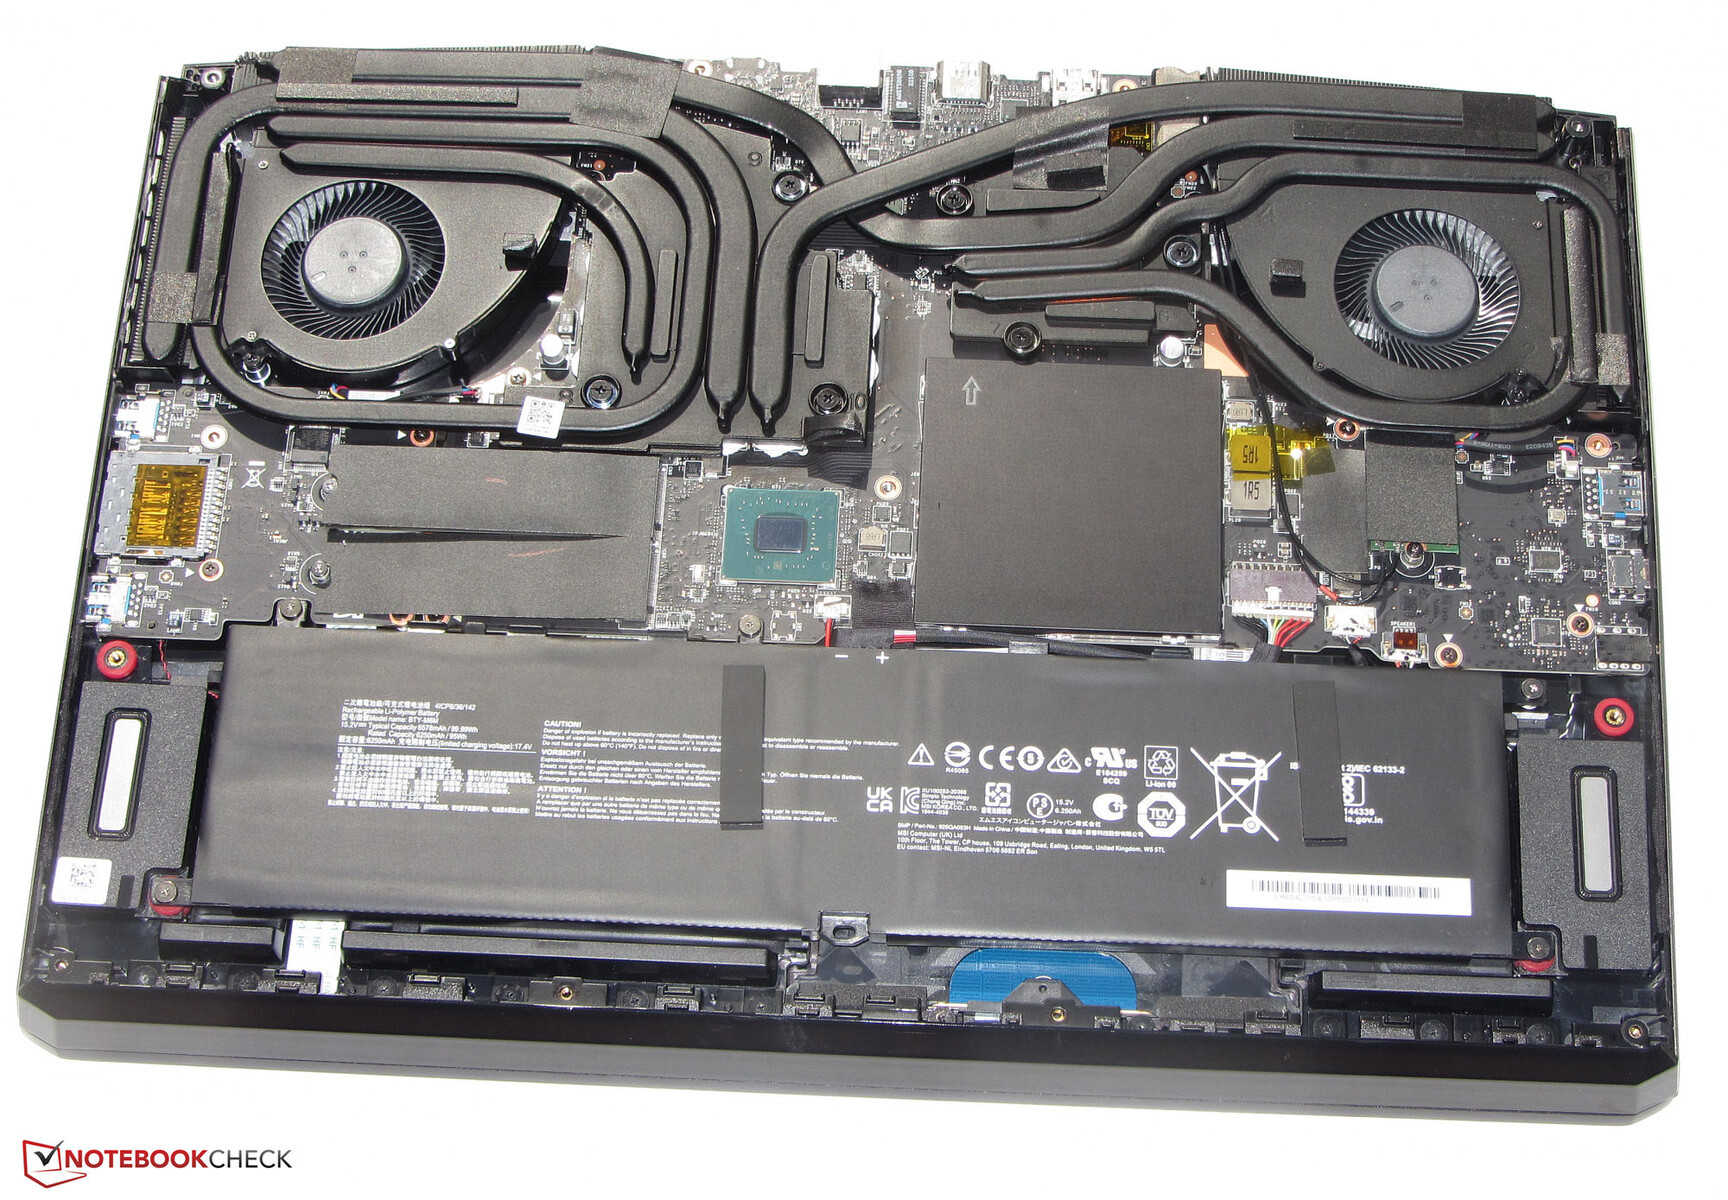
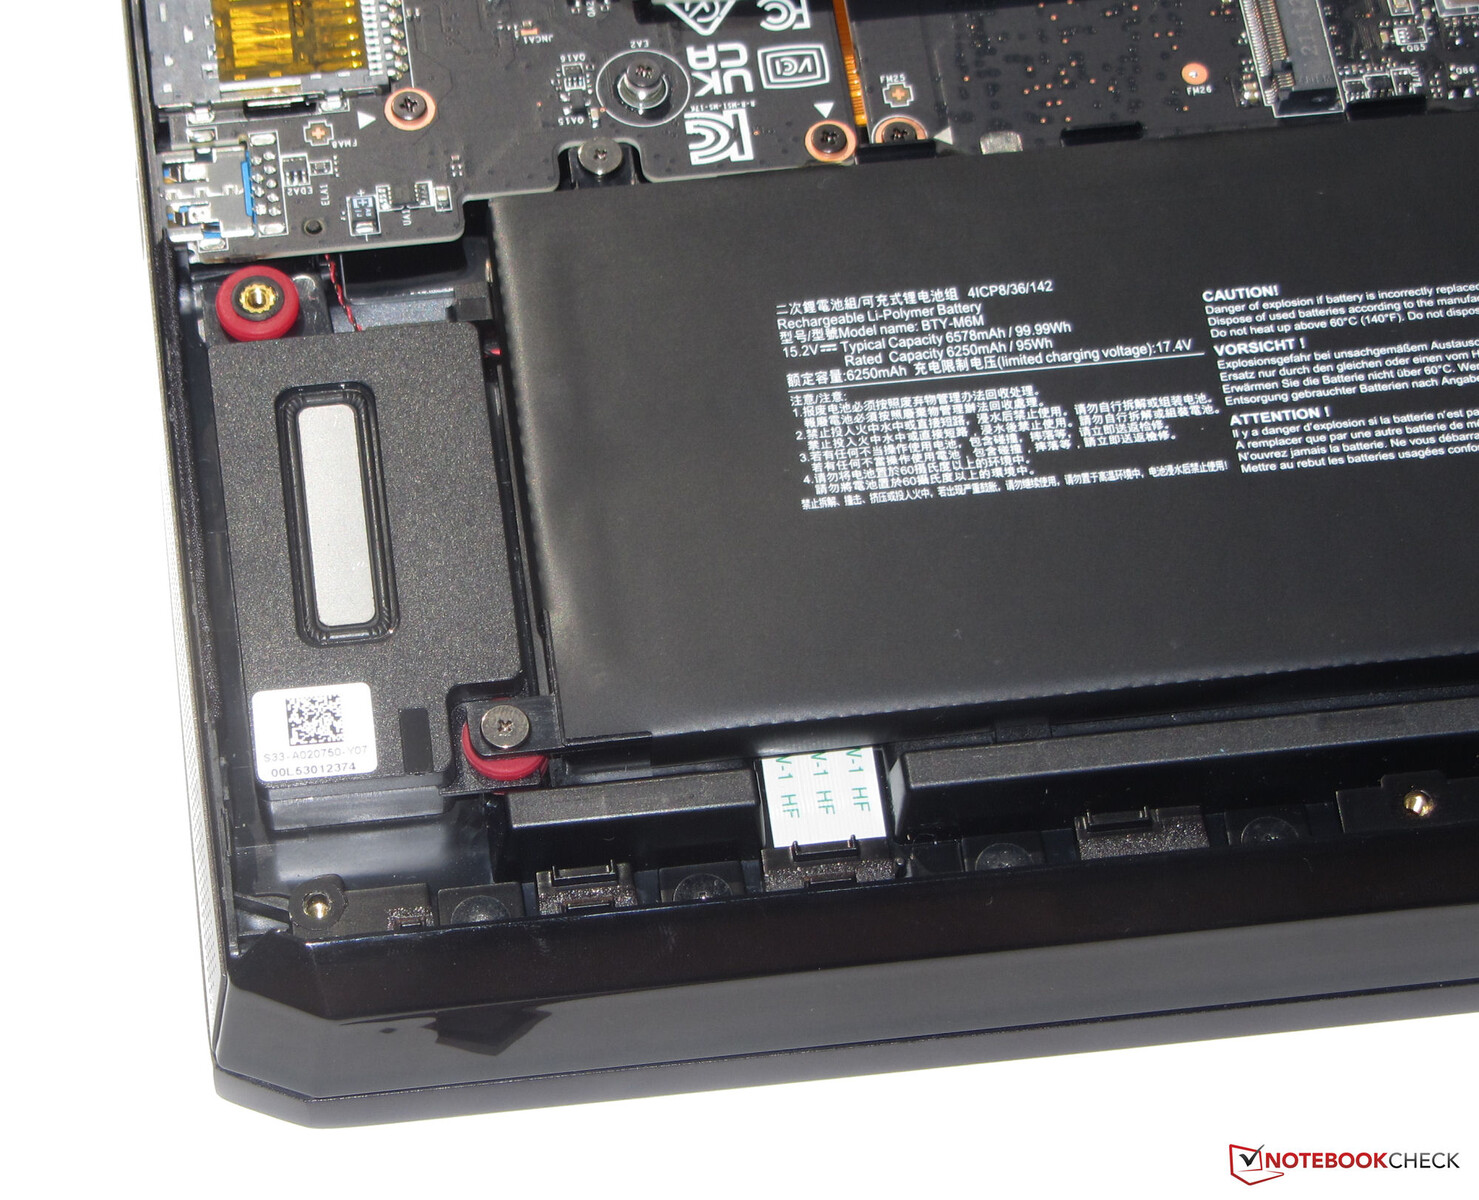
The components of the Raider occupy a metal chassis with matte-black, smooth surfaces. There is a user-facing LED strip that can be switched off on the base unit, which allows for colorful light effects on the case that otherwise lacks colorful accents. Thus, nothing precludes users from using the device in professional settings. The MSI laptop's appearance is further enhanced by the fairly thin bezels. The internal battery (screwed-in, not glued) as well as the remainder of the hardware are all accessible after removing the bottom plate.
We did not notice any manufacturing flaws on the 17.3-inch device. The clearances are even and there are no excess material protrusions. The base unit is very resistant to twisting from the corners, while the lid can be twisted slightly. Both fall within the normal ranges. The hinges hold the lid firmly in place, but they allow for some teetering. The lid can be opened up to a maximum angle of around 140 degrees. It can also be opened with one hand.

Within our comparison, the MSI laptop and the Alienware x17 R2 are the heaviest devices. In terms of the dimensions, the GE77 falls into the average range - not as compact as the Blade and the X30, but significantly more compact than the x17.
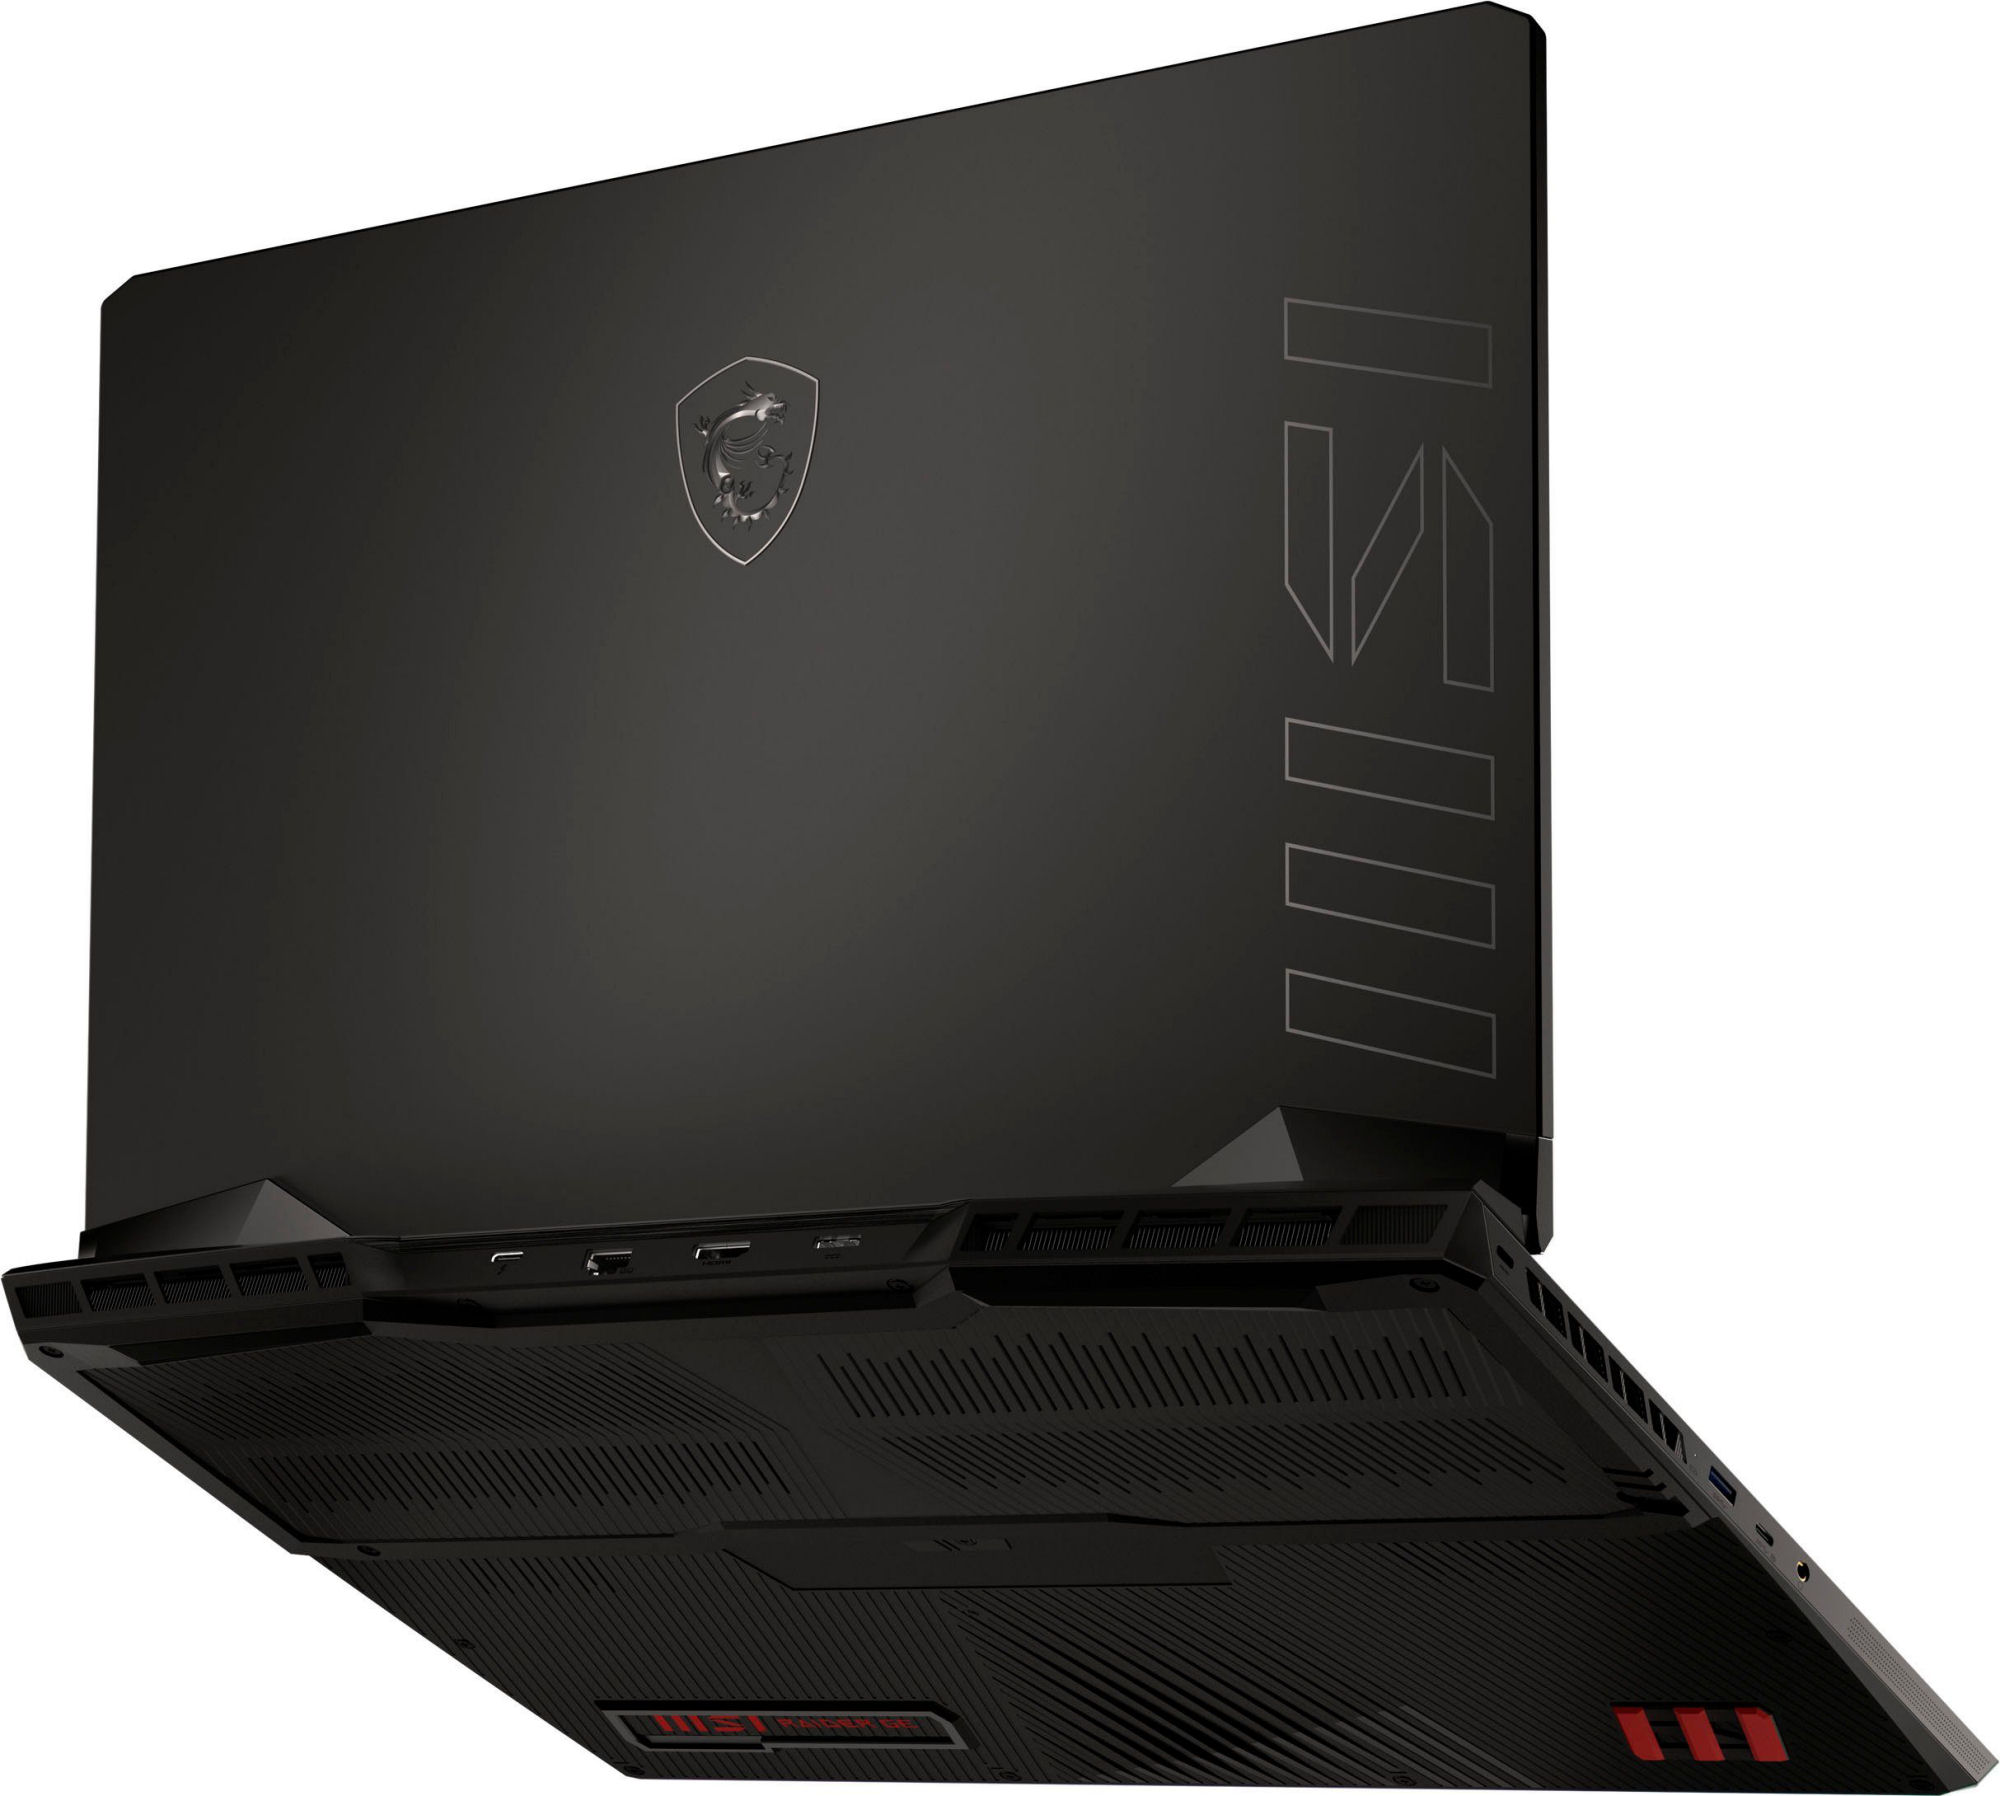
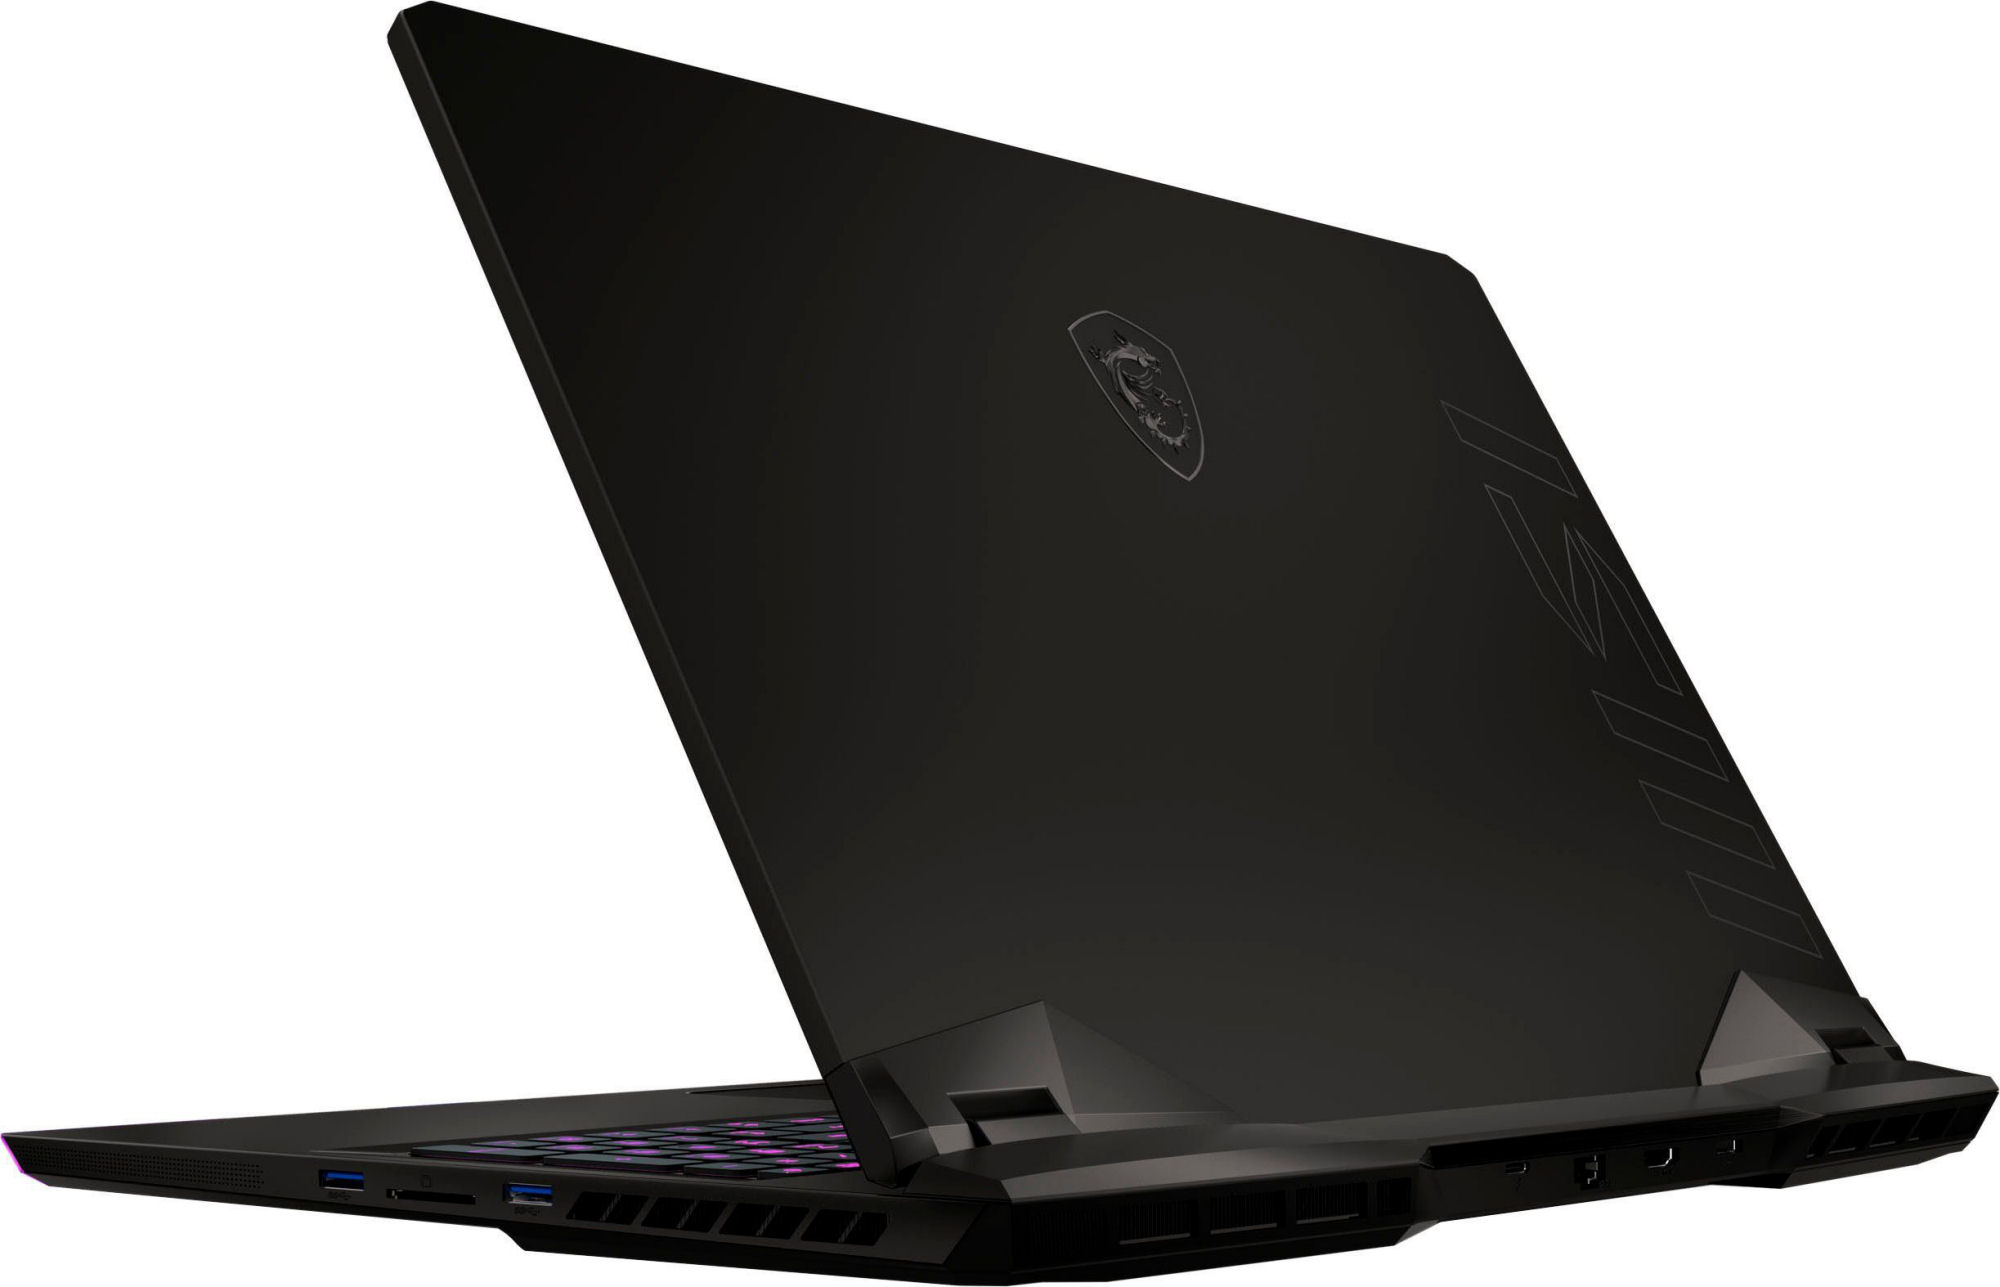
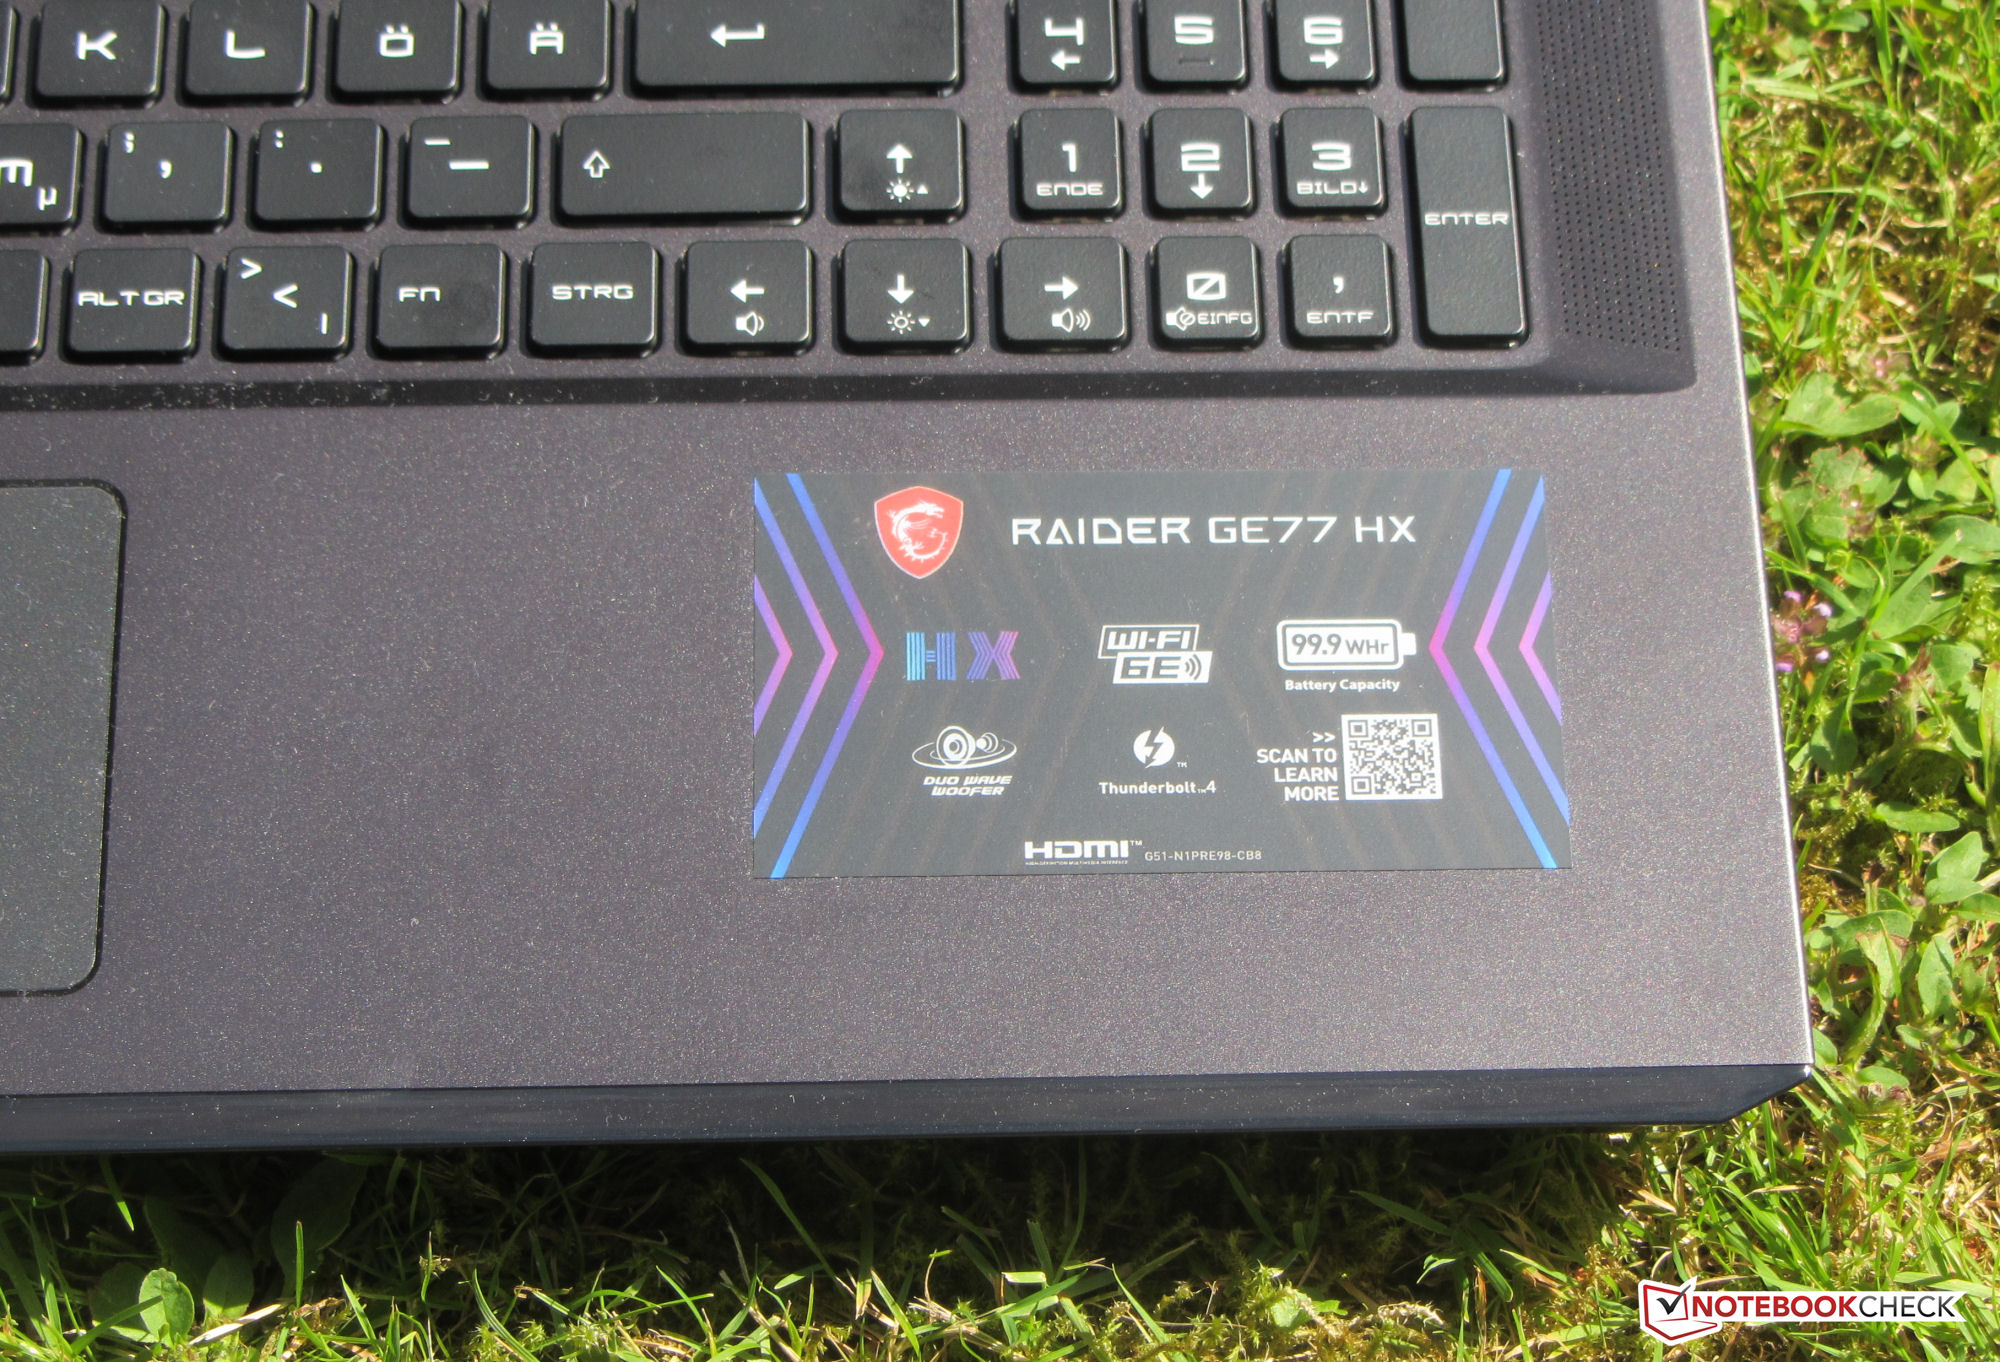
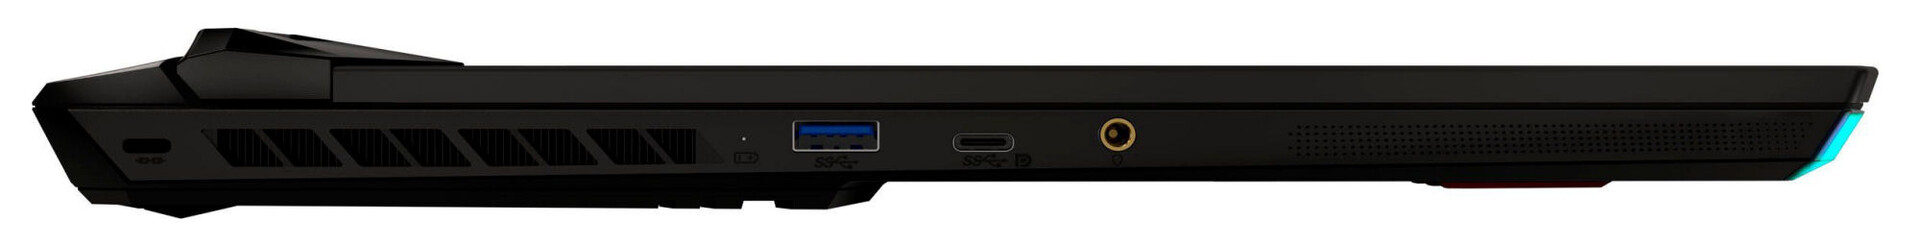
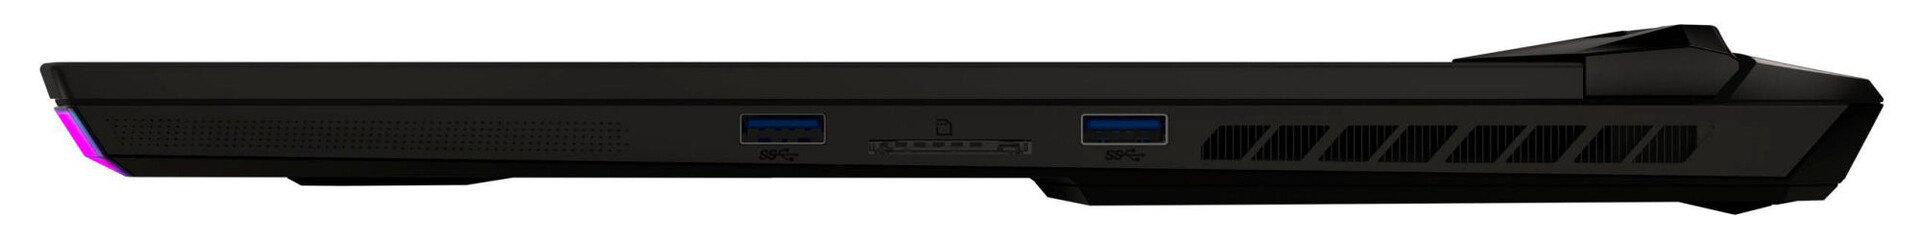
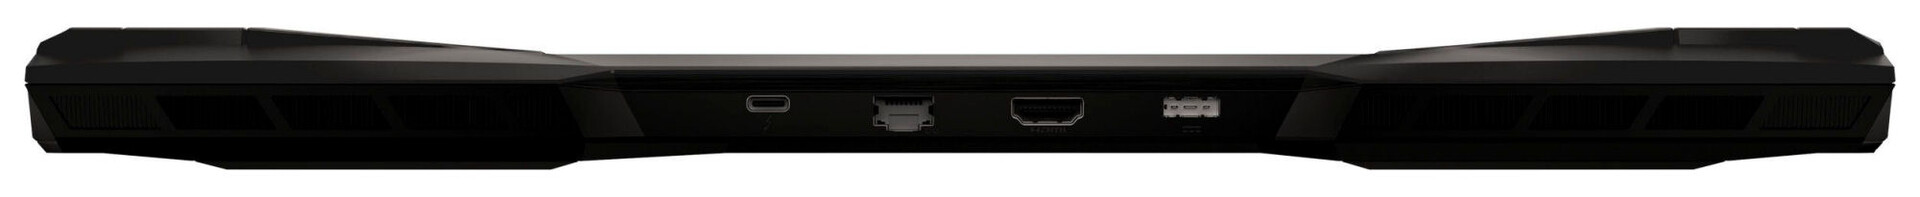
Connectivity - MSI system with Thunderbolt 4
The GE77 comes with three USB-A ports (1x USB 3.2 Gen 2, 2x USB 3.2 Gen 1) and two USB-C ports (1x Thunderbolt 4, 1x USB 3.2 Gen 2). The latter support DisplayPort via USB-C, but not Power Delivery. In total, the system has three video outputs (2x DP, 1x HDMI). Furthermore, there is a combined audio jack, a 2.5-Gb/s Ethernet port, and a cable lock port.
There are ports on three sides of the case. Two video outputs, the Ethernet port and the AC adapter port are on the back of the case. This simplifies cable management by making cables less likely to get in the way.
SD Card Reader
| SD Card Reader - average JPG Copy Test (av. of 3 runs) | |
| Alienware x17 R2 P48E (AV Pro V60) | |
| Razer Blade 17 Early 2022 (AV PRO microSD 128 GB V60) | |
| Average of class Gaming (20 - 210, n=71, last 2 years) | |
| Medion Erazer Beast X30 (AV PRO microSD 128 GB V60) | |
| MSI Raider GE77 HX 12UHS (AV PRO microSD 128 GB V60) | |
Communication
We recorded excellent Wi-Fi transfer rates under optimal conditions (no other Wi-Fi devices in proximity, low distance between the laptop and server) and exhaust the capabilities of the Wi-Fi chips (Killer AX1675i = Intel AX211; 802.11 ax).
There is also an Ethernet chip (Killer E3100G, 2.5 Gb/s) for wired communications.
| Networking - iperf3 receive AXE11000 6GHz | |
| MSI Raider GE77 HX 12UHS | |
| Average Killer Wi-Fi 6E AX1675i 160MHz Wireless Network Adapter (1327 - 1788, n=20) | |
| Average of class Gaming (975 - 1788, n=48, last 2 years) | |
Webcam
The webcam captures images at a maximum resolution of 1920 x 1080. The color accuracy is lackluster. The colors deviate from their ideal values. There is no mechanical webcam cover.


Accessories
The laptop comes with the usual documents (quick start guide, warranty information).
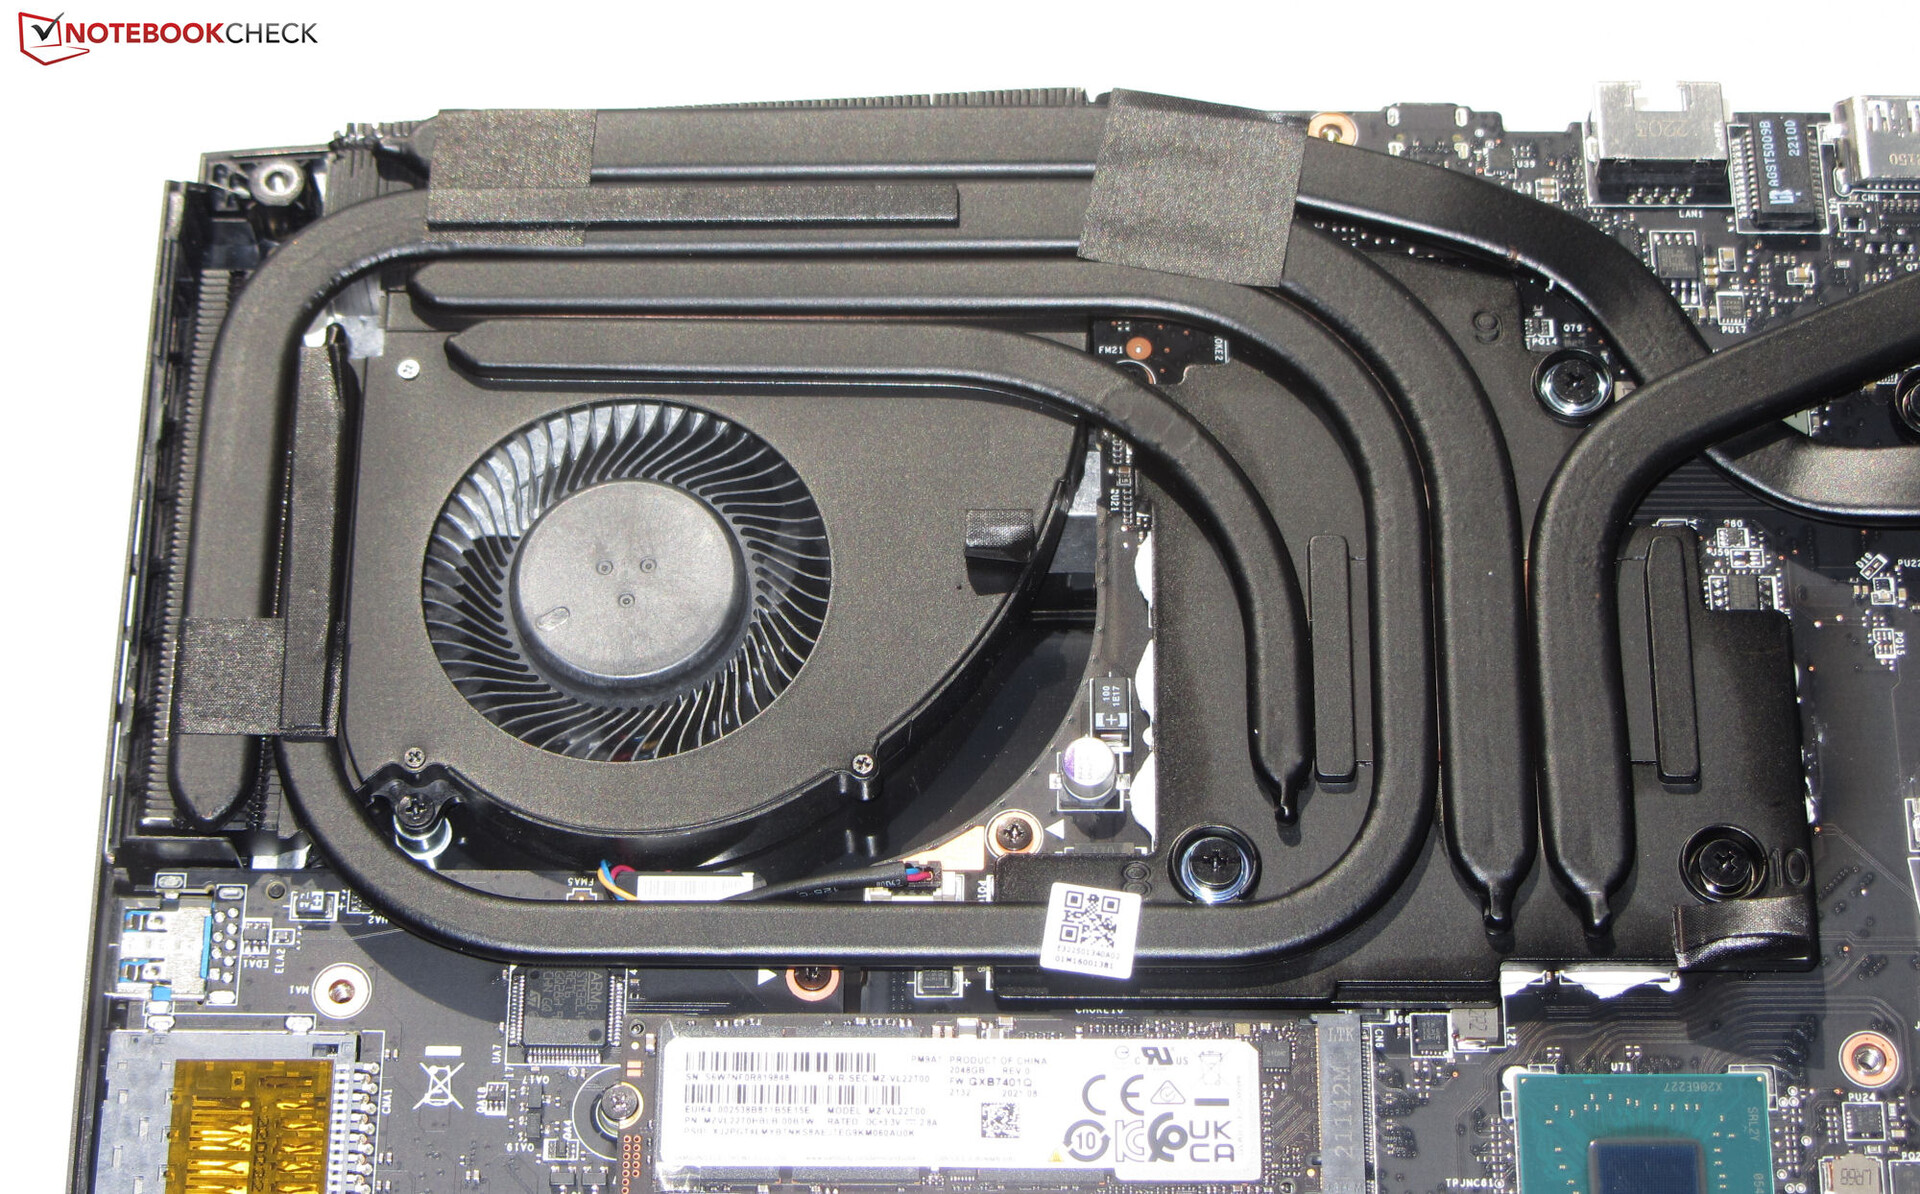
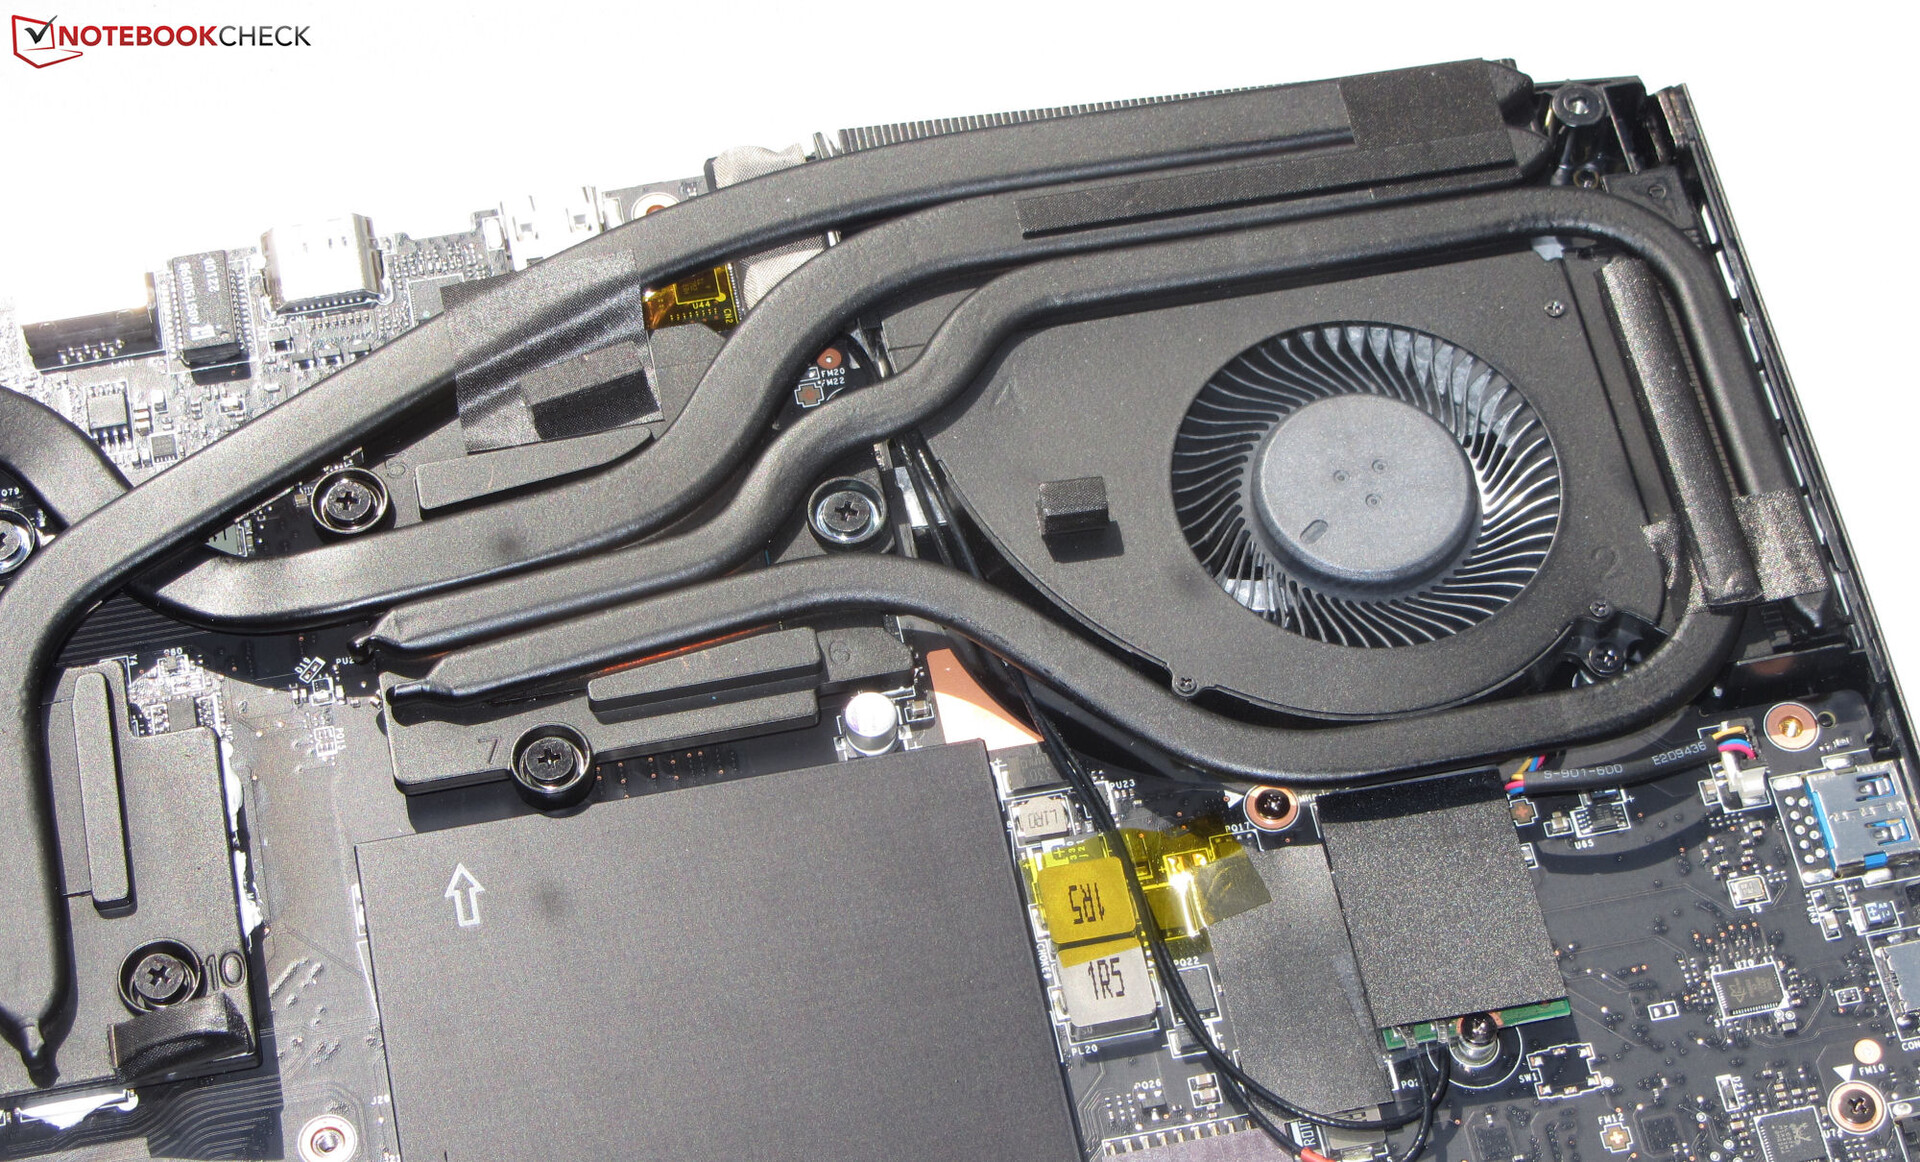
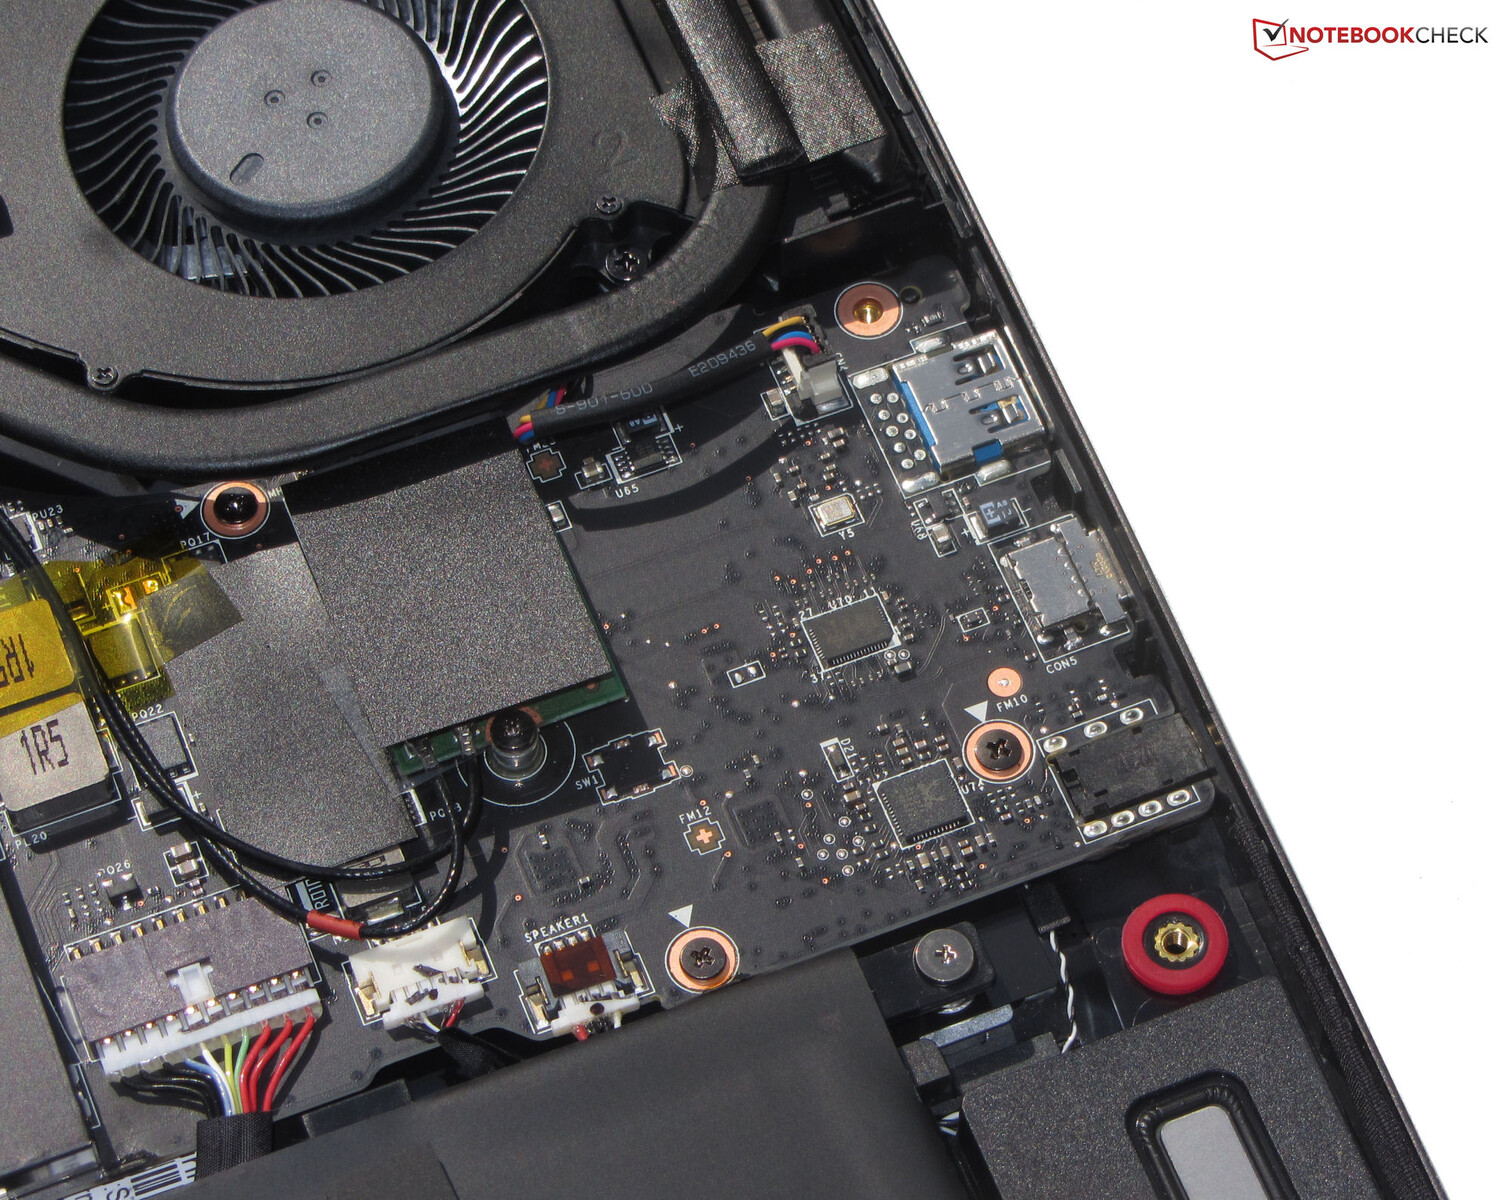
Maintenance
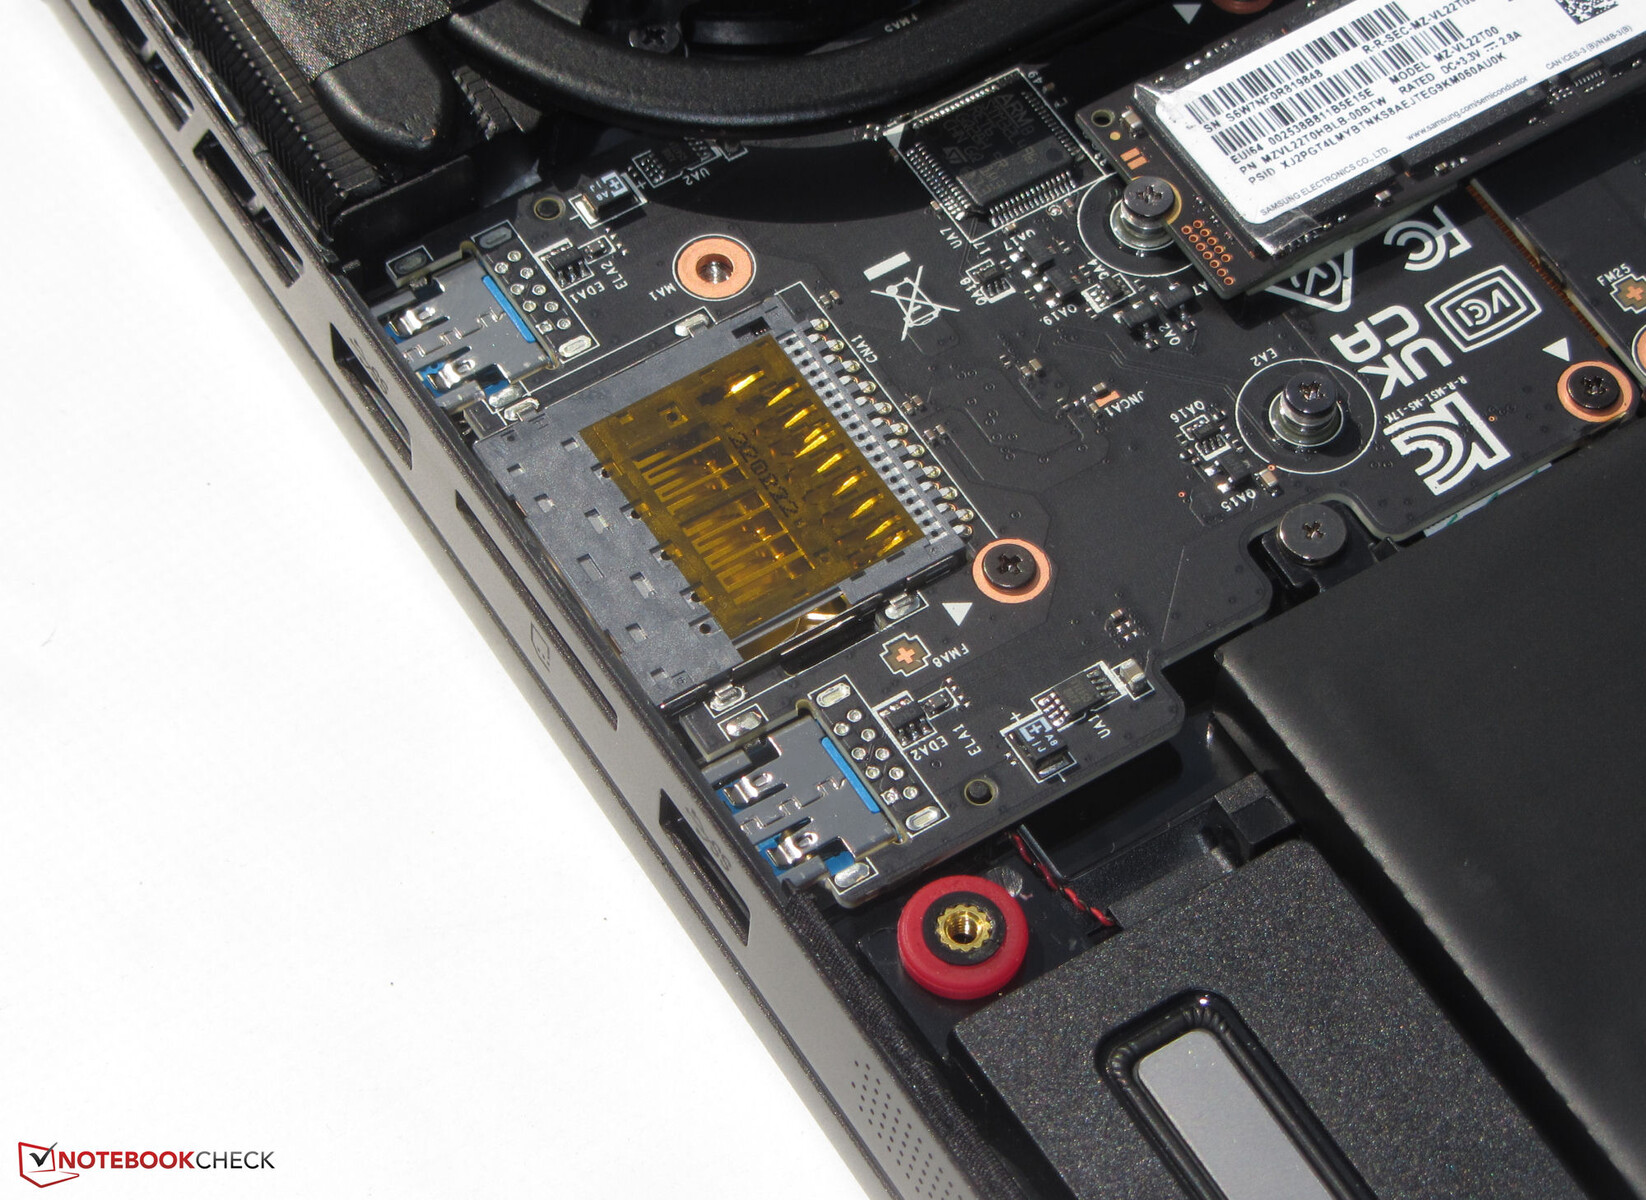
Maintenance and upgrades can be performed without any hassle. After loosening all the screws on the bottom, the bottom plate can be removed fairly easily - an object with a sharp edge may be helpful here. Then, users have access to the SSD (PCIe4, M.2-2280), the secondary SSD slot (PCIe4, M.2-2280), the Wi-Fi module, the battery, the RAM (hidden underneath an additional, tightly attached cover), the speakers, and the fans.
Warranty
MSI offers a standard one-year limited warranty. Warranty extensions to two and three years cost 80 USD and 140 USD, respectively.
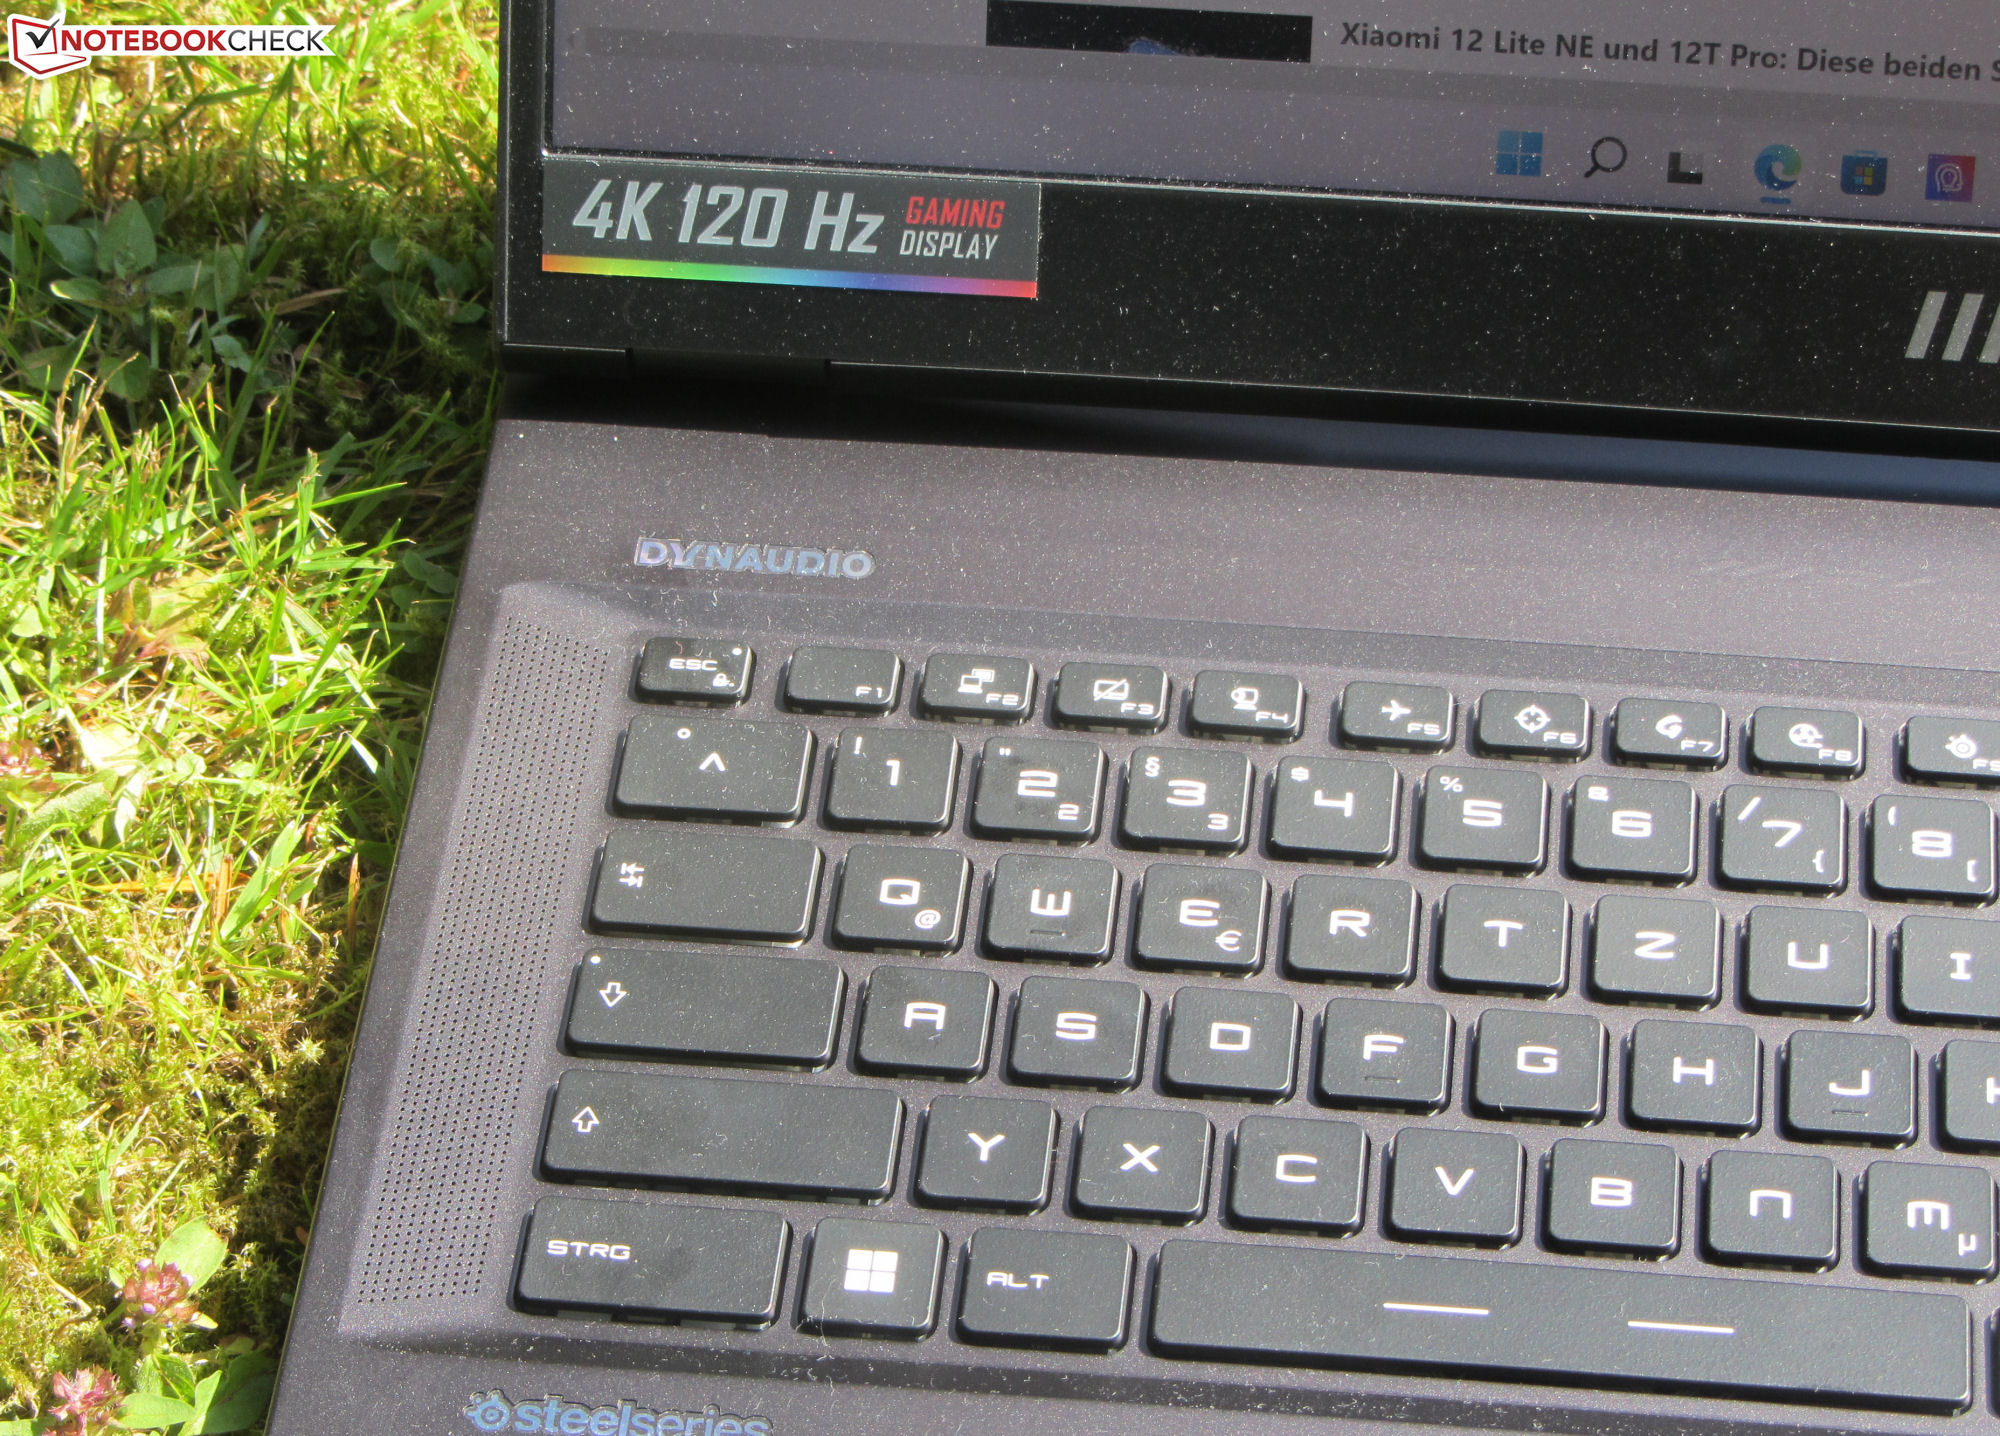
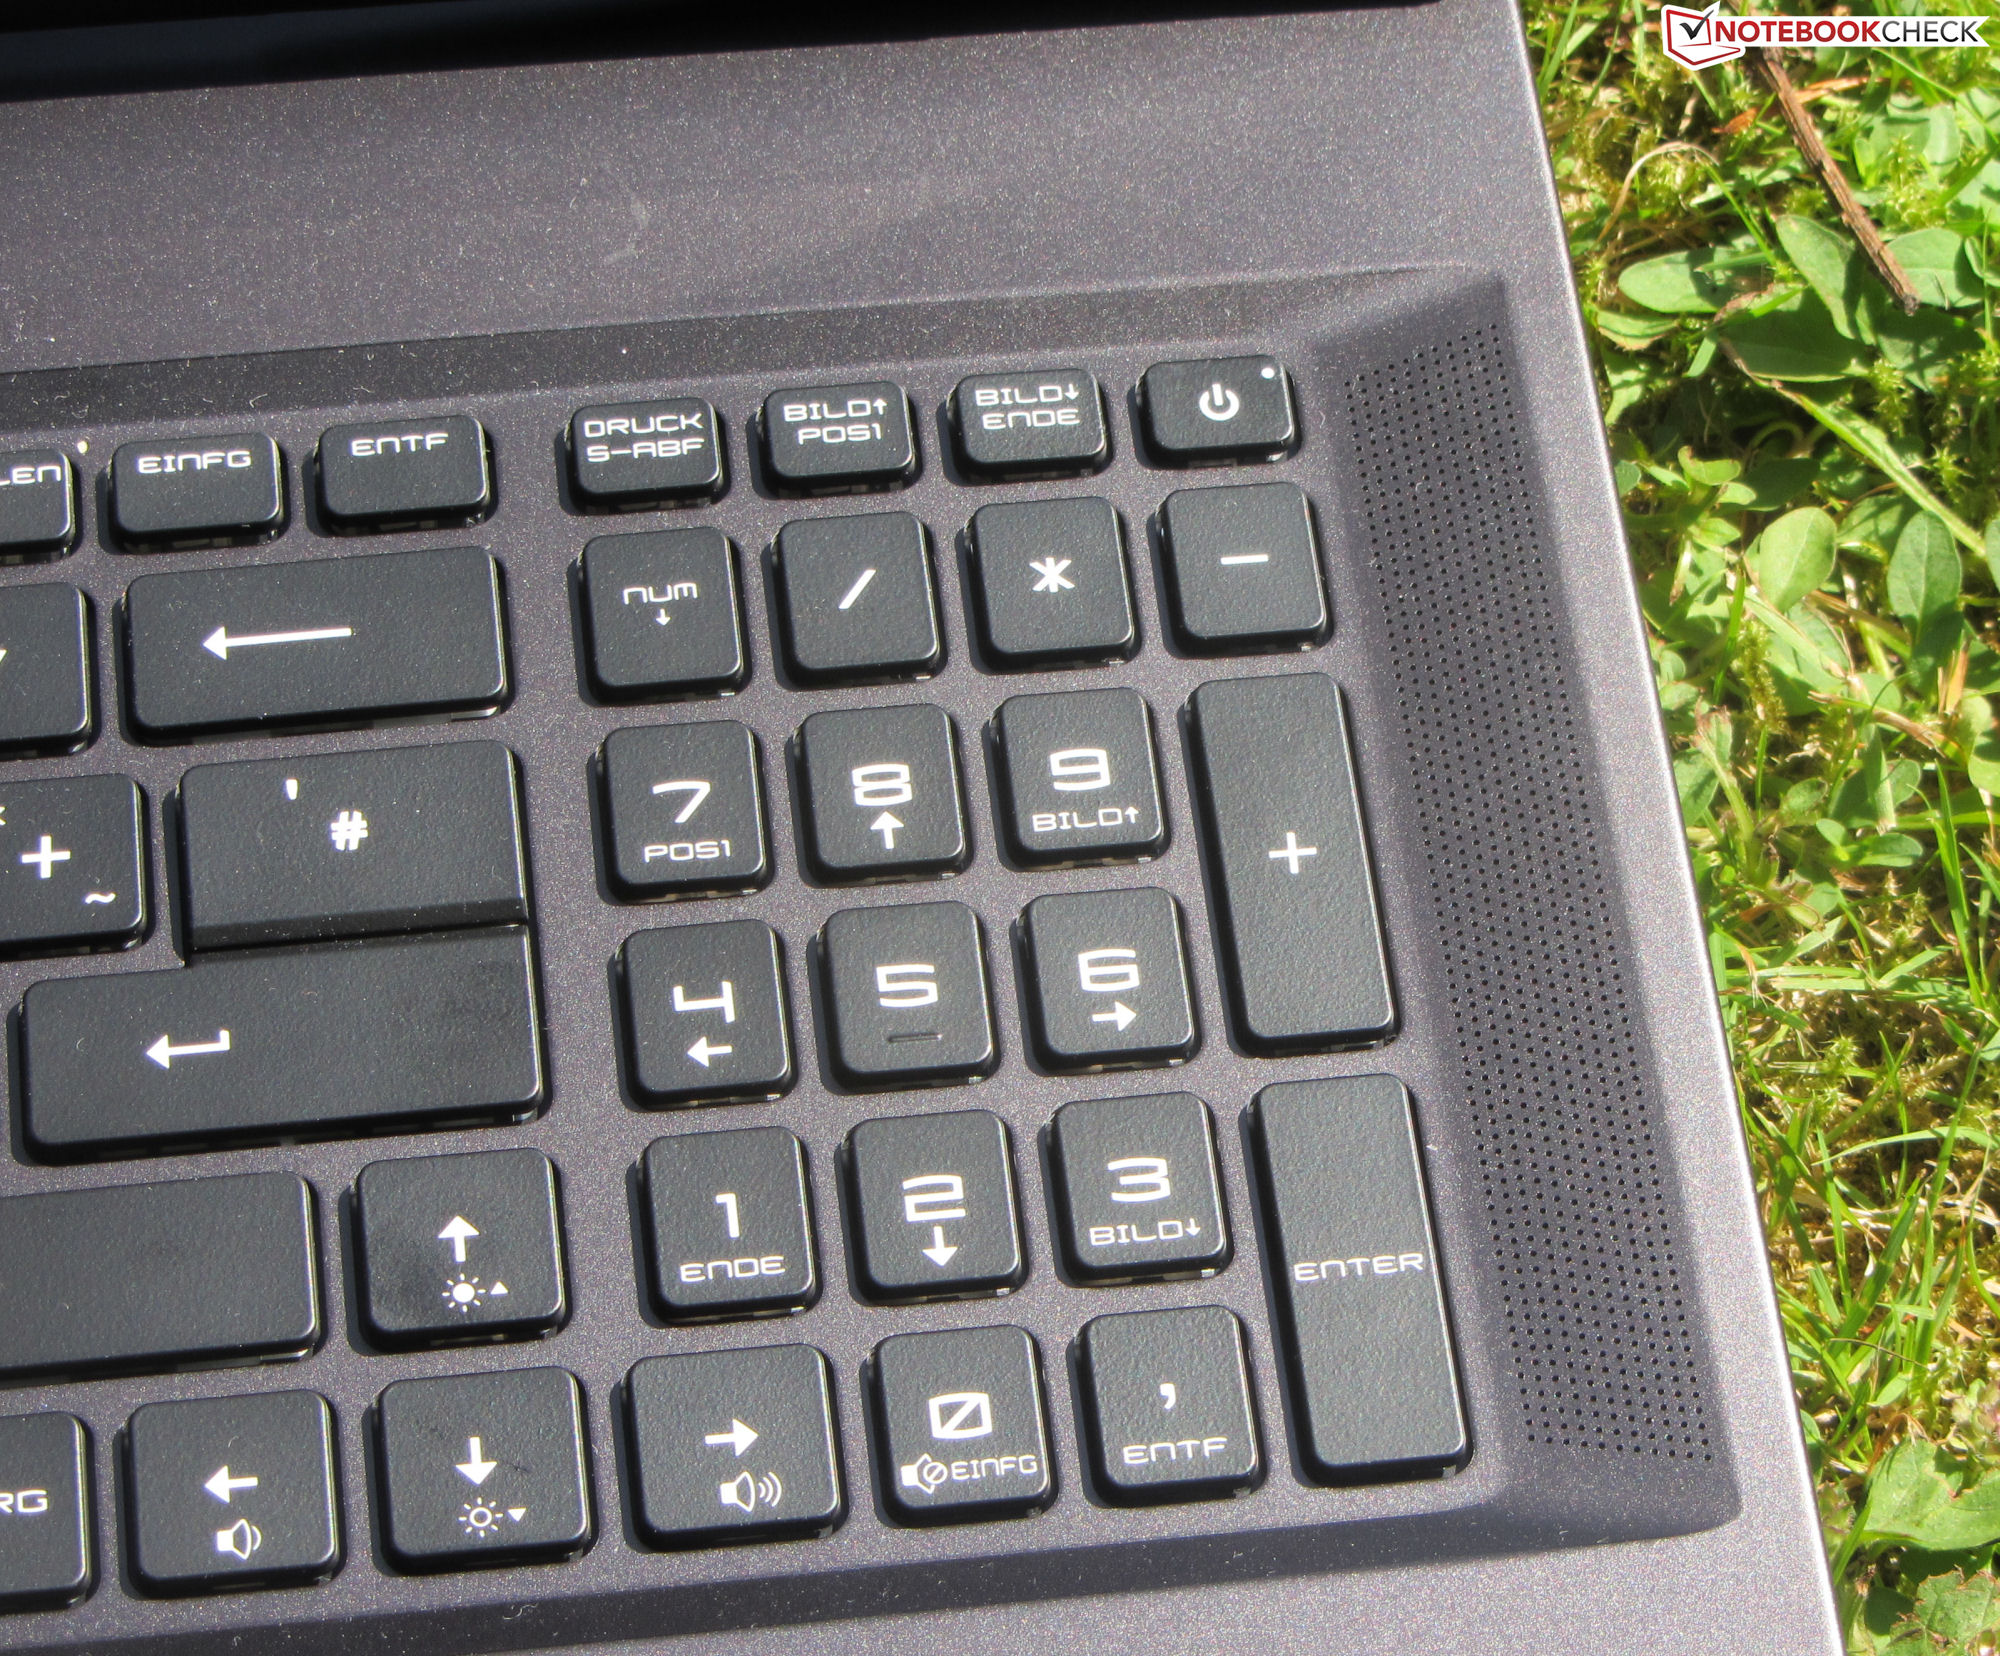
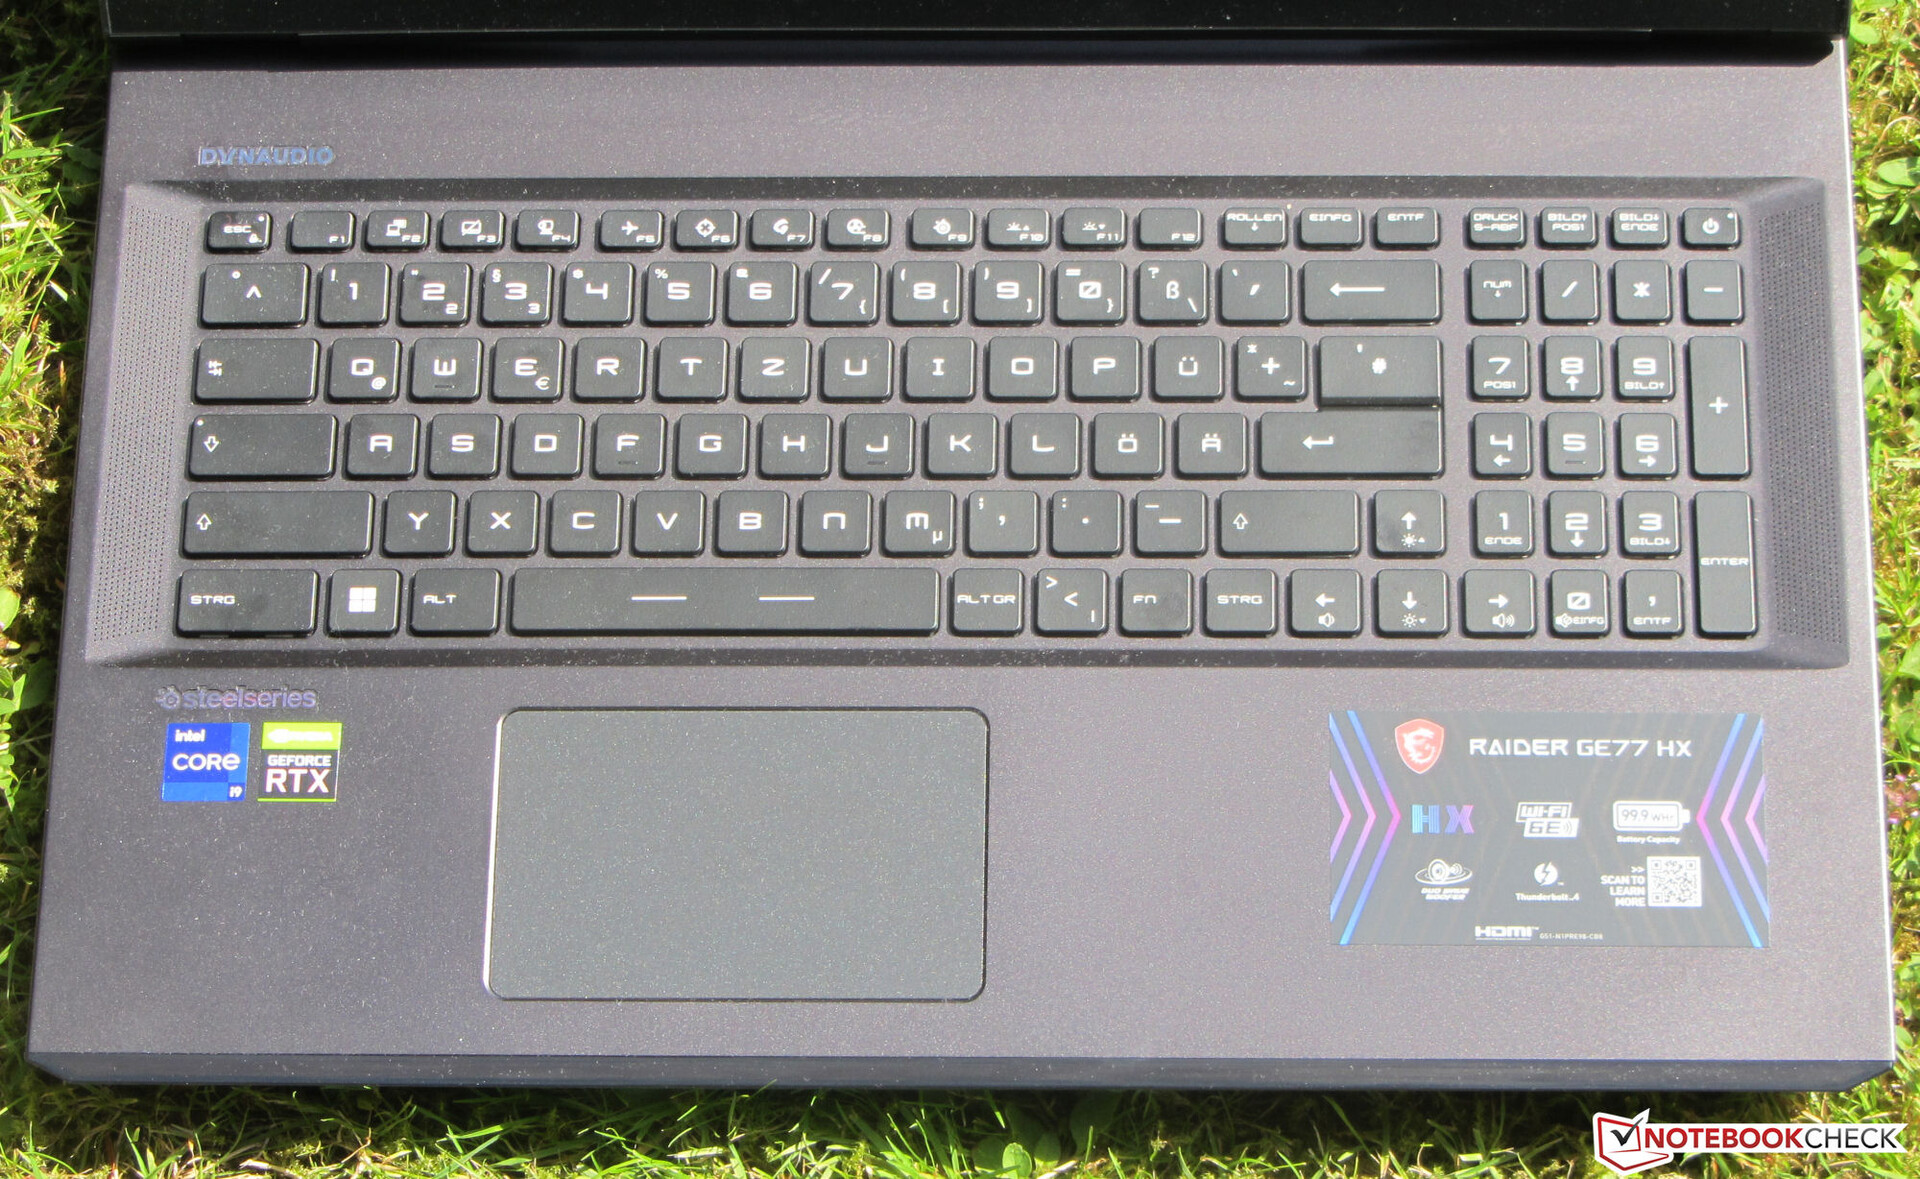
Input Devices - Keyboard with an RGB backlight
Keyboard
The flat, slightly roughened keys of the backlit chiclet keyboard offer moderate travel and a distinct actuation point. The keyboard feedback is decent. While typing, the keyboard barely yields. As per MSI's usual design, the "Fn" key is not located where one would expect it to be from other laptops. The keyboard backlight has three brightness settings, which can be controlled via two function keys. Overall, MSI delivers with a keyboard that is suitable for day-to-day use.
Touchpad
The smooth surface of the multi-touch enabled ClickPad (approx. 10.5 x 6.5 cm or 4.13 x 2.56 in) has good gliding properties. The pad responds well all the way into the corners. It offers short travel and a distinct actuation point.
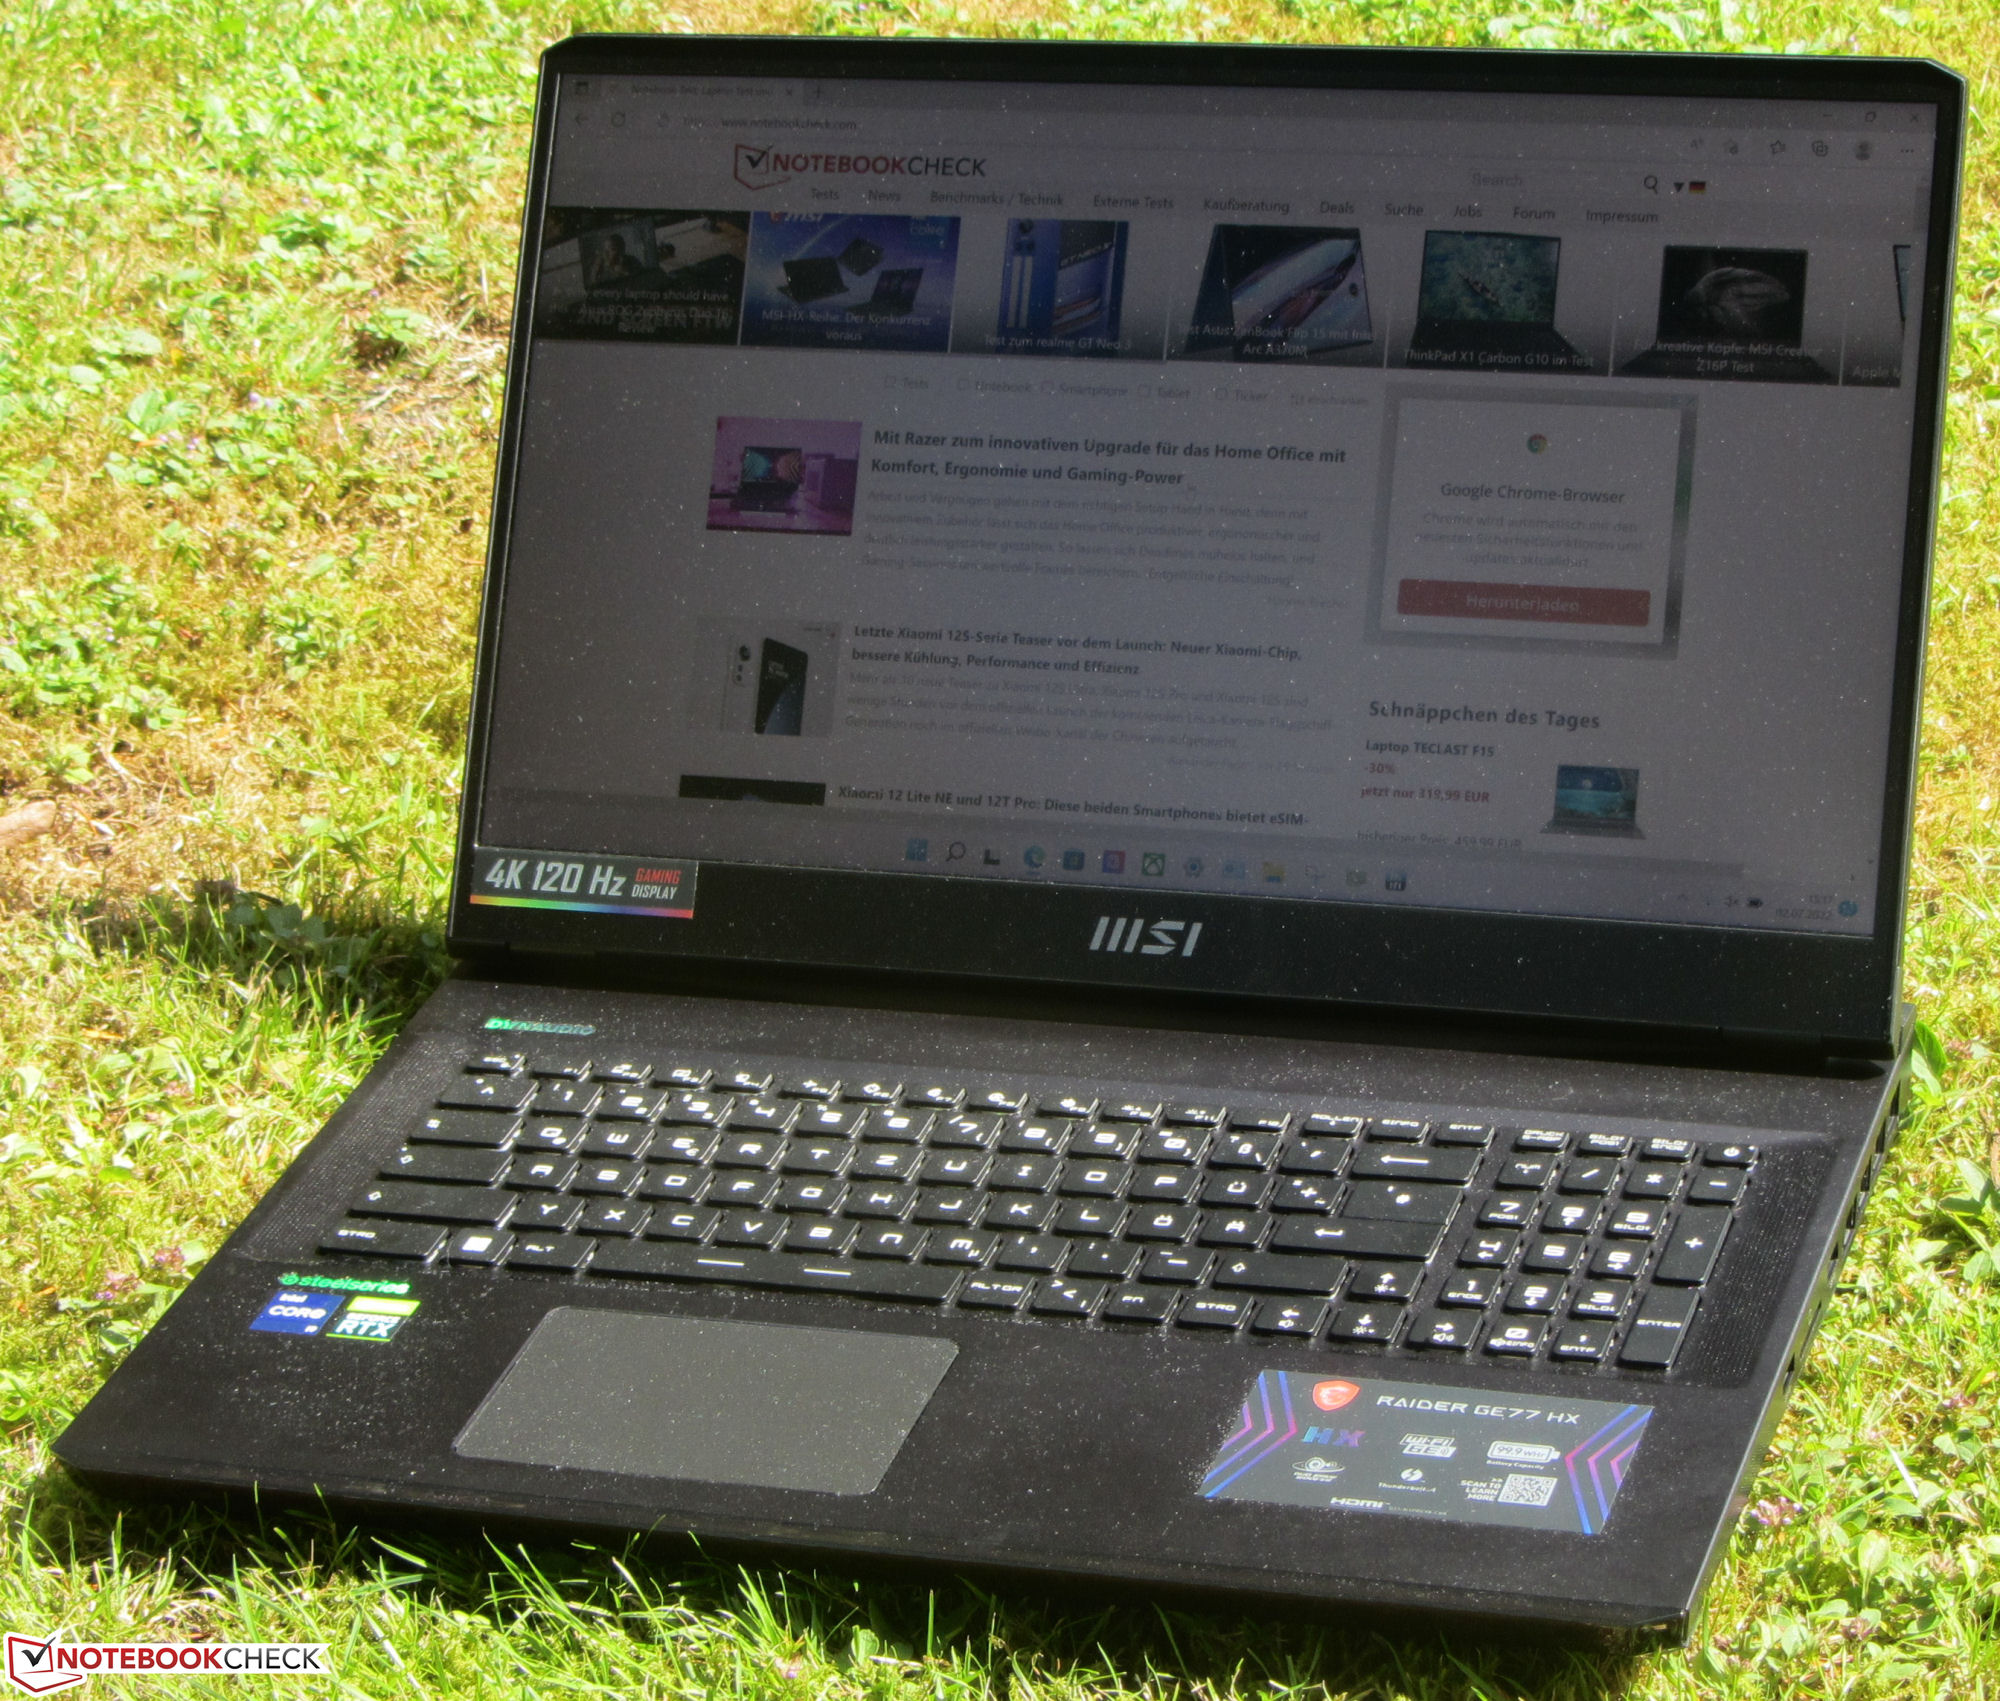
Display - IPS panel
While the brightness (371.2 nits) of the matte 17.3-inch display (3840 x 2160 pixels) exceeds the desired minimum (> 300 nits), the contrast is lackluster (733:1) - we expect more from a laptop that costs 5,200 Euros. For reference, we consider values of 1000:1 and higher good. The 120-Hz panel comes with short response times. We also did not detect any PWM flickering.
| |||||||||||||||||||||||||
Brightness Distribution: 84 %
Center on Battery: 381 cd/m²
Contrast: 733:1 (Black: 0.52 cd/m²)
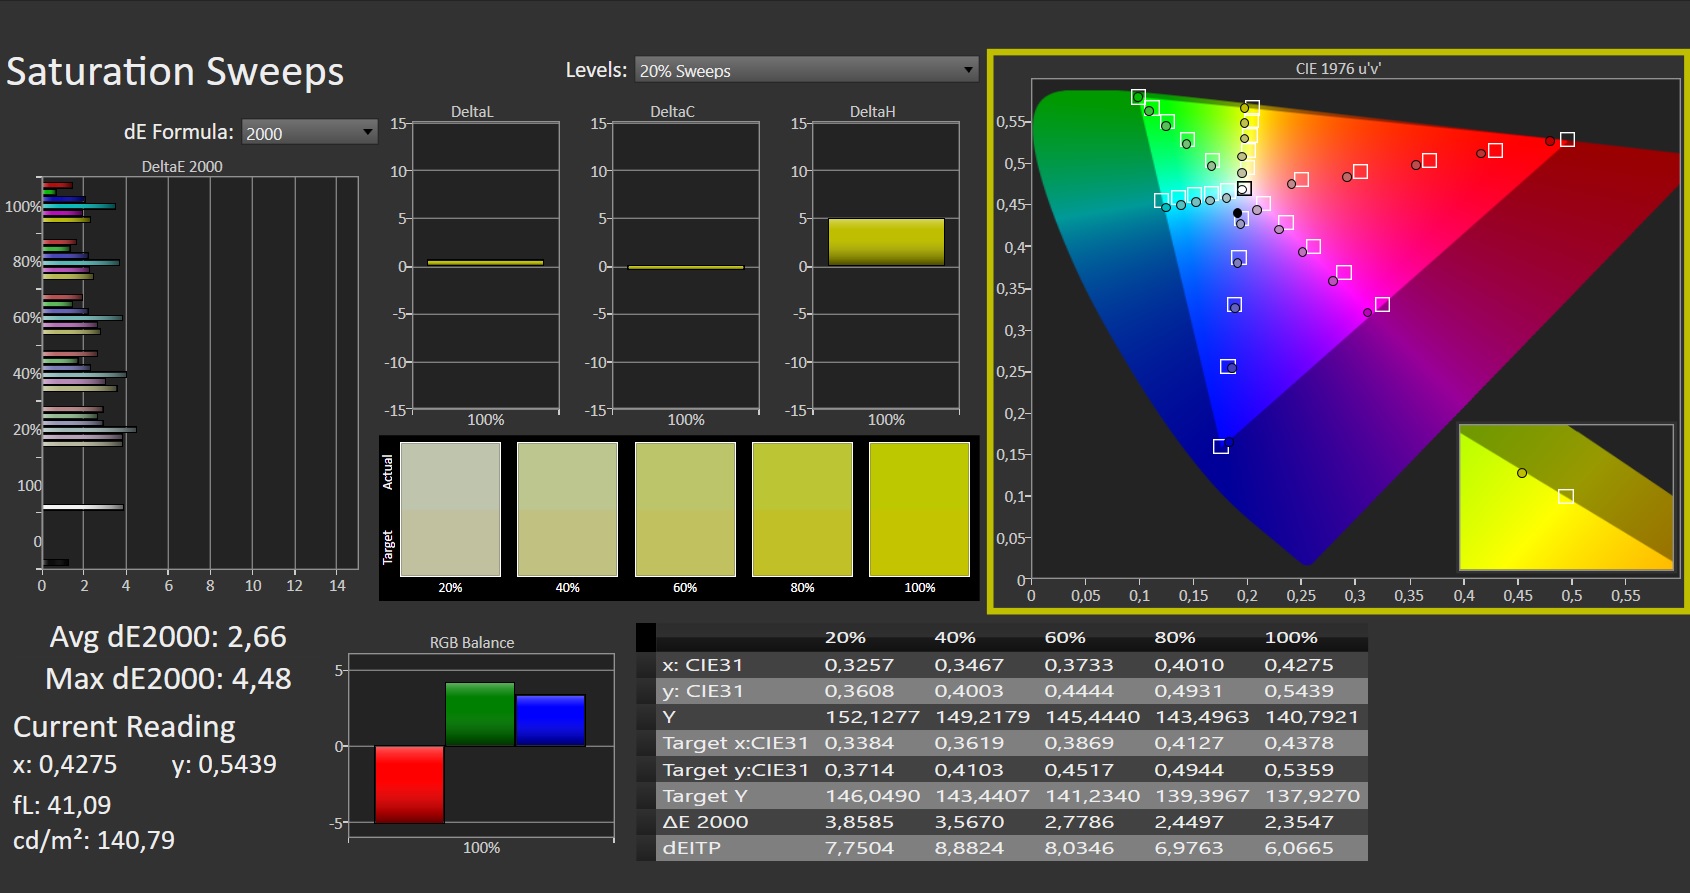
calibrated: 2.53
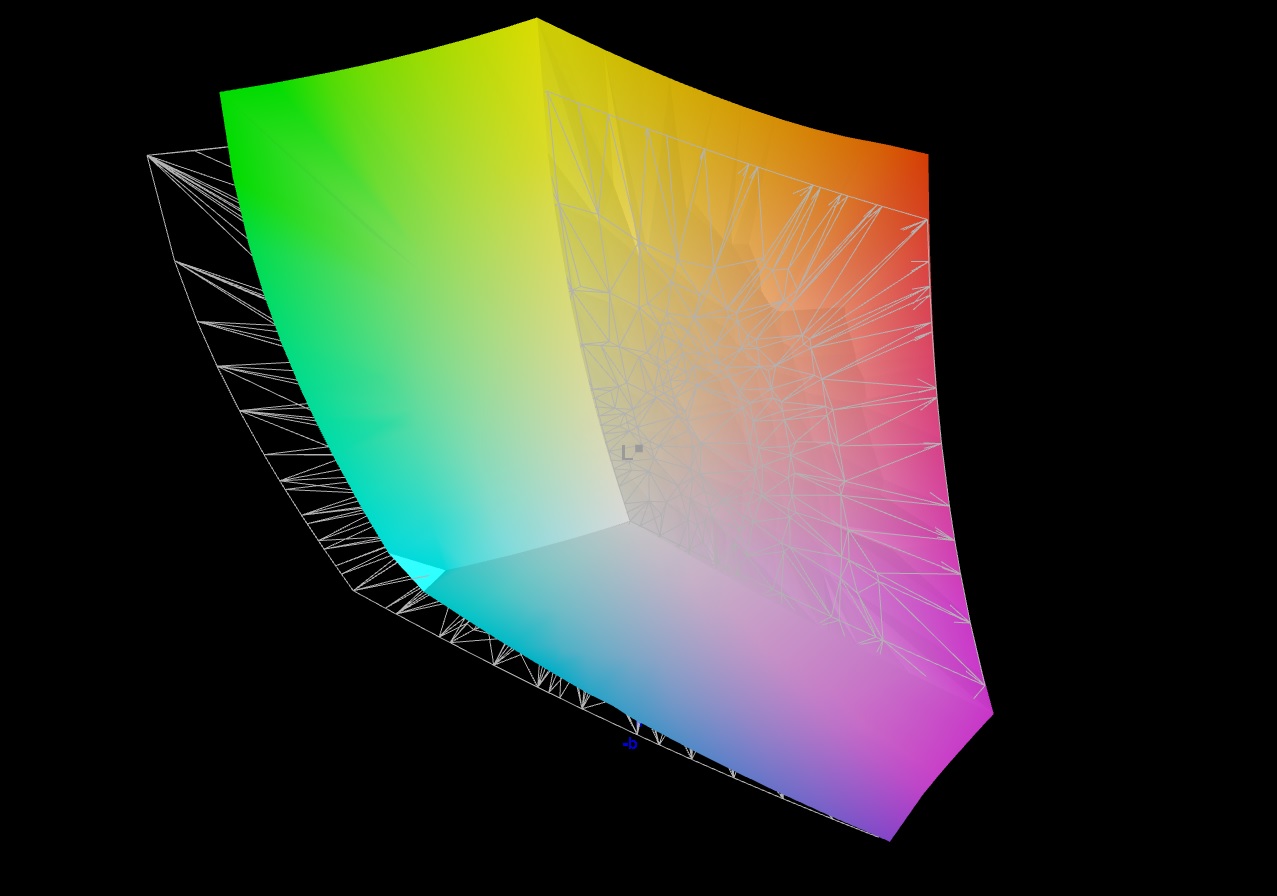
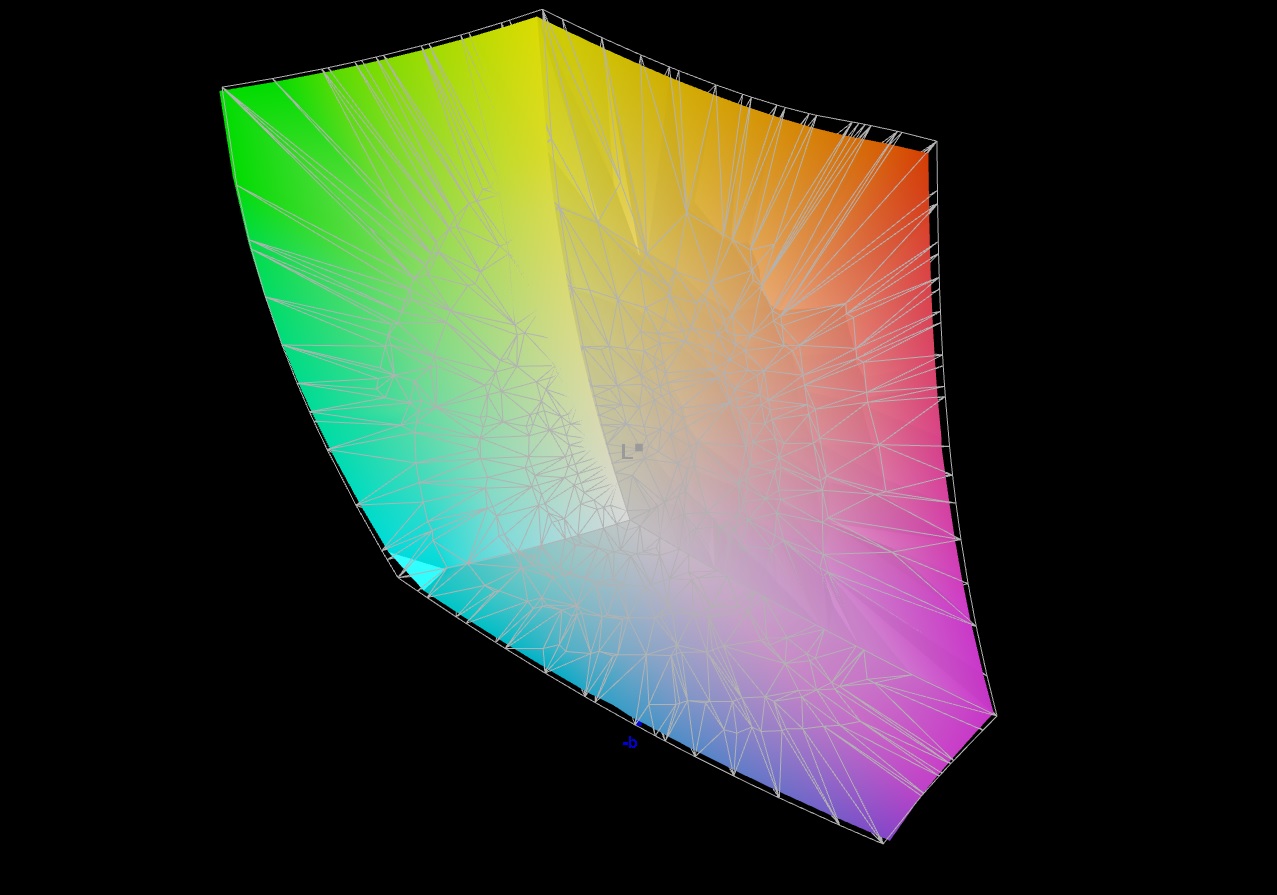
85.8% AdobeRGB 1998 (Argyll 3D)
99.8% sRGB (Argyll 3D)
96.6% Display P3 (Argyll 3D)
| MSI Raider GE77 HX 12UHS AU Optronics B173ZAN06.1, IPS, 3840x2160, 17.3" | Razer Blade 17 Early 2022 AU Optronics B173ZAN06.9, IPS, 3840x2160, 17.3" | Alienware x17 R2 P48E AU Optronics B173HAN, IPS, 1920x1080, 17.3" | Medion Erazer Beast X30 BOE CQ NE173QHM-NZ3, IPS, 2560x1440, 17.3" | |
|---|---|---|---|---|
| Display | 2% | -8% | -17% | |
| Display P3 Coverage (%) | 96.6 | 99.4 3% | 79.2 -18% | 67.7 -30% |
| sRGB Coverage (%) | 99.8 | 100 0% | 99.8 0% | 97.6 -2% |
| AdobeRGB 1998 Coverage (%) | 85.8 | 87.3 2% | 79.6 -7% | 69.2 -19% |
| Response Times | -15% | -89% | -102% | |
| Response Time Grey 50% / Grey 80% * (ms) | 5.8 ? | 7.5 ? -29% | 12.4 ? -114% | 14.7 ? -153% |
| Response Time Black / White * (ms) | 5.6 ? | 5.6 ? -0% | 9.2 ? -64% | 8.4 ? -50% |
| PWM Frequency (Hz) | ||||
| Screen | 35% | 31% | 24% | |
| Brightness middle (cd/m²) | 381 | 503 32% | 365.4 -4% | 377 -1% |
| Brightness (cd/m²) | 371 | 486 31% | 344 -7% | 352 -5% |
| Brightness Distribution (%) | 84 | 84 0% | 85 1% | 86 2% |
| Black Level * (cd/m²) | 0.52 | 0.44 15% | 0.29 44% | 0.32 38% |
| Contrast (:1) | 733 | 1143 56% | 1260 72% | 1178 61% |
| Colorchecker dE 2000 calibrated * | 2.53 | 0.6 76% | 0.51 80% | 1.3 49% |
| Colorchecker dE 2000 * | 1.08 | 3.17 | 2.91 | |
| Colorchecker dE 2000 max. * | 4.54 | 7.69 | 6.78 | |
| Greyscale dE 2000 * | 1.3 | 5.3 | 3.4 | |
| Gamma | 2.151 102% | 2.18 101% | 2.109 104% | |
| CCT | 6541 99% | 5879 111% | 7273 89% | |
| Total Average (Program / Settings) | 7% /
17% | -22% /
-2% | -32% /
-10% |
* ... smaller is better
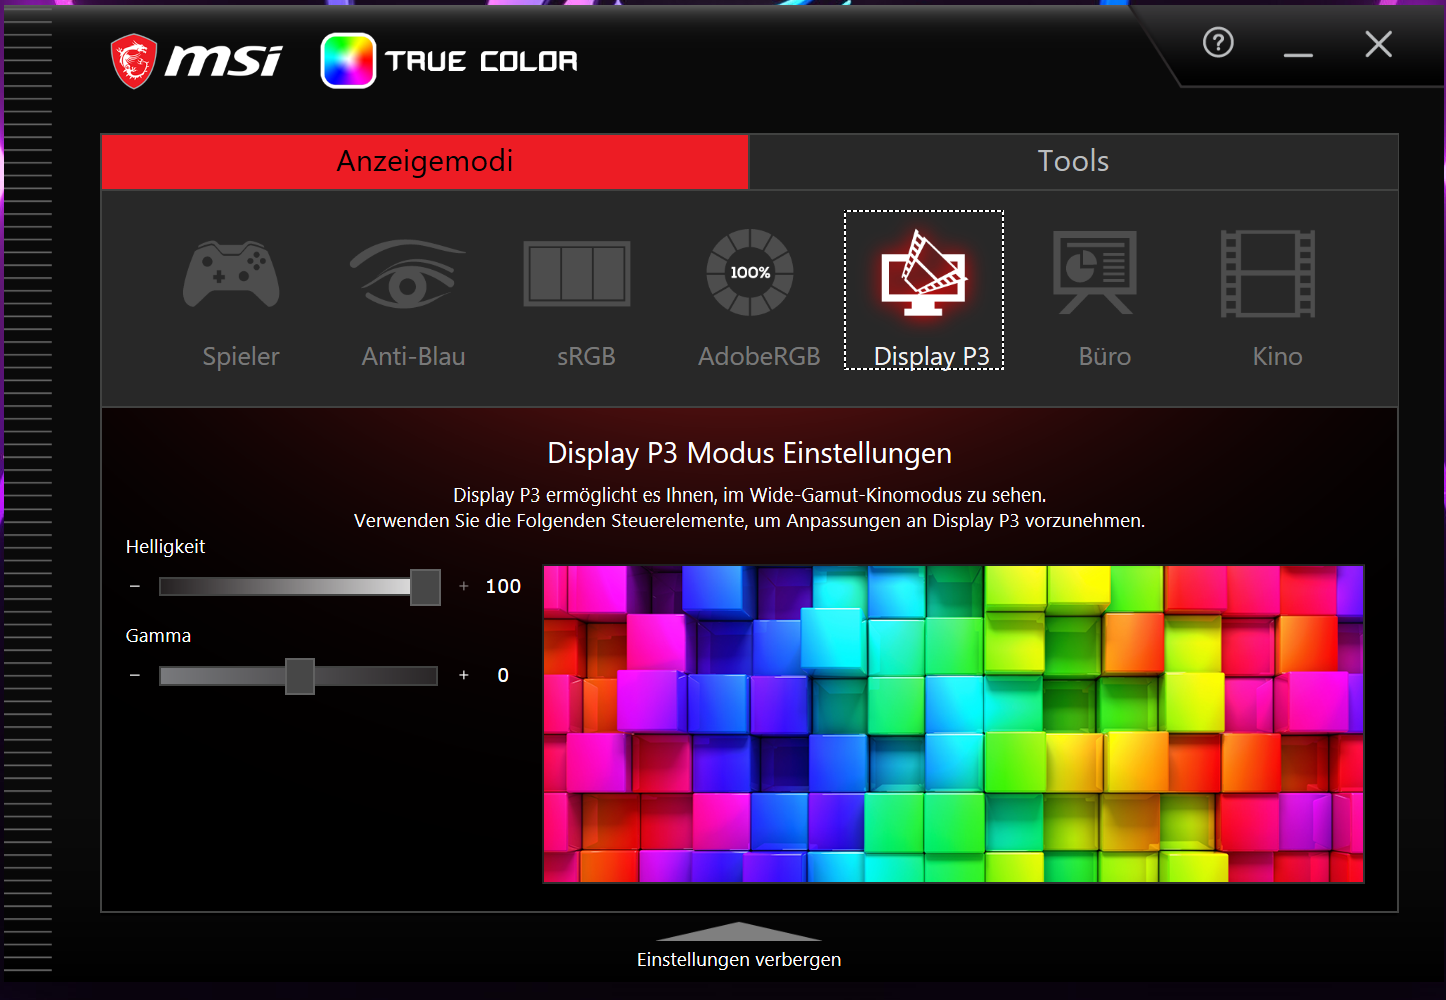
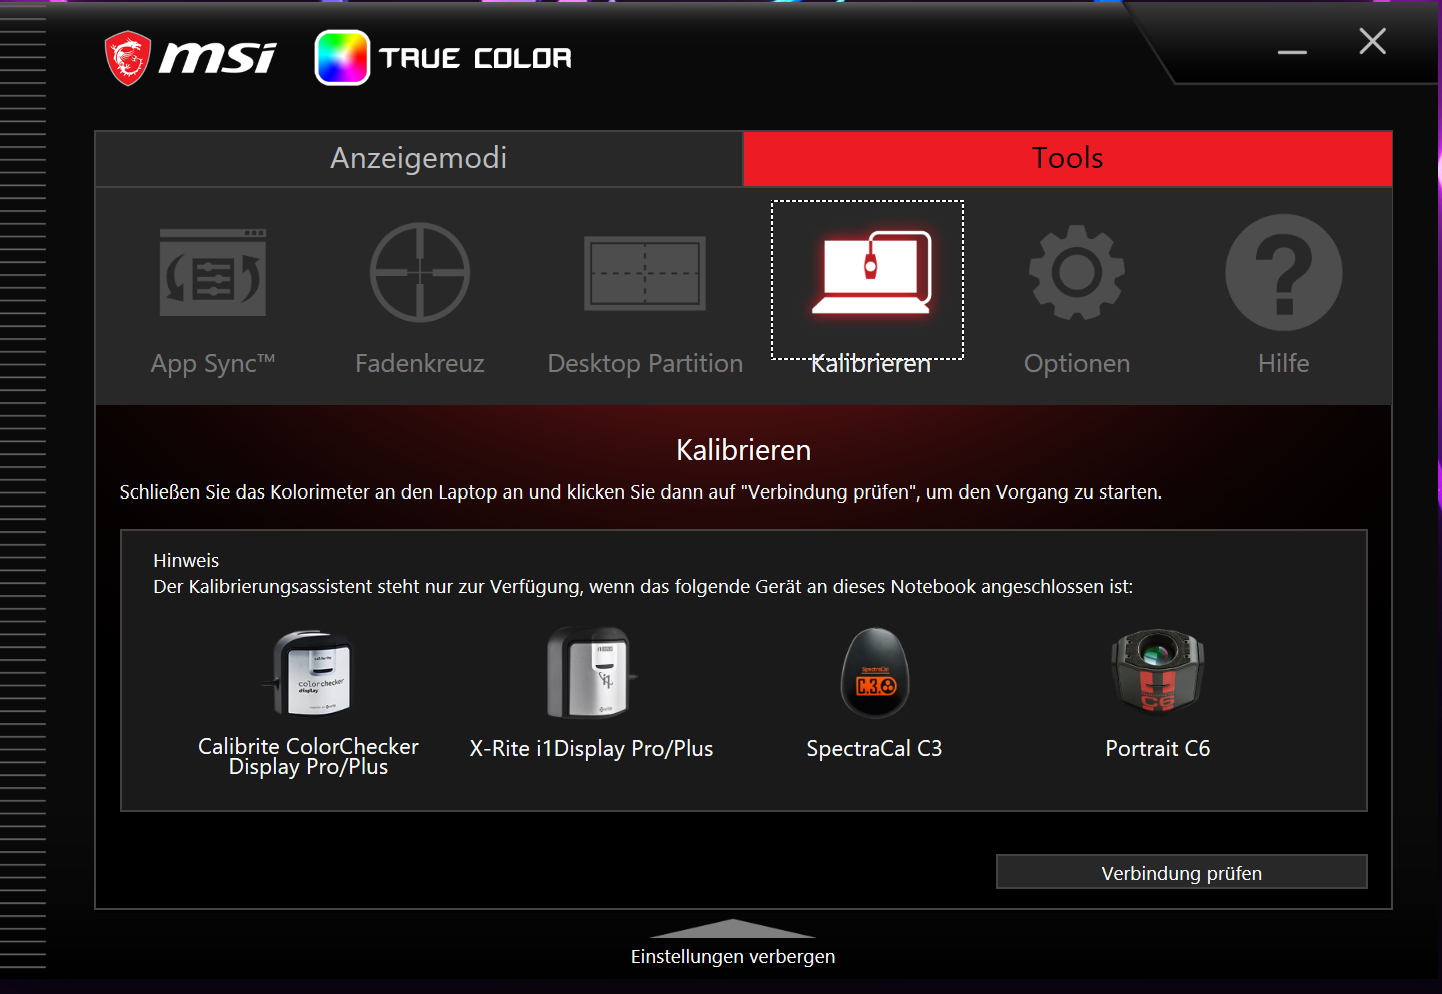
The preinstalled MSI True Color software allows users to adjust the colors for a certain color space or use case. We used the preset "Display P3". However: The color accuracy is fairly poor ex-factory - regardless of the preset selection. All colors appear overblown and milky with measurements that are completely off. This cannot be what MSI intended.
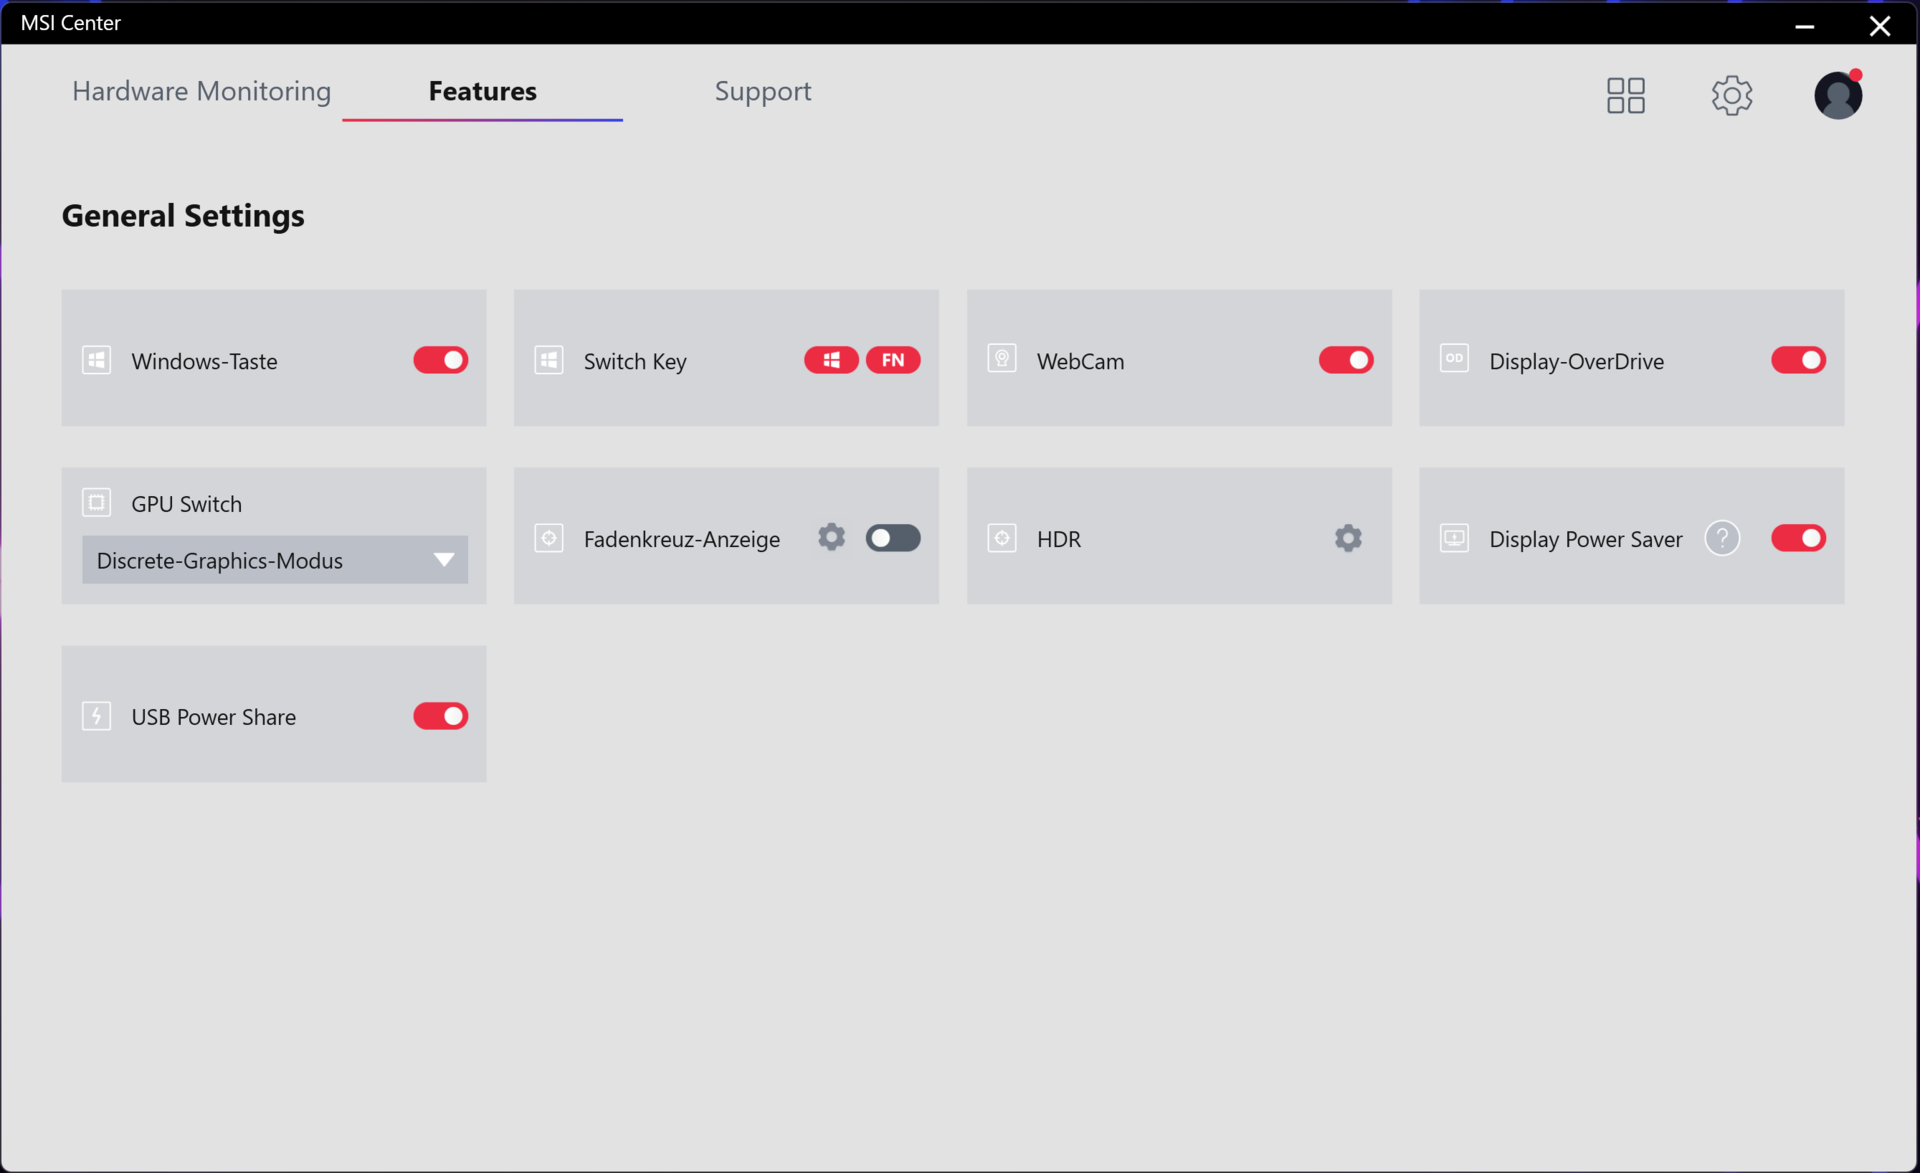
We suspect that the True Color software, the preinstalled color profile, and/or the iGPU or its drivers interfere with each other. Why? As soon as the dGPU mode (= the laptop exclusively uses the GeForce GPU) is enabled, the display looks fantastic and the colors become accurate. The difference is immediately noticeable.
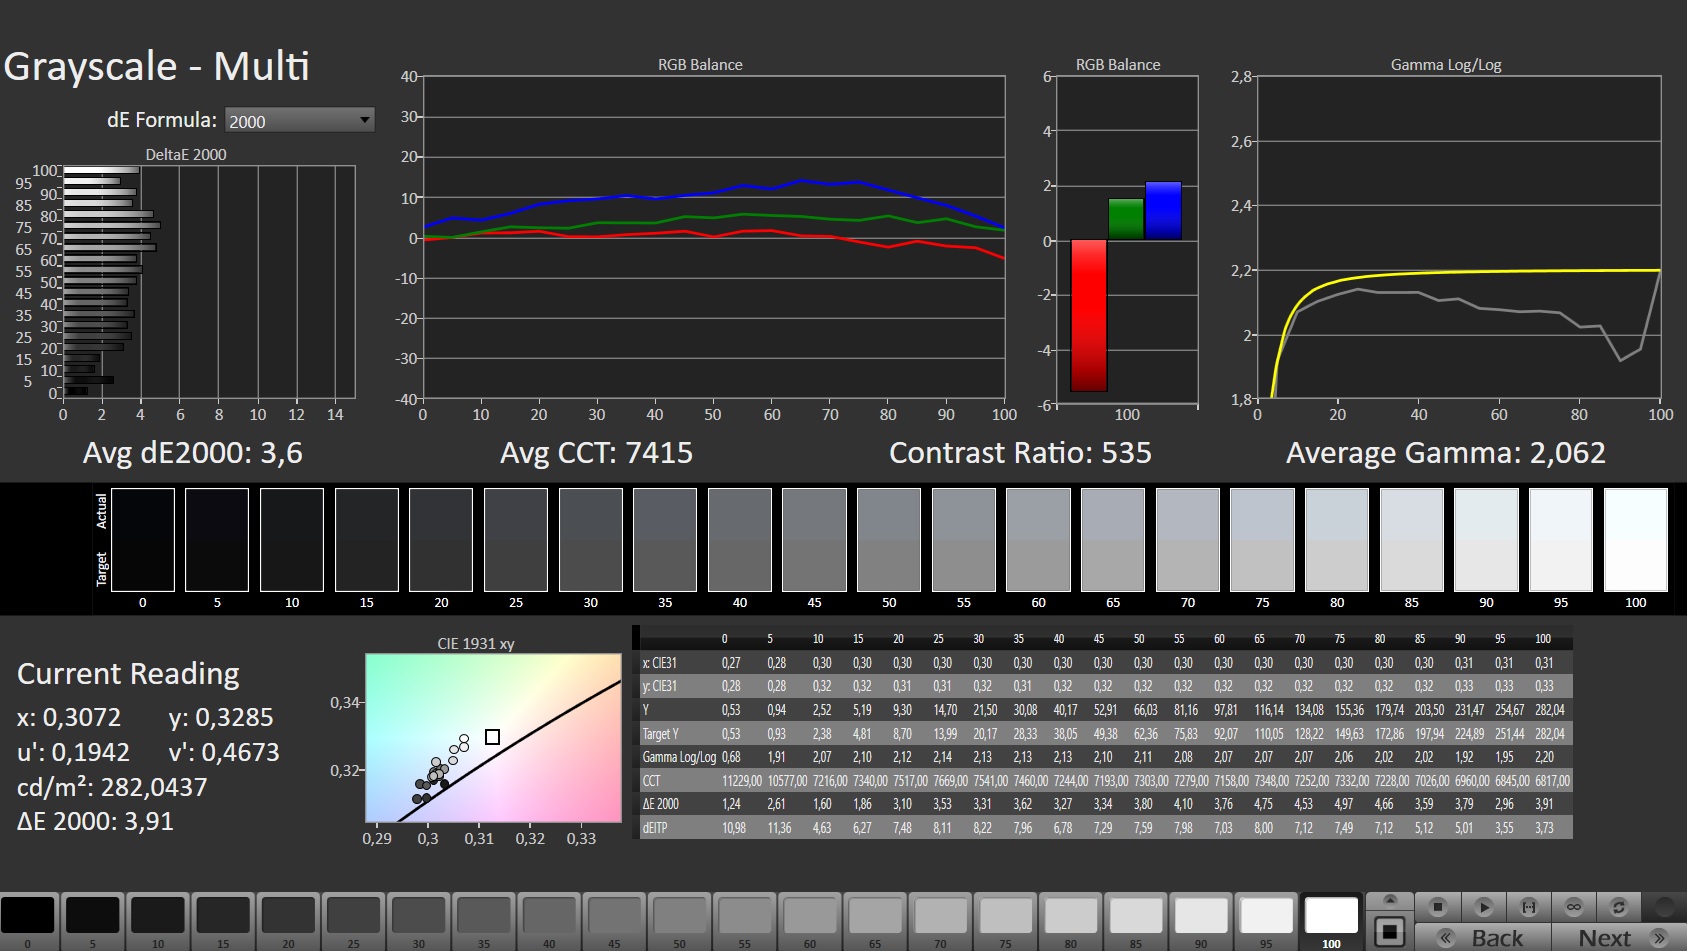
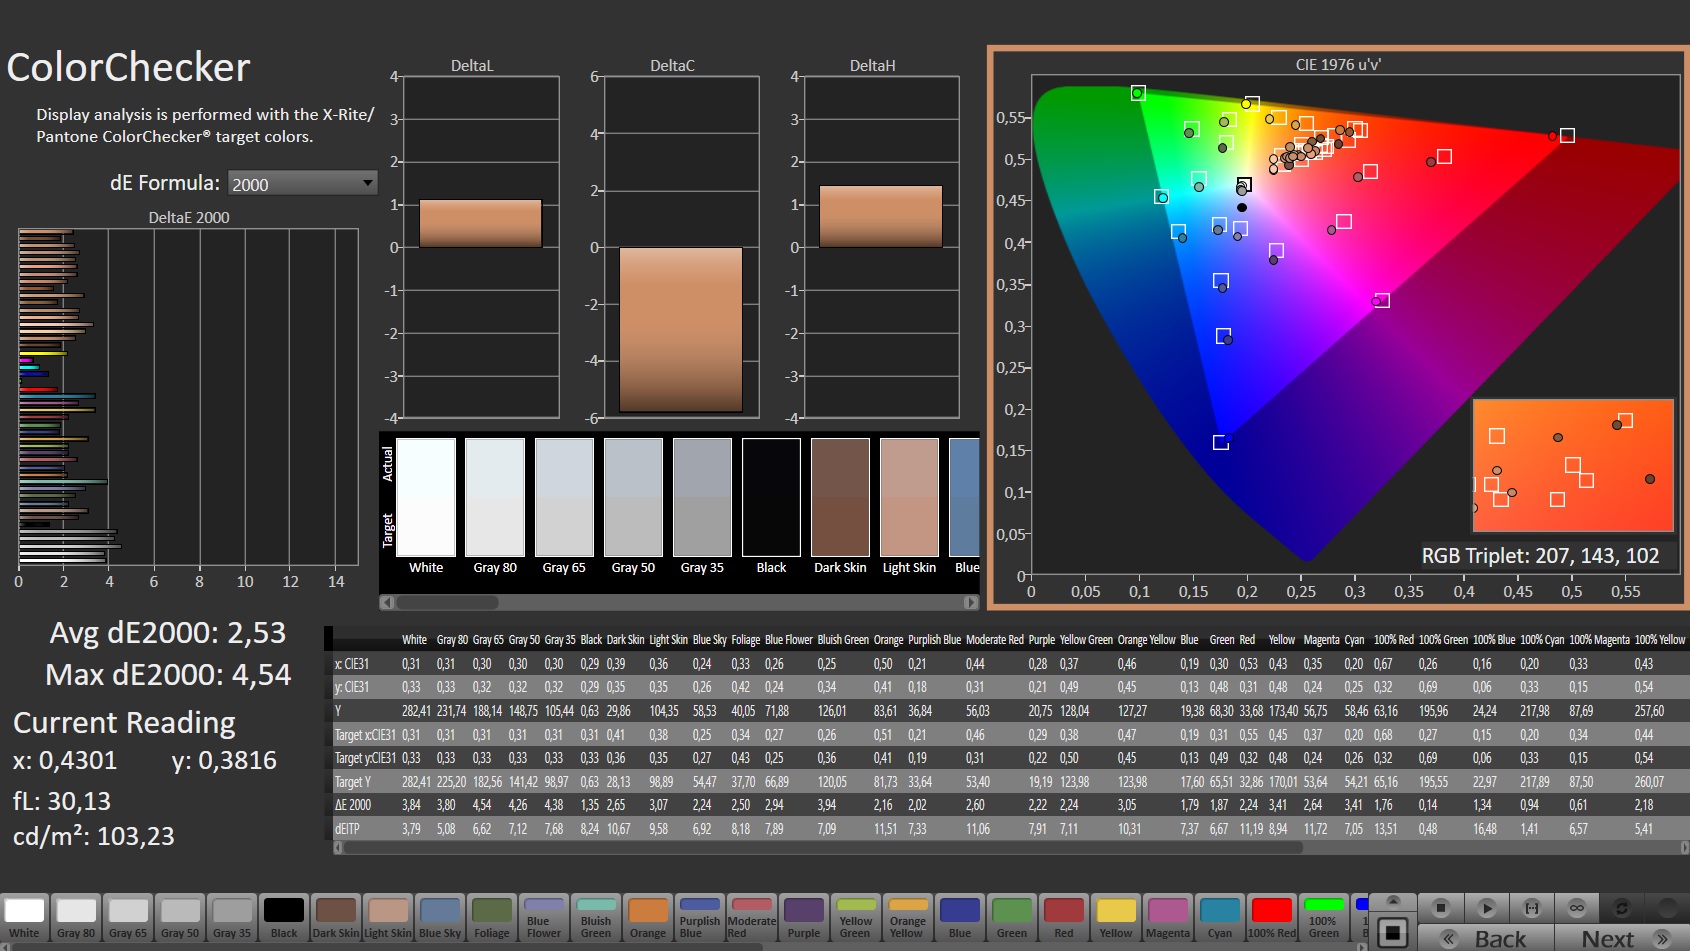
A calibration of the display (Optimus mode) results in significant improvements. The color deviation falls within the desired range (deltaE < 3) and the grayscale appears more even. The screen is able to display the sRGB (100 %) and DCI-P3 (97 %) color spaces entirely, and almost entirely, respectively, as well as 86 % of the AdobeRGB color space.
Note: The linked color profile changes the colors according to our calibration.

Display Response Times
| ↔ Response Time Black to White | ||
|---|---|---|
| 5.6 ms ... rise ↗ and fall ↘ combined | ↗ 1.9 ms rise | 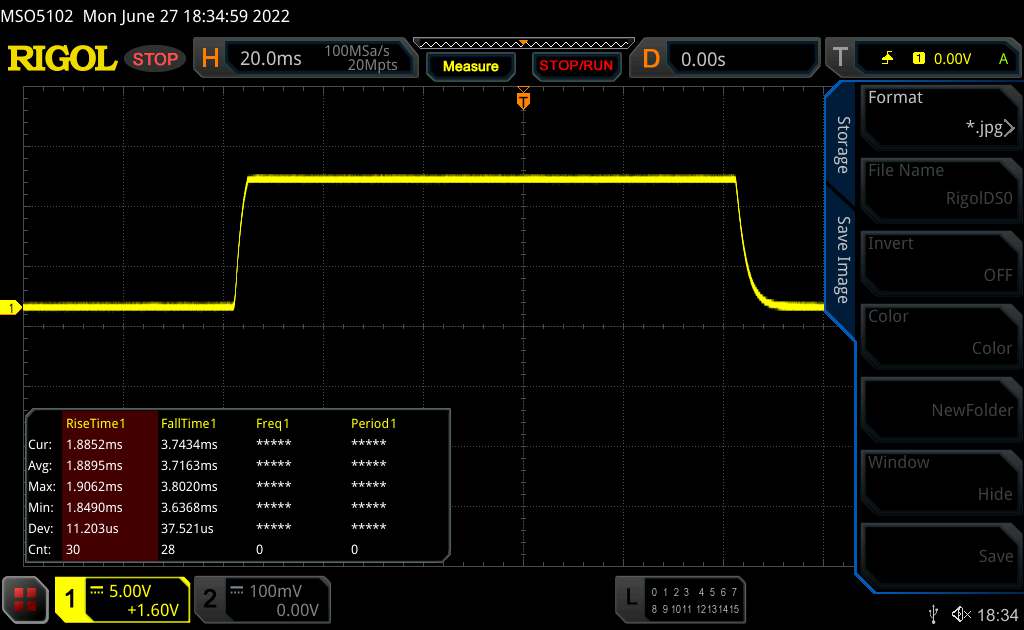 |
| ↘ 3.7 ms fall | ||
| The screen shows very fast response rates in our tests and should be very well suited for fast-paced gaming. In comparison, all tested devices range from 0.1 (minimum) to 240 (maximum) ms. » 17 % of all devices are better. This means that the measured response time is better than the average of all tested devices (20.2 ms). | ||
| ↔ Response Time 50% Grey to 80% Grey | ||
| 5.8 ms ... rise ↗ and fall ↘ combined | ↗ 1.6 ms rise | 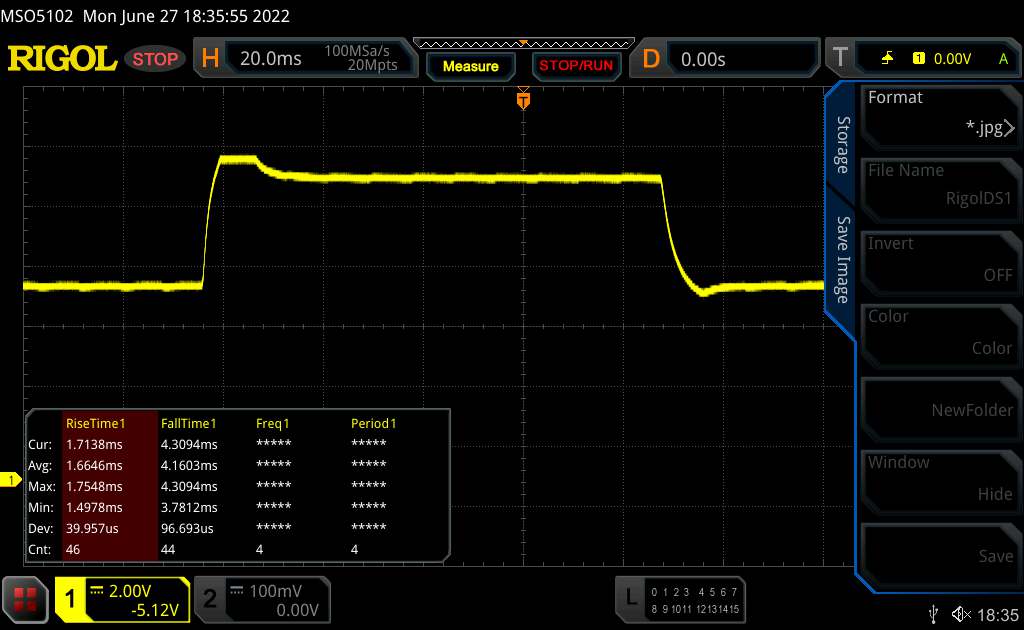 |
| ↘ 4.2 ms fall | ||
| The screen shows very fast response rates in our tests and should be very well suited for fast-paced gaming. In comparison, all tested devices range from 0.165 (minimum) to 636 (maximum) ms. » 17 % of all devices are better. This means that the measured response time is better than the average of all tested devices (31.6 ms). | ||
Screen Flickering / PWM (Pulse-Width Modulation)
| Screen flickering / PWM not detected |  | ||
In comparison: 53 % of all tested devices do not use PWM to dim the display. If PWM was detected, an average of 8084 (minimum: 5 - maximum: 343500) Hz was measured. | |||
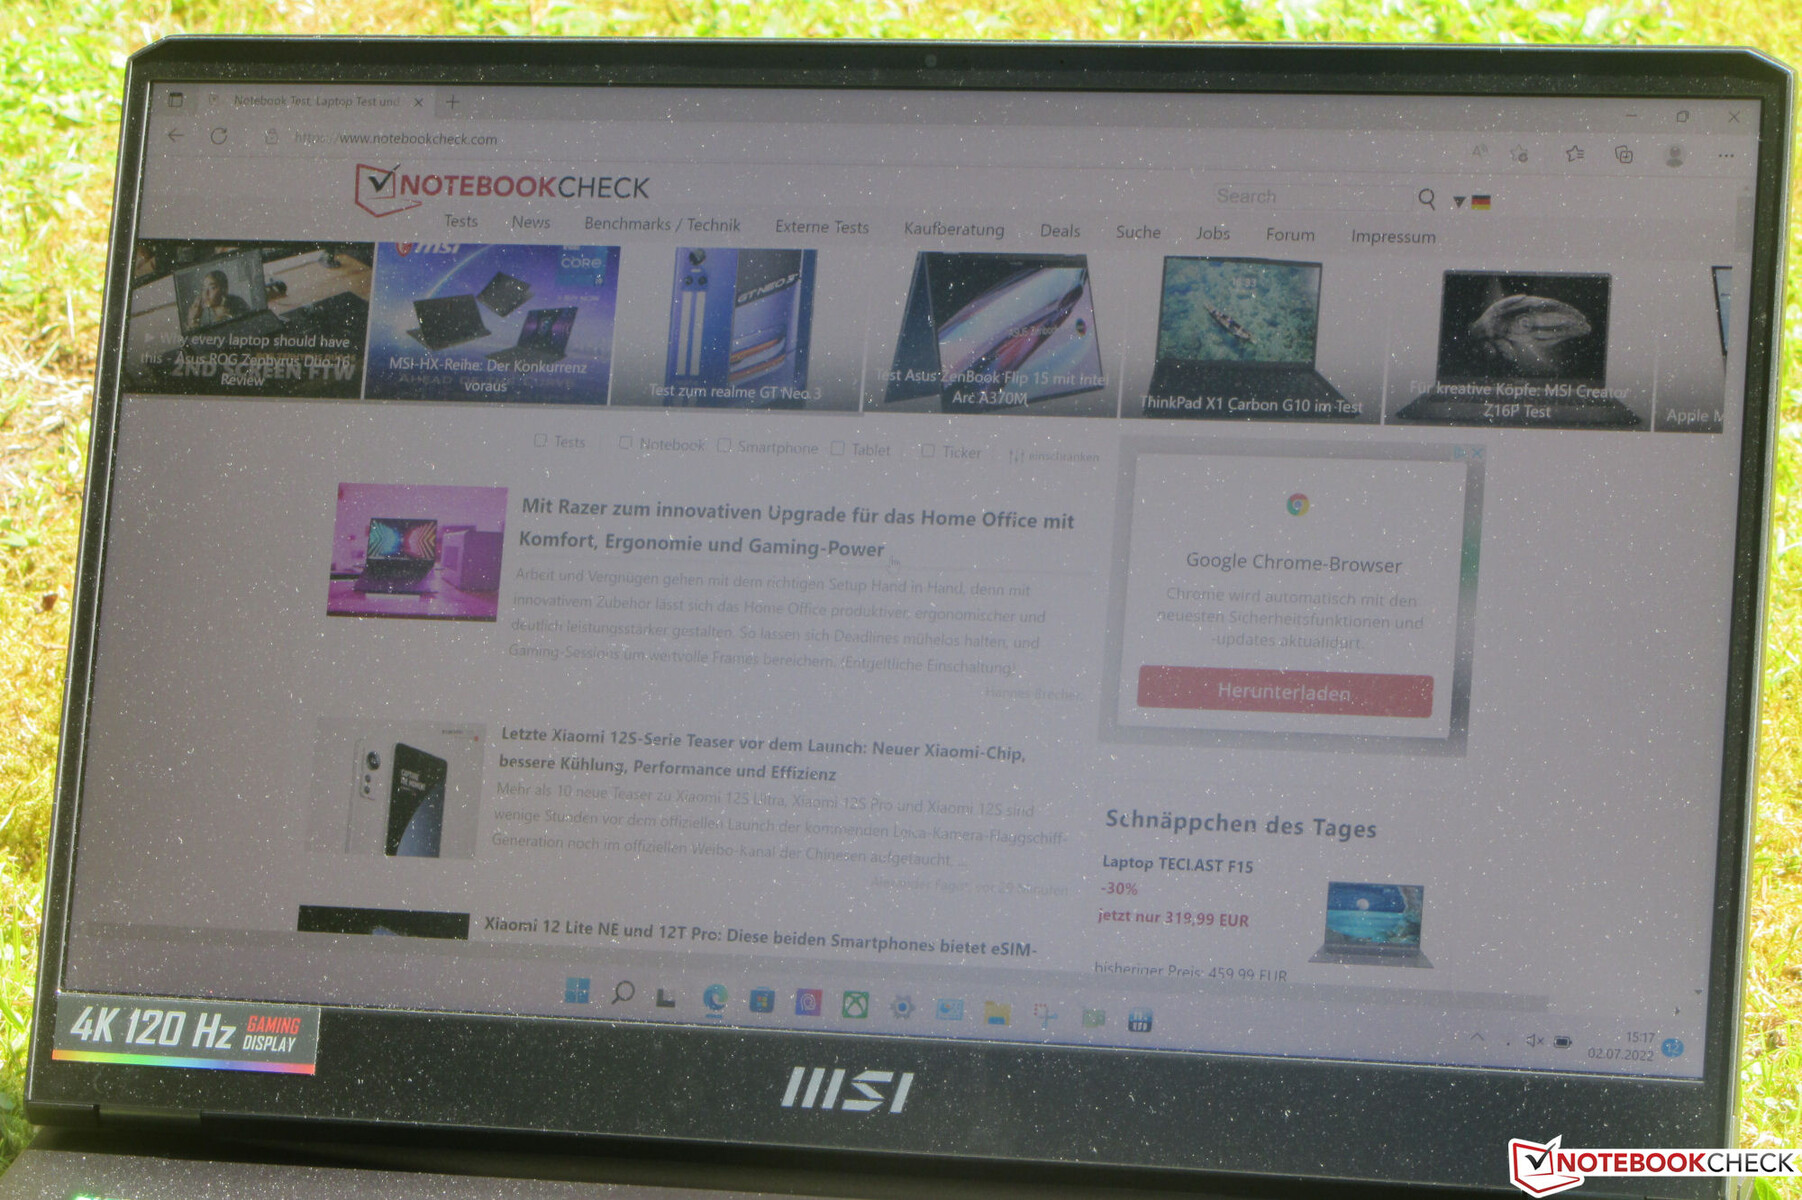
The IPS panel has good viewing angles and remains readable from any position. Outdoors, the screen content can be read provided the sun does not shine too brightly.

Performance - Ampere and Alder Lake shine
With the Raider GE77 HX 12UHS, MSI has a high-performance 17.3-inch laptop on offer that checks all the boxes for demanding scenarios.
Test Conditions
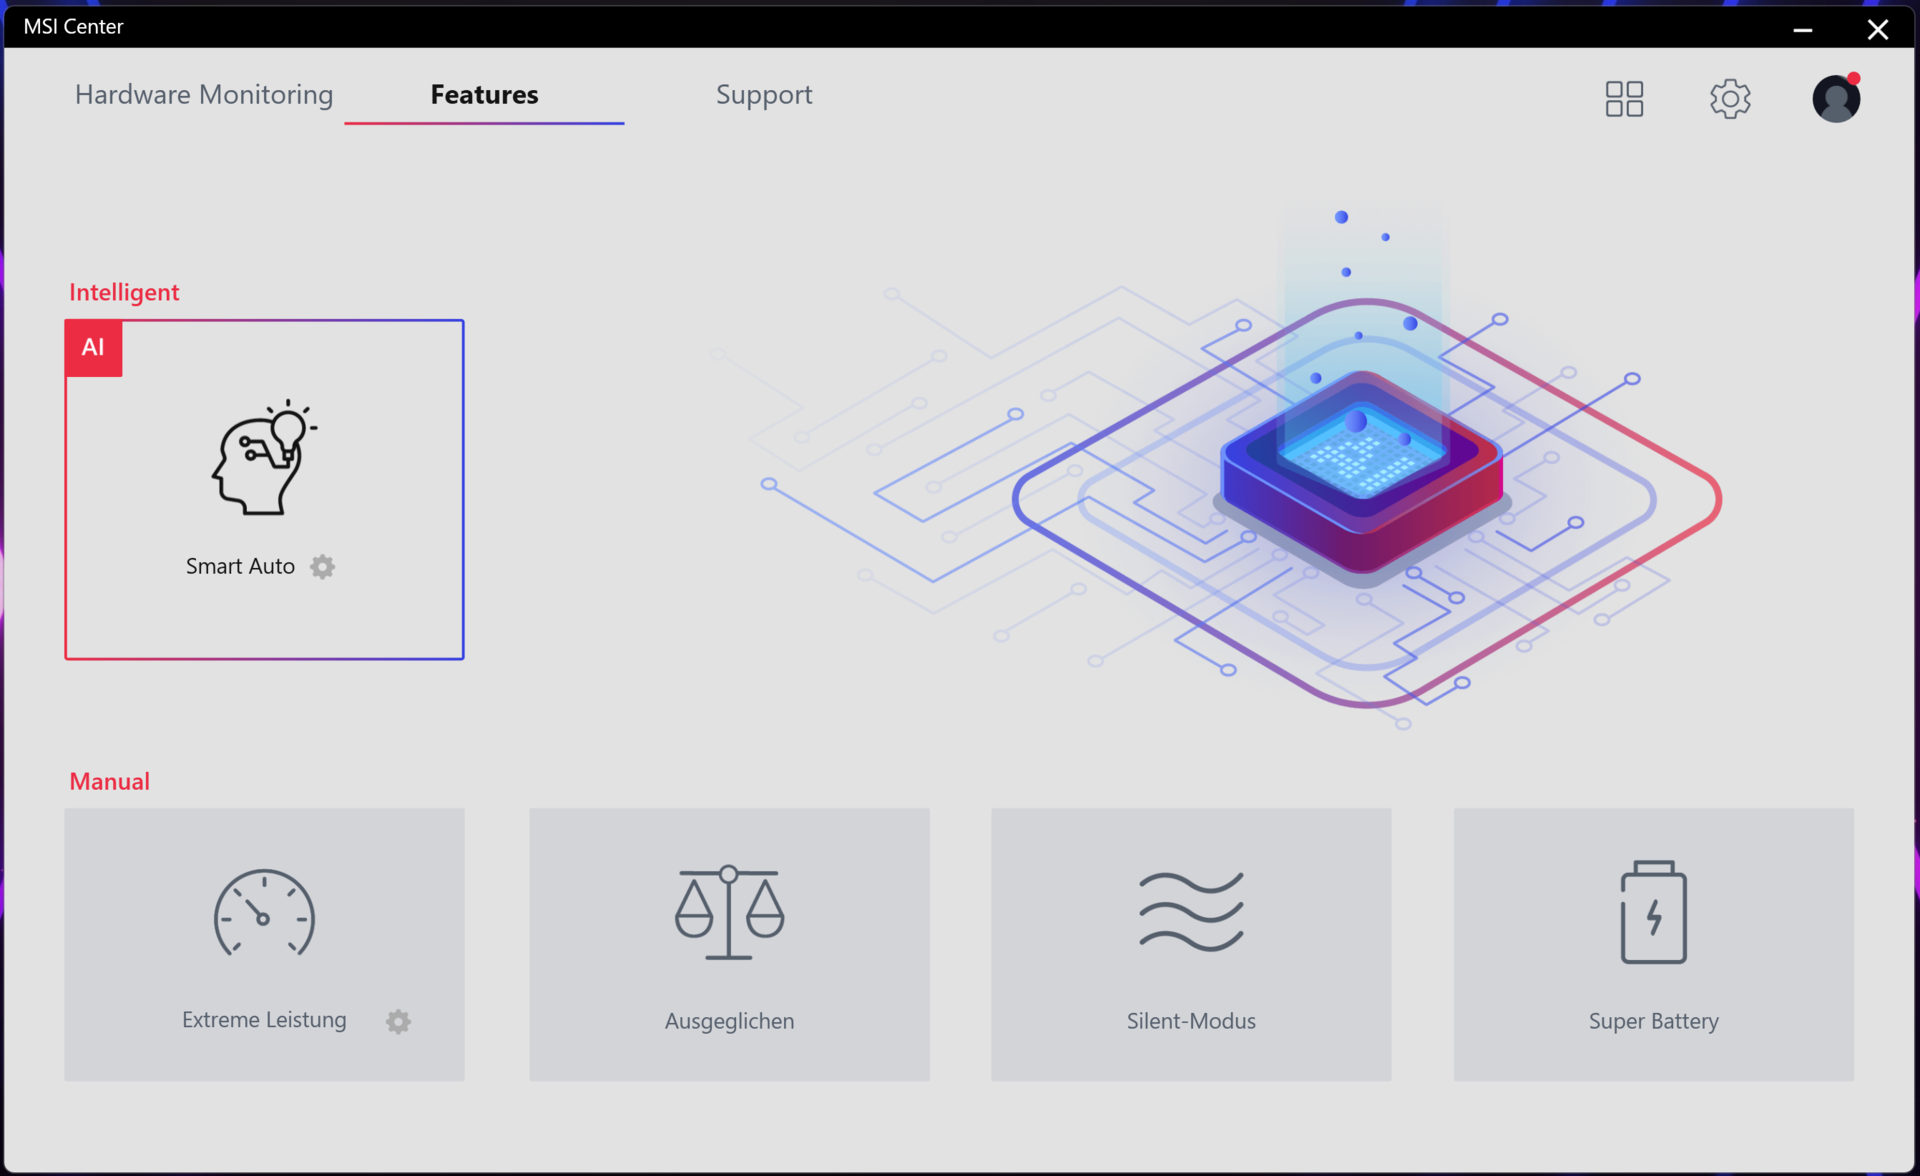
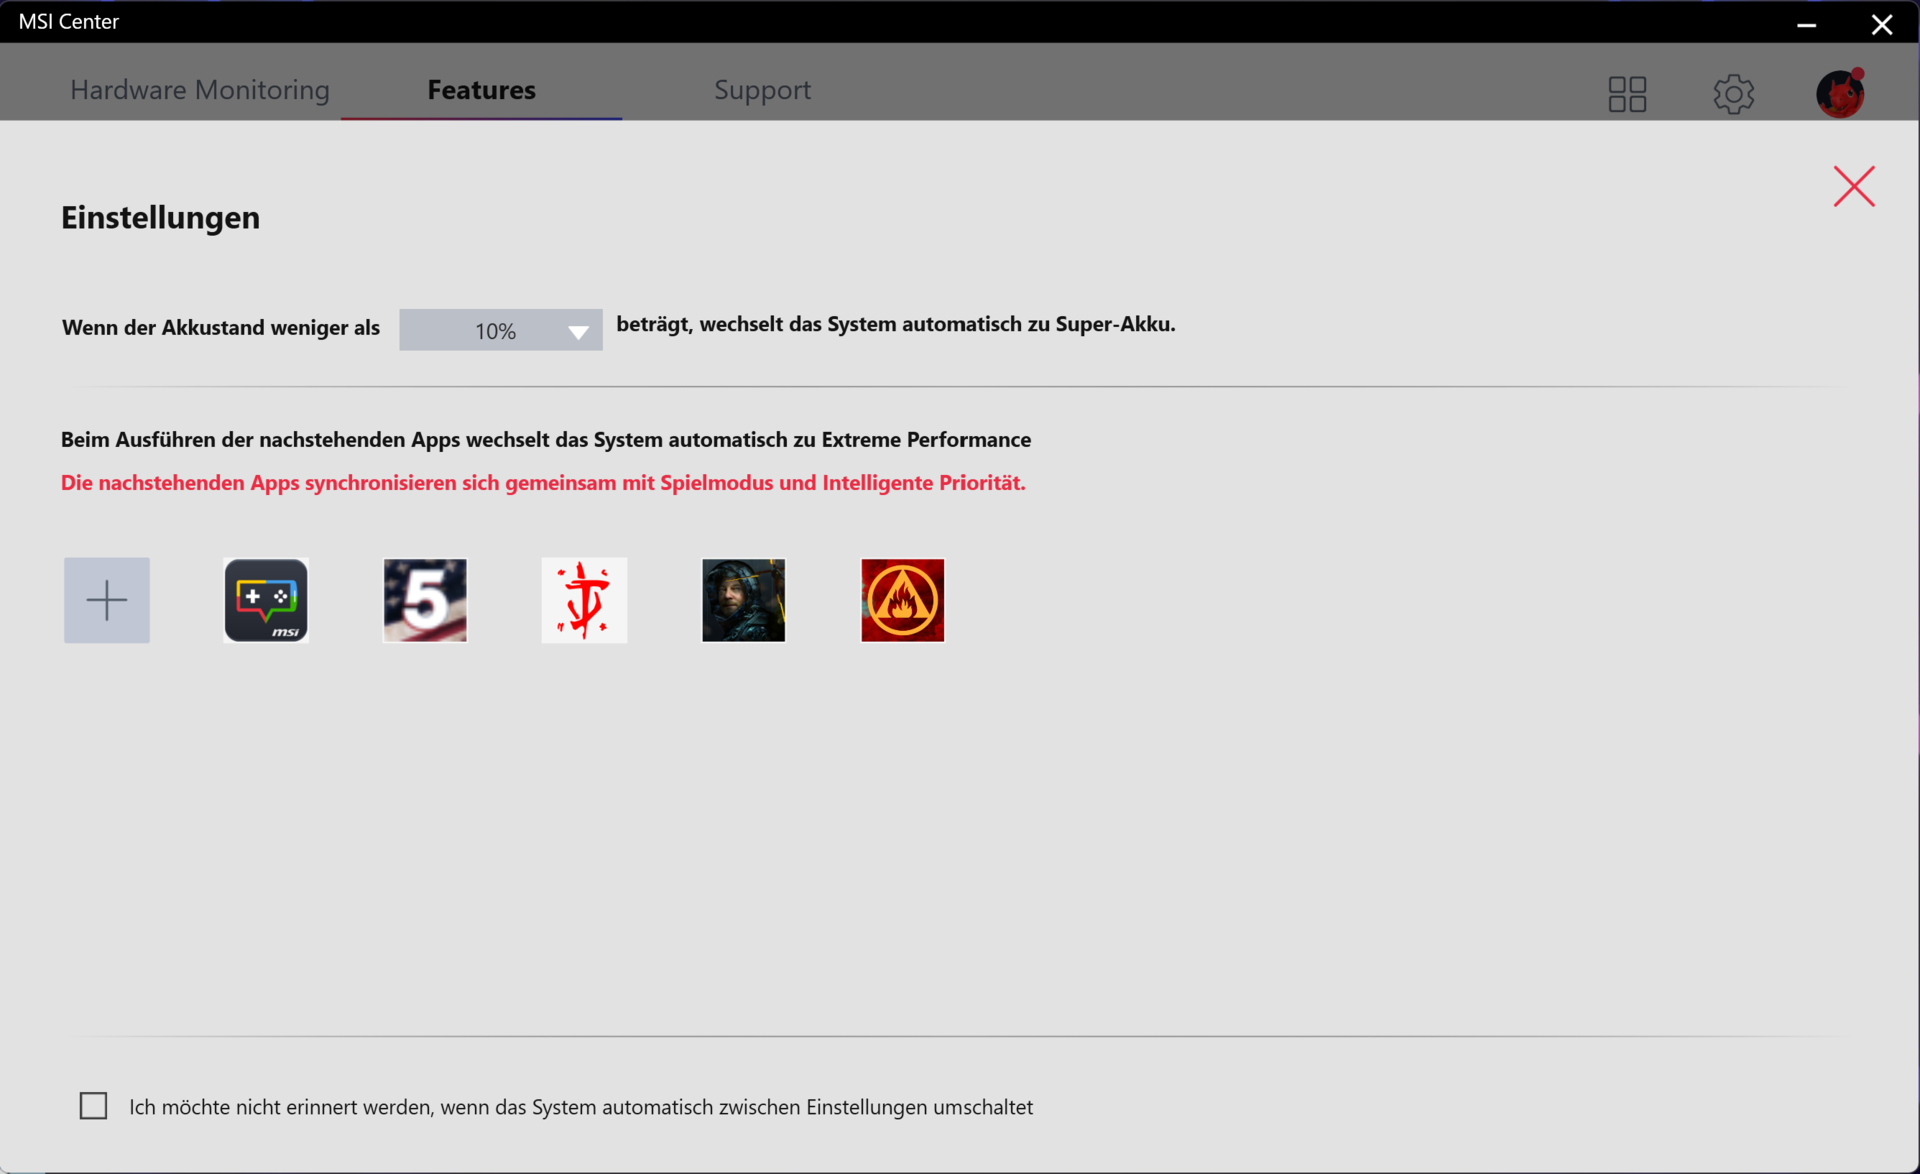
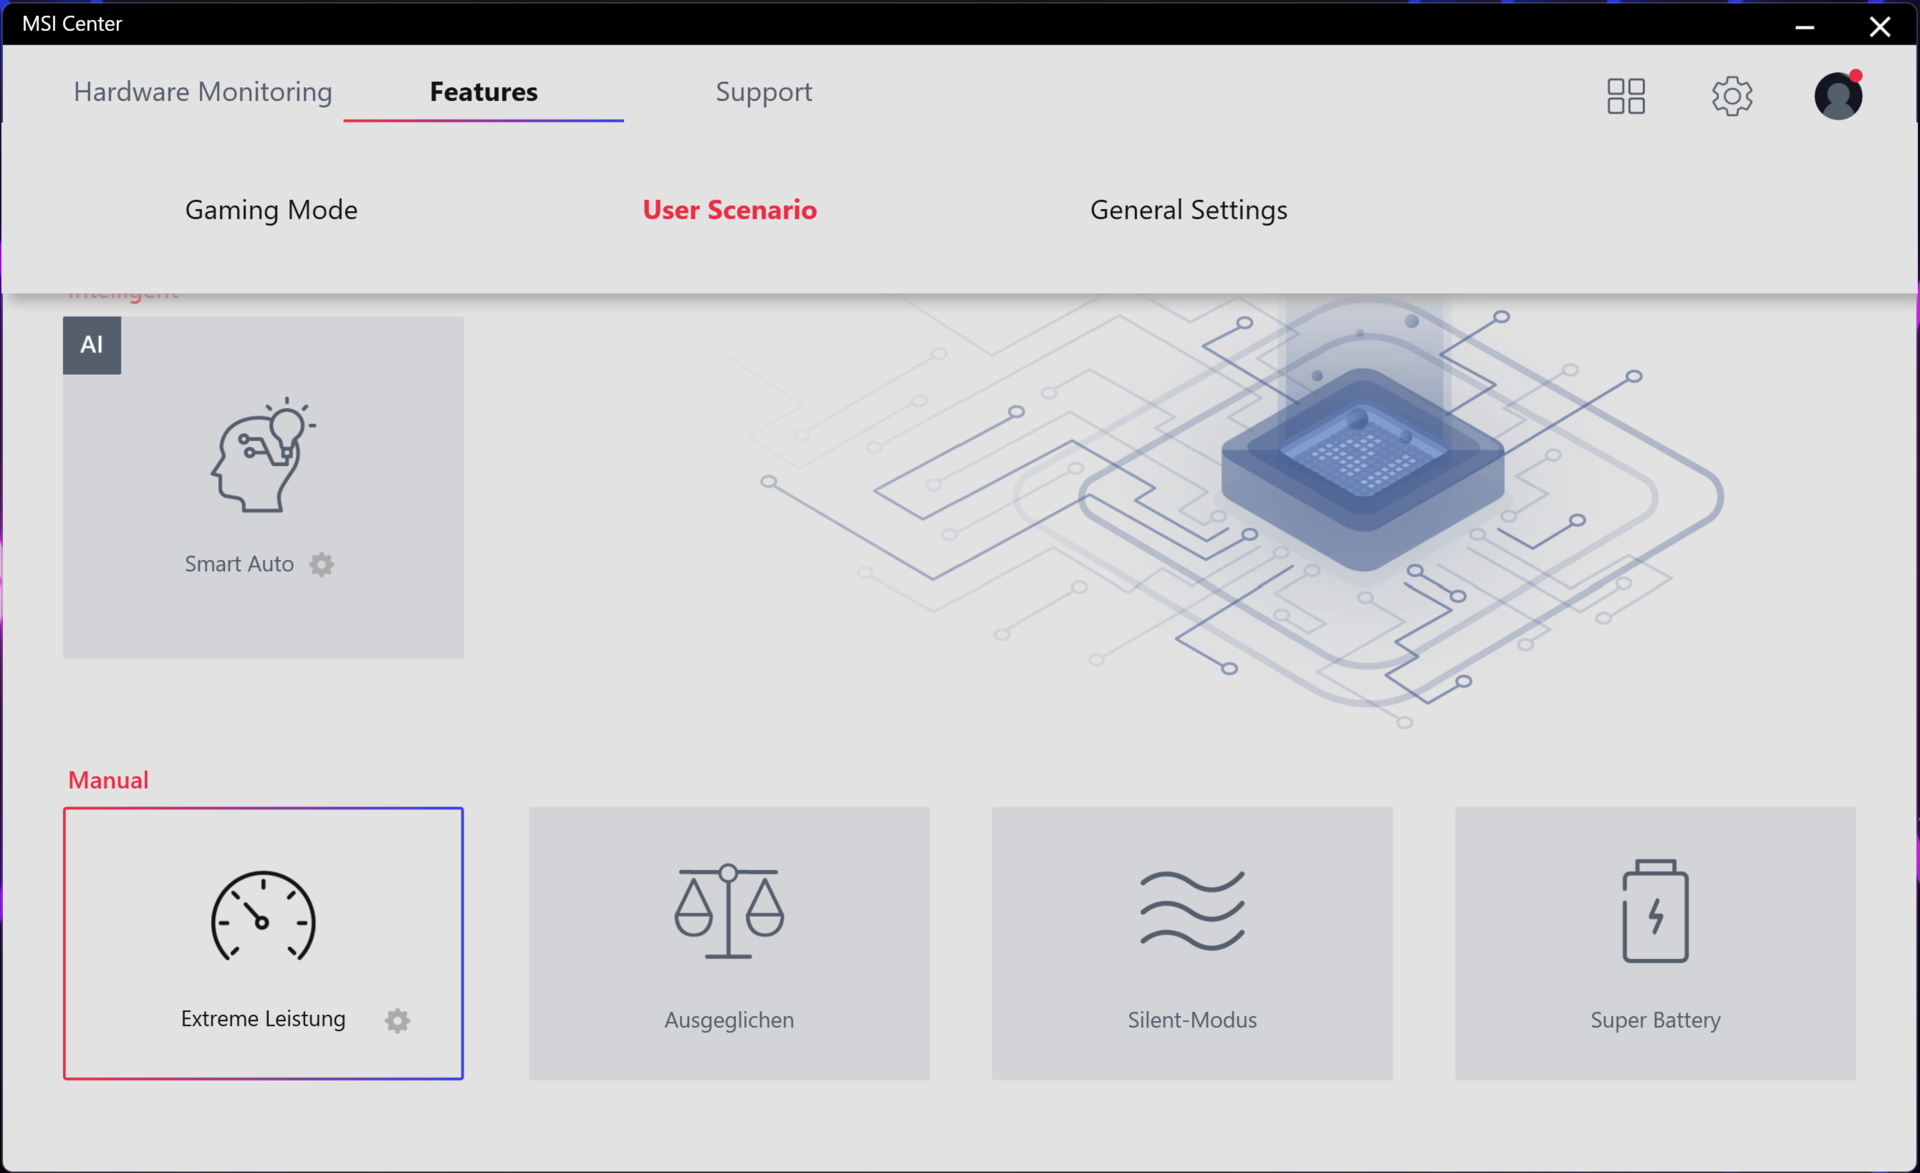
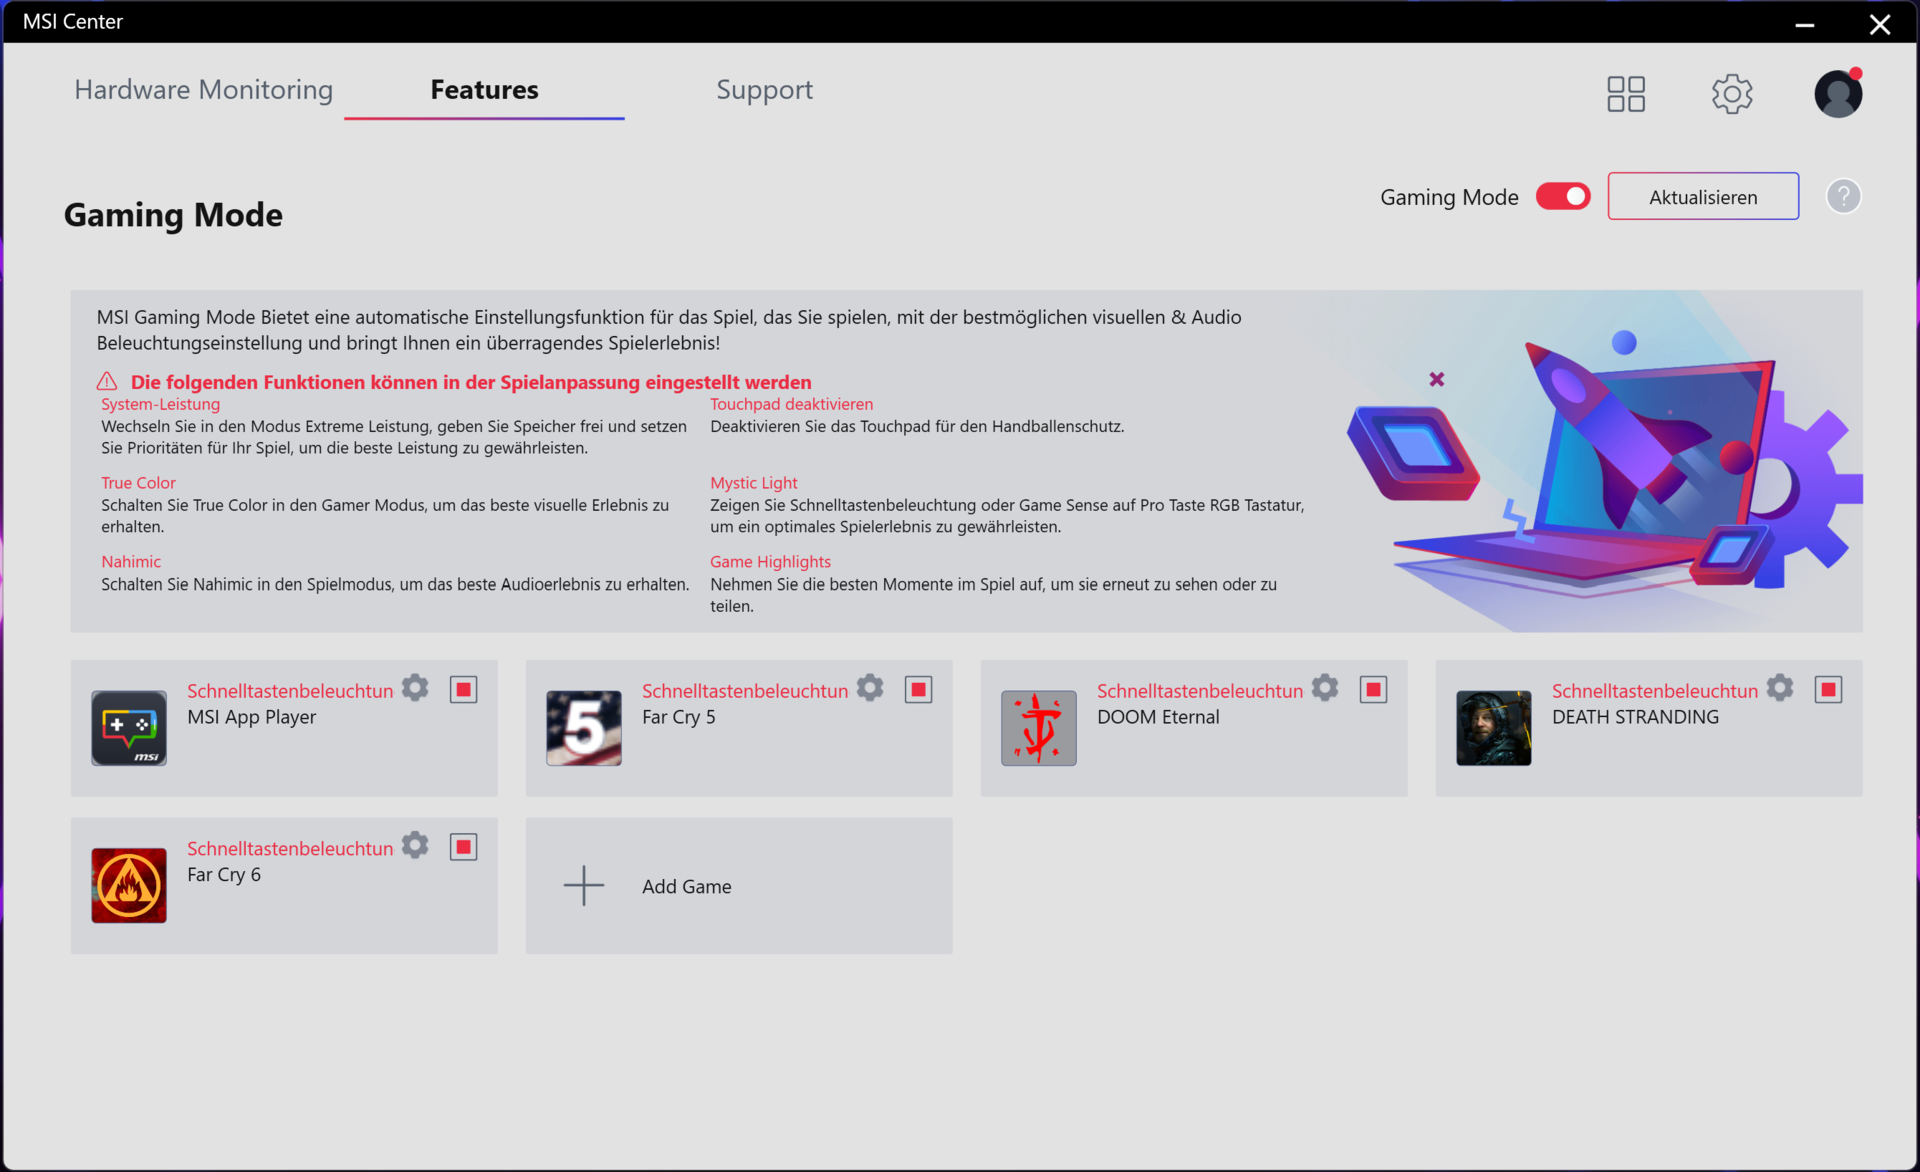
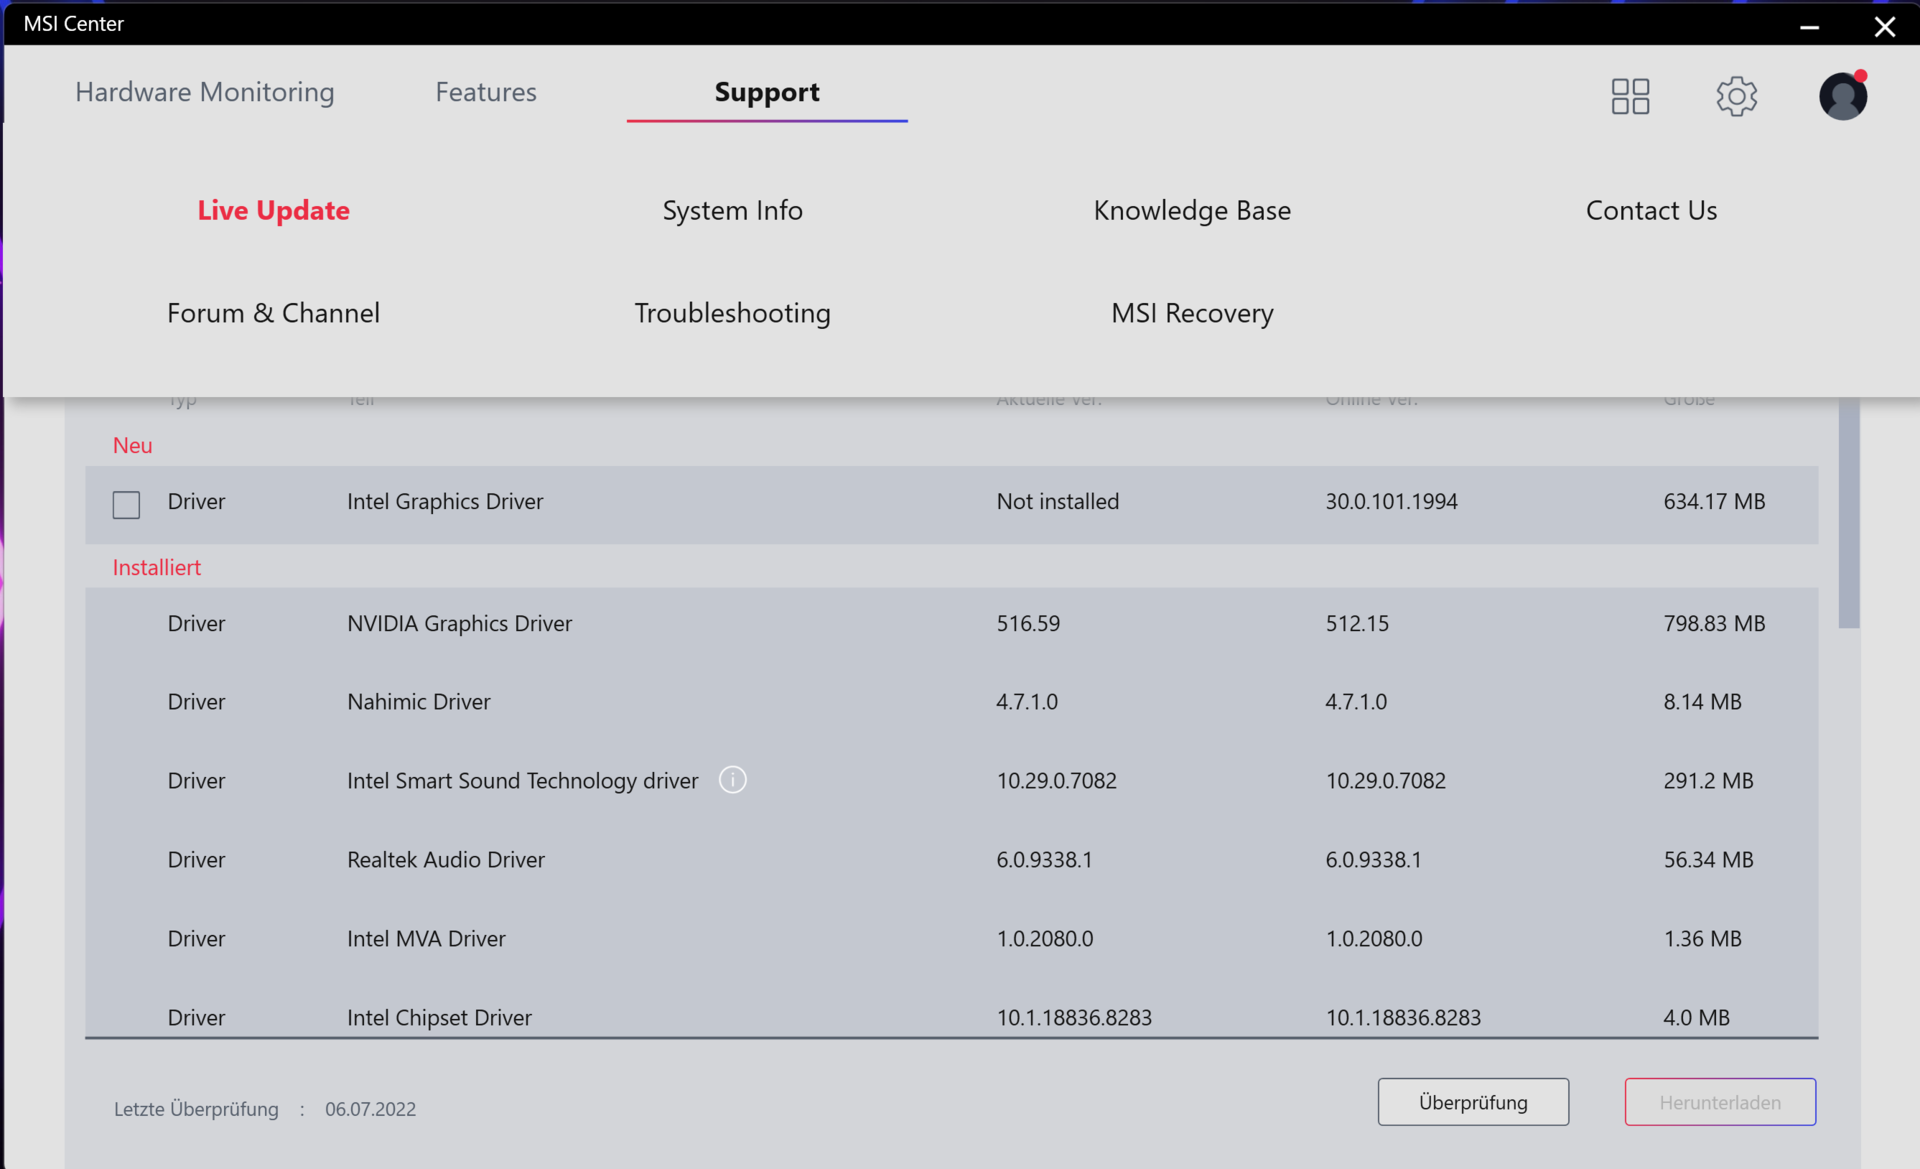
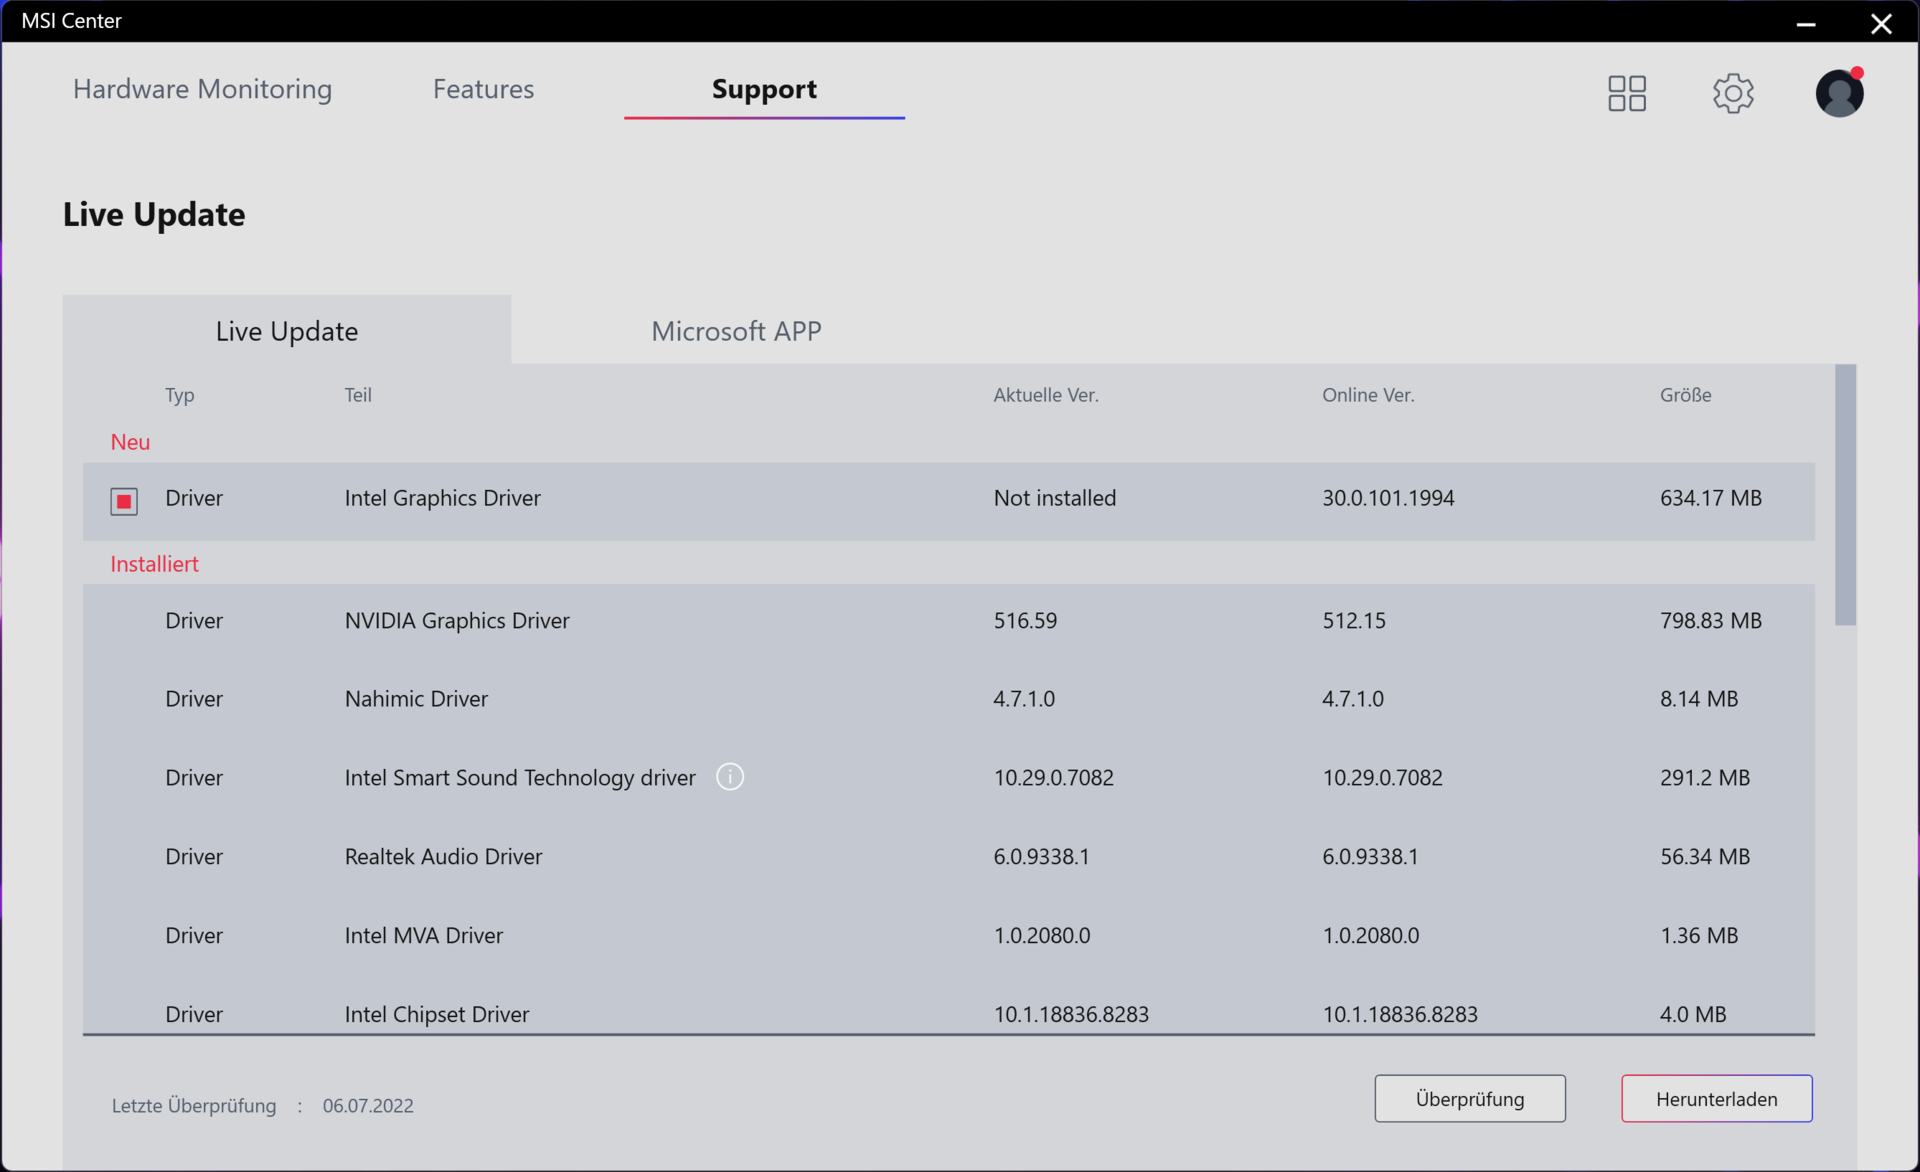
Users can manually switch between four power profiles via the preinstalled MSI Center software. When enabling - like we did - the universal, AI based "Smart Auto" function, the MSI Center automatically chooses the profile based on the current scenario. This feature also allows users to create a list of applications, which enable the "Extreme performance" profile when launched.
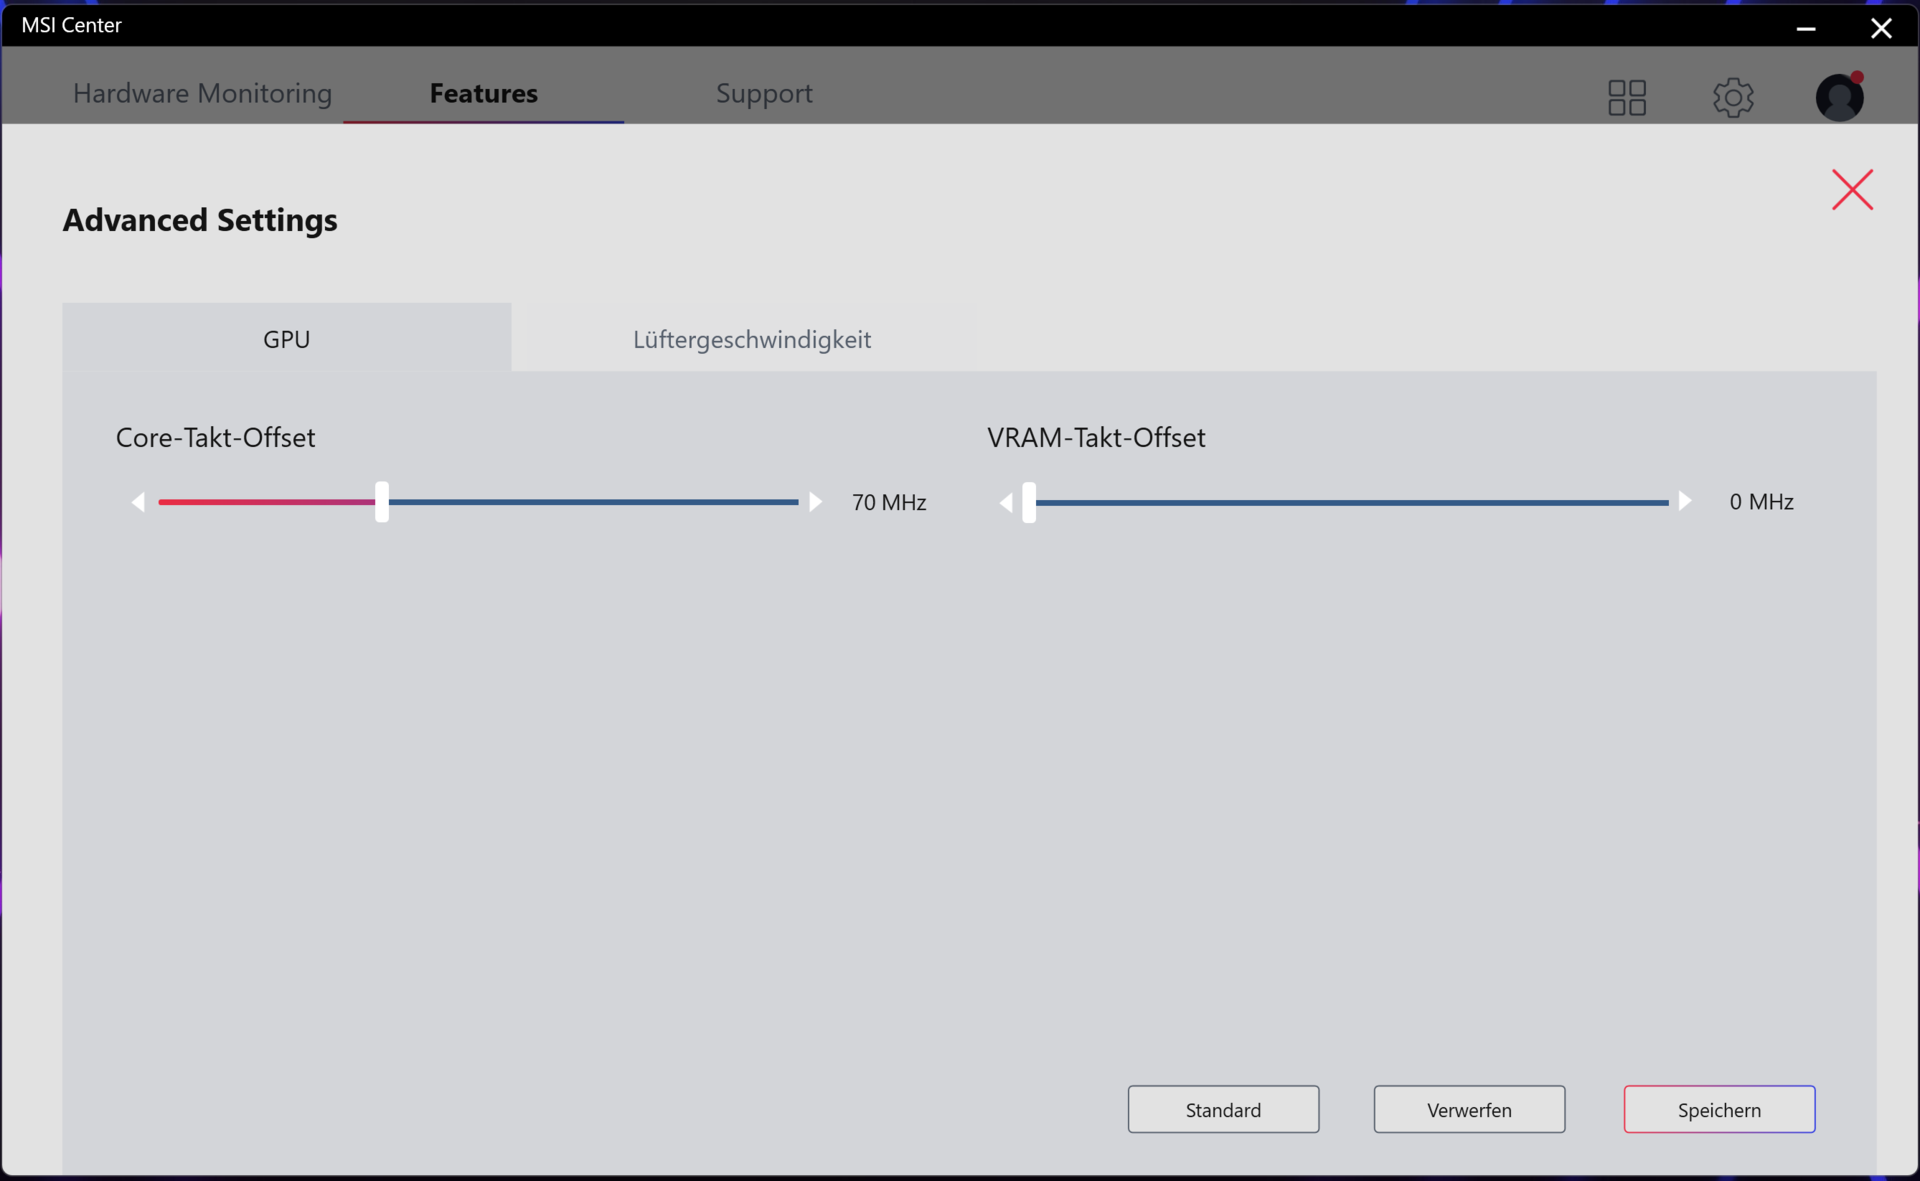
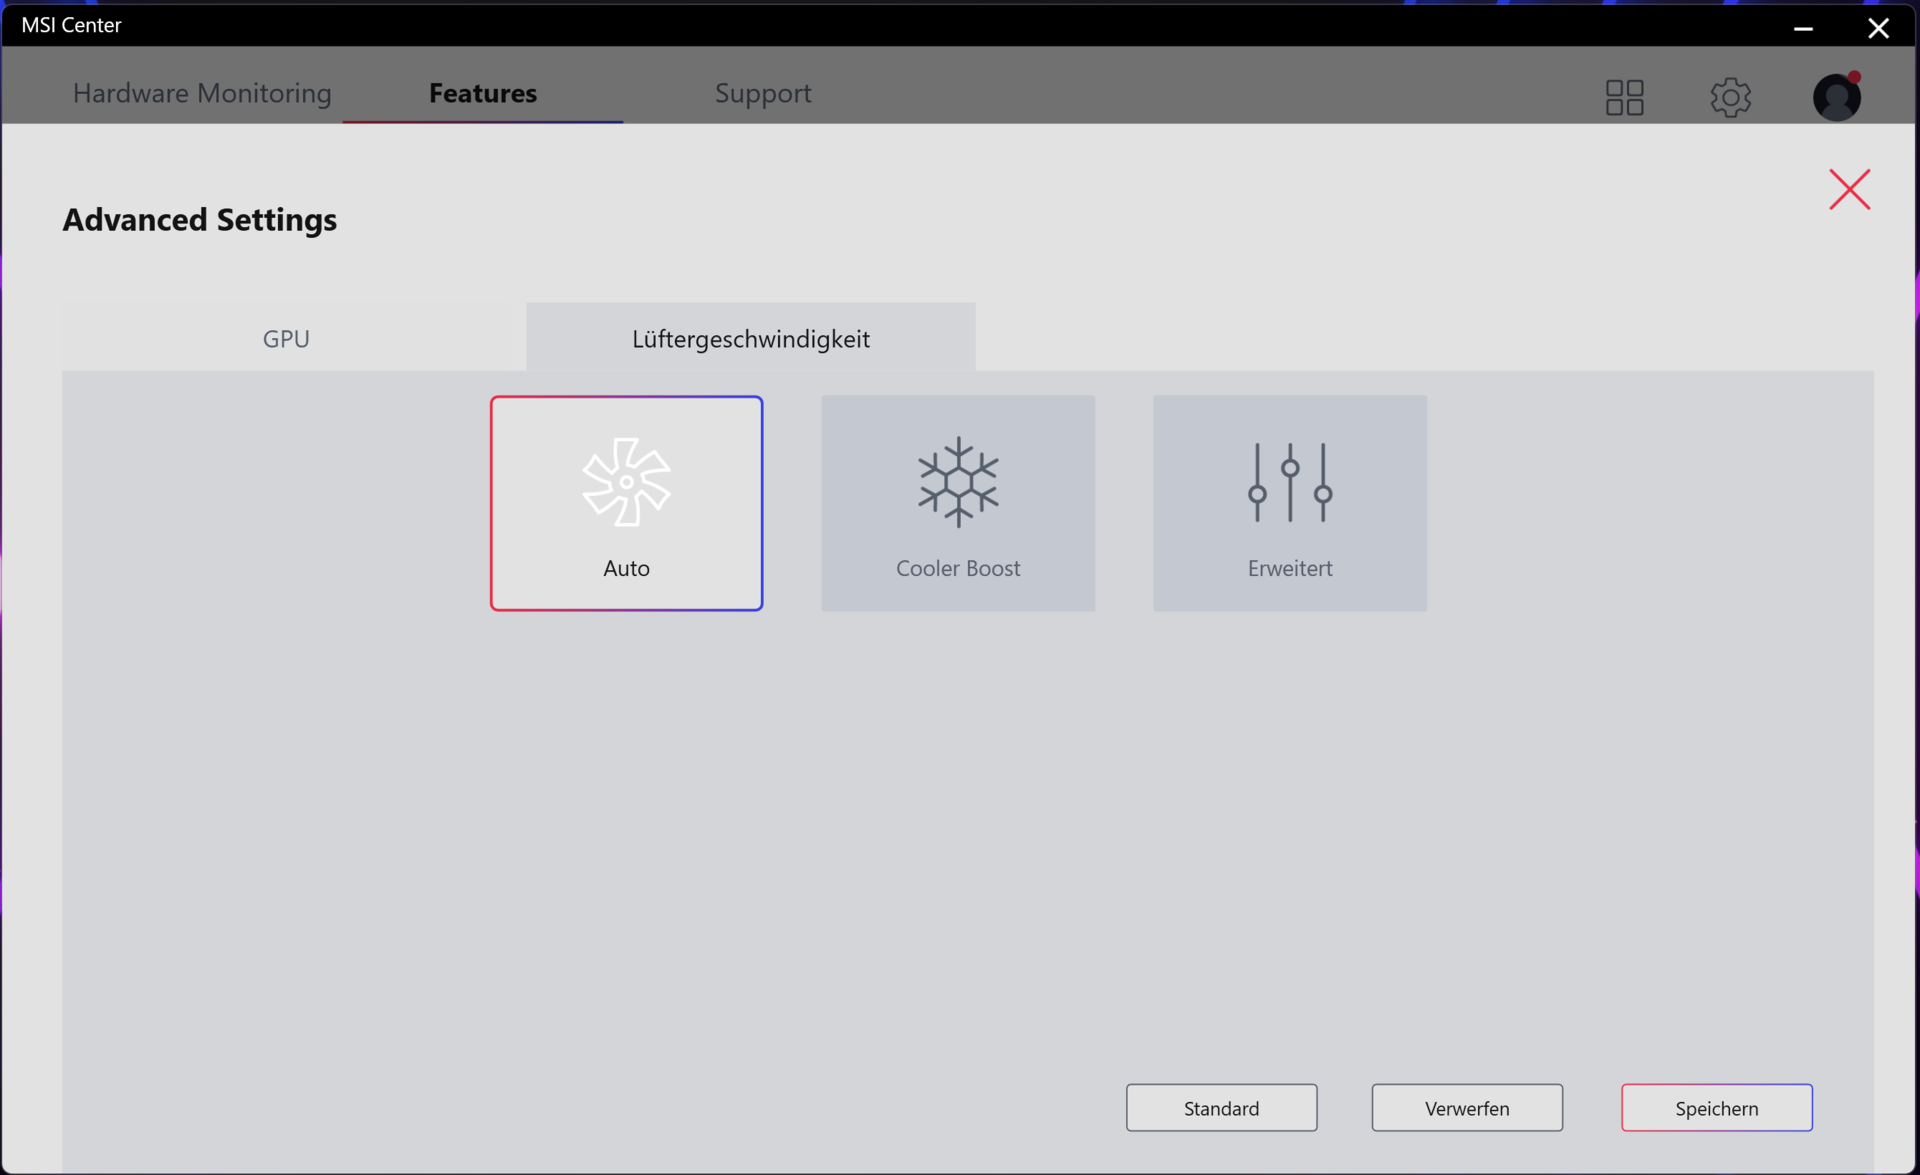
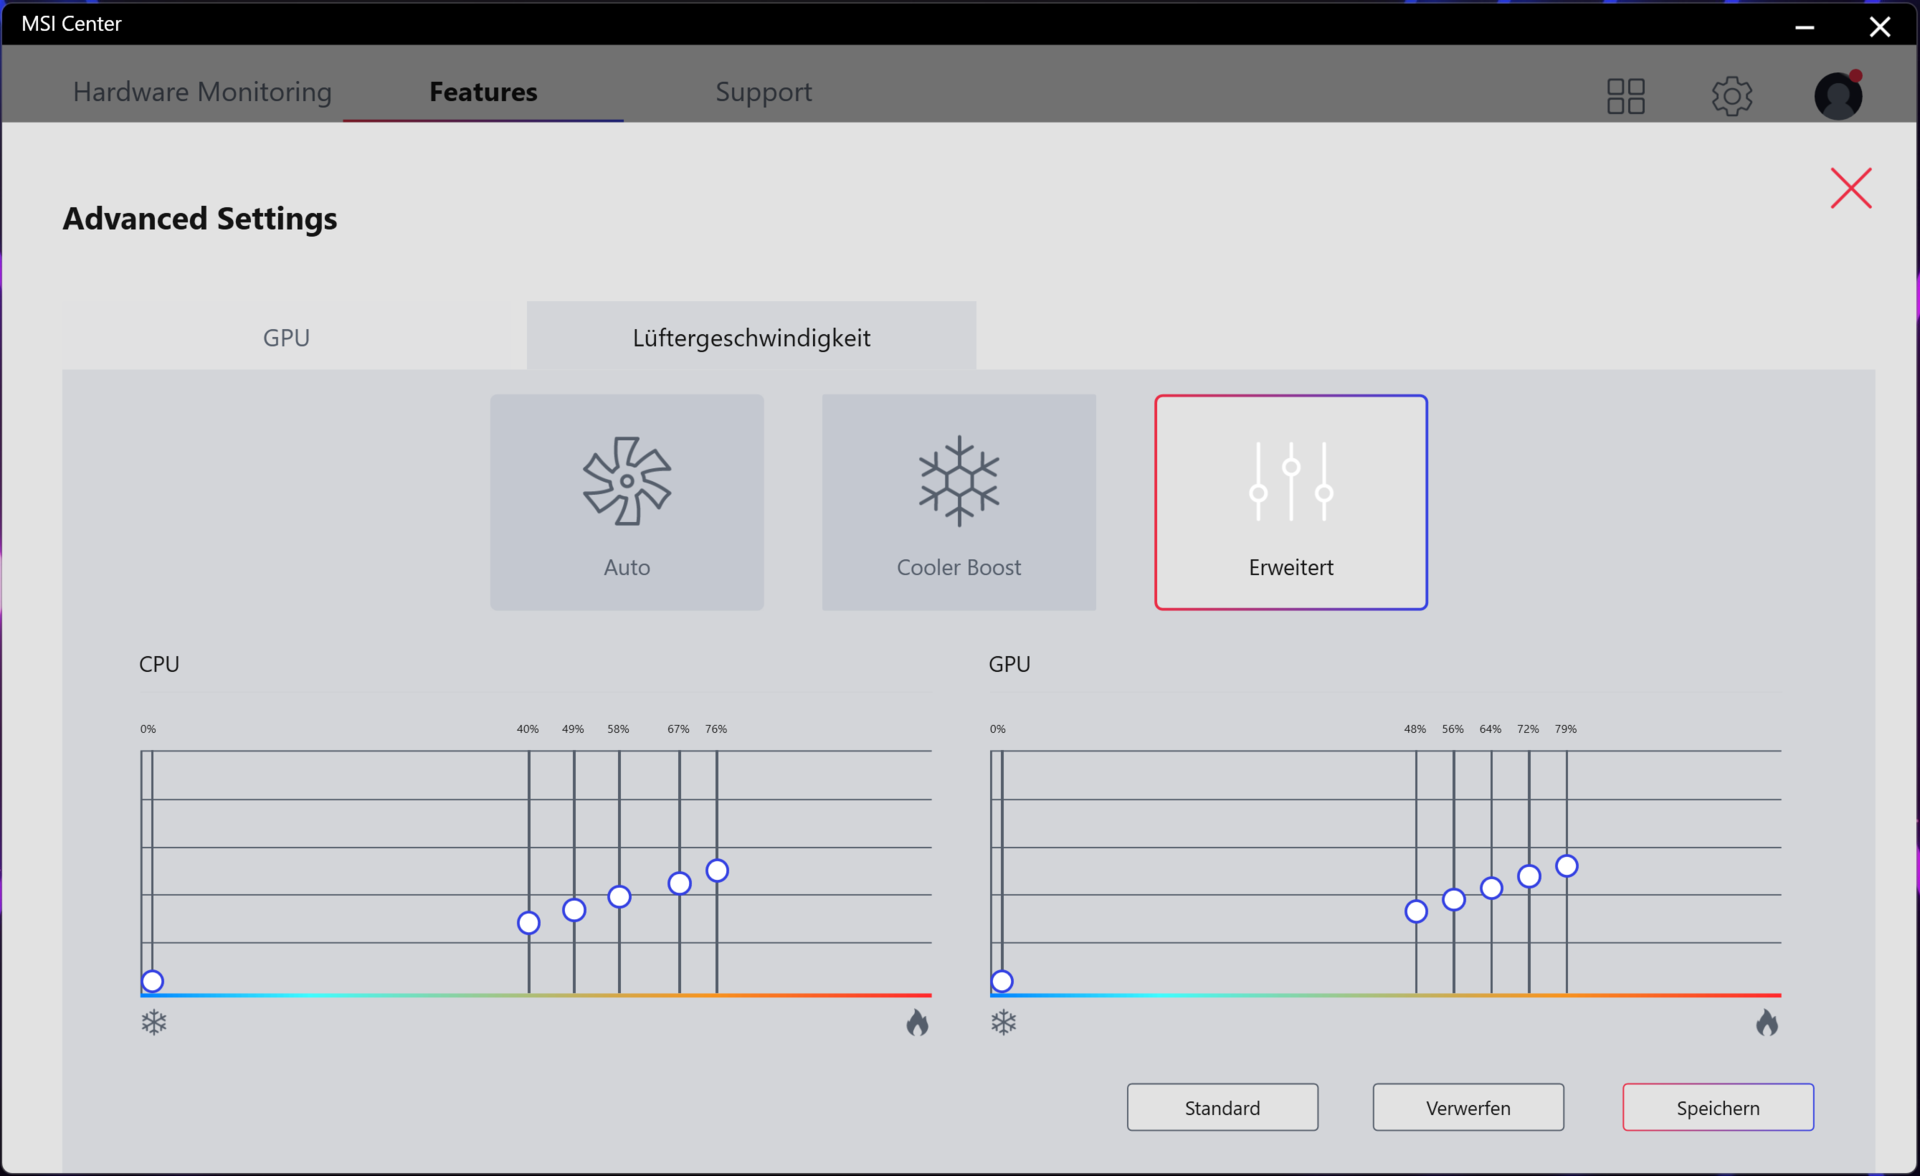
The profile "Extreme profile" offers various tuning options. It is possible to overclock the GPU and the VRAM, for example. Additionally, users have access to the fan controls. Here, the options are "Auto", "Cooler Boost" (fans run at maximum speeds), and "Advanced" (adjustable fan curves).
Bug, benchmark optimization, or useful feature? Running through our benchmark suite produces somewhat curious results when using the "Silent mode": Launching certain benchmarks causes the MSI Center to automatically switch to the "Extreme performance" profile. This was the case for the Cinebench benchmarks and the AIDA64 benchmarks.
| Extreme performance | Balanced | Silent mode | Super battery | |
|---|---|---|---|---|
| Power Limit 1 | 115 watts | 110 watts | 30 watts | 15 watts |
| Power Limit 2 | 180 watts | 150 watts | 30 watts | 15 watts |
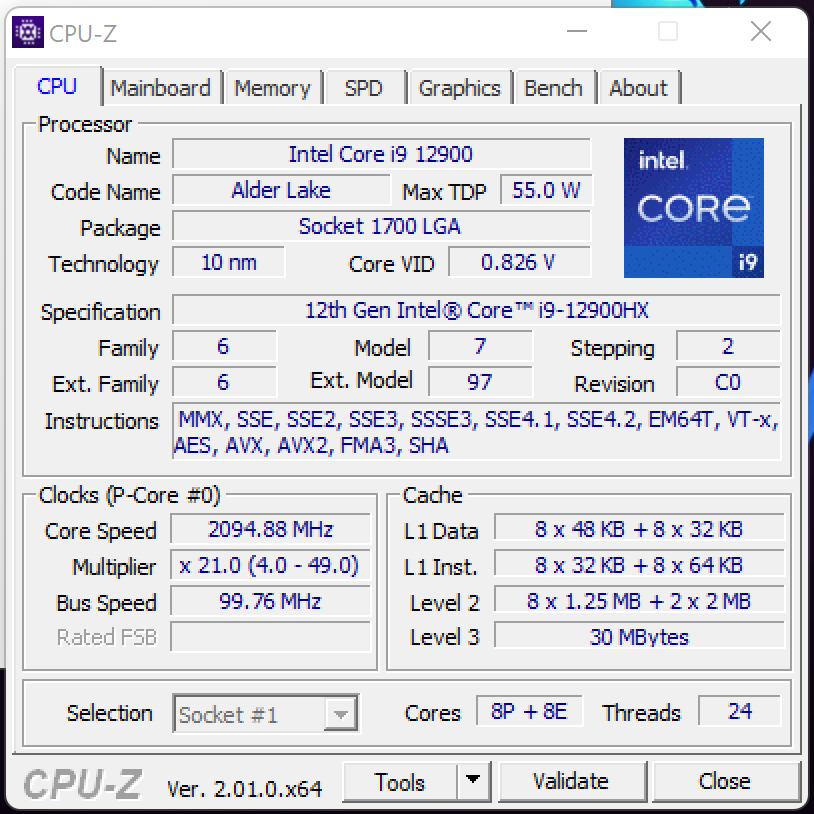
Processor
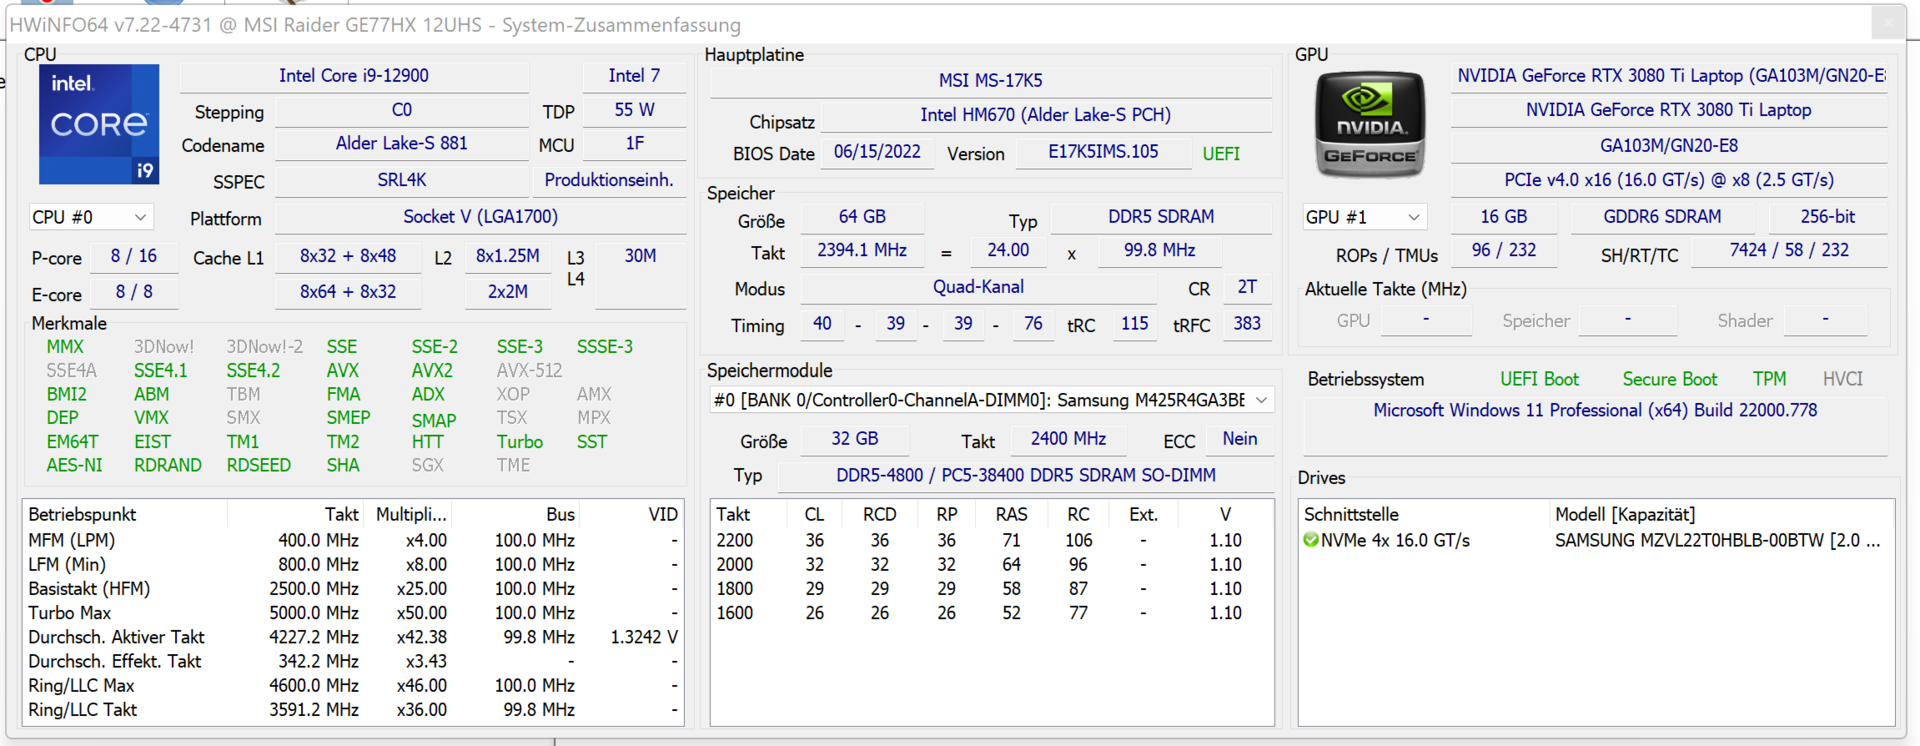
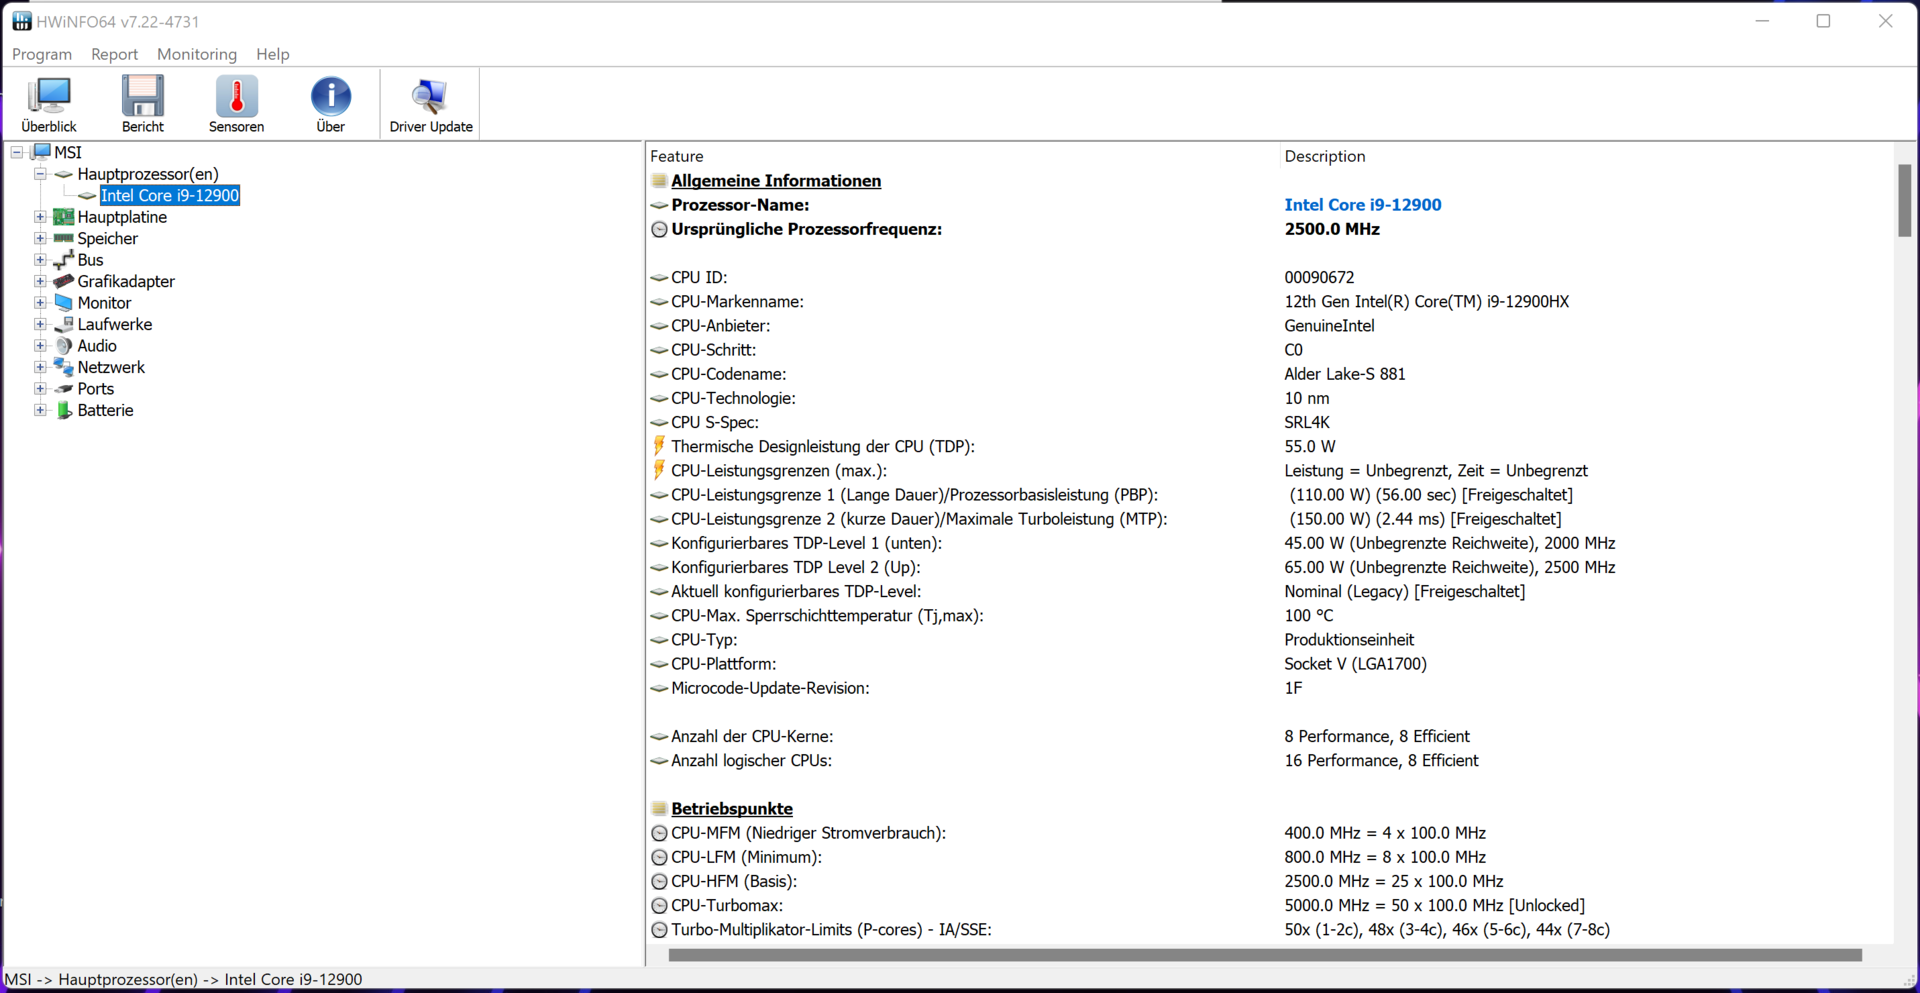
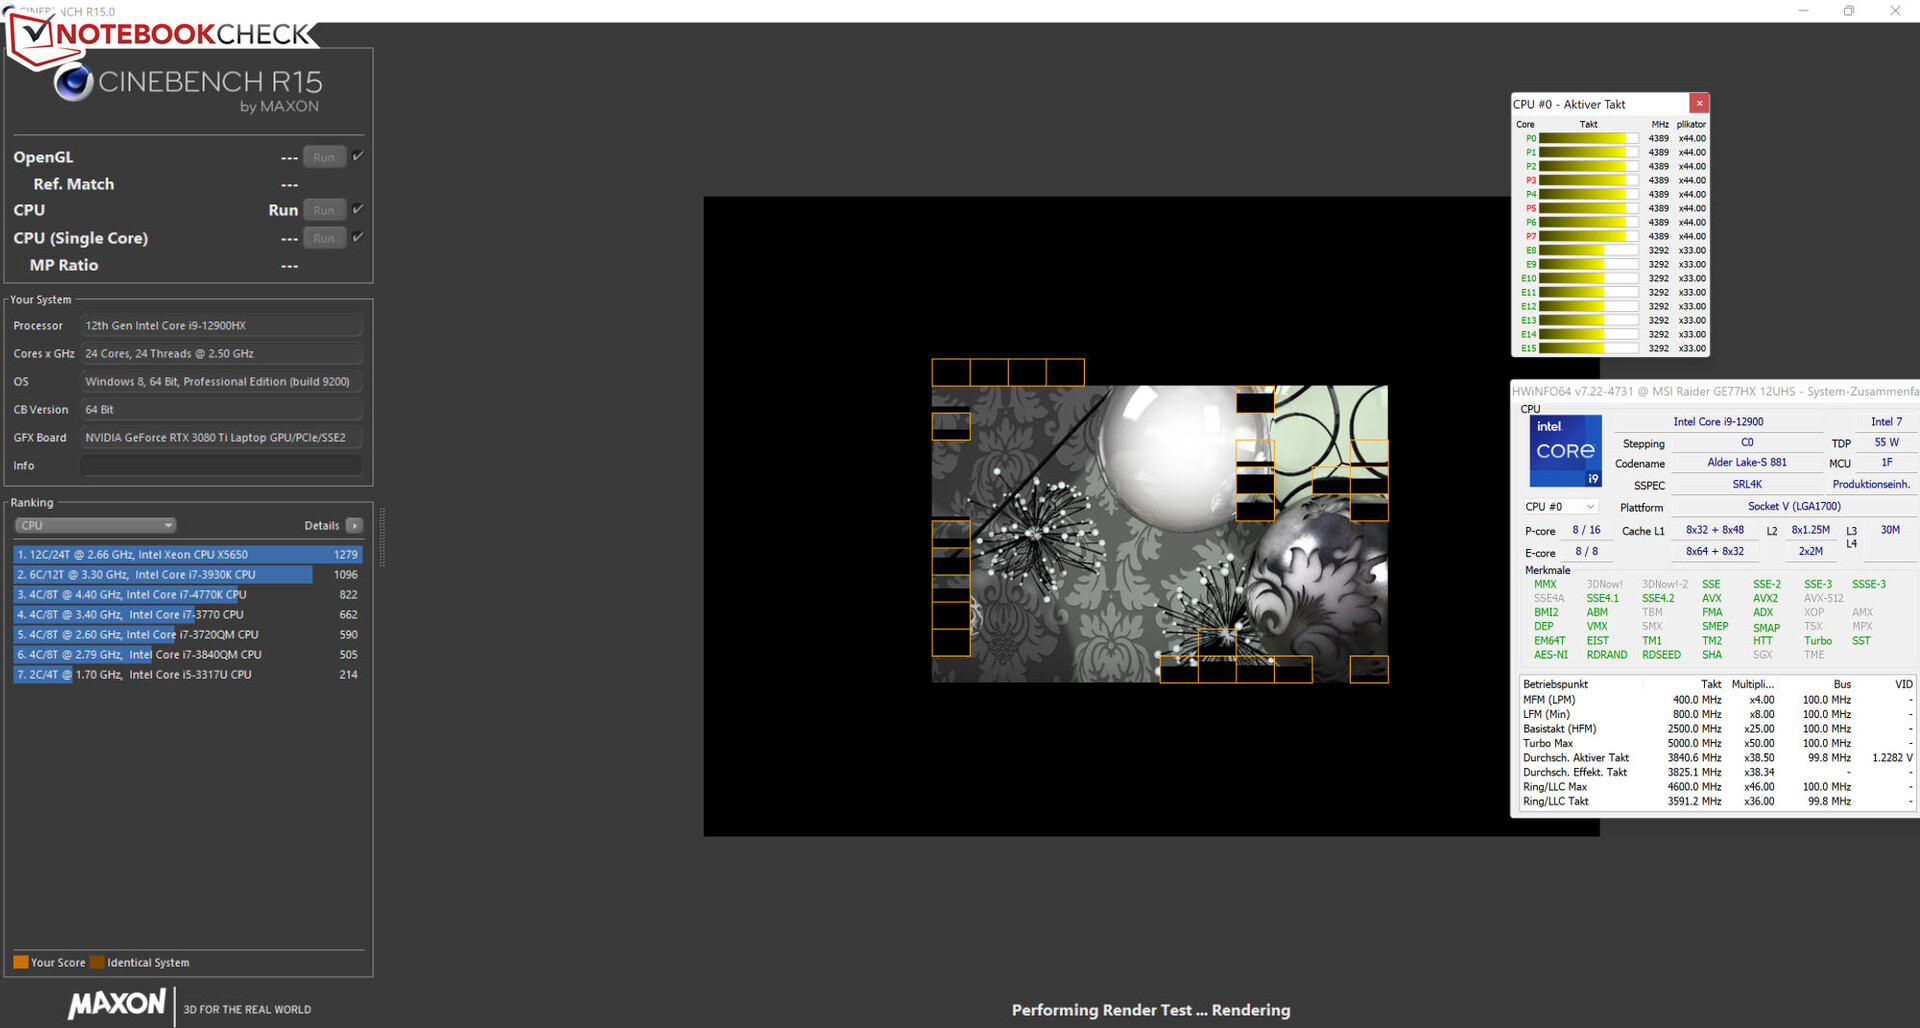
The Core i7-12900HX processor (Alder Lake) consists of eight performance cores (Hyper-threading, 2.3 to 5 GHz) and eight efficiency cores (no Hyper-threading, 1.7 to 3.6 GHz). In total, there are 24 logical CPU cores.
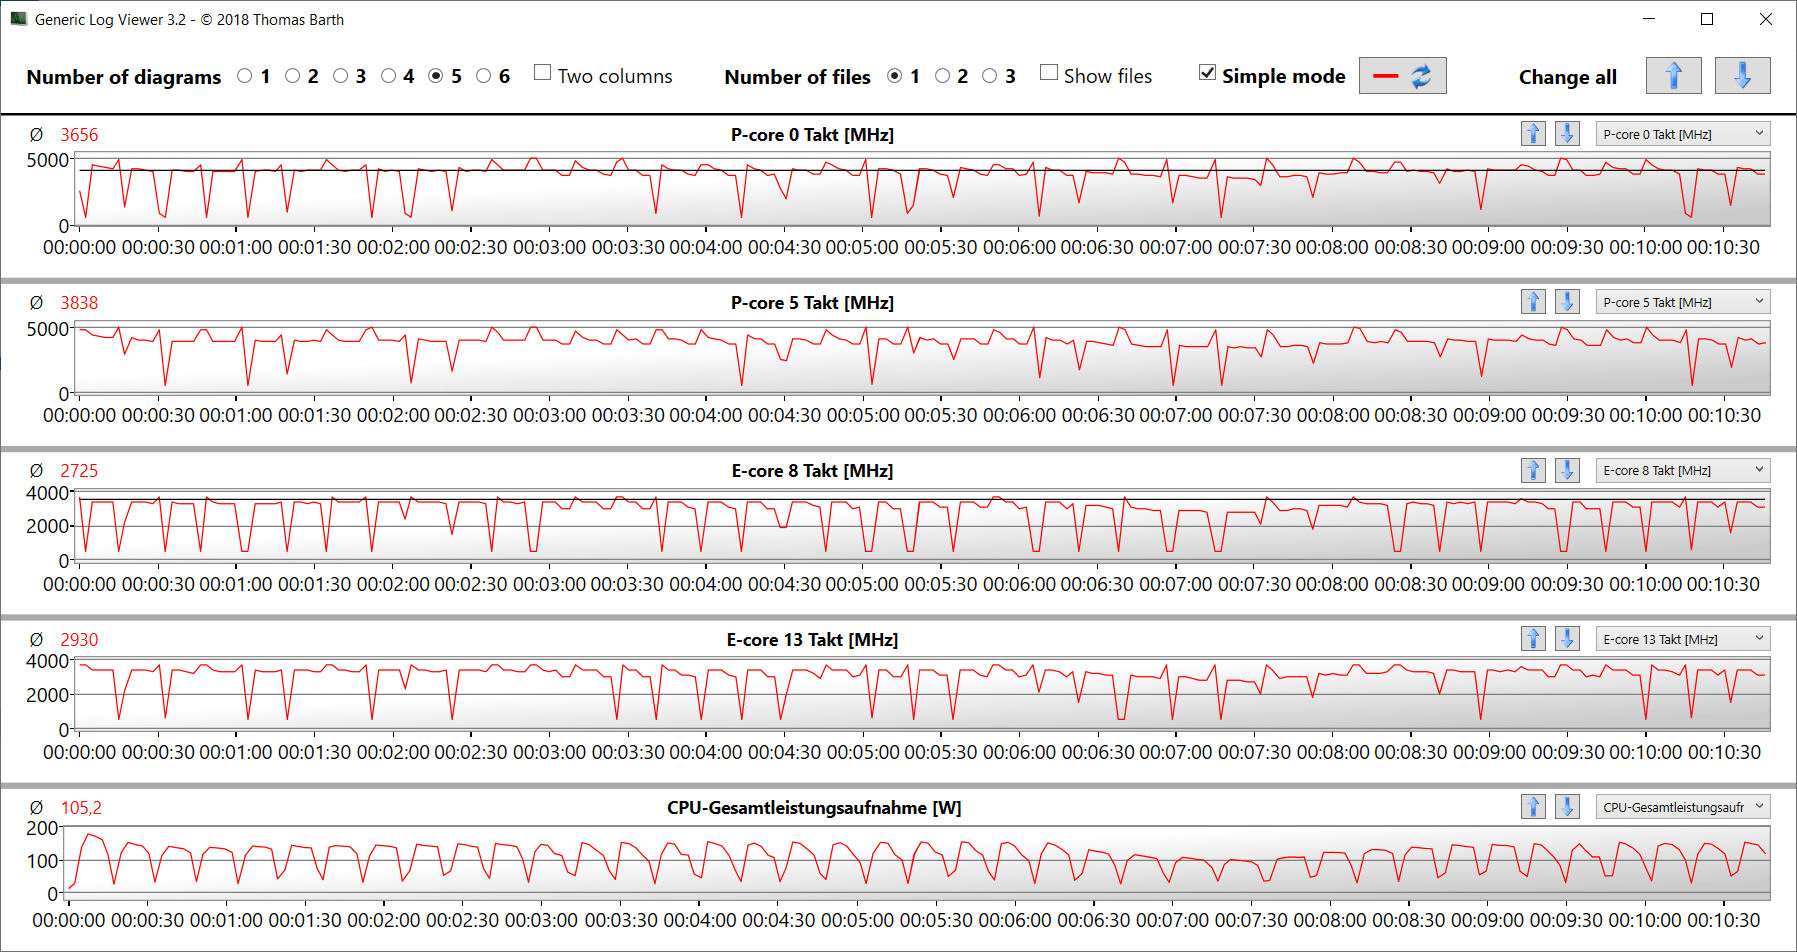
The clock speeds remain high throughout the Cinebench R15 Multi benchmark (P cores: 4.4 to 4.5 GHz, E cores: 3.3 to 3.4 GHz) and the single-thread test (P cores: 500 MHz to 5 GHz, E cores: 400 MHz to 3.6 GHz). In battery mode, the single-thread clock rates are similar (P cores: 400 MHz to 4.8 GHz, E cores: 400 MHz to 3.6 GHz), whereas the multi-thread clock speeds (P cores: 1.7 to 2.6 GHz, E cores: 1.4 to 2 GHz) are not.
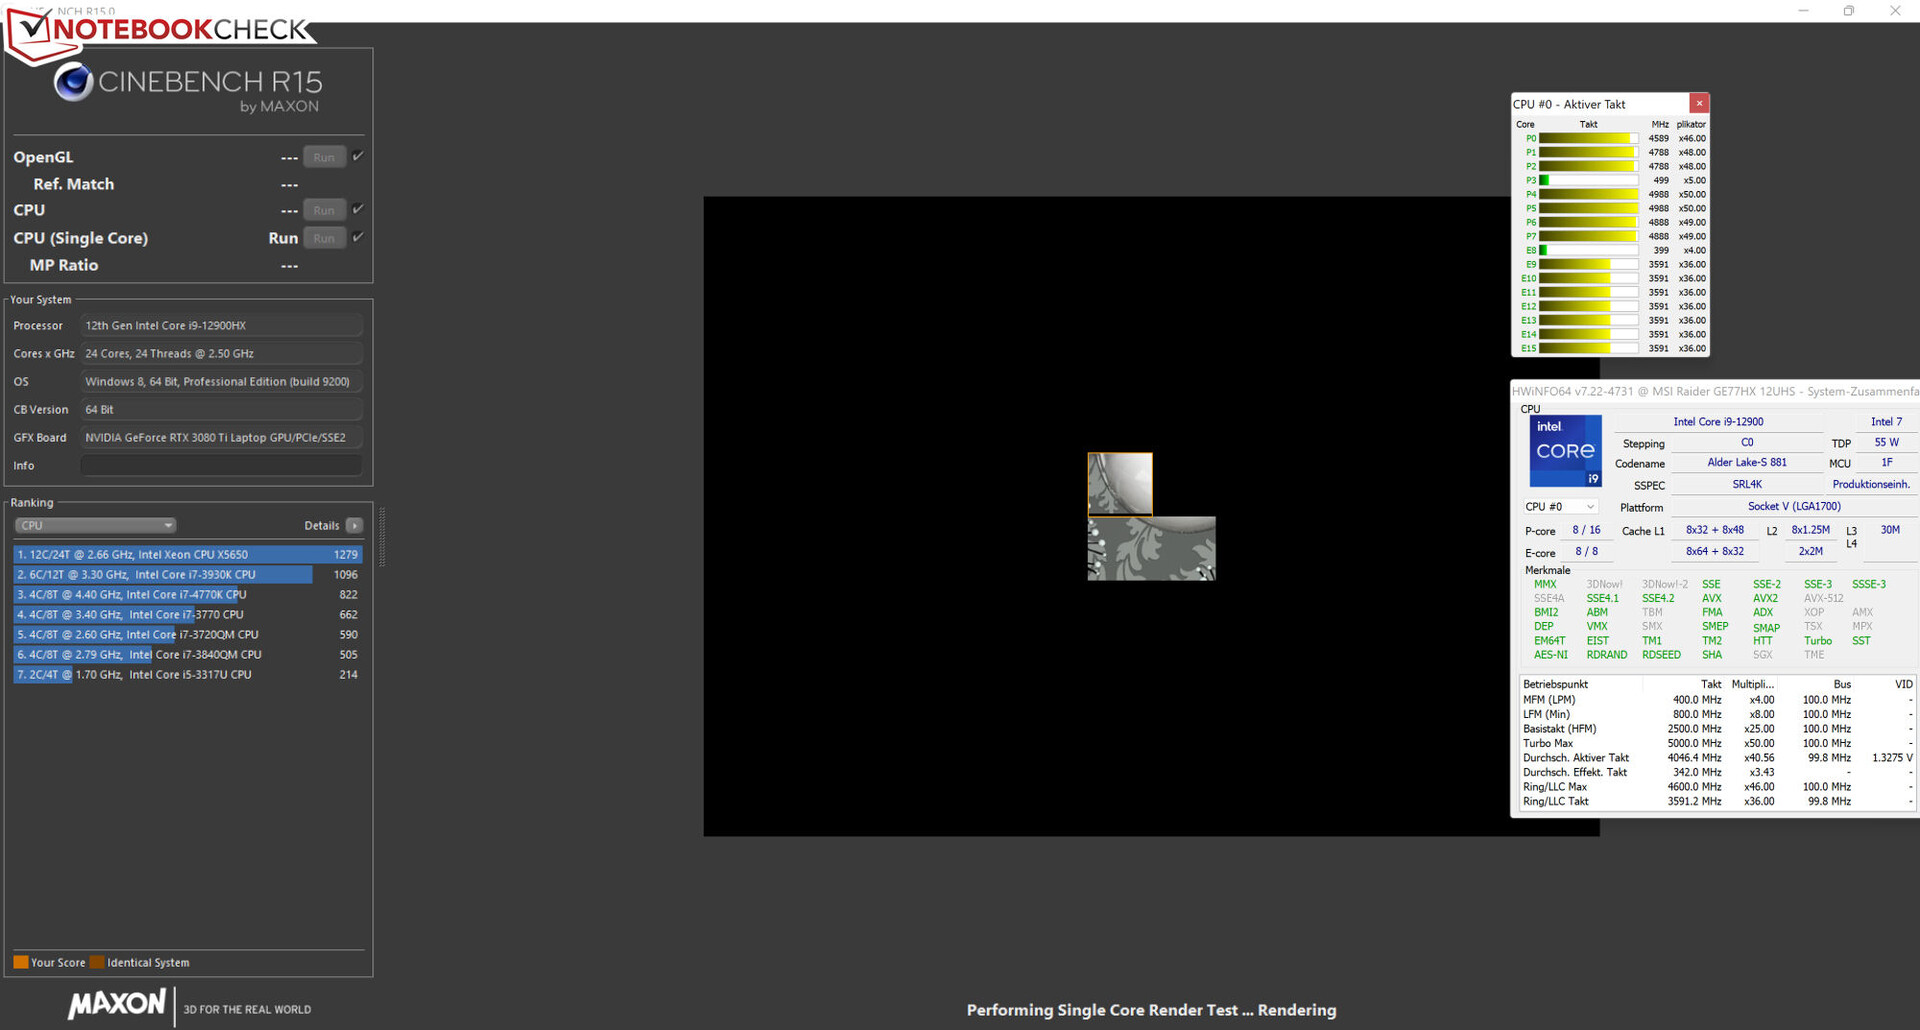
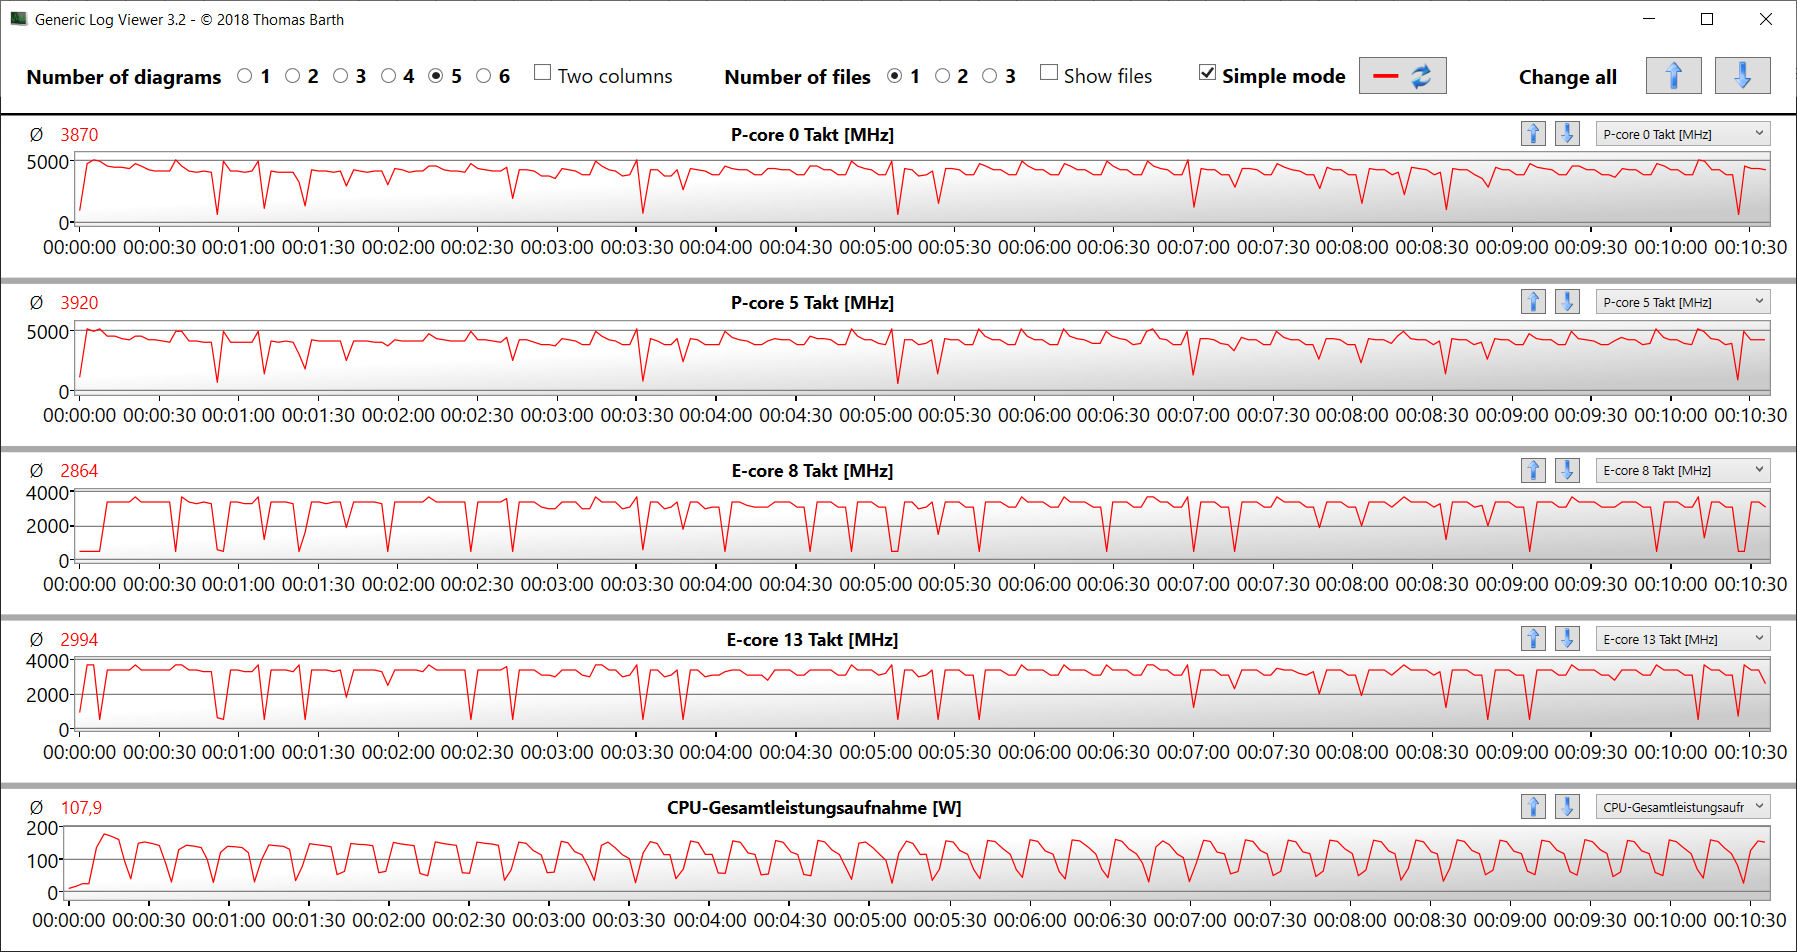
We determine whether the CPU turbo is permanently active while on mains by running the Cinebench R15 Multi benchmark in a loop. Here, we observe consistently high clock speeds. The profile "Extreme performance" results in a more even performance level.
Cinebench R15 Multi Loop
| CPU Performance rating - Percent | |
| Average of class Gaming | |
| MSI Raider GE77 HX 12UHS | |
| MSI Raider GE77 HX 12UHS | |
| Average Intel Core i9-12900HX | |
| Alienware x17 R2 P48E | |
| Medion Erazer Beast X30 | |
| Razer Blade 17 Early 2022 | |
| Cinebench R23 | |
| Multi Core | |
| Average of class Gaming (5668 - 40970, n=149, last 2 years) | |
| MSI Raider GE77 HX 12UHS (Extreme Leistung) | |
| MSI Raider GE77 HX 12UHS | |
| Average Intel Core i9-12900HX (18337 - 23482, n=8) | |
| Medion Erazer Beast X30 | |
| Alienware x17 R2 P48E | |
| Razer Blade 17 Early 2022 | |
| Single Core | |
| Average of class Gaming (1136 - 2267, n=149, last 2 years) | |
| Average Intel Core i9-12900HX (1897 - 1936, n=8) | |
| Razer Blade 17 Early 2022 | |
| MSI Raider GE77 HX 12UHS | |
| Alienware x17 R2 P48E | |
| MSI Raider GE77 HX 12UHS (Extreme Leistung) | |
| Medion Erazer Beast X30 | |
| Cinebench R20 | |
| CPU (Multi Core) | |
| Average of class Gaming (2179 - 16108, n=148, last 2 years) | |
| MSI Raider GE77 HX 12UHS (Extreme Leistung) | |
| MSI Raider GE77 HX 12UHS | |
| Average Intel Core i9-12900HX (7037 - 9042, n=8) | |
| Medion Erazer Beast X30 | |
| Alienware x17 R2 P48E | |
| Razer Blade 17 Early 2022 | |
| CPU (Single Core) | |
| Average of class Gaming (439 - 870, n=148, last 2 years) | |
| MSI Raider GE77 HX 12UHS | |
| Average Intel Core i9-12900HX (728 - 745, n=8) | |
| MSI Raider GE77 HX 12UHS (Extreme Leistung) | |
| Alienware x17 R2 P48E | |
| Razer Blade 17 Early 2022 | |
| Medion Erazer Beast X30 | |
| Cinebench R15 | |
| CPU Multi 64Bit | |
| Average of class Gaming (1537 - 6271, n=148, last 2 years) | |
| MSI Raider GE77 HX 12UHS | |
| MSI Raider GE77 HX 12UHS (Extreme Leistung) | |
| Average Intel Core i9-12900HX (2830 - 3652, n=8) | |
| Alienware x17 R2 P48E | |
| Medion Erazer Beast X30 | |
| Razer Blade 17 Early 2022 | |
| CPU Single 64Bit | |
| Average of class Gaming (188.8 - 343, n=147, last 2 years) | |
| MSI Raider GE77 HX 12UHS | |
| Average Intel Core i9-12900HX (274 - 282, n=8) | |
| MSI Raider GE77 HX 12UHS (Extreme Leistung) | |
| Alienware x17 R2 P48E | |
| Razer Blade 17 Early 2022 | |
| Medion Erazer Beast X30 | |
| Blender - v2.79 BMW27 CPU | |
| Razer Blade 17 Early 2022 | |
| Medion Erazer Beast X30 | |
| Alienware x17 R2 P48E | |
| Average of class Gaming (80 - 517, n=144, last 2 years) | |
| Average Intel Core i9-12900HX (144 - 201, n=8) | |
| MSI Raider GE77 HX 12UHS | |
| MSI Raider GE77 HX 12UHS (Extreme Leistung) | |
| 7-Zip 18.03 | |
| 7z b 4 | |
| Average of class Gaming (23795 - 148086, n=146, last 2 years) | |
| MSI Raider GE77 HX 12UHS (Extreme Leistung) | |
| MSI Raider GE77 HX 12UHS | |
| Average Intel Core i9-12900HX (69778 - 88128, n=7) | |
| Medion Erazer Beast X30 | |
| Alienware x17 R2 P48E | |
| Razer Blade 17 Early 2022 | |
| 7z b 4 -mmt1 | |
| Average of class Gaming (4199 - 7508, n=146, last 2 years) | |
| MSI Raider GE77 HX 12UHS | |
| Average Intel Core i9-12900HX (6165 - 6358, n=7) | |
| MSI Raider GE77 HX 12UHS (Extreme Leistung) | |
| Razer Blade 17 Early 2022 | |
| Alienware x17 R2 P48E | |
| Medion Erazer Beast X30 | |
| Geekbench 5.5 | |
| Multi-Core | |
| MSI Raider GE77 HX 12UHS (Extreme Leistung) | |
| Average of class Gaming (4557 - 27010, n=145, last 2 years) | |
| MSI Raider GE77 HX 12UHS | |
| Average Intel Core i9-12900HX (15116 - 16925, n=8) | |
| Alienware x17 R2 P48E | |
| Medion Erazer Beast X30 | |
| Razer Blade 17 Early 2022 | |
| Single-Core | |
| Average of class Gaming (986 - 2423, n=145, last 2 years) | |
| MSI Raider GE77 HX 12UHS | |
| Average Intel Core i9-12900HX (1874 - 1949, n=8) | |
| MSI Raider GE77 HX 12UHS (Extreme Leistung) | |
| Alienware x17 R2 P48E | |
| Razer Blade 17 Early 2022 | |
| Medion Erazer Beast X30 | |
| HWBOT x265 Benchmark v2.2 - 4k Preset | |
| Average of class Gaming (7.7 - 44.3, n=146, last 2 years) | |
| MSI Raider GE77 HX 12UHS (Extreme Leistung) | |
| MSI Raider GE77 HX 12UHS | |
| Average Intel Core i9-12900HX (19.6 - 26.6, n=7) | |
| Alienware x17 R2 P48E | |
| Medion Erazer Beast X30 | |
| Razer Blade 17 Early 2022 | |
| LibreOffice - 20 Documents To PDF | |
| Medion Erazer Beast X30 | |
| Average of class Gaming (19 - 88.8, n=145, last 2 years) | |
| MSI Raider GE77 HX 12UHS | |
| Alienware x17 R2 P48E | |
| Razer Blade 17 Early 2022 | |
| Average Intel Core i9-12900HX (33.6 - 42.4, n=7) | |
| MSI Raider GE77 HX 12UHS (Extreme Leistung) | |
| R Benchmark 2.5 - Overall mean | |
| Medion Erazer Beast X30 | |
| Razer Blade 17 Early 2022 | |
| Alienware x17 R2 P48E | |
| Average of class Gaming (0.3551 - 0.759, n=147, last 2 years) | |
| MSI Raider GE77 HX 12UHS | |
| MSI Raider GE77 HX 12UHS (Extreme Leistung) | |
| Average Intel Core i9-12900HX (0.4159 - 0.4242, n=7) | |
* ... smaller is better
AIDA64: FP32 Ray-Trace | FPU Julia | CPU SHA3 | CPU Queen | FPU SinJulia | FPU Mandel | CPU AES | CPU ZLib | FP64 Ray-Trace | CPU PhotoWorxx
| Performance rating | |
| Average of class Gaming | |
| MSI Raider GE77 HX 12UHS | |
| MSI Raider GE77 HX 12UHS | |
| Average Intel Core i9-12900HX | |
| Alienware x17 R2 P48E | |
| Medion Erazer Beast X30 | |
| Razer Blade 17 Early 2022 | |
| AIDA64 / FP32 Ray-Trace | |
| Average of class Gaming (7192 - 85542, n=145, last 2 years) | |
| MSI Raider GE77 HX 12UHS (v6.70.6000, Extreme Leistung) | |
| MSI Raider GE77 HX 12UHS (v6.70.6000) | |
| Average Intel Core i9-12900HX (11535 - 22183, n=7) | |
| Alienware x17 R2 P48E (v6.50.5800) | |
| Medion Erazer Beast X30 (v6.50.5800) | |
| Razer Blade 17 Early 2022 (v6.50.5800) | |
| AIDA64 / FPU Julia | |
| Average of class Gaming (35040 - 238426, n=145, last 2 years) | |
| MSI Raider GE77 HX 12UHS (v6.70.6000) | |
| MSI Raider GE77 HX 12UHS (v6.70.6000, Extreme Leistung) | |
| Average Intel Core i9-12900HX (52916 - 110093, n=7) | |
| Alienware x17 R2 P48E (v6.50.5800) | |
| Medion Erazer Beast X30 (v6.50.5800) | |
| Razer Blade 17 Early 2022 (v6.50.5800) | |
| AIDA64 / CPU SHA3 | |
| Average of class Gaming (1728 - 9817, n=145, last 2 years) | |
| MSI Raider GE77 HX 12UHS (v6.70.6000) | |
| MSI Raider GE77 HX 12UHS (v6.70.6000, Extreme Leistung) | |
| Average Intel Core i9-12900HX (3559 - 5123, n=7) | |
| Alienware x17 R2 P48E (v6.50.5800) | |
| Medion Erazer Beast X30 (v6.50.5800) | |
| Razer Blade 17 Early 2022 (v6.50.5800) | |
| AIDA64 / CPU Queen | |
| Average of class Gaming (49785 - 173351, n=145, last 2 years) | |
| Alienware x17 R2 P48E (v6.50.5800) | |
| Medion Erazer Beast X30 (v6.50.5800) | |
| Average Intel Core i9-12900HX (101029 - 104457, n=7) | |
| MSI Raider GE77 HX 12UHS (v6.70.6000) | |
| MSI Raider GE77 HX 12UHS (v6.70.6000, Extreme Leistung) | |
| Razer Blade 17 Early 2022 (v6.50.5800) | |
| AIDA64 / FPU SinJulia | |
| Average of class Gaming (4424 - 33636, n=145, last 2 years) | |
| MSI Raider GE77 HX 12UHS (v6.70.6000, Extreme Leistung) | |
| MSI Raider GE77 HX 12UHS (v6.70.6000) | |
| Average Intel Core i9-12900HX (10475 - 13062, n=7) | |
| Alienware x17 R2 P48E (v6.50.5800) | |
| Medion Erazer Beast X30 (v6.50.5800) | |
| Razer Blade 17 Early 2022 (v6.50.5800) | |
| AIDA64 / FPU Mandel | |
| Average of class Gaming (17585 - 128721, n=145, last 2 years) | |
| MSI Raider GE77 HX 12UHS (v6.70.6000, Extreme Leistung) | |
| MSI Raider GE77 HX 12UHS (v6.70.6000) | |
| Average Intel Core i9-12900HX (31779 - 53628, n=7) | |
| Alienware x17 R2 P48E (v6.50.5800) | |
| Medion Erazer Beast X30 (v6.50.5800) | |
| Razer Blade 17 Early 2022 (v6.50.5800) | |
| AIDA64 / CPU AES | |
| MSI Raider GE77 HX 12UHS (v6.70.6000) | |
| MSI Raider GE77 HX 12UHS (v6.70.6000, Extreme Leistung) | |
| Average Intel Core i9-12900HX (125268 - 183146, n=7) | |
| Average of class Gaming (19065 - 247074, n=145, last 2 years) | |
| Alienware x17 R2 P48E (v6.50.5800) | |
| Medion Erazer Beast X30 (v6.50.5800) | |
| Razer Blade 17 Early 2022 (v6.50.5800) | |
| AIDA64 / CPU ZLib | |
| Average of class Gaming (373 - 2531, n=145, last 2 years) | |
| MSI Raider GE77 HX 12UHS (v6.70.6000) | |
| MSI Raider GE77 HX 12UHS (v6.70.6000, Extreme Leistung) | |
| Average Intel Core i9-12900HX (990 - 1408, n=7) | |
| Alienware x17 R2 P48E (v6.50.5800) | |
| Medion Erazer Beast X30 (v6.50.5800) | |
| Razer Blade 17 Early 2022 (v6.50.5800) | |
| AIDA64 / FP64 Ray-Trace | |
| Average of class Gaming (3856 - 45446, n=145, last 2 years) | |
| MSI Raider GE77 HX 12UHS (v6.70.6000, Extreme Leistung) | |
| MSI Raider GE77 HX 12UHS (v6.70.6000) | |
| Average Intel Core i9-12900HX (6663 - 11913, n=7) | |
| Alienware x17 R2 P48E (v6.50.5800) | |
| Medion Erazer Beast X30 (v6.50.5800) | |
| Razer Blade 17 Early 2022 (v6.50.5800) | |
| AIDA64 / CPU PhotoWorxx | |
| MSI Raider GE77 HX 12UHS (v6.70.6000) | |
| MSI Raider GE77 HX 12UHS (v6.70.6000, Extreme Leistung) | |
| Average of class Gaming (10805 - 62916, n=145, last 2 years) | |
| Average Intel Core i9-12900HX (40239 - 47710, n=7) | |
| Medion Erazer Beast X30 (v6.50.5800) | |
| Razer Blade 17 Early 2022 (v6.50.5800) | |
| Alienware x17 R2 P48E (v6.50.5800) | |
System Performance
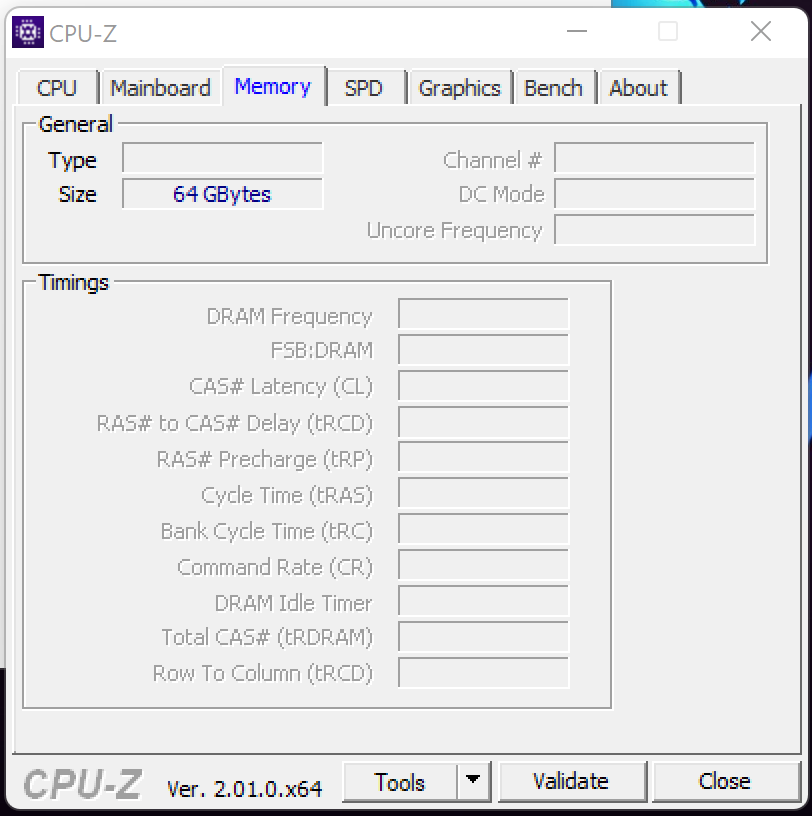
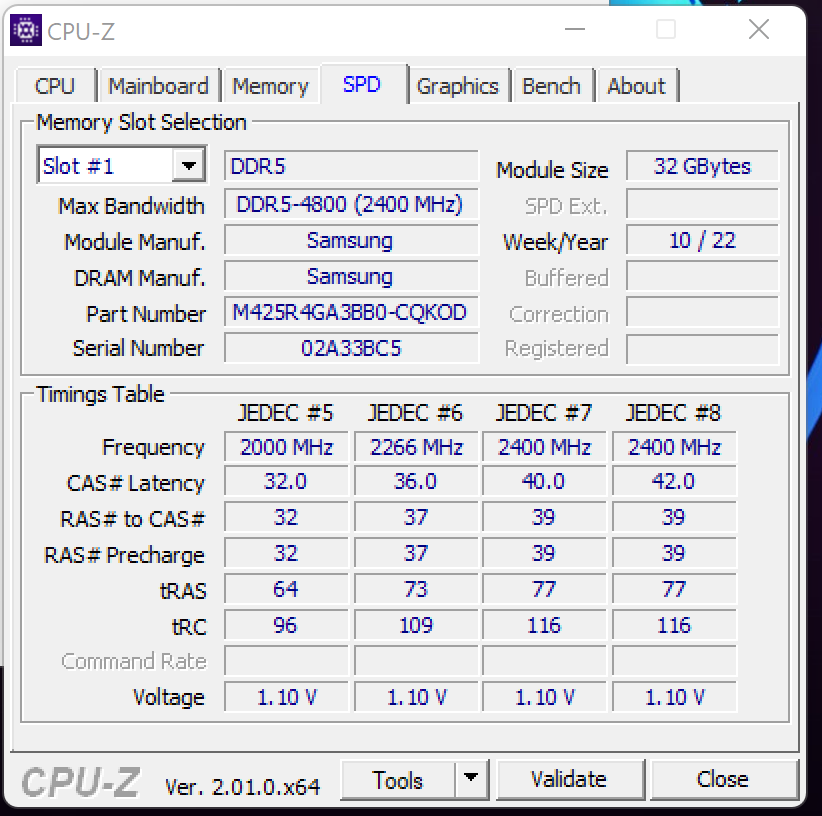
The GE77 is currently one of the fastest laptops on the market. The combination of 24 logical CPU cores and an RTX 3080 Ti GPU with a maximum TGP makes the system fit for any demanding use case - be it video editing, gaming or rendering. The transfer rates of the DDR4-4800 memory are above average. This may stem from the CPU's cache, which is larger on this particular model compared to other Intel processors. Additionally, the system achieves good results in the PCMark benchmarks.
CrossMark: Overall | Productivity | Creativity | Responsiveness
| PCMark 10 / Score | |
| MSI Raider GE77 HX 12UHS (dGPU, Extreme Leistung) | |
| Alienware x17 R2 P48E | |
| Average of class Gaming (5776 - 9667, n=123, last 2 years) | |
| Average Intel Core i9-12900HX, NVIDIA GeForce RTX 3080 Ti Laptop GPU (6812 - 8636, n=6) | |
| Medion Erazer Beast X30 | |
| Razer Blade 17 Early 2022 | |
| MSI Raider GE77 HX 12UHS | |
| PCMark 10 / Essentials | |
| Alienware x17 R2 P48E | |
| MSI Raider GE77 HX 12UHS (dGPU, Extreme Leistung) | |
| Average of class Gaming (8810 - 12600, n=127, last 2 years) | |
| Average Intel Core i9-12900HX, NVIDIA GeForce RTX 3080 Ti Laptop GPU (9598 - 11192, n=6) | |
| Razer Blade 17 Early 2022 | |
| Medion Erazer Beast X30 | |
| MSI Raider GE77 HX 12UHS | |
| PCMark 10 / Productivity | |
| MSI Raider GE77 HX 12UHS (dGPU, Extreme Leistung) | |
| Average Intel Core i9-12900HX, NVIDIA GeForce RTX 3080 Ti Laptop GPU (9365 - 10932, n=6) | |
| Alienware x17 R2 P48E | |
| Average of class Gaming (6662 - 16716, n=123, last 2 years) | |
| MSI Raider GE77 HX 12UHS | |
| Medion Erazer Beast X30 | |
| Razer Blade 17 Early 2022 | |
| PCMark 10 / Digital Content Creation | |
| MSI Raider GE77 HX 12UHS (dGPU, Extreme Leistung) | |
| Average of class Gaming (7440 - 19351, n=123, last 2 years) | |
| Alienware x17 R2 P48E | |
| Average Intel Core i9-12900HX, NVIDIA GeForce RTX 3080 Ti Laptop GPU (9543 - 14291, n=6) | |
| Medion Erazer Beast X30 | |
| Razer Blade 17 Early 2022 | |
| MSI Raider GE77 HX 12UHS | |
| CrossMark / Overall | |
| MSI Raider GE77 HX 12UHS | |
| MSI Raider GE77 HX 12UHS (dGPU, Extreme Leistung) | |
| Average Intel Core i9-12900HX, NVIDIA GeForce RTX 3080 Ti Laptop GPU (2108 - 2170, n=5) | |
| Average of class Gaming (1247 - 2344, n=118, last 2 years) | |
| Alienware x17 R2 P48E | |
| Razer Blade 17 Early 2022 | |
| Medion Erazer Beast X30 | |
| CrossMark / Productivity | |
| MSI Raider GE77 HX 12UHS | |
| MSI Raider GE77 HX 12UHS (dGPU, Extreme Leistung) | |
| Average Intel Core i9-12900HX, NVIDIA GeForce RTX 3080 Ti Laptop GPU (1978 - 2047, n=5) | |
| Average of class Gaming (1299 - 2211, n=118, last 2 years) | |
| Alienware x17 R2 P48E | |
| Razer Blade 17 Early 2022 | |
| Medion Erazer Beast X30 | |
| CrossMark / Creativity | |
| MSI Raider GE77 HX 12UHS | |
| Average Intel Core i9-12900HX, NVIDIA GeForce RTX 3080 Ti Laptop GPU (2288 - 2366, n=5) | |
| MSI Raider GE77 HX 12UHS (dGPU, Extreme Leistung) | |
| Average of class Gaming (1275 - 2729, n=118, last 2 years) | |
| Alienware x17 R2 P48E | |
| Medion Erazer Beast X30 | |
| Razer Blade 17 Early 2022 | |
| CrossMark / Responsiveness | |
| MSI Raider GE77 HX 12UHS | |
| Average Intel Core i9-12900HX, NVIDIA GeForce RTX 3080 Ti Laptop GPU (1991 - 2090, n=5) | |
| MSI Raider GE77 HX 12UHS (dGPU, Extreme Leistung) | |
| Average of class Gaming (1030 - 2330, n=118, last 2 years) | |
| Alienware x17 R2 P48E | |
| Razer Blade 17 Early 2022 | |
| Medion Erazer Beast X30 | |
| PCMark 8 Home Score Accelerated v2 | 4209 points | |
| PCMark 8 Creative Score Accelerated v2 | 6879 points | |
| PCMark 8 Work Score Accelerated v2 | 5259 points | |
| PCMark 10 Score | 6993 points | |
Help | ||
| AIDA64 / Memory Copy | |
| Average of class Gaming (21750 - 108104, n=145, last 2 years) | |
| MSI Raider GE77 HX 12UHS | |
| MSI Raider GE77 HX 12UHS (v6.70.6000, Extreme Leistung) | |
| Average Intel Core i9-12900HX (62852 - 70863, n=7) | |
| Medion Erazer Beast X30 (v6.50.5800) | |
| Razer Blade 17 Early 2022 (v6.50.5800) | |
| Alienware x17 R2 P48E (v6.50.5800) | |
| AIDA64 / Memory Read | |
| Average of class Gaming (22956 - 104349, n=145, last 2 years) | |
| MSI Raider GE77 HX 12UHS | |
| MSI Raider GE77 HX 12UHS (v6.70.6000, Extreme Leistung) | |
| Average Intel Core i9-12900HX (62140 - 72930, n=7) | |
| Medion Erazer Beast X30 (v6.50.5800) | |
| Razer Blade 17 Early 2022 (v6.50.5800) | |
| Alienware x17 R2 P48E (v6.50.5800) | |
| AIDA64 / Memory Write | |
| Average of class Gaming (22297 - 133486, n=145, last 2 years) | |
| MSI Raider GE77 HX 12UHS (v6.70.6000, Extreme Leistung) | |
| MSI Raider GE77 HX 12UHS (v6.70.6000) | |
| Medion Erazer Beast X30 (v6.50.5800) | |
| Average Intel Core i9-12900HX (60001 - 68782, n=7) | |
| Razer Blade 17 Early 2022 (v6.50.5800) | |
| Alienware x17 R2 P48E (v6.50.5800) | |
| AIDA64 / Memory Latency | |
| Average of class Gaming (59.5 - 259, n=145, last 2 years) | |
| Alienware x17 R2 P48E (v6.50.5800) | |
| Average Intel Core i9-12900HX (83.9 - 93.4, n=7) | |
| MSI Raider GE77 HX 12UHS (v6.70.6000, Extreme Leistung) | |
| MSI Raider GE77 HX 12UHS (v6.70.6000) | |
| Medion Erazer Beast X30 (v6.50.5800) | |
* ... smaller is better
DPC Latencies
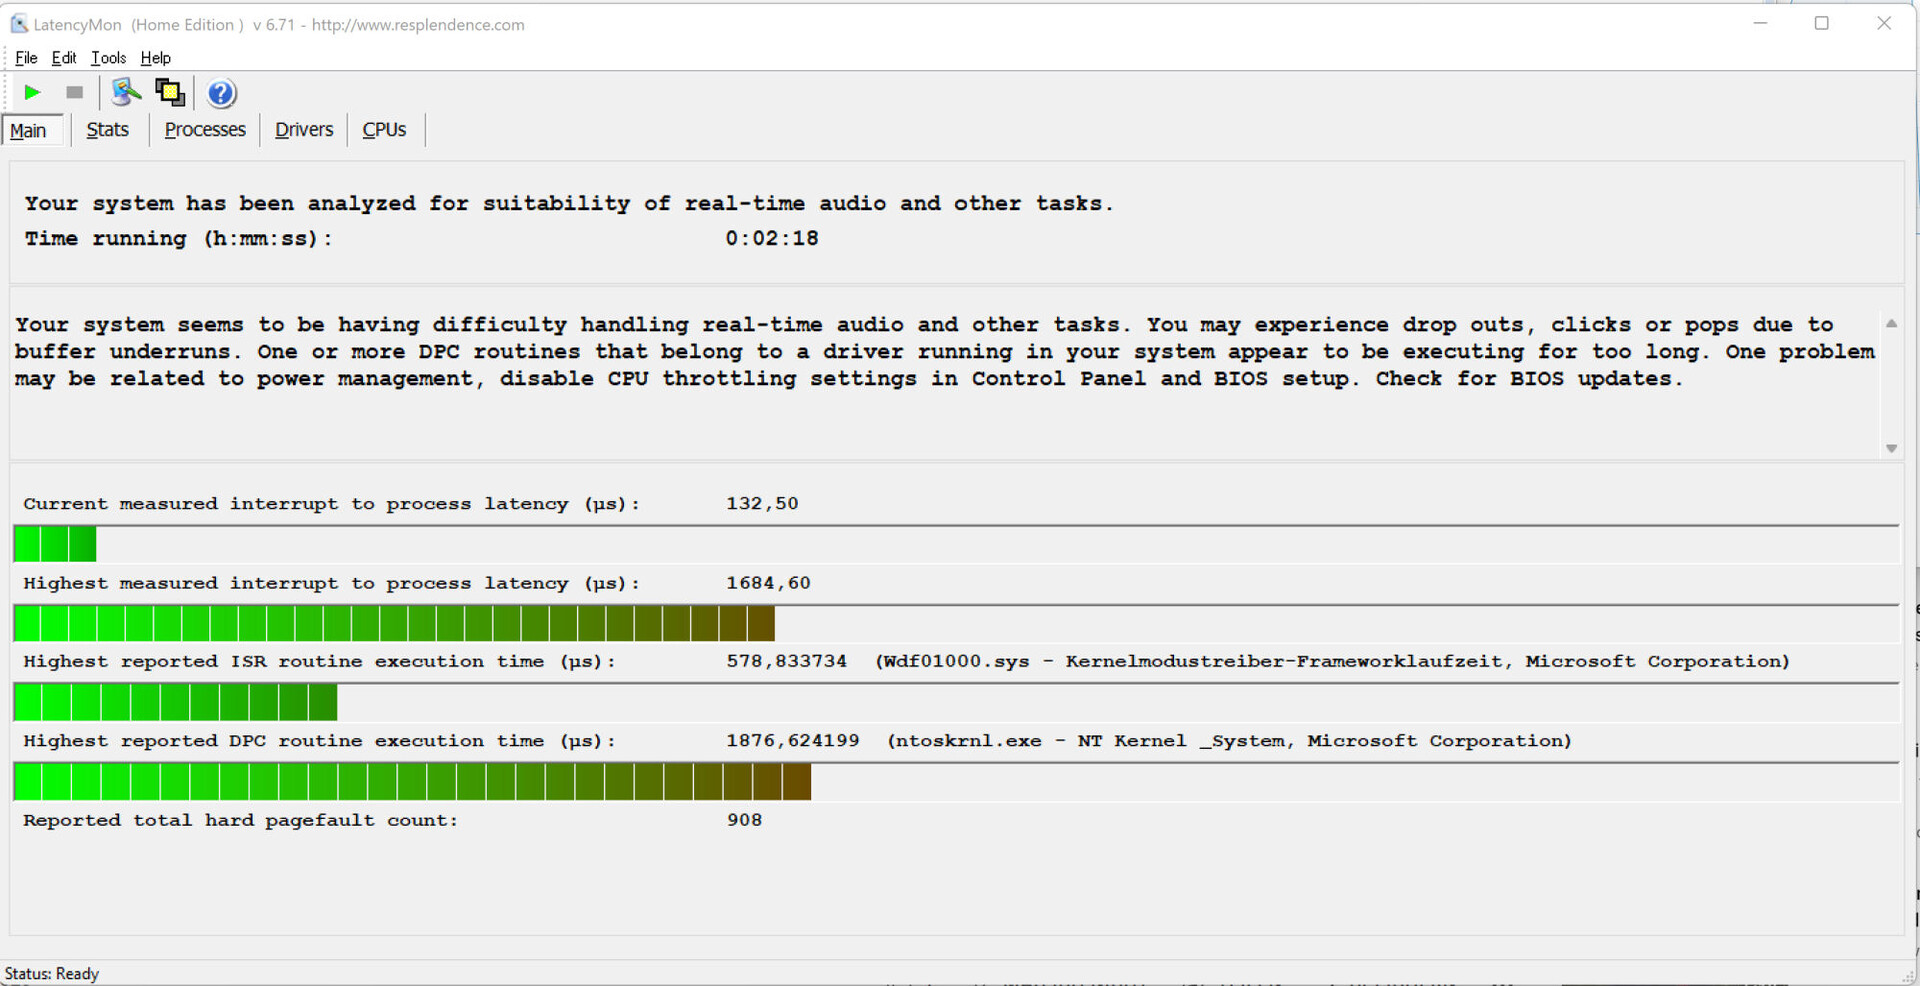
The standardized Latency Monitor test (web browsing, 4K video playback, Prime95 high load) shows somewhat problematic DPC latencies. The system does not appear to be suitable for editing video and audio in real time. Future software updates may improve or exacerbate the situation.
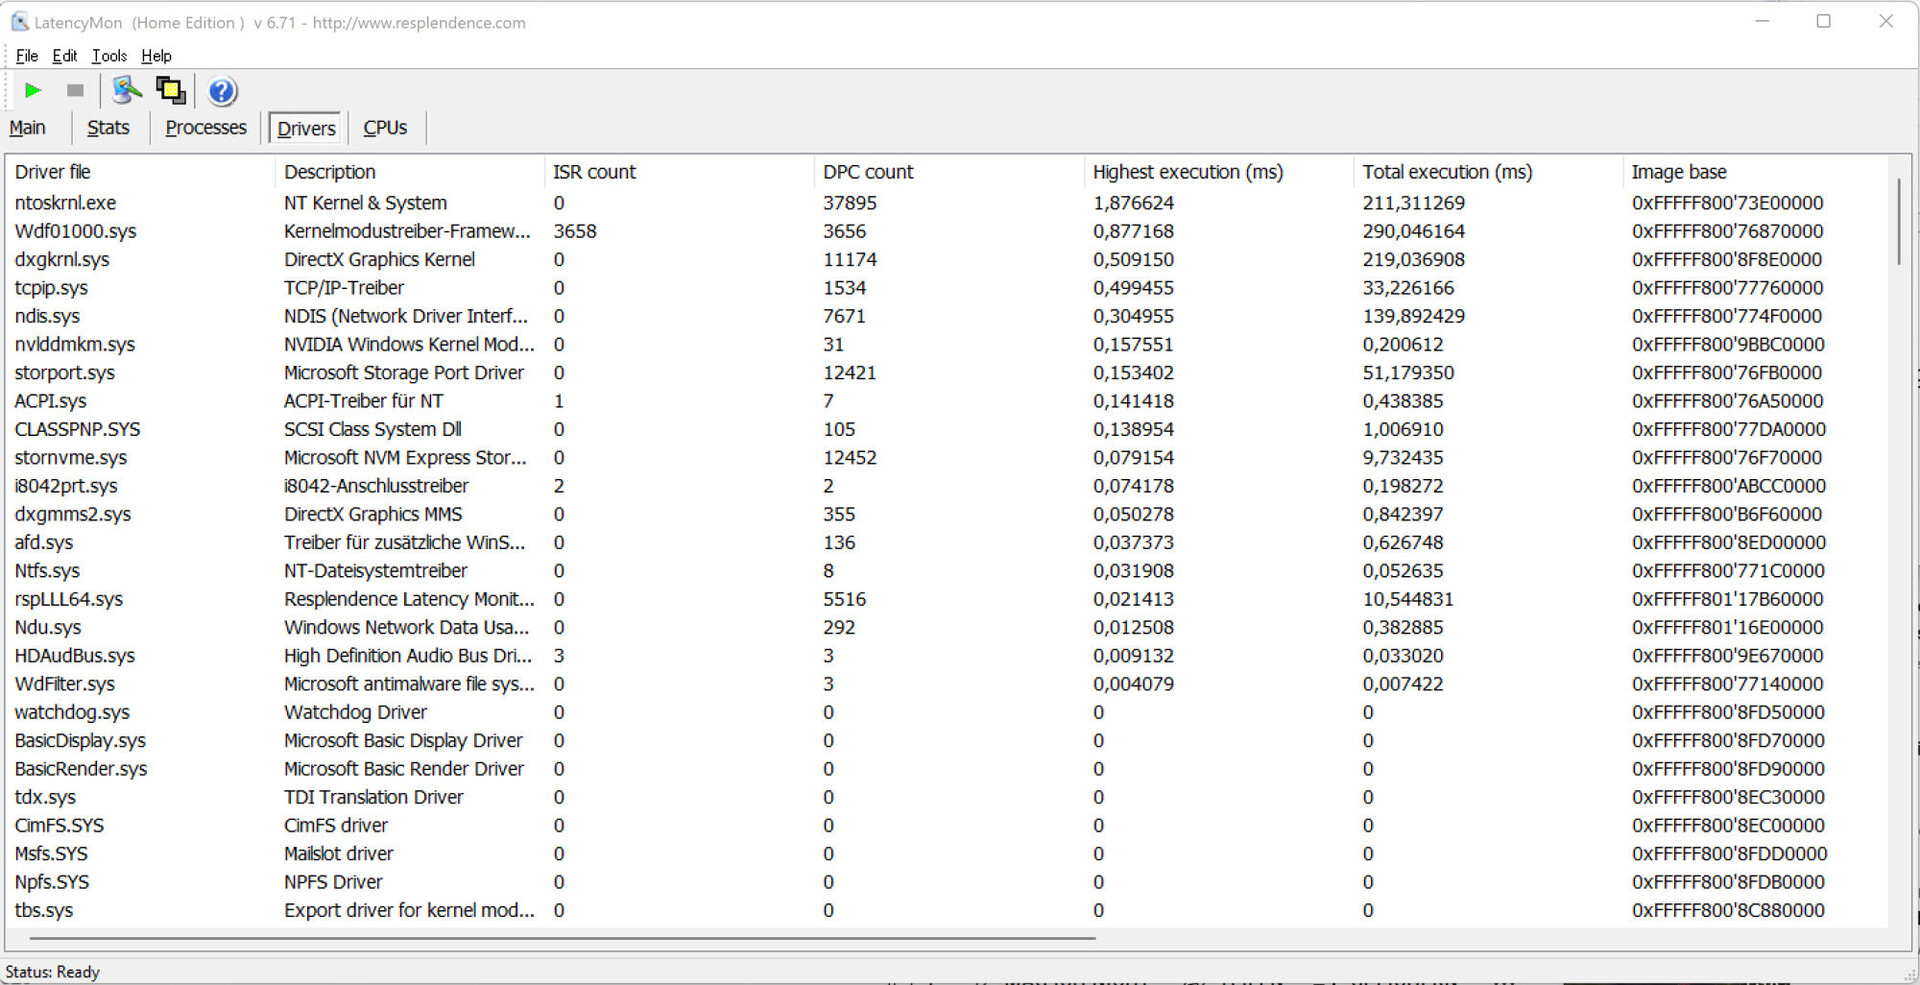
| DPC Latencies / LatencyMon - interrupt to process latency (max), Web, Youtube, Prime95 | |
| MSI Raider GE77 HX 12UHS | |
| Alienware x17 R2 P48E | |
| Medion Erazer Beast X30 | |
| Razer Blade 17 Early 2022 | |
* ... smaller is better
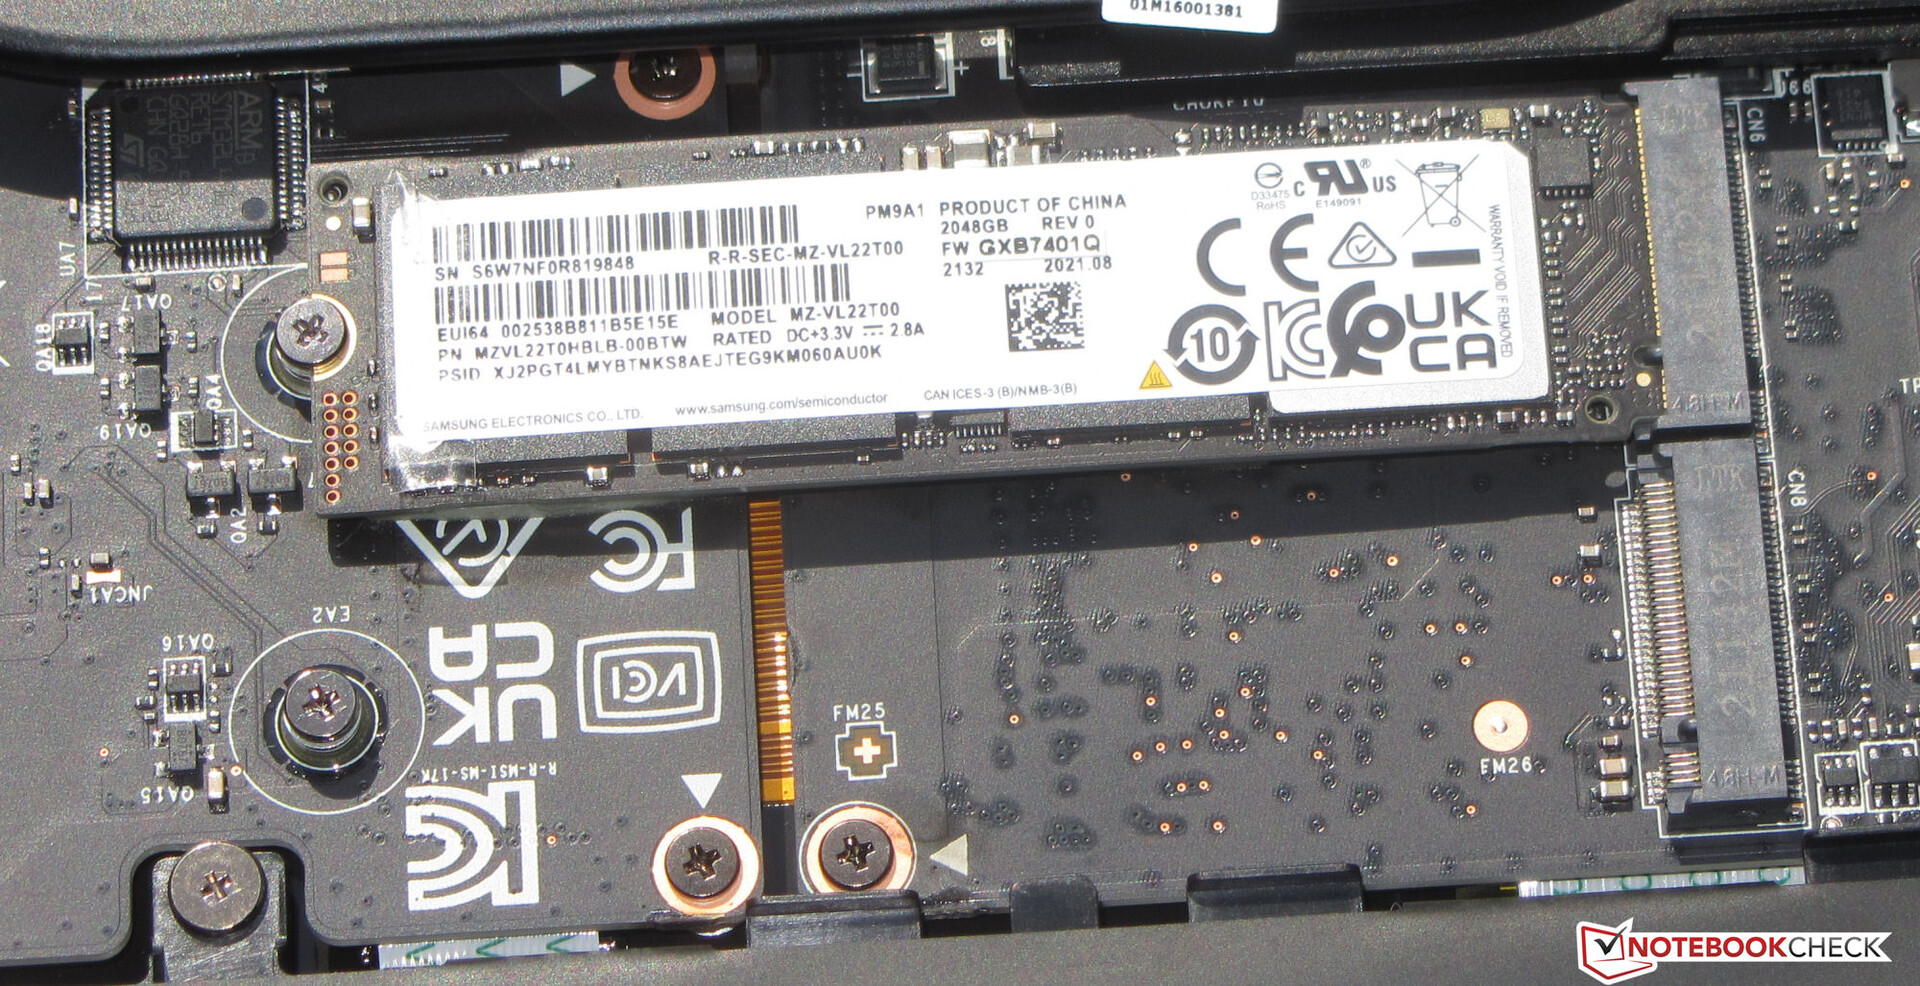
Storage Solution
MSI equips the Raider with a 2-TB SSD (PCIe4, M.2-2280) from Samsung with excellent transfer speeds. There is space for a secondary PCIe4 SSD.

| Drive Performance rating - Percent | |
| MSI Raider GE77 HX 12UHS | |
| Medion Erazer Beast X30 | |
| Razer Blade 17 Early 2022 | |
| Average Samsung PM9A1 MZVL22T0HBLB | |
| Average of class Gaming | |
| Alienware x17 R2 P48E | |
* ... smaller is better
Disk Throttling: DiskSpd Read Loop, Queue Depth 8
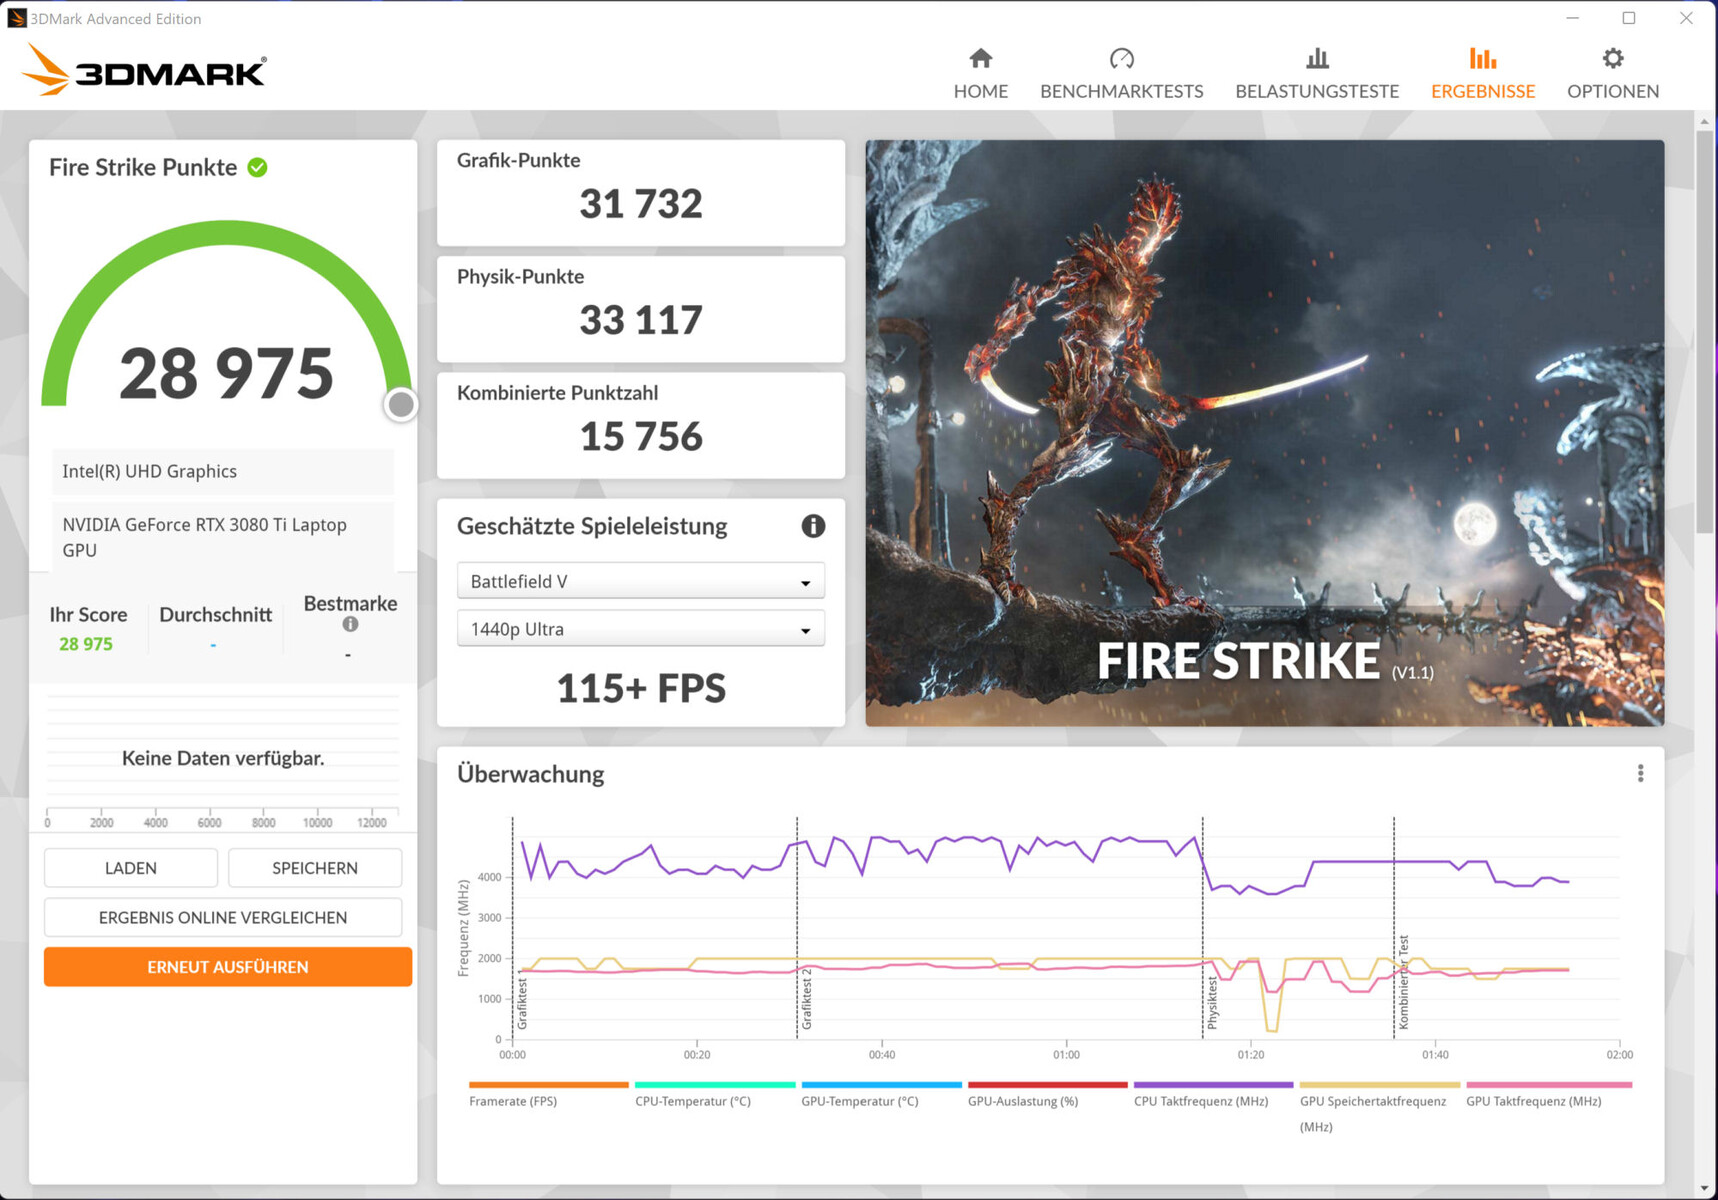
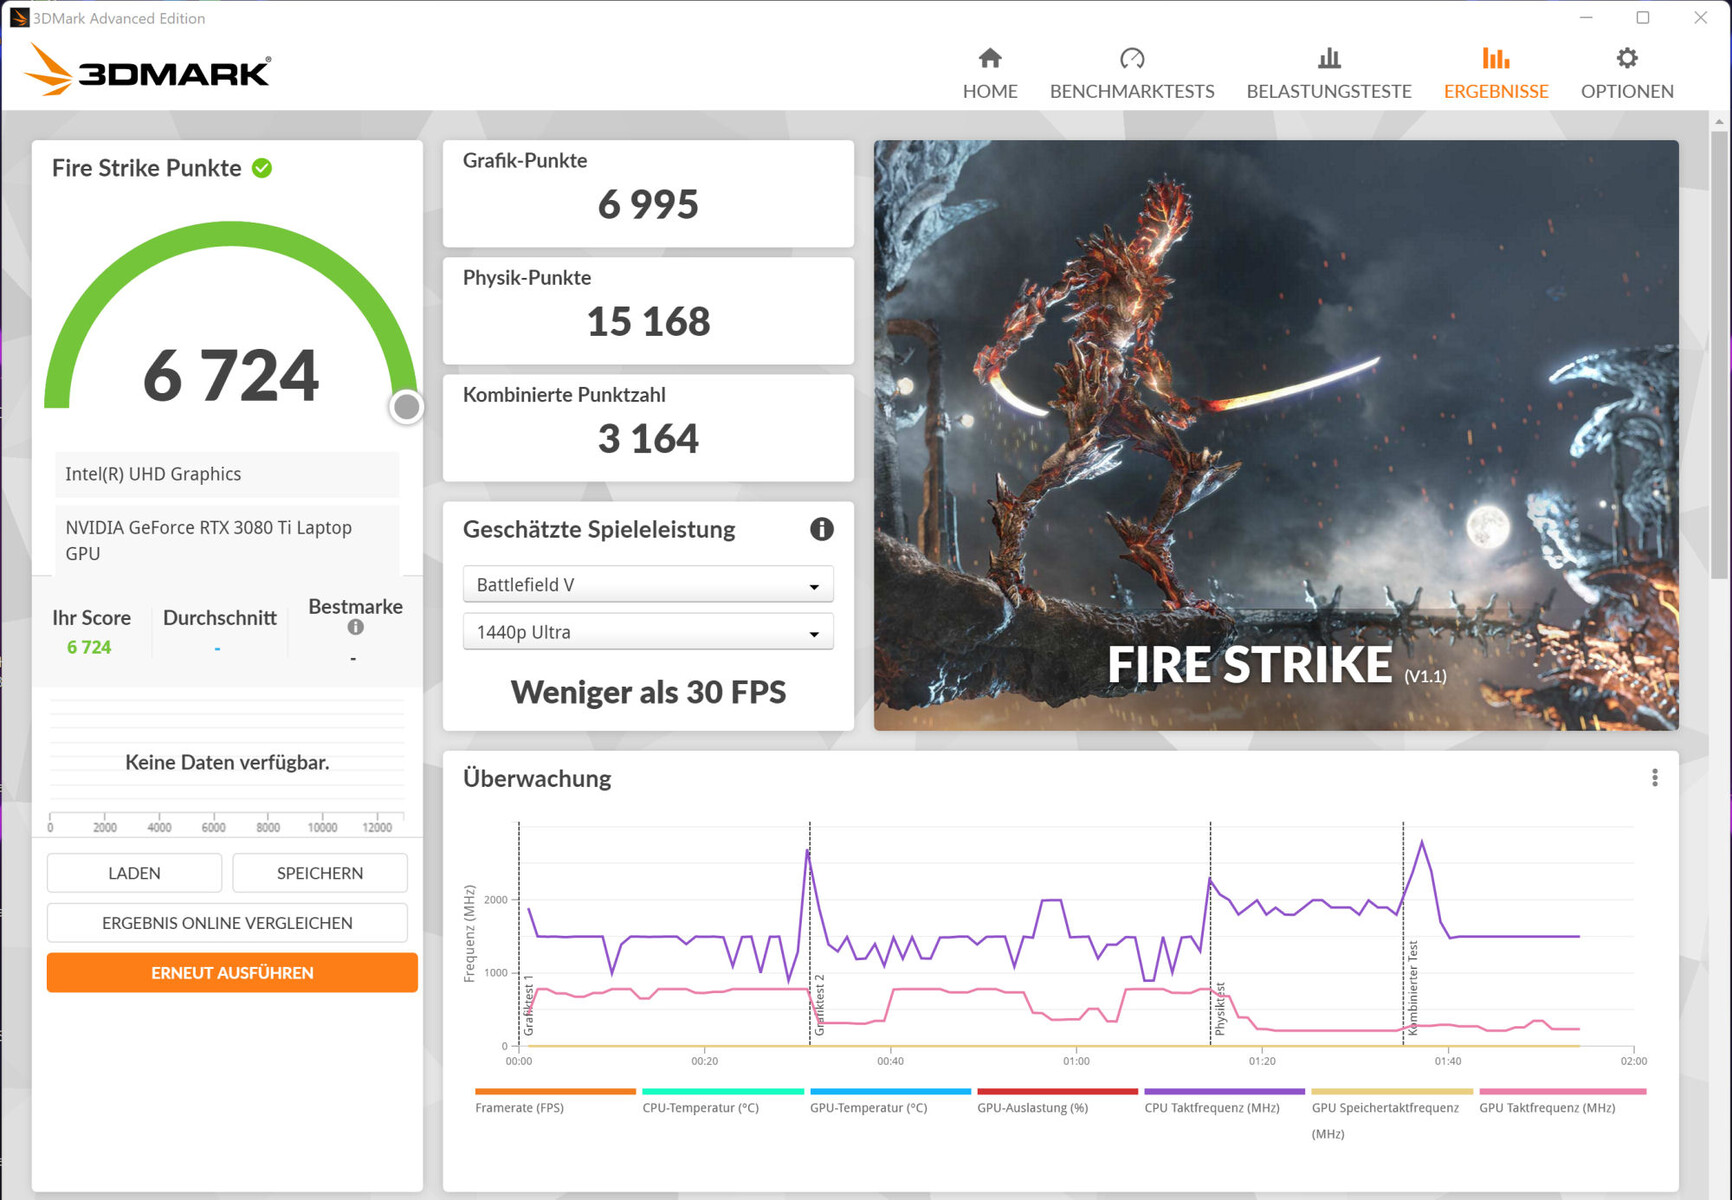
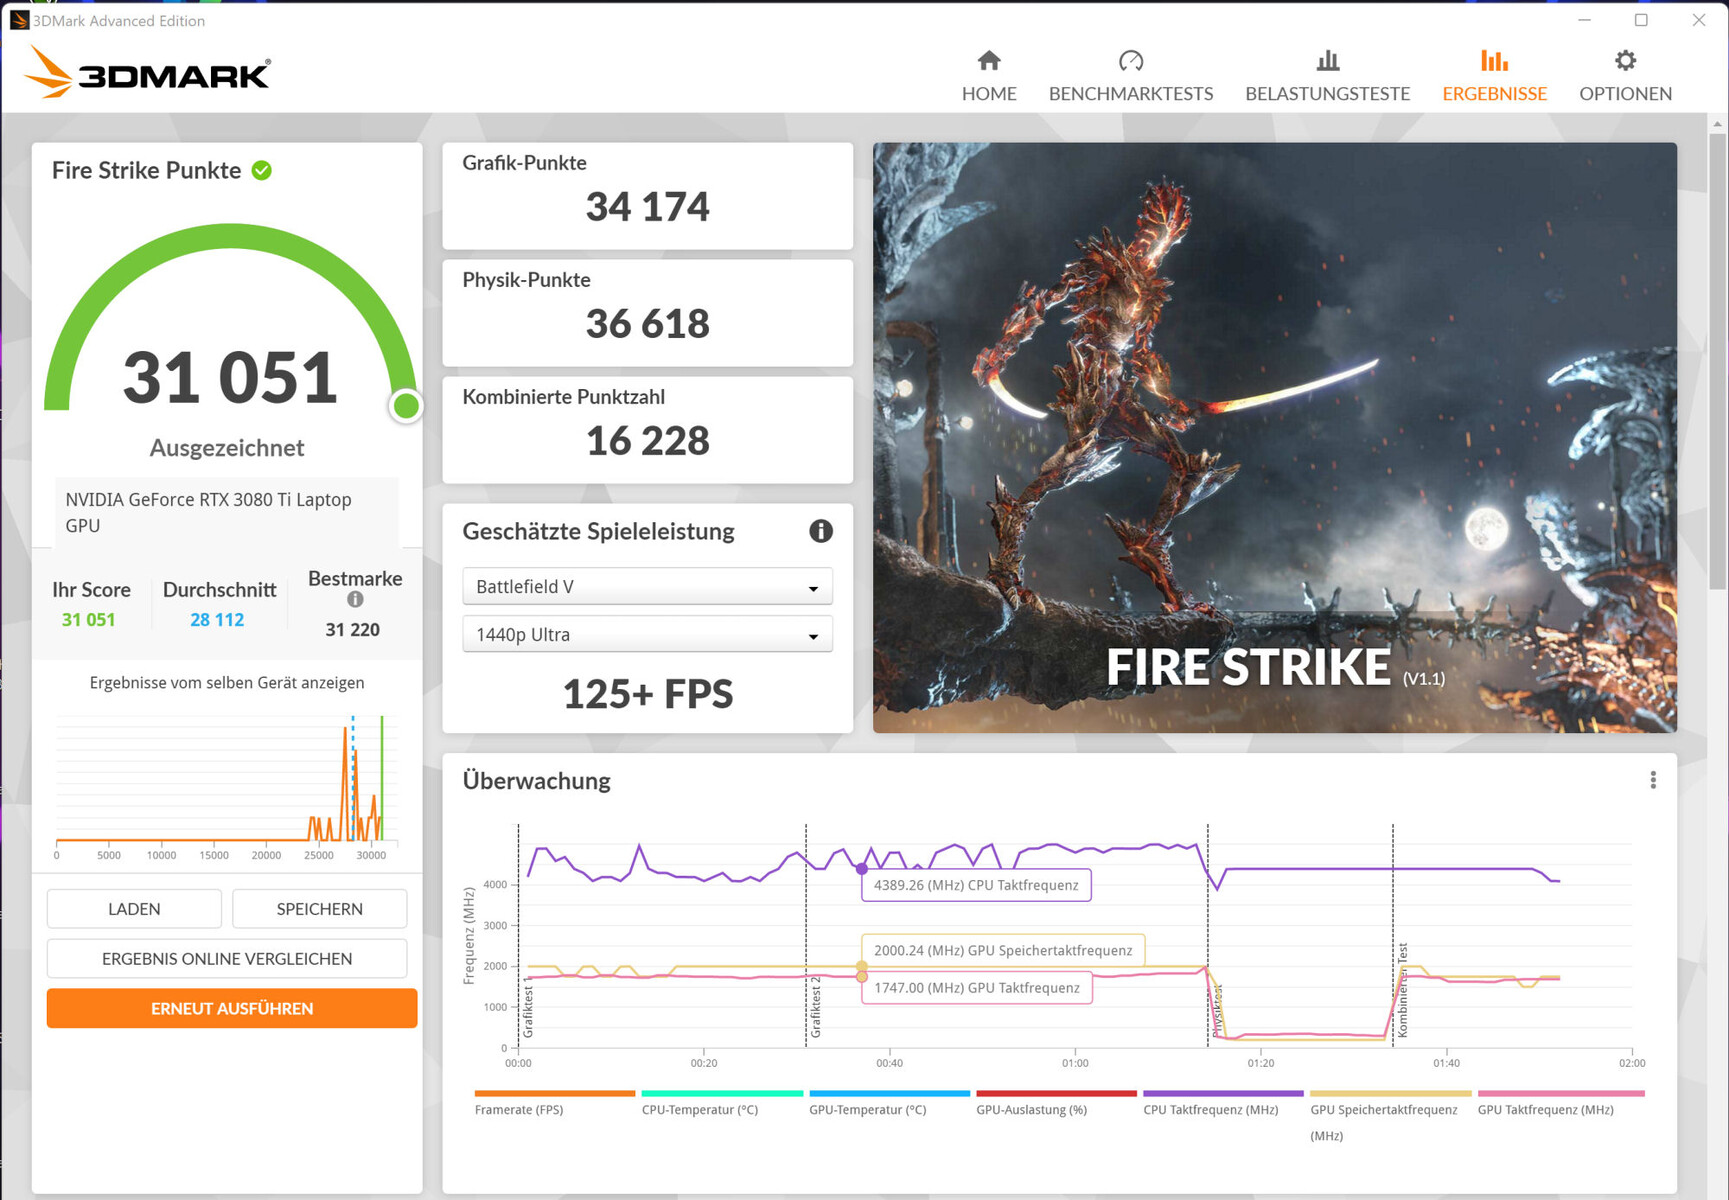
GPU Performance
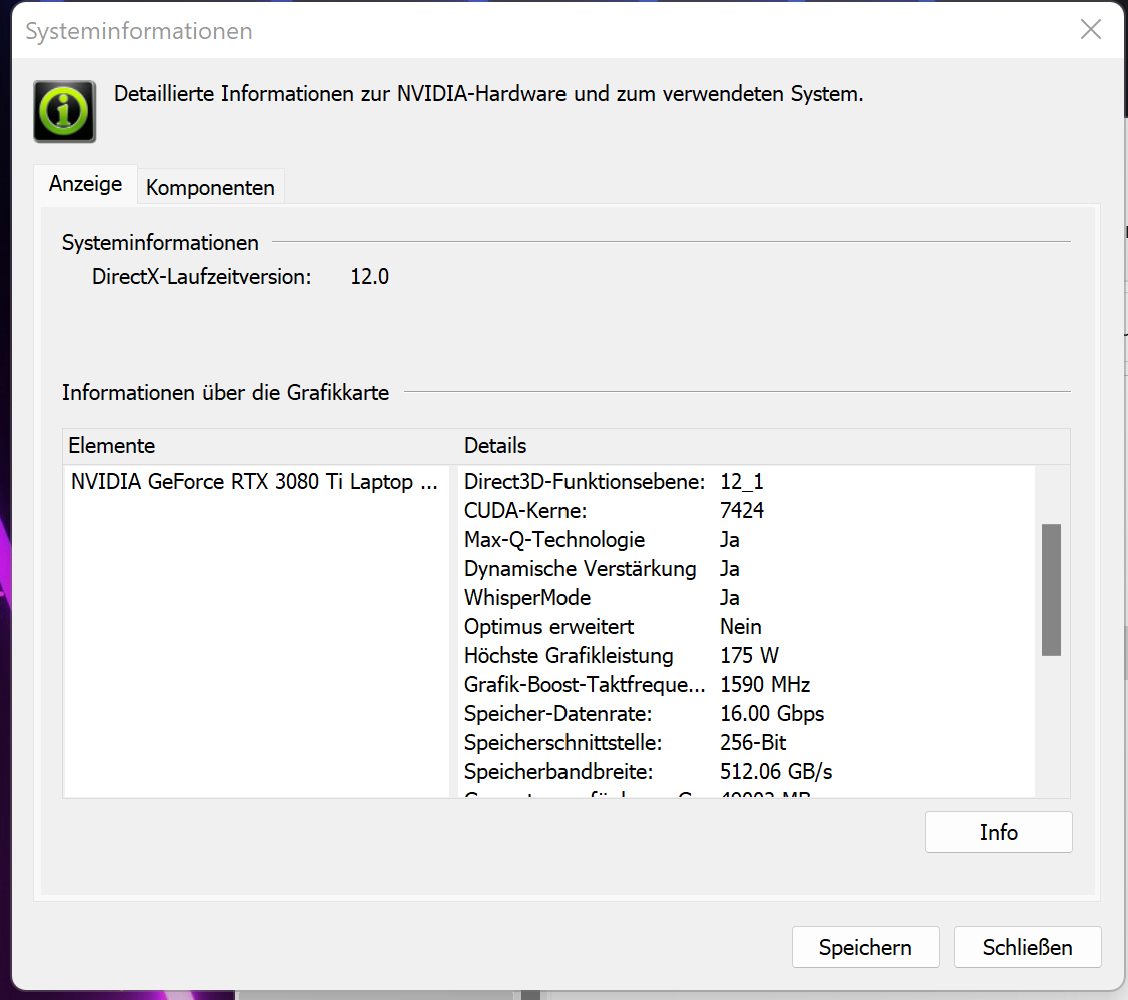
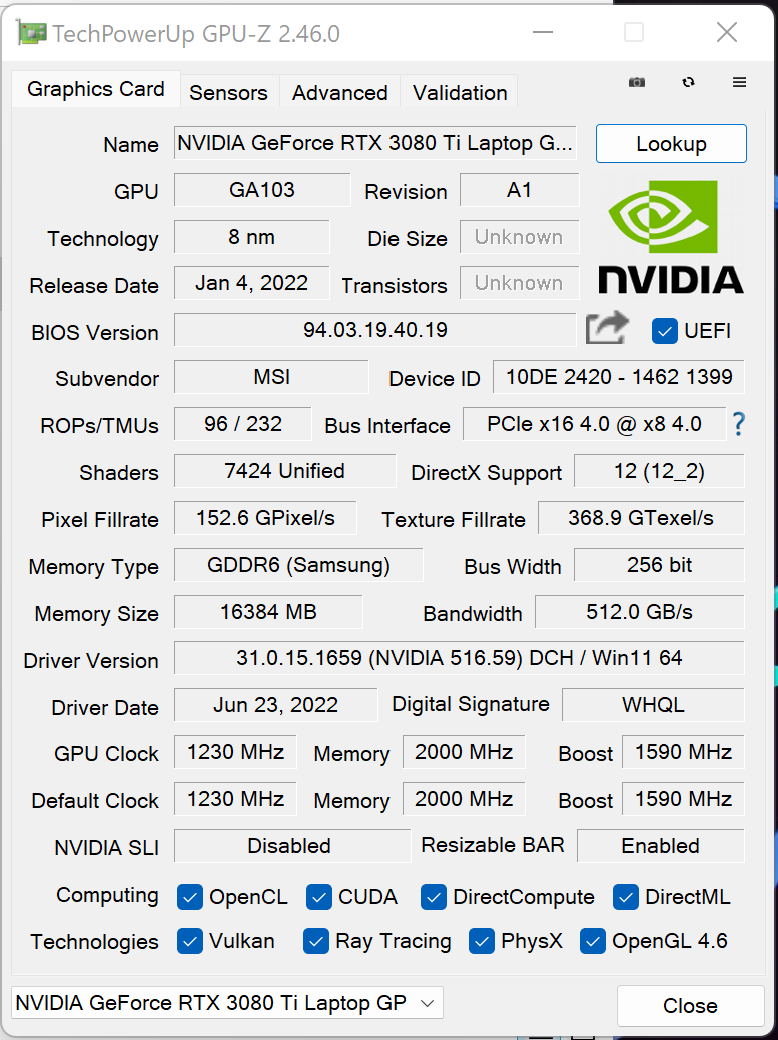
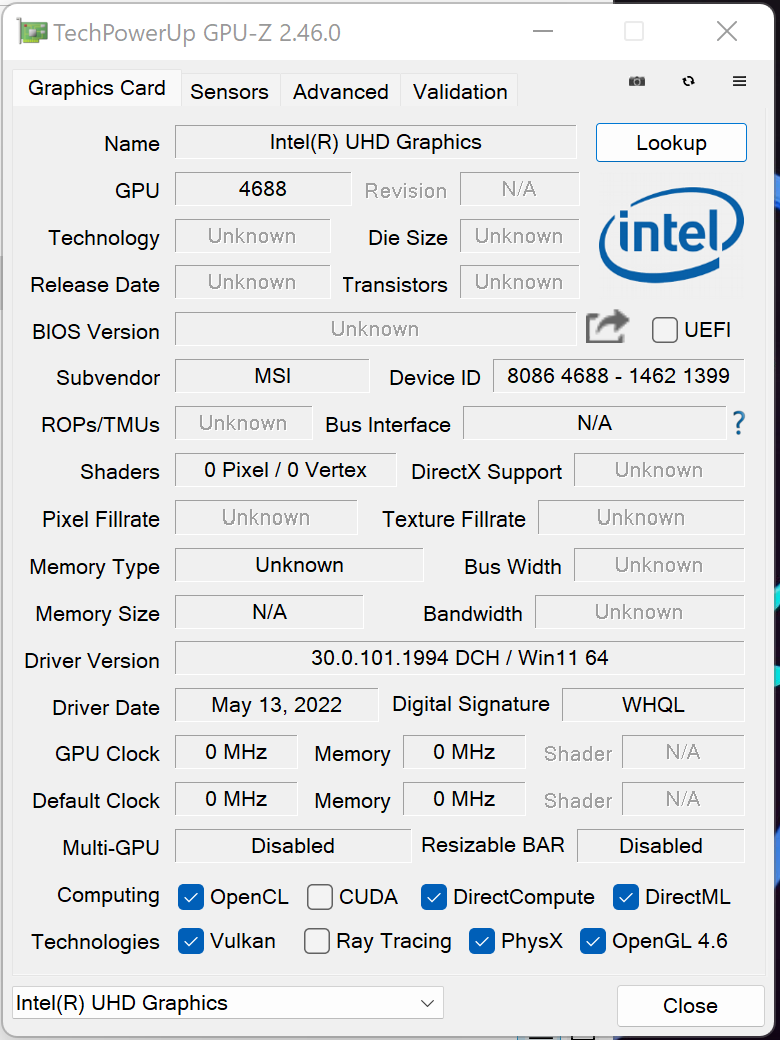
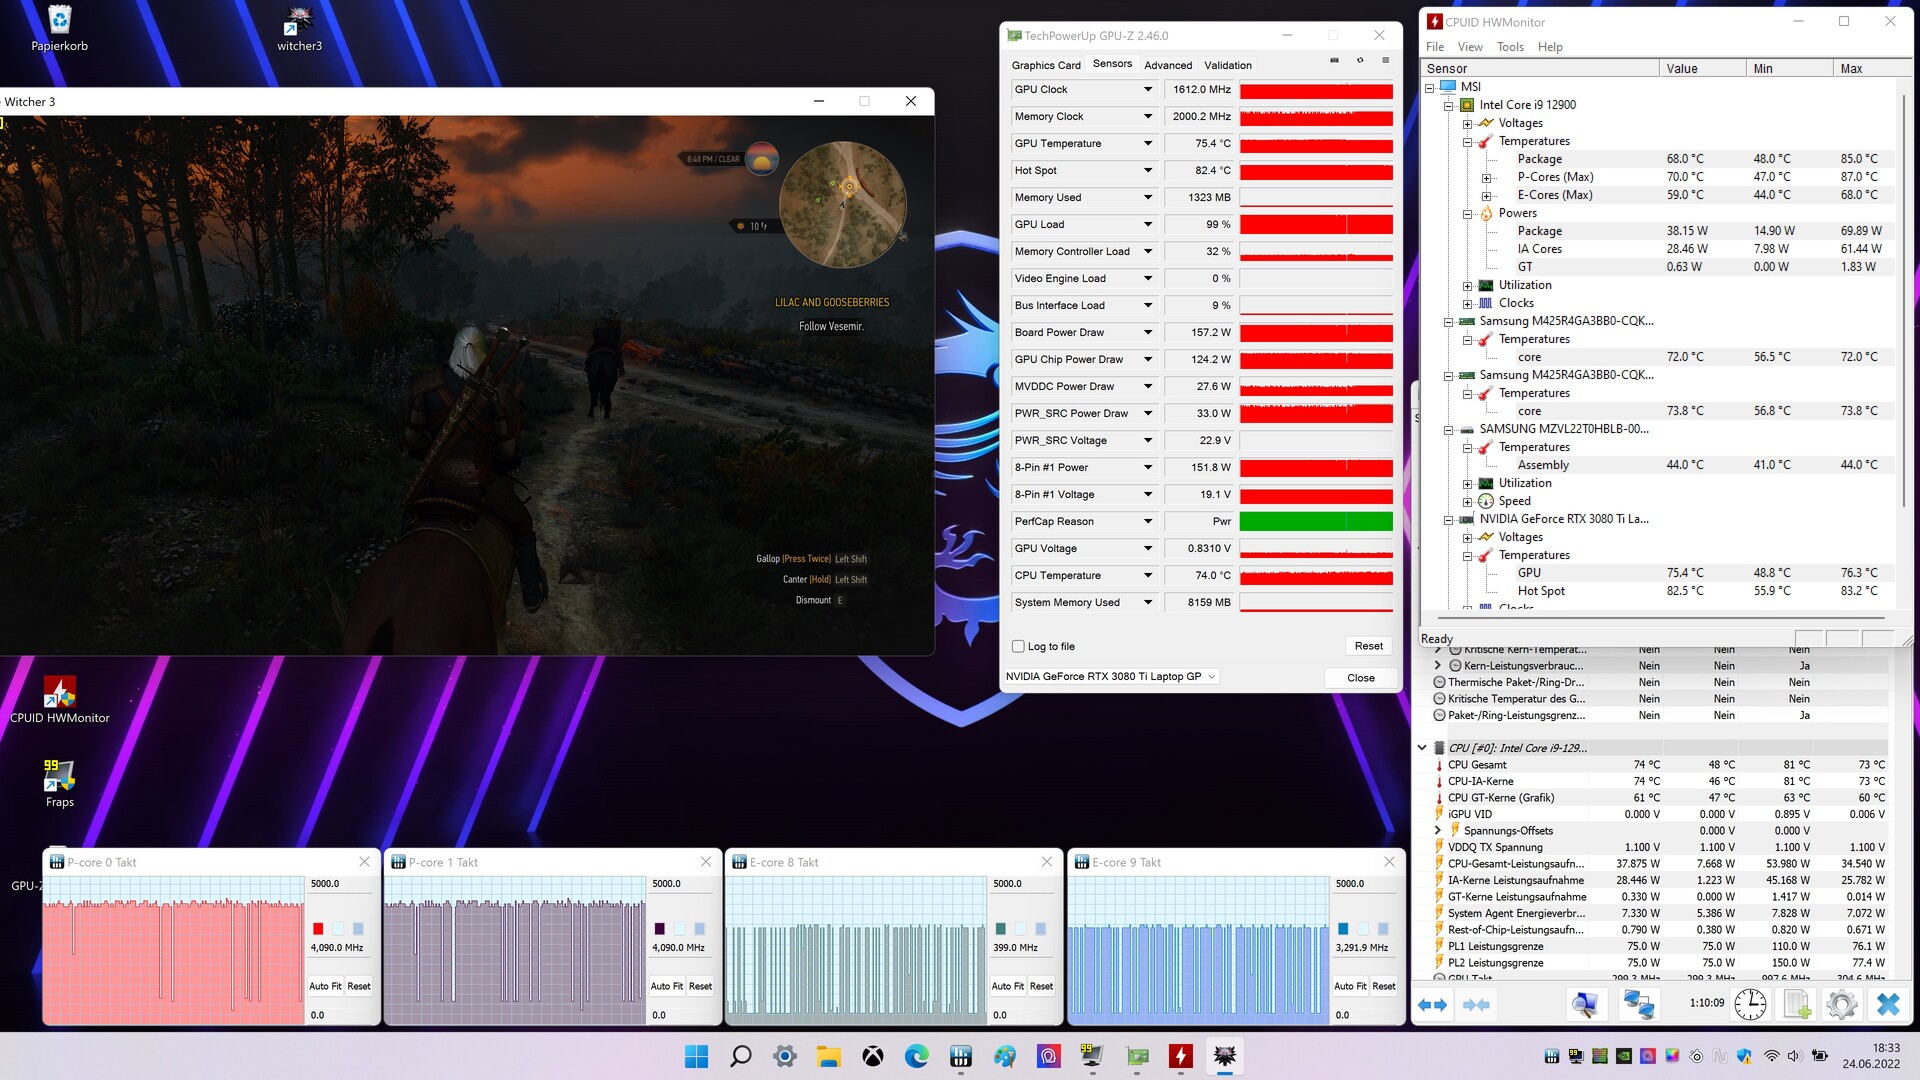
The actual performance of an RTX 3000 GPU depends on several factors: The Cooling solution, memory configuration, and the maximum TGP selected by the manufacturer within Nvidia's specified limits. For the installed GeForce RTX 3080 Ti laptop GPU, MSI sets a maximum TGP of 175 watts. The GPU has access to fast GDDR6 graphics memory (16384 MB).
The benchmark results exceed the average of our previous RTX 3080 Ti measurements. By combining the power profile "Extreme performance" with the direct video output via the GeForce GPU, we measured some of the highest scores we have seen from this GPU. As our The Witcher 3 test shows, however, the TGP range is not being fully exhausted. Advanced Optimus is not supported. Thus, switching between dGPU and Optimus requires a reboot.
It does not end there, however: The MSI Center software offers overclocking settings for the GPU and the VRAM. Of course, users who choose to overclock, do so at their own risk. The overclocking features can be found under the power profile "Extreme performance" (Select the profile, then click on the cog wheel).
| 3DMark Performance rating - Percent | |
| Average of class Gaming | |
| MSI Raider GE77 HX 12UHS | |
| Alienware x17 R2 P48E | |
| MSI Raider GE77 HX 12UHS | |
| Razer Blade 17 Early 2022 | |
| Medion Erazer Beast X30 | |
| Average NVIDIA GeForce RTX 3080 Ti Laptop GPU | |
| 3DMark 11 - 1280x720 Performance GPU | |
| Average of class Gaming (13523 - 80022, n=140, last 2 years) | |
| MSI Raider GE77 HX 12UHS | |
| Alienware x17 R2 P48E | |
| MSI Raider GE77 HX 12UHS (dGPU, Extreme Leistung) | |
| Razer Blade 17 Early 2022 | |
| Medion Erazer Beast X30 | |
| Average NVIDIA GeForce RTX 3080 Ti Laptop GPU (13920 - 45841, n=45) | |
| 3DMark | |
| 1920x1080 Fire Strike Graphics | |
| Average of class Gaming (6487 - 62849, n=154, last 2 years) | |
| MSI Raider GE77 HX 12UHS (dGPU, Extreme Leistung) | |
| Alienware x17 R2 P48E | |
| MSI Raider GE77 HX 12UHS | |
| Medion Erazer Beast X30 | |
| Razer Blade 17 Early 2022 | |
| Average NVIDIA GeForce RTX 3080 Ti Laptop GPU (6928 - 34439, n=43) | |
| 2560x1440 Time Spy Graphics | |
| Average of class Gaming (2295 - 25984, n=151, last 2 years) | |
| Alienware x17 R2 P48E | |
| MSI Raider GE77 HX 12UHS (dGPU, Extreme Leistung) | |
| MSI Raider GE77 HX 12UHS | |
| Razer Blade 17 Early 2022 | |
| Medion Erazer Beast X30 | |
| Average NVIDIA GeForce RTX 3080 Ti Laptop GPU (4921 - 13835, n=43) | |
| 2560x1440 Port Royal Graphics | |
| Average of class Gaming (984 - 16978, n=83, last 2 years) | |
| MSI Raider GE77 HX 12UHS (dGPU, Extreme Leistung) | |
| Alienware x17 R2 P48E | |
| MSI Raider GE77 HX 12UHS | |
| Razer Blade 17 Early 2022 | |
| Average NVIDIA GeForce RTX 3080 Ti Laptop GPU (6423 - 8462, n=28) | |
| Medion Erazer Beast X30 | |
V-Ray Benchmark Next 4.10: GPU | CPU
Geekbench 5.5: OpenCL Score
SPECviewperf 13: Solidworks (sw-04) | Siemens NX (snx-03) | Showcase (showcase-02) | Medical (medical-02) | Maya (maya-05) | Energy (energy-02) | Creo (creo-02) | Catia (catia-05) | 3ds Max (3dsmax-06)
| V-Ray 5 Benchmark / GPU RTX | |
| Average of class Gaming (556 - 4077, n=65, last 2 years) | |
| MSI Raider GE77 HX 12UHS (5.0.1, Extreme Leistung) | |
| MSI Raider GE77 HX 12UHS (5.0.1) | |
| Razer Blade 17 Early 2022 (5.0.1) | |
| MSI Raider GE77 HX 12UHS (5.0.1, dGPU, Extreme Leistung) | |
| Medion Erazer Beast X30 (5.0.1) | |
| Average NVIDIA GeForce RTX 3080 Ti Laptop GPU (1225 - 1915, n=19) | |
| V-Ray 5 Benchmark / GPU CUDA | |
| Average of class Gaming (425 - 3288, n=66, last 2 years) | |
| MSI Raider GE77 HX 12UHS (5.0.1, Extreme Leistung) | |
| Razer Blade 17 Early 2022 (5.0.1) | |
| MSI Raider GE77 HX 12UHS (5.0.1) | |
| MSI Raider GE77 HX 12UHS (5.0.1, dGPU, Extreme Leistung) | |
| Medion Erazer Beast X30 (5.0.1) | |
| Average NVIDIA GeForce RTX 3080 Ti Laptop GPU (846 - 1384, n=20) | |
| V-Ray 5 Benchmark / CPU | |
| Average of class Gaming (4081 - 30302, n=67, last 2 years) | |
| MSI Raider GE77 HX 12UHS (5.0.1, dGPU, Extreme Leistung) | |
| MSI Raider GE77 HX 12UHS (5.0.1) | |
| MSI Raider GE77 HX 12UHS (5.0.1, Extreme Leistung) | |
| Alienware x17 R2 P48E (5.0.1) | |
| Average NVIDIA GeForce RTX 3080 Ti Laptop GPU (3692 - 15811, n=25) | |
| Medion Erazer Beast X30 (5.0.1) | |
| Razer Blade 17 Early 2022 (5.0.1) | |
| V-Ray Benchmark Next 4.10 / GPU | |
| Average of class Gaming (54 - 1333, n=133, last 2 years) | |
| MSI Raider GE77 HX 12UHS (v4.10.07 ) | |
| Medion Erazer Beast X30 (v4.10.07 ) | |
| MSI Raider GE77 HX 12UHS (v4.10.07, Extreme Leistung) | |
| MSI Raider GE77 HX 12UHS (v4.10.07, dGPU, Extreme Leistung) | |
| Average NVIDIA GeForce RTX 3080 Ti Laptop GPU (311 - 552, n=35) | |
| Razer Blade 17 Early 2022 (v4.10.07 ) | |
| V-Ray Benchmark Next 4.10 / CPU | |
| Average of class Gaming (6122 - 45327, n=133, last 2 years) | |
| MSI Raider GE77 HX 12UHS (v4.10.07, Extreme Leistung) | |
| MSI Raider GE77 HX 12UHS (v4.10.07, dGPU, Extreme Leistung) | |
| MSI Raider GE77 HX 12UHS (v4.10.07 ) | |
| Medion Erazer Beast X30 (v4.10.07 ) | |
| Average NVIDIA GeForce RTX 3080 Ti Laptop GPU (5564 - 23947, n=35) | |
| Razer Blade 17 Early 2022 (v4.10.07 ) | |
| Geekbench 5.5 / OpenCL Score | |
| Average of class Gaming (5039 - 277970, n=143, last 2 years) | |
| MSI Raider GE77 HX 12UHS | |
| MSI Raider GE77 HX 12UHS (Extreme Leistung) | |
| Alienware x17 R2 P48E | |
| Medion Erazer Beast X30 | |
| Average NVIDIA GeForce RTX 3080 Ti Laptop GPU (88580 - 151633, n=41) | |
| Razer Blade 17 Early 2022 | |
| SPECviewperf 13 / Solidworks (sw-04) | |
| Razer Blade 17 Early 2022 (dGPU, 175W) | |
| MSI Raider GE77 HX 12UHS | |
| Average NVIDIA GeForce RTX 3080 Ti Laptop GPU (62.9 - 133.4, n=8) | |
| Average of class Gaming (n=1last 2 years) | |
| SPECviewperf 13 / Siemens NX (snx-03) | |
| MSI Raider GE77 HX 12UHS | |
| Razer Blade 17 Early 2022 (dGPU, 175W) | |
| Average NVIDIA GeForce RTX 3080 Ti Laptop GPU (18.3 - 25.3, n=8) | |
| Average of class Gaming (n=1last 2 years) | |
| SPECviewperf 13 / Showcase (showcase-02) | |
| Razer Blade 17 Early 2022 (dGPU, 175W) | |
| MSI Raider GE77 HX 12UHS | |
| Average NVIDIA GeForce RTX 3080 Ti Laptop GPU (110 - 175, n=8) | |
| Average of class Gaming (n=1last 2 years) | |
| SPECviewperf 13 / Medical (medical-02) | |
| Razer Blade 17 Early 2022 (dGPU, 175W) | |
| MSI Raider GE77 HX 12UHS | |
| Average NVIDIA GeForce RTX 3080 Ti Laptop GPU (65.3 - 79.1, n=8) | |
| Average of class Gaming (n=1last 2 years) | |
| SPECviewperf 13 / Maya (maya-05) | |
| Razer Blade 17 Early 2022 (dGPU, 175W) | |
| Average NVIDIA GeForce RTX 3080 Ti Laptop GPU (212 - 430, n=8) | |
| MSI Raider GE77 HX 12UHS | |
| Average of class Gaming (n=1last 2 years) | |
| SPECviewperf 13 / Energy (energy-02) | |
| MSI Raider GE77 HX 12UHS | |
| Razer Blade 17 Early 2022 (dGPU, 175W) | |
| Average NVIDIA GeForce RTX 3080 Ti Laptop GPU (19.3 - 27.3, n=8) | |
| Average of class Gaming (n=1last 2 years) | |
| SPECviewperf 13 / Creo (creo-02) | |
| Razer Blade 17 Early 2022 (dGPU, 175W) | |
| MSI Raider GE77 HX 12UHS | |
| Average NVIDIA GeForce RTX 3080 Ti Laptop GPU (177.4 - 311, n=8) | |
| Average of class Gaming (n=1last 2 years) | |
| SPECviewperf 13 / Catia (catia-05) | |
| Razer Blade 17 Early 2022 (dGPU, 175W) | |
| MSI Raider GE77 HX 12UHS | |
| Average NVIDIA GeForce RTX 3080 Ti Laptop GPU (130.4 - 190.3, n=8) | |
| Average of class Gaming (n=1last 2 years) | |
| SPECviewperf 13 / 3ds Max (3dsmax-06) | |
| Razer Blade 17 Early 2022 (dGPU, 175W) | |
| MSI Raider GE77 HX 12UHS | |
| Average NVIDIA GeForce RTX 3080 Ti Laptop GPU (161 - 260, n=8) | |
| Average of class Gaming (n=1last 2 years) | |
| 3DMark 06 Standard Score | 58305 points | |
| 3DMark 11 Performance | 36734 points | |
| 3DMark Cloud Gate Standard Score | 61721 points | |
| 3DMark Fire Strike Score | 28975 points | |
| 3DMark Time Spy Score | 13320 points | |
Help | ||
Gaming Performance
The hardware allows for 4K gaming at high to maximum settings. The frame rates range above the average for an RTX 3080 Ti. Switching to direct video output via the GeForce GPU results in an increase of the values. Often times, the GE77 then produces some of the highest frame rates we have seen with this GPU.
| The Witcher 3 - 1920x1080 Ultra Graphics & Postprocessing (HBAO+) | |
| Average of class Gaming (18.4 - 240, n=54, last 2 years) | |
| MSI Raider GE77 HX 12UHS (dGPU, Extreme Leistung) | |
| Alienware x17 R2 P48E | |
| MSI Raider GE77 HX 12UHS | |
| Razer Blade 17 Early 2022 | |
| Medion Erazer Beast X30 | |
| Average NVIDIA GeForce RTX 3080 Ti Laptop GPU (30 - 130.6, n=43) | |
| Dota 2 Reborn | |
| 3840x2160 ultra (3/3) best looking | |
| MSI Raider GE77 HX 12UHS (dGPU, Extreme Leistung) | |
| Average of class Gaming (105.2 - 199.2, n=43, last 2 years) | |
| MSI Raider GE77 HX 12UHS (Extreme Leistung) | |
| MSI Raider GE77 HX 12UHS | |
| Average NVIDIA GeForce RTX 3080 Ti Laptop GPU (70.8 - 155.6, n=19) | |
| Razer Blade 17 Early 2022 | |
| 1920x1080 ultra (3/3) best looking | |
| MSI Raider GE77 HX 12UHS (Extreme Leistung) | |
| MSI Raider GE77 HX 12UHS (dGPU, Extreme Leistung) | |
| MSI Raider GE77 HX 12UHS | |
| Alienware x17 R2 P48E | |
| Average of class Gaming (65.1 - 248, n=147, last 2 years) | |
| Medion Erazer Beast X30 | |
| Average NVIDIA GeForce RTX 3080 Ti Laptop GPU (29.9 - 170.5, n=45) | |
| Razer Blade 17 Early 2022 | |
| X-Plane 11.11 | |
| 3840x2160 high (fps_test=3) | |
| MSI Raider GE77 HX 12UHS (dGPU, Extreme Leistung) | |
| MSI Raider GE77 HX 12UHS | |
| MSI Raider GE77 HX 12UHS (Extreme Leistung) | |
| Average of class Gaming (62.9 - 145.5, n=43, last 2 years) | |
| Average NVIDIA GeForce RTX 3080 Ti Laptop GPU (32.9 - 109.5, n=20) | |
| Razer Blade 17 Early 2022 | |
| 1920x1080 high (fps_test=3) | |
| MSI Raider GE77 HX 12UHS (dGPU, Extreme Leistung) | |
| MSI Raider GE77 HX 12UHS | |
| MSI Raider GE77 HX 12UHS (Extreme Leistung) | |
| Alienware x17 R2 P48E | |
| Average of class Gaming (33.4 - 150.2, n=150, last 2 years) | |
| Average NVIDIA GeForce RTX 3080 Ti Laptop GPU (32.6 - 127, n=45) | |
| Medion Erazer Beast X30 | |
| Razer Blade 17 Early 2022 | |
| Final Fantasy XV Benchmark | |
| 3840x2160 High Quality | |
| Average of class Gaming (32.6 - 111.8, n=40, last 2 years) | |
| MSI Raider GE77 HX 12UHS (1.3, dGPU, Extreme Leistung) | |
| MSI Raider GE77 HX 12UHS (1.3, Extreme Leistung) | |
| MSI Raider GE77 HX 12UHS (1.3) | |
| Razer Blade 17 Early 2022 (1.3) | |
| Average NVIDIA GeForce RTX 3080 Ti Laptop GPU (35.1 - 61.2, n=18) | |
| 1920x1080 High Quality | |
| MSI Raider GE77 HX 12UHS (1.3, dGPU, Extreme Leistung) | |
| MSI Raider GE77 HX 12UHS (1.3, Extreme Leistung) | |
| Average of class Gaming (19.2 - 215, n=143, last 2 years) | |
| MSI Raider GE77 HX 12UHS (1.3) | |
| Alienware x17 R2 P48E (1.3) | |
| Average NVIDIA GeForce RTX 3080 Ti Laptop GPU (30.7 - 140.6, n=42) | |
| Razer Blade 17 Early 2022 (1.3) | |
| Medion Erazer Beast X30 (1.3) | |
| GTA V | |
| 1920x1080 Highest AA:4xMSAA + FX AF:16x | |
| MSI Raider GE77 HX 12UHS (Extreme Leistung) | |
| MSI Raider GE77 HX 12UHS (dGPU, Extreme Leistung) | |
| MSI Raider GE77 HX 12UHS | |
| Alienware x17 R2 P48E | |
| Average of class Gaming (12.1 - 186.9, n=131, last 2 years) | |
| Average NVIDIA GeForce RTX 3080 Ti Laptop GPU (30 - 139.2, n=42) | |
| Medion Erazer Beast X30 | |
| Razer Blade 17 Early 2022 | |
| 3840x2160 Highest AA:4xMSAA + FX AF:16x | |
| Average of class Gaming (33.6 - 116.7, n=29, last 2 years) | |
| MSI Raider GE77 HX 12UHS (Extreme Leistung) | |
| MSI Raider GE77 HX 12UHS (dGPU, Extreme Leistung) | |
| MSI Raider GE77 HX 12UHS | |
| Razer Blade 17 Early 2022 | |
| Average NVIDIA GeForce RTX 3080 Ti Laptop GPU (37.7 - 67.2, n=14) | |
| Strange Brigade | |
| 3840x2160 ultra AA:ultra AF:16 | |
| Average of class Gaming (54.5 - 187.2, n=40, last 2 years) | |
| MSI Raider GE77 HX 12UHS (1.47.22.14 D3D12, dGPU, Extreme Leistung) | |
| MSI Raider GE77 HX 12UHS (1.47.22.14 D3D12, Extreme Leistung) | |
| MSI Raider GE77 HX 12UHS (1.47.22.14 D3D12) | |
| Razer Blade 17 Early 2022 (1.47.22.14 D3D12) | |
| Average NVIDIA GeForce RTX 3080 Ti Laptop GPU (61.7 - 100.7, n=15) | |
| 1920x1080 ultra AA:ultra AF:16 | |
| Average of class Gaming (38.9 - 456, n=130, last 2 years) | |
| MSI Raider GE77 HX 12UHS (1.47.22.14 D3D12, dGPU, Extreme Leistung) | |
| Alienware x17 R2 P48E (1.47.22.14 D3D12) | |
| MSI Raider GE77 HX 12UHS (1.47.22.14 D3D12, Extreme Leistung) | |
| MSI Raider GE77 HX 12UHS (1.47.22.14 D3D12) | |
| Razer Blade 17 Early 2022 (1.47.22.14 D3D12) | |
| Medion Erazer Beast X30 (1.47.22.14 D3D12) | |
| Average NVIDIA GeForce RTX 3080 Ti Laptop GPU (42.3 - 224, n=41) | |
| F1 2021 | |
| 1920x1080 Ultra High Preset + Raytracing AA:T AF:16x | |
| MSI Raider GE77 HX 12UHS (874931, dGPU, Extreme Leistung) | |
| MSI Raider GE77 HX 12UHS (874931) | |
| MSI Raider GE77 HX 12UHS (874931, Extreme Leistung) | |
| Average of class Gaming (123.1 - 146.7, n=3, last 2 years) | |
| Razer Blade 17 Early 2022 (874931) | |
| Medion Erazer Beast X30 (874931) | |
| Average NVIDIA GeForce RTX 3080 Ti Laptop GPU (30.2 - 160.6, n=30) | |
| 3840x2160 Ultra High Preset + Raytracing AA:T AF:16x | |
| MSI Raider GE77 HX 12UHS (874931, dGPU, Extreme Leistung) | |
| MSI Raider GE77 HX 12UHS (874931, Extreme Leistung) | |
| MSI Raider GE77 HX 12UHS (874931) | |
| Razer Blade 17 Early 2022 (874931) | |
| Average NVIDIA GeForce RTX 3080 Ti Laptop GPU (41.1 - 70.2, n=18) | |
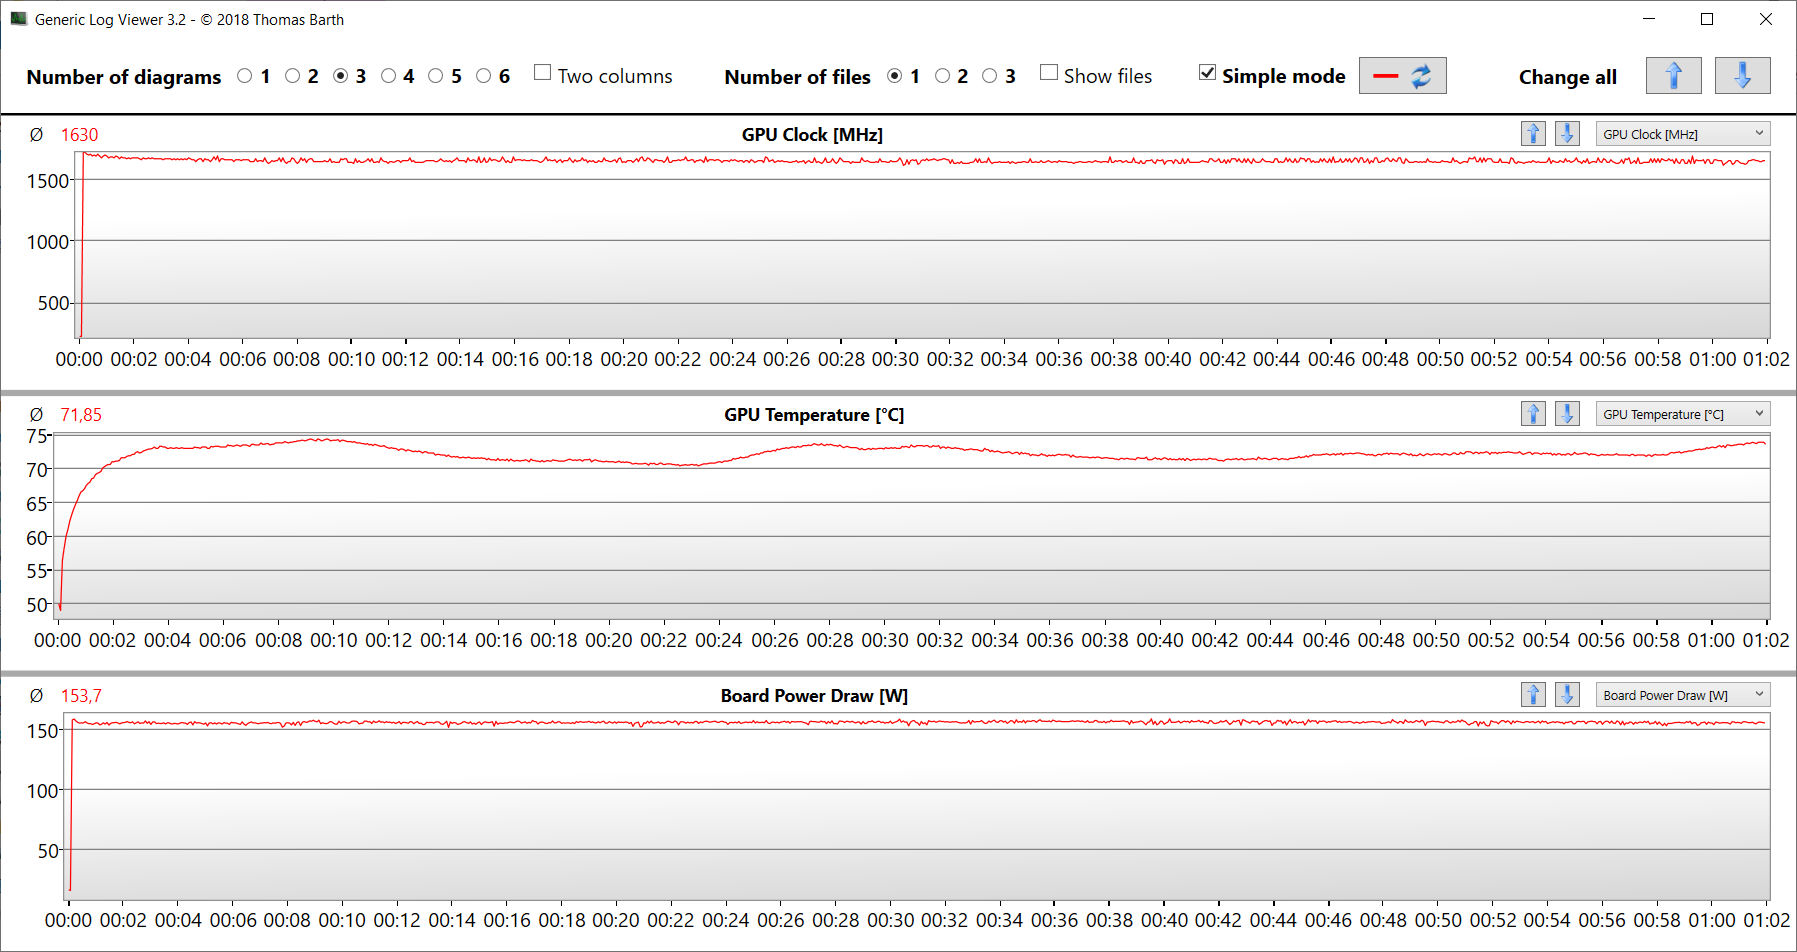
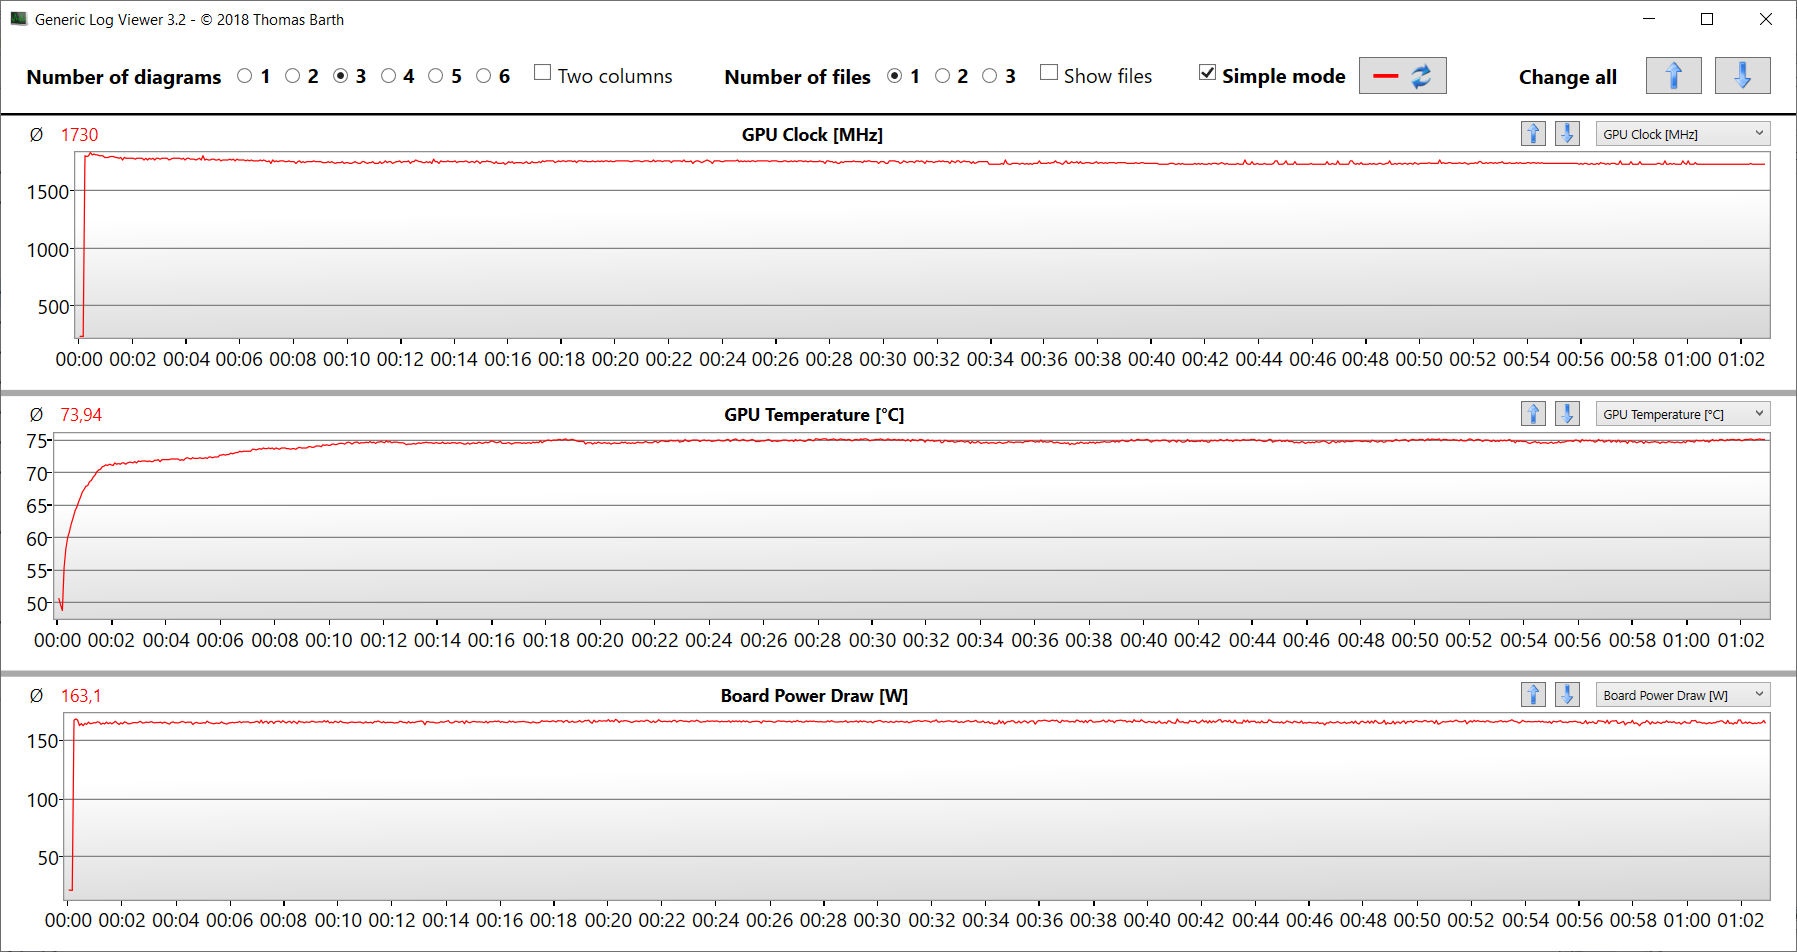
In order to determine whether the frame rates remain consistent over a long period of time, we run the game "The Witcher 3" for 60 minutes at Full HD resolution and maximum quality settings. The character is not moved throughout the test. We did not notice any frame rate dips.
Witcher 3 FPS Chart
| low | med. | high | ultra | QHD | 4K | |
|---|---|---|---|---|---|---|
| GTA V (2015) | 186.8 | 187 | 184.3 | 136 | 121.1 | 122 |
| The Witcher 3 (2015) | 498 | 392 | 249 | 126.7 | 62.1 | |
| Dota 2 Reborn (2015) | 203 | 184 | 174.8 | 165.7 | 144.7 | |
| Final Fantasy XV Benchmark (2018) | 217 | 175.6 | 132 | 98.6 | 57.9 | |
| X-Plane 11.11 (2018) | 172.8 | 152.3 | 121.1 | 103 | ||
| Far Cry 5 (2018) | 214 | 176 | 167 | 156 | 131 | 73 |
| Strange Brigade (2018) | 505 | 291 | 234 | 209 | 159.9 | 96.6 |
| F1 2021 (2021) | 354 | 243 | 207 | 133.8 | 104.3 | 64 |
Emissions - MSI system gets noisy under load
System Noise
Even during idle and under low loads, the fan control does not work entirely smoothly. For example, the fans stand still at times for a completely silent experience; at other times, they become very noticeable (up to 46 dB(A)). Under load, the MSI laptop produces very high maximum noise levels of up to 55 dB(A) (Witcher 3 test) or 57 dB(A) (stress test).
For quiet operation, using the "Silent mode" is recommended. The system is then quieter, but not entirely silent - at the same time the performance is significantly reduced.
Noise level
| Idle |
| 26 / 34 / 46 dB(A) |
| Load |
| 50 / 57 dB(A) |
 | ||
30 dB silent 40 dB(A) audible 50 dB(A) loud |
||
min: | ||
| MSI Raider GE77 HX 12UHS Intel Core i9-12900HX, NVIDIA GeForce RTX 3080 Ti Laptop GPU | Razer Blade 17 Early 2022 Intel Core i9-12900H, NVIDIA GeForce RTX 3080 Ti Laptop GPU | Alienware x17 R2 P48E Intel Core i9-12900HK, NVIDIA GeForce RTX 3080 Ti Laptop GPU | Medion Erazer Beast X30 Intel Core i9-12900HK, NVIDIA GeForce RTX 3080 Ti Laptop GPU | |
|---|---|---|---|---|
| Noise | 10% | 22% | 8% | |
| off / environment * (dB) | 26 | 26 -0% | 22.7 13% | 26 -0% |
| Idle Minimum * (dB) | 26 | 26 -0% | 23.1 11% | 27 -4% |
| Idle Average * (dB) | 34 | 27 21% | 23.1 32% | 29 15% |
| Idle Maximum * (dB) | 46 | 32 30% | 23.1 50% | 34 26% |
| Load Average * (dB) | 50 | 50 -0% | 31.9 36% | 48 4% |
| Witcher 3 ultra * (dB) | 55 | 51 7% | 52.5 5% | 51 7% |
| Load Maximum * (dB) | 57 | 51 11% | 52.5 8% | 53 7% |
* ... smaller is better
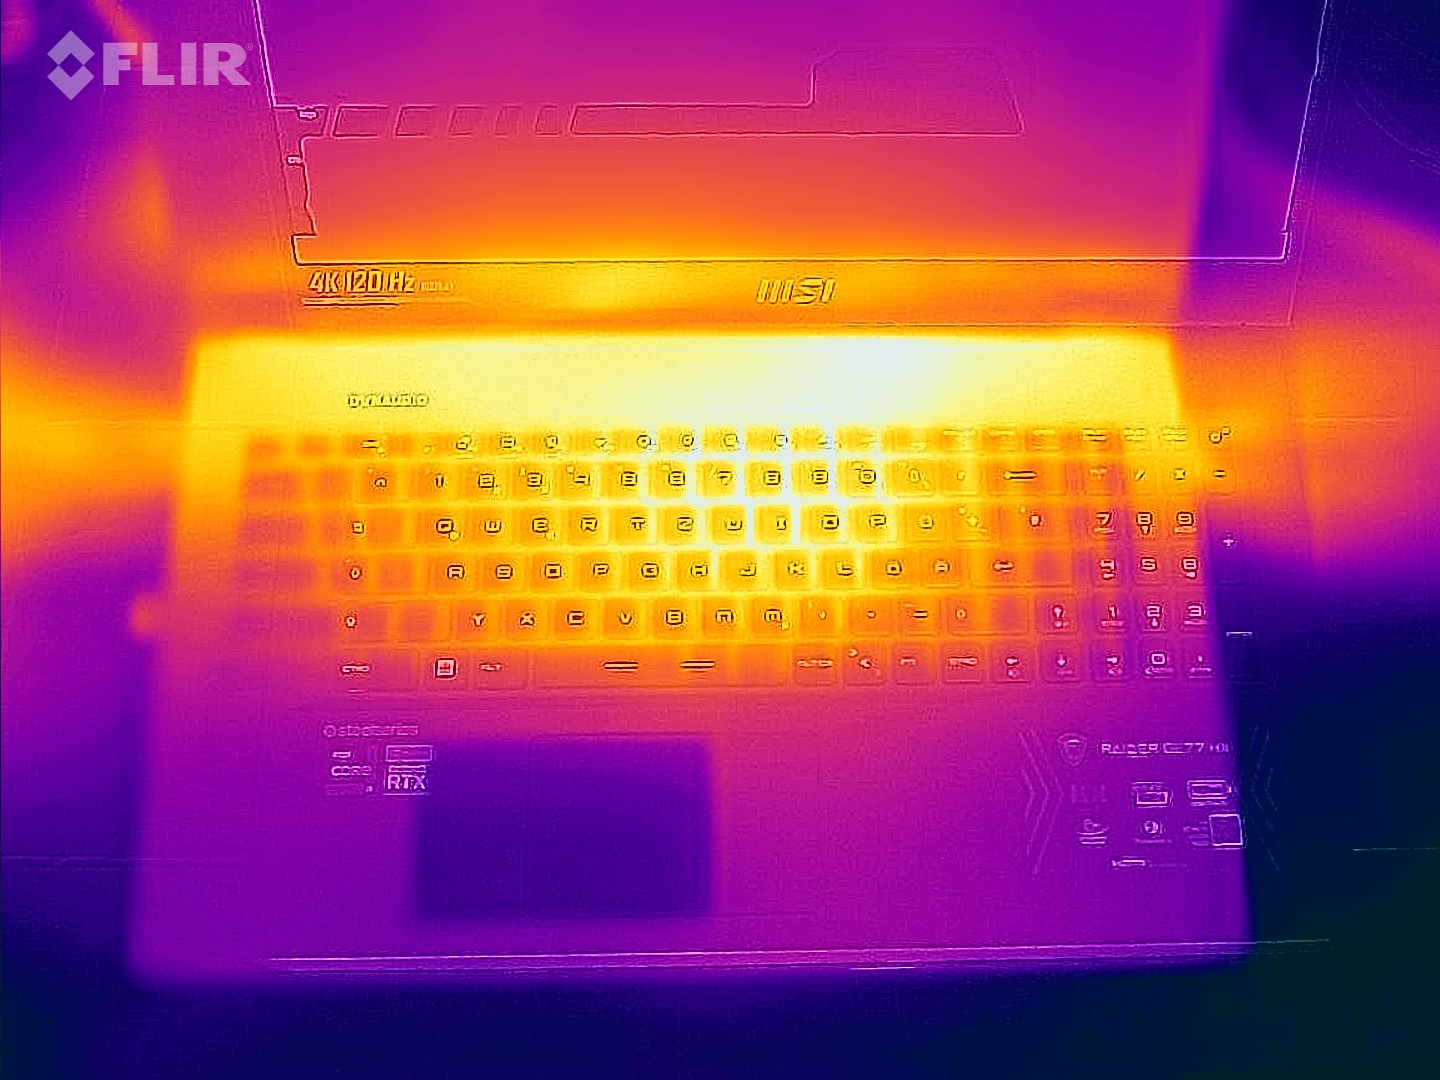
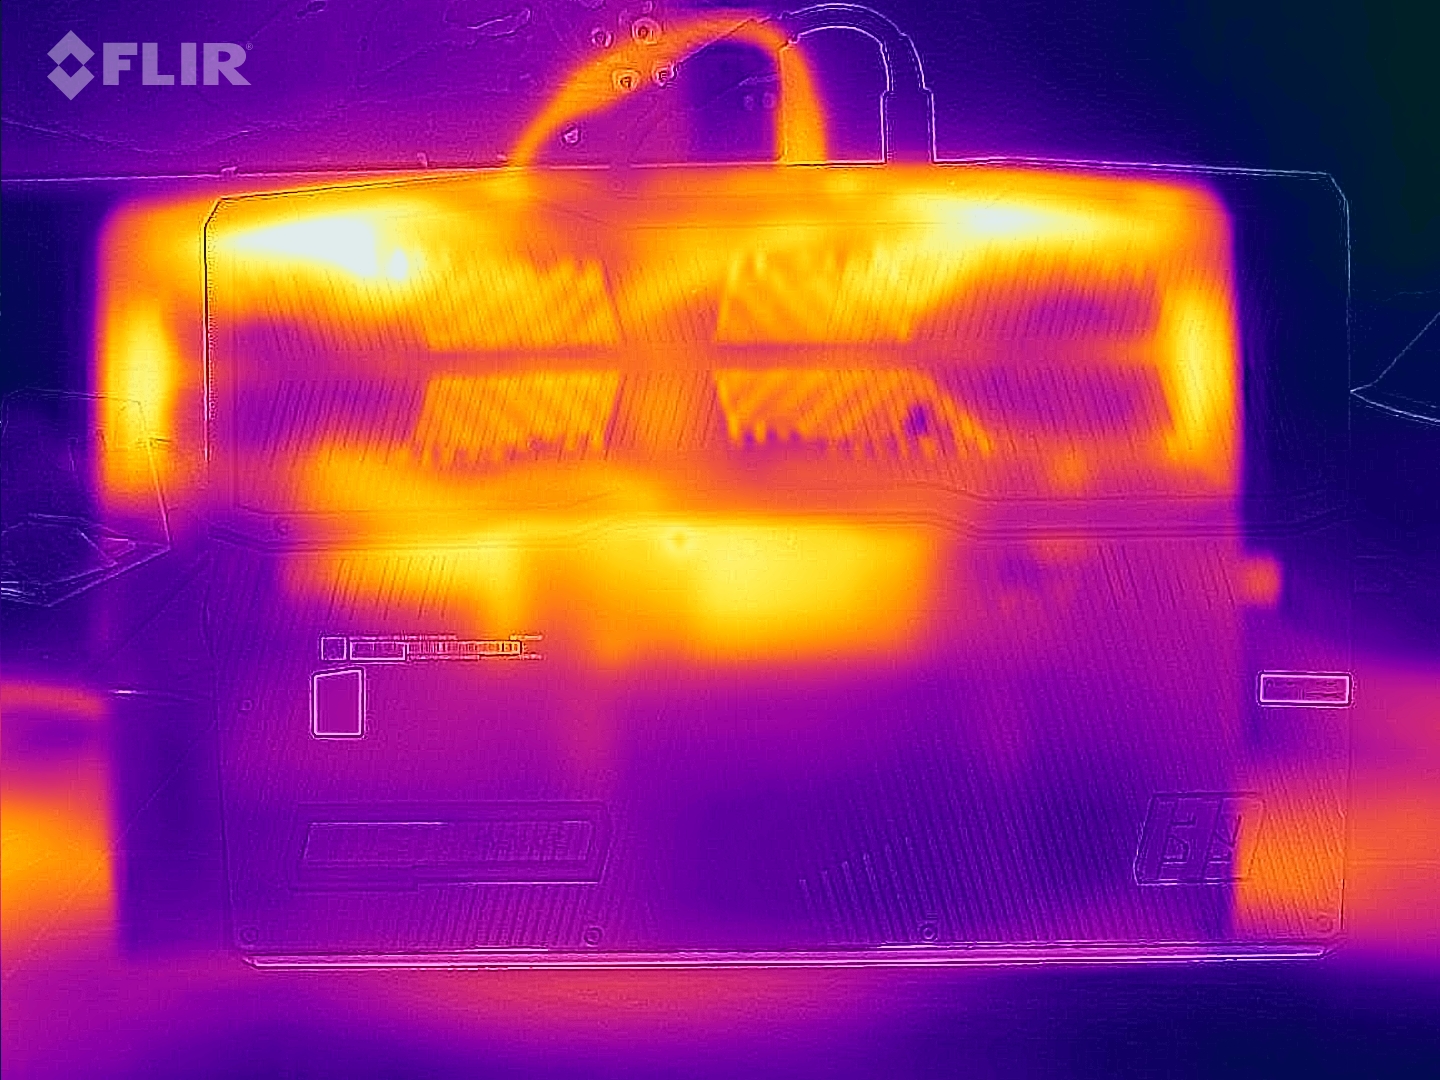
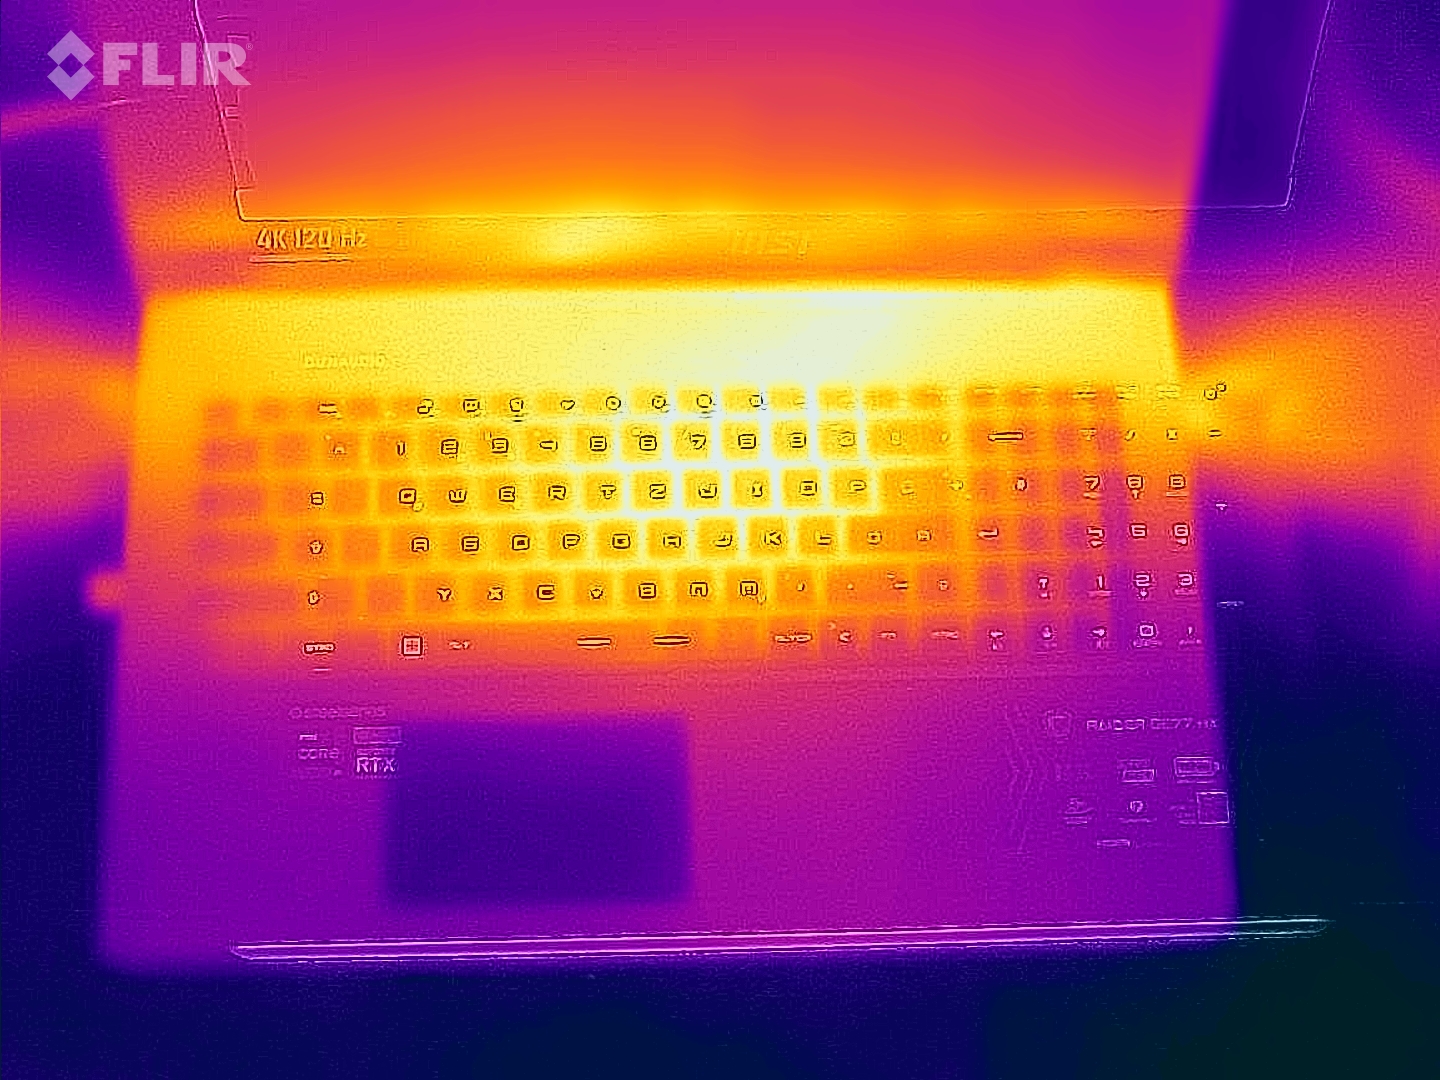
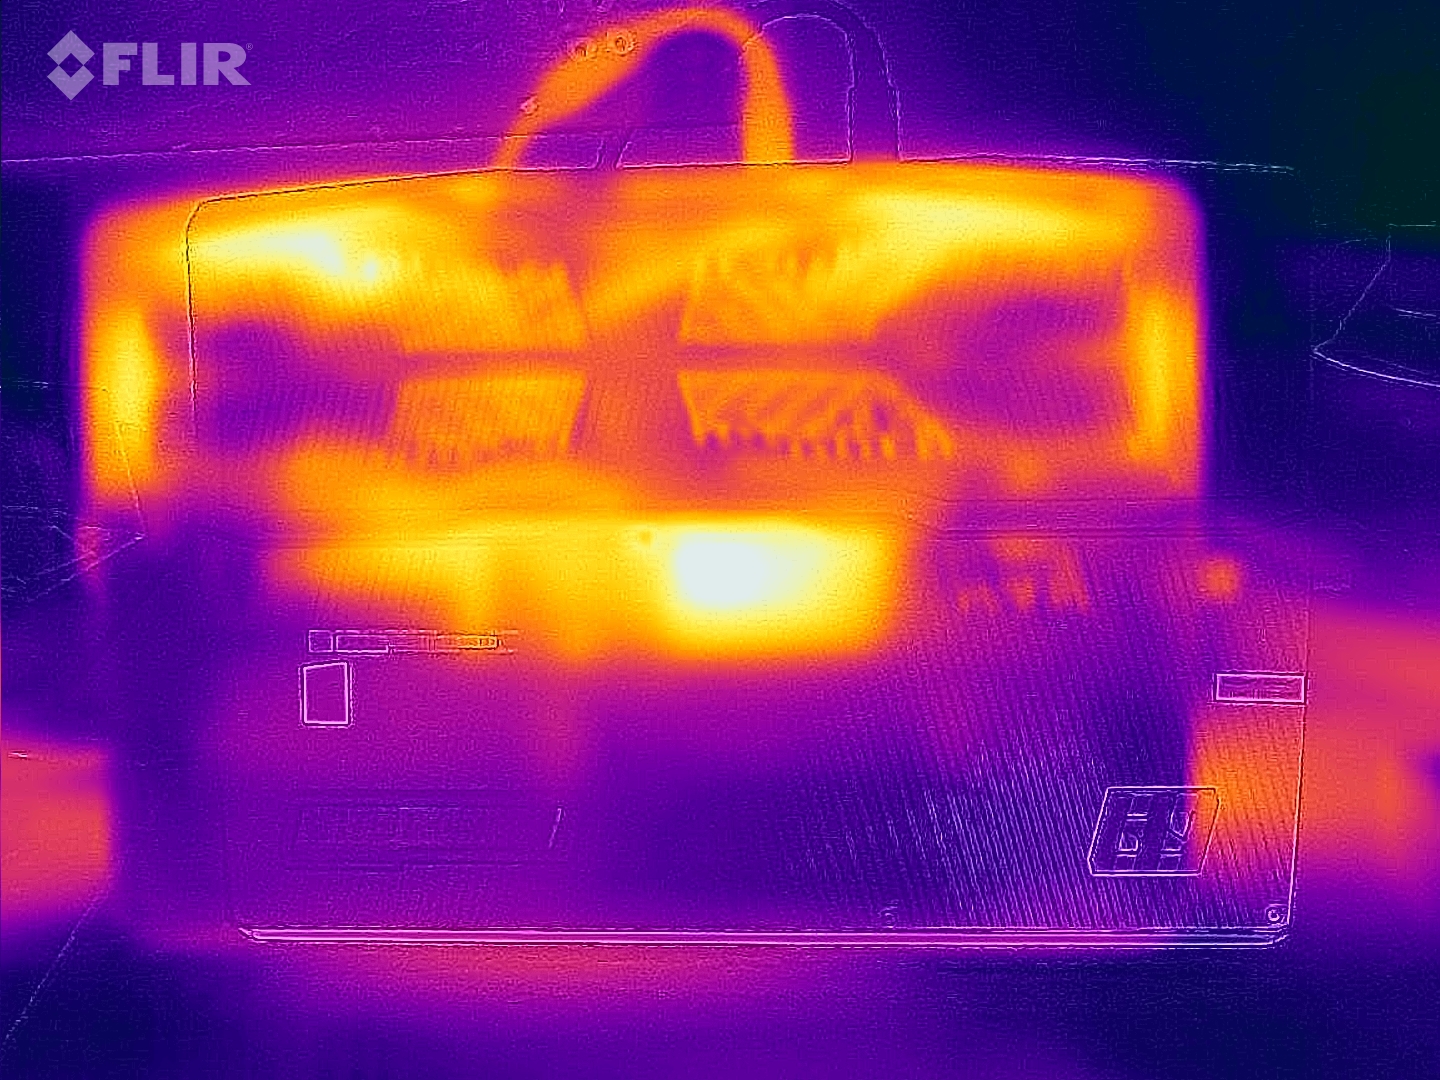
Temperature
During daily use (office, web) the surface temperatures remain within an acceptable range. Under load (stress test, Witcher 3 test), the laptop heats up significantly, but not excessively. Users will not have to worry about the CPU temperatures, either.
(-) The maximum temperature on the upper side is 53 °C / 127 F, compared to the average of 40.4 °C / 105 F, ranging from 21.2 to 68.8 °C for the class Gaming.
(-) The bottom heats up to a maximum of 58 °C / 136 F, compared to the average of 43.3 °C / 110 F
(±) In idle usage, the average temperature for the upper side is 34.8 °C / 95 F, compared to the device average of 33.9 °C / 93 F.
(-) Playing The Witcher 3, the average temperature for the upper side is 44.1 °C / 111 F, compared to the device average of 33.9 °C / 93 F.
(+) The palmrests and touchpad are reaching skin temperature as a maximum (35 °C / 95 F) and are therefore not hot.
(-) The average temperature of the palmrest area of similar devices was 28.8 °C / 83.8 F (-6.2 °C / -11.2 F).
| MSI Raider GE77 HX 12UHS Intel Core i9-12900HX, NVIDIA GeForce RTX 3080 Ti Laptop GPU | Razer Blade 17 Early 2022 Intel Core i9-12900H, NVIDIA GeForce RTX 3080 Ti Laptop GPU | Alienware x17 R2 P48E Intel Core i9-12900HK, NVIDIA GeForce RTX 3080 Ti Laptop GPU | Medion Erazer Beast X30 Intel Core i9-12900HK, NVIDIA GeForce RTX 3080 Ti Laptop GPU | |
|---|---|---|---|---|
| Heat | 7% | 21% | 5% | |
| Maximum Upper Side * (°C) | 53 | 50 6% | 49.6 6% | 55 -4% |
| Maximum Bottom * (°C) | 58 | 56 3% | 42.4 27% | 62 -7% |
| Idle Upper Side * (°C) | 38 | 36 5% | 29.2 23% | 32 16% |
| Idle Bottom * (°C) | 43 | 38 12% | 32 26% | 36 16% |
* ... smaller is better
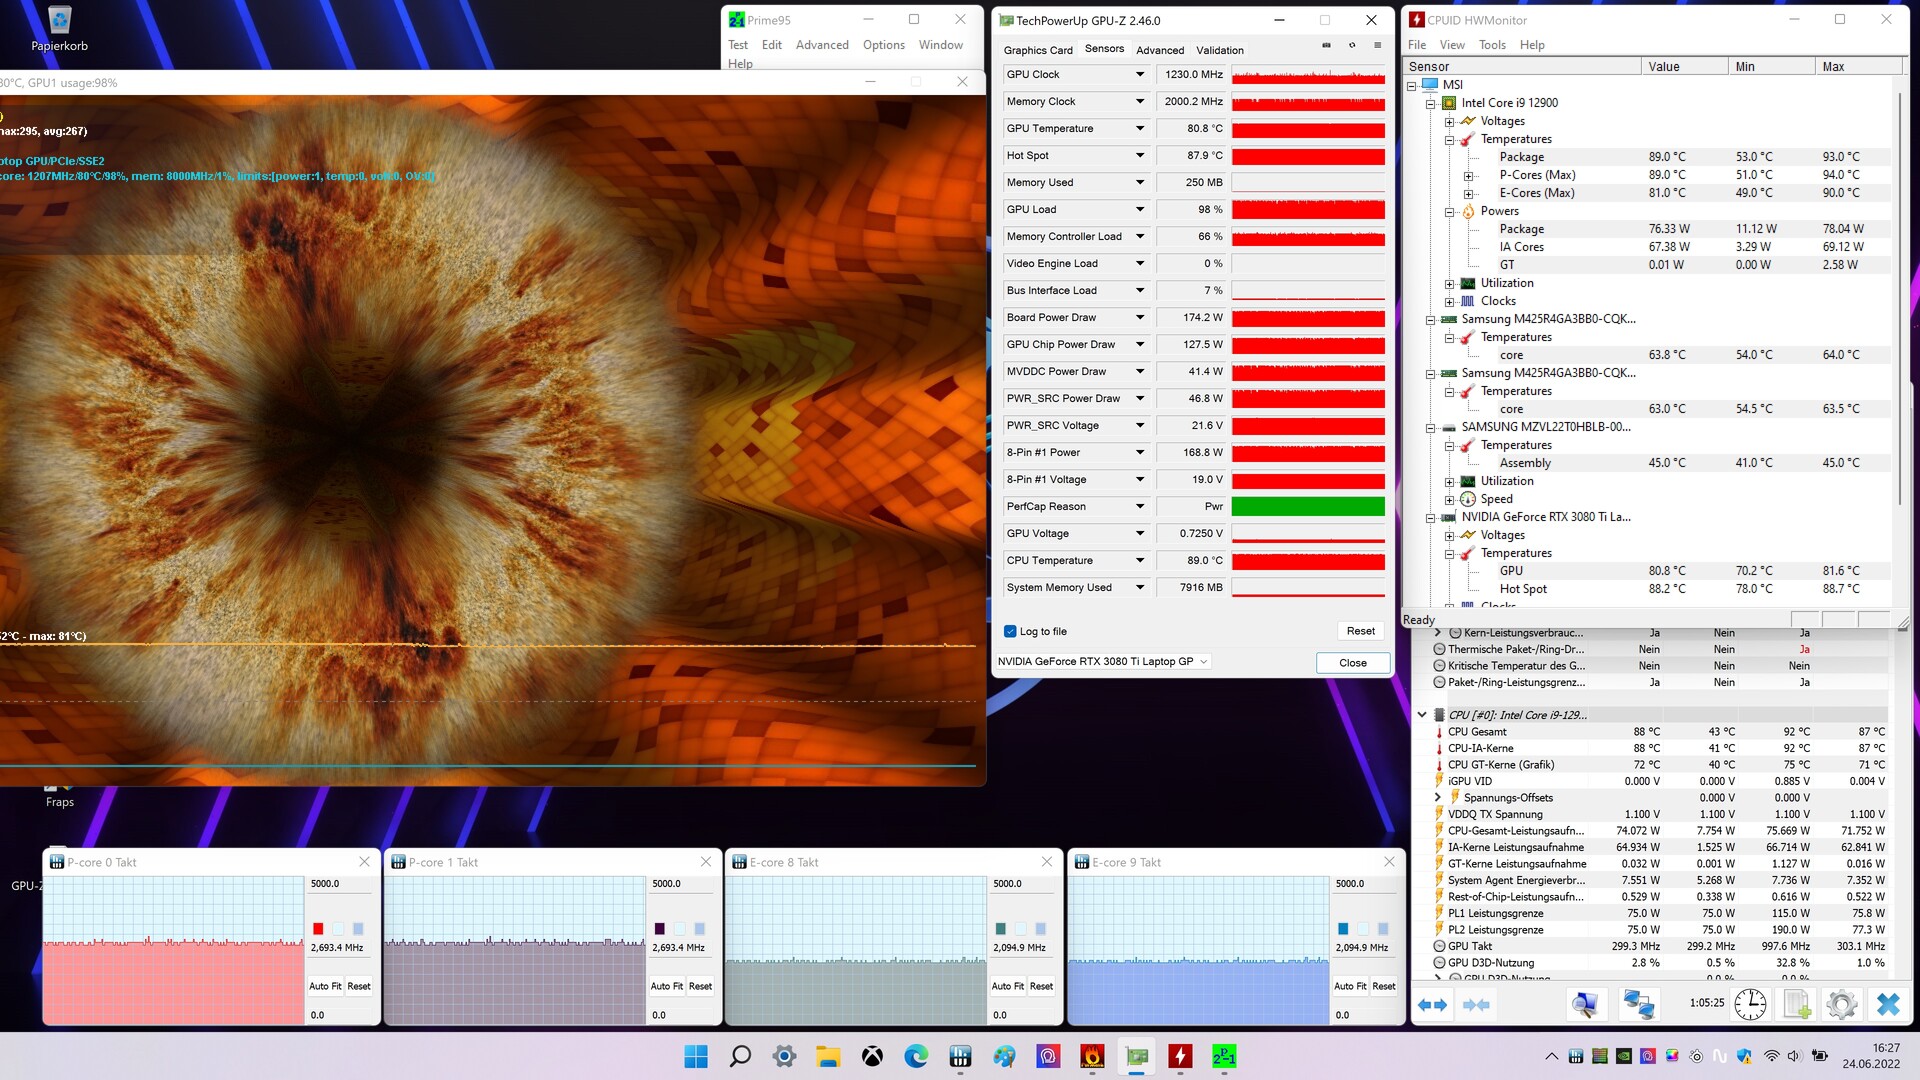
Stress Test
At the beginning of the stress test (running Prime95 and FurMark for at least one hour), both the CPU and GPU run at high speeds. Subsequently, the clock speeds drop to 1.3 (CPU) and 1100 MHz (GPU). The stress test represents an extreme scenario. We use this test to determine whether the system remains stable under full load.
Speakers
The laptop comes with two speakers and two woofers, which together produce decent sound - although slightly more bass would not hurt. For a better sound experience, headphones or external speakers are recommended.
MSI Raider GE77 HX 12UHS audio analysis
(+) | speakers can play relatively loud (85 dB)
Bass 100 - 315 Hz
(±) | reduced bass - on average 11% lower than median
(±) | linearity of bass is average (11.3% delta to prev. frequency)
Mids 400 - 2000 Hz
(+) | balanced mids - only 4.3% away from median
(+) | mids are linear (3.2% delta to prev. frequency)
Highs 2 - 16 kHz
(+) | balanced highs - only 2.3% away from median
(+) | highs are linear (5% delta to prev. frequency)
Overall 100 - 16.000 Hz
(+) | overall sound is linear (11% difference to median)
Compared to same class
» 7% of all tested devices in this class were better, 3% similar, 89% worse
» The best had a delta of 6%, average was 18%, worst was 132%
Compared to all devices tested
» 6% of all tested devices were better, 2% similar, 92% worse
» The best had a delta of 4%, average was 24%, worst was 134%
Razer Blade 17 Early 2022 audio analysis
(+) | speakers can play relatively loud (83 dB)
Bass 100 - 315 Hz
(±) | reduced bass - on average 7.4% lower than median
(±) | linearity of bass is average (9.7% delta to prev. frequency)
Mids 400 - 2000 Hz
(+) | balanced mids - only 3% away from median
(+) | mids are linear (3.7% delta to prev. frequency)
Highs 2 - 16 kHz
(+) | balanced highs - only 2.5% away from median
(+) | highs are linear (6.1% delta to prev. frequency)
Overall 100 - 16.000 Hz
(+) | overall sound is linear (9.2% difference to median)
Compared to same class
» 3% of all tested devices in this class were better, 1% similar, 96% worse
» The best had a delta of 6%, average was 18%, worst was 132%
Compared to all devices tested
» 3% of all tested devices were better, 1% similar, 96% worse
» The best had a delta of 4%, average was 24%, worst was 134%
Energy Management - Gaming Laptop with decent battery life
Energy Consumption
The energy consumption during idle matches our expectations for the installed hardware. During the Witcher 3 and stress tests, the power draw rises to an average of 247 watts and 352 watts, respectively - the latter value represents a temporary peak. While the power consumption remains steady throughout the Witcher 3 test, it fluctuates during the stress test. The included 330-watt AC adapter is sufficiently dimensioned.
| Off / Standby | |
| Idle | |
| Load |
|
Key:
min: | |
| MSI Raider GE77 HX 12UHS Intel Core i9-12900HX, NVIDIA GeForce RTX 3080 Ti Laptop GPU | Razer Blade 17 Early 2022 Intel Core i9-12900H, NVIDIA GeForce RTX 3080 Ti Laptop GPU | Alienware x17 R2 P48E Intel Core i9-12900HK, NVIDIA GeForce RTX 3080 Ti Laptop GPU | Medion Erazer Beast X30 Intel Core i9-12900HK, NVIDIA GeForce RTX 3080 Ti Laptop GPU | Average NVIDIA GeForce RTX 3080 Ti Laptop GPU | Average of class Gaming | |
|---|---|---|---|---|---|---|
| Power Consumption | -3% | -38% | 16% | -5% | 11% | |
| Idle Minimum * (Watt) | 13 | 17 -31% | 24.1 -85% | 12 8% | 17.2 ? -32% | 13.5 ? -4% |
| Idle Average * (Watt) | 19 | 23 -21% | 28.5 -50% | 16 16% | 23.3 ? -23% | 19.3 ? -2% |
| Idle Maximum * (Watt) | 29 | 34 -17% | 60 -107% | 22 24% | 30.8 ? -6% | 25.8 ? 11% |
| Load Average * (Watt) | 143 | 120 16% | 128.7 10% | 118 17% | 121.2 ? 15% | 110.9 ? 22% |
| Witcher 3 ultra * (Watt) | 247 | 229 7% | 254 -3% | 223 10% | ||
| Load Maximum * (Watt) | 352 | 243 31% | 323 8% | 290 18% | 276 ? 22% | 260 ? 26% |
* ... smaller is better
Consumption Witcher 3 / Stress Test
Consumption external Monitor
Battery Life
The 17.3-inch laptop reaches a runtime of 5:24 h and 6:29 h in our Wi-Fi (periodically accessing websites via a script) and video (short film Big Buck Bunny (H.264 codec, FHD)) test. Energy saving features of the laptop are disabled for both tests and the display brightness is set to 150 nits. For the video test, the wireless modules were also disabled.
| MSI Raider GE77 HX 12UHS i9-12900HX, GeForce RTX 3080 Ti Laptop GPU, 99.99 Wh | Razer Blade 17 Early 2022 i9-12900H, GeForce RTX 3080 Ti Laptop GPU, 82 Wh | Alienware x17 R2 P48E i9-12900HK, GeForce RTX 3080 Ti Laptop GPU, 87 Wh | Medion Erazer Beast X30 i9-12900HK, GeForce RTX 3080 Ti Laptop GPU, 91.2 Wh | Average of class Gaming | |
|---|---|---|---|---|---|
| Battery runtime | -25% | -61% | 1% | 5% | |
| Reader / Idle (h) | 9.8 | 7.1 -28% | 3.9 -60% | 7.7 -21% | 9.62 ? -2% |
| H.264 (h) | 6.5 | 4.8 -26% | 6.4 -2% | 8.1 ? 25% | |
| WiFi v1.3 (h) | 5.4 | 3.8 -30% | 2 -63% | 5.7 6% | 6.78 ? 26% |
| Load (h) | 2 | 1.7 -15% | 0.8 -60% | 2.4 20% | 1.43 ? -28% |
Pros
Cons
Verdict - A lot of power for a lot of money
For our configuration of the Raider GE77, MSI demands around 5,200 USD. For the price, buyers receive a very powerful laptop for demanding applications such as video editing, rendering, and 4K gaming.
The MSI Raider GE77 HX 12 UHS is one of the most powerful laptops currently available.
The main components consist of a Core i9-12900HX CPU, a GeForce RTX 3080 Ti Laptop GPU (175 watts TGP, 16 GB VRAM), and 64 GB of RAM, which makes for a high overall performance level. The GeForce GPU in particular scores some of the highest scores we have seen from this chip.
Both the CPU and the GPU are able to run at continuously high clock speeds. The relatively high heat and noise emissions match our expectations for this device class. With approximately 5.5 to 6.5 hours, the battery life is good for a powerful 4K laptop. The Thunderbolt 4 port allows for additional expandability via an external GPU or a docking solution.
The matte 4K display (IPS, 120 Hz) offers sufficient maximum brightness, short response times, and a good color space coverage. It is lacking in terms of contrast, however. Although the color accuracy was off ex-factory, this can be fixed with a calibration. We suspect a conflict between the MSI True Color software, the preinstalled color profile and/or the iGPU or its drivers. This is unacceptable for a laptop in this price category.
The Razer Blade 17 (Early 2022) is a potential alternative to the GE77. While it offers a lower overall performance level than the MSI system, it is more compact and lighter. In terms of battery life, it cannot compete with the Raider.
Price and Availability
Various configurations of the MSI Raider GE77 HX 12UHS are available on MSI's official store (Core i9-12800HX, RTX 3080 Ti, FHD 360 Hz, 1 TB SSD) and online retailers such as Xotic PC (Core i9-12900HX, RTX 3080 Ti, QHD 240 Hz, 1 TB SSD) for about 3,000 USD and 3700 USD, respectively.
MSI Raider GE77 HX 12UHS
- 07/12/2022 v7 (old)
Sascha Mölck
Price comparison

