MSI Raider GE66 12UHS notebook review: Passes with flying colors
MSI continues to expand its repertoire of high-end gaming notebooks. With the GE66 12UHS, the Taiwanese company aims to harness the power of both the Intel Core i9 12900HK and the Nvidia RTX 3080 Ti with the help of a "Phase-Change Liquid Metal Pad" on the CPU as well as an improved heatsink. While the overall design has changed little compared to the predecessor (the MSI GE66 10SFS), the manufacturer has nonetheless made many adjustments under the hood.
In the following review, we find out whether the device can keep up with the competition in the form of the Razer Blade 15 Advanced Early 2022, the Schenker XMG Neo 15 Early 2022 and the Lenovo Legion 5 Pro 16 G7.
Possible Competitors in Comparison
Rating | Date | Model | Weight | Height | Size | Resolution | Price |
|---|---|---|---|---|---|---|---|
| 87.4 % v7 (old) | 06 / 2022 | MSI Raider GE66 12UHS i9-12900HK, GeForce RTX 3080 Ti Laptop GPU | 2.4 kg | 23.4 mm | 15.60" | 3840x2160 | |
| 84.6 % v7 (old) | 07 / 2020 | MSI GE66 Raider 10SFS i9-10980HK, GeForce RTX 2070 Super Mobile | 2.4 kg | 23 mm | 15.60" | 1920x1080 | |
| 89.1 % v7 (old) | 03 / 2022 | Razer Blade 15 2022 i7-12800H, GeForce RTX 3080 Ti Laptop GPU | 2.1 kg | 16.99 mm | 15.60" | 2560x1440 | |
v (old) | 03 / 2022 | Schenker XMG Neo 15 E22 (Early 2022, RTX 3080 Ti) i7-12700H, GeForce RTX 3080 Ti Laptop GPU | 2.2 kg | 26.6 mm | 15.60" | 2560x1440 | |
| 88 % v7 (old) | 03 / 2022 | Lenovo Legion 5 Pro 16 G7 i7 RTX 3070Ti i7-12700H, GeForce RTX 3070 Ti Laptop GPU | 2.6 kg | 26.6 mm | 16.00" | 2560x1600 |
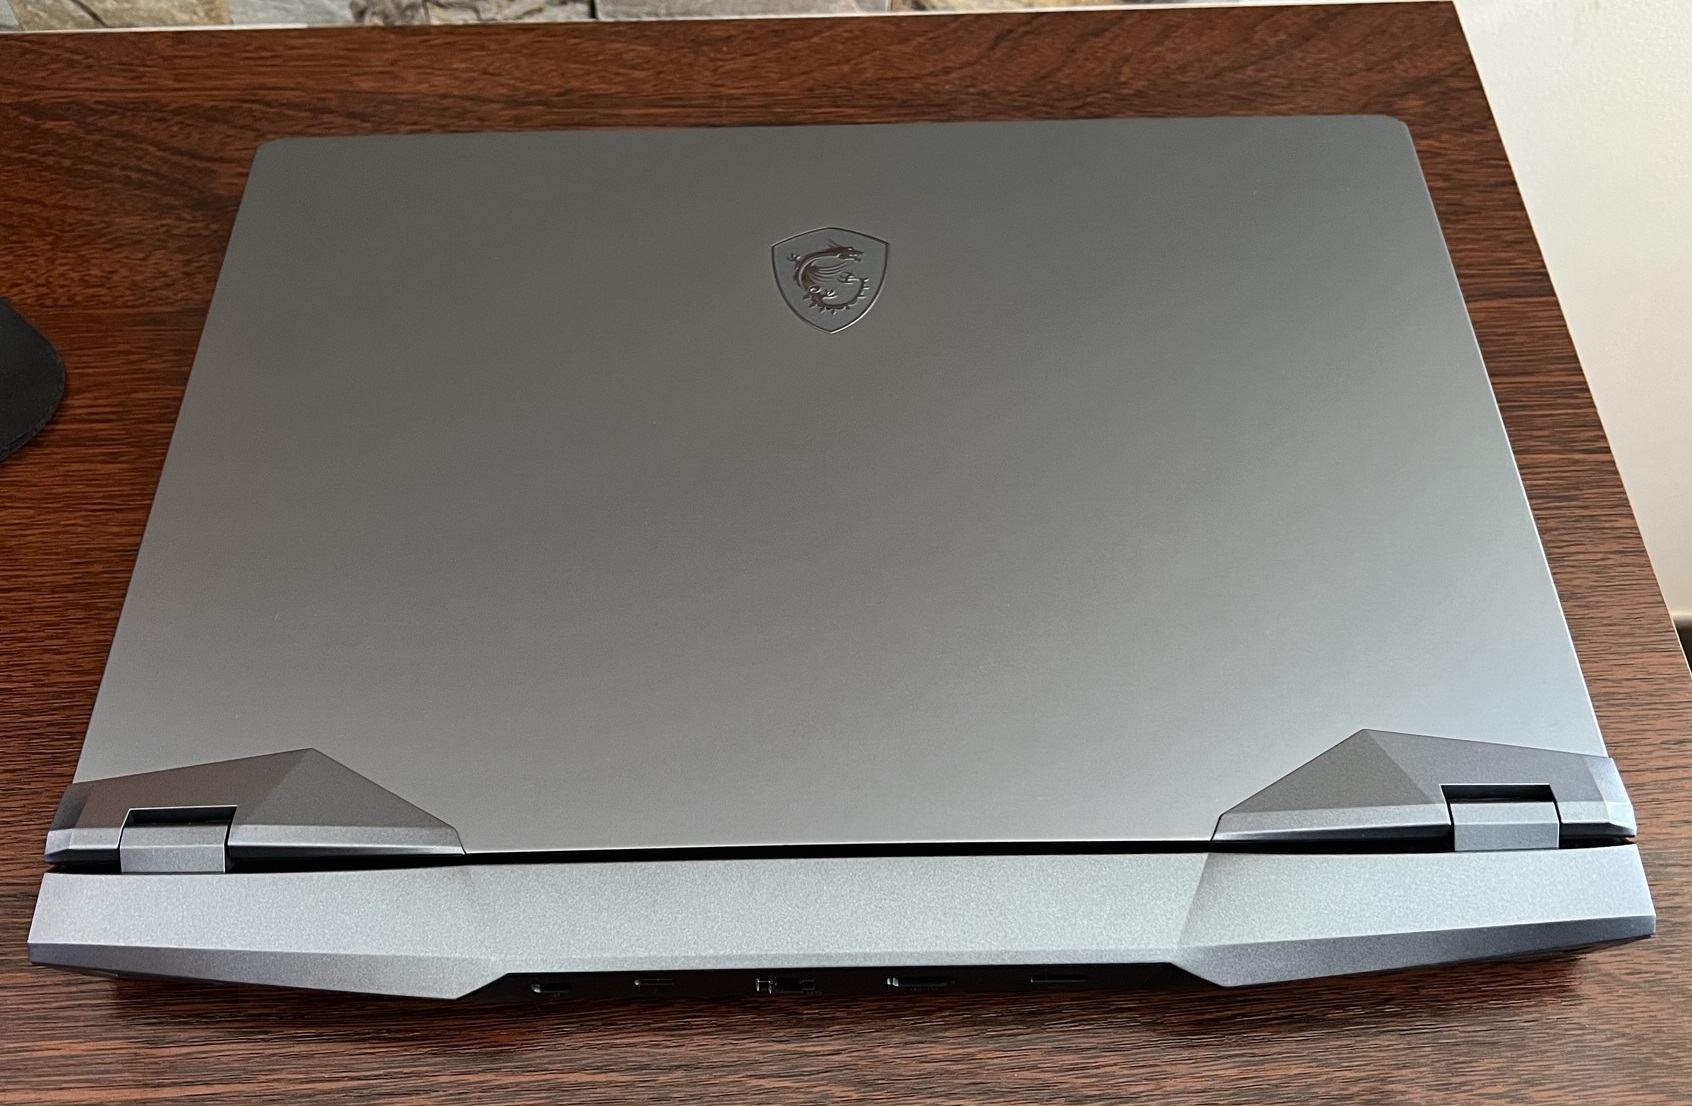
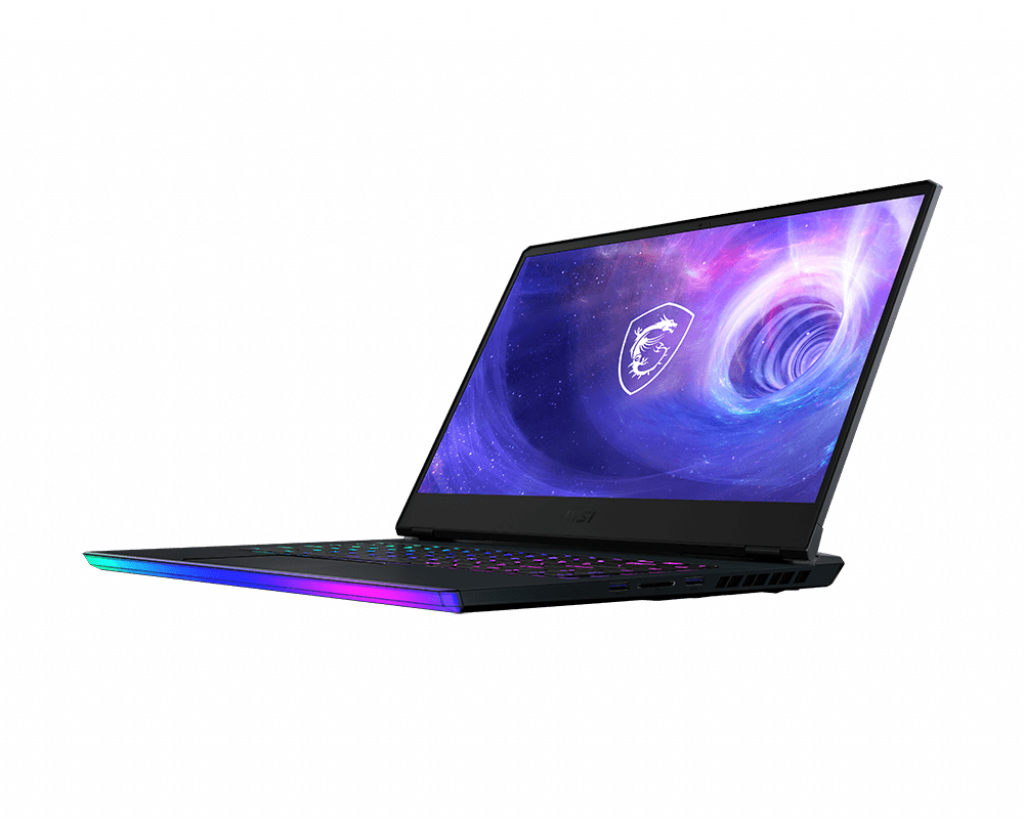
Case: MSI laptop with slightly altered appearance
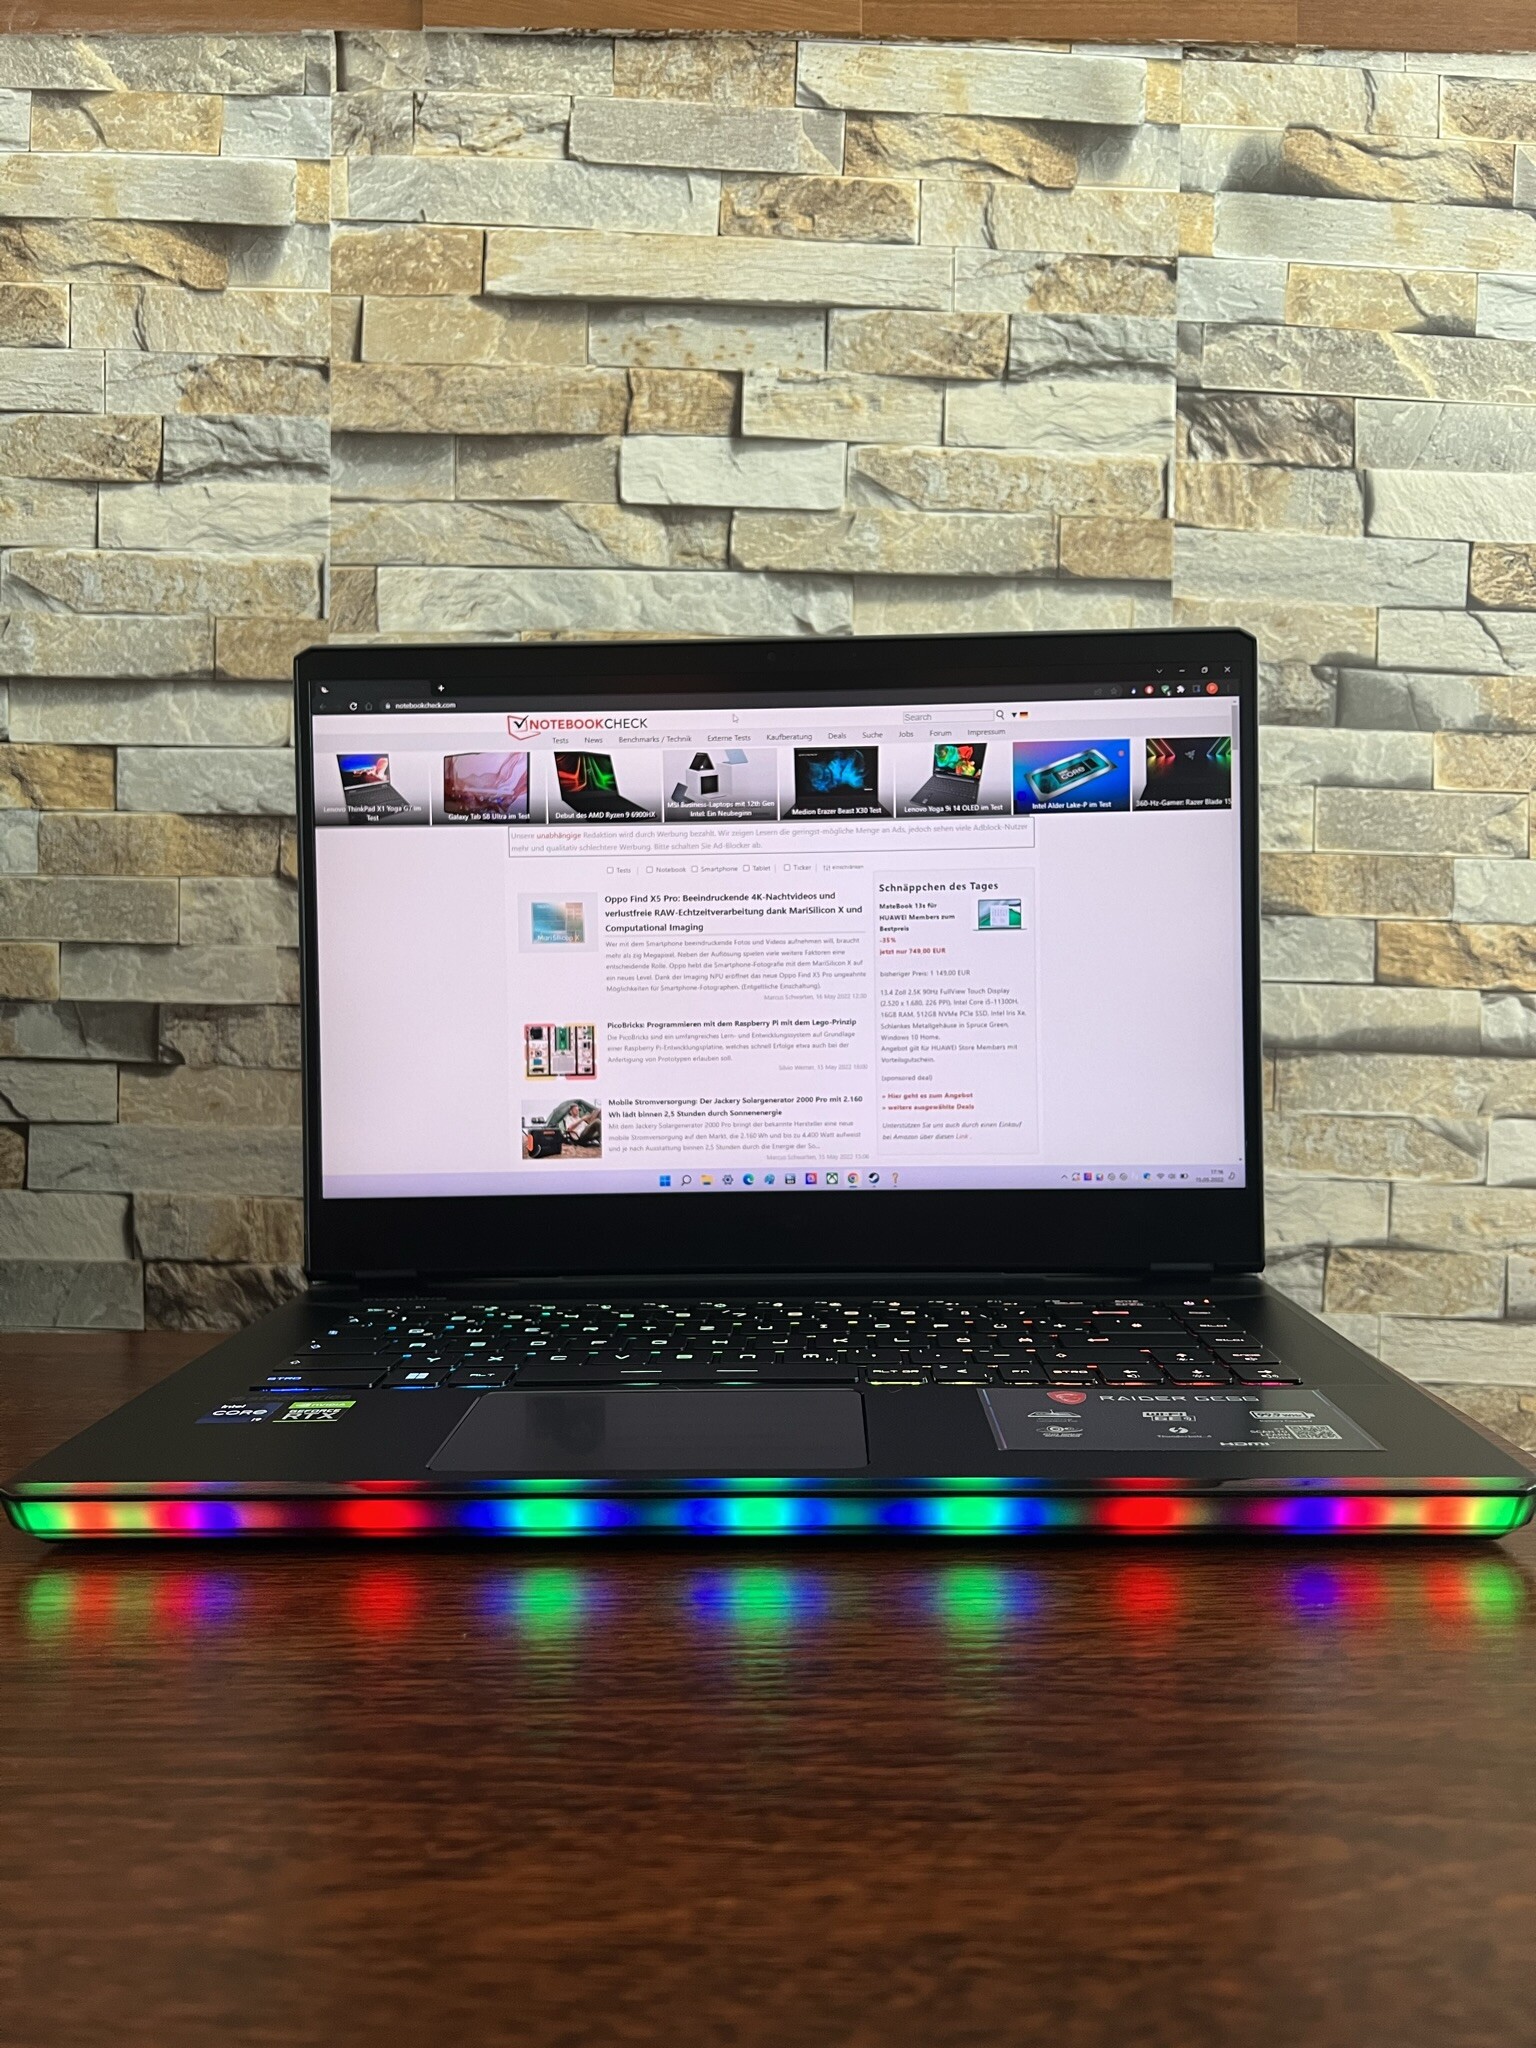
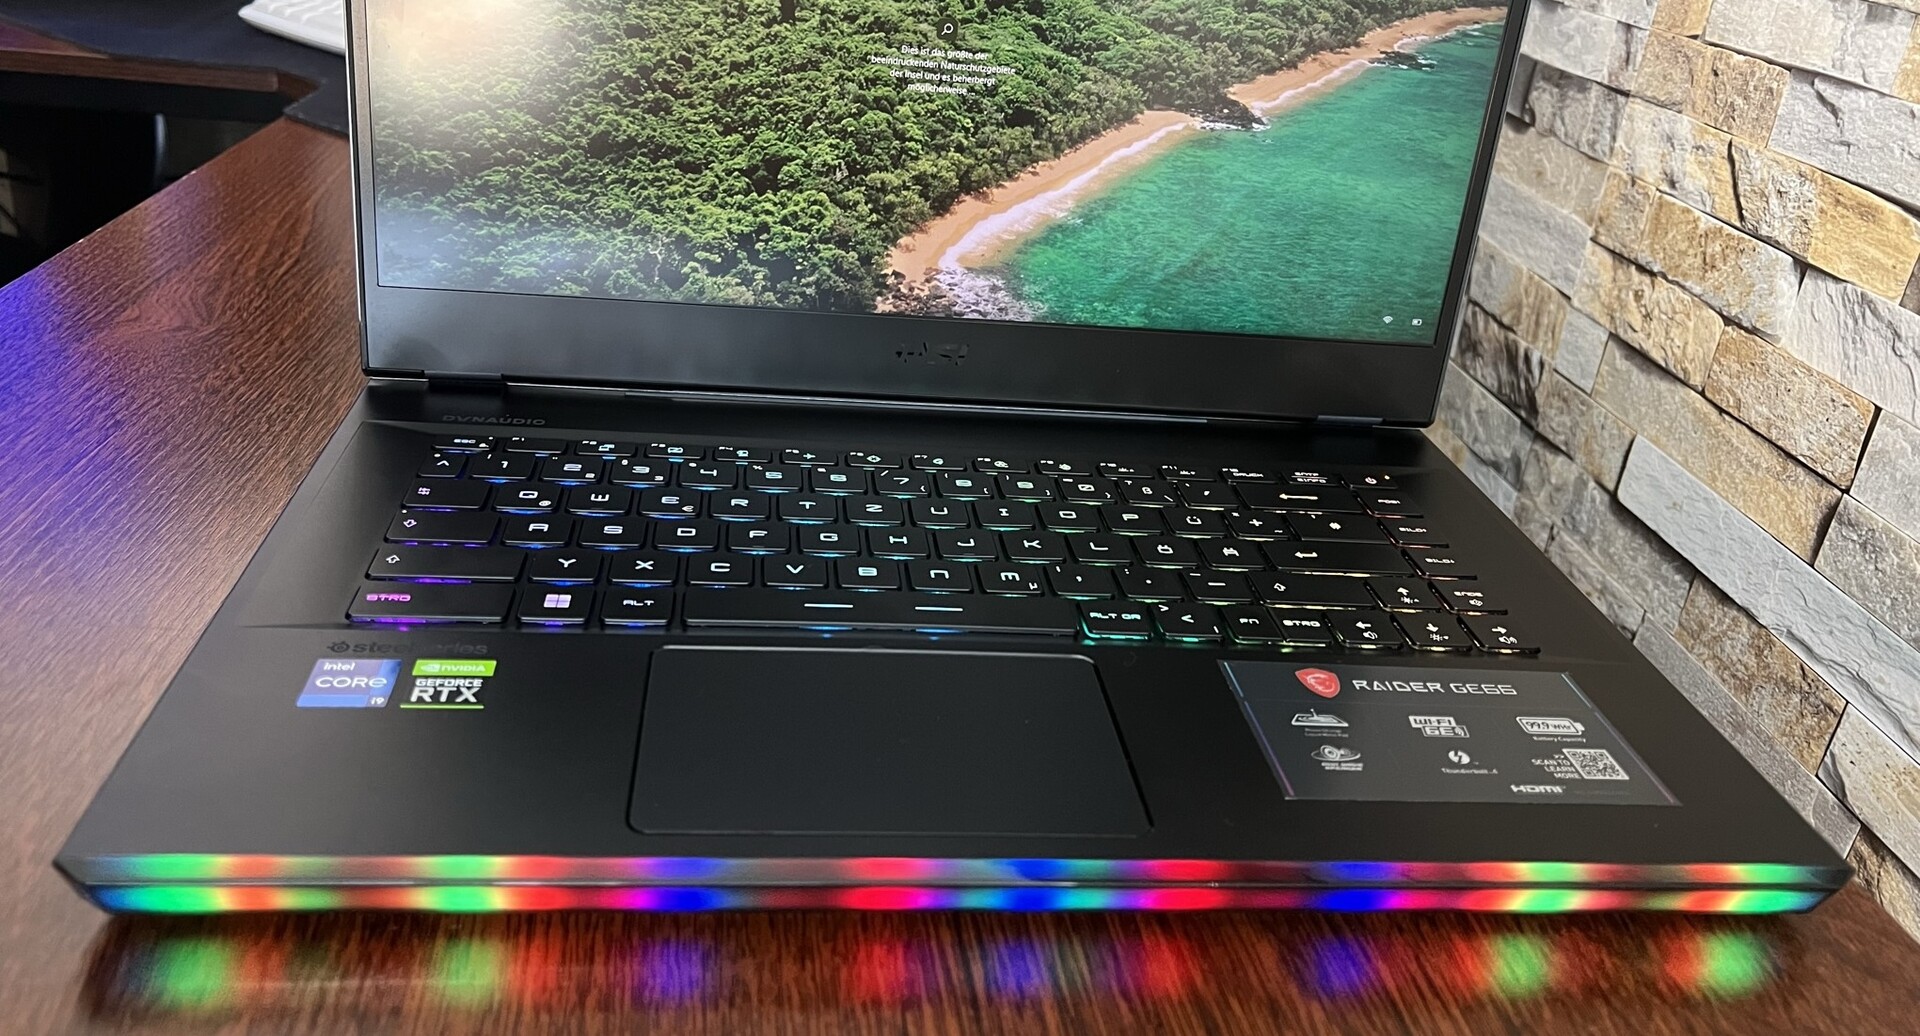
The case and design of the MSI Raider GE66 12 UHS have not changed compared to the predecessor, except for a more pleasing as well as higher-quality light bar on the front. We thus refer you to the review of the predecessor for more details on the case: MSI GE66 10SFS.
Compared to other gaming notebooks, our review device has the second highest weight (2.4 kg). In terms of size, the GE66 is more of a laptop giant. The Razer Blade demonstrates what is possible in terms of mobility.
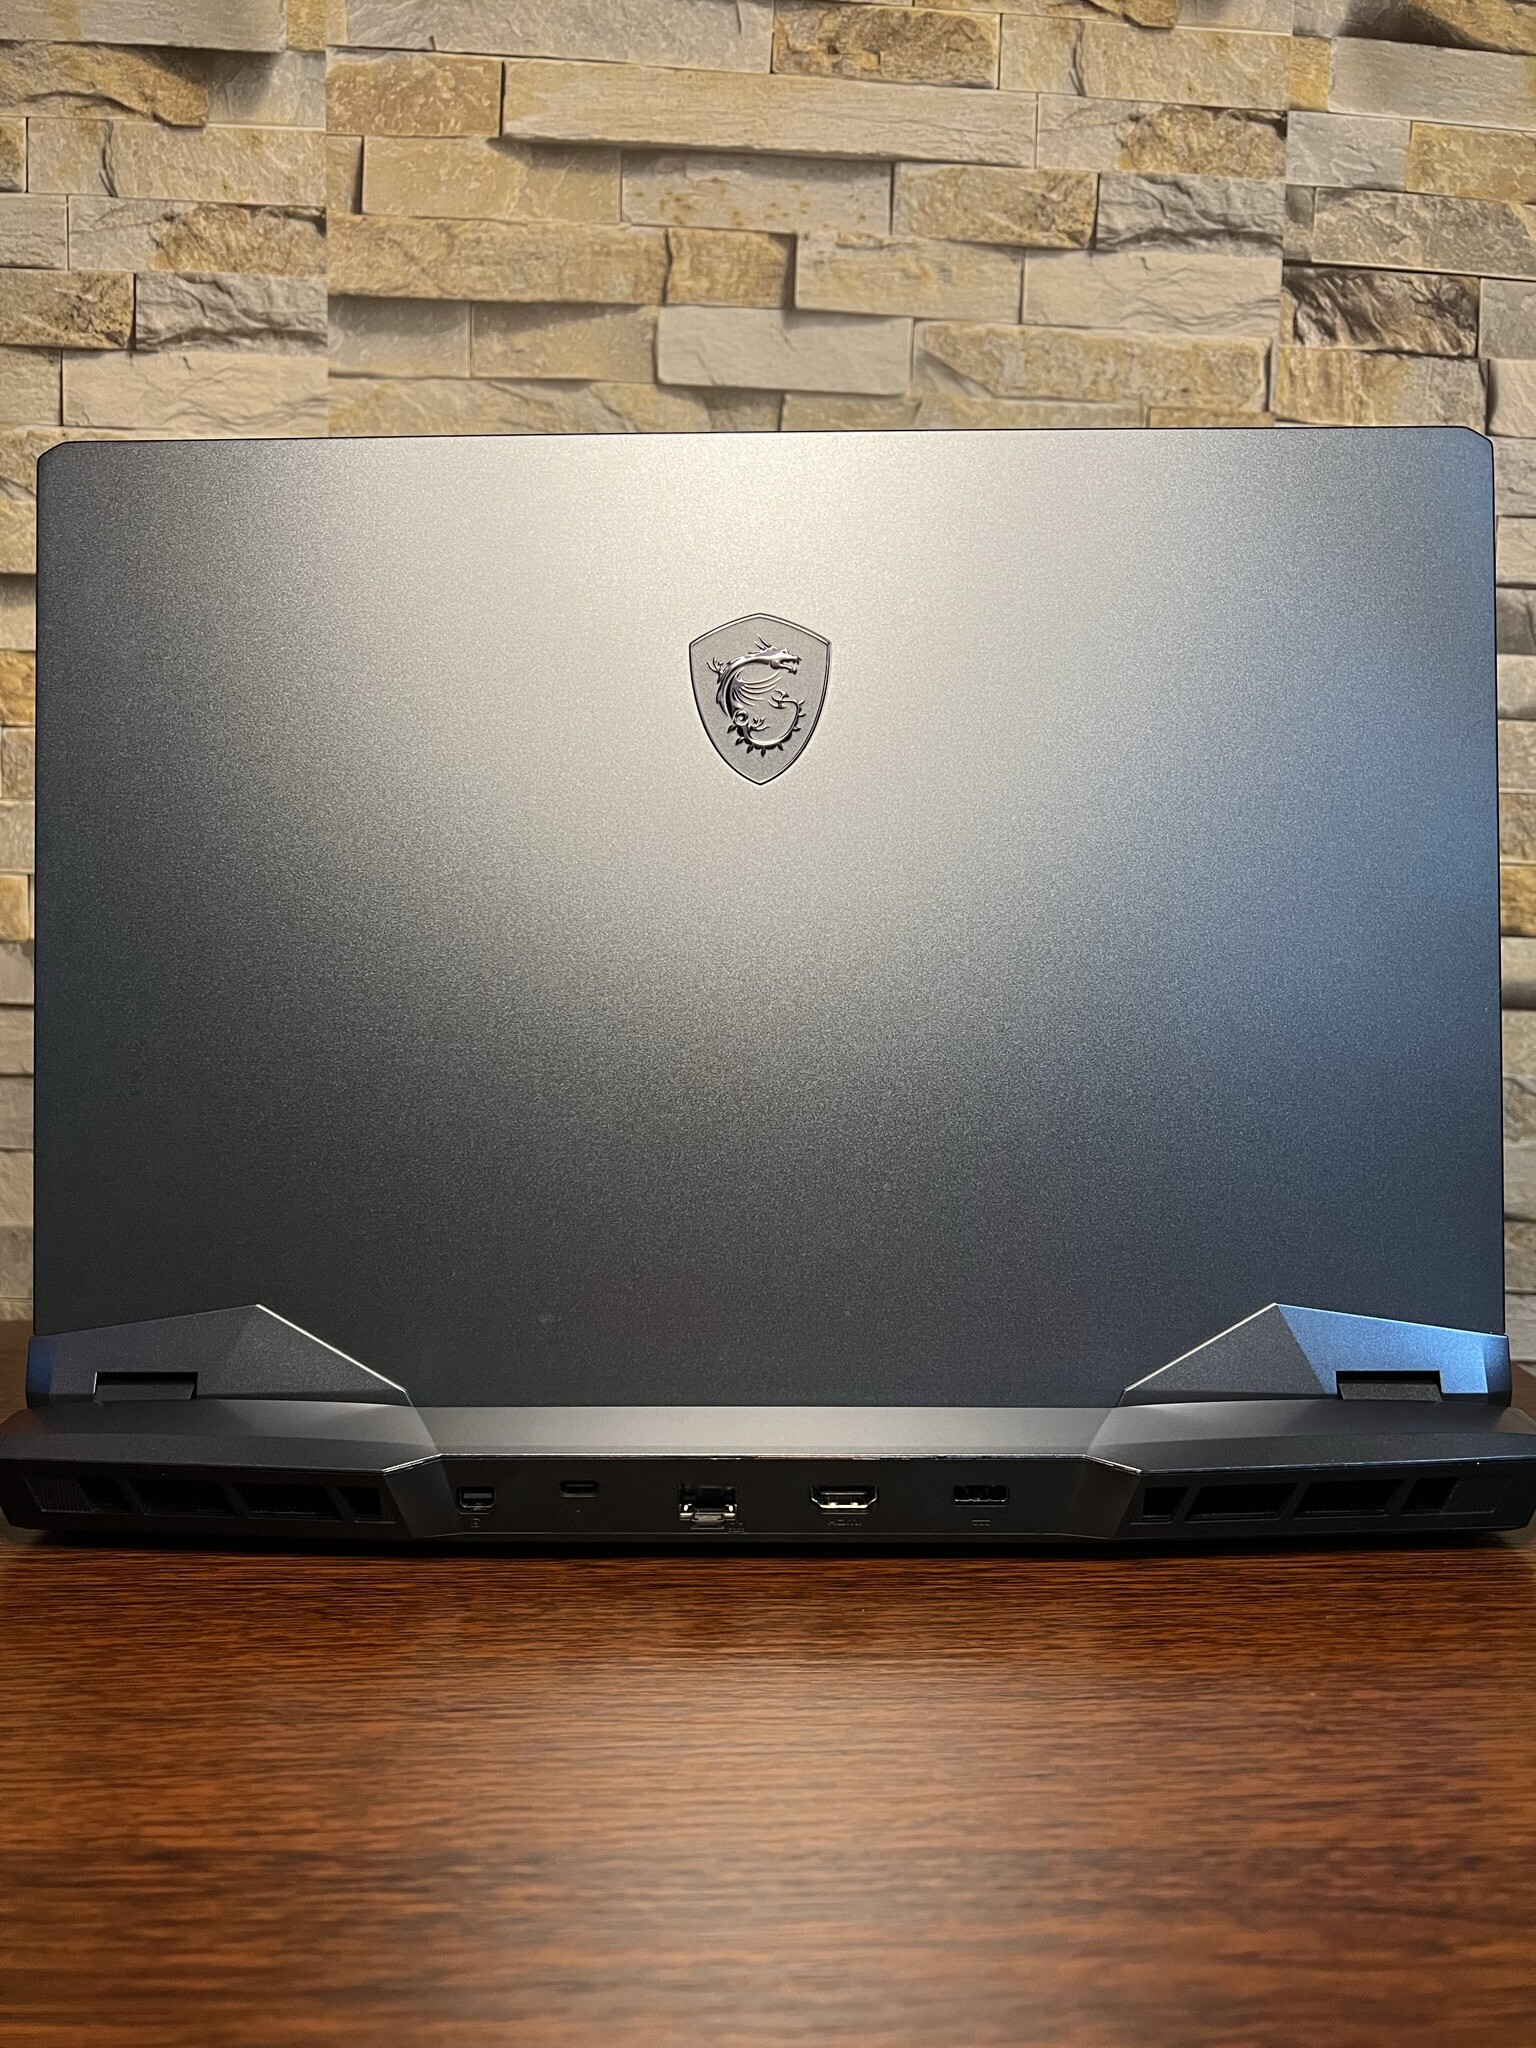
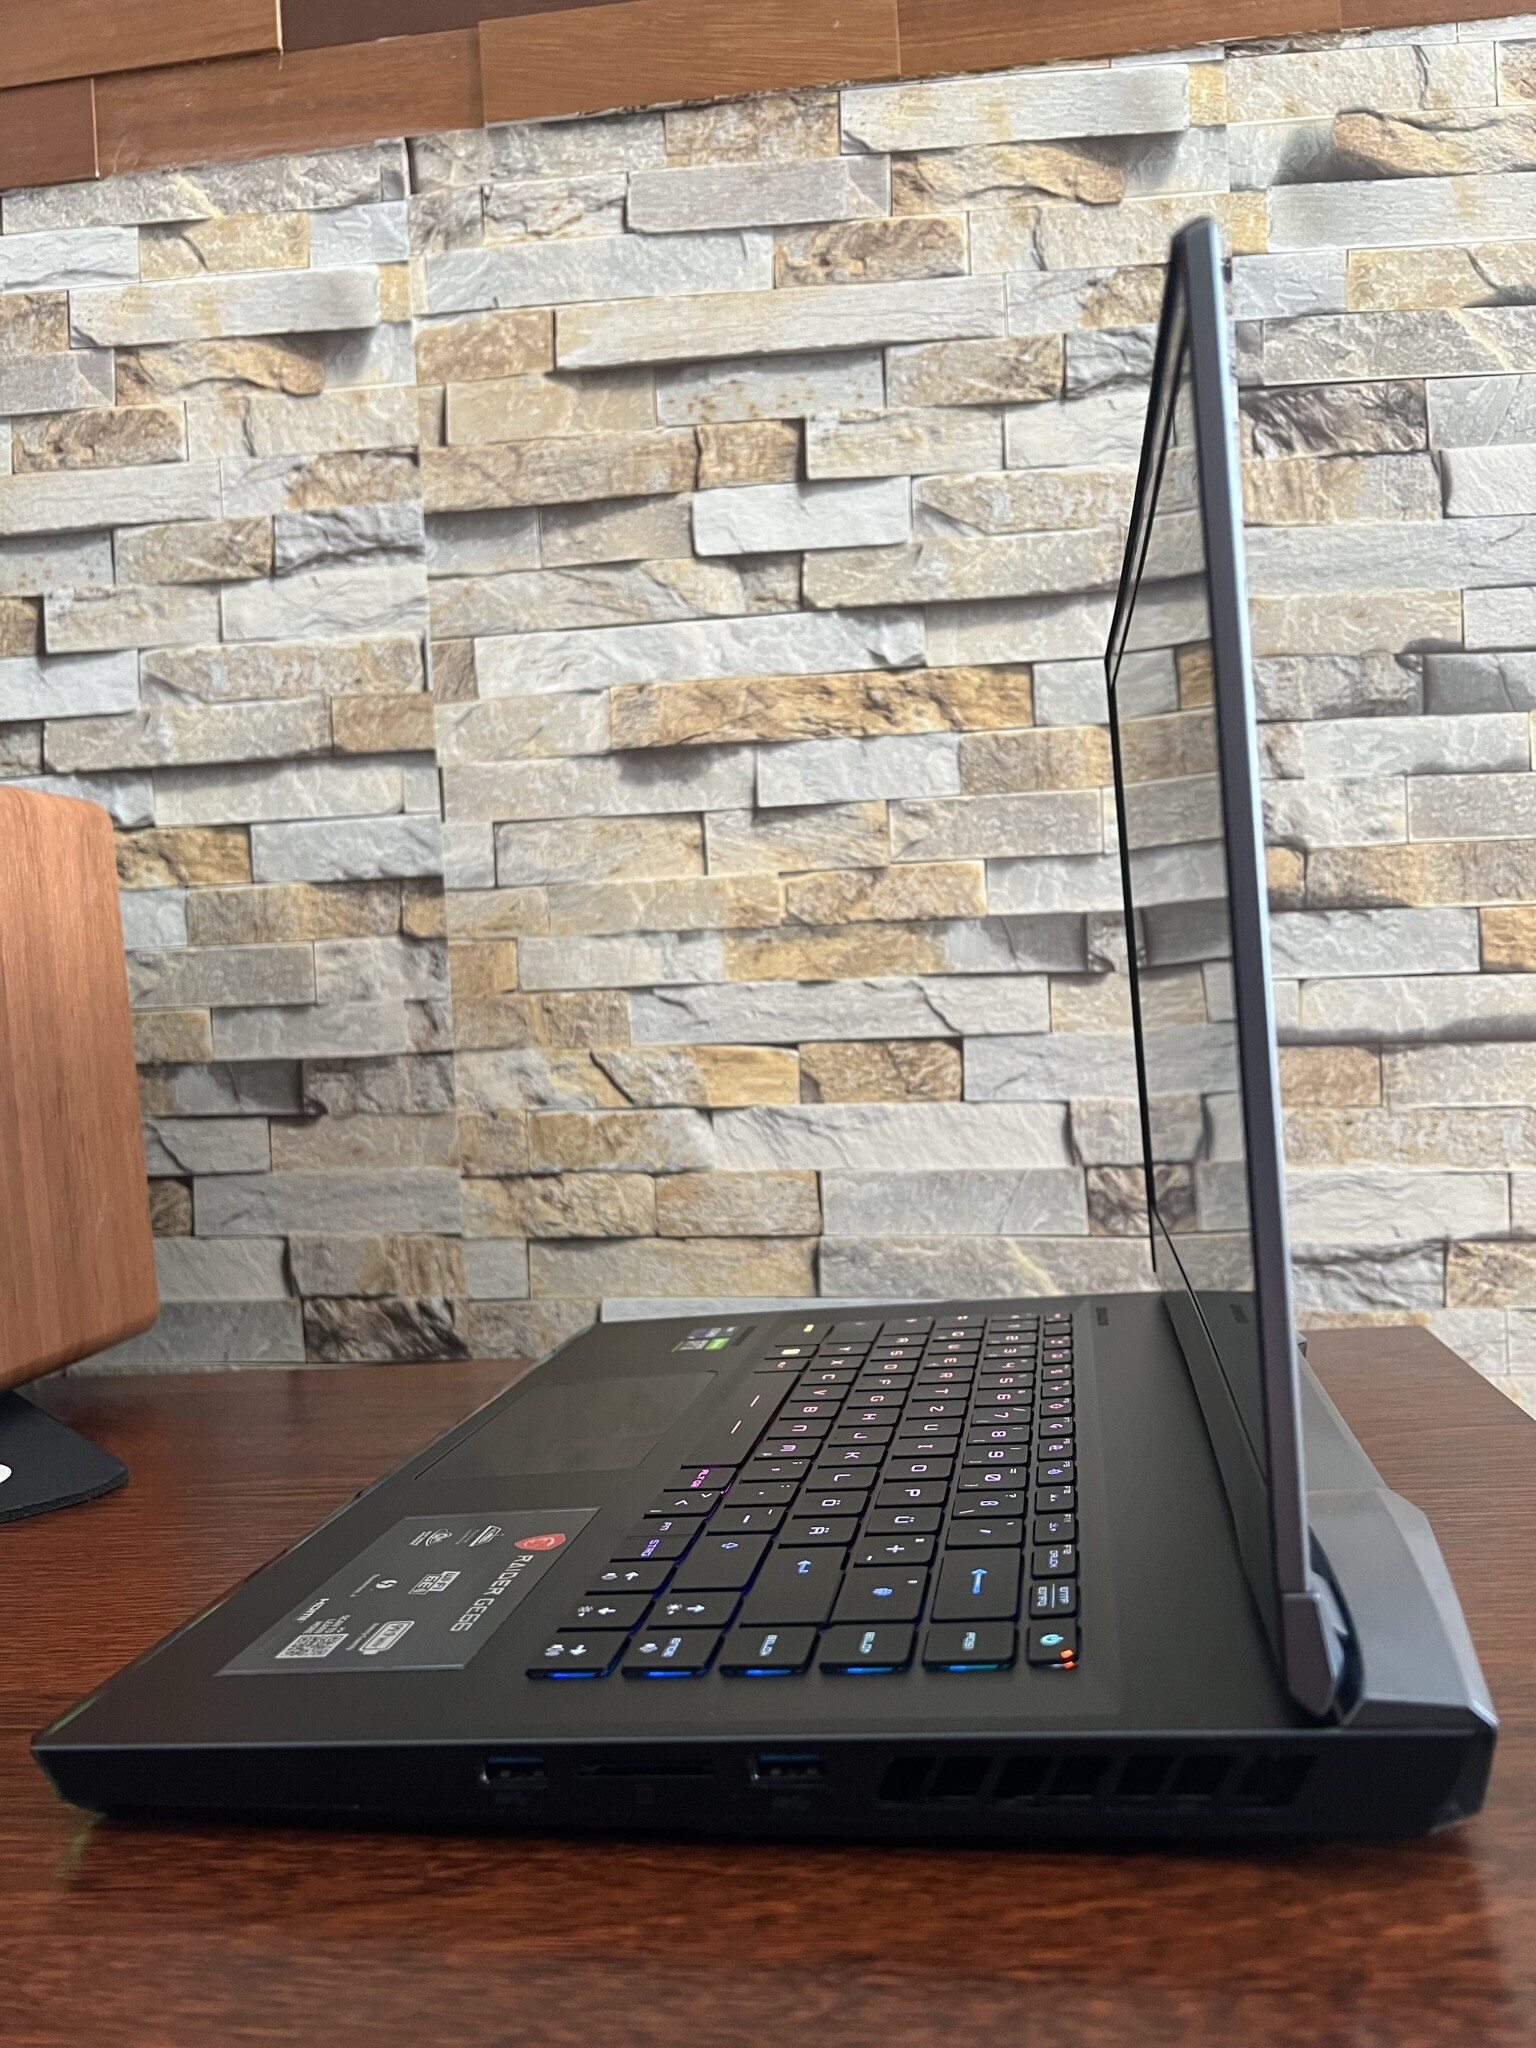
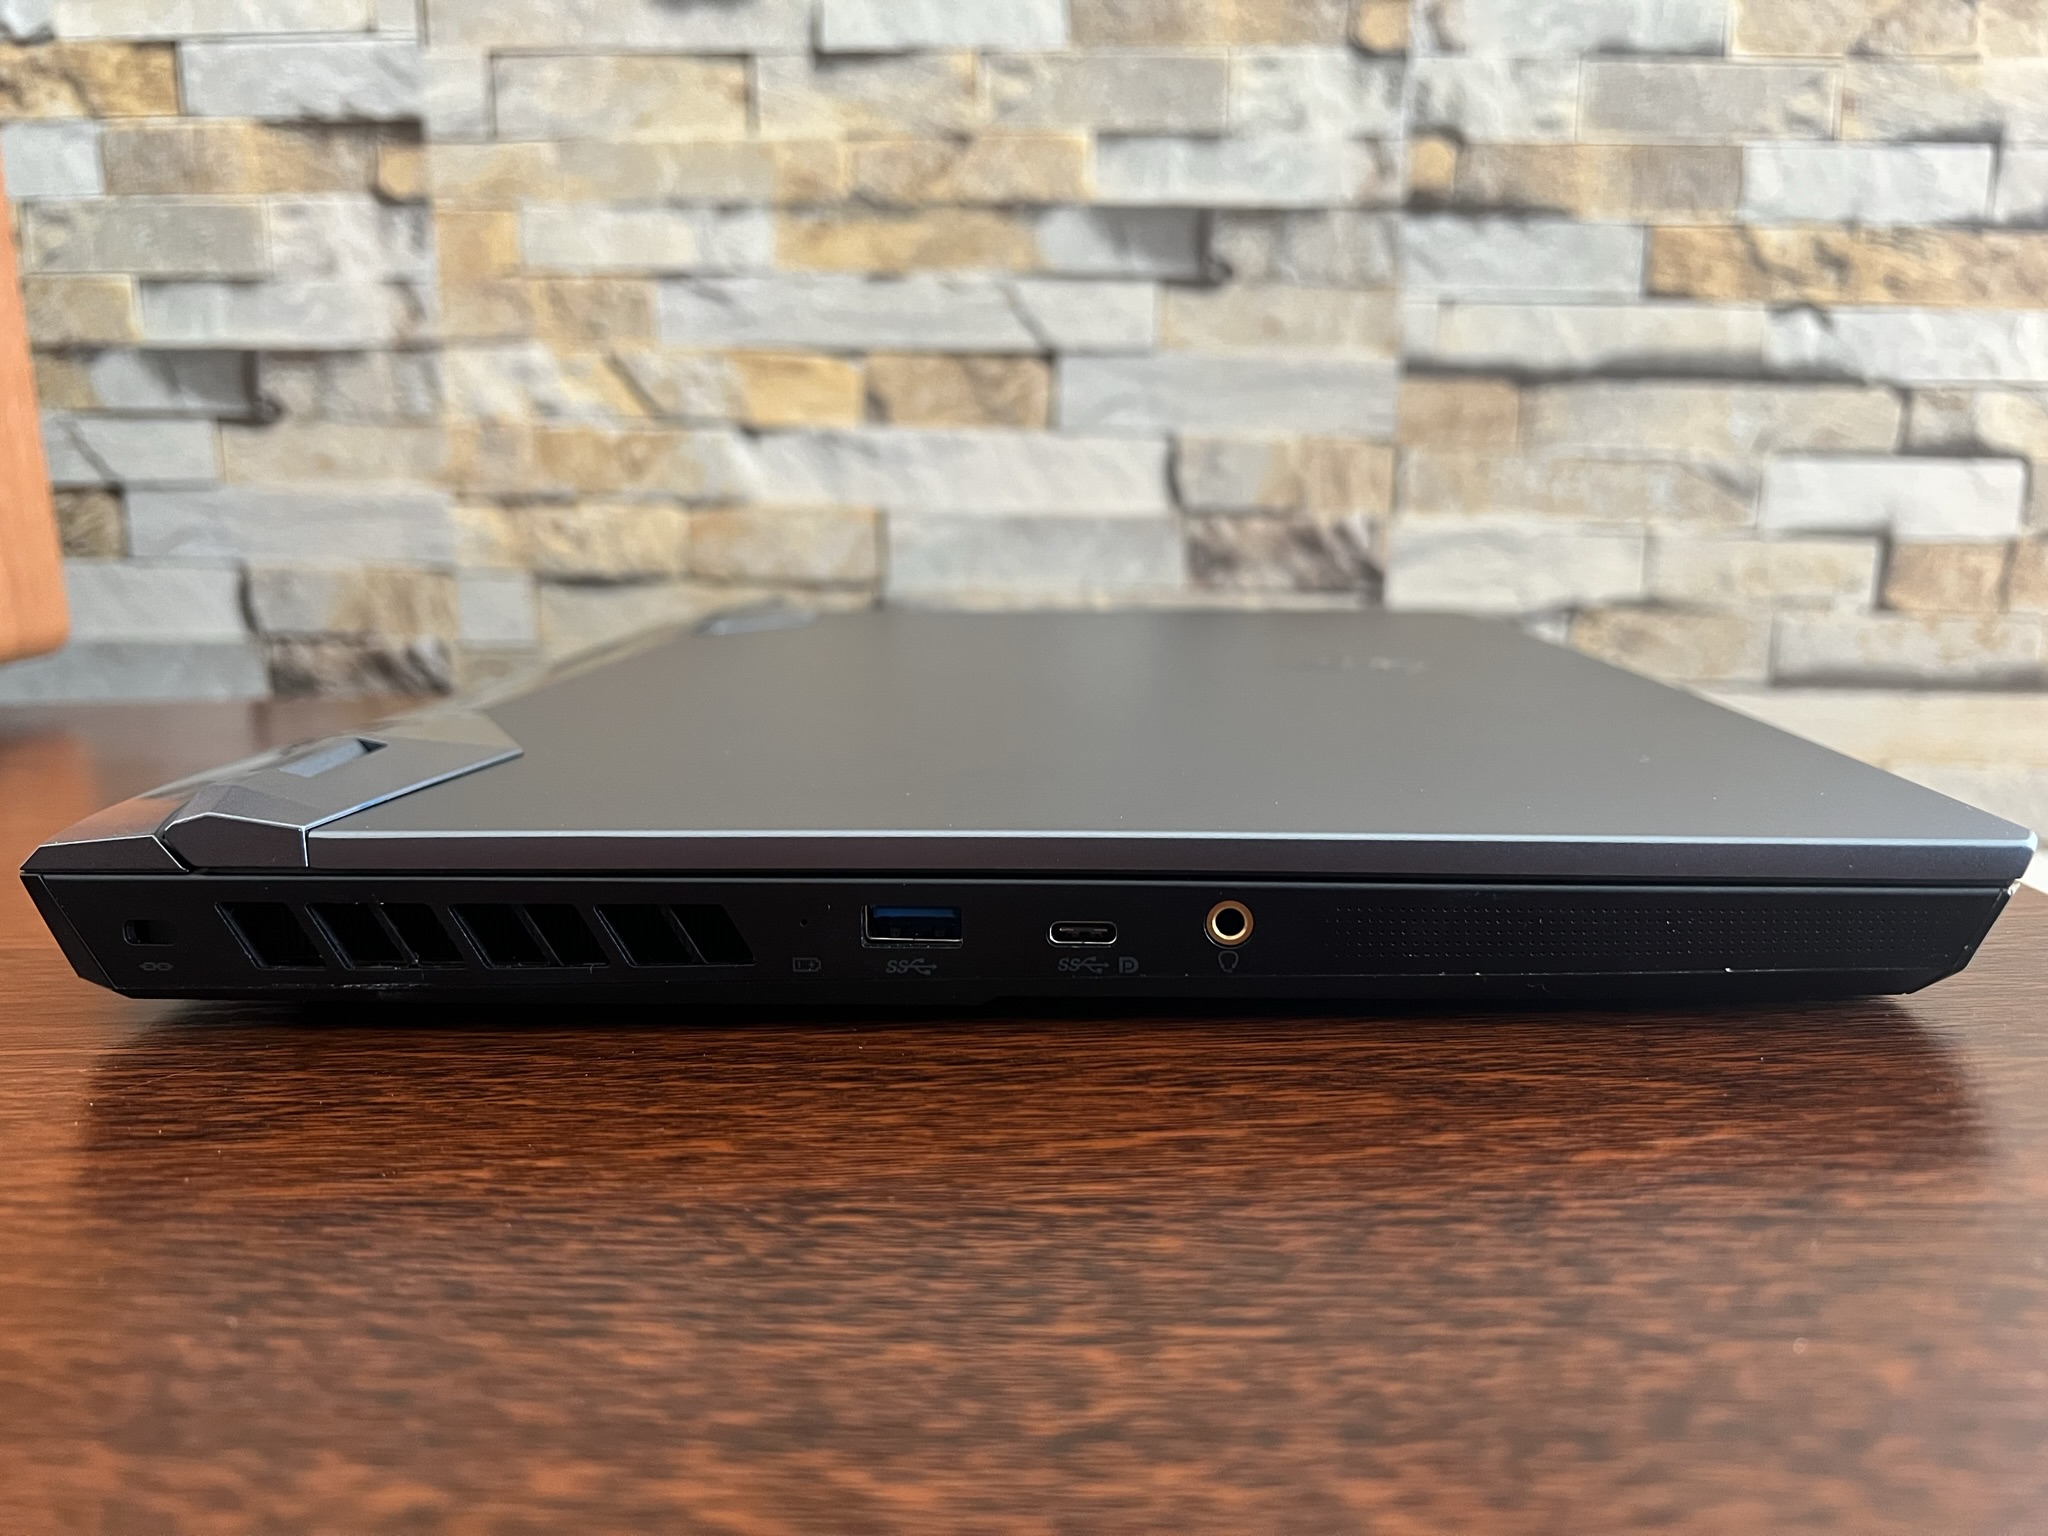
Connectivity: Upgraded to modern ports
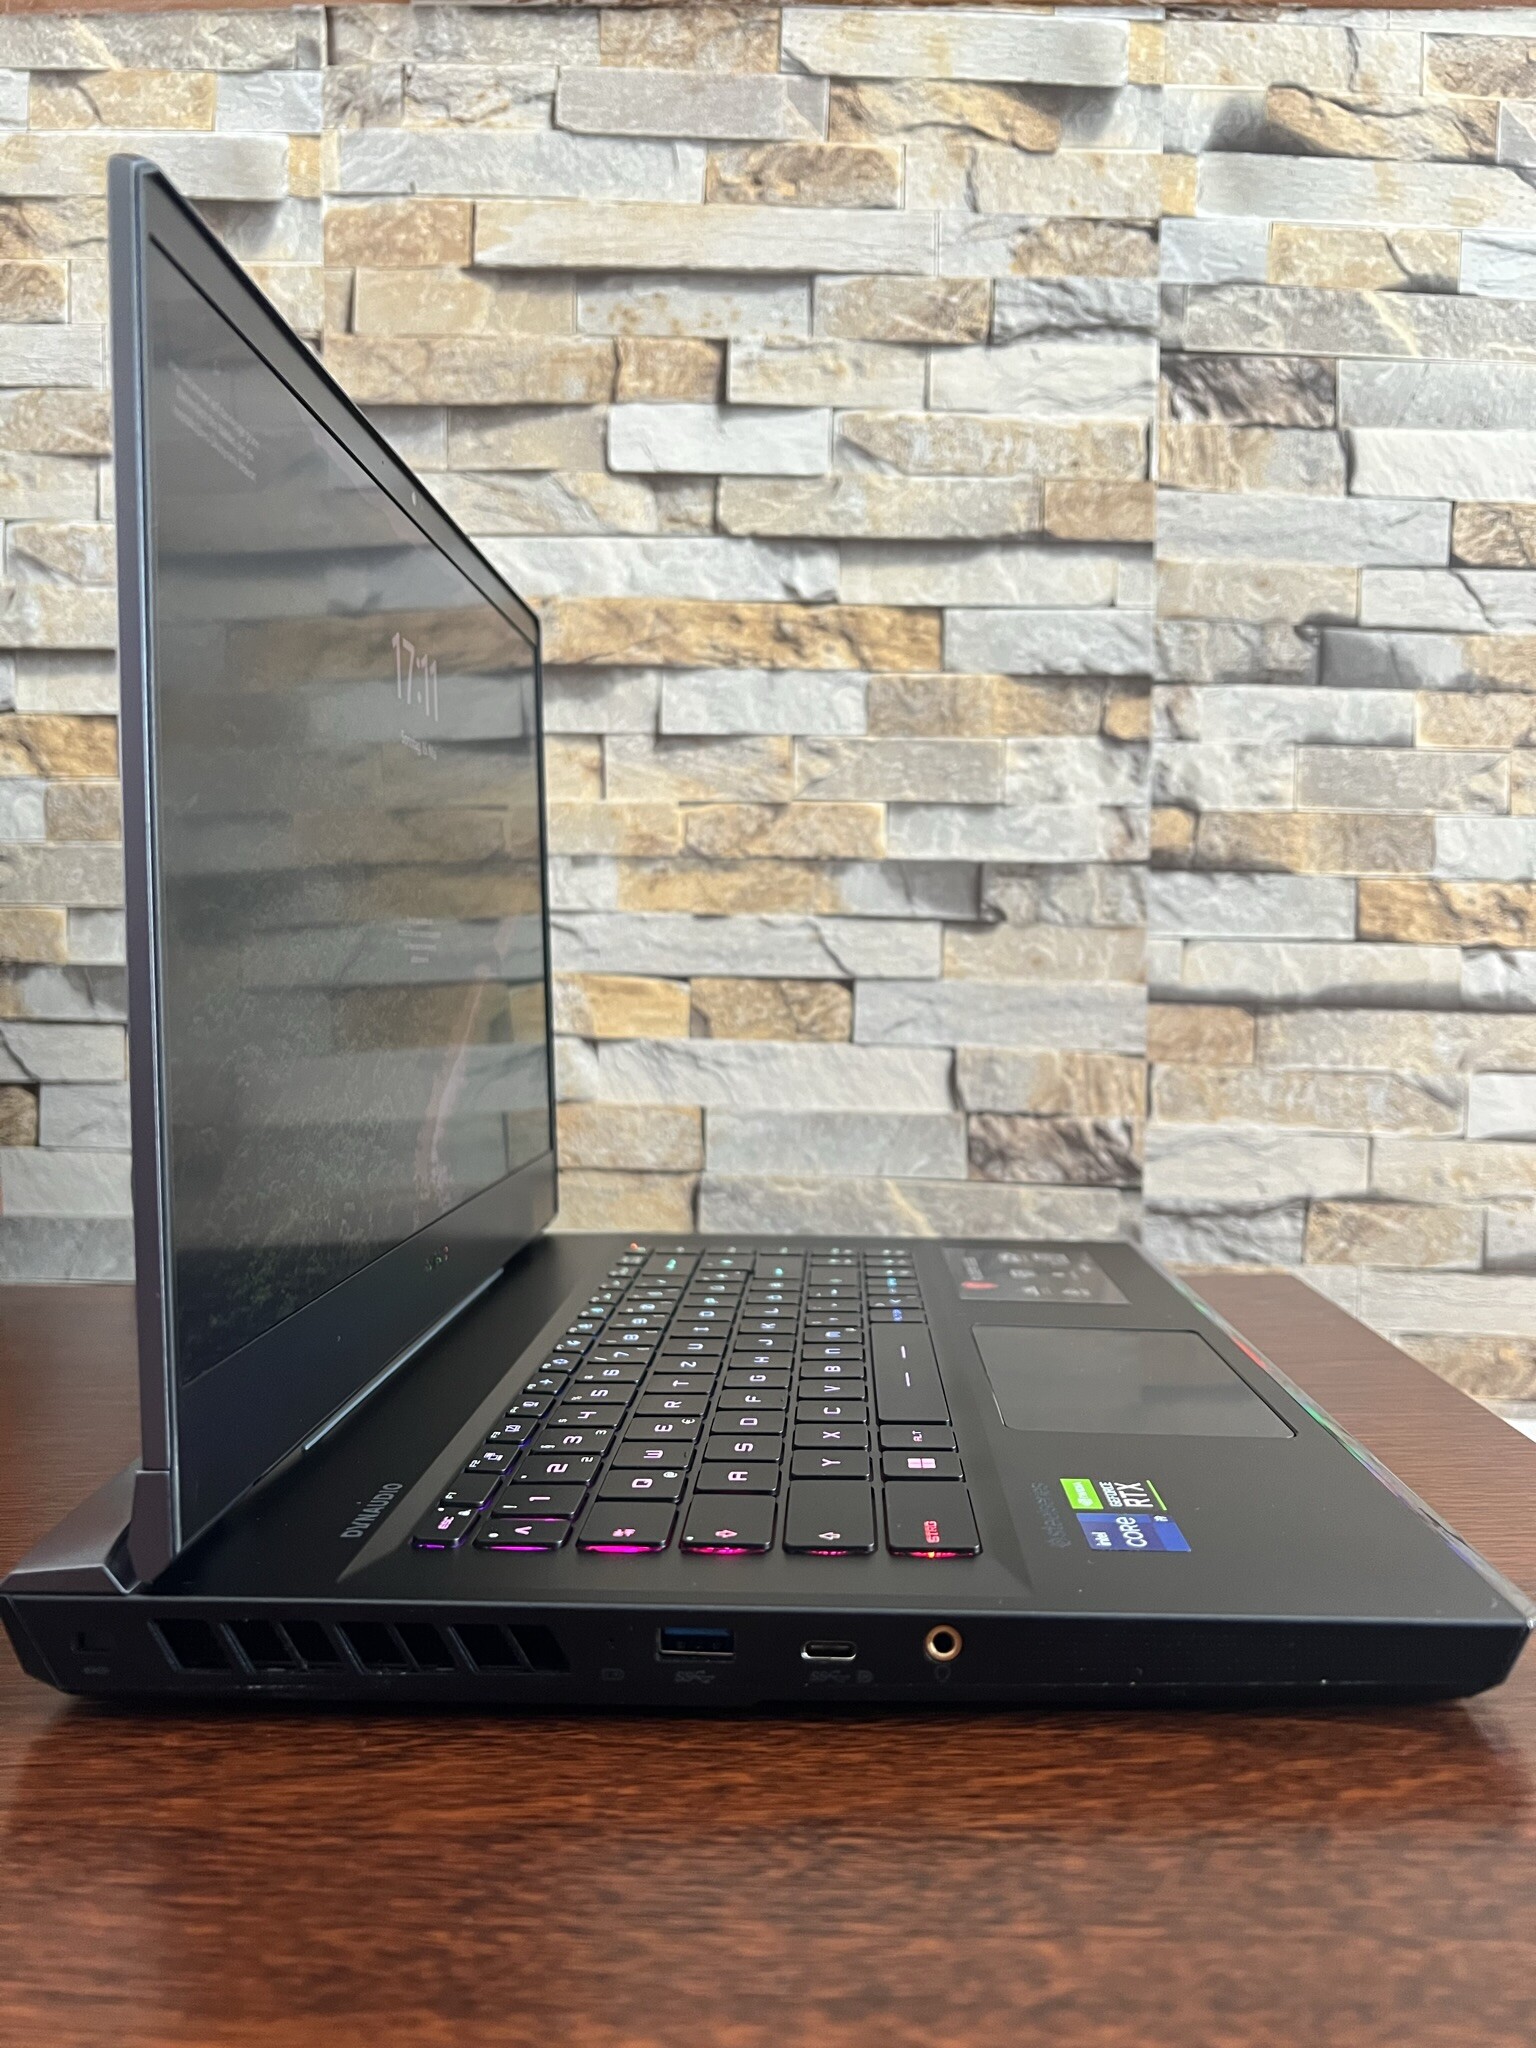
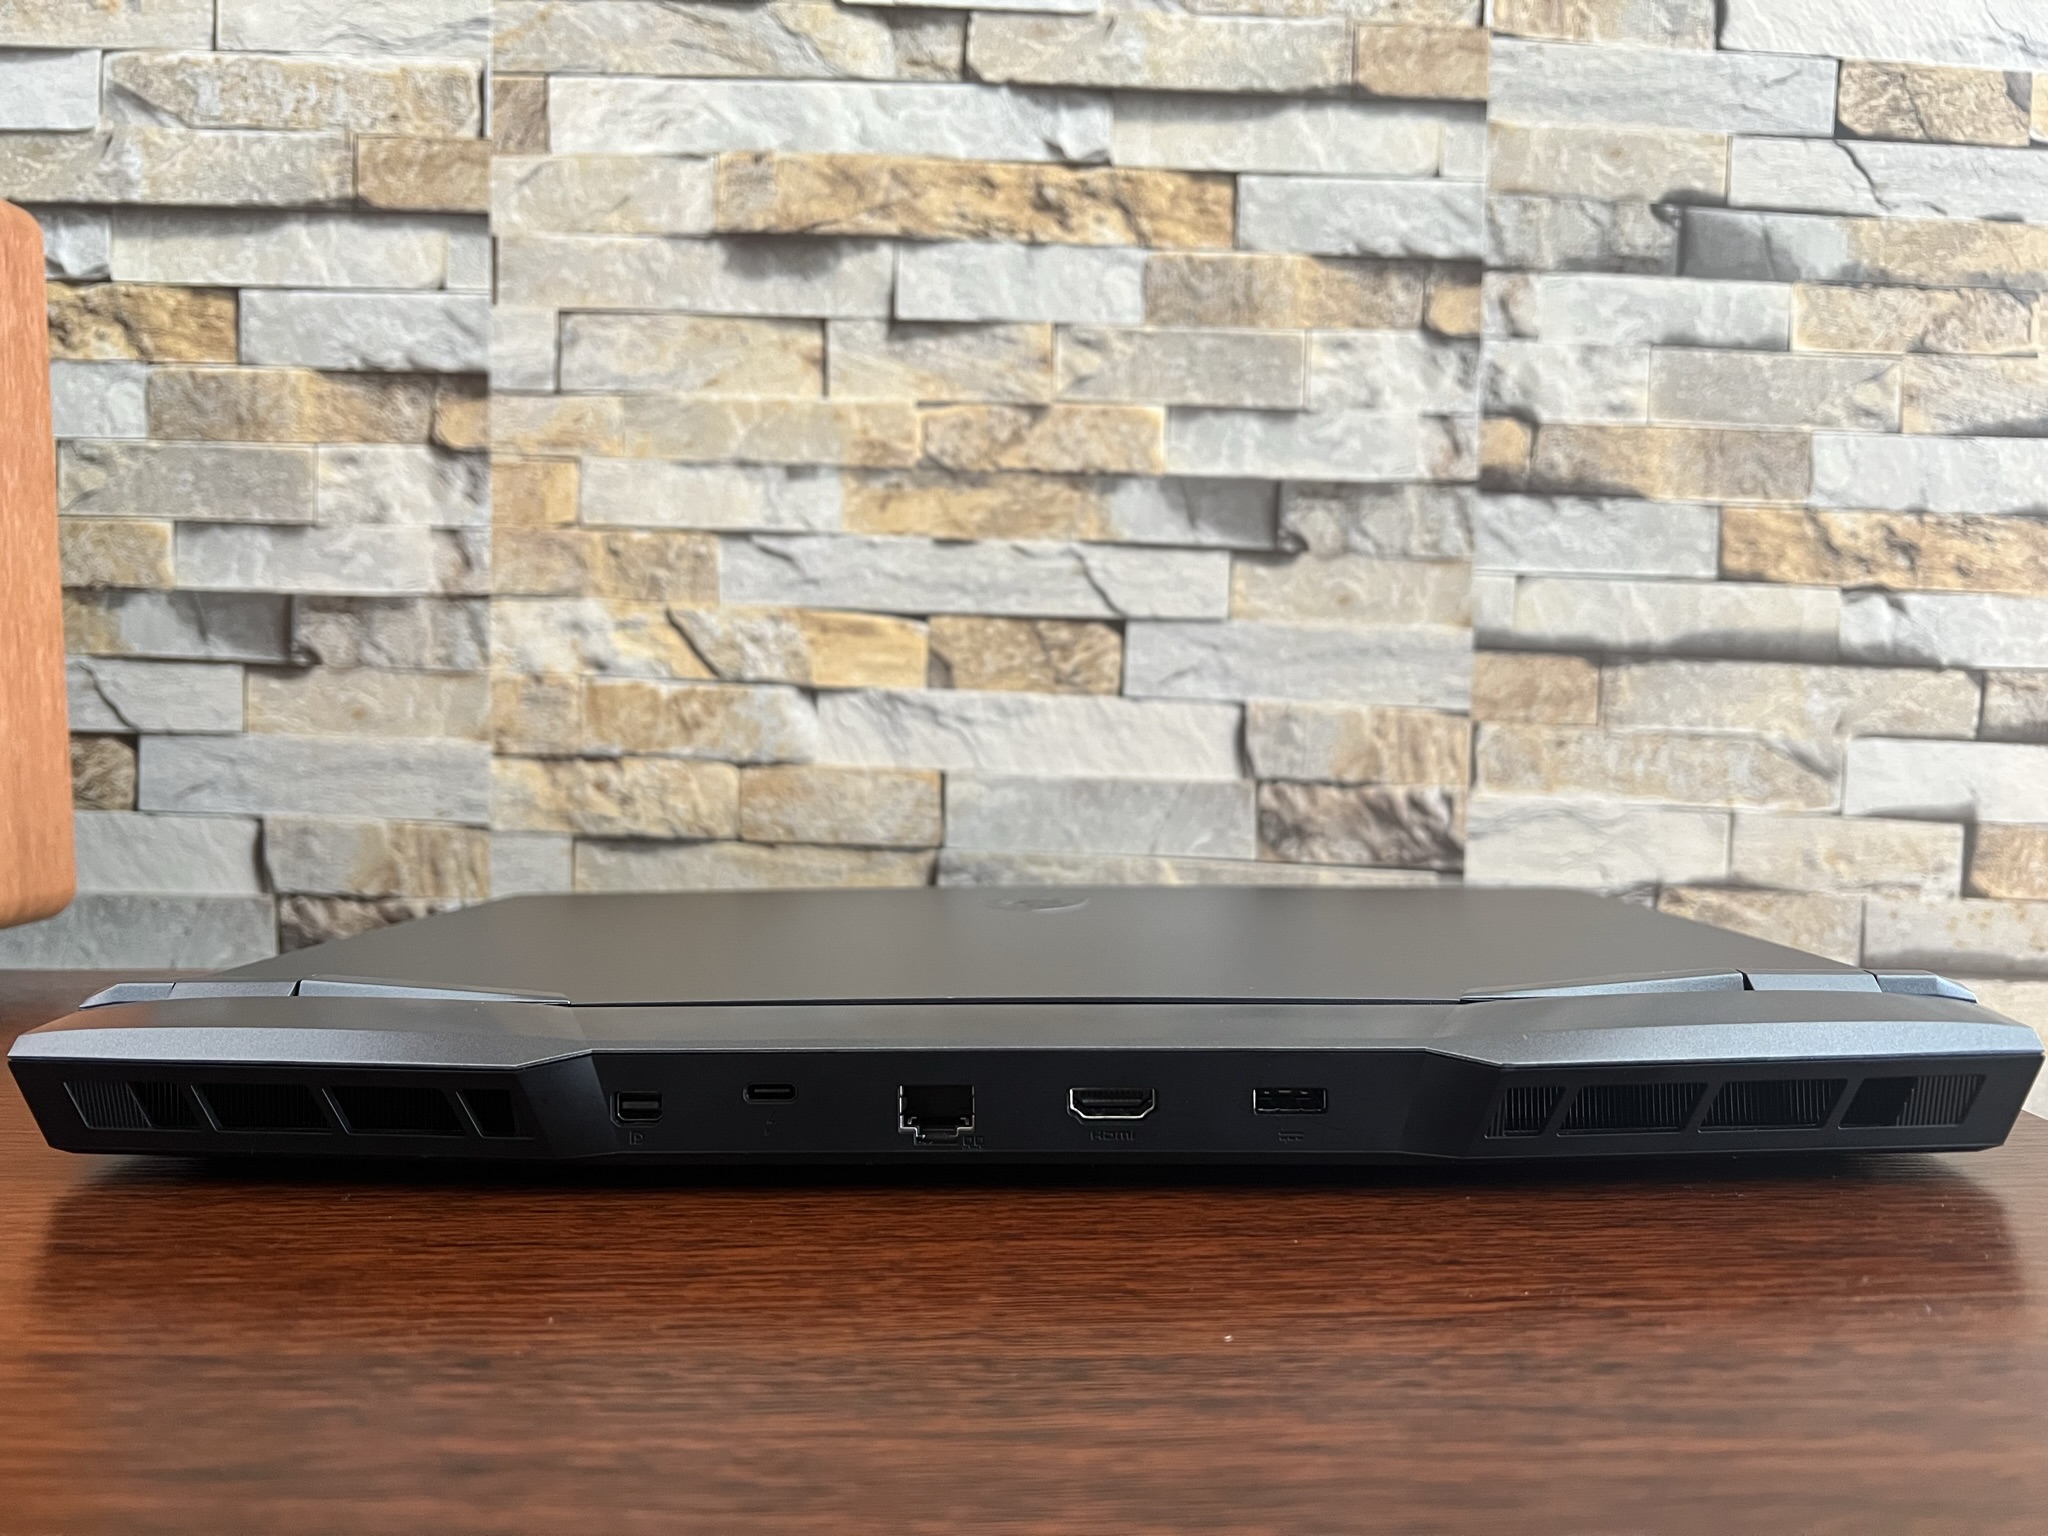
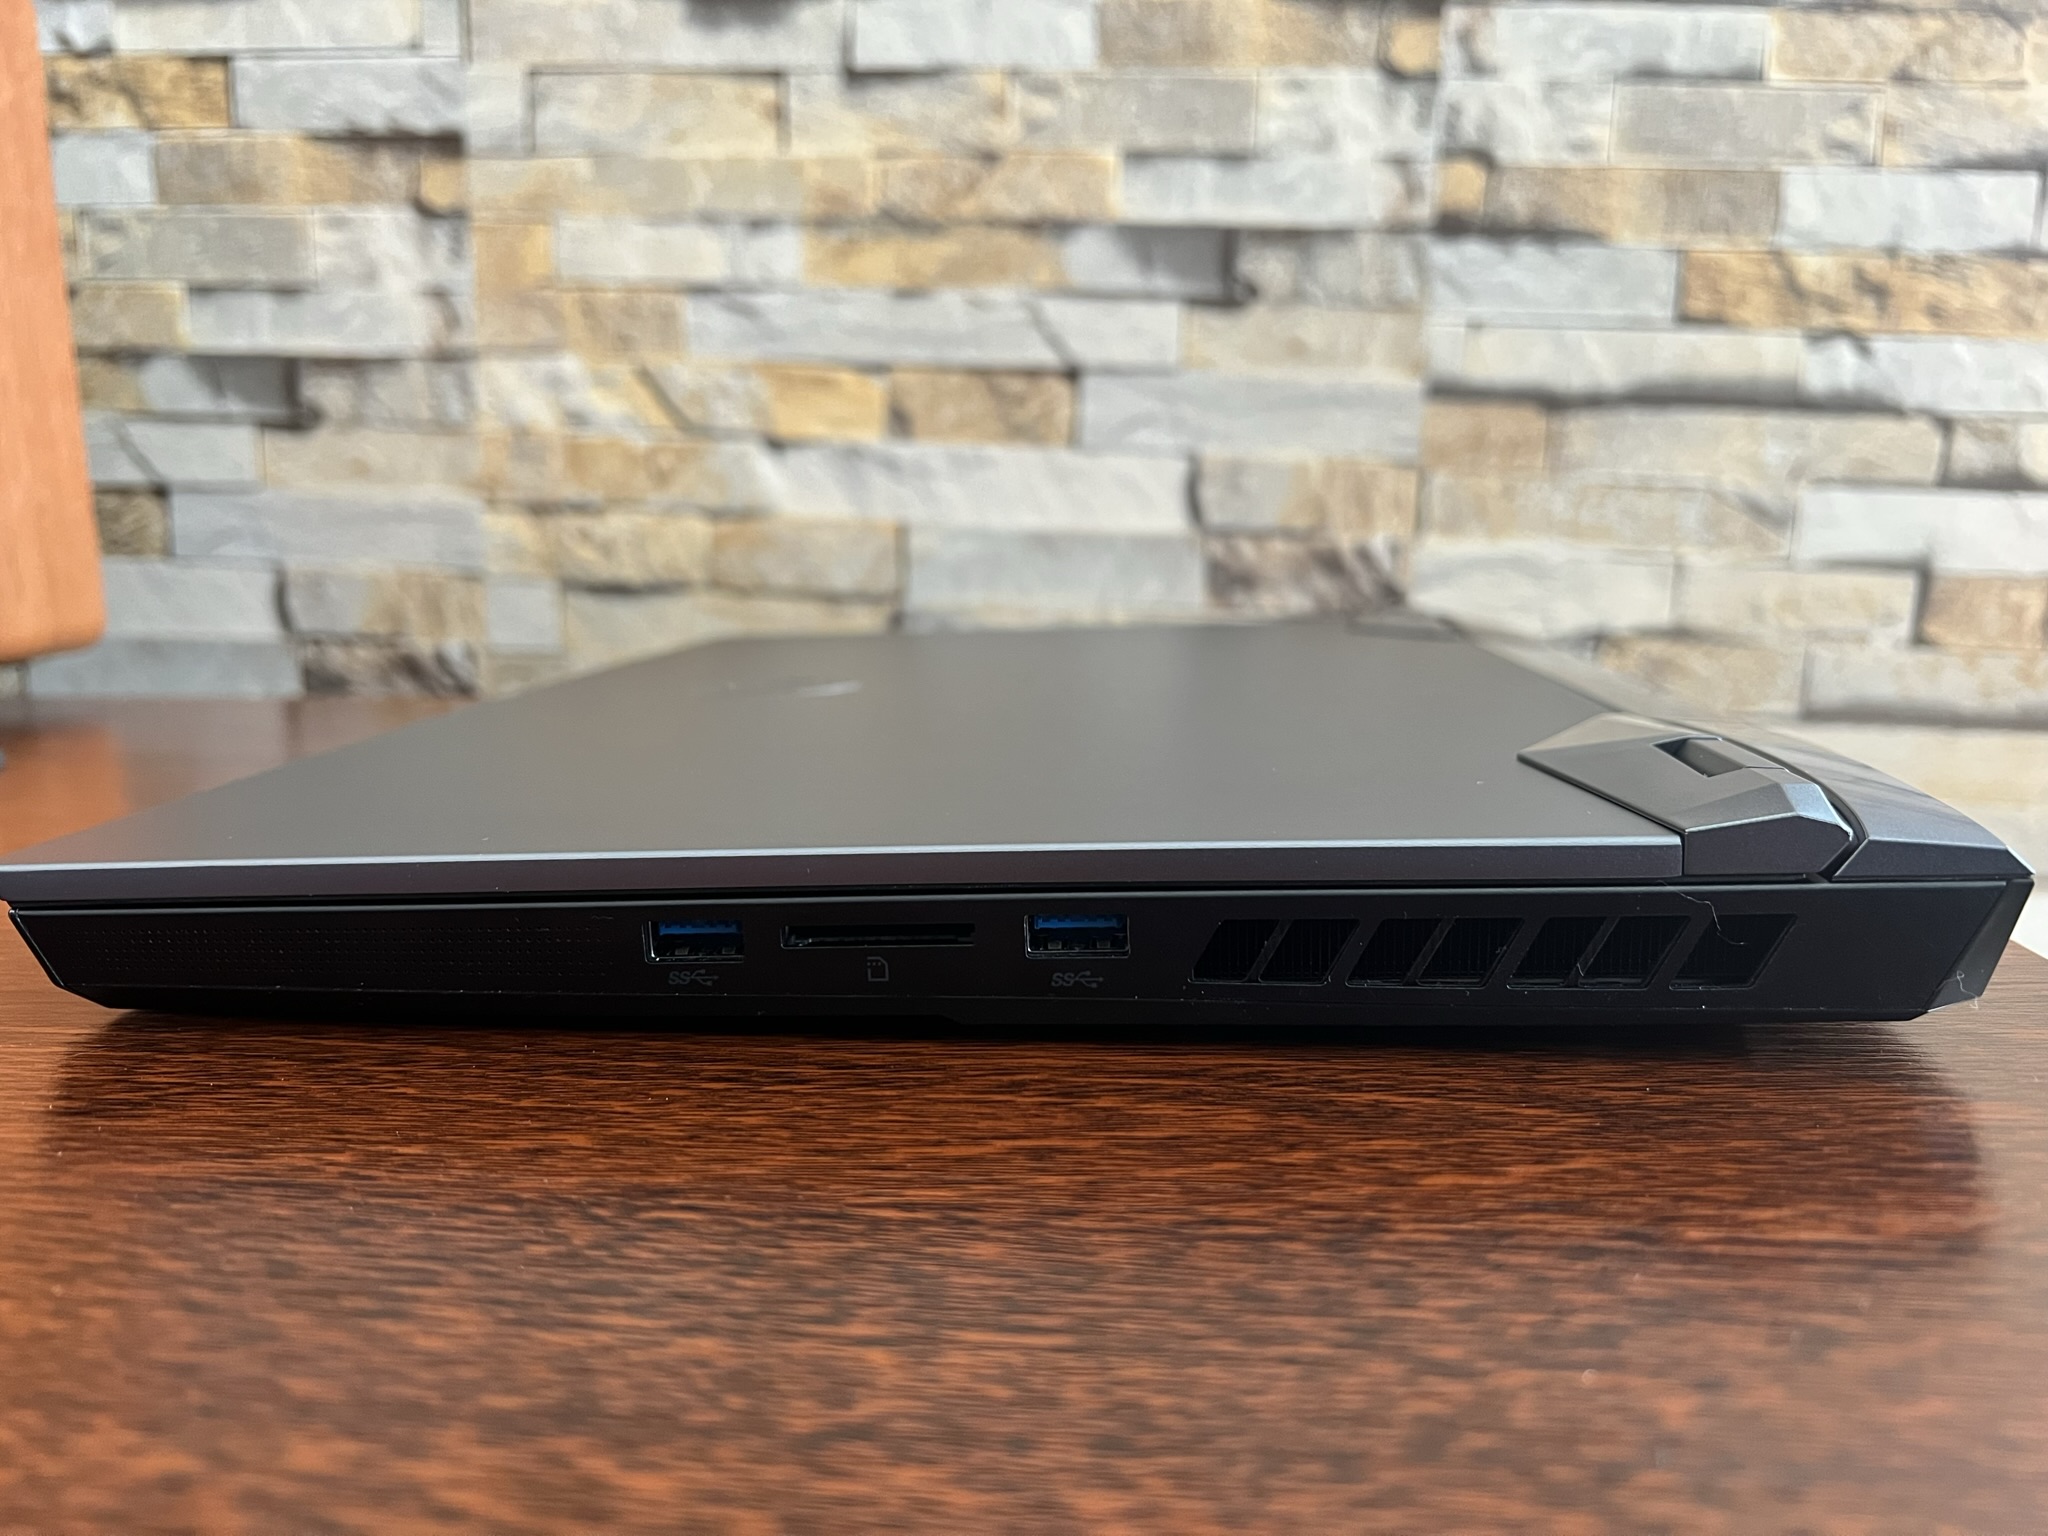
All port positions also remained unchanged in relation to the MSI GE66 10SFS. Only the USB-C port on the back has been upgraded to Thunderbolt 4, and the USB-C 3.2 port on the left side now supports the DisplayPort function.
SD Card Reader
The performance of the SD card reader falls short of expectations in testing with our AV PRO V60 microSD reference card. Only the Schenker XMG Neo 15 Early 2022 performs worse in the comparison field.
| SD Card Reader - average JPG Copy Test (av. of 3 runs) | |
| MSI GE66 Raider 10SFS (Toshiba Exceria Pro SDXC 64 GB UHS-II) | |
| Razer Blade 15 2022 (Toshiba Exceria Pro SDXC 64 GB UHS-II) | |
| Average of class Gaming (20.9 - 210, n=54, last 2 years) | |
| MSI Raider GE66 12UHS (AV PRO microSD 128 GB V60) | |
| Schenker XMG Neo 15 E22 (Early 2022, RTX 3080 Ti) | |
Communication
Our review device comes out at the top in Wi-Fi performance and shows excellent rates that are only just surpassed by the Razer Blade 15 Advanced Early 2022.
Webcam
The webcam offers Full HD and delivers decent images for a notebook webcam. While these tend to be noisy and blurry in low-light conditions, the overall image quality should suffice for everyday tasks such as video conferencing.


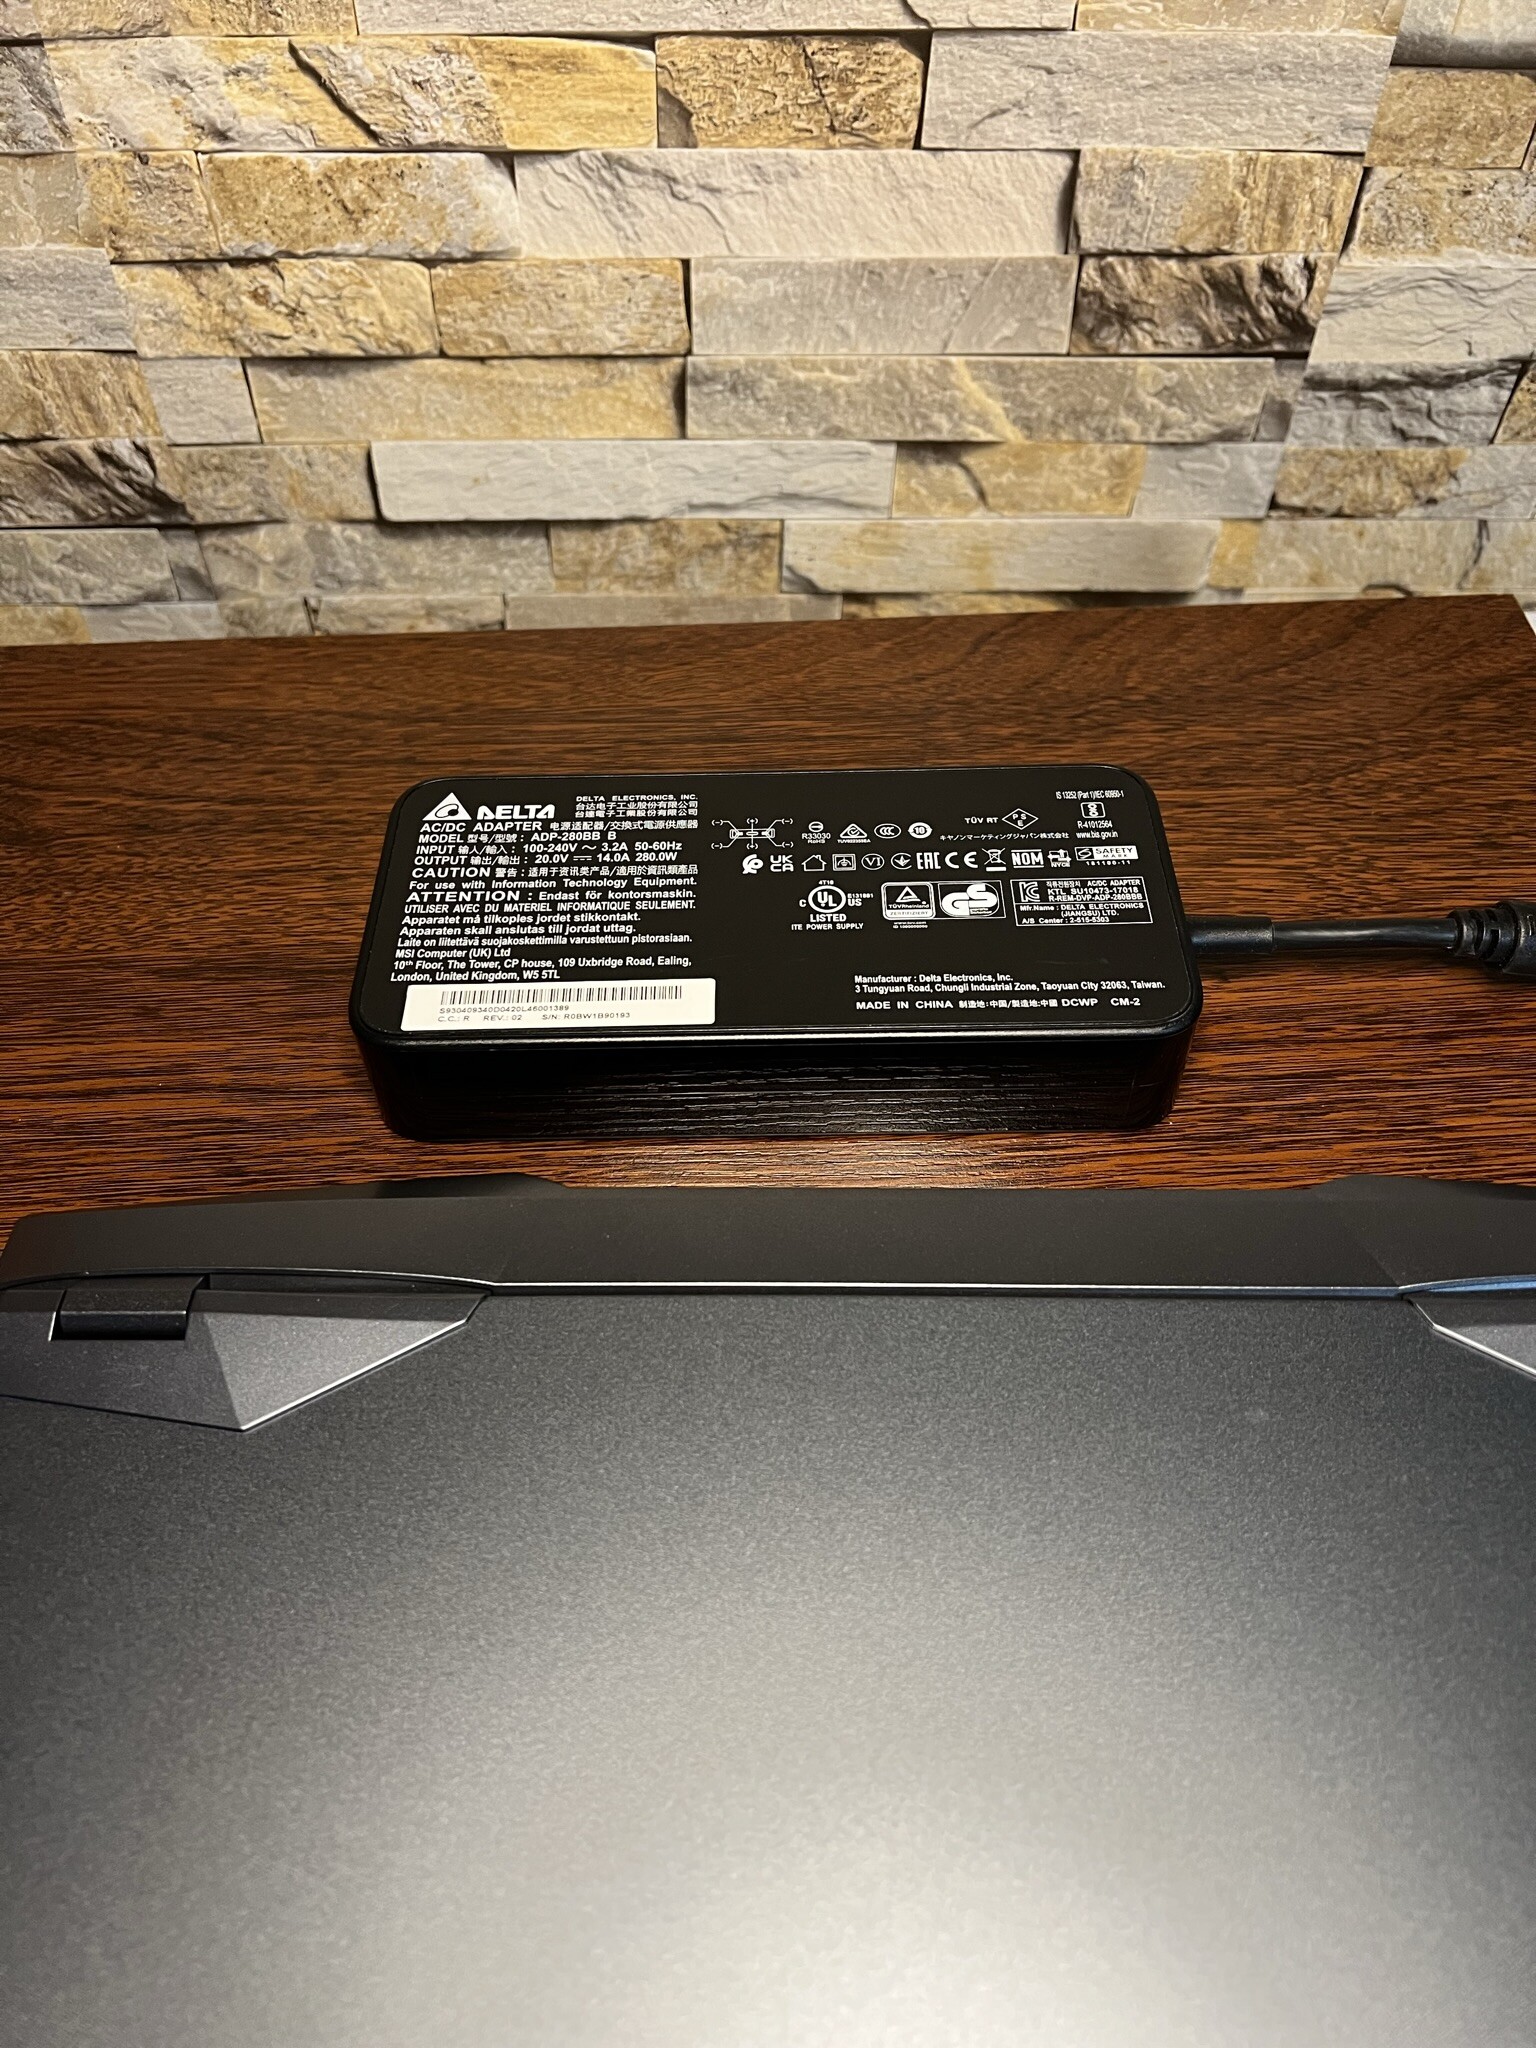
Accessories
Excluding the notebook, the scope of delivery includes the necessary documentation for the device as well as the power adapter. Like the 280 watts of its predecessor, the unchanged power supply still provides enough power for the installed hardware.
Maintenance
In 2022, service support is not always a given for every device. Some manufacturers deliberately make it difficult for users who want to maintain their devices themselves. Dell, for example, installs the motherboard back-to-front in its Alienware laptops (fan and heat sink are directly underneath the keyboard and are difficult to access). Those wanting to replace the heat conduction pads or paste are thus faced with a cumbersome procedure.
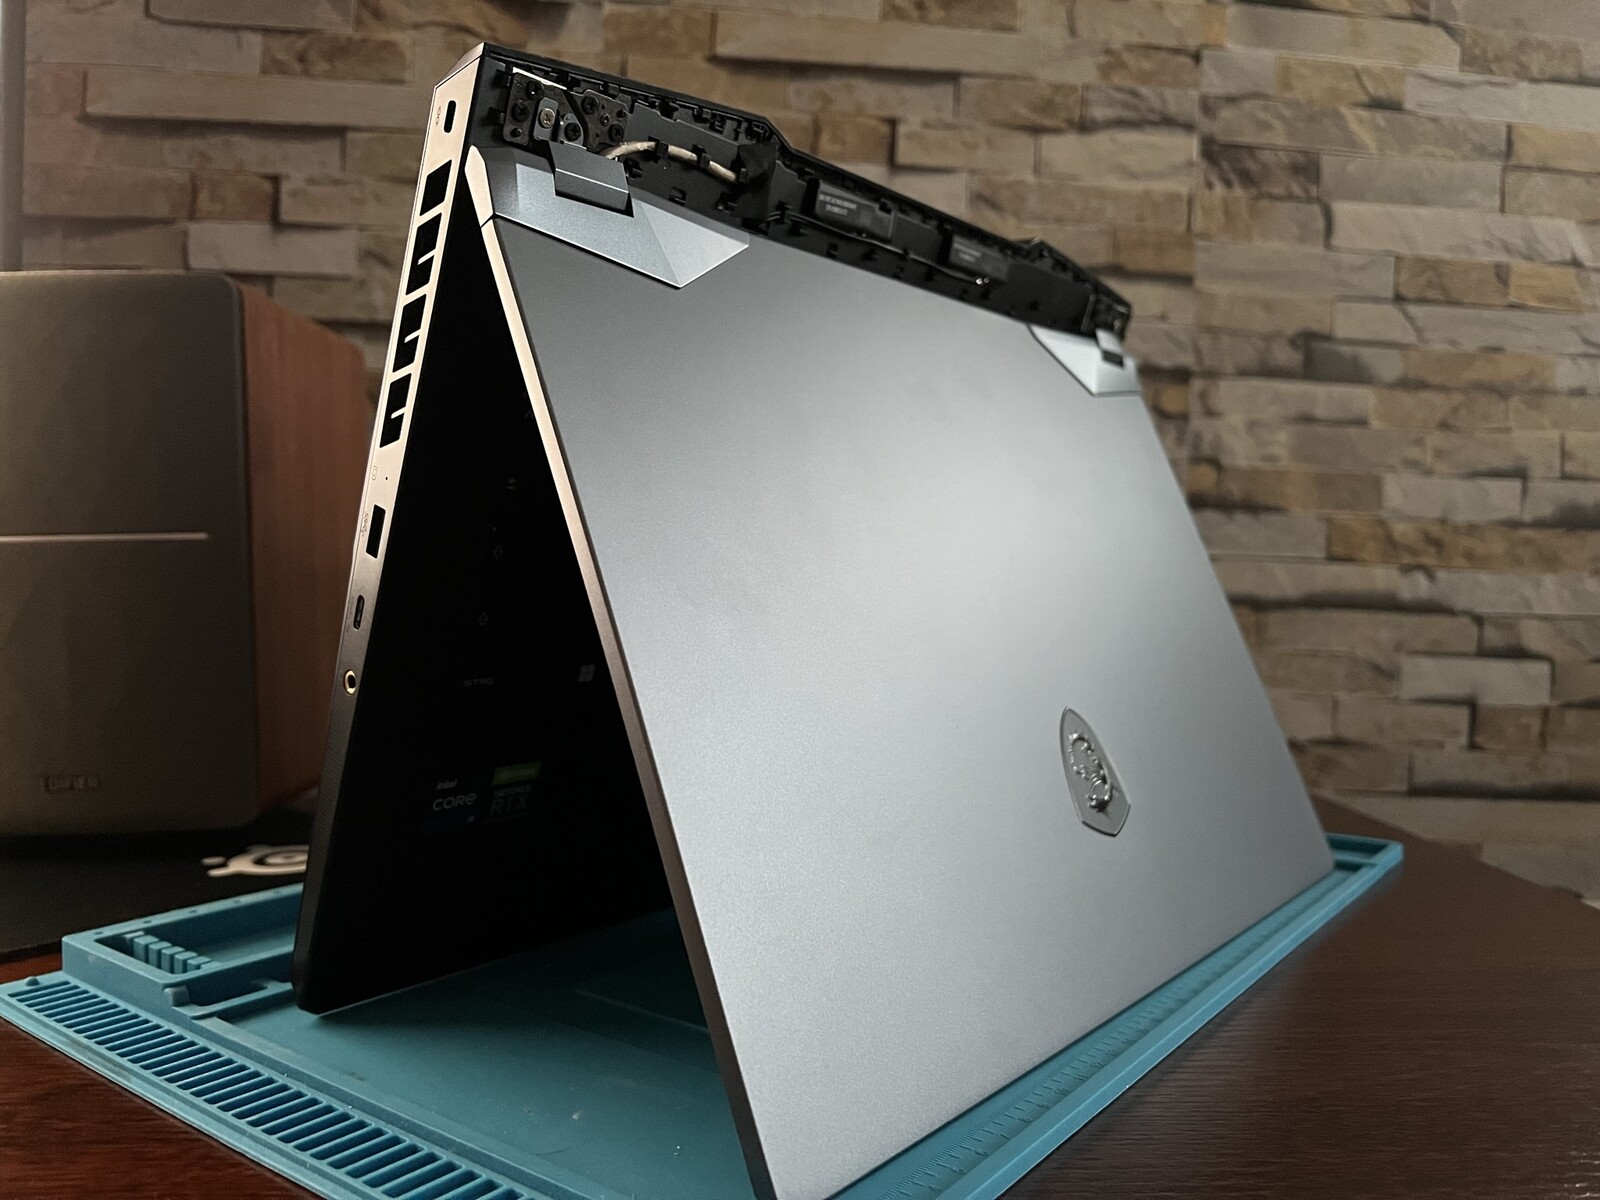
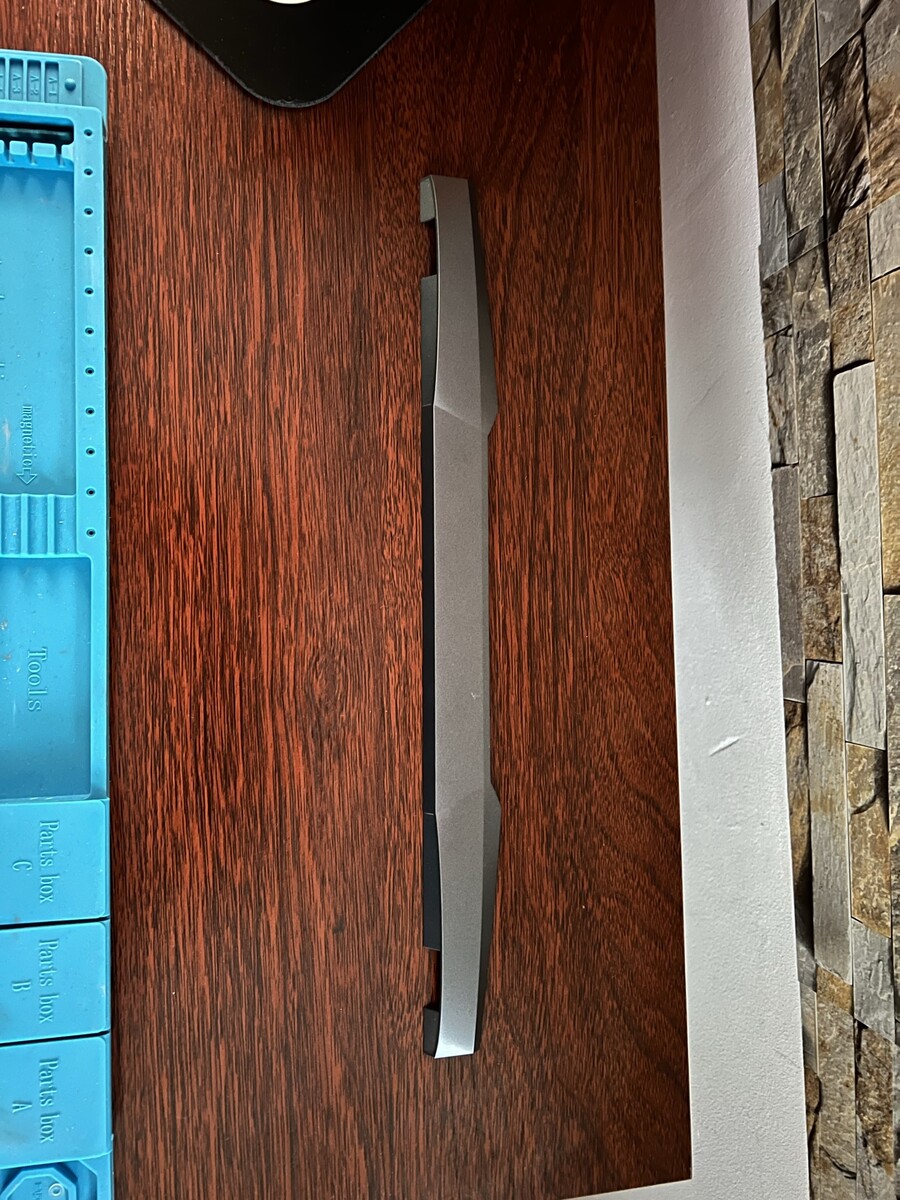
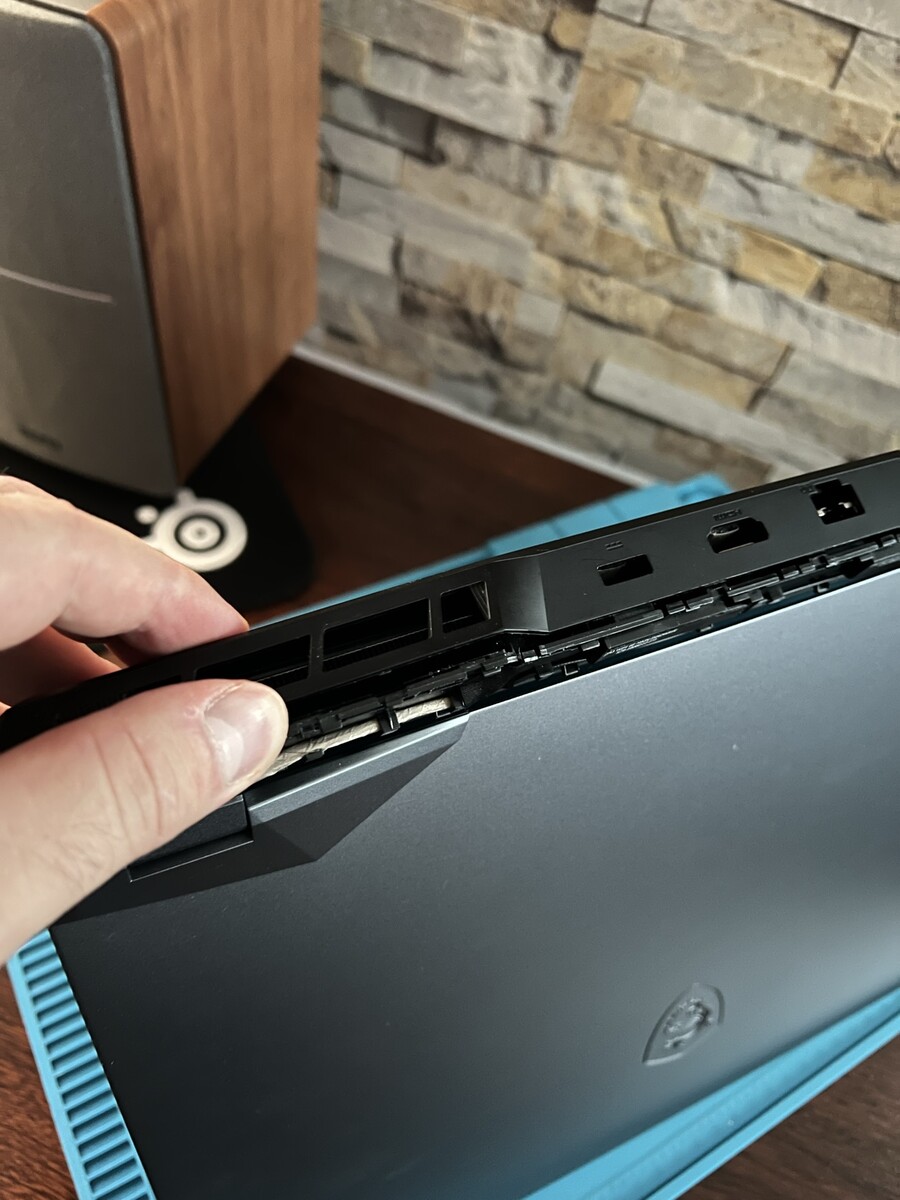
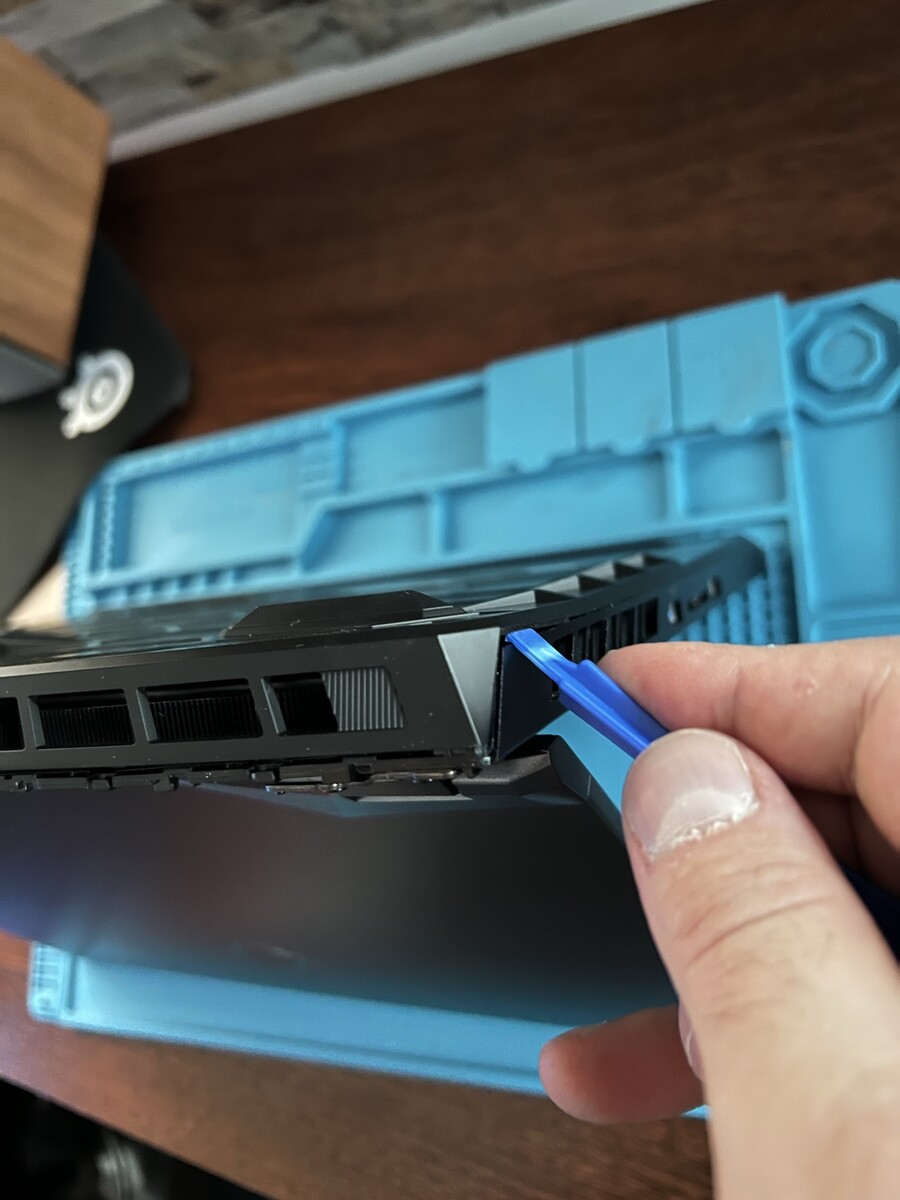
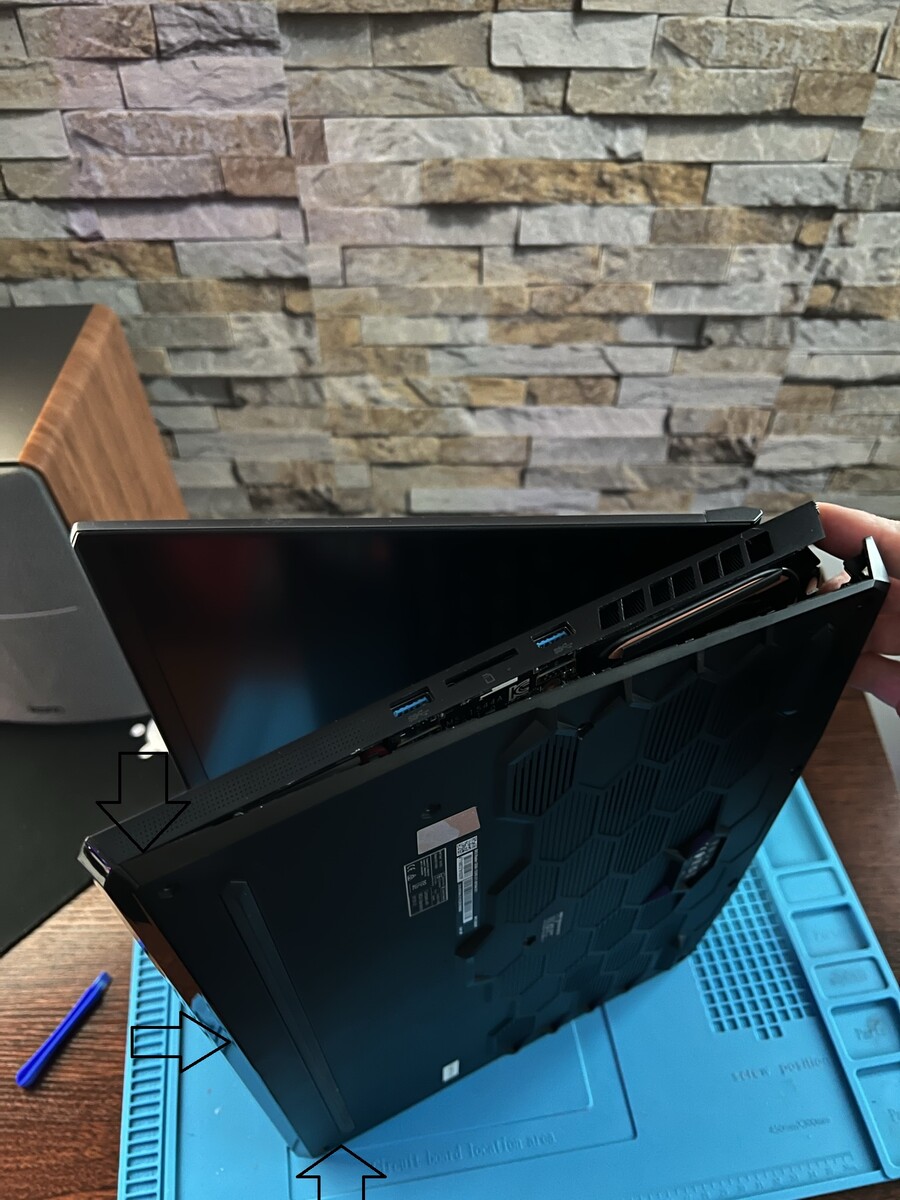
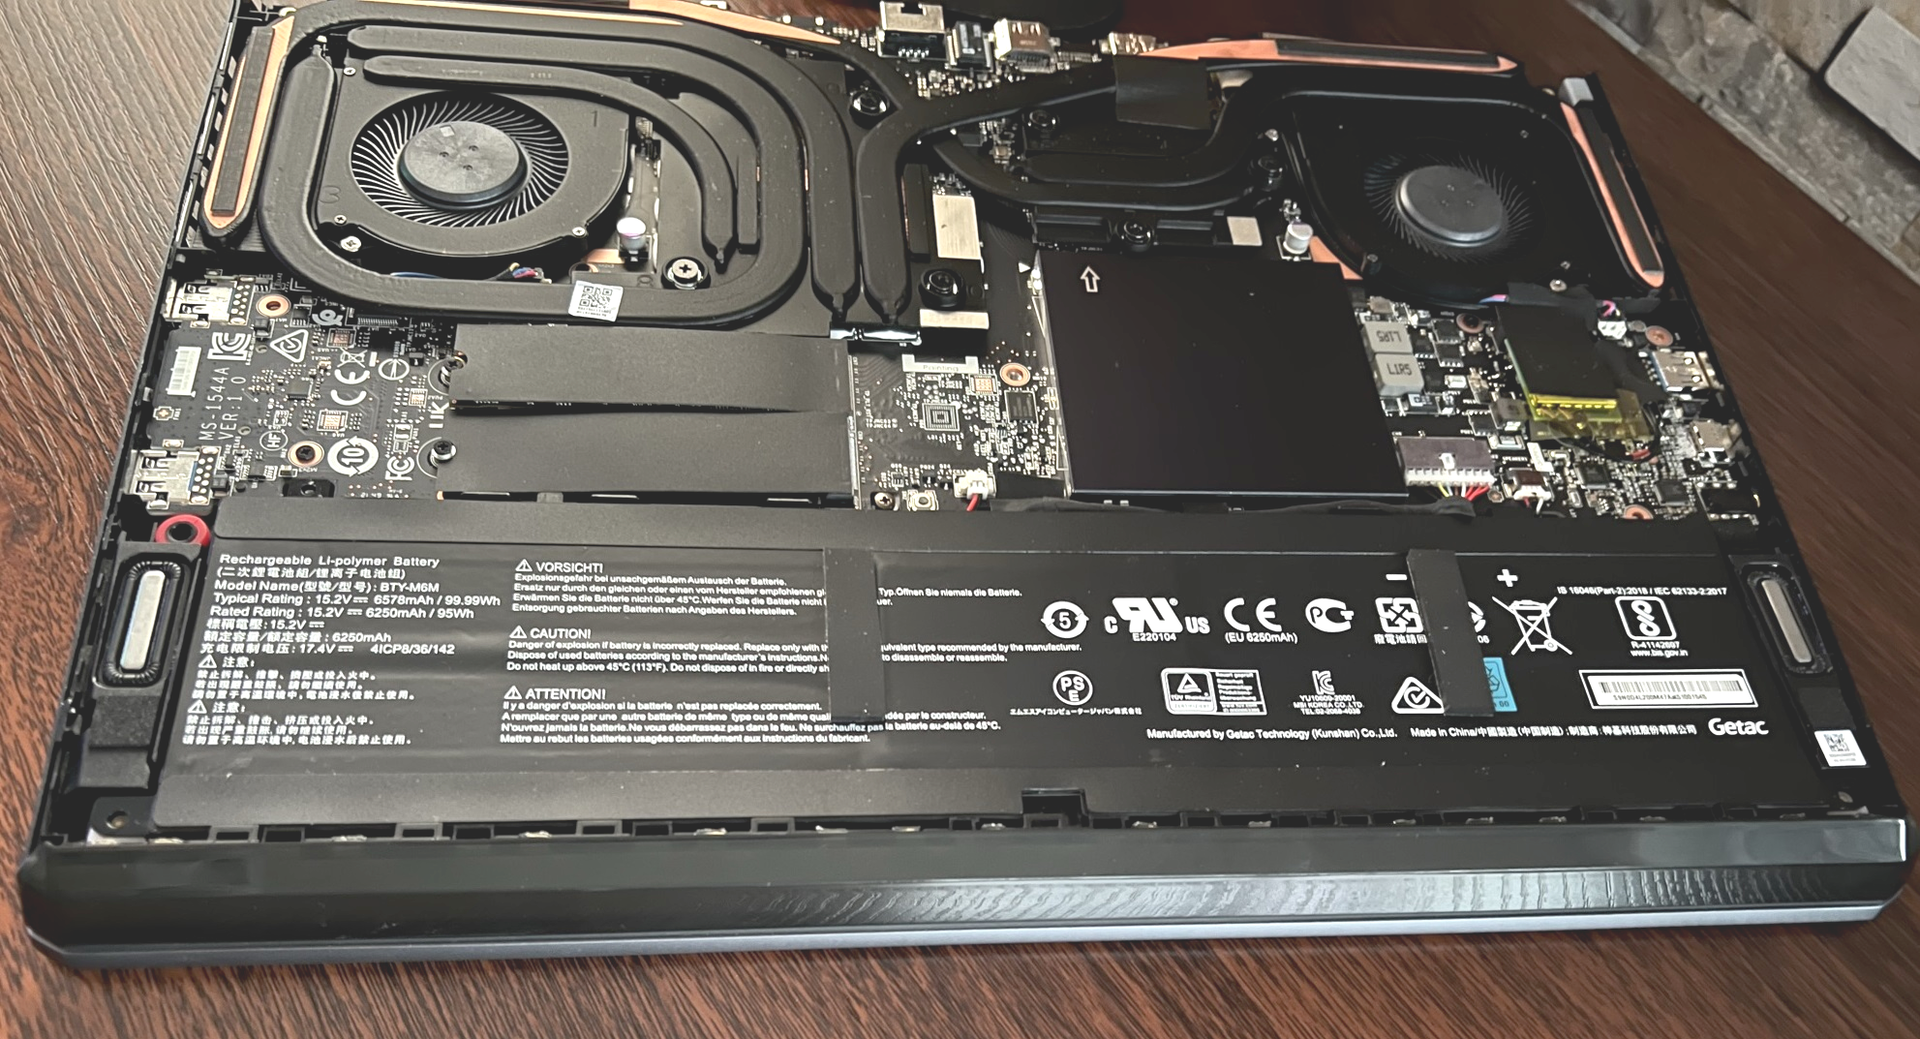
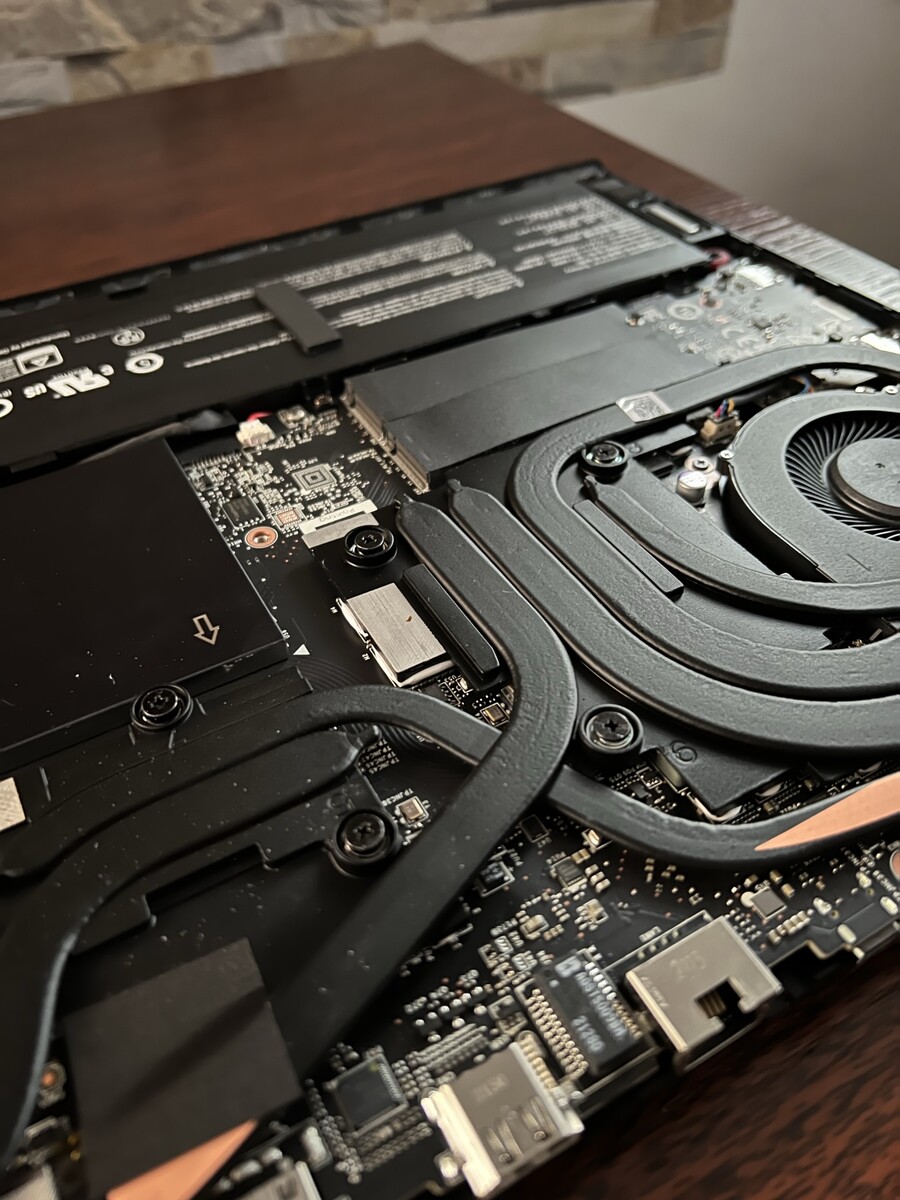
This is not the case with our MSI Raider GE66 12 UHS, where the only remotely difficult task lies in removing 11 Phillips screws to detach the baseplate. This also applies to the plastic cover behind the display. For those interested, there is a small series of photos below that show how to access the inner workings of the MSI Raider GE66 12 UHS without damaging the sensitive plastic parts.
Once you have removed the top cover and the bottom shell, you have direct access to the two PCI Gen 4 slots. You can also replace the Wi-Fi card, clean the fans and, if necessary, replace the cooling system and the SO-DIMM modules, which are located underneath a passive cooling block.
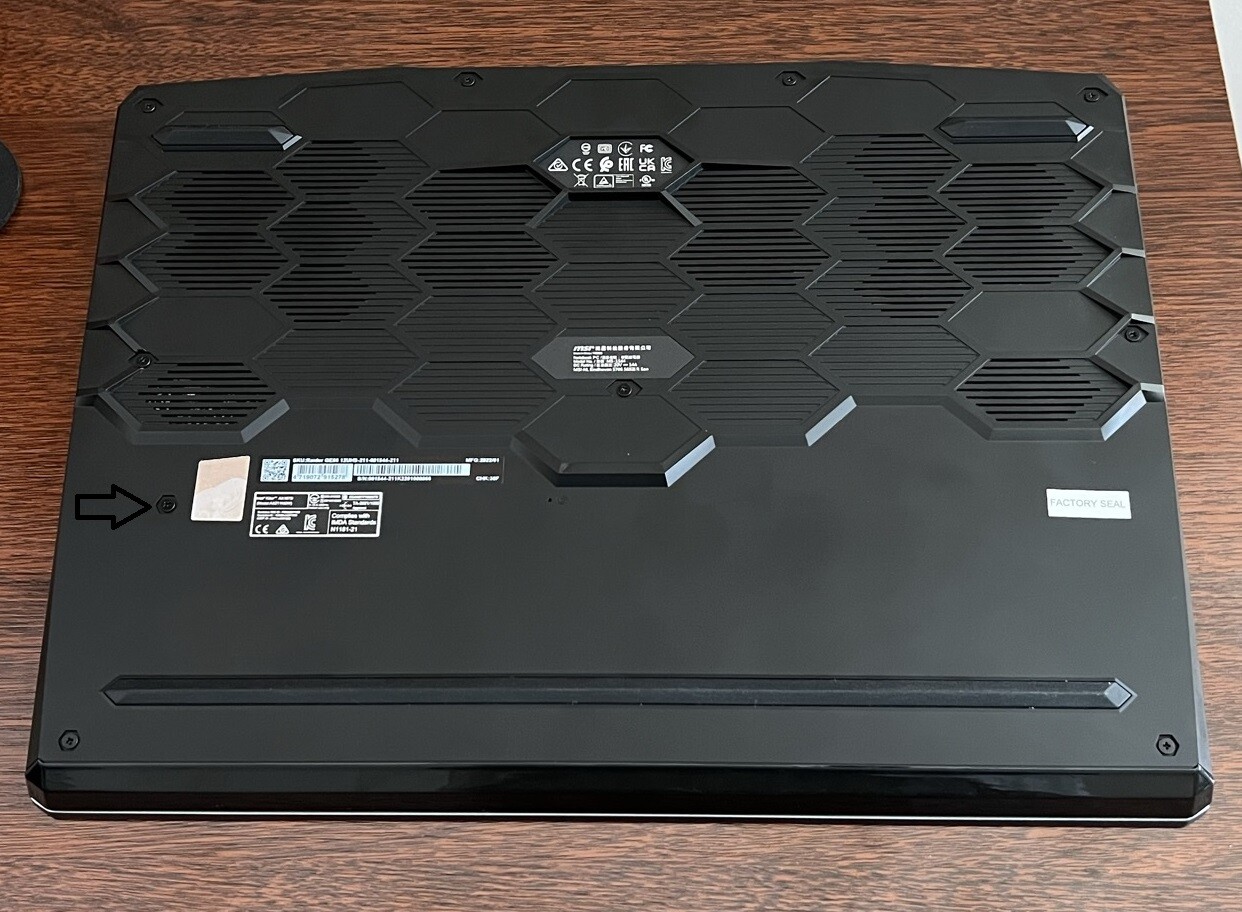
Warranty
As in the case of the predecessor, MSI grants the Raider GE66 a 24-month warranty with pick-up & return service. This applies to Germany only, so the warranty policy may differ in other countries. Important to note is that the warranty seal has no relevance for German-speaking countries insofar that the user is allowed to open the device for upgrading and maintenance without the warranty becoming void. However, this applies only under the condition that the work is carried out professionally. If damage or defects indicate that the work was not done professionally, this can render the warranty invalid. Furthermore, the device must be restored to its original configuration if servicing is required, since parts may have to be replaced for the repair and MSI requires the original parts.
Input devices: Great gaming keyboard with sleek light bar
The keyboard and layout as well as the touchpad have not changed compared to the MSI GE66 10SFS. We therefore again refer you to the review of the predecessor model.
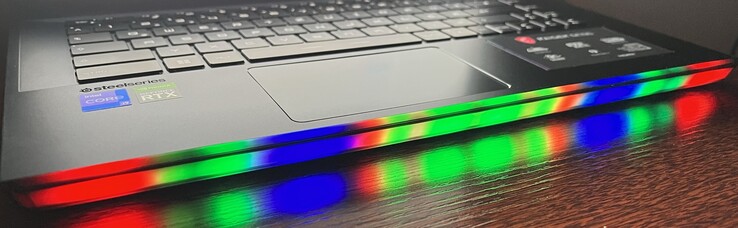
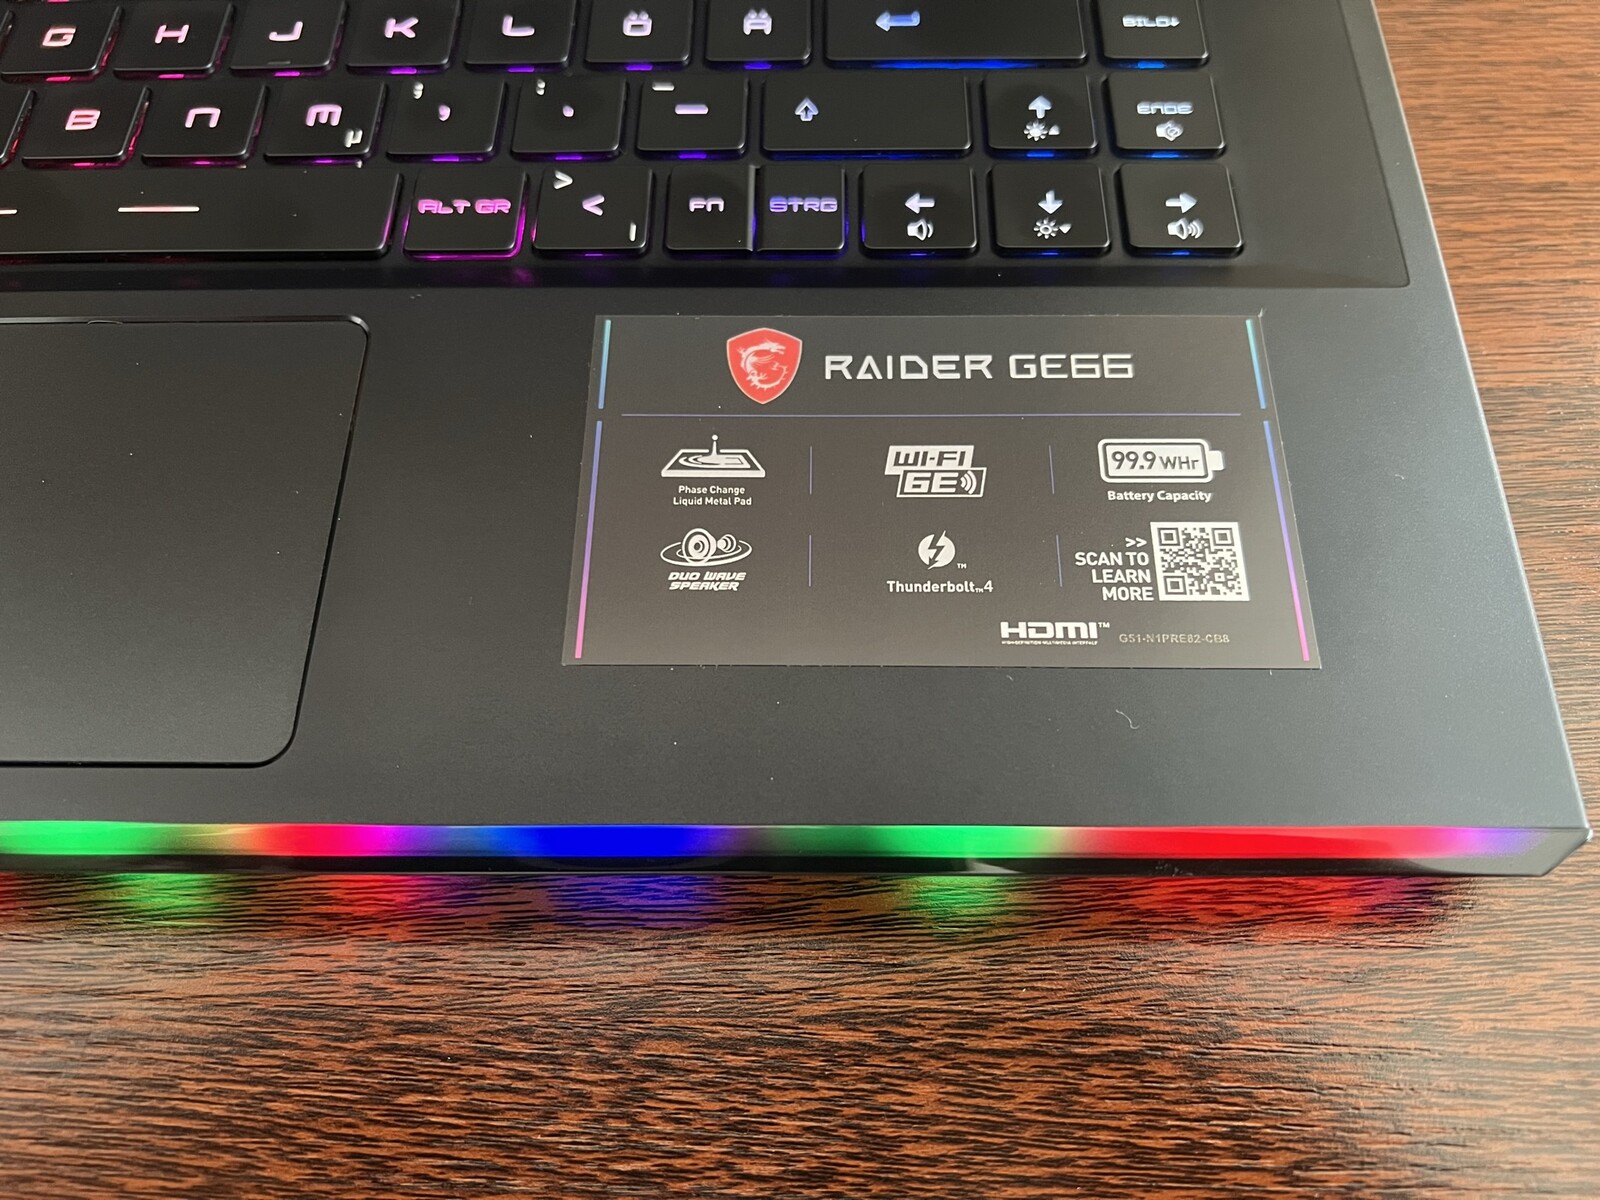
One point worth mentioning is the light bar, which has been enlarged and offers even more lighting on the chassis and front for RGB fans. The illumination also looks more pleasant and of higher quality.
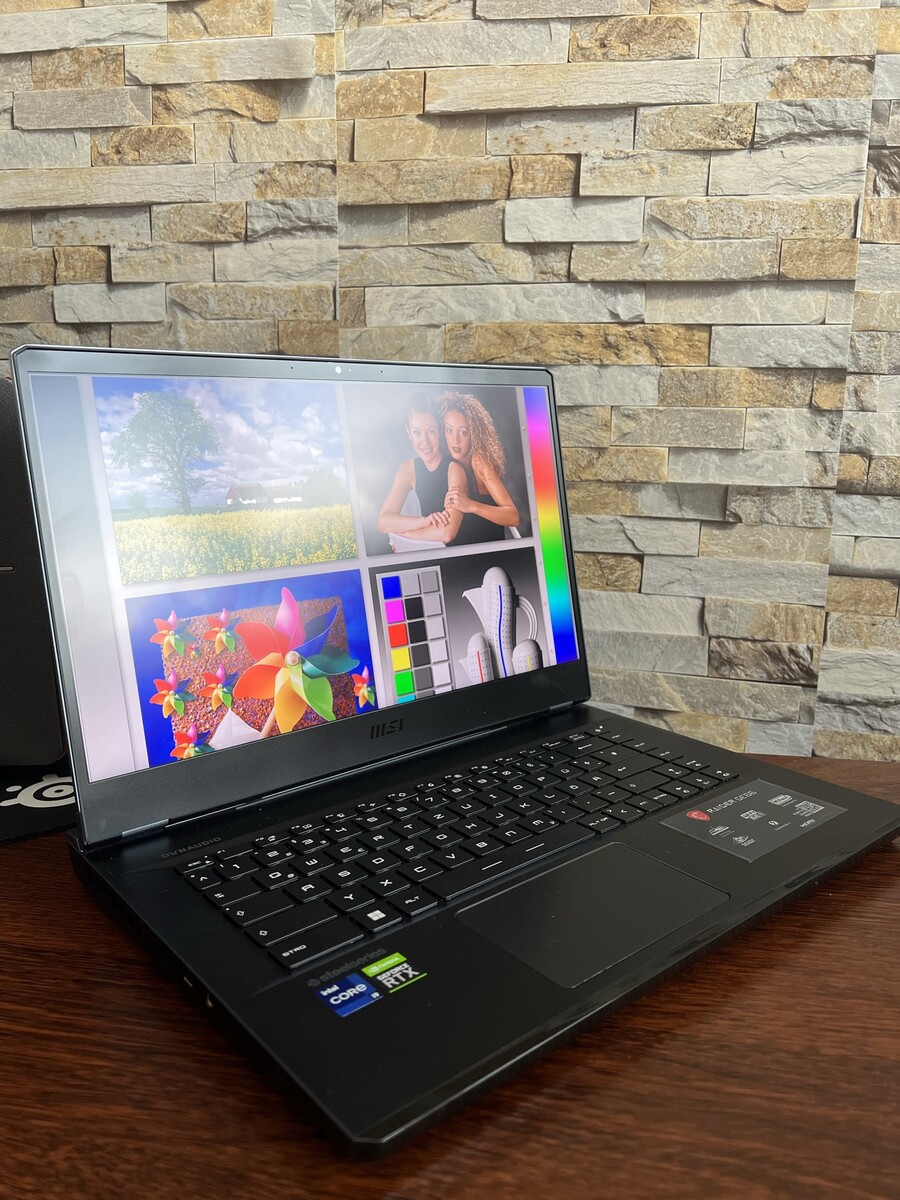
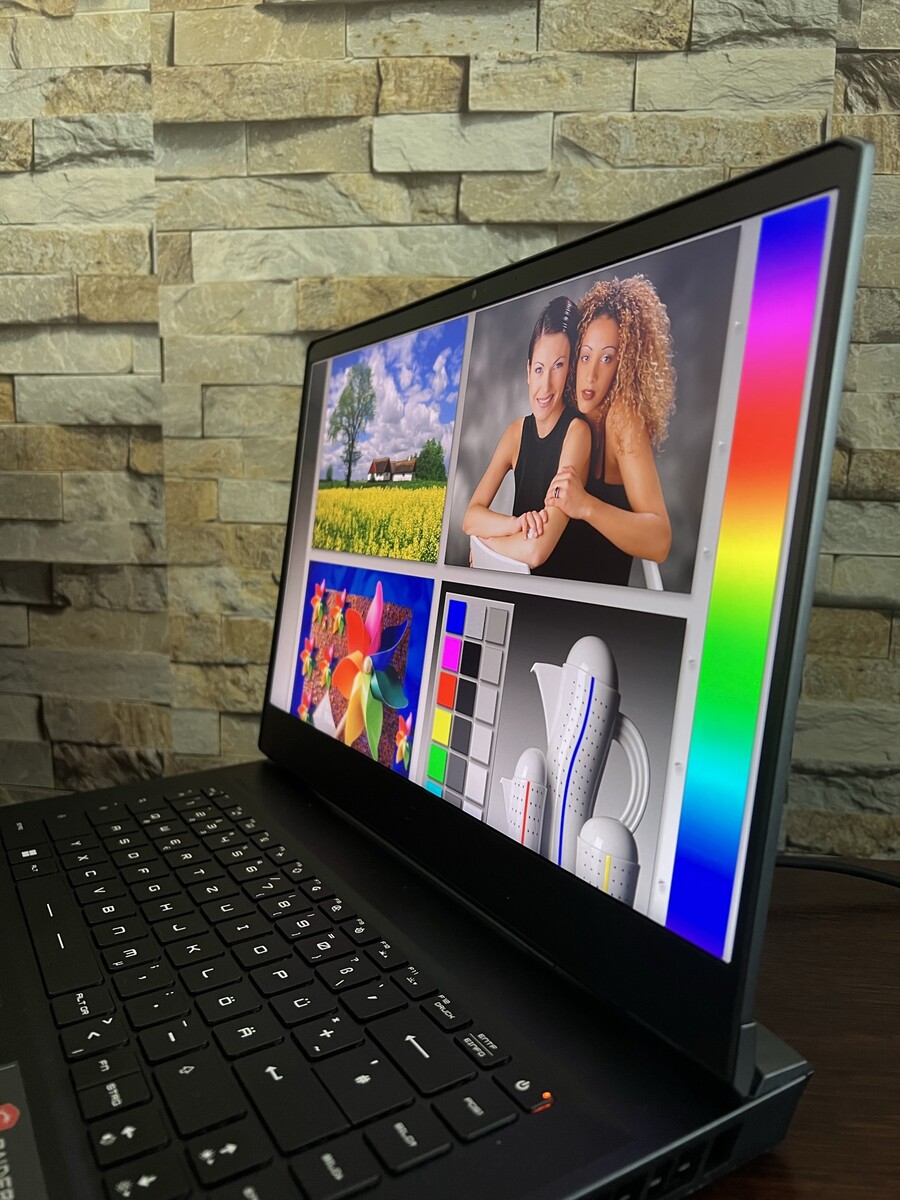
Display: 4K panel with 120 Hz

MSI has installed a non-reflective IPS panel with a refresh rate of 120 Hz in the Raider GE66 12UHS, which has 4K resolution and subjectively looks excellent. Whether a 4K panel is suitable for a 15-incher is debatable: it is definitely an advantage for professional users who are also into gaming. Beyond that, the installed hardware falls into the absolute high-end range and is definitely configured to run games smoothly in 4K resolution. MSI also offers alternatives, starting with a QHD panel with 240 Hz or 165 Hz (and 100% DCI-P3 coverage in each case), up to a Full HD panel with 360 Hz.
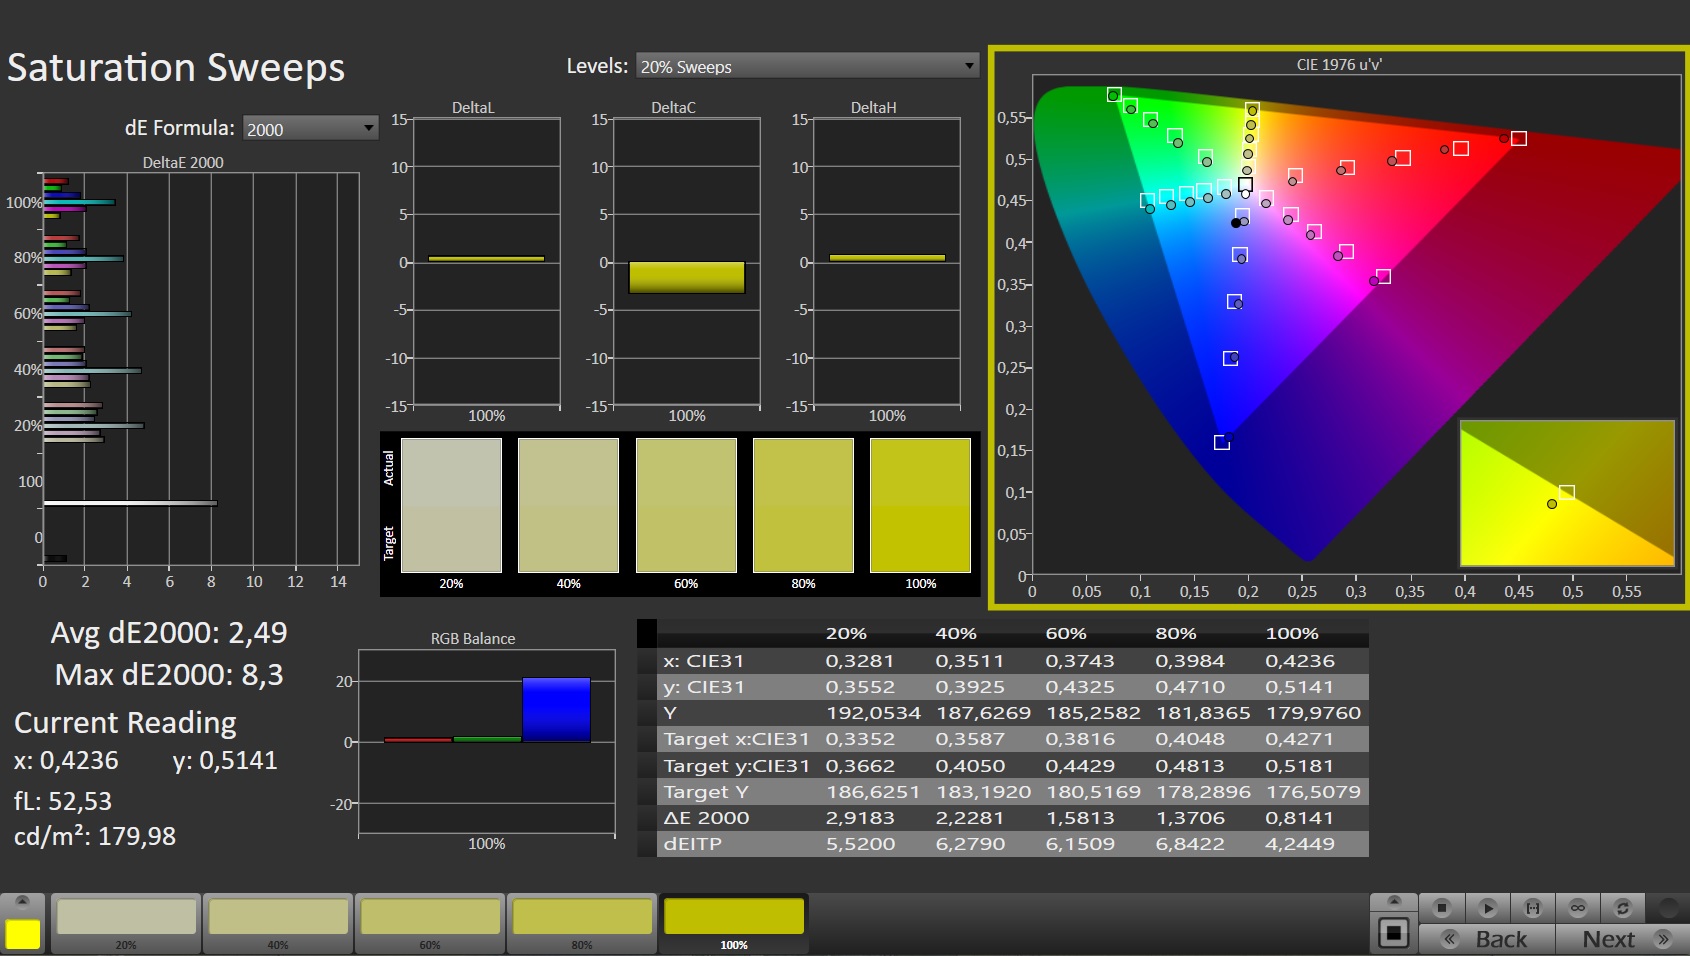
Comparing the values of the 4K display in the review device with those of the FHD panel (240 Hz) in the predecessor, the following picture emerges: The GE66 12UHS with its 4K panel is 20% brighter at 347 cd/m² and offers a higher color space coverage at 80.4% DCI-P3 versus 68% as well as 94.7% AdobeRGB versus 69.8%. The review device with its 4K display does not use PWM, even though the predecessor had this only at a very high frequency. However, there are also disadvantages, such as higher response times and poorer black and contrast values.
| |||||||||||||||||||||||||
Brightness Distribution: 90 %
Center on Battery: 351 cd/m²
Contrast: 1003:1 (Black: 0.35 cd/m²)
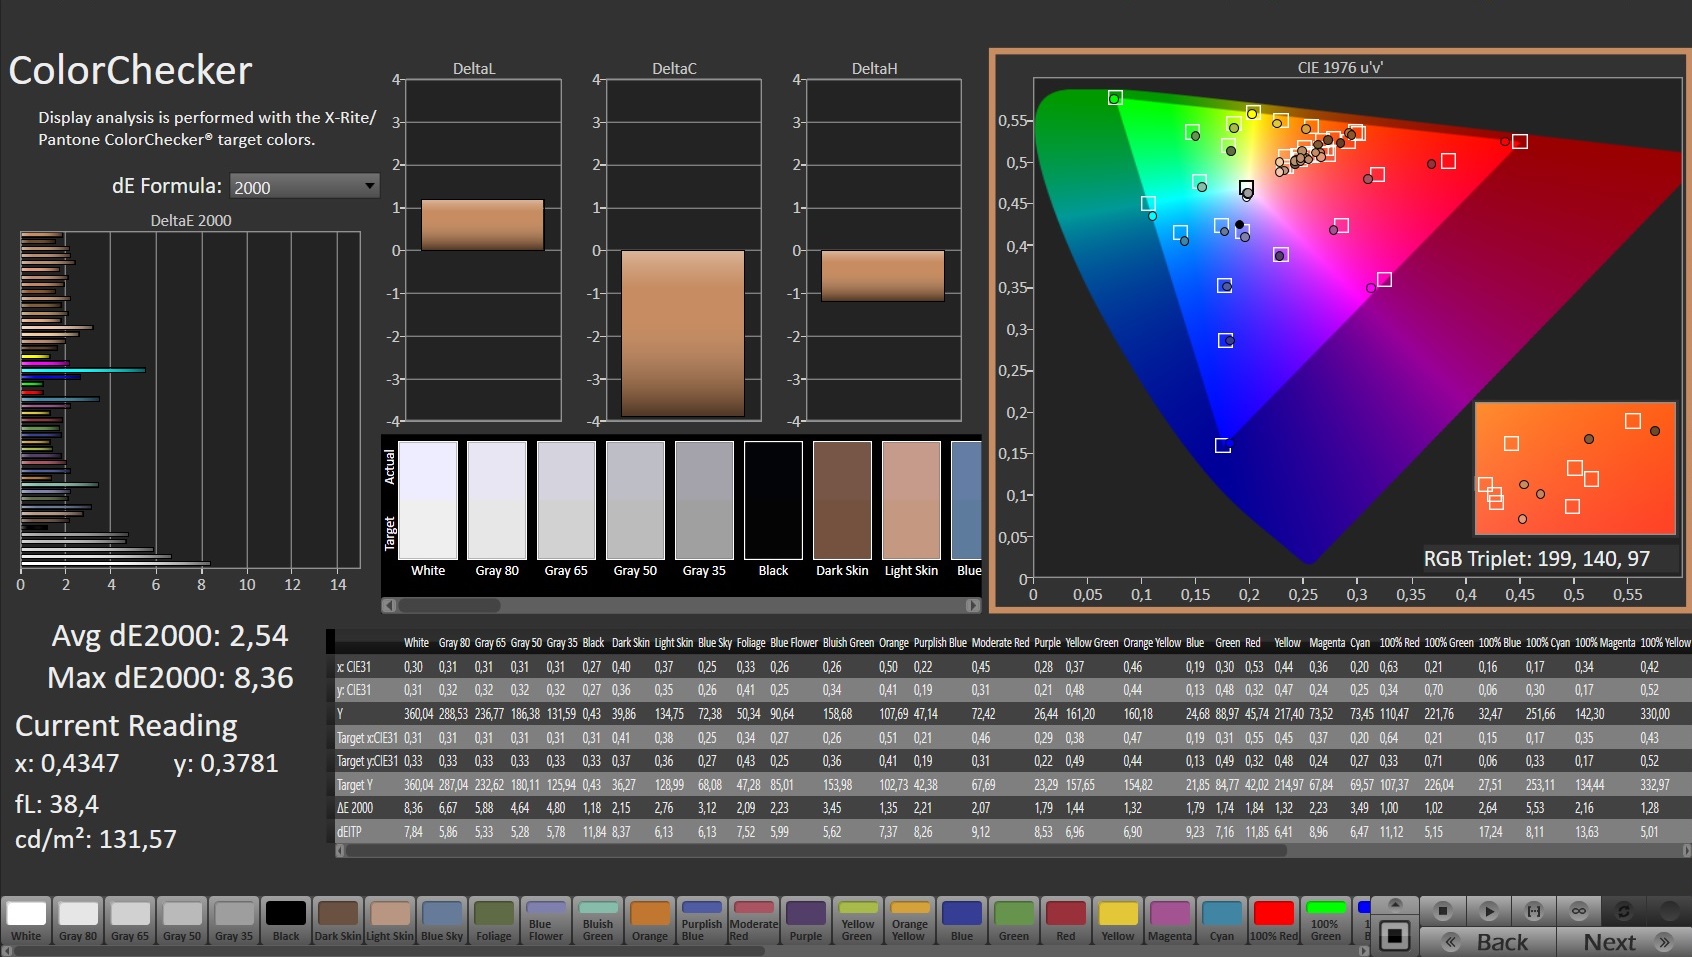
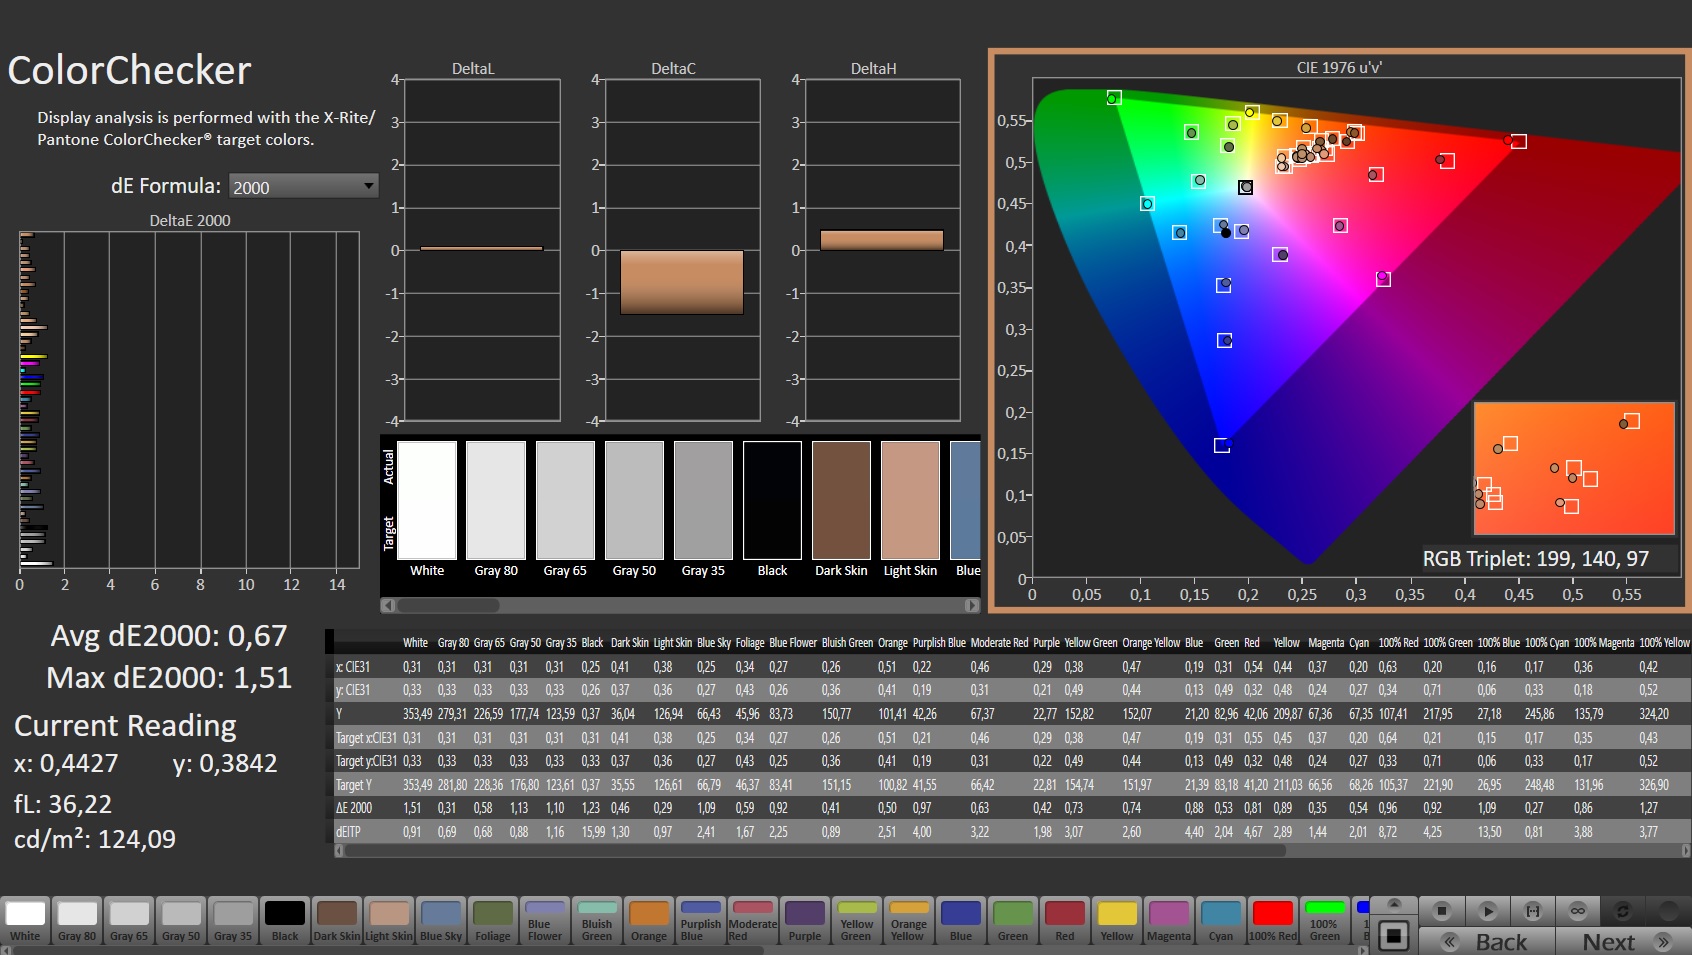
ΔE ColorChecker Calman: 2.54 | ∀{0.5-29.43 Ø4.73}
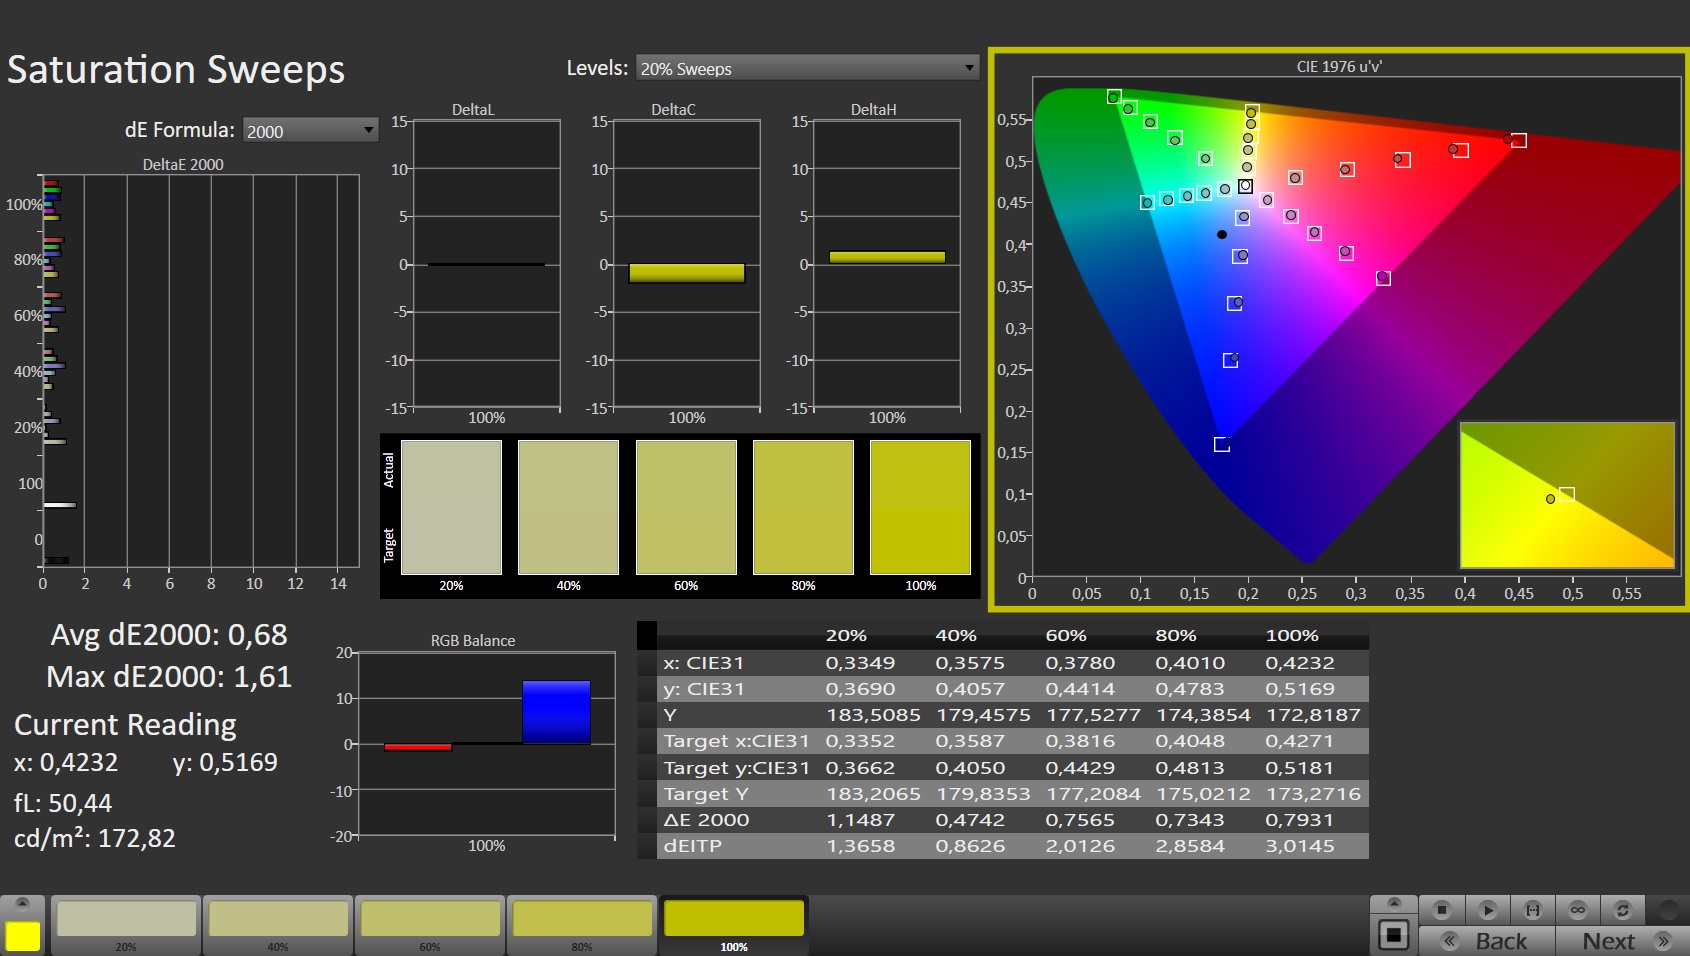
calibrated: 0.67
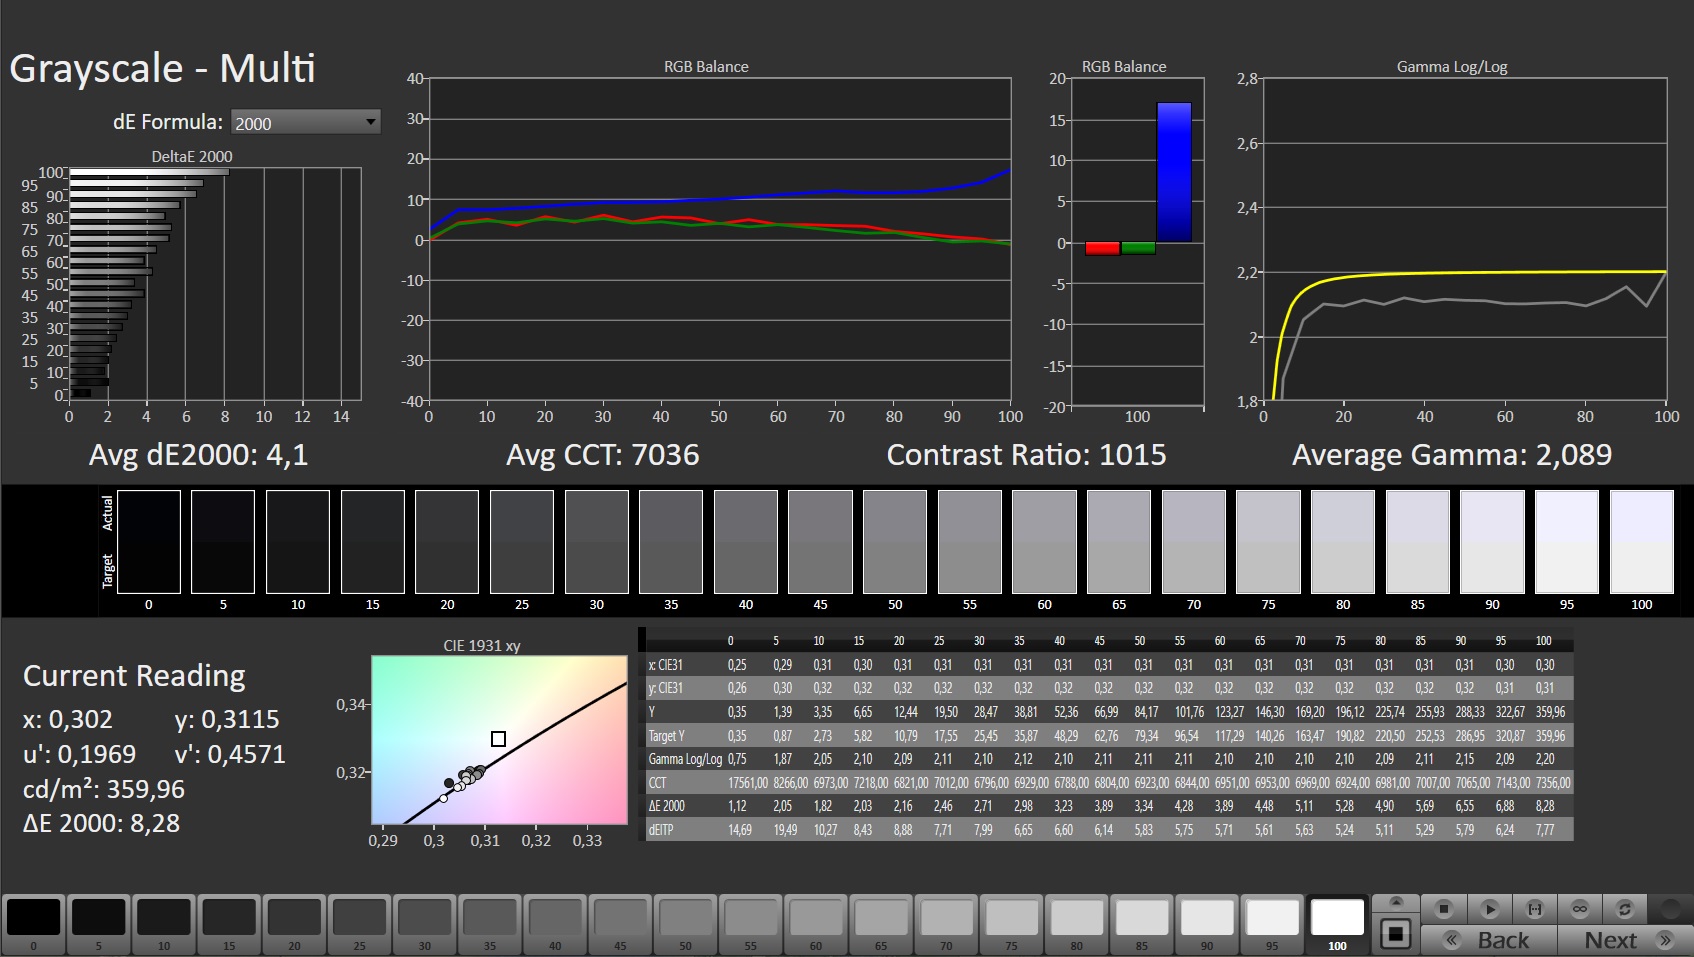
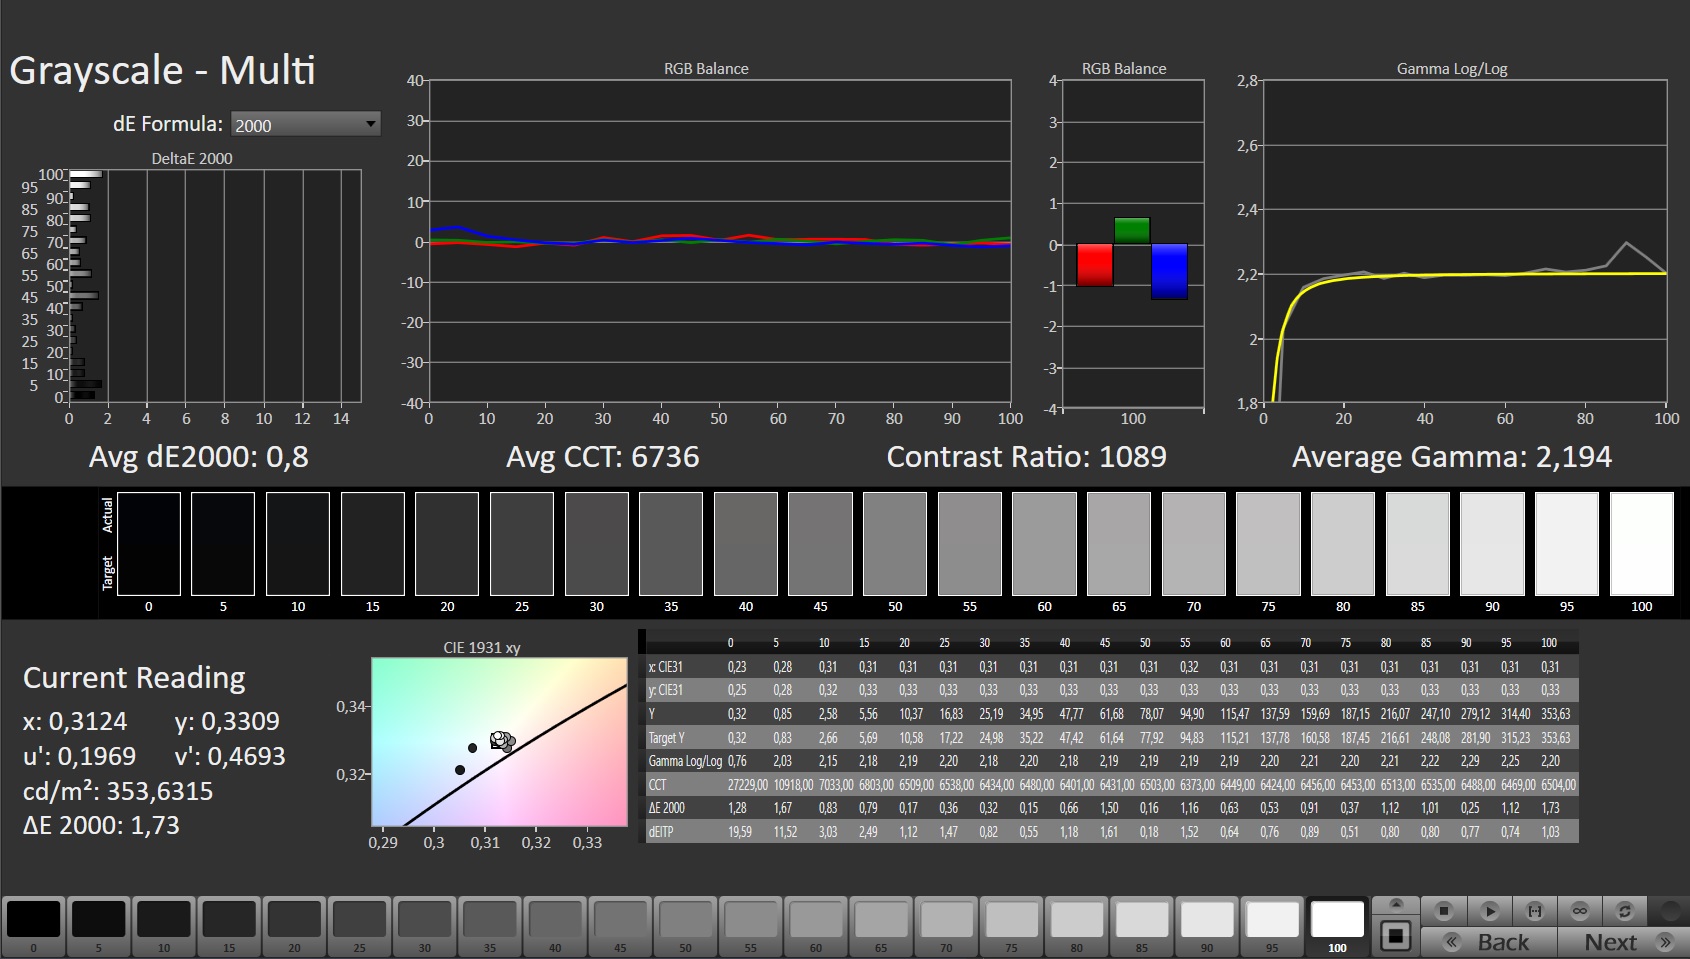
ΔE Greyscale Calman: 4.1 | ∀{0.09-98 Ø4.97}
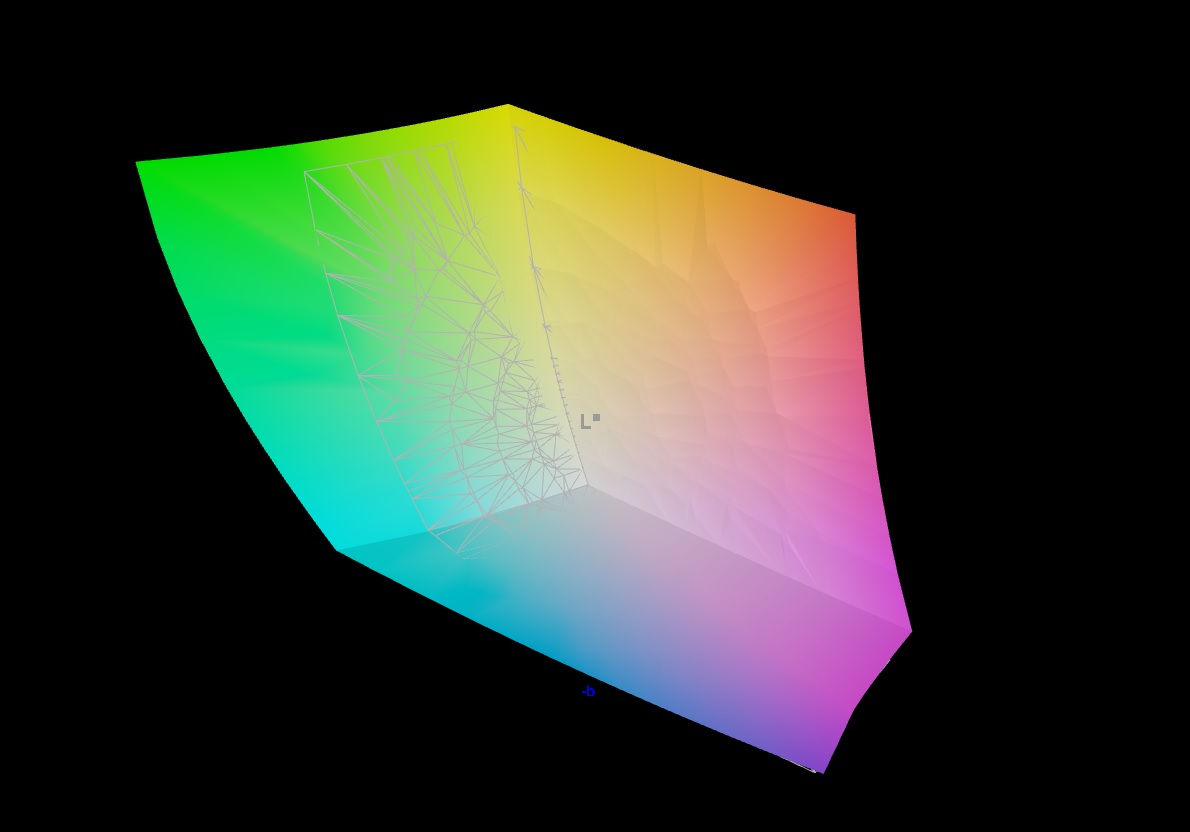
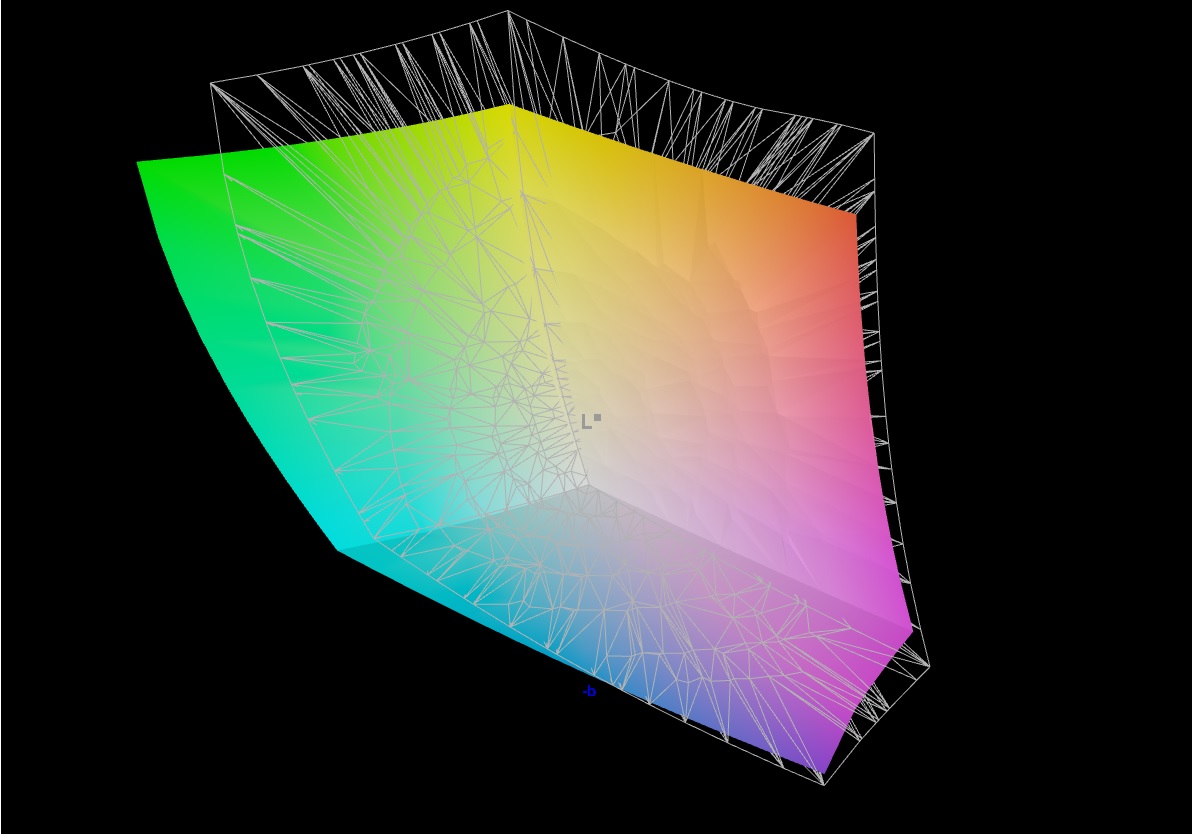
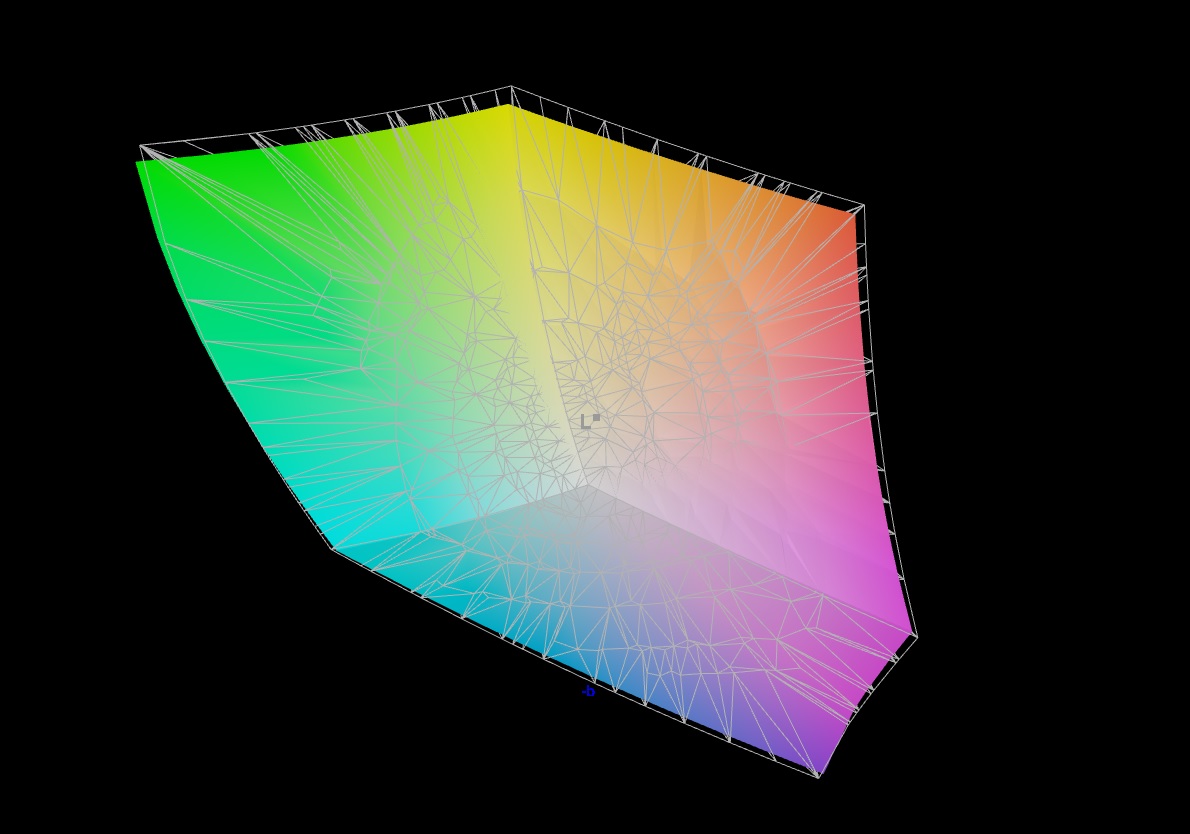
94.7% AdobeRGB 1998 (Argyll 3D)
98.4% sRGB (Argyll 3D)
80.4% Display P3 (Argyll 3D)
Gamma: 2.089
CCT: 7036 K
| MSI Raider GE66 12UHS AUO51EB, IPS, 3840x2160, 15.6" | MSI GE66 Raider 10SFS Sharp LQ156M1JW03 (SHP14C5), IPS-Level, 1920x1080, 15.6" | Razer Blade 15 2022 Sharp LQ156T1JW03, IPS, 2560x1440, 15.6" | Schenker XMG Neo 15 E22 (Early 2022, RTX 3080 Ti) BOE0A67 (BOE CQ NE156QHM-NZ1), IPS, 2560x1440, 15.6" | Lenovo Legion 5 Pro 16 G7 i7 RTX 3070Ti NE160QDM-NY1, IPS, 2560x1600, 16" | |
|---|---|---|---|---|---|
| Display | -13% | 6% | -14% | ||
| Display P3 Coverage (%) | 80.4 | 68 -15% | 99.1 23% | 68.7 -15% | |
| sRGB Coverage (%) | 98.4 | 99 1% | 99.9 2% | 97.6 -1% | |
| AdobeRGB 1998 Coverage (%) | 94.7 | 69.8 -26% | 86.8 -8% | 70.9 -25% | |
| Response Times | 16% | 16% | 20% | 24% | |
| Response Time Grey 50% / Grey 80% * (ms) | 18.8 ? | 16.4 ? 13% | 14.4 ? 23% | 14.4 ? 23% | 17.6 ? 6% |
| Response Time Black / White * (ms) | 12.8 ? | 10.4 ? 19% | 11.6 ? 9% | 10.8 ? 16% | 7.6 ? 41% |
| PWM Frequency (Hz) | 23580 ? | ||||
| Screen | 23% | -19% | 4% | 9% | |
| Brightness middle (cd/m²) | 351 | 291 -17% | 286 -19% | 295 -16% | 502 43% |
| Brightness (cd/m²) | 347 | 278 -20% | 271 -22% | 277 -20% | 491 41% |
| Brightness Distribution (%) | 90 | 91 1% | 89 -1% | 62 -31% | 91 1% |
| Black Level * (cd/m²) | 0.35 | 0.25 29% | 0.25 29% | 0.28 20% | 0.37 -6% |
| Contrast (:1) | 1003 | 1164 16% | 1144 14% | 1054 5% | 1357 35% |
| Colorchecker dE 2000 * | 2.54 | 1.19 53% | 2.74 -8% | 2.36 7% | 2.7 -6% |
| Colorchecker dE 2000 max. * | 8.36 | 3.04 64% | 5.21 38% | 4.24 49% | 4.5 46% |
| Colorchecker dE 2000 calibrated * | 0.67 | 2.52 -276% | 1.4 -109% | ||
| Greyscale dE 2000 * | 4.1 | 1.9 54% | 1.1 73% | 3.43 16% | 2.7 34% |
| Gamma | 2.089 105% | 2.216 99% | 2.2 100% | 2.44 90% | 2.44 90% |
| CCT | 7036 92% | 7018 93% | 6408 101% | 6266 104% | 6326 103% |
| Color Space (Percent of AdobeRGB 1998) (%) | 70 | ||||
| Color Space (Percent of sRGB) (%) | 92 | ||||
| Total Average (Program / Settings) | 9% /
13% | 1% /
-9% | 12% /
7% | 6% /
6% |
* ... smaller is better
The color accuracy of the display ex werks can be improved, especially grayscale. Upon calibration with the photospectrometer, we achieved very good average grayscale and color DeltaE values of 0.8 and 0.67, respectively. The ICC profile of our calibration is available for download here.
Display Response Times
| ↔ Response Time Black to White | ||
|---|---|---|
| 12.8 ms ... rise ↗ and fall ↘ combined | ↗ 6.8 ms rise | 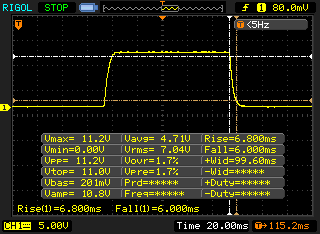 |
| ↘ 6 ms fall | ||
| The screen shows good response rates in our tests, but may be too slow for competitive gamers. In comparison, all tested devices range from 0.1 (minimum) to 240 (maximum) ms. » 33 % of all devices are better. This means that the measured response time is better than the average of all tested devices (19.9 ms). | ||
| ↔ Response Time 50% Grey to 80% Grey | ||
| 18.8 ms ... rise ↗ and fall ↘ combined | ↗ 9.2 ms rise | 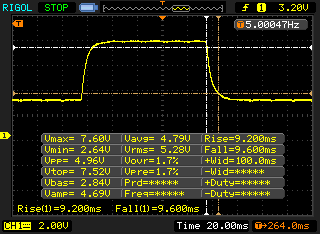 |
| ↘ 9.6 ms fall | ||
| The screen shows good response rates in our tests, but may be too slow for competitive gamers. In comparison, all tested devices range from 0.165 (minimum) to 636 (maximum) ms. » 32 % of all devices are better. This means that the measured response time is better than the average of all tested devices (31.1 ms). | ||
Screen Flickering / PWM (Pulse-Width Modulation)
| Screen flickering / PWM not detected | 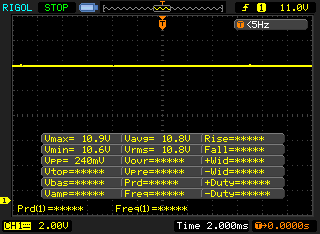 | ||
In comparison: 52 % of all tested devices do not use PWM to dim the display. If PWM was detected, an average of 7810 (minimum: 5 - maximum: 343500) Hz was measured. | |||
Even with a non-reflective display and a brightness of 347 cd/m², we cannot recommend the Raider GE66 12UHS for use in direct sunlight, at least when we work without MSI True Color. With this tool and its diverse settings, the legibility of display content can be improved somewhat. But in terms of overall outdoor use, you should look for a shady spot for optimal conditions.
The inbuilt IPS panel of our review device remains viewing-angle stable even when viewed from an extremely wide angles. The brightness remains unchanged and the colors do not become distorted either.
Performance: Clever liquid metal cooling solution for the MSI GE66 12UHS
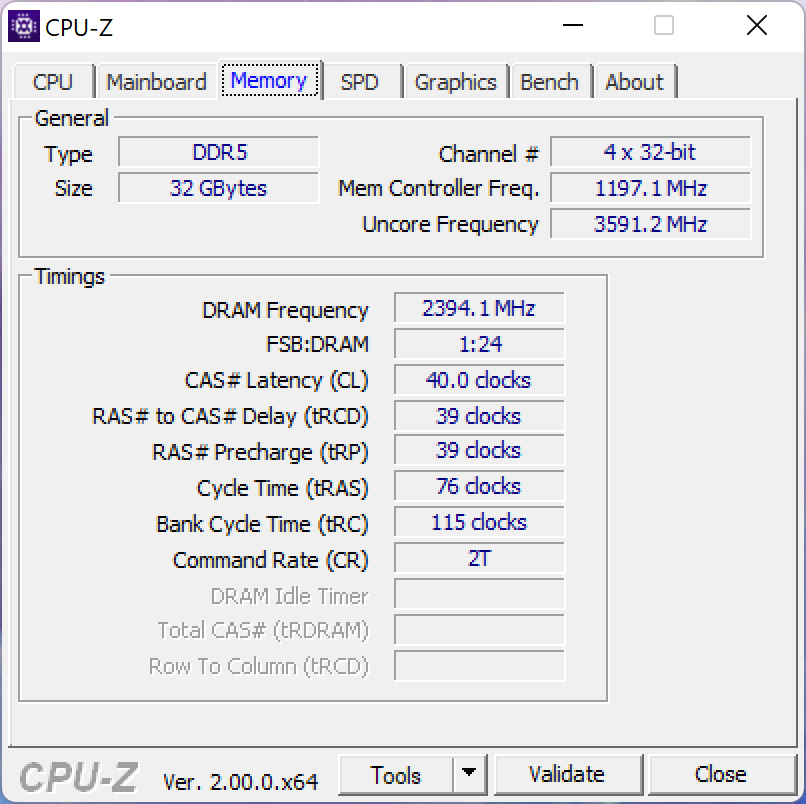
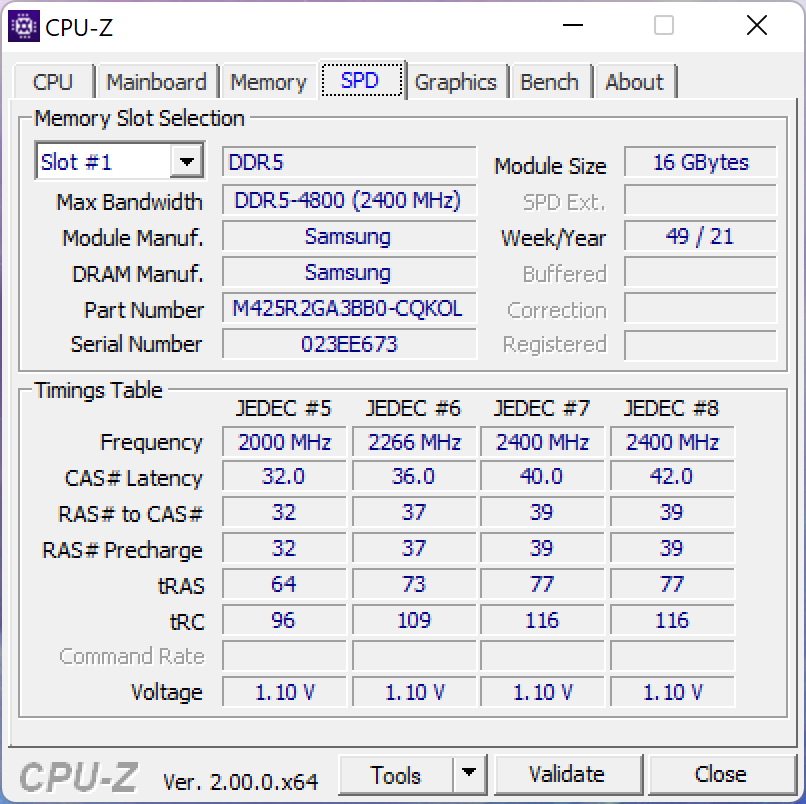
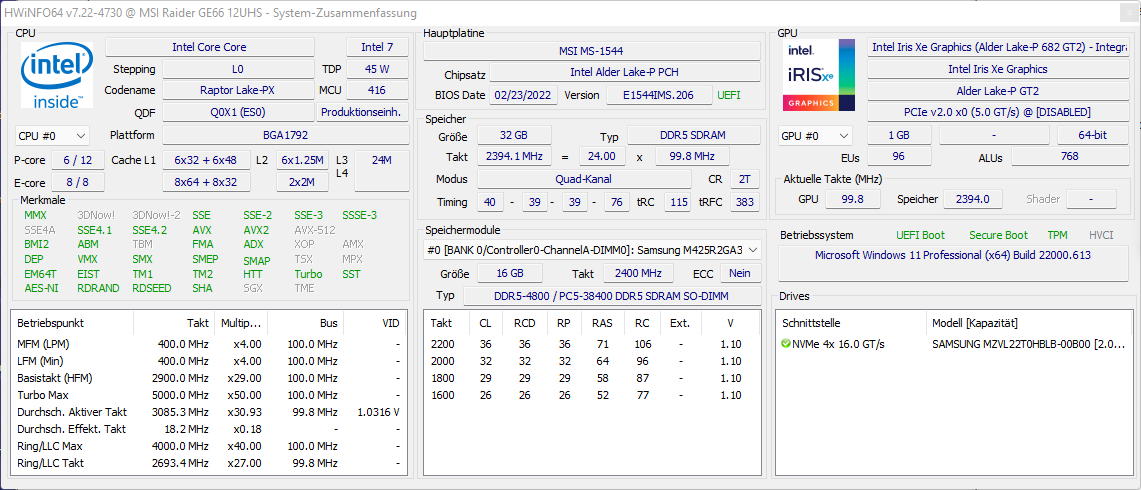
The MSI GE66 12UHS is available in various configurations. So you can purchase the system with an Intel Core i7 12700H instead of the Intel Core i9 12900HK. Regarding the GPU configuration, the system is either available with the RTX 3080 with 8 GB VRAM and 150 watts of TDP (Total Dynamic Power) or with the RTX 3080 Ti, which is equipped with 16 GB VRAM and also has TDP of 150 watts. Both configurations use either 16 GB of DDR5 RAM at 4,800 MHz or 32 GB of DDR5 RAM at the same clock rate, each running in dual-channel mode. SSDs are installed in either the 1 TB or 2 TB size.
Our review device is the top-end version with the Intel Core i9 12900HK, the RTX 3080 Ti and 32 GB DDR5 RAM, rounded off by a 2 TB SSD.
Test Conditions
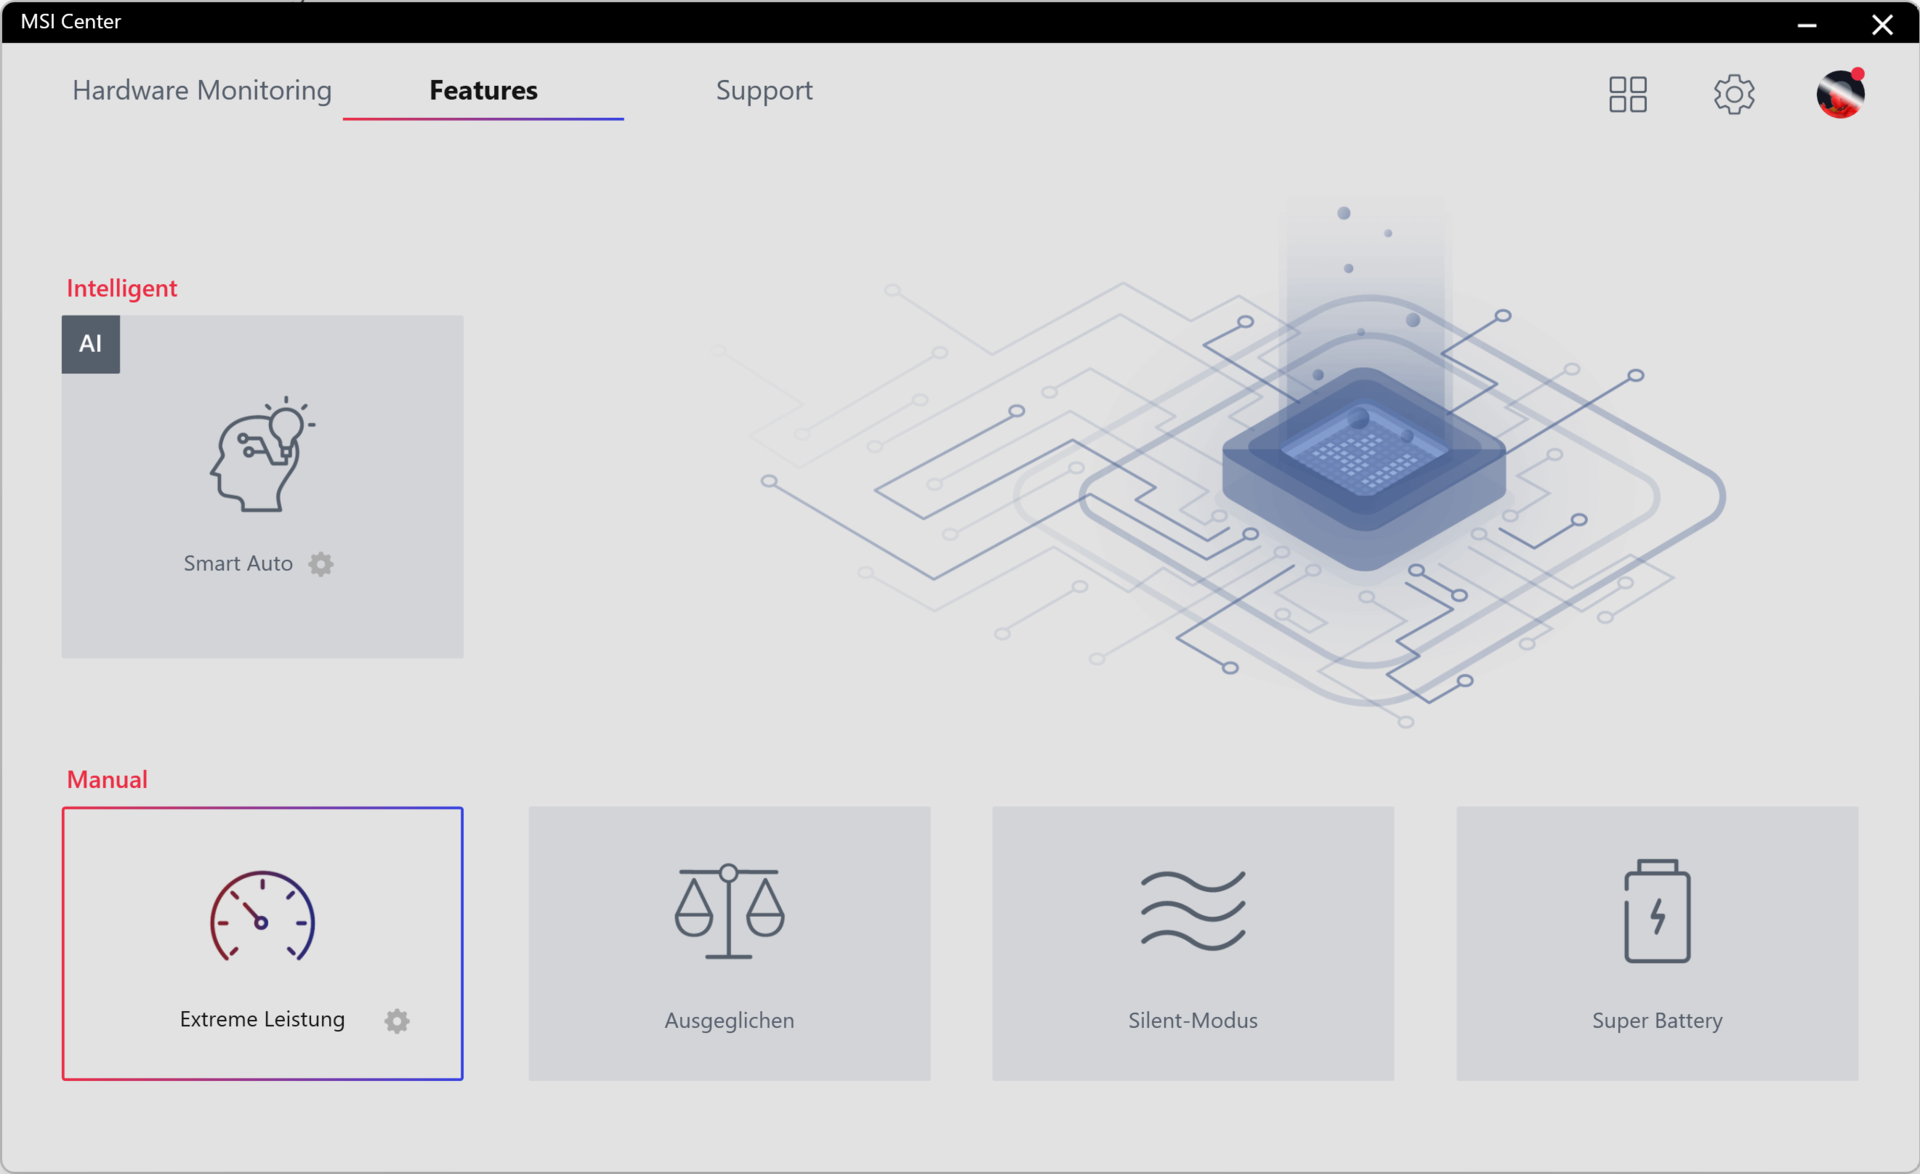
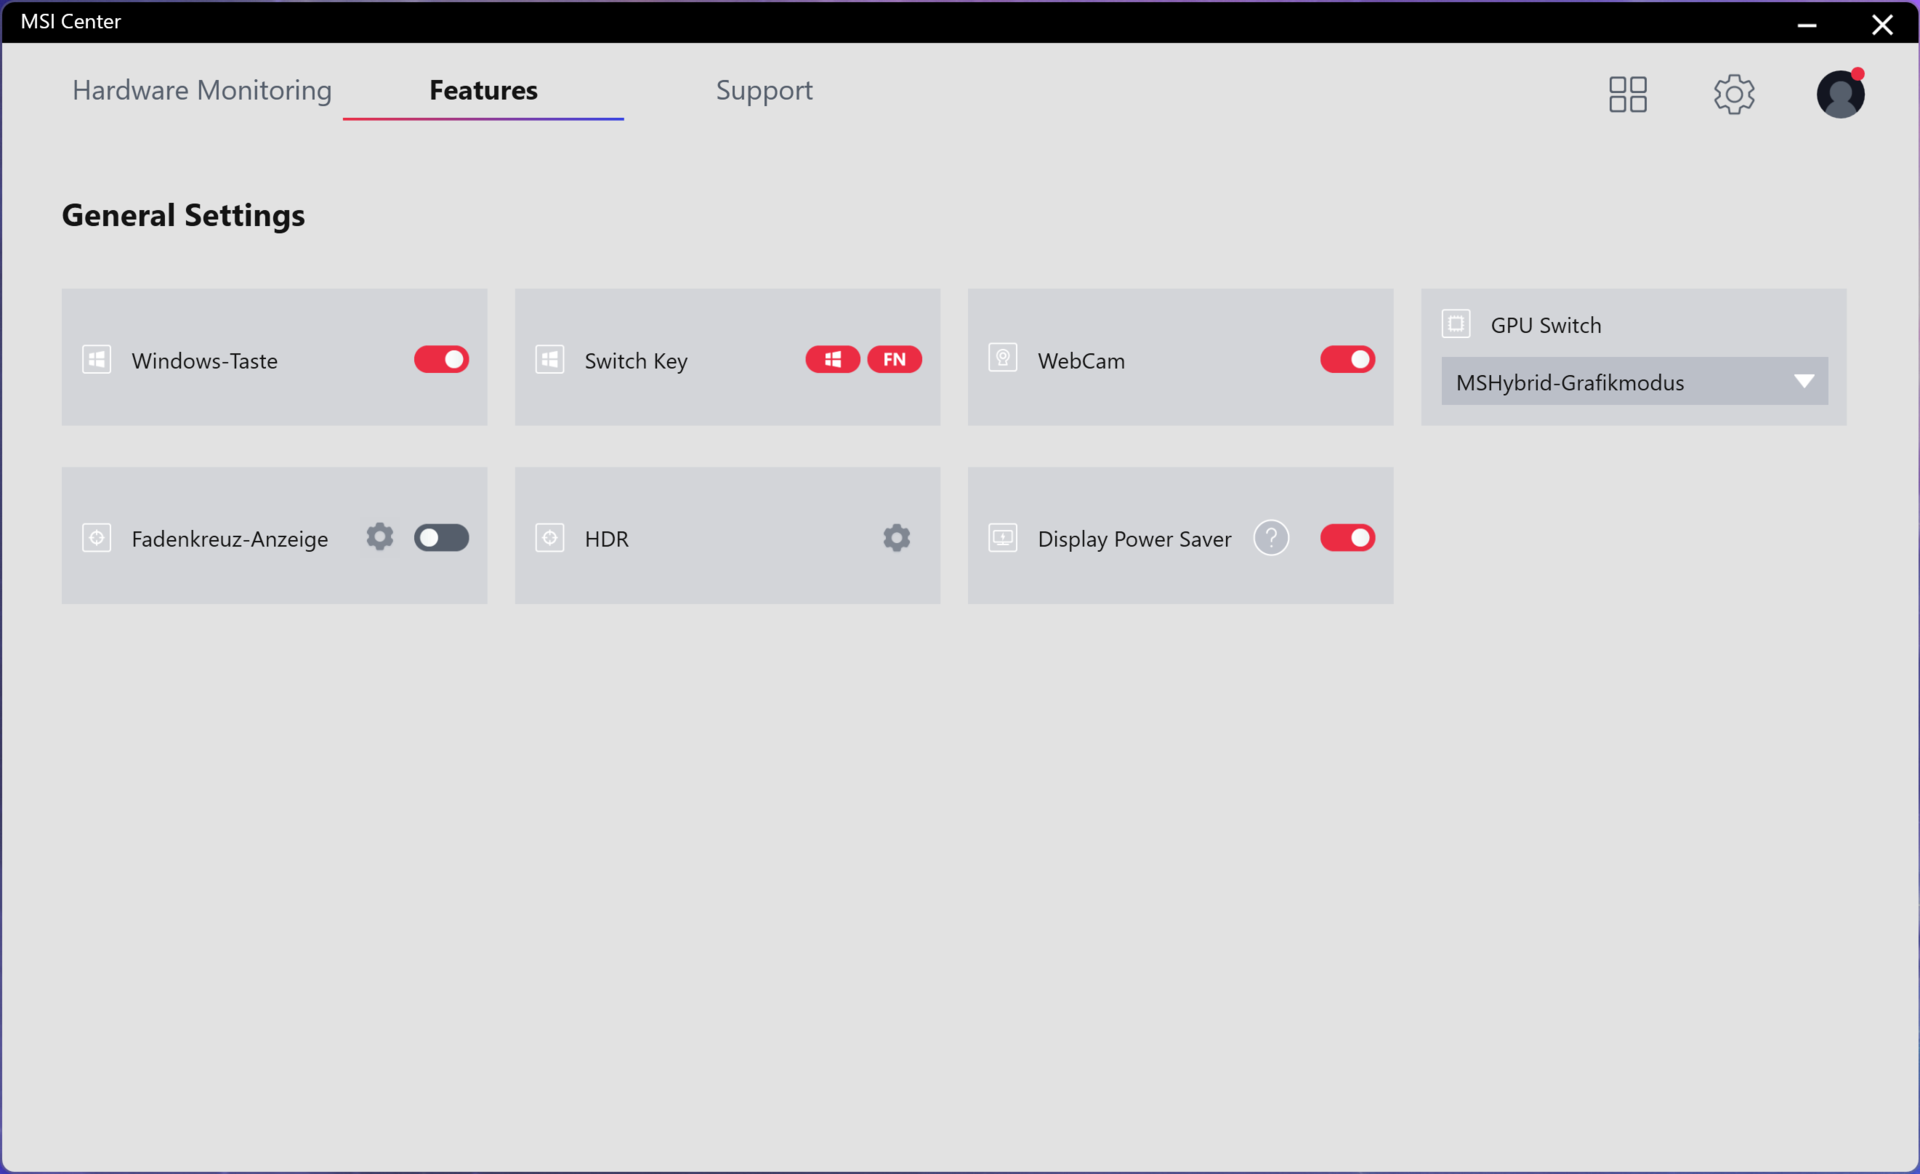
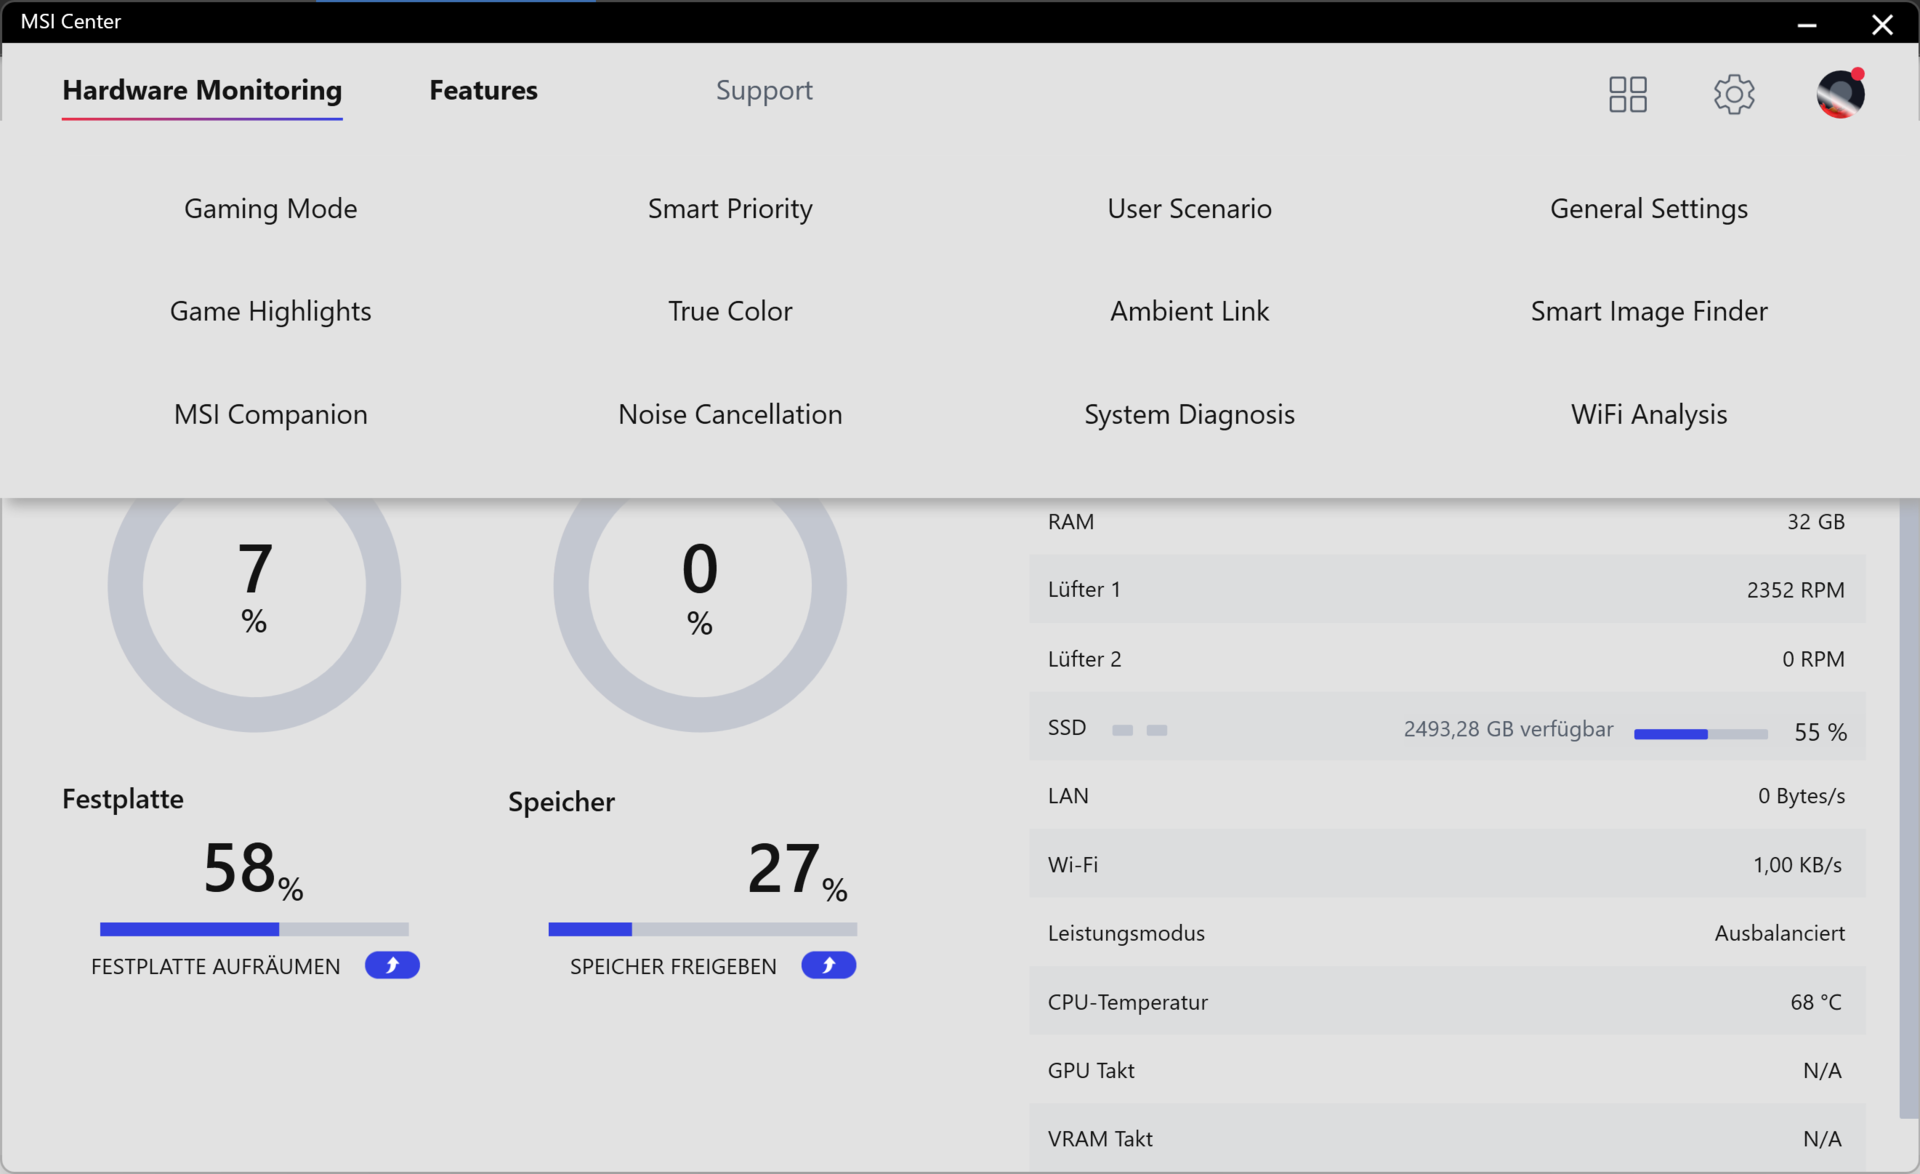
For optimal benchmark results, we set our laptop to "Extreme Performance" mode via the MSI Center (otherwise set to "Smart Auto" as the default setting). Many important system settings can be adjusted via the platform (no account creation necessary). These include the fan profiles as well as general settings and other features such as "Live Update" for finding the latest system drivers. Unfortunately, not all drivers can be installed automatically and some have to be installed manually. We also liked the option of running the GPU either in "Discrete Graphics Mode" (RTX 3080 Ti only) or in "MSHybrid Graphics Mode" (Advanced-Optimus) to not only save battery life but also to be able to use the Thunderbolt 4 video output, since this is disabled in "Discrete Graphics Mode". A system restart is necessary in each case.
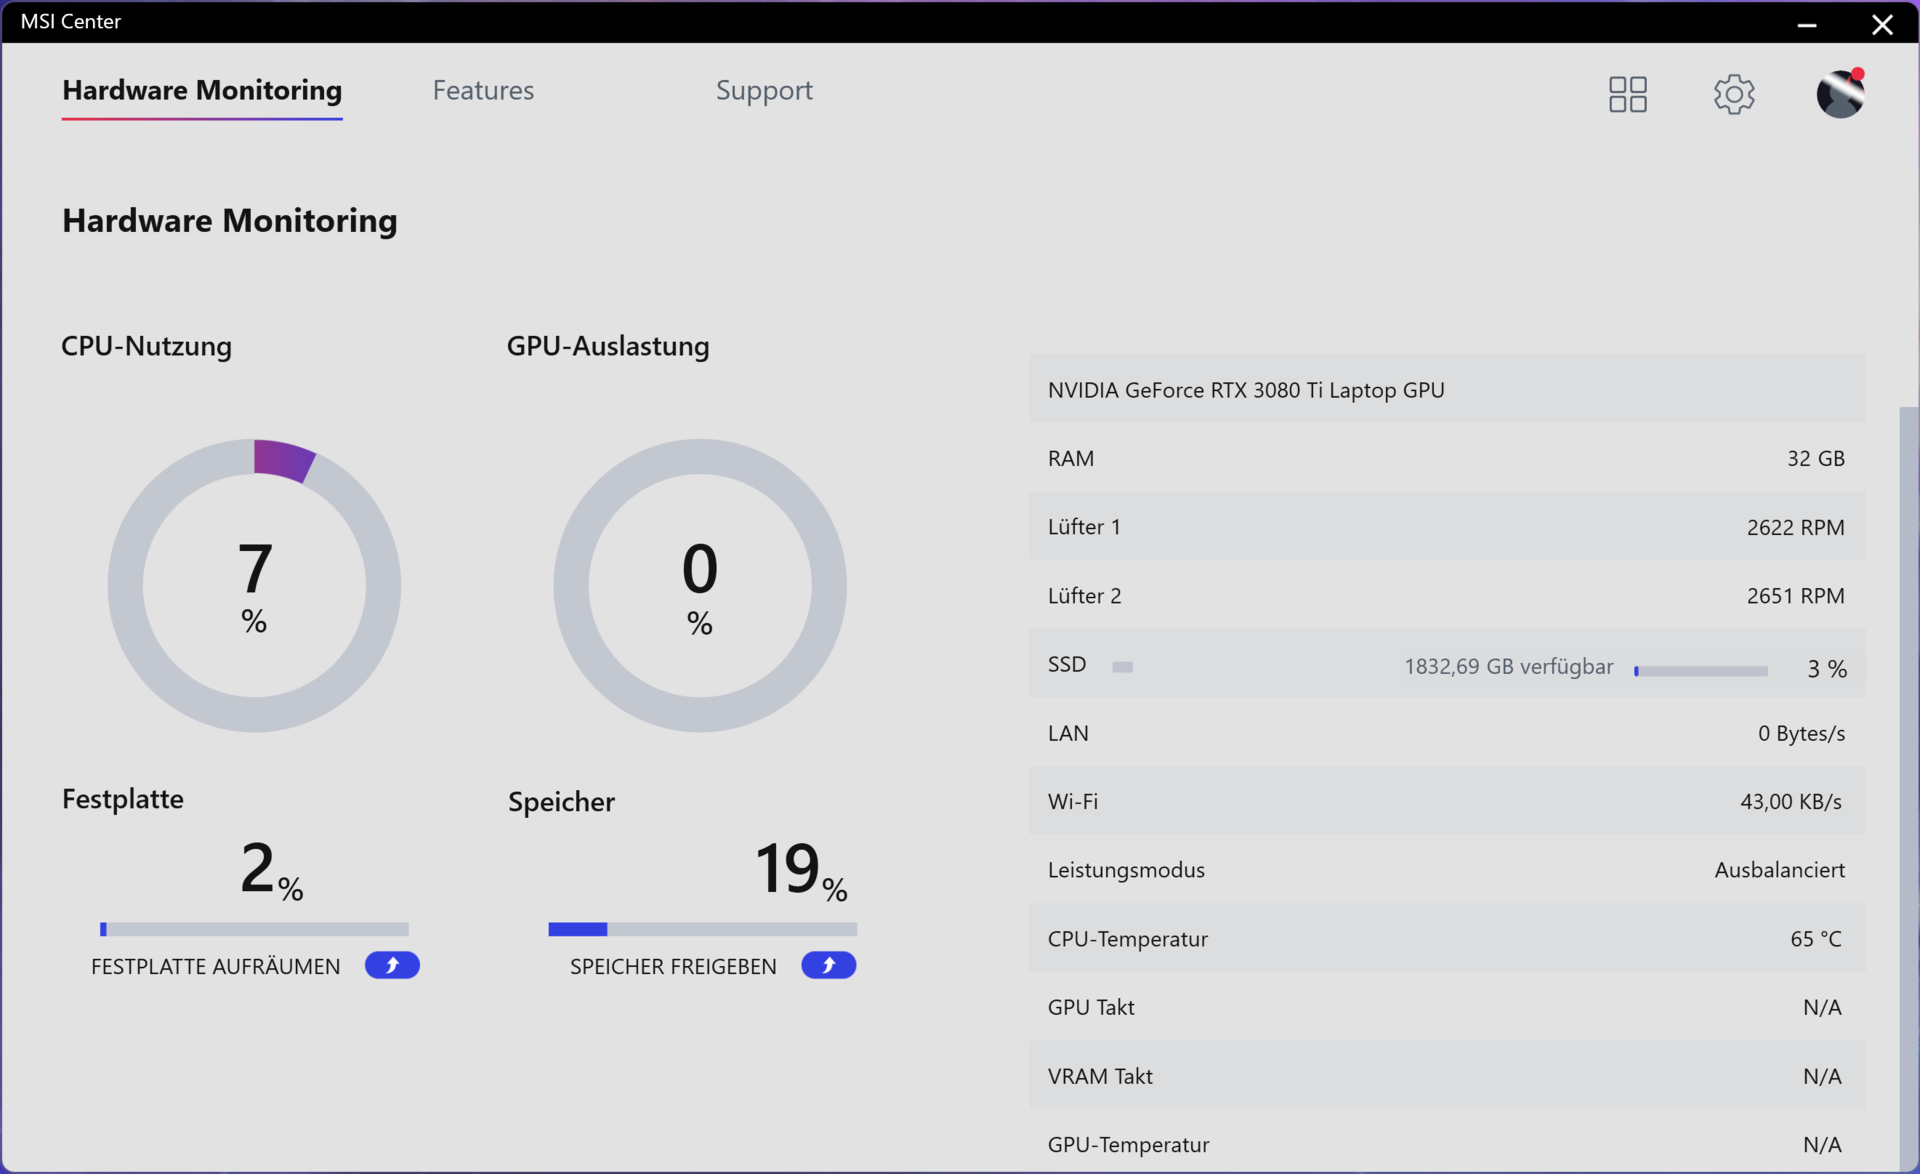
Several shortcomings were observed in the form of occasionally long waiting times during the start up of MSI Center, which also frequently crashed for no apparent reason, and the constant freezing of the "Hardware Monitoring" tool in our review device.
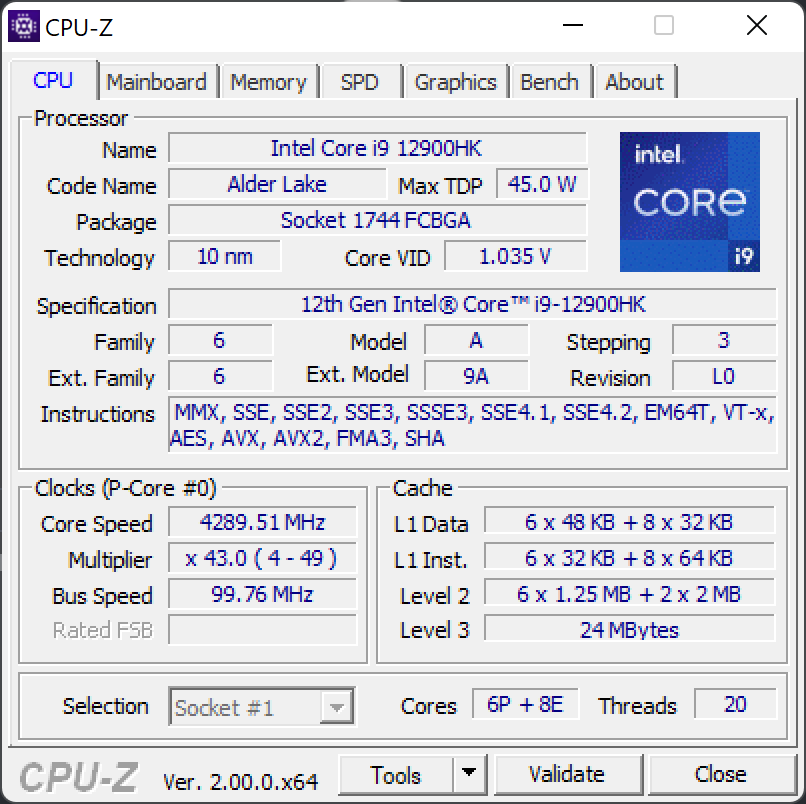
Processor
Our review device uses an Intel Core i9 12900HK, one of the strongest mobile CPUs from Intel alongside the soon-to-be released Intel Core i9 12950HX. The Intel Core i9 12900HK has 14 cores (20 threads), 6 performance and 8 efficiency cores, which offer a Turbo Boost of up to 5 GHz and 24 MB L3 cache.
In the Cinebench R23 benchmark with automatic fan control as well as the "Extreme Performance" profile, the CPU briefly consumes 86 watts before being thermally throttled. The maximum score in this scenario is 16,236 points in the multi-core benchmark. This score drops to 12,729 points in battery mode under the same conditions. If you leave performance and fan control to the AI (artificial intelligence) in "Smart Auto Mode", the score increases only marginally to 16,533 points and the CPU briefly consumes 90 watts instead of 86 watts. If you change the fan mode to "Cooler Boost" in the "Extreme Performance" profile, you reach almost 17,000 points and a peak load of 92 watts, but you have to put up with considerably higher levels of noise.
MSI equips the installed processor with a "Phase-Change Liquid Metal Pad", whose function is to act as a heat conduction pad in solid form until it melts at 58 degrees Celsius and turns into liquid metal, which is then supposed to significantly improve thermal conductivity at high temperatures.
Our test results: Even with liquid metal, the 15-incher does not fully exhaust the potential of its Intel Core i9 12900HK and is even beaten by the Intel Core i7 12700H of certain comparison devices. The big brother of the MSI GE66 12UHS, the GE76 12UHS, also manages "only" 2,722 points in our Cinebench R15 multi sustained load test with the same CPU. The Lenovo Legion 5 Pro 16 G7 and the Schenker Neo 15, both with 12700H processors, outperform both the GE66 and the larger MSI GE76 12UHS. Compared to the predecessor with the Intel Core i9 10980HK, our review device nevertheless manages a remarkable performance increase of over 50%.
Cinebench R15 Multi Sustained Load
* ... smaller is better
AIDA64: FP32 Ray-Trace | FPU Julia | CPU SHA3 | CPU Queen | FPU SinJulia | FPU Mandel | CPU AES | CPU ZLib | FP64 Ray-Trace | CPU PhotoWorxx
| Performance rating | |
| Average of class Gaming | |
| Lenovo Legion 5 Pro 16 G7 i7 RTX 3070Ti | |
| MSI Raider GE66 12UHS | |
| Schenker XMG Neo 15 E22 (Early 2022, RTX 3080 Ti) | |
| Average Intel Core i9-12900HK | |
| MSI GE66 Raider 10SFS | |
| Razer Blade 15 2022 | |
| AIDA64 / FP32 Ray-Trace | |
| Average of class Gaming (10227 - 85542, n=109, last 2 years) | |
| MSI GE66 Raider 10SFS | |
| Average Intel Core i9-12900HK (2677 - 13948, n=15) | |
| Lenovo Legion 5 Pro 16 G7 i7 RTX 3070Ti | |
| Schenker XMG Neo 15 E22 (Early 2022, RTX 3080 Ti) | |
| MSI Raider GE66 12UHS | |
| Razer Blade 15 2022 | |
| AIDA64 / FPU Julia | |
| Average of class Gaming (51376 - 238426, n=109, last 2 years) | |
| MSI GE66 Raider 10SFS | |
| Average Intel Core i9-12900HK (12762 - 70764, n=15) | |
| Schenker XMG Neo 15 E22 (Early 2022, RTX 3080 Ti) | |
| Lenovo Legion 5 Pro 16 G7 i7 RTX 3070Ti | |
| MSI Raider GE66 12UHS | |
| Razer Blade 15 2022 | |
| AIDA64 / CPU SHA3 | |
| Average of class Gaming (2180 - 9817, n=109, last 2 years) | |
| Lenovo Legion 5 Pro 16 G7 i7 RTX 3070Ti | |
| Schenker XMG Neo 15 E22 (Early 2022, RTX 3080 Ti) | |
| MSI Raider GE66 12UHS | |
| Average Intel Core i9-12900HK (841 - 3504, n=15) | |
| MSI GE66 Raider 10SFS | |
| Razer Blade 15 2022 | |
| AIDA64 / CPU Queen | |
| Average of class Gaming (49785 - 173351, n=101, last 2 years) | |
| MSI Raider GE66 12UHS | |
| Lenovo Legion 5 Pro 16 G7 i7 RTX 3070Ti | |
| Schenker XMG Neo 15 E22 (Early 2022, RTX 3080 Ti) | |
| Average Intel Core i9-12900HK (60202 - 107161, n=15) | |
| MSI GE66 Raider 10SFS | |
| Razer Blade 15 2022 | |
| AIDA64 / FPU SinJulia | |
| Average of class Gaming (4424 - 33636, n=109, last 2 years) | |
| MSI GE66 Raider 10SFS | |
| Schenker XMG Neo 15 E22 (Early 2022, RTX 3080 Ti) | |
| Lenovo Legion 5 Pro 16 G7 i7 RTX 3070Ti | |
| MSI Raider GE66 12UHS | |
| Razer Blade 15 2022 | |
| Average Intel Core i9-12900HK (3225 - 10402, n=15) | |
| AIDA64 / FPU Mandel | |
| Average of class Gaming (25115 - 128721, n=109, last 2 years) | |
| MSI GE66 Raider 10SFS | |
| Lenovo Legion 5 Pro 16 G7 i7 RTX 3070Ti | |
| Schenker XMG Neo 15 E22 (Early 2022, RTX 3080 Ti) | |
| Average Intel Core i9-12900HK (7417 - 34233, n=15) | |
| MSI Raider GE66 12UHS | |
| Razer Blade 15 2022 | |
| AIDA64 / CPU AES | |
| Average of class Gaming (39258 - 247074, n=109, last 2 years) | |
| Lenovo Legion 5 Pro 16 G7 i7 RTX 3070Ti | |
| MSI Raider GE66 12UHS | |
| Average Intel Core i9-12900HK (32382 - 112498, n=15) | |
| Schenker XMG Neo 15 E22 (Early 2022, RTX 3080 Ti) | |
| Razer Blade 15 2022 | |
| MSI GE66 Raider 10SFS | |
| AIDA64 / CPU ZLib | |
| Average of class Gaming (574 - 2531, n=109, last 2 years) | |
| Lenovo Legion 5 Pro 16 G7 i7 RTX 3070Ti | |
| Schenker XMG Neo 15 E22 (Early 2022, RTX 3080 Ti) | |
| MSI Raider GE66 12UHS | |
| Average Intel Core i9-12900HK (314 - 1209, n=15) | |
| Razer Blade 15 2022 | |
| MSI GE66 Raider 10SFS | |
| AIDA64 / FP64 Ray-Trace | |
| Average of class Gaming (5509 - 45446, n=109, last 2 years) | |
| MSI GE66 Raider 10SFS | |
| Lenovo Legion 5 Pro 16 G7 i7 RTX 3070Ti | |
| Schenker XMG Neo 15 E22 (Early 2022, RTX 3080 Ti) | |
| Average Intel Core i9-12900HK (1501 - 7616, n=15) | |
| MSI Raider GE66 12UHS | |
| Razer Blade 15 2022 | |
| AIDA64 / CPU PhotoWorxx | |
| Average of class Gaming (12271 - 89891, n=109, last 2 years) | |
| Razer Blade 15 2022 | |
| MSI Raider GE66 12UHS | |
| Schenker XMG Neo 15 E22 (Early 2022, RTX 3080 Ti) | |
| Average Intel Core i9-12900HK (24446 - 42462, n=15) | |
| Lenovo Legion 5 Pro 16 G7 i7 RTX 3070Ti | |
| MSI GE66 Raider 10SFS | |
System Performance
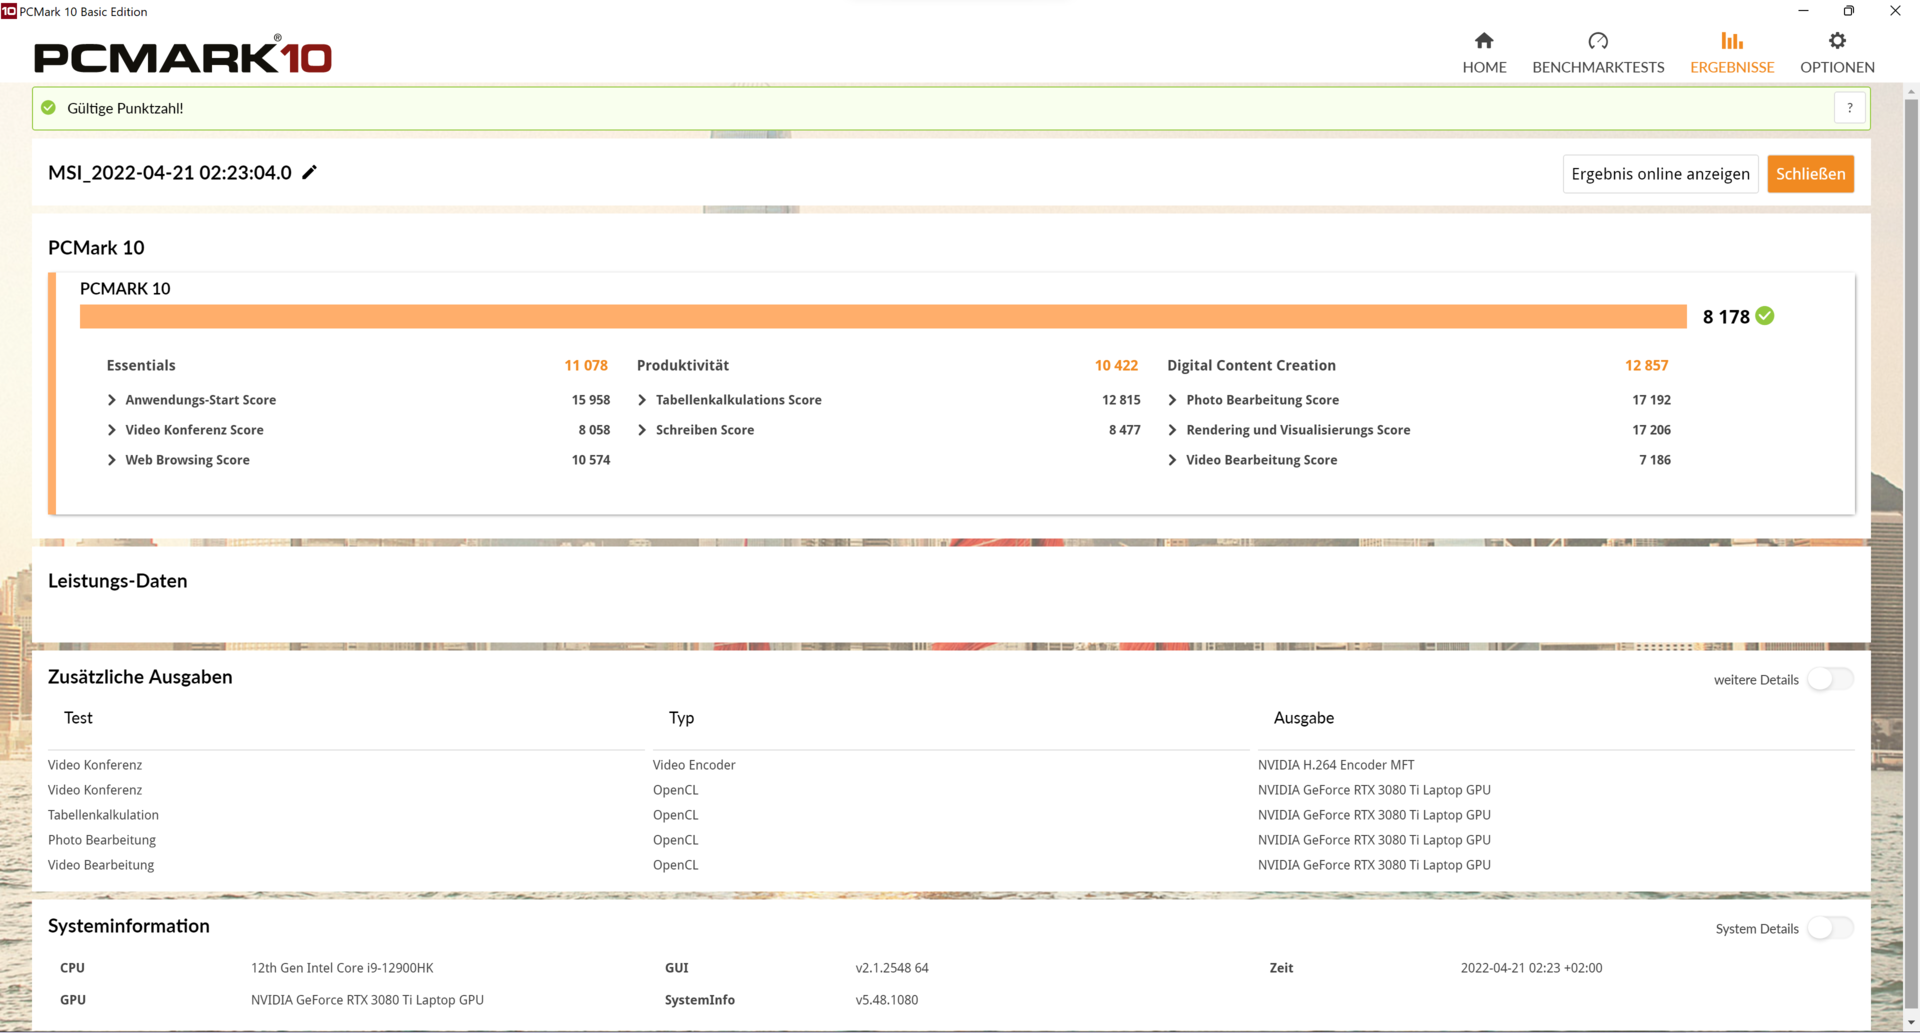
As expected, system performance turns out to be high. Our MSI GE66 12UHS wipes the floor with the competition and displays excellent performance in all tested categories.
CrossMark: Overall | Productivity | Creativity | Responsiveness
| PCMark 10 / Score | |
| Average of class Gaming (5828 - 11574, n=95, last 2 years) | |
| MSI Raider GE66 12UHS | |
| Average Intel Core i9-12900HK, NVIDIA GeForce RTX 3080 Ti Laptop GPU (7149 - 8186, n=5) | |
| Razer Blade 15 2022 | |
| Lenovo Legion 5 Pro 16 G7 i7 RTX 3070Ti | |
| Schenker XMG Neo 15 E22 (Early 2022, RTX 3080 Ti) | |
| MSI GE66 Raider 10SFS | |
| PCMark 10 / Essentials | |
| MSI Raider GE66 12UHS | |
| Average Intel Core i9-12900HK, NVIDIA GeForce RTX 3080 Ti Laptop GPU (9870 - 11205, n=5) | |
| Razer Blade 15 2022 | |
| Average of class Gaming (8810 - 12600, n=99, last 2 years) | |
| Schenker XMG Neo 15 E22 (Early 2022, RTX 3080 Ti) | |
| Lenovo Legion 5 Pro 16 G7 i7 RTX 3070Ti | |
| MSI GE66 Raider 10SFS | |
| PCMark 10 / Productivity | |
| Average of class Gaming (6845 - 18766, n=97, last 2 years) | |
| MSI Raider GE66 12UHS | |
| Average Intel Core i9-12900HK, NVIDIA GeForce RTX 3080 Ti Laptop GPU (9173 - 10422, n=5) | |
| Lenovo Legion 5 Pro 16 G7 i7 RTX 3070Ti | |
| Razer Blade 15 2022 | |
| Schenker XMG Neo 15 E22 (Early 2022, RTX 3080 Ti) | |
| MSI GE66 Raider 10SFS | |
| PCMark 10 / Digital Content Creation | |
| Average of class Gaming (7602 - 19657, n=97, last 2 years) | |
| MSI Raider GE66 12UHS | |
| Average Intel Core i9-12900HK, NVIDIA GeForce RTX 3080 Ti Laptop GPU (10951 - 13098, n=5) | |
| Razer Blade 15 2022 | |
| Lenovo Legion 5 Pro 16 G7 i7 RTX 3070Ti | |
| Schenker XMG Neo 15 E22 (Early 2022, RTX 3080 Ti) | |
| MSI GE66 Raider 10SFS | |
| CrossMark / Overall | |
| Average of class Gaming (1366 - 2409, n=97, last 2 years) | |
| Lenovo Legion 5 Pro 16 G7 i7 RTX 3070Ti | |
| Average Intel Core i9-12900HK, NVIDIA GeForce RTX 3080 Ti Laptop GPU (970 - 2138, n=5) | |
| CrossMark / Productivity | |
| Lenovo Legion 5 Pro 16 G7 i7 RTX 3070Ti | |
| Average of class Gaming (1386 - 2254, n=97, last 2 years) | |
| Average Intel Core i9-12900HK, NVIDIA GeForce RTX 3080 Ti Laptop GPU (921 - 2038, n=5) | |
| CrossMark / Creativity | |
| Average of class Gaming (1343 - 2729, n=97, last 2 years) | |
| Lenovo Legion 5 Pro 16 G7 i7 RTX 3070Ti | |
| Average Intel Core i9-12900HK, NVIDIA GeForce RTX 3080 Ti Laptop GPU (1007 - 2210, n=5) | |
| CrossMark / Responsiveness | |
| Lenovo Legion 5 Pro 16 G7 i7 RTX 3070Ti | |
| Average Intel Core i9-12900HK, NVIDIA GeForce RTX 3080 Ti Laptop GPU (1012 - 2234, n=5) | |
| Average of class Gaming (1226 - 2334, n=97, last 2 years) | |
| PCMark 10 Score | 8178 points | |
Help | ||
| AIDA64 / Memory Copy | |
| Average of class Gaming (21750 - 129946, n=109, last 2 years) | |
| Schenker XMG Neo 15 E22 (Early 2022, RTX 3080 Ti) | |
| MSI Raider GE66 12UHS | |
| Razer Blade 15 2022 | |
| Average Intel Core i9-12900HK (42967 - 62959, n=15) | |
| Lenovo Legion 5 Pro 16 G7 i7 RTX 3070Ti | |
| MSI GE66 Raider 10SFS | |
| AIDA64 / Memory Read | |
| Average of class Gaming (22956 - 118858, n=109, last 2 years) | |
| MSI Raider GE66 12UHS | |
| Schenker XMG Neo 15 E22 (Early 2022, RTX 3080 Ti) | |
| Razer Blade 15 2022 | |
| Average Intel Core i9-12900HK (44419 - 66989, n=15) | |
| Lenovo Legion 5 Pro 16 G7 i7 RTX 3070Ti | |
| MSI GE66 Raider 10SFS | |
| AIDA64 / Memory Write | |
| Average of class Gaming (22297 - 135096, n=109, last 2 years) | |
| Razer Blade 15 2022 | |
| Schenker XMG Neo 15 E22 (Early 2022, RTX 3080 Ti) | |
| MSI Raider GE66 12UHS | |
| Lenovo Legion 5 Pro 16 G7 i7 RTX 3070Ti | |
| Average Intel Core i9-12900HK (42144 - 65268, n=15) | |
| MSI GE66 Raider 10SFS | |
| AIDA64 / Memory Latency | |
| Average of class Gaming (75.3 - 259, n=109, last 2 years) | |
| Lenovo Legion 5 Pro 16 G7 i7 RTX 3070Ti | |
| MSI Raider GE66 12UHS | |
| Average Intel Core i9-12900HK (79.9 - 109, n=15) | |
| MSI GE66 Raider 10SFS | |
| Schenker XMG Neo 15 E22 (Early 2022, RTX 3080 Ti) | |
| Razer Blade 15 2022 | |
* ... smaller is better
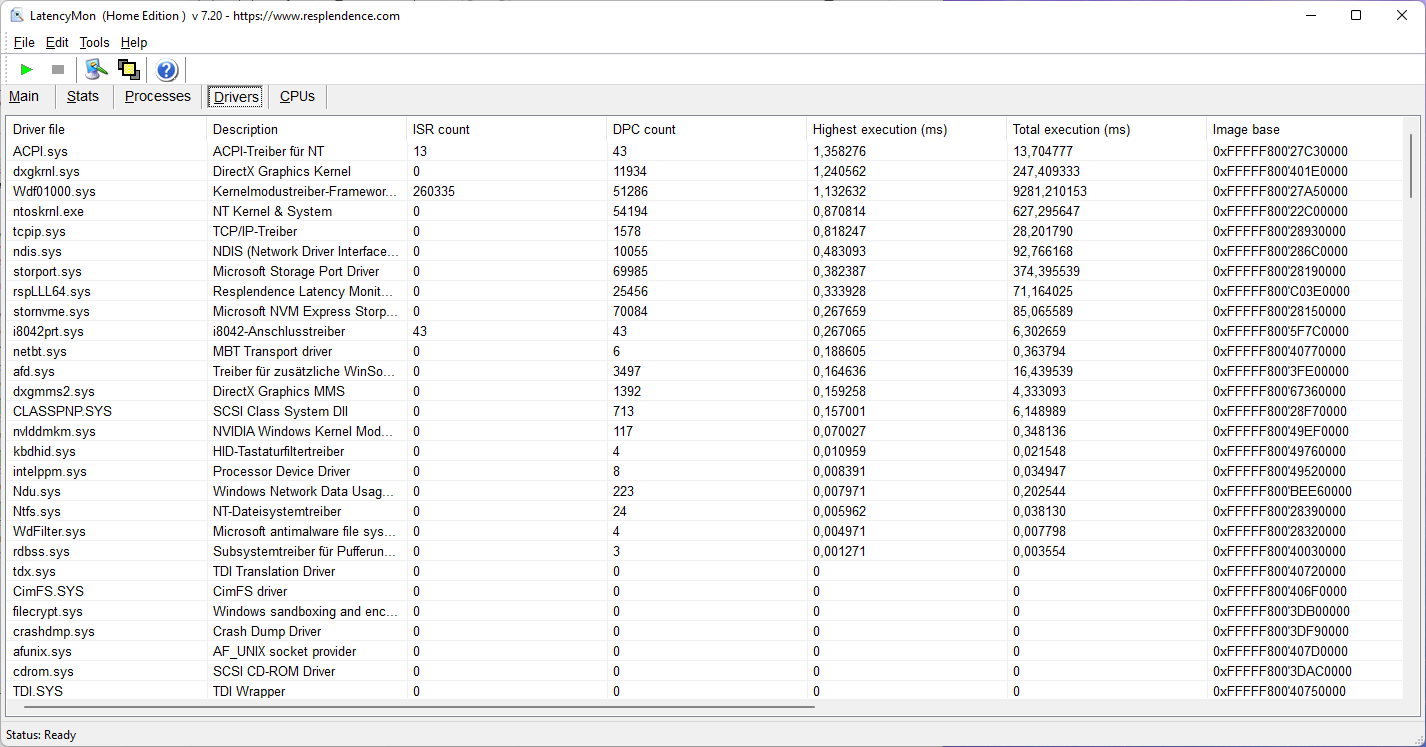
DPC Latencies
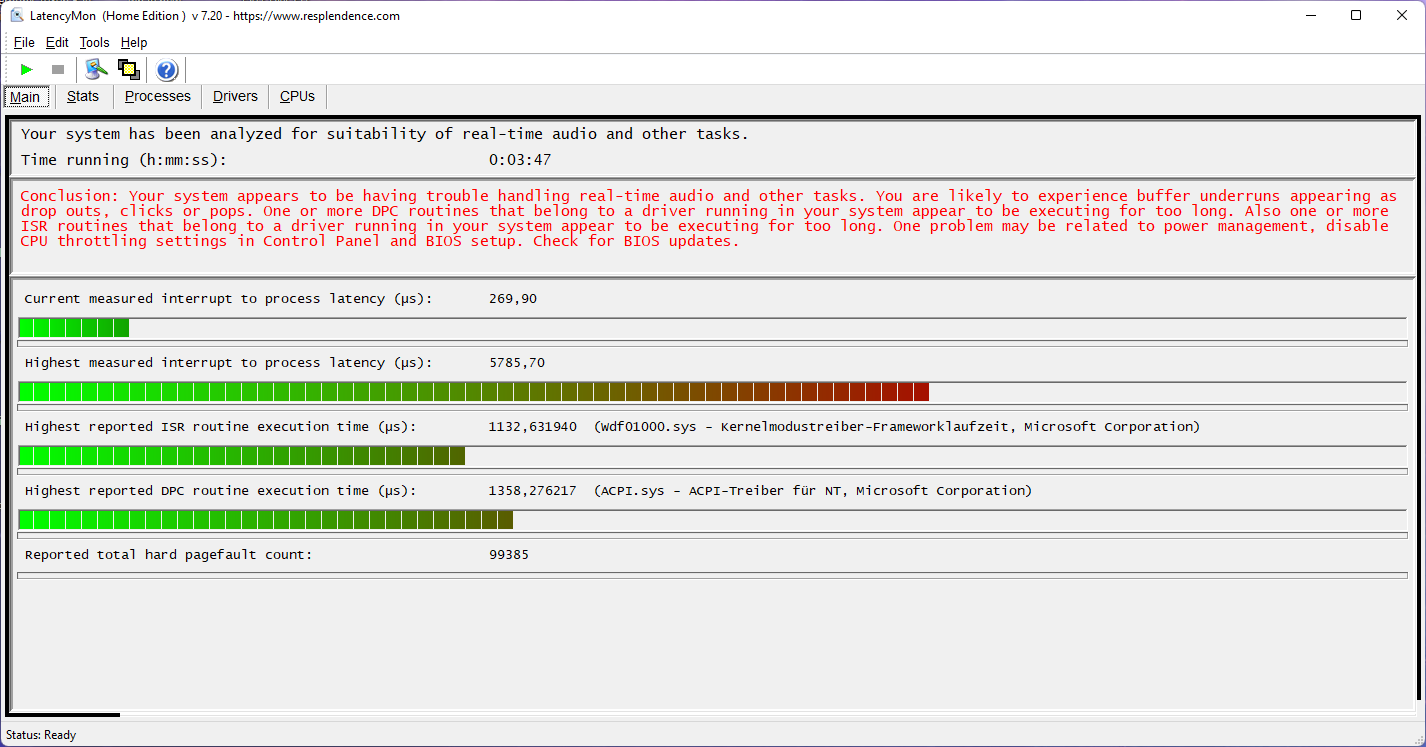
Testing of the DPC latencies reveals that our review device is not suitable for real-time video processing with the current drivers and system software. Latency issues were detected in both YouTube 4K video and real-time audio processing.
| DPC Latencies / LatencyMon - interrupt to process latency (max), Web, Youtube, Prime95 | |
| MSI Raider GE66 12UHS | |
| Razer Blade 15 2022 | |
| MSI GE66 Raider 10SFS | |
| Schenker XMG Neo 15 E22 (Early 2022, RTX 3080 Ti) | |
| Lenovo Legion 5 Pro 16 G7 i7 RTX 3070Ti | |
* ... smaller is better
Storage Devices
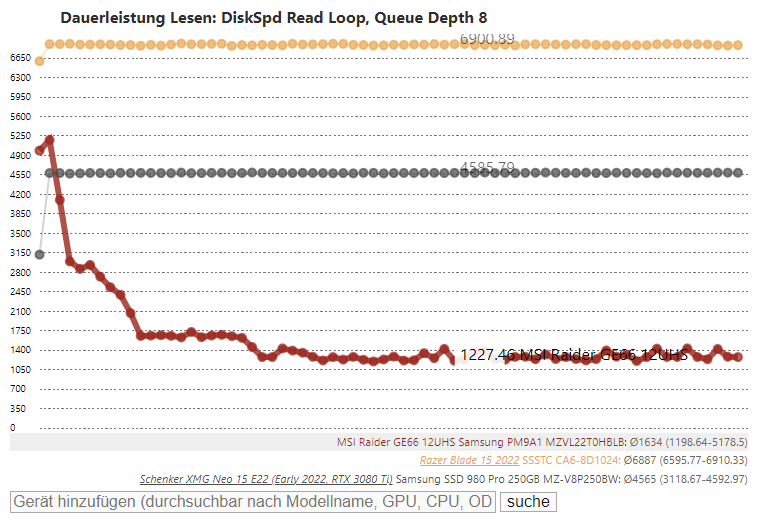
The 2 TB SSD (designation PM9A1, OEM counterpart to the Samsung Evo 980 Pro) installed in our system delivers very good performance and is only beaten by the 1 TB version of the same SSD, which is also installed in Lenovo's Legion 5 Pro 16 G7. However, our diskspeed benchmark showed a massive drop in performance that persisted over the entire test period. We also observed the same problem in our review of the Asus ROG Strix Scar 15 G533ZW, equipped with the same SSD. MSI has been informed about the issue.
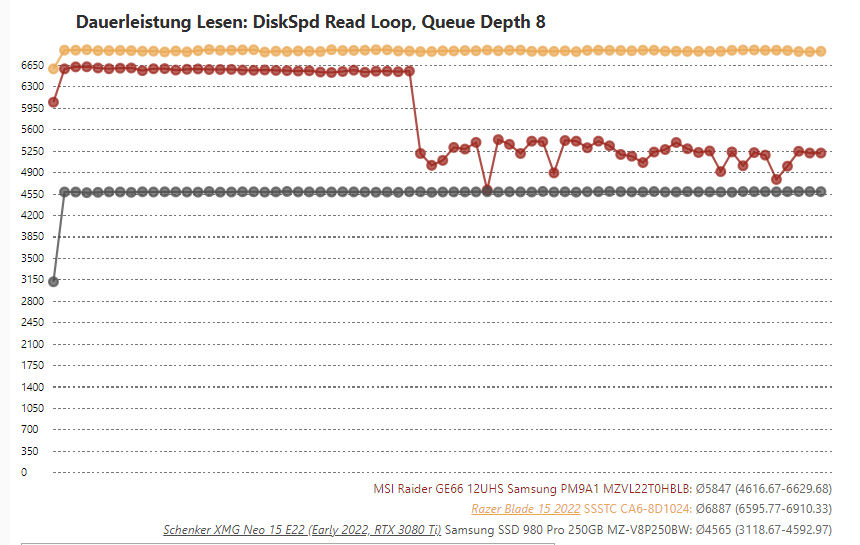
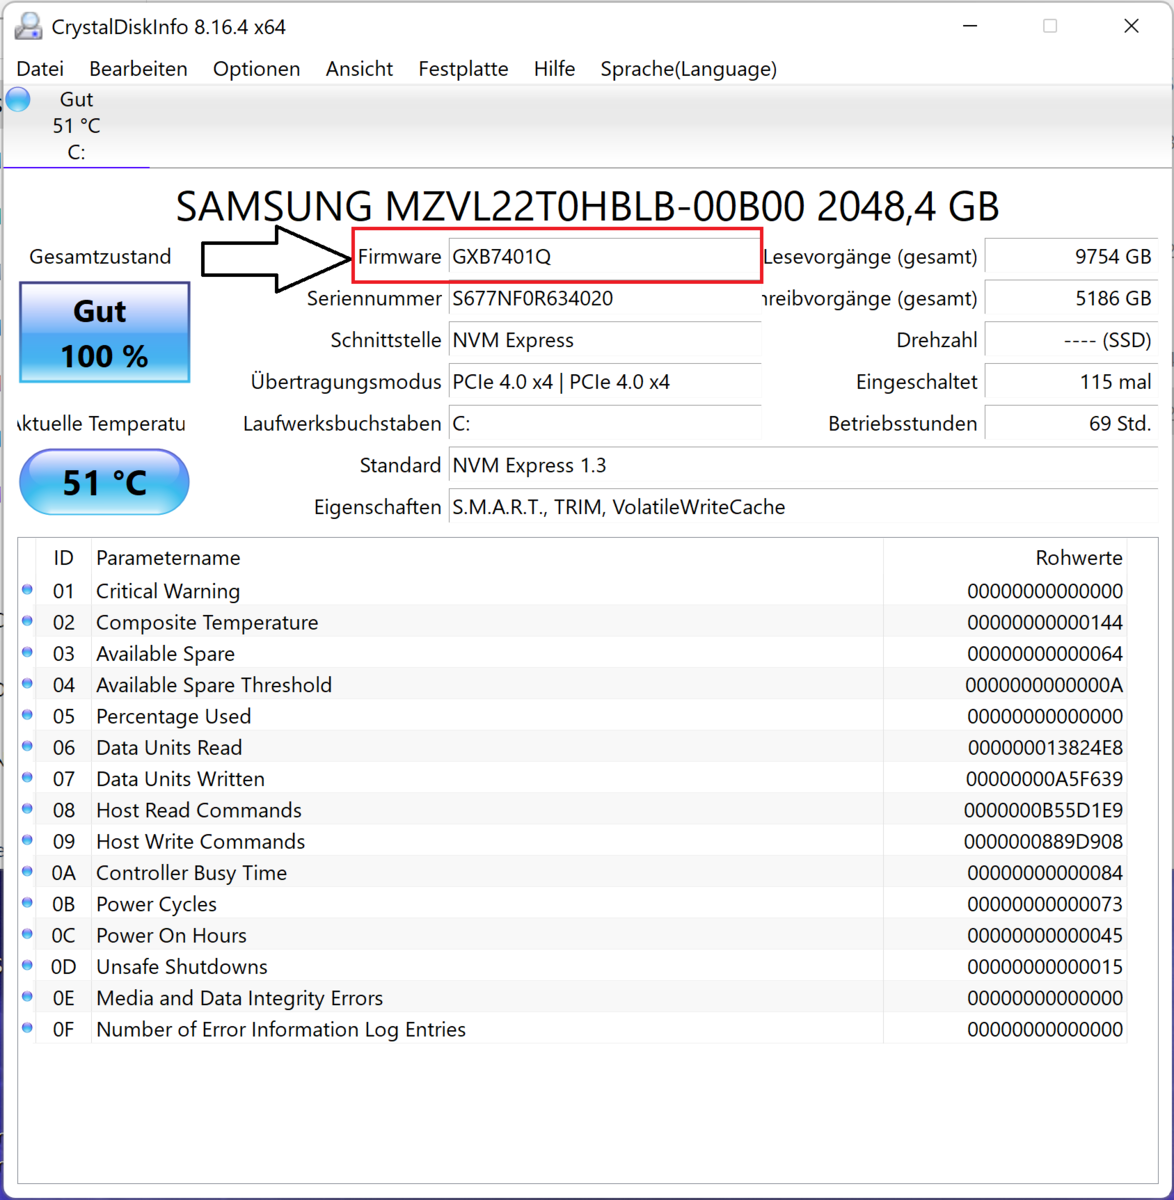
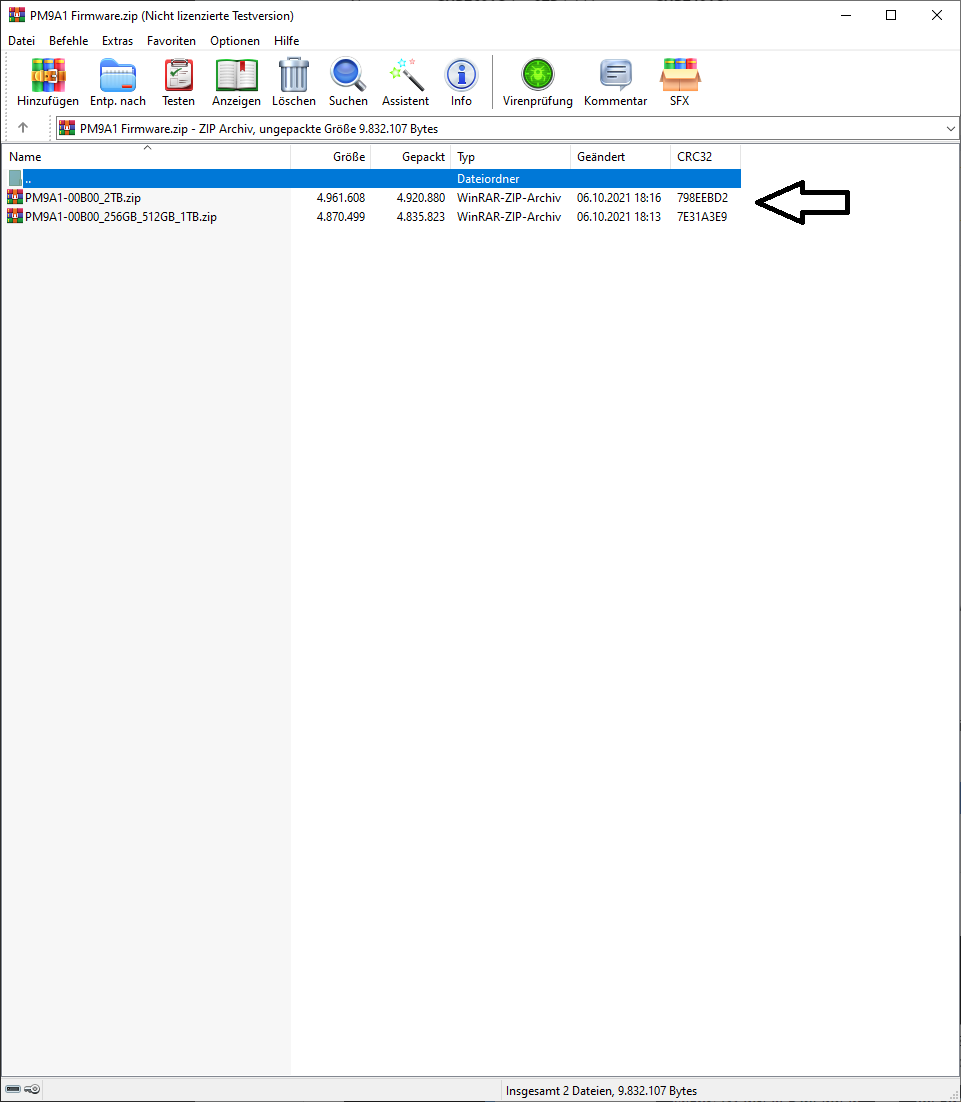
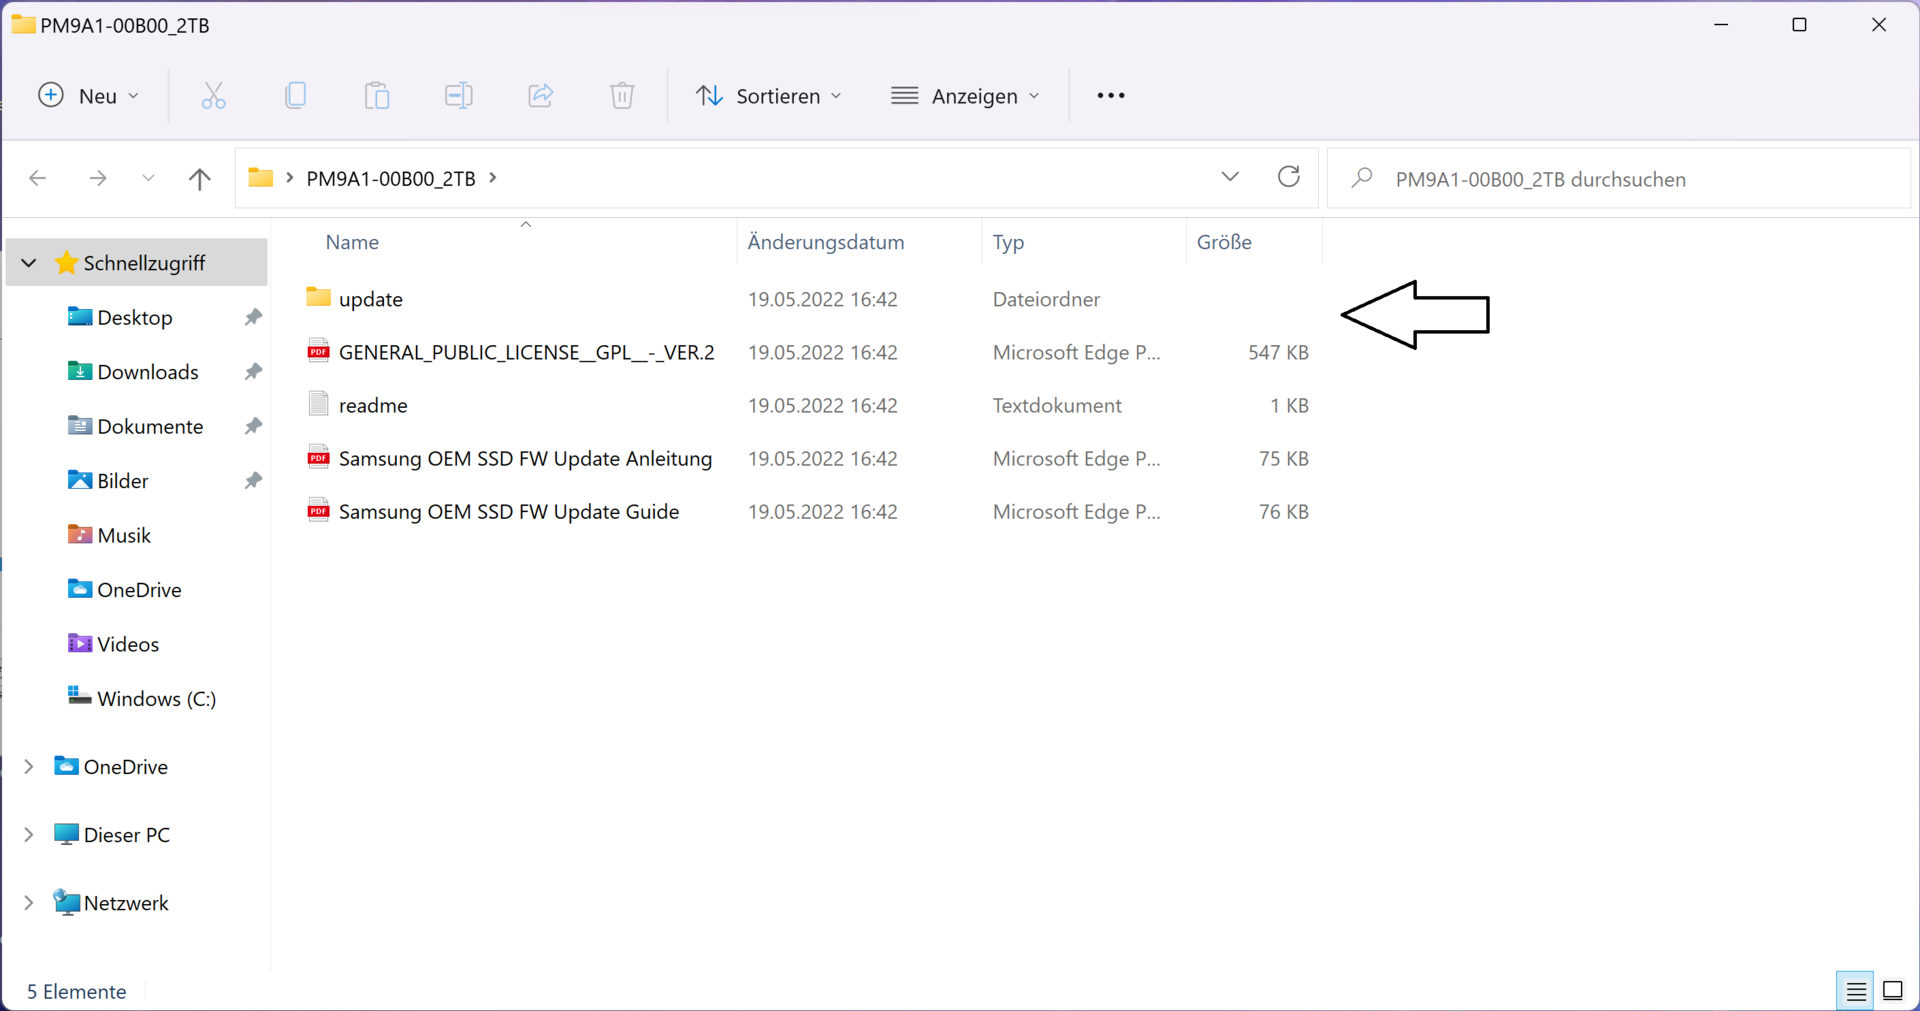
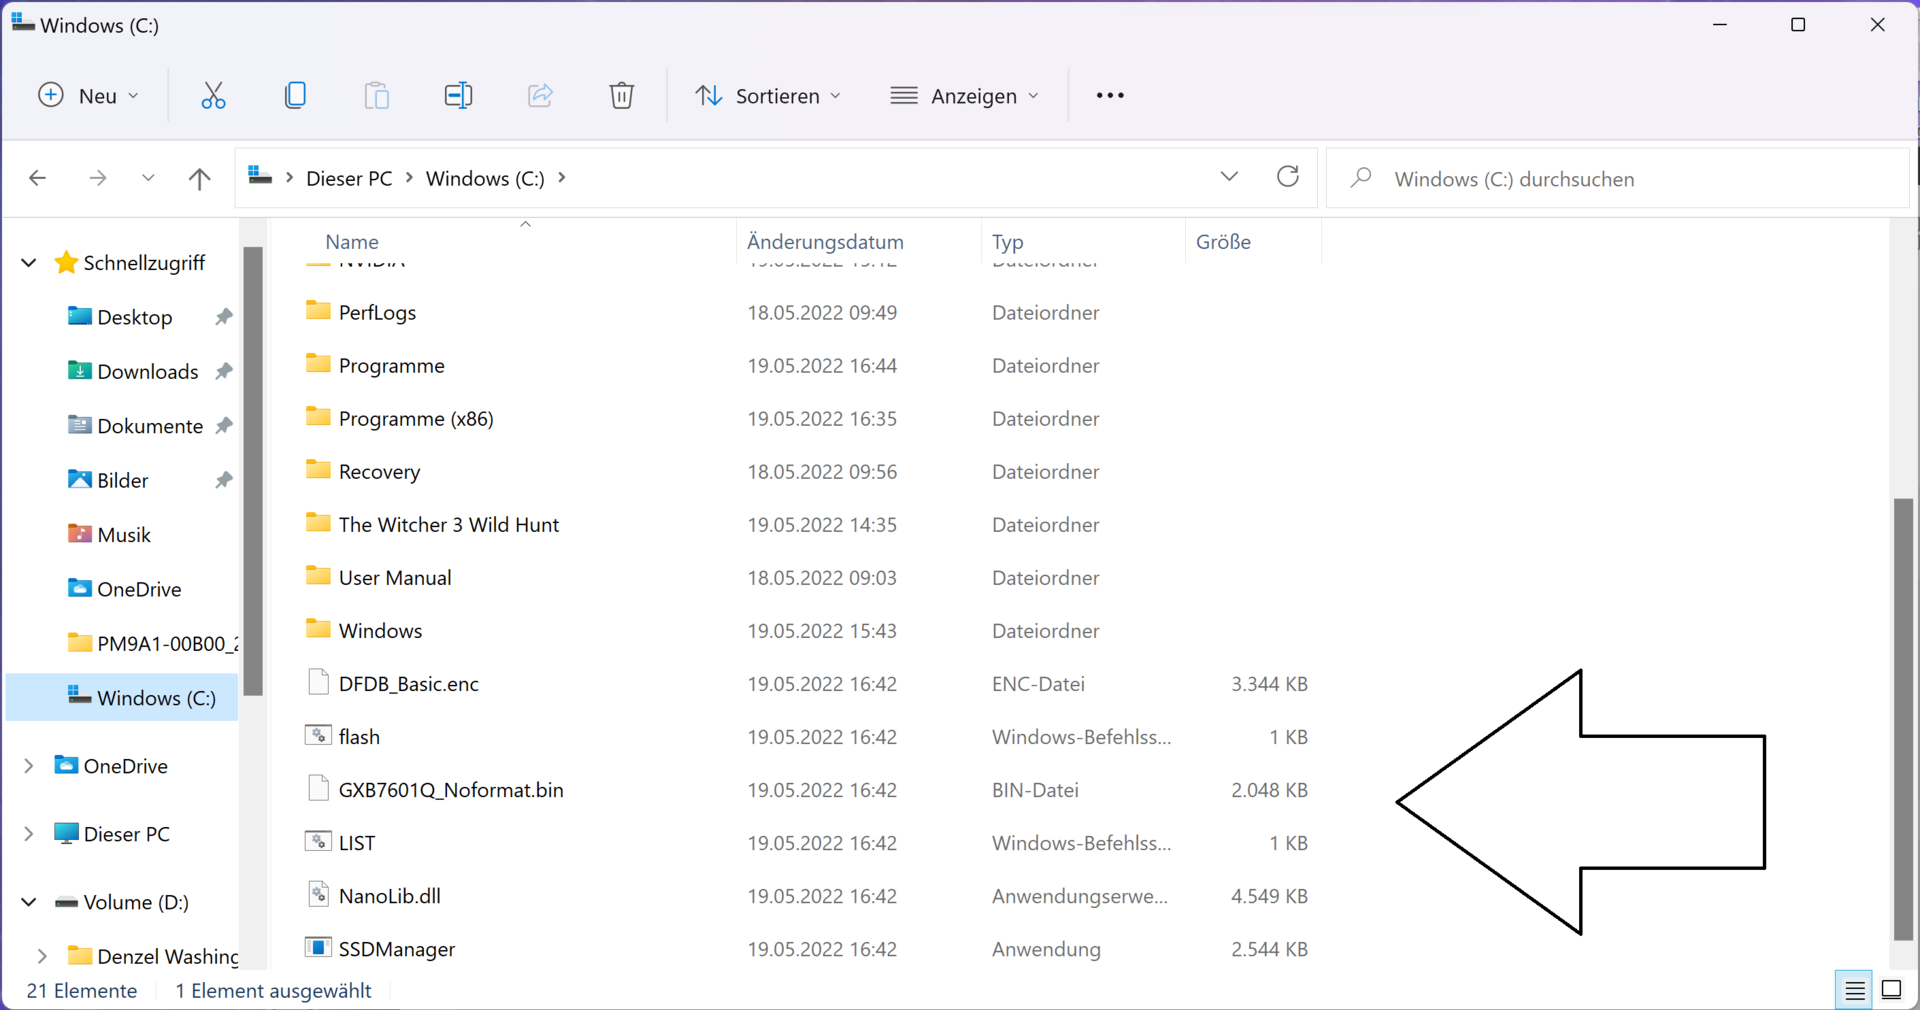
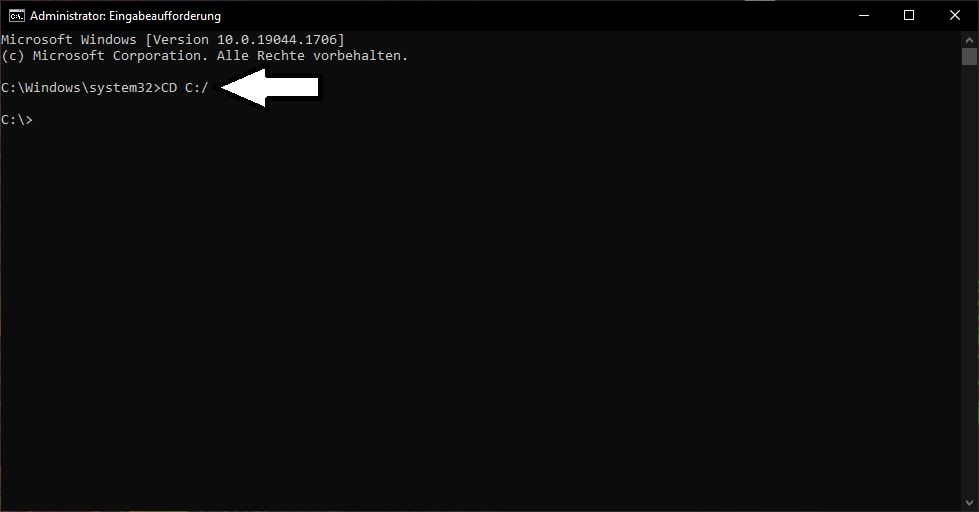
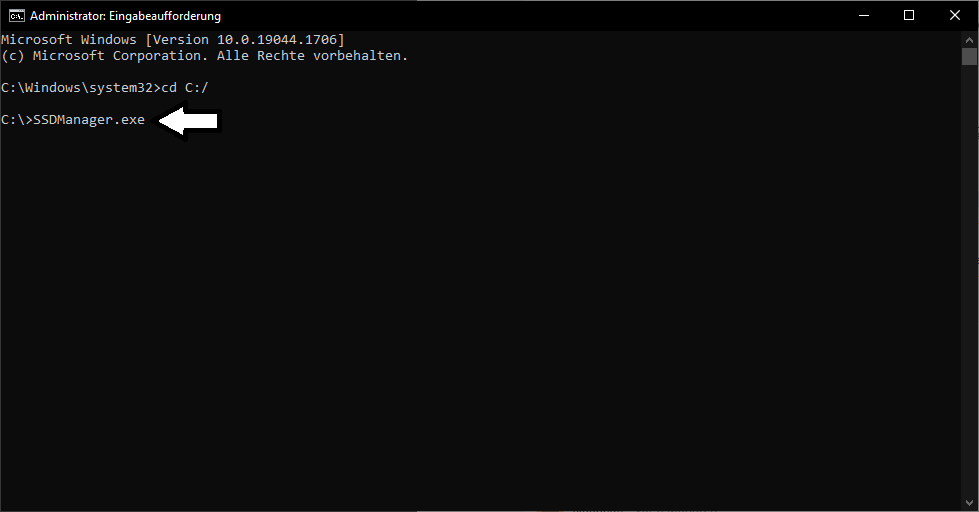
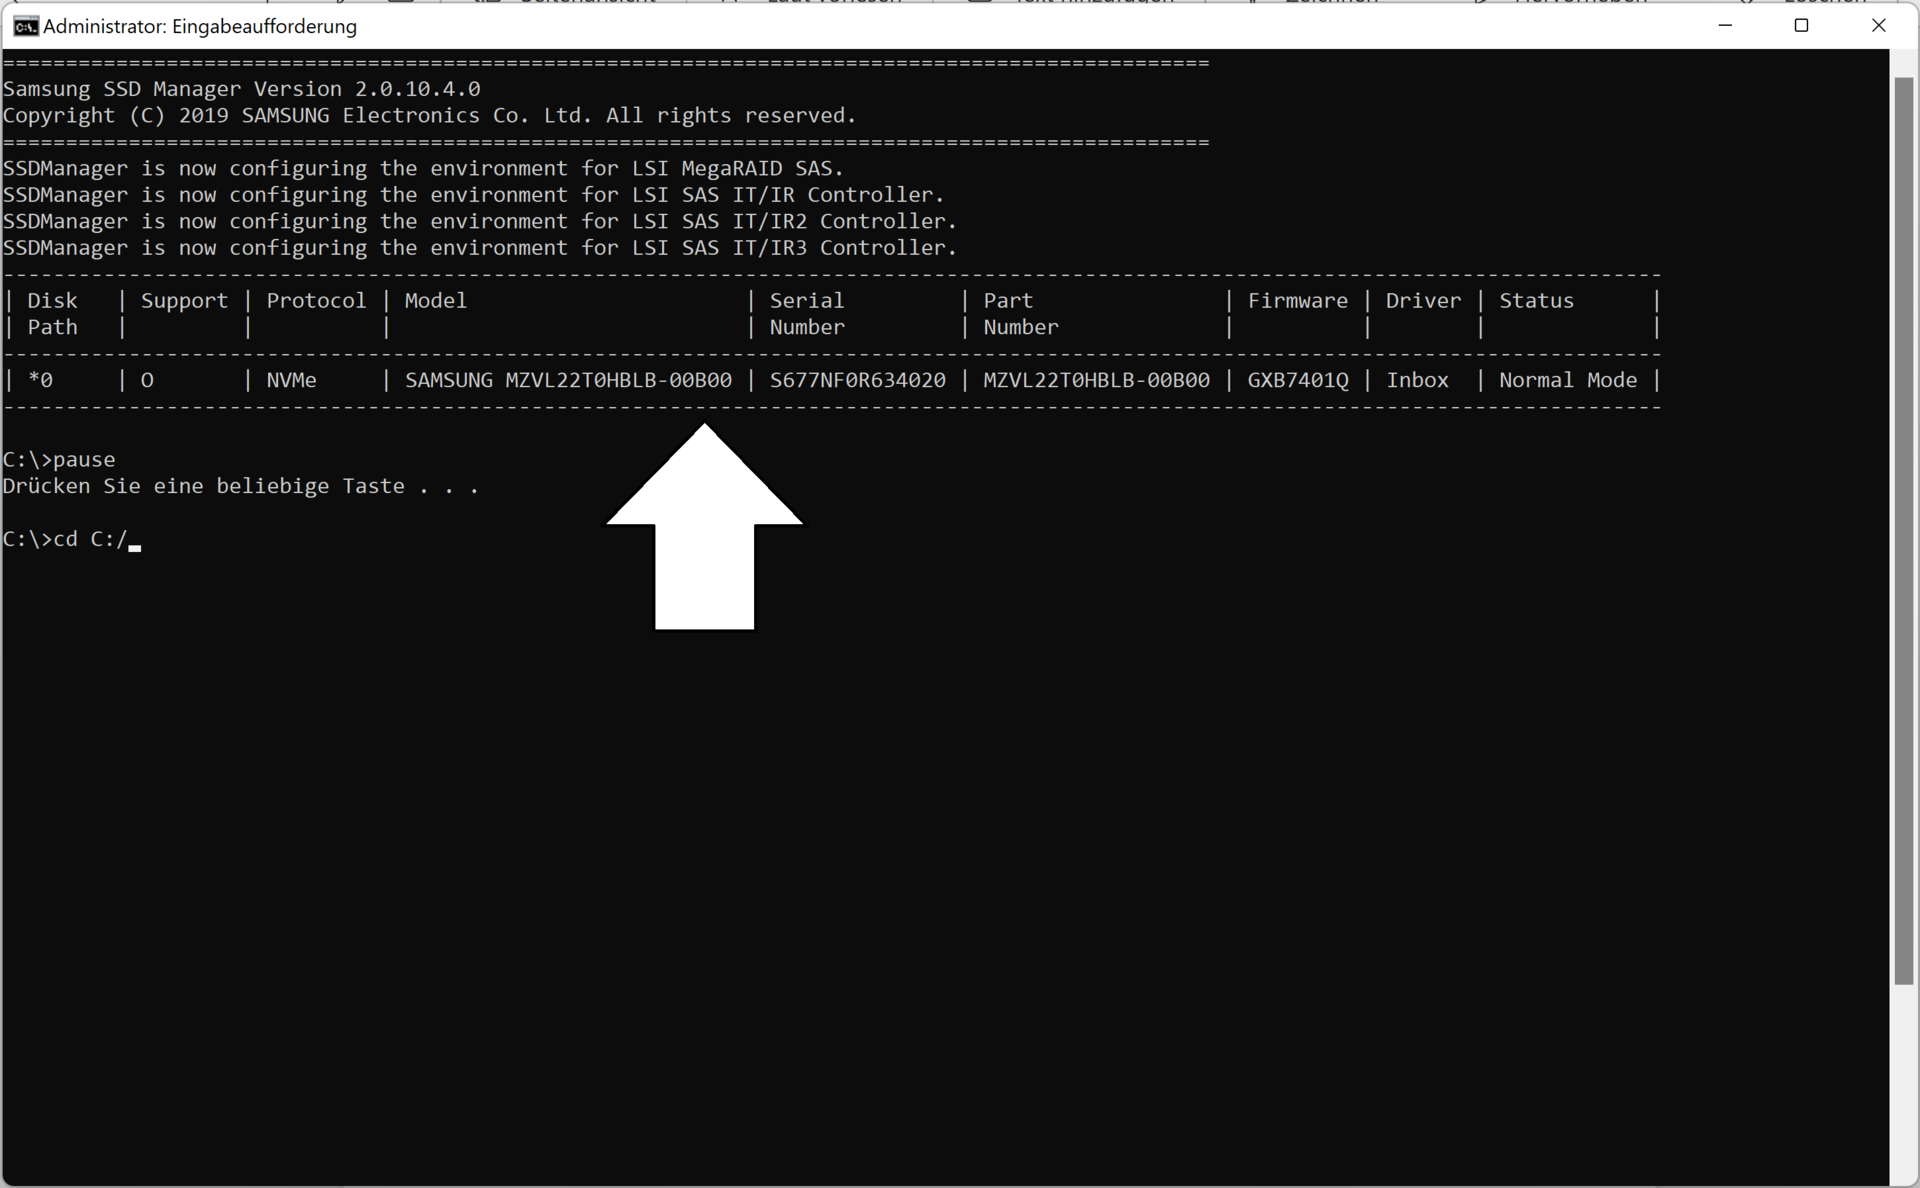
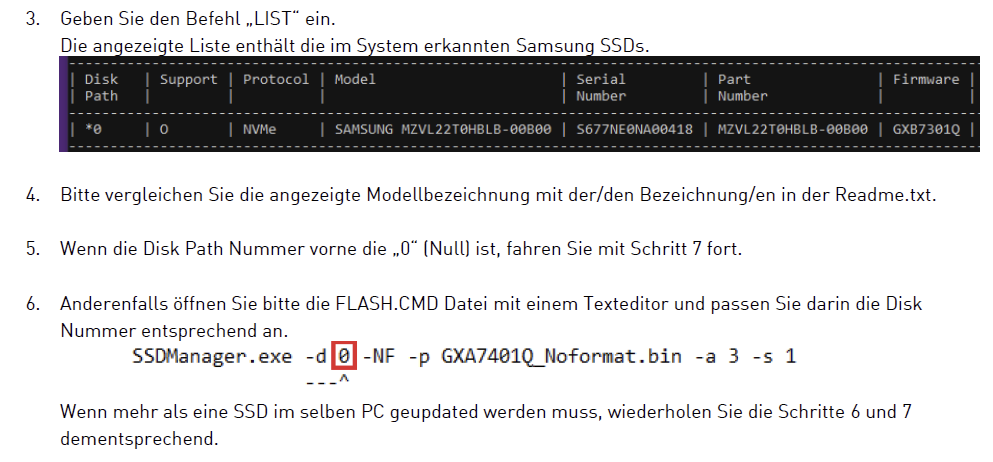
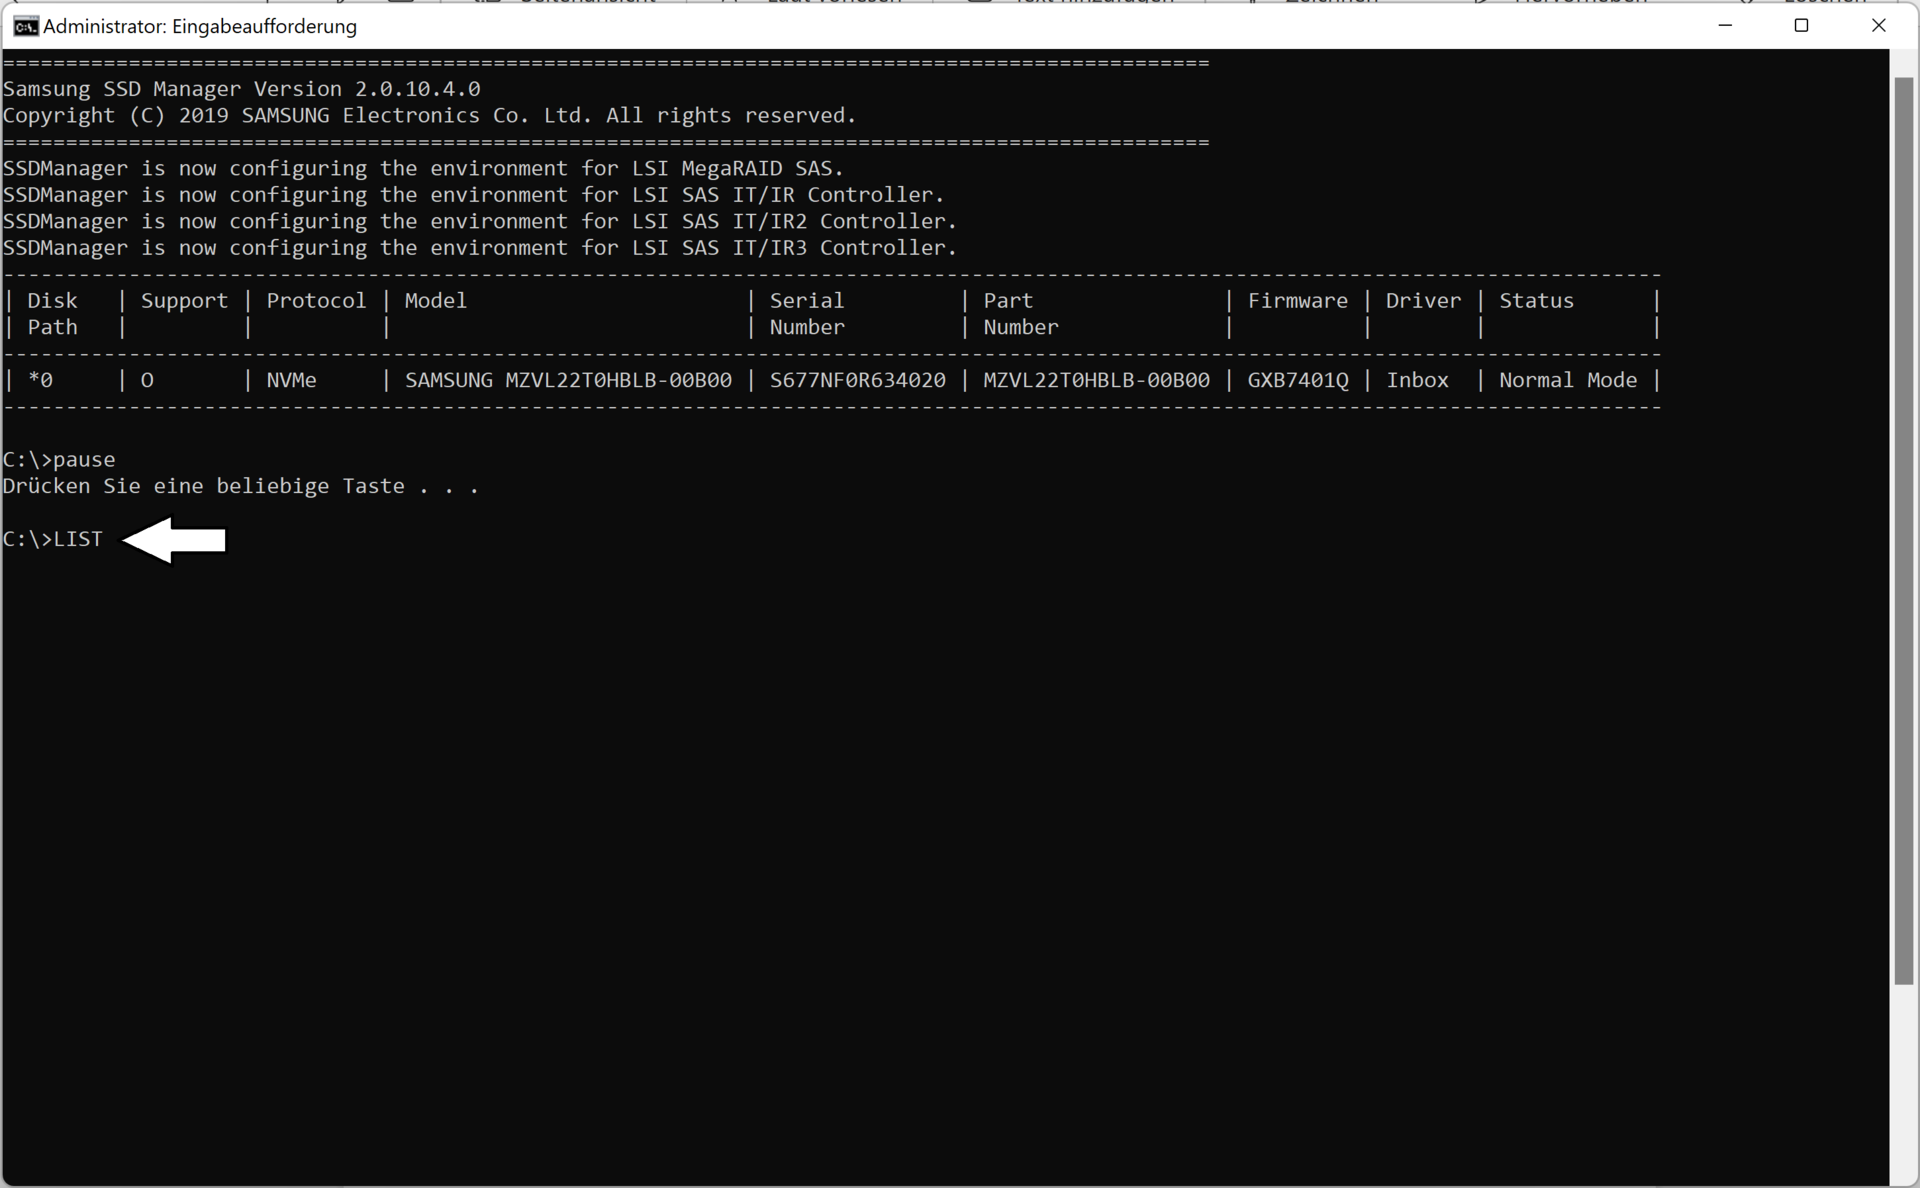
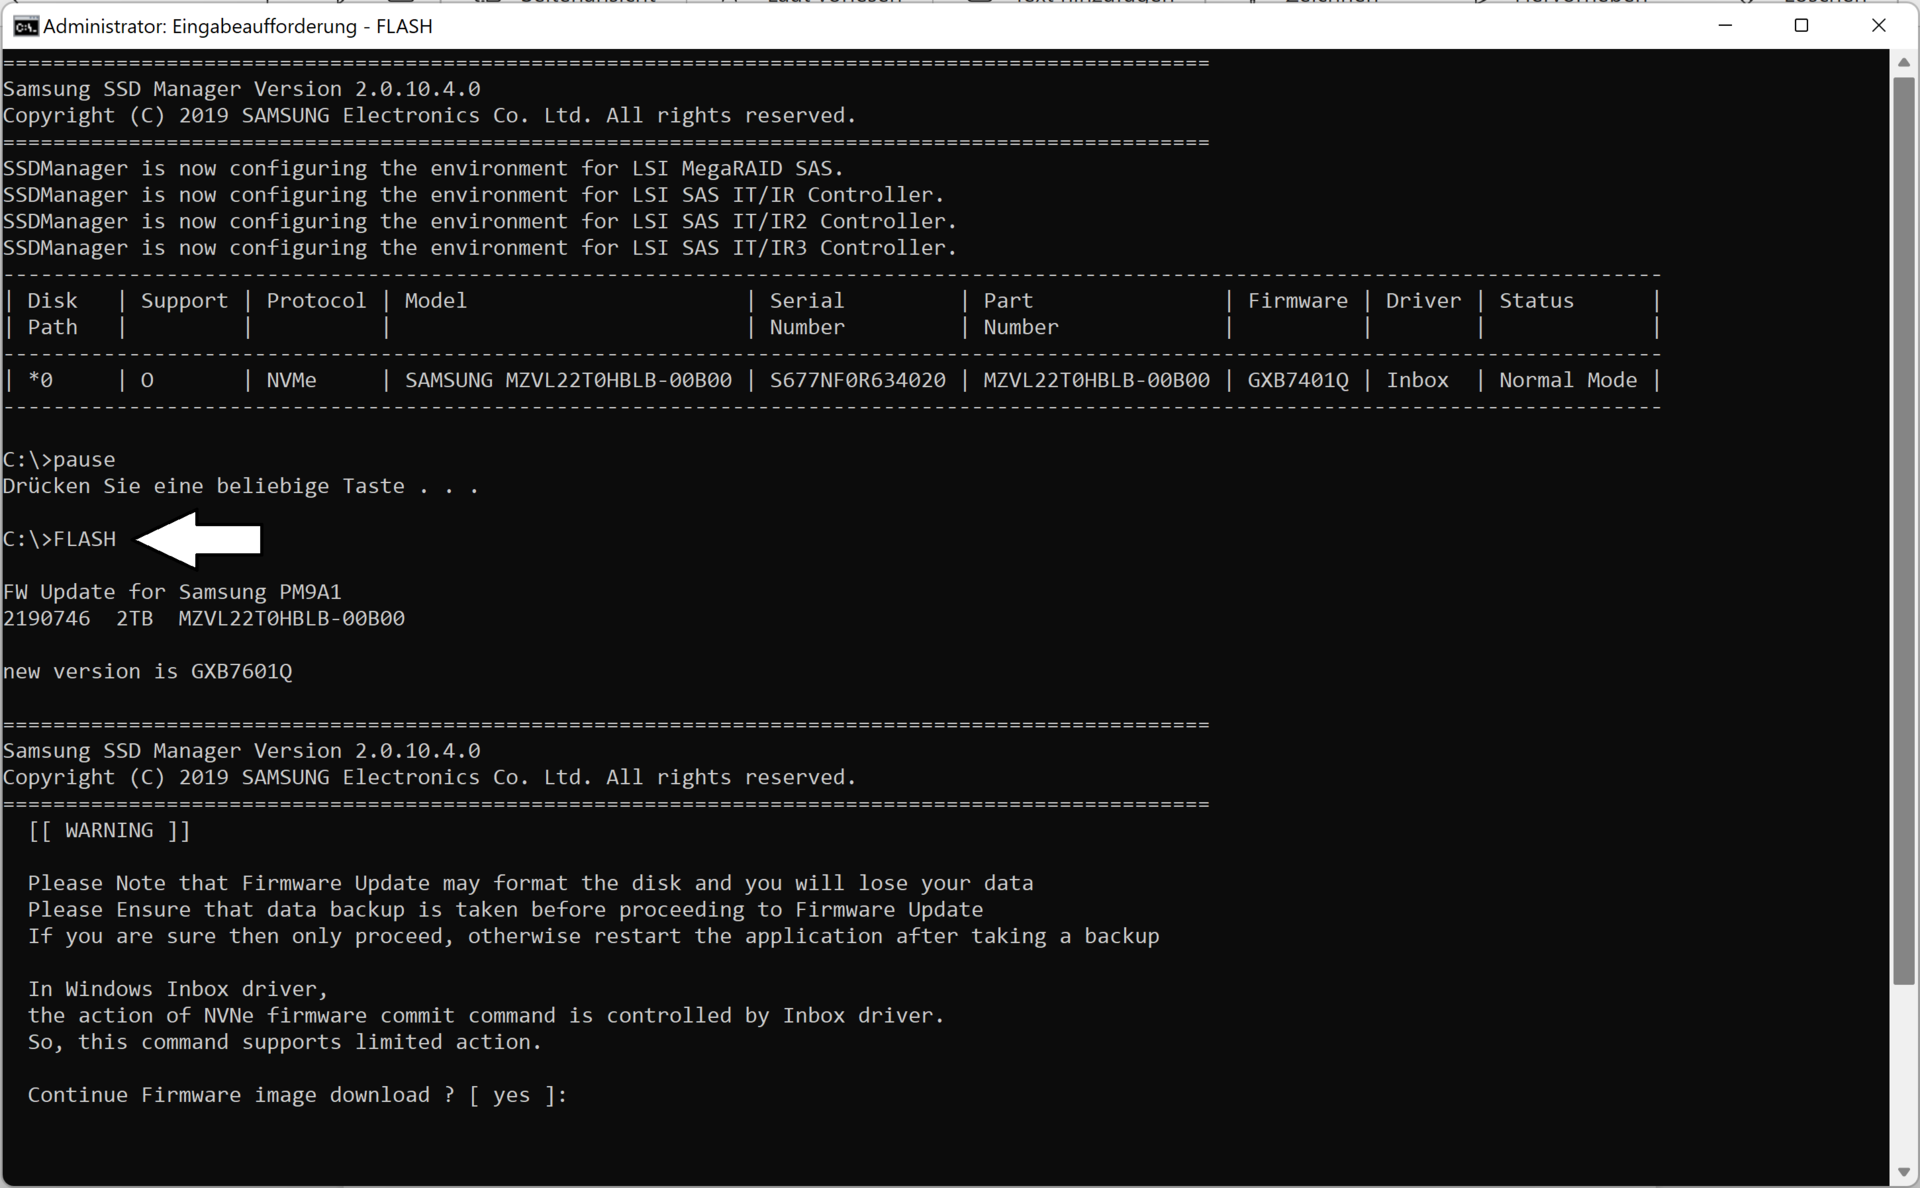
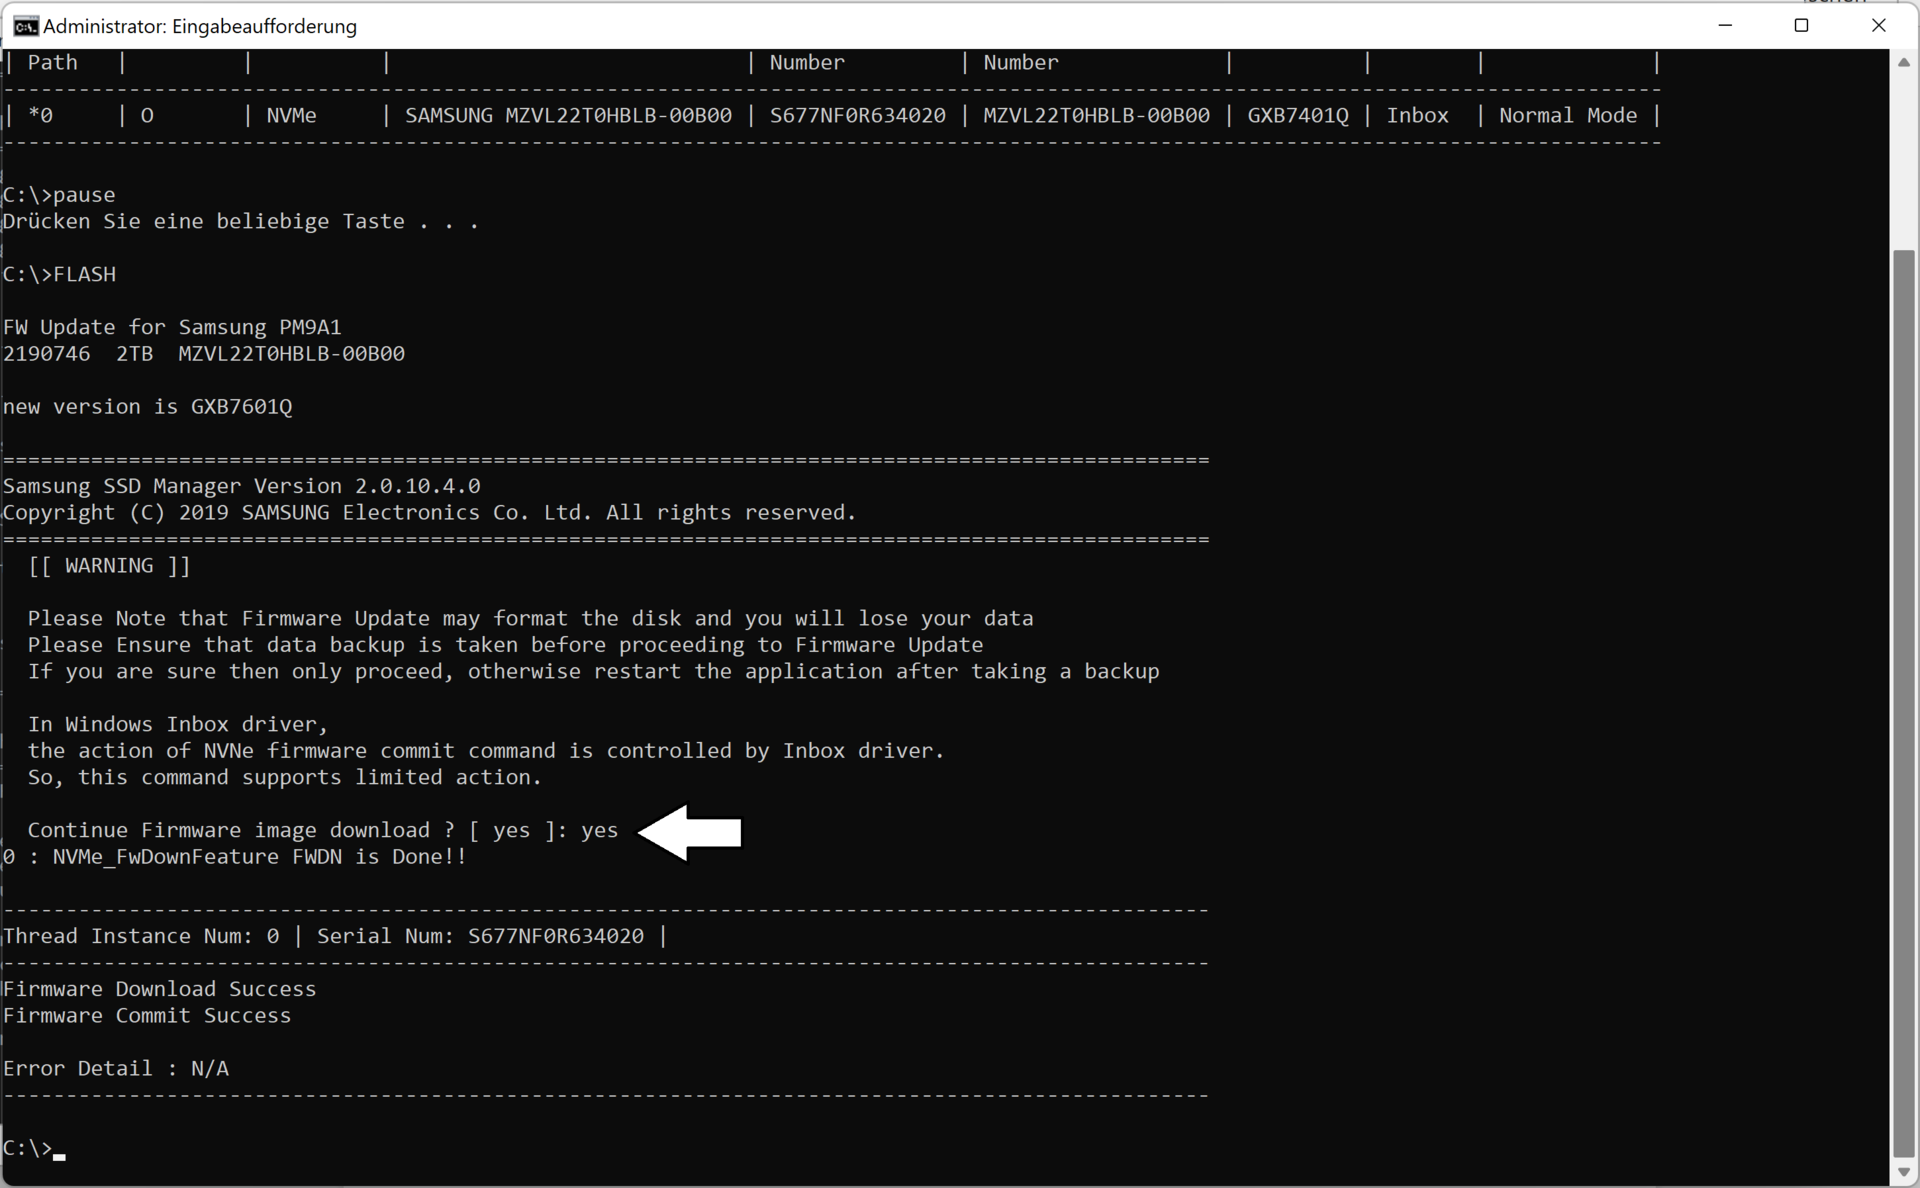
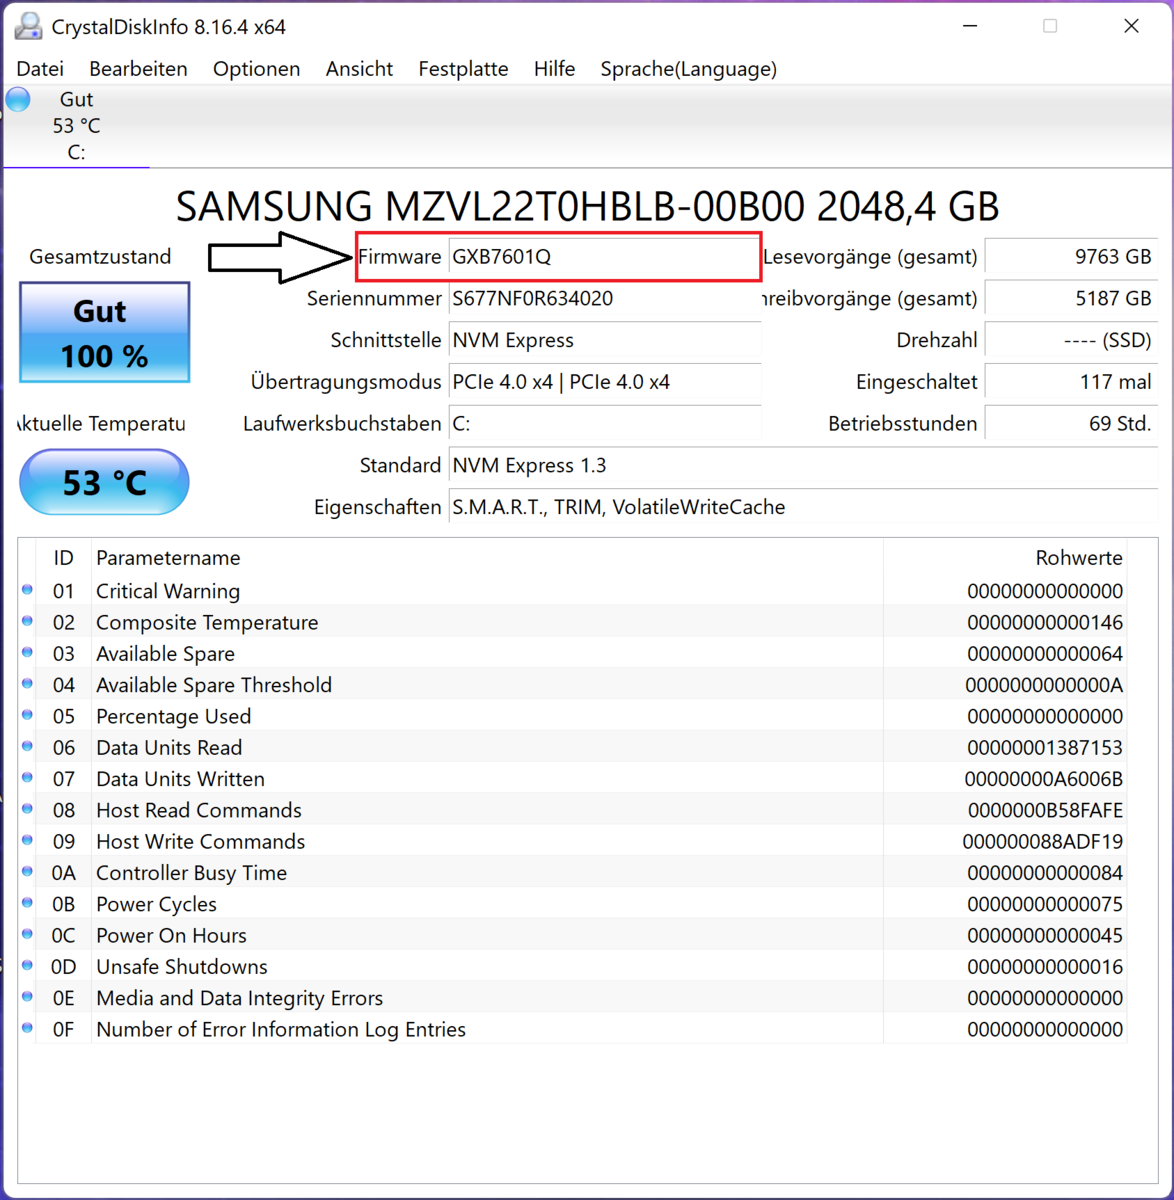
Two reasons for the poor values: the main reason is a problem with the firmware that cannot be solved automatically via Windows or via the MSI support page. For the outdated firmware (version: GXB7401Q), there is now a fix with which you can update to the current version (GXB7601Q) via the command prompt. Unfortunately, the driver cannot be installed via the device manager. Further research revealed that this is a well-known problem of the Samsung PM9A1 in the 256 GB, 512 GB, 1 TB and 2 TB formats.
The second cause for the SDD performance drop during longer sustained loads is due to its passive cooling. This cannot be cooled sufficiently even in "Cooler Boost Mode", so the Samsung Elpis S4LV003 controller, which is the heart of the SSD, begins to throttle from 74 degrees Celsius. Experienced users who are confident enough to open their device may be able to remedy the issue by placing a good thermal pad for SSDs underneath the passive cooling plate.
In the following series of images, we show you how to install the update without loss of data. The firmware can be downloaded here (source: Reddit). Caution: Flashing of the firmware is done at your own risk.

* ... smaller is better
Sustained Read before the update: DiskSpd Read Loop, Queue Depth 8
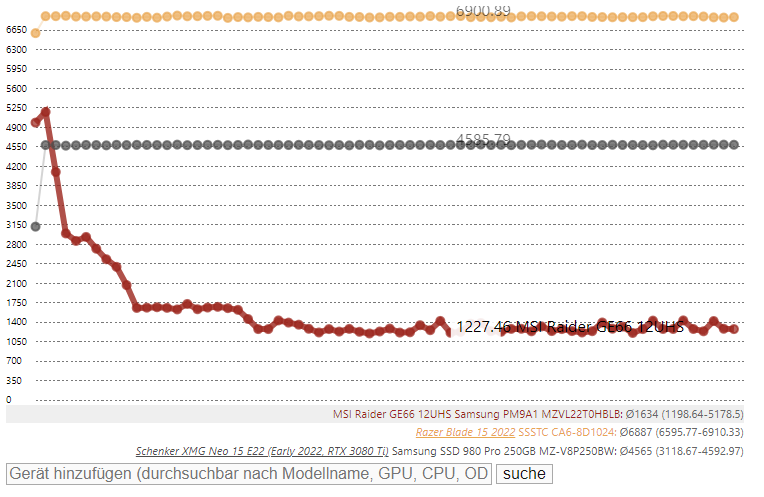
Sustained Read after the update: DiskSpd Read Loop, Queue Depth 8
Graphics Card
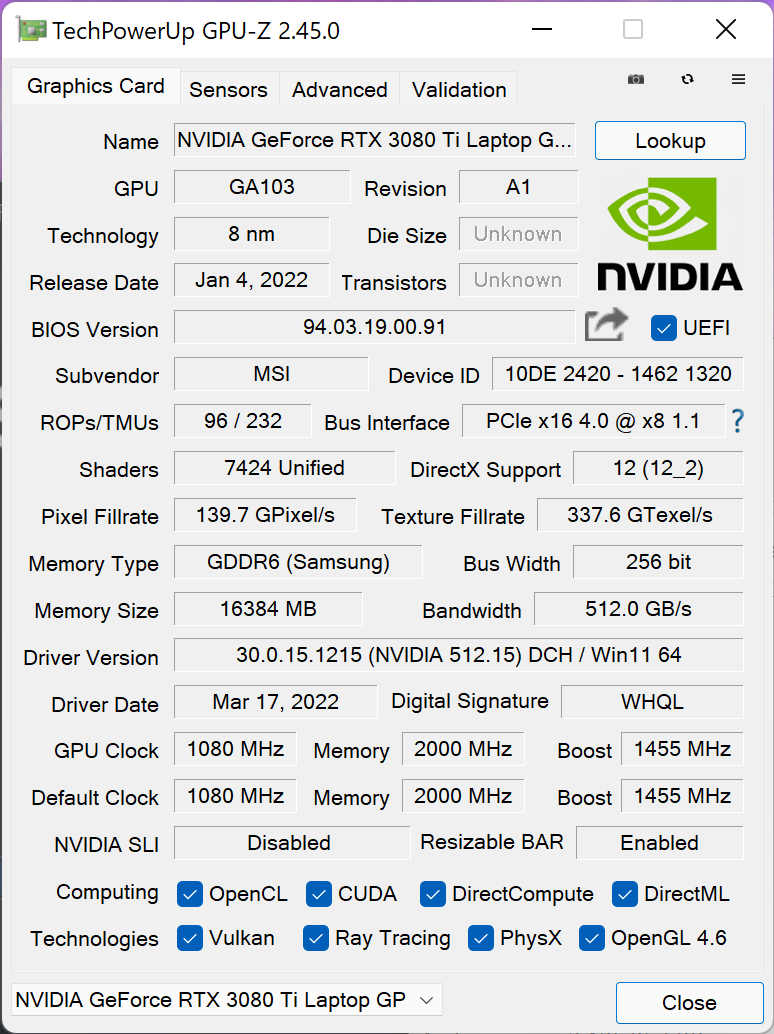
MSI uses the most powerful mobile graphics solution currently available in our review device: the Nvidia Geforce RTX 3080 Ti, which comes with 16 GB of GDDR6 memory and a maximum graphics power of 150 watts.
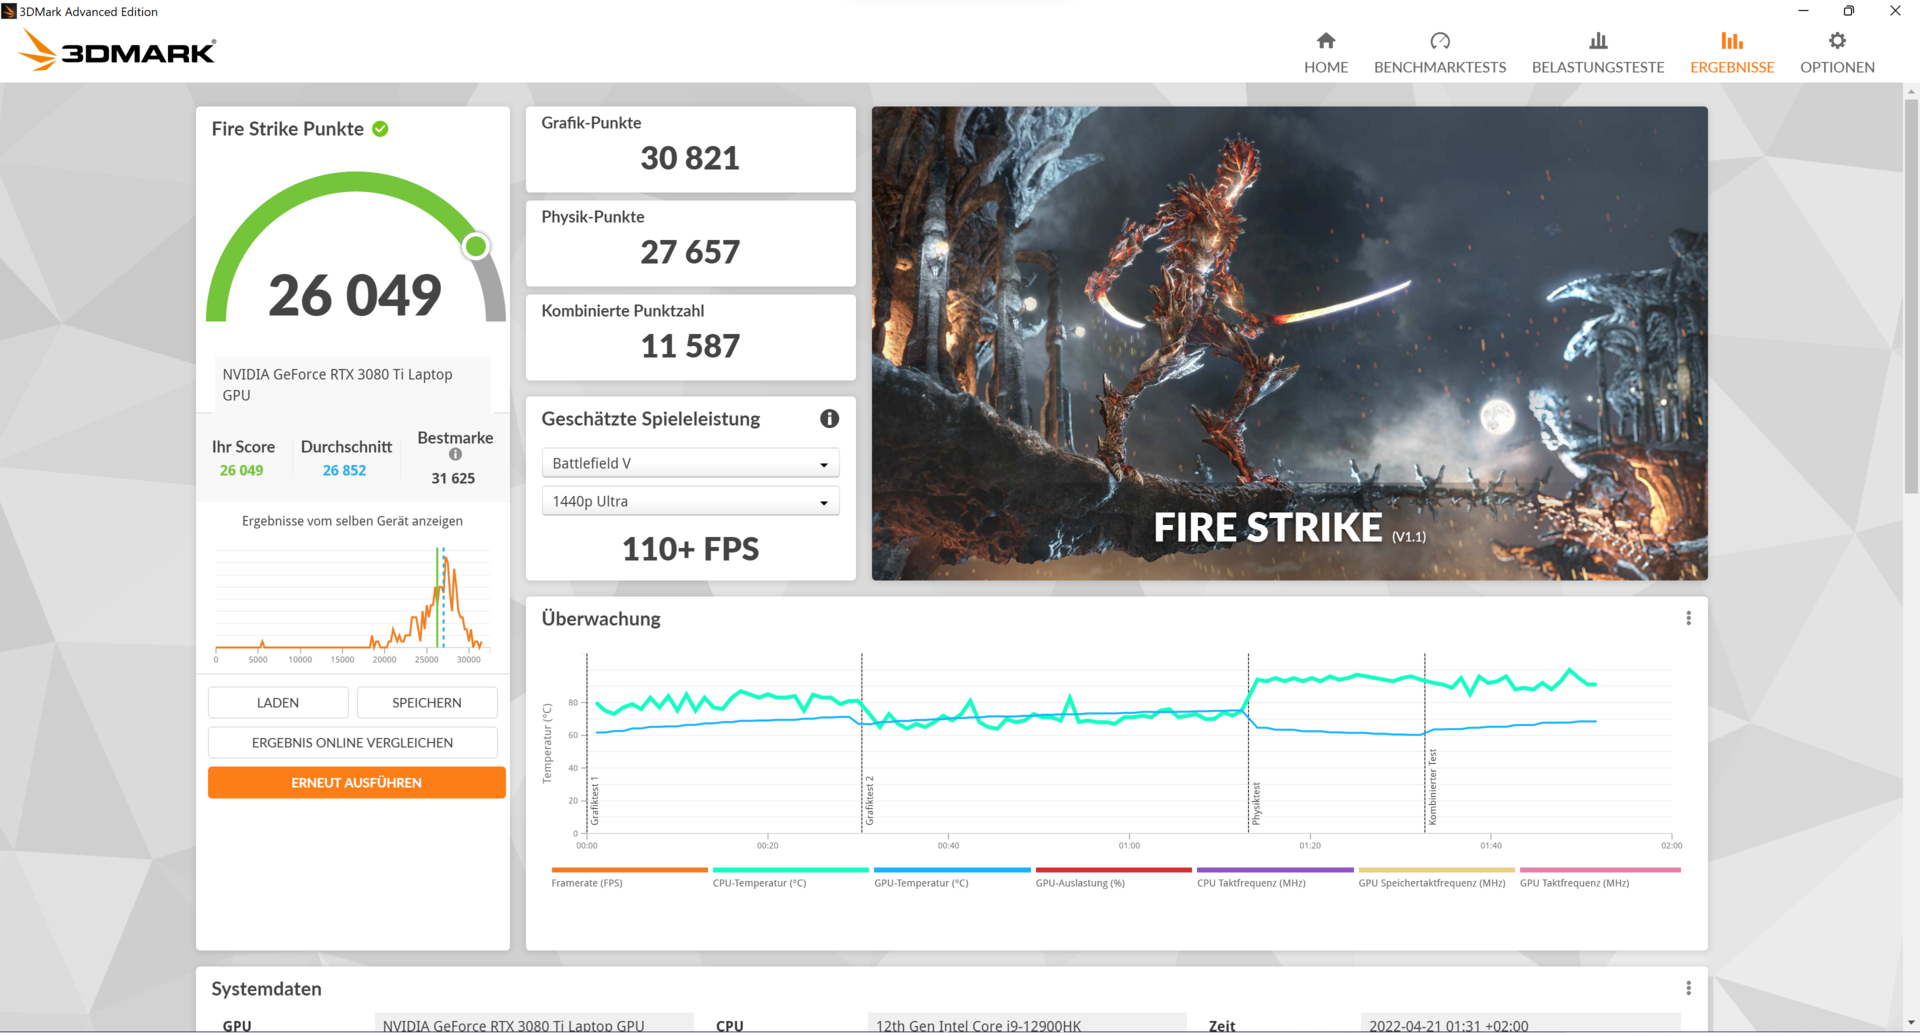
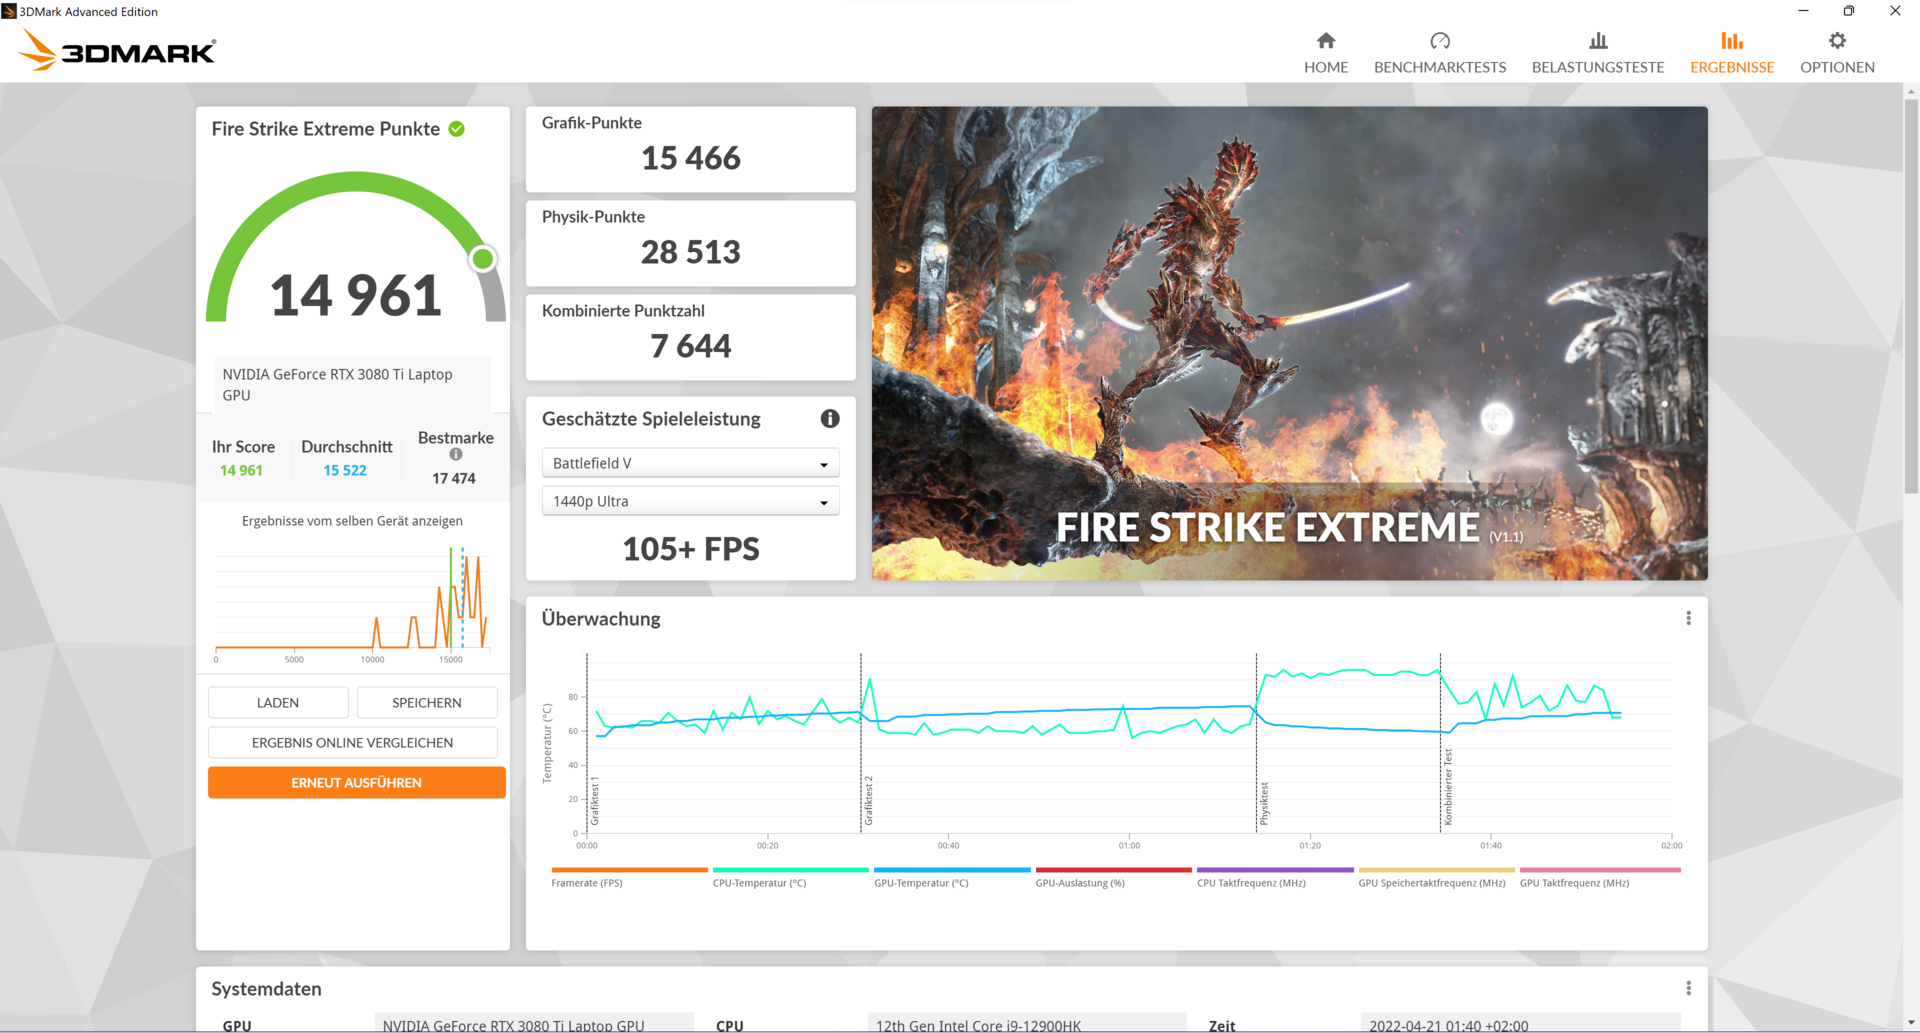
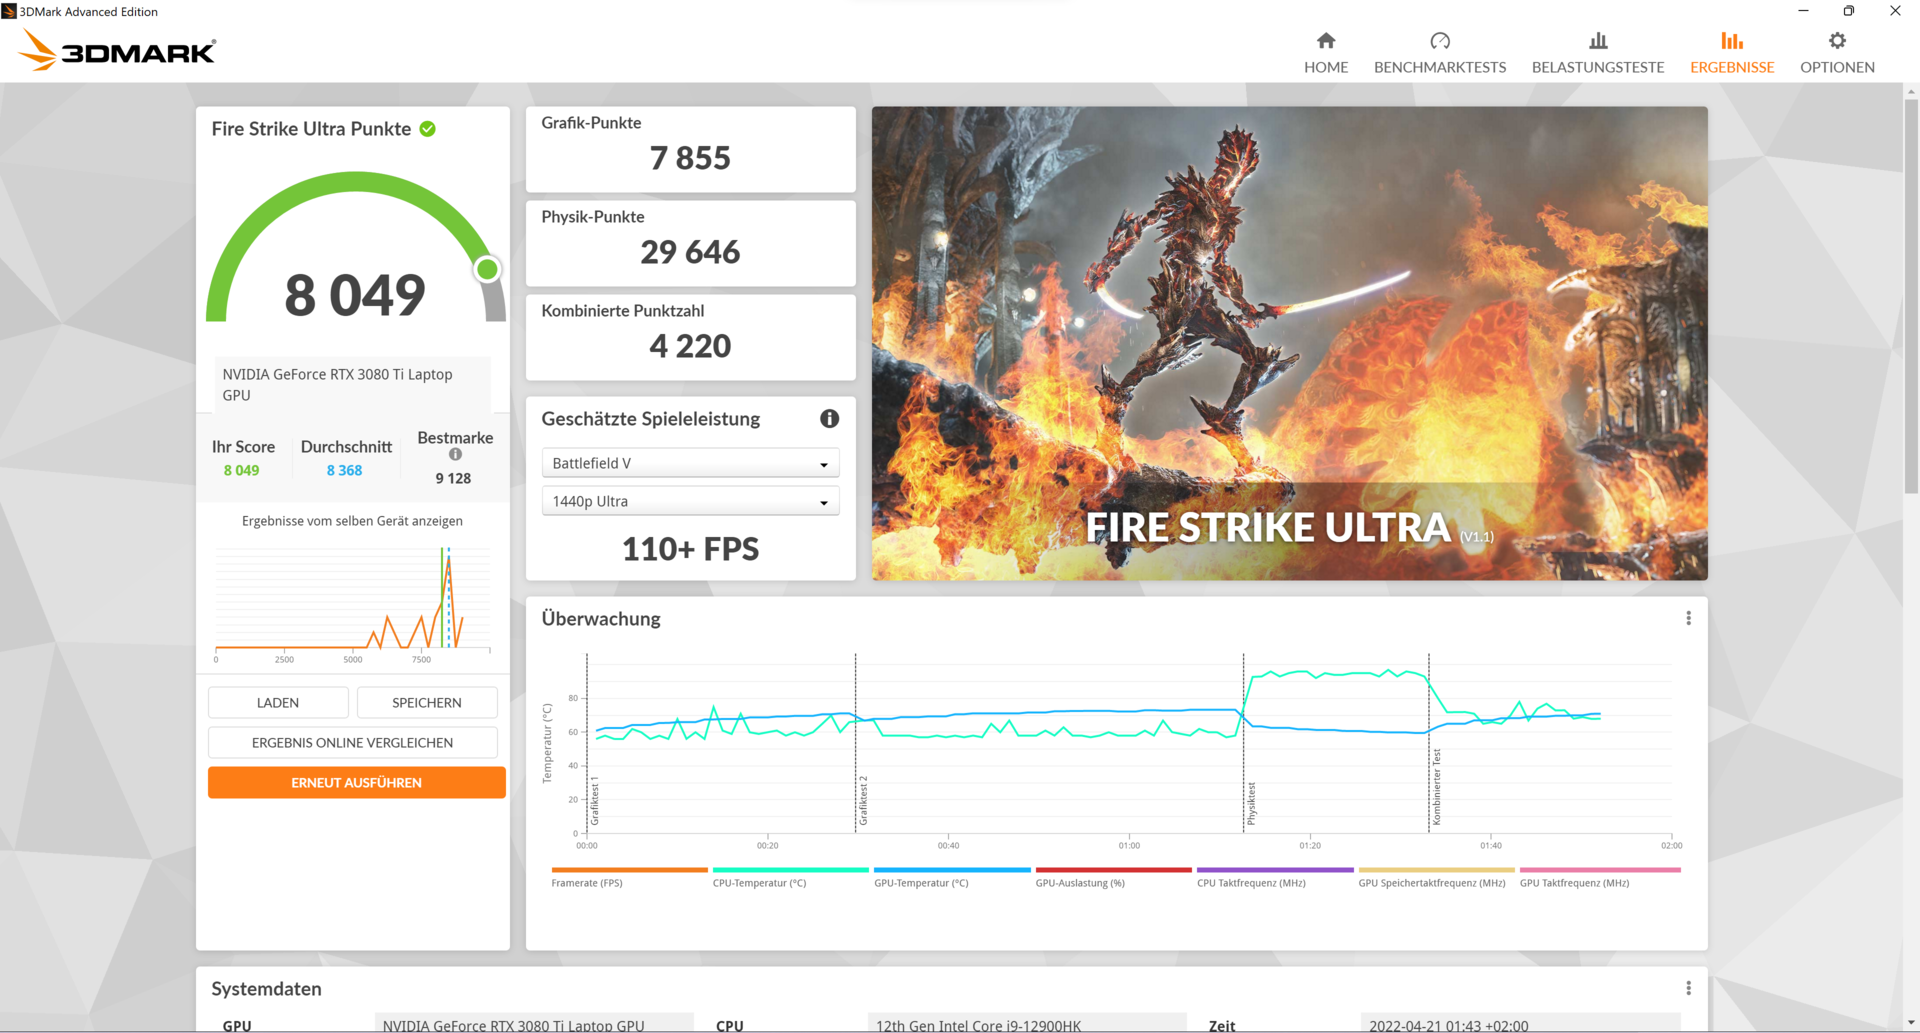
MSI's specification of 150 watts is also reached in our benchmarks, which is reflected in the excellent results. Our MSI GE66 12UHS overtakes the entire competition in the synthetic benchmarks. An exception is the Schenker XMG Neo 15 Early 2022 (i7-12700H and RTX 3080 Ti) with a TDP of 175 watts, which overtakes our review device by 6% in the 3DMark Fire Strike benchmark. On the other hand, the MSI GE66 beats the Neo 15 in all other synthetic benchmarks.
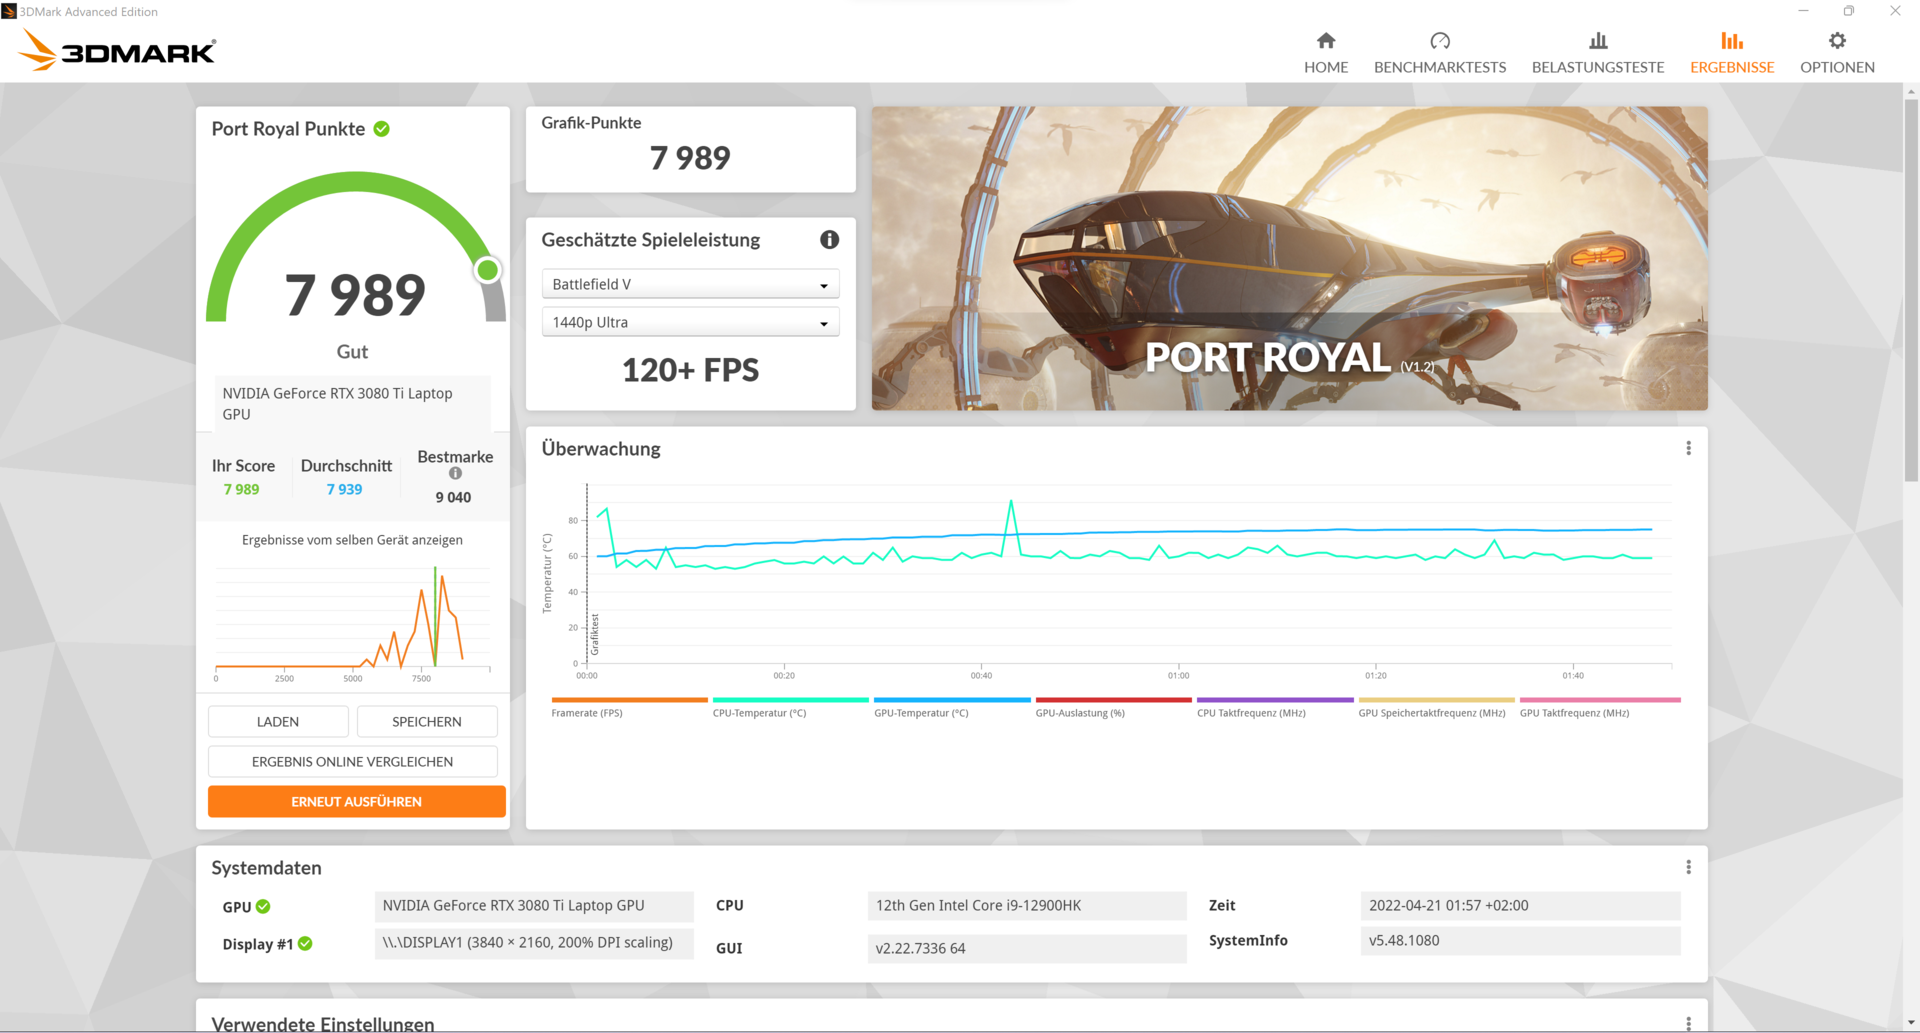
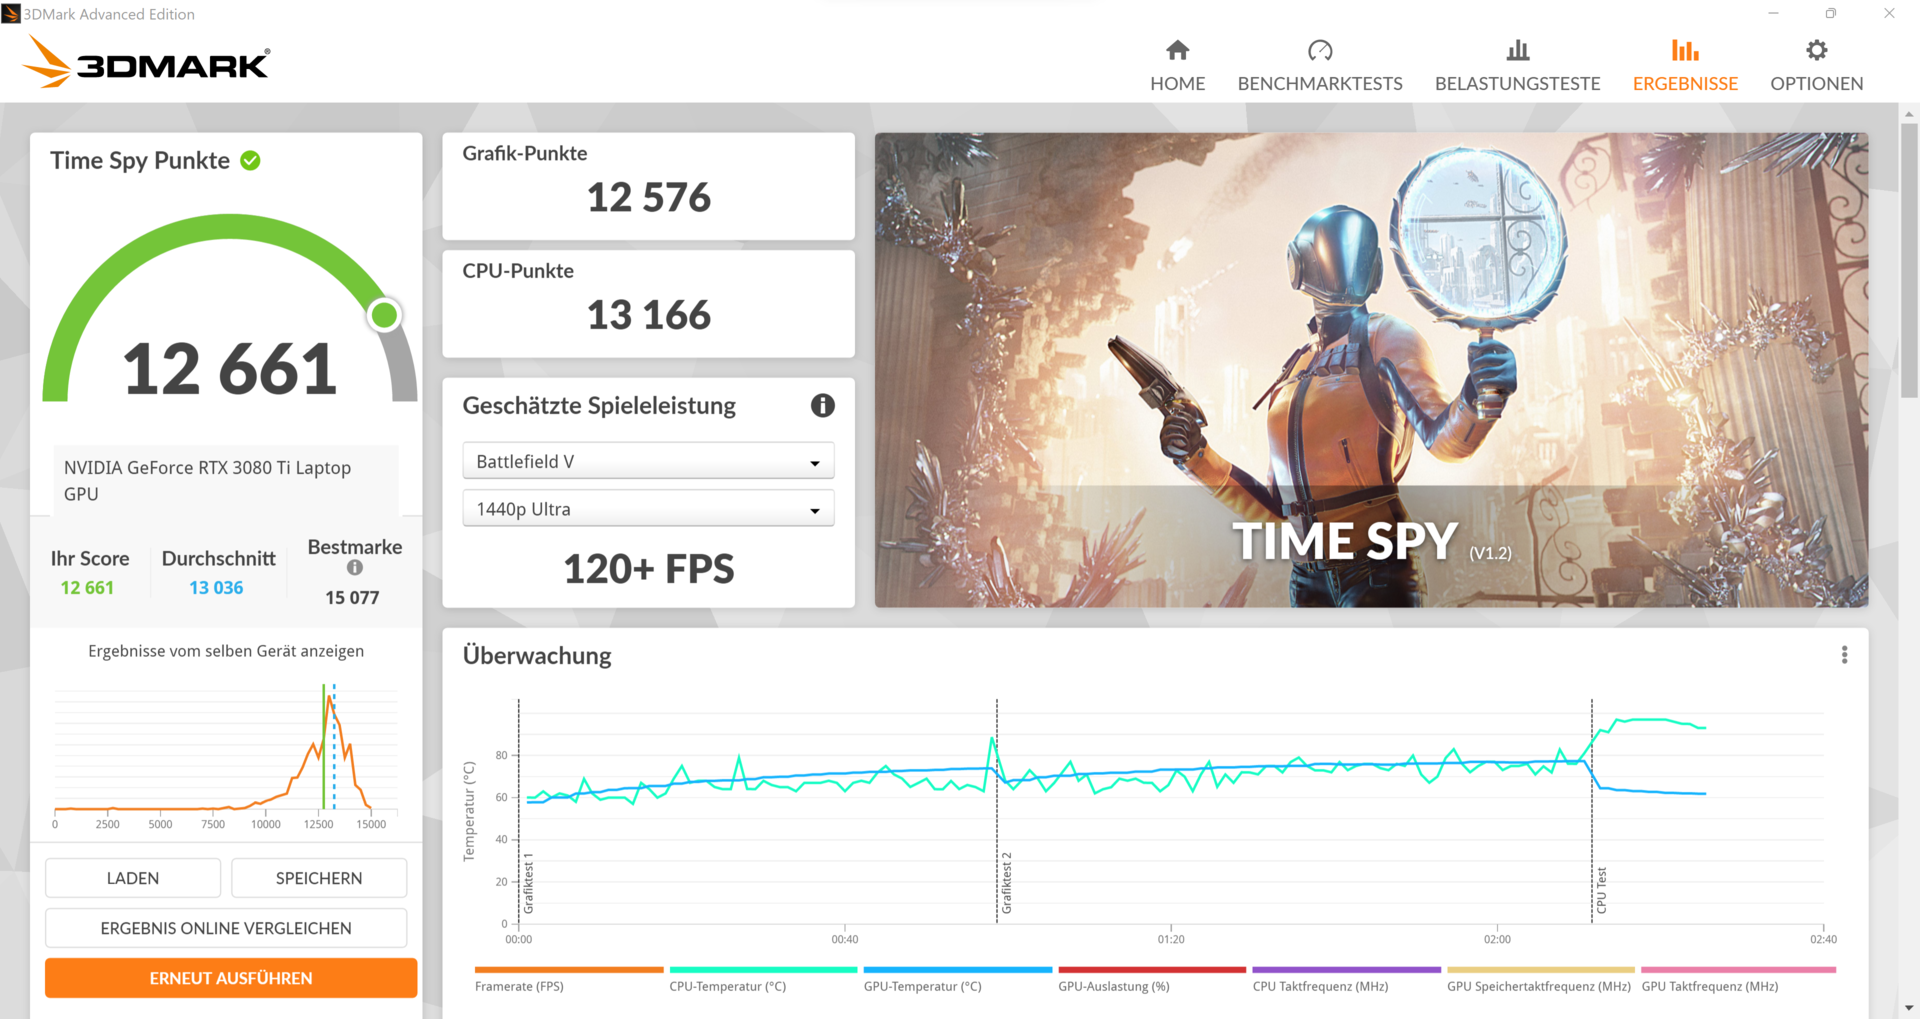
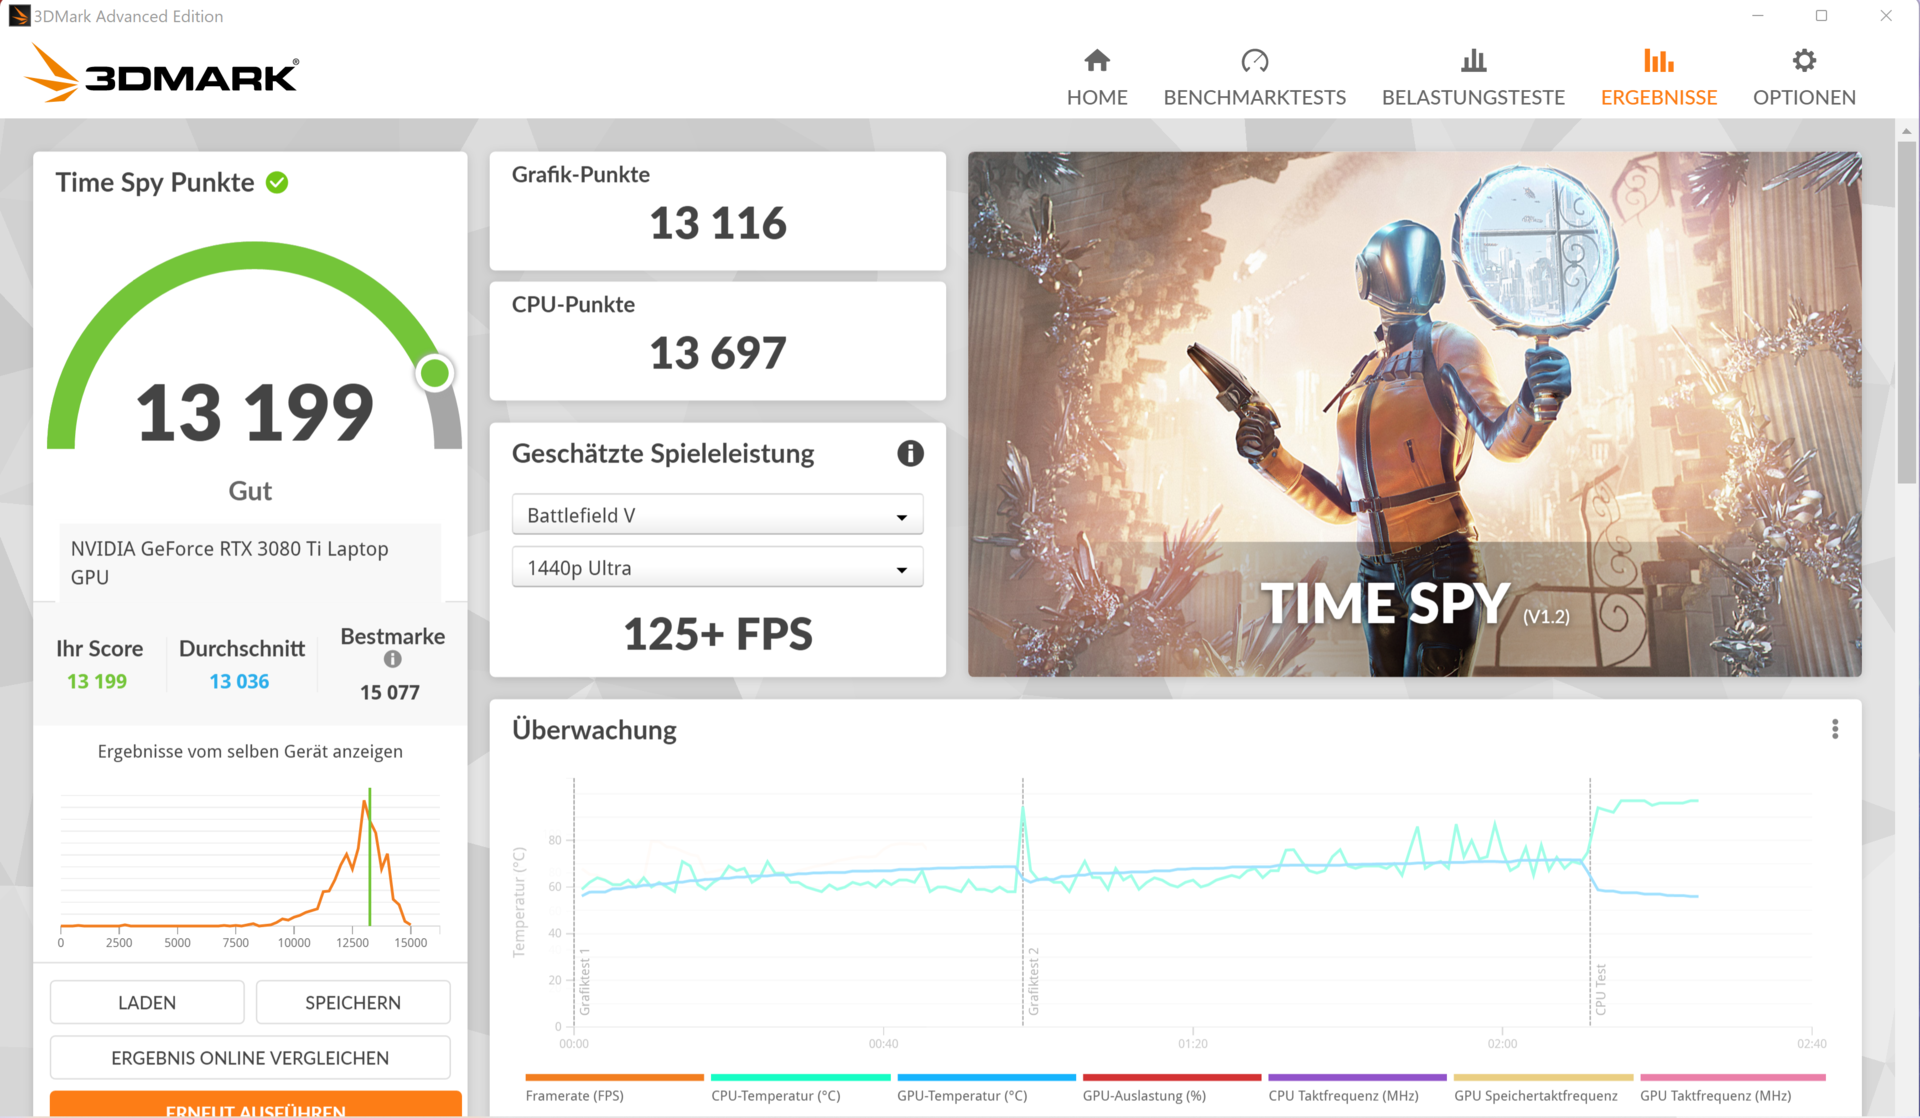
If we switch our GE66 12UHS from "MSHybrid" to "Discrete Graphics" mode via the GPU switch in the MSI Center, we see a performance gain of over 500 points in the 3DMark Time Spy benchmark. However, if we unplug the power supply, we see performance drop by 80%. Gaming on battery power should thus not be on the wish list.
| 3DMark Performance rating - Percent | |
| Average of class Gaming | |
| Schenker XMG Neo 15 E22 (Early 2022, RTX 3080 Ti) -2! | |
| MSI Raider GE66 12UHS | |
| Average NVIDIA GeForce RTX 3080 Ti Laptop GPU | |
| Razer Blade 15 2022 -1! | |
| Lenovo Legion 5 Pro 16 G7 i7 RTX 3070Ti -3! | |
| MSI GE66 Raider 10SFS -1! | |
| 3DMark 11 Performance | 35599 points | |
| 3DMark Cloud Gate Standard Score | 65582 points | |
| 3DMark Fire Strike Score | 26049 points | |
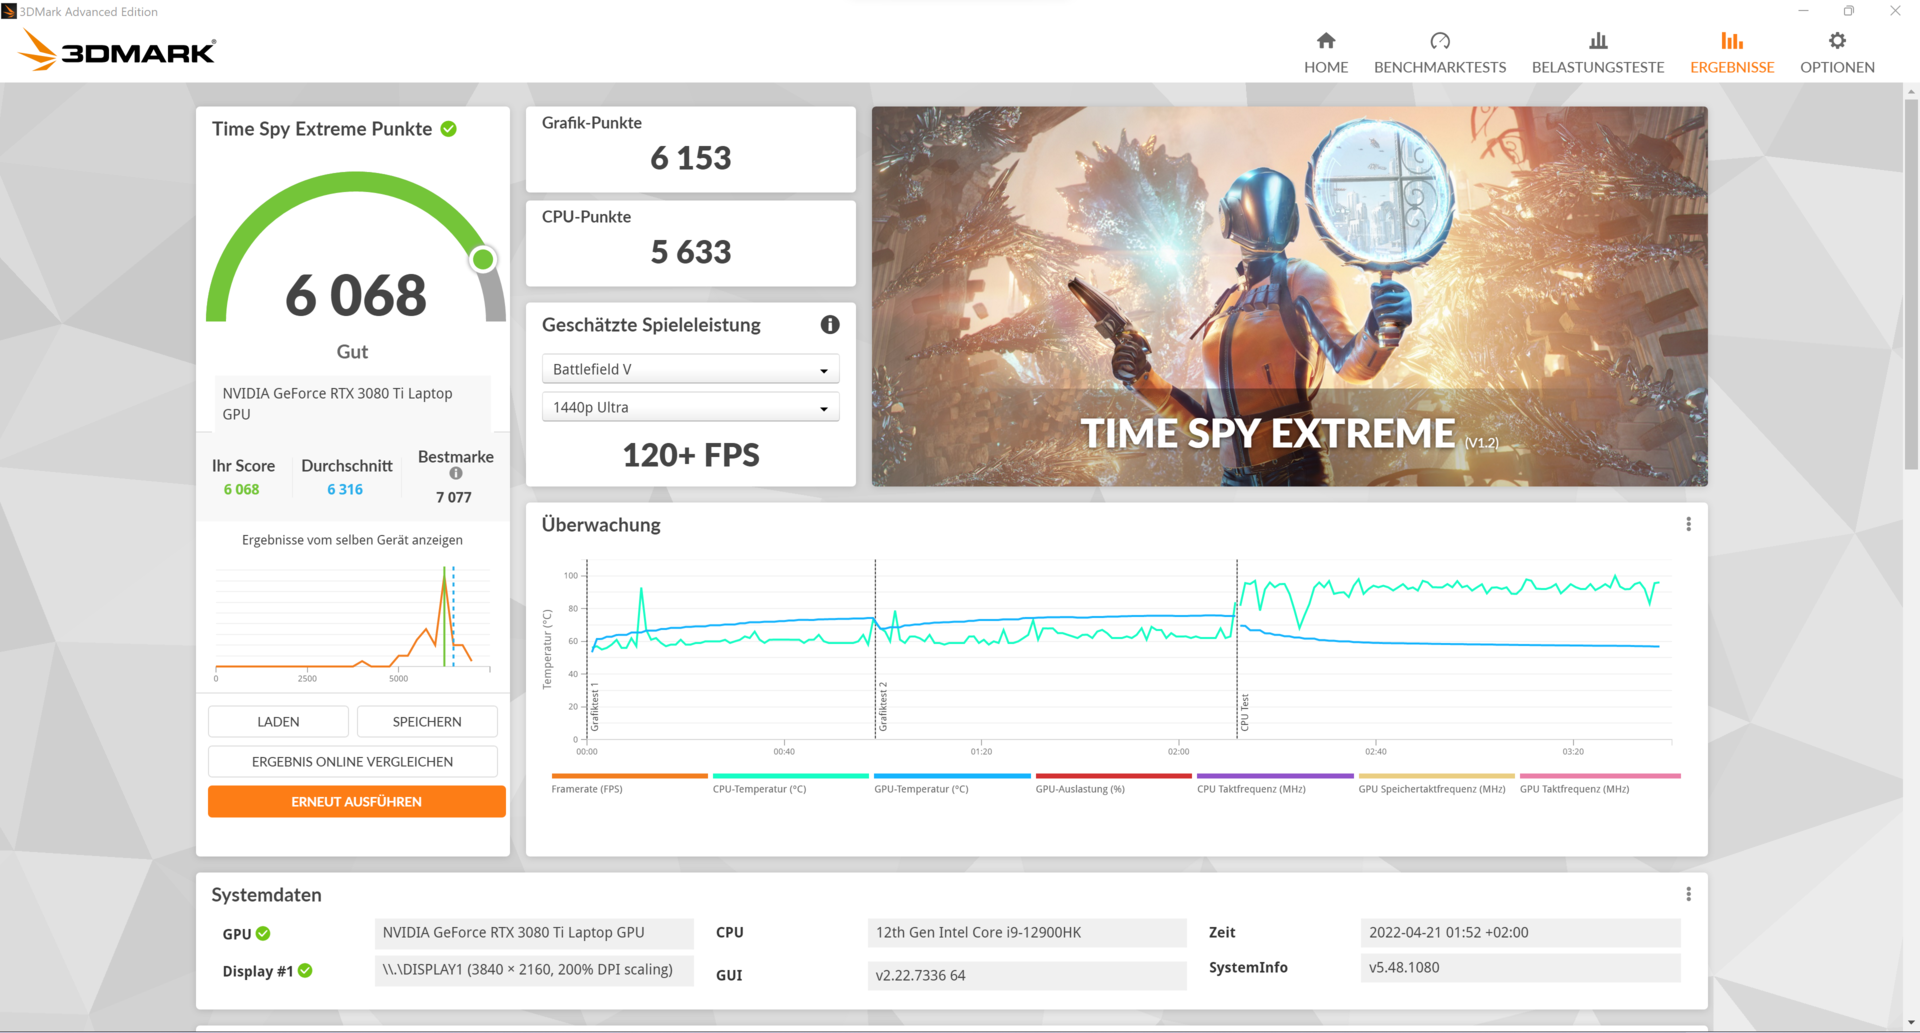
| 3DMark Fire Strike Extreme Score | 14961 points | |
| 3DMark Time Spy Score | 12848 points | |
Help | ||
Gaming Performance
The gaming performance of the MSI GE66 12 UHS in the practical test is excellent. MSI gets everything out of the installed RTX 3080 Ti with its maximum allowance of 150 watts and even outperforms devices such as the Schenker XMG Neo 15, whose RTX 3080 Ti even has an additional 25 watts at its disposal.
| The Witcher 3 | |
| 3840x2160 High Graphics & Postprocessing (Nvidia HairWorks Off) | |
| Average of class Gaming (114 - 169.8, n=3, last 2 years) | |
| Average NVIDIA GeForce RTX 3080 Ti Laptop GPU (62.1 - 94.3, n=8) | |
| MSI Raider GE66 12UHS | |
| MSI GE66 Raider 10SFS | |
| 1920x1080 Ultra Graphics & Postprocessing (HBAO+) | |
| Average of class Gaming (95 - 240, n=8, last 2 years) | |
| Schenker XMG Neo 15 E22 (Early 2022, RTX 3080 Ti) | |
| Average NVIDIA GeForce RTX 3080 Ti Laptop GPU (30 - 130.6, n=43) | |
| MSI Raider GE66 12UHS | |
| Razer Blade 15 2022 | |
| Lenovo Legion 5 Pro 16 G7 i7 RTX 3070Ti | |
| MSI GE66 Raider 10SFS | |
| F1 2021 | |
| 2560x1440 Ultra High Preset + Raytracing AA:T AF:16x | |
| Lenovo Legion 5 Pro 16 G7 i7 RTX 3070Ti | |
| Average NVIDIA GeForce RTX 3080 Ti Laptop GPU (30 - 120.1, n=19) | |
| 1920x1080 Ultra High Preset + Raytracing AA:T AF:16x | |
| MSI Raider GE66 12UHS | |
| Lenovo Legion 5 Pro 16 G7 i7 RTX 3070Ti | |
| Average NVIDIA GeForce RTX 3080 Ti Laptop GPU (30.2 - 160.6, n=30) | |
| F1 2020 - 1920x1080 Ultra High Preset AA:T AF:16x | |
| Average NVIDIA GeForce RTX 3080 Ti Laptop GPU (190.4 - 197.9, n=2) | |
| MSI Raider GE66 12UHS | |
| Horizon Zero Dawn | |
| 3840x2160 Ultimate Quality | |
| Average NVIDIA GeForce RTX 3080 Ti Laptop GPU (56 - 61, n=2) | |
| MSI Raider GE66 12UHS | |
| 2560x1440 Ultimate Quality | |
| Average NVIDIA GeForce RTX 3080 Ti Laptop GPU (98 - 109, n=3) | |
| MSI Raider GE66 12UHS | |
| 1920x1080 Ultimate Quality | |
| Average NVIDIA GeForce RTX 3080 Ti Laptop GPU (118 - 128, n=3) | |
| MSI Raider GE66 12UHS | |
| 1920x1080 Favor Quality | |
| MSI Raider GE66 12UHS | |
| Average NVIDIA GeForce RTX 3080 Ti Laptop GPU (130 - 141, n=3) | |
| Far Cry 6 | |
| 1920x1080 Ultra Graphics Quality + HD Textures + DXR AA:T | |
| Average of class Gaming (n=1last 2 years) | |
| MSI Raider GE66 12UHS | |
| Average NVIDIA GeForce RTX 3080 Ti Laptop GPU (91 - 92, n=3) | |
| 3840x2160 Ultra Graphics Quality + HD Textures AA:T | |
| MSI Raider GE66 12UHS | |
| Average NVIDIA GeForce RTX 3080 Ti Laptop GPU (46.2 - 57, n=4) | |
| Average of class Gaming (n=1last 2 years) | |
| 2560x1440 Ultra Graphics Quality + HD Textures AA:T | |
| Average of class Gaming (74.5 - 116.7, n=2, last 2 years) | |
| MSI Raider GE66 12UHS | |
| Average NVIDIA GeForce RTX 3080 Ti Laptop GPU (75.2 - 93, n=5) | |
| 1920x1080 Ultra Graphics Quality + HD Textures AA:T | |
| Average of class Gaming (96.3 - 135.7, n=3, last 2 years) | |
| MSI Raider GE66 12UHS | |
| Average NVIDIA GeForce RTX 3080 Ti Laptop GPU (71.3 - 114, n=6) | |
| Assassin´s Creed Valhalla | |
| 3840x2160 Ultra High Preset | |
| Average NVIDIA GeForce RTX 3080 Ti Laptop GPU (45 - 50, n=2) | |
| MSI Raider GE66 12UHS | |
| 2560x1440 Ultra High Preset | |
| Average NVIDIA GeForce RTX 3080 Ti Laptop GPU (68 - 74, n=3) | |
| MSI Raider GE66 12UHS | |
| 1920x1080 Ultra High Preset | |
| Average NVIDIA GeForce RTX 3080 Ti Laptop GPU (85 - 93, n=3) | |
| MSI Raider GE66 12UHS | |
| 1920x1080 High Preset | |
| Average NVIDIA GeForce RTX 3080 Ti Laptop GPU (99 - 103, n=3) | |
| MSI Raider GE66 12UHS | |
In other benchmarks regarding performance under continuous load, we recorded a drop in gaming performance of up to 12%. In the "Extreme Performance" profile with automatic fan control, the fans are limited to a maximum of 5,100 RPM (rounds per minute), which was clearly insufficient for keeping the CPU and GPU adequately cool during longer gaming periods and so resulted in eventual throttling. We repeated the whole thing under the same profile and activated "Cooler Boost Mode" (fans running at 6,000 RPM). The result: the waste heat of the components was sufficiently dissipated under these conditions and we no longer observed any reduced FPS rates over the test period.
Witcher 3 FPS Chart
| low | med. | high | ultra | QHD | 4K | |
|---|---|---|---|---|---|---|
| GTA V (2015) | 187 | 181 | 172.6 | 109.4 | ||
| The Witcher 3 (2015) | 411 | 344 | 223 | 110 | 77.49 | |
| Dota 2 Reborn (2015) | 187.4 | 170.8 | 166.9 | 156.8 | 142.3 | |
| Final Fantasy XV Benchmark (2018) | 212 | 160.3 | 119.6 | 89.5 | 52.1 | |
| X-Plane 11.11 (2018) | 170 | 149.6 | 117.5 | 102.1 | ||
| Far Cry 5 (2018) | 164 | 153 | 144 | 124 | 70 | |
| Strange Brigade (2018) | 490 | 284 | 224 | 199.8 | 146.9 | 86.9 |
| F1 2020 (2020) | 345 | 303 | 270 | 190.4 | ||
| Horizon Zero Dawn (2020) | 168 | 156 | 141 | 122 | 98 | 56 |
| Assassin´s Creed Valhalla (2020) | 115 | 100 | 87 | 70 | 45 | |
| F1 2021 (2021) | 394 | 351 | 292 | 142.7 | ||
| Far Cry 6 (2021) | 143 | 126 | 114 | 92 | 54 | |
| Cyberpunk 2077 1.6 (2022) | 158.75 | 159.68 | 145.61 | 144.08 | 56.83 | 27.62 |
Emissions: GE66 strikes good balance between performance and volume
Noise
For the installed hardware, the MSI GE 66 12UHS gives a balanced picture overall in terms of fan noise. During everyday use, the fans occasionally rev up depending on activity and fan profile. Under load, the fan control reacts swiftly to avoid performance drops due to temperatures rising too quickly. Even under "Extreme Performance", both fans are limited to a maximum of 5,100 RPM, although a maximum of 6,000 RPM is possible, but this is reserved for "Cooler Boost" mode. That said, users can also create a custom fan profile for CPU and GPU and thus adjust the volume to their needs. Moreover, there is the possibility of managing fan control automatically via AI. This functioned quite well in everyday use, but the fans sometimes reacted too slowly in the face of rapid temperature increases and high loads. Overall, even the 45 dB at 5,100 RPM seems tolerable when gaming. This is partly due to the fact that the installed fans do not tend to emit high-frequency noise or coil whine.
Noise level
| Idle |
| 27 / 30 / 39 dB(A) |
| Load |
| 45 / 47 dB(A) |
 | ||
30 dB silent 40 dB(A) audible 50 dB(A) loud |
||
min: | ||
| MSI Raider GE66 12UHS Intel Core i9-12900HK, NVIDIA GeForce RTX 3080 Ti Laptop GPU | MSI GE66 Raider 10SFS Intel Core i9-10980HK, NVIDIA GeForce RTX 2070 Super Mobile | Razer Blade 15 2022 Intel Core i7-12800H, NVIDIA GeForce RTX 3080 Ti Laptop GPU | Schenker XMG Neo 15 E22 (Early 2022, RTX 3080 Ti) Intel Core i7-12700H, NVIDIA GeForce RTX 3080 Ti Laptop GPU | Lenovo Legion 5 Pro 16 G7 i7 RTX 3070Ti Intel Core i7-12700H, NVIDIA GeForce RTX 3070 Ti Laptop GPU | |
|---|---|---|---|---|---|
| Noise | -16% | 5% | 7% | -1% | |
| off / environment * (dB) | 26 | 30 -15% | 25.4 2% | 24 8% | 24.6 5% |
| Idle Minimum * (dB) | 27 | 30 -11% | 26.2 3% | 24 11% | 28.4 -5% |
| Idle Average * (dB) | 30 | 35 -17% | 26.2 13% | 24 20% | 28.4 5% |
| Idle Maximum * (dB) | 39 | 44 -13% | 28.4 27% | 27.76 29% | 28.4 27% |
| Load Average * (dB) | 45 | 53 -18% | 44.7 1% | 38.81 14% | 49.4 -10% |
| Witcher 3 ultra * (dB) | 45 | 53 -18% | 44.7 1% | 54.2 -20% | 49.4 -10% |
| Load Maximum * (dB) | 47 | 55 -17% | 51.9 -10% | 54.18 -15% | 54.7 -16% |
* ... smaller is better
Temperature
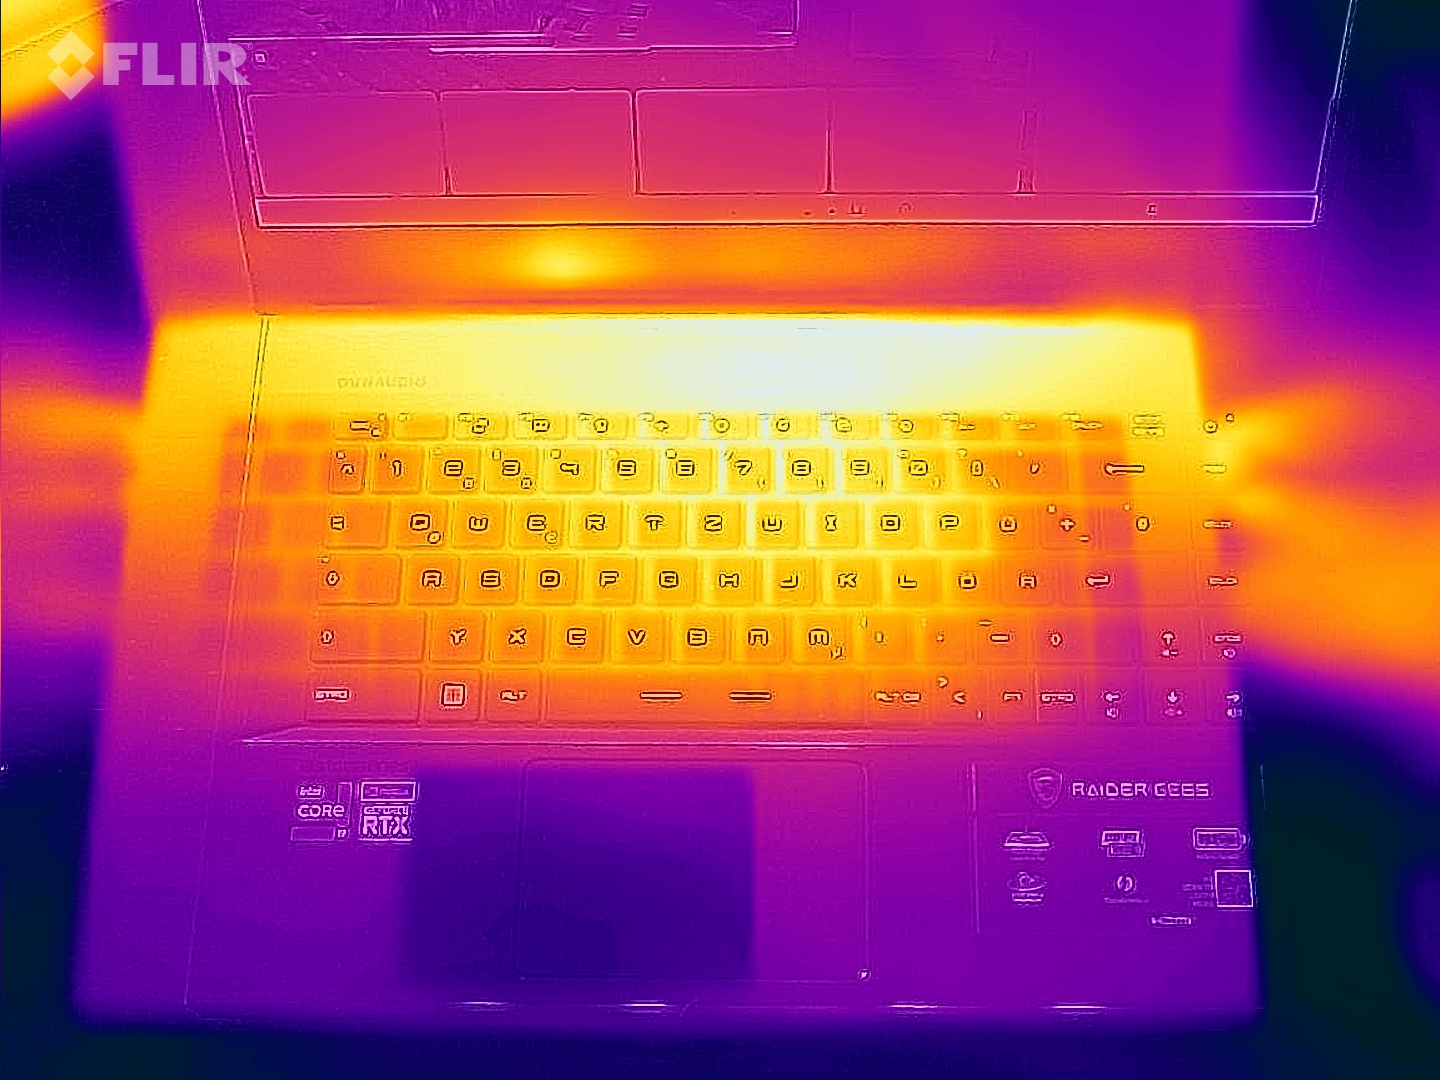
During everyday work, such as web browsing, working with Office, or media playback, the trackpad and palm rest always remain pleasantly cool. The keyboard, on the other hand, heats up slightly, but this does not impact the typing experience. Even operation on the lap is theoretically possible in summer temperatures in this scenario, although this is rather unlikely due to the laptop's size and weight. Among other things, the fan control ensures that the underside of the device heats up only slightly during undemanding tasks.
Under load (stress test, Witcher 3 test), the notebook heats up considerably. The underside heats up to an average of 52 degrees Celsius and shows maximum rates of 62 to 65 degrees Celsius. We recorded an average temperature of 45 degrees Celsius on the upper side, with most of the waste heat concentrated in the rear area as well as in the keyboard. The keys also heat up, but can still be used without discomfort. An average of just 34 degrees Celsius was measured on the palm rests and the touchpad, even under high load.
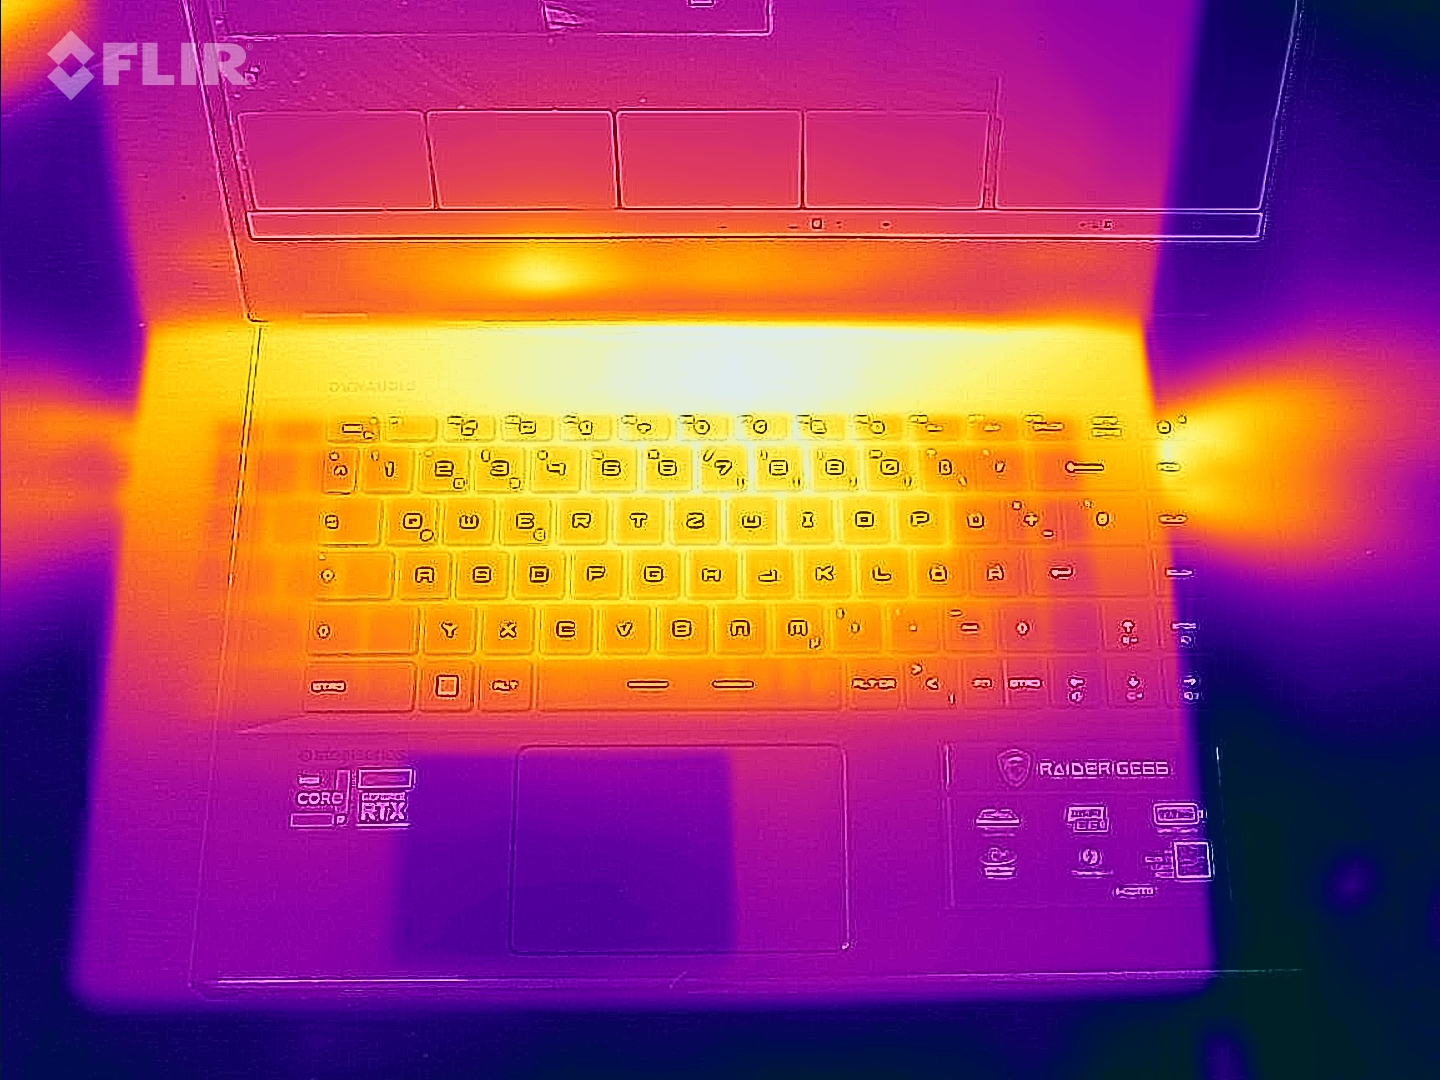
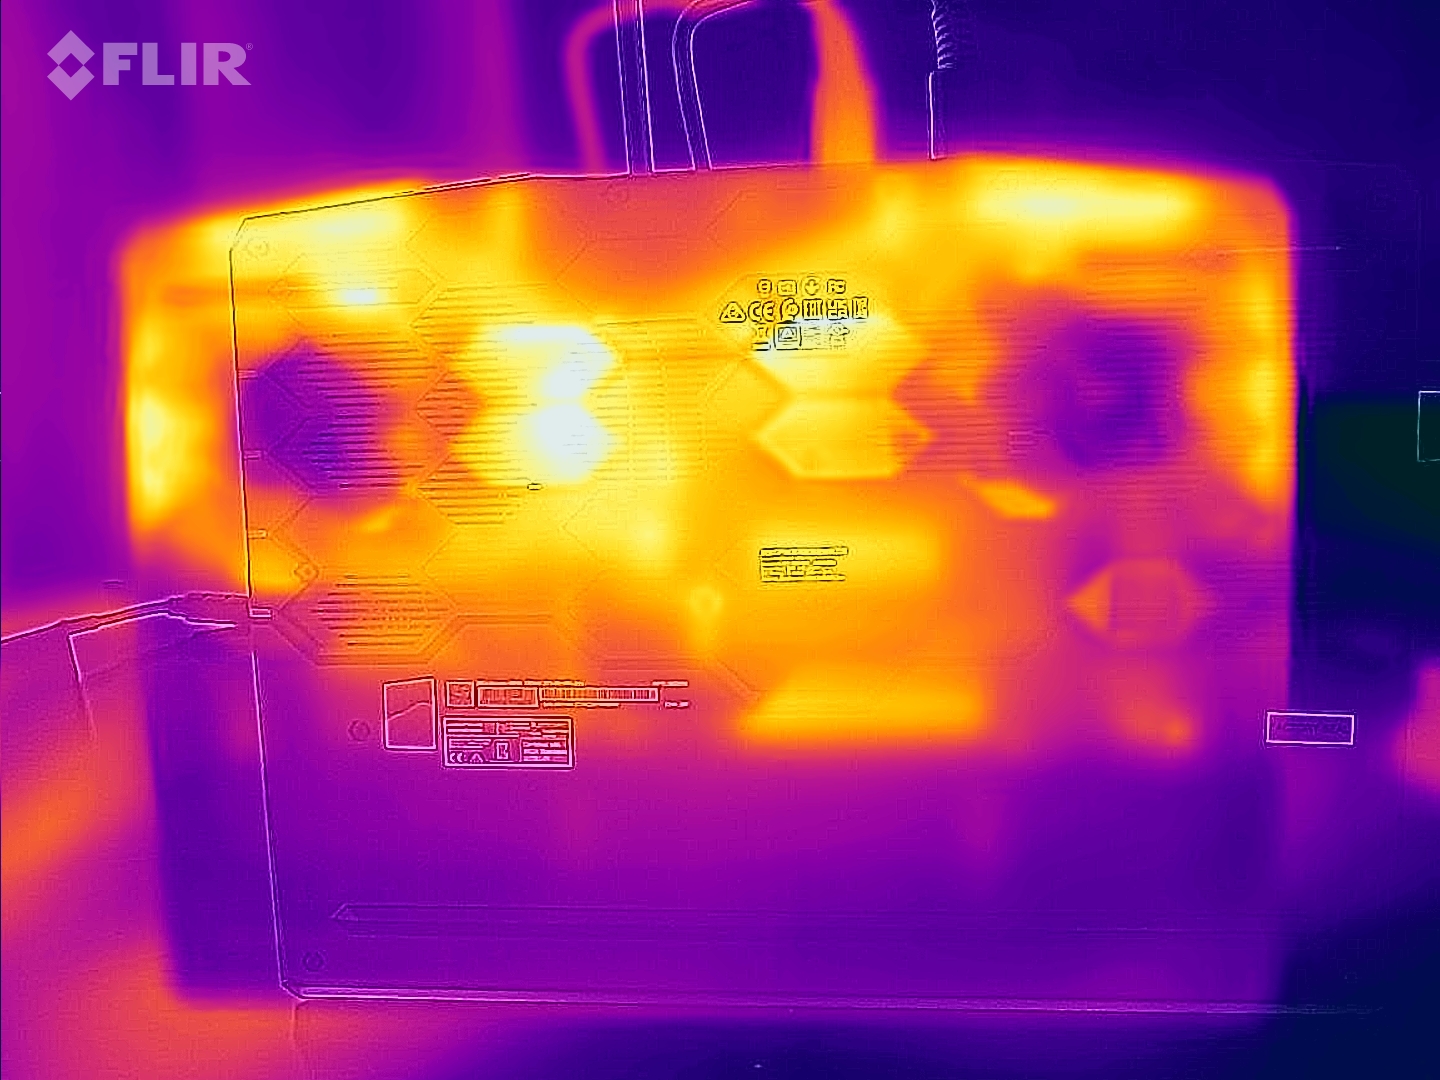
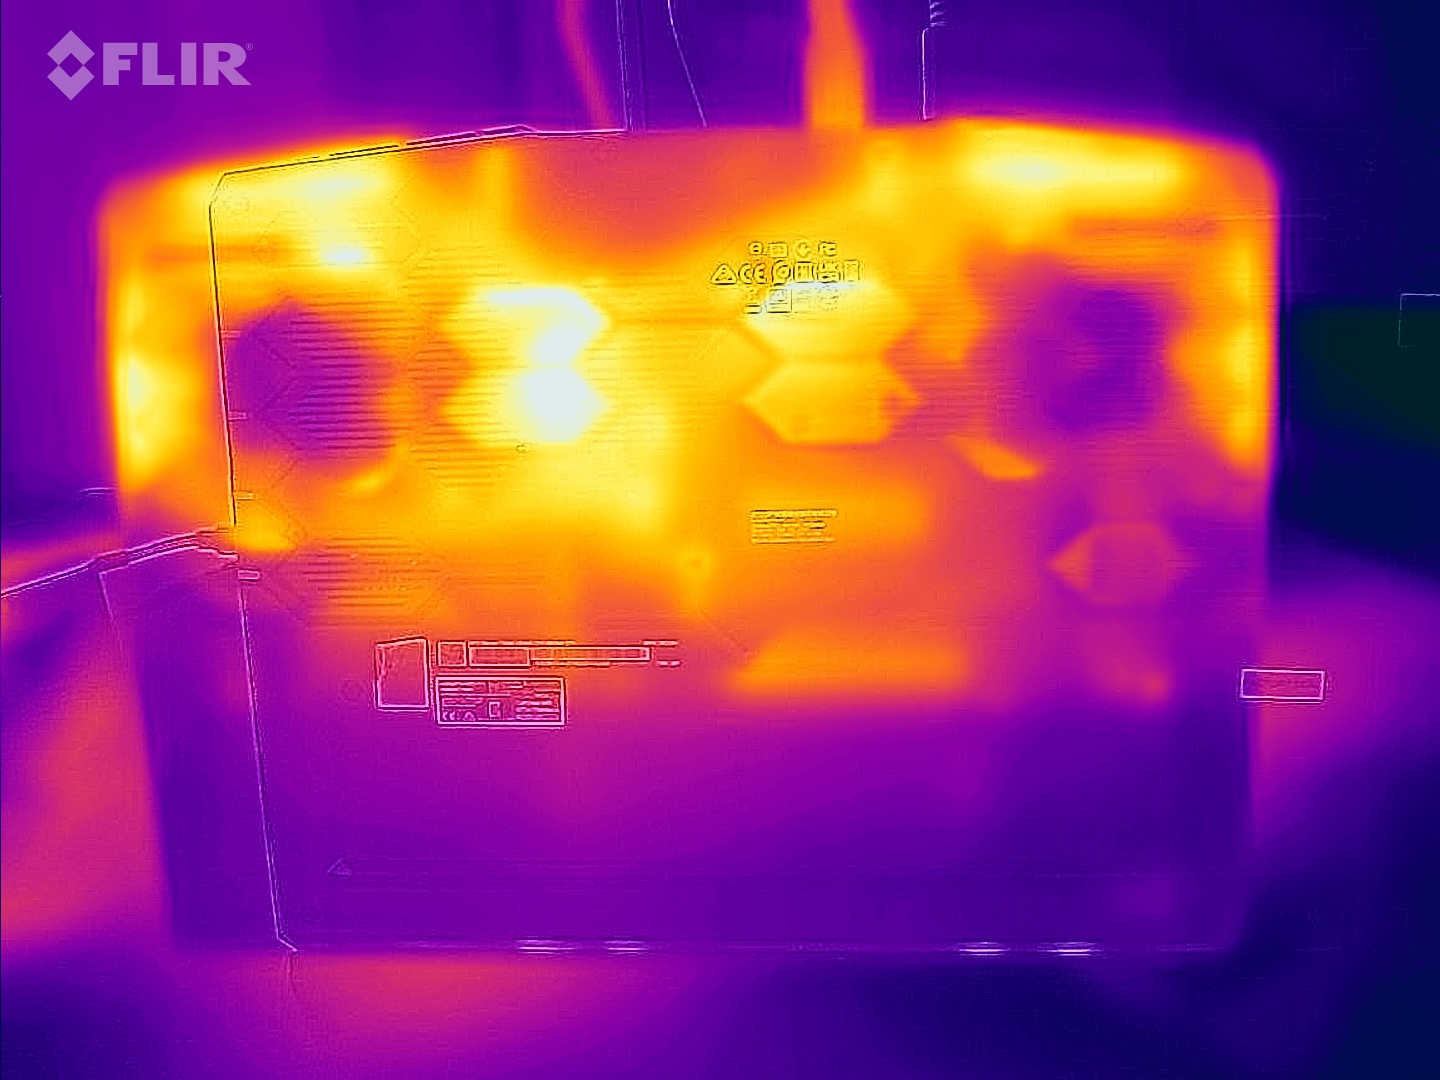
(-) The maximum temperature on the upper side is 54 °C / 129 F, compared to the average of 40.4 °C / 105 F, ranging from 21.2 to 68.8 °C for the class Gaming.
(-) The bottom heats up to a maximum of 65 °C / 149 F, compared to the average of 43.2 °C / 110 F
(+) In idle usage, the average temperature for the upper side is 28.7 °C / 84 F, compared to the device average of 33.9 °C / 93 F.
(-) Playing The Witcher 3, the average temperature for the upper side is 45.4 °C / 114 F, compared to the device average of 33.9 °C / 93 F.
(±) The palmrests and touchpad can get very hot to the touch with a maximum of 36 °C / 96.8 F.
(-) The average temperature of the palmrest area of similar devices was 28.8 °C / 83.8 F (-7.2 °C / -13 F).
| MSI Raider GE66 12UHS Intel Core i9-12900HK, NVIDIA GeForce RTX 3080 Ti Laptop GPU | MSI GE66 Raider 10SFS Intel Core i9-10980HK, NVIDIA GeForce RTX 2070 Super Mobile | Razer Blade 15 2022 Intel Core i7-12800H, NVIDIA GeForce RTX 3080 Ti Laptop GPU | Schenker XMG Neo 15 E22 (Early 2022, RTX 3080 Ti) Intel Core i7-12700H, NVIDIA GeForce RTX 3080 Ti Laptop GPU | Lenovo Legion 5 Pro 16 G7 i7 RTX 3070Ti Intel Core i7-12700H, NVIDIA GeForce RTX 3070 Ti Laptop GPU | |
|---|---|---|---|---|---|
| Heat | 8% | 0% | -3% | 9% | |
| Maximum Upper Side * (°C) | 54 | 49 9% | 50 7% | 52 4% | 45.3 16% |
| Maximum Bottom * (°C) | 65 | 52 20% | 47 28% | 68 -5% | 61.2 6% |
| Idle Upper Side * (°C) | 30 | 30 -0% | 37.4 -25% | 32 -7% | 28.6 5% |
| Idle Bottom * (°C) | 35 | 34 3% | 38.4 -10% | 36 -3% | 31.4 10% |
* ... smaller is better
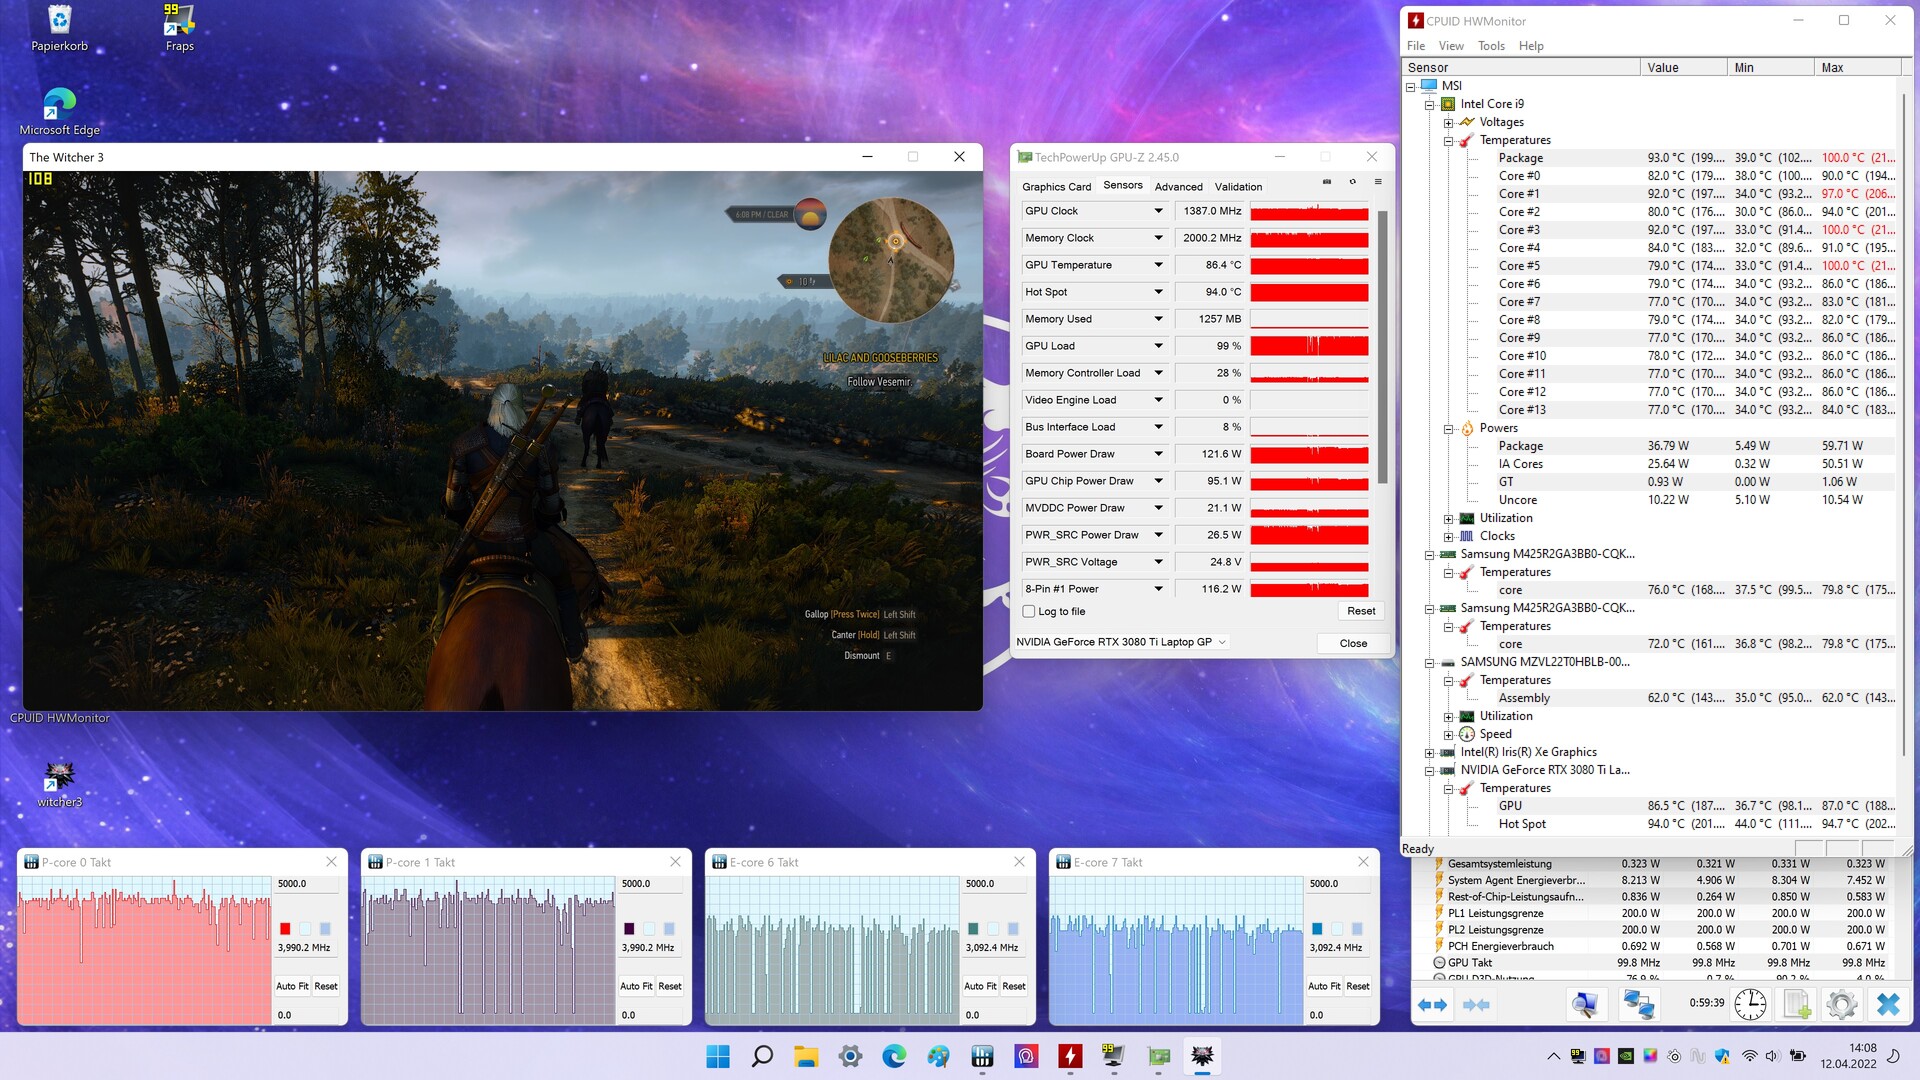
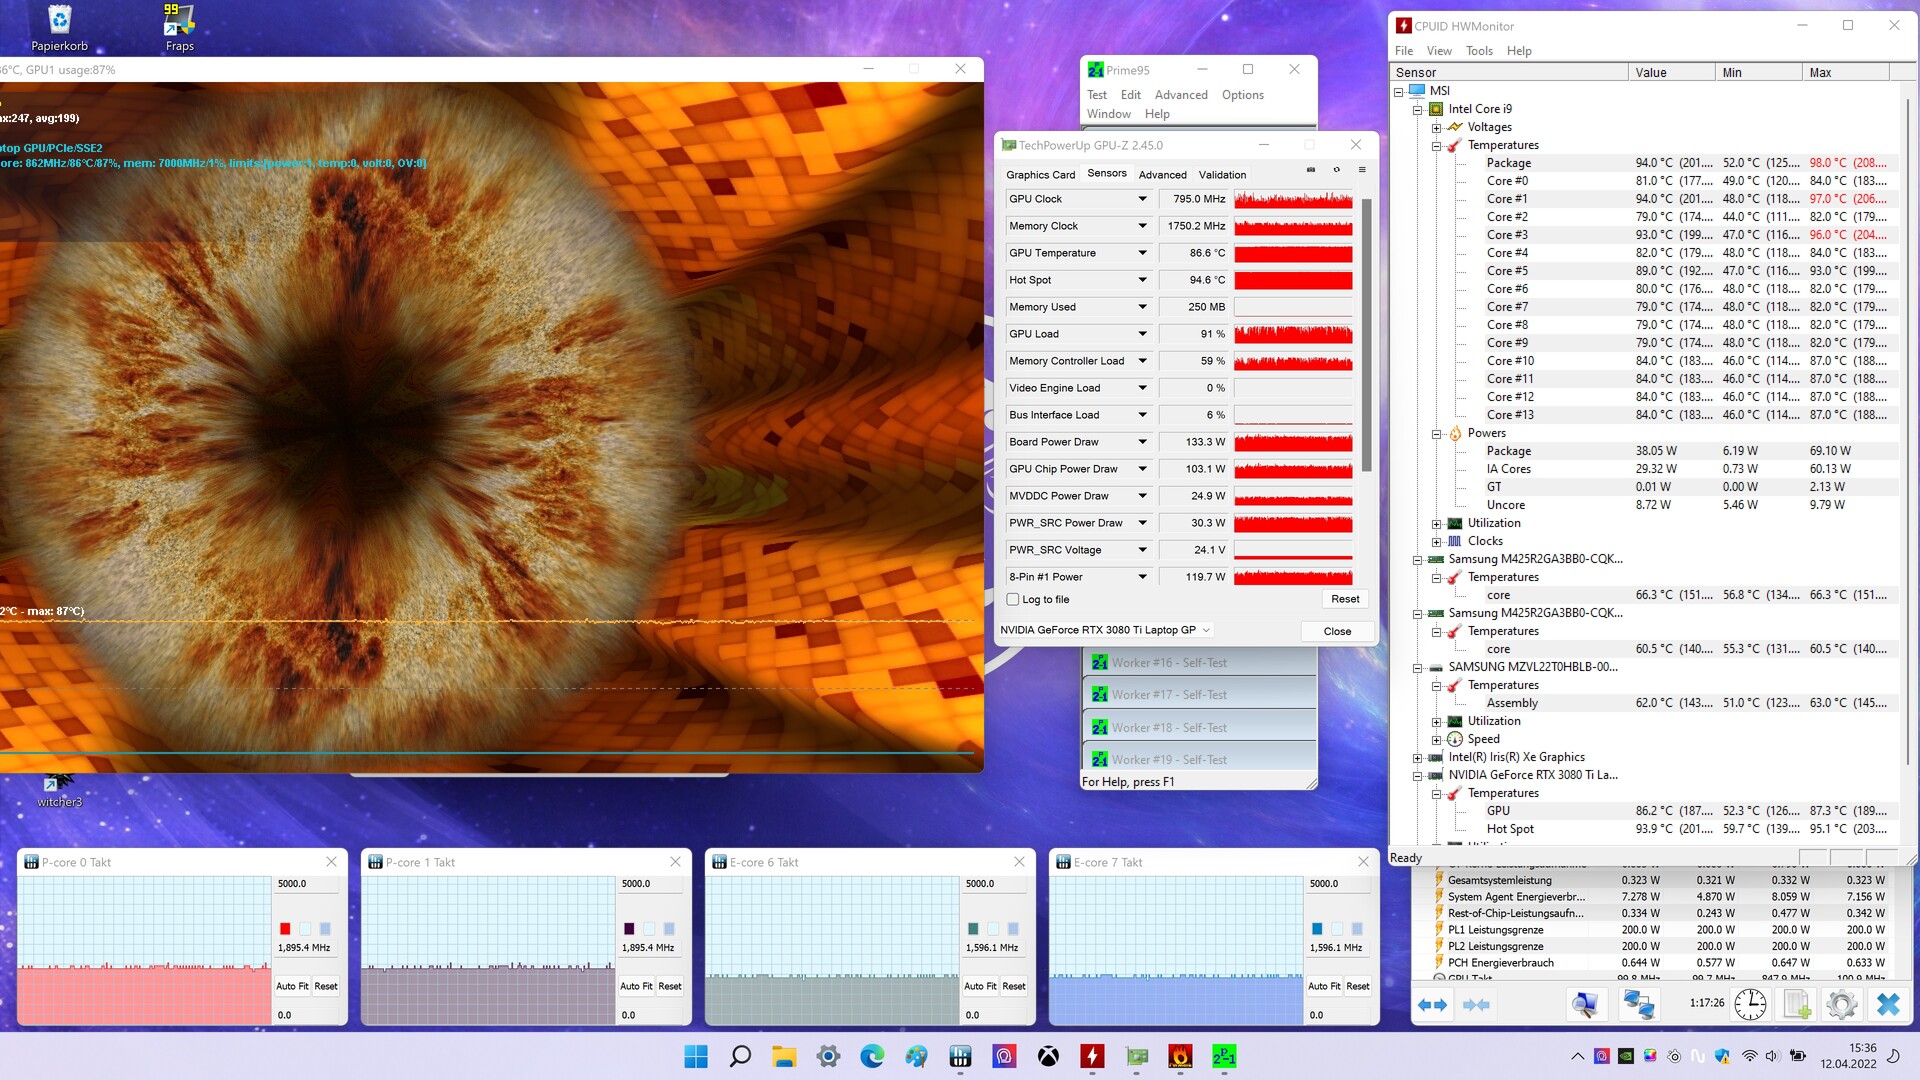
Stress Test
In the Witcher 3 test, the system is able to discharge a maximum of around 160 watts simultaneously. This is divided into 122 watts of GPU power and 37 watts for the CPU. Temperatures in this scenario average 93 degrees Celsius on the CPU side, with maximum values running up to 100 degrees Celsius. For the graphics card, we see average temperatures of 86 degrees Celsius. The CPU clock initially runs at 4,800 MHz in the P-cores before settling at 3,990 MHz. The E-cores briefly run at 3,800 MHz before decreasing to 3,100 MHz. The graphics card's average clock rate was 1,387 MHz.
In the stress test with Furmark and Prime 95 running at the same time, the device treats itself to 133 watts of GPU power. The CPU consumes 38 watts, so the test system is able to dissipate just over 170 watts with the cooling system. Unlike in the Witcher 3 test, the processor's temperature increases to a maximum of 98 degrees Celsius before settling at 94 degrees Celsius. The temperature values of the graphics card settled again at an average of 86 degrees Celsius. The CPU clock initially ran at the same speeds of the first scenario before leveling out at 1,900 MHz for the P-cores and 1,600 MHz for the E-cores. The clock rate of the RTX 3080 Ti falls to 795 MHz. The two fans ran at a maximum of 5,100 RPM in the stress test. The GPU fan behaved dynamically despite the extreme conditions and moved between 4,000 RPM and 5,100 RPM over the test period.
Speakers
The duo-wave speakers installed by MSI have more bass, more balanced mids as well as high tones in relation to the predecessor, making them suitable for media consumption of all kinds and resulting in a good amount of volume. However, we found the bass a bit lacking when playing games and listening to music.
MSI Raider GE66 12UHS audio analysis
(+) | speakers can play relatively loud (84 dB)
Bass 100 - 315 Hz
(-) | nearly no bass - on average 17% lower than median
(±) | linearity of bass is average (11% delta to prev. frequency)
Mids 400 - 2000 Hz
(±) | higher mids - on average 5.6% higher than median
(+) | mids are linear (3.9% delta to prev. frequency)
Highs 2 - 16 kHz
(+) | balanced highs - only 4.6% away from median
(+) | highs are linear (6.3% delta to prev. frequency)
Overall 100 - 16.000 Hz
(±) | linearity of overall sound is average (17.1% difference to median)
Compared to same class
» 46% of all tested devices in this class were better, 12% similar, 43% worse
» The best had a delta of 6%, average was 18%, worst was 132%
Compared to all devices tested
» 31% of all tested devices were better, 8% similar, 61% worse
» The best had a delta of 4%, average was 24%, worst was 134%
MSI GE66 Raider 10SFS audio analysis
(+) | speakers can play relatively loud (84 dB)
Bass 100 - 315 Hz
(-) | nearly no bass - on average 32.4% lower than median
(+) | bass is linear (5.9% delta to prev. frequency)
Mids 400 - 2000 Hz
(±) | higher mids - on average 7.4% higher than median
(±) | linearity of mids is average (8.9% delta to prev. frequency)
Highs 2 - 16 kHz
(±) | higher highs - on average 5.3% higher than median
(±) | linearity of highs is average (8.9% delta to prev. frequency)
Overall 100 - 16.000 Hz
(±) | linearity of overall sound is average (26.7% difference to median)
Compared to same class
» 93% of all tested devices in this class were better, 1% similar, 6% worse
» The best had a delta of 6%, average was 18%, worst was 132%
Compared to all devices tested
» 82% of all tested devices were better, 4% similar, 14% worse
» The best had a delta of 4%, average was 24%, worst was 134%
Energy Mangement: Good runtimes
Power Consumption
The energy consumption of the MSI GE66 12UHS is acceptable in idle mode, under load and in the Witcher 3 stress test. Although our device consumes more power than its predecessor, it also has considerably more powerful hardware installed. The maximum capacity of the 280 watt power supply is not exhausted with a recorded peak consumption of 242 watts. In the Witcher 3 test, the consumption of 202 watts is mostly below the values of the competition. The Lenovo Legion with the Intel Core i7 12700H and the RTX 3070 Ti consumes 227 watts, 12% more than our review device with the Intel Core i9 12900HK and the RTX 3080 Ti.
| Off / Standby | |
| Idle | |
| Load |
|
Key:
min: | |
| MSI Raider GE66 12UHS Intel Core i9-12900HK, | MSI GE66 Raider 10SFS Intel Core i9-10980HK, | Razer Blade 15 2022 Intel Core i7-12800H, | Schenker XMG Neo 15 E22 (Early 2022, RTX 3080 Ti) Intel Core i7-12700H, | Lenovo Legion 5 Pro 16 G7 i7 RTX 3070Ti Intel Core i7-12700H, | Average of class Gaming | |
|---|---|---|---|---|---|---|
| Power Consumption | 14% | -38% | -0% | 8% | 3% | |
| Idle Minimum * (Watt) | 16 | 6 62% | 33.2 -108% | 14 12% | 8.6 46% | 13.4 ? 16% |
| Idle Average * (Watt) | 19 | 14 26% | 36.4 -92% | 18 5% | 17.6 7% | 19.1 ? -1% |
| Idle Maximum * (Watt) | 26 | 25 4% | 37.6 -45% | 19 27% | 18.5 29% | 24.7 ? 5% |
| Load Average * (Watt) | 110 | 108 2% | 116.7 -6% | 115 -5% | 110 -0% | 108.4 ? 1% |
| Witcher 3 ultra * (Watt) | 202 | 195 3% | 172 15% | 228 -13% | 227 -12% | |
| Load Maximum * (Watt) | 242 | 280 -16% | 228.6 6% | 307 -27% | 294.6 -22% | 254 ? -5% |
* ... smaller is better
Power Consumption Witcher 3 / Stress Test
Use with an external monitor
Battery Life
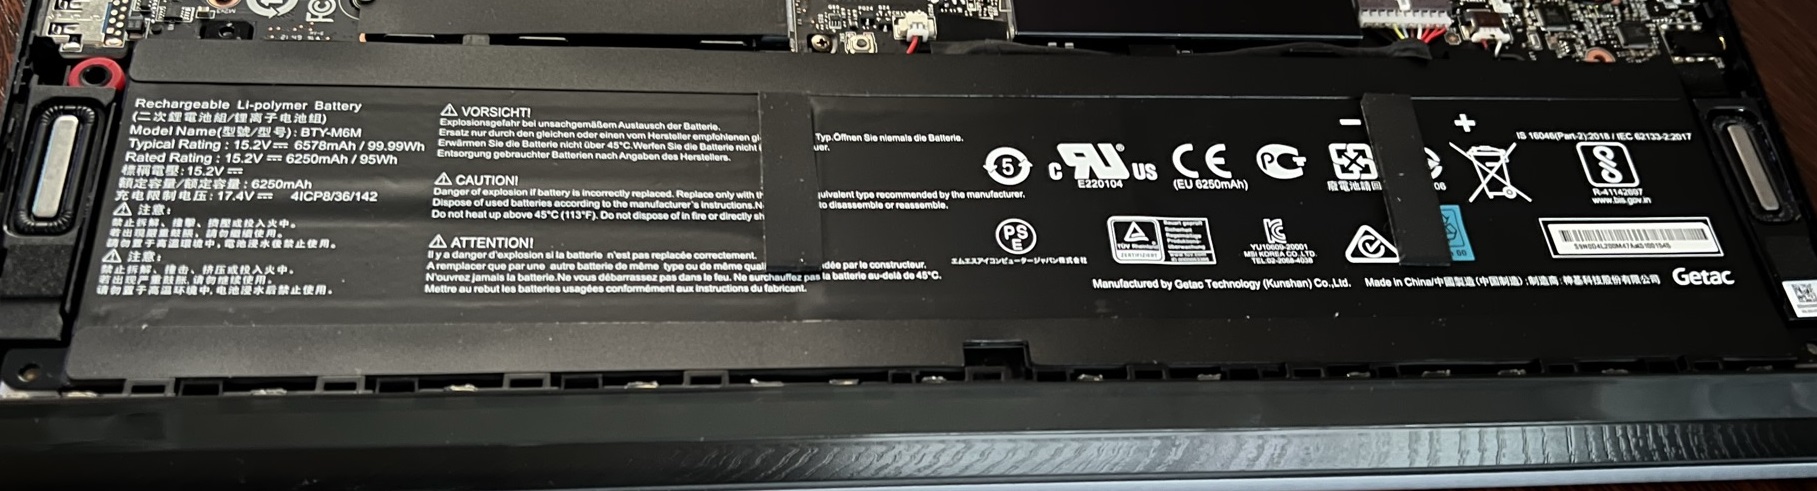
Compared to the MSI GE66 10SFS, our review device offers a slightly shorter runtime in the Wi-Fi test with much better performance and the same battery capacity. The Razer Blade 15 2022 and the Lenovo Legion 5 Pro with their nominally weaker hardware are overtaken by our MSI GE66 12UHS. Only the Schenker XMG Neo 15 Early 2022 with a smaller battery and weaker processor manages to outperform our review sample by around 20%.
| MSI Raider GE66 12UHS i9-12900HK, GeForce RTX 3080 Ti Laptop GPU, 99 Wh | MSI GE66 Raider 10SFS i9-10980HK, GeForce RTX 2070 Super Mobile, 99.99 Wh | Razer Blade 15 2022 i7-12800H, GeForce RTX 3080 Ti Laptop GPU, 80 Wh | Schenker XMG Neo 15 E22 (Early 2022, RTX 3080 Ti) i7-12700H, GeForce RTX 3080 Ti Laptop GPU, 93 Wh | Lenovo Legion 5 Pro 16 G7 i7 RTX 3070Ti i7-12700H, GeForce RTX 3070 Ti Laptop GPU, 80 Wh | Average of class Gaming | |
|---|---|---|---|---|---|---|
| Battery runtime | 7% | -14% | 46% | -27% | 8% | |
| H.264 (h) | 7.1 | 6.9 -3% | 6.3 -11% | 8.26 ? 16% | ||
| WiFi v1.3 (h) | 5.7 | 6.1 7% | 4.9 -14% | 6.7 18% | 5.4 -5% | 6.94 ? 22% |
| Load (h) | 1.7 | 1.8 6% | 3.8 124% | 0.6 -65% | 1.47 ? -14% | |
| Reader / Idle (h) | 7.6 | 8.71 ? |
Pros
Cons
Verdict: High-end notebook with strong performance
Compared to its predecessor, namely the MSI GE66 10SFS, we found that the MSI GE66 12UHS is visually identical apart from the modified light bar. The keyboard and trackpad are still very good and score well with precise inputs as well as high build quality. Thanks to a new liquid metal cooling solution, the Intel Core i9 12900HK brings a performance increase of around 50 percent over the predecessor's Intel Core i9 10980HK. The installed graphics card in our device delivers up to 30 percent higher frame rates than the RTX 2070 Super in the MSI GE66 10SFS. Opening the notebook, however, is still no easy matter. Another minor drawback is that if you play for several hours, the keys in particular heat up noticeably. Our test device delivered good rates with its 120 Hz 4K IPS panel. The possibility of upgrading to DDR5 RAM and the option of connecting two NVMe SSDs via the PCI Gen 4 interface ensures future viability of the device.
The gaming performance of the MSI GE66 12UHS is outstanding. All titles in our review ran smoothly in 4K resolution at high to maximum details.
Another positive aspect is the improved cooling system. The automatic, AI-supported fan control provides a good compromise between performance and noise. Unfortunately, the system is unable to dissipate the generated heat fast enough during longer gaming sessions, which leads to performance drops of about 10%. Then again, this problem can be solved by manually setting the fans to full speed (Cooler Boost). The MSI Center can be used to control many of the notebook's core functions and provides the user with useful additional features. However, the MSI Center continues to be error-prone, crashing randomly in our tests and resetting previously set performance profiles. We also observed performance losses of up to 80% in the installed Samsung PM9A1 SSD under continuous load.
Price and Availability
MSI Raider GE66 12UHS
- 05/30/2022 v7 (old)
Patrick Schüdzig
Price comparison
