 Deutsch
 English
 Español
 Français
 Italiano
 Nederlands
 Polski
 Português
 Русский
 Türkçe
 Svenska
 Chinese
 Magyar
Preliminary XMG Neo 15 E22 with RTX 3080 Ti (Tongfang GM5AG8W) Review: Is water cooling an interim but viable solution for gaming laptops?
Note: Both the Neo 15 and the Oasis are explicitly pre-production devices. A lot can still change in the run up to release and production flaws can still exist. We recommend readers to note this while considering the benchmarks below. The finished systems could likely perform differently.
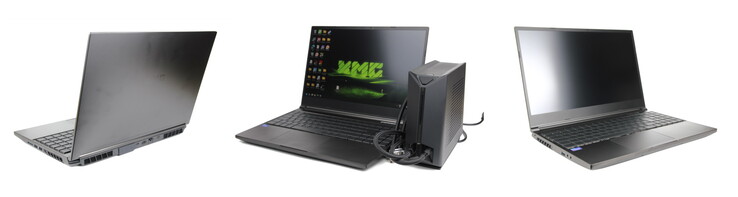
Schenker dares to step into the unknown with the new XMG Neo 15 E22. The manufacturer now equips the laptop with a new port for an optional water-cooling system. You can also order the XMG Oasis for 199 Euros when you buy the Neo. This is supposed to reduce the temperatures and noise levels dramatically during gaming or other stress. But will customers accept the purchase and operation of such an additional device? How does the XMG Neo with a hotspur RTX 3080 Ti perform without water cooling? We look into these aspects in our test.
Schenker upgrades the XMG Neo in several areas. The brand new RTX 3080 Ti Laptop GPU is used instead of an RTX 3080, an Alder Lake-H CPU is used instead of Tiger Lake, and then there is this new port for water cooling. Our configuration costs about 3,442 Euros without the XMG Oasis (the external water cooling), opting for which adds another 199 Euros.
We compare the new Neo 15 E22 with its equally strong predecessor from last year (87% rating). We also created a comparison element named "XMG Neo plus XMG Oasis" and add it to the benchmark comparisons. Additionally, we also consider other high-end gaming laptops for comparison. These include the Asus ROG Strix Scar 15 G533QS, the Razer Blade 15 Advanced Model, the Alienware m15 R6, and also the 17-inch MSI Raider GE76 with Alder Lake and RTX 3080 Ti due to the lack of a CPU/GPU comparison from the new generation.
Possible competitors in comparison
Rating | Date | Model | Weight | Height | Size | Resolution | Best Price |
|---|---|---|---|---|---|---|---|
03/2022 | SCHENKER XMG Neo 15 E22 (Early 2022, RTX 3080 Ti) i7-12700H, GeForce RTX 3080 Ti Laptop GPU | 2.2 kg | 26.6 mm | 15.60" | 2560x1440 | ||
| 87 % | 06/2021 | SCHENKER XMG Neo 15 Tiger Lake i7-11800H, GeForce RTX 3080 Laptop GPU | 2.2 kg | 26 mm | 15.60" | 2560x1440 | |
| 88.9 % | 07/2021 | Razer Blade 15 Advanced (Mid 2021) i7-11800H, GeForce RTX 3080 Laptop GPU | 2 kg | 16.99 mm | 15.60" | 1920x1080 | |
| 86.3 % | 07/2021 | Asus ROG Strix Scar 15 G533QS R9 5900HX, GeForce RTX 3080 Laptop GPU | 2.3 kg | 27.2 mm | 15.60" | 2560x1440 | |
| 86.1 % | 11/2021 | Alienware m15 R6, i7-11800H RTX 3080 i7-11800H, GeForce RTX 3080 Laptop GPU | 2.5 kg | 22.85 mm | 15.60" | 1920x1080 | |
| 87.5 % | 01/2022 | MSI GE76 Raider i9-12900HK, GeForce RTX 3080 Ti Laptop GPU | 3 kg | 26 mm | 17.30" | 1920x1080 |
Case: A port for water cooling!
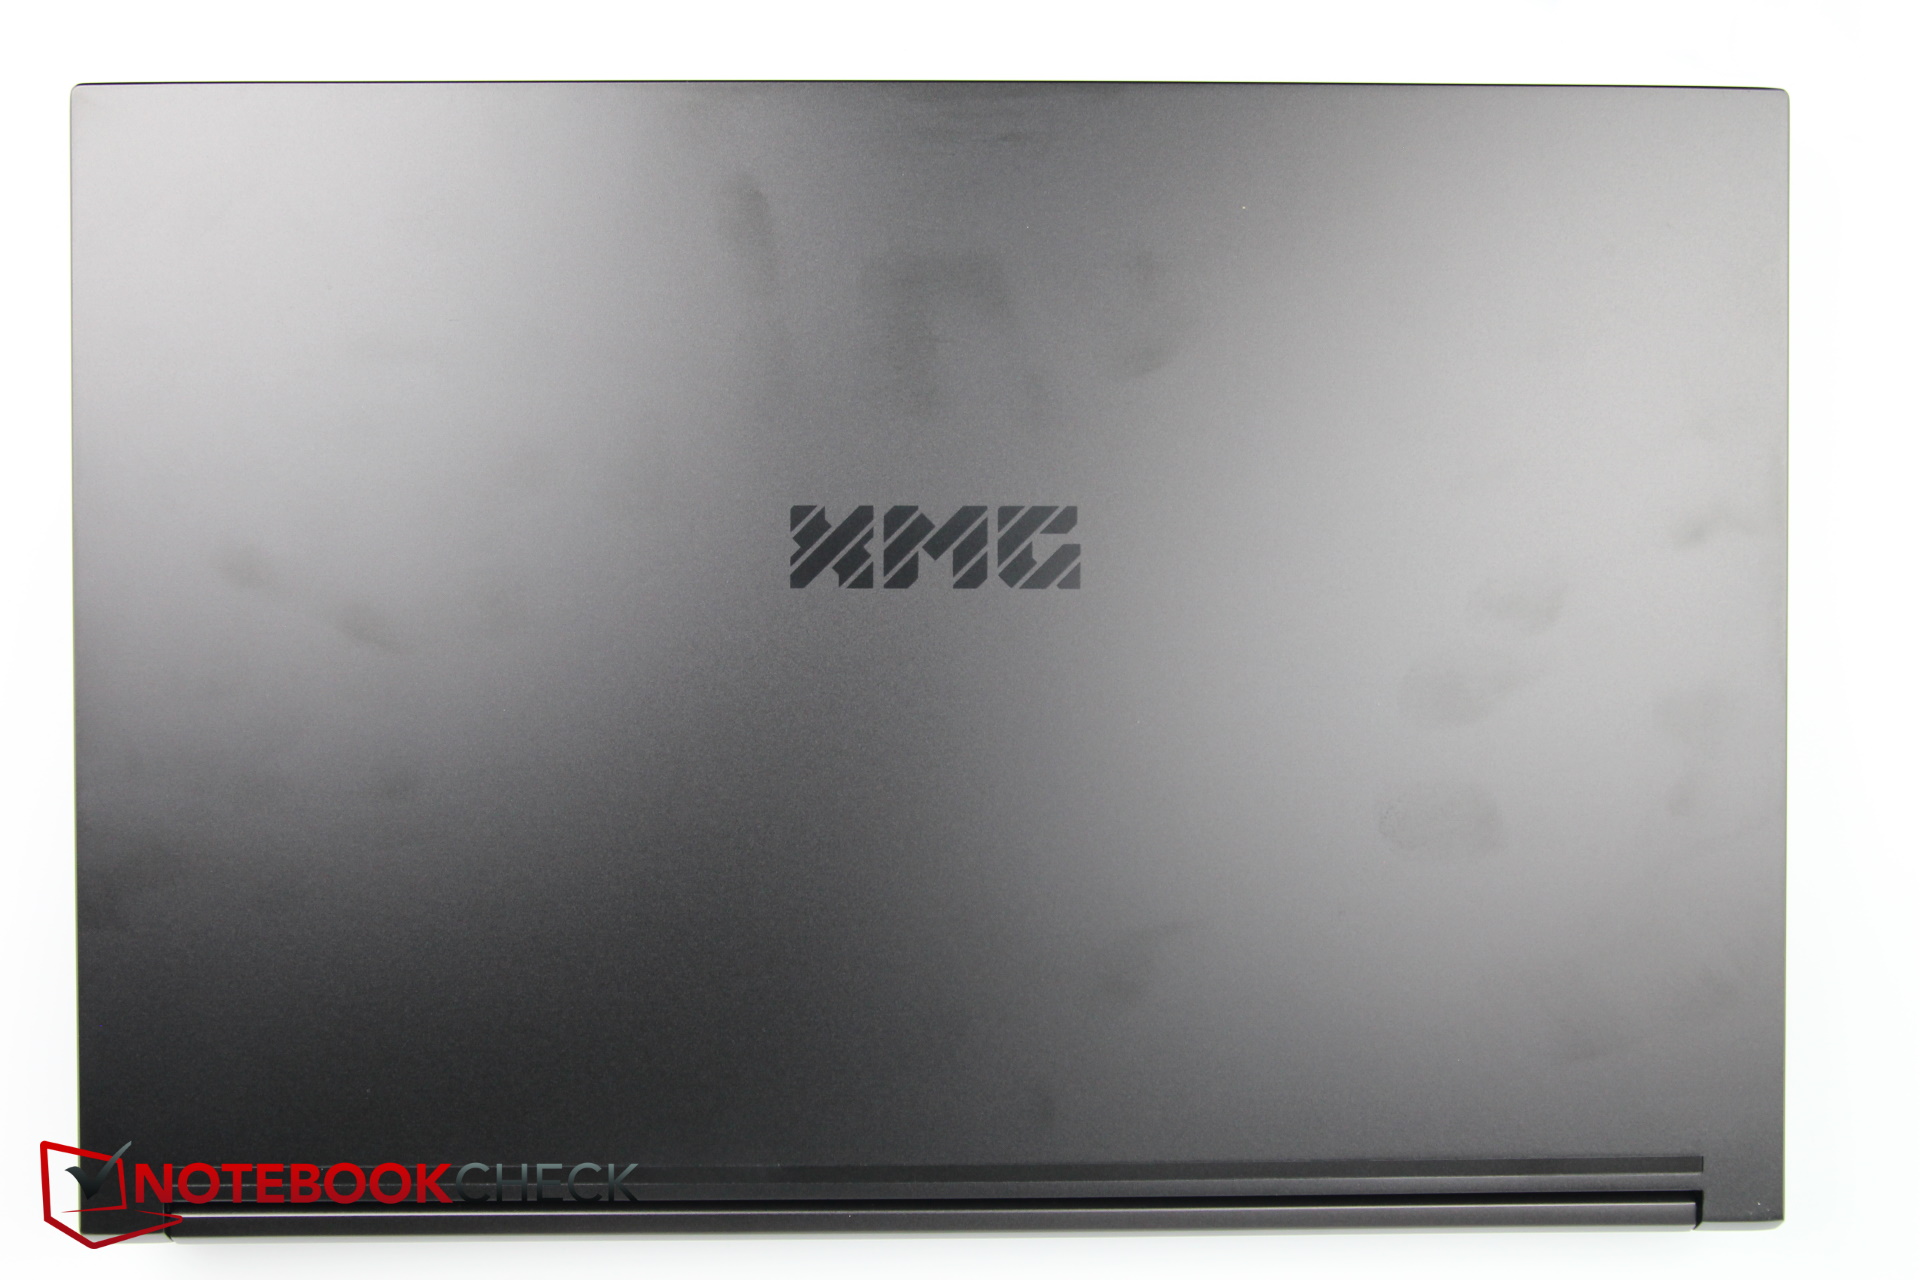
The casing is largely identical to that of the predecessor — only the water connection at the back is a new addition. Additionally, the power plug has been made more robust. The bottom is made of plastic while the rest of the chassis including the lid and even the display edges are made of matte black aluminum. The base in particular looks very sturdy, but the display lid is also relatively torsion-resistant though its surface strongly attracts fingerprints. The overall build quality is very good.
The design is rather plain, so that the laptop does not only look appropriate on the desk for gamers but also for creative and professional users. There is a strip with small holes in the case at the front edge, which means that the keyboard illumination shines through faintly to the front as an "LED strip".


Despite the additional water circuit, the laptop has not become thicker. It definitely does not belong to the slim crowd, but it is not particularly thick either in view of the extremely potent hardware. Nevertheless, the Razer Blade and the Alienware M15 are noticeably thinner.
The 2.2 kg heft is also moderate considering the hardware. The Razer Blade is 200 g lighter while the Alienware is 300 g heavier.
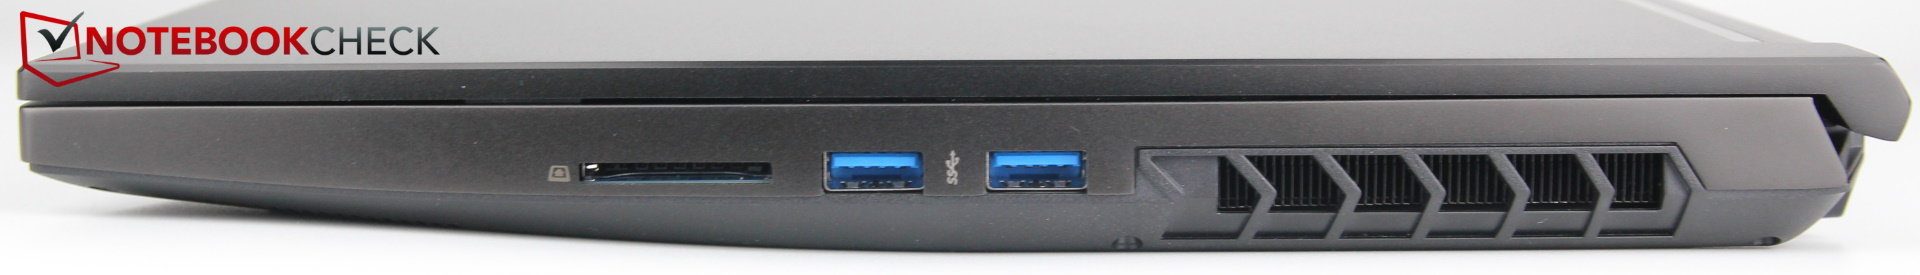
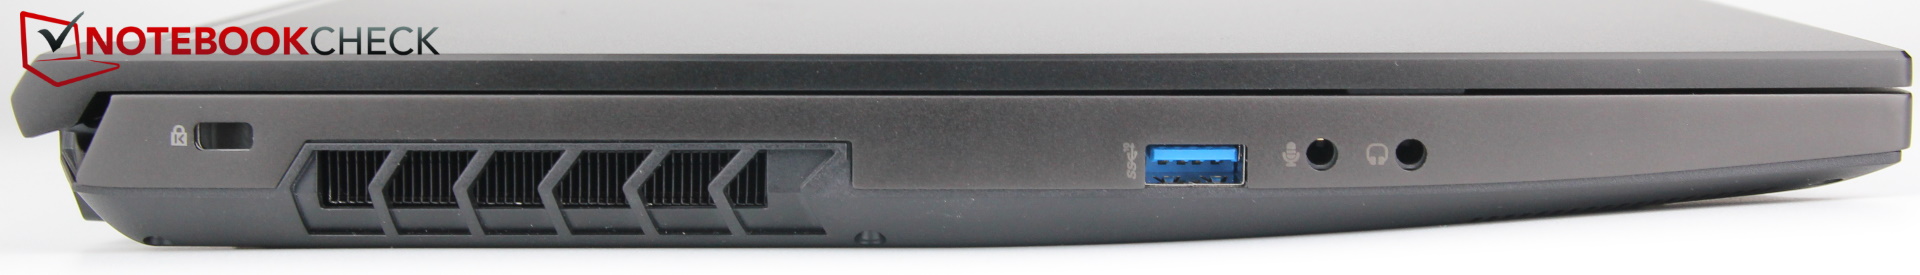
Equipment: Thunderbolt 4 and water connection!

While the water port does take up some space, Schenker does not forgo the other ports. From SD card readers to USB-C with Thunderbolt 4 and two audio jacks, everything is on board. The laptop cannot be charged via USB-C. Also, Alder Lake laptops with Thunderbolt 4 are not VR-ready per se because the DisplayPort signals are no longer sent directly to the dGPU but via the iGPU. They are only VR-ready when there is a second USB-C port with a connection to the dGPU or a dedicated DisplayPort.
The ports are quite close to each other, but that is only annoying in certain situations. The considerably cheaper MSI GP66 Leopard 11UH shows how port placement can be better.
A word about the power supply: The cable that goes from the power supply to the laptop is very short and therefore annoying. If you have a slightly higher table and have to pull the cable from the front of the table to the back of the laptop port, the power supply hangs in the air and tightens very annoyingly. A slightly longer cable would have been desirable.


SD Card Reader

The installed SD reader has been one of the slower models for at least two generations. The class average is about twice as fast — if one is installed at all, because many of the competing manufacturers do not even install an SD card reader anymore.
Our test card AV PRO microSD 128 GB V60 does not snap in but is only inserted and with half the card protruding outside the slot.
| SD Card Reader | |
| average JPG Copy Test (av. of 3 runs) | |
| Average of class Gaming (19 - 202, n=99, last 2 years) | |
| MSI GE76 Raider (AV PRO microSD 128 GB V60) | |
| SCHENKER XMG Neo 15 Tiger Lake (AV PRO microSD 128 GB V60) | |
| SCHENKER XMG Neo 15 E22 (Early 2022, RTX 3080 Ti) | |
| maximum AS SSD Seq Read Test (1GB) | |
| Average of class Gaming (25.8 - 269, n=93, last 2 years) | |
| SCHENKER XMG Neo 15 Tiger Lake (AV PRO microSD 128 GB V60) | |
| SCHENKER XMG Neo 15 E22 (Early 2022, RTX 3080 Ti) | |
Communication
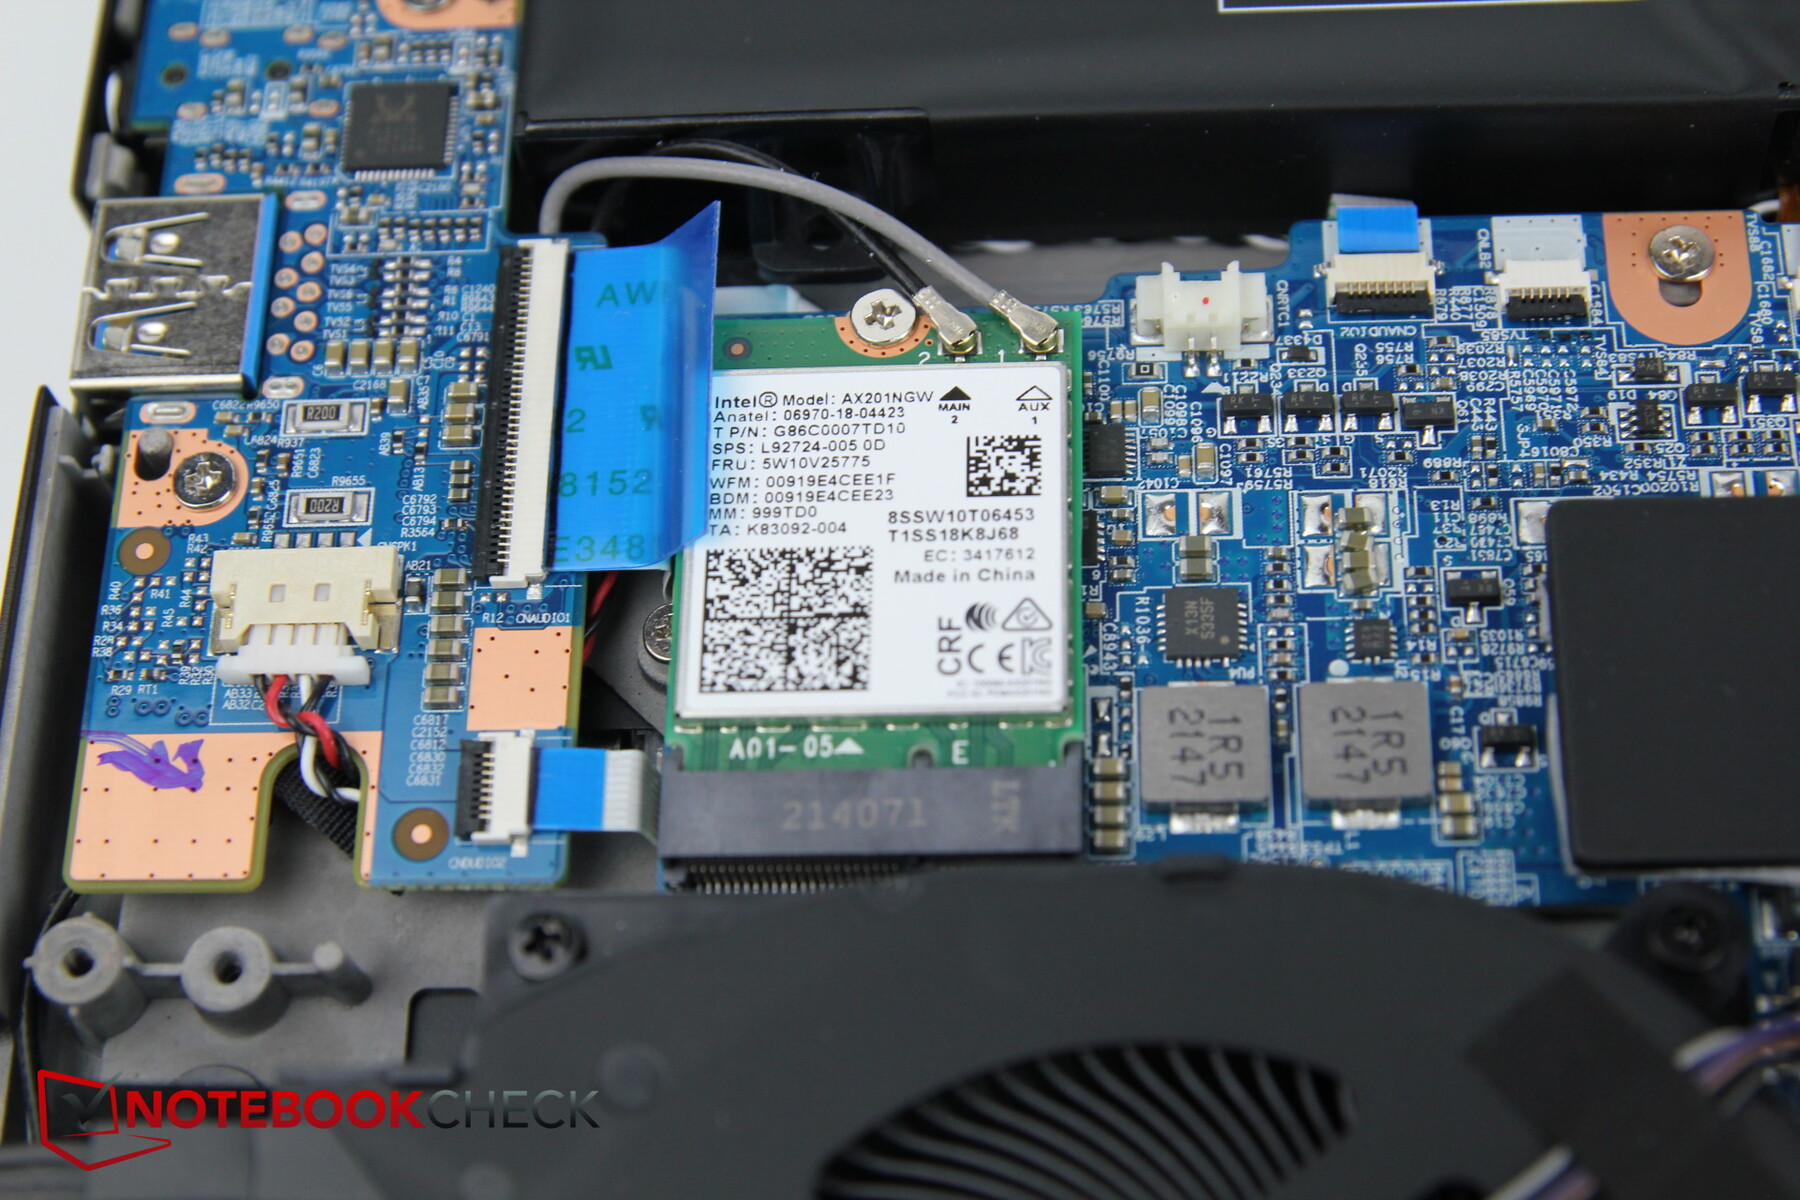
The Intel AX201 is the same WLAN module as in the predecessor and can be swapped out if needed.
However, we measured transfer rates of just under 1 GBit/s, whereas the predecessor achieved over 1.5 GBit/s. Whether this can be optimized with driver updates remains to be seen.
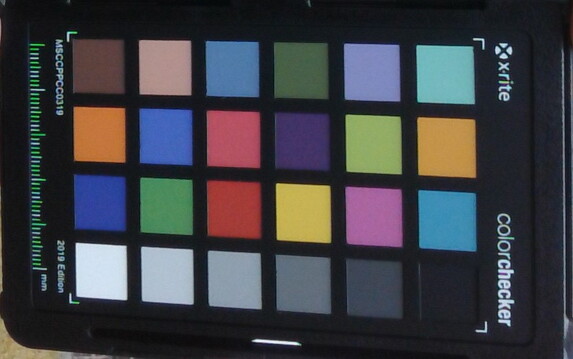
Webcam
Schenker installs a Full HD camera. The color deviations are okay, but the picture is still very noisy even in medium light conditions and looks washed out.
 GeForce RTX 3080 Ti Laptop GPU, i7-12700H, Samsung SSD 980 Pro 250GB MZ-V8P250BW")
 GeForce RTX 3080 Ti Laptop GPU, i7-12700H, Samsung SSD 980 Pro 250GB MZ-V8P250BW")
Security
A Kensington lock port is available as is a TPM 2.0 chip. However, a fingerprint sensor is missing.
Accessories
Since this is a pre-production model, no statements can be made about the accessories yet. As is typical for Schenker, the driver CD and USB stick should be included. The XMG Oasis, which is often mentioned in the review, can be purchased for an additional 199 Euros (~$199).
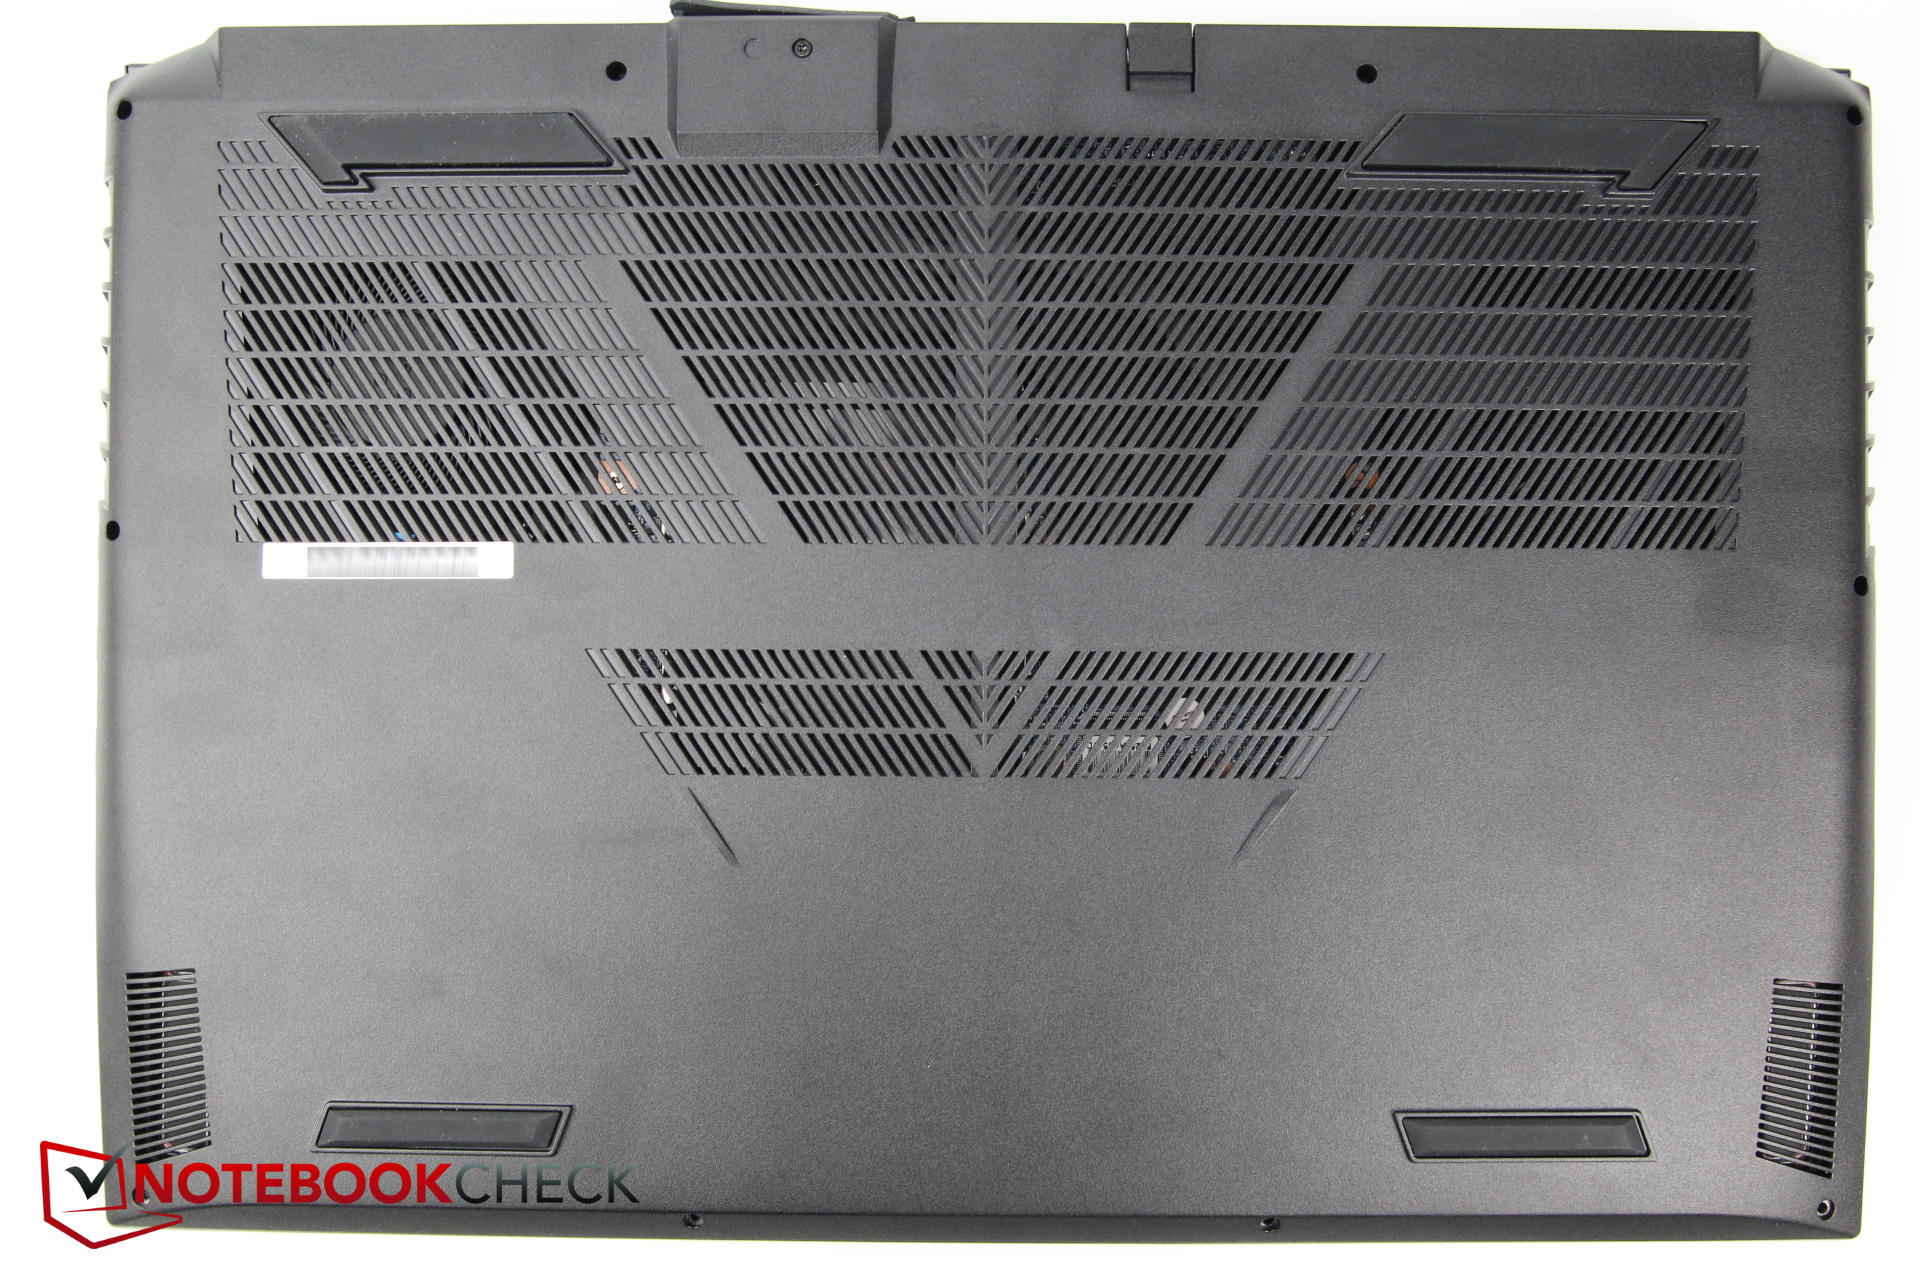
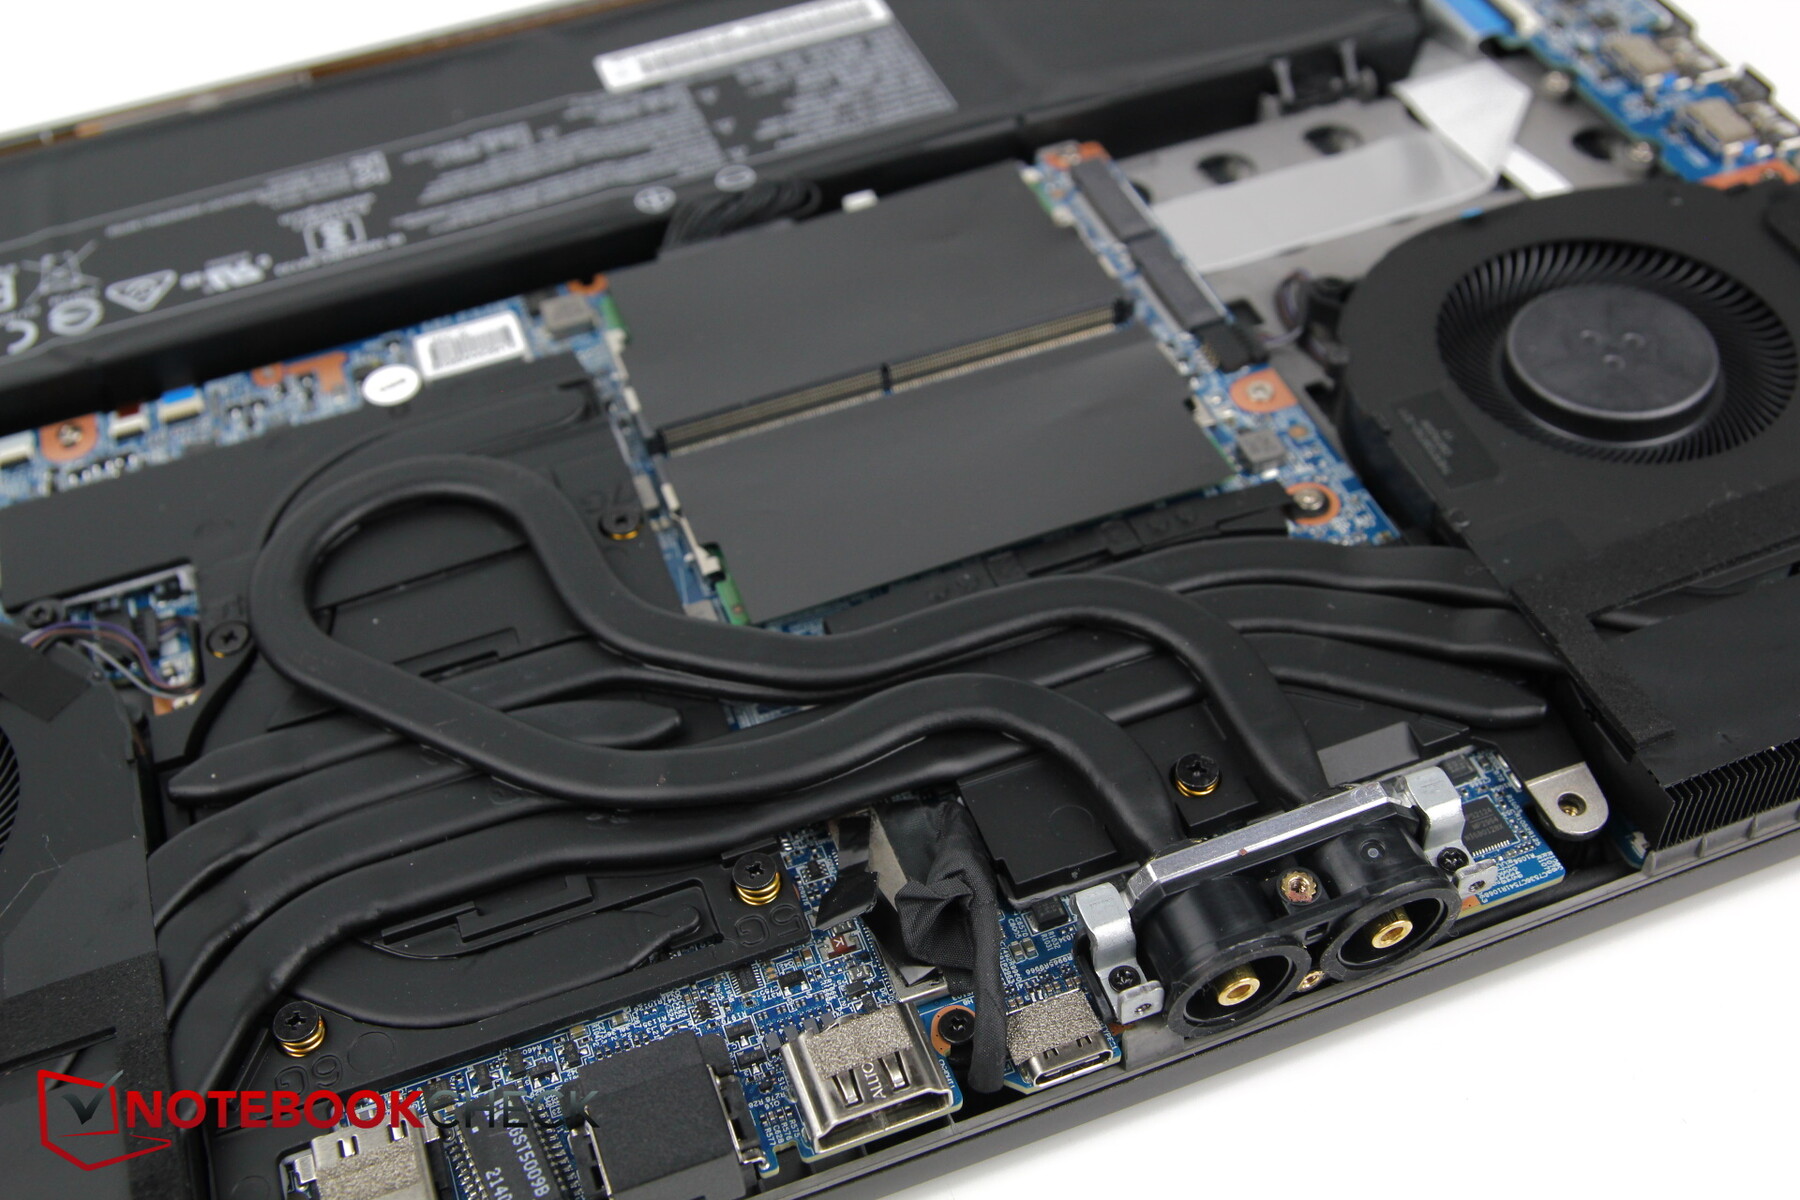
Maintenance

Overall maintenance is quite simple. The water-cooling system only requires four additional Phillips screws (14 in total) to be removed. After that, the case can be pried open relatively easily.
The fans, the heat pipes including the water circuit, two RAM, and M.2 SSD slots as well as the Wi-Fi module are then accessible. This also shows how easy it would be to implement an effective, additional water circuit for the manufacturer should the model become popular.


Warranty
Schenker usually grants a two-year warranty on its laptops.
Input devices: Optomechanical keyboard
Keyboard
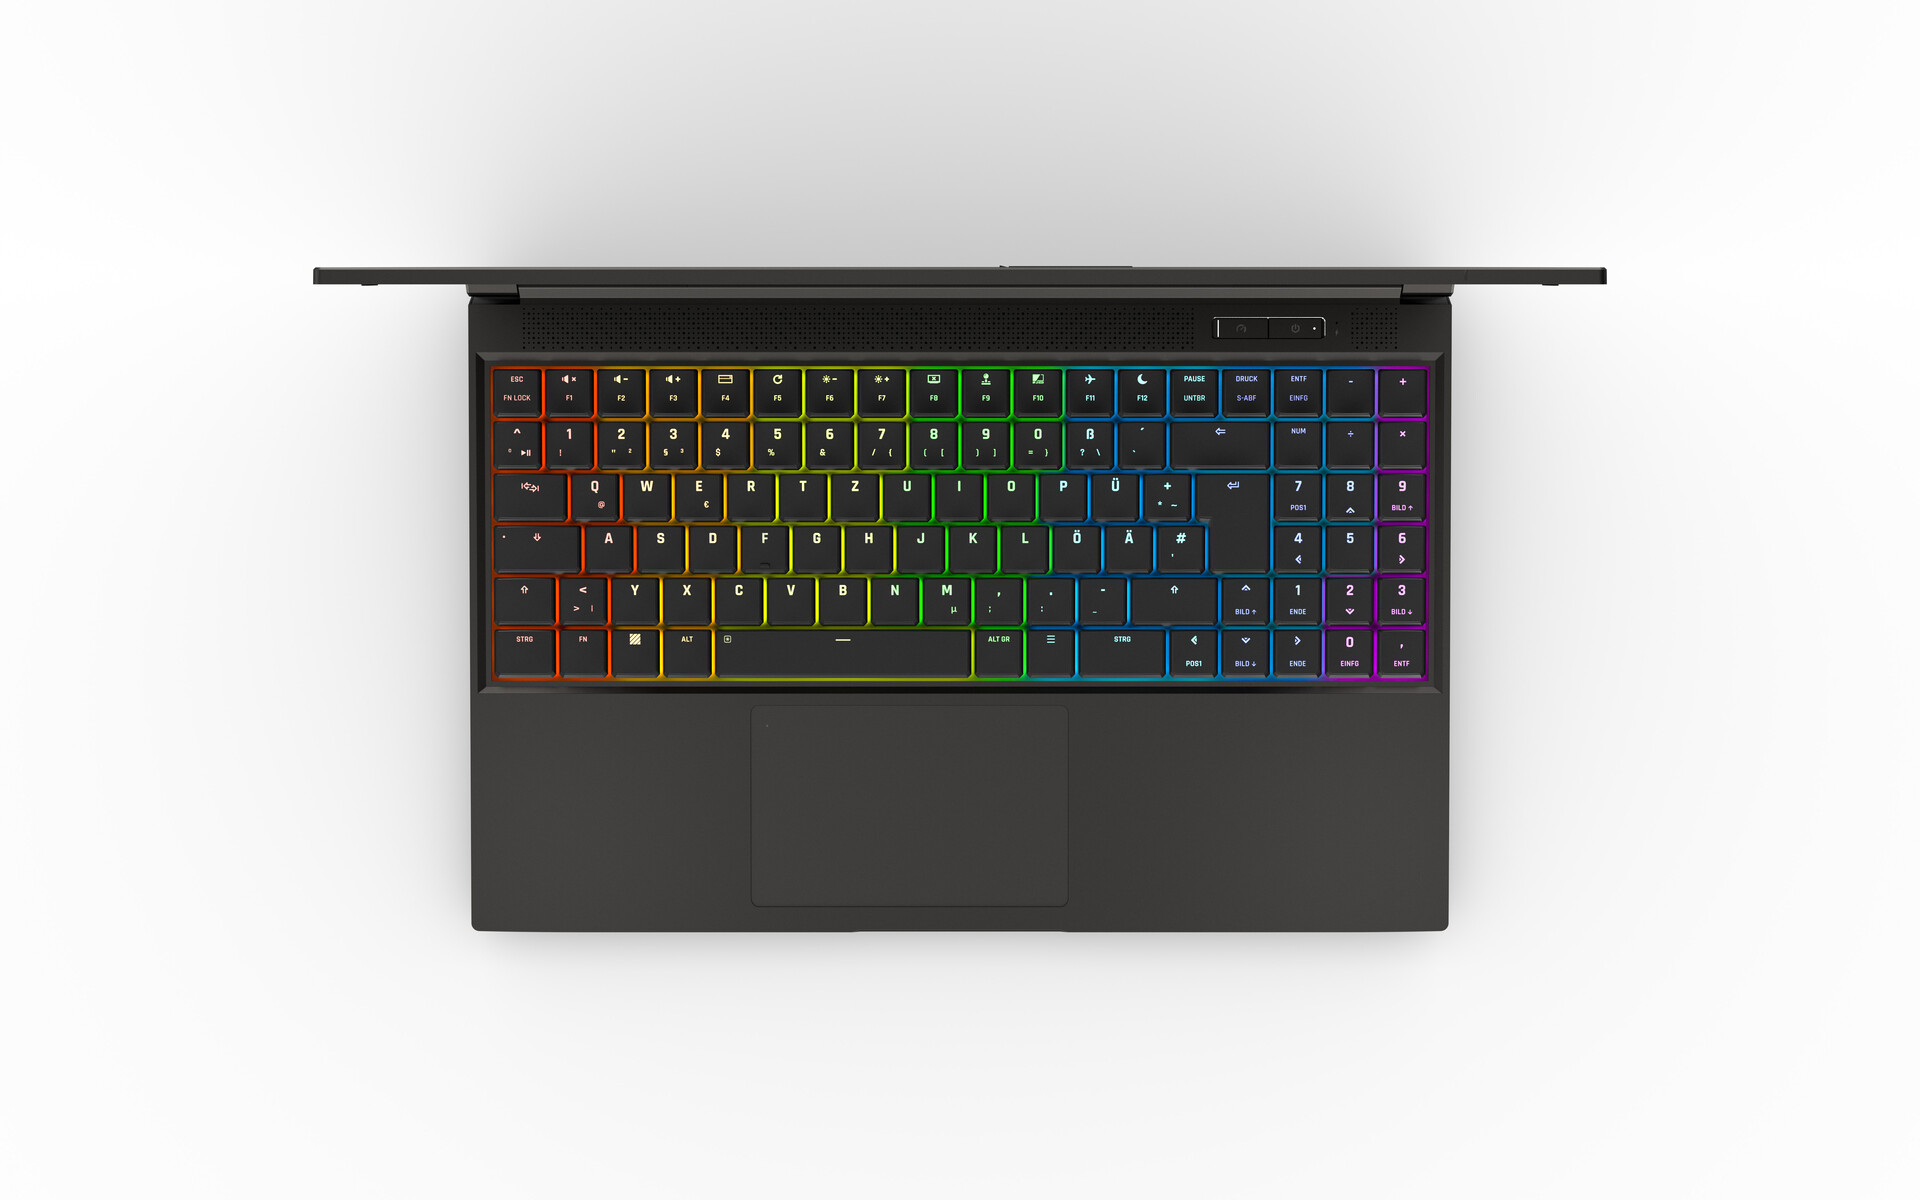
The manufacturer uses an optomechanical keyboard with RGB single-key illumination, number pad, N-key rollover and anti-ghosting features. The tactile silent switches have a 2 mm stroke and a 1 mm travel.
The keys trigger with clear feedback at the beginning of the stroke; typing feels good and is quick.
Our pre-production model came with blank keys, so we cannot say anything about the lettering just yet. The unlabeled numpad looks very crowded on the right, and there is no gap with the rest of the keyboard. Nevertheless, the arrow keys are normal in size, even though they are somewhat squeezed between the keyboard and numpad.
The power switch as well as a dedicated switch to toggle through various performance modes are incorporated above the right of the keyboard.
Noise is slightly louder than some of the quieter chiclet keyboards due to the optomechanical switches. However, it is significantly quieter than full-sized mechanical keyboards.


Touchpad

The rather large touchpad measures about 11.6 cm x 7.4 cm and has a very smooth surface, which hardly falters even during slow movements.
Tapping the upper left corner twice deactivates the touchpad and activates it again in the same way, which is convenient.
The integrated buttons are quite crisp and leave a reliable impression. We did not encounter any problems when using the touchpad.
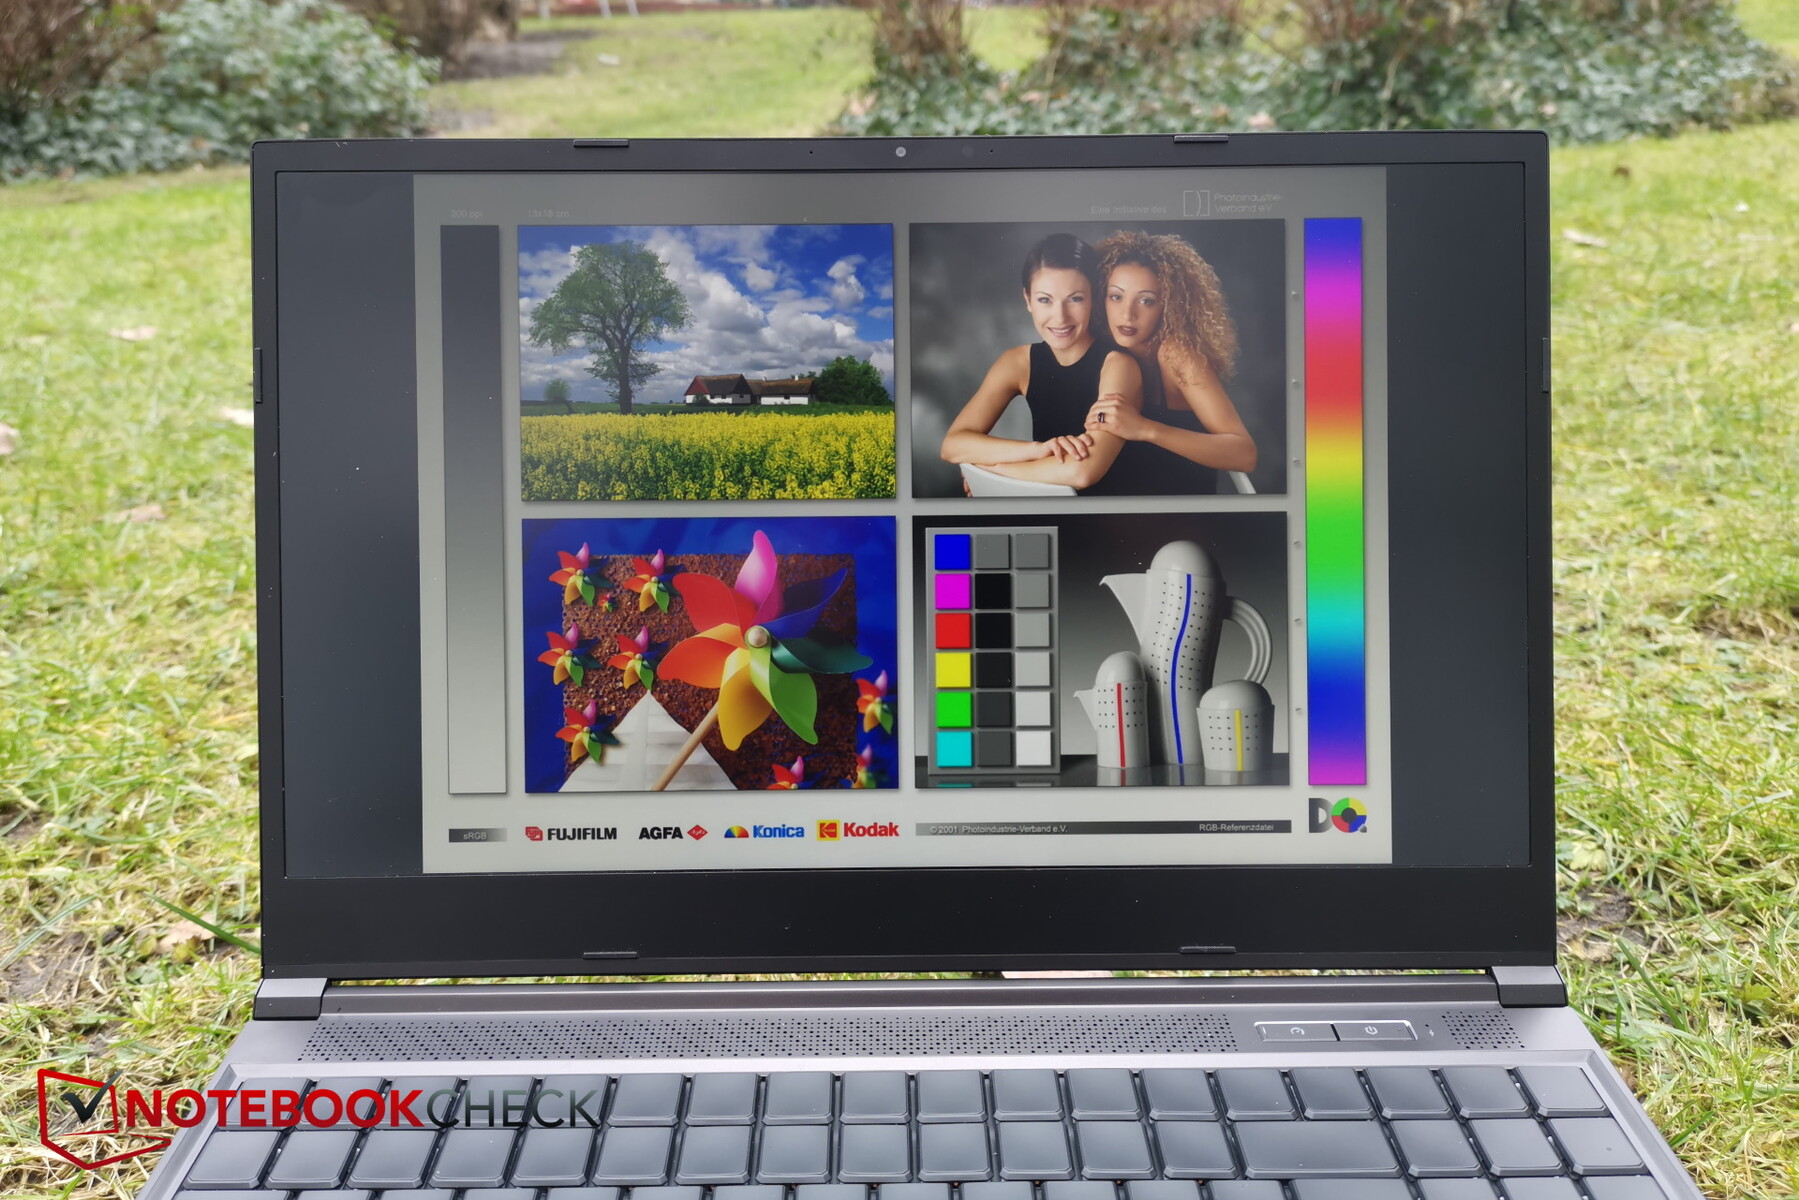
Display: A pre-production model to sort out
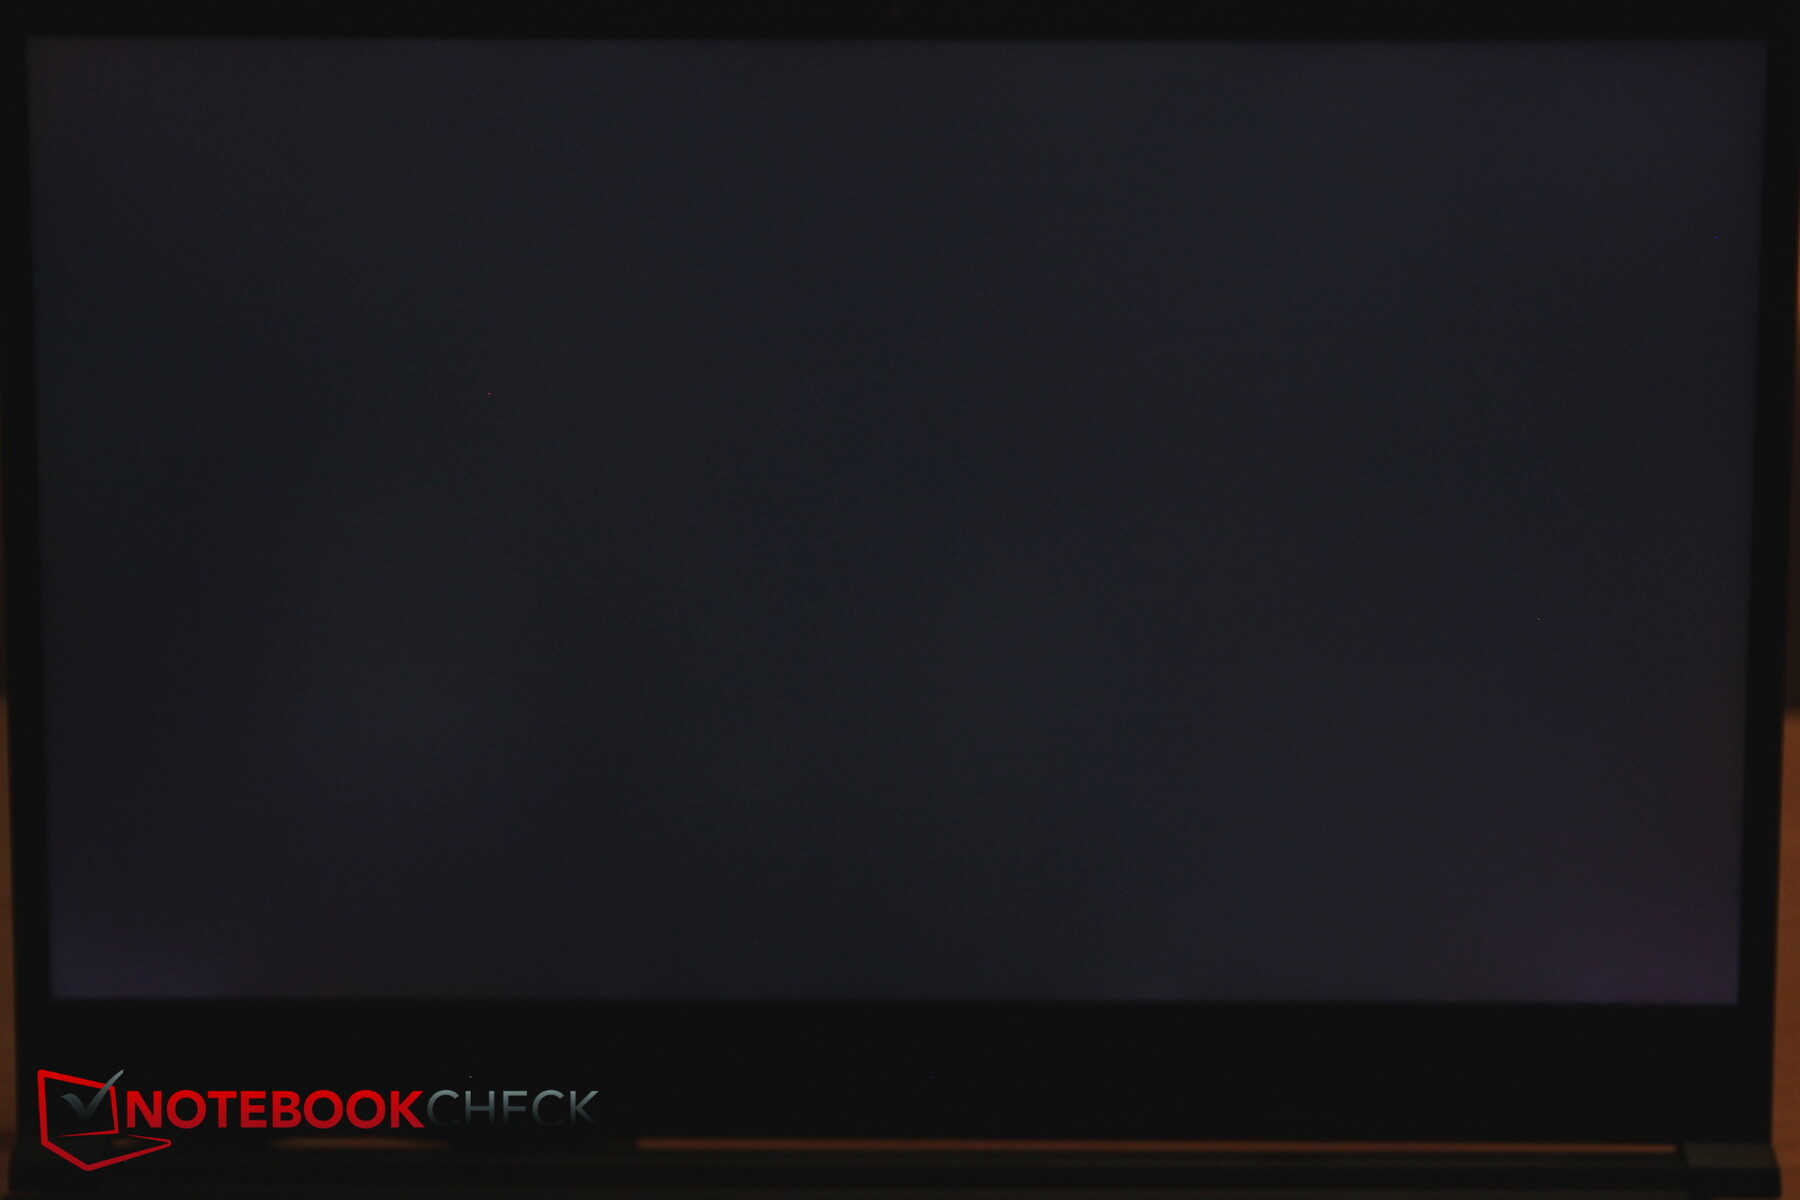
Like its predecessor, Schenker uses a matte IPS display from BOE with a WQHD resolution (2,560 x 1,440 pixels). However, the models differ slightly. Instead of 165 Hz, there is now a 240 Hz panel. However, as in the previous model, the current one falls short of the 350 nits advertised by the manufacturer; we measured only 273 nits on average.
The brightness distribution of the pre-production model is also so bad with only 62%. Schenker assured us that such a panel would not be sold. Thus, there will still be some changes until the release. Therefore, we will not measure the color space for the time being
| |||||||||||||||||||||||||
Brightness Distribution: 62 %
Center on Battery: 293 cd/m²
Contrast: 1054:1 (Black: 0.28 cd/m²)
ΔE Color 2.36 | 0.5-29.43 Ø5
ΔE Greyscale 3.43 | 0.57-98 Ø5.3
Gamma: 2.44
| SCHENKER XMG Neo 15 E22 (Early 2022, RTX 3080 Ti) BOE0A67 (BOE CQ NE156QHM-NZ1), IPS, 2560x1440, 15.60 | SCHENKER XMG Neo 15 Tiger Lake BOE CQ NE156QHM-NY2, IPS, 2560x1440, 15.60 | Razer Blade 15 Advanced (Mid 2021) TL156VDXP02-0, IPS, 1920x1080, 15.60 | Asus ROG Strix Scar 15 G533QS BOE CQ NE156QHM-NY1, IPS, 2560x1440, 15.60 | Alienware m15 R6, i7-11800H RTX 3080 AU Optronics AUO9092 (B156HAN), IPS, 1920x1080, 15.60 | MSI GE76 Raider AU Optronics B173HAN05.4 (AUOE295), IPS-Level, 1920x1080, 17.30 | |
|---|---|---|---|---|---|---|
| Display | ||||||
| Display P3 Coverage | 68.6 | 66.9 | 97.6 | 74.1 | 63.1 | |
| sRGB Coverage | 98.6 | 97.1 | 99.9 | 99.5 | 94 | |
| AdobeRGB 1998 Coverage | 69.3 | 69 | 85.3 | 75.7 | 65.2 | |
| Response Times | -11% | 39% | -6% | 65% | 36% | |
| Response Time Grey 50% / Grey 80% * | 14.4 ? | 16 ? -11% | 4.2 ? 71% | 14 ? 3% | 2.8 81% | 5.6 ? 61% |
| Response Time Black / White * | 10.8 ? | 12 ? -11% | 10 ? 7% | 12.4 ? -15% | 5.6 48% | 9.6 ? 11% |
| PWM Frequency | ||||||
| Screen | -20% | 8% | -8% | -1% | 23% | |
| Brightness middle | 295 | 324 10% | 353.4 20% | 304.3 3% | 359 22% | 290 -2% |
| Brightness | 277 | 307 11% | 340 23% | 286 3% | 344 24% | 290 5% |
| Brightness Distribution | 62 | 91 47% | 92 48% | 76 23% | 85 37% | 96 55% |
| Black Level * | 0.28 | 0.27 4% | 0.31 -11% | 0.33 -18% | 0.35 -25% | 0.23 18% |
| Contrast | 1054 | 1200 14% | 1140 8% | 922 -13% | 1026 -3% | 1261 20% |
| Colorchecker dE 2000 * | 2.36 | 3.36 -42% | 2.17 8% | 2.76 -17% | 3.3 -40% | 1.59 33% |
| Colorchecker dE 2000 max. * | 4.24 | 9.87 -133% | 5.69 -34% | 5.57 -31% | 4.84 -14% | 3.17 25% |
| Greyscale dE 2000 * | 3.43 | 5.8 -69% | 3.4 1% | 4 -17% | 3.66 -7% | 2.5 27% |
| Gamma | 2.44 90% | 2.311 95% | 2.2 100% | 2.14 103% | 2.43 91% | 2.253 98% |
| CCT | 6266 104% | 7087 92% | 6830 95% | 6844 95% | 5896 110% | 6640 98% |
| Colorchecker dE 2000 calibrated * | 1.23 | 1.05 | 2.38 | 3.28 | 0.87 | |
| Color Space (Percent of AdobeRGB 1998) | 69 | |||||
| Color Space (Percent of sRGB) | 93 | |||||
| Total Average (Program / Settings) | -16% /
-18% | 24% /
14% | -7% /
-8% | 32% /
12% | 30% /
25% |
* ... smaller is better
That being said, the display is quite well-calibrated ex-factory and the Delta E values are low. Black levels and contrast are well above average.


Display Response Times
| ↔ Response Time Black to White | ||
|---|---|---|
| 10.8 ms ... rise ↗ and fall ↘ combined | ↗ 5.4 ms rise |  |
| ↘ 5.4 ms fall | ||
| The screen shows good response rates in our tests, but may be too slow for competitive gamers. In comparison, all tested devices range from 0.1 (minimum) to 240 (maximum) ms. » 24 % of all devices are better. This means that the measured response time is better than the average of all tested devices (21.5 ms). | ||
| ↔ Response Time 50% Grey to 80% Grey | ||
| 14.4 ms ... rise ↗ and fall ↘ combined | ↗ 6.6 ms rise | 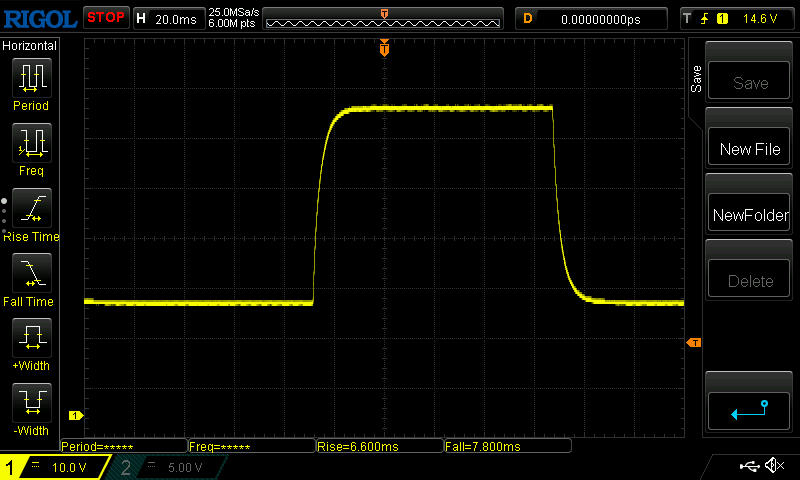 |
| ↘ 7.8 ms fall | ||
| The screen shows good response rates in our tests, but may be too slow for competitive gamers. In comparison, all tested devices range from 0.2 (minimum) to 636 (maximum) ms. » 23 % of all devices are better. This means that the measured response time is better than the average of all tested devices (33.7 ms). | ||
Screen Flickering / PWM (Pulse-Width Modulation)
| Screen flickering / PWM not detected | 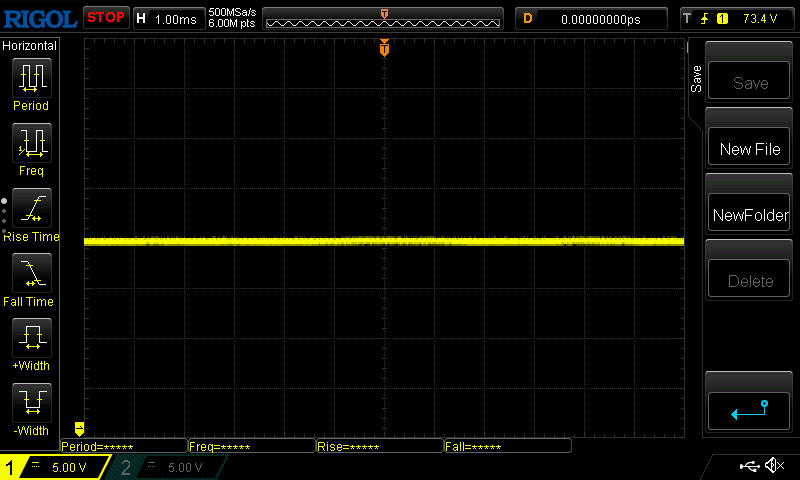 | ||
In comparison: 53 % of all tested devices do not use PWM to dim the display. If PWM was detected, an average of 17853 (minimum: 5 - maximum: 3846000) Hz was measured. | |||
The response times are somewhat on the lower side for gaming. The panel does not use PWM.
Outdoors, the matte coating eliminates most reflections. The black levels and contrast are also good enough to still see the screen's content well, at least on cloudy days and in the shade.

Viewing angle stability is good. Even at extreme angles, the decrease in picture quality is rather low.

Performance: High!
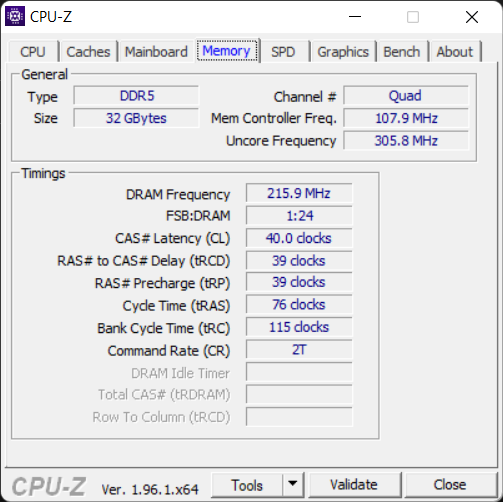
We are dealing with absolutely high-end hardware here, especially the new RTX 3080 Ti which can run with at a maximum TGP of 175 W via the Control Center. The new Alder Lake Intel Core i7-12700H processor and, for the first time, 32 GB of DDR5 RAM make the "new Neo" a real high-performance gaming laptop.


Test conditions
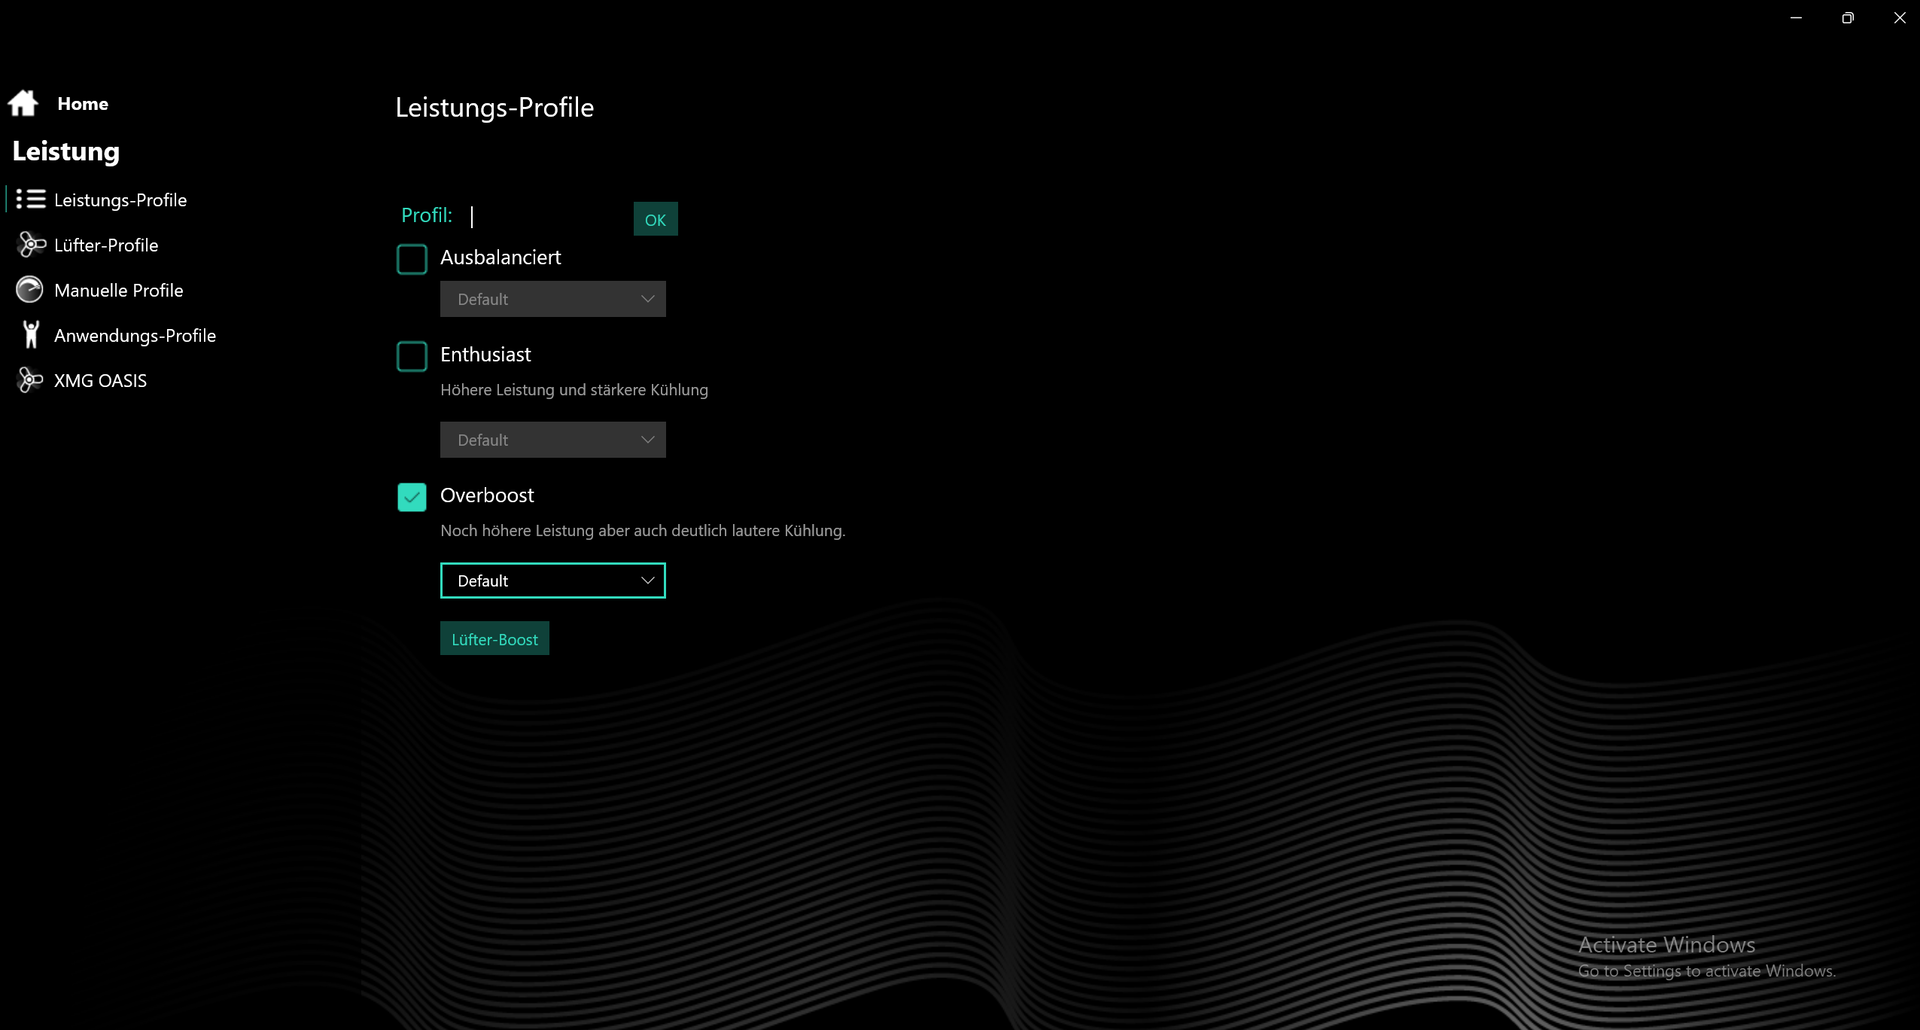
For the best benchmark results, we enabled the Overboost mode in the Control Center and also maximized the CPU's PL values in the manual performance settings.
For the GPU, we set the Dynamic Boost to 25 W. With the Dynamic Boost set, you can no longer set the GPU's TGP yourself. The option is grayed out and is fixed at 150 W, so the maximum 175 W is maxed out in total.


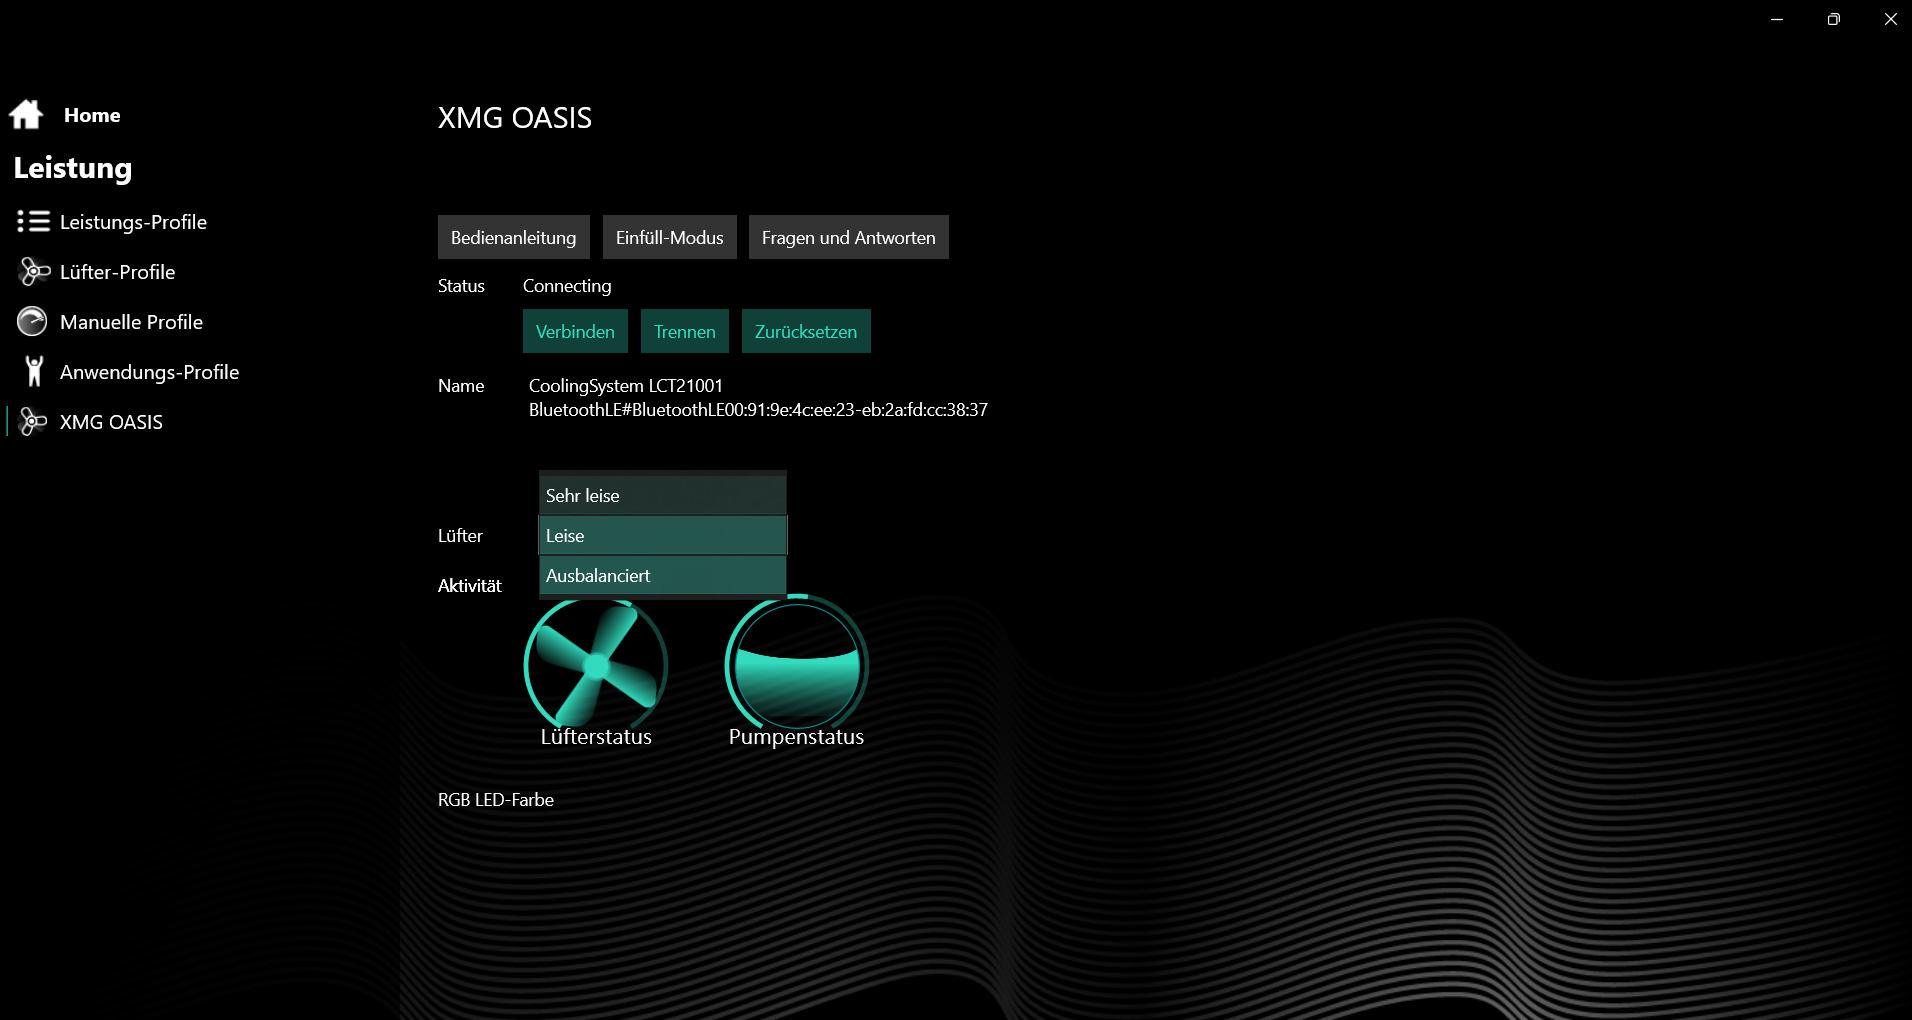
The XMG Oasis also offers several fan profiles (Very Quiet, Quiet, and Balanced). Unless specified, we used the Balanced mode for the best cooling performance.
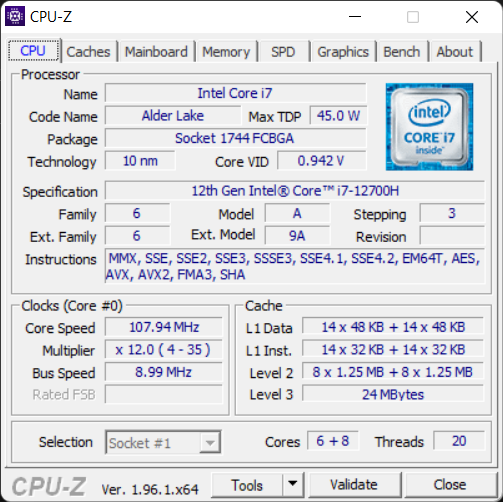
Processor
The Intel Core i7-12700H is a high-end CPU based on the new Alder Lake architecture. It has a total of 14 cores, which are divided into performance (6 P-cores) and efficiency cores (8 E-cores) for the first time like in ARM processors. Only the P-cores support Hyperthreading, so you get a total of 20 threads. An Intel Xe graphics unit with 96 EUs and a clock of up to 1.4 GHz is integrated into the CPU.
In the one-hour Cinebench loop, the CPU goes head-to-head with its slightly higher clocked sister model Core i9-12900HK and even wins it by a narrow margin over time. Only the Core i9-12900HK's output power is higher.
The performance is minimally higher with Oasis than without, and the small performance drop seen in the beginning does not happen. However, there is no difference in short-term performance.
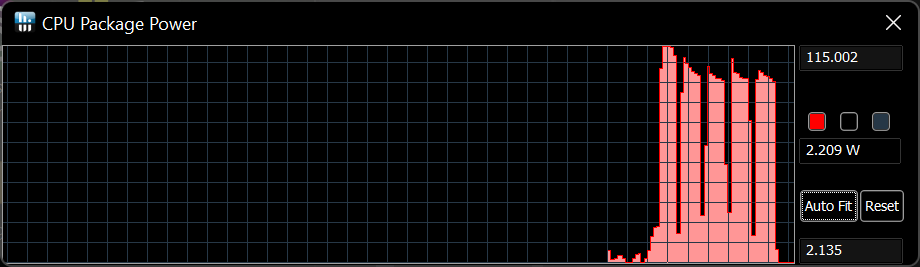
The package power is a maximum of 115 W in the first run and only 100 W later on. With Oasis, the package power does not drop to 100 W but remains quite stable at 115 W.

The Core i7-12700H beats its Tiger Lake predecessor by a whole 30% in the multi-thread test! The same applies to the AMD Ryzen 9 5900HX in the Asus ROG Strix Scar 15. The two Alder Lake CPUs are also virtually on par in the other benchmarks and lead the charts.
More than 50% of the CPU's performance is lost in battery mode. Only 1,214 points are achieved in Cinebench R15 Multi compared to 2,824 points on DC power.


Cinebench R15 Multi Dauertest
Cinebench R23: Multi Core | Single Core
Cinebench R20: CPU (Multi Core) | CPU (Single Core)
Cinebench R15: CPU Multi 64Bit | CPU Single 64Bit
Blender: v2.79 BMW27 CPU
7-Zip 18.03: 7z b 4 | 7z b 4 -mmt1
Geekbench 5.5: Multi-Core | Single-Core
HWBOT x265 Benchmark v2.2: 4k Preset
LibreOffice : 20 Documents To PDF
R Benchmark 2.5: Overall mean
| CPU Performance Rating | |
| MSI GE76 Raider | |
| Average of class Gaming | |
| SCHENKER XMG Neo 15 E22 (Early 2022, RTX 3080 Ti) | |
| SCHENKER XMG Oasis | |
| Average Intel Core i7-12700H | |
| SCHENKER XMG Neo 15 Tiger Lake | |
| Asus ROG Strix Scar 15 G533QS -2! | |
| Alienware m15 R6, i7-11800H RTX 3080 | |
| Razer Blade 15 Advanced (Mid 2021) -2! | |
| Cinebench R23 / Multi Core | |
| Average of class Gaming (2435 - 34613, n=229, last 2 years) | |
| SCHENKER XMG Neo 15 E22 (Early 2022, RTX 3080 Ti) | |
| SCHENKER XMG Oasis | |
| MSI GE76 Raider | |
| Average Intel Core i7-12700H (4032 - 19330, n=63) | |
| SCHENKER XMG Neo 15 Tiger Lake | |
| Asus ROG Strix Scar 15 G533QS | |
| Alienware m15 R6, i7-11800H RTX 3080 | |
| Razer Blade 15 Advanced (Mid 2021) | |
| Cinebench R23 / Single Core | |
| MSI GE76 Raider | |
| Average of class Gaming (527 - 2235, n=227, last 2 years) | |
| SCHENKER XMG Oasis | |
| SCHENKER XMG Neo 15 E22 (Early 2022, RTX 3080 Ti) | |
| Average Intel Core i7-12700H (778 - 1826, n=62) | |
| SCHENKER XMG Neo 15 Tiger Lake | |
| Razer Blade 15 Advanced (Mid 2021) | |
| Alienware m15 R6, i7-11800H RTX 3080 | |
| Asus ROG Strix Scar 15 G533QS | |
| Cinebench R20 / CPU (Multi Core) | |
| Average of class Gaming (930 - 13769, n=227, last 2 years) | |
| SCHENKER XMG Oasis | |
| SCHENKER XMG Neo 15 E22 (Early 2022, RTX 3080 Ti) | |
| MSI GE76 Raider | |
| Average Intel Core i7-12700H (1576 - 7407, n=63) | |
| SCHENKER XMG Neo 15 Tiger Lake | |
| Asus ROG Strix Scar 15 G533QS | |
| Razer Blade 15 Advanced (Mid 2021) | |
| Alienware m15 R6, i7-11800H RTX 3080 | |
| Cinebench R20 / CPU (Single Core) | |
| MSI GE76 Raider | |
| Average of class Gaming (169 - 855, n=227, last 2 years) | |
| SCHENKER XMG Neo 15 E22 (Early 2022, RTX 3080 Ti) | |
| SCHENKER XMG Oasis | |
| Average Intel Core i7-12700H (300 - 704, n=63) | |
| Razer Blade 15 Advanced (Mid 2021) | |
| SCHENKER XMG Neo 15 Tiger Lake | |
| Alienware m15 R6, i7-11800H RTX 3080 | |
| Asus ROG Strix Scar 15 G533QS | |
| Cinebench R15 / CPU Multi 64Bit | |
| Average of class Gaming (400 - 5663, n=231, last 2 years) | |
| MSI GE76 Raider | |
| SCHENKER XMG Oasis | |
| SCHENKER XMG Neo 15 E22 (Early 2022, RTX 3080 Ti) | |
| Average Intel Core i7-12700H (1379 - 2916, n=69) | |
| Asus ROG Strix Scar 15 G533QS | |
| SCHENKER XMG Neo 15 Tiger Lake | |
| Alienware m15 R6, i7-11800H RTX 3080 | |
| Razer Blade 15 Advanced (Mid 2021) | |
| Cinebench R15 / CPU Single 64Bit | |
| MSI GE76 Raider | |
| Average of class Gaming (79.2 - 318, n=230, last 2 years) | |
| SCHENKER XMG Neo 15 E22 (Early 2022, RTX 3080 Ti) | |
| SCHENKER XMG Oasis | |
| Average Intel Core i7-12700H (113 - 263, n=64) | |
| Asus ROG Strix Scar 15 G533QS | |
| SCHENKER XMG Neo 15 Tiger Lake | |
| Razer Blade 15 Advanced (Mid 2021) | |
| Alienware m15 R6, i7-11800H RTX 3080 | |
| Blender / v2.79 BMW27 CPU | |
| Alienware m15 R6, i7-11800H RTX 3080 | |
| Razer Blade 15 Advanced (Mid 2021) | |
| Asus ROG Strix Scar 15 G533QS | |
| Average Intel Core i7-12700H (168 - 732, n=62) | |
| SCHENKER XMG Neo 15 Tiger Lake | |
| Average of class Gaming (87 - 1259, n=224, last 2 years) | |
| MSI GE76 Raider | |
| SCHENKER XMG Neo 15 E22 (Early 2022, RTX 3080 Ti) | |
| SCHENKER XMG Oasis | |
| 7-Zip 18.03 / 7z b 4 | |
| Average of class Gaming (11386 - 140932, n=226, last 2 years) | |
| SCHENKER XMG Oasis | |
| SCHENKER XMG Neo 15 E22 (Early 2022, RTX 3080 Ti) | |
| MSI GE76 Raider | |
| Asus ROG Strix Scar 15 G533QS | |
| Average Intel Core i7-12700H (22844 - 73067, n=62) | |
| SCHENKER XMG Neo 15 Tiger Lake | |
| Razer Blade 15 Advanced (Mid 2021) | |
| Alienware m15 R6, i7-11800H RTX 3080 | |
| 7-Zip 18.03 / 7z b 4 -mmt1 | |
| Average of class Gaming (2685 - 7581, n=226, last 2 years) | |
| MSI GE76 Raider | |
| SCHENKER XMG Oasis | |
| SCHENKER XMG Neo 15 E22 (Early 2022, RTX 3080 Ti) | |
| SCHENKER XMG Neo 15 Tiger Lake | |
| Average Intel Core i7-12700H (2743 - 5972, n=62) | |
| Asus ROG Strix Scar 15 G533QS | |
| Razer Blade 15 Advanced (Mid 2021) | |
| Alienware m15 R6, i7-11800H RTX 3080 | |
| Geekbench 5.5 / Multi-Core | |
| SCHENKER XMG Neo 15 E22 (Early 2022, RTX 3080 Ti) | |
| Average of class Gaming (1946 - 22200, n=231, last 2 years) | |
| MSI GE76 Raider | |
| SCHENKER XMG Oasis | |
| Average Intel Core i7-12700H (5144 - 13745, n=63) | |
| SCHENKER XMG Neo 15 Tiger Lake | |
| Alienware m15 R6, i7-11800H RTX 3080 | |
| Geekbench 5.5 / Single-Core | |
| MSI GE76 Raider | |
| Average of class Gaming (158 - 2210, n=231, last 2 years) | |
| SCHENKER XMG Neo 15 E22 (Early 2022, RTX 3080 Ti) | |
| SCHENKER XMG Oasis | |
| Average Intel Core i7-12700H (803 - 1851, n=63) | |
| SCHENKER XMG Neo 15 Tiger Lake | |
| Alienware m15 R6, i7-11800H RTX 3080 | |
| HWBOT x265 Benchmark v2.2 / 4k Preset | |
| SCHENKER XMG Oasis | |
| Average of class Gaming (3 - 37.6, n=229, last 2 years) | |
| SCHENKER XMG Neo 15 E22 (Early 2022, RTX 3080 Ti) | |
| MSI GE76 Raider | |
| SCHENKER XMG Neo 15 Tiger Lake | |
| Average Intel Core i7-12700H (4.67 - 21.8, n=63) | |
| Asus ROG Strix Scar 15 G533QS | |
| Razer Blade 15 Advanced (Mid 2021) | |
| Alienware m15 R6, i7-11800H RTX 3080 | |
| LibreOffice / 20 Documents To PDF | |
| Asus ROG Strix Scar 15 G533QS | |
| Average of class Gaming (32.8 - 332, n=223, last 2 years) | |
| SCHENKER XMG Oasis | |
| SCHENKER XMG Neo 15 Tiger Lake | |
| Razer Blade 15 Advanced (Mid 2021) | |
| Average Intel Core i7-12700H (34.2 - 95.3, n=62) | |
| Alienware m15 R6, i7-11800H RTX 3080 | |
| SCHENKER XMG Neo 15 E22 (Early 2022, RTX 3080 Ti) | |
| MSI GE76 Raider | |
| R Benchmark 2.5 / Overall mean | |
| Alienware m15 R6, i7-11800H RTX 3080 | |
| SCHENKER XMG Neo 15 Tiger Lake | |
| Razer Blade 15 Advanced (Mid 2021) | |
| Asus ROG Strix Scar 15 G533QS | |
| Average Intel Core i7-12700H (0.4441 - 1.052, n=62) | |
| Average of class Gaming (0.3609 - 4.47, n=226, last 2 years) | |
| SCHENKER XMG Neo 15 E22 (Early 2022, RTX 3080 Ti) | |
| SCHENKER XMG Oasis | |
| MSI GE76 Raider | |
* ... smaller is better
AIDA64: FP32 Ray-Trace | FPU Julia | CPU SHA3 | CPU Queen | FPU SinJulia | FPU Mandel | CPU AES | CPU ZLib | FP64 Ray-Trace | CPU PhotoWorxx
| Performance Rating | |
| Average of class Gaming | |
| Asus ROG Strix Scar 15 G533QS | |
| Alienware m15 R6, i7-11800H RTX 3080 | |
| MSI GE76 Raider | |
| SCHENKER XMG Oasis | |
| SCHENKER XMG Neo 15 E22 (Early 2022, RTX 3080 Ti) | |
| Average Intel Core i7-12700H | |
| AIDA64 / FP32 Ray-Trace | |
| Average of class Gaming (3069 - 60169, n=222, last 2 years) | |
| Alienware m15 R6, i7-11800H RTX 3080 | |
| Asus ROG Strix Scar 15 G533QS | |
| Average Intel Core i7-12700H (2585 - 17957, n=62) | |
| SCHENKER XMG Oasis | |
| SCHENKER XMG Neo 15 E22 (Early 2022, RTX 3080 Ti) | |
| MSI GE76 Raider | |
| AIDA64 / FPU Julia | |
| Asus ROG Strix Scar 15 G533QS | |
| Average of class Gaming (18567 - 252486, n=222, last 2 years) | |
| Alienware m15 R6, i7-11800H RTX 3080 | |
| Average Intel Core i7-12700H (12439 - 90760, n=62) | |
| SCHENKER XMG Neo 15 E22 (Early 2022, RTX 3080 Ti) | |
| SCHENKER XMG Oasis | |
| MSI GE76 Raider | |
| AIDA64 / CPU SHA3 | |
| Alienware m15 R6, i7-11800H RTX 3080 | |
| Average of class Gaming (629 - 10389, n=222, last 2 years) | |
| Asus ROG Strix Scar 15 G533QS | |
| SCHENKER XMG Oasis | |
| SCHENKER XMG Neo 15 E22 (Early 2022, RTX 3080 Ti) | |
| MSI GE76 Raider | |
| Average Intel Core i7-12700H (833 - 4242, n=62) | |
| AIDA64 / CPU Queen | |
| Average of class Gaming (15371 - 200651, n=222, last 2 years) | |
| MSI GE76 Raider | |
| Asus ROG Strix Scar 15 G533QS | |
| SCHENKER XMG Oasis | |
| Average Intel Core i7-12700H (57923 - 103202, n=62) | |
| SCHENKER XMG Neo 15 E22 (Early 2022, RTX 3080 Ti) | |
| Alienware m15 R6, i7-11800H RTX 3080 | |
| AIDA64 / FPU SinJulia | |
| Asus ROG Strix Scar 15 G533QS | |
| Average of class Gaming (2137 - 32988, n=222, last 2 years) | |
| MSI GE76 Raider | |
| SCHENKER XMG Oasis | |
| SCHENKER XMG Neo 15 E22 (Early 2022, RTX 3080 Ti) | |
| Alienware m15 R6, i7-11800H RTX 3080 | |
| Average Intel Core i7-12700H (3249 - 9939, n=62) | |
| AIDA64 / FPU Mandel | |
| Asus ROG Strix Scar 15 G533QS | |
| Average of class Gaming (10291 - 134044, n=222, last 2 years) | |
| Alienware m15 R6, i7-11800H RTX 3080 | |
| Average Intel Core i7-12700H (7135 - 44760, n=62) | |
| SCHENKER XMG Oasis | |
| SCHENKER XMG Neo 15 E22 (Early 2022, RTX 3080 Ti) | |
| MSI GE76 Raider | |
| AIDA64 / CPU AES | |
| Alienware m15 R6, i7-11800H RTX 3080 | |
| Asus ROG Strix Scar 15 G533QS | |
| Average of class Gaming (19065 - 328679, n=222, last 2 years) | |
| MSI GE76 Raider | |
| Average Intel Core i7-12700H (31839 - 144360, n=62) | |
| SCHENKER XMG Neo 15 E22 (Early 2022, RTX 3080 Ti) | |
| SCHENKER XMG Oasis | |
| AIDA64 / CPU ZLib | |
| Average of class Gaming (150.9 - 2409, n=222, last 2 years) | |
| SCHENKER XMG Neo 15 E22 (Early 2022, RTX 3080 Ti) | |
| SCHENKER XMG Oasis | |
| MSI GE76 Raider | |
| Average Intel Core i7-12700H (305 - 1171, n=62) | |
| Asus ROG Strix Scar 15 G533QS | |
| Alienware m15 R6, i7-11800H RTX 3080 | |
| AIDA64 / FP64 Ray-Trace | |
| Average of class Gaming (1518 - 31796, n=222, last 2 years) | |
| Alienware m15 R6, i7-11800H RTX 3080 | |
| Asus ROG Strix Scar 15 G533QS | |
| Average Intel Core i7-12700H (1437 - 9692, n=62) | |
| SCHENKER XMG Oasis | |
| SCHENKER XMG Neo 15 E22 (Early 2022, RTX 3080 Ti) | |
| MSI GE76 Raider | |
| AIDA64 / CPU PhotoWorxx | |
| SCHENKER XMG Oasis | |
| SCHENKER XMG Neo 15 E22 (Early 2022, RTX 3080 Ti) | |
| MSI GE76 Raider | |
| Average of class Gaming (10805 - 60161, n=223, last 2 years) | |
| Average Intel Core i7-12700H (12863 - 52207, n=62) | |
| Asus ROG Strix Scar 15 G533QS | |
| Alienware m15 R6, i7-11800H RTX 3080 | |
System performance
The scores in PCMark 10 are not convincing across the board. The Razer Blade 15 overtakes the Neo 15 in the overall score. On the other hand, the Neo 15 is only just behind the MSI GE76 Raider with similar hardware in the Digital Content Creation test, but the laptop falls a bit behind in Essentials and Productivity. In the latter, the Neo with the Oasis attachment performs about 10% better.

| PCMark 10 / Score | |
| MSI GE76 Raider | |
| Average of class Gaming (5235 - 9852, n=197, last 2 years) | |
| SCHENKER XMG Oasis | |
| Average Intel Core i7-12700H, NVIDIA GeForce RTX 3080 Ti Laptop GPU (6868 - 7638, n=7) | |
| Razer Blade 15 Advanced (Mid 2021) | |
| SCHENKER XMG Neo 15 E22 (Early 2022, RTX 3080 Ti) | |
| Asus ROG Strix Scar 15 G533QS | |
| SCHENKER XMG Neo 15 Tiger Lake | |
| Alienware m15 R6, i7-11800H RTX 3080 | |
| PCMark 10 / Essentials | |
| Razer Blade 15 Advanced (Mid 2021) | |
| Average of class Gaming (8300 - 12334, n=196, last 2 years) | |
| MSI GE76 Raider | |
| Average Intel Core i7-12700H, NVIDIA GeForce RTX 3080 Ti Laptop GPU (9987 - 11318, n=7) | |
| SCHENKER XMG Neo 15 Tiger Lake | |
| Asus ROG Strix Scar 15 G533QS | |
| SCHENKER XMG Neo 15 E22 (Early 2022, RTX 3080 Ti) | |
| Alienware m15 R6, i7-11800H RTX 3080 | |
| SCHENKER XMG Oasis | |
| PCMark 10 / Productivity | |
| MSI GE76 Raider | |
| Asus ROG Strix Scar 15 G533QS | |
| SCHENKER XMG Oasis | |
| Average of class Gaming (6662 - 11833, n=196, last 2 years) | |
| Average Intel Core i7-12700H, NVIDIA GeForce RTX 3080 Ti Laptop GPU (8944 - 10726, n=7) | |
| Alienware m15 R6, i7-11800H RTX 3080 | |
| Razer Blade 15 Advanced (Mid 2021) | |
| SCHENKER XMG Neo 15 Tiger Lake | |
| SCHENKER XMG Neo 15 E22 (Early 2022, RTX 3080 Ti) | |
| PCMark 10 / Digital Content Creation | |
| MSI GE76 Raider | |
| SCHENKER XMG Oasis | |
| Average of class Gaming (6462 - 18475, n=196, last 2 years) | |
| SCHENKER XMG Neo 15 E22 (Early 2022, RTX 3080 Ti) | |
| Average Intel Core i7-12700H, NVIDIA GeForce RTX 3080 Ti Laptop GPU (8956 - 12249, n=7) | |
| SCHENKER XMG Neo 15 Tiger Lake | |
| Razer Blade 15 Advanced (Mid 2021) | |
| Alienware m15 R6, i7-11800H RTX 3080 | |
| Asus ROG Strix Scar 15 G533QS | |
| PCMark 10 Score | 7240 points | |
Help | ||
| AIDA64 / Memory Copy | |
| SCHENKER XMG Neo 15 E22 (Early 2022, RTX 3080 Ti) | |
| MSI GE76 Raider | |
| SCHENKER XMG Oasis | |
| Average of class Gaming (21842 - 92565, n=222, last 2 years) | |
| Average Intel Core i7-12700H (25615 - 80511, n=62) | |
| Alienware m15 R6, i7-11800H RTX 3080 | |
| Asus ROG Strix Scar 15 G533QS | |
| AIDA64 / Memory Read | |
| SCHENKER XMG Oasis | |
| SCHENKER XMG Neo 15 E22 (Early 2022, RTX 3080 Ti) | |
| MSI GE76 Raider | |
| Average of class Gaming (24879 - 90647, n=222, last 2 years) | |
| Average Intel Core i7-12700H (25586 - 79442, n=62) | |
| Alienware m15 R6, i7-11800H RTX 3080 | |
| Asus ROG Strix Scar 15 G533QS | |
| AIDA64 / Memory Write | |
| SCHENKER XMG Oasis | |
| SCHENKER XMG Neo 15 E22 (Early 2022, RTX 3080 Ti) | |
| MSI GE76 Raider | |
| Average of class Gaming (21619 - 103259, n=222, last 2 years) | |
| Average Intel Core i7-12700H (23679 - 88660, n=62) | |
| Asus ROG Strix Scar 15 G533QS | |
| Alienware m15 R6, i7-11800H RTX 3080 | |
| AIDA64 / Memory Latency | |
| Alienware m15 R6, i7-11800H RTX 3080 | |
| MSI GE76 Raider | |
| Average of class Gaming (59.5 - 152.5, n=219, last 2 years) | |
| Asus ROG Strix Scar 15 G533QS | |
| Average Intel Core i7-12700H (76.2 - 133.9, n=60) | |
| SCHENKER XMG Neo 15 Tiger Lake | |
| Razer Blade 15 Advanced (Mid 2021) | |
| SCHENKER XMG Neo 15 E22 (Early 2022, RTX 3080 Ti) | |
| SCHENKER XMG Oasis | |
* ... smaller is better
DPC latencies
LatencyMon already shows increased latency when opening the Edge browser. It gets a bit worse when opening multiple tabs and playing our 4K/60 fps YouTube video. Nevertheless, the video plays without dropped frames.


| DPC Latencies / LatencyMon - interrupt to process latency (max), Web, Youtube, Prime95 | |
| Razer Blade 15 Advanced (Mid 2021) | |
| MSI GE76 Raider | |
| Asus ROG Strix Scar 15 G533QS | |
| Alienware m15 R6, i7-11800H RTX 3080 | |
| SCHENKER XMG Neo 15 E22 (Early 2022, RTX 3080 Ti) | |
| SCHENKER XMG Neo 15 Tiger Lake | |
* ... smaller is better
Mass storage
Our pre-production model from China initially did not have an SSD. Schenker sent us a fast Samsung 980 Pro with unfortunately only 250 GB for the tests, which will almost never be installed due to its small size and does not even appear in our SSD best list so far.
With Windows 11 Home installed, only about 60 to 80 GB remained for other programs. The production model will probably have at least 512 GB.

* ... smaller is better
Continuous load read: DiskSpd Read Loop, Queue Depth 8
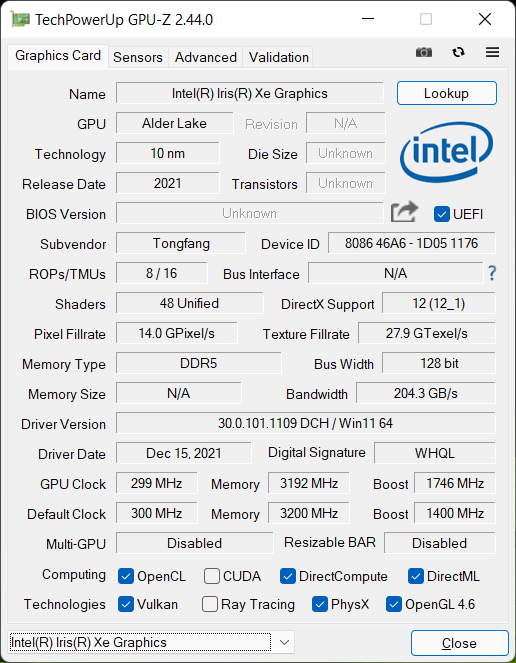
Graphics card
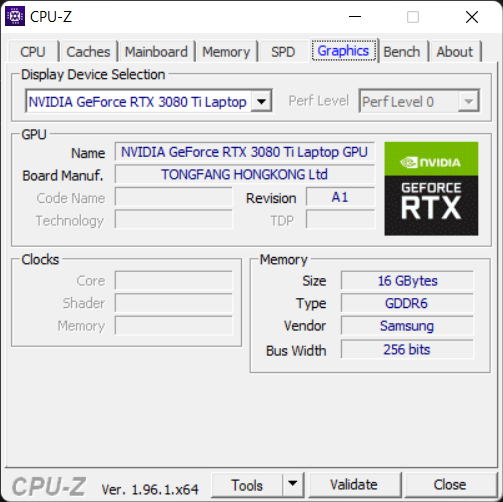
The brand-new Nvidia GeForce RTX 3080 Ti Laptop GPU is currently the fastest graphics card for notebooks. Max-Q and Whisper Mode are available, but there's no Advanced Optimus in the Neo 15. The card has a GDDR6 video memory of 16 GB.

Once again, Nvidia lets manufacturers decide about power consumption and thus performance. Schenker passes this decision on to the customer via the Control Center.
In 3DMark tests, the Neo 15 usually ranks just behind the MSI GE76 Raider that also runs the RTX 3080 Ti at full 175 W. However, the Neo 15's predecessor is only a few percentage points behind in many 3DMark tests and about 12% behind in the overall performance rating.
There are hardly any noteworthy differences with Oasis, and the combination is usually even behind the Neo-only rates.
Away from the power outlet, the 3D performance drops considerably. In 3DMark 11, the laptop loses a whole 87% performance. In The Witcher 3 WQHD, the frame rate drops from just under 100 fps to only about 10 to 11 fps — a loss of almost 90 percent as well! Unfortunately, this is standard in view of the high power consumption of current GPUs.
| 3DMark 11 Performance | 35910 points | |
| 3DMark Cloud Gate Standard Score | 63903 points | |
| 3DMark Fire Strike Score | 27983 points | |
| 3DMark Time Spy Score | 12480 points | |
Help | ||
Gaming performance
With the RTX 3080 Ti in full configuration, the Neo 15 plays all current games smoothly in the native WQHD resolution. There should also be enough reserves for 4K most of the time.
The Witcher 3 runs at about 95 fps in 2,560 x 1,440 pixels ultra and at 120 fps in full HD. Far Cry 5 also runs at over 100 fps in native resolution.
Laptops with an RTX 3080 lag by about 10% while the MSI GE76 Raider is minimally faster. We could not install GTA V as the SSD capacity is too small and Windows 11is too space-consuming. Hopefully, we can make up for that in the production model.
With Oasis cooling, The Witcher 3 and Far Cry 5 run about 3 to 5% faster, which is normally not noticeable in practice, but result in bigger differences in temperatures.
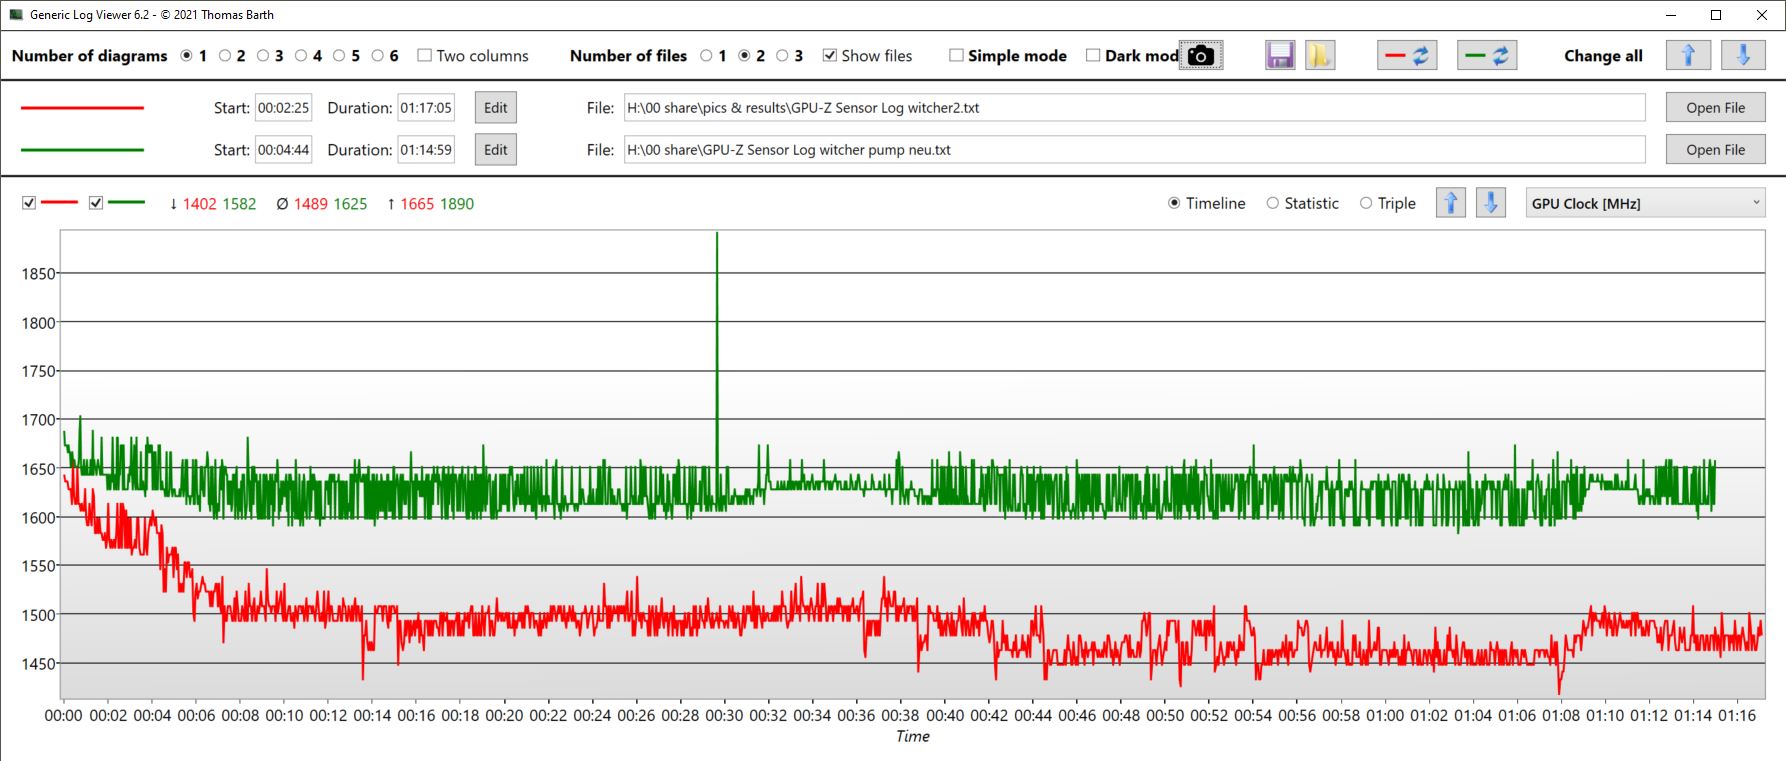
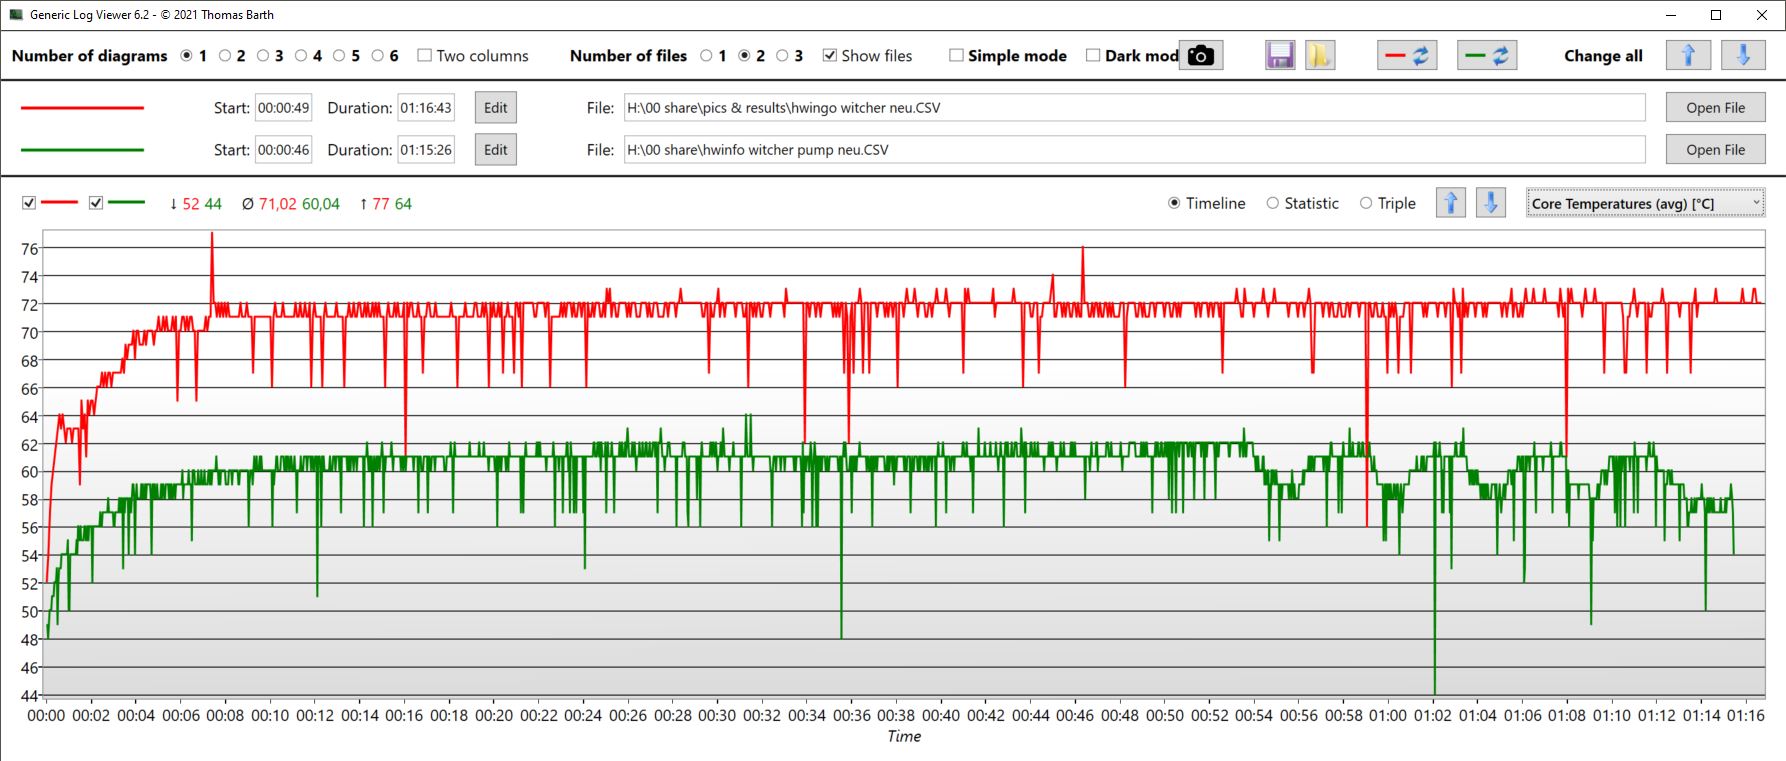
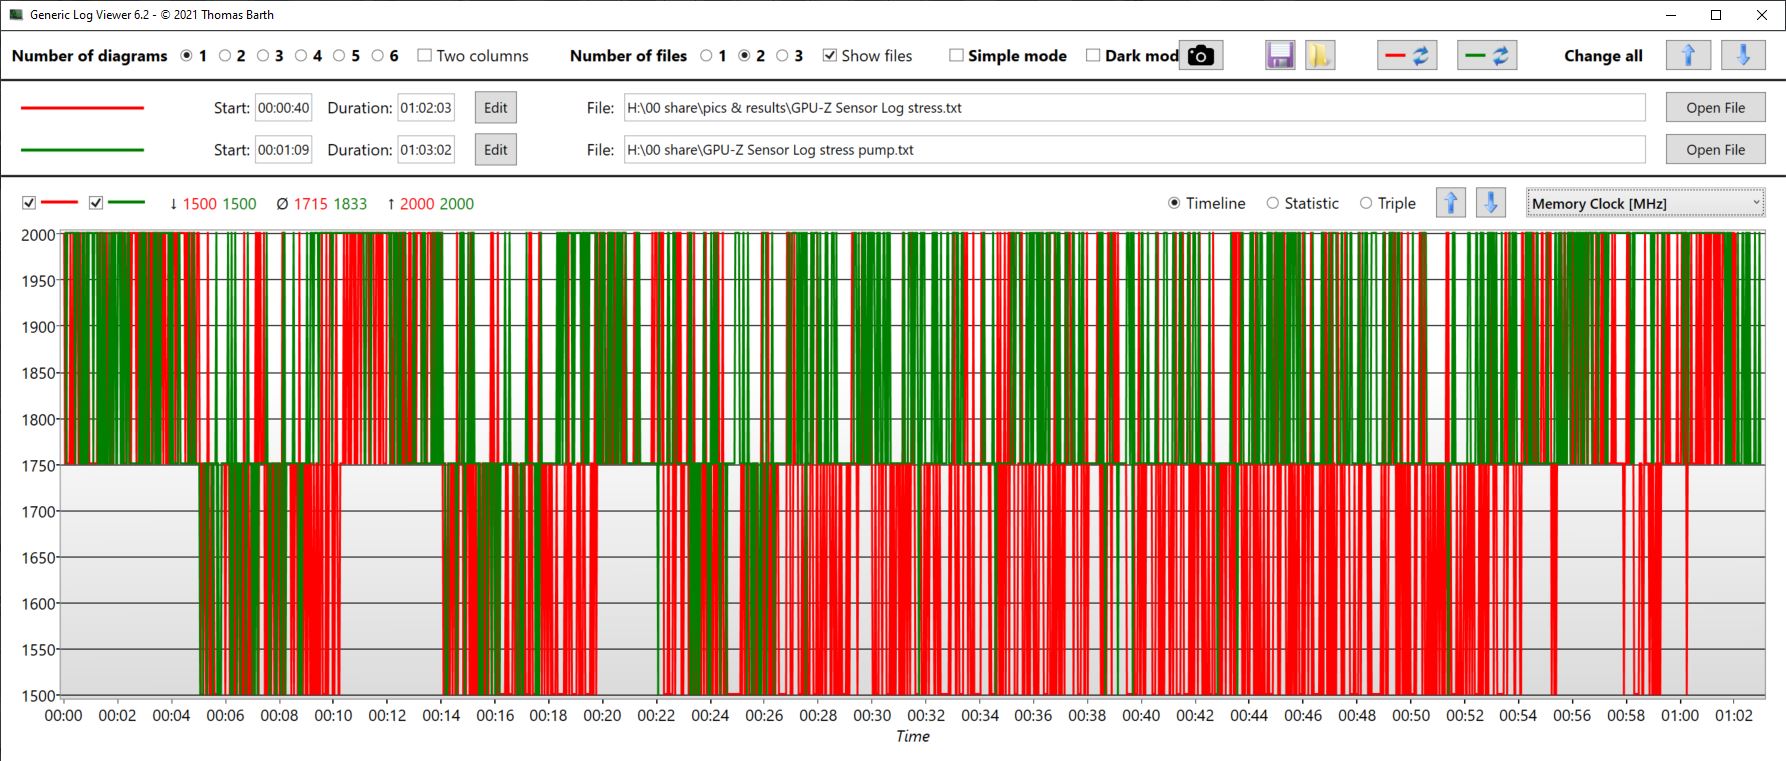
The evaluation of an hour of The Witcher 3 stress shows that the GPU of the Neo 15 is able to clock about 150 MHz higher on average with Oasis, stays a whole 16 °C cooler, draws more power, and can use more memory.


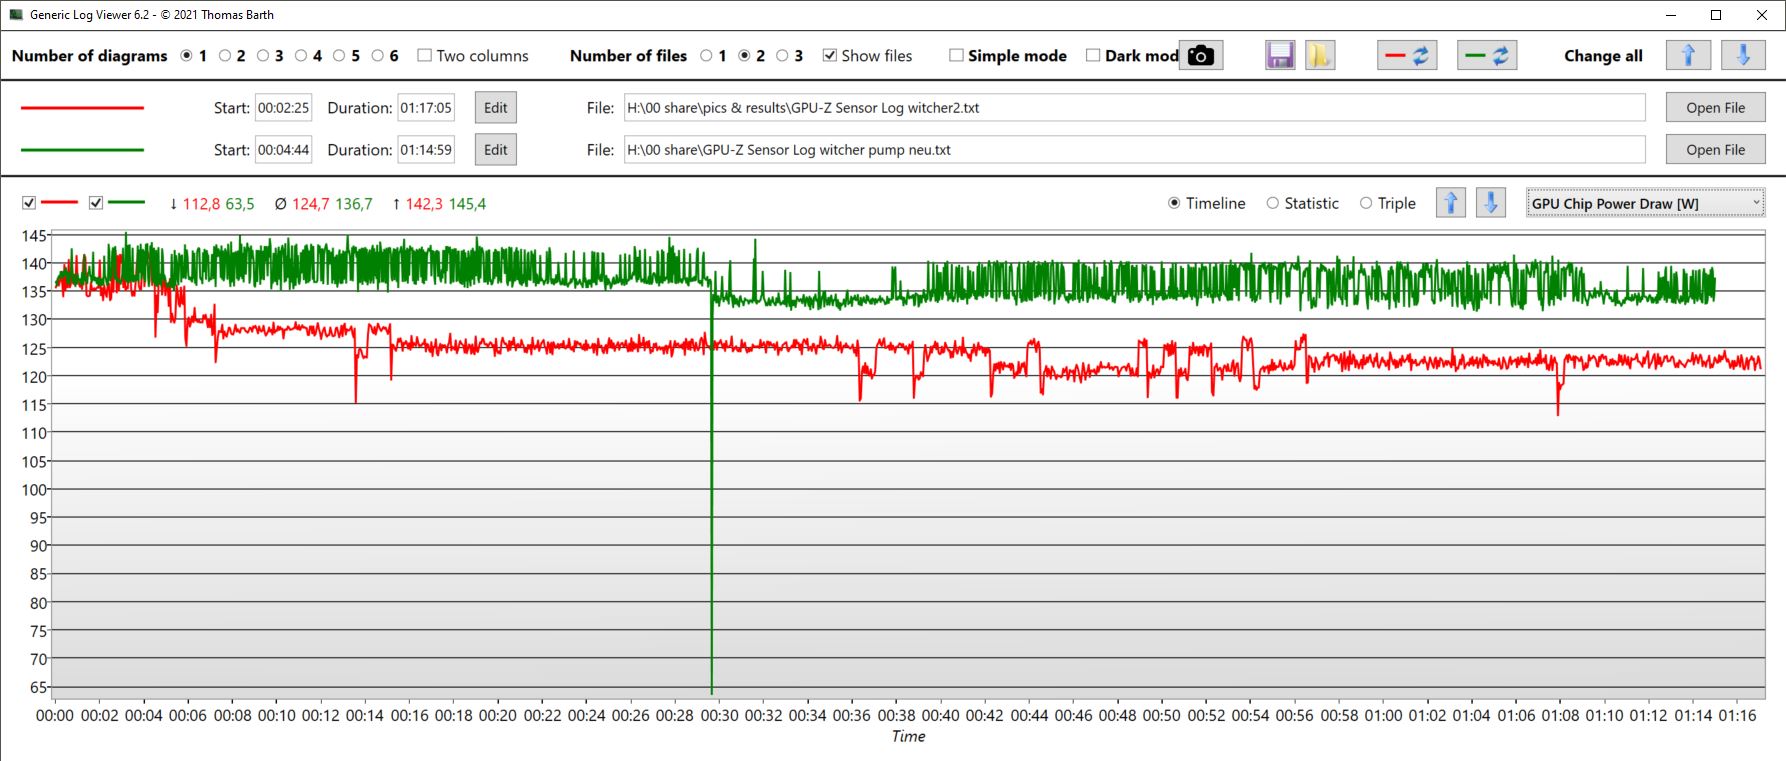
The effect is somewhat smaller on the CPU in The Witcher 3 stress. The clock rate is almost the same, and there's no apparent thermal throttling with the CPU even without Oasis. Nevertheless, the CPU temperatures are about 11 °C lower with Oasis attached.

The frame rate in The Witcher 3 only decreases slightly over an hour but does not behave quite consistently either. With Oasis, the frame rate is similar but is always about 7% above of what we've seen without the water cooling. Thus, the long-term performance is minimally better.
The Witcher 3 - FPS Diagram
| low | med. | high | ultra | QHD | |
| The Witcher 3 (2015) | 388.4 | 325.6 | 212.4 | 121 | |
| Dota 2 Reborn (2015) | 175 | 162 | 153 | 147 | |
| Final Fantasy XV Benchmark (2018) | 151 | 115 | 87.4 | ||
| X-Plane 11.11 (2018) | 142 | 124 | 101 | ||
| Far Cry 5 (2018) | 164 | 145 | 140 | 131 | 116 |
Emissions: Did we mention water cooling?
Noise emissions
The Overboost mode we used with manually maximized TDP/TGP values is certainly not the usual use case. The hardware offers enough power to also be operated in the much quieter Enthusiast or Balanced modes (with Whisper Mode).
Even in Overboost mode, the device is, at least, not louder than the predecessor with an RTX 3080. The comparison devices run only slightly quieter as well.
With Oasis, the noise emissions unfortunately drop only marginally (Oasis Balanced) — from about 54 to 53 dB in The Witcher 3. The noise-level drop is similarly low in the stress test. The not-necessarily-quiet fan of the Oasis adds its volume to that of the internal fan, which then spins at lower speeds. Overall, the difference is less than we would like.
However, these values were measured after one hour of gaming and stress test. During short loads, such as a 3DMark06 subtest, we noticed that the internal fans did not start up at all due to Oasis. From this point of view, the noise emissions are already significantly lower in theory. Furthermore, three fan profiles can be set for Oasis (Balanced, Quiet, Very Quiet). Under Quiet, The Witcher 3 only produces 49 dB instead of 53 or 54 dB (measured at a distance of 15 - 20 cm).
Under load, we hear a whirring sound from the Neo case, but it fades into the background due to the overall fan sound.
Noise Level
| Idle |
| 24 / 24 / 27.76 dB(A) |
| Load |
| 38.81 / 54.18 dB(A) |
 | ||
30 dB silent 40 dB(A) audible 50 dB(A) loud |
||
min: | ||
| SCHENKER XMG Neo 15 E22 (Early 2022, RTX 3080 Ti) GeForce RTX 3080 Ti Laptop GPU, i7-12700H, Samsung SSD 980 Pro 250GB MZ-V8P250BW | SCHENKER XMG Neo 15 Tiger Lake GeForce RTX 3080 Laptop GPU, i7-11800H, Samsung SSD 980 Pro 1TB MZ-V8P1T0BW | Razer Blade 15 Advanced (Mid 2021) GeForce RTX 3080 Laptop GPU, i7-11800H, SSSTC CA6-8D1024 | Asus ROG Strix Scar 15 G533QS GeForce RTX 3080 Laptop GPU, R9 5900HX, ADATA Swordfish 2 TB | Alienware m15 R6, i7-11800H RTX 3080 GeForce RTX 3080 Laptop GPU, i7-11800H, Samsung PM9A1 MZVL21T0HCLR | MSI GE76 Raider GeForce RTX 3080 Ti Laptop GPU, i9-12900HK, Samsung PM9A1 MZVL22T0HBLB | |
|---|---|---|---|---|---|---|
| Noise | -11% | 1% | -6% | 0% | -14% | |
| off / environment * | 24 | 25 -4% | 25.1 -5% | 25.5 -6% | 23 4% | 26 -8% |
| Idle Minimum * | 24 | 27 -13% | 25.3 -5% | 25.5 -6% | 23 4% | 26 -8% |
| Idle Average * | 24 | 30 -25% | 25.3 -5% | 25.5 -6% | 23 4% | 27 -13% |
| Idle Maximum * | 27.76 | 32 -15% | 25.3 9% | 37.1 -34% | 30 -8% | 40 -44% |
| Load Average * | 38.81 | 46 -19% | 42 -8% | 39.2 -1% | 41.26 -6% | 50 -29% |
| Witcher 3 ultra * | 54.2 | 52 4% | 45.6 16% | 50.5 7% | 53.4 1% | 53 2% |
| Load Maximum * | 54.18 | 55 -2% | 51.6 5% | 51.8 4% | 53.37 1% | 53 2% |
* ... smaller is better
Temperature
The Oasis can finally show its strengths in temperature emissions. We saw the significantly lower GPU and CPU temperatures above, and that carries over at least partially to the surface temperatures.
Because of the unhindered RTX 3080 Ti, we measured up to 68 °C on the underside after one hour of stress testing. However, Schenker also suspects a defect of the pre-release model here. With Oasis, this value is reduced to a much more tolerable 51 °C.
(-) The maximum temperature on the upper side is 52 °C / 126 F, compared to the average of 40.4 °C / 105 F, ranging from 21.2 to 68.8 °C for the class Gaming.
(-) The bottom heats up to a maximum of 68 °C / 154 F, compared to the average of 43.2 °C / 110 F
(+) In idle usage, the average temperature for the upper side is 29 °C / 84 F, compared to the device average of 33.8 °C / 93 F.
(-) Playing The Witcher 3, the average temperature for the upper side is 39 °C / 102 F, compared to the device average of 33.8 °C / 93 F.
(±) The palmrests and touchpad can get very hot to the touch with a maximum of 36 °C / 96.8 F.
(-) The average temperature of the palmrest area of similar devices was 28.9 °C / 84 F (-7.1 °C / -12.8 F).
| SCHENKER XMG Neo 15 E22 (Early 2022, RTX 3080 Ti) Intel Core i7-12700H, NVIDIA GeForce RTX 3080 Ti Laptop GPU | SCHENKER XMG Oasis | SCHENKER XMG Neo 15 Tiger Lake Intel Core i7-11800H, NVIDIA GeForce RTX 3080 Laptop GPU | Razer Blade 15 Advanced (Mid 2021) Intel Core i7-11800H, NVIDIA GeForce RTX 3080 Laptop GPU | Asus ROG Strix Scar 15 G533QS AMD Ryzen 9 5900HX, NVIDIA GeForce RTX 3080 Laptop GPU | Alienware m15 R6, i7-11800H RTX 3080 Intel Core i7-11800H, NVIDIA GeForce RTX 3080 Laptop GPU | MSI GE76 Raider Intel Core i9-12900HK, NVIDIA GeForce RTX 3080 Ti Laptop GPU | |
|---|---|---|---|---|---|---|---|
| Heat | 22% | 11% | 3% | 8% | -5% | 11% | |
| Maximum Upper Side * | 52 | 42 19% | 39 25% | 51 2% | 43.4 17% | 61 -17% | 43 17% |
| Maximum Bottom * | 68 | 51 25% | 50 26% | 52 24% | 48.2 29% | 58 15% | 47 31% |
| Idle Upper Side * | 32 | 34 -6% | 35.2 -10% | 35.2 -10% | 38 -19% | 33 -3% | |
| Idle Bottom * | 36 | 37 -3% | 37.8 -5% | 37 -3% | 36 -0% | 37 -3% |
* ... smaller is better
Stress test
The cores start our stress test at approximately 3.6 GHz. Over the course of the hour, the clock decreases and then fluctuates between 2.2 and 3 GHz. The average clock is around 2.6 GHz. With Oasis, the average clocks are at a much higher 3.1 GHz with 8 °C lower core temperatures at the same time, while the package power is raised by is 25 W!


The GPU clock seems to be about the same, but the memory clock apparently drops more often without Oasis. At the same time, Oasis provides on average of 20 °C lower GPU temperatures!
A new 3DMark 11 run directly after the stress produced the same score as a run without prior stress.


| Air Cooling/Oasis | |||
| CPU Clock (GHz) | GPU Clock (MHz) | Average CPU Temperature (°C) | Average GPU Temperature (°C) |
| Prime95 + FurMark Stress | 2.6/3.1 | 1.3 | 88/80 |
| Witcher 3 Stress | 2.5/2.6 | 1.5/1.6 | 71/60 |
Loudspeaker
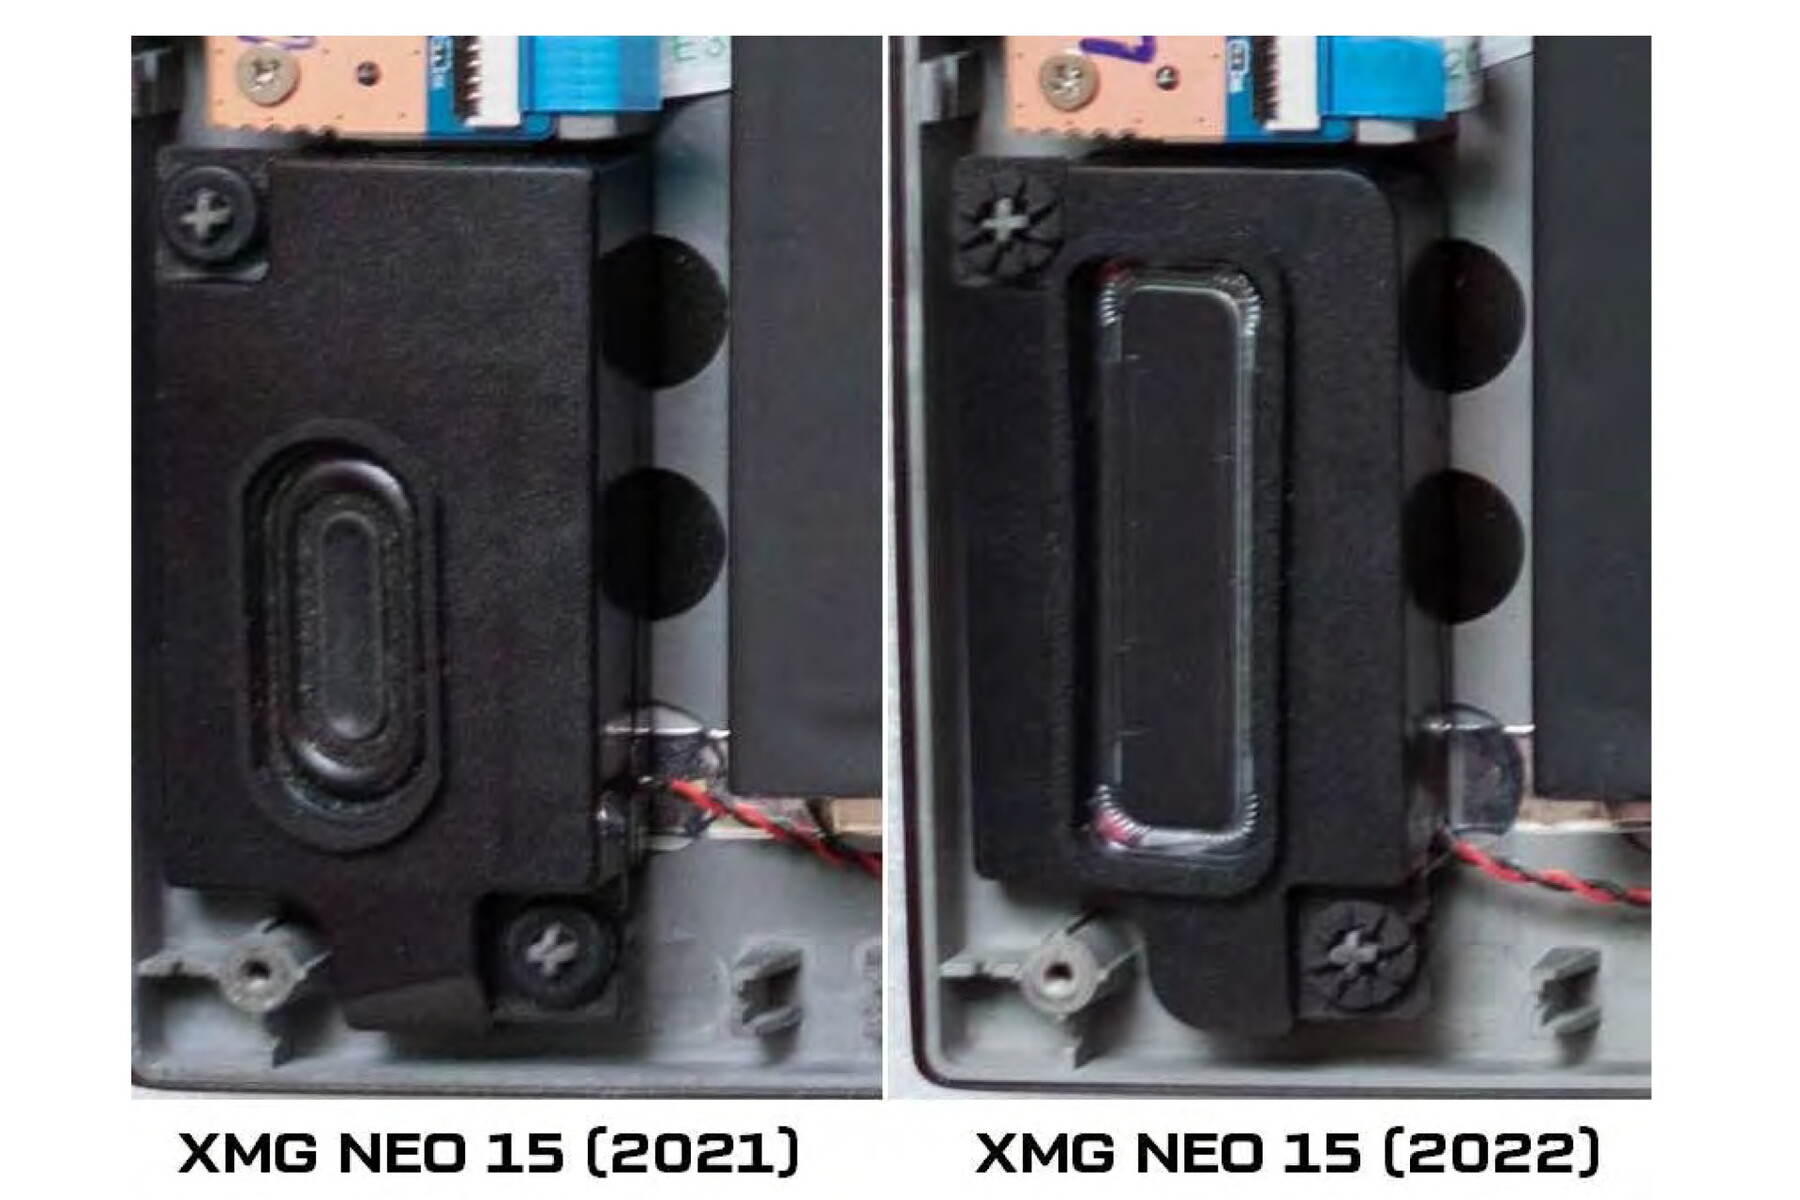
Schenker has enlarged the speakers in the new Neo. They are now minimally louder and offer minimally more bass, but it is still clearly too low.
A microphone/line-in and a headset port are available for analog third-party devices.
SCHENKER XMG Neo 15 E22 (Early 2022, RTX 3080 Ti) audio analysis
(±) | speaker loudness is average but good (80.8 dB)
Bass 100 - 315 Hz
(-) | nearly no bass - on average 16.5% lower than median
(±) | linearity of bass is average (7.6% delta to prev. frequency)
Mids 400 - 2000 Hz
(±) | higher mids - on average 6.7% higher than median
(±) | linearity of mids is average (7.5% delta to prev. frequency)
Highs 2 - 16 kHz
(+) | balanced highs - only 2.8% away from median
(+) | highs are linear (5.2% delta to prev. frequency)
Overall 100 - 16.000 Hz
(±) | linearity of overall sound is average (17% difference to median)
Compared to same class
» 42% of all tested devices in this class were better, 12% similar, 46% worse
» The best had a delta of 6%, average was 18%, worst was 132%
Compared to all devices tested
» 25% of all tested devices were better, 7% similar, 67% worse
» The best had a delta of 4%, average was 25%, worst was 134%
SCHENKER XMG Neo 15 Tiger Lake audio analysis
(±) | speaker loudness is average but good (79 dB)
Bass 100 - 315 Hz
(-) | nearly no bass - on average 22.6% lower than median
(±) | linearity of bass is average (9.5% delta to prev. frequency)
Mids 400 - 2000 Hz
(+) | balanced mids - only 4.7% away from median
(±) | linearity of mids is average (9.1% delta to prev. frequency)
Highs 2 - 16 kHz
(+) | balanced highs - only 4.1% away from median
(+) | highs are linear (5.3% delta to prev. frequency)
Overall 100 - 16.000 Hz
(±) | linearity of overall sound is average (19.4% difference to median)
Compared to same class
» 64% of all tested devices in this class were better, 8% similar, 29% worse
» The best had a delta of 6%, average was 18%, worst was 132%
Compared to all devices tested
» 42% of all tested devices were better, 8% similar, 50% worse
» The best had a delta of 4%, average was 25%, worst was 134%
Energy management: High consumption, good battery performance
Power consumption
The RTX 3080 Ti naturally places certain demands on the power supply. The system draws an average of 228 W from the socket in The Witcher 3, which increases by about 10 W with the XMG Oasis. However, the consumption can also shoot up to 280 W especially at the beginning.
Even more power is consumed during the stress test. We measured an average of 242 W and load peaks of up to 330 W in addition to a fluctuating consumption that always jumps up to about 280 W in the long run. Overall, power consumption is as high as performance.
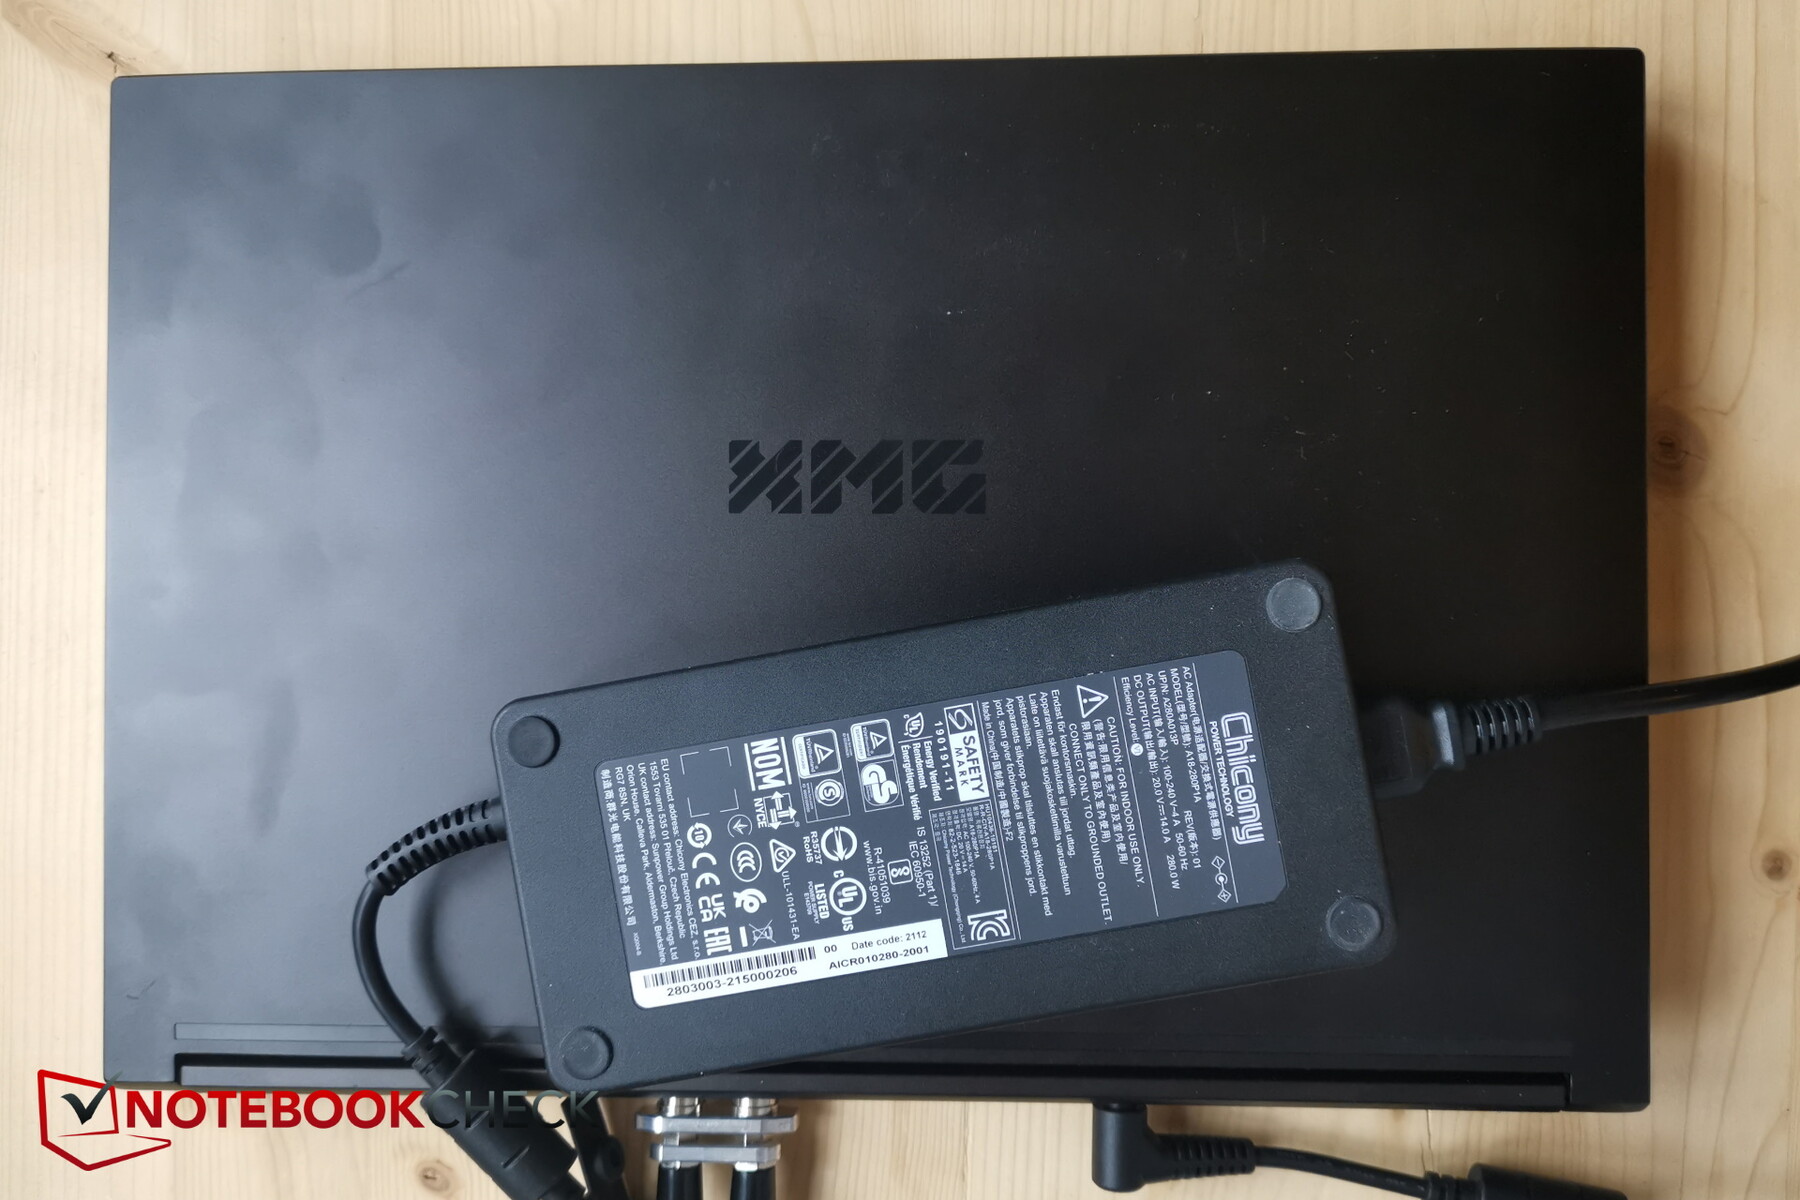
The short-connected, large power supply (~18 x 8.5 x 3.4 cm) is designed for 280 W output power and should actually be able to accommodate the values measured at the beginning, but reliable charging in all situations may not be a possibility. There are plans for a 330 W power supply.
| Idle | |
| Load |
|
| SCHENKER XMG Neo 15 E22 (Early 2022, RTX 3080 Ti) i7-12700H, GeForce RTX 3080 Ti Laptop GPU, Samsung SSD 980 Pro 250GB MZ-V8P250BW, IPS, 2560x1440, 15.60 | SCHENKER XMG Neo 15 Tiger Lake i7-11800H, GeForce RTX 3080 Laptop GPU, Samsung SSD 980 Pro 1TB MZ-V8P1T0BW, IPS, 2560x1440, 15.60 | Razer Blade 15 Advanced (Mid 2021) i7-11800H, GeForce RTX 3080 Laptop GPU, SSSTC CA6-8D1024, IPS, 1920x1080, 15.60 | Asus ROG Strix Scar 15 G533QS R9 5900HX, GeForce RTX 3080 Laptop GPU, ADATA Swordfish 2 TB, IPS, 2560x1440, 15.60 | Alienware m15 R6, i7-11800H RTX 3080 i7-11800H, GeForce RTX 3080 Laptop GPU, Samsung PM9A1 MZVL21T0HCLR, IPS, 1920x1080, 15.60 | MSI GE76 Raider i9-12900HK, GeForce RTX 3080 Ti Laptop GPU, Samsung PM9A1 MZVL22T0HBLB, IPS-Level, 1920x1080, 17.30 | Average NVIDIA GeForce RTX 3080 Ti Laptop GPU | Average of class Gaming | |
|---|---|---|---|---|---|---|---|---|
| Power Consumption | 6% | -19% | 5% | 3% | -5% | -22% | -5% | |
| Idle Minimum * | 14 | 15 -7% | 19.5 -39% | 11.2 20% | 14 -0% | 12 14% | 17.2 ? -23% | 13.9 ? 1% |
| Idle Average * | 18 | 17 6% | 23.3 -29% | 16.4 9% | 18 -0% | 17 6% | 23.3 ? -29% | 19.1 ? -6% |
| Idle Maximum * | 19 | 22 -16% | 40.1 -111% | 29.4 -55% | 29 -53% | 28 -47% | 30.8 ? -62% | 26.9 ? -42% |
| Load Average * | 115 | 101 12% | 98.9 14% | 106.2 8% | 93 19% | 118 -3% | 121.2 ? -5% | 111.4 ? 3% |
| Witcher 3 ultra * | 228 | 195 14% | 174 24% | 189 17% | 190 17% | 252 -11% | ||
| Load Maximum * | 307 | 230 25% | 214 30% | 213.6 30% | 203 34% | 272 11% | 276 ? 10% | 251 ? 18% |
* ... smaller is better
Power consumption - The Witcher 3 / Stress test
Power consumption with external monitor
Battery life
The 93-Wh-battery does well. Apparently, some improvements in the power-saving mechanisms can be made via the offered performance profiles. The predecessor lasts less with the same size battery. We measured around 6 to 7 hours in our Wi-Fi and video test.
| SCHENKER XMG Neo 15 E22 (Early 2022, RTX 3080 Ti) i7-12700H, GeForce RTX 3080 Ti Laptop GPU, 93 Wh | SCHENKER XMG Neo 15 Tiger Lake i7-11800H, GeForce RTX 3080 Laptop GPU, 93 Wh | Razer Blade 15 Advanced (Mid 2021) i7-11800H, GeForce RTX 3080 Laptop GPU, 80 Wh | Asus ROG Strix Scar 15 G533QS R9 5900HX, GeForce RTX 3080 Laptop GPU, 90 Wh | Alienware m15 R6, i7-11800H RTX 3080 i7-11800H, GeForce RTX 3080 Laptop GPU, 84 Wh | MSI GE76 Raider i9-12900HK, GeForce RTX 3080 Ti Laptop GPU, 99.99 Wh | Average of class Gaming | |
|---|---|---|---|---|---|---|---|
| Battery Runtime | -20% | -12% | -27% | -34% | -24% | -25% | |
| H.264 | 413 | 352 -15% | 333 -19% | 397 ? -4% | |||
| WiFi v1.3 | 403 | 338 -16% | 353 -12% | 440 9% | 302 -25% | 306 -24% | 366 ? -9% |
| Load | 228 | 161 -29% | 85 -63% | 98 -57% | 83.9 ? -63% | ||
| Reader / Idle | 668 | 541 ? |
Verdict: Real added value through Oasis

The XMG Neo 15 is a great gaming laptop with a unique value-added selling point — the water port. The thermal throttling does not overly interfere even when air-cooled, which results not only in a very high gaming performance but also very high surface temperatures.
With the 200 Euro external water-cooling system, the XMG Oasis, the temperatures drop perceivably. Consequently, the noise also decreases and performance can also be higher depending on the application as long as thermal throttling is avoided due to the temperature drop. Overall, the Oasis's soundscape could still be optimized, perhaps at the pump or the gurgling that occurs despite venting. That being said, on the whole, the advantages convinced us. The combination can definitely pay off for gamers with high performance demands and also in terms of the system's longevity.
Details, such as the display, will first have to be clarified in our test of a production model. But the pre-production model already does a lot of things right.
The XMG Neo 15 has an extremely high performance and has a real unique value-added selling point in the form of the XMG Oasis, which, however, costs an additional 199 Euros. Without water cooling, the pre-production model gets very hot.
Price and availability
The pre-production model is currently not yet available. However, it can already be pre-ordered at bestware with delivery expected to start at the beginning of April. Our test configuration but with a 512 GB SSD instead of 250 GB costs €3,427.00 there.
More articles related to this device
SCHENKER XMG Neo 15 E22 (Early 2022, RTX 3080 Ti) (XMG Neo 15 Series)Related Articles


Pricecompare

