 Deutsch
 English
 Español
 Français
 Italiano
 Nederlands
 Polski
 Português
 Русский
 Türkçe
 Svenska
 Chinese
 Magyar
Inexpensive MSI GP66 Leopard 11UH in review: Gamer with RTX 3080 for under €2,000
Back in April we reviewed the predecessor MSI GP66 Leopard 10UG with Comet Lake CPU and praised the redesigned case. Newer GP66 Leopard 11UH is now equipped with a Tiger Lake CPU and the case has also changed. But the best thing is that the powerful gamer can already be purchased for less than 2,000 Euros in configuration with RTX 3080!
The GP66 11UH also comes with a QHD display or RTX 3070 as an alternative; our test model is equipped with a fast Full HD display.
The MSI is apparently one of the cheapest gaming laptops with RTX 3080, so it is not easy to find a proper competition in this price range. That's why we also used for comparison somewhat more expensive (up to +500 Euro) models here: Aorus 15P YD, the ASUS ROG Strix Scar 15, the Schenker XMG Neo 15 as well as the considerably more expensive Alienware m15 R6.
Possible competitors in comparison
Rating | Date | Model | Weight | Height | Size | Resolution | Best Price |
|---|---|---|---|---|---|---|---|
| 85.4 % | 12/2021 | MSI GP66 Leopard 11UH-028 i7-11800H, GeForce RTX 3080 Laptop GPU | 2.3 kg | 23.4 mm | 15.60" | 1920x1080 | |
| 84.2 % | 04/2021 | MSI GP66 Leopard 10UG i7-10870H, GeForce RTX 3070 Laptop GPU | 2.3 kg | 23.4 mm | 15.60" | 1920x1080 | |
| 86.4 % | 06/2021 | Aorus 15P YD i7-11800H, GeForce RTX 3080 Laptop GPU | 2.2 kg | 27 mm | 15.60" | 1920x1080 | |
| 86.3 % | 07/2021 | Asus ROG Strix Scar 15 G533QS R9 5900HX, GeForce RTX 3080 Laptop GPU | 2.3 kg | 27.2 mm | 15.60" | 2560x1440 | |
| 87 % | 06/2021 | SCHENKER XMG Neo 15 Tiger Lake i7-11800H, GeForce RTX 3080 Laptop GPU | 2.2 kg | 26 mm | 15.60" | 2560x1440 | |
| 86.1 % | 11/2021 | Alienware m15 R6, i7-11800H RTX 3080 i7-11800H, GeForce RTX 3080 Laptop GPU | 2.5 kg | 22.85 mm | 15.60" | 1920x1080 |
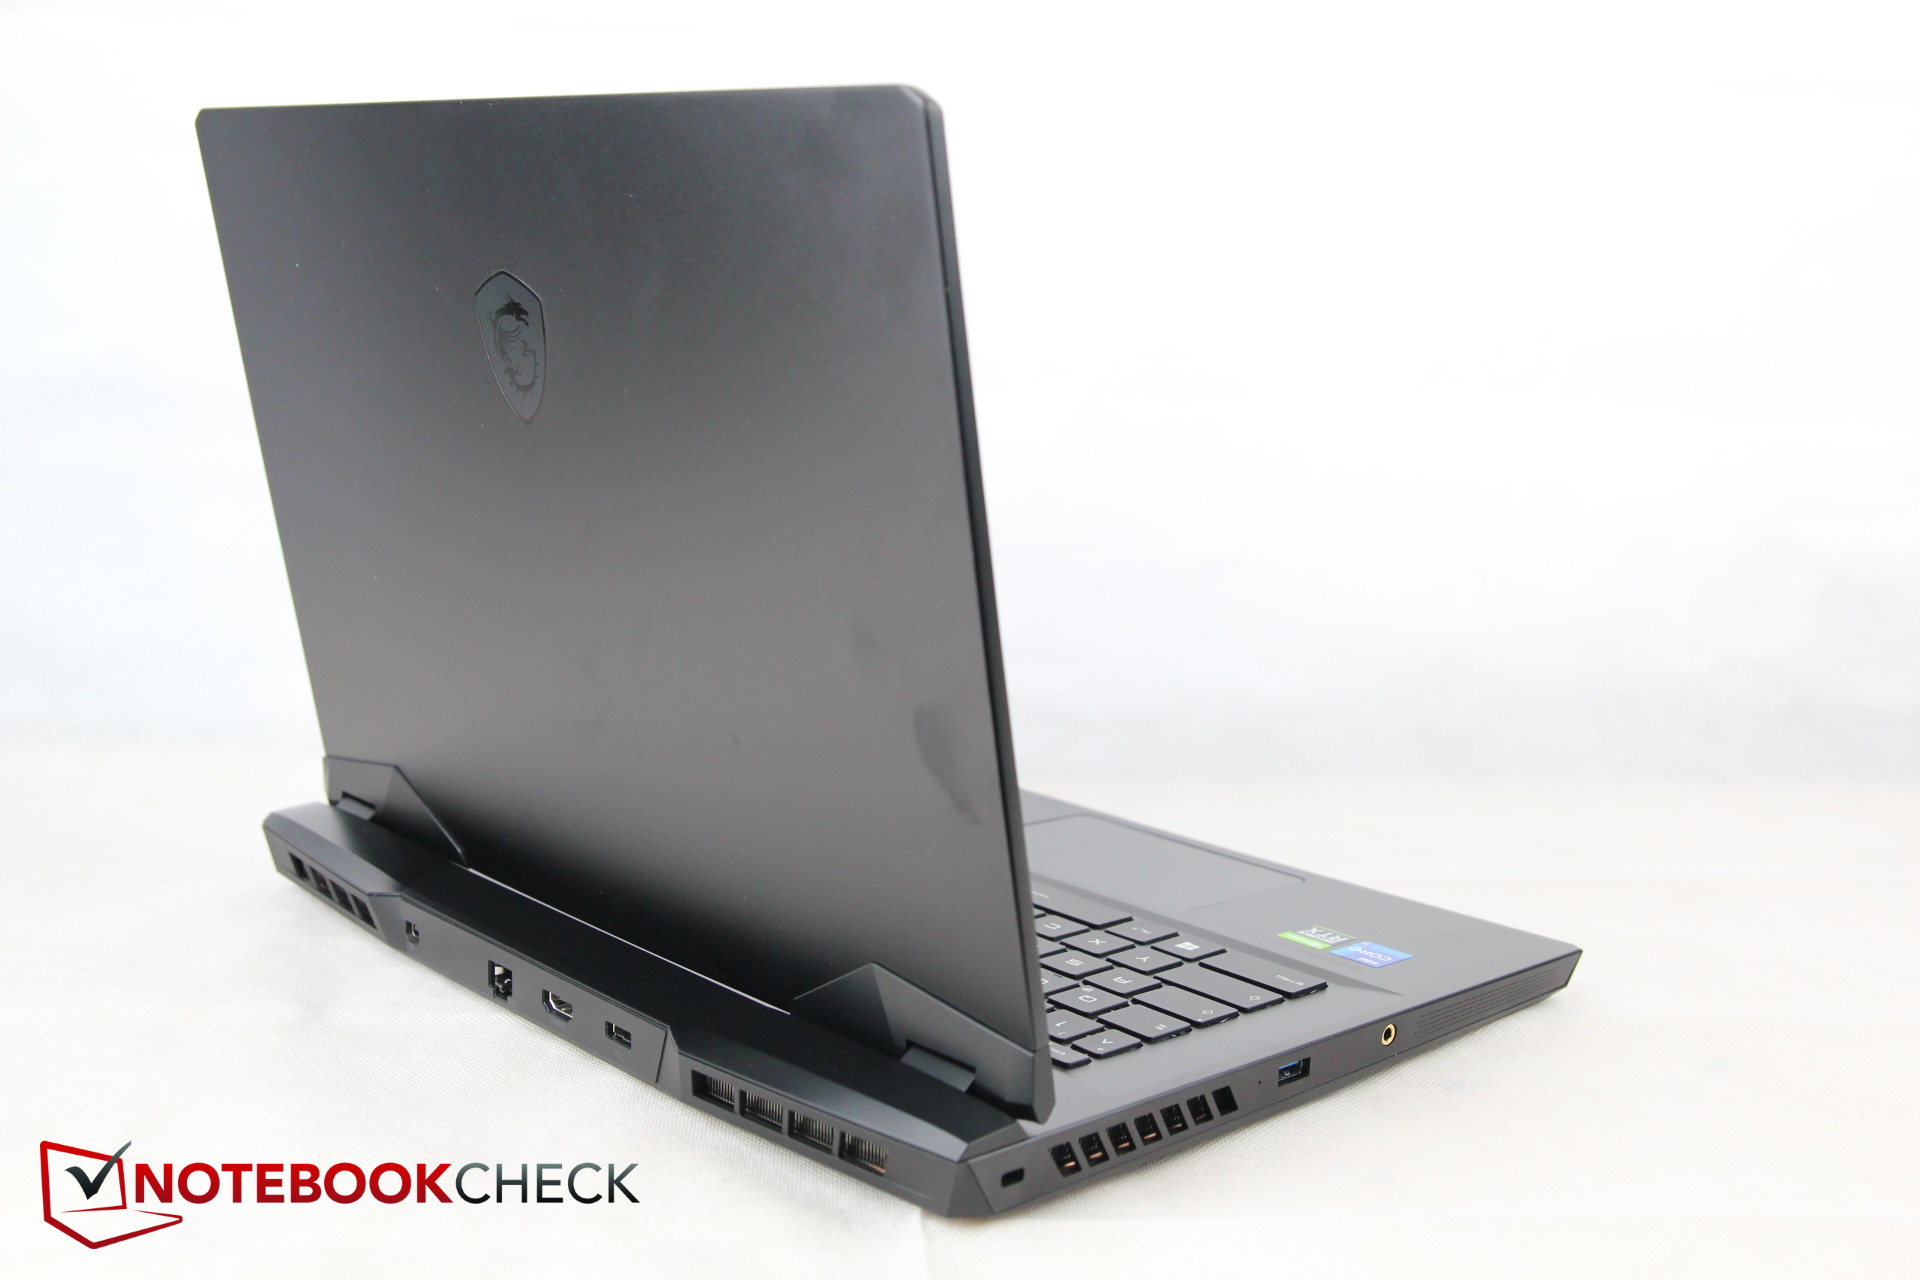
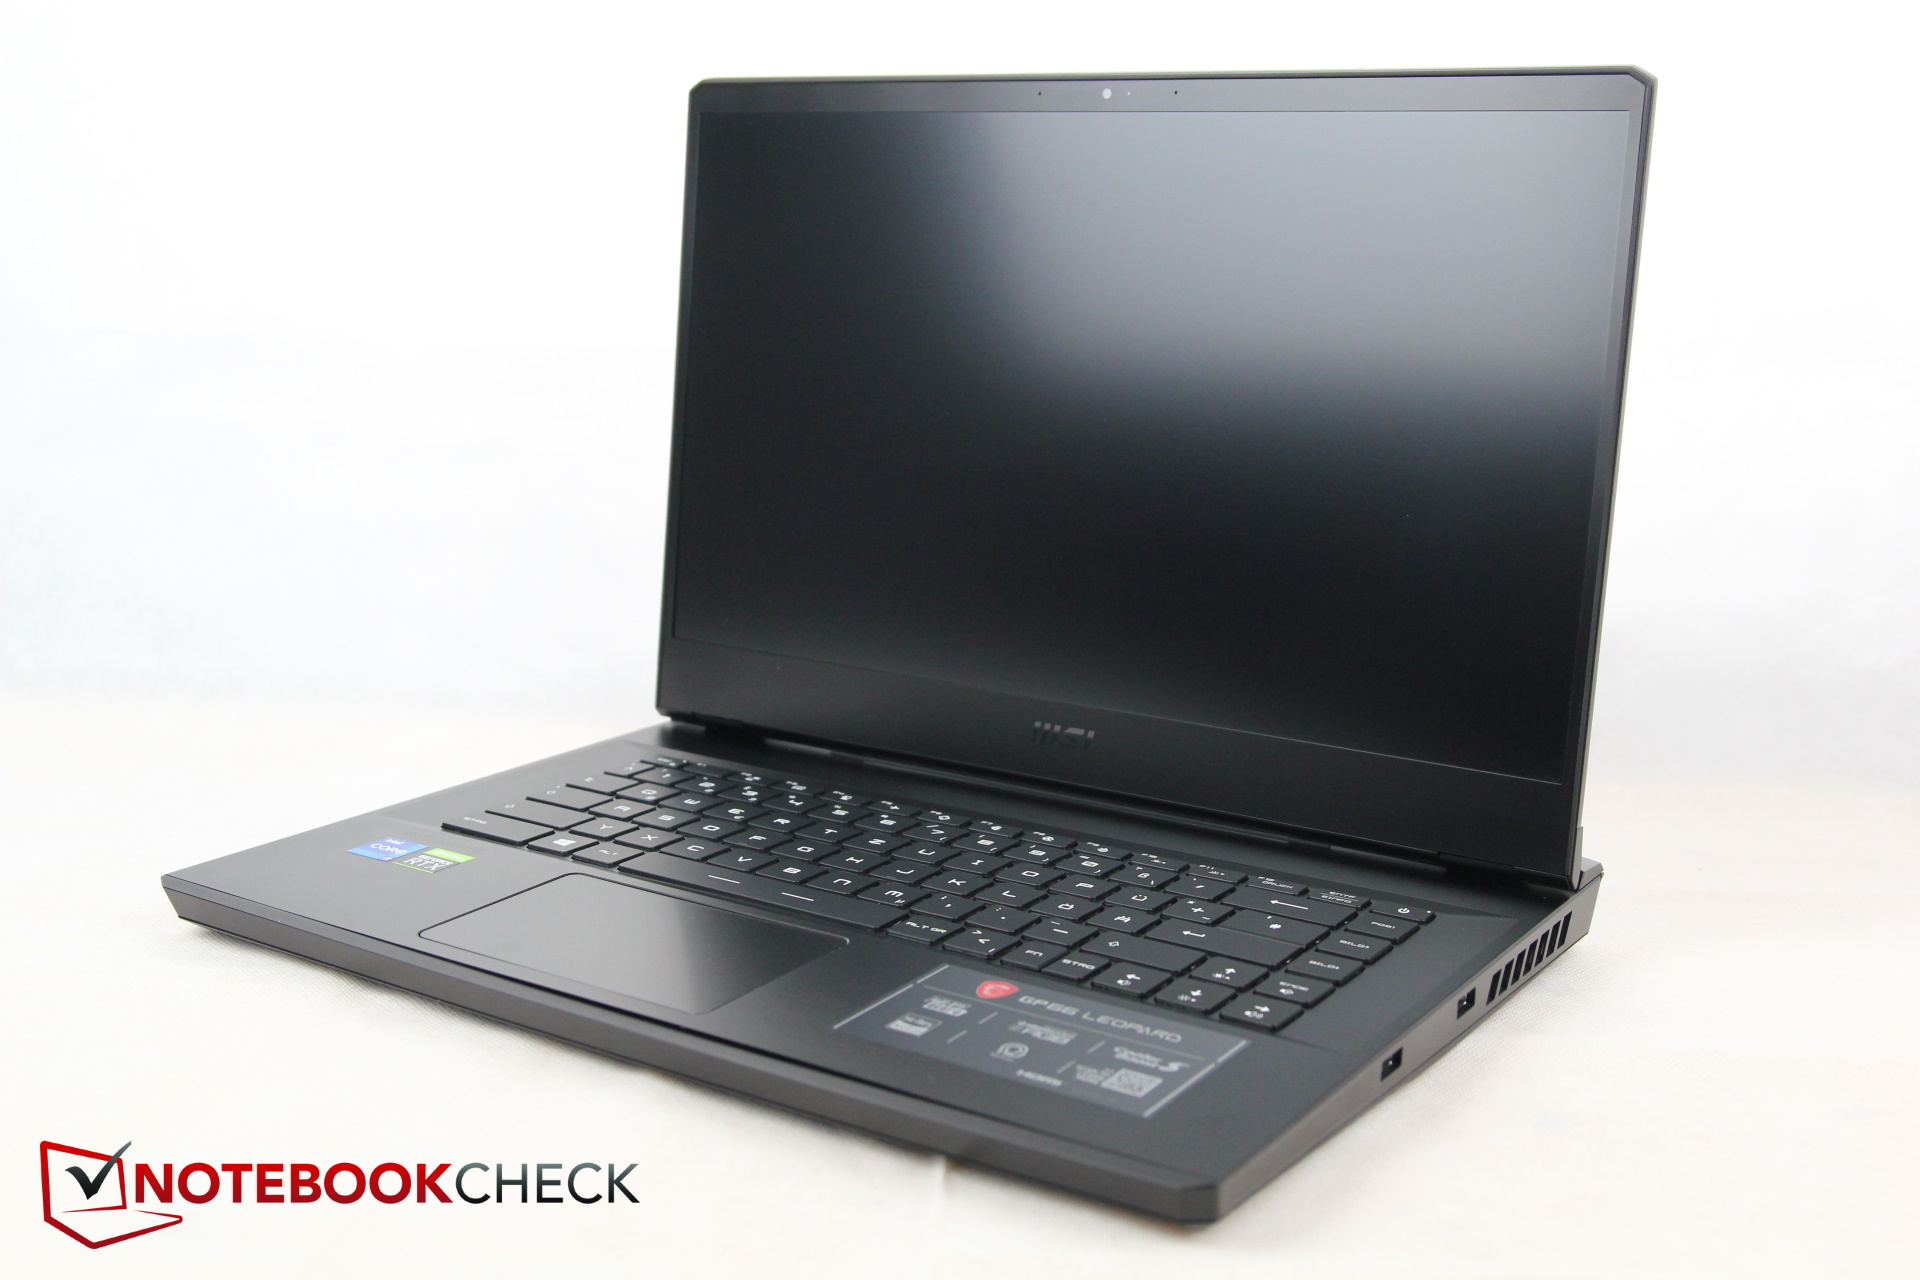
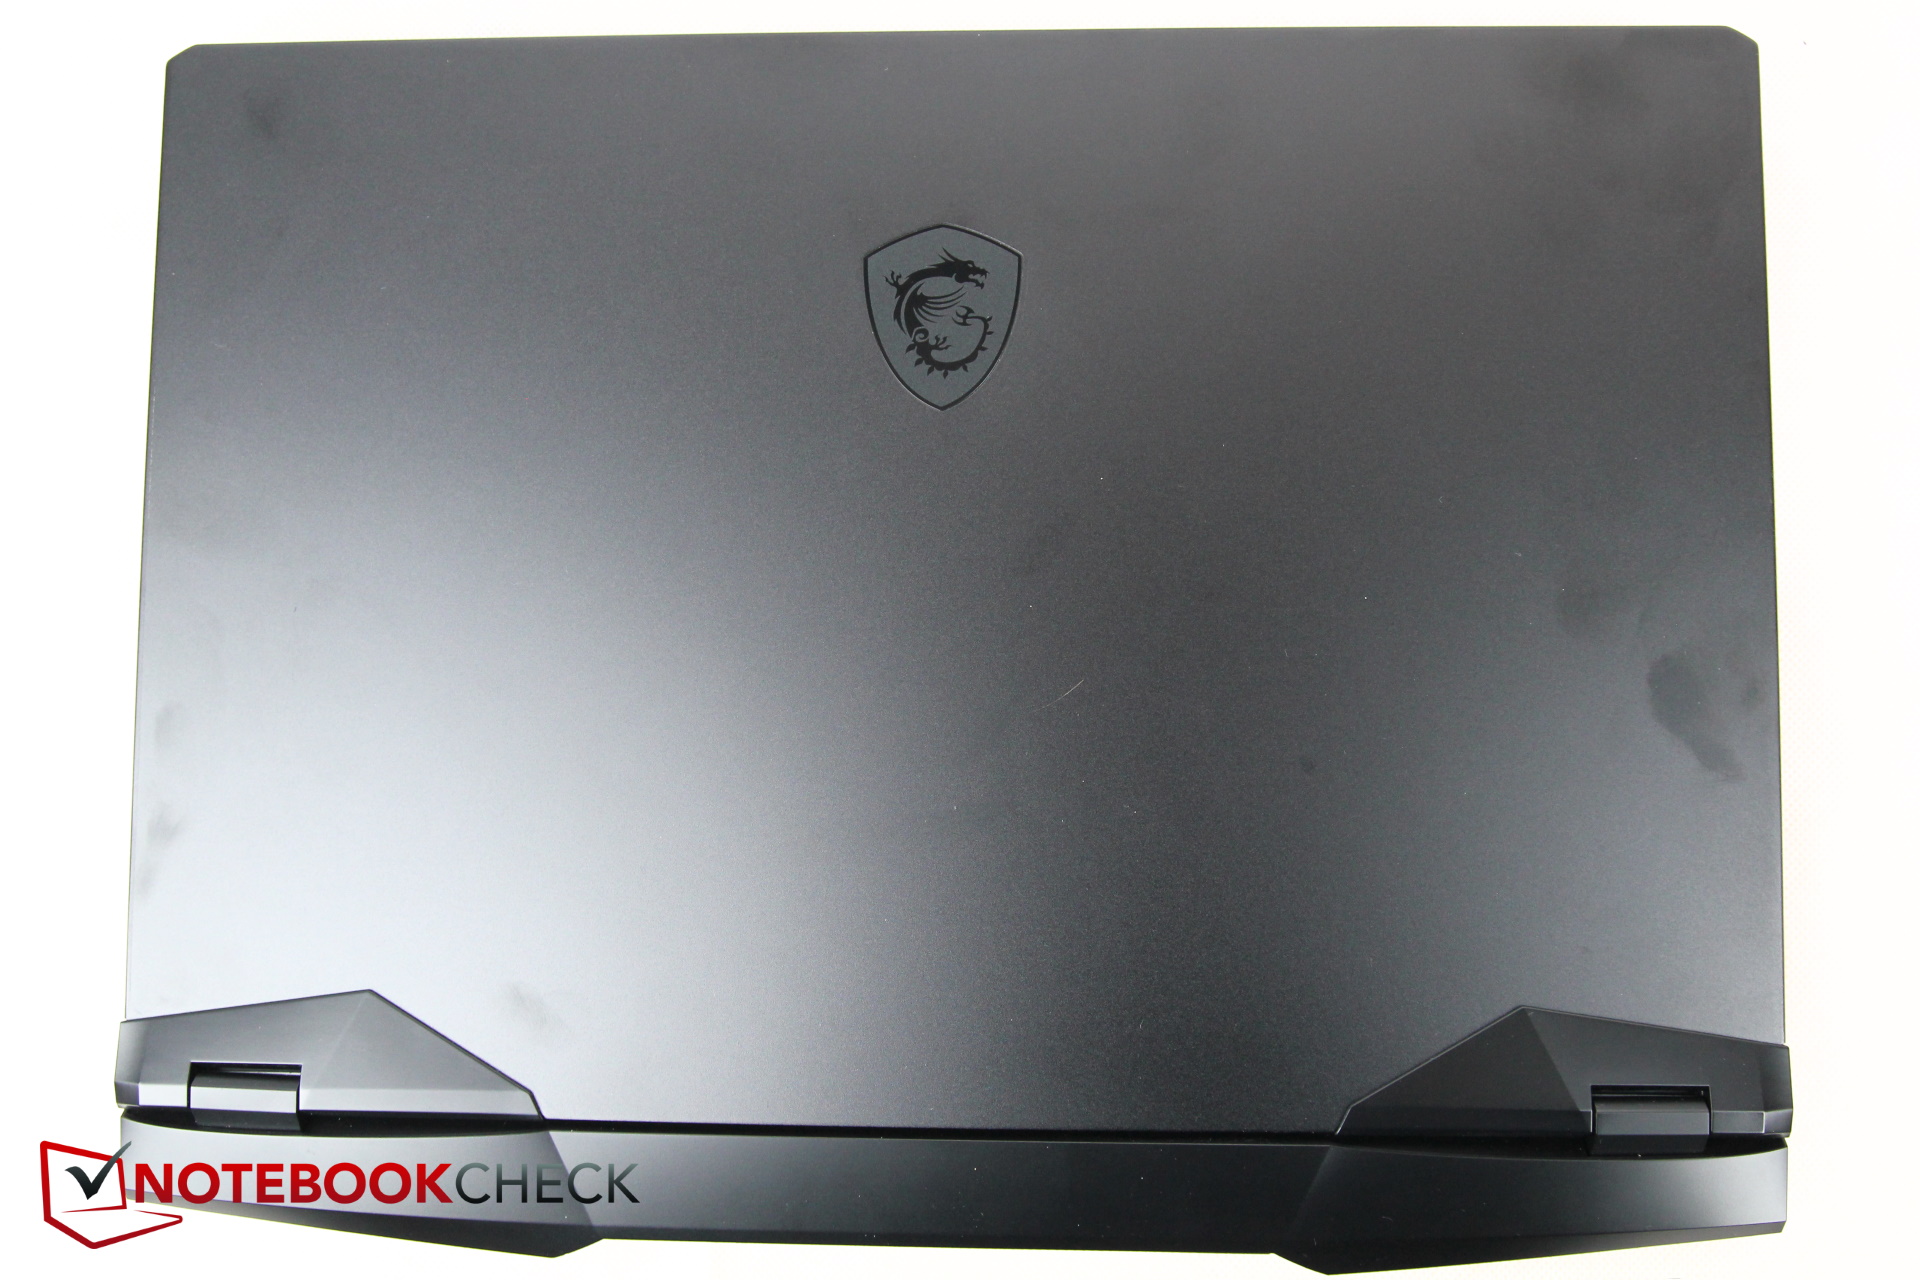
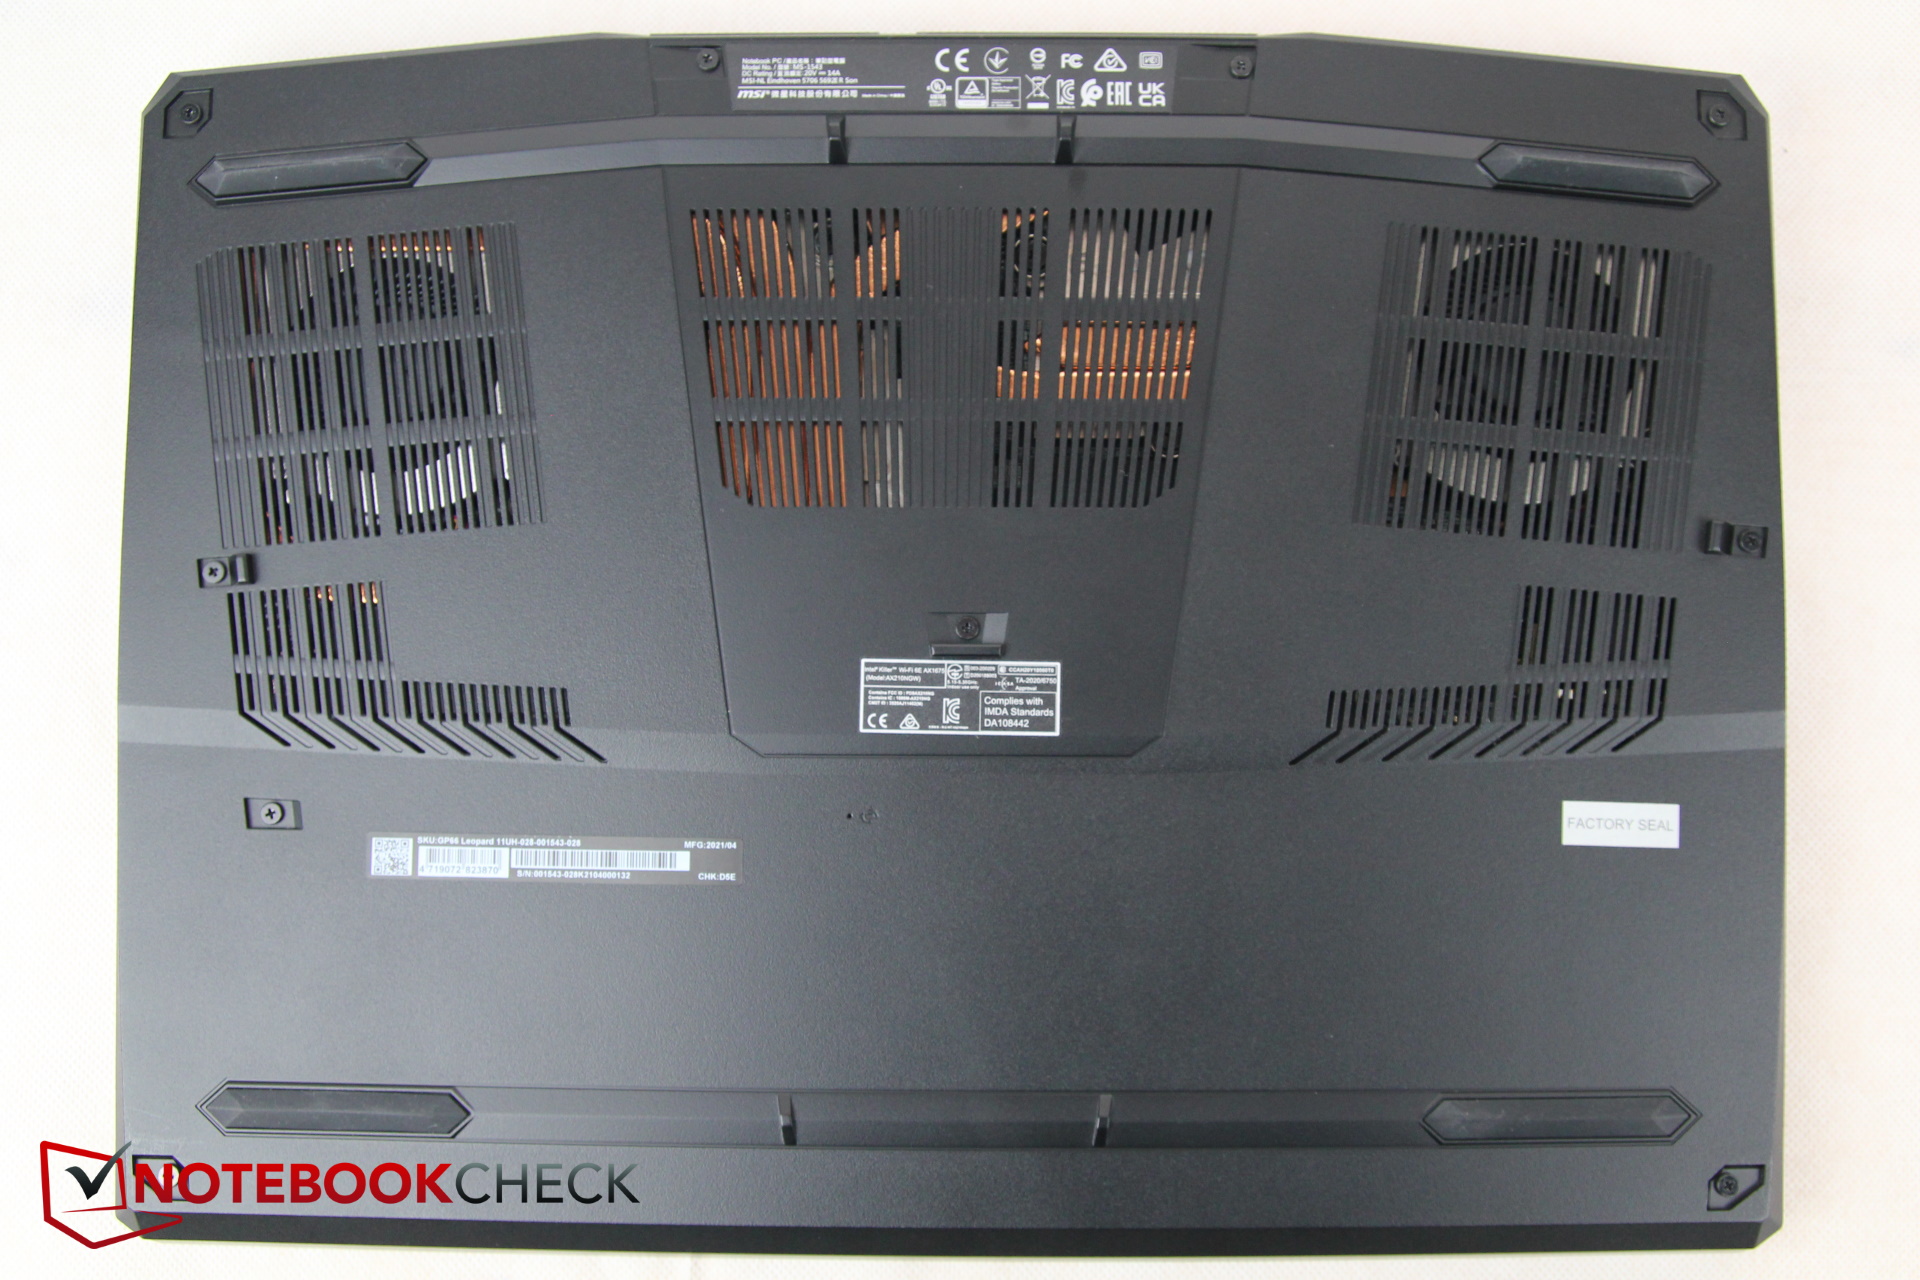
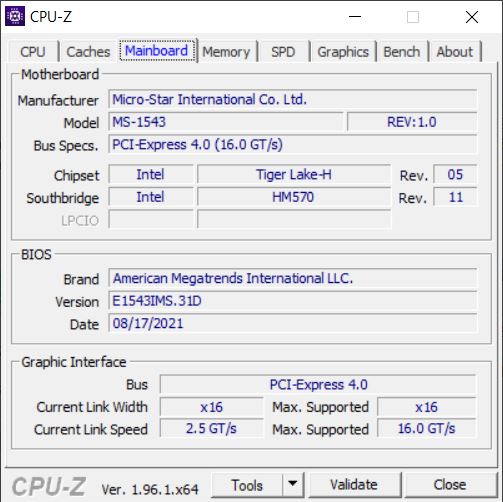
Case - MSI's slight manufacturing flaws
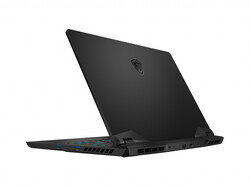
The casing itself remains quite similar, but there are some crucial changes in the ports (see below). The display lid and base are made of dark, smooth metal, while the bottom is still made of plastic. At the back, the cooling system extends, increasing the depth of the laptop, similar to the Alienware.
The lid is surprisingly sturdy, as is the base in theory. However, our test sample have some problem: when we press the base to the left of the touchpad, the latter lifts away from the touchpad and large gaps appear - that's probably a reason why the touchpad rattles.
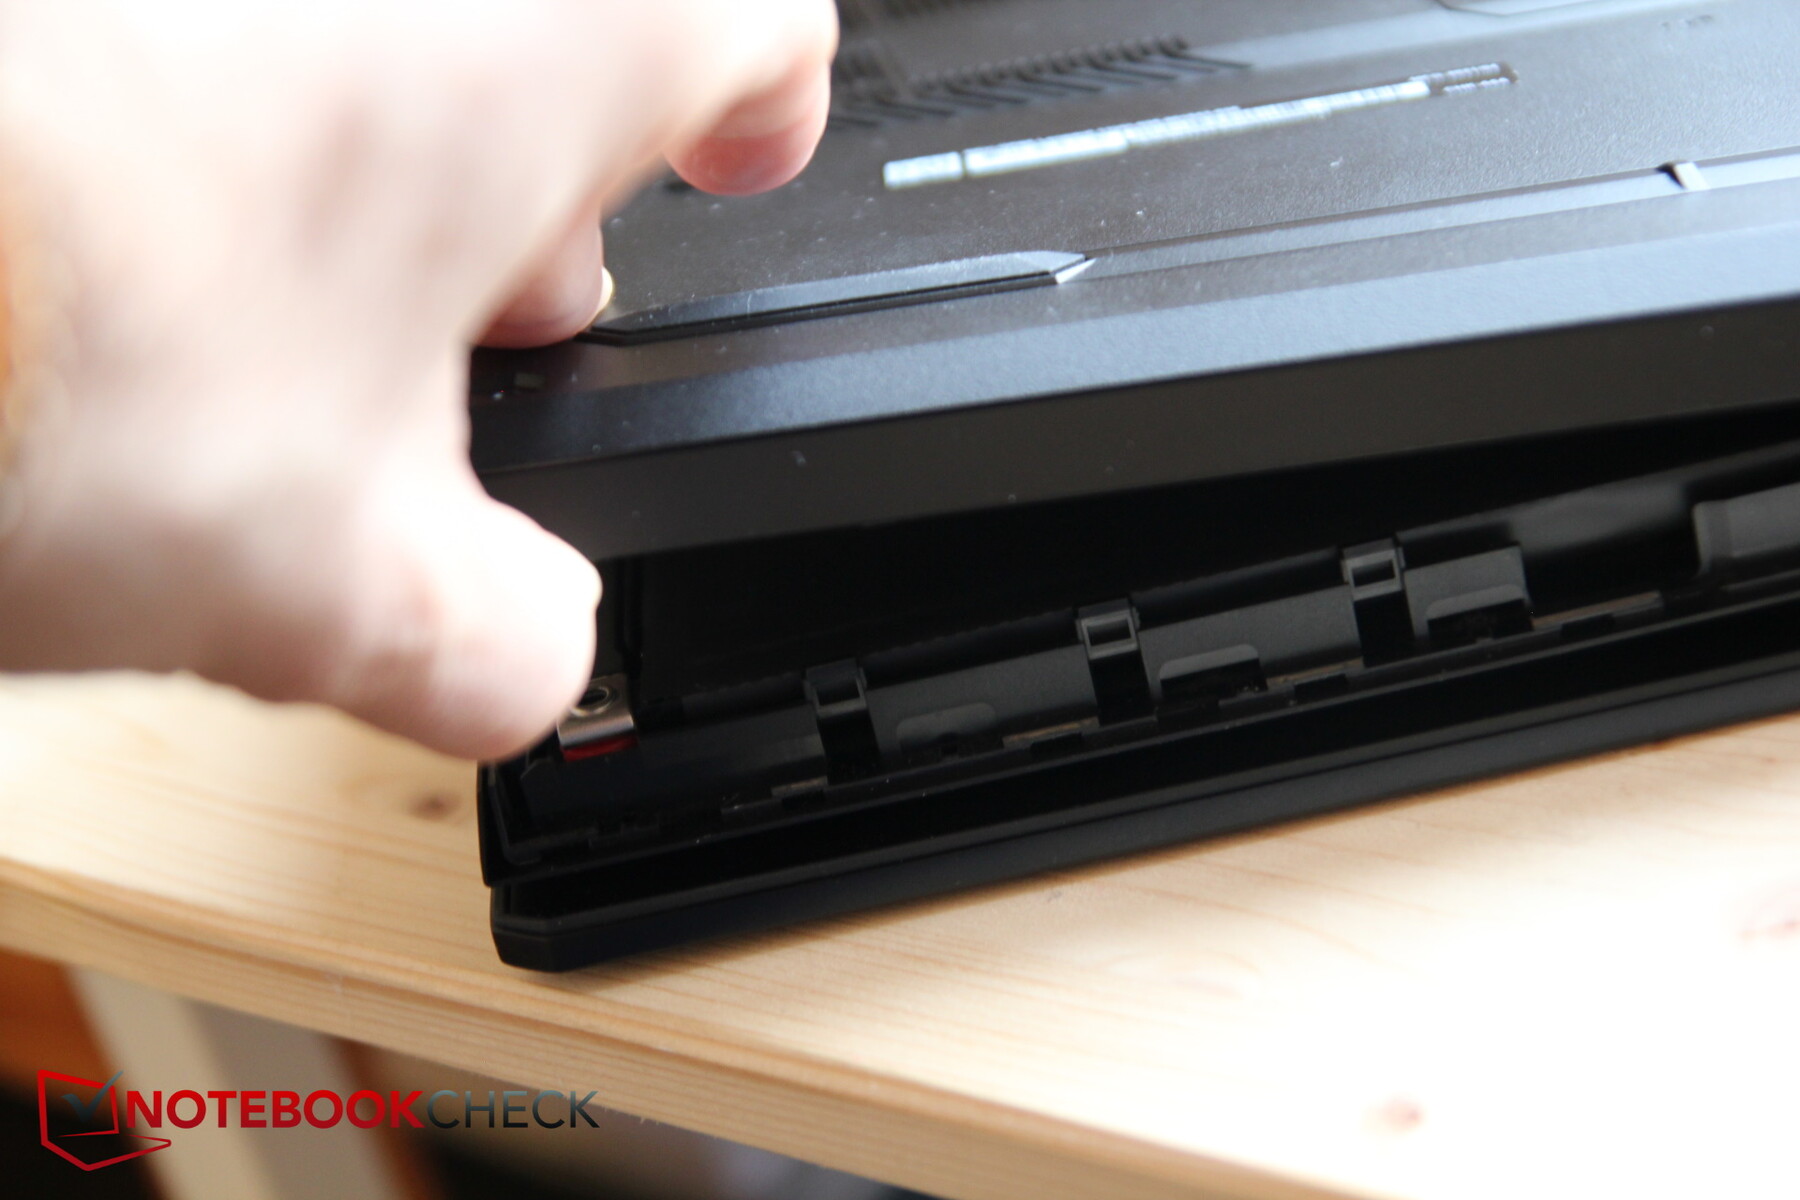
In general, the base only seems to be quite loosely connected to the surface, and the front edge also comes off very quickly, as you can also see in the photo. This should benefit maintenance, but on the other hand it does not really make a good impression in terms of build quality. The build itself looks very sturdy though, so it should be okay on the non-defective unit.
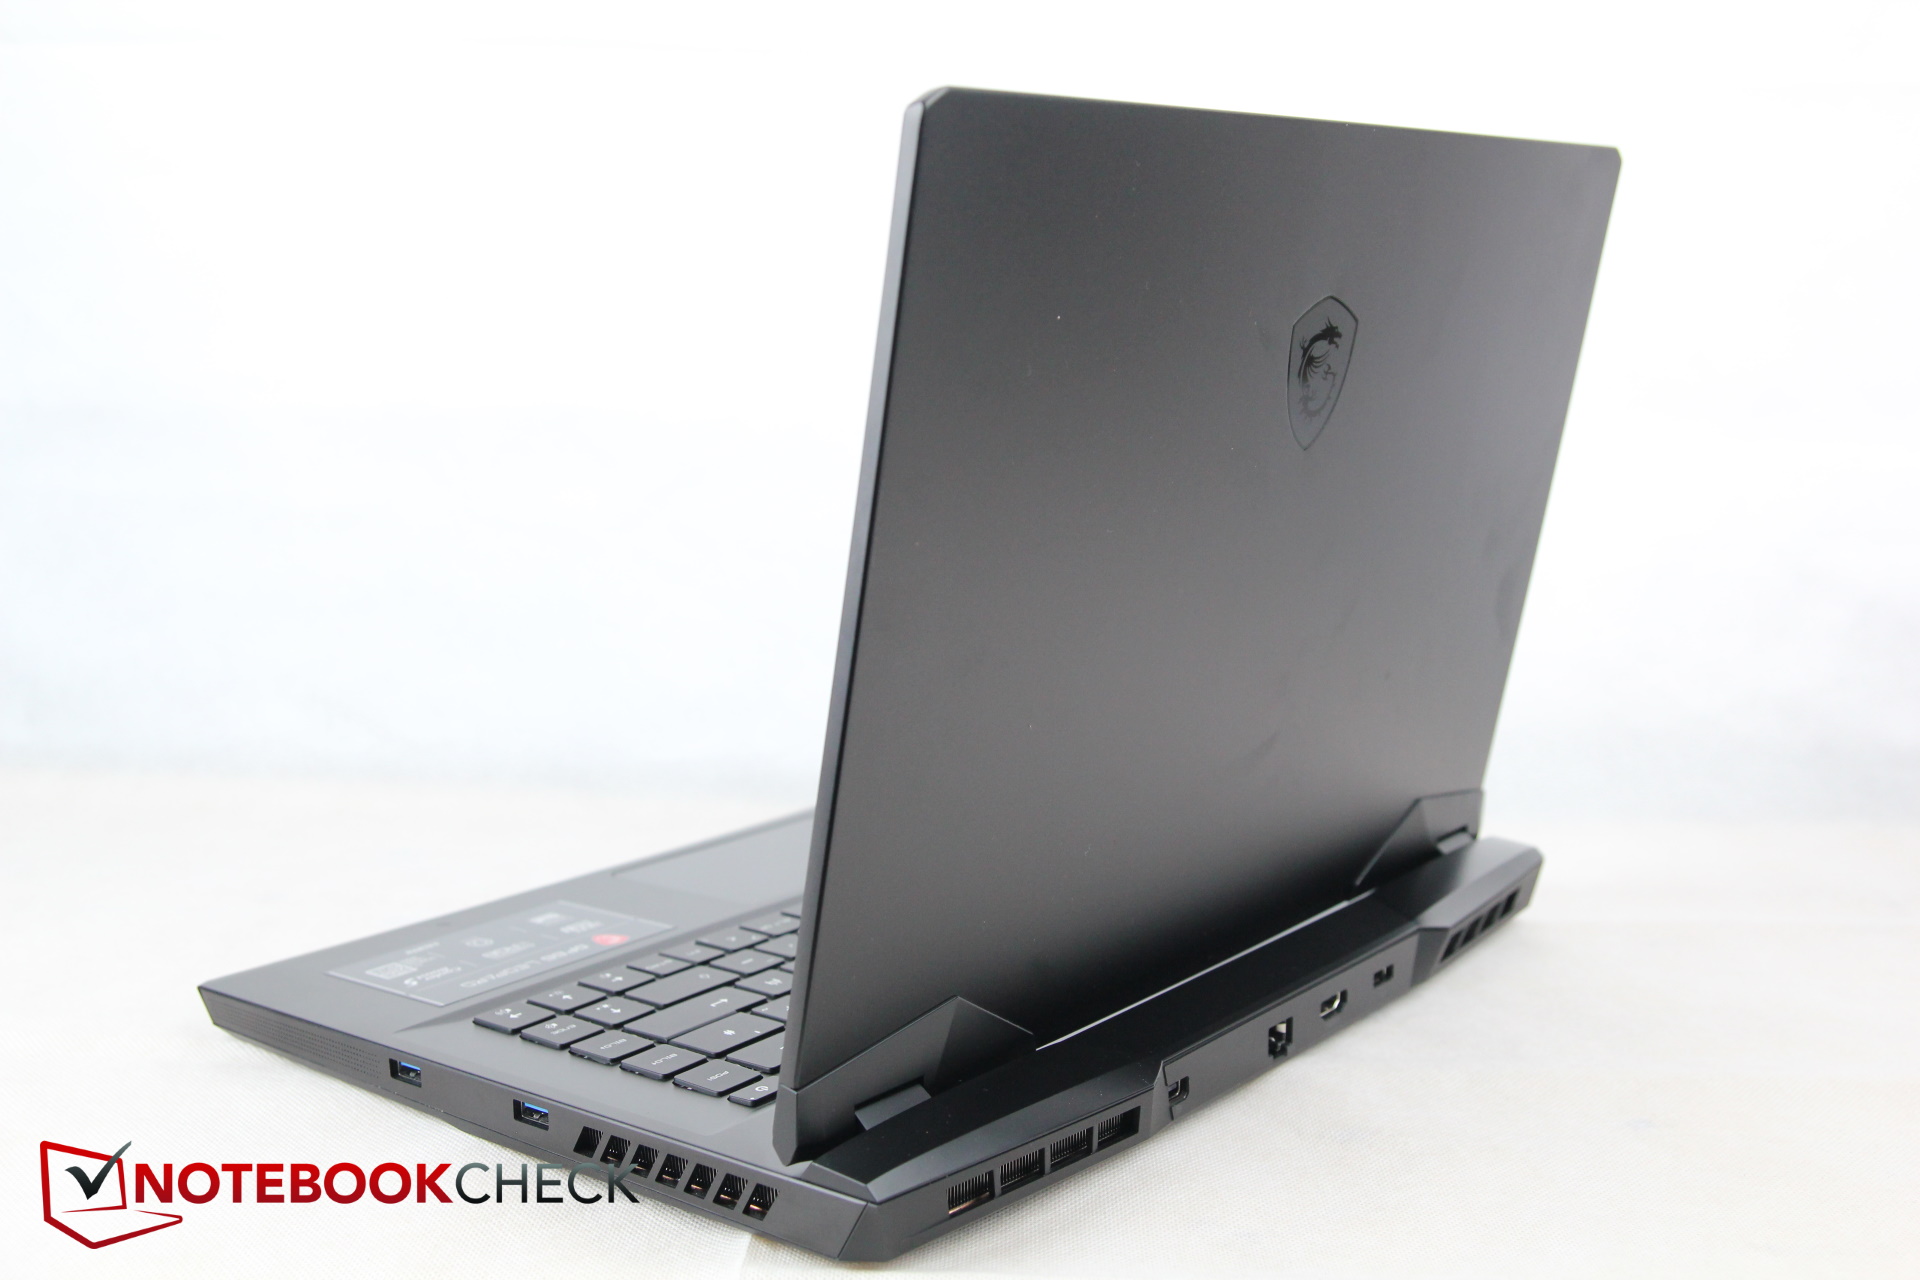
The GP66 is deeper than most of its rivals due to its protruding cooling system. Thus, it is very similar to the Alienware, which is another 5 mm deeper. Fortunately, it is not quite as heavy as the latter, but on par with the rest of the competition. Apart from that, it is one of the thinnest devices in the comparison. Again, only the new Alienware is a bit thinner.
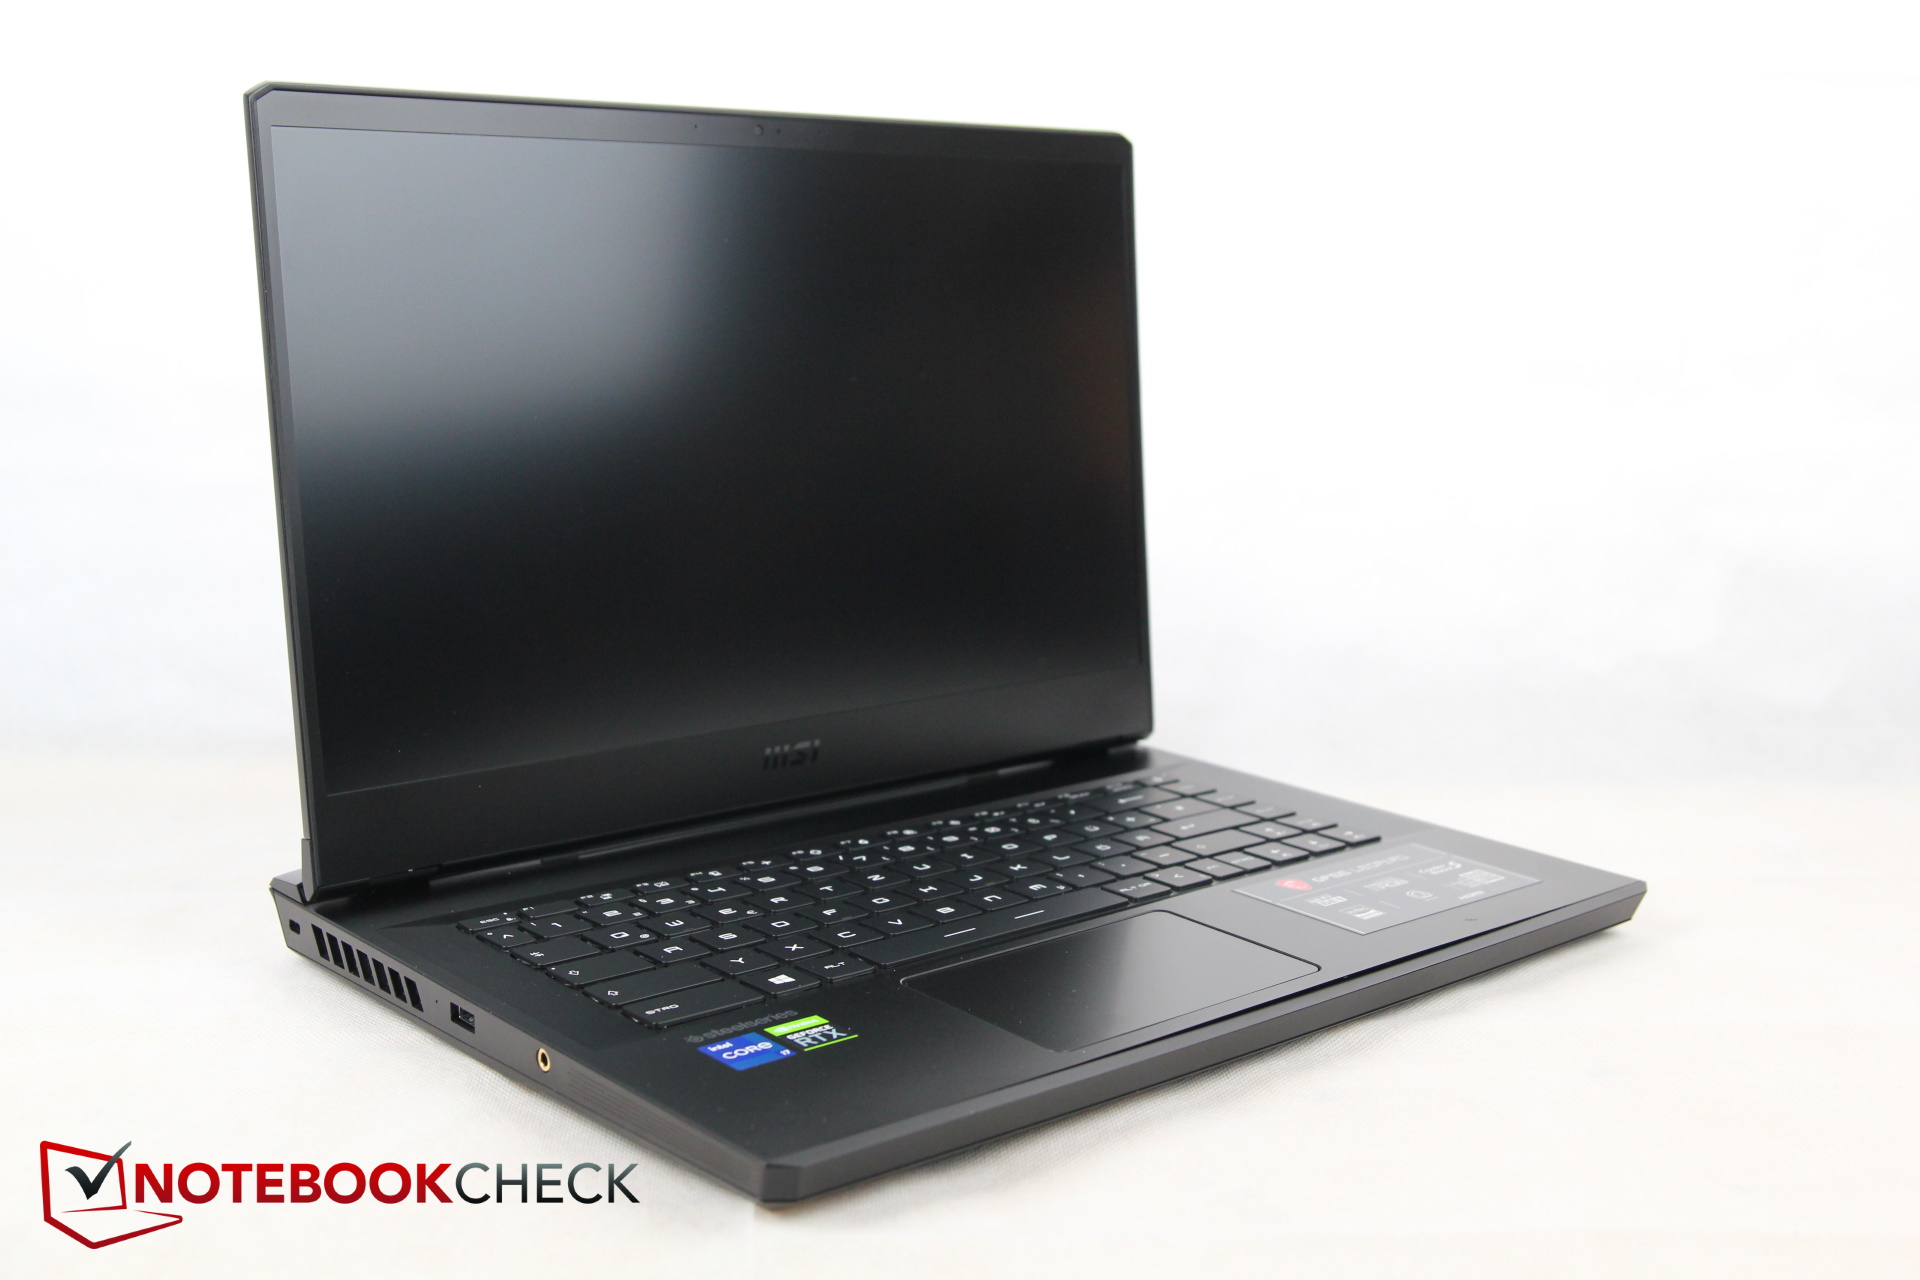
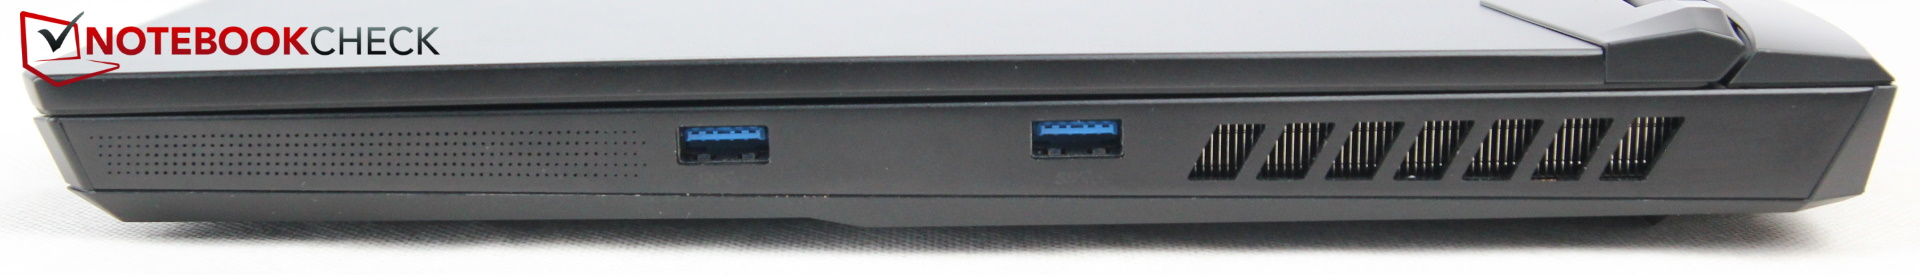
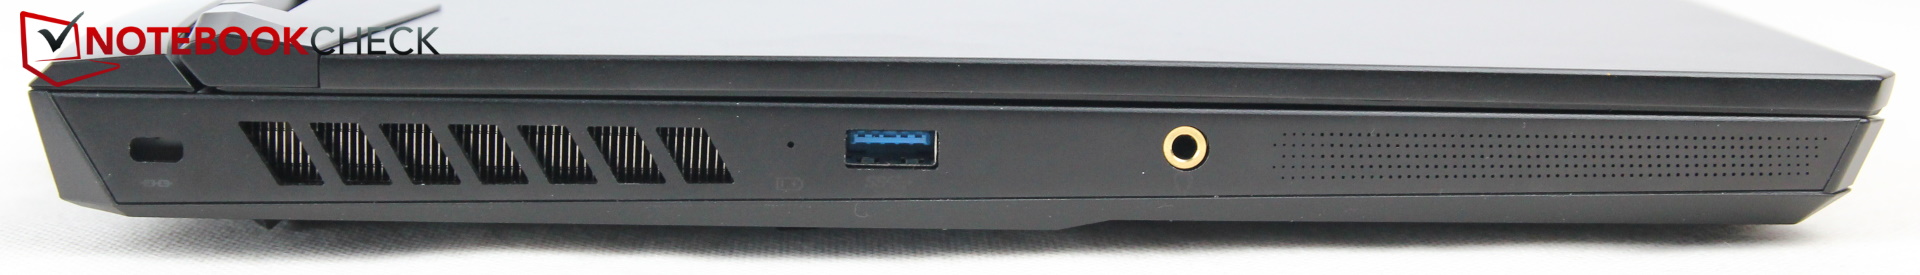
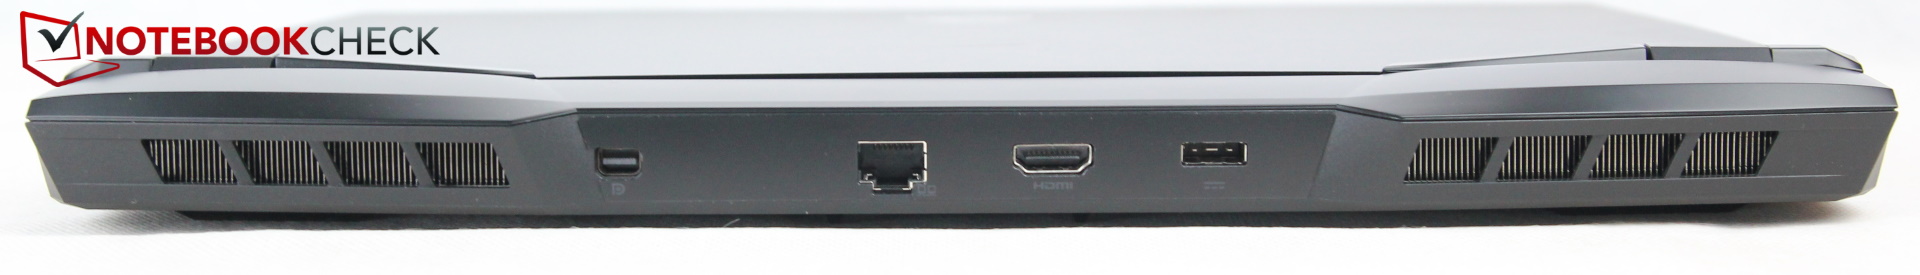
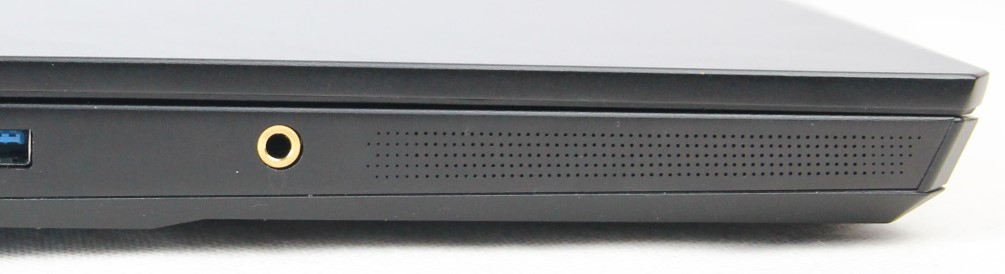
Features - Honestly MSI, no USB-C?
Compared to its predecessor, the GP66 10UG, MSI dropped the MiniDP port in favor of a USB-C port. With the current GP66 11UH, MSI takes a step back and brings back the Mini DisplayPort, which is a welcome move. But the manufacturer also eliminates the USB-C port! Thus, the GP66 Leopard is the only modern laptop without a USB-C port! We do not know why MSI did this, since a USB-C port has become the absolute standard nowadays. So as a side effect, the laptop only has three USB ports. There is also no SD reader.
The remaining few ports are well distributed on the three sides, i.e. left, right and back of the case. MSI really has to be praised here, as there are a lot of space between the various ports, which at least puts things into perspective a bit in view of the meager variety of options. All potentially thick cables (HDMI, DP, LAN, power) are routed to the rear, and there are only USB-A and headset port on the sides - very good.
Communication
MSI replaces the Intel AX201 with a Killer Wi-Fi 6E AX1675 with Bluetooth 5.2 support. This does not make the Wi-Fi much faster. Although it is in the gigabit range, it falls short of the module's potential. Especially the reception curve has a downward slope, but the transmission power is quite constant.
Webcam
A standard HD webcam provides acceptable picture at best in Zoom, Teams and other conferencing apps. The picture looks washed out even in good light, and the color deviations are quite pronounced especially in the red and green color ranges.


Security
A Kensington port is on board, as is TPM. However, there is no fingerprint scanner or other security technology - which is acceptable for a gaming laptop.
Maintenance
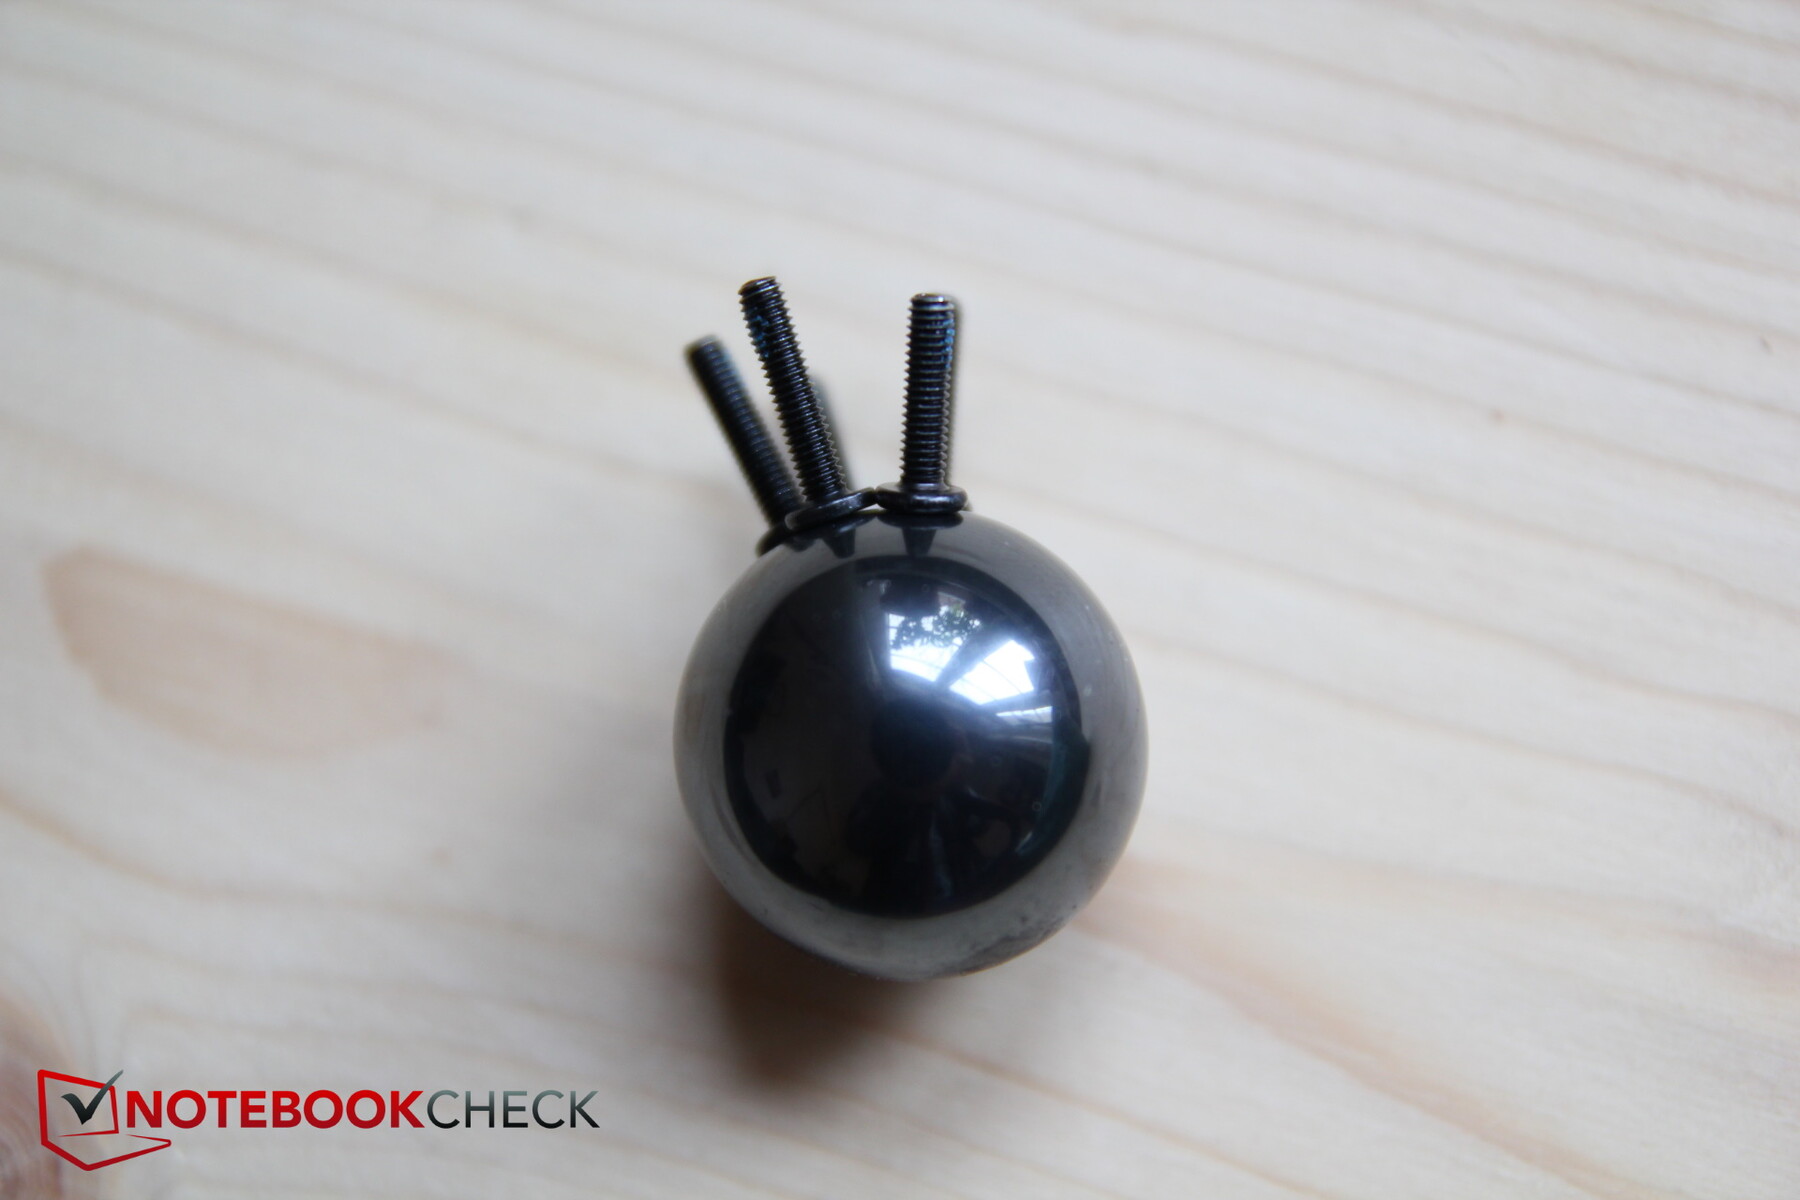
The base plate is secured by at least 10 Phillips screws (1 shorter than all the others) and various latches. And although the front edge of our model was already partially detached before, maintenance proved to be more complicated than expected.
The front edge came off well, but the sides and rear edge did not at all. Especially in the area of the headset socket, the base plate was still so tightly latched (not directly at the edge, but inside) that we had to abort the opening attempt despite the lever tool, because of fear of damaging the thin plastic plate. The rear edge did not yield either. Hidden screws should not have been the problem, at least on the side.
The inner construction should be similar to the MSI GP66 Leopard 10UG (see maintenance section), but opening it was also problematic.
Accessories & Warranty
Apart from the power supply, there are no other accessories in the box. Note: MSI ships the GP66 Leopard without an operating system, but various stores should include a Windows license.
MSI offers a 2-year warranty with pick-up and return service.
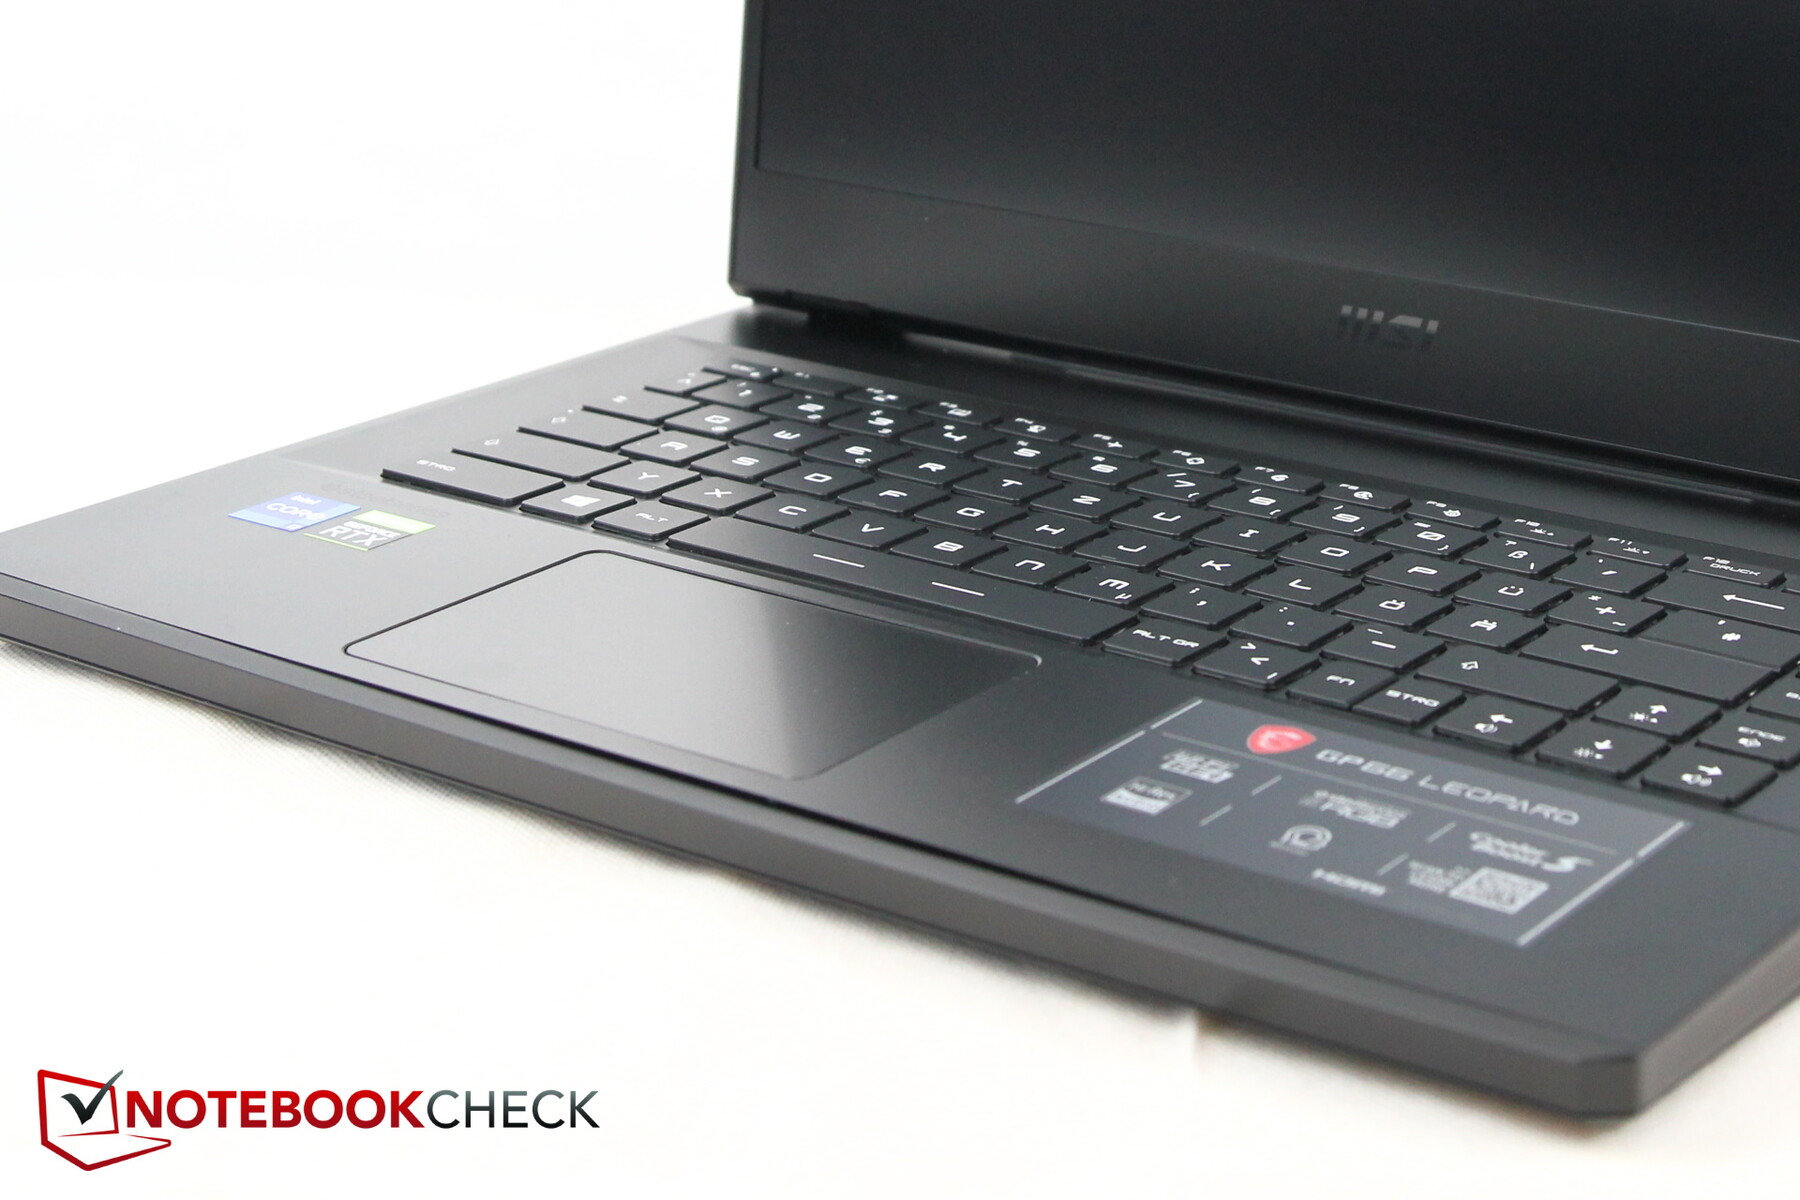
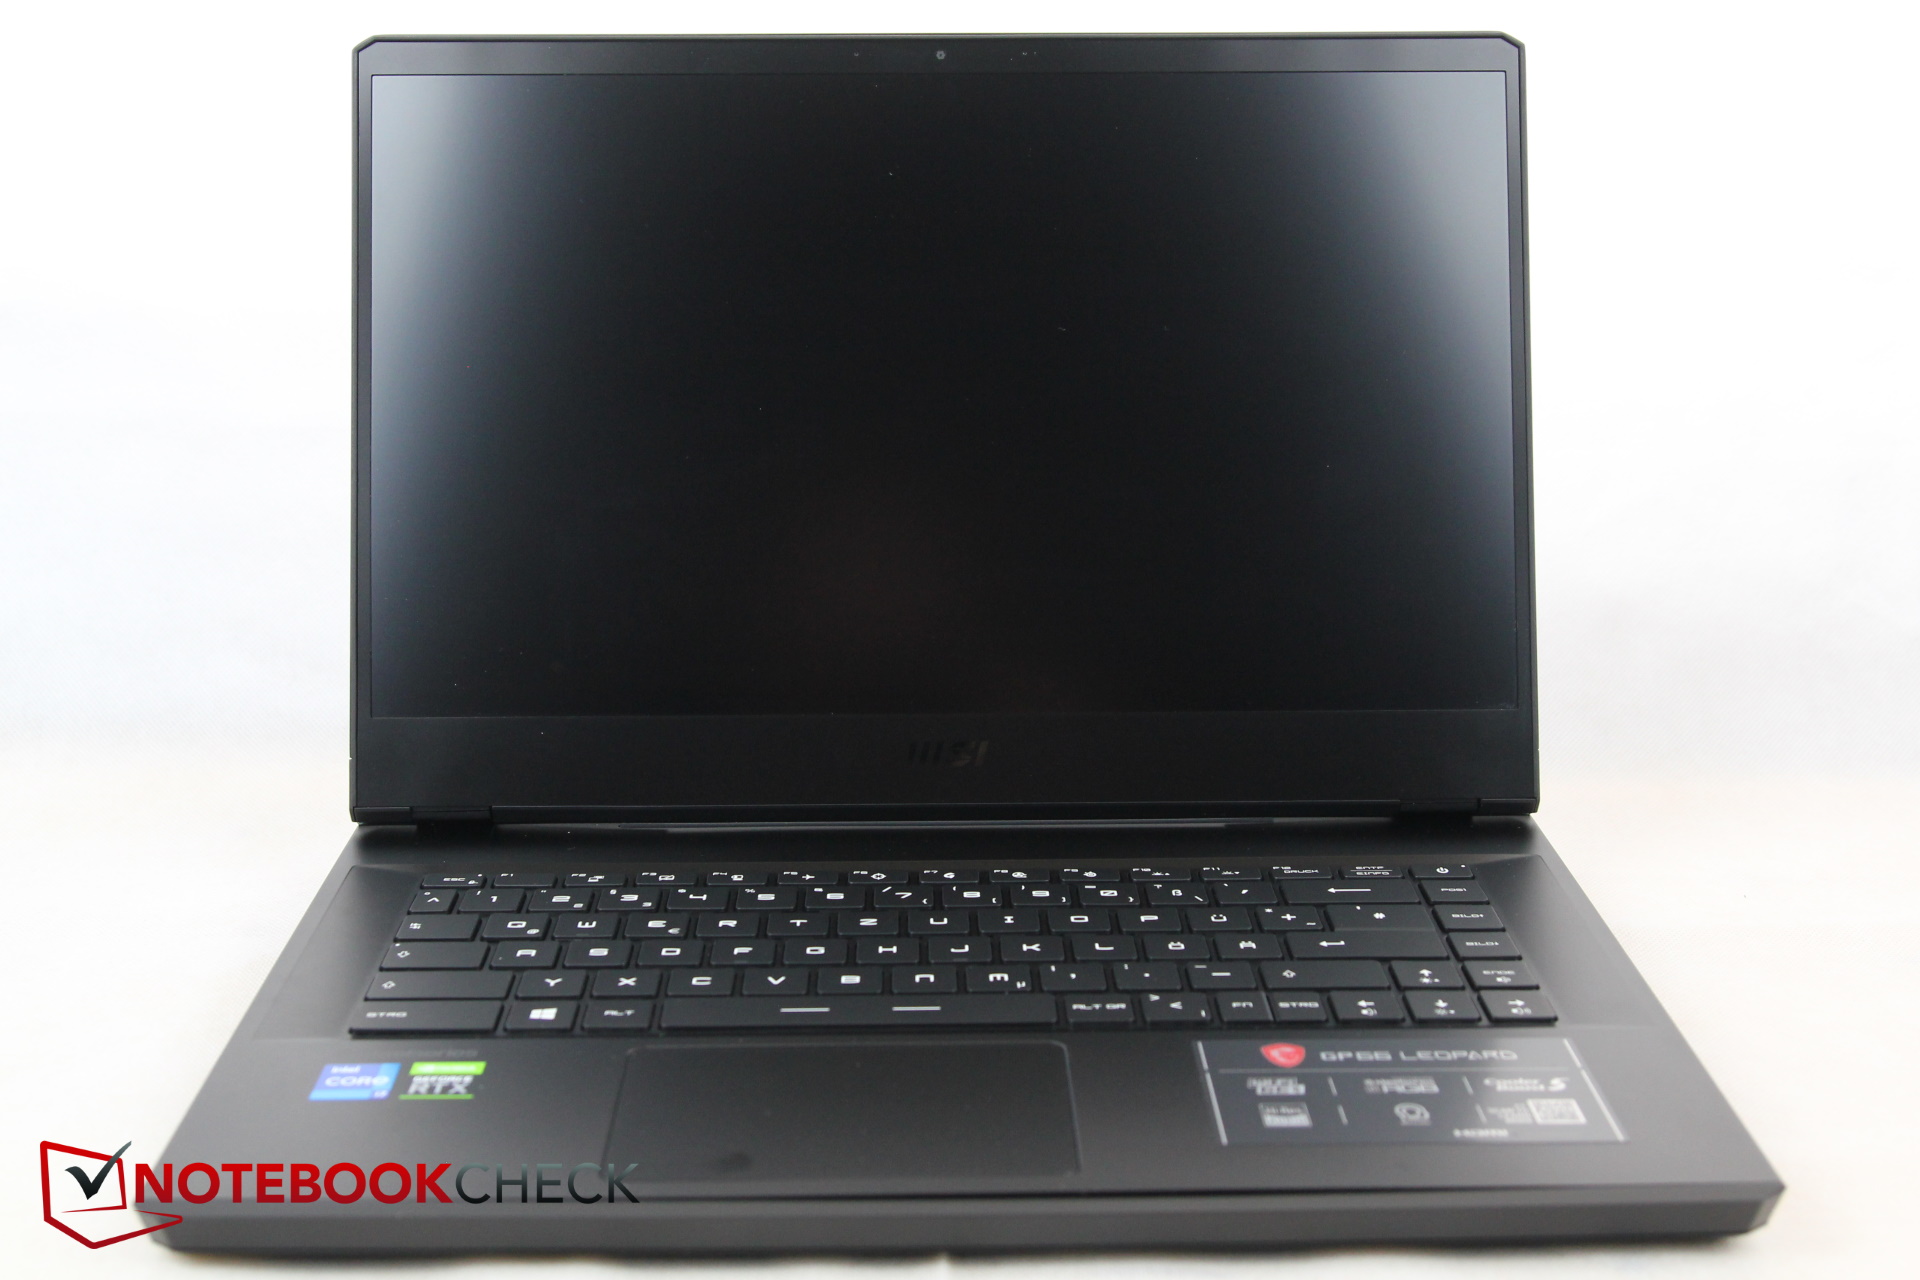
Input devices - Good keyboard, touchpad rattles
Keyboard
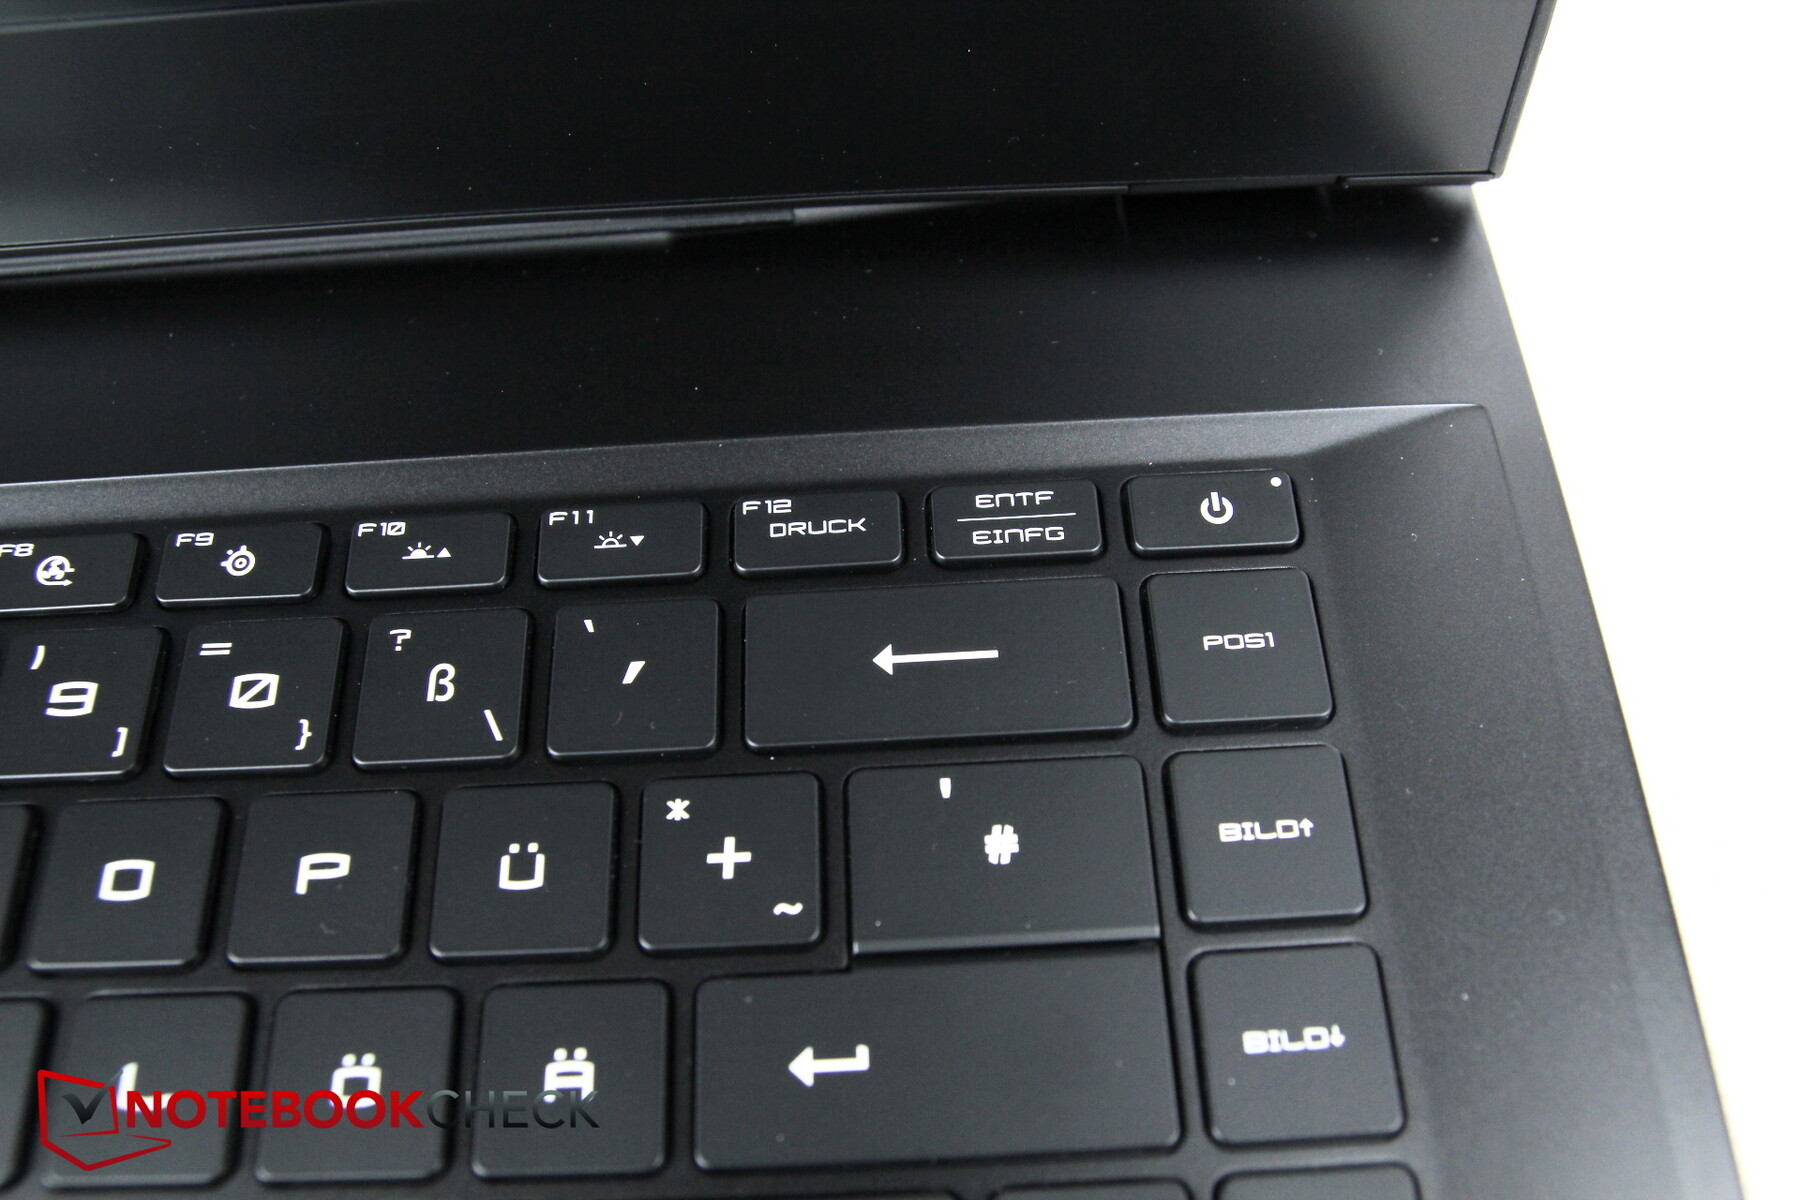
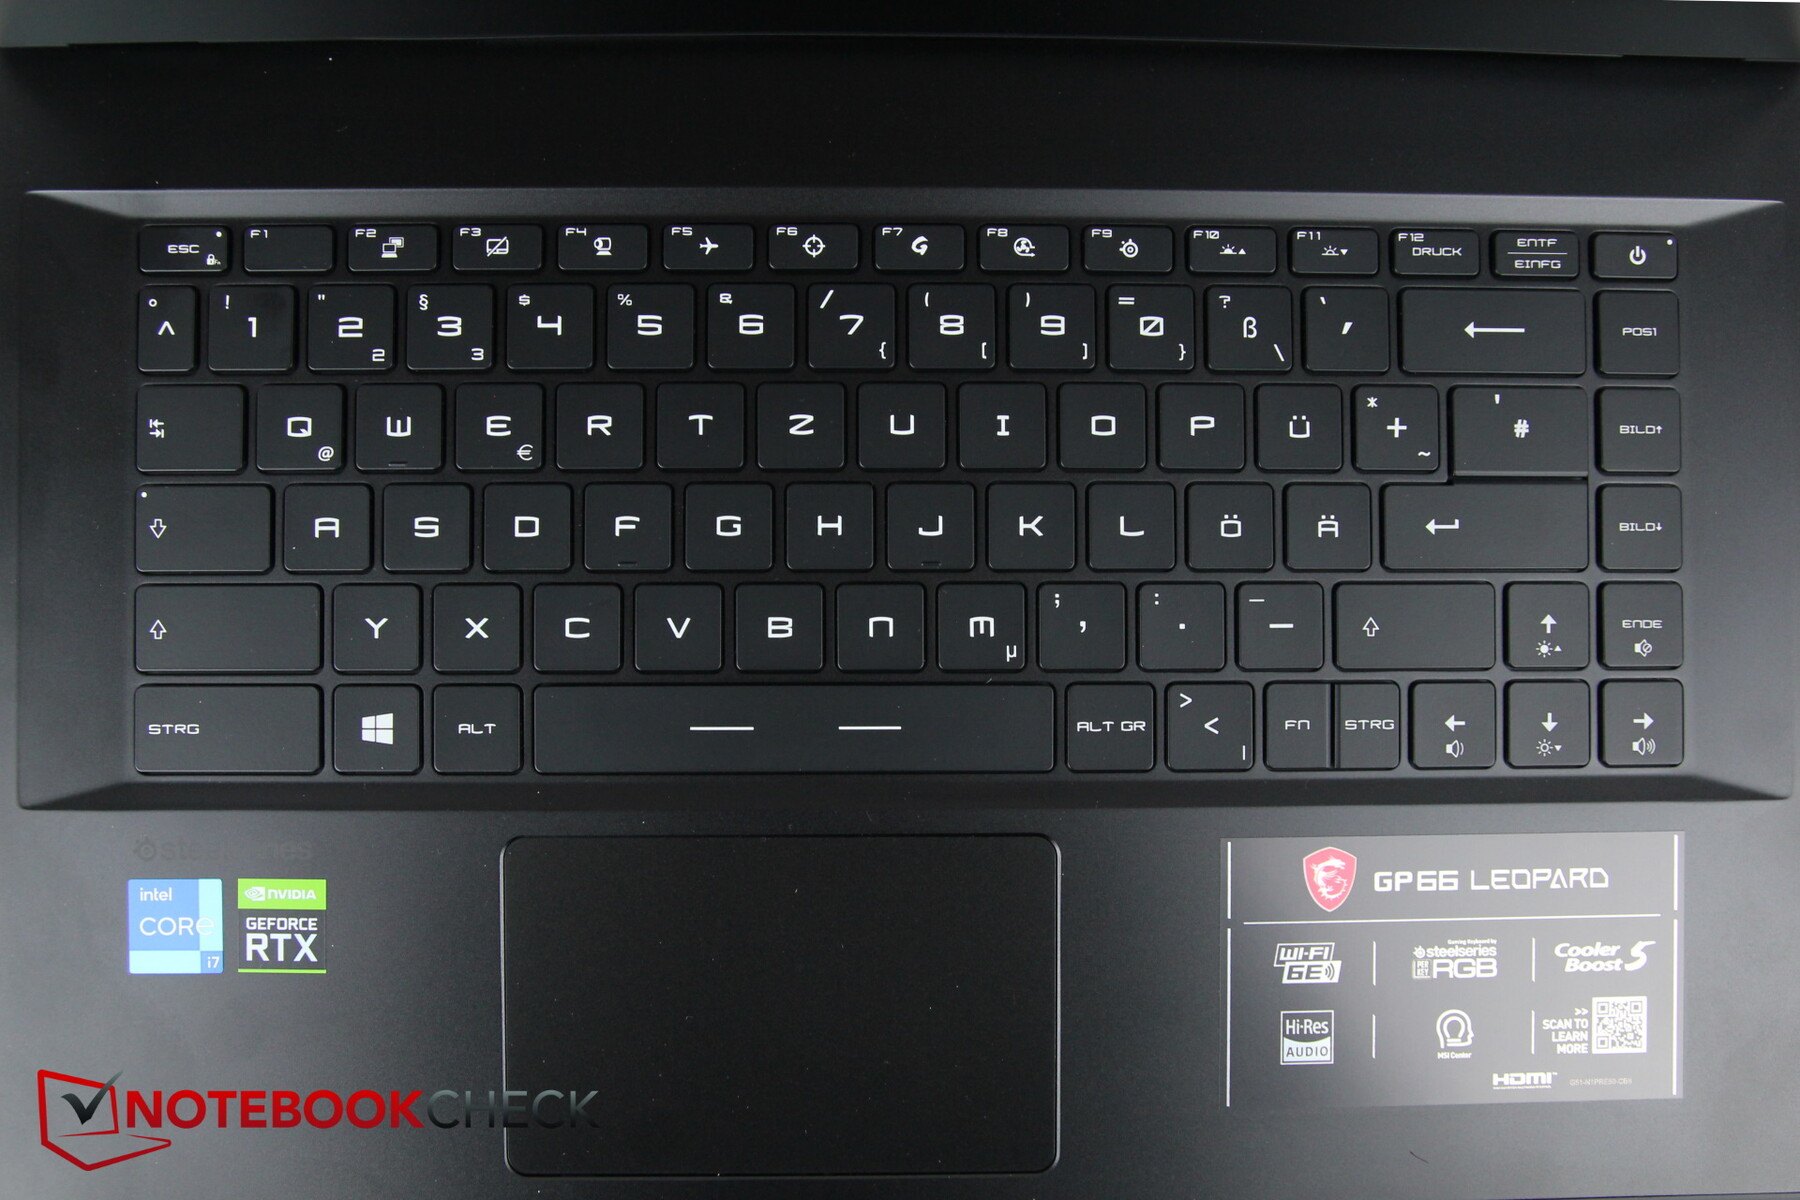
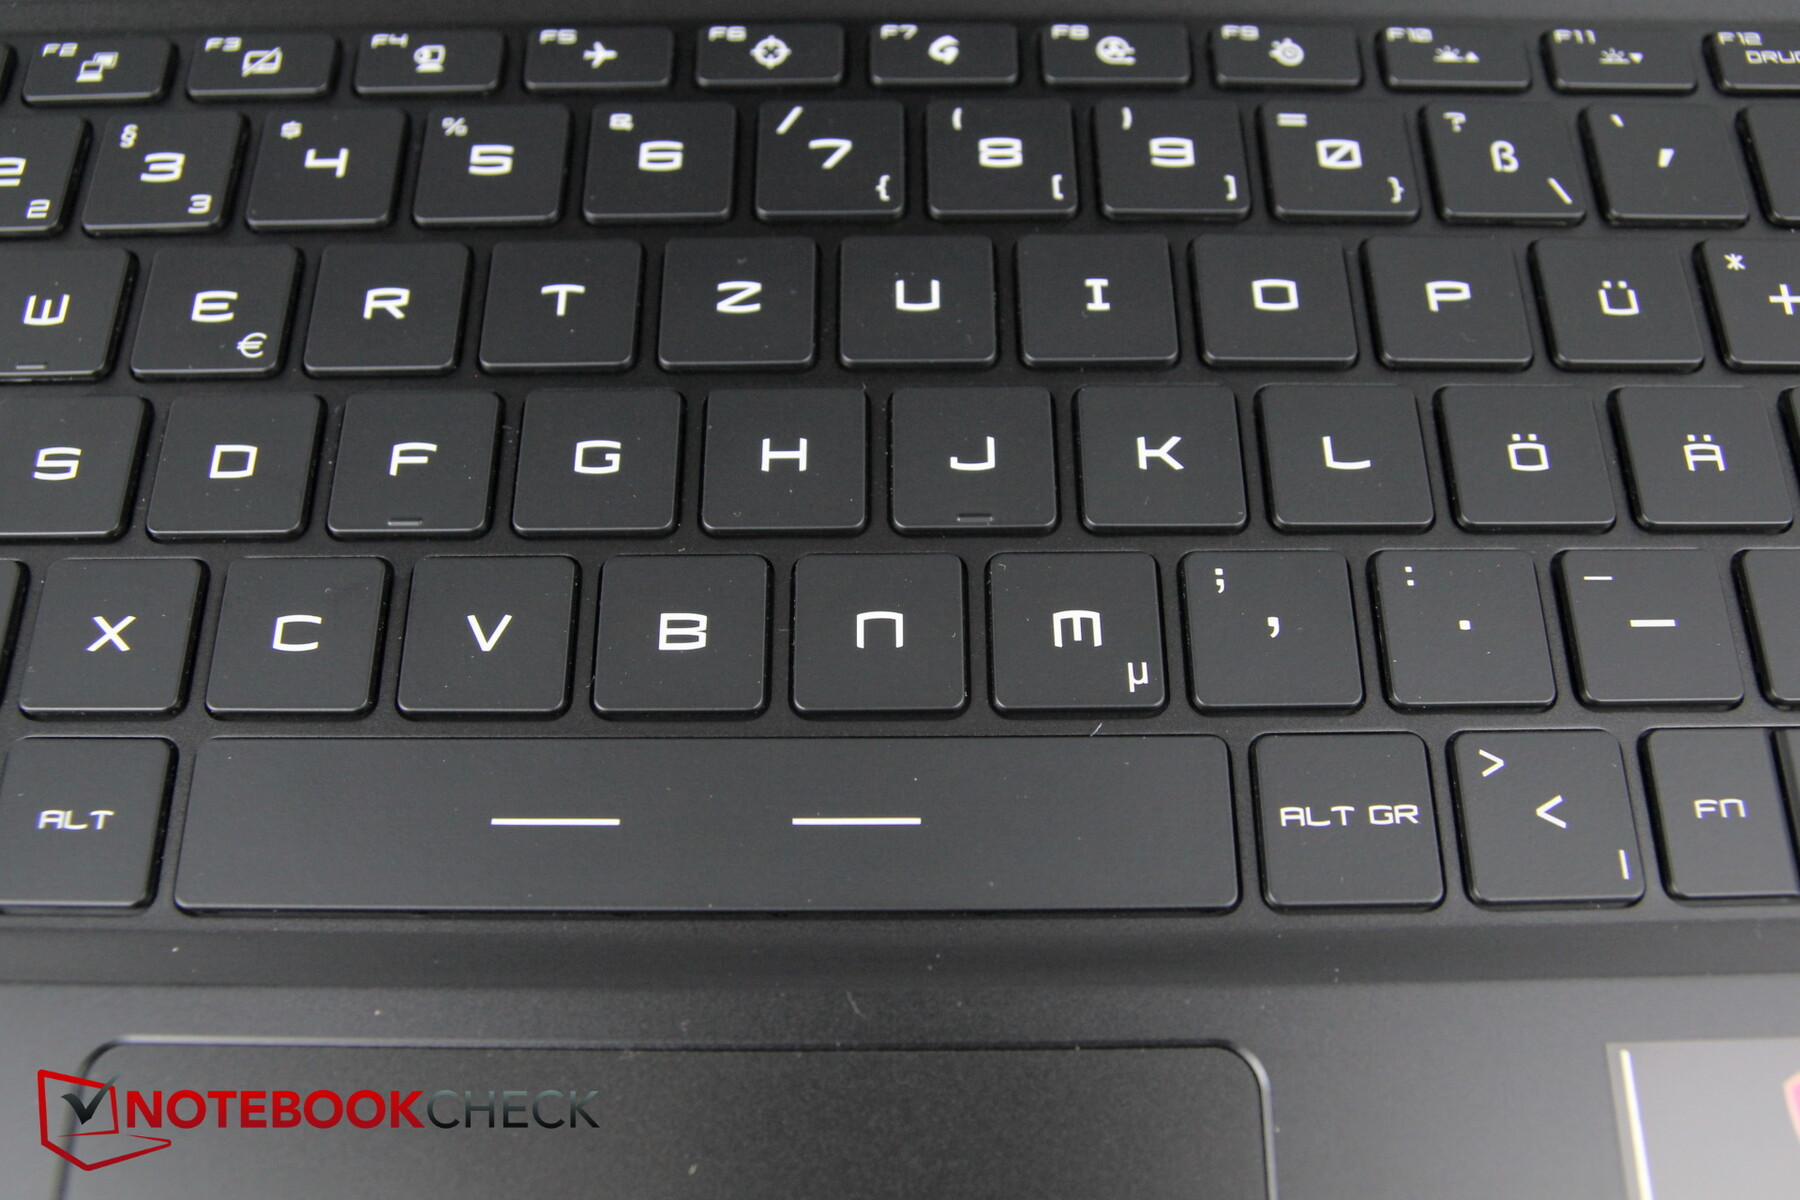
Despite its 15.6-inch size, the Leopard does not have a NumPad. On the other hand, this ensures that all keys are quite large and also well spaced. The lettering is large and easy to read, even if the selected font is a bit unusual, which should explicitly appeal to gamers. The power key is part of the keyboard and located in the upper right corner. It can be triggered unintentionally during text processing due to the close proximity of "insert" and "pos1".
The stroke is quite short, but the feedback is still crisp. The typing noise is very moderate, only the space bar is minimally louder. Overall, typing on the GP66 is fun and fast.
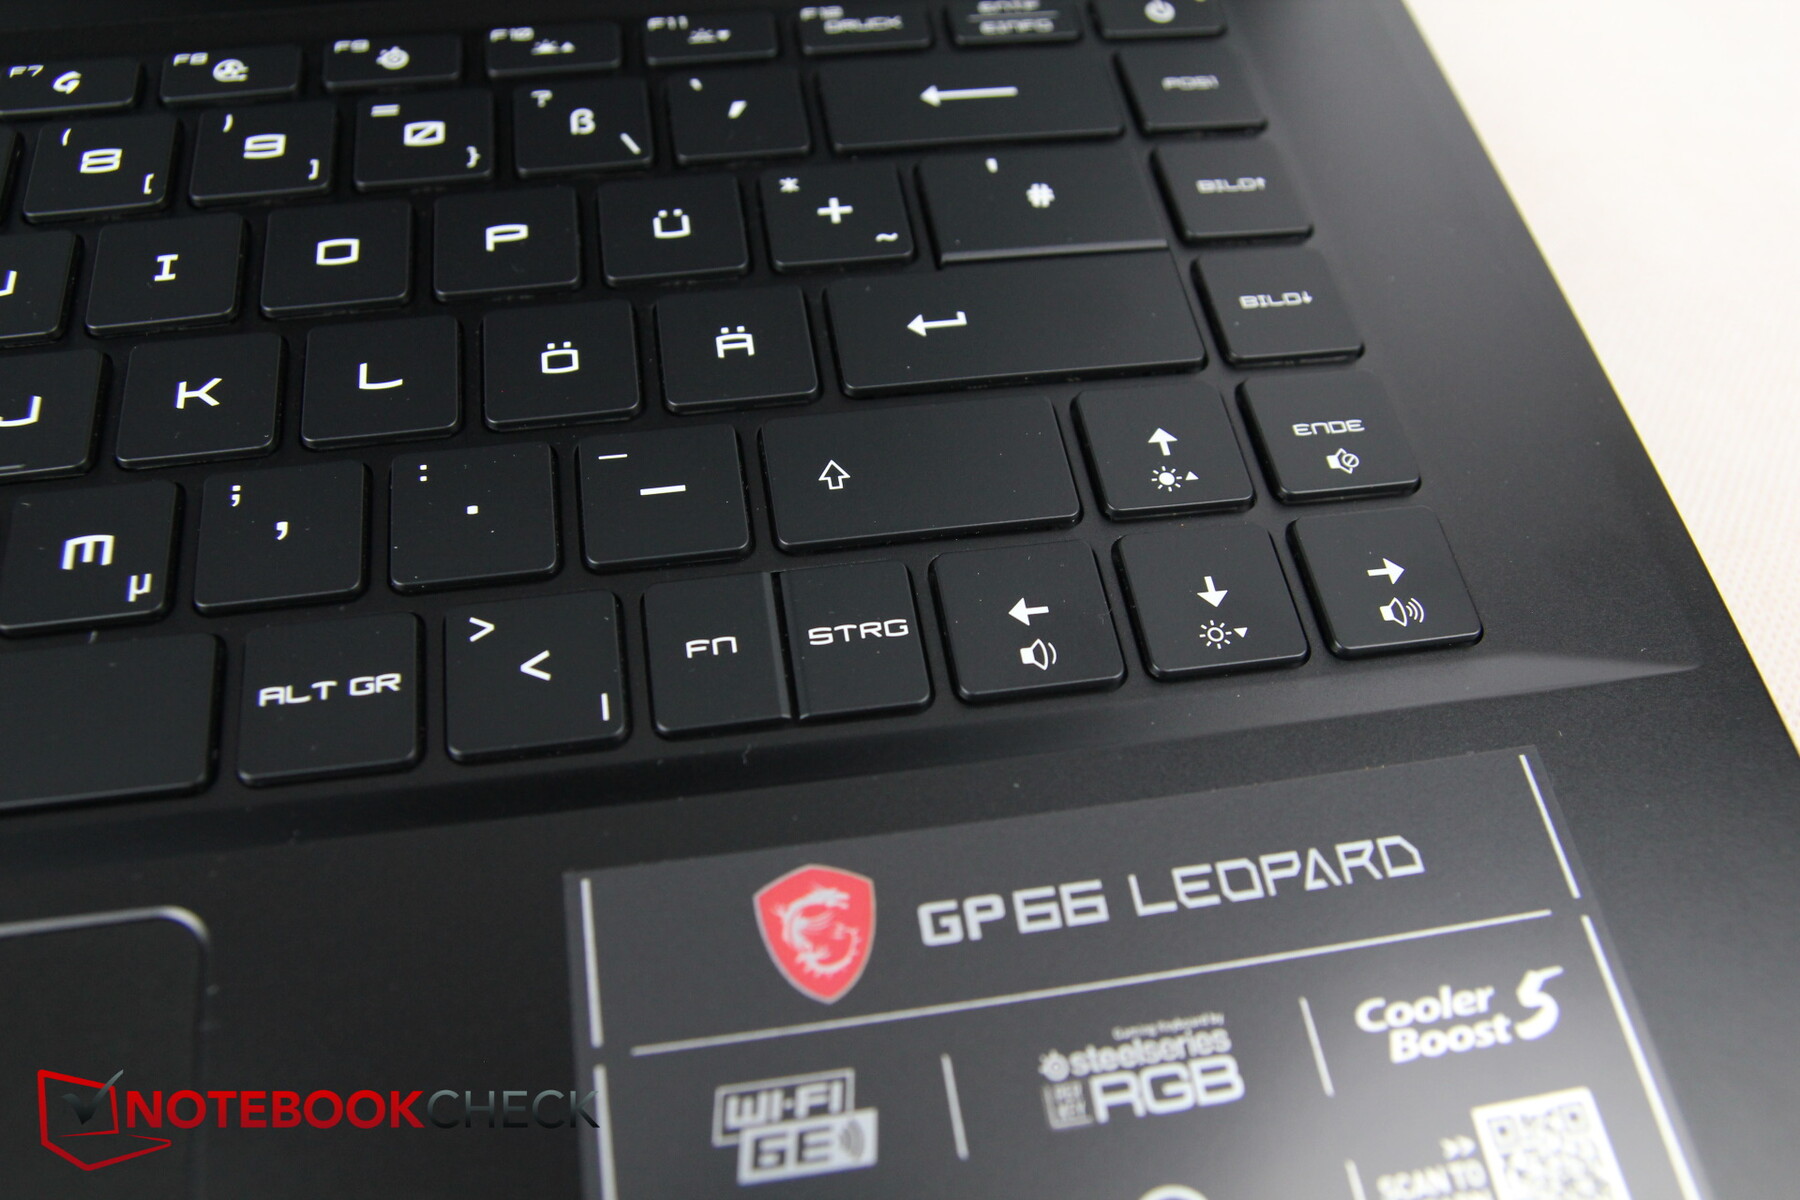
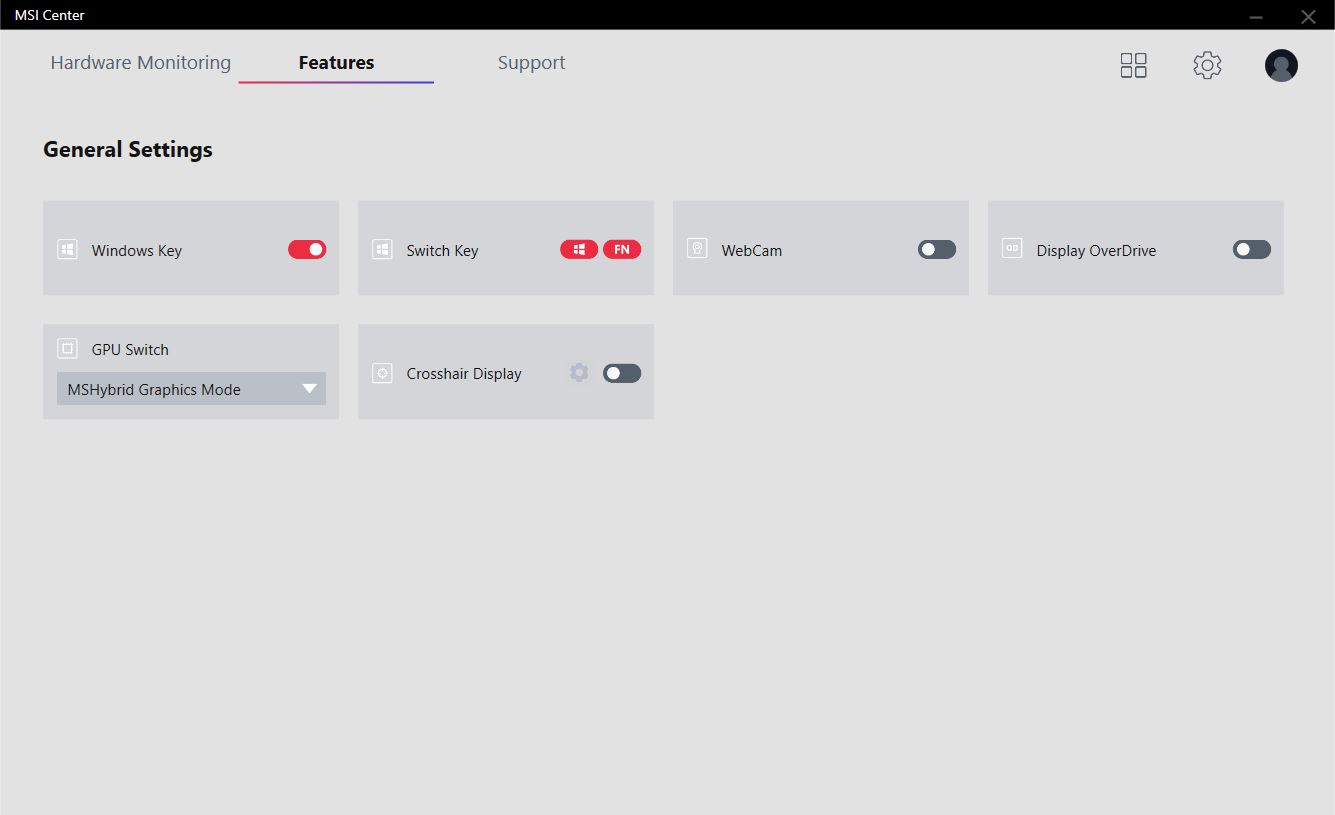
MSI solves one thing very unconventionally: so important "fn" key is not on the left, but on the right and shares its place with the right Ctrl key. On the one hand, this means that you have to think twice and key combinations are sometimes quite awkward because you either can't use both hands for widely separated key combinations or you have to press the second key with the left hand. The key is also very narrow, which is particularly unfavorable since it is usually pressed with the right thumb. At least you can also swap the function of the fn key with the Windows key in the MSI Center.
In this context, there is a cool feature with a weakness: the keyboard has a 3-stage backlight. When the fn key is pressed, the illumination of all other keys is temporarily turned off and only the special functions of the F keys, i.e. the keys with which the fn key can now be combined, light up red. This feature has a disadvantage, however, because if we change the illumination level of the backlight, we do not immediately see the effect of this change, because the special keys that light up red do not change the illumination level, unlike the other keys.
Touchpad
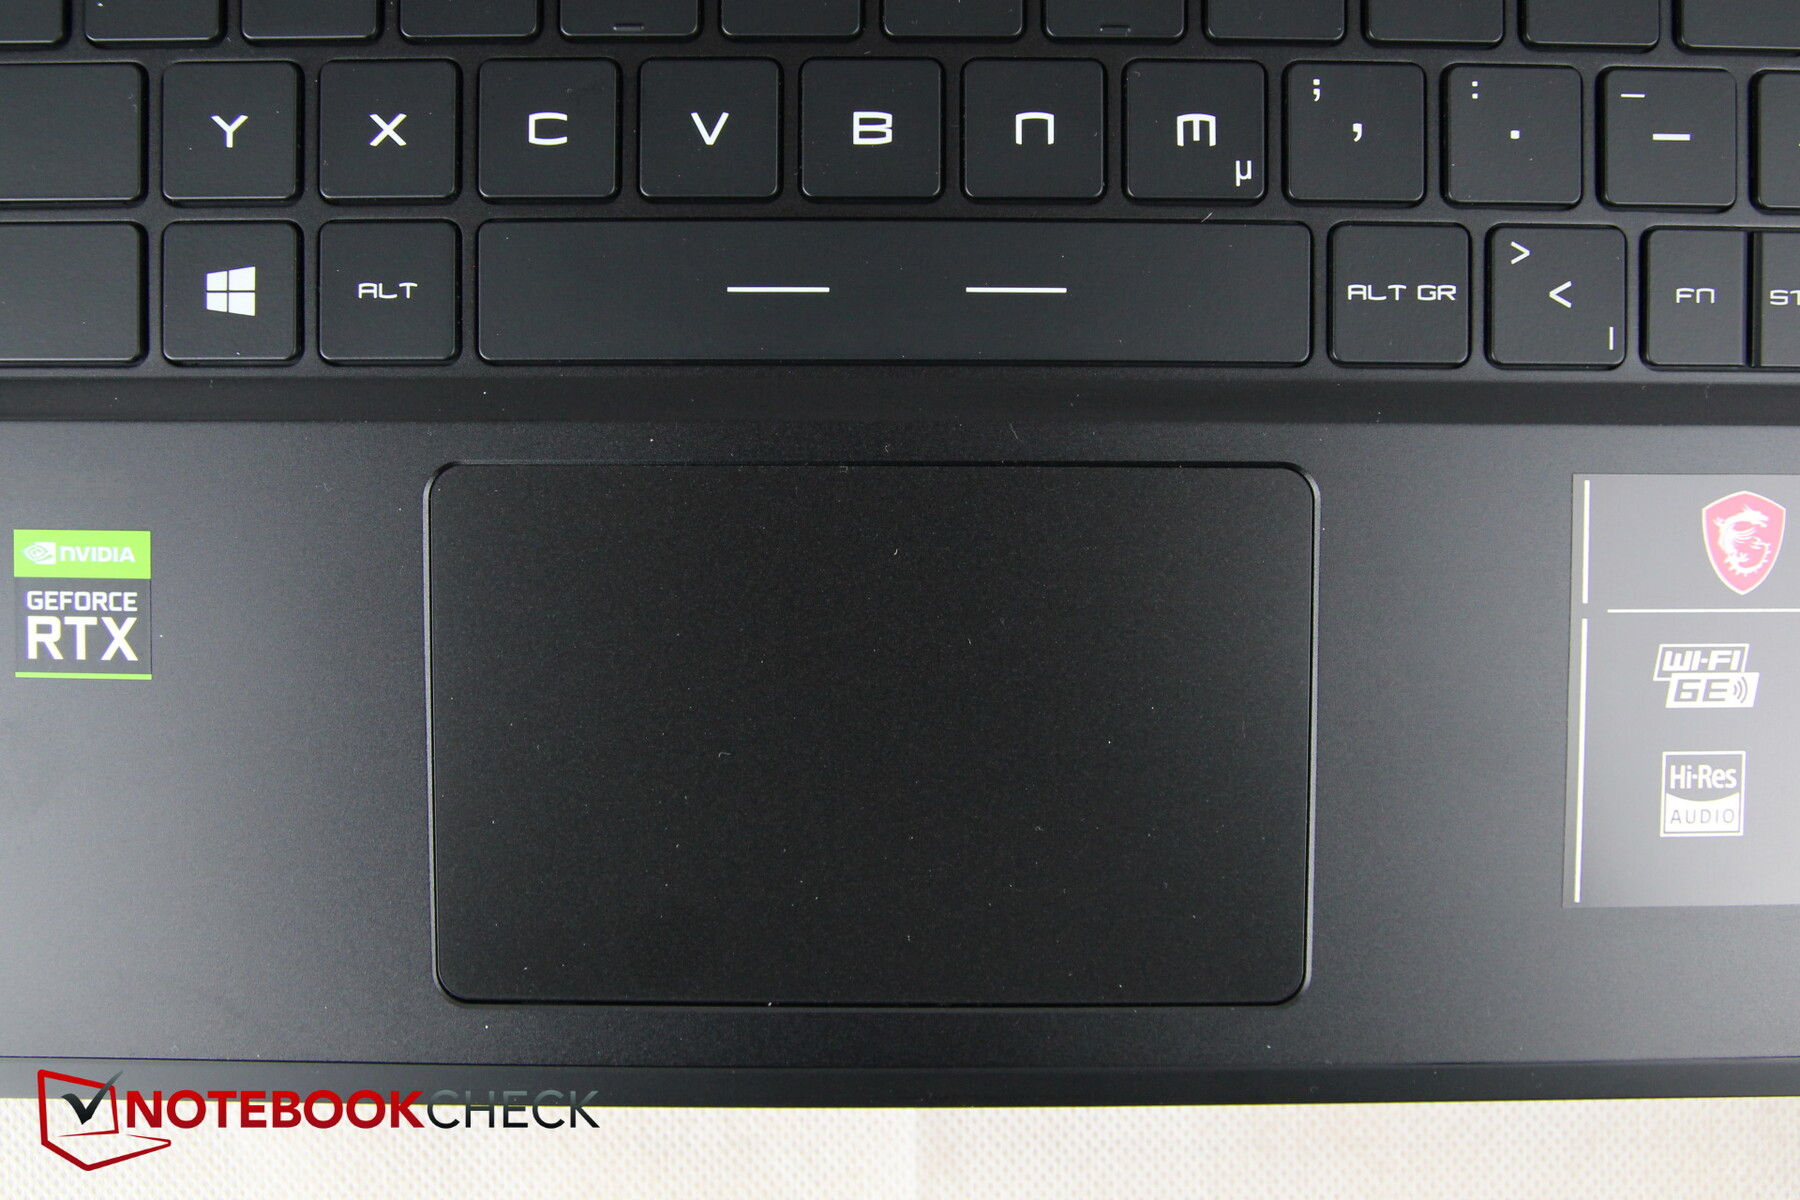
The touchpad measures about 10.5 by 6.5 cm and has internal click buttons. The surface's gliding capabilities are good, but it clearly falters during slow movements or wet fingers. The pad is also rather imprecise in the lower corners.
As mentioned at the beginning, the touchpad of our test model rattles when you tap it lightly with your finger. This is quite annoying and also quite loud when you want to trigger clicks with a finger tap.
The clicking of the integrated keys is quite sluggish, especially double clicks feel unnecessarily strenuous, which you would rather trigger with a finger tap, where the rattling noise comes to light again. Overall, the touchpad, unlike the keyboard, does not cut the best figure.
Display
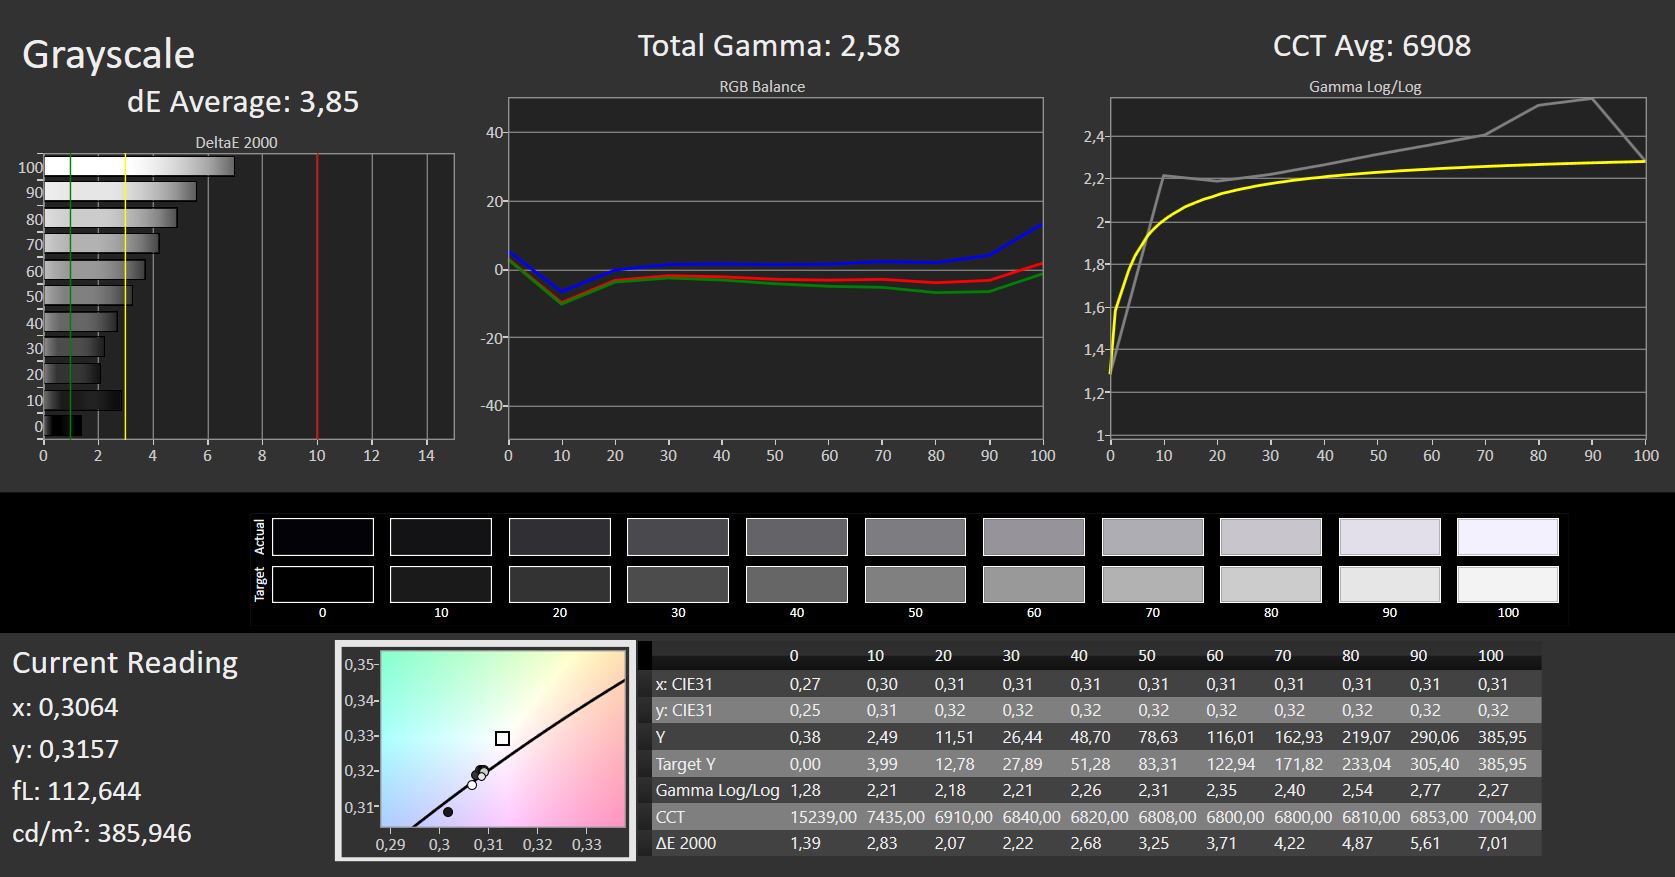
MSI uses a matte Full HD IPS panel from LG Display with 144 Hz. It is the same panel as in the Schenker XMG Apex 15 NH57E. Its average brightness of about 360 nits is the highest among comparison, and its distribution of 87 percent is decent. Alternatively, the GP66 is also available with a QHD panel (2560 x 1440 pixels).
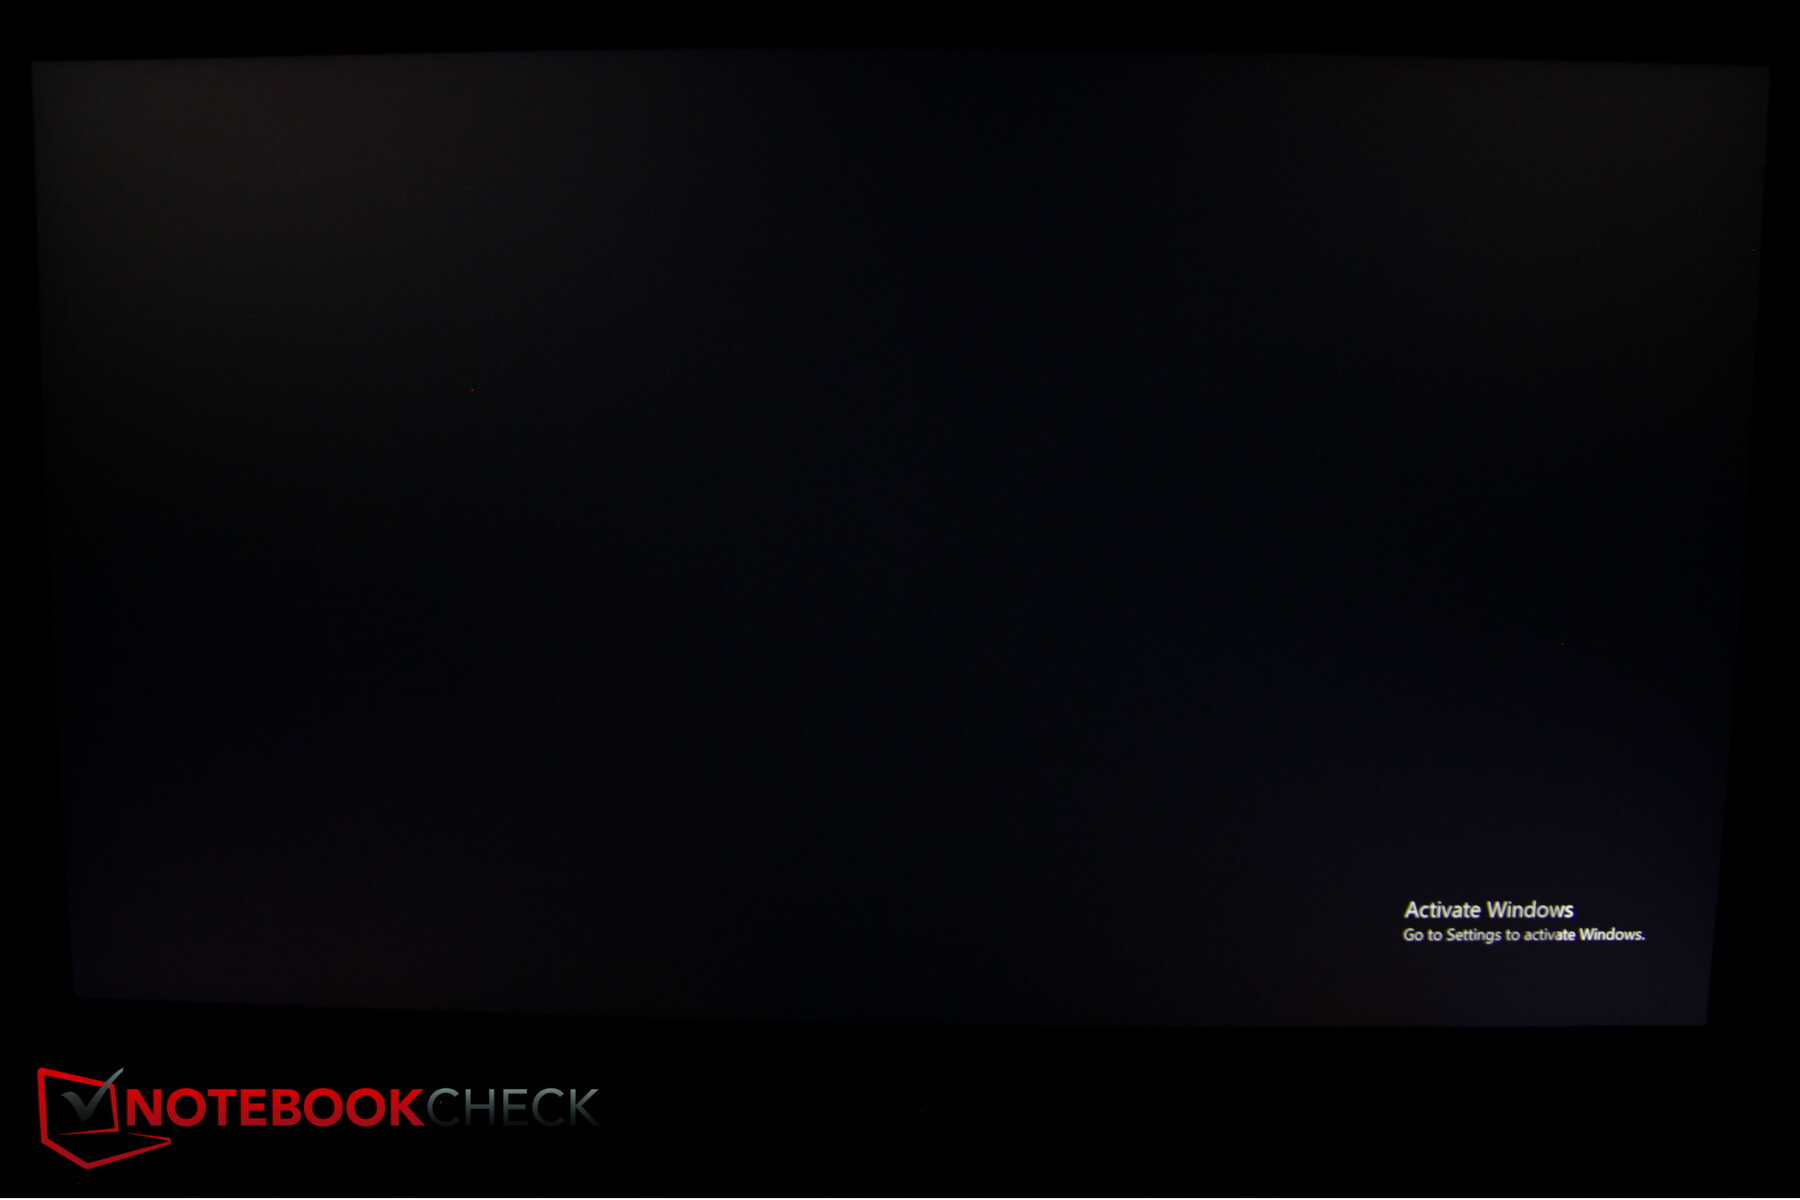
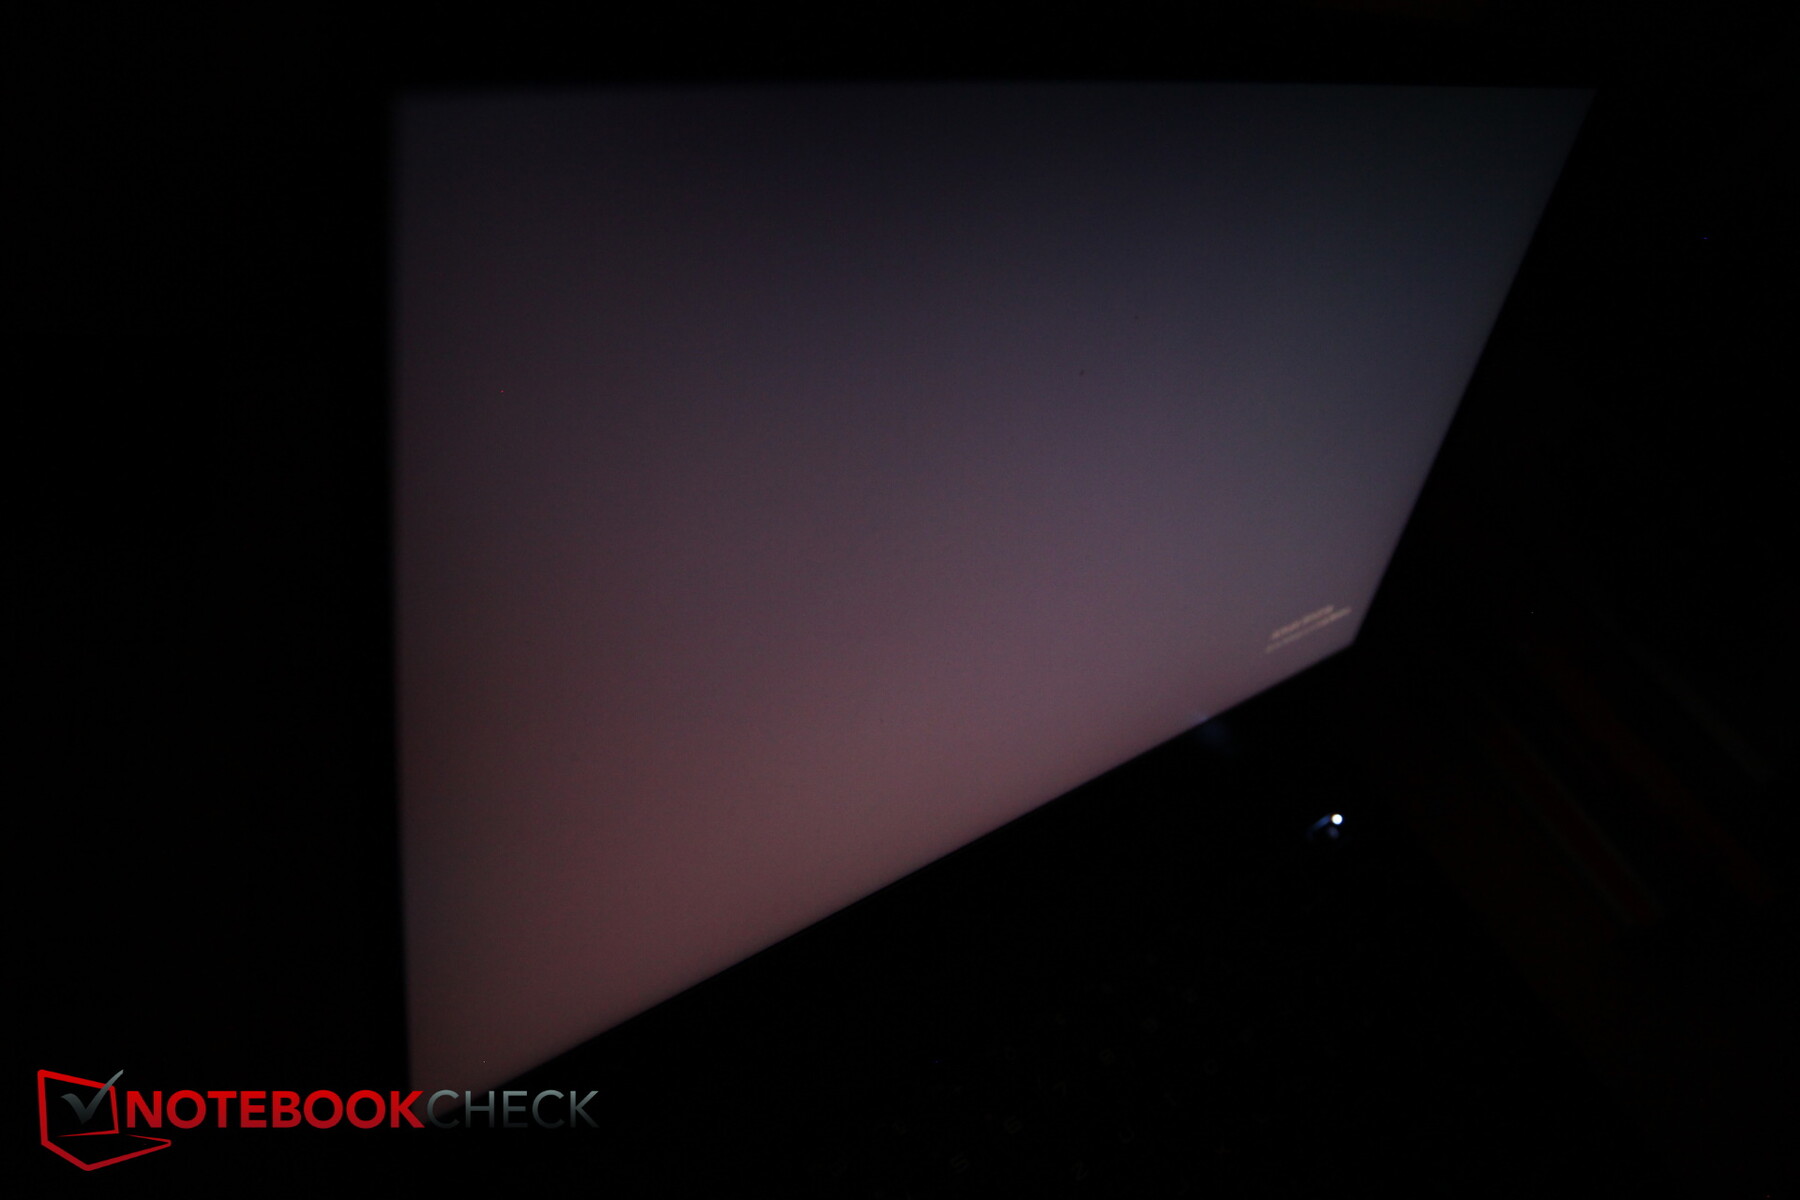
The black value is too high, which is why the contrast does not produce top rates, but it is still comparable with the competition. Only the Schenker XMG Neo is clearly better here. When looking at the display from the side with a black image, you can clearly see the strong background glow. The black value naturally improves with reduced brightness.
Screen bleeding is hardly significant in our test model, the pixel grid is a bit grainy due to the matte surface. The panel's response times are okay, PWM is not used.
| |||||||||||||||||||||||||
Brightness Distribution: 87 %
Center on Battery: 390 cd/m²
Contrast: 951:1 (Black: 0.41 cd/m²)
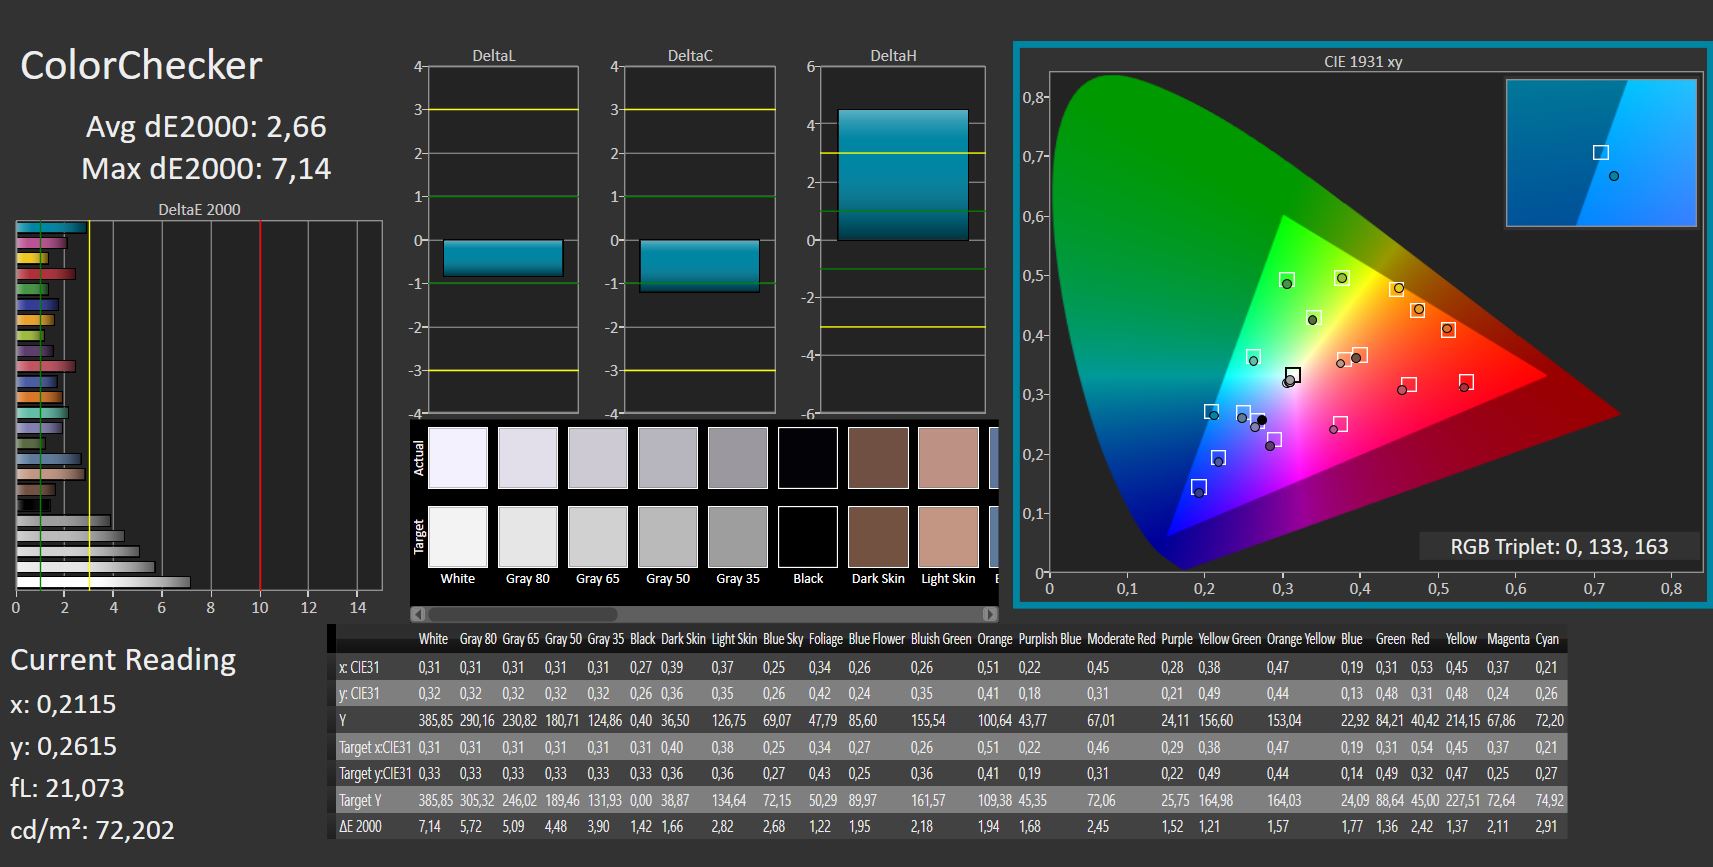
ΔE Color 2.66 | 0.5-29.43 Ø5, calibrated: 2.56
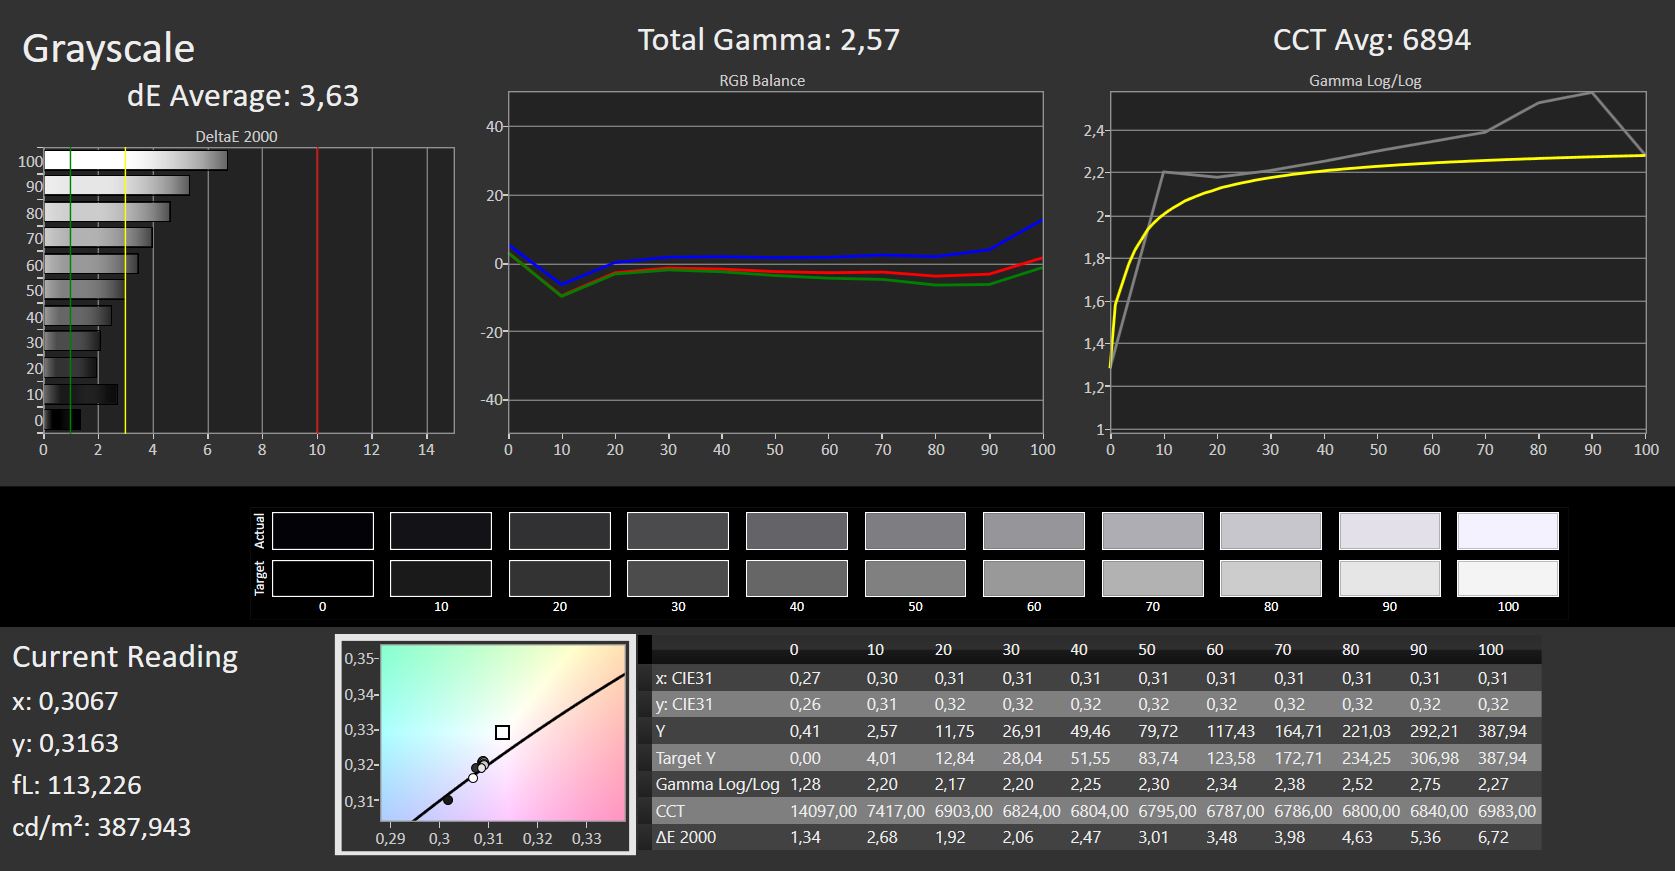
ΔE Greyscale 3.63 | 0.57-98 Ø5.3
66% AdobeRGB 1998 (Argyll 2.2.0 3D)
95.8% sRGB (Argyll 2.2.0 3D)
65.2% Display P3 (Argyll 2.2.0 3D)
Gamma: 2.57
| MSI GP66 Leopard 11UH-028 LGD0625 (LP156WFG-SPB3), IPS, 1920x1080, 15.60 | MSI GP66 Leopard 10UG Sharp LQ156M1JW03, IPS, 1920x1080, 15.60 | Aorus 15P YD BOE09B9, IPS, 1920x1080, 15.60 | Asus ROG Strix Scar 15 G533QS BOE CQ NE156QHM-NY1, IPS, 2560x1440, 15.60 | SCHENKER XMG Neo 15 Tiger Lake BOE CQ NE156QHM-NY2, IPS, 2560x1440, 15.60 | Alienware m15 R6, i7-11800H RTX 3080 AU Optronics AUO9092 (B156HAN), IPS, 1920x1080, 15.60 | |
|---|---|---|---|---|---|---|
| Display | 5% | 7% | 28% | 4% | 11% | |
| Display P3 Coverage | 65.2 | 68.3 5% | 70.2 8% | 97.6 50% | 68.6 5% | 74.1 14% |
| sRGB Coverage | 95.8 | 99.2 4% | 98.5 3% | 99.9 4% | 98.6 3% | 99.5 4% |
| AdobeRGB 1998 Coverage | 66 | 70.4 7% | 72.4 10% | 85.3 29% | 69.3 5% | 75.7 15% |
| Response Times | 7% | 6% | -8% | -13% | 64% | |
| Response Time Grey 50% / Grey 80% * | 14 ? | 13.6 ? 3% | 14 ? -0% | 14 ? -0% | 16 ? -14% | 2.8 80% |
| Response Time Black / White * | 10.8 ? | 9.6 ? 11% | 9.6 ? 11% | 12.4 ? -15% | 12 ? -11% | 5.6 48% |
| PWM Frequency | 23580 ? | |||||
| Screen | -15% | -7% | -3% | -4% | -1% | |
| Brightness middle | 390 | 225.9 -42% | 337 -14% | 304.3 -22% | 324 -17% | 359 -8% |
| Brightness | 362 | 211 -42% | 316 -13% | 286 -21% | 307 -15% | 344 -5% |
| Brightness Distribution | 87 | 83 -5% | 85 -2% | 76 -13% | 91 5% | 85 -2% |
| Black Level * | 0.41 | 0.23 44% | 0.31 24% | 0.33 20% | 0.27 34% | 0.35 15% |
| Contrast | 951 | 982 3% | 1087 14% | 922 -3% | 1200 26% | 1026 8% |
| Colorchecker dE 2000 * | 2.66 | 3.98 -50% | 3.87 -45% | 2.76 -4% | 3.36 -26% | 3.3 -24% |
| Colorchecker dE 2000 max. * | 7.14 | 8.95 -25% | 8.09 -13% | 5.57 22% | 9.87 -38% | 4.84 32% |
| Colorchecker dE 2000 calibrated * | 2.56 | 1.15 55% | 1.15 55% | 2.38 7% | 1.23 52% | 3.28 -28% |
| Greyscale dE 2000 * | 3.63 | 6.4 -76% | 6.1 -68% | 4 -10% | 5.8 -60% | 3.66 -1% |
| Gamma | 2.57 86% | 2.25 98% | 2.132 103% | 2.14 103% | 2.311 95% | 2.43 91% |
| CCT | 6894 94% | 6991 93% | 6891 94% | 6844 95% | 7087 92% | 5896 110% |
| Color Space (Percent of AdobeRGB 1998) | 64.5 | 72 | 69 | |||
| Color Space (Percent of sRGB) | 99.3 | 94 | 93 | |||
| Total Average (Program / Settings) | -1% /
-8% | 2% /
-2% | 6% /
3% | -4% /
-4% | 25% /
11% |
* ... smaller is better
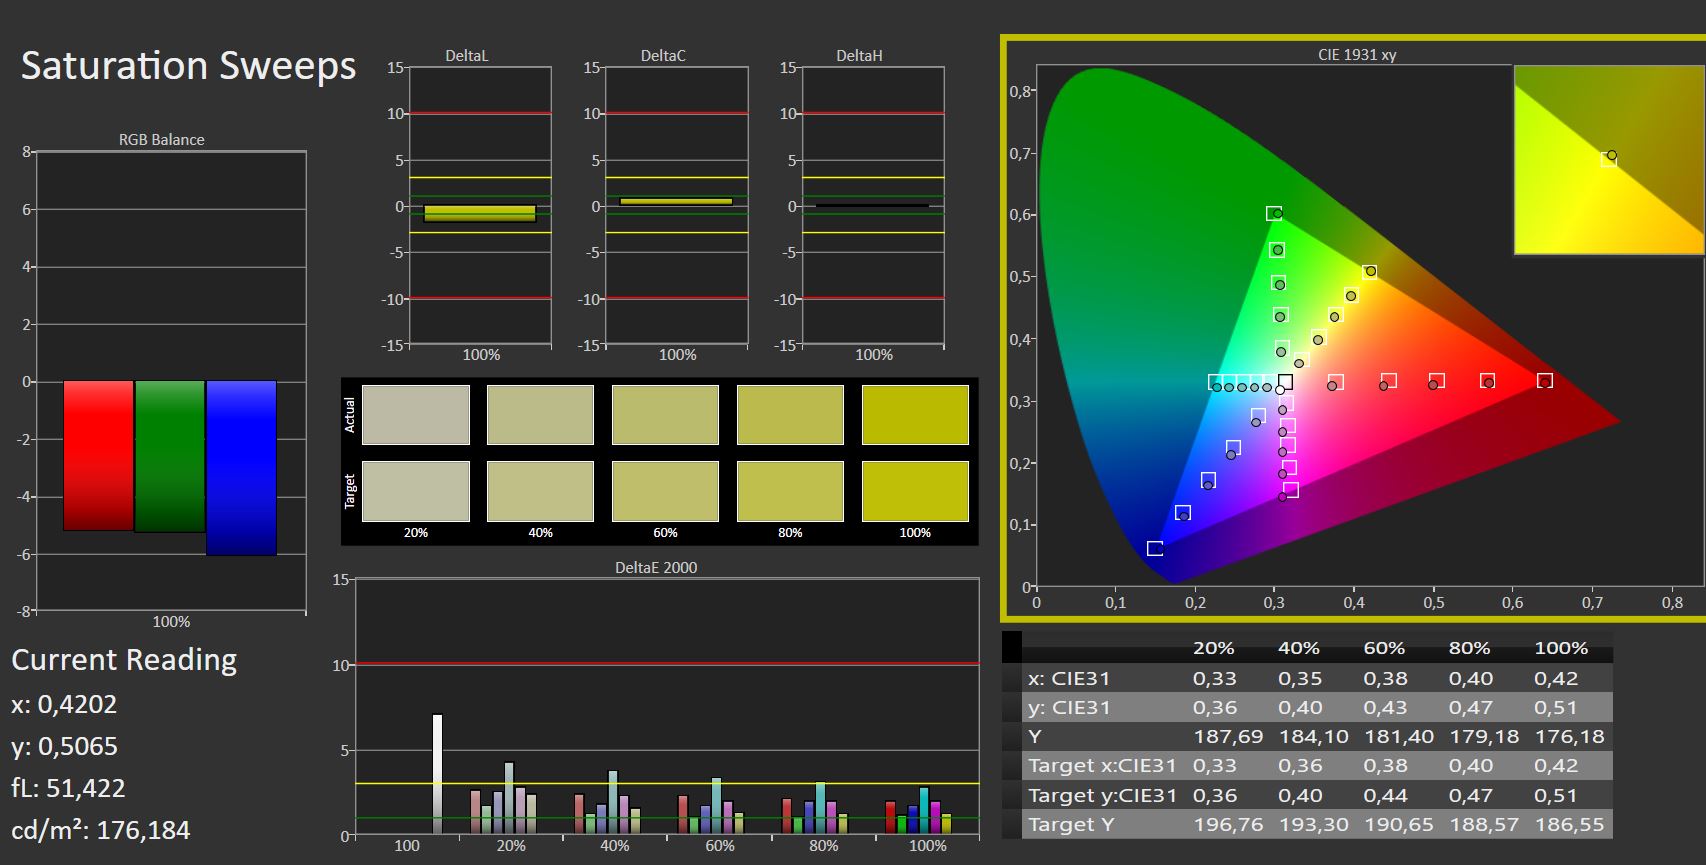
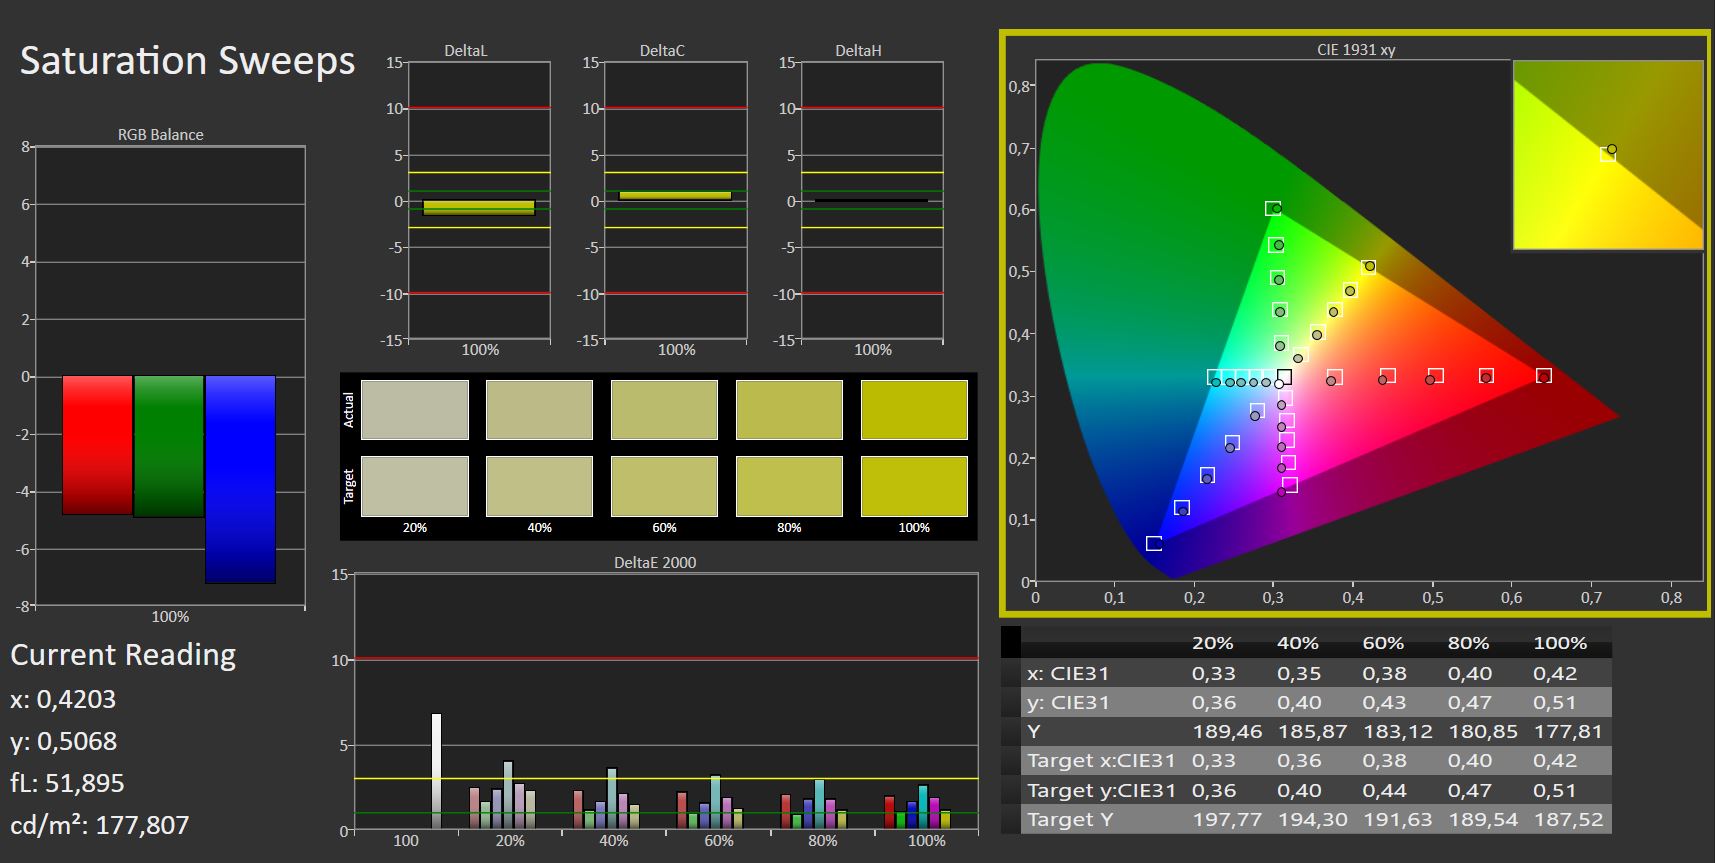
The competition is only slightly better in terms of color space coverage. Only the Asus ROG is clearly ahead here, since it also covers AdobeRGB almost completely, whereas our MSI only covers 66% of it. Therefore, the Asus is preferable for image editing.
The display is configured well ex-works, and a manual calibration does not improve it much.

Display Response Times
| ↔ Response Time Black to White | ||
|---|---|---|
| 10.8 ms ... rise ↗ and fall ↘ combined | ↗ 6.2 ms rise | 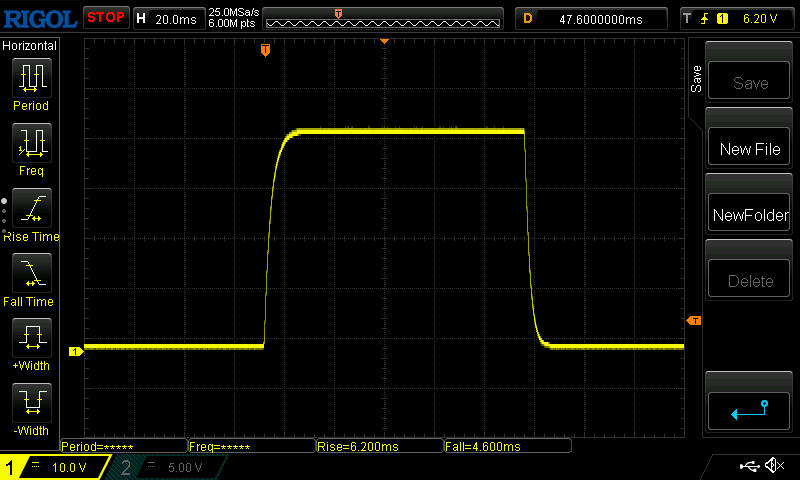 |
| ↘ 4.6 ms fall | ||
| The screen shows good response rates in our tests, but may be too slow for competitive gamers. In comparison, all tested devices range from 0.1 (minimum) to 240 (maximum) ms. » 24 % of all devices are better. This means that the measured response time is better than the average of all tested devices (21.5 ms). | ||
| ↔ Response Time 50% Grey to 80% Grey | ||
| 14 ms ... rise ↗ and fall ↘ combined | ↗ 7 ms rise | 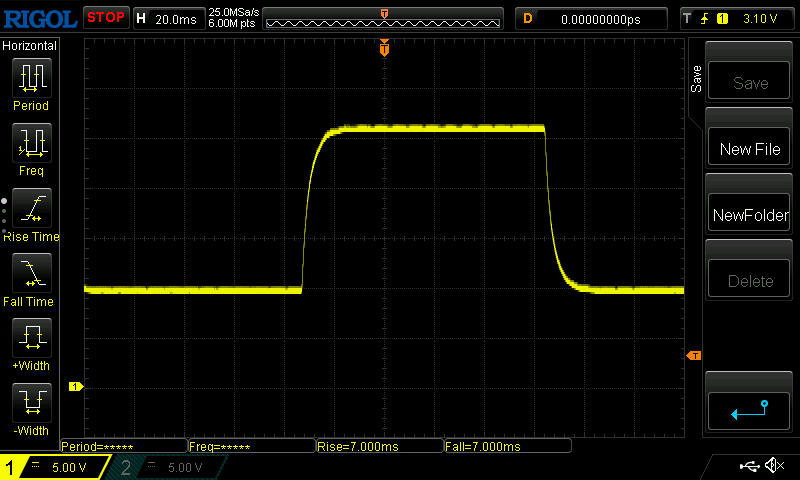 |
| ↘ 7 ms fall | ||
| The screen shows good response rates in our tests, but may be too slow for competitive gamers. In comparison, all tested devices range from 0.2 (minimum) to 636 (maximum) ms. » 22 % of all devices are better. This means that the measured response time is better than the average of all tested devices (33.7 ms). | ||
Screen Flickering / PWM (Pulse-Width Modulation)
| Screen flickering / PWM not detected |  | ||
In comparison: 53 % of all tested devices do not use PWM to dim the display. If PWM was detected, an average of 17900 (minimum: 5 - maximum: 3846000) Hz was measured. | |||
Due to the good brightness and the matte surface, visibility outdoors is good - at least in the shade and with direct top view. Direct sunlight as well as oblique viewing angles should be avoided.
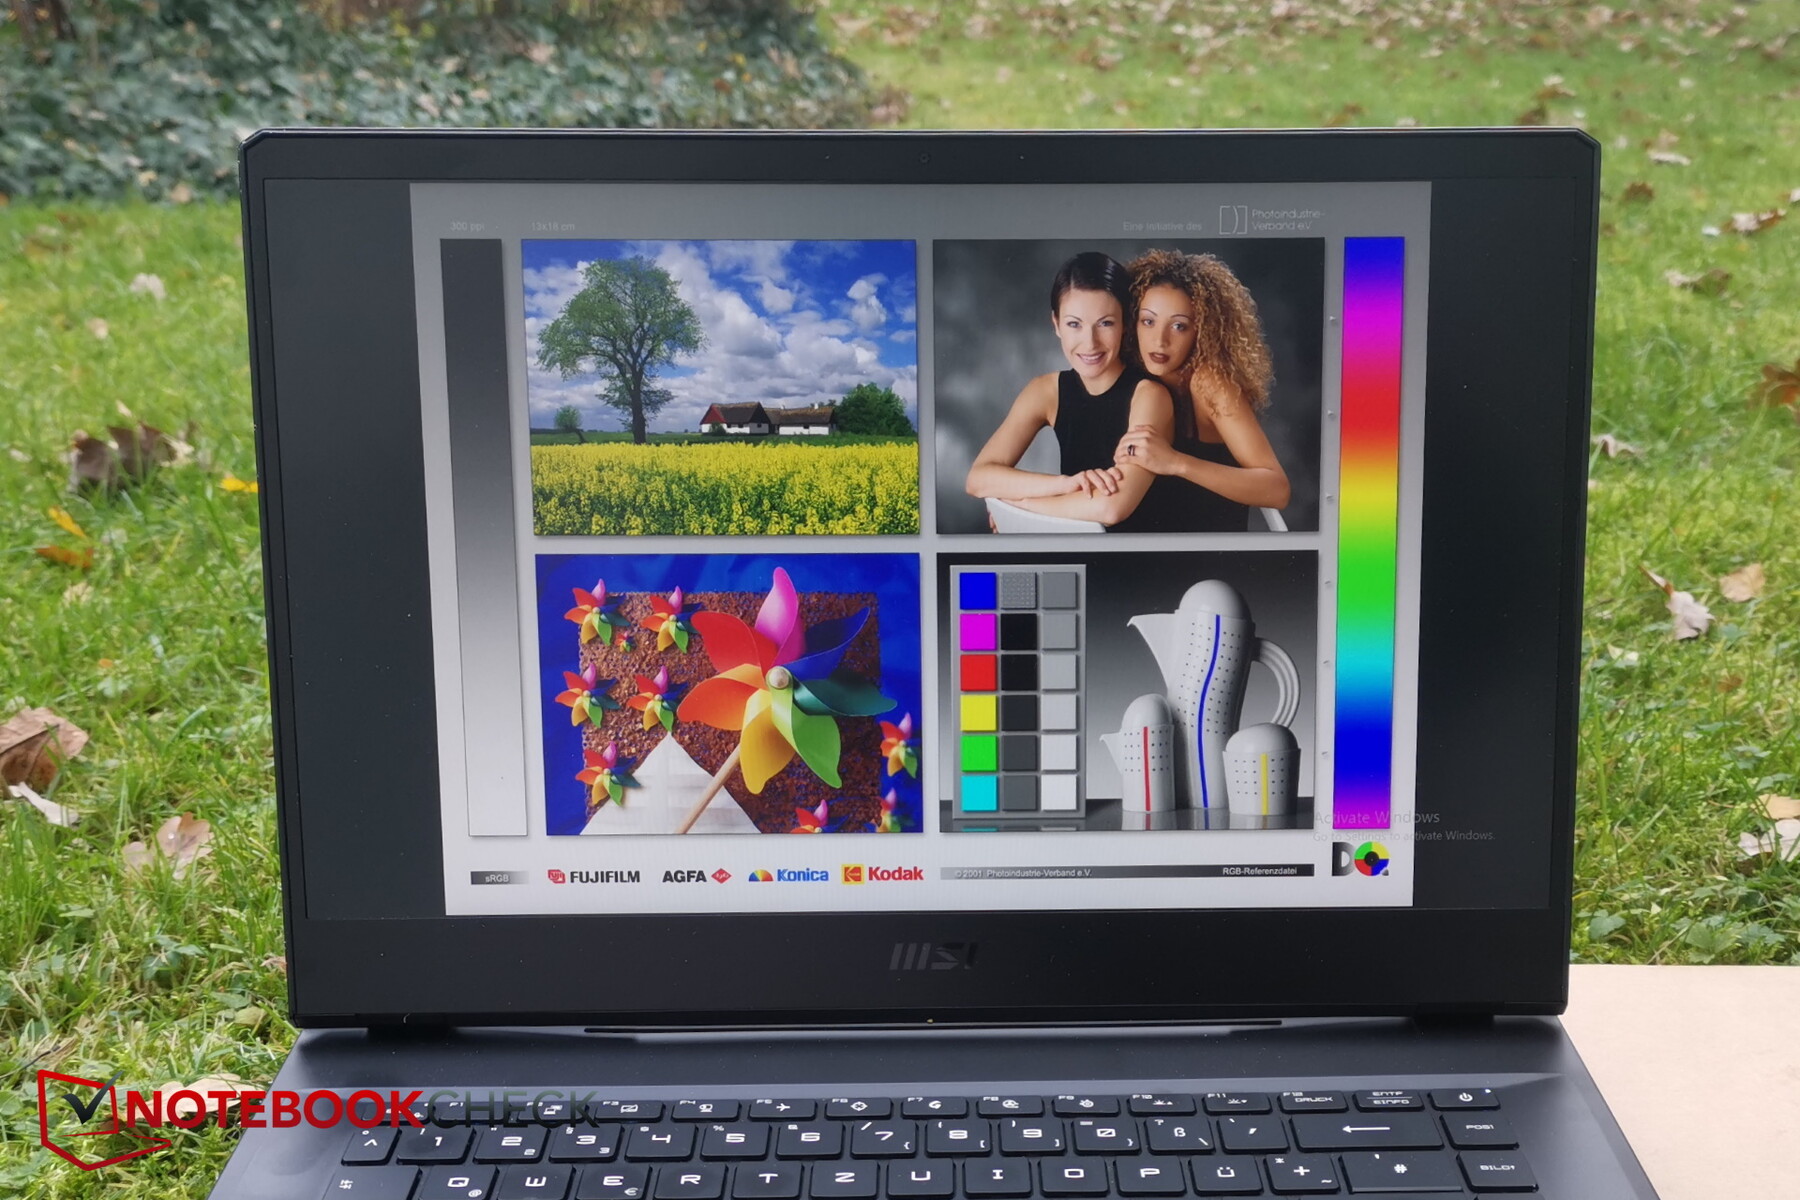
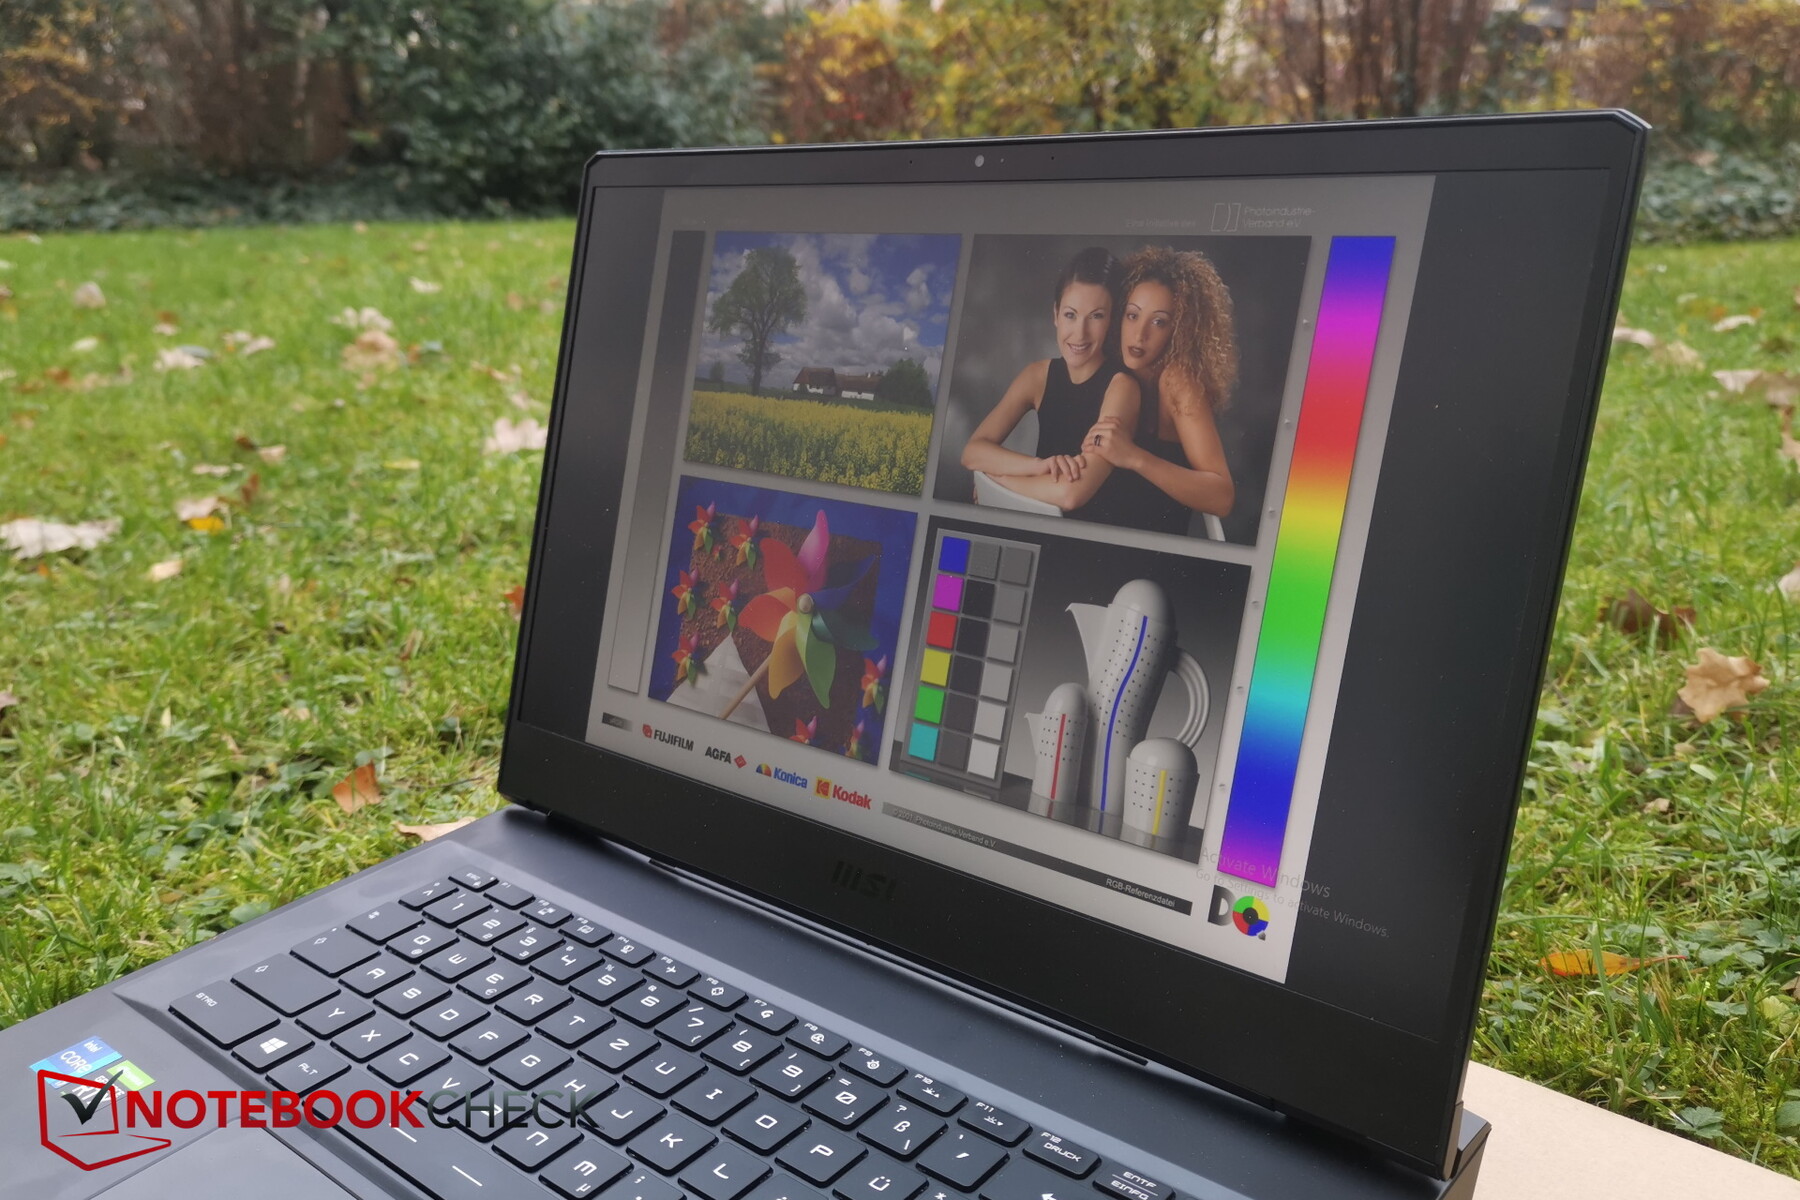
When viewing from extreme angles, some brightness is lost in particular, but only very little as is typical for IPS, and the content can still be recognized well.

Performance - Only the CPU benefits from the MSI Center
MSI's Leopard is a gaming laptop, which is indicated by the RTX 3080. Theoretically, the laptop should be able to render all current games smoothly in the native resolution and also have enough reserves for 4K resolutions.
Test conditions
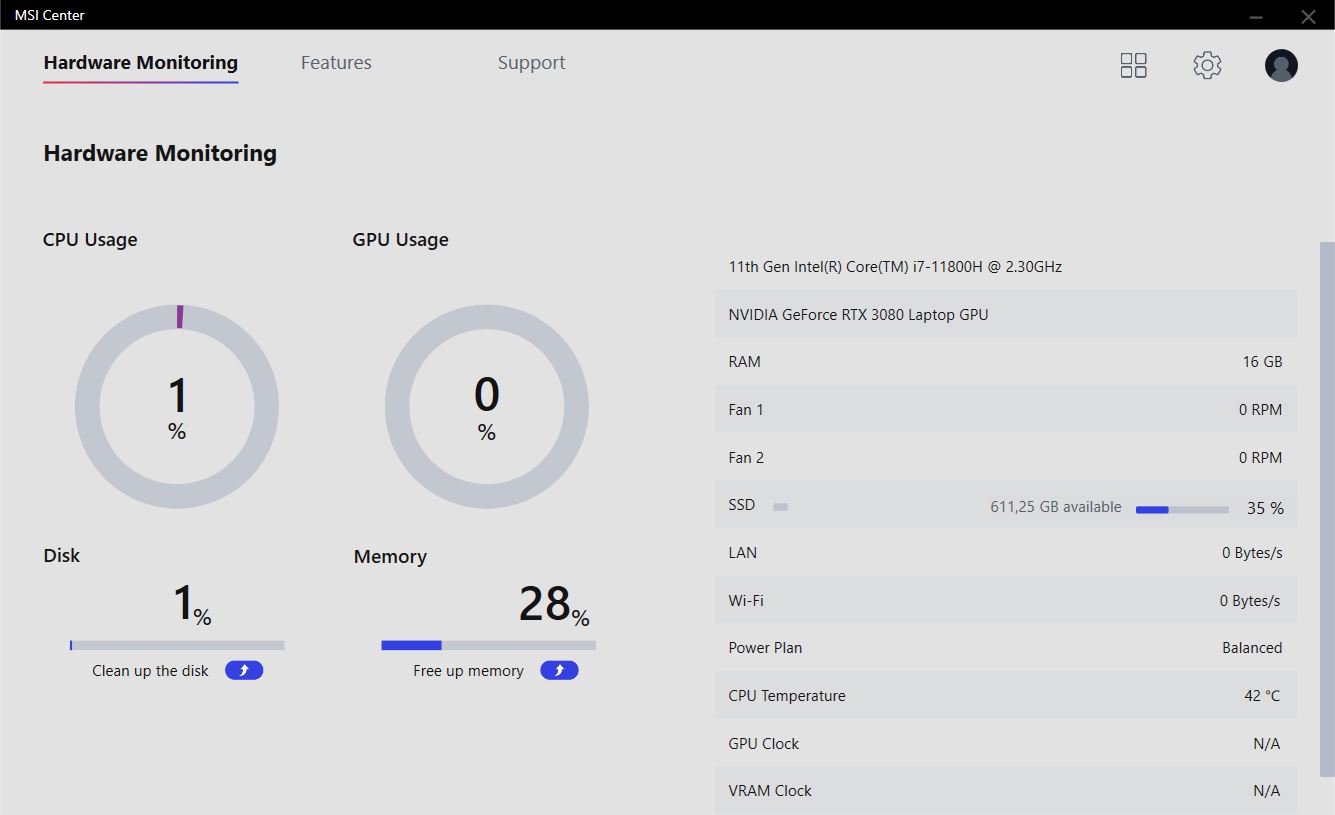
We performed all benchmarks when the MSI Center was not yet installed. After all, the GP66 is only officially shipped with FreeDOS and not with a Windows license. The Windows performance slider of our test unit was always set to "Best Performance" for the performance benchmarks.
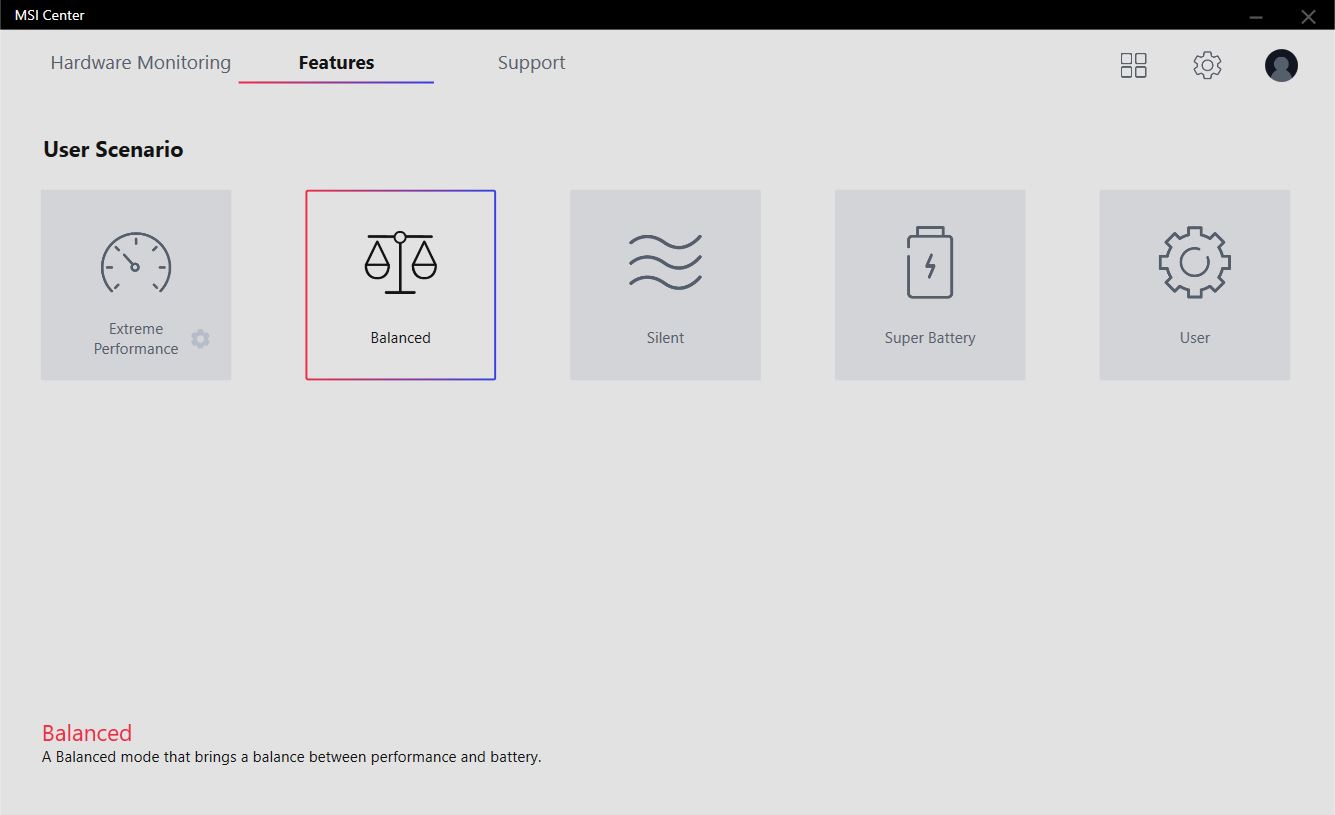
The MSI Center, on the other hand, uses other performance modes, which are hidden under "User Scenario". We will go into the differences to the Windows mode in the performance sections. In the MSI settings, you can also choose between hybrid graphics mode or discrete GPU only.
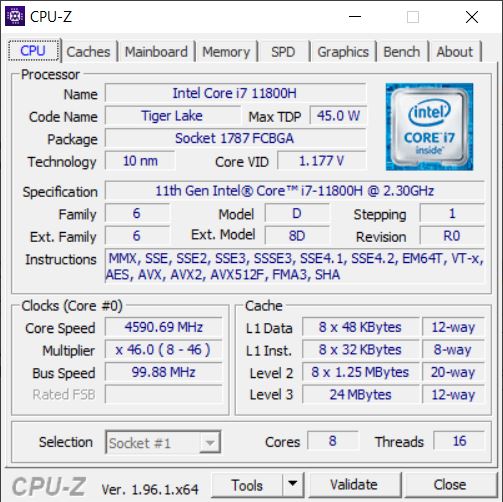
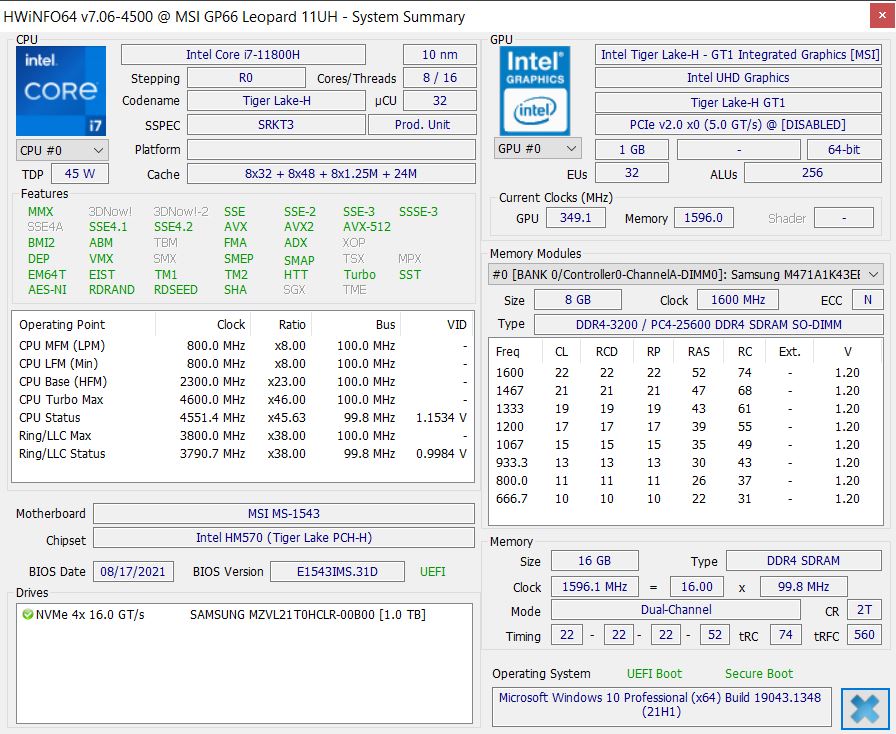
Processor
Like many of the current Intel gaming laptops, the MSI Leopard is equipped with an Intel Core i7-11800H processor. It has eight cores, which clock from 2.3 to 4.6 GHz individually. A maximum clock of 4.2 GHz is possible when all cores under load.
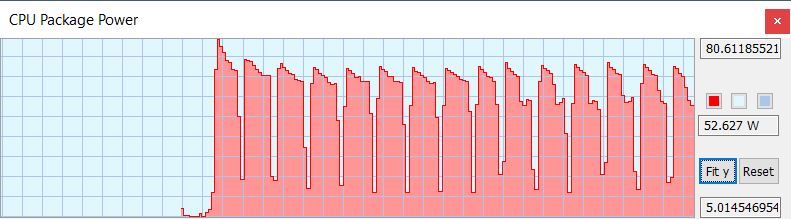
In our Cinebench loop performance only decreases minimally and overall, the GP 66 11UH is about 25% faster than its predecessor. Via HWinfo, we can see that the CPU allows itself 80 W at the beginning, but the following runs rather start at 75 W and finish with 53 W. Nevertheless, the results just surpass those of the Aorus with the same CPU.
The "Extreme Performance" mode benefits the CPU power in particular. Instead of 75 W before, the CPU is even can allow itself 90 W for a short time, which quickly goes back to 74 W instead of 53 W within one run. However, even in Extreme mode, the GP66 does not quite reach the performance of the unbridled XMG Neo or the Asus ROG with an AMD CPU.
The performance drops significantly on battery power: from formerly around 2,000 points, only 1,178 points remain.
Cinebench R15 Multi endurance test
Cinebench R23: Multi Core | Single Core
Cinebench R20: CPU (Multi Core) | CPU (Single Core)
Cinebench R15: CPU Multi 64Bit | CPU Single 64Bit
Blender: v2.79 BMW27 CPU
7-Zip 18.03: 7z b 4 | 7z b 4 -mmt1
Geekbench 5.5: Multi-Core | Single-Core
HWBOT x265 Benchmark v2.2: 4k Preset
LibreOffice : 20 Documents To PDF
R Benchmark 2.5: Overall mean
| CPU Performance Rating | |
| Average of class Gaming | |
| SCHENKER XMG Neo 15 Tiger Lake | |
| MSI GP66 Leopard 11UH-028 | |
| Asus ROG Strix Scar 15 G533QS -2! | |
| Alienware m15 R6, i7-11800H RTX 3080 | |
| Average Intel Core i7-11800H | |
| Aorus 15P YD -2! | |
| MSI GP66 Leopard 10UG | |
| Cinebench R23 / Multi Core | |
| Average of class Gaming (2435 - 34613, n=230, last 2 years) | |
| SCHENKER XMG Neo 15 Tiger Lake | |
| Asus ROG Strix Scar 15 G533QS | |
| Alienware m15 R6, i7-11800H RTX 3080 | |
| MSI GP66 Leopard 11UH-028 | |
| Average Intel Core i7-11800H (6508 - 14088, n=48) | |
| MSI GP66 Leopard 10UG | |
| Cinebench R23 / Single Core | |
| Average of class Gaming (527 - 2235, n=228, last 2 years) | |
| MSI GP66 Leopard 11UH-028 | |
| SCHENKER XMG Neo 15 Tiger Lake | |
| Average Intel Core i7-11800H (1386 - 1522, n=45) | |
| Alienware m15 R6, i7-11800H RTX 3080 | |
| Asus ROG Strix Scar 15 G533QS | |
| MSI GP66 Leopard 10UG | |
| Cinebench R20 / CPU (Multi Core) | |
| Average of class Gaming (930 - 13769, n=228, last 2 years) | |
| SCHENKER XMG Neo 15 Tiger Lake | |
| Asus ROG Strix Scar 15 G533QS | |
| Aorus 15P YD | |
| MSI GP66 Leopard 11UH-028 | |
| Alienware m15 R6, i7-11800H RTX 3080 | |
| Average Intel Core i7-11800H (2498 - 5408, n=50) | |
| MSI GP66 Leopard 10UG | |
| Cinebench R20 / CPU (Single Core) | |
| Average of class Gaming (169 - 855, n=228, last 2 years) | |
| Aorus 15P YD | |
| MSI GP66 Leopard 11UH-028 | |
| SCHENKER XMG Neo 15 Tiger Lake | |
| Alienware m15 R6, i7-11800H RTX 3080 | |
| Average Intel Core i7-11800H (520 - 586, n=47) | |
| Asus ROG Strix Scar 15 G533QS | |
| MSI GP66 Leopard 10UG | |
| Cinebench R15 / CPU Multi 64Bit | |
| Average of class Gaming (400 - 5663, n=232, last 2 years) | |
| Asus ROG Strix Scar 15 G533QS | |
| SCHENKER XMG Neo 15 Tiger Lake | |
| Alienware m15 R6, i7-11800H RTX 3080 | |
| MSI GP66 Leopard 11UH-028 | |
| Aorus 15P YD | |
| Average Intel Core i7-11800H (1342 - 2173, n=50) | |
| MSI GP66 Leopard 10UG | |
| Cinebench R15 / CPU Single 64Bit | |
| Average of class Gaming (79.2 - 318, n=231, last 2 years) | |
| Asus ROG Strix Scar 15 G533QS | |
| Aorus 15P YD | |
| SCHENKER XMG Neo 15 Tiger Lake | |
| MSI GP66 Leopard 11UH-028 | |
| Alienware m15 R6, i7-11800H RTX 3080 | |
| Average Intel Core i7-11800H (201 - 231, n=46) | |
| MSI GP66 Leopard 10UG | |
| Blender / v2.79 BMW27 CPU | |
| Aorus 15P YD | |
| MSI GP66 Leopard 10UG | |
| Average Intel Core i7-11800H (217 - 454, n=46) | |
| Alienware m15 R6, i7-11800H RTX 3080 | |
| MSI GP66 Leopard 11UH-028 | |
| Asus ROG Strix Scar 15 G533QS | |
| SCHENKER XMG Neo 15 Tiger Lake | |
| Average of class Gaming (87 - 1259, n=226, last 2 years) | |
| 7-Zip 18.03 / 7z b 4 | |
| Average of class Gaming (11386 - 140932, n=227, last 2 years) | |
| Asus ROG Strix Scar 15 G533QS | |
| SCHENKER XMG Neo 15 Tiger Lake | |
| MSI GP66 Leopard 11UH-028 | |
| Alienware m15 R6, i7-11800H RTX 3080 | |
| Average Intel Core i7-11800H (33718 - 56758, n=46) | |
| Aorus 15P YD | |
| MSI GP66 Leopard 10UG | |
| 7-Zip 18.03 / 7z b 4 -mmt1 | |
| Average of class Gaming (2685 - 7581, n=227, last 2 years) | |
| SCHENKER XMG Neo 15 Tiger Lake | |
| Aorus 15P YD | |
| MSI GP66 Leopard 11UH-028 | |
| Asus ROG Strix Scar 15 G533QS | |
| Average Intel Core i7-11800H (5138 - 5732, n=46) | |
| Alienware m15 R6, i7-11800H RTX 3080 | |
| MSI GP66 Leopard 10UG | |
| Geekbench 5.5 / Multi-Core | |
| Average of class Gaming (1946 - 22200, n=232, last 2 years) | |
| SCHENKER XMG Neo 15 Tiger Lake | |
| Alienware m15 R6, i7-11800H RTX 3080 | |
| MSI GP66 Leopard 11UH-028 | |
| Aorus 15P YD | |
| Average Intel Core i7-11800H (4655 - 9851, n=40) | |
| MSI GP66 Leopard 10UG | |
| Geekbench 5.5 / Single-Core | |
| Average of class Gaming (158 - 2210, n=232, last 2 years) | |
| SCHENKER XMG Neo 15 Tiger Lake | |
| Aorus 15P YD | |
| MSI GP66 Leopard 11UH-028 | |
| Alienware m15 R6, i7-11800H RTX 3080 | |
| Average Intel Core i7-11800H (1429 - 1625, n=40) | |
| MSI GP66 Leopard 10UG | |
| HWBOT x265 Benchmark v2.2 / 4k Preset | |
| Average of class Gaming (3 - 37.6, n=230, last 2 years) | |
| SCHENKER XMG Neo 15 Tiger Lake | |
| Asus ROG Strix Scar 15 G533QS | |
| MSI GP66 Leopard 11UH-028 | |
| Average Intel Core i7-11800H (7.38 - 17.4, n=46) | |
| Alienware m15 R6, i7-11800H RTX 3080 | |
| MSI GP66 Leopard 10UG | |
| Aorus 15P YD | |
| LibreOffice / 20 Documents To PDF | |
| Asus ROG Strix Scar 15 G533QS | |
| MSI GP66 Leopard 10UG | |
| Average of class Gaming (32.8 - 332, n=224, last 2 years) | |
| MSI GP66 Leopard 11UH-028 | |
| SCHENKER XMG Neo 15 Tiger Lake | |
| Average Intel Core i7-11800H (38.6 - 59.9, n=45) | |
| Alienware m15 R6, i7-11800H RTX 3080 | |
| Aorus 15P YD | |
| R Benchmark 2.5 / Overall mean | |
| MSI GP66 Leopard 10UG | |
| MSI GP66 Leopard 11UH-028 | |
| Average Intel Core i7-11800H (0.548 - 0.615, n=46) | |
| Aorus 15P YD | |
| Alienware m15 R6, i7-11800H RTX 3080 | |
| SCHENKER XMG Neo 15 Tiger Lake | |
| Asus ROG Strix Scar 15 G533QS | |
| Average of class Gaming (0.3609 - 4.47, n=227, last 2 years) | |
* ... smaller is better
AIDA64: FP32 Ray-Trace | FPU Julia | CPU SHA3 | CPU Queen | FPU SinJulia | FPU Mandel | CPU AES | CPU ZLib | FP64 Ray-Trace | CPU PhotoWorxx
| Performance Rating | |
| Average of class Gaming | |
| Asus ROG Strix Scar 15 G533QS | |
| Alienware m15 R6, i7-11800H RTX 3080 | |
| MSI GP66 Leopard 11UH-028 | |
| Average Intel Core i7-11800H | |
| MSI GP66 Leopard 10UG | |
| AIDA64 / FP32 Ray-Trace | |
| Average of class Gaming (3069 - 60169, n=223, last 2 years) | |
| Alienware m15 R6, i7-11800H RTX 3080 | |
| Asus ROG Strix Scar 15 G533QS | |
| MSI GP66 Leopard 11UH-028 | |
| Average Intel Core i7-11800H (8772 - 15961, n=20) | |
| MSI GP66 Leopard 10UG | |
| AIDA64 / FPU Julia | |
| Asus ROG Strix Scar 15 G533QS | |
| Average of class Gaming (18567 - 252486, n=223, last 2 years) | |
| Alienware m15 R6, i7-11800H RTX 3080 | |
| MSI GP66 Leopard 11UH-028 | |
| MSI GP66 Leopard 10UG | |
| Average Intel Core i7-11800H (39404 - 65636, n=20) | |
| AIDA64 / CPU SHA3 | |
| Alienware m15 R6, i7-11800H RTX 3080 | |
| Average of class Gaming (629 - 10389, n=223, last 2 years) | |
| MSI GP66 Leopard 11UH-028 | |
| Average Intel Core i7-11800H (2599 - 4439, n=20) | |
| Asus ROG Strix Scar 15 G533QS | |
| MSI GP66 Leopard 10UG | |
| AIDA64 / CPU Queen | |
| Average of class Gaming (15371 - 200651, n=223, last 2 years) | |
| Asus ROG Strix Scar 15 G533QS | |
| MSI GP66 Leopard 11UH-028 | |
| Alienware m15 R6, i7-11800H RTX 3080 | |
| Average Intel Core i7-11800H (85233 - 91941, n=20) | |
| MSI GP66 Leopard 10UG | |
| AIDA64 / FPU SinJulia | |
| Asus ROG Strix Scar 15 G533QS | |
| Average of class Gaming (2137 - 32988, n=223, last 2 years) | |
| MSI GP66 Leopard 11UH-028 | |
| Alienware m15 R6, i7-11800H RTX 3080 | |
| MSI GP66 Leopard 10UG | |
| Average Intel Core i7-11800H (6420 - 9792, n=20) | |
| AIDA64 / FPU Mandel | |
| Asus ROG Strix Scar 15 G533QS | |
| Average of class Gaming (10291 - 134044, n=223, last 2 years) | |
| Alienware m15 R6, i7-11800H RTX 3080 | |
| MSI GP66 Leopard 11UH-028 | |
| Average Intel Core i7-11800H (23365 - 39464, n=20) | |
| MSI GP66 Leopard 10UG | |
| AIDA64 / CPU AES | |
| Alienware m15 R6, i7-11800H RTX 3080 | |
| MSI GP66 Leopard 11UH-028 | |
| Asus ROG Strix Scar 15 G533QS | |
| Average Intel Core i7-11800H (74617 - 149388, n=20) | |
| Average of class Gaming (19065 - 328679, n=223, last 2 years) | |
| MSI GP66 Leopard 10UG | |
| AIDA64 / CPU ZLib | |
| Average of class Gaming (150.9 - 2409, n=223, last 2 years) | |
| Asus ROG Strix Scar 15 G533QS | |
| Alienware m15 R6, i7-11800H RTX 3080 | |
| MSI GP66 Leopard 11UH-028 | |
| MSI GP66 Leopard 10UG | |
| Average Intel Core i7-11800H (461 - 830, n=43) | |
| AIDA64 / FP64 Ray-Trace | |
| Average of class Gaming (1518 - 31796, n=223, last 2 years) | |
| Alienware m15 R6, i7-11800H RTX 3080 | |
| Asus ROG Strix Scar 15 G533QS | |
| MSI GP66 Leopard 11UH-028 | |
| Average Intel Core i7-11800H (4545 - 8717, n=21) | |
| MSI GP66 Leopard 10UG | |
| AIDA64 / CPU PhotoWorxx | |
| Average of class Gaming (10805 - 60161, n=224, last 2 years) | |
| Asus ROG Strix Scar 15 G533QS | |
| Alienware m15 R6, i7-11800H RTX 3080 | |
| MSI GP66 Leopard 11UH-028 | |
| MSI GP66 Leopard 10UG | |
| Average Intel Core i7-11800H (11898 - 26757, n=21) | |
System performance
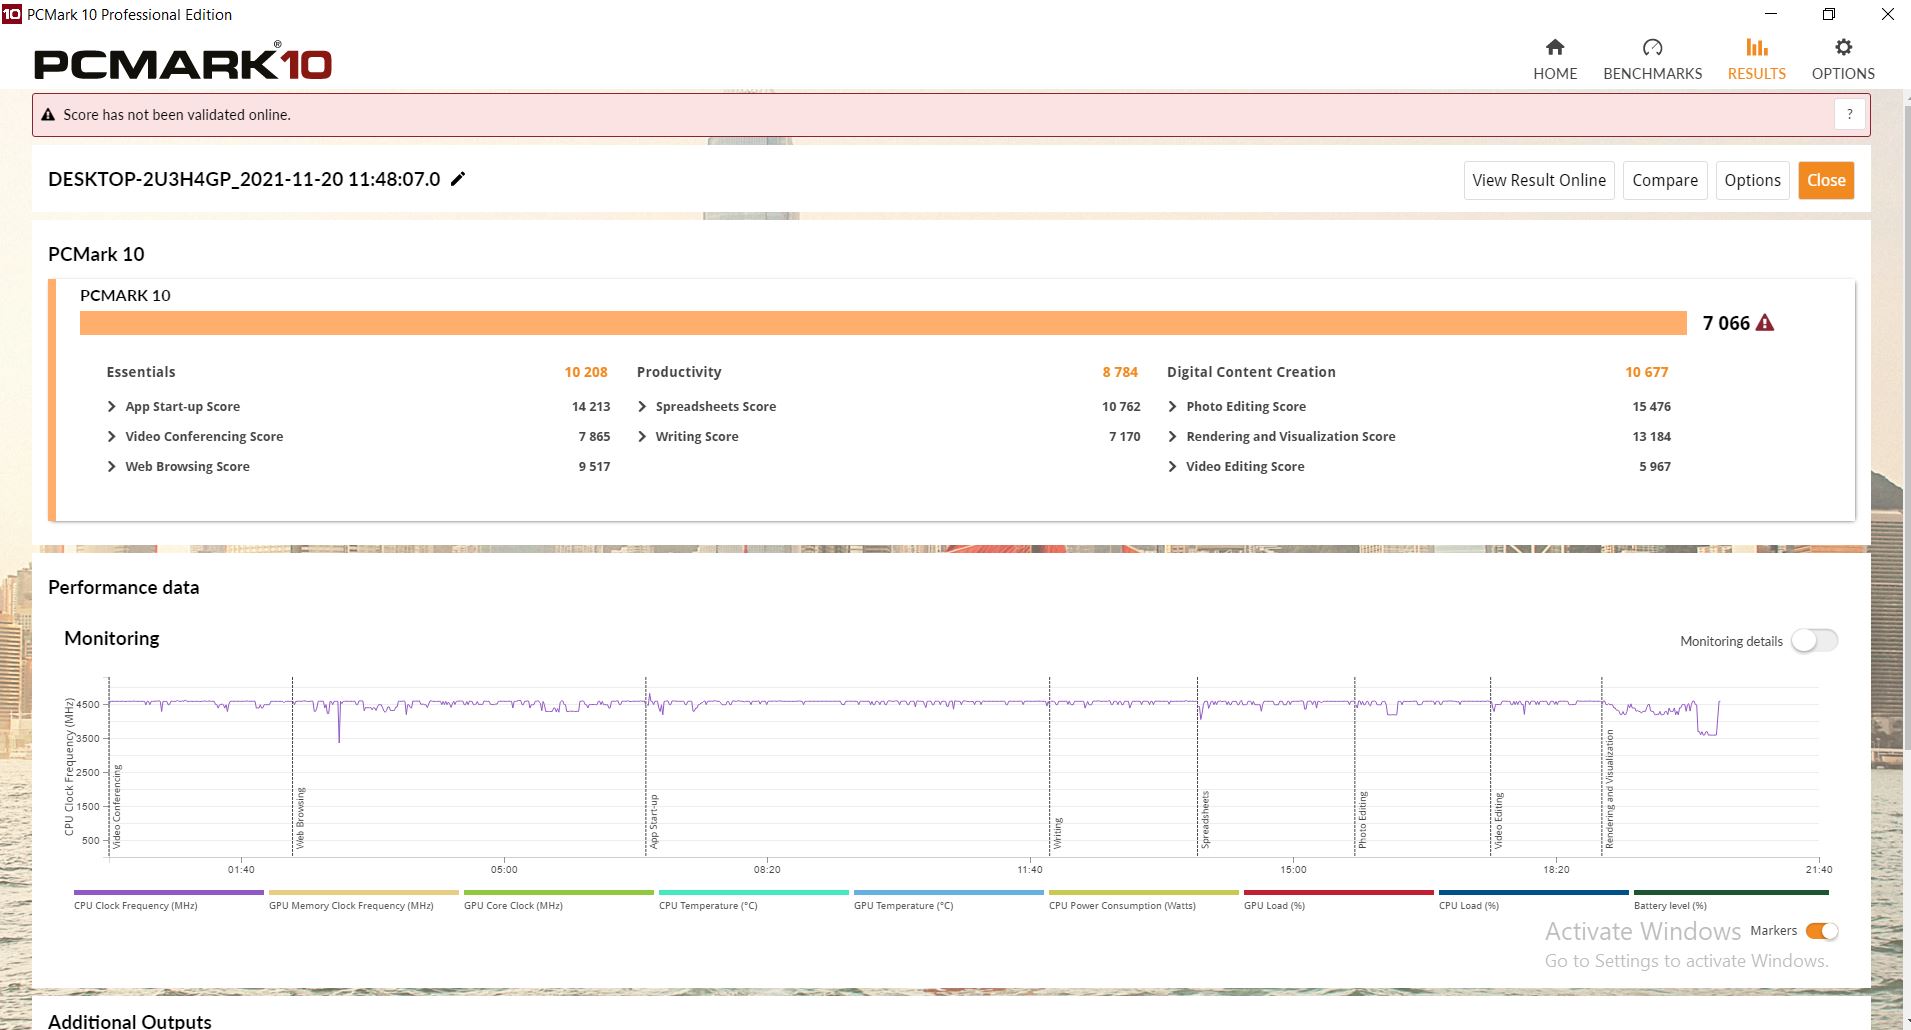
The Leopard performs roughly on the expected level in PCMark 10. Nevertheless, the rivals are often a tad better, but this is more likely to be due to the measurement accuracy.
| PCMark 10 / Score | |
| Average of class Gaming (5235 - 9852, n=197, last 2 years) | |
| Asus ROG Strix Scar 15 G533QS | |
| Aorus 15P YD | |
| SCHENKER XMG Neo 15 Tiger Lake | |
| Alienware m15 R6, i7-11800H RTX 3080 | |
| Average Intel Core i7-11800H, NVIDIA GeForce RTX 3080 Laptop GPU (6673 - 7470, n=11) | |
| MSI GP66 Leopard 11UH-028 | |
| MSI GP66 Leopard 10UG | |
| PCMark 10 / Essentials | |
| Average of class Gaming (8300 - 12334, n=196, last 2 years) | |
| Aorus 15P YD | |
| Average Intel Core i7-11800H, NVIDIA GeForce RTX 3080 Laptop GPU (9862 - 11064, n=11) | |
| SCHENKER XMG Neo 15 Tiger Lake | |
| Asus ROG Strix Scar 15 G533QS | |
| MSI GP66 Leopard 11UH-028 | |
| Alienware m15 R6, i7-11800H RTX 3080 | |
| MSI GP66 Leopard 10UG | |
| PCMark 10 / Productivity | |
| Asus ROG Strix Scar 15 G533QS | |
| Average of class Gaming (6662 - 11833, n=196, last 2 years) | |
| Alienware m15 R6, i7-11800H RTX 3080 | |
| Aorus 15P YD | |
| Average Intel Core i7-11800H, NVIDIA GeForce RTX 3080 Laptop GPU (8278 - 9803, n=11) | |
| SCHENKER XMG Neo 15 Tiger Lake | |
| MSI GP66 Leopard 11UH-028 | |
| MSI GP66 Leopard 10UG | |
| PCMark 10 / Digital Content Creation | |
| Average of class Gaming (6462 - 18475, n=196, last 2 years) | |
| SCHENKER XMG Neo 15 Tiger Lake | |
| Alienware m15 R6, i7-11800H RTX 3080 | |
| MSI GP66 Leopard 11UH-028 | |
| Average Intel Core i7-11800H, NVIDIA GeForce RTX 3080 Laptop GPU (9881 - 11323, n=11) | |
| Aorus 15P YD | |
| MSI GP66 Leopard 10UG | |
| Asus ROG Strix Scar 15 G533QS | |
| PCMark 10 Score | 7066 points | |
Help | ||
| AIDA64 / Memory Copy | |
| Average of class Gaming (21842 - 92565, n=223, last 2 years) | |
| MSI GP66 Leopard 11UH-028 | |
| Alienware m15 R6, i7-11800H RTX 3080 | |
| Asus ROG Strix Scar 15 G533QS | |
| Average Intel Core i7-11800H (24508 - 48144, n=21) | |
| MSI GP66 Leopard 10UG | |
| AIDA64 / Memory Read | |
| Average of class Gaming (24879 - 90647, n=223, last 2 years) | |
| MSI GP66 Leopard 11UH-028 | |
| Alienware m15 R6, i7-11800H RTX 3080 | |
| Asus ROG Strix Scar 15 G533QS | |
| Average Intel Core i7-11800H (25882 - 50365, n=20) | |
| MSI GP66 Leopard 10UG | |
| AIDA64 / Memory Write | |
| Average of class Gaming (21619 - 103259, n=223, last 2 years) | |
| MSI GP66 Leopard 10UG | |
| Asus ROG Strix Scar 15 G533QS | |
| MSI GP66 Leopard 11UH-028 | |
| Alienware m15 R6, i7-11800H RTX 3080 | |
| Average Intel Core i7-11800H (22240 - 46214, n=20) | |
| AIDA64 / Memory Latency | |
| Alienware m15 R6, i7-11800H RTX 3080 | |
| MSI GP66 Leopard 11UH-028 | |
| Average of class Gaming (59.5 - 152.5, n=220, last 2 years) | |
| Asus ROG Strix Scar 15 G533QS | |
| MSI GP66 Leopard 10UG | |
| Average Intel Core i7-11800H (71.9 - 104.1, n=44) | |
| Aorus 15P YD | |
| SCHENKER XMG Neo 15 Tiger Lake | |
* ... smaller is better
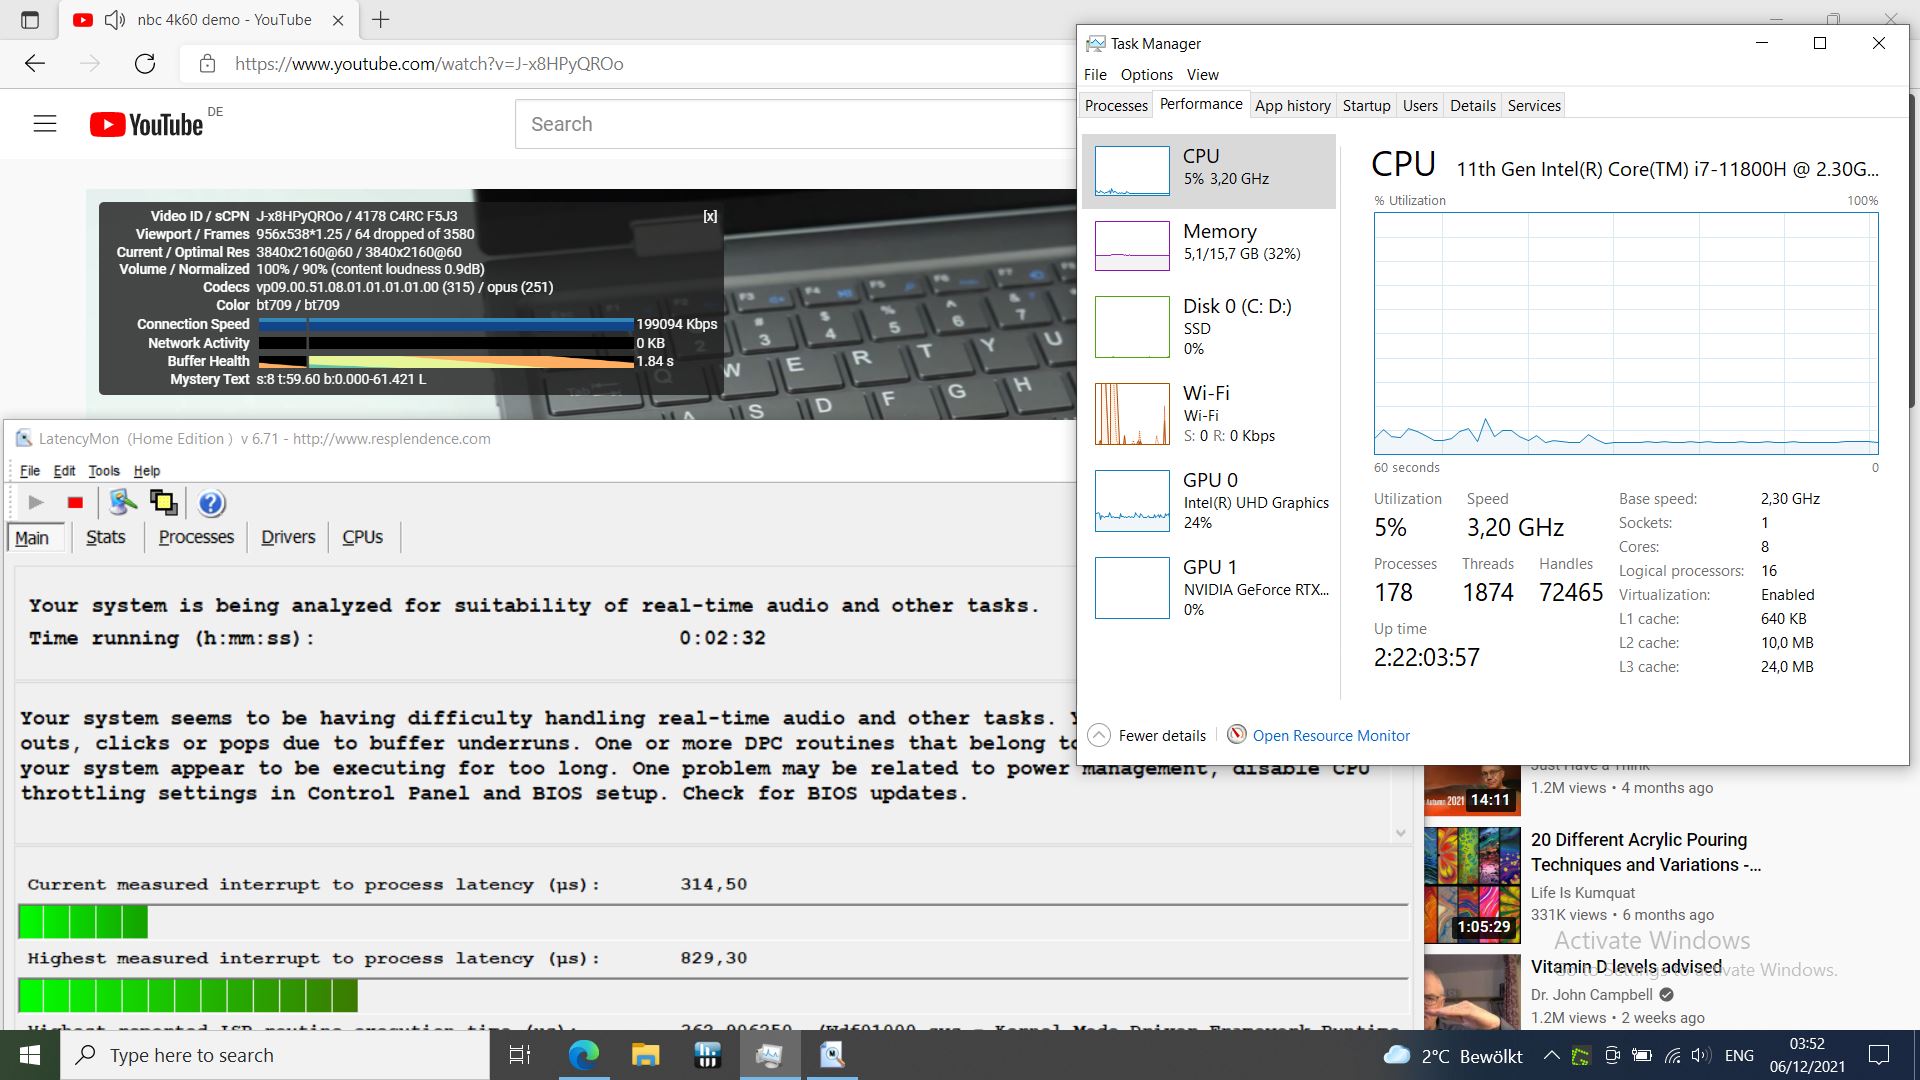
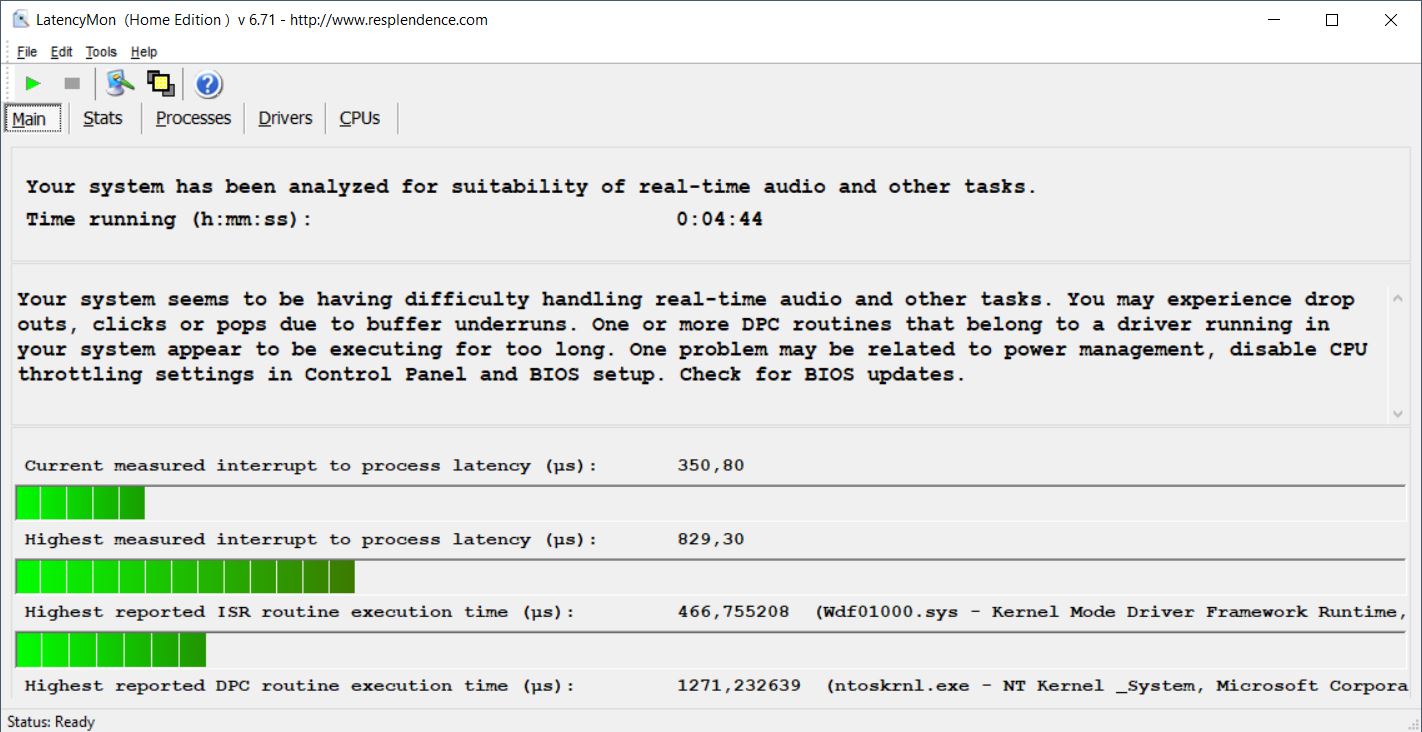
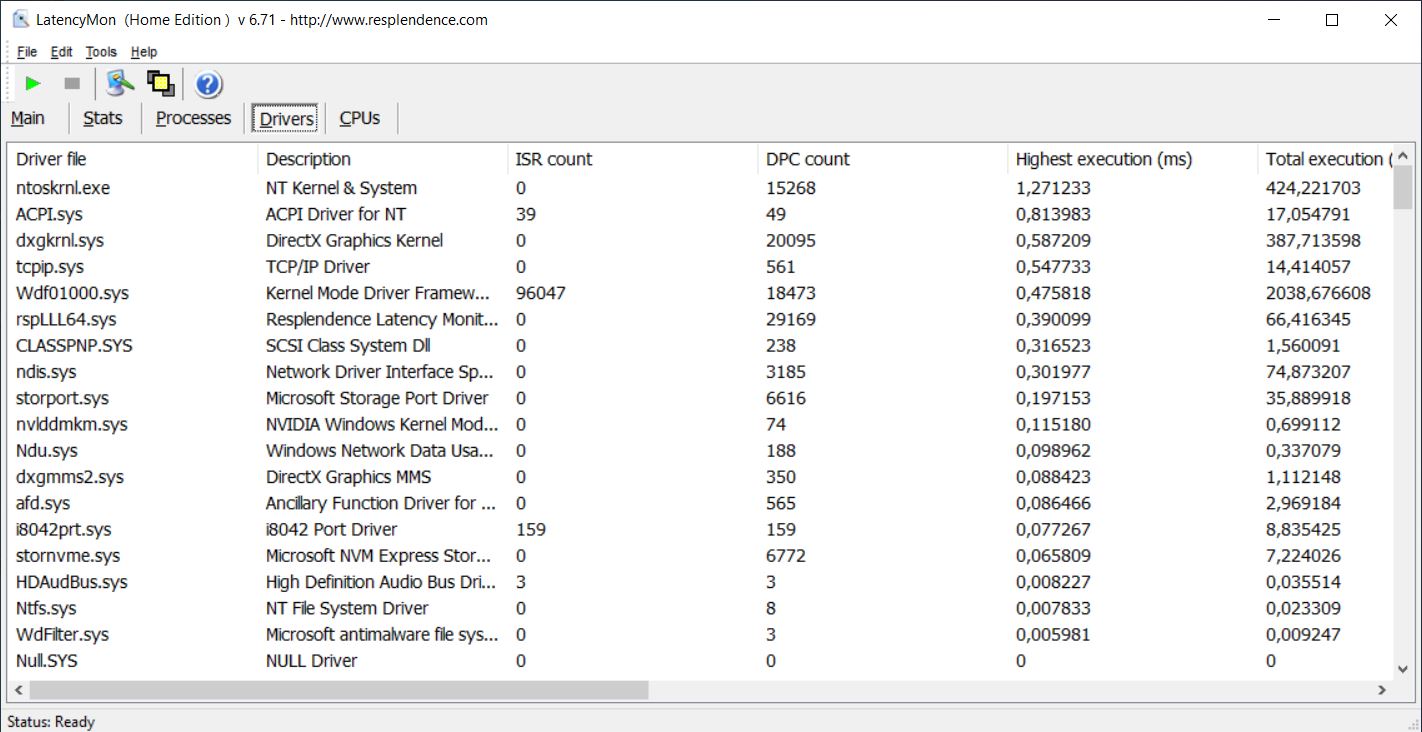
DPC latencies
The GP66 has latency problems with several open browser tabs or our 4K/60 fps YouTube video. The Leopard collected dropped frames every second in the test video, 64 in the end. Among other things, the NT kernel & system driver is to blame. The competition has similarly high latency rates, but manages better with video playback, except for the Alienware.
| DPC Latencies / LatencyMon - interrupt to process latency (max), Web, Youtube, Prime95 | |
| Asus ROG Strix Scar 15 G533QS | |
| Alienware m15 R6, i7-11800H RTX 3080 | |
| MSI GP66 Leopard 11UH-028 | |
| Aorus 15P YD | |
| SCHENKER XMG Neo 15 Tiger Lake | |
| MSI GP66 Leopard 10UG | |
* ... smaller is better
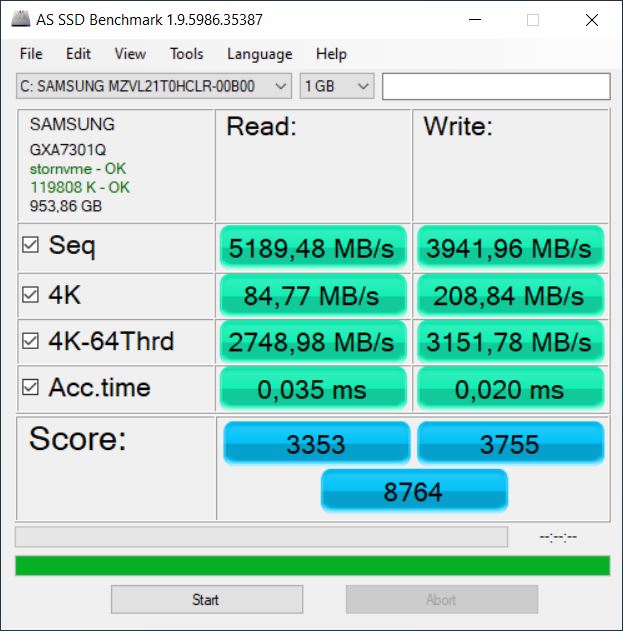
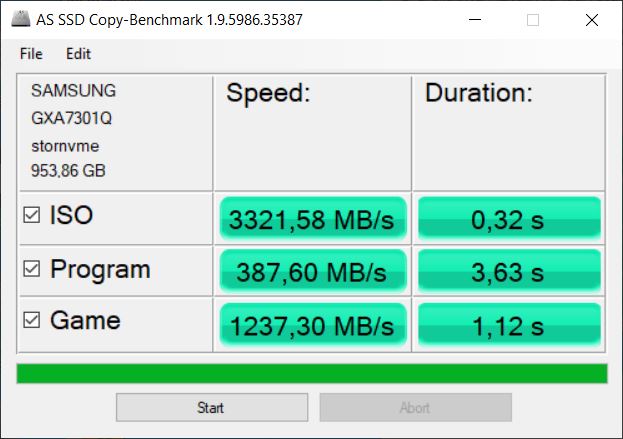
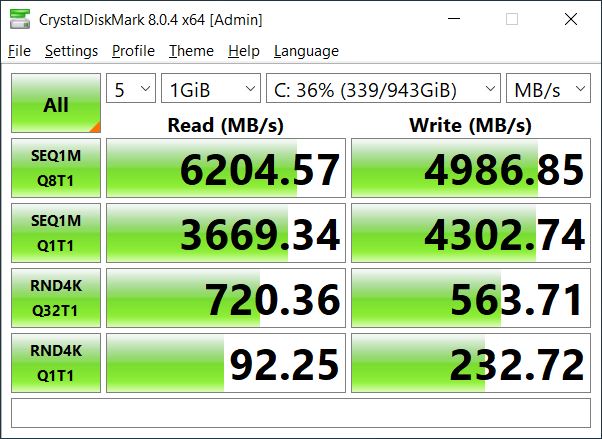
Storage
The installed NVMe SSD from Samsung with 1 TB of storage is very fast (SSD/HDD best list) however, its top performance drops by more than half in the endurance test. This should hardly be noticed in everyday use, and the remaining endurance performance is still relatively high.

* ... smaller is better
Continuous load read: DiskSpd Read Loop, Queue Depth 8
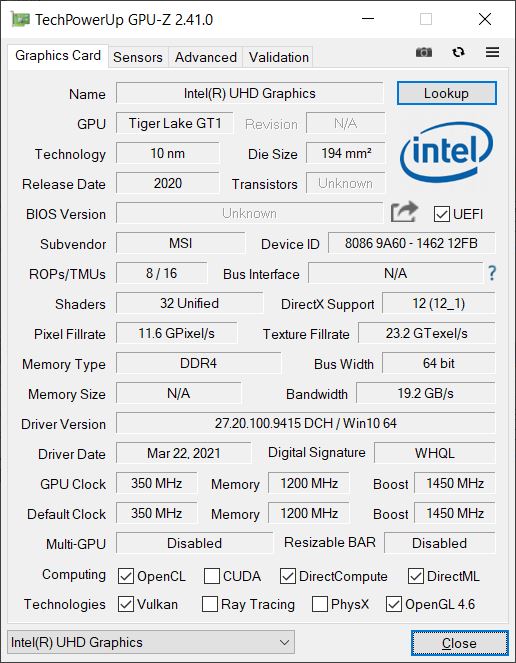
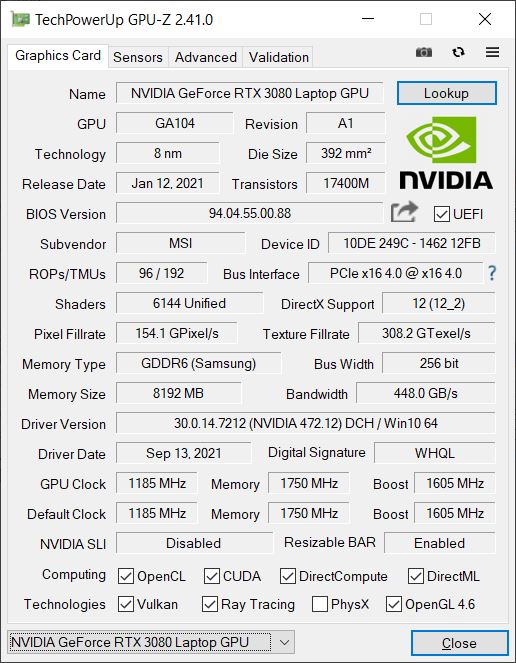
Graphics card
Besides the CPU-integrated Intel UHD Graphics Xe (32EUs), the laptop have discrete NVIDIA GeForce RTX 3080 laptop GPU that ensures smooth frame rates. The GPU is allowed to consume 140 W including Dynamic Boost, whereas the same card in the Schenker XMG Neo allows itself the full 165 W. Other GP66 variants are also available with RTX 3070 equipped.
Thus, the Schenker is often a few percentage points ahead in the 3DMarks, but the Leopard can lead the rest of the competition.
The graphics performance drops considerably on battery power, by a whole 65% in 3DMark 11. In The Witcher 3 (Ultra), the frame rate dropped spontaneously from a good 120 fps to only an unplayable 11 fps! Thus, mobile gaming is only possible with very big sacrifices.
| 3DMark 11 Performance | 30689 points | |
| 3DMark Cloud Gate Standard Score | 51452 points | |
| 3DMark Fire Strike Score | 24909 points | |
| 3DMark Time Spy Score | 11030 points | |
Help | ||
Gaming performance
The MSI displays all tested games in Full HD even in ultra settings at around 100 fps. Thus, there is still enough room for displaying 4K content.
The Leopard does quite well in comparison, but the differences between the competitors with RTX 3080 are rather small. Only the XMG Neo with 165 W RTX can slightly outperform MSI, depending on the game.
In Extreme Performance Mode, we achieved a gain of just under 5% in The Witcher 3 (Ultra). The GPU is clearly more decisive than the CPU that benefits from the mode.
The Witcher 3 starts at about 120 fps on the GP66. After the first few minutes, this value drops and levels off at a fairly constant 110 fps, and this value is still maintained after an hour. In this respect, the laptop only loses insignificant part of performance over time.
Witcher 3 FPS Diagramm
| low | med. | high | ultra | |
| GTA V (2015) | 184 | 177 | 166 | 103 |
| The Witcher 3 (2015) | 344.8 | 300 | 196.5 | 110.2 |
| Dota 2 Reborn (2015) | 168 | 151 | 143 | 135 |
| Final Fantasy XV Benchmark (2018) | 136 | |||
| X-Plane 11.11 (2018) | 121 | 107 | 85.7 | |
| Far Cry 5 (2018) | 152 | 123 | 119 | 111 |
| Strange Brigade (2018) | 492 | 267 | 223 | 197 |
| New World (2021) | 132.7 | 105.4 | 96.7 | 90.4 |
Emissions - Exemplary fan behavior
Noise emissions
The fans are often quiet when idling and we generally like the adaptive fan behavior because the fans calm down very quickly even after heavy load. Even after a full hour in The Witcher 3, the fans quieted down considerably about 30 seconds later and purred quite quietly while idling.
The fans also stay off for the most part in Extreme Performance Mode during idle and calm down quite quickly even after heavy loads. However, if you additionally activate the "Cooler Boost", the fans suddenly jump up to the maximum speed with the noise of 58 dB.
The performance variance between Balanced, Extreme Performance and Extreme Performance plus Cooler Boost is interesting - it is virtually non-existent or barely existent! On the other hand, there are significant differences in the noise level. We measured around 47 dB under Balanced, around 53 dB under Extreme Performance (entered here as the maximum value) and the aforementioned 58 dB with Cooler Boost!
Thus, the GP66 is one of the quietest laptops in balanced mode, and one of the loudest with Cooler Boost. We did not detect any electronic noise.
Noise Level
| Idle |
| 23 / 23 / 30.11 dB(A) |
| Load |
| 41.86 / 53 dB(A) |
 | ||
30 dB silent 40 dB(A) audible 50 dB(A) loud |
||
min: | ||
| MSI GP66 Leopard 11UH-028 GeForce RTX 3080 Laptop GPU, i7-11800H, Samsung PM9A1 MZVL21T0HCLR | MSI GP66 Leopard 10UG GeForce RTX 3070 Laptop GPU, i7-10870H, Kingston OM8PCP31024F | Aorus 15P YD GeForce RTX 3080 Laptop GPU, i7-11800H, Samsung PM9A1 MZVL21T0HCLR | Asus ROG Strix Scar 15 G533QS GeForce RTX 3080 Laptop GPU, R9 5900HX, ADATA Swordfish 2 TB | SCHENKER XMG Neo 15 Tiger Lake GeForce RTX 3080 Laptop GPU, i7-11800H, Samsung SSD 980 Pro 1TB MZ-V8P1T0BW | Alienware m15 R6, i7-11800H RTX 3080 GeForce RTX 3080 Laptop GPU, i7-11800H, Samsung PM9A1 MZVL21T0HCLR | |
|---|---|---|---|---|---|---|
| Noise | -5% | -12% | -8% | -12% | -2% | |
| off / environment * | 23 | 24.7 -7% | 25 -9% | 25.5 -11% | 25 -9% | 23 -0% |
| Idle Minimum * | 23 | 26.8 -17% | 26 -13% | 25.5 -11% | 27 -17% | 23 -0% |
| Idle Average * | 23 | 26.8 -17% | 30 -30% | 25.5 -11% | 30 -30% | 23 -0% |
| Idle Maximum * | 30.11 | 26.8 11% | 34 -13% | 37.1 -23% | 32 -6% | 30 -0% |
| Load Average * | 41.86 | 40.4 3% | 43 -3% | 39.2 6% | 46 -10% | 41.26 1% |
| Witcher 3 ultra * | 47.79 | 48.8 -2% | 50 -5% | 50.5 -6% | 52 -9% | 53.4 -12% |
| Load Maximum * | 53 | 57.2 -8% | 57 -8% | 51.8 2% | 55 -4% | 53.37 -1% |
* ... smaller is better
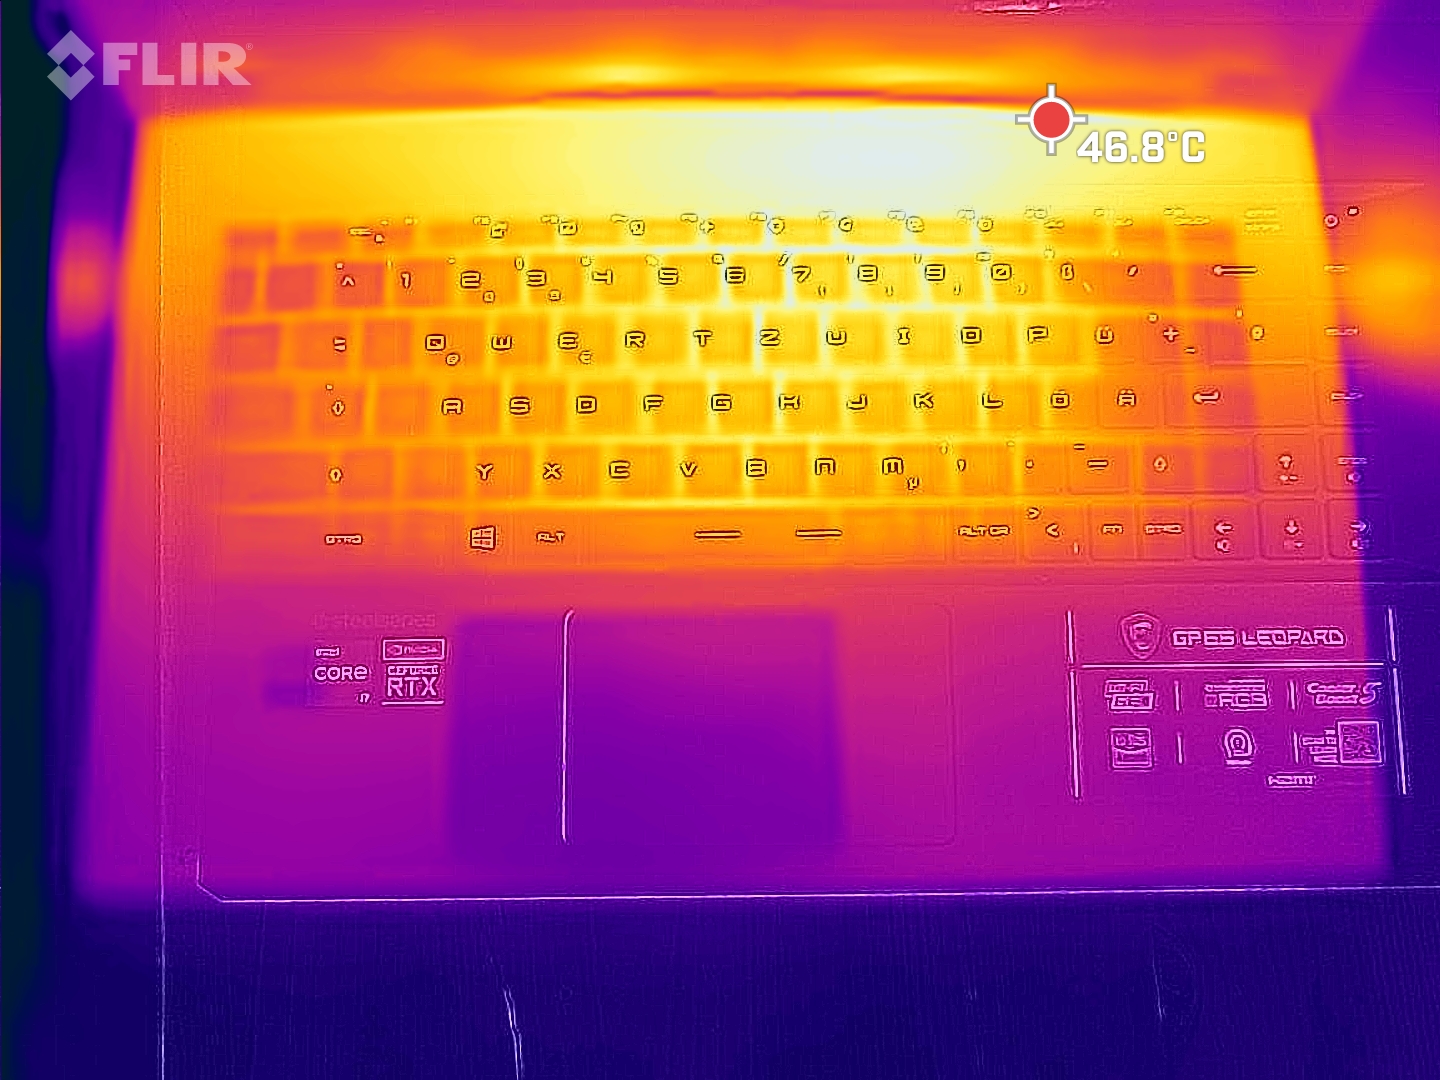
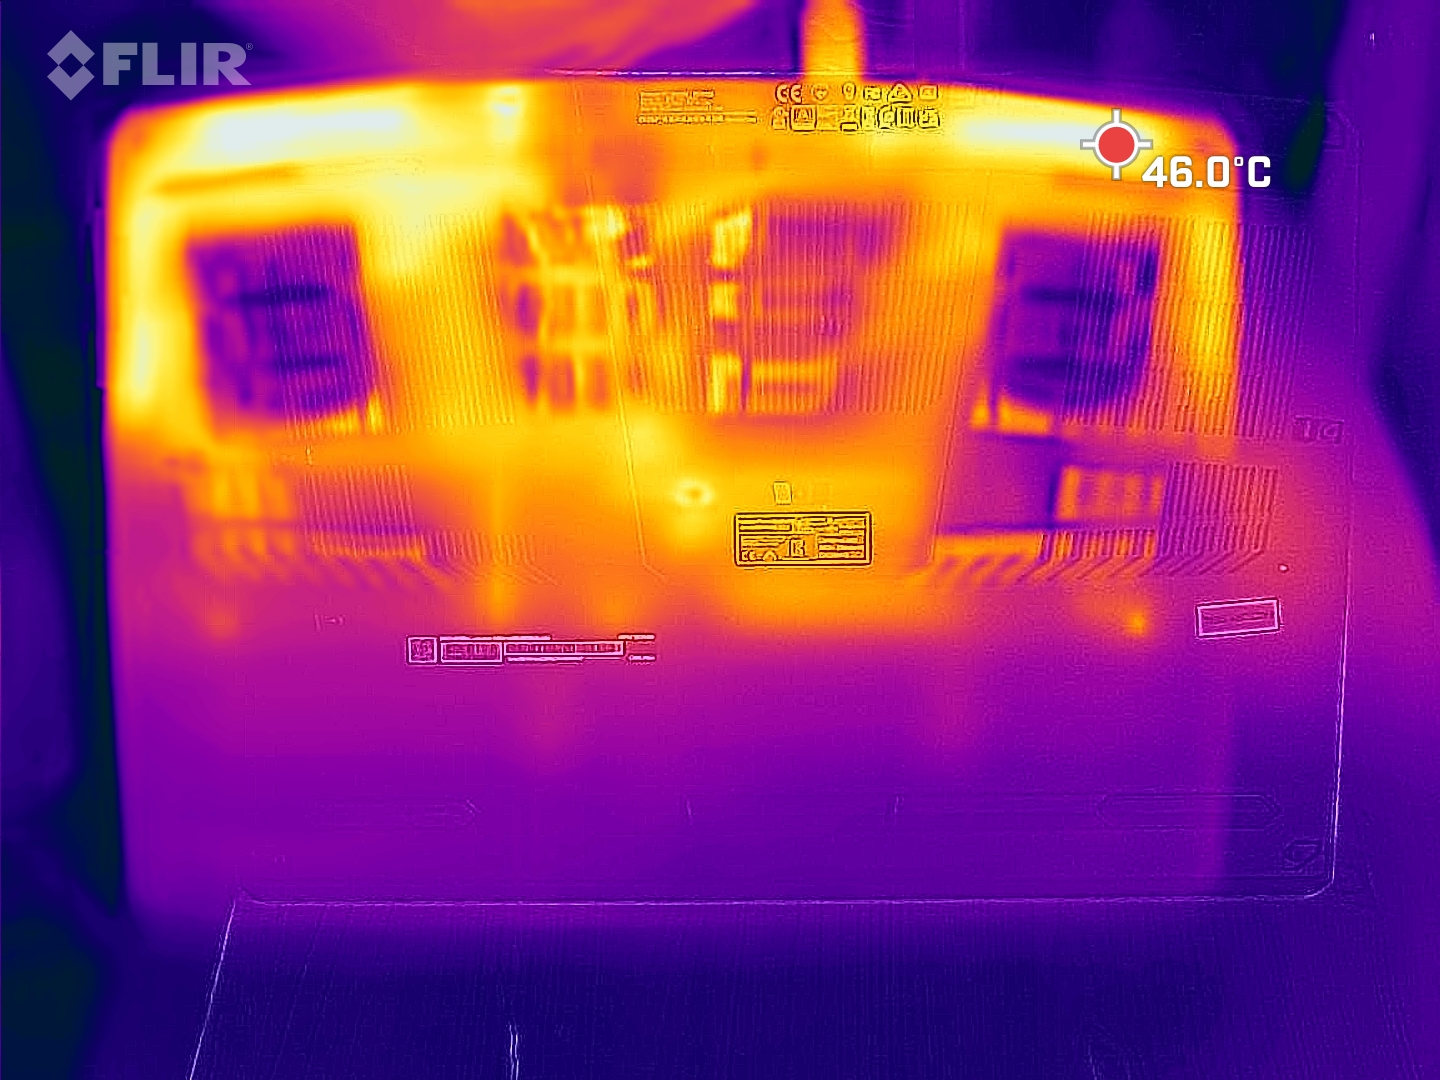
Temperature
Hot spots on the top and bottom reach up to 54 °C during gaming, which puts the gamer in the middle among the competition. The Alienware and the Aorus get hotter, while the Asus and the XMG stay cooler but have the louder cooling system.
All afforementioned measurements were taken in the Balanced mode. Since the performance does not increase much in the higher modes, at least not in gaming, the temperatures will probably drop even more due to the faster spinning fans.
(-) The maximum temperature on the upper side is 49 °C / 120 F, compared to the average of 40.4 °C / 105 F, ranging from 21.2 to 68.8 °C for the class Gaming.
(-) The bottom heats up to a maximum of 47 °C / 117 F, compared to the average of 43.2 °C / 110 F
(+) In idle usage, the average temperature for the upper side is 26.7 °C / 80 F, compared to the device average of 33.8 °C / 93 F.
(-) Playing The Witcher 3, the average temperature for the upper side is 43.9 °C / 111 F, compared to the device average of 33.8 °C / 93 F.
(+) The palmrests and touchpad are reaching skin temperature as a maximum (32 °C / 89.6 F) and are therefore not hot.
(-) The average temperature of the palmrest area of similar devices was 28.9 °C / 84 F (-3.1 °C / -5.6 F).
| MSI GP66 Leopard 11UH-028 Intel Core i7-11800H, NVIDIA GeForce RTX 3080 Laptop GPU | MSI GP66 Leopard 10UG Intel Core i7-10870H, NVIDIA GeForce RTX 3070 Laptop GPU | Aorus 15P YD Intel Core i7-11800H, NVIDIA GeForce RTX 3080 Laptop GPU | Asus ROG Strix Scar 15 G533QS AMD Ryzen 9 5900HX, NVIDIA GeForce RTX 3080 Laptop GPU | SCHENKER XMG Neo 15 Tiger Lake Intel Core i7-11800H, NVIDIA GeForce RTX 3080 Laptop GPU | Alienware m15 R6, i7-11800H RTX 3080 Intel Core i7-11800H, NVIDIA GeForce RTX 3080 Laptop GPU | |
|---|---|---|---|---|---|---|
| Heat | 3% | -9% | -5% | -2% | -20% | |
| Maximum Upper Side * | 49 | 42.8 13% | 49 -0% | 43.4 11% | 39 20% | 61 -24% |
| Maximum Bottom * | 47 | 50 -6% | 57 -21% | 48.2 -3% | 50 -6% | 58 -23% |
| Idle Upper Side * | 31 | 33 -6% | 33 -6% | 35.2 -14% | 34 -10% | 38 -23% |
| Idle Bottom * | 33 | 29 12% | 36 -9% | 37 -12% | 37 -12% | 36 -9% |
* ... smaller is better
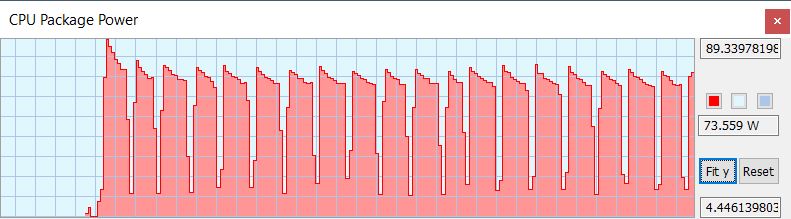
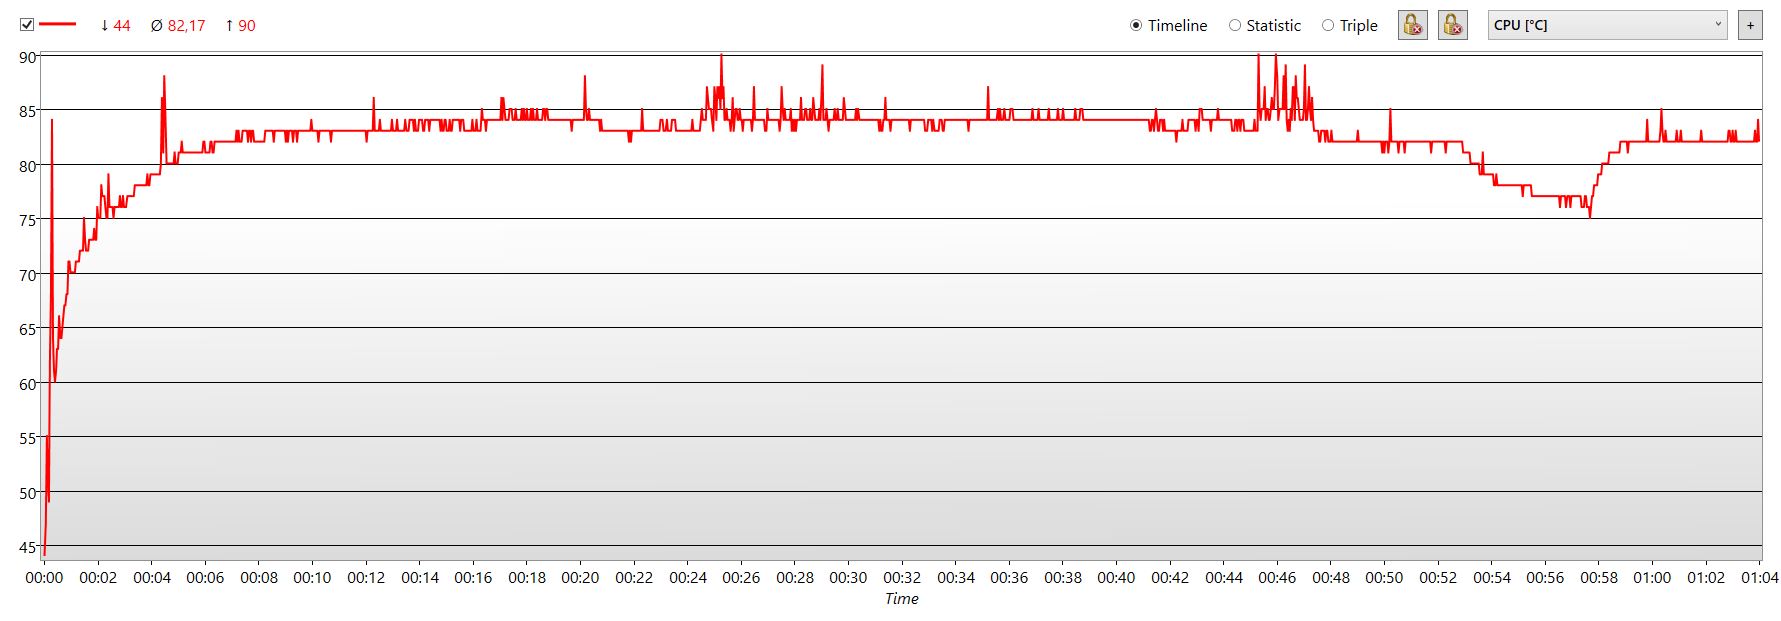
Stress test
The 8 cores of the CPU start our stress test with around 4.2 GHz. However, after the core temperature reaches 96 °C in about one minute, the clock rate is throttled. It briefly drops below 3 GHz, but later exceeds this limit again. We measured about 3.3 GHz after an hour, and the temperature levels out between 82 and 86 °C depending on the clock rates.
The GPU clock fluctuates between 1.3 and 1.7 GHz over the entire test period. The GPU cores reach temperatures of up to 76 °C.
The system quickly calms down again after the stress test. Another 3DMark 11 run directly after the end of the stress test yielded roughly the same score as before.
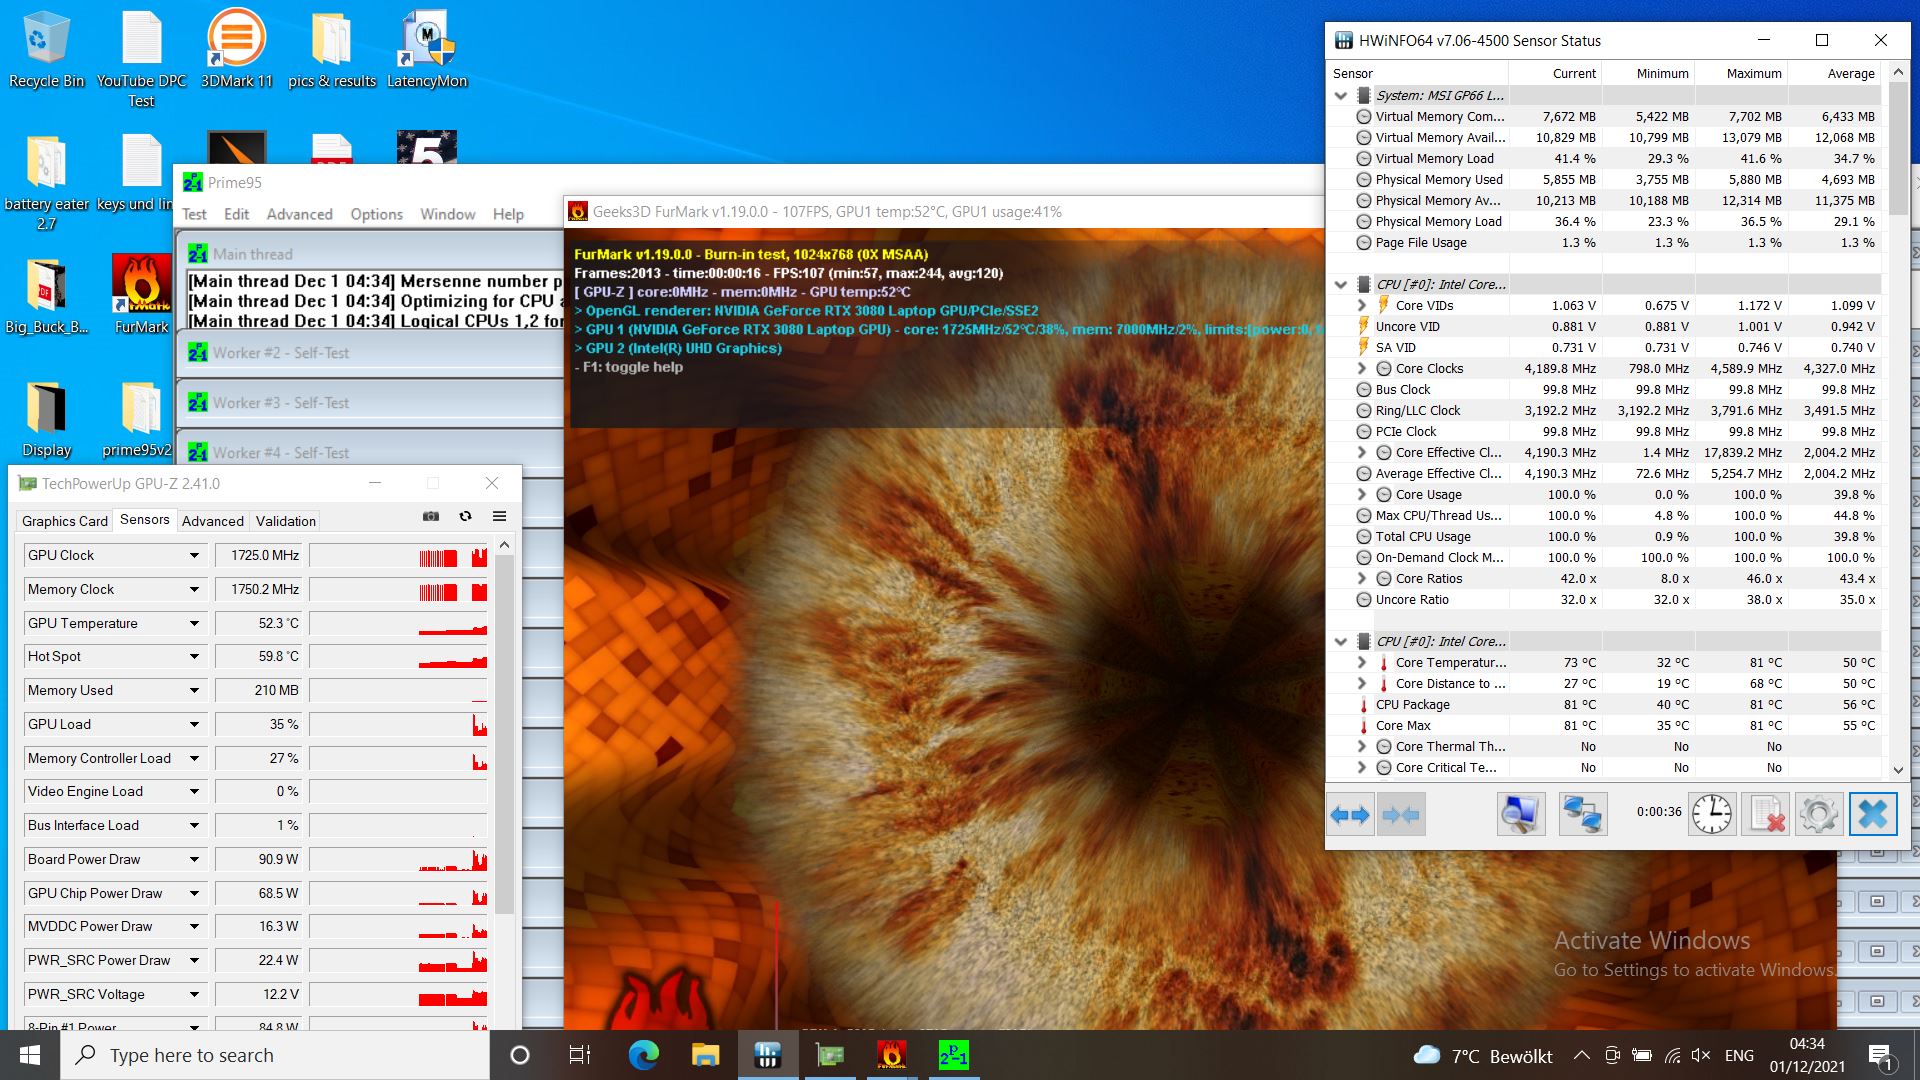
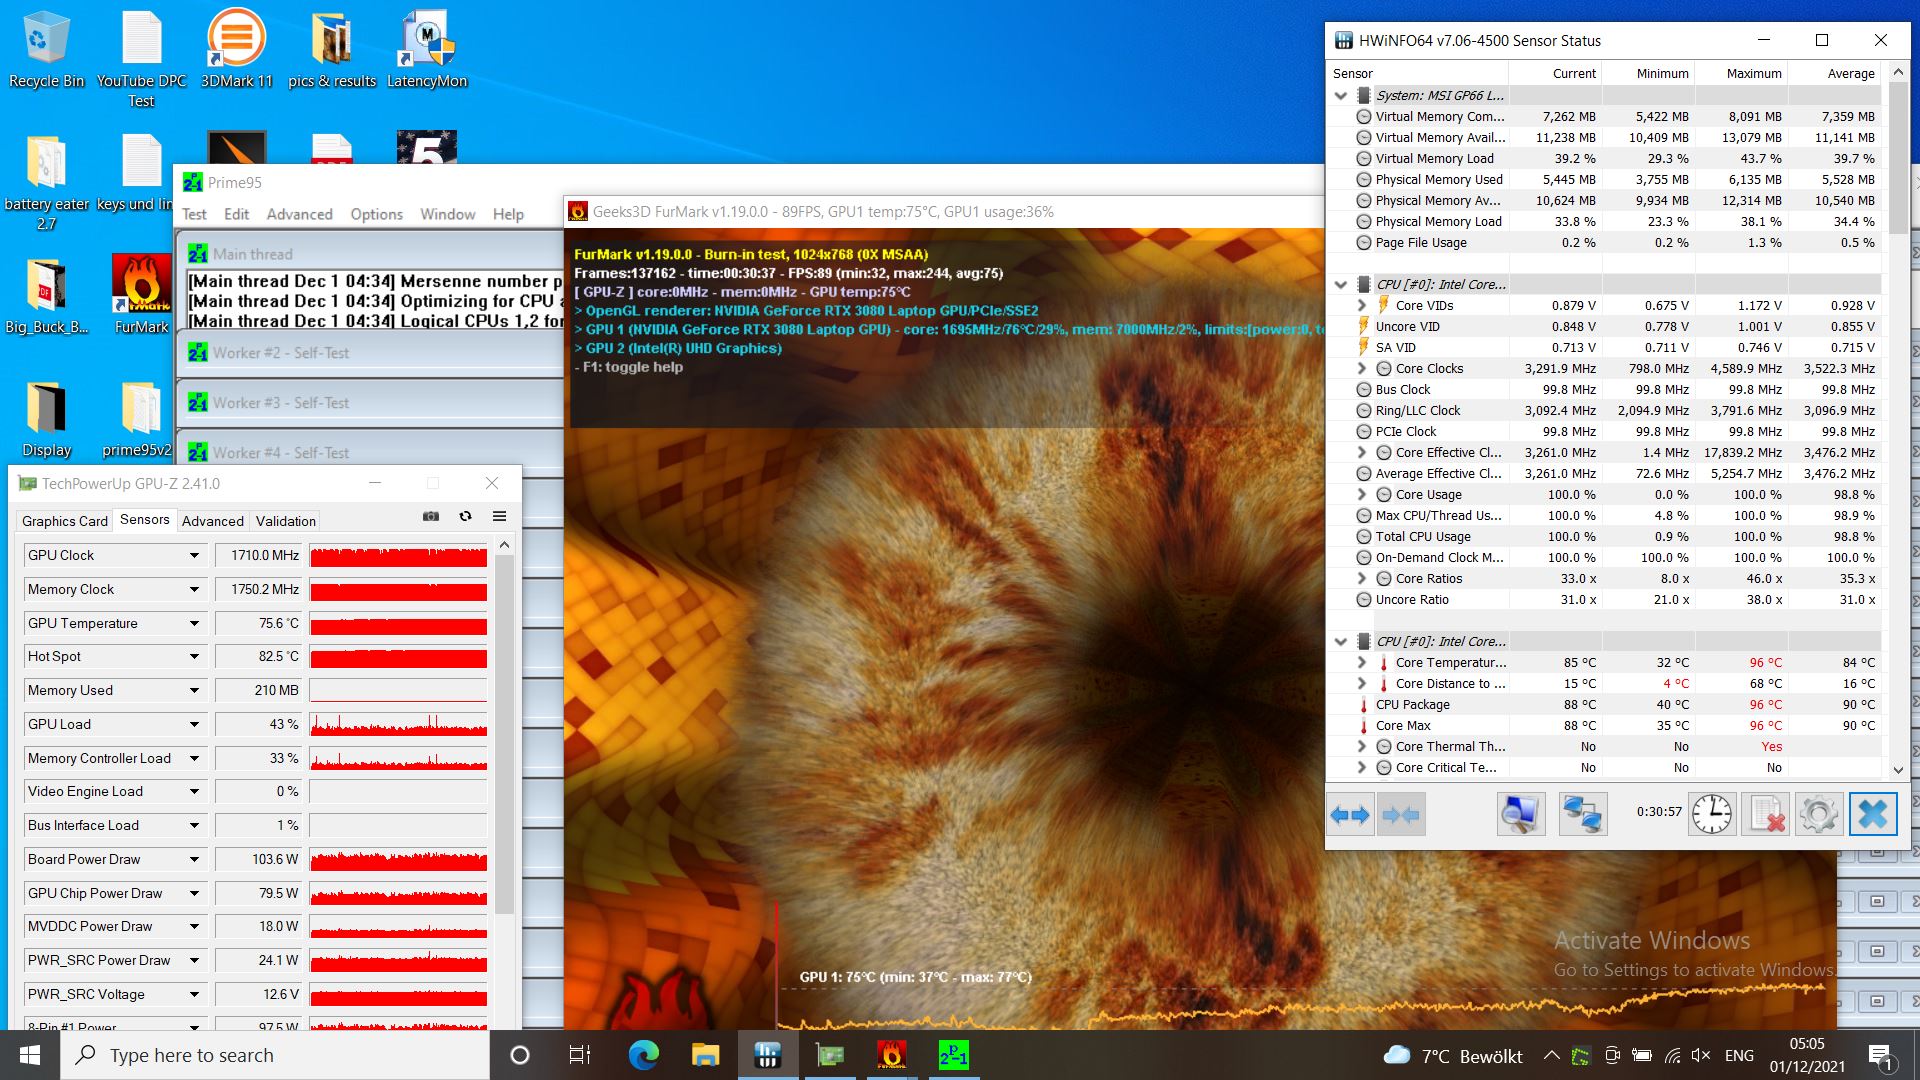
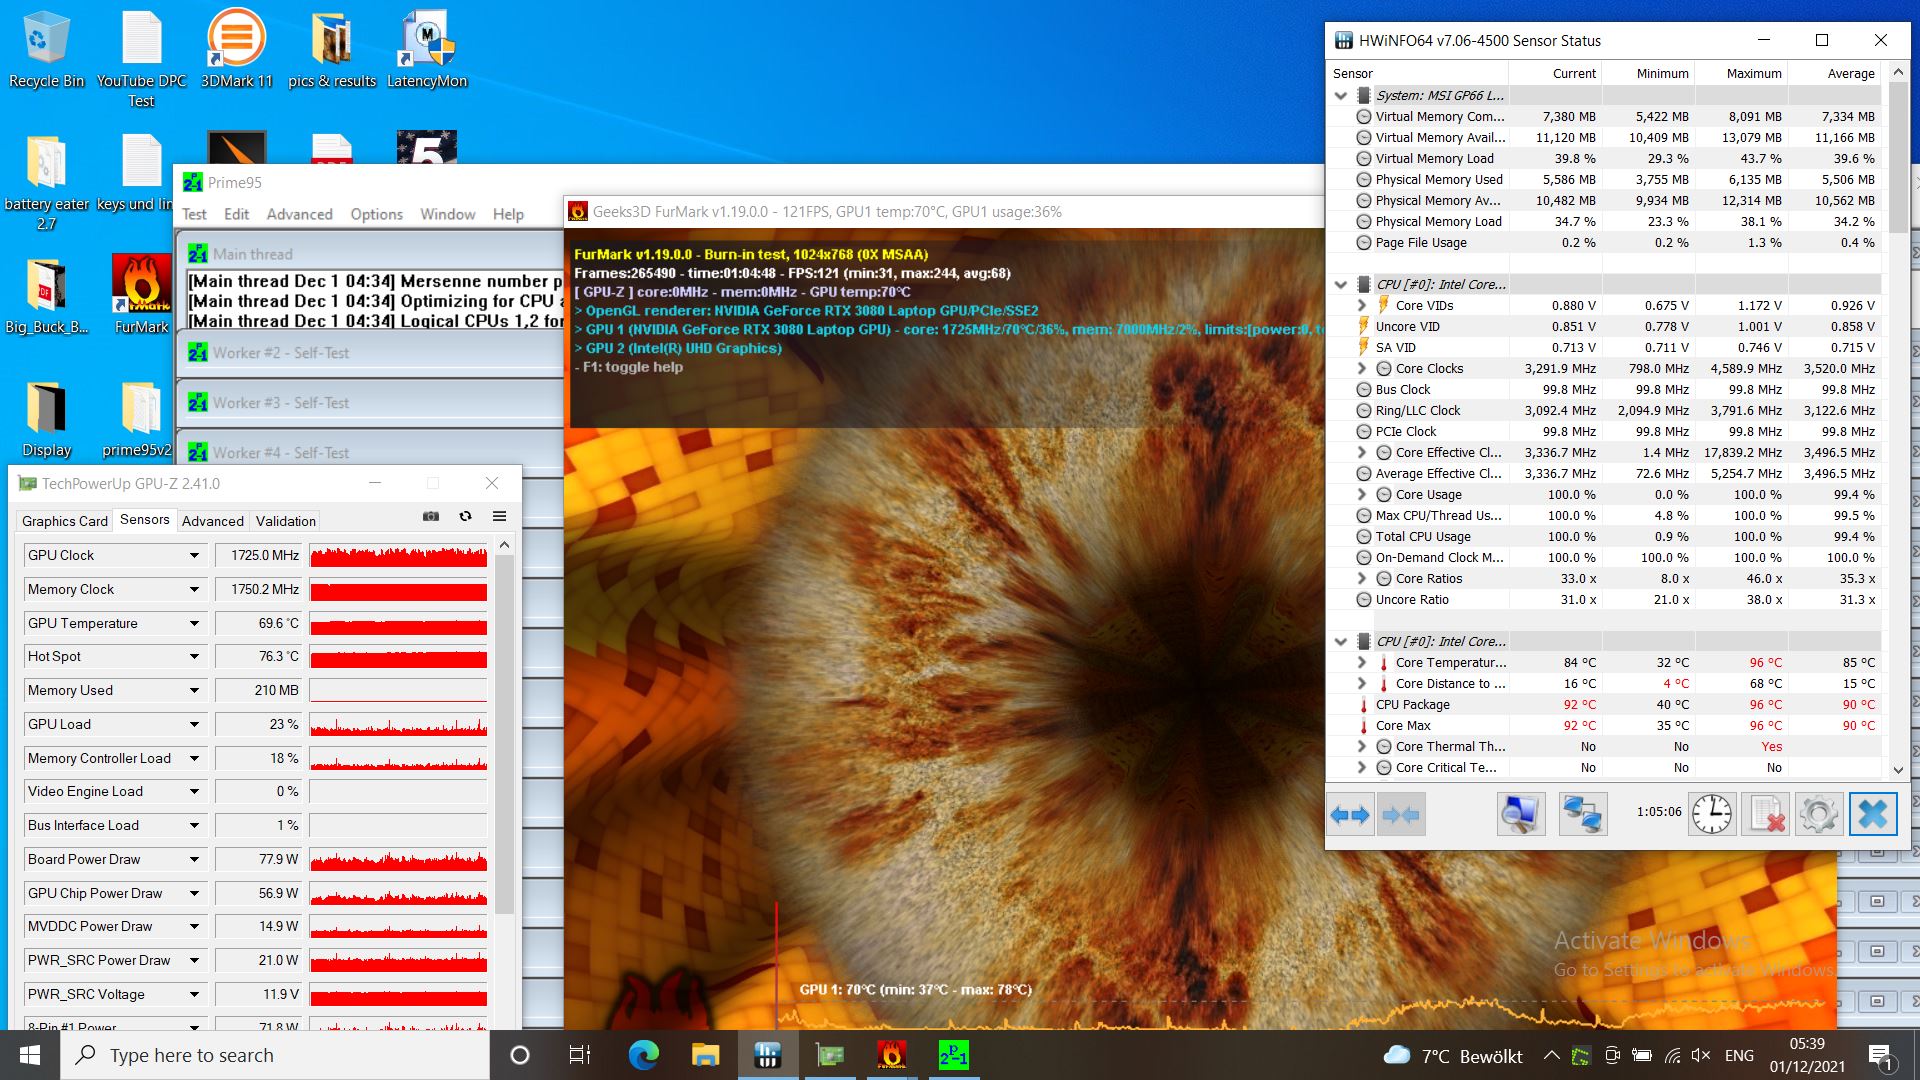
| CPU Clock(GHz) | GPUClock | AverageCPU Temperature (°C) | AverageGPU Temperature (°C) | |
| System Idle | 4.5 GHz | 350 MHz | 35 | 32 |
| Prime95 + FurMark Stress | 2.8 - 3.3 GHz | 1.3 - 1.7 GHz | 85 | 76 |
| Witcher 3 Stress | 4.2 GHz | 1.3 - 1.7 GHz | 85 | 76 |
Loudspeaker
On the positive side, the speakers can play quite loud, and the mids and trebles seem quite balanced. Nevertheless, they naturally suffer from the common complaint of all conventional laptop speakers - the lack of bass. External audio devices, such as headphones, can be connected via the analog gold-plated mini-jack headset port.
MSI GP66 Leopard 11UH-028 audio analysis
(+) | speakers can play relatively loud (85.6 dB)
Bass 100 - 315 Hz
(-) | nearly no bass - on average 22.9% lower than median
(±) | linearity of bass is average (8.9% delta to prev. frequency)
Mids 400 - 2000 Hz
(+) | balanced mids - only 2.8% away from median
(+) | mids are linear (3.9% delta to prev. frequency)
Highs 2 - 16 kHz
(+) | balanced highs - only 4.6% away from median
(+) | highs are linear (6.6% delta to prev. frequency)
Overall 100 - 16.000 Hz
(±) | linearity of overall sound is average (16.9% difference to median)
Compared to same class
» 41% of all tested devices in this class were better, 11% similar, 47% worse
» The best had a delta of 6%, average was 18%, worst was 132%
Compared to all devices tested
» 25% of all tested devices were better, 7% similar, 68% worse
» The best had a delta of 4%, average was 25%, worst was 134%
SCHENKER XMG Neo 15 Tiger Lake audio analysis
(±) | speaker loudness is average but good (79 dB)
Bass 100 - 315 Hz
(-) | nearly no bass - on average 22.6% lower than median
(±) | linearity of bass is average (9.5% delta to prev. frequency)
Mids 400 - 2000 Hz
(+) | balanced mids - only 4.7% away from median
(±) | linearity of mids is average (9.1% delta to prev. frequency)
Highs 2 - 16 kHz
(+) | balanced highs - only 4.1% away from median
(+) | highs are linear (5.3% delta to prev. frequency)
Overall 100 - 16.000 Hz
(±) | linearity of overall sound is average (19.4% difference to median)
Compared to same class
» 64% of all tested devices in this class were better, 8% similar, 29% worse
» The best had a delta of 6%, average was 18%, worst was 132%
Compared to all devices tested
» 42% of all tested devices were better, 8% similar, 50% worse
» The best had a delta of 4%, average was 25%, worst was 134%
Power management - Leopard with mini battery
Energy absorption
We measured an average consumption of 207 W when playing The Witcher 3, which is a bit more than the competition needs. The maximum is 223 W, which is between the top consumers Aorus and Alienware and the more frugal other competitors.
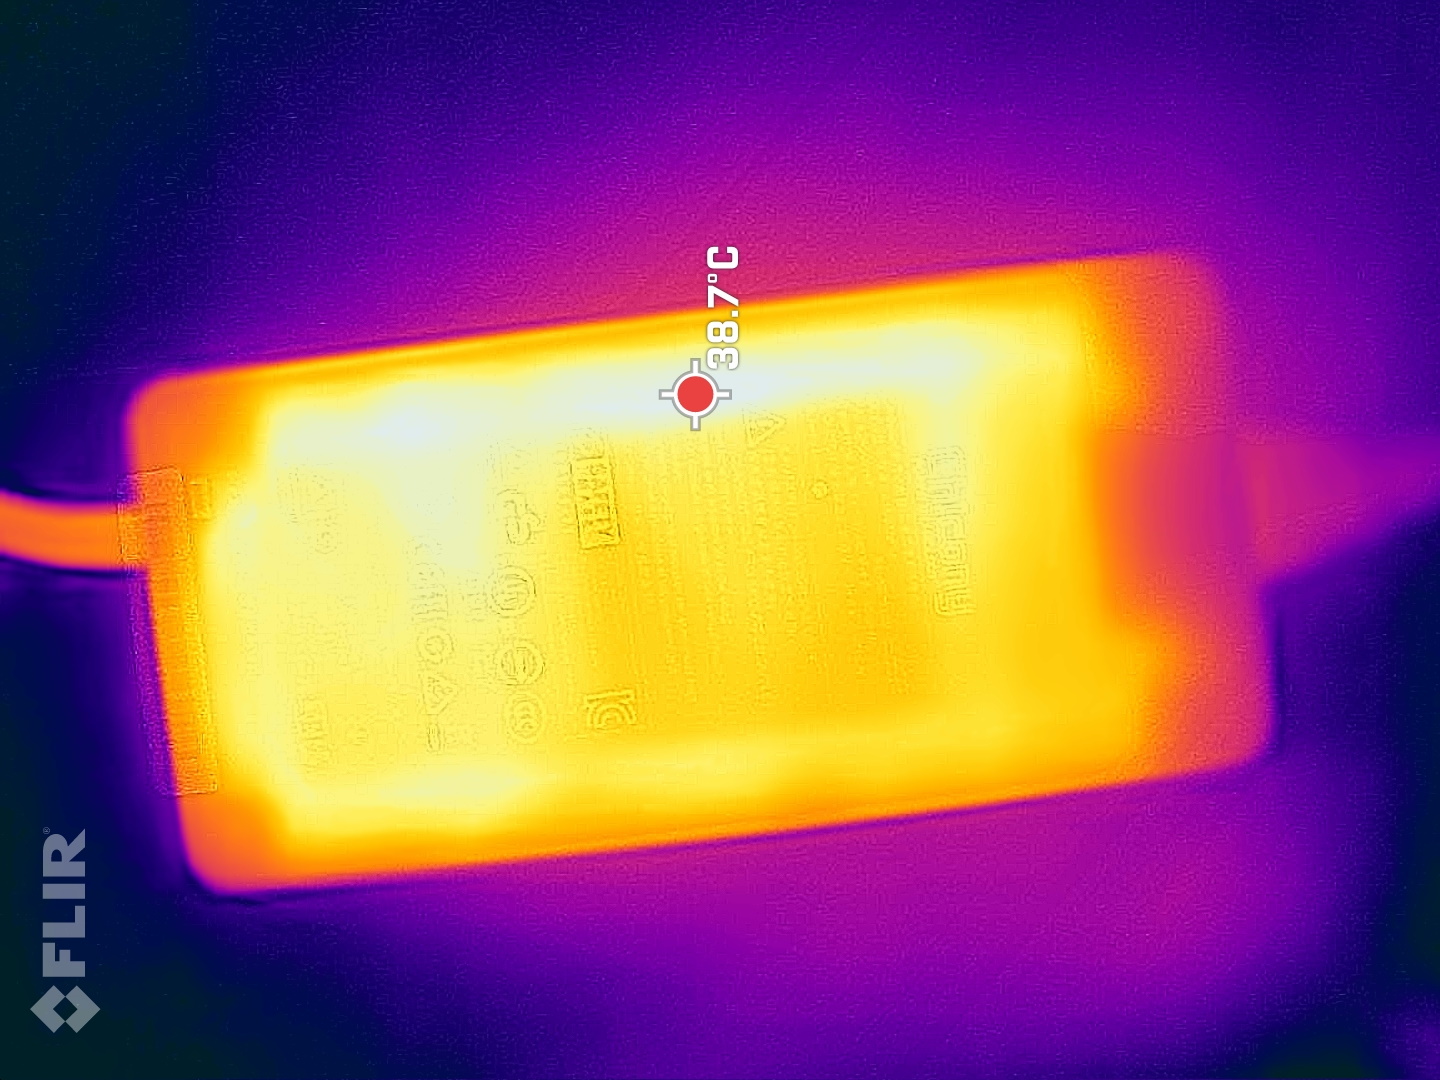
The power supply is generously sized with 280 W and should not have any problems with charging.
| Idle | |
| Load |
|
| MSI GP66 Leopard 11UH-028 i7-11800H, GeForce RTX 3080 Laptop GPU, Samsung PM9A1 MZVL21T0HCLR, IPS, 1920x1080, 15.60 | MSI GP66 Leopard 10UG i7-10870H, GeForce RTX 3070 Laptop GPU, Kingston OM8PCP31024F, IPS, 1920x1080, 15.60 | Aorus 15P YD i7-11800H, GeForce RTX 3080 Laptop GPU, Samsung PM9A1 MZVL21T0HCLR, IPS, 1920x1080, 15.60 | Asus ROG Strix Scar 15 G533QS R9 5900HX, GeForce RTX 3080 Laptop GPU, ADATA Swordfish 2 TB, IPS, 2560x1440, 15.60 | SCHENKER XMG Neo 15 Tiger Lake i7-11800H, GeForce RTX 3080 Laptop GPU, Samsung SSD 980 Pro 1TB MZ-V8P1T0BW, IPS, 2560x1440, 15.60 | Alienware m15 R6, i7-11800H RTX 3080 i7-11800H, GeForce RTX 3080 Laptop GPU, Samsung PM9A1 MZVL21T0HCLR, IPS, 1920x1080, 15.60 | Average NVIDIA GeForce RTX 3080 Laptop GPU | Average of class Gaming | |
|---|---|---|---|---|---|---|---|---|
| Power Consumption | -7% | -40% | -7% | -7% | -9% | -39% | -19% | |
| Idle Minimum * | 13 | 15.3 -18% | 23 -77% | 11.2 14% | 15 -15% | 14 -8% | 19.6 ? -51% | 13.8 ? -6% |
| Idle Average * | 17 | 21.2 -25% | 25 -47% | 16.4 4% | 17 -0% | 18 -6% | 24.1 ? -42% | 19.2 ? -13% |
| Idle Maximum * | 18 | 22.3 -24% | 35 -94% | 29.4 -63% | 22 -22% | 29 -61% | 33.3 ? -85% | 26.9 ? -49% |
| Load Average * | 96 | 82.3 14% | 101 -5% | 106.2 -11% | 101 -5% | 93 3% | 107.9 ? -12% | 111.1 ? -16% |
| Witcher 3 ultra * | 207 | 191.2 8% | 190 8% | 189 9% | 195 6% | 190 8% | ||
| Load Maximum * | 223 | 216.6 3% | 280 -26% | 213.6 4% | 230 -3% | 203 9% | 230 ? -3% | 251 ? -13% |
* ... smaller is better
Power consumption Witcher 3 / Stress test
Battery life
MSI uses a 65 Wh battery, which is very small for a gaming laptop with RTX 3080. The competition has batteries with 84 or 90 Wh and more!
Accordingly, the runtimes are poor away from the socket, and the Leopard's budget price is noticed here. Only 3.5 hours of surfing or watching videos are disappointingly low, the competition lasts 40 to 100 percent longer (Asus ROG). Laptop can only offer a three quarters of an hour for gaming (The Witcher 3).
| MSI GP66 Leopard 11UH-028 i7-11800H, GeForce RTX 3080 Laptop GPU, 65 Wh | MSI GP66 Leopard 10UG i7-10870H, GeForce RTX 3070 Laptop GPU, 65 Wh | Aorus 15P YD i7-11800H, GeForce RTX 3080 Laptop GPU, 99 Wh | Asus ROG Strix Scar 15 G533QS R9 5900HX, GeForce RTX 3080 Laptop GPU, 90 Wh | SCHENKER XMG Neo 15 Tiger Lake i7-11800H, GeForce RTX 3080 Laptop GPU, 93 Wh | Alienware m15 R6, i7-11800H RTX 3080 i7-11800H, GeForce RTX 3080 Laptop GPU, 84 Wh | Average of class Gaming | |
|---|---|---|---|---|---|---|---|
| Battery Runtime | 15% | 65% | 63% | 86% | 47% | 63% | |
| H.264 | 207 | 352 70% | 333 61% | 399 ? 93% | |||
| WiFi v1.3 | 217 | 304 40% | 319 47% | 440 103% | 338 56% | 302 39% | 368 ? 70% |
| Witcher 3 ultra | 49 | 81.6 ? 67% | |||||
| Load | 69 | 62 -10% | 126 83% | 85 23% | 161 133% | 98 42% | 84.4 ? 22% |
| Reader / Idle | 398 | 448 | 668 | 544 ? |
Pros
Cons
Verdict - Good budget high-performance gamer
A modern gaming laptop with an Nvidia RTX 3080 and correspondingly high, competitive performance for less than 2,000 Euros is probably a rarity nowadays. The MSI also does a lot right outside of the pure performance despite it's low price. For example, the adaptive cooling system really surprised us positively, even in Extreme Performance Mode - much more expensive competitors like the Alienwares can take a leaf out of this book. And the display is not a budget panel either, but at least outshines the competition in terms of brightness.
Of course, you also have to accept a few compromises in this price category. These include the Leopard's poor battery runtimes and the less than optimal build quality, which is also noticeable in the more complicated maintenance. We are almost shocked that the new GP66 model no longer has a USB-C port, which is no longer up-to-date at the end of 2021! If you can get over that, you will hardly get a cheaper RTX 3080 gamer at the moment that still does so much right at the same time.
The Leopard GP66 11UH is a budget gaming laptop that makes even high-end models look pale in some places. Of course, there are drawbacks like the lack of USB-C or the low battery runtimes, but performance, cooling and display also fit into higher categories.
Competition is rare in this price range with these specs. And even the more expensive rivals do not do everything better, see the cooling system. The comparison devices in the test are all more expensive, but they are anything but superior in terms of performance, display, and especially the cooling system. However, you have to pay more for USB-C or longer battery runtimes. Alternatively, we recommend taking a look at our Top list of inexpensive gaming laptops.
Price and availability
Our test model is currently the cheapest at Computeruniverse, where the laptop currently costs €1,899 (~$2,140). But our configuration is also available at Cyberport for just under €2,000 (~$2,253) to get hold of.
MSI GP66 Leopard 11UH-028
-
12/08/2021 v7
Christian Hintze


Pricecompare

