 Deutsch
 English
 Español
 Français
 Italiano
 Nederlands
 Polski
 Português
 Русский
 Türkçe
 Svenska
 Chinese
 Magyar
Razer Blade 15 Advanced Model 11th Gen Intel (2021) Review: Small Changes, Big CPU Gains
Even though the Blade 15 was already refreshed earlier this year with 10th gen Intel Coffee Lake-H CPUs and a 360 Hz display, Razer was quick to update the series yet again once Intel made available its 11th gen Tiger Lake-H processor SKUs. The end result is a visually similar model but with several internal updates that enthusiasts and gamers will appreciate.
We recommend checking out our existing review on the early 2021 and 2020 Blade 15 models as this 11th gen version shares the same 360 Hz display, keyboard, and skeleton as its immediate predecessors. This page will focus on the performance differences users can expect between the 10th and 11th gen Intel Blade 15 options.
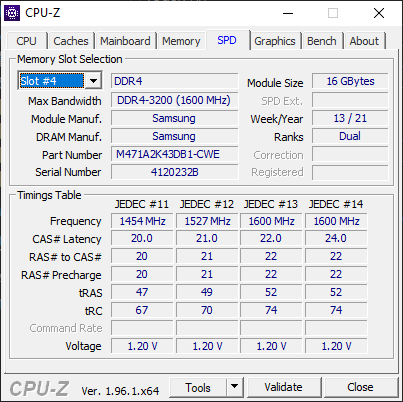
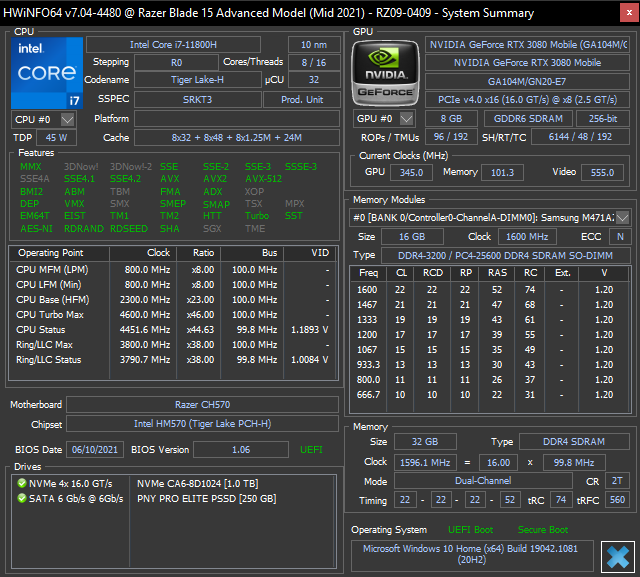
Our exact configuration with the Core i7-11800H, 360 Hz display, 1 TB PCIe 4 SSD, 32 GB RAM, and GeForce RTX 3080 can be found online for $3100 USD. Other SKUs are also available in different resolutions, refresh rates, RAM/SSD capacities, and RTX GPUs. One option in particular includes the Core i9-11900H to make it the first Blade 15 model with a Core i9 option.
Alternatives to the Blade 15 include other ultrathin gaming laptops like the MSI GS66, Asus Zephyrus S series, Aorus series, or the Dell Alienware X15.
More Razer reviews:
potential competitors in comparison
Rating | Date | Model | Weight | Height | Size | Resolution | Best Price |
|---|---|---|---|---|---|---|---|
| 88.9 % | 07/2021 | Razer Blade 15 Advanced (Mid 2021) i7-11800H, GeForce RTX 3080 Laptop GPU | 2 kg | 16.99 mm | 15.60" | 1920x1080 | |
| 85.9 % | 06/2021 | Asus TUF Gaming F15 FX506HM i7-11800H, GeForce RTX 3060 Laptop GPU | 2.3 kg | 24.9 mm | 15.60" | 1920x1080 | |
| 84.7 % | 06/2021 | Alienware m15 R5 Ryzen Edition R7 5800H, GeForce RTX 3060 Laptop GPU | 2.5 kg | 22.85 mm | 15.60" | 1920x1080 | |
| 86.4 % | 06/2021 | Aorus 15P YD i7-11800H, GeForce RTX 3080 Laptop GPU | 2.2 kg | 27 mm | 15.60" | 1920x1080 | |
| 83.3 % | 02/2020 | SCHENKER XMG Pro 15 i7-9750H, GeForce RTX 2070 Mobile | 2.5 kg | 30 mm | 15.60" | 1920x1080 |
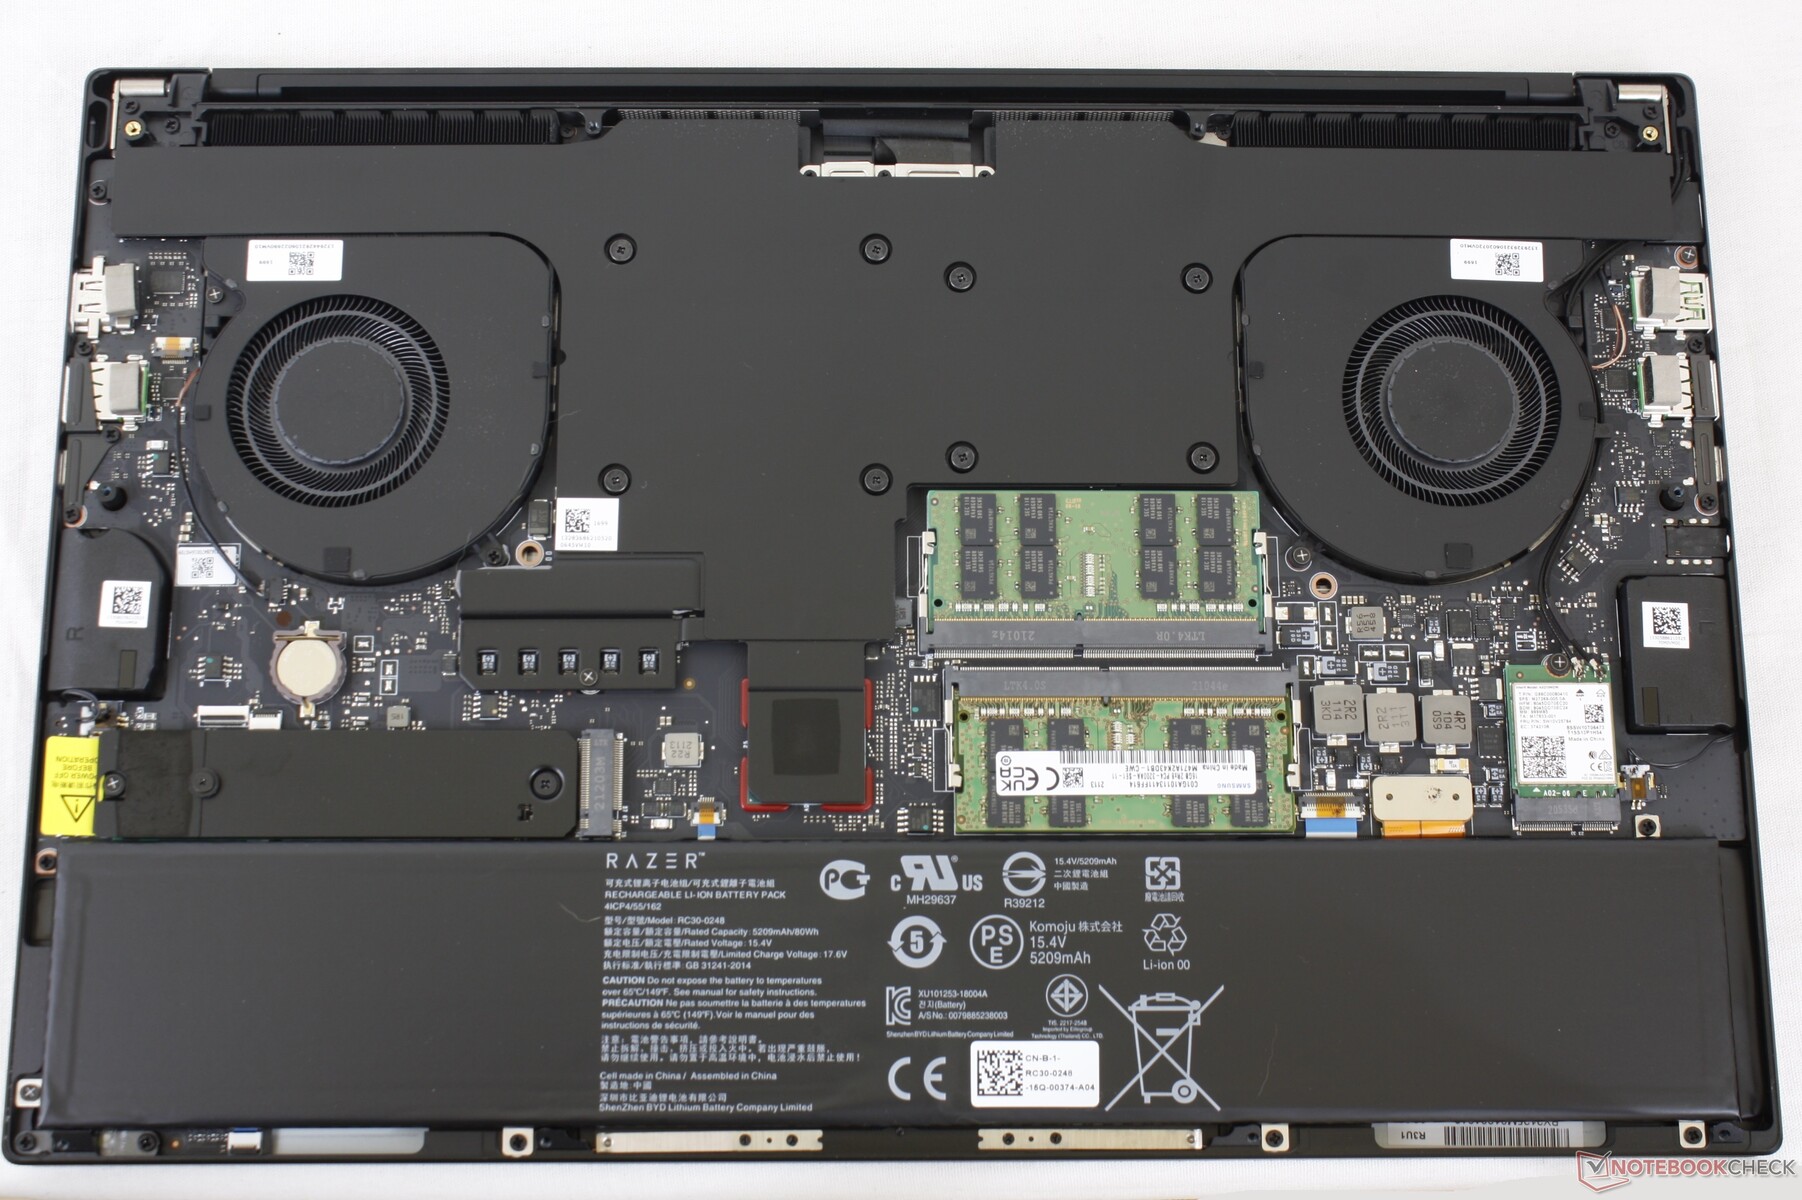
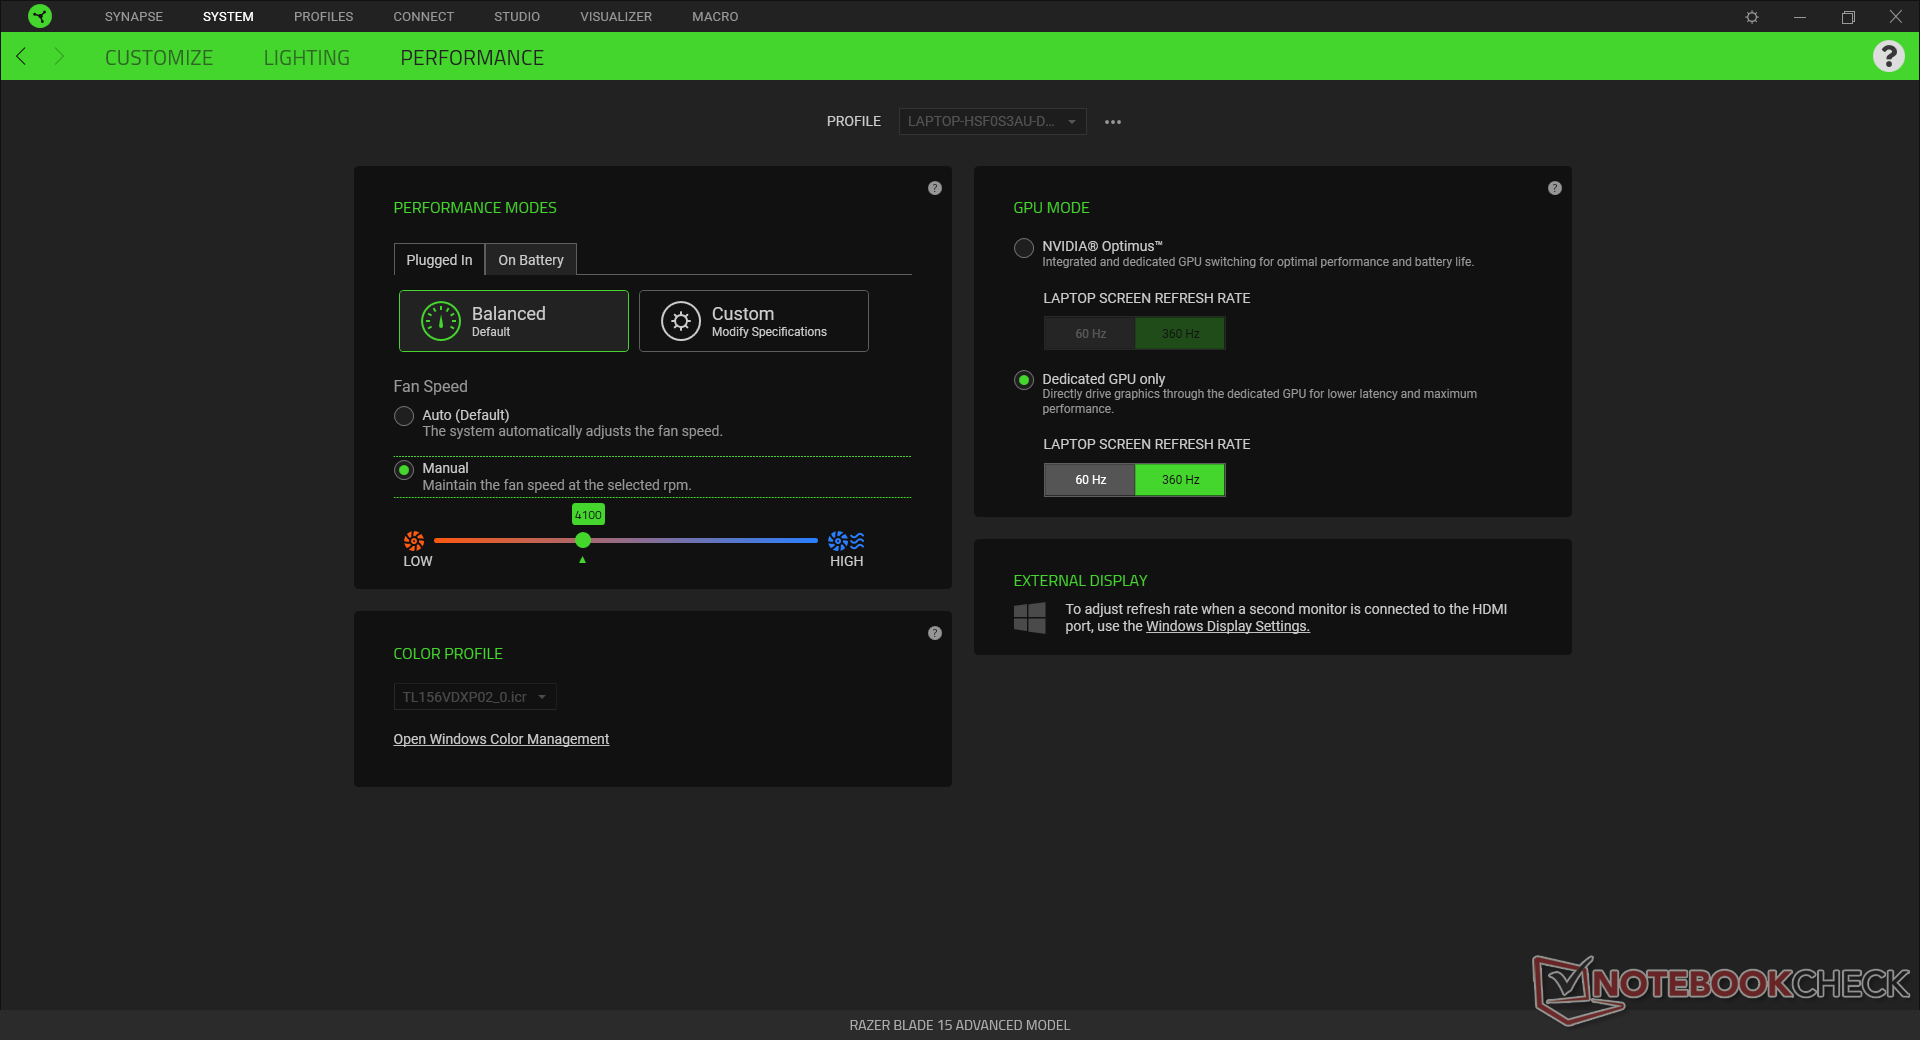
Case — Slim and Lightweight with Ultrahigh Performance
Since the chassis remains identical year-over-year, here are the major differences between the 10th gen Blade 15 and newer 11th gen version:
- Intel 11th gen Tiger Lake-H Core i7-11800H and Core i9-10900H CPU options
- Higher PL2 (90 W to 160 W) CPU Turbo Boost target
- GPU has been upgraded from 95 W TGP to 105 W TGP
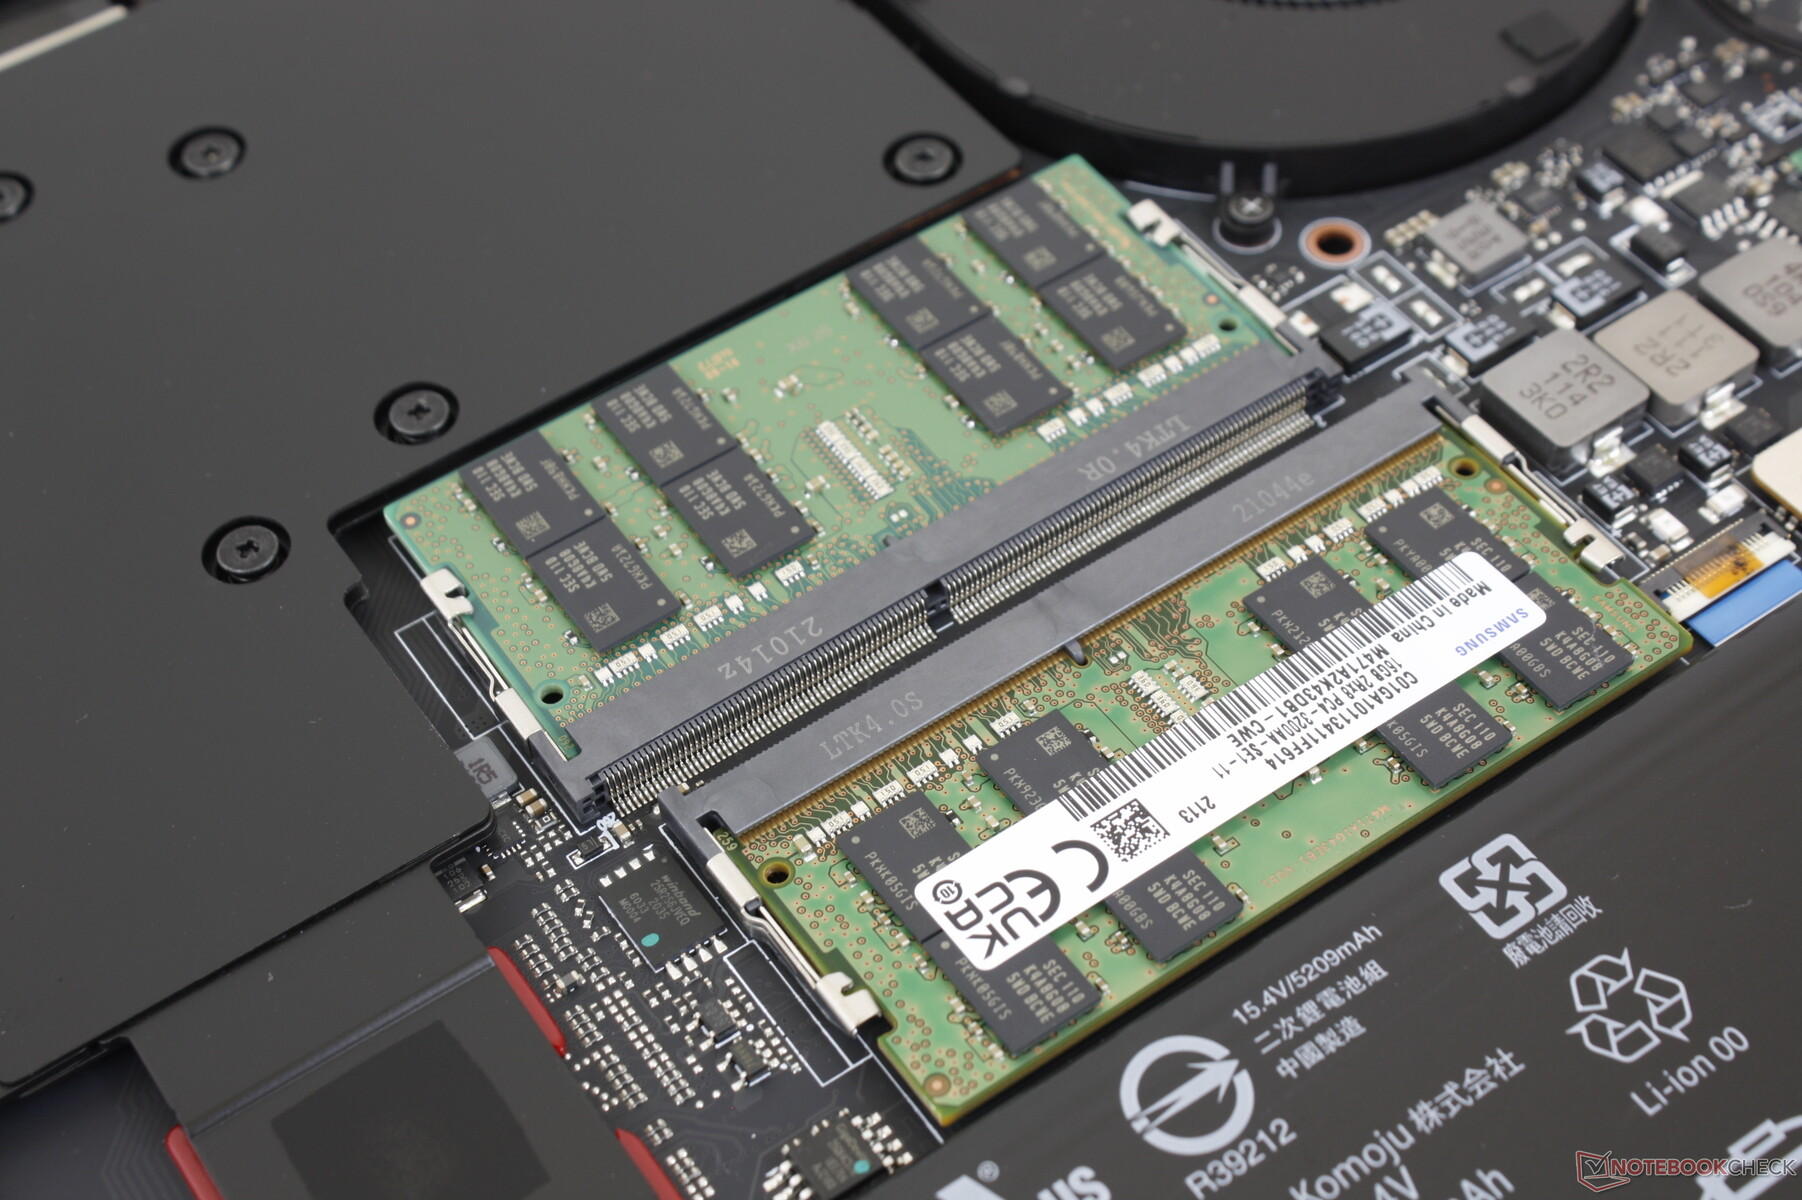
- Full support for up to two PCIe 4 NVMe SSDs
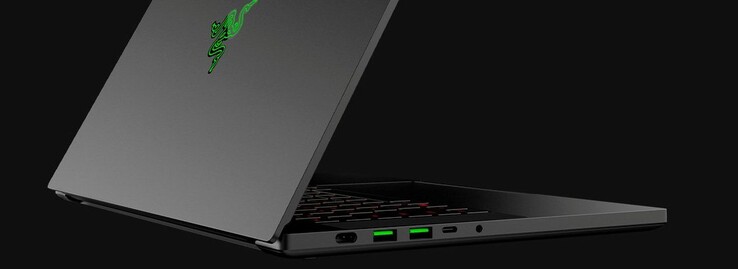
- Full support for Thunderbolt 4
- Webcam has been upgraded from 1 MP to 2 MP (or 720p to 1080p)
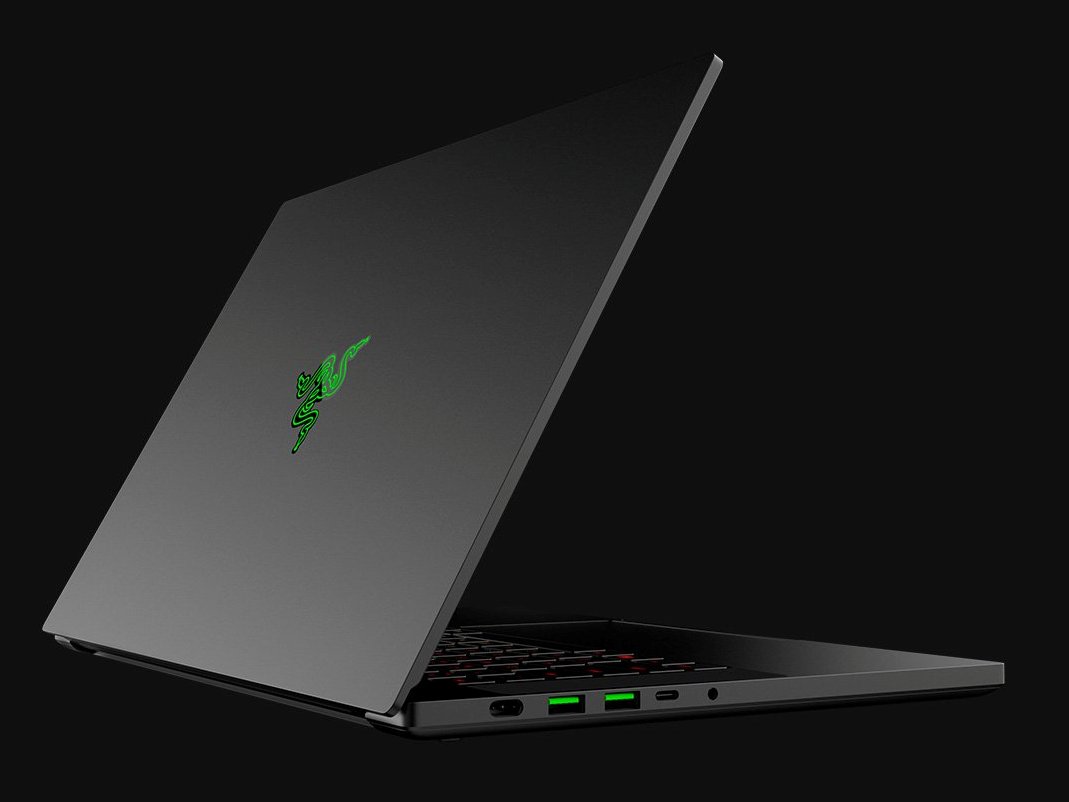
Both USB-C ports support Power Delivery, charging, data, and DisplayPort-out. We couldn't get DisplayPort-out working on our test unit, however, and so we recommend users to double-check this after purchasing.
Communication
Webcam
There is still no camera shutter despite the upgrade from 720p to 1080p. Additionally, users can only record at up to 30 FPS with no 60 FPS mode.
 GeForce RTX 3080 Laptop GPU, i7-11800H, SSSTC CA6-8D1024")
 GeForce RTX 3080 Laptop GPU, i7-11800H, SSSTC CA6-8D1024")
Maintenance
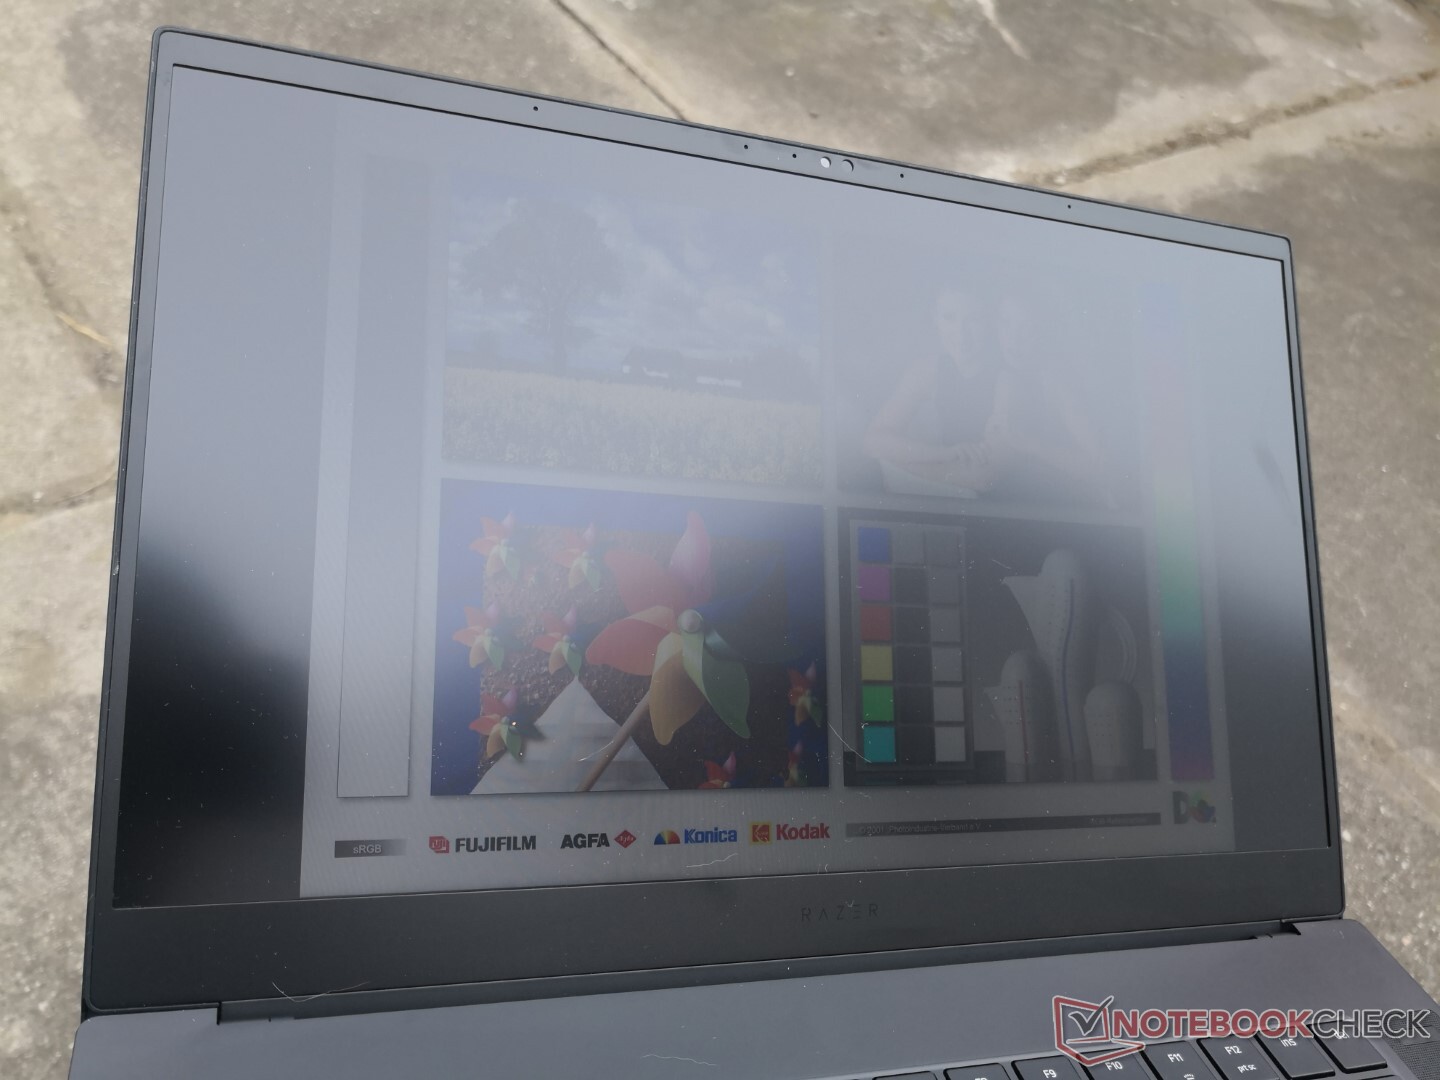
Display
Our mid-2021 model comes with the same TL156VDXP02-0 IPS panel as found on the early 2021 model. Most attributes are the same but with one interesting difference: gray-to-gray response times are notably faster on this newer model even after double checking. We're not sure if this was a deliberate change from the manufacturer or if there was a measurement error on our early 2021 10th gen model, but we certainly appreciate the fast response times no less.
G-Sync is not supported on the internal display.

| |||||||||||||||||||||||||
Brightness Distribution: 92 %
Center on Battery: 353.4 cd/m²
Contrast: 1140:1 (Black: 0.31 cd/m²)
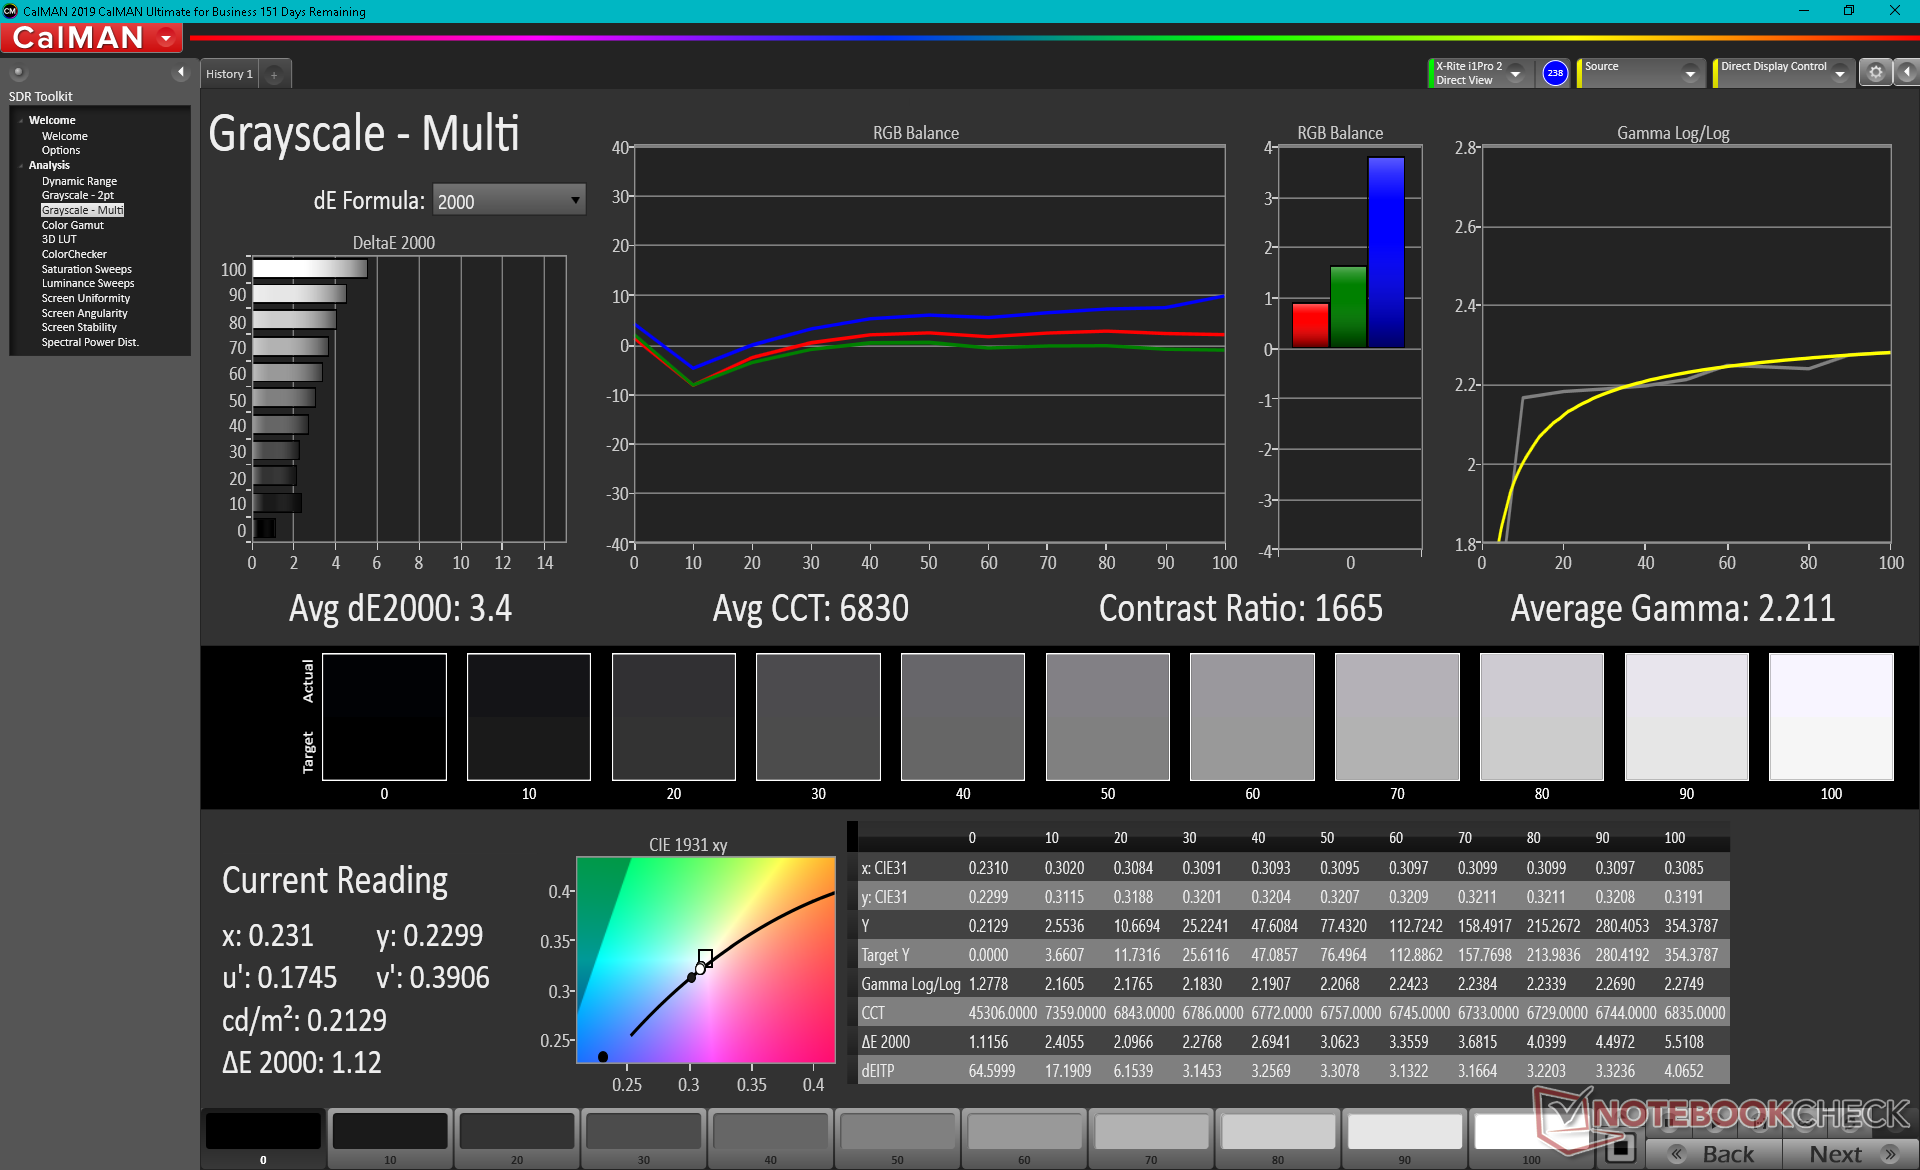
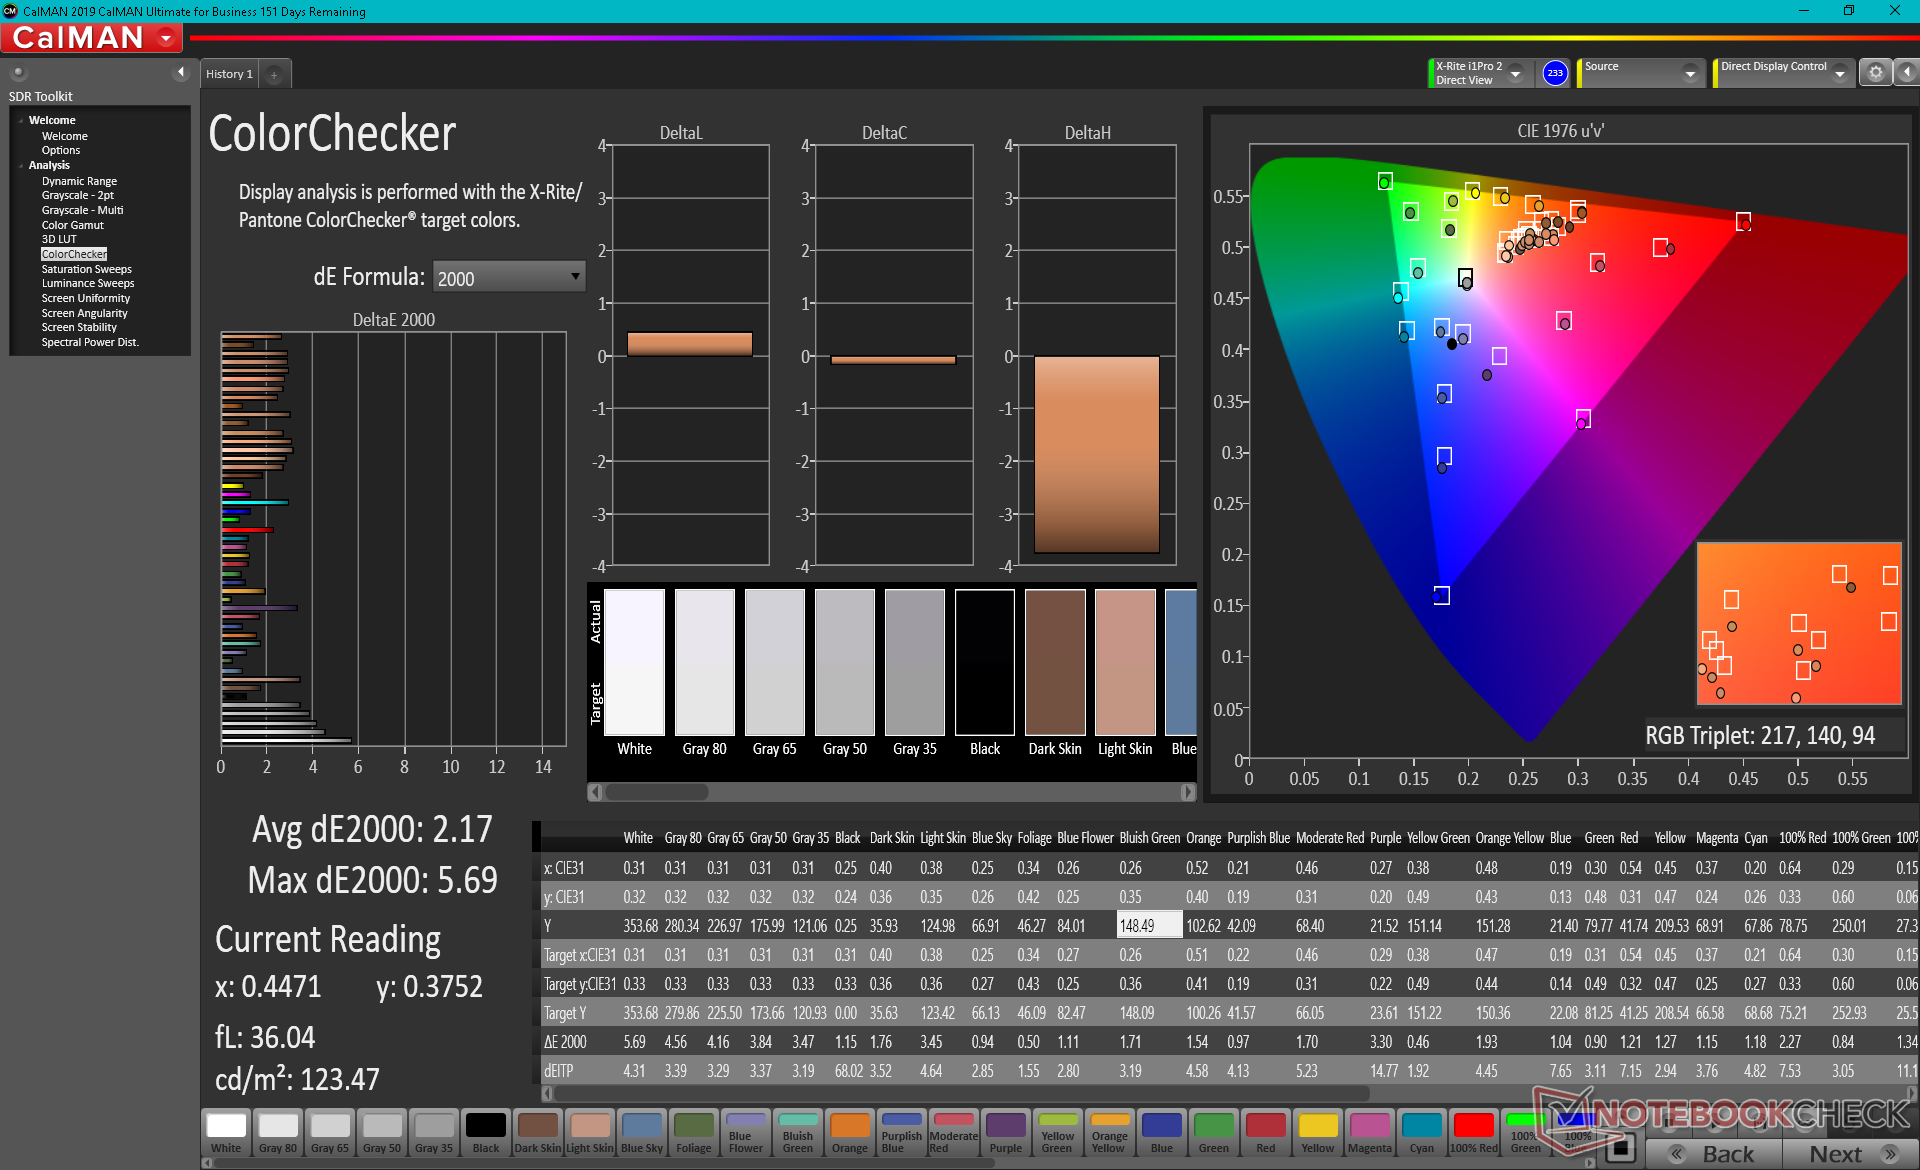
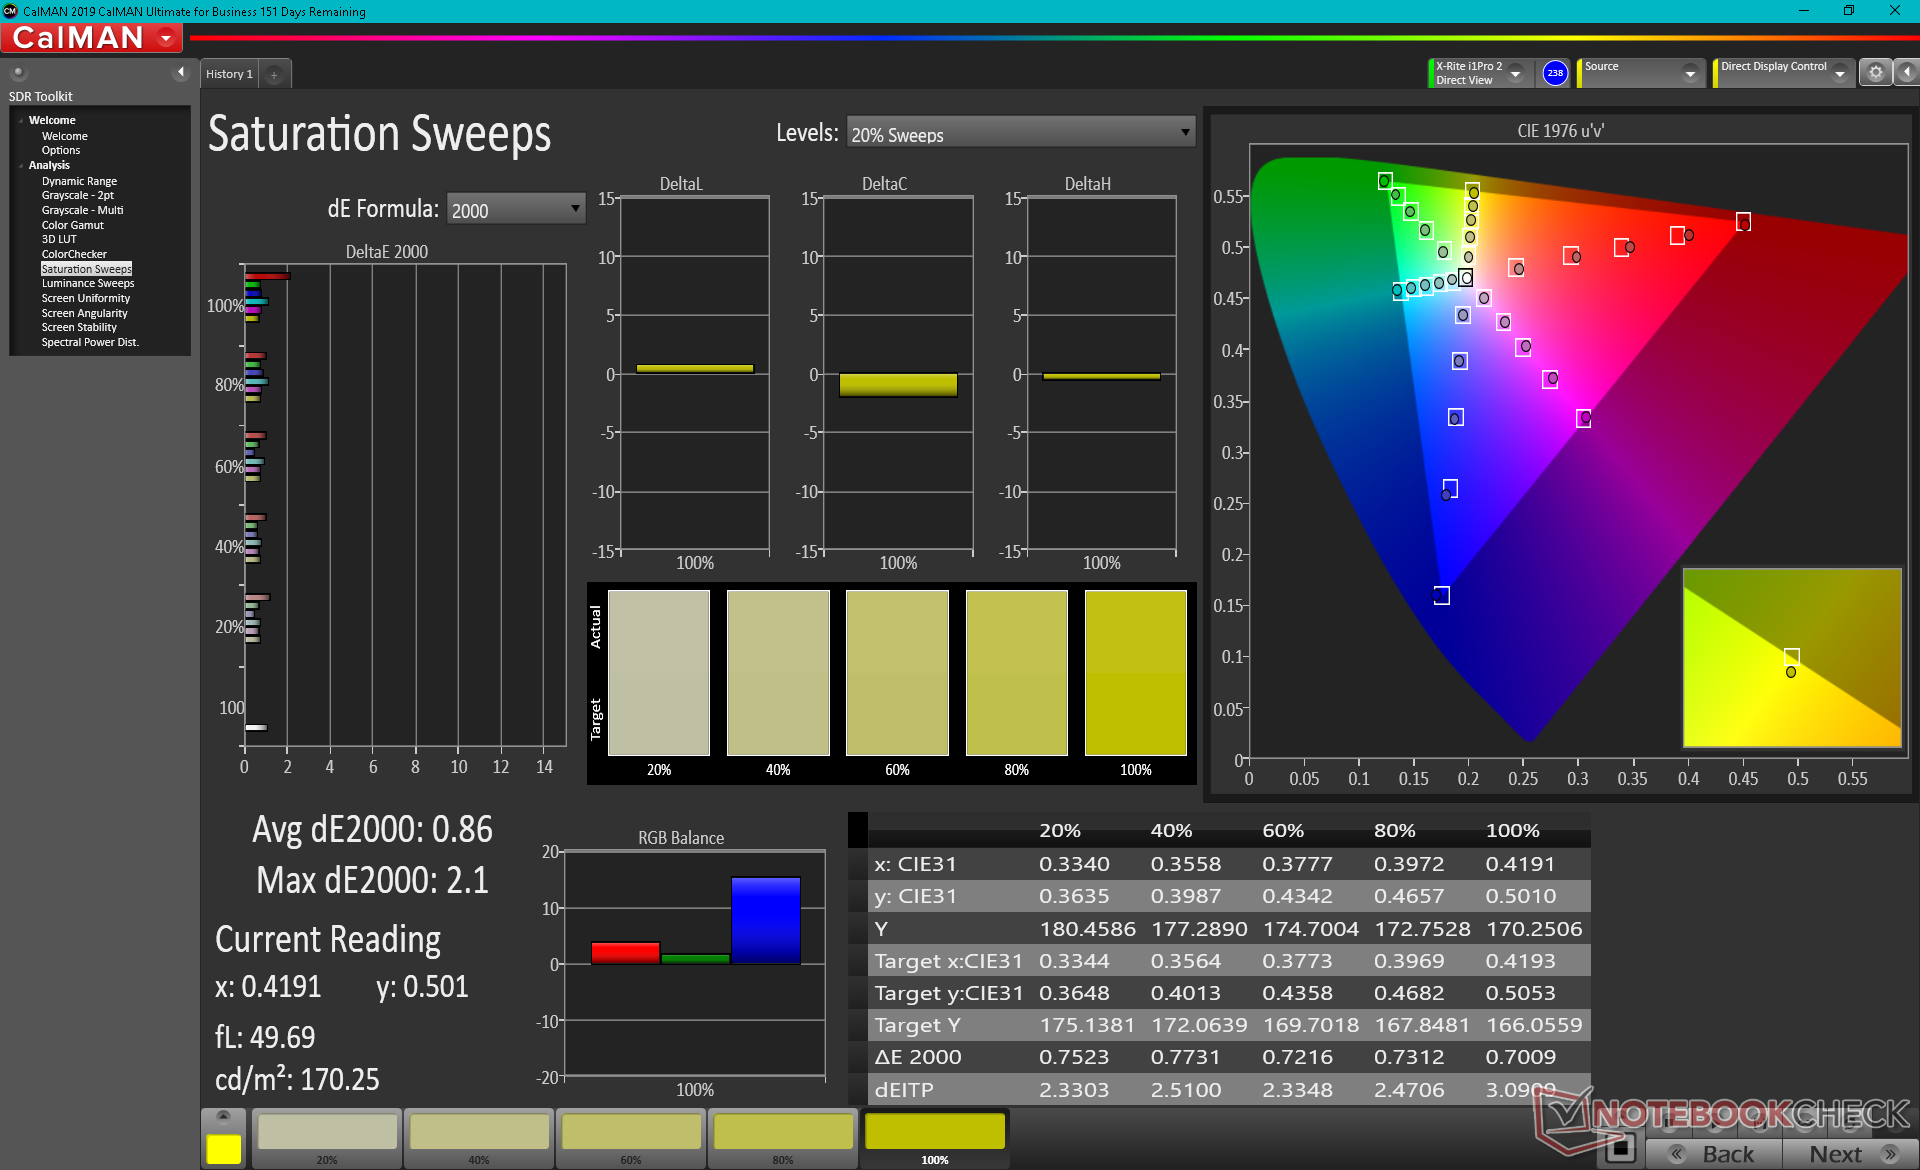
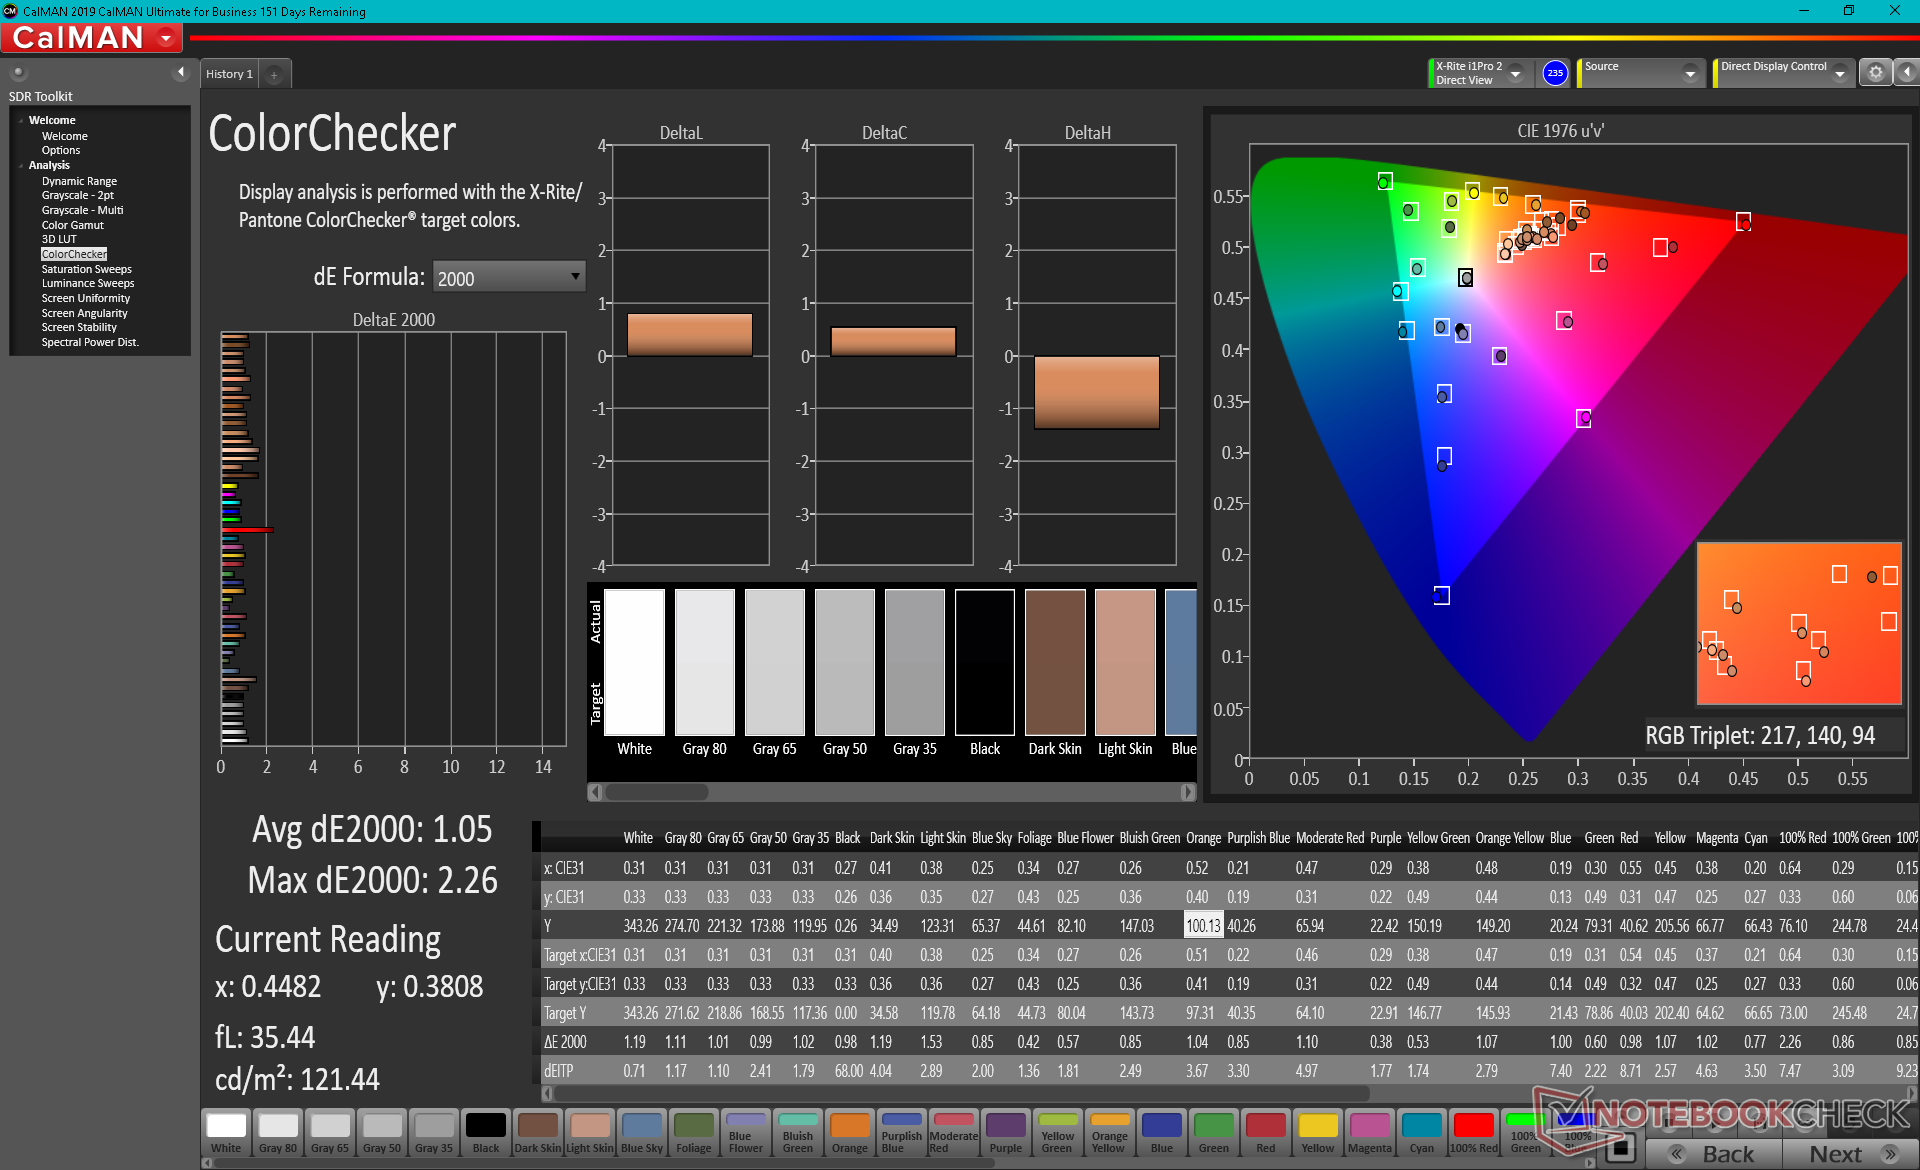
ΔE Color 2.17 | 0.5-29.43 Ø5, calibrated: 1.05
ΔE Greyscale 3.4 | 0.57-98 Ø5.3
69% AdobeRGB 1998 (Argyll 2.2.0 3D)
97.1% sRGB (Argyll 2.2.0 3D)
66.9% Display P3 (Argyll 2.2.0 3D)
Gamma: 2.2
| Razer Blade 15 Advanced (Mid 2021) TL156VDXP02-0, IPS, 15.60, 1920x1080 | Razer Blade 15 Advanced Model Early 2021 TL156VDXP02-0, IPS, 15.60, 1920x1080 | Razer Blade 15 RTX 2080 Super Max-Q AU Optronics B156HAN12.0, IPS, 15.60, 1920x1080 | Asus TUF Gaming F15 FX506HM Chi Mei N156HRA-EA1, IPS, 15.60, 1920x1080 | Alienware m15 R5 Ryzen Edition B156HAN, IPS, 15.60, 1920x1080 | Aorus 15P YD BOE09B9, IPS, 15.60, 1920x1080 | |
|---|---|---|---|---|---|---|
| Display | -1% | 3% | -36% | 4% | ||
| Display P3 Coverage | 66.9 | 65.9 -1% | 70.2 5% | 41.9 -37% | 70.2 5% | |
| sRGB Coverage | 97.1 | 96.4 -1% | 99 2% | 62.9 -35% | 98.5 1% | |
| AdobeRGB 1998 Coverage | 69 | 68 -1% | 71.4 3% | 43.3 -37% | 72.4 5% | |
| Response Times | -143% | -17% | -346% | 11% | -115% | |
| Response Time Grey 50% / Grey 80% * | 4.2 ? | 16 ? -281% | 6 ? -43% | 28.4 ? -576% | 4 ? 5% | 14 ? -233% |
| Response Time Black / White * | 10 ? | 10.4 ? -4% | 9 ? 10% | 21.6 ? -116% | 8.4 ? 16% | 9.6 ? 4% |
| PWM Frequency | ||||||
| Screen | 20% | 3% | -74% | -4% | -26% | |
| Brightness middle | 353.4 | 338 -4% | 347 -2% | 268.3 -24% | 329 -7% | 337 -5% |
| Brightness | 340 | 334 -2% | 328 -4% | 257 -24% | 321 -6% | 316 -7% |
| Brightness Distribution | 92 | 94 2% | 89 -3% | 84 -9% | 92 0% | 85 -8% |
| Black Level * | 0.31 | 0.24 23% | 0.285 8% | 0.34 -10% | 0.27 13% | 0.31 -0% |
| Contrast | 1140 | 1408 24% | 1218 7% | 789 -31% | 1219 7% | 1087 -5% |
| Colorchecker dE 2000 * | 2.17 | 1.39 36% | 2.35 -8% | 5.05 -133% | 2.78 -28% | 3.87 -78% |
| Colorchecker dE 2000 max. * | 5.69 | 3.31 42% | 4.15 27% | 15.43 -171% | 4.88 14% | 8.09 -42% |
| Colorchecker dE 2000 calibrated * | 1.05 | 0.97 8% | 1.16 -10% | 3.21 -206% | 1.63 -55% | 1.15 -10% |
| Greyscale dE 2000 * | 3.4 | 1.6 53% | 3.04 11% | 5.5 -62% | 2.5 26% | 6.1 -79% |
| Gamma | 2.2 100% | 2.291 96% | 2.35 94% | 2.35 94% | 2.106 104% | 2.132 103% |
| CCT | 6830 95% | 6626 98% | 6658 98% | 7392 88% | 6201 105% | 6891 94% |
| Color Space (Percent of AdobeRGB 1998) | 68 | 65 | 76 | 72 | ||
| Color Space (Percent of sRGB) | 89 | 99 | 99 | 94 | ||
| Total Average (Program / Settings) | -41% /
-8% | -4% /
0% | -152% /
-105% | 4% /
-1% | -46% /
-32% |
* ... smaller is better
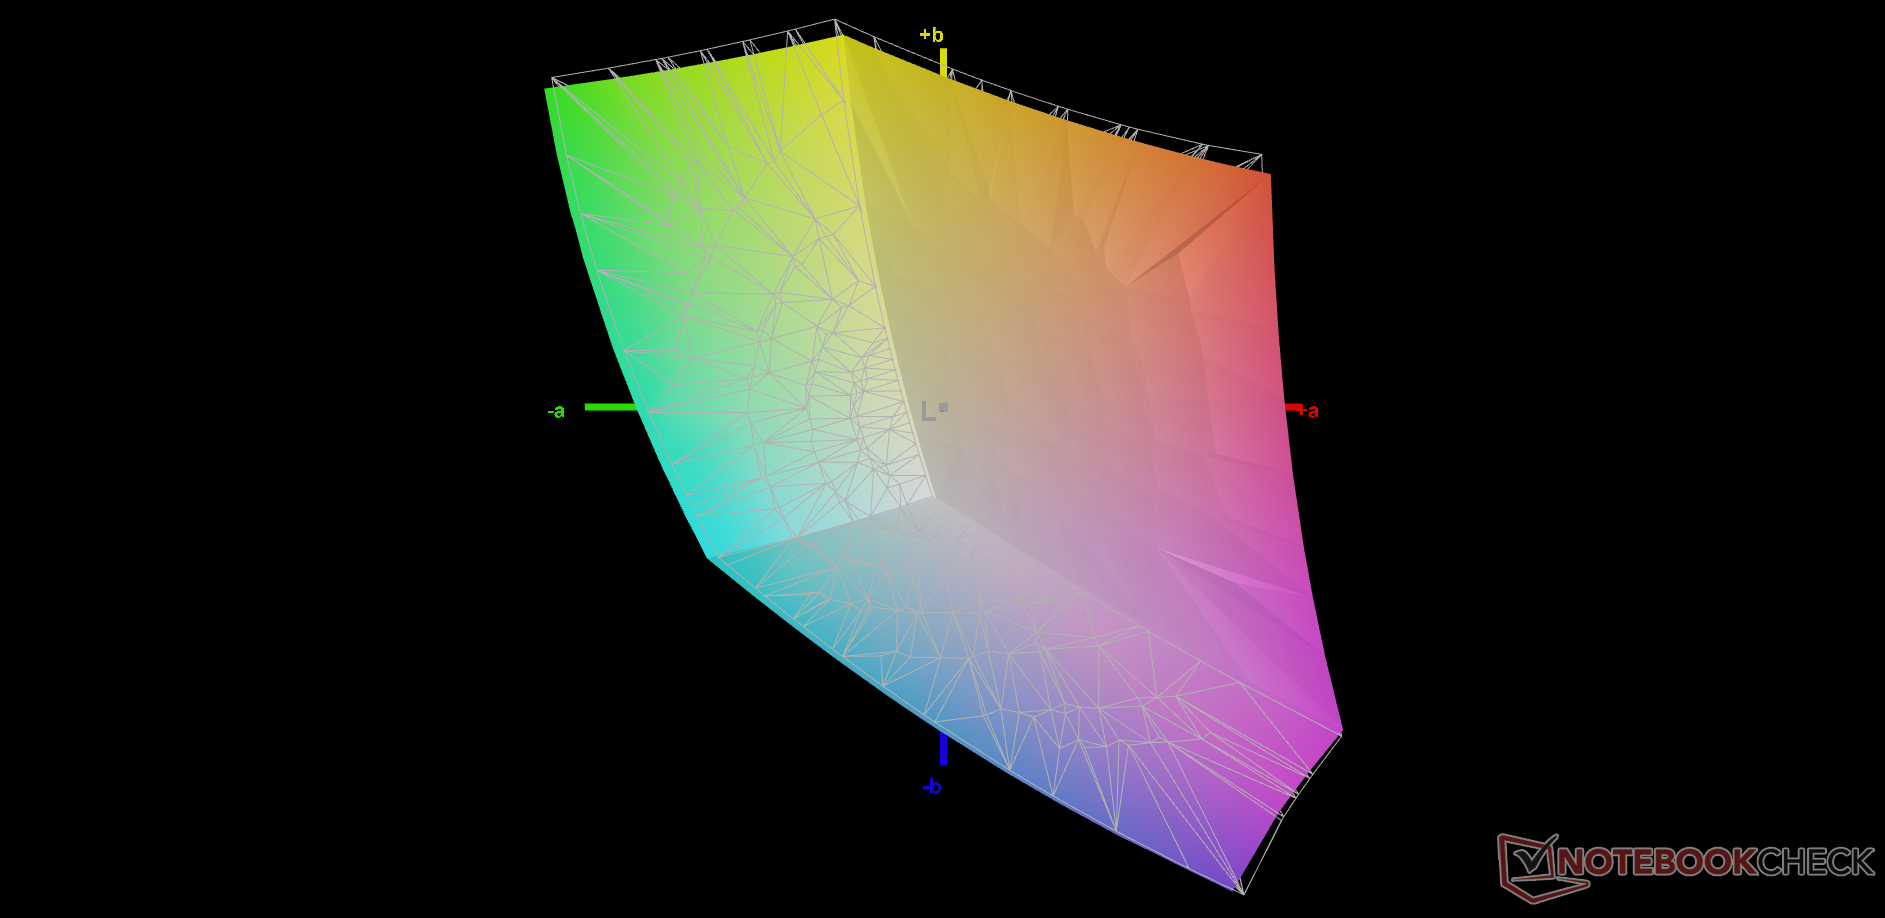
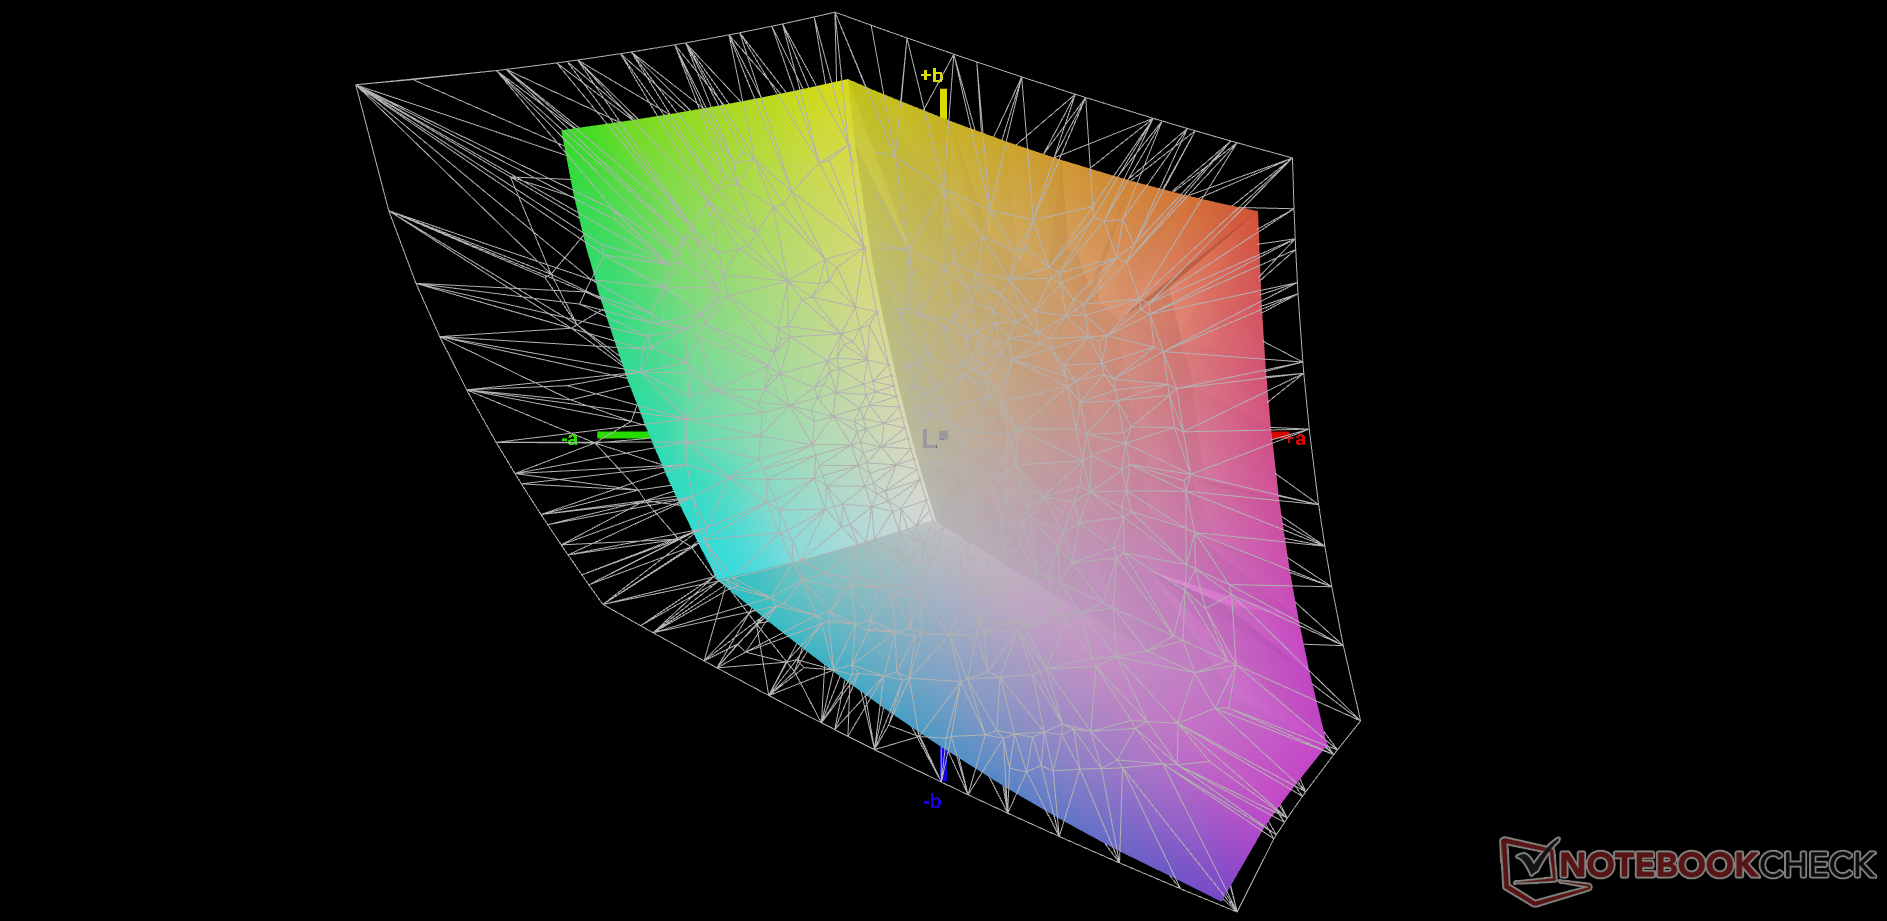
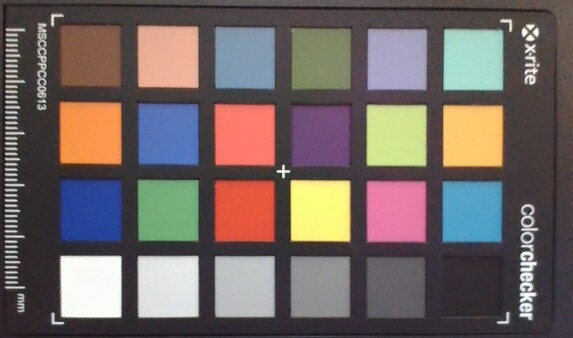
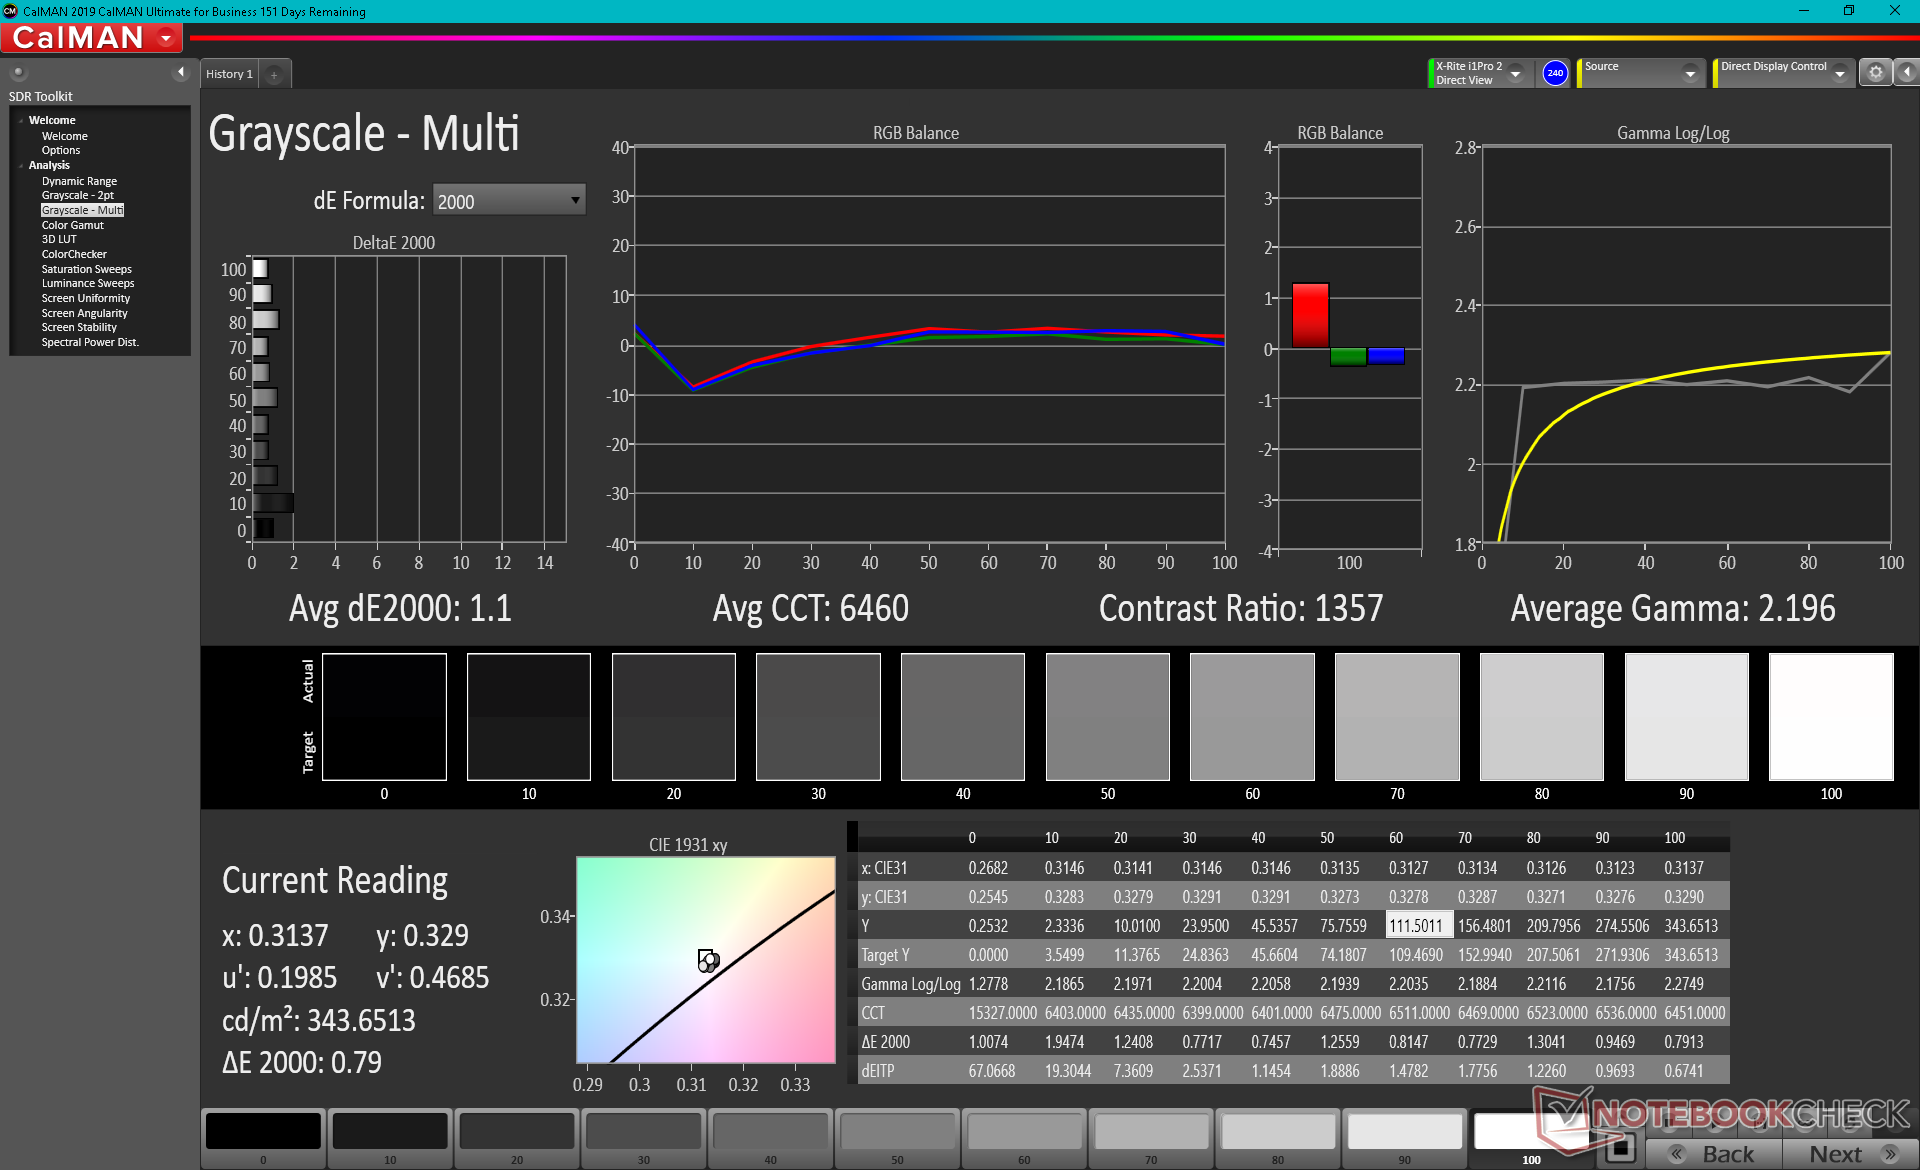
The display is factory calibrated out of the box, but it doesn't seem to be perfect. Our independent X-Rite colorimeter measurements show average grayscale and color deltaE values of 3.5 and 2.17, respectively, which suggests that there may be room for improvement. We're able to push the deltaE values to just 1.1 and 1.05 after calibrating the display ourselves.
Display Response Times
| ↔ Response Time Black to White | ||
|---|---|---|
| 10 ms ... rise ↗ and fall ↘ combined | ↗ 5.2 ms rise | 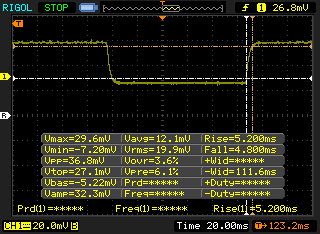 |
| ↘ 4.8 ms fall | ||
| The screen shows good response rates in our tests, but may be too slow for competitive gamers. In comparison, all tested devices range from 0.1 (minimum) to 240 (maximum) ms. » 22 % of all devices are better. This means that the measured response time is better than the average of all tested devices (21.5 ms). | ||
| ↔ Response Time 50% Grey to 80% Grey | ||
| 4.2 ms ... rise ↗ and fall ↘ combined | ↗ 2.6 ms rise | 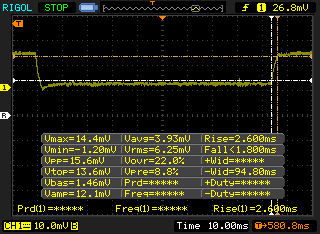 |
| ↘ 1.6 ms fall | ||
| The screen shows very fast response rates in our tests and should be very well suited for fast-paced gaming. In comparison, all tested devices range from 0.2 (minimum) to 636 (maximum) ms. » 11 % of all devices are better. This means that the measured response time is better than the average of all tested devices (33.7 ms). | ||
Screen Flickering / PWM (Pulse-Width Modulation)
| Screen flickering / PWM not detected | 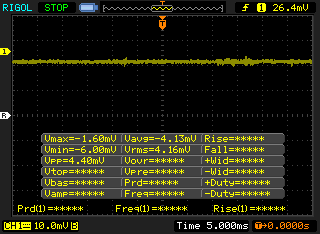 | ||
In comparison: 53 % of all tested devices do not use PWM to dim the display. If PWM was detected, an average of 17915 (minimum: 5 - maximum: 3846000) Hz was measured. | |||

Performance
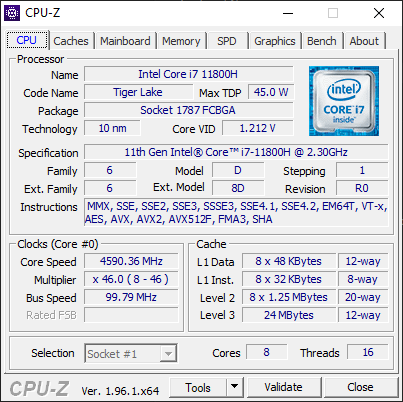
Processor
CPU performance is significantly ahead of the Core i7-10875H in the 10th gen Blade 15 by as much as 20 percent and 80 percent in single-threaded and multi-threaded benchmarks, respectively. The processor in the 10th gen Blade 15 was underperforming anyway and so it's good to see that the 11th gen Blade 15 is back on track in terms of CPU performance. Scores are within single-digit percentage points of the average Core i7-11800H laptop in our database whereas the i7-10875H in the older Blade 15 would be behind by as much as 20 percent.
Upgrading to the Core i9-11900H SKU would likely boost performance by just a few percentage points if our Asus ROG Zephyrus S17 GX703HSD is of any indication.
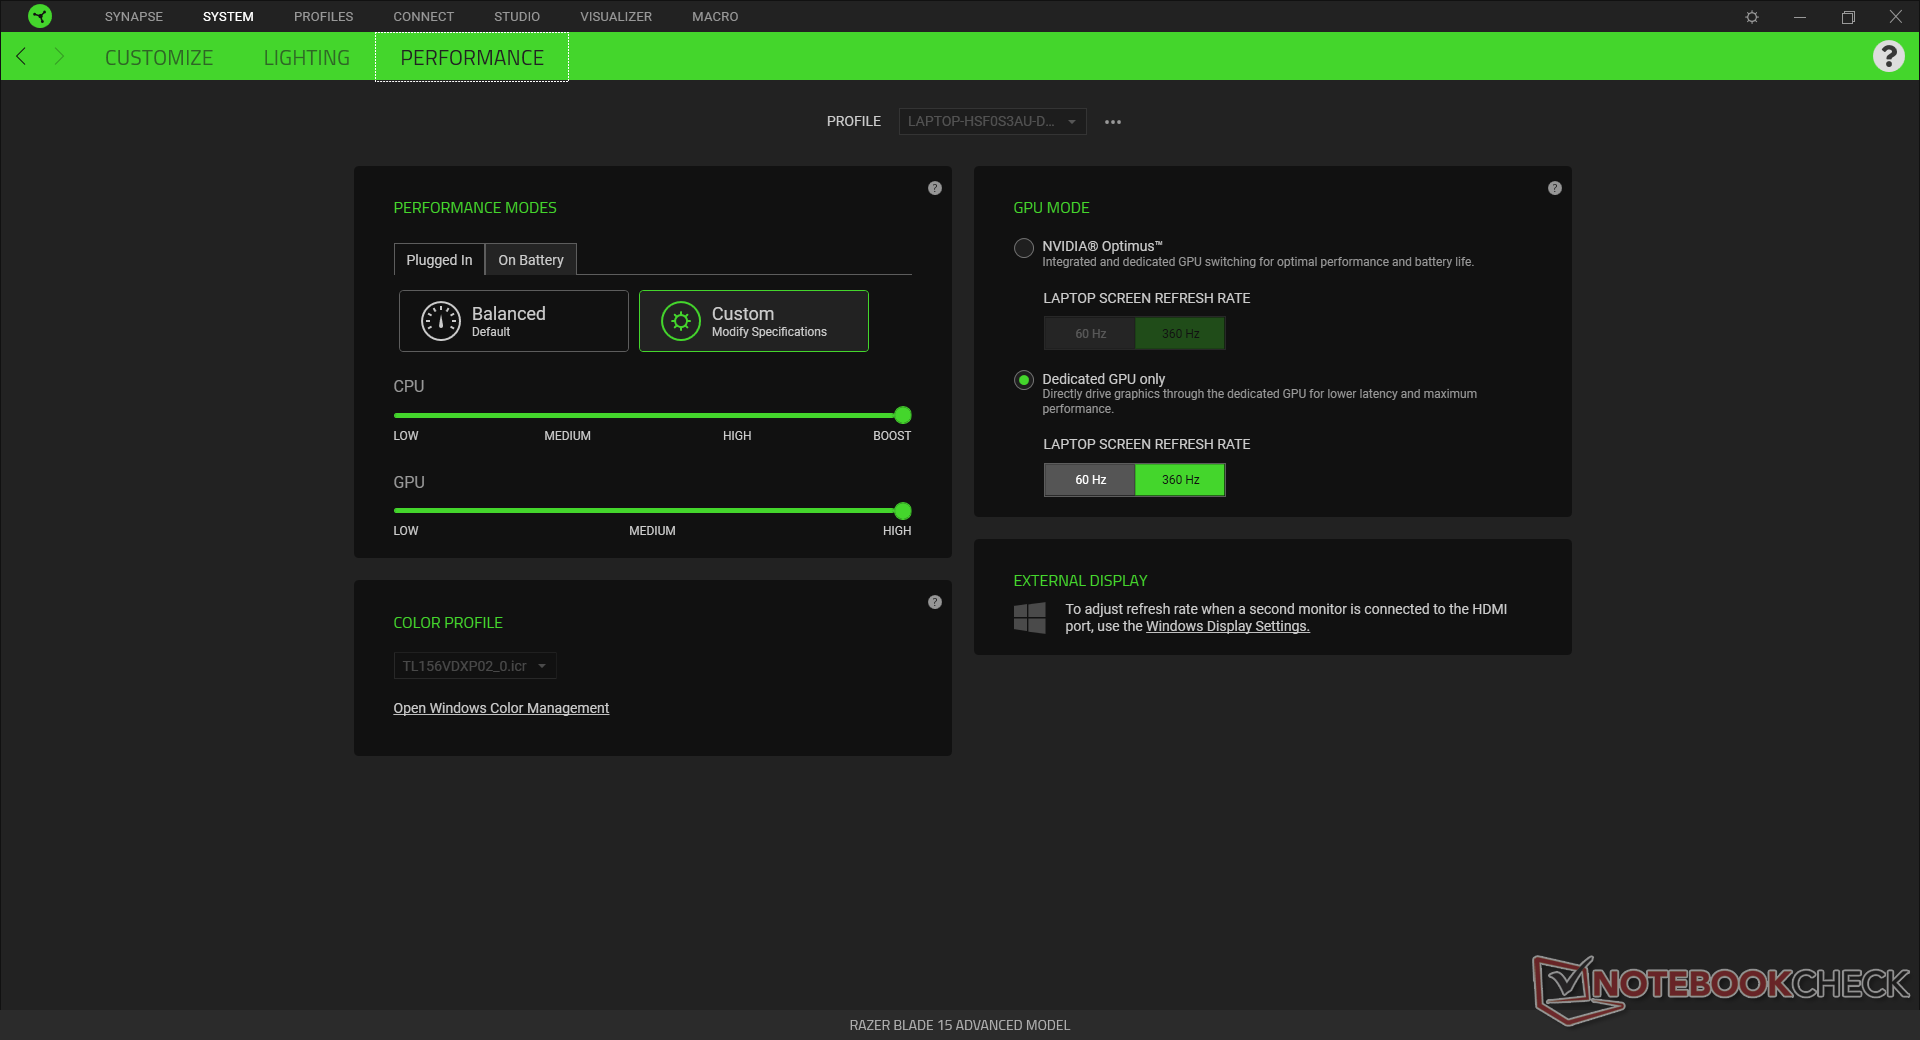
Performance sustainability is excellent with no fluctuations in scores or clock rates over time as shown by our CineBench R15 xT loop graph below. All benchmarks were performed with the system set to 'Boost' and 'High' via Razer Synapse.
Cinebench R15 Multi Loop
Cinebench R23: Multi Core | Single Core
Cinebench R15: CPU Multi 64Bit | CPU Single 64Bit
Blender: v2.79 BMW27 CPU
7-Zip 18.03: 7z b 4 -mmt1 | 7z b 4
Geekbench 5.5: Single-Core | Multi-Core
HWBOT x265 Benchmark v2.2: 4k Preset
LibreOffice : 20 Documents To PDF
R Benchmark 2.5: Overall mean
* ... smaller is better
System Performance
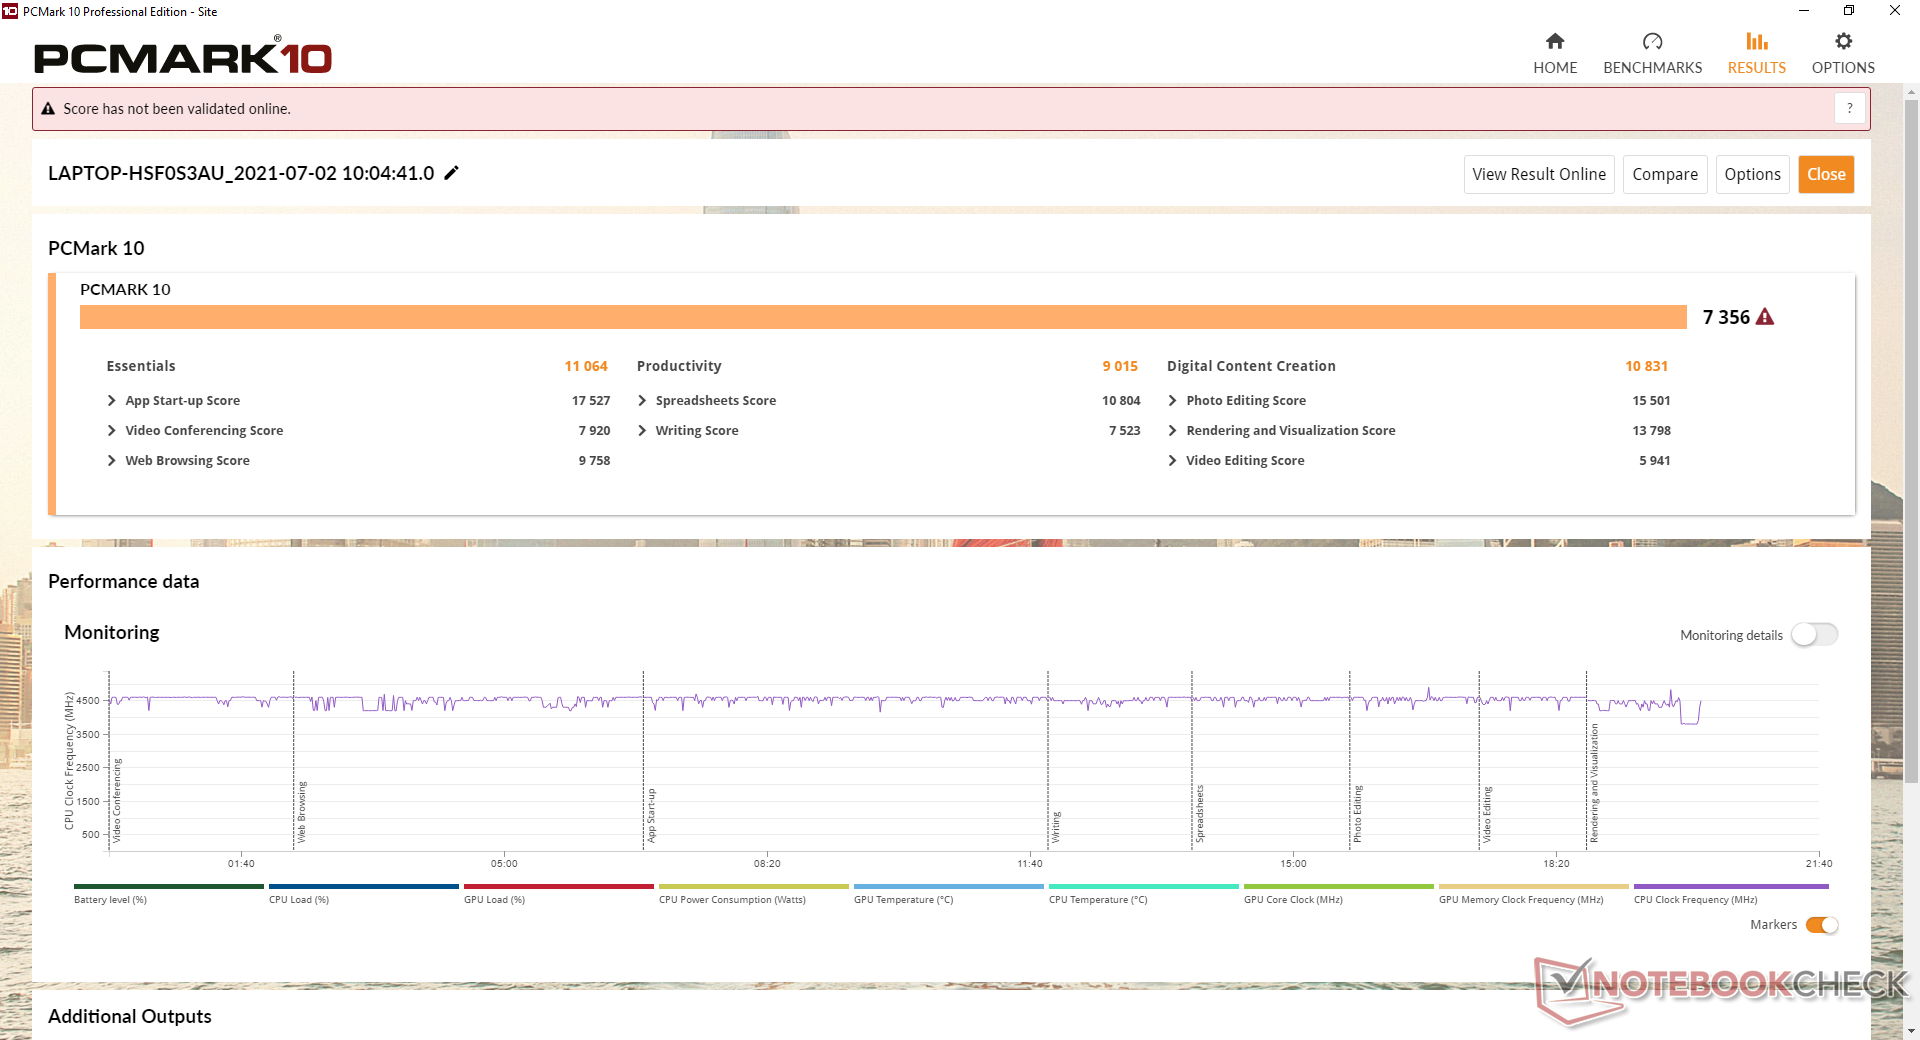
PCMark scores are consistently ahead of the 10th gen Blade 15 by double-digit percentage points in many cases. We suspect that the super-fast PCIe 4 SSD is playing a major part here since the benchmark tends to favor systems with fast storage performance.
| PCMark 10 / Score | |
| Razer Blade 15 Advanced (Mid 2021) | |
| Aorus 15P YD | |
| Average Intel Core i7-11800H, NVIDIA GeForce RTX 3080 Laptop GPU (6673 - 7470, n=11) | |
| Asus TUF Gaming F15 FX506HM | |
| Alienware m15 R5 Ryzen Edition | |
| Razer Blade 15 Advanced Model Early 2021 | |
| Razer Blade 15 RTX 2080 Super Max-Q | |
| PCMark 10 / Essentials | |
| Razer Blade 15 Advanced (Mid 2021) | |
| Aorus 15P YD | |
| Asus TUF Gaming F15 FX506HM | |
| Average Intel Core i7-11800H, NVIDIA GeForce RTX 3080 Laptop GPU (9862 - 11064, n=11) | |
| Alienware m15 R5 Ryzen Edition | |
| Razer Blade 15 Advanced Model Early 2021 | |
| Razer Blade 15 RTX 2080 Super Max-Q | |
| PCMark 10 / Productivity | |
| Aorus 15P YD | |
| Average Intel Core i7-11800H, NVIDIA GeForce RTX 3080 Laptop GPU (8278 - 9803, n=11) | |
| Razer Blade 15 Advanced (Mid 2021) | |
| Alienware m15 R5 Ryzen Edition | |
| Asus TUF Gaming F15 FX506HM | |
| Razer Blade 15 Advanced Model Early 2021 | |
| Razer Blade 15 RTX 2080 Super Max-Q | |
| PCMark 10 / Digital Content Creation | |
| Razer Blade 15 Advanced (Mid 2021) | |
| Average Intel Core i7-11800H, NVIDIA GeForce RTX 3080 Laptop GPU (9881 - 11323, n=11) | |
| Aorus 15P YD | |
| Asus TUF Gaming F15 FX506HM | |
| Alienware m15 R5 Ryzen Edition | |
| Razer Blade 15 Advanced Model Early 2021 | |
| Razer Blade 15 RTX 2080 Super Max-Q | |
| PCMark 10 Score | 7356 points | |
Help | ||
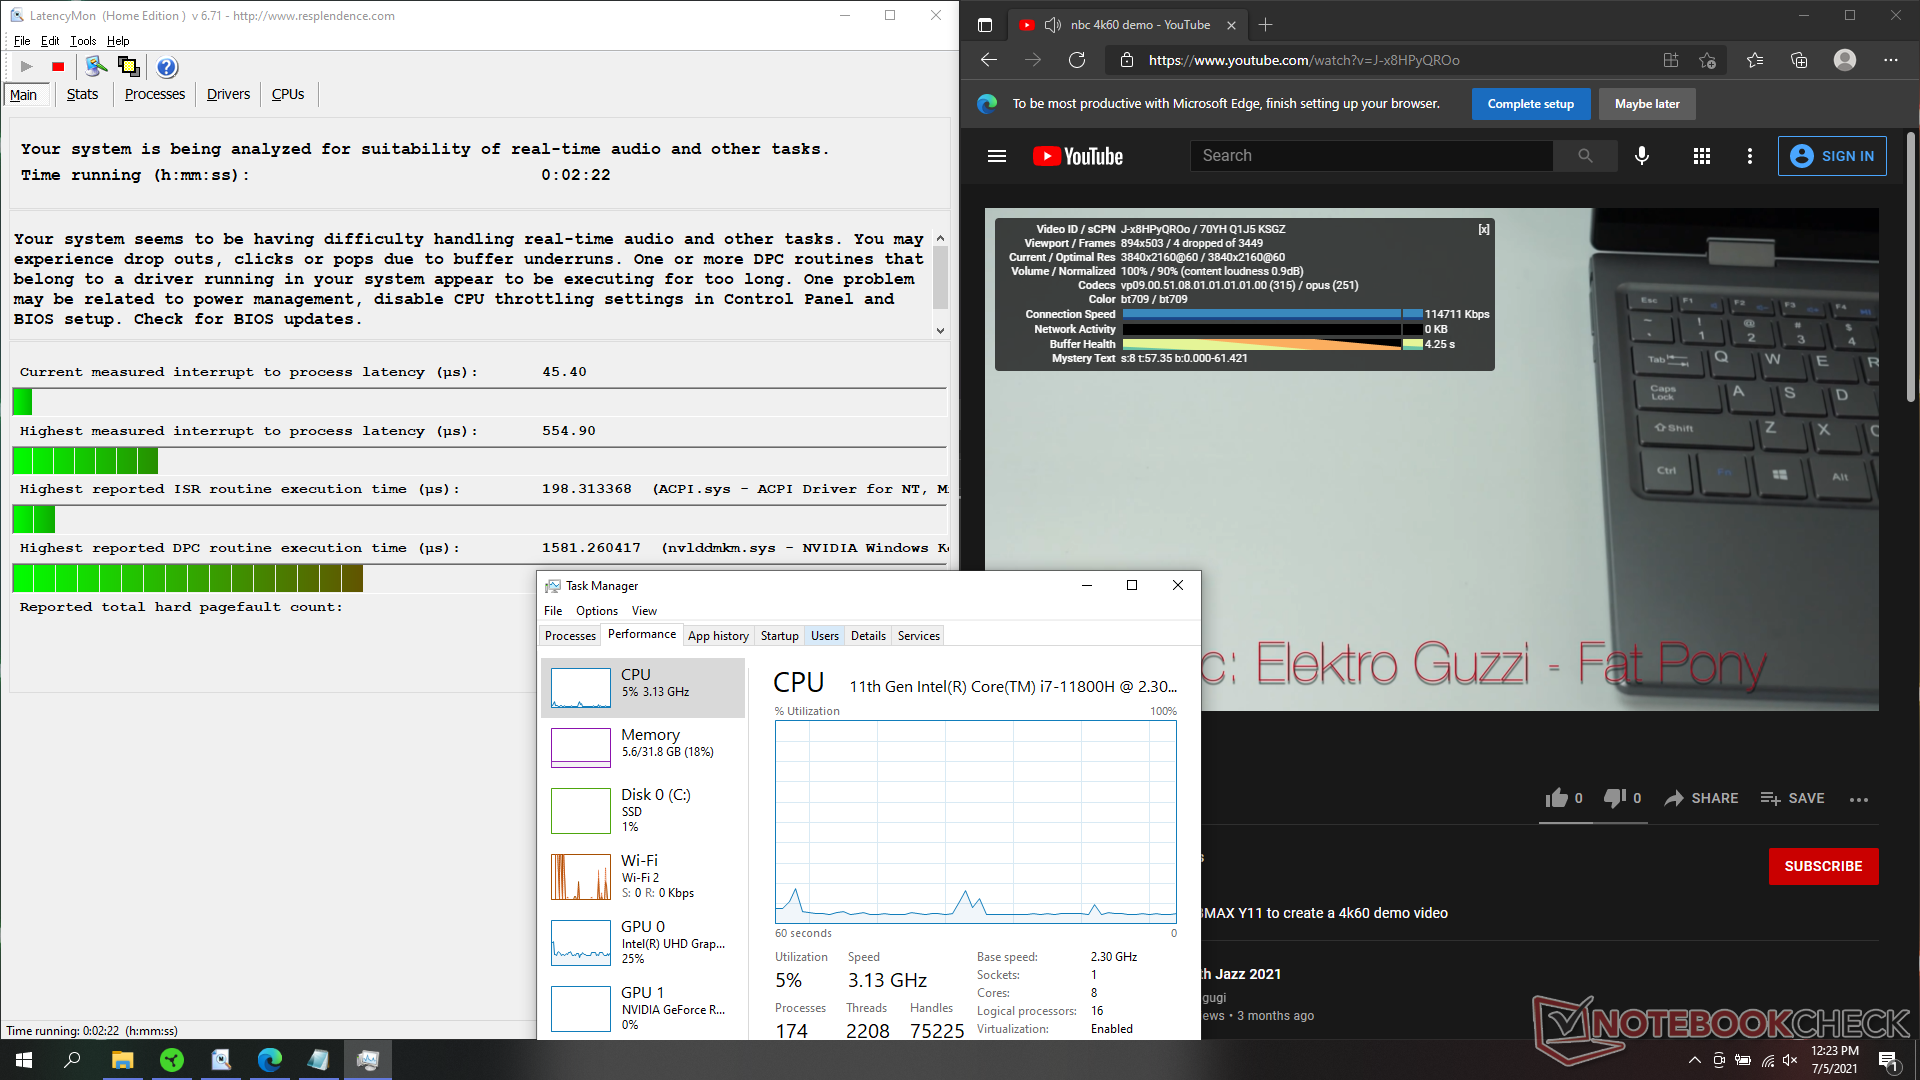
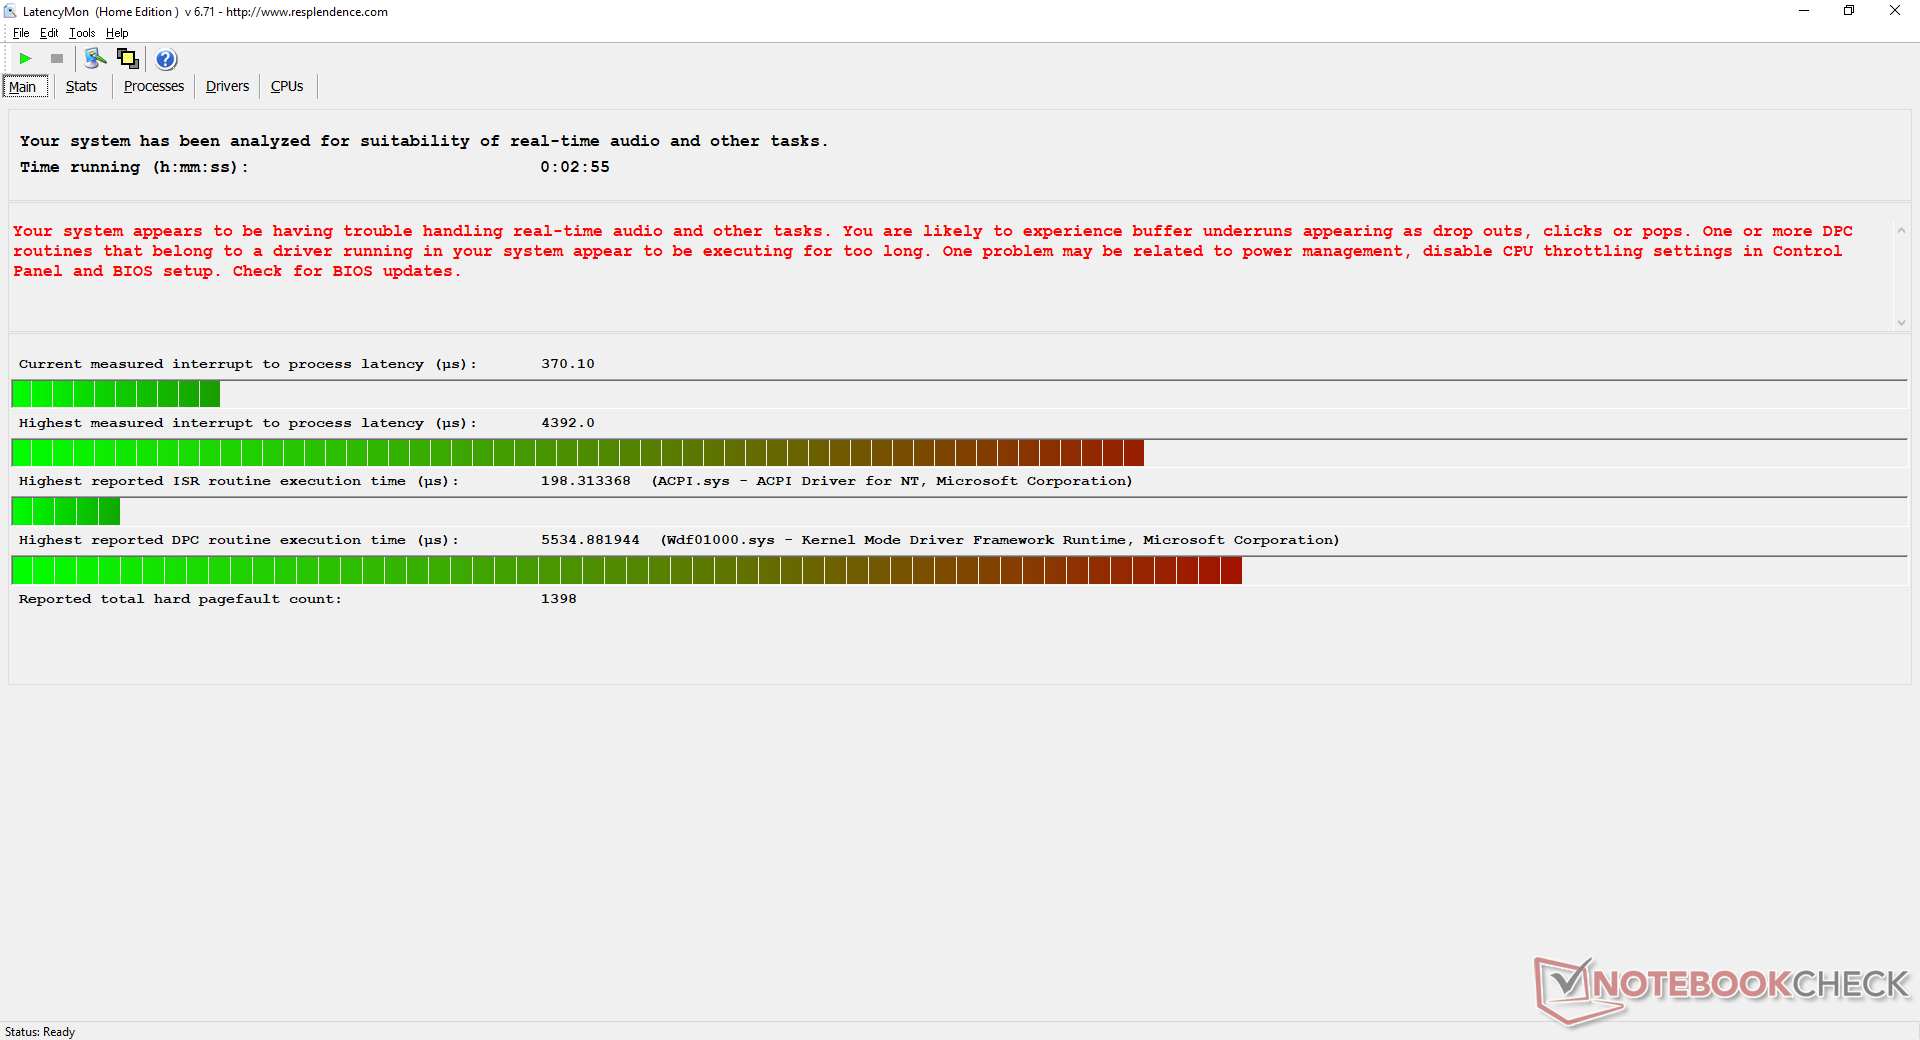
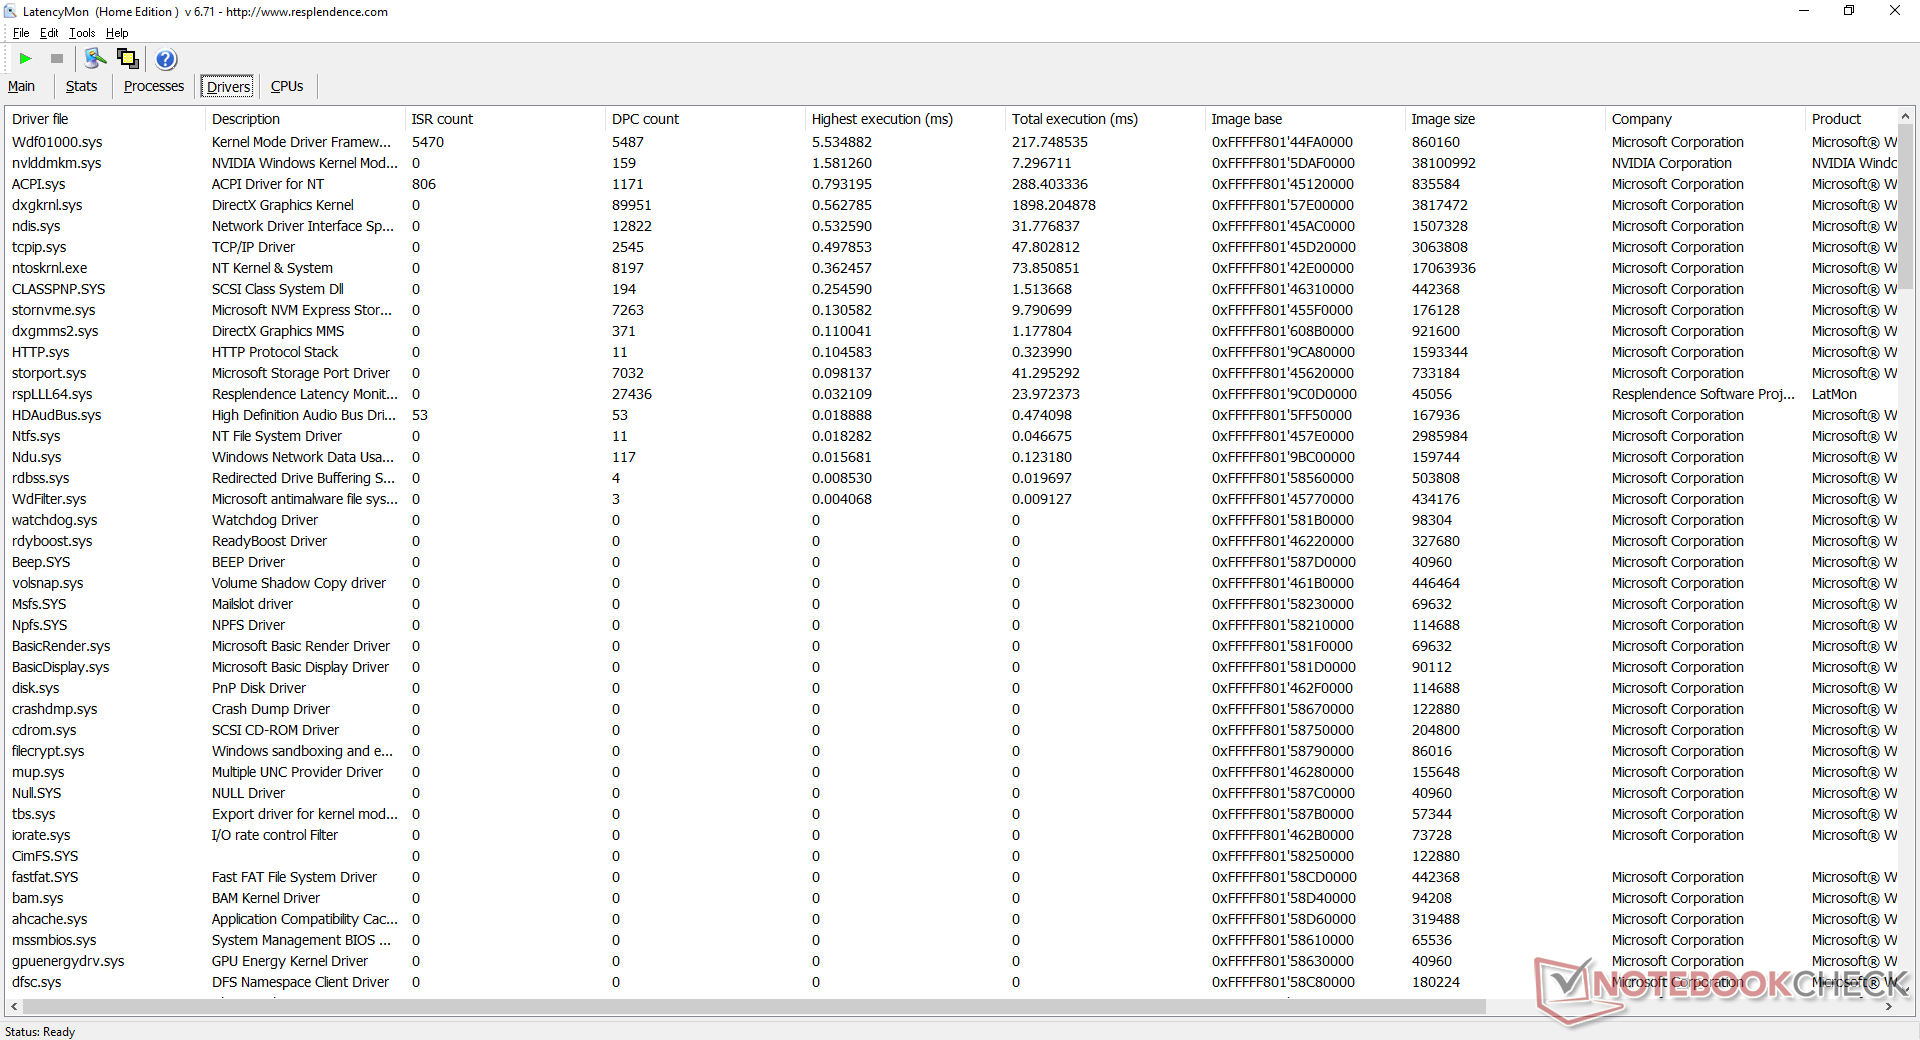
DPC Latency
LatencyMon reveals no major DPC latency issues when browsing the web or video streaming at 4K. Once the CPU is heavily stressed, however, latency would spike to as high as 4392 μs. We tested this twice with Prime95 and the results are repeatable.
| DPC Latencies / LatencyMon - interrupt to process latency (max), Web, Youtube, Prime95 | |
| Razer Blade 15 Advanced (Mid 2021) | |
| Asus TUF Gaming F15 FX506HM | |
| Razer Blade 15 RTX 2080 Super Max-Q | |
| Aorus 15P YD | |
| Razer Blade 15 Advanced Model Early 2021 | |
| Alienware m15 R5 Ryzen Edition | |
* ... smaller is better
Storage Devices
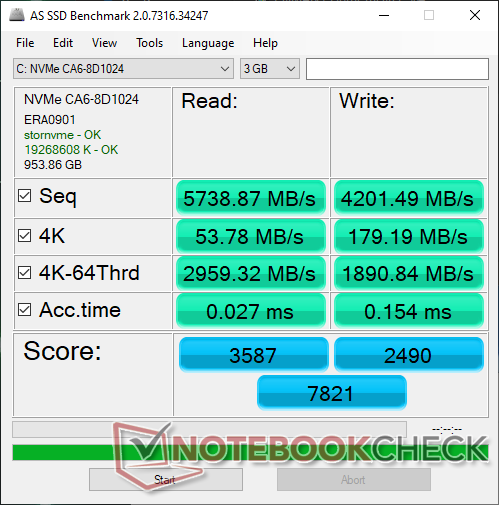
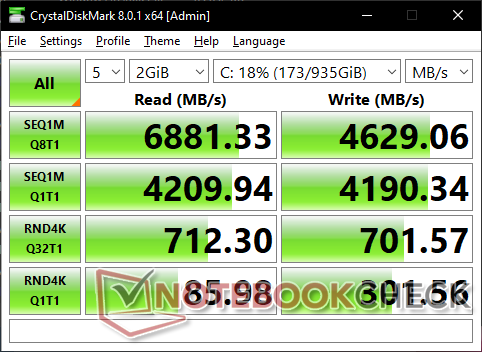
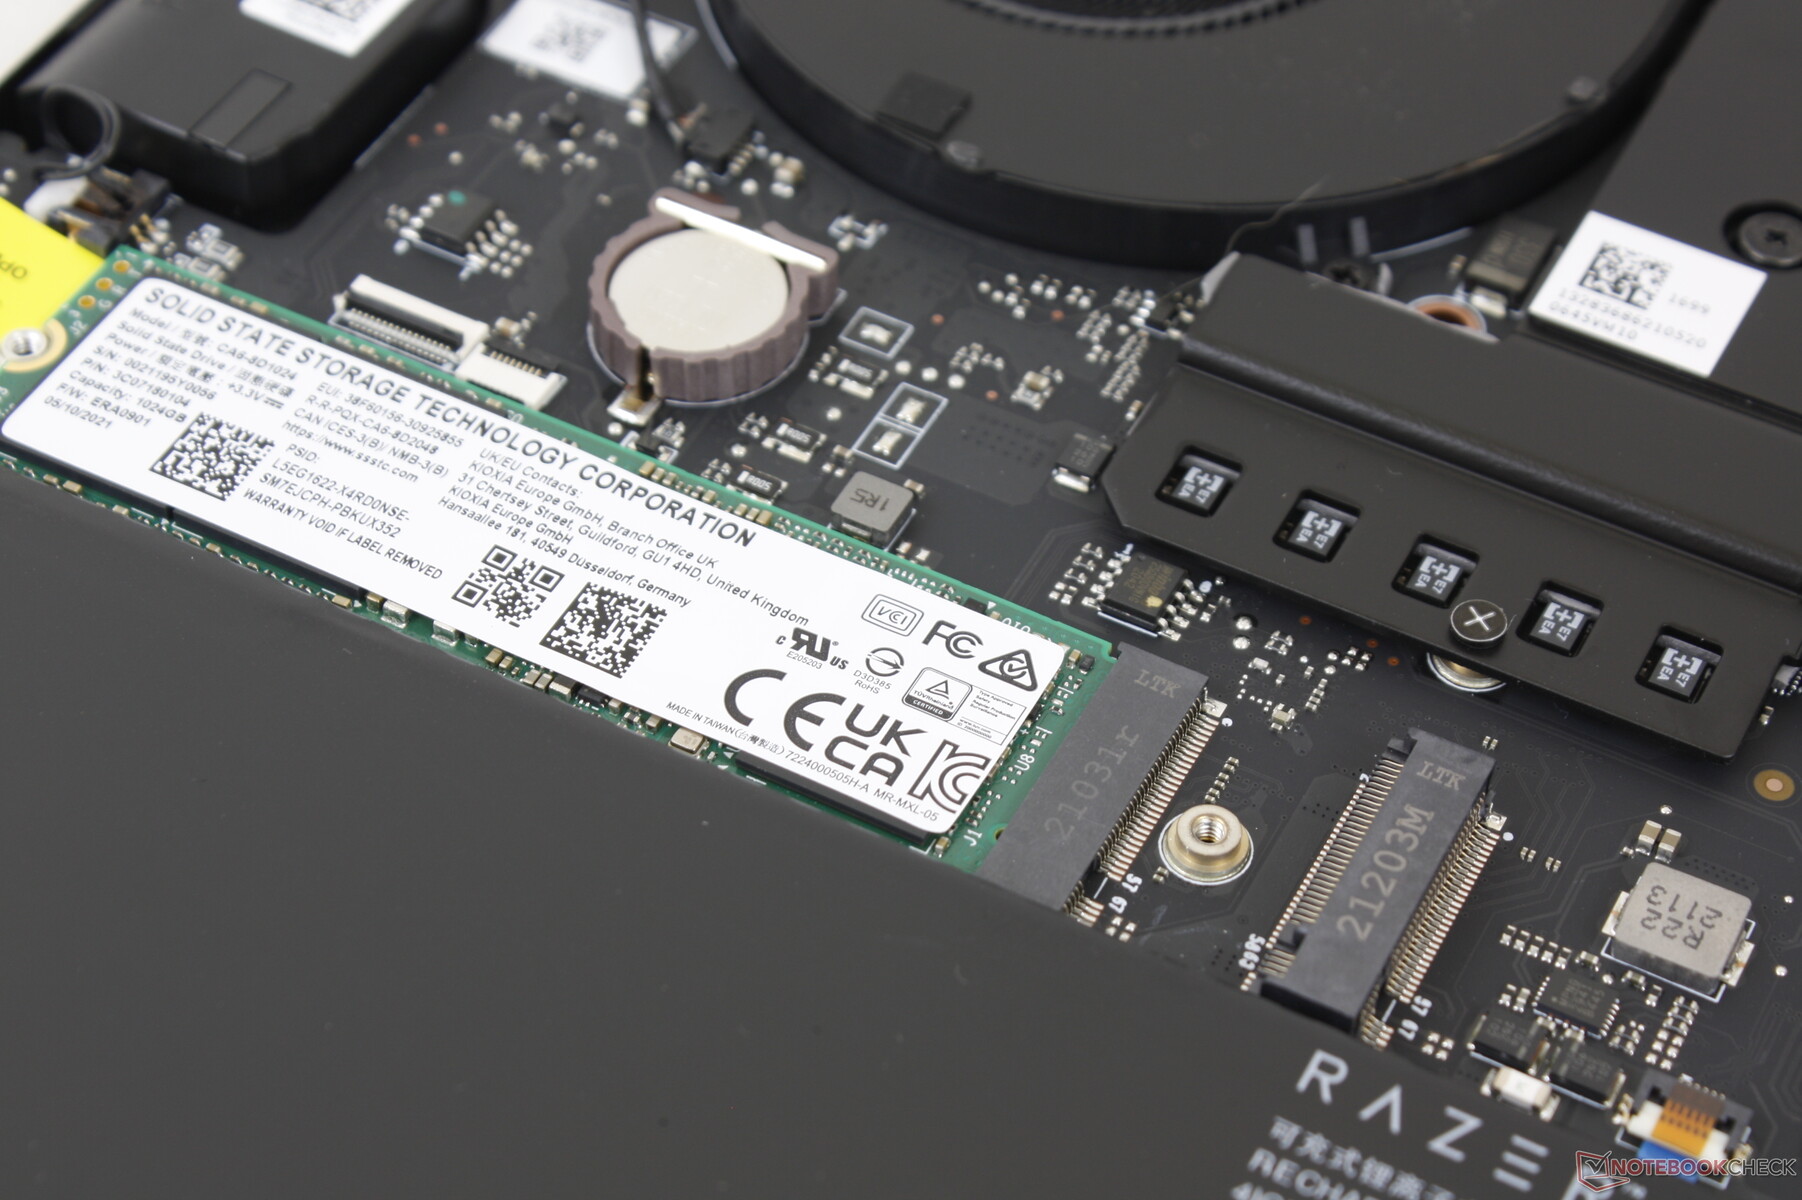
A major differentiating factor separating the 11th gen Blade 15 from all prior models is its support for fast PCIe 4 NVMe SSDs. Indeed, sequential read and write rates here approach 6800+ MB/s and 4800 MB/s, respectively, compared to "only" 3200 MB/s and 3000 MB/s on the 10th gen Blade 15 with its Samsung PM981a.
The PCIe 4 SSD here comes from SSSTC (formerly Lite-On). The Samsung PM9A1 PCIe 4 NVMe SSD appears to be slightly faster than our SSSTC solution.
| Razer Blade 15 Advanced (Mid 2021) SSSTC CA6-8D1024 | Razer Blade 15 Advanced Model Early 2021 Samsung PM981a MZVLB1T0HBLR | Asus TUF Gaming F15 FX506HM SK Hynix HFM001TD3JX013N | Alienware m15 R5 Ryzen Edition Toshiba KBG40ZNS512G NVMe | Aorus 15P YD Samsung PM9A1 MZVL21T0HCLR | |
|---|---|---|---|---|---|
| AS SSD | -30% | -27% | -69% | 13% | |
| Seq Read | 5739 | 2112 -63% | 2873 -50% | 2082 -64% | 5376 -6% |
| Seq Write | 4201 | 2024 -52% | 1619 -61% | 825 -80% | 3669 -13% |
| 4K Read | 53.8 | 46.53 -14% | 57.5 7% | 42.41 -21% | 56.5 5% |
| 4K Write | 179.2 | 89.7 -50% | 149.6 -17% | 98.3 -45% | 157.7 -12% |
| 4K-64 Read | 2959 | 1747 -41% | 1252 -58% | 1255 -58% | 2720 -8% |
| 4K-64 Write | 1891 | 1962 4% | 2196 16% | 738 -61% | 3366 78% |
| Access Time Read * | 0.027 | 0.052 -93% | 0.04 -48% | 0.109 -304% | 0.04 -48% |
| Access Time Write * | 0.154 | 0.04 74% | 0.082 47% | 0.17 -10% | 0.027 82% |
| Score Read | 3587 | 2004 -44% | 1597 -55% | 1506 -58% | 3314 -8% |
| Score Write | 2490 | 2254 -9% | 2508 1% | 918 -63% | 3890 56% |
| Score Total | 7821 | 5280 -32% | 4869 -38% | 3136 -60% | 8804 13% |
| Copy ISO MB/s | 3027 | 2128 -30% | 1583 -48% | 1391 -54% | |
| Copy Program MB/s | 1177 | 707 -40% | 964 -18% | 645 -45% | |
| Copy Game MB/s | 2170 | 1471 -32% | 943 -57% | 1101 -49% | |
| CrystalDiskMark 5.2 / 6 | -46% | -40% | -54% | 0% | |
| Write 4K | 295.6 | 138 -53% | 168.1 -43% | 116.9 -60% | 230.4 -22% |
| Read 4K | 85.7 | 47.41 -45% | 65.1 -24% | 44.56 -48% | 91.8 7% |
| Write Seq | 4149 | 1922 -54% | 2124 -49% | 1552 -63% | 4301 4% |
| Read Seq | 4203 | 1673 -60% | 2204 -48% | 1682 -60% | 4474 6% |
| Write 4K Q32T1 | 715 | 445.5 -38% | 455.3 -36% | 497.8 -30% | 656 -8% |
| Read 4K Q32T1 | 709 | 534 -25% | 465.6 -34% | 436.8 -38% | 722 2% |
| Write Seq Q32T1 | 4681 | 2976 -36% | 2911 -38% | 1461 -69% | 5198 11% |
| Read Seq Q32T1 | 6905 | 3232 -53% | 3519 -49% | 2364 -66% | 7065 2% |
| Total Average (Program / Settings) | -38% /
-36% | -34% /
-32% | -62% /
-64% | 7% /
7% |
* ... smaller is better

Disk Throttling: DiskSpd Read Loop, Queue Depth 8
GPU Performance
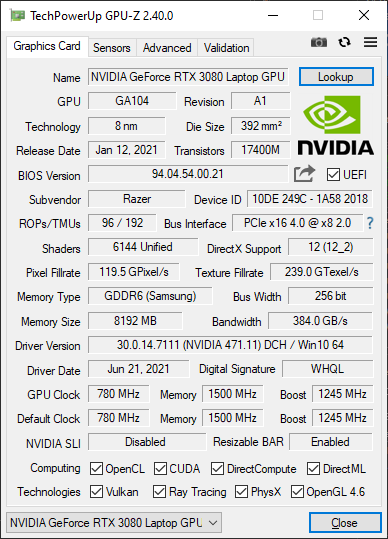
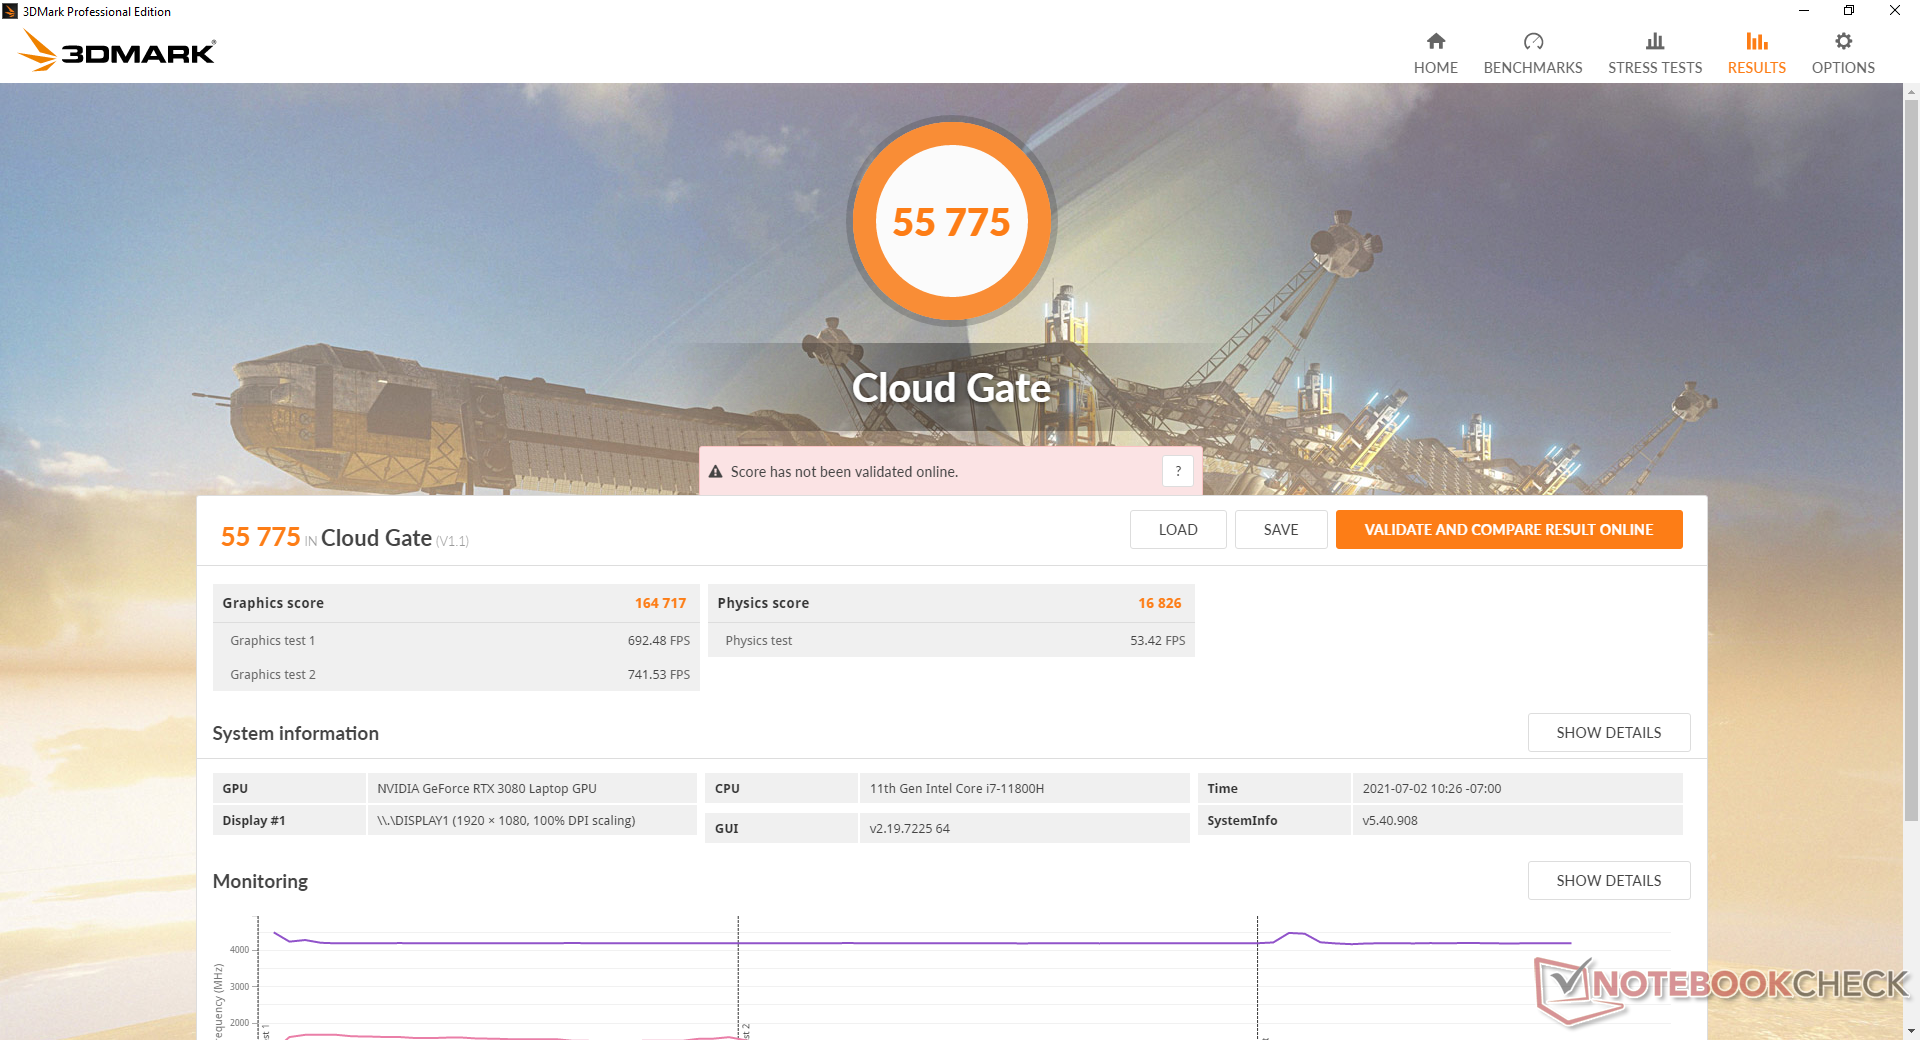
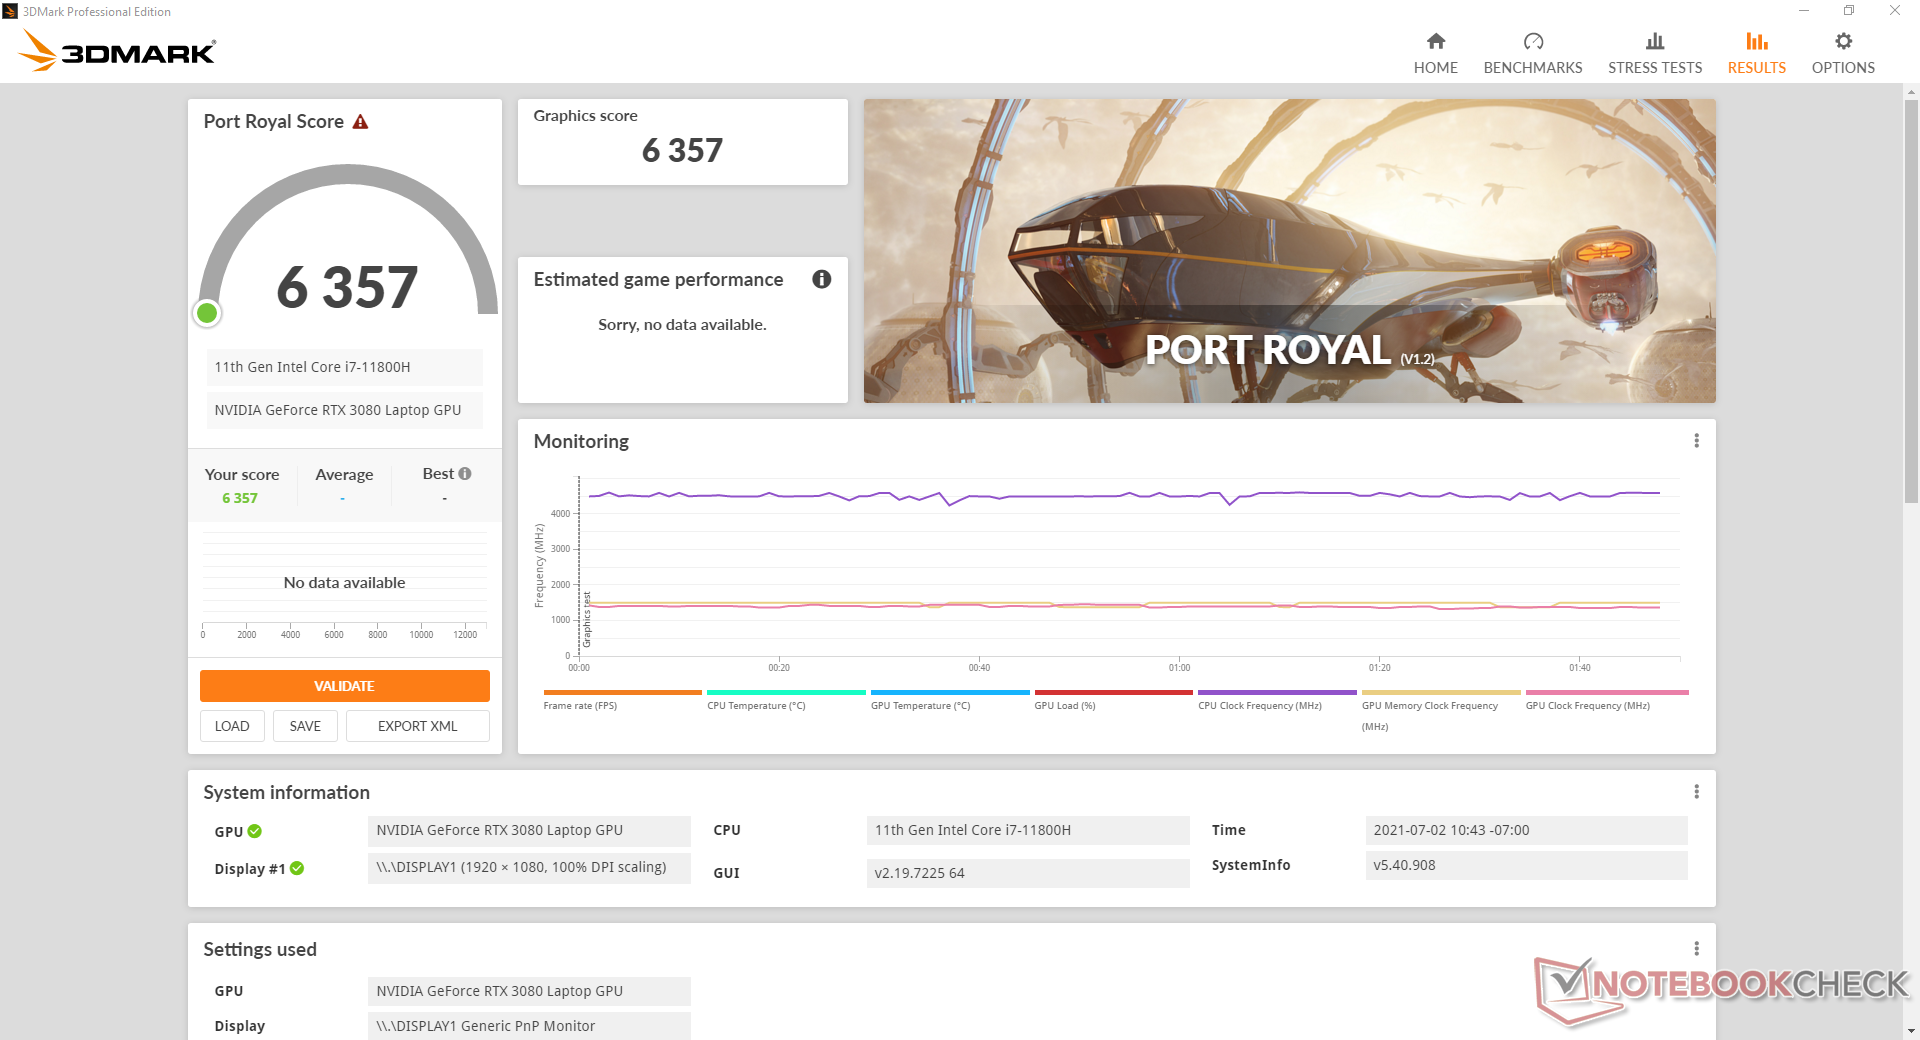
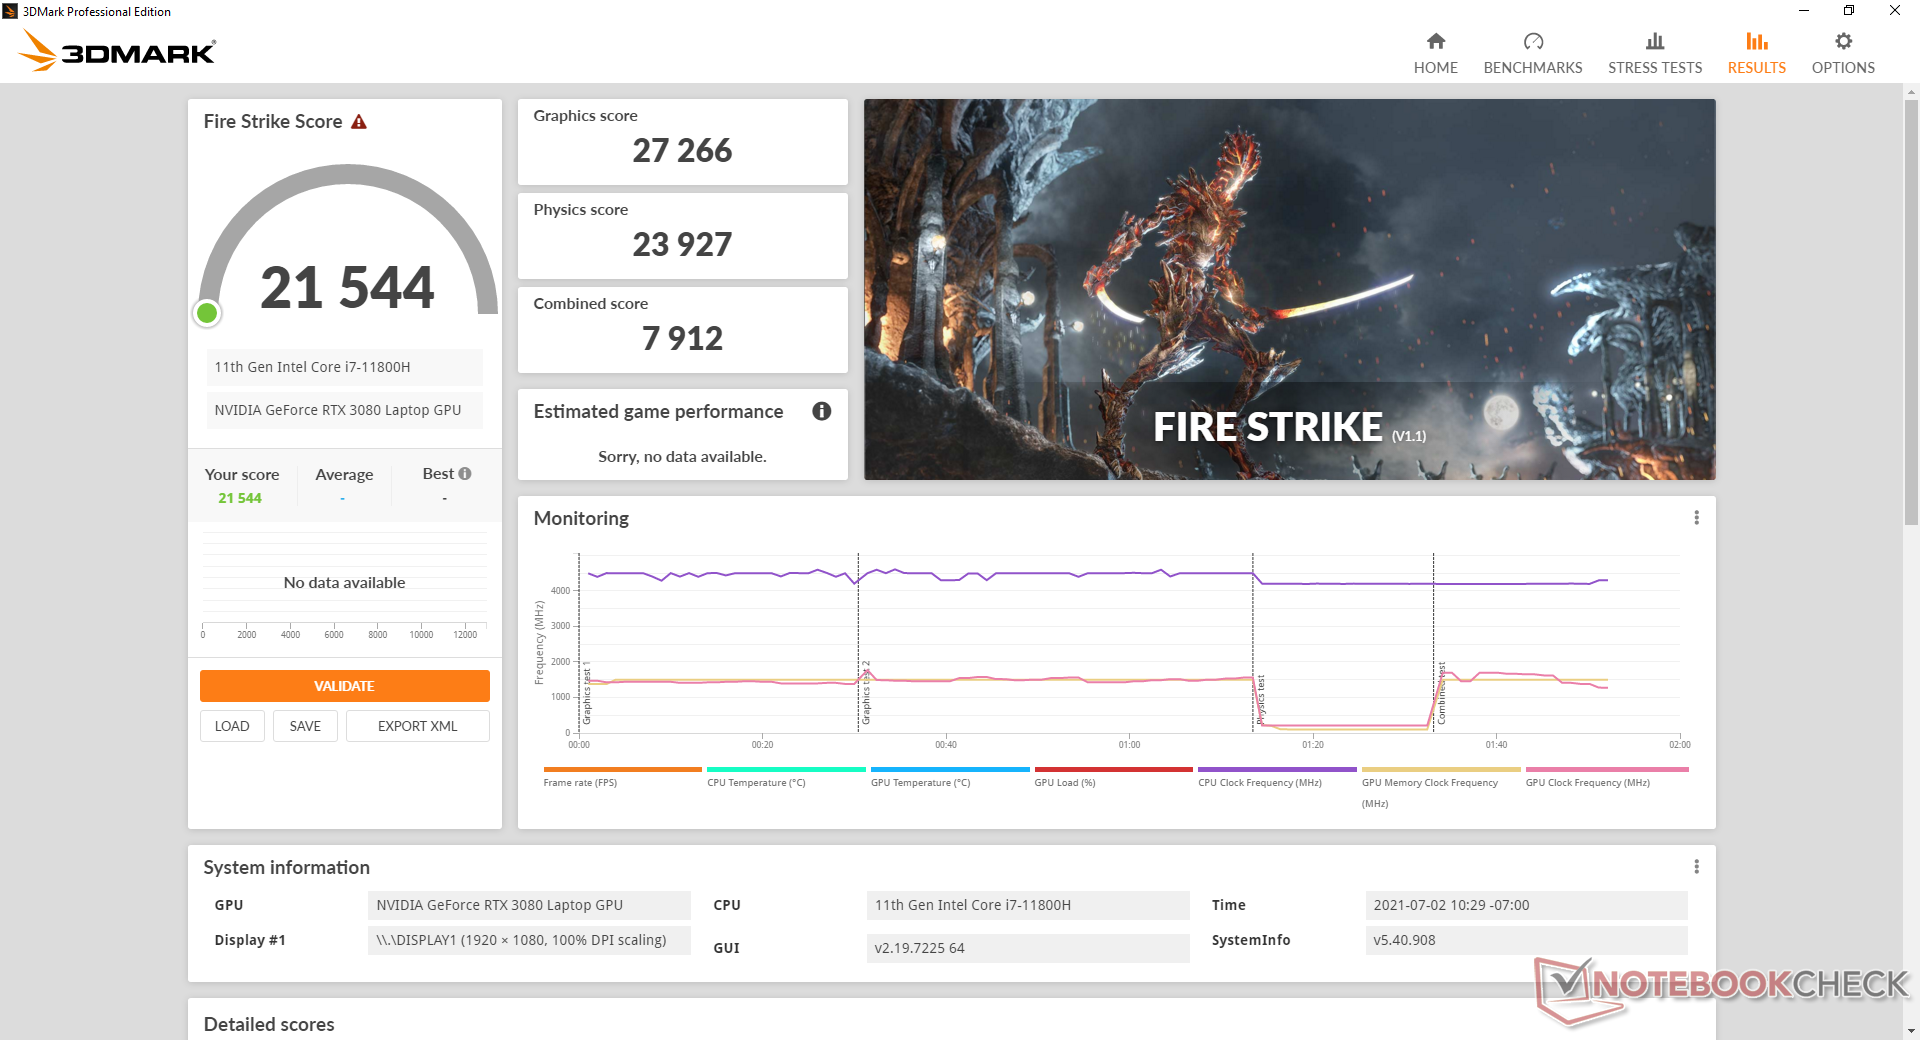
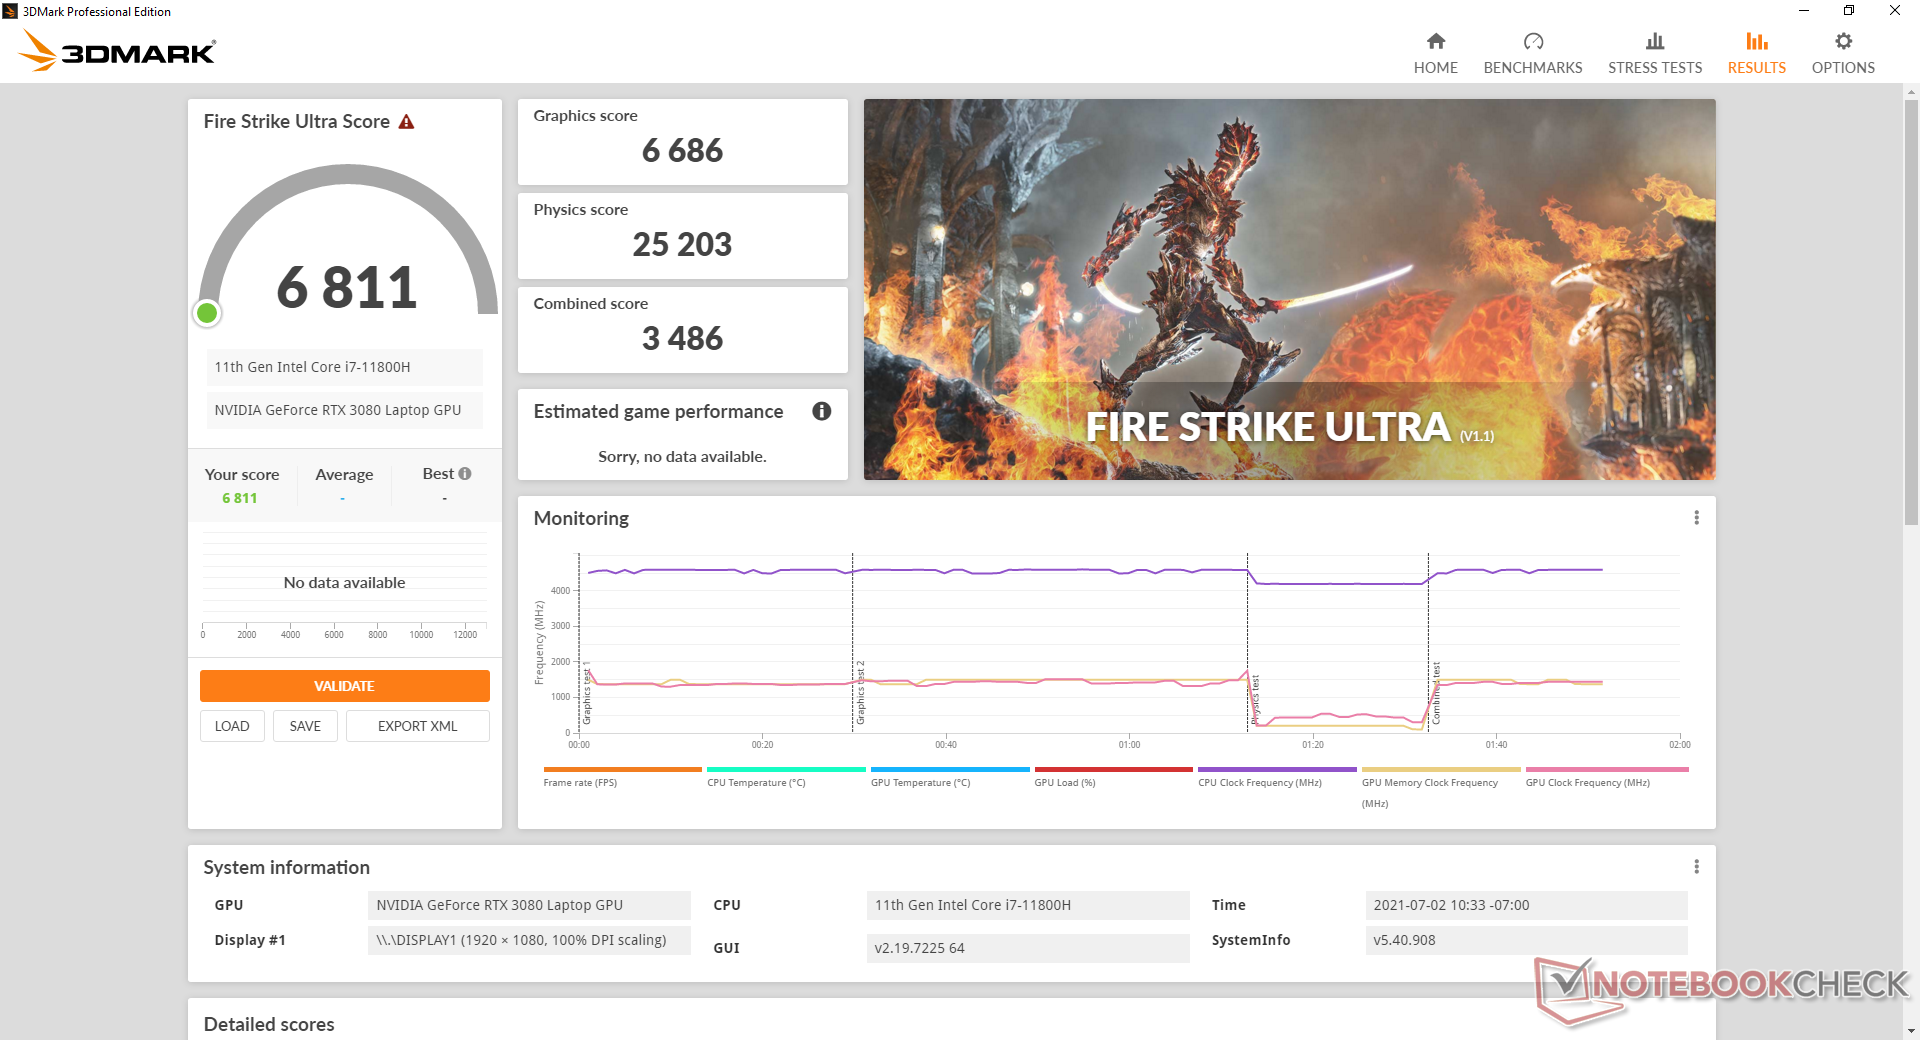
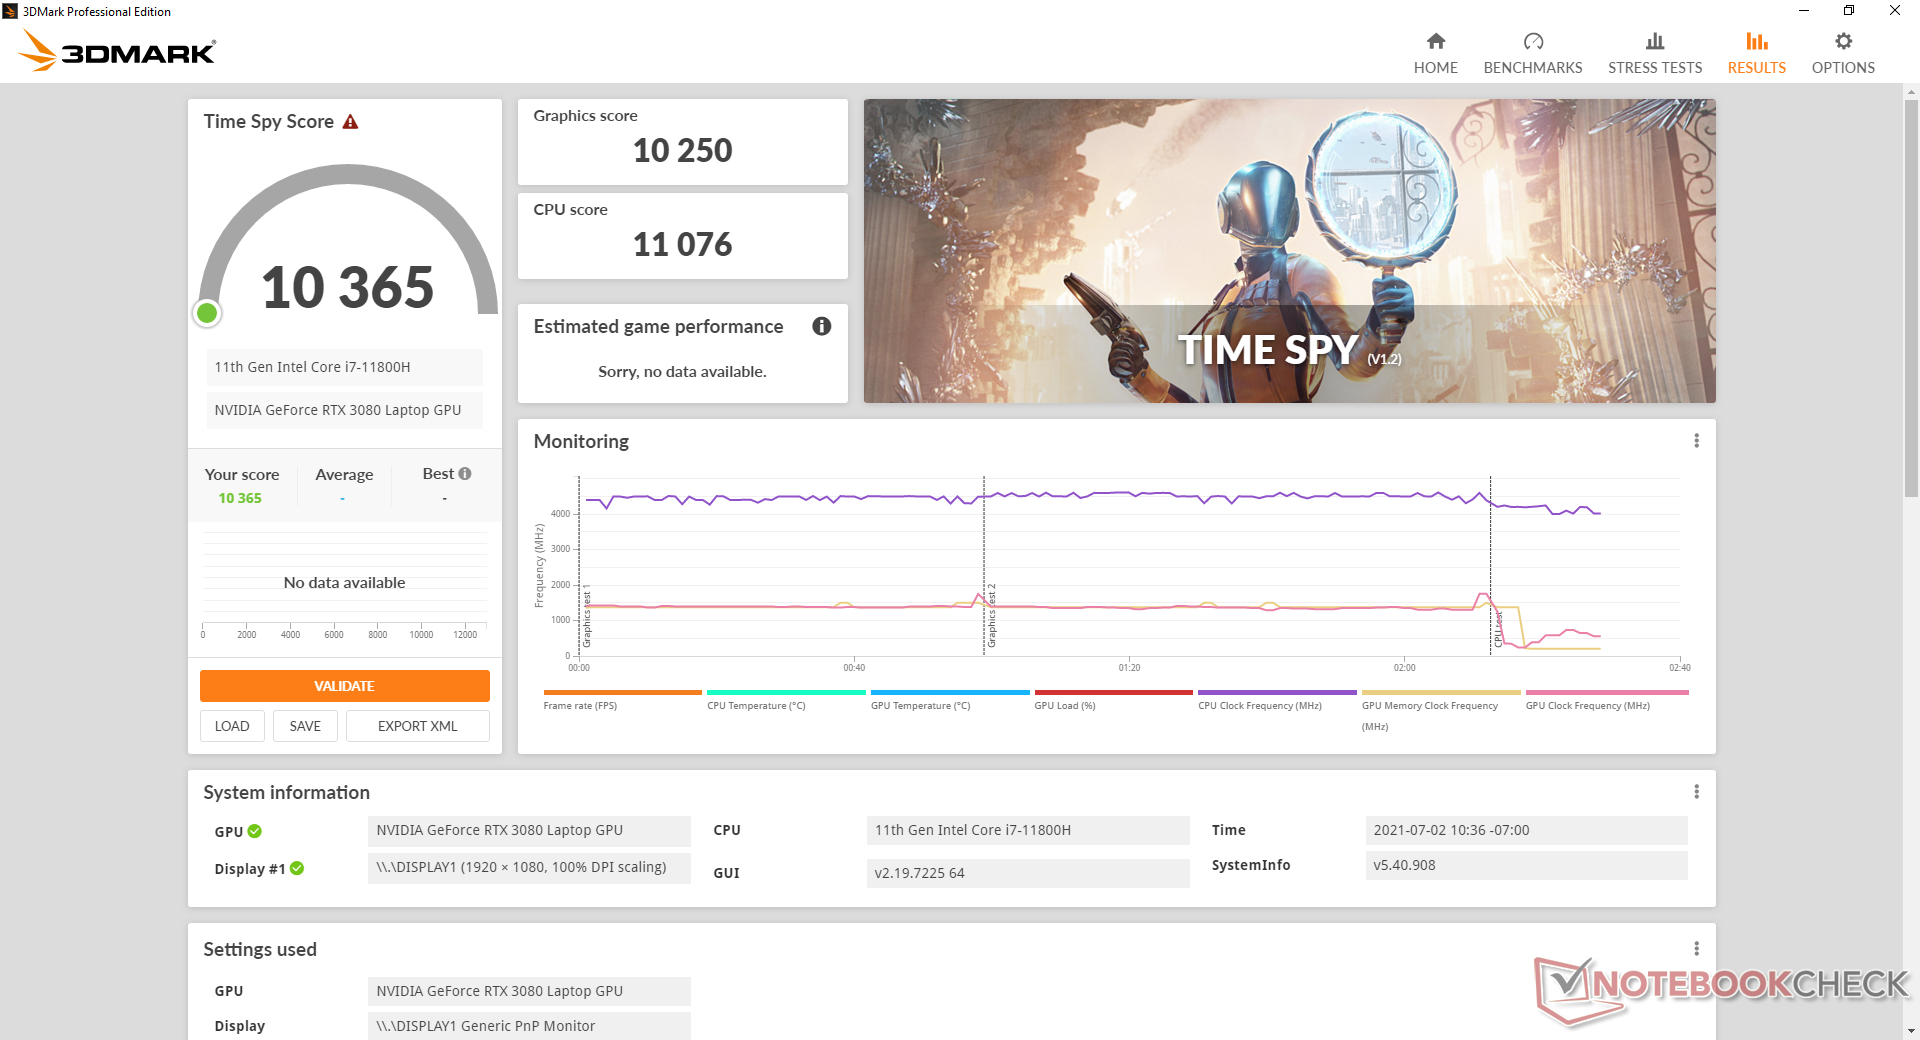
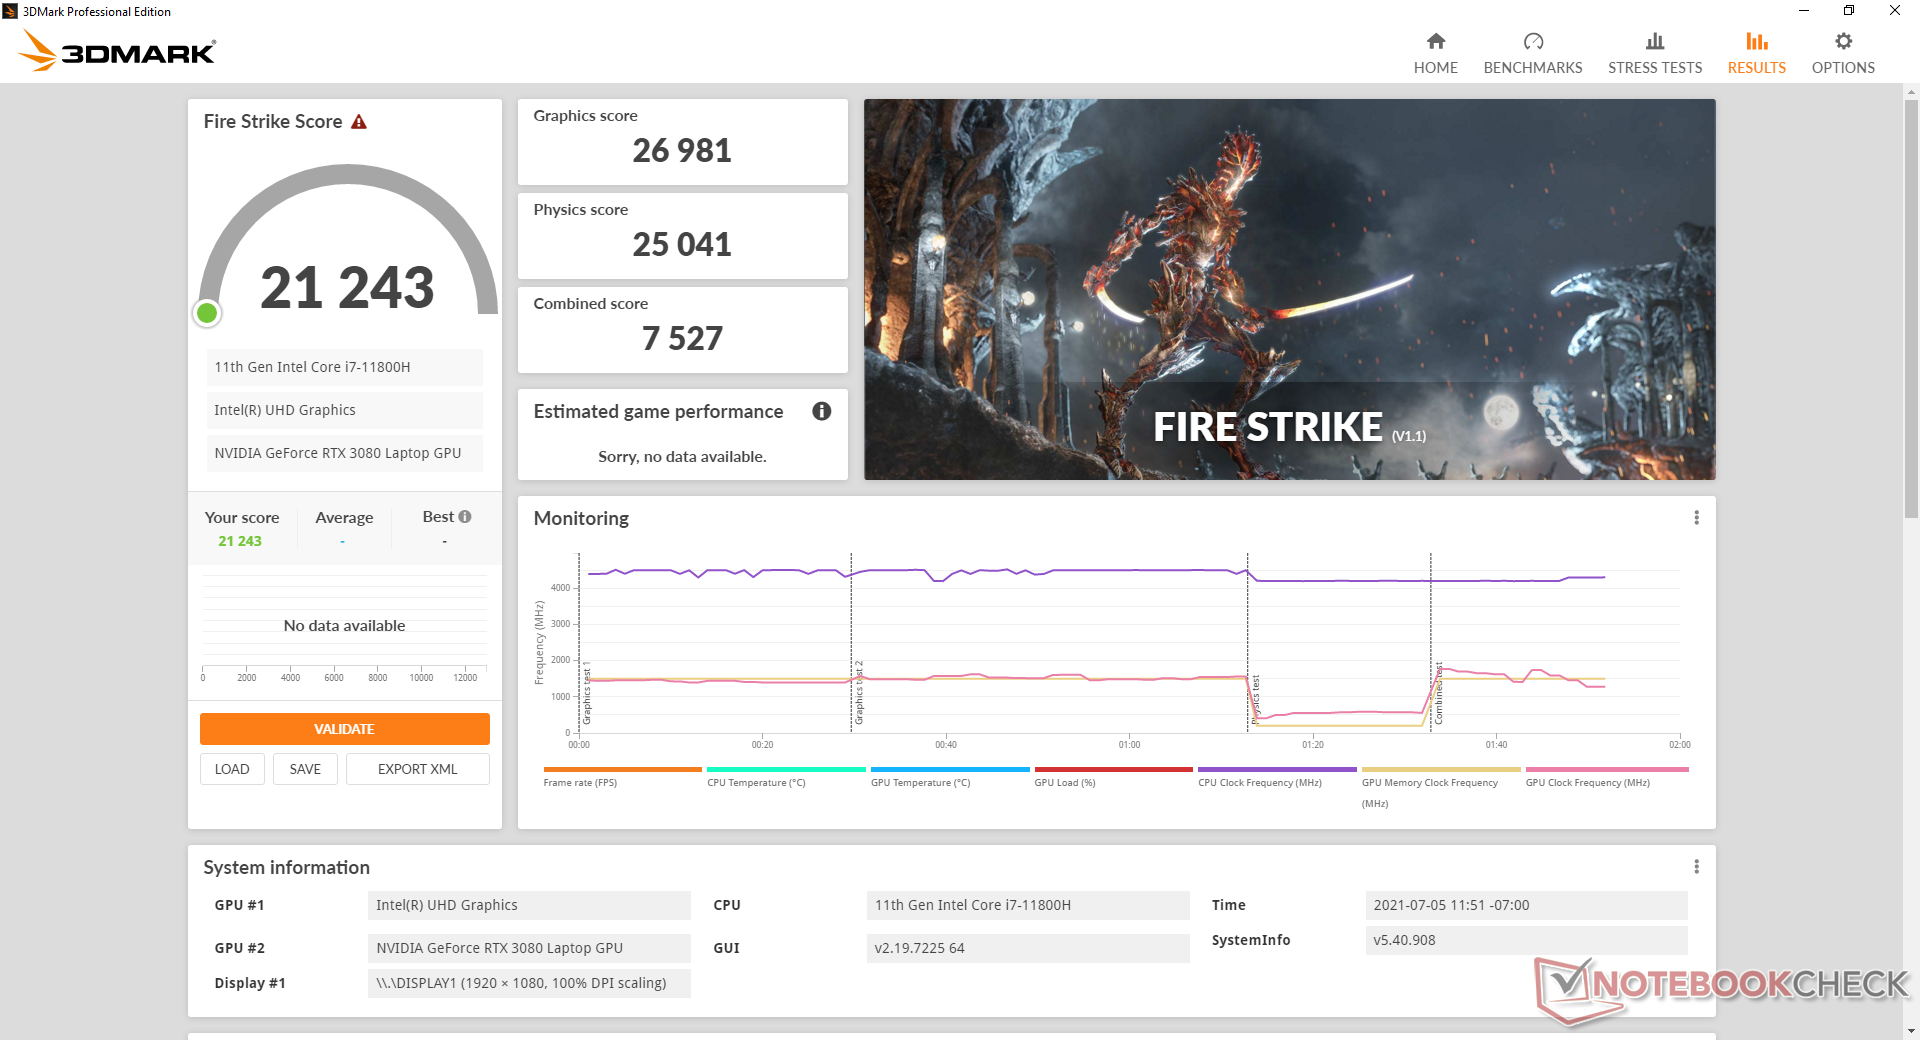
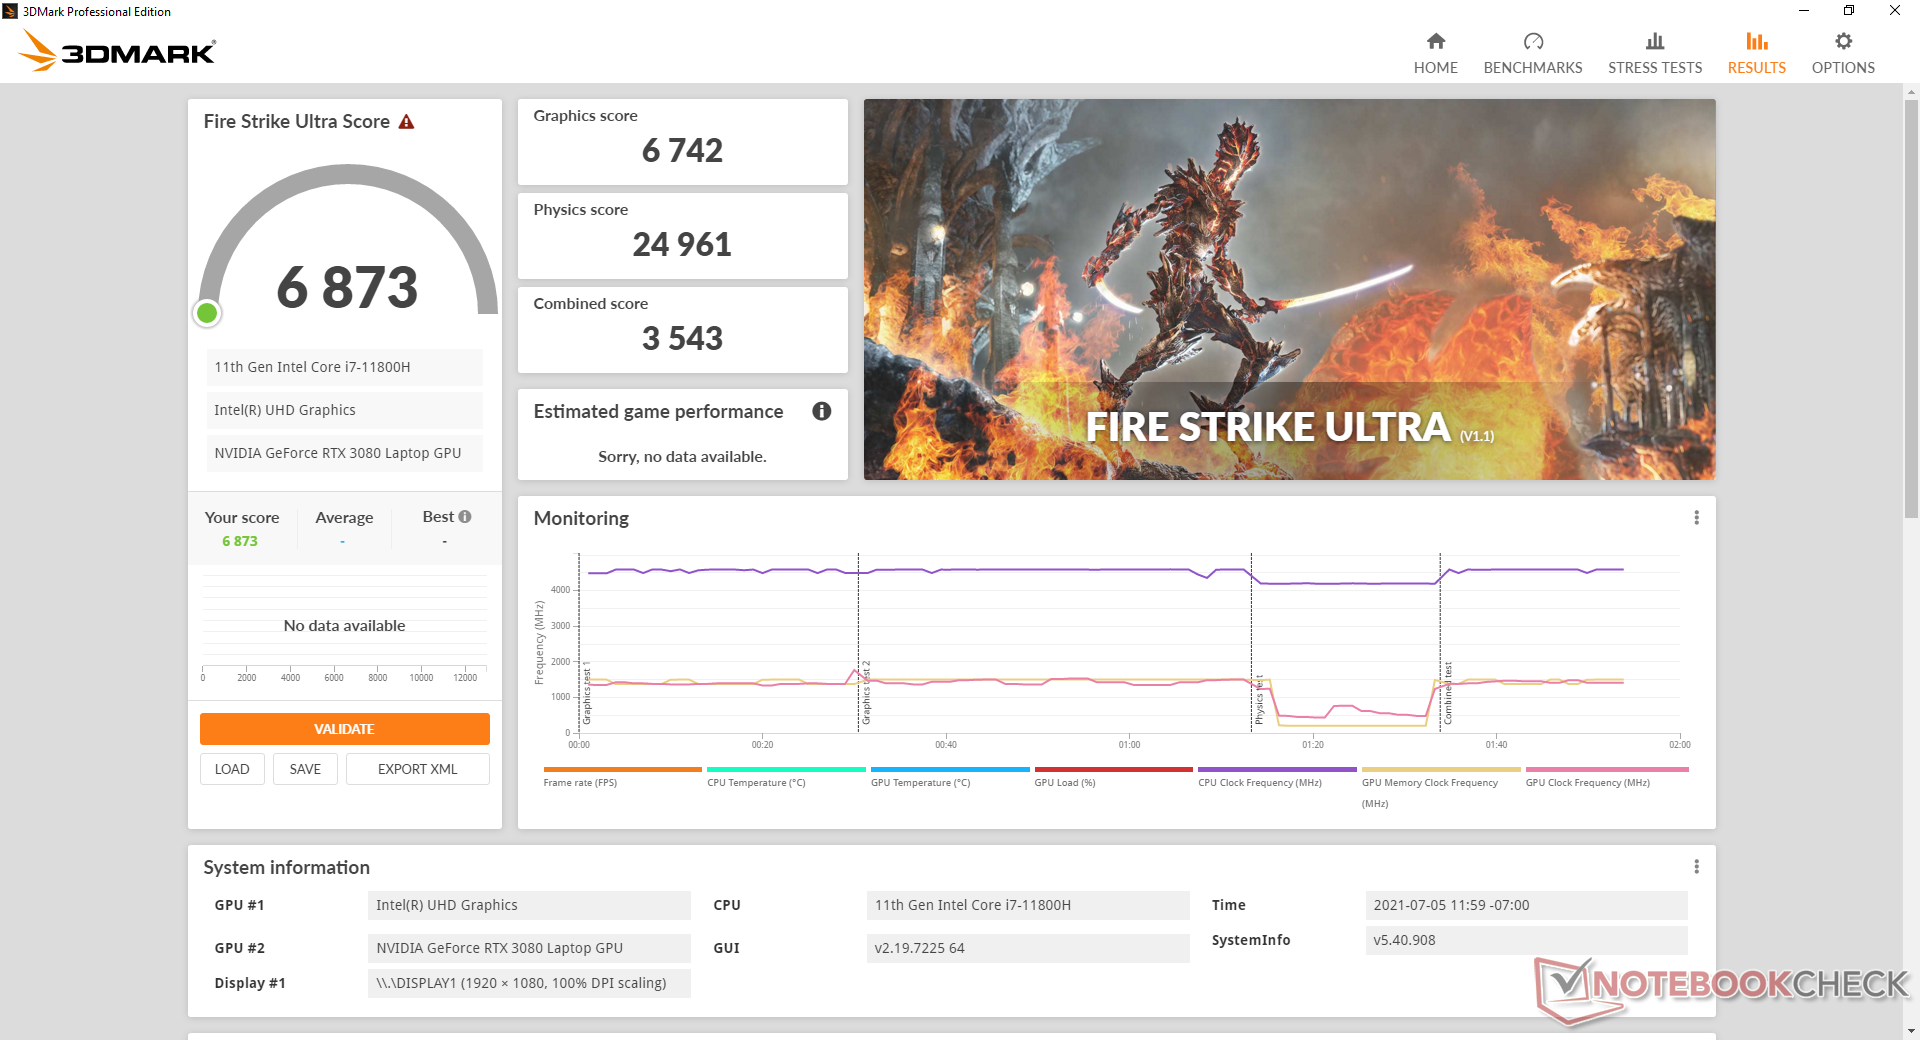
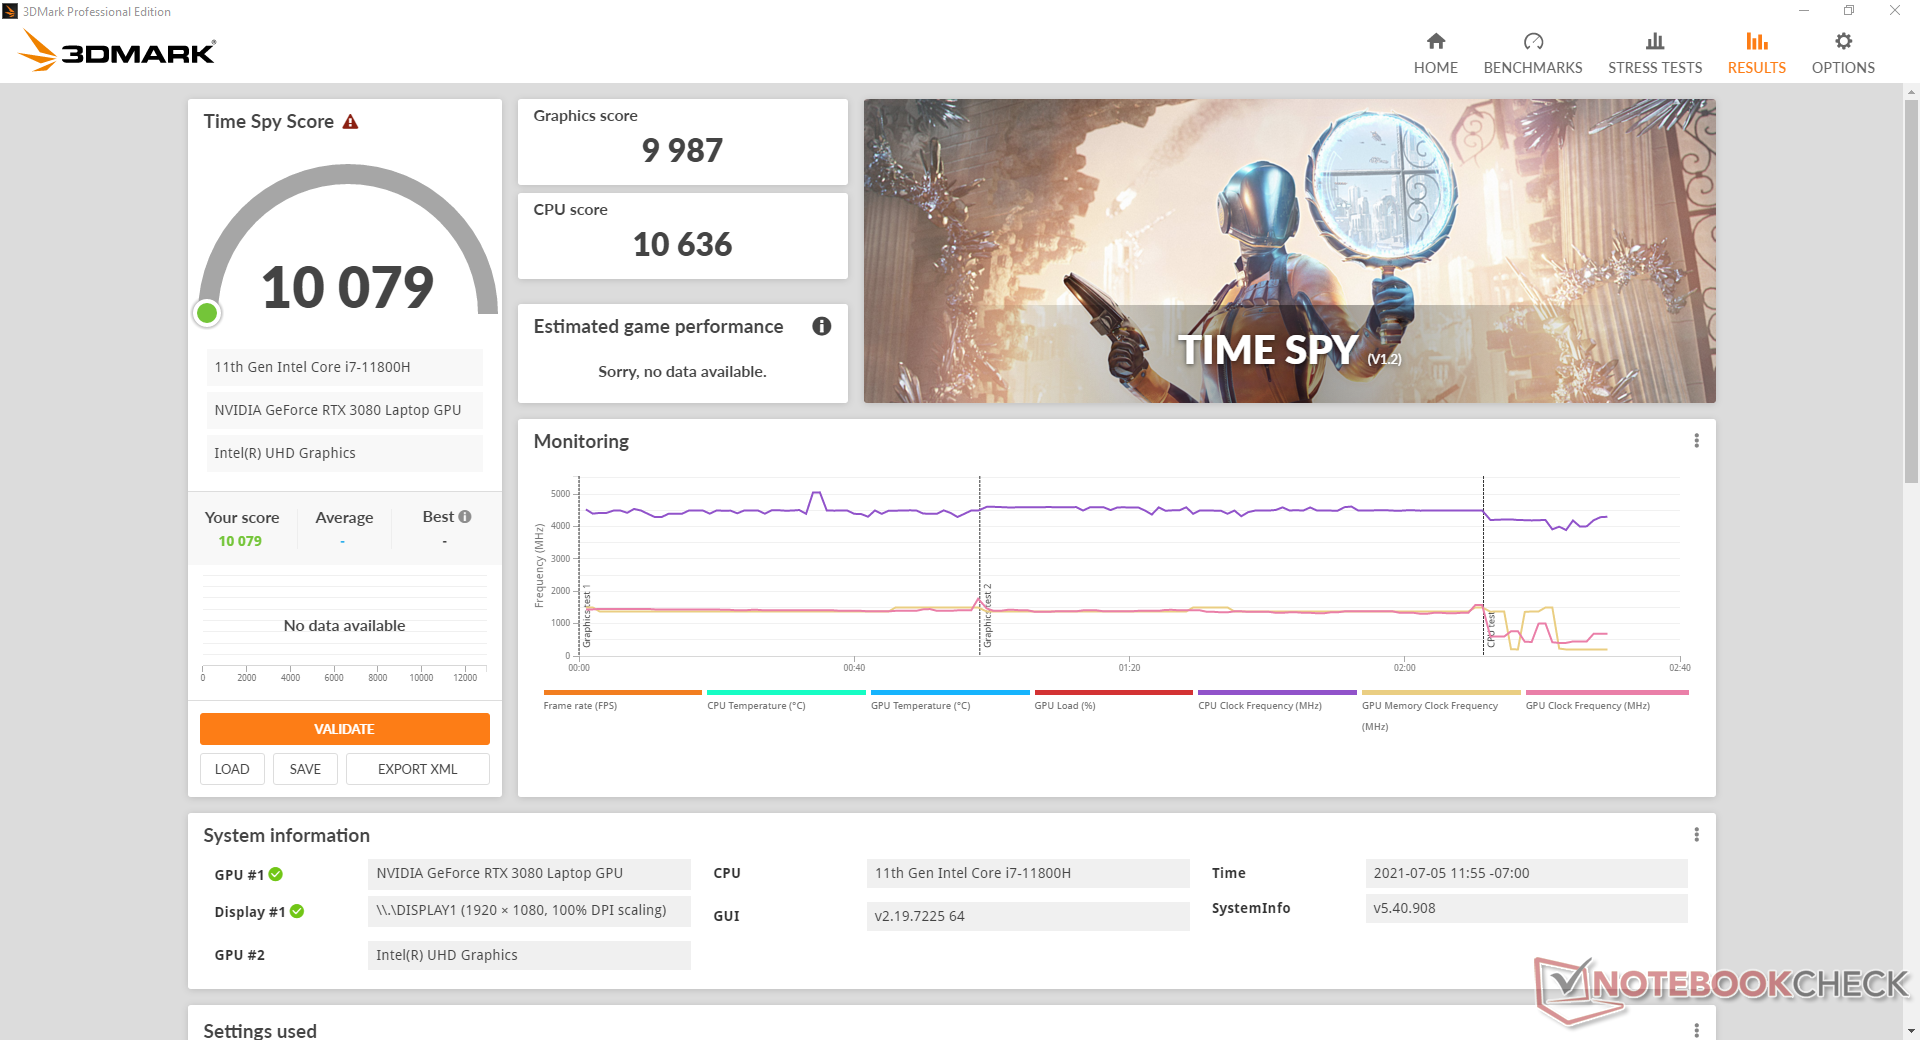
3DMark scores are 9 to 14 percent higher than on the 10th gen Intel Blade 15 with the exact same Nvidia GPU (albeit at lower TGP). Thus, users in the market for a Blade 15 may want to consider this latest 11th gen model over the 10th gen one for the minor graphics boost. Larger laptops with the same RTX 3080 like the MSI GE76 10UH can run even faster than our Razer since they are capable of higher TGP ceilings.
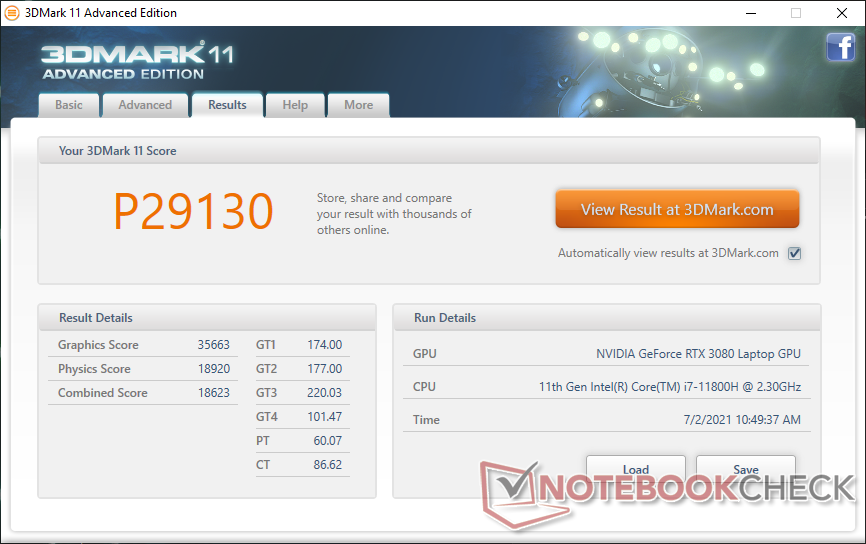
| 3DMark 11 Performance | 29130 points | |
| 3DMark Cloud Gate Standard Score | 55775 points | |
| 3DMark Fire Strike Score | 21544 points | |
| 3DMark Time Spy Score | 10365 points | |
Help | ||
Gaming Performance
Performance in real-world games is identical to the 10th gen Intel Blade 15 at worst and up to 30 percent faster at best based on our tested games. Users will see the highest benefits when running undemanding games at lower resolutions or settings where performance tends to be CPU-bound such as in DOTA 2 or X-Plane. More demanding games like Assassin´s Creed Valhalla will see just minor boosts.
See our dedicated GeForce RTX 3080 mobile page for more technical information and benchmarks.
Witcher 3 FPS Chart
| low | med. | high | ultra | |
| GTA V (2015) | 186 | 180 | 175 | 110 |
| The Witcher 3 (2015) | 465.4 | 317.3 | 197.3 | 102.8 |
| Dota 2 Reborn (2015) | 174 | 157 | 151 | 142 |
| Final Fantasy XV Benchmark (2018) | 199 | 130 | 97.1 | |
| X-Plane 11.11 (2018) | 138 | 123 | 97.3 | |
| Strange Brigade (2018) | 507 | 253 | 204 | 179 |
| Shadow of the Tomb Raider (2018) | 146 | 127 | 124 | 115 |
| Assassin´s Creed Valhalla (2020) | 134 | 93 | 79 | 68 |
Emissions
System Noise
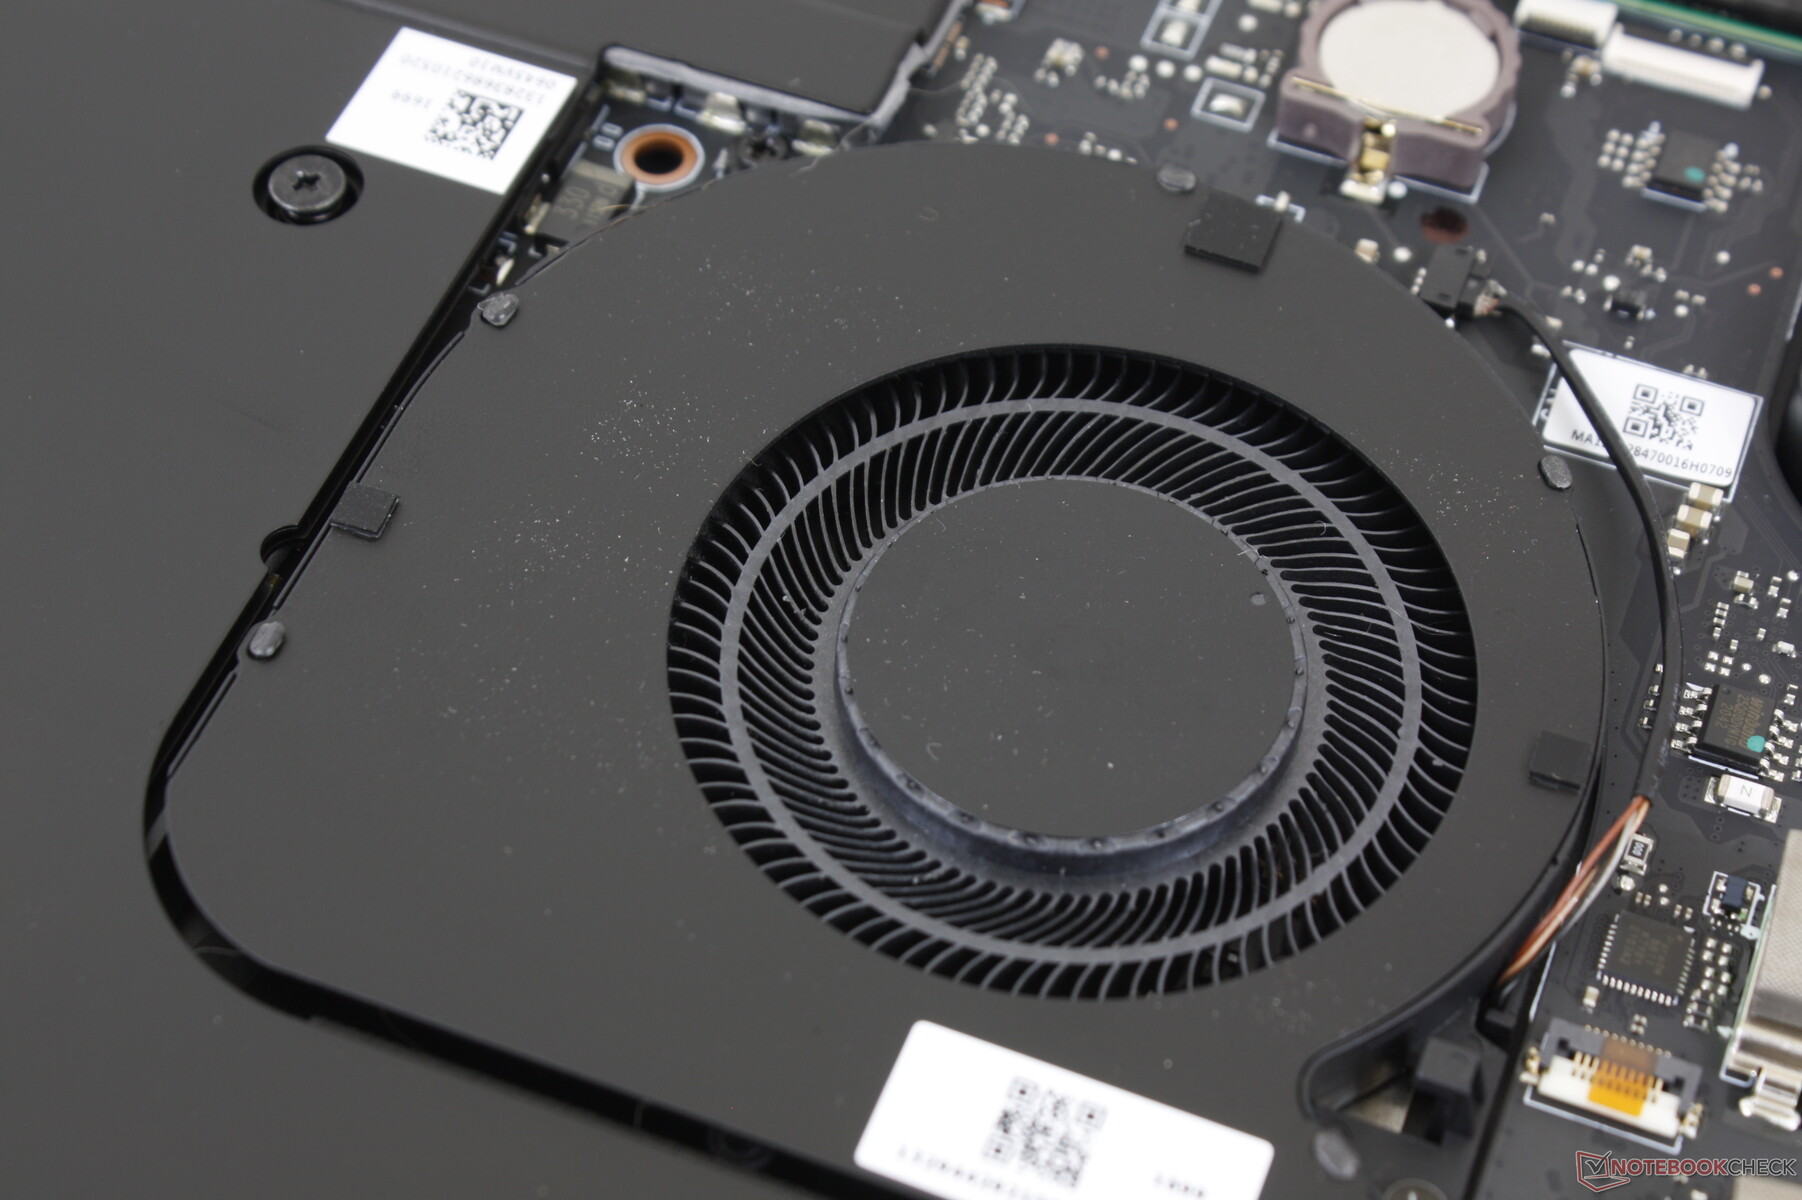
Fan noise behavior is largely the same as what we discovered on the 10th gen Intel Blade 15. Users may want to set the fans to auto mode with Optimus active or else they will pulse more frequently when web browsing or video streaming. The fans will generally idle when the system is set to its lowest performance settings, but a noise of around 29 to 31 dB(A) will be more realistic during actual usage.
Gaming loads will increase fan noise to the 46 to 52 dB(A) range which is actually slightly louder than what we recorded on the 10th gen Intel model. It's certainly a loud laptop, but it's not significantly any different from other gaming laptops in its size class.
Our unit suffers from some slight electronic noise or coil whine. We're able to pickup an audible high-pitched noise of 25.3 dB(A) against a silent background of 25.1 dB(A) simply by idling on desktop.
| Razer Blade 15 Advanced (Mid 2021) GeForce RTX 3080 Laptop GPU, i7-11800H, SSSTC CA6-8D1024 | Razer Blade 15 Advanced Model Early 2021 GeForce RTX 3080 Laptop GPU, i7-10875H, Samsung PM981a MZVLB1T0HBLR | Razer Blade 15 RTX 2080 Super Max-Q GeForce RTX 2080 Super Max-Q, i7-10875H, Samsung PM981a MZVLB1T0HBLR | Asus TUF Gaming F15 FX506HM GeForce RTX 3060 Laptop GPU, i7-11800H, SK Hynix HFM001TD3JX013N | Alienware m15 R5 Ryzen Edition GeForce RTX 3060 Laptop GPU, R7 5800H, Toshiba KBG40ZNS512G NVMe | Aorus 15P YD GeForce RTX 3080 Laptop GPU, i7-11800H, Samsung PM9A1 MZVL21T0HCLR | |
|---|---|---|---|---|---|---|
| Noise | -8% | -12% | 7% | -5% | -11% | |
| off / environment * | 25.1 | 24 4% | 30.1 -20% | 24.8 1% | 24 4% | 25 -0% |
| Idle Minimum * | 25.3 | 26 -3% | 30.1 -19% | 24.6 3% | 24 5% | 26 -3% |
| Idle Average * | 25.3 | 28 -11% | 30.1 -19% | 24.9 2% | 25 1% | 30 -19% |
| Idle Maximum * | 25.3 | 40 -58% | 30.1 -19% | 24.9 2% | 35 -38% | 34 -34% |
| Load Average * | 42 | 45 -7% | 46.8 -11% | 27.1 35% | 44 -5% | 43 -2% |
| Witcher 3 ultra * | 45.6 | 43 6% | 48.4 -6% | 46.4 -2% | 48 -5% | 50 -10% |
| Load Maximum * | 51.6 | 45 13% | 46 11% | 49 5% | 50 3% | 57 -10% |
* ... smaller is better
Noise Level
| Idle |
| 25.3 / 25.3 / 25.3 dB(A) |
| Load |
| 42 / 51.6 dB(A) |
 | ||
30 dB silent 40 dB(A) audible 50 dB(A) loud |
||
min: | ||
Temperature
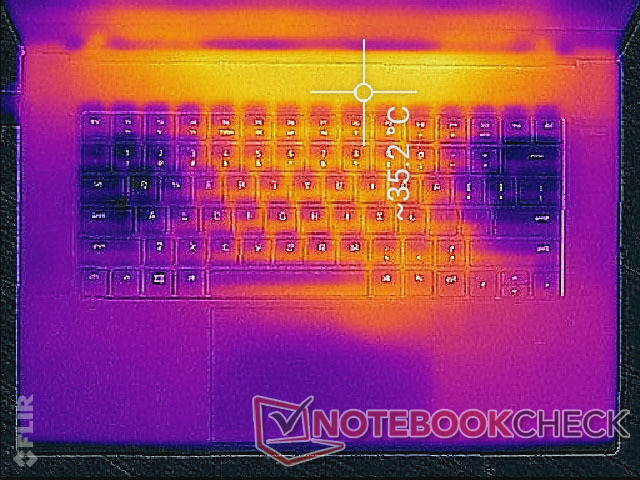
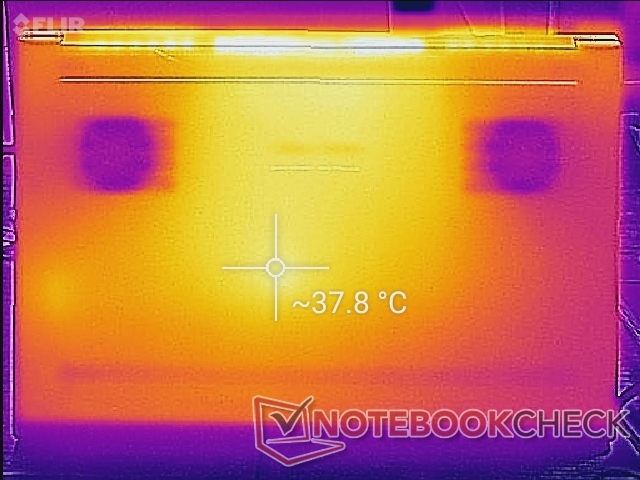
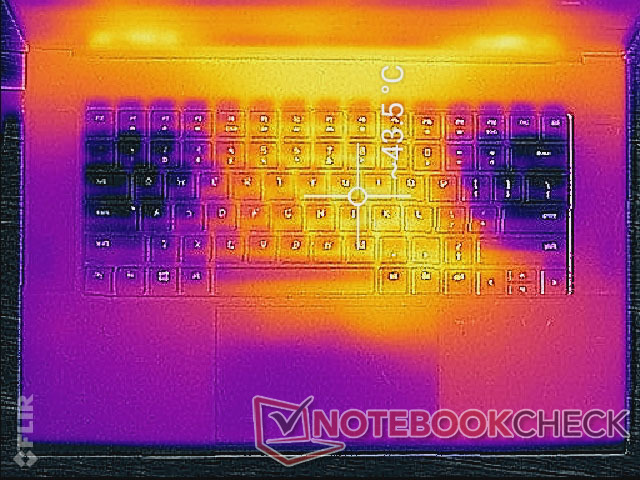
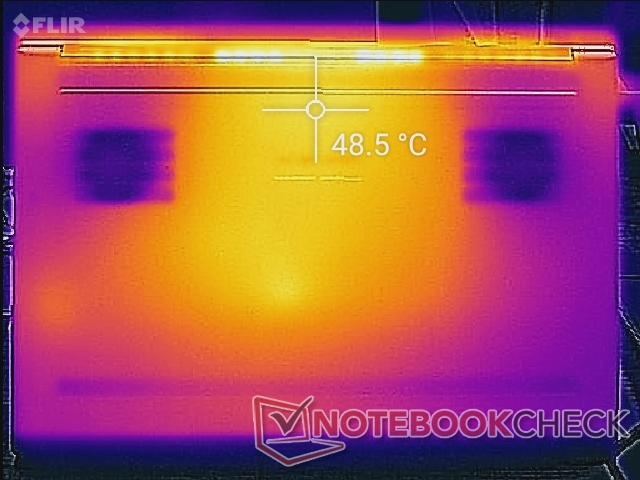
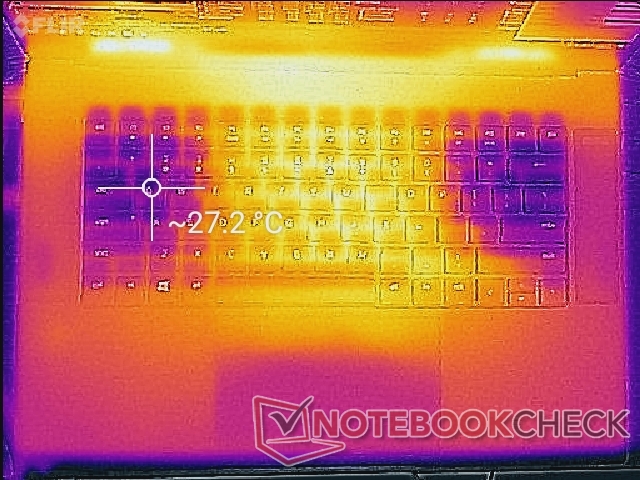
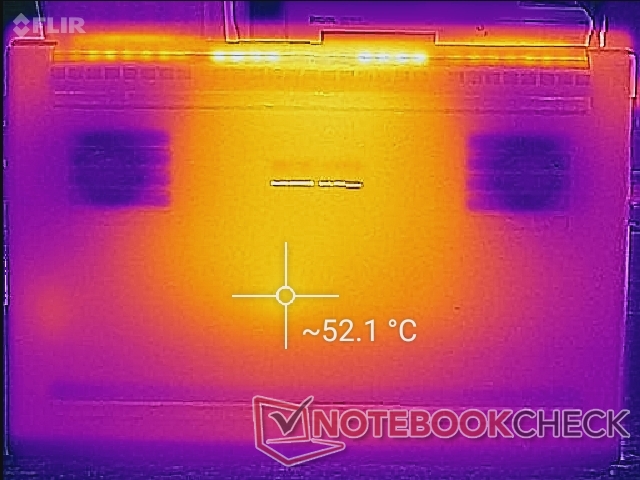
Surface hot spots can be as warm as 52 C when gaming which is not much cooler or warmer than what we recorded on the 10th gen Intel Blade 15 model. The palm rests can get much warmer than on most other laptops at almost 40 C while the WASD keys remain cooler since the fans are drawing cool air through the keys.
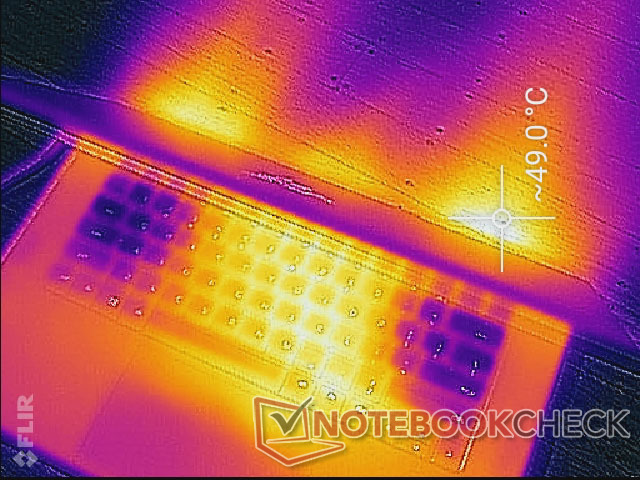
(-) The maximum temperature on the upper side is 51 °C / 124 F, compared to the average of 40.4 °C / 105 F, ranging from 21.2 to 68.8 °C for the class Gaming.
(-) The bottom heats up to a maximum of 52 °C / 126 F, compared to the average of 43.2 °C / 110 F
(+) In idle usage, the average temperature for the upper side is 30.7 °C / 87 F, compared to the device average of 33.8 °C / 93 F.
(±) Playing The Witcher 3, the average temperature for the upper side is 36.2 °C / 97 F, compared to the device average of 33.8 °C / 93 F.
(±) The palmrests and touchpad can get very hot to the touch with a maximum of 38.6 °C / 101.5 F.
(-) The average temperature of the palmrest area of similar devices was 28.9 °C / 84 F (-9.7 °C / -17.5 F).
Stress Test
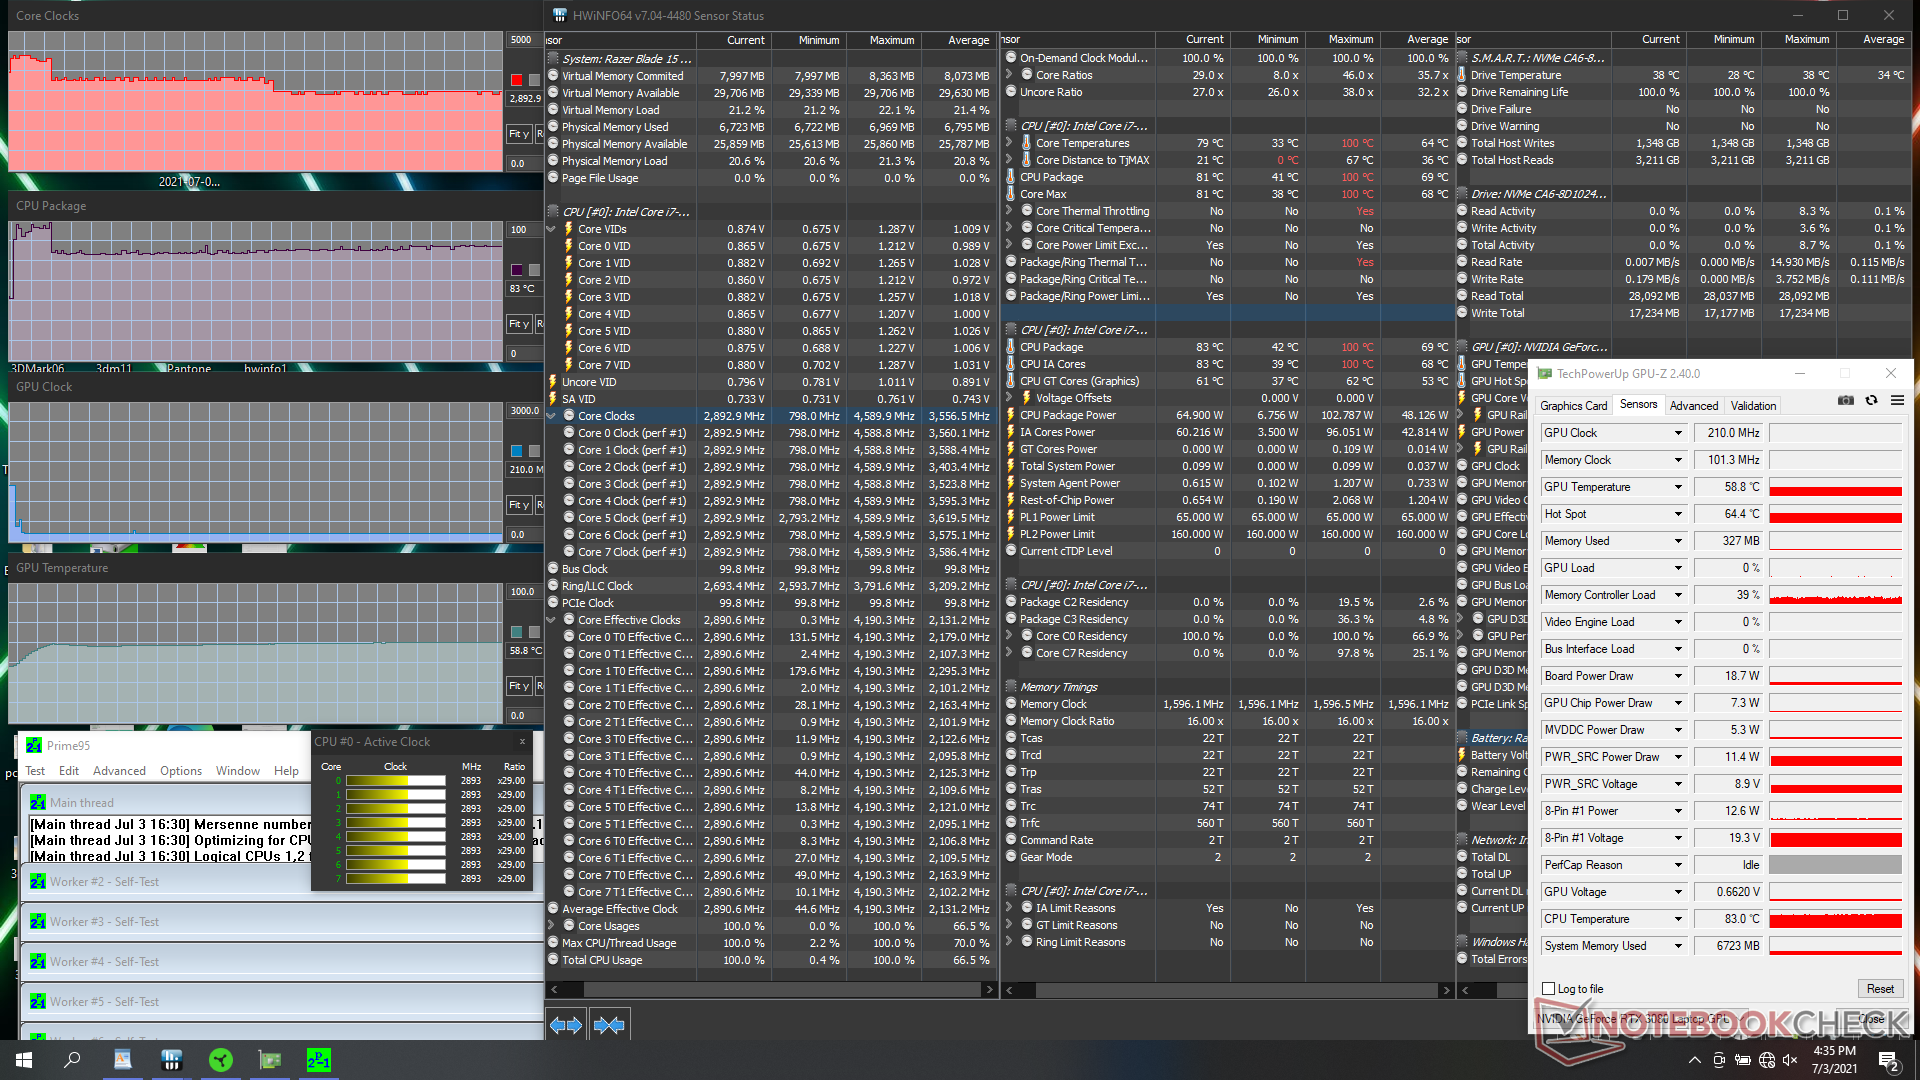
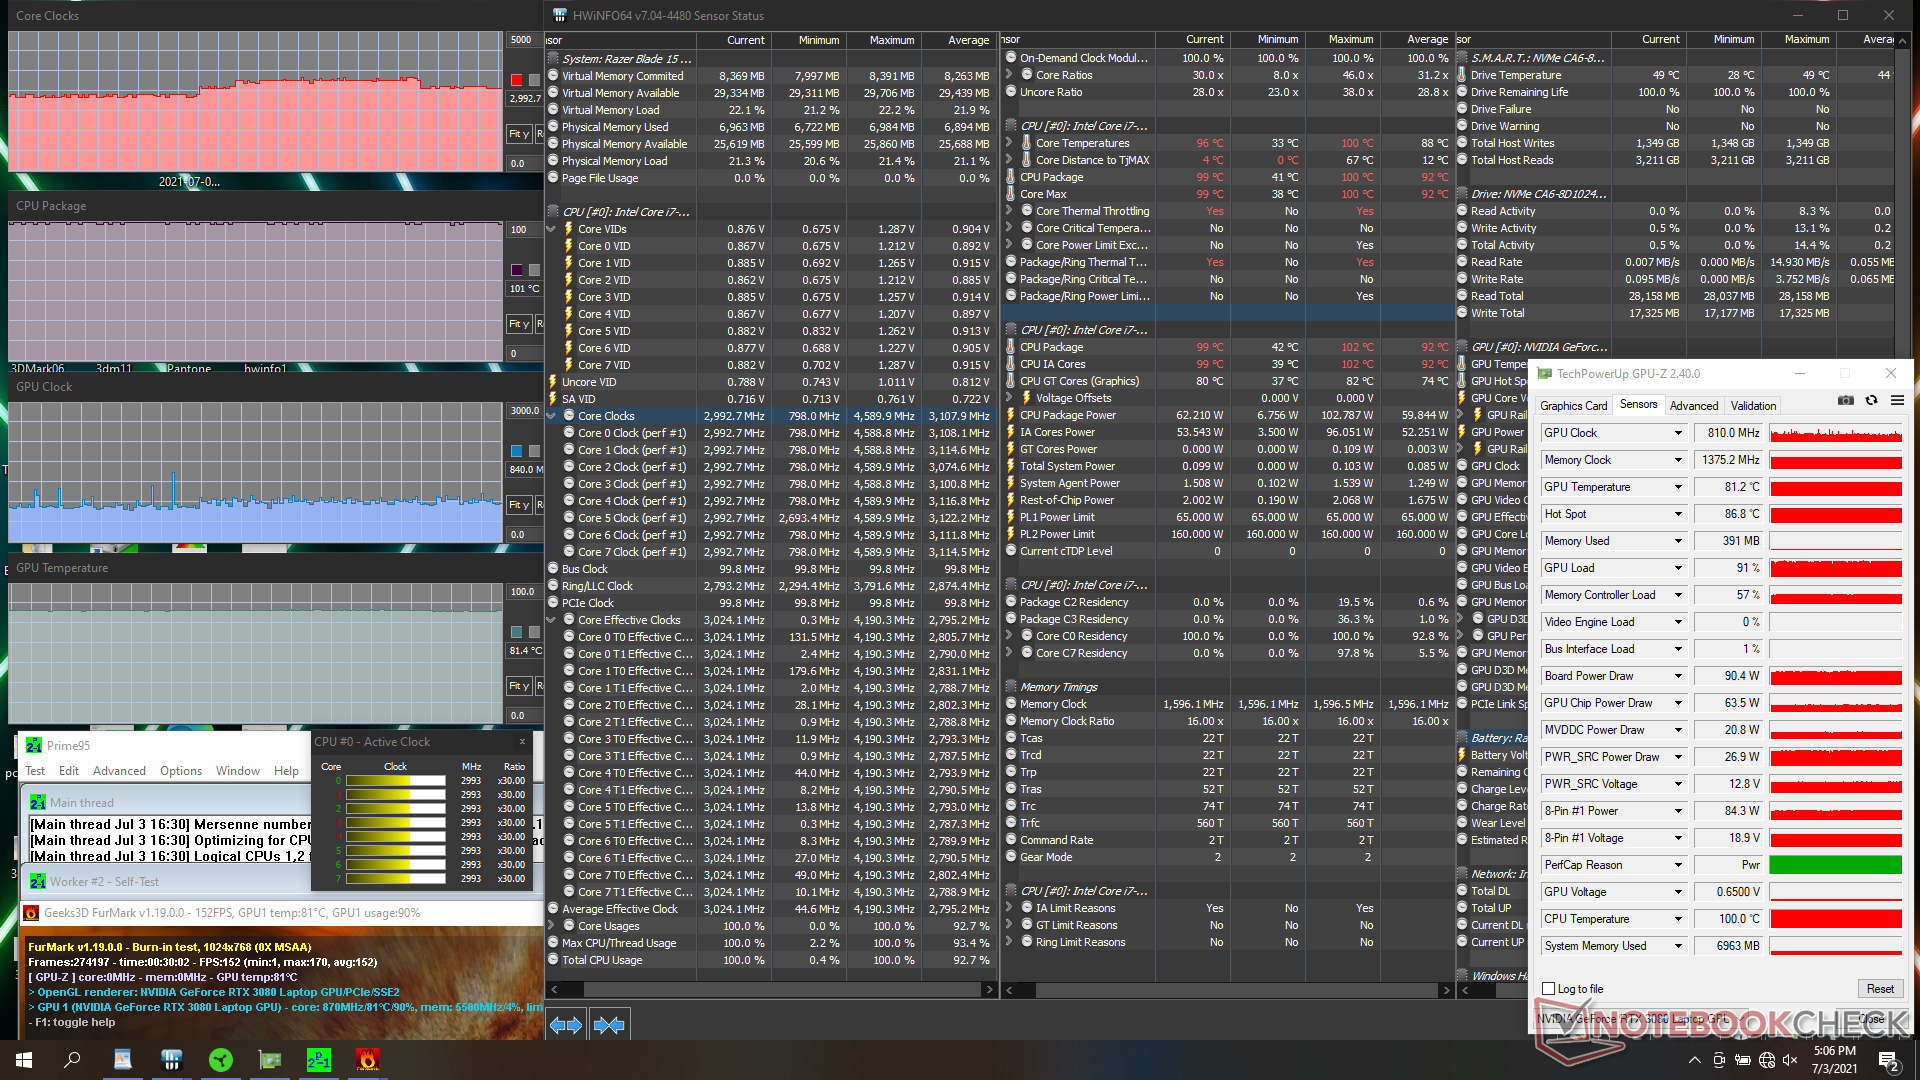
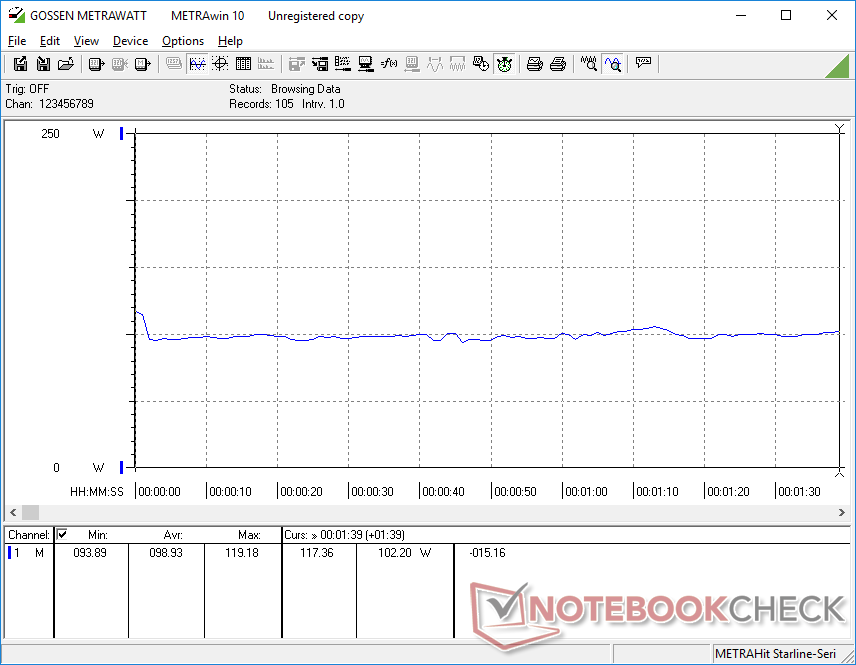
When stressed with Prime95, the CPU would boost to 4.2 GHz for just the first few seconds until core temperature reaches 100 C. Thereafter, clock rates would drop to the 3.3 to 3.4 GHz range in order to maintain cooler temperatures. After several more minutes, clock rates would eventually stabilize in the 2.8 to 2.9 GHz range for a flat core temperature of 83 C.
Running Witcher 3 shows the CPU and GPU stabilizing at 83 C and 80 C, respectively, compared to 73 C and 71 C on the 10th gen Blade 15. Core temperatures are notably warmer as a result, but they fortunately come with faster overall performance as exemplified by the benchmarks above. The higher PL2 and TGP ceilings are likely responsible for these higher core temperatures. GPU-Z reports a GPU board power draw of about 97 W when running the game to be just slightly lower than the target 105 W TGP.
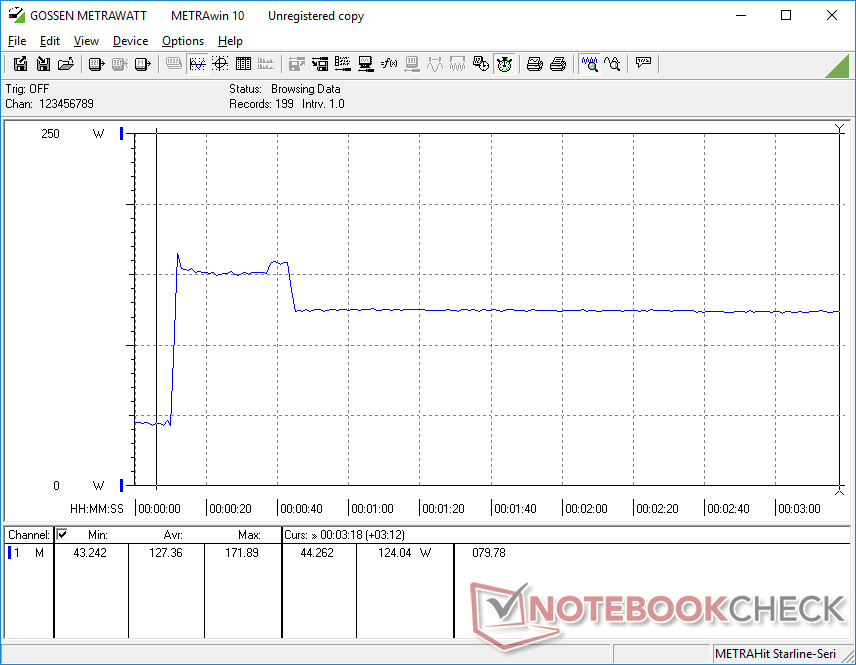
Running on battery power will limit performance. A Fire Strike run on batteries would return Physics and Graphics scores of 11073 and 18527 points, respectively, compared to 23927 and 27266 points when on mains.
| CPU Clock (GHz) | GPU Clock (MHz) | Average CPU Temperature (°C) | Average GPU Temperature (°C) | |
| System Idle | -- | -- | 43 | 38 |
| Prime95 Stress | 2.9 | -- | 83 | 59 |
| Prime95 + FurMark Stress | 2.7 - 3.3 | 680 - 1100 | 100 | 81 |
| Witcher 3 Stress | 3.3 - 4.3 | 1470 | 83 | 80 |
Speakers
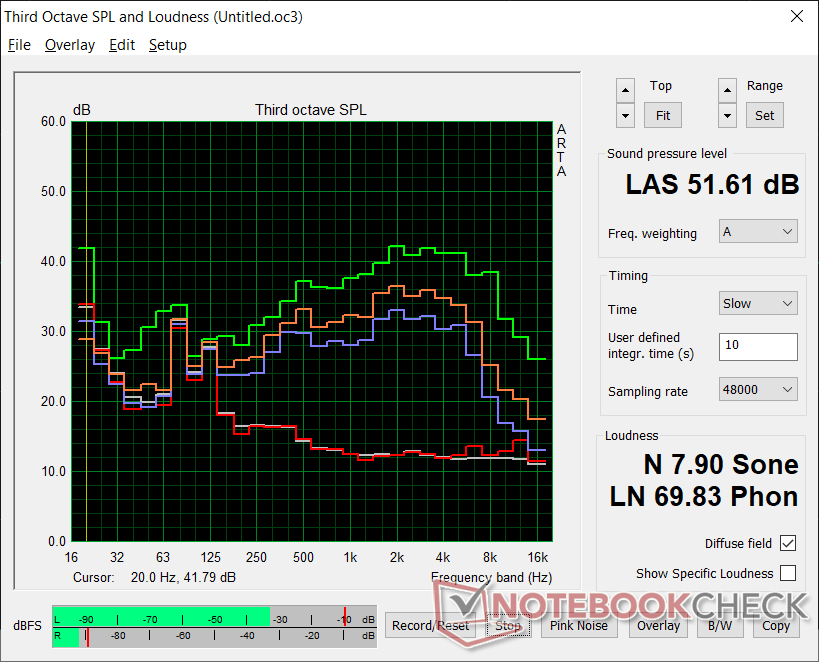
Razer Blade 15 Advanced (Mid 2021) audio analysis
(+) | speakers can play relatively loud (84.6 dB)
Bass 100 - 315 Hz
(-) | nearly no bass - on average 20.1% lower than median
(±) | linearity of bass is average (12.8% delta to prev. frequency)
Mids 400 - 2000 Hz
(+) | balanced mids - only 3.6% away from median
(+) | mids are linear (4.1% delta to prev. frequency)
Highs 2 - 16 kHz
(+) | balanced highs - only 4.9% away from median
(±) | linearity of highs is average (8.3% delta to prev. frequency)
Overall 100 - 16.000 Hz
(±) | linearity of overall sound is average (15.8% difference to median)
Compared to same class
» 34% of all tested devices in this class were better, 7% similar, 59% worse
» The best had a delta of 6%, average was 18%, worst was 132%
Compared to all devices tested
» 20% of all tested devices were better, 5% similar, 76% worse
» The best had a delta of 4%, average was 25%, worst was 134%
Apple MacBook 12 (Early 2016) 1.1 GHz audio analysis
(+) | speakers can play relatively loud (83.6 dB)
Bass 100 - 315 Hz
(±) | reduced bass - on average 11.3% lower than median
(±) | linearity of bass is average (14.2% delta to prev. frequency)
Mids 400 - 2000 Hz
(+) | balanced mids - only 2.4% away from median
(+) | mids are linear (5.5% delta to prev. frequency)
Highs 2 - 16 kHz
(+) | balanced highs - only 2% away from median
(+) | highs are linear (4.5% delta to prev. frequency)
Overall 100 - 16.000 Hz
(+) | overall sound is linear (10.2% difference to median)
Compared to same class
» 5% of all tested devices in this class were better, 2% similar, 93% worse
» The best had a delta of 5%, average was 19%, worst was 53%
Compared to all devices tested
» 3% of all tested devices were better, 1% similar, 96% worse
» The best had a delta of 4%, average was 25%, worst was 134%
Energy Management
Power Consumption
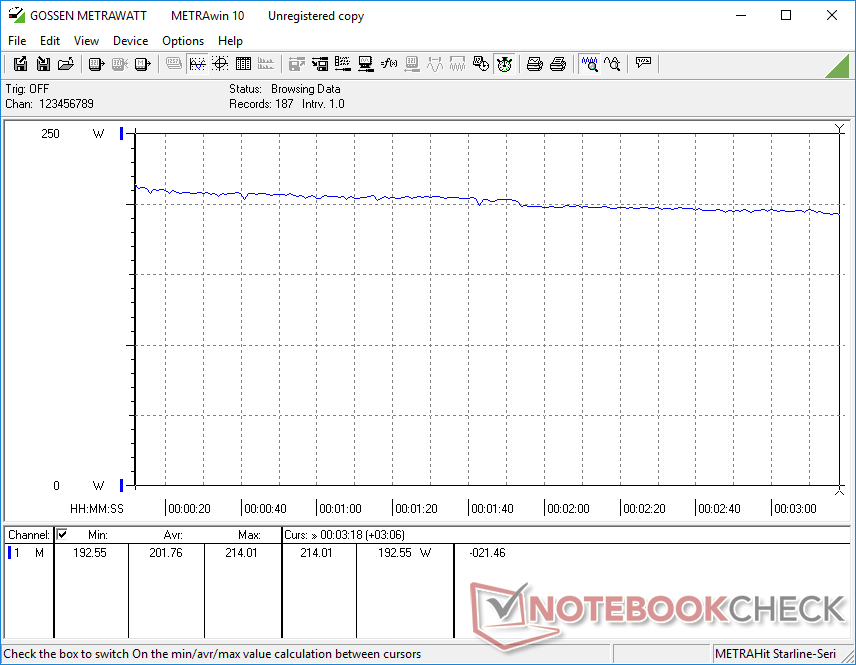
The new 11th gen Intel model is more power-hungry across the board than the earlier 10th gen Intel mode which may explain the shorter battery runtimes we recorded in the next section below. Simply idling on desktop at the lowest brightness setting on Power Saver mode with the integrated GPU active would still draw almost 20 W. Idling on desktop with the discrete GPU active and on High Performance mode would double this demand.
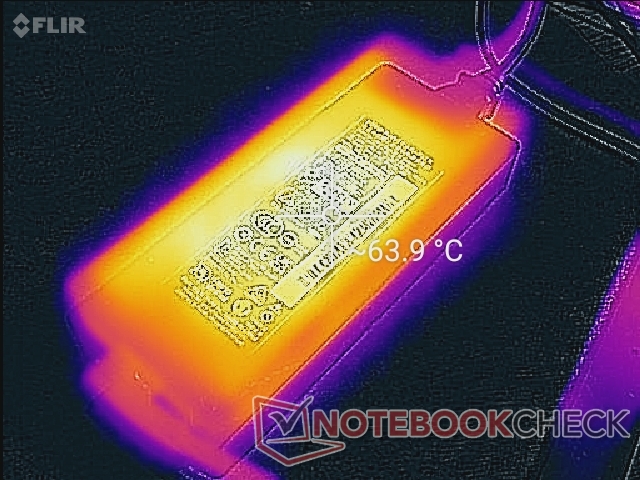
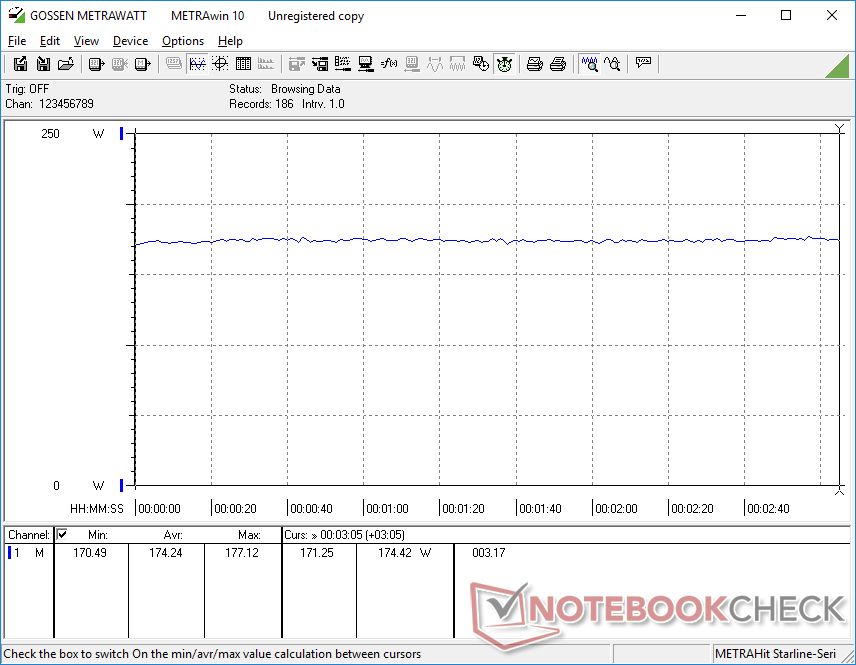
Running Witcher 3 draws an average of 174 W which is high but still lower than on the Aorus 15P with the same CPU and GPU. We're able to record a maximum draw of 214 W from the medium-sized (~17 x 7 x 2.5 cm) 230 W AC adapter.
| Off / Standby | |
| Idle | |
| Load |
|
| Razer Blade 15 Advanced (Mid 2021) i7-11800H, GeForce RTX 3080 Laptop GPU, SSSTC CA6-8D1024, IPS, 1920x1080, 15.60 | Razer Blade 15 Advanced Model Early 2021 i7-10875H, GeForce RTX 3080 Laptop GPU, Samsung PM981a MZVLB1T0HBLR, IPS, 1920x1080, 15.60 | Razer Blade 15 RTX 2080 Super Max-Q i7-10875H, GeForce RTX 2080 Super Max-Q, Samsung PM981a MZVLB1T0HBLR, IPS, 1920x1080, 15.60 | Asus TUF Gaming F15 FX506HM i7-11800H, GeForce RTX 3060 Laptop GPU, SK Hynix HFM001TD3JX013N, IPS, 1920x1080, 15.60 | Alienware m15 R5 Ryzen Edition R7 5800H, GeForce RTX 3060 Laptop GPU, Toshiba KBG40ZNS512G NVMe, IPS, 1920x1080, 15.60 | Aorus 15P YD i7-11800H, GeForce RTX 3080 Laptop GPU, Samsung PM9A1 MZVL21T0HCLR, IPS, 1920x1080, 15.60 | |
|---|---|---|---|---|---|---|
| Power Consumption | 28% | 26% | 29% | 15% | -9% | |
| Idle Minimum * | 19.5 | 13 33% | 10.6 46% | 9.5 51% | 11 44% | 23 -18% |
| Idle Average * | 23.3 | 15 36% | 13.1 44% | 12.1 48% | 14 40% | 25 -7% |
| Idle Maximum * | 40.1 | 22 45% | 15.8 61% | 22.5 44% | 25 38% | 35 13% |
| Load Average * | 98.9 | 98 1% | 131 -32% | 99.5 -1% | 123 -24% | 101 -2% |
| Witcher 3 ultra * | 174 | 126 28% | 146 16% | 157 10% | 176 -1% | 190 -9% |
| Load Maximum * | 214 | 165 23% | 169 21% | 173.5 19% | 226 -6% | 280 -31% |
* ... smaller is better
Power Consumption Witcher 3
Battery Life
Web browsing on Balanced mode with the iGPU active and at 150 nit brightness is a few hours shorter than what we recorded on the 10th gen Blade 15. Users may be able to make up that difference by setting the system to power saver mode and the refresh rate to 60 Hz instead of the default 360 Hz.
Users can recharge via USB-C through either port.
| Razer Blade 15 Advanced (Mid 2021) i7-11800H, GeForce RTX 3080 Laptop GPU, 80 Wh | Razer Blade 15 Advanced Model Early 2021 i7-10875H, GeForce RTX 3080 Laptop GPU, 80 Wh | Razer Blade 15 RTX 2080 Super Max-Q i7-10875H, GeForce RTX 2080 Super Max-Q, 80 Wh | Asus TUF Gaming F15 FX506HM i7-11800H, GeForce RTX 3060 Laptop GPU, 90 Wh | Alienware m15 R5 Ryzen Edition R7 5800H, GeForce RTX 3060 Laptop GPU, 86 Wh | Aorus 15P YD i7-11800H, GeForce RTX 3080 Laptop GPU, 99 Wh | |
|---|---|---|---|---|---|---|
| Battery Runtime | 52% | 4% | 34% | -13% | -10% | |
| WiFi v1.3 | 353 | 538 52% | 366 4% | 473 34% | 306 -13% | 319 -10% |
| Reader / Idle | 866 | 522 | 660 | 881 | 448 | |
| Load | 120 | 113 | 119 | 55 | 126 | |
| Witcher 3 ultra | 96 |
Pros
Cons
Verdict
Since the Core i7-10875H in the 10th gen Blade 15 would underperform when stressed, we were afraid to see the same with the Core i7-11800H in the newer 11th gen Blade 15 model. Fortunately, this proved to not be the case. The CPU in the new Blade 15 would be within just a few percentage points of the average laptop in our database equipped with the same i7-11800H. Users are getting at least a 30 percent boost in raw multi-thread performance over the i7-10875H in the older Blade 15. Raw GPU performance is up as well by 10 to 15 percent due in part to the higher TGP target. Some games will see similar boosts in frame rates depending on how CPU-heavy they may be.
The latest 2021 Blade 15 is the fastest version of itself thus far especially in terms of CPU power. Its overall gaming performance, however, is only a marginal improvement over the early 2021 Blade 15 model that's only a few months old.
The faster CPU and GPU come at the cost of higher core temperatures, higher power consumption, and shorter battery life than on the 10th gen Intel Blade 15. These drawbacks might turn away users looking to maximize power efficiency, but performance hunters may happily accept these setbacks for the speedier processors, higher resolution webcam, PCIe 4 NVMe SSD support, and Thunderbolt 4 compatibility.
Price and availability
The 11th gen Intel Blade 15 is not yet widely available across third party channels as of this writing. Ordering directly from Razer may be the best way to secure a unit.
Razer Blade 15 Advanced (Mid 2021)
-
07/07/2021 v7
Allen Ngo
More articles related to this device
Razer Blade 15 Advanced (Mid 2021) (Blade 15 Series)Related Articles


Pricecompare
