 Deutsch
 English
 Español
 Français
 Italiano
 Nederlands
 Polski
 Português
 Русский
 Türkçe
 Svenska
 Chinese
 Magyar
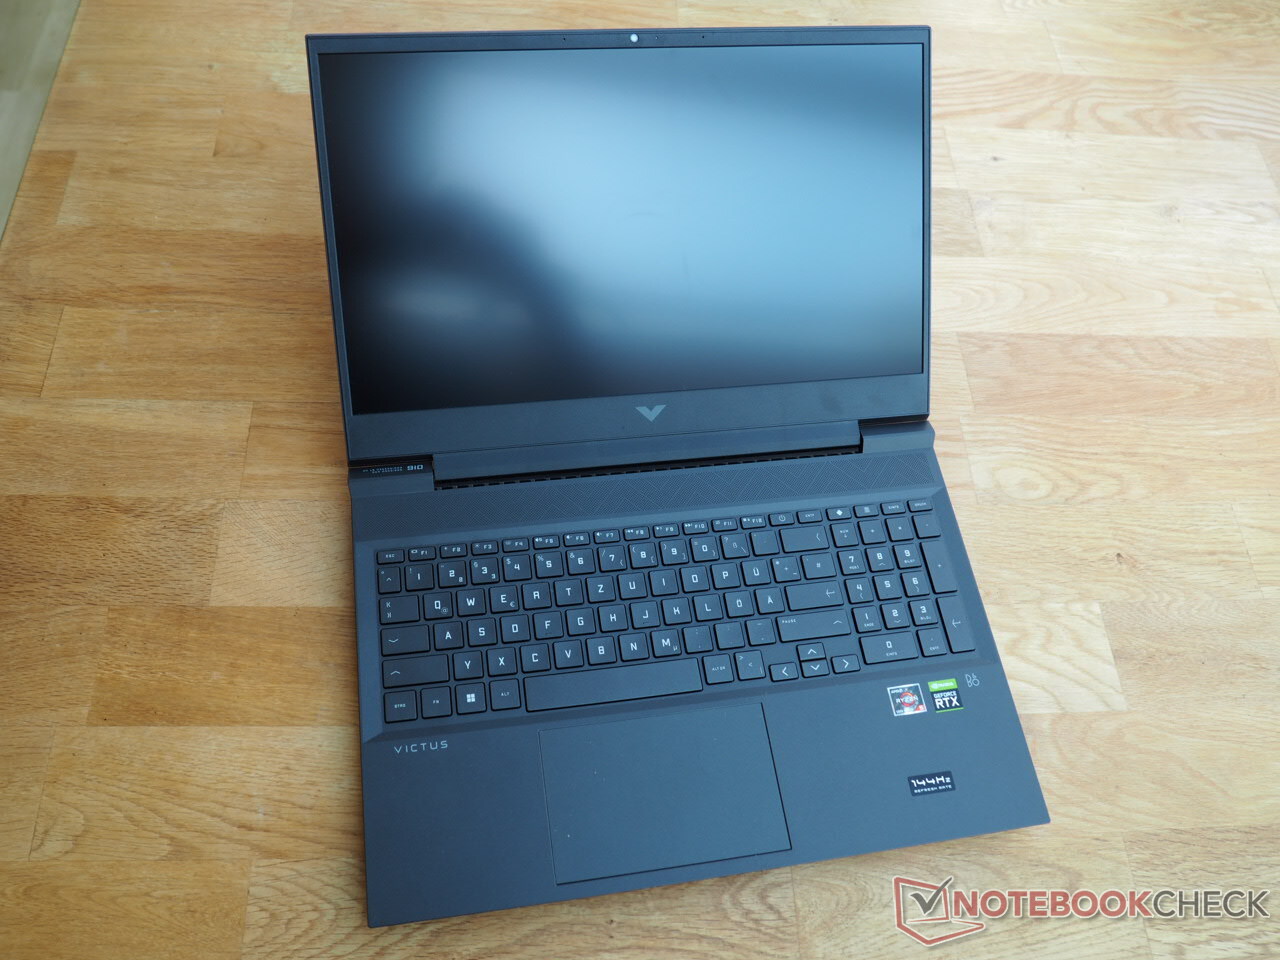
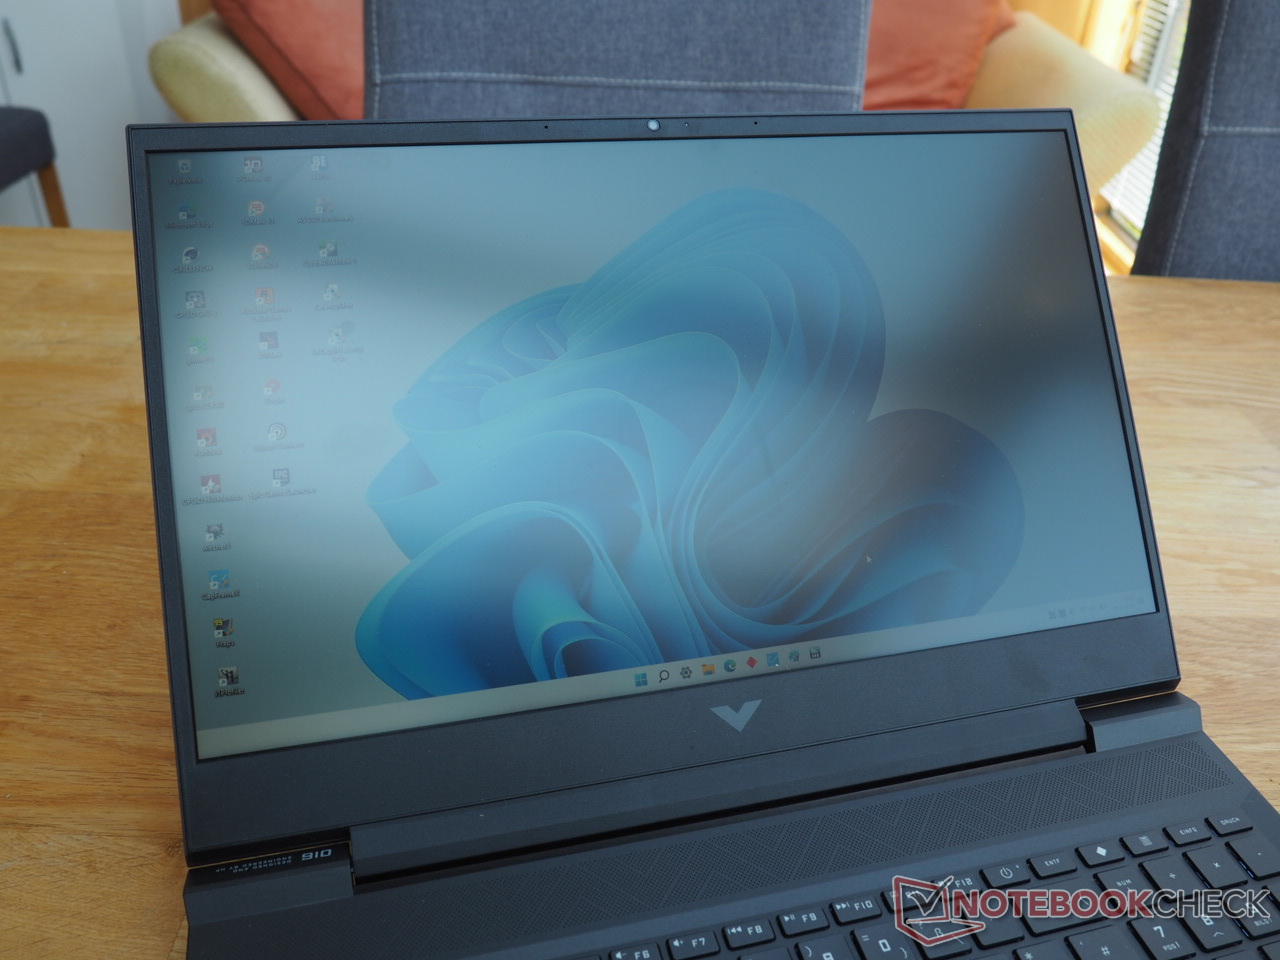
HP Victus 16 review: Affordable gaming laptop with AMD CPU and Nvidia GPU

After we already tested a more expensive version of the Victus 16 with a Ryzen 7 5800H and GeForce RTX 3060 several months ago, we are now putting the affordable model of the Victus 16-0145ng to the test. Even though HP cuts costs by not including a Windows operating system (we installed Windows 11 Home), a Ryzen 5 5600H and a GeForce RTX 3050 Ti for around 920 Euros ($975) is still impressive. Similarly, including 16 GB of DDR4-RAM and a 512-GB NVMe SSD at that price also gives no reason for complaint. At least on paper, the IPS display also strikes a good figure, since 144 Hz indicate an adequate reproduction of fast games.
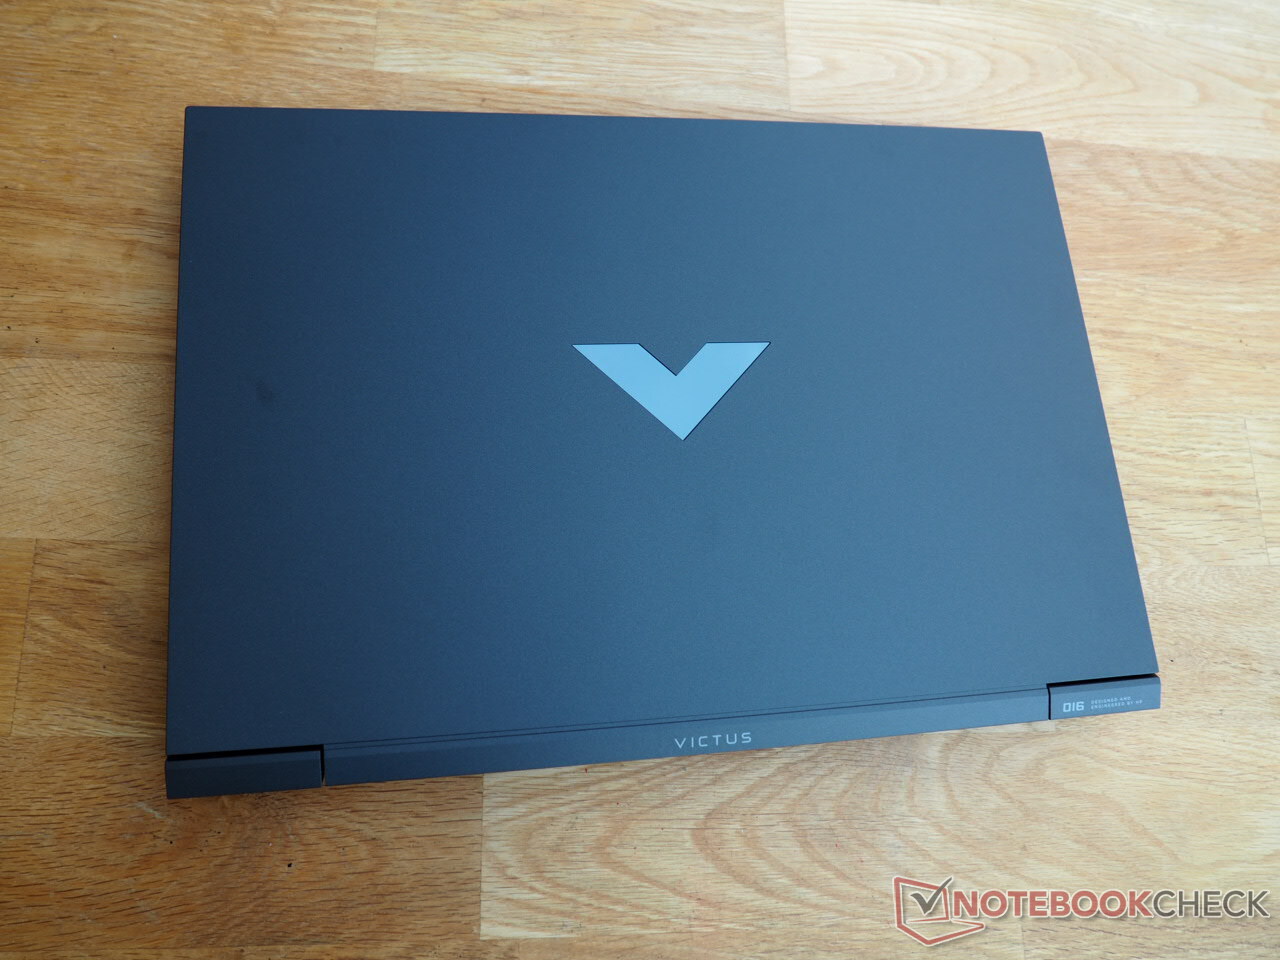
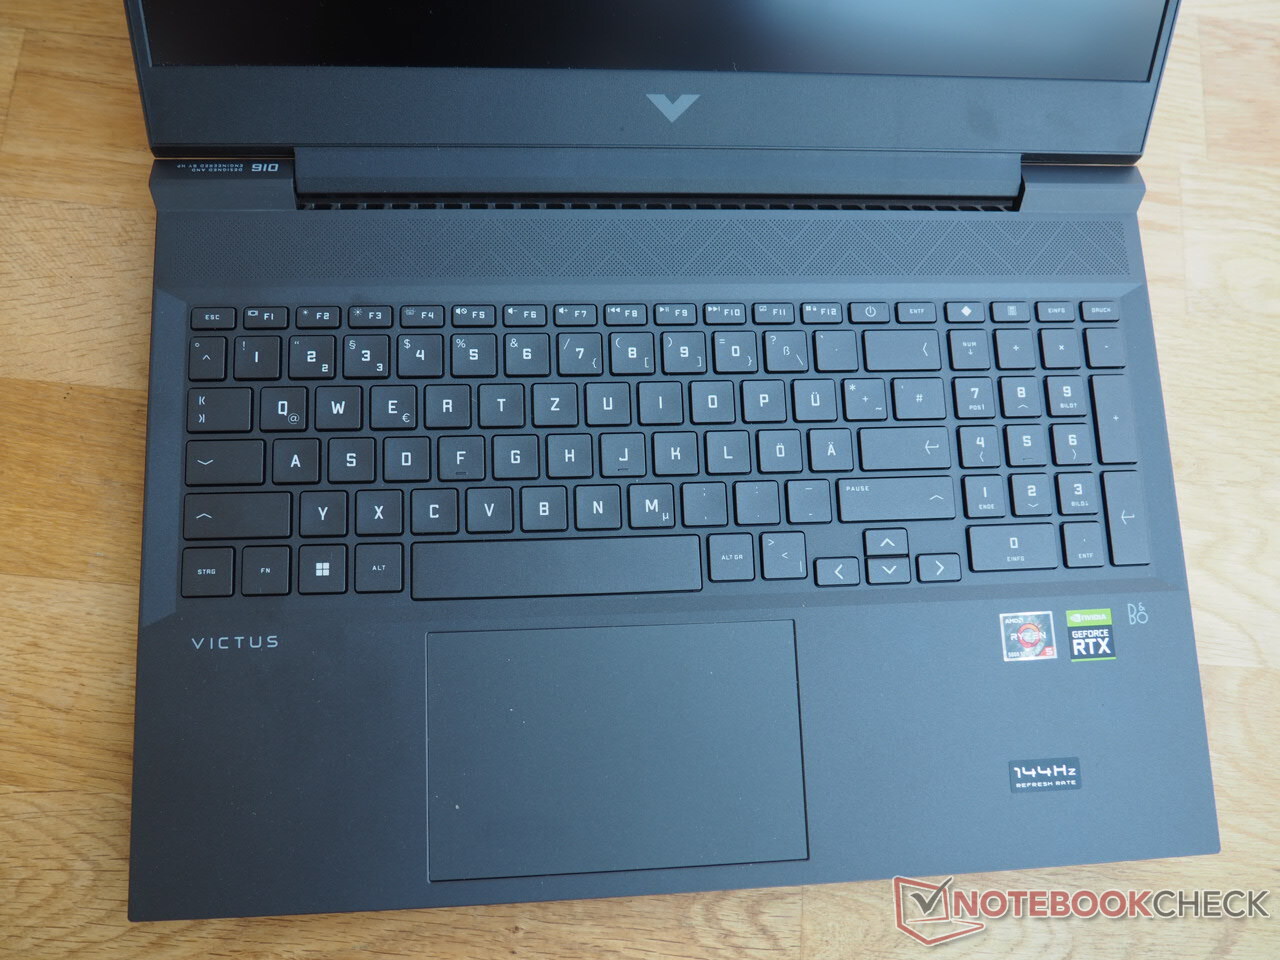
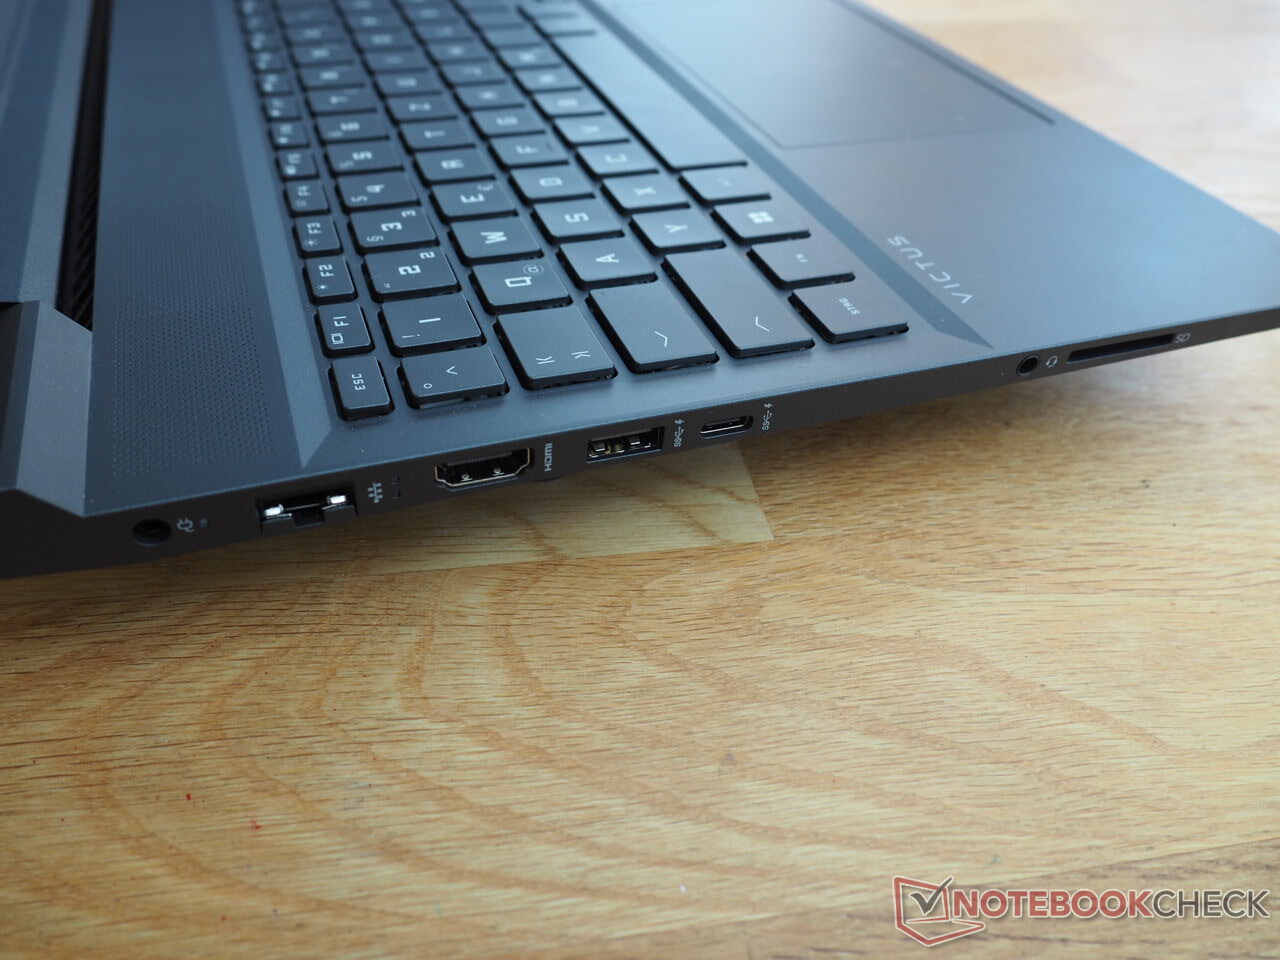
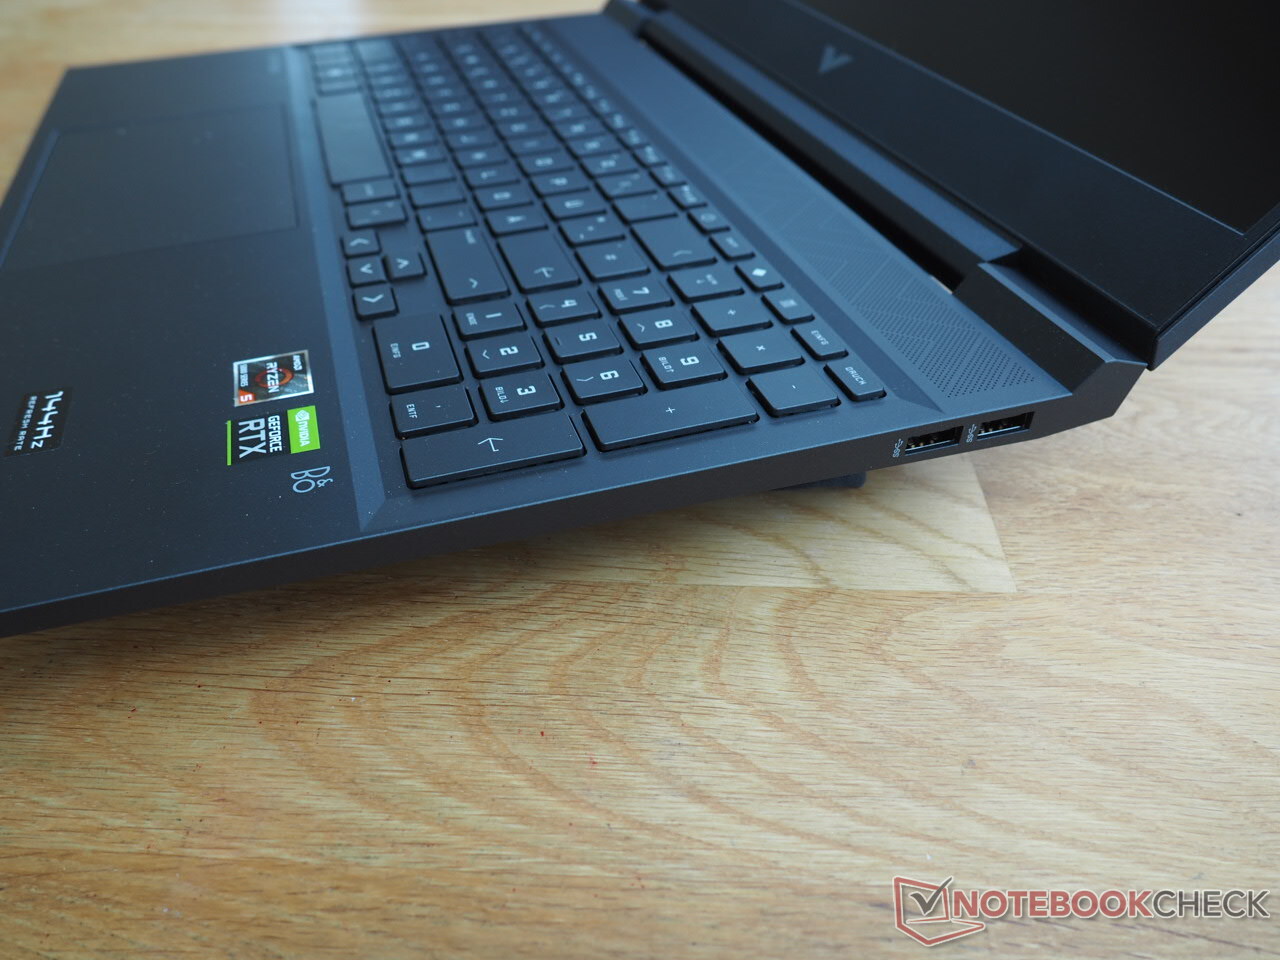
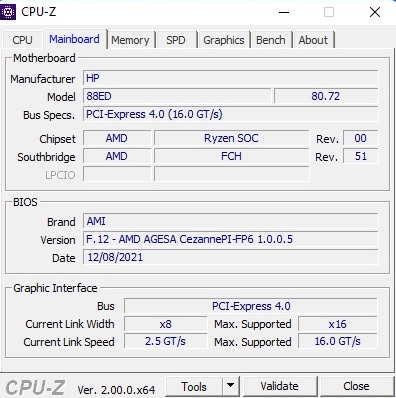
Since apart from some minor details, the case is identical to the model we tested previously, we won't discuss the case, equipment (connections, etc.), and input devices further here. You can find the corresponding information in the review of the Victus 16-e0179ng.
Possible Competitors in Comparison
Rating | Date | Model | Weight | Height | Size | Resolution | Best Price |
|---|---|---|---|---|---|---|---|
| 82.3 % | 05/2022 | HP Victus 16-e0145ng R5 5600H, GeForce RTX 3050 Ti Laptop GPU | 2.4 kg | 23.5 mm | 16.10" | 1920x1080 | |
| 84.3 % | 09/2021 | HP Victus 16-e0179ng R7 5800H, GeForce RTX 3060 Laptop GPU | 2.5 kg | 23.5 mm | 16.10" | 1920x1080 | |
| 79.7 % | 03/2022 | Lenovo Ideapad Gaming 3 15IHU-82K1002RGE i5-11300H, GeForce RTX 3050 Ti Laptop GPU | 2 kg | 24.2 mm | 15.60" | 1920x1080 | |
| 82.7 % | 10/2021 | Dell G15 5515 R7 5800H, GeForce RTX 3050 Ti Laptop GPU | 2.4 kg | 24.9 mm | 15.60" | 1920x1080 | |
| 83.4 % | 08/2021 | Asus ROG Strix G17 G713QE-RB74 R7 5800H, GeForce RTX 3050 Ti Laptop GPU | 2.5 kg | 24.6 mm | 17.30" | 1920x1080 |
The competitors of the 16-incher include other affordable gaming laptops with a GeForce RTX 3050 Ti such as the Lenovo Ideapad Gaming 3 15IHU, the Dell G15 5515, and the Asus Strix G17 G713QE. These laptops appear in the charts as comparison devices – as long as values for them are available.
SD Card Reader
| SD Card Reader - average JPG Copy Test (av. of 3 runs) | |
| Average of class Gaming (19 - 202, n=100, last 2 years) | |
| HP Victus 16-e0179ng (AV PRO microSD 128 GB V60) | |
| HP Victus 16-e0145ng (AV PRO microSD 128 GB V60) | |
Communication
| Networking | |
| iperf3 transmit AXE11000 | |
| Average of class Gaming (469 - 1793, n=152, last 2 years) | |
| HP Victus 16-e0145ng | |
| iperf3 receive AXE11000 | |
| Average of class Gaming (685 - 1890, n=158, last 2 years) | |
| HP Victus 16-e0145ng | |
Webcam


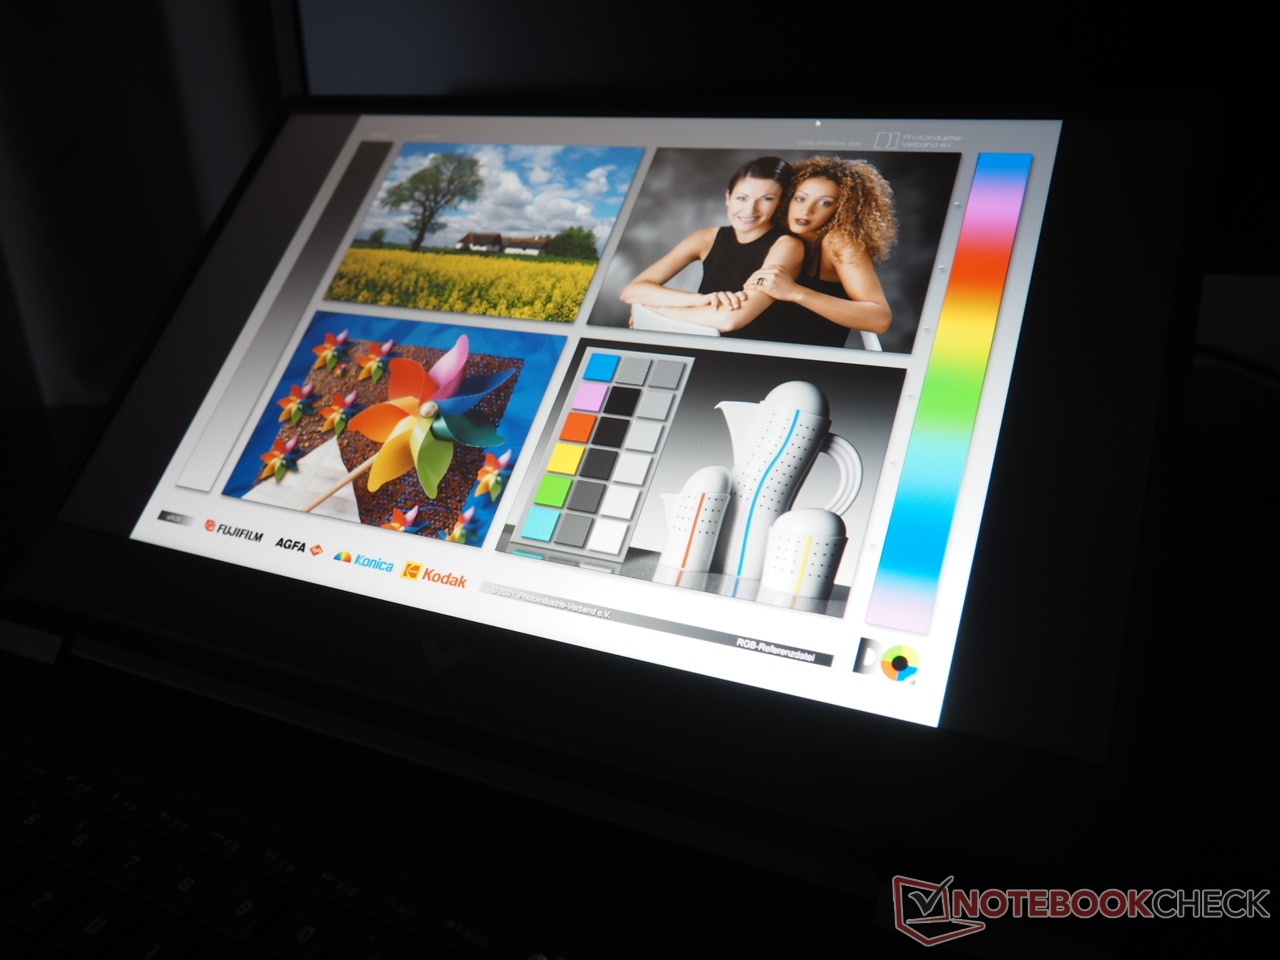
Display
While the more expensive sibling is equipped with a good Full-HD display, unfortunately some cost cutting measures by the manufacturer are clearly noticeable in the Victus 16-e0145ng.
| |||||||||||||||||||||||||
Brightness Distribution: 88 %
Center on Battery: 257 cd/m²
Contrast: 1028:1 (Black: 0.25 cd/m²)
ΔE Color 6.91 | 0.5-29.43 Ø5, calibrated: 3.61
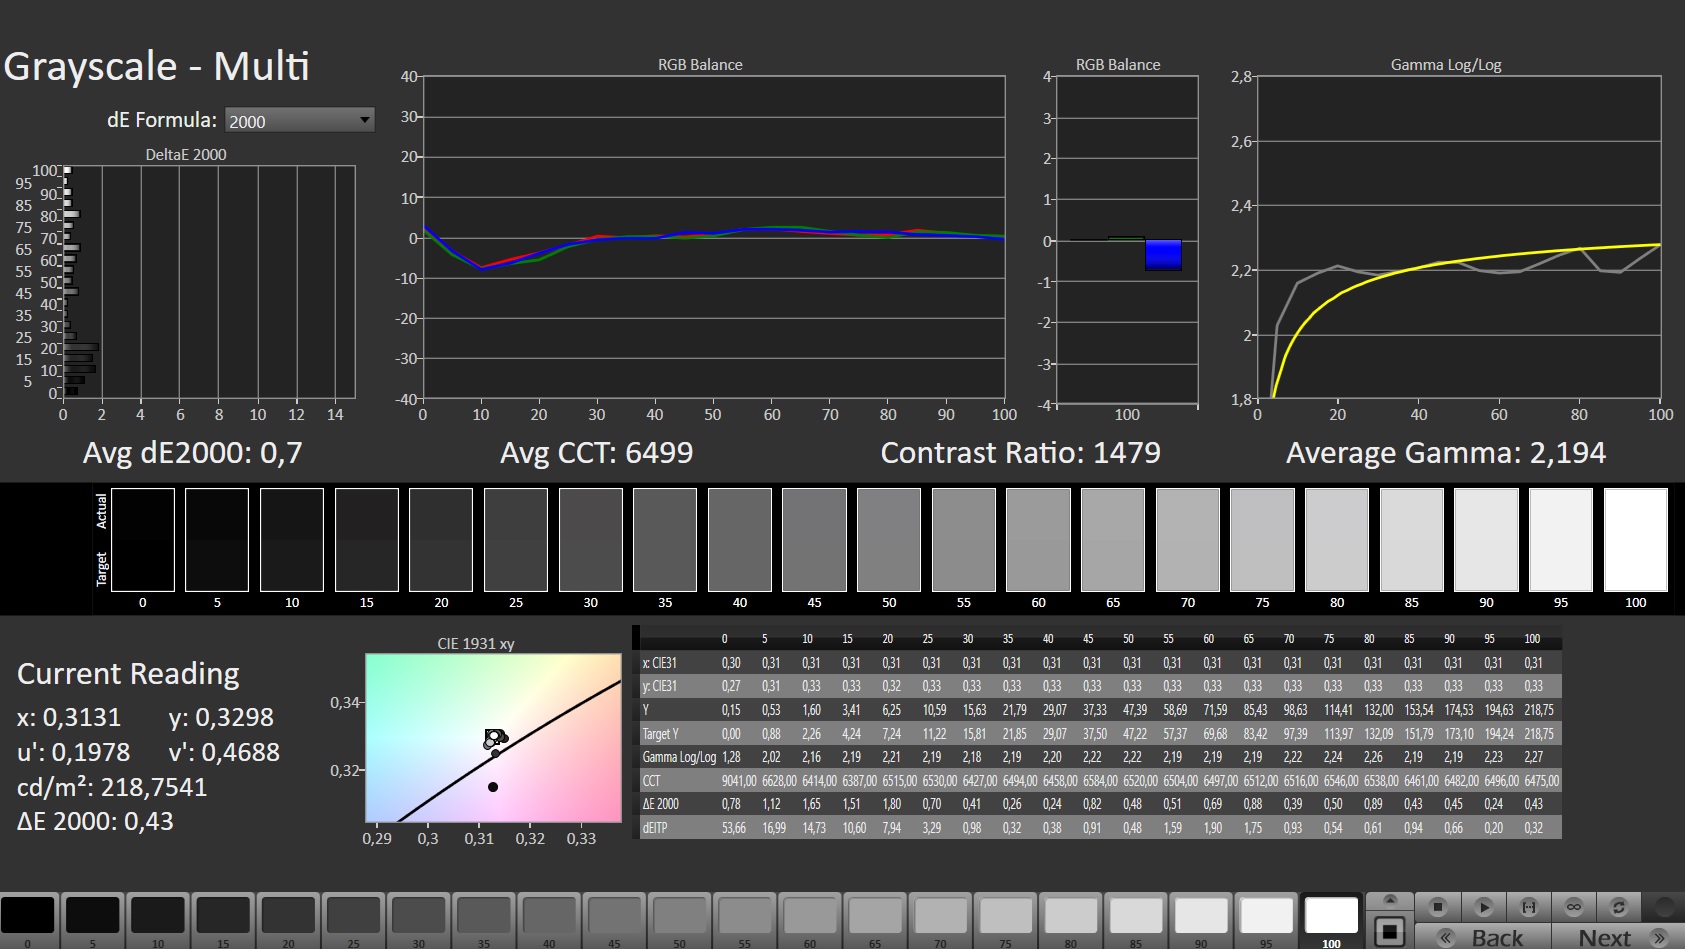
ΔE Greyscale 7.5 | 0.57-98 Ø5.3
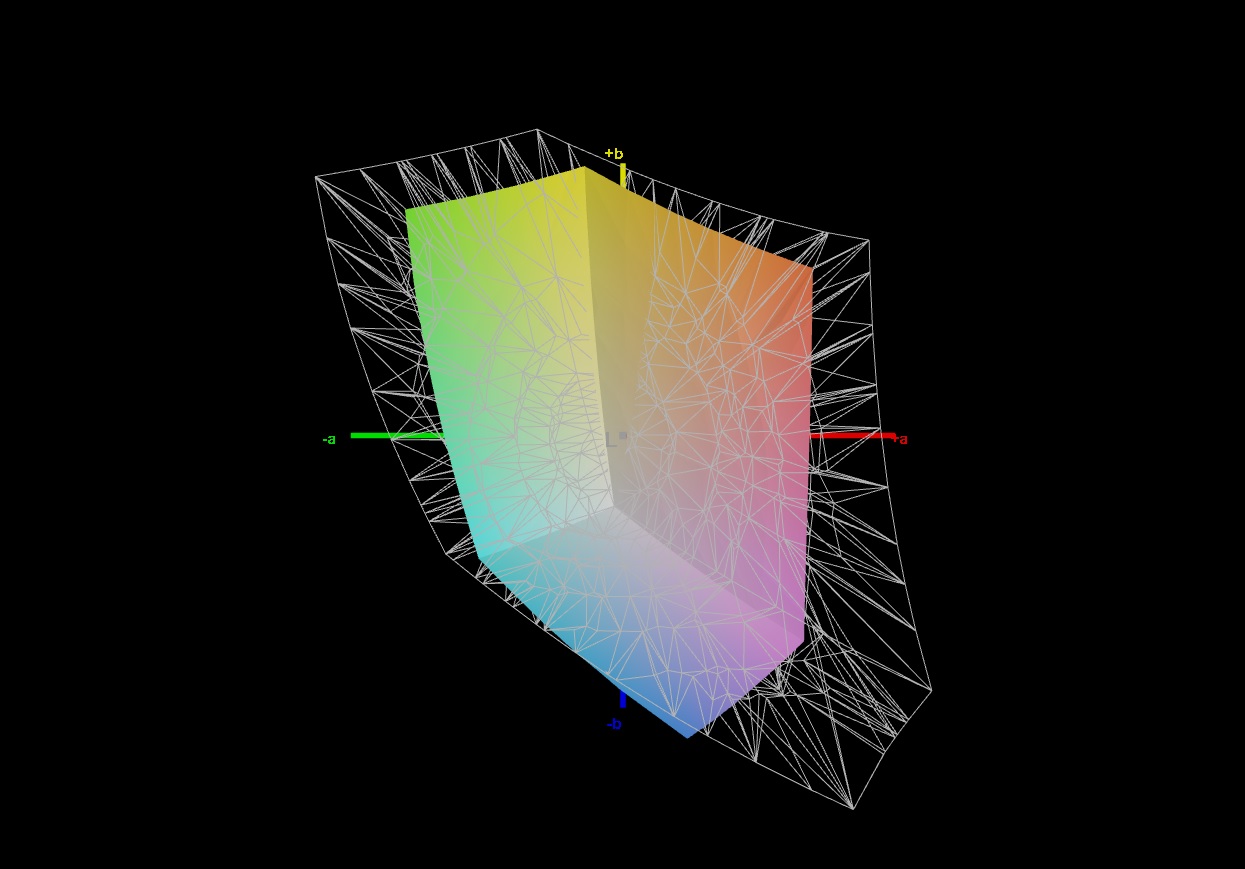
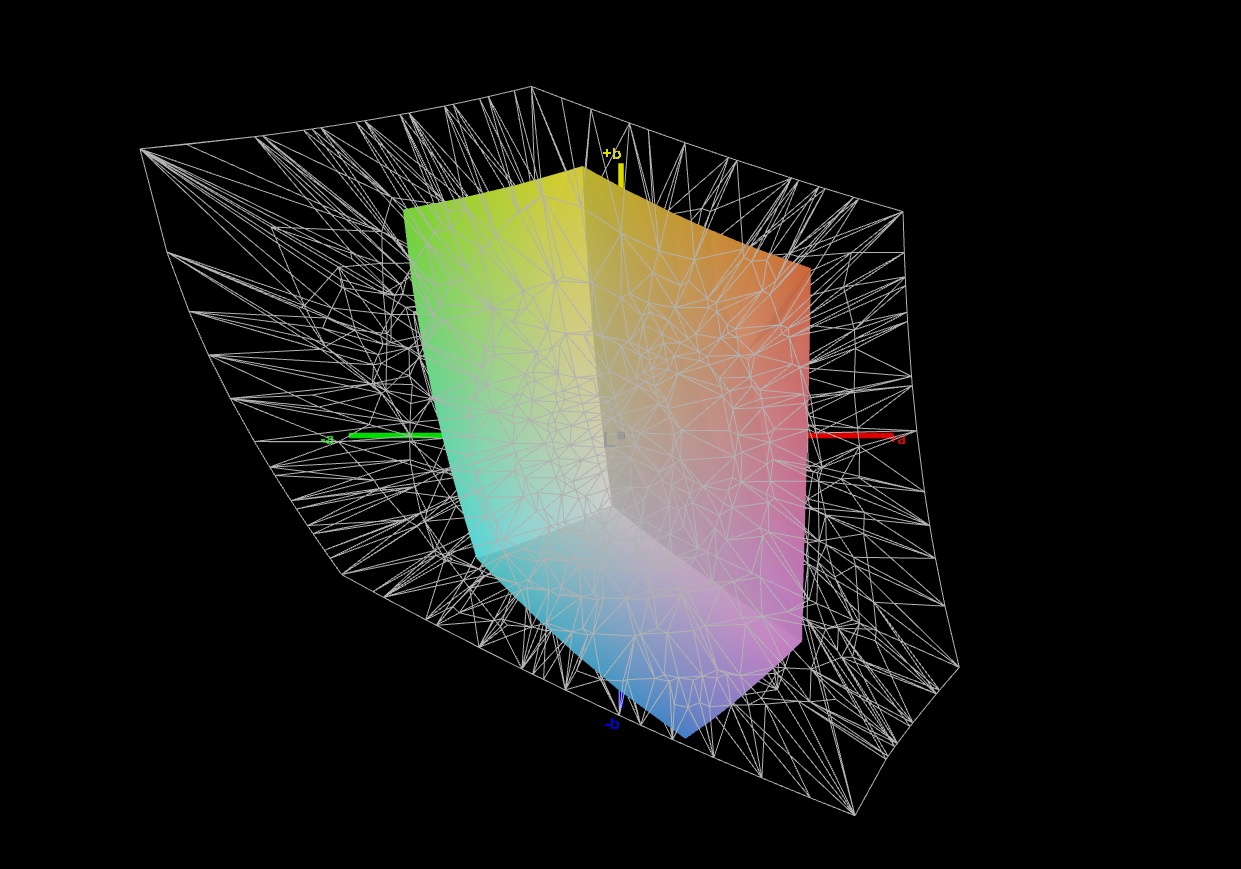
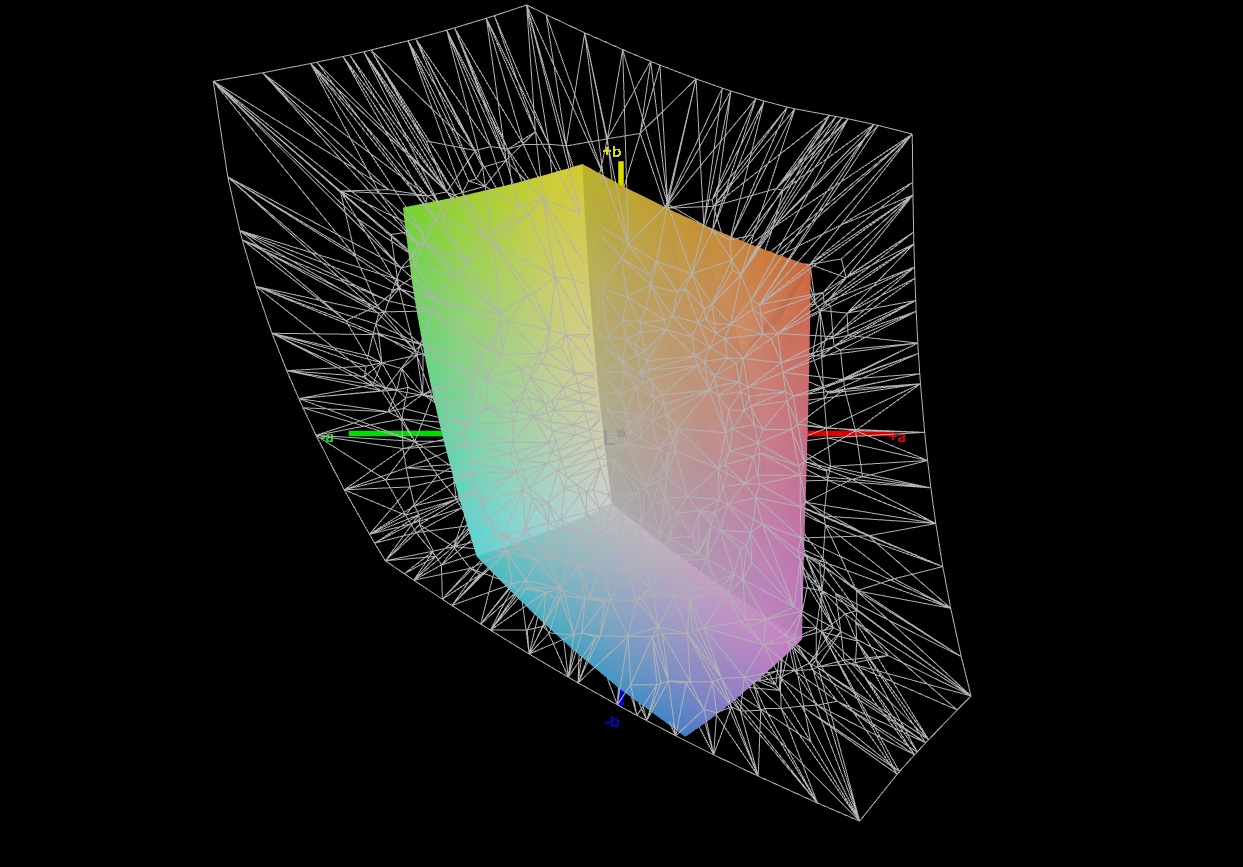
43% AdobeRGB 1998 (Argyll 2.2.0 3D)
61.9% sRGB (Argyll 2.2.0 3D)
41.6% Display P3 (Argyll 2.2.0 3D)
Gamma: 2.125
| HP Victus 16-e0145ng CMN1609, IPS, 1920x1080, 16.10 | HP Victus 16-e0179ng BOE09BE, IPS, 1920x1080, 16.10 | Lenovo Ideapad Gaming 3 15IHU-82K1002RGE LEN156FHD, IPS, 1920x1080, 15.60 | Dell G15 5515 BOE092A, IPS, 1920x1080, 15.60 | Asus ROG Strix G17 G713QE-RB74 AU Optronics B173HAN04.9, IPS, 1920x1080, 17.30 | |
|---|---|---|---|---|---|
| Display | 69% | -4% | -7% | -3% | |
| Display P3 Coverage | 41.6 | 72.6 75% | 39.7 -5% | 39.1 -6% | 40.2 -3% |
| sRGB Coverage | 61.9 | 100 62% | 59.6 -4% | 56.9 -8% | 60.3 -3% |
| AdobeRGB 1998 Coverage | 43 | 73.5 71% | 41.1 -4% | 40.4 -6% | 41.6 -3% |
| Response Times | 47% | -69% | 14% | 5% | |
| Response Time Grey 50% / Grey 80% * | 29.6 ? | 9.6 ? 68% | 46.4 ? -57% | 25.2 ? 15% | 26.8 ? 9% |
| Response Time Black / White * | 19.4 ? | 14.4 ? 26% | 35.2 ? -81% | 16.8 ? 13% | 19.2 ? 1% |
| PWM Frequency | 200 ? | ||||
| Screen | 36% | 13% | 0% | 27% | |
| Brightness middle | 257 | 361 40% | 307 19% | 278 8% | 270.5 5% |
| Brightness | 239 | 341 43% | 292 22% | 262 10% | 269 13% |
| Brightness Distribution | 88 | 88 0% | 88 0% | 83 -6% | 92 5% |
| Black Level * | 0.25 | 0.3 -20% | 0.21 16% | 0.36 -44% | 0.19 24% |
| Contrast | 1028 | 1203 17% | 1462 42% | 772 -25% | 1424 39% |
| Colorchecker dE 2000 * | 6.91 | 2.44 65% | 5.9 15% | 5.74 17% | 4.39 36% |
| Colorchecker dE 2000 max. * | 22.27 | 6.37 71% | 21.6 3% | 19.63 12% | 20.8 7% |
| Colorchecker dE 2000 calibrated * | 3.61 | 1.26 65% | 4.8 -33% | 4.7 -30% | 1.56 57% |
| Greyscale dE 2000 * | 7.5 | 4.6 39% | 4.9 35% | 3.1 59% | 3.1 59% |
| Gamma | 2.125 104% | 2.268 97% | 2.26 97% | 2.011 109% | 2.14 103% |
| CCT | 6025 108% | 6609 98% | 6504 100% | 6207 105% | 6927 94% |
| Total Average (Program / Settings) | 51% /
44% | -20% /
-2% | 2% /
1% | 10% /
18% |
* ... smaller is better
Even though the competitors are not exemplary in this regard either, delivering similarly meager results, neither the brightness nor the color space coverage are adequate anymore in 2022. Only 62% of the sRGB color space and an average brightness of 239 cd/m² make for a very pale and dark image, particularly in bright surroundings.
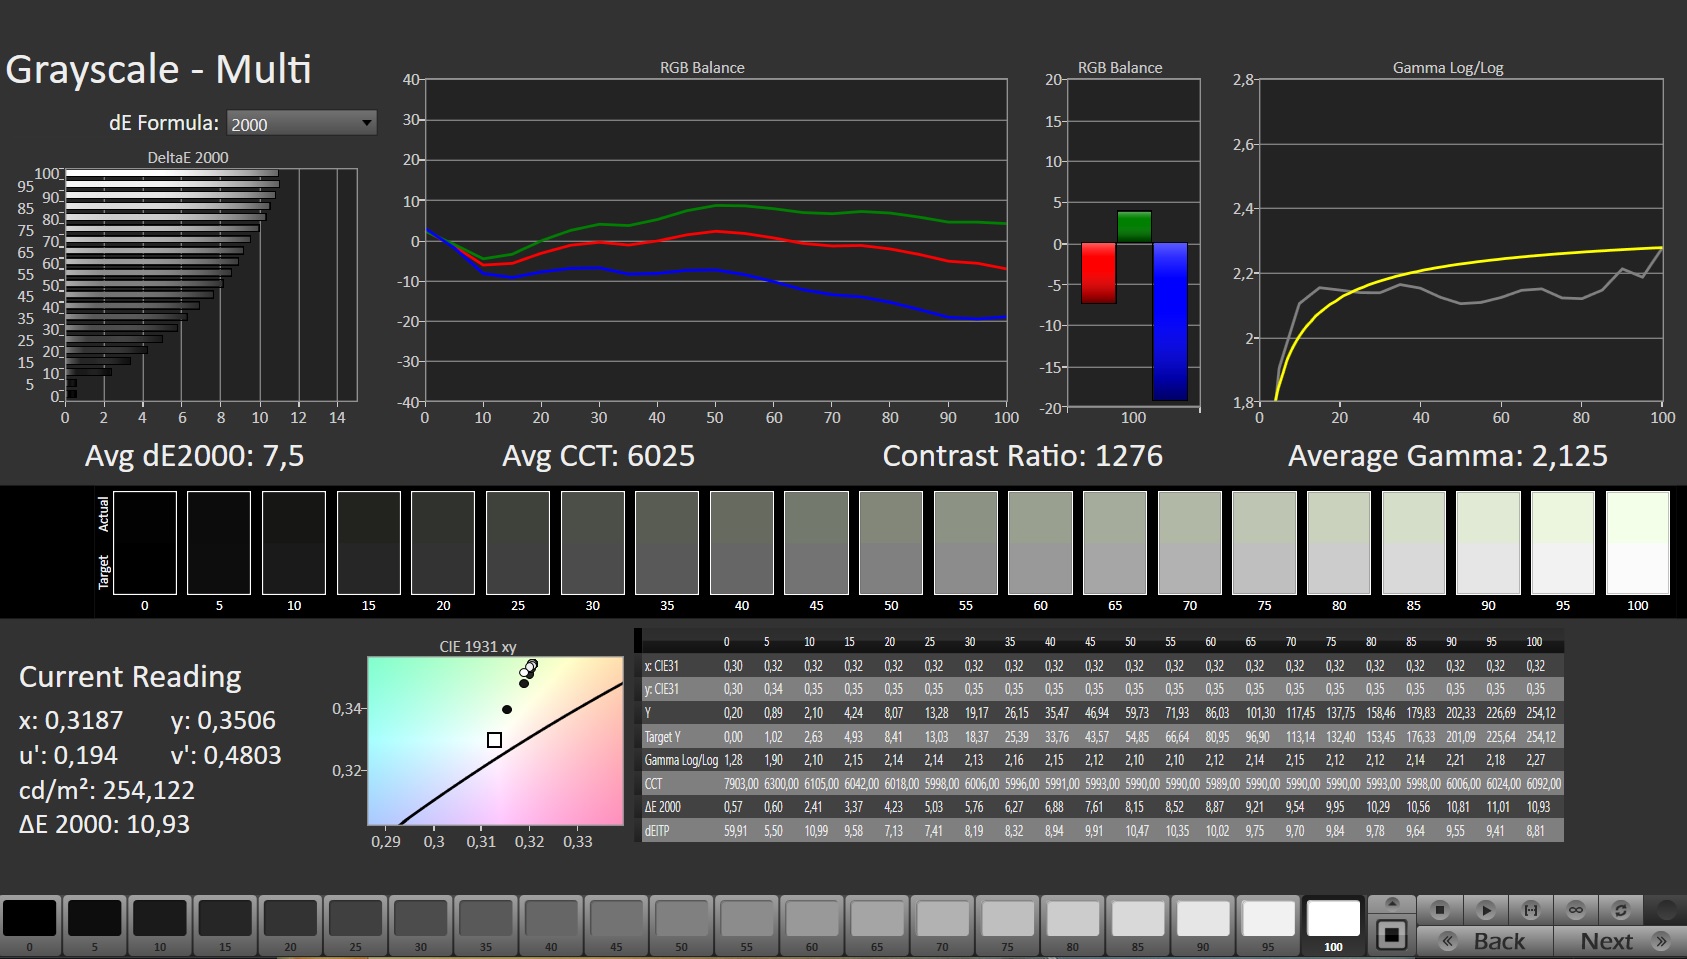
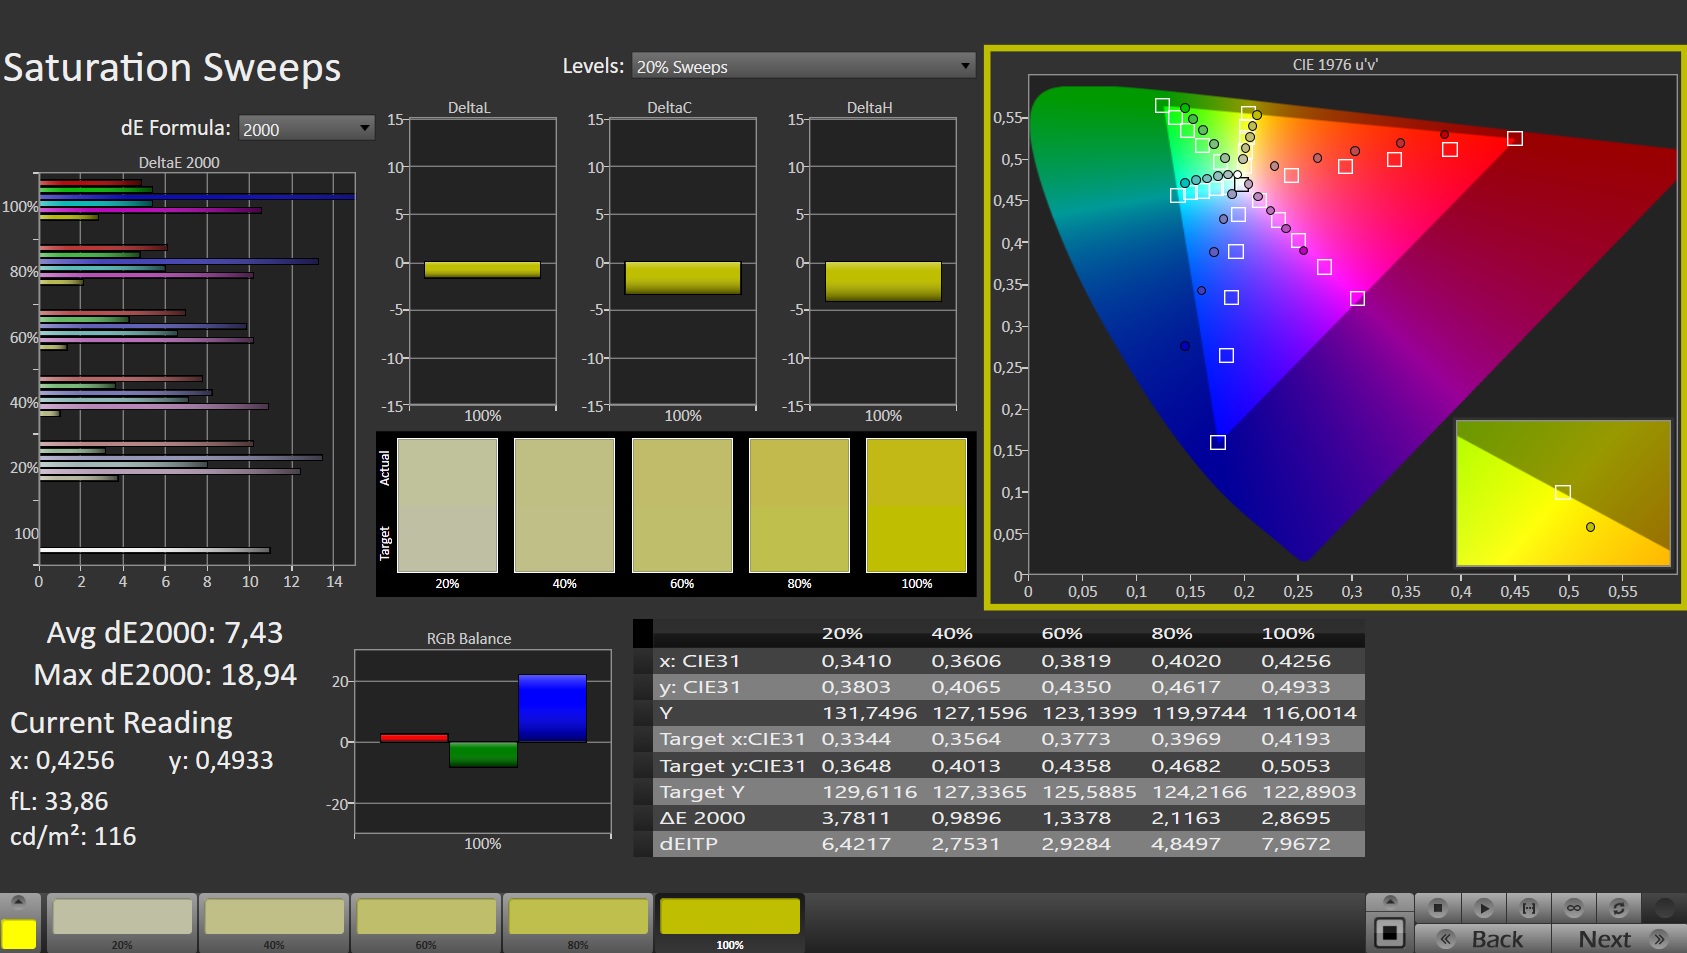
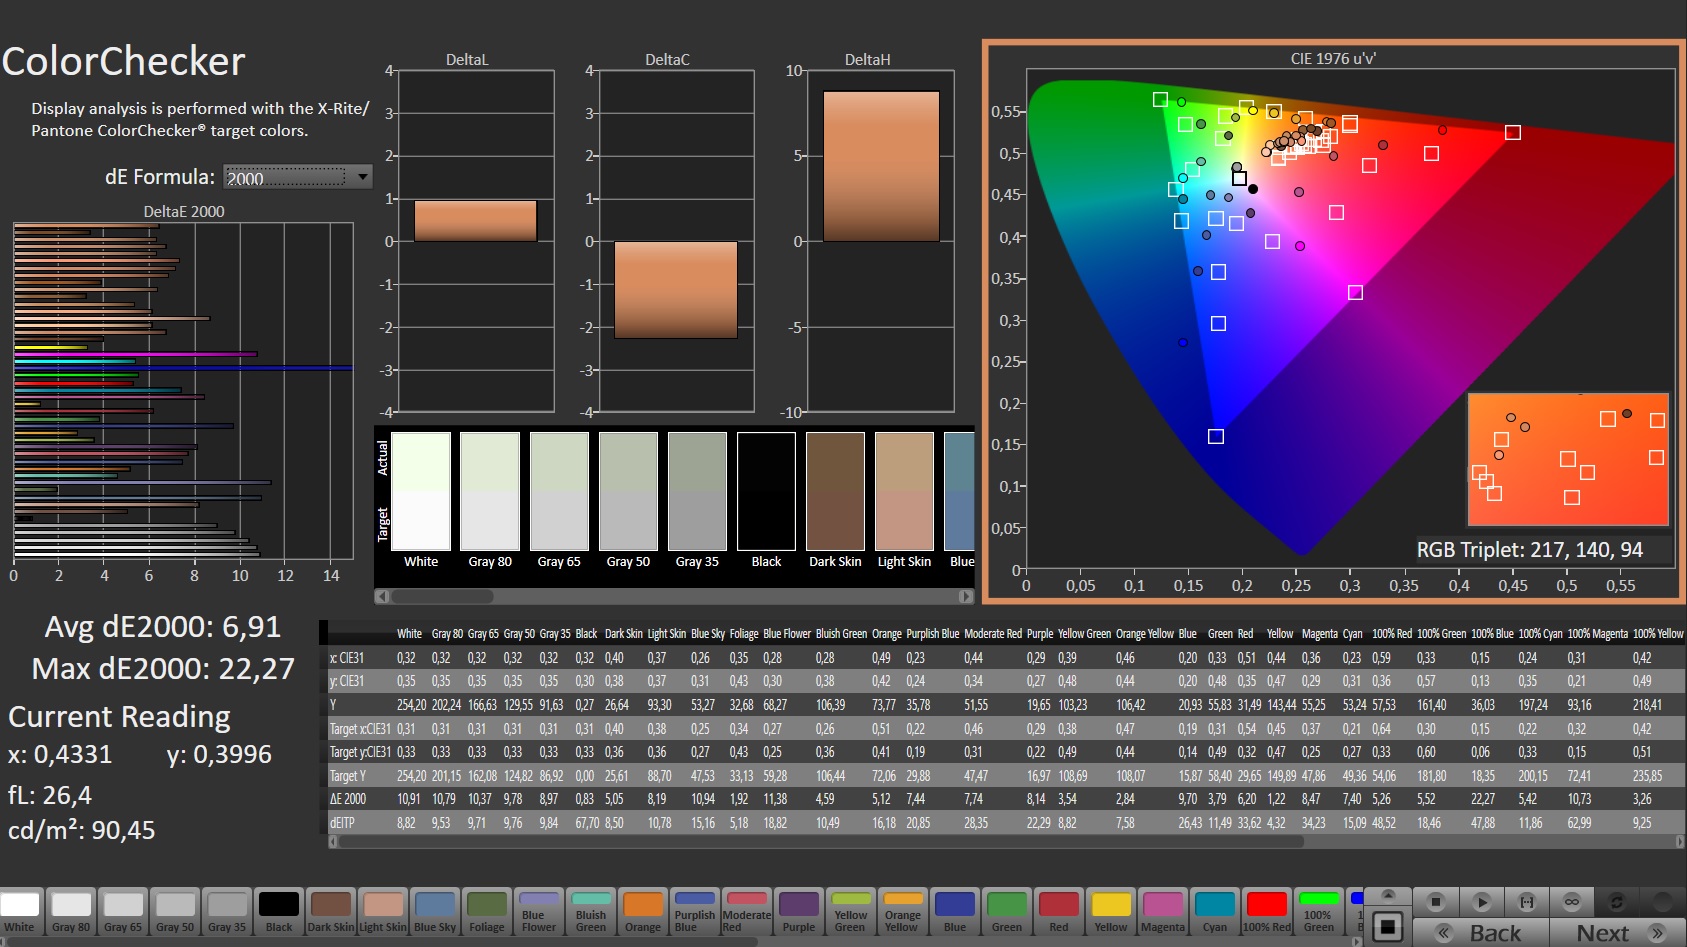
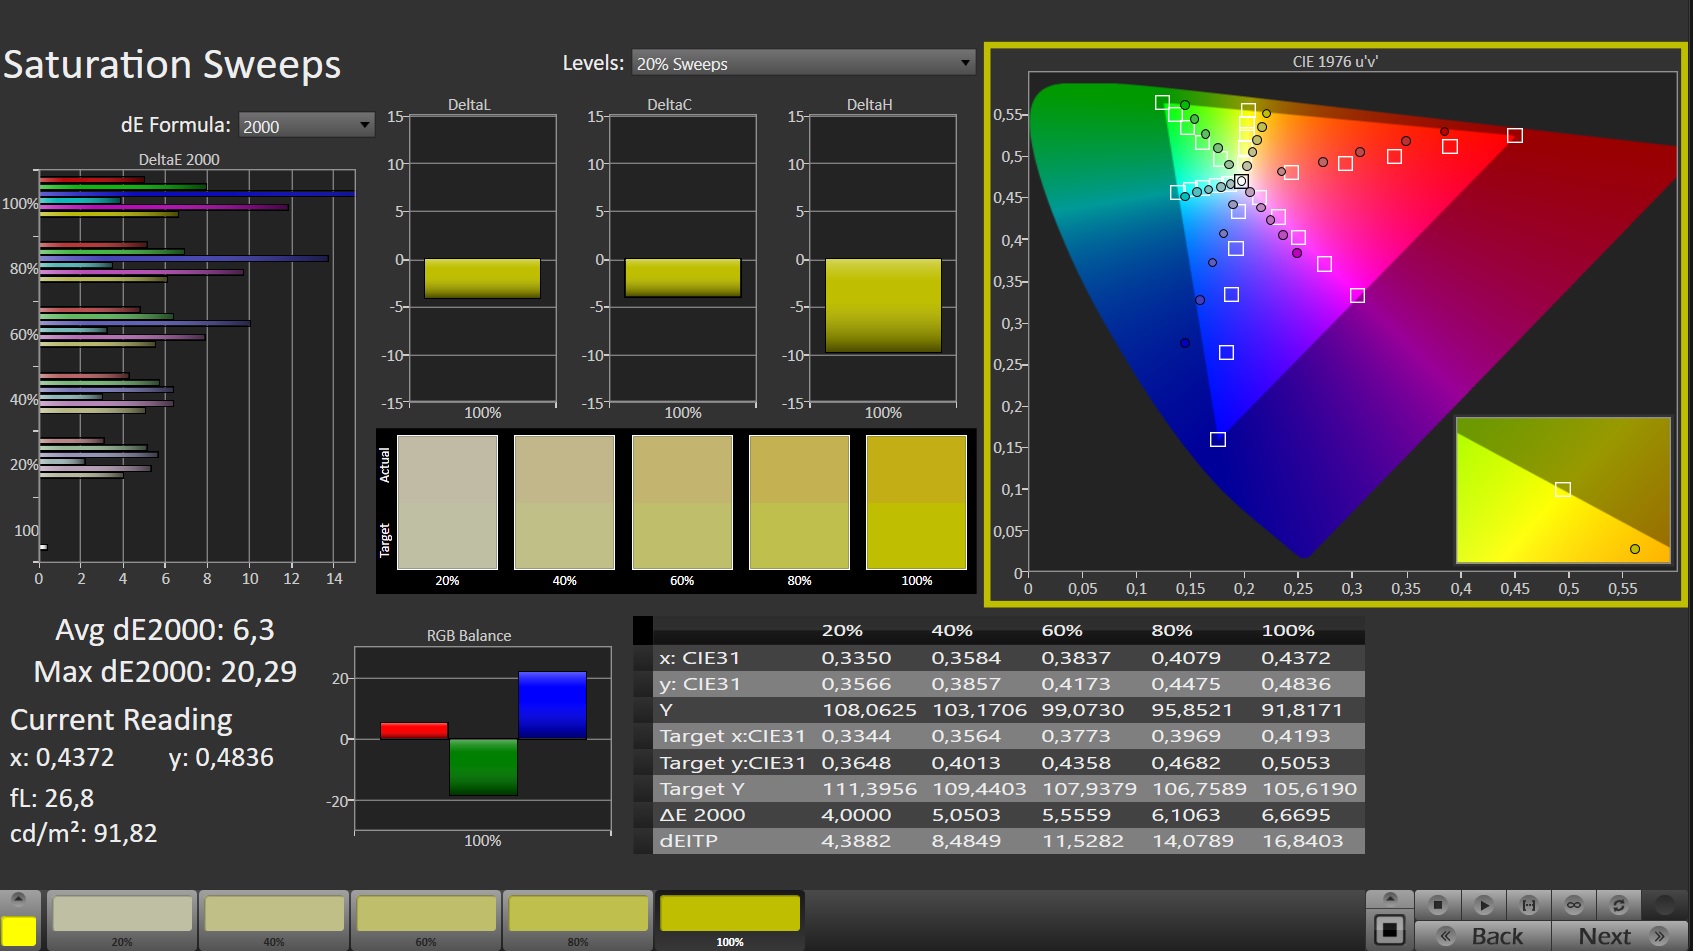
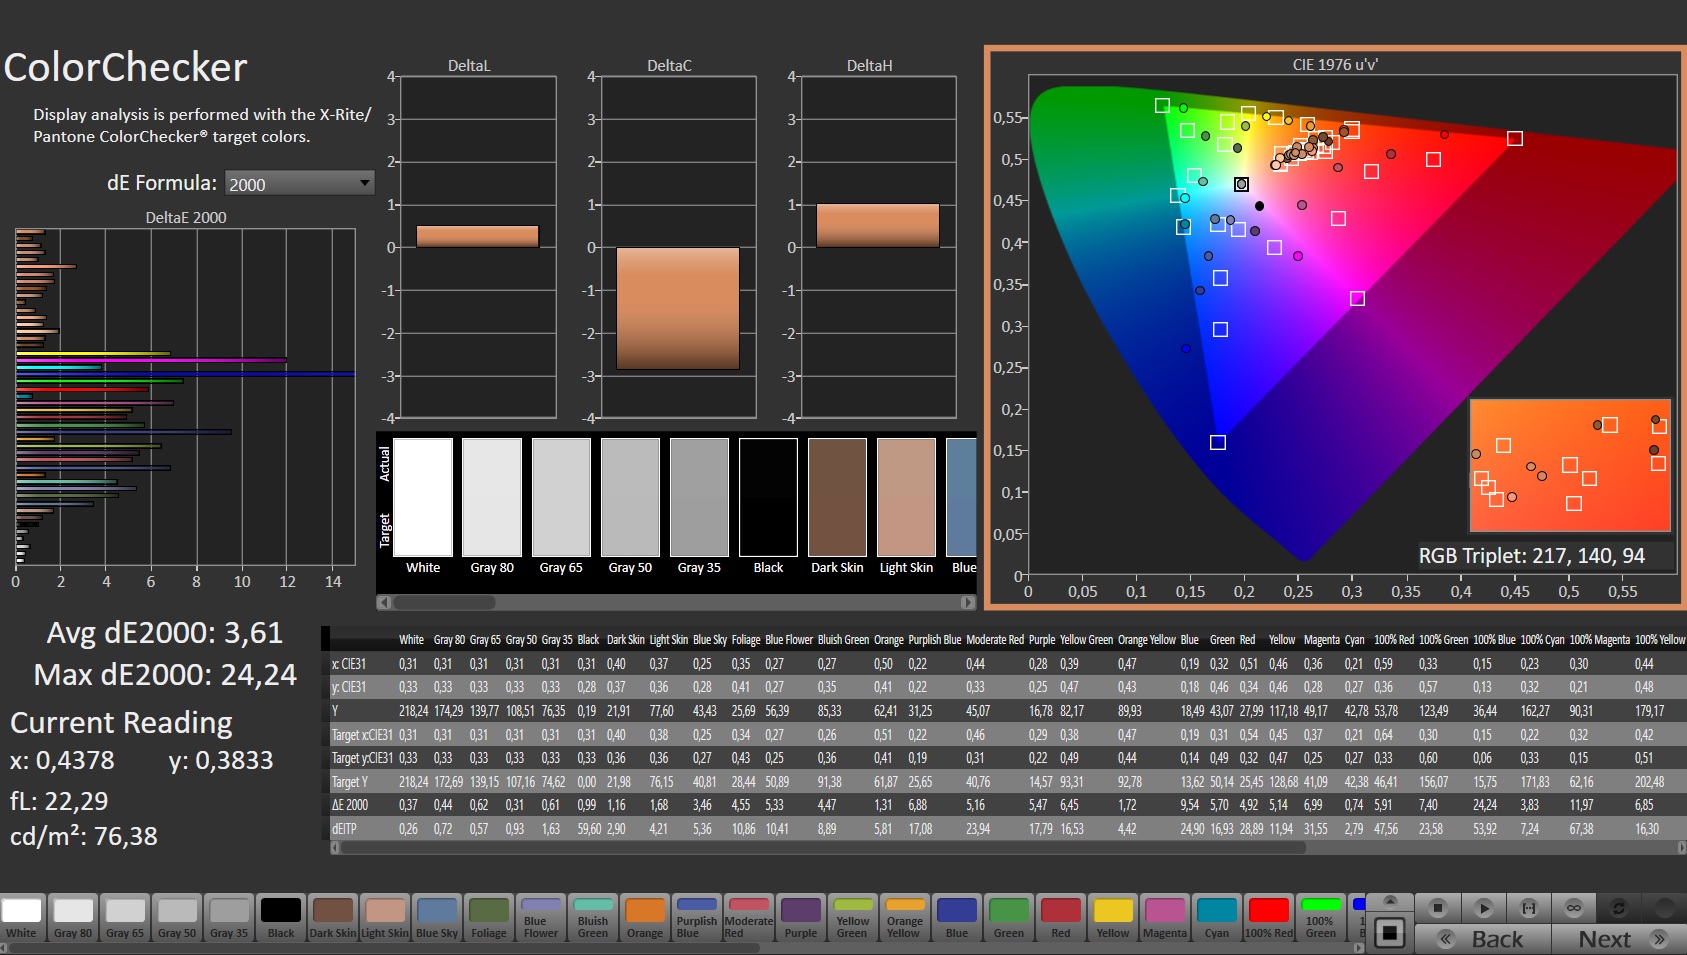
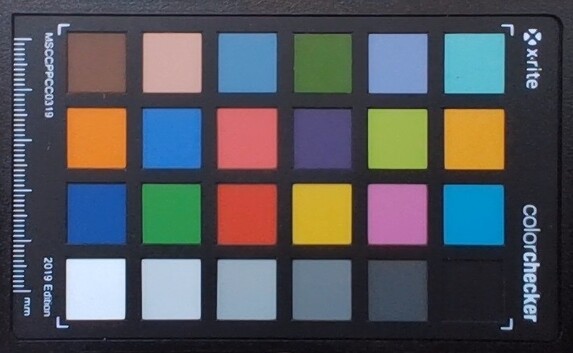
The color accuracy turns out similarly disappointing. In the state of delivery, the panel struggles with a green tint, but at least you can alleviate this with a calibration (as usual, you can download our ICC file from the link to the right of the brightness distribution schematics above).
The subject of the response times gives us less reason for complaint. Considering the price, almost 19 ms black-to-white and 30 ms grey-to-grey are okay. The same goes for the viewing angle stability, which ranges at a typical level for IPS screens.
Display Response Times
| ↔ Response Time Black to White | ||
|---|---|---|
| 19.4 ms ... rise ↗ and fall ↘ combined | ↗ 9.7 ms rise | 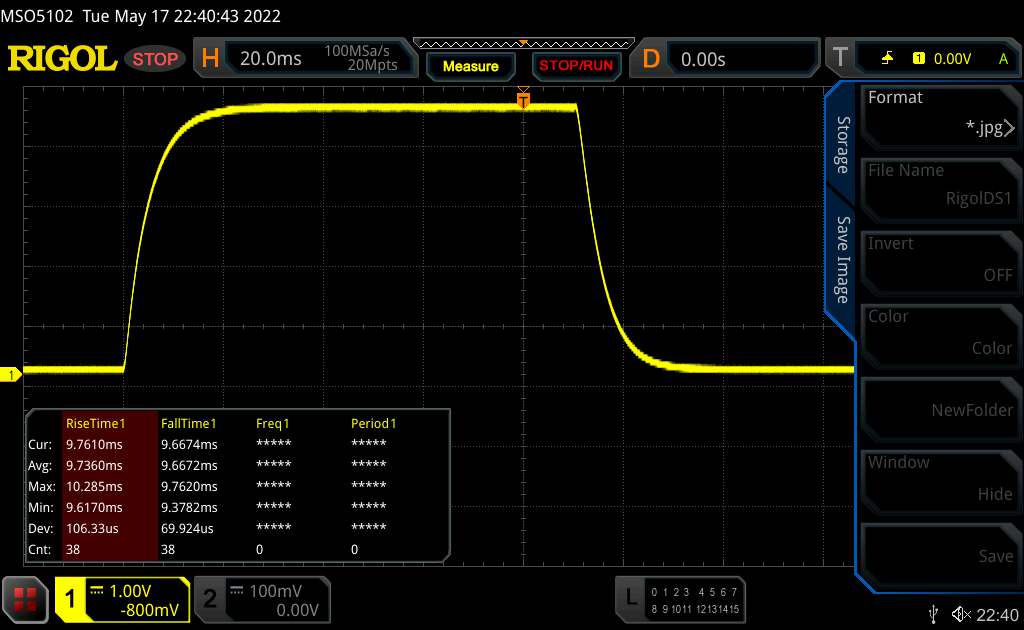 |
| ↘ 9.7 ms fall | ||
| The screen shows good response rates in our tests, but may be too slow for competitive gamers. In comparison, all tested devices range from 0.1 (minimum) to 240 (maximum) ms. » 37 % of all devices are better. This means that the measured response time is similar to the average of all tested devices (21.5 ms). | ||
| ↔ Response Time 50% Grey to 80% Grey | ||
| 29.6 ms ... rise ↗ and fall ↘ combined | ↗ 13.8 ms rise | 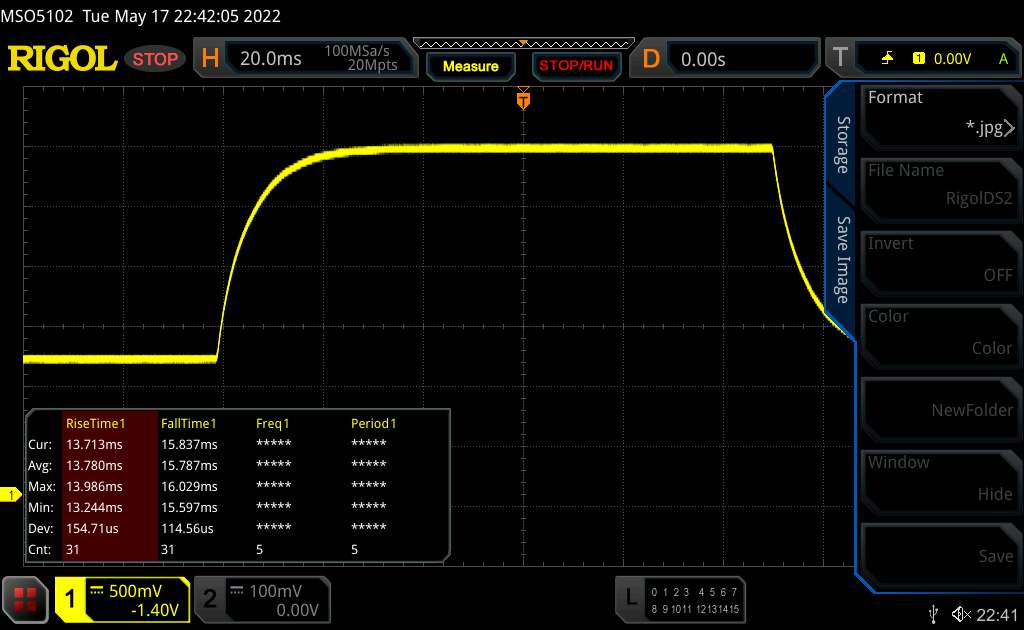 |
| ↘ 15.8 ms fall | ||
| The screen shows relatively slow response rates in our tests and may be too slow for gamers. In comparison, all tested devices range from 0.2 (minimum) to 636 (maximum) ms. » 33 % of all devices are better. This means that the measured response time is better than the average of all tested devices (33.7 ms). | ||
Screen Flickering / PWM (Pulse-Width Modulation)
| Screen flickering / PWM not detected |  | ||
In comparison: 53 % of all tested devices do not use PWM to dim the display. If PWM was detected, an average of 17924 (minimum: 5 - maximum: 3846000) Hz was measured. | |||
Performance
With the equipment of our test unit, the Victus 16 belongs to the gaming midrange. The components used are balanced and should attract price-conscious gamers.
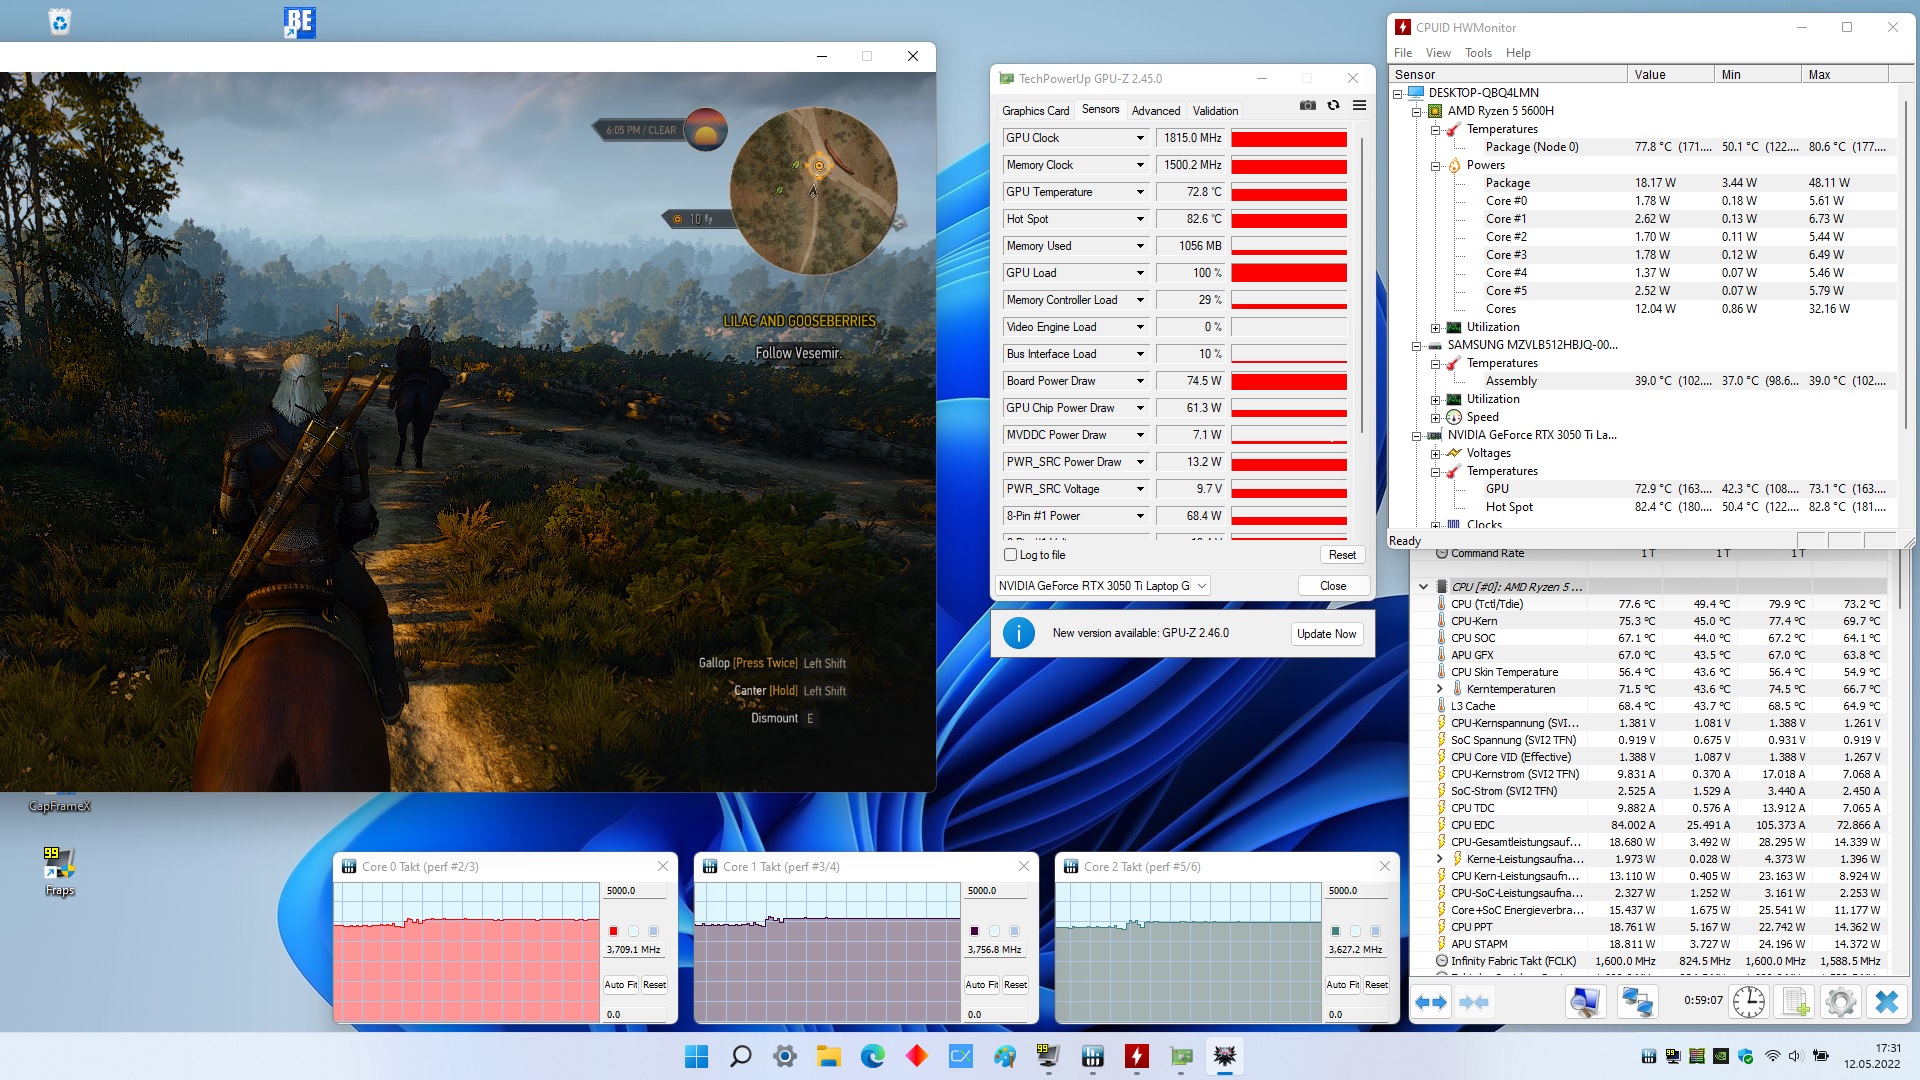
Test Conditions
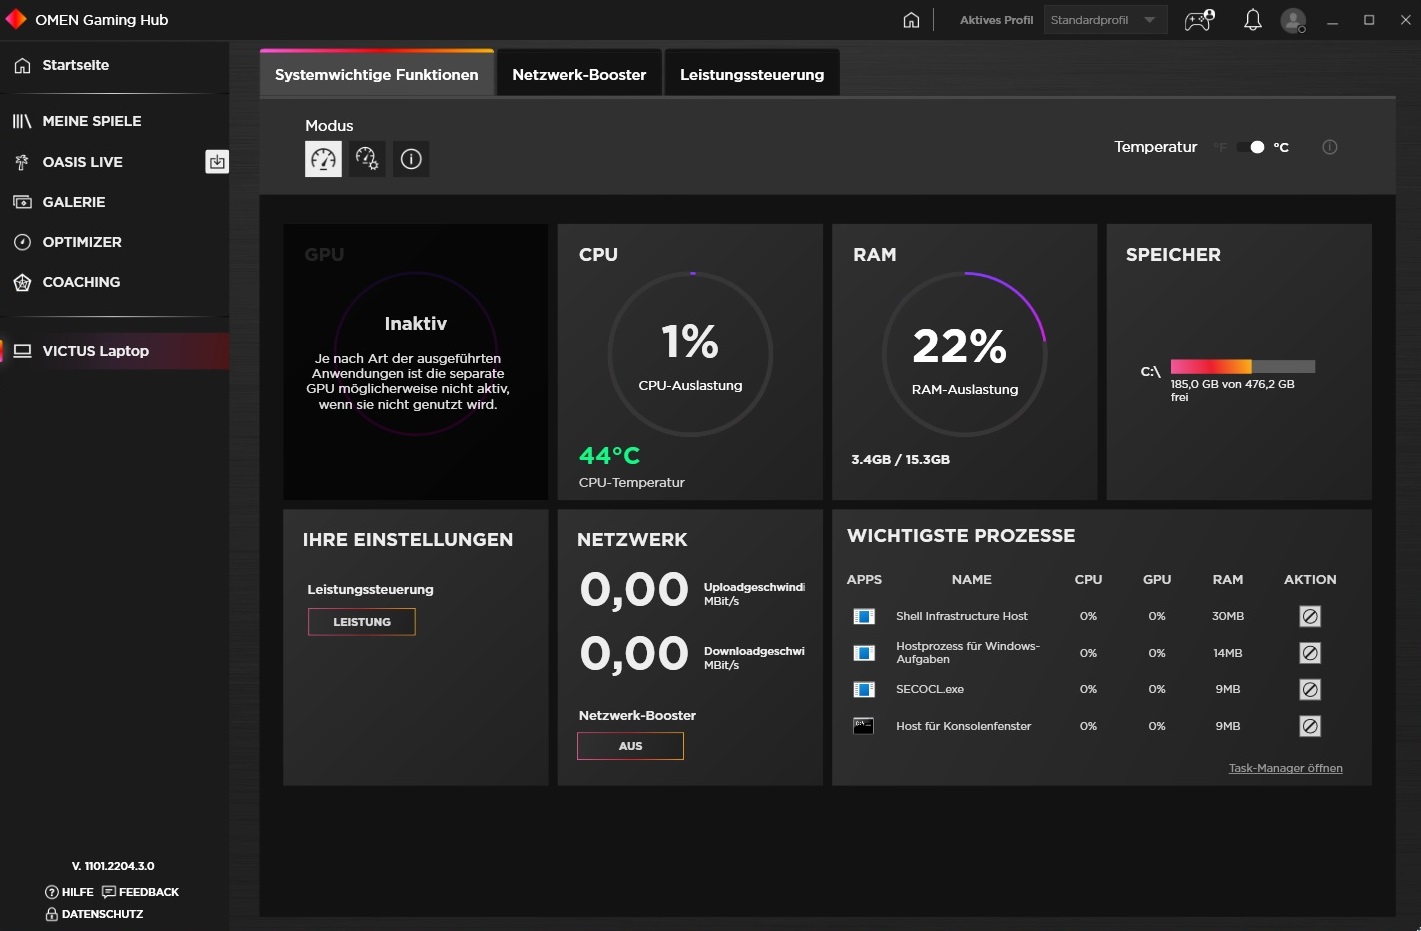
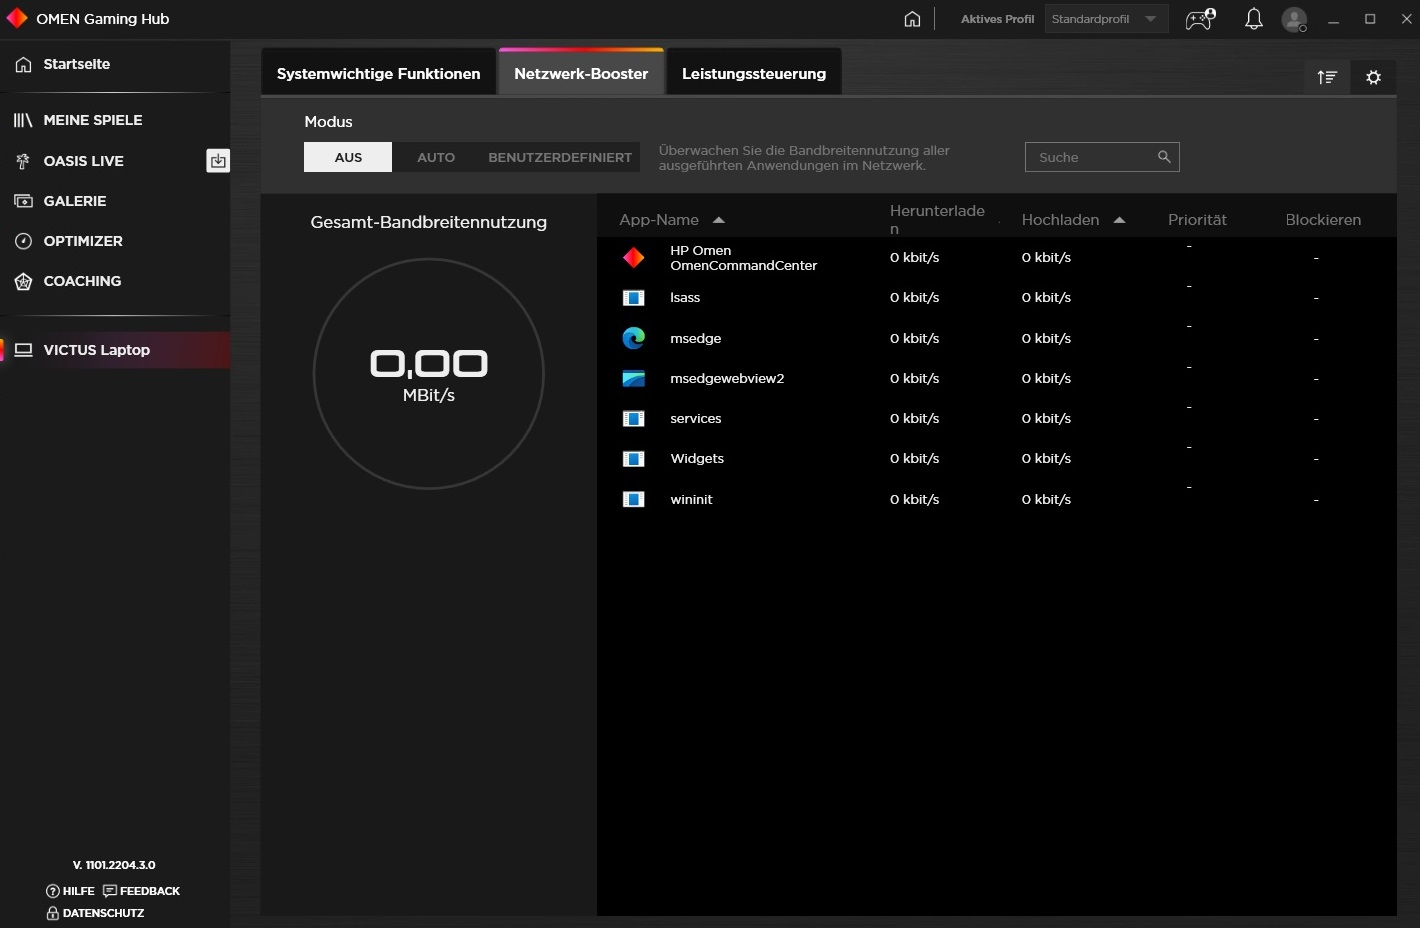
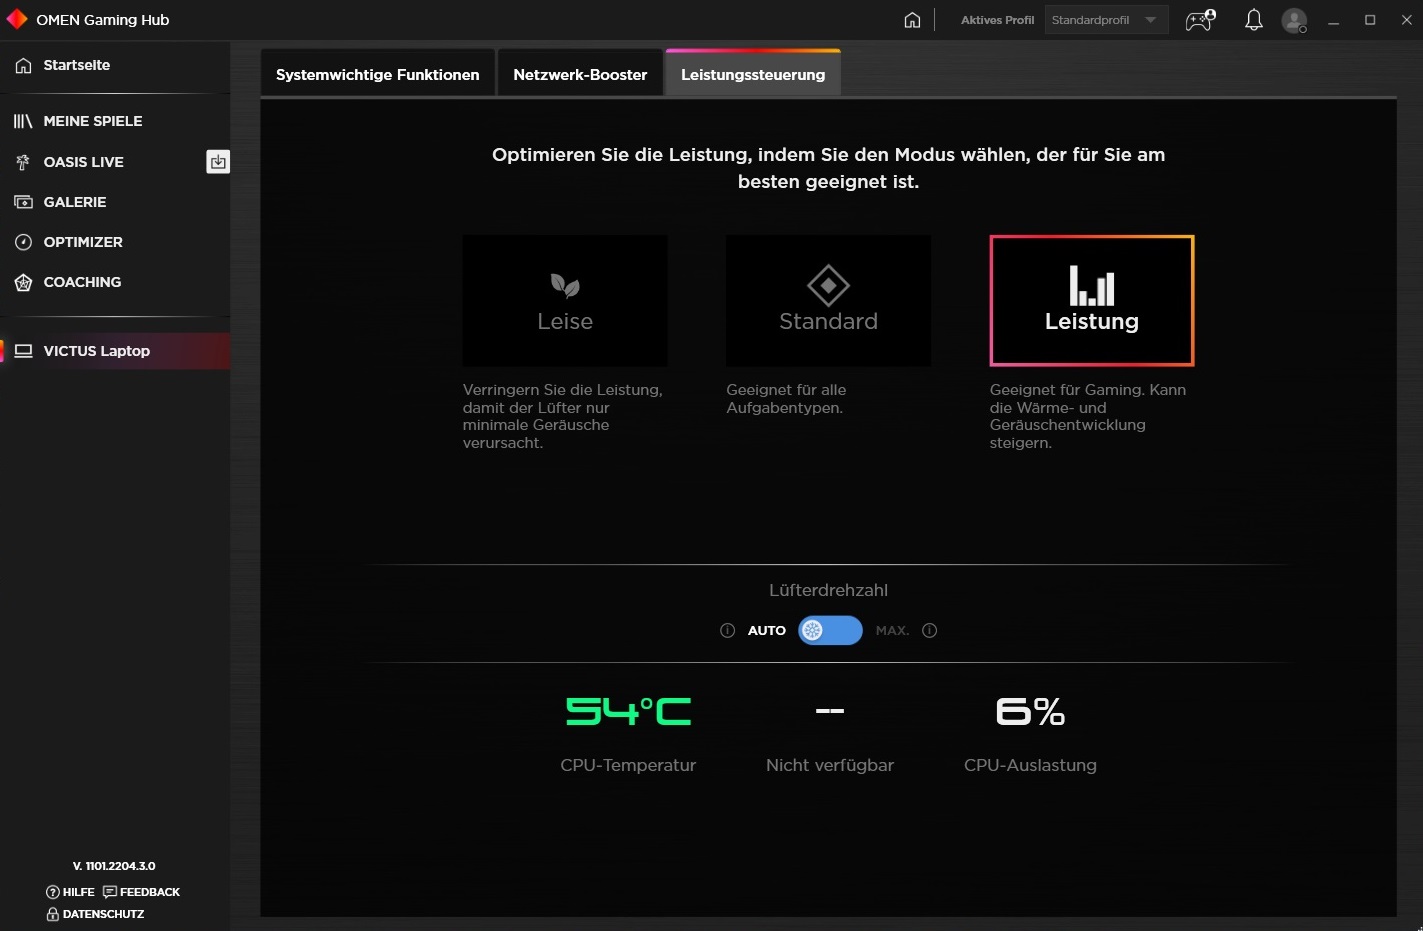
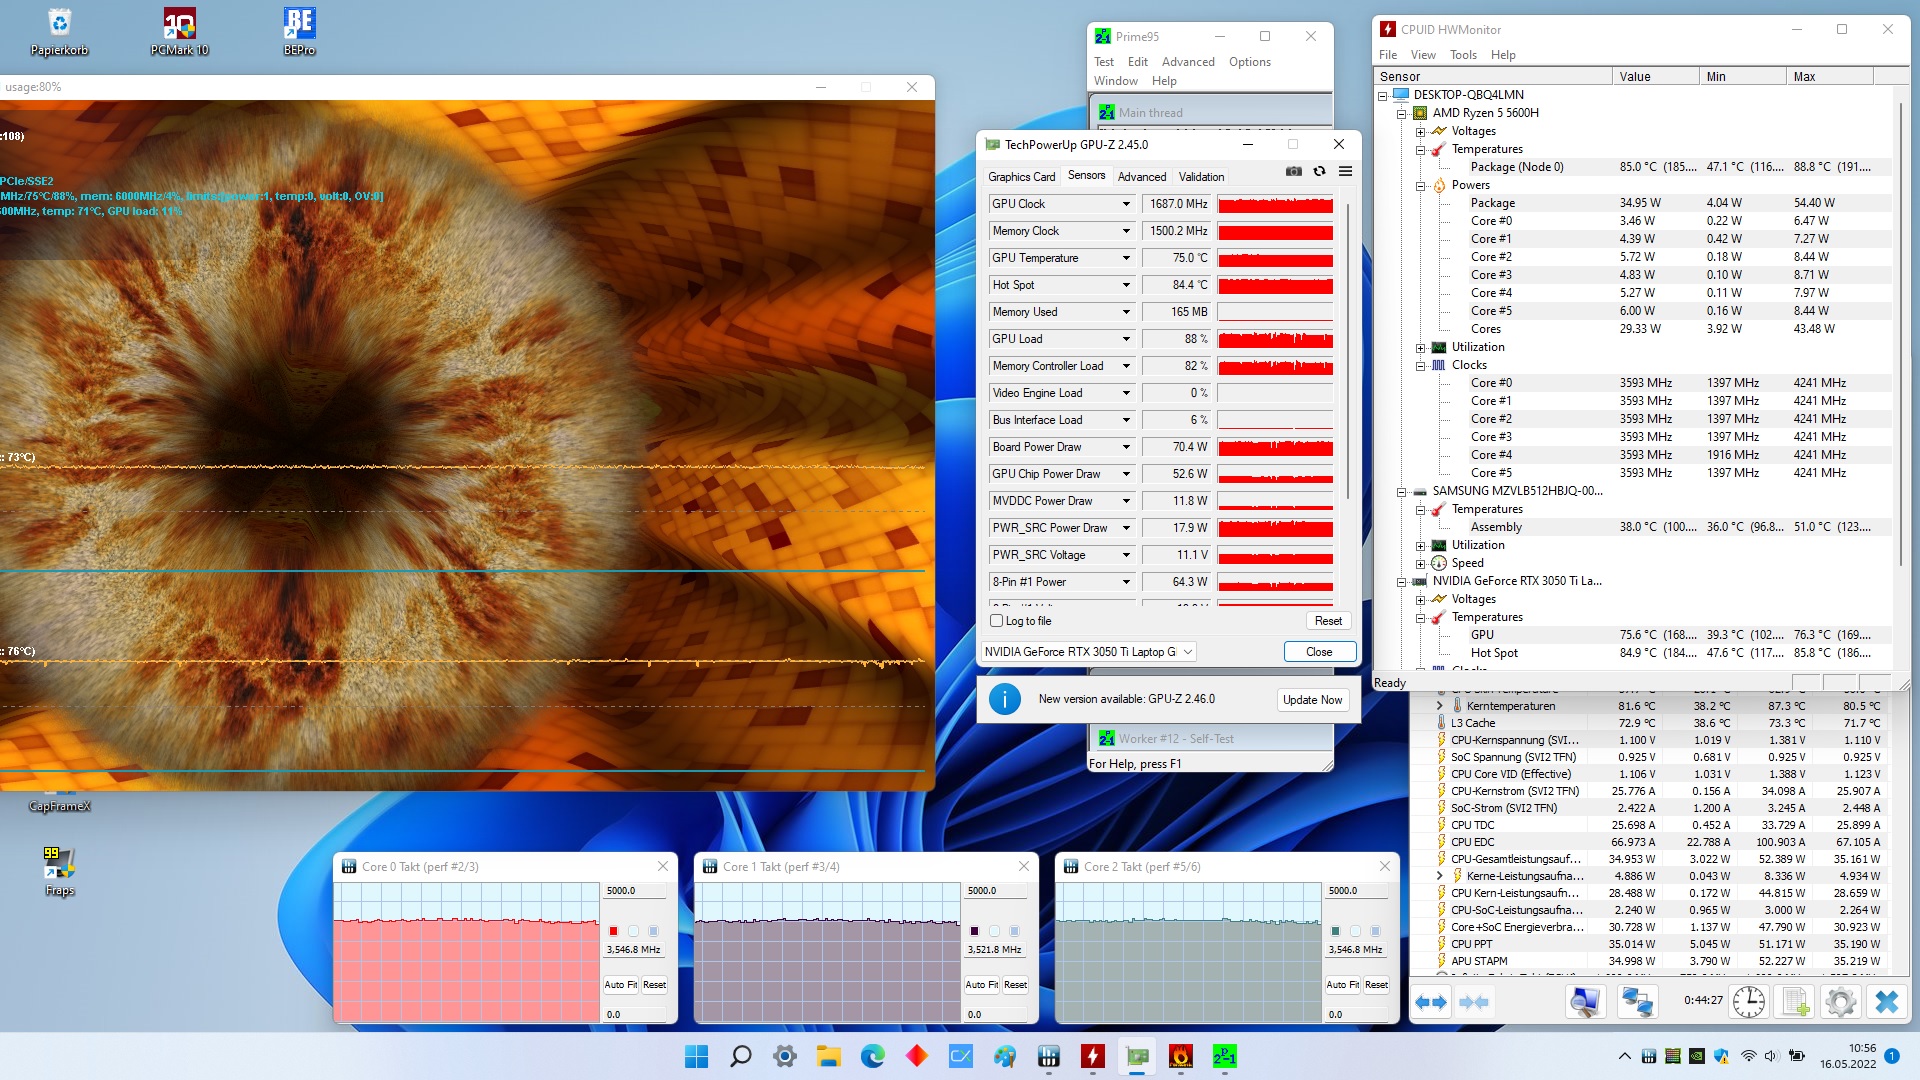
The Omen Gaming Hub, which should be preinstalled in models with Windows, offers three different performance profiles. With the exception of the battery tests, all the measurements were performed using the highest mode (see screenshot #3). The fan control was always adjusted to the automatic setting.
Processor
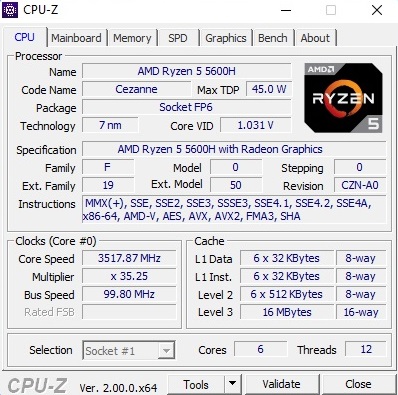
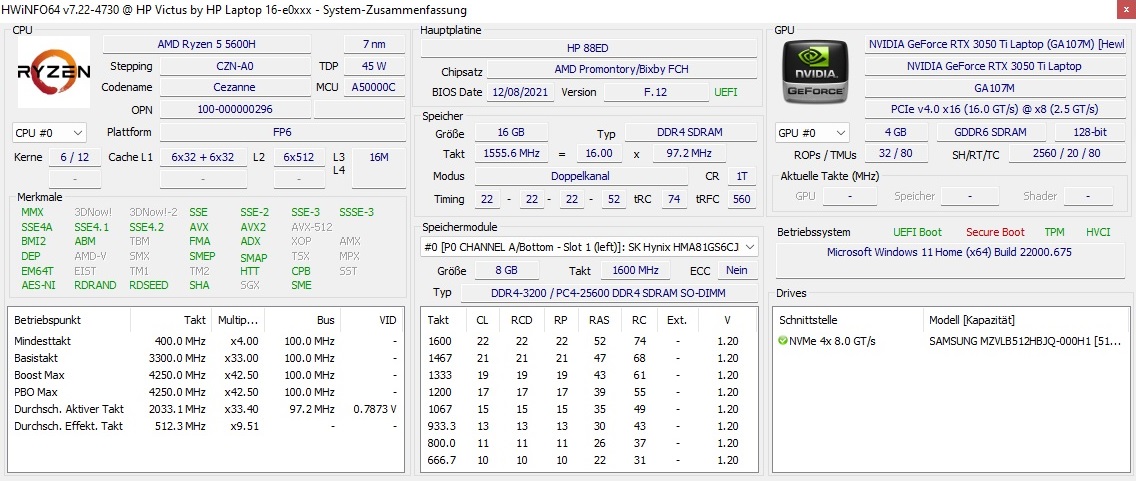
The Ryzen 5 5600H is a hexacore processor that is specified at 45 watts and able to operate on up to 12 threads simultaneously. Under load, the 7-nm model has a clock speed of 3.3 to 4.2 GHz.
In our Cinebench loop, the performance develops very evenly, similarly to the competitors. As you can see in the table, the Ryzen 5600H is significantly faster than Intel's Core i5-11300H, which only contains 4 cores, though (max. 8 threads). Thanks to using the Ryzen 7 5800H (8C/16T), the other competitors are slightly faster.
Cinebench R15 Multi Constant Load Test
* ... smaller is better
AIDA64: FP32 Ray-Trace | FPU Julia | CPU SHA3 | CPU Queen | FPU SinJulia | FPU Mandel | CPU AES | CPU ZLib | FP64 Ray-Trace | CPU PhotoWorxx
| Performance Rating | |
| Average of class Gaming | |
| Asus ROG Strix G17 G713QE-RB74 | |
| HP Victus 16-e0179ng | |
| Dell G15 5515 | |
| HP Victus 16-e0145ng | |
| Average AMD Ryzen 5 5600H | |
| Lenovo Ideapad Gaming 3 15IHU-82K1002RGE | |
| AIDA64 / FP32 Ray-Trace | |
| Average of class Gaming (3069 - 60169, n=222, last 2 years) | |
| Asus ROG Strix G17 G713QE-RB74 | |
| HP Victus 16-e0179ng | |
| Dell G15 5515 | |
| HP Victus 16-e0145ng | |
| Average AMD Ryzen 5 5600H (9181 - 12636, n=14) | |
| Lenovo Ideapad Gaming 3 15IHU-82K1002RGE | |
| AIDA64 / FPU Julia | |
| Asus ROG Strix G17 G713QE-RB74 | |
| Average of class Gaming (18567 - 252486, n=222, last 2 years) | |
| HP Victus 16-e0179ng | |
| Dell G15 5515 | |
| HP Victus 16-e0145ng | |
| Average AMD Ryzen 5 5600H (51994 - 78250, n=14) | |
| Lenovo Ideapad Gaming 3 15IHU-82K1002RGE | |
| AIDA64 / CPU SHA3 | |
| Average of class Gaming (629 - 10389, n=222, last 2 years) | |
| Asus ROG Strix G17 G713QE-RB74 | |
| HP Victus 16-e0179ng | |
| Dell G15 5515 | |
| HP Victus 16-e0145ng | |
| Average AMD Ryzen 5 5600H (1587 - 2675, n=14) | |
| Lenovo Ideapad Gaming 3 15IHU-82K1002RGE | |
| AIDA64 / CPU Queen | |
| Average of class Gaming (15371 - 200651, n=222, last 2 years) | |
| Asus ROG Strix G17 G713QE-RB74 | |
| HP Victus 16-e0179ng | |
| Dell G15 5515 | |
| HP Victus 16-e0145ng | |
| Average AMD Ryzen 5 5600H (66699 - 77213, n=14) | |
| Lenovo Ideapad Gaming 3 15IHU-82K1002RGE | |
| AIDA64 / FPU SinJulia | |
| Average of class Gaming (2137 - 32988, n=222, last 2 years) | |
| Dell G15 5515 | |
| HP Victus 16-e0179ng | |
| Asus ROG Strix G17 G713QE-RB74 | |
| HP Victus 16-e0145ng | |
| Average AMD Ryzen 5 5600H (8340 - 9159, n=14) | |
| Lenovo Ideapad Gaming 3 15IHU-82K1002RGE | |
| AIDA64 / FPU Mandel | |
| Asus ROG Strix G17 G713QE-RB74 | |
| HP Victus 16-e0179ng | |
| Dell G15 5515 | |
| Average of class Gaming (10291 - 134044, n=222, last 2 years) | |
| HP Victus 16-e0145ng | |
| Average AMD Ryzen 5 5600H (28268 - 43274, n=14) | |
| Lenovo Ideapad Gaming 3 15IHU-82K1002RGE | |
| AIDA64 / CPU AES | |
| Asus ROG Strix G17 G713QE-RB74 | |
| HP Victus 16-e0179ng | |
| Dell G15 5515 | |
| Average of class Gaming (19065 - 328679, n=222, last 2 years) | |
| Average AMD Ryzen 5 5600H (39852 - 98939, n=14) | |
| Lenovo Ideapad Gaming 3 15IHU-82K1002RGE | |
| HP Victus 16-e0145ng | |
| AIDA64 / CPU ZLib | |
| Average of class Gaming (150.9 - 2409, n=222, last 2 years) | |
| Asus ROG Strix G17 G713QE-RB74 | |
| HP Victus 16-e0179ng | |
| Dell G15 5515 | |
| HP Victus 16-e0145ng | |
| Average AMD Ryzen 5 5600H (507 - 649, n=14) | |
| Lenovo Ideapad Gaming 3 15IHU-82K1002RGE | |
| AIDA64 / FP64 Ray-Trace | |
| Average of class Gaming (1518 - 31796, n=222, last 2 years) | |
| Asus ROG Strix G17 G713QE-RB74 | |
| HP Victus 16-e0179ng | |
| Dell G15 5515 | |
| HP Victus 16-e0145ng | |
| Average AMD Ryzen 5 5600H (4811 - 6652, n=14) | |
| Lenovo Ideapad Gaming 3 15IHU-82K1002RGE | |
| AIDA64 / CPU PhotoWorxx | |
| Average of class Gaming (10805 - 60161, n=223, last 2 years) | |
| HP Victus 16-e0145ng | |
| HP Victus 16-e0179ng | |
| Average AMD Ryzen 5 5600H (7419 - 24746, n=14) | |
| Asus ROG Strix G17 G713QE-RB74 | |
| Dell G15 5515 | |
| Lenovo Ideapad Gaming 3 15IHU-82K1002RGE | |
System Performance
Despite being equipped with the top SSD, it is only sufficient for the next to last place of our test field in the system performance. However, 6076 points in the PCMark 10 is still a good result and indicate a capable allrounder.
CrossMark: Overall | Productivity | Creativity | Responsiveness
| PCMark 10 / Score | |
| Average of class Gaming (5235 - 9852, n=197, last 2 years) | |
| HP Victus 16-e0179ng | |
| Asus ROG Strix G17 G713QE-RB74 | |
| Dell G15 5515 | |
| HP Victus 16-e0145ng | |
| Lenovo Ideapad Gaming 3 15IHU-82K1002RGE | |
| PCMark 10 / Essentials | |
| Average of class Gaming (8300 - 12334, n=196, last 2 years) | |
| Asus ROG Strix G17 G713QE-RB74 | |
| HP Victus 16-e0179ng | |
| HP Victus 16-e0145ng | |
| Dell G15 5515 | |
| Lenovo Ideapad Gaming 3 15IHU-82K1002RGE | |
| PCMark 10 / Productivity | |
| Average of class Gaming (7244 - 11833, n=196, last 2 years) | |
| Asus ROG Strix G17 G713QE-RB74 | |
| Lenovo Ideapad Gaming 3 15IHU-82K1002RGE | |
| HP Victus 16-e0179ng | |
| Dell G15 5515 | |
| HP Victus 16-e0145ng | |
| PCMark 10 / Digital Content Creation | |
| Average of class Gaming (6462 - 18475, n=196, last 2 years) | |
| HP Victus 16-e0179ng | |
| Asus ROG Strix G17 G713QE-RB74 | |
| HP Victus 16-e0145ng | |
| Dell G15 5515 | |
| Lenovo Ideapad Gaming 3 15IHU-82K1002RGE | |
| CrossMark / Overall | |
| Average of class Gaming (1247 - 2334, n=167, last 2 years) | |
| Lenovo Ideapad Gaming 3 15IHU-82K1002RGE | |
| CrossMark / Productivity | |
| Average of class Gaming (1299 - 2204, n=167, last 2 years) | |
| Lenovo Ideapad Gaming 3 15IHU-82K1002RGE | |
| CrossMark / Creativity | |
| Average of class Gaming (1275 - 2514, n=167, last 2 years) | |
| Lenovo Ideapad Gaming 3 15IHU-82K1002RGE | |
| CrossMark / Responsiveness | |
| Average of class Gaming (1030 - 2330, n=167, last 2 years) | |
| Lenovo Ideapad Gaming 3 15IHU-82K1002RGE | |
| PCMark 10 Score | 6076 points | |
Help | ||
| AIDA64 / Memory Copy | |
| Average of class Gaming (21842 - 92565, n=222, last 2 years) | |
| HP Victus 16-e0145ng | |
| HP Victus 16-e0179ng | |
| Dell G15 5515 | |
| Asus ROG Strix G17 G713QE-RB74 | |
| Average AMD Ryzen 5 5600H (20549 - 42141, n=14) | |
| Lenovo Ideapad Gaming 3 15IHU-82K1002RGE | |
| AIDA64 / Memory Read | |
| Average of class Gaming (24879 - 90647, n=222, last 2 years) | |
| HP Victus 16-e0145ng | |
| HP Victus 16-e0179ng | |
| Dell G15 5515 | |
| Asus ROG Strix G17 G713QE-RB74 | |
| Average AMD Ryzen 5 5600H (22917 - 47595, n=14) | |
| Lenovo Ideapad Gaming 3 15IHU-82K1002RGE | |
| AIDA64 / Memory Write | |
| Average of class Gaming (21619 - 103259, n=222, last 2 years) | |
| HP Victus 16-e0145ng | |
| HP Victus 16-e0179ng | |
| Average AMD Ryzen 5 5600H (20226 - 44872, n=14) | |
| Dell G15 5515 | |
| Asus ROG Strix G17 G713QE-RB74 | |
| Lenovo Ideapad Gaming 3 15IHU-82K1002RGE | |
| AIDA64 / Memory Latency | |
| Lenovo Ideapad Gaming 3 15IHU-82K1002RGE | |
| Average of class Gaming (59.5 - 152.5, n=219, last 2 years) | |
| HP Victus 16-e0179ng | |
| Asus ROG Strix G17 G713QE-RB74 | |
| Average AMD Ryzen 5 5600H (75 - 89.1, n=14) | |
| Dell G15 5515 | |
| HP Victus 16-e0145ng | |
* ... smaller is better
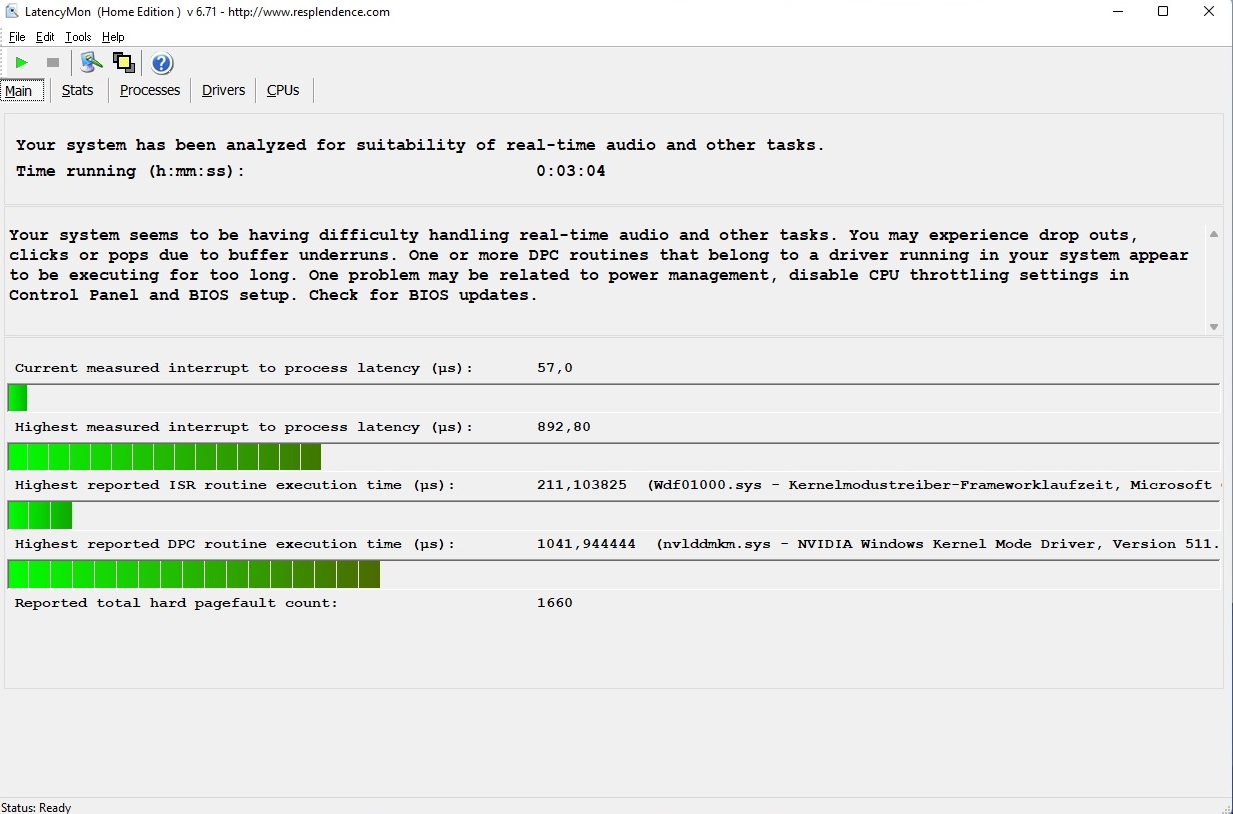
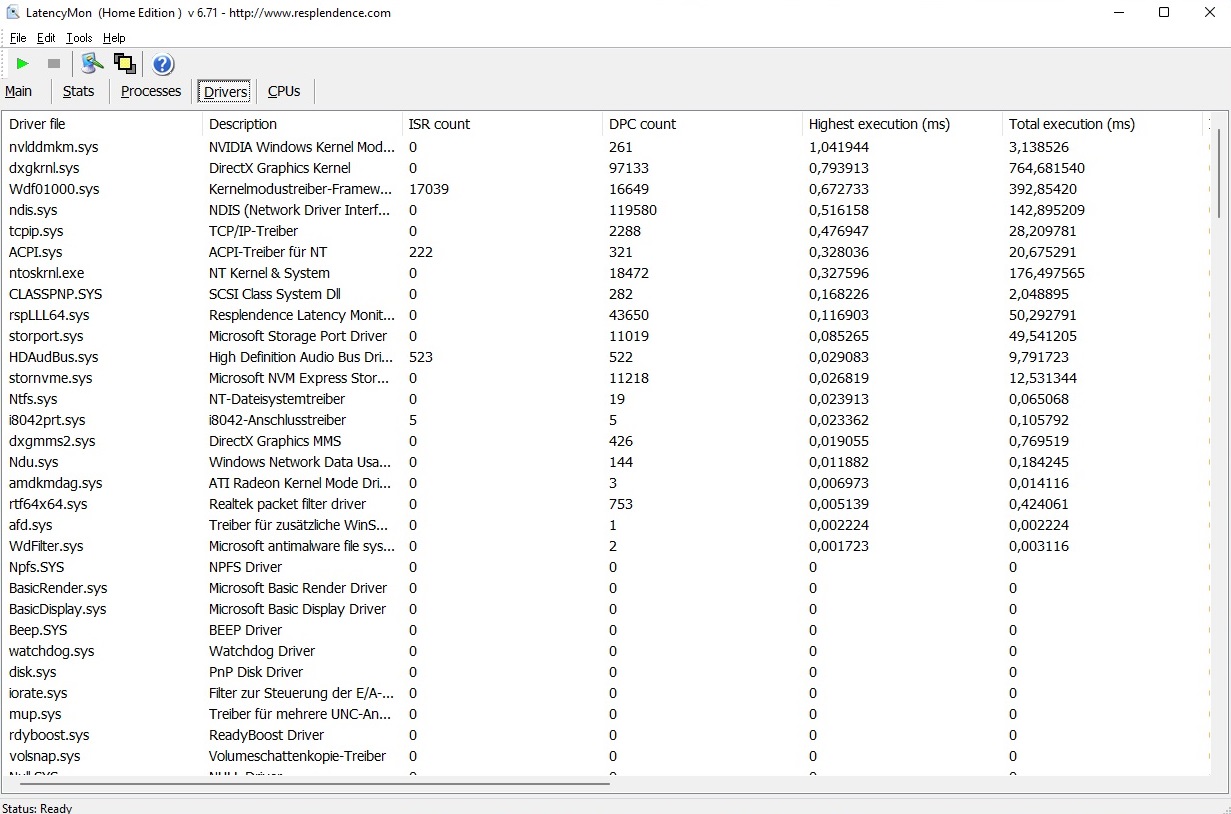
DPC Latencies
As it happens so often, there is some need for improvement in the latencies. According to the LatencyMon tool, the Victus 16 without any further adjustments is not ideally suited for real-time audio and video processing.
| DPC Latencies / LatencyMon - interrupt to process latency (max), Web, Youtube, Prime95 | |
| HP Victus 16-e0179ng | |
| Asus ROG Strix G17 G713QE-RB74 | |
| Lenovo Ideapad Gaming 3 15IHU-82K1002RGE | |
| HP Victus 16-e0145ng | |
| Dell G15 5515 | |
* ... smaller is better
Storage Solution
Our test configuration collects some positive points with its storage solution. Even though the storage capacity of the Samsung PM981a with its 512 GB does not create any enthusiasm, the M.2 drive on NVMe basis fares very well in the benchmarks, leaving even the 1-TB drive of the more expensive Victus 16 model just barely behind.

| Drive Performance Rating - Percent | |
| Average of class Gaming | |
| HP Victus 16-e0179ng | |
| HP Victus 16-e0145ng | |
| Dell G15 5515 | |
| Asus ROG Strix G17 G713QE-RB74 | |
| Lenovo Ideapad Gaming 3 15IHU-82K1002RGE | |
* ... smaller is better
Constant Performance Reading: DiskSpd Read Loop, Queue Depth 8
Graphics Card
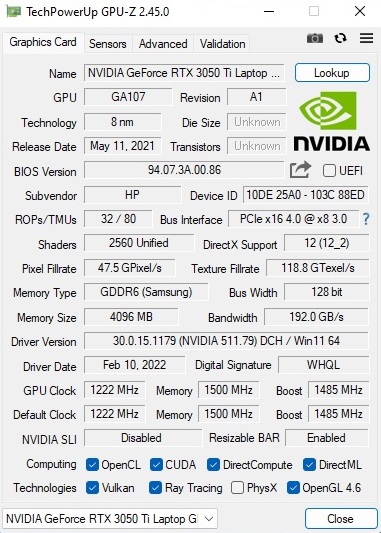
With the GeForce RTX 3050 Ti, Nvidia offers a successful midrange GPU, as long as you disregard the mediocre raytracing performance. The DirectX-12 model is able to use 2560 shaders and includes 4 GB of GDDR6-VRAM. Unfortunately, the latter isn't up to date anymore at this point. We currently expect at least 6 GB from midrange devices. Demanding games will therefore reach their limits in higher resolutions and settings.
Generally, the performance of Nvidia's Ampere chips depends very much on the configured TGP. At 75 watts (including Dynamic Boost), HD has chosen a fairly high value for the RTX 3050 Ti, which is also reflected in the above average scores in the synthetic graphics benchmarks and tests using real games. However, the Victus 16 still has a hard time against the competitors. Both the Asus Strix G17 G713QE and the Dell G5 5515 are able to achieve a small advantage in most cases. The GeForce RTX 3060 of the more expensive Victus 16 moves ahead by about 30% most of the time.
| 3DMark 11 Performance | 17816 points | |
| 3DMark Cloud Gate Standard Score | 36899 points | |
| 3DMark Fire Strike Score | 13022 points | |
| 3DMark Time Spy Score | 5910 points | |
Help | ||
Gaming Performance
Less demanding or not extremely computing intensive games don't create any unsurmountable challenges for the GeForce RTX 3050 Ti, and high to maximum settings in the native resolution of 1920 x 1080 are no problem most of the time. Things only become tight in demanding games such as Forza Horizon 5, Dying Light 2, or God of War, where it is not always sufficient for smooth frame rates with all the controls set to the maximum.
| The Witcher 3 | |
| 1920x1080 High Graphics & Postprocessing (Nvidia HairWorks Off) | |
| Average of class Gaming (17.5 - 449, n=165, last 2 years) | |
| HP Victus 16-e0179ng | |
| Asus ROG Strix G17 G713QE-RB74 | |
| HP Victus 16-e0145ng | |
| Dell G15 5515 | |
| Lenovo Ideapad Gaming 3 15IHU-82K1002RGE | |
| Average NVIDIA GeForce RTX 3050 Ti Laptop GPU (30 - 110, n=26) | |
| 1920x1080 Ultra Graphics & Postprocessing (HBAO+) | |
| Average of class Gaming (8.61 - 216, n=225, last 2 years) | |
| HP Victus 16-e0179ng | |
| Asus ROG Strix G17 G713QE-RB74 | |
| Dell G15 5515 | |
| HP Victus 16-e0145ng | |
| Average NVIDIA GeForce RTX 3050 Ti Laptop GPU (19 - 58.5, n=29) | |
| Lenovo Ideapad Gaming 3 15IHU-82K1002RGE | |
During the constant load test with The Witcher 3 (1 hour @FHD/Ultra), we do not see any conspicuous behavior. The performance remains fairly stable during the whole time.
The Witcher 3 FPS Chart
| low | med. | high | ultra | |
| GTA V (2015) | 167.7 | 131.4 | 73.7 | |
| The Witcher 3 (2015) | 176 | 104 | 54.9 | |
| Dota 2 Reborn (2015) | 139.6 | 125.3 | 118 | 113 |
| Final Fantasy XV Benchmark (2018) | 76.4 | 54.9 | ||
| X-Plane 11.11 (2018) | 99.3 | 91.2 | 74.2 | |
| Strange Brigade (2018) | 140.1 | 114.5 | 98.9 | |
| Alan Wake Remastered (2021) | 105.4 | 95.3 | ||
| Back 4 Blood (2021) | 142.8 | 123.8 | 116.2 | |
| Guardians of the Galaxy (2021) | 83 | 82 | 79 | |
| Riders Republic (2021) | 88 | 69 | 54 | |
| Forza Horizon 5 (2021) | 93 | 84 | 19 | |
| Farming Simulator 22 (2021) | 130 | 104.8 | 92.3 | |
| Halo Infinite (2021) | 89.1 | 59 | 51.5 | |
| God of War (2022) | 64.3 | 50.3 | 31.3 | |
| Rainbow Six Extraction (2022) | 116 | 112 | 86 | |
| Dying Light 2 (2022) | 47 | 39.6 | ||
| Elden Ring (2022) | 59.6 | 59.6 | 56.2 | |
| Ghostwire Tokyo (2022) | 91.1 | 90 | 88.2 | |
| Tiny Tina's Wonderlands (2022) | 99.3 | 68.6 | 51.8 | |
| Vampire Bloodhunt (2022) | 132.4 | 86.2 | 86.1 |
Emissions
Noise Emissions
The noise development leaves some mixed feelings. Although some other gaming laptops become even louder under load, 44 to 53 dB(A) in 3D operation aren't really good at all either. With these values, the Victus 16 comes close to its faster sibling. Surprisingly, we even measure a slightly higher noise level during idle operation. When the laptop isn't busy for a moment, the fans are either turned off or run already at a very audible noise level. A constant, discrete fan speed would have been preferable here.
Noise Level
| Idle |
| 26 / 28 / 34 dB(A) |
| Load |
| 44 / 53 dB(A) |
 | ||
30 dB silent 40 dB(A) audible 50 dB(A) loud |
||
min: | ||
| HP Victus 16-e0145ng R5 5600H, GeForce RTX 3050 Ti Laptop GPU | HP Victus 16-e0179ng R7 5800H, GeForce RTX 3060 Laptop GPU | Lenovo Ideapad Gaming 3 15IHU-82K1002RGE i5-11300H, GeForce RTX 3050 Ti Laptop GPU | Dell G15 5515 R7 5800H, GeForce RTX 3050 Ti Laptop GPU | Asus ROG Strix G17 G713QE-RB74 R7 5800H, GeForce RTX 3050 Ti Laptop GPU | |
|---|---|---|---|---|---|
| Noise | 4% | 7% | 7% | 9% | |
| off / environment * | 26 | 24 8% | 23.9 8% | 24 8% | 24.9 4% |
| Idle Minimum * | 26 | 24 8% | 23.9 8% | 25 4% | 25.1 3% |
| Idle Average * | 28 | 25 11% | 26.8 4% | 26 7% | 25.1 10% |
| Idle Maximum * | 34 | 34 -0% | 26.8 21% | 30 12% | 25.1 26% |
| Load Average * | 44 | 44 -0% | 43.5 1% | 44 -0% | 36.3 17% |
| Witcher 3 ultra * | 48 | 50 -4% | 43.5 9% | 44 8% | 49.9 -4% |
| Load Maximum * | 53 | 52 2% | 53.1 -0% | 48 9% | 49.9 6% |
* ... smaller is better
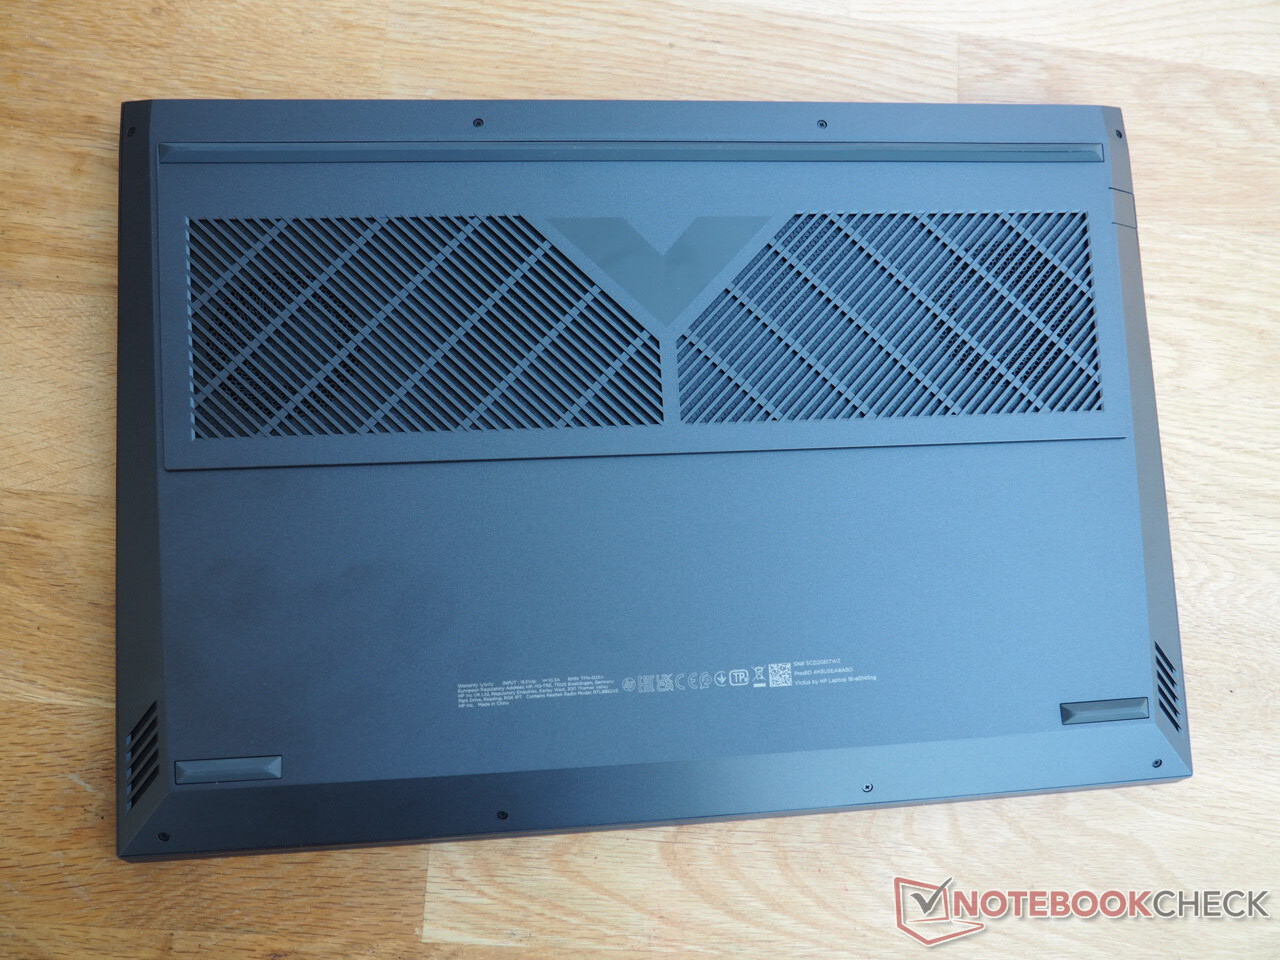
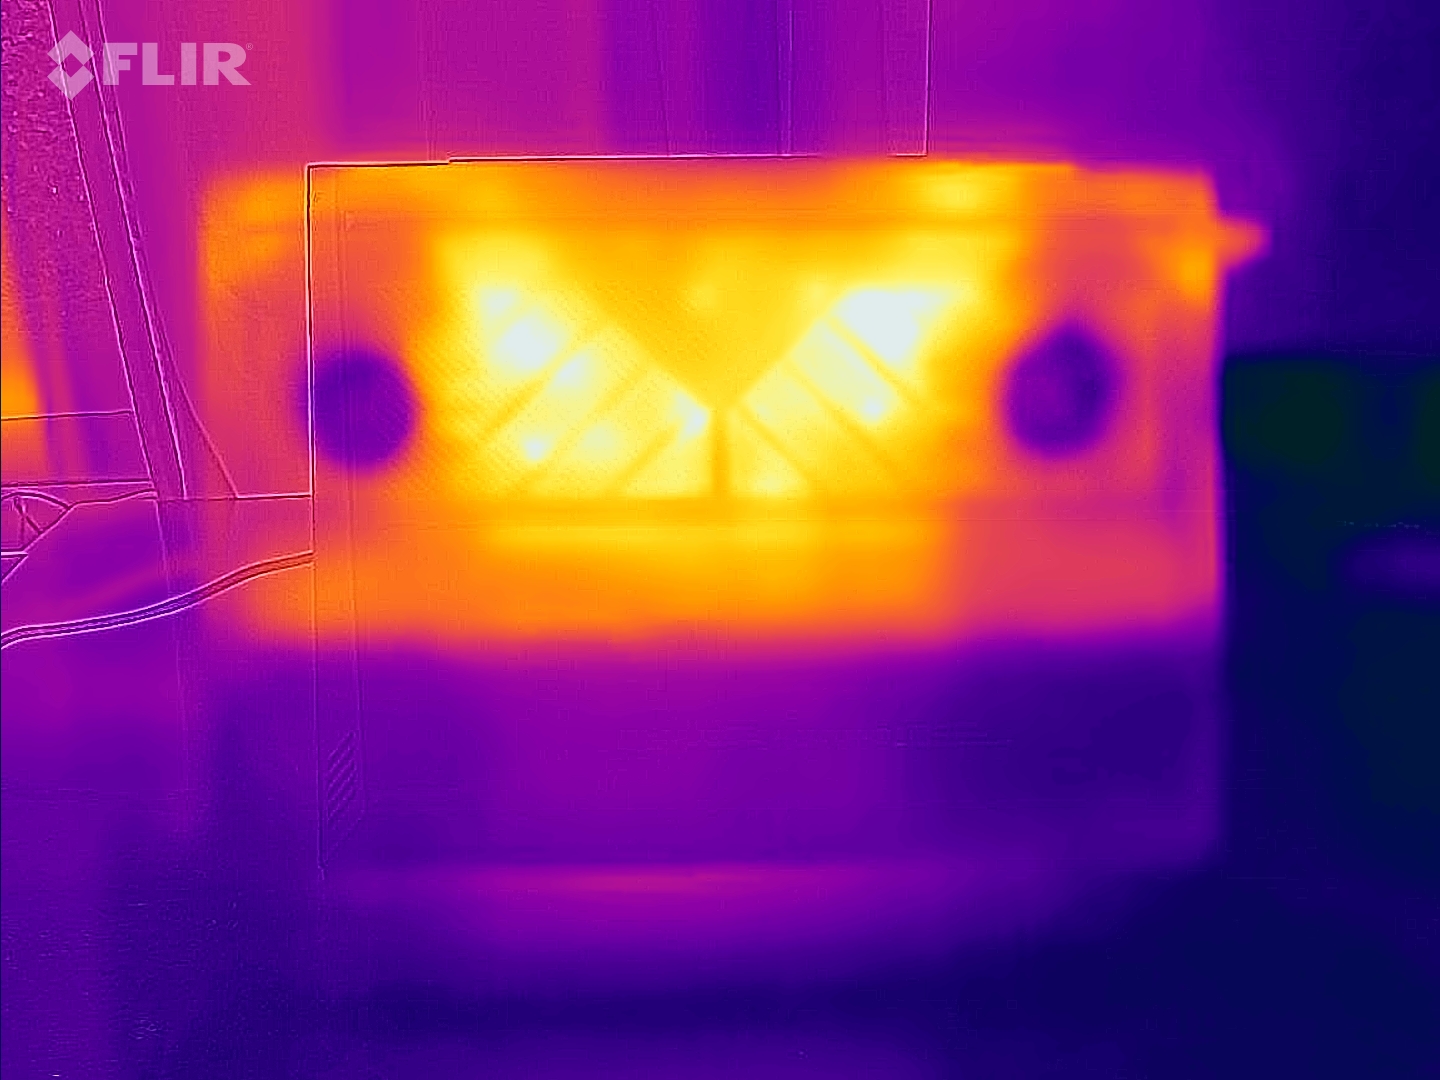
Temperatures
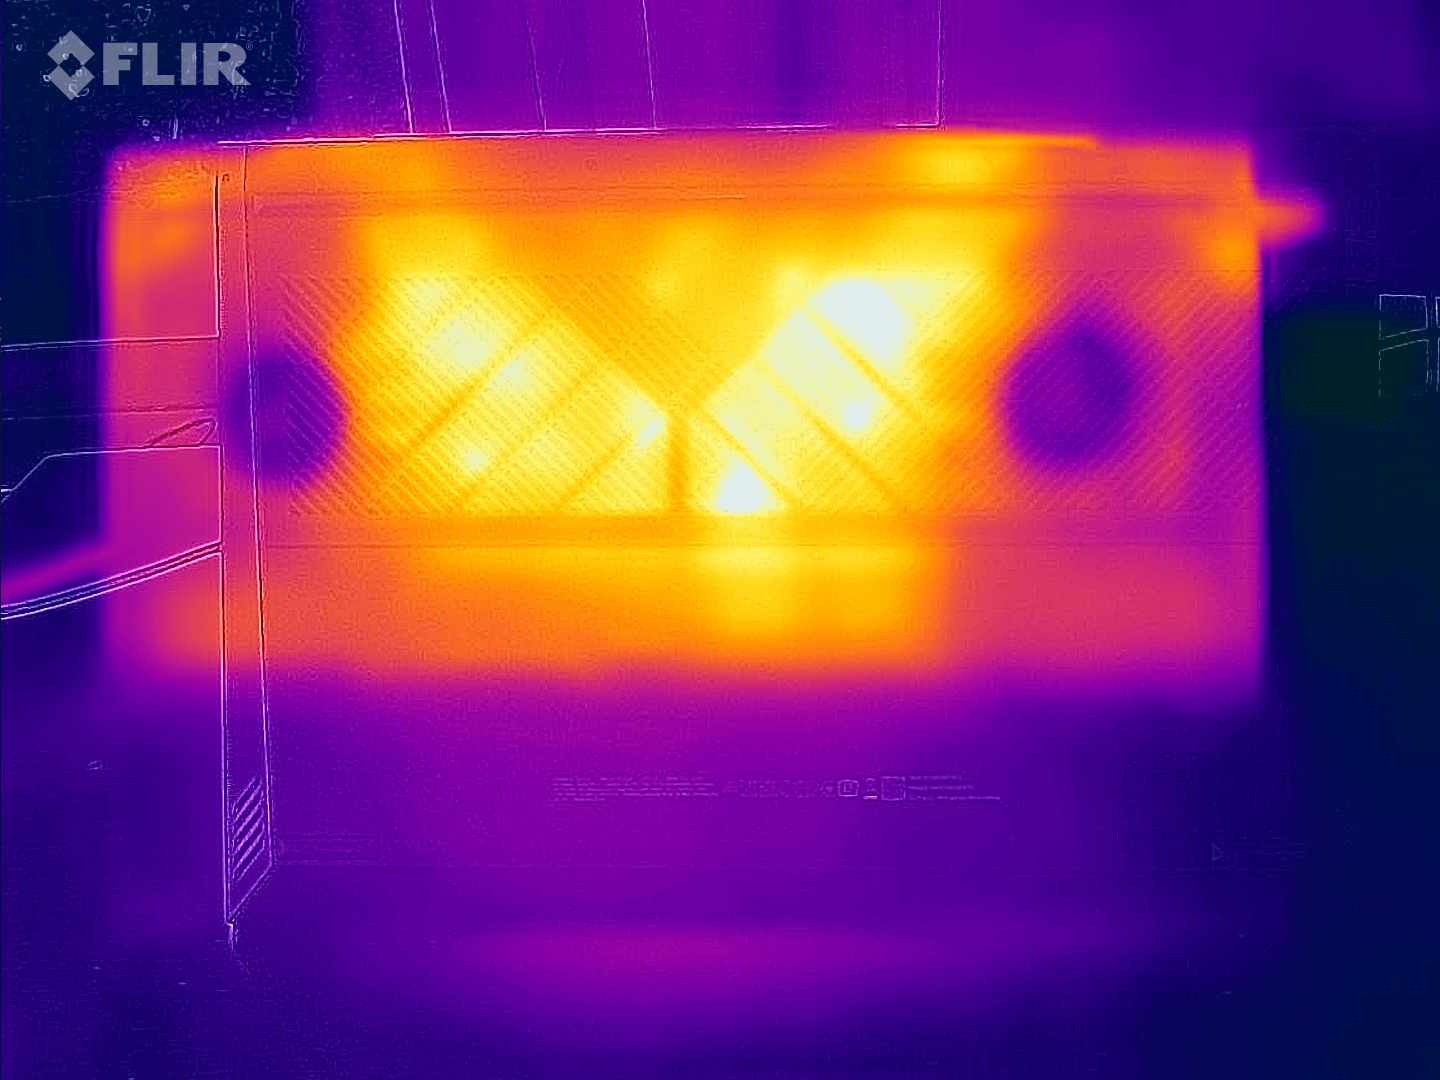
As usual, the case warms up particularly in the back half. At two spots on the Victus 16, we measured more than 50 °C (122 °F) under load. However, this value is still within the typical range for gaming laptops. Inside the case, mainly the processor heats up. After an hour of the stress test with the Furmark and Prime95 tools, the Ryzen 5 5600H stays at a comfortable 85 °C (185 °F). The GeForce RTX 3050 Ti reaches a moderate 75 °C (167 °F).
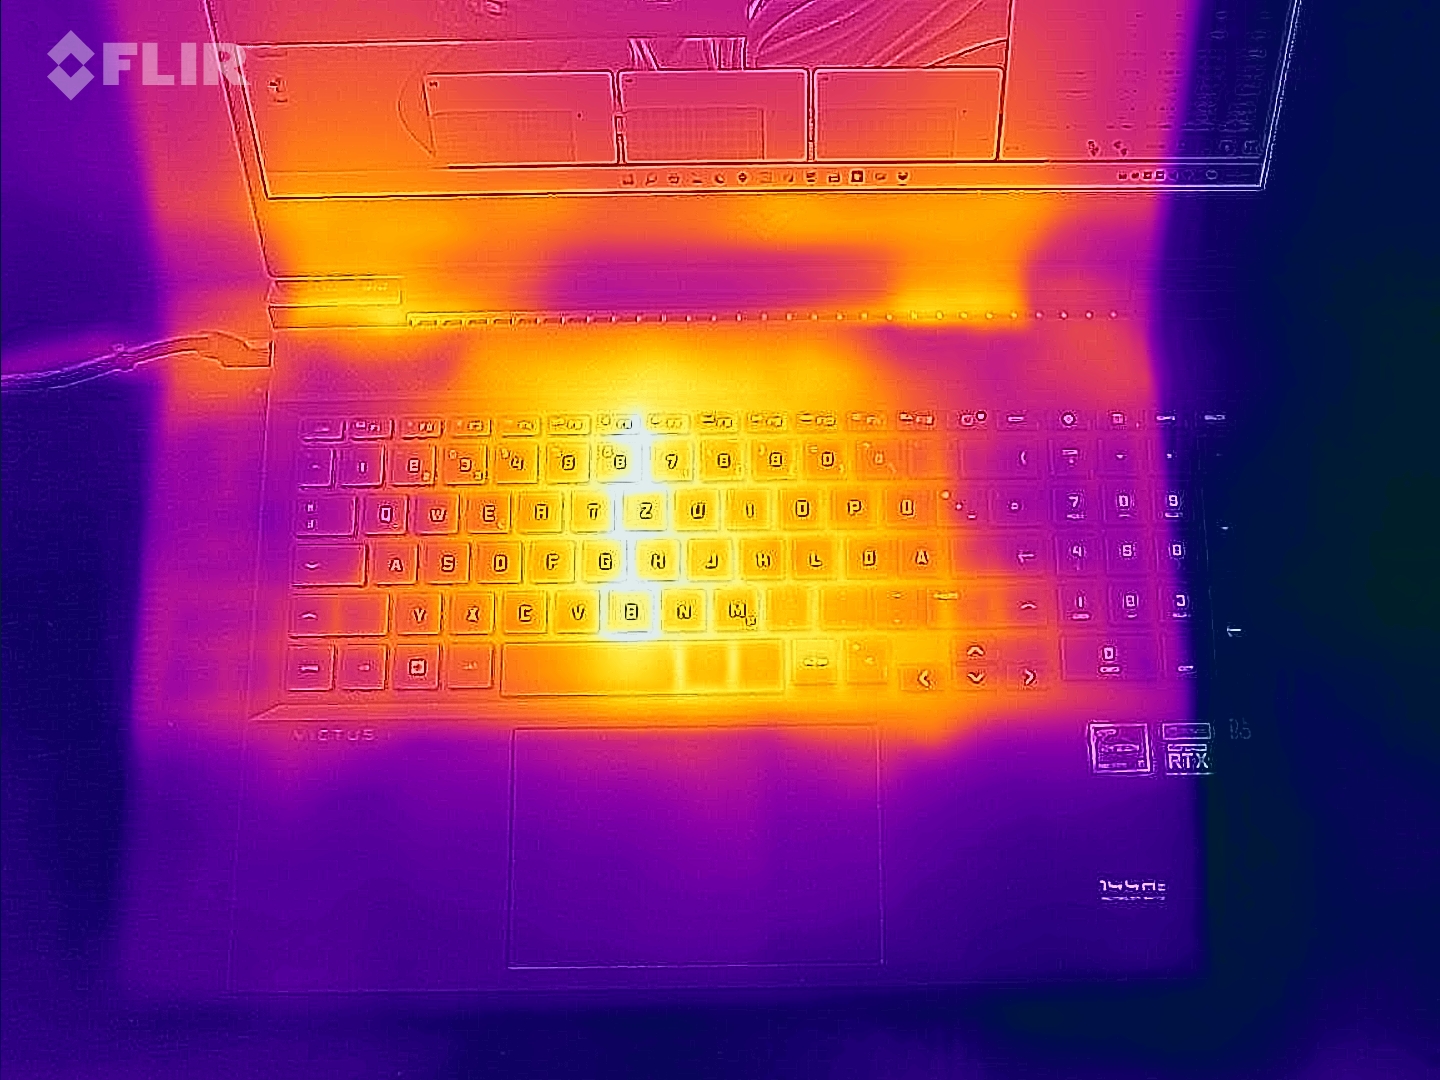
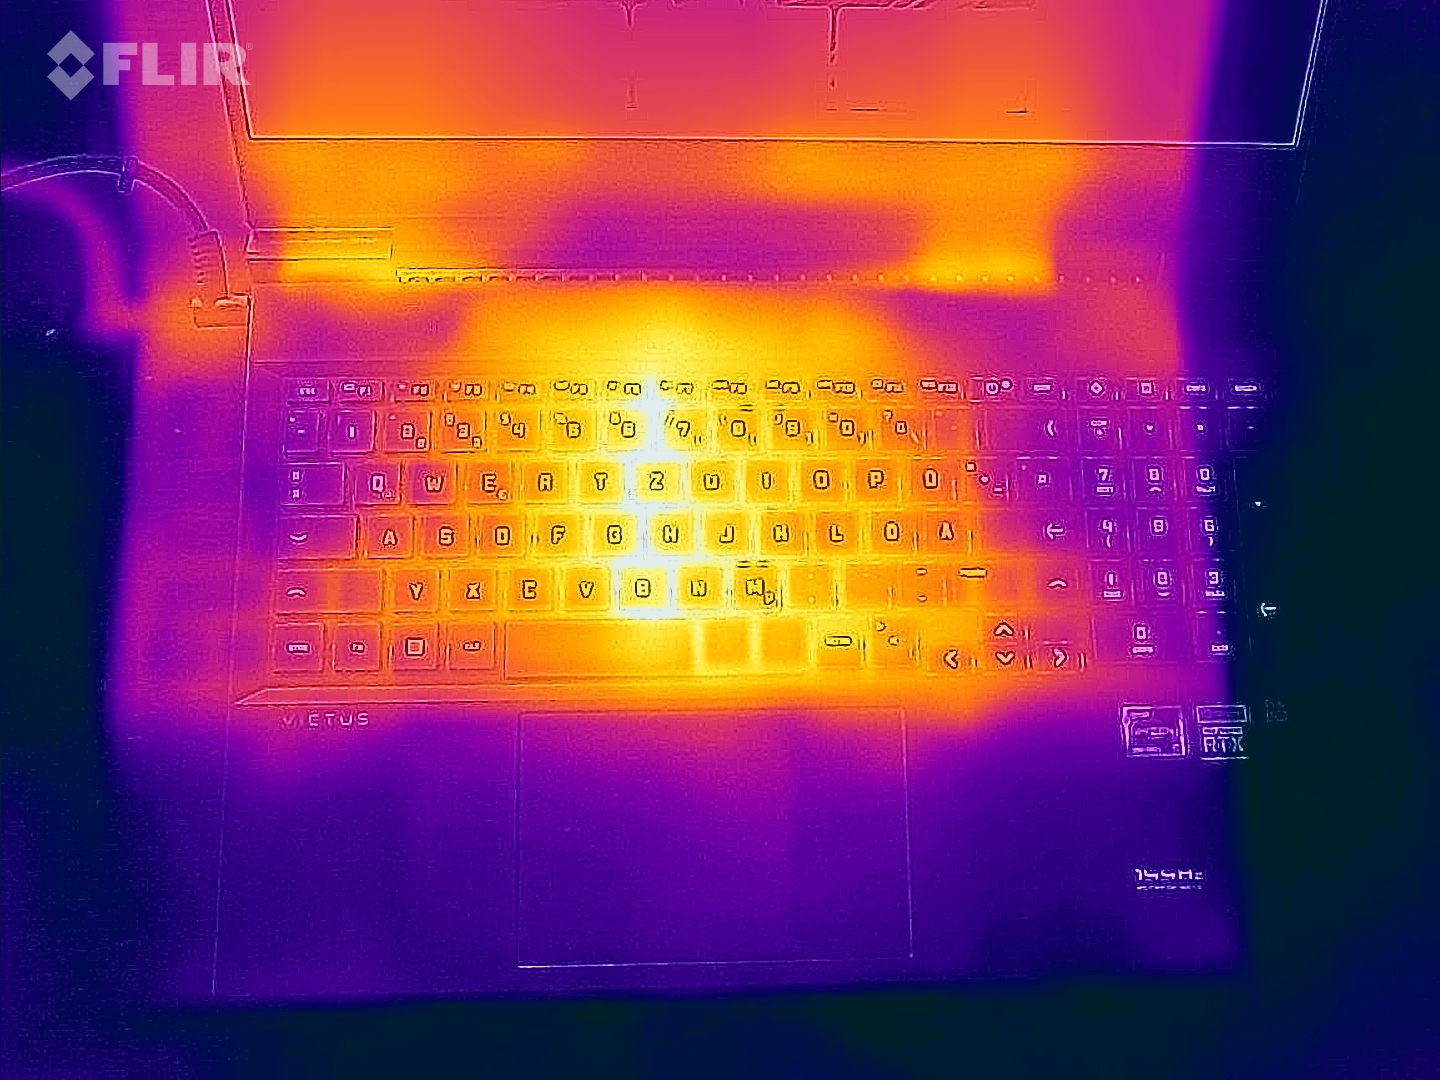
(-) The maximum temperature on the upper side is 54 °C / 129 F, compared to the average of 40.4 °C / 105 F, ranging from 21.2 to 68.8 °C for the class Gaming.
(-) The bottom heats up to a maximum of 47 °C / 117 F, compared to the average of 43.2 °C / 110 F
(+) In idle usage, the average temperature for the upper side is 31.7 °C / 89 F, compared to the device average of 33.8 °C / 93 F.
(-) Playing The Witcher 3, the average temperature for the upper side is 40 °C / 104 F, compared to the device average of 33.8 °C / 93 F.
(±) The palmrests and touchpad can get very hot to the touch with a maximum of 37 °C / 98.6 F.
(-) The average temperature of the palmrest area of similar devices was 28.9 °C / 84 F (-8.1 °C / -14.6 F).
| HP Victus 16-e0145ng R5 5600H, GeForce RTX 3050 Ti Laptop GPU | HP Victus 16-e0179ng R7 5800H, GeForce RTX 3060 Laptop GPU | Lenovo Ideapad Gaming 3 15IHU-82K1002RGE i5-11300H, GeForce RTX 3050 Ti Laptop GPU | Dell G15 5515 R7 5800H, GeForce RTX 3050 Ti Laptop GPU | Asus ROG Strix G17 G713QE-RB74 R7 5800H, GeForce RTX 3050 Ti Laptop GPU | |
|---|---|---|---|---|---|
| Heat | -12% | 18% | 14% | 3% | |
| Maximum Upper Side * | 54 | 51 6% | 43.2 20% | 50 7% | 43.8 19% |
| Maximum Bottom * | 47 | 52 -11% | 47.9 -2% | 49 -4% | 47.2 -0% |
| Idle Upper Side * | 41 | 46 -12% | 24.9 39% | 26 37% | 33.4 19% |
| Idle Bottom * | 31 | 41 -32% | 27 13% | 26 16% | 39.4 -27% |
* ... smaller is better
Speakers
HP Victus 16-e0145ng audio analysis
(±) | speaker loudness is average but good (79 dB)
Bass 100 - 315 Hz
(-) | nearly no bass - on average 21% lower than median
(±) | linearity of bass is average (12.6% delta to prev. frequency)
Mids 400 - 2000 Hz
(+) | balanced mids - only 1.1% away from median
(+) | mids are linear (3.6% delta to prev. frequency)
Highs 2 - 16 kHz
(+) | balanced highs - only 4.2% away from median
(+) | highs are linear (5.3% delta to prev. frequency)
Overall 100 - 16.000 Hz
(±) | linearity of overall sound is average (16.2% difference to median)
Compared to same class
» 37% of all tested devices in this class were better, 7% similar, 56% worse
» The best had a delta of 6%, average was 18%, worst was 132%
Compared to all devices tested
» 21% of all tested devices were better, 5% similar, 74% worse
» The best had a delta of 4%, average was 25%, worst was 134%
Lenovo Ideapad Gaming 3 15IHU-82K1002RGE audio analysis
(±) | speaker loudness is average but good (80 dB)
Bass 100 - 315 Hz
(-) | nearly no bass - on average 23.8% lower than median
(±) | linearity of bass is average (10.3% delta to prev. frequency)
Mids 400 - 2000 Hz
(±) | higher mids - on average 6.7% higher than median
(+) | mids are linear (6% delta to prev. frequency)
Highs 2 - 16 kHz
(+) | balanced highs - only 3.6% away from median
(±) | linearity of highs is average (7.4% delta to prev. frequency)
Overall 100 - 16.000 Hz
(±) | linearity of overall sound is average (20.7% difference to median)
Compared to same class
» 72% of all tested devices in this class were better, 4% similar, 24% worse
» The best had a delta of 6%, average was 18%, worst was 132%
Compared to all devices tested
» 50% of all tested devices were better, 8% similar, 42% worse
» The best had a delta of 4%, average was 25%, worst was 134%
Power Management
Power Consumption
The power consumption is unremarkable. Between 7 and 15 watts during idle operation and between 93 and 185 watts in 3D operation is relatively efficient for a gaming laptop and appropriate for the hardware used.
| Off / Standby | |
| Idle | |
| Load |
|
| HP Victus 16-e0145ng R5 5600H, GeForce RTX 3050 Ti Laptop GPU | HP Victus 16-e0179ng R7 5800H, GeForce RTX 3060 Laptop GPU | Lenovo Ideapad Gaming 3 15IHU-82K1002RGE i5-11300H, GeForce RTX 3050 Ti Laptop GPU | Dell G15 5515 R7 5800H, GeForce RTX 3050 Ti Laptop GPU | Asus ROG Strix G17 G713QE-RB74 R7 5800H, GeForce RTX 3050 Ti Laptop GPU | Average of class Gaming | |
|---|---|---|---|---|---|---|
| Power Consumption | -7% | 19% | 2% | -19% | -68% | |
| Idle Minimum * | 7 | 5 29% | 4.9 30% | 5 29% | 9.2 -31% | 13.7 ? -96% |
| Idle Average * | 9 | 10 -11% | 8.3 8% | 9 -0% | 12.6 -40% | 19.1 ? -112% |
| Idle Maximum * | 15 | 20 -33% | 8.9 41% | 20 -33% | 23.3 -55% | 26.8 ? -79% |
| Load Average * | 93 | 108 -16% | 81 13% | 94 -1% | 89.3 4% | 110.9 ? -19% |
| Witcher 3 ultra * | 134.5 | 145 -8% | 119 12% | 123 9% | 136 -1% | |
| Load Maximum * | 185 | 189 -2% | 172 7% | 172 7% | 162.7 12% | 250 ? -35% |
* ... smaller is better
Power Consumption The Witcher 3 / Stress Test
Power Consumption With External Monitor
Battery Life
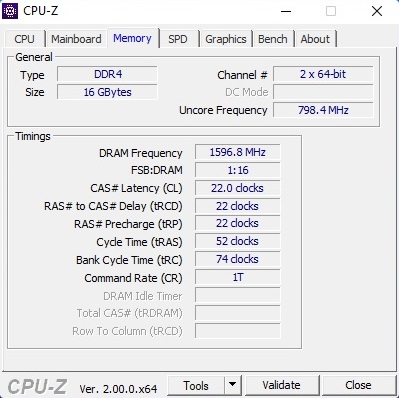
The battery capacity is the same as that of the more expensive Victus 16 model. 70 Wh in combination with the automatic graphics switching ensures a solid battery life. The 16-inch laptop lasts for a good 7 hours in our WLAN test with the brightness reduced to 150 cd/m².
| HP Victus 16-e0145ng R5 5600H, GeForce RTX 3050 Ti Laptop GPU, 70 Wh | HP Victus 16-e0179ng R7 5800H, GeForce RTX 3060 Laptop GPU, 70 Wh | Lenovo Ideapad Gaming 3 15IHU-82K1002RGE i5-11300H, GeForce RTX 3050 Ti Laptop GPU, 45 Wh | Dell G15 5515 R7 5800H, GeForce RTX 3050 Ti Laptop GPU, 56 Wh | Asus ROG Strix G17 G713QE-RB74 R7 5800H, GeForce RTX 3050 Ti Laptop GPU, 56 Wh | Average of class Gaming | |
|---|---|---|---|---|---|---|
| Battery Runtime | -17% | -6% | 13% | -16% | -13% | |
| WiFi v1.3 | 424 | 354 -17% | 397 -6% | 478 13% | 358 -16% | 368 ? -13% |
| Reader / Idle | 511 | 807 | 667 | 544 ? | ||
| Load | 76 | 64 | 91 | 66 | 84.2 ? | |
| H.264 | 460 | 529 | 399 ? |
Pros
Cons
Verdict
Gamers who consider their budget and don't have high demands on the image quality might like the Victus 16-e0145ng that we tested here.
The Ryzen 5 5600H, the GeForce RTX 3050 Ti, and the NVMe SSD together form a balanced and fairly powerful package, which is suited for diverse application areas. Aside from the mediocre performance of the display (low color space coverage, meager brightness, etc.), the HP laptop does not show any larger weaknesses. The elegant case houses relatively good input devices and a decent number of ports, although you have to live without Thunderbolt. The battery life and sound are also appropriate for the price, even though they don't really inspire enthusiasm.
Overall, we liked the Victus 16-e0145ng a little better than the Lenovo Ideapad Gaming 3 15IHU. On the other hand, the comparably equipped Dell G15 5515 and Asus ROG Strix G17 G713QE competitors are slightly ahead in our evaluation.
Price and Availability
A similarly equipped version of the HP Victus 16, only with a Ryzen 7, is available from the HP store for about $950.
HP Victus 16-e0145ng
-
05/18/2022 v7
Florian Glaser


Pricecompare

