

Gigabyte G7 KE in review: Affordable gaming laptop with a powerful RTX 3060

The G7 KE is a 17.3-inch gaming laptop from the lower price range. Gigabyte combines an Alder Lake Core i5 CPU with a RTX 3060 GPU for around 1,200 Euros (~1,300 USD). Cheaper models with a GeForce RTX 3050 (G7 GE) or GeForce RTX 3050 Ti (G7 ME) are also available. Competitors include devices such as the HP Pavilion Gaming 17, Acer Nitro 5 AN517-55, Lenovo IdeaPad Gaming 3 15IAH7 or the Asus TUF Gaming F17 FX707Z.
Potential Competitors in Comparison
Rating | Date | Model | Weight | Height | Size | Resolution | Price |
|---|---|---|---|---|---|---|---|
| 83.3 % v7 (old) | 01 / 2023 | Gigabyte G7 KE i5-12500H, GeForce RTX 3060 Laptop GPU | 2.6 kg | 25 mm | 17.30" | 1920x1080 | |
| 82.7 % v7 (old) | 09 / 2022 | HP Pavilion Gaming 17-cd2146ng i5-11300H, GeForce RTX 3050 Ti Laptop GPU | 2.8 kg | 25 mm | 17.30" | 1920x1080 | |
| 83.9 % v7 (old) | 08 / 2022 | Acer Nitro 5 AN517-55-738R i7-12700H, GeForce RTX 3060 Laptop GPU | 3.1 kg | 28.6 mm | 17.30" | 1920x1080 | |
| 84.1 % v7 (old) | 04 / 2022 | Asus TUF Gaming F17 FX707Z-HX011W i7-12700H, GeForce RTX 3060 Laptop GPU | 2.5 kg | 25 mm | 17.30" | 1920x1080 | |
| 82.8 % v7 (old) | 10 / 2022 | Lenovo IdeaPad Gaming 3 15IAH7 i5-12500H, GeForce RTX 3050 Ti Laptop GPU | 2.4 kg | 26 mm | 15.60" | 1920x1080 |
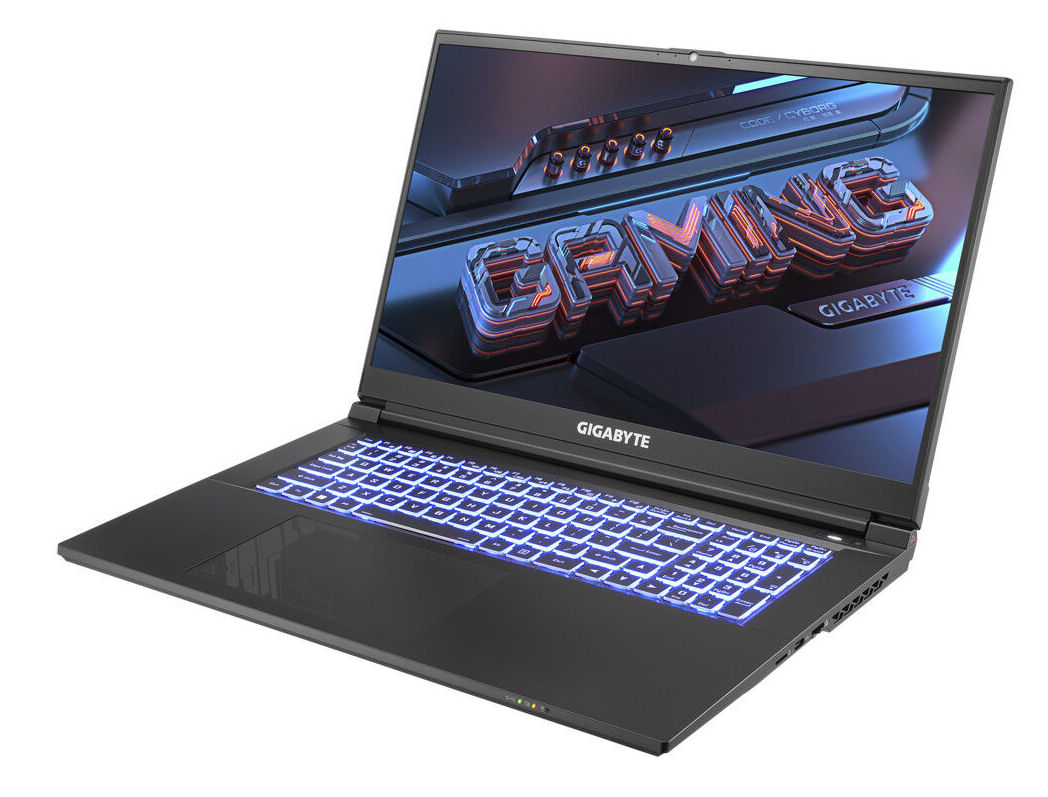
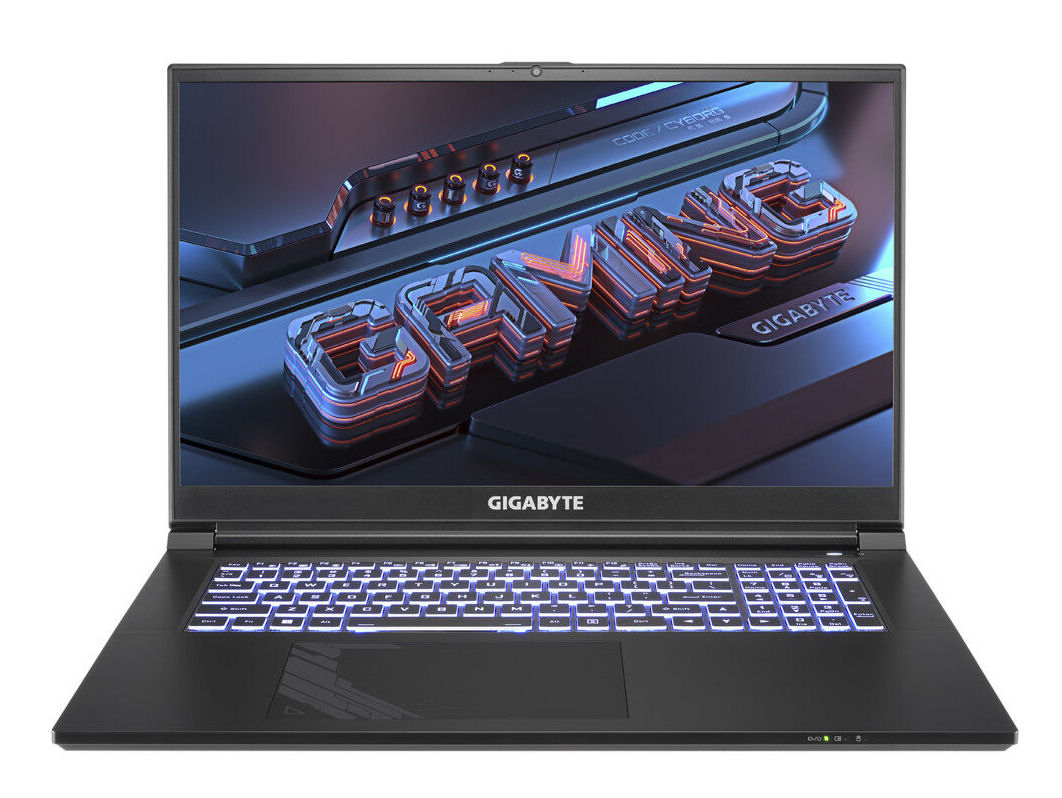
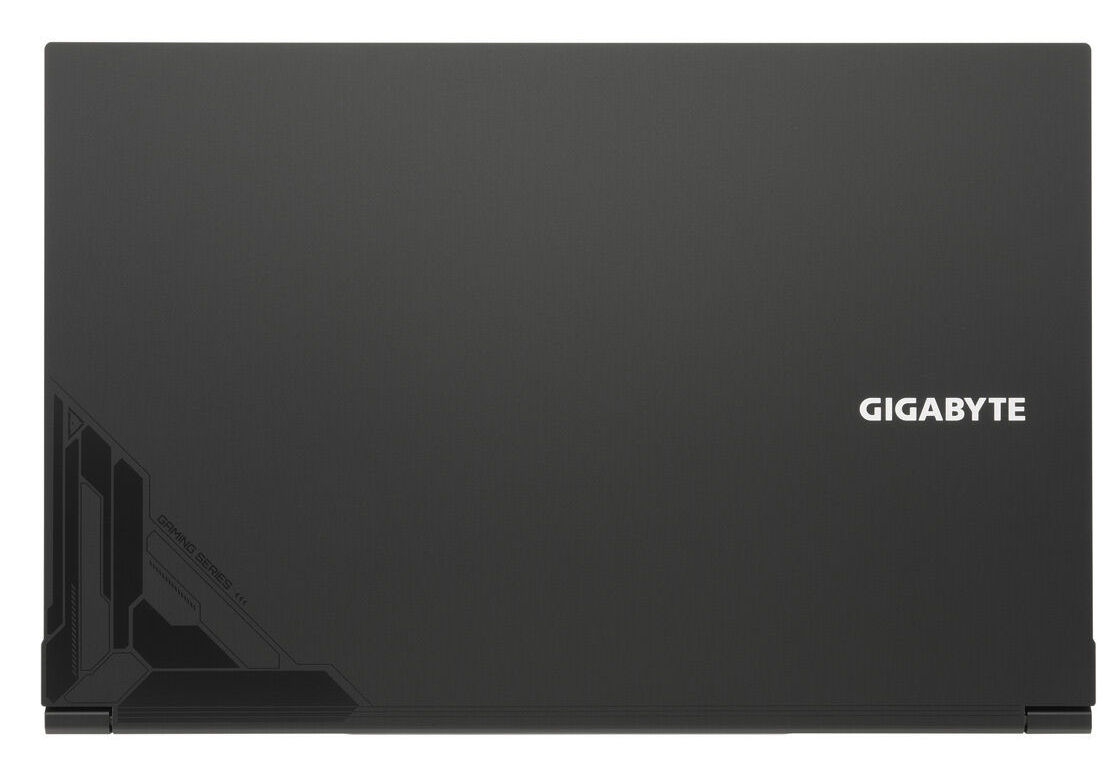
Case - G7 With a Plastic Chassis
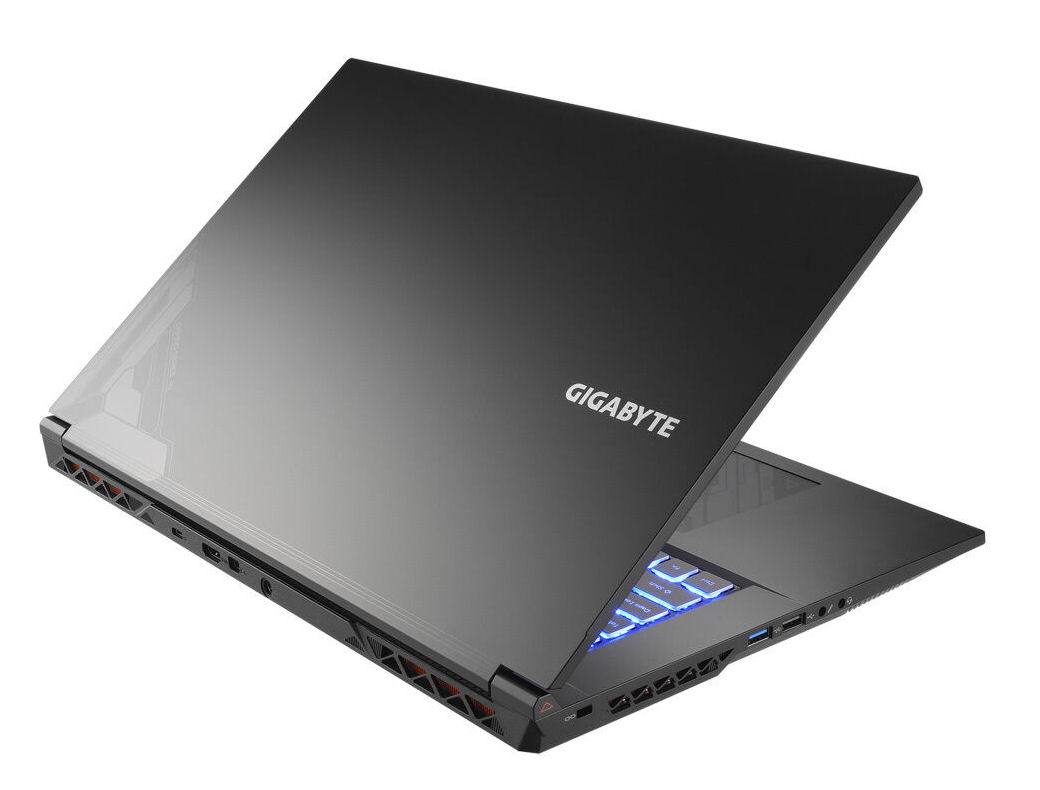
Gigabyte does not use premium materials for the chassis of the G7. Instead, the manufacturer relies on black plastic with smooth, matte surfaces. There are a few subtle, visual, black and gray accents printed on the back of the lid and the clickpad. The design of the chassis is very straightforward otherwise and could be described as "functional". The battery (screwed in, not glued) and the other internal components can be accessed after removing the bottom plate.
The build quality of the chassis warrants no criticism. The clearances are tight and there is no protruding excess material. Although the base unit can be twisted from the corners, this should not be an issue during daily use. The rigidity of the lid leaves something to be desired, however. While the hinges hold the display firmly in place, they allow for some teetering. The display can be opened up to a maximum angle of about 140 degrees. Opening the lid with one hand is possible.
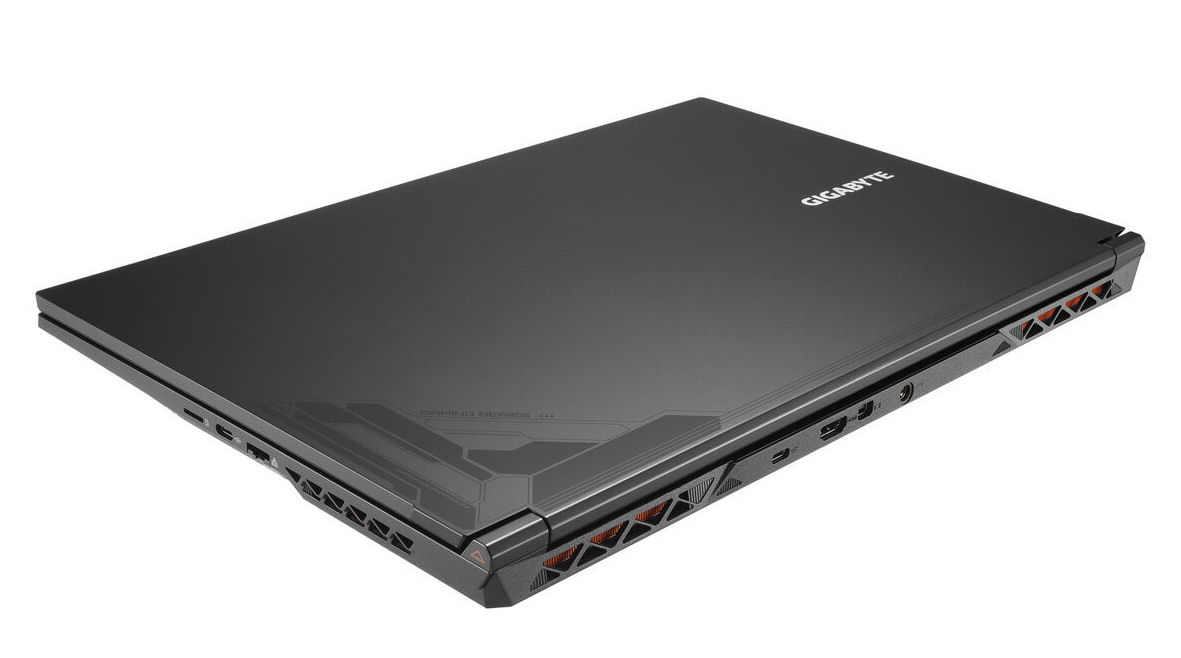


The G7 is one of the most compact and lightweight 17.3-inch devices in our comparison. Only the Asus TUF Gaming F17 manages to surpass it by a small margin.
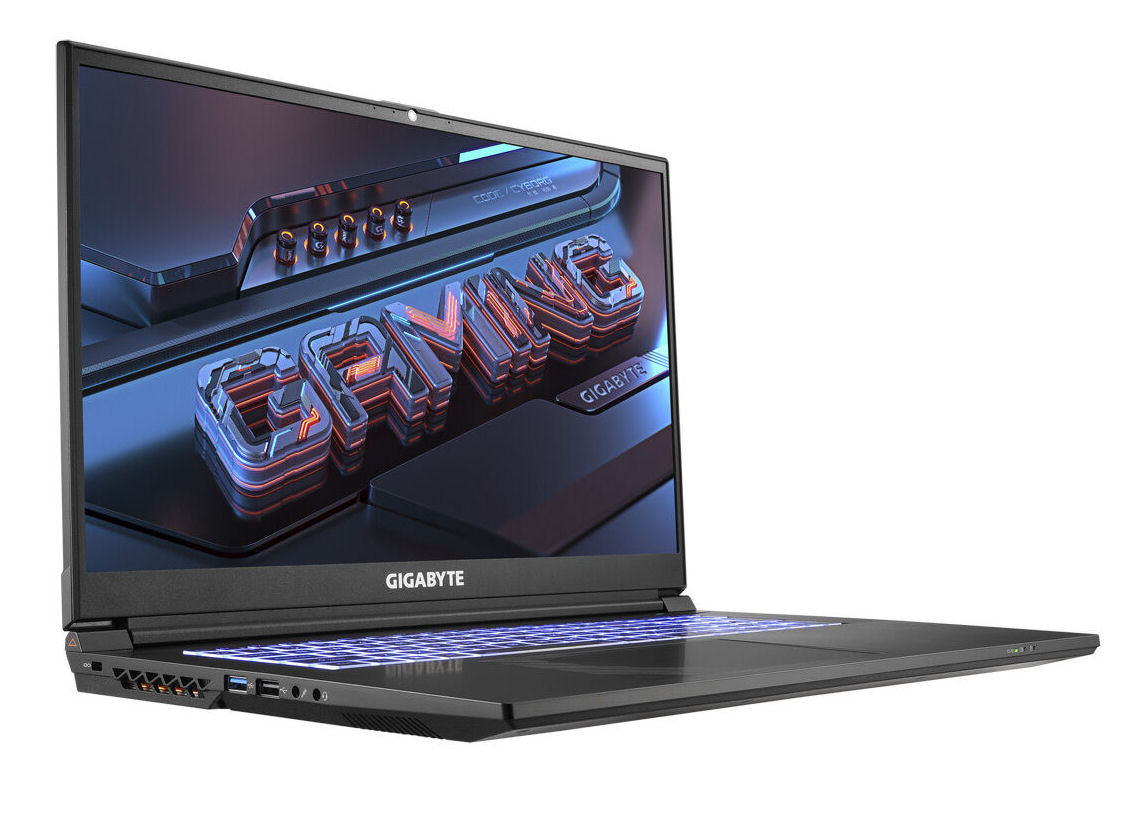
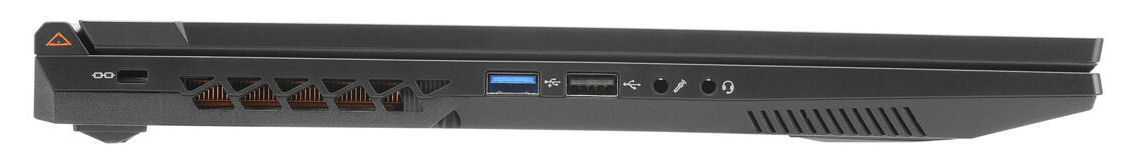
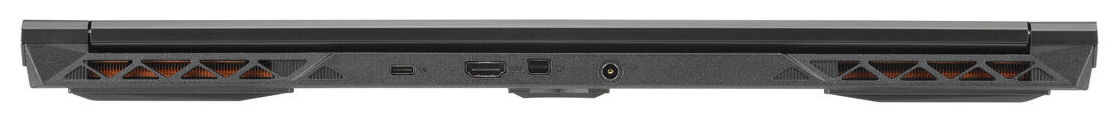
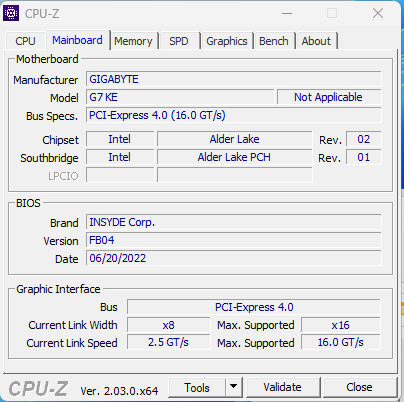
Connectivity - Gigabyte Notebook With Thunderbolt 4
The G7 comes with two USB-A ports (1x USB 2.0, 1x USB 3.2 gen. 1) and two USB-C ports (1x USB 3.2 gen. 2, 1x Thunderbolt 4). The type-C interfaces do not support Power Delivery and only the TB4 port supports DisplayPort via USB-C. Combined with the HDMI port (2.1) and the dedicated Mini DisplayPort (1.4), this amounts to a total of three video outputs.
The G7's ports are distributed across three sides of the laptop. The two dedicated video outputs are located on the back of the device. Thus, connected cables run along the rear and do not get in the way. The same does not hold true for Ethernet cables: The port can be found on the right edge of the model.

SD Card Reader
The performance of the microSD card reader (reference card: AV Pro SD microSD 128 GB V60) is average with sequential reads at around 89 MB/s.
| SD Card Reader | |
| average JPG Copy Test (av. of 3 runs) | |
| Average of class Gaming (20 - 210, n=70, last 2 years) | |
| HP Pavilion Gaming 17-cd2146ng (AV PRO microSD 128 GB V60) | |
| maximum AS SSD Seq Read Test (1GB) | |
| Average of class Gaming (25.5 - 261, n=66, last 2 years) | |
| Gigabyte G7 KE (AV PRO microSD 128 GB V60) | |
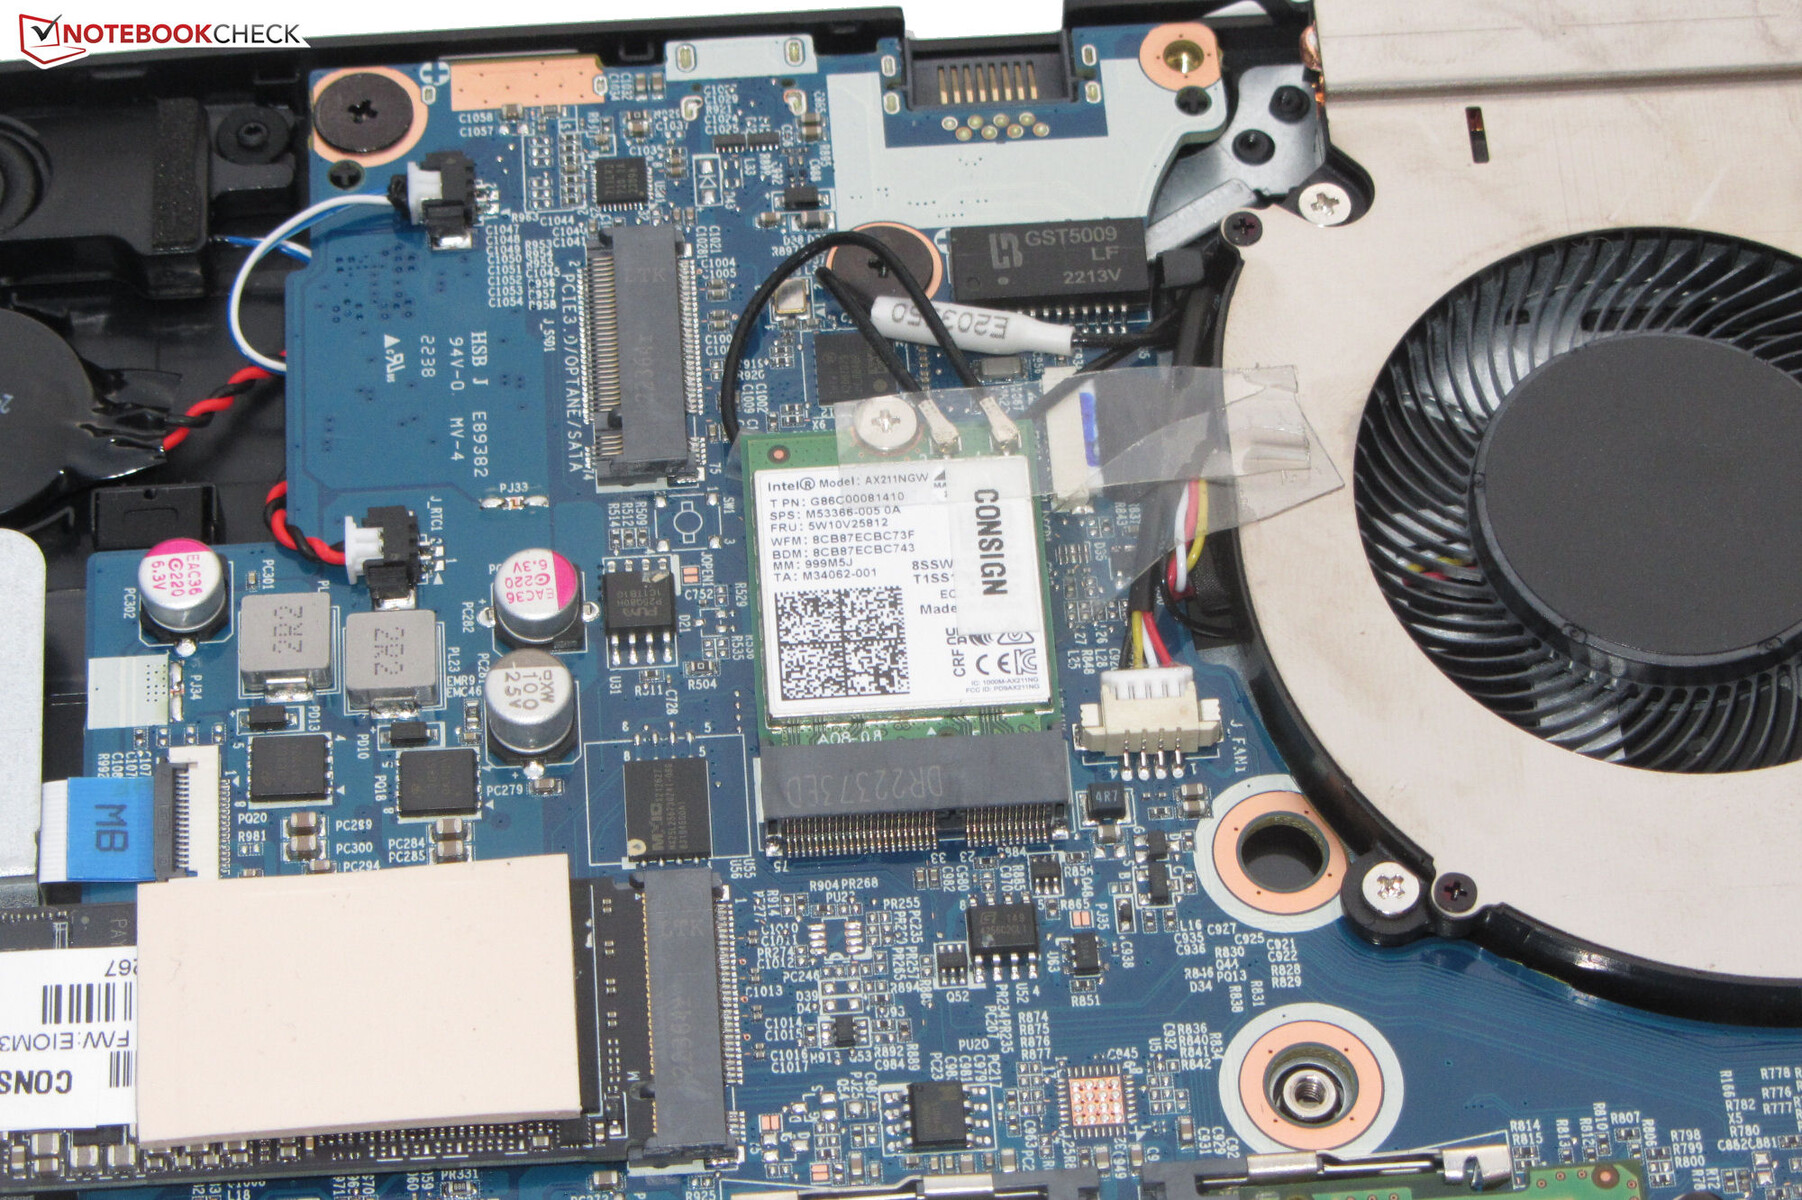
Communication
Under ideal conditions (no other Wi-Fi devices in proximity, short distance between the laptop and server), the Wi-Fi transfer speeds are excellent and more or less exhaust the capabilities of the Wi-Fi module (Intel AX211; Wi-Fi 6E, 802.11ax). Meanwhile, a Gigabit Ethernet interface (I-219V) from Intel handles wired networking.
Webcam
The webcam (0.9 MP) captures pictures with a maximum resolution of 1280 x 720 pixels. The camera produces decent results with a relatively low overall color deviation. The camera is not equipped with a mechanical webcam shutter.


Accessories
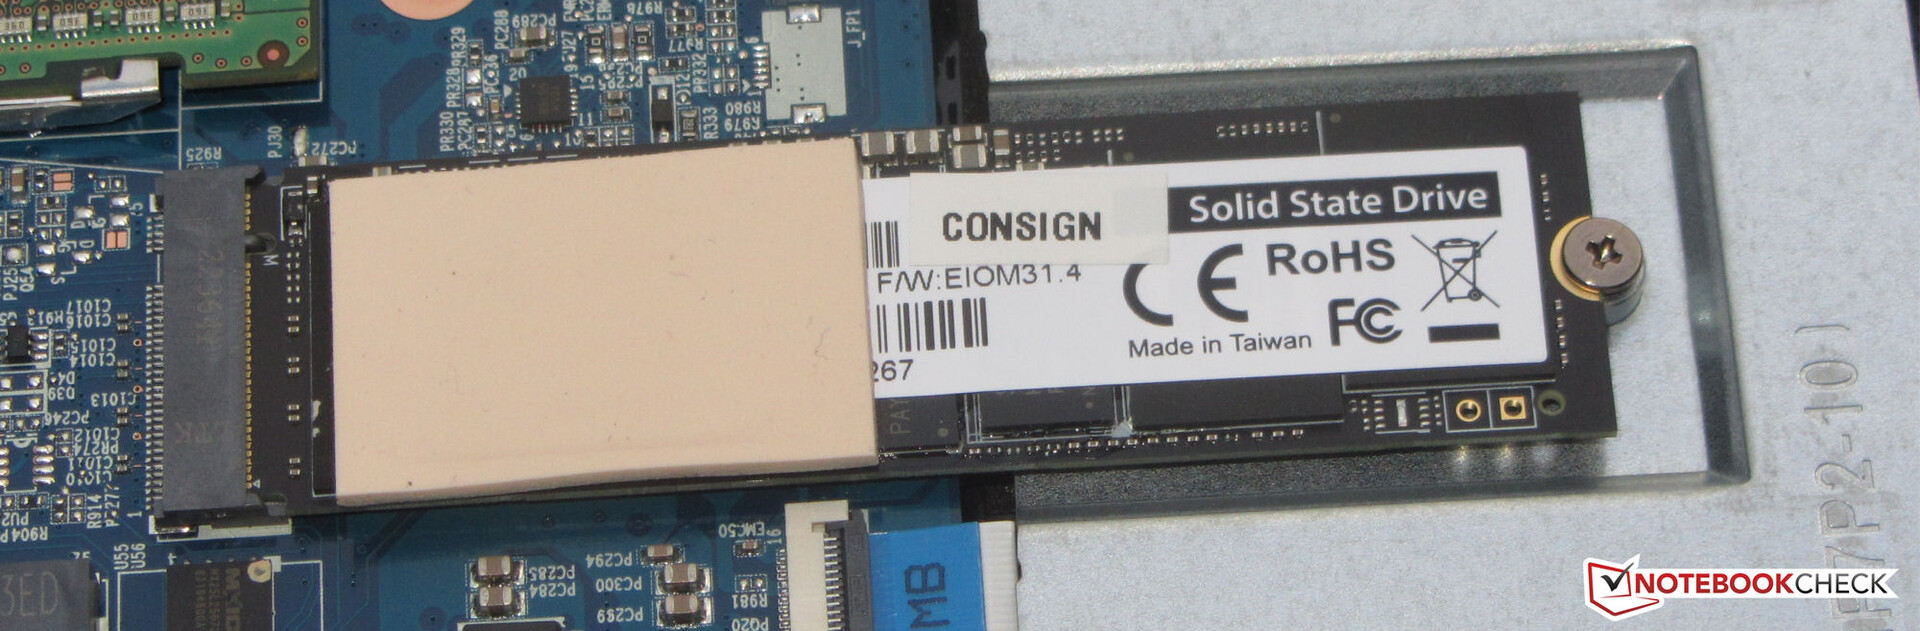
Aside from the usual paperwork (quick-start guide and warranty information), the laptop also includes a screw for installing and a thermal pad for cooling the secondary SSD.
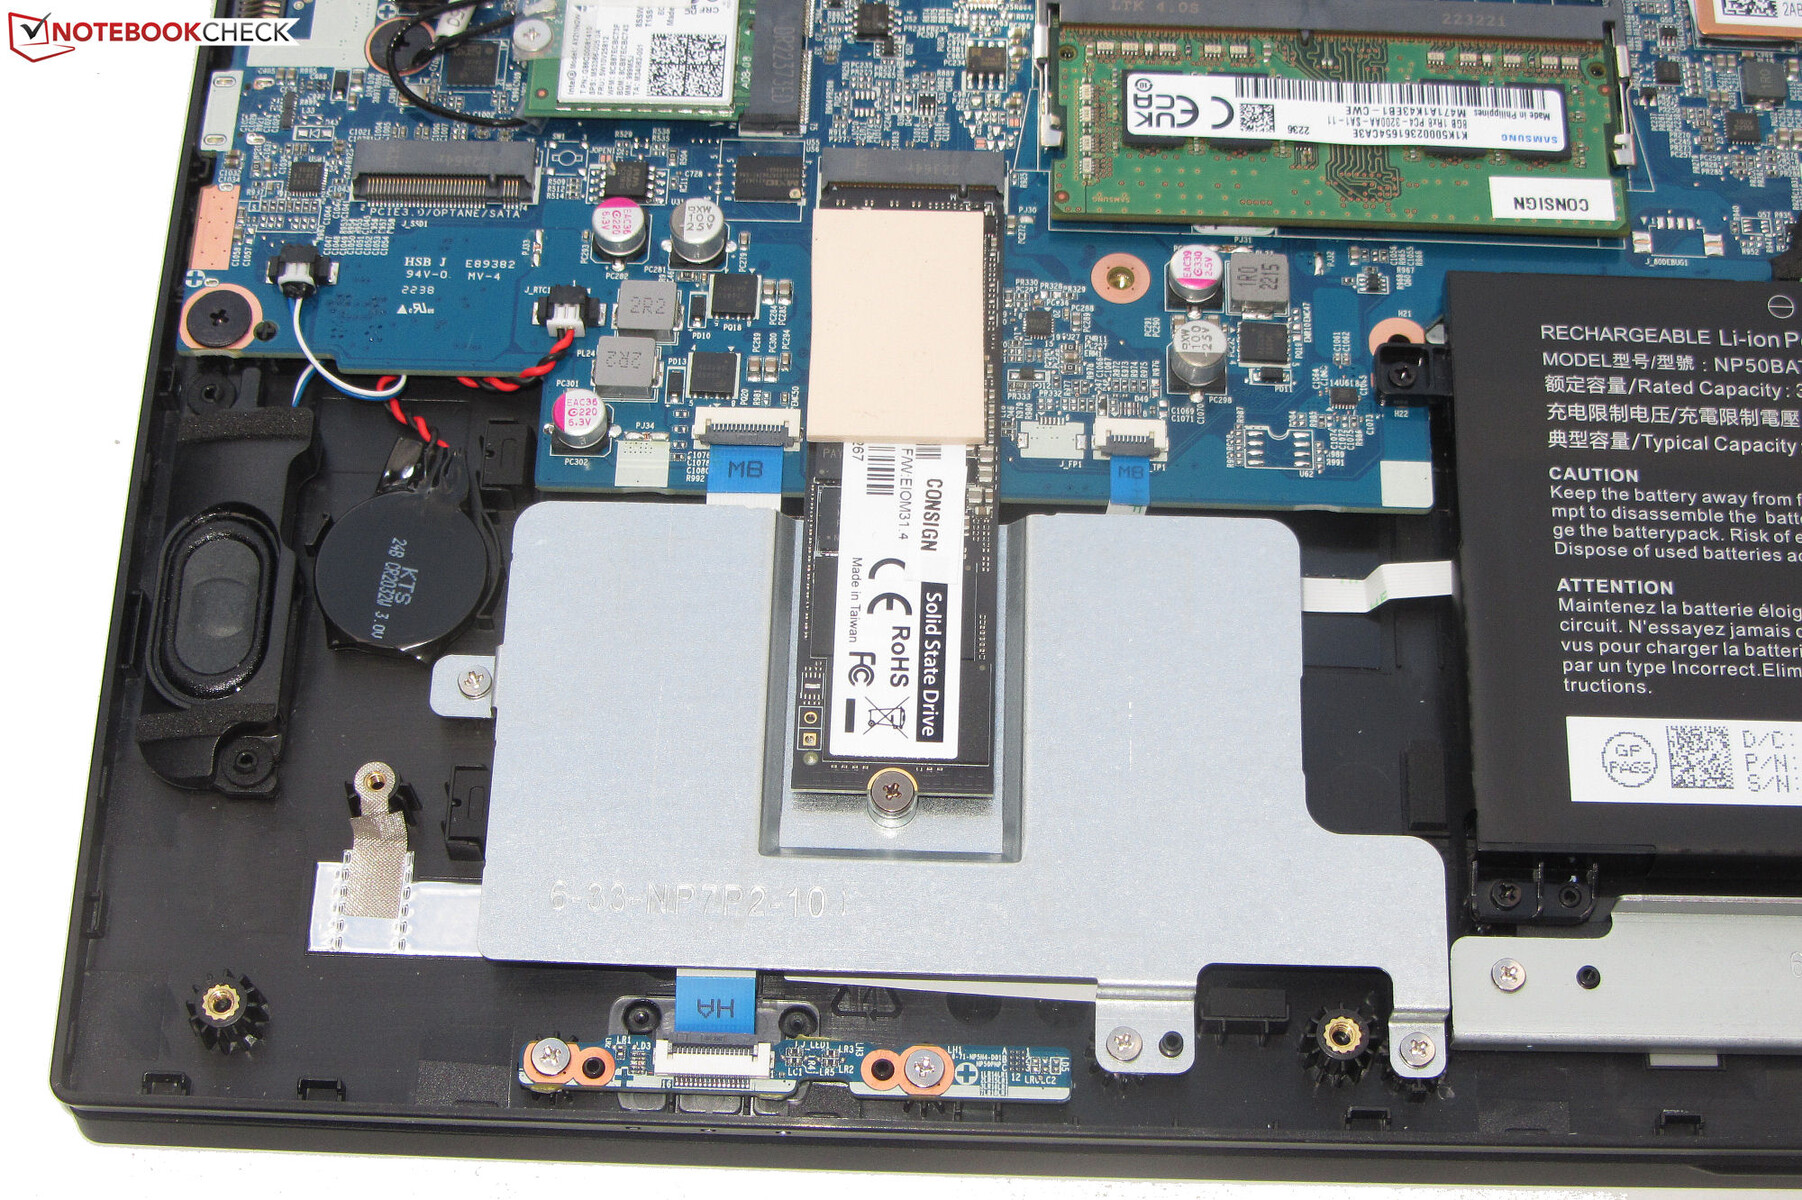
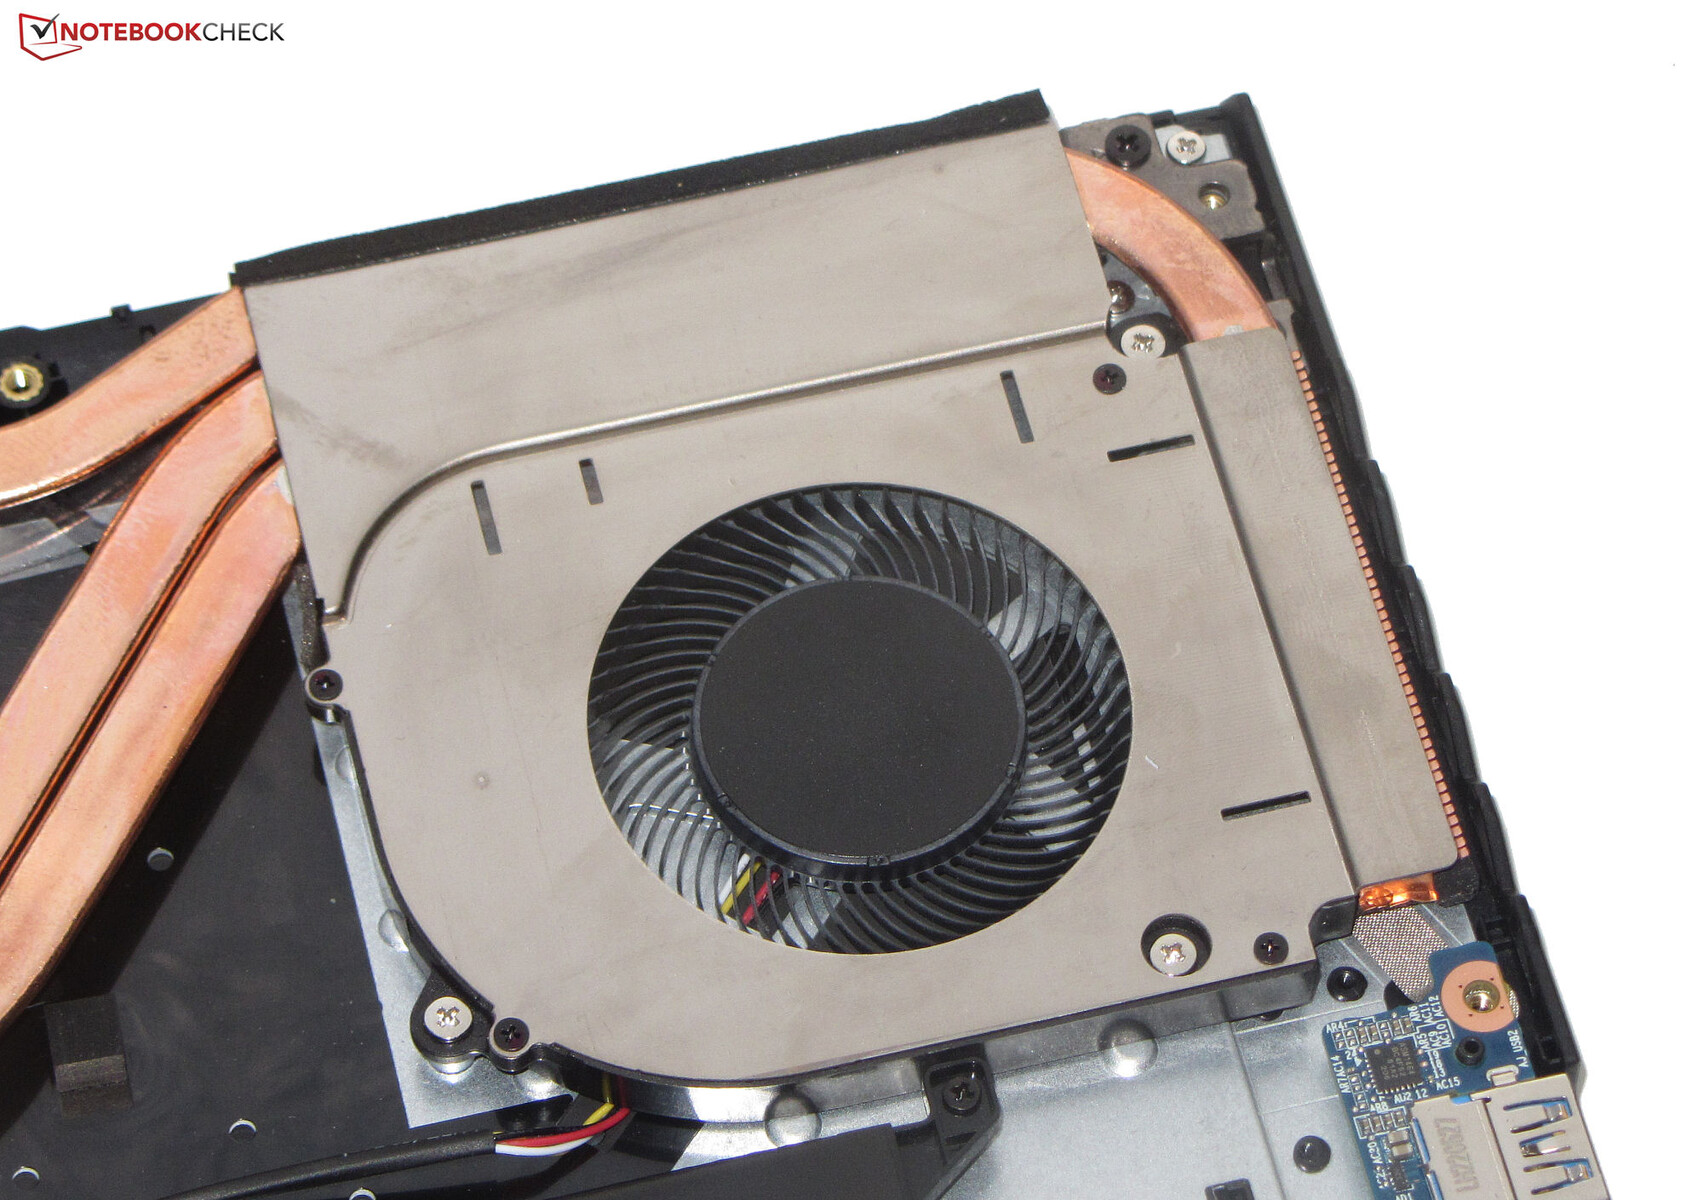
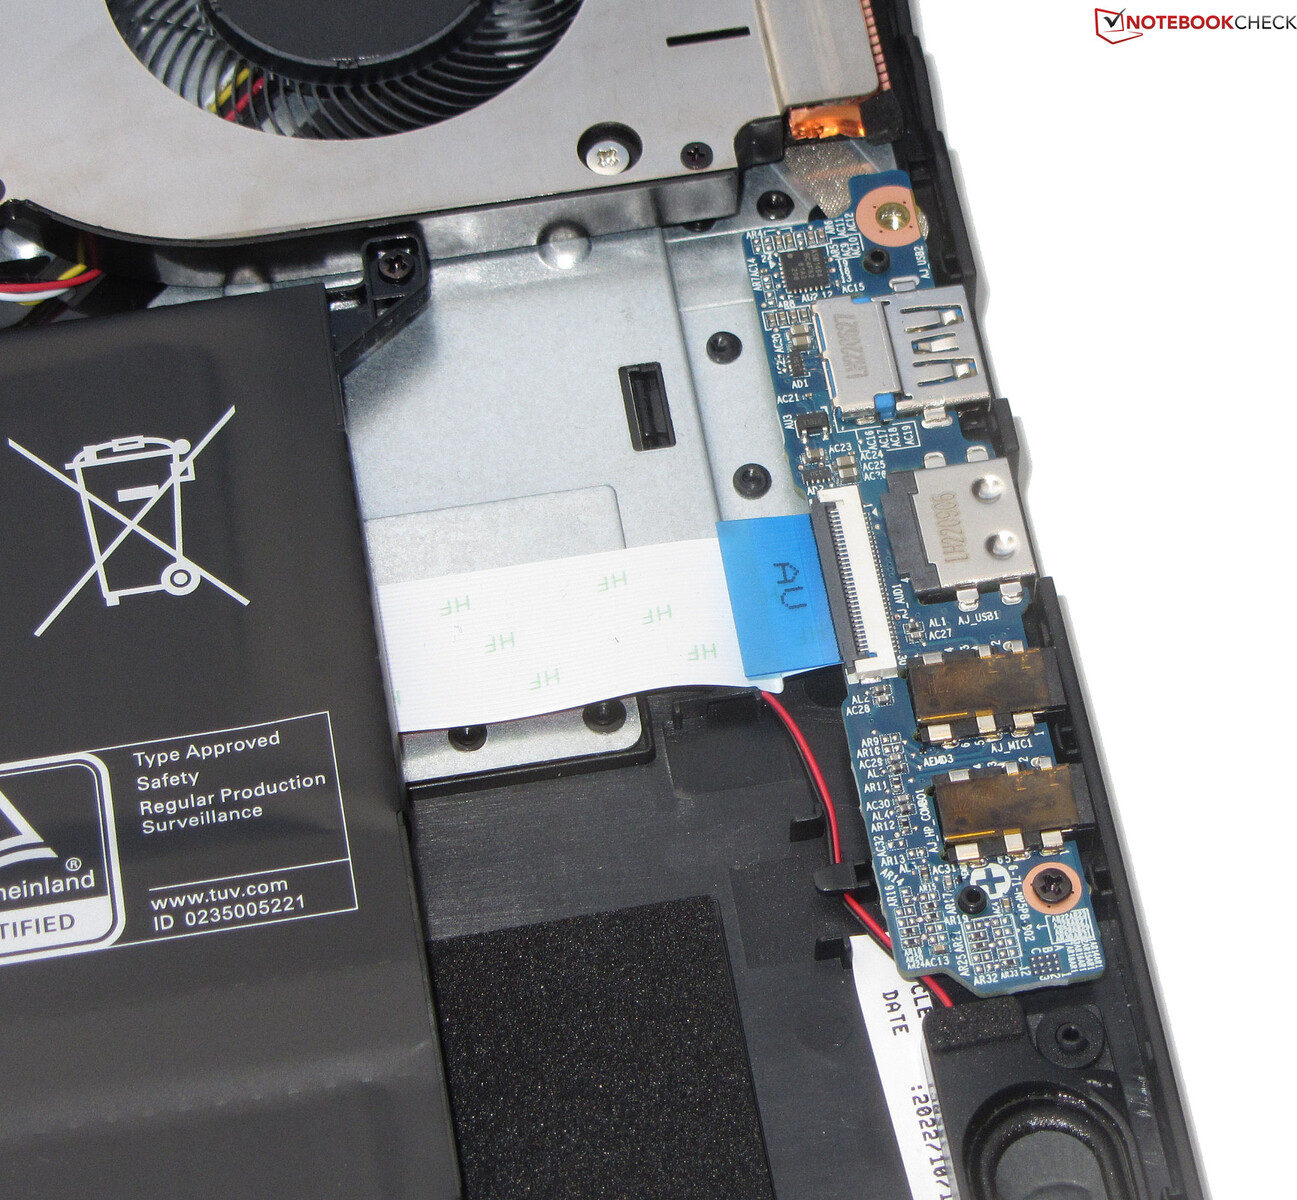
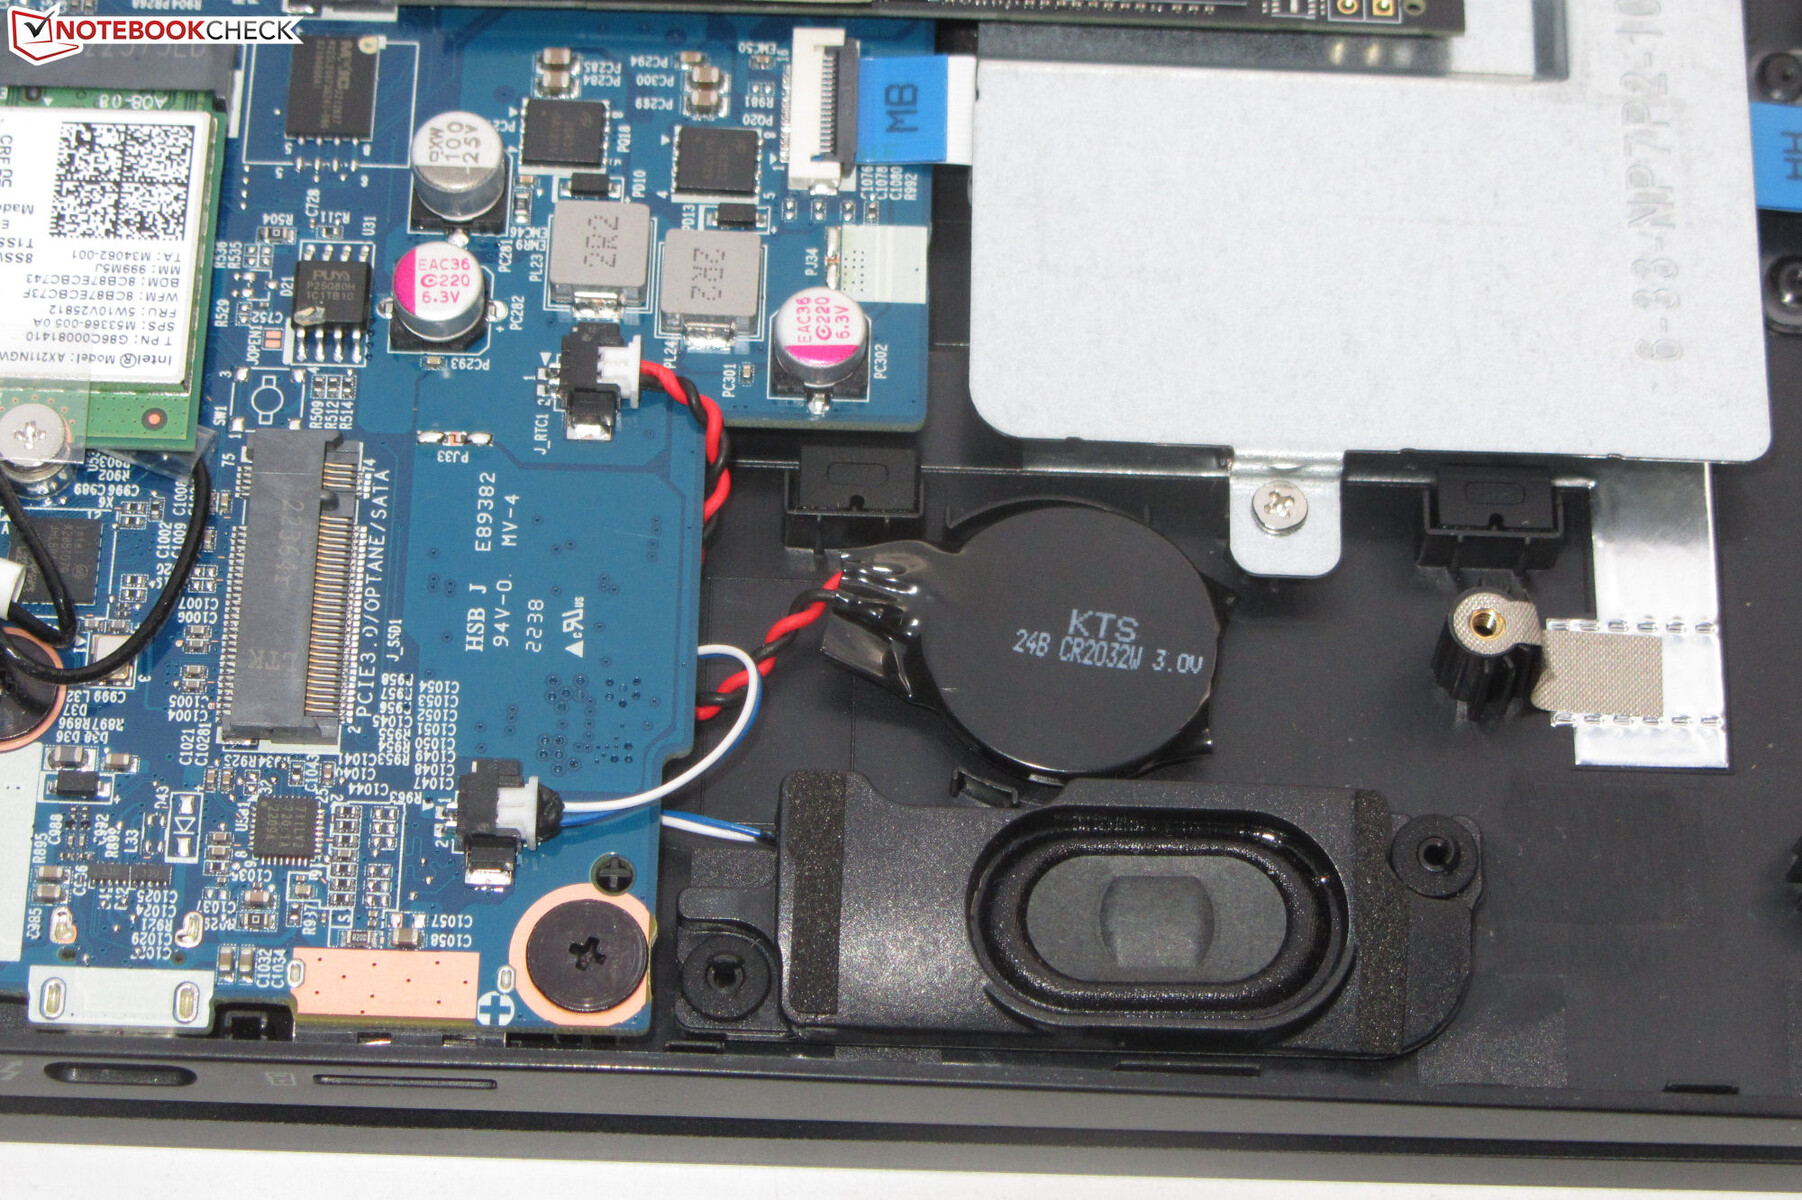
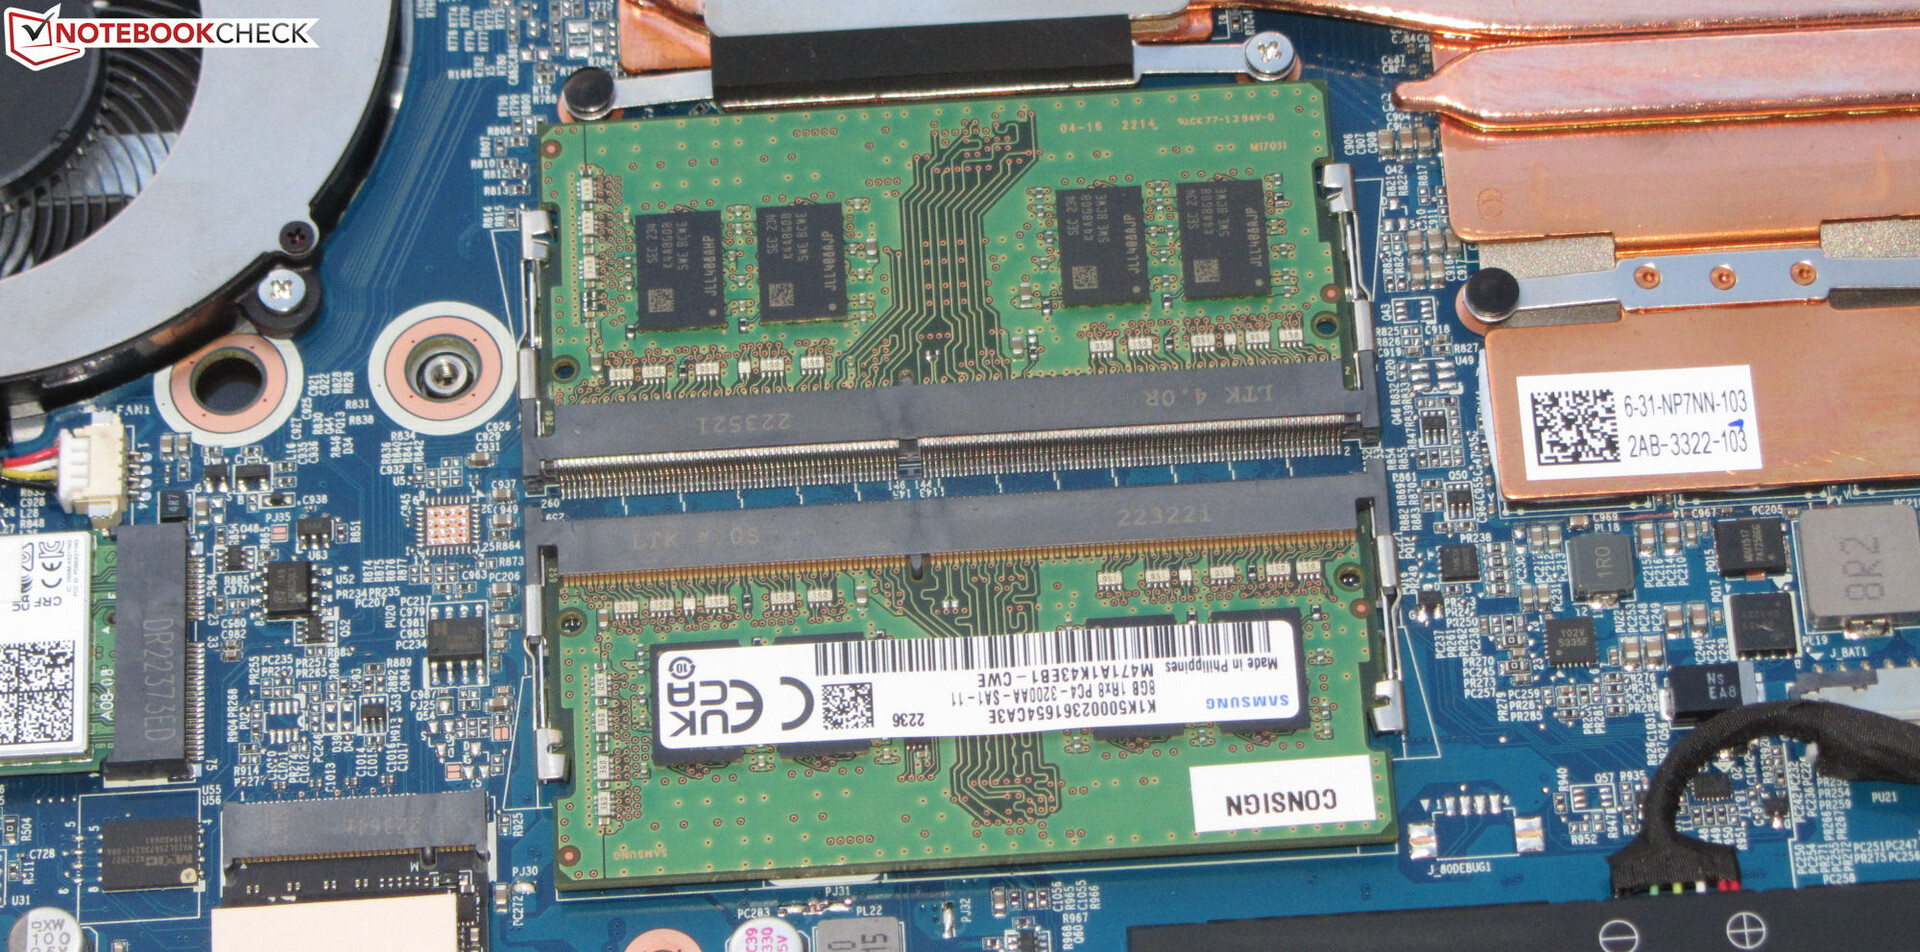
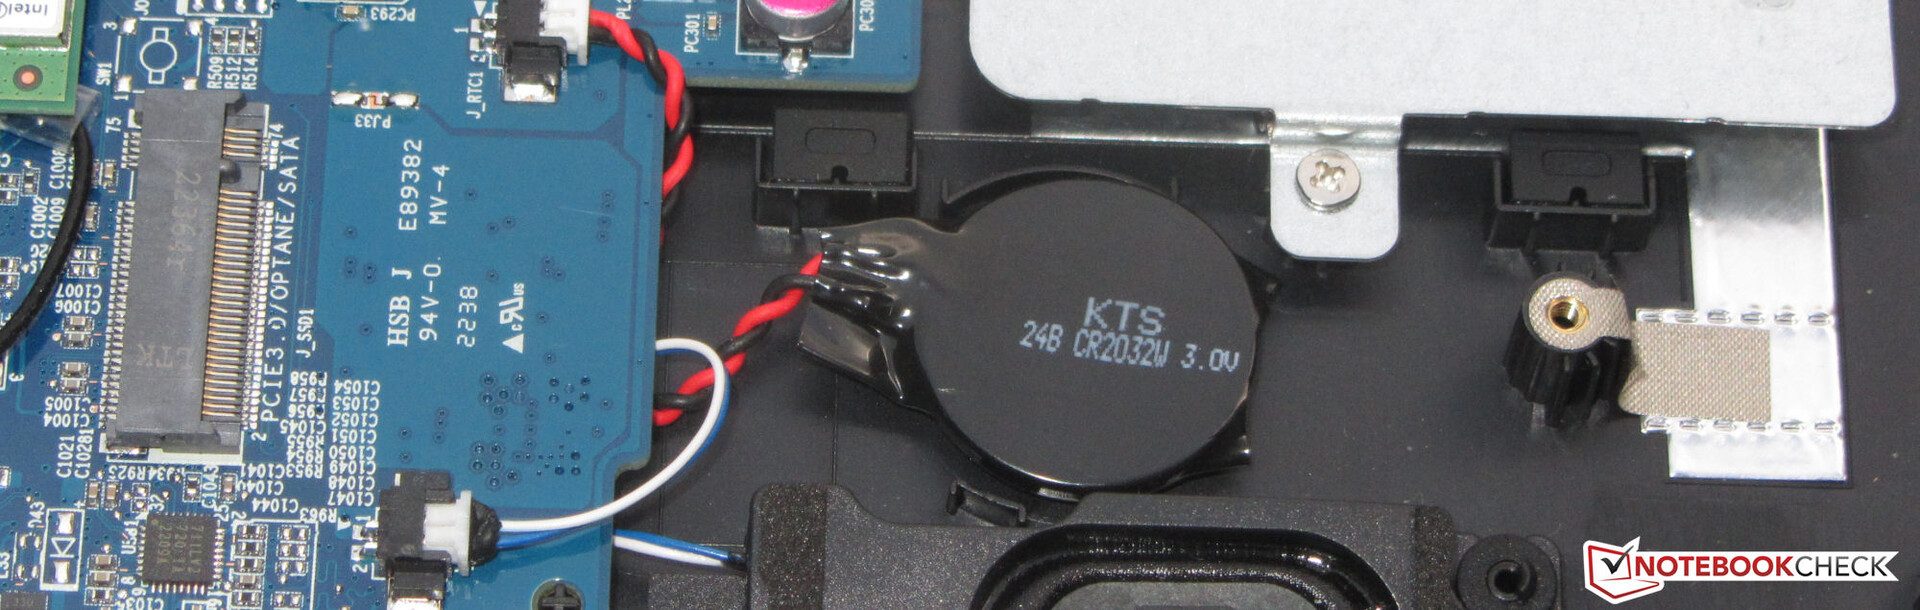
Maintenance
After removing all the screws on the bottom of the device, the bottom plate can be removed with the help of a sharp edge - it is attached very firmly in certain areas, however. On the inside, users can access the SSD (PCIe 4), the secondary M.2 slot (PCIe 3), the Wi-Fi module, the RAM slots (both in use), the BIOS battery, the fans, and the main battery.


Warranty
The 17.3-inch Gigabyte model comes with a standard, one-year limited warranty. There are currently no warranty extensions available.
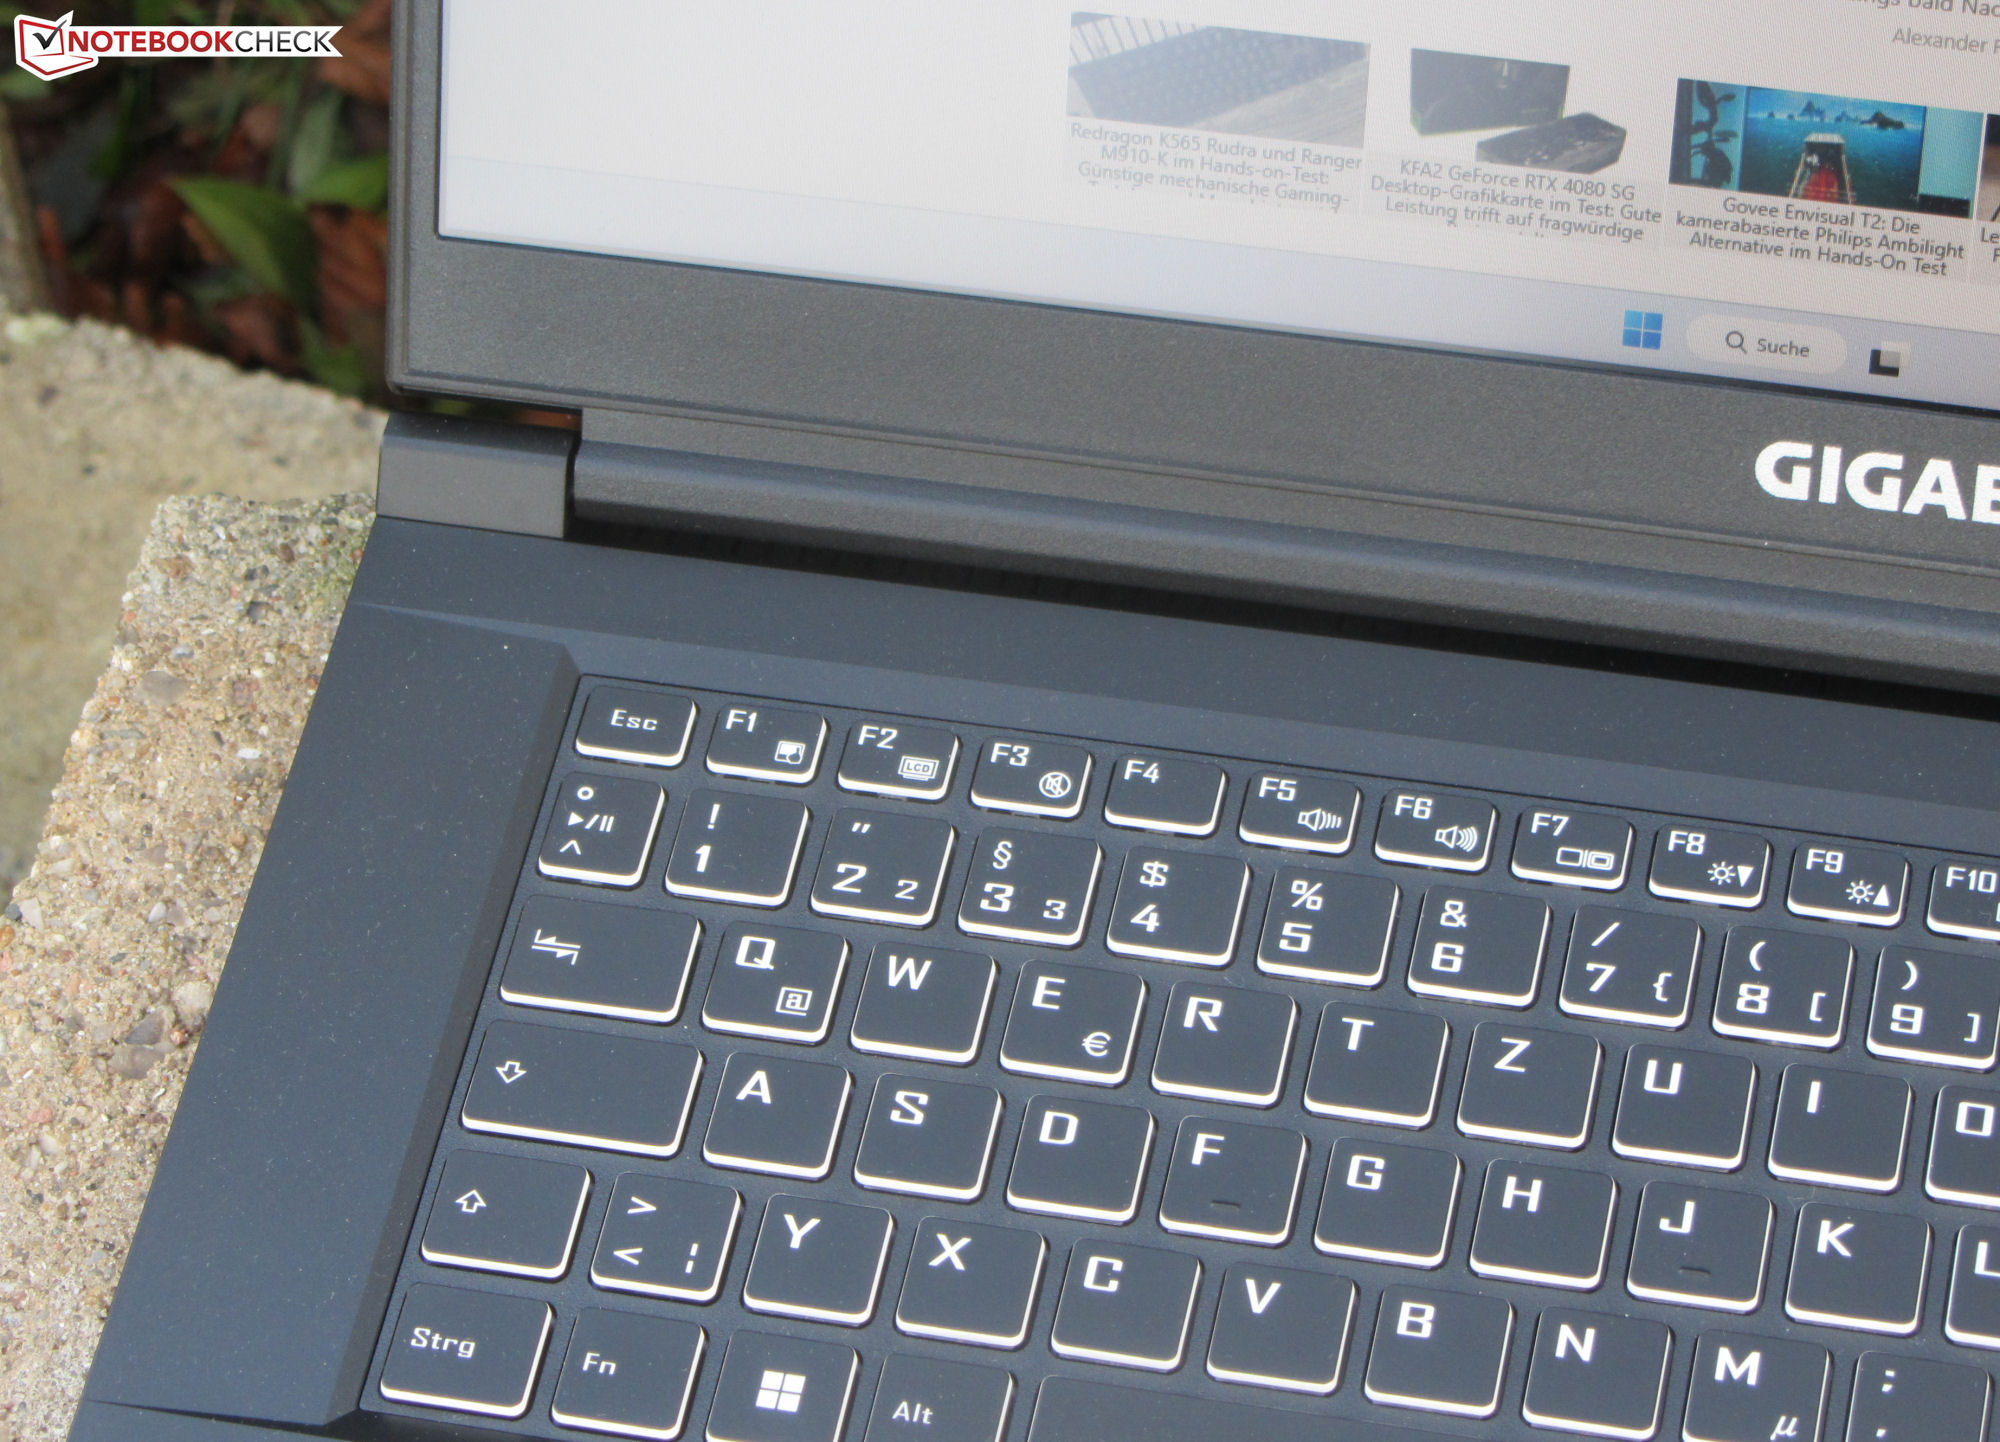
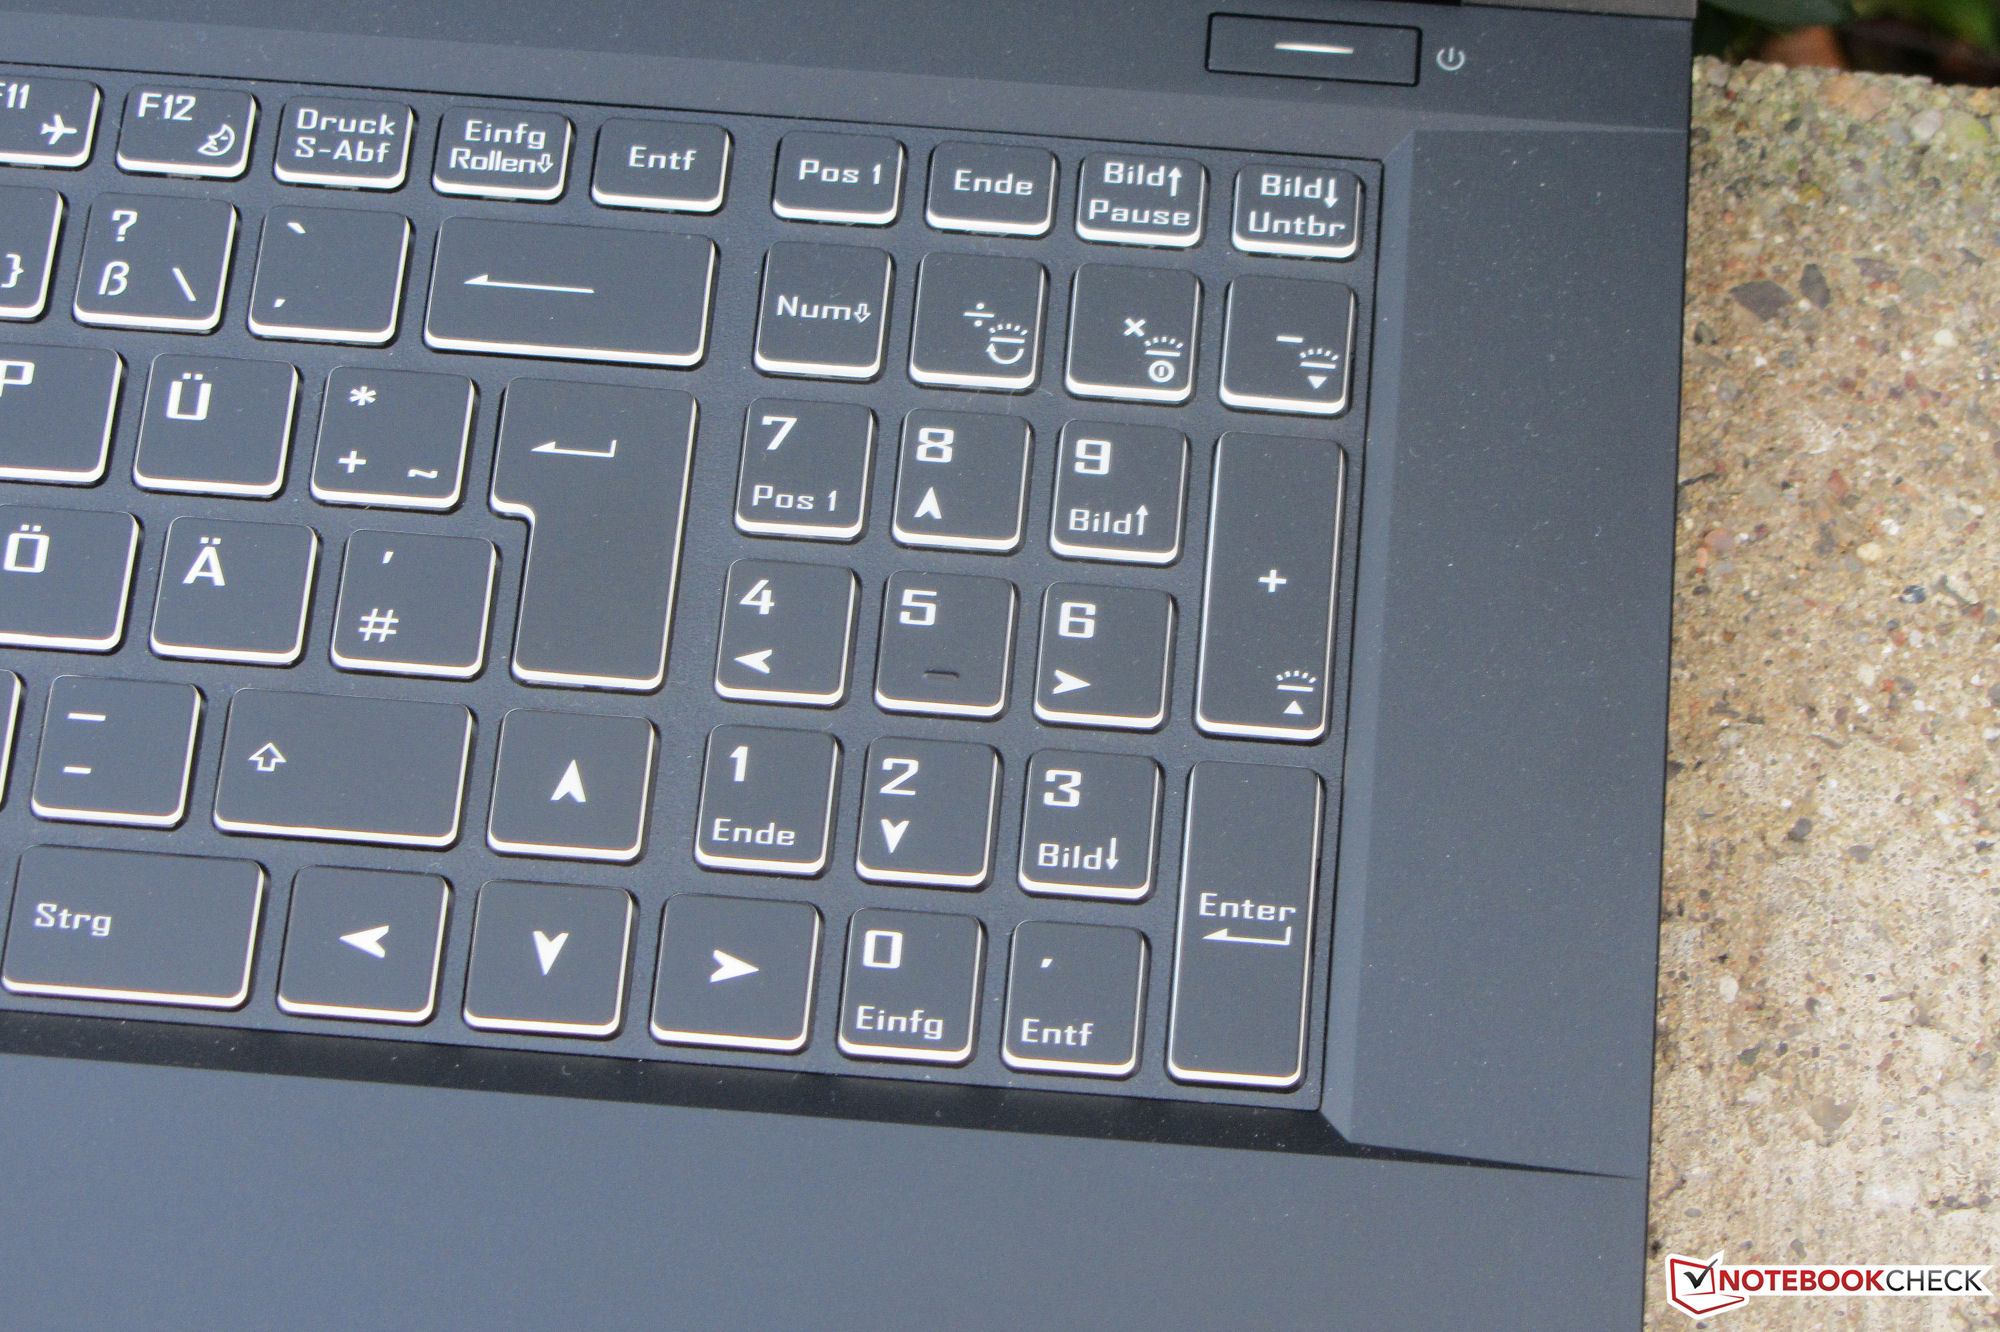
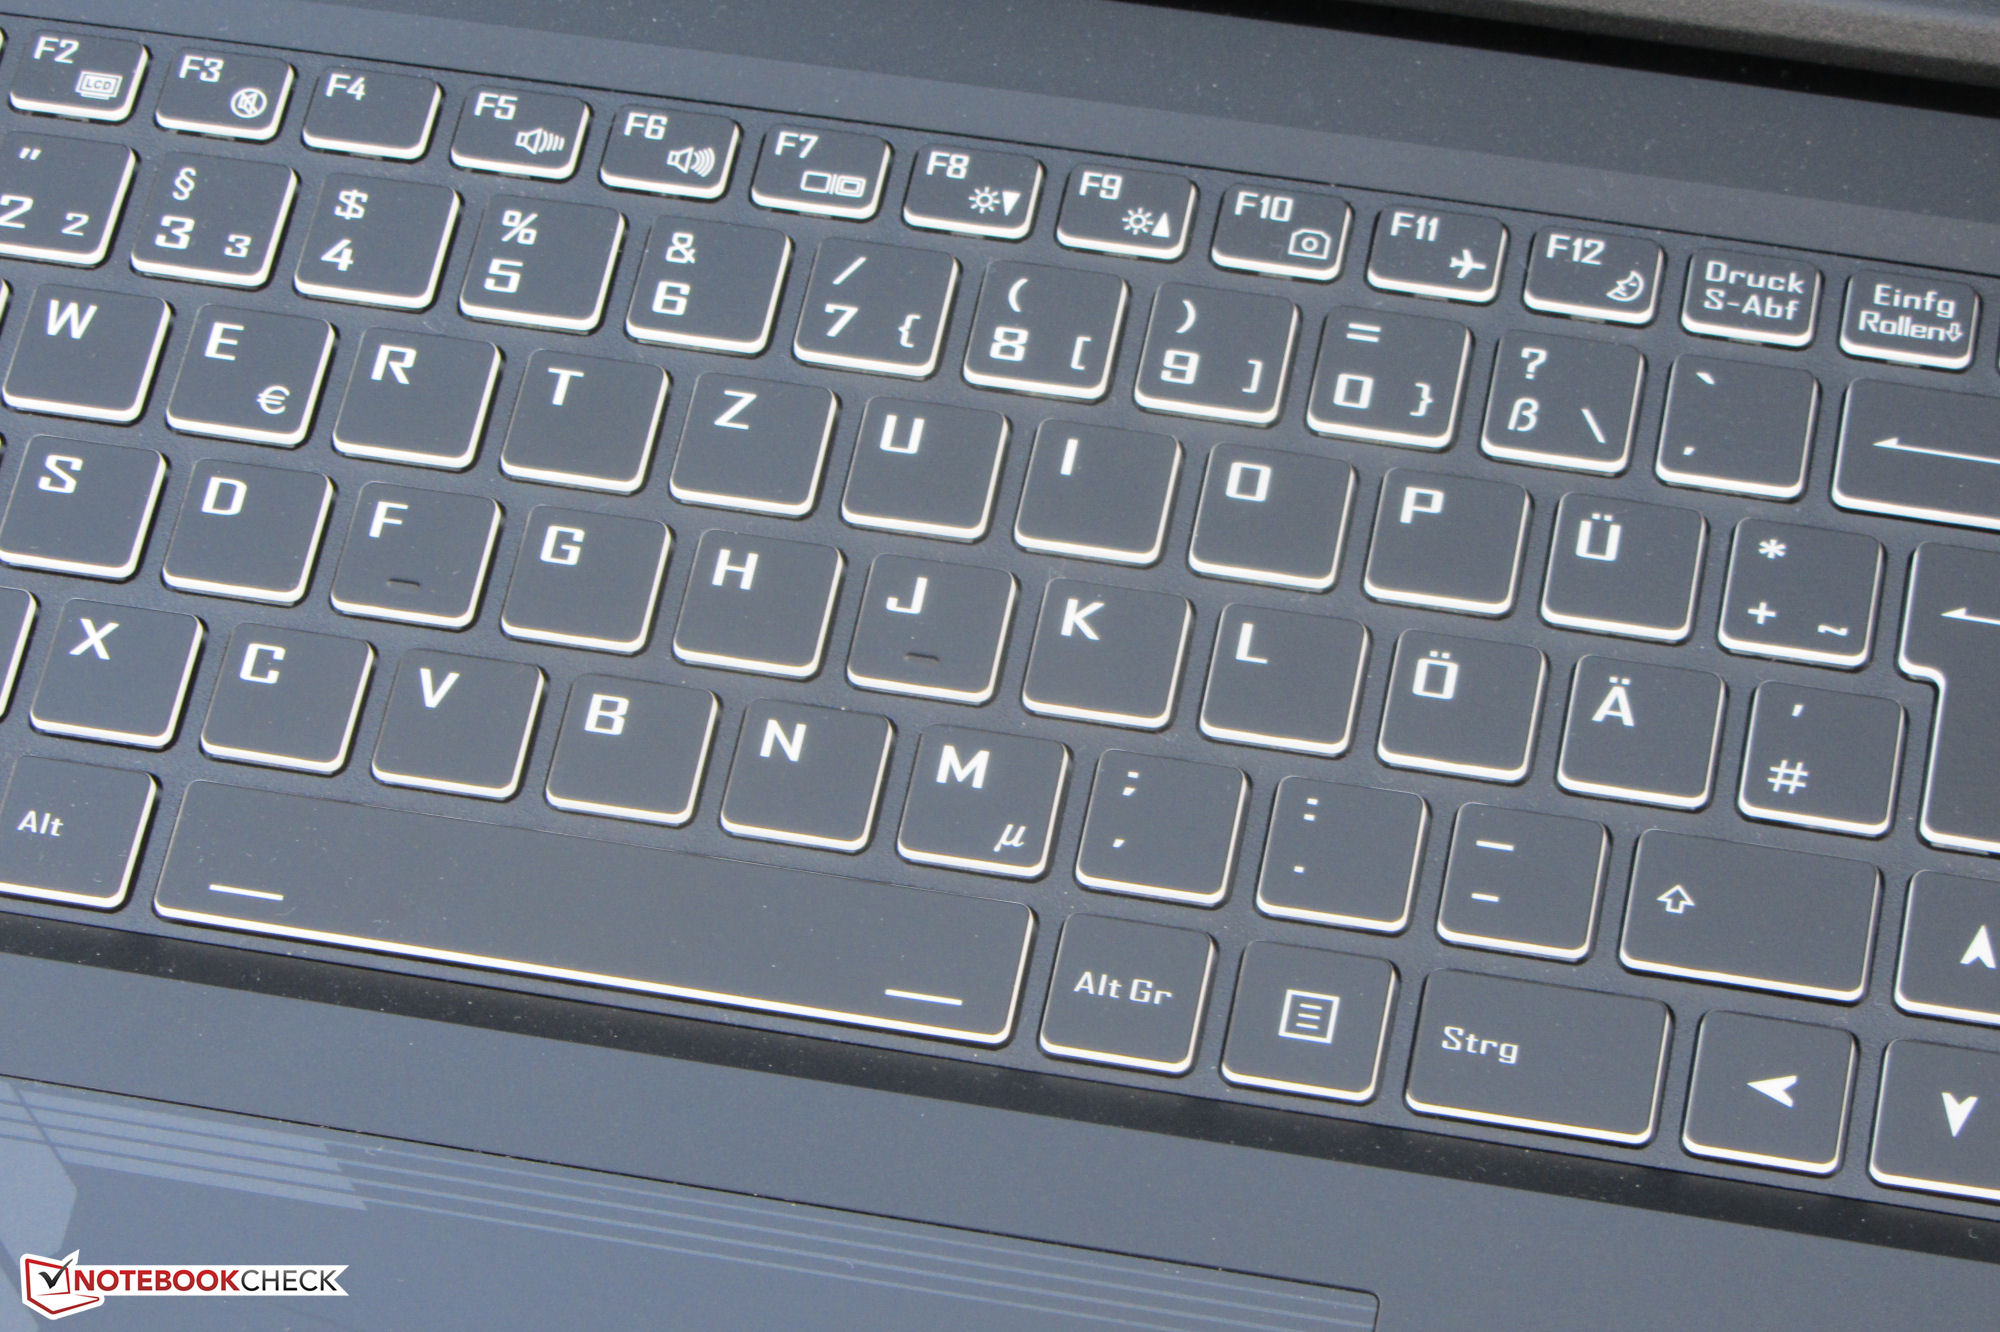
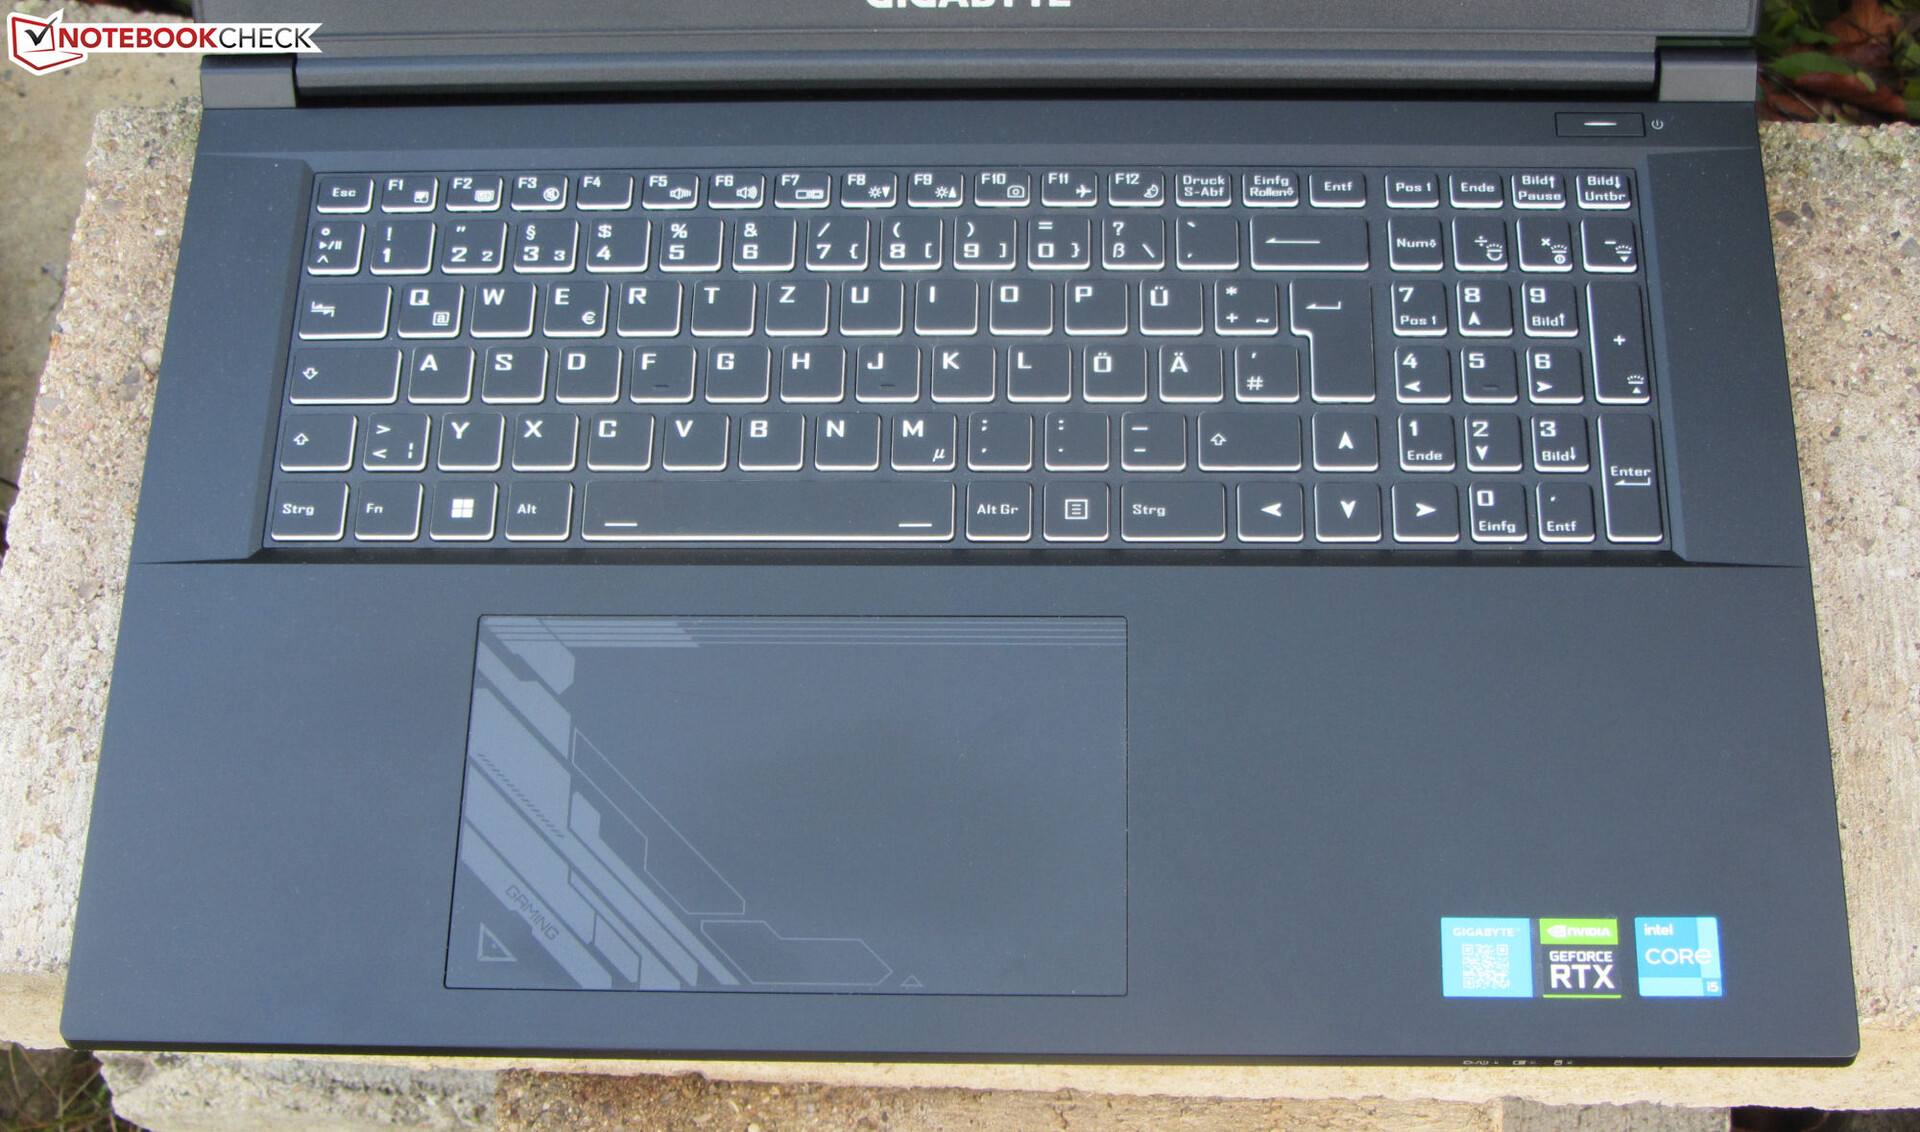
Input Devices - Keyboard With RGB Backlighting
Keyboard
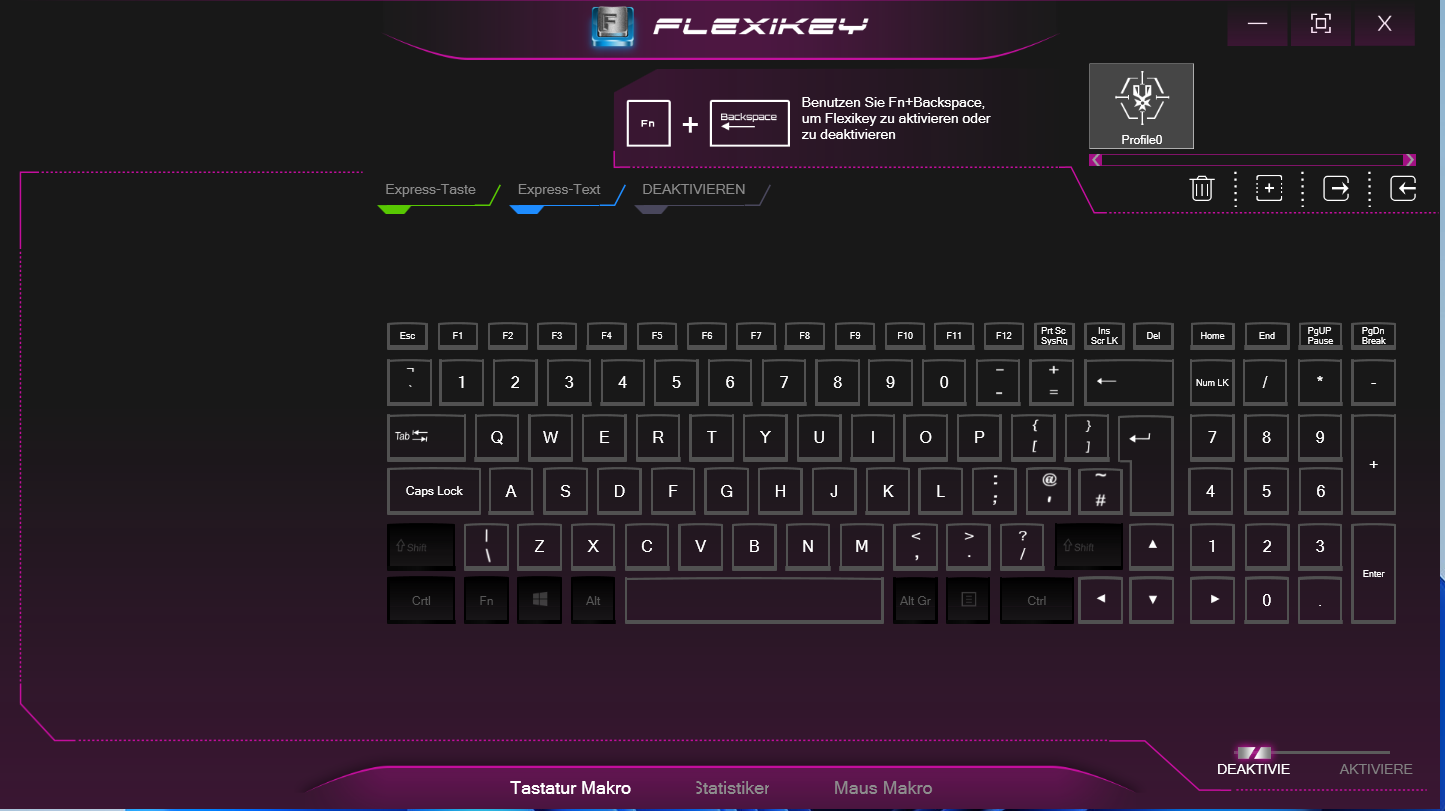
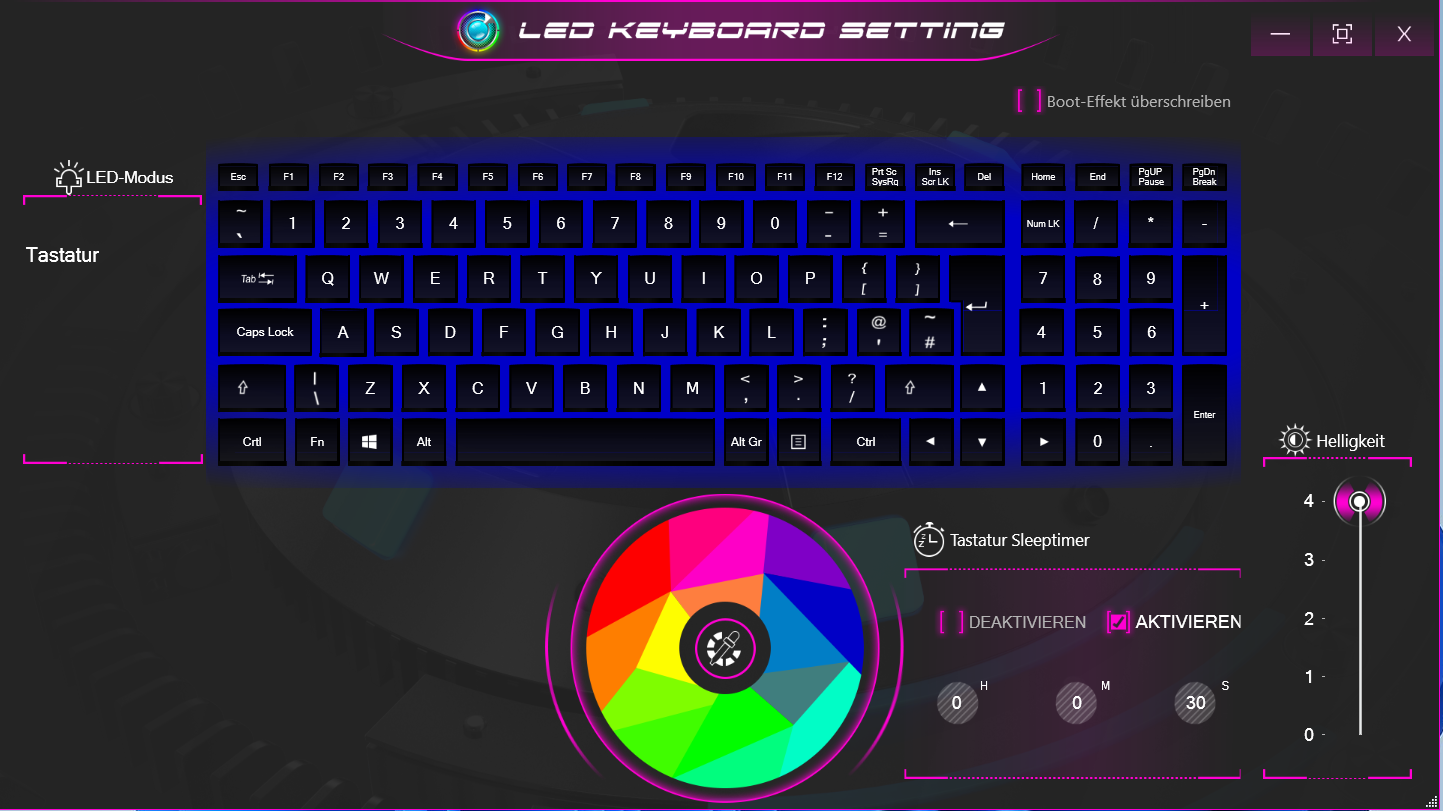
The flat, smooth keys of the backlit chiclet keyboard offer moderate travel and a distinct actuation point. The key feedback could have been firmer. The keyboard area slightly yields while typing, although this should not be an issue in practice. Good: The keyboard uses fullsize arrow keys. The RGB backlight (four levels) can be controlled via three function keys. Overall, Gigabyte delivers a good keyboard for day-to-day use.
Touchpad
Thanks to the large, multi-touch enabled clickpad (~ 15.2 x 9.1 cm) there is technically no need for an external mouse, since the smooth surface offers good gliding properties. It is responsive all the way into the corners. The touchpad has short travel and a distinct actuation point.
Display - 300-Hz IPS
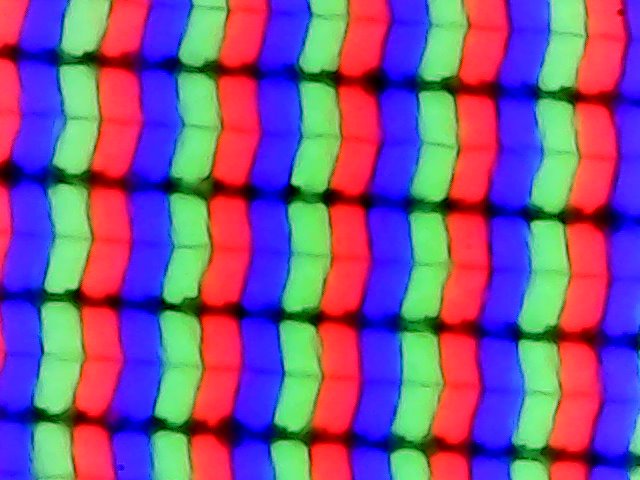
Gigabyte fits the G7 with a matte 17.3-inch screen (1920 x 1080 pixels). The brightness (300 nits) and contrast ratio (1535:1) of the responsive 300-Hz panel meet and exceed our expectations (>300 nits and 1000:1). Additionally, the display does not suffer from PWM flickering at any brightness level.
| |||||||||||||||||||||||||
Brightness Distribution: 93 %
Center on Battery: 307 cd/m²
Contrast: 1535:1 (Black: 0.2 cd/m²)
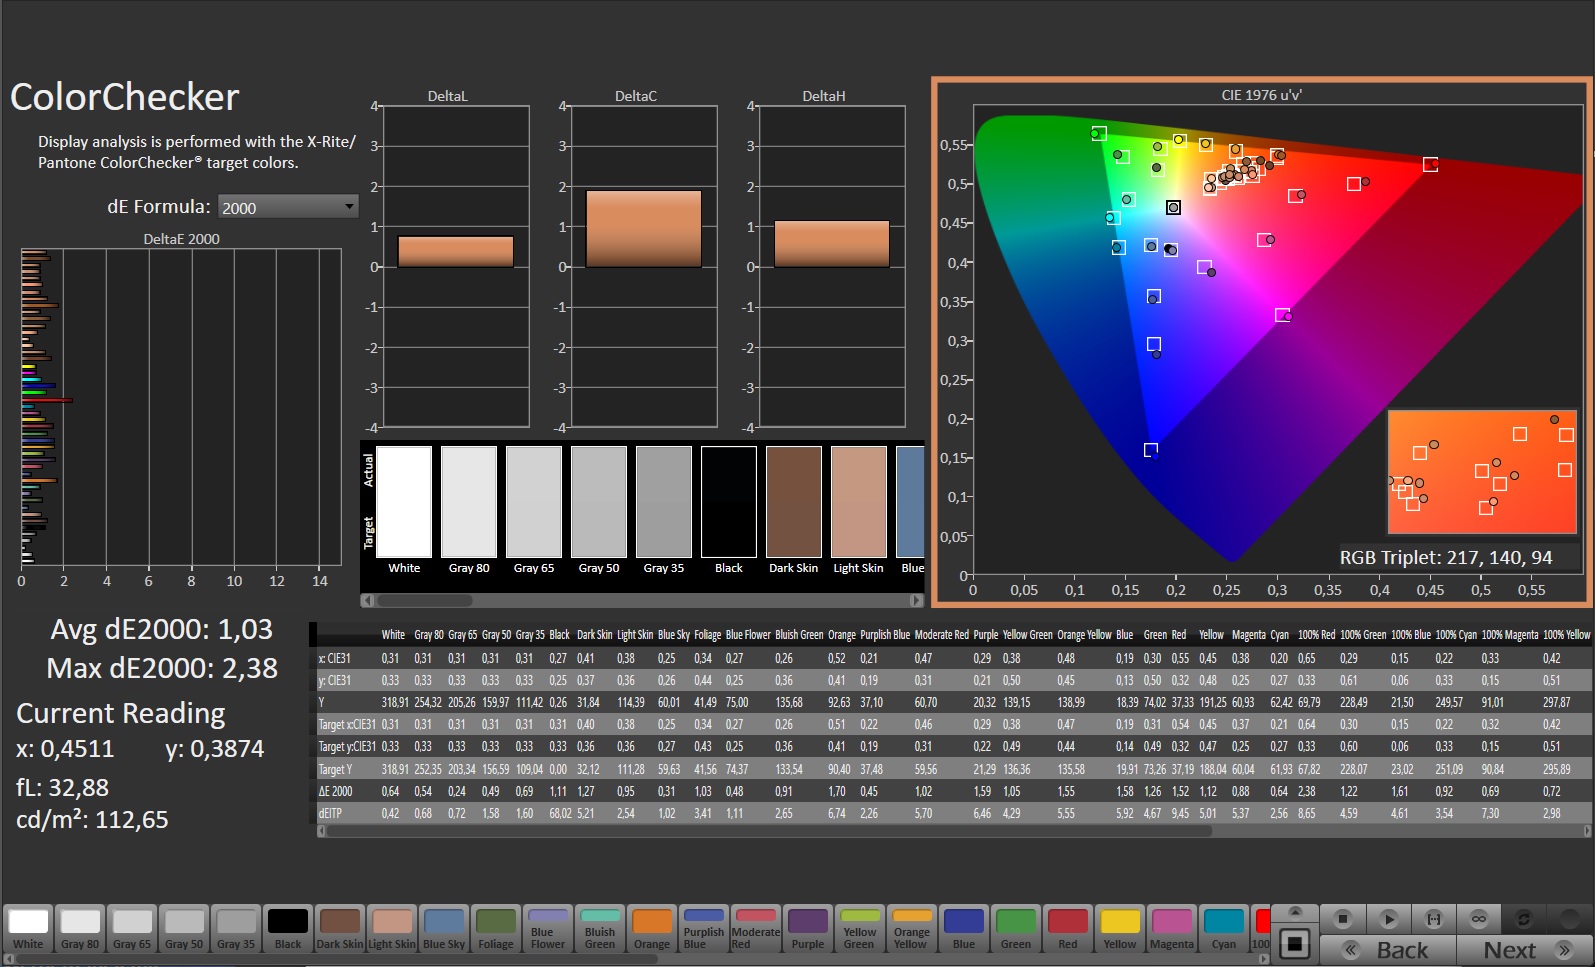
ΔE ColorChecker Calman: 1.32 | ∀{0.5-29.43 Ø4.77}
calibrated: 1.03
ΔE Greyscale Calman: 2.1 | ∀{0.09-98 Ø5}
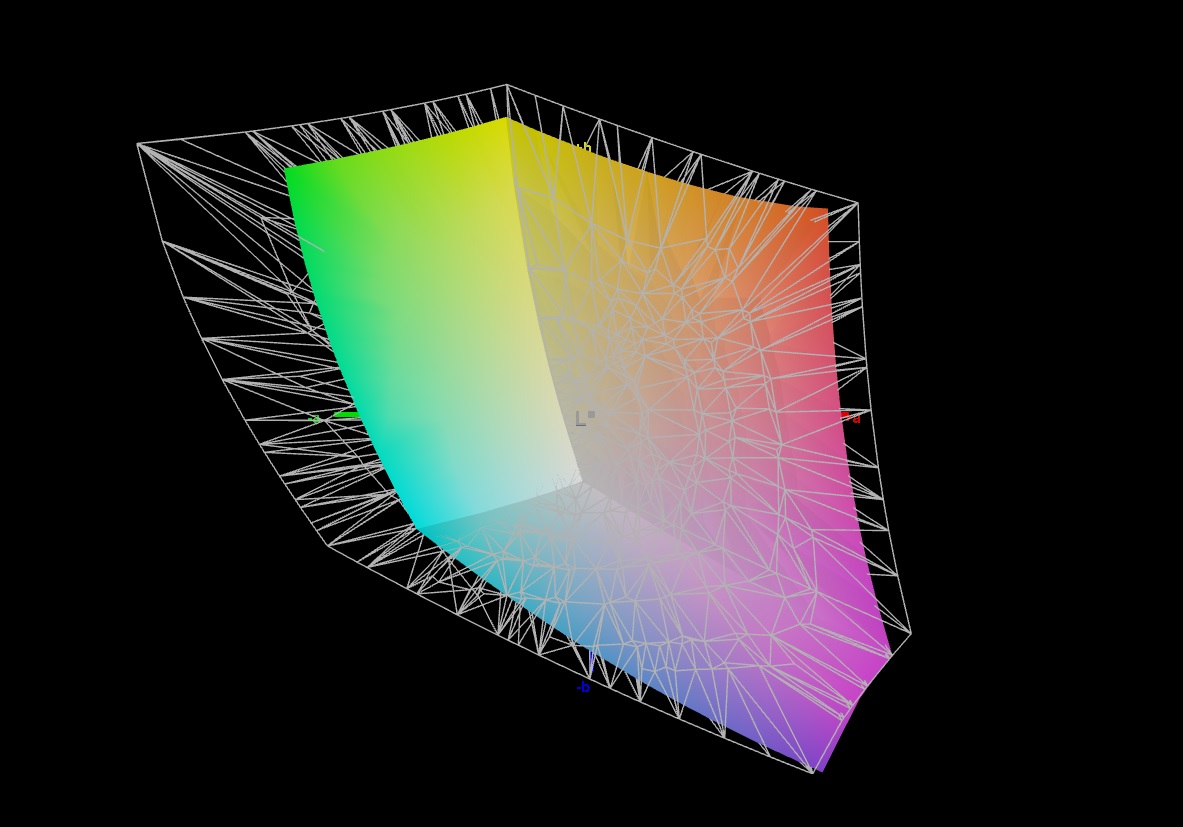
71.7% AdobeRGB 1998 (Argyll 3D)
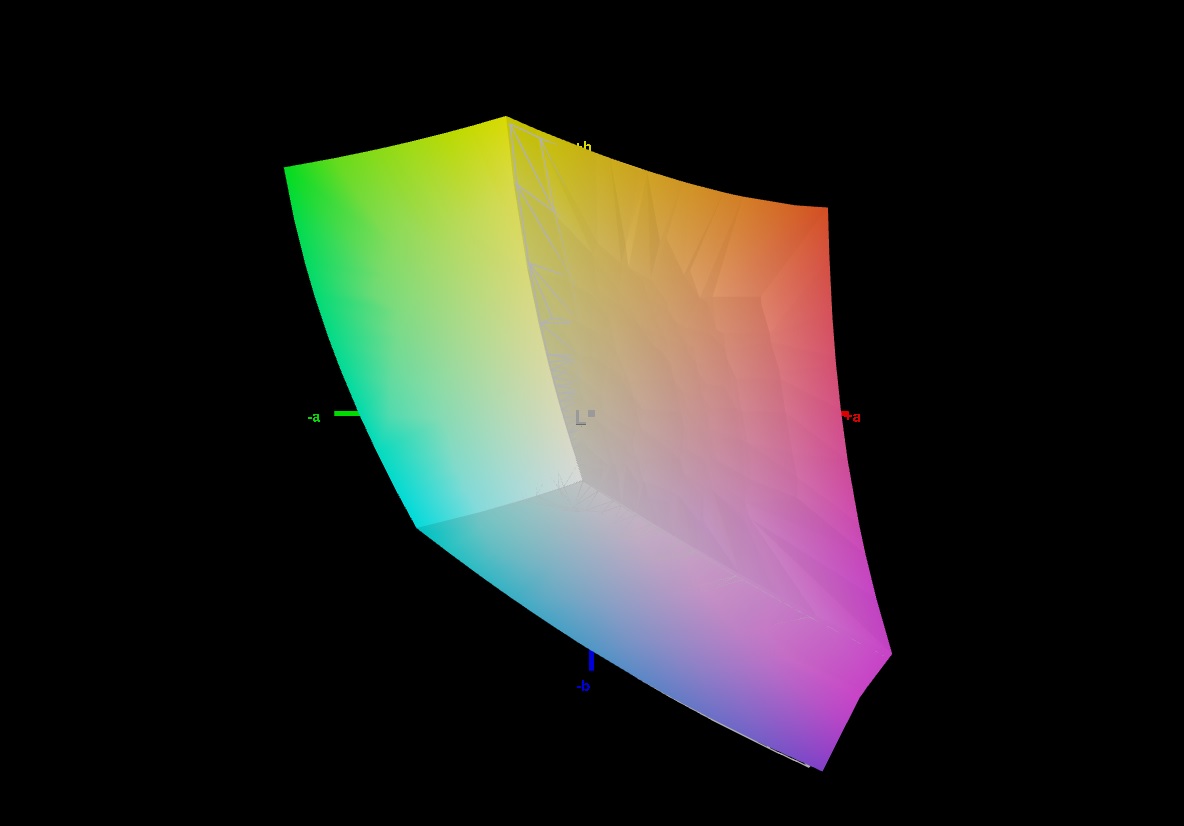
99.8% sRGB (Argyll 3D)
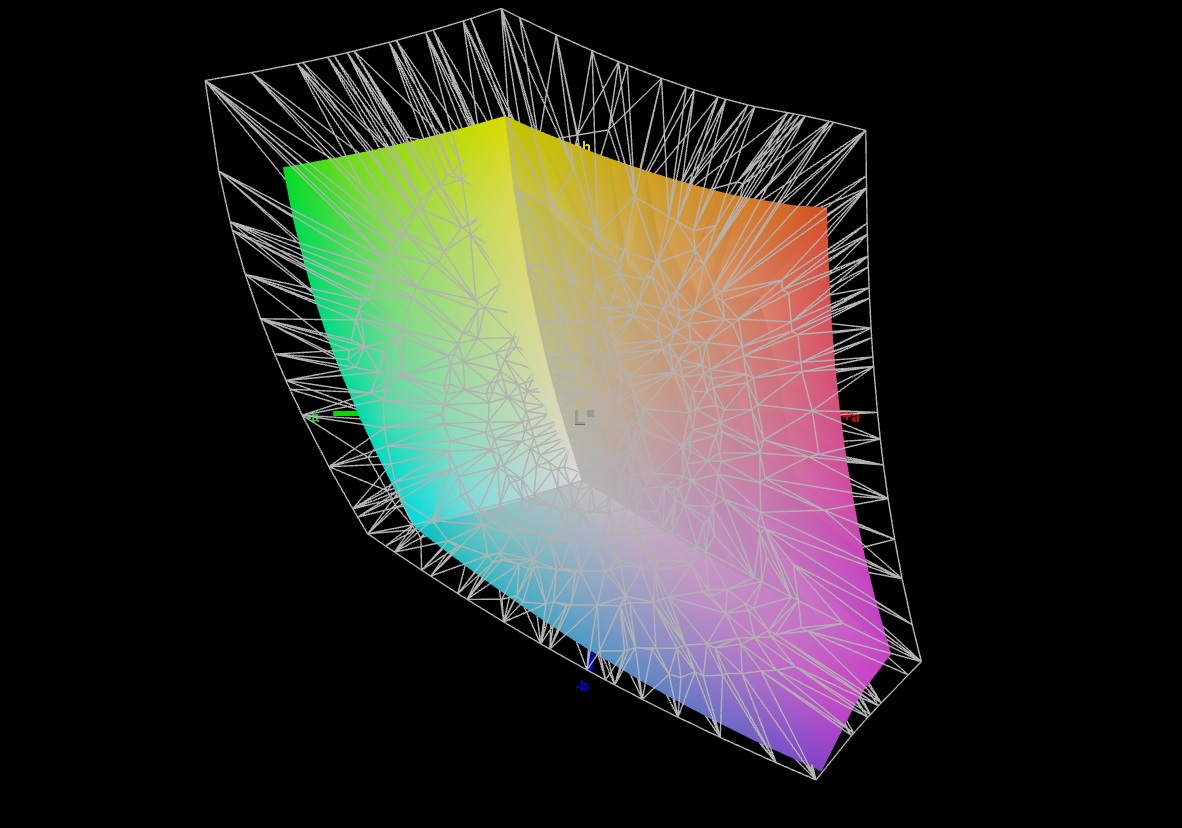
70.4% Display P3 (Argyll 3D)
Gamma: 2.247
CCT: 6815 K
| Gigabyte G7 KE AU Optronics B173HAN05.1, IPS, 1920x1080, 17.3" | HP Pavilion Gaming 17-cd2146ng LGD0611, IPS, 1920x1080, 17.3" | Acer Nitro 5 AN517-55-738R B173HAN04.0, IPS, 1920x1080, 17.3" | Asus TUF Gaming F17 FX707Z-HX011W AU Optronics B173HAN04.9 (AUO4B9D), IPS, 1920x1080, 17.3" | Lenovo IdeaPad Gaming 3 15IAH7 Lenovo LEN156FHD, IPS, 1920x1080, 15.6" | |
|---|---|---|---|---|---|
| Display | -6% | -15% | -42% | -2% | |
| Display P3 Coverage (%) | 70.4 | 64.8 -8% | 58.9 -16% | 40.2 -43% | 69.1 -2% |
| sRGB Coverage (%) | 99.8 | 96.8 -3% | 86.4 -13% | 59.7 -40% | 99.2 -1% |
| AdobeRGB 1998 Coverage (%) | 71.7 | 66.5 -7% | 60.5 -16% | 41.5 -42% | 69.9 -3% |
| Response Times | -80% | -8% | -471% | -81% | |
| Response Time Grey 50% / Grey 80% * (ms) | 5 ? | 12.7 ? -154% | 6 ? -20% | 39.2 ? -684% | 13 ? -160% |
| Response Time Black / White * (ms) | 8.3 ? | 8.7 ? -5% | 8 ? 4% | 29.6 ? -257% | 8.4 ? -1% |
| PWM Frequency (Hz) | |||||
| Screen | -44% | -59% | -97% | -46% | |
| Brightness middle (cd/m²) | 307 | 328 7% | 286 -7% | 287 -7% | 338 10% |
| Brightness (cd/m²) | 301 | 317 5% | 278 -8% | 268 -11% | 329 9% |
| Brightness Distribution (%) | 93 | 94 1% | 89 -4% | 89 -4% | 92 -1% |
| Black Level * (cd/m²) | 0.2 | 0.23 -15% | 0.32 -60% | 0.17 15% | 0.27 -35% |
| Contrast (:1) | 1535 | 1426 -7% | 894 -42% | 1688 10% | 1252 -18% |
| Colorchecker dE 2000 * | 1.32 | 3.83 -190% | 3.05 -131% | 5.1 -286% | 2.88 -118% |
| Colorchecker dE 2000 max. * | 4.6 | 8.51 -85% | 5.83 -27% | 8.72 -90% | 9.35 -103% |
| Colorchecker dE 2000 calibrated * | 1.03 | 0.83 19% | 3.13 -204% | 5.1 -395% | 1.22 -18% |
| Greyscale dE 2000 * | 2.1 | 4.9 -133% | 3.17 -51% | 4.24 -102% | 5 -138% |
| Gamma | 2.247 98% | 2.177 101% | 2.29 96% | 2.44 90% | 2.162 102% |
| CCT | 6815 95% | 7881 82% | 6916 94% | 6008 108% | 7497 87% |
| Total Average (Program / Settings) | -43% /
-41% | -27% /
-43% | -203% /
-138% | -43% /
-41% |
* ... smaller is better
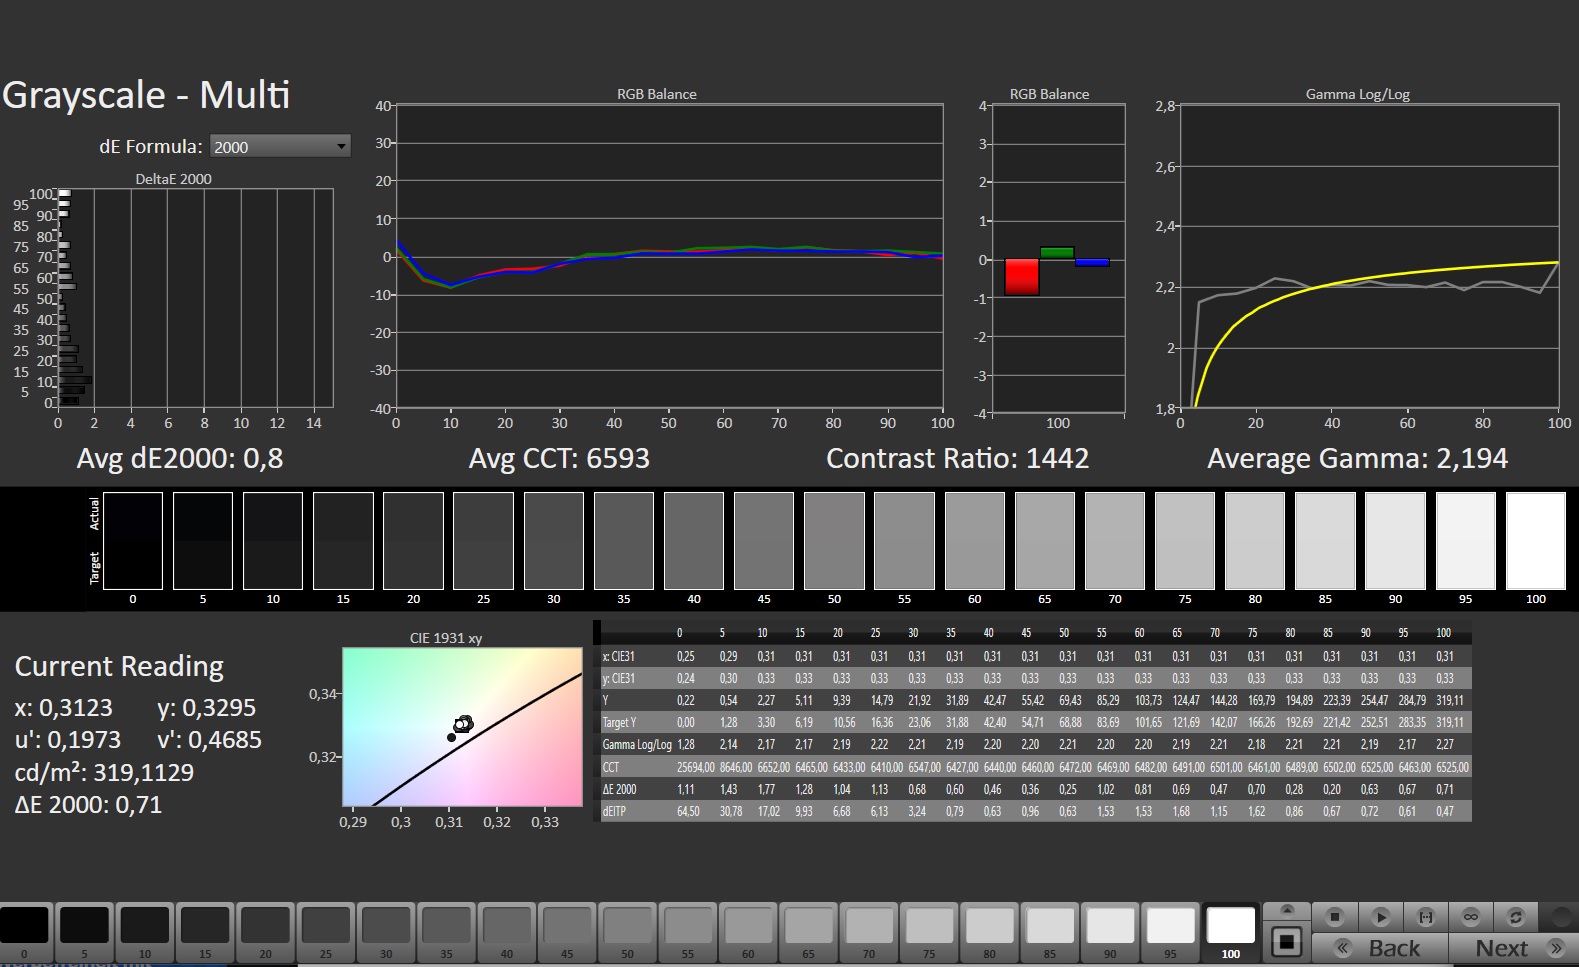
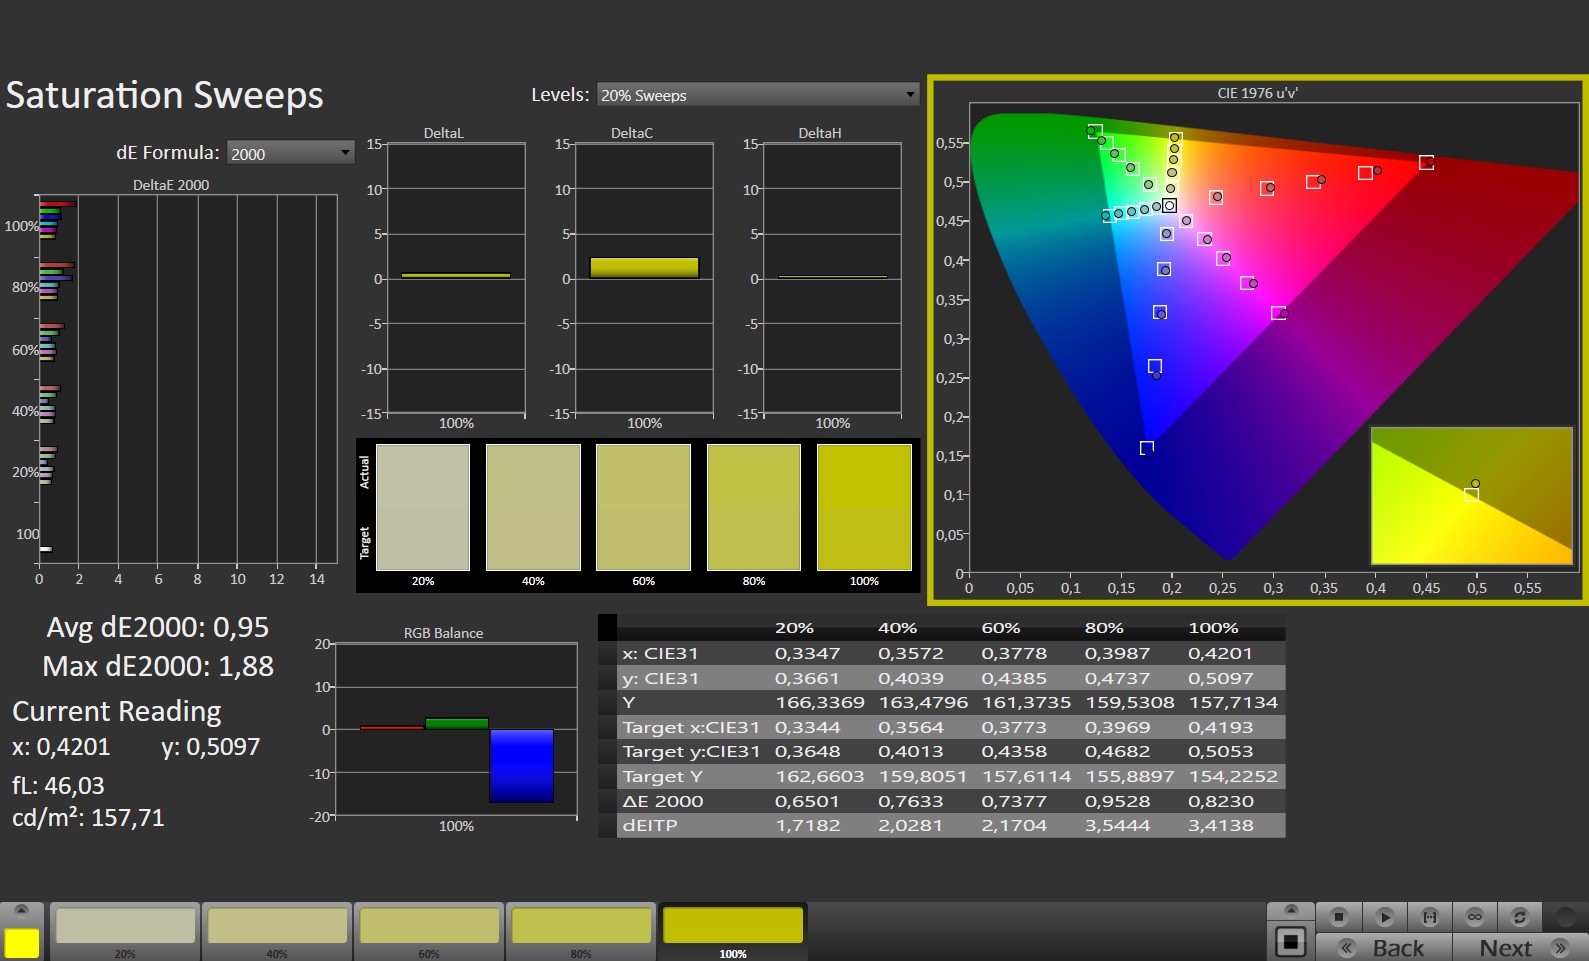
The color accuracy of the display is very good ex-factory: With a deviation of 1.32, it comfortably falls within the ideal range (deltaE < 3). After calibrating the display ourselves, the deviation drops to 1.03 for an even more precise representation of the grayscale. The display is capable of reproducing the entire sRGB color space (100 %), whereas the AdobeRGB (72 %) and DCI-P3 (70 %) color spaces cannot be displayed in their entirety. These results are similar to those of most competitors.


Display Response Times
| ↔ Response Time Black to White | ||
|---|---|---|
| 8.3 ms ... rise ↗ and fall ↘ combined | ↗ 4.2 ms rise | 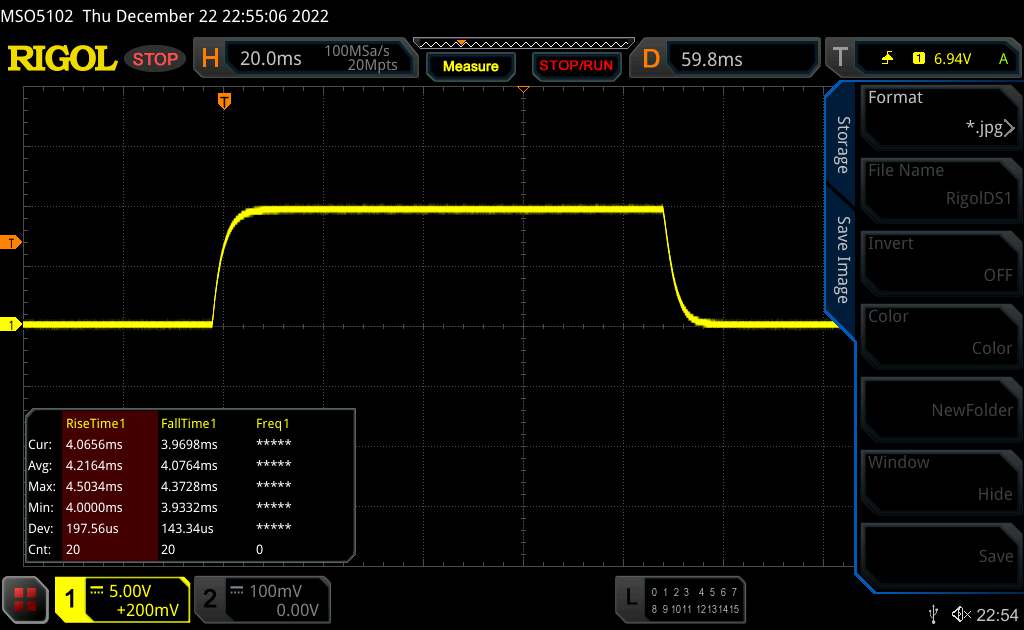 |
| ↘ 4.1 ms fall | ||
| The screen shows fast response rates in our tests and should be suited for gaming. In comparison, all tested devices range from 0.1 (minimum) to 240 (maximum) ms. » 22 % of all devices are better. This means that the measured response time is better than the average of all tested devices (20.2 ms). | ||
| ↔ Response Time 50% Grey to 80% Grey | ||
| 5 ms ... rise ↗ and fall ↘ combined | ↗ 2.1 ms rise | 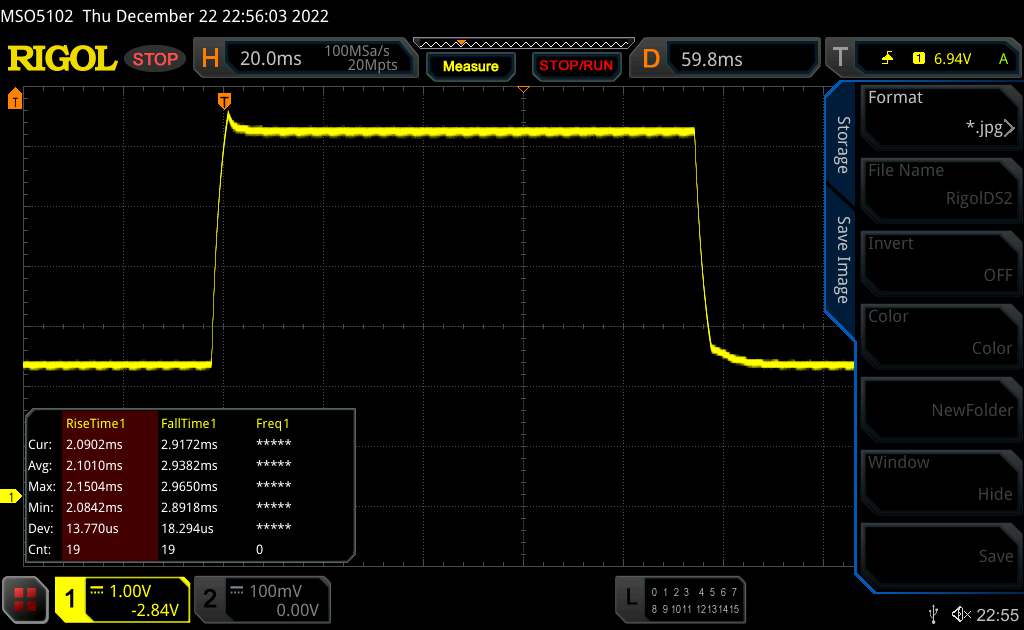 |
| ↘ 2.9 ms fall | ||
| The screen shows very fast response rates in our tests and should be very well suited for fast-paced gaming. In comparison, all tested devices range from 0.165 (minimum) to 636 (maximum) ms. » 16 % of all devices are better. This means that the measured response time is better than the average of all tested devices (31.6 ms). | ||
Screen Flickering / PWM (Pulse-Width Modulation)
| Screen flickering / PWM not detected |  | ||
In comparison: 53 % of all tested devices do not use PWM to dim the display. If PWM was detected, an average of 8084 (minimum: 5 - maximum: 343500) Hz was measured. | |||
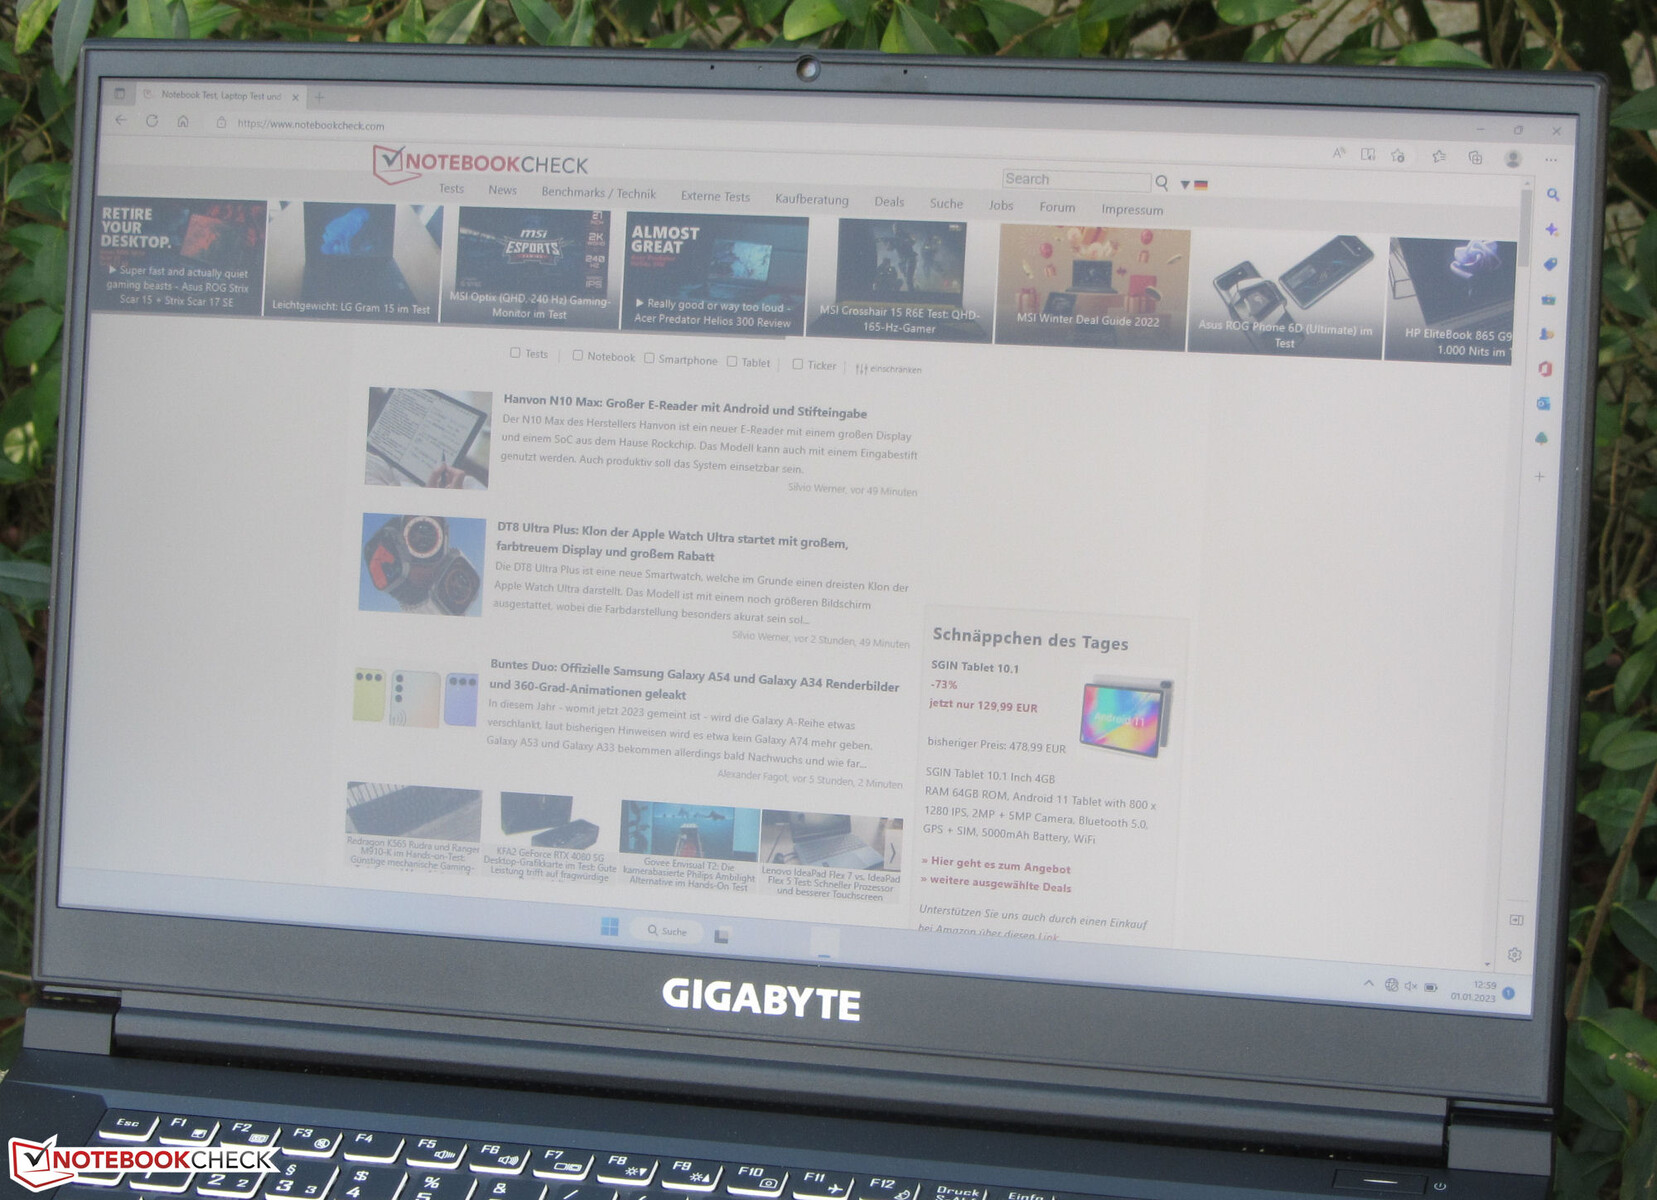
The IPS panel has good viewing angles and can be read from any angle. The outdoor readability is good as well, provided the sun does not shine too brightly.

Performance - Gigabyte Relies on Alder Lake and Ampere
Gigabyte liefert mit dem G7 KE ein verhältnismäßig günstiges Gaming-Notebook, das auf FHD-Gaming (hohe bis maximale Settings) ausgelegt ist, aber auch in Bereichen wie Videobearbeitung und Rendering eine gute Figur abgibt.
Testing Conditions
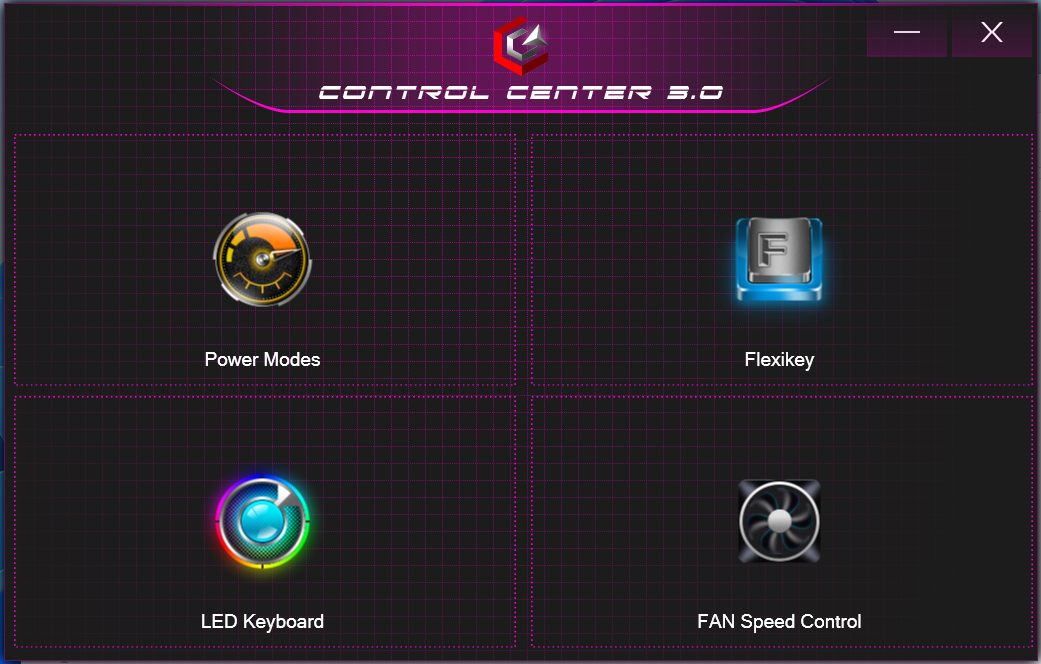
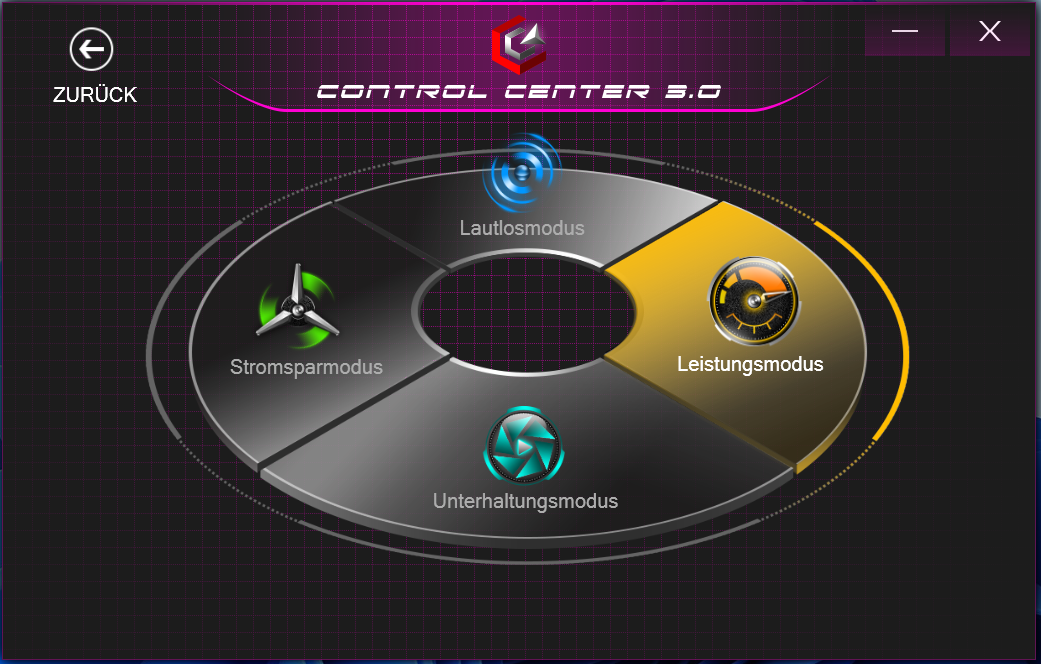
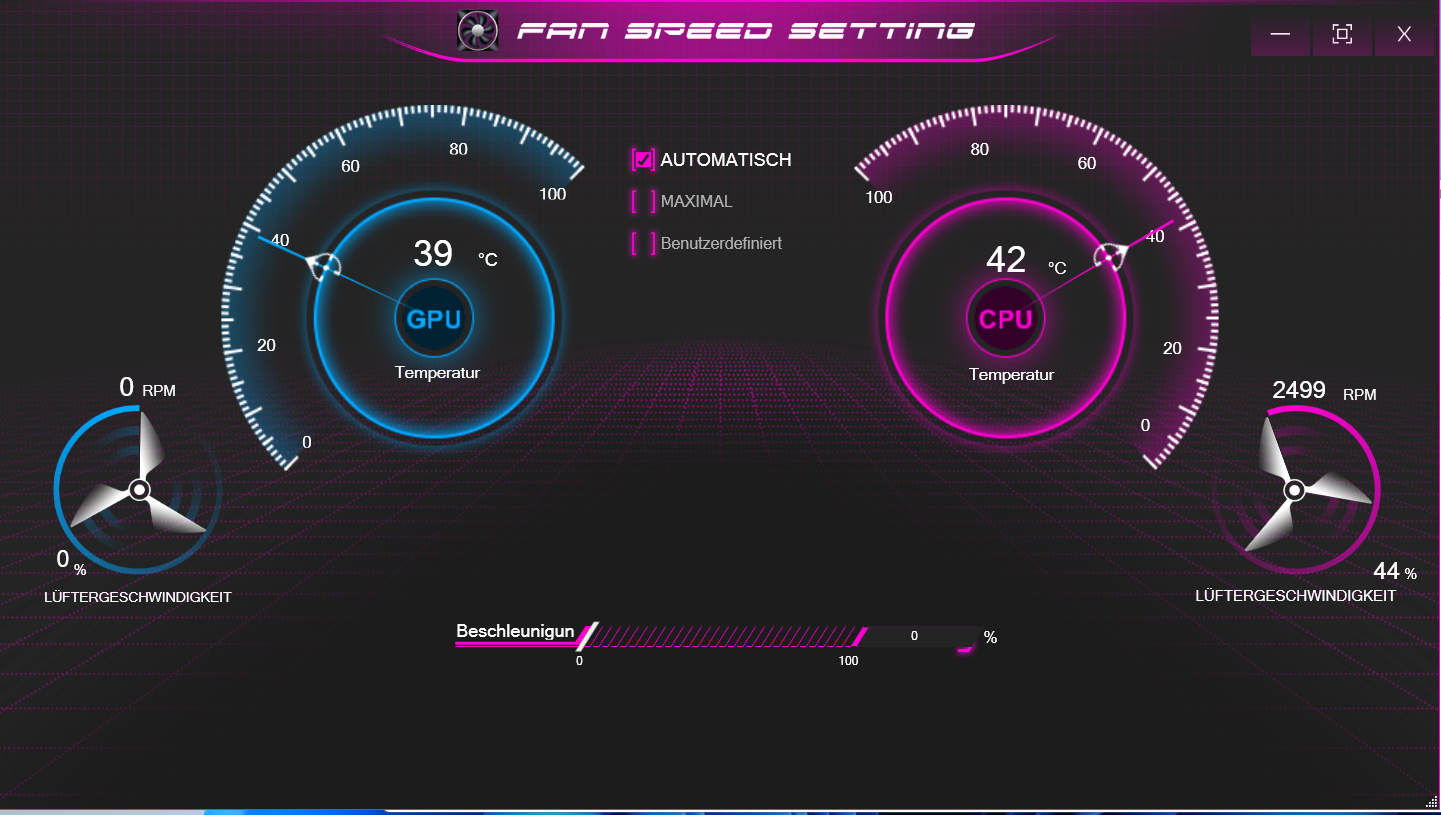
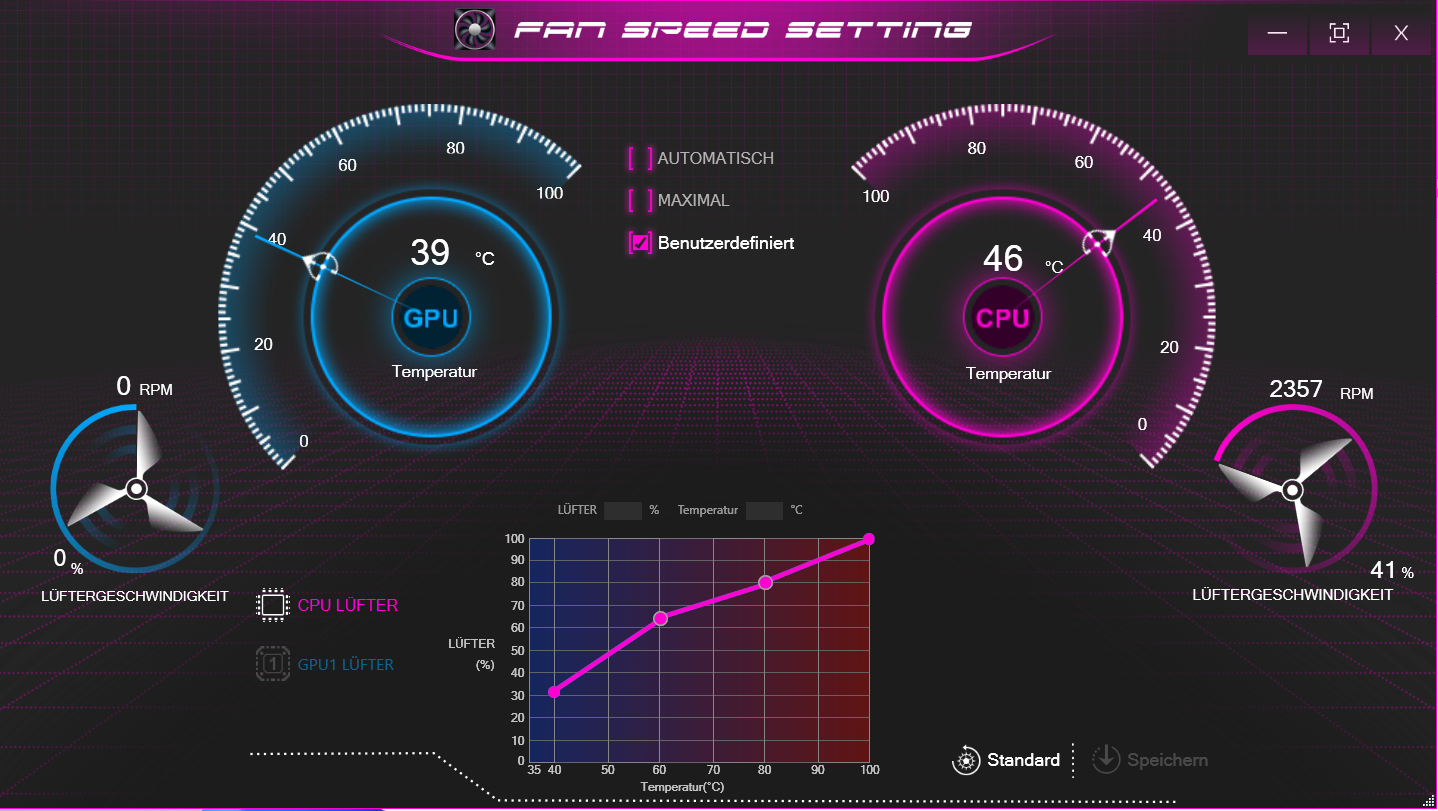
The preinstalled Control Center allows users to control various parameters such as choosing a power profile (see table). We used the "Performance" (benchmarks) and "energy saver" (battery tests) profiles.
| Power Profile | Entertainment Mode | Energy Saver Mode | Quiet Mode | |
|---|---|---|---|---|
| Power Limit 1 | 80 watts | 45 watts | 15 watts | 15 watts |
| Power Limit 2 | 135 watts | 115 watts | 30 watts | 30 watts |
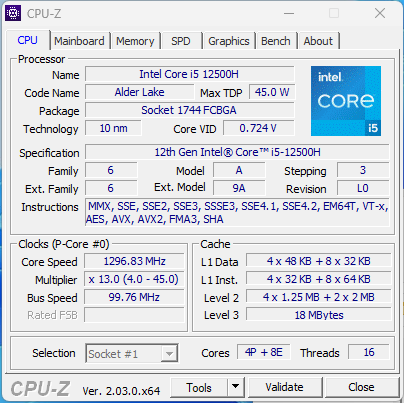
Processor
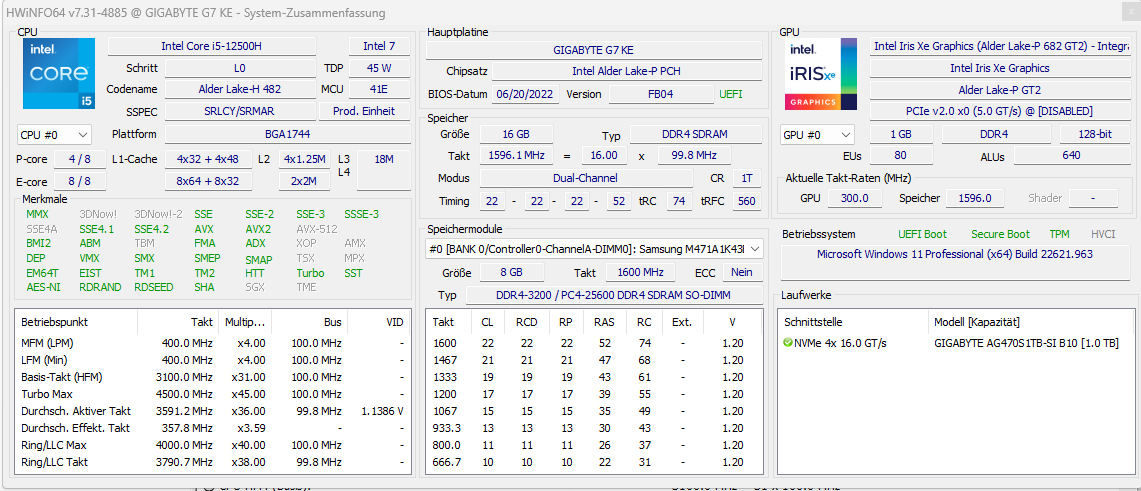
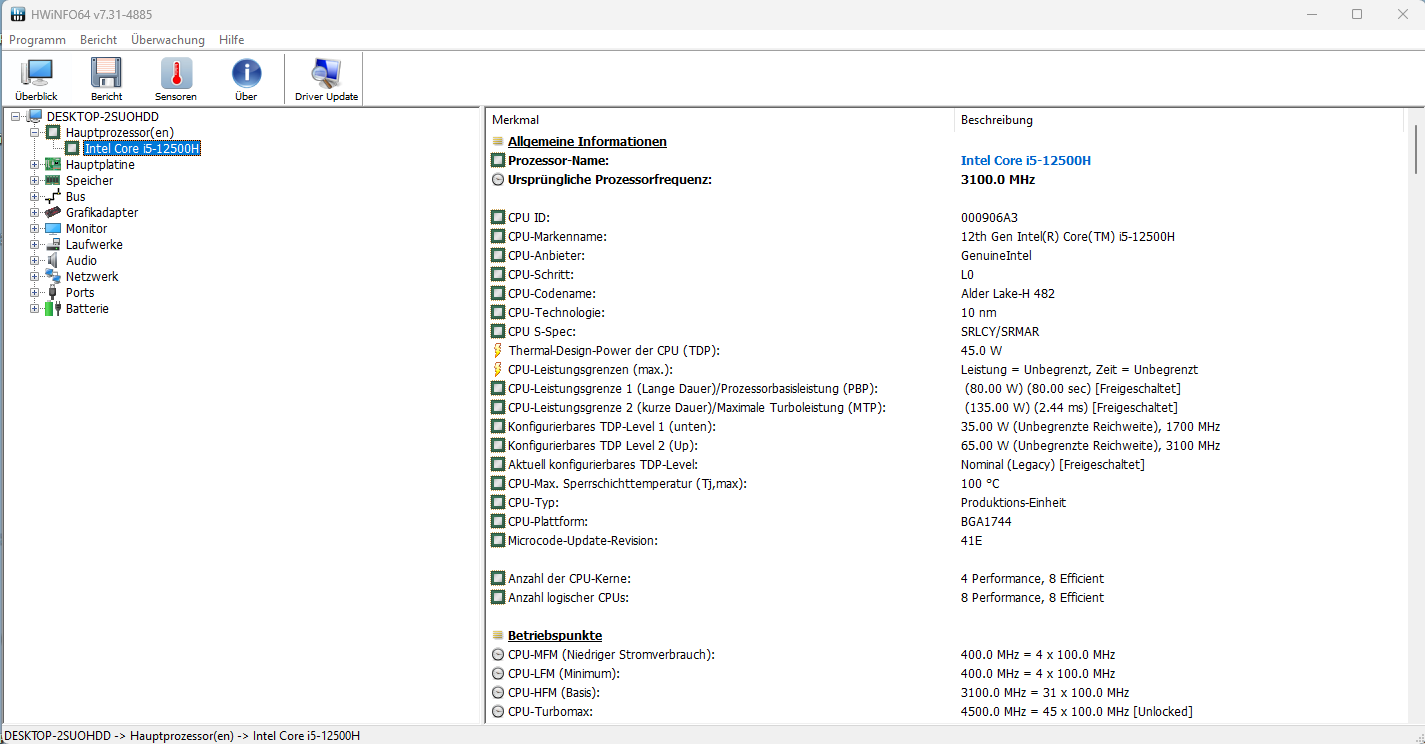
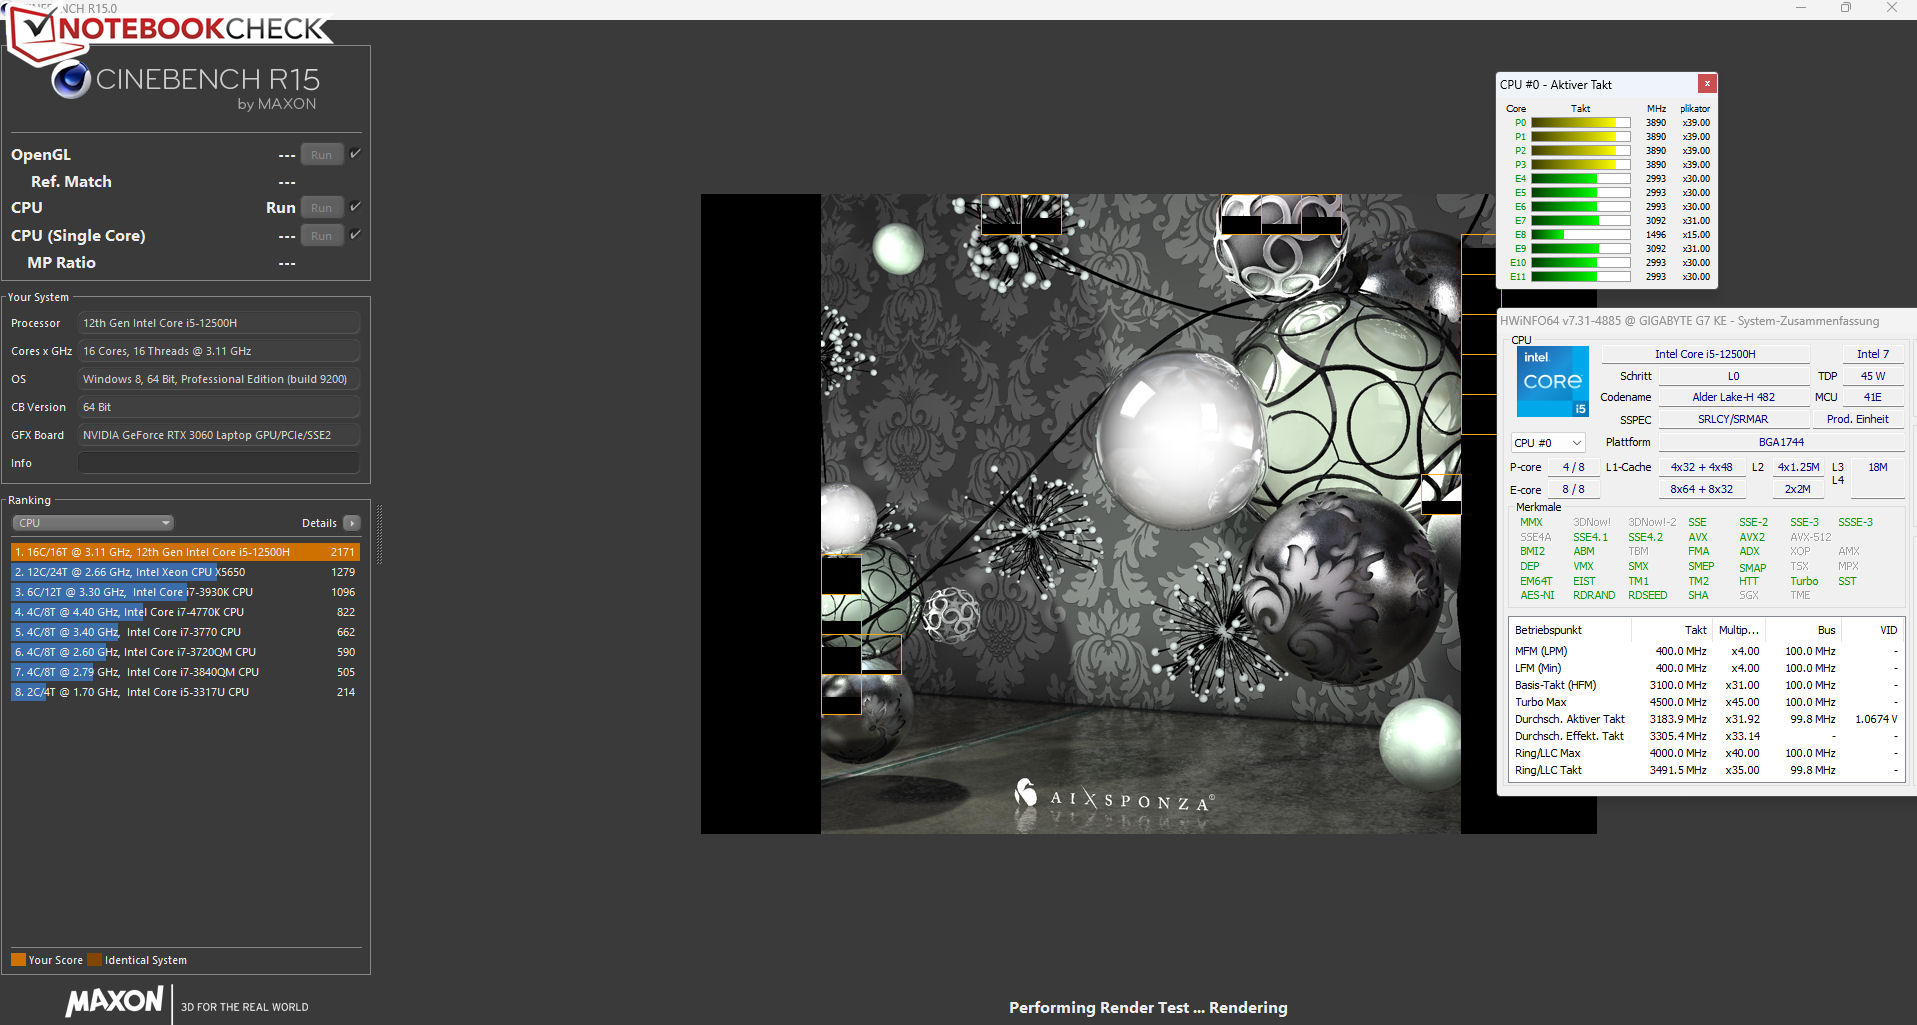
The Core i5-12500H processor (Alder Lake) consists of four performance cores (Hyper-Threading, 2.5 to 4.5 GHz) and eight efficiency cores (no Hyper-Threading, 1.8 to 3.3 GHz). Thus, there are a total of 16 logical CPU cores.
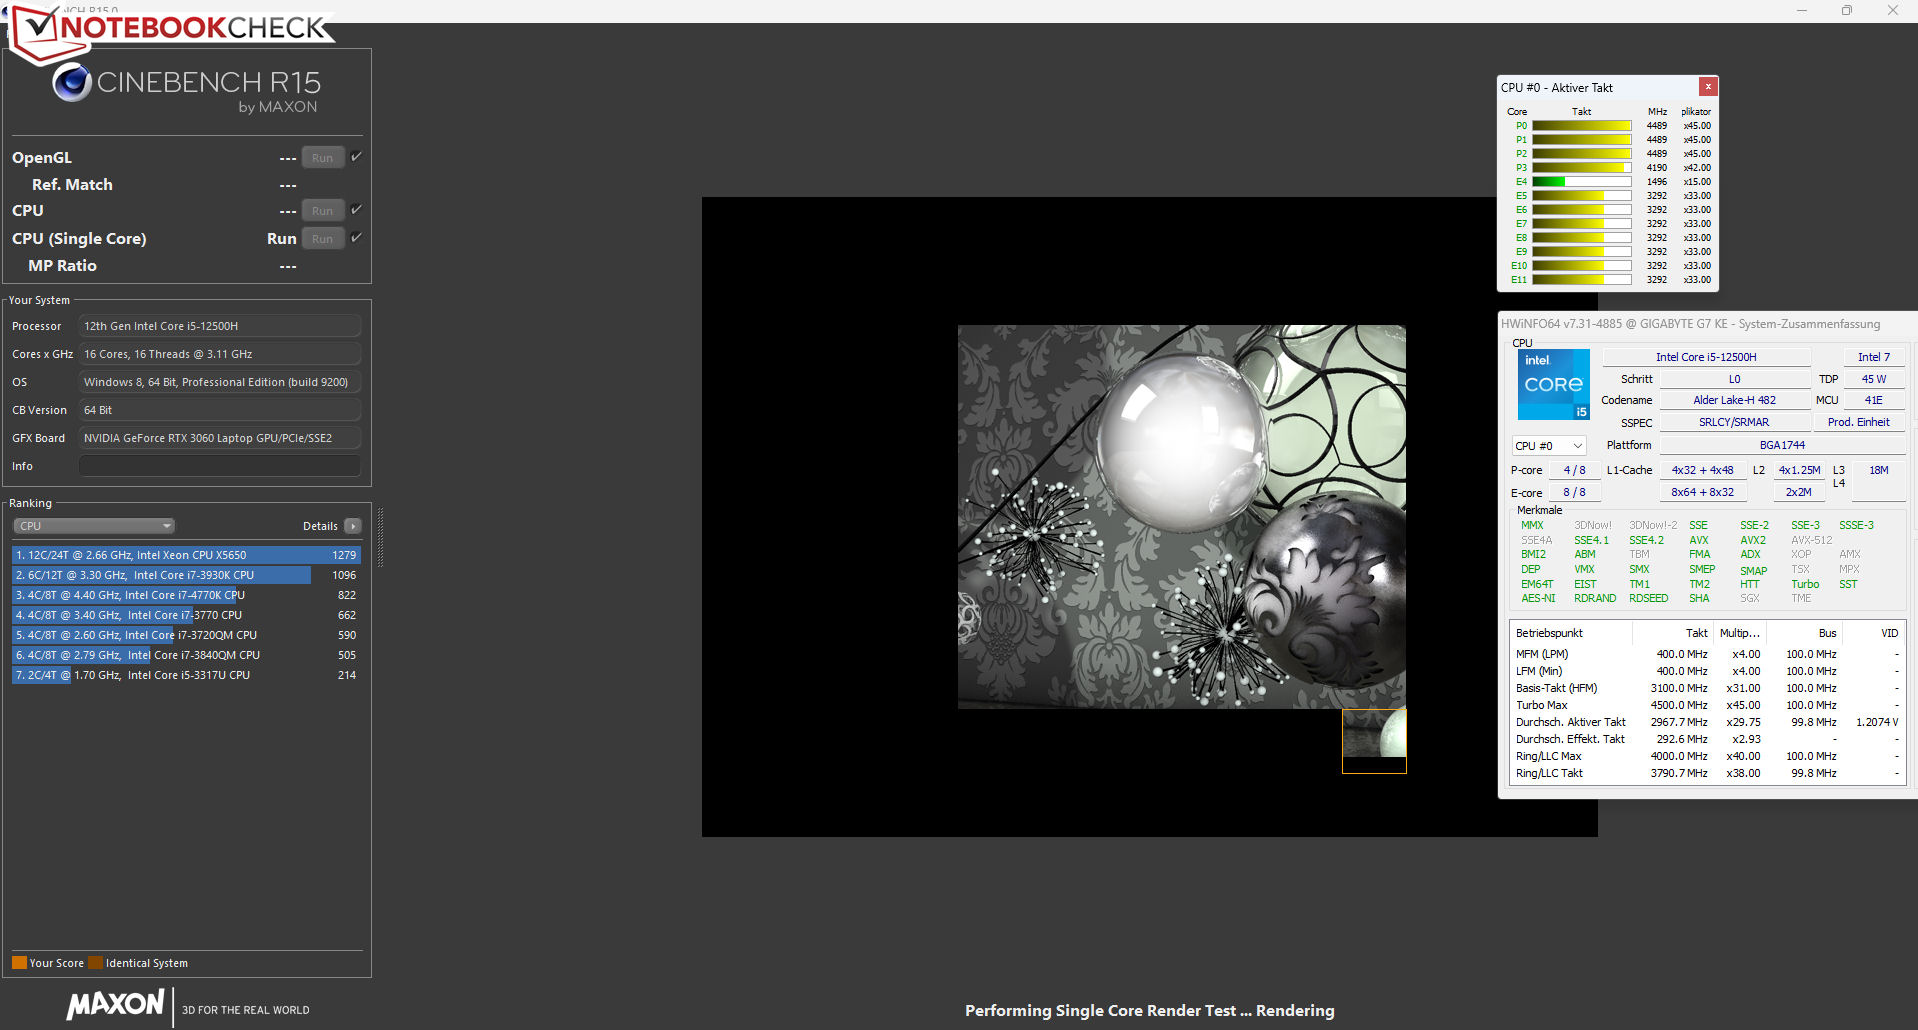
The average clock speeds during both the multi-core (P cores: 3.9 to 4.2 GHz, E cores: 1.5 to 3.1 GHz) and single-core (P cores: 4.2 to 4.5 GHz, E cores: 1.5 to 3.3 GHz) benchmarks are high. The clock speeds are reduced in battery mode. With our CB15 loop, we were able to confirm the continuous use of the CPU Turbo. The Core i5's benchmark results are slightly above average overall.
Cinebench R15 Multi Loop


* ... smaller is better
AIDA64: FP32 Ray-Trace | FPU Julia | CPU SHA3 | CPU Queen | FPU SinJulia | FPU Mandel | CPU AES | CPU ZLib | FP64 Ray-Trace | CPU PhotoWorxx
| Performance rating | |
| Average of class Gaming | |
| Gigabyte G7 KE | |
| Lenovo IdeaPad Gaming 3 15IAH7 | |
| Average Intel Core i5-12500H | |
| Acer Nitro 5 AN517-55-738R | |
| Asus TUF Gaming F17 FX707Z-HX011W | |
| HP Pavilion Gaming 17-cd2146ng | |
| AIDA64 / FP32 Ray-Trace | |
| Average of class Gaming (7192 - 85542, n=144, last 2 years) | |
| Lenovo IdeaPad Gaming 3 15IAH7 | |
| Gigabyte G7 KE | |
| Average Intel Core i5-12500H (6851 - 13947, n=9) | |
| Acer Nitro 5 AN517-55-738R | |
| HP Pavilion Gaming 17-cd2146ng | |
| Asus TUF Gaming F17 FX707Z-HX011W | |
| AIDA64 / FPU Julia | |
| Average of class Gaming (35040 - 238426, n=144, last 2 years) | |
| Lenovo IdeaPad Gaming 3 15IAH7 | |
| Gigabyte G7 KE | |
| Average Intel Core i5-12500H (29874 - 68178, n=9) | |
| Acer Nitro 5 AN517-55-738R | |
| Asus TUF Gaming F17 FX707Z-HX011W | |
| HP Pavilion Gaming 17-cd2146ng | |
| AIDA64 / CPU SHA3 | |
| Average of class Gaming (1728 - 9817, n=144, last 2 years) | |
| Lenovo IdeaPad Gaming 3 15IAH7 | |
| Gigabyte G7 KE | |
| Average Intel Core i5-12500H (2287 - 3337, n=9) | |
| Acer Nitro 5 AN517-55-738R | |
| Asus TUF Gaming F17 FX707Z-HX011W | |
| HP Pavilion Gaming 17-cd2146ng | |
| AIDA64 / CPU Queen | |
| Average of class Gaming (49785 - 173351, n=144, last 2 years) | |
| Asus TUF Gaming F17 FX707Z-HX011W | |
| Acer Nitro 5 AN517-55-738R | |
| Lenovo IdeaPad Gaming 3 15IAH7 | |
| Gigabyte G7 KE | |
| Average Intel Core i5-12500H (77935 - 80703, n=9) | |
| HP Pavilion Gaming 17-cd2146ng | |
| AIDA64 / FPU SinJulia | |
| Average of class Gaming (4424 - 33636, n=144, last 2 years) | |
| Acer Nitro 5 AN517-55-738R | |
| Asus TUF Gaming F17 FX707Z-HX011W | |
| Gigabyte G7 KE | |
| Lenovo IdeaPad Gaming 3 15IAH7 | |
| Average Intel Core i5-12500H (6590 - 7431, n=9) | |
| HP Pavilion Gaming 17-cd2146ng | |
| AIDA64 / FPU Mandel | |
| Average of class Gaming (17585 - 128721, n=144, last 2 years) | |
| Lenovo IdeaPad Gaming 3 15IAH7 | |
| Gigabyte G7 KE | |
| Average Intel Core i5-12500H (18252 - 34041, n=9) | |
| Acer Nitro 5 AN517-55-738R | |
| Asus TUF Gaming F17 FX707Z-HX011W | |
| HP Pavilion Gaming 17-cd2146ng | |
| AIDA64 / CPU AES | |
| Lenovo IdeaPad Gaming 3 15IAH7 | |
| Gigabyte G7 KE | |
| Average of class Gaming (19065 - 247074, n=144, last 2 years) | |
| Average Intel Core i5-12500H (50298 - 111567, n=9) | |
| Acer Nitro 5 AN517-55-738R | |
| Asus TUF Gaming F17 FX707Z-HX011W | |
| HP Pavilion Gaming 17-cd2146ng | |
| AIDA64 / CPU ZLib | |
| Average of class Gaming (373 - 2531, n=144, last 2 years) | |
| Gigabyte G7 KE | |
| Acer Nitro 5 AN517-55-738R | |
| Lenovo IdeaPad Gaming 3 15IAH7 | |
| Average Intel Core i5-12500H (746 - 924, n=9) | |
| Asus TUF Gaming F17 FX707Z-HX011W | |
| HP Pavilion Gaming 17-cd2146ng | |
| AIDA64 / FP64 Ray-Trace | |
| Average of class Gaming (3856 - 45446, n=144, last 2 years) | |
| Lenovo IdeaPad Gaming 3 15IAH7 | |
| Gigabyte G7 KE | |
| Average Intel Core i5-12500H (3848 - 7405, n=9) | |
| Acer Nitro 5 AN517-55-738R | |
| Asus TUF Gaming F17 FX707Z-HX011W | |
| HP Pavilion Gaming 17-cd2146ng | |
| AIDA64 / CPU PhotoWorxx | |
| Average of class Gaming (10805 - 62916, n=144, last 2 years) | |
| Asus TUF Gaming F17 FX707Z-HX011W | |
| Average Intel Core i5-12500H (13686 - 43813, n=9) | |
| Gigabyte G7 KE | |
| HP Pavilion Gaming 17-cd2146ng | |
| Acer Nitro 5 AN517-55-738R | |
| Lenovo IdeaPad Gaming 3 15IAH7 | |
System Performance
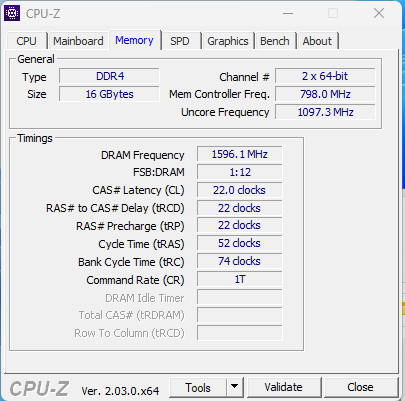
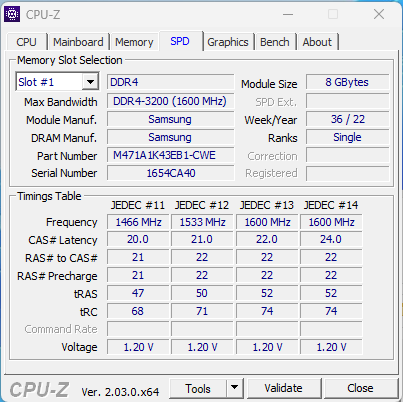
The system is smooth and responsive and delivers sufficient performance for rendering, video editing, and gaming purposes. The results of the PCMark tests are good. For DDR4-3200 memory, the transfer rates of the system memory match our expectations.
CrossMark: Overall | Productivity | Creativity | Responsiveness
| PCMark 10 / Score | |
| Average of class Gaming (5776 - 9667, n=122, last 2 years) | |
| Lenovo IdeaPad Gaming 3 15IAH7 | |
| Average Intel Core i5-12500H, NVIDIA GeForce RTX 3060 Laptop GPU (6126 - 7201, n=2) | |
| Acer Nitro 5 AN517-55-738R | |
| Gigabyte G7 KE | |
| Asus TUF Gaming F17 FX707Z-HX011W | |
| HP Pavilion Gaming 17-cd2146ng | |
| PCMark 10 / Essentials | |
| Average Intel Core i5-12500H, NVIDIA GeForce RTX 3060 Laptop GPU (10301 - 11150, n=2) | |
| Average of class Gaming (8810 - 12600, n=127, last 2 years) | |
| Gigabyte G7 KE | |
| Lenovo IdeaPad Gaming 3 15IAH7 | |
| Acer Nitro 5 AN517-55-738R | |
| Asus TUF Gaming F17 FX707Z-HX011W | |
| HP Pavilion Gaming 17-cd2146ng | |
| PCMark 10 / Productivity | |
| Average of class Gaming (6662 - 16716, n=122, last 2 years) | |
| Lenovo IdeaPad Gaming 3 15IAH7 | |
| Average Intel Core i5-12500H, NVIDIA GeForce RTX 3060 Laptop GPU (9038 - 9475, n=2) | |
| Acer Nitro 5 AN517-55-738R | |
| Gigabyte G7 KE | |
| HP Pavilion Gaming 17-cd2146ng | |
| Asus TUF Gaming F17 FX707Z-HX011W | |
| PCMark 10 / Digital Content Creation | |
| Average of class Gaming (7440 - 19351, n=122, last 2 years) | |
| Asus TUF Gaming F17 FX707Z-HX011W | |
| Acer Nitro 5 AN517-55-738R | |
| Lenovo IdeaPad Gaming 3 15IAH7 | |
| Average Intel Core i5-12500H, NVIDIA GeForce RTX 3060 Laptop GPU (6703 - 9593, n=2) | |
| Gigabyte G7 KE | |
| HP Pavilion Gaming 17-cd2146ng | |
| CrossMark / Overall | |
| Average of class Gaming (1247 - 2344, n=118, last 2 years) | |
| Gigabyte G7 KE | |
| Acer Nitro 5 AN517-55-738R | |
| Average Intel Core i5-12500H, NVIDIA GeForce RTX 3060 Laptop GPU (1752 - 1824, n=2) | |
| Asus TUF Gaming F17 FX707Z-HX011W | |
| CrossMark / Productivity | |
| Average of class Gaming (1299 - 2211, n=118, last 2 years) | |
| Gigabyte G7 KE | |
| Acer Nitro 5 AN517-55-738R | |
| Average Intel Core i5-12500H, NVIDIA GeForce RTX 3060 Laptop GPU (1720 - 1804, n=2) | |
| Asus TUF Gaming F17 FX707Z-HX011W | |
| CrossMark / Creativity | |
| Average of class Gaming (1275 - 2729, n=118, last 2 years) | |
| Asus TUF Gaming F17 FX707Z-HX011W | |
| Acer Nitro 5 AN517-55-738R | |
| Gigabyte G7 KE | |
| Average Intel Core i5-12500H, NVIDIA GeForce RTX 3060 Laptop GPU (1778 - 1800, n=2) | |
| CrossMark / Responsiveness | |
| Gigabyte G7 KE | |
| Average Intel Core i5-12500H, NVIDIA GeForce RTX 3060 Laptop GPU (1771 - 1966, n=2) | |
| Average of class Gaming (1030 - 2330, n=118, last 2 years) | |
| Acer Nitro 5 AN517-55-738R | |
| Asus TUF Gaming F17 FX707Z-HX011W | |
| PCMark 8 Home Score Accelerated v2 | 4560 points | |
| PCMark 8 Work Score Accelerated v2 | 6853 points | |
| PCMark 10 Score | 6126 points | |
Help | ||
| AIDA64 / Memory Copy | |
| Average of class Gaming (21750 - 108104, n=144, last 2 years) | |
| Asus TUF Gaming F17 FX707Z-HX011W | |
| Average Intel Core i5-12500H (23850 - 66598, n=9) | |
| Gigabyte G7 KE | |
| Acer Nitro 5 AN517-55-738R | |
| HP Pavilion Gaming 17-cd2146ng | |
| Lenovo IdeaPad Gaming 3 15IAH7 | |
| AIDA64 / Memory Read | |
| Average of class Gaming (22956 - 104349, n=144, last 2 years) | |
| Asus TUF Gaming F17 FX707Z-HX011W | |
| Average Intel Core i5-12500H (24879 - 68013, n=9) | |
| Gigabyte G7 KE | |
| Acer Nitro 5 AN517-55-738R | |
| HP Pavilion Gaming 17-cd2146ng | |
| Lenovo IdeaPad Gaming 3 15IAH7 | |
| AIDA64 / Memory Write | |
| Average of class Gaming (22297 - 133486, n=144, last 2 years) | |
| Asus TUF Gaming F17 FX707Z-HX011W | |
| Acer Nitro 5 AN517-55-738R | |
| Average Intel Core i5-12500H (23543 - 58797, n=9) | |
| Gigabyte G7 KE | |
| HP Pavilion Gaming 17-cd2146ng | |
| Lenovo IdeaPad Gaming 3 15IAH7 | |
| AIDA64 / Memory Latency | |
| Average of class Gaming (59.5 - 259, n=144, last 2 years) | |
| Average Intel Core i5-12500H (83.8 - 114.7, n=9) | |
| Lenovo IdeaPad Gaming 3 15IAH7 | |
| Gigabyte G7 KE | |
| HP Pavilion Gaming 17-cd2146ng | |
| Asus TUF Gaming F17 FX707Z-HX011W | |
| Acer Nitro 5 AN517-55-738R | |
* ... smaller is better
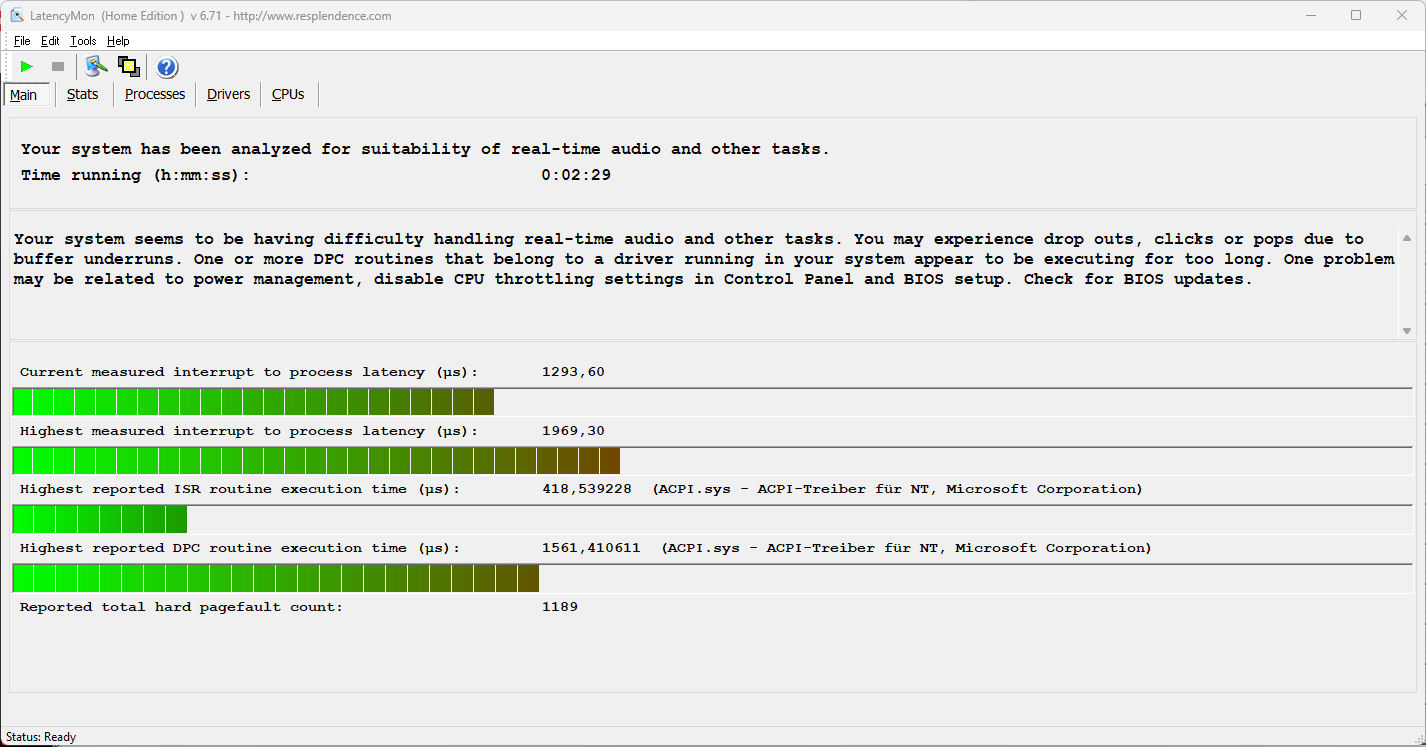
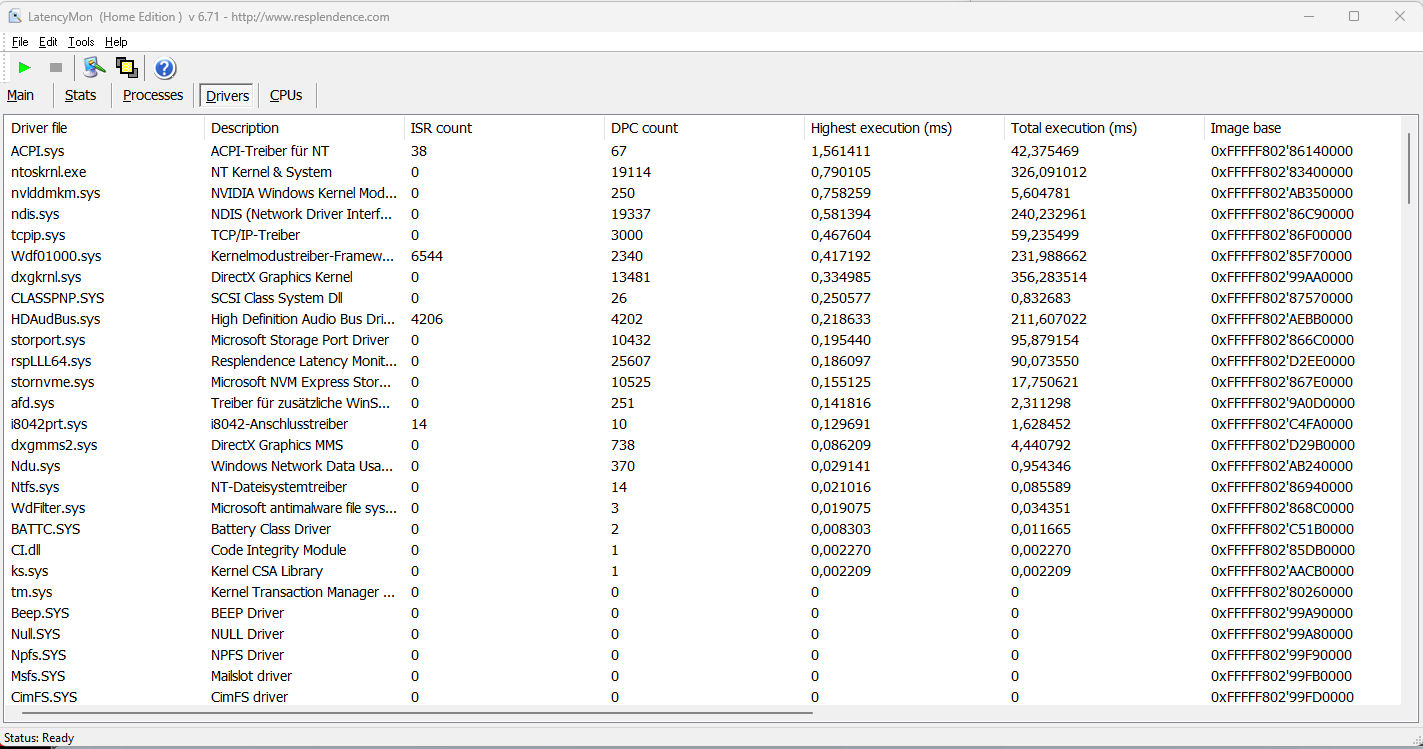
DPC Latency
Our standardized Latency Monitor test (web browsing, 4K video playback, Prime95 high load) reveals problematic DPC latencies. With the hardware and software setup at the time of testing, the system appears to be unsuitable for real-time audio and video editing. Future software updates may improve or worsen the issue.
| DPC Latencies / LatencyMon - interrupt to process latency (max), Web, Youtube, Prime95 | |
| Asus TUF Gaming F17 FX707Z-HX011W | |
| Gigabyte G7 KE | |
| Lenovo IdeaPad Gaming 3 15IAH7 | |
| HP Pavilion Gaming 17-cd2146ng | |
| Acer Nitro 5 AN517-55-738R | |
* ... smaller is better
Storage Solution
Gigabyte equips the laptop with its own PCIe-4 SSD (1 TB, M.2-2280), which achieves excellent transfer rates. Unfortunately, the drive suffers from thermal throttling despite the metal cooling sheet on the inside of the bottom plate. There is space for a total of two M.2-2280 SSDs (1x PCIe 4.0, 1x PCIe 3.0).

* ... smaller is better
Disk Throttling: DiskSpd Read Loop, Queue Depth 8
GPU Performance
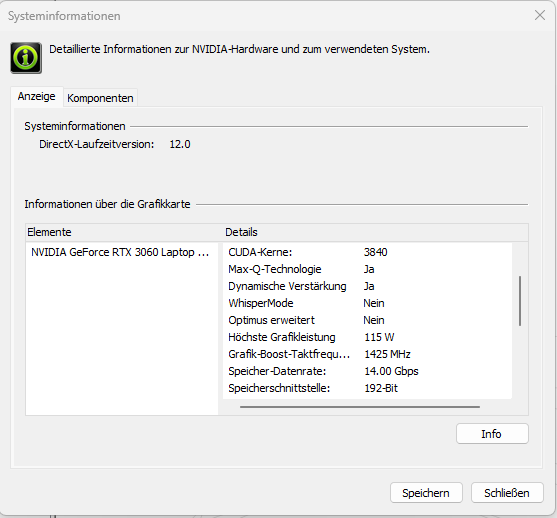
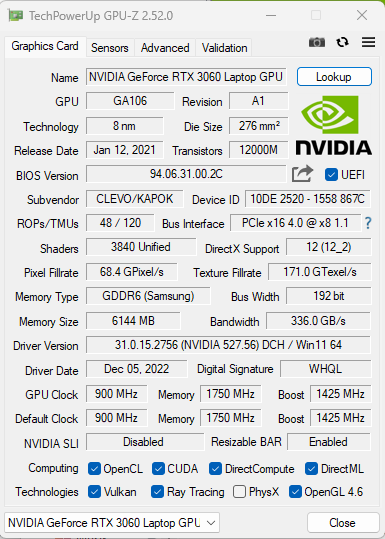
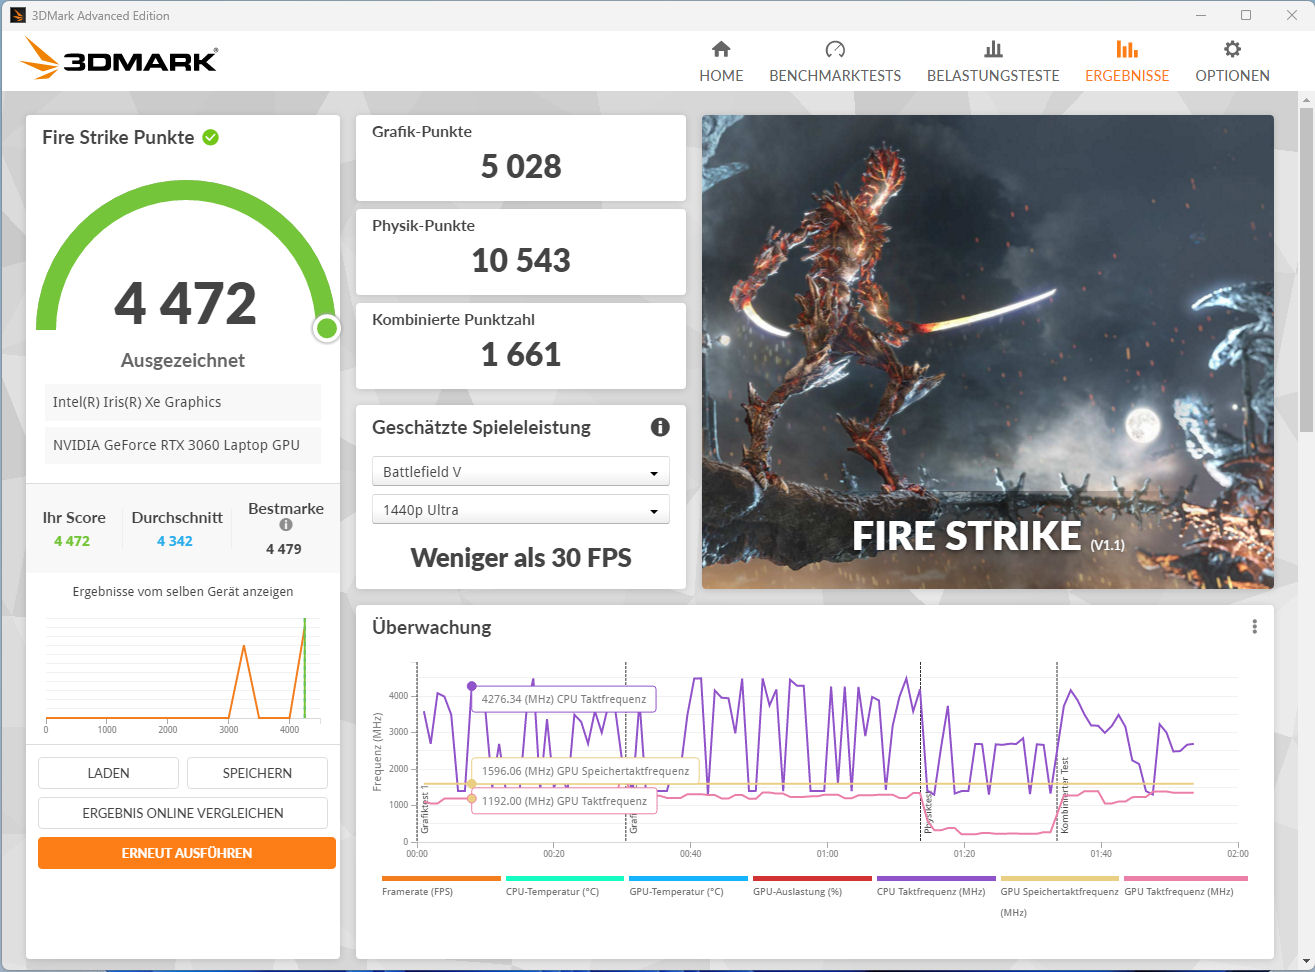
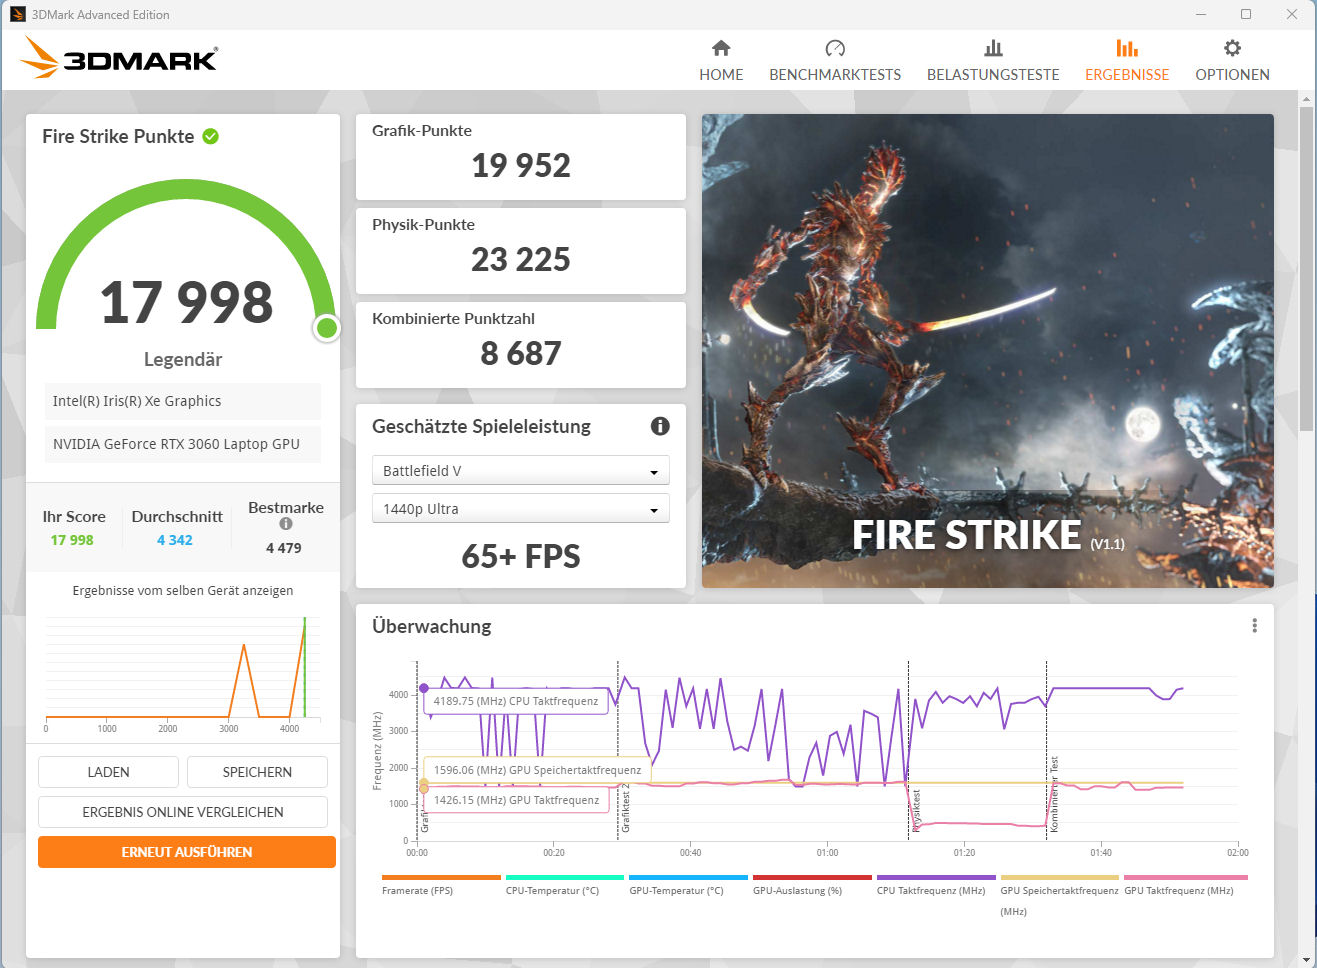
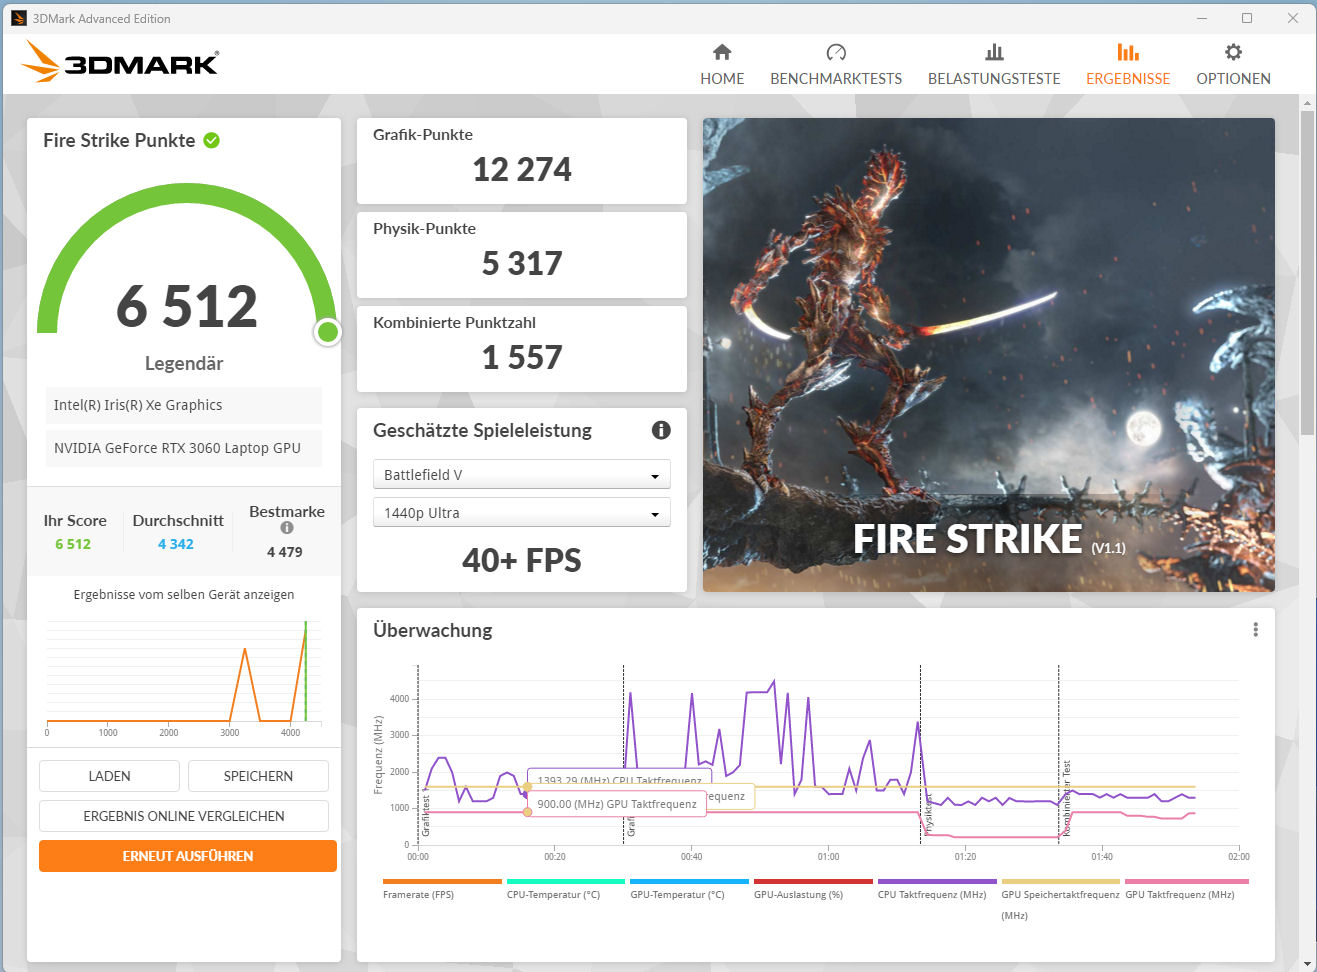
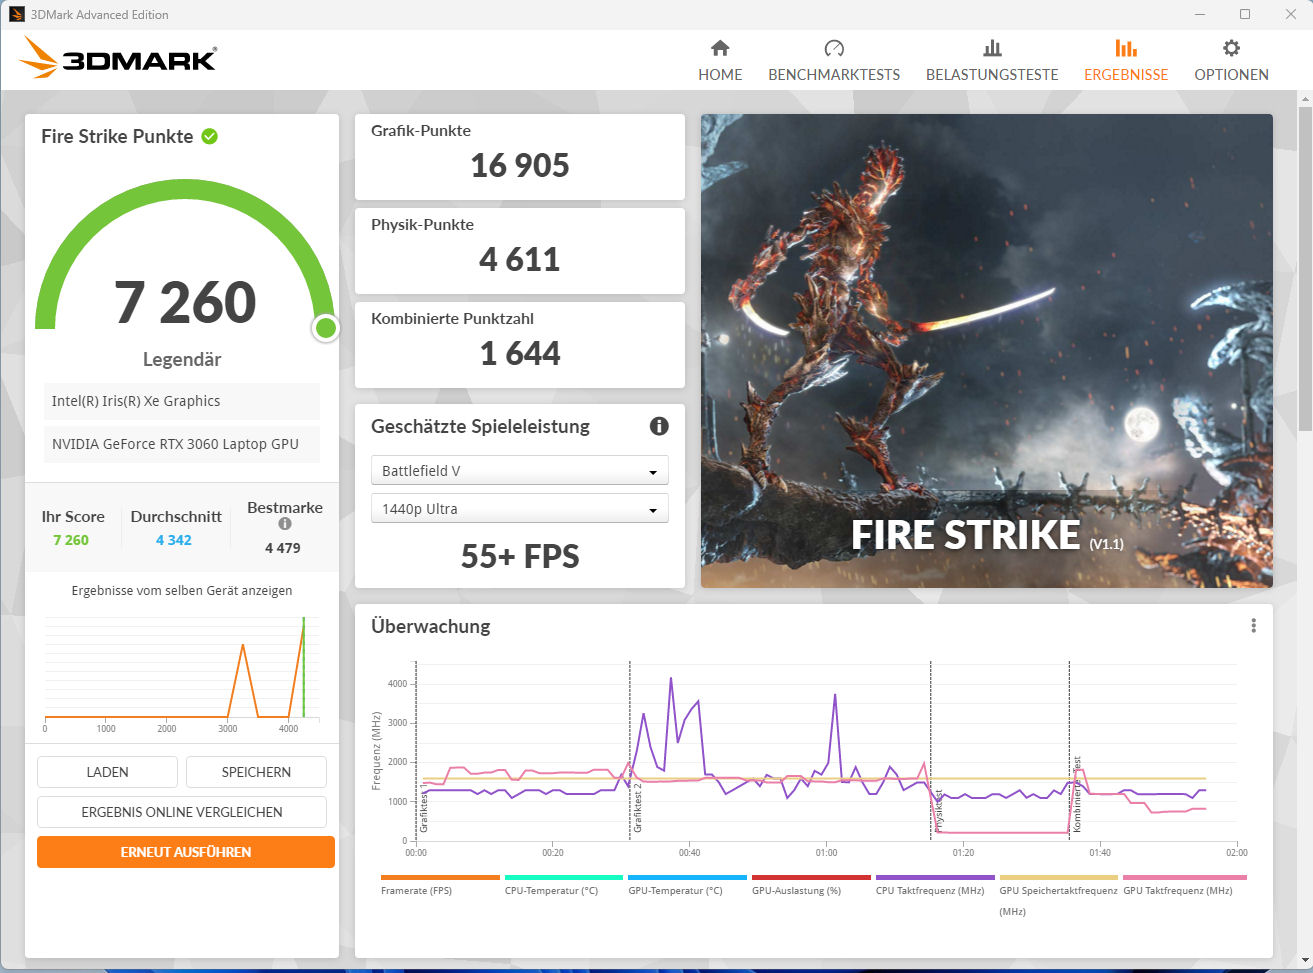
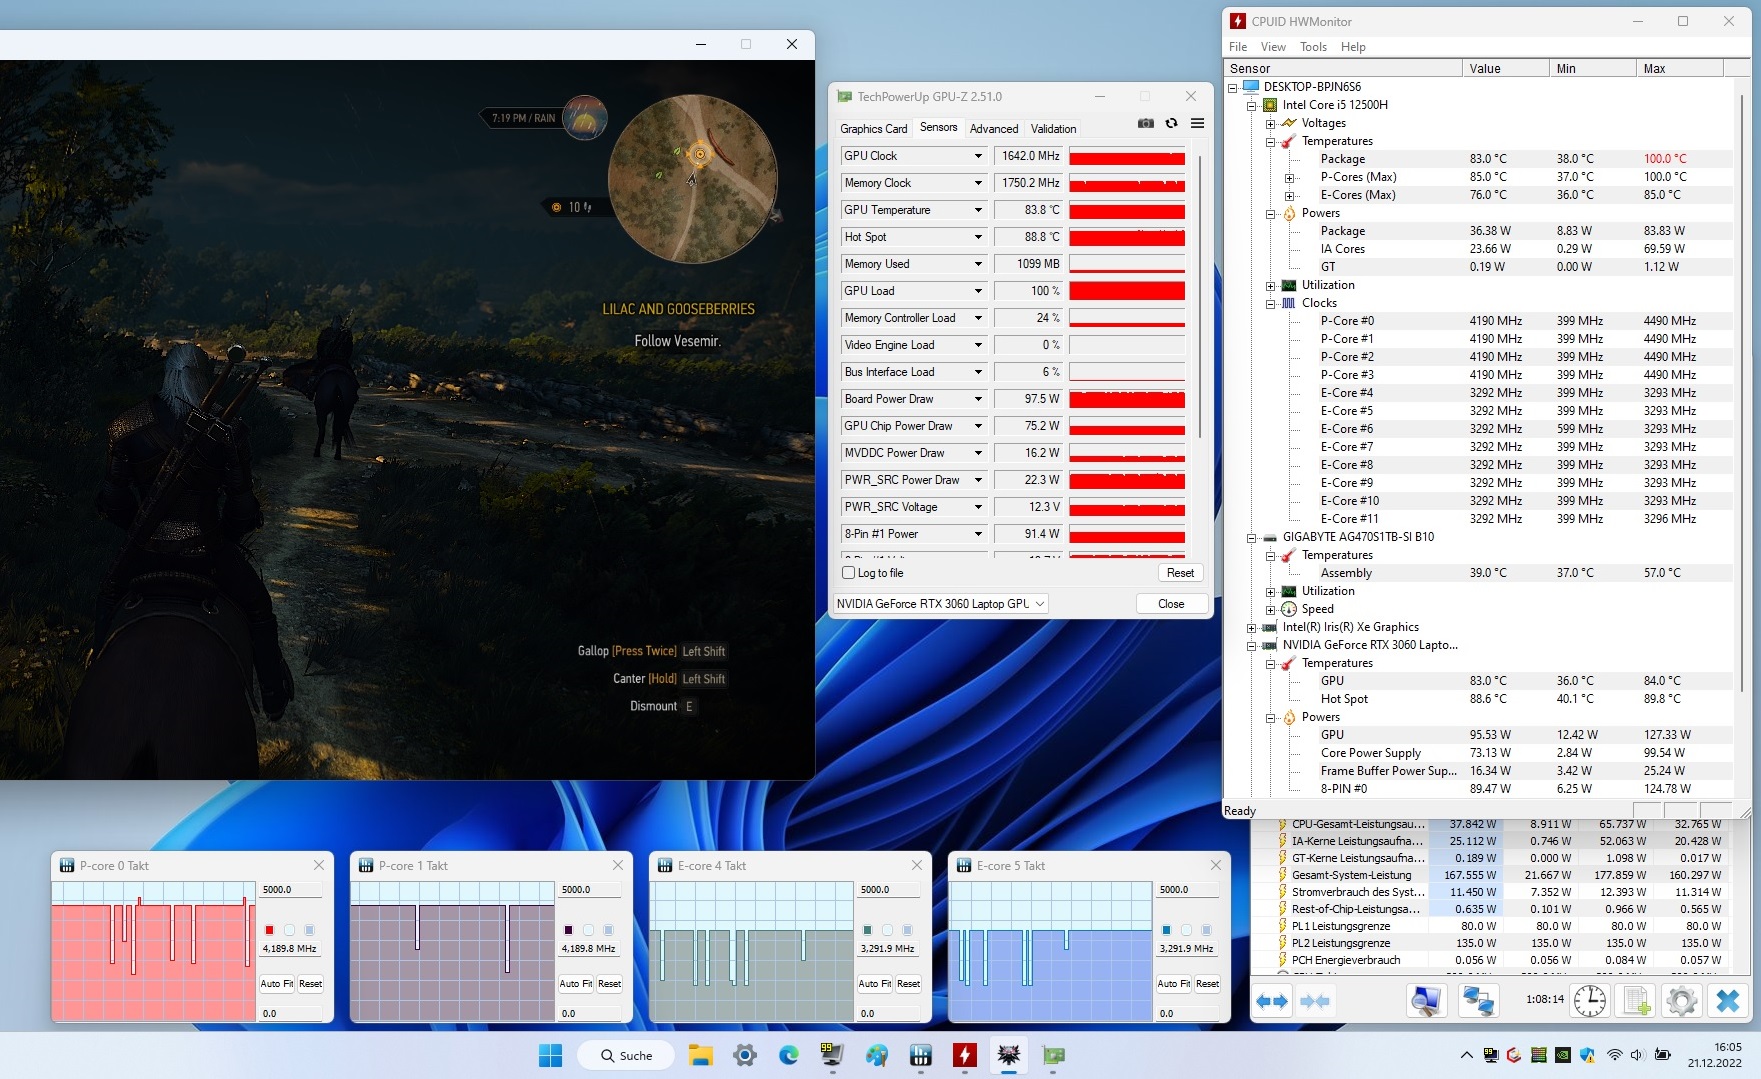
The performance of an RTX-3000 GPU depends on a few factors in practice: The cooling solution, memory configuration, and the maximum TGP, which is set by the laptop manufacturer within Nvidia's specified range. In this case, Gigabyte set the maximum TGP of the dedicated GeForce RTX 3060 laptop GPU to 115 watts. As our Witcher 3 test shows, however, this TGP value is not quite reached.
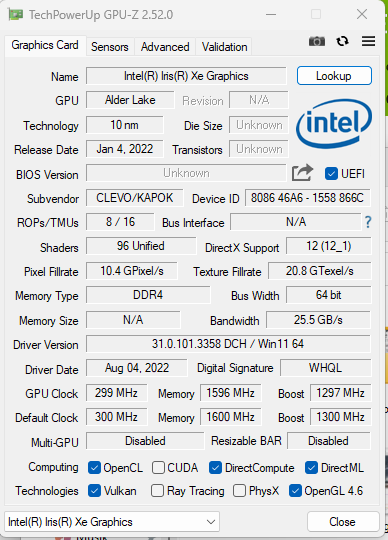
The 3DMark results exceed the average of our previously reviewed RTX 3060 models. The GPU has access to fast GDDR6 video memory (6144 MB). The Iris Xe Graphics G7 80EU integrated graphics solution of the processor is active and the laptop uses Nvidia's Optimus graphics switching technology. Although a dGPU mode is available, it did not result in improved performance.


| 3DMark 06 Standard Score | 47733 points | |
| 3DMark 11 Performance | 26102 points | |
| 3DMark Cloud Gate Standard Score | 37608 points | |
| 3DMark Fire Strike Score | 20063 points | |
| 3DMark Time Spy Score | 8799 points | |
Help | ||
| GPUScore: Sacred Path | |
| 2560x1440 Official VRS | |
| Average NVIDIA GeForce RTX 3060 Laptop GPU (111.2 - 113.7, n=2) | |
| Average of class Gaming (13.8 - 330, n=172, last 2 years) | |
| Gigabyte G7 KE | |
| 2560x1440 Official | |
| Average of class Gaming (11 - 331, n=272, last 2 years) | |
| Average NVIDIA GeForce RTX 3060 Laptop GPU (2.34 - 110.1, n=3) | |
| Gigabyte G7 KE | |
| Geekbench 5.5 - Vulkan Score 5.5 | |
| Average of class Gaming (9296 - 203514, n=126, last 2 years) | |
| Average NVIDIA GeForce RTX 3060 Laptop GPU (46619 - 81150, n=25) | |
| Gigabyte G7 KE | |
| Acer Nitro 5 AN517-55-738R | |
* ... smaller is better
Gaming Performance
The installed components allow for FHD gaming at high to maximum settings. Using an external monitor with a higher resolution is also possible, although this may require reducing the settings. The frame rates exceed the average for an RTX 3060 from our database.
| The Witcher 3 - 1920x1080 Ultra Graphics & Postprocessing (HBAO+) | |
| Average of class Gaming (18.4 - 240, n=54, last 2 years) | |
| Asus TUF Gaming F17 FX707Z-HX011W | |
| Acer Nitro 5 AN517-55-738R | |
| Gigabyte G7 KE | |
| Average NVIDIA GeForce RTX 3060 Laptop GPU (58.2 - 91.5, n=48) | |
| Lenovo IdeaPad Gaming 3 15IAH7 | |
| HP Pavilion Gaming 17-cd2146ng | |
In order to determine whether the frame rates remain consistent over a prolonged period of time, we run The Witcher 3 for about 60 minutes at Full HD resolution and maximum quality settings. The character is not moved during the entire duration. We did not observe a dip in performance.
Witcher 3 FPS Graph
| low | med. | high | ultra | |
|---|---|---|---|---|
| GTA V (2015) | 182.8 | 179.5 | 172.1 | 103 |
| The Witcher 3 (2015) | 339 | 233 | 137.1 | 82.4 |
| Dota 2 Reborn (2015) | 170.5 | 153 | 145.9 | 137.3 |
| Final Fantasy XV Benchmark (2018) | 180.4 | 112.4 | 84.7 | |
| X-Plane 11.11 (2018) | 120.5 | 106 | 86.8 | |
| Far Cry 5 (2018) | 168 | 131 | 122 | 115 |
| Strange Brigade (2018) | 369 | 211 | 168 | 146.4 |
| Flight Simulator 2020 (2020) | 135.7 | 85.1 | 62.8 | 45.9 |
| Guardians of the Galaxy (2021) | 120 | 114 | 114 | 110 |
| Cyberpunk 2077 1.6 (2022) | 96.7 | 75.5 | 66 | 60.7 |
| F1 22 (2022) | 190.5 | 186.3 | 149.6 | 54.4 |
| The Quarry (2022) | 126.9 | 97.2 | 80 | 64.1 |
| A Plague Tale Requiem (2022) | 87.5 | 73 | 62.8 | 52.8 |
| Uncharted Legacy of Thieves Collection (2022) | 72.2 | 69.8 | 65.6 | 62.3 |
| Call of Duty Modern Warfare 2 2022 (2022) | 111 | 99 | 77 | 72 |
| Spider-Man Miles Morales (2022) | 103.3 | 94.2 | 86.4 | 77.5 |
| The Callisto Protocol (2022) | 105.5 | 83.9 | 55.6 | 55.3 |
| Need for Speed Unbound (2022) | 114.9 | 106.7 | 88.6 | 76.6 |
| High On Life (2023) | 177.1 | 134.2 | 99.3 | 79.4 |
| The Witcher 3 v4 (2023) | 170.1 | 132.2 | 108.4 | 87.5 |
| Dead Space Remake (2023) | 69.2 | 66.5 | 59 | 54 |
Emissions - Gigabyte System Can Be Very Loud
Noise Emissions
Even during daily use (office, web), the two fans are frequently noticeable - noise levels of up to 38 dB(A) are possible. They only rarely idle. Under load, the laptop can reach very high noise levels of up to 59 dB(A) (stress test) and 56 dB(A) (Witcher 3) - this makes our test model substantially louder than most competitors in these scenarios. The noise emissions can be reduced by using one of the three performance profiles "Entertainment", "Energy Saver", "Quiet" - at the cost of some performance.
Noise level
| Idle |
| 27 / 35 / 38 dB(A) |
| Load |
| 52 / 59 dB(A) |
 | ||
30 dB silent 40 dB(A) audible 50 dB(A) loud |
||
min: | ||
| Gigabyte G7 KE i5-12500H, GeForce RTX 3060 Laptop GPU | HP Pavilion Gaming 17-cd2146ng i5-11300H, GeForce RTX 3050 Ti Laptop GPU | Acer Nitro 5 AN517-55-738R i7-12700H, GeForce RTX 3060 Laptop GPU | Asus TUF Gaming F17 FX707Z-HX011W i7-12700H, GeForce RTX 3060 Laptop GPU | Lenovo IdeaPad Gaming 3 15IAH7 i5-12500H, GeForce RTX 3050 Ti Laptop GPU | |
|---|---|---|---|---|---|
| Noise | 17% | 9% | 21% | 11% | |
| off / environment * (dB) | 27 | 25 7% | 25.5 6% | 24 11% | 25 7% |
| Idle Minimum * (dB) | 27 | 27 -0% | 25.5 6% | 24 11% | 29 -7% |
| Idle Average * (dB) | 35 | 28 20% | 25.5 27% | 24 31% | 30 14% |
| Idle Maximum * (dB) | 38 | 30 21% | 27 29% | 24 37% | 32 16% |
| Load Average * (dB) | 52 | 39 25% | 52.6 -1% | 42.6 18% | 42 19% |
| Witcher 3 ultra * (dB) | 56 | 44 21% | 46.84 16% | 46 18% | |
| Load Maximum * (dB) | 59 | 46 22% | 68.2 -16% | 46.84 21% | 54 8% |
* ... smaller is better
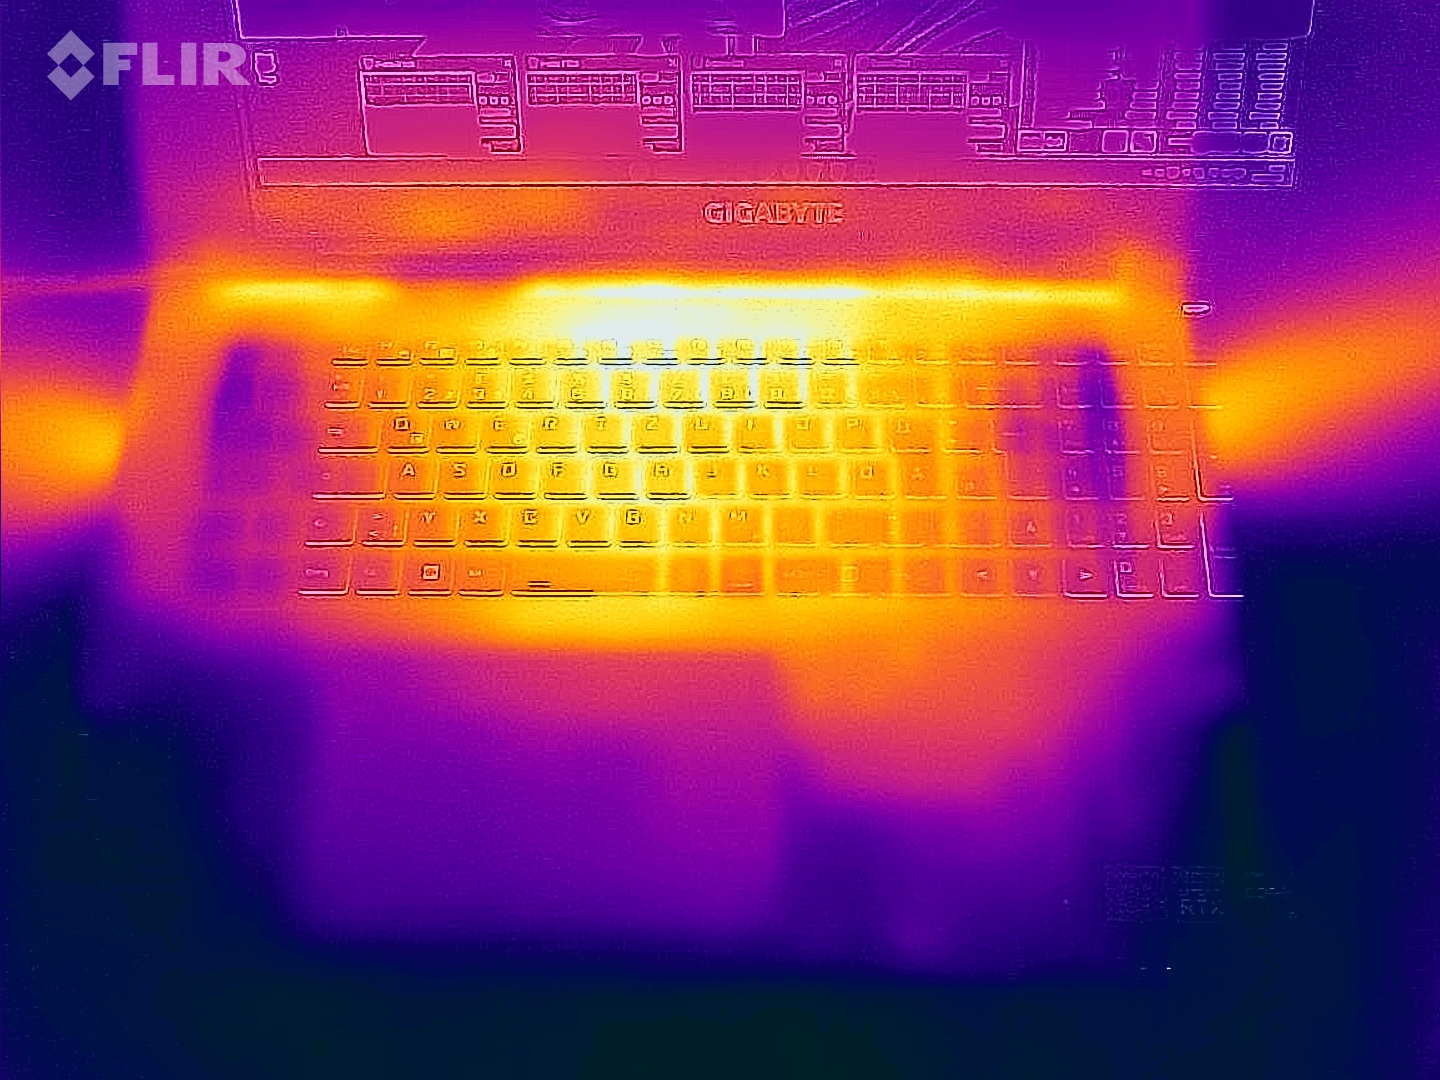
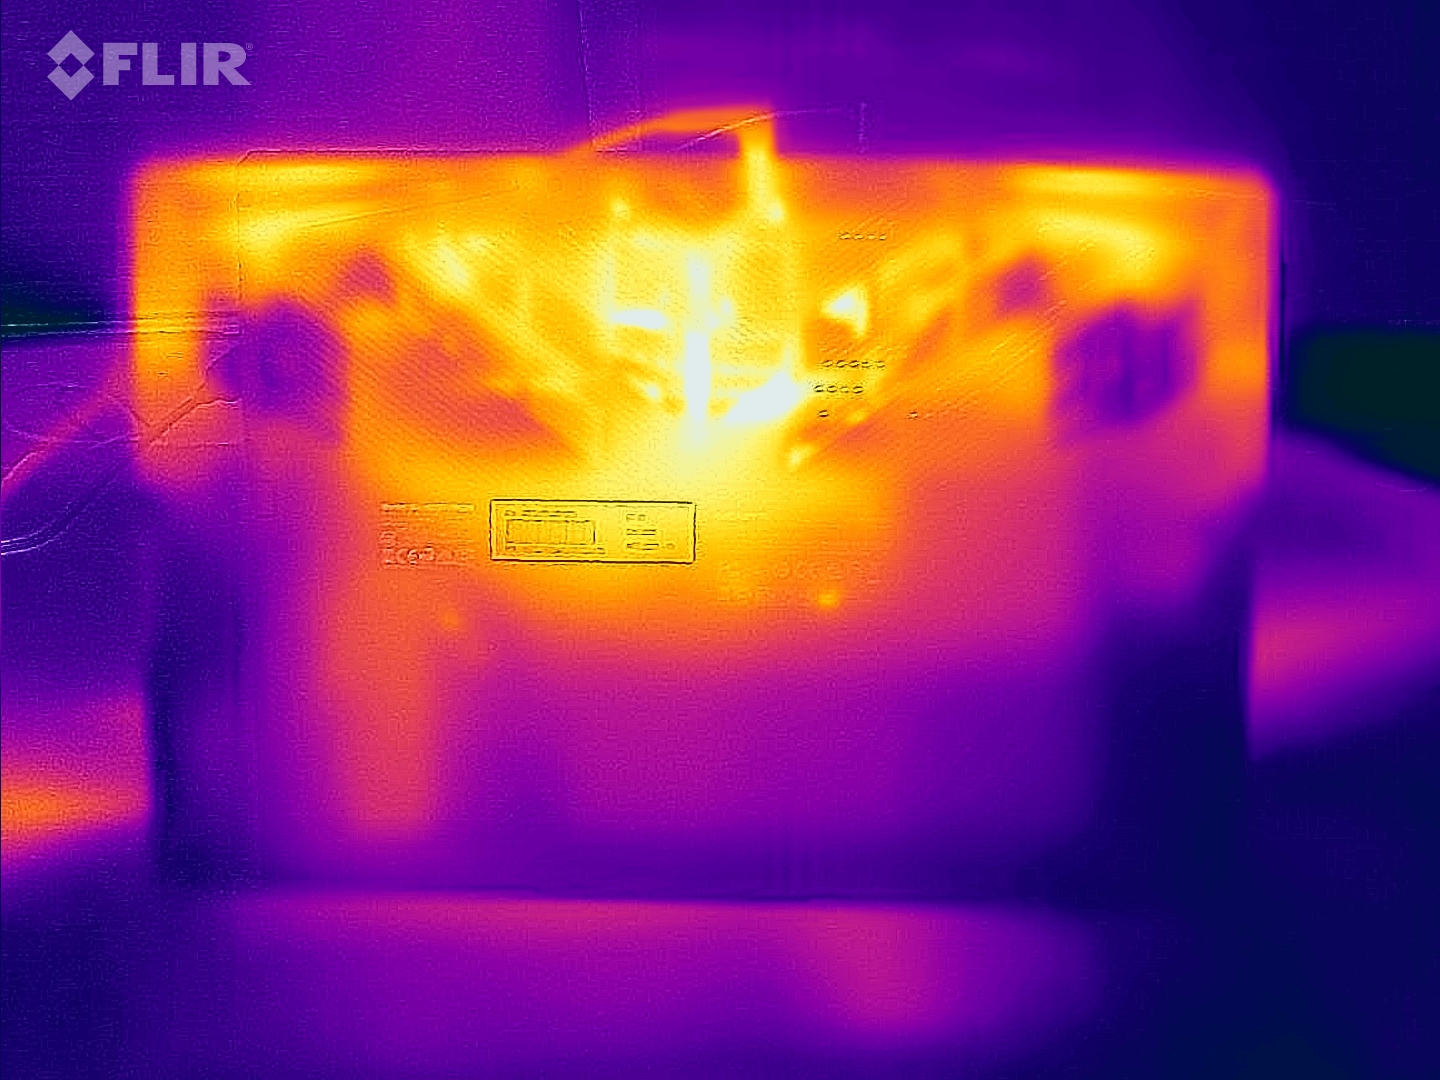
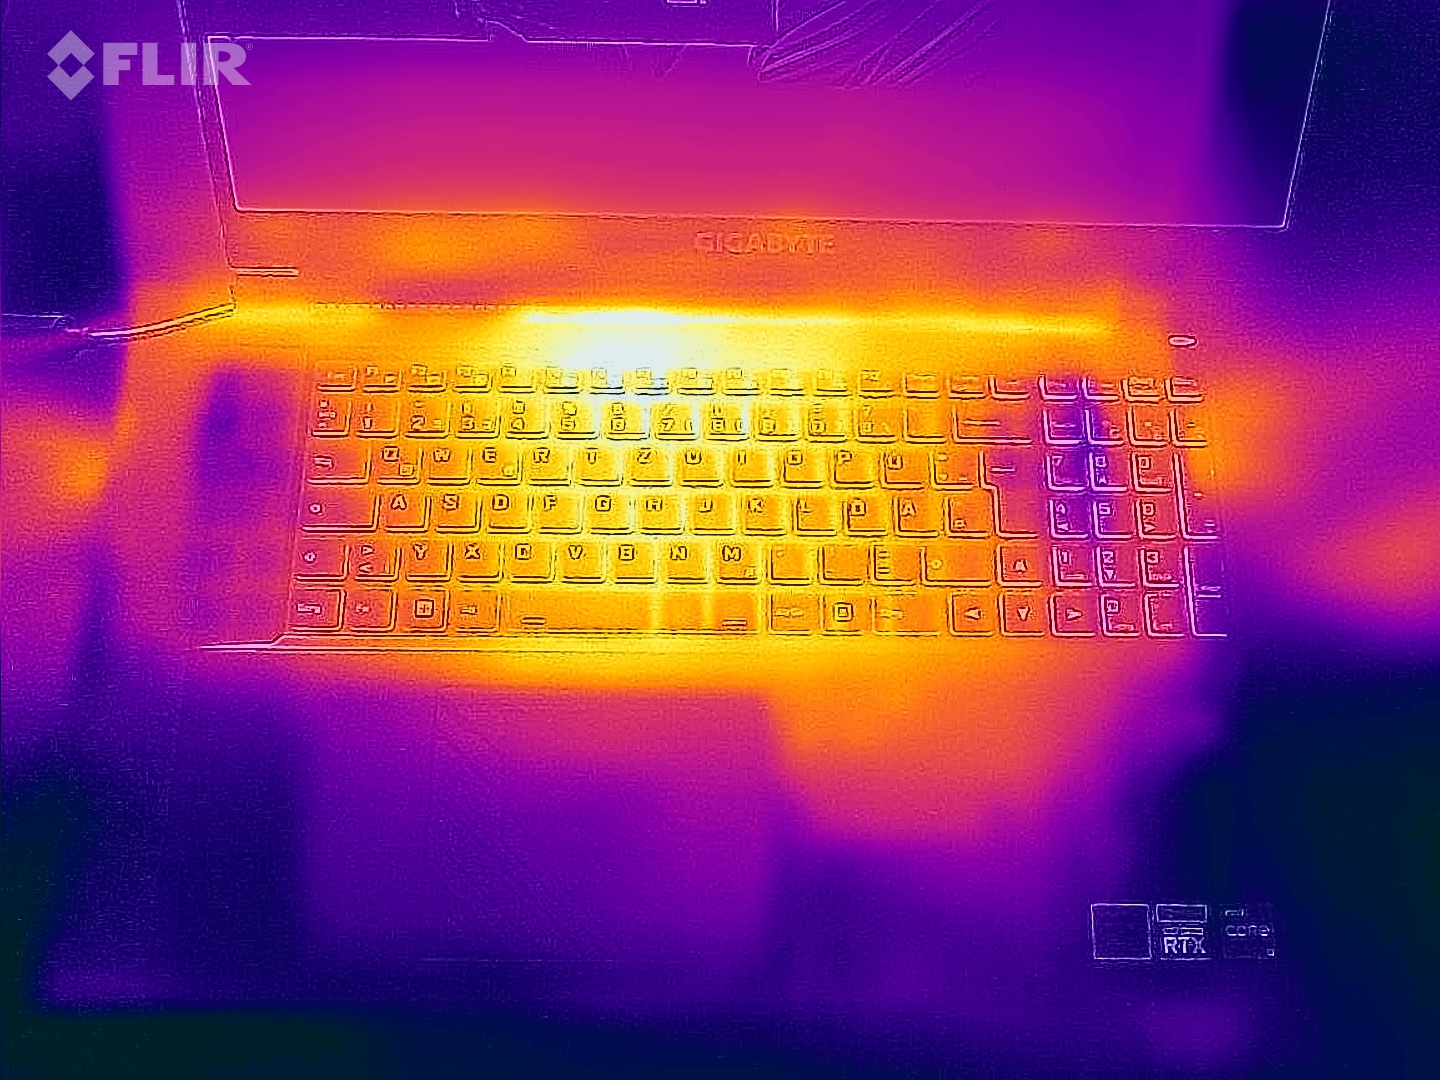
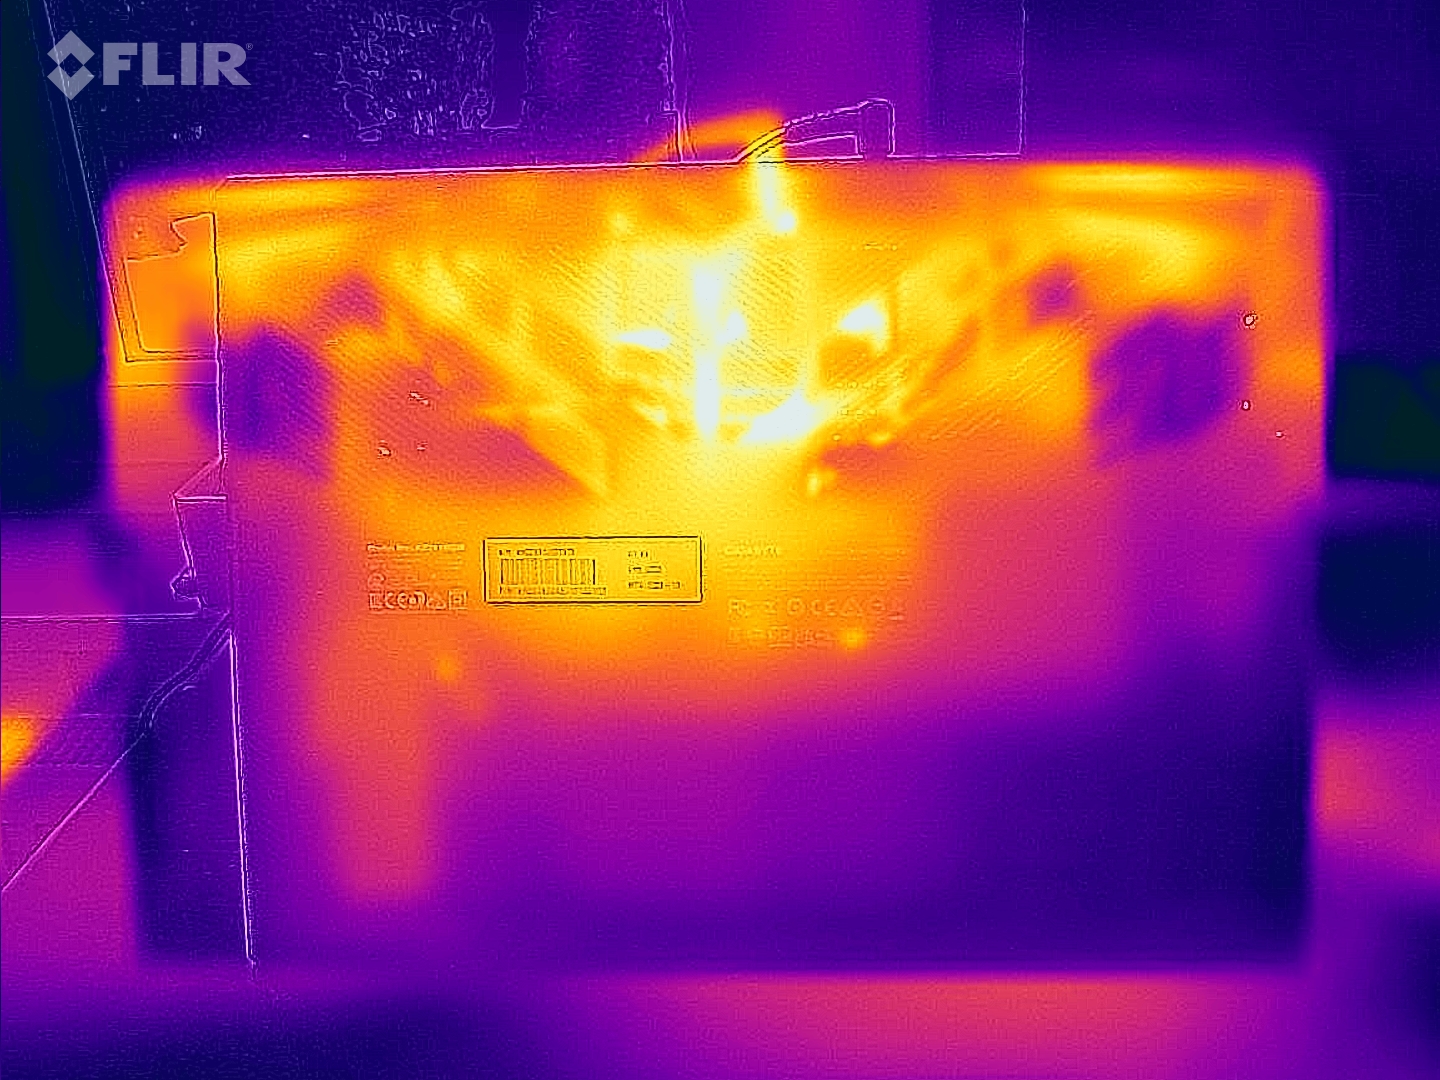
Temperatures
During day-to-day use (office, web), the surface temperatures remain reasonable. While the heat development under load (stress test, Witcher 3) is significant, it does not reach critical levels. The CPU reaches temperatures close to its 100-°C limit.
(-) The maximum temperature on the upper side is 52 °C / 126 F, compared to the average of 40.4 °C / 105 F, ranging from 21.2 to 68.8 °C for the class Gaming.
(-) The bottom heats up to a maximum of 54 °C / 129 F, compared to the average of 43.3 °C / 110 F
(+) In idle usage, the average temperature for the upper side is 26.6 °C / 80 F, compared to the device average of 33.9 °C / 93 F.
(-) Playing The Witcher 3, the average temperature for the upper side is 40.6 °C / 105 F, compared to the device average of 33.9 °C / 93 F.
(+) The palmrests and touchpad are reaching skin temperature as a maximum (34 °C / 93.2 F) and are therefore not hot.
(-) The average temperature of the palmrest area of similar devices was 28.8 °C / 83.8 F (-5.2 °C / -9.4 F).
| Gigabyte G7 KE Intel Core i5-12500H, NVIDIA GeForce RTX 3060 Laptop GPU | HP Pavilion Gaming 17-cd2146ng Intel Core i5-11300H, NVIDIA GeForce RTX 3050 Ti Laptop GPU | Acer Nitro 5 AN517-55-738R Intel Core i7-12700H, NVIDIA GeForce RTX 3060 Laptop GPU | Asus TUF Gaming F17 FX707Z-HX011W Intel Core i7-12700H, NVIDIA GeForce RTX 3060 Laptop GPU | Lenovo IdeaPad Gaming 3 15IAH7 Intel Core i5-12500H, NVIDIA GeForce RTX 3050 Ti Laptop GPU | |
|---|---|---|---|---|---|
| Heat | 12% | -6% | 1% | 13% | |
| Maximum Upper Side * (°C) | 52 | 44 15% | 48.3 7% | 52 -0% | 47 10% |
| Maximum Bottom * (°C) | 54 | 48 11% | 52 4% | 47 13% | 52 4% |
| Idle Upper Side * (°C) | 28 | 27 4% | 34.5 -23% | 31 -11% | 25 11% |
| Idle Bottom * (°C) | 32 | 27 16% | 35.8 -12% | 31 3% | 24 25% |
* ... smaller is better
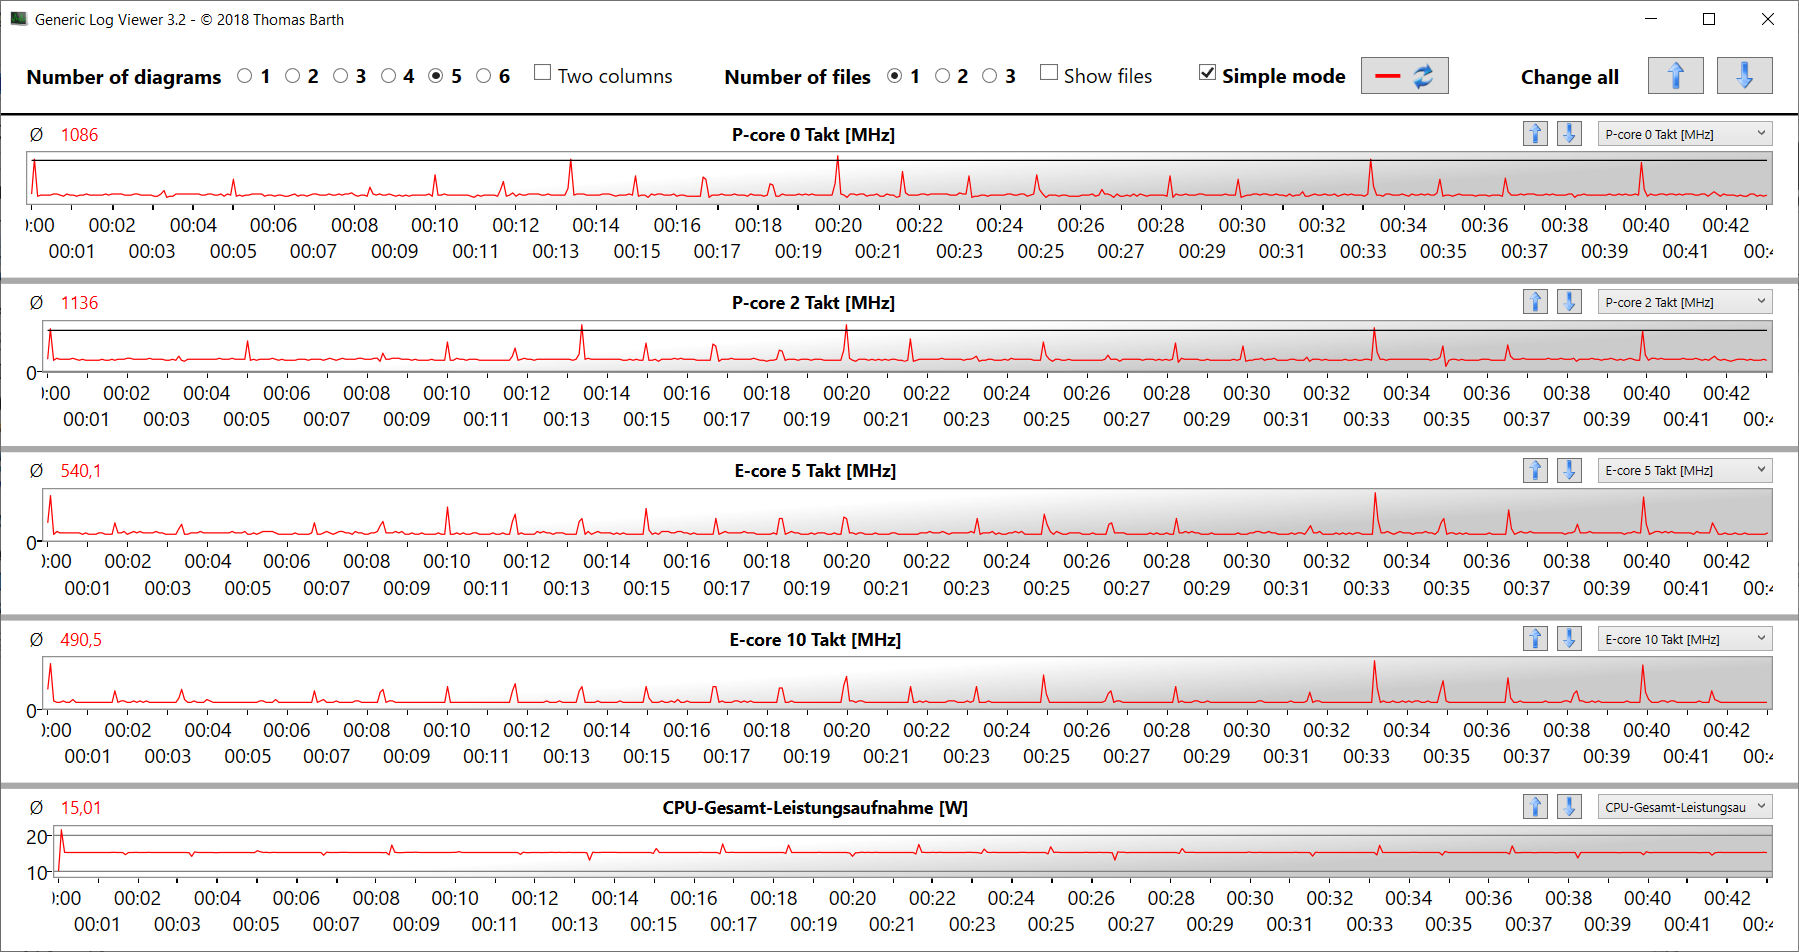
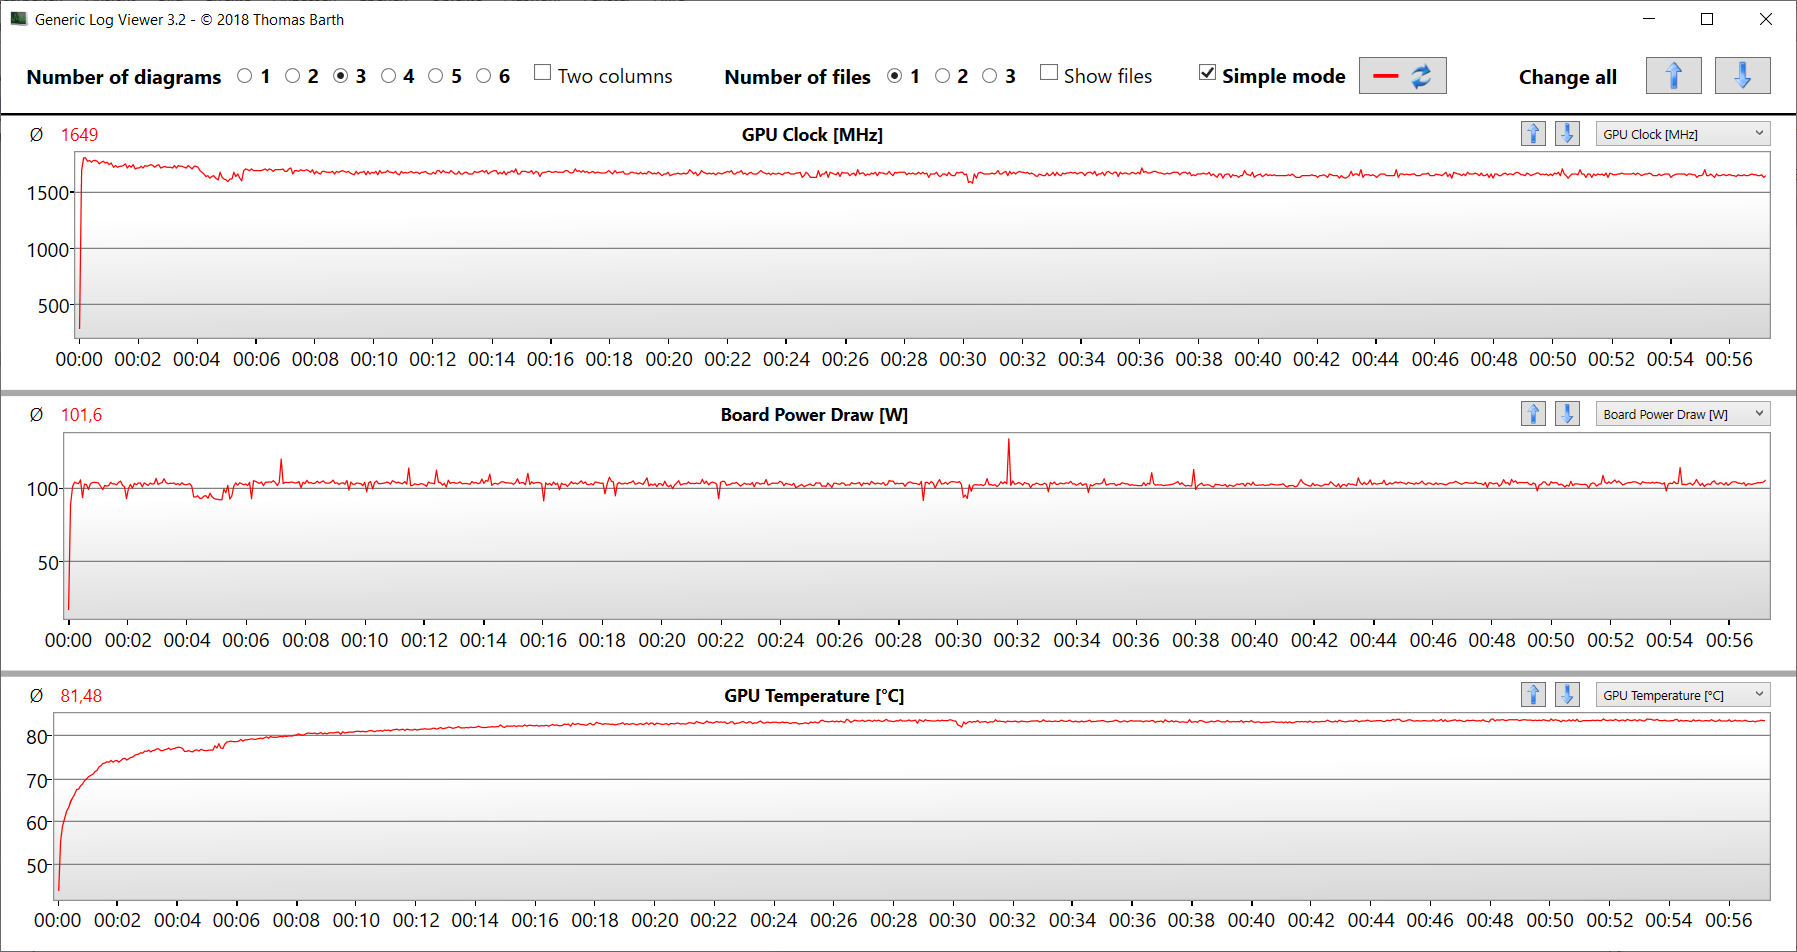
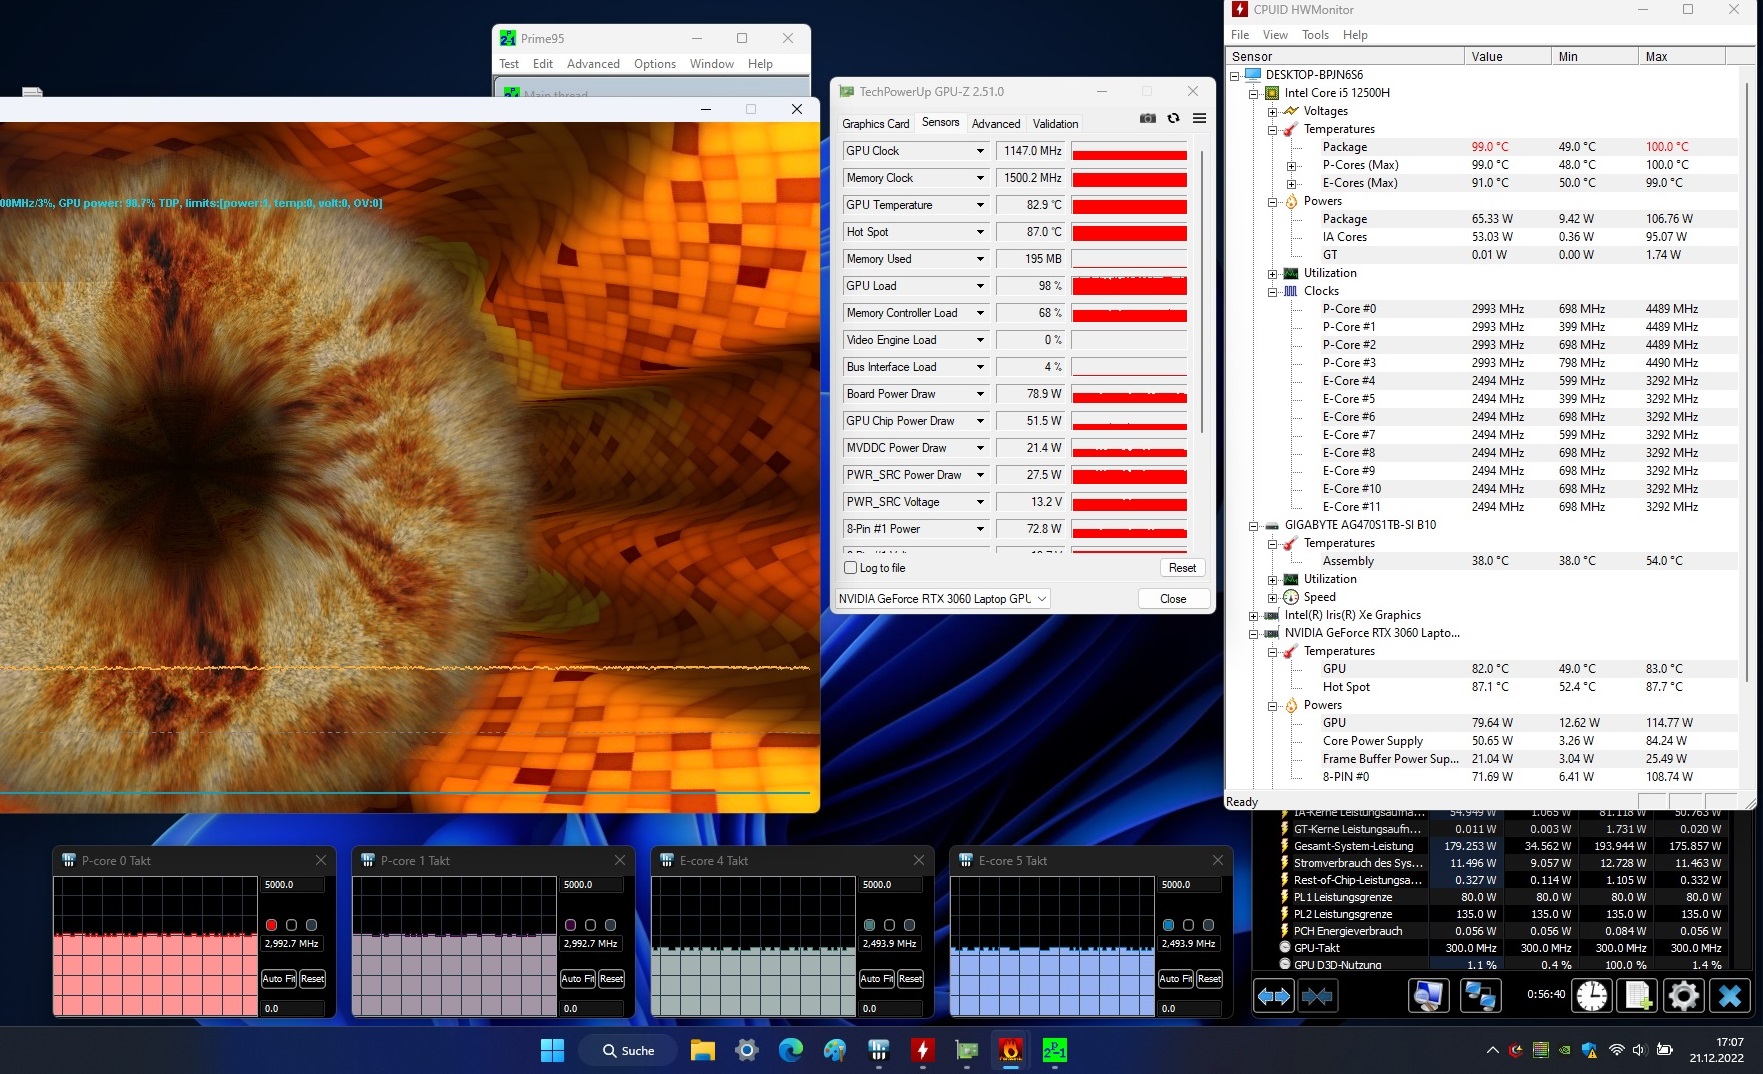
Stress Test
Our stress test (continuous Prime95 and FurMark stress) represents an extreme scenario and serves as a stability test for when the system is at 100 % load. The CPU clock speed drops from 4.1 GHz (P cores) and 3.1 GHz (E cores) to around the base clock (P: 3 GHz, E: 2.5 GHz) over the course of 15 minutes and then remains at that level. The GPU clock speed initially fluctuates between 1200 MHz and 1500 MHz, before eventually stabilizing at 1150 MHz.
Speakers
The sound produced by the stereo speakers is thin and lacking in terms of the bass. We recommend external headphones or speakers for better audio.
Gigabyte G7 KE audio analysis
(±) | speaker loudness is average but good (79 dB)
Bass 100 - 315 Hz
(-) | nearly no bass - on average 23.4% lower than median
(±) | linearity of bass is average (10.8% delta to prev. frequency)
Mids 400 - 2000 Hz
(±) | higher mids - on average 11.1% higher than median
(±) | linearity of mids is average (10.6% delta to prev. frequency)
Highs 2 - 16 kHz
(±) | higher highs - on average 6.5% higher than median
(±) | linearity of highs is average (7.7% delta to prev. frequency)
Overall 100 - 16.000 Hz
(-) | overall sound is not linear (32% difference to median)
Compared to same class
» 97% of all tested devices in this class were better, 1% similar, 2% worse
» The best had a delta of 6%, average was 18%, worst was 132%
Compared to all devices tested
» 91% of all tested devices were better, 2% similar, 7% worse
» The best had a delta of 4%, average was 24%, worst was 134%
HP Pavilion Gaming 17-cd2146ng audio analysis
(±) | speaker loudness is average but good (80 dB)
Bass 100 - 315 Hz
(-) | nearly no bass - on average 19.5% lower than median
(±) | linearity of bass is average (11.5% delta to prev. frequency)
Mids 400 - 2000 Hz
(+) | balanced mids - only 3.2% away from median
(+) | mids are linear (3.8% delta to prev. frequency)
Highs 2 - 16 kHz
(±) | higher highs - on average 8.6% higher than median
(±) | linearity of highs is average (8% delta to prev. frequency)
Overall 100 - 16.000 Hz
(±) | linearity of overall sound is average (20.5% difference to median)
Compared to same class
» 73% of all tested devices in this class were better, 5% similar, 22% worse
» The best had a delta of 6%, average was 18%, worst was 132%
Compared to all devices tested
» 54% of all tested devices were better, 8% similar, 39% worse
» The best had a delta of 4%, average was 24%, worst was 134%
Energy Management - G7 Laptop With Acceptable Runtimes
Energy Consumption
During idle, we observe a slightly increased power draw from the Gigabyte laptop. A glance at competitors shows where the normal range for an Optimus laptop. During the stress test and the Witcher 3 test, the power draw matches our expectations for the installed components. The included AC adapter is well dimensioned and able to manage short consumption peaks, which exceed its power rating (180 watts).
| Off / Standby | |
| Idle | |
| Load |
|
Key:
min: | |
| Gigabyte G7 KE i5-12500H, GeForce RTX 3060 Laptop GPU | HP Pavilion Gaming 17-cd2146ng i5-11300H, GeForce RTX 3050 Ti Laptop GPU | Acer Nitro 5 AN517-55-738R i7-12700H, GeForce RTX 3060 Laptop GPU | Asus TUF Gaming F17 FX707Z-HX011W i7-12700H, GeForce RTX 3060 Laptop GPU | Lenovo IdeaPad Gaming 3 15IAH7 i5-12500H, GeForce RTX 3050 Ti Laptop GPU | Average of class Gaming | |
|---|---|---|---|---|---|---|
| Power Consumption | 35% | 3% | 25% | 28% | -7% | |
| Idle Minimum * (Watt) | 15 | 3 80% | 9.7 35% | 6.6 56% | 8 47% | 13.5 ? 10% |
| Idle Average * (Watt) | 17 | 8 53% | 14.6 14% | 8.3 51% | 10 41% | 19.3 ? -14% |
| Idle Maximum * (Watt) | 24 | 28 -17% | 16.7 30% | 11.8 51% | 16 33% | 25.8 ? -8% |
| Load Average * (Watt) | 111 | 88 21% | 166 -50% | 119 -7% | 99 11% | 110.9 ? -0% |
| Witcher 3 ultra * (Watt) | 174.1 | 98.2 44% | 169 3% | 144.6 17% | ||
| Load Maximum * (Watt) | 208 | 152 27% | 235 -13% | 222 -7% | 168 19% | 260 ? -25% |
* ... smaller is better
Consumption Witcher 3 / Stress Test
Consumption external Monitor
Battery Life
The 17.3-inch laptop reaches a runtime of 5:17 h and 2:12 h in our Wi-Fi (web browsing via a script) and video test (playback of H.264 codec, FHD short film Big Buck Bunny in a loop), respectively. We disabled the energy saver features of the laptop and set the display's brightness to approximately 150 nits prior to running the tests. Furthermore, we disabled the wireless modules for the video test.
The video runtime is very disappointing. Usually, we would expect at least parity with the Wi-Fi runtime. Evidently, the system suffers from an increased power draw during playback. In order to rule out a software issue, we tested multiple different versions of the driver for the Intel iGPU, which was used for playback. Similarly, the operating system also does not seem to be the culprit: We observe a short runtime under both Windows 10 and Windows 11. This suggests an internal problem that only Gigabyte may be able to fix.
| Gigabyte G7 KE i5-12500H, GeForce RTX 3060 Laptop GPU, 54 Wh | HP Pavilion Gaming 17-cd2146ng i5-11300H, GeForce RTX 3050 Ti Laptop GPU, 52.5 Wh | Acer Nitro 5 AN517-55-738R i7-12700H, GeForce RTX 3060 Laptop GPU, 90.61 Wh | Asus TUF Gaming F17 FX707Z-HX011W i7-12700H, GeForce RTX 3060 Laptop GPU, 90 Wh | Lenovo IdeaPad Gaming 3 15IAH7 i5-12500H, GeForce RTX 3050 Ti Laptop GPU, 60 Wh | Average of class Gaming | |
|---|---|---|---|---|---|---|
| Battery runtime | -6% | 69% | 130% | 11% | 85% | |
| Reader / Idle (h) | 7.1 | 11.7 65% | 9.62 ? 35% | |||
| H.264 (h) | 2.2 | 5.3 141% | 7.7 250% | 8.1 ? 268% | ||
| WiFi v1.3 (h) | 5.3 | 5 -6% | 6.5 23% | 8.7 64% | 5.9 11% | 6.78 ? 28% |
| Load (h) | 1.3 | 1.9 46% | 2.3 77% | 1.43 ? 10% |
Pros
Cons
Verdict - Affordable Gaming Notebook
With the G7 KE, Gigabyte created a relatively affordable FHD gaming laptop, which also performs well when it comes to video editing and rendering - this is made possible by the Core i5-12500H CPU and the GeForce RTX 3060 laptop GPU. Meanwhile, the blazing-fast PCIe-4 SSD (1 TB) ensures short loading times.
The Gigabyte G7 KE is a solid gaming laptop. The drawbacks we found are fairly minor.
Although the system's heat development under load is not excessive, the resulting noise levels are relatively high - many competitors fare better in this regard. We were pleased with the quality of the matte 17.3-inch display (FHD, IPS, 300 Hz, sRGB) overall.
The G7 reaches fairly acceptable runtimes in spite of its low-capacity battery (54 Wh). Unfortunately, the battery cannot be recharged via a universal USB-C charger - neither one of the USB-C ports (1x Thunderbolt 4, 1x USB 3.2 gen. 2) offer Power Delivery support.
The lack of an included Windows OS is not an insignificant reason for the relatively cheap price. If you do not own a valid Windows license and do not wish to purchase one, installing a Linux distribution should also be possible. However, the installation and setup process of the alternative OS may be very challenging for some users.
The Asus TUF Gaming F17 can be an alternative to the G7 KE. Although it is equipped with the same GPU, its 3D performance is slightly better and the battery life is longer as well. That being said, the system comes at a premium of about 200-300 USD.
Price and Availability
While the Gigabyte G7 KE as configured is not yet widely available from major retailers in the US, we expect models to arrive soon for around 1,200 USD.
Gigabyte G7 KE
- 01/21/2023 v7 (old)
Sascha Mölck
Price comparison

