

MSI GF65 9SD Laptop Review: GeForce GTX 1660 Ti for under $1000
The entry-level MSI GF65 is an update to last year's GF63. Along with the GP series and GL series, the GF series is home to some of MSI's least expensive gaming laptops for consumers on tighter budgets. SKUs range from the Core i5-9300H to Core i7-9750H CPU, 1080p 60 Hz, 120 Hz, or 144 Hz display, and up to 64 GB of DDR4 RAM. The GeForce GTX 1660 Ti GPU and 1080p resolution remain fixed across all configurations for now.
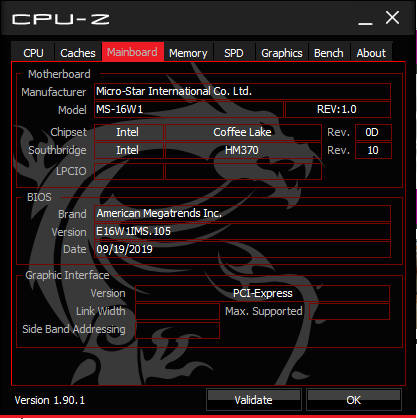
Visually, the GF65 is identical to the GF63 down to their keyboards, clickpads, ports, and even dimensions. We therefore recommend checking out our existing review on the GF63 as many of our comments will apply here on the GF65. Despite their similar chassis designs, there are some notable internal upgrades to the motherboard of the GF65 that we will detail below.
Direct competitors to the MSI GF65 are other budget gaming laptops including the 15.6-inch HP Pavilion 15 Gaming, Lenovo Legion Y540, Asus TUF FX505, Acer Nitro 5, and the Dell G3 and G5 series. Our GF65 9SD test unit can currently be found on CUKUSA.com for $950 USD.
More MSI reviews:
Rating | Date | Model | Weight | Height | Size | Resolution | Price |
|---|---|---|---|---|---|---|---|
| 78.8 % v7 (old) | 10 / 2019 | MSI GF65 9SD i7-9750H, GeForce GTX 1660 Ti Mobile | 1.9 kg | 21.7 mm | 15.60" | 1920x1080 | |
| 80.4 % v6 (old) | 07 / 2019 | Asus TUF FX505DT-EB73 R7 3750H, GeForce GTX 1650 Mobile | 2.2 kg | 26.8 mm | 15.60" | 1920x1080 | |
| 82.3 % v7 (old) | 10 / 2019 | Dell G7 7590 i7-9750H, GeForce RTX 2060 Mobile | 2.5 kg | 19.9 mm | 15.60" | 1920x1080 | |
| 82.3 % v7 (old) | 08 / 2019 | Lenovo Legion Y540-15IRH-81SX00B2GE i7-9750H, GeForce GTX 1660 Ti Mobile | 2.2 kg | 26 mm | 15.60" | 1920x1080 |
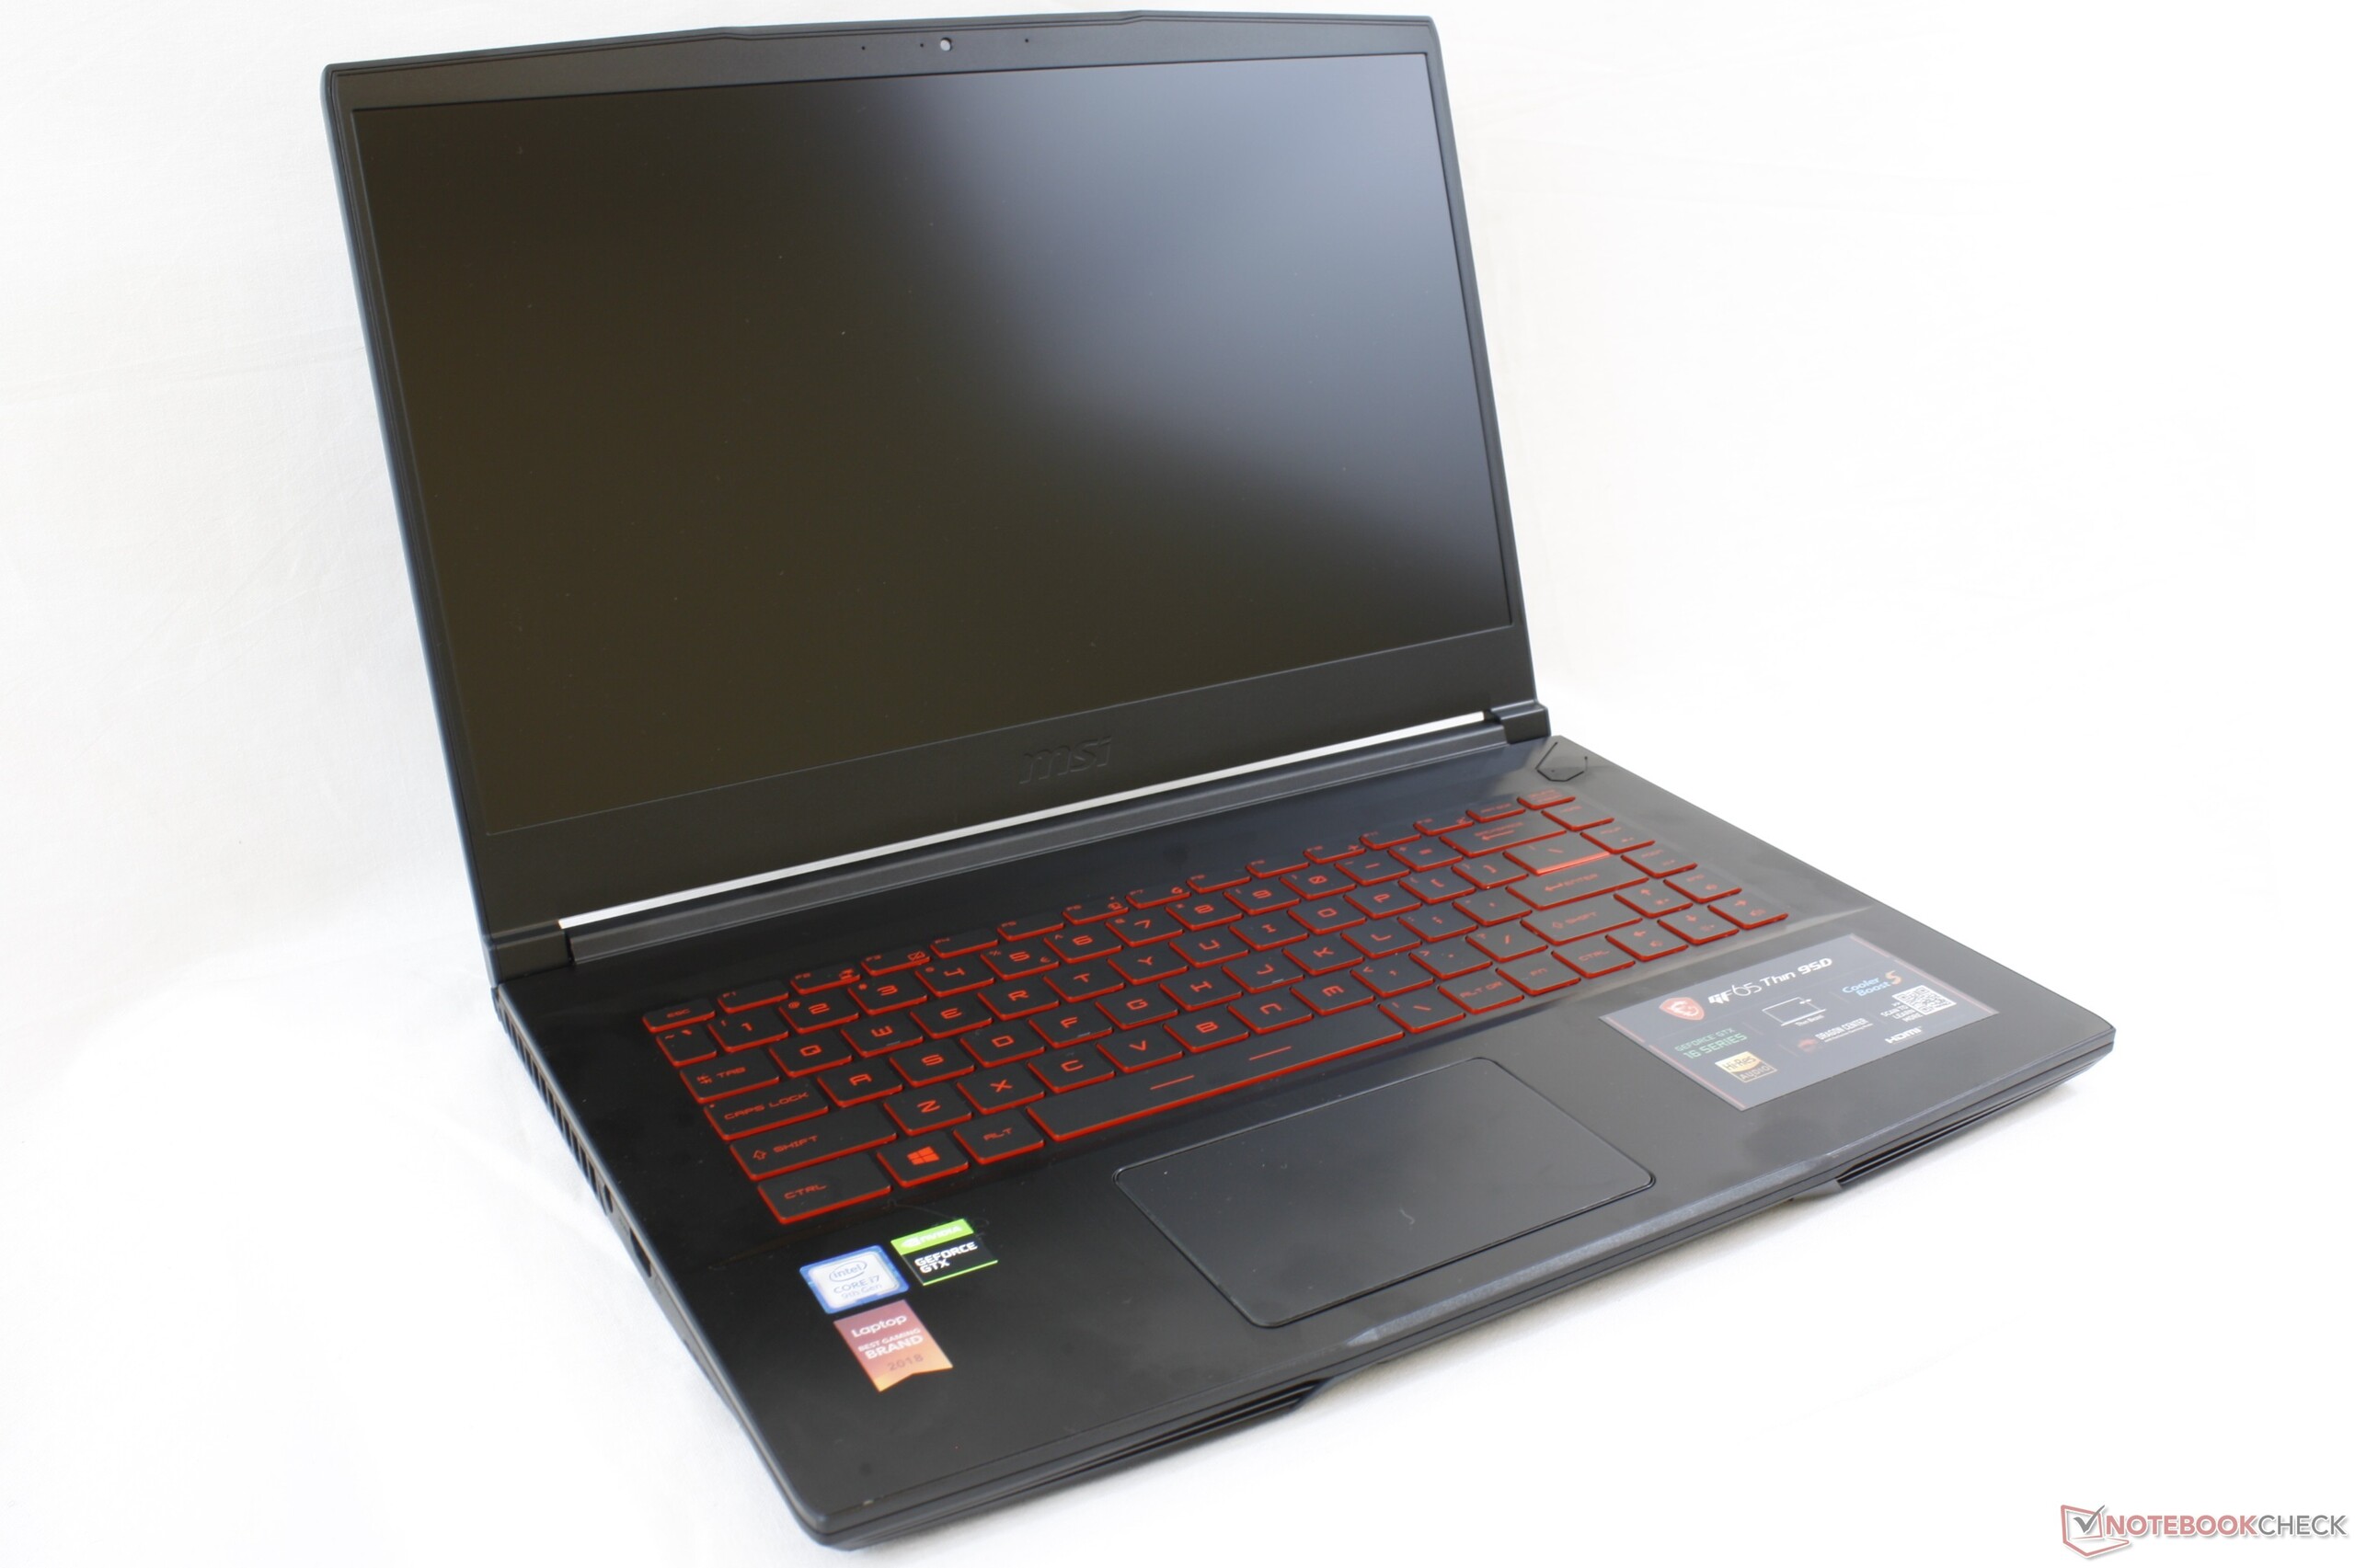
Case
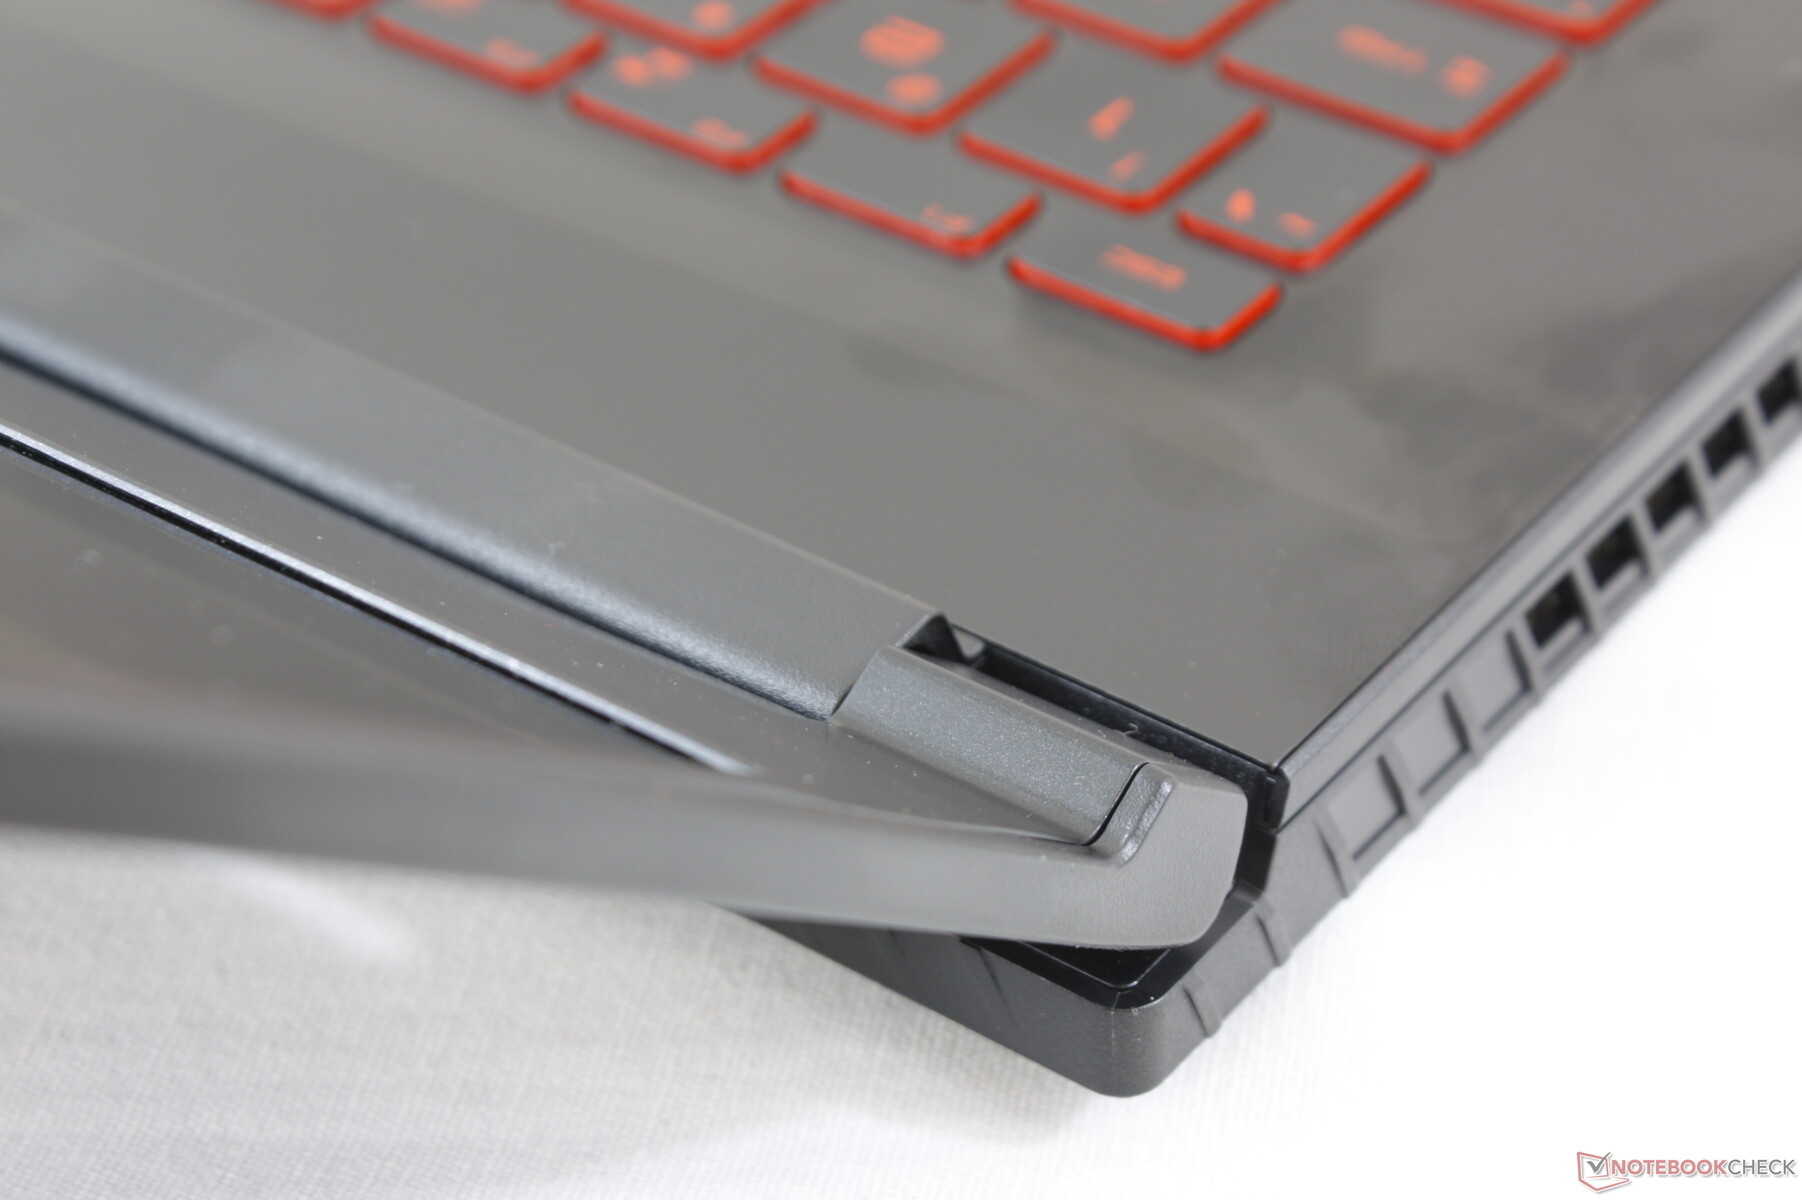
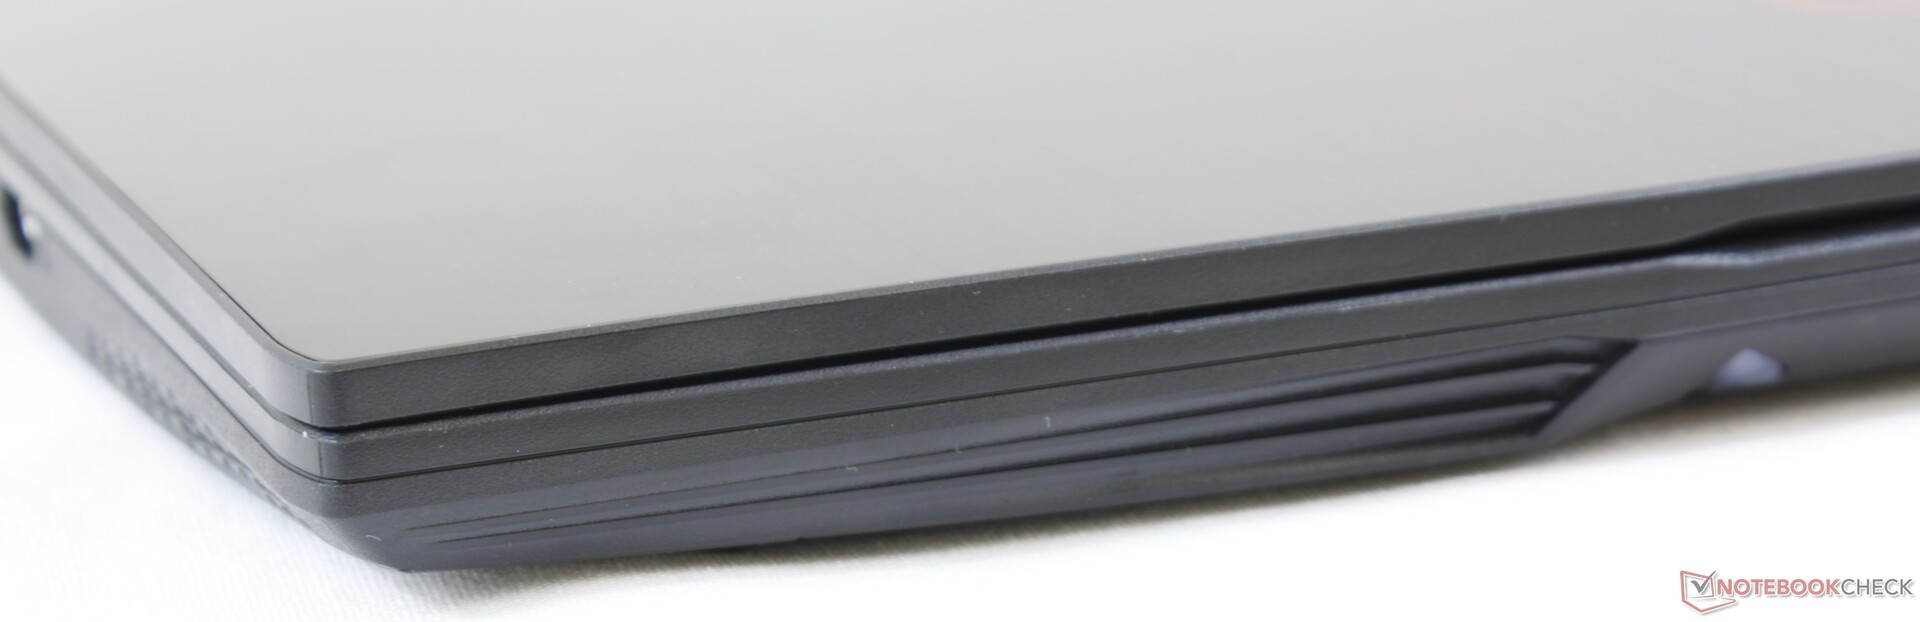
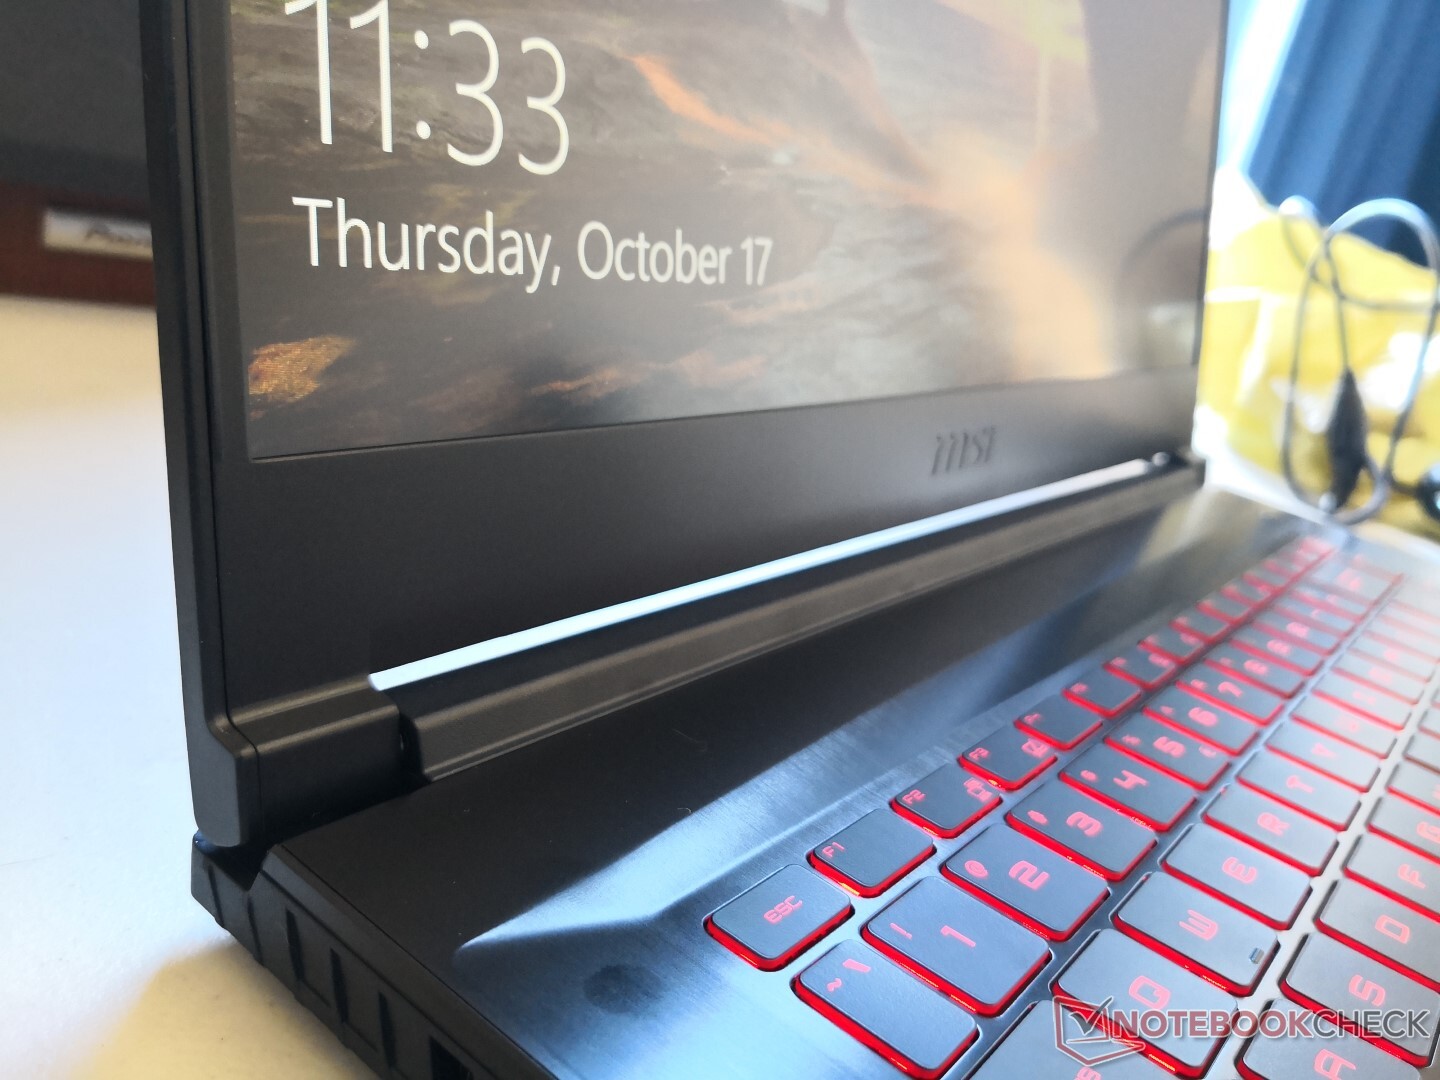
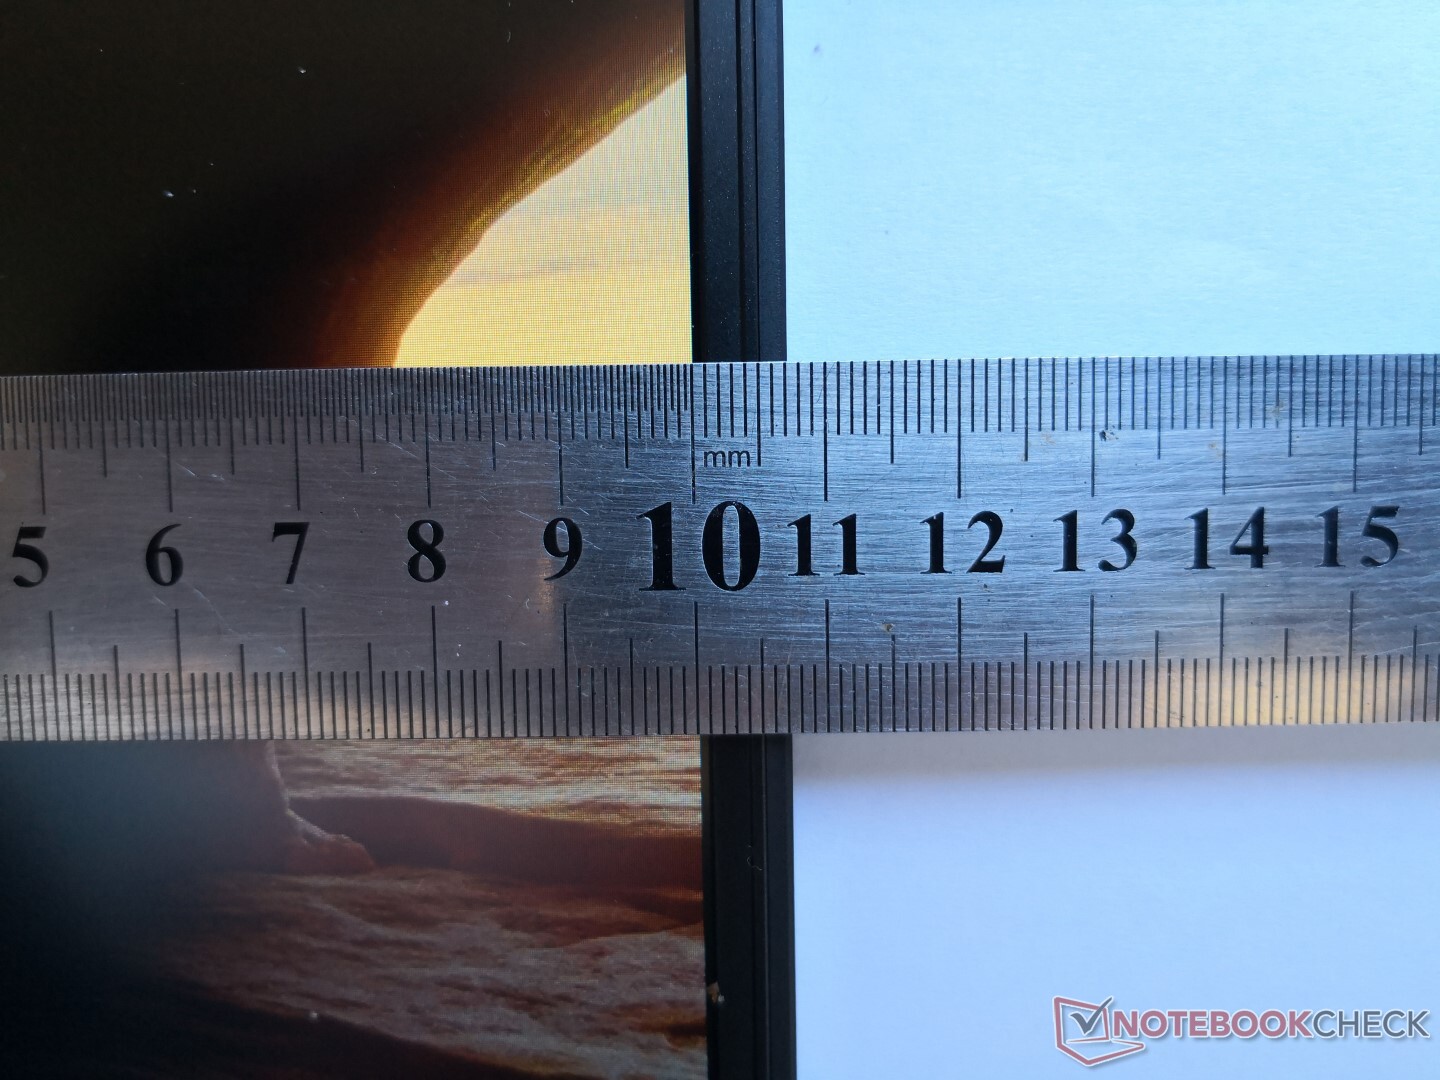
As mentioned above, the chassis remains identical to the GF63 since the GF63 chassis is barely one year old. The design is notable for introducing narrow bezels to MSI's budget GP series as the feature was previously exclusive to the higher-end GS series. In addition, the MSI system is one of the lighter entry-level gaming laptops as well by a few hundred grams when compared to the Legion Y540 or Asus TUF FX505DT.
It's worth mentioning that the chassis is nearly identical to the WP65 workstation albeit with different internals, different bottom plate designs, and rearranged ports.

Connectivity
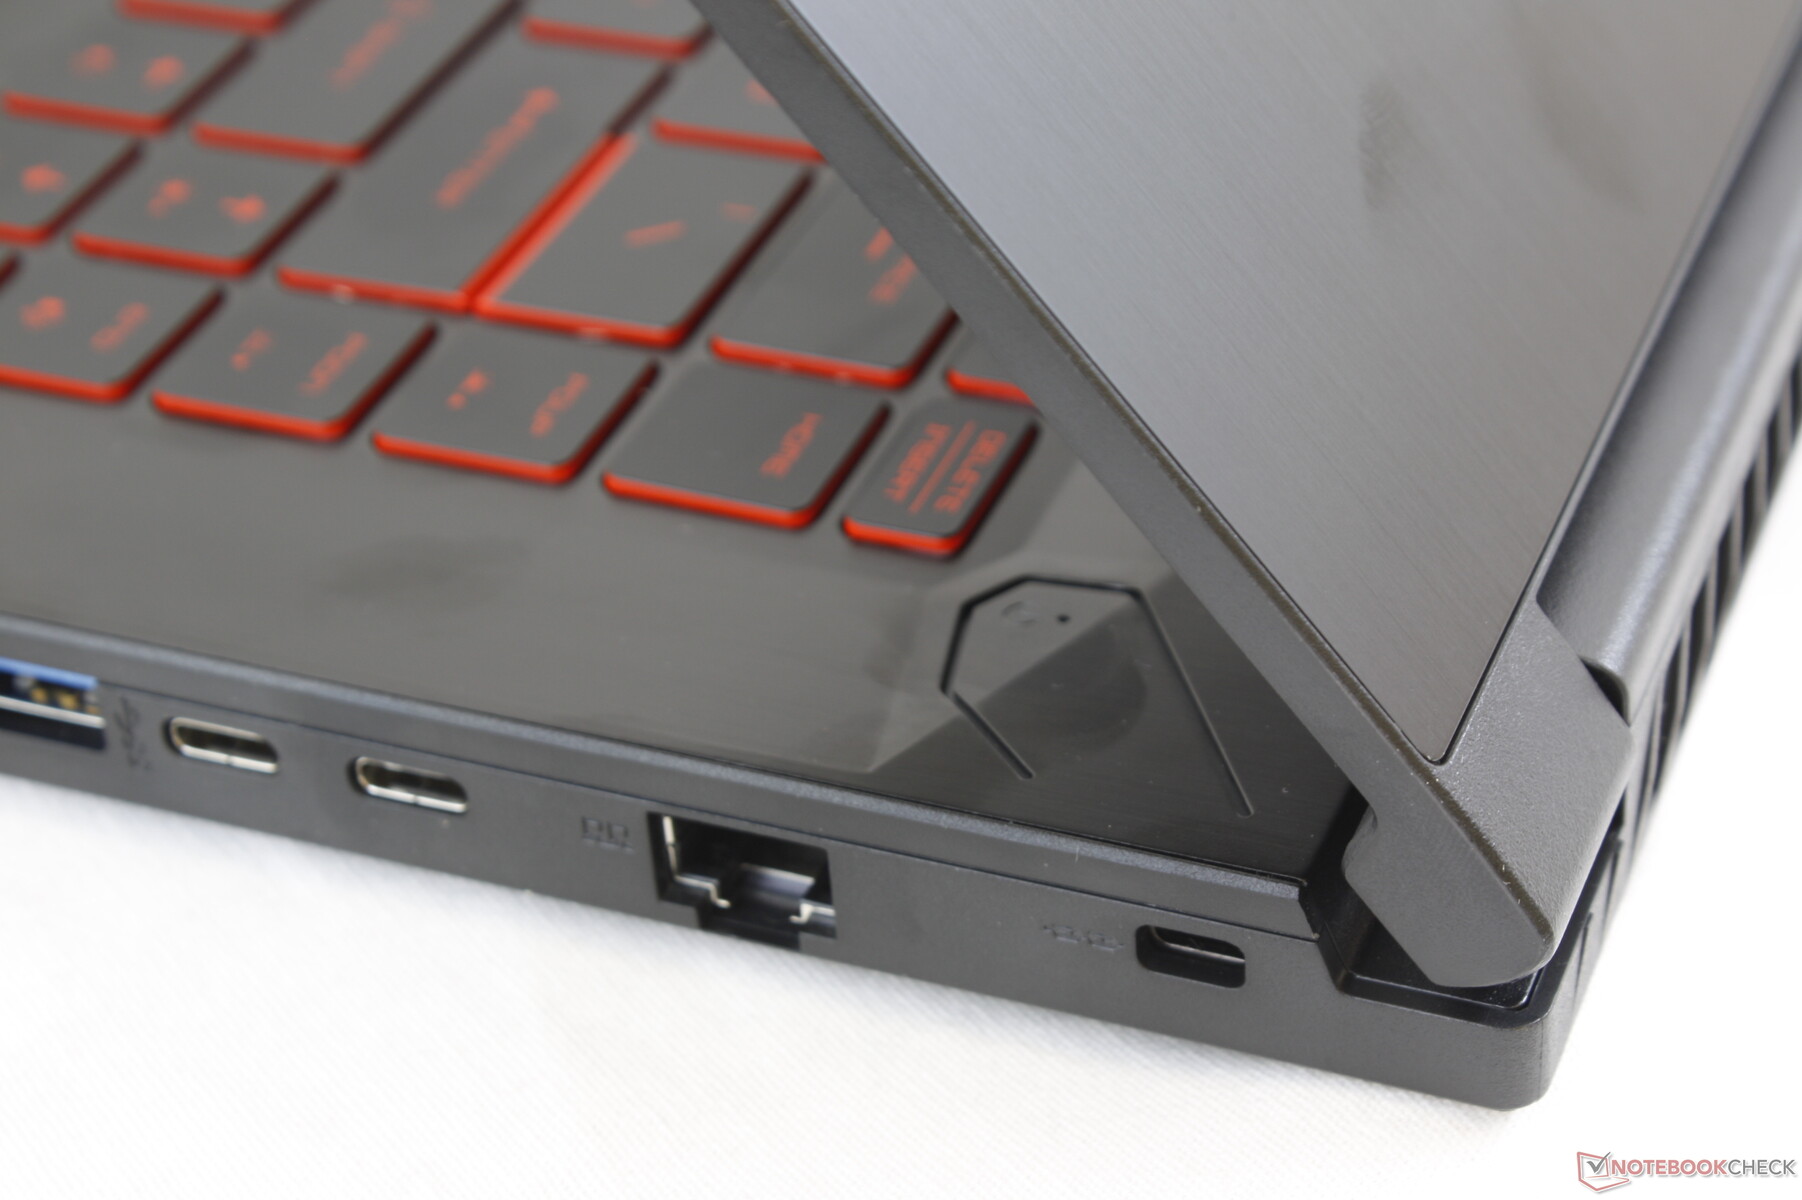
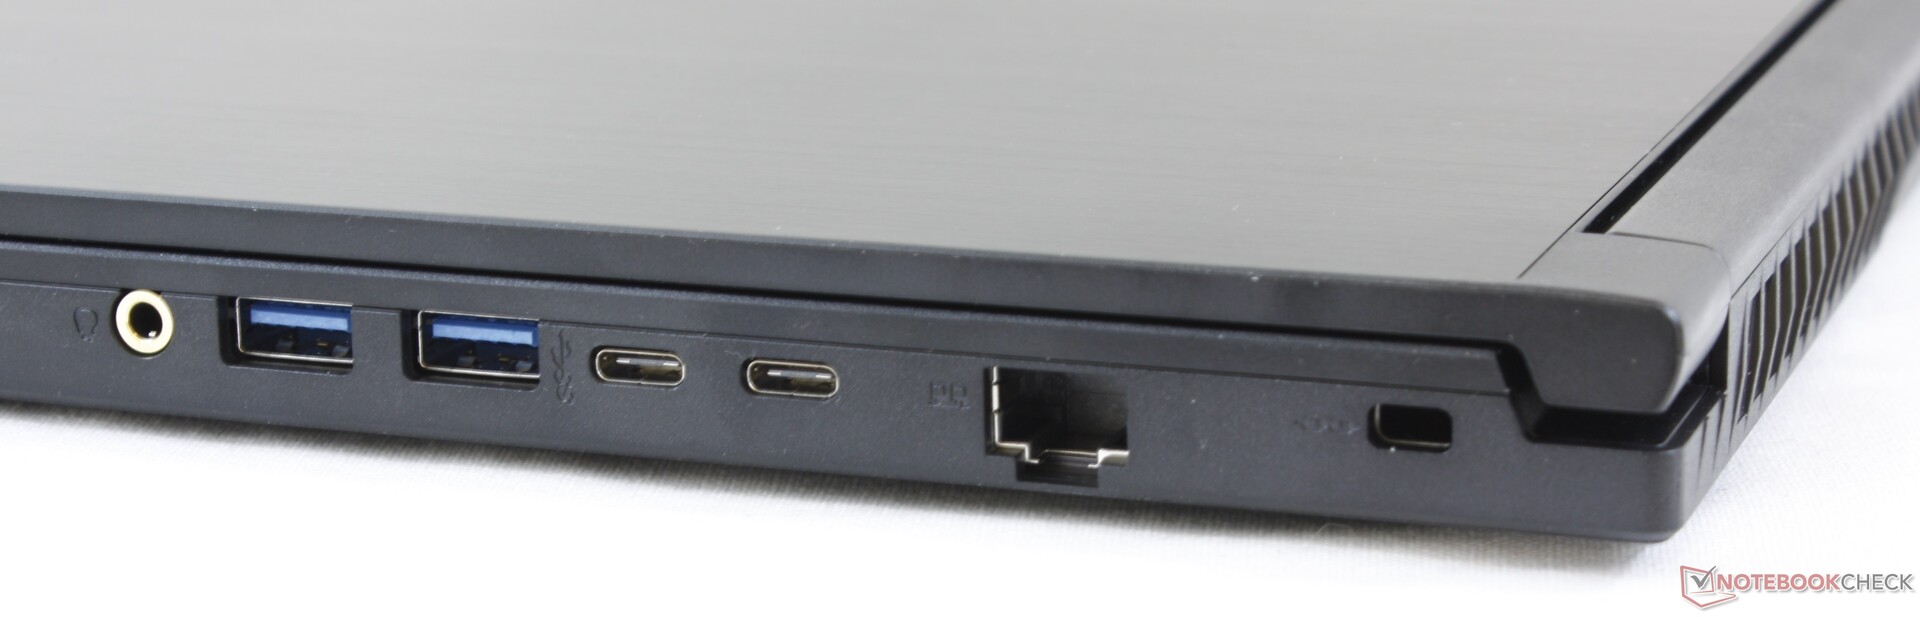
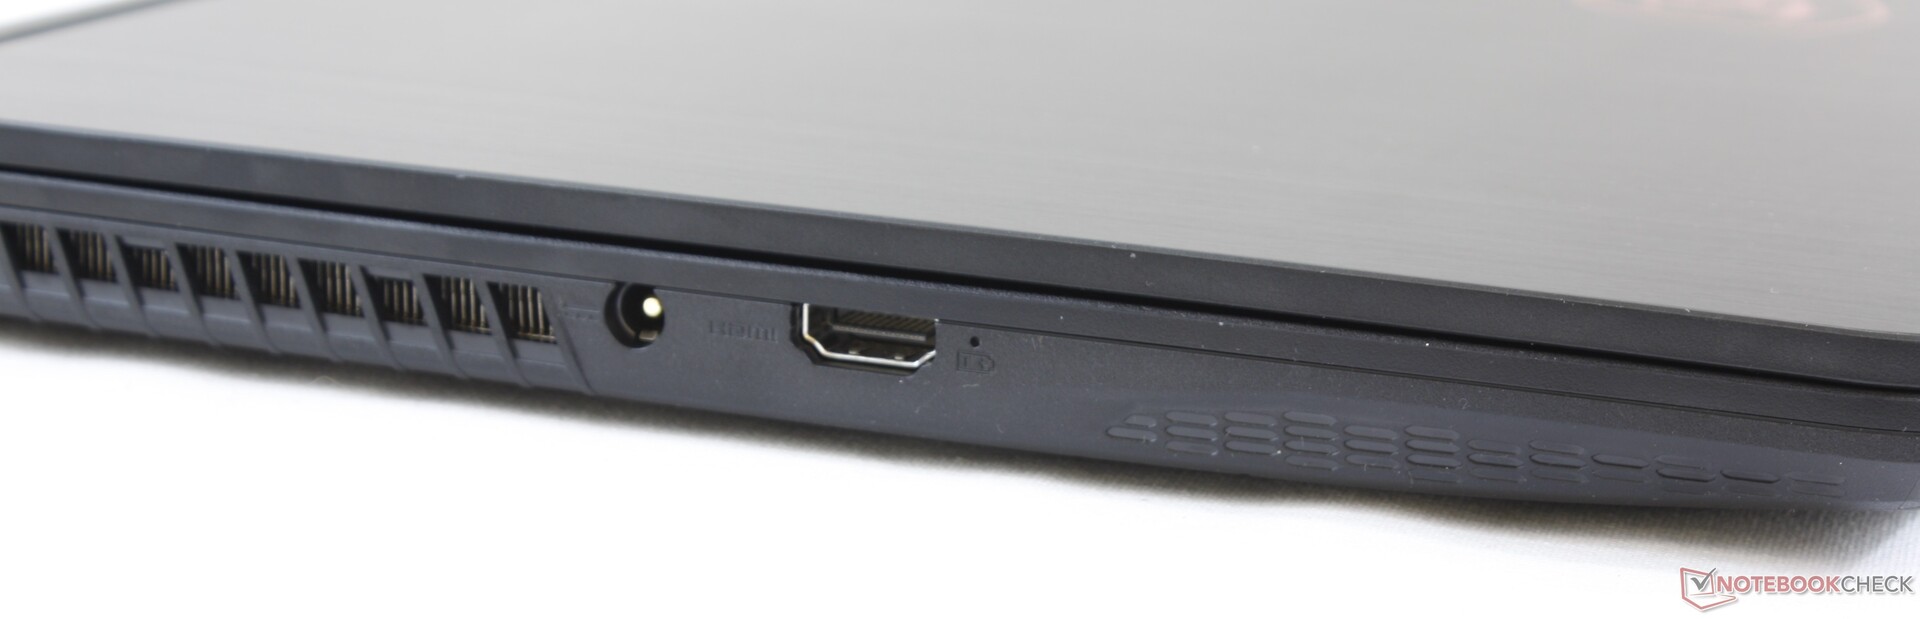
While port options are decent for a budget gaming laptop, the positioning of the ports is questionable. There are no USB ports along the left edge and many of the ports are very close to the front edge where cables can occupy valuable desk space.The HDMI port, for example, is closer to the front of the laptop than it is to the rear. The bright side is that all ports are easy to reach since none are along the rear.
Communication
WLAN has been upgraded from the 1x1 Intel 9462 with Bluetooth 4.2 on last year's GF63 to the more modern 2x2 Intel 9560 with Bluetooth 5. Transfer rates can be up to 4x faster should you have an 802.11ac network to support it. Transmit speeds are slower than usual likely due to a bug in our server setup, but we experienced no connectivity issues otherwise.
| Networking | |
| iperf3 transmit AX12 | |
| Aorus 15-SA | |
| Lenovo Legion Y540-15IRH-81SX00B2GE | |
| Asus TUF FX505DT-EB73 | |
| MSI GF63 8RC | |
| MSI GF65 9SD | |
| iperf3 receive AX12 | |
| Aorus 15-SA | |
| MSI GF65 9SD | |
| Lenovo Legion Y540-15IRH-81SX00B2GE | |
| Asus TUF FX505DT-EB73 | |
| MSI GF63 8RC | |
Maintenance
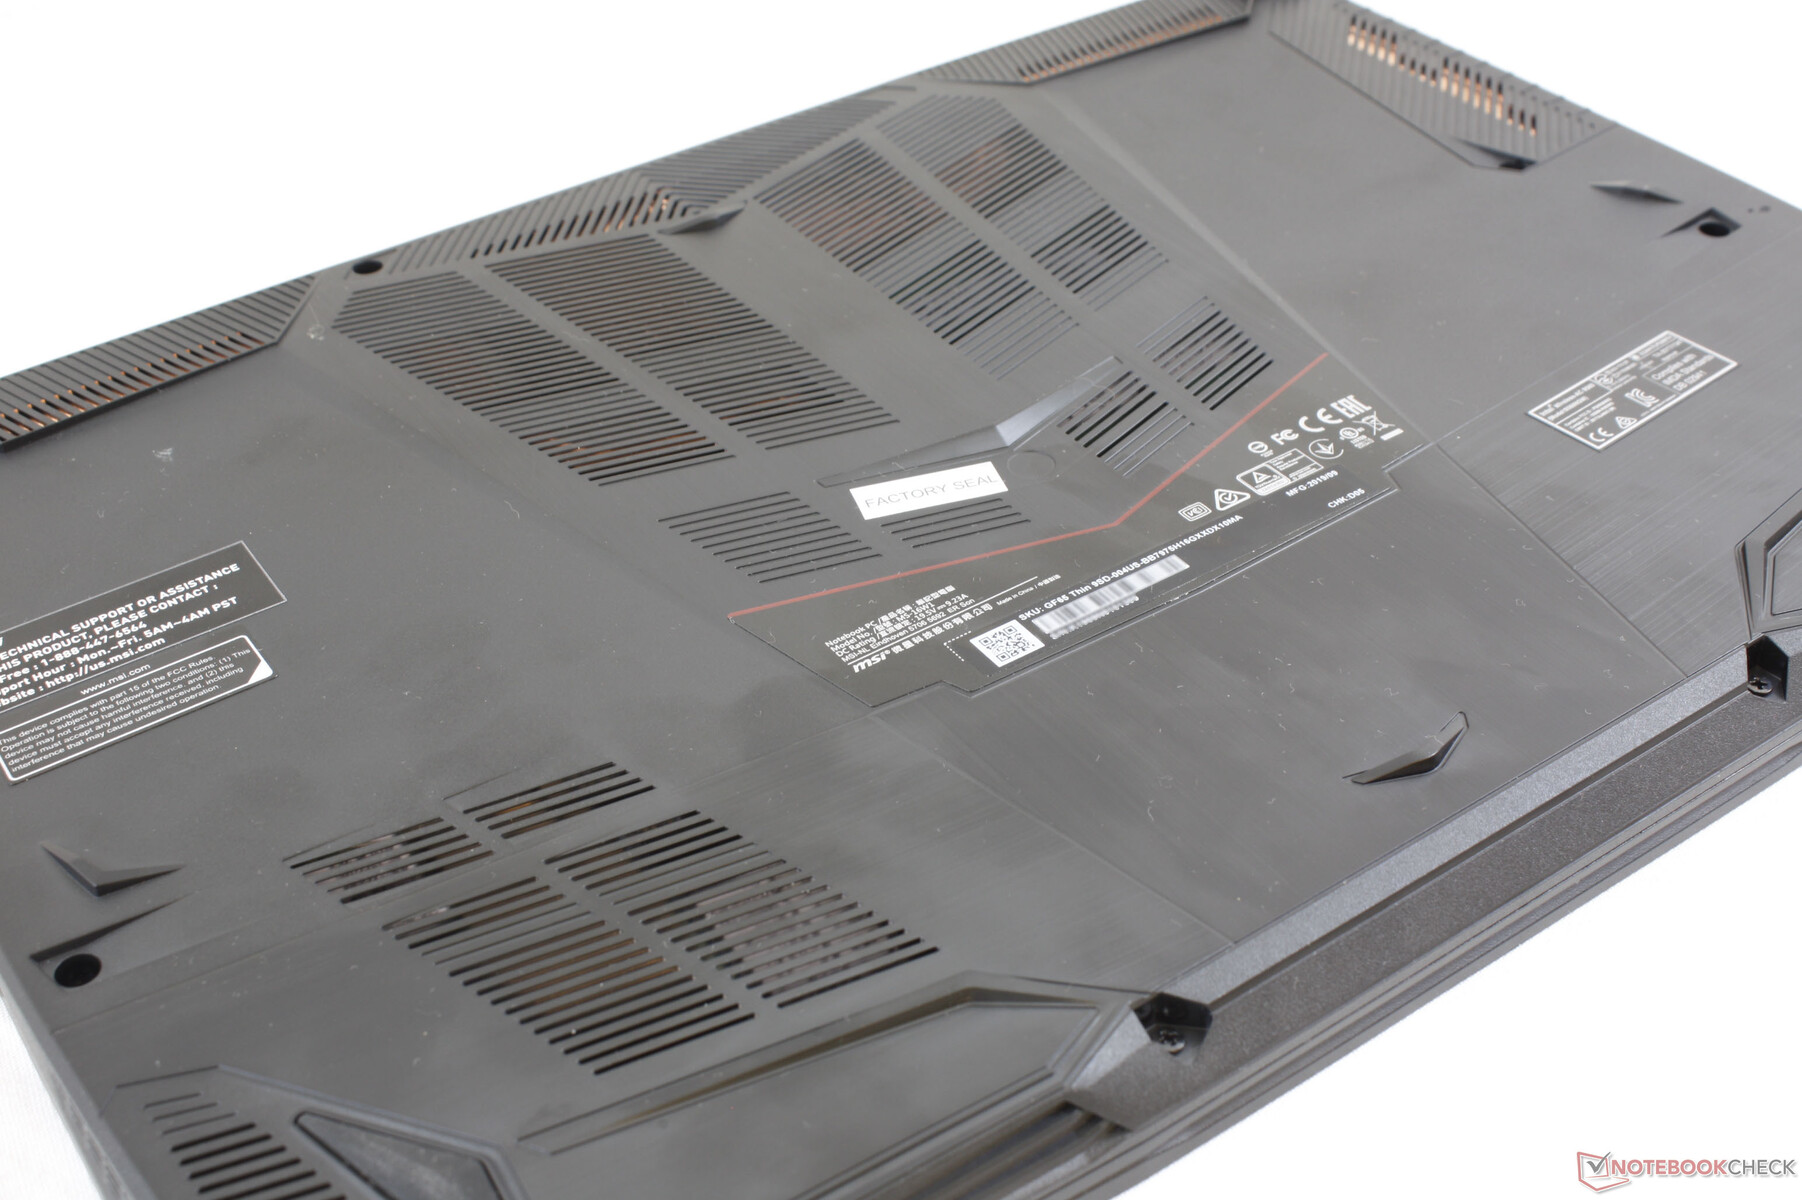
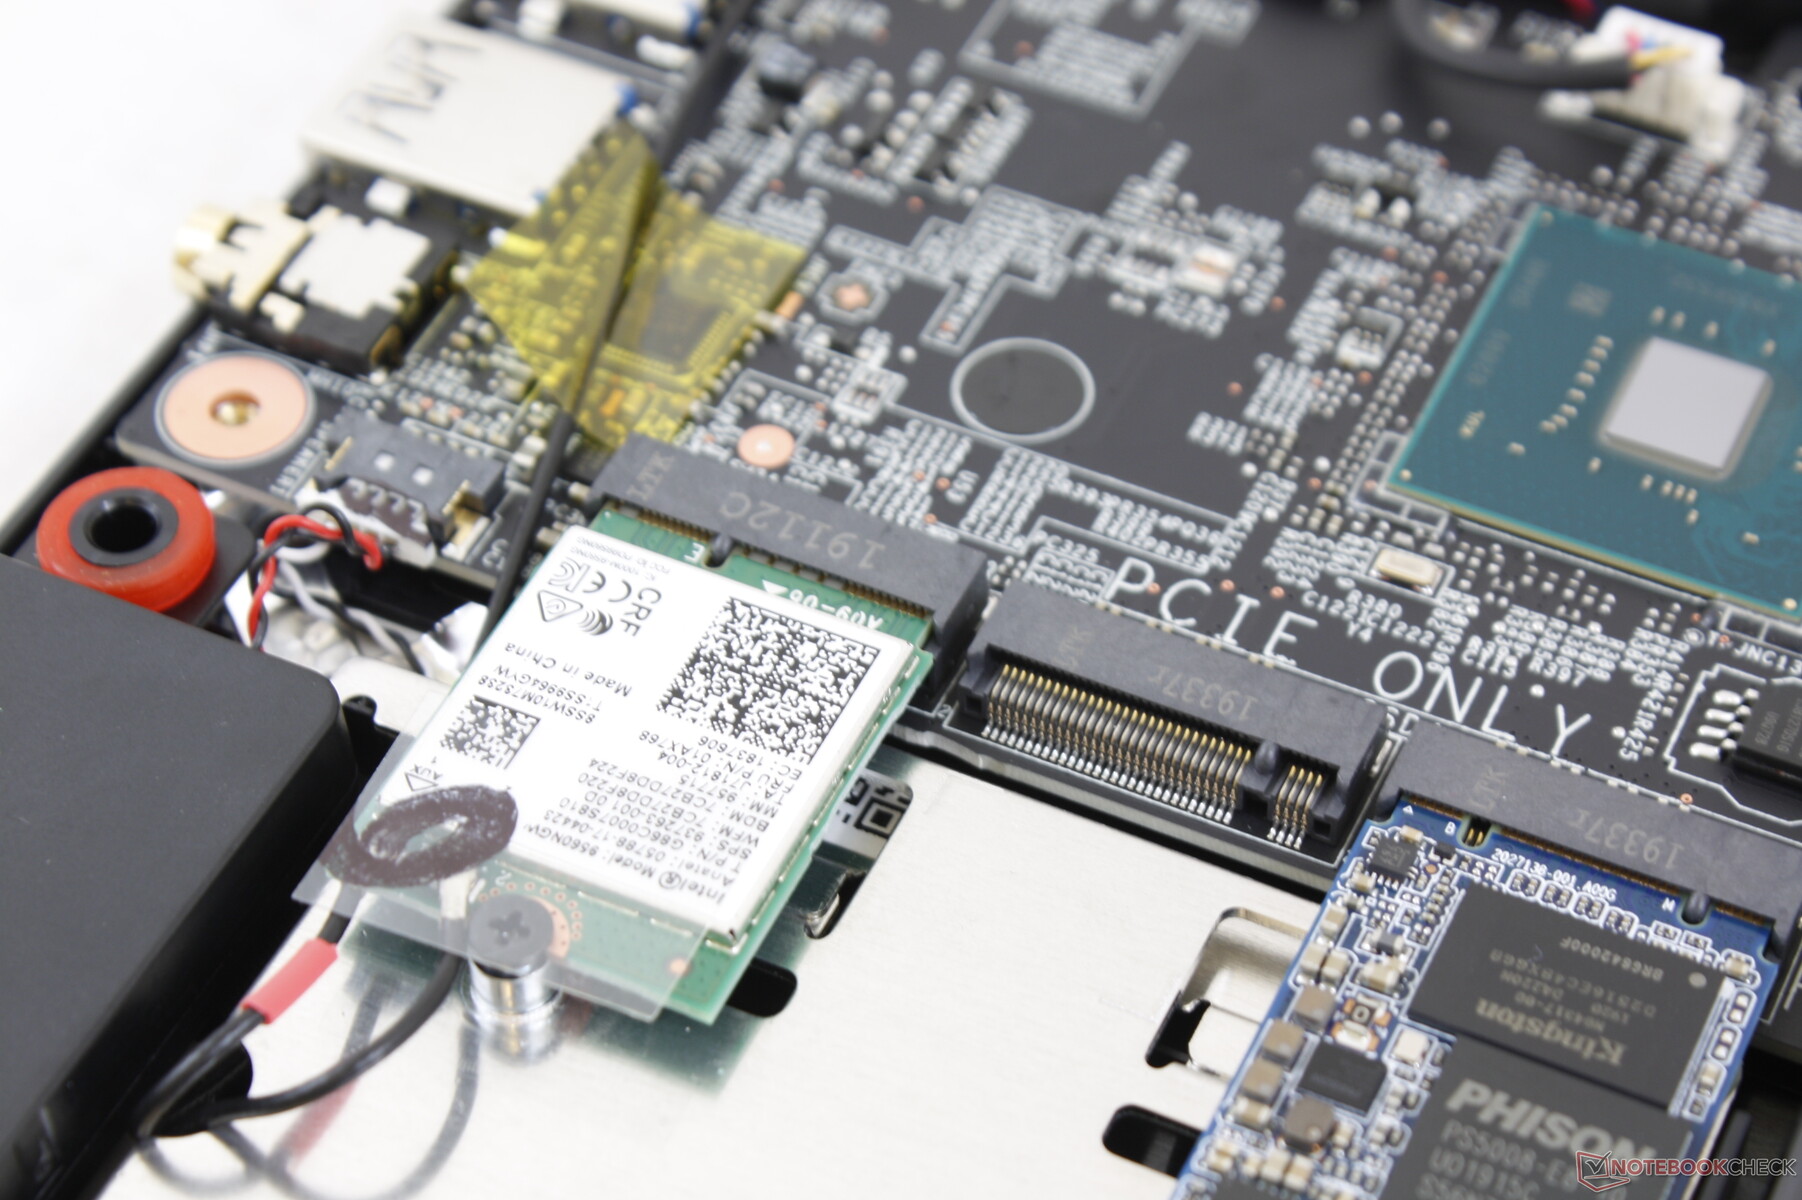
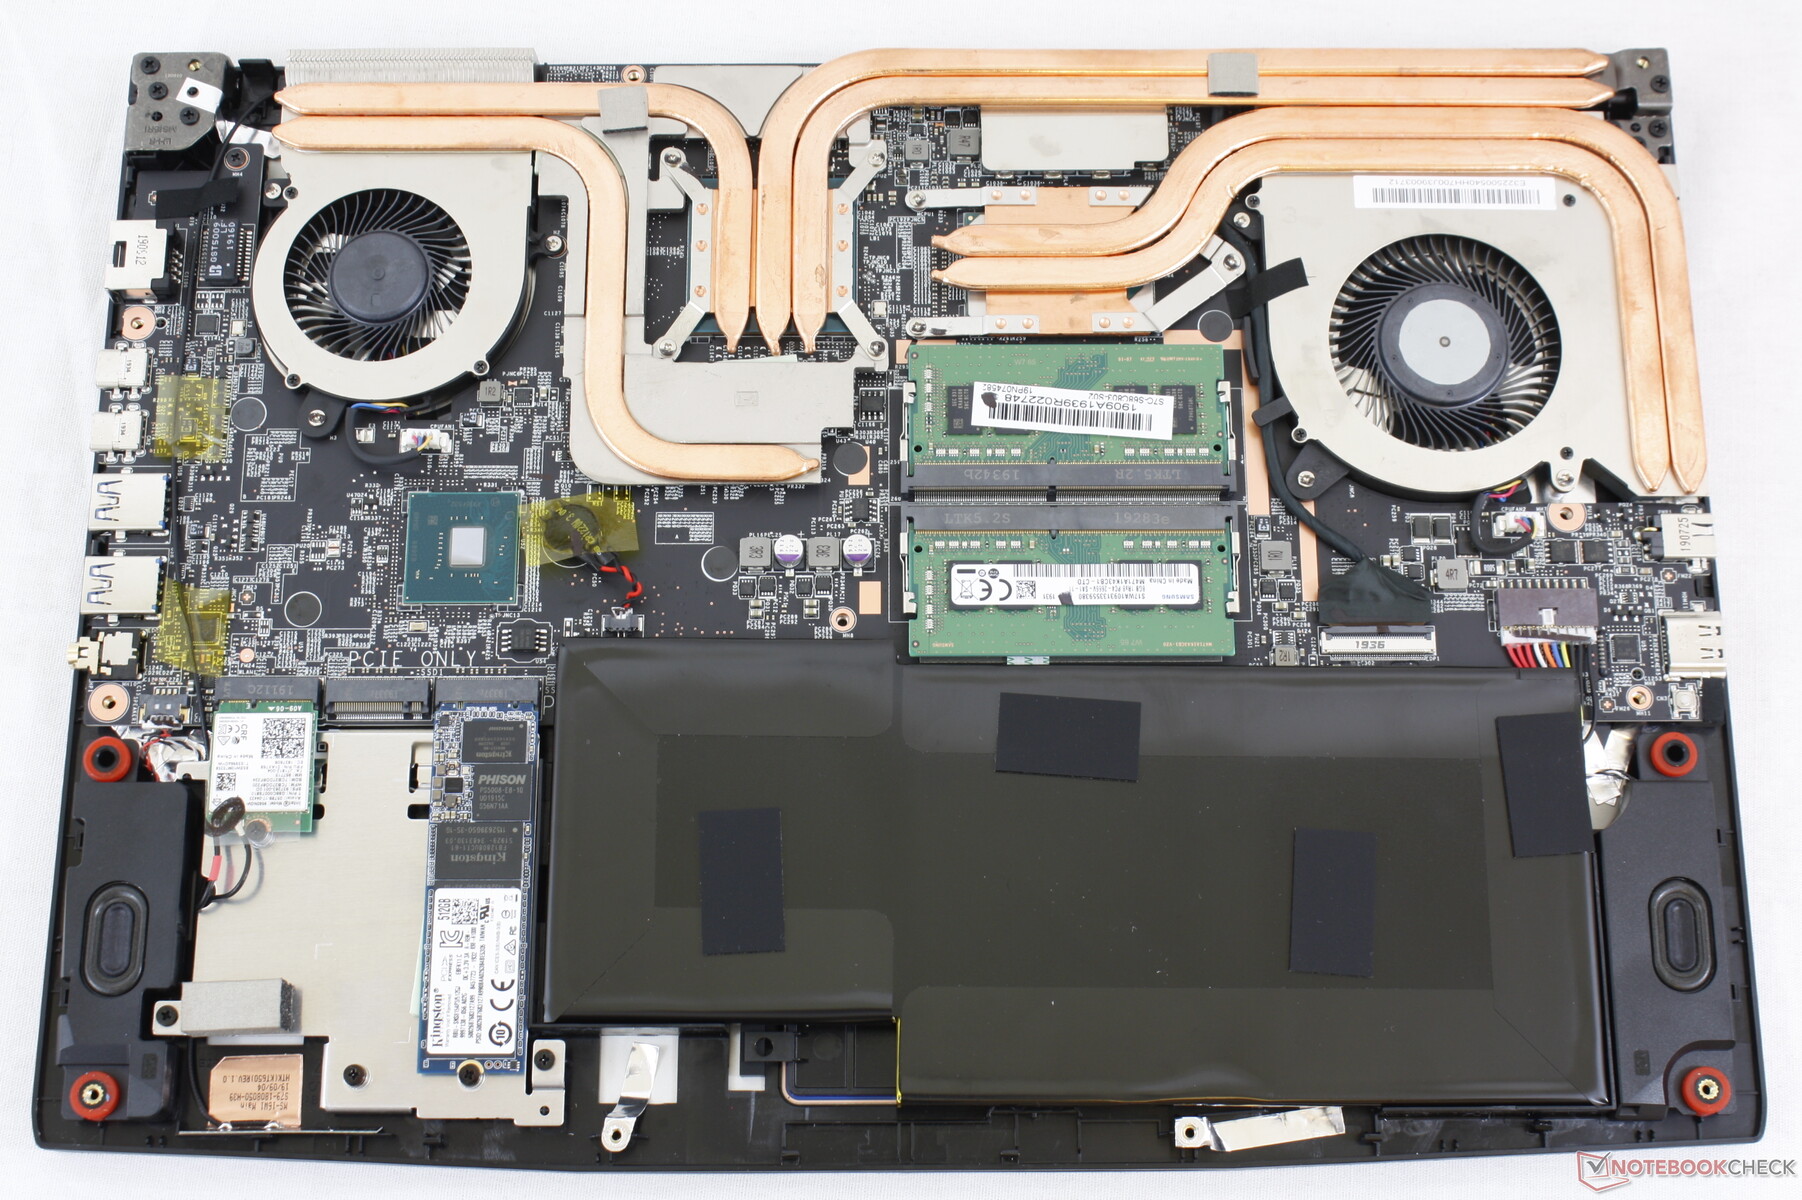
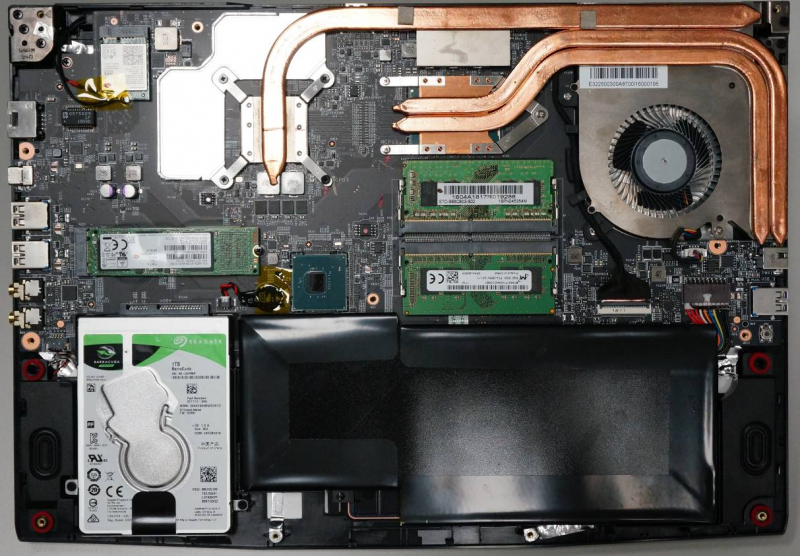
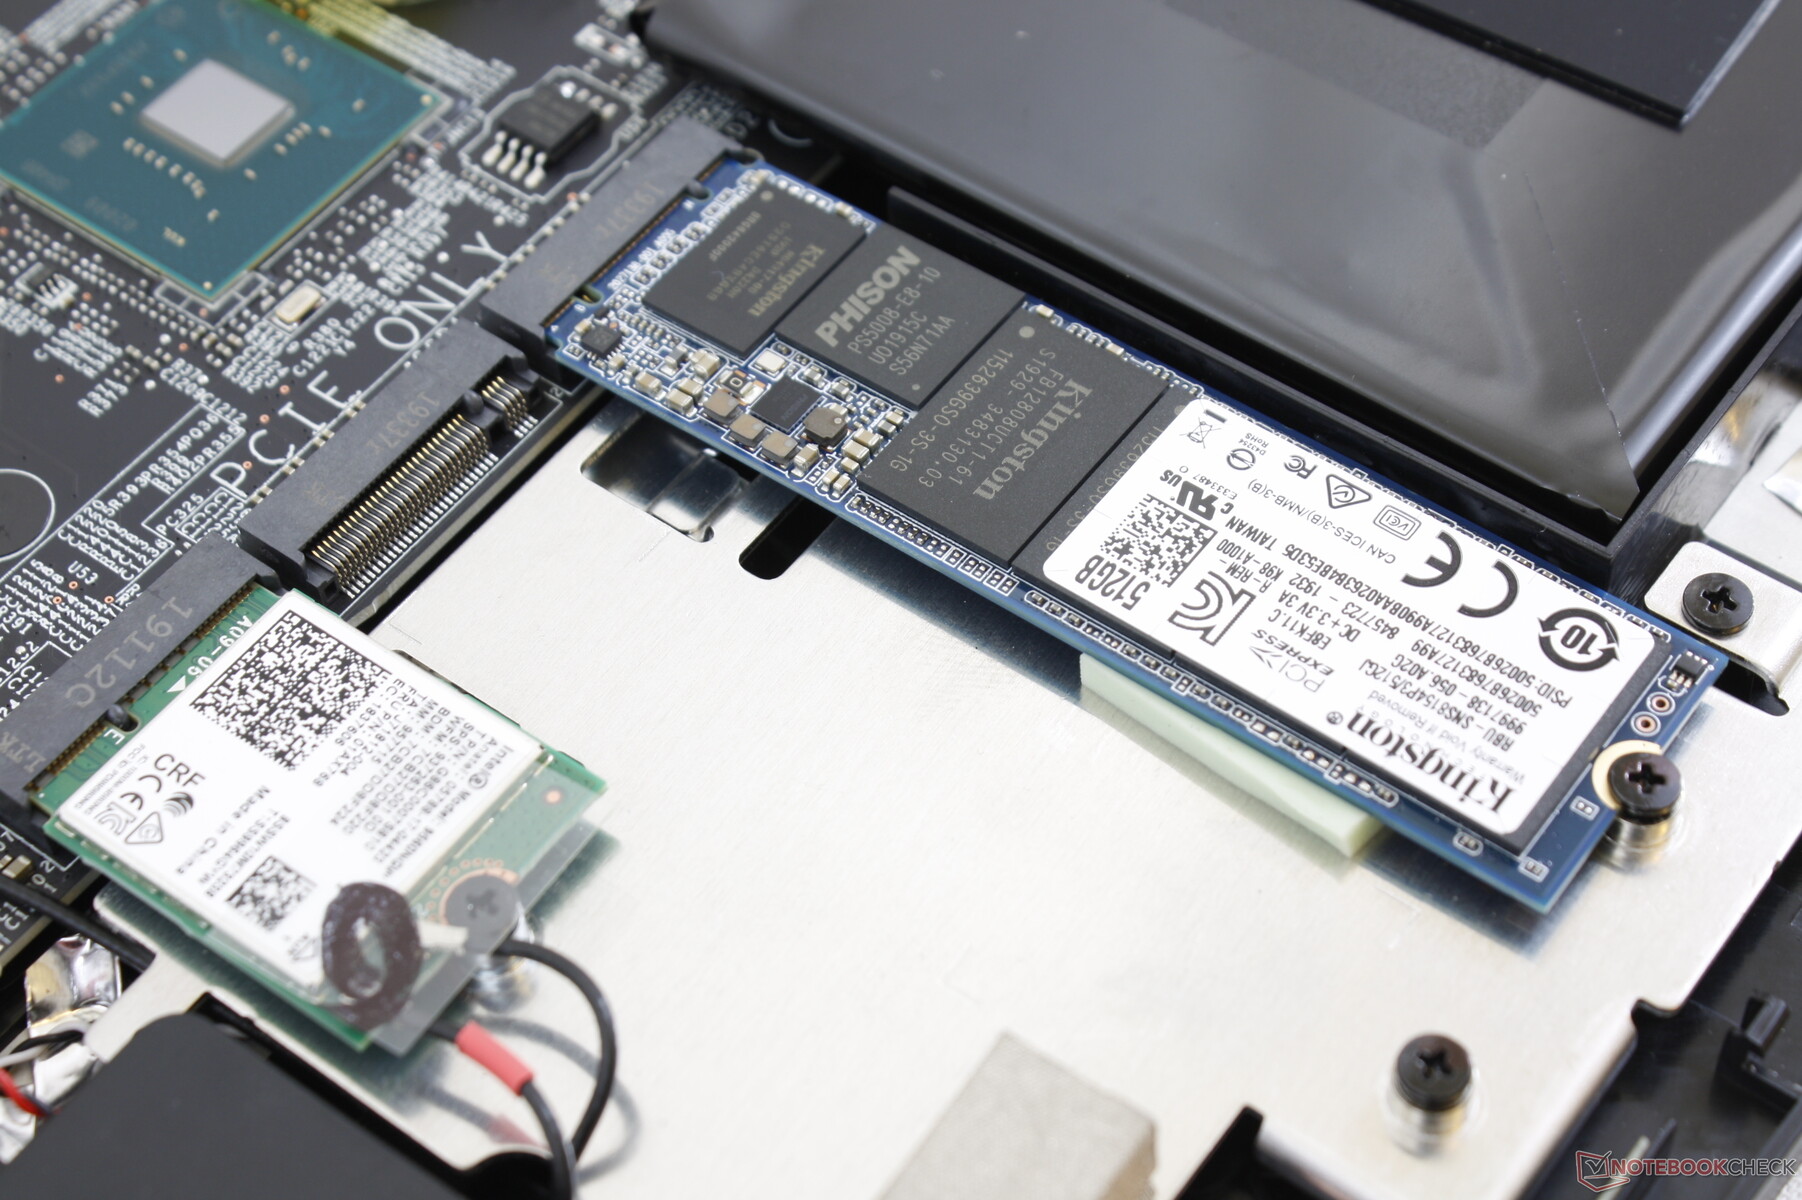
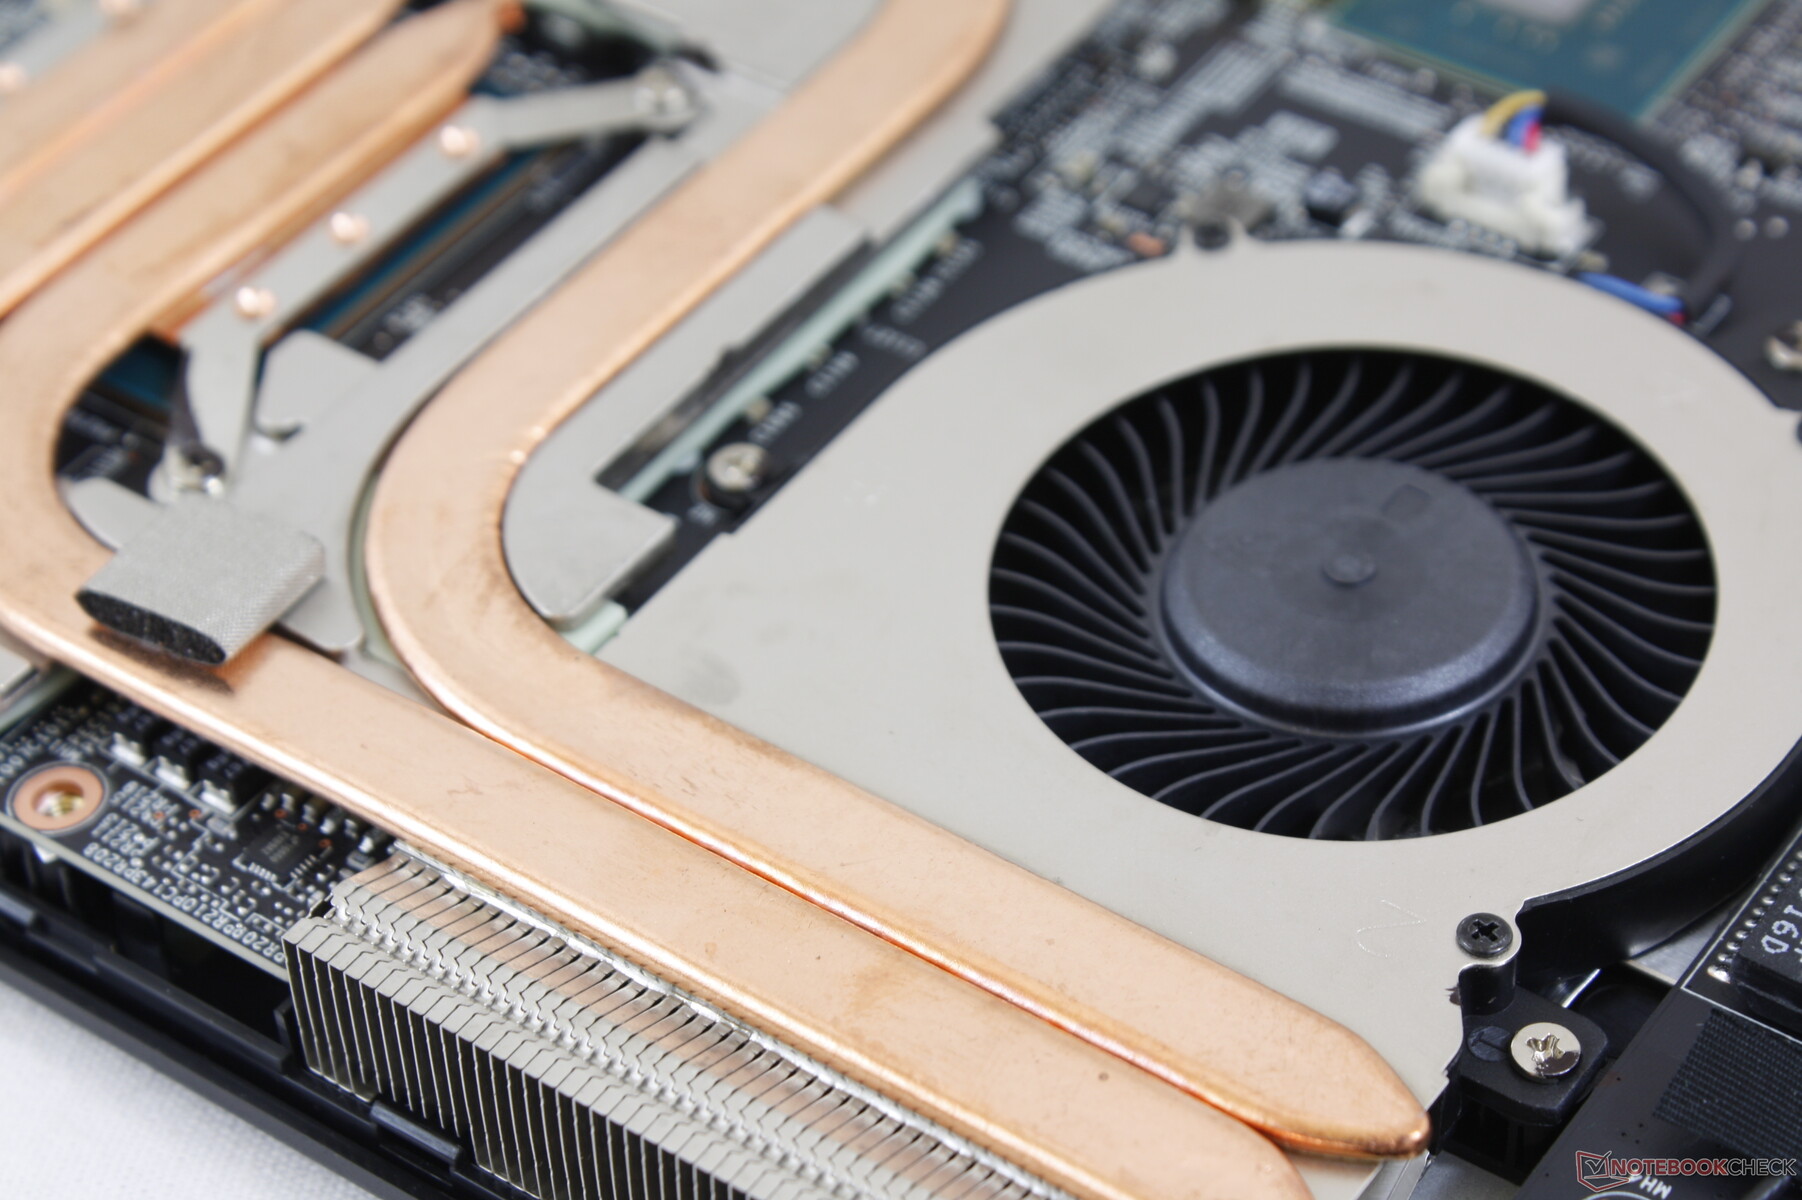
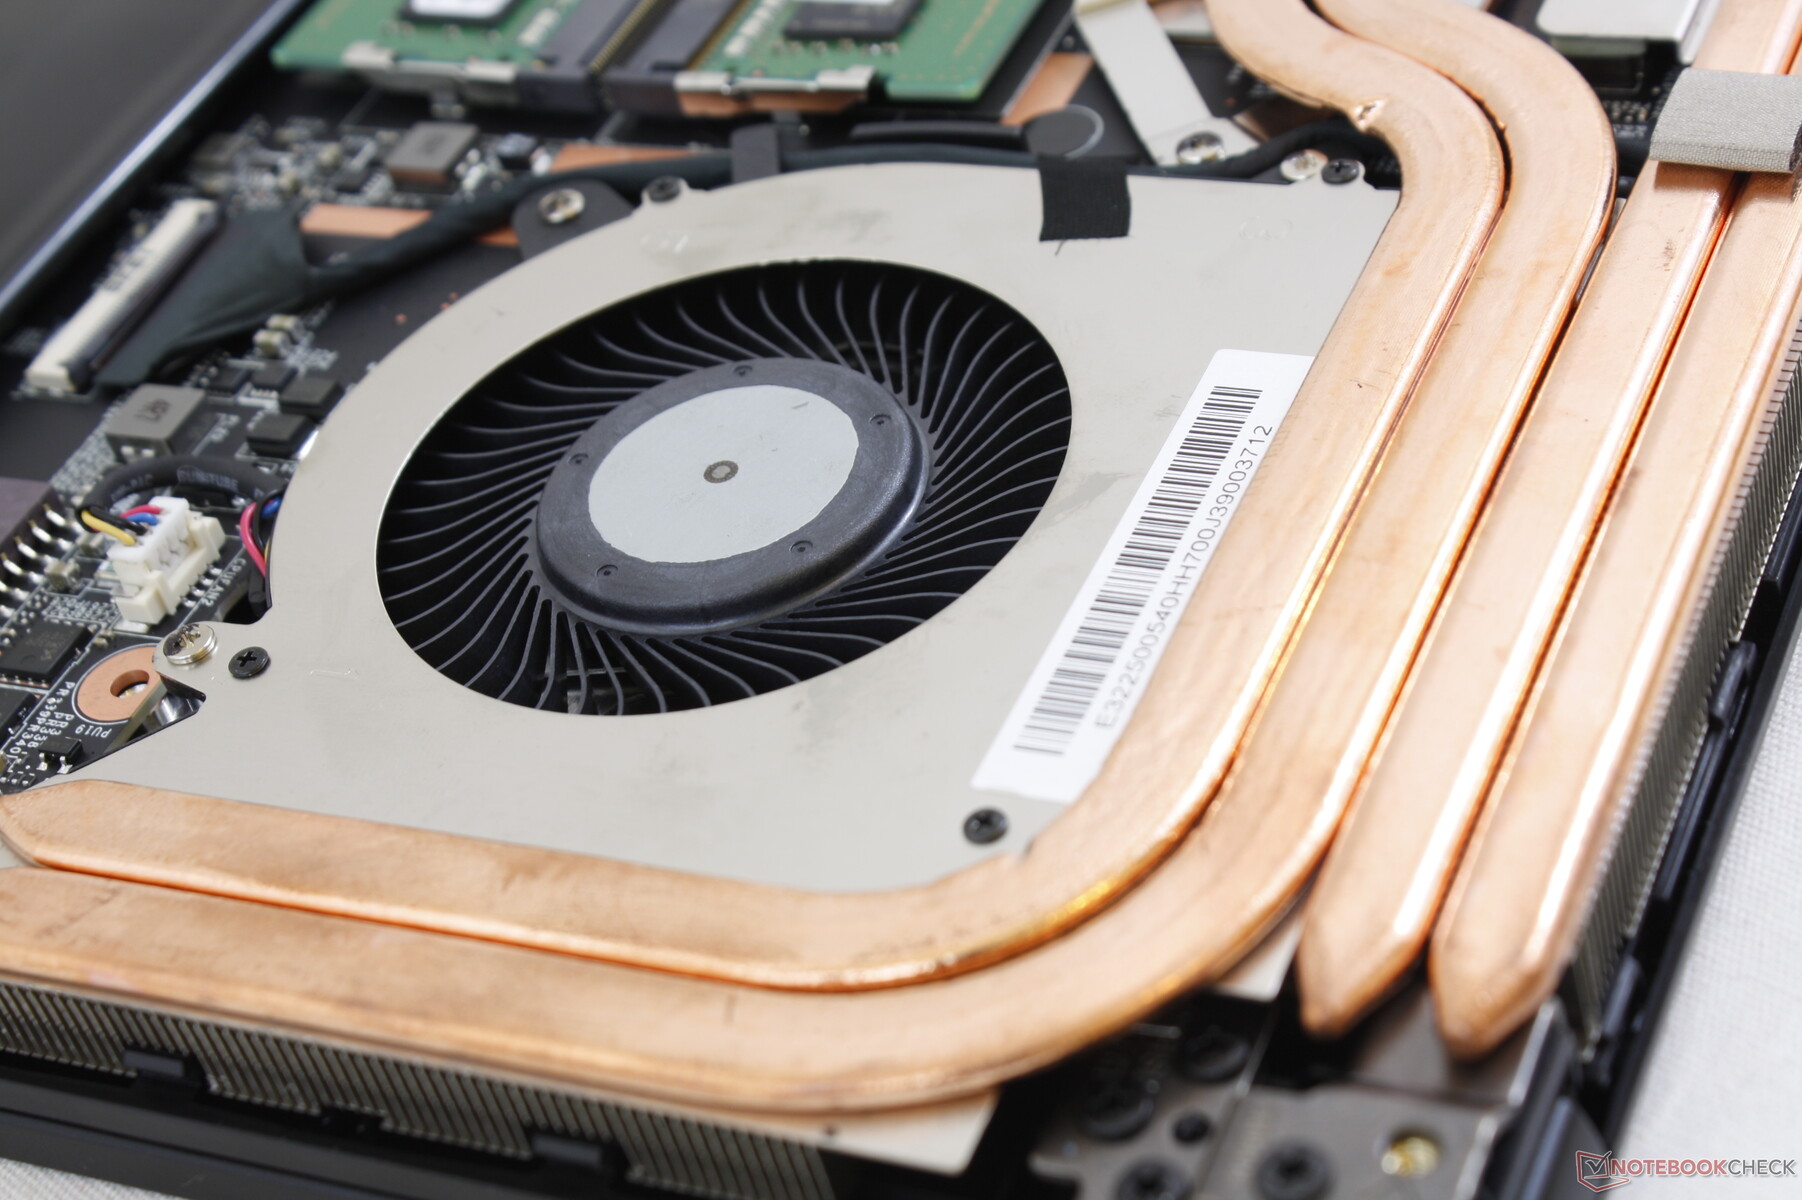
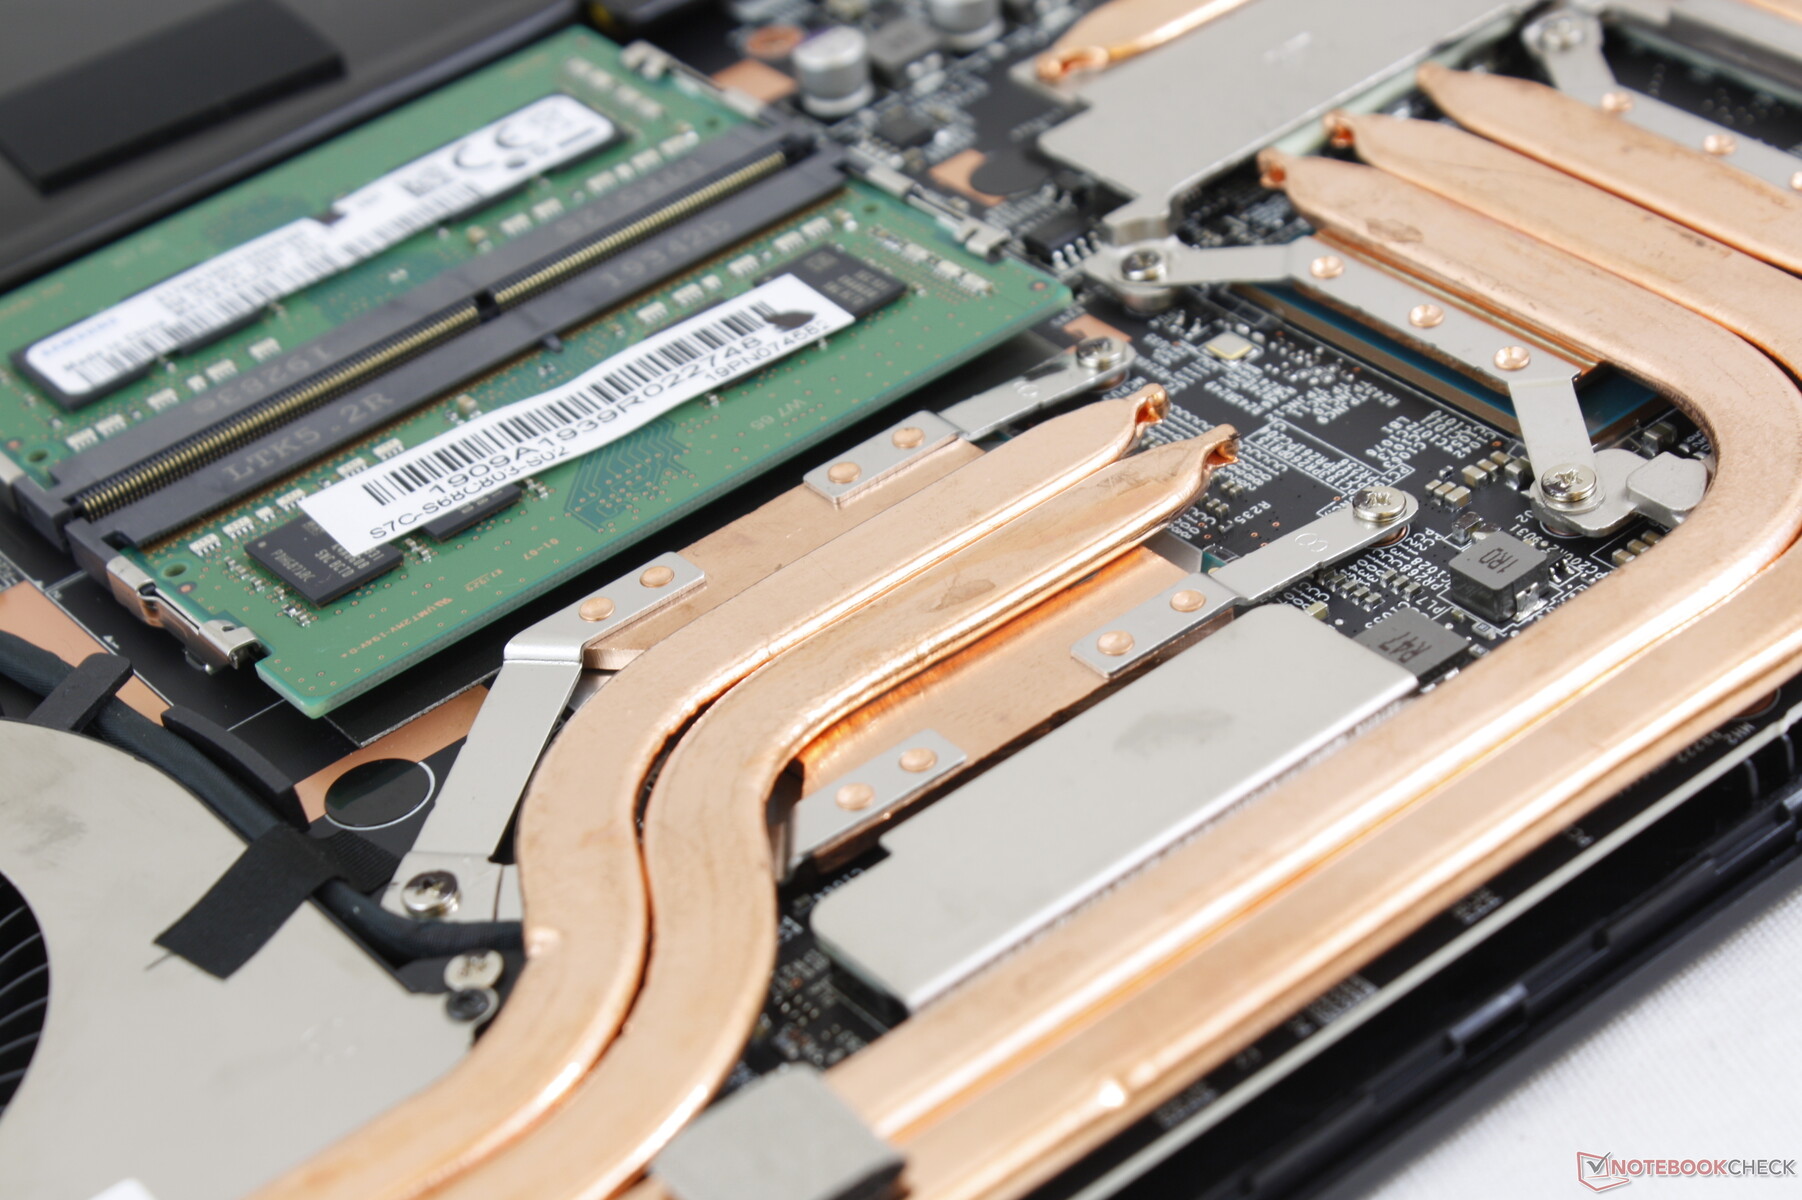
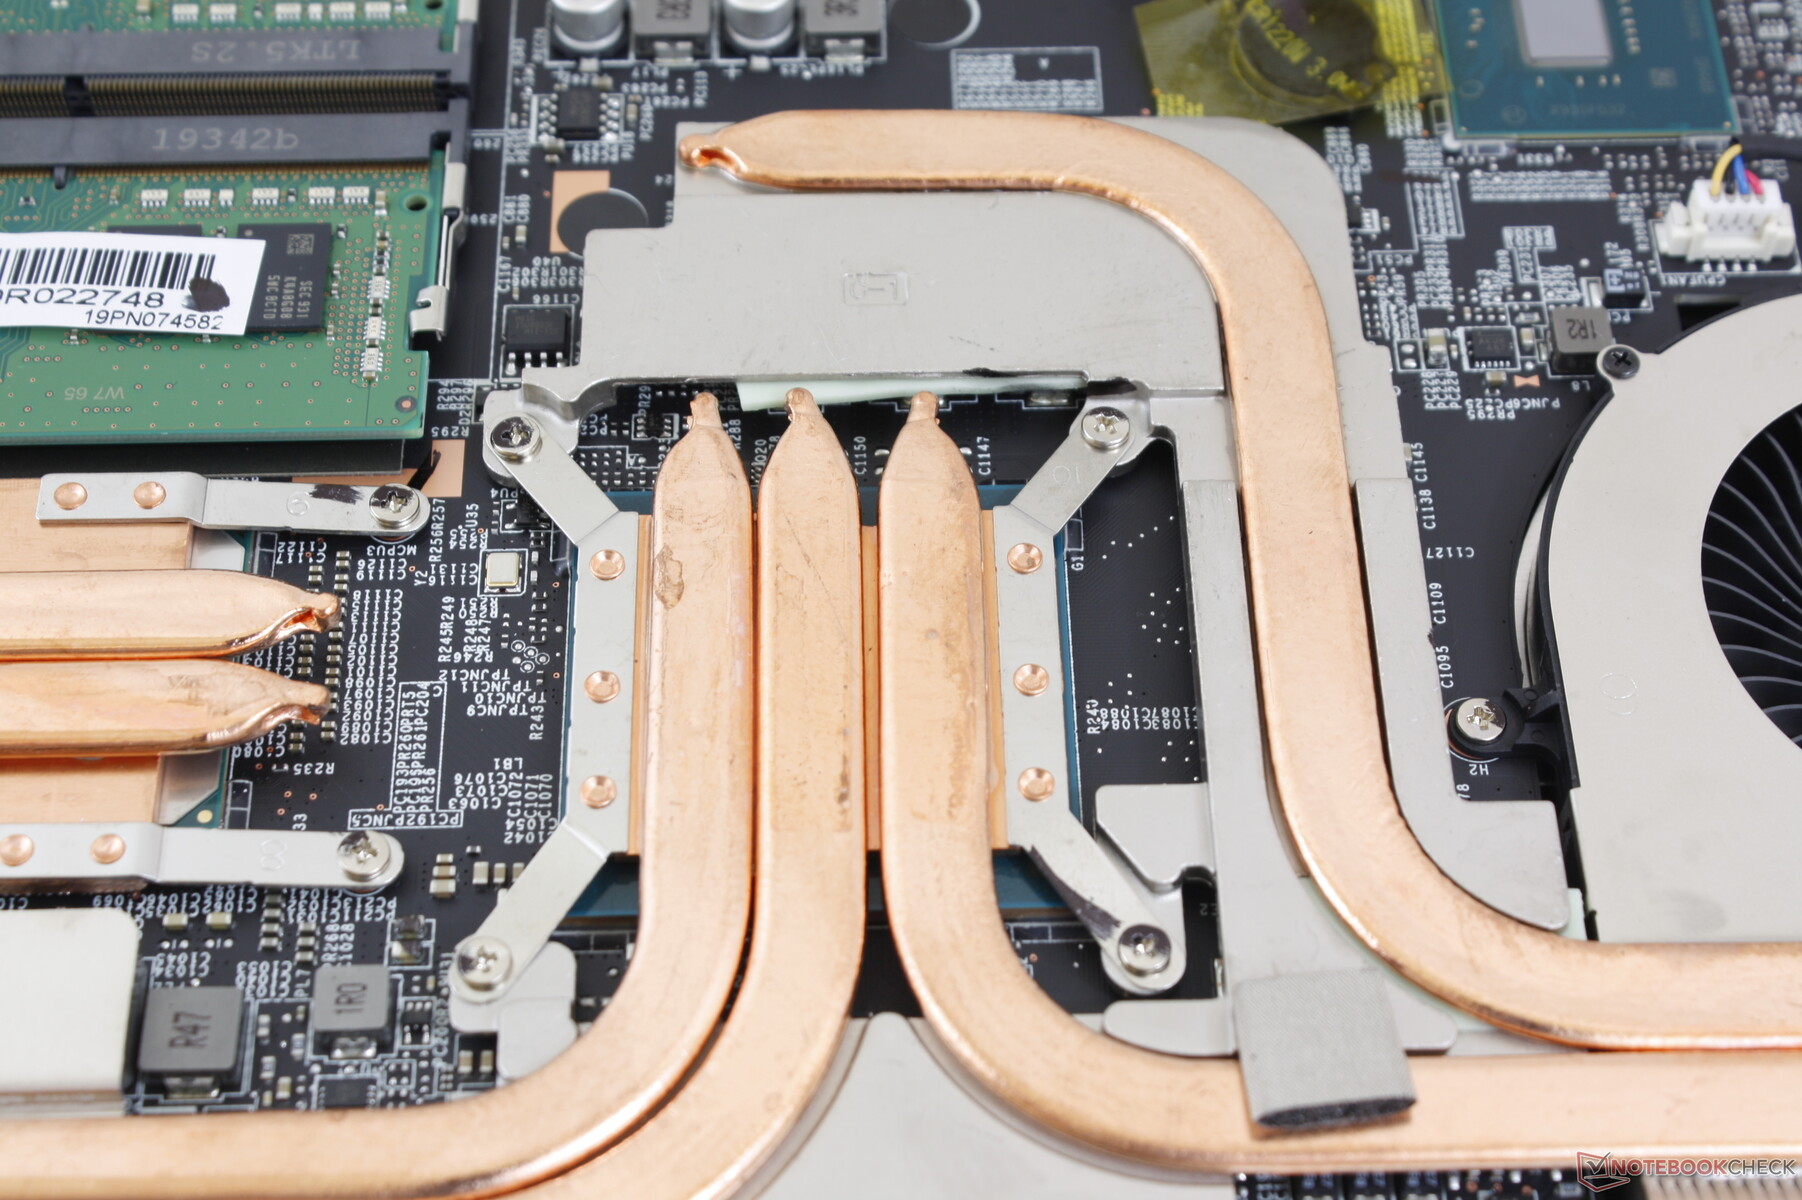
The bottom panel will require a Philips screwdriver and sharp edge to remove. It's latched very tightly around the 3.5 mm jack so care should be taken around this area. MSI had to relocate the WLAN module in order to integrate more copper heat pipes for the faster Turing GPU as shown by our comparison shots below.
Note that a Factory Seal sticker must be torn if you want to service the machine in any way.
Accessories and Warranty
There are no included extras in the box other than the usual manuals and the standard one-year limited warranty applies. Registering your purchase online with MSI may net a warranty extension for free.
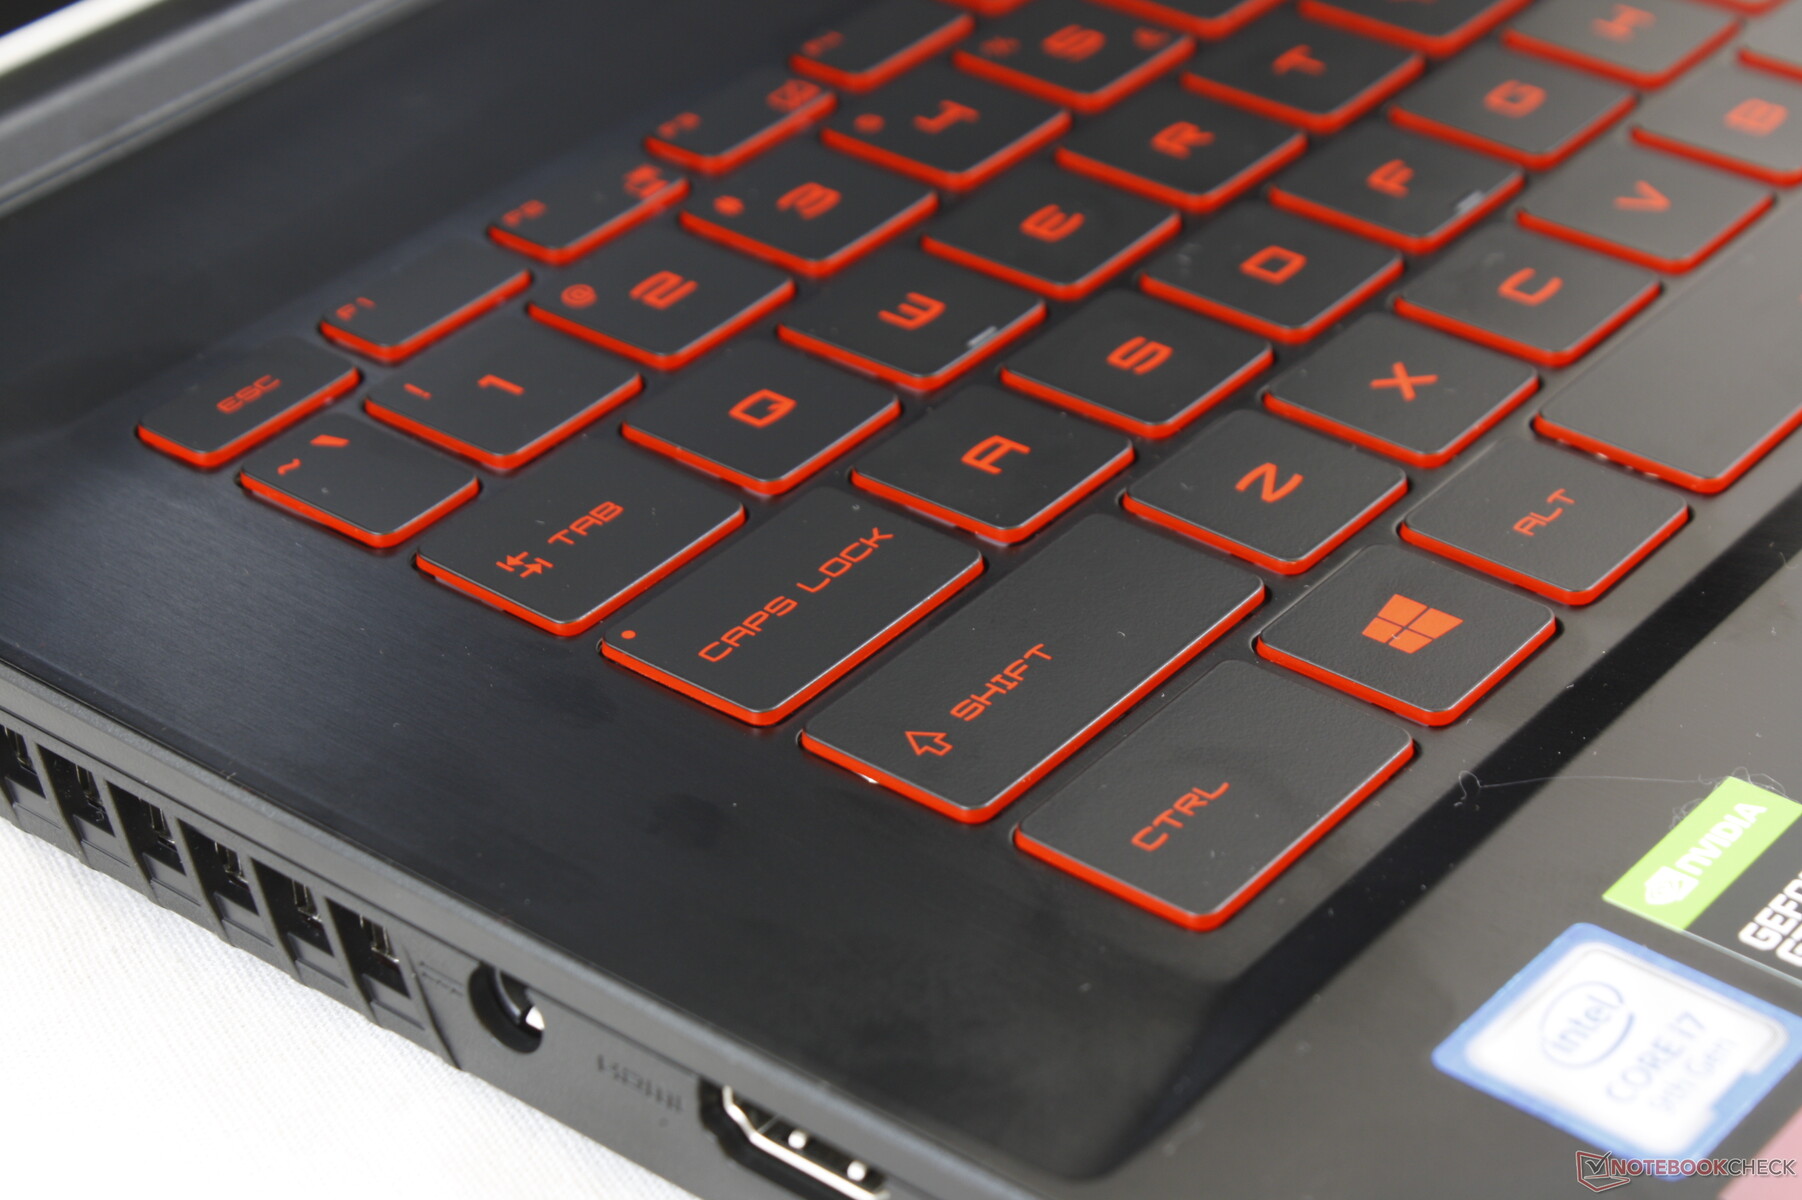
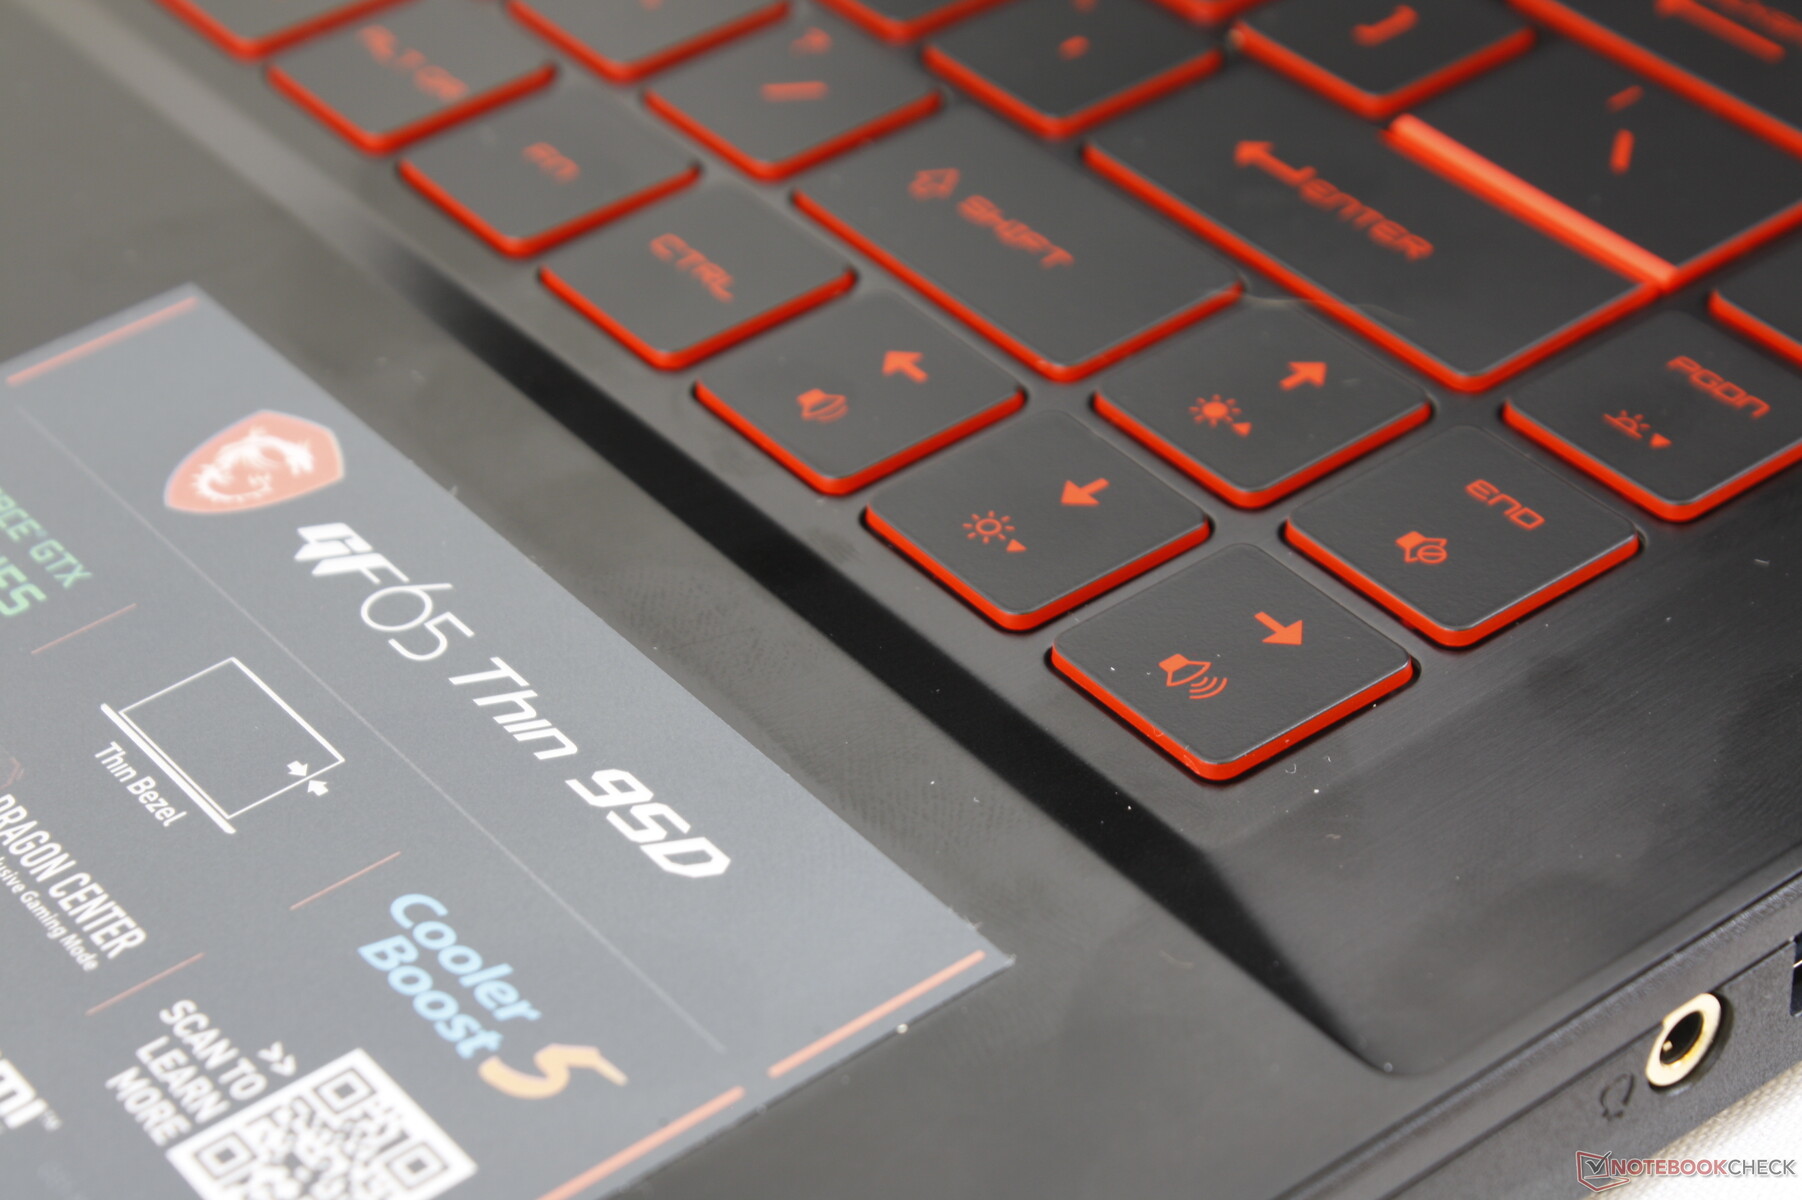
Input Devices
Keyboard and Touchpad
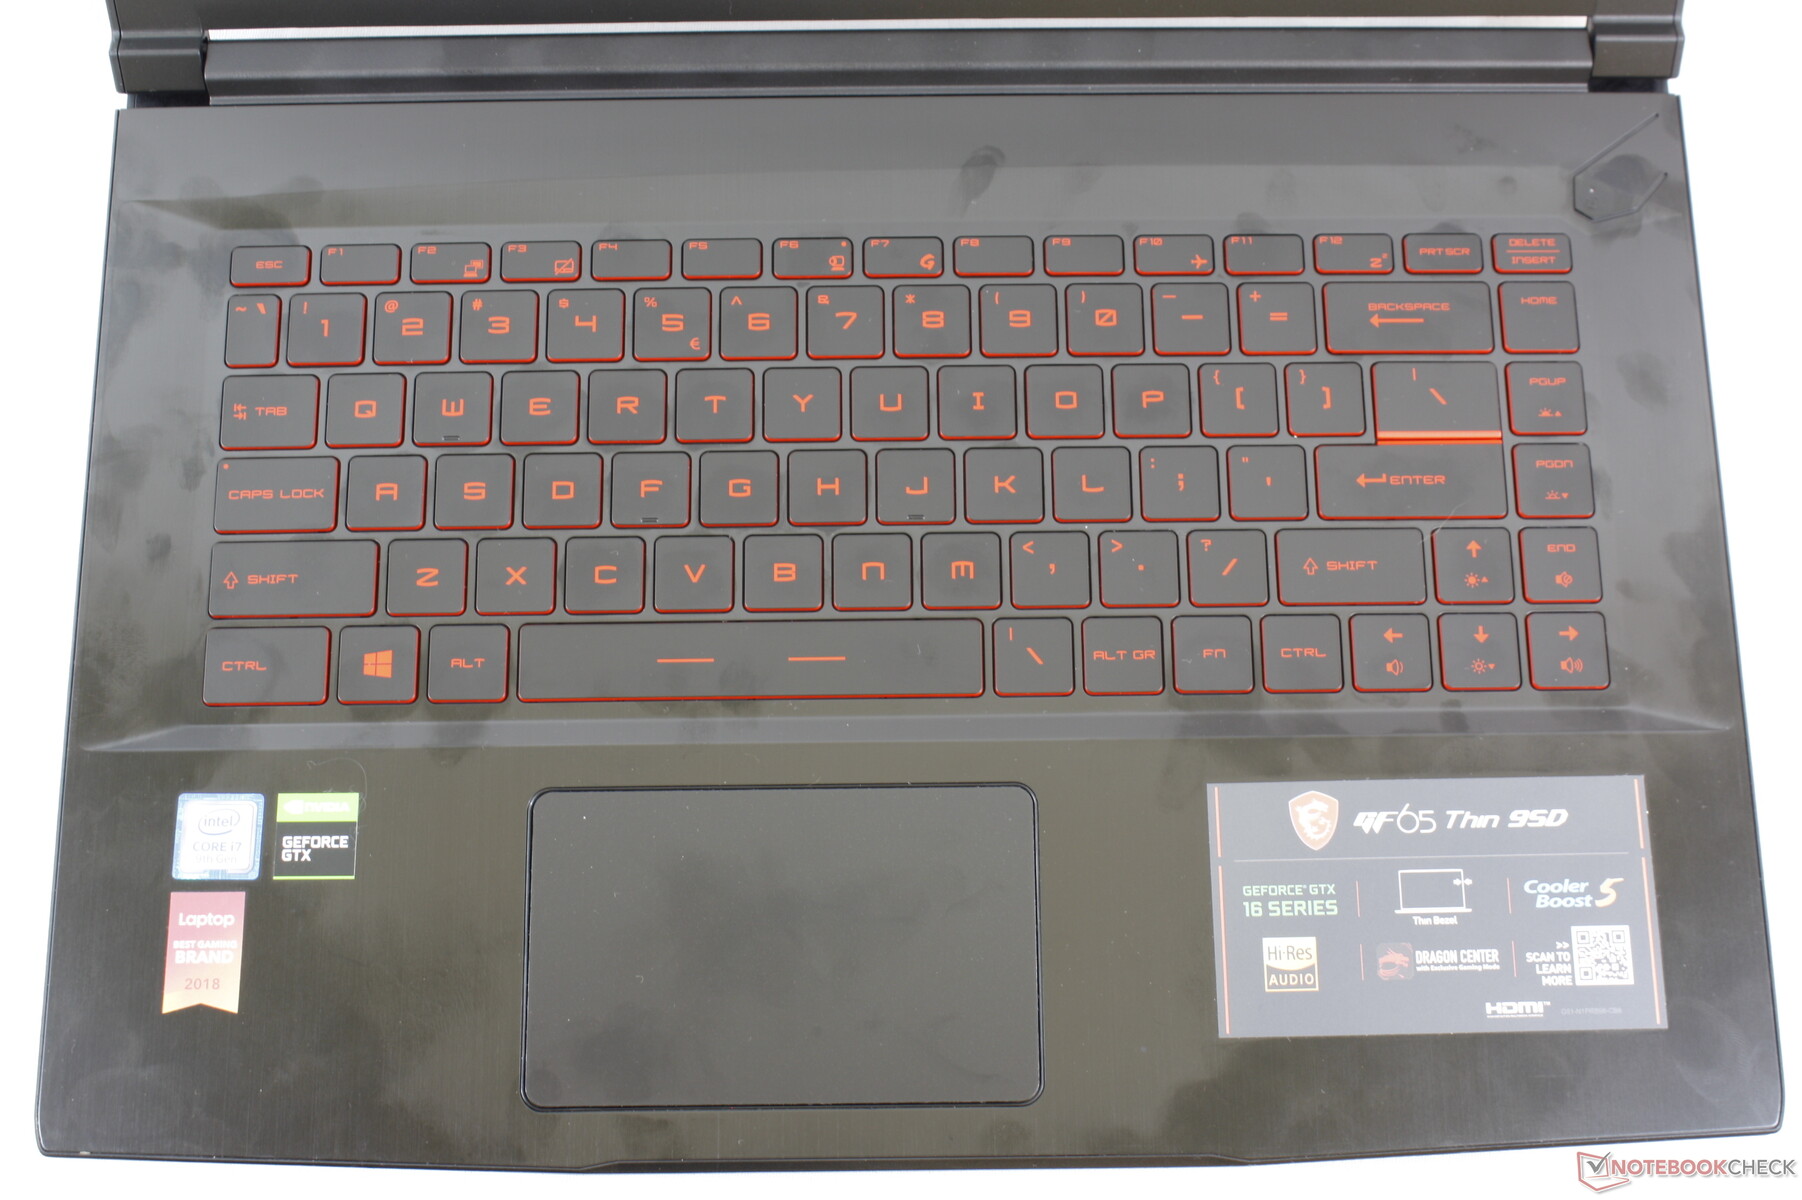
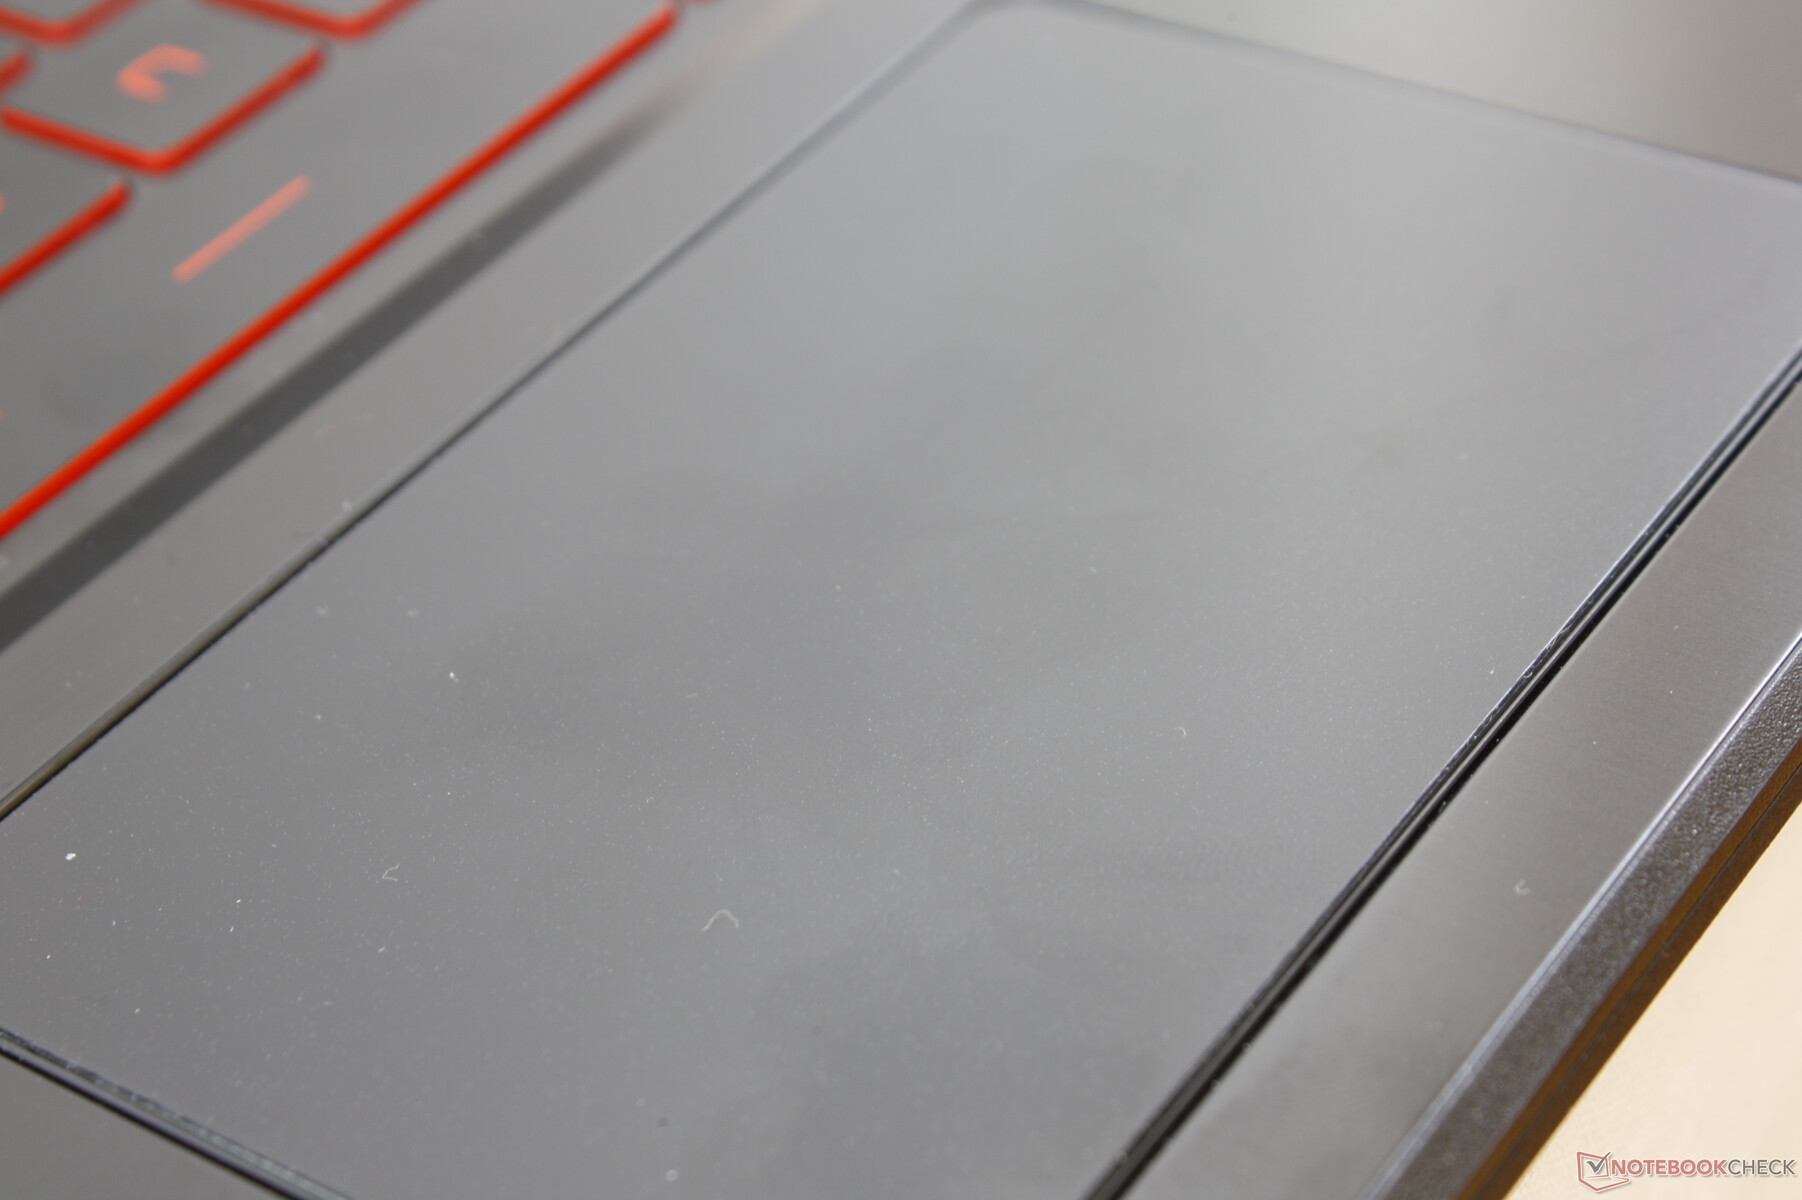
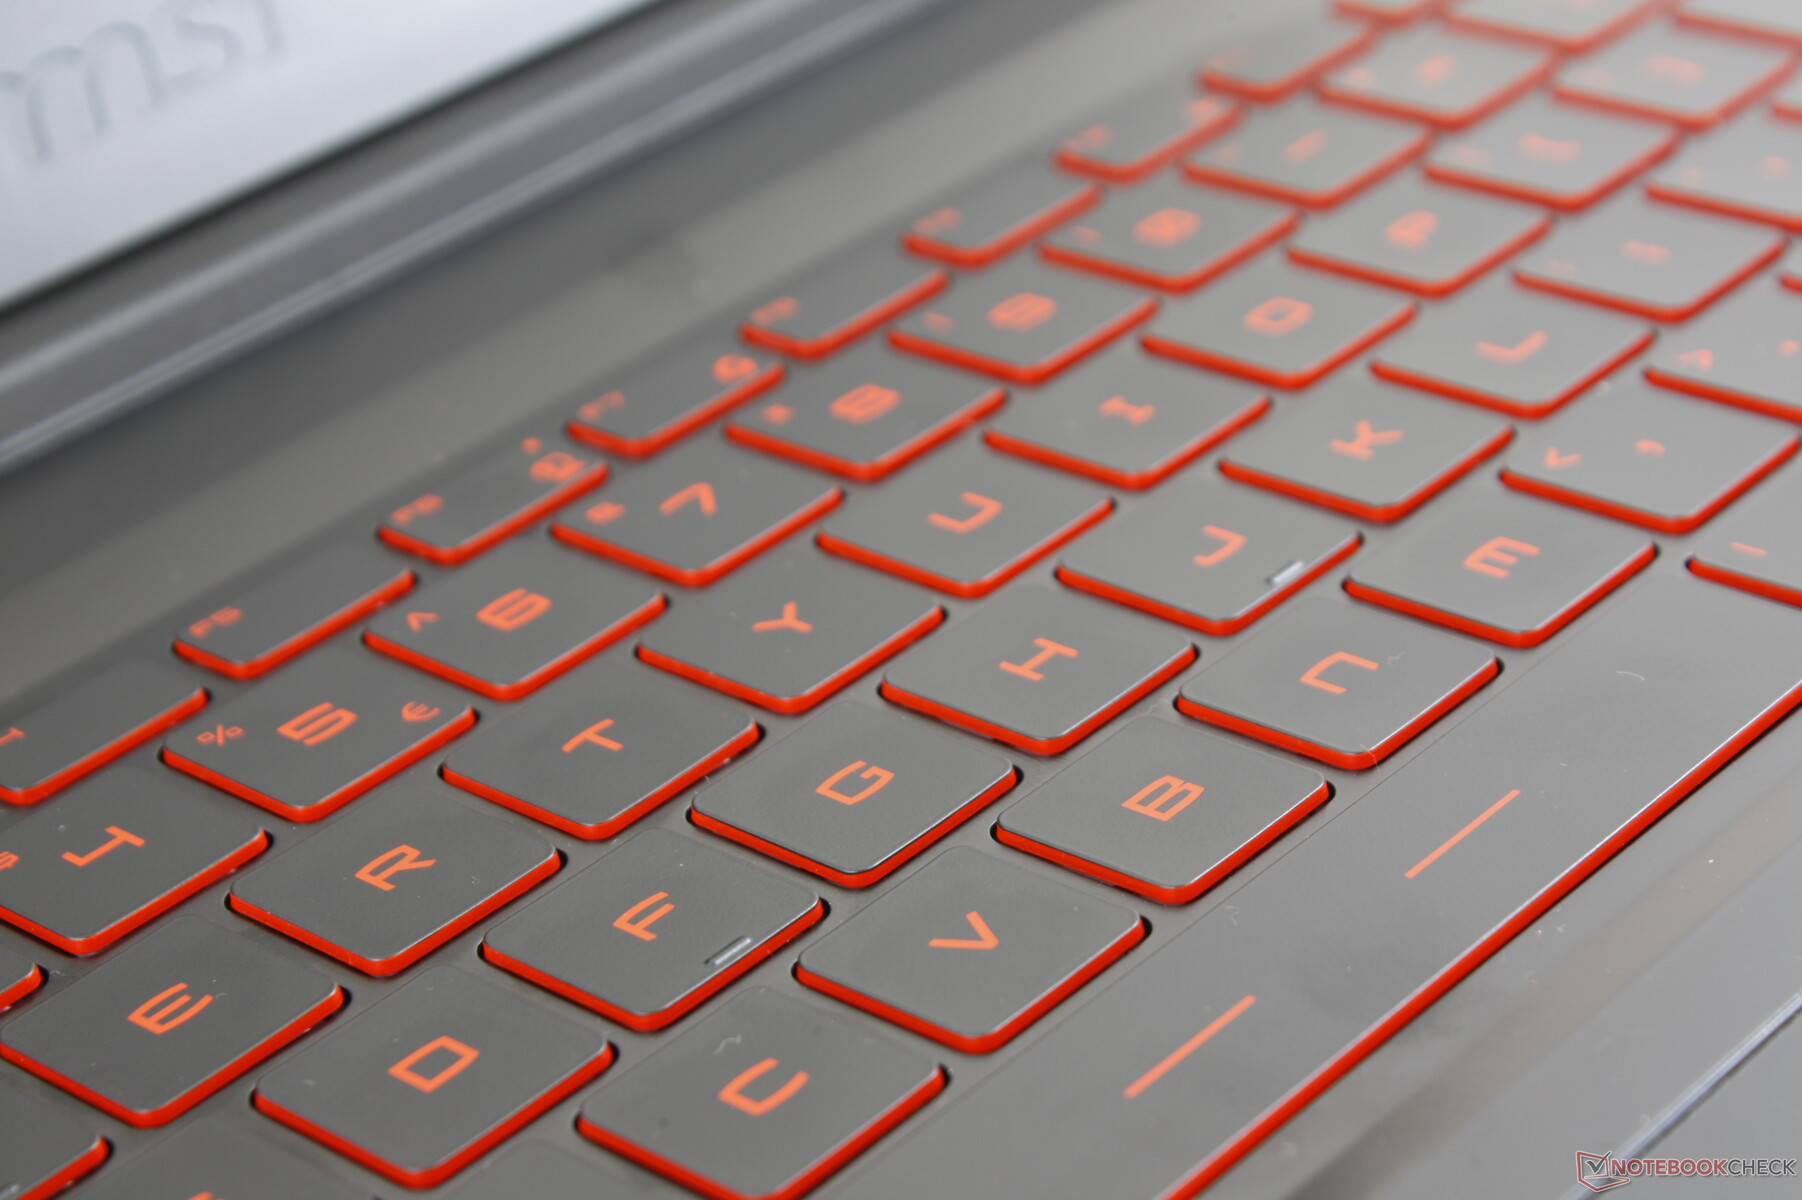
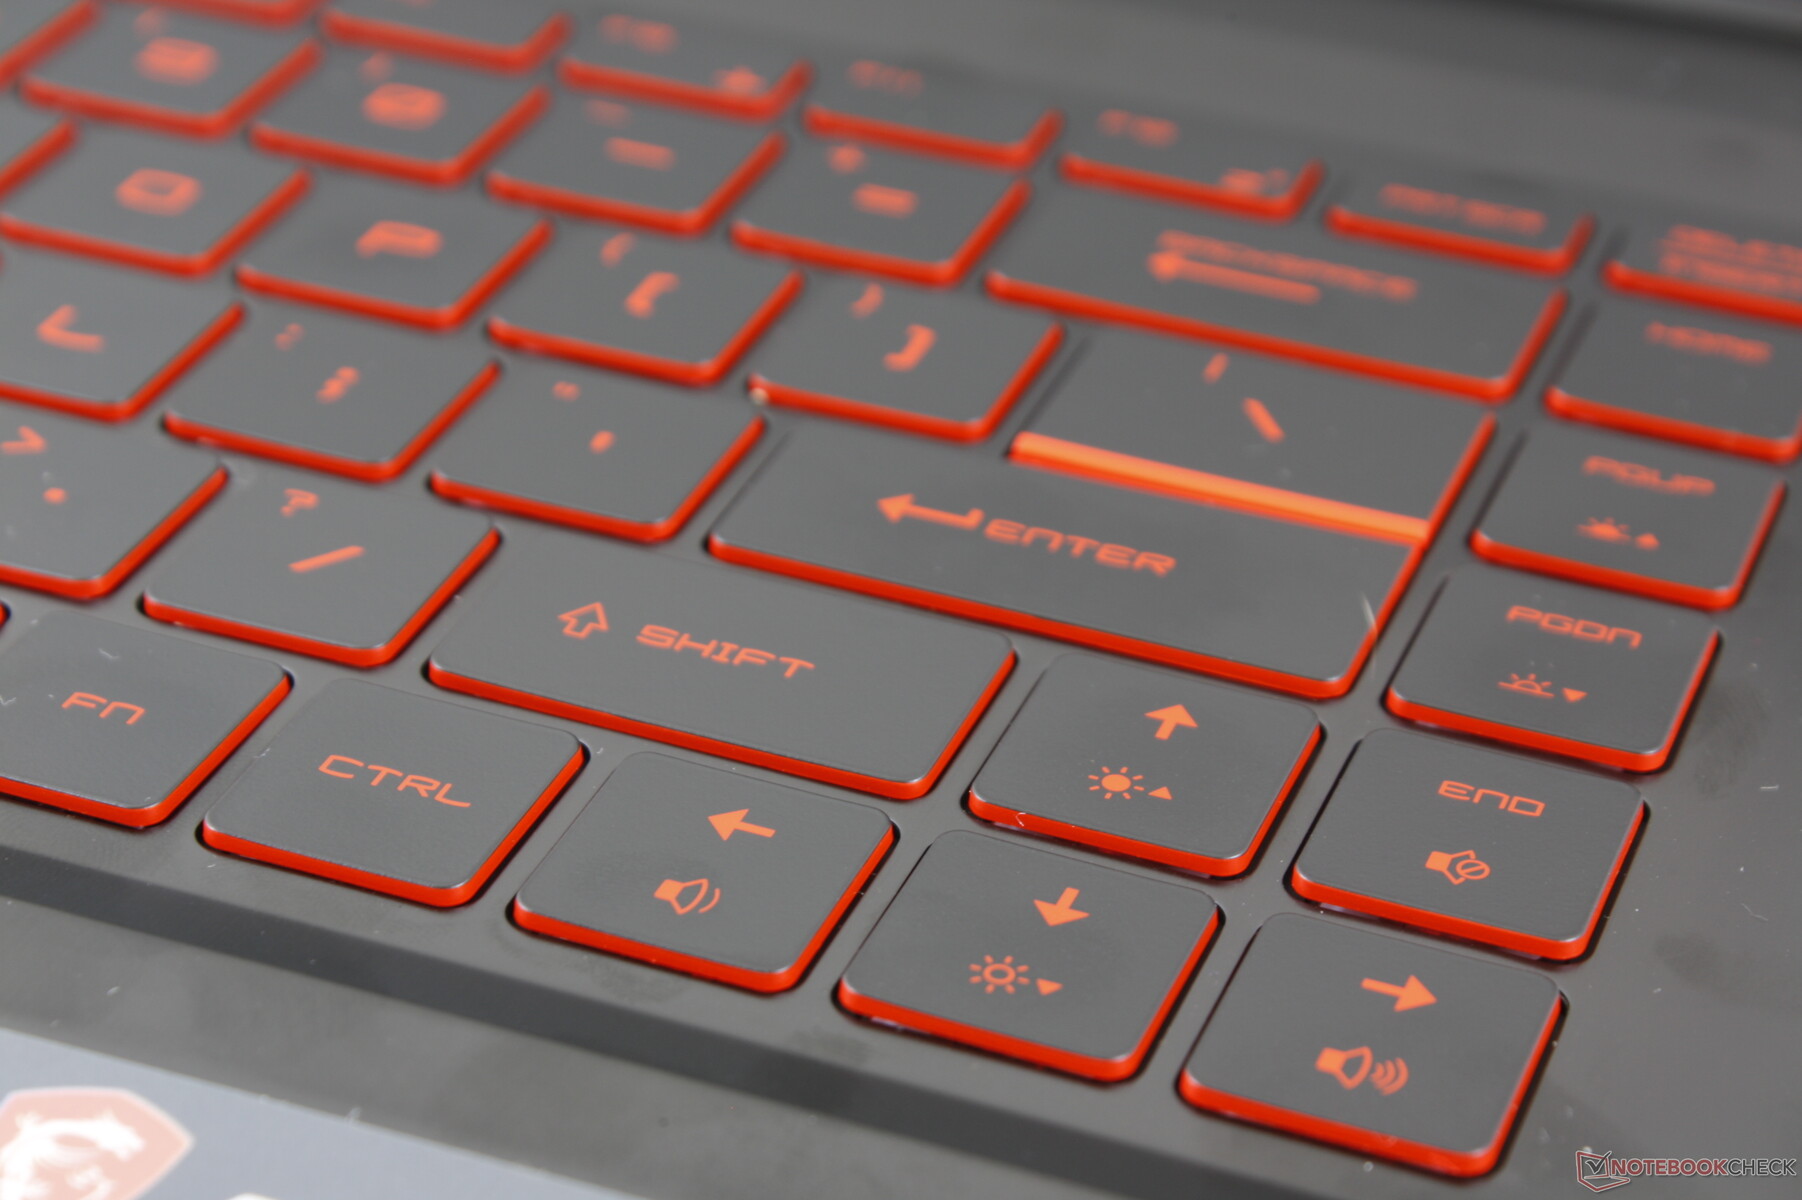
The keyboard and clickpad (10.6 x 6.5 cm) are identical to the ones on both the GF63 and WP65 and so we refer to our respective reviews for more information. In short, the GF series drops the SteelSeries keyboards as found on most higher-end MSI laptops like the GS, GE, and GT models for a shallower and more Ultrabook-like typing experience. The single-zone backlight offers three levels of illumination for all key symbols.
Display
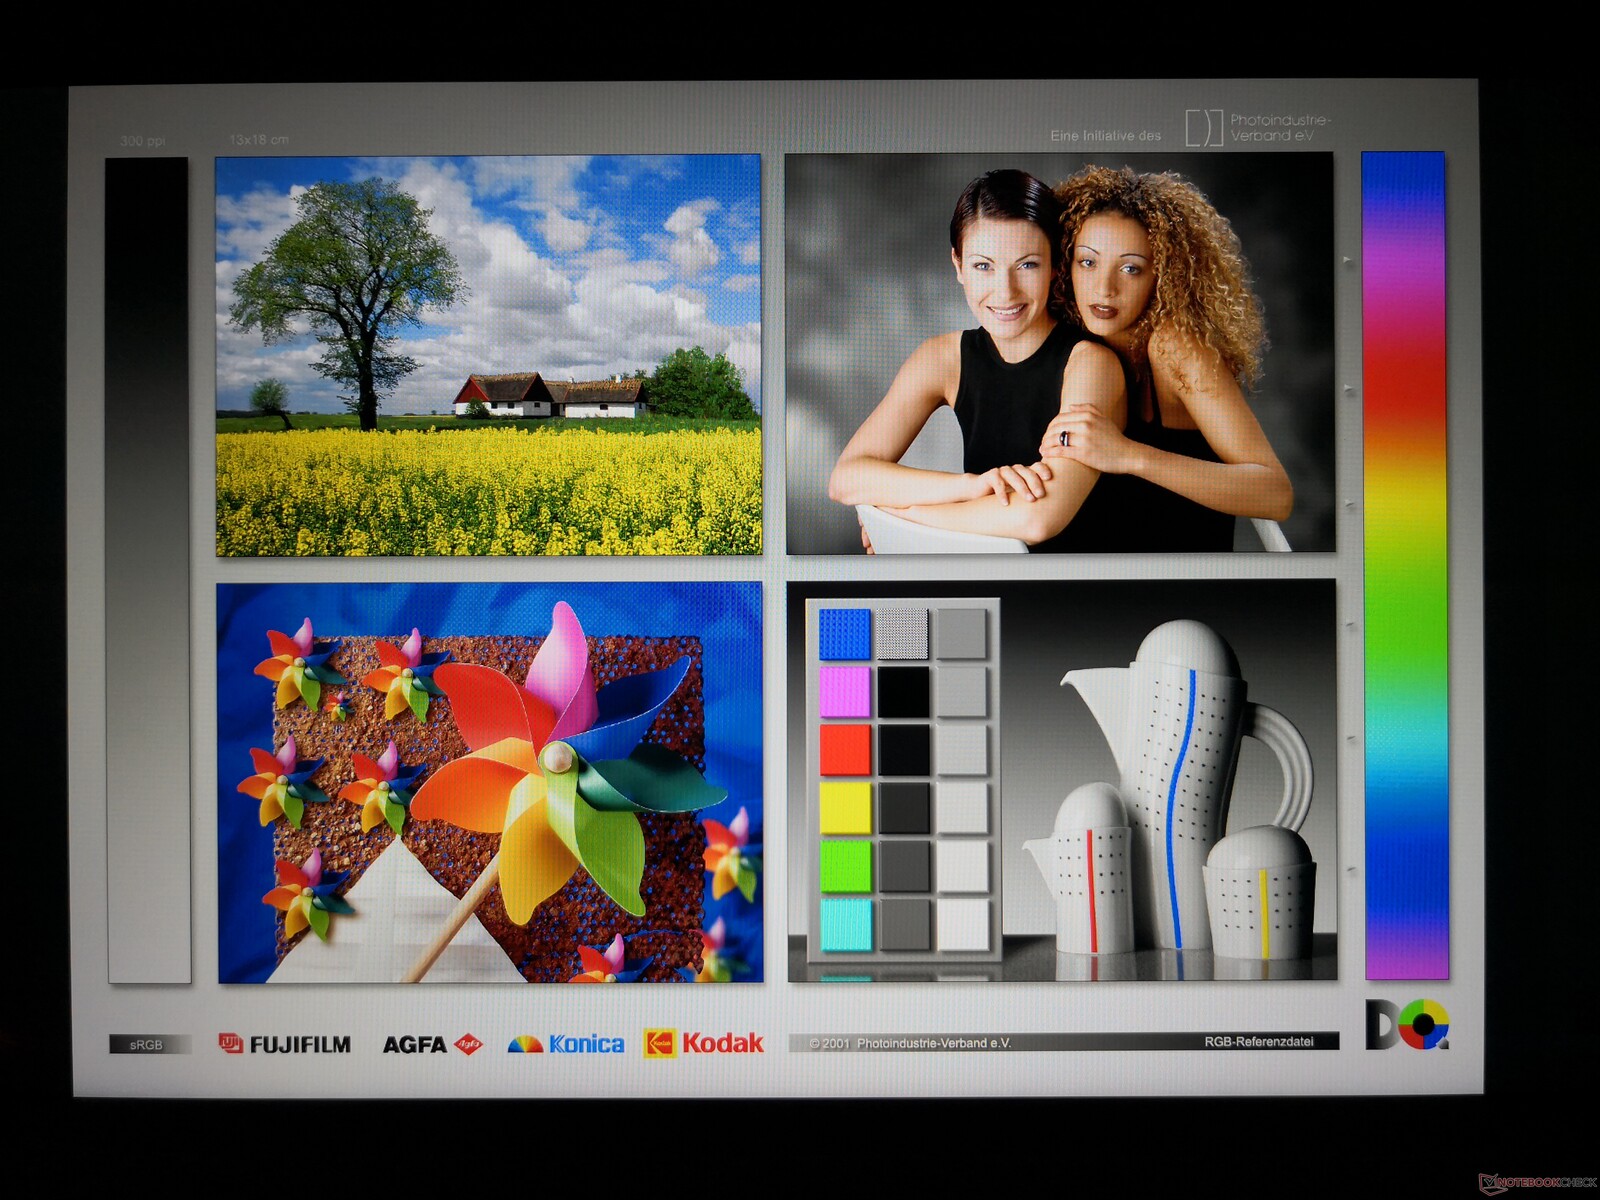
Our test unit comes equipped with the 120 Hz 1080p IPS display option. The AU Optronics B156HAN13.0 panel here is the same one MSI uses on the GL65 for a very similar visual experience between them. It's an upgrade from the 60 Hz AU Optronics panel as found on the GE63 that we tested last year, but other core attributes like the average response times, average brightness, narrow gamut, and decent contrast ratio are otherwise quite similar as shown by the comparison table below.
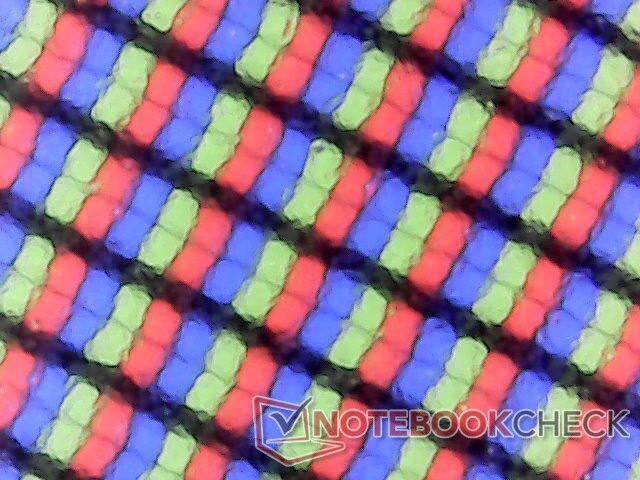
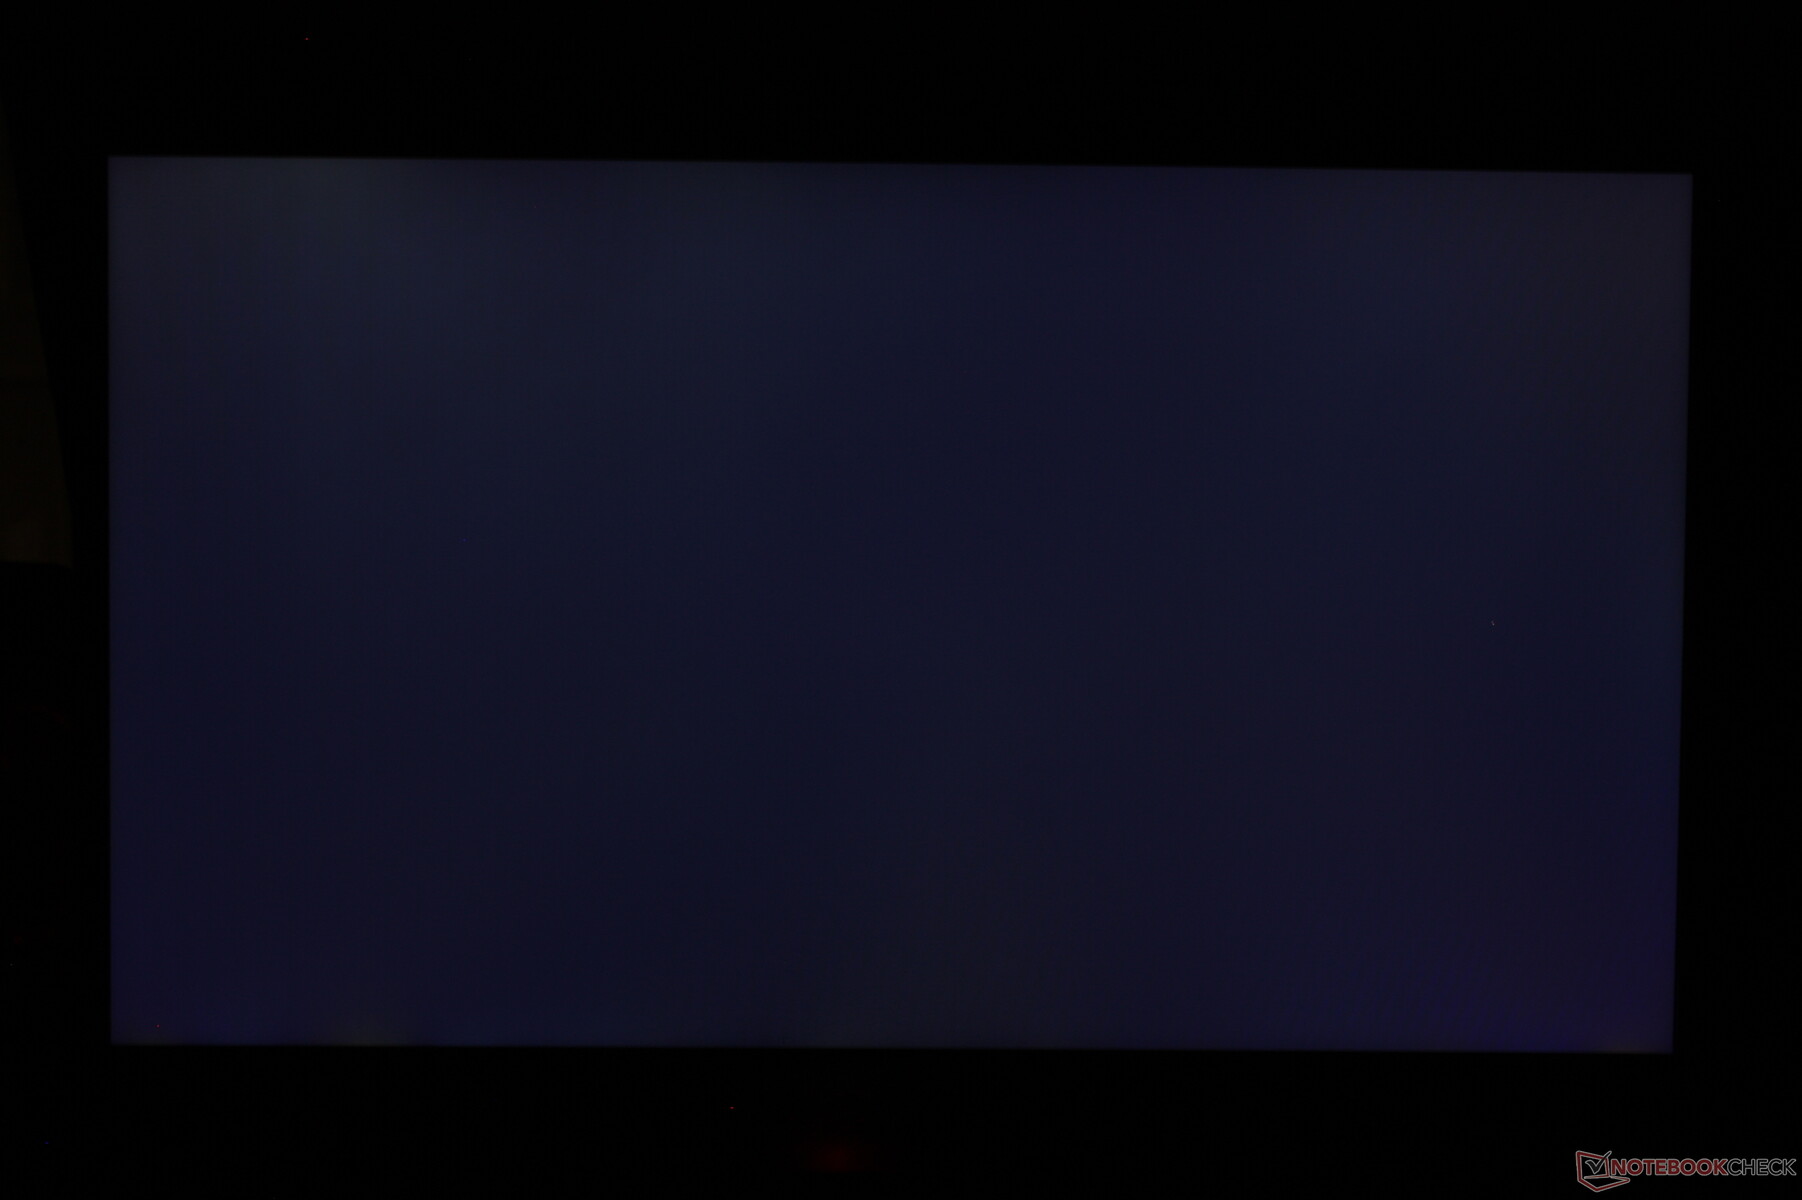
Light-moderate uneven backlight bleeding is present on our unit, but it's thankfully difficult to notice in practice. The display is only slightly grainy as is common on most matte panels.
| |||||||||||||||||||||||||
Brightness Distribution: 90 %
Center on Battery: 258.5 cd/m²
Contrast: 923:1 (Black: 0.28 cd/m²)
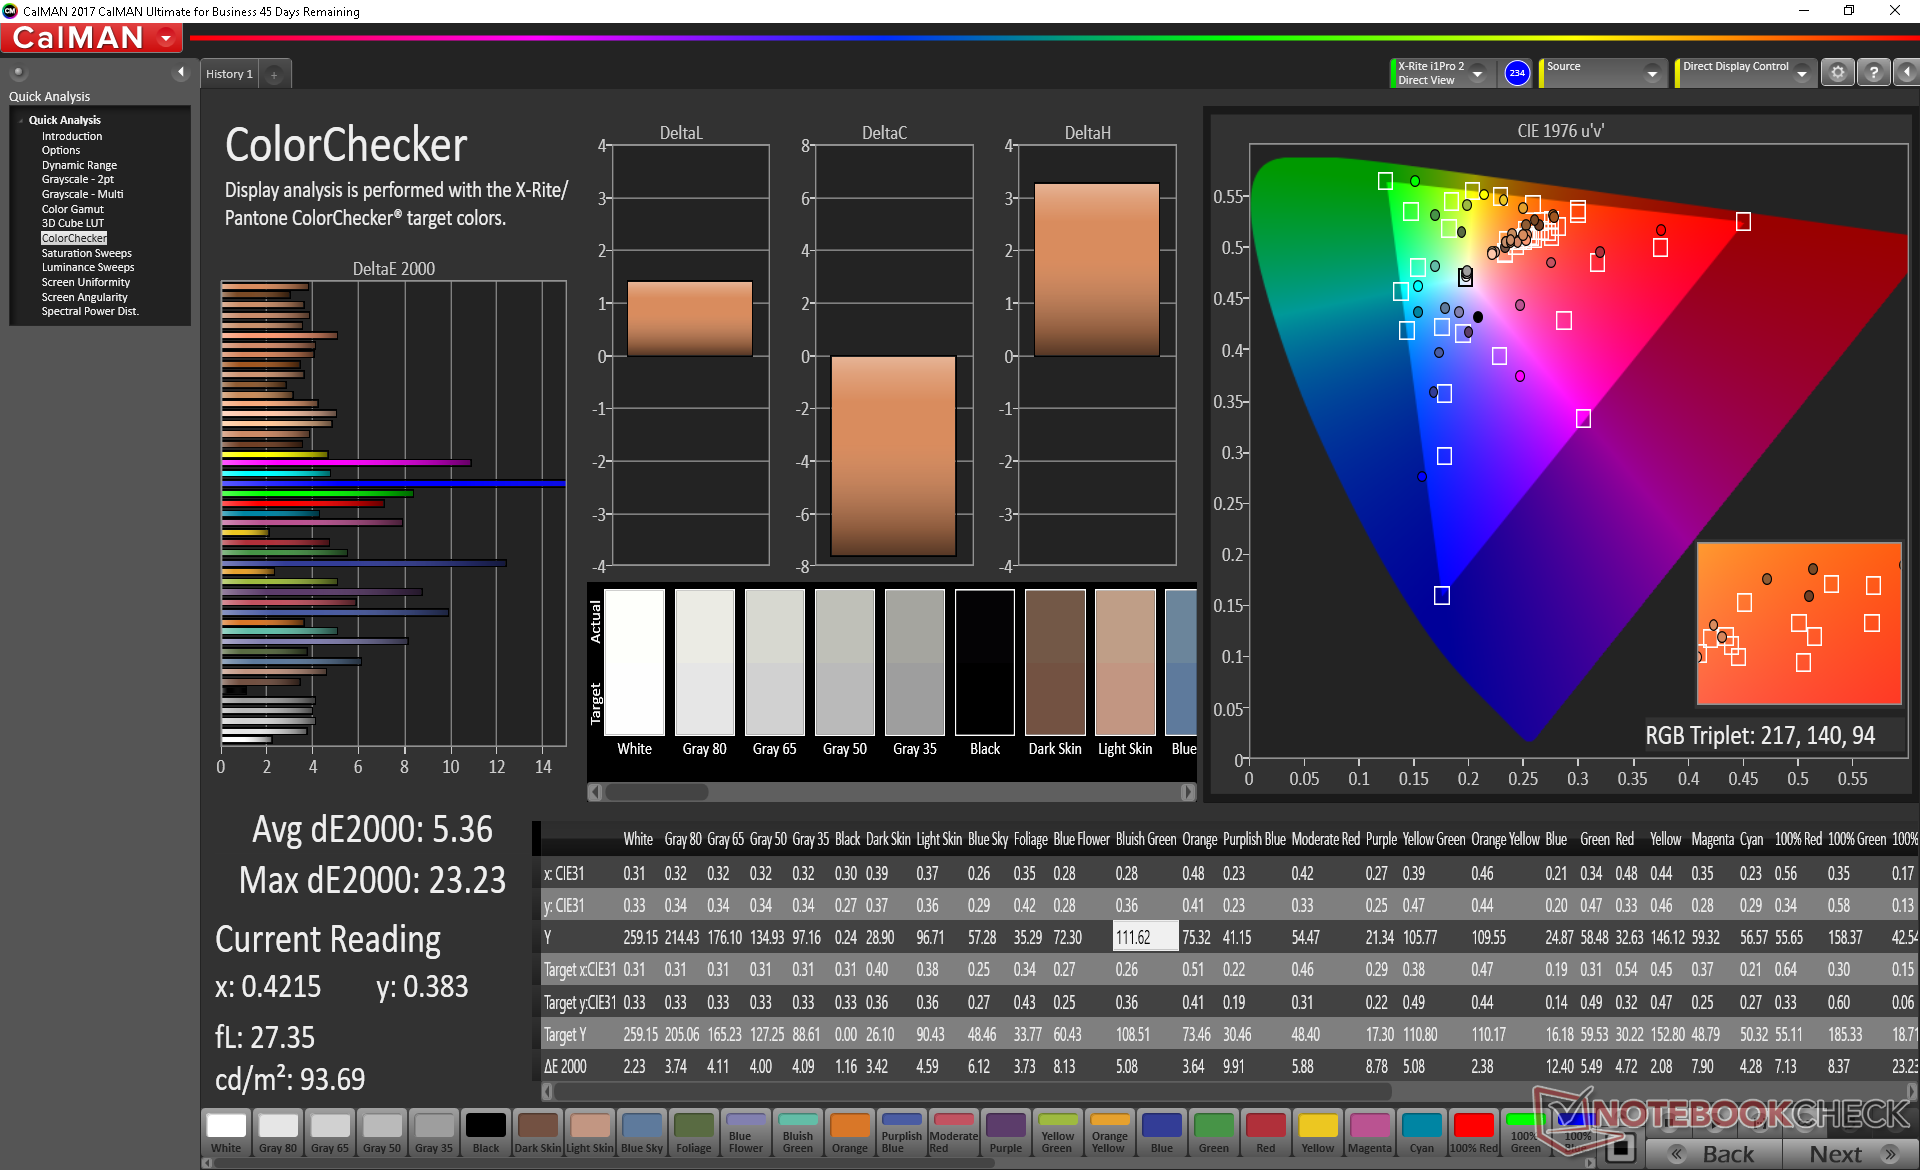
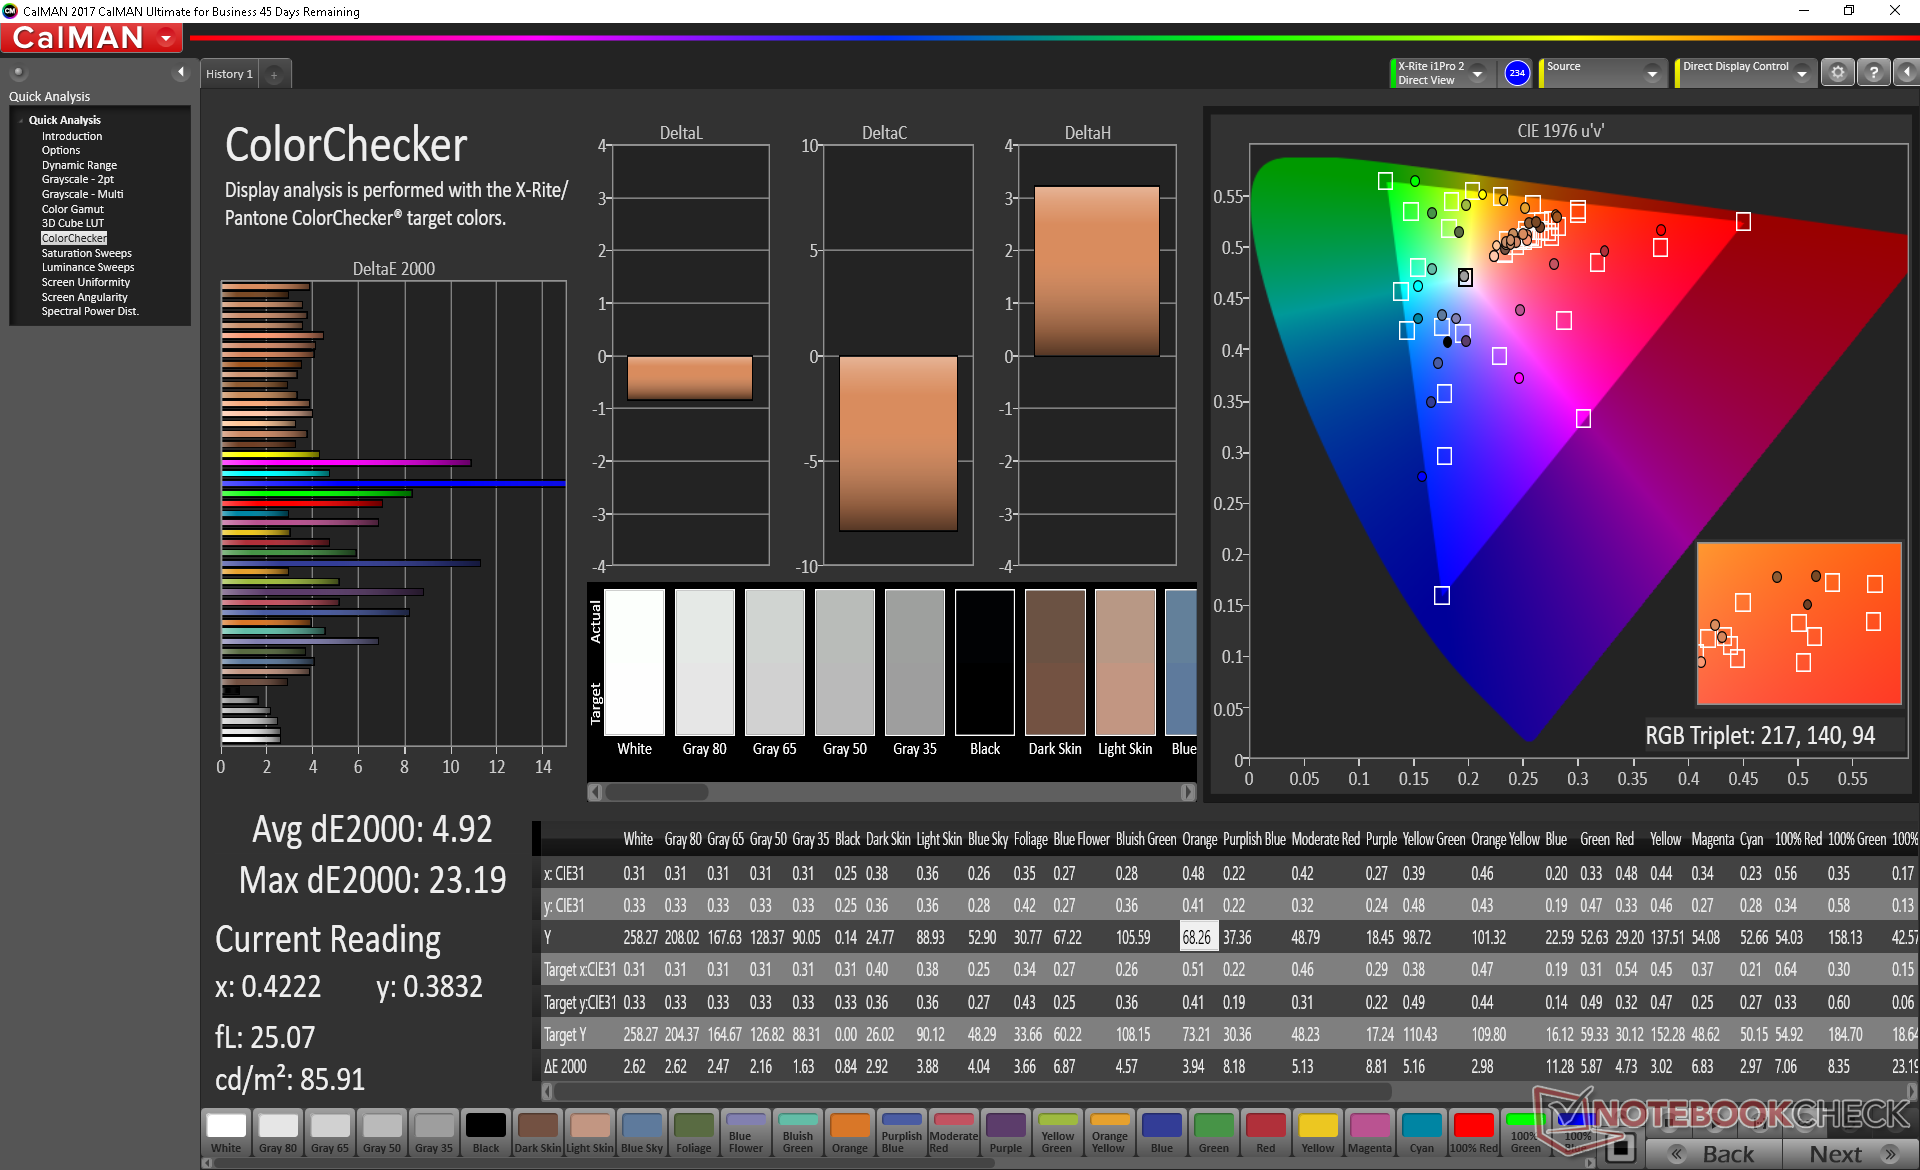
ΔE ColorChecker Calman: 5.36 | ∀{0.5-29.43 Ø4.82}
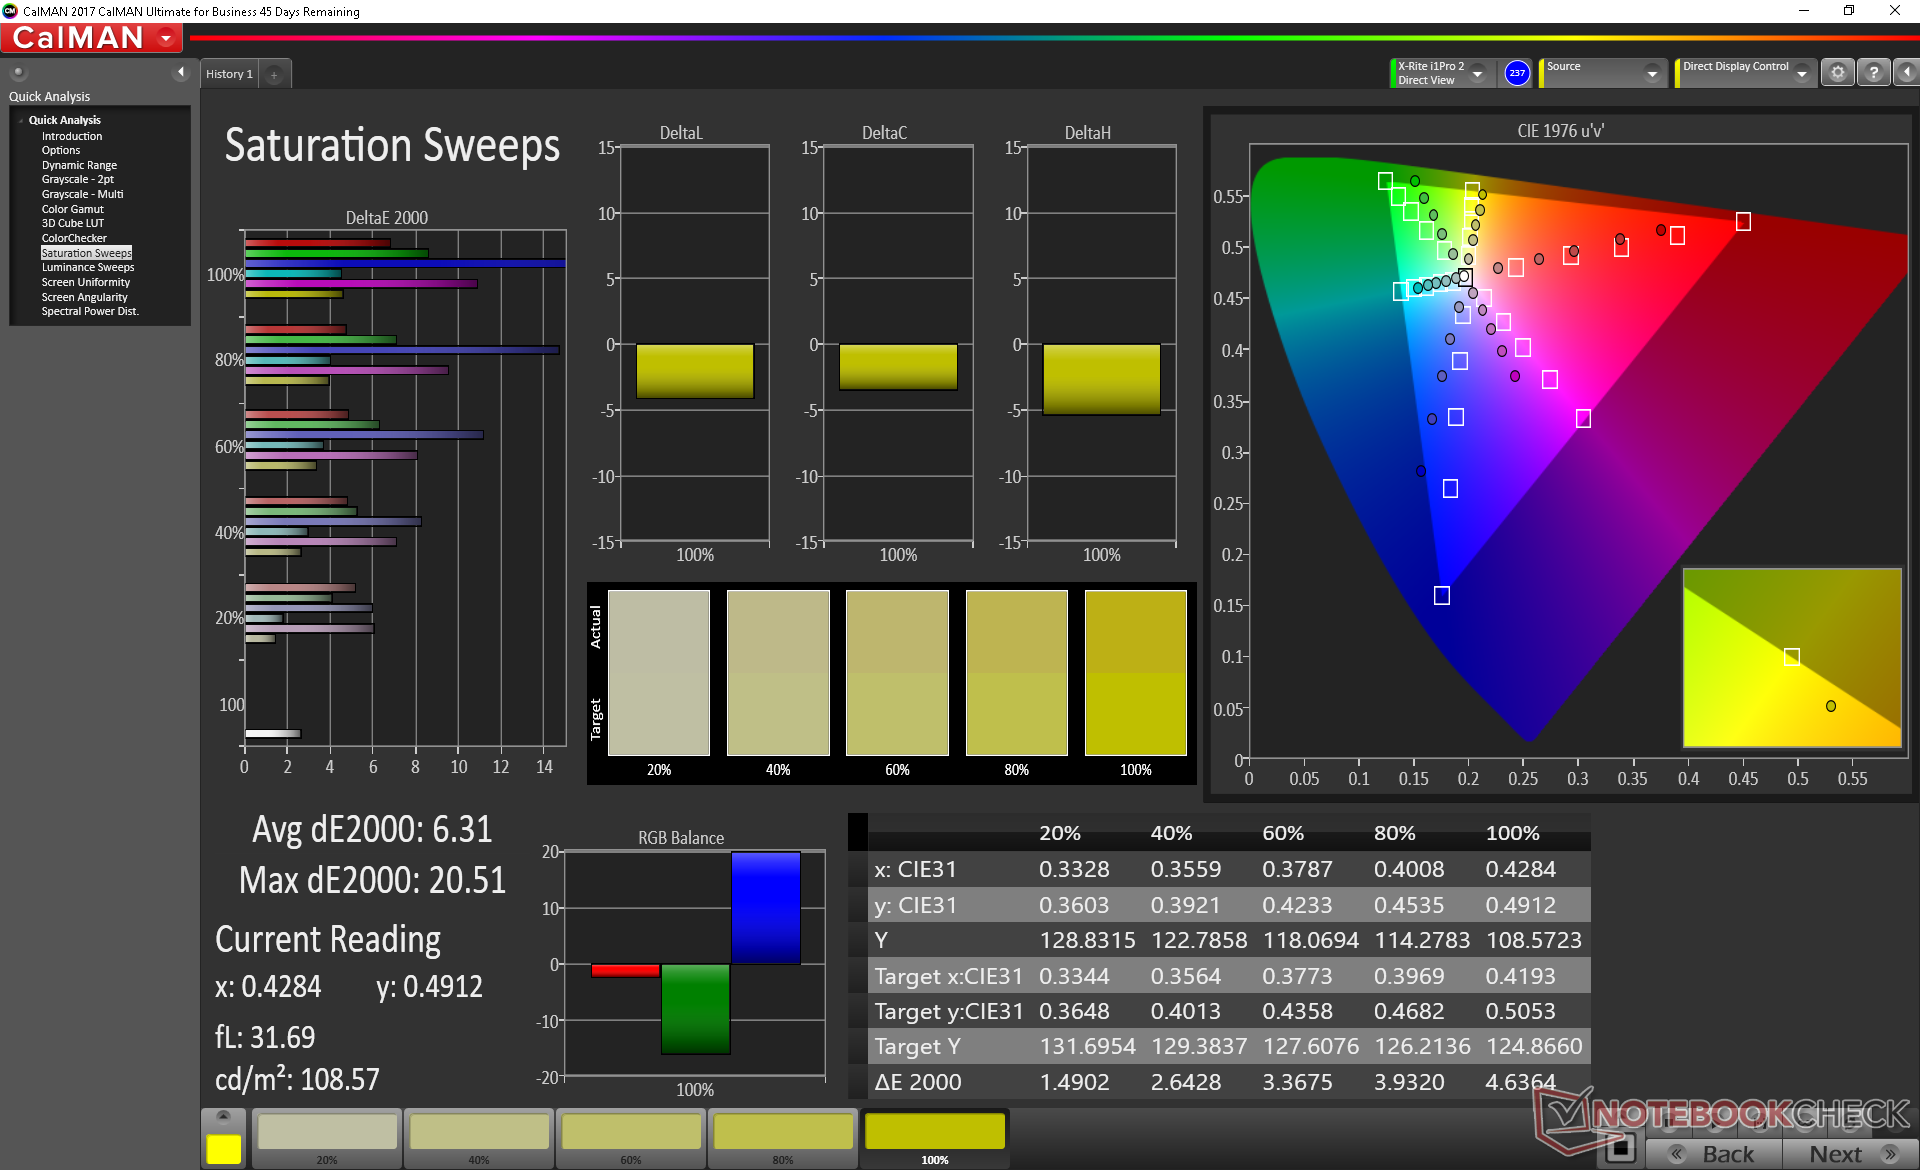
calibrated: 4.92
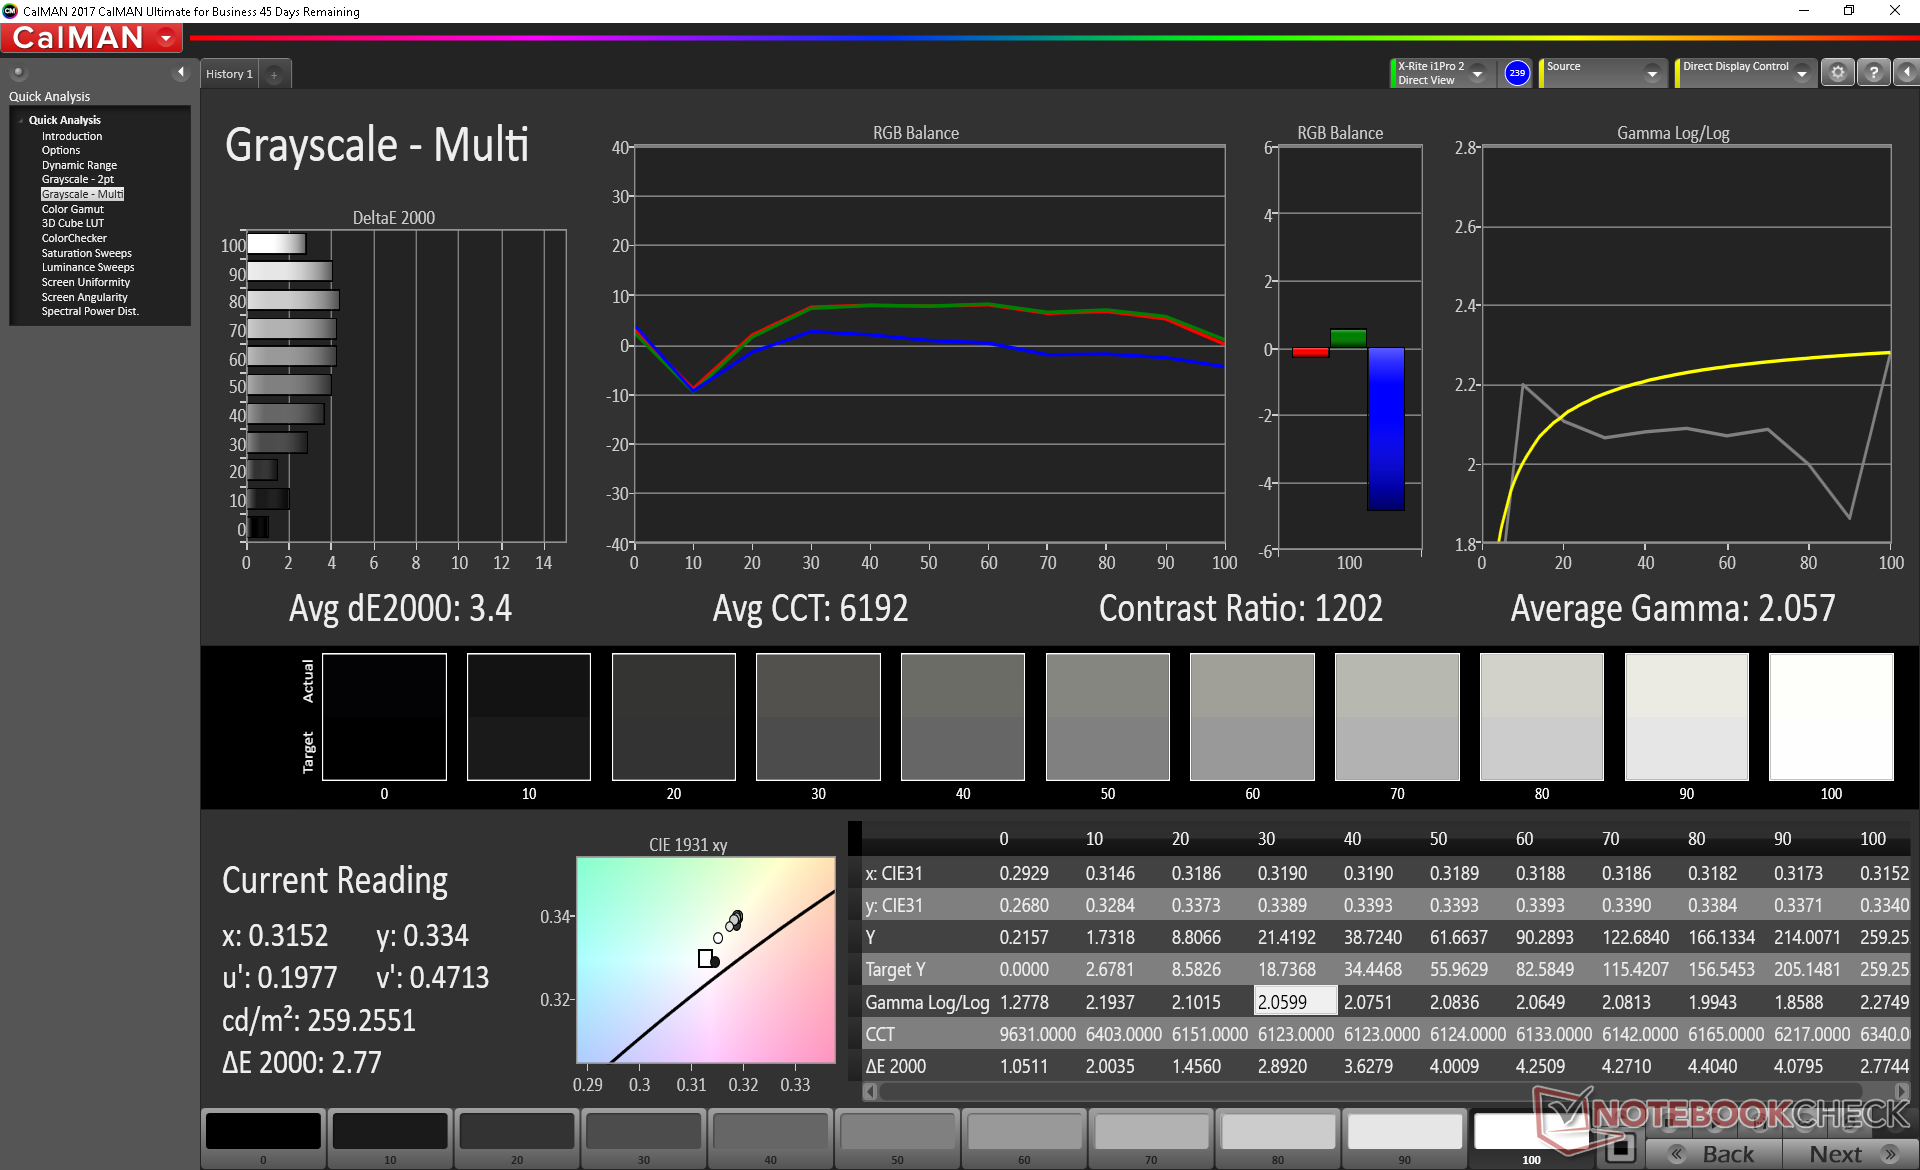
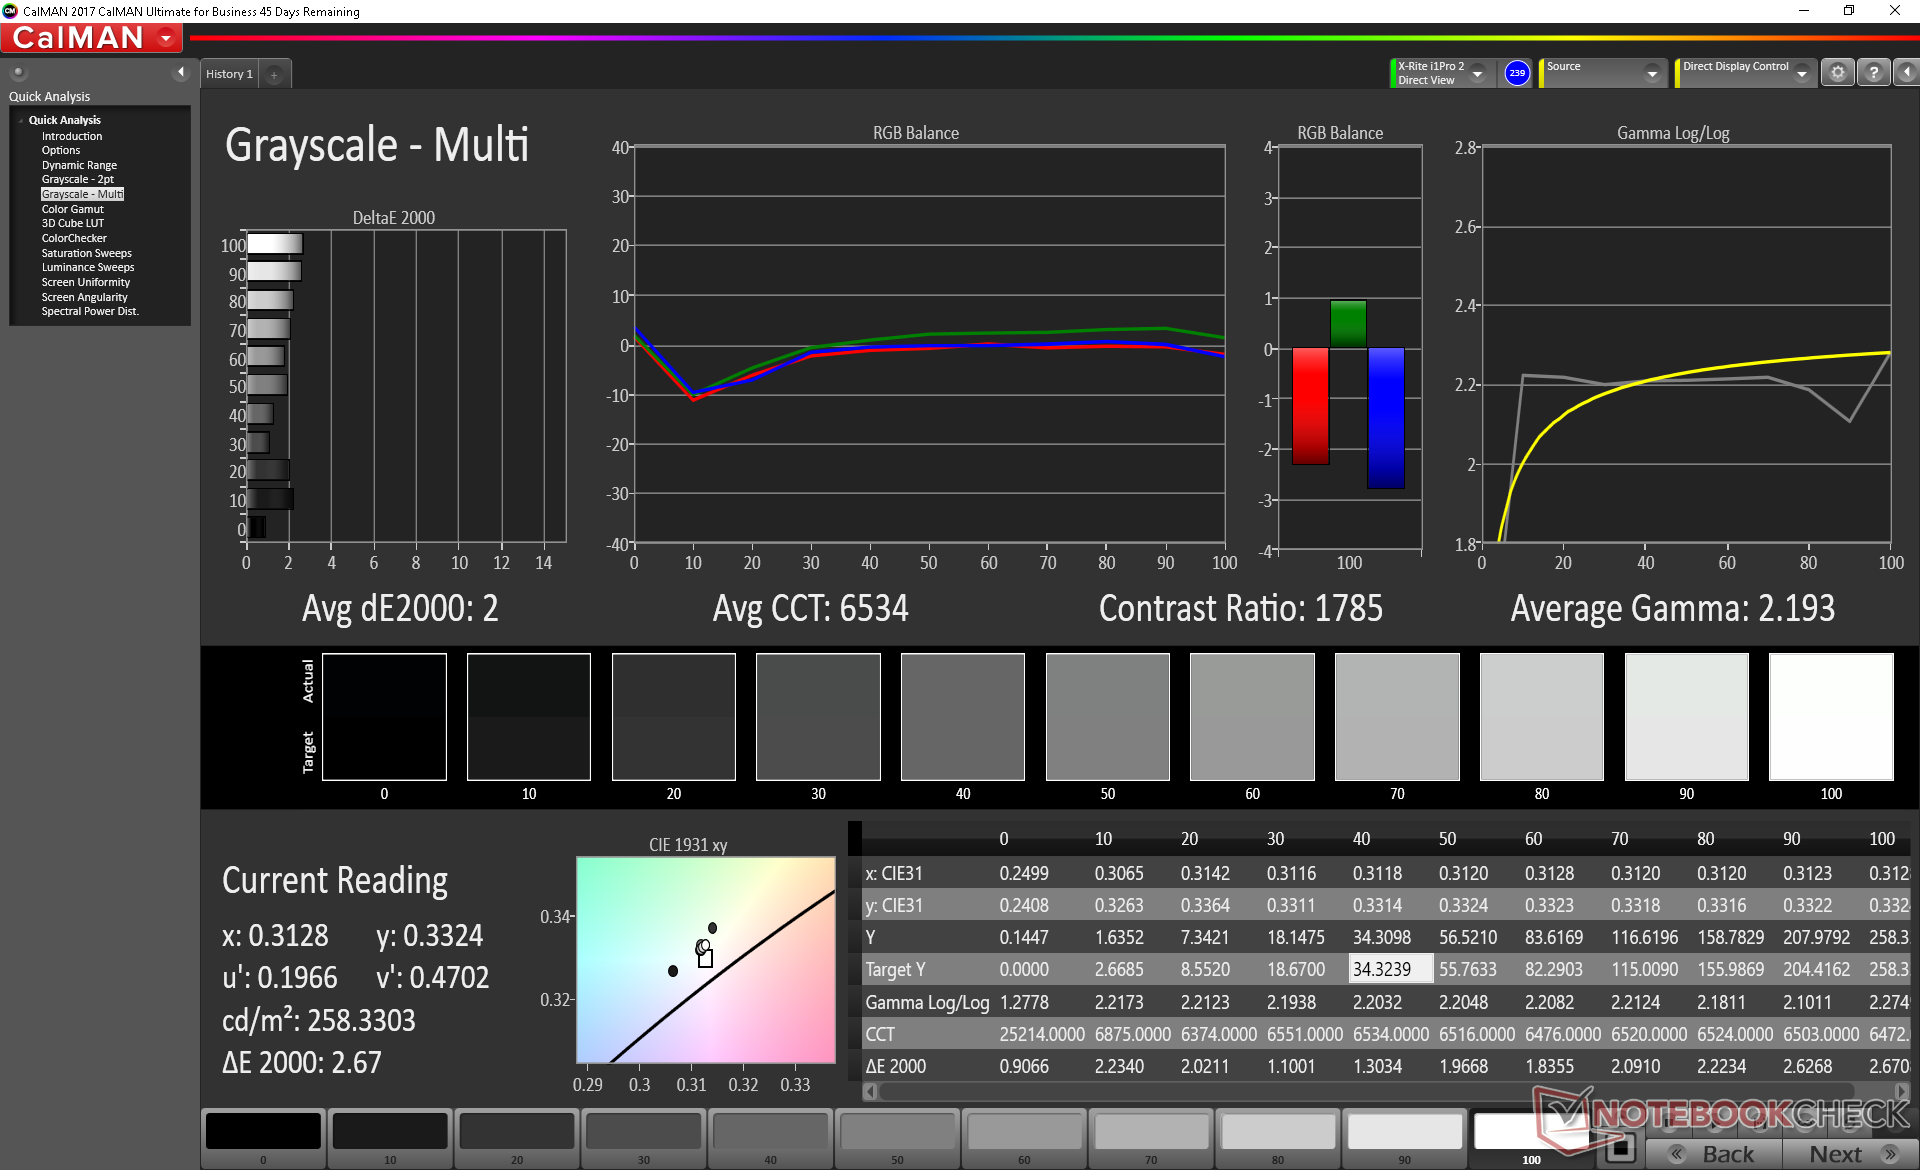
ΔE Greyscale Calman: 3.4 | ∀{0.09-98 Ø5.1}
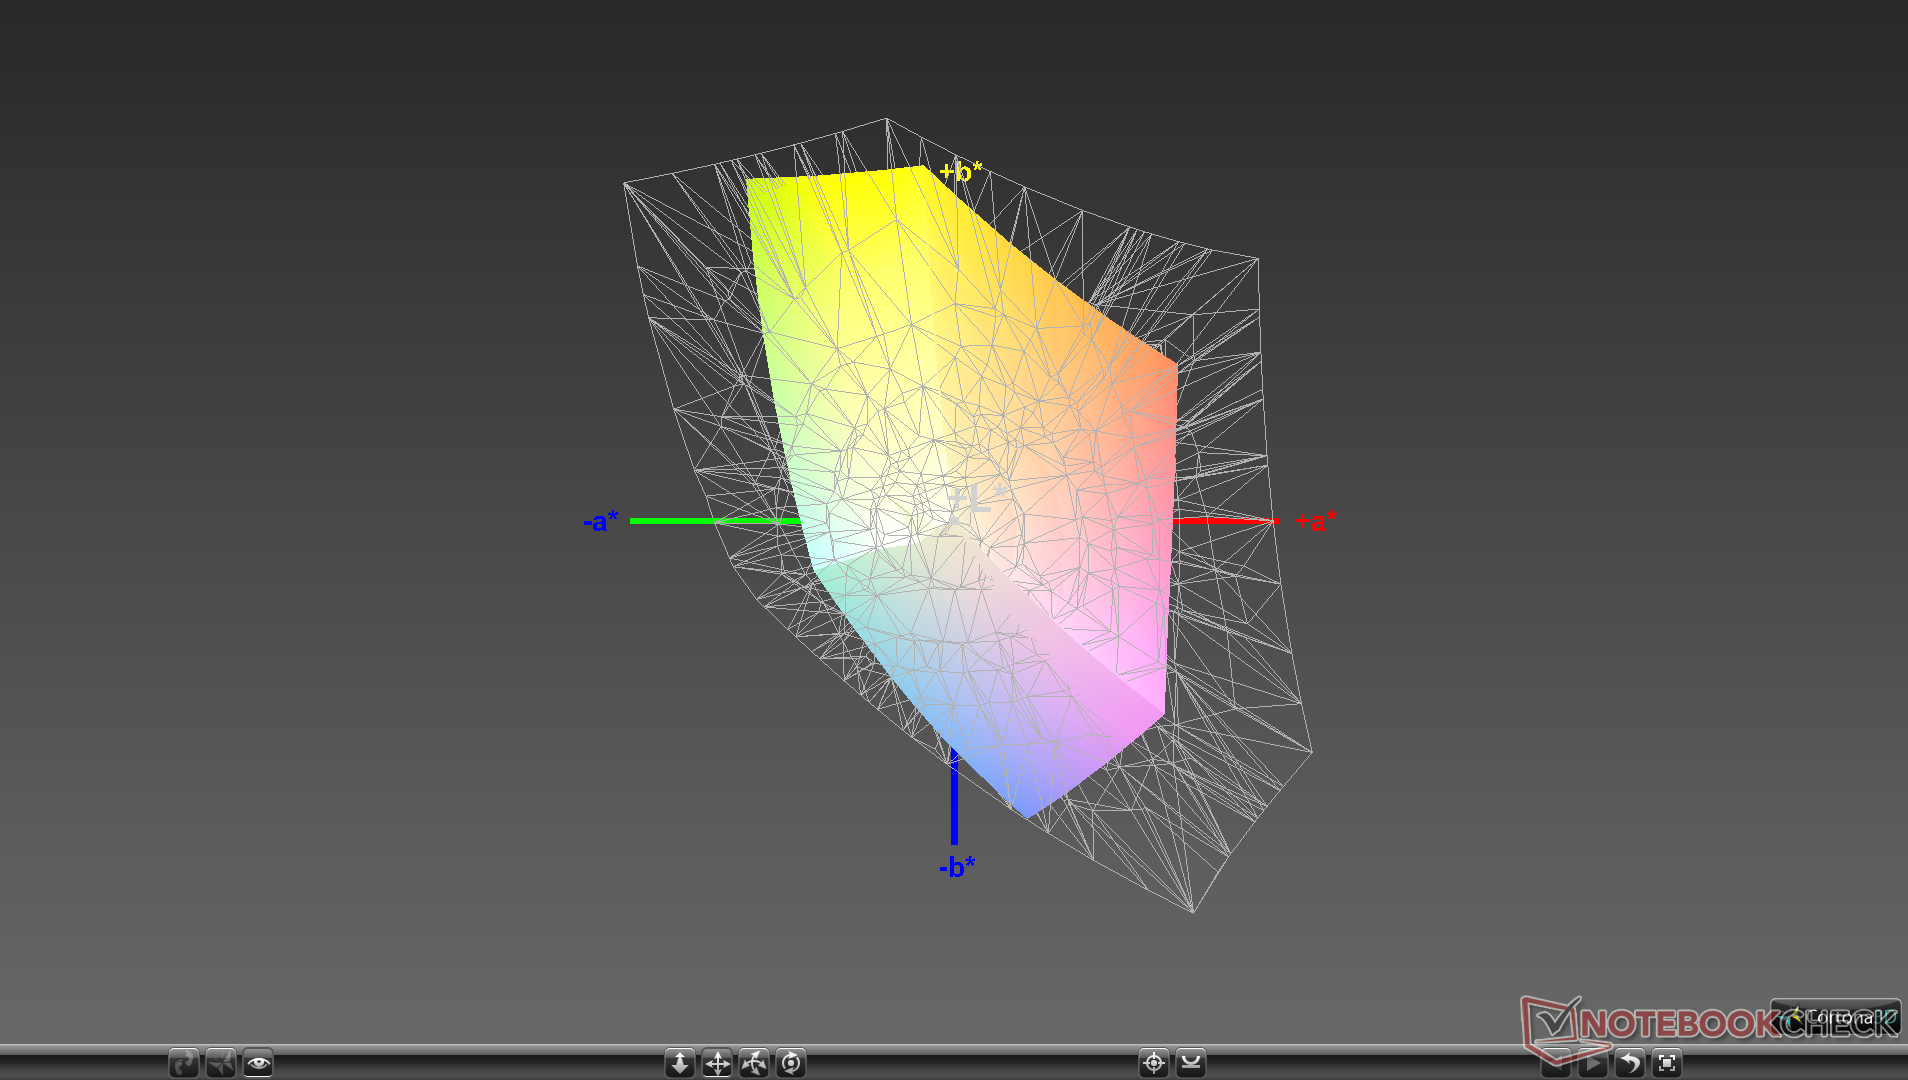
53.8% sRGB (Argyll 1.6.3 3D)
34.2% AdobeRGB 1998 (Argyll 1.6.3 3D)
37.26% AdobeRGB 1998 (Argyll 3D)
54.1% sRGB (Argyll 3D)
36.06% Display P3 (Argyll 3D)
Gamma: 2.06
CCT: 6192 K
| MSI GF65 9SD AU Optronics B156HAN13.0, IPS, 15.6", 1920x1080 | MSI GF63 8RC AU Optronics B156HAN02.1, IPS, 15.6", 1920x1080 | Asus TUF FX505DT-EB73 Panda LM156LF-GL, IPS, 15.6", 1920x1080 | Aorus 15-SA LG Philips LP156WFG-SPB2 (LGD05E8), IPS, 15.6", 1920x1080 | Dell G7 7590 AU Optronics B156HAN, IPS, 15.6", 1920x1080 | Lenovo Legion Y540-15IRH-81SX00B2GE BOE 084D, IPS, 15.6", 1920x1080 | |
|---|---|---|---|---|---|---|
| Display | 9% | 10% | 76% | 73% | 74% | |
| Display P3 Coverage | 36.06 | 39.43 9% | 39.56 10% | 64.3 78% | 64.4 79% | 63.6 76% |
| sRGB Coverage | 54.1 | 59.3 10% | 59.5 10% | 93.6 73% | 90 66% | 91.7 70% |
| AdobeRGB 1998 Coverage | 37.26 | 40.73 9% | 40.91 10% | 65.6 76% | 65.3 75% | 65.2 75% |
| Response Times | 0% | 3% | 53% | 58% | 64% | |
| Response Time Grey 50% / Grey 80% * | 35.2 ? | 33.2 ? 6% | 30.4 ? 14% | 15.6 ? 56% | 14 ? 60% | 8.8 ? 75% |
| Response Time Black / White * | 25.6 ? | 27.2 ? -6% | 27.6 ? -8% | 12.8 ? 50% | 11.2 ? 56% | 12 ? 53% |
| PWM Frequency | ||||||
| Screen | -3% | -2% | 30% | -3% | 29% | |
| Brightness middle | 258.5 | 266.6 3% | 286.2 11% | 266 3% | 330.5 28% | 299 16% |
| Brightness | 254 | 257 1% | 267 5% | 254 0% | 324 28% | 290 14% |
| Brightness Distribution | 90 | 89 -1% | 84 -7% | 90 0% | 91 1% | 89 -1% |
| Black Level * | 0.28 | 0.29 -4% | 0.33 -18% | 0.28 -0% | 0.71 -154% | 0.29 -4% |
| Contrast | 923 | 919 0% | 867 -6% | 950 3% | 465 -50% | 1031 12% |
| Colorchecker dE 2000 * | 5.36 | 5.93 -11% | 5.45 -2% | 3.11 42% | 5.33 1% | 3.7 31% |
| Colorchecker dE 2000 max. * | 23.23 | 16.28 30% | 18.08 22% | 5.84 75% | 11.08 52% | 7 70% |
| Colorchecker dE 2000 calibrated * | 4.92 | 3.6 27% | 4.47 9% | 1.37 72% | 3.63 26% | 2 59% |
| Greyscale dE 2000 * | 3.4 | 6.8 -100% | 5.3 -56% | 3.94 -16% | 6.7 -97% | 4.1 -21% |
| Gamma | 2.06 107% | 2.43 91% | 2.1 105% | 2.53 87% | 2.24 98% | 2.19 100% |
| CCT | 6192 105% | 7192 90% | 7679 85% | 6210 105% | 8035 81% | 7166 91% |
| Color Space (Percent of AdobeRGB 1998) | 34.2 | 37.6 10% | 37.6 10% | 60 75% | 58.3 70% | 59.3 73% |
| Color Space (Percent of sRGB) | 53.8 | 59.3 10% | 59.1 10% | 93 73% | 89.5 66% | 91.5 70% |
| Total Average (Program / Settings) | 2% /
-0% | 4% /
1% | 53% /
41% | 43% /
19% | 56% /
42% |
* ... smaller is better
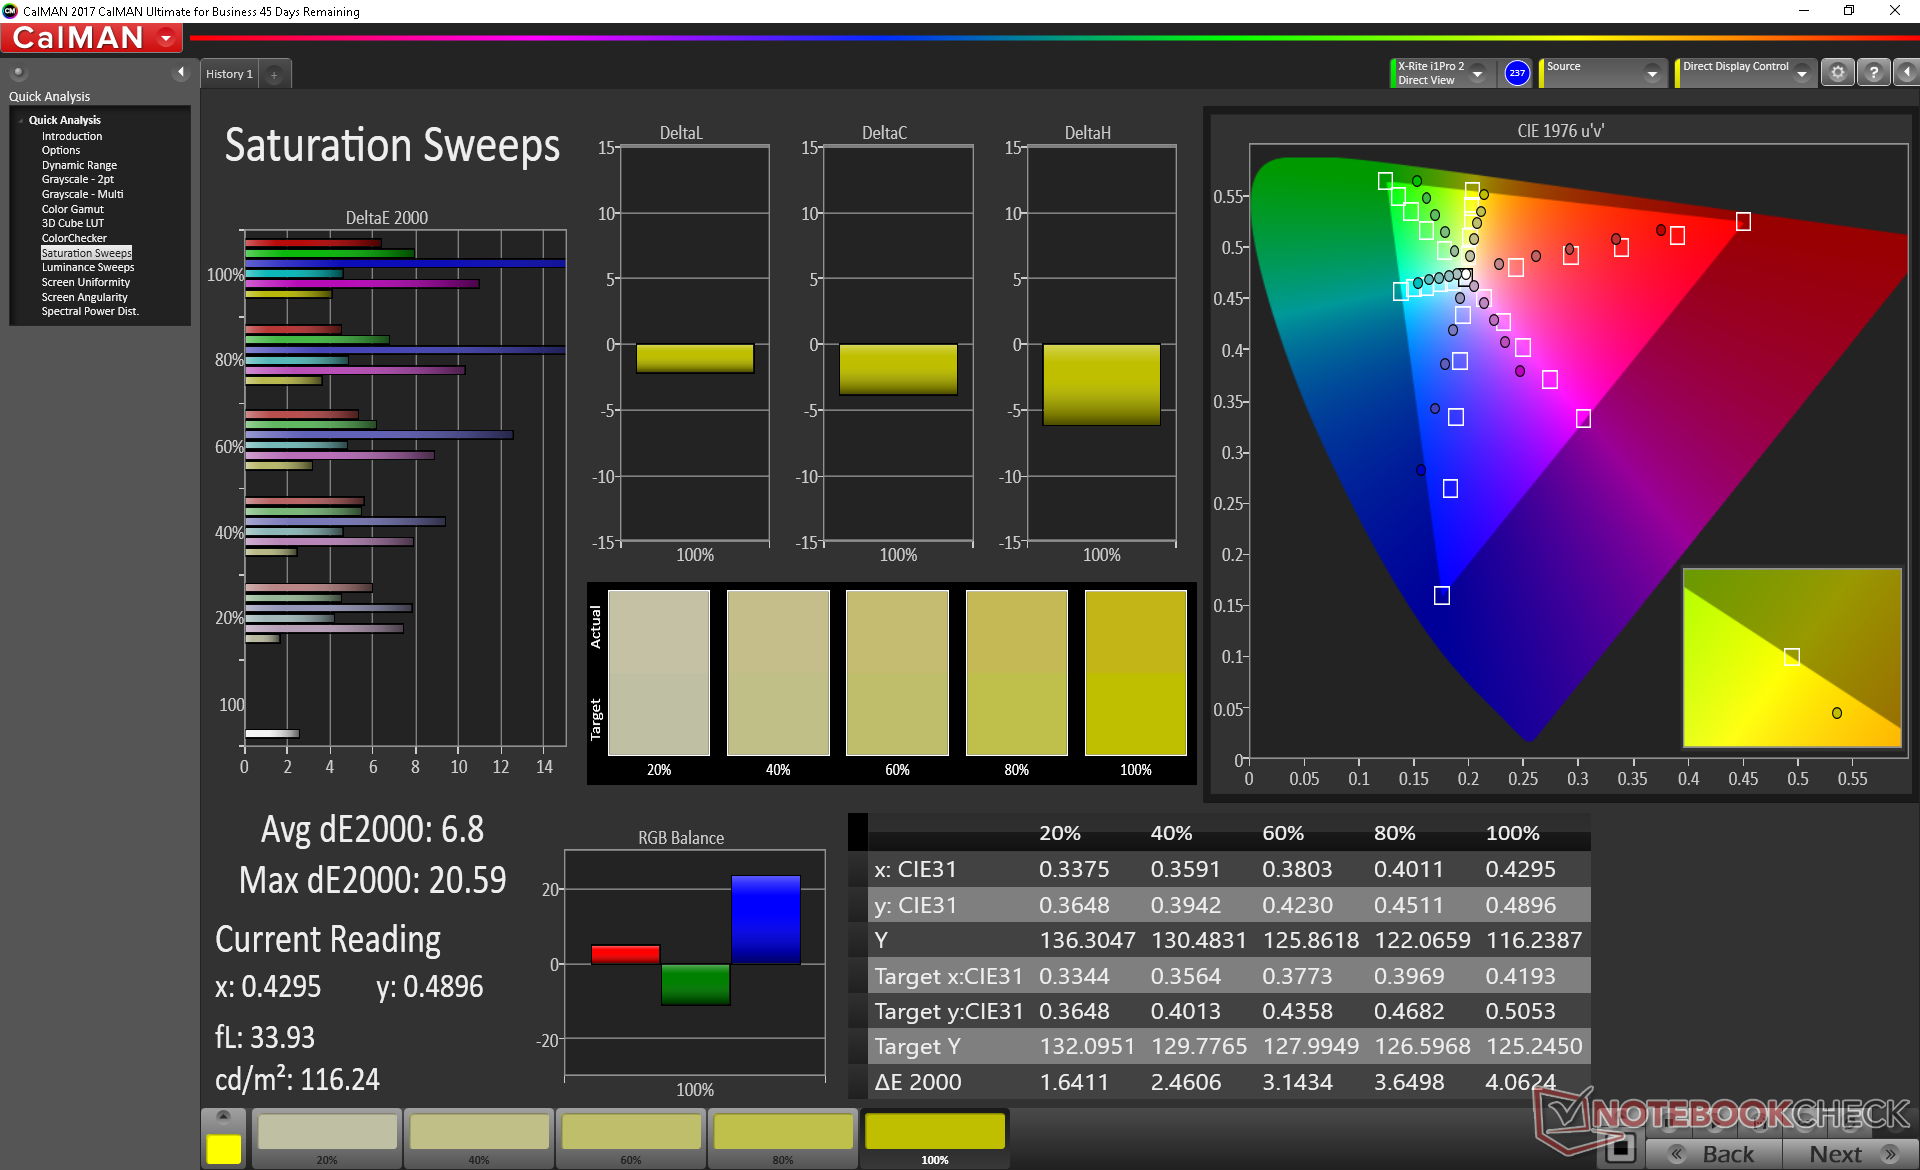
Color space is limited at just 54 percent and 34 percent of sRGB and AdobeRGB, respectively, compared to >90 percent sRGB on pricier laptops like the Aorus 15, Dell G7 15 7590, or MSI's own GS series. This is not the laptop to use for any sort of professional graphics work.

Further measurements with an X-Rite colorimeter show a warmer color temperature than expected in contrast to older budget MSI laptops where color temperature was usually far too cool. An end-user calibration addresses this and slightly improves grayscale in the process. Color accuracy, however, remains poor due to the limited color space mentioned above. Blue in particular looks shallow and is represented most inaccurately out of all the primary and secondary colors.
Display Response Times
| ↔ Response Time Black to White | ||
|---|---|---|
| 25.6 ms ... rise ↗ and fall ↘ combined | ↗ 12.4 ms rise | 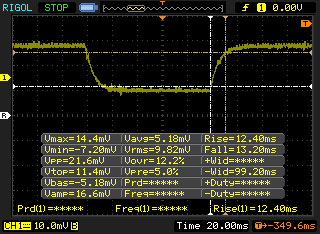 |
| ↘ 13.2 ms fall | ||
| The screen shows relatively slow response rates in our tests and may be too slow for gamers. In comparison, all tested devices range from 0.1 (minimum) to 240 (maximum) ms. » 59 % of all devices are better. This means that the measured response time is worse than the average of all tested devices (20.4 ms). | ||
| ↔ Response Time 50% Grey to 80% Grey | ||
| 35.2 ms ... rise ↗ and fall ↘ combined | ↗ 18 ms rise |  |
| ↘ 17.2 ms fall | ||
| The screen shows slow response rates in our tests and will be unsatisfactory for gamers. In comparison, all tested devices range from 0.165 (minimum) to 636 (maximum) ms. » 47 % of all devices are better. This means that the measured response time is similar to the average of all tested devices (32 ms). | ||
Screen Flickering / PWM (Pulse-Width Modulation)
| Screen flickering / PWM not detected | 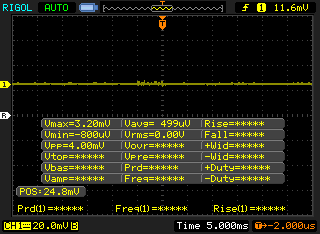 | ||
In comparison: 53 % of all tested devices do not use PWM to dim the display. If PWM was detected, an average of 8320 (minimum: 5 - maximum: 343500) Hz was measured. | |||
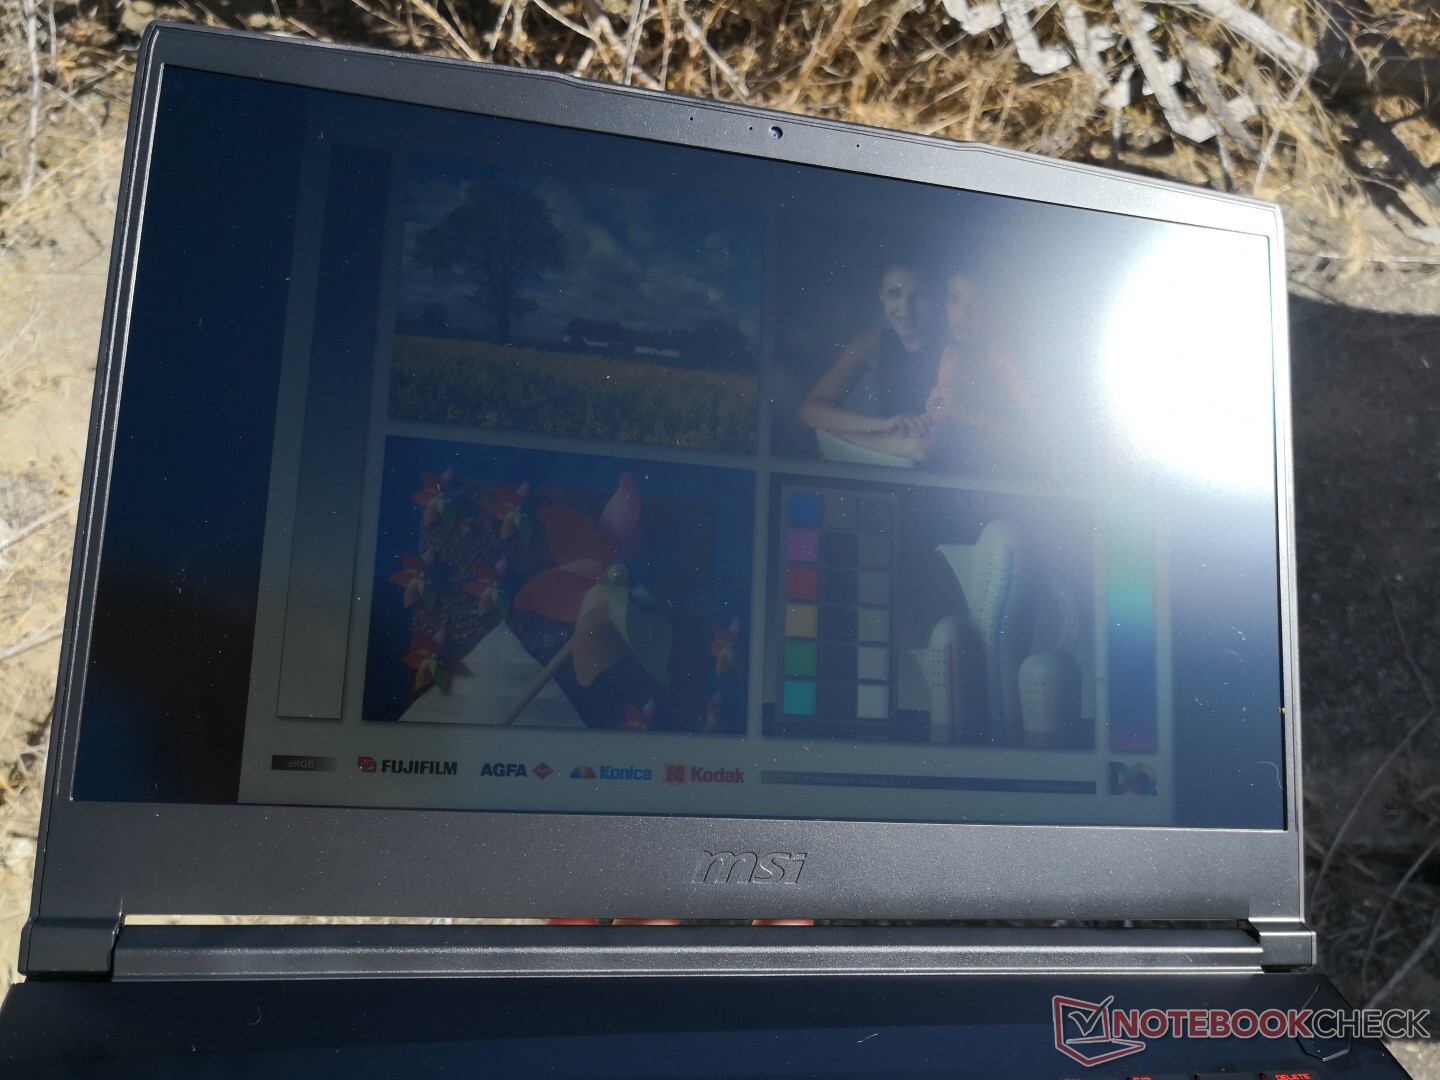
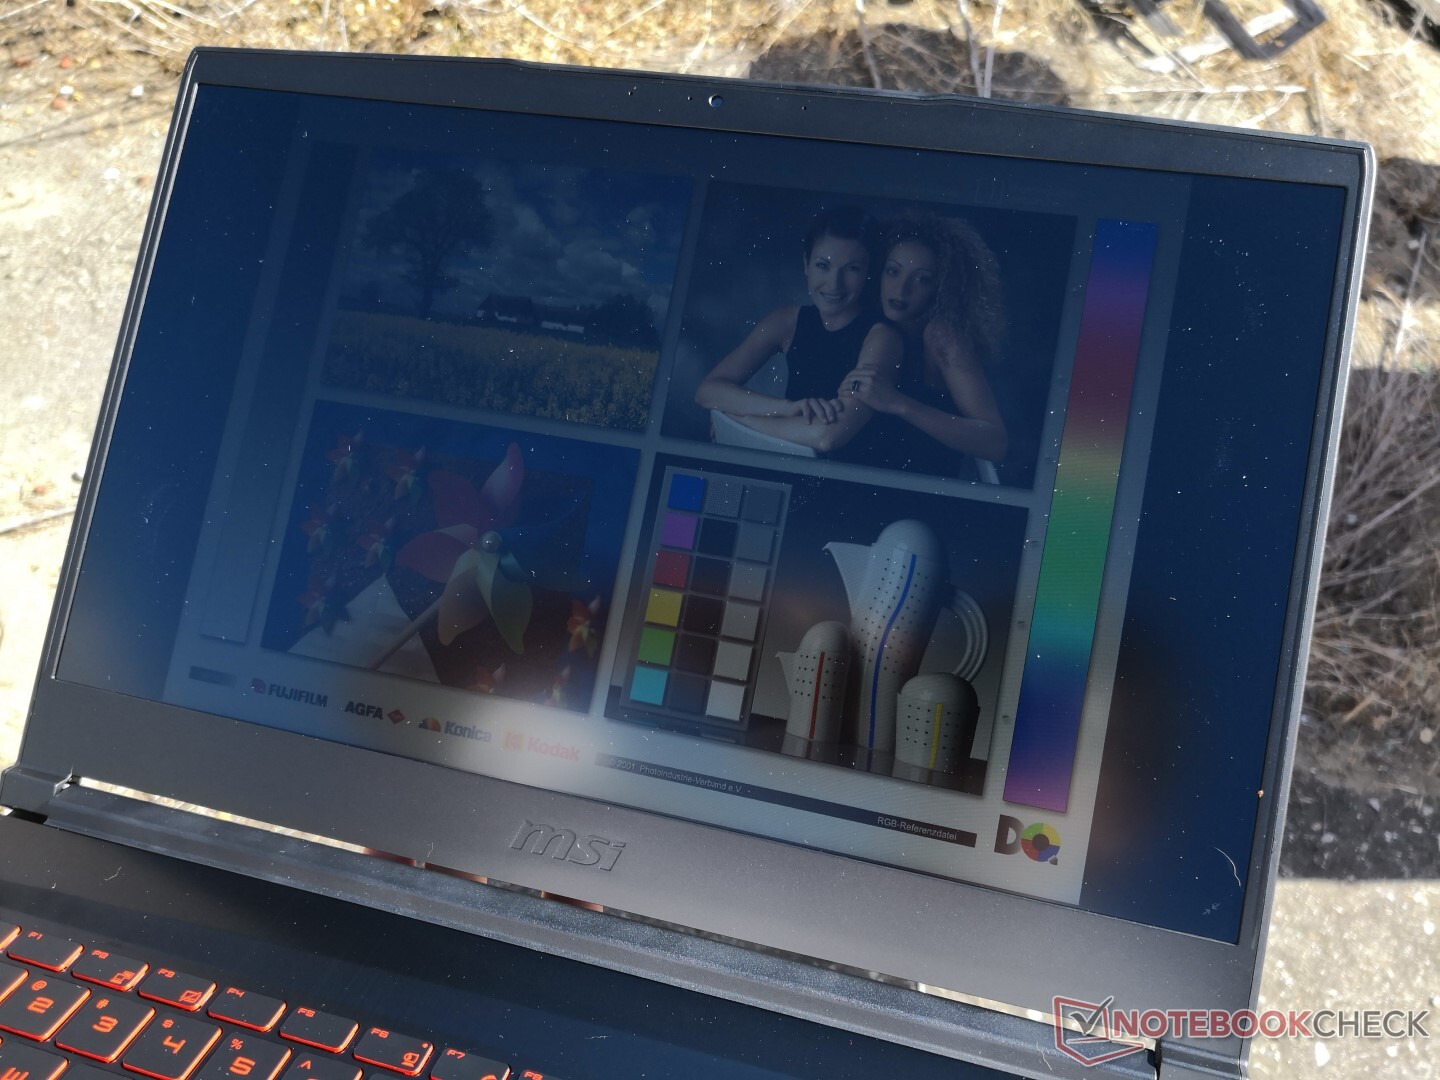
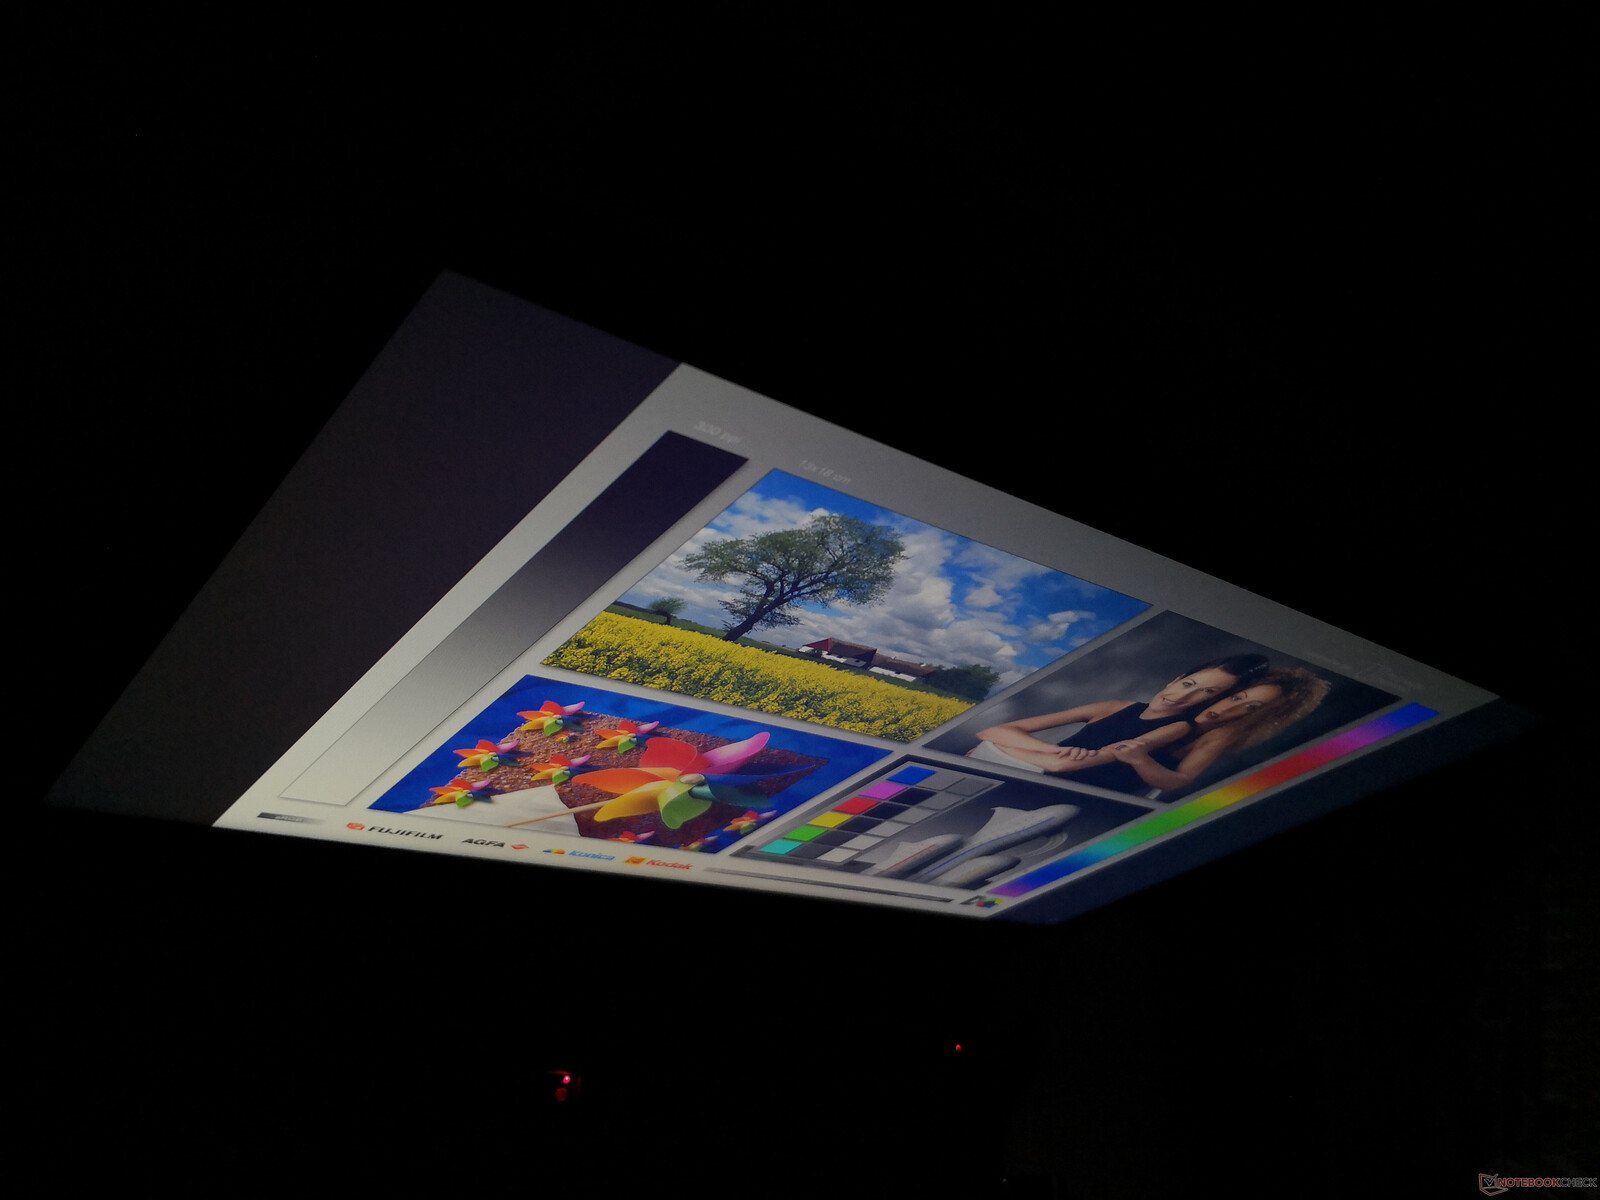
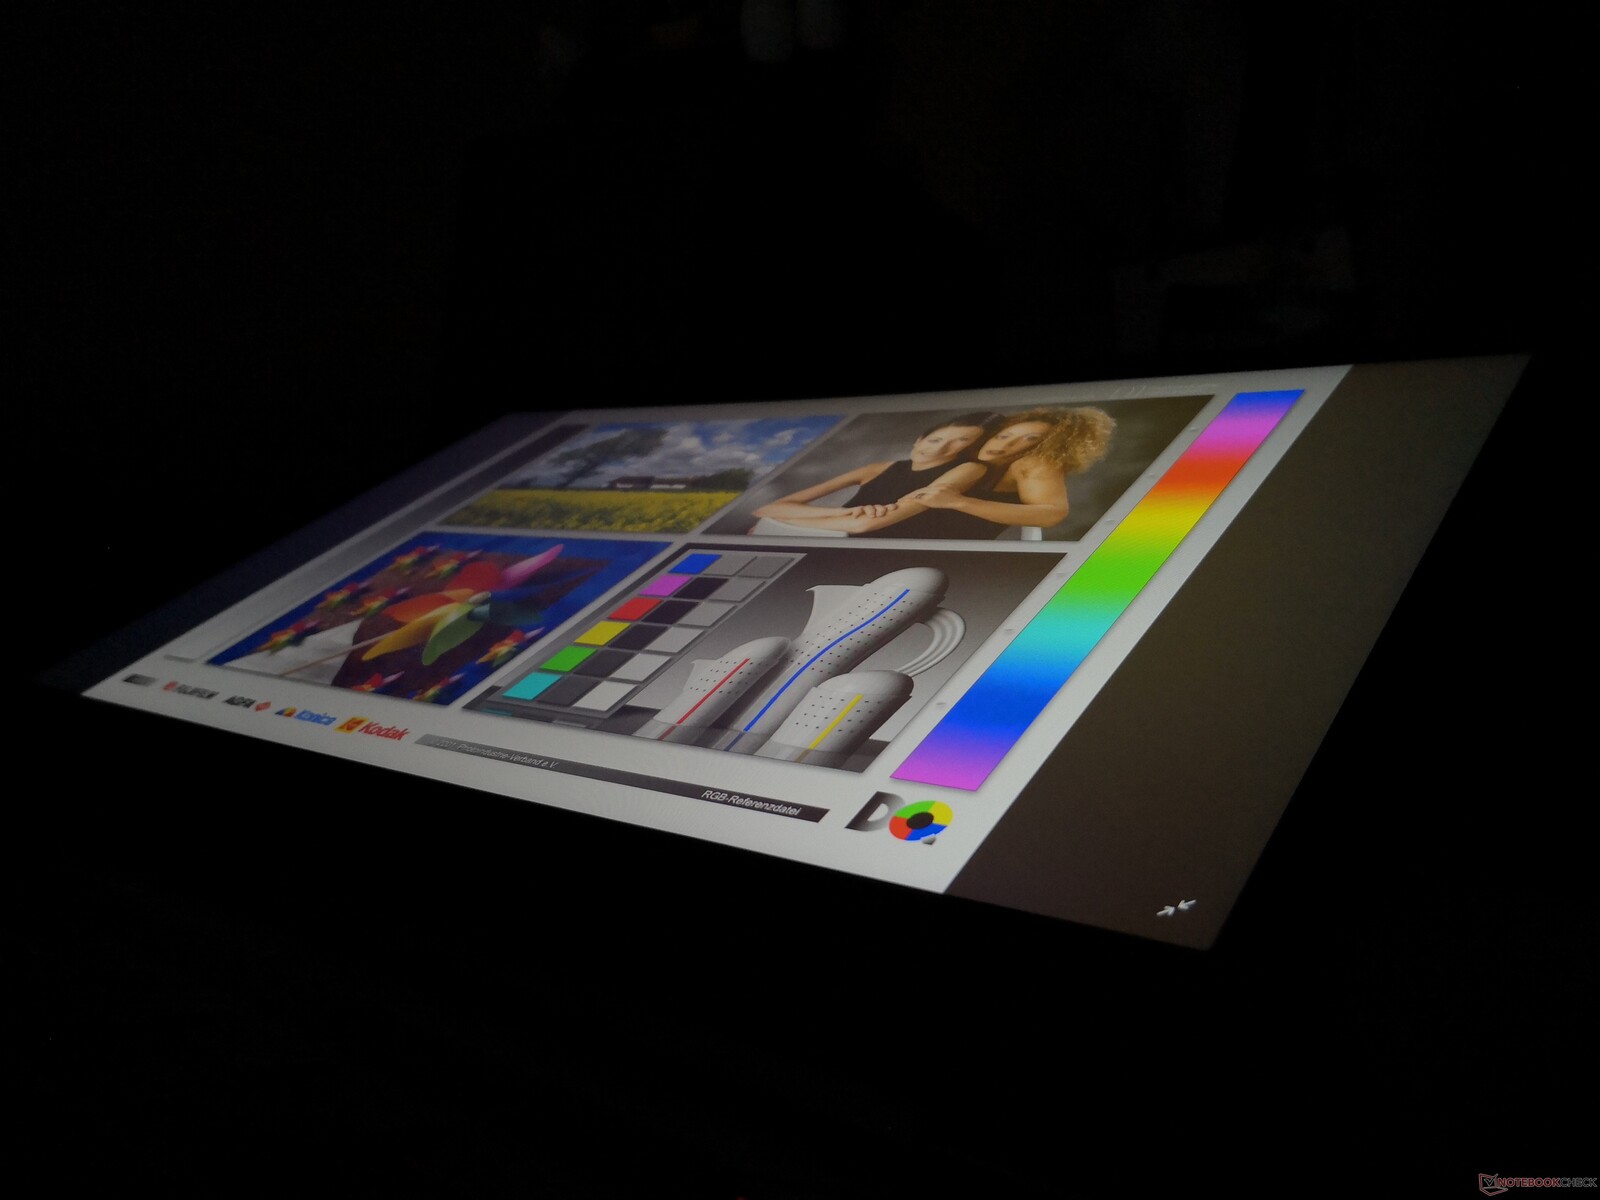
Outdoor visibility is essentially the same as on the GF63 since their brightness levels and contrast ratios are comparable. In other words, expect lots of squinting, washed out colors, and some glare even if under shade. Viewing angles are wide with the usual changes to contrast and colors only if viewing from abnormally extreme angles.

Performance
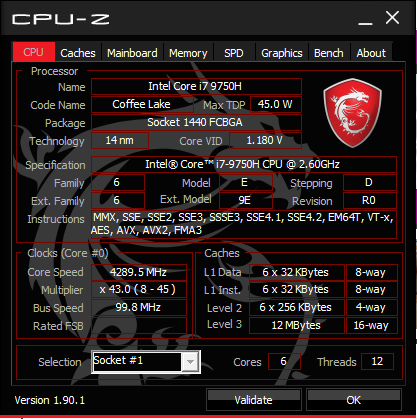
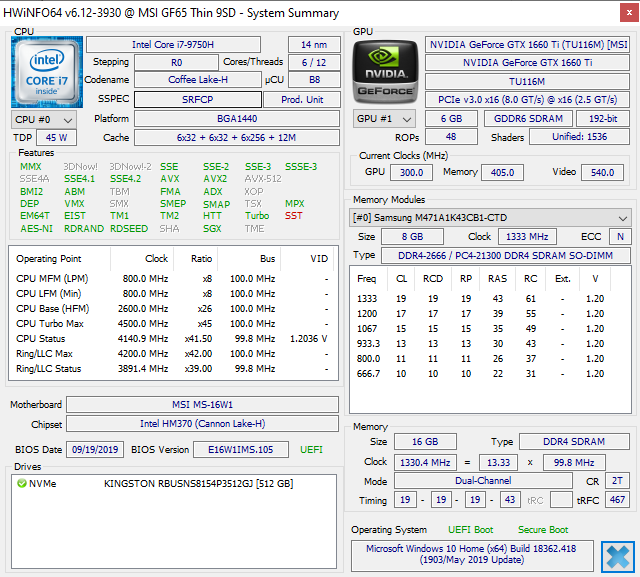
The hexa-core Core i7-9750H CPU and GTX 1660 Ti GPU are mid-range gaming specifications and a massive step up from the Core i5-9300H and GTX 1650 that most budget gaming laptops carry. Enthusiast alternatives like the MSI GE75 may carry even faster octa-core Core i9-9880H and GeForce RTX options.
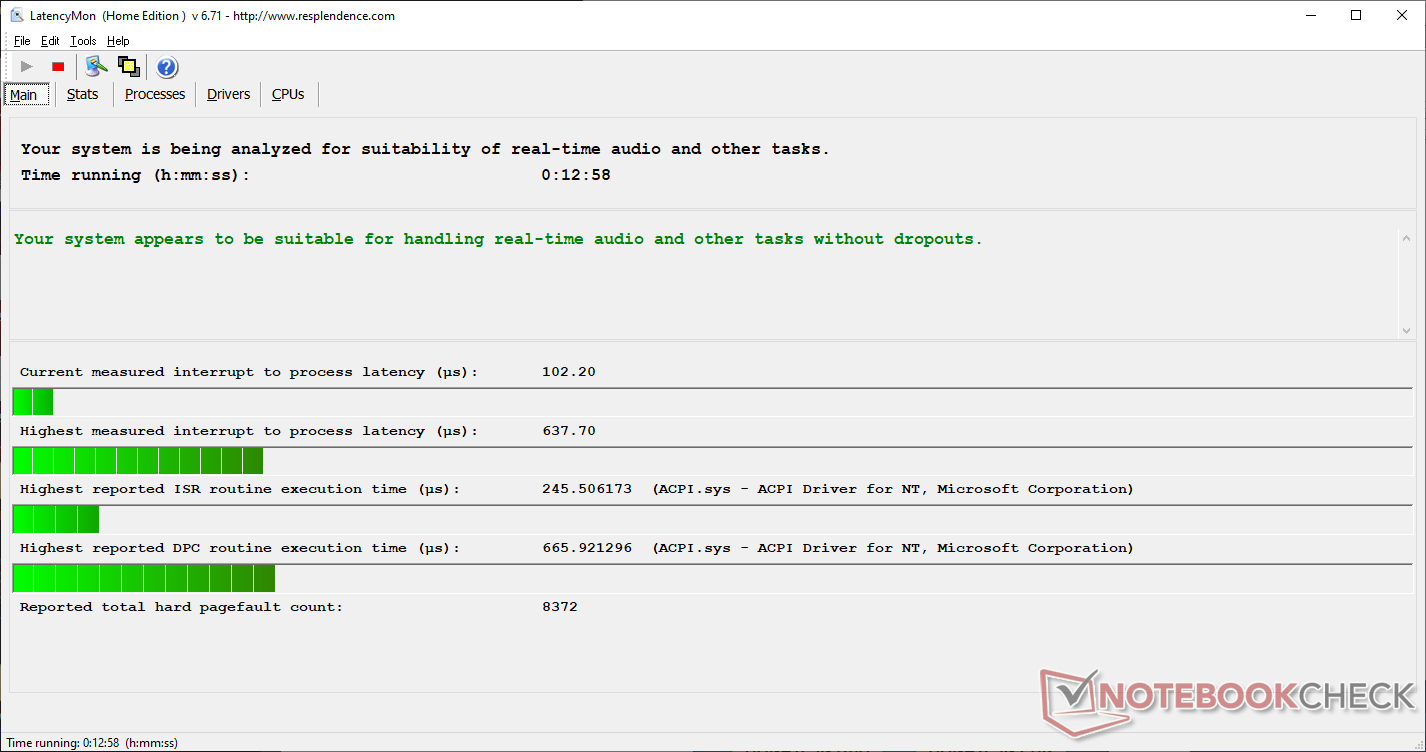
Optimus comes standard to automatically exclude G-Sync SKUs. LatencyMon shows no DPC latency issues much like what we discovered on the MSI WP65.
Processor
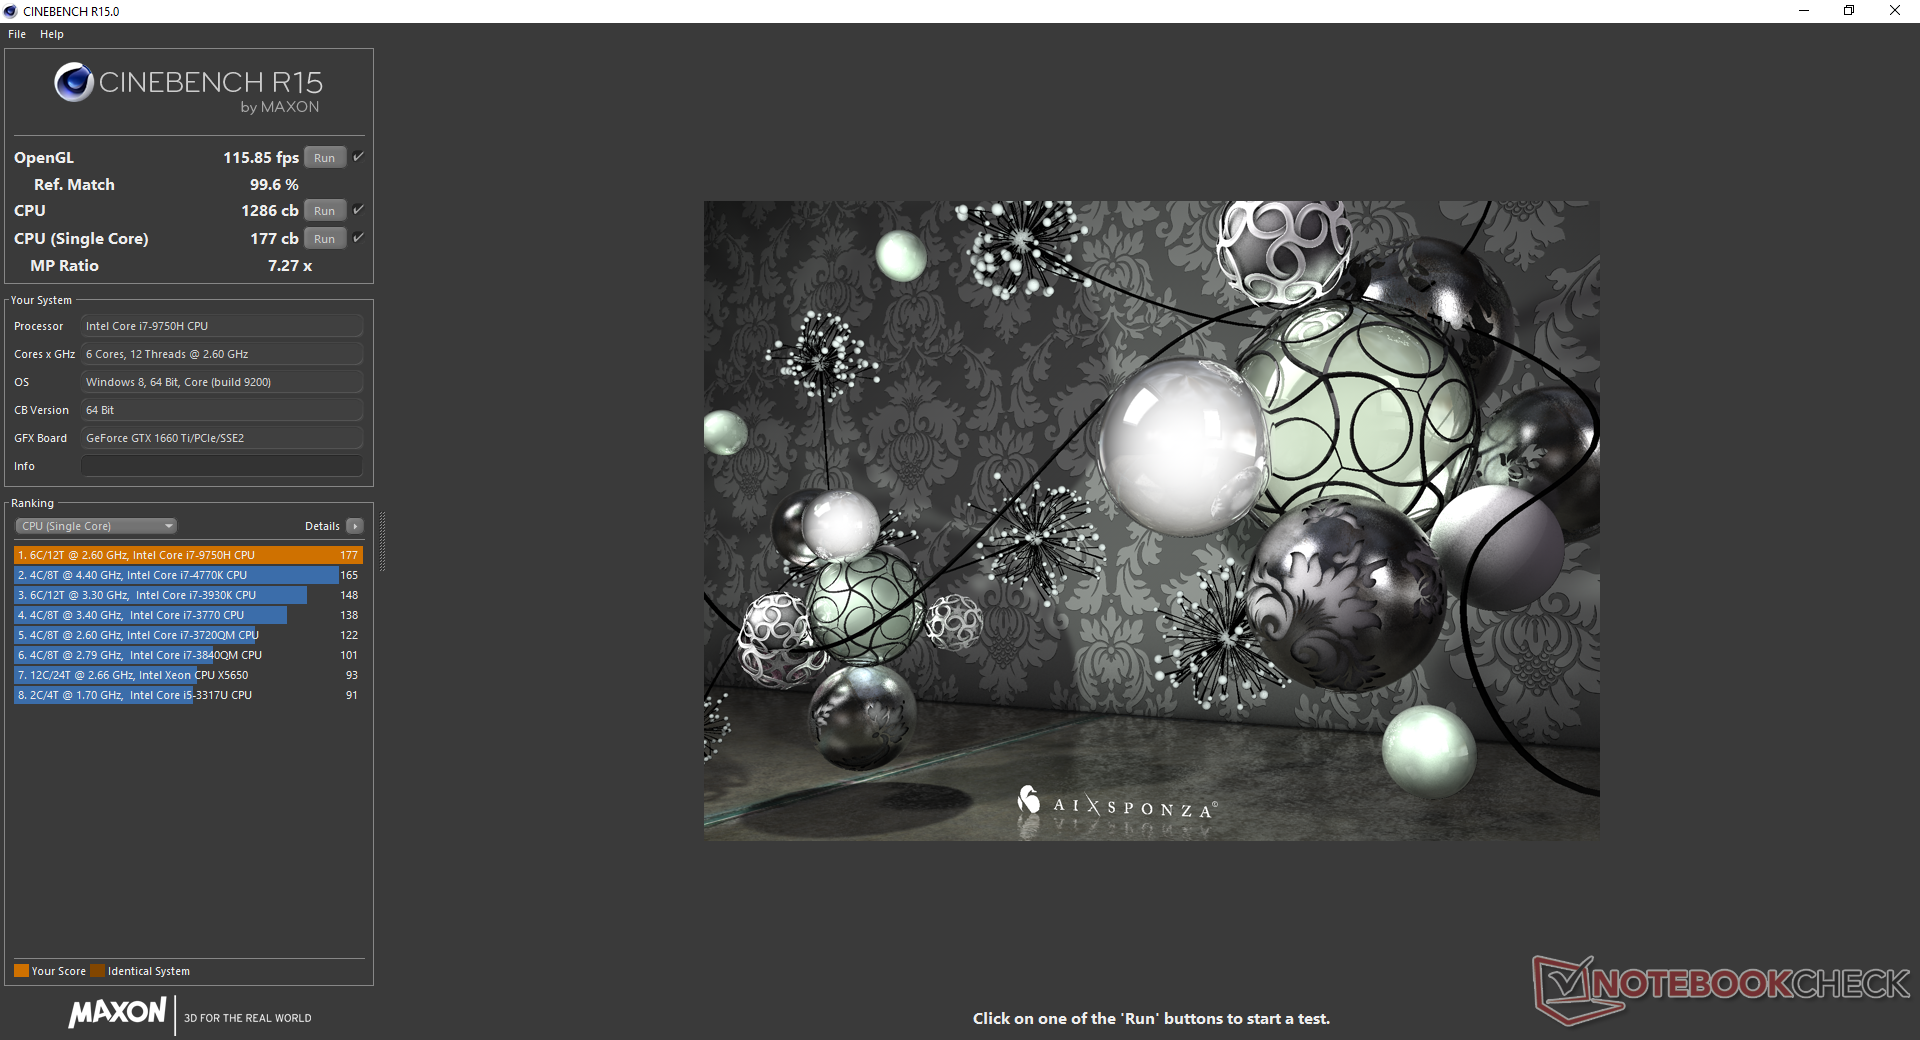
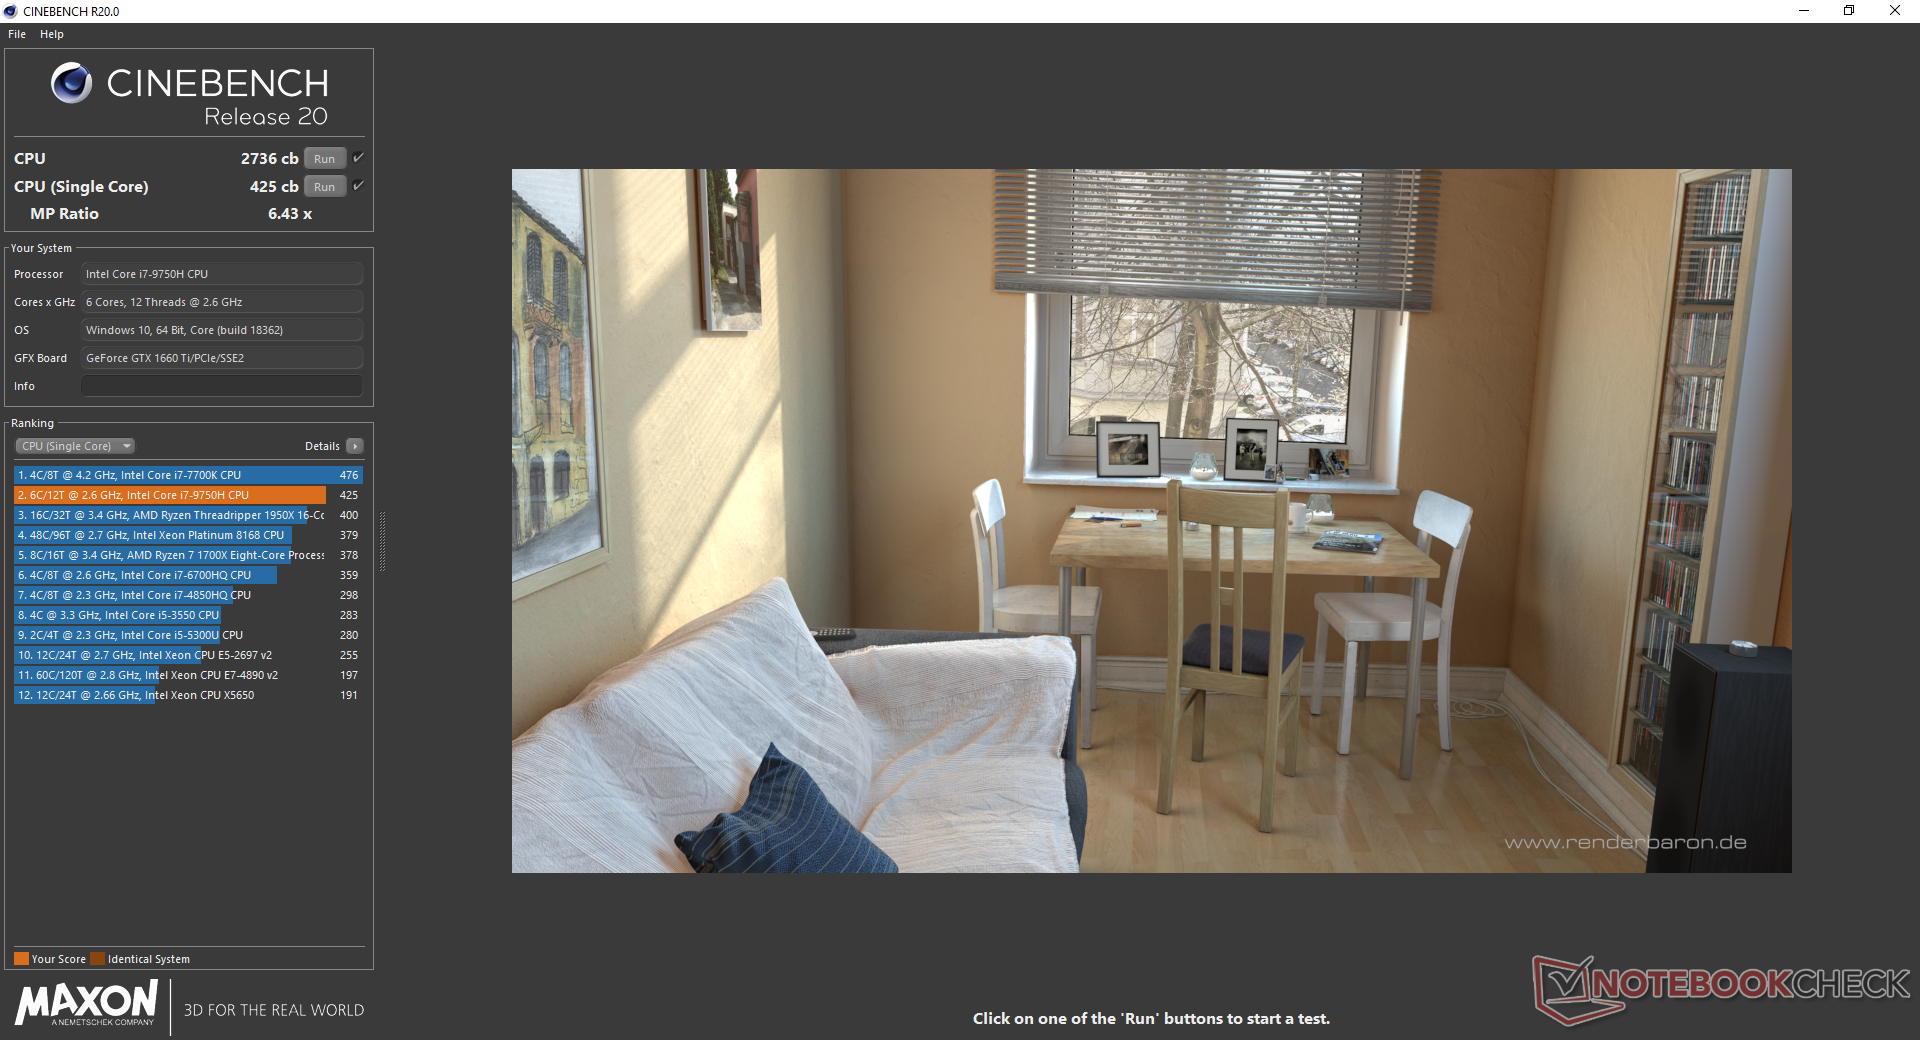
CPU performance is essentially identical to the MSI GL65 9SEK equipped with the same Core i7-9750H CPU. Performance drops by about 10 percent when running CineBench R15 Multi-Thread in a loop to show that maximum Turbo Boost is short-lived. Users upgrading from the Core i7-8750H won't see much of a difference, but upgrading from quad-core CPUs like the Core i7-7700HQ, i5-8300H, i5-9300H, or Ryzen 7 3750H will bring noticeable improvements.
See our dedicated page on the Core i7-9750H for more technical information and benchmark comparisons.
| wPrime 2.10 - 1024m | |
| Dell XPS 13 7390 2-in-1 Core i7 | |
| MSI GF62VR 7RF-877 | |
| MSI GV62 8RE-016US | |
| Asus ROG Zephyrus G15 GA502DU | |
| Average Intel Core i7-9750H (n=1) | |
| MSI GE75 9SG | |
* ... smaller is better
System Performance
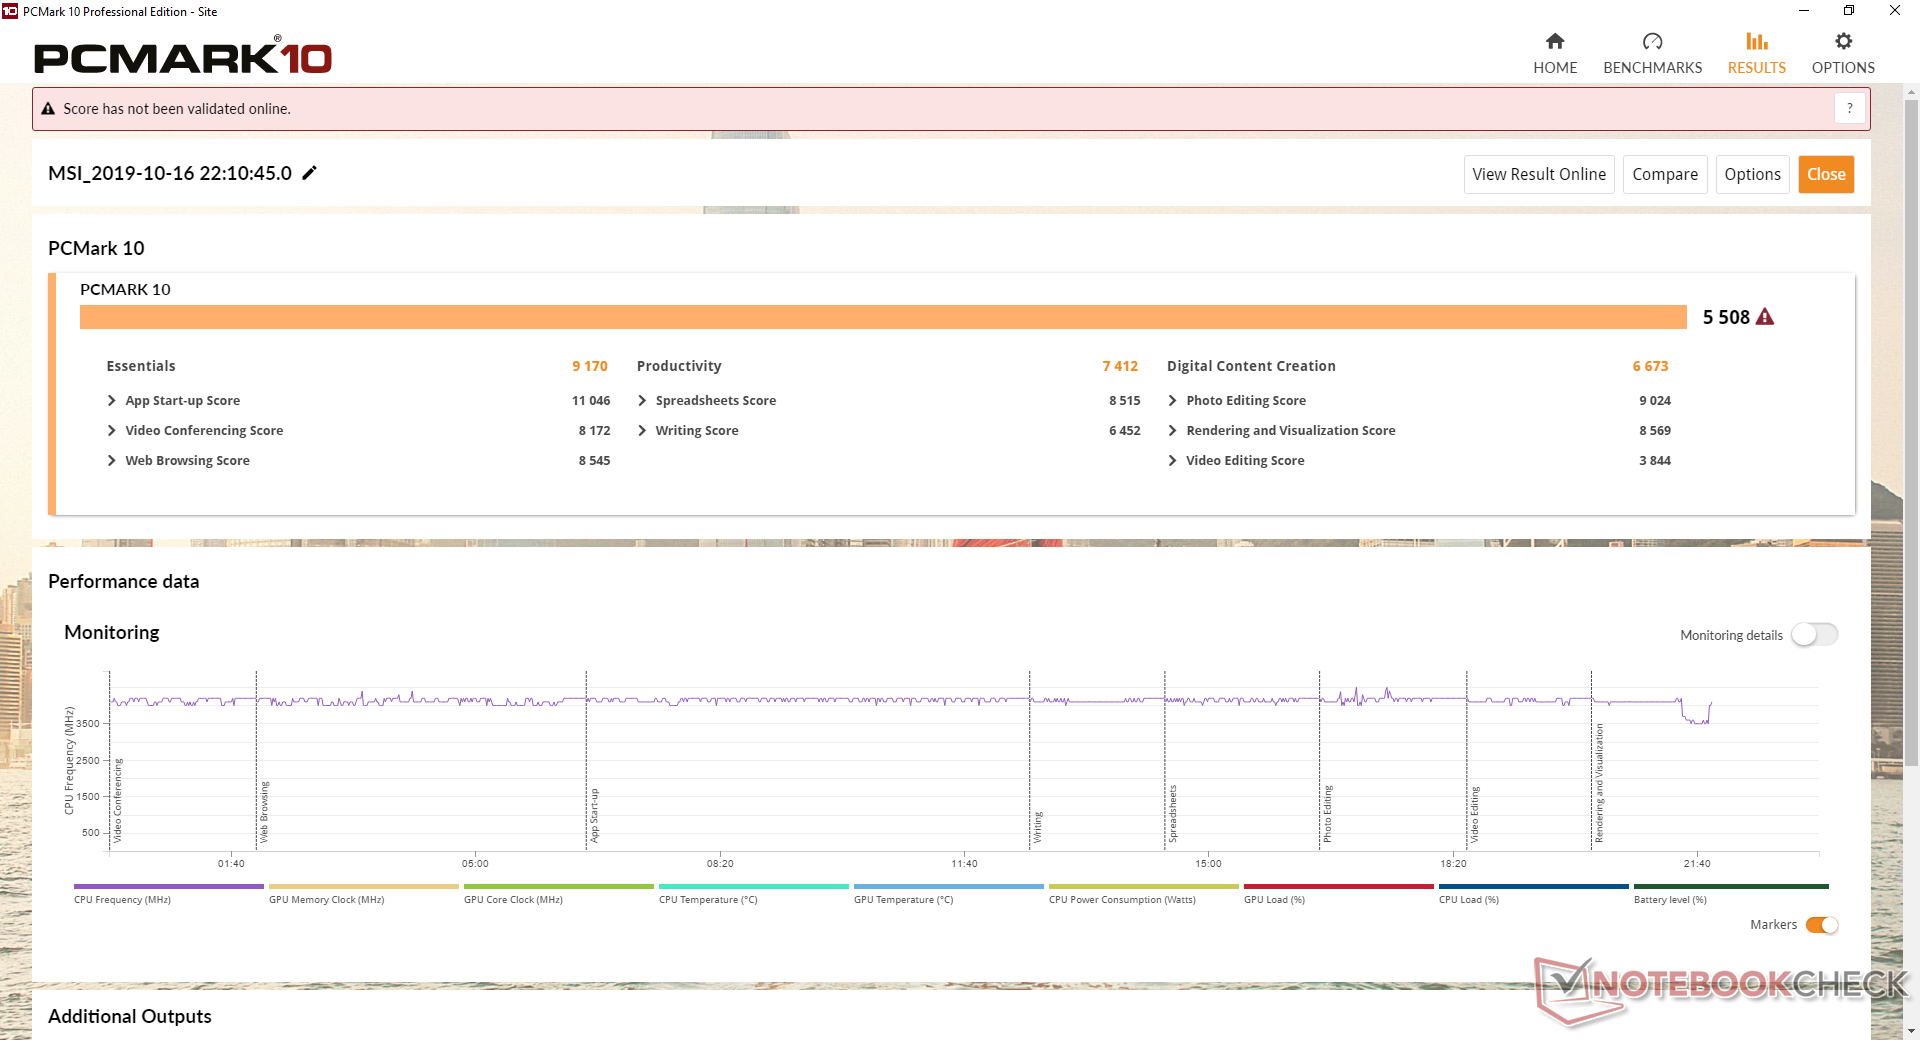
PCMark benchmarks are nearly identical to the Dell G7 15 7590 while being consistently ahead of the Asus TUF FX705 with the slower Ryzen 5 3550H CPU and GTX 1650 graphics. The older MSI GF63 is far behind due in part to its slower primary HDD.
We experienced no software or hardware issues during our time with the test unit. Be prepared for the usual Norton Anti-Virus and MSI pop-ups during the initial boot up.
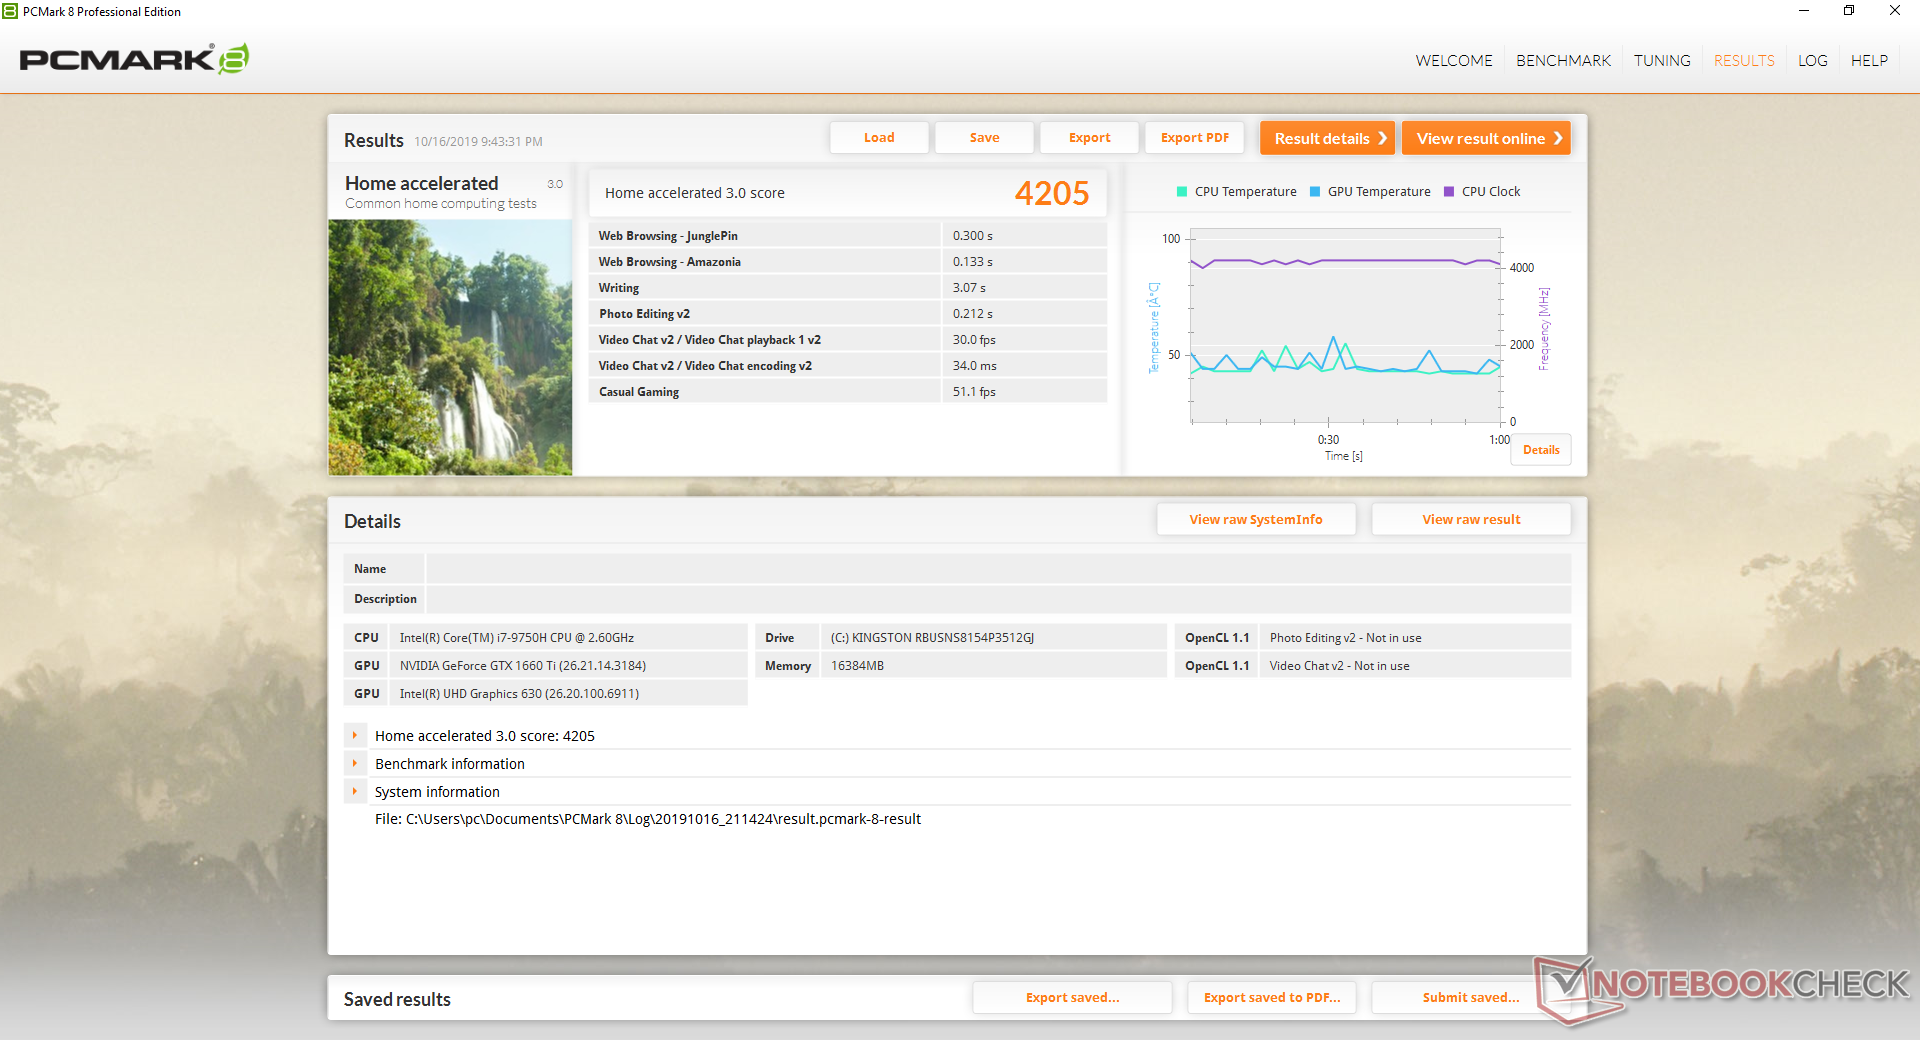
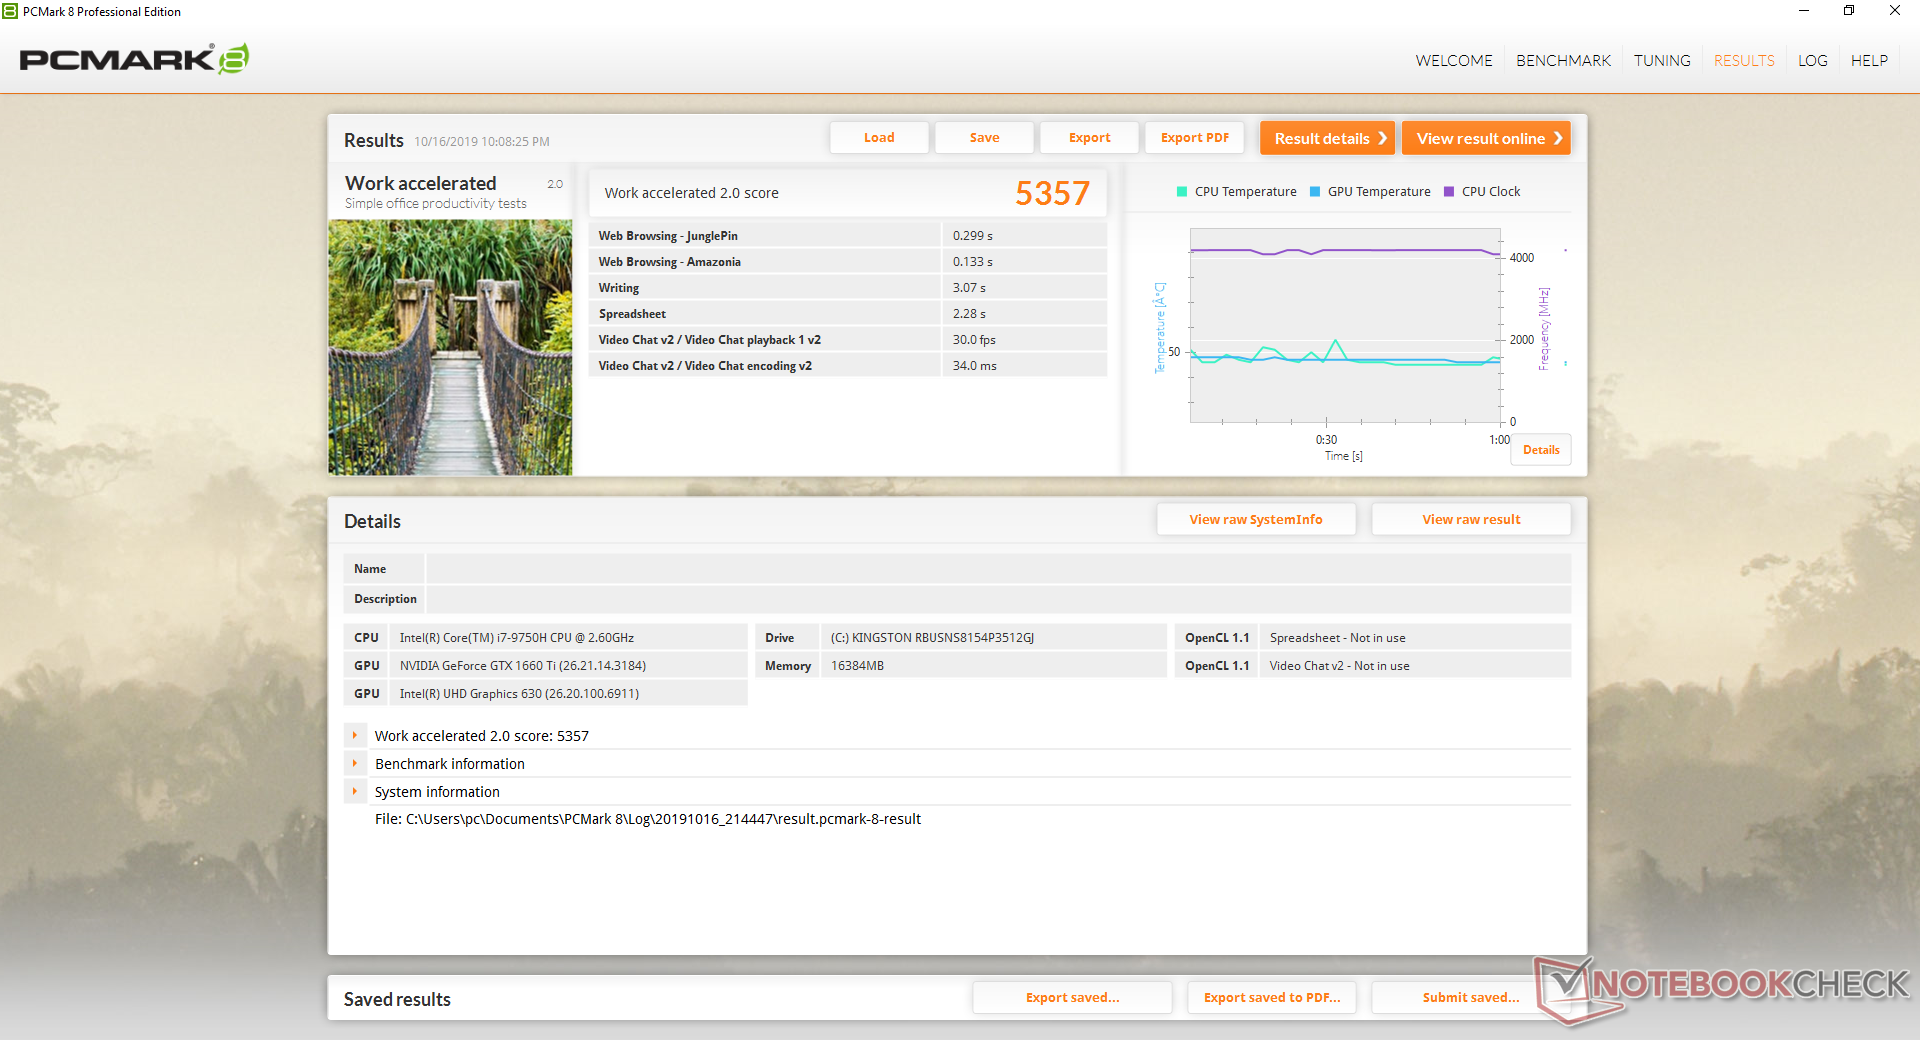
| PCMark 8 Home Score Accelerated v2 | 4205 points | |
| PCMark 8 Work Score Accelerated v2 | 5357 points | |
| PCMark 10 Score | 5508 points | |
Help | ||
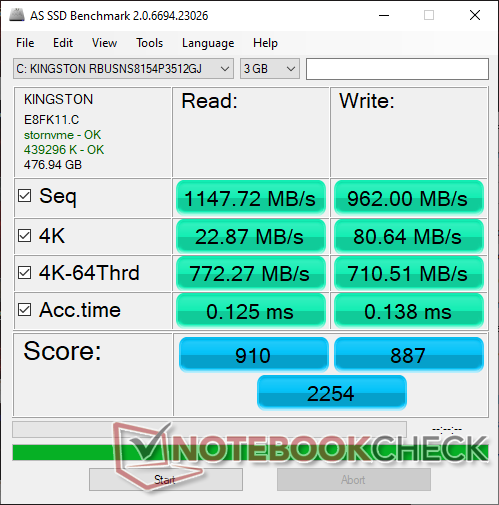
Storage Devices
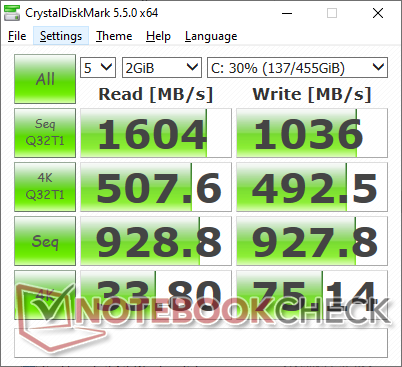
Two M.2 NVMe PCIe slots are available with no 2.5-inch SATA III options. The 512 GB Kingston RBUSNS8154P3512GJ SSD in our test unit is a budget NVMe drive with sequential read and write rates of about 1000 MB/s each. Pricier NVMe drives like the Samsung PM981 or Intel 760p can offer over twice the sequential read and/or write rates.
Keep in mind that the system will likely come with different SSDs and thus different storage performance depending on the reseller.
| MSI GF65 9SD Kingston RBUSNS8154P3512GJ | Asus TUF FX505DT-EB73 Intel SSD 660p SSDPEKNW512G8 | Aorus 15-SA Intel SSD 760p SSDPEKKW512G8 | Dell G7 7590 Toshiba BG3 KBG30ZMS256G | Lenovo Legion Y540-15IRH-81SX00B2GE WDC PC SN720 SDAPNTW-512G | |
|---|---|---|---|---|---|
| AS SSD | 7% | 50% | -52% | 92% | |
| Seq Read | 1148 | 1019 -11% | 2601 127% | 1013 -12% | 2927 155% |
| Seq Write | 962 | 889 -8% | 1507 57% | 203.8 -79% | 2149 123% |
| 4K Read | 22.87 | 48.22 111% | 56.3 146% | 29.57 29% | 42.43 86% |
| 4K Write | 80.6 | 115.5 43% | 110.3 37% | 71.4 -11% | 147.1 83% |
| 4K-64 Read | 772 | 321.5 -58% | 877 14% | 332.1 -57% | 1286 67% |
| 4K-64 Write | 711 | 787 11% | 914 29% | 152.9 -78% | 1432 101% |
| Access Time Read * | 0.125 | 0.065 48% | 0.05 60% | 0.183 -46% | 0.065 48% |
| Access Time Write * | 0.138 | 0.047 66% | 0.034 75% | 0.248 -80% | 0.026 81% |
| Score Read | 910 | 472 -48% | 1193 31% | 463 -49% | 1621 78% |
| Score Write | 887 | 992 12% | 1175 32% | 245 -72% | 1794 102% |
| Score Total | 2254 | 1717 -24% | 2938 30% | 913 -59% | 4208 87% |
| Copy ISO MB/s | 1103 | 942 -15% | 2104 91% | 263.6 -76% | |
| Copy Program MB/s | 537 | 444.5 -17% | 387.7 -28% | 213.8 -60% | |
| Copy Game MB/s | 997 | 867 -13% | 1021 2% | 188 -81% |
* ... smaller is better

GPU Performance
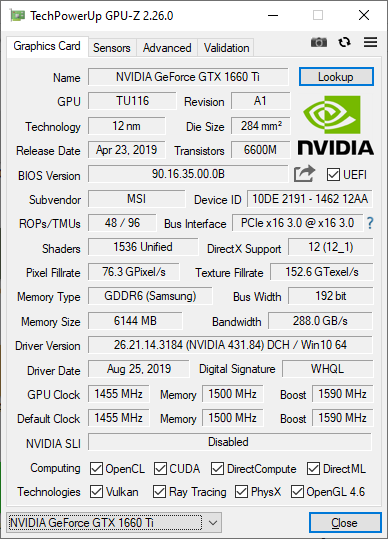
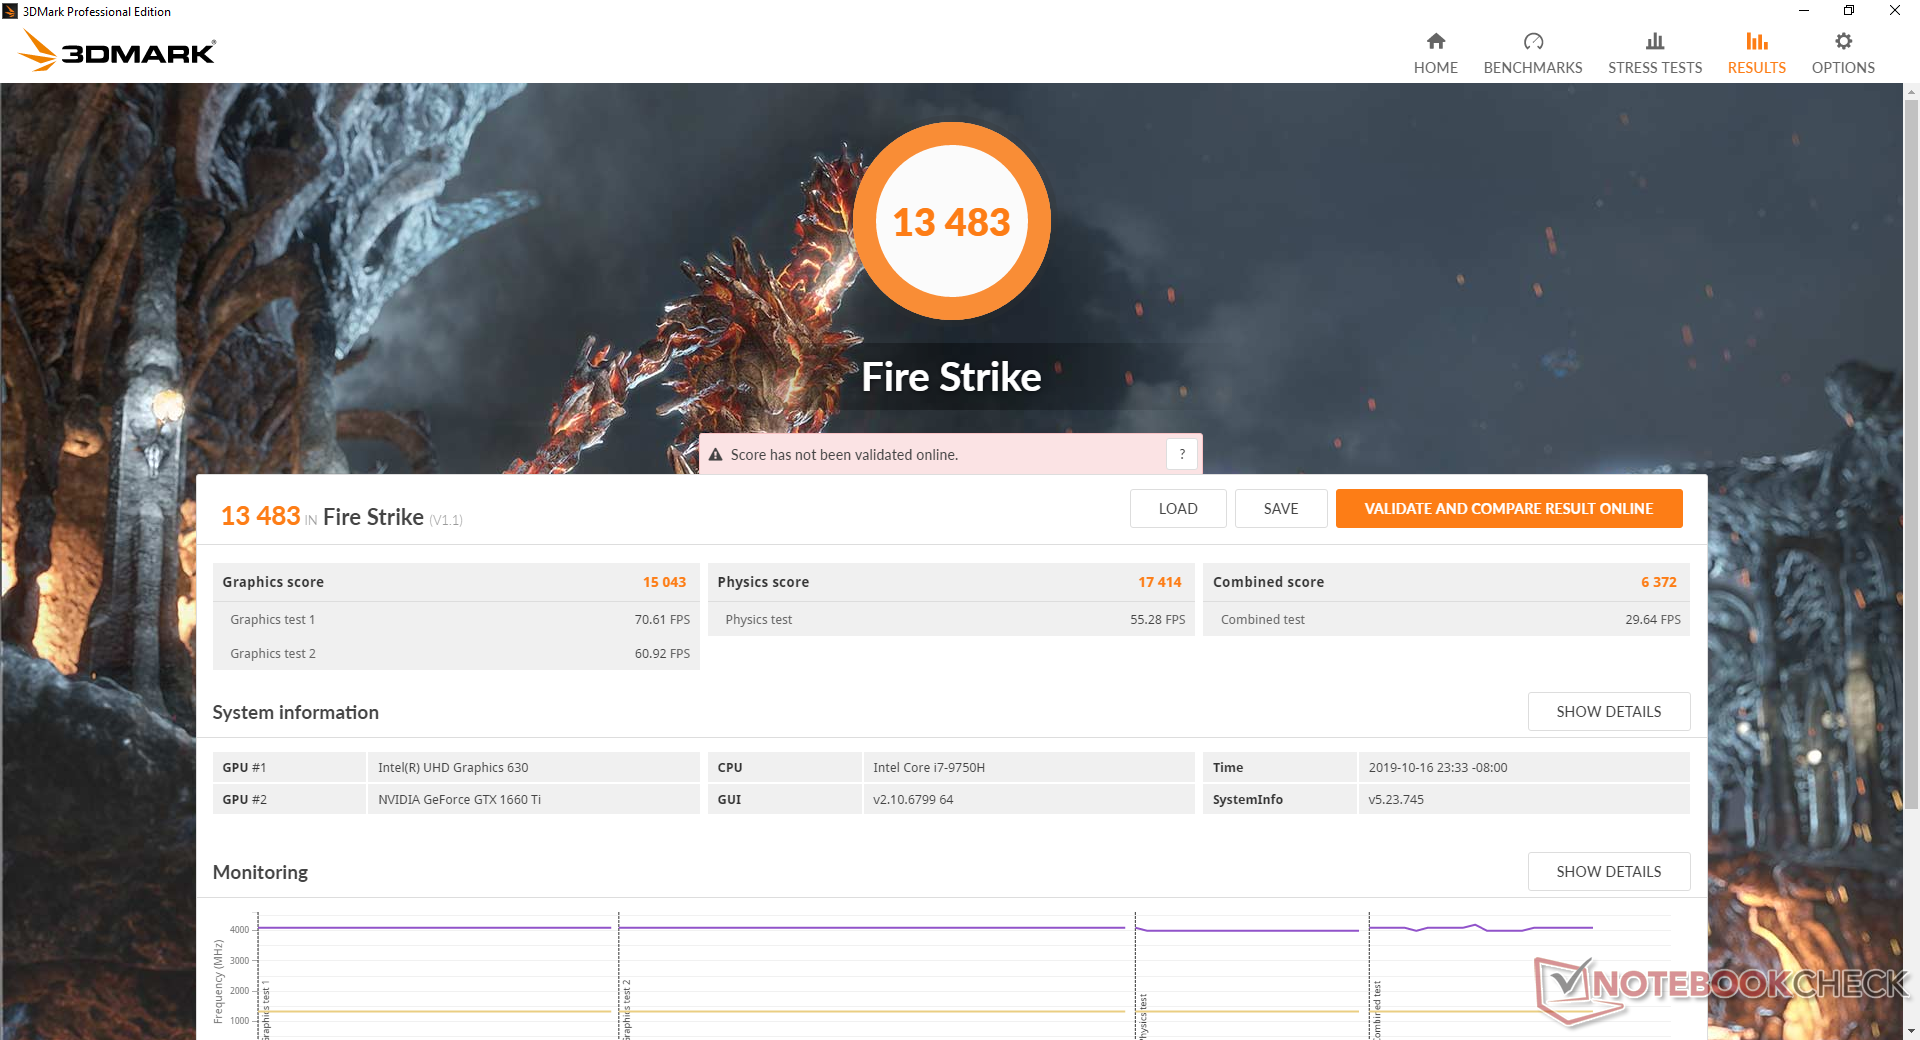
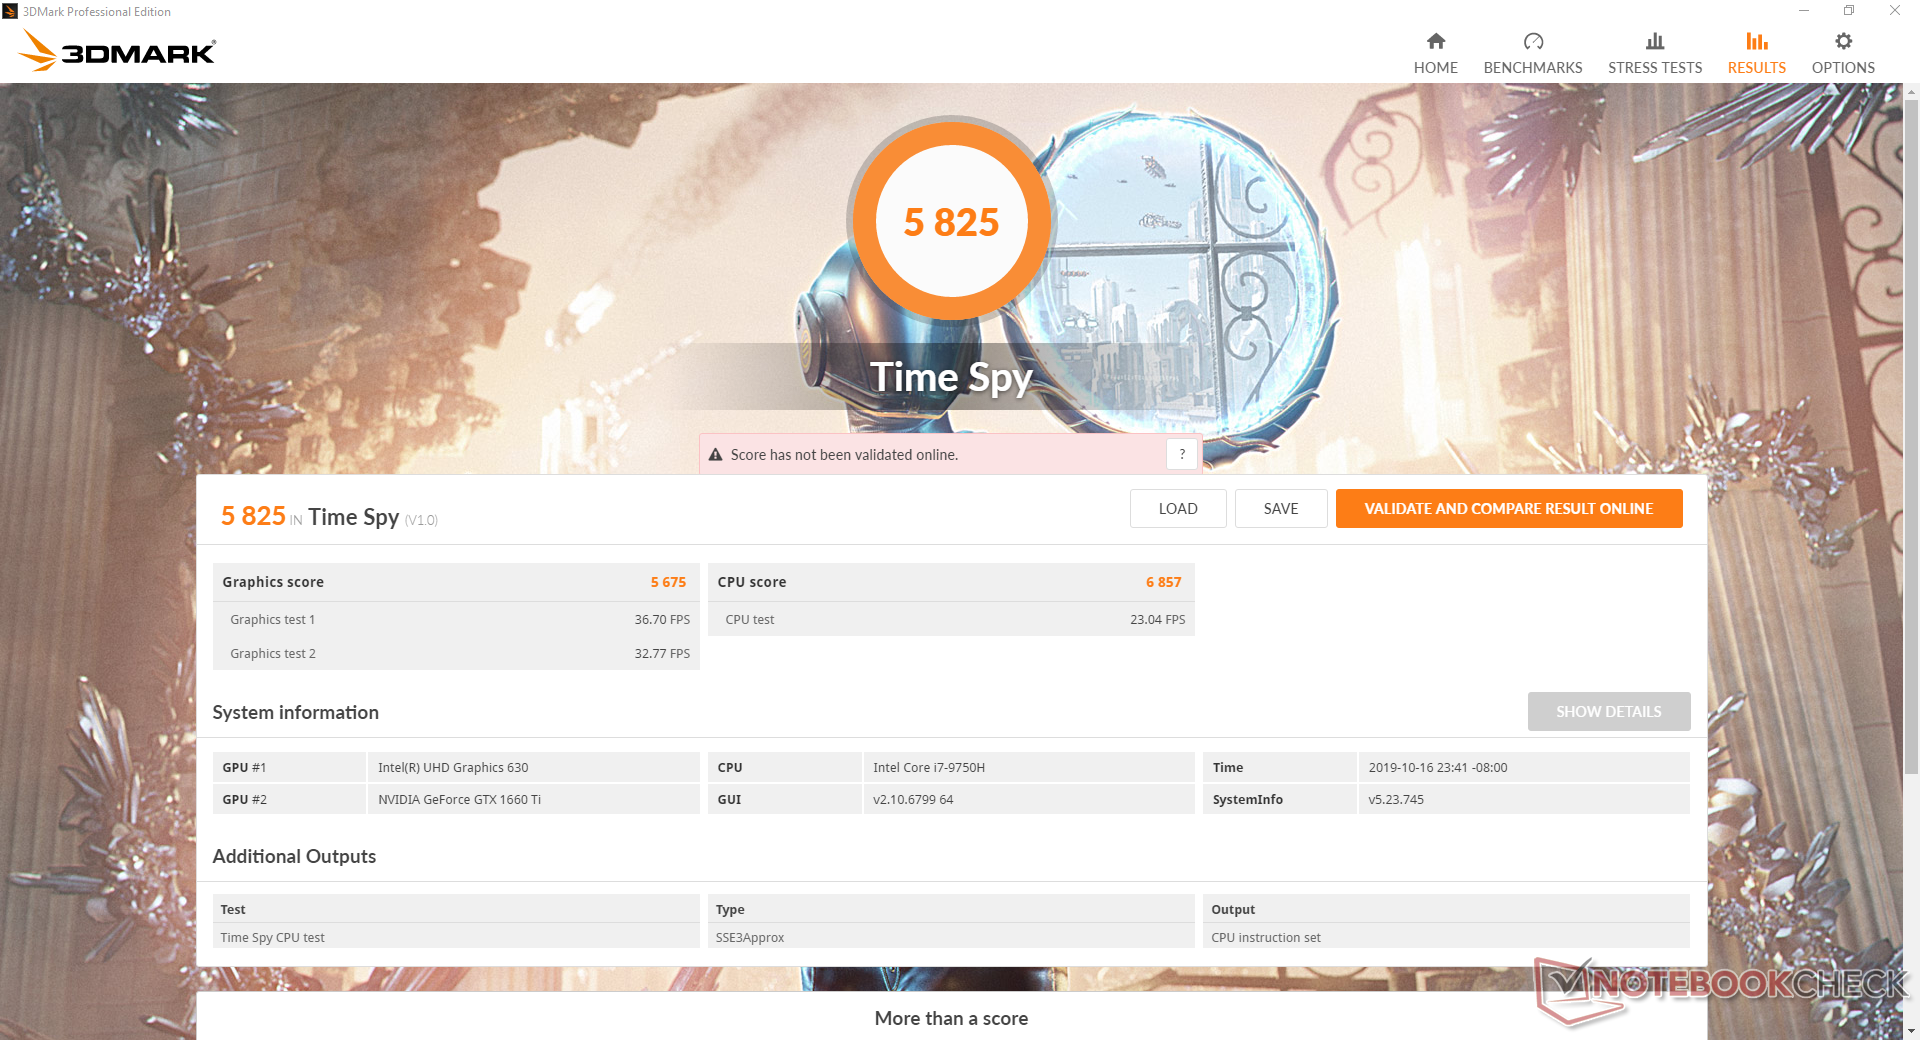
The GeForce GTX 1660 Ti is performing where we expect it to be at within 1 percent of the average GTX 1660 Ti in our database. When compared to the desktop GTX 1660 Ti, our mobile version is only about 2 to 7 percent slower. Overall performance is very close to the mobile RTX 2060 when excluding any DLSS or ray-tracing features.
See our dedicated page on the mobile GTX 1660 Ti for more technical information and benchmark comparisons. Idling on Witcher 3 shows no recurring frame dips to suggest no interrupting background activity or major throttling issues when gaming.
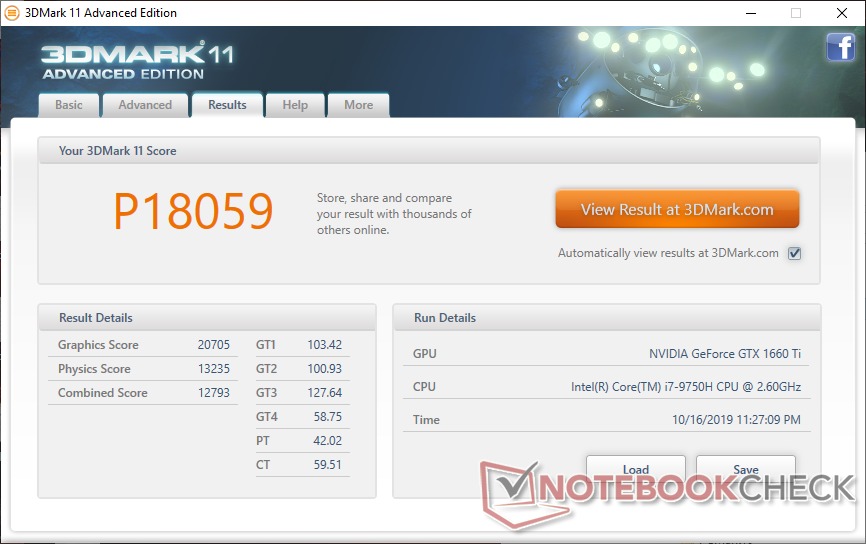

| 3DMark 11 Performance | 18059 points | |
| 3DMark Cloud Gate Standard Score | 36975 points | |
| 3DMark Fire Strike Score | 13483 points | |
| 3DMark Time Spy Score | 5825 points | |
Help | ||
| Shadow of the Tomb Raider - 1920x1080 Highest Preset AA:T | |
| Zotac GeForce GTX 1660 Ti 6 GB | |
| Dell G7 7590 | |
| Average NVIDIA GeForce GTX 1660 Ti Mobile (62 - 73, n=8) | |
| MSI GL73 8SE-010US | |
| MSI GF65 9SD | |
| Asus ROG Zephyrus G15 GA502DU | |
| MSI GF75 Thin 9SC | |
| low | med. | high | ultra | |
|---|---|---|---|---|
| BioShock Infinite (2013) | 317.1 | 264 | 250.9 | 128.6 |
| The Witcher 3 (2015) | 287.9 | 191.6 | 116 | 60.6 |
| Shadow of the Tomb Raider (2018) | 135 | 81 | 72 | 64 |
Emissions
System Noise
Since the GTX 1660 Ti is more demanding than the GTX 1050, MSI has upgraded the cooling solution to include more heat pipes and an additional fan when compared to the GF63. Fan noise is always present no matter the setting even when set to Power Saver at just over 33 dB(A) against a background of 28.7 dB(A). Thankfully, the fans do not pulse when browsing or streaming which would have been annoying.
When gaming, fan noise jumps to 49.5 dB(A) to be noticeably louder than the less powerful GF63. Enabling Cooler Boost mode (i.e., Maximum fan mode) will bump fan noise to a constant 59.5 dB(A).
| MSI GF65 9SD GeForce GTX 1660 Ti Mobile, i7-9750H, Kingston RBUSNS8154P3512GJ | MSI GF63 8RC GeForce GTX 1050 Mobile, i5-8300H, Seagate BarraCuda Pro Compute 1TB ST1000LM049 | Lenovo Legion Y540-15IRH-81SX00B2GE GeForce GTX 1660 Ti Mobile, i7-9750H, WDC PC SN720 SDAPNTW-512G | Dell G7 7590 GeForce RTX 2060 Mobile, i7-9750H, Toshiba BG3 KBG30ZMS256G | Aorus 15-SA GeForce GTX 1660 Ti Mobile, i7-9750H, Intel SSD 760p SSDPEKKW512G8 | Asus ROG Zephyrus G15 GA502DU GeForce GTX 1660 Ti Max-Q, R7 3750H, Intel SSD 660p SSDPEKNW512G8 | |
|---|---|---|---|---|---|---|
| Noise | 6% | 12% | 5% | -7% | 3% | |
| off / environment * | 28.7 | 28 2% | 29.3 -2% | 28.4 1% | 29 -1% | 28 2% |
| Idle Minimum * | 33.3 | 33.8 -2% | 29.3 12% | 29.5 11% | 32 4% | 29.4 12% |
| Idle Average * | 33.9 | 34 -0% | 29.3 14% | 29.6 13% | 35 -3% | 31.9 6% |
| Idle Maximum * | 33.9 | 34.2 -1% | 29.3 14% | 29.6 13% | 41 -21% | 33 3% |
| Load Average * | 41 | 37.3 9% | 35.7 13% | 45 -10% | 54 -32% | 41.2 -0% |
| Witcher 3 ultra * | 49.5 | 43.4 12% | 44.2 11% | 51.5 -4% | 52 -5% | 53.8 -9% |
| Load Maximum * | 59.5 | 46 23% | 45.6 23% | 53 11% | 56 6% | 55.7 6% |
* ... smaller is better
Noise Level
| Idle |
| 33.3 / 33.9 / 33.9 dB(A) |
| Load |
| 41 / 59.5 dB(A) |
 | ||
30 dB silent 40 dB(A) audible 50 dB(A) loud |
||
min: | ||
Temperature
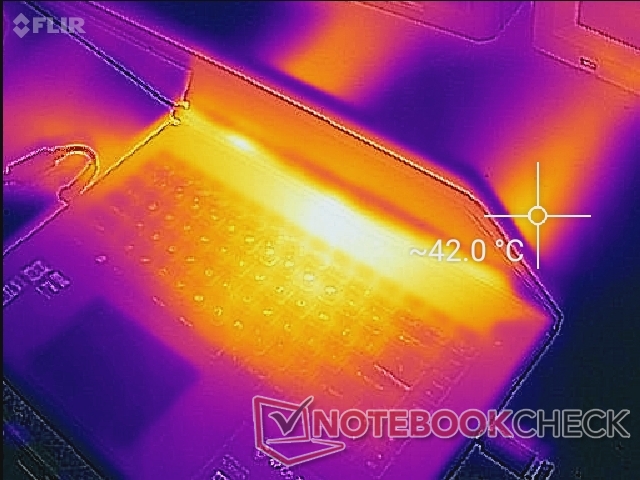
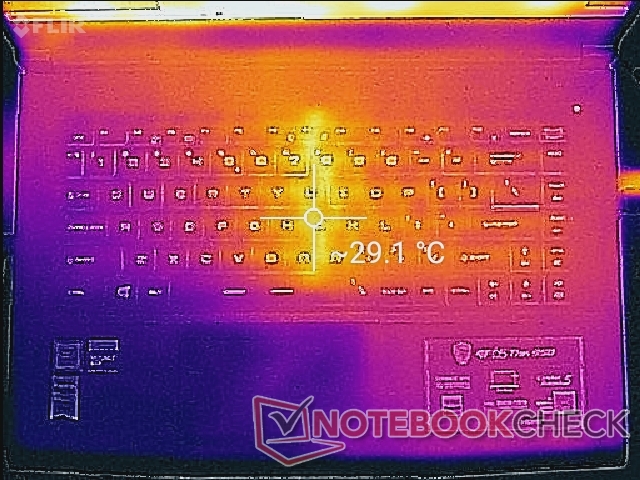
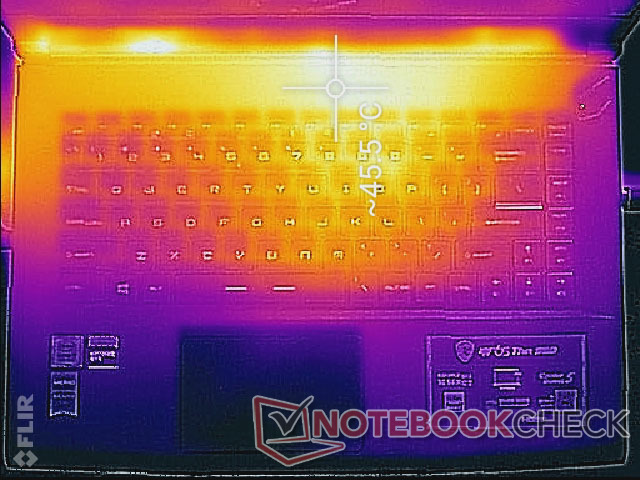
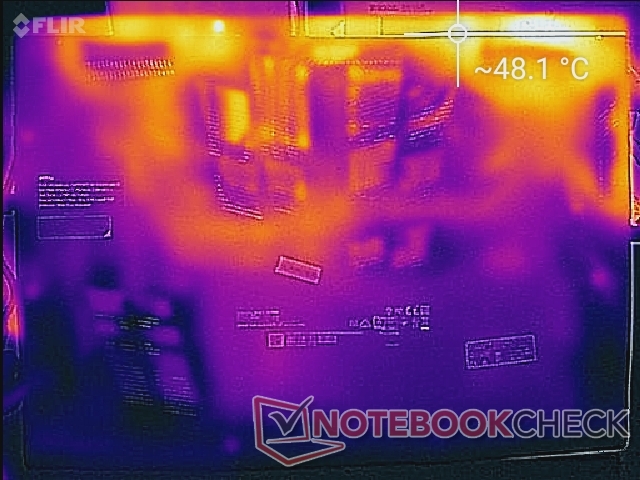
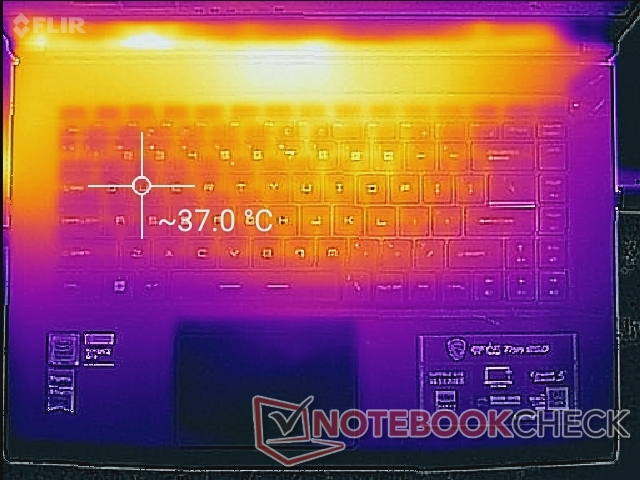
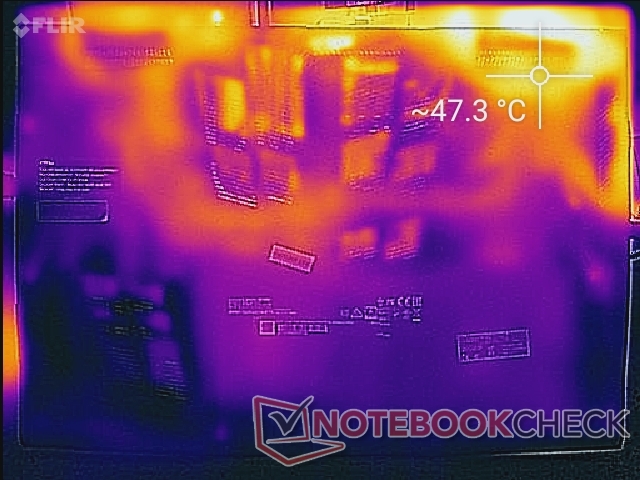
Surface temperatures when idling average below 30 C with the keyboard center being the warmest at about 29 C as shown by the temperature maps below. When gaming, the hot spot shifts to the top row of keyboard keys where fingers are unlikely to touch. The WASD keys can become as warm as 37 C while the palm rests will remain cool no matter the load.
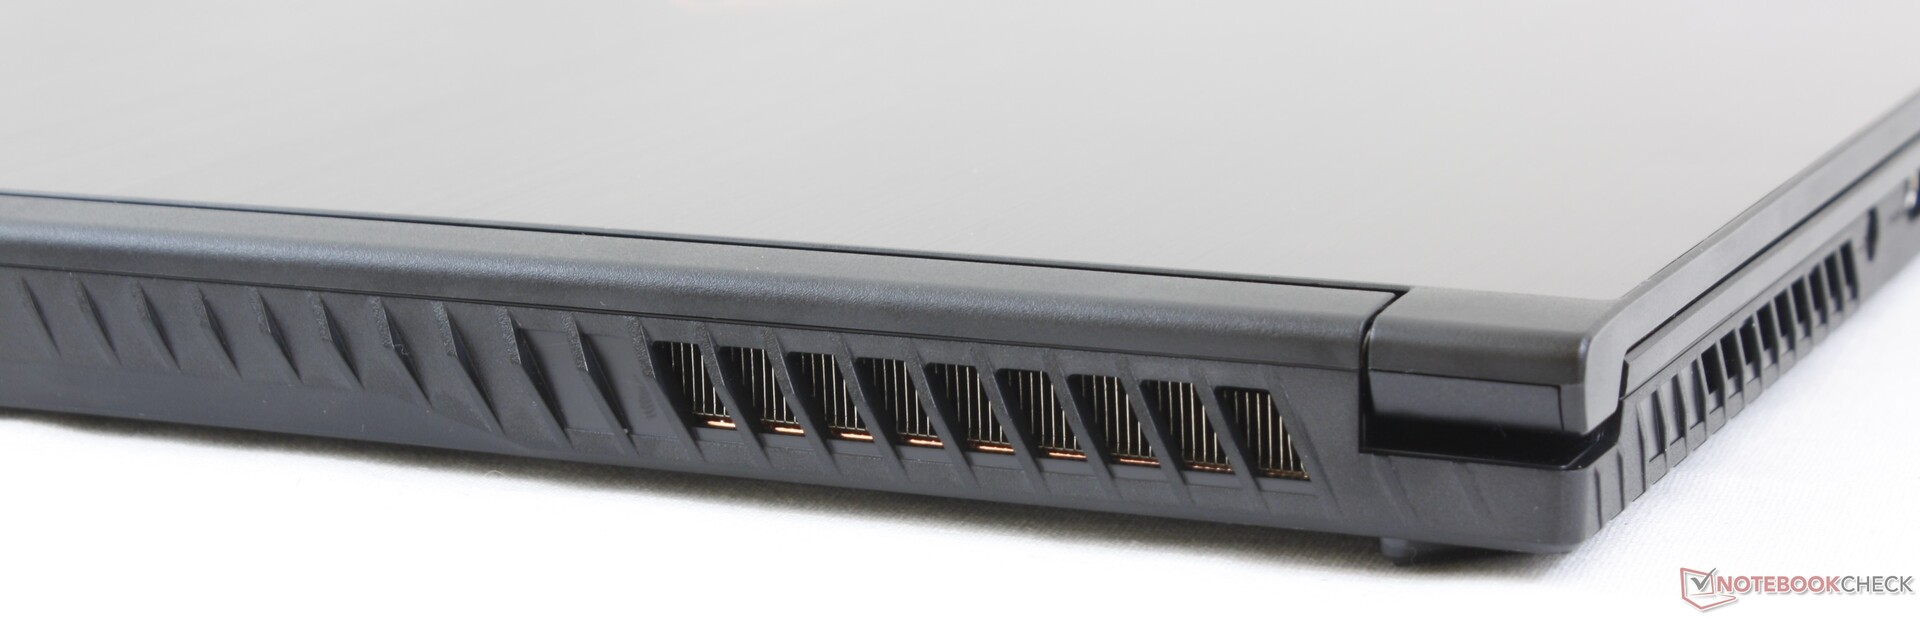
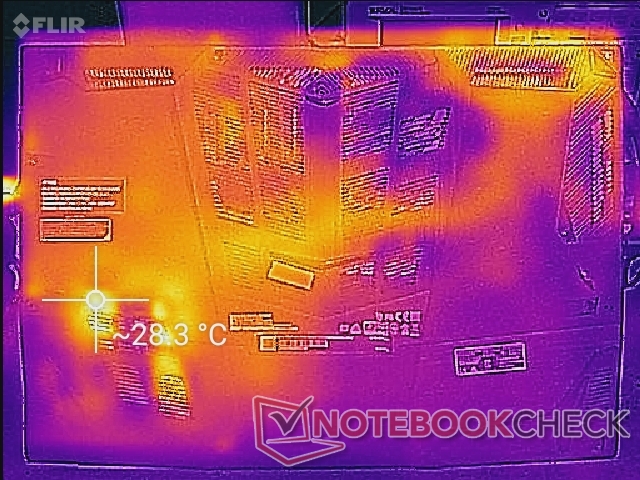
The bottom panel has a fair number of grilles exposing the copper heat pipes. These areas can thus become very warm when under high processing loads and so it's important to not impede these openings.
(-) The maximum temperature on the upper side is 52.8 °C / 127 F, compared to the average of 40.5 °C / 105 F, ranging from 21.2 to 68.8 °C for the class Gaming.
(-) The bottom heats up to a maximum of 53 °C / 127 F, compared to the average of 43.3 °C / 110 F
(+) In idle usage, the average temperature for the upper side is 26.5 °C / 80 F, compared to the device average of 33.9 °C / 93 F.
(±) Playing The Witcher 3, the average temperature for the upper side is 33.4 °C / 92 F, compared to the device average of 33.9 °C / 93 F.
(+) The palmrests and touchpad are cooler than skin temperature with a maximum of 26.2 °C / 79.2 F and are therefore cool to the touch.
(+) The average temperature of the palmrest area of similar devices was 28.9 °C / 84 F (+2.7 °C / 4.8 F).
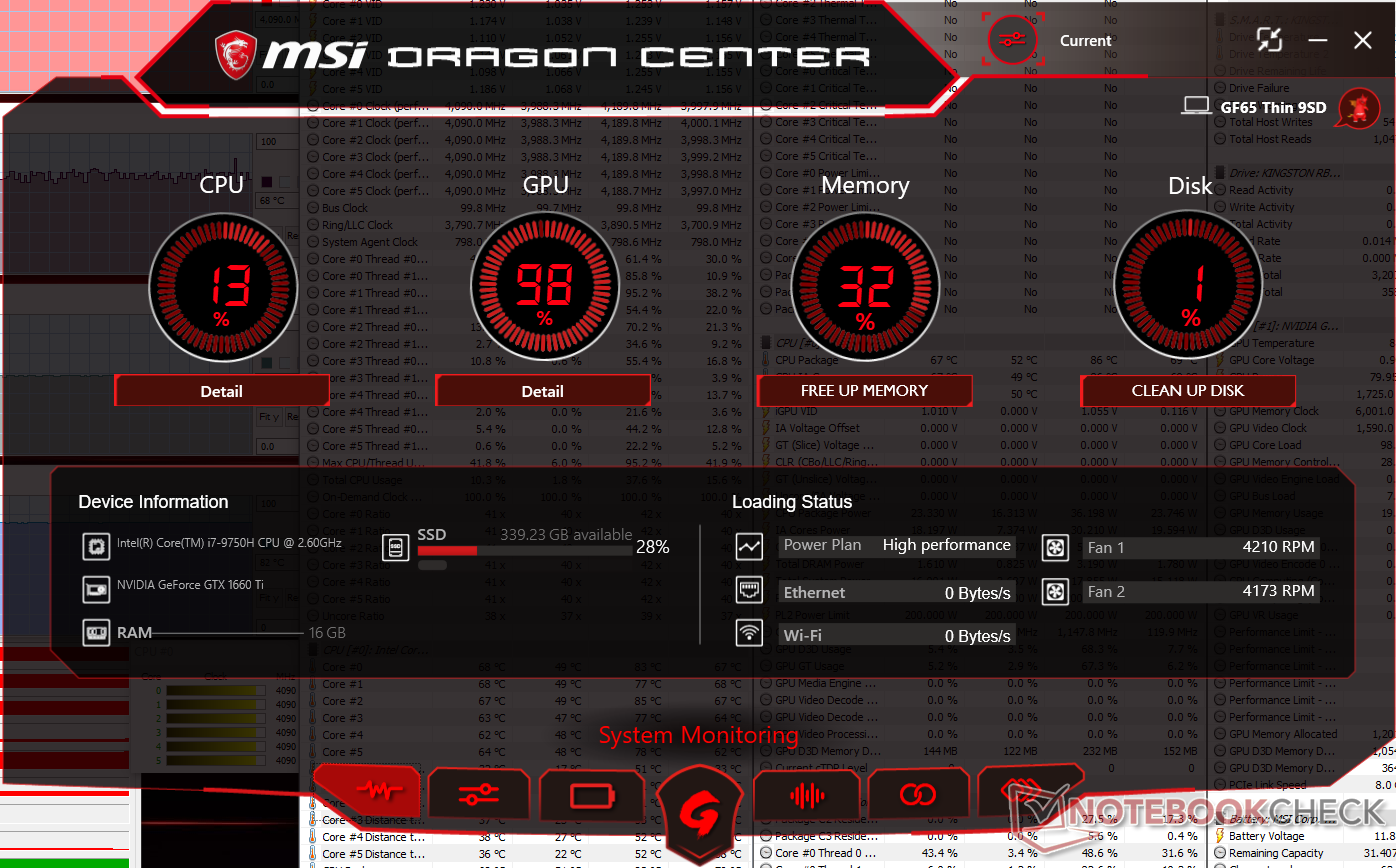
Stress Test
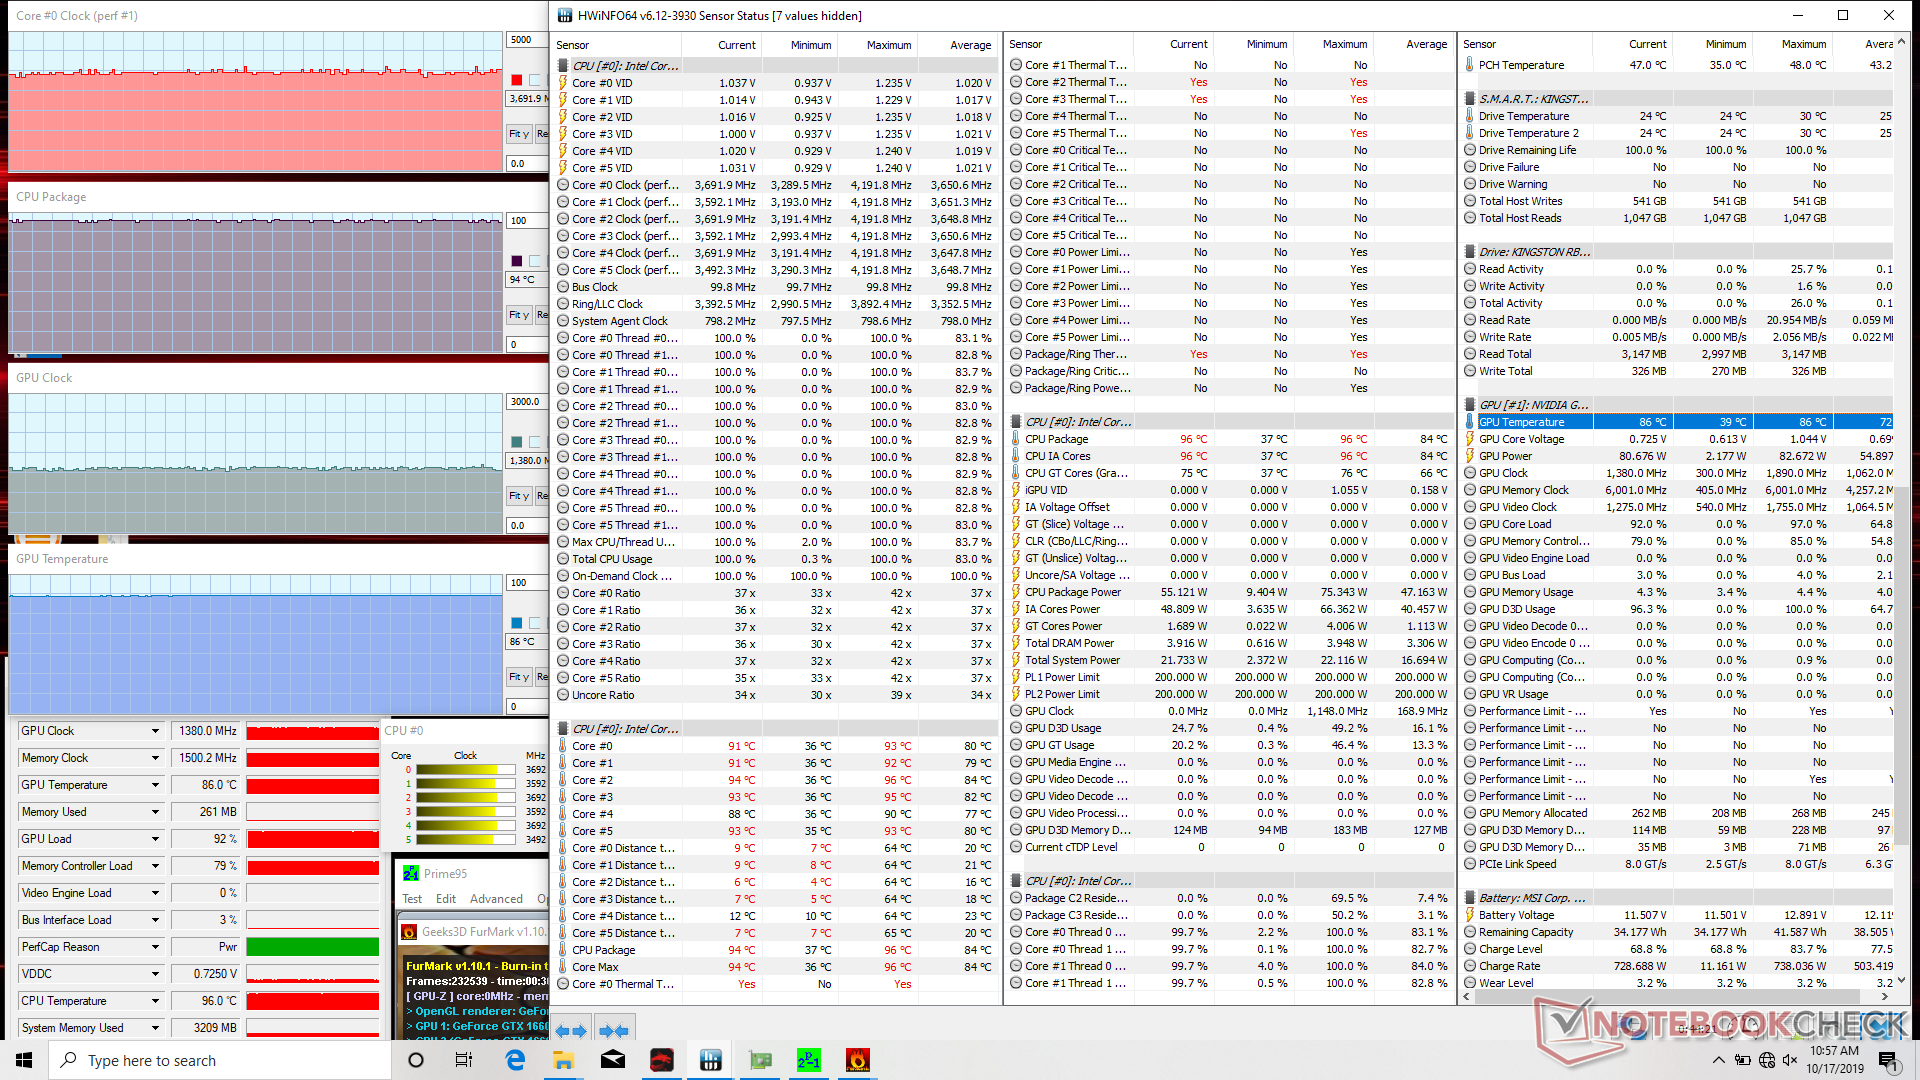
We subject the system to synthetic stress to identify for any potential throttling or stability issues. When running Prime95, CPU clock rate will boost to 4.0 GHz for about 30 seconds until core temperature reaches 95 C. Thereafter, clock rate drops to the 3.5 GHz range in order to maintain a cooler core temperature of ~86 C. Running both Prime95 and FurMark simultaneously will induce constant CPU and GPU temperatures of 94 C and 86 C, respectively, when Auto fan mode is engaged.
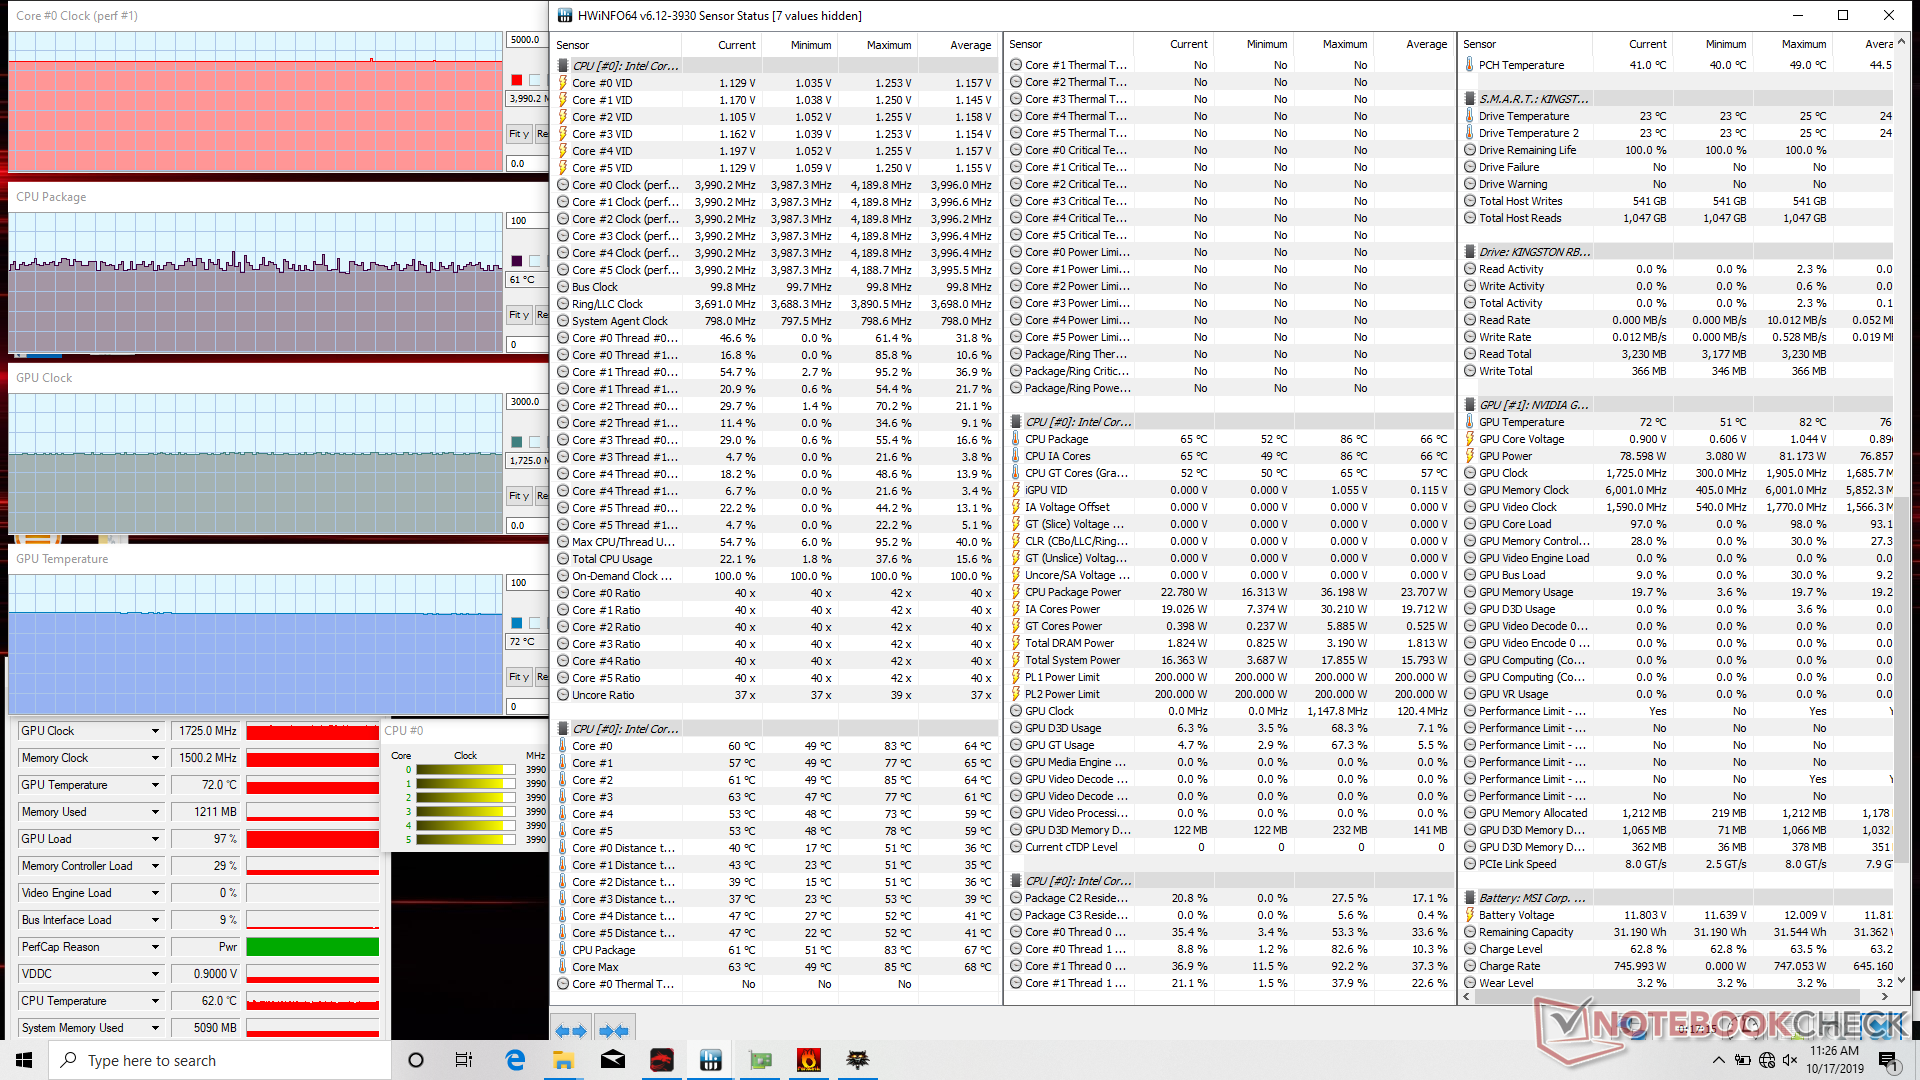
Core temperatures are cooler when running Witcher 3 as shown by the table below. If Cooler Boost fan mode (i.e., Turbo fan) is active, core temperature can drop by as much as 10 degrees at the cost of louder fan noise. Note that performance will not increase significantly when on Cooler Boost mode meaning that Cooler Boost is primarily for temperature control rather than performance control.
Running on battery power will limit performance. A Fire Strike run on batteries returns Physics and Graphics scores of 11928 and 3738 points, respectively, compared to 17414 and 15043 points when on mains.
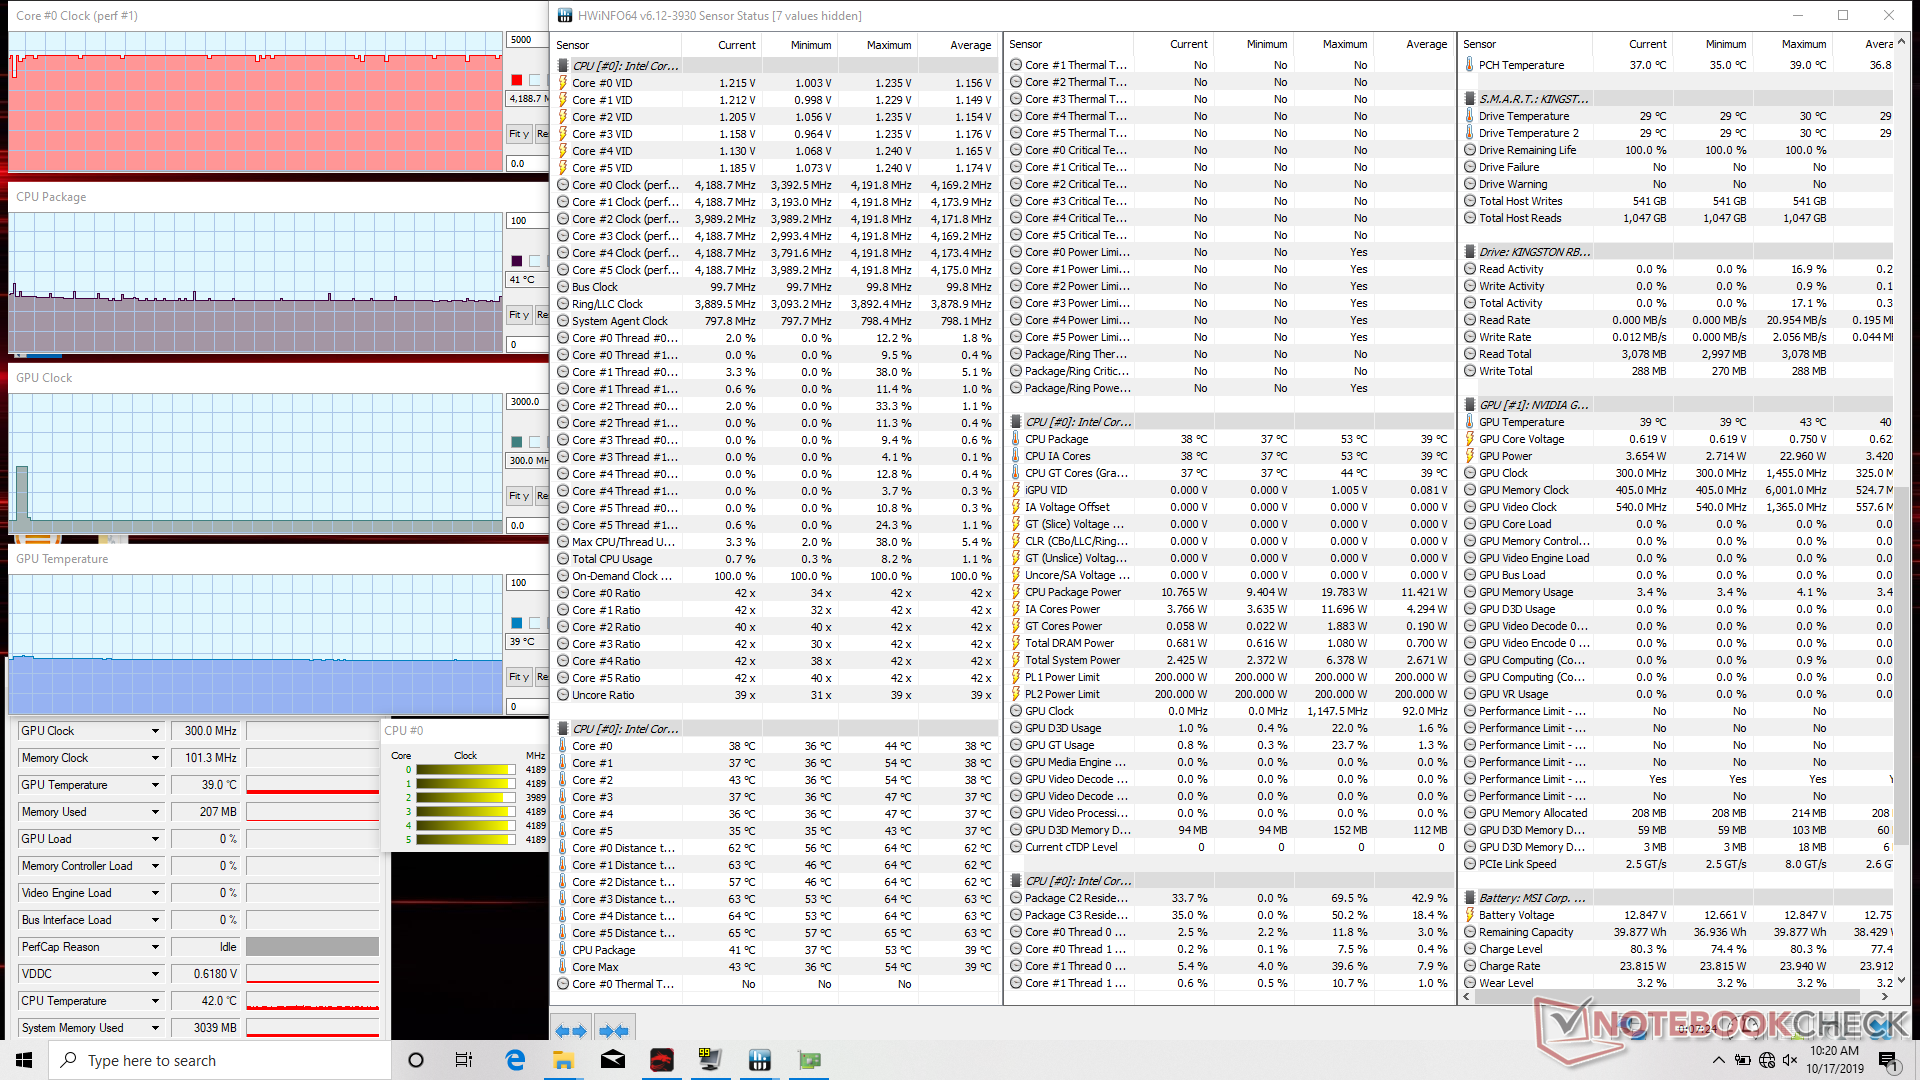
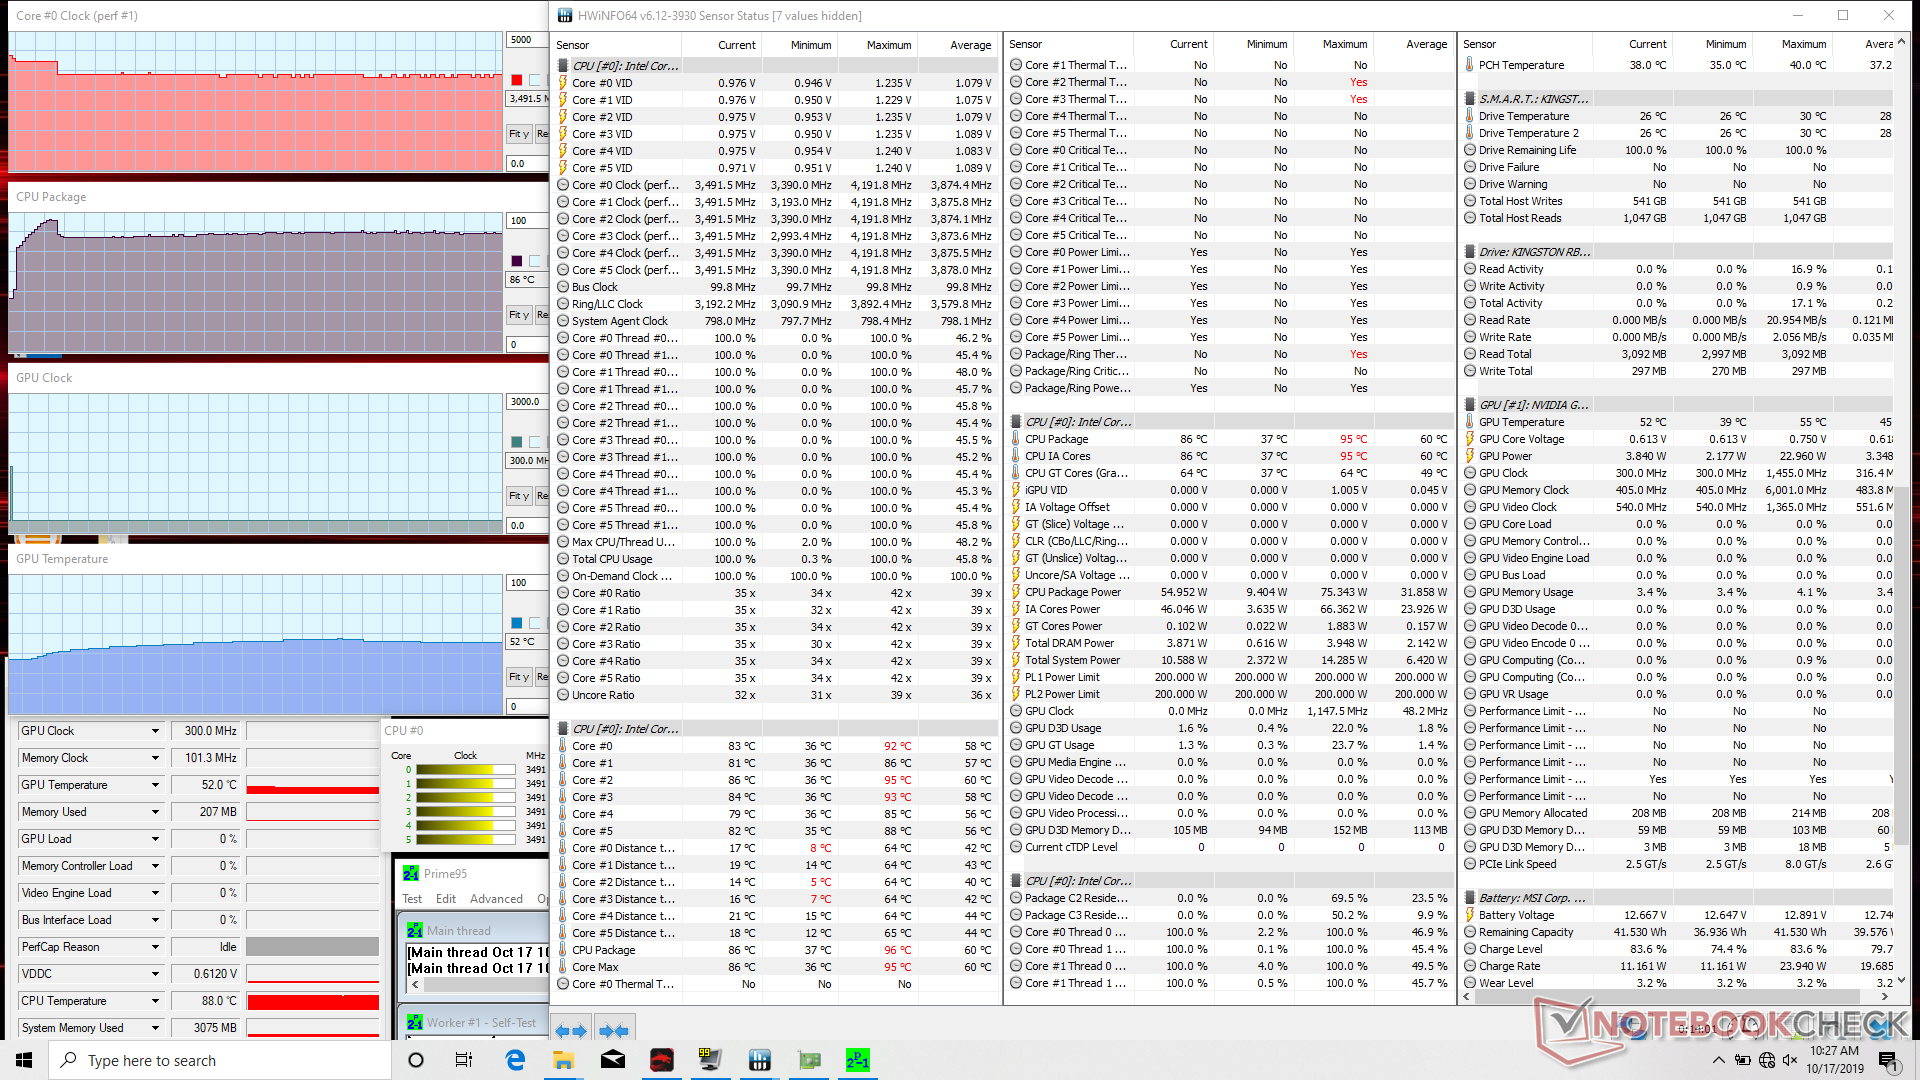
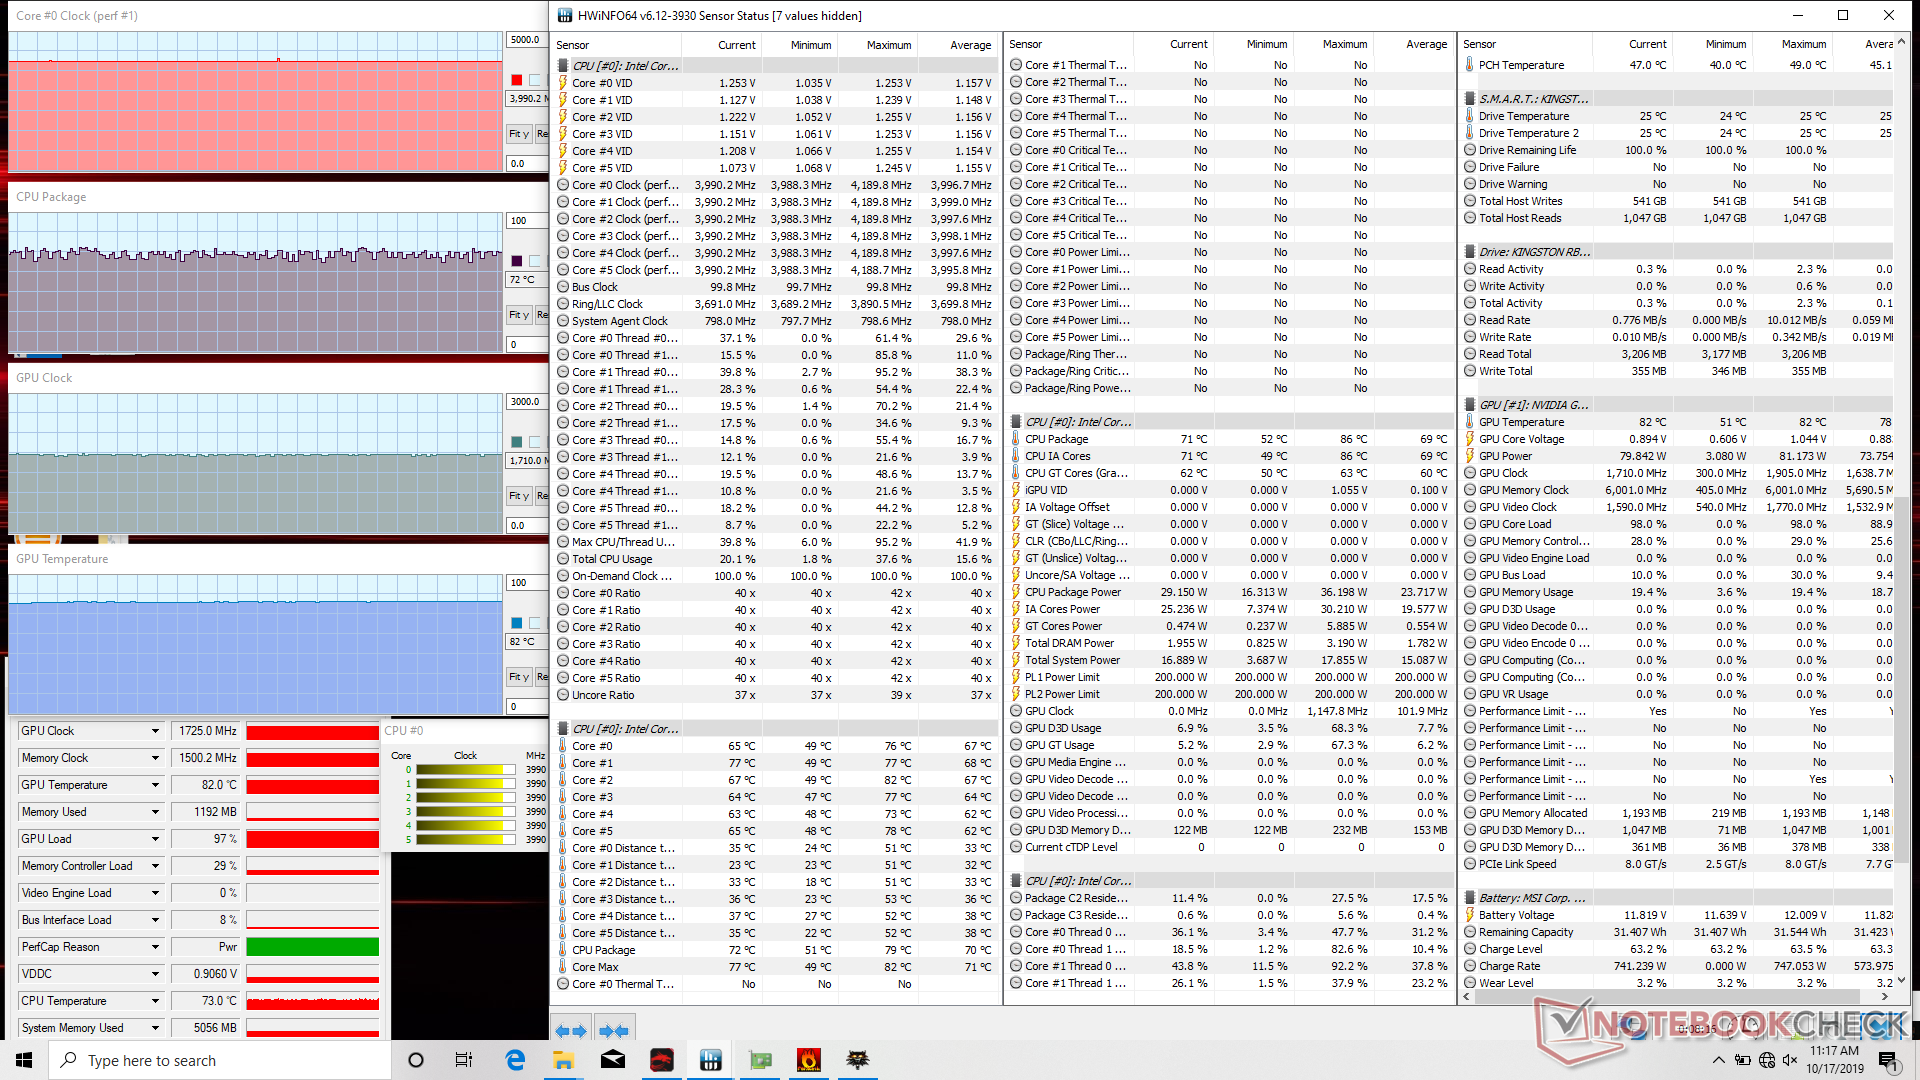
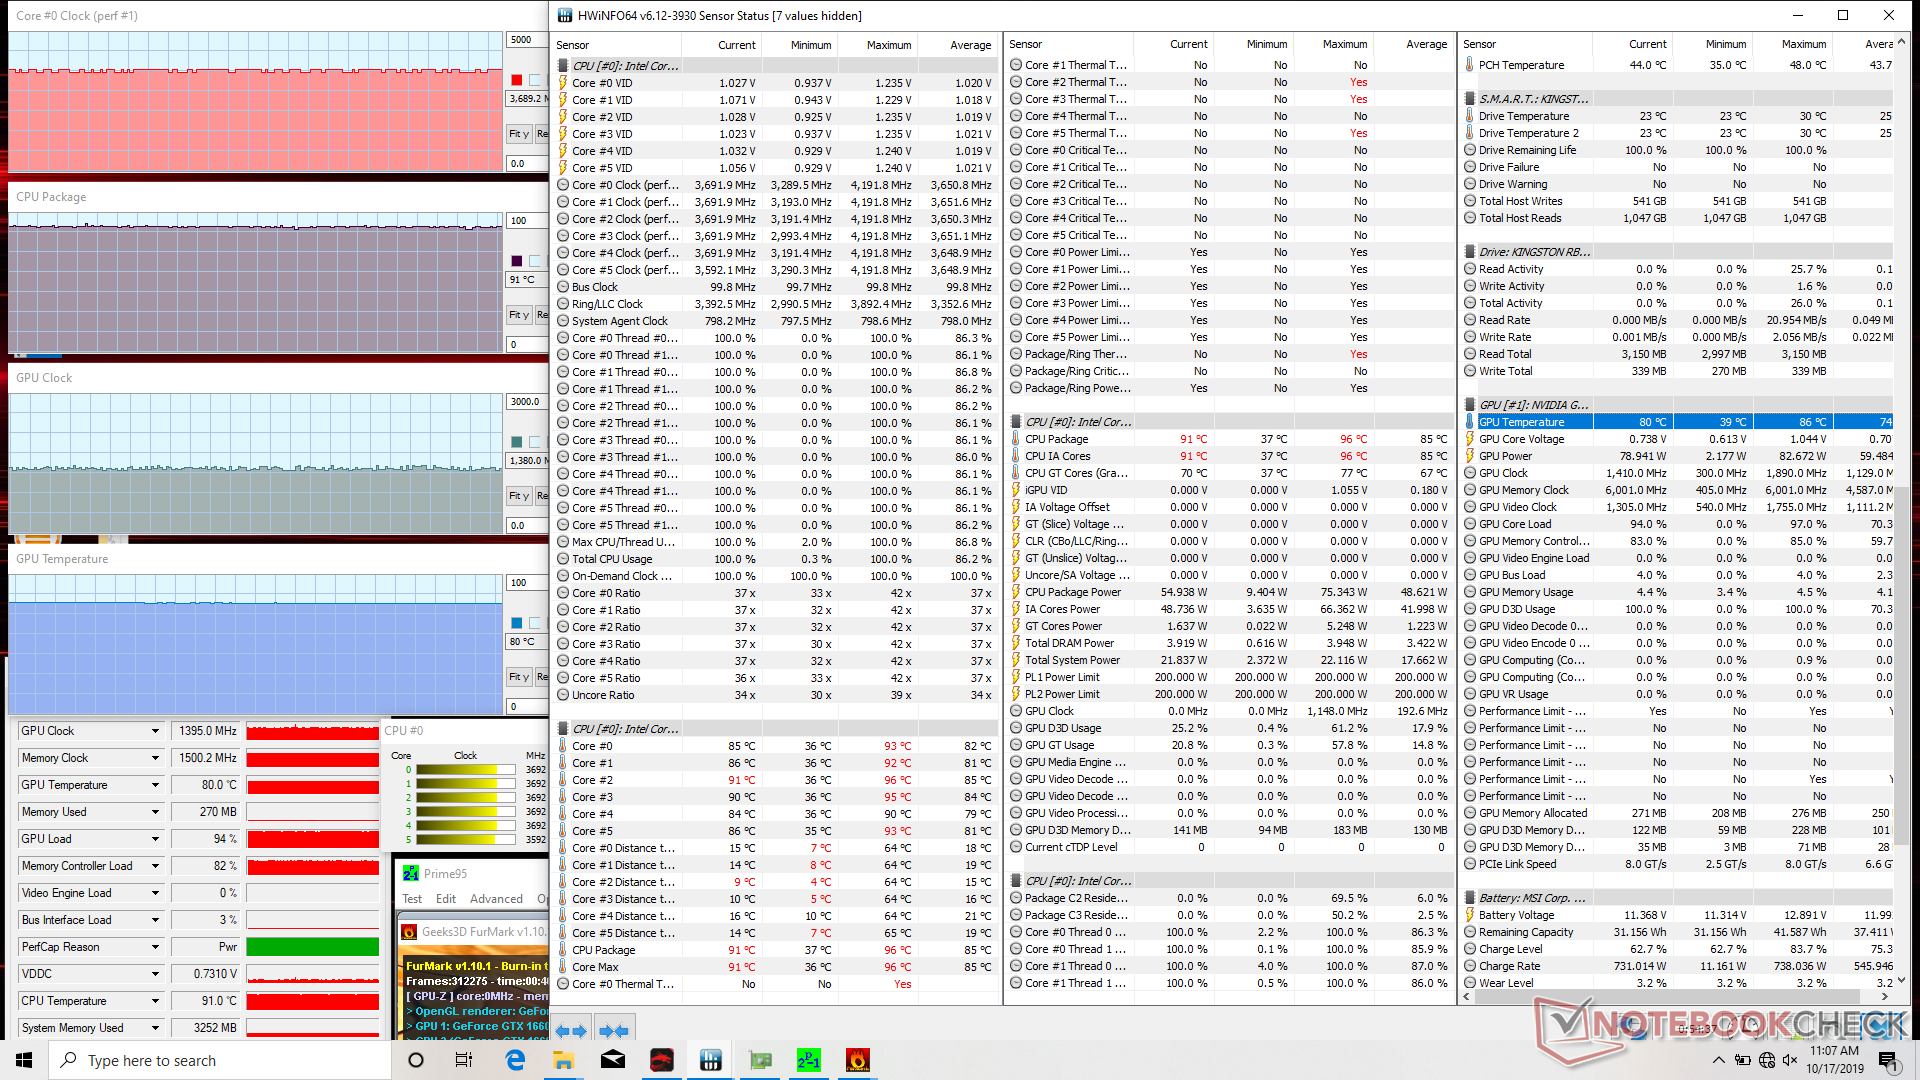

| CPU Clock (GHz) | GPU Clock (MHz) | Average CPU Temperature (°C) | Average GPU Temperature (°C) | |
| System Idle | -- | -- | 40 | 39 |
| Prime95 Stress | 3.4 - 3.5 | -- | 86 | 52 |
| Prime95 + FurMark Stress (Auto fan) | 3.5 - 3.7 | 1380 | 94 | 86 |
| Prime95 + FurMark Stress (Cooler Boost fan) | 3.6 - 3.7 | 1395 | 91 | 80 |
| Witcher 3 Stress (Auto fan) | 4.0 | 1725 | ~72 | 82 |
| Witcher 3 Stress (Cooler Boost fan) | 4.0 | 1725 | ~61 | 72 |
Speakers
The 2x 2 W stereo speakers offer a balanced audio experience as shown by the pink noise graph below. Whereas the pink noise graphs on most other inexpensive laptops look more like a hill, the graph for the GF65 appears more linear before roll off begins at about 250 Hz. Maximum volume will cause the palm rests to vibrate just slightly to the touch.


MSI GF65 9SD audio analysis
(+) | speakers can play relatively loud (84.6 dB)
Bass 100 - 315 Hz
(-) | nearly no bass - on average 19.5% lower than median
(-) | bass is not linear (15.4% delta to prev. frequency)
Mids 400 - 2000 Hz
(+) | balanced mids - only 1.9% away from median
(+) | mids are linear (5.8% delta to prev. frequency)
Highs 2 - 16 kHz
(+) | balanced highs - only 2.5% away from median
(±) | linearity of highs is average (10.5% delta to prev. frequency)
Overall 100 - 16.000 Hz
(±) | linearity of overall sound is average (17.4% difference to median)
Compared to same class
» 47% of all tested devices in this class were better, 12% similar, 41% worse
» The best had a delta of 6%, average was 18%, worst was 132%
Compared to all devices tested
» 31% of all tested devices were better, 8% similar, 61% worse
» The best had a delta of 4%, average was 24%, worst was 134%
Apple MacBook 12 (Early 2016) 1.1 GHz audio analysis
(+) | speakers can play relatively loud (83.6 dB)
Bass 100 - 315 Hz
(±) | reduced bass - on average 11.3% lower than median
(±) | linearity of bass is average (14.2% delta to prev. frequency)
Mids 400 - 2000 Hz
(+) | balanced mids - only 2.4% away from median
(+) | mids are linear (5.5% delta to prev. frequency)
Highs 2 - 16 kHz
(+) | balanced highs - only 2% away from median
(+) | highs are linear (4.5% delta to prev. frequency)
Overall 100 - 16.000 Hz
(+) | overall sound is linear (10.2% difference to median)
Compared to same class
» 7% of all tested devices in this class were better, 2% similar, 91% worse
» The best had a delta of 5%, average was 19%, worst was 53%
Compared to all devices tested
» 4% of all tested devices were better, 1% similar, 95% worse
» The best had a delta of 4%, average was 24%, worst was 134%
Energy Management
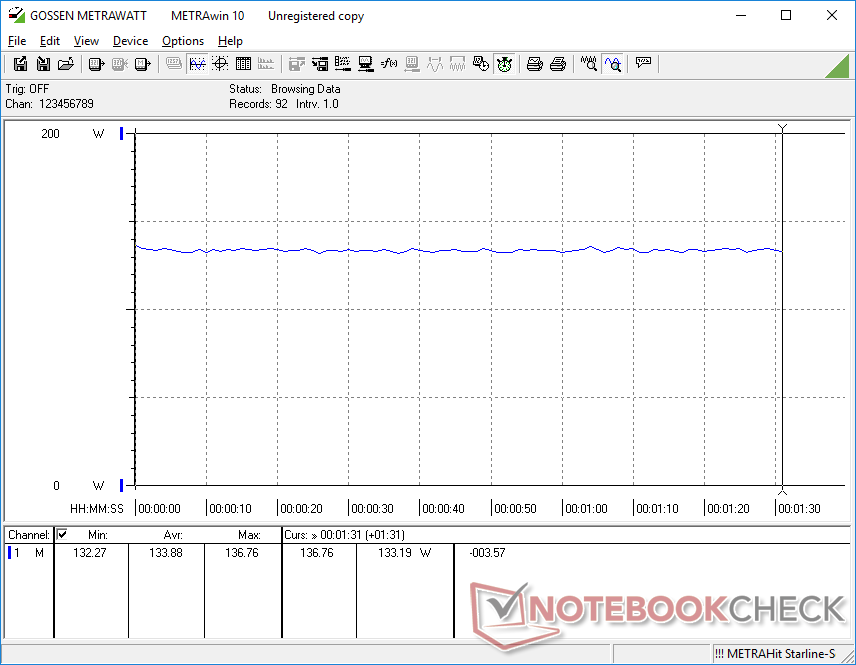
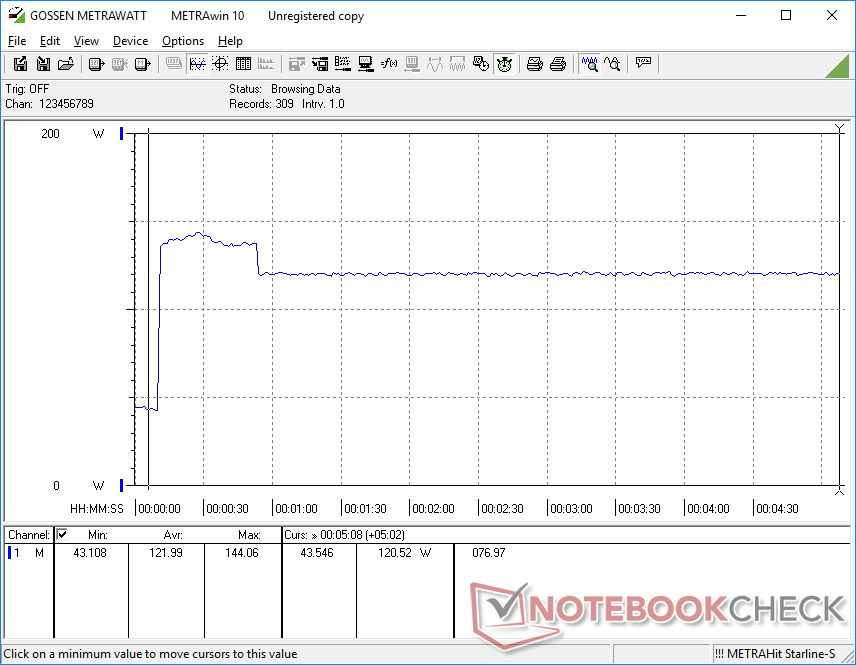
Power Consumption
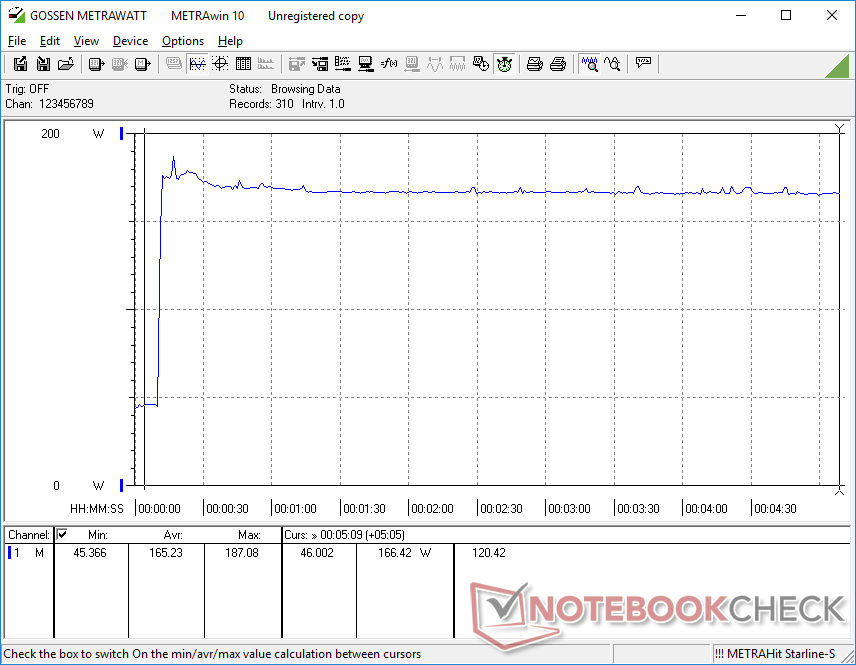
Idling on desktop demands anywhere between 9 W and 22 W depending on the brightness and power profile. When running Witcher 3, consumption becomes steady at about 134 W compared to just 93 W on the older GF63 with GTX 1050 graphics. The 44 percent increase is a small price to pay relative to the 130 percent to 260 percent increase in graphics horsepower when jumping from the GTX 1050 to the GTX 1660 Ti.
We're able to record a maximum draw of 187 W from the medium-sized (~15.3 x 7.5 x 3 cm) 180 W AC adapter. Recharge rate will slow to a crawl if the CPU and GPU are each at 100 percent utilization.

| Off / Standby | |
| Idle | |
| Load |
|
Key:
min: | |
| MSI GF65 9SD i7-9750H, GeForce GTX 1660 Ti Mobile, Kingston RBUSNS8154P3512GJ, IPS, 1920x1080, 15.6" | Asus ROG Zephyrus G15 GA502DU R7 3750H, GeForce GTX 1660 Ti Max-Q, Intel SSD 660p SSDPEKNW512G8, IPS, 1920x1080, 15.6" | MSI GF63 8RC i5-8300H, GeForce GTX 1050 Mobile, Seagate BarraCuda Pro Compute 1TB ST1000LM049, IPS, 1920x1080, 15.6" | Aorus 15-SA i7-9750H, GeForce GTX 1660 Ti Mobile, Intel SSD 760p SSDPEKKW512G8, IPS, 1920x1080, 15.6" | Dell G7 7590 i7-9750H, GeForce RTX 2060 Mobile, Toshiba BG3 KBG30ZMS256G, IPS, 1920x1080, 15.6" | Lenovo Legion Y7000P-1060 i7-8750H, GeForce GTX 1060 Mobile, Samsung SSD PM981 MZVLB256HAHQ, IPS, 1920x1080, 15.6" | |
|---|---|---|---|---|---|---|
| Power Consumption | 6% | 29% | -38% | -35% | 14% | |
| Idle Minimum * | 9.5 | 7.4 22% | 5.4 43% | 20 -111% | 11.2 -18% | 4.9 48% |
| Idle Average * | 12.4 | 8.6 31% | 10.4 16% | 23 -85% | 16.3 -31% | 8.1 35% |
| Idle Maximum * | 22 | 39.1 -78% | 10.5 52% | 29 -32% | 46.2 -110% | 16.5 25% |
| Load Average * | 80.8 | 65.9 18% | 84.7 -5% | 87 -8% | 123.3 -53% | 109.2 -35% |
| Witcher 3 ultra * | 133.9 | 106.9 20% | 92.7 31% | 136 -2% | 135.6 -1% | 124.6 7% |
| Load Maximum * | 187.1 | 141.3 24% | 119.9 36% | 173 8% | 181.5 3% | 175.2 6% |
* ... smaller is better
Battery Life
Battery capacity remains the same as the last generation GF63 at 51 Wh. Runtimes are therefore nearly the same at just over 5 hours of real-world WLAN use.
Recharging from empty to full capacity takes a bit longer than usual at 2 to 2.5 hours.
| MSI GF65 9SD i7-9750H, GeForce GTX 1660 Ti Mobile, 51 Wh | Asus ROG Zephyrus G15 GA502DU R7 3750H, GeForce GTX 1660 Ti Max-Q, 76 Wh | MSI GF63 8RC i5-8300H, GeForce GTX 1050 Mobile, 51 Wh | Lenovo Legion Y540-15IRH-81SX00B2GE i7-9750H, GeForce GTX 1660 Ti Mobile, 57 Wh | Dell G7 7590 i7-9750H, GeForce RTX 2060 Mobile, 60 Wh | Aorus 15-SA i7-9750H, GeForce GTX 1660 Ti Mobile, 62 Wh | |
|---|---|---|---|---|---|---|
| Battery Runtime | 58% | 9% | -52% | -10% | -45% | |
| WiFi v1.3 | 305 | 482 58% | 332 9% | 145 -52% | 275 -10% | 169 -45% |
| Reader / Idle | 916 | 571 | 240 | 666 | 208 | |
| Load | 123 | 56 | 76 | 106 | 122 |
Pros
Cons
Verdict

The most notable upgrade from the older GF63 is the GTX 1660 Ti GPU in the GF65. The GF63 is limited to the GTX 1050 Ti which offers roughly 50 percent slower graphics performance than the GTX 1660 Ti. The difference when gaming will be tangible.
Other than the GPU swap, the GF65 sports additional M.2 slots, 120/144 Hz display options, fans, and copper heat pipes under the hood in order to accommodate the more power-hungry GPU. Almost everything else is nearly the same including the average battery life, average black-white response times, budget chassis, great speakers, and moderately difficult serviceability. One important change, however, is fan noise because the GF65 will be louder than its predecessor when gaming.
You're getting a lot of gaming power from the MSI GF65 GTX 1660 Ti for under $1000 especially when you consider that slower GTX 1060 laptops launched at even higher prices. You'll have to cope with the loud fan noise, moderate level of ghosting, and unconventional port positioning.
MSI GF65 9SD
- 05/15/2020 v7 (old)
Allen Ngo


Price comparison
