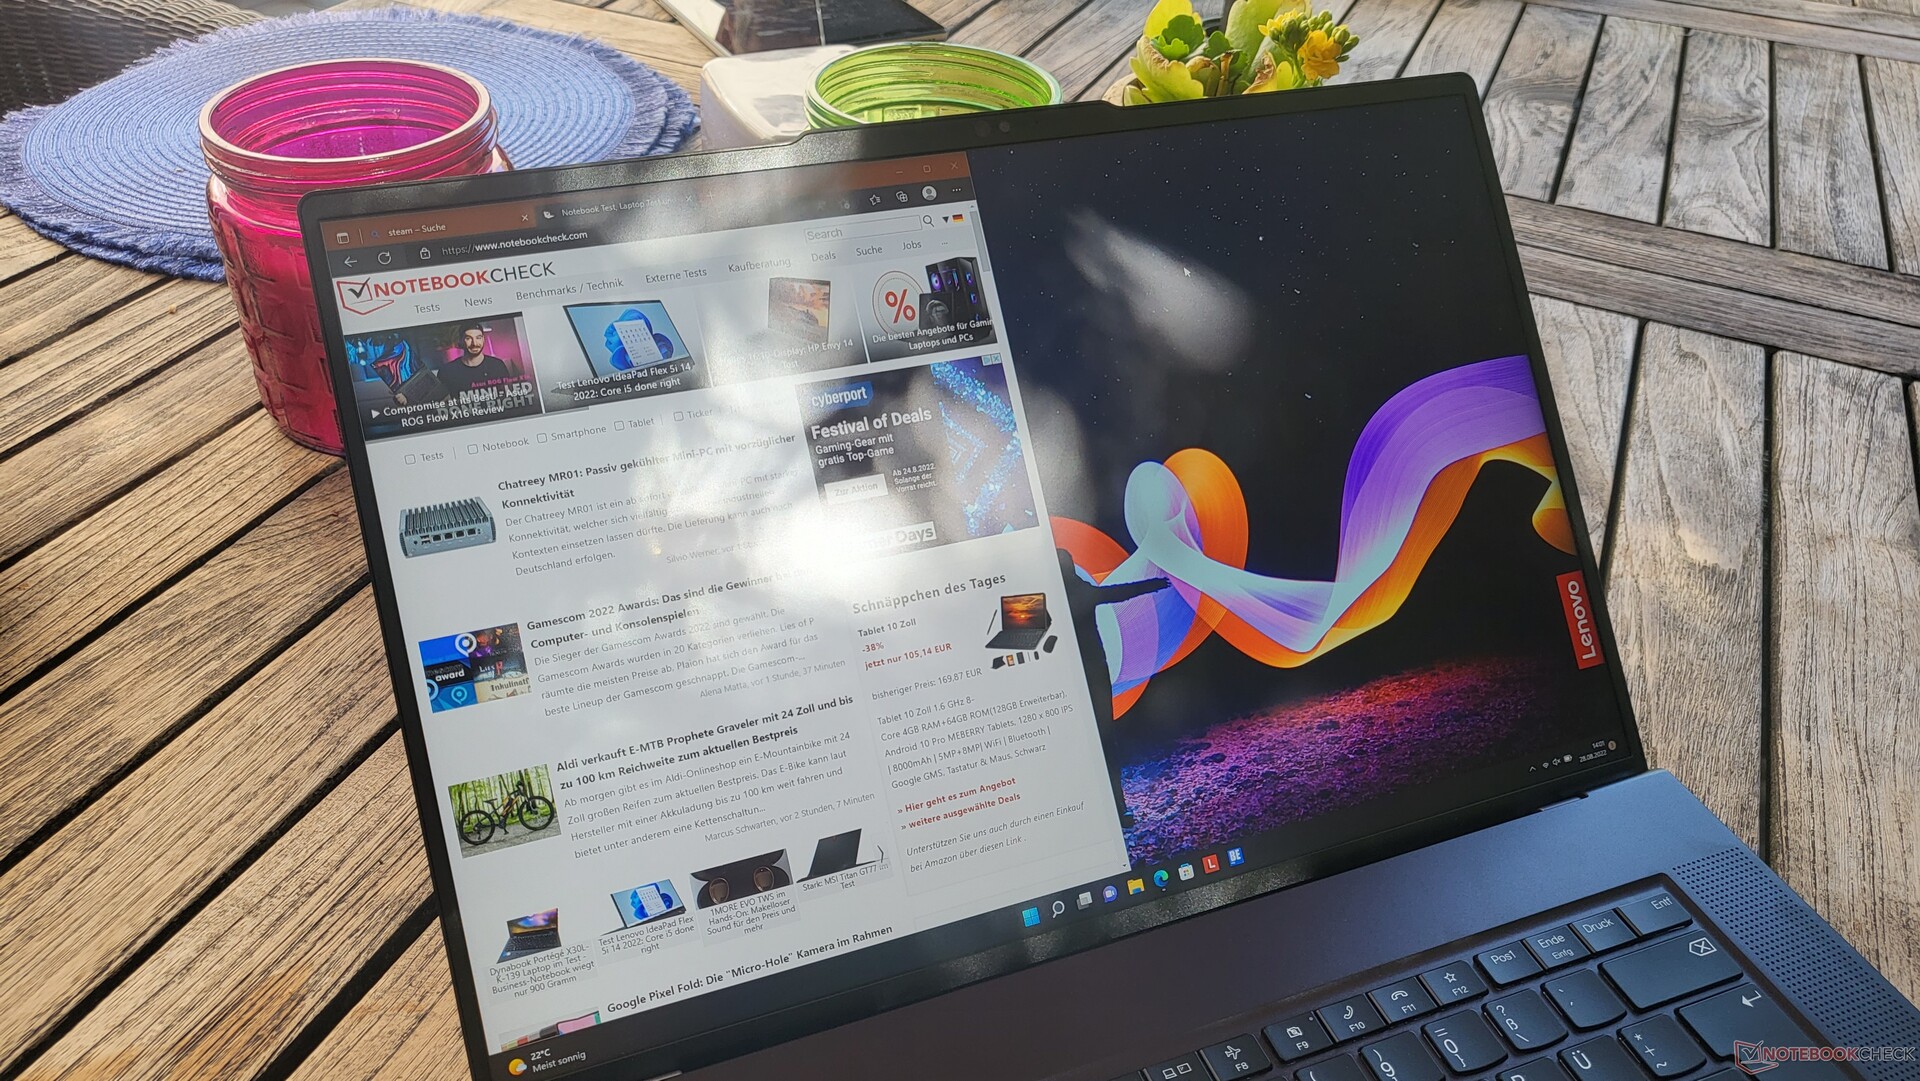
Lenovo ThinkPad Z16 G1 laptop review: Powerful AMD flagship with a hickup
ThinkPad and AMD - a combination that hasn't been seen very often for a long time. However, in the last few years this has definitely changed, now culminating in the Lenovo ThinkPad Z series, the first high-end series with the Ryzen chips. In the beginning of the year, Lenovo announced two models and sizes. We were already able to test the smaller Lenovo ThinkPad Z13, and now follows the model with the large 16-inch display, the Lenovo ThinkPad Z16.
While the Z13 clearly places the focus on mobility, the Z16 targets the multimedia sector and is supposed to compete with laptops such as the Dell XPS 15 and Apple MacBook Pro 16, and even with the Lenovo ThinkPad X1 Extreme, the current Lenovo top dog for multimedia customers.
Possible Competitors in Comparison
Rating | Date | Model | Weight | Height | Size | Resolution | Price |
|---|---|---|---|---|---|---|---|
| 87.3 % v7 (old) | 10 / 2022 | Lenovo ThinkPad Z16 G1 21D5S00T00 R7 PRO 6850H, Radeon RX 6500M | 1.9 kg | 15.8 mm | 16.00" | 1920x1200 | |
| 89 % v7 (old) | 11 / 2021 | Lenovo ThinkPad X1 Extreme G4-20Y5CTO1WW (3050 Ti) i7-11800H, GeForce RTX 3050 Ti Laptop GPU | 2 kg | 18.2 mm | 16.00" | 3840x2400 | |
| 88.3 % v7 (old) | 12 / 2021 | Lenovo ThinkPad X1 Extreme G4-20Y50040GE i9-11950H, GeForce RTX 3080 Laptop GPU | 1.9 kg | 18.2 mm | 16.00" | 3840x2400 | |
| 89.5 % v7 (old) | 05 / 2022 | Dell XPS 15 9520 RTX 3050 Ti i7-12700H, GeForce RTX 3050 Ti Laptop GPU | 1.9 kg | 18 mm | 15.60" | 3456x2160 | |
| 89.3 % v7 (old) | 06 / 2022 | Dell XPS 17 9720 i7-12700H, GeForce RTX 3050 4GB Laptop GPU | 2.5 kg | 19.5 mm | 17.00" | 3840x2400 | |
| 93.2 % v7 (old) | 11 / 2021 | Apple MacBook Pro 16 2021 M1 Pro M1 Pro, M1 Pro 16-Core GPU | 2.2 kg | 16.8 mm | 16.20" | 3456x2234 | |
| 92.5 % v7 (old) | 11 / 2021 | Apple MacBook Pro 16 2021 M1 Max M1 Max, M1 Max 32-Core GPU | 2.2 kg | 16.8 mm | 16.20" | 3456x2234 |
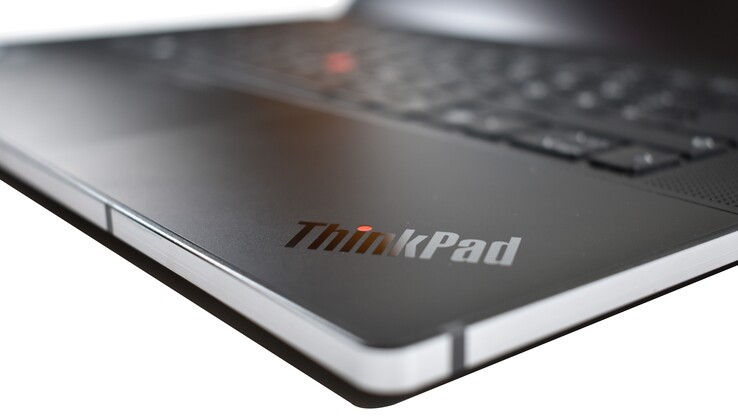
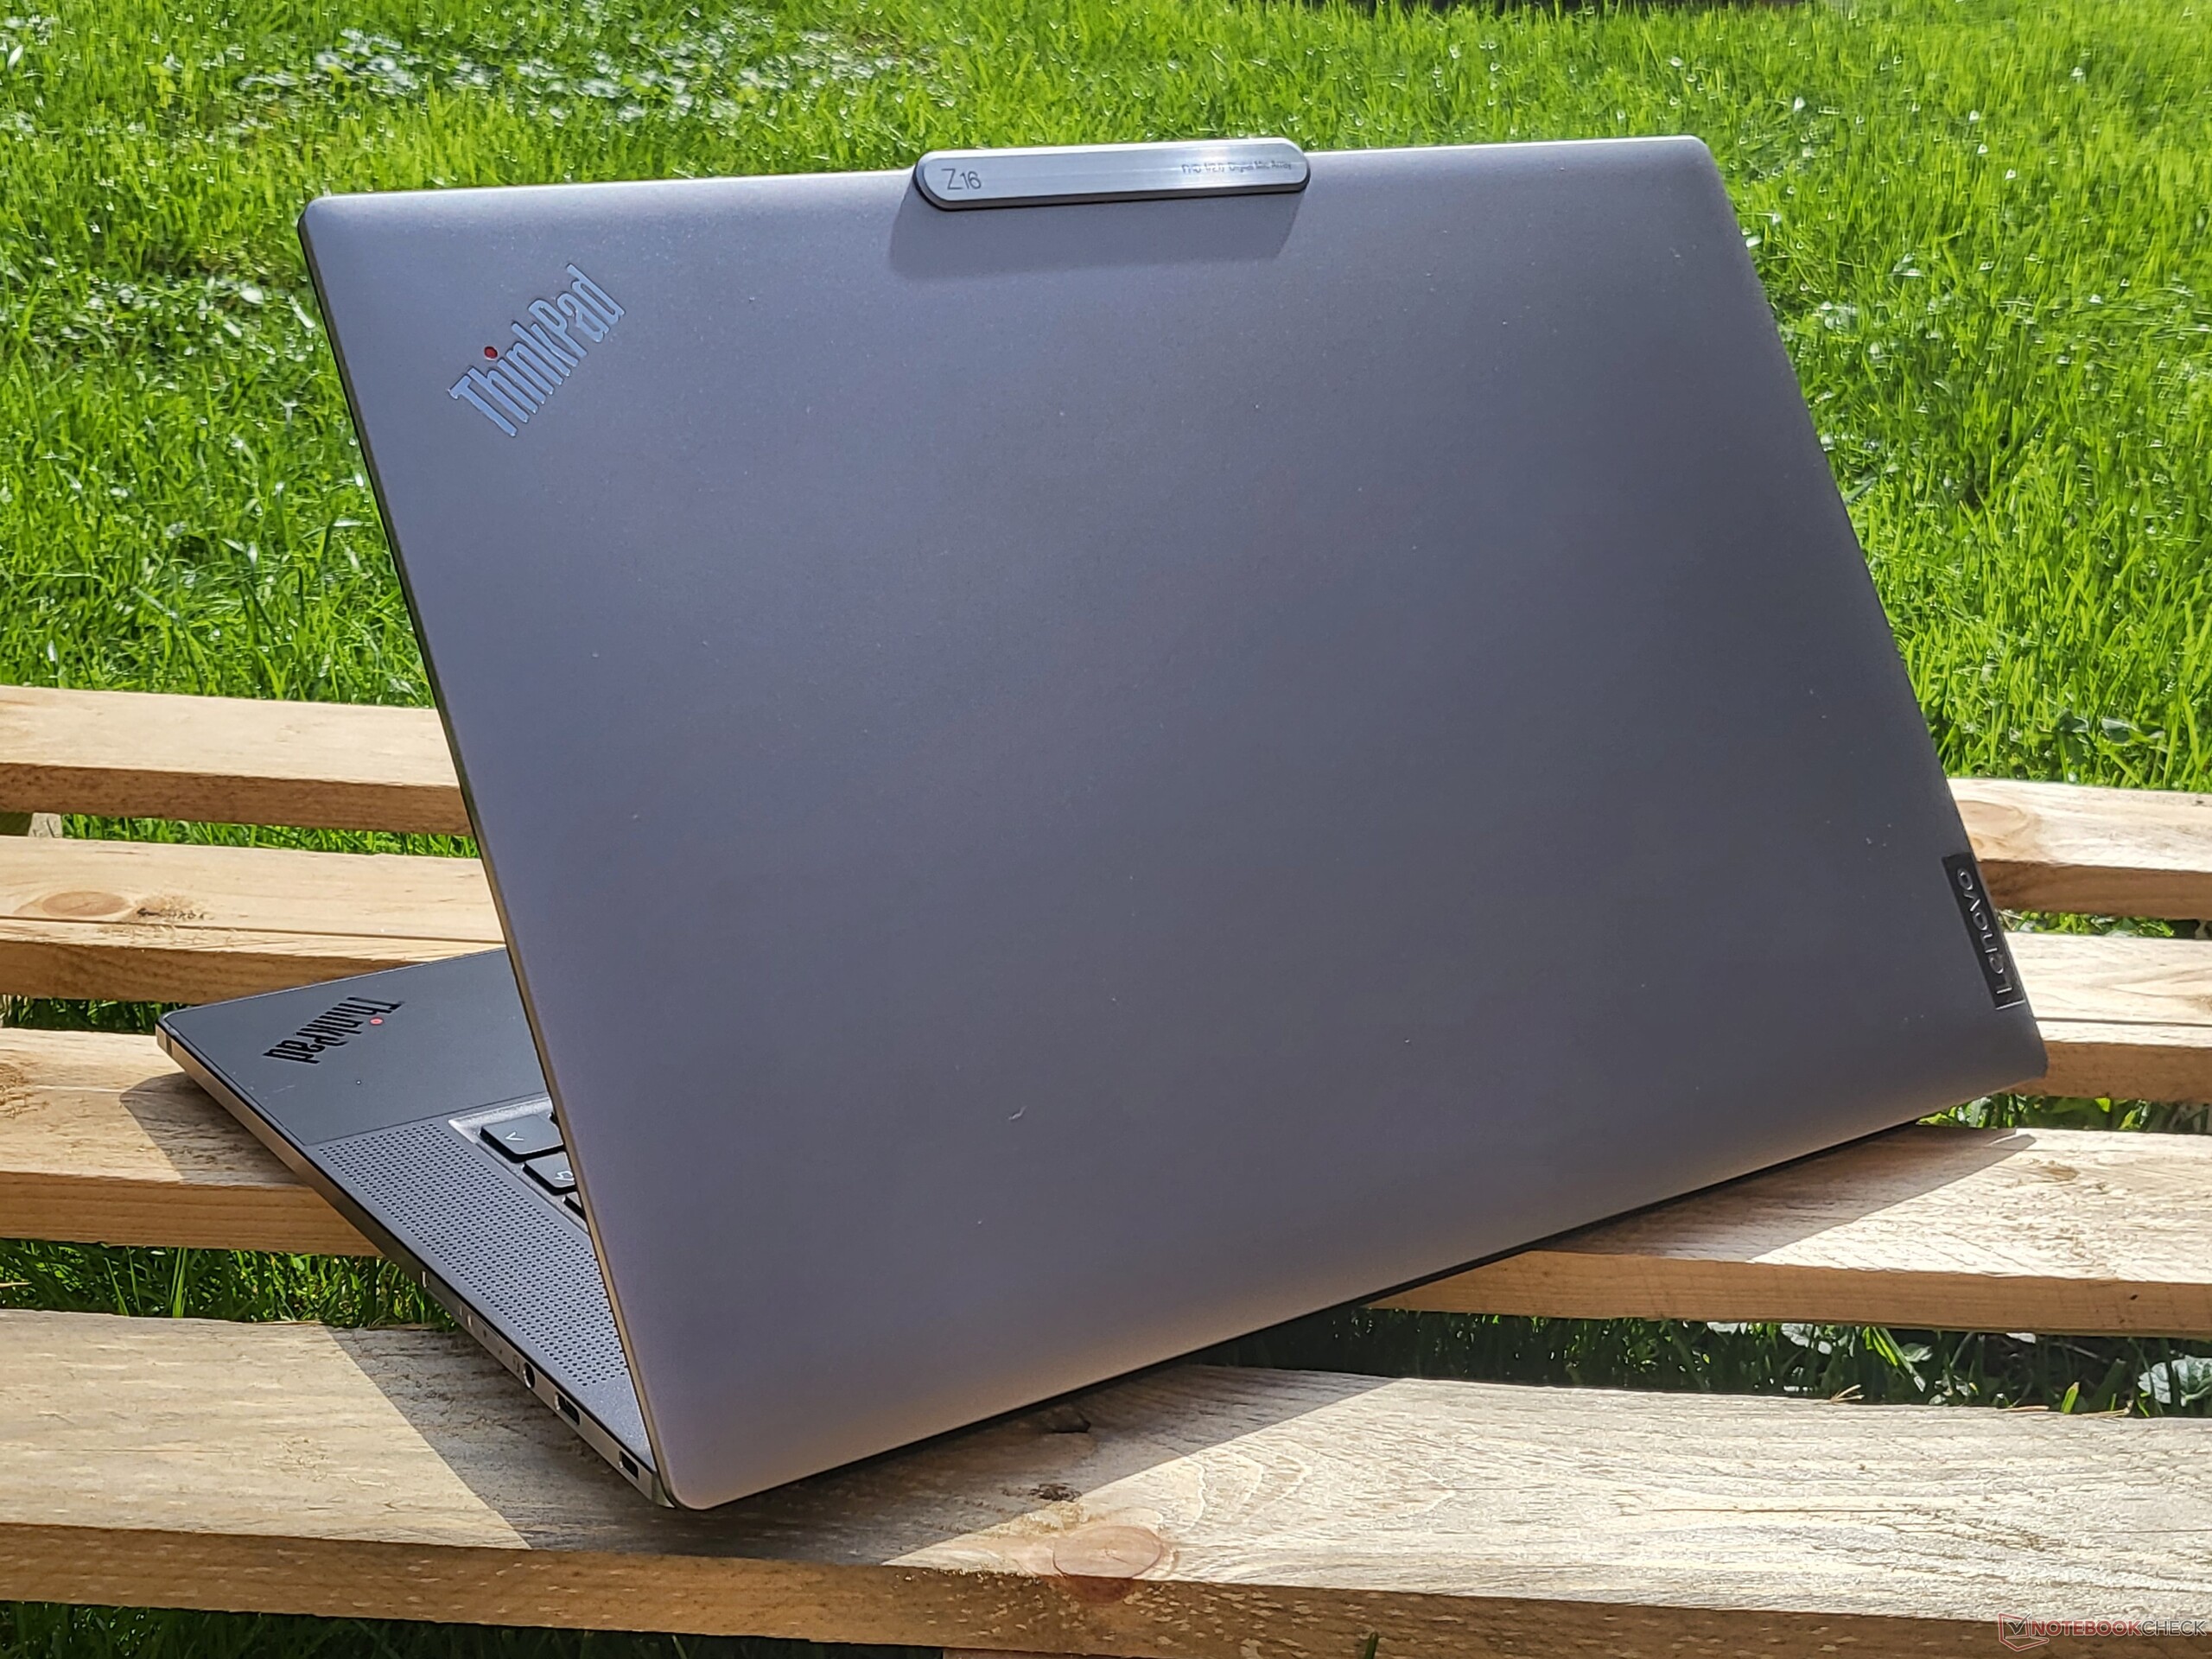
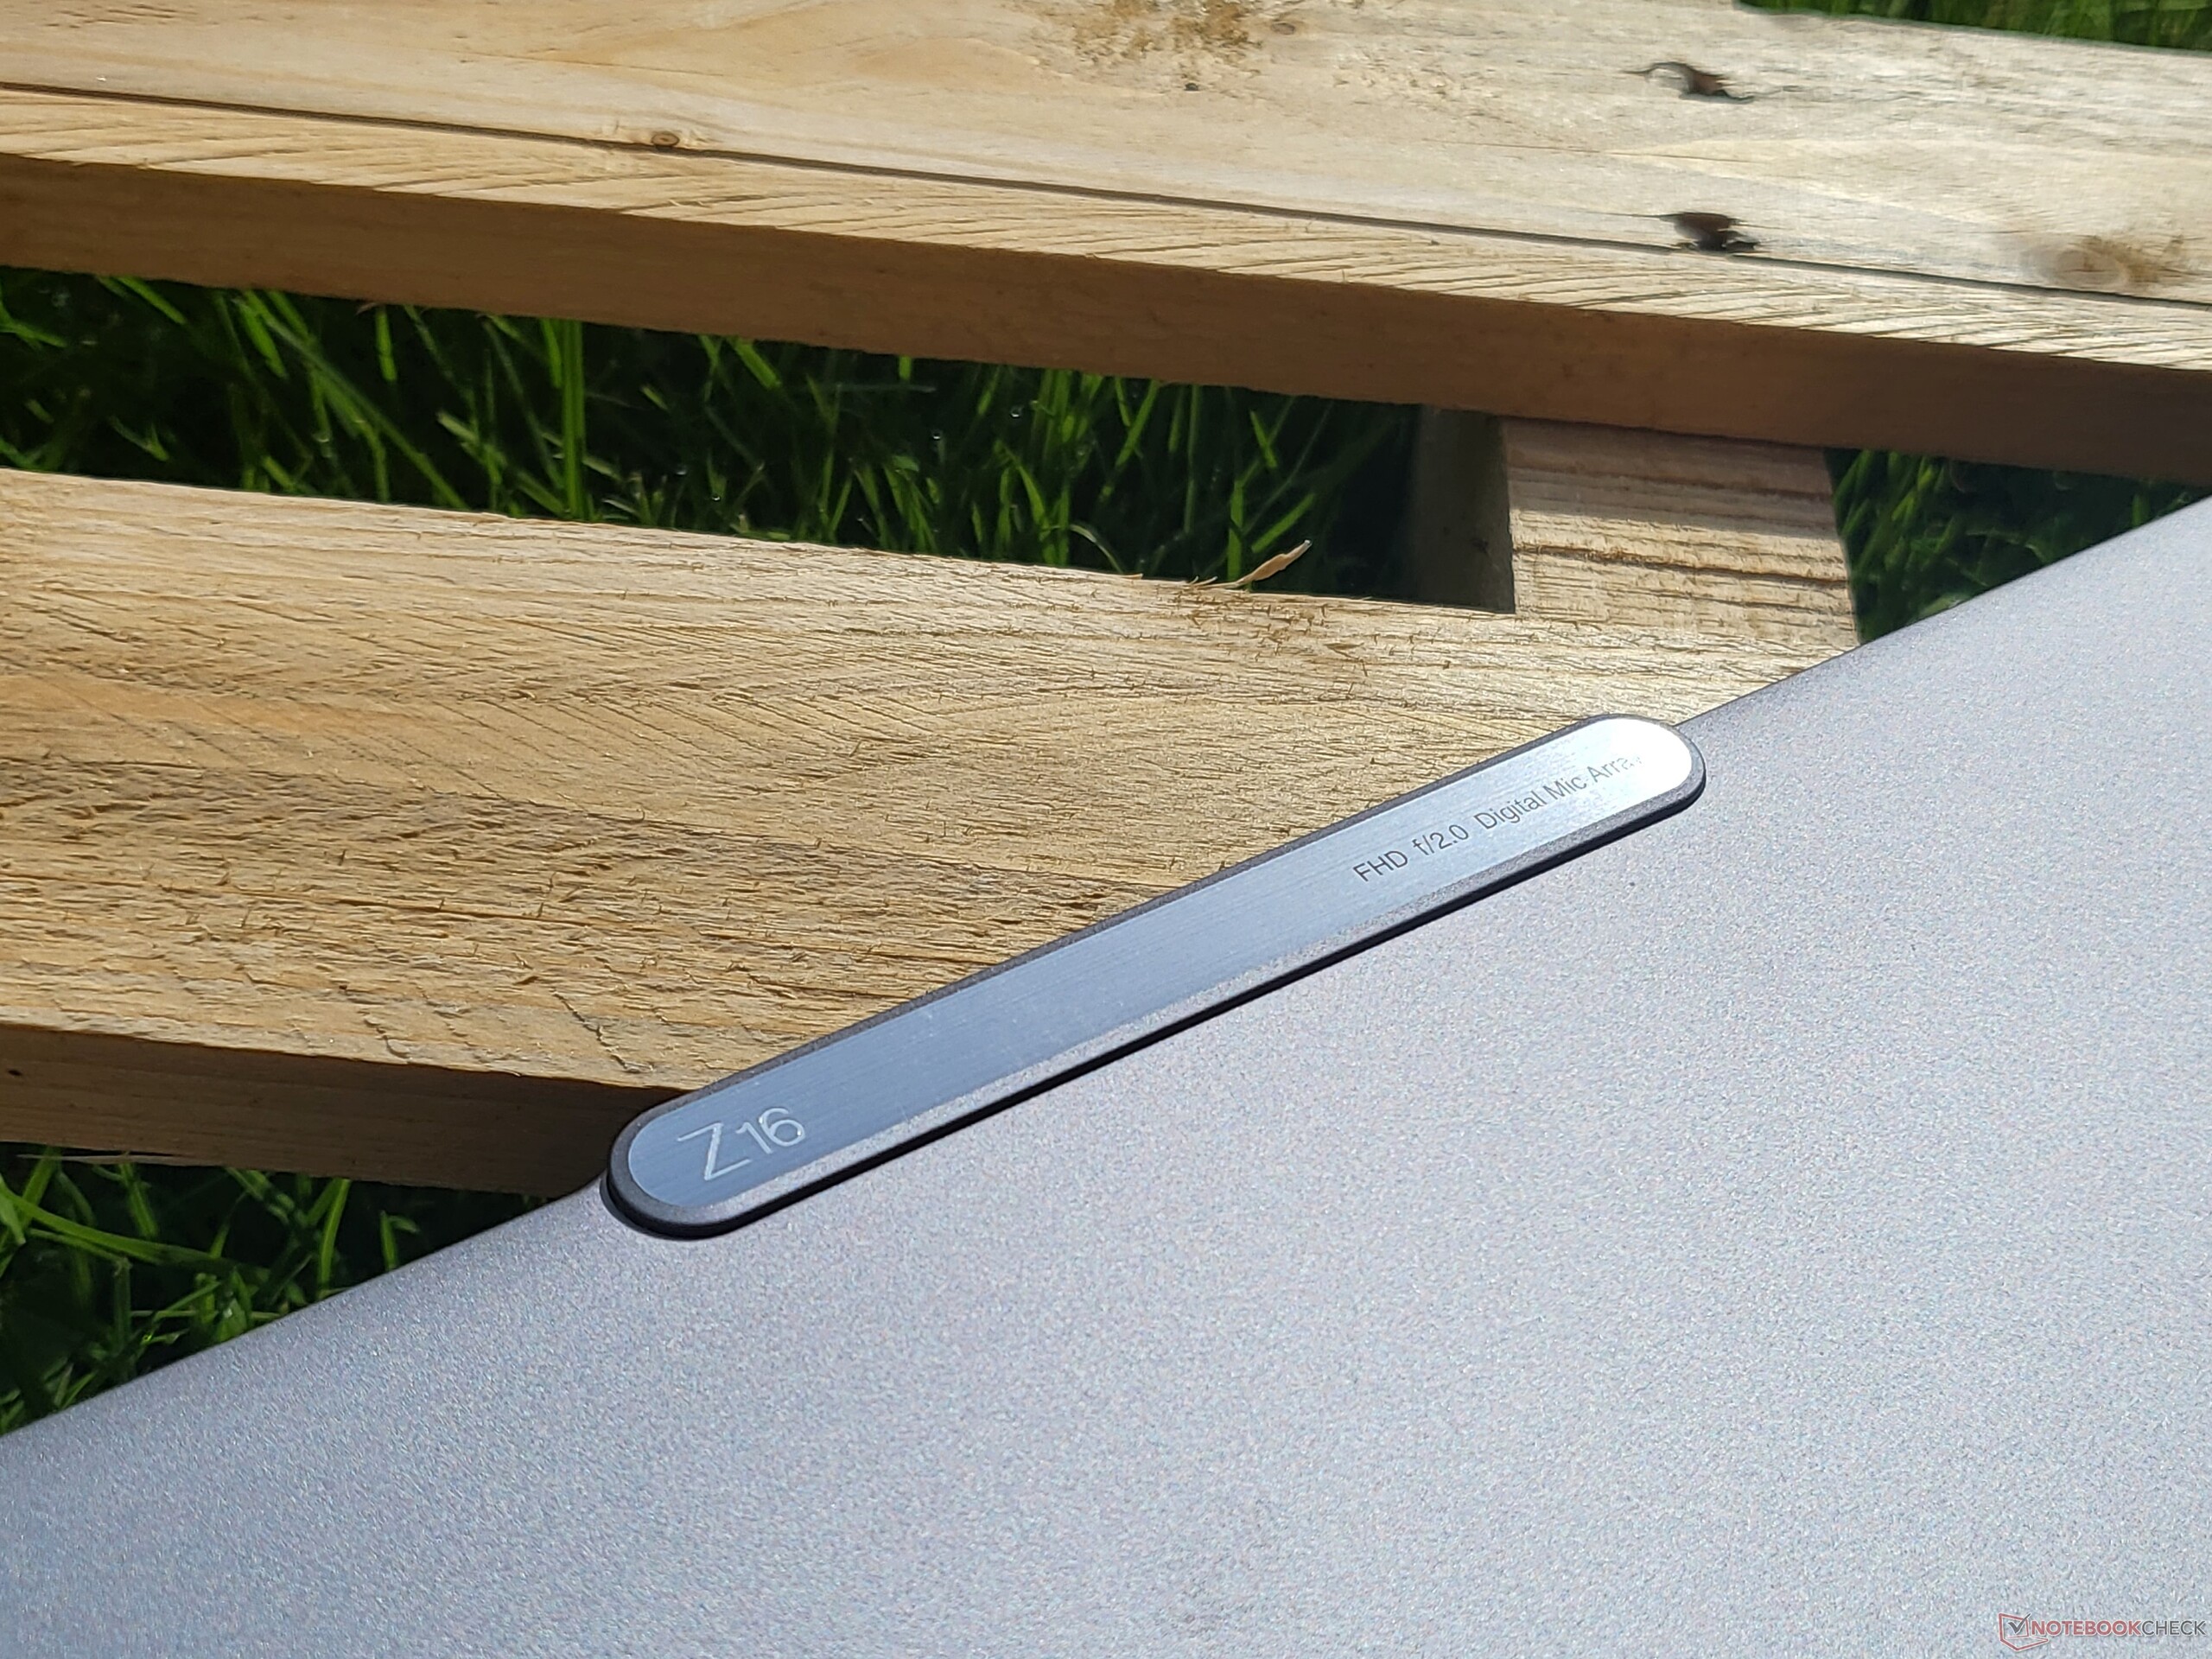
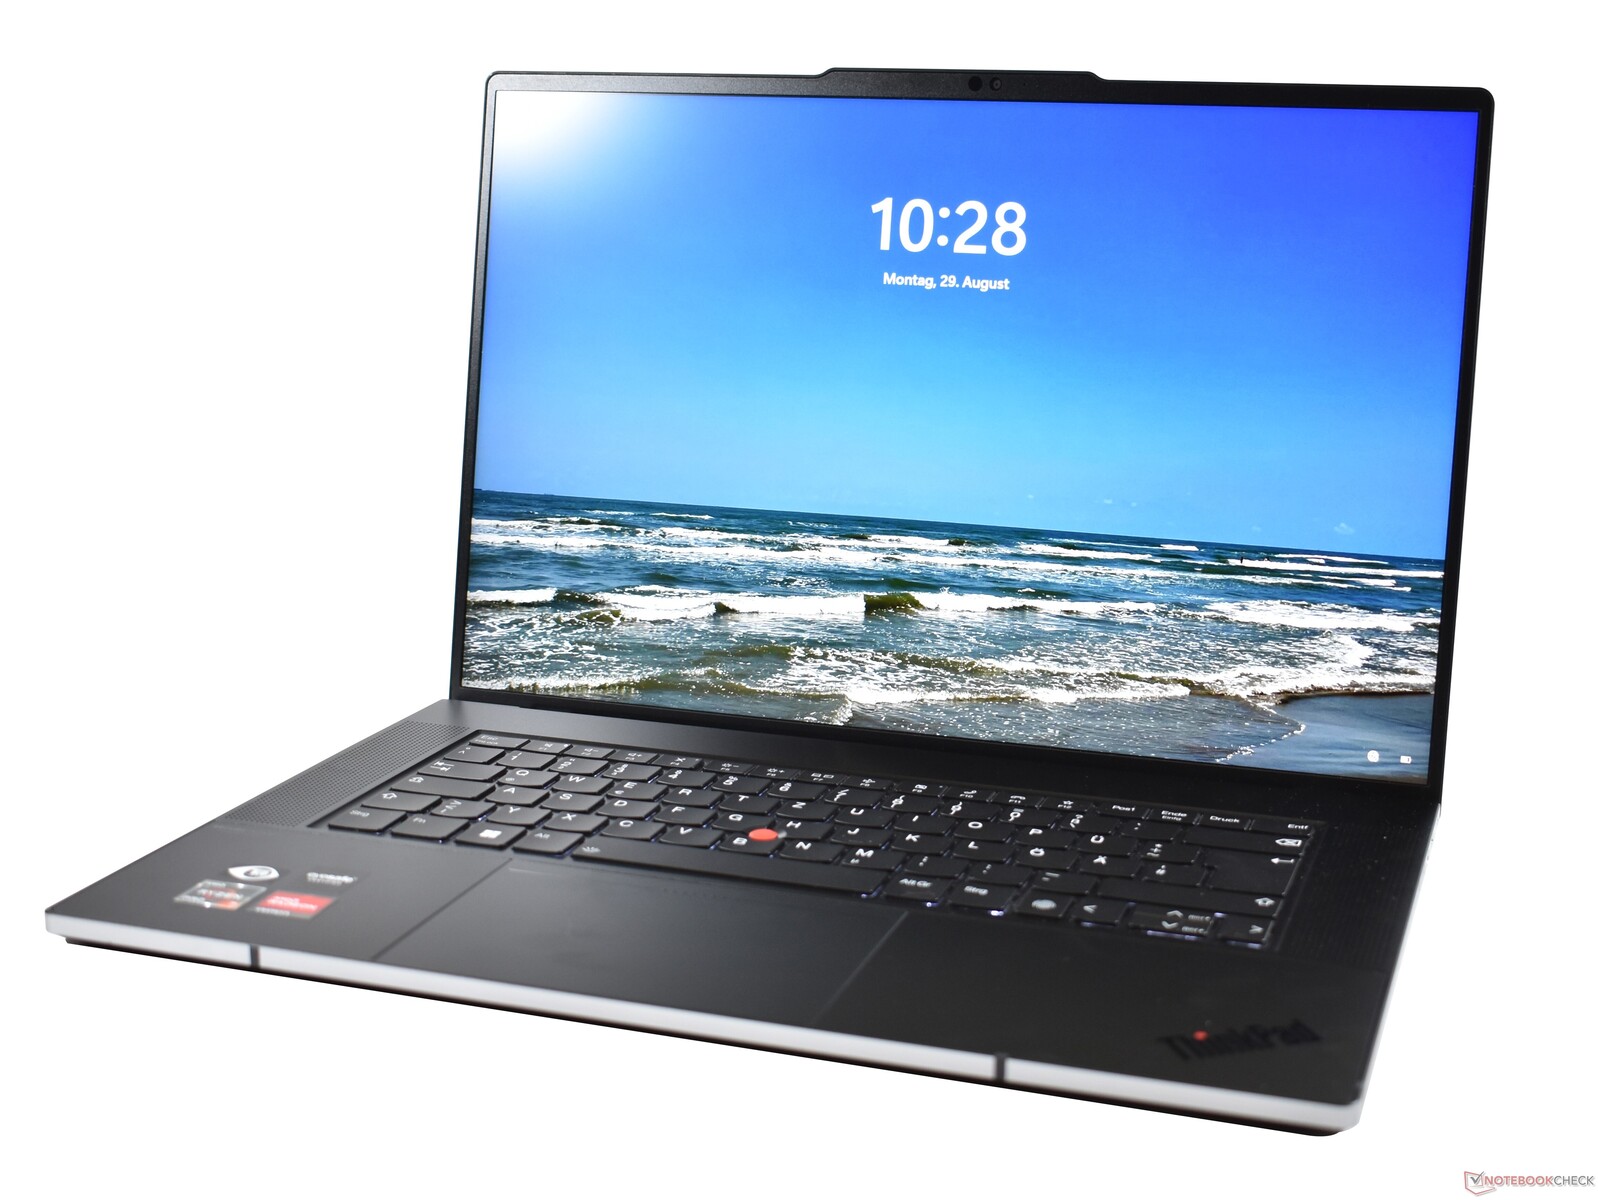
A compact aluminum case: Lenovo ThinkPad Z16 G1
The largest difference compared to the established ThinkPad X1 Extreme series is in the design: While the X1 Extreme uses classic ThinkPad attributes, the looks of the ThinkPad Z16 are a much closer match to the mainstream of the laptop market. With its large touchpad, the rectangular keyboard, and silver display lid, it looks like a hybrid between an XPS or MacBook and a ThinkPad. Of course Lenovo will also place its own accents, such as the camera bulge on the display lid, for example, which is also very practical to use for raising the lid. This can be done easily with one hand, but only up to an opening angle of about 135 degrees. 180 degrees, like with other ThinkPads, are not possible here.
In terms of the choice of materials, Lenovo also takes a different path than with the X1 series. The display lid is made of silver aluminum, the keyboard frame is anodized black, and the bottom is black lacquer. Only the display frame is made of plastic. Another interesting feature is the palm rests, since they are made of matte glass. This creates some haptics for the Z16 that are a level above the X1 Extreme, but this might also be a matter of taste. At least, the Z16 will definitely have less problems with greasy surfaces. The stability of the case is also at a very high level, but naturally, the thin display lid is weaker than the base.
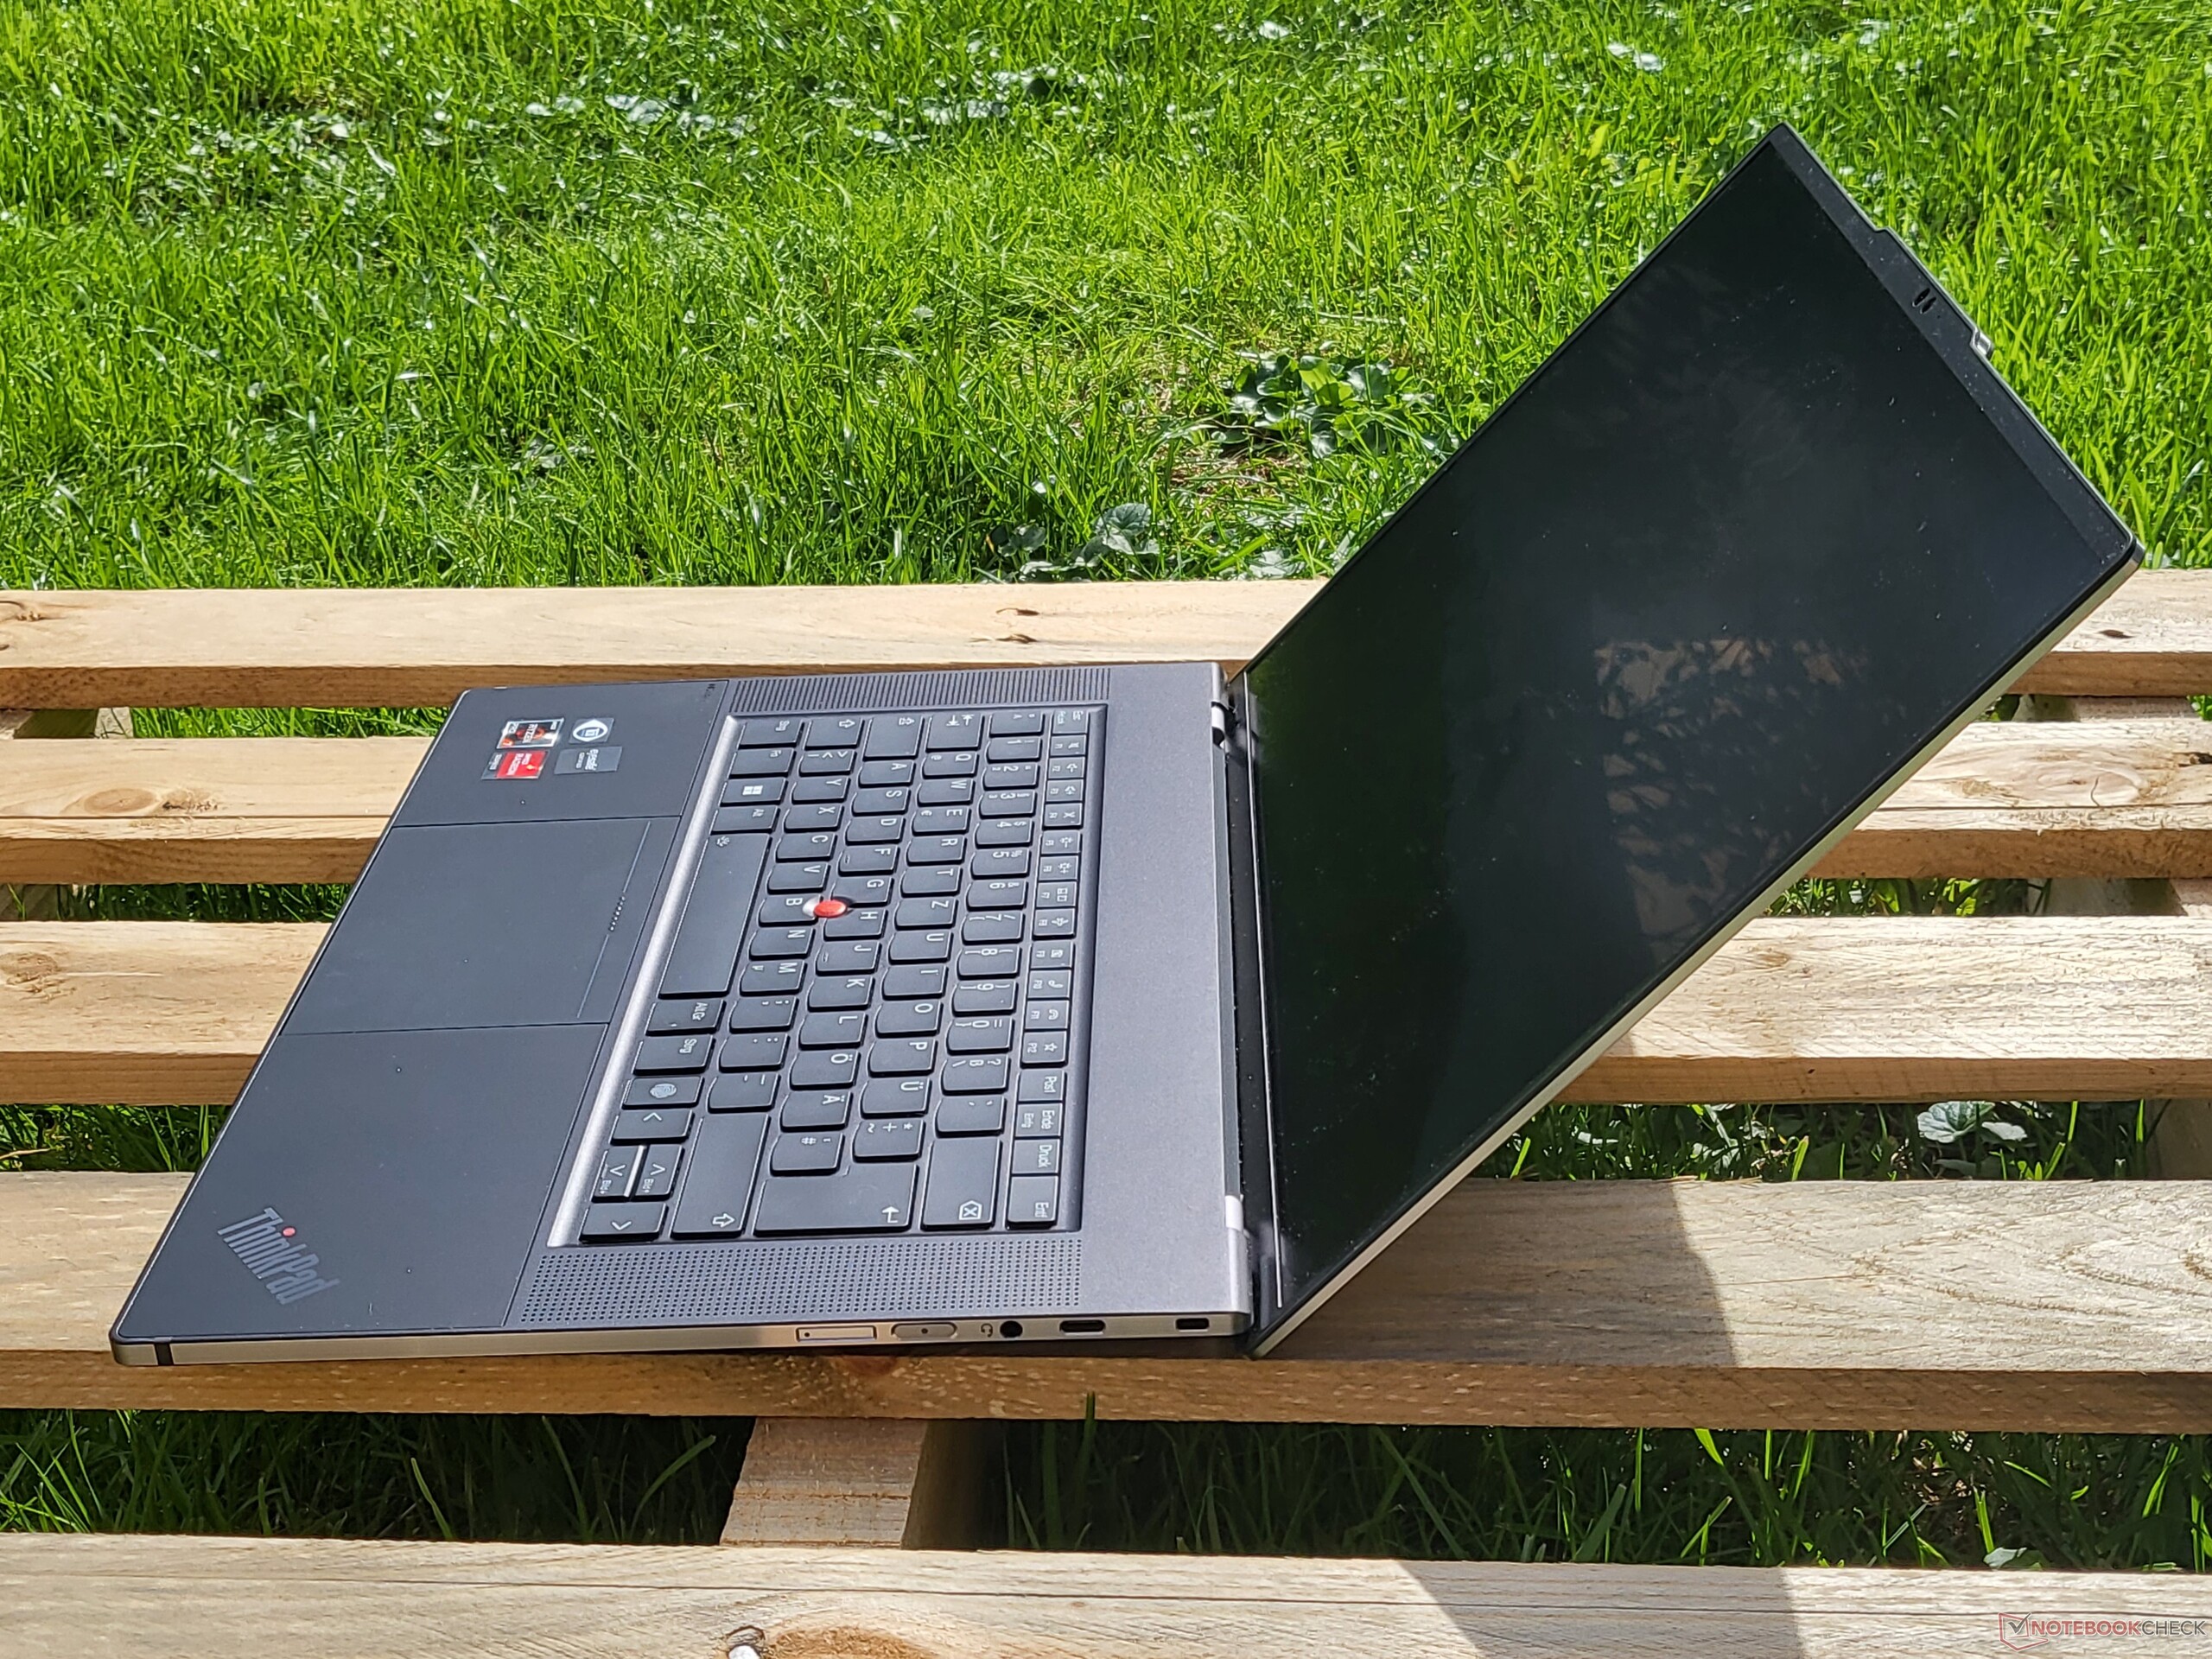
The ThinkPad Z16 is the most compact 16-inch laptop in our comparison. The Dell XPS 15 is smaller, but it "only" offers a 15.6-inch LCD. In terms of the thickness, the Z16 is also ahead, since it is slimmer than all other competitors. In terms of their weight, all the competitors are extremely close to each other.
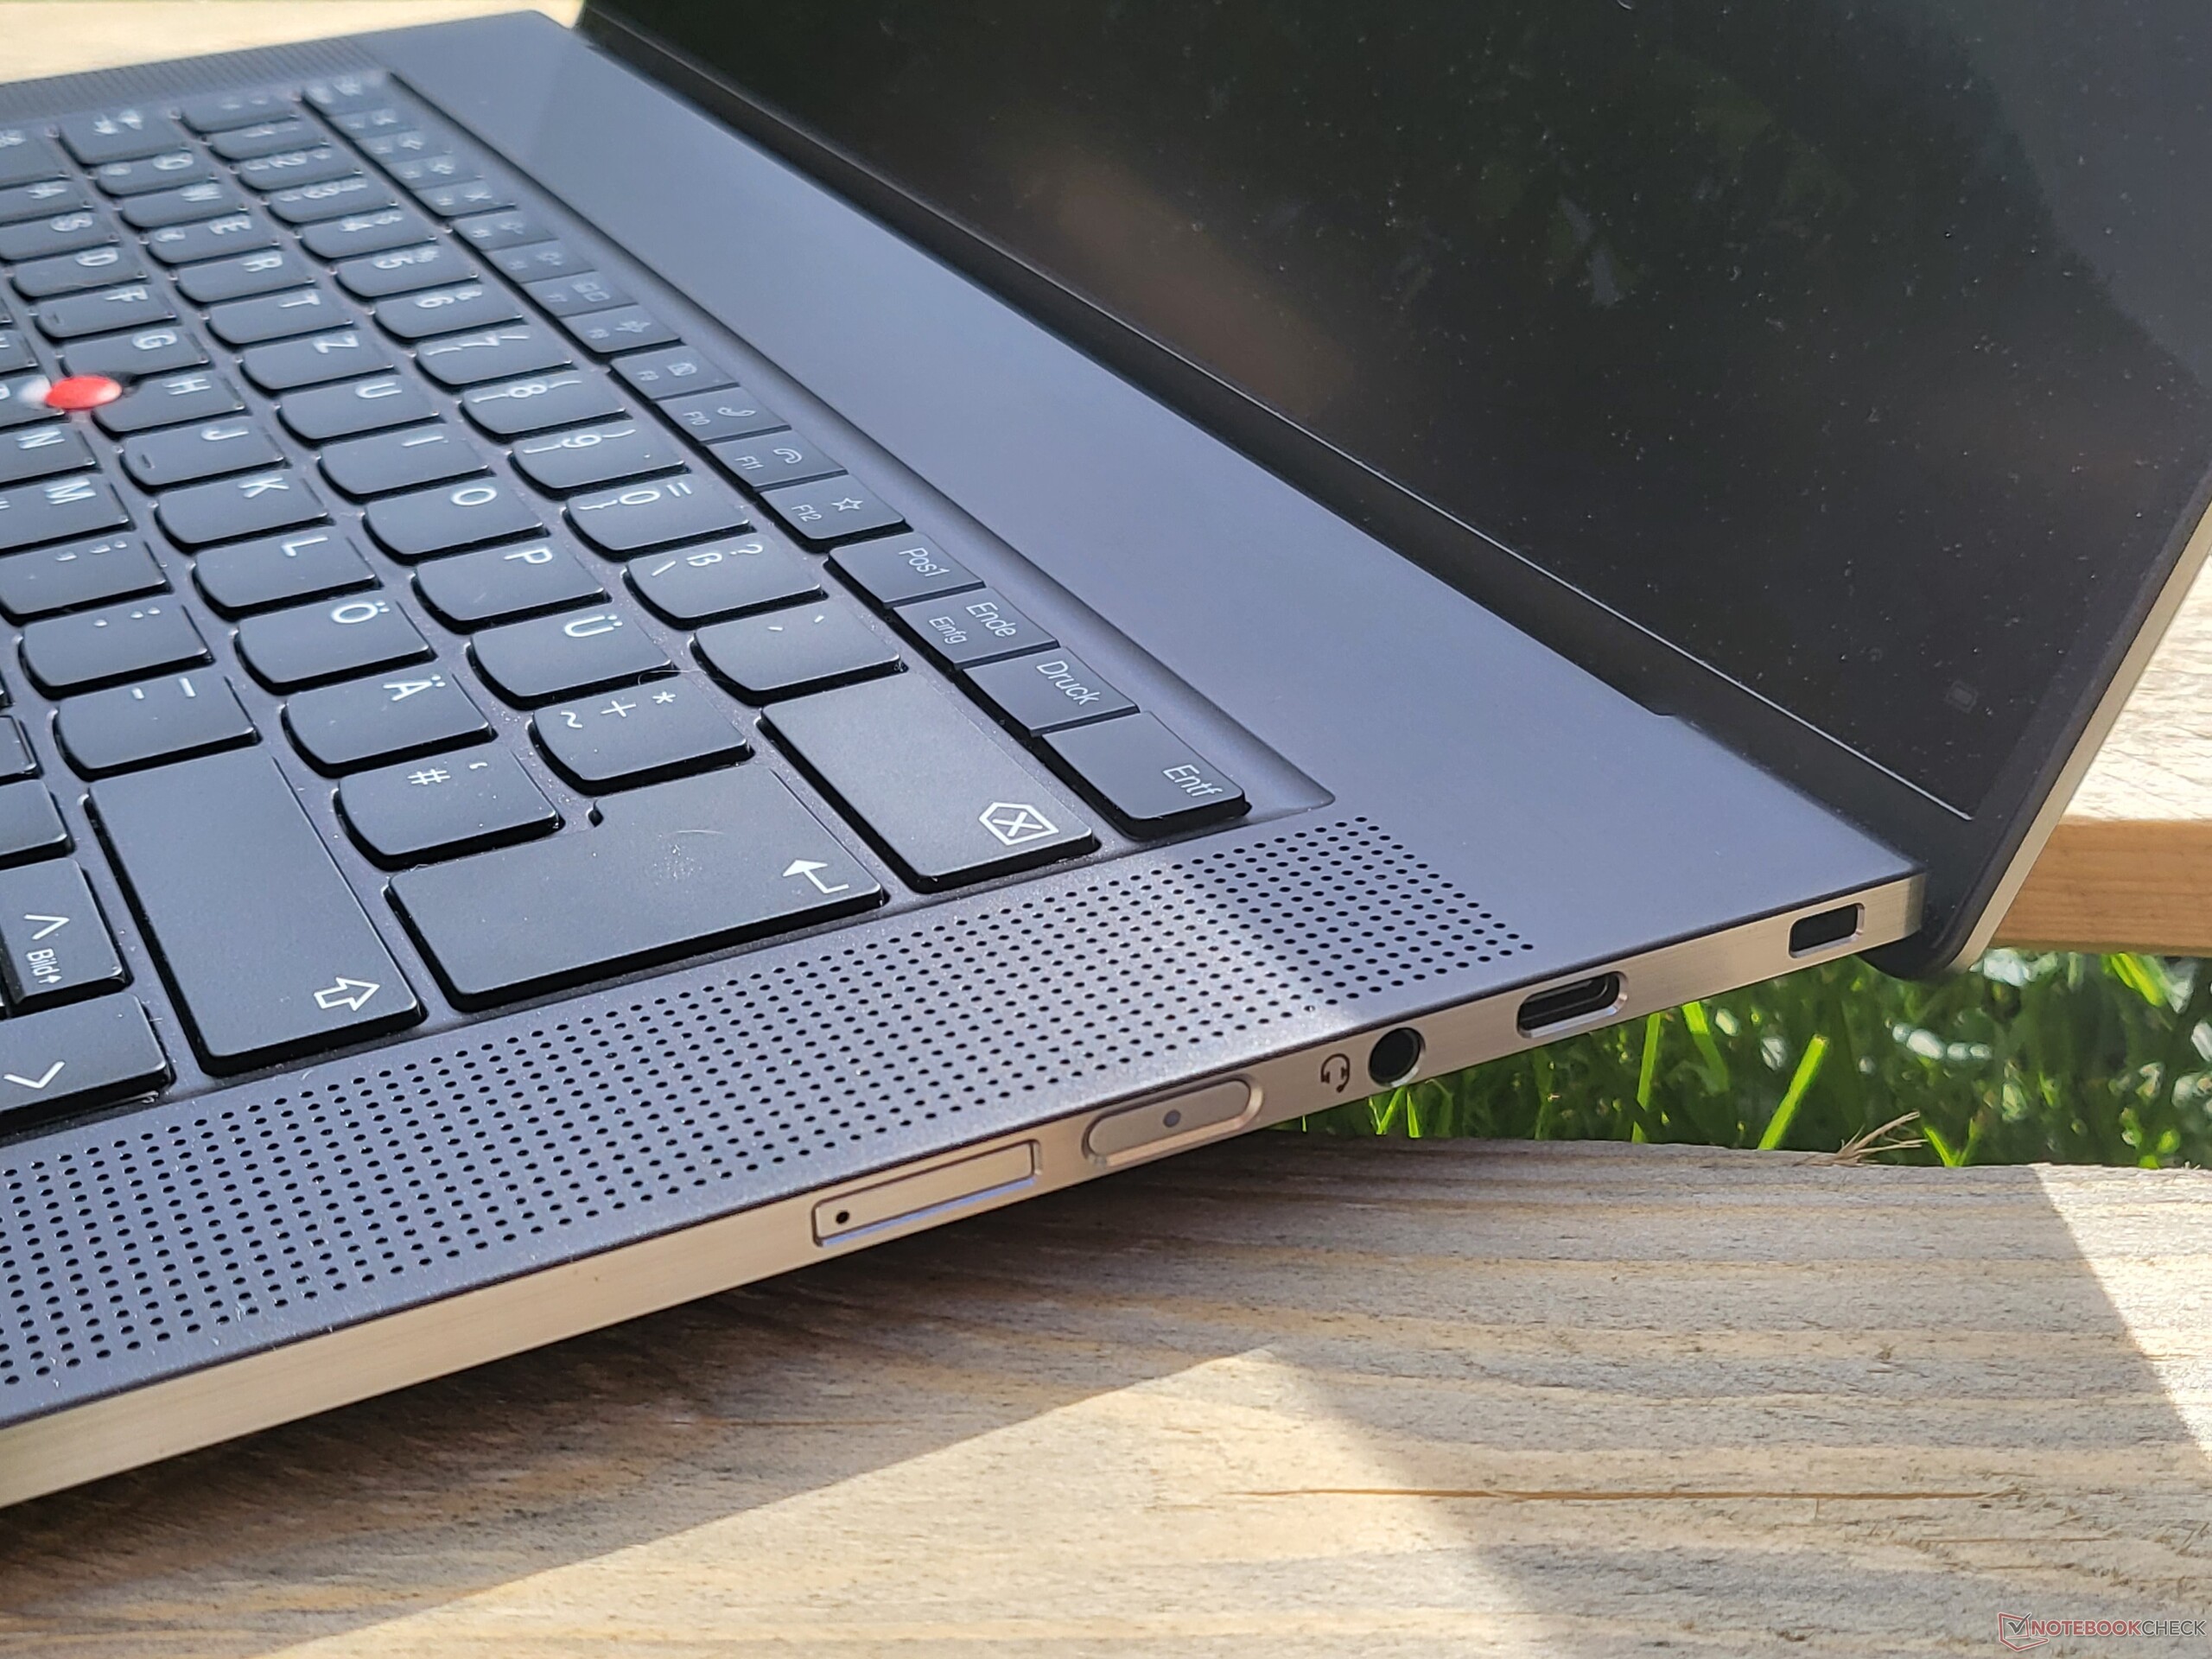
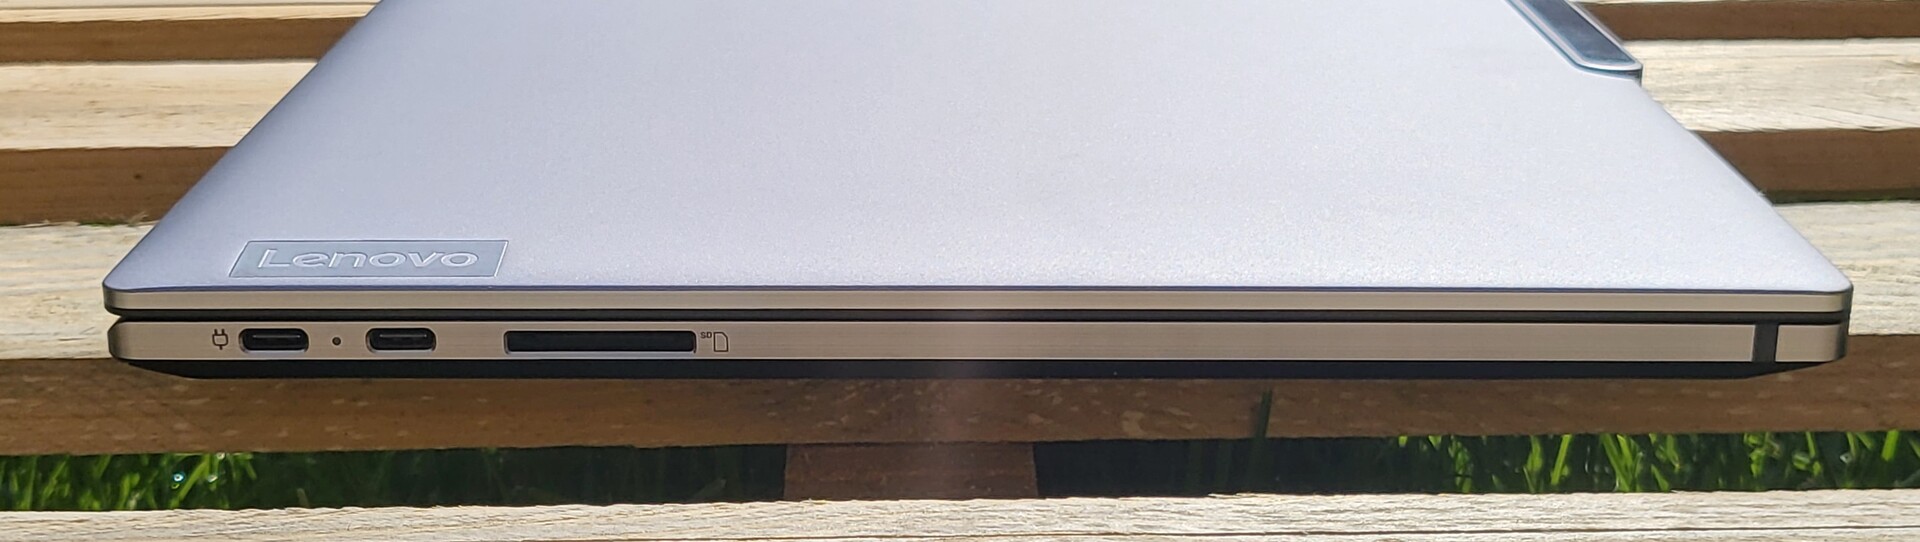
Equipment: Lenovo with a sparse port selection
The connection equipment is identical to that of the Dell XPS 15 9520, which makes it one of the weakest in our test field. In this point, the Z16 clearly lags behind the ThinkPad X1 Extreme, and even the Apple MacBook Pro 16 at least offers HDMI.
In contrast to Intel laptops, there is no Thunderbolt 4 with AMD. On the other hand, the ThinkPad Z16 includes USB 4, which offers the same feature set as Thunderbolt 3. However, compatibility with Thunderbolt accessories isn't guaranteed and has to be determined individually.
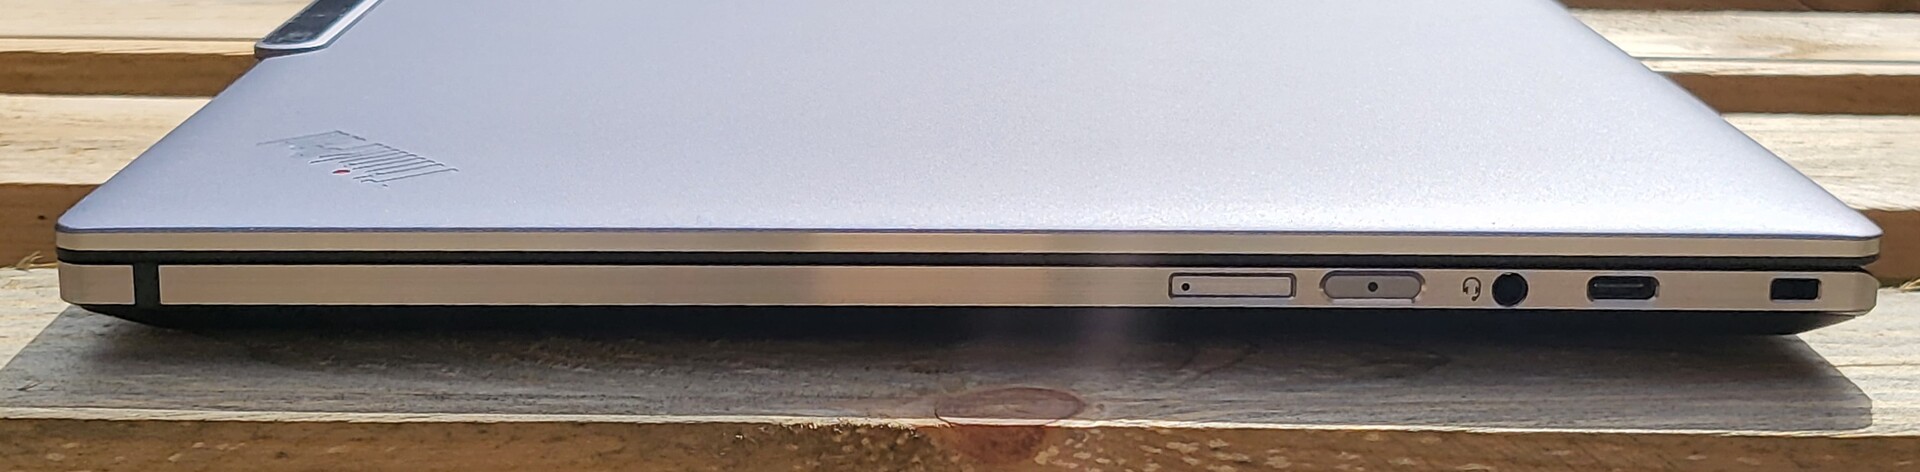
SD Card Reader
The Lenovo ThinkPad Z16 G1 includes a full-size SD card reader, but SD cards cannot be inserted fully. The card reader is extremely fast, particularly when reading data. We tested this with our 128-GB AV Pro microSD reference card.
| SD Card Reader | |
| average JPG Copy Test (av. of 3 runs) | |
| Dell XPS 17 9720 (Toshiba Exceria Pro SDXC 64 GB UHS-II) | |
| Lenovo ThinkPad X1 Extreme G4-20Y5CTO1WW (3050 Ti) (AV Pro V60) | |
| Dell XPS 15 9520 RTX 3050 Ti (Toshiba Exceria Pro SDXC 64 GB UHS-II) | |
| Apple MacBook Pro 16 2021 M1 Pro (Angelbird AV Pro V60) | |
| Average of class Multimedia (21.1 - 531, n=44, last 2 years) | |
| Lenovo ThinkPad Z16 G1 21D5S00T00 | |
| maximum AS SSD Seq Read Test (1GB) | |
| Lenovo ThinkPad Z16 G1 21D5S00T00 | |
| Dell XPS 17 9720 (Toshiba Exceria Pro SDXC 64 GB UHS-II) | |
| Dell XPS 15 9520 RTX 3050 Ti (Toshiba Exceria Pro SDXC 64 GB UHS-II) | |
| Average of class Multimedia (27.4 - 1455, n=44, last 2 years) | |
| Lenovo ThinkPad X1 Extreme G4-20Y5CTO1WW (3050 Ti) (AV Pro V60) | |
Communication
Lenovo labels the built-in Qualcomm WCN685x (2x2) as "Qualcomm NFA-725A." It is a Wi-Fi 6E card. With some slight variations, the ThinkPad Z16 achieves very good results with this Wi-Fi module.
Our test unit also includes a 4G module from Quectel. If you need WWAN, it has to be already included in your order, since you cannot install it later.
| Networking | |
| Lenovo ThinkPad Z16 G1 21D5S00T00 | |
| iperf3 receive AXE11000 6GHz | |
| iperf3 receive AXE11000 | |
| iperf3 transmit AXE11000 6GHz | |
| iperf3 transmit AXE11000 | |
| Lenovo ThinkPad X1 Extreme G4-20Y5CTO1WW (3050 Ti) | |
| iperf3 transmit AX12 | |
| iperf3 receive AX12 | |
| Dell XPS 15 9520 RTX 3050 Ti | |
| iperf3 receive AXE11000 | |
| iperf3 transmit AXE11000 | |
| Dell XPS 17 9720 | |
| iperf3 receive AXE11000 | |
| iperf3 transmit AXE11000 | |
| Apple MacBook Pro 16 2021 M1 Pro | |
| iperf3 transmit AX12 | |
| iperf3 receive AX12 | |
| iperf3 receive AXE11000 | |
| iperf3 transmit AXE11000 | |
Webcam
Lenovo gives a lot of room to the webcam in terms of the design, and the 1080p camera is also relatively good for a laptop. However, there is still a lot of room for improvement, and the selfie shooter in a smartphone is still much better.


Security
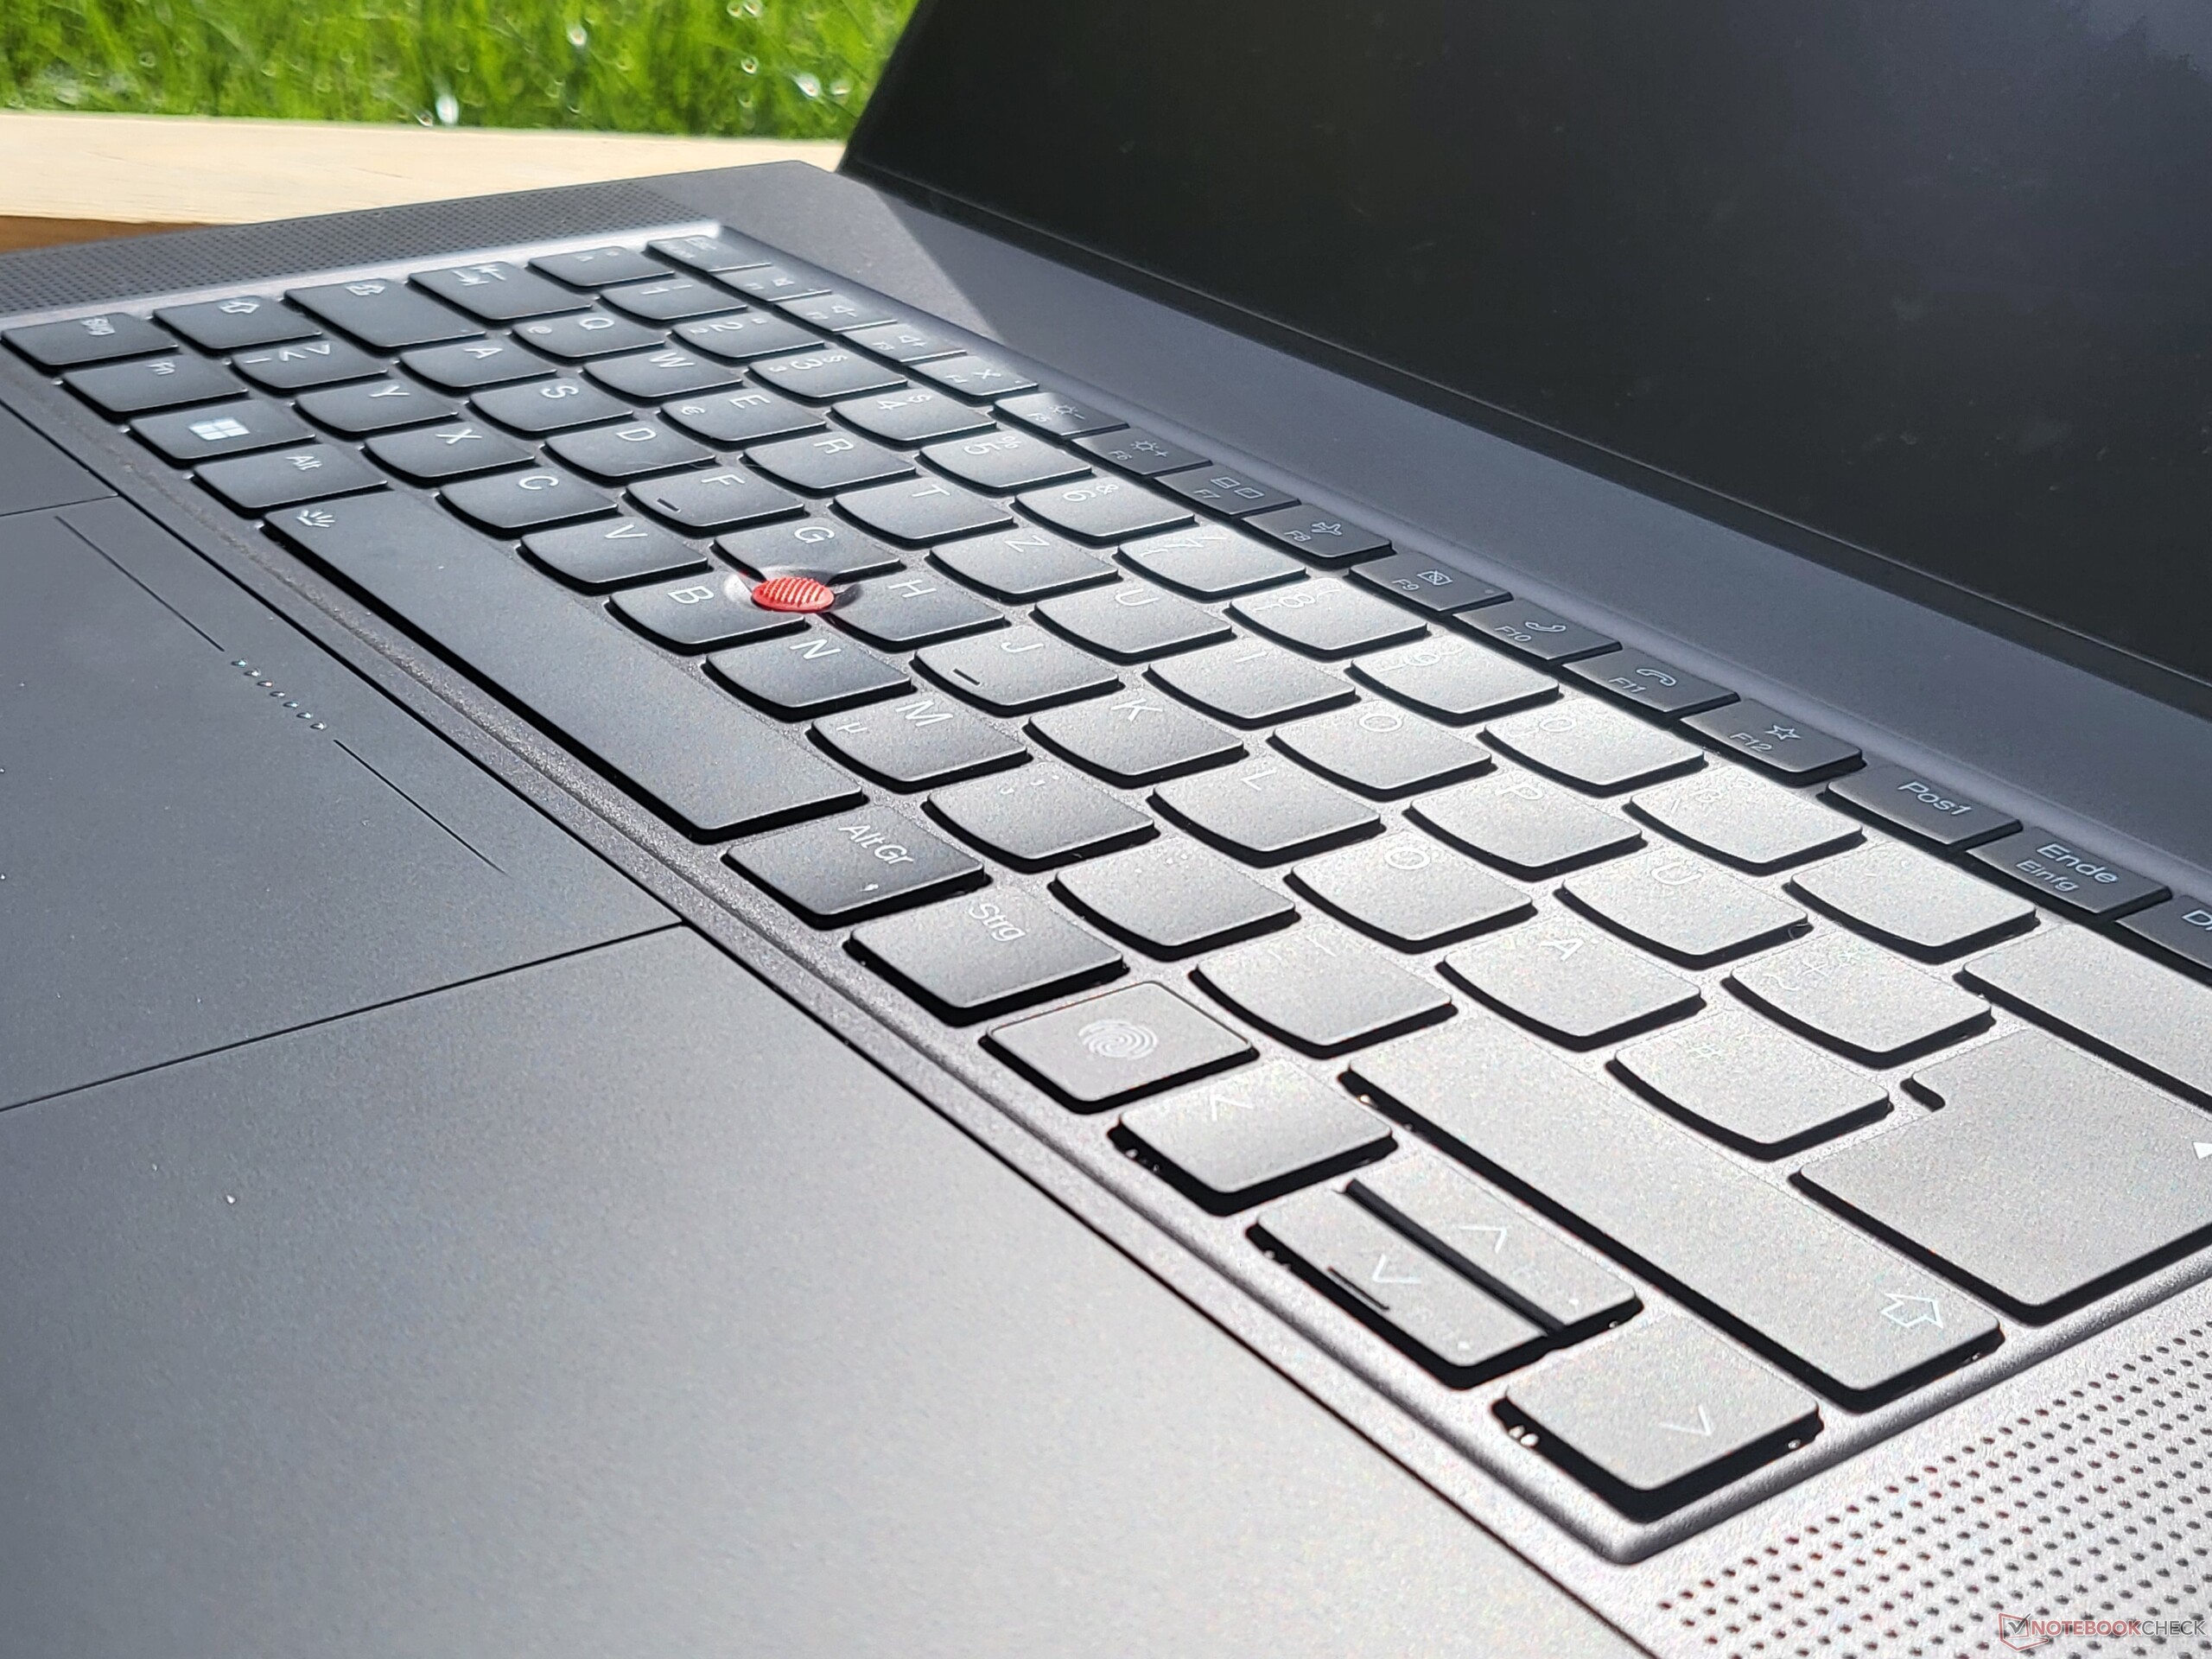
In addition to dTMP, the Lenovo ThinkPad Z16 also includes a fingerprint reader in the keyboard, the infrared camera for Windows Hello, and a Kensington Lock. What is not included is a smartcard reader and a physical webcam shutter, but you can turn off the camera electronically by pressing the F9 key instead.
Accessories
Besides the 135-Watt charger with a USB-C connector, no other accessories are included.
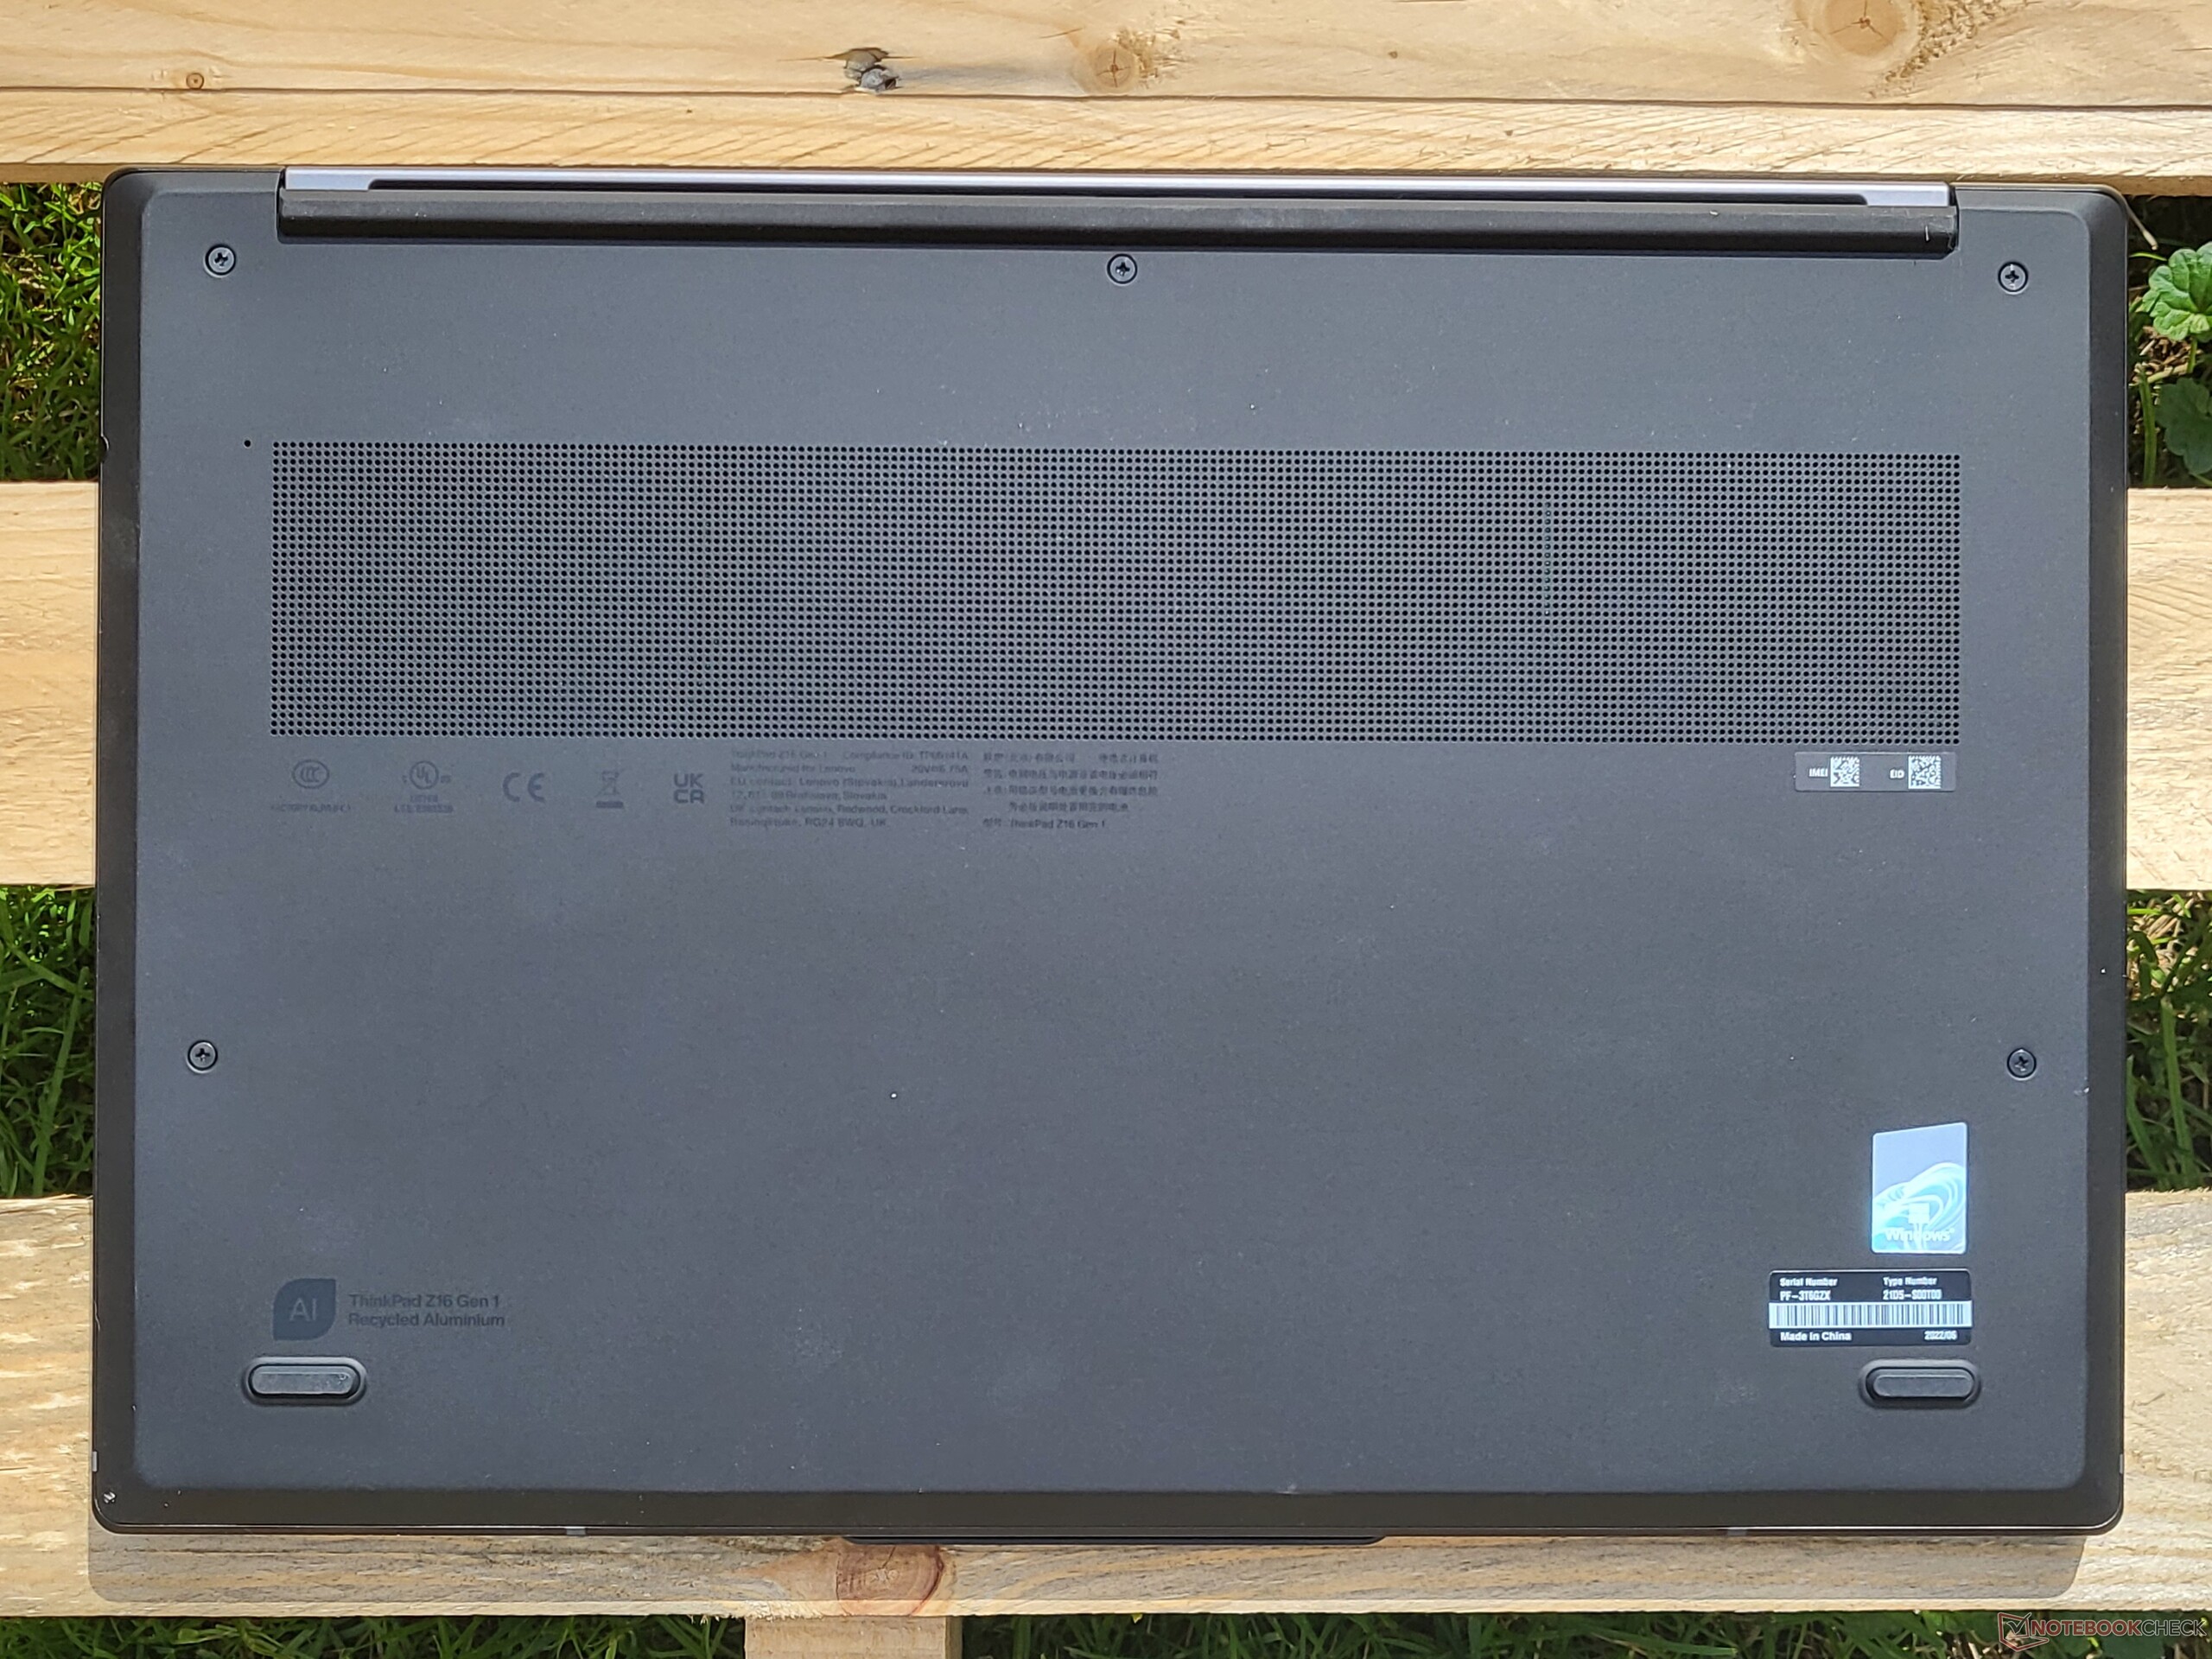
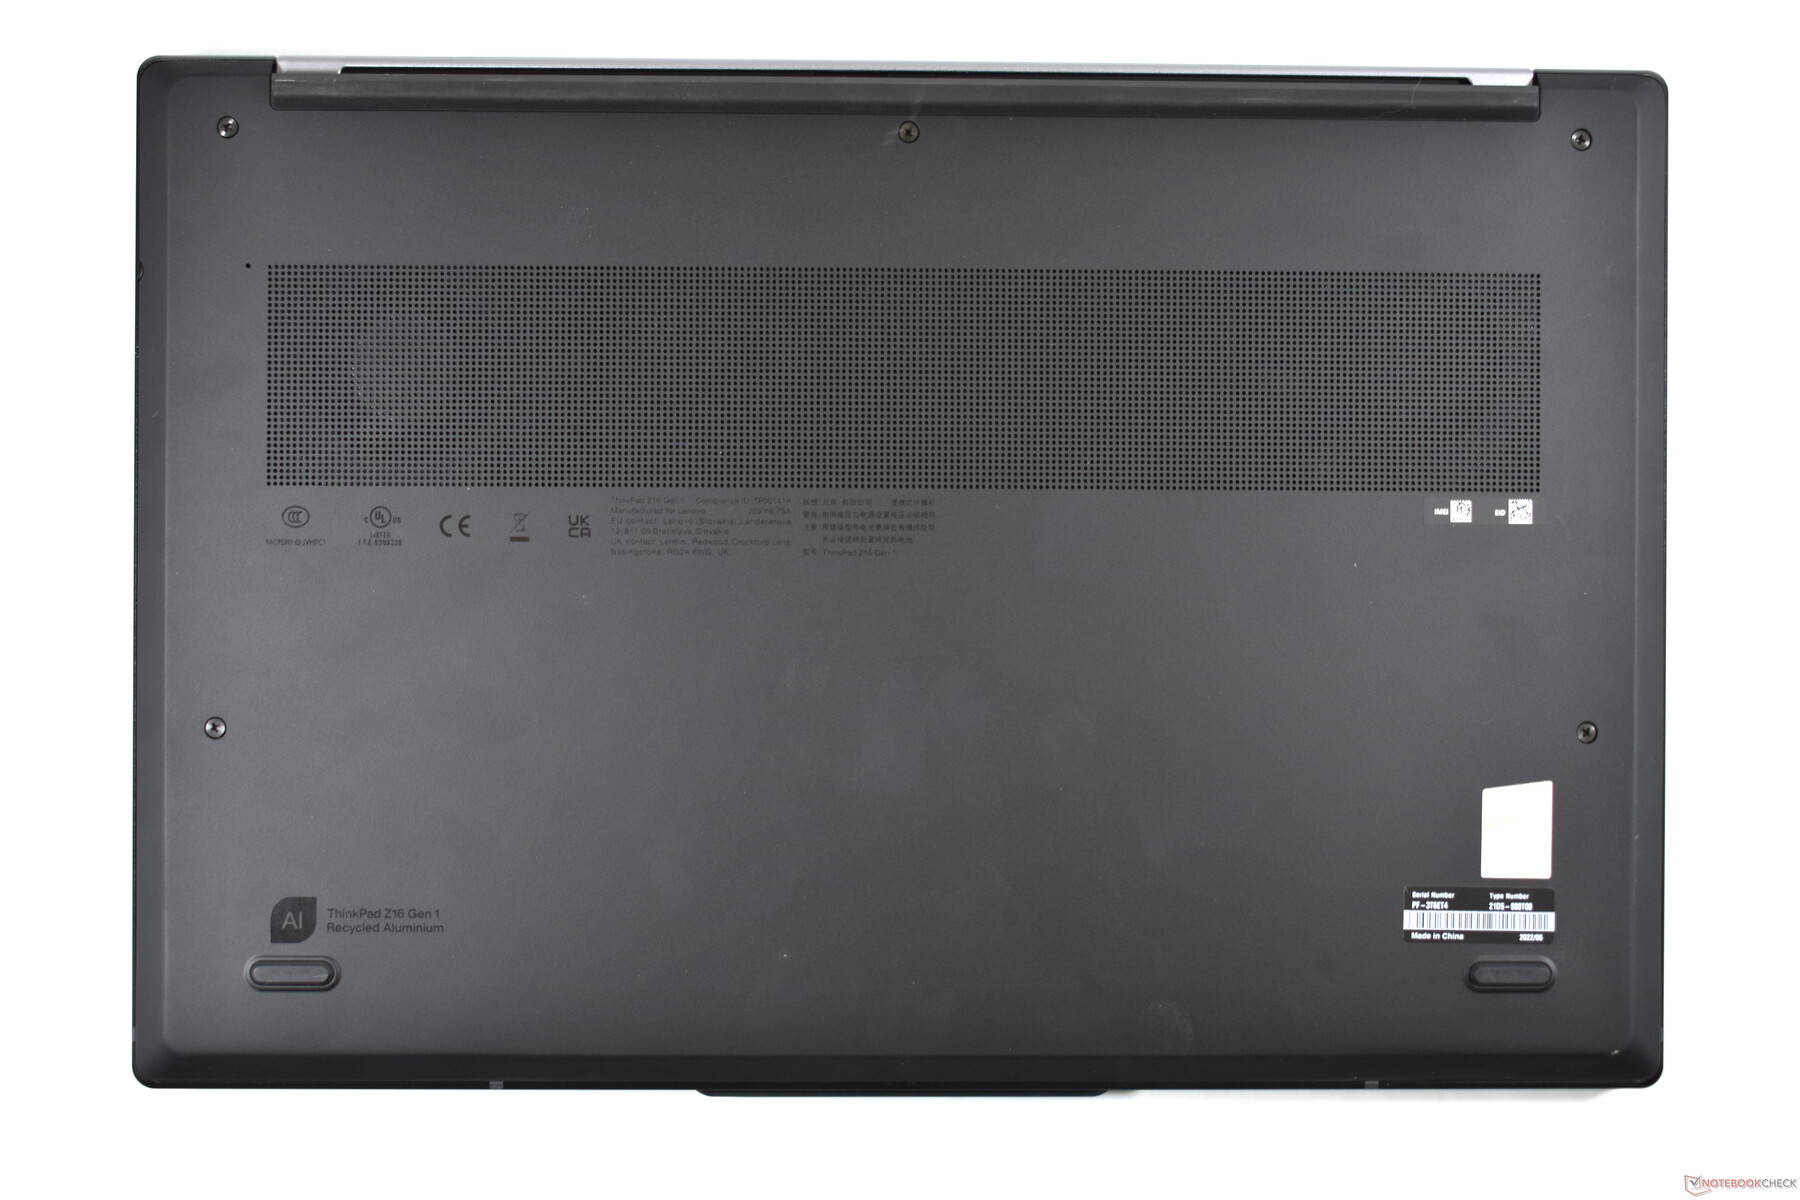
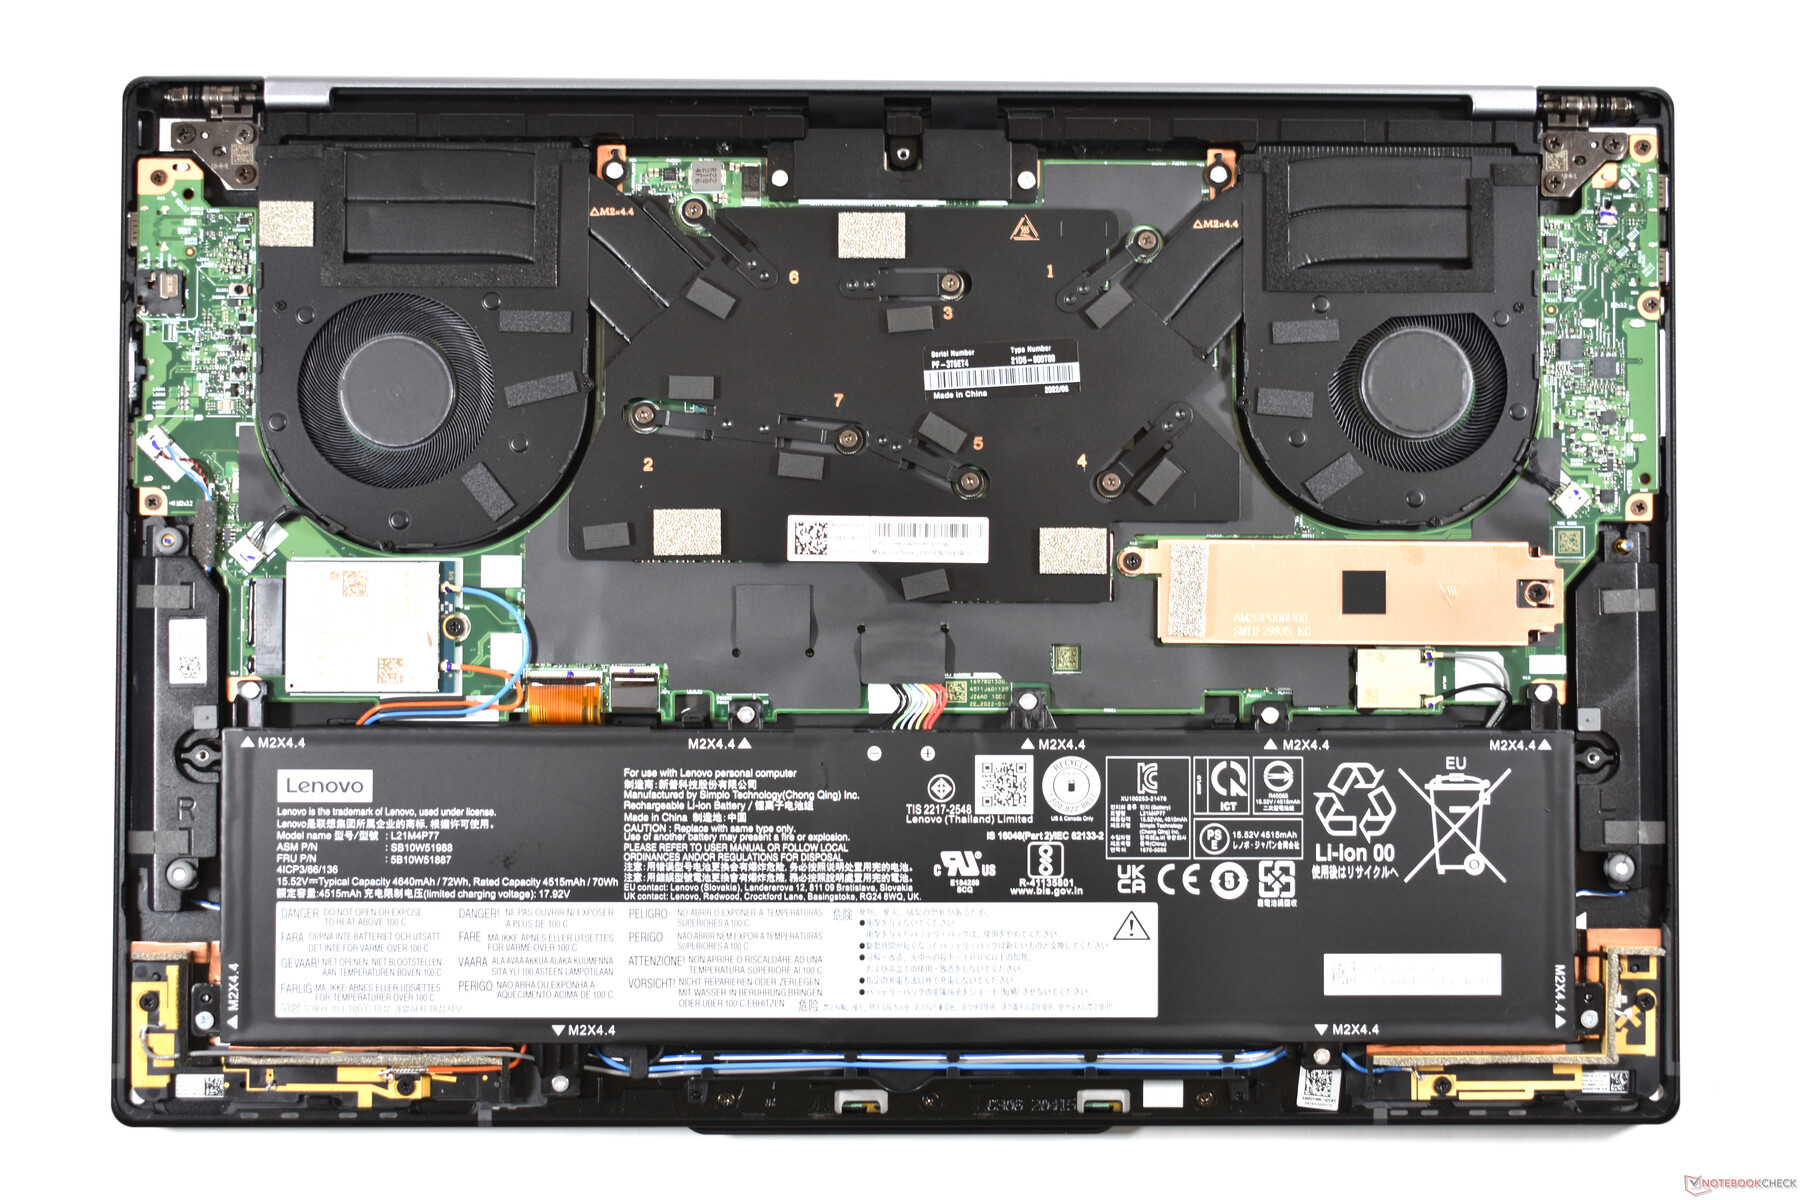
Maintenance
Lenovo makes it very easy to access the insides of the ThinkPad Z16 Gen 1. After removing the five Philips screws, you can directly remove the back cover. Unfortunately, there are not many options for upgrades, and the ThinkPad Z16 is not very modular at all for such a large laptop. The RAM and the Wi-Fi module are soldered in, and there is only a single M.2-2280 slot. The WWAN card occupies an M.2-2242 slot.
Of course, you can clean the fans or replace the battery, but the ThinkPad laptop clearly disappoints us in terms of upgrade options. Both the Dell XPS models and the ThinkPad X1 Extreme are significantly more modular.
Warranty
Our test unit is a special model from Campuspoint, offering a very generous warranty package: 36 months of on-site service and "Premier Support." The warranty varies depending on the country, and ThinkPads are often sold with only a year of warranty in the US. However, in all cases the warranty can be expanded up to five years and also upgraded by services such as a replacement of the integrated battery. In addition, the Z16 also includes an international warranty as a ThinkPad, but there is no on-site service outside your country of purchase.
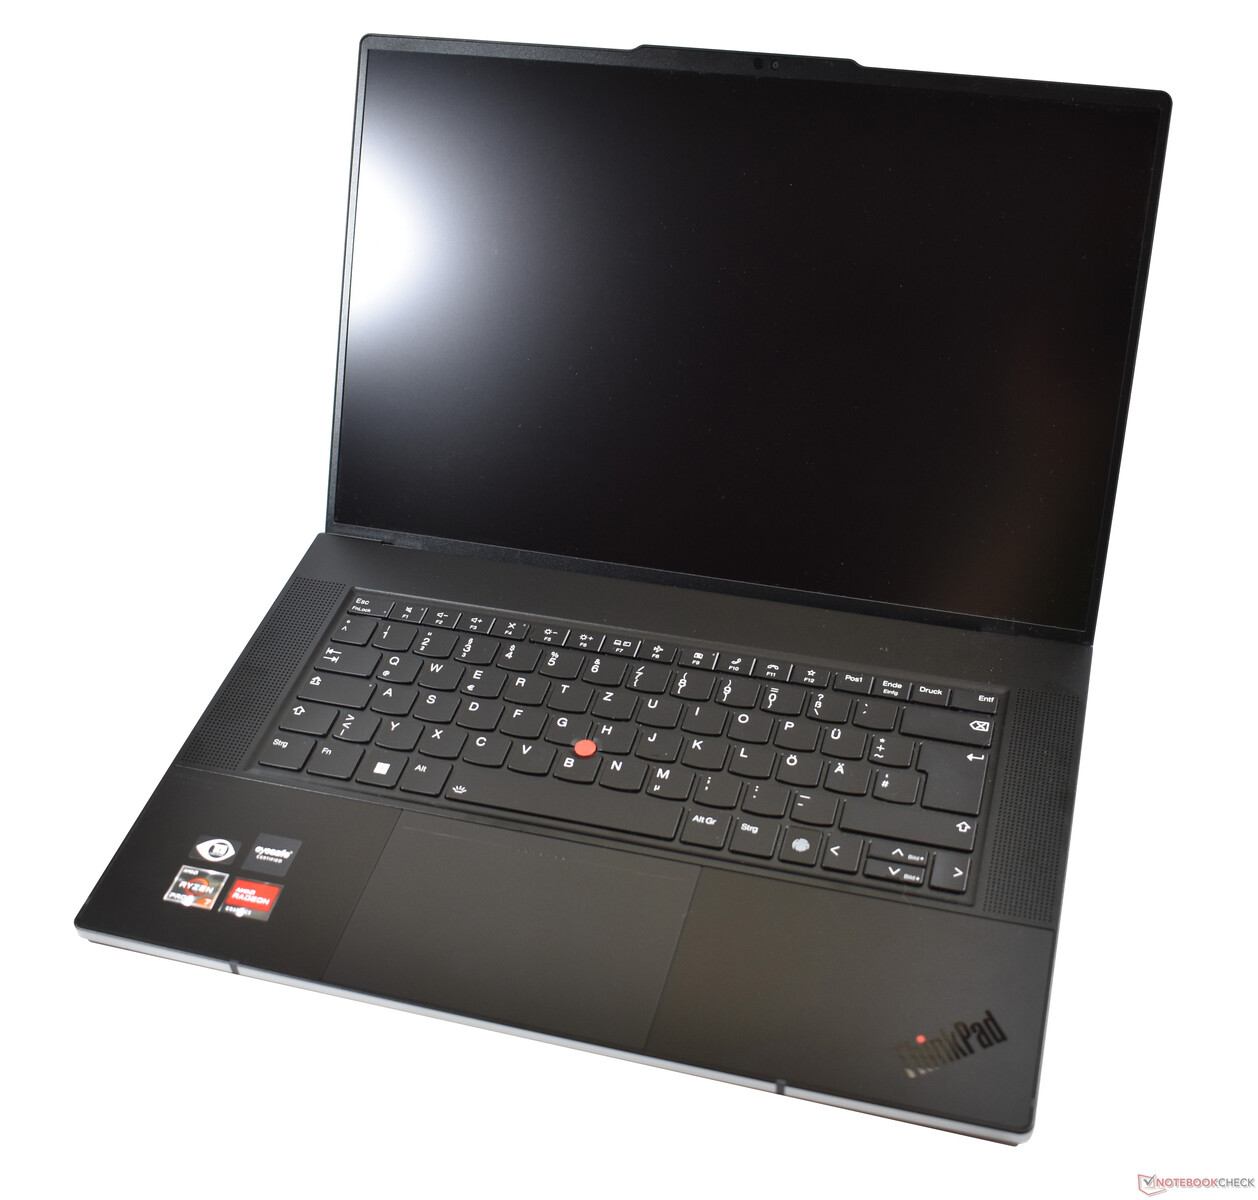
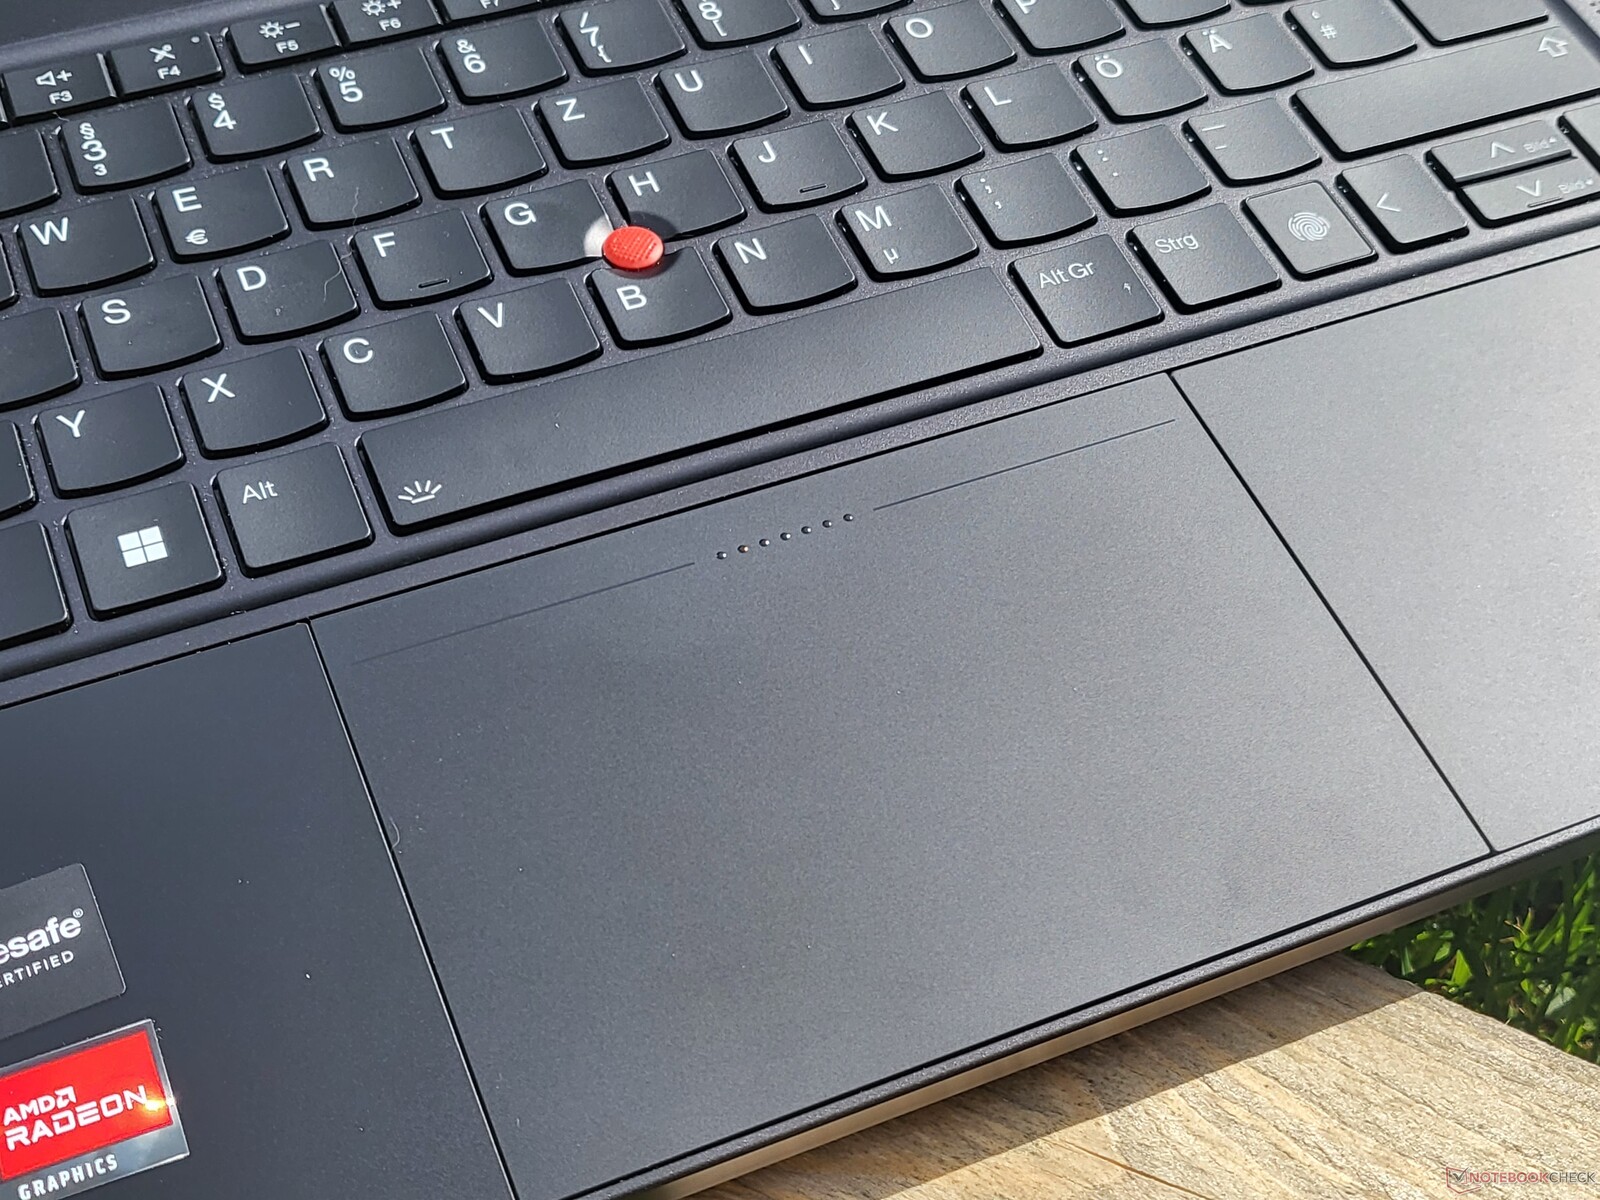
Input Devices: The best touchpad in a Lenovo ThinkPad
Keyboard
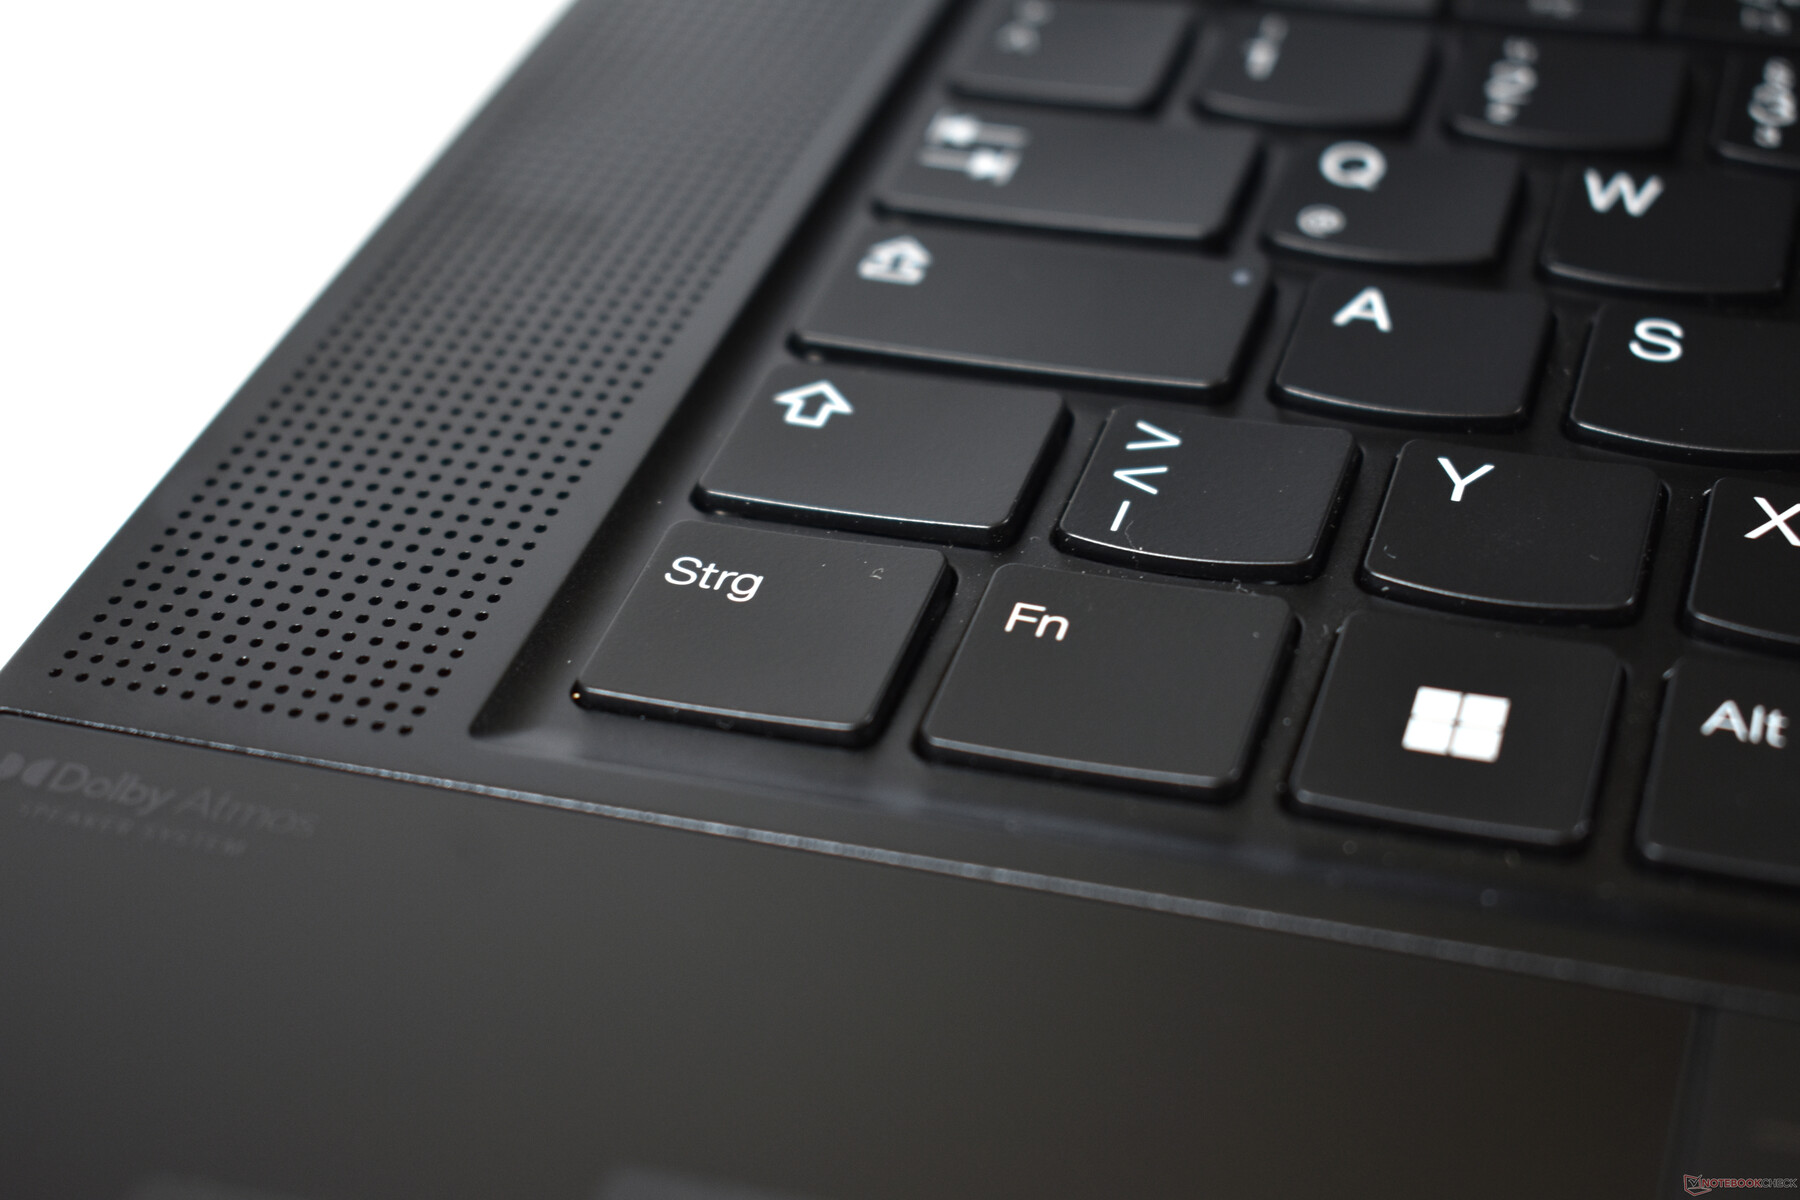
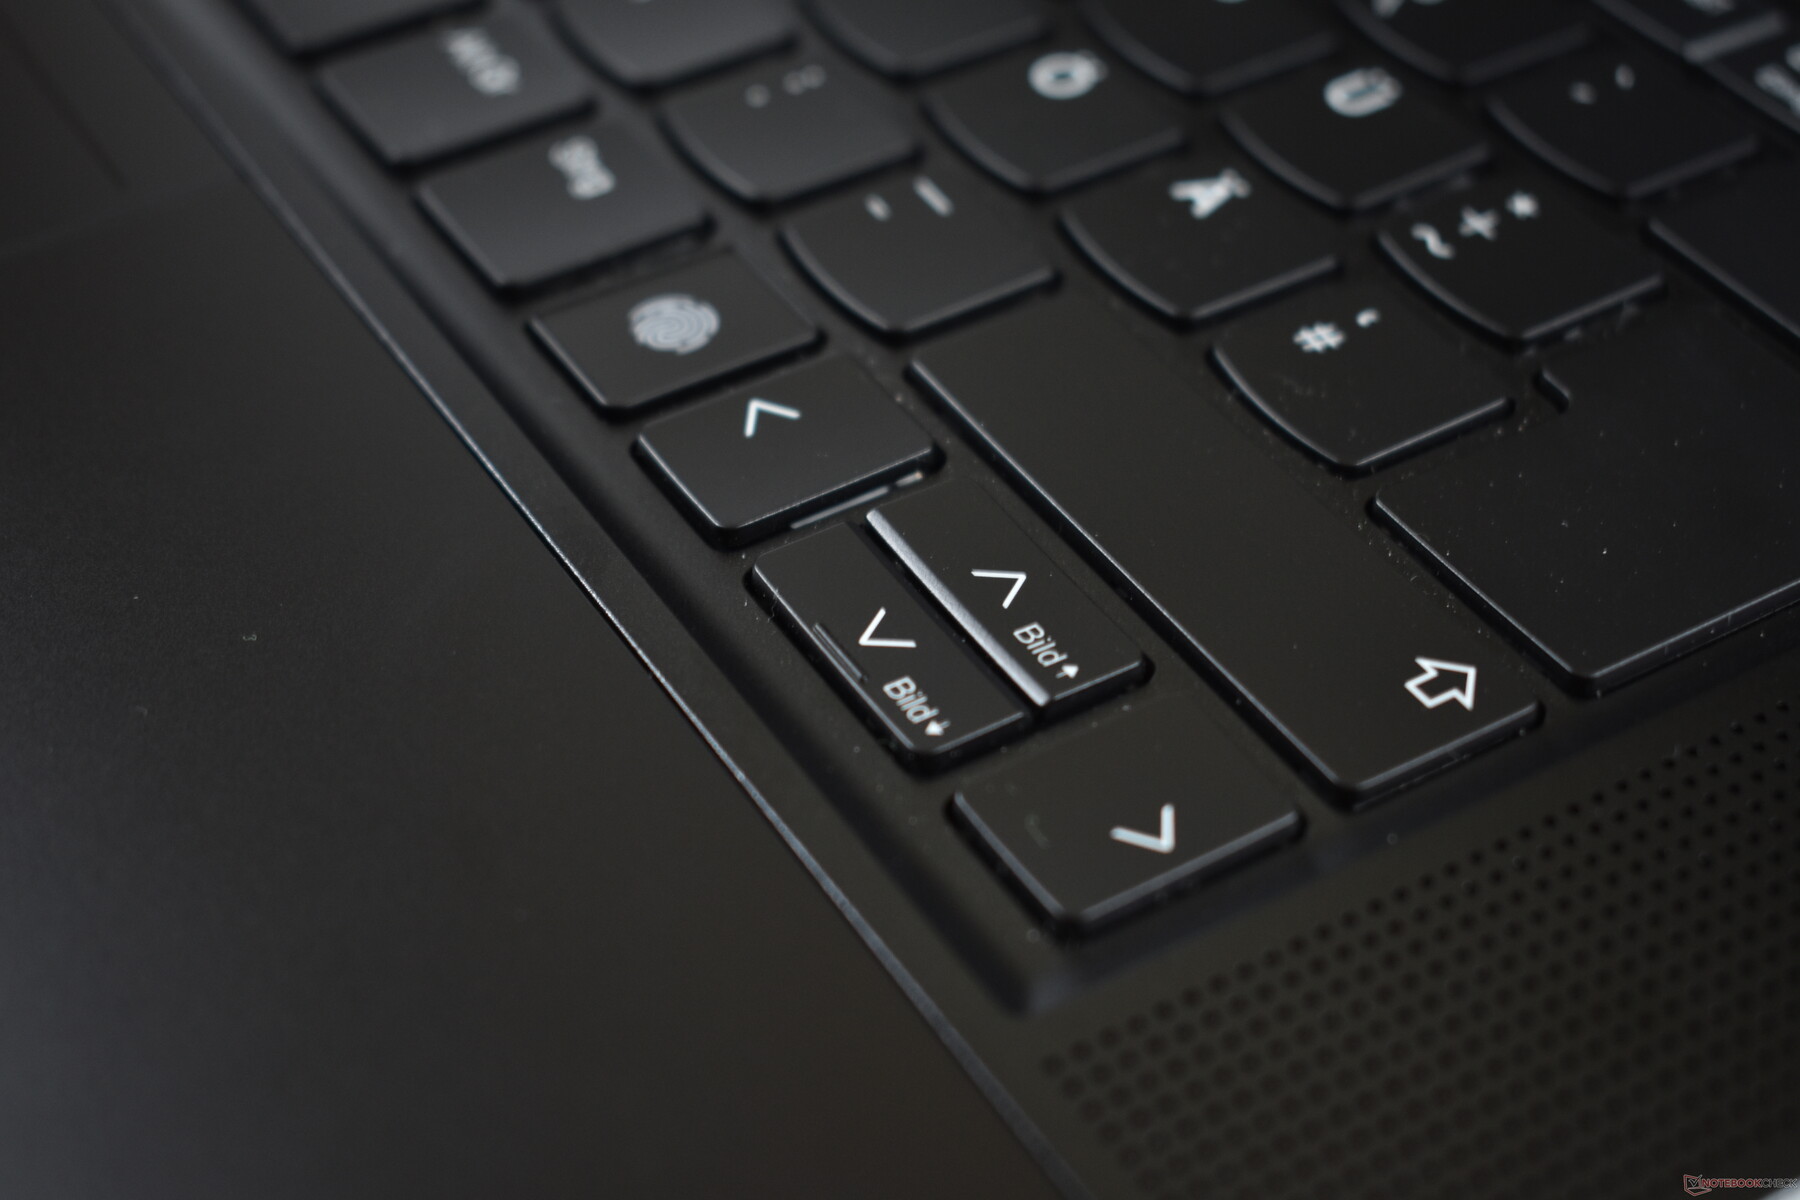
The two-level backlit keyboard is also closer to the laptop mainstream, and the outer keys don't have the ThinkPad-typical U-shaped key form anymore. Lenovo also forced the keyboard overall into a rectangular form and removed the recess for the arrow keys that is otherwise customary for ThinkPads. Together with this change, the Image up/down keys were also removed. And finally, Lenovo has also switched the Ctrl and Fn keys, with the Ctrl key now being on the outside.
Offering a key stroke of only 1.35 mm (~0.053 in), the keys are again slimmer than in many other current ThinkPad laptops. For example, the X1 Extreme offers 1.5 mm (~0.059 in). In addition, the key tops are flatter. This results in the typing experience feeling less luxurious and not very ThinkPad typical. However, compared to the Dell XPS and the MacBook Pro, the keyboard is still better, offering a clear and crisp pressure point and a resistance that is just right. At 28.5 cm (~11.2 in), the keyboard also has the full standard width.
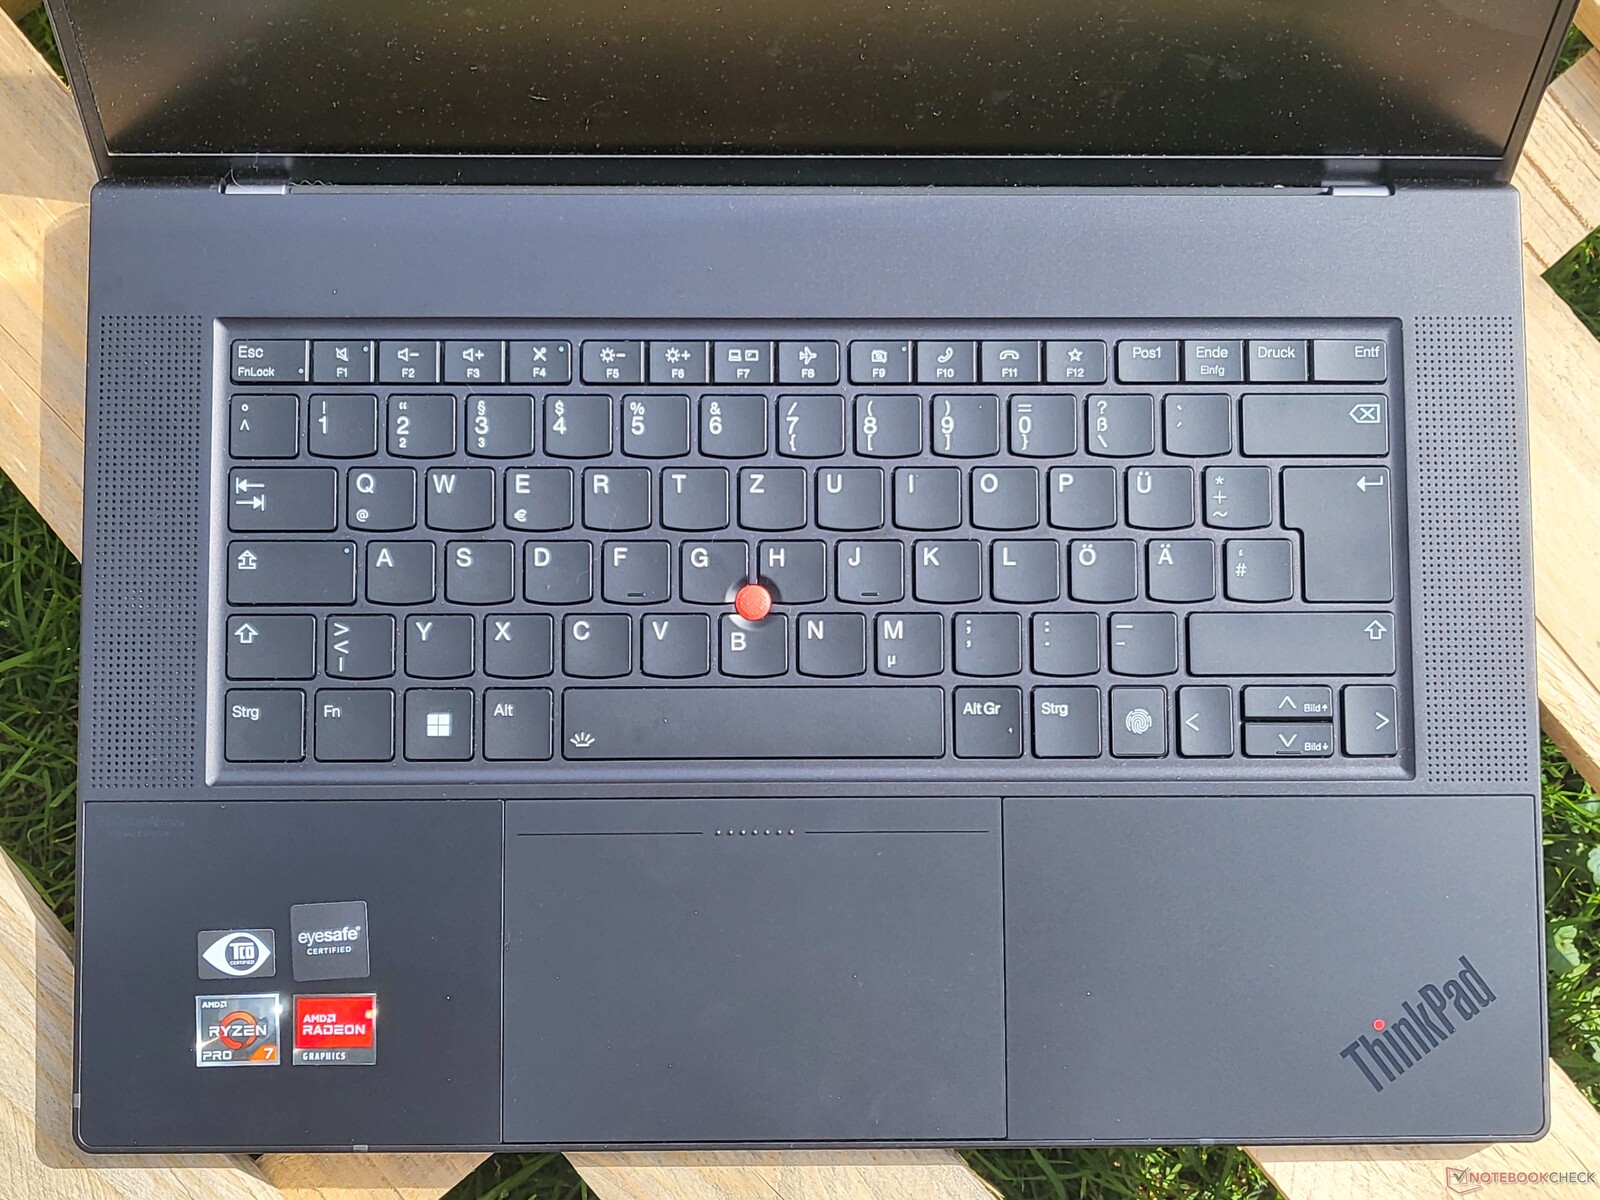
TrackPad and TrackPoint
Without further ado: The Z16 has the best and also largest TrackPad (12 x 8 cm) of all the current ThinkPads. The surface is made of matte glass, just like the palm rest. This has an extremely high quality and also ensures ideal sliding characteristics. The haptic motor of the ClickPad, which simulates real clicks, is also very good. The ClickPad can be clicked evenly everywhere, in contrast to the usual mechanic TrackPads that you can only use for clicking in the bottom area. With its high-quality haptics, software implementation, and spacious size, the ThinkPad laptop can be operated extremely comfortably using the touchpad.
Compared to other ThinkPads, what is slightly less comfortable is the TrackPoint without any dedicated keys. On the other hand, the TrackPoint continues to be a great option, if you have to quickly move the mouse cursor while typing. In this haptic solution, the integrated TrackPoint keys are better than we would have previously thought.
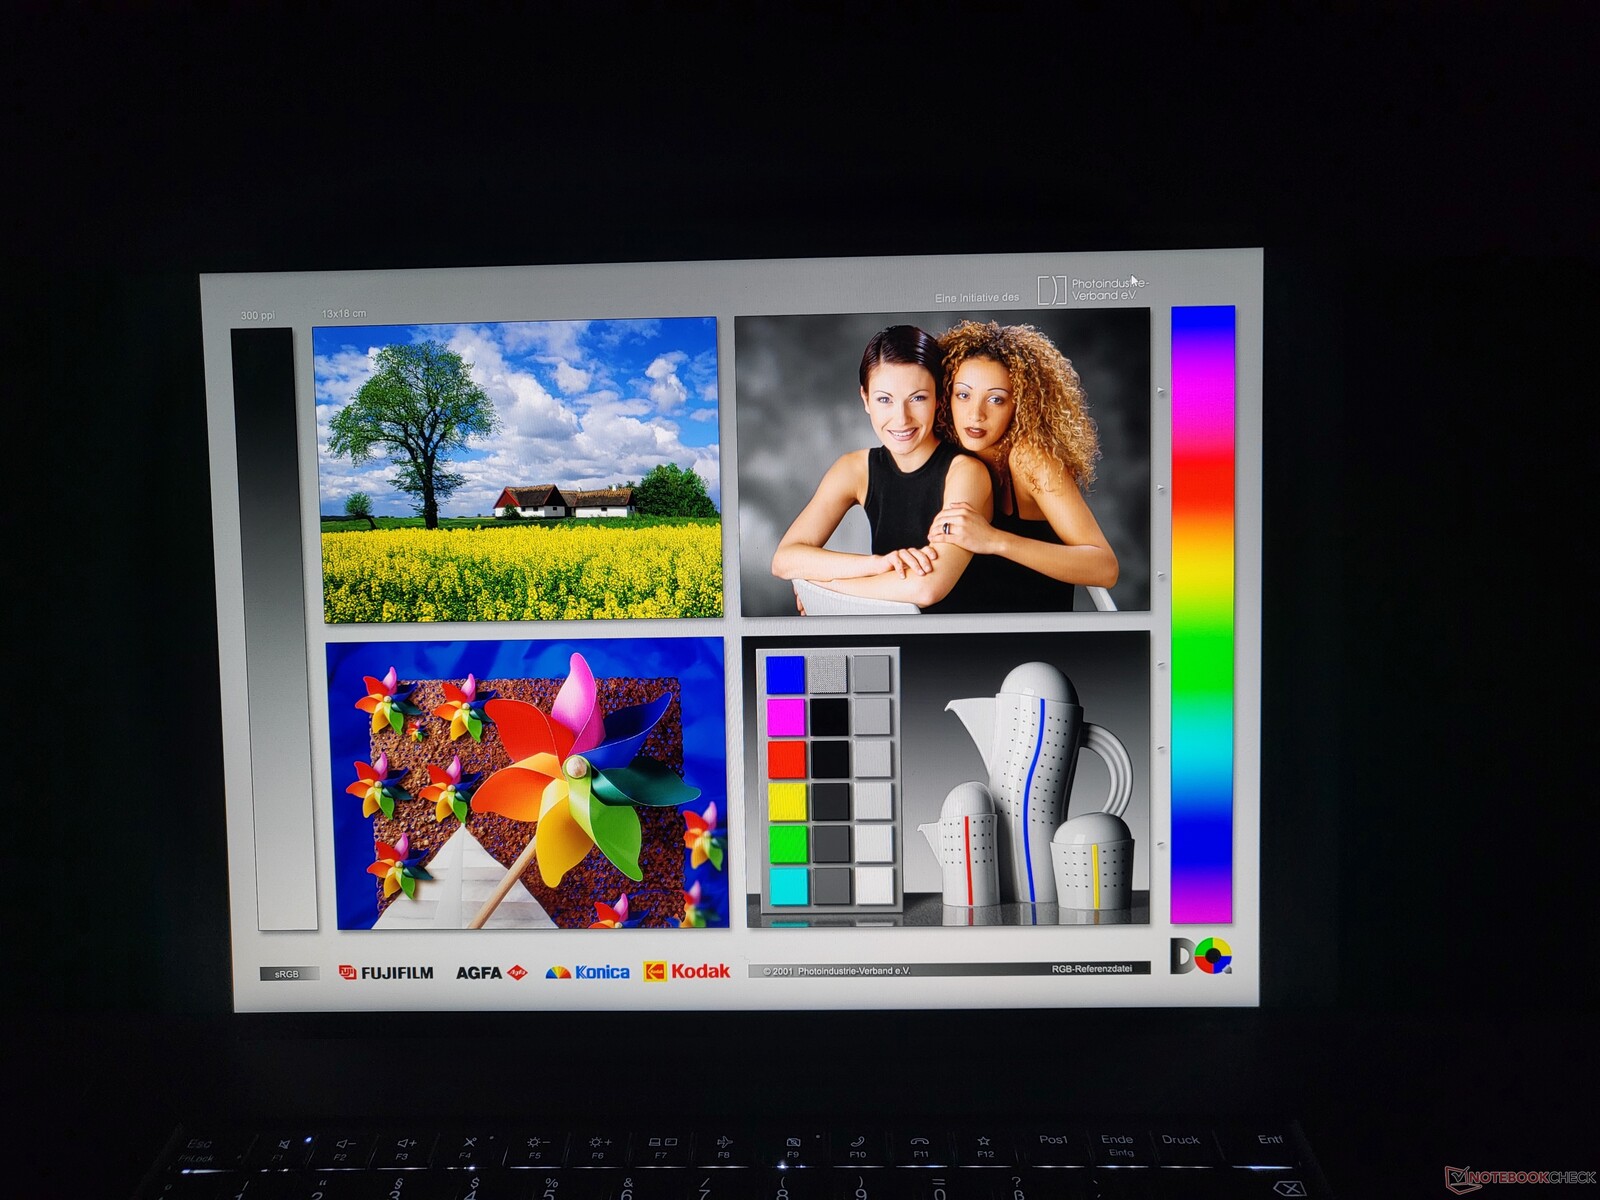
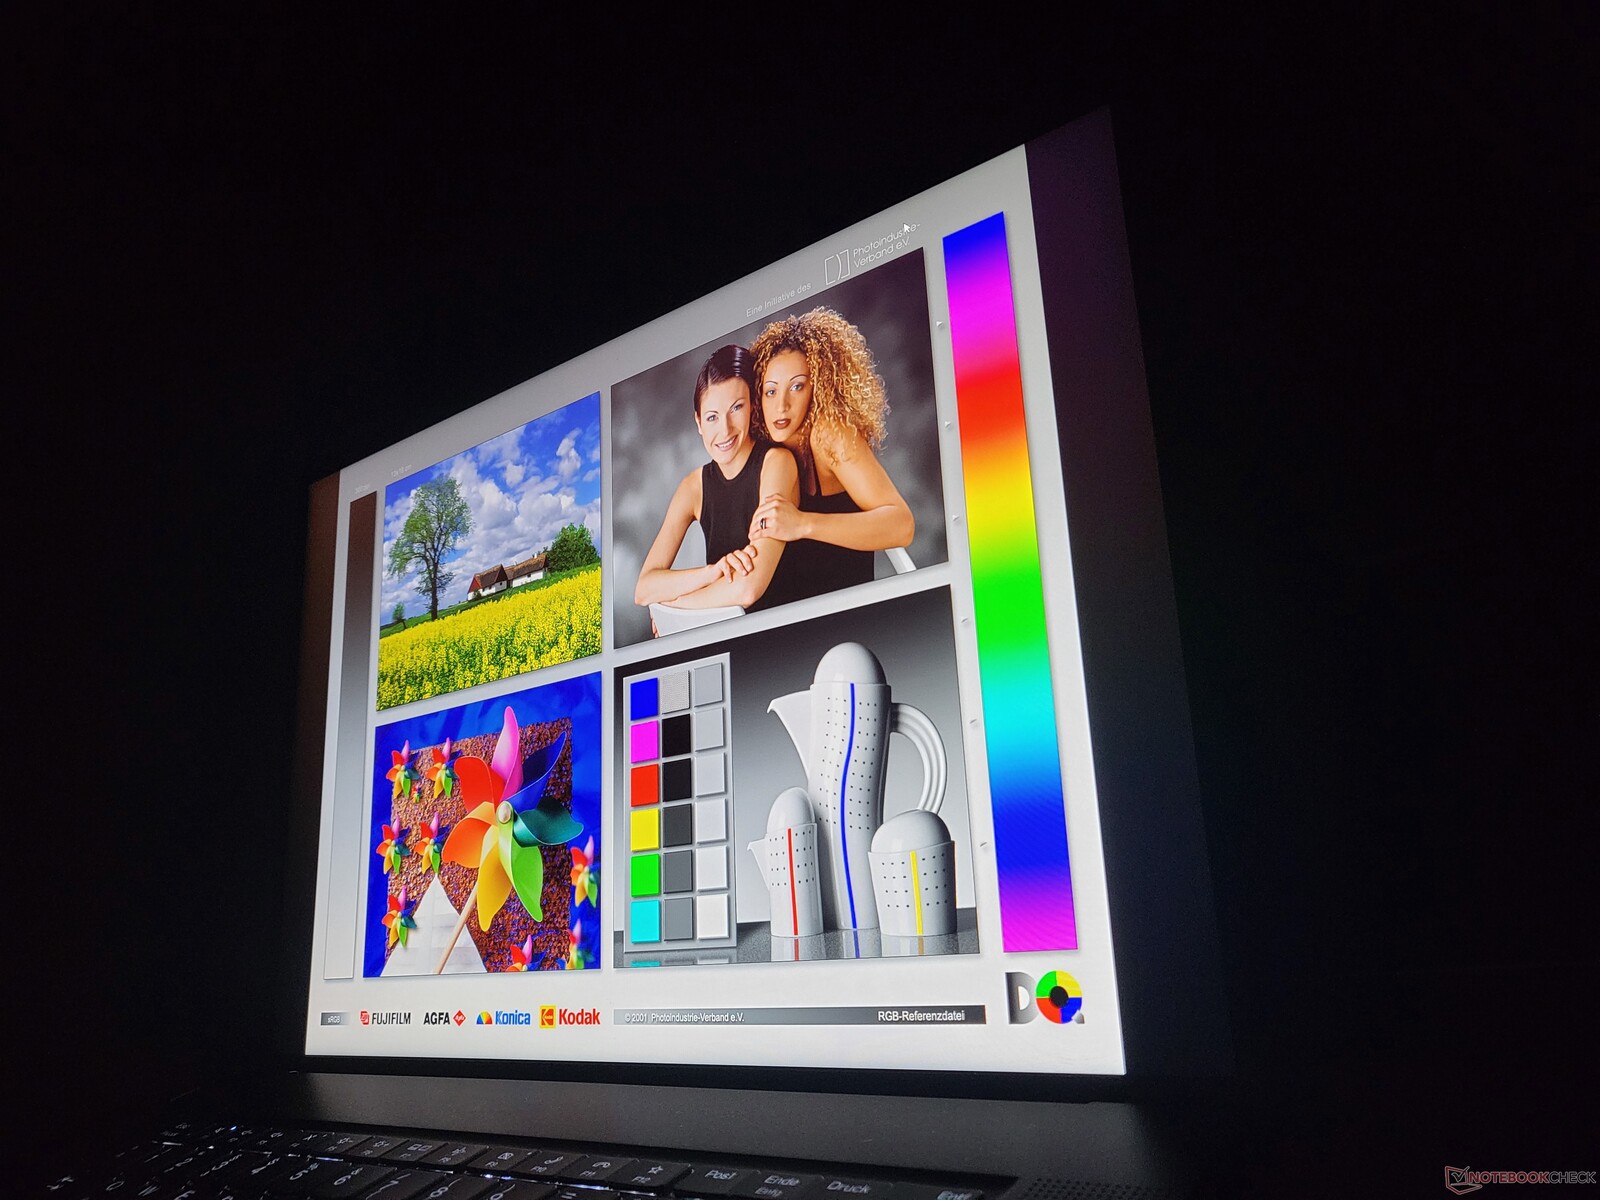
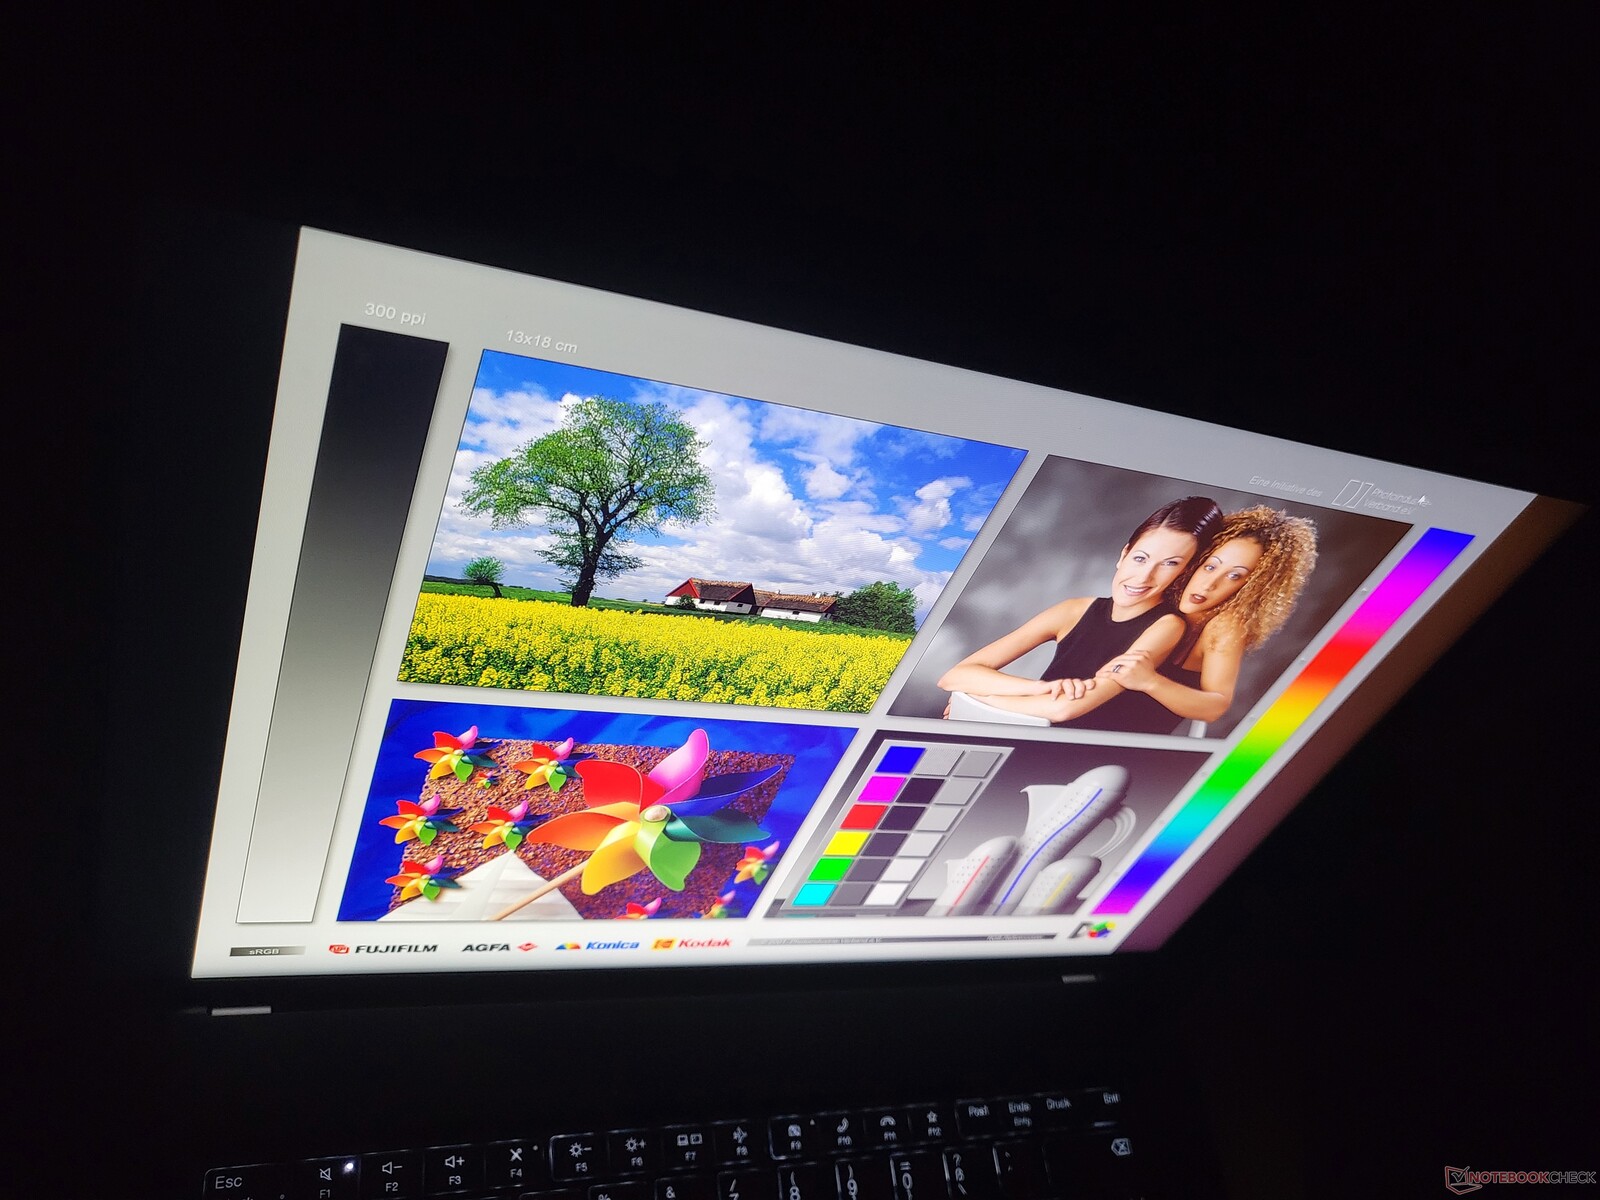
ThinkPad Z16 Gen 1: Matte WUXGA display with a good brightness
Lenovo almost always offers several display options with its ThinkPad laptops, and the Lenovo ThinkPad Z16 Gen 1 is no exception from this rule. Buyers can choose among the following displays that all have the 16:10 format and 16-inch diagonal in common:
- IPS WUXGA (1,920 x 1,200), 400 cd/m², matte, 100% sRGB, Low Power
- IPS WUXGA (1,920 x 1,200), 400 cd/m², semi-glossy, 100% sRGB, Low Power, Touch
- OLED WQUXGA (3,840 x 2,400), 400 cd/m² (SDR), semi-glossy, 100 % DCI-P3, Touch, Dolby Vision
What stands out compared to the ThinkPad X1 Extreme is that there is no 2.5K option (2,560 x 1,600). Users have to select between a fairly low and a very high resolution. In the case of our test unit, we have the basic option. This more than fulfills the promised 400 cd/m², since the average brightness is 446 cd/m².
| |||||||||||||||||||||||||
Brightness Distribution: 83 %
Center on Battery: 487 cd/m²
Contrast: 1571:1 (Black: 0.31 cd/m²)
ΔE ColorChecker Calman: 1.8 | ∀{0.5-29.43 Ø4.75}
calibrated: 0.8
ΔE Greyscale Calman: 2.3 | ∀{0.09-98 Ø5}
72.1% AdobeRGB 1998 (Argyll 3D)
99.7% sRGB (Argyll 3D)
70% Display P3 (Argyll 3D)
Gamma: 2.16
CCT: 6867 K
| Lenovo ThinkPad Z16 G1 21D5S00T00 NE160WUM-N62 , IPS LED, 1920x1200, 16" | Lenovo ThinkPad X1 Extreme G4-20Y5CTO1WW (3050 Ti) LP160UQ1-SPB1, IPS LED, 3840x2400, 16" | Dell XPS 15 9520 RTX 3050 Ti Samsung 156XG01, OLED, 3456x2160, 15.6" | Dell XPS 17 9720 Sharp LQ170R1, IPS, 3840x2400, 17" | Apple MacBook Pro 16 2021 M1 Pro Liquid Retina XDR, Mini-LED, 3456x2234, 16.2" | |
|---|---|---|---|---|---|
| Display | 18% | 20% | 25% | 21% | |
| Display P3 Coverage (%) | 70 | 84.3 20% | 97.8 40% | 94.8 35% | 99.1 42% |
| sRGB Coverage (%) | 99.7 | 98.3 -1% | 99.9 0% | 100 0% | 100 0% |
| AdobeRGB 1998 Coverage (%) | 72.1 | 97.8 36% | 86 19% | 100 39% | 88 22% |
| Response Times | -59% | 94% | -24% | -137% | |
| Response Time Grey 50% / Grey 80% * (ms) | 40 ? | 60 ? -50% | 1.9 ? 95% | 53.2 ? -33% | 42.8 ? -7% |
| Response Time Black / White * (ms) | 25 ? | 42 ? -68% | 1.9 ? 92% | 28.4 ? -14% | 91.6 ? -266% |
| PWM Frequency (Hz) | 59.52 ? | 17990 ? | 14880 | ||
| Screen | -14% | -55% | -23% | 212% | |
| Brightness middle (cd/m²) | 487 | 639 31% | 381.4 -22% | 438 -10% | 514 6% |
| Brightness (cd/m²) | 446 | 612 37% | 384 -14% | 411 -8% | 497 11% |
| Brightness Distribution (%) | 83 | 84 1% | 95 14% | 86 4% | 95 14% |
| Black Level * (cd/m²) | 0.31 | 0.47 -52% | 0.27 13% | 0.02 94% | |
| Contrast (:1) | 1571 | 1360 -13% | 1622 3% | 25700 1536% | |
| Colorchecker dE 2000 * | 1.8 | 2.2 -22% | 4.34 -141% | 2.5 -39% | 1.4 22% |
| Colorchecker dE 2000 max. * | 3.3 | 5.3 -61% | 9.24 -180% | 6.3 -91% | 2.8 15% |
| Colorchecker dE 2000 calibrated * | 0.8 | 1.4 -75% | 0.8 -0% | ||
| Greyscale dE 2000 * | 2.3 | 1.7 26% | 2 13% | 4.2 -83% | 2.3 -0% |
| Gamma | 2.16 102% | 2.31 95% | 2.13 103% | 2.22 99% | 2.27 97% |
| CCT | 6867 95% | 6390 102% | 6210 105% | 7034 92% | 6792 96% |
| Total Average (Program / Settings) | -18% /
-14% | 20% /
-8% | -7% /
-13% | 32% /
115% |
* ... smaller is better
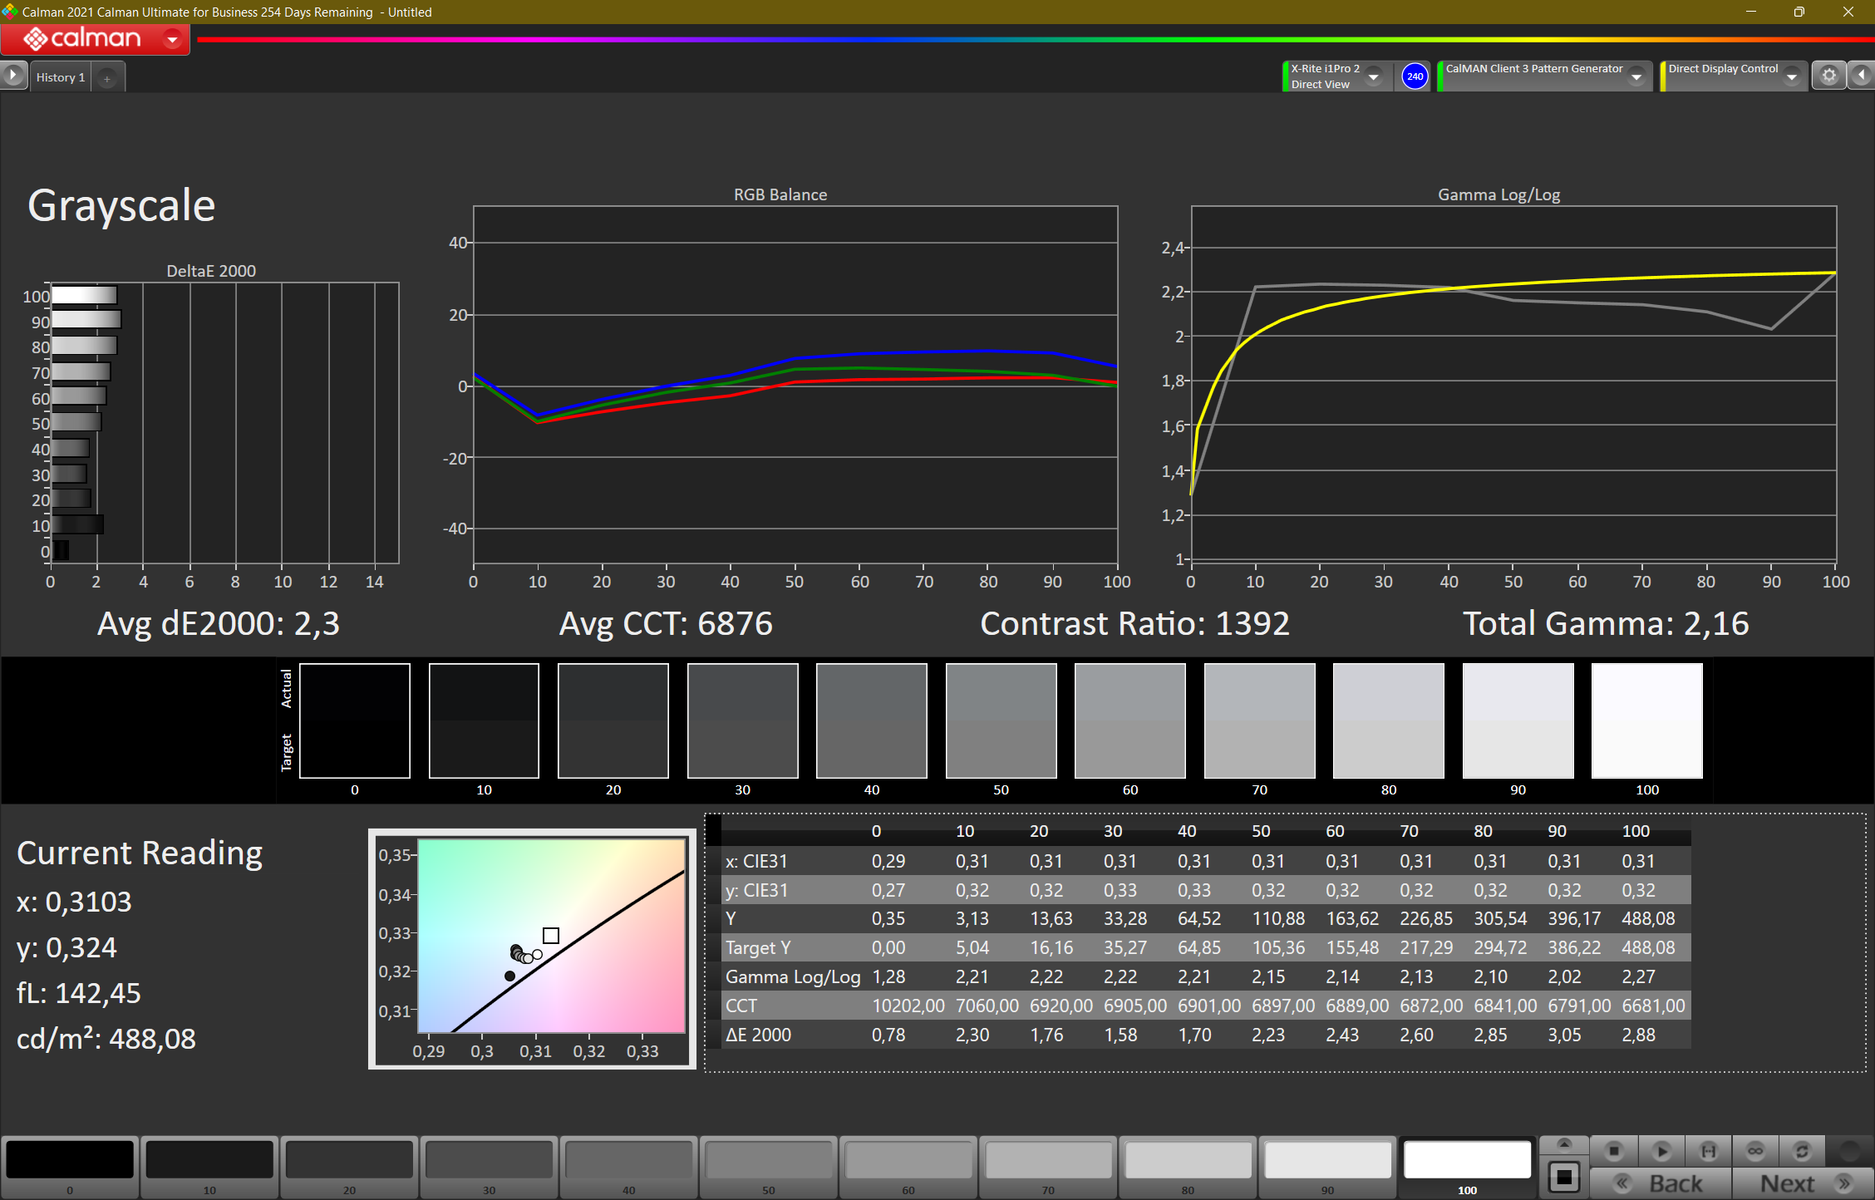
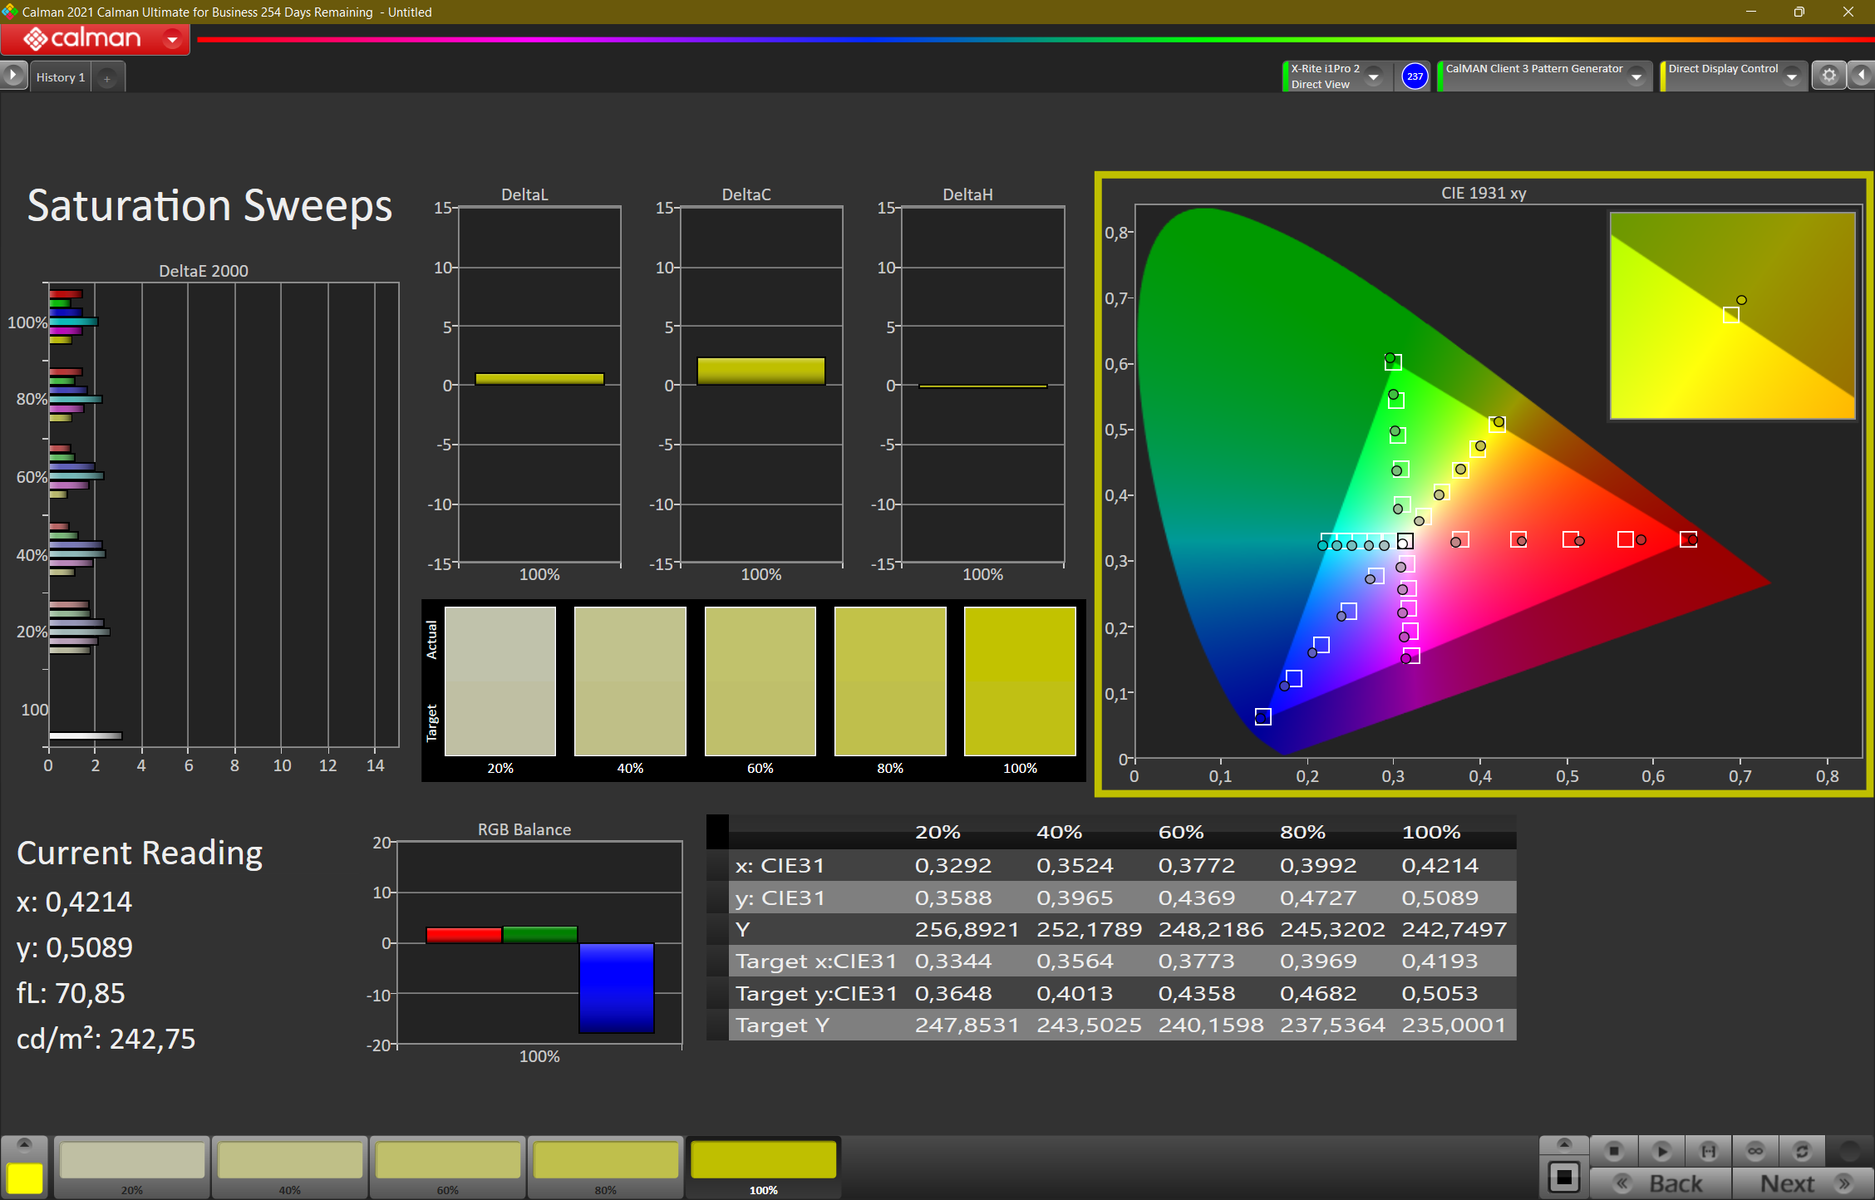
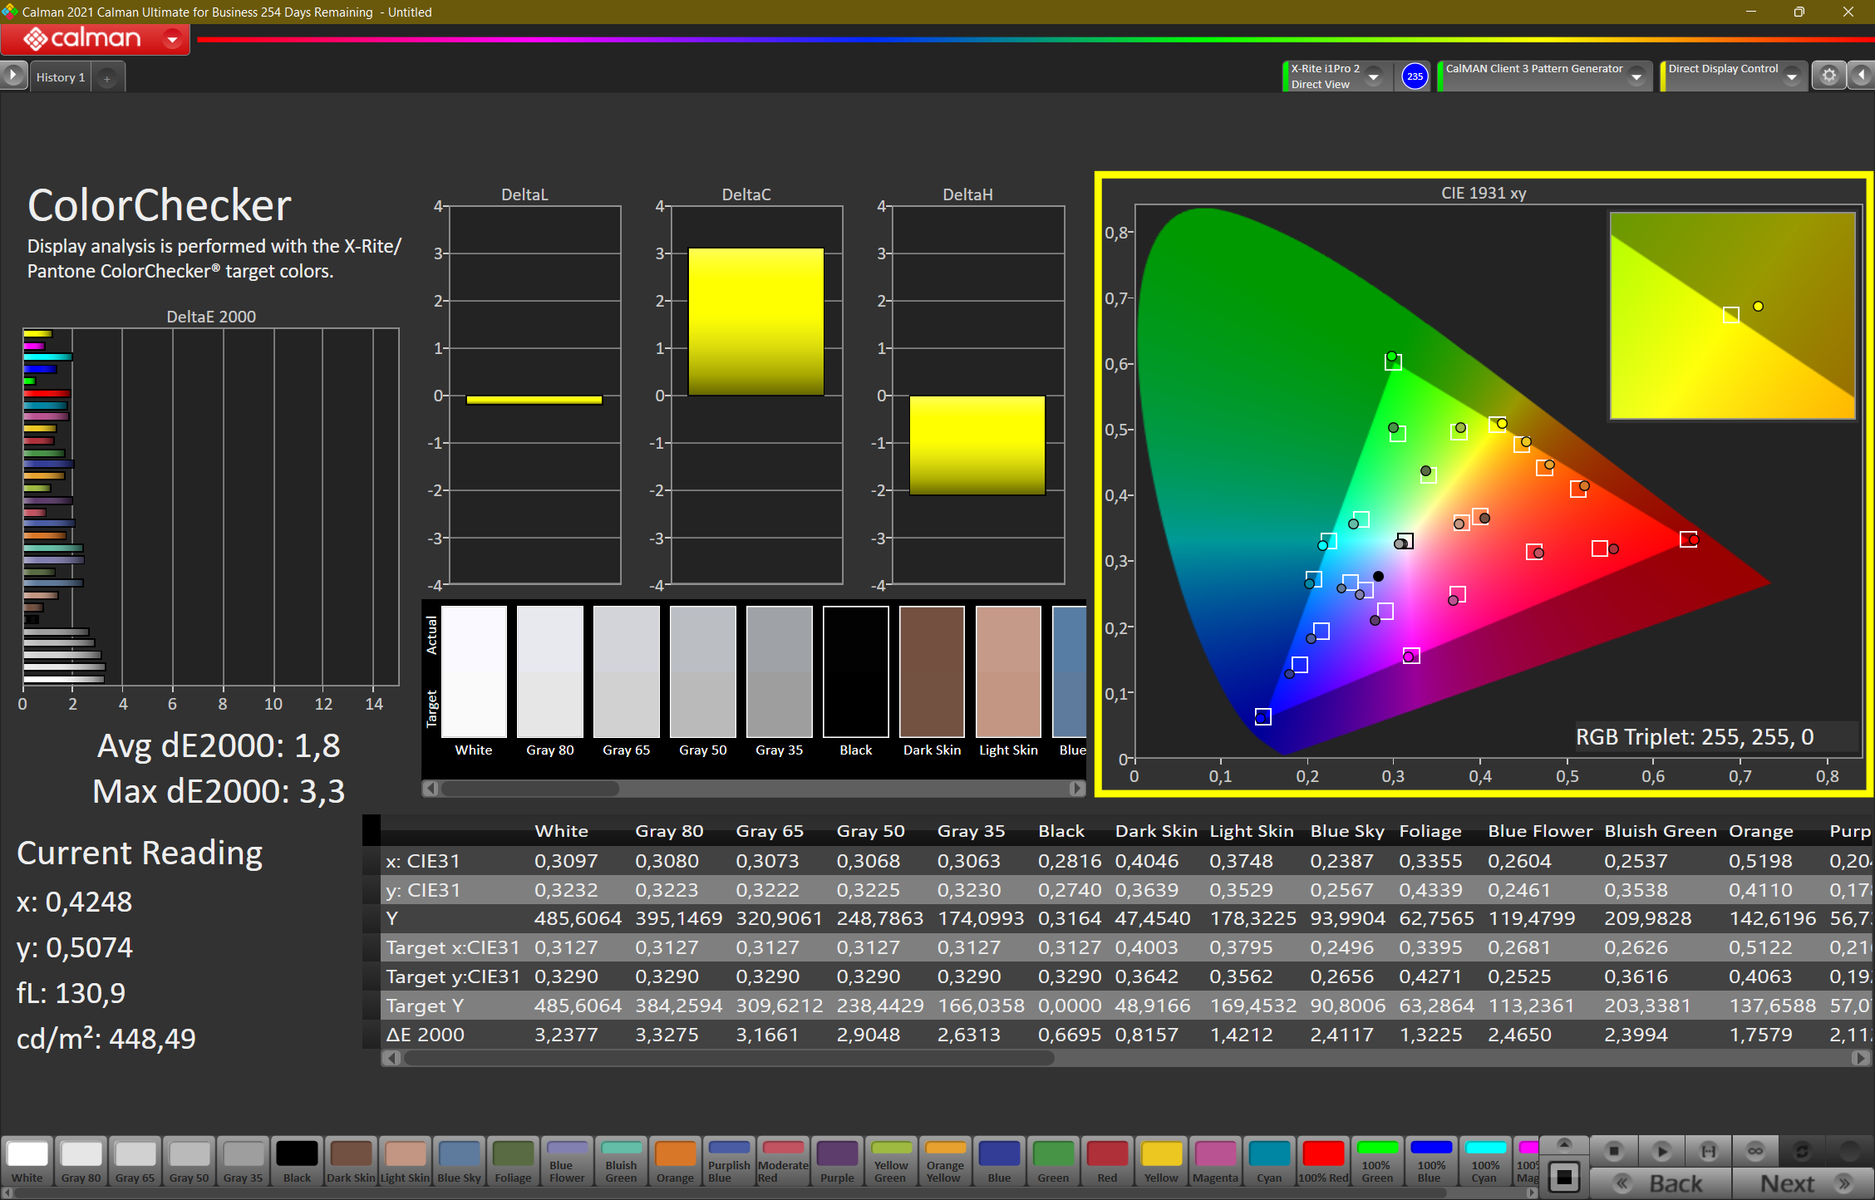
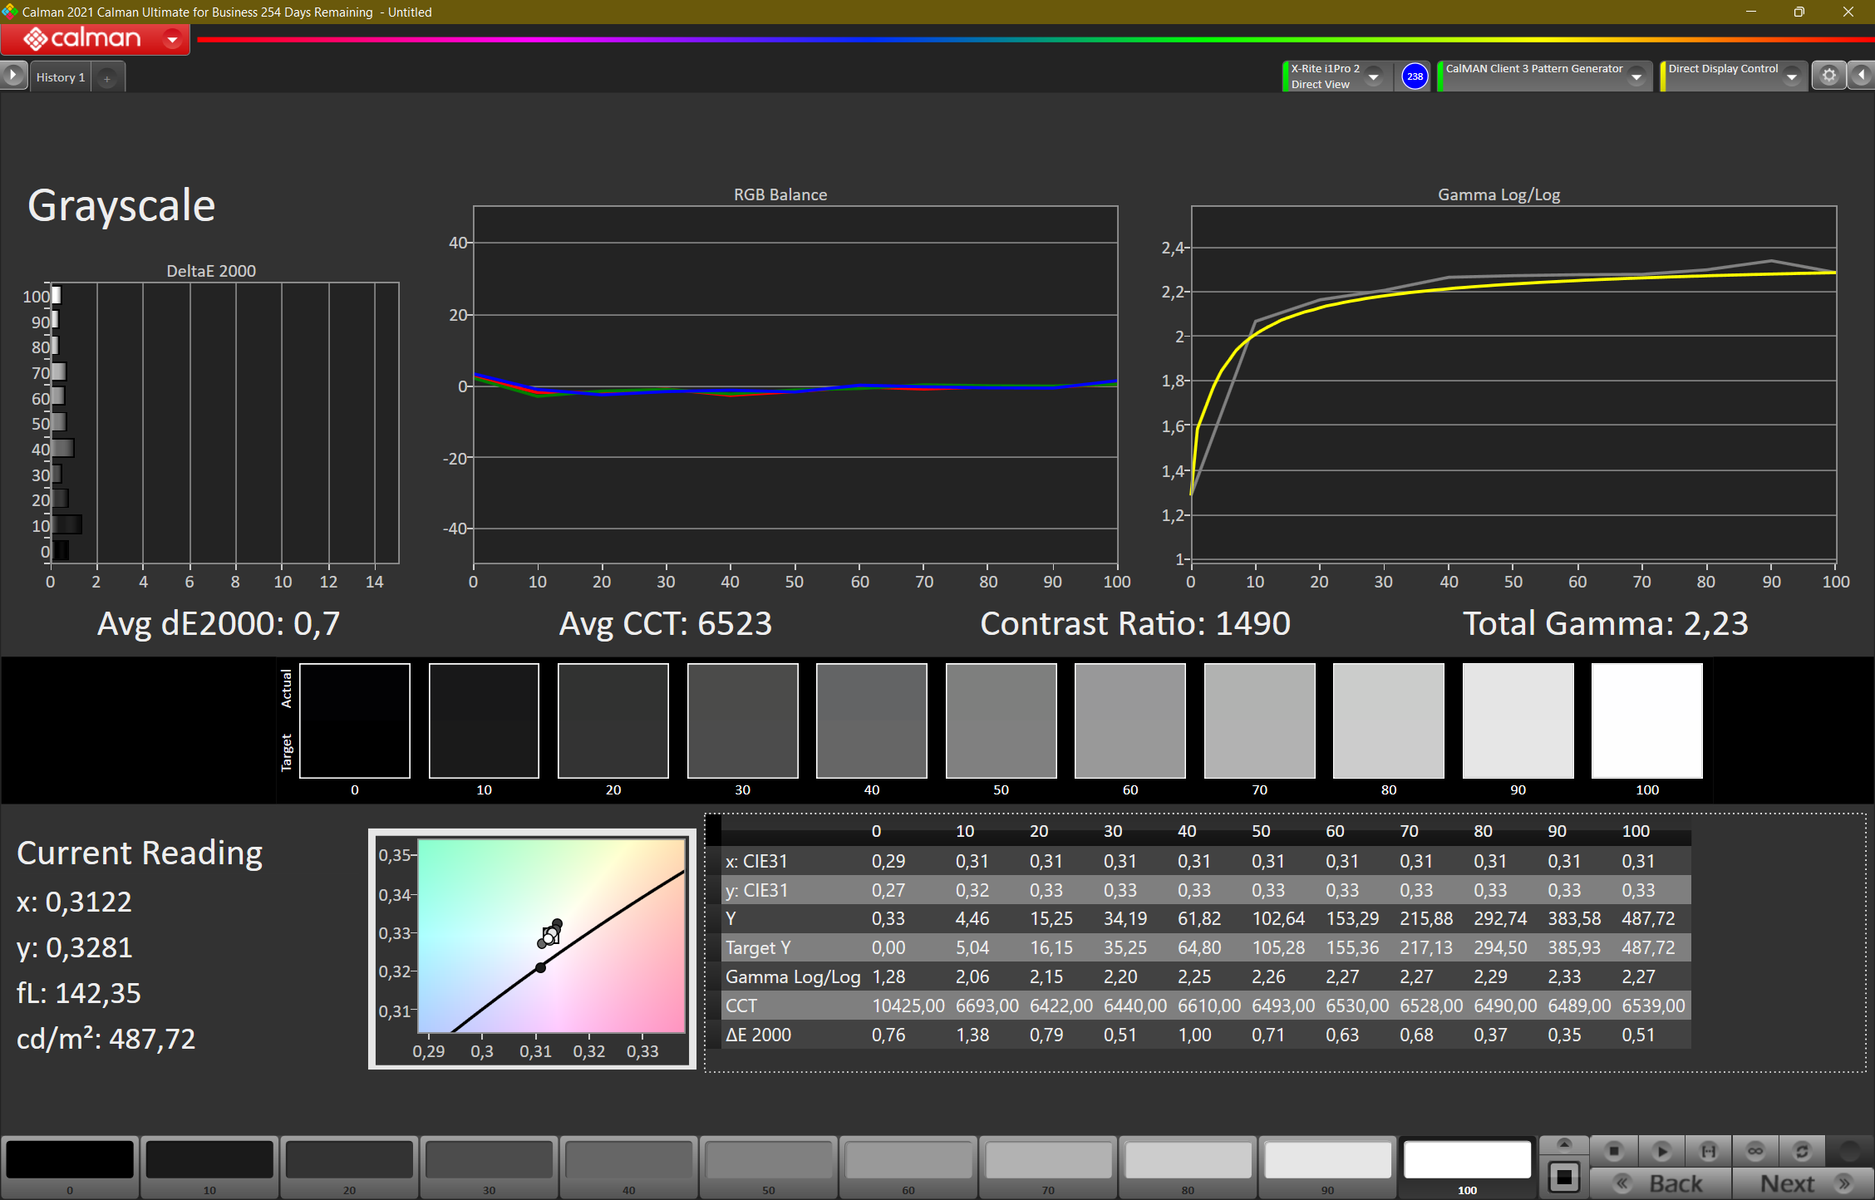
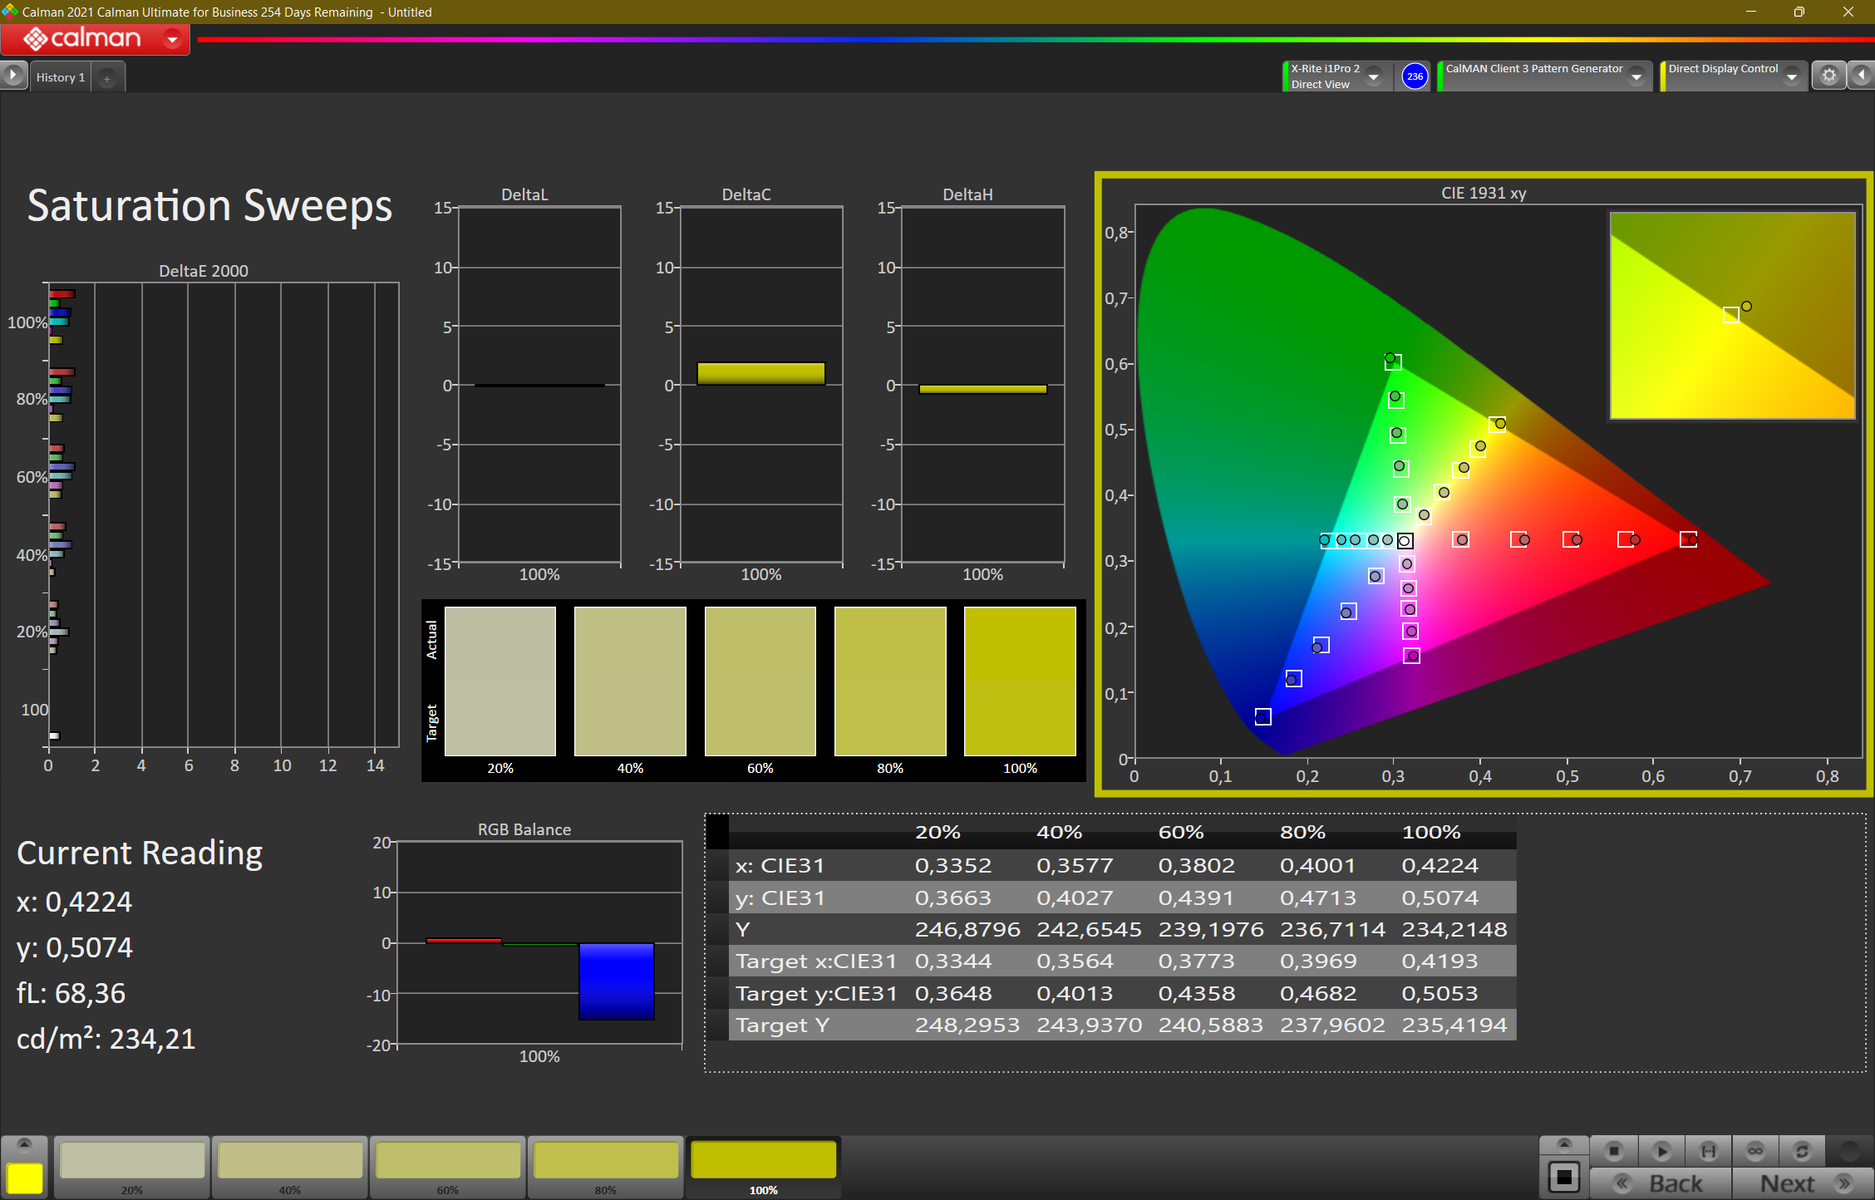
The display of the Lenovo ThinkPad Z16 G1 is already relatively well-adjusted in the state of delivery, which is shown in its low Delta-E deviations. We measured the display using CalMan and the X-Rite i1 Pro 2 Colorimeter. A calibration with the i1 Profiler was able to drop the Delta-E value even further, leading to a quite accurate color reproduction. As always, the created color profile is available for your free download above.
Lenovo's marketing promises 100% sRGB color space coverage, and we measured 99.7%. With this, the LCD display is suited for simple image processing. In order to get an even wider color space coverage, you'd have to select the optional OLED panel.
Due to its relatively high brightness and matte display surface, the ThinkPad Z16 laptop can be used outdoors without any problems, as long as you avoid direct sunlight.
Display Response Times
| ↔ Response Time Black to White | ||
|---|---|---|
| 25 ms ... rise ↗ and fall ↘ combined | ↗ 12 ms rise | 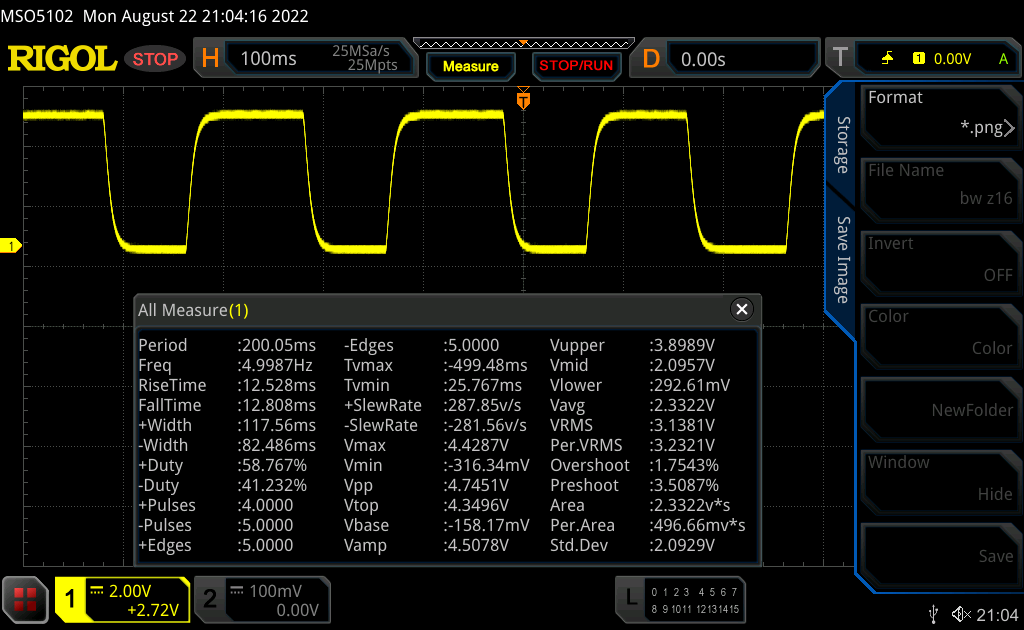 |
| ↘ 13 ms fall | ||
| The screen shows relatively slow response rates in our tests and may be too slow for gamers. In comparison, all tested devices range from 0.1 (minimum) to 240 (maximum) ms. » 58 % of all devices are better. This means that the measured response time is worse than the average of all tested devices (20 ms). | ||
| ↔ Response Time 50% Grey to 80% Grey | ||
| 40 ms ... rise ↗ and fall ↘ combined | ↗ 17 ms rise | 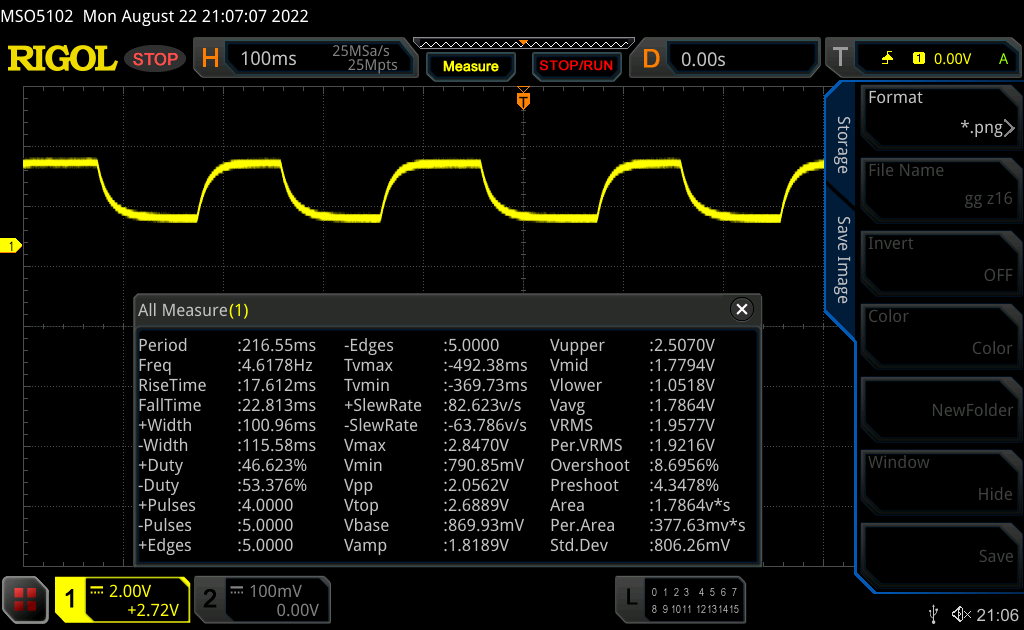 |
| ↘ 23 ms fall | ||
| The screen shows slow response rates in our tests and will be unsatisfactory for gamers. In comparison, all tested devices range from 0.165 (minimum) to 636 (maximum) ms. » 61 % of all devices are better. This means that the measured response time is worse than the average of all tested devices (31.4 ms). | ||
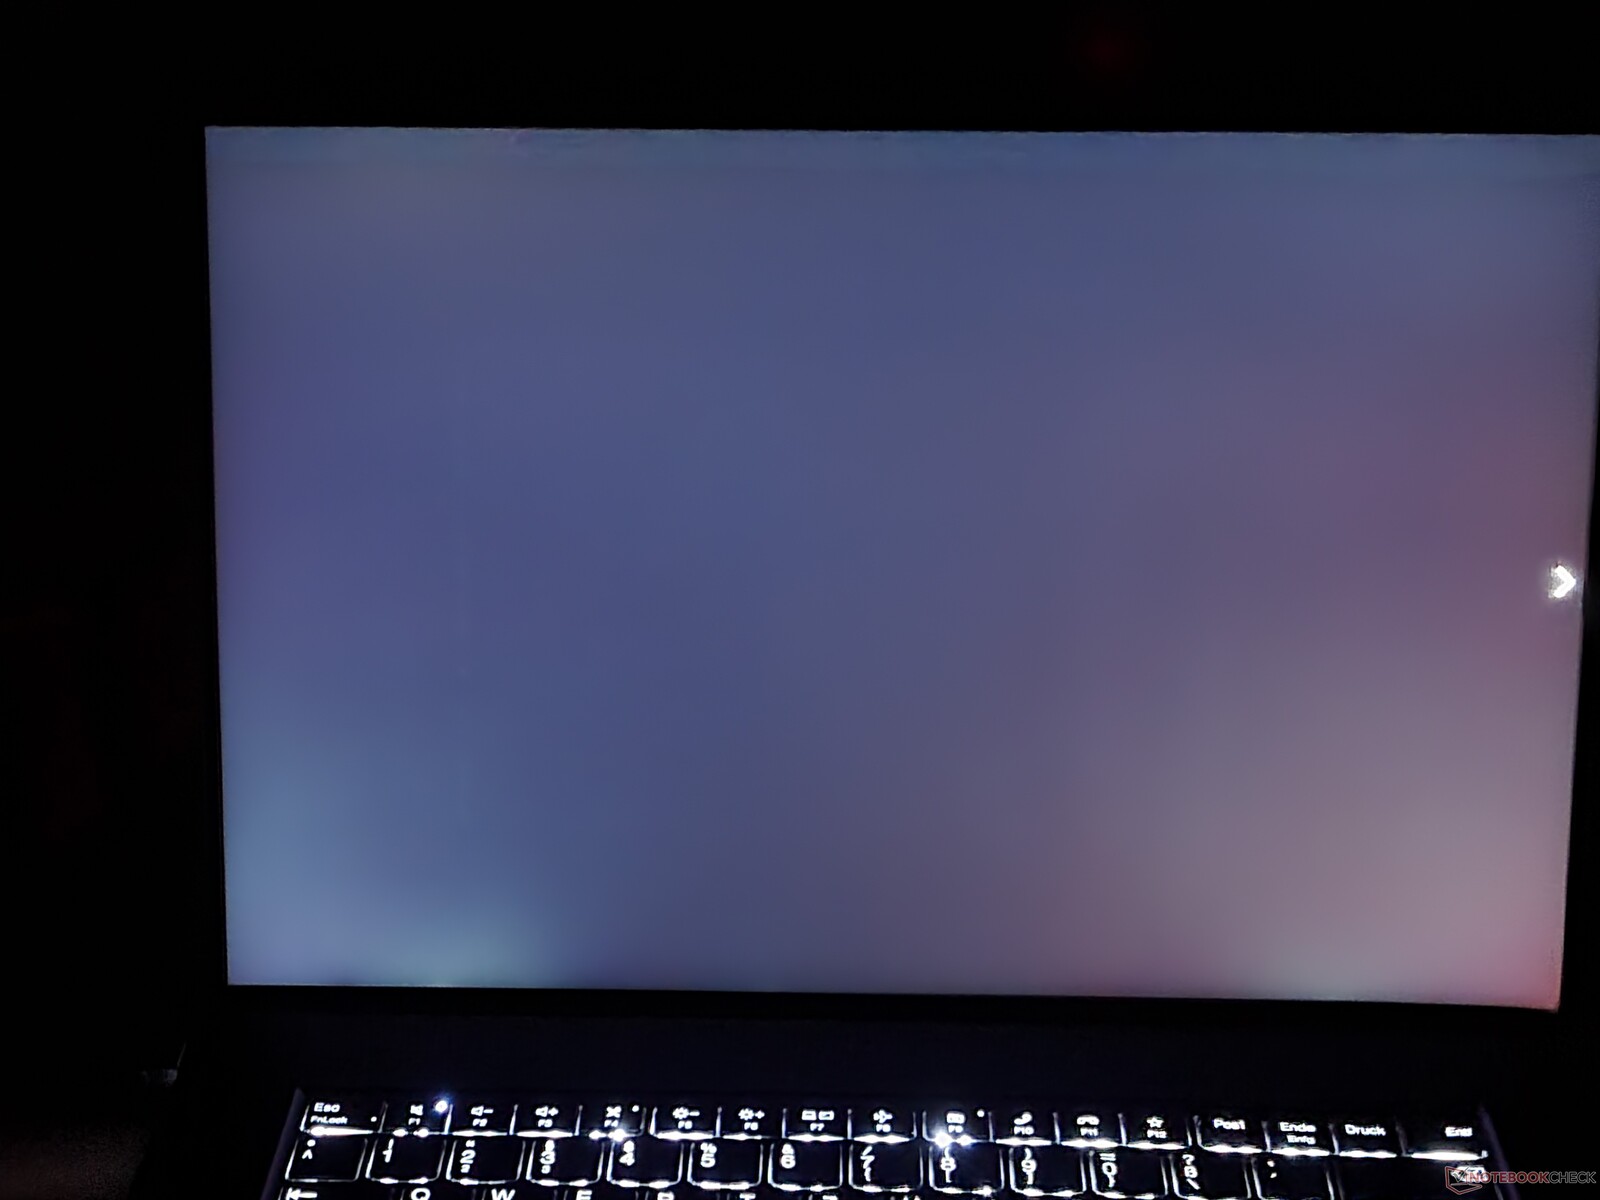
Screen Flickering / PWM (Pulse-Width Modulation)
| Screen flickering / PWM not detected | 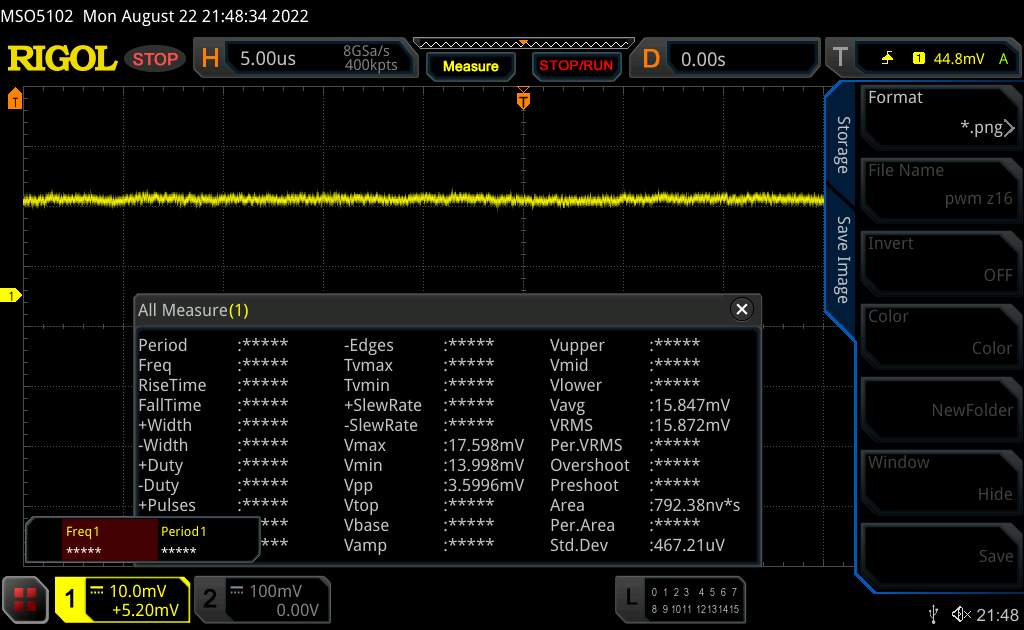 | ||
In comparison: 53 % of all tested devices do not use PWM to dim the display. If PWM was detected, an average of 7979 (minimum: 5 - maximum: 343500) Hz was measured. | |||
Performance: AMD Ryzen 6000H meets Radeon RX 6500M
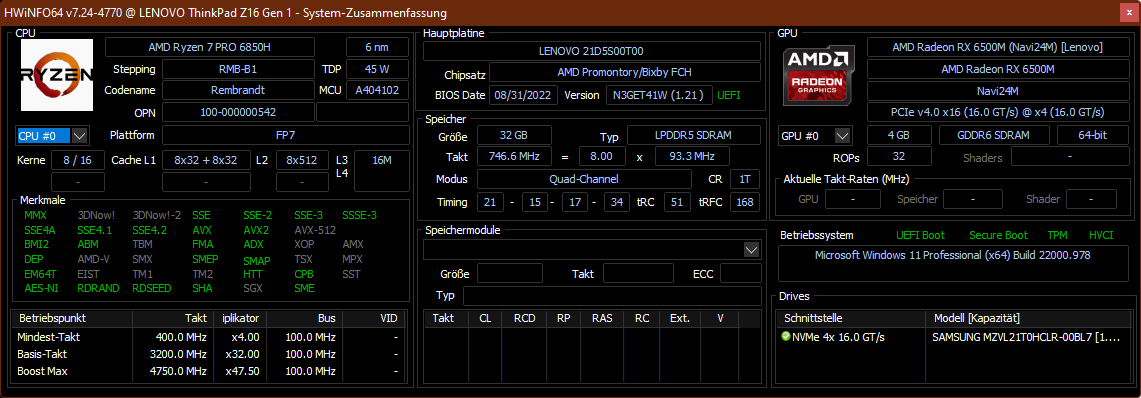
The selection of processors for the ThinkPad Z16 Gen 1 includes three choices, with all CPUs being part of AMD's Ryzen Pro lineup for business customers. The AMD Ryzen 5 Pro 6650H with six cores serves as the entry level, and you can also get the Ryzen 7 Pro 6850H and the Ryzen 9 Pro 6950H, both with eight cores. As graphics chip, you can either use the integrated Radeon GPU or optionally get the AMD Radeon RX 6500M. The Lenovo ThinkPad Z16 is the first ThinkPad that you can buy with a combination of AMD CPU and AMD dGPU.
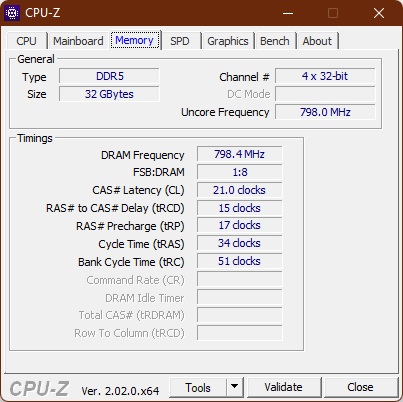
In the ThinkPad Z series, Lenovo uses soldered LPDDR5-6400 memory, with the Z16 offering either 16 or 32 GB of RAM. A single M.2-2280 SSD serves as the storage.

Test Conditions
Our test was performed under difficult conditions, since the Z16 created some big problems for us. Our first test unit constantly restarted when the Wi-Fi was activated. We then received an exchange device, which solved the problems to a large extent, and the replacement ThinkPad was significantly more stable.
In the Windows "Best Performance" mode, the CPU of the ThinkPad Z16 has a short-term power limit of 65 watts, and in the long term, the processor can consume 47 watts.
Processor
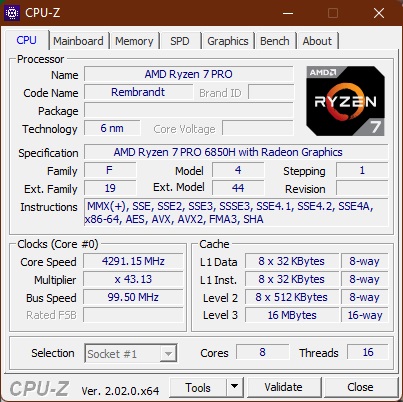
The AMD Ryzen 7 Pro 6850H is a processor of the 2022 Rembrandt generation that has a typical TDP of 45 watts as a chip of the H series. Its eight cores (16 threads with Hyperthreading) have a basic clock speed of 3.2 GHz and a maximum speed of 4.7 GHz. For some additional comparisons with other processors, we recommend our CPU comparison list.
The Lenovo ThinkPad Z16 Gen 1 is the first ThinkPad with the AMD-H series. In the benchmark tests, it achieves a very good performance, although it remains behind the competitors in several disciplines. The Intel Core-i CPUs of the 12th generation are better in both the single and multicore performance, even though the advantage doesn't last long in the multicore performance. The M1 Pro and Max processors also have advantages, aside from the emulated benchmarks.
Even though the "Ultra Performance" mode isn't available in battery operation, the CPU performance remains almost unchanged in battery operation despite this (11,963 points in the Cinebench R23 Multicore test).
Cinebench R15 Multi Constant Load Test
Cinebench R23: Multi Core | Single Core
Cinebench R20: CPU (Multi Core) | CPU (Single Core)
Cinebench R15: CPU Multi 64Bit | CPU Single 64Bit
Blender: v2.79 BMW27 CPU
7-Zip 18.03: 7z b 4 | 7z b 4 -mmt1
Geekbench 5.5: Multi-Core | Single-Core
HWBOT x265 Benchmark v2.2: 4k Preset
LibreOffice : 20 Documents To PDF
R Benchmark 2.5: Overall mean
| CPU Performance rating | |
| Average of class Multimedia | |
| Dell XPS 17 9720 | |
| Dell XPS 15 9520 RTX 3050 Ti | |
| Lenovo ThinkPad X1 Extreme G4-20Y50040GE -3! | |
| Apple MacBook Pro 16 2021 M1 Pro -5! | |
| Lenovo ThinkPad Z16 G1 21D5S00T00 | |
| Apple MacBook Pro 16 2021 M1 Max -5! | |
| Lenovo ThinkPad X1 Extreme G4-20Y5CTO1WW (3050 Ti) | |
| Average AMD Ryzen 7 PRO 6850H | |
| Cinebench R23 / Multi Core | |
| Dell XPS 17 9720 | |
| Average of class Multimedia (4861 - 33362, n=78, last 2 years) | |
| Dell XPS 15 9520 RTX 3050 Ti | |
| Lenovo ThinkPad X1 Extreme G4-20Y5CTO1WW (3050 Ti) | |
| Average AMD Ryzen 7 PRO 6850H (12016 - 12770, n=2) | |
| Apple MacBook Pro 16 2021 M1 Max | |
| Apple MacBook Pro 16 2021 M1 Pro | |
| Lenovo ThinkPad X1 Extreme G4-20Y50040GE | |
| Lenovo ThinkPad Z16 G1 21D5S00T00 | |
| Cinebench R23 / Single Core | |
| Average of class Multimedia (1128 - 2459, n=70, last 2 years) | |
| Dell XPS 15 9520 RTX 3050 Ti | |
| Dell XPS 17 9720 | |
| Lenovo ThinkPad X1 Extreme G4-20Y50040GE | |
| Apple MacBook Pro 16 2021 M1 Pro | |
| Apple MacBook Pro 16 2021 M1 Max | |
| Lenovo ThinkPad X1 Extreme G4-20Y5CTO1WW (3050 Ti) | |
| Lenovo ThinkPad Z16 G1 21D5S00T00 | |
| Average AMD Ryzen 7 PRO 6850H (1469 - 1491, n=2) | |
| Cinebench R20 / CPU (Multi Core) | |
| Average of class Multimedia (1887 - 12912, n=62, last 2 years) | |
| Dell XPS 15 9520 RTX 3050 Ti | |
| Lenovo ThinkPad Z16 G1 21D5S00T00 | |
| Dell XPS 17 9720 | |
| Lenovo ThinkPad X1 Extreme G4-20Y5CTO1WW (3050 Ti) | |
| Lenovo ThinkPad X1 Extreme G4-20Y50040GE | |
| Average AMD Ryzen 7 PRO 6850H (2990 - 4946, n=3) | |
| Apple MacBook Pro 16 2021 M1 Max | |
| Apple MacBook Pro 16 2021 M1 Pro | |
| Cinebench R20 / CPU (Single Core) | |
| Average of class Multimedia (420 - 853, n=62, last 2 years) | |
| Dell XPS 15 9520 RTX 3050 Ti | |
| Dell XPS 17 9720 | |
| Lenovo ThinkPad X1 Extreme G4-20Y50040GE | |
| Lenovo ThinkPad X1 Extreme G4-20Y5CTO1WW (3050 Ti) | |
| Lenovo ThinkPad Z16 G1 21D5S00T00 | |
| Average AMD Ryzen 7 PRO 6850H (564 - 583, n=3) | |
| Apple MacBook Pro 16 2021 M1 Pro | |
| Apple MacBook Pro 16 2021 M1 Max | |
| Cinebench R15 / CPU Multi 64Bit | |
| Dell XPS 17 9720 | |
| Dell XPS 17 9720 | |
| Average of class Multimedia (856 - 5224, n=67, last 2 years) | |
| Dell XPS 15 9520 RTX 3050 Ti | |
| Lenovo ThinkPad X1 Extreme G4-20Y50040GE | |
| Lenovo ThinkPad X1 Extreme G4-20Y50040GE | |
| Average AMD Ryzen 7 PRO 6850H (2081 - 2090, n=2) | |
| Lenovo ThinkPad Z16 G1 21D5S00T00 | |
| Lenovo ThinkPad X1 Extreme G4-20Y5CTO1WW (3050 Ti) | |
| Apple MacBook Pro 16 2021 M1 Max | |
| Apple MacBook Pro 16 2021 M1 Pro | |
| Cinebench R15 / CPU Single 64Bit | |
| Average of class Multimedia (99.6 - 326, n=65, last 2 years) | |
| Dell XPS 17 9720 | |
| Dell XPS 15 9520 RTX 3050 Ti | |
| Lenovo ThinkPad X1 Extreme G4-20Y50040GE | |
| Lenovo ThinkPad Z16 G1 21D5S00T00 | |
| Lenovo ThinkPad X1 Extreme G4-20Y5CTO1WW (3050 Ti) | |
| Apple MacBook Pro 16 2021 M1 Pro | |
| Average AMD Ryzen 7 PRO 6850H (166.2 - 244, n=2) | |
| Apple MacBook Pro 16 2021 M1 Max | |
| Blender / v2.79 BMW27 CPU | |
| Lenovo ThinkPad X1 Extreme G4-20Y5CTO1WW (3050 Ti) | |
| Average of class Multimedia (100 - 557, n=63, last 2 years) | |
| Average AMD Ryzen 7 PRO 6850H (235 - 248, n=2) | |
| Dell XPS 17 9720 | |
| Lenovo ThinkPad Z16 G1 21D5S00T00 | |
| Dell XPS 15 9520 RTX 3050 Ti | |
| Apple MacBook Pro 16 2021 M1 Max | |
| Apple MacBook Pro 16 2021 M1 Pro | |
| 7-Zip 18.03 / 7z b 4 | |
| Dell XPS 15 9520 RTX 3050 Ti | |
| Dell XPS 17 9720 | |
| Average of class Multimedia (29095 - 130368, n=61, last 2 years) | |
| Lenovo ThinkPad Z16 G1 21D5S00T00 | |
| Average AMD Ryzen 7 PRO 6850H (52391 - 56498, n=2) | |
| Lenovo ThinkPad X1 Extreme G4-20Y5CTO1WW (3050 Ti) | |
| 7-Zip 18.03 / 7z b 4 -mmt1 | |
| Average of class Multimedia (3666 - 7545, n=61, last 2 years) | |
| Dell XPS 17 9720 | |
| Dell XPS 15 9520 RTX 3050 Ti | |
| Lenovo ThinkPad X1 Extreme G4-20Y5CTO1WW (3050 Ti) | |
| Average AMD Ryzen 7 PRO 6850H (5374 - 5460, n=2) | |
| Lenovo ThinkPad Z16 G1 21D5S00T00 | |
| Geekbench 5.5 / Multi-Core | |
| Dell XPS 17 9720 | |
| Apple MacBook Pro 16 2021 M1 Max | |
| Apple MacBook Pro 16 2021 M1 Pro | |
| Average of class Multimedia (4652 - 20422, n=62, last 2 years) | |
| Dell XPS 15 9520 RTX 3050 Ti | |
| Lenovo ThinkPad Z16 G1 21D5S00T00 | |
| Average AMD Ryzen 7 PRO 6850H (8093 - 8851, n=2) | |
| Lenovo ThinkPad X1 Extreme G4-20Y5CTO1WW (3050 Ti) | |
| Lenovo ThinkPad X1 Extreme G4-20Y50040GE | |
| Geekbench 5.5 / Single-Core | |
| Average of class Multimedia (805 - 2974, n=62, last 2 years) | |
| Apple MacBook Pro 16 2021 M1 Max | |
| Dell XPS 15 9520 RTX 3050 Ti | |
| Apple MacBook Pro 16 2021 M1 Pro | |
| Dell XPS 17 9720 | |
| Lenovo ThinkPad X1 Extreme G4-20Y50040GE | |
| Lenovo ThinkPad X1 Extreme G4-20Y5CTO1WW (3050 Ti) | |
| Lenovo ThinkPad Z16 G1 21D5S00T00 | |
| Average AMD Ryzen 7 PRO 6850H (1474 - 1481, n=2) | |
| HWBOT x265 Benchmark v2.2 / 4k Preset | |
| Average of class Multimedia (5.26 - 36.1, n=61, last 2 years) | |
| Lenovo ThinkPad Z16 G1 21D5S00T00 | |
| Dell XPS 15 9520 RTX 3050 Ti | |
| Dell XPS 17 9720 | |
| Average AMD Ryzen 7 PRO 6850H (12.7 - 15.9, n=2) | |
| Lenovo ThinkPad X1 Extreme G4-20Y50040GE | |
| Lenovo ThinkPad X1 Extreme G4-20Y5CTO1WW (3050 Ti) | |
| LibreOffice / 20 Documents To PDF | |
| Average AMD Ryzen 7 PRO 6850H (50.7 - 95.2, n=2) | |
| Lenovo ThinkPad Z16 G1 21D5S00T00 | |
| Average of class Multimedia (23.9 - 146.7, n=62, last 2 years) | |
| Dell XPS 17 9720 | |
| Lenovo ThinkPad X1 Extreme G4-20Y5CTO1WW (3050 Ti) | |
| Dell XPS 15 9520 RTX 3050 Ti | |
| Lenovo ThinkPad X1 Extreme G4-20Y50040GE | |
| R Benchmark 2.5 / Overall mean | |
| Lenovo ThinkPad X1 Extreme G4-20Y5CTO1WW (3050 Ti) | |
| Lenovo ThinkPad X1 Extreme G4-20Y50040GE | |
| Average AMD Ryzen 7 PRO 6850H (0.516 - 0.524, n=2) | |
| Lenovo ThinkPad Z16 G1 21D5S00T00 | |
| Average of class Multimedia (0.3604 - 0.947, n=61, last 2 years) | |
| Dell XPS 15 9520 RTX 3050 Ti | |
| Dell XPS 17 9720 | |
* ... smaller is better
AIDA64: FP32 Ray-Trace | FPU Julia | CPU SHA3 | CPU Queen | FPU SinJulia | FPU Mandel | CPU AES | CPU ZLib | FP64 Ray-Trace | CPU PhotoWorxx
| Performance rating | |
| Average of class Multimedia | |
| Average AMD Ryzen 7 PRO 6850H | |
| Lenovo ThinkPad Z16 G1 21D5S00T00 | |
| Lenovo ThinkPad X1 Extreme G4-20Y50040GE | |
| Lenovo ThinkPad X1 Extreme G4-20Y5CTO1WW (3050 Ti) | |
| Dell XPS 15 9520 RTX 3050 Ti | |
| Dell XPS 17 9720 | |
| AIDA64 / FP32 Ray-Trace | |
| Average of class Multimedia (2214 - 50388, n=58, last 2 years) | |
| Lenovo ThinkPad Z16 G1 21D5S00T00 | |
| Lenovo ThinkPad X1 Extreme G4-20Y50040GE | |
| Average AMD Ryzen 7 PRO 6850H (15009 - 15301, n=2) | |
| Lenovo ThinkPad X1 Extreme G4-20Y5CTO1WW (3050 Ti) | |
| Dell XPS 15 9520 RTX 3050 Ti | |
| Dell XPS 17 9720 | |
| AIDA64 / FPU Julia | |
| Lenovo ThinkPad Z16 G1 21D5S00T00 | |
| Average AMD Ryzen 7 PRO 6850H (93021 - 94997, n=2) | |
| Average of class Multimedia (12867 - 201874, n=59, last 2 years) | |
| Lenovo ThinkPad X1 Extreme G4-20Y50040GE | |
| Lenovo ThinkPad X1 Extreme G4-20Y5CTO1WW (3050 Ti) | |
| Dell XPS 15 9520 RTX 3050 Ti | |
| Dell XPS 17 9720 | |
| AIDA64 / CPU SHA3 | |
| Lenovo ThinkPad X1 Extreme G4-20Y50040GE | |
| Lenovo ThinkPad X1 Extreme G4-20Y5CTO1WW (3050 Ti) | |
| Average of class Multimedia (653 - 8623, n=59, last 2 years) | |
| Lenovo ThinkPad Z16 G1 21D5S00T00 | |
| Average AMD Ryzen 7 PRO 6850H (3155 - 3169, n=2) | |
| Dell XPS 15 9520 RTX 3050 Ti | |
| Dell XPS 17 9720 | |
| AIDA64 / CPU Queen | |
| Lenovo ThinkPad Z16 G1 21D5S00T00 | |
| Average AMD Ryzen 7 PRO 6850H (100724 - 102905, n=2) | |
| Dell XPS 17 9720 | |
| Dell XPS 15 9520 RTX 3050 Ti | |
| Lenovo ThinkPad X1 Extreme G4-20Y50040GE | |
| Lenovo ThinkPad X1 Extreme G4-20Y5CTO1WW (3050 Ti) | |
| Average of class Multimedia (13483 - 181505, n=56, last 2 years) | |
| AIDA64 / FPU SinJulia | |
| Lenovo ThinkPad Z16 G1 21D5S00T00 | |
| Average AMD Ryzen 7 PRO 6850H (12309 - 12638, n=2) | |
| Lenovo ThinkPad X1 Extreme G4-20Y50040GE | |
| Lenovo ThinkPad X1 Extreme G4-20Y5CTO1WW (3050 Ti) | |
| Average of class Multimedia (1240 - 28794, n=59, last 2 years) | |
| Dell XPS 15 9520 RTX 3050 Ti | |
| Dell XPS 17 9720 | |
| AIDA64 / FPU Mandel | |
| Lenovo ThinkPad Z16 G1 21D5S00T00 | |
| Average AMD Ryzen 7 PRO 6850H (51299 - 51802, n=2) | |
| Average of class Multimedia (6395 - 105740, n=58, last 2 years) | |
| Lenovo ThinkPad X1 Extreme G4-20Y50040GE | |
| Lenovo ThinkPad X1 Extreme G4-20Y5CTO1WW (3050 Ti) | |
| Dell XPS 15 9520 RTX 3050 Ti | |
| Dell XPS 17 9720 | |
| AIDA64 / CPU AES | |
| Lenovo ThinkPad X1 Extreme G4-20Y50040GE | |
| Lenovo ThinkPad X1 Extreme G4-20Y5CTO1WW (3050 Ti) | |
| Average AMD Ryzen 7 PRO 6850H (60476 - 128243, n=2) | |
| Dell XPS 15 9520 RTX 3050 Ti | |
| Dell XPS 17 9720 | |
| Average of class Multimedia (13243 - 126790, n=59, last 2 years) | |
| Lenovo ThinkPad Z16 G1 21D5S00T00 | |
| AIDA64 / CPU ZLib | |
| Average of class Multimedia (167.2 - 2022, n=59, last 2 years) | |
| Dell XPS 17 9720 | |
| Dell XPS 15 9520 RTX 3050 Ti | |
| Lenovo ThinkPad X1 Extreme G4-20Y50040GE | |
| Average AMD Ryzen 7 PRO 6850H (806 - 809, n=2) | |
| Lenovo ThinkPad Z16 G1 21D5S00T00 | |
| Lenovo ThinkPad X1 Extreme G4-20Y5CTO1WW (3050 Ti) | |
| AIDA64 / FP64 Ray-Trace | |
| Average of class Multimedia (1014 - 26875, n=59, last 2 years) | |
| Lenovo ThinkPad X1 Extreme G4-20Y50040GE | |
| Lenovo ThinkPad Z16 G1 21D5S00T00 | |
| Average AMD Ryzen 7 PRO 6850H (7876 - 8104, n=2) | |
| Lenovo ThinkPad X1 Extreme G4-20Y5CTO1WW (3050 Ti) | |
| Dell XPS 15 9520 RTX 3050 Ti | |
| Dell XPS 17 9720 | |
| AIDA64 / CPU PhotoWorxx | |
| Average of class Multimedia (12860 - 88086, n=59, last 2 years) | |
| Dell XPS 17 9720 | |
| Dell XPS 15 9520 RTX 3050 Ti | |
| Lenovo ThinkPad Z16 G1 21D5S00T00 | |
| Average AMD Ryzen 7 PRO 6850H (18157 - 26176, n=2) | |
| Lenovo ThinkPad X1 Extreme G4-20Y5CTO1WW (3050 Ti) | |
| Lenovo ThinkPad X1 Extreme G4-20Y50040GE | |
System Performance
In the PCMark 10, the Lenovo ThinkPad Z16 G1 places in the middle of the field but in the Crossmark, more at the bottom end of the comparison field. In everyday operation, the Lenovo ThinkPad Z16 G1 runs absolutely smoothly and fast.
CrossMark: Overall | Productivity | Creativity | Responsiveness
| PCMark 10 / Score | |
| Average of class Multimedia (4325 - 10386, n=55, last 2 years) | |
| Dell XPS 15 9520 RTX 3050 Ti | |
| Lenovo ThinkPad X1 Extreme G4-20Y50040GE | |
| Dell XPS 17 9720 | |
| Lenovo ThinkPad Z16 G1 21D5S00T00 | |
| Average AMD Ryzen 7 PRO 6850H, AMD Radeon RX 6500M (n=1) | |
| Lenovo ThinkPad X1 Extreme G4-20Y5CTO1WW (3050 Ti) | |
| PCMark 10 / Essentials | |
| Dell XPS 15 9520 RTX 3050 Ti | |
| Lenovo ThinkPad X1 Extreme G4-20Y5CTO1WW (3050 Ti) | |
| Lenovo ThinkPad X1 Extreme G4-20Y50040GE | |
| Average of class Multimedia (8025 - 11664, n=55, last 2 years) | |
| Dell XPS 17 9720 | |
| Lenovo ThinkPad Z16 G1 21D5S00T00 | |
| Average AMD Ryzen 7 PRO 6850H, AMD Radeon RX 6500M (n=1) | |
| PCMark 10 / Productivity | |
| Average of class Multimedia (7323 - 18233, n=55, last 2 years) | |
| Dell XPS 15 9520 RTX 3050 Ti | |
| Dell XPS 17 9720 | |
| Lenovo ThinkPad X1 Extreme G4-20Y50040GE | |
| Lenovo ThinkPad X1 Extreme G4-20Y5CTO1WW (3050 Ti) | |
| Lenovo ThinkPad Z16 G1 21D5S00T00 | |
| Average AMD Ryzen 7 PRO 6850H, AMD Radeon RX 6500M (n=1) | |
| PCMark 10 / Digital Content Creation | |
| Average of class Multimedia (3651 - 16240, n=55, last 2 years) | |
| Lenovo ThinkPad X1 Extreme G4-20Y50040GE | |
| Dell XPS 17 9720 | |
| Dell XPS 15 9520 RTX 3050 Ti | |
| Lenovo ThinkPad Z16 G1 21D5S00T00 | |
| Average AMD Ryzen 7 PRO 6850H, AMD Radeon RX 6500M (n=1) | |
| Lenovo ThinkPad X1 Extreme G4-20Y5CTO1WW (3050 Ti) | |
| CrossMark / Overall | |
| Dell XPS 15 9520 RTX 3050 Ti | |
| Dell XPS 17 9720 | |
| Average of class Multimedia (866 - 2728, n=65, last 2 years) | |
| Lenovo ThinkPad X1 Extreme G4-20Y50040GE | |
| Apple MacBook Pro 16 2021 M1 Max | |
| Apple MacBook Pro 16 2021 M1 Pro | |
| Lenovo ThinkPad Z16 G1 21D5S00T00 | |
| Average AMD Ryzen 7 PRO 6850H, AMD Radeon RX 6500M (n=1) | |
| CrossMark / Productivity | |
| Dell XPS 15 9520 RTX 3050 Ti | |
| Dell XPS 17 9720 | |
| Average of class Multimedia (913 - 2489, n=65, last 2 years) | |
| Lenovo ThinkPad X1 Extreme G4-20Y50040GE | |
| Lenovo ThinkPad Z16 G1 21D5S00T00 | |
| Average AMD Ryzen 7 PRO 6850H, AMD Radeon RX 6500M (n=1) | |
| Apple MacBook Pro 16 2021 M1 Max | |
| Apple MacBook Pro 16 2021 M1 Pro | |
| CrossMark / Creativity | |
| Apple MacBook Pro 16 2021 M1 Max | |
| Dell XPS 17 9720 | |
| Average of class Multimedia (907 - 3465, n=65, last 2 years) | |
| Apple MacBook Pro 16 2021 M1 Pro | |
| Dell XPS 15 9520 RTX 3050 Ti | |
| Lenovo ThinkPad X1 Extreme G4-20Y50040GE | |
| Lenovo ThinkPad Z16 G1 21D5S00T00 | |
| Average AMD Ryzen 7 PRO 6850H, AMD Radeon RX 6500M (n=1) | |
| CrossMark / Responsiveness | |
| Dell XPS 15 9520 RTX 3050 Ti | |
| Dell XPS 17 9720 | |
| Lenovo ThinkPad X1 Extreme G4-20Y50040GE | |
| Average of class Multimedia (605 - 2024, n=65, last 2 years) | |
| Lenovo ThinkPad Z16 G1 21D5S00T00 | |
| Average AMD Ryzen 7 PRO 6850H, AMD Radeon RX 6500M (n=1) | |
| Apple MacBook Pro 16 2021 M1 Max | |
| Apple MacBook Pro 16 2021 M1 Pro | |
| PCMark 10 Score | 6530 points | |
Help | ||
| AIDA64 / Memory Copy | |
| Average of class Multimedia (21158 - 131796, n=59, last 2 years) | |
| Dell XPS 17 9720 | |
| Dell XPS 15 9520 RTX 3050 Ti | |
| Lenovo ThinkPad Z16 G1 21D5S00T00 | |
| Average AMD Ryzen 7 PRO 6850H (30324 - 48504, n=2) | |
| Lenovo ThinkPad X1 Extreme G4-20Y5CTO1WW (3050 Ti) | |
| Lenovo ThinkPad X1 Extreme G4-20Y50040GE | |
| AIDA64 / Memory Read | |
| Average of class Multimedia (19699 - 125604, n=59, last 2 years) | |
| Dell XPS 17 9720 | |
| Dell XPS 15 9520 RTX 3050 Ti | |
| Lenovo ThinkPad Z16 G1 21D5S00T00 | |
| Lenovo ThinkPad X1 Extreme G4-20Y5CTO1WW (3050 Ti) | |
| Average AMD Ryzen 7 PRO 6850H (33791 - 42736, n=2) | |
| Lenovo ThinkPad X1 Extreme G4-20Y50040GE | |
| AIDA64 / Memory Write | |
| Average of class Multimedia (17733 - 134916, n=59, last 2 years) | |
| Dell XPS 17 9720 | |
| Dell XPS 15 9520 RTX 3050 Ti | |
| Lenovo ThinkPad Z16 G1 21D5S00T00 | |
| Average AMD Ryzen 7 PRO 6850H (32728 - 51157, n=2) | |
| Lenovo ThinkPad X1 Extreme G4-20Y5CTO1WW (3050 Ti) | |
| Lenovo ThinkPad X1 Extreme G4-20Y50040GE | |
| AIDA64 / Memory Latency | |
| Lenovo ThinkPad Z16 G1 21D5S00T00 | |
| Average of class Multimedia (7 - 535, n=59, last 2 years) | |
| Average AMD Ryzen 7 PRO 6850H (93.5 - 132.1, n=2) | |
| Dell XPS 15 9520 RTX 3050 Ti | |
| Dell XPS 17 9720 | |
| Lenovo ThinkPad X1 Extreme G4-20Y50040GE | |
| Lenovo ThinkPad X1 Extreme G4-20Y5CTO1WW (3050 Ti) | |
* ... smaller is better
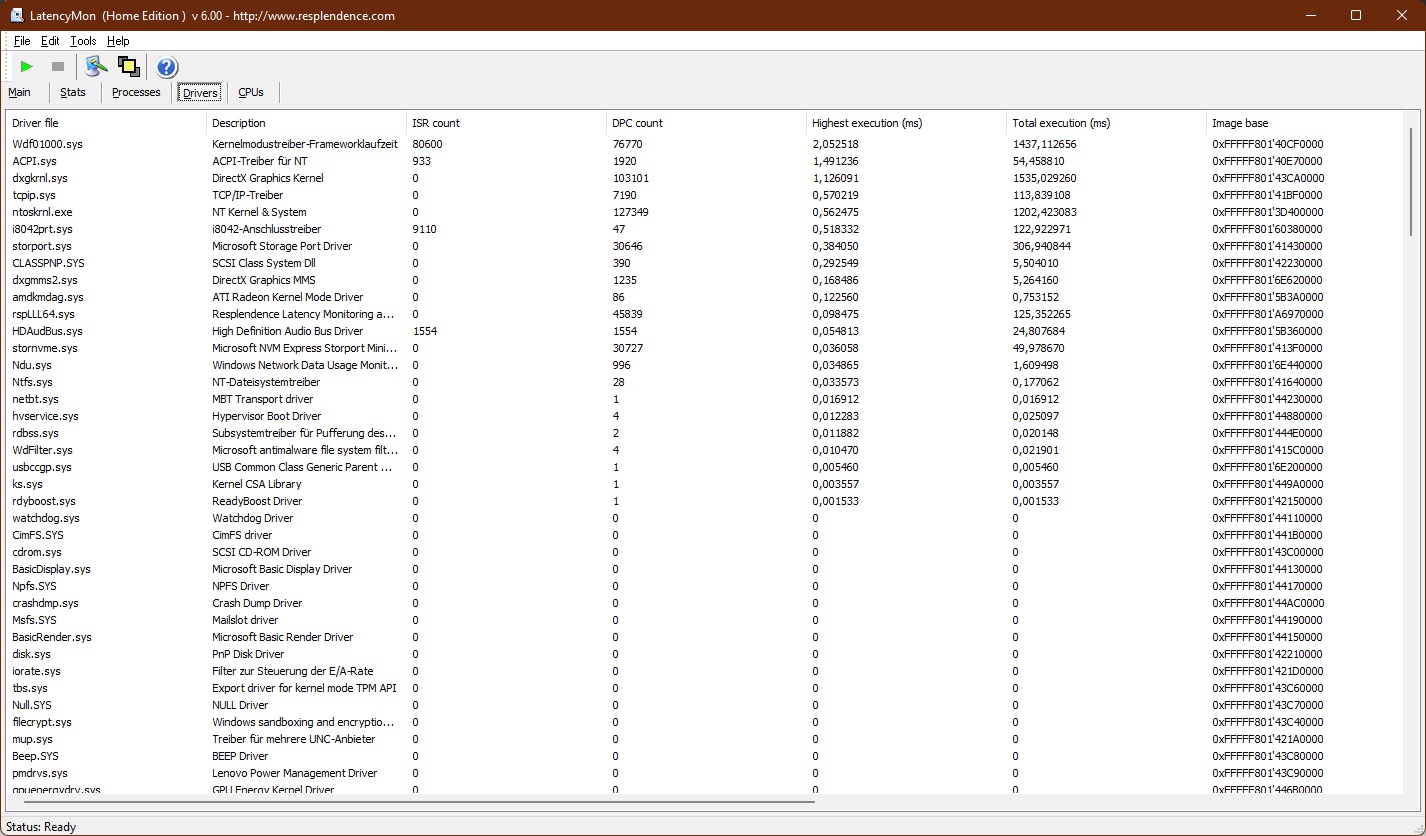
DPC Latencies
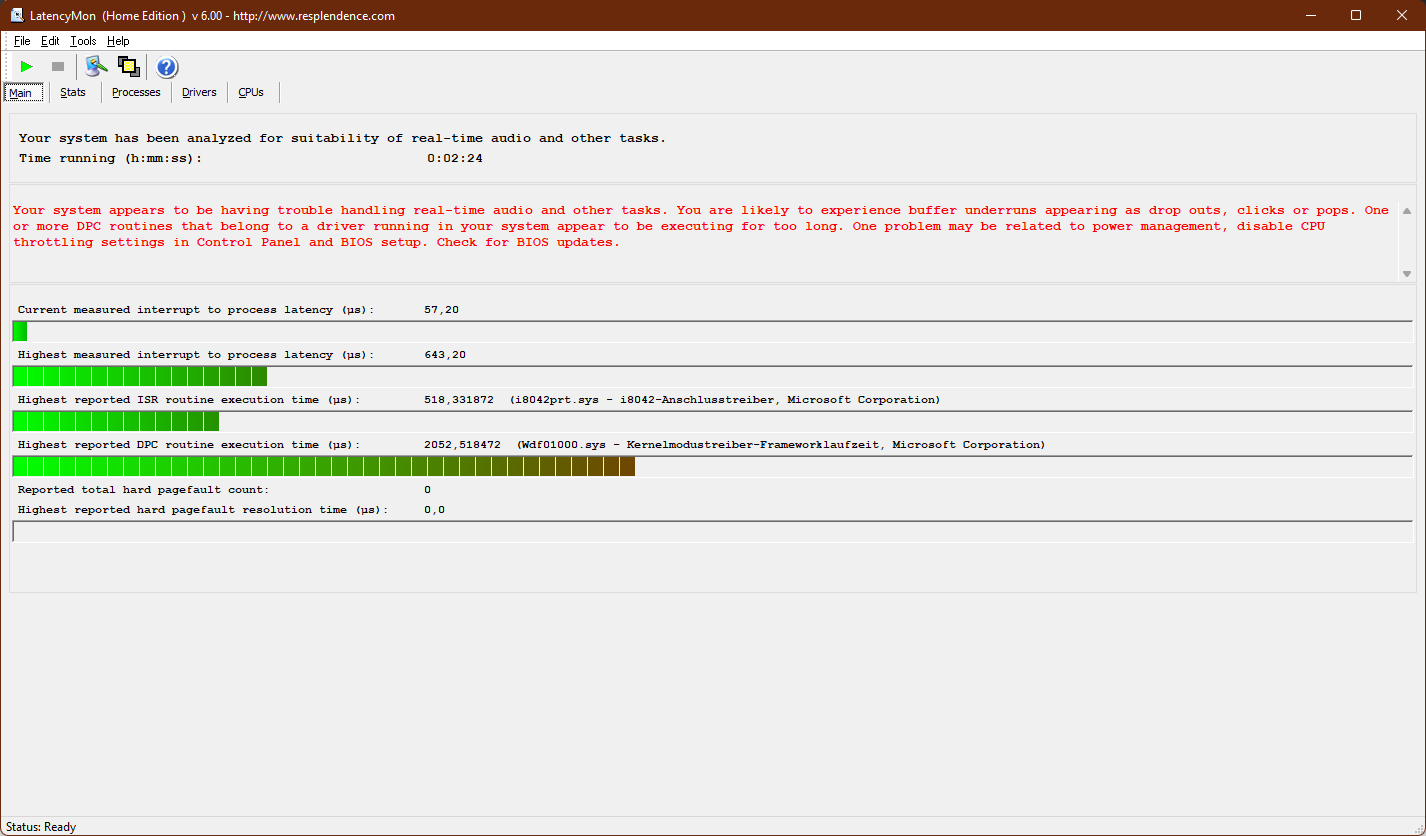
Our test unit of the Lenovo ThinkPad Z16 G1 has problems with DPC latencies, which might lead to some drops during audio and video processing. These problems can be remedied with driver or firmware updates and might vary from unit to unit.
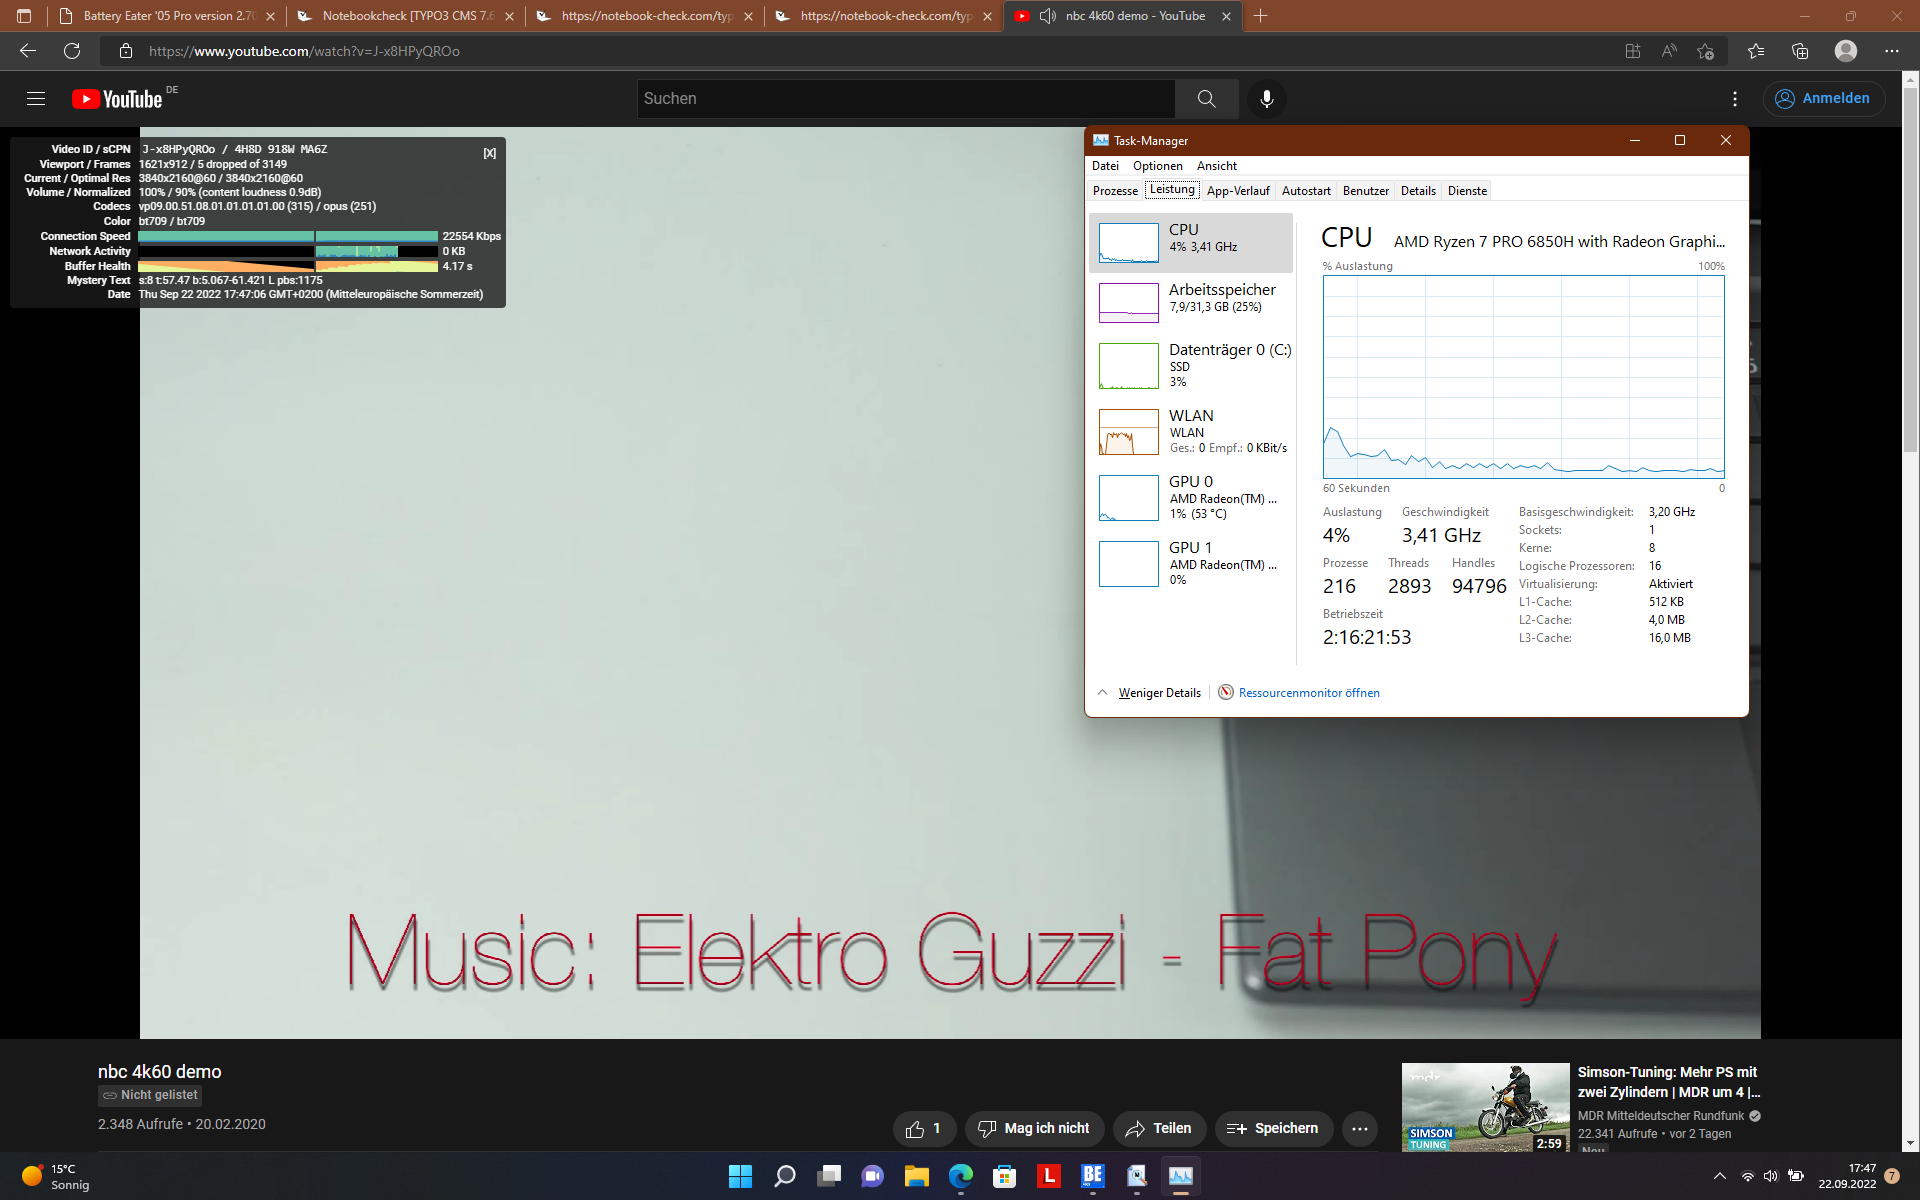
There are hardly any drops in the YouTube test, where the CPU and GPU loads also remain extremely low.
| DPC Latencies / LatencyMon - interrupt to process latency (max), Web, Youtube, Prime95 | |
| Lenovo ThinkPad X1 Extreme G4-20Y50040GE | |
| Dell XPS 17 9720 | |
| Lenovo ThinkPad X1 Extreme G4-20Y5CTO1WW (3050 Ti) | |
| Dell XPS 15 9520 RTX 3050 Ti | |
| Lenovo ThinkPad Z16 G1 21D5S00T00 | |
* ... smaller is better
Storage Solution
The Samsung PM9A1 SSD in the Lenovo ThinkPad Z16 Gen 1 offers a storage capacity of 1 Terrabyte. It is an M.2-2280 SSD that is connected with the newest NVMe PCIe-4.0 standard. The results in our benchmark test paint a mixed picture: Looking at the absolute speed, this is a very fast SSD, but all the other laptops in our comparison are faster, even if the difference isn't very large. In addition, the performance under constant load also varies.

* ... smaller is better
Constant Performance Reading: DiskSpd Read Loop, Queue Depth 8
Graphics Card
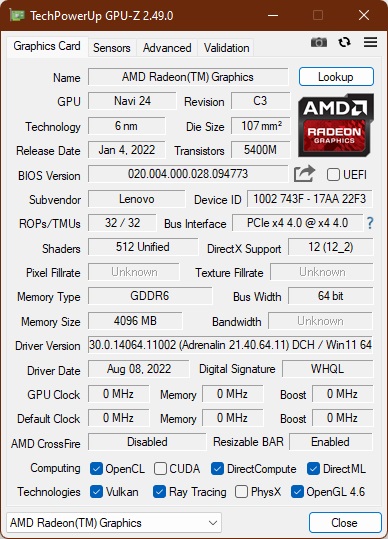
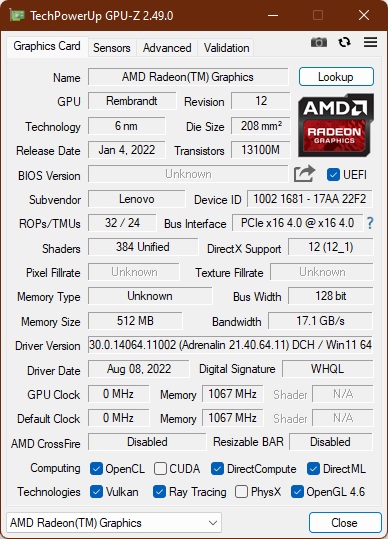
The last time Lenovo used a dedicated graphics chip from AMD in a ThinkPad (at that point in the ThinkPad T500 that still used the brand name ATi), the iPhone was only one year old. Of course, Lenovo didn't pick a very powerful graphics processor with the AMD Radeon RX 6500M. The typical power consumption of this entry-level chip is 50 watts, although it is able to consume 55 watts in the ThinkPad Z16.
With this, the ThinkPad Z16 G1 performs in the same range as the entry-level models of the ThinkPad X1 Extreme with the Nvidia GeForce RTX 3050 Ti and the Dell XPS 15 with the same GPU. This also goes for the graphics performance itself, and in the 3DMark Time Spy and Fire Strike graphics benchmarks, the RX 6500M ranges at the same level as the RTX 3050 Ti.
In battery operation, the graphics performance turns out slightly lower, by about 23% in the 3DMark Time Spy (3429 points).
| 3DMark 06 Standard Score | 35958 points | |
| 3DMark Vantage P Result | 51599 points | |
| 3DMark 11 Performance | 17548 points | |
| 3DMark Ice Storm Standard Score | 116884 points | |
| 3DMark Cloud Gate Standard Score | 92553 points | |
| 3DMark Fire Strike Score | 12287 points | |
| 3DMark Time Spy Score | 4795 points | |
Help | ||
In our test reports, the Blender 3.3 test is relatively new. In the Classroom benchmark in HIP mode, the ThinkPad Z16 with the Radeon RX 6500M achieves a similar performance as the Dell Inspiron 14 Plus 7420 with the RTX 3050 in CUDA mode. The RTX 3050 Ti in the Dell Inspiron 16 Plus 7620 performs about 30% better in this test. In any case, the render time is significantly reduced compared to the CPU mode.
* ... smaller is better
Gaming Performance
As in the synthetic benchmarks, the gaming performance is approximately at the level of the Dell XPS 15 9520 with the RTX 3050 Ti, with the X1 Extreme that has the same Nvidia chip tending to turn out slightly better in the games. Even newer games can be reproduced in high or the highest detail settings, but only at Full-HD resolution. The performance of the AMD Radeon in all likelihood won't be sufficient for 4K gaming.
You should note that the GPU performance suffers from throttling. In our The Witcher 3 loop, the FPS rate drops from an initial 45 to only 35 FPS.
| The Witcher 3 - 1920x1080 High Graphics & Postprocessing (Nvidia HairWorks Off) | |
| Lenovo ThinkPad X1 Extreme G4-20Y50040GE | |
| Dell XPS 17 9720 | |
| Lenovo ThinkPad X1 Extreme G4-20Y5CTO1WW (3050 Ti) | |
| Average of class Multimedia (22 - 242, n=19, last 2 years) | |
| Dell XPS 15 9520 RTX 3050 Ti | |
| Lenovo ThinkPad Z16 G1 21D5S00T00 | |
| Average AMD Radeon RX 6500M (n=1) | |
| F1 2021 - 1920x1080 Ultra High Preset + Raytracing AA:T AF:16x | |
| Dell XPS 17 9720 | |
| Lenovo ThinkPad Z16 G1 21D5S00T00 | |
| Average AMD Radeon RX 6500M (n=1) | |
| GTA V - 1920x1080 High/On (Advanced Graphics Off) AA:2xMSAA + FX AF:8x | |
| Dell XPS 17 9720 | |
| Lenovo ThinkPad X1 Extreme G4-20Y5CTO1WW (3050 Ti) | |
| Lenovo ThinkPad Z16 G1 21D5S00T00 | |
| Average AMD Radeon RX 6500M (90 - 96.6, n=2) | |
| Dell XPS 15 9520 RTX 3050 Ti | |
| Average of class Multimedia (19.5 - 186.1, n=53, last 2 years) | |
The Witcher 3 FPS Chart
| low | med. | high | ultra | |
|---|---|---|---|---|
| GTA V (2015) | 154.7 | 144.8 | 96.6 | 41.8 |
| The Witcher 3 (2015) | 195 | 136.2 | 57.4 | 39.1 |
| Dota 2 Reborn (2015) | 121.5 | 106.1 | 102.2 | 94.8 |
| Final Fantasy XV Benchmark (2018) | 126.6 | 65.8 | 46.9 | |
| X-Plane 11.11 (2018) | 47.7 | 40.7 | 36.8 | |
| Far Cry 5 (2018) | 90 | 75 | 71 | 66 |
| Strange Brigade (2018) | 266 | 119.1 | 98.8 | 86.3 |
| Metro Exodus (2019) | 137.4 | 66.7 | 46.7 | 37 |
| The Division 2 (2019) | 129 | 82 | 67 | 47 |
| Borderlands 3 (2019) | 78.2 | 66.6 | 47.1 | 34.5 |
| Hunt Showdown (2020) | 124.8 | 68.9 | 57.3 | |
| Doom Eternal (2020) | 232 | 101.2 | 57.5 | |
| Gears Tactics (2020) | 257.8 | 125.2 | 82.4 | 56.6 |
| Death Stranding (2020) | 130.4 | 89.3 | 82.2 | 78.9 |
| Horizon Zero Dawn (2020) | 103 | 71 | 59 | 54 |
| Crysis Remastered (2020) | 185.6 | 88.7 | 26.3 | 19.6 |
| Mafia Definitive Edition (2020) | 91.4 | 53 | 48.7 | |
| Star Wars Squadrons (2020) | 267 | 150.5 | 131.7 | 119.6 |
| Watch Dogs Legion (2020) | 81.1 | 70 | 59.1 | 24.6 |
| Dirt 5 (2020) | 159.4 | 72.9 | 56.3 | 37.4 |
| Assassin´s Creed Valhalla (2020) | 113 | 62 | 45 | 39 |
| Yakuza Like a Dragon (2020) | 80.3 | 60.6 | 58.4 | 54.5 |
| Immortals Fenyx Rising (2020) | 89 | 68 | 47 | 41 |
| Hitman 3 (2021) | 157.2 | 102.1 | 88.7 | 80.5 |
| Mass Effect Legendary Edition (2021) | 82.2 | 75.6 | ||
| Days Gone (2021) | 116.3 | 70.6 | 62.7 | 44.2 |
| F1 2021 (2021) | 245 | 139 | 105.1 | 42.9 |
| New World (2021) | 70.3 | 53 | 46.2 | 40.4 |
| Far Cry 6 (2021) | 91.7 | 69.8 | 62.5 | 54.5 |
| Back 4 Blood (2021) | 116 | 95.3 | 92.7 | |
| Guardians of the Galaxy (2021) | 83 | 48 | 47 | 44 |
| Riders Republic (2021) | 71 | 68 | 58 | 43 |
| Forza Horizon 5 (2021) | 152 | 101 | 81 | 27 |
| Battlefield 2042 (2021) | 129.7 | 71.2 | 53.3 | 23.3 |
| Farming Simulator 22 (2021) | 96.6 | 86 | ||
| Halo Infinite (2021) | 62.4 | 43.6 | 42.4 | |
| God of War (2022) | 64.5 | 54.1 | 39.6 | 11.9 |
| Rainbow Six Extraction (2022) | 96 | 69 | 61 | 34 |
| Dying Light 2 (2022) | 58.4 | 46.6 | 37 | |
| GRID Legends (2022) | 146.9 | 105 | 75.9 | 59.9 |
| Cyberpunk 2077 1.6 (2022) | 66.2 | 66.5 | 32.3 | 29.2 |
| Elex 2 (2022) | 53.4 | 51 | 44 | 37.6 |
| Ghostwire Tokyo (2022) | 72.7 | 71 | 65.5 | 66.3 |
| Tiny Tina's Wonderlands (2022) | 118.1 | 88.5 | 45.8 | 29.8 |
| Vampire Bloodhunt (2022) | 142.7 | 115 | 106.7 | 98.1 |
| F1 22 (2022) | 116.3 | 97.2 | 75.6 | 13.9 |
| The Quarry (2022) | 64.1 | 48.3 | 38.9 | 25.4 |
Emissions: The fan remains quiet, but the ThinkPad Z16 runs hot
Noise Emissions
Under low load, the fan of the Lenovo ThinkPad Z16 G1 runs very quietly, so that you can hardly notice it. Even the MacBook Pro 16 mit M1 Pro is minimally louder at this point. This changes under maximum load, since the MacBook is then quieter, even in the more powerful version with the M1 Max. However, the ThinkPad Z16 is still not a loud laptop, and the maximum noise level of the fans remains significantly below that of the Lenovo ThinkPad X1 Extreme G4.
We do not notice any coil whine in the Z16.
Noise level
| Idle |
| 23.7 / 23.7 / 23.7 dB(A) |
| Load |
| 25.9 / 46.9 dB(A) |
 | ||
30 dB silent 40 dB(A) audible 50 dB(A) loud |
||
min: | ||
| Lenovo ThinkPad Z16 G1 21D5S00T00 Radeon RX 6500M, R7 PRO 6850H, Samsung PM9A1 MZVL21T0HCLR | Lenovo ThinkPad X1 Extreme G4-20Y5CTO1WW (3050 Ti) GeForce RTX 3050 Ti Laptop GPU, i7-11800H, Samsung PM9A1 MZVL21T0HCLR | Lenovo ThinkPad X1 Extreme G4-20Y50040GE GeForce RTX 3080 Laptop GPU, i9-11950H, Kioxia XG7 KXG7AZNV1T02 | Dell XPS 15 9520 RTX 3050 Ti GeForce RTX 3050 Ti Laptop GPU, i7-12700H, WDC PC SN810 512GB | Dell XPS 17 9720 GeForce RTX 3050 4GB Laptop GPU, i7-12700H, Micron 3400 MTFDKBA512TFH 512GB | Apple MacBook Pro 16 2021 M1 Pro M1 Pro 16-Core GPU, M1 Pro, Apple SSD AP1024R | Apple MacBook Pro 16 2021 M1 Max M1 Max 32-Core GPU, M1 Max, Apple SSD AP2048R | |
|---|---|---|---|---|---|---|---|
| Noise | -12% | -15% | 3% | -11% | 1% | -7% | |
| off / environment * (dB) | 23.7 | 23.52 1% | 24.7 -4% | 22.8 4% | 24 -1% | 24.7 -4% | 24.2 -2% |
| Idle Minimum * (dB) | 23.7 | 23.52 1% | 24.7 -4% | 22.9 3% | 24 -1% | 24.7 -4% | 24.2 -2% |
| Idle Average * (dB) | 23.7 | 23.52 1% | 24.7 -4% | 22.9 3% | 24 -1% | 24.7 -4% | 24.2 -2% |
| Idle Maximum * (dB) | 23.7 | 23.52 1% | 28.1 -19% | 22.9 3% | 24 -1% | 24.7 -4% | 24.2 -2% |
| Load Average * (dB) | 25.9 | 42.9 -66% | 42.5 -64% | 30.9 -19% | 43.9 -69% | 26.1 -1% | 42.9 -66% |
| Witcher 3 ultra * (dB) | 46.9 | 52.5 -12% | 46.4 1% | 37.8 19% | 48.4 -3% | 39.5 16% | |
| Load Maximum * (dB) | 46.9 | 52.45 -12% | 52.1 -11% | 44.7 5% | 48.4 -3% | 37.4 20% | 42.9 9% |
* ... smaller is better
Temperatures
The Lenovo ThinkPad Z16 Gen 1 remains completely cool during idle operation. On the other hand, the ThinkPad Z16 runs fairly hot under load, whether it is during the stress test or the Witcher 3 test. We measure the maximum temperature above the keyboard at 56.8 ºC (~134 ºF). Even though you can easily avoid touching this area, the rest of the case also heats up significantly. The palm rest reaches a maximum temperature of 36.5 ºC (~98 ºF), which feels noticeably warm and can lead to sweaty hands.
During the stress test, our replacement test unit also fails to remain stable. Both Prime95 and FurMark running lead to frequent sudden reboots. We are therefore unable to include the hour-long stress test.
(-) The maximum temperature on the upper side is 56.8 °C / 134 F, compared to the average of 36.9 °C / 98 F, ranging from 21 to 71 °C for the class Multimedia.
(-) The bottom heats up to a maximum of 53.3 °C / 128 F, compared to the average of 39.1 °C / 102 F
(+) In idle usage, the average temperature for the upper side is 27 °C / 81 F, compared to the device average of 31.3 °C / 88 F.
(-) Playing The Witcher 3, the average temperature for the upper side is 43.8 °C / 111 F, compared to the device average of 31.3 °C / 88 F.
(±) The palmrests and touchpad can get very hot to the touch with a maximum of 36.6 °C / 97.9 F.
(-) The average temperature of the palmrest area of similar devices was 28.7 °C / 83.7 F (-7.9 °C / -14.2 F).
| Lenovo ThinkPad Z16 G1 21D5S00T00 AMD Ryzen 7 PRO 6850H, AMD Radeon RX 6500M | Lenovo ThinkPad X1 Extreme G4-20Y5CTO1WW (3050 Ti) Intel Core i7-11800H, NVIDIA GeForce RTX 3050 Ti Laptop GPU | Lenovo ThinkPad X1 Extreme G4-20Y50040GE Intel Core i9-11950H, NVIDIA GeForce RTX 3080 Laptop GPU | Dell XPS 15 9520 RTX 3050 Ti Intel Core i7-12700H, NVIDIA GeForce RTX 3050 Ti Laptop GPU | Dell XPS 17 9720 Intel Core i7-12700H, NVIDIA GeForce RTX 3050 4GB Laptop GPU | Apple MacBook Pro 16 2021 M1 Pro Apple M1 Pro, Apple M1 Pro 16-Core GPU | Apple MacBook Pro 16 2021 M1 Max Apple M1 Max, Apple M1 Max 32-Core GPU | |
|---|---|---|---|---|---|---|---|
| Heat | 4% | 3% | -1% | 12% | 22% | 21% | |
| Maximum Upper Side * (°C) | 56.8 | 49 14% | 51.4 10% | 51.4 10% | 49.5 13% | 41 28% | 42.3 26% |
| Maximum Bottom * (°C) | 53.3 | 44.4 17% | 55.9 -5% | 51 4% | 38.4 28% | 39 27% | 41.7 22% |
| Idle Upper Side * (°C) | 28.2 | 32.1 -14% | 27.2 4% | 30 -6% | 28 1% | 24 15% | 23.9 15% |
| Idle Bottom * (°C) | 29.4 | 29.8 -1% | 28.8 2% | 33 -12% | 27.8 5% | 24 18% | 23.9 19% |
* ... smaller is better
Speaker
On both sides of the keyboard are the stereo speakers of the Lenovo ThinkPad Z16. They are fairly loud and even have a little bass, but still lose compared to those of the Apple MacBook Pro 16. The MacBook simply offers more bass and volume.
Lenovo ThinkPad Z16 G1 21D5S00T00 audio analysis
(±) | speaker loudness is average but good (75.56 dB)
Bass 100 - 315 Hz
(±) | reduced bass - on average 11.3% lower than median
(±) | linearity of bass is average (13% delta to prev. frequency)
Mids 400 - 2000 Hz
(+) | balanced mids - only 2.6% away from median
(+) | mids are linear (3.2% delta to prev. frequency)
Highs 2 - 16 kHz
(+) | balanced highs - only 2.6% away from median
(+) | highs are linear (5.7% delta to prev. frequency)
Overall 100 - 16.000 Hz
(+) | overall sound is linear (12.5% difference to median)
Compared to same class
» 23% of all tested devices in this class were better, 3% similar, 74% worse
» The best had a delta of 5%, average was 17%, worst was 45%
Compared to all devices tested
» 11% of all tested devices were better, 2% similar, 87% worse
» The best had a delta of 4%, average was 24%, worst was 134%
Dell XPS 17 9720 audio analysis
(+) | speakers can play relatively loud (83.6 dB)
Bass 100 - 315 Hz
(±) | reduced bass - on average 7.3% lower than median
(±) | linearity of bass is average (11.4% delta to prev. frequency)
Mids 400 - 2000 Hz
(+) | balanced mids - only 3.4% away from median
(±) | linearity of mids is average (7.6% delta to prev. frequency)
Highs 2 - 16 kHz
(+) | balanced highs - only 3.7% away from median
(±) | linearity of highs is average (7.1% delta to prev. frequency)
Overall 100 - 16.000 Hz
(+) | overall sound is linear (8.8% difference to median)
Compared to same class
» 10% of all tested devices in this class were better, 2% similar, 88% worse
» The best had a delta of 5%, average was 17%, worst was 45%
Compared to all devices tested
» 3% of all tested devices were better, 1% similar, 97% worse
» The best had a delta of 4%, average was 24%, worst was 134%
Apple MacBook Pro 16 2021 M1 Pro audio analysis
(+) | speakers can play relatively loud (84.7 dB)
Bass 100 - 315 Hz
(+) | good bass - only 3.8% away from median
(+) | bass is linear (5.2% delta to prev. frequency)
Mids 400 - 2000 Hz
(+) | balanced mids - only 1.3% away from median
(+) | mids are linear (2.1% delta to prev. frequency)
Highs 2 - 16 kHz
(+) | balanced highs - only 1.9% away from median
(+) | highs are linear (2.7% delta to prev. frequency)
Overall 100 - 16.000 Hz
(+) | overall sound is linear (4.6% difference to median)
Compared to same class
» 0% of all tested devices in this class were better, 0% similar, 100% worse
» The best had a delta of 5%, average was 17%, worst was 45%
Compared to all devices tested
» 0% of all tested devices were better, 0% similar, 100% worse
» The best had a delta of 4%, average was 24%, worst was 134%
Power Management: ThinkPad with a good battery life despite the small battery
Power Consumption
In this category, the Lenovo ThinkPad Z16 G1 is really the best of its class, and none of its direct competitors runs more efficiently. Only the Apple MacBook Pro 16 with the M1 Pro is slightly more efficient in terms of the minimum idle consumption. However, we should also mention here, that the display of the ThinkPad Z16 Gen 1 has a significantly lower resolution than those of the comparison devices.
The 135-Watt power supply is just large enough for the maximum consumption of about 133 watts.
| Off / Standby | |
| Idle | |
| Load |
|
Key:
min: | |
| Lenovo ThinkPad Z16 G1 21D5S00T00 R7 PRO 6850H, Radeon RX 6500M, Samsung PM9A1 MZVL21T0HCLR, IPS LED, 1920x1200, 16" | Lenovo ThinkPad X1 Extreme G4-20Y5CTO1WW (3050 Ti) i7-11800H, GeForce RTX 3050 Ti Laptop GPU, Samsung PM9A1 MZVL21T0HCLR, IPS LED, 3840x2400, 16" | Lenovo ThinkPad X1 Extreme G4-20Y50040GE i9-11950H, GeForce RTX 3080 Laptop GPU, Kioxia XG7 KXG7AZNV1T02, IPS, 3840x2400, 16" | Dell XPS 15 9520 RTX 3050 Ti i7-12700H, GeForce RTX 3050 Ti Laptop GPU, WDC PC SN810 512GB, OLED, 3456x2160, 15.6" | Dell XPS 17 9720 i7-12700H, GeForce RTX 3050 4GB Laptop GPU, Micron 3400 MTFDKBA512TFH 512GB, IPS, 3840x2400, 17" | Apple MacBook Pro 16 2021 M1 Pro M1 Pro, M1 Pro 16-Core GPU, Apple SSD AP1024R, Mini-LED, 3456x2234, 16.2" | Apple MacBook Pro 16 2021 M1 Max M1 Max, M1 Max 32-Core GPU, Apple SSD AP2048R, Mini-LED, 3456x2234, 16.2" | Average AMD Radeon RX 6500M | Average of class Multimedia | |
|---|---|---|---|---|---|---|---|---|---|
| Power Consumption | -79% | -80% | -13% | -50% | -17% | -38% | 0% | -10% | |
| Idle Minimum * (Watt) | 5.3 | 10.3 -94% | 12.3 -132% | 5.5 -4% | 7.8 -47% | 5 6% | 5.4 -2% | 5.3 ? -0% | 5.87 ? -11% |
| Idle Average * (Watt) | 8.6 | 22.06 -157% | 22.8 -165% | 7.2 16% | 15.1 -76% | 15.1 -76% | 16.4 -91% | 8.6 ? -0% | 10.4 ? -21% |
| Idle Maximum * (Watt) | 9.5 | 23 -142% | 13.9 -46% | 16 -68% | 17 -79% | 15.5 -63% | 16.7 -76% | 9.5 ? -0% | 12.4 ? -31% |
| Load Average * (Watt) | 65.2 | 102.57 -57% | 95.4 -46% | 91.8 -41% | 114 -75% | 54 17% | 94 -44% | 65.2 ? -0% | 67.1 ? -3% |
| Witcher 3 ultra * (Watt) | 93.6 | 106 -13% | 154 -65% | 74.6 20% | 115.2 -23% | 104 -11% | |||
| Load Maximum * (Watt) | 133.81 | 147.8 -10% | 170.7 -28% | 134.7 -1% | 135.6 -1% | 90 33% | 135 -1% | 133.8 ? -0% | 114 ? 15% |
* ... smaller is better
Power Consumption The Witcher 3 / Stress Test
Power Consumption With External Monitor
Battery Life
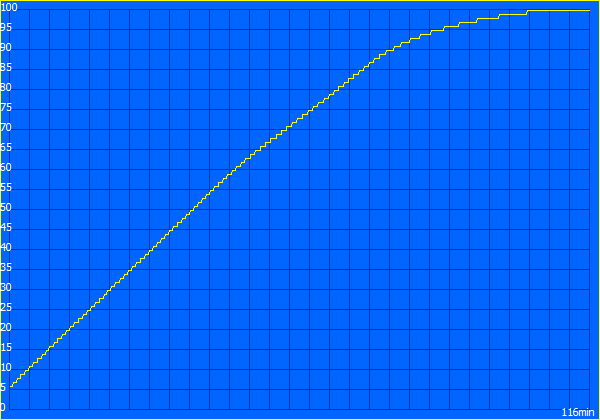
In terms of the battery capacity, the Lenovo ThinkPad Z16 G1 presents itself as relatively miserly with only 72 Watthours. Yet the battery life of the ThinkPad laptop is still better, at least compared to the Windows competitors. On the other hand, it doesn't even come close to reach the values of Apple's MacBook Pro 16, but that also has the largest battery in our comparison field.
At around 10 hours in the Wi-Fi test (at 150 cd/m² brightness), the Z16 doesn't have to hide. At maximum brightness, it still lasts for 8 hours in our automated Wi-Fi test. However, this only goes for the WUXGA version of the Z16, and the optional 4K UHD display should shorten the battery life significantly.
| Lenovo ThinkPad Z16 G1 21D5S00T00 R7 PRO 6850H, Radeon RX 6500M, 72 Wh | Lenovo ThinkPad X1 Extreme G4-20Y5CTO1WW (3050 Ti) i7-11800H, GeForce RTX 3050 Ti Laptop GPU, 90 Wh | Lenovo ThinkPad X1 Extreme G4-20Y50040GE i9-11950H, GeForce RTX 3080 Laptop GPU, 90 Wh | Dell XPS 15 9520 RTX 3050 Ti i7-12700H, GeForce RTX 3050 Ti Laptop GPU, 86 Wh | Apple MacBook Pro 16 2021 M1 Pro M1 Pro, M1 Pro 16-Core GPU, 99.6 Wh | Apple MacBook Pro 16 2021 M1 Max M1 Max, M1 Max 32-Core GPU, 99.6 Wh | Average of class Multimedia | |
|---|---|---|---|---|---|---|---|
| Battery runtime | -40% | -40% | 21% | 59% | 15% | 13% | |
| H.264 (h) | 11.9 | 6.7 -44% | 6.9 -42% | 17.5 47% | 17 43% | 16.3 ? 37% | |
| WiFi v1.3 (h) | 9.9 | 6.6 -33% | 6.8 -31% | 8.8 -11% | 16.9 71% | 14.9 51% | 11.9 ? 20% |
| Load (h) | 2.1 | 1.2 -43% | 1.1 -48% | 3.2 52% | 1.1 -48% | 1.691 ? -19% |
Pros
Cons
Verdict: The Lenovo ThinkPad Z16 G1 is a great laptop, but...

The Lenovo ThinkPad Z16 Gen 1 really gave us some headaches. On paper, it could be a very good laptop, and in our test, this also turned out to be true. However, we are still unable to give it a "very good" recommendation.
First, we should list all the positive aspects of the ThinkPad laptop: The ThinkPad Z16 G1 offers a very good performance in a relatively compact case. The quality of the case is excellent, and with the combination of a lot of aluminum and the glass palm rest, Lenovo does a lot of things right in this regard. The manufacturer also does a good job with the touchpad, which is significantly better than that of all the other ThinkPads. The keyboard is also good, even if it isn't as good as that in other ThinkPads. The ThinkPad Z16 includes a matte, bright display and offers a good battery life, even though the battery is relatively small.
The first large problem of the Z16 is its connections. The ThinkPad Z16 is a 16-inch laptop and a business device. The fact that such a device offers no USB-A port, and particularly no HDMI either, is hardly acceptable. The temperature management also creates some difficulties, since the ThinkPad Z16 gets fairly hot. You better not touch the area above the keyboard under load. In a relatively large ThinkPad, we find the soldered RAM an unnecessary limitation. A significantly less important but still relevant point of complaint: The Z16 lacks an option for a 2.5K display, and there is also no display with a higher refresh rate.
It could be a very good laptop if there only weren't the problems with restarting, since otherwise, we see many positive aspects in the Lenovo ThinkPad Z16 Gen 1.
But all these complains weren't what caused our headaches - that was the already mentioned problem with the restarts, leading us to ask for a new test unit. Fortunately, the problem was significantly less pronounced in our replacement test unit, but unfortunately, the problem still happened.
This leads to a significantly worse evaluation of the ThinkPad Z16 than it would otherwise have to be. This is unfortunate, since otherwise we really don't dislike the ThinkPad, even if its lacking connection equipment is less convincing for its target market than that of the compact ThinkPad Z13. In terms of the ports, the Lenovo ThinkPad X1 Extreme G4 is significantly more flexible. Even the MacBook Pro 16 still offers at least HDMI, but on the other hand, it lacks the WWAN option of the ThinkPad Z16.
Note: Due to the problem with the system stability, the evaluation of the ThinkPad Z16 turned out 3 percentage points lower.
Price and Availability
The Lenovo ThinkPad Z16 Gen 1 is available starting from $1,975 at Lenovo's web shop. Amazon also lists various configurations of the ThinkPad Z16 starting from $1850 (affiliate link).
Lenovo ThinkPad Z16 G1 21D5S00T00
- 09/29/2022 v7 (old)
Benjamin Herzig
Price comparison

