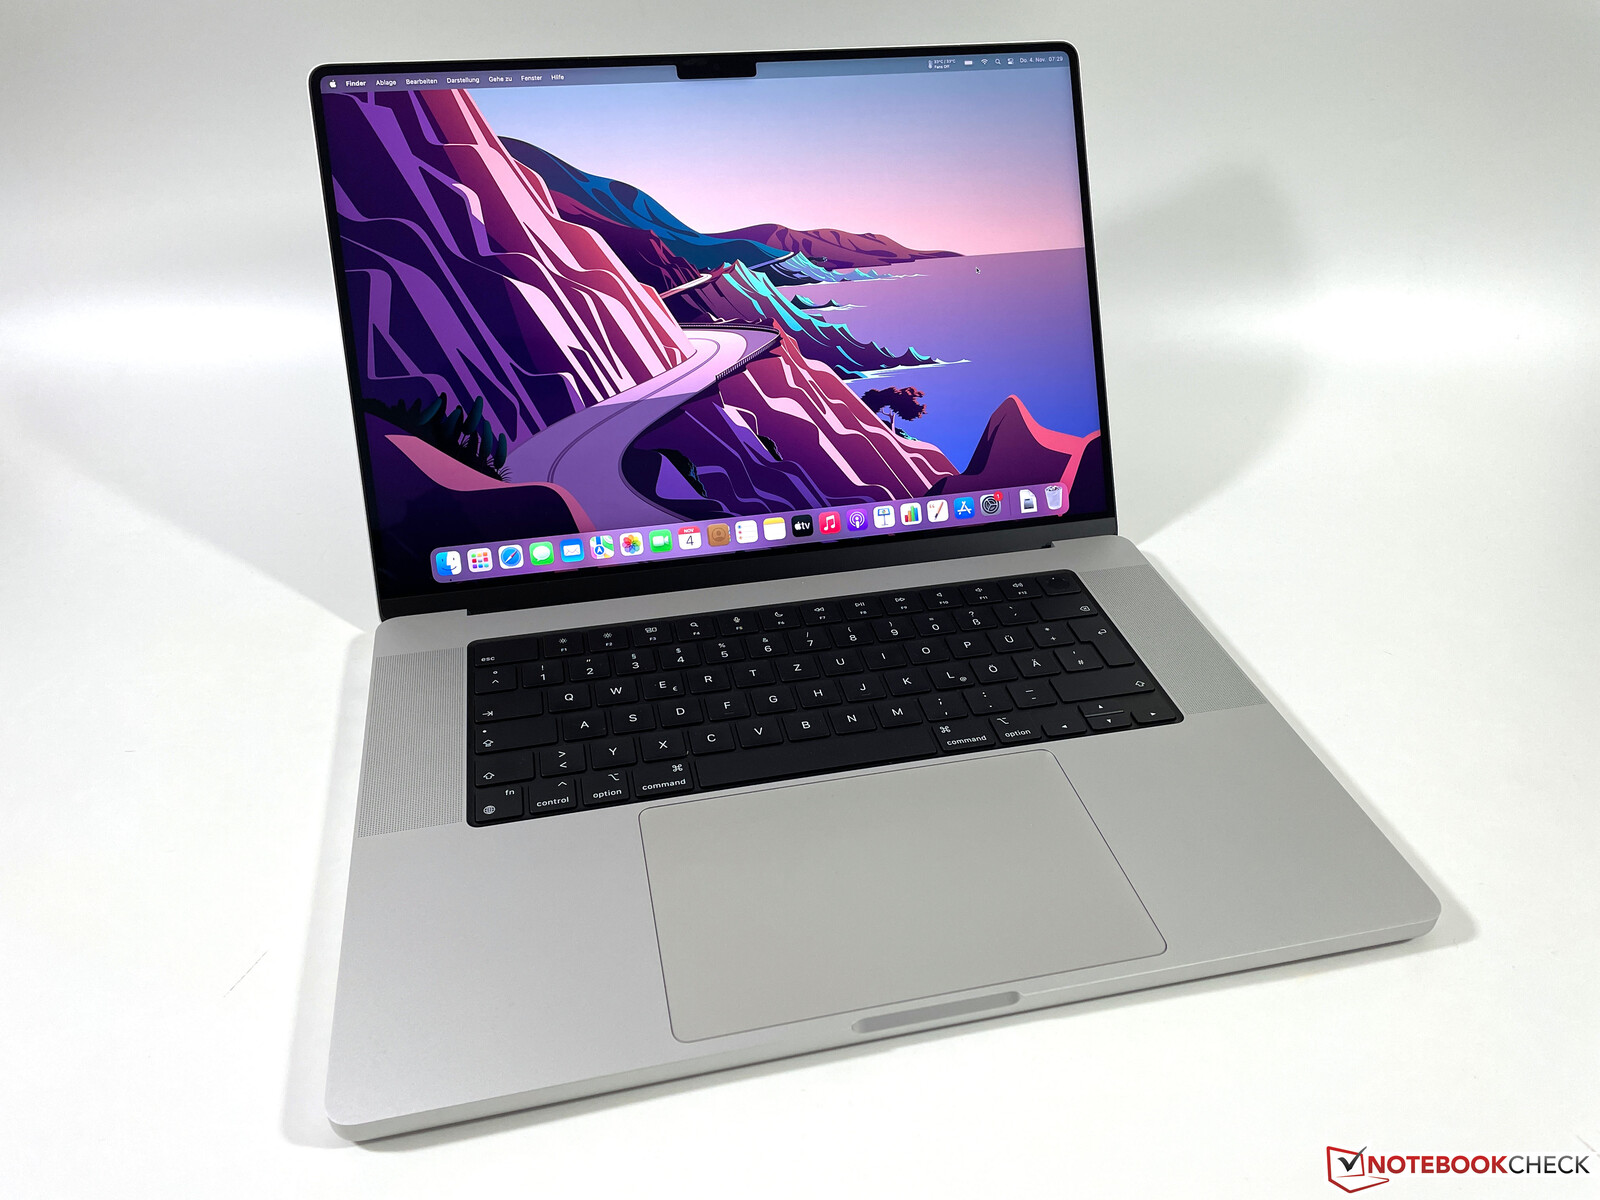
Apple MacBook Pro 16 2021 M1 Max Laptop Review: Full Performance without Throttling
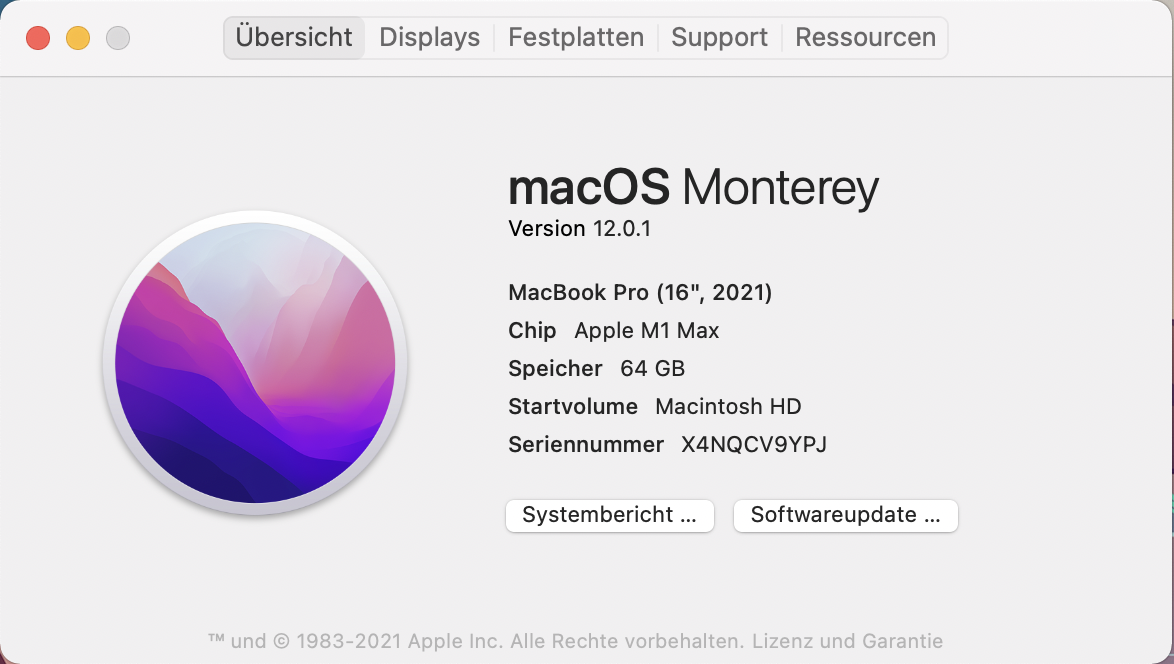
We have already reviewed the entry-level MacBook Pro 16 with Apple’s M1 Pro SoC. Now it is time to take a closer look at the most powerful unit from Cupertino, the MacBook Pro 16 with the M1 Max SoC, 32 GPU cores, and 64 GB RAM. In combination with the 2 TB PCIe 4.0 SSD, it has a retail price of 4769 Euros.
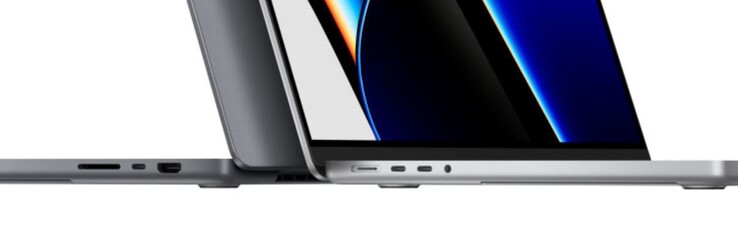
In this article, we will focus on the performance difference between the M1 Max compared to the MBP 16 with the M1 Pro as well as the effects on the temperatures and the fan behavior. The unit with the M1 Max also has an additional performance mode that we will test. All other sections like the chassis, the connectivity, the input devices, the screen and the speakers are identical to the previous review unit, so please have a look at our comprehensive review for all the details:
Potential competitors in comparison
Rating | Date | Model | Weight | Height | Size | Resolution | Price |
|---|---|---|---|---|---|---|---|
| 92.5 % v7 (old) | 11 / 2021 | Apple MacBook Pro 16 2021 M1 Max M1 Max, M1 Max 32-Core GPU | 2.2 kg | 16.8 mm | 16.20" | 3456x2234 | |
| 93.2 % v7 (old) | 11 / 2021 | Apple MacBook Pro 16 2021 M1 Pro M1 Pro, M1 Pro 16-Core GPU | 2.2 kg | 16.8 mm | 16.20" | 3456x2234 | |
| 89.8 % v7 (old) | 11 / 2021 | Lenovo ThinkPad P1 G4-20Y4S0KS00 i7-11850H, GeForce RTX 3070 Laptop GPU | 2 kg | 17.7 mm | 16.00" | 3840x2400 | |
| 87.8 % v7 (old) | 08 / 2021 | HP ZBook Studio 15 G8 i9-11950H, GeForce RTX 3070 Laptop GPU | 1.9 kg | 18 mm | 15.60" | 3840x2160 | |
| 88.9 % v7 (old) | 07 / 2021 | Razer Blade 15 Advanced (Mid 2021) i7-11800H, GeForce RTX 3080 Laptop GPU | 2 kg | 16.99 mm | 15.60" | 1920x1080 | |
| 87.9 % v7 (old) | 07 / 2021 | Dell XPS 17 9710 Core i7 RTX 3060 i7-11800H, GeForce RTX 3060 Laptop GPU | 2.5 kg | 19.5 mm | 17.00" | 3840x2400 |

Performance - Apple M1 Max with 32 GPU Cores
Review Settings
The new MacBook Pro 16 2021 with the M1 Max processor has an optional performance mode. However, it only affects the fan speed and therefore the surface temperatures under load, but there is no performance difference to the standard automatic setting. We have performed all the following benchmarks and measurements with the default automatic mode. The optional power saver mode will limit the package power of the M1 Max to 30W, which means the system will stay silent, even under stress.
Processor
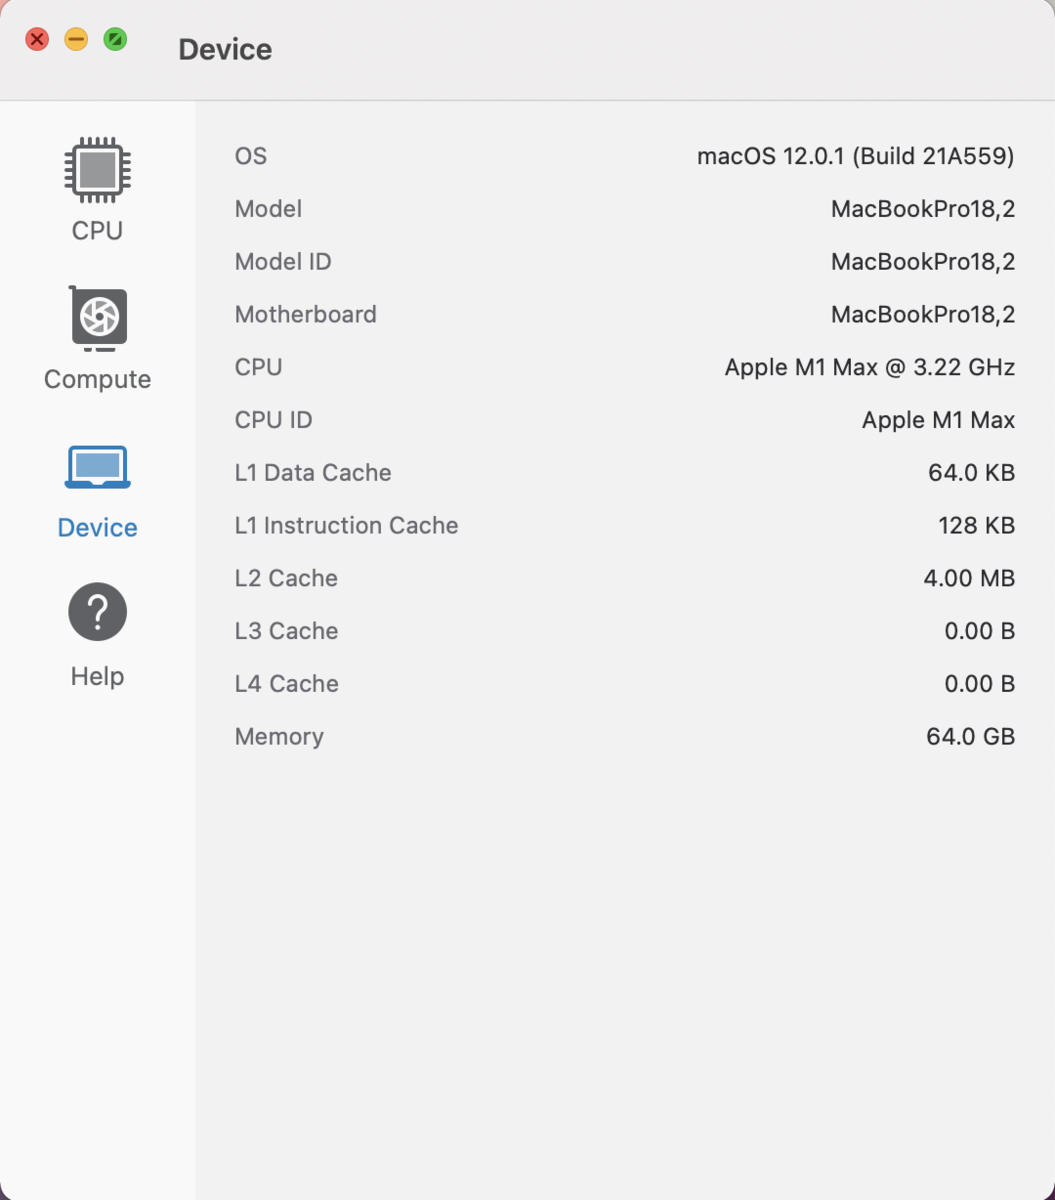
The CPU part of the Apple M1 Max with 10 cores (1 efficiency cluster with two cores + 2 performance clusters with four cores each) are basically identical to the M1 Pro, so we can keep it short here. We determine a maximum consumption of around 29 Watts (~34W package power) in the multi-core benchmarks, both under sustained workloads and on battery power. These consumption values are slightly higher compared to the M1 Pro, but this is caused by the larger chip with additional GPU cores, larger cache, and more RAM. Our benchmark results are, as expected, almost identical to the M1 Pro with minor fluctuations.
Both the single-core as well as multi-core results are comparable to the rivals, but all of them are equipped with 45W CPUs and the often require much more power in reality. Also, almost every Windows competitor reduces the CPU performance on battery power.
Cinebench R15 Multi Loop
Cinebench R23: Multi Core | Single Core
Cinebench R20: CPU (Multi Core) | CPU (Single Core)
Cinebench R15: CPU Multi 64Bit | CPU Single 64Bit
Blender: v2.79 BMW27 CPU
Geekbench 5.5: Multi-Core | Single-Core
| CPU Performance rating | |
| Average of class Multimedia | |
| Lenovo ThinkPad P1 G4-20Y4S0KS00 | |
| HP ZBook Studio 15 G8 | |
| Apple MacBook Pro 16 2021 M1 Pro | |
| Average Apple M1 Max | |
| Apple MacBook Pro 16 2021 M1 Max | |
| Razer Blade 15 Advanced (Mid 2021) -2! | |
| Dell XPS 17 9710 Core i7 RTX 3060 -2! | |
| Cinebench R23 / Multi Core | |
| Average of class Multimedia (4861 - 33362, n=79, last 2 years) | |
| Average Apple M1 Max (12385 - 12396, n=3) | |
| Apple MacBook Pro 16 2021 M1 Max | |
| Apple MacBook Pro 16 2021 M1 Pro | |
| Razer Blade 15 Advanced (Mid 2021) | |
| HP ZBook Studio 15 G8 | |
| Lenovo ThinkPad P1 G4-20Y4S0KS00 | |
| Dell XPS 17 9710 Core i7 RTX 3060 | |
| Cinebench R23 / Single Core | |
| Average of class Multimedia (1128 - 2459, n=71, last 2 years) | |
| HP ZBook Studio 15 G8 | |
| Lenovo ThinkPad P1 G4-20Y4S0KS00 | |
| Apple MacBook Pro 16 2021 M1 Pro | |
| Average Apple M1 Max (1530 - 1536, n=3) | |
| Apple MacBook Pro 16 2021 M1 Max | |
| Razer Blade 15 Advanced (Mid 2021) | |
| Dell XPS 17 9710 Core i7 RTX 3060 | |
| Cinebench R20 / CPU (Multi Core) | |
| Average of class Multimedia (1887 - 12912, n=62, last 2 years) | |
| Razer Blade 15 Advanced (Mid 2021) | |
| Lenovo ThinkPad P1 G4-20Y4S0KS00 | |
| HP ZBook Studio 15 G8 | |
| Dell XPS 17 9710 Core i7 RTX 3060 | |
| Average Apple M1 Max (2735 - 2753, n=3) | |
| Apple MacBook Pro 16 2021 M1 Max | |
| Apple MacBook Pro 16 2021 M1 Pro | |
| Cinebench R20 / CPU (Single Core) | |
| Average of class Multimedia (425 - 853, n=62, last 2 years) | |
| HP ZBook Studio 15 G8 | |
| Lenovo ThinkPad P1 G4-20Y4S0KS00 | |
| Razer Blade 15 Advanced (Mid 2021) | |
| Dell XPS 17 9710 Core i7 RTX 3060 | |
| Apple MacBook Pro 16 2021 M1 Pro | |
| Average Apple M1 Max (390 - 395, n=3) | |
| Apple MacBook Pro 16 2021 M1 Max | |
| Cinebench R15 / CPU Multi 64Bit | |
| Average of class Multimedia (856 - 5224, n=66, last 2 years) | |
| Lenovo ThinkPad P1 G4-20Y4S0KS00 | |
| Razer Blade 15 Advanced (Mid 2021) | |
| Dell XPS 17 9710 Core i7 RTX 3060 | |
| HP ZBook Studio 15 G8 | |
| Apple MacBook Pro 16 2021 M1 Max | |
| Average Apple M1 Max (1689 - 1693, n=3) | |
| Apple MacBook Pro 16 2021 M1 Pro | |
| Cinebench R15 / CPU Single 64Bit | |
| Average of class Multimedia (184.8 - 326, n=64, last 2 years) | |
| HP ZBook Studio 15 G8 | |
| Lenovo ThinkPad P1 G4-20Y4S0KS00 | |
| Razer Blade 15 Advanced (Mid 2021) | |
| Dell XPS 17 9710 Core i7 RTX 3060 | |
| Apple MacBook Pro 16 2021 M1 Pro | |
| Average Apple M1 Max (197 - 210, n=3) | |
| Apple MacBook Pro 16 2021 M1 Max | |
| Blender / v2.79 BMW27 CPU | |
| Dell XPS 17 9710 Core i7 RTX 3060 | |
| Razer Blade 15 Advanced (Mid 2021) | |
| Lenovo ThinkPad P1 G4-20Y4S0KS00 | |
| HP ZBook Studio 15 G8 | |
| Average of class Multimedia (100 - 557, n=63, last 2 years) | |
| Apple MacBook Pro 16 2021 M1 Max | |
| Average Apple M1 Max (187 - 190, n=3) | |
| Apple MacBook Pro 16 2021 M1 Pro | |
| Geekbench 5.5 / Multi-Core | |
| Average of class Multimedia (4652 - 20422, n=60, last 2 years) | |
| Apple MacBook Pro 16 2021 M1 Max | |
| Average Apple M1 Max (12563 - 12818, n=4) | |
| Apple MacBook Pro 16 2021 M1 Pro | |
| Lenovo ThinkPad P1 G4-20Y4S0KS00 | |
| HP ZBook Studio 15 G8 | |
| Geekbench 5.5 / Single-Core | |
| Average of class Multimedia (805 - 2974, n=60, last 2 years) | |
| Average Apple M1 Max (1764 - 1798, n=4) | |
| Apple MacBook Pro 16 2021 M1 Max | |
| Apple MacBook Pro 16 2021 M1 Pro | |
| HP ZBook Studio 15 G8 | |
| Lenovo ThinkPad P1 G4-20Y4S0KS00 | |
* ... smaller is better
System Performance
It is not surprising that the high-end SKU of the MacBook Pro 16 2021 is obviously a very powerful and immensely responsive laptop. During everyday tasks or when you only stress the CPU, you will not notice a difference to the entry-level unit with the M1 Pro though. This is also supported by the cross-system benchmark CrossMark, where the two devices are very similar. The BlackMagic RAW Speed Test shows the advantage of the larger cache, because the CPU test shows a small advantage of 7 percent.
We also performed the two PugetBench tests for Adobe Photoshop as well as Adobe Premiere Pro. The M1 Max performs noticeably better than the M1 Pro, but you should be a bit cautious with the results, since the benchmarks are only compatible with the Intel versions of the applications. These are emulated via Rosetta 2, and it works, but the performance is noticeably worse compared to the native versions. These will be much faster in practice, but we cannot determine the exact performance advantage.
CrossMark: Overall | Productivity | Creativity | Responsiveness
Photoshop PugetBench: Overall Score | GPU Score | General Score | Filter Score
Premiere Pro PugetBench: Overall Score 0.9 | Export 0.9 | Live Playback 0.9 | GPU 0.9
Jetstream 2: 2.0 Total
WebXPRT 3: Overall
Speedometer 2.0: Result 2.0
| Blackmagic RAW Speed Test / 12:1 8K Metal | |
| Average of class Multimedia (78 - 430, n=7, last 2 years) | |
| Apple MacBook Pro 16 2021 M1 Max | |
| Average Apple M1 Max, Apple M1 Max 32-Core GPU (200 - 202, n=2) | |
| Apple MacBook Pro 16 2021 M1 Pro | |
| Apple MacBook Pro 14 2021 M1 Pro Entry | |
| Apple MacBook Pro 16 2019 i9 5500M | |
| Blackmagic RAW Speed Test / 12:1 8K CPU | |
| Average of class Multimedia (44 - 102, n=7, last 2 years) | |
| Apple MacBook Pro 16 2019 i9 5500M | |
| Average Apple M1 Max, Apple M1 Max 32-Core GPU (29 - 30, n=2) | |
| Apple MacBook Pro 16 2021 M1 Max | |
| Apple MacBook Pro 16 2021 M1 Pro | |
| Apple MacBook Pro 14 2021 M1 Pro Entry | |
| CrossMark / Overall | |
| Average of class Multimedia (866 - 2728, n=65, last 2 years) | |
| Lenovo ThinkPad P1 G4-20Y4S0KS00 | |
| Average Apple M1 Max, Apple M1 Max 32-Core GPU (1586 - 1621, n=2) | |
| Apple MacBook Pro 16 2021 M1 Max | |
| Apple MacBook Pro 16 2021 M1 Pro | |
| Apple MacBook Pro 14 2021 M1 Pro Entry | |
| Apple MacBook Air 2020 M1 Entry | |
| Apple MacBook Pro 16 2019 i9 5500M | |
| CrossMark / Productivity | |
| Average of class Multimedia (931 - 2489, n=65, last 2 years) | |
| Lenovo ThinkPad P1 G4-20Y4S0KS00 | |
| Average Apple M1 Max, Apple M1 Max 32-Core GPU (1361 - 1385, n=2) | |
| Apple MacBook Pro 16 2021 M1 Max | |
| Apple MacBook Pro 16 2021 M1 Pro | |
| Apple MacBook Pro 14 2021 M1 Pro Entry | |
| Apple MacBook Air 2020 M1 Entry | |
| Apple MacBook Pro 16 2019 i9 5500M | |
| CrossMark / Creativity | |
| Average of class Multimedia (907 - 3465, n=65, last 2 years) | |
| Average Apple M1 Max, Apple M1 Max 32-Core GPU (2102 - 2153, n=2) | |
| Apple MacBook Pro 16 2021 M1 Max | |
| Apple MacBook Pro 16 2021 M1 Pro | |
| Apple MacBook Pro 14 2021 M1 Pro Entry | |
| Lenovo ThinkPad P1 G4-20Y4S0KS00 | |
| Apple MacBook Air 2020 M1 Entry | |
| Apple MacBook Pro 16 2019 i9 5500M | |
| CrossMark / Responsiveness | |
| Average of class Multimedia (605 - 2024, n=65, last 2 years) | |
| Lenovo ThinkPad P1 G4-20Y4S0KS00 | |
| Average Apple M1 Max, Apple M1 Max 32-Core GPU (1080 - 1107, n=2) | |
| Apple MacBook Pro 16 2021 M1 Max | |
| Apple MacBook Pro 16 2021 M1 Pro | |
| Apple MacBook Pro 14 2021 M1 Pro Entry | |
| Apple MacBook Air 2020 M1 Entry | |
| Apple MacBook Pro 16 2019 i9 5500M | |
| Photoshop PugetBench / Overall Score | |
| Lenovo ThinkPad P1 G4-20Y4S0KS00 | |
| Average Apple M1 Max, Apple M1 Max 32-Core GPU (809 - 989, n=2) | |
| Apple MacBook Pro 16 2021 M1 Max | |
| Apple MacBook Pro 16 2021 M1 Pro | |
| Apple MacBook Pro 16 2019 i9 5500M | |
| Apple MacBook Pro 14 2021 M1 Pro Entry | |
| Apple MacBook Air 2020 M1 Entry | |
| Photoshop PugetBench / GPU Score | |
| Lenovo ThinkPad P1 G4-20Y4S0KS00 | |
| Average Apple M1 Max, Apple M1 Max 32-Core GPU (98.5 - 108.1, n=2) | |
| Apple MacBook Pro 16 2021 M1 Max | |
| Apple MacBook Pro 16 2021 M1 Pro | |
| Apple MacBook Pro 14 2021 M1 Pro Entry | |
| Apple MacBook Pro 16 2019 i9 5500M | |
| Apple MacBook Air 2020 M1 Entry | |
| Photoshop PugetBench / General Score | |
| Average Apple M1 Max, Apple M1 Max 32-Core GPU (86.5 - 97.2, n=2) | |
| Lenovo ThinkPad P1 G4-20Y4S0KS00 | |
| Apple MacBook Pro 16 2021 M1 Max | |
| Apple MacBook Pro 16 2021 M1 Pro | |
| Apple MacBook Pro 14 2021 M1 Pro Entry | |
| Apple MacBook Pro 16 2019 i9 5500M | |
| Apple MacBook Air 2020 M1 Entry | |
| Photoshop PugetBench / Filter Score | |
| Lenovo ThinkPad P1 G4-20Y4S0KS00 | |
| Average Apple M1 Max, Apple M1 Max 32-Core GPU (75.2 - 100.6, n=2) | |
| Apple MacBook Pro 16 2021 M1 Max | |
| Apple MacBook Pro 16 2019 i9 5500M | |
| Apple MacBook Pro 16 2021 M1 Pro | |
| Apple MacBook Pro 14 2021 M1 Pro Entry | |
| Apple MacBook Air 2020 M1 Entry | |
| Premiere Pro PugetBench / Overall Score 0.9 | |
| Apple MacBook Pro 16 2021 M1 Max | |
| Average Apple M1 Max, Apple M1 Max 32-Core GPU (862 - 1080, n=2) | |
| Apple MacBook Pro 14 2021 M1 Pro Entry | |
| Lenovo ThinkPad P1 G4-20Y4S0KS00 | |
| Apple MacBook Pro 16 2021 M1 Pro | |
| Apple MacBook Air 2020 M1 Entry | |
| Premiere Pro PugetBench / Export 0.9 | |
| Average Apple M1 Max, Apple M1 Max 32-Core GPU (53.2 - 90.9, n=2) | |
| Lenovo ThinkPad P1 G4-20Y4S0KS00 | |
| Apple MacBook Pro 16 2021 M1 Max | |
| Apple MacBook Pro 16 2021 M1 Pro | |
| Apple MacBook Pro 14 2021 M1 Pro Entry | |
| Apple MacBook Air 2020 M1 Entry | |
| Premiere Pro PugetBench / Live Playback 0.9 | |
| Apple MacBook Pro 16 2021 M1 Max | |
| Apple MacBook Pro 14 2021 M1 Pro Entry | |
| Average Apple M1 Max, Apple M1 Max 32-Core GPU (106 - 216, n=2) | |
| Apple MacBook Pro 16 2021 M1 Pro | |
| Lenovo ThinkPad P1 G4-20Y4S0KS00 | |
| Apple MacBook Air 2020 M1 Entry | |
| Premiere Pro PugetBench / GPU 0.9 | |
| Lenovo ThinkPad P1 G4-20Y4S0KS00 | |
| Average Apple M1 Max, Apple M1 Max 32-Core GPU (54.8 - 55.8, n=2) | |
| Apple MacBook Pro 16 2021 M1 Max | |
| Apple MacBook Pro 16 2021 M1 Pro | |
| Apple MacBook Pro 14 2021 M1 Pro Entry | |
| Apple MacBook Air 2020 M1 Entry | |
| Jetstream 2 / 2.0 Total | |
| Average of class Multimedia (287 - 481, n=34, last 2 years) | |
| Average Apple M1 Max, Apple M1 Max 32-Core GPU (215 - 215, n=2) | |
| Apple MacBook Pro 16 2021 M1 Max | |
| Apple MacBook Pro 16 2021 M1 Pro | |
| Apple MacBook Pro 14 2021 M1 Pro Entry | |
| HP ZBook Studio 15 G8 | |
| Apple MacBook Air 2020 M1 Entry | |
| Apple MacBook Air 2020 M1 Entry | |
| Dell XPS 17 9710 Core i7 RTX 3060 | |
| Razer Blade 15 Advanced (Mid 2021) | |
| Apple MacBook Pro 13 Late 2020 M1 Entry (8 / 256 GB) | |
| Speedometer 2.0 / Result 2.0 | |
| Average of class Multimedia (337 - 946, n=33, last 2 years) | |
| Average Apple M1 Max, Apple M1 Max 32-Core GPU (272 - 349, n=2) | |
| Apple MacBook Pro 16 2021 M1 Pro | |
| Apple MacBook Pro 16 2021 M1 Max | |
| Apple MacBook Air 2020 M1 Entry | |
| Apple MacBook Air 2020 M1 Entry | |
| Apple MacBook Pro 14 2021 M1 Pro Entry | |
| Apple MacBook Pro 13 Late 2020 M1 Entry (8 / 256 GB) | |
Storage Devices
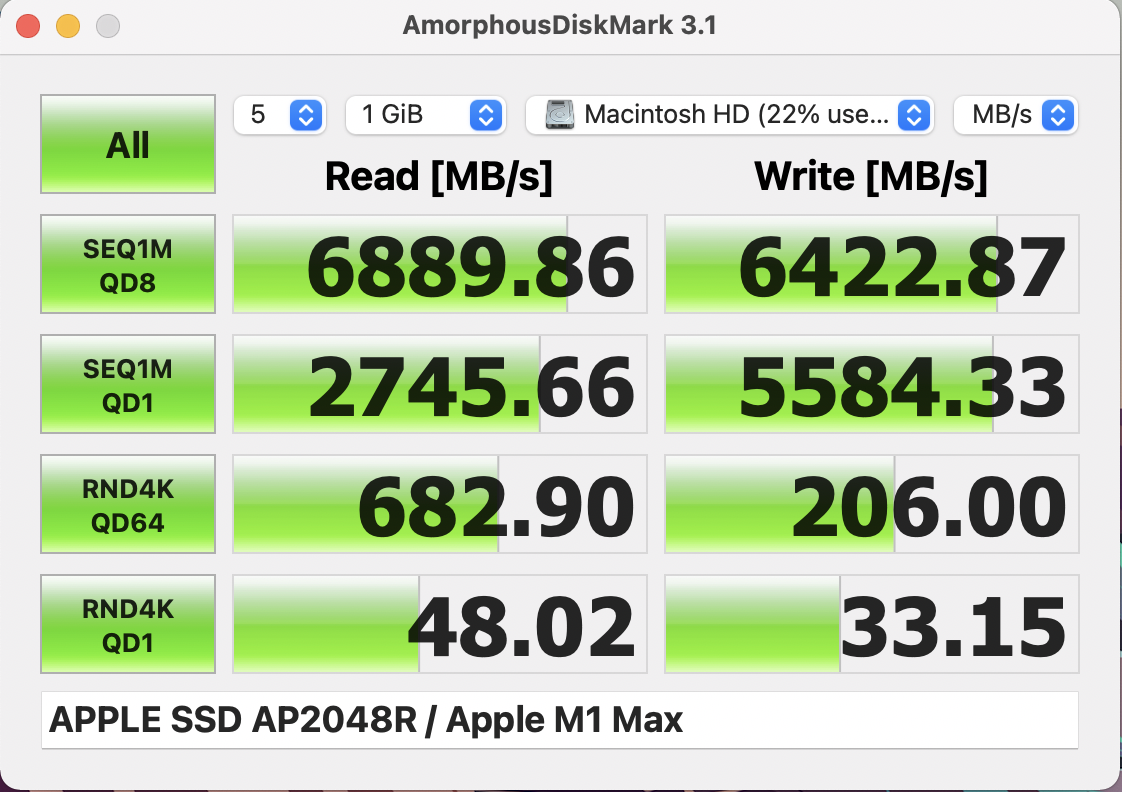
Our review unit is equipped with a fast PCIe 4.0 SSD and a storage capacity of 2 TB. After the initial set-up, you can use 1.97 TB for your own files. The drive manages excellent transfer rates of almost 7 GB/s in the benchmarks. You can equip the MacBook Pro with up to 8 TB of SSD storage, but Apple charges a steep premium for it (+2070 Euros compared to the 2 TB SSD). More SSD benchmarks are available in our Tech section.
GPU Performance - 32 GPU Cores
The high-end version of the MacBook Pro 16 2021 with the fastest M1 Max is equipped with four GPU clusters and eight cores each. We can determine a maximum consumption of 44W for the GPU during the benchmarks, and the results are much better compared to the M1 Pro with 16 GPU cores with an advantage between 60 up to 95 percent. The Wild Life Extreme Unlimited benchmark, which is running natively on the MacBook, shows comparable performance figures to the GeForce RTX 3070, even though the M1 Max does not even require half of the power. The graphics performance is also completely stable on battery power.
You can play games on the MacBook Pro 16, but the number of available games is the big limitation. There are currently only a few native titles and some can be emulated. Our gaming benchmarks once again show an advantage of around 70-80 percent over the M1 Pro and the performance in Shadow of the Tomb Raider is roughly comparable to fast versions of the GeForce RTX 3060. However, there is once again the problem that it is an emulated title.
Apps like CrossWare add support for Windows titles like Witcher 3 or GTA V and the performance is actually not bad. As an example, we have captured the GTA V benchmark sequence in the video below. You can clearly see that the performance is very good with ultra settings (1920 x 1200 pixels), but there are noticeable stutters. You can still play the game like this, but the MacBook Pro 16, even with the powerful M1 Max, is just not a gaming laptop.
| low | med. | high | ultra | |
|---|---|---|---|---|
| Shadow of the Tomb Raider (2018) | 140 | 104 | 97 | 87 |
| Total War: Three Kingdoms (2019) | 201 | 127 | 80 | 59 |
| Borderlands 3 (2019) | 65.5 | 55.3 | 47.6 | 40.7 |
System Noise
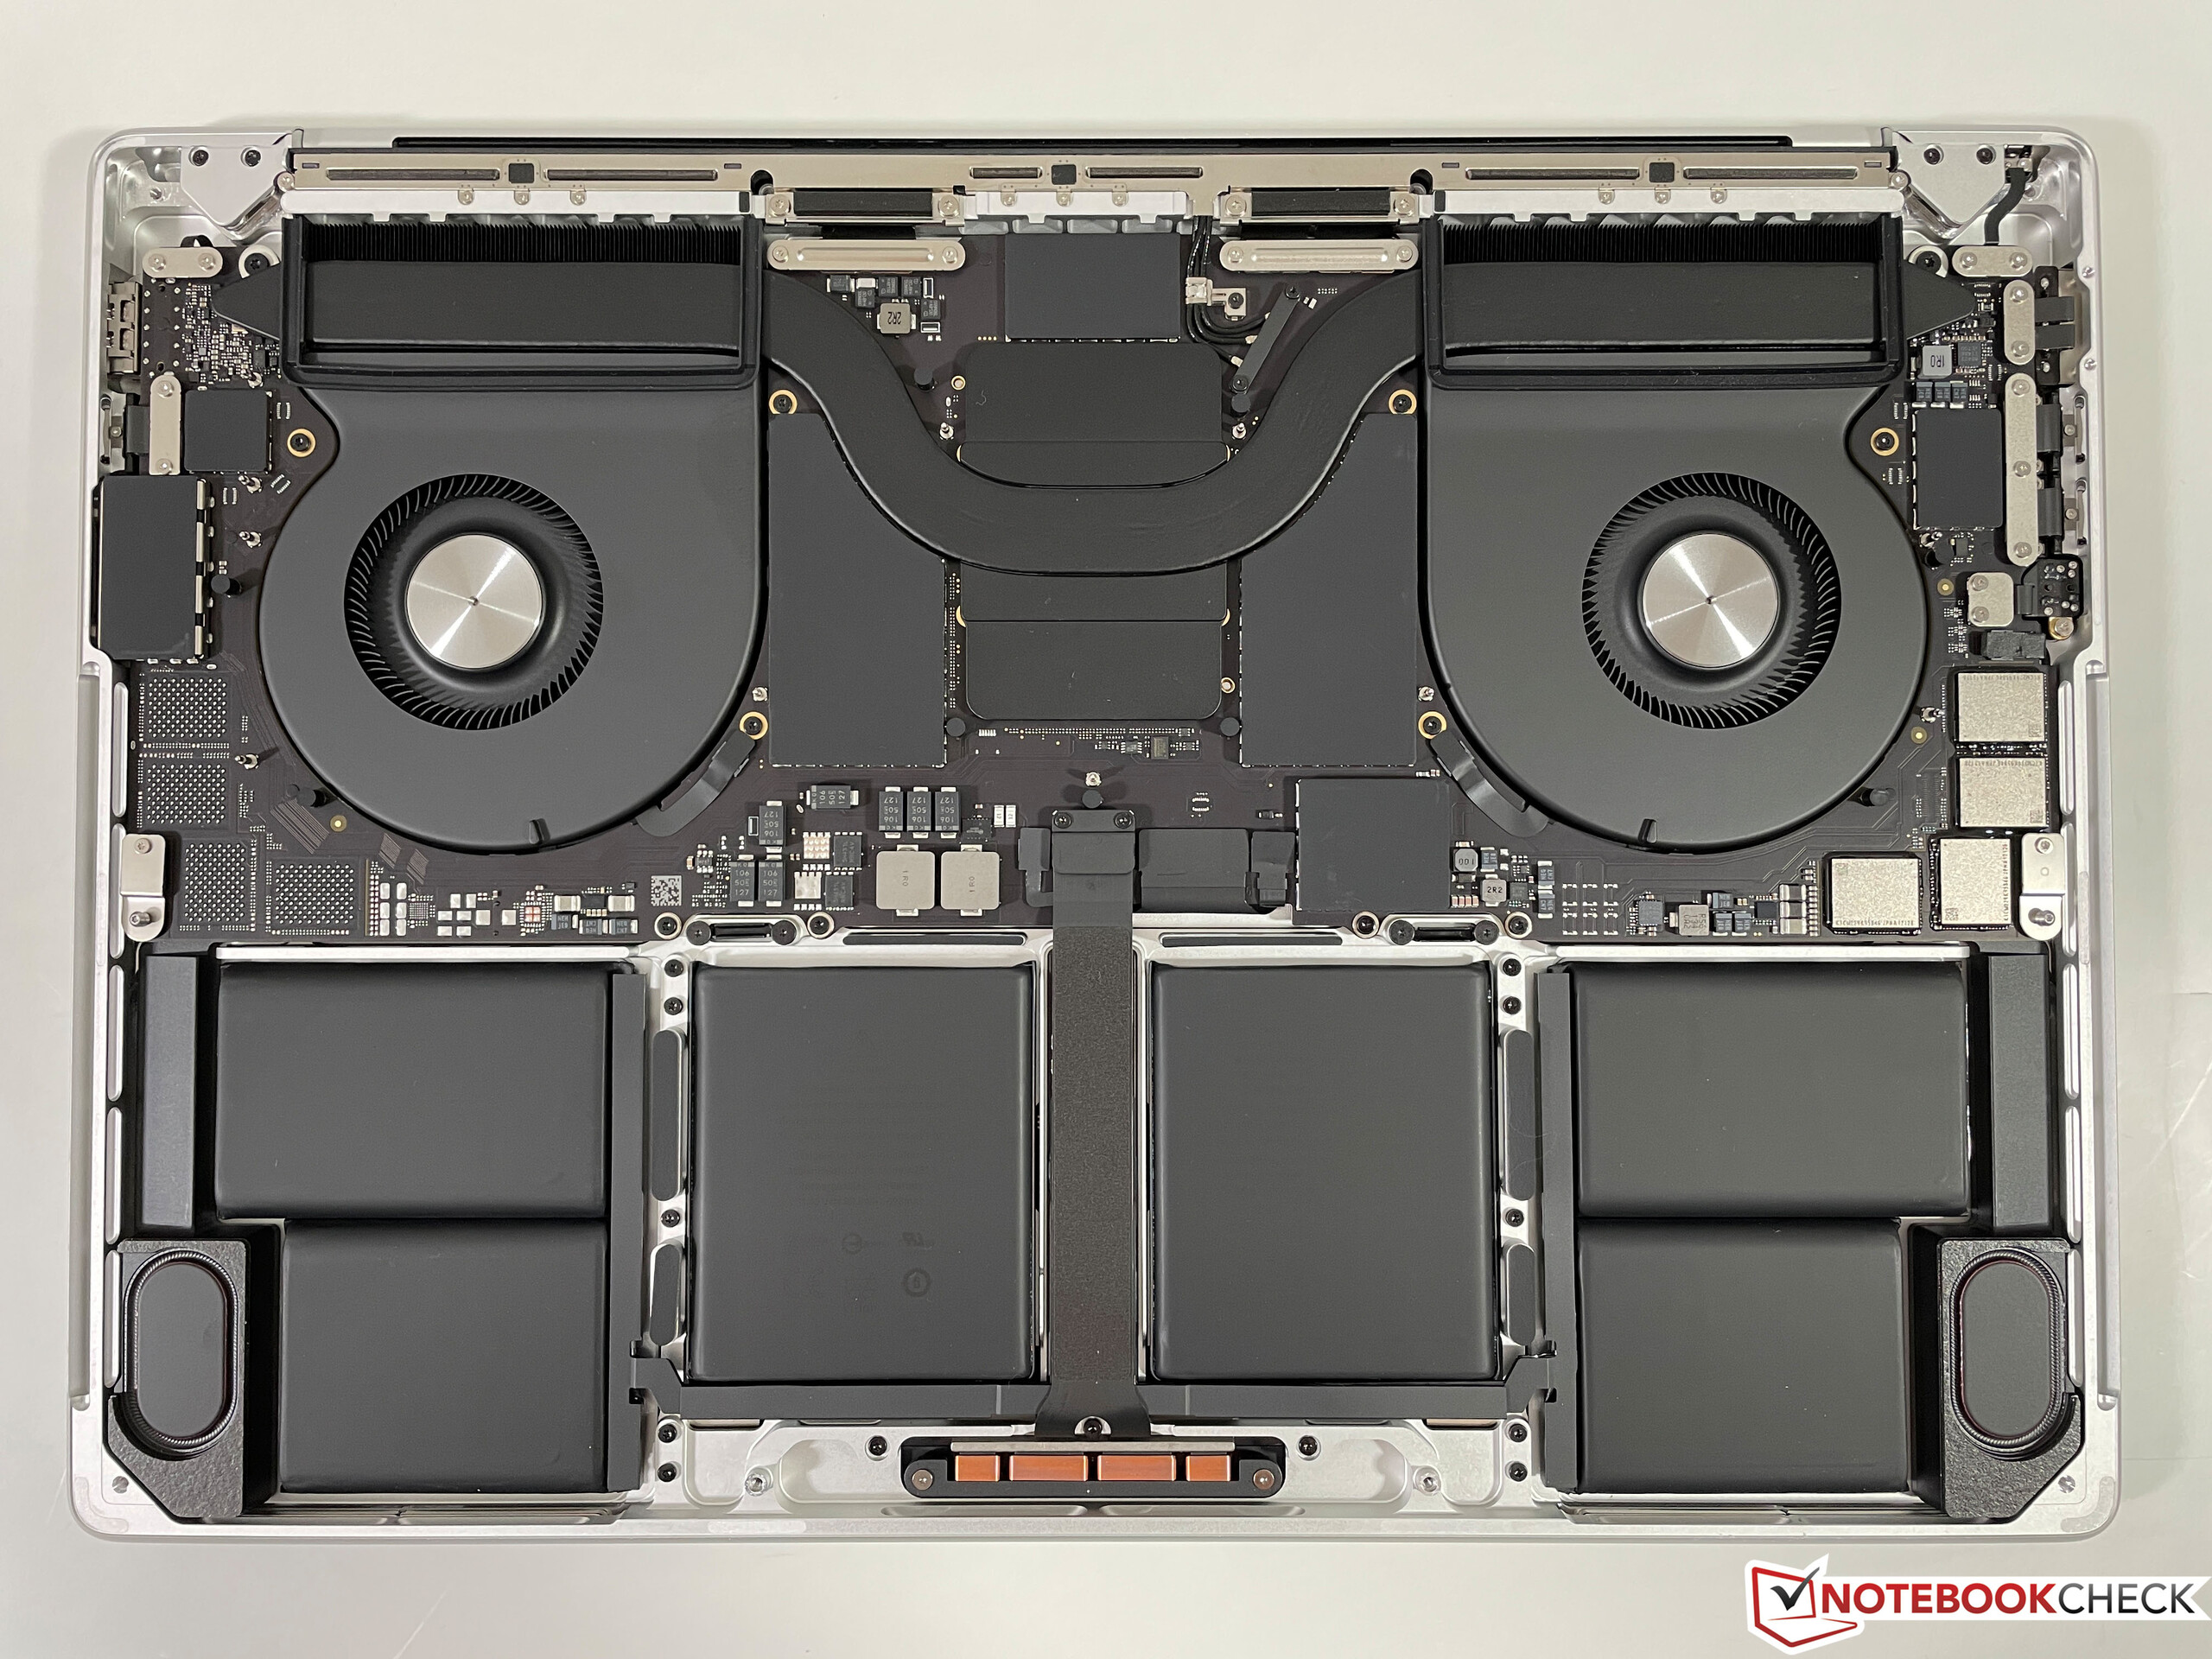
The MacBook Pro 16 with the M1 Max processor is silent while idling and during light workloads, because the fans are turned off and there are no other electronic noises (like coil whine), either. Pure CPU load will result in the lowest fan speed (1600 rpm), which is hardly audible at all. It will only get louder when you start to stress the 32 GPU cores.
The fans of the MacBook Pro 16 M1 Max can reach a higher maximum speed (5348 rpm on the left side and 5776 rpm on the right side) compared to the M1 Pro unit (4280 and 4750 rpm, respectively). However, these maximum speeds are pretty theoretical, because there was only one scenario where we could reach the maximum speed. We had to start the stress test (CB R23 and 3DMark Wildlife Extreme) in the normal mode and switched to the performance mode after a couple of minutes. The MBP 16 will then increase the fans speed to the maximum value for a few minutes, which results in loud 55.6 dB(A). After a while, the fans will level off at 4400 rpm (49.5 dB(A). If you start the stress test with the performance mode, the fan speed will fluctuate between 4000 (47.3 dB(A)) and 4900 rpm (52 dB(A)) with an average of 4400 rpm (49.5 dB(A)). Like we said before, there is no performance advantage, so it does not make sense to use the performance mode.
If you just leave the energy settings in the default automatic mode, the stress test will only result in 3600 rpm, which results in 42.9 dB(A). During our gaming test of the Witcher 3, the fan speed will fluctuate a bit with an average of 3200 rpm (39.5 dB(A)). We can also observe 3600 rpm in the PugetBench benchmark (Premiere Pro), but keep in mind that this is the emulated version of the app. The overall fan noise is a very convenient murmur and you can still work very comfortably without headphones. All these results are identical for mains as well as battery power.
The optional energy-saver mode will limit the package power of the M1 Max to 30W, which results in a completely silent operation, even during the stress test.
Noise level
| Idle |
| 24.2 / 24.2 / 24.2 dB(A) |
| Load |
| 42.9 / 42.9 dB(A) |
 | ||
30 dB silent 40 dB(A) audible 50 dB(A) loud |
||
min: | ||
| Apple MacBook Pro 16 2021 M1 Max M1 Max 32-Core GPU, M1 Max, Apple SSD AP2048R | Apple MacBook Pro 16 2021 M1 Pro M1 Pro 16-Core GPU, M1 Pro, Apple SSD AP1024R | Lenovo ThinkPad P1 G4-20Y4S0KS00 GeForce RTX 3070 Laptop GPU, i7-11850H, Samsung PM9A1 MZVL21T0HCLR | HP ZBook Studio 15 G8 GeForce RTX 3070 Laptop GPU, i9-11950H, Samsung PM981a MZVLB2T0HALB | Razer Blade 15 Advanced (Mid 2021) GeForce RTX 3080 Laptop GPU, i7-11800H, SSSTC CA6-8D1024 | Dell XPS 17 9710 Core i7 RTX 3060 GeForce RTX 3060 Laptop GPU, i7-11800H, Micron 2300 1TB MTFDHBA1T0TDV | |
|---|---|---|---|---|---|---|
| Noise | 7% | -4% | -7% | -7% | -9% | |
| off / environment * (dB) | 24.2 | 24.7 -2% | 23.8 2% | 23.5 3% | 25.1 -4% | 25.5 -5% |
| Idle Minimum * (dB) | 24.2 | 24.7 -2% | 23.8 2% | 25.3 -5% | 25.3 -5% | 25.2 -4% |
| Idle Average * (dB) | 24.2 | 24.7 -2% | 23.8 2% | 25.3 -5% | 25.3 -5% | 25.2 -4% |
| Idle Maximum * (dB) | 24.2 | 24.7 -2% | 28.3 -17% | 25.3 -5% | 25.3 -5% | 25.2 -4% |
| Load Average * (dB) | 42.9 | 26.1 39% | 38.6 10% | 41.2 4% | 42 2% | 45.9 -7% |
| Witcher 3 ultra * (dB) | 39.5 | 47.4 -20% | 49.4 -25% | 45.6 -15% | 49 -24% | |
| Load Maximum * (dB) | 42.9 | 37.4 13% | 47.4 -10% | 49.4 -15% | 51.6 -20% | 50.4 -17% |
* ... smaller is better
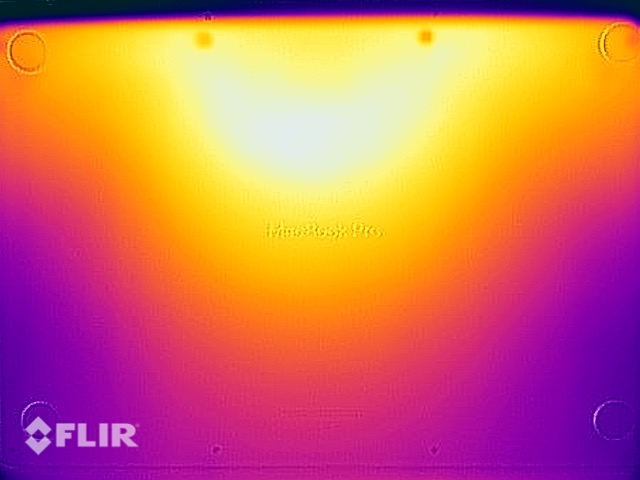
Temperature
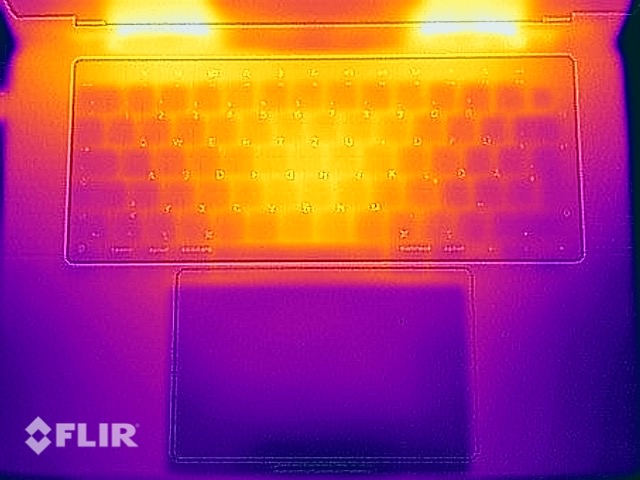
The new MacBook Pro 16 does not have any temperature issues, because you will hardly notice any warmer surfaces during everyday tasks and the temperatures are not critical at all, even when you really stress the unit.
Contrary to our standard procedure (Cinebench R15 + FurMark), we use the two native apps Cinebench R23 and 3DMark Wildlife Extreme (stress test for each app) for the stress test on the MacBook Pro. We managed to get the highest consumption figures with this combination. Contrary to powerful Windows laptops, the performance is rock solid over the course of the one-hour test and the surface temperatures are still very low. We can only measure about 42 °C on the top and the bottom of the base unit. The chassis gets a slightly warmer during the Witcher 3 test due to the lower fan speeds, but the difference is hardly worth noticing.
We also performed the stress test with the optional performance mode and looked at the temperatures. As mentioned before, it does not affect the performance, but the surface temperatures are even lower at up to 39.9 °C due to the higher fan speeds. All in all, these results are excellent considering the levels of performance and the fan noise. Even the PSU temperatures are completely okay at up to 43 °C.
We cannot notice a difference in terms of fan speed or surface temperatures when we use an external display.
(±) The maximum temperature on the upper side is 42.3 °C / 108 F, compared to the average of 36.8 °C / 98 F, ranging from 21 to 71 °C for the class Multimedia.
(±) The bottom heats up to a maximum of 41.7 °C / 107 F, compared to the average of 39.1 °C / 102 F
(+) In idle usage, the average temperature for the upper side is 23.5 °C / 74 F, compared to the device average of 31.3 °C / 88 F.
(±) Playing The Witcher 3, the average temperature for the upper side is 36.9 °C / 98 F, compared to the device average of 31.3 °C / 88 F.
(+) The palmrests and touchpad are cooler than skin temperature with a maximum of 30.2 °C / 86.4 F and are therefore cool to the touch.
(±) The average temperature of the palmrest area of similar devices was 28.7 °C / 83.7 F (-1.5 °C / -2.7 F).
Surface temperatures stress test with the optional Performance Mode:
(+) The maximum temperature on the upper side is 39.9 °C / 104 F, compared to the average of 36.8 °C / 98 F, ranging from 21 to 71 °C for the class Multimedia.
(+) The bottom heats up to a maximum of 38.7 °C / 102 F, compared to the average of 39.1 °C / 102 F
(+) The palmrests and touchpad are cooler than skin temperature with a maximum of 25.9 °C / 78.6 F and are therefore cool to the touch.
(+) The average temperature of the palmrest area of similar devices was 28.7 °C / 83.7 F (+2.8 °C / 5.1 F).
| Apple MacBook Pro 16 2021 M1 Max Apple M1 Max, Apple M1 Max 32-Core GPU | Apple MacBook Pro 16 2021 M1 Pro Apple M1 Pro, Apple M1 Pro 16-Core GPU | Lenovo ThinkPad P1 G4-20Y4S0KS00 Intel Core i7-11850H, NVIDIA GeForce RTX 3070 Laptop GPU | HP ZBook Studio 15 G8 Intel Core i9-11950H, NVIDIA GeForce RTX 3070 Laptop GPU | Razer Blade 15 Advanced (Mid 2021) Intel Core i7-11800H, NVIDIA GeForce RTX 3080 Laptop GPU | Dell XPS 17 9710 Core i7 RTX 3060 Intel Core i7-11800H, NVIDIA GeForce RTX 3060 Laptop GPU | |
|---|---|---|---|---|---|---|
| Heat | 2% | -23% | -21% | -38% | -28% | |
| Maximum Upper Side * (°C) | 42.3 | 41 3% | 51 -21% | 49 -16% | 51 -21% | 50.2 -19% |
| Maximum Bottom * (°C) | 41.7 | 39 6% | 53.5 -28% | 54.2 -30% | 52 -25% | 38.4 8% |
| Idle Upper Side * (°C) | 23.9 | 24 -0% | 28.8 -21% | 26.2 -10% | 35.2 -47% | 37.6 -57% |
| Idle Bottom * (°C) | 23.9 | 24 -0% | 29.3 -23% | 30.2 -26% | 37.8 -58% | 34.2 -43% |
* ... smaller is better
Energy Management - M1 Max consumes more power
Power Consumption
The MacBook Pro 16 with the M1 Max has a slightly higher idle consumption compared to the unit with the M1 Pro, which is a result of the additional GPU cores, larger cache, and more RAM. We also managed to measure peak consumption of up to 30W when the panel reached full HDR brightness during the playback of HDR videos.
We can see a maximum package power of almost 90W (more precisely 86W), but there are fluctuations due to the changes in the benchmark sequences. You can see this behavior very well in the following chart, where the consumption during our stress test fluctuated between 90 and up to 135 Watts. It will repeatedly hit the higher figures with an average consumption of 115 Watts. Gaming (tested with Witcher 3 via Steam/CrossWare) results in a steady consumption of more than 100 Watts (~61W package power). The 140W power adapter is sufficient to cover the peaks under full stress.
| Off / Standby | |
| Idle | |
| Load |
|
Key:
min: | |
| Apple MacBook Pro 16 2021 M1 Max M1 Max, M1 Max 32-Core GPU, 99.6 Wh | Apple MacBook Pro 16 2021 M1 Pro M1 Pro, M1 Pro 16-Core GPU, 99.6 Wh | Lenovo ThinkPad P1 G4-20Y4S0KS00 i7-11850H, GeForce RTX 3070 Laptop GPU, 90 Wh | HP ZBook Studio 15 G8 i9-11950H, GeForce RTX 3070 Laptop GPU, 83 Wh | Razer Blade 15 Advanced (Mid 2021) i7-11800H, GeForce RTX 3080 Laptop GPU, 80 Wh | Dell XPS 17 9710 Core i7 RTX 3060 i7-11800H, GeForce RTX 3060 Laptop GPU, 97 Wh | Average of class Multimedia | |
|---|---|---|---|---|---|---|---|
| Power Consumption | 20% | -28% | -48% | -96% | -13% | 22% | |
| Idle Minimum * (Watt) | 5.4 | 5 7% | 8.1 -50% | 11 -104% | 19.5 -261% | 7.5 -39% | 5.65 ? -5% |
| Idle Average * (Watt) | 16.4 | 15.1 8% | 20.2 -23% | 18.8 -15% | 23.3 -42% | 15.7 4% | 10 ? 39% |
| Idle Maximum * (Watt) | 16.7 | 15.5 7% | 21.9 -31% | 31.7 -90% | 40.1 -140% | 23.1 -38% | 12.3 ? 26% |
| Load Average * (Watt) | 94 | 54 43% | 88.2 6% | 105.2 -12% | 98.9 -5% | 87.2 7% | 65.1 ? 31% |
| Witcher 3 ultra * (Watt) | 104 | 149 -43% | 148 -42% | 174 -67% | 116 -12% | ||
| Load Maximum * (Watt) | 135 | 90 33% | 170.6 -26% | 171.8 -27% | 214 -59% | 131.6 3% | 112.5 ? 17% |
* ... smaller is better
Power Consumption Witcher 3 / Stress test
Battery Runtime
The slightly higher consumption values also have an effect on the battery runtimes, and the results for the MBP 16 M1 Max are a bit shorter compared to the M1 Pro unit. The Wi-Fi test at 150 nits (slightly more than 50% of the maximum SDR brightness) determines almost 15 hours and therefore 2 hours less than on the M1 Pro unit. This result drops to little more than 7 hours when we use the maximum SDR brightness of 500 nits. There is no difference between Safari in a window or in full-screen mode.
Our standard h.264 test video at 150 nits runs for 17 hours and therefore only 30 minutes less compared to the MBP 16 with the M1 Pro. We also checked the battery runtime during video playback of a 4K HDR video on YouTube at maximum brightness, which resulted in a runtime of 4:37 hours. This is currently not possible anymore, because there were reports of problems with HDR videos and YouTube currently does not offer HDR videos on the new MacBook Pro model (also 14 inch).
The performance is not limited on battery power, even when you stress both the CPU as well as the GPU. This is surprising considering an average consumption of 115W during the stress test and as a result, the 99.6 Wh battery does not last very long in this scenario. The result of 63 minutes is only made possible because the performance is massively reduced to 13W package power when the battery levels reaches 5% remaining capacity, which is the case after just 50 minutes.
| Apple MacBook Pro 16 2021 M1 Max M1 Max, M1 Max 32-Core GPU, 99.6 Wh | Apple MacBook Pro 16 2021 M1 Pro M1 Pro, M1 Pro 16-Core GPU, 99.6 Wh | Lenovo ThinkPad P1 G4-20Y4S0KS00 i7-11850H, GeForce RTX 3070 Laptop GPU, 90 Wh | HP ZBook Studio 15 G8 i9-11950H, GeForce RTX 3070 Laptop GPU, 83 Wh | Razer Blade 15 Advanced (Mid 2021) i7-11800H, GeForce RTX 3080 Laptop GPU, 80 Wh | Dell XPS 17 9710 Core i7 RTX 3060 i7-11800H, GeForce RTX 3060 Laptop GPU, 97 Wh | Average of class Multimedia | |
|---|---|---|---|---|---|---|---|
| Battery runtime | 8% | -34% | 3% | -60% | 44% | 9% | |
| H.264 (h) | 17 | 17.5 3% | 7.2 -58% | 16.2 ? -5% | |||
| WiFi v1.3 (h) | 14.9 | 16.9 13% | 7 -53% | 6.2 -58% | 5.9 -60% | 7.6 -49% | 12 ? -19% |
| Load (h) | 1.1 | 1.2 9% | 1.8 64% | 2.6 136% | 1.669 ? 52% | ||
| Reader / Idle (h) | 12.9 | 17.7 | 25.2 ? |
Pros
Cons
Verdict - M1 Max convinces with performance and cool operation
The MacBook Pro 16 2021 with the fastest version of the M1 Max processor including 32 GPU cores does not only convince with its performance, but mainly the low temperatures as well as the comparatively quiet fans. The powerful cooling solution and the efficient chip design definitely pay off here, because the temperatures are completely uncritical even under maximum load. And you can even use the maximum performance on battery power, which is unheard of in this performance range so far. The optional performance mode on the other hand results in slightly louder fans and lower surface temperatures, but we do not think it is really necessary.
The performance of the M1 Max and the M1 Pro is pretty much identical in terms of the CPU, and the big difference is the number of GPU cores. Whether you really need the additional power obviously depends on your usage scenario. If you edit plenty of videos or plan to use more external screens, then the M1 Max is the way to go. But if you are just looking for a high-end multimedia laptop, then we recommend the base model of the MacBook Pro 16 with the M1 Pro.
The high-end model of the new MacBook Pro 16 2021 does not only convince with the increased graphics performance of the M1 Max SoC, but also the excellent emission results.
Otherwise, you get the same pros and cons we have already discussed in our in-depth review of the MBP 16 base model. Thanks to the great Mini-LED screen and the excellent speakers, there is not much to complain about, even though there is still room for improvements in terms of connectivity, for example. The MacBook Pro will also not suit every user. If you just want one device for everything and also like to play some games, you are pretty much forced to use a powerful Windows laptop like the ThinkPad X1 Extreme G4, Razer Blade 15, or the Dell XPS 17 (the XPS 15 is not available with a similarly powerful GPU). This is also the case if you rely on software that is just not available for MacBook.
Price and Availability
The availability of the new MacBook Pro 16 is currently limited. The best option is a pickup in one of Apple's retail stores, where you can get our test unit with the 2 TB SDD for $4299.
Apple MacBook Pro 16 2021 M1 Max
- 11/24/2021 v7 (old)
Andreas Osthoff
Price comparison
