 Deutsch
 English
 Español
 Français
 Italiano
 Nederlands
 Polski
 Português
 Русский
 Türkçe
 Svenska
 Chinese
 Magyar
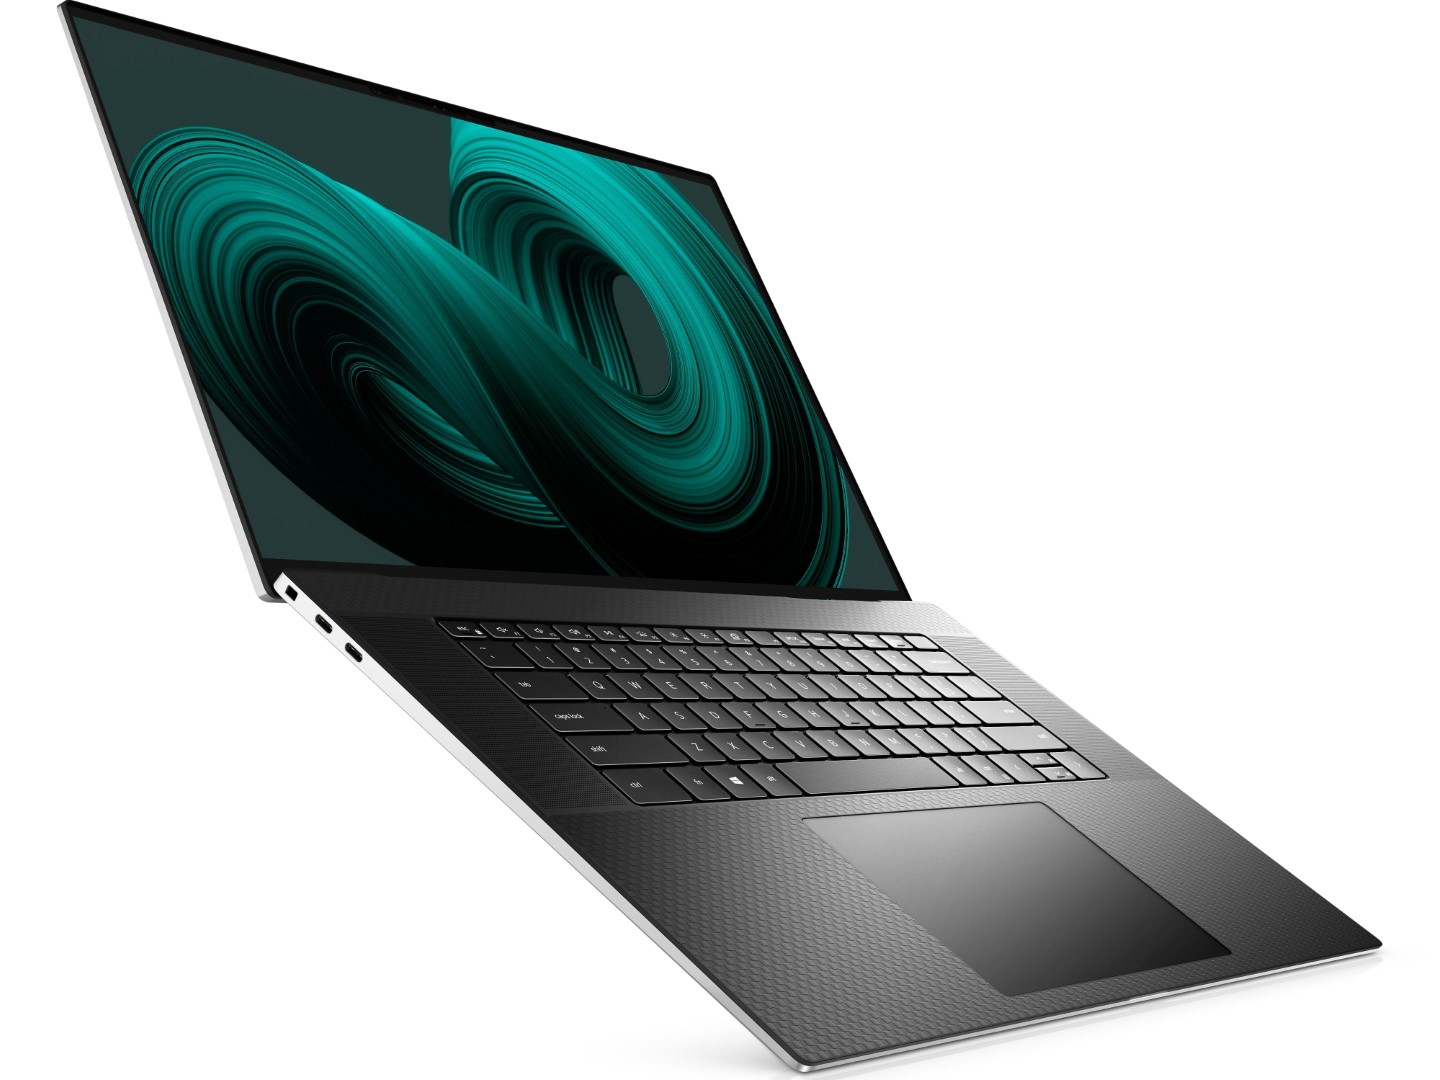
Dell XPS 17 9710 11th Gen Intel Laptop Review: Small Changes That Matter
It's been exactly one year since we reviewed the original XPS 17 9700 with 10th gen Intel and GeForce RTX 2060 Max-Q graphics. Now, Dell is ready to ship its second generation XPS 17 9710 series updated with 11th gen Intel and GeForce RTX 3060 graphics. Our test unit today is an upper midrange configuration with the Core i7-11800H CPU, RTX 3060 GPU, and 2400p touchscreen for just under $2900 USD. Other SKUs include the Core i9-11900H or RTX 3050 with 1200p display for higher and lower starting prices, respectively.
The 2021 XPS 17 is physically identical to the 2020 version and so we recommend checking out our existing two reviews on last year's model to learn more about the chassis and its features. Nonetheless, there are a handful of under-the-hood updates that make the XPS 17 9710 worth considering over the 9700.
Alternatives to the XPS 17 include high performance 17.3-inch laptops like the Gigabyte Aero 17, LG Ultra 17, or the Razer Blade Pro 17 to some degree. However, the XPS 17 remains unique with its 17.0-inch 16:10 4K aspect ratio.
More Dell reviews:
potential competitors in comparison
Rating | Date | Model | Weight | Height | Size | Resolution | Best Price |
|---|---|---|---|---|---|---|---|
| 87.9 % | 07/2021 | Dell XPS 17 9710 Core i7 RTX 3060 i7-11800H, GeForce RTX 3060 Laptop GPU | 2.5 kg | 19.5 mm | 17.00" | 3840x2400 | |
| 87.9 % | 07/2020 | Dell XPS 17 9700 Core i7 RTX 2060 Max-Q i7-10875H, GeForce RTX 2060 Max-Q | 2.5 kg | 19.5 mm | 17.00" | 3840x2400 | |
| 87.8 % | 02/2021 | Razer Blade Pro 17 2021 (QHD Touch) i7-10875H, GeForce RTX 3080 Laptop GPU | 3 kg | 19.9 mm | 17.30" | 3840x2160 | |
| 87.6 % | 01/2021 | Gigabyte Aero 17 HDR YC i9-10980HK, GeForce RTX 3080 Laptop GPU | 2.8 kg | 21.4 mm | 17.30" | 3840x2160 | |
| 82.8 % | 09/2020 | LG Ultra 17U70N i5-10210U, GeForce GTX 1650 Mobile | 2 kg | 20.4 mm | 17.00" | 2560x1600 | |
| 84.3 % | 08/2020 | Eluktronics RP-17 R7 4800H, GeForce RTX 2060 Mobile | 2.6 kg | 30 mm | 17.30" | 1920x1080 |
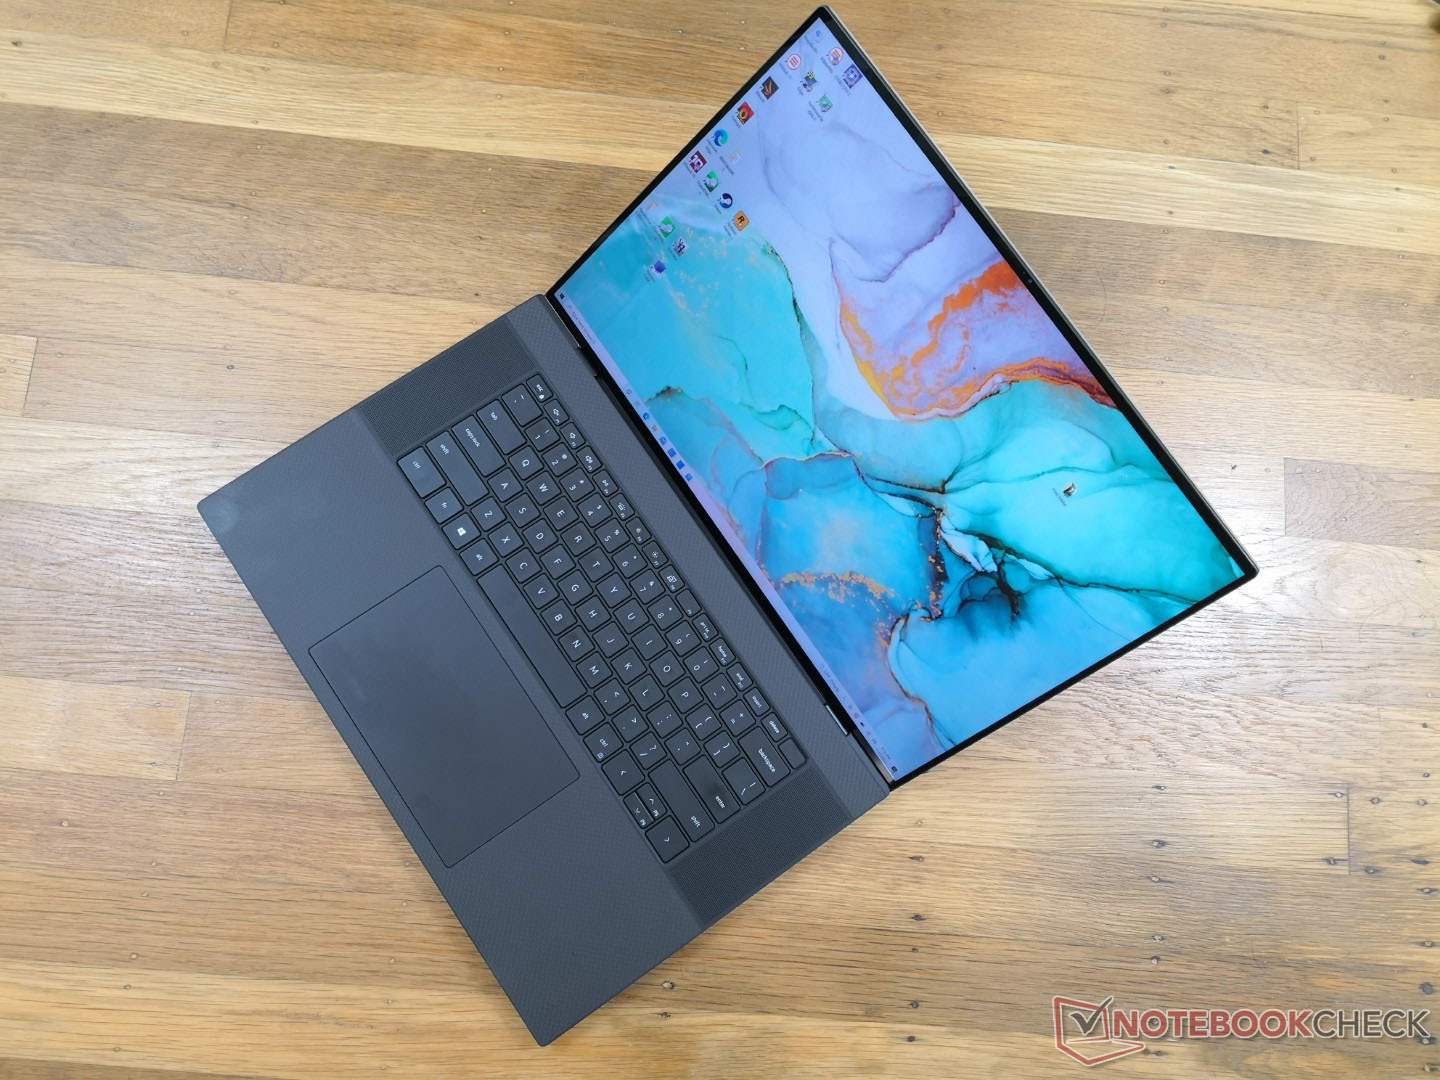
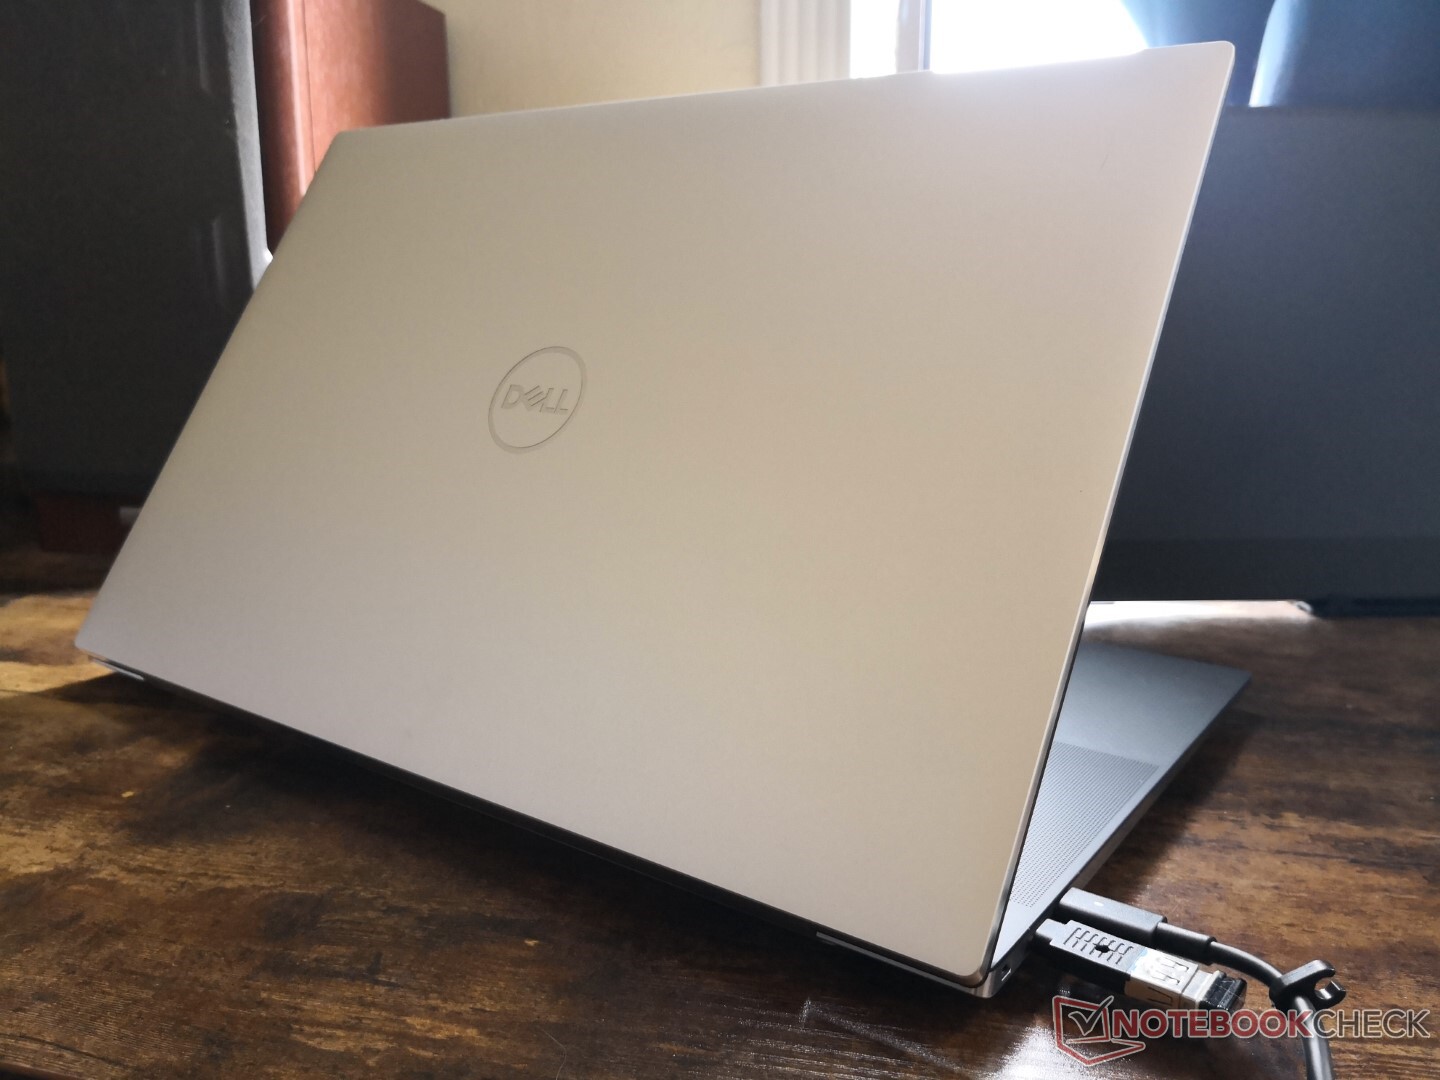
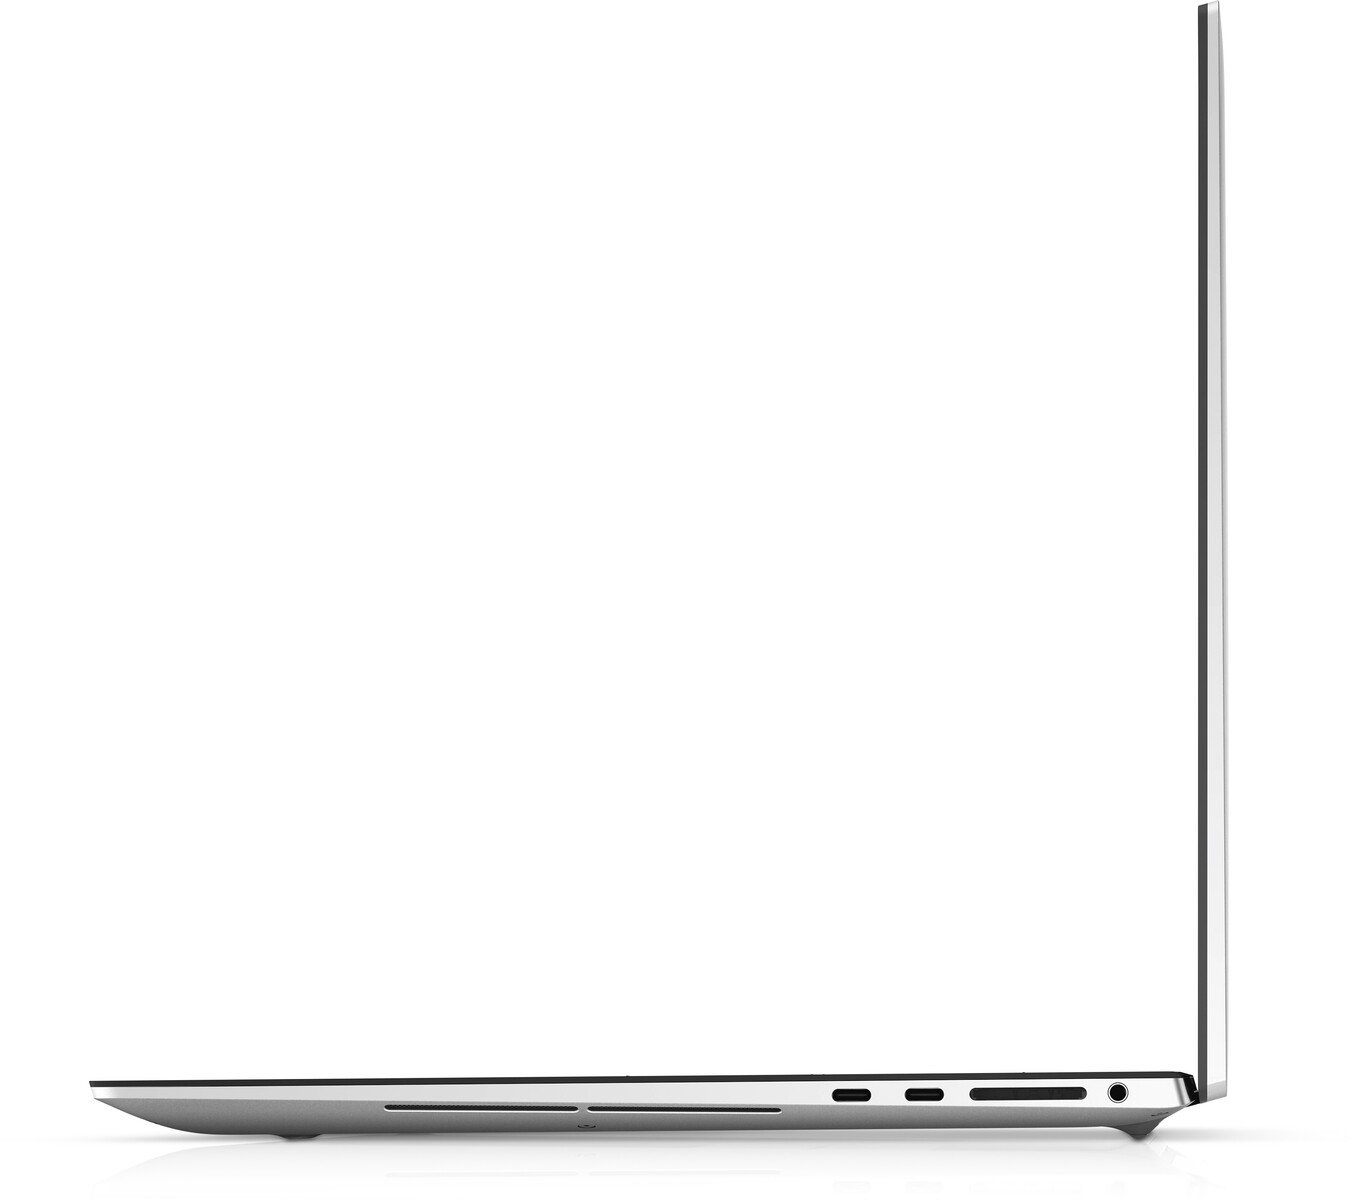
Case — Incredibly High Screen-to-Body Ratio
The chassis is only a year old and so Dell has made no changes to the exterior design of the XPS 17 9710. Even so, it would have been great to at least see an additional color option like the glass fiber XPS 13 or even a webcam shutter that continues to be conspicuously missing.
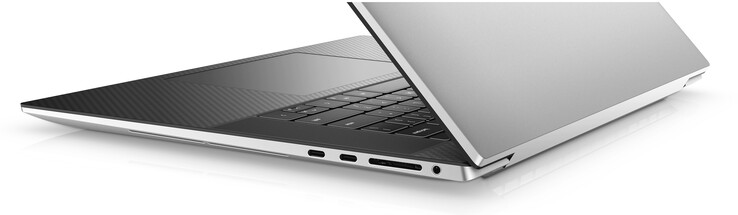
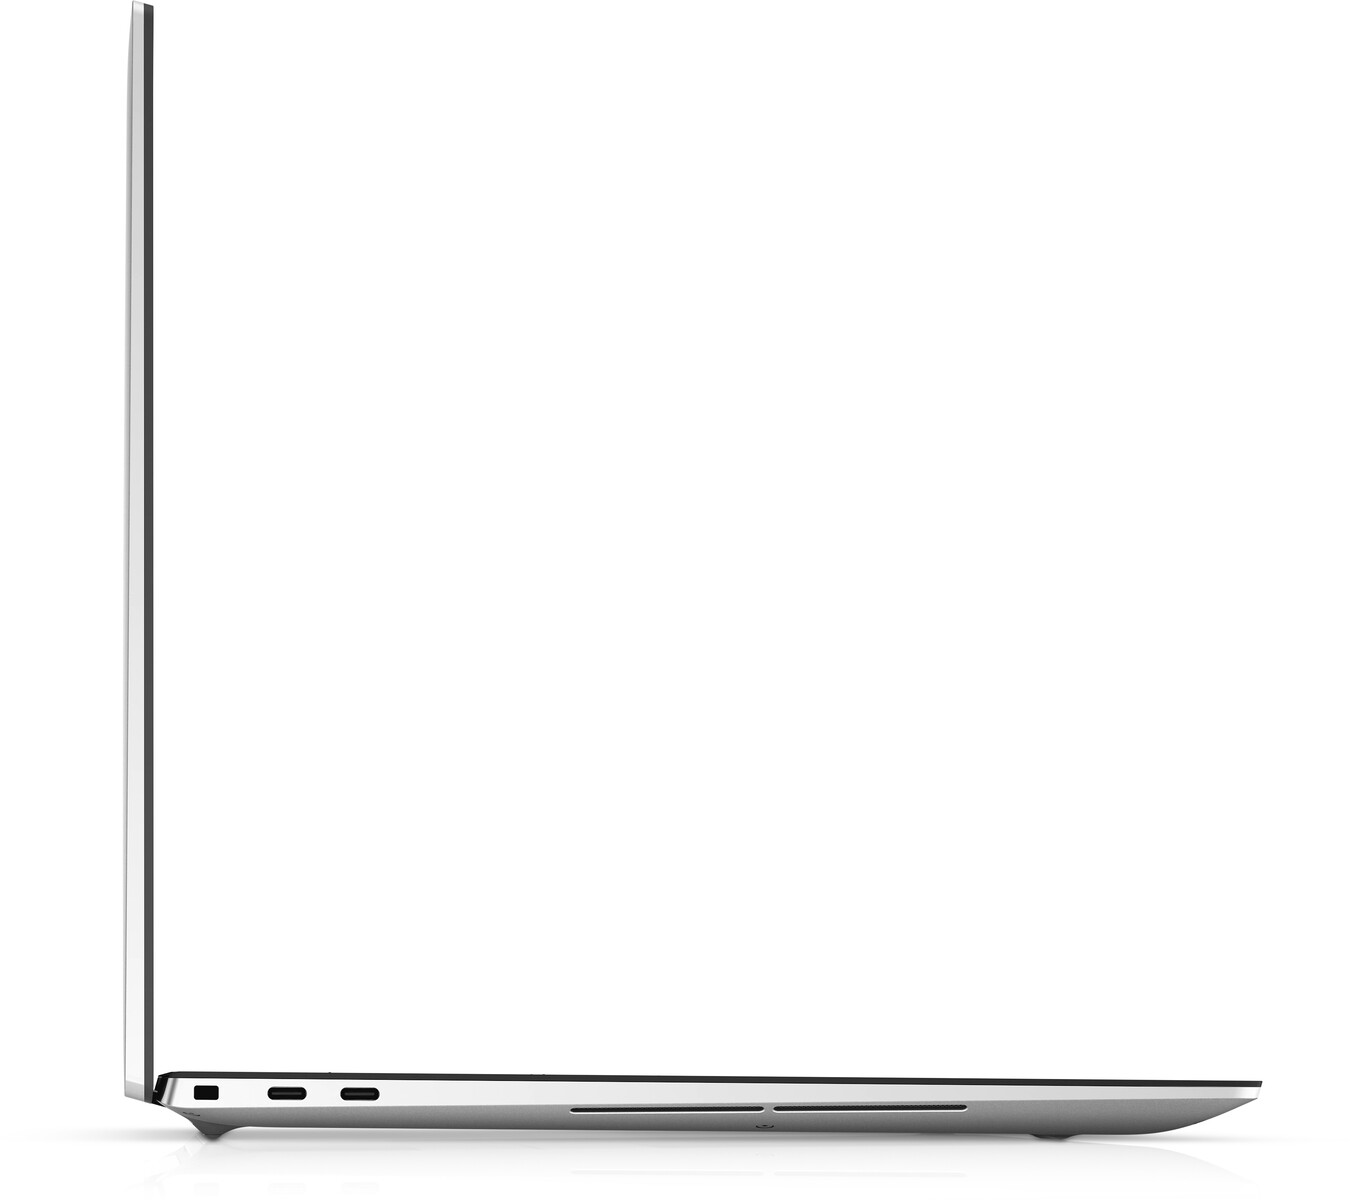
Connectivity — Too Many Thunderbolt 4 Ports?
As if the four Thunderbolt 3 ports on the XPS 17 9700 weren't enough, they have all been updated to Thunderbolt 4 on this latest model. Most accessories outside of eGPUs are unlikely to benefit from the upgrade since Thunderbolt 3 and Thunderbolt 4 share the same 40 Gbps ceiling.
SD Card Reader — It's Not Dead
The SD card reader is here to stay and we're glad to see it supported on consumer models like the XPS 17. Moving 1 GB of pictures from our UHS-II test card takes only 5 to 6 seconds.
| SD Card Reader | |
| average JPG Copy Test (av. of 3 runs) | |
| Razer Blade Pro 17 2021 (QHD Touch) (Toshiba Exceria Pro SDXC 64 GB UHS-II) | |
| Dell XPS 17 9700 Core i7 RTX 2060 Max-Q (Toshiba Exceria Pro SDXC 64 GB UHS-II) | |
| Gigabyte Aero 17 HDR YC (Toshiba Exceria Pro SDXC 64 GB UHS-II) | |
| Dell XPS 17 9710 Core i7 RTX 3060 (AV PRO microSD 128 GB V60) | |
| LG Ultra 17U70N (Toshiba Exceria Pro M501 microSDXC 64GB) | |
| Eluktronics RP-17 (Toshiba Exceria Pro SDXC 64 GB UHS-II) | |
| maximum AS SSD Seq Read Test (1GB) | |
| Gigabyte Aero 17 HDR YC (Toshiba Exceria Pro SDXC 64 GB UHS-II) | |
| Dell XPS 17 9700 Core i7 RTX 2060 Max-Q (Toshiba Exceria Pro SDXC 64 GB UHS-II) | |
| Razer Blade Pro 17 2021 (QHD Touch) (Toshiba Exceria Pro SDXC 64 GB UHS-II) | |
| Dell XPS 17 9710 Core i7 RTX 3060 (AV PRO microSD 128 GB V60) | |
| LG Ultra 17U70N (Toshiba Exceria Pro M501 microSDXC 64GB) | |
| Eluktronics RP-17 (Toshiba Exceria Pro SDXC 64 GB UHS-II) | |
Communication
The Intel-Killer 1650s comes standard for Wi-Fi 6 and Bluetooth 5.2 connectivity. The main difference between this and the more common Intel AX200/201 is its support for the Killer Networking software which offers additional features that enthusiasts might appreciate.
Webcam
The 720p webcam remains the same. It would have been great to see a 1080p upgrade much like on the latest Razer Blade 15.


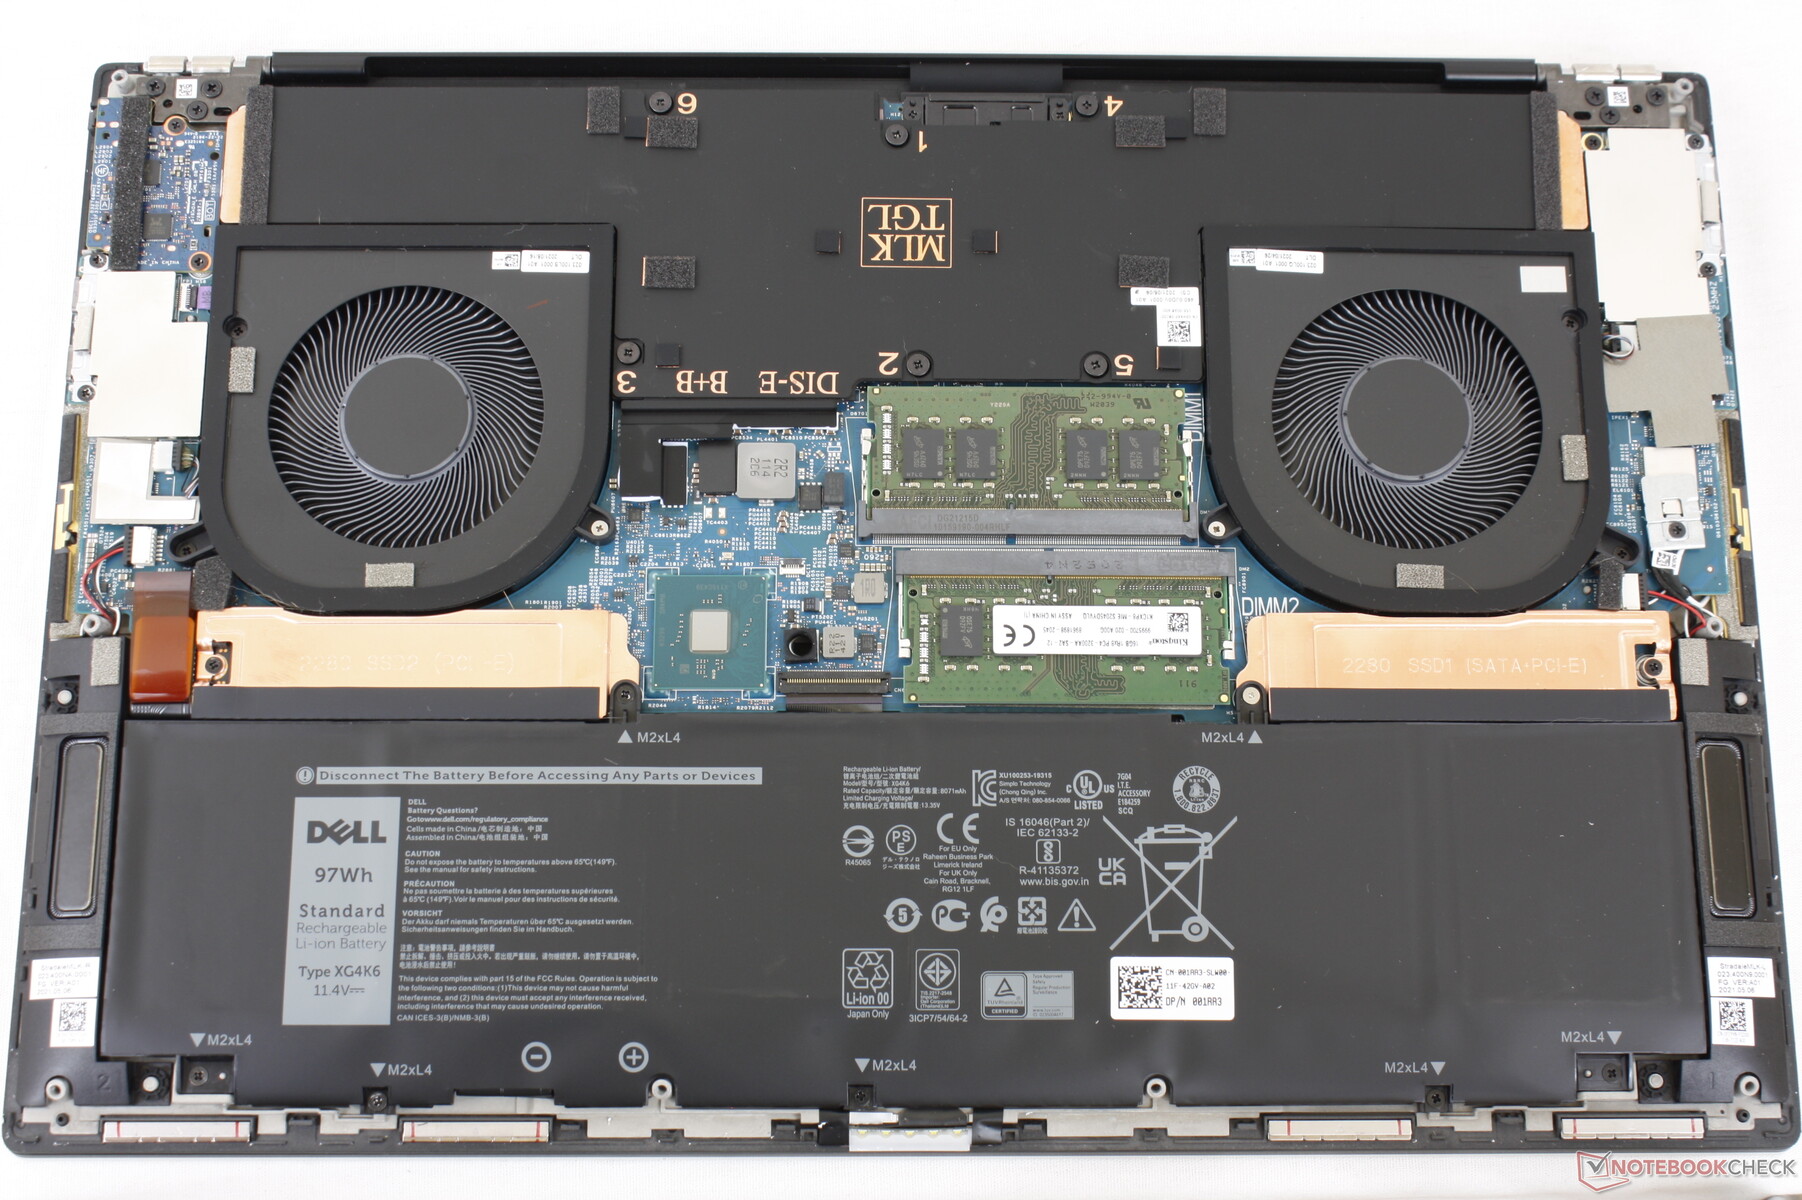
Maintenance
The bottom panel is more difficult to remove than on the XPS 15 since its edges and corners are tighter and sharper.
Accessories and Warranty
Dell includes a handy USB-C to HDMI and USB-A adapter to make up for the fact that the chassis integrates neither of these ports. The standard one-year limited warranty applies with plenty of extension options if ordered directly from Dell.
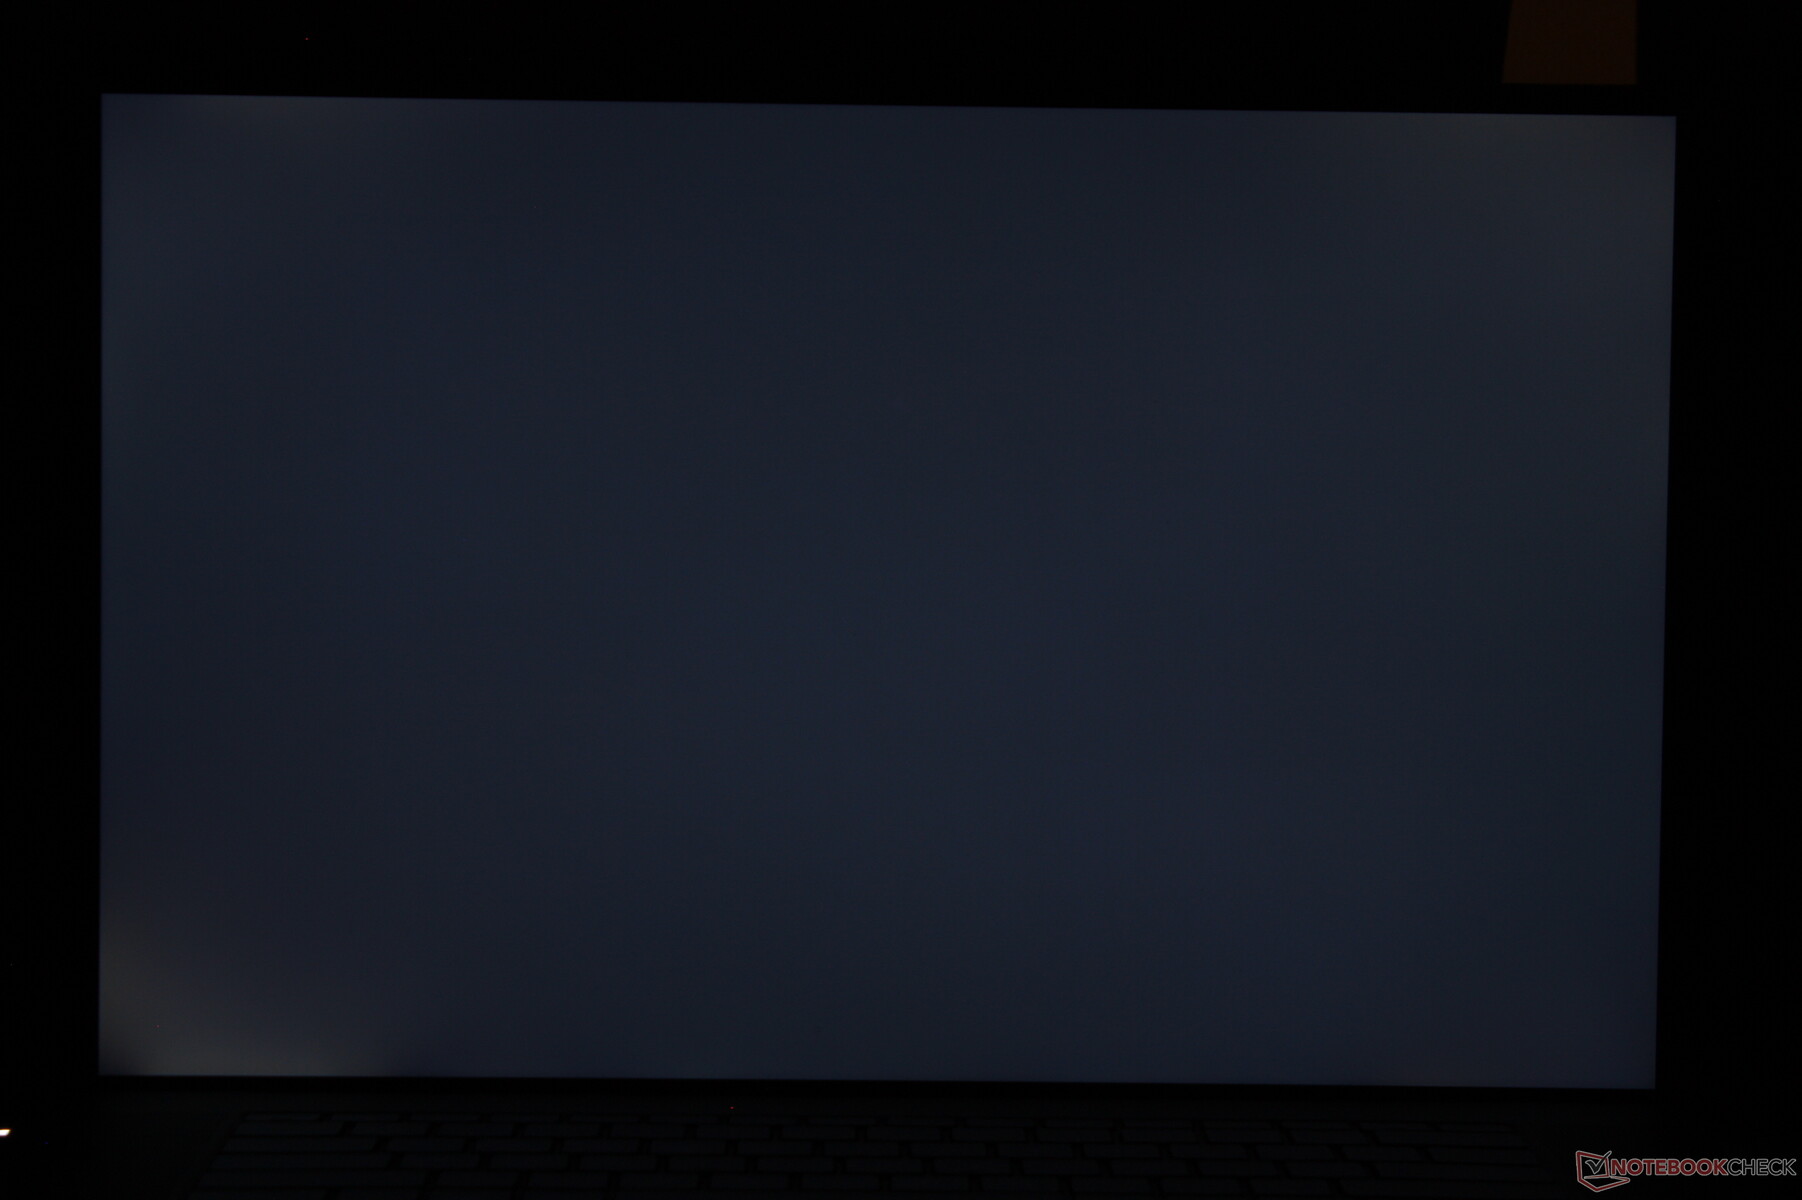
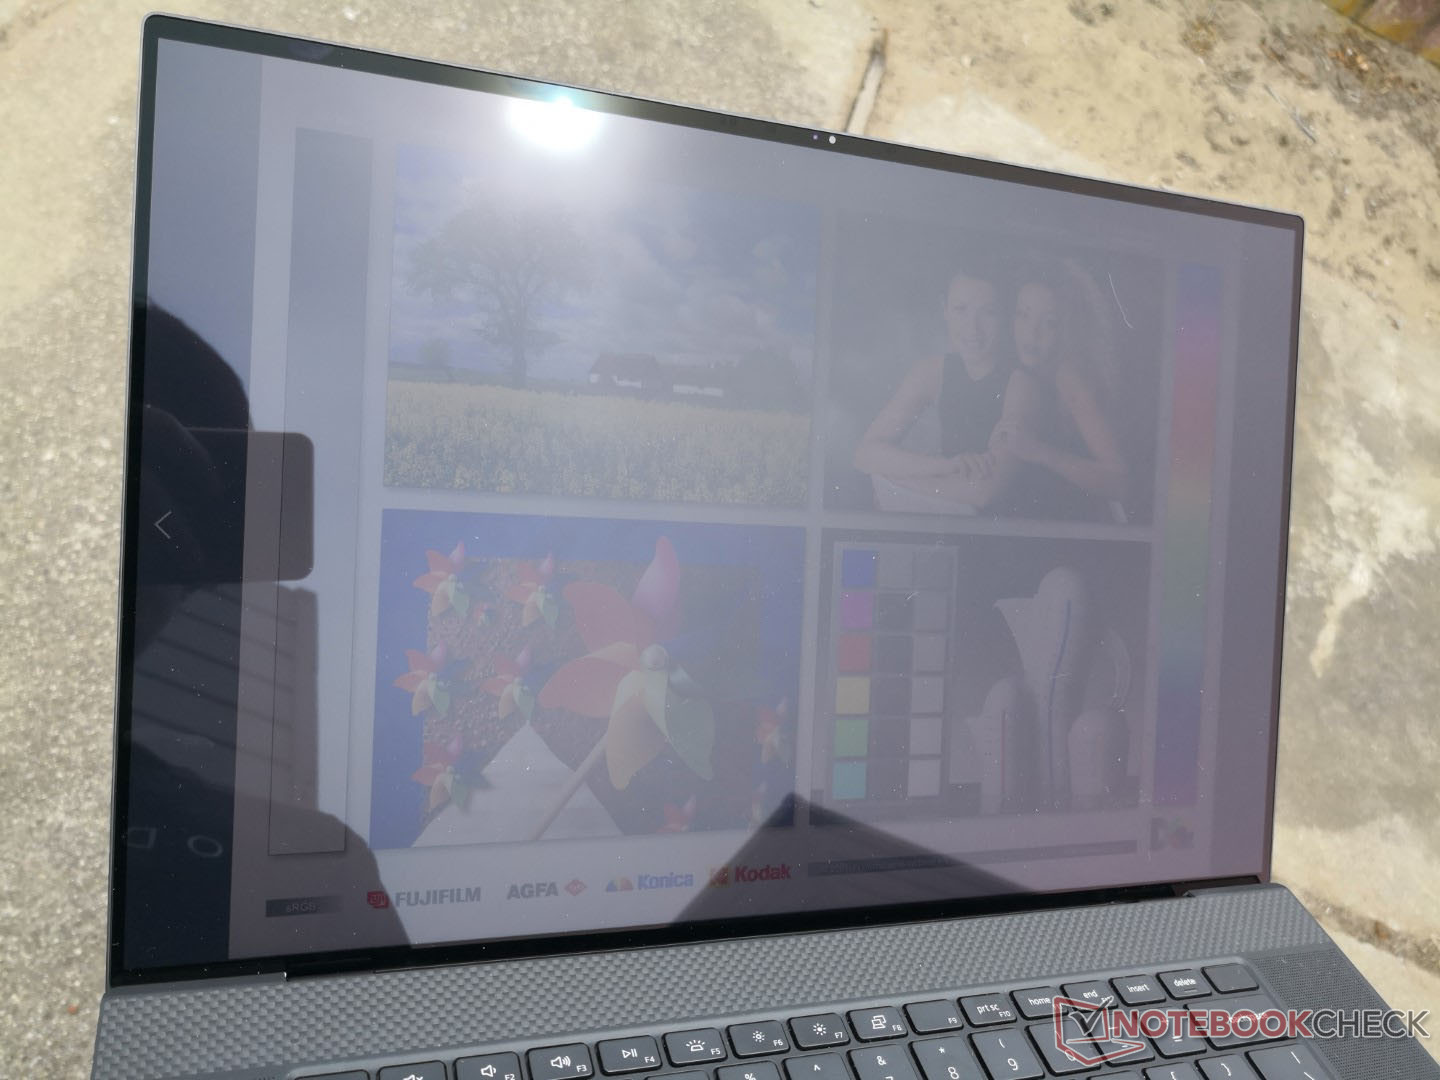
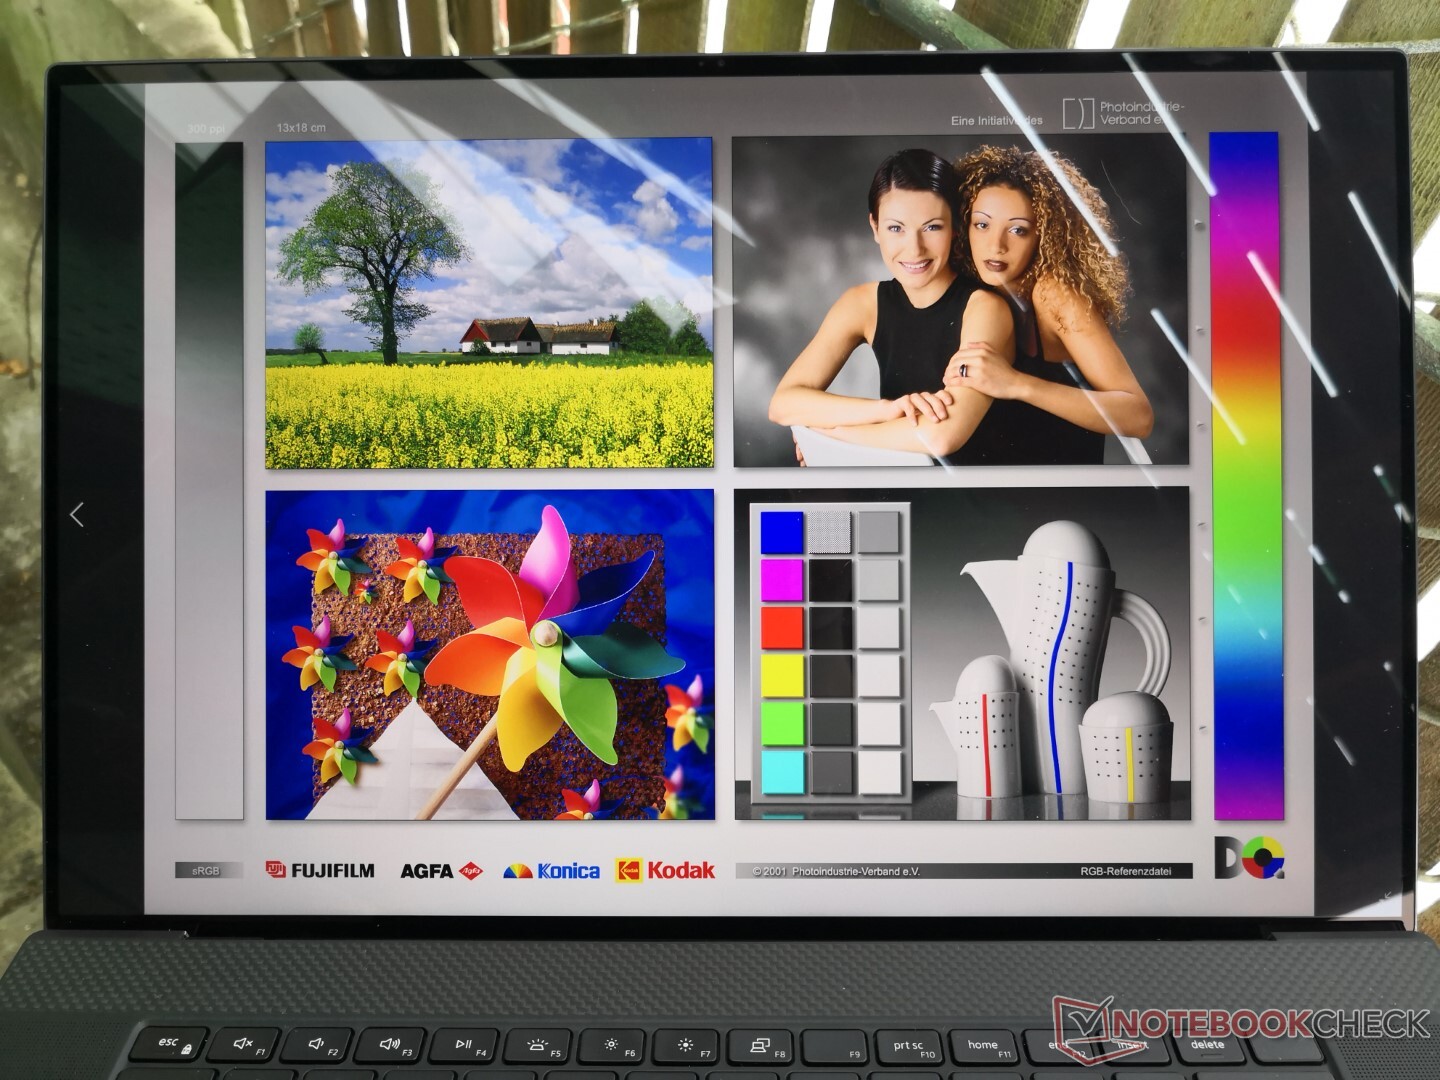
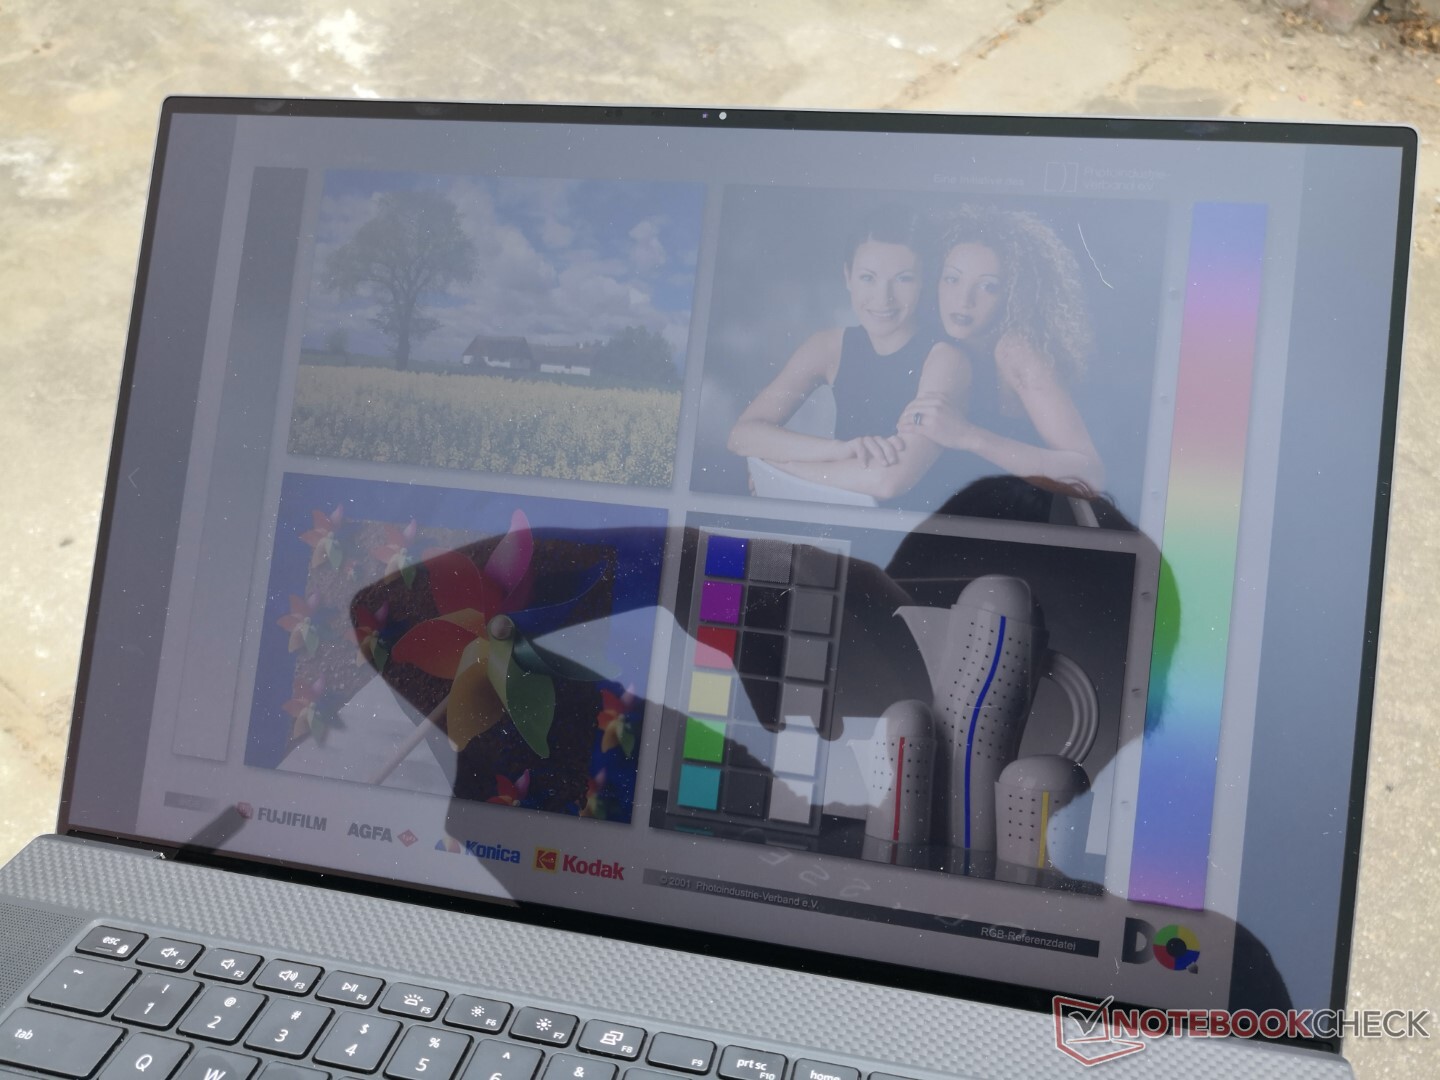
Display — The First 17.0-inch 16:10 4K Touchscreen
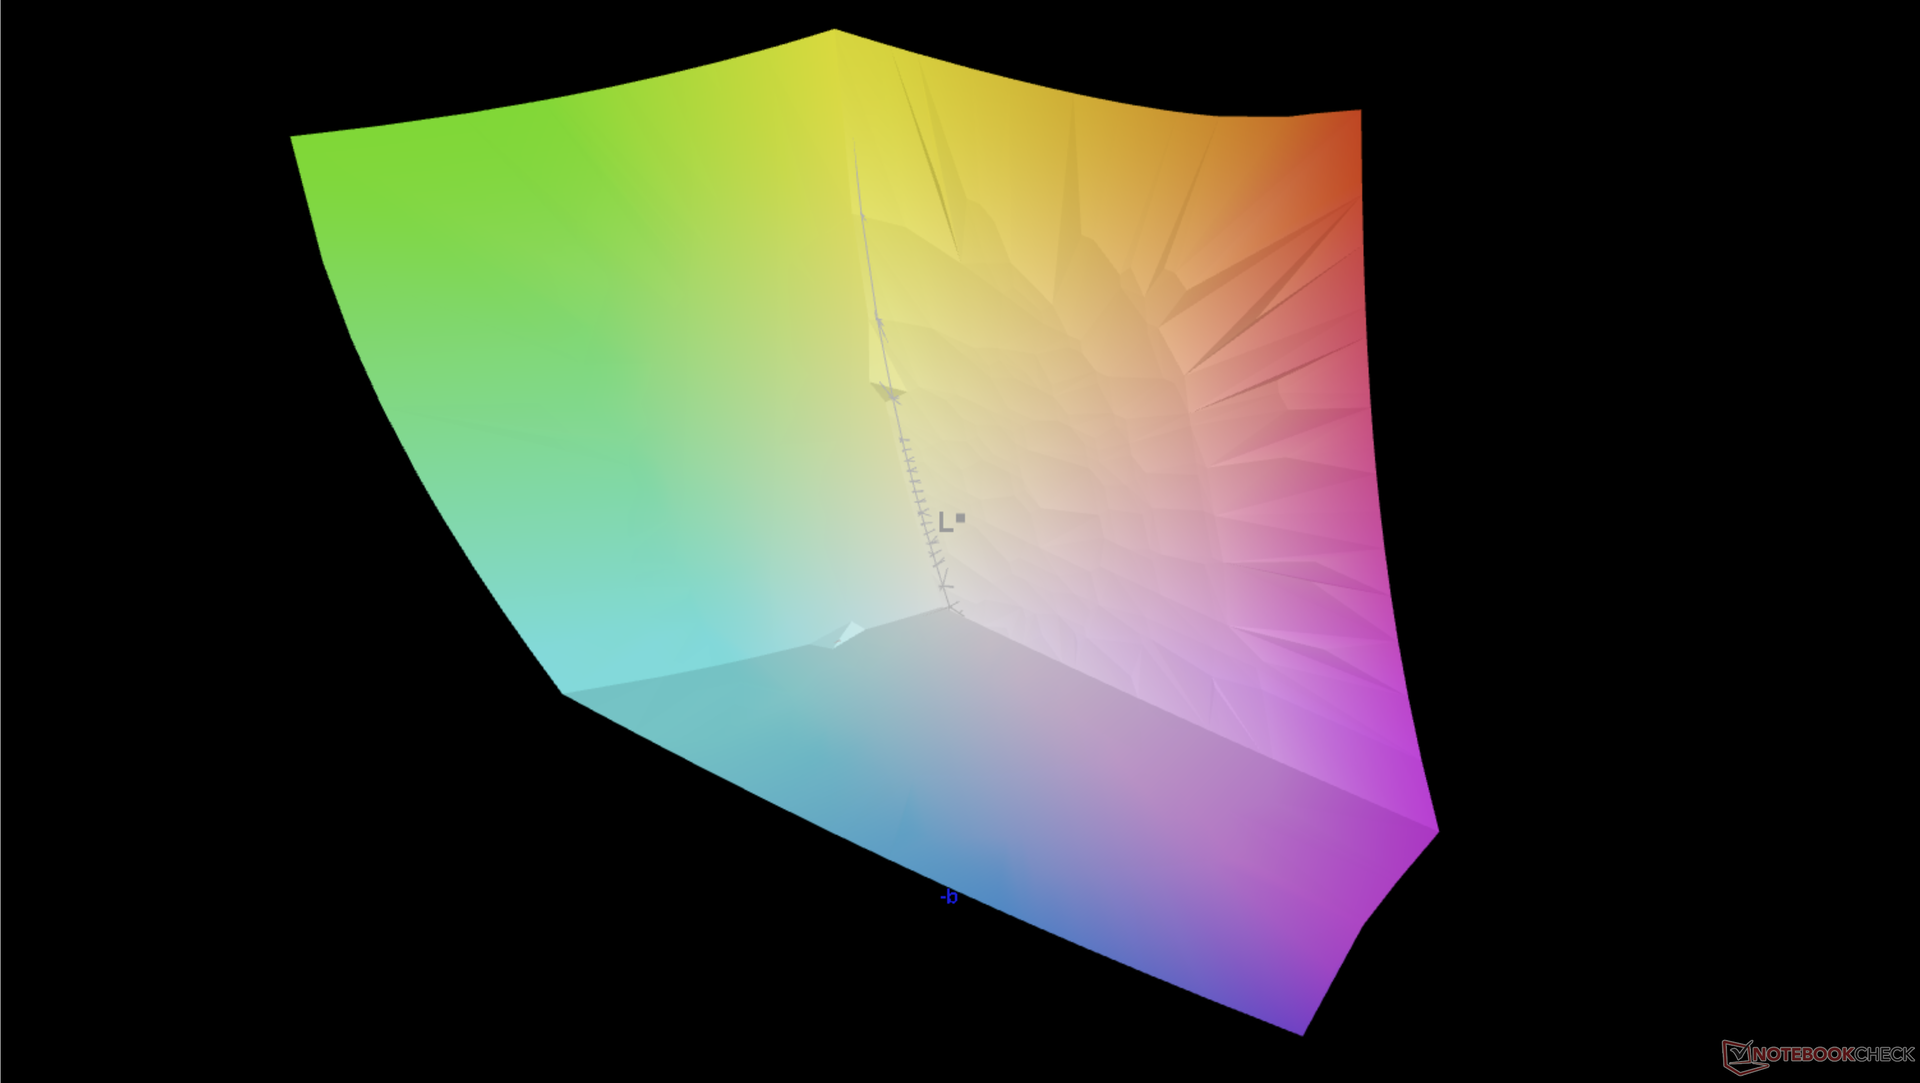
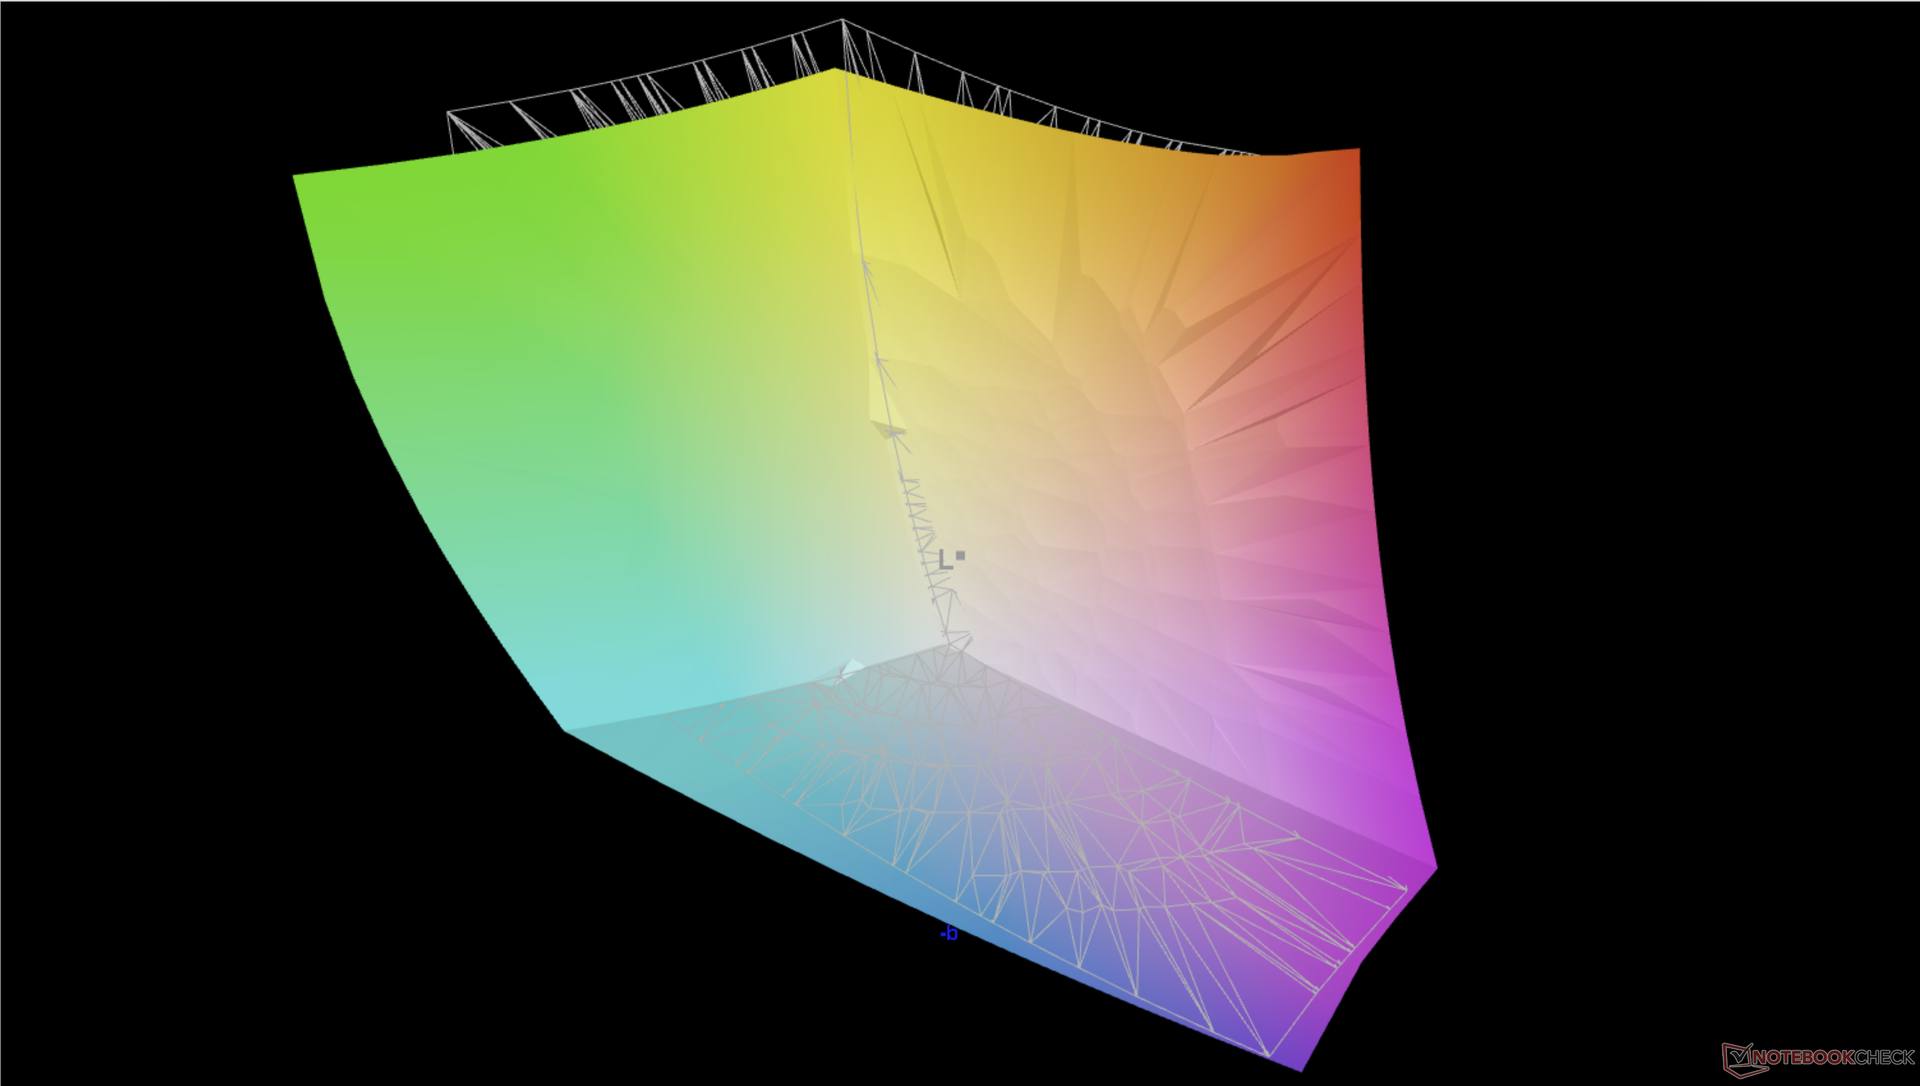
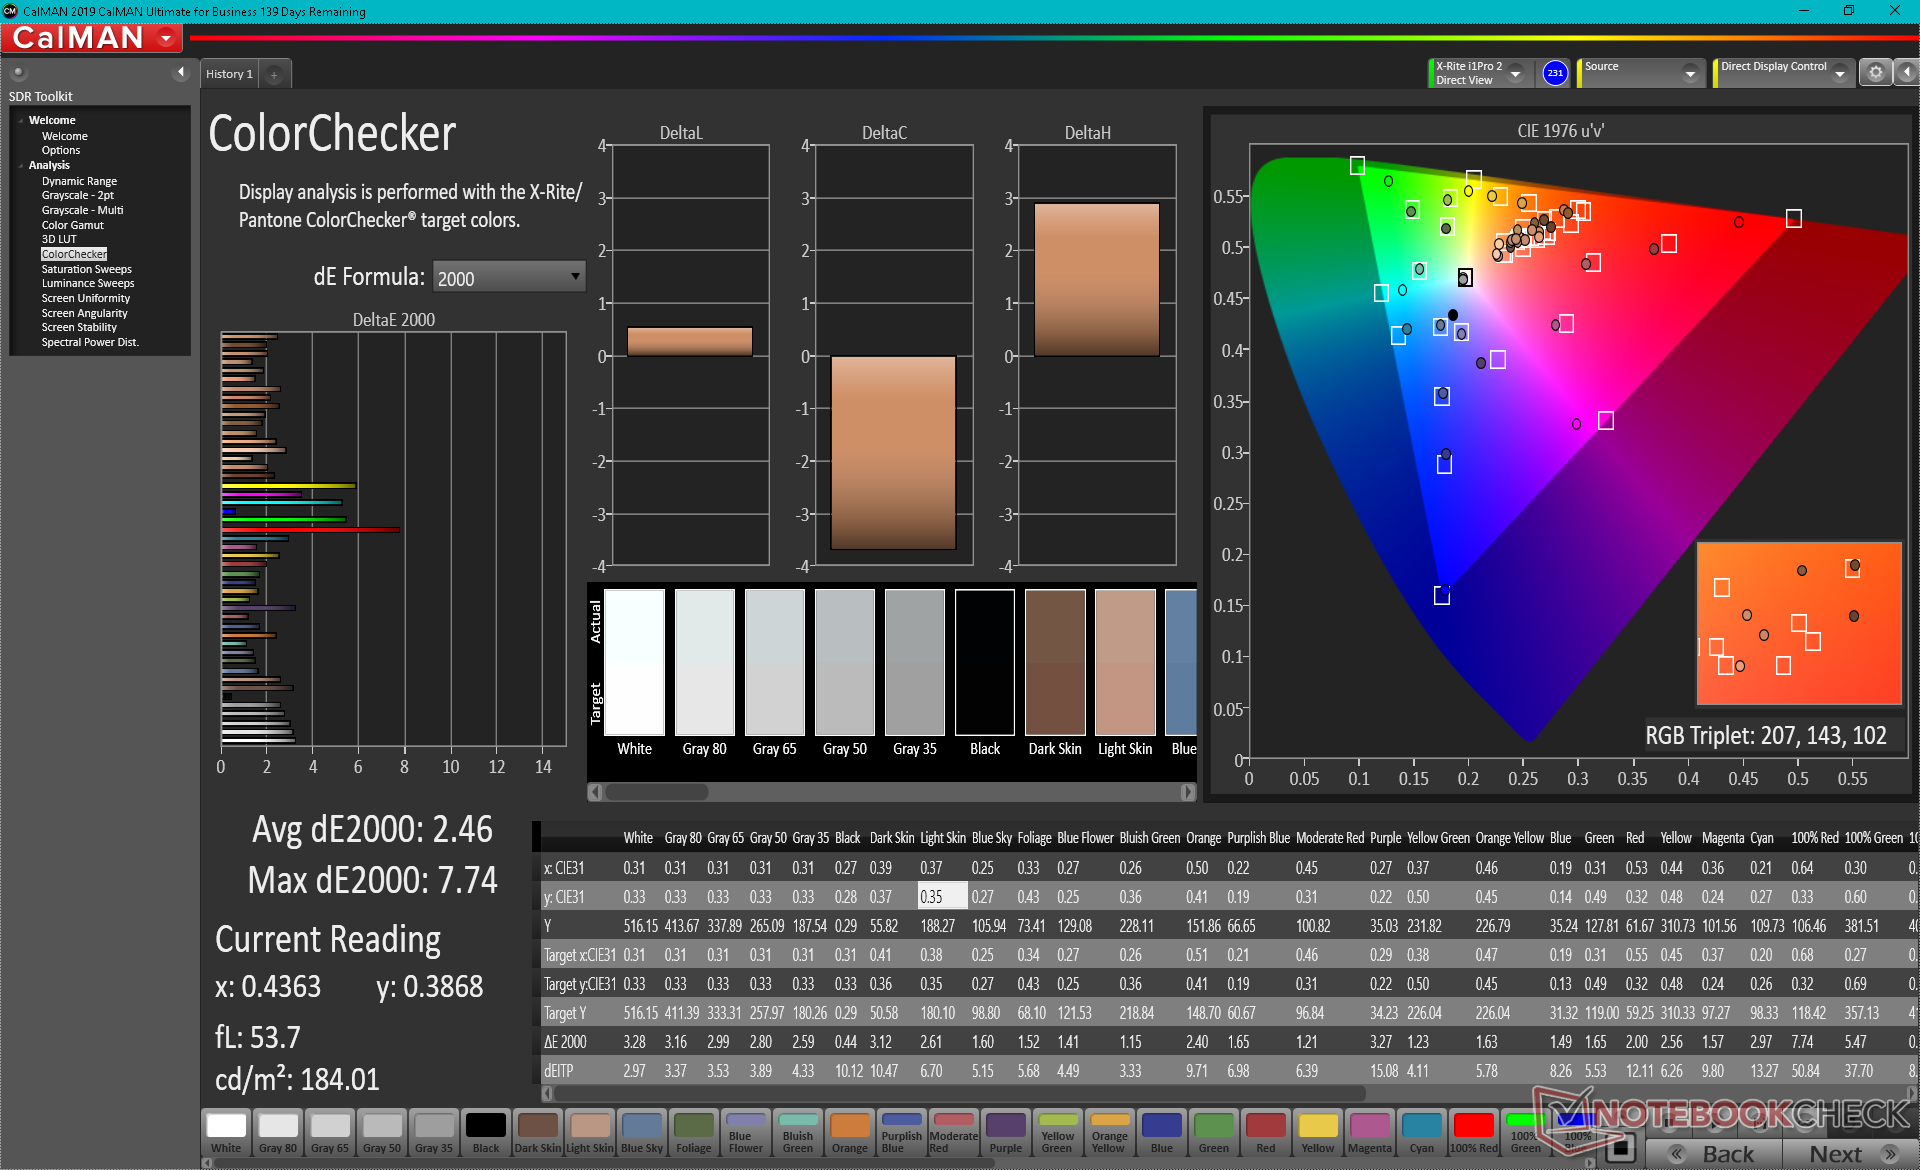
Though the processors have changed, the display has not. The 2021 XPS 17 uses the same Sharp LQ170R1 3840 x 2400 touchscreen as found on the 2020 version for the same visual experience. We don't see this as a problem since the XPS 17 continues to have one of the highest screen-to-body ratios and highest quality displays in terms of color coverage (95 percent DCI-P3), contrast (~1500:1), and brightness (~500 nits) for its 16:10 category.

| |||||||||||||||||||||||||
Brightness Distribution: 85 %
Center on Battery: 536.5 cd/m²
Contrast: 1450:1 (Black: 0.37 cd/m²)
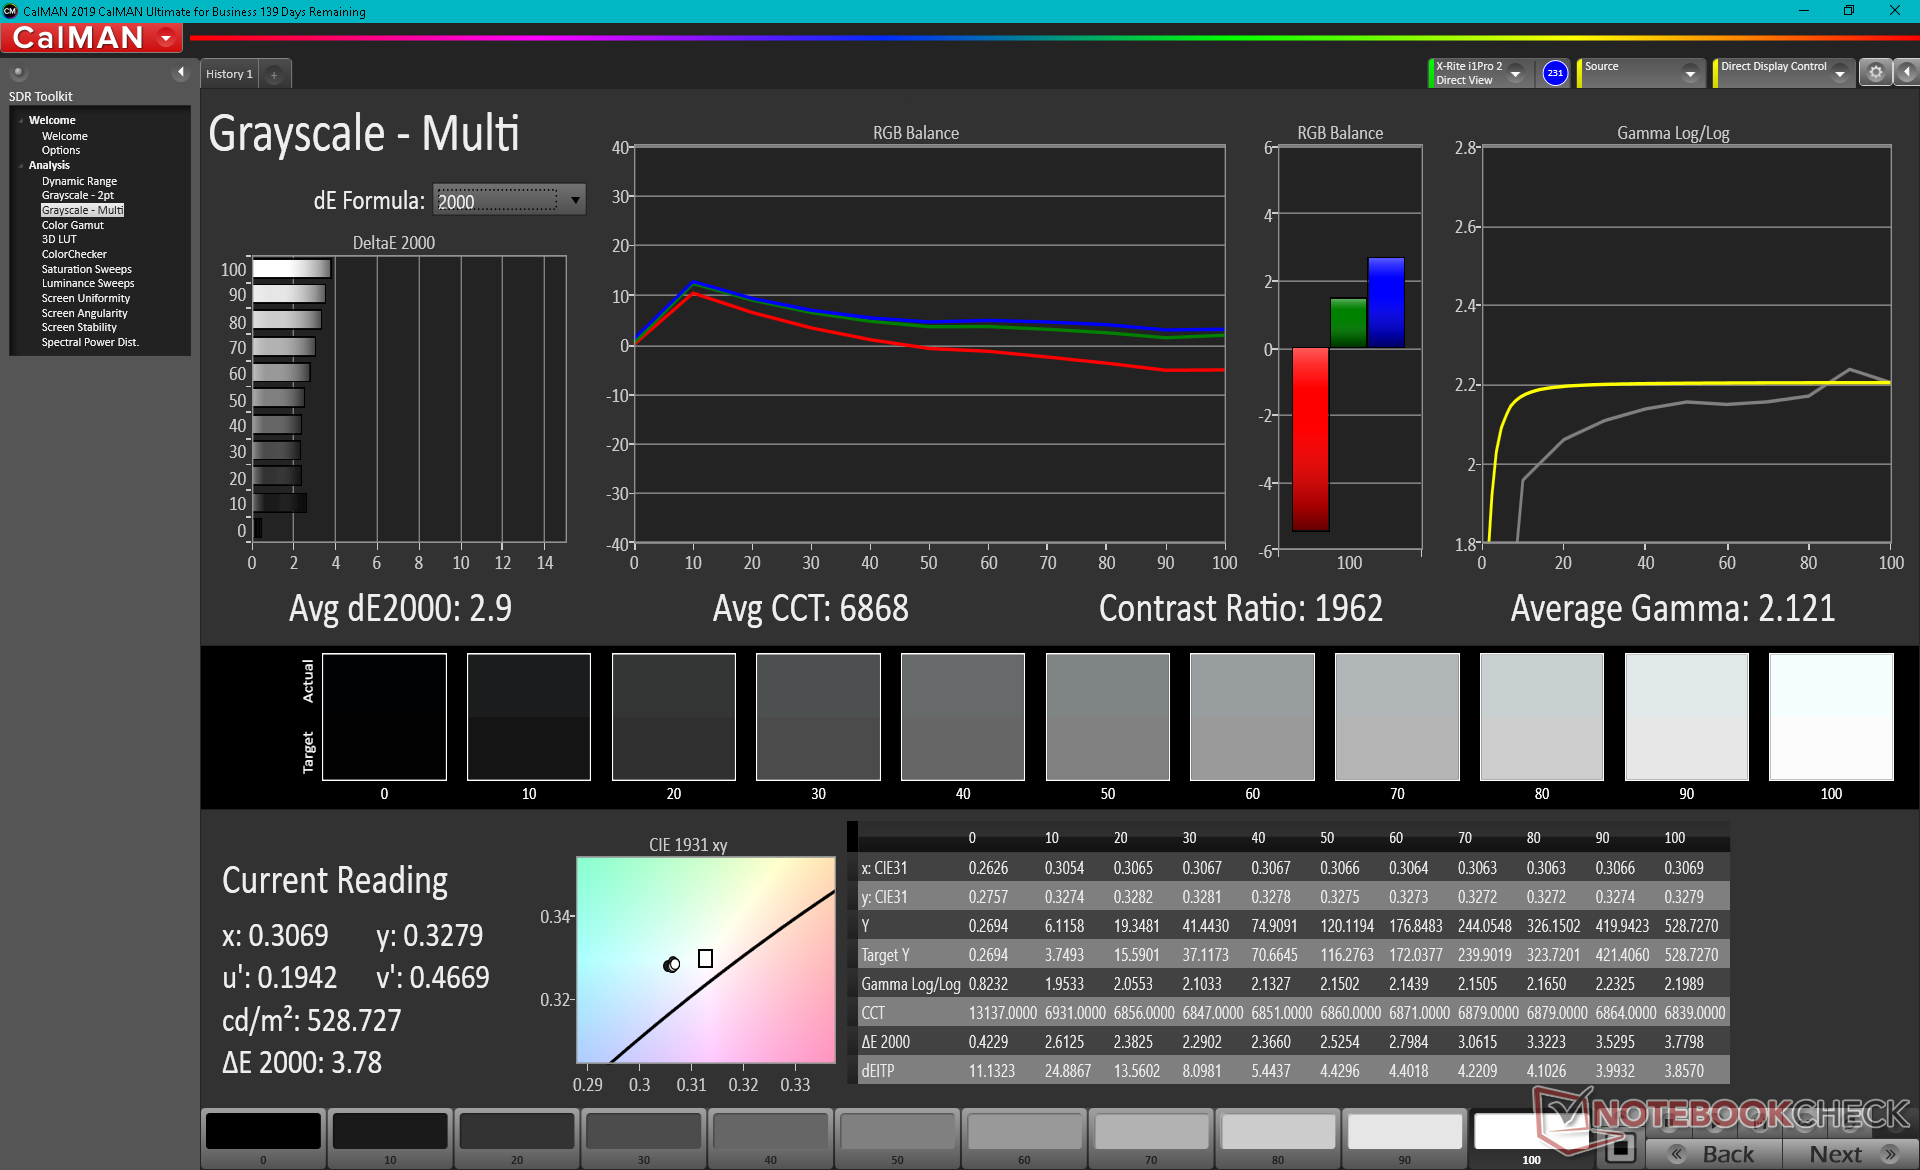
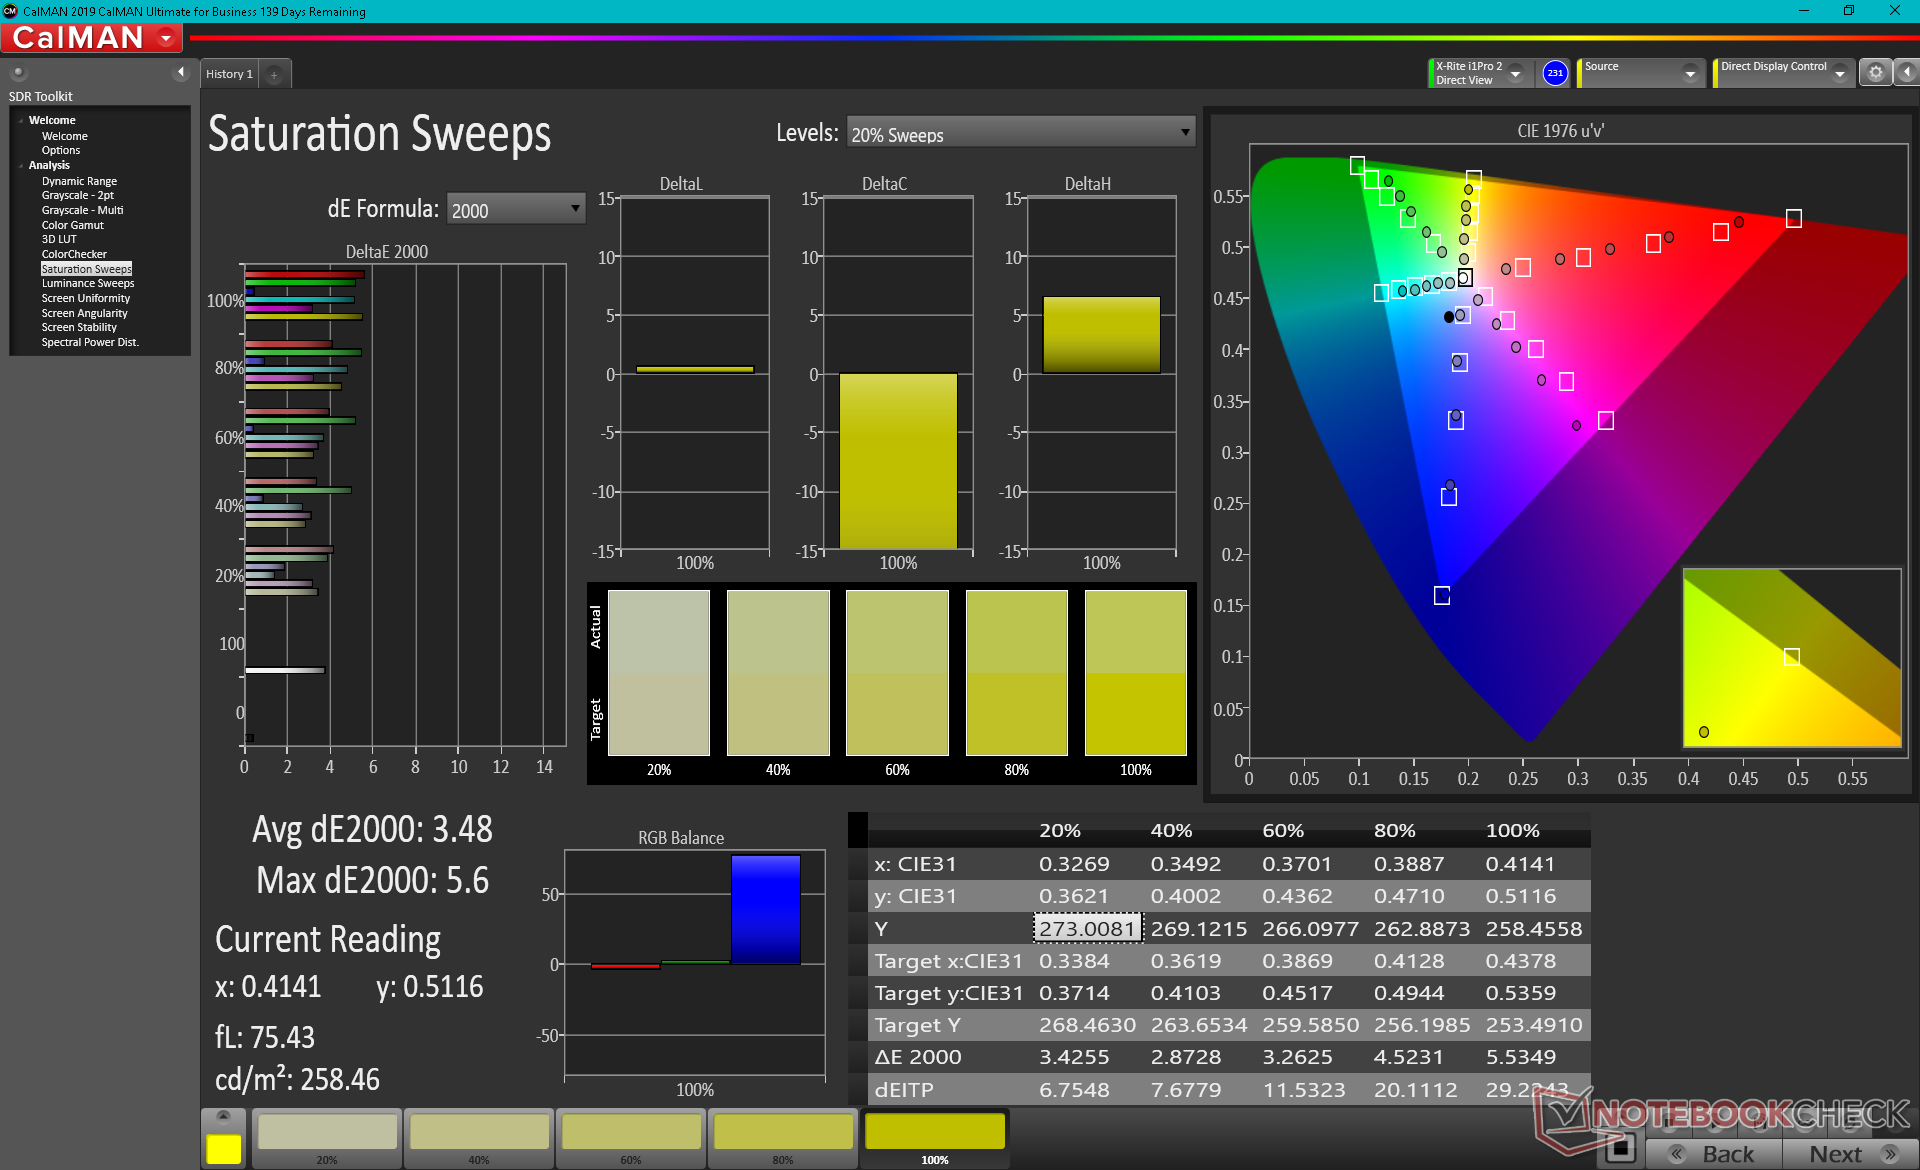
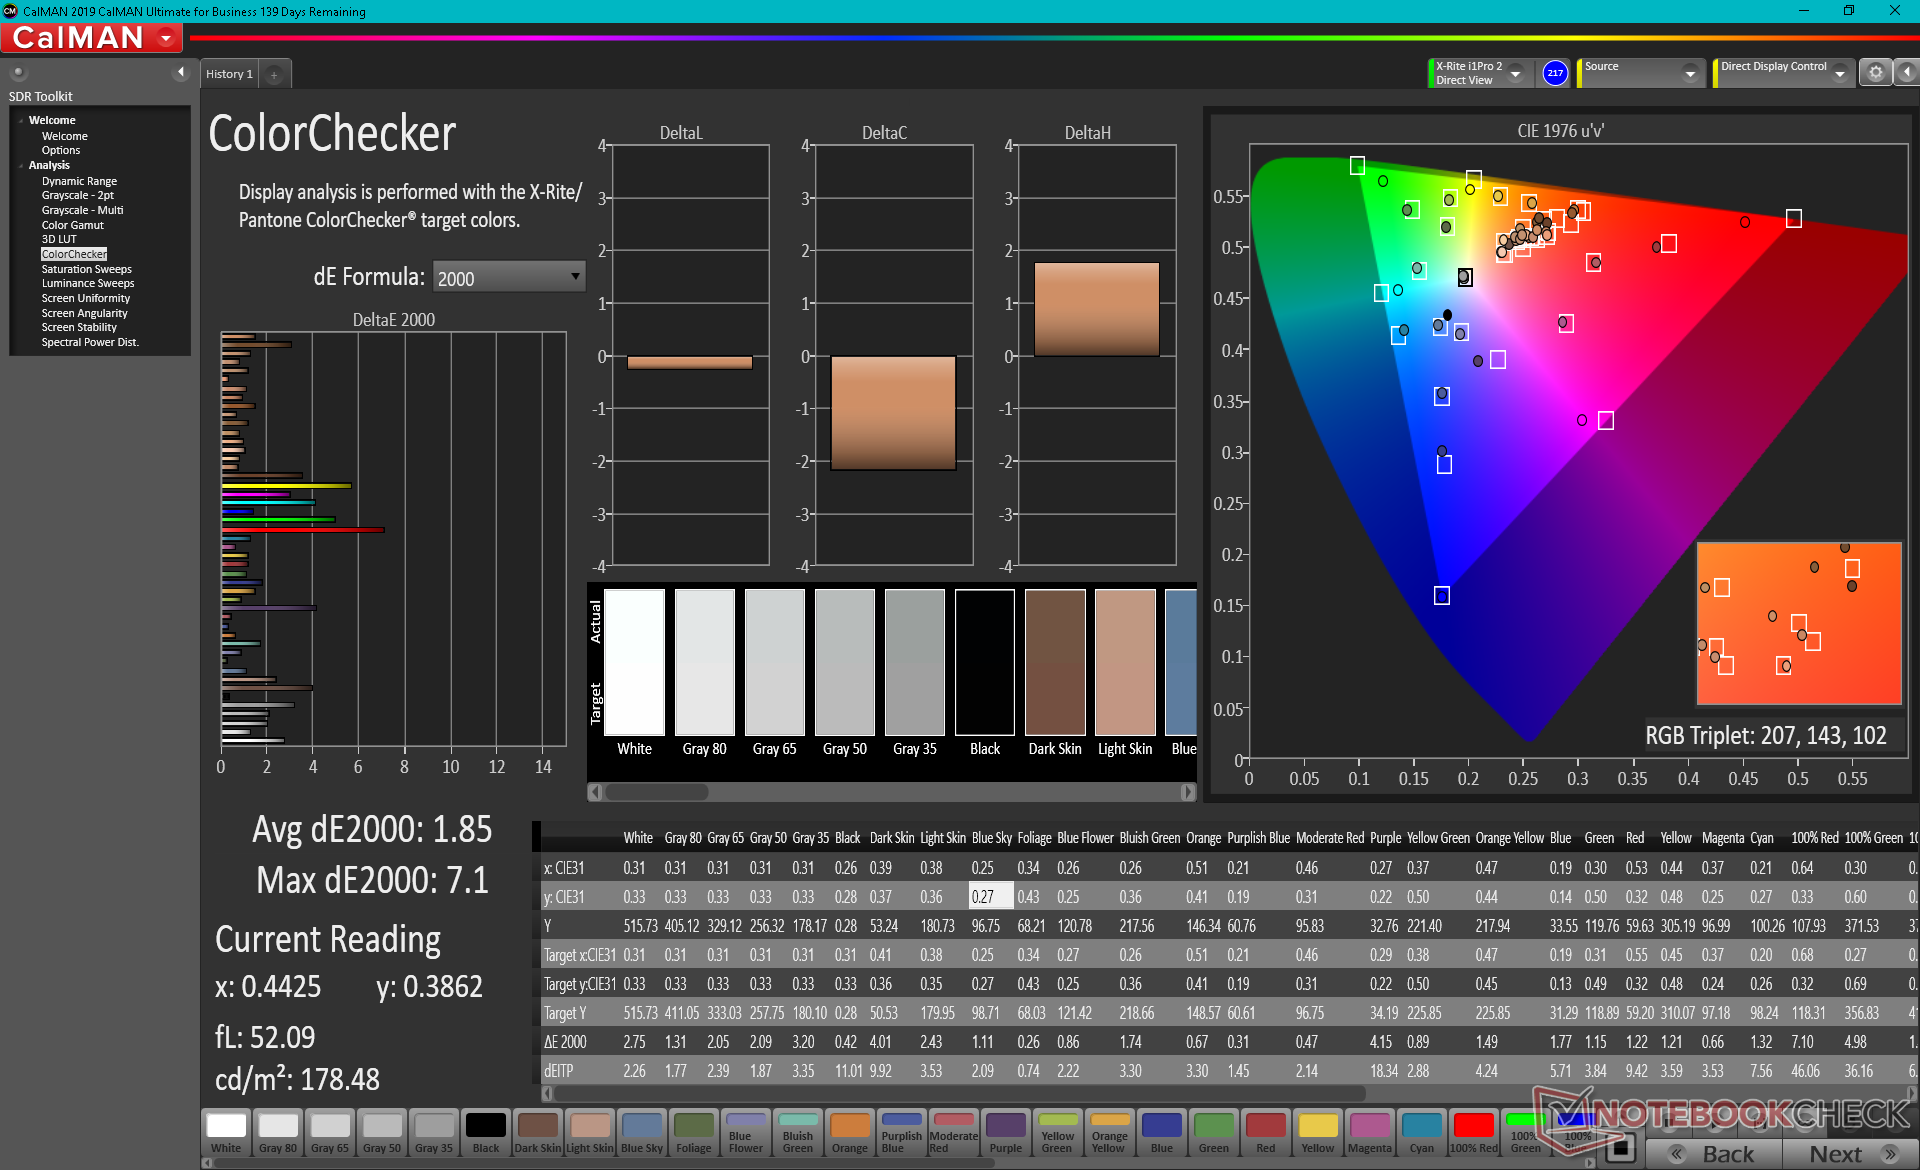
ΔE Color 2.46 | 0.5-29.43 Ø5, calibrated: 1.85
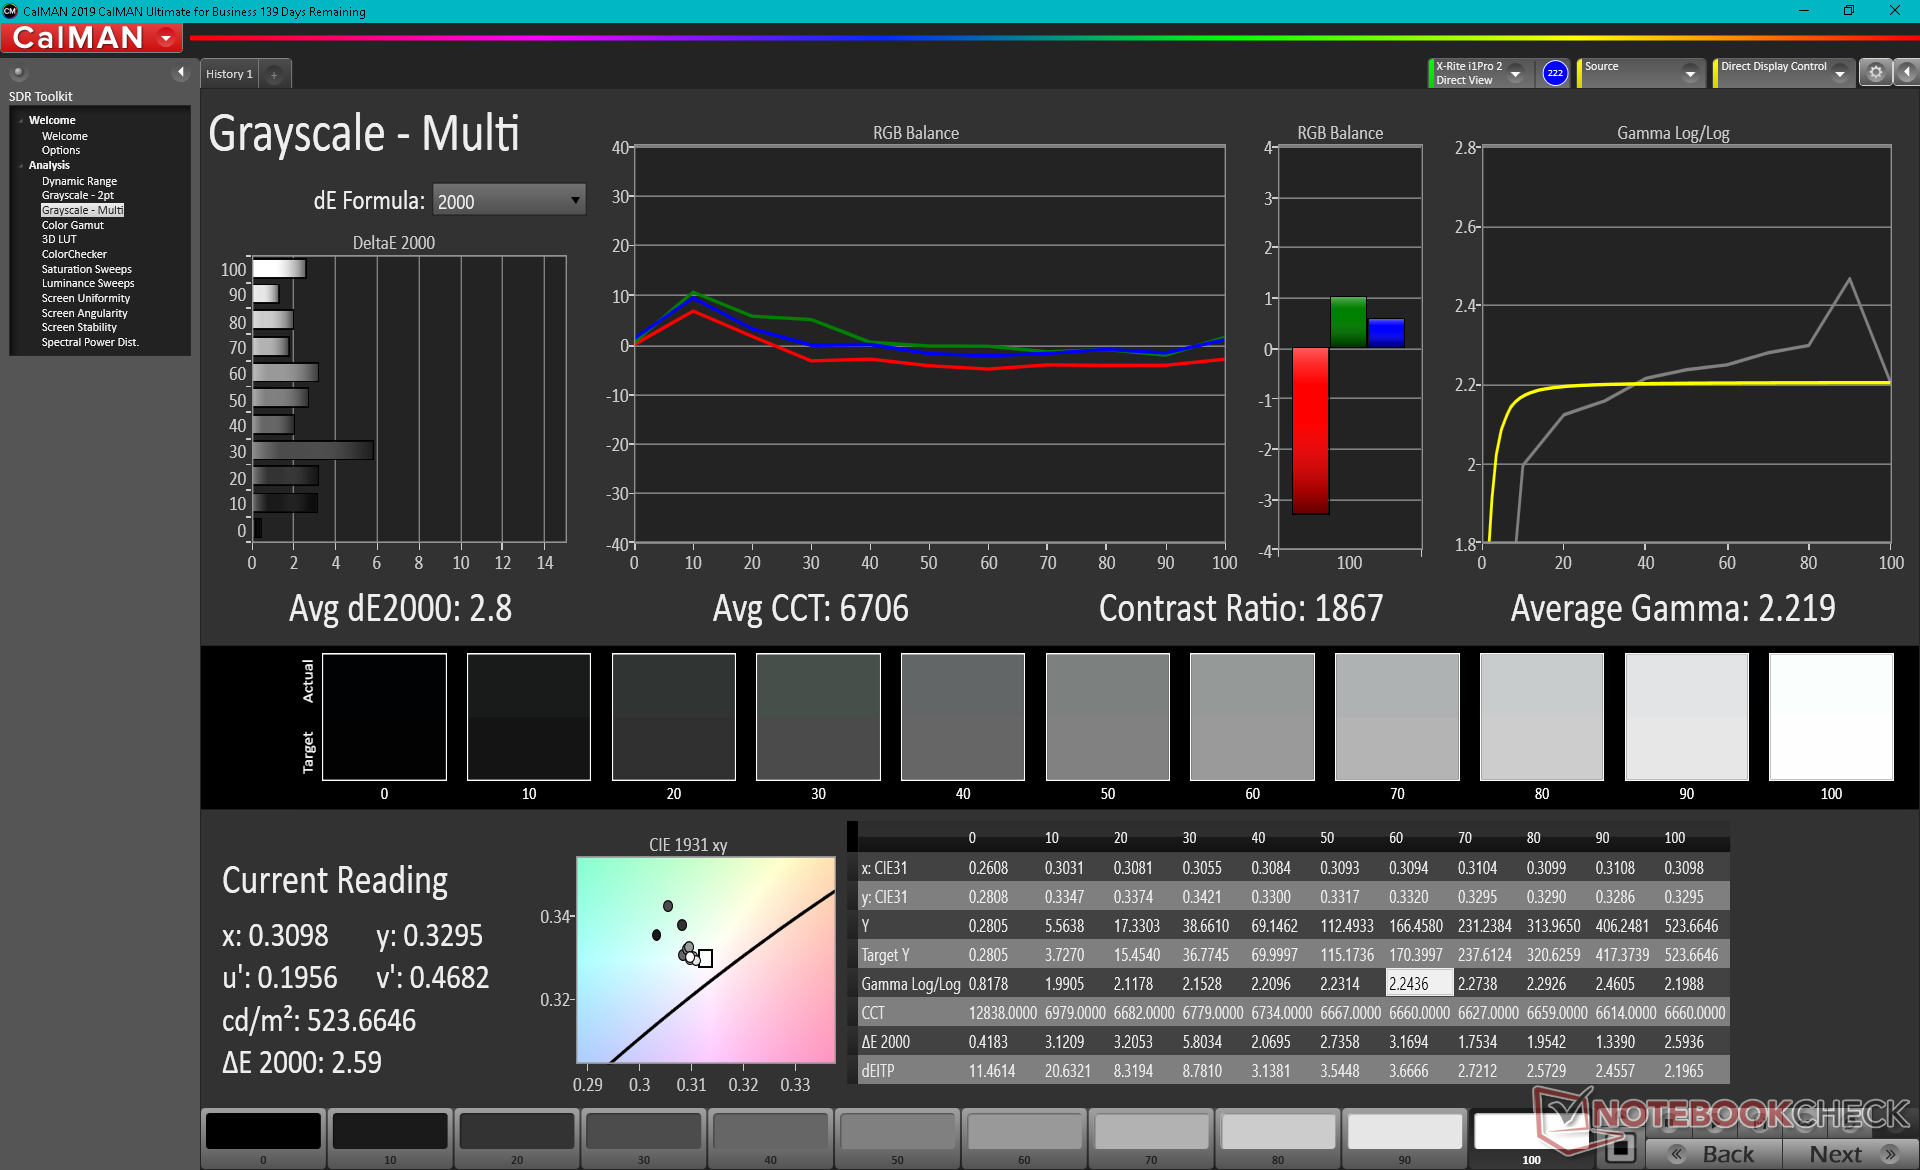
ΔE Greyscale 2.9 | 0.57-98 Ø5.3
100% AdobeRGB 1998 (Argyll 2.2.0 3D)
100% sRGB (Argyll 2.2.0 3D)
94.8% Display P3 (Argyll 2.2.0 3D)
Gamma: 2.12
| Dell XPS 17 9710 Core i7 RTX 3060 Sharp LQ170R1, IPS, 17.00, 3840x2400 | Dell XPS 17 9700 Core i7 RTX 2060 Max-Q Sharp LQ170R1, IPS, 17.00, 3840x2400 | Razer Blade Pro 17 2021 (QHD Touch) AU Optronics B173ZAN03.3, IPS, 17.30, 3840x2160 | Gigabyte Aero 17 HDR YC AUO B173ZAN03.2 (AUO329B), IPS-Level, 17.30, 3840x2160 | LG Ultra 17U70N LG LP170WQ1-SPA1, IPS, 17.00, 2560x1600 | Eluktronics RP-17 BOE NV173FHM-N44, IPS, 17.30, 1920x1080 | |
|---|---|---|---|---|---|---|
| Display | -2% | -2% | -3% | -24% | -25% | |
| Display P3 Coverage | 94.8 | 90.5 -5% | 88.6 -7% | 87.3 -8% | 64.2 -32% | 64.7 -32% |
| sRGB Coverage | 100 | 100 0% | 100 0% | 100 0% | 94.5 -5% | 92 -8% |
| AdobeRGB 1998 Coverage | 100 | 99.8 0% | 99.9 0% | 99.9 0% | 65.2 -35% | 65.8 -34% |
| Response Times | -7% | 64% | 4% | 10% | 56% | |
| Response Time Grey 50% / Grey 80% * | 44.8 ? | 51.2 ? -14% | 15.2 ? 66% | 51.6 ? -15% | 41.2 ? 8% | 22.4 ? 50% |
| Response Time Black / White * | 32 ? | 32 ? -0% | 12 ? 62% | 24.8 ? 22% | 28.4 ? 11% | 12 ? 62% |
| PWM Frequency | 943 | |||||
| Screen | -11% | -68% | 19% | 6% | -25% | |
| Brightness middle | 536.5 | 539.4 1% | 407.2 -24% | 458 -15% | 415.4 -23% | 311.5 -42% |
| Brightness | 489 | 494 1% | 403 -18% | 446 -9% | 385 -21% | 301 -38% |
| Brightness Distribution | 85 | 84 -1% | 90 6% | 92 8% | 88 4% | 91 7% |
| Black Level * | 0.37 | 0.32 14% | 0.42 -14% | 0.37 -0% | 0.24 35% | 0.31 16% |
| Contrast | 1450 | 1686 16% | 970 -33% | 1238 -15% | 1731 19% | 1005 -31% |
| Colorchecker dE 2000 * | 2.46 | 4.12 -67% | 7.25 -195% | 1.52 38% | 2.42 2% | 4.13 -68% |
| Colorchecker dE 2000 max. * | 7.74 | 7.65 1% | 12.51 -62% | 2.51 68% | 5.55 28% | 7.32 5% |
| Colorchecker dE 2000 calibrated * | 1.85 | 3.91 -111% | 3.62 -96% | 0.66 64% | 1.68 9% | 2.93 -58% |
| Greyscale dE 2000 * | 2.9 | 1.5 48% | 8.1 -179% | 1.9 34% | 2.9 -0% | 3.3 -14% |
| Gamma | 2.12 104% | 2.15 102% | 2.24 98% | 2.145 103% | 2.21 100% | 2.17 101% |
| CCT | 6868 95% | 6438 101% | 5925 110% | 6534 99% | 6864 95% | 7157 91% |
| Color Space (Percent of AdobeRGB 1998) | 90.4 | 88.1 | 100 | 60.2 | 59.5 | |
| Color Space (Percent of sRGB) | 100 | 100 | 100 | 94.2 | 91.6 | |
| Total Average (Program / Settings) | -7% /
-8% | -2% /
-35% | 7% /
12% | -3% /
0% | 2% /
-13% |
* ... smaller is better
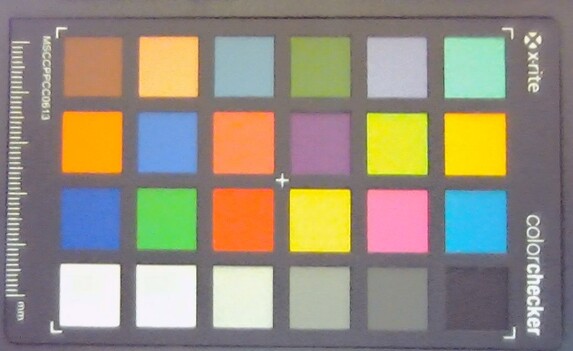
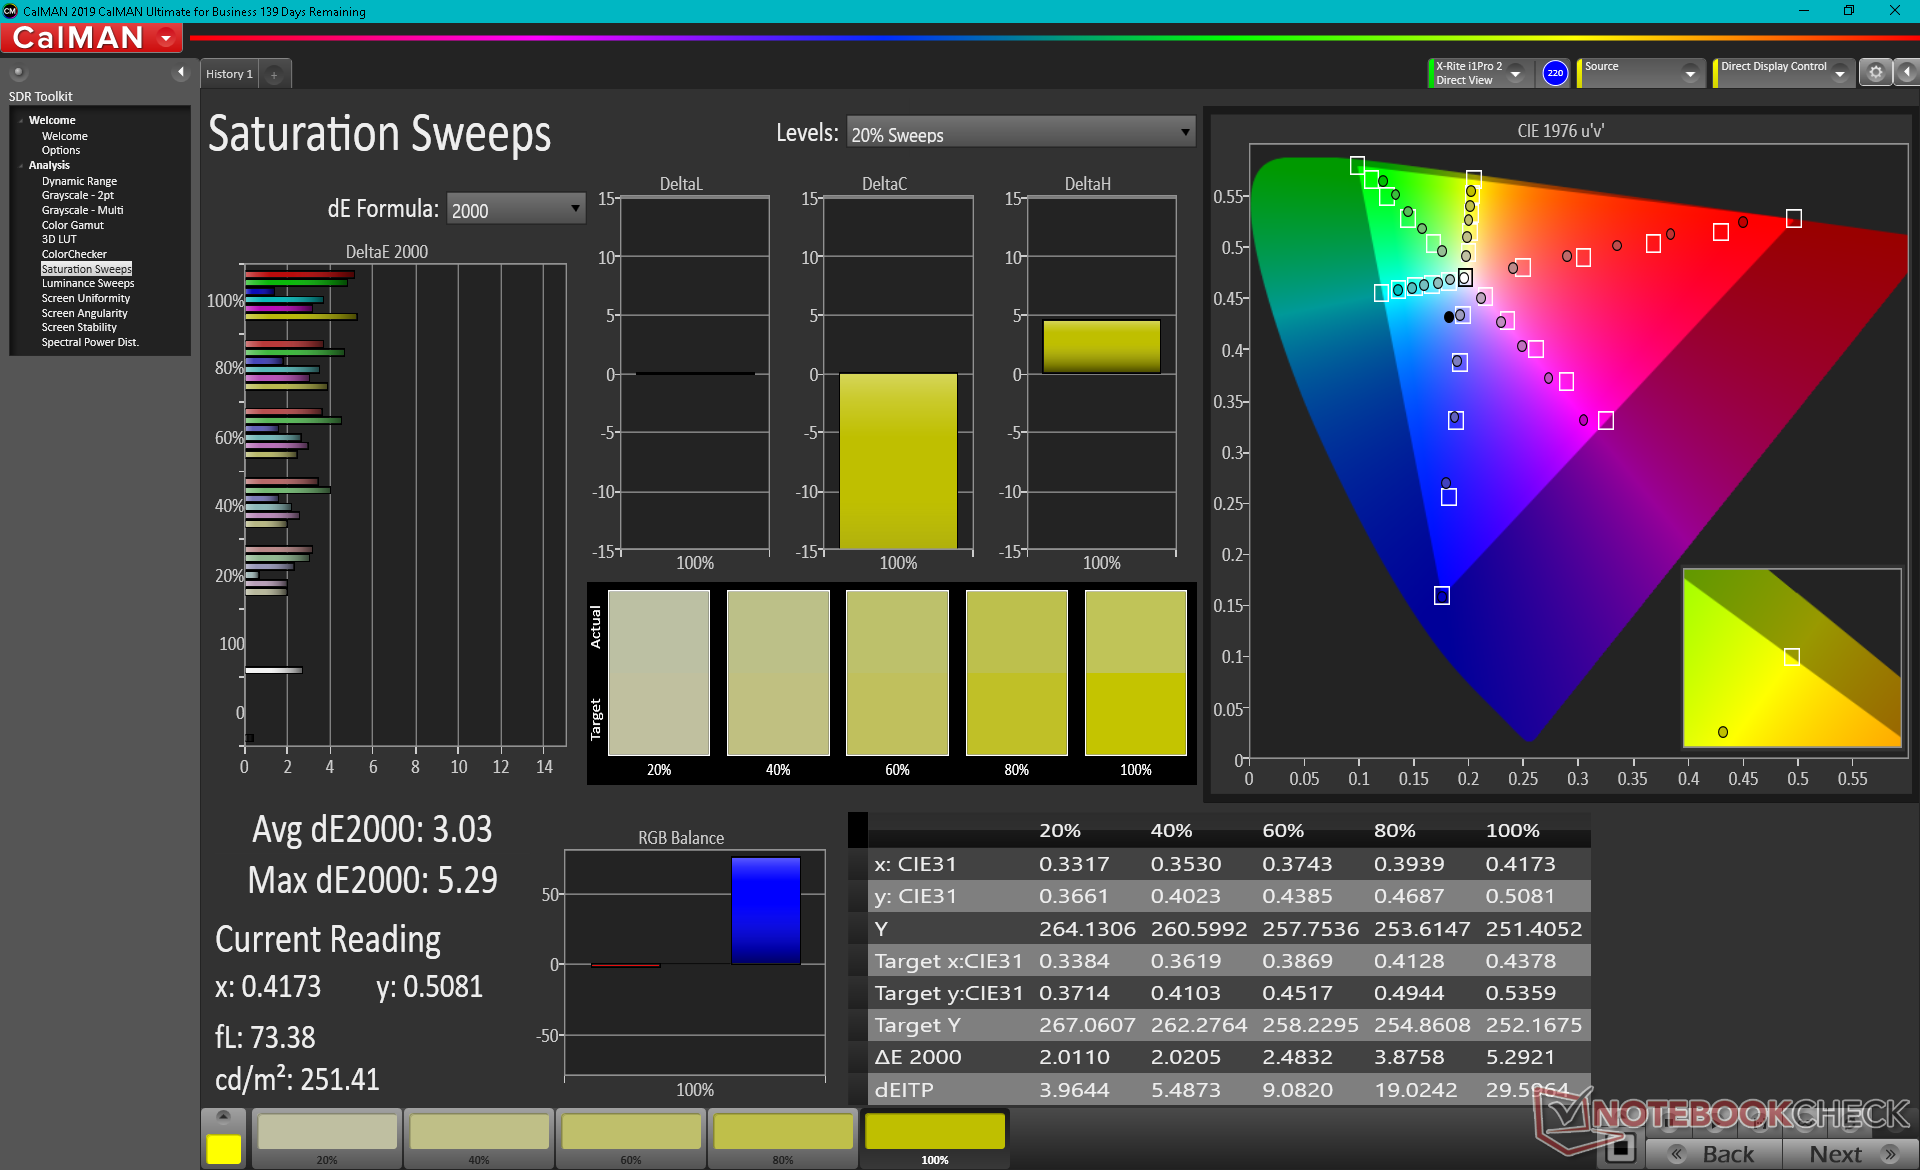
The display is well calibrated out of the box with average grayscale and color DeltaE values of just 2.9 and 2.46, respectively. Calibrating the panel even further ourselves would reduce the average color DeltaE to 1.85, but solid primary and secondary colors would remain more inaccurate than other colors.
Display Response Times
| ↔ Response Time Black to White | ||
|---|---|---|
| 32 ms ... rise ↗ and fall ↘ combined | ↗ 15.6 ms rise | 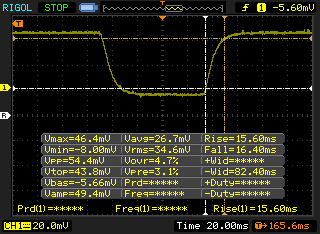 |
| ↘ 16.4 ms fall | ||
| The screen shows slow response rates in our tests and will be unsatisfactory for gamers. In comparison, all tested devices range from 0.1 (minimum) to 240 (maximum) ms. » 84 % of all devices are better. This means that the measured response time is worse than the average of all tested devices (21.5 ms). | ||
| ↔ Response Time 50% Grey to 80% Grey | ||
| 44.8 ms ... rise ↗ and fall ↘ combined | ↗ 20.8 ms rise | 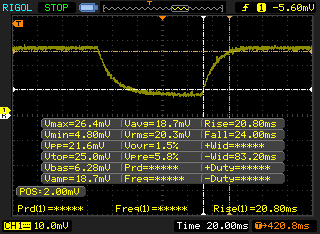 |
| ↘ 24 ms fall | ||
| The screen shows slow response rates in our tests and will be unsatisfactory for gamers. In comparison, all tested devices range from 0.2 (minimum) to 636 (maximum) ms. » 73 % of all devices are better. This means that the measured response time is worse than the average of all tested devices (33.7 ms). | ||
Screen Flickering / PWM (Pulse-Width Modulation)
| Screen flickering / PWM not detected | 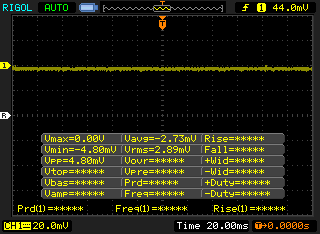 | ||
In comparison: 53 % of all tested devices do not use PWM to dim the display. If PWM was detected, an average of 17900 (minimum: 5 - maximum: 3846000) Hz was measured. | |||

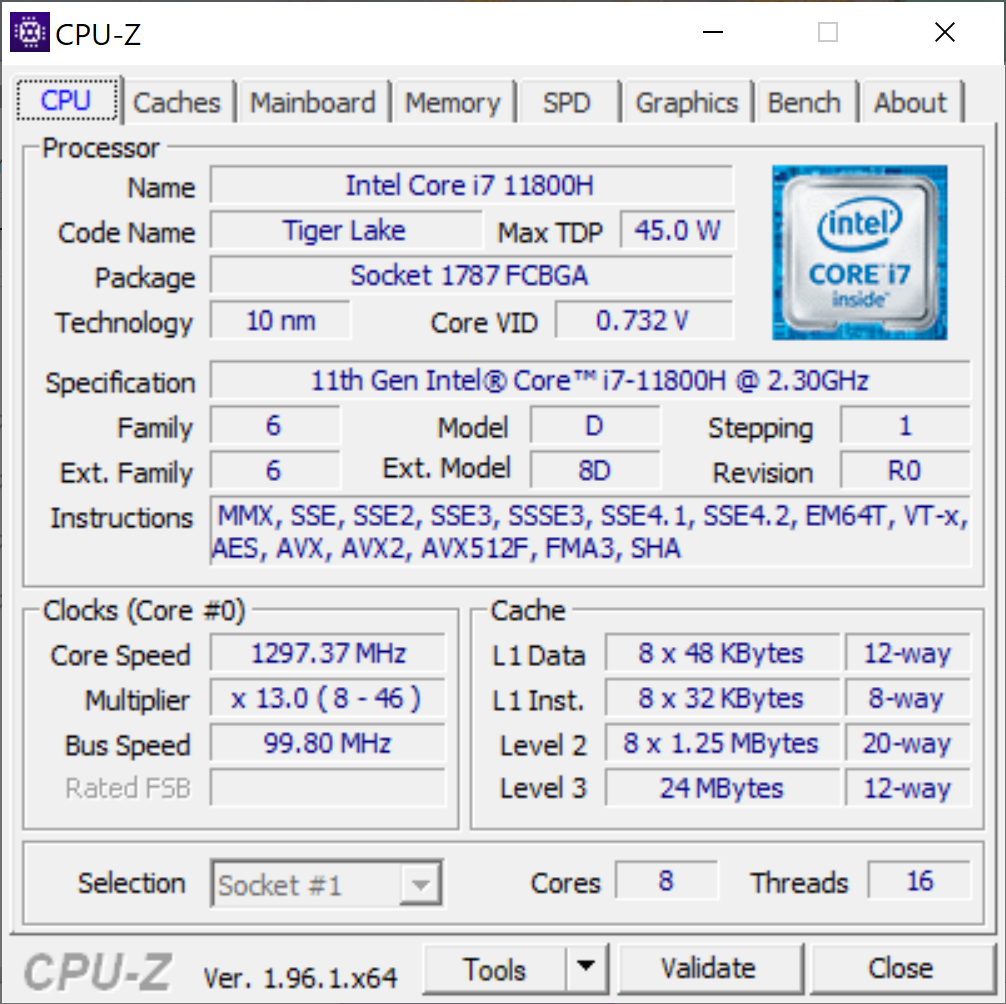
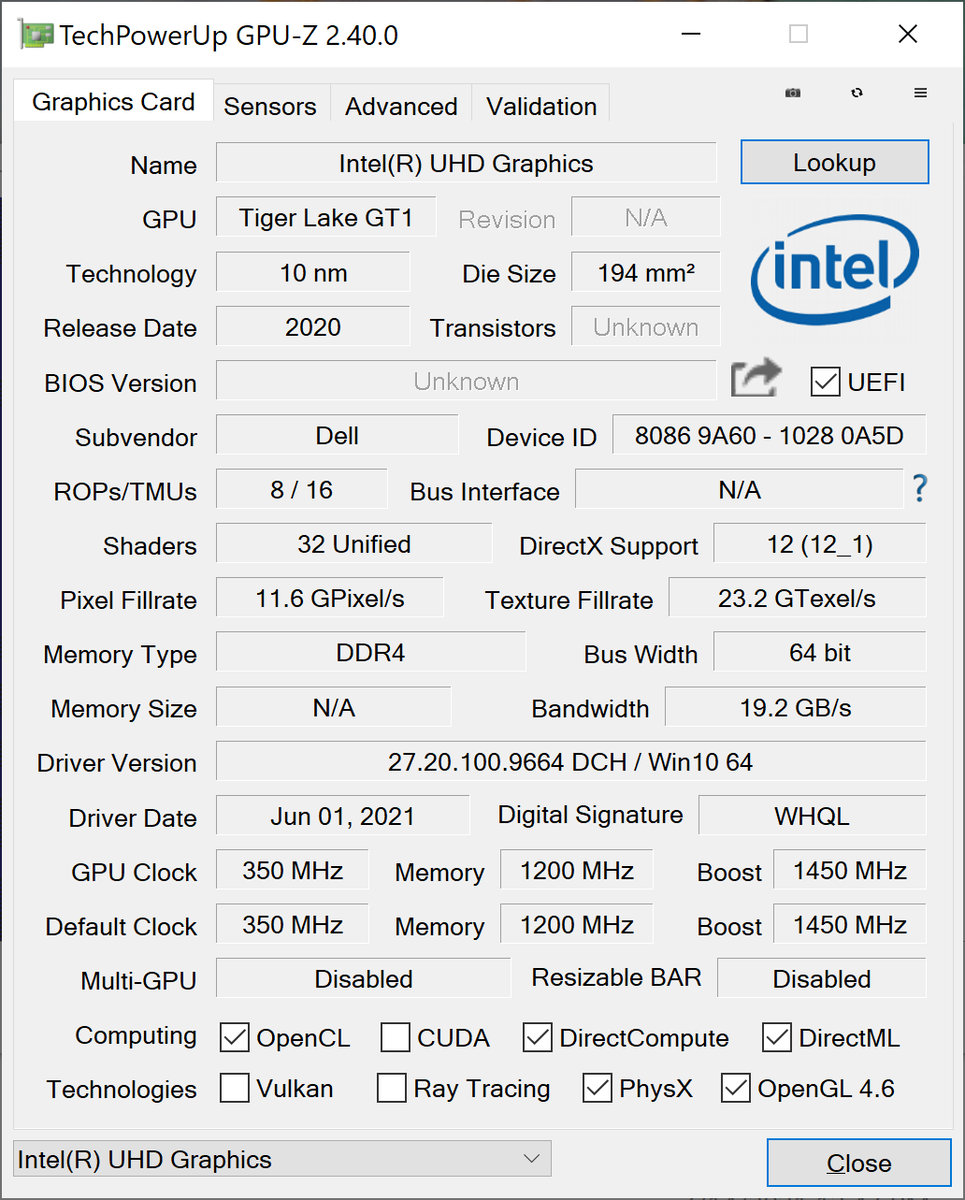
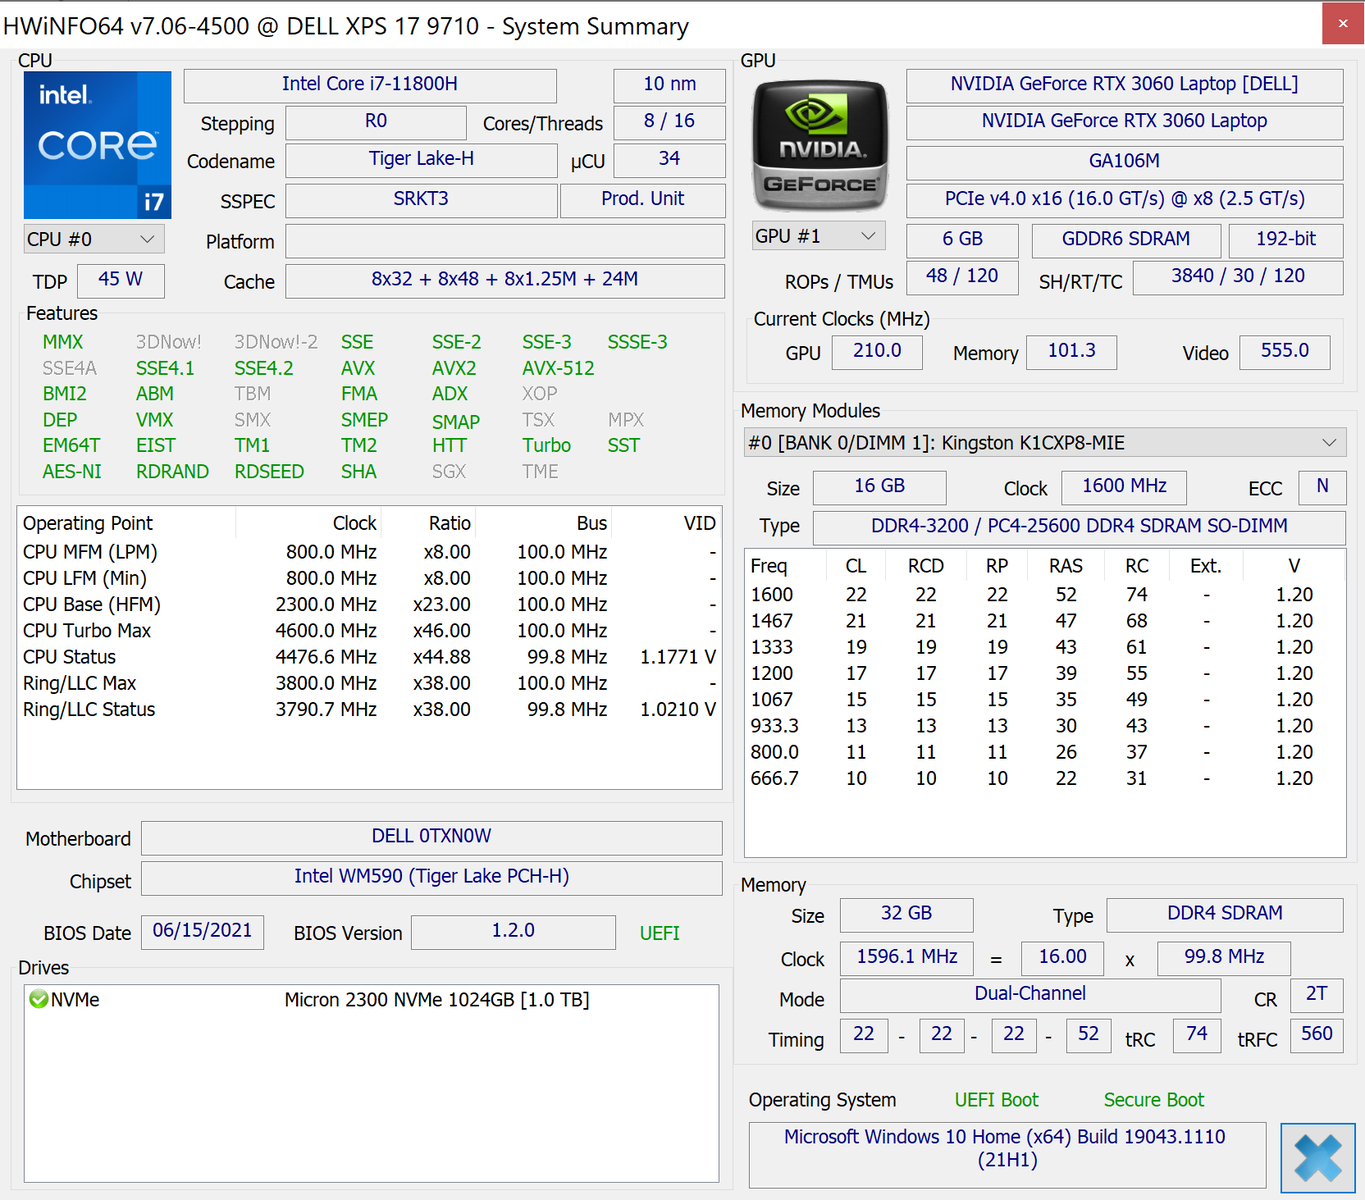
Performance — 45 W TDP CPU with 70 W TGP GPU
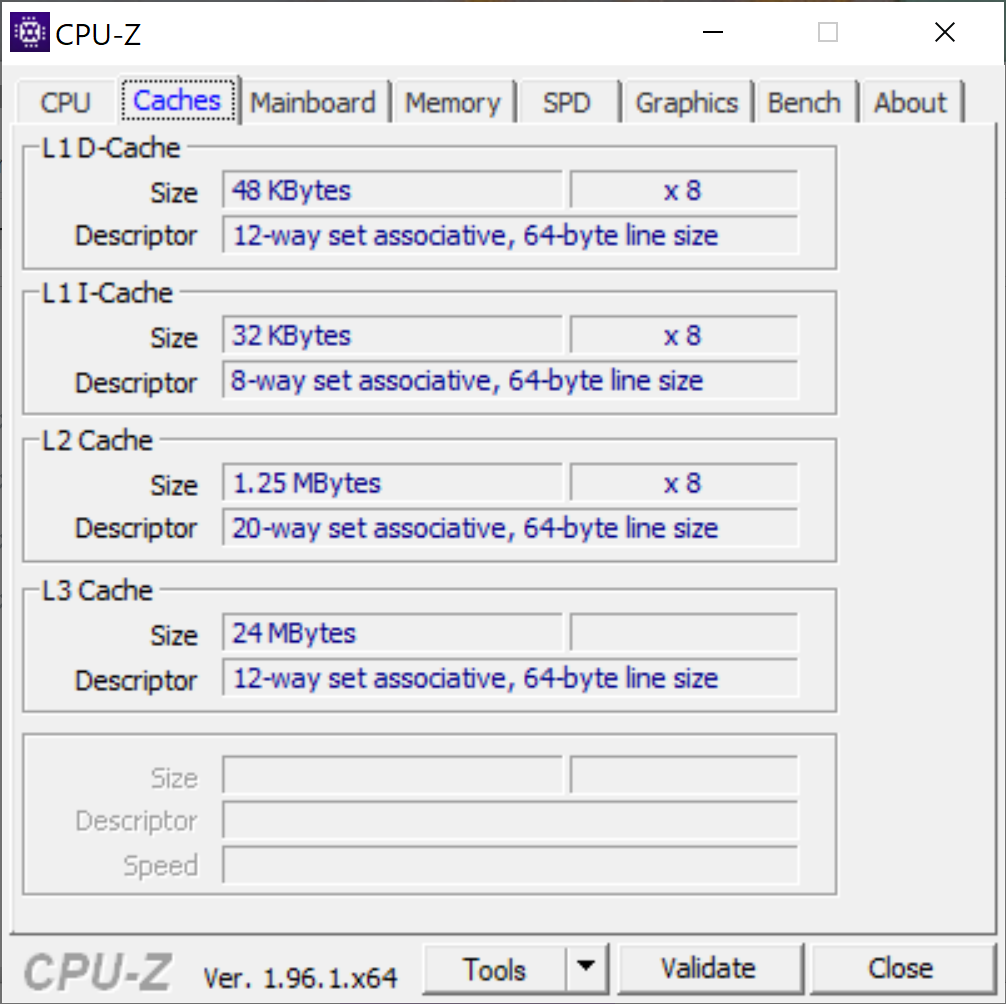
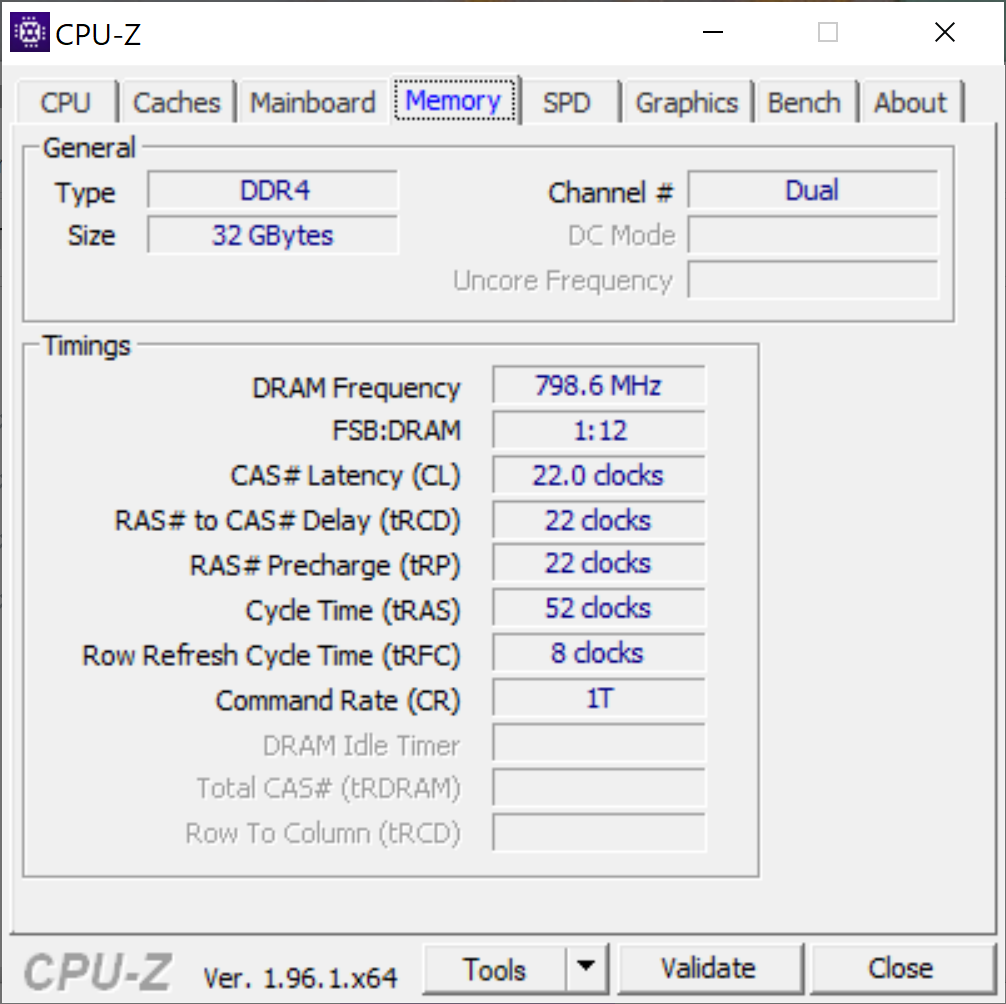
Core options include the 11th gen Core i5-11400H, i7-11800H, or i9-11900H CPU with UHD Graphics, GeForce RTX 3050, or RTX 3060. RAM speed (3200 MHz) remains the same as on the XPS 17 9700. Resizable BAR, Optimus, and Dynamic Book 2.0 come standard if configured with dedicated graphics but with no support for internal G-Sync (Advanced Optimus) or WhisperMode 2.0.
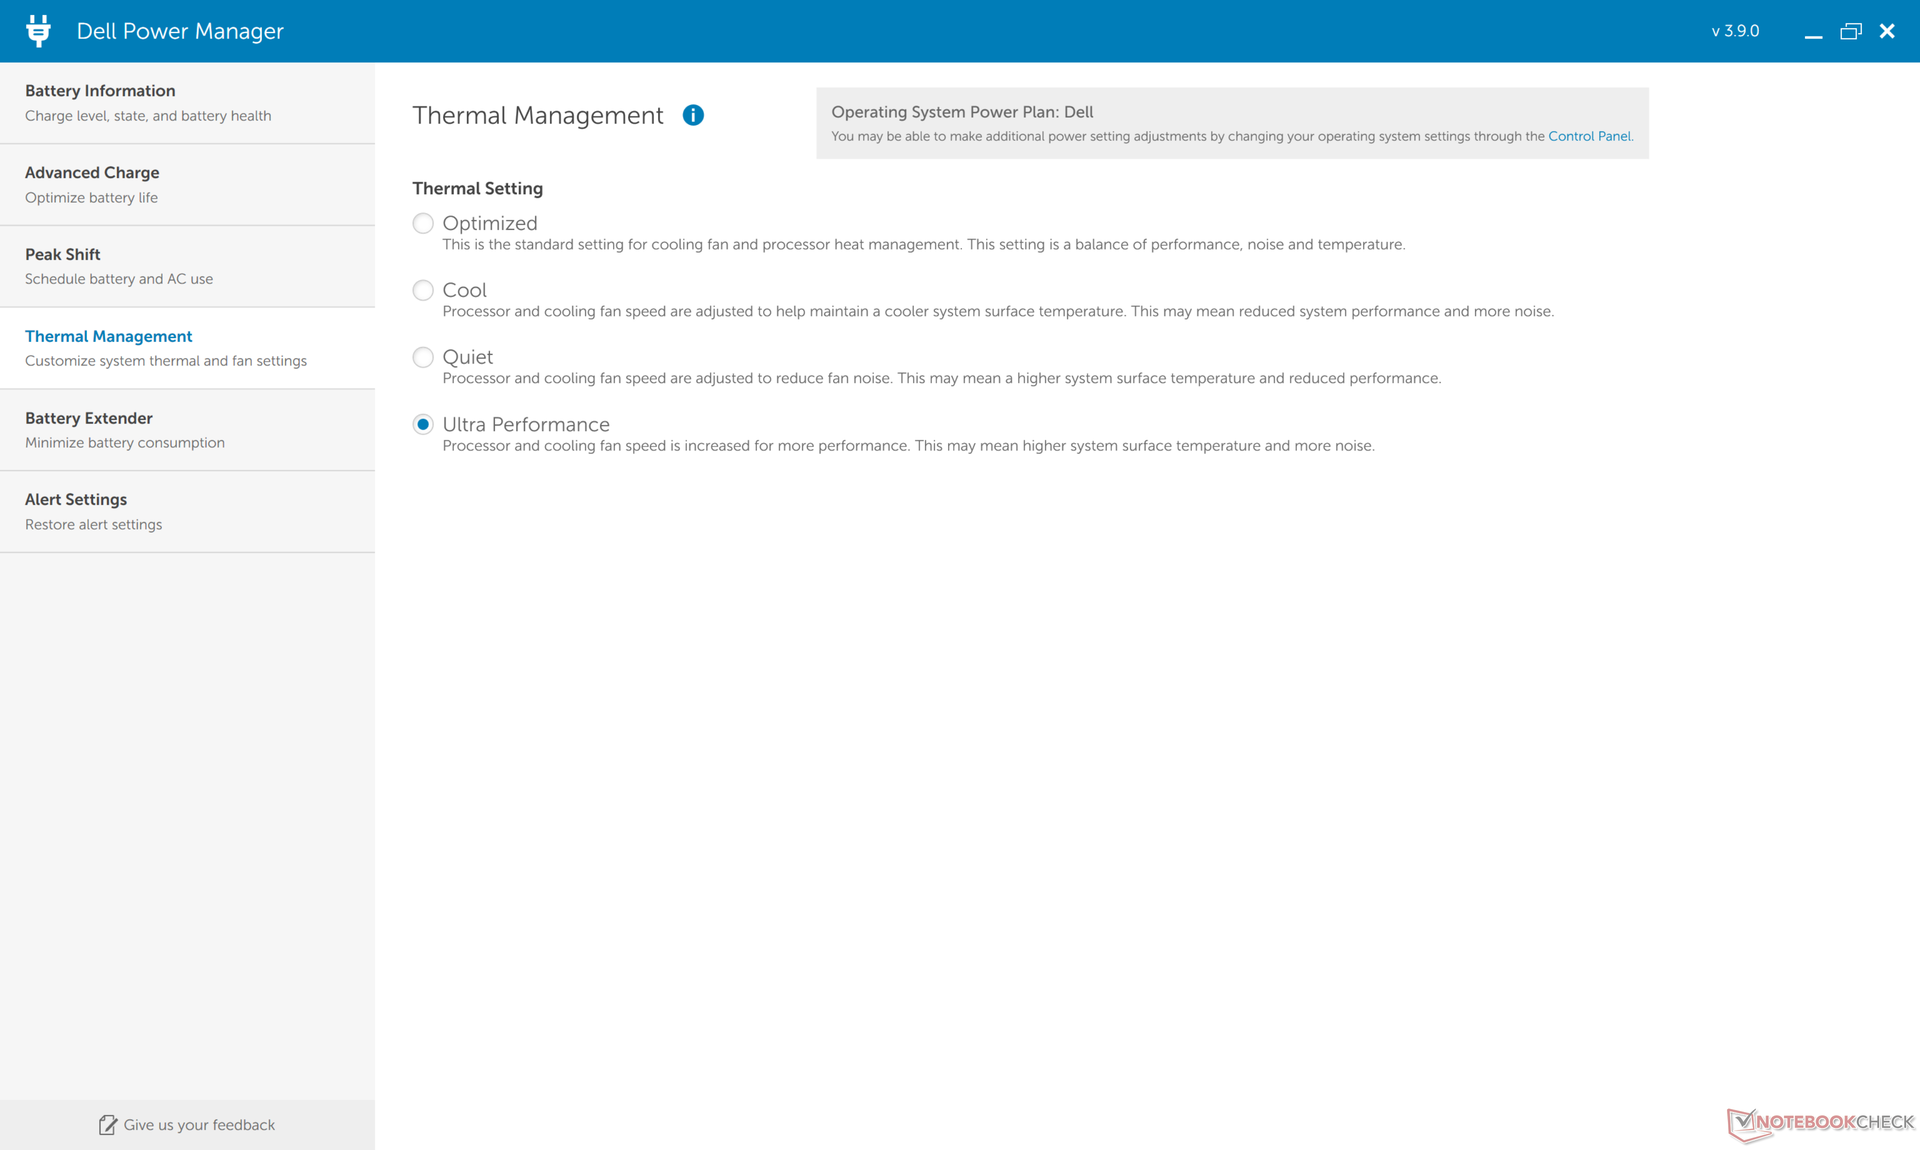
Our test unit was set to Ultra Performance mode via Dell Power Manager for the highest possible scores.
Processor
Single-thread and multi-thread performance are up 20 percent and 30 percent, respectively, from the Core i7-10875H in last year's model. Performance sustainability remains excellent as well as shown by our CineBench R15 xT loop results below.
Upgrading to the costlier Core i9-11900H SKU will more than likely bring only marginal performance benefits of just a few percentage points. Core temperatures on our i7-11800H unit are already hovering around 90 C when under load and so a higher-clocked Core i9 part will have almost no additional headroom.
Cinebench R15 Multi Loop
Cinebench R23: Multi Core | Single Core
Cinebench R15: CPU Multi 64Bit | CPU Single 64Bit
Blender: v2.79 BMW27 CPU
7-Zip 18.03: 7z b 4 -mmt1 | 7z b 4
Geekbench 5.5: Single-Core | Multi-Core
HWBOT x265 Benchmark v2.2: 4k Preset
LibreOffice : 20 Documents To PDF
R Benchmark 2.5: Overall mean
| Cinebench R23 / Multi Core | |
| SCHENKER XMG Ultra 17 Rocket Lake | |
| SCHENKER XMG Neo 17 (Early 2021, RTX 3070, 5800H) | |
| Dell XPS 17 9710 Core i7 RTX 3060 | |
| Average Intel Core i7-11800H (6508 - 14088, n=48) | |
| Asus TUF Gaming F17 FX706HM | |
| Gigabyte Aero 17 HDR YC | |
| Razer Blade Pro 17 2021 (QHD Touch) | |
| Cinebench R23 / Single Core | |
| SCHENKER XMG Ultra 17 Rocket Lake | |
| Asus TUF Gaming F17 FX706HM | |
| Dell XPS 17 9710 Core i7 RTX 3060 | |
| Average Intel Core i7-11800H (1386 - 1522, n=45) | |
| SCHENKER XMG Neo 17 (Early 2021, RTX 3070, 5800H) | |
| Gigabyte Aero 17 HDR YC | |
| Razer Blade Pro 17 2021 (QHD Touch) | |
Cinebench R23: Multi Core | Single Core
Cinebench R15: CPU Multi 64Bit | CPU Single 64Bit
Blender: v2.79 BMW27 CPU
7-Zip 18.03: 7z b 4 -mmt1 | 7z b 4
Geekbench 5.5: Single-Core | Multi-Core
HWBOT x265 Benchmark v2.2: 4k Preset
LibreOffice : 20 Documents To PDF
R Benchmark 2.5: Overall mean
* ... smaller is better
System Performance
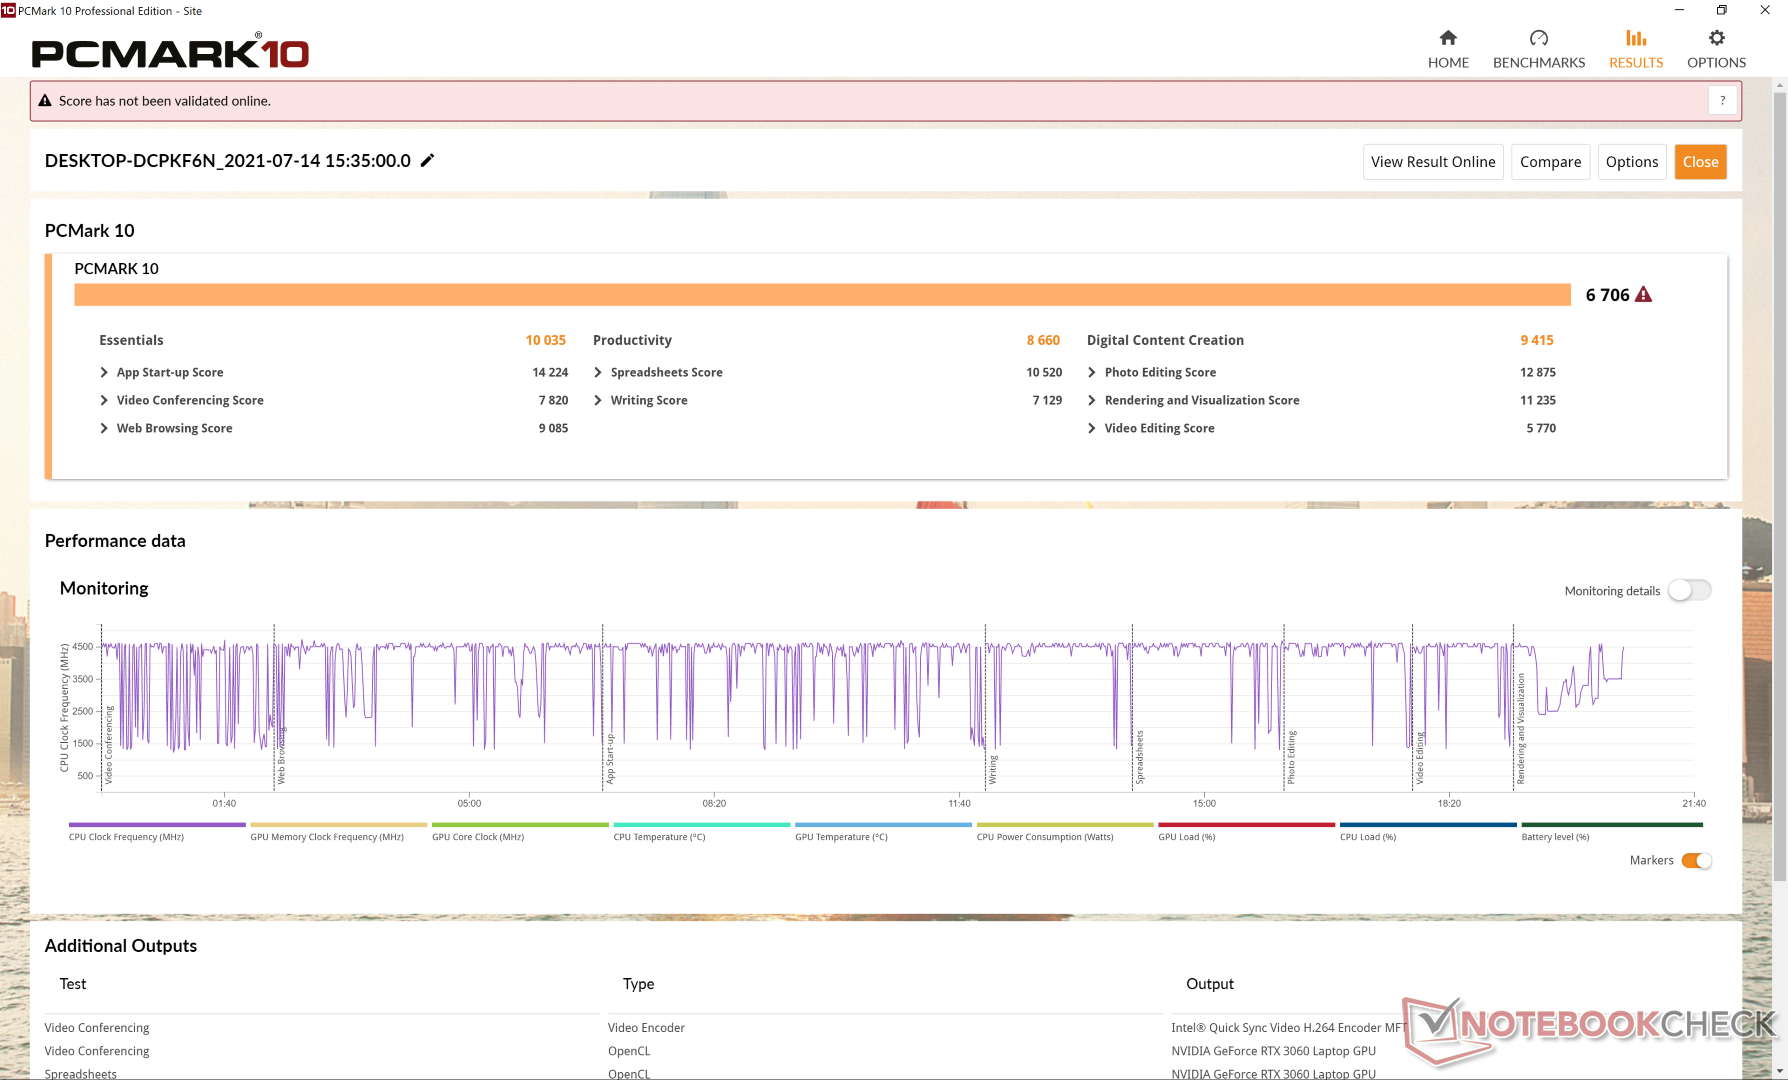
PCMark scores are consistently higher than on last year's XPS 17 9700 and most other laptops with older 10th gen Comet Lake-H CPUs for that matter. The greatest boost is in Digital Content Creation where graphics performance matters most.
| PCMark 10 / Score | |
| Dell XPS 17 9710 Core i7 RTX 3060 | |
| Average Intel Core i7-11800H, NVIDIA GeForce RTX 3060 Laptop GPU (6156 - 6865, n=4) | |
| Razer Blade Pro 17 2021 (QHD Touch) | |
| Gigabyte Aero 17 HDR YC | |
| Dell XPS 17 9700 Core i7 RTX 2060 Max-Q | |
| Eluktronics RP-17 | |
| LG Ultra 17U70N | |
| PCMark 10 / Essentials | |
| Dell XPS 17 9710 Core i7 RTX 3060 | |
| Razer Blade Pro 17 2021 (QHD Touch) | |
| Average Intel Core i7-11800H, NVIDIA GeForce RTX 3060 Laptop GPU (9063 - 10522, n=4) | |
| Dell XPS 17 9700 Core i7 RTX 2060 Max-Q | |
| Gigabyte Aero 17 HDR YC | |
| Eluktronics RP-17 | |
| LG Ultra 17U70N | |
| PCMark 10 / Productivity | |
| Gigabyte Aero 17 HDR YC | |
| Dell XPS 17 9710 Core i7 RTX 3060 | |
| Average Intel Core i7-11800H, NVIDIA GeForce RTX 3060 Laptop GPU (8200 - 8874, n=4) | |
| Razer Blade Pro 17 2021 (QHD Touch) | |
| Dell XPS 17 9700 Core i7 RTX 2060 Max-Q | |
| LG Ultra 17U70N | |
| Eluktronics RP-17 | |
| PCMark 10 / Digital Content Creation | |
| Dell XPS 17 9710 Core i7 RTX 3060 | |
| Gigabyte Aero 17 HDR YC | |
| Razer Blade Pro 17 2021 (QHD Touch) | |
| Average Intel Core i7-11800H, NVIDIA GeForce RTX 3060 Laptop GPU (8520 - 9423, n=4) | |
| Dell XPS 17 9700 Core i7 RTX 2060 Max-Q | |
| Eluktronics RP-17 | |
| LG Ultra 17U70N | |
| PCMark 10 Score | 6706 points | |
Help | ||
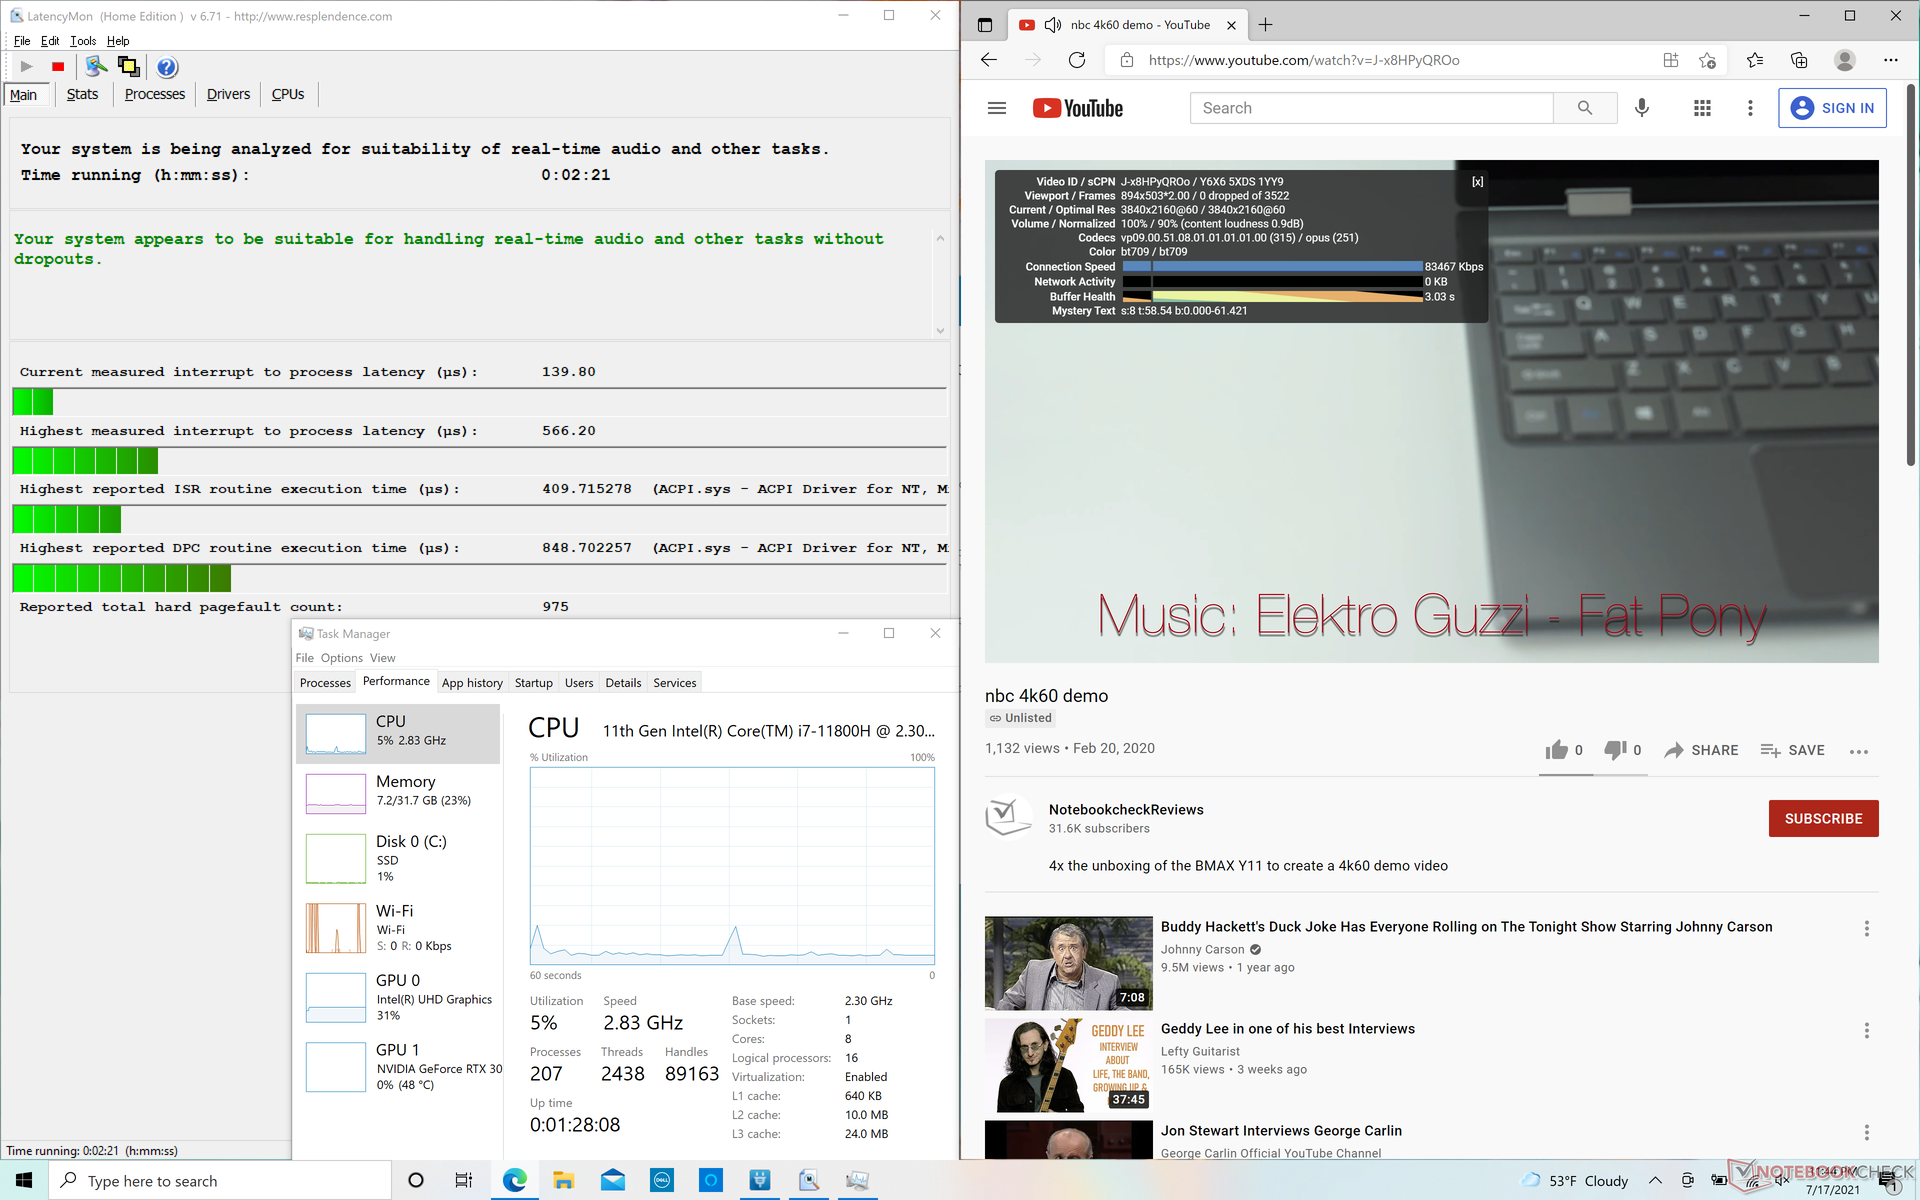
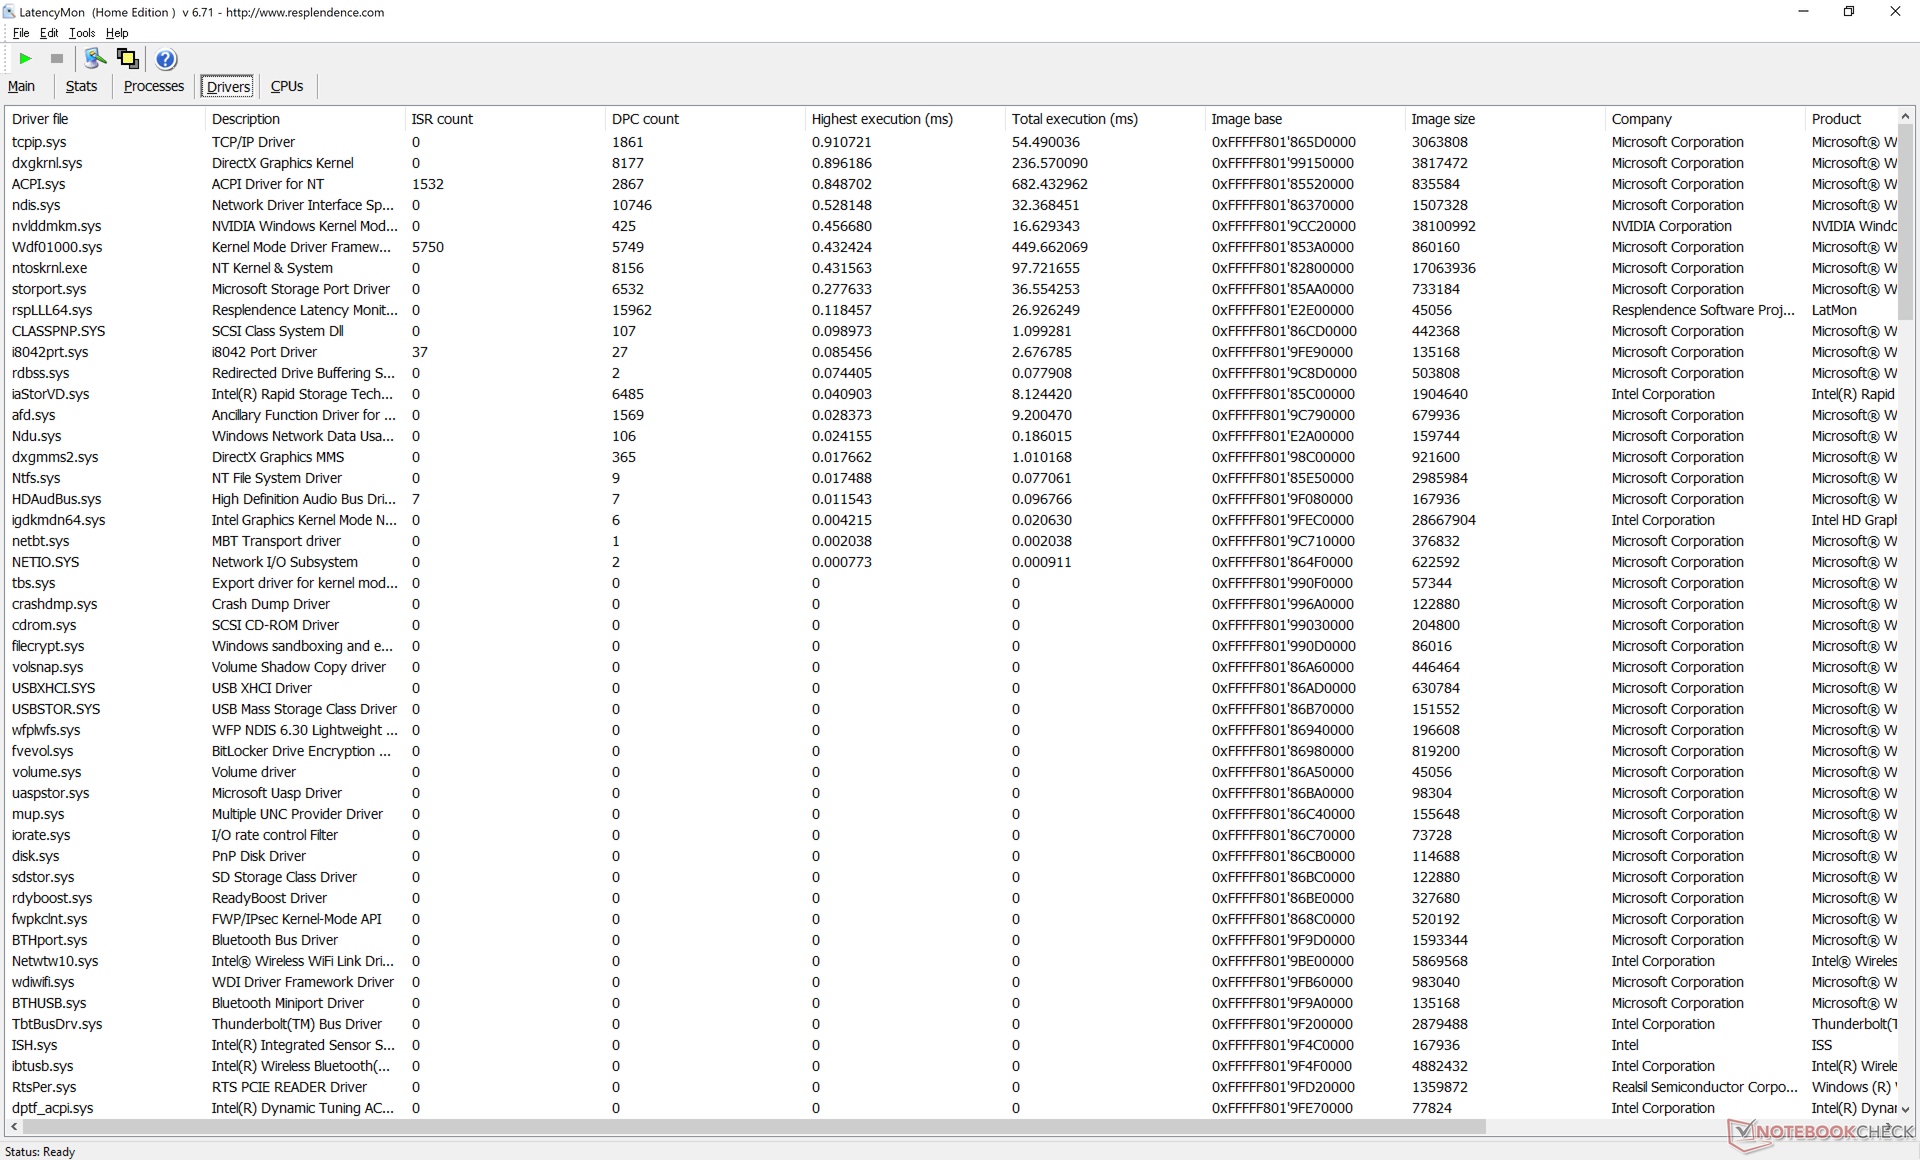
DPC Latency
LatencyMon shows no DPC latency issues when browsing through multiple tabs on our homepage. 4K video playback at 60 FPS is also smooth and with no dropped frames.
| DPC Latencies / LatencyMon - interrupt to process latency (max), Web, Youtube, Prime95 | |
| Gigabyte Aero 17 HDR YC | |
| Razer Blade Pro 17 2021 (QHD Touch) | |
| Eluktronics RP-17 | |
| LG Ultra 17U70N | |
| Dell XPS 17 9700 Core i7 RTX 2060 Max-Q | |
| Dell XPS 17 9710 Core i7 RTX 3060 | |
* ... smaller is better
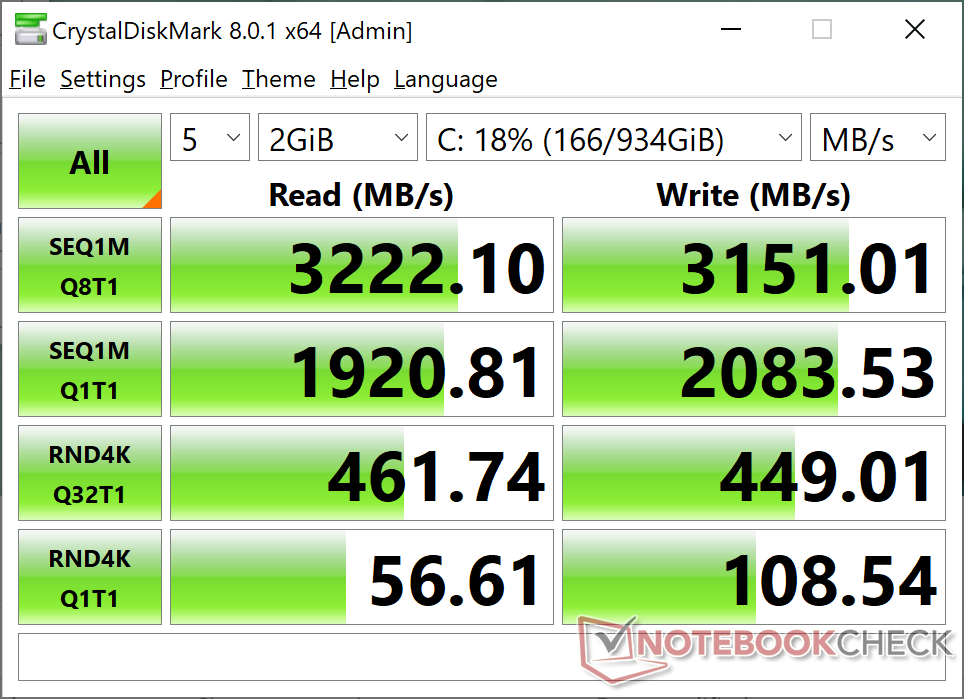
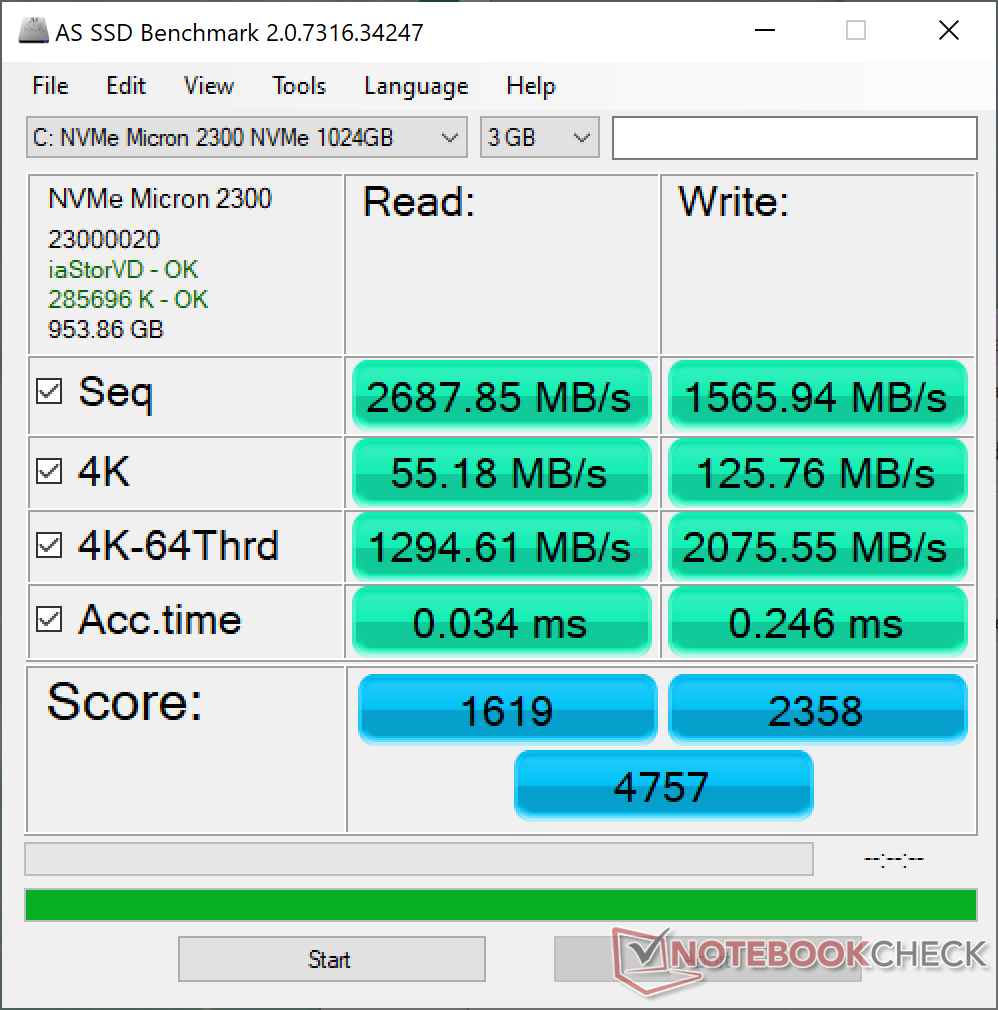
Storage Devices
Dell has upgraded both PCIe 3.0 M.2 2280 slots on the XPS 17 9700 to PCIe 4 x4 for the 9710. Nonetheless, our test unit comes with a 1 TB Micron 2300 PCIe 3.0 NVMe SSD which can't fully utilize the wider PCIe 4 bandwidth. Performance is still much faster than the Micron 2200S that shipped on our older XPS 17 9700 unit.
| Dell XPS 17 9710 Core i7 RTX 3060 Micron 2300 1TB MTFDHBA1T0TDV | Dell XPS 17 9700 Core i7 RTX 2060 Max-Q Micron 2200S 1TB MTFDHBA1T0TCK | Razer Blade Pro 17 2021 (QHD Touch) Samsung PM981a MZVLB1T0HBLR | Gigabyte Aero 17 HDR YC ESR01TBTLCG-EAC-4 | Eluktronics RP-17 Phison PS5013 PRO-X-1TB-G2R NVMe SSD | |
|---|---|---|---|---|---|
| AS SSD | -53% | 4% | 11% | -4% | |
| Seq Read | 2688 | 1141 -58% | 2068 -23% | 2674 -1% | 1689 -37% |
| Seq Write | 1566 | 994 -37% | 2047 31% | 2458 57% | 1695 8% |
| 4K Read | 55.2 | 31.98 -42% | 47.85 -13% | 52.1 -6% | 50 -9% |
| 4K Write | 125.8 | 61 -52% | 87.4 -31% | 113.4 -10% | 182.9 45% |
| 4K-64 Read | 1295 | 790 -39% | 1932 49% | 1881 45% | 1043 -19% |
| 4K-64 Write | 2076 | 845 -59% | 2017 -3% | 2849 37% | 1841 -11% |
| Access Time Read * | 0.034 | 0.063 -85% | 0.055 -62% | 0.102 -200% | 0.04 -18% |
| Access Time Write * | 0.246 | 0.679 -176% | 0.128 48% | 0.033 87% | 0.102 59% |
| Score Read | 1619 | 966 -40% | 2187 35% | 2201 36% | 1262 -22% |
| Score Write | 2358 | 1005 -57% | 2309 -2% | 3208 36% | 2194 -7% |
| Score Total | 4757 | 2448 -49% | 5612 18% | 6524 37% | 4112 -14% |
| Copy ISO MB/s | 1563 | 1732 11% | 2400 54% | 2124 36% | |
| Copy Program MB/s | 976 | 717 -27% | 684 -30% | 579 -41% | |
| Copy Game MB/s | 1786 | 1343 -25% | 1629 -9% | 1304 -27% | |
| CrystalDiskMark 5.2 / 6 | -29% | -2% | 10% | 4% | |
| Write 4K | 109.2 | 64.1 -41% | 123.5 13% | 141.2 29% | 226.1 107% |
| Read 4K | 56.6 | 39.93 -29% | 45.96 -19% | 46.48 -18% | 54.7 -3% |
| Write Seq | 2073 | 1191 -43% | 1861 -10% | 2433 17% | 1868 -10% |
| Read Seq | 1916 | 1418 -26% | 1584 -17% | 1742 -9% | 1648 -14% |
| Write 4K Q32T1 | 487 | 450.3 -8% | 466.4 -4% | 565 16% | 429.9 -12% |
| Read 4K Q32T1 | 463.2 | 365 -21% | 566 22% | 655 41% | 521 12% |
| Write Seq Q32T1 | 3155 | 1563 -50% | 2981 -6% | 3028 -4% | 2248 -29% |
| Read Seq Q32T1 | 3209 | 2683 -16% | 3260 2% | 3424 7% | 2484 -23% |
| Total Average (Program / Settings) | -41% /
-44% | 1% /
2% | 11% /
10% | 0% /
-1% |
* ... smaller is better

Disk Throttling: DiskSpd Read Loop, Queue Depth 8
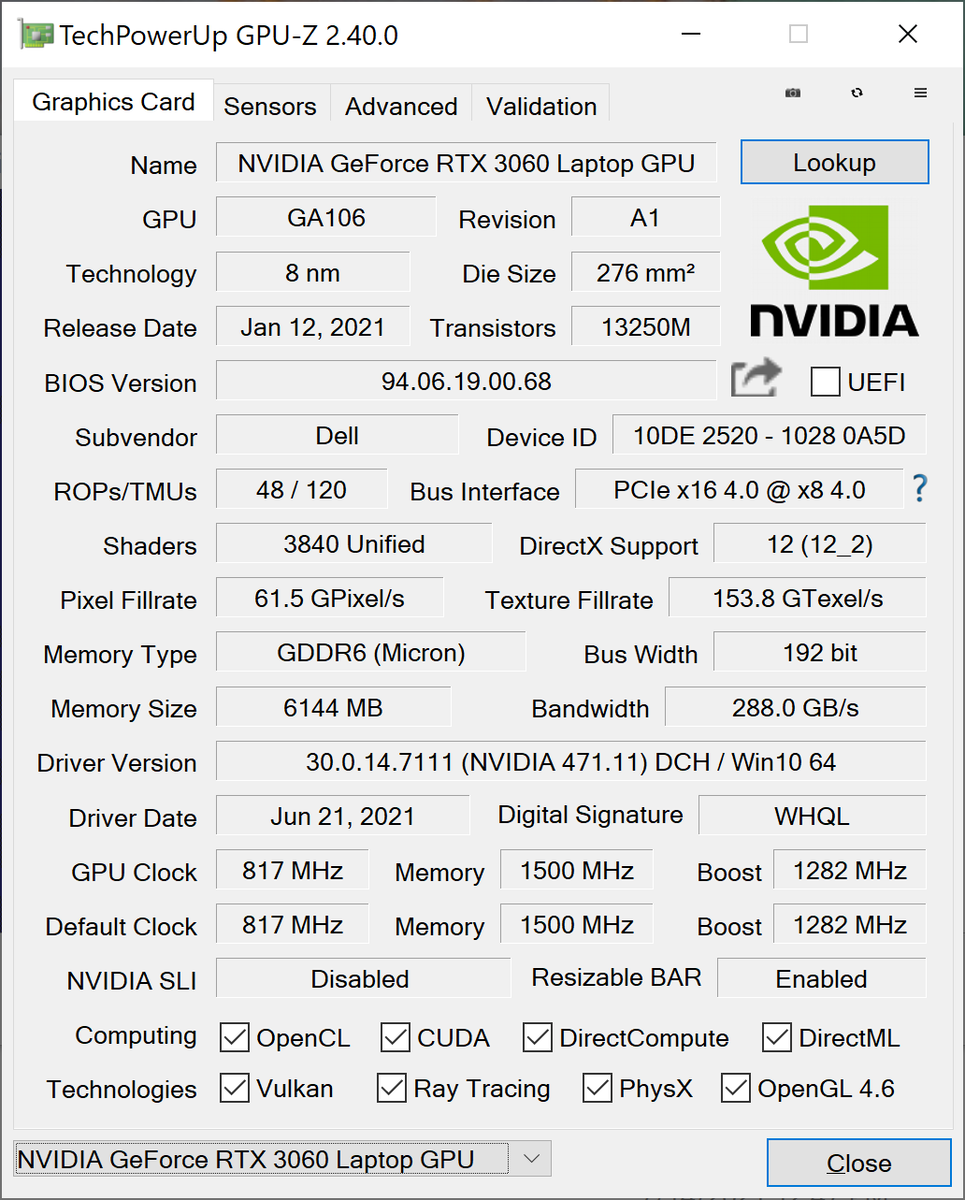
GPU Performance — Max-Q at Heart
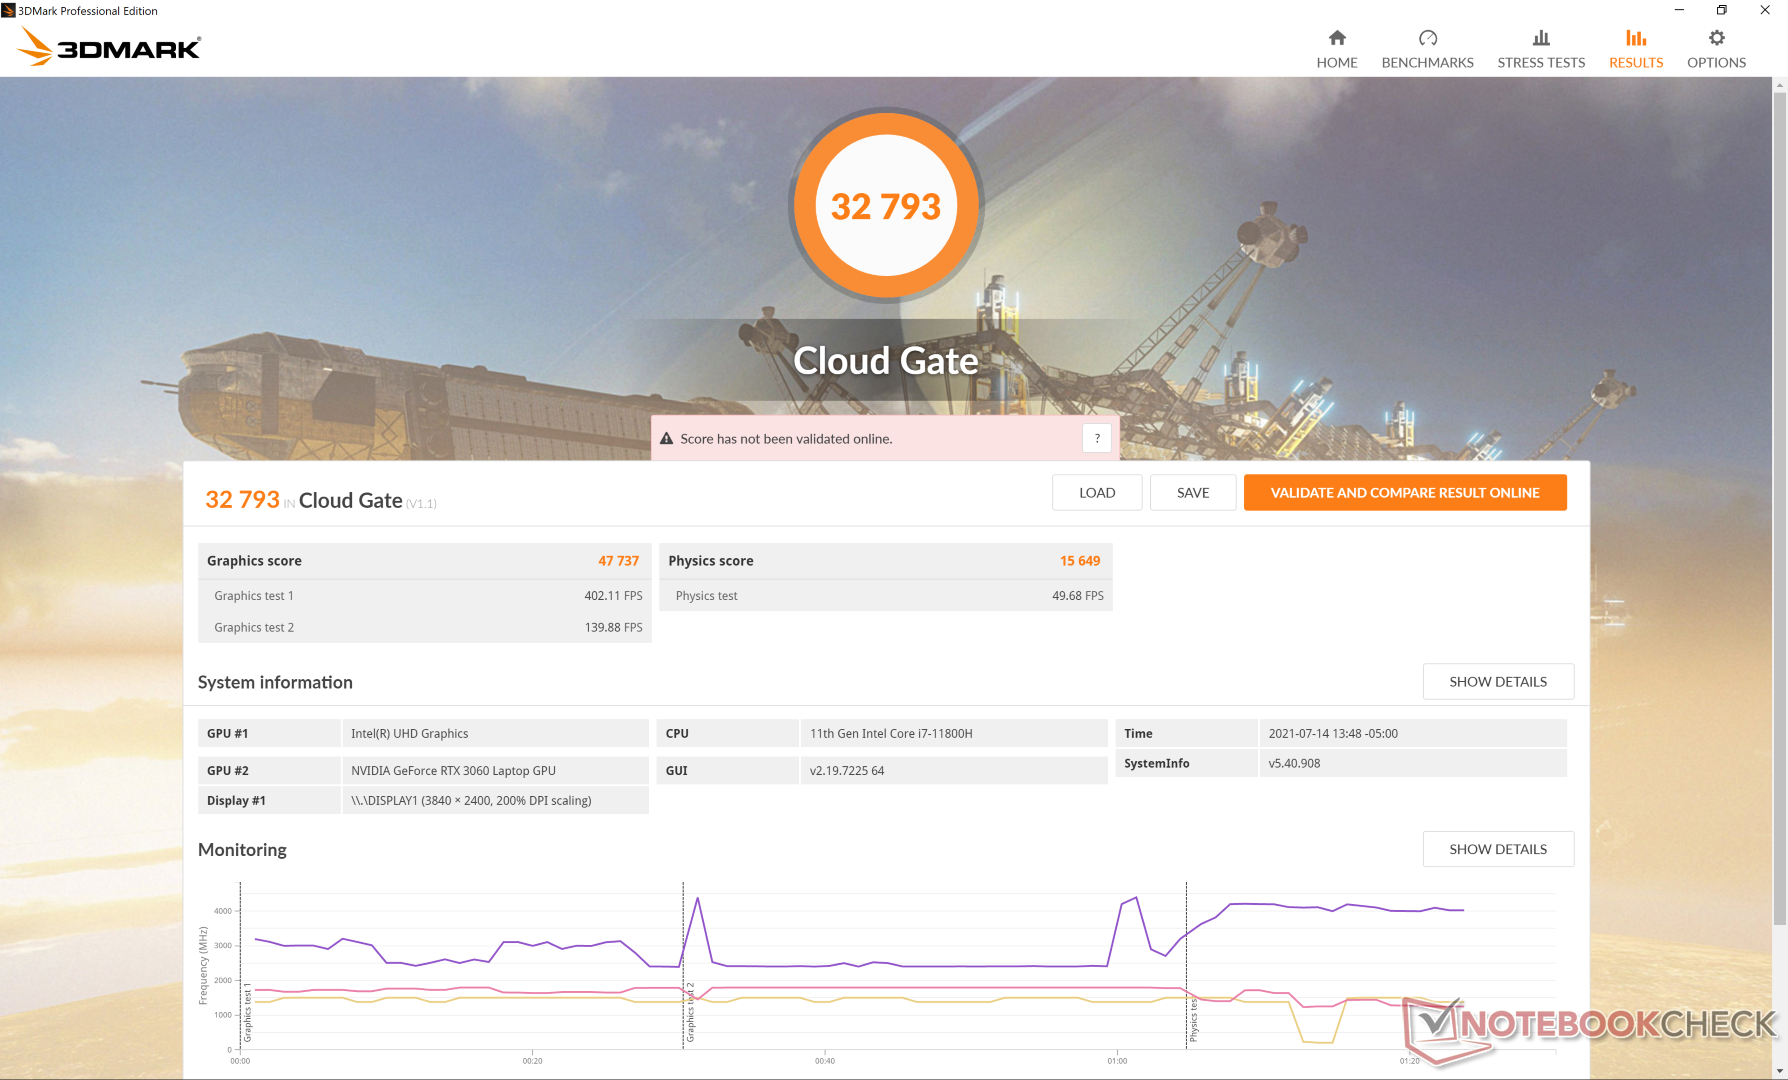
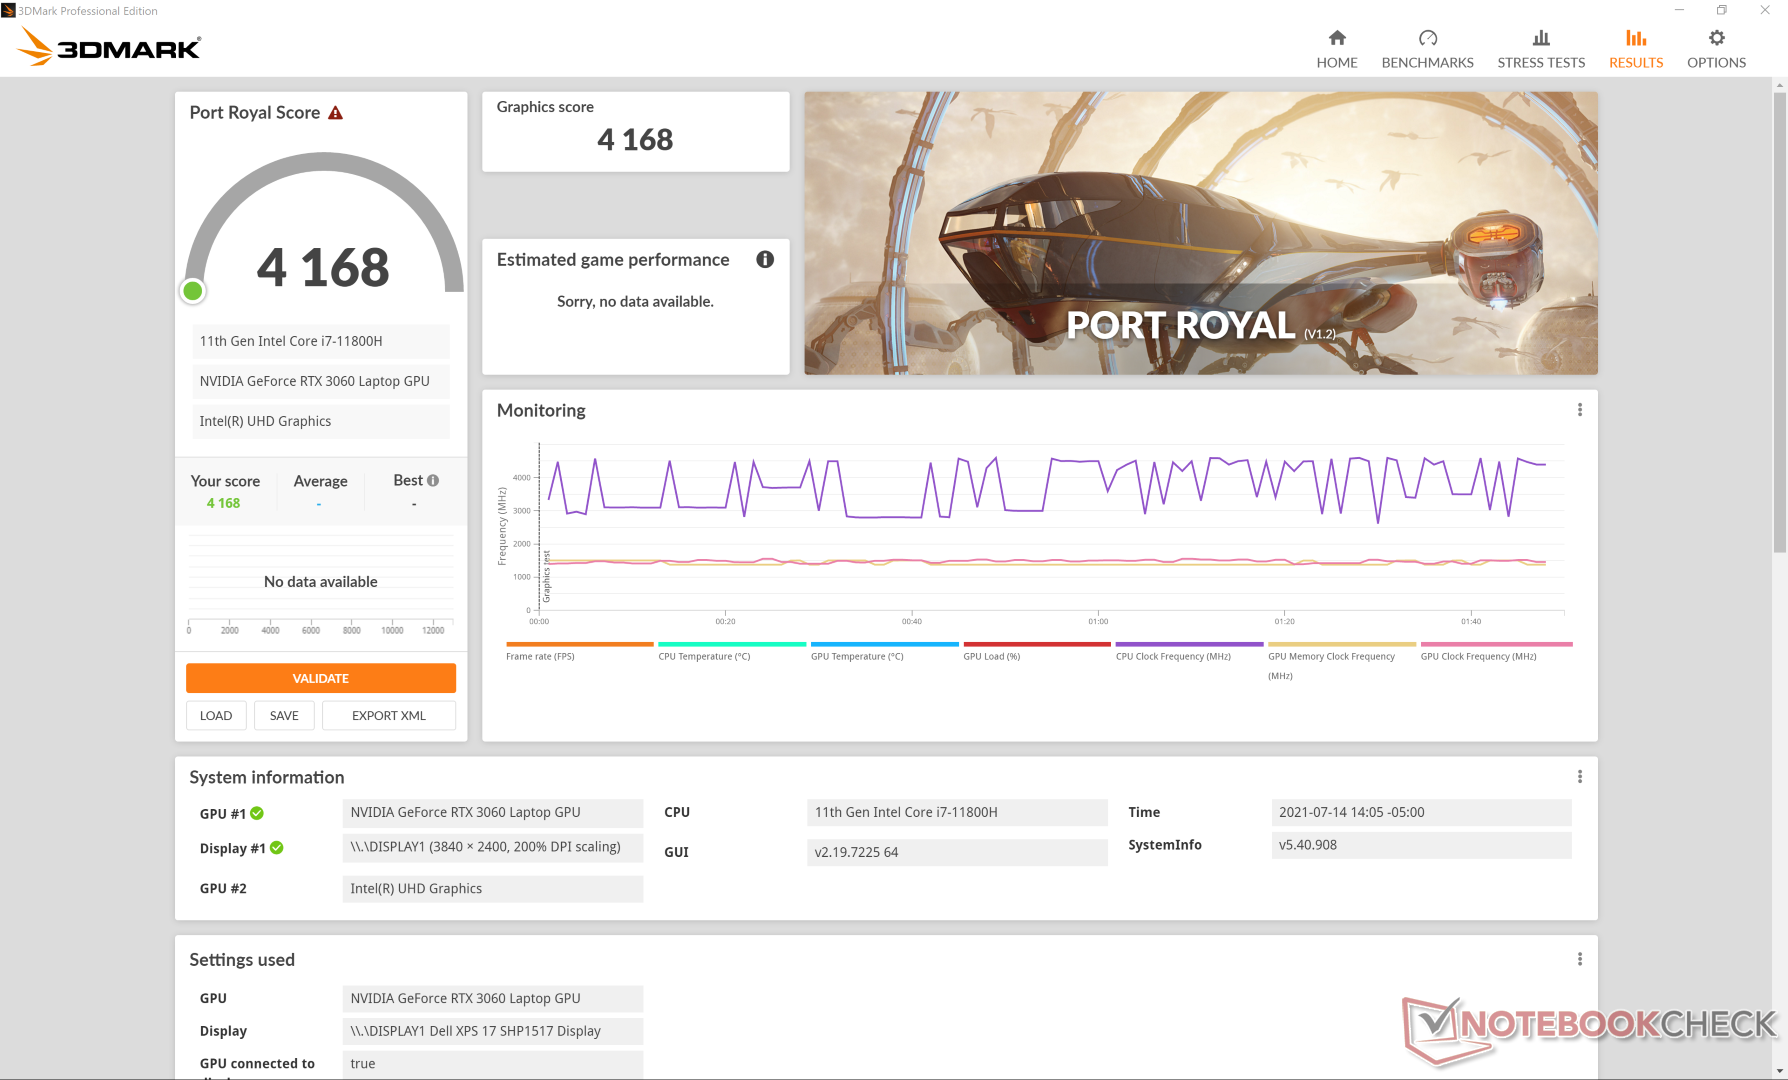
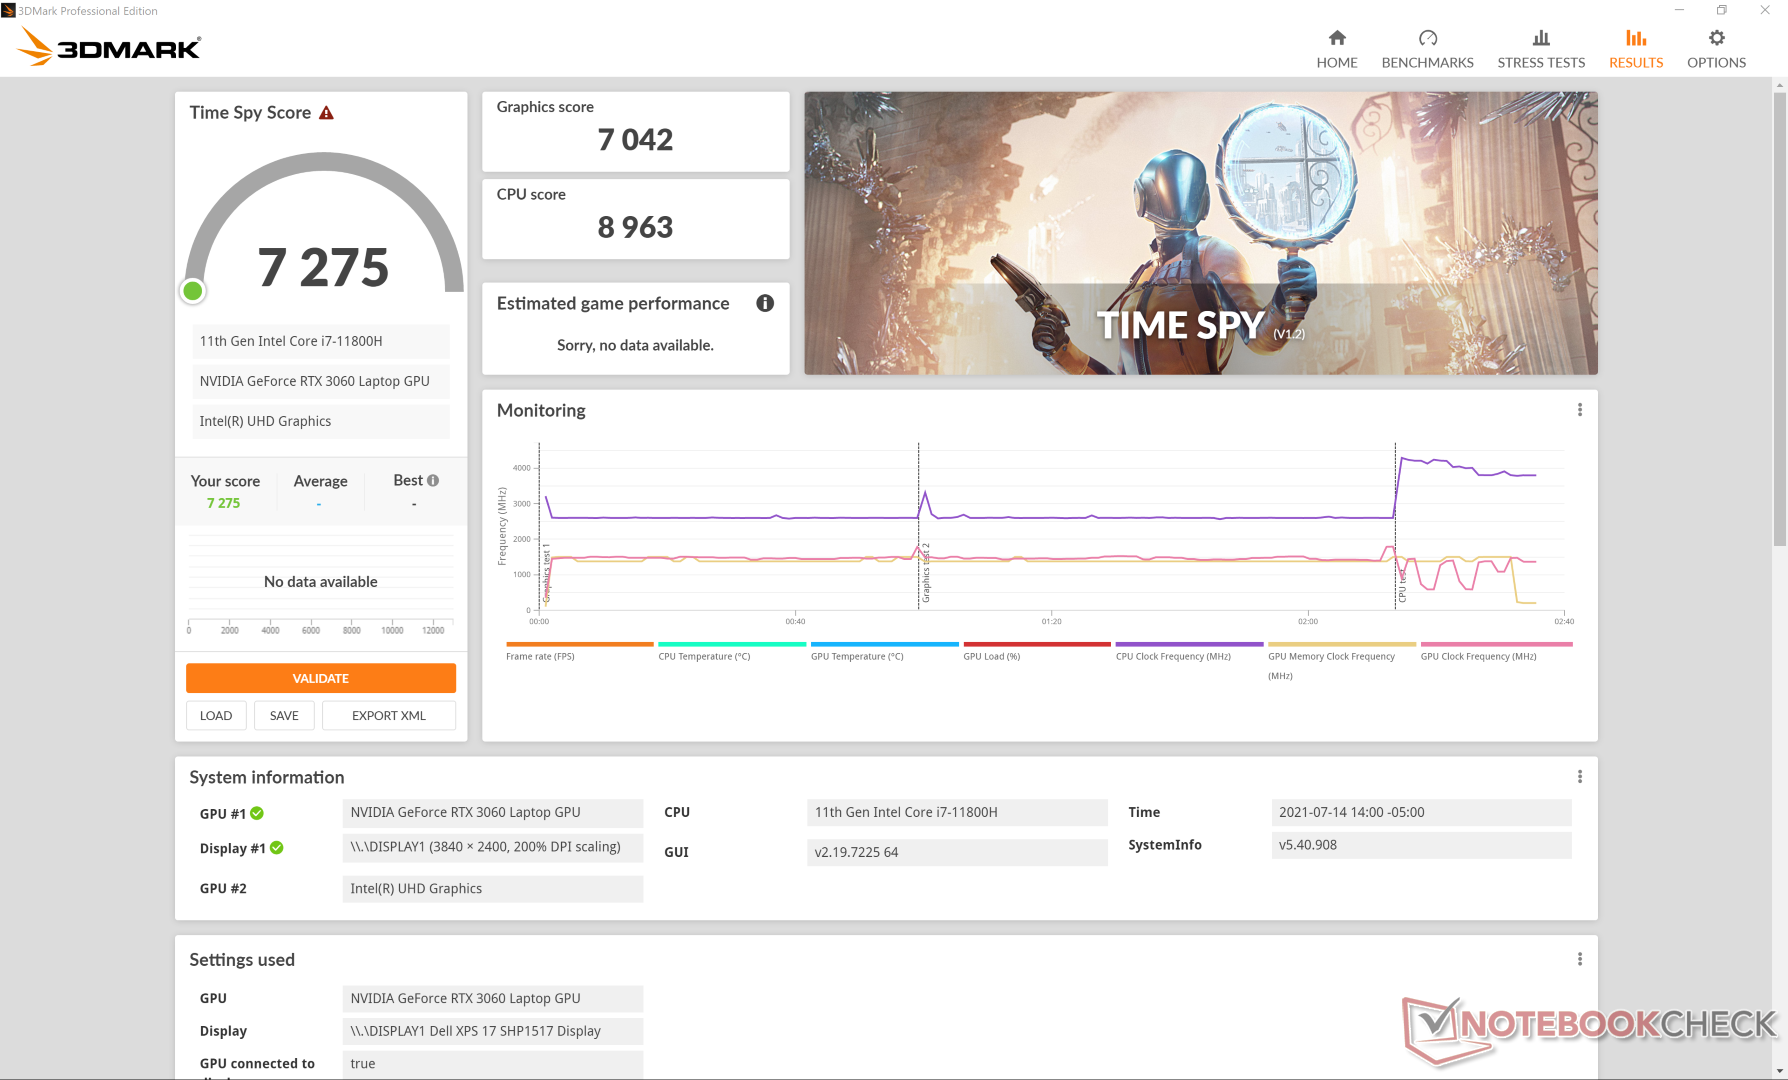
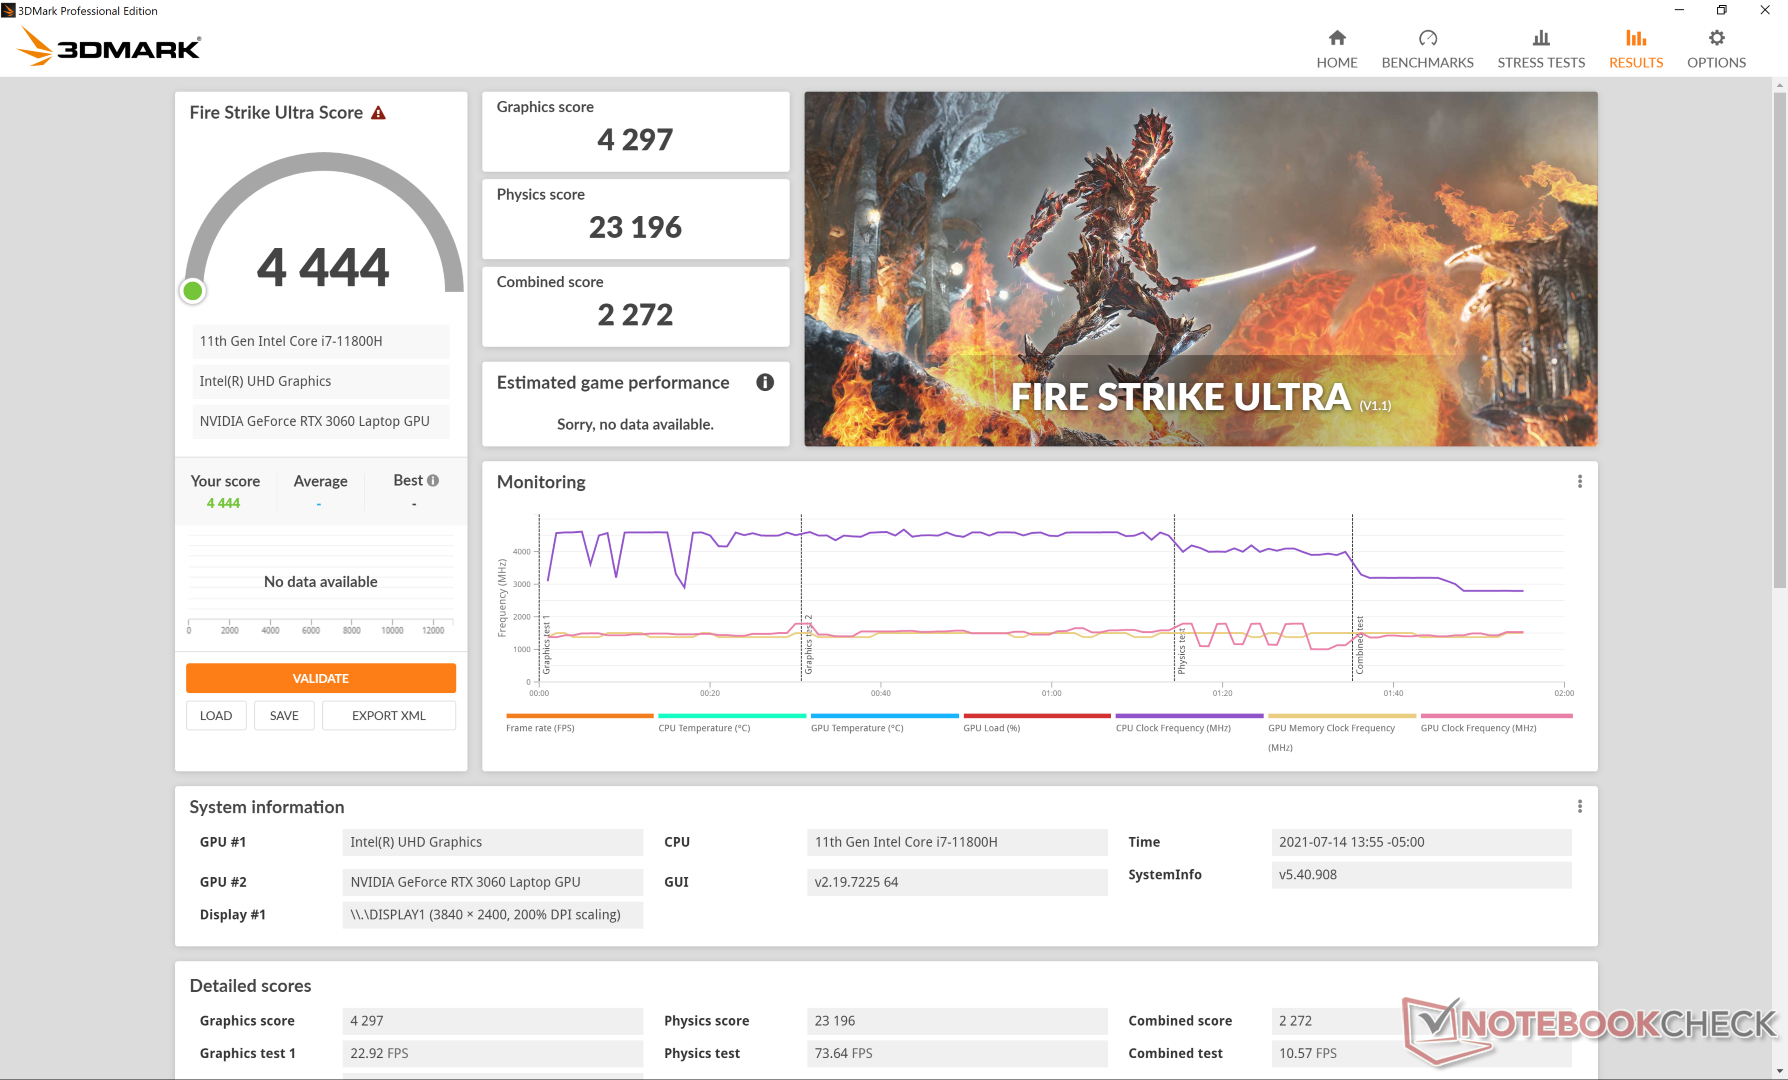
Raw graphics performance is about 30 percent faster than the RTX 2060 Max-Q in last year's XPS 17 9700 to be a respectable year-over-year upgrade. Perhaps more surprisingly, performance is only about 10 percent slower than a 130 W GeForce RTX 3060 despite the much lower 70 W TGP envelope on our Dell GPU.
Gaming performance is excellent with results that are very close to laptops equipped with GeForce RTX 2070 graphics. However, we recommend gaming on an external monitor when possible because of the slow black-white and gray-gray response times on the internal XPS 17 display for very noticeable ghosting. Gaming isn't the primary focus for XPS laptops, after all.
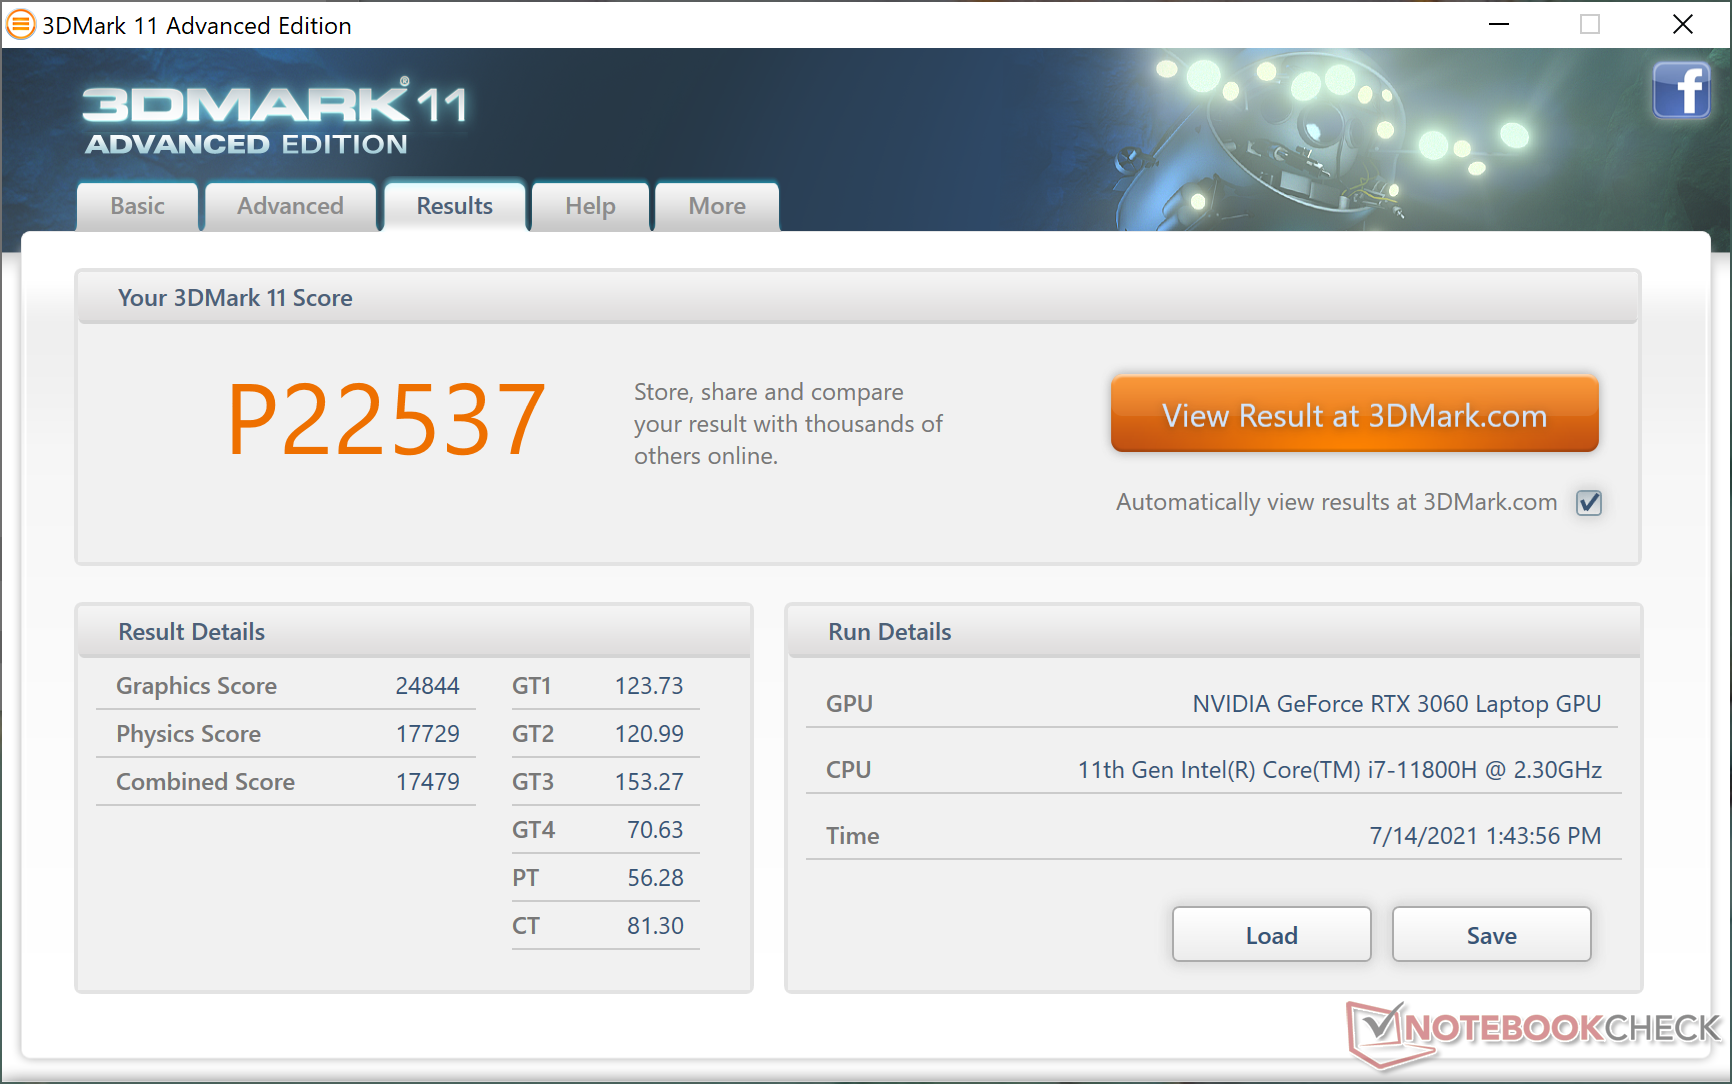
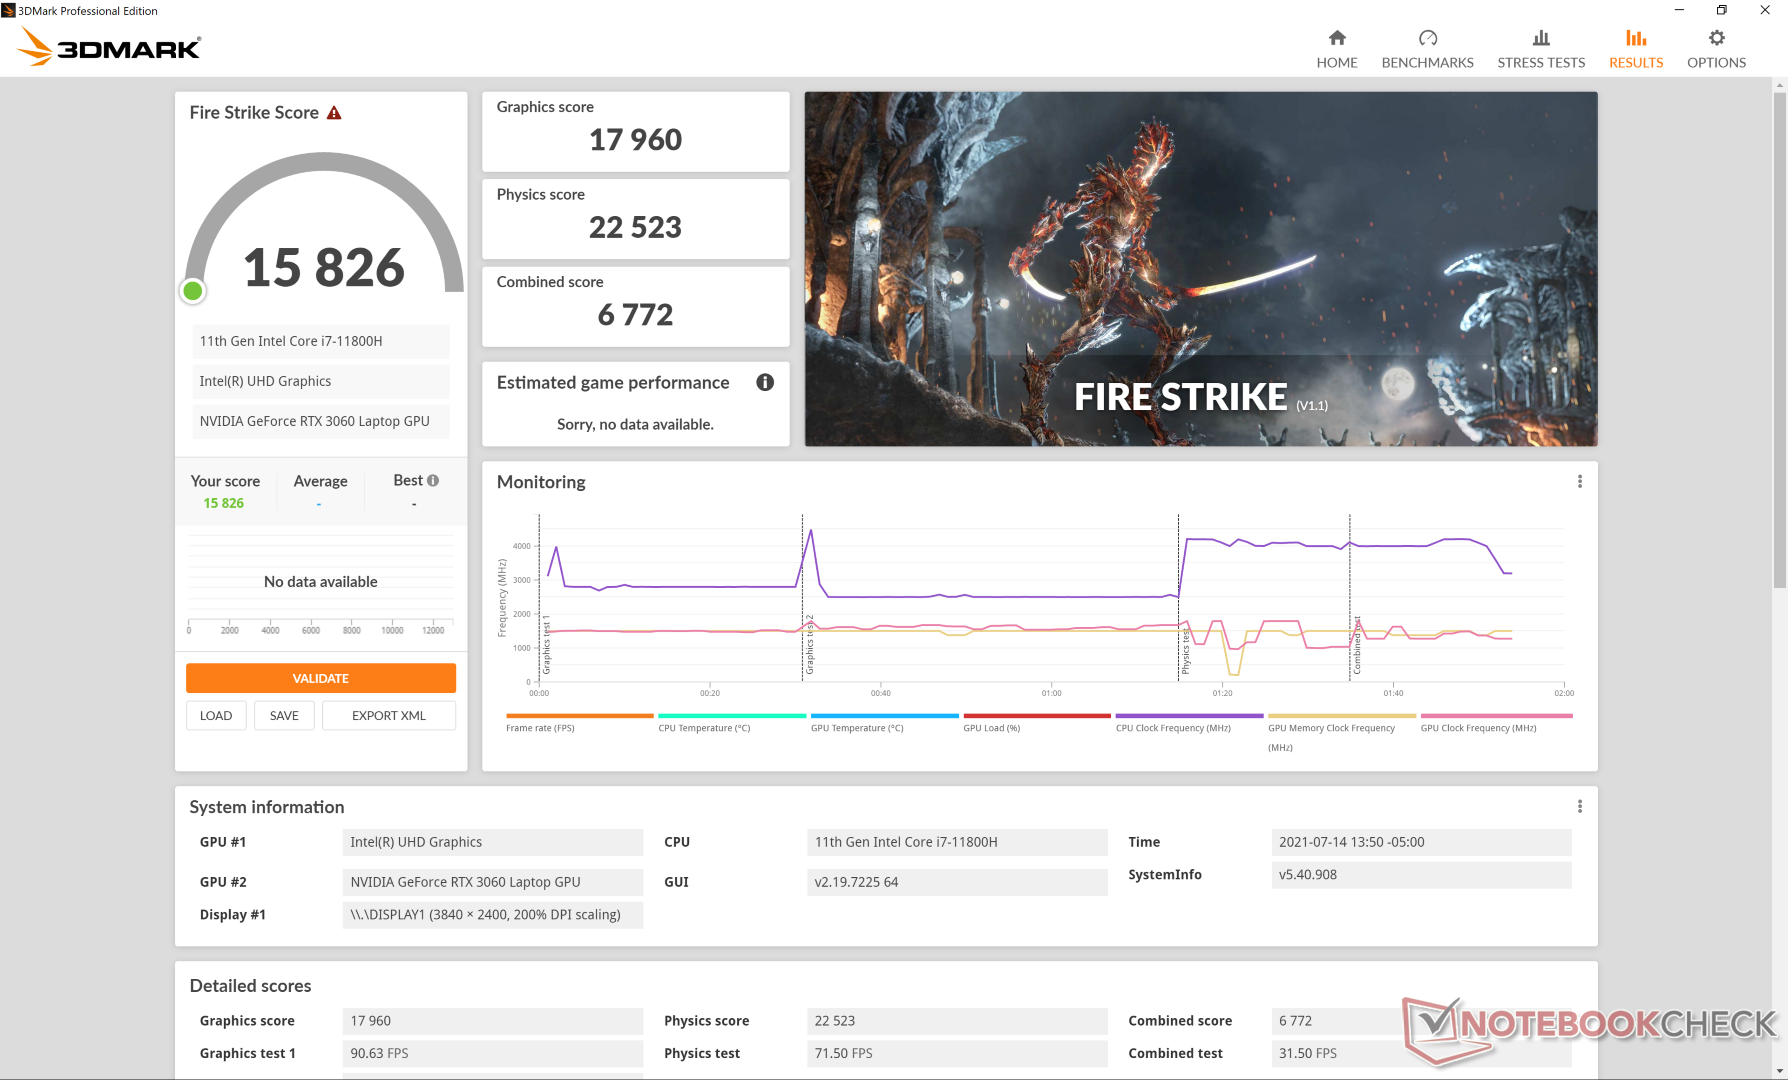
| 3DMark 11 Performance | 22537 points | |
| 3DMark Cloud Gate Standard Score | 32793 points | |
| 3DMark Fire Strike Score | 15826 points | |
| 3DMark Time Spy Score | 7275 points | |
Help | ||
Witcher 3 FPS Chart
| low | med. | high | ultra | QHD | 4K | |
| GTA V (2015) | 181 | 178 | 155 | 81.6 | 63.6 | |
| The Witcher 3 (2015) | 341.6 | 218.1 | 142.2 | 72.3 | ||
| Dota 2 Reborn (2015) | 168 | 148 | 133 | 126 | ||
| Final Fantasy XV Benchmark (2018) | 140 | 98.2 | 73.5 | 54.9 | 31.4 | |
| X-Plane 11.11 (2018) | 125 | 105 | 84.6 | 60.2 | ||
| Strange Brigade (2018) | 348 | 176 | 140 | 123 | 91.1 |
Emissions
System Noise — Quiet Like an Ultrabook, Loud Like a Gamer
Fan behavior hasn't really changed since both the power ceiling and cooling solution have remained the same. When running 3DMark 06 and Witcher 3 on Optimized mode, fan noise would stabilize at 29.2 dB(A) and 46.2 dB(A), respectively. When running Witcher 3 on Ultra Performance mode, fan noise would top out at 49 dB(A) which is what we recorded on last year's model. This range is more similar to gaming laptops than other Ultrabooks since the XPS 17 is carrying a gaming-level GPU.
It's recommended to run the system on Optimized mode or lower and with the iGPU active when the extra performance isn't needed. Otherwise, the fans will pulse more frequently especially when launching applications.
| Dell XPS 17 9710 Core i7 RTX 3060 GeForce RTX 3060 Laptop GPU, i7-11800H, Micron 2300 1TB MTFDHBA1T0TDV | Dell XPS 17 9700 Core i7 RTX 2060 Max-Q GeForce RTX 2060 Max-Q, i7-10875H, Micron 2200S 1TB MTFDHBA1T0TCK | Razer Blade Pro 17 2021 (QHD Touch) GeForce RTX 3080 Laptop GPU, i7-10875H, Samsung PM981a MZVLB1T0HBLR | Gigabyte Aero 17 HDR YC GeForce RTX 3080 Laptop GPU, i9-10980HK, ESR01TBTLCG-EAC-4 | LG Ultra 17U70N GeForce GTX 1650 Mobile, i5-10210U, Samsung SSD PM981a MZVLB512HBJQ | Eluktronics RP-17 GeForce RTX 2060 Mobile, R7 4800H, Phison PS5013 PRO-X-1TB-G2R NVMe SSD | |
|---|---|---|---|---|---|---|
| Noise | -5% | -7% | -10% | -3% | -3% | |
| off / environment * | 25.5 | 28 -10% | 26.1 -2% | 26 -2% | 27 -6% | 26.2 -3% |
| Idle Minimum * | 25.2 | 28 -11% | 26.1 -4% | 30 -19% | 27.3 -8% | 26.2 -4% |
| Idle Average * | 25.2 | 28 -11% | 26.5 -5% | 32 -27% | 27.3 -8% | 26.2 -4% |
| Idle Maximum * | 25.2 | 28 -11% | 30.7 -22% | 36 -43% | 31.7 -26% | 30 -19% |
| Load Average * | 45.9 | 43.2 6% | 43.5 5% | 45 2% | 43.6 5% | 38.5 16% |
| Witcher 3 ultra * | 49 | 49 -0% | 54 -10% | 42 14% | 45.3 8% | 47.2 4% |
| Load Maximum * | 50.4 | 50.5 -0% | 55 -9% | 49 3% | 44.7 11% | 54.6 -8% |
* ... smaller is better
Noise Level
| Idle |
| 25.2 / 25.2 / 25.2 dB(A) |
| Load |
| 45.9 / 50.4 dB(A) |
 | ||
30 dB silent 40 dB(A) audible 50 dB(A) loud |
||
min: | ||
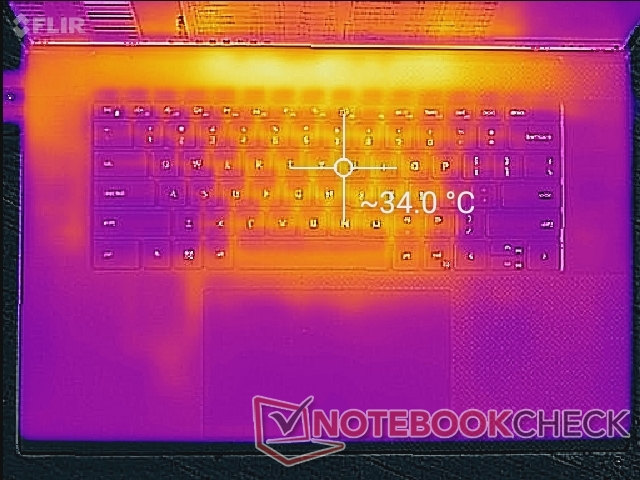
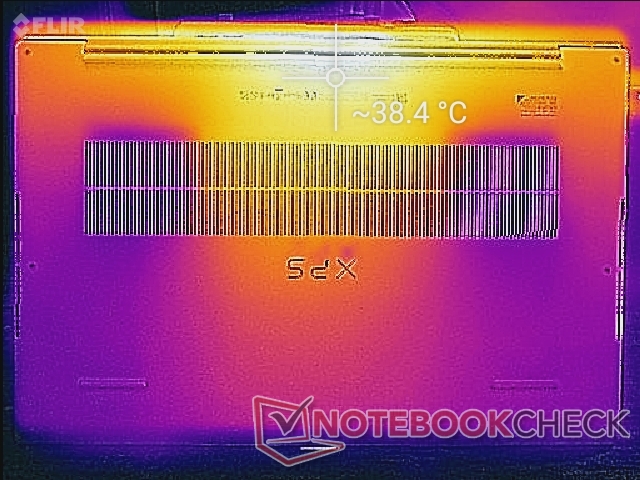
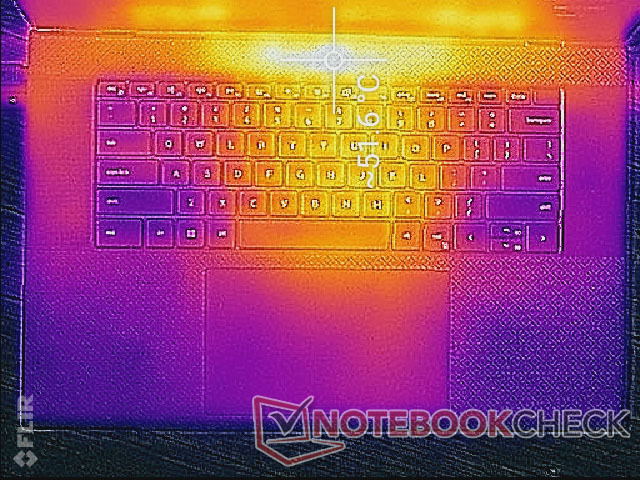
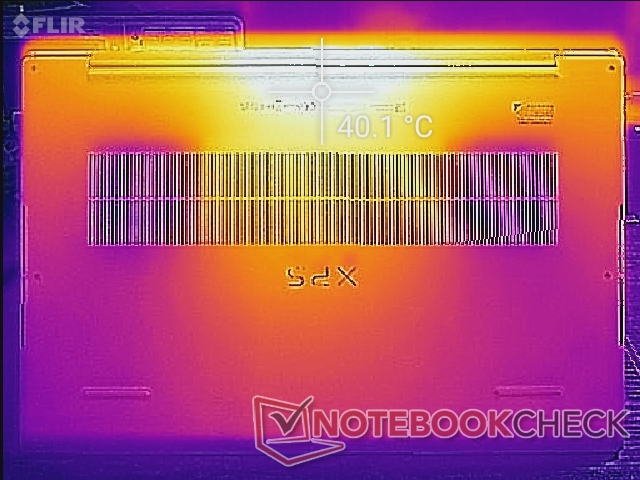
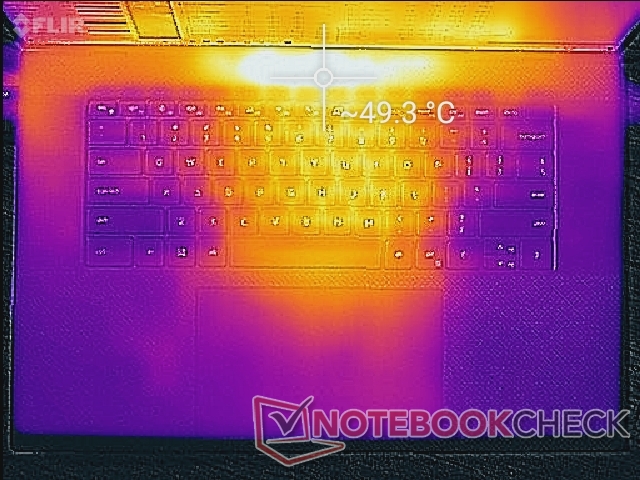
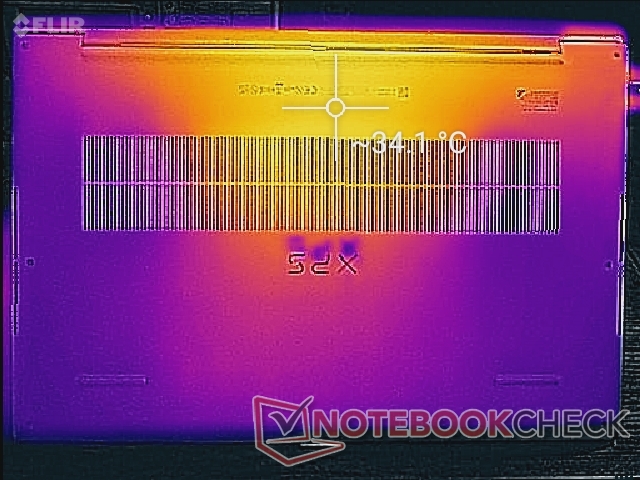
Temperature
Hot spots when running high loads for long periods can reach up to 51 C and 41 C on the top and bottom surfaces of the laptop, respectively. These same spots would be warm at 34 C to 37 C even when idling on desktop. However, the hot spots are concentrated toward the rear center of the chassis while the palm rests remain much cooler. This is similar to what we observed on the Razer Blade Pro 17 but to an even greater degree on the Dell.
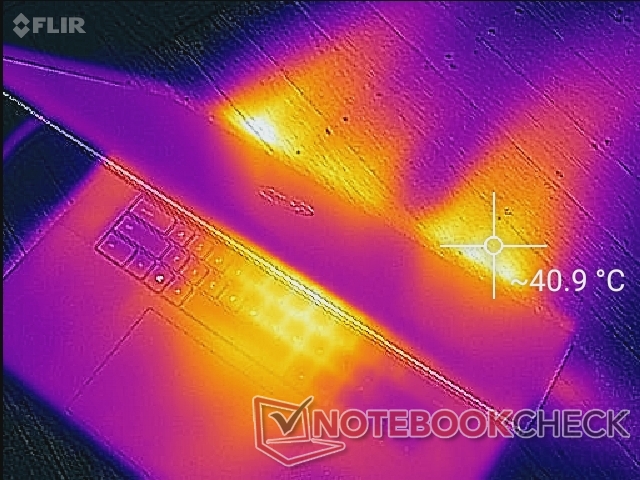
(-) The maximum temperature on the upper side is 50.2 °C / 122 F, compared to the average of 36.9 °C / 98 F, ranging from 21.1 to 71 °C for the class Multimedia.
(+) The bottom heats up to a maximum of 38.4 °C / 101 F, compared to the average of 39.1 °C / 102 F
(+) In idle usage, the average temperature for the upper side is 29.4 °C / 85 F, compared to the device average of 31.2 °C / 88 F.
(±) Playing The Witcher 3, the average temperature for the upper side is 33.9 °C / 93 F, compared to the device average of 31.2 °C / 88 F.
(+) The palmrests and touchpad are cooler than skin temperature with a maximum of 29.8 °C / 85.6 F and are therefore cool to the touch.
(±) The average temperature of the palmrest area of similar devices was 28.8 °C / 83.8 F (-1 °C / -1.8 F).
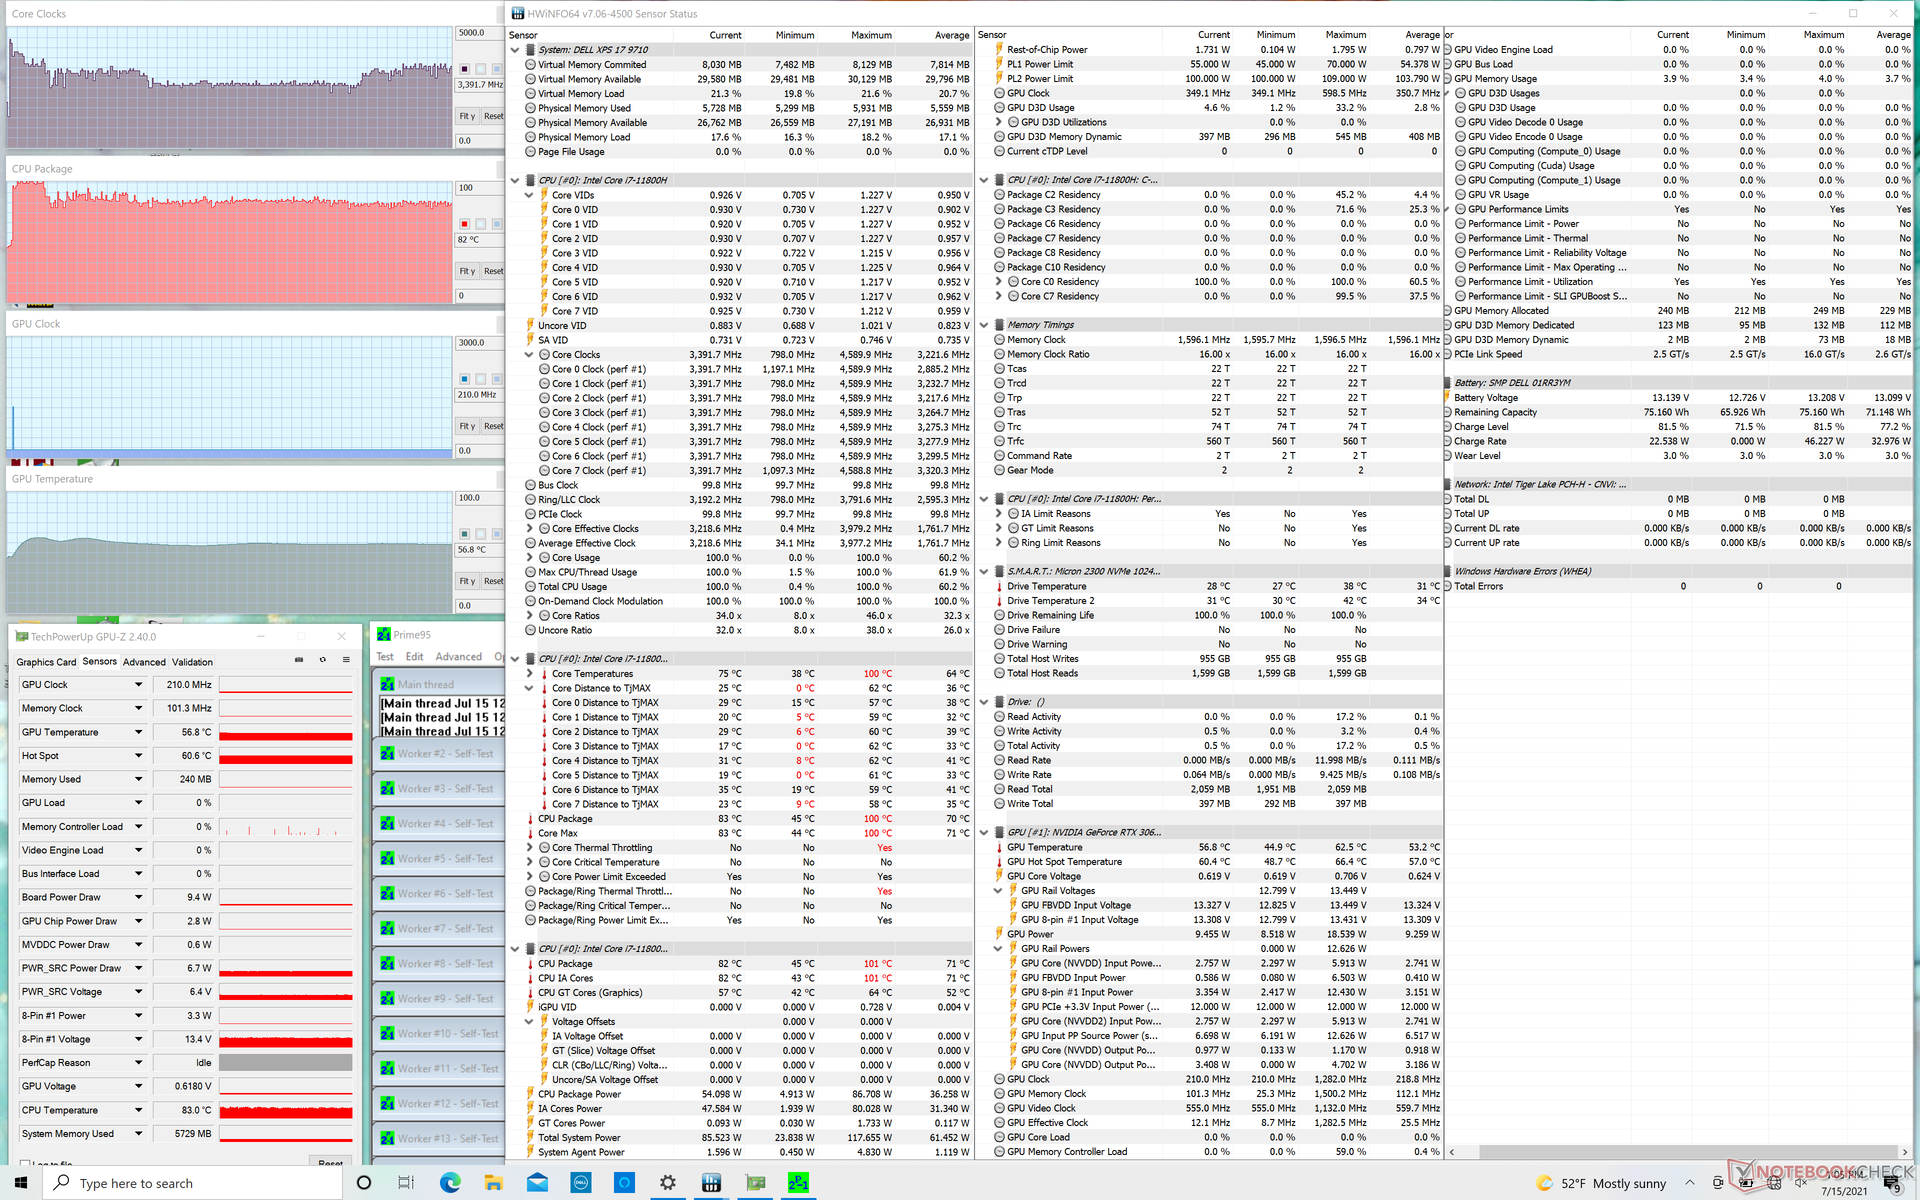
Stress Test
When stressed with Prime95, the CPU would boost to 3.6 to 4 GHz and at a balmy core temperature of 100 C. After about 90 seconds, however, clock rate would range between 2.5 GHz and 3.4 GHz in order to maintain a cooler core temperature of 82 C. Running this same test on the XPS 17 9700 would result in core clock rates and temperatures of 2.9 to 3.1 GHz and 99 C, respectively, to suggest that the XPS 19 9710 can downclock the CPU Turbo Boost even further for lower temperatures when necessary.
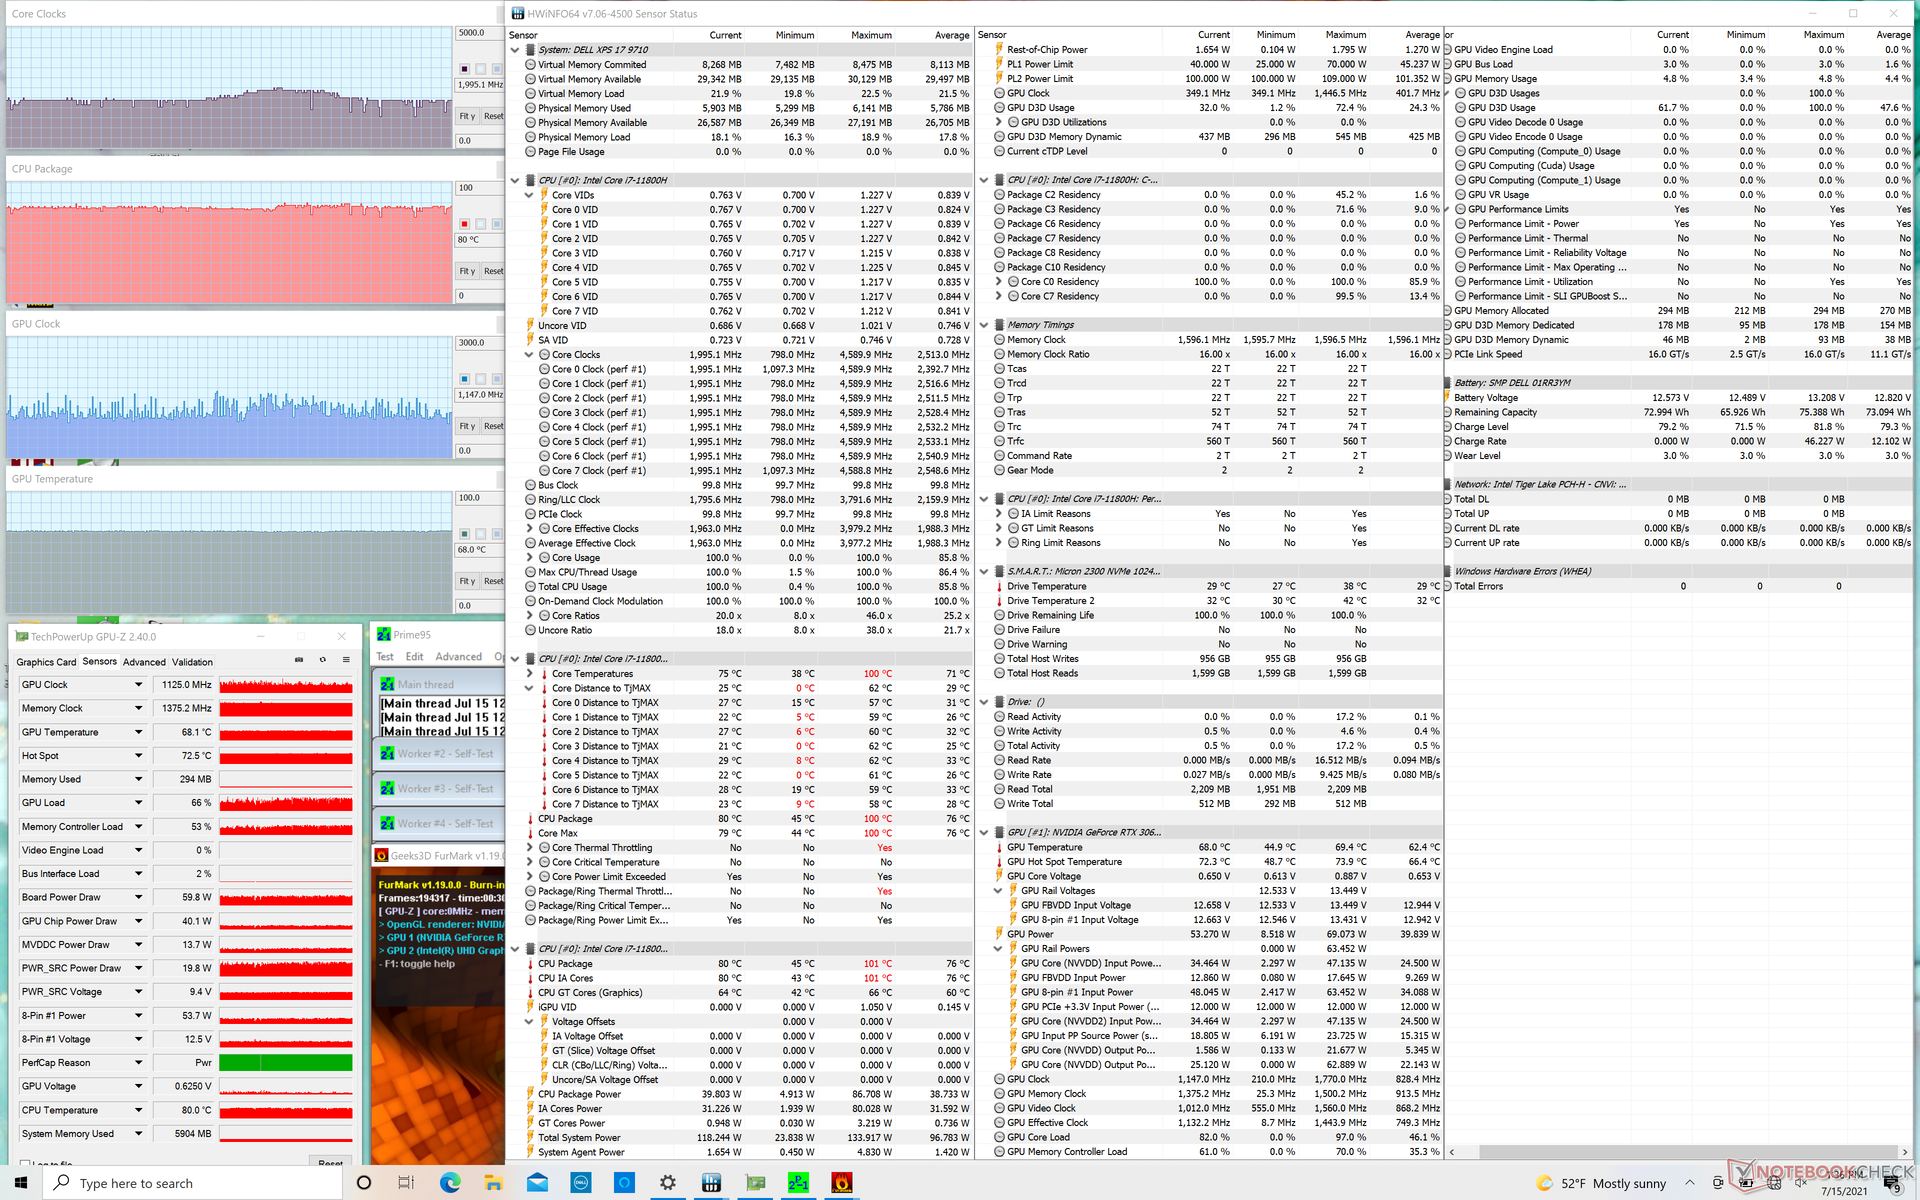
Running Witcher 3 shows both higher GPU clocks and core temperatures than on the RTX 2060 Max-Q. On the other hand, CPU clock rates are lower for a lower CPU temperature. Power distribution appears to be more finetuned on the XPS 17 9710 than on the 9700 as a result. Core temperatures are actually very close to what we observed on the Eluktronics RP-17 which is a thicker 17.3-inch laptop but with the older RTX 2060 GPU.
Running on batteries will limit performance. A Fire Strike test on battery power would return Physics and Graphics scores of 14102 and 13572 points, respectively, compared to 22523 and 17960 points when on mains.
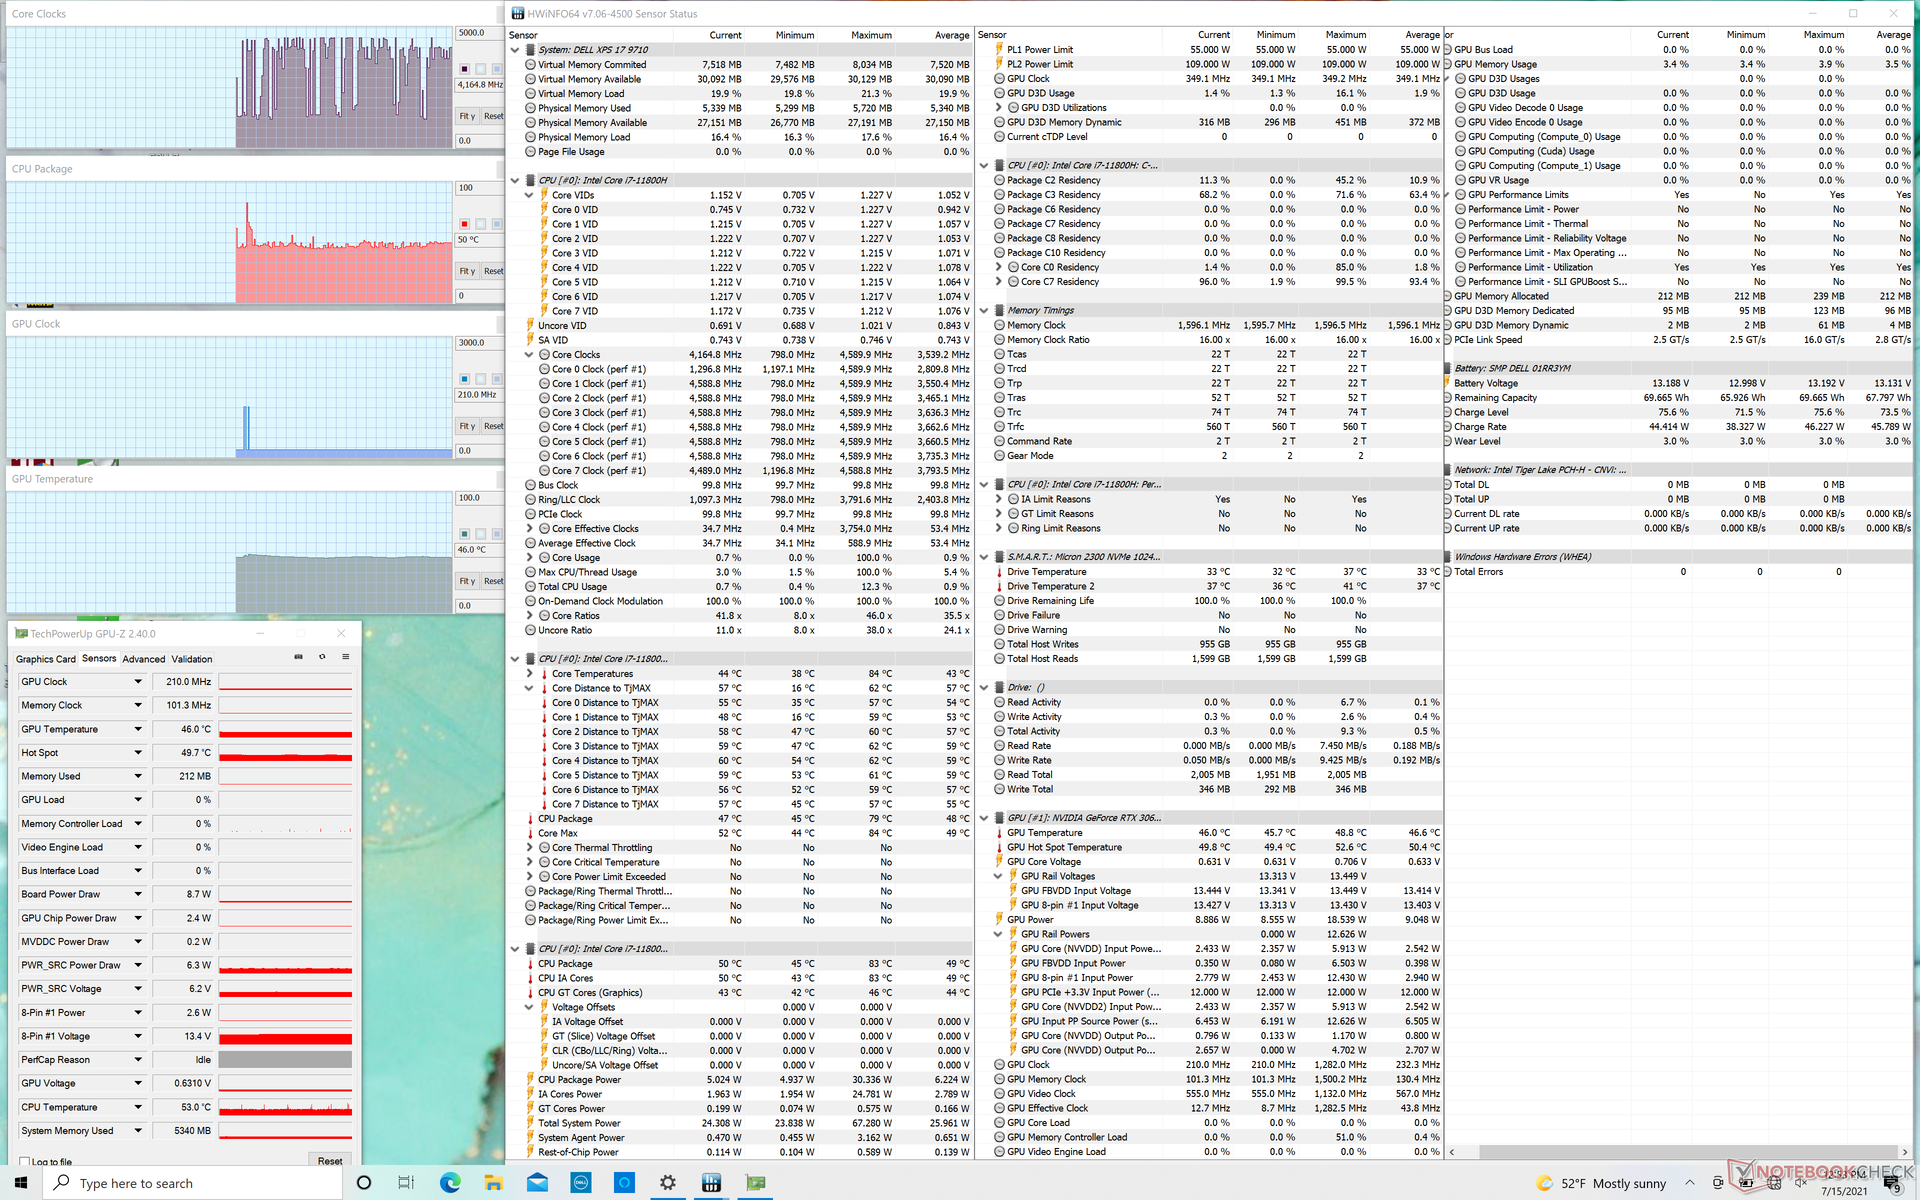
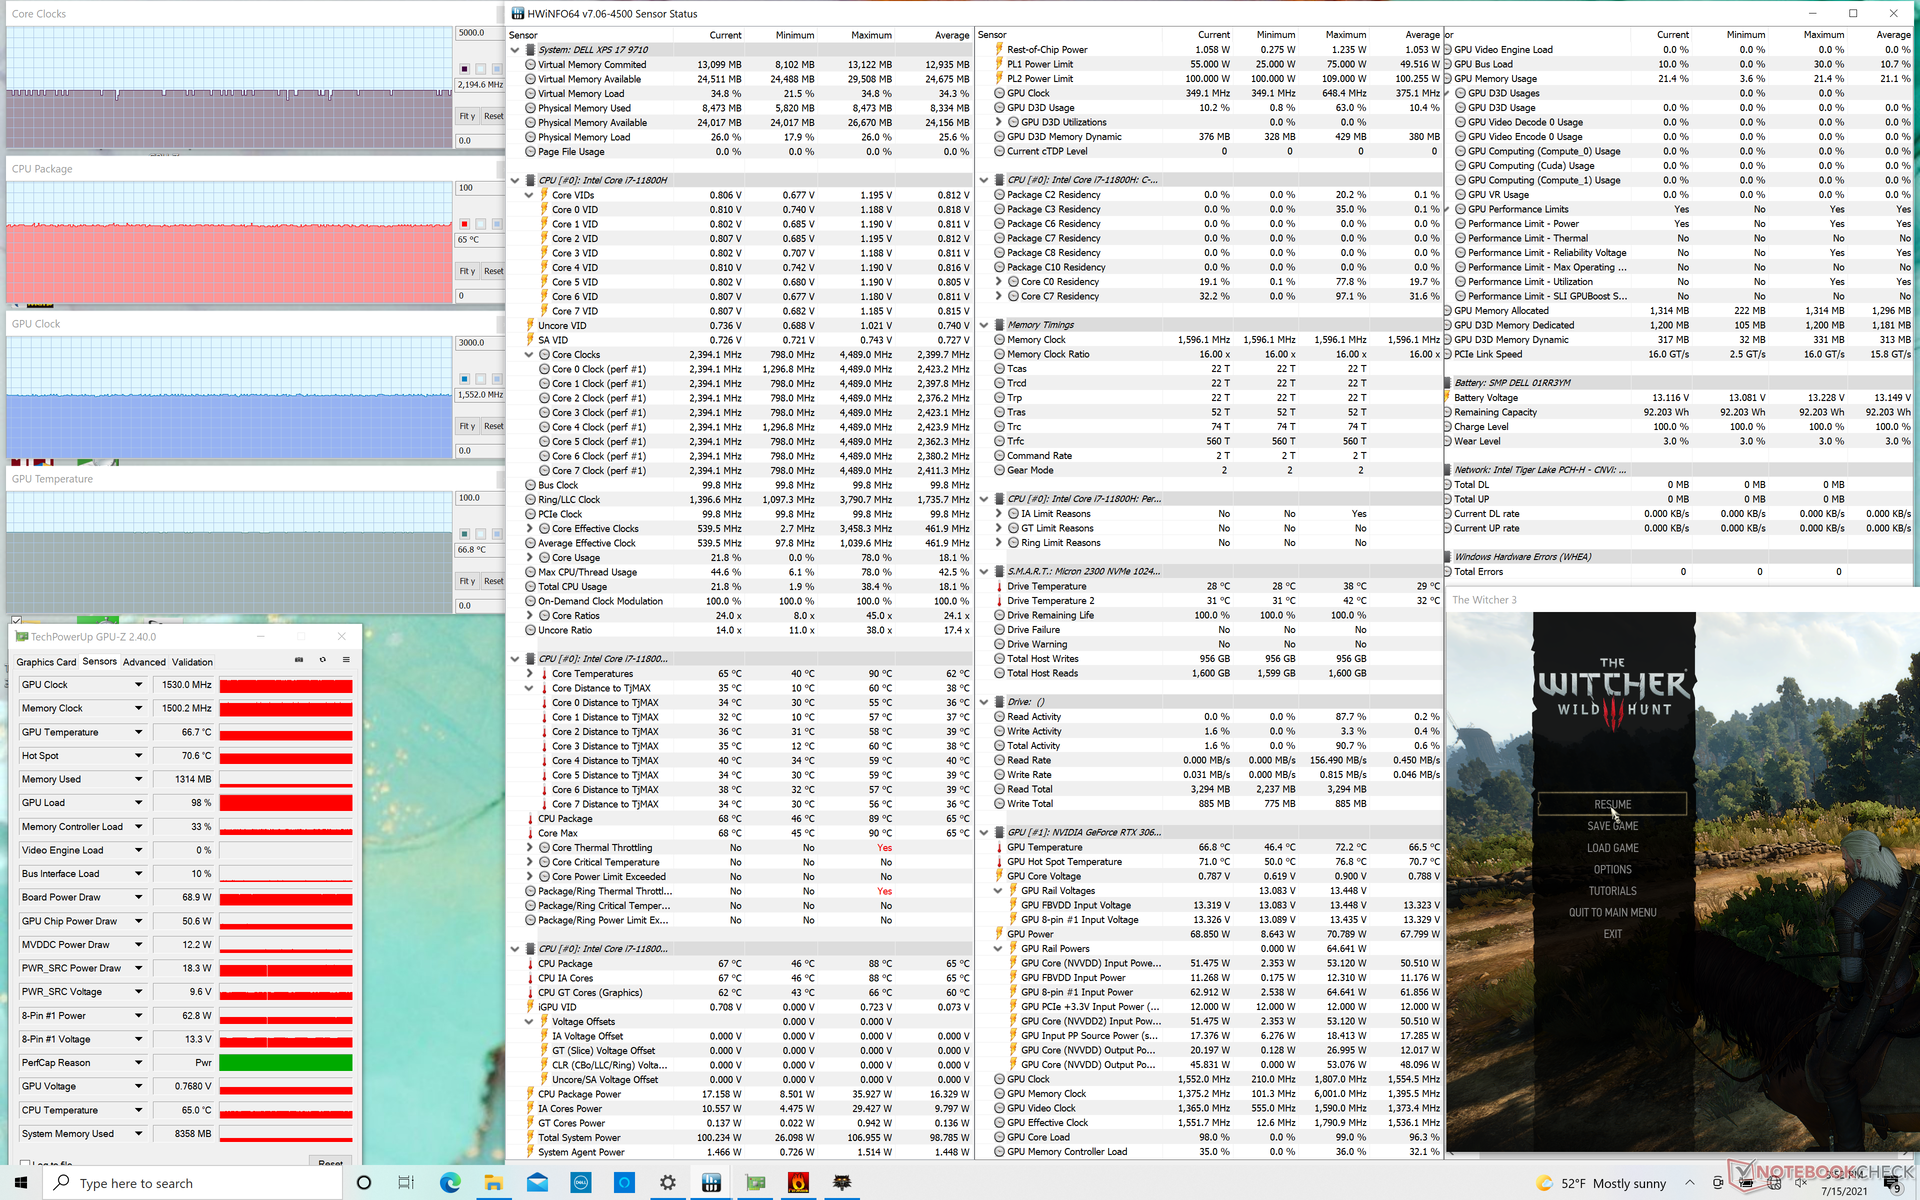
| CPU Clock (GHz) | GPU Clock (MHz) | Average CPU Temperature (°C) | Average GPU Temperature (°C) | |
| System Idle | -- | -- | 50 | 46 |
| Prime95 Stress | 2.5 - 3.4 | -- | 82 | 51 |
| Prime95 + FurMark Stress | 1.7 - 2.5 | ~1147 | 80 | 68 |
| Witcher 3 Stress | 2.2 | 1530 | 65 | 67 |
Speakers
The quad speakers (2x 2.5 W subwoofer + 2x 1.5 W tweeters) remain unchanged from last year's XPS 17 9700. Audio quality is more balanced than on most other laptops as exemplified by the relatively flat pink noise curve. However, maximum volume could have been a bit louder.


Dell XPS 17 9710 Core i7 RTX 3060 audio analysis
(±) | speaker loudness is average but good (78.3 dB)
Bass 100 - 315 Hz
(±) | reduced bass - on average 5.3% lower than median
(±) | linearity of bass is average (10.7% delta to prev. frequency)
Mids 400 - 2000 Hz
(+) | balanced mids - only 2.6% away from median
(+) | mids are linear (4.5% delta to prev. frequency)
Highs 2 - 16 kHz
(+) | balanced highs - only 2.2% away from median
(+) | highs are linear (5% delta to prev. frequency)
Overall 100 - 16.000 Hz
(+) | overall sound is linear (8.7% difference to median)
Compared to same class
» 7% of all tested devices in this class were better, 1% similar, 92% worse
» The best had a delta of 5%, average was 18%, worst was 45%
Compared to all devices tested
» 2% of all tested devices were better, 0% similar, 98% worse
» The best had a delta of 4%, average was 25%, worst was 134%
Apple MacBook 12 (Early 2016) 1.1 GHz audio analysis
(+) | speakers can play relatively loud (83.6 dB)
Bass 100 - 315 Hz
(±) | reduced bass - on average 11.3% lower than median
(±) | linearity of bass is average (14.2% delta to prev. frequency)
Mids 400 - 2000 Hz
(+) | balanced mids - only 2.4% away from median
(+) | mids are linear (5.5% delta to prev. frequency)
Highs 2 - 16 kHz
(+) | balanced highs - only 2% away from median
(+) | highs are linear (4.5% delta to prev. frequency)
Overall 100 - 16.000 Hz
(+) | overall sound is linear (10.2% difference to median)
Compared to same class
» 5% of all tested devices in this class were better, 2% similar, 93% worse
» The best had a delta of 5%, average was 19%, worst was 53%
Compared to all devices tested
» 3% of all tested devices were better, 1% similar, 96% worse
» The best had a delta of 4%, average was 25%, worst was 134%
Energy Management
Power Consumption
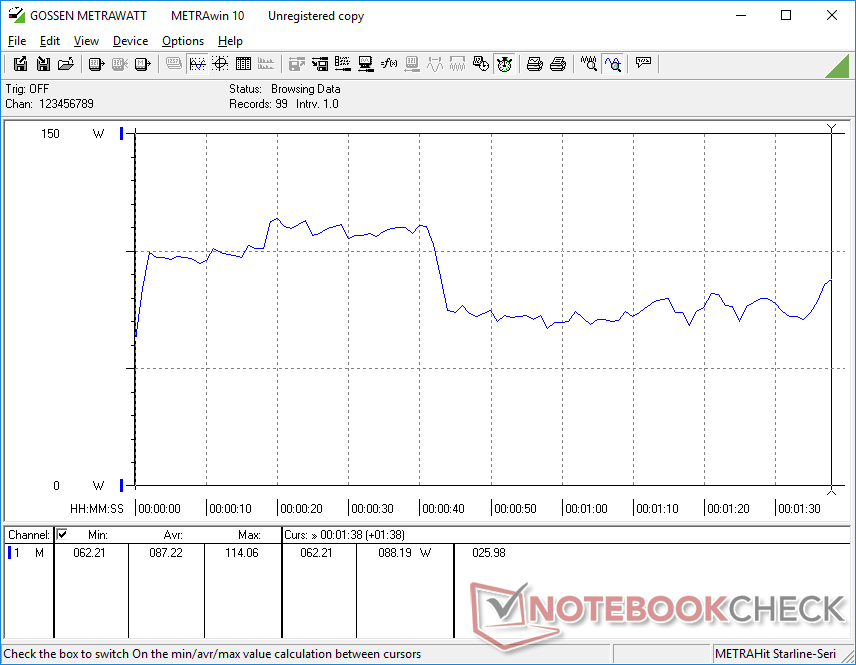
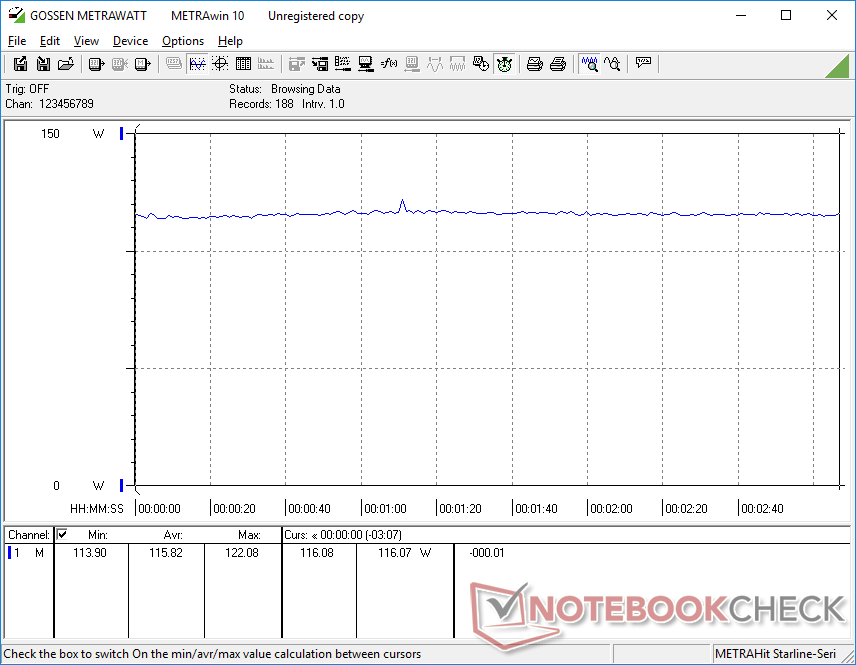
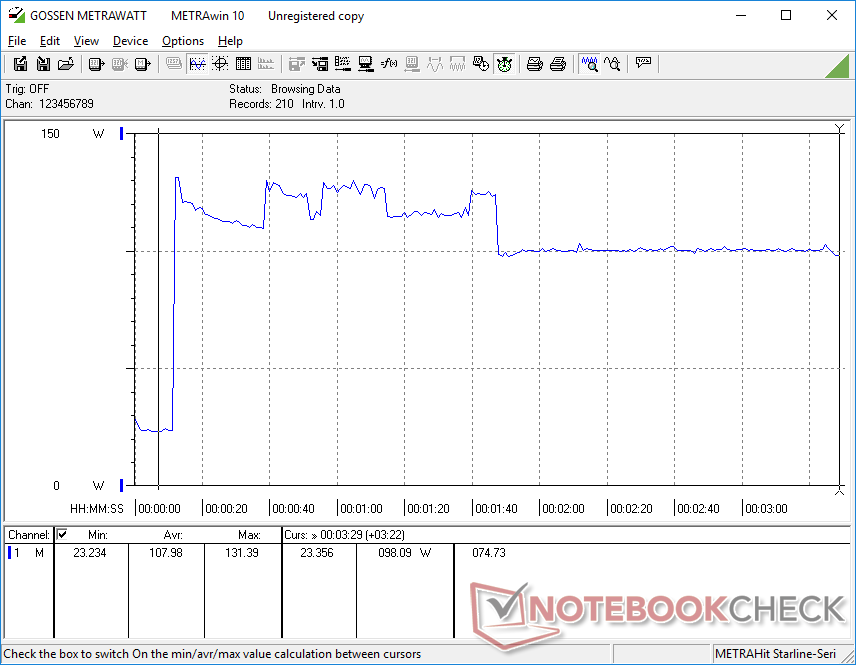
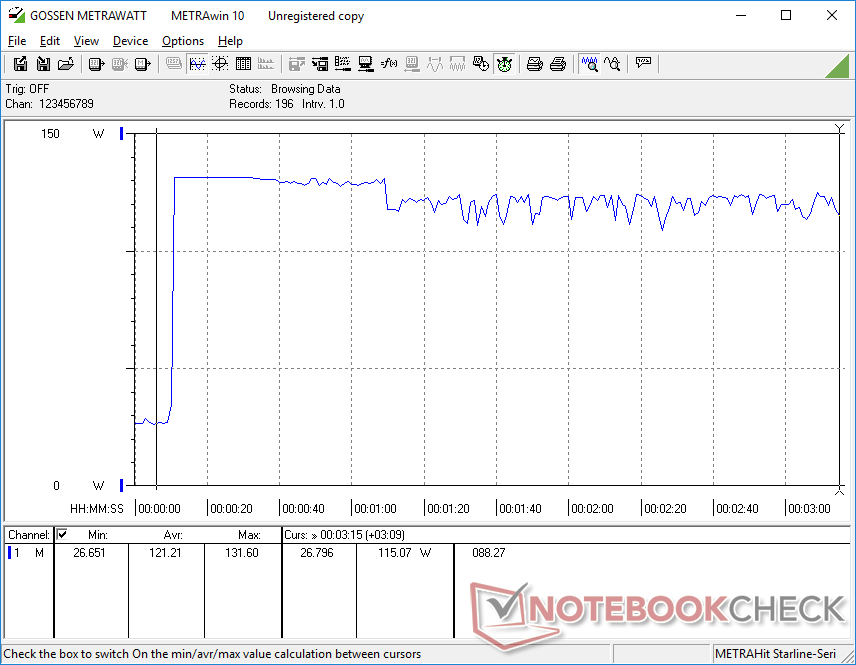
As noted twice before, we recorded lower-than-expected power consumption readings from our XPS 17 9700 SKU leading to battery drain even when connected to an outlet. Fortunately, Dell has all but remedied the problem on the XPS 17 9710. The battery will no longer drain when running demanding loads and it will instead remain at whatever charge it is currently on. For example, running Witcher 3 at 80 percent or 100 percent battery charge whilst connected to mains will neither drain nor charge the battery in our tests.
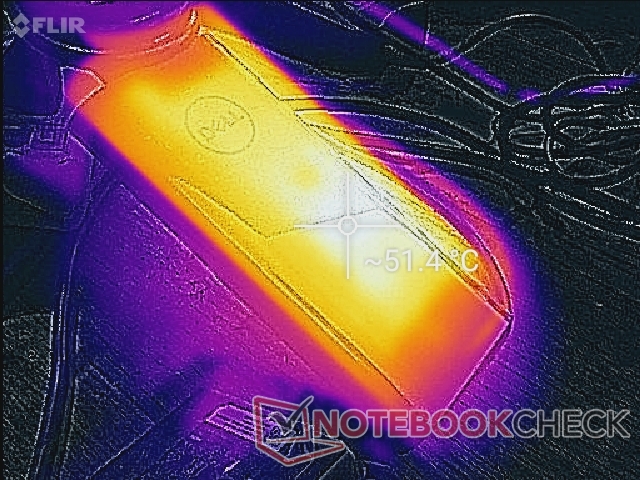
We're able to record a new maximum draw of 131.6 W from the same 130 W AC adapter when both the CPU and GPU are at 100 percent utilization. Dell uses its own proprietary USB-C power delivery method to push beyond the standard 100 W USB-C limit. Perhaps an even higher target of 150 W or more would have allowed the laptop to both charge and game simultaneously.
The Dell system will ship with a 90 W USB-C AC adapter instead of 130 W if configured with no GeForce graphics.
| Off / Standby | |
| Idle | |
| Load |
|
| Dell XPS 17 9710 Core i7 RTX 3060 i7-11800H, GeForce RTX 3060 Laptop GPU, Micron 2300 1TB MTFDHBA1T0TDV, IPS, 3840x2400, 17.00 | Dell XPS 17 9700 Core i7 RTX 2060 Max-Q i7-10875H, GeForce RTX 2060 Max-Q, Micron 2200S 1TB MTFDHBA1T0TCK, IPS, 3840x2400, 17.00 | Gigabyte Aero 17 HDR YC i9-10980HK, GeForce RTX 3080 Laptop GPU, ESR01TBTLCG-EAC-4, IPS-Level, 3840x2160, 17.30 | LG Ultra 17U70N i5-10210U, GeForce GTX 1650 Mobile, Samsung SSD PM981a MZVLB512HBJQ, IPS, 2560x1600, 17.00 | Eluktronics RP-17 R7 4800H, GeForce RTX 2060 Mobile, Phison PS5013 PRO-X-1TB-G2R NVMe SSD, IPS, 1920x1080, 17.30 | |
|---|---|---|---|---|---|
| Power Consumption | 2% | -58% | 21% | -64% | |
| Idle Minimum * | 7.5 | 5.8 23% | 17 -127% | 3.7 51% | 20.2 -169% |
| Idle Average * | 15.7 | 20.6 -31% | 21 -34% | 8.8 44% | 24.5 -56% |
| Idle Maximum * | 23.1 | 21 9% | 33 -43% | 30.6 -32% | 28.7 -24% |
| Load Average * | 87.2 | 104.7 -20% | 113 -30% | 67.4 23% | 110.4 -27% |
| Witcher 3 ultra * | 116 | 99.2 14% | 157 -35% | 84.5 27% | 166.3 -43% |
| Load Maximum * | 131.6 | 107.6 18% | 237 -80% | 114 13% | 217.4 -65% |
* ... smaller is better
Power Consumption Witcher 3 / Stresstest
Battery Life
Runtimes are generally the same as on the XPS 9700 if not a bit shorter. We're able to squeeze out 7.5 hours of real-world WLAN use compared to 9.5 hours on last year's model.
Charging from empty to full capacity takes just over 2 full hours compared to 1.5 hours on most other Ultrabooks since the XPS 17 carries a larger-than-average 97 Wh battery pack.
| Dell XPS 17 9710 Core i7 RTX 3060 i7-11800H, GeForce RTX 3060 Laptop GPU, 97 Wh | Dell XPS 17 9700 Core i7 RTX 2060 Max-Q i7-10875H, GeForce RTX 2060 Max-Q, 97 Wh | Razer Blade Pro 17 2021 (QHD Touch) i7-10875H, GeForce RTX 3080 Laptop GPU, 70.5 Wh | Gigabyte Aero 17 HDR YC i9-10980HK, GeForce RTX 3080 Laptop GPU, 99 Wh | LG Ultra 17U70N i5-10210U, GeForce GTX 1650 Mobile, 72 Wh | Eluktronics RP-17 R7 4800H, GeForce RTX 2060 Mobile, 62 Wh | |
|---|---|---|---|---|---|---|
| Battery Runtime | 13% | -37% | -35% | 23% | -50% | |
| Reader / Idle | 1060 | 1425 34% | 593 -44% | 620 -42% | 1487 40% | |
| WiFi v1.3 | 453 | 580 28% | 356 -21% | 354 -22% | 821 81% | 263 -42% |
| Load | 157 | 120 -24% | 86 -45% | 92 -41% | 77 -51% | 68 -57% |
Pros
Cons
Verdict — Second Time's The Charm
If you were interested in the XPS 17 but were hesitant to buy a first generation model, then this second generation update looks like the best time to jump in. Not only does it address some of the bugs we encountered on last year's model, but it also manages to boost CPU and GPU performance by about 30 percent without needing to rely on louder fans or new cooling. The XPS 17 9710 is the more optimized model that the original XPS 17 9700 should have been.
Good things come to those who wait. The 2021 XPS 17 is the faster and more optimized version of the 2020 XPS 17 for essentially the same launch price.
Price has remained about the same as well. Last year's XPS 17 9700 with Core i7-10875H and RTX 2060 Max-Q launched for just under $3000 USD while our configuration with the Core i7-11800H and RTX 3060 comes in at around $2900. New owners would be getting faster performance without needing to pay more than early adopters.
Other smaller updates like the Thunderbolt 4 ports and PCIe 4 SSD slots are nice additions, but most users outside of enthusiasts won't fully appreciate these changes. We would still love to see more conspicuous updates like a webcam shutter, higher quality webcam, or potential color options to make the system even more attractive than it already is.
There still aren't many direct competitors to the XPS 17 even after a full year in the market due to the system's unique 17.0-inch 16:10 aspect ratio. The lighter LG Ultra 17 or Gram 17 come to mind, but these are significantly slower and of lower build quality. Users who don't mind the more common 17.3-inch 16:9 form factor can find options from Razer or MSI with faster GeForce RTX options than the Dell.
Price and availability
The XPS 17 9710 is not yet widely available across major retailers as of this writing except for Dell's own online storefront. Our exact configuration can be found for $2900 USD while lesser SKUs with the base Core i5, integrated graphics, 8 GB RAM, 512 GB SSD, and FHD+ display start at $1500.
Dell XPS 17 9710 Core i7 RTX 3060
-
07/19/2021 v7
Allen Ngo
More articles related to this device
Dell XPS 17 9710 Core i7 RTX 3060 (XPS 17 Series)Related Articles


Pricecompare
