Notebookcheck Logo

Intel Core i7-12700K vs Intel Core i7-13700H vs Intel Core i9-13905H

Intel Core i7-12700K

► remove from comparison Intel i7-12700K

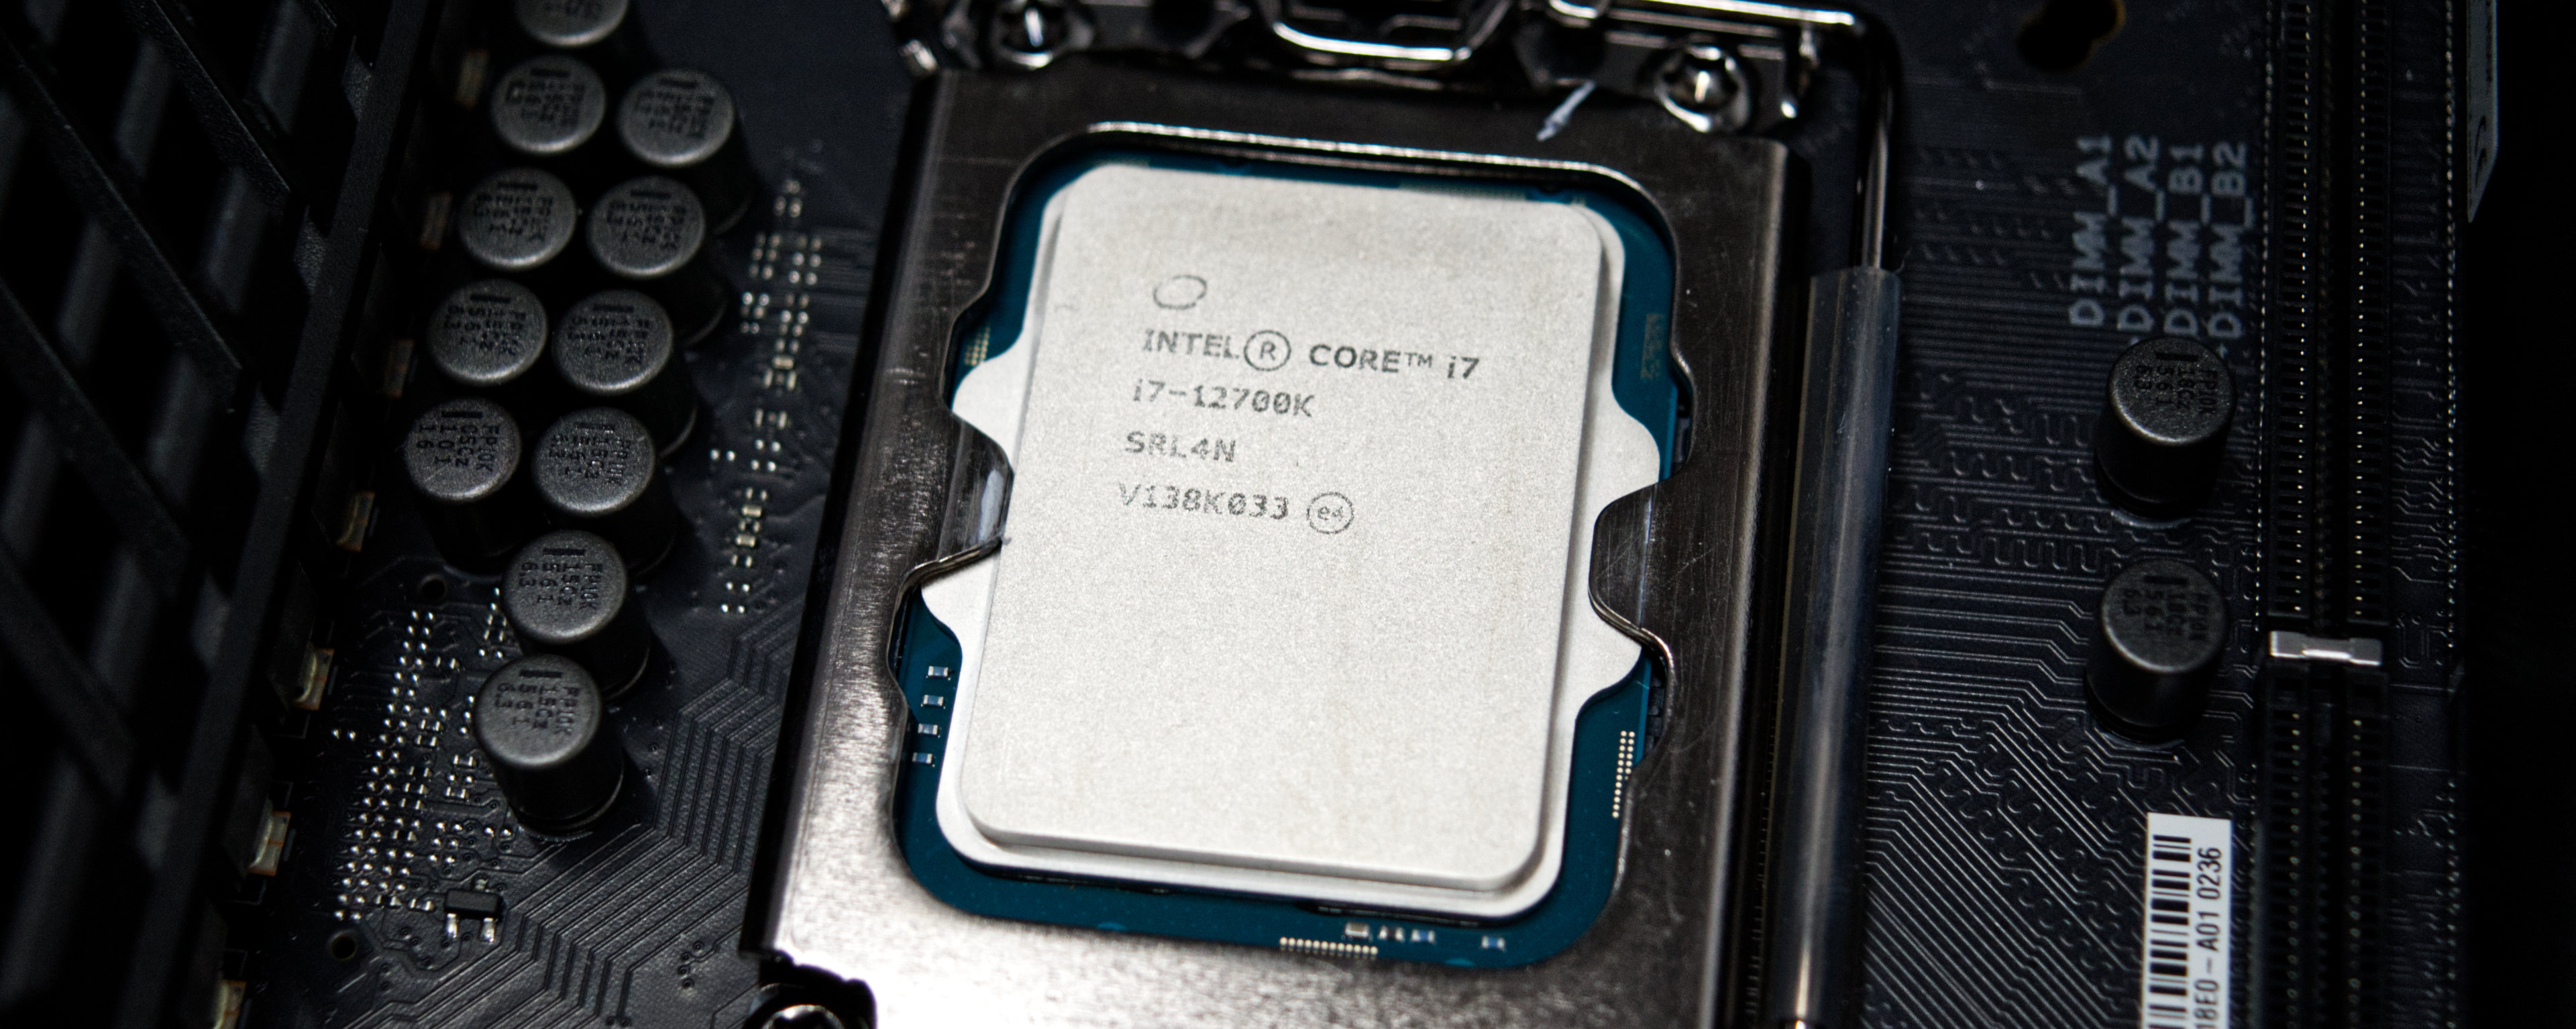
The Intel Core i7-12700K is a high end CPU for desktops based on the Alder Lake architecture. It was first announced in November 2021 and offers 8 performance cores and 4 efficiency cores. The performance cores (P-cores) support HyperThreading, leading to 20 Threads that can be processed at once. The performance cores can clock with up to 5 GHz (Turbo Boost Max 3.0), the efficiency cores can clock with up to 3.9 GHz. All cores can use 25 MB Smart Cache. The integrated memory controller supports up to 128 GB DDR5 with 4800 MT/s (dual channel).

Thread Director (in hardware) can support the operating system to decide which thread to use on the performance or efficiency cores for the best performance.

The integrated graphics adapter is based on the Xe-architecture and called Intel UHD Graphics 770. It clocks between 300 and 1.5 GHz.

For AI tasks, the CPU also integrates GNA 3.0 and DL Boost. Quick Sync in version 8 is the same as in the Rocket Lake CPUs and supports MPEG-2, AVC, VC-1 decode, JPEG, VP8 decode, VP9, HEVC and AV1 decode in hardware.

Performance

The average 12700K in our database is way ahead of the Ryzen 7 5800X and the Ryzen 9 3900X, as far as multi-thread benchmark scores are concerned. Which is a very, very impressive result, as of late 2022.

Power consumption

This Core i7 series chip has a Base power consumption of 125 W, with its highest Intel-recommended Turbo power consumption sitting at 190 W. It might be a good idea to get an AIO cooling solution for a chip this power hungry.

The i7-12700K is manufactured on Intel's fourth-generation 10 nm process marketed as Intel 7 for lower-than-average, as of early 2023, energy efficiency.

Intel Core i7-13700H

► remove from comparison Intel i7-13700H

The Intel Core i7-13700H is a high-end mobile CPU for laptops based on the Raptor Lake-H series (Alder Lake architecture). It was announced in early 2023 and offers 6 performance cores (P-cores, Golden Cove architecture) and 8 efficient cores (E-cores, Gracemont architecture). The P-cores support Hyper-Threading leading to 20 supported threads when combined with the E-cores. The clock rate ranges from 2.4 to 5 GHz (single core turbo, all-core 4.7 GHz) on the performance cluster and 1.8 to 3.7 GHz on the efficiency cluster. The performance of the E-cores should be similar to old Skylake cores (compare with the Core i7-6920HQ). All cores can use up to 24 MB L3 cache.

Performance

The average 13700H in our database delivers multi-thread benchmark scores that are most similar to those of the Ryzen 9 PRO 7940HS, Core i7-12700H, Core i9-12900H. This is a very, very fast CPU, as of mid 2023, even if it does not quite manage to demolish its direct predecessor (the 12700H).

Thanks to its powerful cooling solution and a long-term CPU power limit of 90 W, the MSI Pulse 17 B13VGK is among the fastest systems built around the i7-13700H that we know of. It can be 60% faster in CPU-bound workloads than the slowest system in our database powered by the same chip, as of August 2023.

Features

The integrated memory controller supports various memory types up to DDR5-5200 (up from 4800 MHz for the 12th gen). The Thread Director (in hardware) can support the operating system to decide which thread to use on the performance or efficient cores for the best performance. For AI tasks, the CPU also integrates GNA 3.0 and DL Boost (via AVX2). Quick Sync in version 8 is the same as in the Rocket Lake CPUs and supports MPEG-2, AVC, VC-1 decode, JPEG, VP8 decode, VP9, HEVC, and AV1 decode in hardware. The CPU now supports PCIe 5.0 x8 for a GPU and two PCIe 4.0 x4 for SSDs.

The integrated graphics card is based on the Xe-architecture and offers 96 EUs (Execution Units) clocked at up to 1.5 GHz.

The CPU is rated at 45 W base power (115 W PL2) but most laptops will use a PL1 of around 60 Watt. The SoC is manufactured in a 10nm process at Intel, which is known as Intel 7 (improved over the 12th Gen).

Intel Core i9-13905H

► remove from comparison Intel i9-13905H

The Intel Core i9-13905H is a high-end mobile CPU for laptops based on the Raptor Lake-H series (Alder Lake architecture). It was announced in early 2023 and offers 6 performance cores (P-cores, Golden Cove architecture) and 8 efficient cores (E-cores, Gracemont architecture). The P-cores support Hyper-Threading leading to 20 supported threads when combined with the E-cores. The clock rate ranges from 2.6 to 5.4 GHz (single core turbo, all-core 4.9 GHz) on the performance cluster and 1.9 to 4.1 GHz on the efficiency cluster. The performance of the E-cores should be similar to old Skylake cores (compare with the Core i7-6920HQ). All cores can use up to 24 MB L3 cache. Similar to the i9-13900H but without vPro support and the 13905H uses a different package and socket.

Performance

Thanks to the high core count and high clock speed, the Core i9-13905H is (together with the 13900HK) the fastest 45W CPU for laptops and only bested by Raptor Lake-HX based models with more cores and improved P-cores (e.g., the i9-13980HX). Still, the CPU is very well suited for all demanding use cases like gaming, content creation, and scientific calculations.

Features

The integrated memory controller supports various memory types up to DDR5-5200 (up from 4800 MHz for the 12th gen). The Thread Director (in hardware) can support the operating system to decide which thread to use on the performance or efficient cores for the best performance. For AI tasks, the CPU also integrates GNA 3.0 and DL Boost (via AVX2). Quick Sync in version 8 is the same as in the Rocket Lake CPUs and supports MPEG-2, AVC, VC-1 decode, JPEG, VP8 decode, VP9, HEVC, and AV1 decode in hardware. The CPU now supports PCIe 5.0 x8 for a GPU and two PCIe 4.0 x4 for SSDs.

The integrated graphics card is based on the Xe-architecture and offers 96 EUs (Execution Units) .

The CPU is rated at 45 W base power (115 W PL2) but most laptops will use a PL1 of around 60 Watt. The SoC is manufactured in a 10nm process at Intel, which is known as Intel 7 (improved over the 12th Gen).

ModelIntel Core i7-12700KIntel Core i7-13700HIntel Core i9-13905H
CodenameAlder LakeRaptor Lake-HRaptor Lake-H
SeriesIntel Alder Lake-SIntel Raptor Lake-HIntel Raptor Lake-H
Series: Raptor Lake-H Raptor Lake-H
Intel Core i9-12900K3.2 - 5.2 GHz16 / 24 cores30 MB L3
Intel Core i9-129002.4 - 5.1 GHz16 / 24 cores20 MB L3
Intel Core i7-12700K « 2.7 - 5 GHz12 / 20 cores25 MB L3
Intel Core i7-12700F3.3 - 4.9 GHz12 / 20 cores25 MB L3
Intel Core i7-127003.3 - 4.9 GHz12 / 20 cores25 MB L3
Intel Core i5-12600K2.8 - 4.9 GHz10 / 16 cores20 MB L3
Intel Core i9-13900HK1.9 - 5.4 GHz14 / 20 cores24 MB L3
Intel Core i9-13905H1.9 - 5.4 GHz14 / 20 cores24 MB L3
Intel Core i9-13900H1.9 - 5.4 GHz14 / 20 cores24 MB L3
Intel Core i7-13800H1.8 - 5.2 GHz14 / 20 cores24 MB L3
Intel Core i7-13705H1.8 - 5 GHz14 / 20 cores24 MB L3
Intel Core i7-13700H « 1.8 - 5 GHz14 / 20 cores24 MB L3
Intel Core i7-13620H1.8 - 4.9 GHz10 / 16 cores24 MB L3
Intel Core i5-13600H2.1 - 4.8 GHz12 / 16 cores18 MB L3
Intel Core i5-13505H1.9 - 4.7 GHz12 / 16 cores18 MB L3
Intel Core i5-13500H1.9 - 4.7 GHz12 / 16 cores18 MB L3
Intel Core i5-13420H1.5 - 4.6 GHz8 / 12 cores12 MB L3
Intel Core i9-13900HK1.9 - 5.4 GHz14 / 20 cores24 MB L3
Intel Core i9-13905H « 1.9 - 5.4 GHz14 / 20 cores24 MB L3
Intel Core i9-13900H1.9 - 5.4 GHz14 / 20 cores24 MB L3
Intel Core i7-13800H1.8 - 5.2 GHz14 / 20 cores24 MB L3
Intel Core i7-13705H1.8 - 5 GHz14 / 20 cores24 MB L3
Intel Core i7-13700H1.8 - 5 GHz14 / 20 cores24 MB L3
Intel Core i7-13620H1.8 - 4.9 GHz10 / 16 cores24 MB L3
Intel Core i5-13600H2.1 - 4.8 GHz12 / 16 cores18 MB L3
Intel Core i5-13505H1.9 - 4.7 GHz12 / 16 cores18 MB L3
Intel Core i5-13500H1.9 - 4.7 GHz12 / 16 cores18 MB L3
Intel Core i5-13420H1.5 - 4.6 GHz8 / 12 cores12 MB L3
Clock2700 - 5000 MHz1800 - 5000 MHz1900 - 5400 MHz
L2 Cache12 MB11.5 MB11.5 MB
L3 Cache25 MB24 MB24 MB
Cores / Threads12 / 2014 / 20
6 x 5.0 GHz Intel Golden Cove P-Core
8 x 3.7 GHz Intel Gracemont E-Core
14 / 20
6 x 5.4 GHz Intel Golden Cove P-Core
8 x 4.1 GHz Intel Gracemont E-Core
TDP125 Watt45 Watt45 Watt
Technology10 nm10 nm10 nm
max. Temp.100 °C100 °C100 °C
SocketLGA1700BGA1744FCBGA1792
FeaturesDDR4-3200/DDR5-4800 RAM, PCIe 5, Thr. Dir., DL Boost, GNA, vPro Enterp., MMX, SSE, SSE2, SSE3, SSSE3, SSE4.1, SSE4.2, AVX, AVX2, BMI2, ABM, FMA, ADX, SMEP, SMAP, EIST, TM1, TM2, HT, Turbo, SST, AES-NI, RDRAND, RDSEED, SHADDR4-3200/LPDDR4x-4266/DDR5-5200/LPDDR5-6400/LPDDR5x-6400 RAM, PCIe 5, Thr. Dir., DL Boost, GNA, MMX, SSE, SSE2, SSE3, SSSE3, SSE4.1, SSE4.2, AVX, AVX2, BMI2, ABM, FMA, ADX, SMEP, SMAP, EIST, TM1, TM2, HT, Turbo, SST, AES-NI, RDRAND, RDSEED, SHAThread Director
iGPUIntel UHD Graphics 770 (300 - 1500 MHz)Intel Iris Xe Graphics G7 96EUs ( - 1500 MHz)Intel Iris Xe Graphics G7 96EUs ( - 1500 MHz)
Architecturex86x86x86
$409 U.S.
Announced
Manufacturerark.intel.comark.intel.comark.intel.com
L1 Cache1.2 MB1.2 MB

Benchmarks

Performance Rating - CB R15 + R20 + 7-Zip + X265 + Blender + 3DM11 CPU - i7-12700K
41.2 pt (69%)
Restrict / Search: Model: Max. age: years
Performance Rating - CB R15 + R20 + 7-Zip + X265 + Blender + 3DM11 CPU - i7-13700H
39.4 pt (66%)
Restrict / Search: Model: Max. age: years
Performance Rating - CB R15 + R20 + 7-Zip + X265 + Blender + 3DM11 CPU - i9-13905H
37.7 pt (63%)
Restrict / Search: Model: Max. age: years
Cinebench 2024 - Cinebench 2024 CPU Single Core
111 Points (56%)
Cinebench 2024 - Cinebench 2024 CPU Multi Core
818 Points (15%)
Cinebench R23 - Cinebench R23 Multi Core
min: 17003     avg: 19784     median: 19784 (18%)     max: 22565 Points
min: 5890     avg: 15098     median: 15474 (14%)     max: 20034 Points
min: 17880     avg: 19384     median: 20034 (19%)     max: 20237 Points
Cinebench R23 - Cinebench R23 Single Core
min: 1806     avg: 1851     median: 1850.5 (75%)     max: 1895 Points
min: 1323     avg: 1798     median: 1856 (75%)     max: 1914 Points
min: 1652     avg: 1901     median: 2020 (82%)     max: 2030 Points
Cinebench R20 - Cinebench R20 CPU (Single Core)
min: 731     avg: 736     median: 735.5 (80%)     max: 740 Points
min: 508     avg: 694     median: 719 (78%)     max: 741 Points
min: 622     avg: 679     median: 639 (70%)     max: 775 Points
Cinebench R20 - Cinebench R20 CPU (Multi Core)
min: 6953     avg: 7801     median: 7800.5 (19%)     max: 8648 Points
min: 2322     avg: 5880     median: 5986 (15%)     max: 7674 Points
min: 6462     avg: 7028     median: 7152 (17%)     max: 7469 Points
Cinebench R15 - Cinebench R15 CPU Multi 64 Bit
3325 Points (21%)
min: 905     avg: 2419     median: 2496 (16%)     max: 2982 Points
min: 2676     avg: 2821     median: 2857 (18%)     max: 2931 Points
Cinebench R15 - Cinebench R15 CPU Single 64 Bit
272 Points (75%)
min: 213     avg: 260.5     median: 269 (75%)     max: 278 Points
min: 235     avg: 255.3     median: 246 (68%)     max: 285 Points
Cinebench R11.5 - Cinebench R11.5 CPU Multi 64 Bit
38.4 Points (50%)
33.8 Points (44%)
Cinebench R11.5 - Cinebench R11.5 CPU Single 64 Bit
3.3 Points (78%)
3.3 Points (78%)
Cinebench R10 - Cinebench R10 Rend. Single (32bit)
9305 Points (56%)
min: 10126     avg: 10307     median: 10306.5 (62%)     max: 10487 Points
Cinebench R10 - Cinebench R10 Rend. Multi (32bit)
63484 Points (46%)
min: 43763     avg: 54693     median: 54693 (40%)     max: 65623 Points
Cinebench R10 - Cinebench R10 Rend. Multi (64bit)
102539 Points (65%)
min: 58980     avg: 79695     median: 79694.5 (51%)     max: 100409 Points
Cinebench R10 - Cinebench R10 Rend. Single (64bit)
15179 Points (18%)
min: 14555     avg: 14911     median: 14910.5 (18%)     max: 15266 Points
wPrime 2.10 - wPrime 2.0 1024m *
171.2 s (2%)
min: 208.804     avg: 442     median: 442 (5%)     max: 675.203 s
wPrime 2.10 - wPrime 2.0 32m *
2.7 s (1%)
min: 2.935     avg: 4     median: 4 (1%)     max: 5.1 s
WinRAR - WinRAR 4.0
10389 Points (16%)
min: 7310     avg: 7435     median: 7434.5 (12%)     max: 7559 Points
7-Zip 18.03 - 7-Zip 18.03 Multi Thread 4 runs
min: 65508     avg: 73439     median: 73438.5 (42%)     max: 81369 MIPS
min: 27322     avg: 60430     median: 60842 (35%)     max: 76344 MIPS
min: 68880     avg: 71701     median: 69892 (40%)     max: 76332 MIPS
7-Zip 18.03 - 7-Zip 18.03 Single Thread 4 runs
min: 6117     avg: 6270     median: 6269.5 (74%)     max: 6422 MIPS
min: 4825     avg: 5863     median: 6027 (71%)     max: 6238 MIPS
min: 4871     avg: 5487     median: 5520 (65%)     max: 6069 MIPS
X264 HD Benchmark 4.0 - x264 Pass 2
179 fps (5%)
min: 97.7     avg: 132.6     median: 132.6 (3%)     max: 167.5 fps
X264 HD Benchmark 4.0 - x264 Pass 1
349.5 fps (9%)
min: 267     avg: 303.8     median: 303.8 (8%)     max: 340.5 fps
HWBOT x265 Benchmark v2.2 - HWBOT x265 4k Preset
min: 14.9     avg: 20.5     median: 20.5 (36%)     max: 26.1 fps
min: 6.72     avg: 16.6     median: 16.8 (30%)     max: 21.2 fps
min: 20.5     avg: 21.5     median: 21.2 (37%)     max: 22.9 fps
TrueCrypt - TrueCrypt Serpent
1.6 GB/s (47%)
min: 1.1     avg: 1.3     median: 1.3 (38%)     max: 1.5 GB/s
TrueCrypt - TrueCrypt Twofish
2.8 GB/s (48%)
min: 2.1     avg: 2.5     median: 2.5 (43%)     max: 2.9 GB/s
TrueCrypt - TrueCrypt AES
15.7 GB/s (41%)
min: 10.9     avg: 13.5     median: 13.5 (35%)     max: 16.1 GB/s
Blender - Blender 3.3 Classroom CPU *
min: 295     avg: 410.4     median: 386 (5%)     max: 907 Seconds
min: 280     avg: 296     median: 302 (4%)     max: 306 Seconds
Blender - Blender 2.79 BMW27 CPU *
min: 152.3     avg: 173.1     median: 173.1 (1%)     max: 193.9 Seconds
min: 169     avg: 232.6     median: 217 (2%)     max: 555 Seconds
min: 163     avg: 171.3     median: 173 (1%)     max: 178 Seconds
R Benchmark 2.5 - R Benchmark 2.5 *
min: 0.412     avg: 0.4     median: 0.4 (9%)     max: 0.423 sec
min: 0.4308     avg: 0.5     median: 0.4 (10%)     max: 0.607 sec
min: 0.4178     avg: 0.5     median: 0.5 (10%)     max: 0.4974 sec
3DMark 06 - CPU - 3DMark 06 - CPU
16827 Points (36%)
min: 10981     avg: 14929     median: 15371 (33%)     max: 19810 Points
Super Pi mod 1.5 XS 1M - Super Pi mod 1.5 XS 1M *
7.3 s (2%)
min: 6.58     avg: 6.7     median: 6.7 (1%)     max: 6.797 s
Super Pi mod 1.5 XS 2M - Super Pi mod 1.5 XS 2M *
16.6 s (1%)
min: 14.61     avg: 14.7     median: 14.7 (1%)     max: 14.75 s
Super Pi Mod 1.5 XS 32M - Super Pi mod 1.5 XS 32M *
387 s (2%)
371.9 s (2%)
3DMark Vantage - 3DM Vant. Perf. CPU no Physx
93250 Points (72%)
min: 46783     avg: 63290     median: 63290 (49%)     max: 79797 Points
3DMark 11 - 3DM11 Performance Physics
min: 23129     avg: 24947     median: 24947 (61%)     max: 26765 Points
min: 7388     avg: 19747     median: 20456 (50%)     max: 25179 Points
min: 22494     avg: 23911     median: 23894 (59%)     max: 25346 Points
3DMark - 3DMark Ice Storm Physics
109742 Points (89%)
min: 81147     avg: 90147     median: 90672 (74%)     max: 100286 Points
3DMark - 3DMark Ice Storm Extreme Physics
112268 Points (91%)
min: 82858     avg: 93935     median: 94043 (76%)     max: 104795 Points
3DMark - 3DMark Ice Storm Unlimited Physics
109389 Points (88%)
min: 89385     avg: 98599     median: 99315.5 (80%)     max: 106378 Points
3DMark - 3DMark Cloud Gate Physics
min: 21804     avg: 23017     median: 23017 (58%)     max: 24230 Points
min: 7531     avg: 17006     median: 17735.5 (45%)     max: 22289 Points
21588 Points (55%)
3DMark - 3DMark Fire Strike Standard Physics
min: 31240     avg: 34160     median: 34159.5 (61%)     max: 37079 Points
min: 4242     avg: 24409     median: 25981 (46%)     max: 30010 Points
min: 27625     avg: 29475     median: 29193 (52%)     max: 31606 Points
3DMark - 3DMark Time Spy CPU
min: 13915     avg: 15550     median: 15550 (66%)     max: 17185 Points
min: 4312     avg: 10357     median: 10993 (46%)     max: 13904 Points
min: 12800     avg: 13567     median: 13653 (58%)     max: 14249 Points
Geekbench 6.5 - Geekbench 6.5 Single-Core
2580 Points (60%)
min: 2316     avg: 2556     median: 2610 (60%)     max: 2639 Points
2404 Points (56%)
Geekbench 6.5 - Geekbench 6.5 Multi-Core
16200 Points (63%)
min: 8415     avg: 11709     median: 11809 (46%)     max: 13832 Points
14212 Points (55%)
Geekbench 6.0 - Geekbench 6.0 Single-Core
min: 2221     avg: 2450     median: 2511.5 (80%)     max: 2549 Points
2152 Points (68%)
Geekbench 6.0 - Geekbench 6.0 Multi-Core
min: 11159     avg: 12536     median: 12235.5 (50%)     max: 14121 Points
12937 Points (53%)
Geekbench 5.5 - Geekbench 5.1 - 5.5 64 Bit Single-Core
min: 1890     avg: 1912     median: 1911.5 (64%)     max: 1933 Points
min: 1362     avg: 1794     median: 1829 (61%)     max: 1919 Points
min: 1672     avg: 1774     median: 1685 (57%)     max: 1966 Points
Geekbench 5.5 - Geekbench 5.1 - 5.5 64 Bit Multi-Core
min: 12475     avg: 14016     median: 14016 (25%)     max: 15557 Points
min: 6165     avg: 11675     median: 11831 (21%)     max: 14215 Points
min: 13661     avg: 14122     median: 13707 (25%)     max: 14999 Points
Geekbench 5.0 - Geekbench 5.0 64 Bit Single-Core
min: 1835     avg: 1841     median: 1840.5 (8%)     max: 1846 Points
min: 1761     avg: 1815     median: 1823 (8%)     max: 1854 Points
1898 Points (8%)
Geekbench 5.0 - Geekbench 5.0 64 Bit Multi-Core
min: 12318     avg: 13879     median: 13879 (44%)     max: 15440 Points
min: 8740     avg: 12106     median: 13027 (41%)     max: 13628 Points
14690 Points (46%)
Geekbench 4.4 - Geekbench 4.1 - 4.4 64 Bit Single-Core
8133 Points (81%)
min: 7830     avg: 7957     median: 7956.5 (79%)     max: 8083 Points
Geekbench 4.4 - Geekbench 4.1 - 4.4 64 Bit Multi-Core
55786 Points (55%)
min: 34337     avg: 42578     median: 42578 (42%)     max: 50819 Points
Mozilla Kraken 1.1 - Kraken 1.1 Total Score *
min: 496     avg: 498     median: 498 (1%)     max: 500 ms
min: 490     avg: 513     median: 500 (1%)     max: 570 ms
min: 465     avg: 522     median: 545 (1%)     max: 557 ms
Octane V2 - Octane V2 Total Score
min: 78885     avg: 90890     median: 92987 (61%)     max: 96738 Points
WebXPRT 4 - WebXPRT 4 Score
min: 208     avg: 262.3     median: 269 (70%)     max: 325 Points
min: 243     avg: 265.5     median: 265.5 (69%)     max: 288 Points
WebXPRT 3 - WebXPRT 3 Score
min: 301     avg: 303.5     median: 303.5 (54%)     max: 306 Points
min: 215     avg: 288.8     median: 295.5 (53%)     max: 321 Points
min: 267     avg: 301.5     median: 301.5 (54%)     max: 336 Points
CrossMark - CrossMark Overall
1999 Points (75%)
min: 1205     avg: 1750     median: 1760 (66%)     max: 2073 Points
min: 1774     avg: 1884     median: 1883.5 (70%)     max: 1993 Points
Power Consumption - Prime95 Power Consumption - external Monitor *
min: 132.1     avg: 206.6     median: 206.6 (36%)     max: 281 Watt
min: 37.8     avg: 87.6     median: 82.1 (14%)     max: 148 Watt
min: 139.4     avg: 140     median: 140 (24%)     max: 140.6 Watt
Power Consumption - Cinebench R15 Multi Power Consumption - external Monitor *
278.2 Watt (51%)
min: 61.4     avg: 111.7     median: 112.4 (21%)     max: 166 Watt
168.6 Watt (31%)
Power Consumption - Idle Power Consumption - external Monitor *
min: 4.1     avg: 13.1     median: 14.3 (9%)     max: 24.4 Watt
min: 16     avg: 16.6     median: 16.6 (11%)     max: 17.2 Watt
Power Consumption - Idle Power Consumption 150cd 1min *
min: 5.21     avg: 11.4     median: 11.3 (8%)     max: 20.1 Watt
min: 11.7     avg: 15.8     median: 15.8 (11%)     max: 19.9 Watt
Power Consumption - Power Efficiency - Cinebench R15 Multi external Monitor
12 Points per Watt (9%)
min: 17.9     avg: 23.5     median: 23.3 (17%)     max: 29.6 Points per Watt
16.9 Points per Watt (13%)

Average Benchmarks Intel Core i7-12700K → 100% n=24

Average Benchmarks Intel Core i7-13700H → 87% n=24

Average Benchmarks Intel Core i9-13905H → 94% n=24

- Range of benchmark values for this graphics card
red legend - Average benchmark values for this graphics card
* Smaller numbers mean a higher performance
1 This benchmark is not used for the average calculation

v1.35
log 08. 05:20:26

#0 ran 0s before starting gpusingle class +0s ... 0s

#1 checking url part for id 14033 +0s ... 0s

#2 checking url part for id 14721 +0s ... 0s

#3 checking url part for id 14983 +0s ... 0s

#4 redirected to Ajax server, took 1765167626s time from redirect:0 +0s ... 0s

#5 did not recreate cache, as it is less than 5 days old! Created at Sun, 07 Dec 2025 05:18:56 +0100 +0s ... 0s

#6 composed specs +0.008s ... 0.008s

#7 did output specs +0s ... 0.008s

#8 getting avg benchmarks for device 14033 +0.004s ... 0.012s

#9 got single benchmarks 14033 +0.006s ... 0.018s

#10 getting avg benchmarks for device 14721 +0.005s ... 0.022s

#11 got single benchmarks 14721 +0.04s ... 0.062s

#12 getting avg benchmarks for device 14983 +0.004s ... 0.066s

#13 got single benchmarks 14983 +0.007s ... 0.073s

#14 got avg benchmarks for devices +0s ... 0.073s

#15 min, max, avg, median took s +0.083s ... 0.156s

#16 return log +0s ... 0.156s

Please share our article, every link counts!
Mail Logo
> Expert Reviews and News on Laptops, Smartphones and Tech Innovations > Benchmarks / Tech > Processor Comparison - Head 2 Head
Redaktion, 2017-09- 8 (Update: 2023-07- 1)