




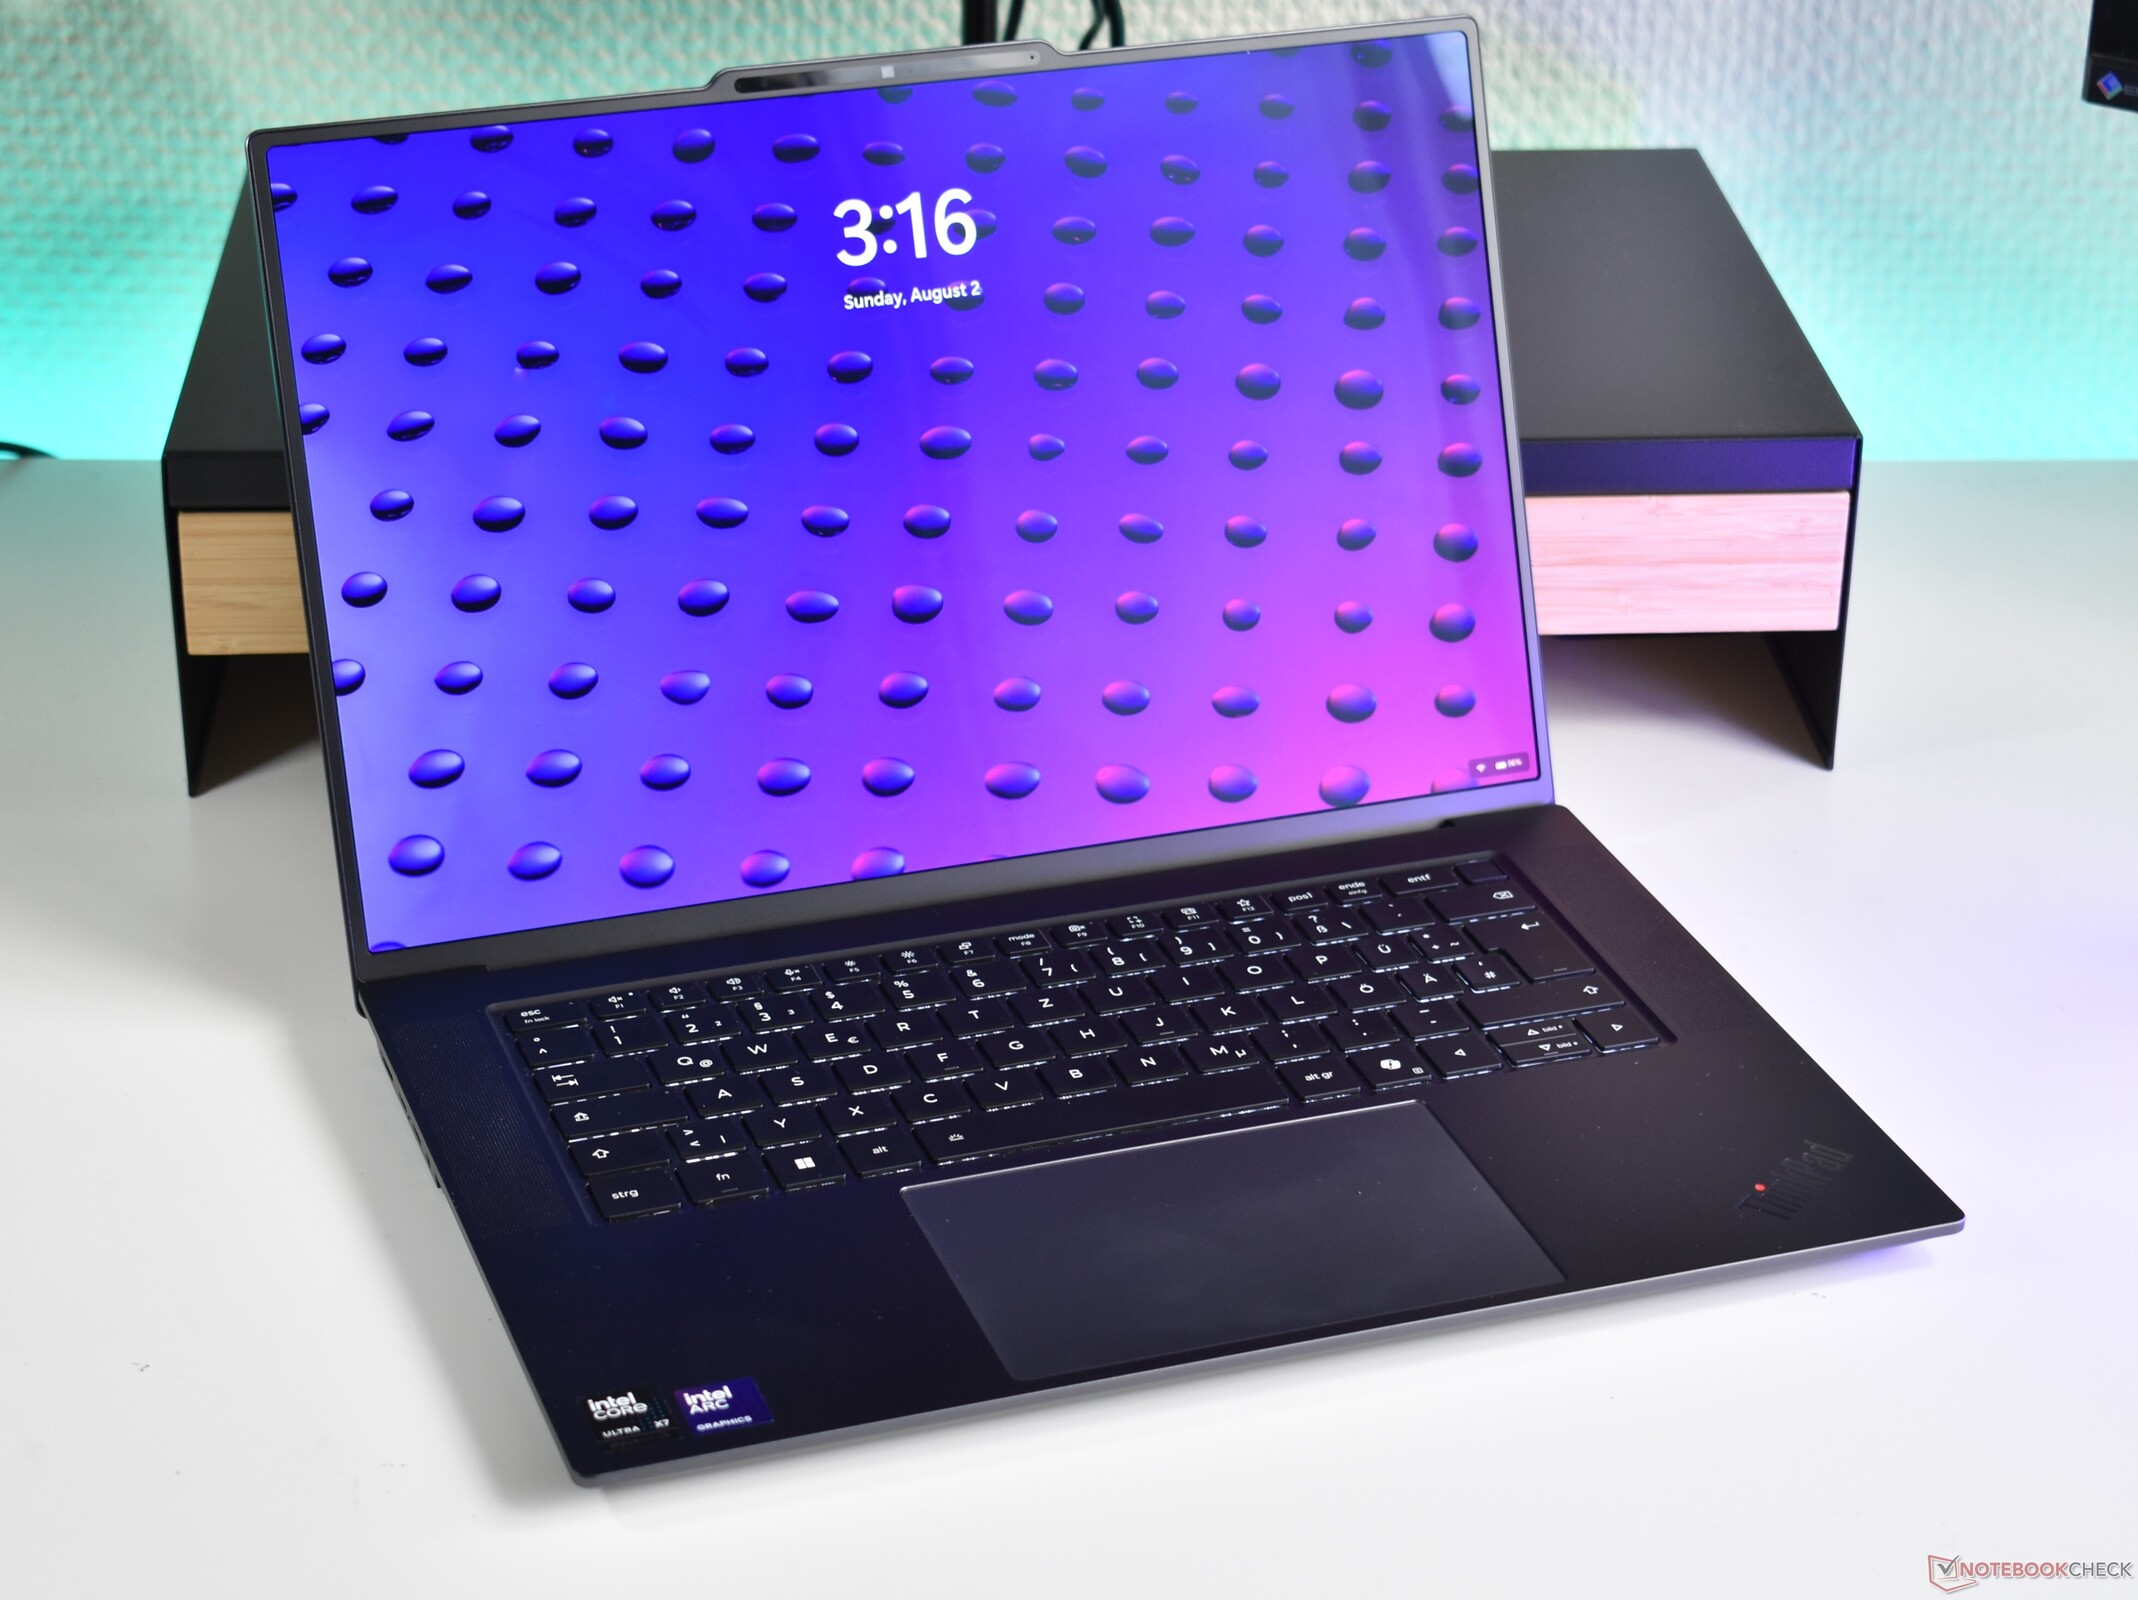
Verdict: A strong contender against Macs
With the X9-15, Lenovo released a competitor to the Apple MacBook Air 15 in 2025. With the 2026 addition to the ThinkPad X9 series, the Lenovo ThinkPad X9-15p Gen 1 Aura Edition, things are a bit less clear-cut: This device is more powerful than the older model, but not quite on the same level as a MacBook Pro, for example. And of course, there is no 15-inch MacBook Pro, either.
In many ways, the ThinkPad X9-15p occupies a space between the MacBook Pro and MacBook Air: It is much more versatile and useful than the MacBook Air, with more ports and better memory options, but a bit less powerful than a MacBook Pro. From our point of view, this combination works: This is a high-quality laptop with many strong points and only a few real shortcomings. Overall, if you are looking for a powerful 15.3-inch work laptop, the Lenovo ThinkPad X9-15p Gen 1 is a very strong competitor and perhaps the best ThinkPad of the year, alongside the ThinkPad X1 Carbon Gen 14. Thanks to its minimum of 32 GB of RAM, this device should also serve you well over the long term.
Pros
Cons
Price and Availability
In the US, at the time of this review, the Lenovo ThinkPad X9-15p Gen 1 Aura Edition starts at roughly $1,950 at Lenovo.com.

- $1,699.95Lenovo Thinkpad X9-14 Gen 1 21QA0006US 14" Copilot+ PC Notebook - WUXGA - Intel Core Ultra 7 268V - vPro Technology - Intel Evo Platform - 32 GB - 1 TB SSD - English Keyboard - Black, Gray
- $1,153.99Lenovo ThinkPad X9-15 Gen 1 21Q60026US 15.3" Copilot+ PC Notebook - 2.8K - Intel Core Ultra 5 226V - Intel Evo Platform - 16 GB - 512 GB SSD - English Keyboard - Black, Arctic Gray
- $59.99RUNMEIJIA Laptop Cover Case for Lenovo ThinkPad X9-15 /X9-15p Gen 1 Aura Edition (15ʺ Intel) Series [not Compatible with Any Other Model] 2-in-1 PU Leather Detachable Notebook Sleeve (Black)
When Lenovo announced the ThinkPad X9 series in early 2025, it was clearly aimed at being an enterprise-friendly Apple MacBook Air competitor. In 2026, Lenovo expanded the line to also target the Apple MacBook Pro: With the Lenovo ThinkPad X9-15p Gen 1, the manufacturer places a much stronger focus on performance than it did with the earlier Lenovo ThinkPad X9-15, which was powered by Intel's Lunar Lake CPU series. Today, we are taking a look at its Intel Panther Lake successor.
Specifications: Core Ultra X7 and 15.3-inch screen
Case: The most MacBook-like ThinkPad
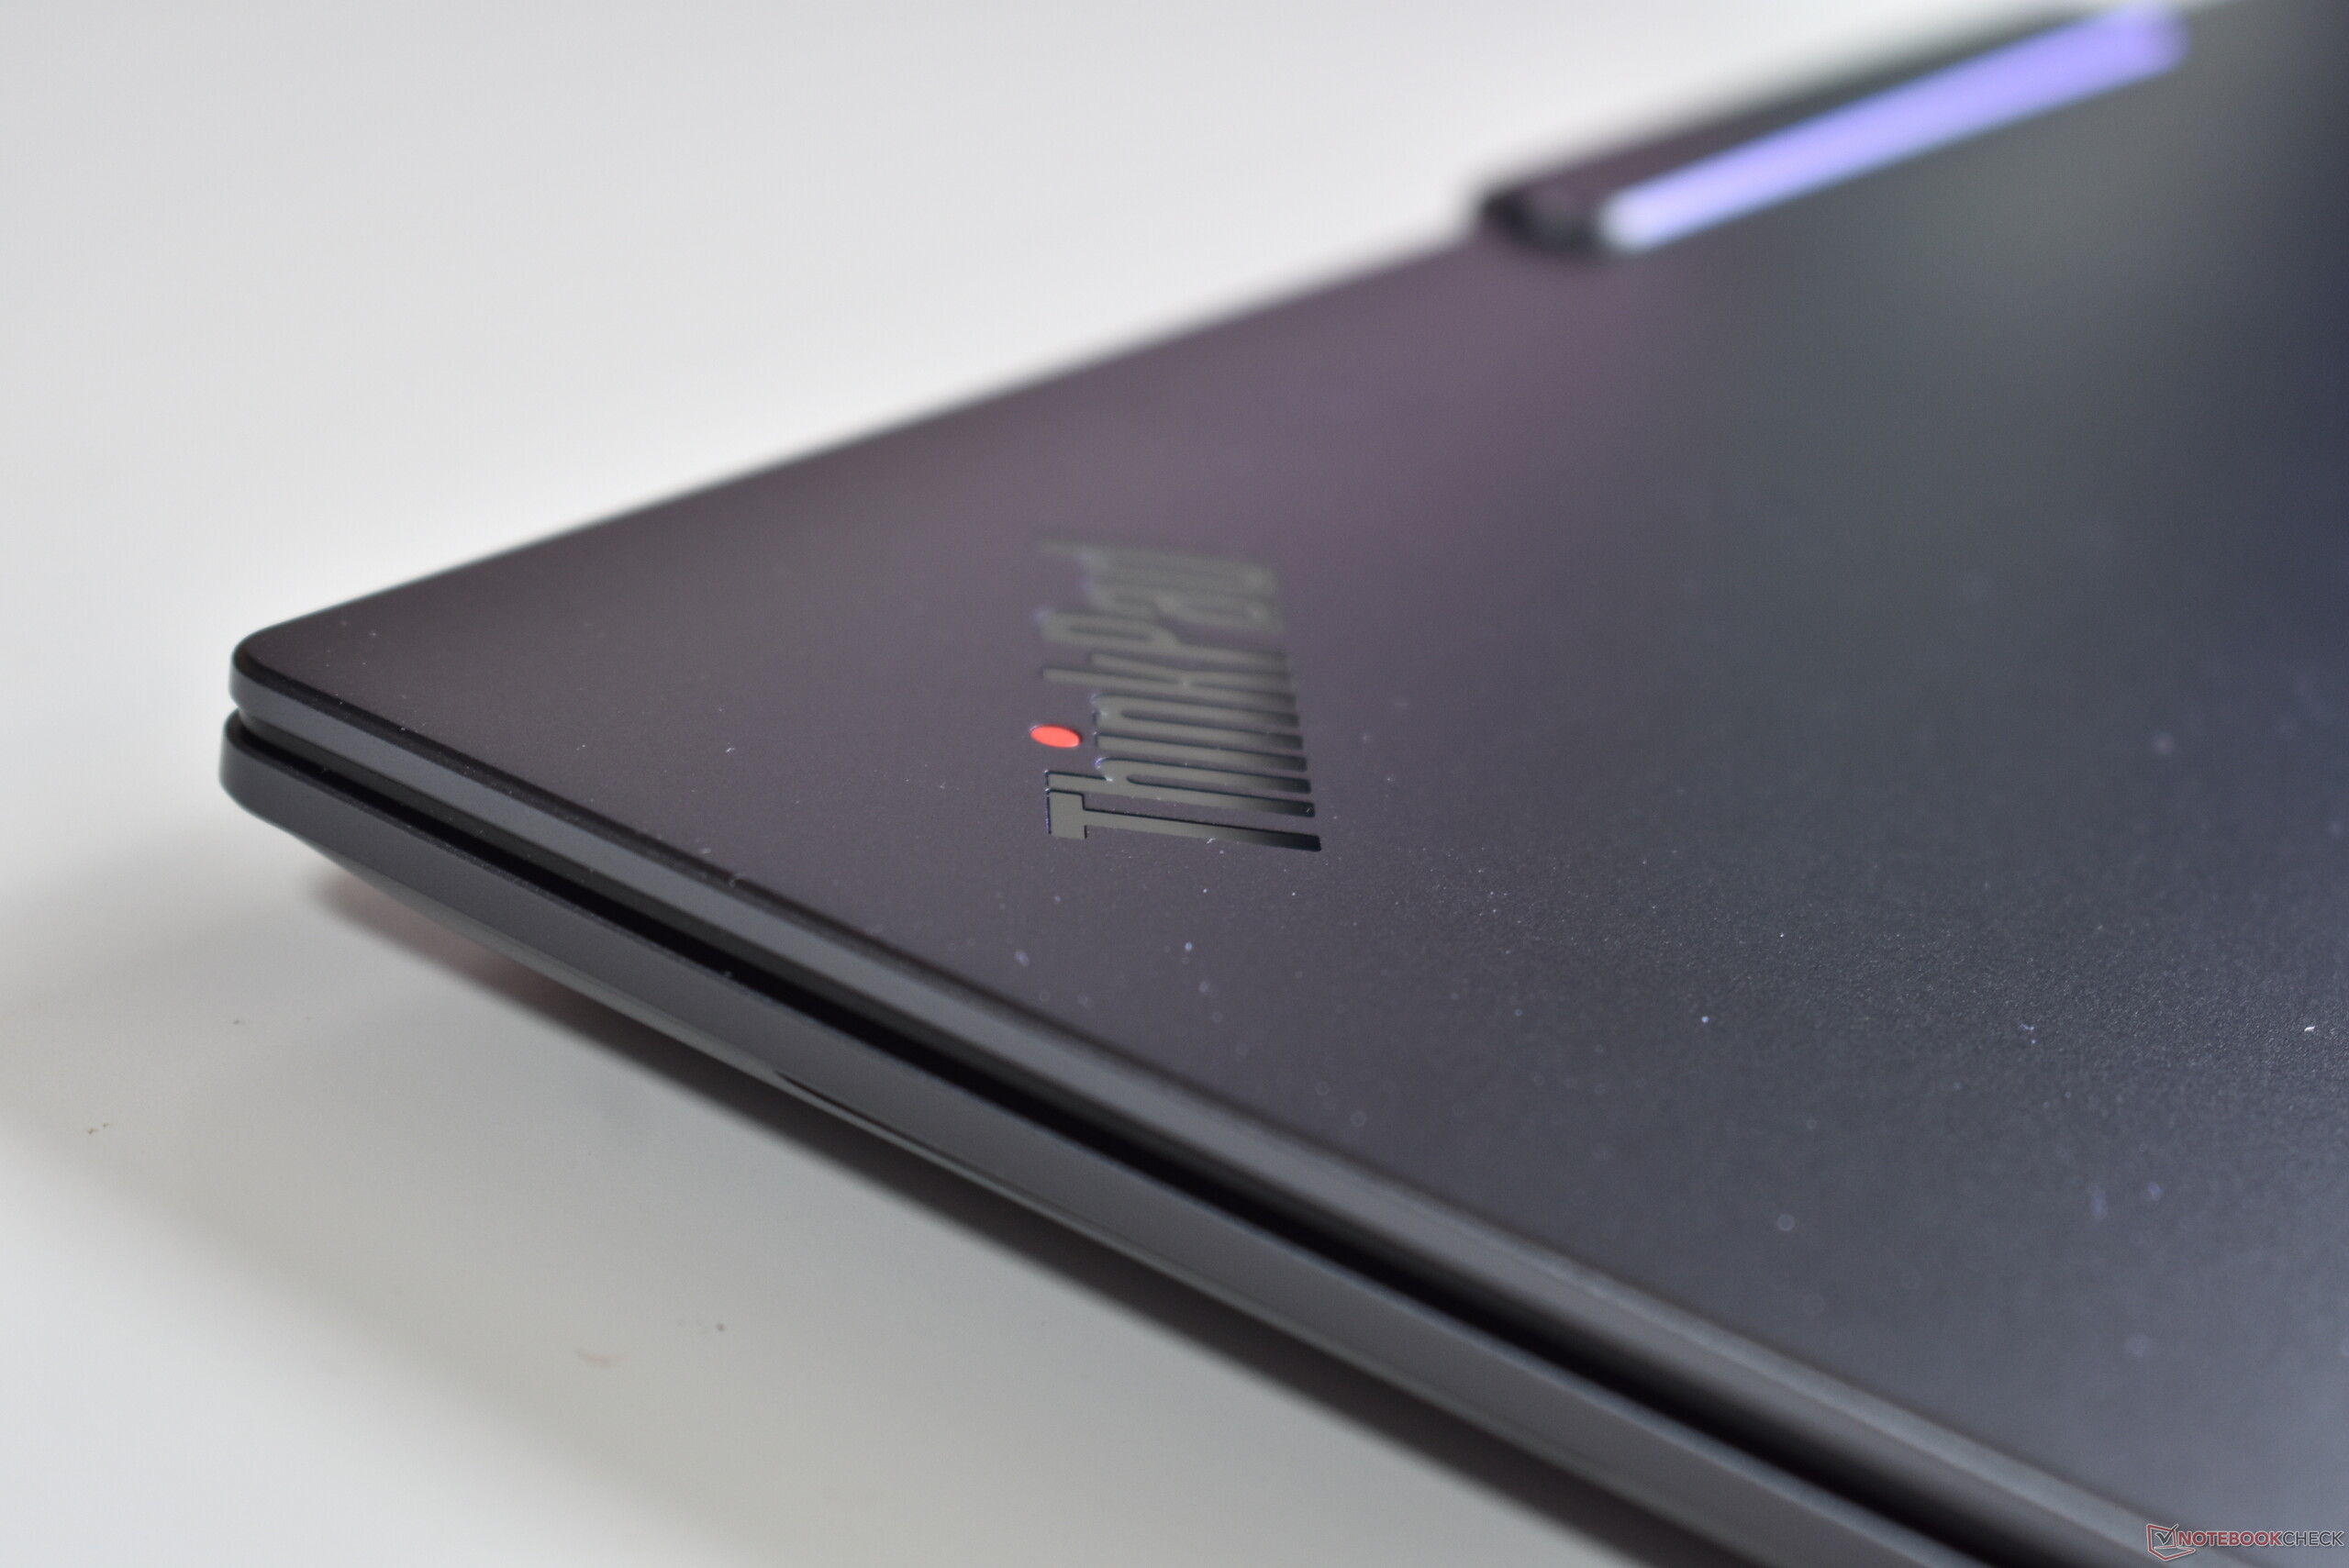
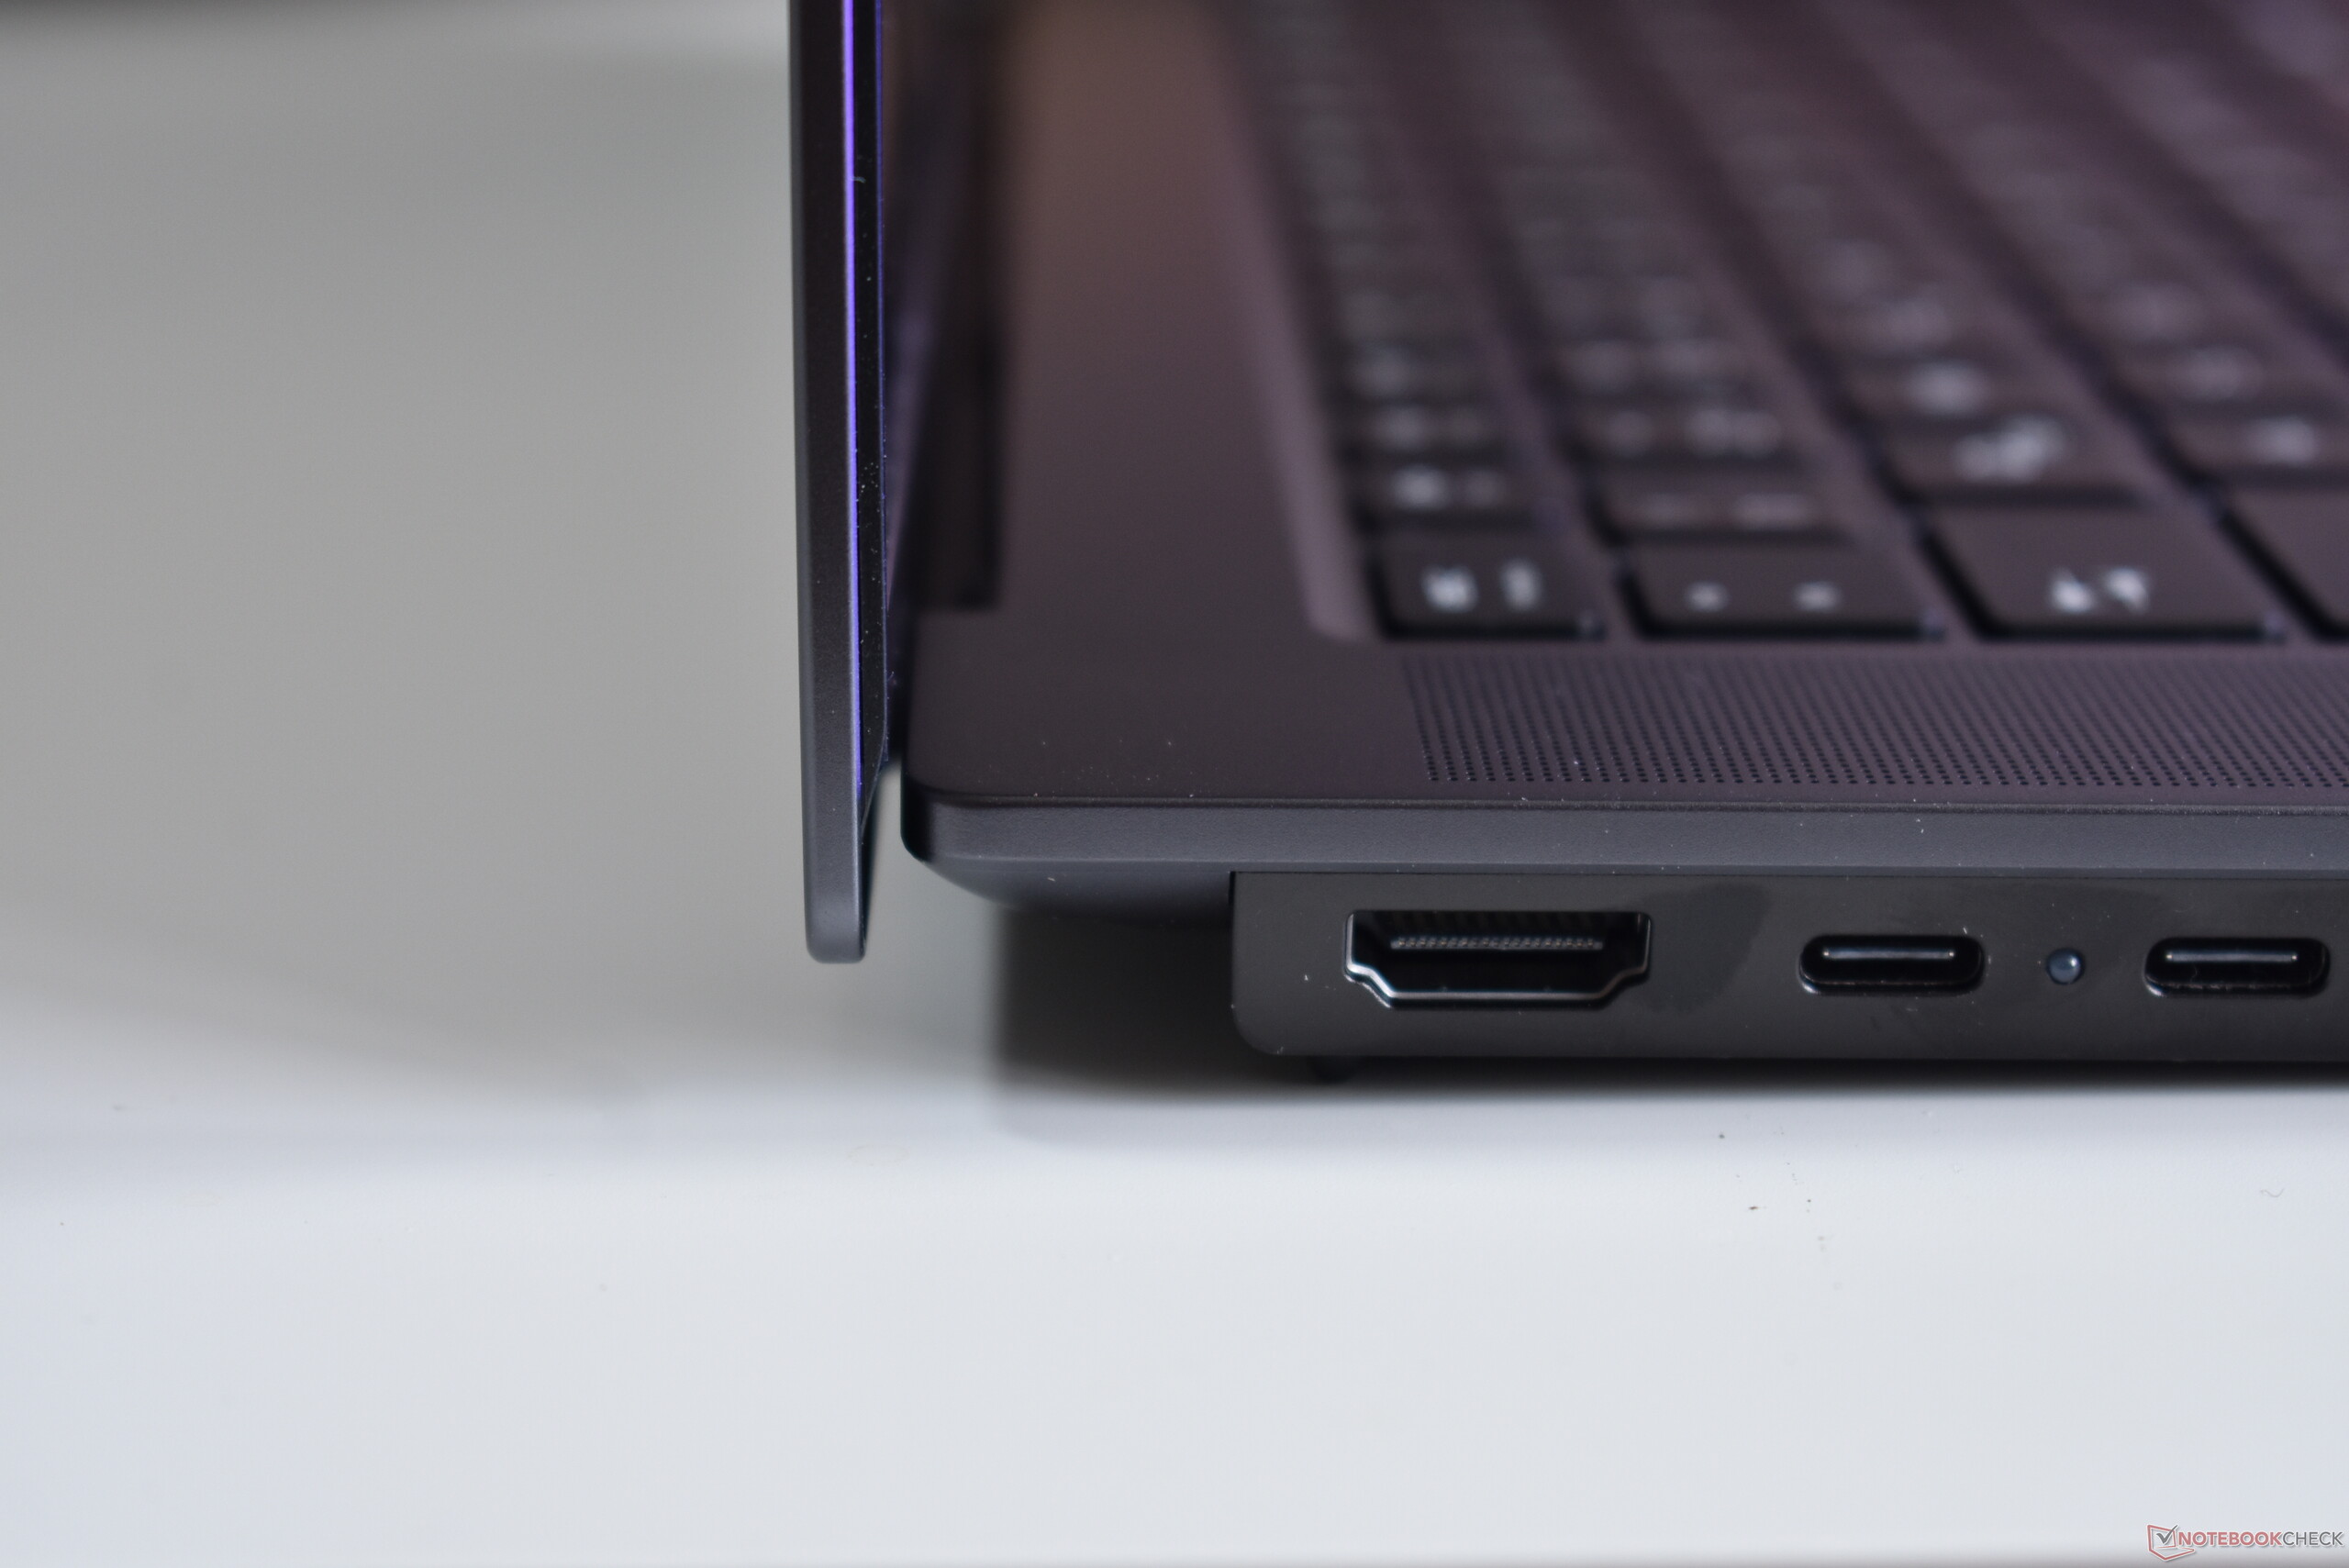
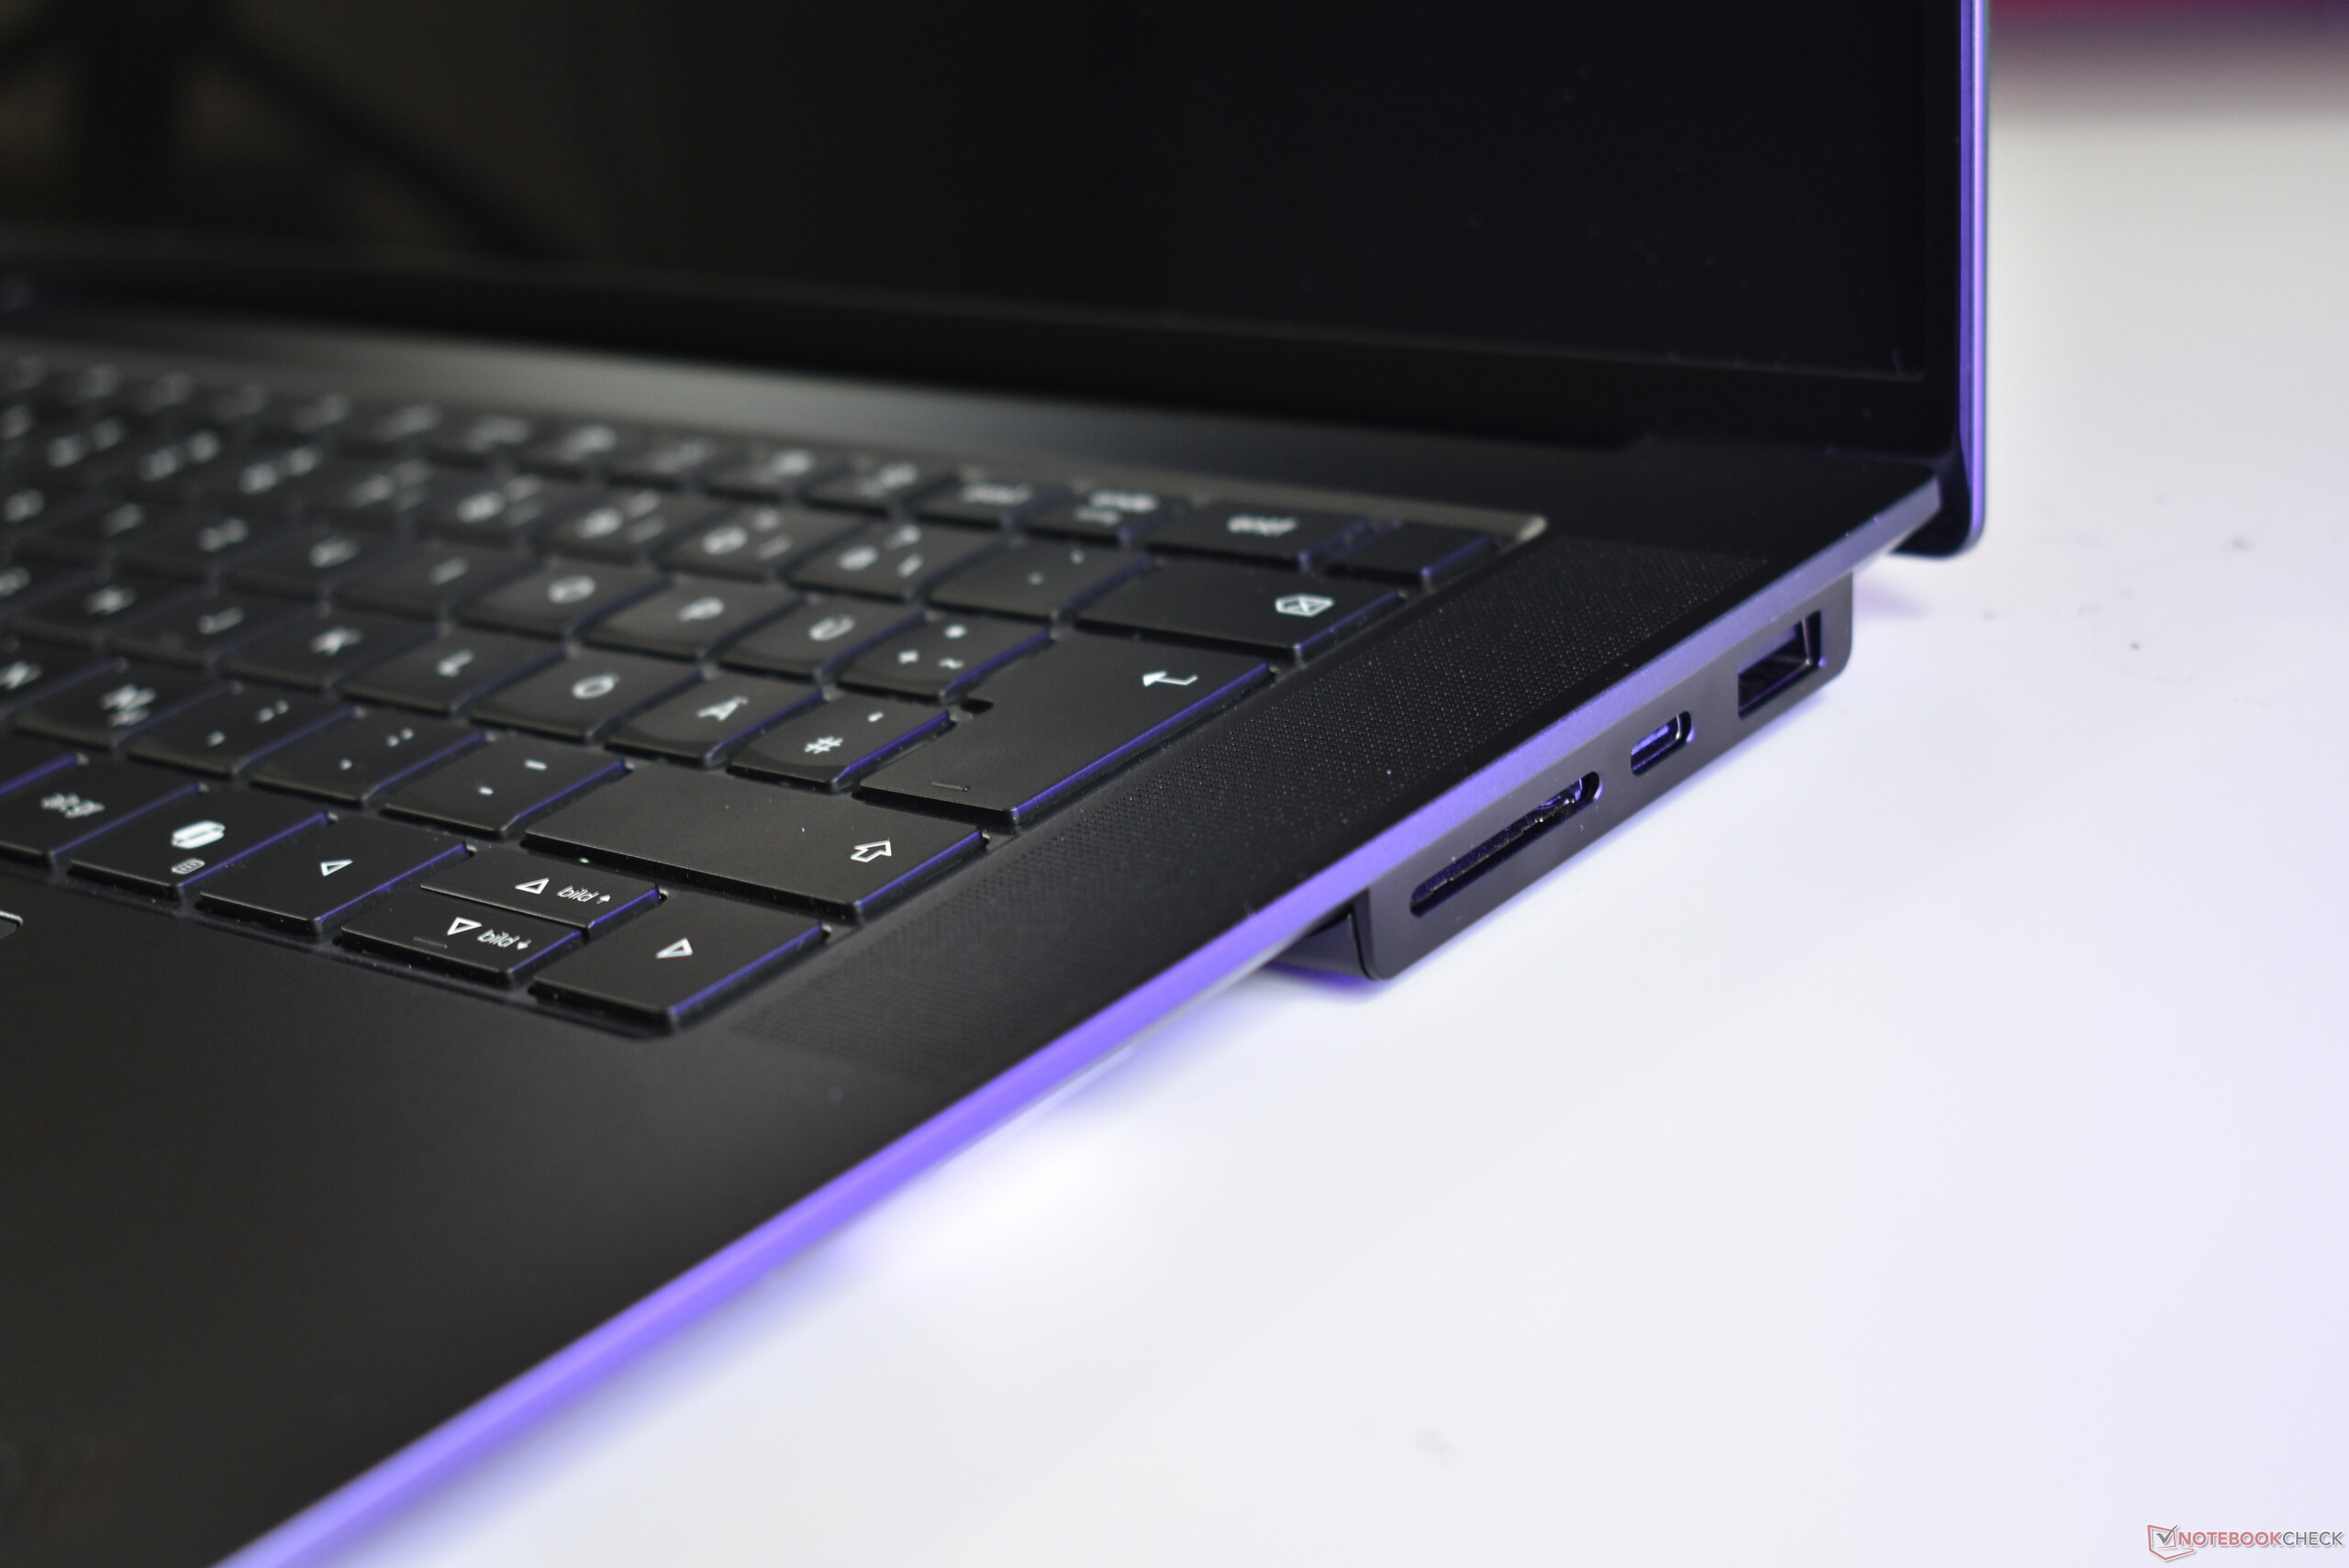
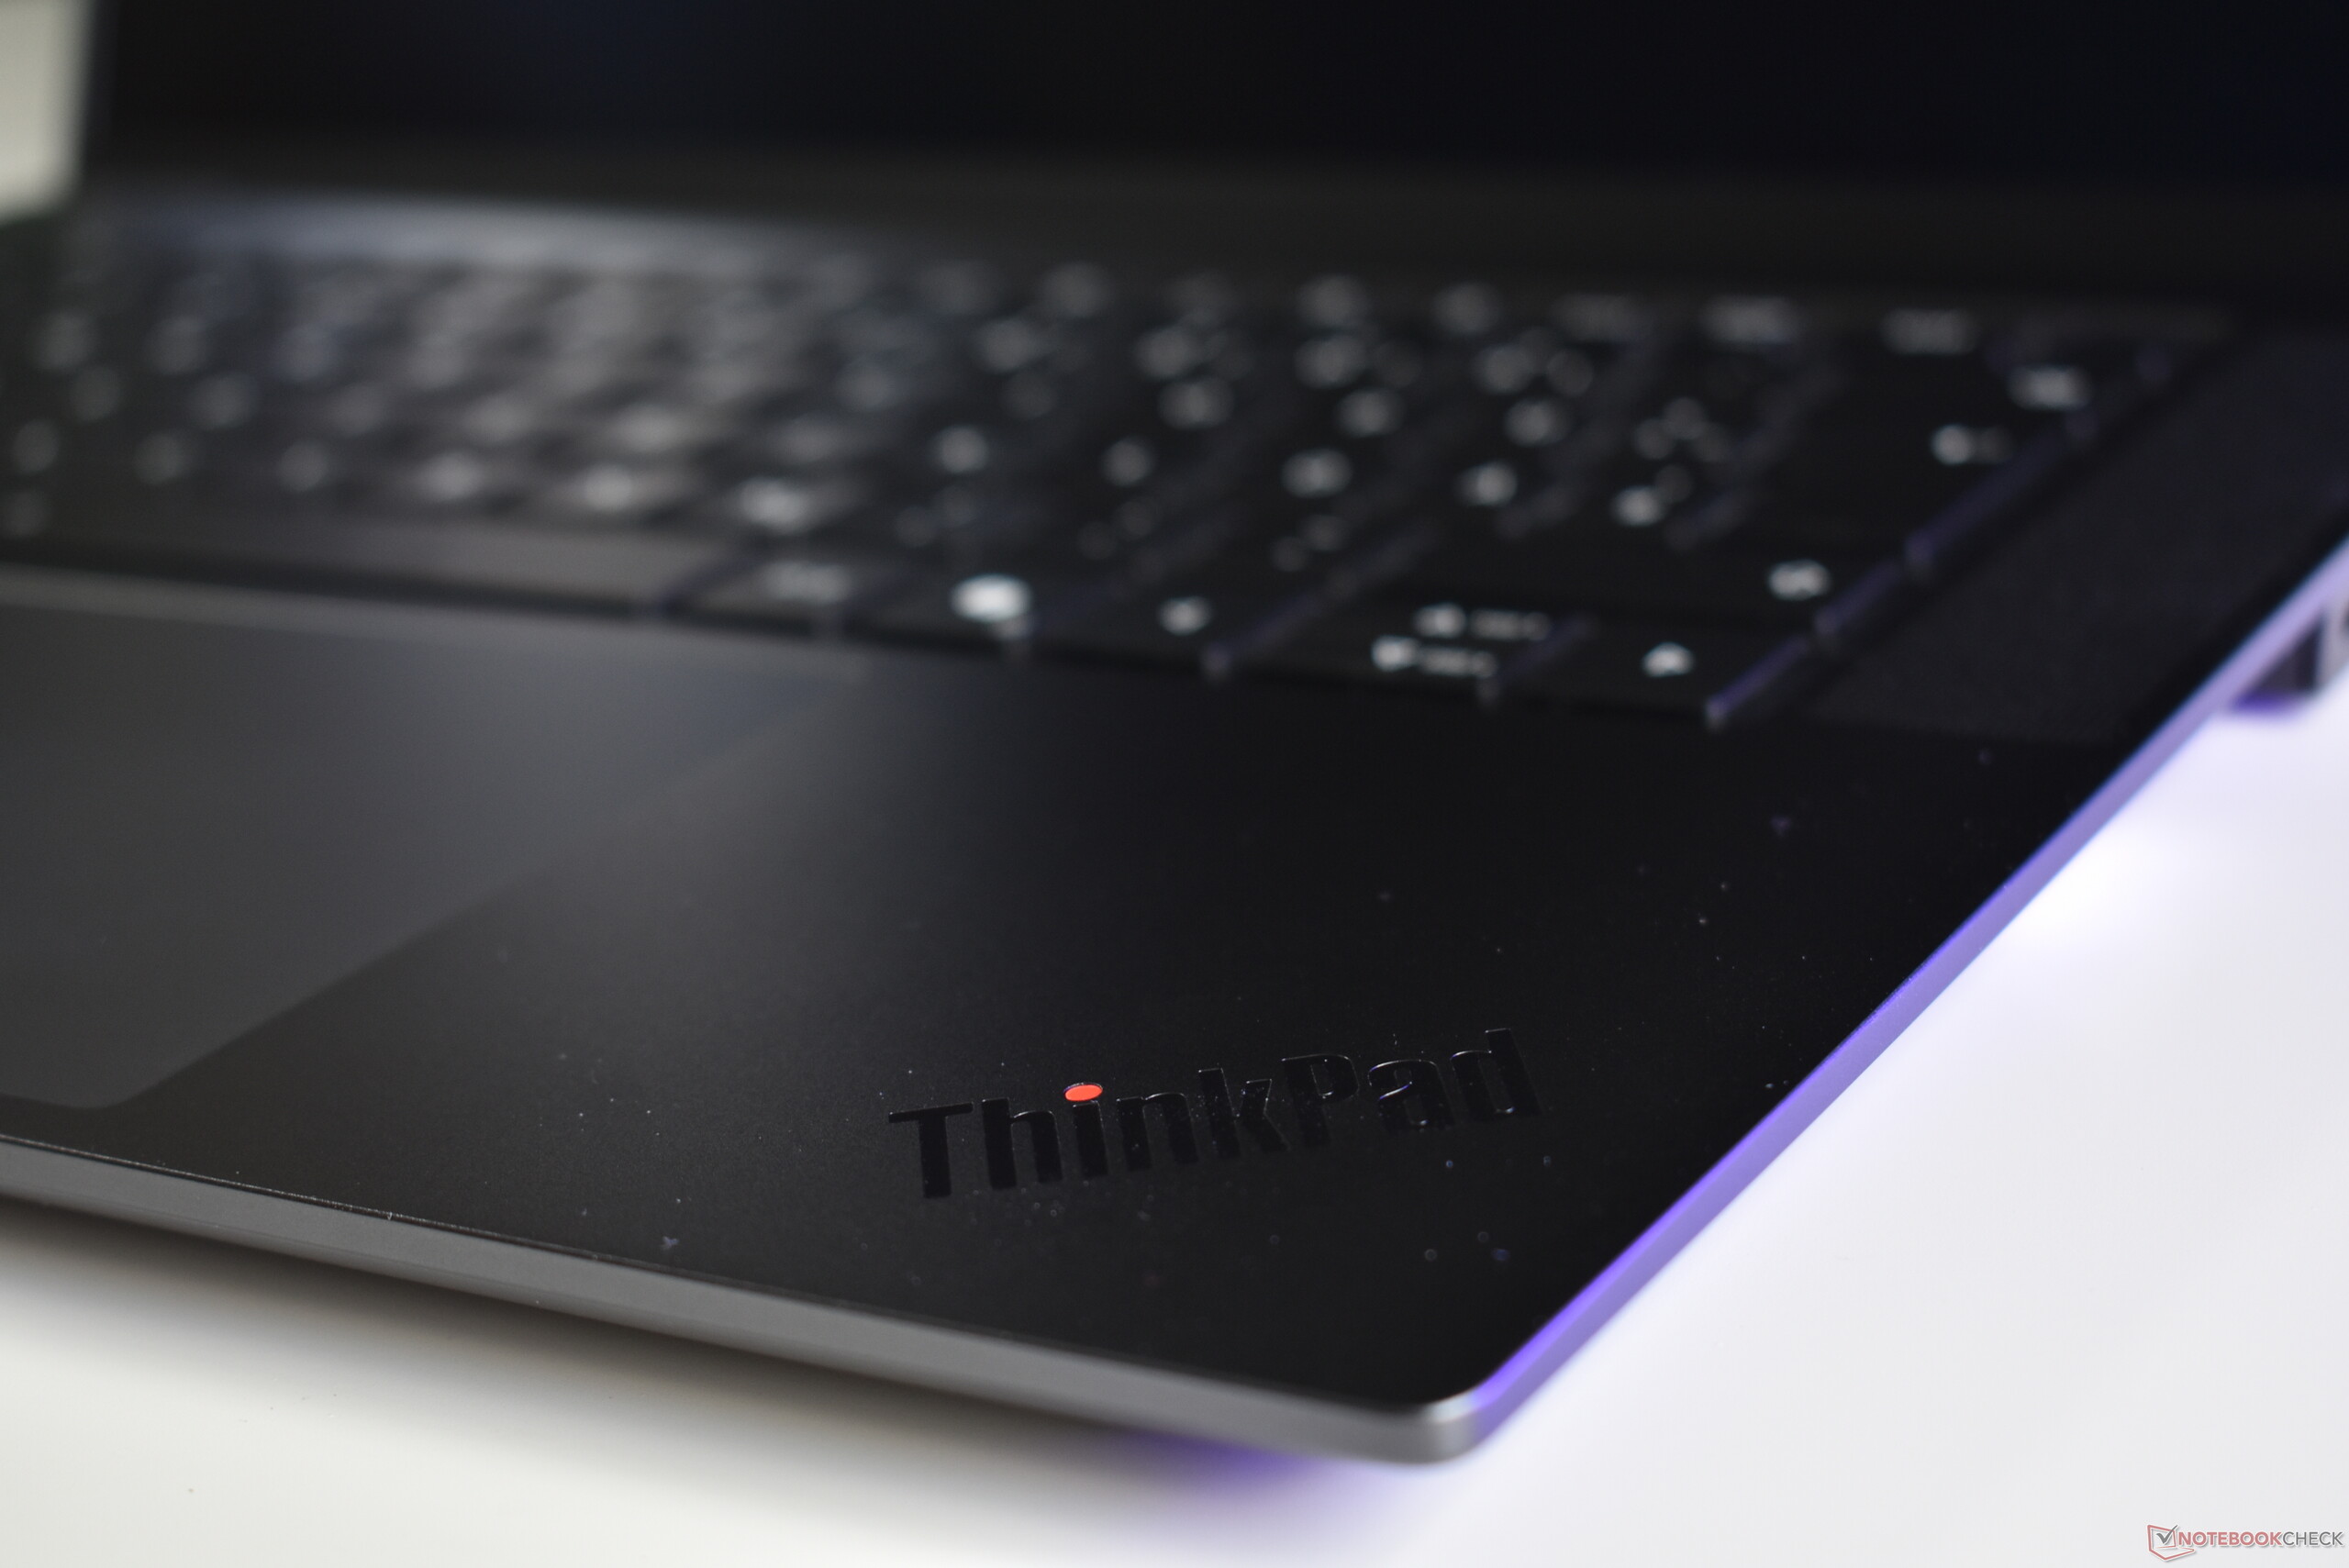
Compared with the earlier Lenovo ThinkPad X9-15, the new Lenovo ThinkPad X9-15p Gen 1 changes little in terms of design. This means that Lenovo still uses an all-aluminum chassis with a dark-gray colorway accentuated by some black elements, such as the keyboard, display bezel, and area around the ports. This black port section is a bit wider on the X9-15p to accommodate the additional ports and larger cooling fans. The X9-15p also has up-firing speakers with large speaker grilles to the left and right of the keyboard.
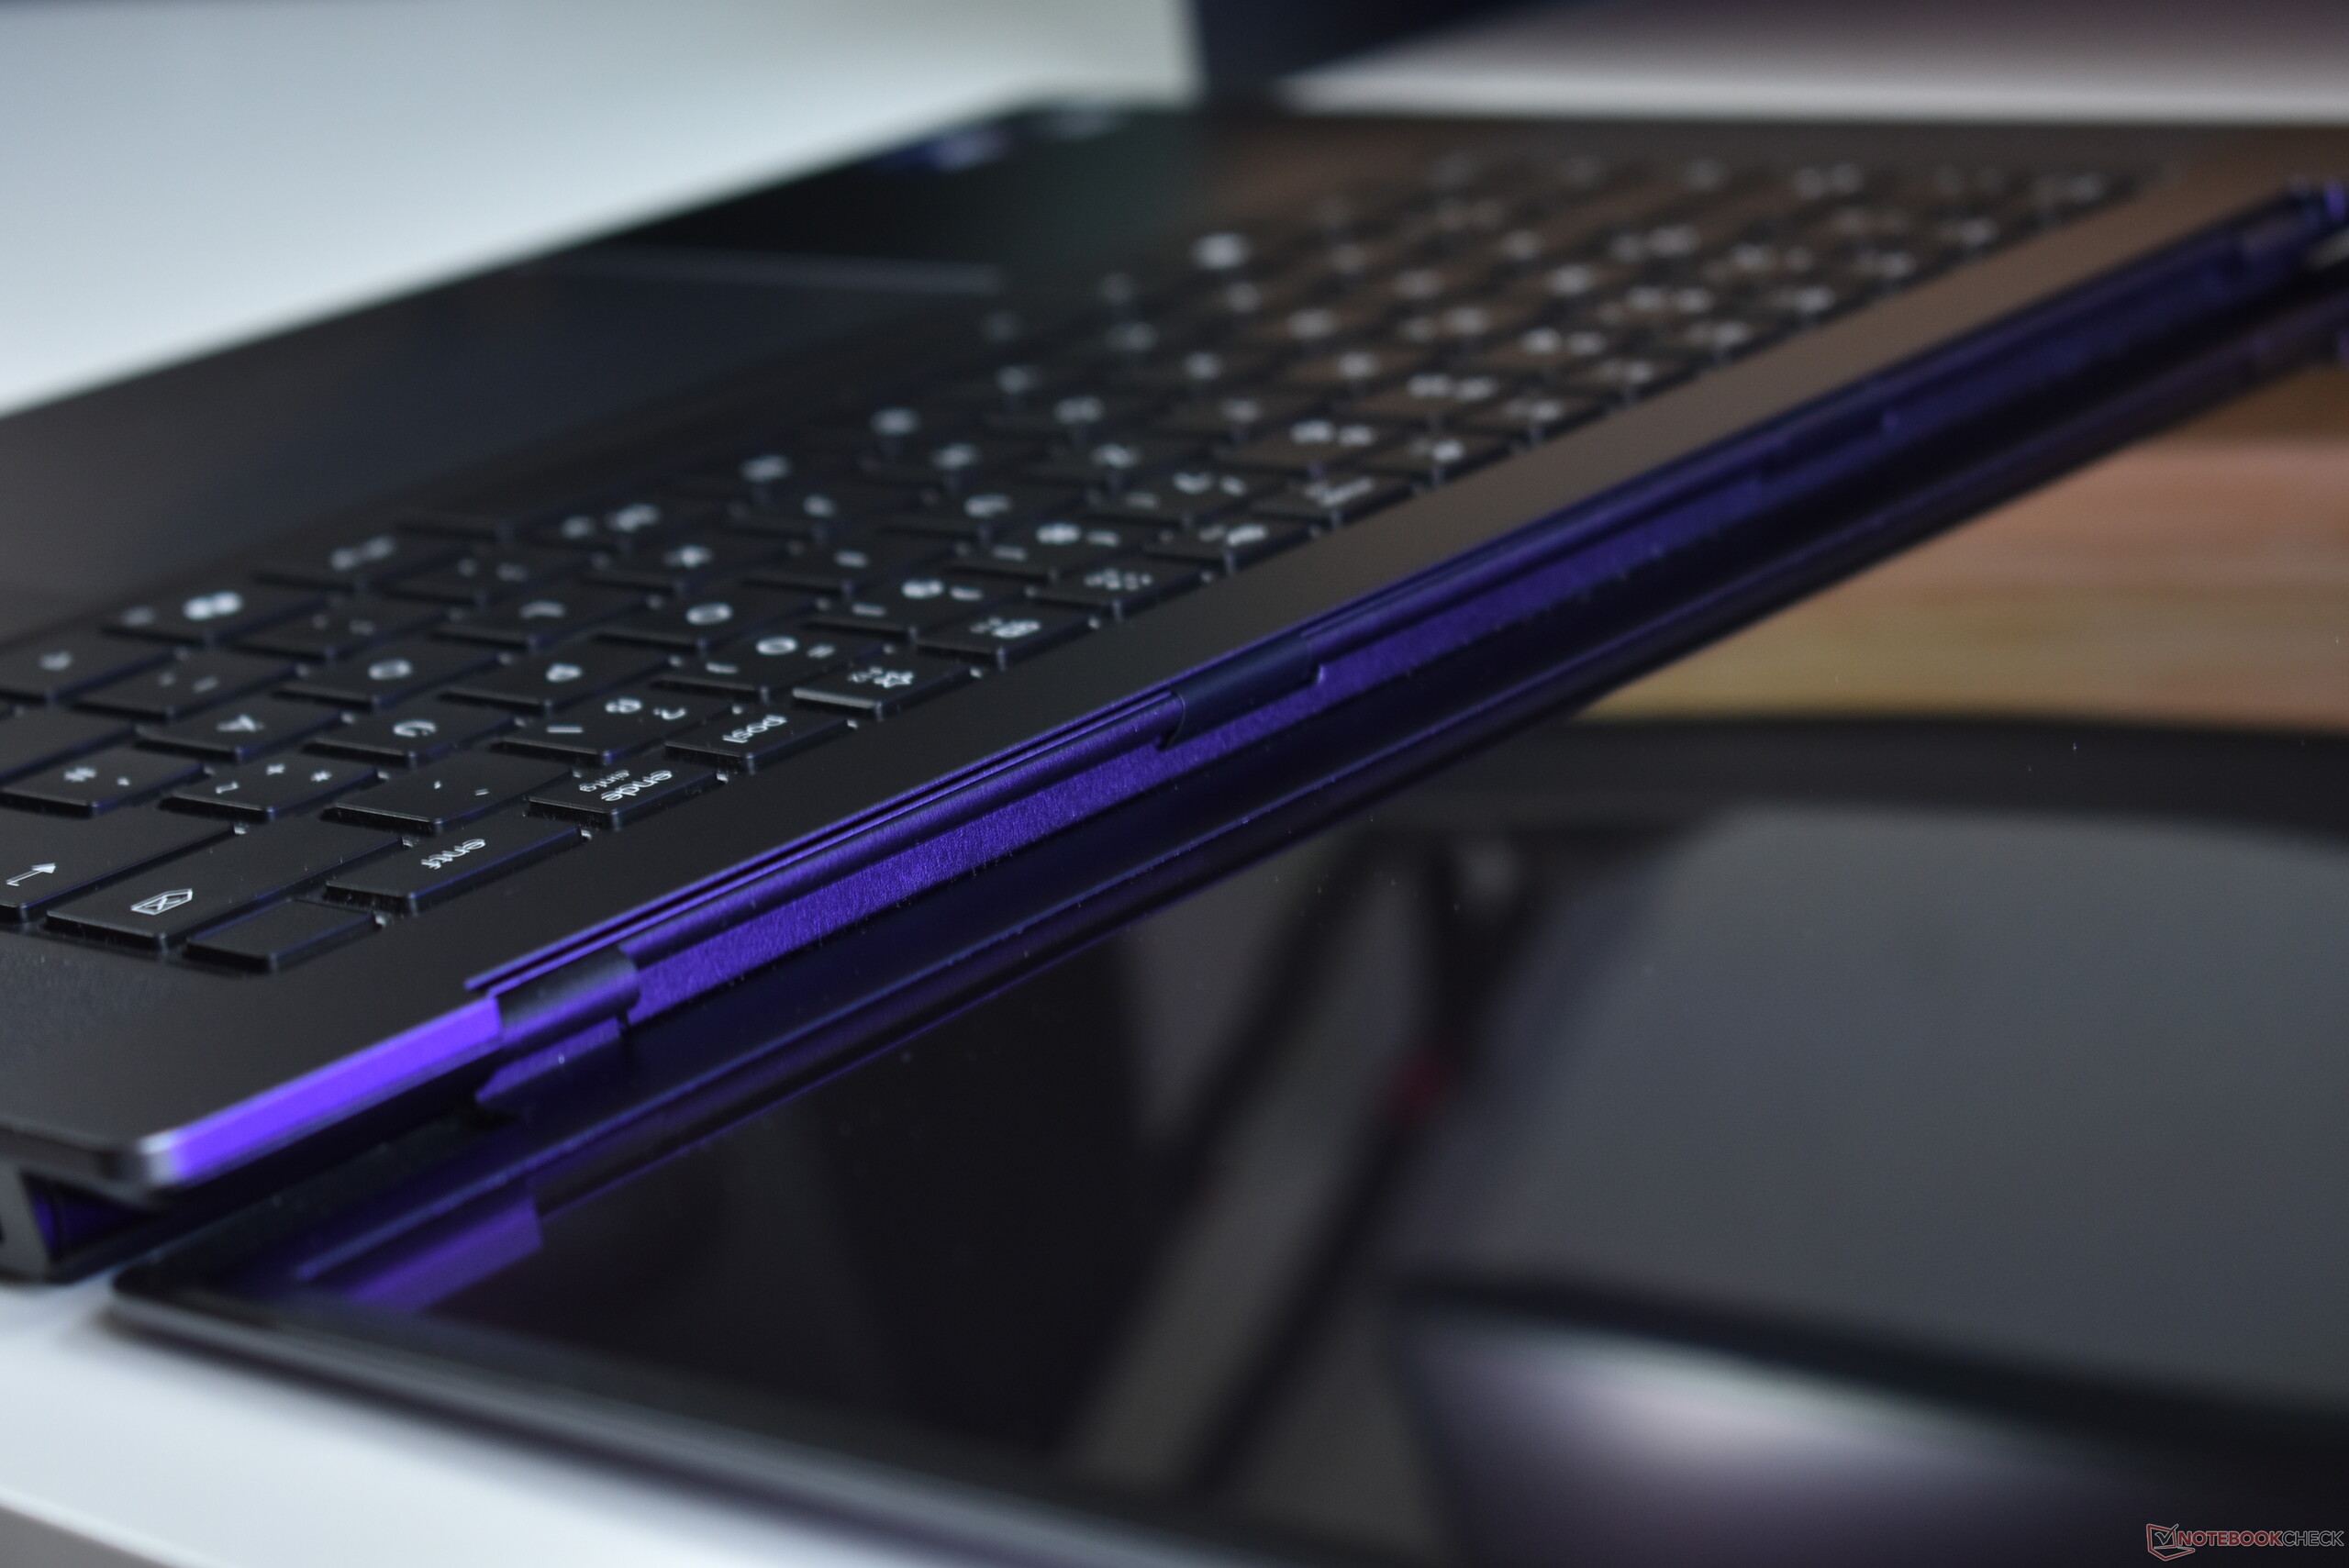
The quality of the chassis is great. It offers the premium feel of an all-metal design, and the chassis components can barely be twisted or bent. The hidden drop-down hinges are also excellent: They allow the screen to open fully flat (180 degrees), and there is barely any wobble. Plus, the screen can be opened with one hand.
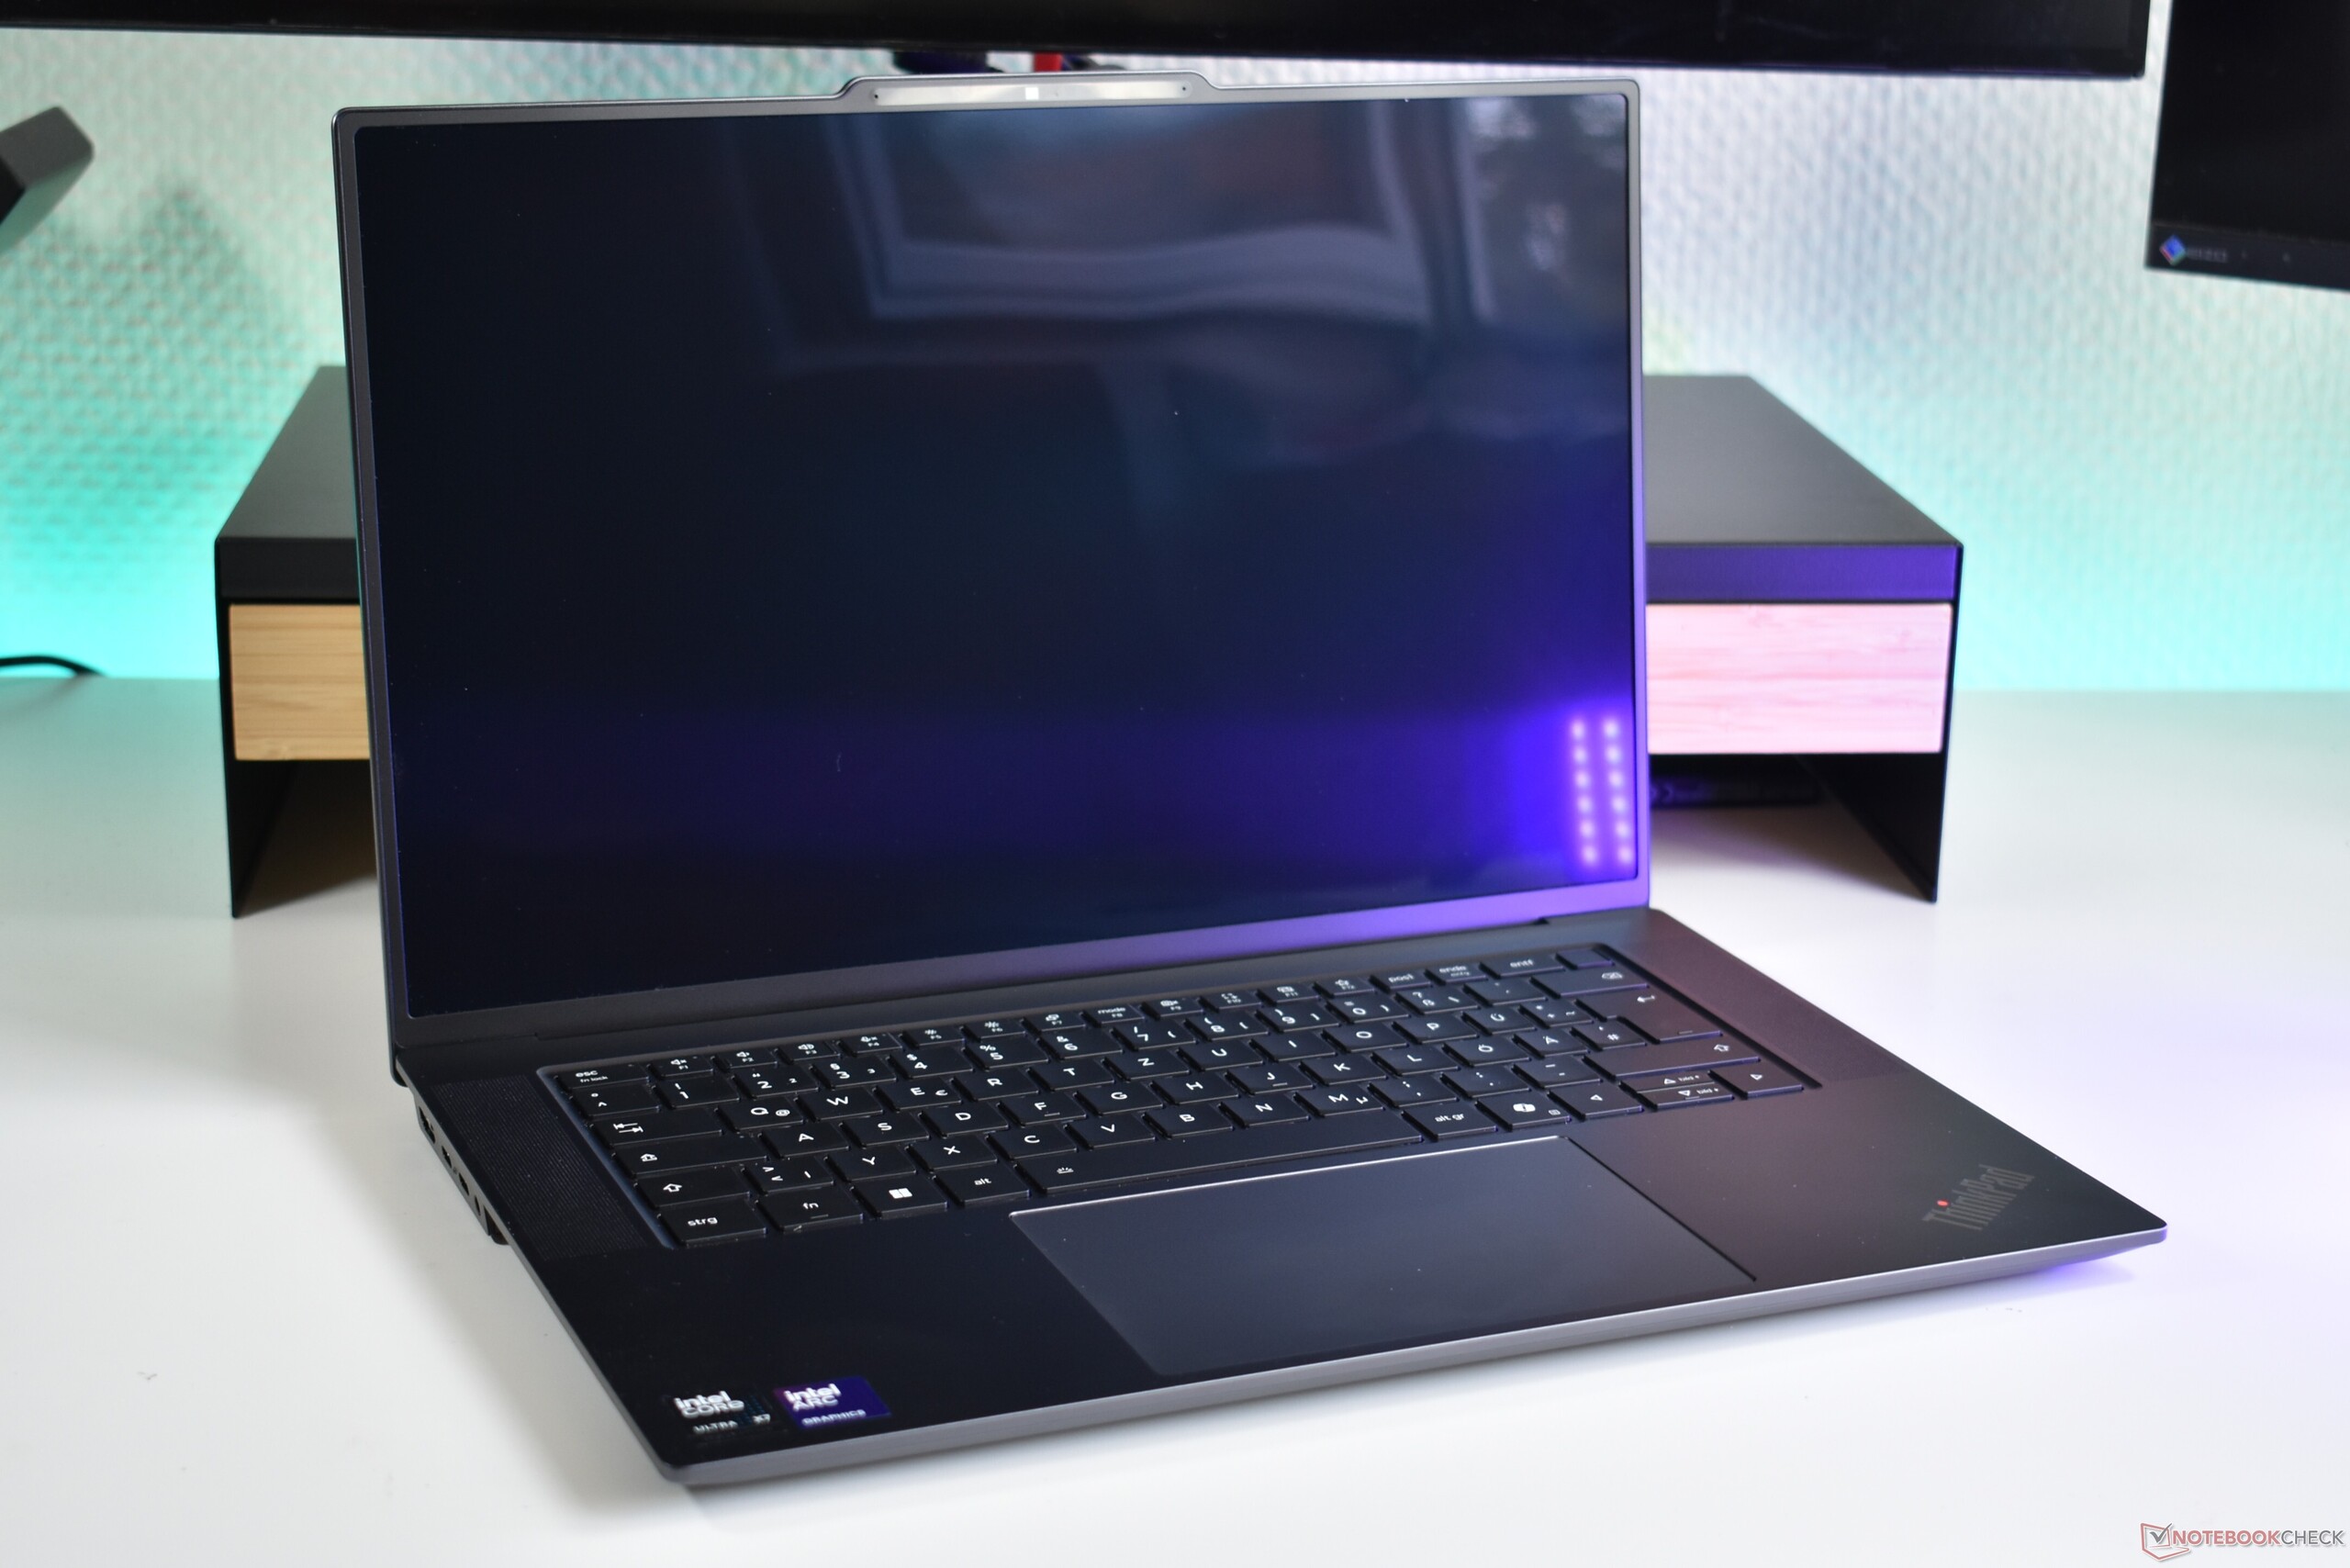
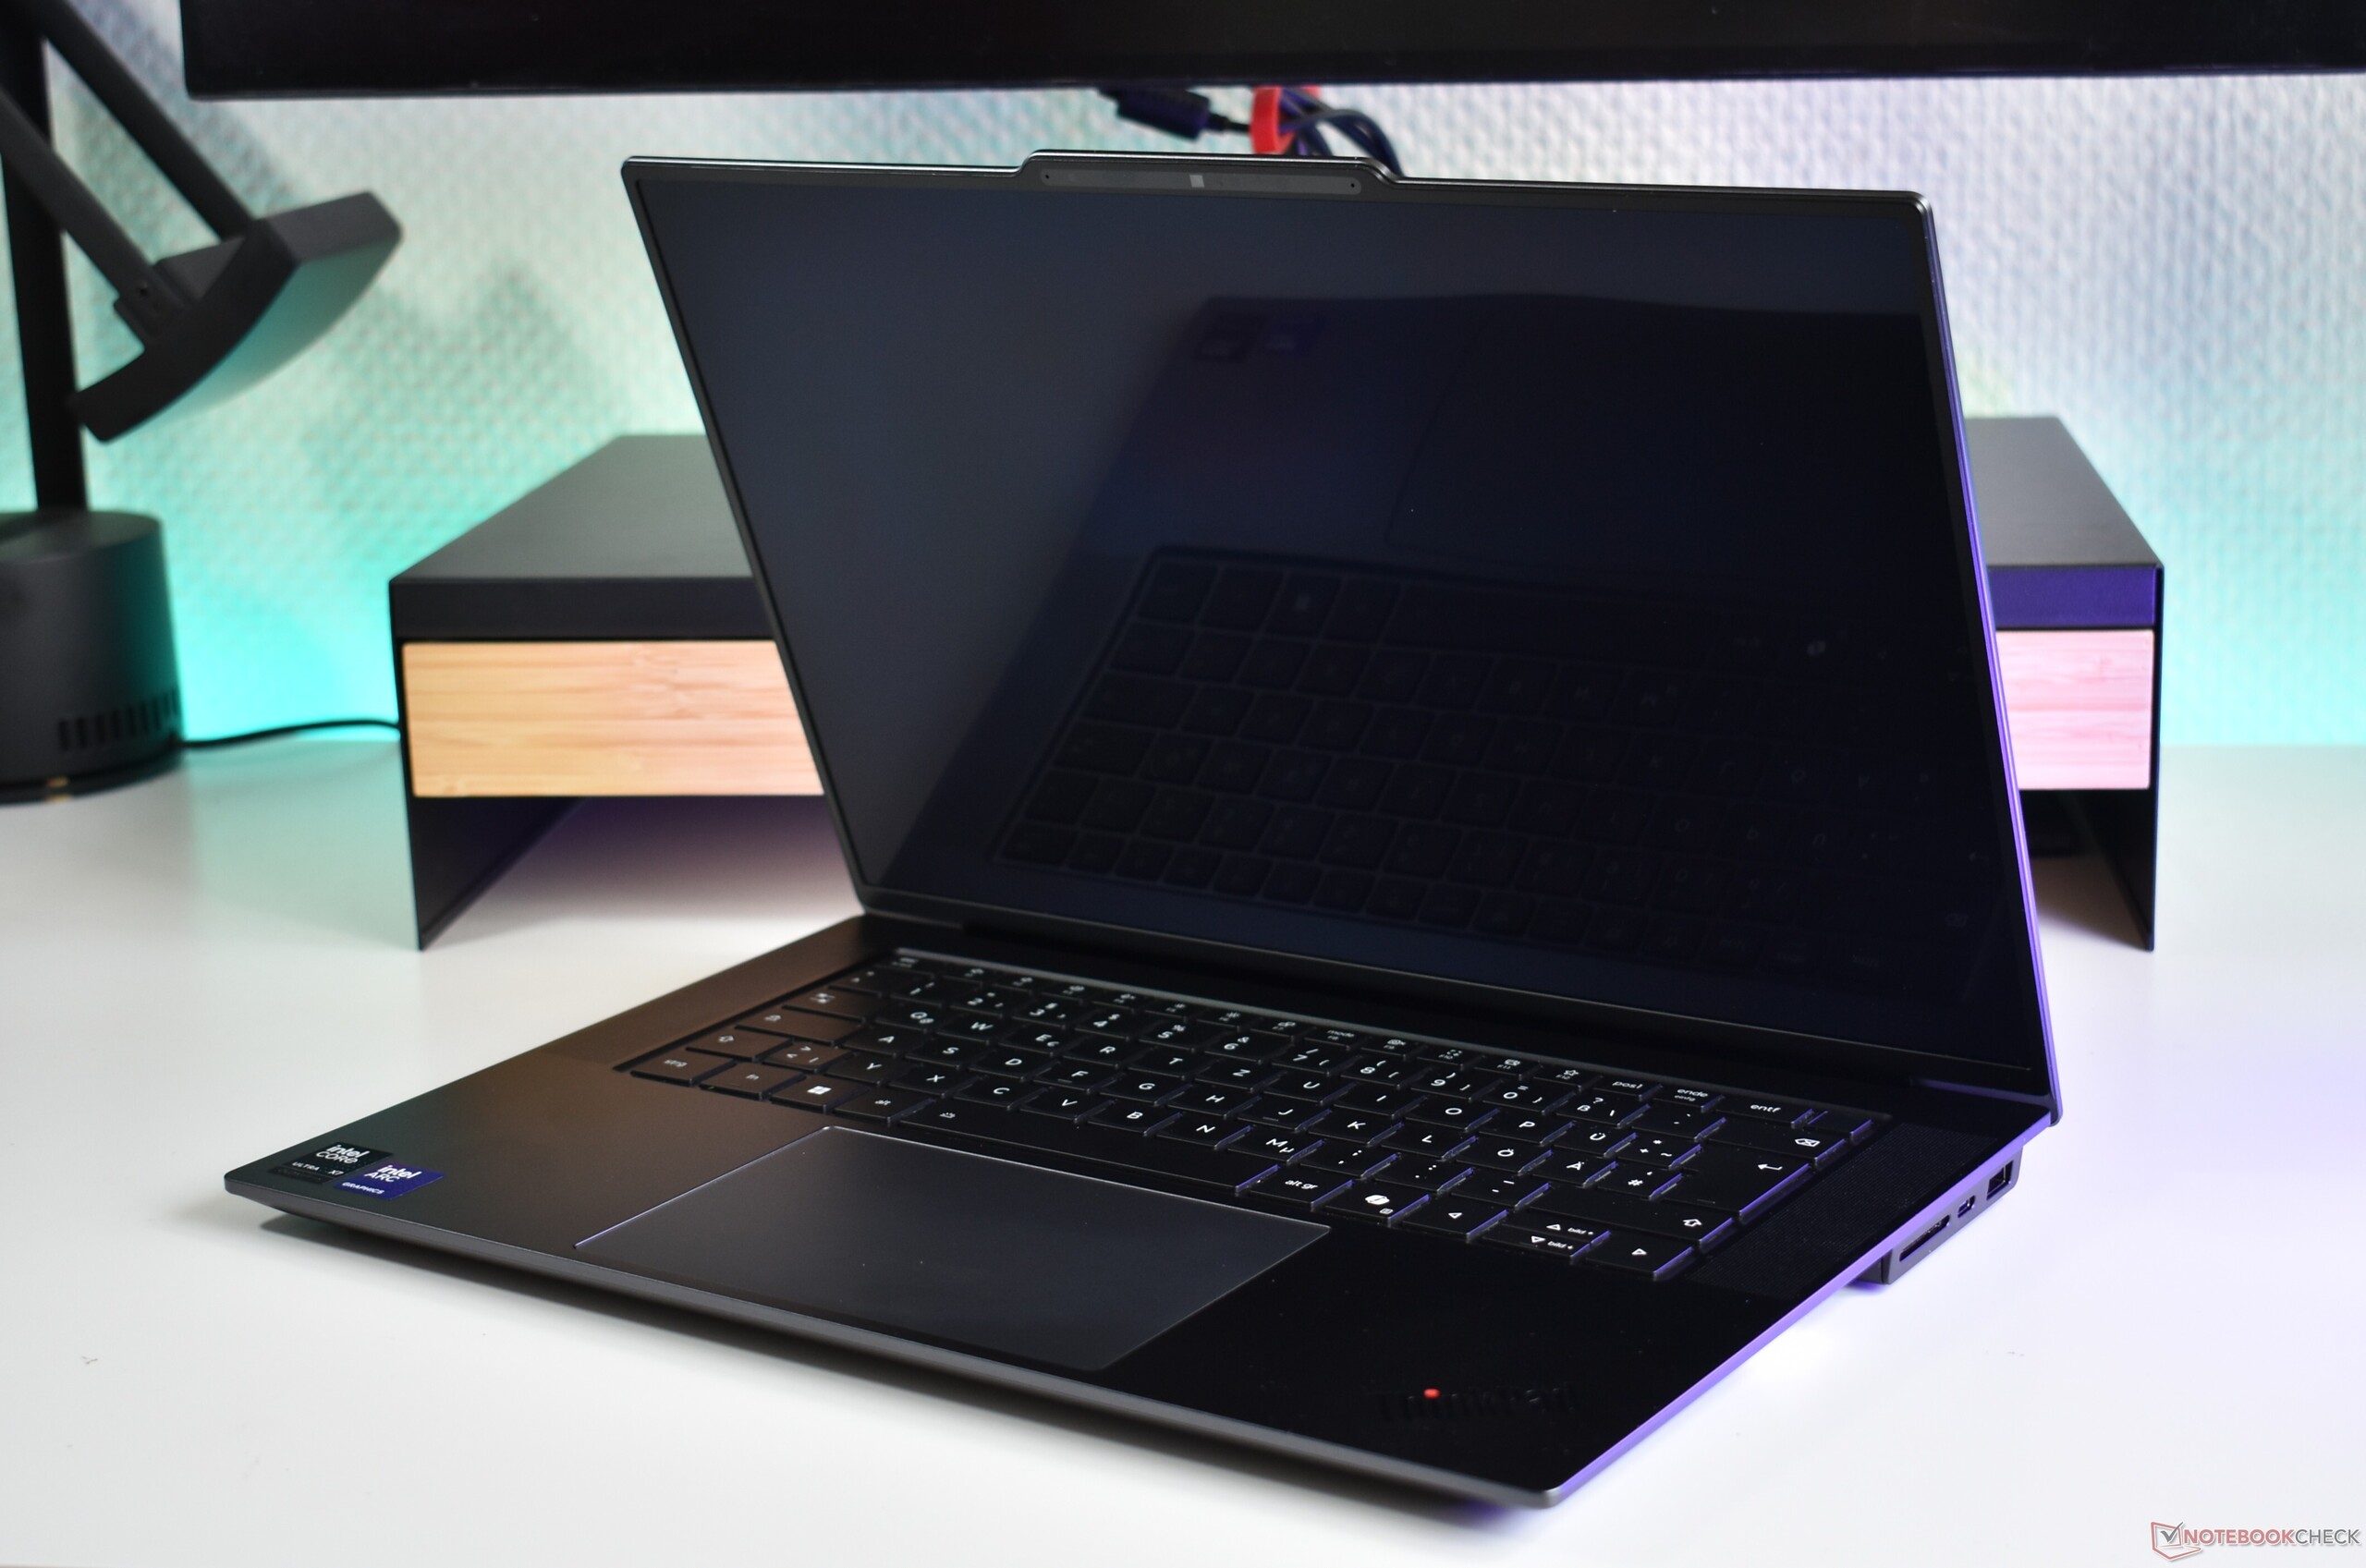
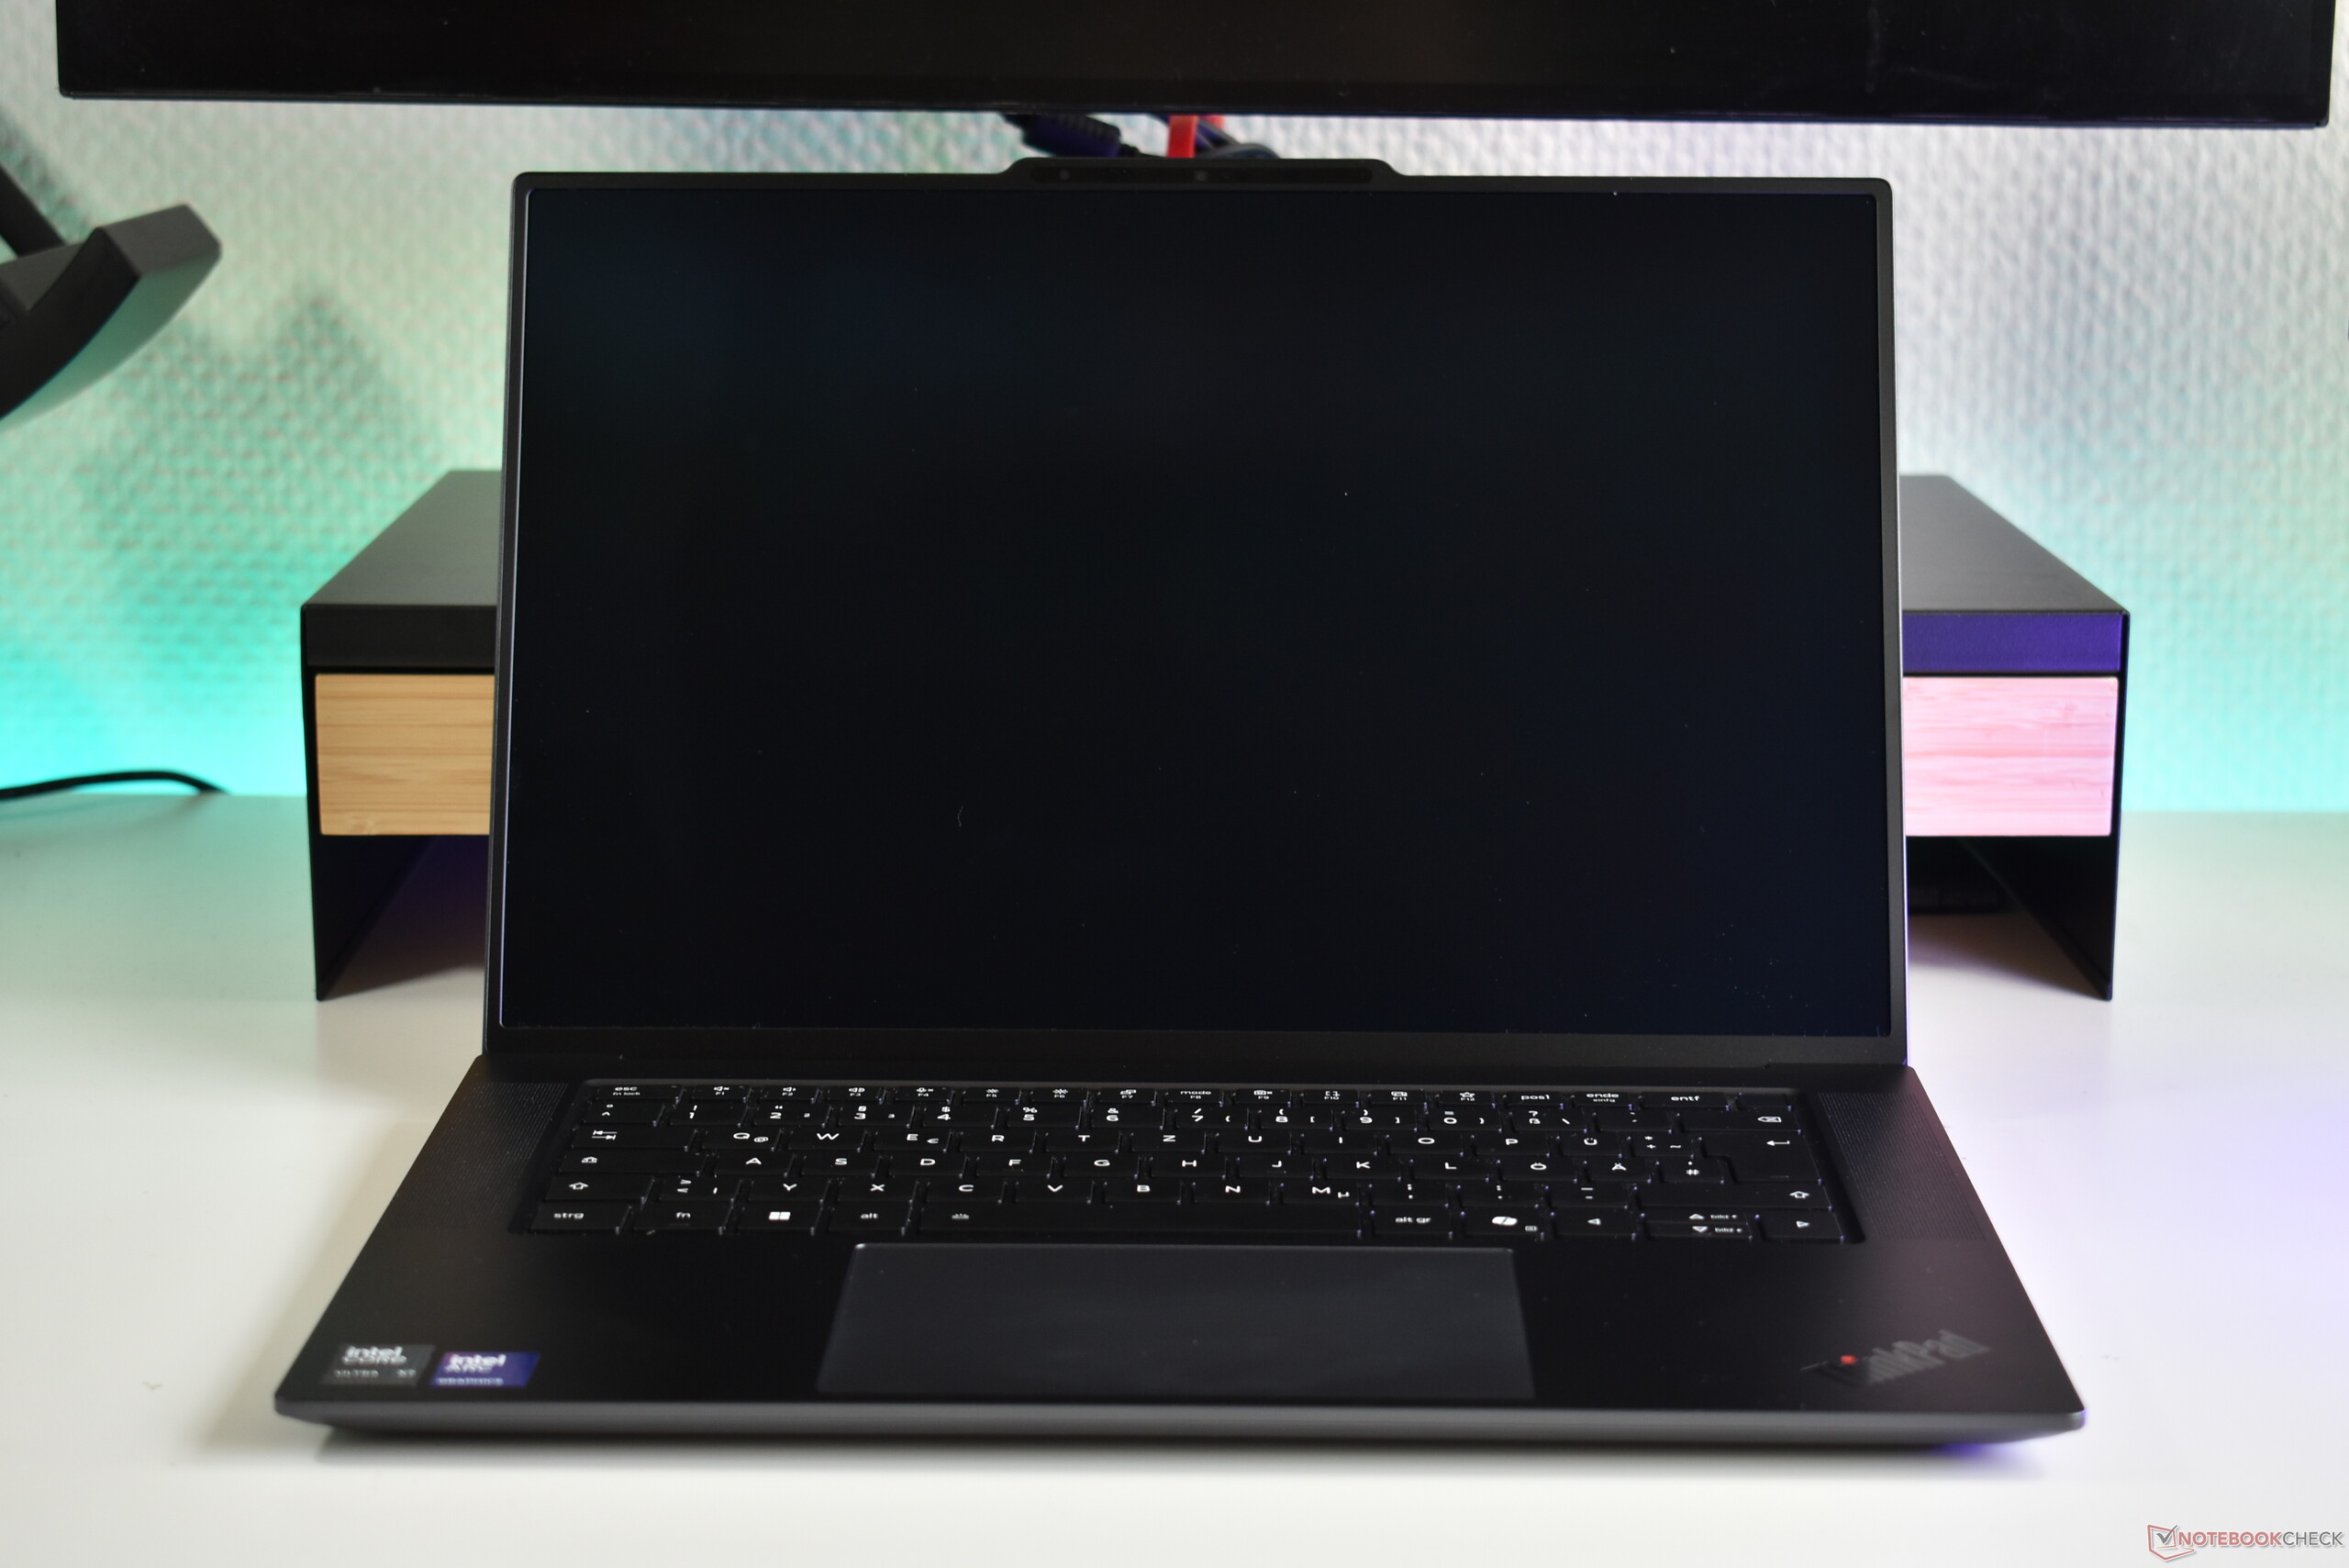
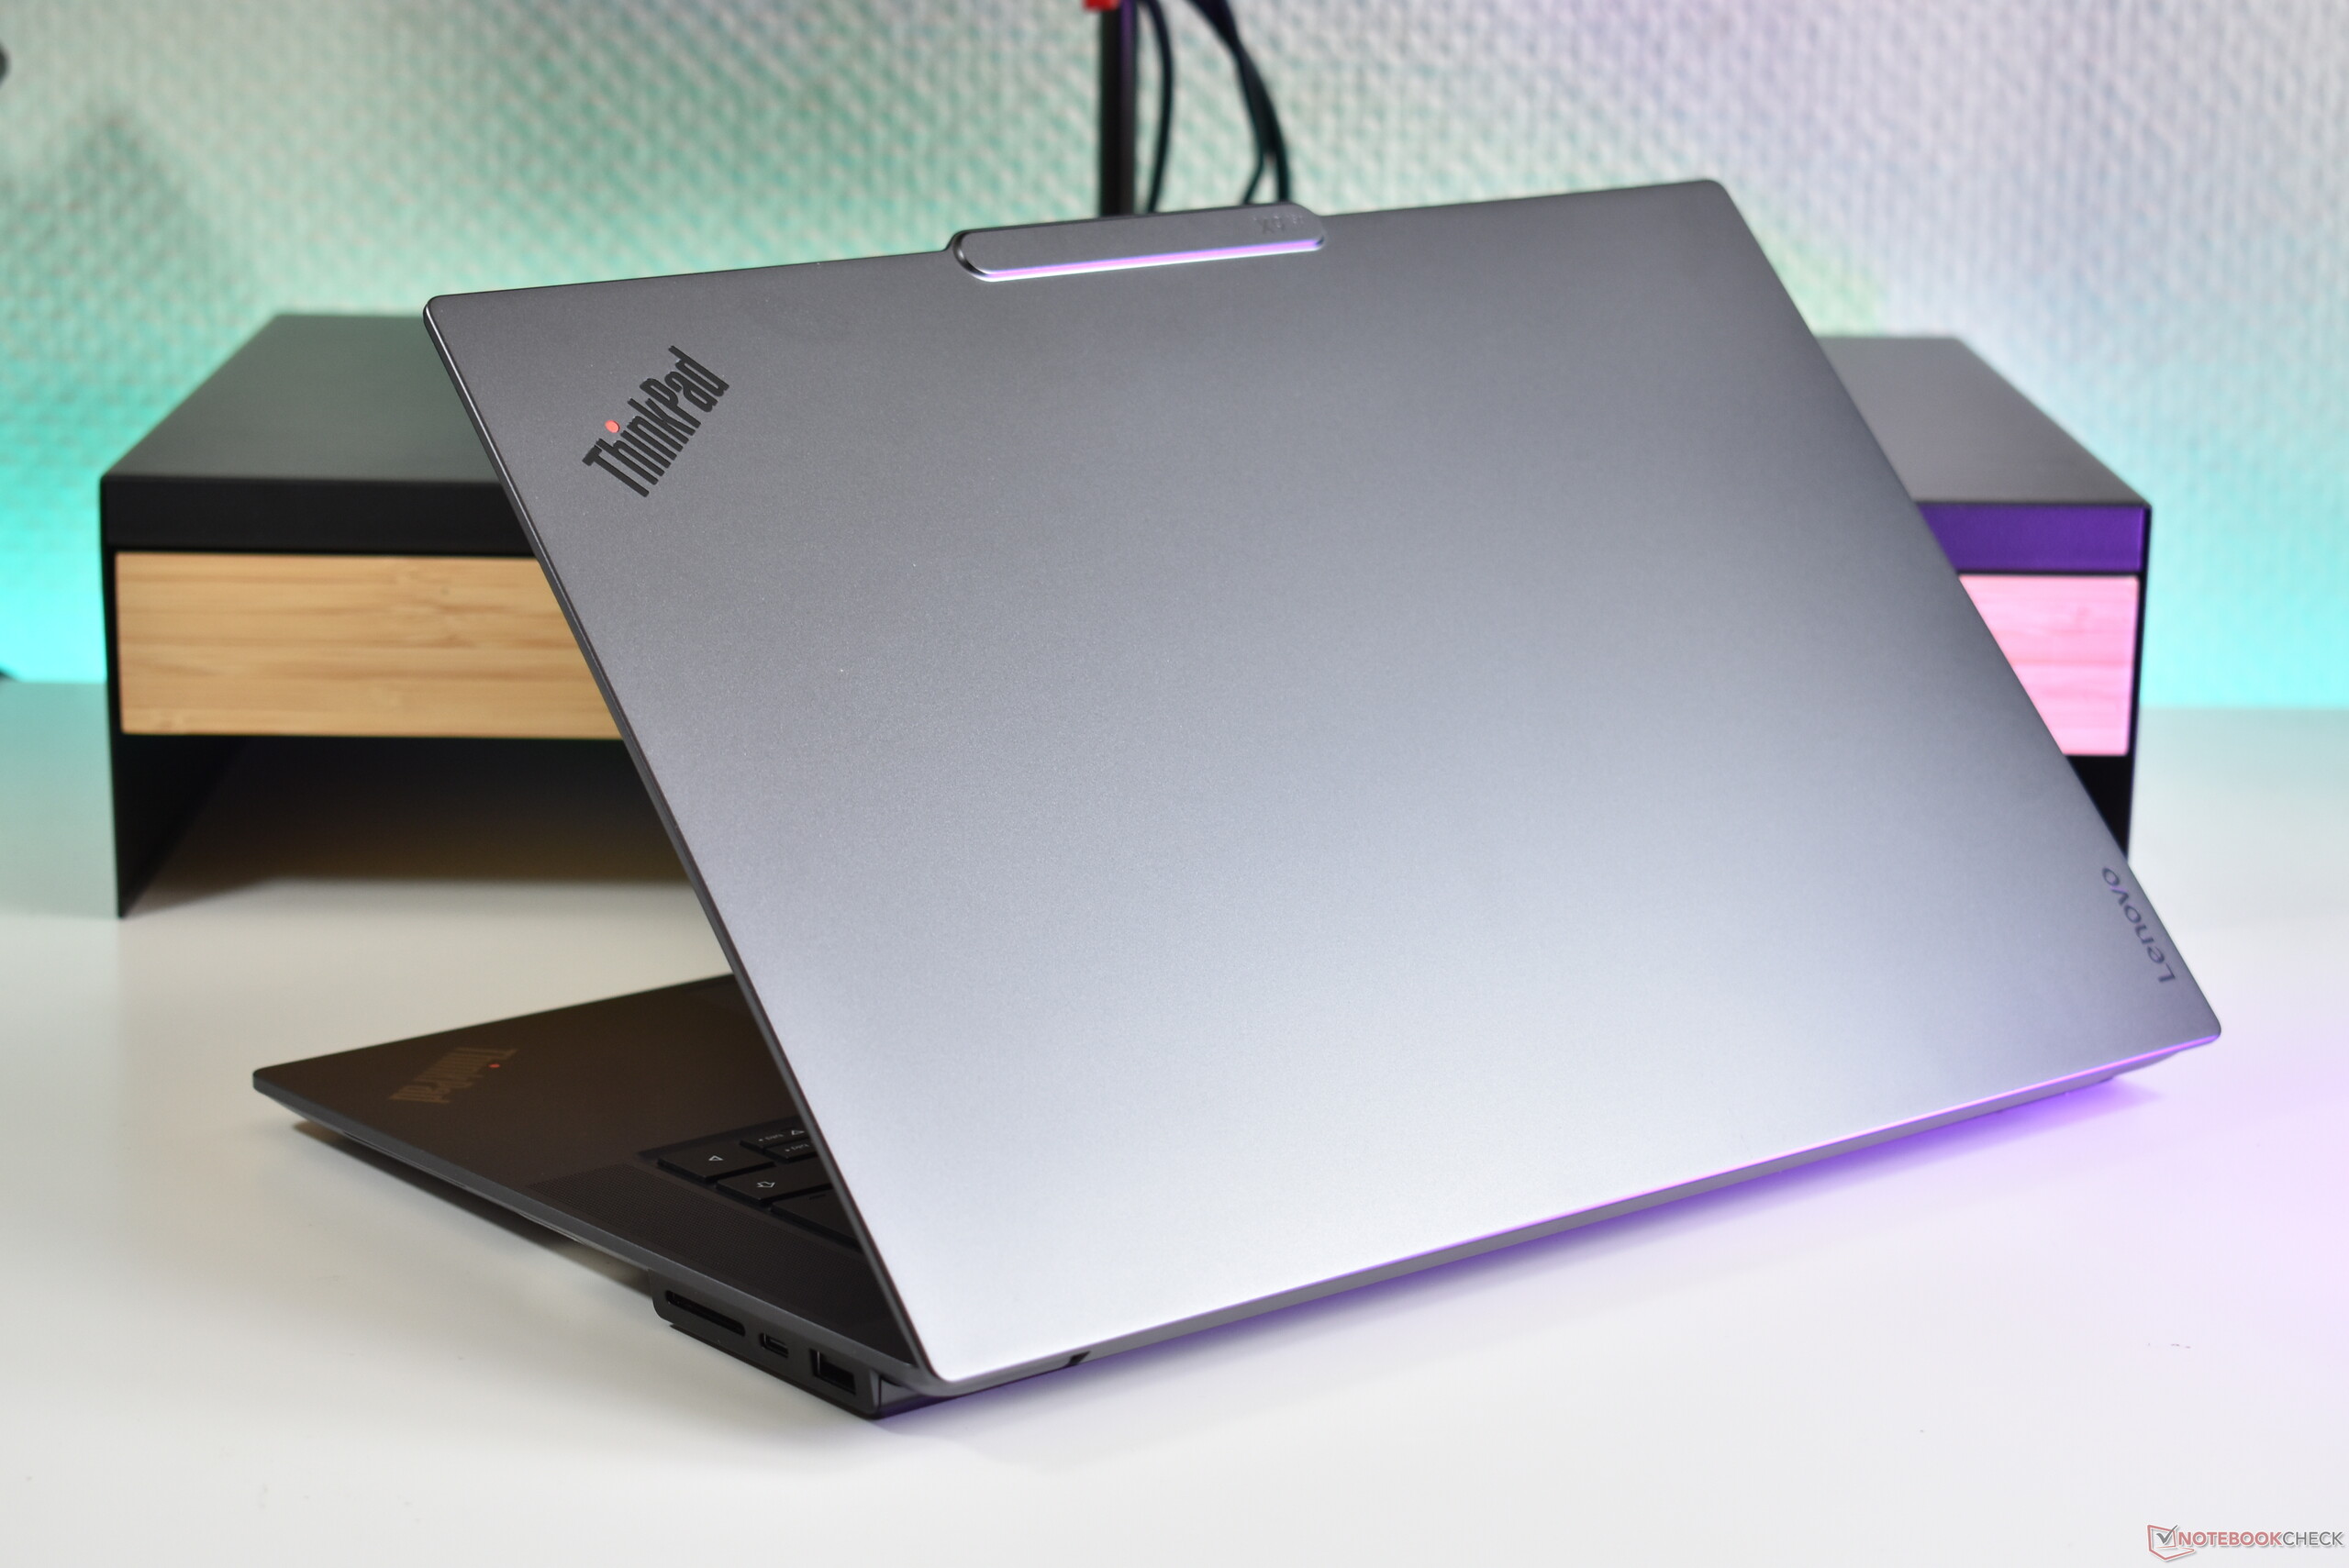
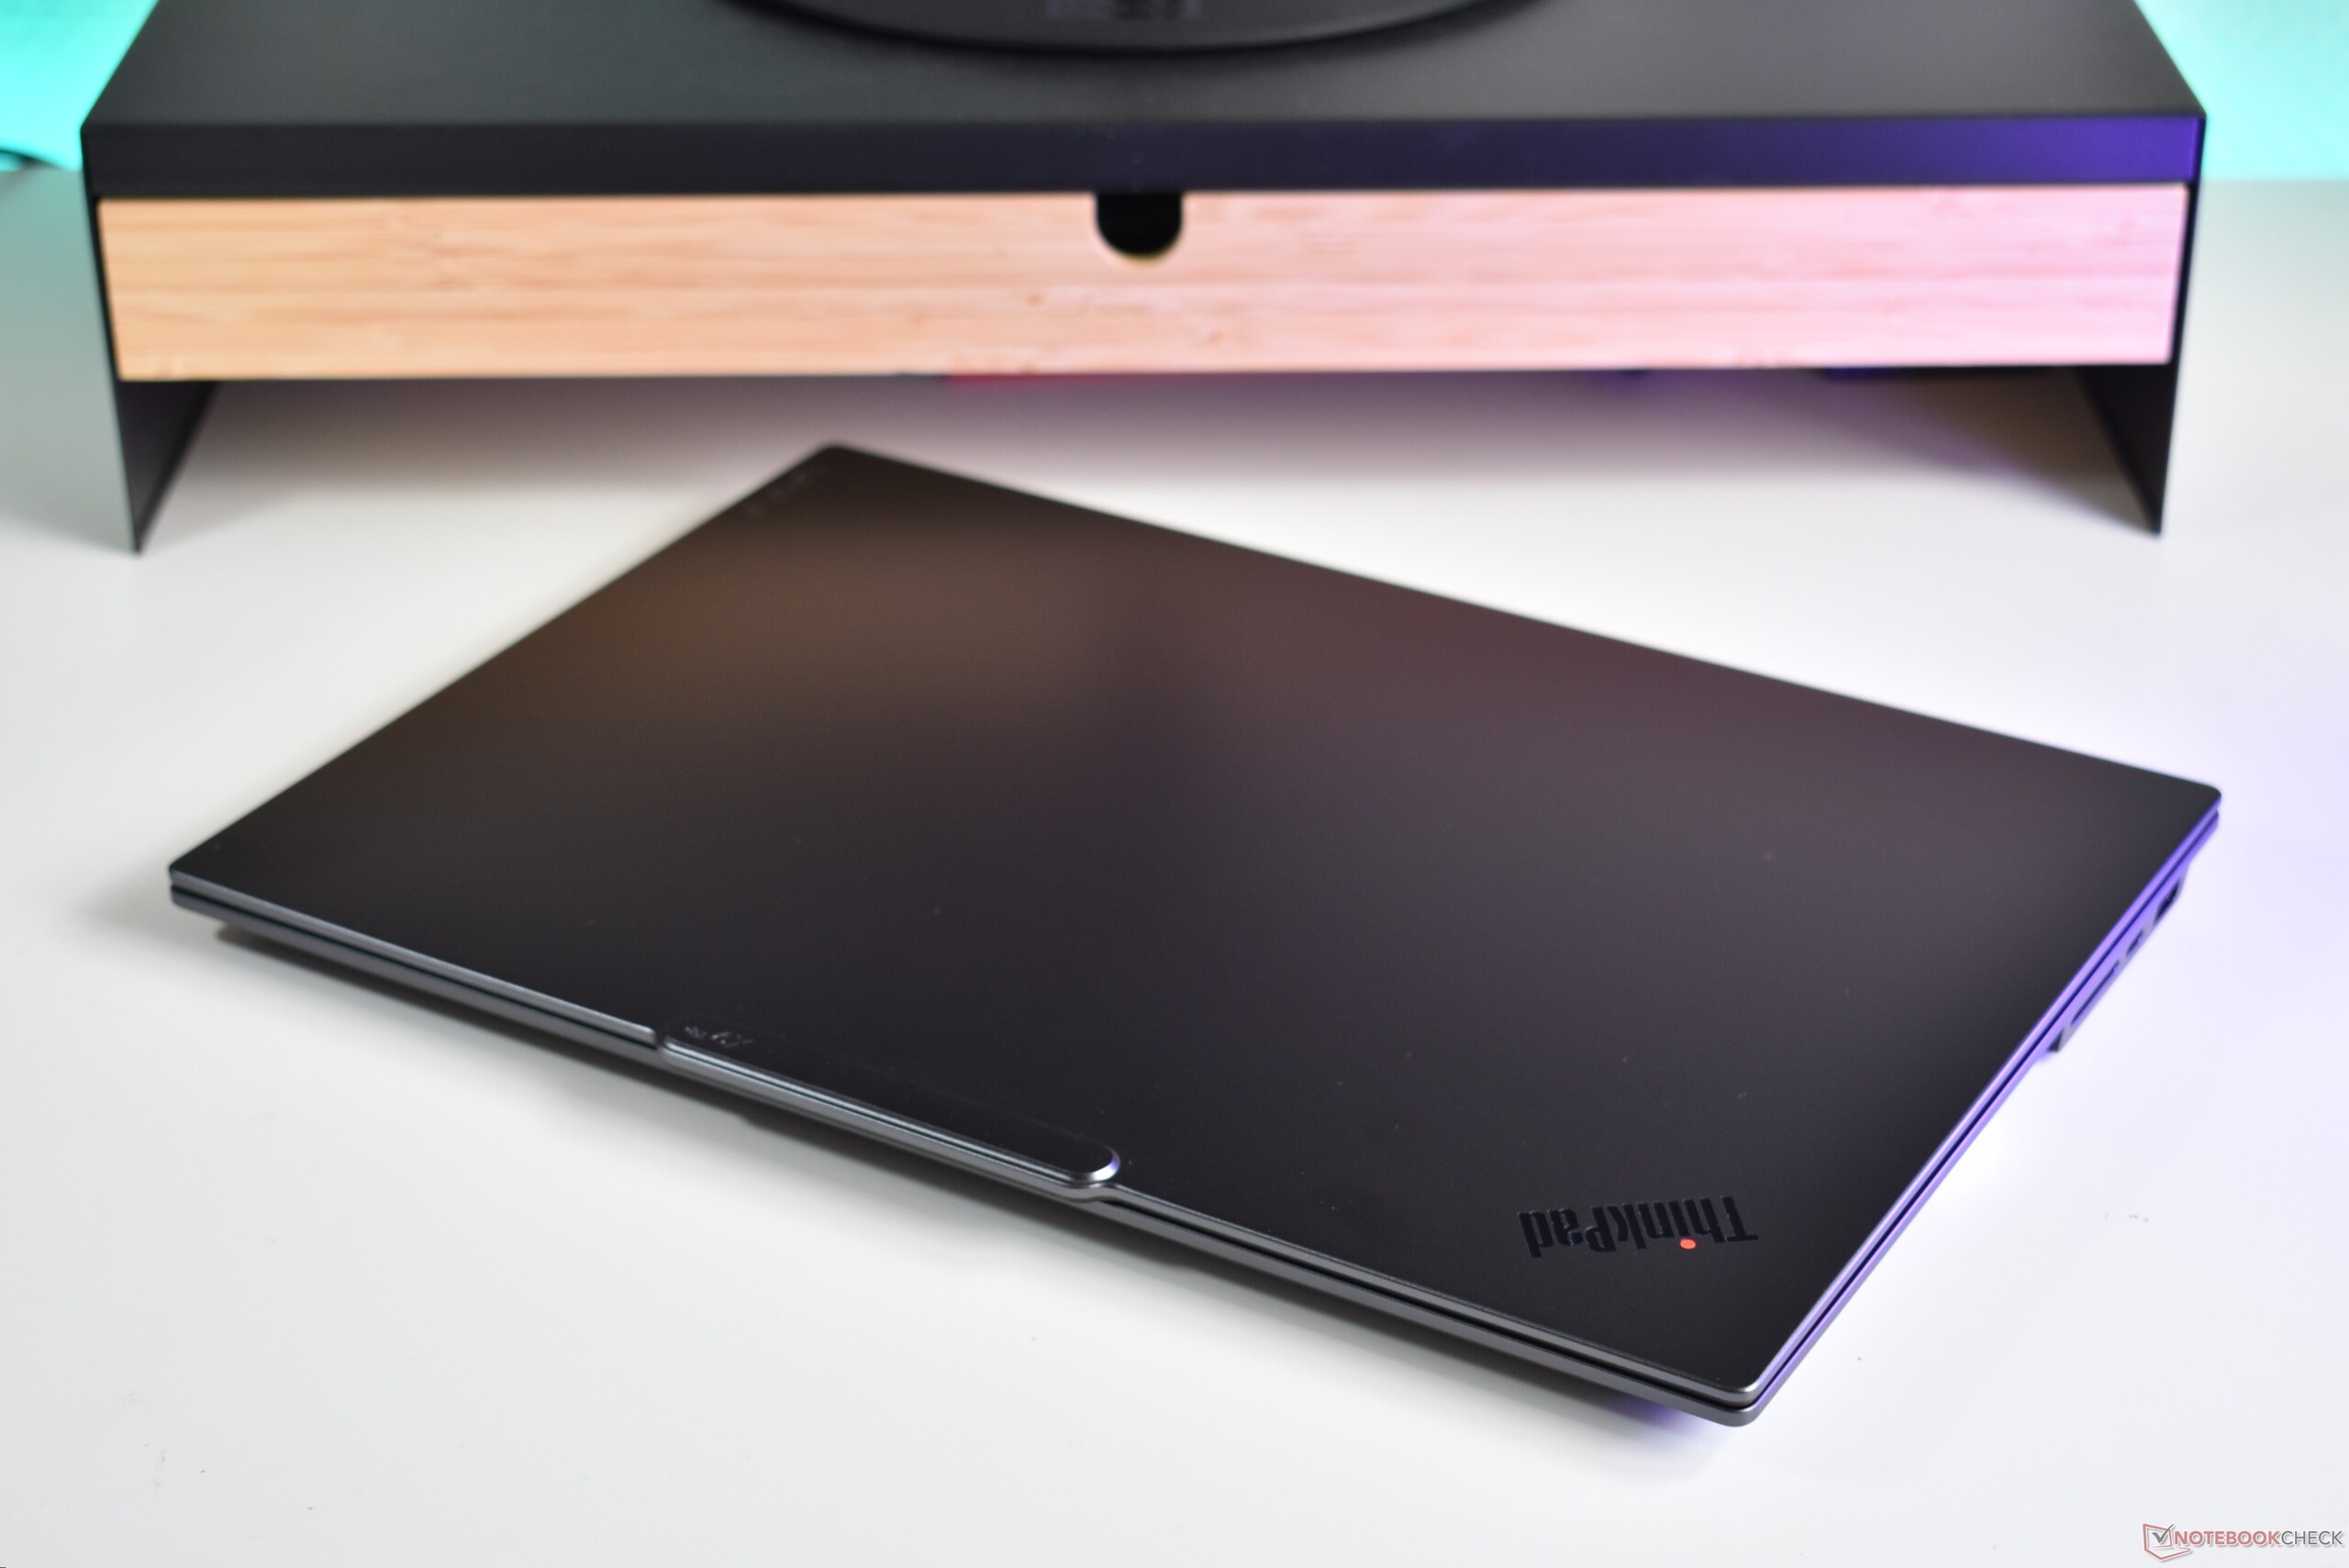
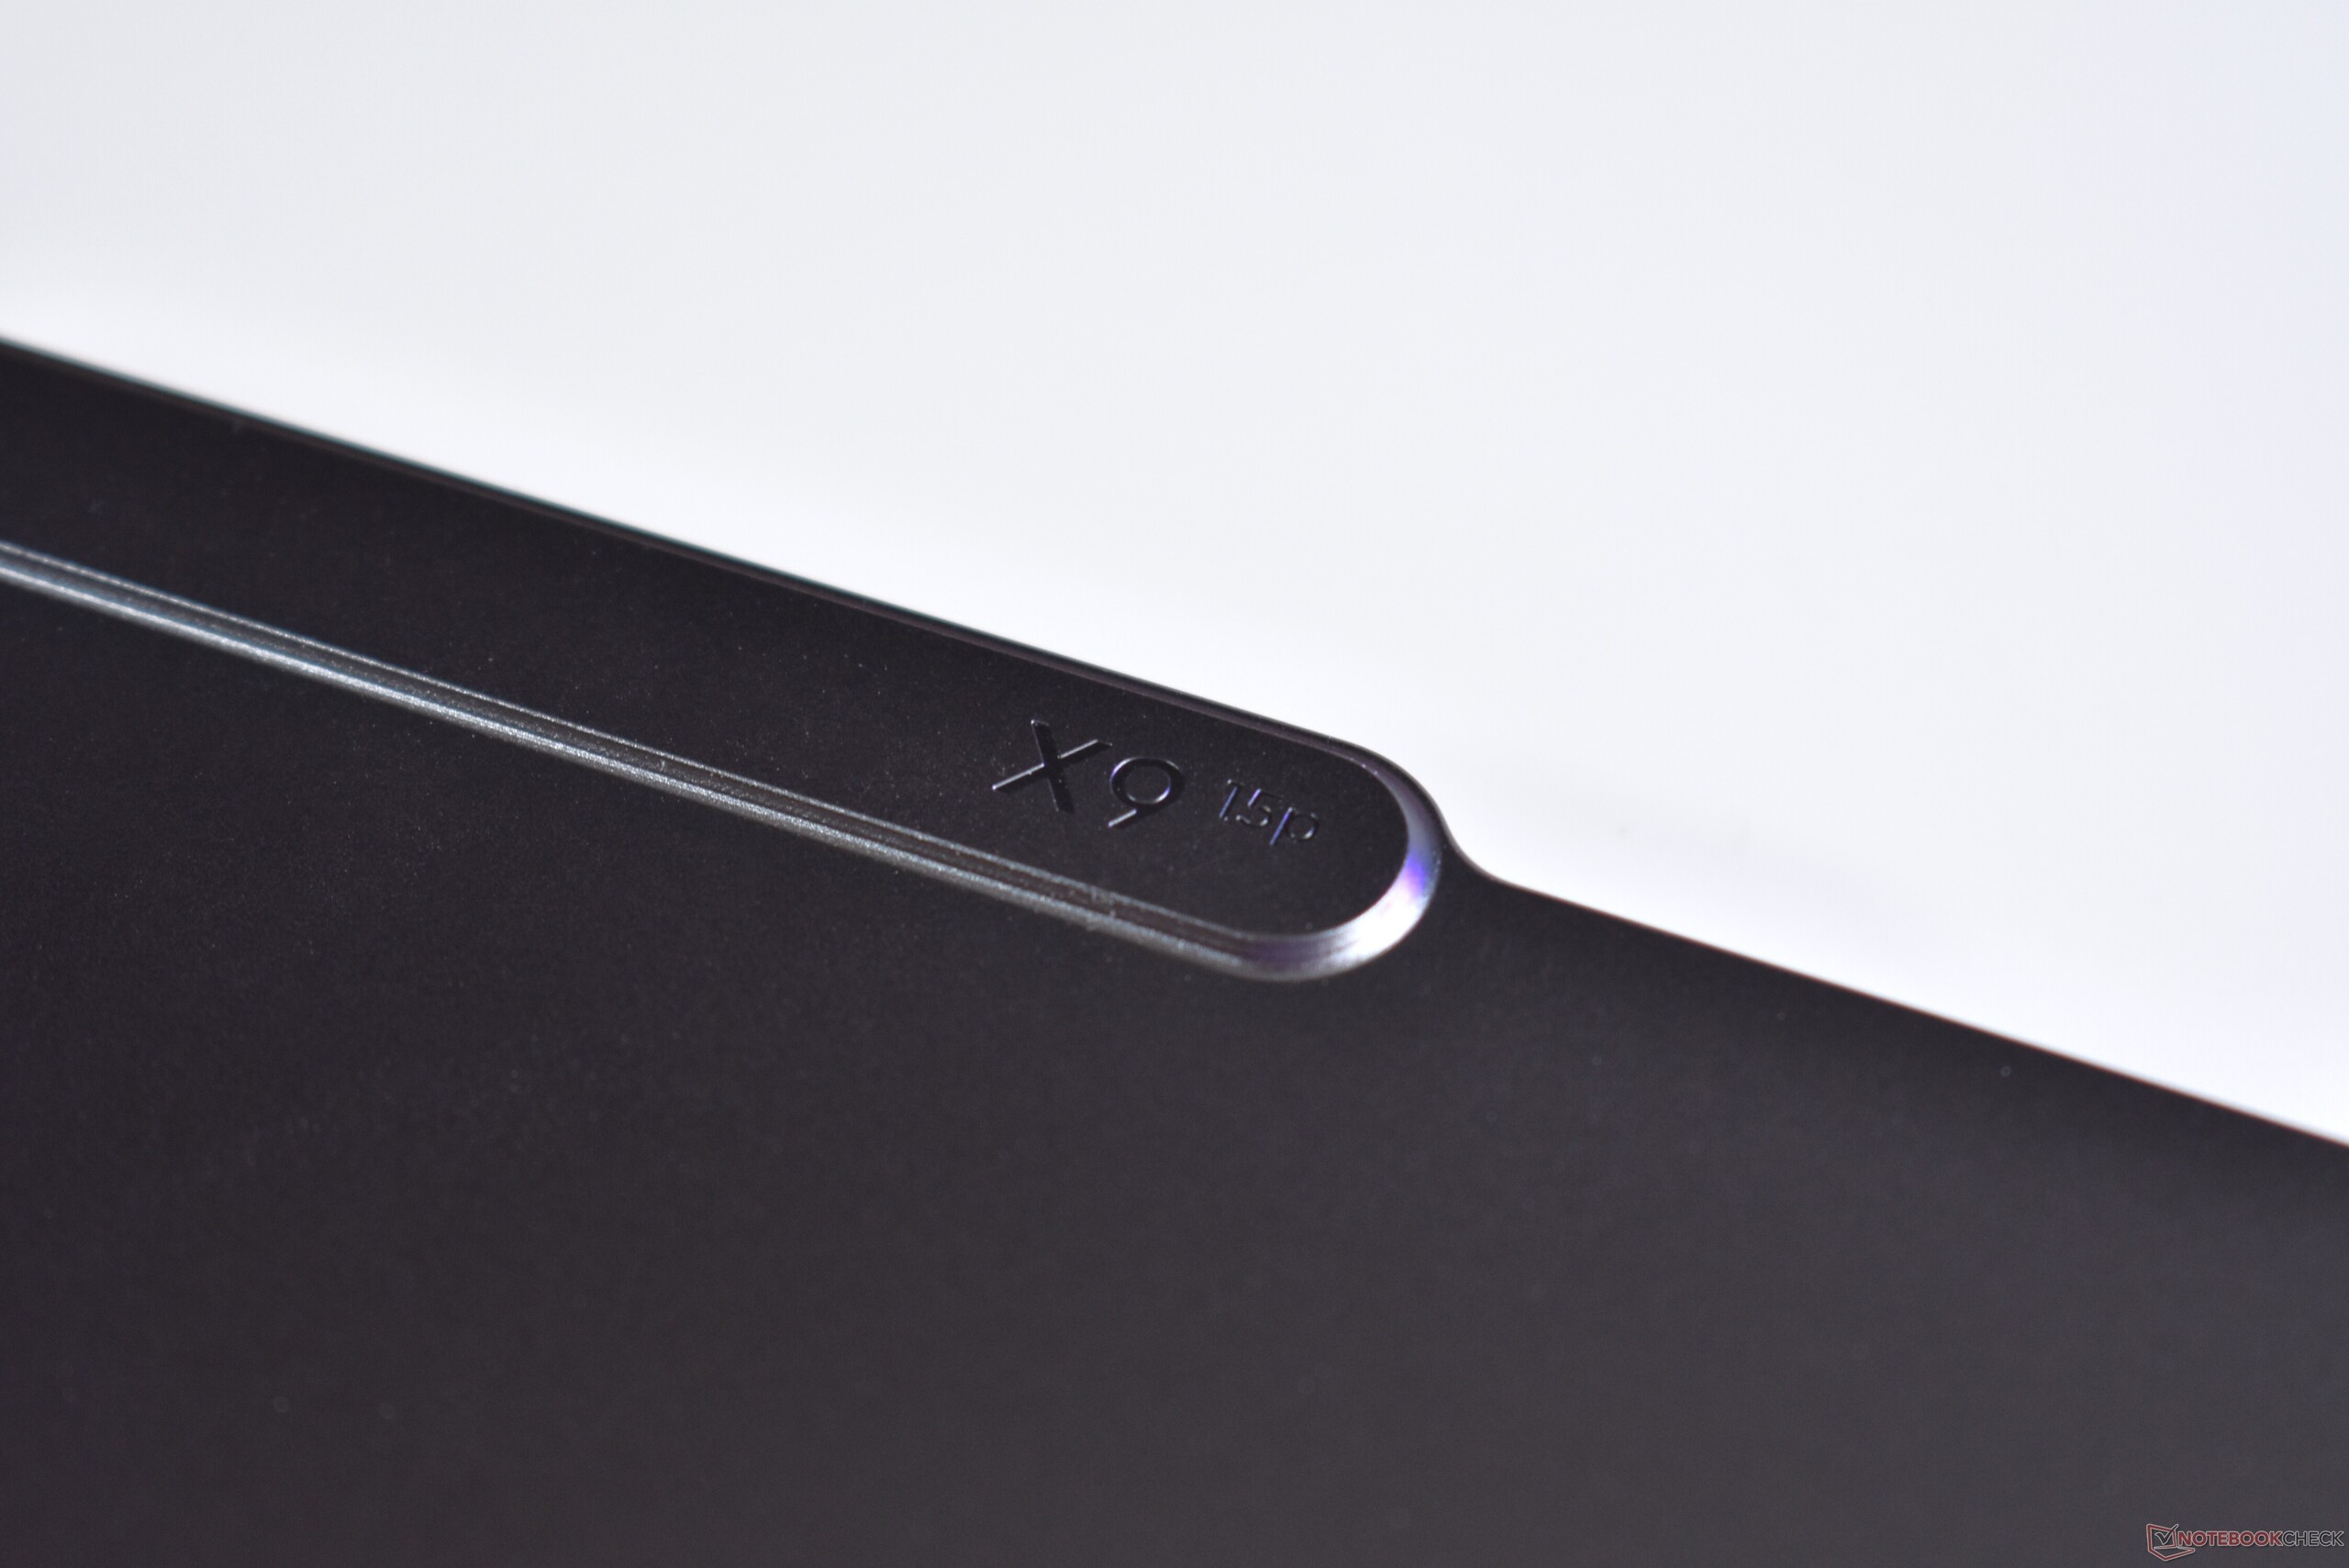
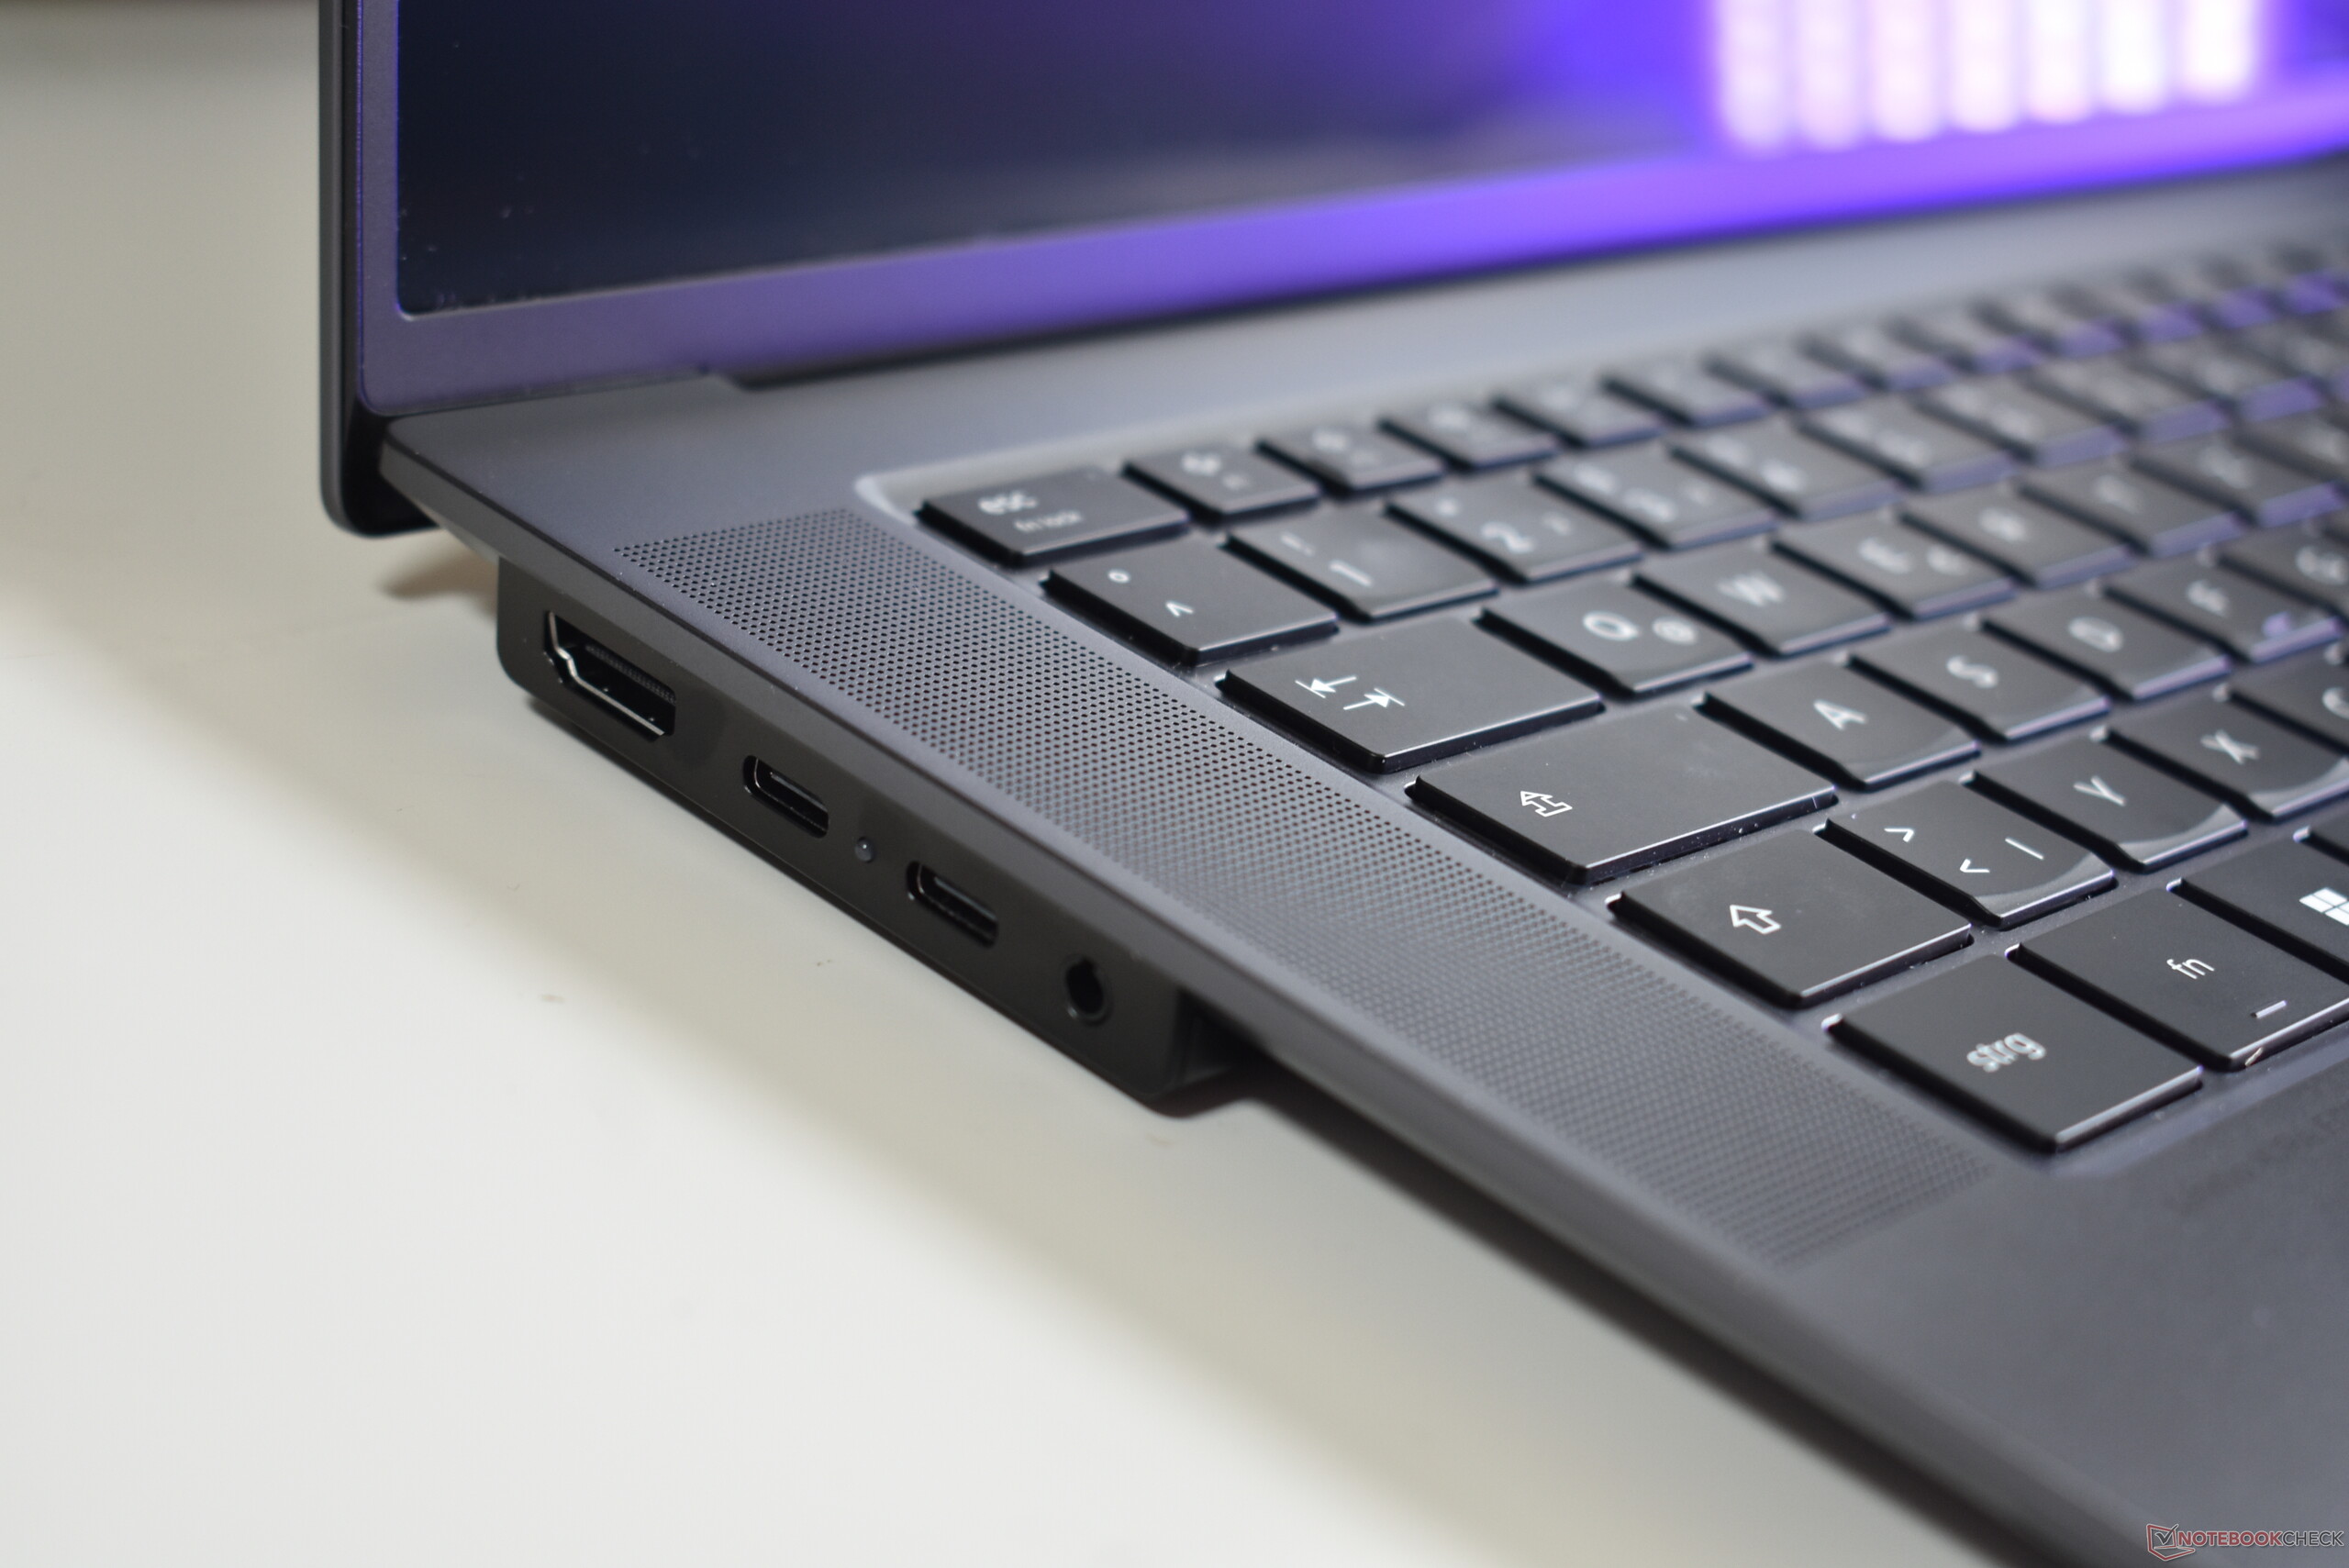
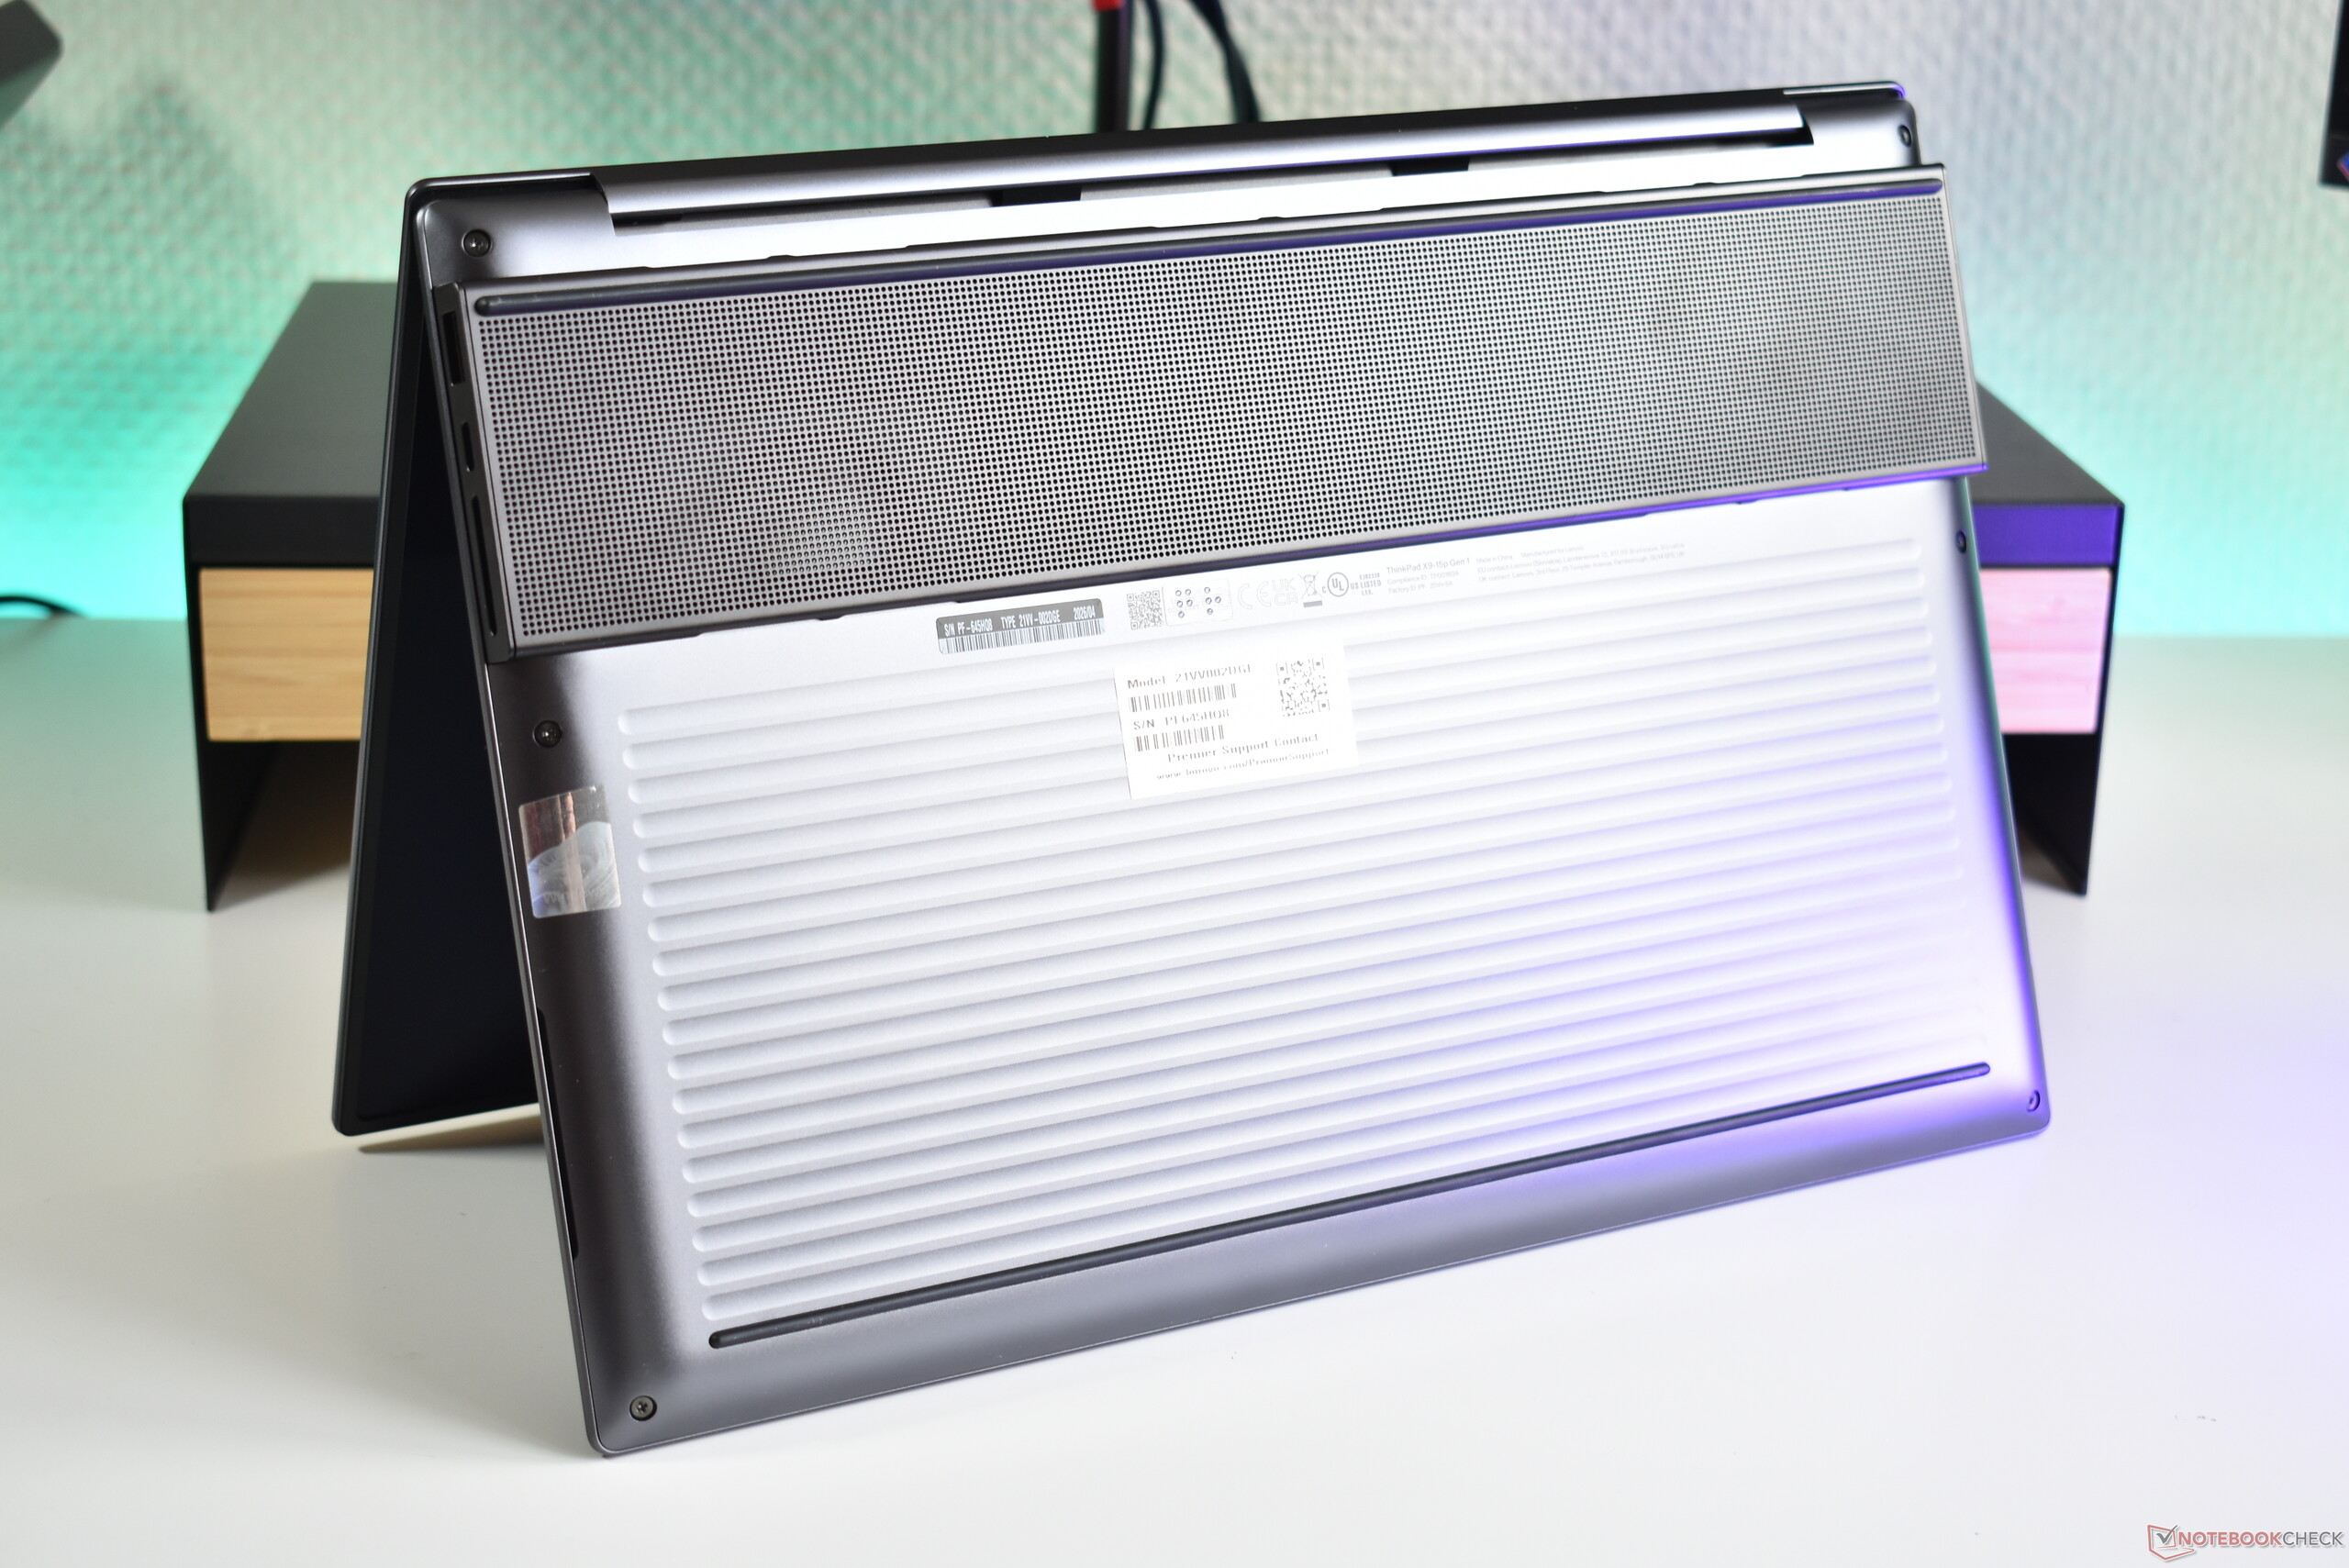
Despite weighing 200 g more, the X9-15p has the same dimensions as the ThinkPad X9-15. The Apple MacBook Air 15 weighs about the same as the X9-15p, while the Dell XPS 16 and Apple MacBook Pro 14 are both slightly heavier. The ThinkPad is the thickest of the bunch and sits between the MacBook Pro and the XPS 16 in terms of size.
Connectivity
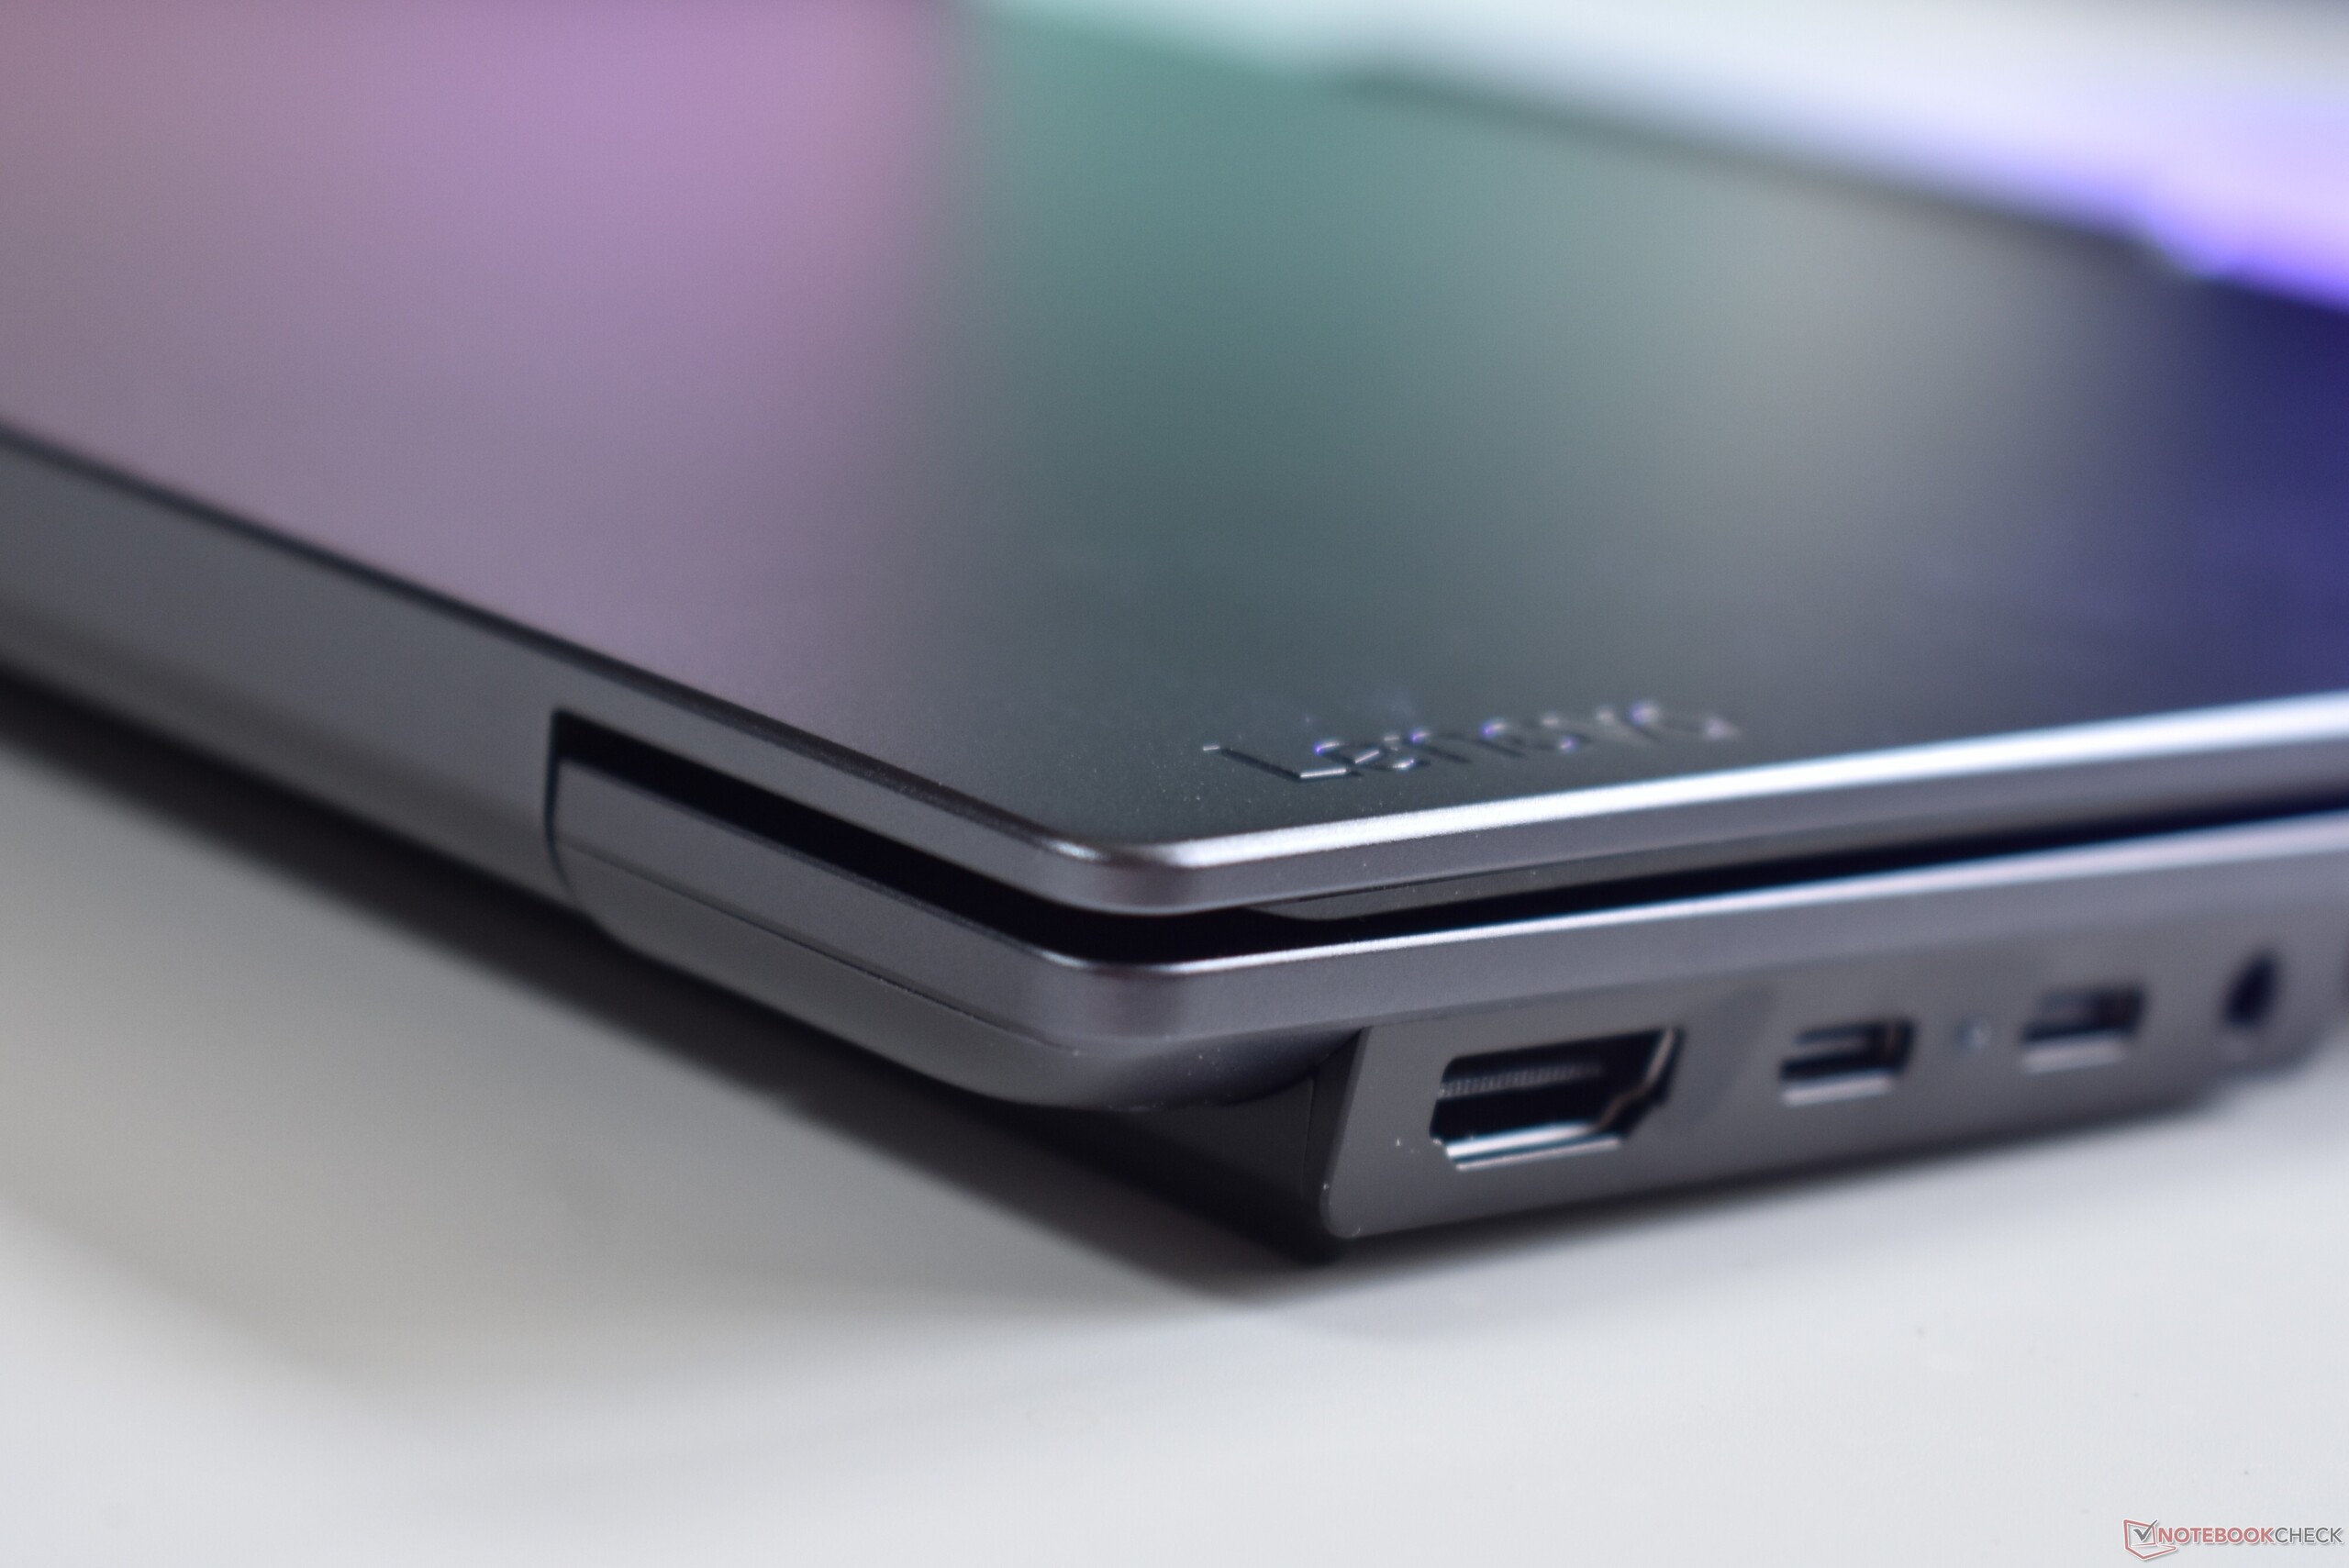
Lenovo has upgraded the connectivity options, adding another Thunderbolt 4 port on the left side and an SD card reader on the right. There are still USB-C ports on both sides, so the device can be charged from either side. Overall, this is a good selection of ports for a capable multimedia laptop.


SD Card Reader
The SD card reader offers average speeds, as testing with our AV PRO microSD 128 GB V60 reference card shows.
| SD Card Reader | |
| average JPG Copy Test (av. of 3 runs) | |
| Apple MacBook Pro 14 2026 M5 Max (Angelbird AV Pro V60) | |
| Average of class Multimedia (22.3 - 531, n=36, last 2 years) | |
| Lenovo ThinkPad X9-15p Gen 1 | |
| maximum AS SSD Seq Read Test (1GB) | |
| Apple MacBook Pro 14 2026 M5 Max (Angelbird AV Pro V60) | |
| Average of class Multimedia (37.3 - 1455, n=35, last 2 years) | |
| Lenovo ThinkPad X9-15p Gen 1 | |
Communication
Relying on Wi-Fi, the Lenovo ThinkPad X9-15p Gen 1 does not offer RJ45 Ethernet or 5G/4G connectivity and instead depends entirely on the Intel BE211 Wi-Fi 7 card. If you have a modern router, the transfer speeds are great.
| Networking | |
| iperf3 transmit Wi-Fi6/7 RT-BE96U | |
| Average Intel Wi-Fi 7 BE211 320MHz (2341 - 4557, n=7) | |
| Lenovo ThinkPad X9-15p Gen 1 | |
| Average of class Multimedia (906 - 3618, n=4, last 2 years) | |
| iperf3 receive Wi-Fi6/7 RT-BE96U | |
| Average Intel Wi-Fi 7 BE211 320MHz (1998 - 3290, n=7) | |
| Lenovo ThinkPad X9-15p Gen 1 | |
| Average of class Multimedia (996 - 2878, n=4, last 2 years) | |
| iperf3 receive AXE11000 6GHz | |
| Dell XPS 16 Core Ultra X7 358H | |
| Average Intel Wi-Fi 7 BE211 320MHz (1450 - 1757, n=17) | |
| Average of class Multimedia (1212 - 2361, n=22, last 2 years) | |
| iperf3 transmit AXE11000 6GHz | |
| Dell XPS 16 Core Ultra X7 358H | |
| Average Intel Wi-Fi 7 BE211 320MHz (1247 - 1662, n=17) | |
| Average of class Multimedia (869 - 2373, n=22, last 2 years) | |
Webcam
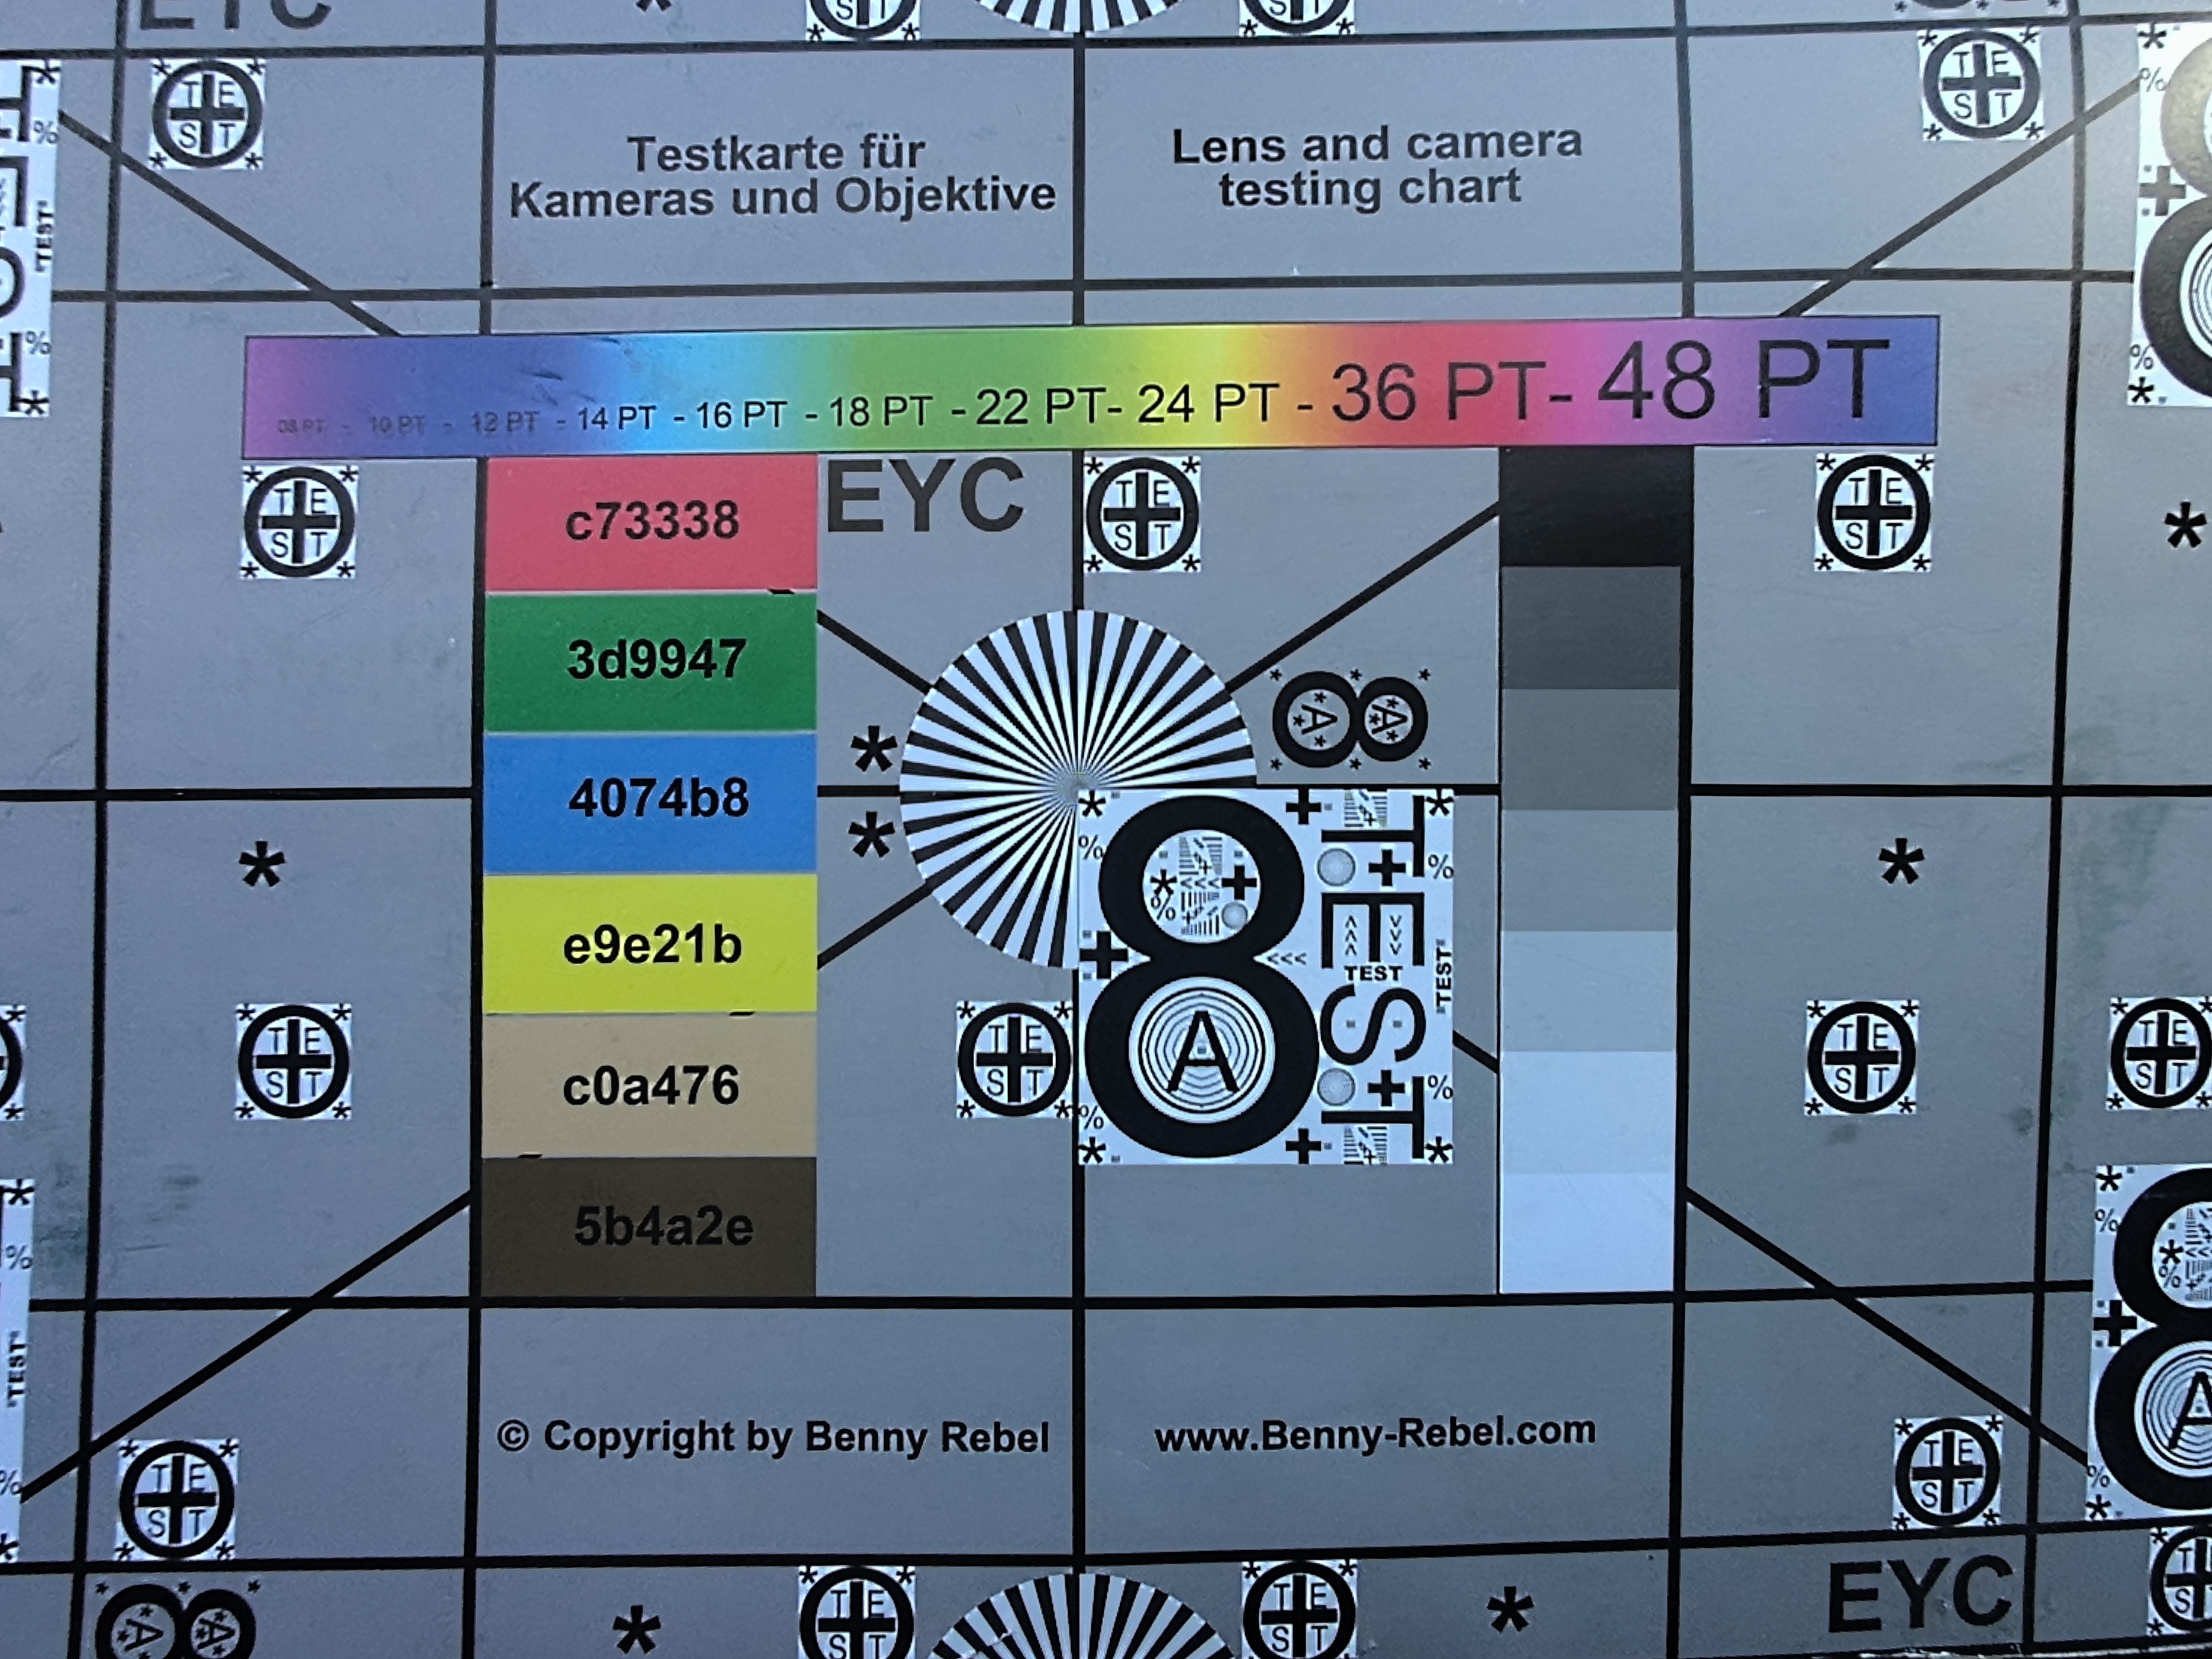
The 10 MP camera delivers surprisingly mediocre results—not quite what we expected from a product marketed as having a good webcam. It is certainly good enough for video calls, but it is far from great.


Security
It may be a ThinkPad, but the Lenovo ThinkPad X9-15p has a much more limited array of security features. For example, there is no smart card reader or Kensington lock slot. In addition, Lenovo replaces the physical camera shutter with an electronic shutter, which seems to work just fine but certainly does not provide the same peace of mind as a physical piece of plastic blocking the lens.
Accessories
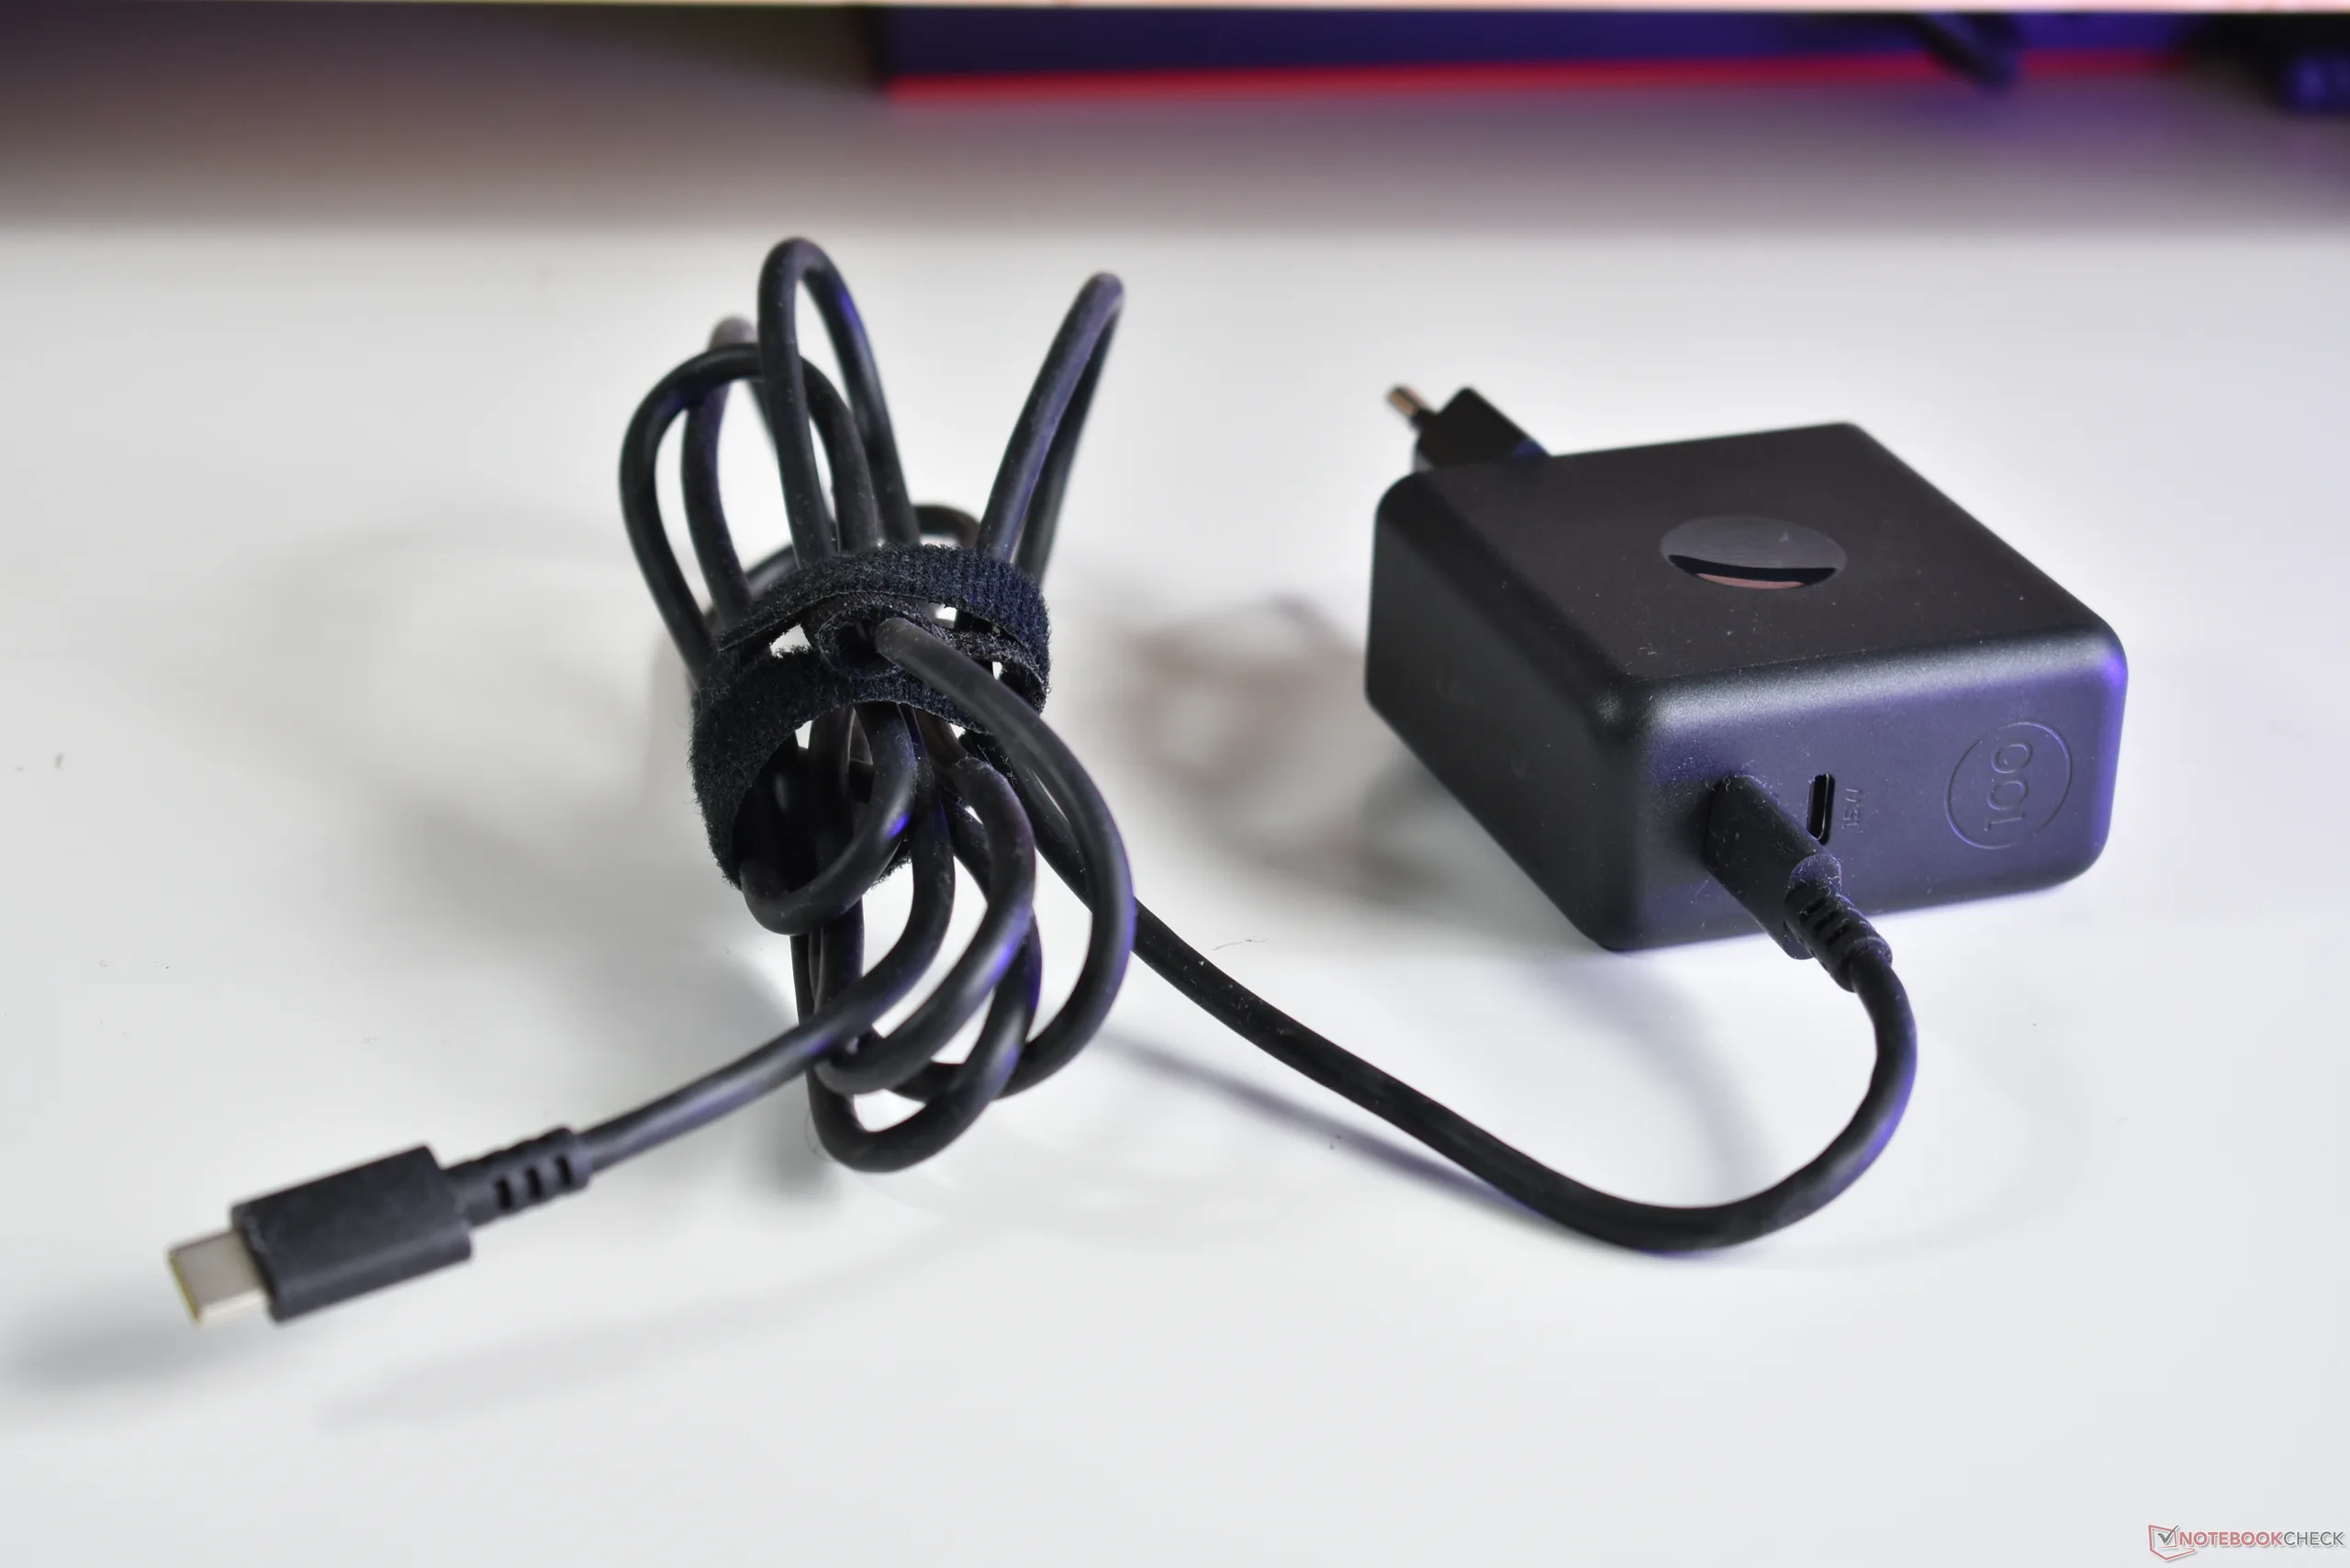
There are no included accessories besides the wall-mounted 100 W USB-C GaN charger, which includes a second 15 W USB-C port on the brick that can be used to charge a smartphone or another device.
Maintenance
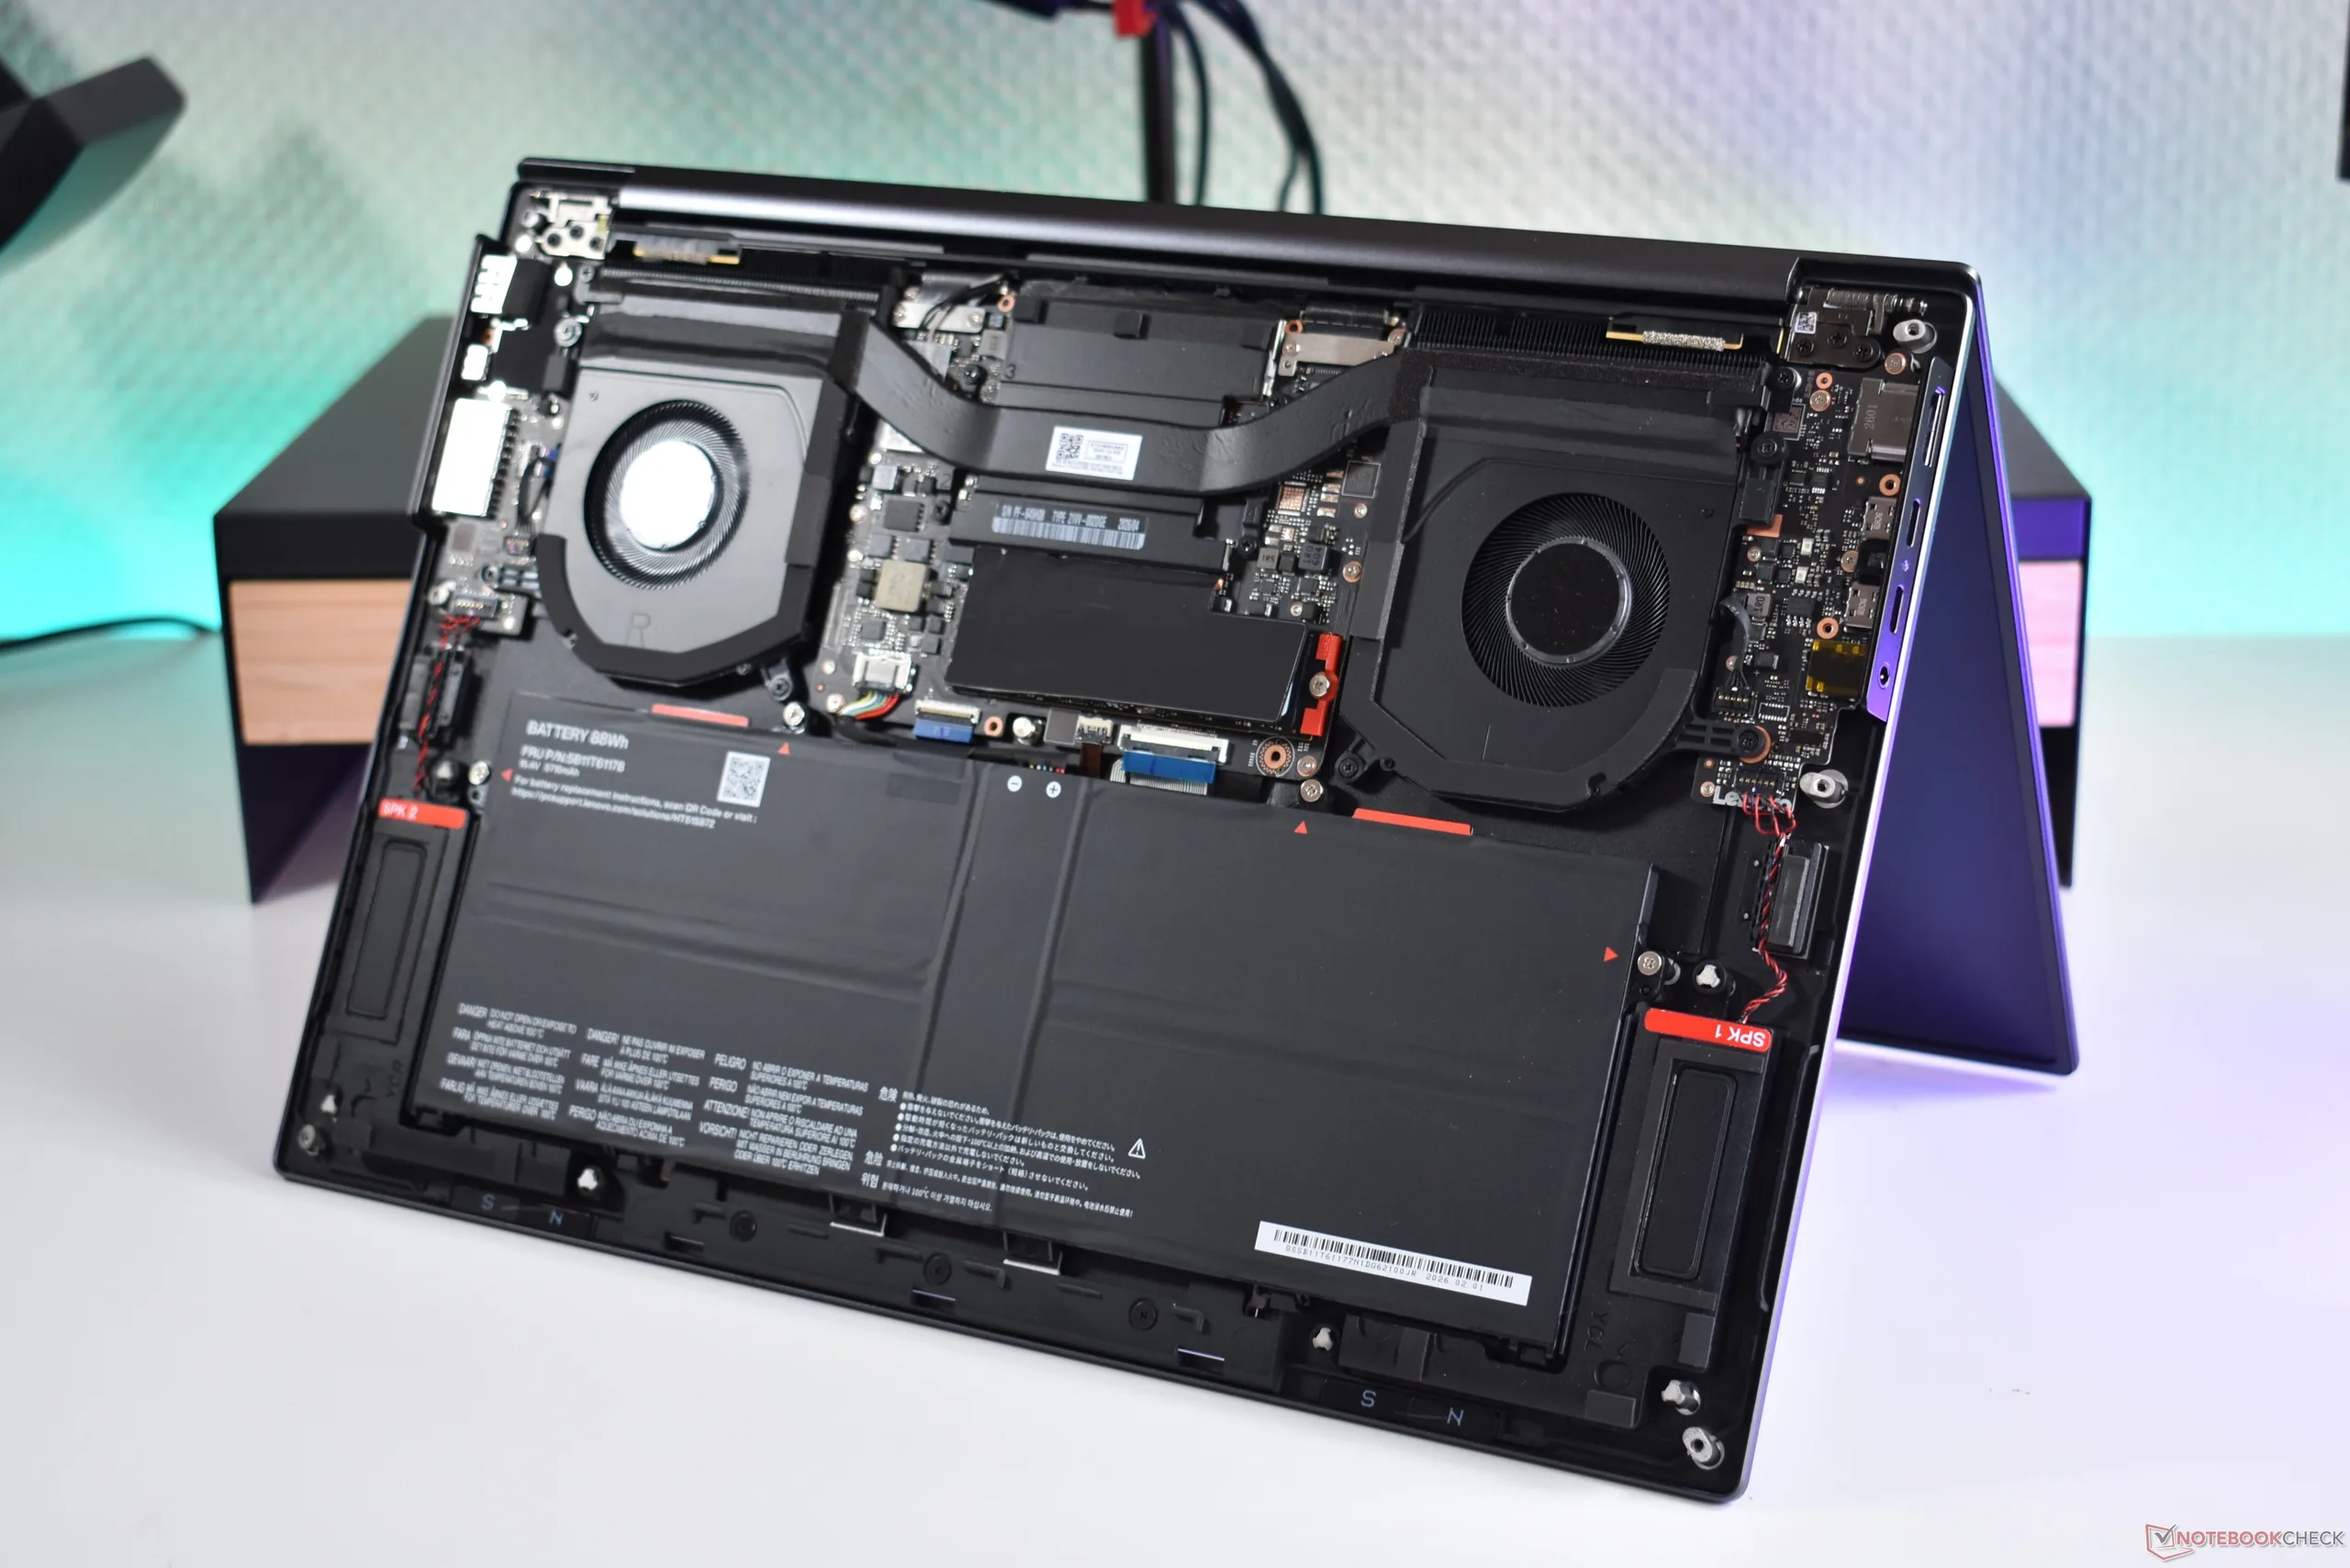
Six Phillips-head screws must be removed to access the internals, which is easy enough to do. There is not much to upgrade, as the RAM and Wi-Fi card are soldered and there is no WWAN card, but the ThinkPad is quite repairable. The fans can be cleaned without having to reapply thermal paste, and all the ports are located on daughterboards. Removing the internal battery is also easy, as it is just screwed down. Sadly, the keyboard is not easily replaceable, but most other components can be repaired.
Sustainability
As is standard for all ThinkPad laptops, the Lenovo ThinkPad X9-15p Gen 1 is delivered in plastic-free, compostable packaging. In addition, 50 percent of the aluminum comes from recycled sources. As this is a ThinkPad, you can expect replacement parts and updates to be available for a long time, along with video and written maintenance manuals. The lifecycle CO2-equivalent emissions of the Lenovo laptop are 138 kg CO2e, according to Lenovo.
Warranty
The Lenovo ThinkPad X9-15p Gen 1 sold in Germany has a 36-month warranty, which includes one year of Premier Support with on-site service. After the first year, it reverts to regular bring-in service. As this is a business model, the warranty also applies internationally, though without on-site service. Optional warranty upgrades are available.
Input Devices
Keyboard
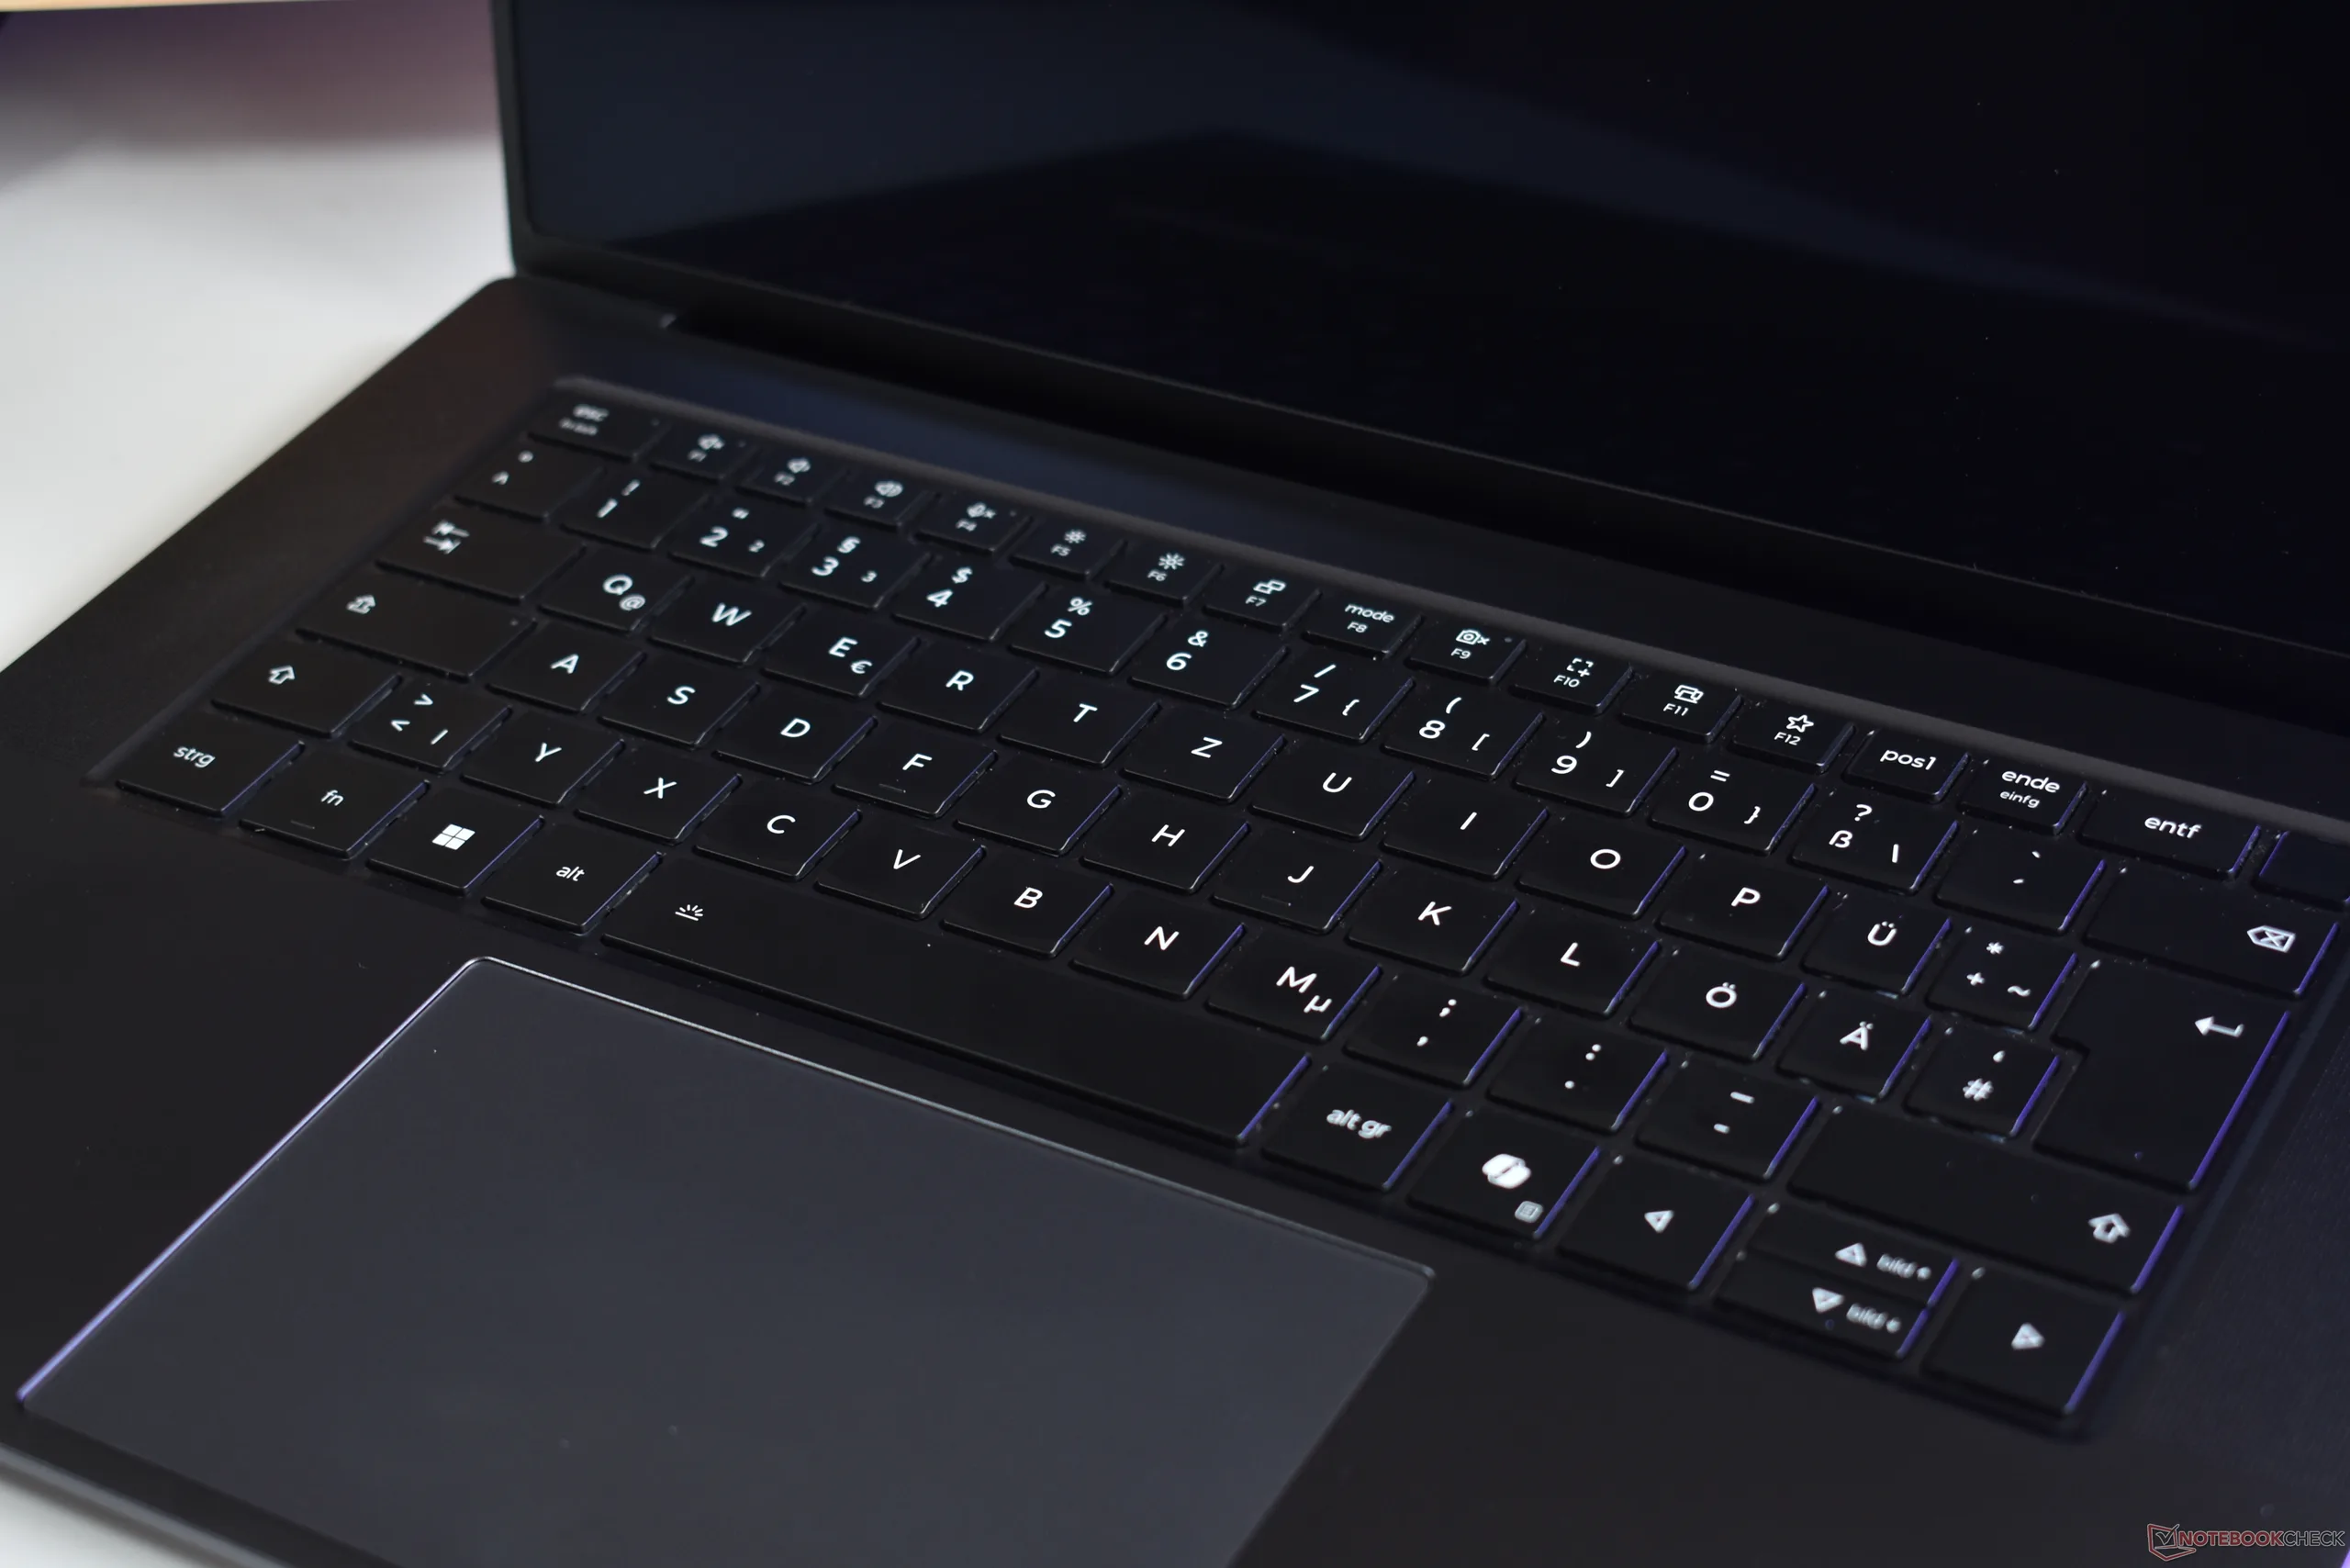
Lenovo retains the same keyboard design as on the 2025 Lenovo ThinkPad X9-15 Gen 1. This is not the same keyboard used on nearly all other ThinkPads, as it has a different keycap style, with squarer chiclet keys and just 1.35 mm of key travel. As with the previous model, there is no numpad, which we appreciate. Overall, the backlit keyboard provides a great typing experience that makes composing long texts effortless, though it is not quite as good as those of other ThinkPads. The same is true of the keyboard layout, which features compressed vertical arrow keys.
Touchpad
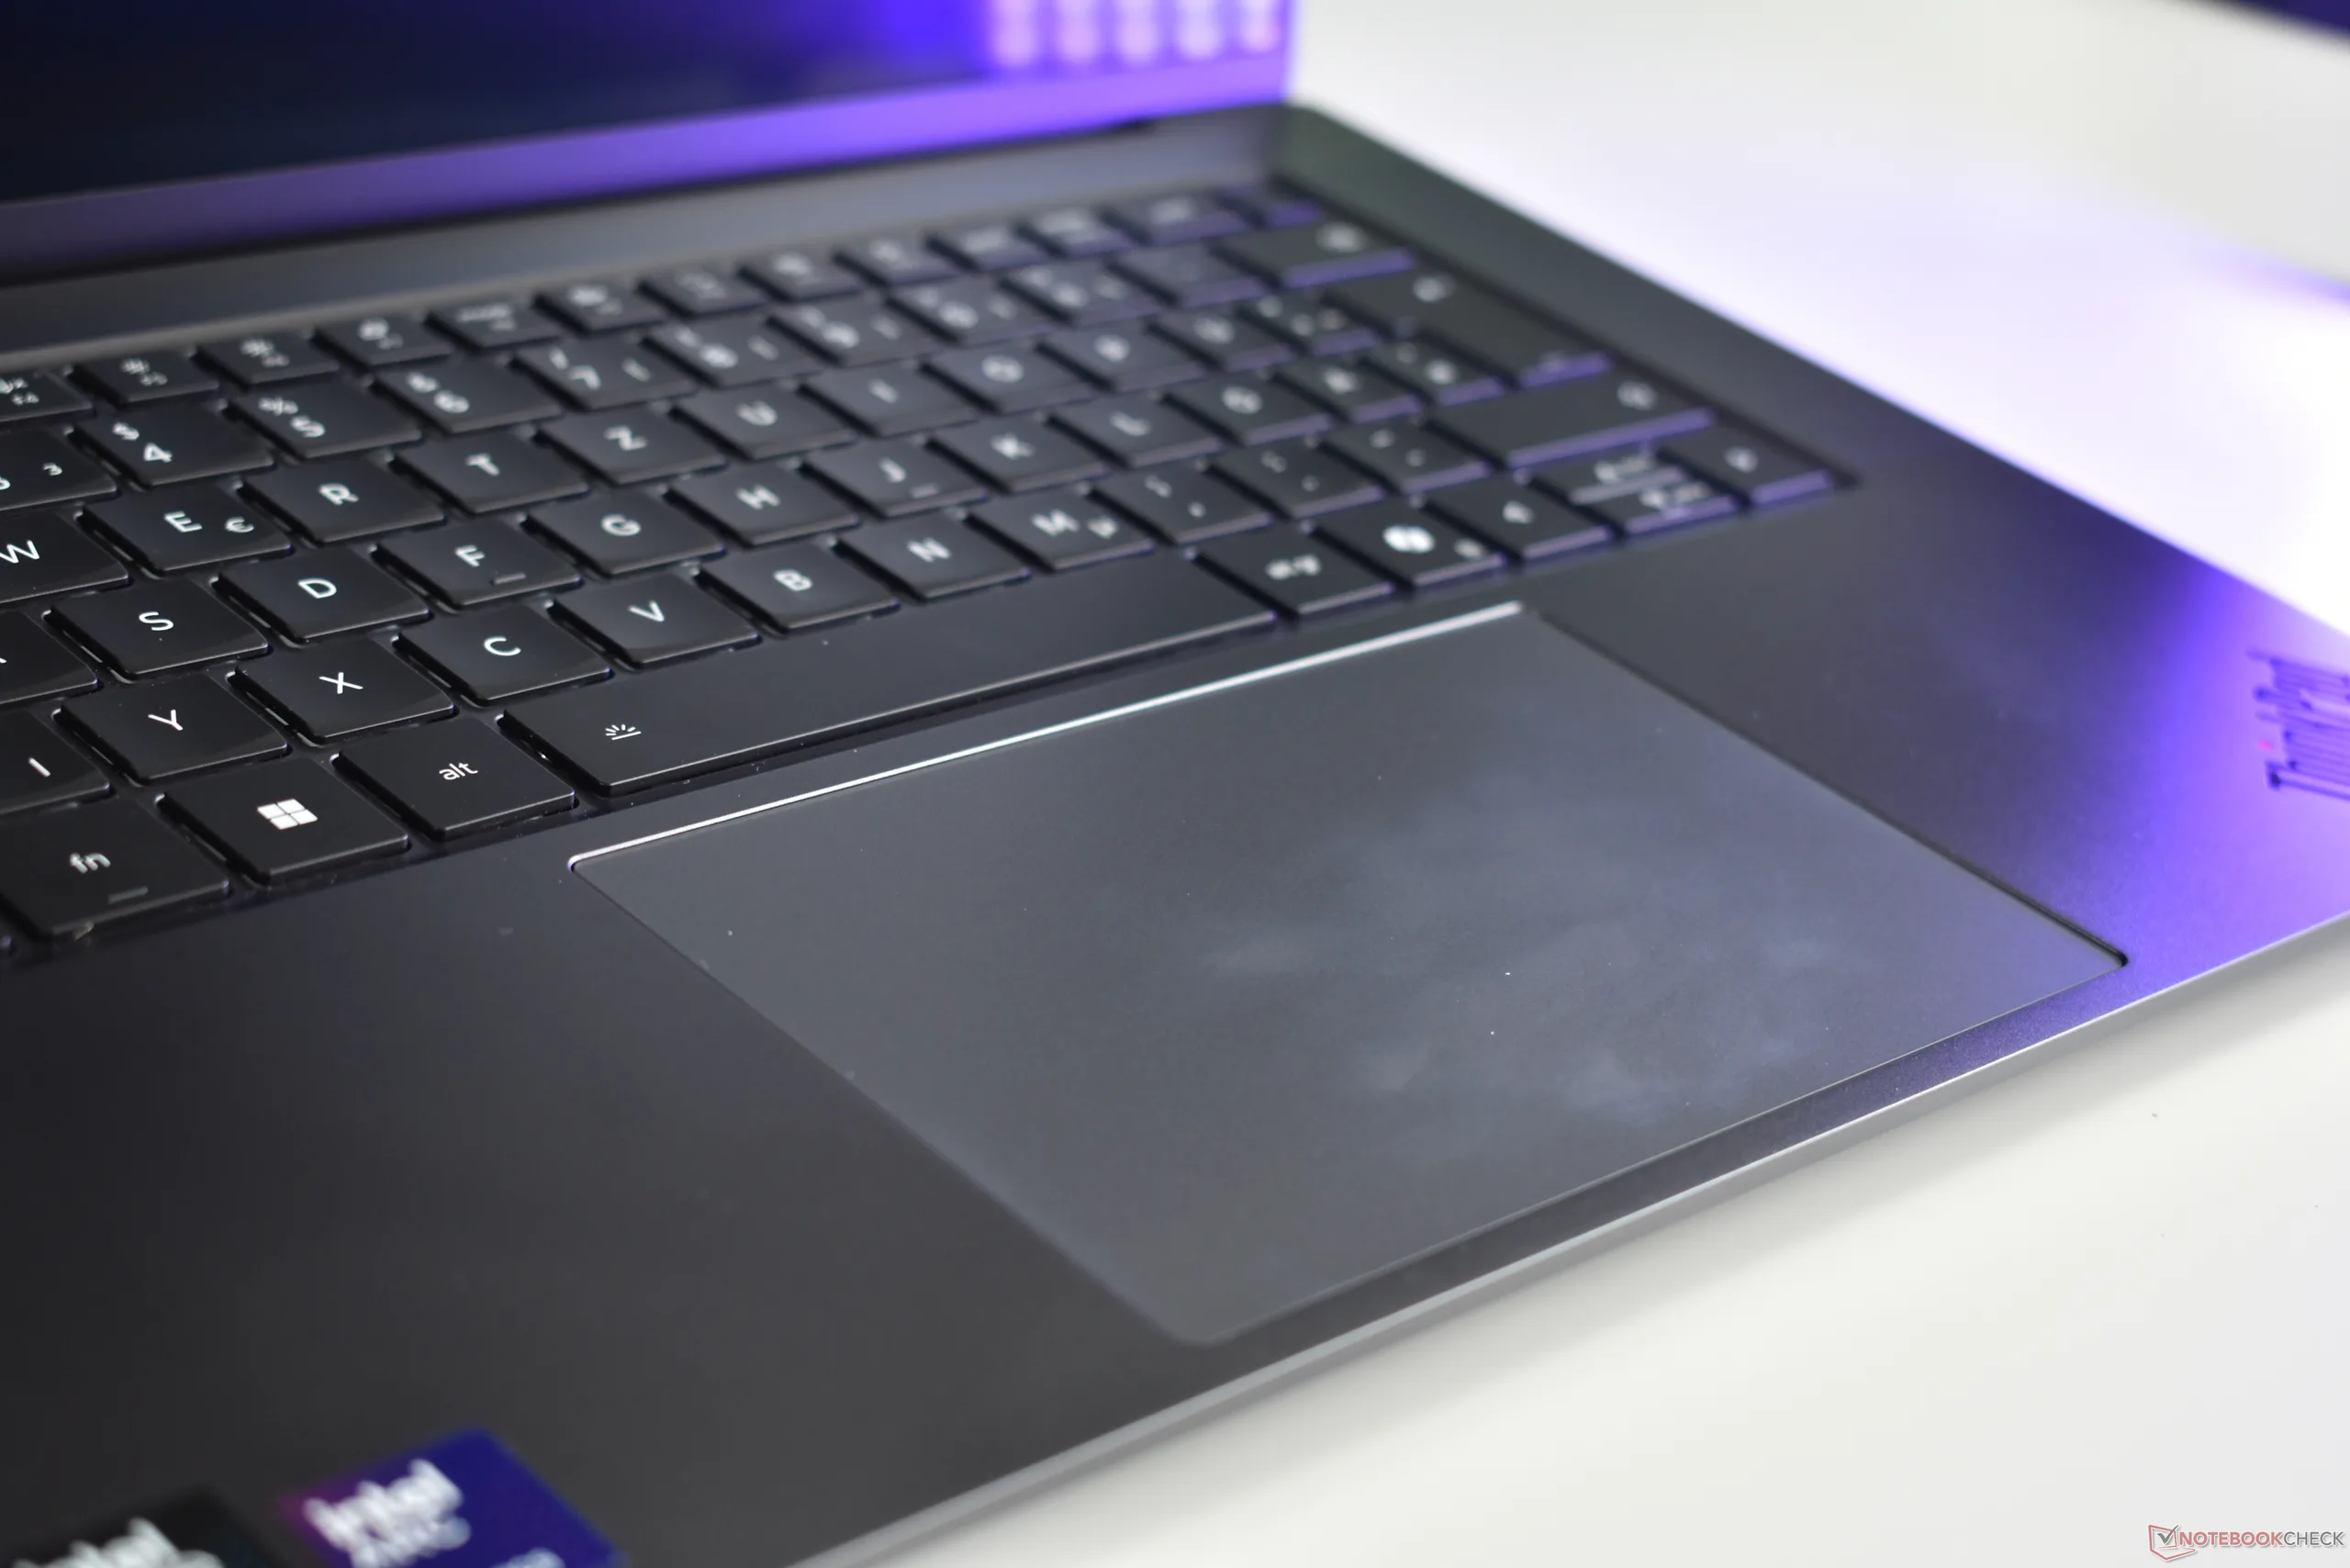
Sacrificing the iconic ThinkPad TrackPoint, the Lenovo ThinkPad X9-15p Gen 1 offers the largest touchpad of any ThinkPad. The glass forcepad measures 13.5 x 8.5 cm, and since it is haptic, you can click anywhere. As far as touchpads go, this provides an excellent experience, and you will be hard-pressed to find a much better one in the Windows laptop market.
Display

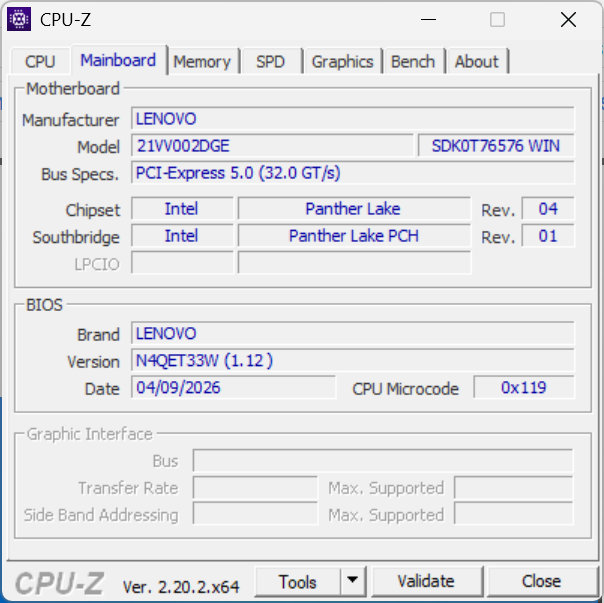
There is only one screen available for the ThinkPad X9-15p Gen 1 Aura Edition: a 15.3-inch 2.8K (2,880 x 1,800) OLED panel with 500 cd/m² of brightness, HDR support (peak brightness of 1,100 cd/m²), 100 percent DCI-P3 color-gamut coverage, and a glossy surface with an anti-reflective coating. The only choice is whether the screen has an optional touch layer; our review unit is equipped with the multitouch version.
Made by Samsung, the ThinkPad's OLED screen is nearly identical to that of the older ThinkPad X9-15. This means that it is slightly less bright than the MacBook Air 15 but offers better color reproduction. The measured peak brightness with HDR enabled reached 1,076 cd/m².
| |||||||||||||||||||||||||
Brightness Distribution: 98 %
Center on Battery: 489 cd/m²
Contrast: ∞:1 (Black: 0 cd/m²)
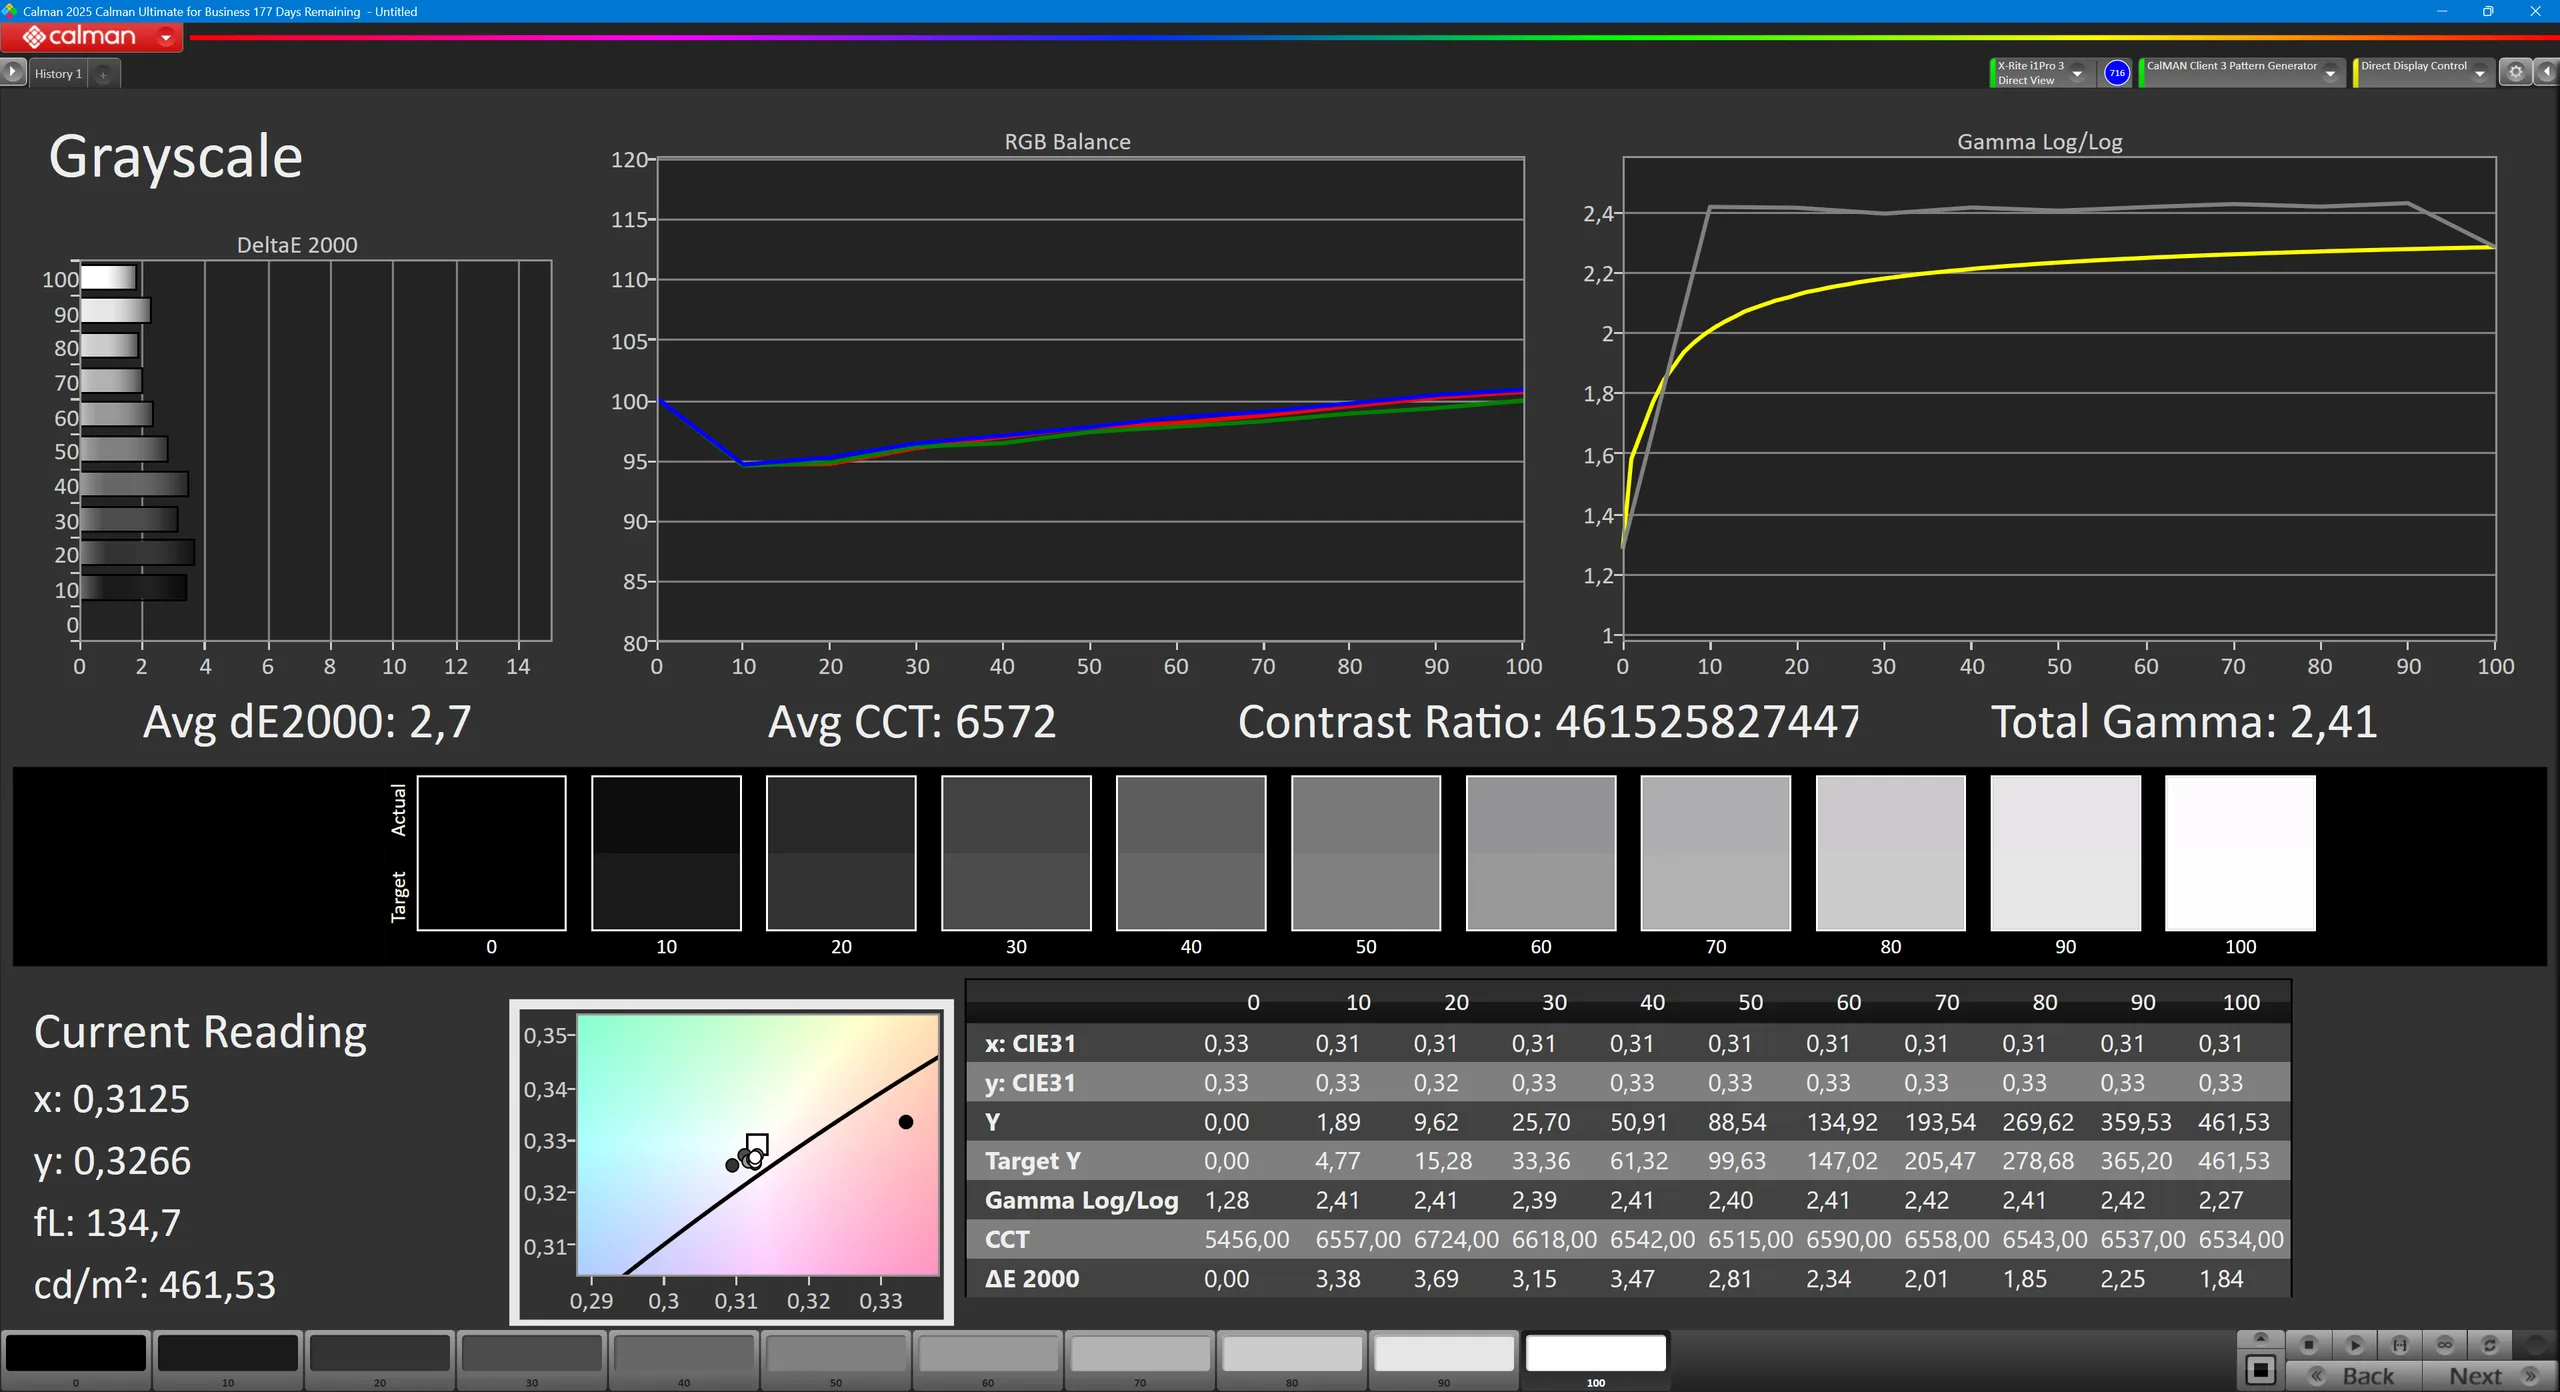
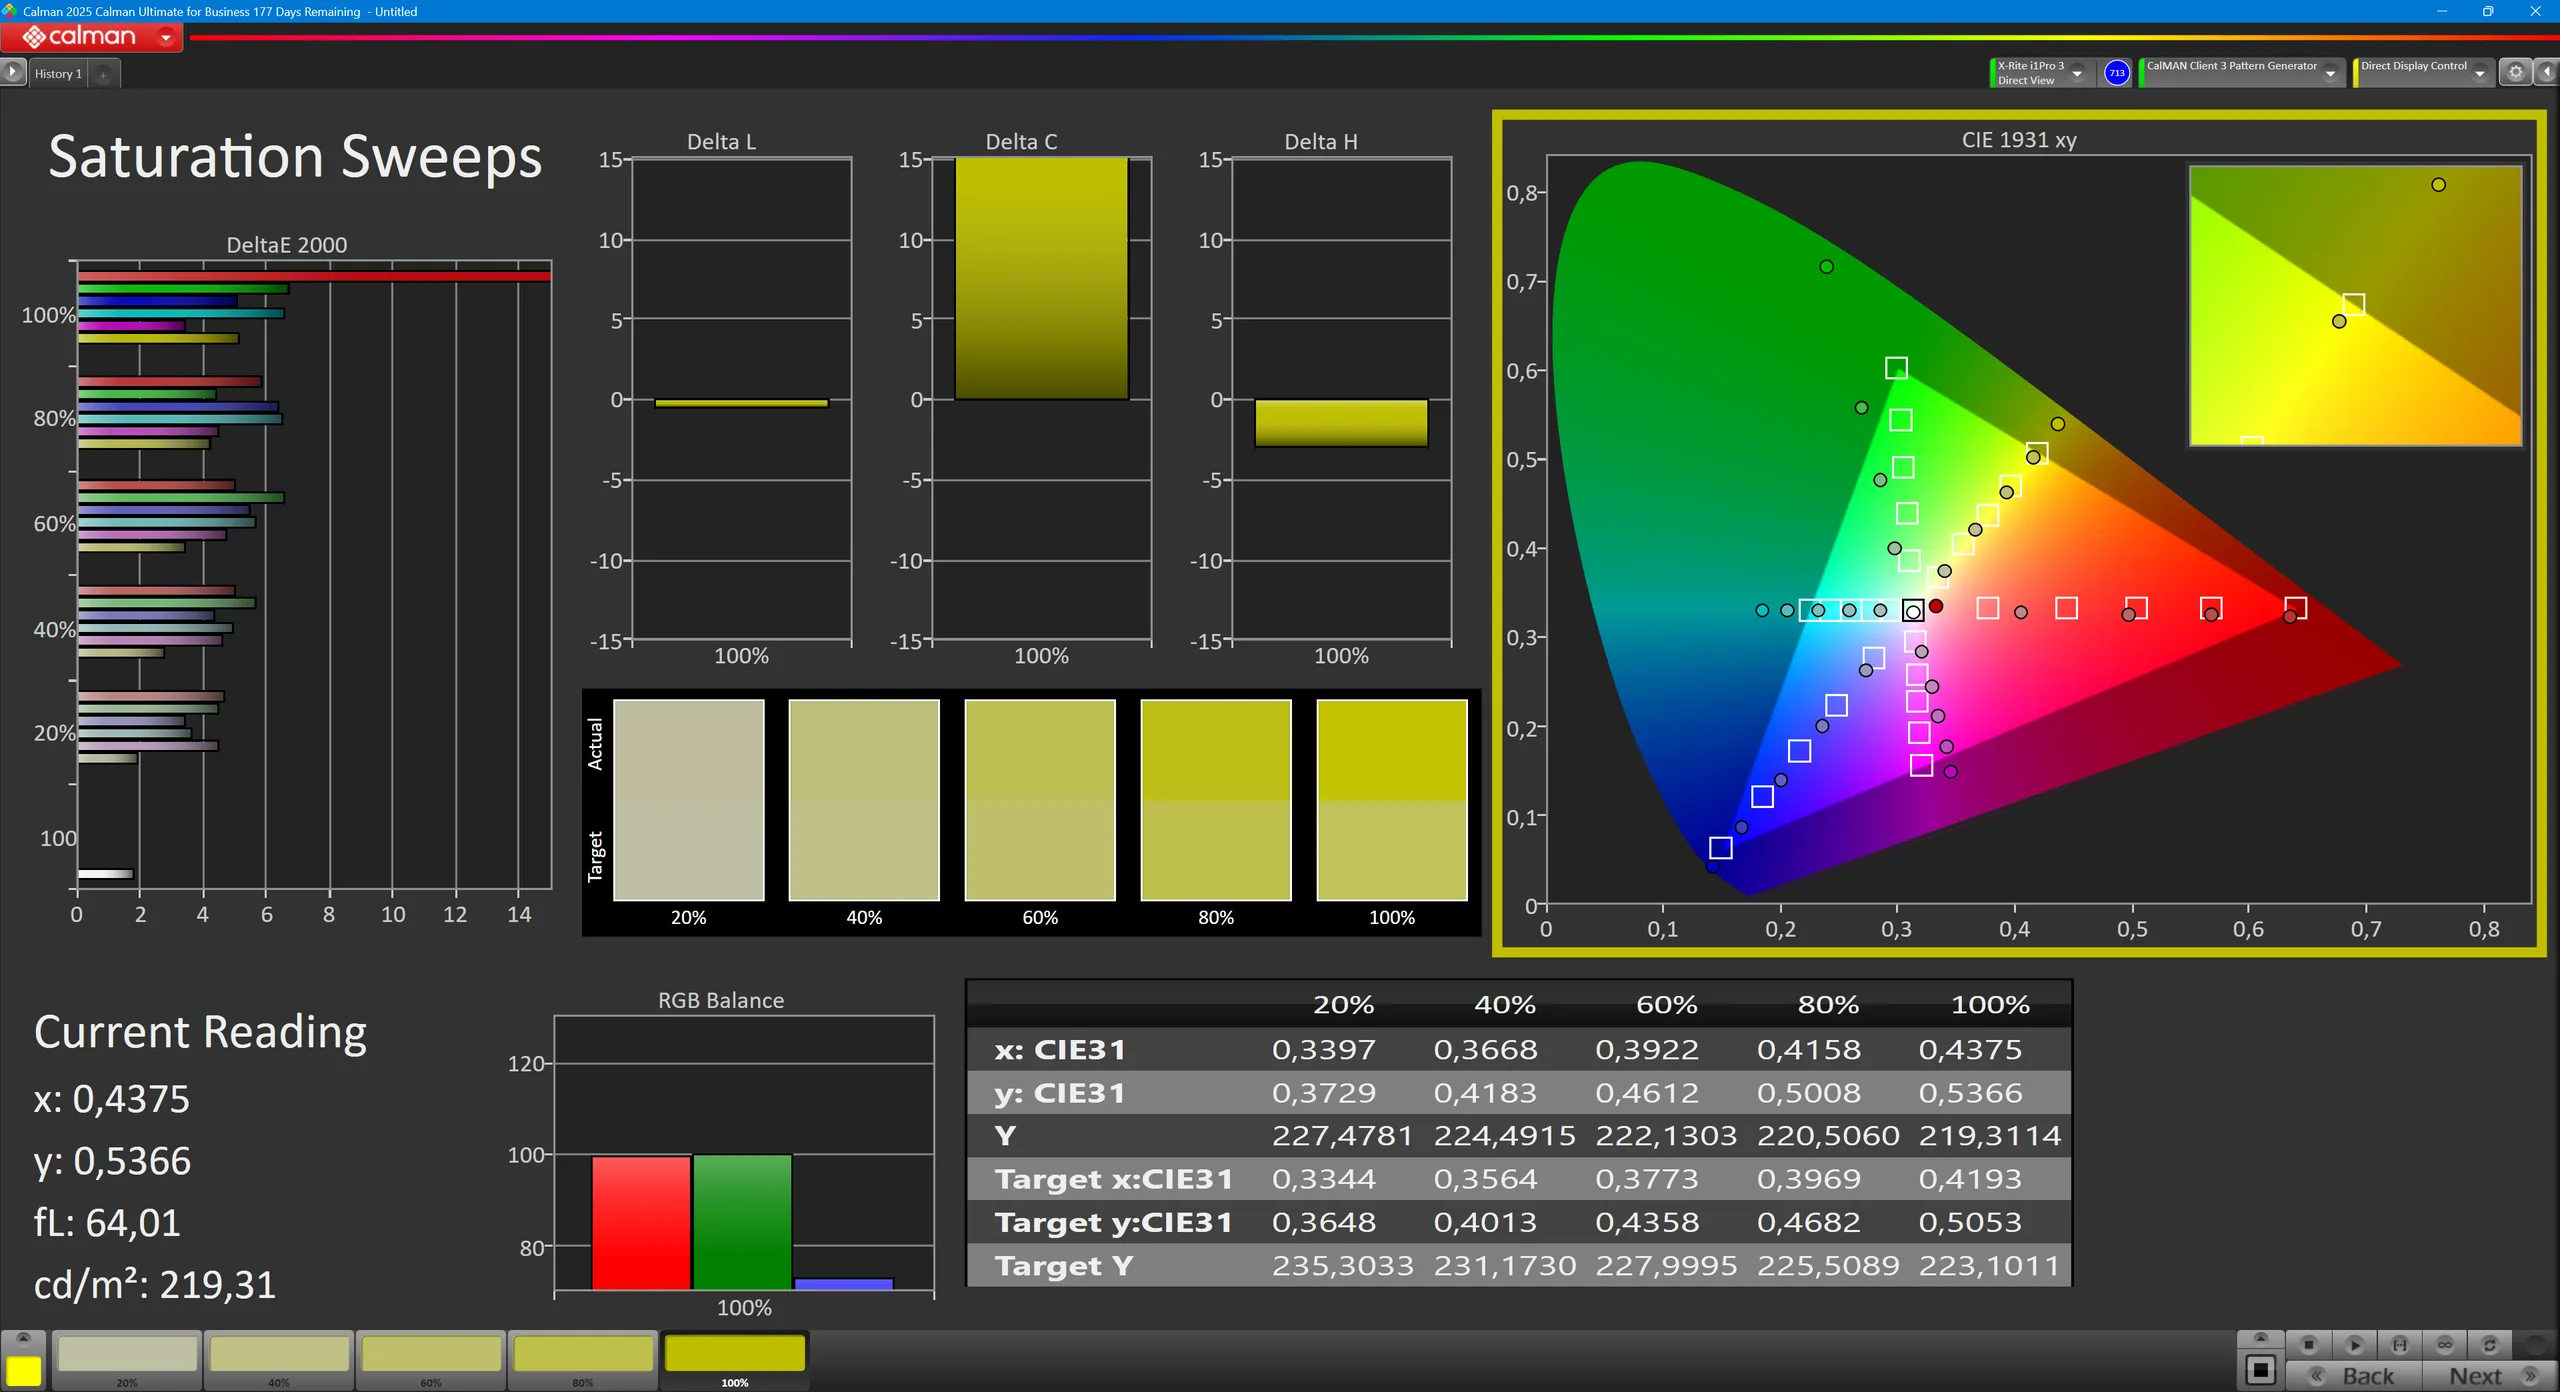
ΔE ColorChecker Calman: 4.6 | ∀{0.5-29.43 Ø4.7}
calibrated: 5
ΔE Greyscale Calman: 2.6 | ∀{0.09-98 Ø4.95}
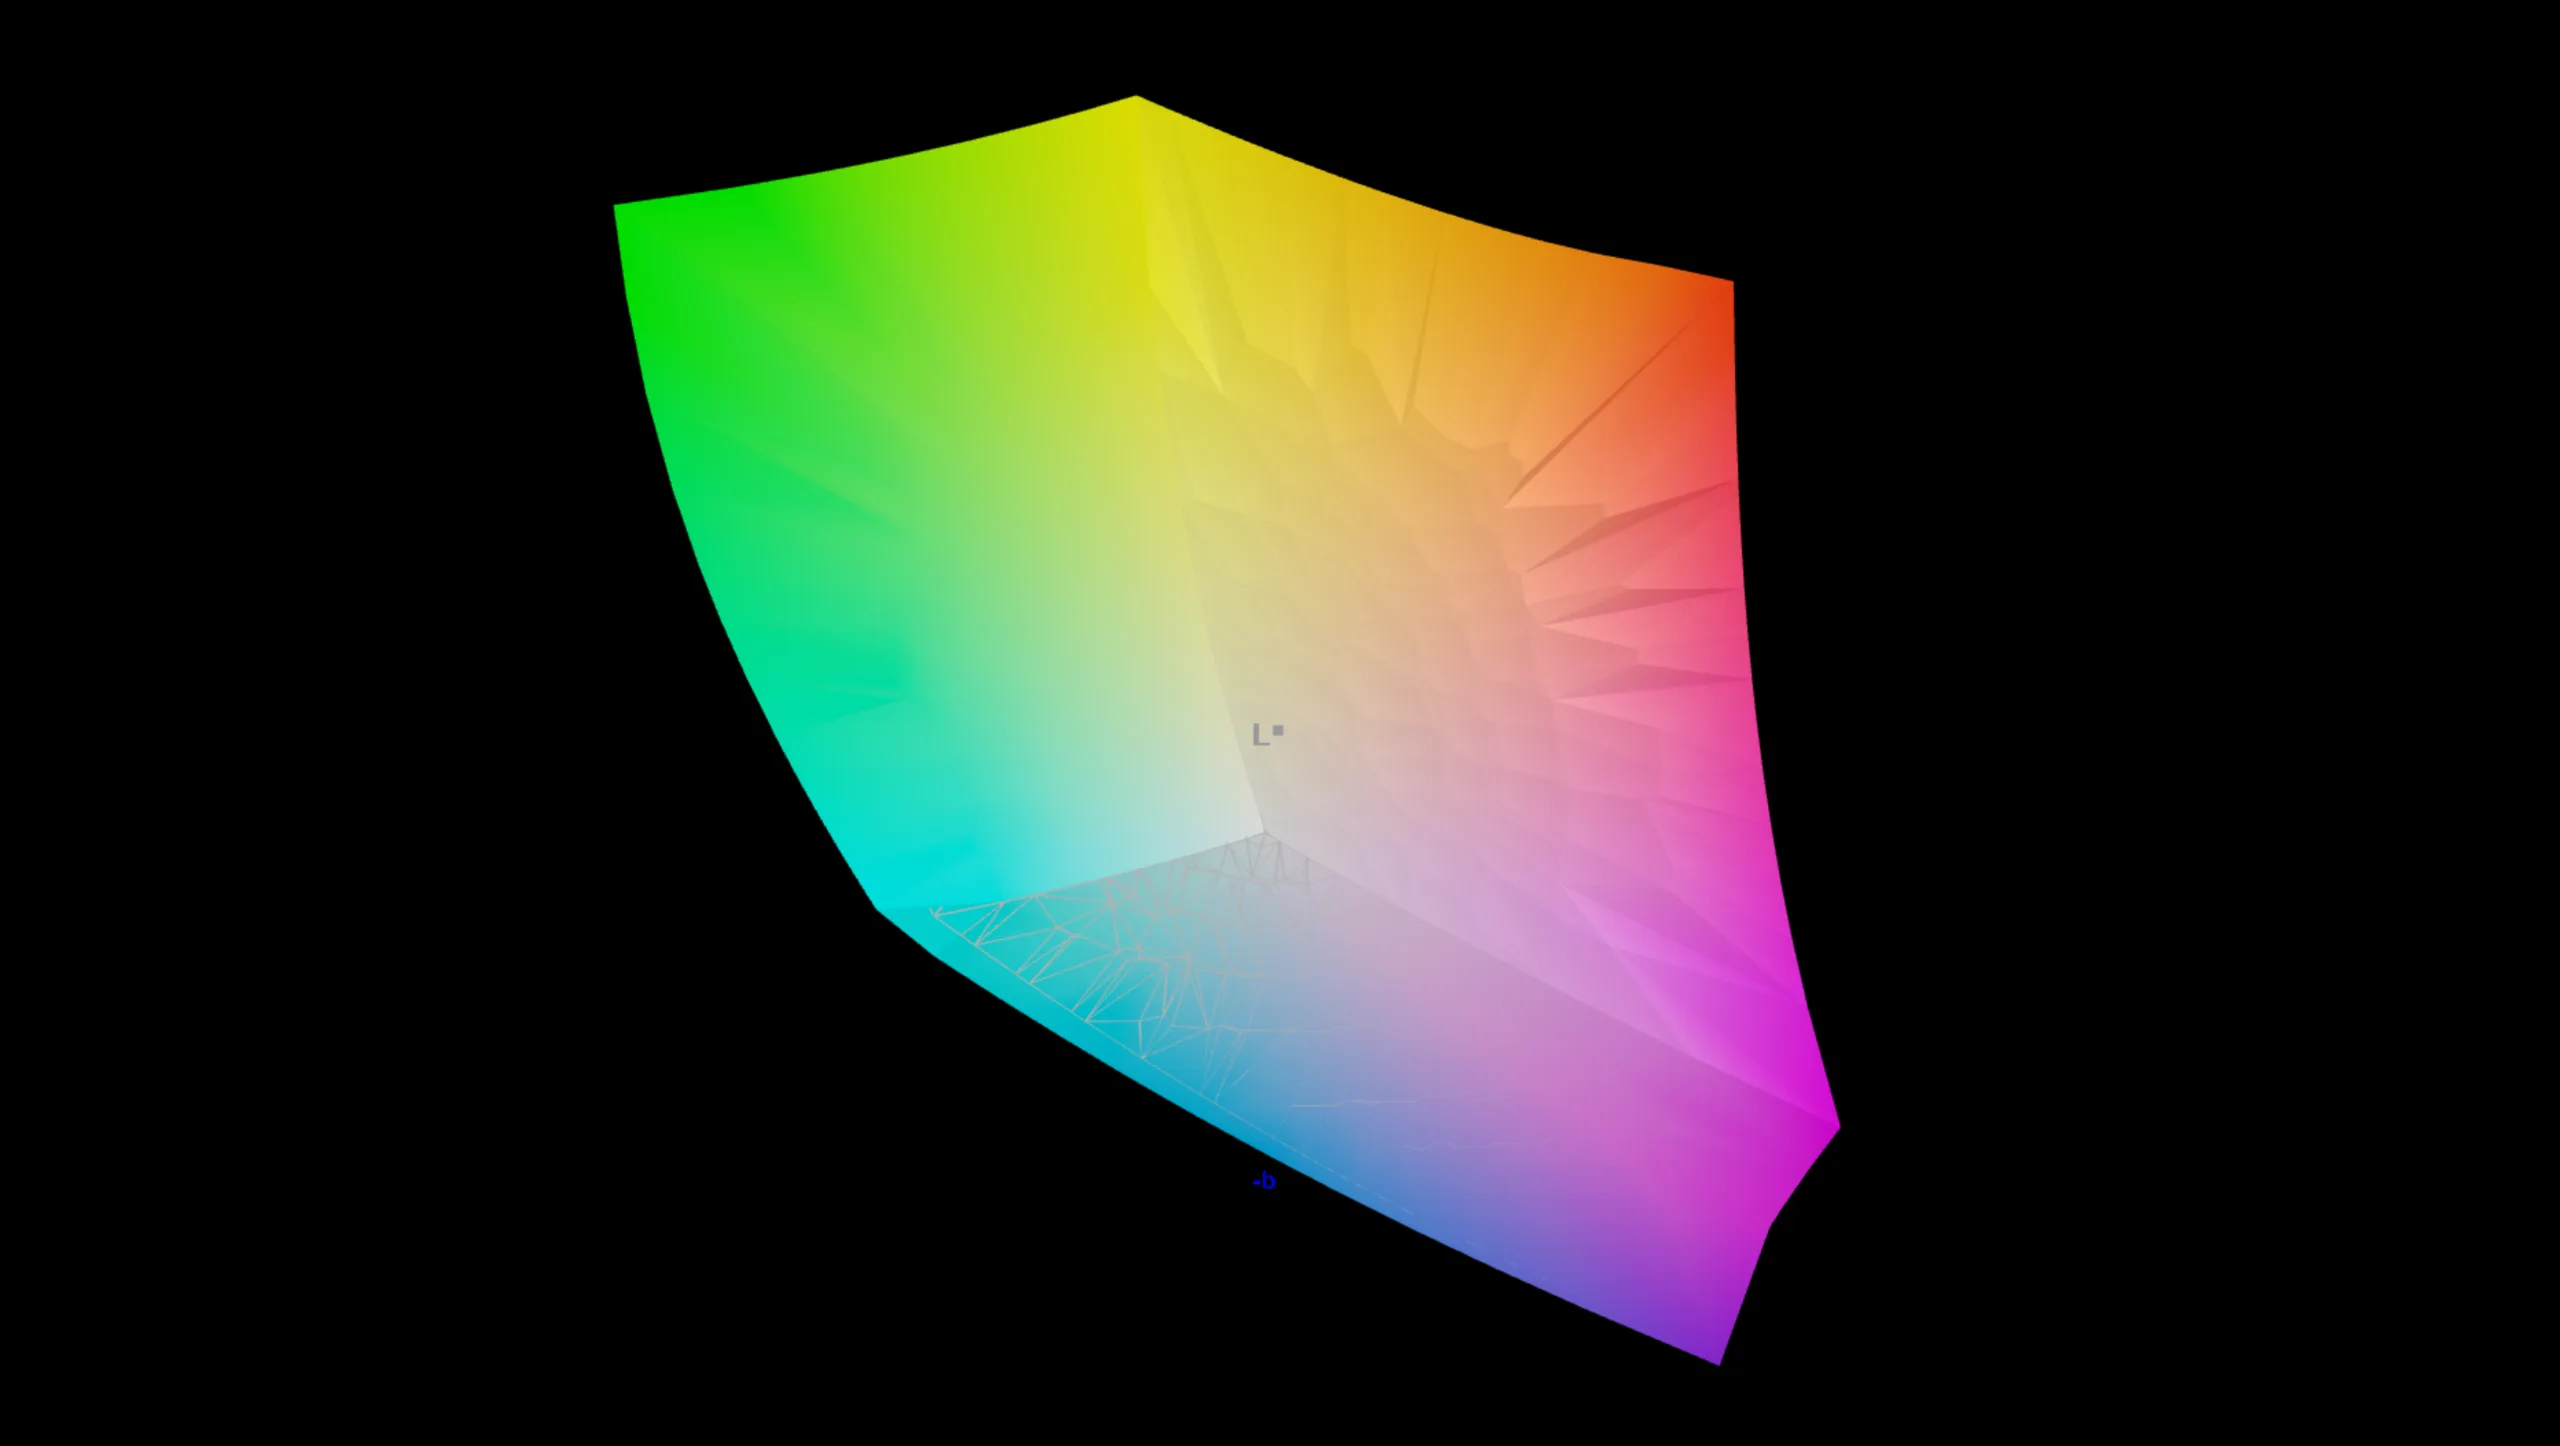
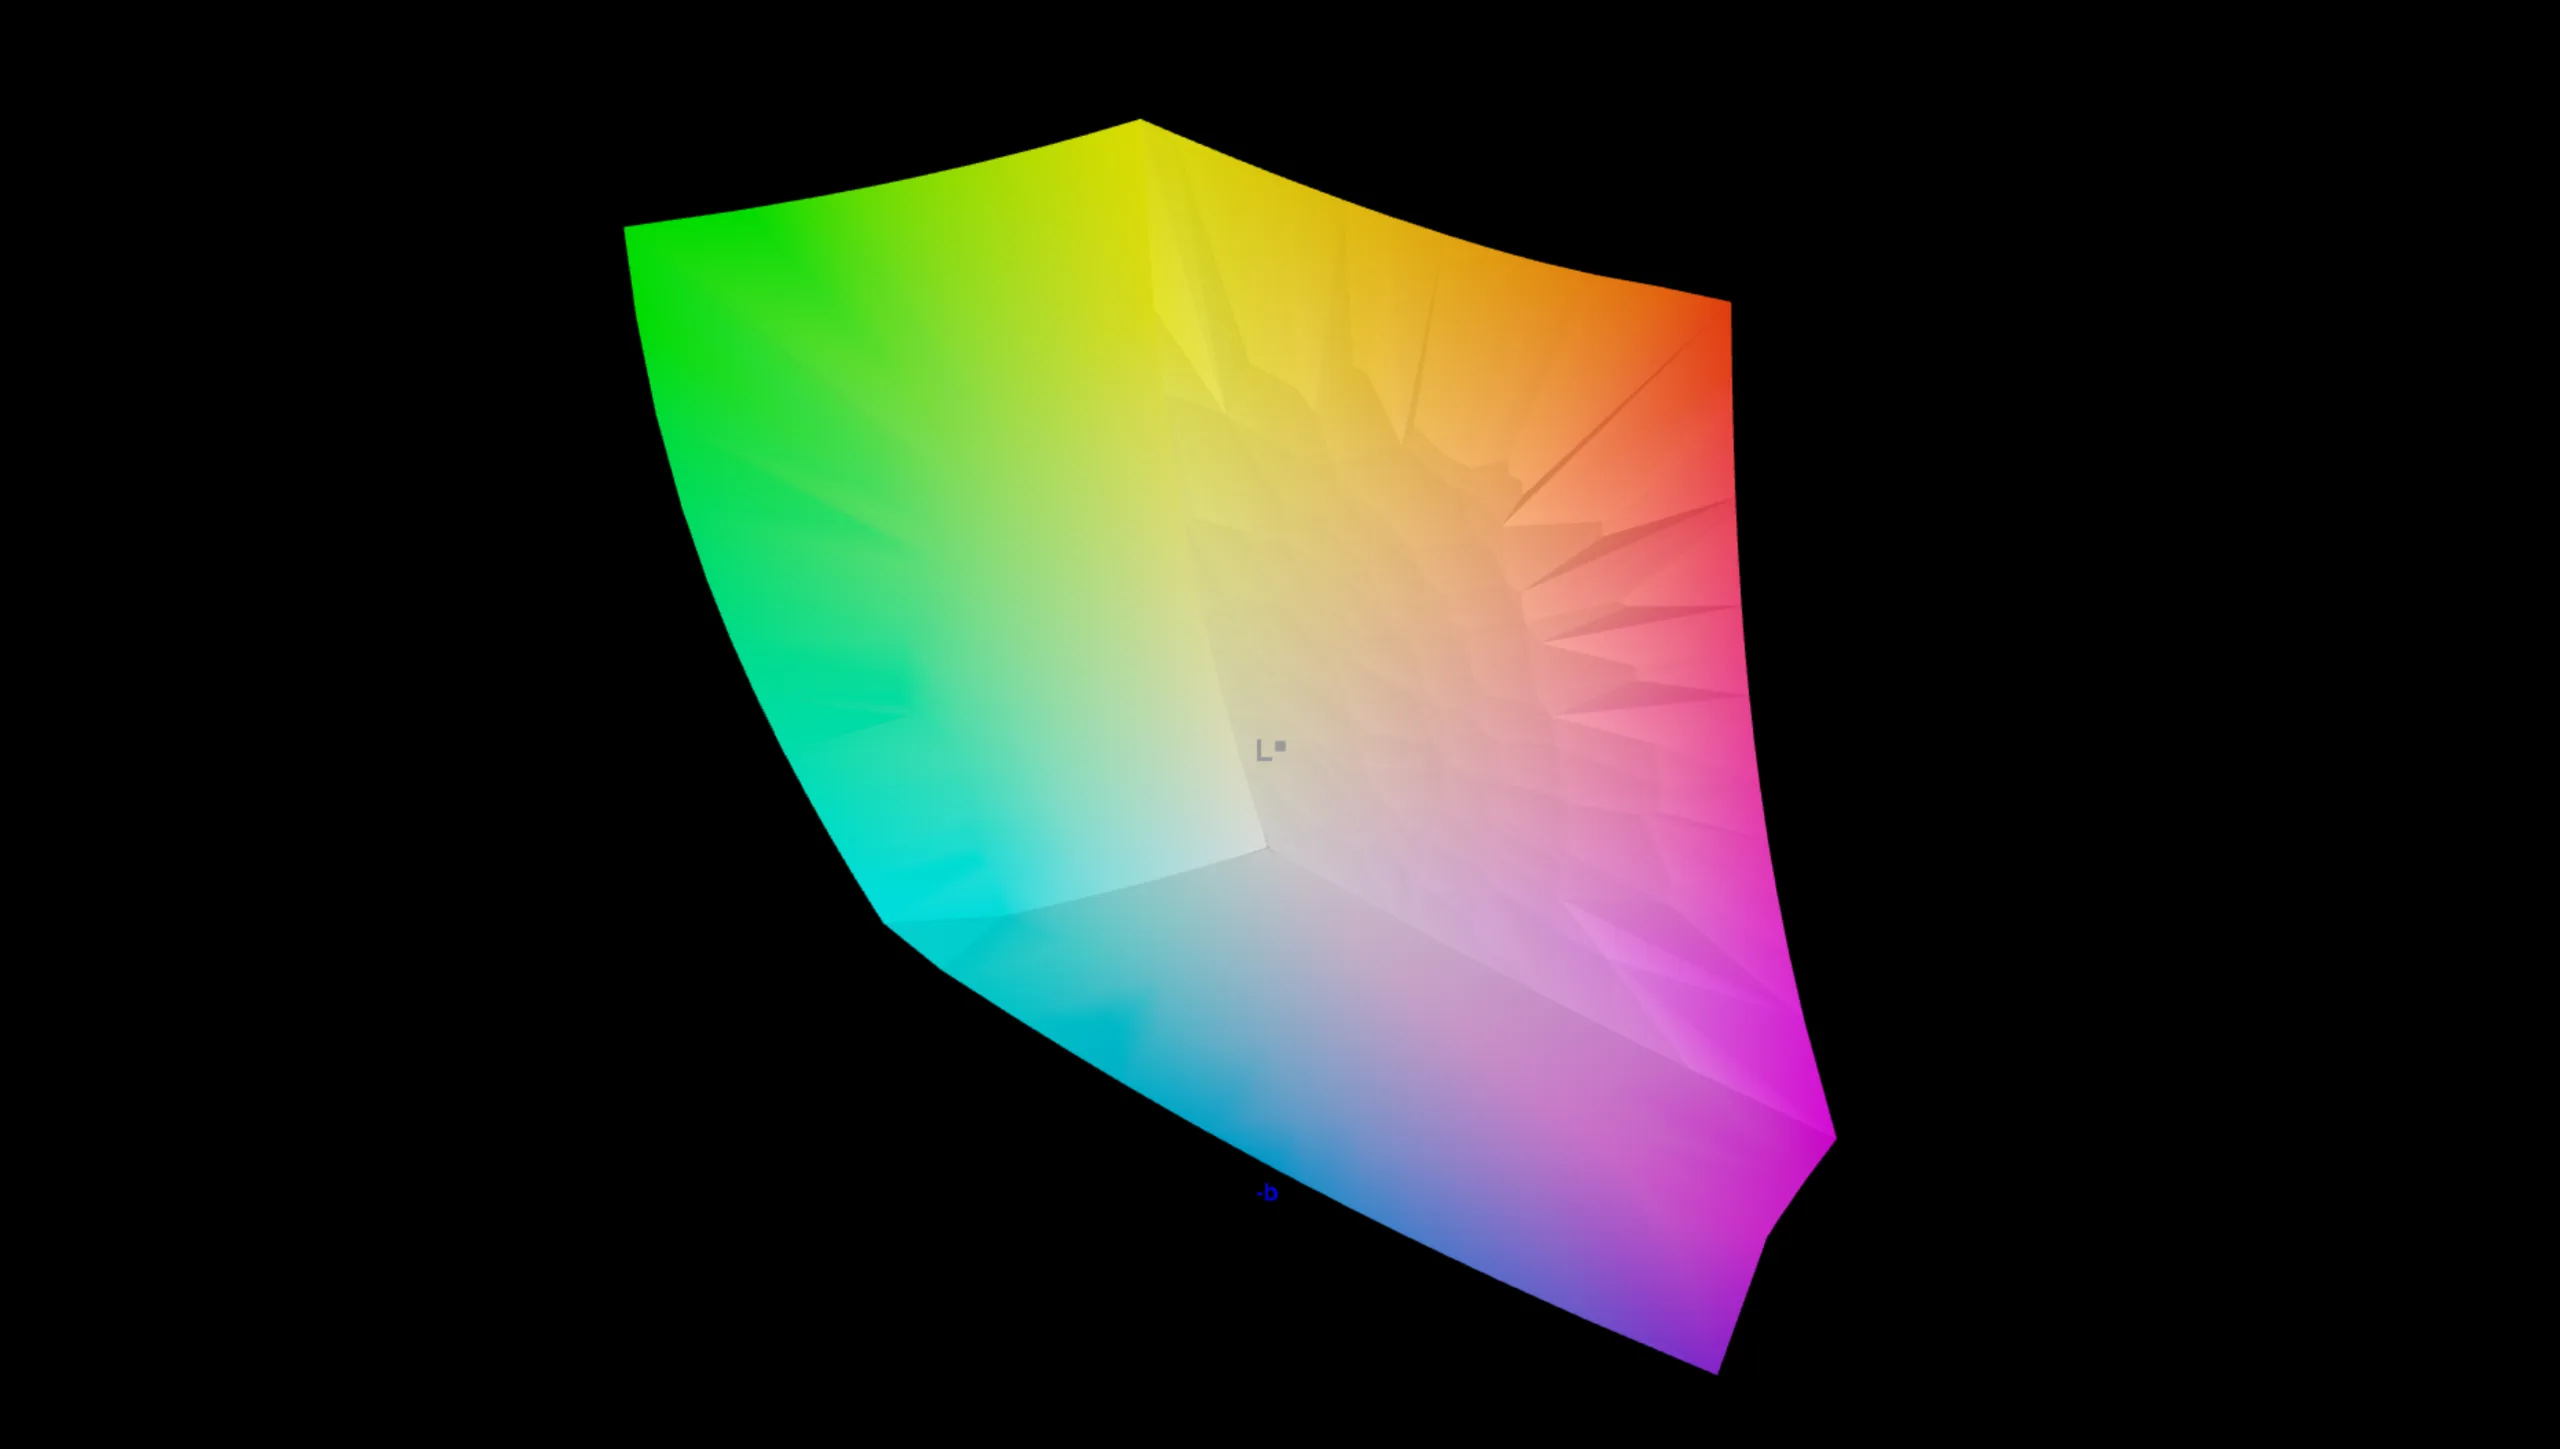
94.3% AdobeRGB 1998 (Argyll 3D)
100% sRGB (Argyll 3D)
99.1% Display P3 (Argyll 3D)
Gamma: 2.18
CCT: 6334 K
| Lenovo ThinkPad X9-15p Gen 1 ATNA53JB03-0, OLED, 2880x1800, 15.3", 120 Hz | Lenovo ThinkPad X9-15 Aura Edition ATNA53JB01-0, OLED, 2880x1800, 15.3", 120 Hz | Apple MacBook Air 15 M5 IPS, 2880x1864, 15.3", 60 Hz | Dell XPS 16 Core Ultra X7 358H LG Philips 160WV1, OLED, 3200x2000, 16", 120 Hz | |
|---|---|---|---|---|
| Display | 0% | -4% | 1% | |
| HDR Peak Brightness (cd/m²) | 518 | |||
| Display P3 Coverage (%) | 99.1 | 100 1% | 97.5 -2% | 99.5 0% |
| sRGB Coverage (%) | 100 | 100 0% | 98.3 -2% | 100 0% |
| AdobeRGB 1998 Coverage (%) | 94.3 | 94.6 0% | 86.3 -8% | 96.5 2% |
| Response Times | 24% | -1691% | 30% | |
| Response Time Grey 50% / Grey 80% * (ms) | 1.1 ? | 1.46 ? -33% | 26.9 ? -2345% | 0.65 ? 41% |
| Response Time Black / White * (ms) | 1.4 ? | 0.44 ? 69% | 15.9 ? -1036% | 0.87 ? 38% |
| PWM Frequency (Hz) | 1194 ? | 1200 ? | 240.2 ? | |
| PWM Amplitude * (%) | 35 | 22 37% | 31 11% | |
| Screen | 32% | 26% | 13% | |
| Brightness middle (cd/m²) | 489 | 509 4% | 538 10% | 395.4 -19% |
| Brightness (cd/m²) | 492 | 508 3% | 521 6% | 392 -20% |
| Brightness Distribution (%) | 98 | 97 -1% | 90 -8% | 95 -3% |
| Black Level * (cd/m²) | 0.01 | 0.44 | ||
| Colorchecker dE 2000 * | 4.6 | 1.1 76% | 2.1 54% | 3.69 20% |
| Colorchecker dE 2000 max. * | 8.2 | 2.5 70% | 4.1 50% | 7.94 3% |
| Colorchecker dE 2000 calibrated * | 5 | 0.7 86% | 0.68 86% | |
| Greyscale dE 2000 * | 2.6 | 1.5 42% | 3.1 -19% | 1.9 27% |
| Gamma | 2.18 101% | 2.28 96% | 2.19 100% | 2.28 96% |
| CCT | 6334 103% | 6294 103% | 7075 92% | 6274 104% |
| Contrast (:1) | 50900 | 1223 | ||
| Total Average (Program / Settings) | 19% /
22% | -556% /
-268% | 15% /
14% |
* ... smaller is better
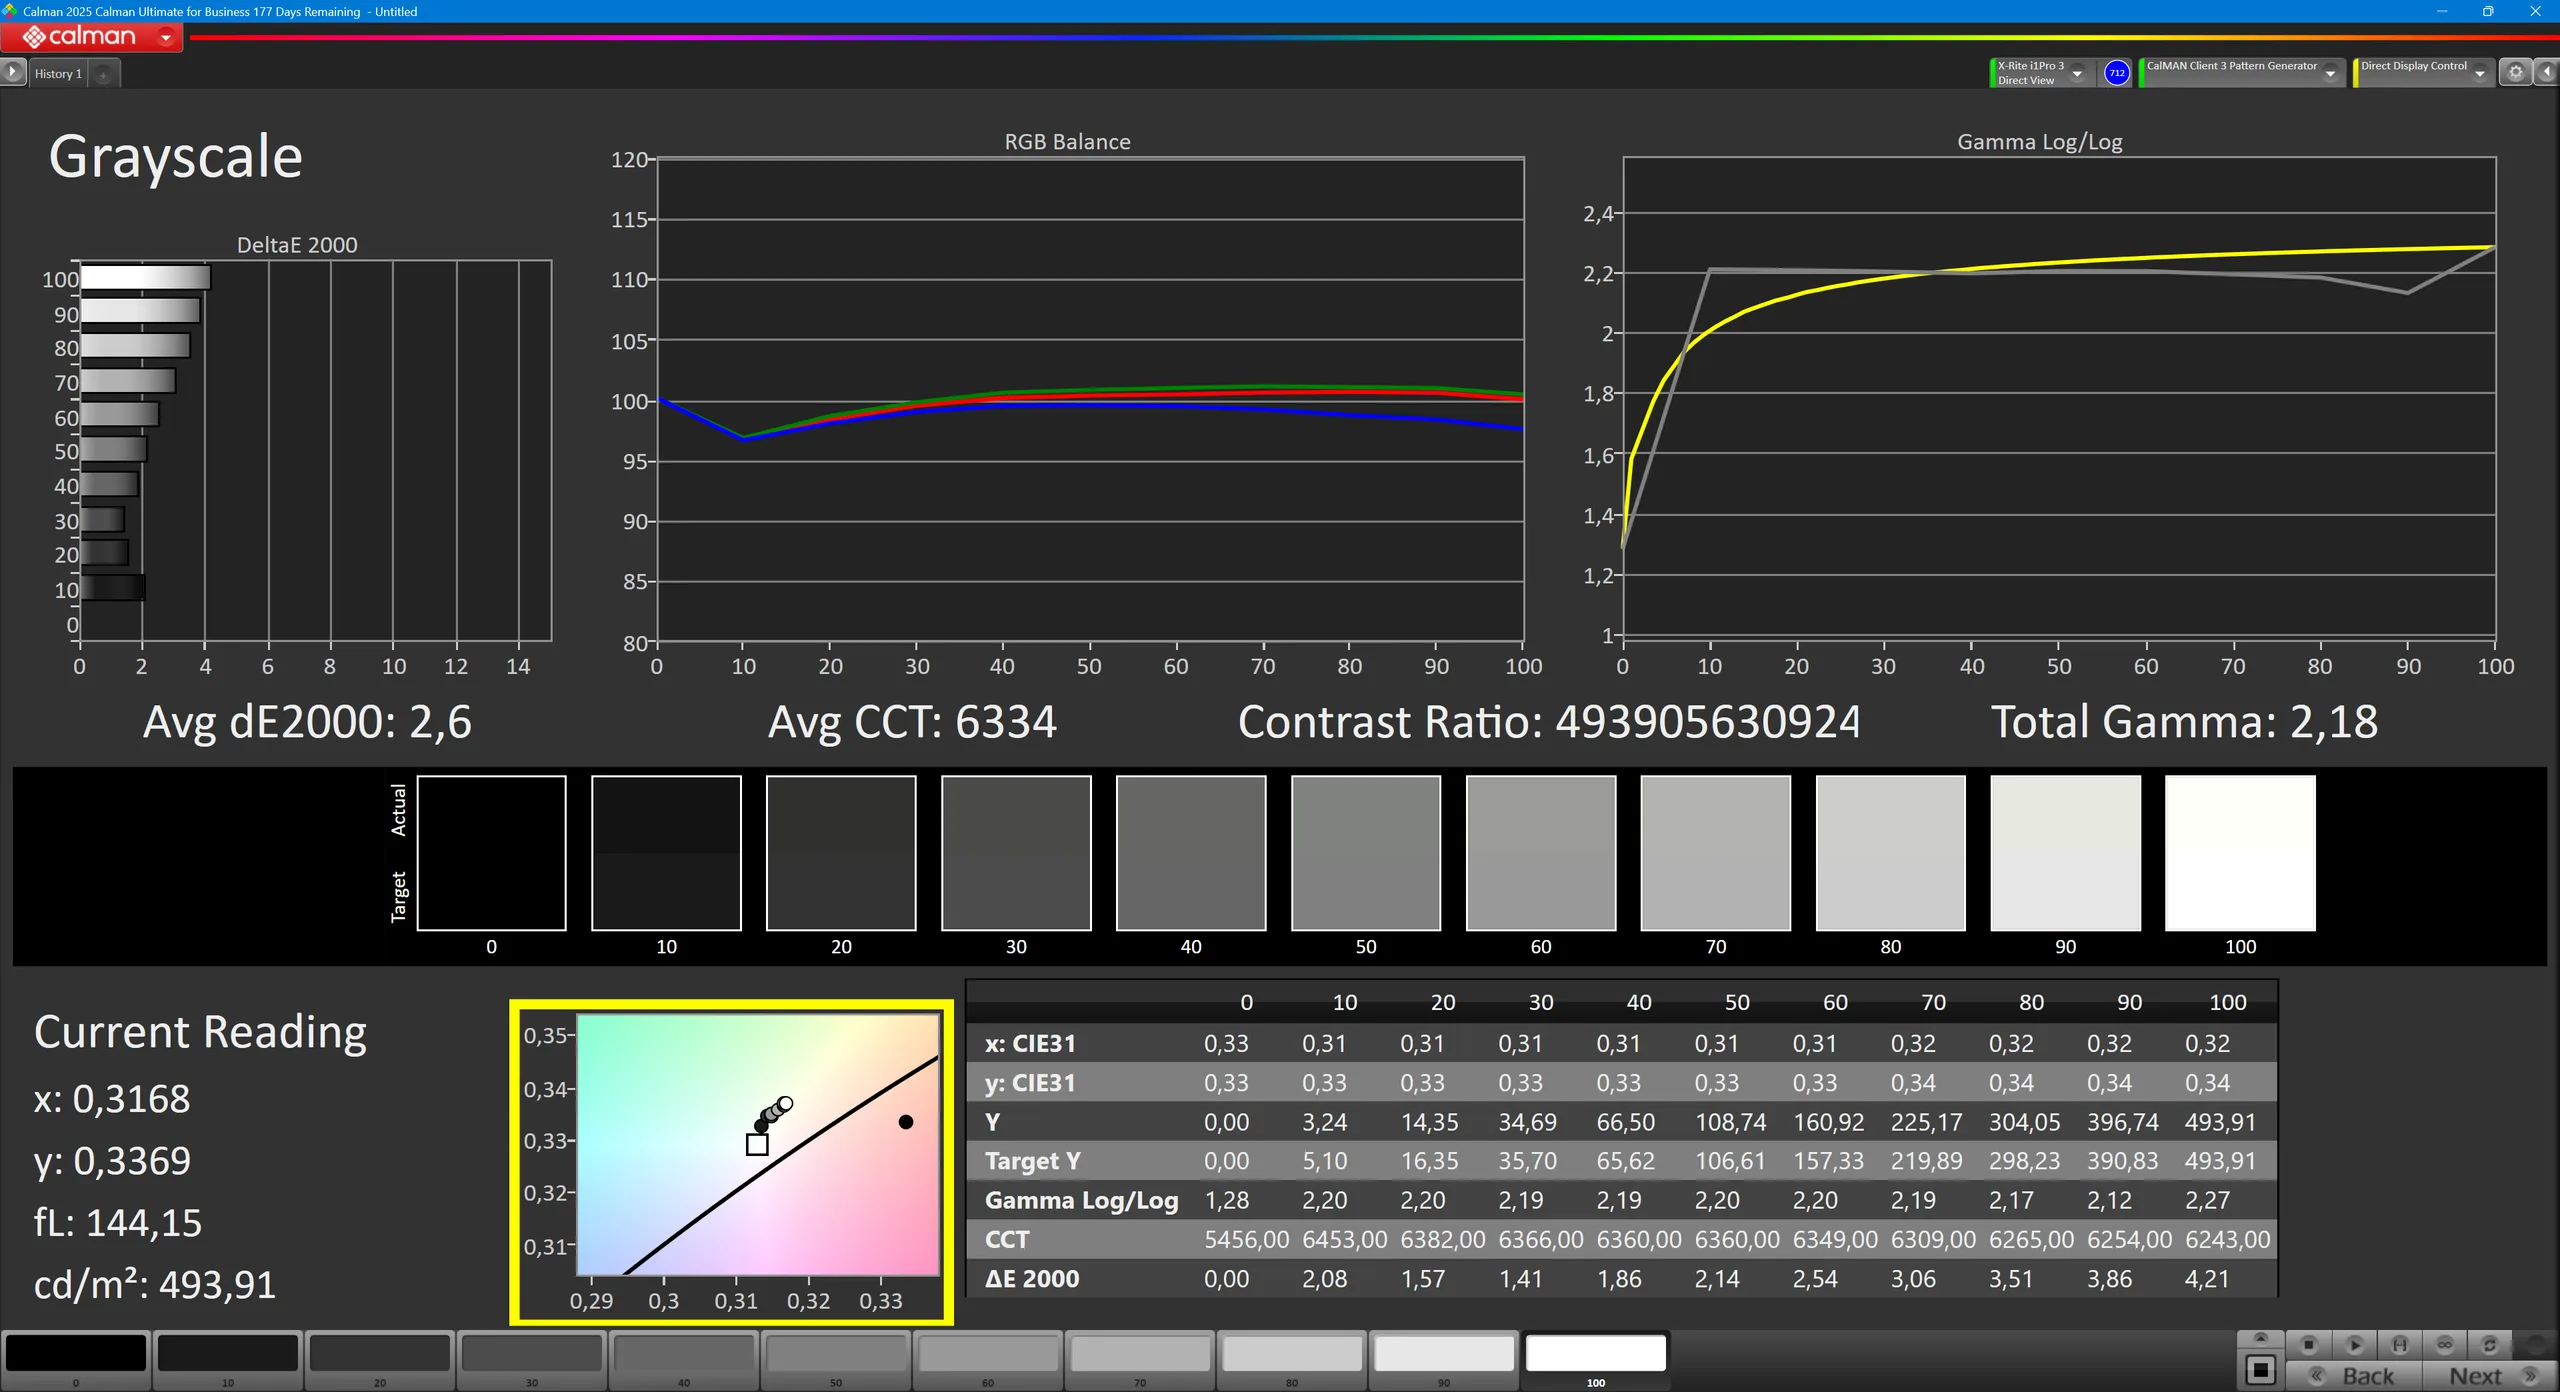
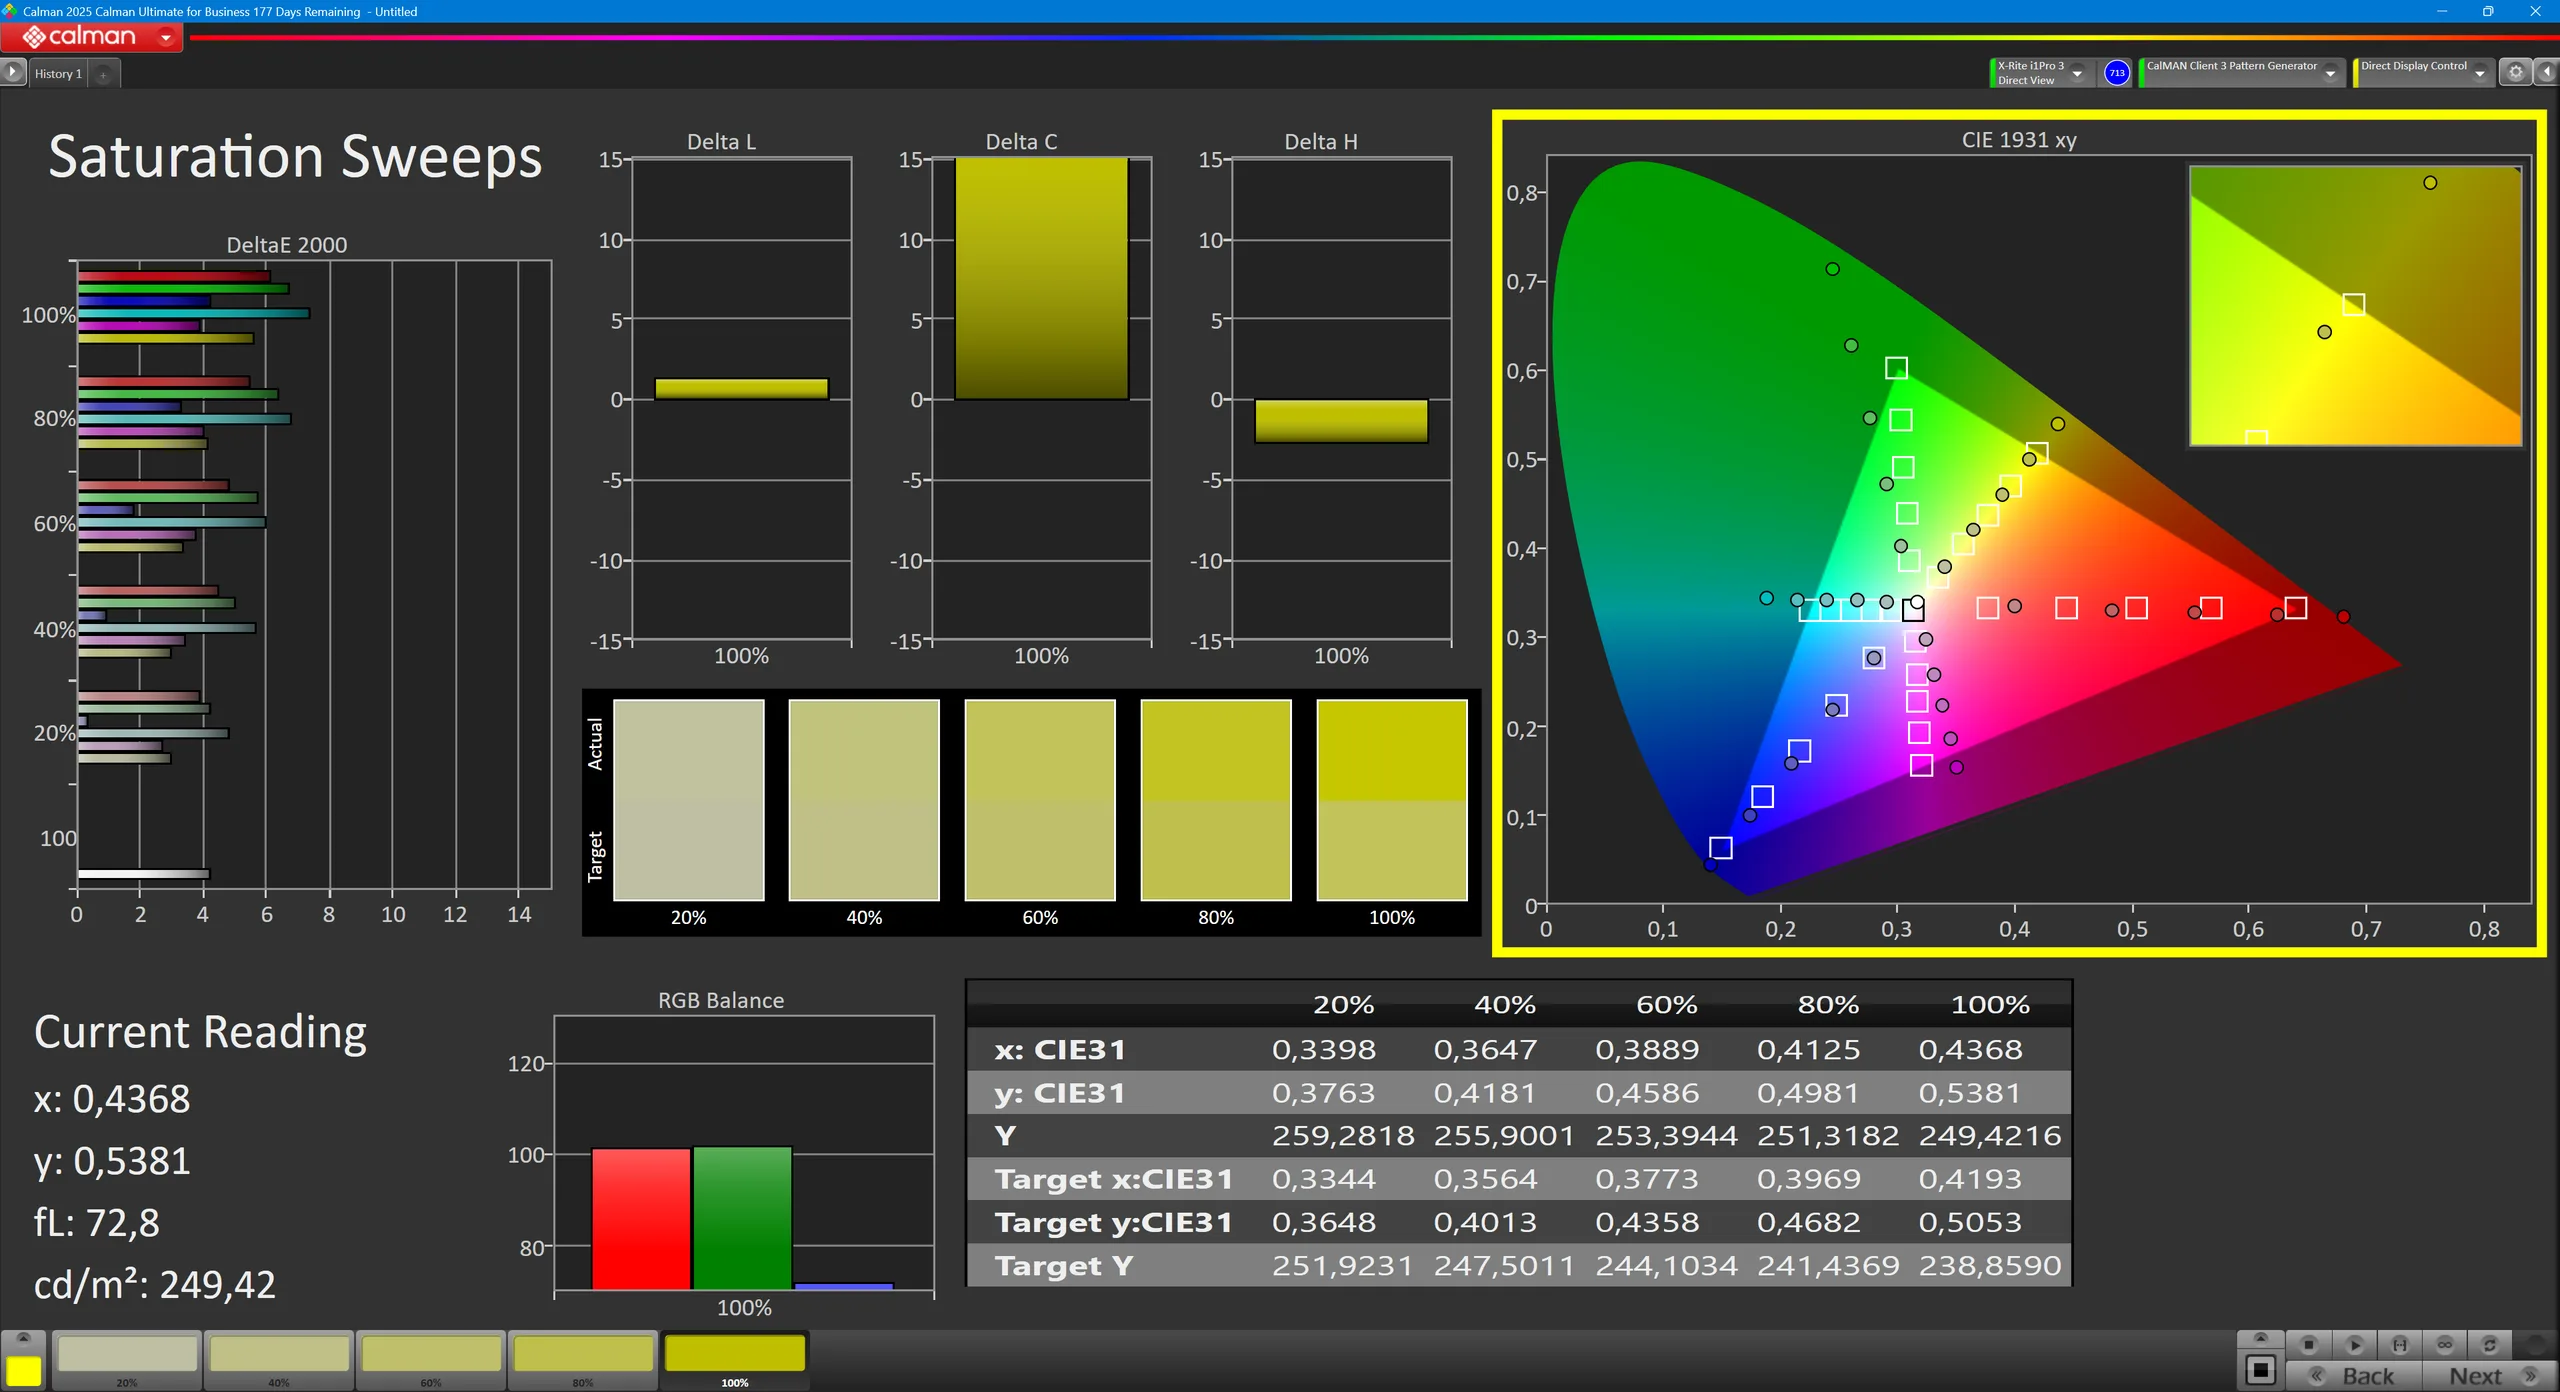

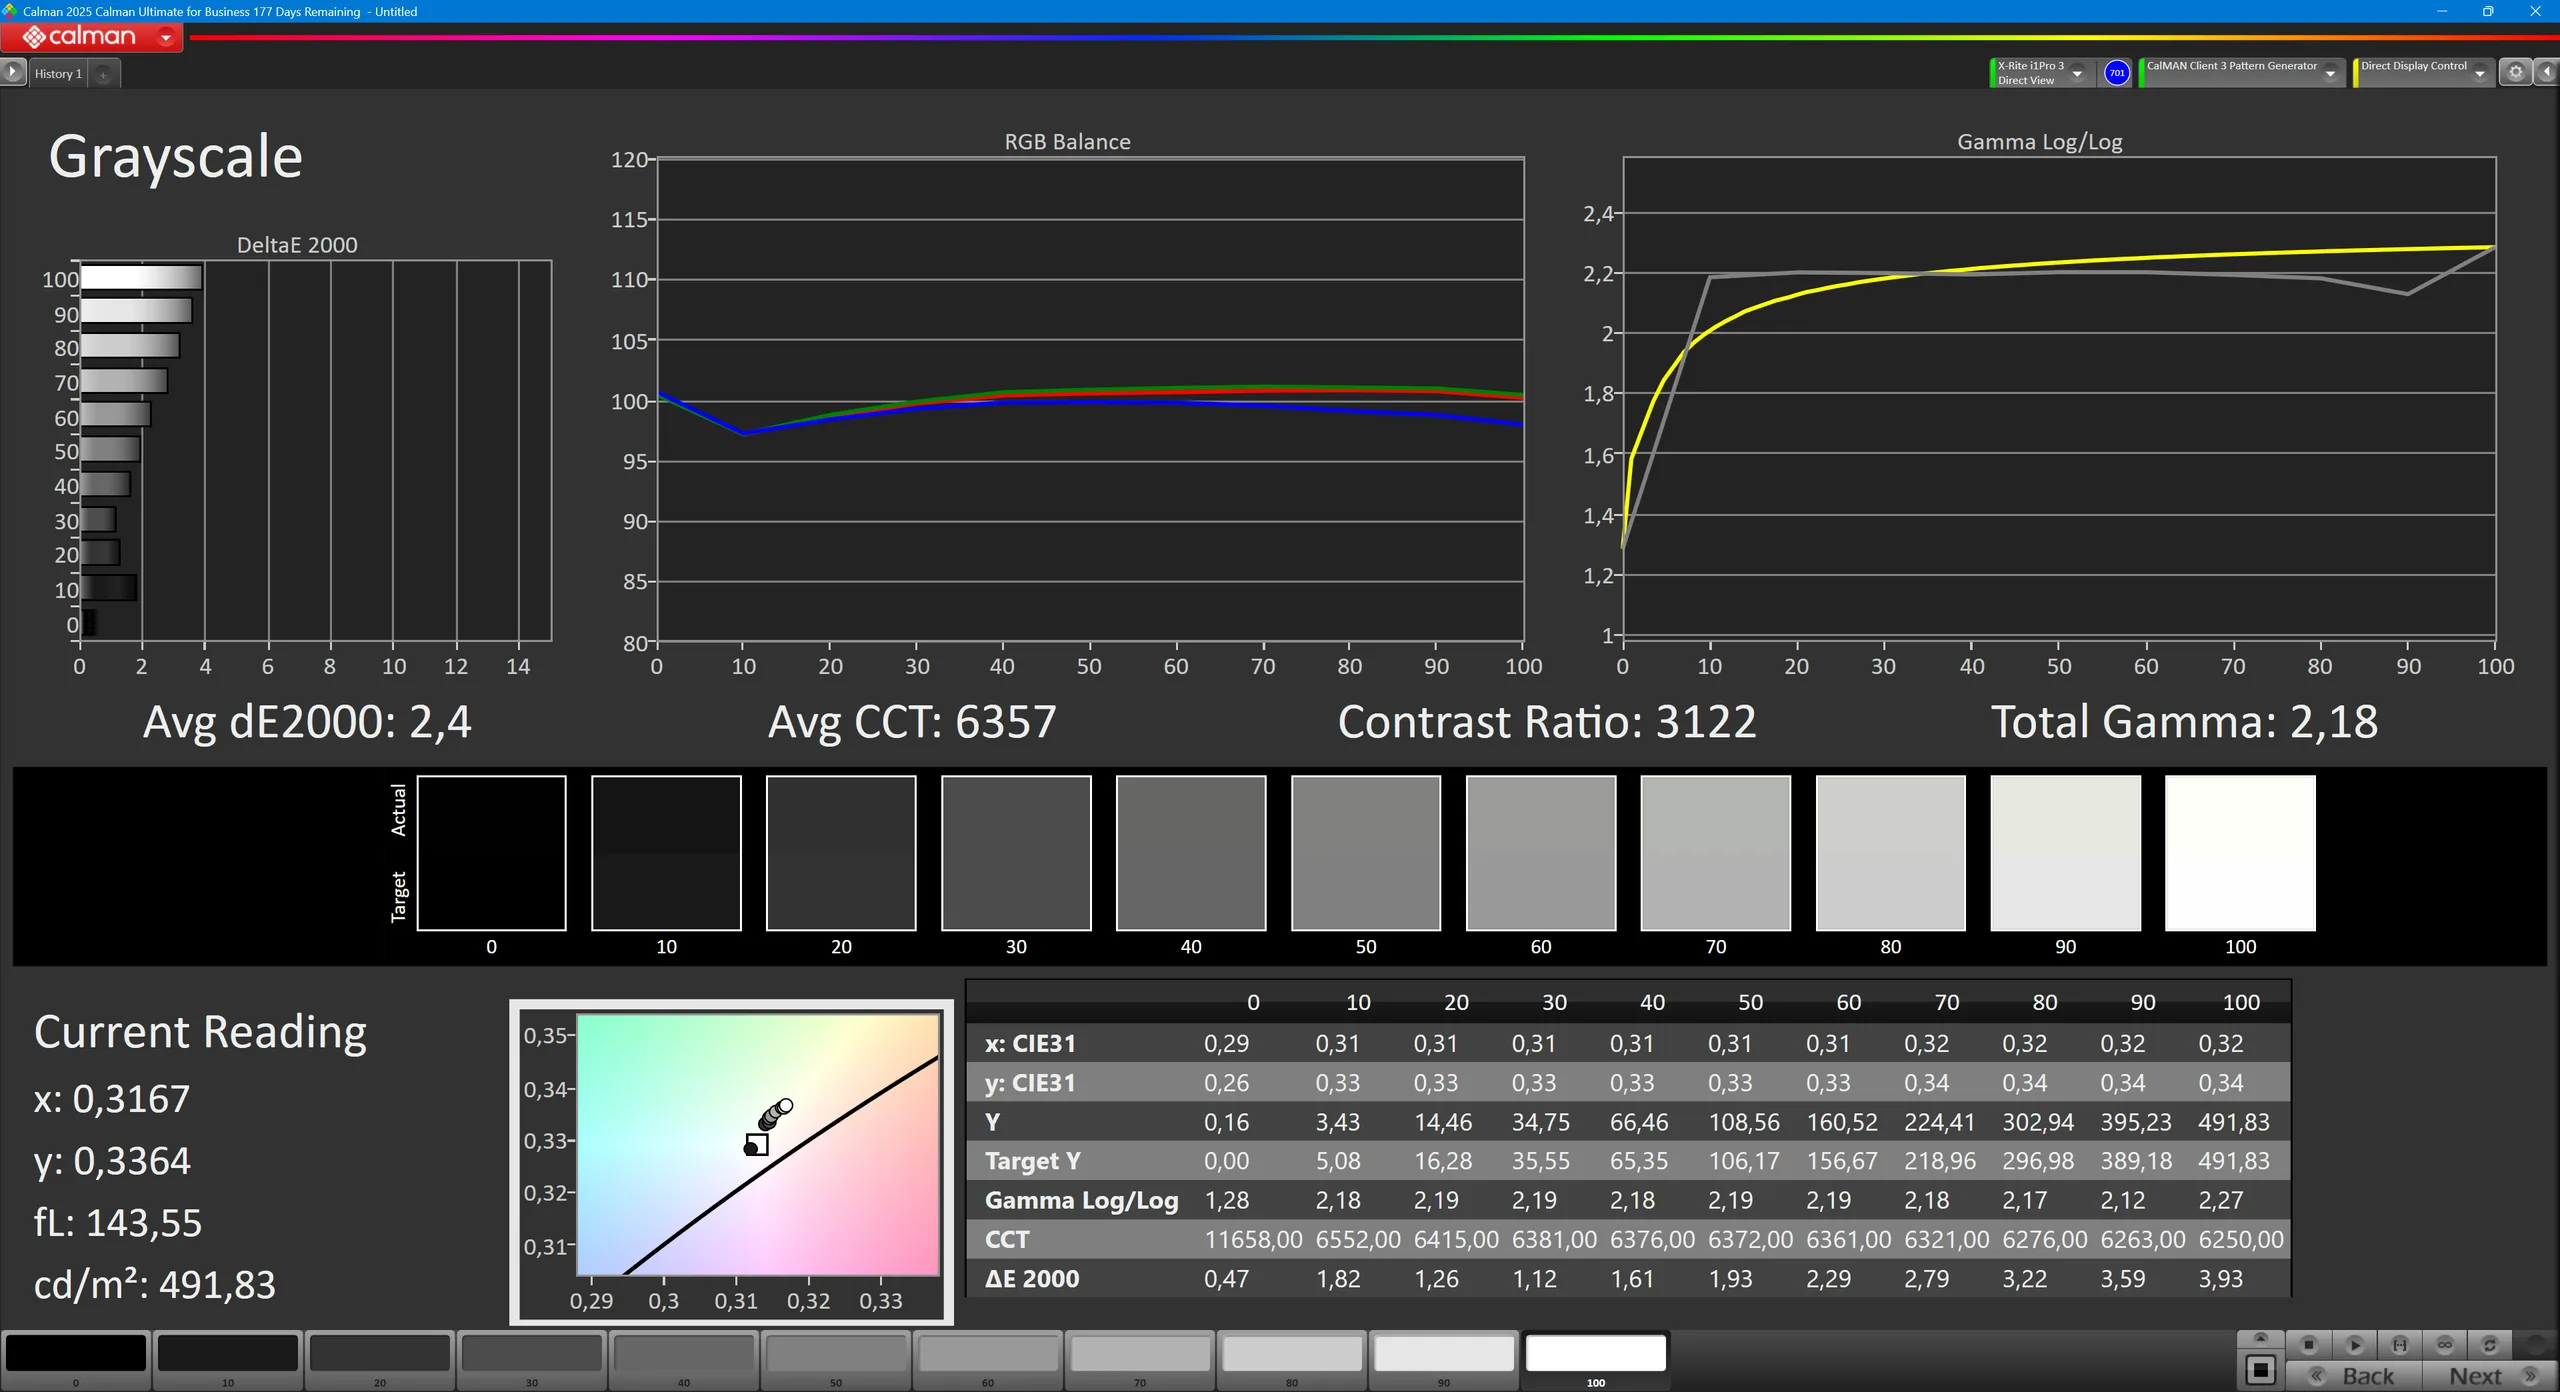
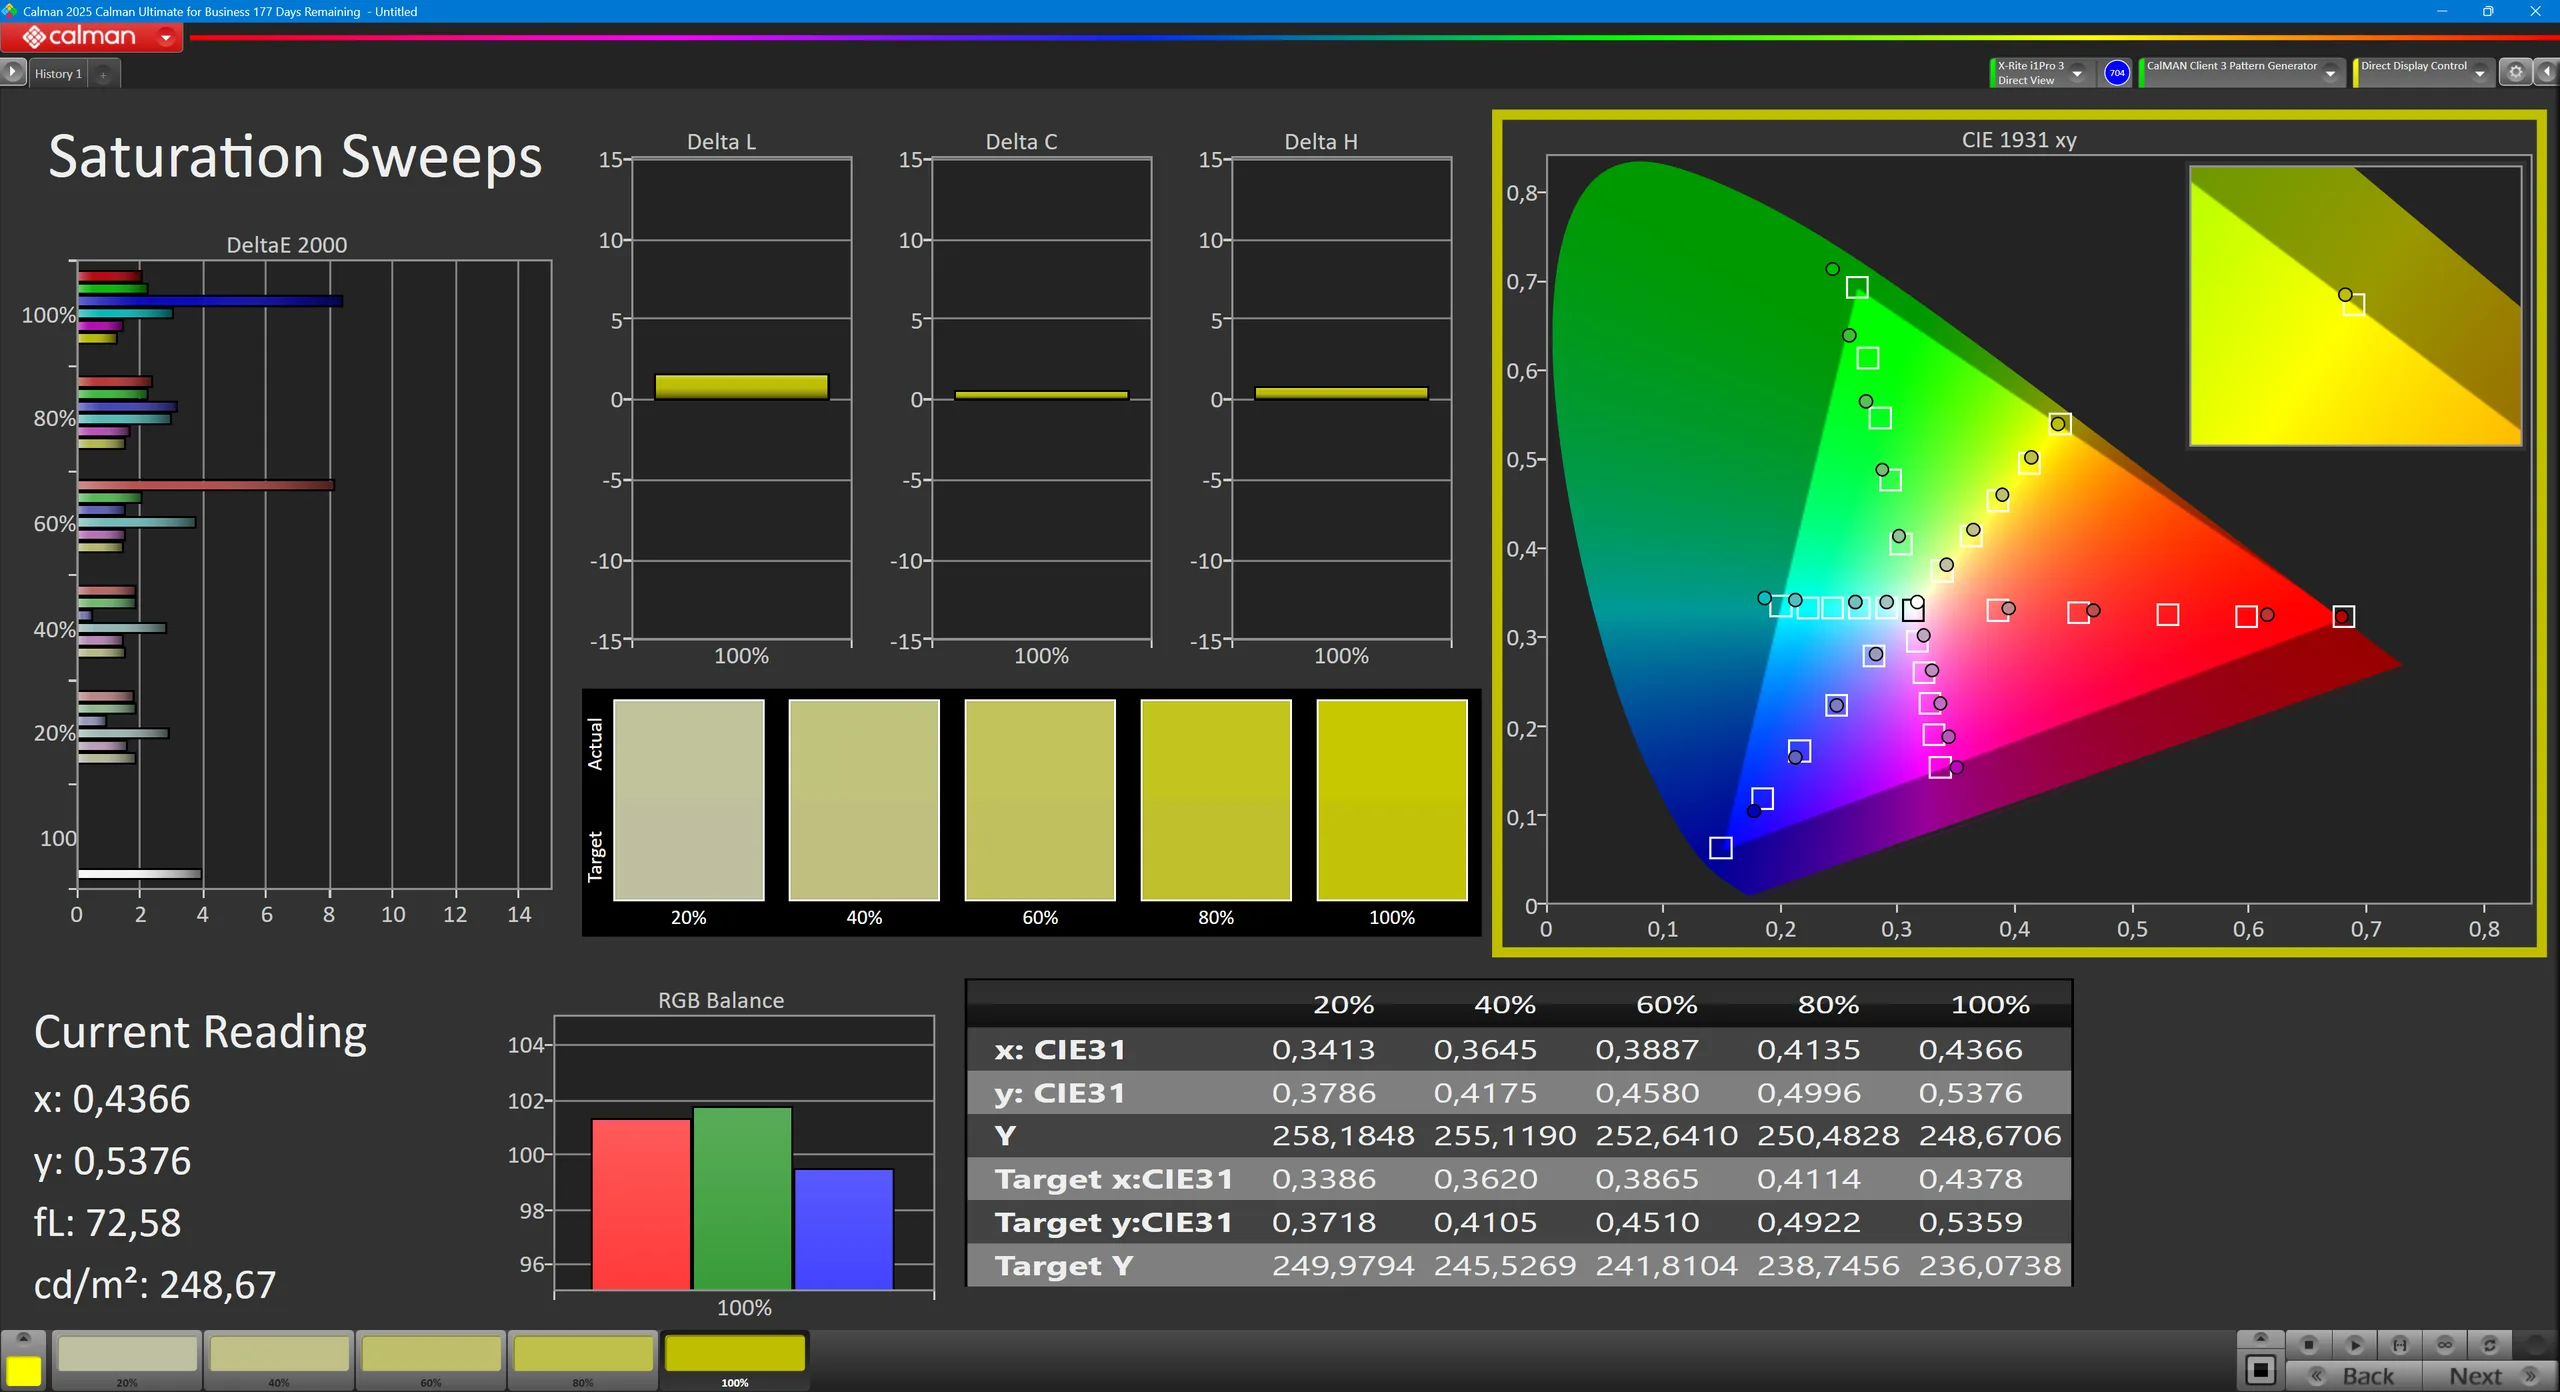


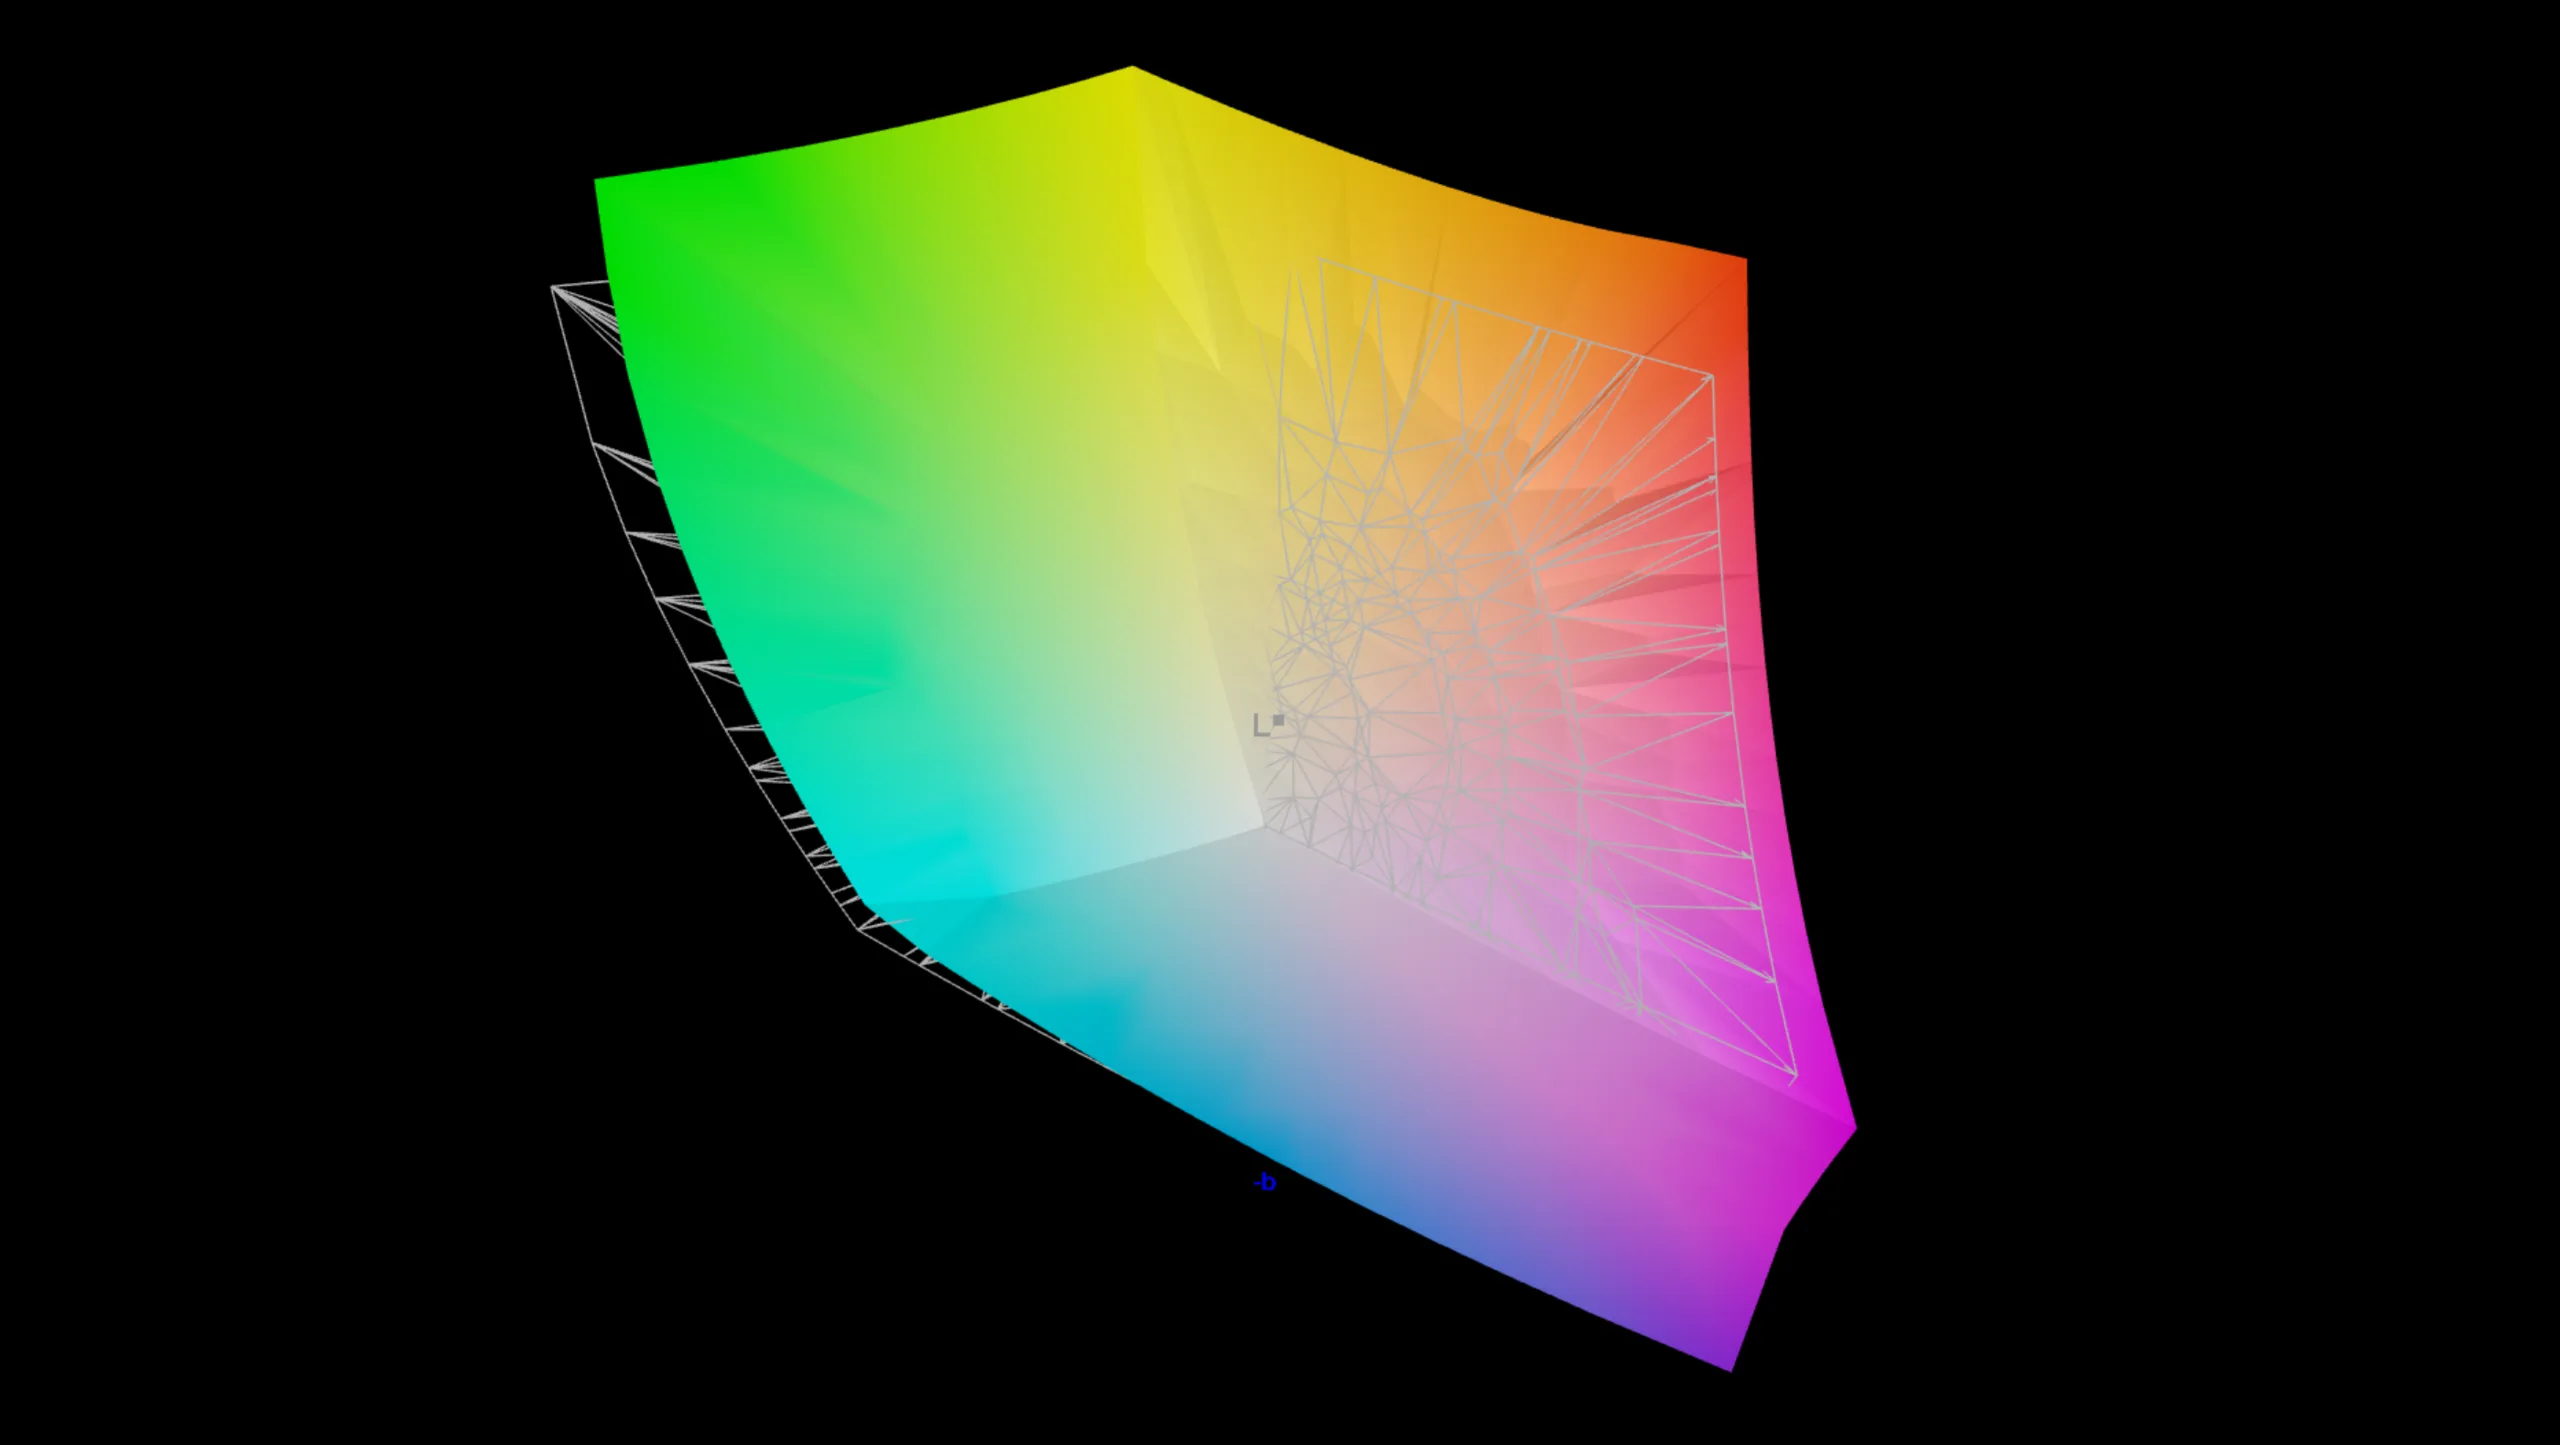
The factory color profile is clearly best suited to the DCI-P3 color gamut. The display covers this wide gamut almost completely, as well as covering all of sRGB and most of Adobe RGB, making it great for color-critical work.
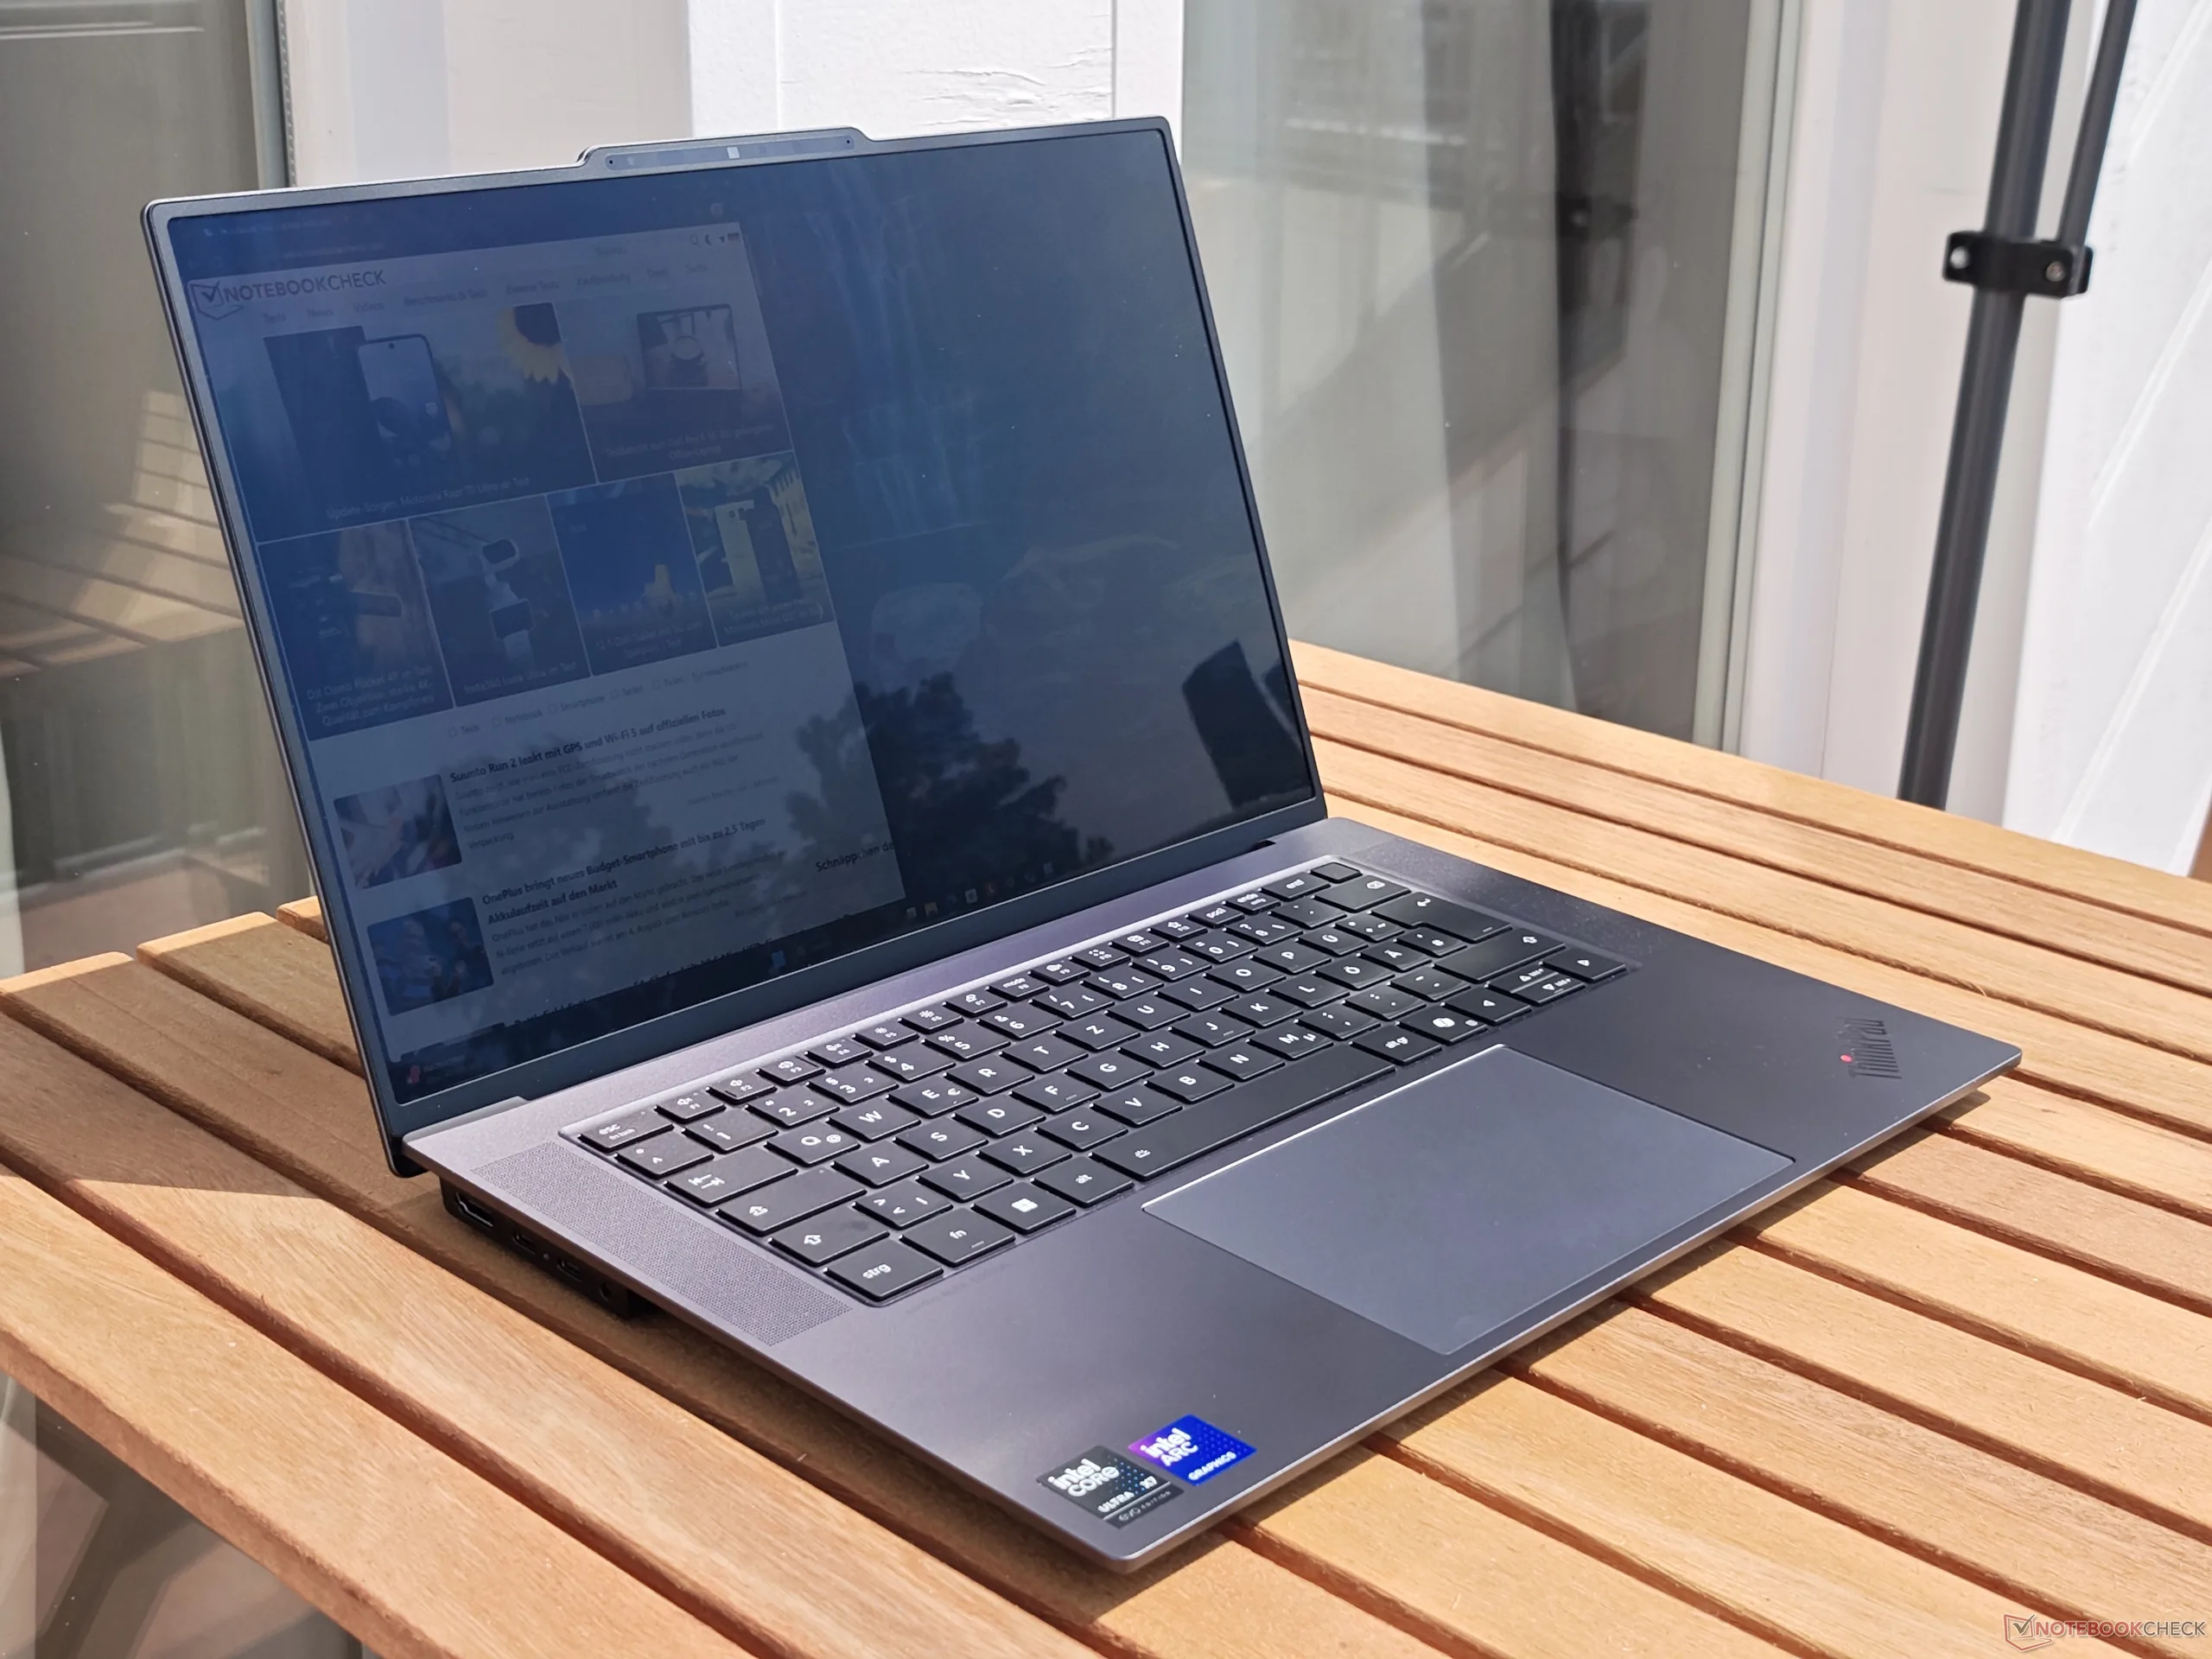
In direct sunlight, the glossy surface can make the screen's content difficult to see. Using it in the shade is certainly possible.
Display Response Times
| ↔ Response Time Black to White | ||
|---|---|---|
| 1.4 ms ... rise ↗ and fall ↘ combined | ↗ 0.7 ms rise | 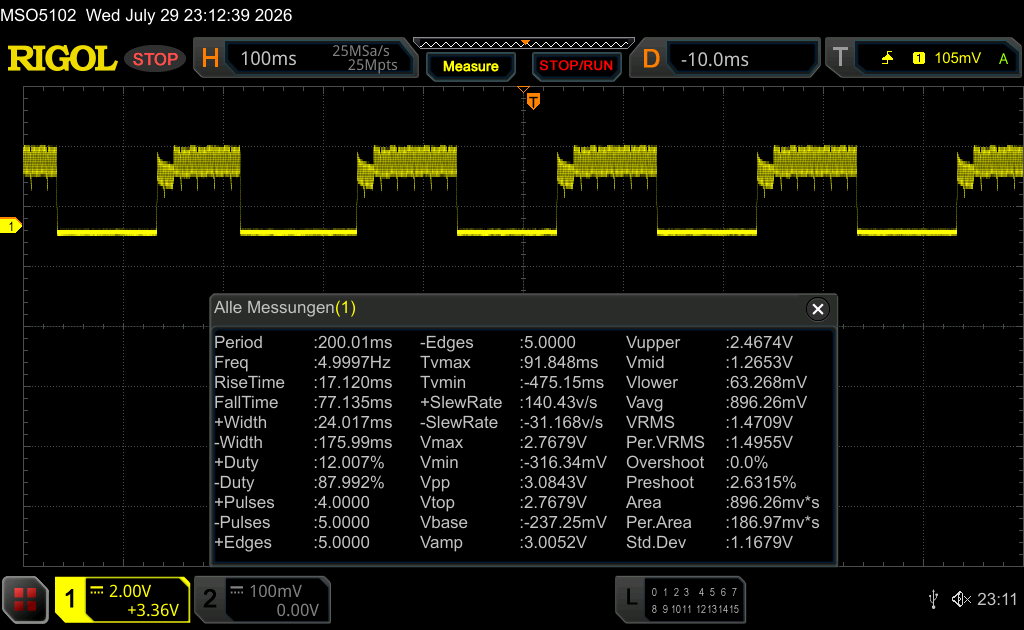 |
| ↘ 0.7 ms fall | ||
| The screen shows very fast response rates in our tests and should be very well suited for fast-paced gaming. In comparison, all tested devices range from 0.1 (minimum) to 240 (maximum) ms. » 9 % of all devices are better. This means that the measured response time is better than the average of all tested devices (19.7 ms). | ||
| ↔ Response Time 50% Grey to 80% Grey | ||
| 1.1 ms ... rise ↗ and fall ↘ combined | ↗ 0.5 ms rise | 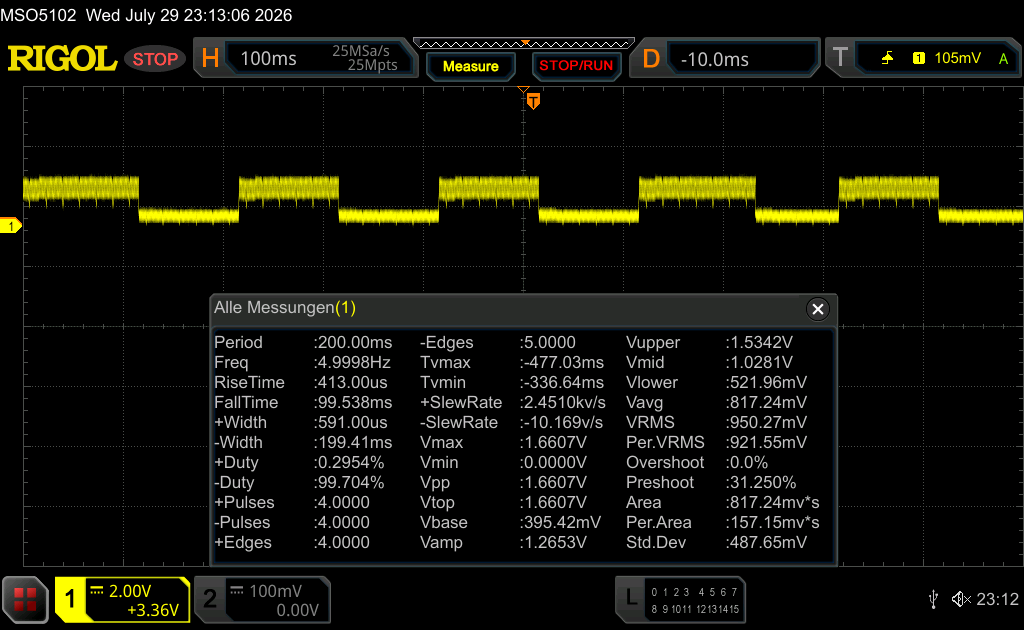 |
| ↘ 0.6 ms fall | ||
| The screen shows very fast response rates in our tests and should be very well suited for fast-paced gaming. In comparison, all tested devices range from 0.13 (minimum) to 636 (maximum) ms. » 5 % of all devices are better. This means that the measured response time is better than the average of all tested devices (30.8 ms). | ||
Screen Flickering / PWM (Pulse-Width Modulation)
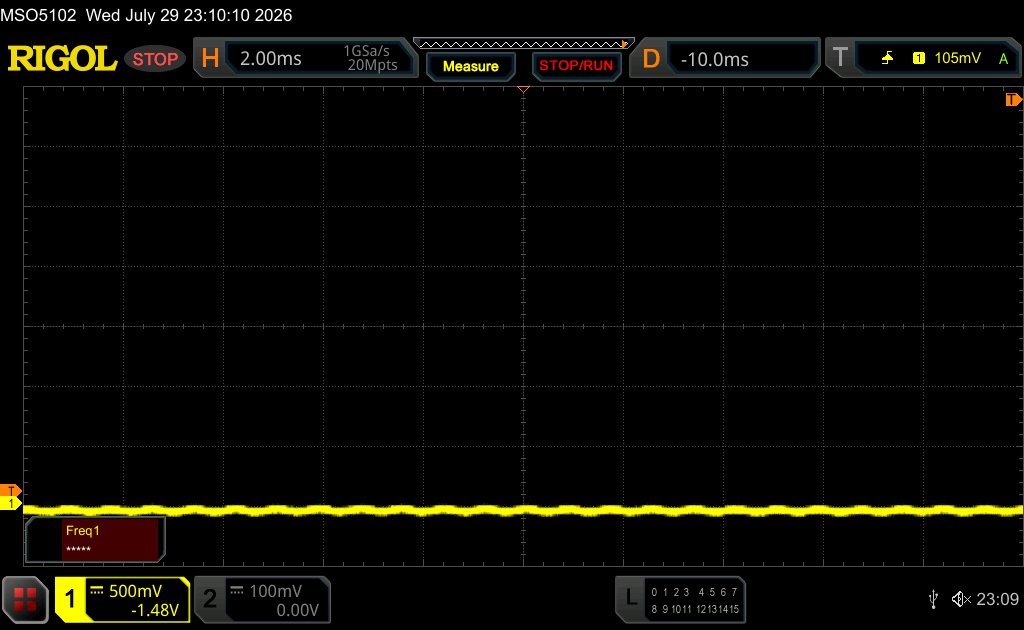
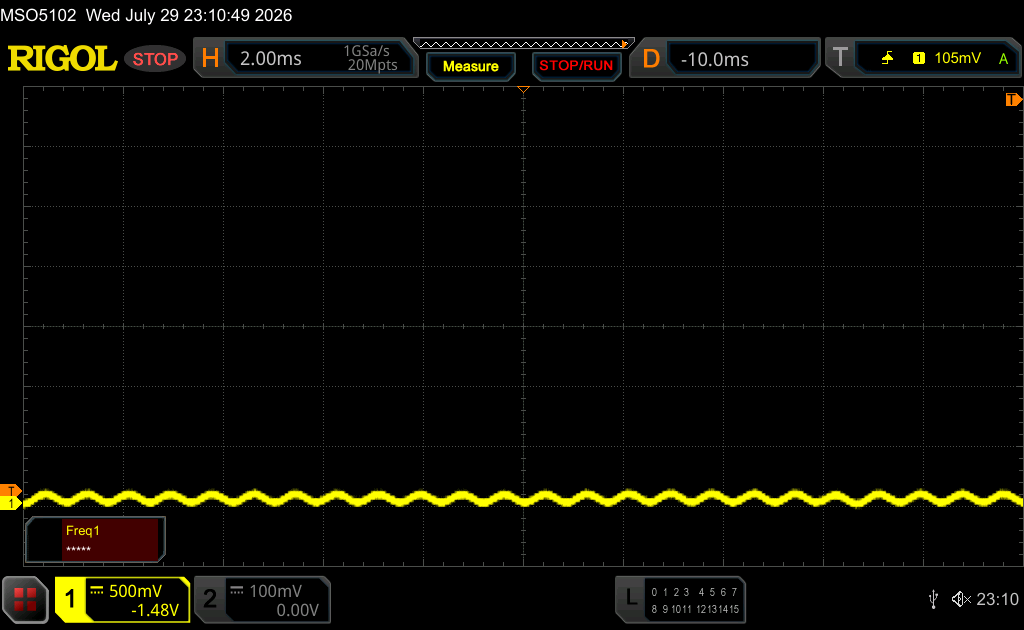
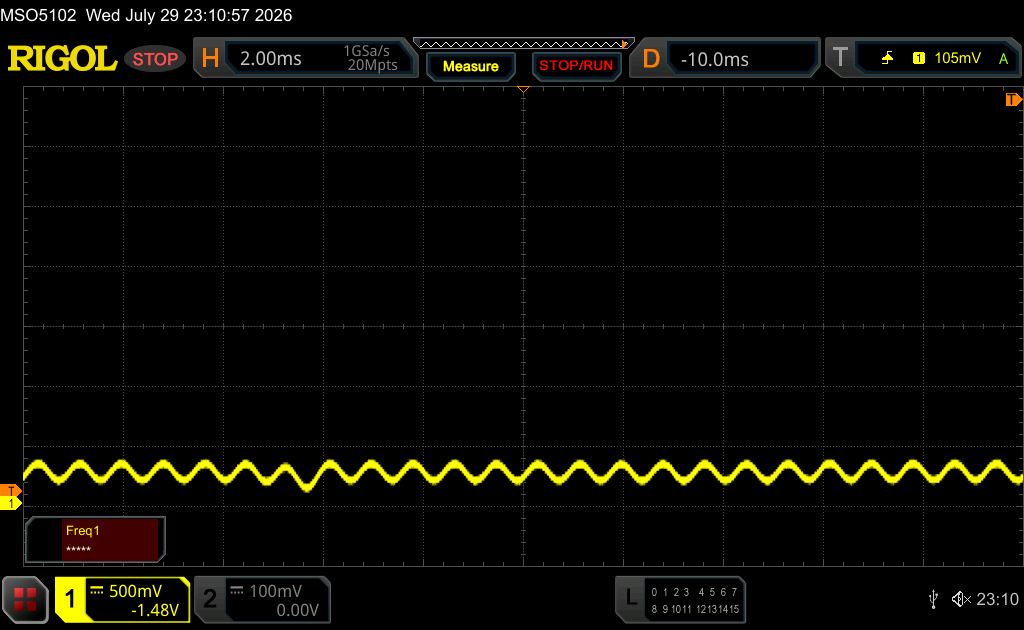
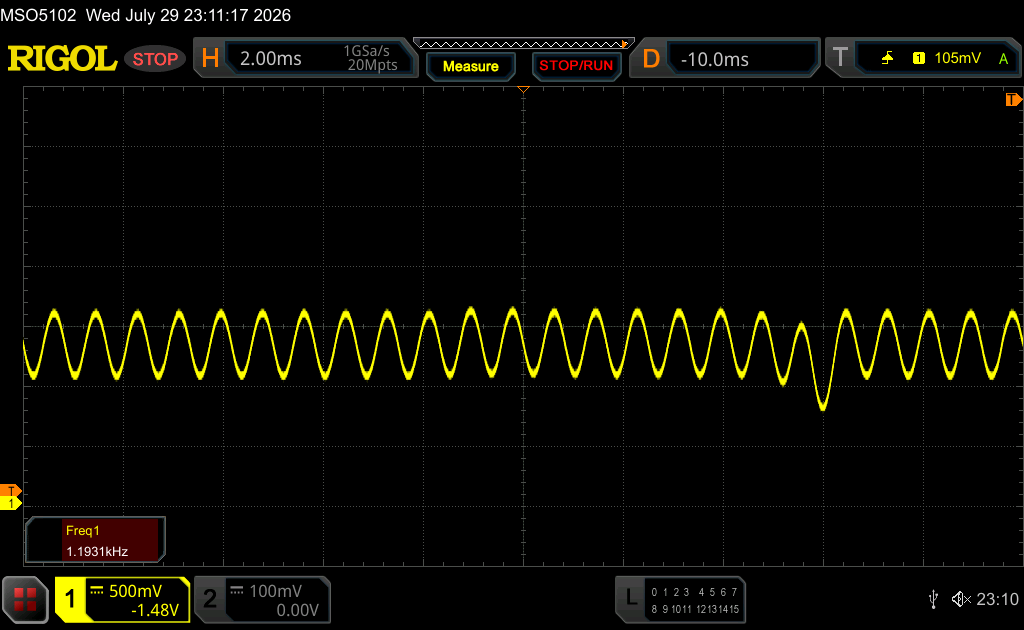
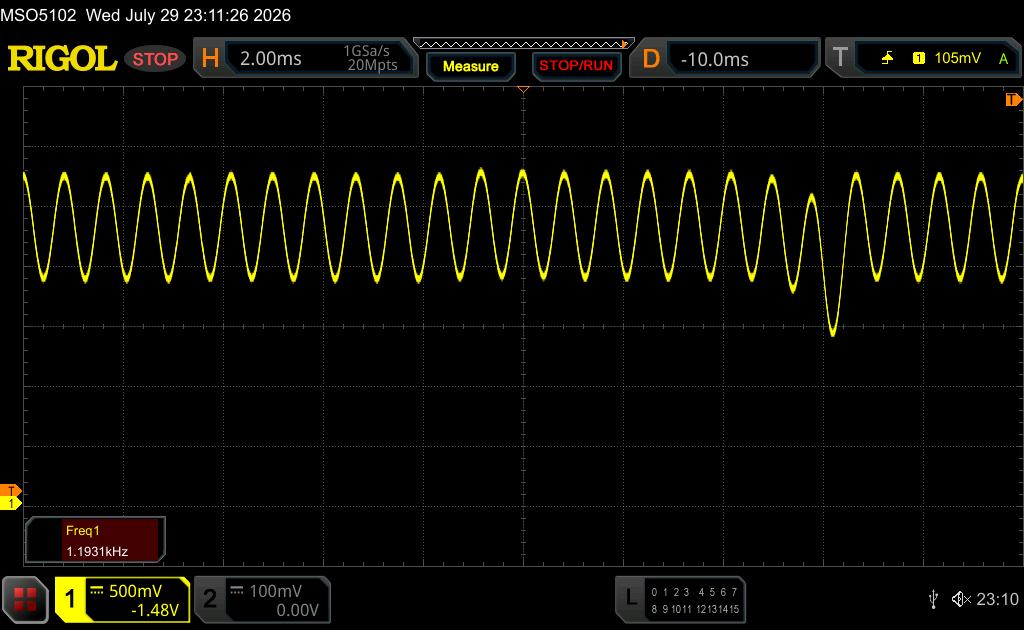
| Screen flickering / PWM detected | 1194 Hz Amplitude: 35 % | ≤ 100 % brightness setting | 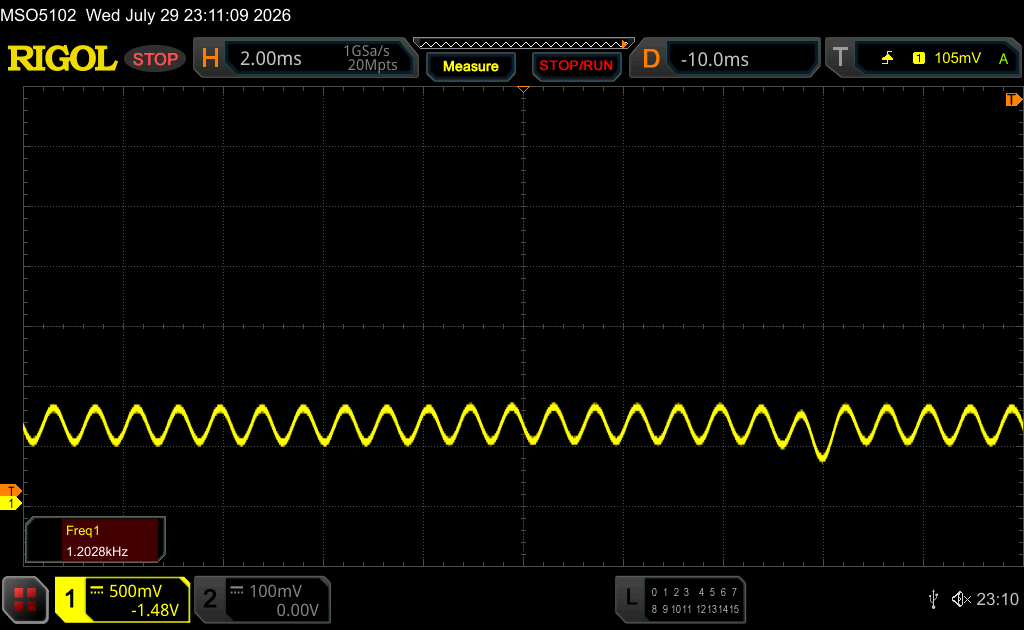 |
The display backlight flickers at 1194 Hz (worst case, e.g., utilizing PWM) Flickering detected at a brightness setting of 100 % and below. There should be no flickering or PWM above this brightness setting. The frequency of 1194 Hz is quite high, so most users sensitive to PWM should not notice any flickering. In comparison: 52 % of all tested devices do not use PWM to dim the display. If PWM was detected, an average of 7659 (minimum: 5 - maximum: 343500) Hz was measured. | |||


Performance
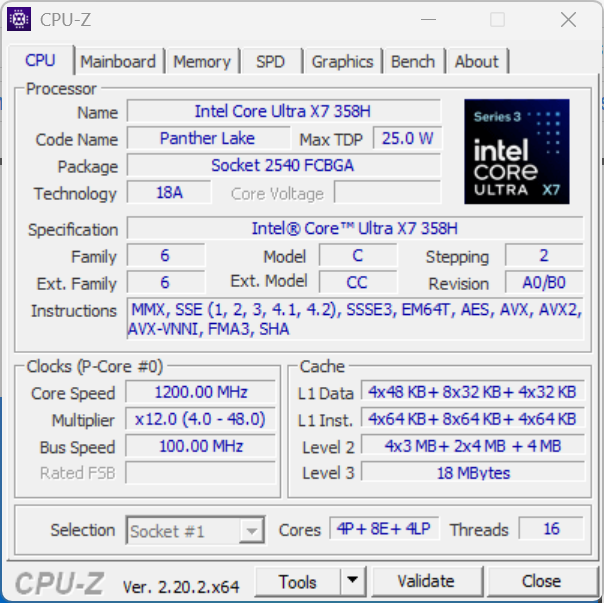
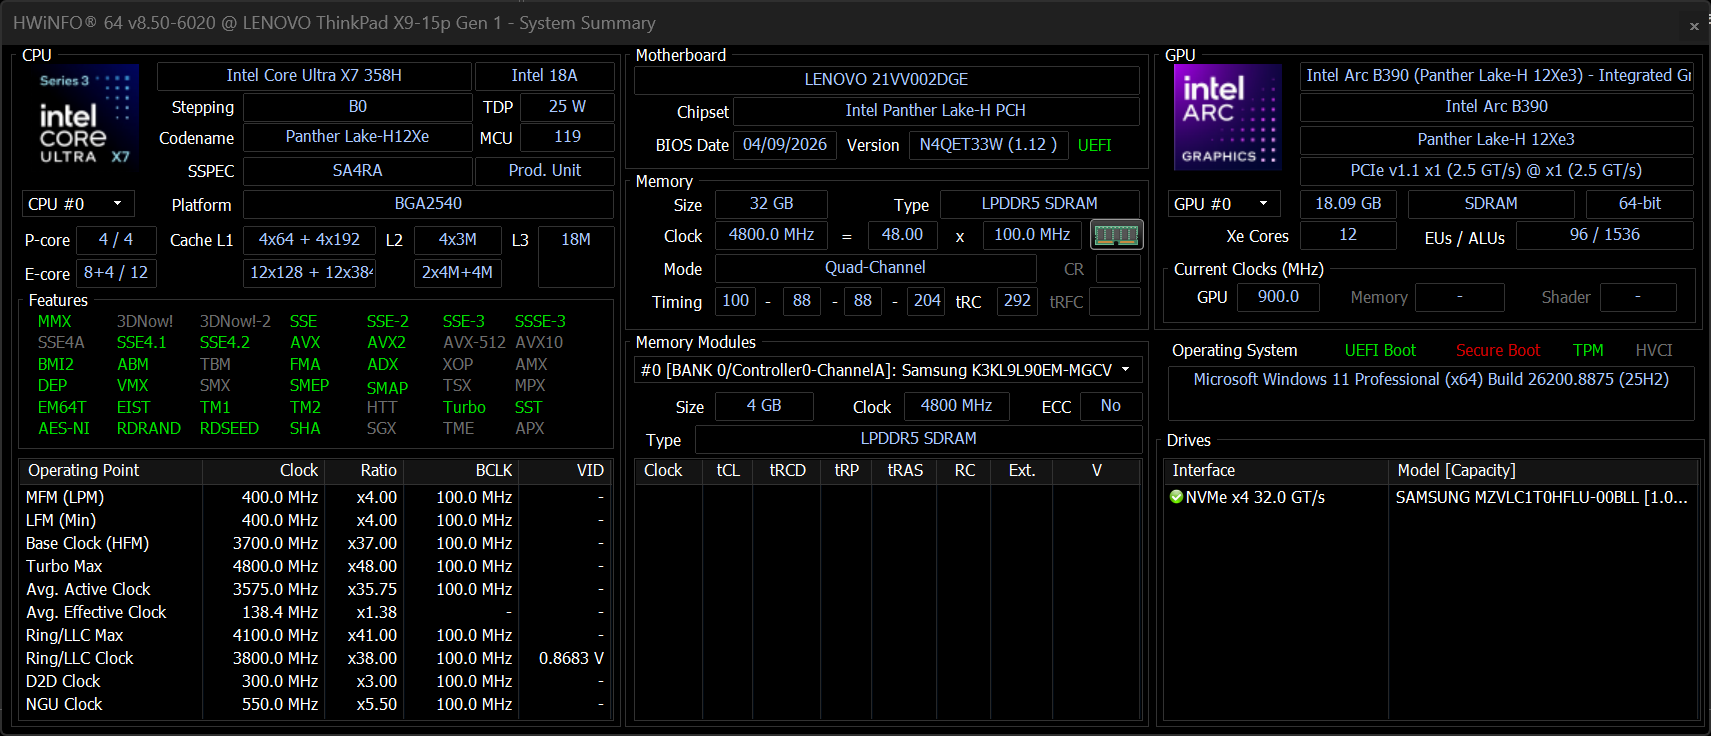
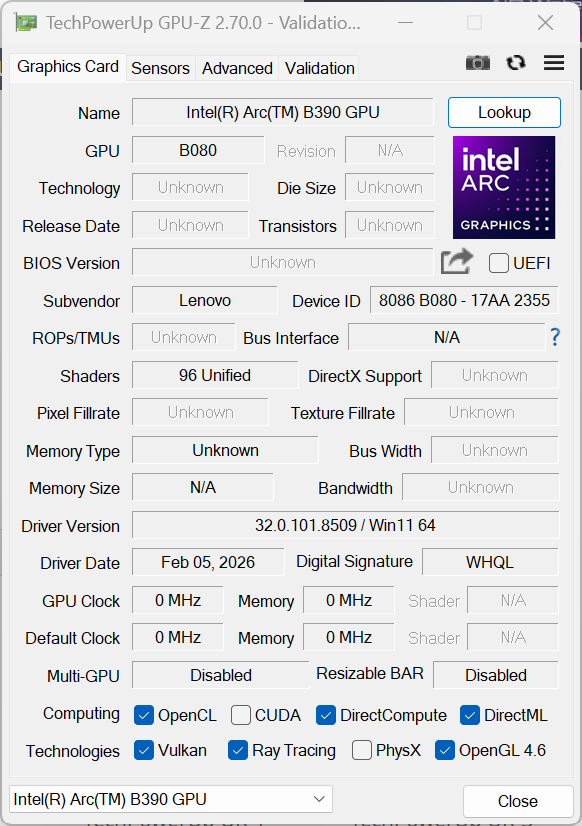
Customers buying the Lenovo ThinkPad X9-15p Gen 1 Aura Edition can choose from several Intel Panther Lake CPUs, all of which have at least 12 CPU cores (Intel Core Ultra 5 338H, Ultra X7 358H, Ultra X7 368H, Ultra X9 378H, Ultra X9 388H) and the more powerful Intel iGPUs (Intel Arc B370, Arc B390).
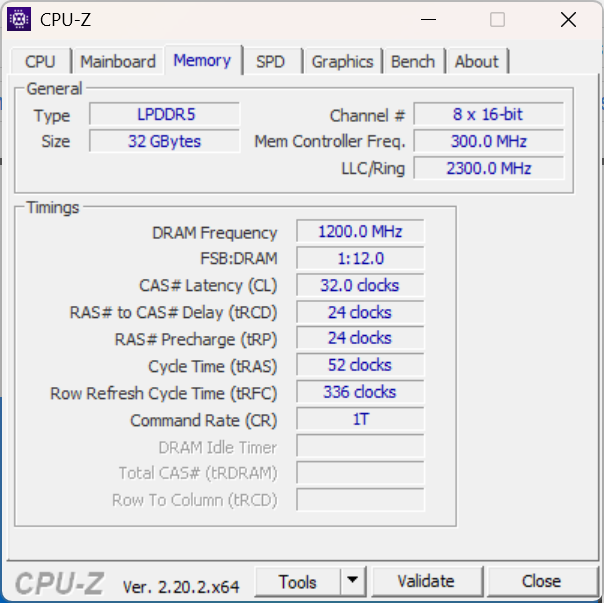
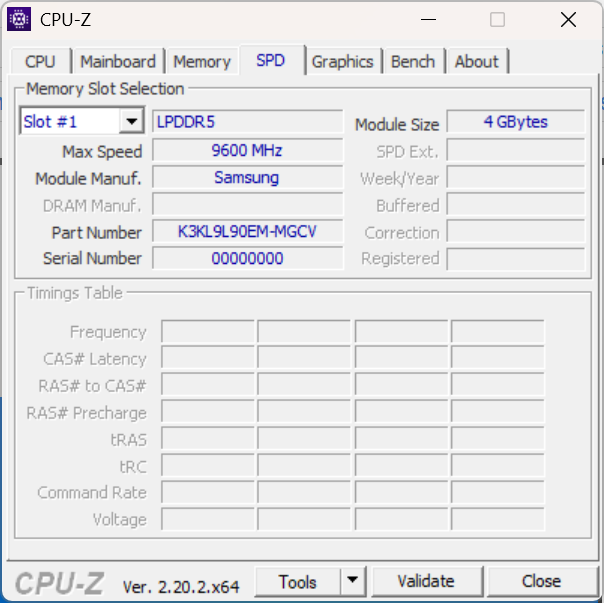
Lenovo underscores the performance-centric approach of the ThinkPad X9-15p by offering only 32 or 64 GB of soldered LPDDR5X-9600 memory. There is a single M.2 2280 NVMe PCIe 5.0 SSD with a factory capacity of up to 2 TB.
Testing Conditions
- Best Power Efficiency: PL1 15 W / PL2 45 W
- Balanced: PL1 25 W / PL2 50 W
- Best Performance: PL1 50 W / PL2 60 W
All benchmarks were performed in "Best Performance" mode, which keeps power consumption under sustained load at 50 W.
Processor Performance
The Intel Core Ultra X7 358H is a modern "Panther Lake" processor with a total of 16 cores: four P-cores (up to 4.8 GHz), eight E-cores (up to 3.7 GHz), and four low-power E-cores (up to 3.3 GHz). The processor is rated for a typical power consumption of 25 W but can use up to 80 W. More performance comparisons are available in our CPU benchmark list.
In the CPU benchmarks, the Lenovo ThinkPad X9-15p Gen 1 performs well, outperforming the average for this Core Ultra X7 processor and also beating the larger Dell XPS 16. Compared with the older Lenovo ThinkPad X9-15, our review device is roughly 44 percent faster on average across all CPU benchmarks.
There was no CPU throttling when the device ran on battery power.
Cinebench R15 Multi Loop
Cinebench R23: Multi Core | Single Core
Cinebench R20: CPU (Multi Core) | CPU (Single Core)
Cinebench R15: CPU Multi 64Bit | CPU Single 64Bit
Blender: v2.79 BMW27 CPU
7-Zip 18.03: 7z b 4 | 7z b 4 -mmt1
Geekbench 6.7: Multi-Core | Single-Core
Geekbench 5.5: Multi-Core | Single-Core
HWBOT x265 Benchmark v2.2: 4k Preset
LibreOffice : 20 Documents To PDF
R Benchmark 2.5: Overall mean
| CPU Performance rating | |
| Apple MacBook Pro 14 2026 M5 Max -14! | |
| Lenovo ThinkPad X9-15p Gen 1 | |
| Dell XPS 16 Core Ultra X7 358H | |
| Average Intel Core Ultra X7 358H | |
| Apple MacBook Air 15 M5 -14! | |
| Average of class Multimedia | |
| Lenovo ThinkPad X9-15 Aura Edition | |
| Cinebench R23 / Multi Core | |
| Lenovo ThinkPad X9-15p Gen 1 | |
| Average Intel Core Ultra X7 358H (13187 - 19916, n=13) | |
| Dell XPS 16 Core Ultra X7 358H | |
| Average of class Multimedia (4861 - 33362, n=62, last 2 years) | |
| Lenovo ThinkPad X9-15 Aura Edition | |
| Cinebench R23 / Single Core | |
| Dell XPS 16 Core Ultra X7 358H | |
| Lenovo ThinkPad X9-15p Gen 1 | |
| Average Intel Core Ultra X7 358H (1936 - 2087, n=12) | |
| Average of class Multimedia (1237 - 2459, n=61, last 2 years) | |
| Lenovo ThinkPad X9-15 Aura Edition | |
| Cinebench R20 / CPU (Multi Core) | |
| Lenovo ThinkPad X9-15p Gen 1 | |
| Dell XPS 16 Core Ultra X7 358H | |
| Average Intel Core Ultra X7 358H (4751 - 7749, n=11) | |
| Average of class Multimedia (1887 - 12912, n=53, last 2 years) | |
| Lenovo ThinkPad X9-15 Aura Edition | |
| Cinebench R20 / CPU (Single Core) | |
| Lenovo ThinkPad X9-15p Gen 1 | |
| Dell XPS 16 Core Ultra X7 358H | |
| Average Intel Core Ultra X7 358H (736 - 792, n=11) | |
| Average of class Multimedia (482 - 853, n=53, last 2 years) | |
| Lenovo ThinkPad X9-15 Aura Edition | |
| Cinebench R15 / CPU Multi 64Bit | |
| Lenovo ThinkPad X9-15p Gen 1 | |
| Dell XPS 16 Core Ultra X7 358H | |
| Average Intel Core Ultra X7 358H (2375 - 3135, n=11) | |
| Average of class Multimedia (856 - 5224, n=58, last 2 years) | |
| Lenovo ThinkPad X9-15 Aura Edition | |
| Cinebench R15 / CPU Single 64Bit | |
| Dell XPS 16 Core Ultra X7 358H | |
| Lenovo ThinkPad X9-15p Gen 1 | |
| Average Intel Core Ultra X7 358H (262 - 312, n=11) | |
| Lenovo ThinkPad X9-15 Aura Edition | |
| Average of class Multimedia (184.8 - 326, n=55, last 2 years) | |
| Blender / v2.79 BMW27 CPU | |
| Lenovo ThinkPad X9-15 Aura Edition | |
| Average of class Multimedia (100 - 557, n=54, last 2 years) | |
| Dell XPS 16 Core Ultra X7 358H | |
| Average Intel Core Ultra X7 358H (171 - 218, n=11) | |
| Lenovo ThinkPad X9-15p Gen 1 | |
| 7-Zip 18.03 / 7z b 4 | |
| Lenovo ThinkPad X9-15p Gen 1 | |
| Dell XPS 16 Core Ultra X7 358H | |
| Average Intel Core Ultra X7 358H (55491 - 68930, n=11) | |
| Average of class Multimedia (26062 - 130368, n=51, last 2 years) | |
| Lenovo ThinkPad X9-15 Aura Edition | |
| 7-Zip 18.03 / 7z b 4 -mmt1 | |
| Lenovo ThinkPad X9-15p Gen 1 | |
| Dell XPS 16 Core Ultra X7 358H | |
| Average Intel Core Ultra X7 358H (5984 - 6526, n=11) | |
| Average of class Multimedia (4526 - 7545, n=52, last 2 years) | |
| Lenovo ThinkPad X9-15 Aura Edition | |
| Geekbench 6.7 / Multi-Core | |
| Apple MacBook Pro 14 2026 M5 Max | |
| Apple MacBook Air 15 M5 | |
| Dell XPS 16 Core Ultra X7 358H | |
| Lenovo ThinkPad X9-15p Gen 1 | |
| Average Intel Core Ultra X7 358H (14309 - 17121, n=11) | |
| Average of class Multimedia (4983 - 30057, n=63, last 2 years) | |
| Lenovo ThinkPad X9-15 Aura Edition | |
| Geekbench 6.7 / Single-Core | |
| Apple MacBook Pro 14 2026 M5 Max | |
| Apple MacBook Air 15 M5 | |
| Average of class Multimedia (1591 - 4336, n=63, last 2 years) | |
| Dell XPS 16 Core Ultra X7 358H | |
| Lenovo ThinkPad X9-15p Gen 1 | |
| Average Intel Core Ultra X7 358H (2778 - 2927, n=11) | |
| Lenovo ThinkPad X9-15 Aura Edition | |
| Geekbench 5.5 / Multi-Core | |
| Dell XPS 16 Core Ultra X7 358H | |
| Lenovo ThinkPad X9-15p Gen 1 | |
| Average Intel Core Ultra X7 358H (13951 - 17028, n=10) | |
| Average of class Multimedia (4652 - 20422, n=53, last 2 years) | |
| Lenovo ThinkPad X9-15 Aura Edition | |
| Geekbench 5.5 / Single-Core | |
| Dell XPS 16 Core Ultra X7 358H | |
| Lenovo ThinkPad X9-15p Gen 1 | |
| Average Intel Core Ultra X7 358H (2027 - 2142, n=10) | |
| Lenovo ThinkPad X9-15 Aura Edition | |
| Average of class Multimedia (805 - 2974, n=53, last 2 years) | |
| HWBOT x265 Benchmark v2.2 / 4k Preset | |
| Lenovo ThinkPad X9-15p Gen 1 | |
| Average Intel Core Ultra X7 358H (18.1 - 23.1, n=11) | |
| Dell XPS 16 Core Ultra X7 358H | |
| Average of class Multimedia (6.08 - 36.1, n=52, last 2 years) | |
| Lenovo ThinkPad X9-15 Aura Edition | |
| LibreOffice / 20 Documents To PDF | |
| Dell XPS 16 Core Ultra X7 358H | |
| Average of class Multimedia (23.9 - 72.5, n=53, last 2 years) | |
| Lenovo ThinkPad X9-15p Gen 1 | |
| Average Intel Core Ultra X7 358H (38.5 - 56.9, n=11) | |
| Lenovo ThinkPad X9-15 Aura Edition | |
| R Benchmark 2.5 / Overall mean | |
| Lenovo ThinkPad X9-15 Aura Edition | |
| Average of class Multimedia (0.3604 - 0.609, n=52, last 2 years) | |
| Average Intel Core Ultra X7 358H (0.4127 - 0.4483, n=12) | |
| Lenovo ThinkPad X9-15p Gen 1 | |
| Dell XPS 16 Core Ultra X7 358H | |
* ... smaller is better
AIDA64: FP32 Ray-Trace | FPU Julia | CPU SHA3 | CPU Queen | FPU SinJulia | FPU Mandel | CPU AES | CPU ZLib | FP64 Ray-Trace | CPU PhotoWorxx | CPU CheckMate
| Performance rating | |
| Lenovo ThinkPad X9-15p Gen 1 -1! | |
| Average of class Multimedia | |
| Dell XPS 16 Core Ultra X7 358H -1! | |
| Average Intel Core Ultra X7 358H | |
| Lenovo ThinkPad X9-15 Aura Edition | |
| AIDA64 / FP32 Ray-Trace | |
| Lenovo ThinkPad X9-15p Gen 1 (v8.20.8100) | |
| Average of class Multimedia (2214 - 50388, n=50, last 2 years) | |
| Dell XPS 16 Core Ultra X7 358H (v8.20.8100) | |
| Average Intel Core Ultra X7 358H (11953 - 18710, n=12) | |
| Lenovo ThinkPad X9-15 Aura Edition (v6.92.6600) | |
| Lenovo ThinkPad X9-15 Aura Edition (v6.92.6600) | |
| Lenovo ThinkPad X9-15 Aura Edition (v8.20.8100) | |
| AIDA64 / FPU Julia | |
| Lenovo ThinkPad X9-15p Gen 1 (v8.20.8100) | |
| Average of class Multimedia (12867 - 201874, n=50, last 2 years) | |
| Dell XPS 16 Core Ultra X7 358H (v8.20.8100) | |
| Average Intel Core Ultra X7 358H (29930 - 96559, n=12) | |
| Lenovo ThinkPad X9-15 Aura Edition (v6.92.6600) | |
| Lenovo ThinkPad X9-15 Aura Edition (v8.20.8100) | |
| Lenovo ThinkPad X9-15 Aura Edition (v6.92.6600) | |
| AIDA64 / CPU SHA3 | |
| Lenovo ThinkPad X9-15p Gen 1 (v8.20.8100) | |
| Average Intel Core Ultra X7 358H (3910 - 4955, n=12) | |
| Dell XPS 16 Core Ultra X7 358H (v8.20.8100) | |
| Average of class Multimedia (626 - 8623, n=50, last 2 years) | |
| Lenovo ThinkPad X9-15 Aura Edition (v6.92.6600) | |
| Lenovo ThinkPad X9-15 Aura Edition (v8.20.8100) | |
| Lenovo ThinkPad X9-15 Aura Edition (v6.92.6600) | |
| AIDA64 / CPU Queen | |
| Average of class Multimedia (13483 - 181505, n=34, last 2 years) | |
| Average Intel Core Ultra X7 358H (63425 - 63827, n=3) | |
| Lenovo ThinkPad X9-15 Aura Edition (v6.92.6600) | |
| Lenovo ThinkPad X9-15 Aura Edition (v6.92.6600) | |
| AIDA64 / FPU SinJulia | |
| Average of class Multimedia (886 - 28794, n=50, last 2 years) | |
| Lenovo ThinkPad X9-15p Gen 1 (v8.20.8100) | |
| Dell XPS 16 Core Ultra X7 358H (v8.20.8100) | |
| Average Intel Core Ultra X7 358H (4734 - 7038, n=12) | |
| Lenovo ThinkPad X9-15 Aura Edition (v8.20.8100) | |
| Lenovo ThinkPad X9-15 Aura Edition (v6.92.6600) | |
| Lenovo ThinkPad X9-15 Aura Edition (v6.92.6600) | |
| AIDA64 / FPU Mandel | |
| Lenovo ThinkPad X9-15p Gen 1 (v8.20.8100) | |
| Average of class Multimedia (6395 - 105740, n=50, last 2 years) | |
| Dell XPS 16 Core Ultra X7 358H (v8.20.8100) | |
| Average Intel Core Ultra X7 358H (14716 - 50766, n=12) | |
| Lenovo ThinkPad X9-15 Aura Edition (v6.92.6600) | |
| Lenovo ThinkPad X9-15 Aura Edition (v6.92.6600) | |
| Lenovo ThinkPad X9-15 Aura Edition (v8.20.8100) | |
| AIDA64 / CPU AES | |
| Lenovo ThinkPad X9-15p Gen 1 (v8.20.8100) | |
| Average of class Multimedia (8171 - 126790, n=50, last 2 years) | |
| Dell XPS 16 Core Ultra X7 358H (v8.20.8100) | |
| Average Intel Core Ultra X7 358H (5014 - 68737, n=12) | |
| Lenovo ThinkPad X9-15 Aura Edition (v8.20.8100) | |
| Lenovo ThinkPad X9-15 Aura Edition (v6.92.6600) | |
| Lenovo ThinkPad X9-15 Aura Edition (v6.92.6600) | |
| AIDA64 / CPU ZLib | |
| Lenovo ThinkPad X9-15p Gen 1 (v8.20.8100) | |
| Average Intel Core Ultra X7 358H (932 - 1205, n=12) | |
| Average of class Multimedia (143.8 - 2022, n=50, last 2 years) | |
| Dell XPS 16 Core Ultra X7 358H (v8.20.8100) | |
| Lenovo ThinkPad X9-15 Aura Edition (v6.92.6600) | |
| Lenovo ThinkPad X9-15 Aura Edition (v8.20.8100) | |
| Lenovo ThinkPad X9-15 Aura Edition (v6.92.6600) | |
| AIDA64 / FP64 Ray-Trace | |
| Average of class Multimedia (1014 - 26875, n=50, last 2 years) | |
| Lenovo ThinkPad X9-15p Gen 1 (v8.20.8100) | |
| Dell XPS 16 Core Ultra X7 358H (v8.20.8100) | |
| Average Intel Core Ultra X7 358H (5918 - 9612, n=12) | |
| Lenovo ThinkPad X9-15 Aura Edition (v6.92.6600) | |
| Lenovo ThinkPad X9-15 Aura Edition (v6.92.6600) | |
| Lenovo ThinkPad X9-15 Aura Edition (v8.20.8100) | |
| AIDA64 / CPU PhotoWorxx | |
| Lenovo ThinkPad X9-15p Gen 1 (v8.20.8100) | |
| Dell XPS 16 Core Ultra X7 358H (v8.20.8100) | |
| Average Intel Core Ultra X7 358H (27646 - 88533, n=12) | |
| Lenovo ThinkPad X9-15 Aura Edition (v8.20.8100) | |
| Lenovo ThinkPad X9-15 Aura Edition (v6.92.6600) | |
| Lenovo ThinkPad X9-15 Aura Edition (v6.92.6600) | |
| Average of class Multimedia (8187 - 88533, n=50, last 2 years) | |
| AIDA64 / CPU CheckMate | |
| Average Intel Core Ultra X7 358H (3721 - 4475, n=10) | |
| Lenovo ThinkPad X9-15p Gen 1 (v8.20.8100) | |
| Dell XPS 16 Core Ultra X7 358H (v8.20.8100) | |
| Average of class Multimedia (569 - 4742, n=19, last 2 years) | |
| Lenovo ThinkPad X9-15 Aura Edition (v8.20.8100) | |
System Performance
Compared with the older X9-15, the Lenovo ThinkPad X9-15p Gen 1 Aura Edition is clearly a step up in system performance. In everyday use, this laptop flies.
PCMark 10: Score | Essentials | Productivity | Digital Content Creation
CrossMark: Overall | Productivity | Creativity | Responsiveness
WebXPRT 3: Overall
WebXPRT 4: Overall
Mozilla Kraken 1.1: Total
| Performance rating | |
| Apple MacBook Pro 14 2026 M5 Max -4! | |
| Apple MacBook Air 15 M5 -4! | |
| Lenovo ThinkPad X9-15p Gen 1 | |
| Dell XPS 16 Core Ultra X7 358H | |
| Average Intel Core Ultra X7 358H, Intel Arc B390 12 Xe3 Panther Lake iGPU | |
| Average of class Multimedia | |
| Lenovo ThinkPad X9-15 Aura Edition | |
| PCMark 10 / Score | |
| Dell XPS 16 Core Ultra X7 358H | |
| Average Intel Core Ultra X7 358H, Intel Arc B390 12 Xe3 Panther Lake iGPU (8834 - 9880, n=11) | |
| Lenovo ThinkPad X9-15p Gen 1 | |
| Average of class Multimedia (4325 - 10386, n=50, last 2 years) | |
| Lenovo ThinkPad X9-15 Aura Edition | |
| PCMark 10 / Essentials | |
| Dell XPS 16 Core Ultra X7 358H | |
| Average Intel Core Ultra X7 358H, Intel Arc B390 12 Xe3 Panther Lake iGPU (10110 - 11263, n=10) | |
| Lenovo ThinkPad X9-15p Gen 1 | |
| Lenovo ThinkPad X9-15 Aura Edition | |
| Average of class Multimedia (8025 - 11664, n=49, last 2 years) | |
| PCMark 10 / Productivity | |
| Dell XPS 16 Core Ultra X7 358H | |
| Average Intel Core Ultra X7 358H, Intel Arc B390 12 Xe3 Panther Lake iGPU (13908 - 16780, n=10) | |
| Lenovo ThinkPad X9-15p Gen 1 | |
| Average of class Multimedia (7323 - 18233, n=49, last 2 years) | |
| Lenovo ThinkPad X9-15 Aura Edition | |
| PCMark 10 / Digital Content Creation | |
| Lenovo ThinkPad X9-15p Gen 1 | |
| Dell XPS 16 Core Ultra X7 358H | |
| Average Intel Core Ultra X7 358H, Intel Arc B390 12 Xe3 Panther Lake iGPU (11524 - 13893, n=10) | |
| Average of class Multimedia (3738 - 16240, n=49, last 2 years) | |
| Lenovo ThinkPad X9-15 Aura Edition | |
| CrossMark / Overall | |
| Apple MacBook Pro 14 2026 M5 Max | |
| Apple MacBook Air 15 M5 | |
| Lenovo ThinkPad X9-15p Gen 1 | |
| Dell XPS 16 Core Ultra X7 358H | |
| Average Intel Core Ultra X7 358H, Intel Arc B390 12 Xe3 Panther Lake iGPU (1884 - 2182, n=11) | |
| Average of class Multimedia (866 - 3231, n=58, last 2 years) | |
| Lenovo ThinkPad X9-15 Aura Edition | |
| CrossMark / Productivity | |
| Apple MacBook Pro 14 2026 M5 Max | |
| Apple MacBook Air 15 M5 | |
| Lenovo ThinkPad X9-15p Gen 1 | |
| Dell XPS 16 Core Ultra X7 358H | |
| Average Intel Core Ultra X7 358H, Intel Arc B390 12 Xe3 Panther Lake iGPU (1678 - 1960, n=11) | |
| Average of class Multimedia (931 - 2677, n=58, last 2 years) | |
| Lenovo ThinkPad X9-15 Aura Edition | |
| CrossMark / Creativity | |
| Apple MacBook Pro 14 2026 M5 Max | |
| Apple MacBook Air 15 M5 | |
| Lenovo ThinkPad X9-15p Gen 1 | |
| Dell XPS 16 Core Ultra X7 358H | |
| Average Intel Core Ultra X7 358H, Intel Arc B390 12 Xe3 Panther Lake iGPU (2241 - 2563, n=11) | |
| Average of class Multimedia (907 - 4522, n=58, last 2 years) | |
| Lenovo ThinkPad X9-15 Aura Edition | |
| CrossMark / Responsiveness | |
| Lenovo ThinkPad X9-15p Gen 1 | |
| Apple MacBook Pro 14 2026 M5 Max | |
| Dell XPS 16 Core Ultra X7 358H | |
| Average Intel Core Ultra X7 358H, Intel Arc B390 12 Xe3 Panther Lake iGPU (1560 - 1855, n=11) | |
| Apple MacBook Air 15 M5 | |
| Average of class Multimedia (605 - 2073, n=58, last 2 years) | |
| Lenovo ThinkPad X9-15 Aura Edition | |
| WebXPRT 3 / Overall | |
| Apple MacBook Pro 14 2026 M5 Max | |
| Apple MacBook Air 15 M5 | |
| Lenovo ThinkPad X9-15p Gen 1 | |
| Average of class Multimedia (197.4 - 622, n=61, last 2 years) | |
| Average Intel Core Ultra X7 358H, Intel Arc B390 12 Xe3 Panther Lake iGPU (293 - 350, n=11) | |
| Dell XPS 16 Core Ultra X7 358H | |
| Lenovo ThinkPad X9-15 Aura Edition | |
| WebXPRT 4 / Overall | |
| Apple MacBook Pro 14 2026 M5 Max | |
| Apple MacBook Air 15 M5 | |
| Lenovo ThinkPad X9-15p Gen 1 | |
| Dell XPS 16 Core Ultra X7 358H | |
| Average Intel Core Ultra X7 358H, Intel Arc B390 12 Xe3 Panther Lake iGPU (278 - 310, n=10) | |
| Average of class Multimedia (167.3 - 415, n=61, last 2 years) | |
| Lenovo ThinkPad X9-15 Aura Edition | |
| Mozilla Kraken 1.1 / Total | |
| Lenovo ThinkPad X9-15 Aura Edition | |
| Lenovo ThinkPad X9-15p Gen 1 | |
| Average Intel Core Ultra X7 358H, Intel Arc B390 12 Xe3 Panther Lake iGPU (445 - 465, n=11) | |
| Dell XPS 16 Core Ultra X7 358H | |
| Average of class Multimedia (228 - 835, n=62, last 2 years) | |
| Apple MacBook Air 15 M5 | |
| Apple MacBook Pro 14 2026 M5 Max | |
* ... smaller is better
| PCMark 10 Score | 9303 points | |
Help | ||
| AIDA64 / Memory Copy | |
| Dell XPS 16 Core Ultra X7 358H | |
| Lenovo ThinkPad X9-15p Gen 1 | |
| Average Intel Core Ultra X7 358H (102745 - 132135, n=10) | |
| Lenovo ThinkPad X9-15 Aura Edition | |
| Average of class Multimedia (11299 - 132135, n=50, last 2 years) | |
| AIDA64 / Memory Read | |
| Lenovo ThinkPad X9-15p Gen 1 | |
| Dell XPS 16 Core Ultra X7 358H | |
| Average Intel Core Ultra X7 358H (97755 - 120727, n=12) | |
| Lenovo ThinkPad X9-15 Aura Edition | |
| Average of class Multimedia (11624 - 174586, n=50, last 2 years) | |
| AIDA64 / Memory Write | |
| Dell XPS 16 Core Ultra X7 358H | |
| Lenovo ThinkPad X9-15p Gen 1 | |
| Average Intel Core Ultra X7 358H (105712 - 134998, n=12) | |
| Lenovo ThinkPad X9-15 Aura Edition | |
| Average of class Multimedia (11755 - 134998, n=50, last 2 years) | |
| AIDA64 / Memory Latency | |
| Average of class Multimedia (78.1 - 535, n=49, last 2 years) | |
| Lenovo ThinkPad X9-15 Aura Edition | |
| Dell XPS 16 Core Ultra X7 358H | |
| Lenovo ThinkPad X9-15p Gen 1 | |
| Average Intel Core Ultra X7 358H (0 - 104.4, n=12) | |
* ... smaller is better
DPC Latency
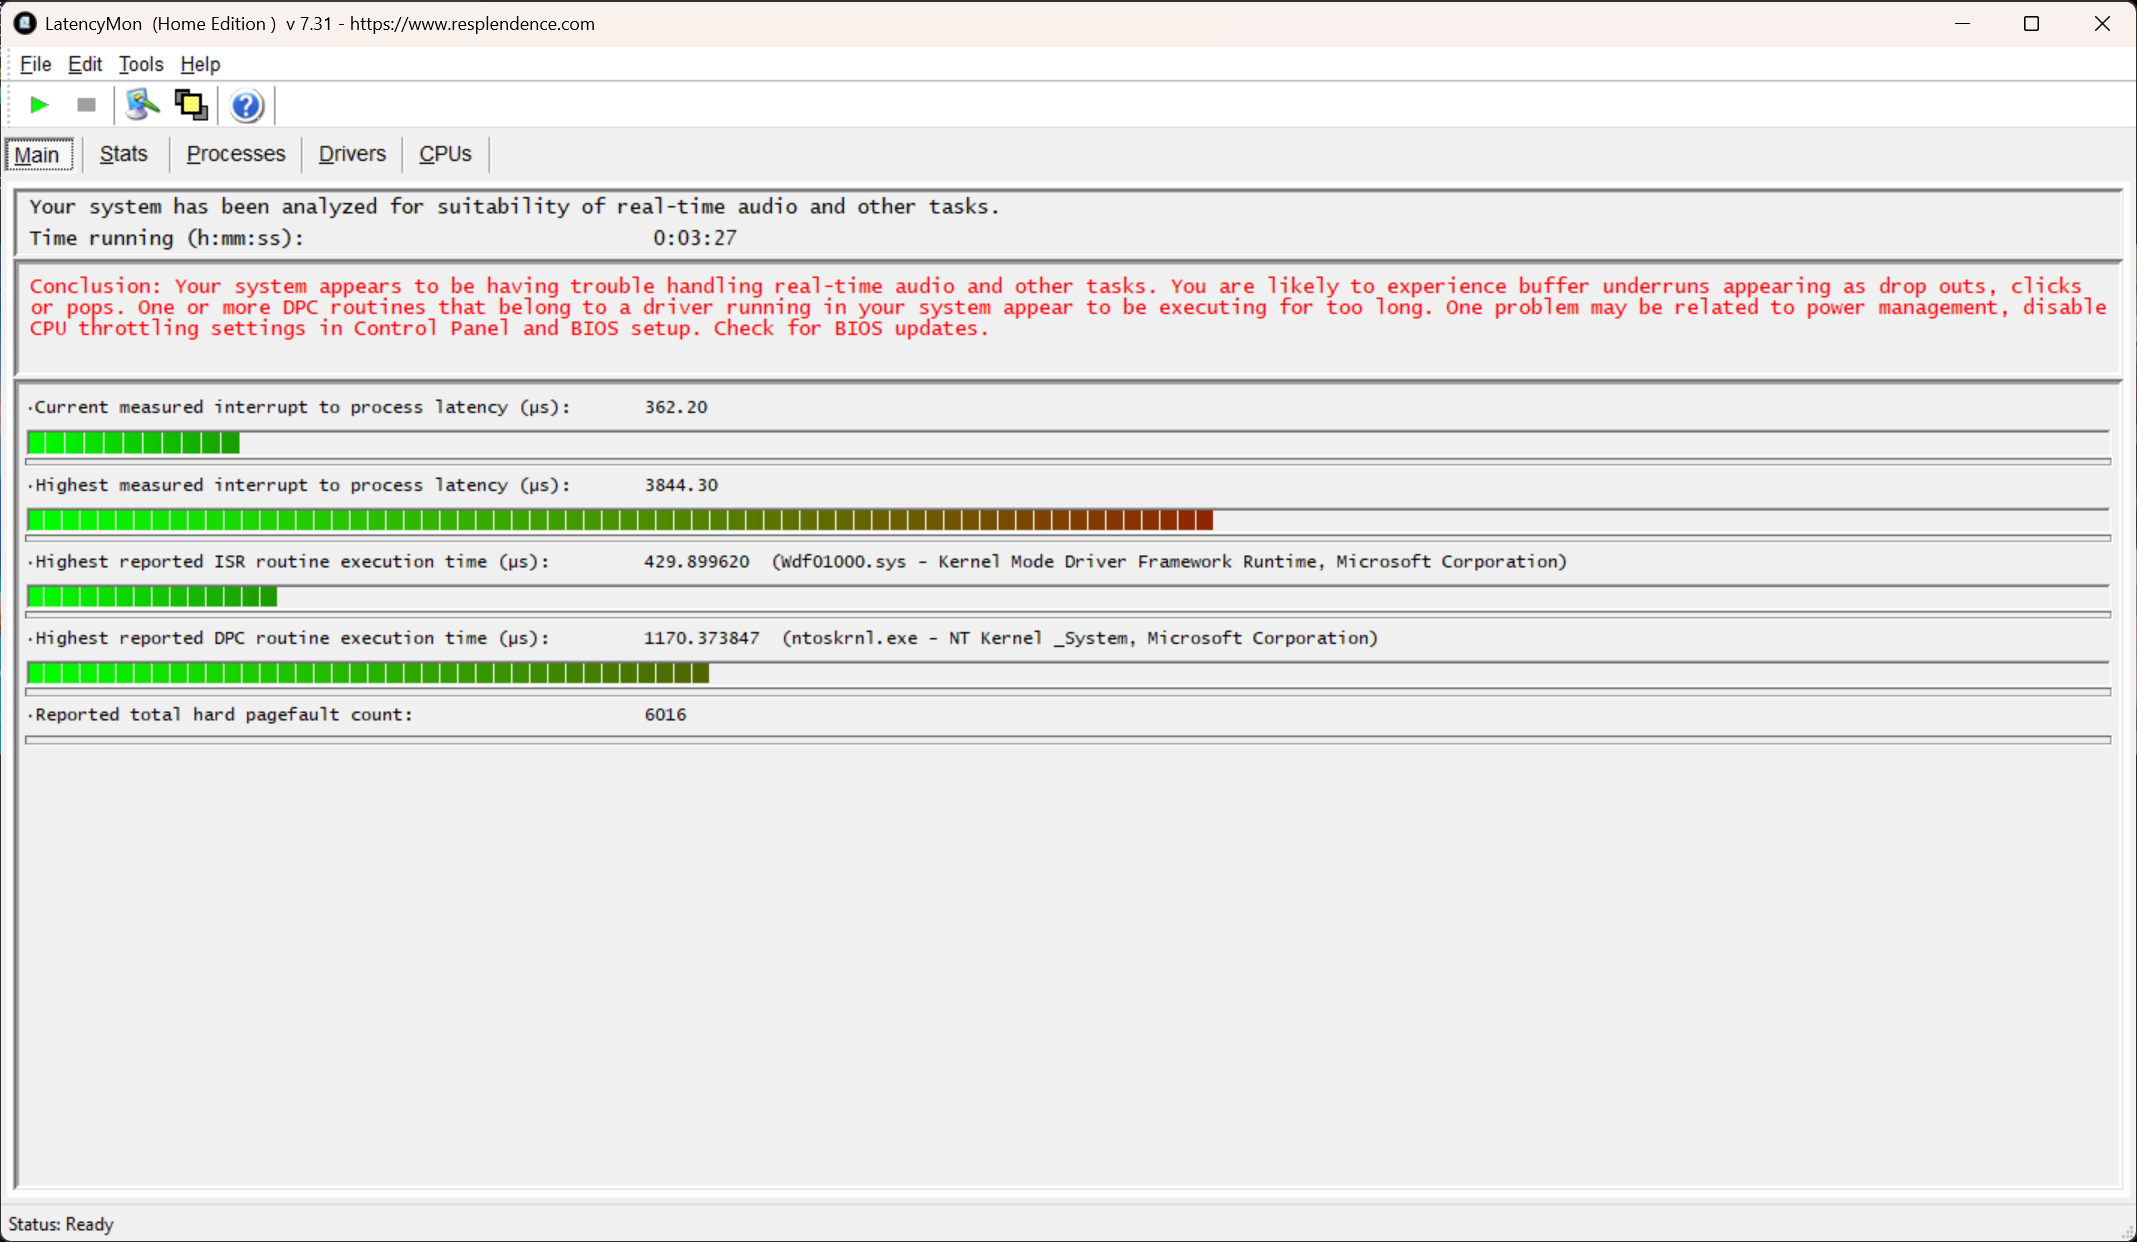
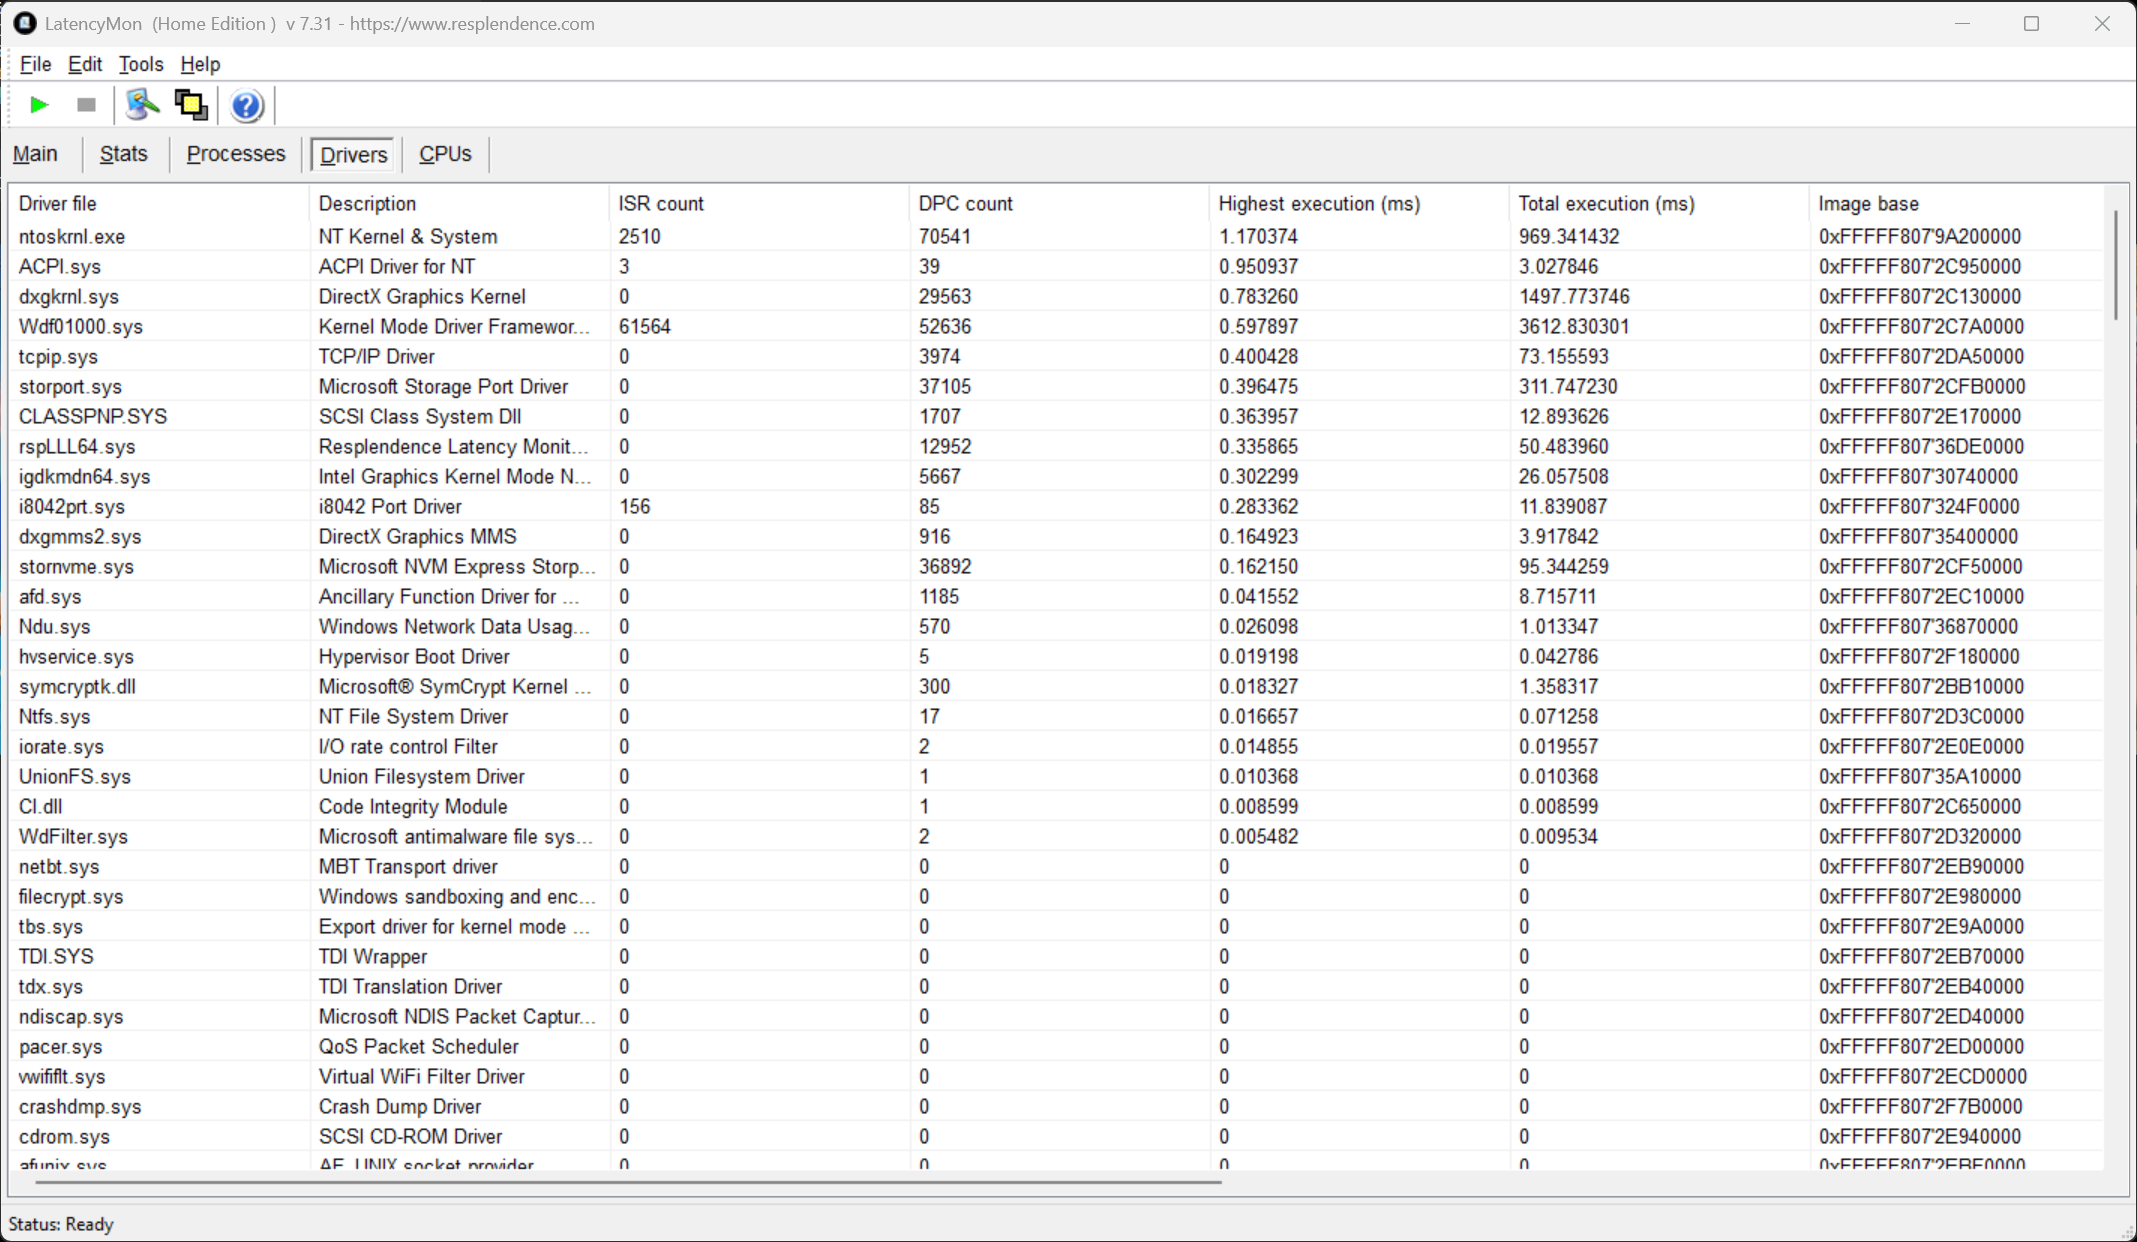
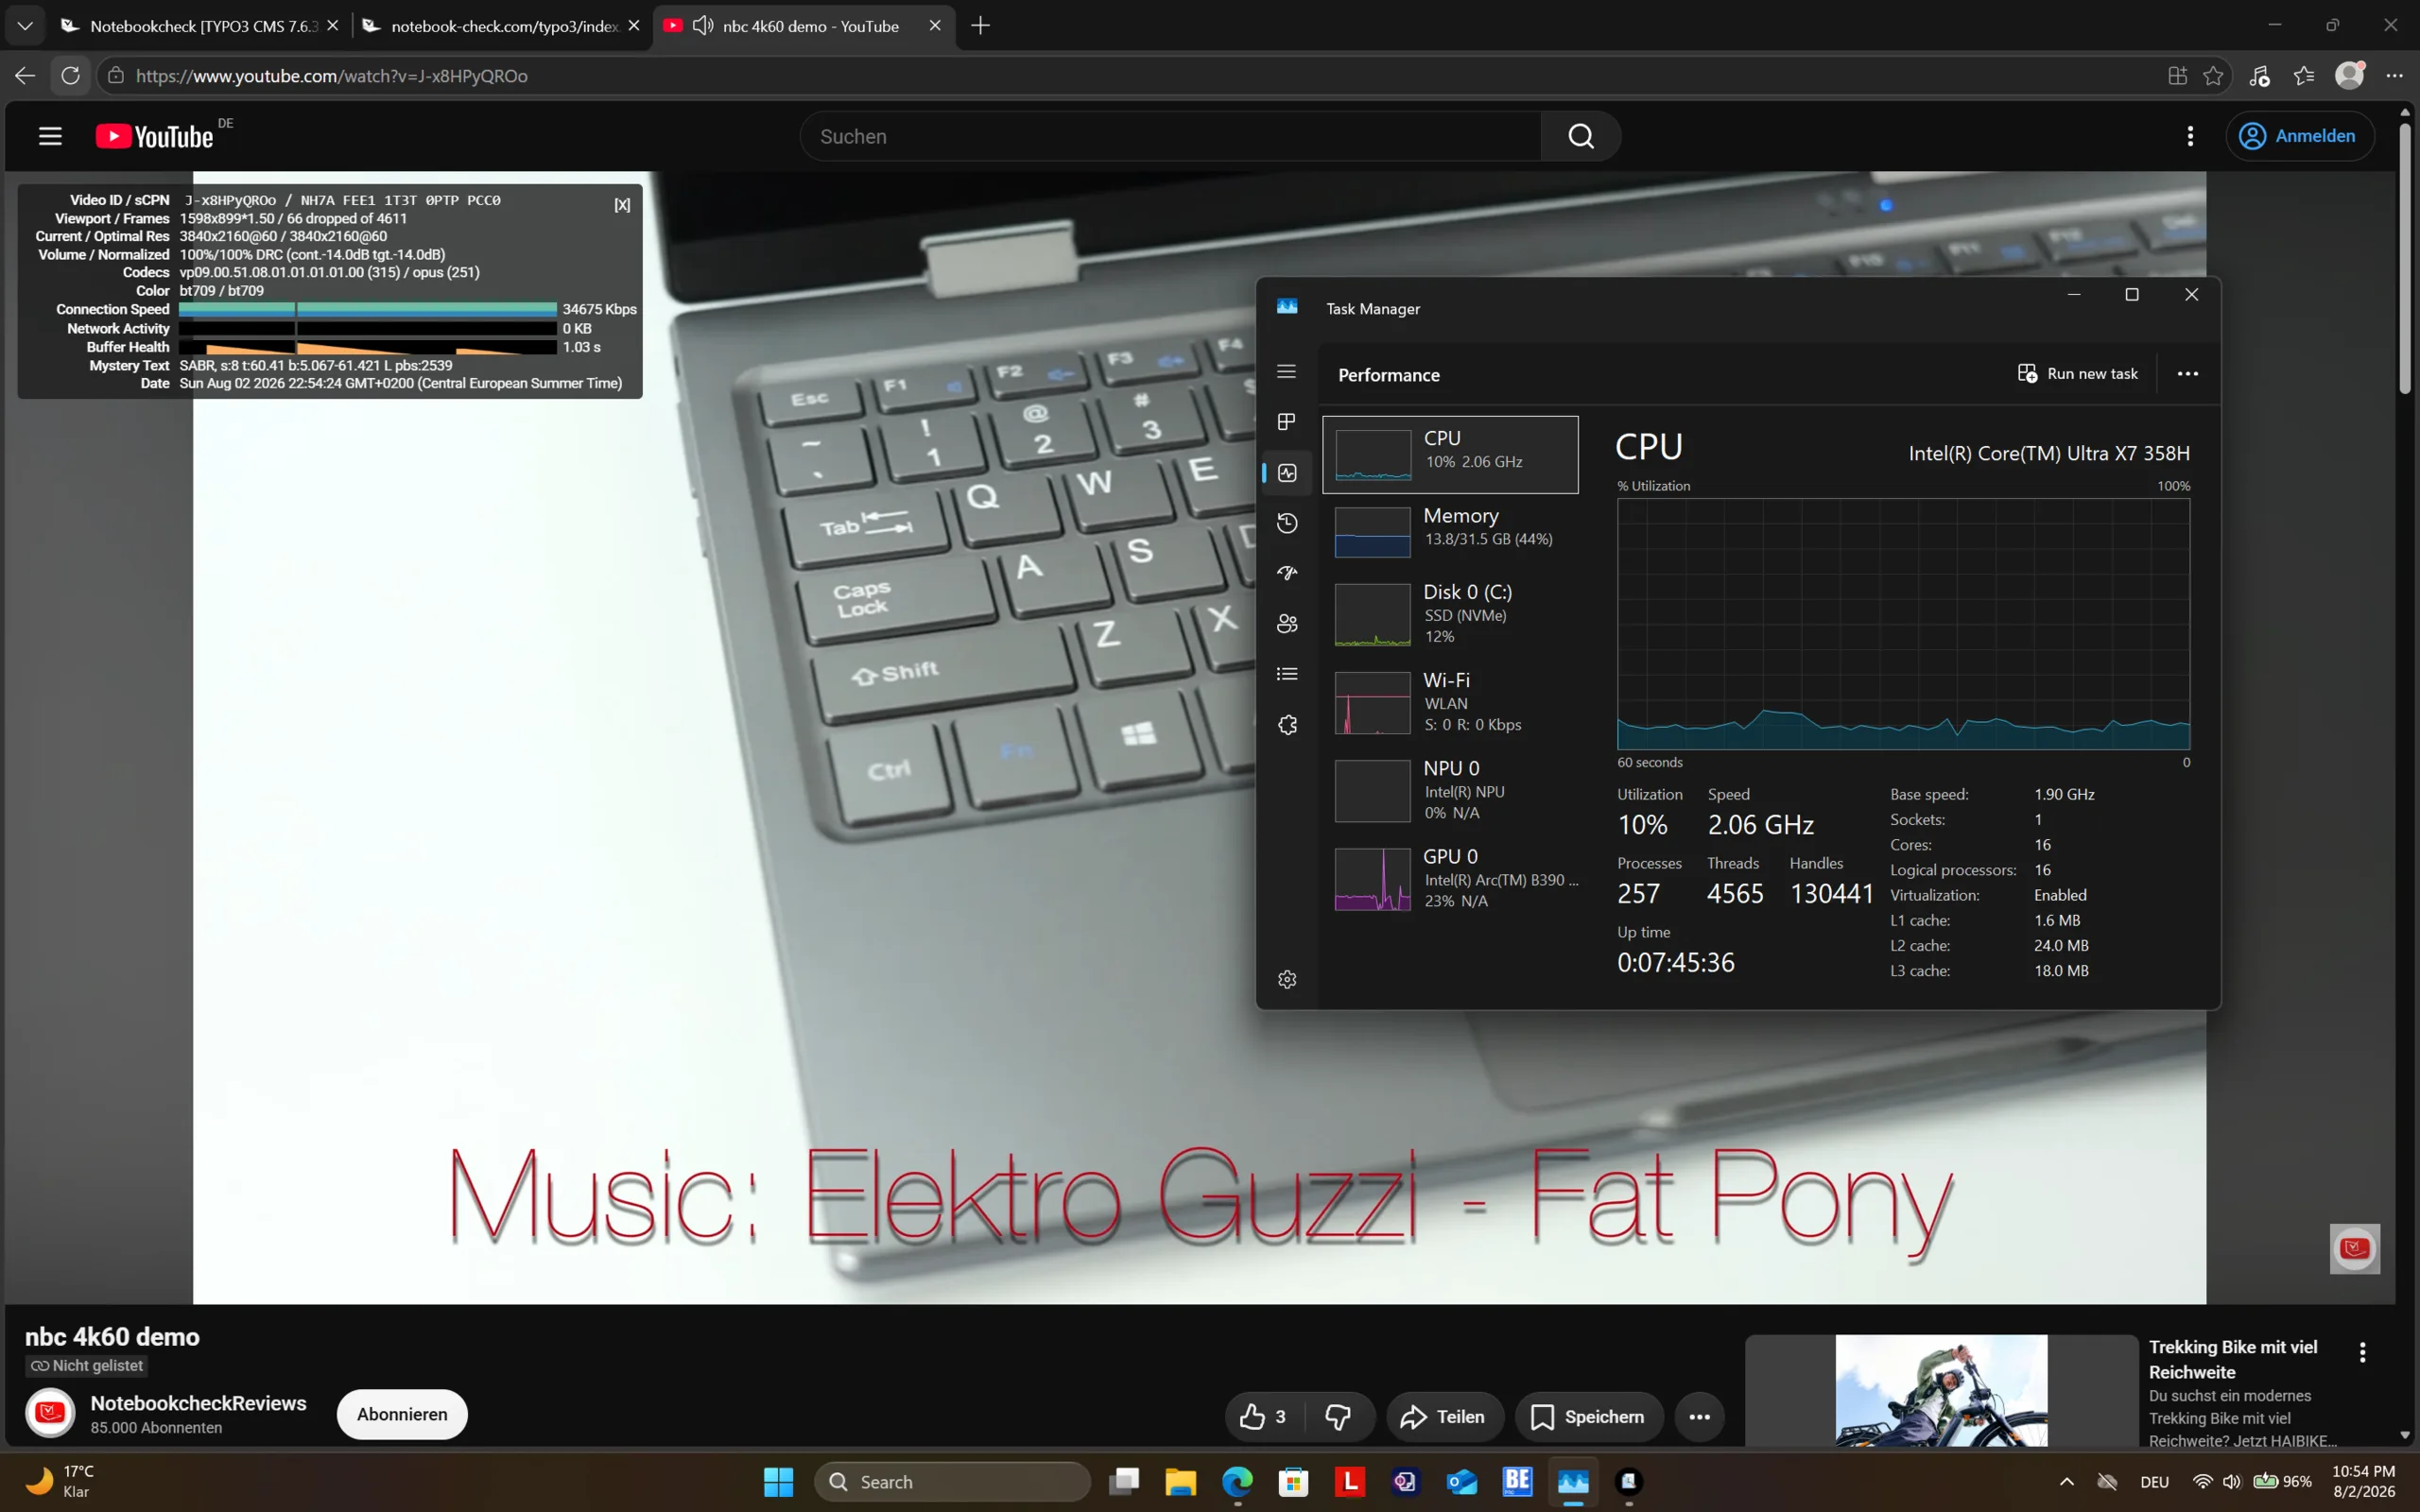
| DPC Latencies / LatencyMon - interrupt to process latency (max), Web, Youtube, Prime95 | |
| Lenovo ThinkPad X9-15p Gen 1 | |
| Average of class Multimedia (327 - 7067, n=48, last 2 years) | |
| Lenovo ThinkPad X9-15 Aura Edition | |
| Dell XPS 16 Core Ultra X7 358H | |
* ... smaller is better
Storage Devices
Lenovo upgrades the storage solution from a small M.2 2242 NVMe PCIe 4.0 SSD to a larger and faster M.2 2280 NVMe PCIe 5.0 drive. The 1 TB SSD in our review unit is made by Samsung, and it easily outperforms those in the other laptops in the comparison. However, it does throttle under sustained load.

| Drive Performance rating - Percent | |
| Lenovo ThinkPad X9-15p Gen 1 | |
| Average Samsung PM9E1 1 TB MZVLC1T0HFLU | |
| Average of class Multimedia | |
| Dell XPS 16 Core Ultra X7 358H | |
| Lenovo ThinkPad X9-15 Aura Edition | |
* ... smaller is better
Disk Throttling: DiskSpd Read Loop, Queue Depth 8
Graphics Card
The Lenovo ThinkPad X9-15p relies on the Intel Arc B390, currently Intel's most powerful iGPU. The 12 Xe³ cores rely on system RAM, as the GPU does not have dedicated memory. In our benchmarks, this GPU performed very well, outperforming the Intel Arc 140V in the ThinkPad X9-15 by 76 percent in 3DMark and 64 percent in games.
| 3DMark 11 Performance | 18650 points | |
| 3DMark Fire Strike Score | 14507 points | |
| 3DMark Time Spy Score | 7842 points | |
Help | ||
* ... smaller is better
| GTA V - 1920x1080 Highest AA:4xMSAA + FX AF:16x | |
| Average of class Multimedia (7.92 - 141.6, n=50, last 2 years) | |
| Lenovo ThinkPad X9-15p Gen 1 | |
| Dell XPS 16 Core Ultra X7 358H | |
| Lenovo ThinkPad X9-15 Aura Edition | |
| Final Fantasy XV Benchmark - 1920x1080 High Quality | |
| Lenovo ThinkPad X9-15p Gen 1 | |
| Dell XPS 16 Core Ultra X7 358H | |
| Average of class Multimedia (7.61 - 144.4, n=53, last 2 years) | |
| Lenovo ThinkPad X9-15 Aura Edition | |
| Dota 2 Reborn - 1920x1080 ultra (3/3) best looking | |
| Lenovo ThinkPad X9-15p Gen 1 | |
| Dell XPS 16 Core Ultra X7 358H | |
| Average of class Multimedia (30.3 - 179.9, n=54, last 2 years) | |
| Lenovo ThinkPad X9-15 Aura Edition | |
| X-Plane 11.11 - 1920x1080 high (fps_test=3) | |
| Average of class Multimedia (16.9 - 141.1, n=52, last 2 years) | |
| Lenovo ThinkPad X9-15p Gen 1 | |
| Dell XPS 16 Core Ultra X7 358H | |
| Lenovo ThinkPad X9-15 Aura Edition | |
Cyberpunk 2077 Ultra FPS Chart
| low | med. | high | ultra | QHD | |
|---|---|---|---|---|---|
| GTA V (2015) | 178 | 114.5 | 46.2 | 32.1 | |
| Dota 2 Reborn (2015) | 152.4 | 149.3 | 121.8 | 117.2 | |
| Final Fantasy XV Benchmark (2018) | 140.4 | 80.4 | 57.9 | 43.1 | |
| X-Plane 11.11 (2018) | 62.1 | 50.4 | 42.8 | ||
| Baldur's Gate 3 (2023) | 76.5 | 60 | 57.6 | 50.1 | 36.1 |
| Cyberpunk 2077 (2023) | 84.7 | 67.6 | 58.8 | 50.4 | 29.9 |
| Assassin's Creed Shadows (2025) | 36 | 34 | 30 | 22 | 18 |
| F1 25 (2025) | 152.2 | 126.9 | 97.5 | 19.9 |
Emissions
System Noise
Despite its powerful components, the Lenovo ThinkPad X9-15p Gen 1 Aura Edition is not a loud system at all. The fans remain off during normal use. Under sustained load, they reach a maximum of around 43.8 dB(A), well below the levels of the Apple MacBook Pro 14 and Dell XPS 16, and even below that of the less powerful X9-15.
We did not detect any coil whine.
Noise level
| Idle |
| 22.9 / 22.9 / 22.9 dB(A) |
| Load |
| 31.4 / 43.7 dB(A) |
 | ||
30 dB silent 40 dB(A) audible 50 dB(A) loud |
||
min:  , med: , med:  , max: , max:  Earthworks M23R, Arta (15 cm distance) environment noise: 22.9 dB(A) Earthworks M23R, Arta (15 cm distance) environment noise: 22.9 dB(A) | ||
| Lenovo ThinkPad X9-15p Gen 1 Ultra X7 358H, Arc B390 Panther Lake iGPU | Lenovo ThinkPad X9-15 Aura Edition Core Ultra 7 258V, Arc 140V | Apple MacBook Pro 14 2026 M5 Max M5 Max, M5 Max 40-Core GPU | Apple MacBook Air 15 M5 M5 10-Core, M5 10-Core GPU | Dell XPS 16 Core Ultra X7 358H Ultra X7 358H, Arc B390 Panther Lake iGPU | |
|---|---|---|---|---|---|
| Noise | -5% | -7% | -5% | ||
| off / environment * (dB) | 22.9 | 24.4 -7% | 23.1 -1% | 23.3 -2% | |
| Idle Minimum * (dB) | 22.9 | 24.4 -7% | 23.1 -1% | 23.4 -2% | |
| Idle Average * (dB) | 22.9 | 24.4 -7% | 23.1 -1% | 23.4 -2% | |
| Idle Maximum * (dB) | 22.9 | 24.4 -7% | 23.1 -1% | 25.8 -13% | |
| Load Average * (dB) | 31.4 | 35.8 -14% | 36.8 -17% | 38 -21% | |
| Cyberpunk 2077 ultra * (dB) | 43.8 | 39.4 10% | 47.8 -9% | 38.1 13% | |
| Load Maximum * (dB) | 43.7 | 45 -3% | 53.2 -22% | 48.6 -11% |
* ... smaller is better
Temperature
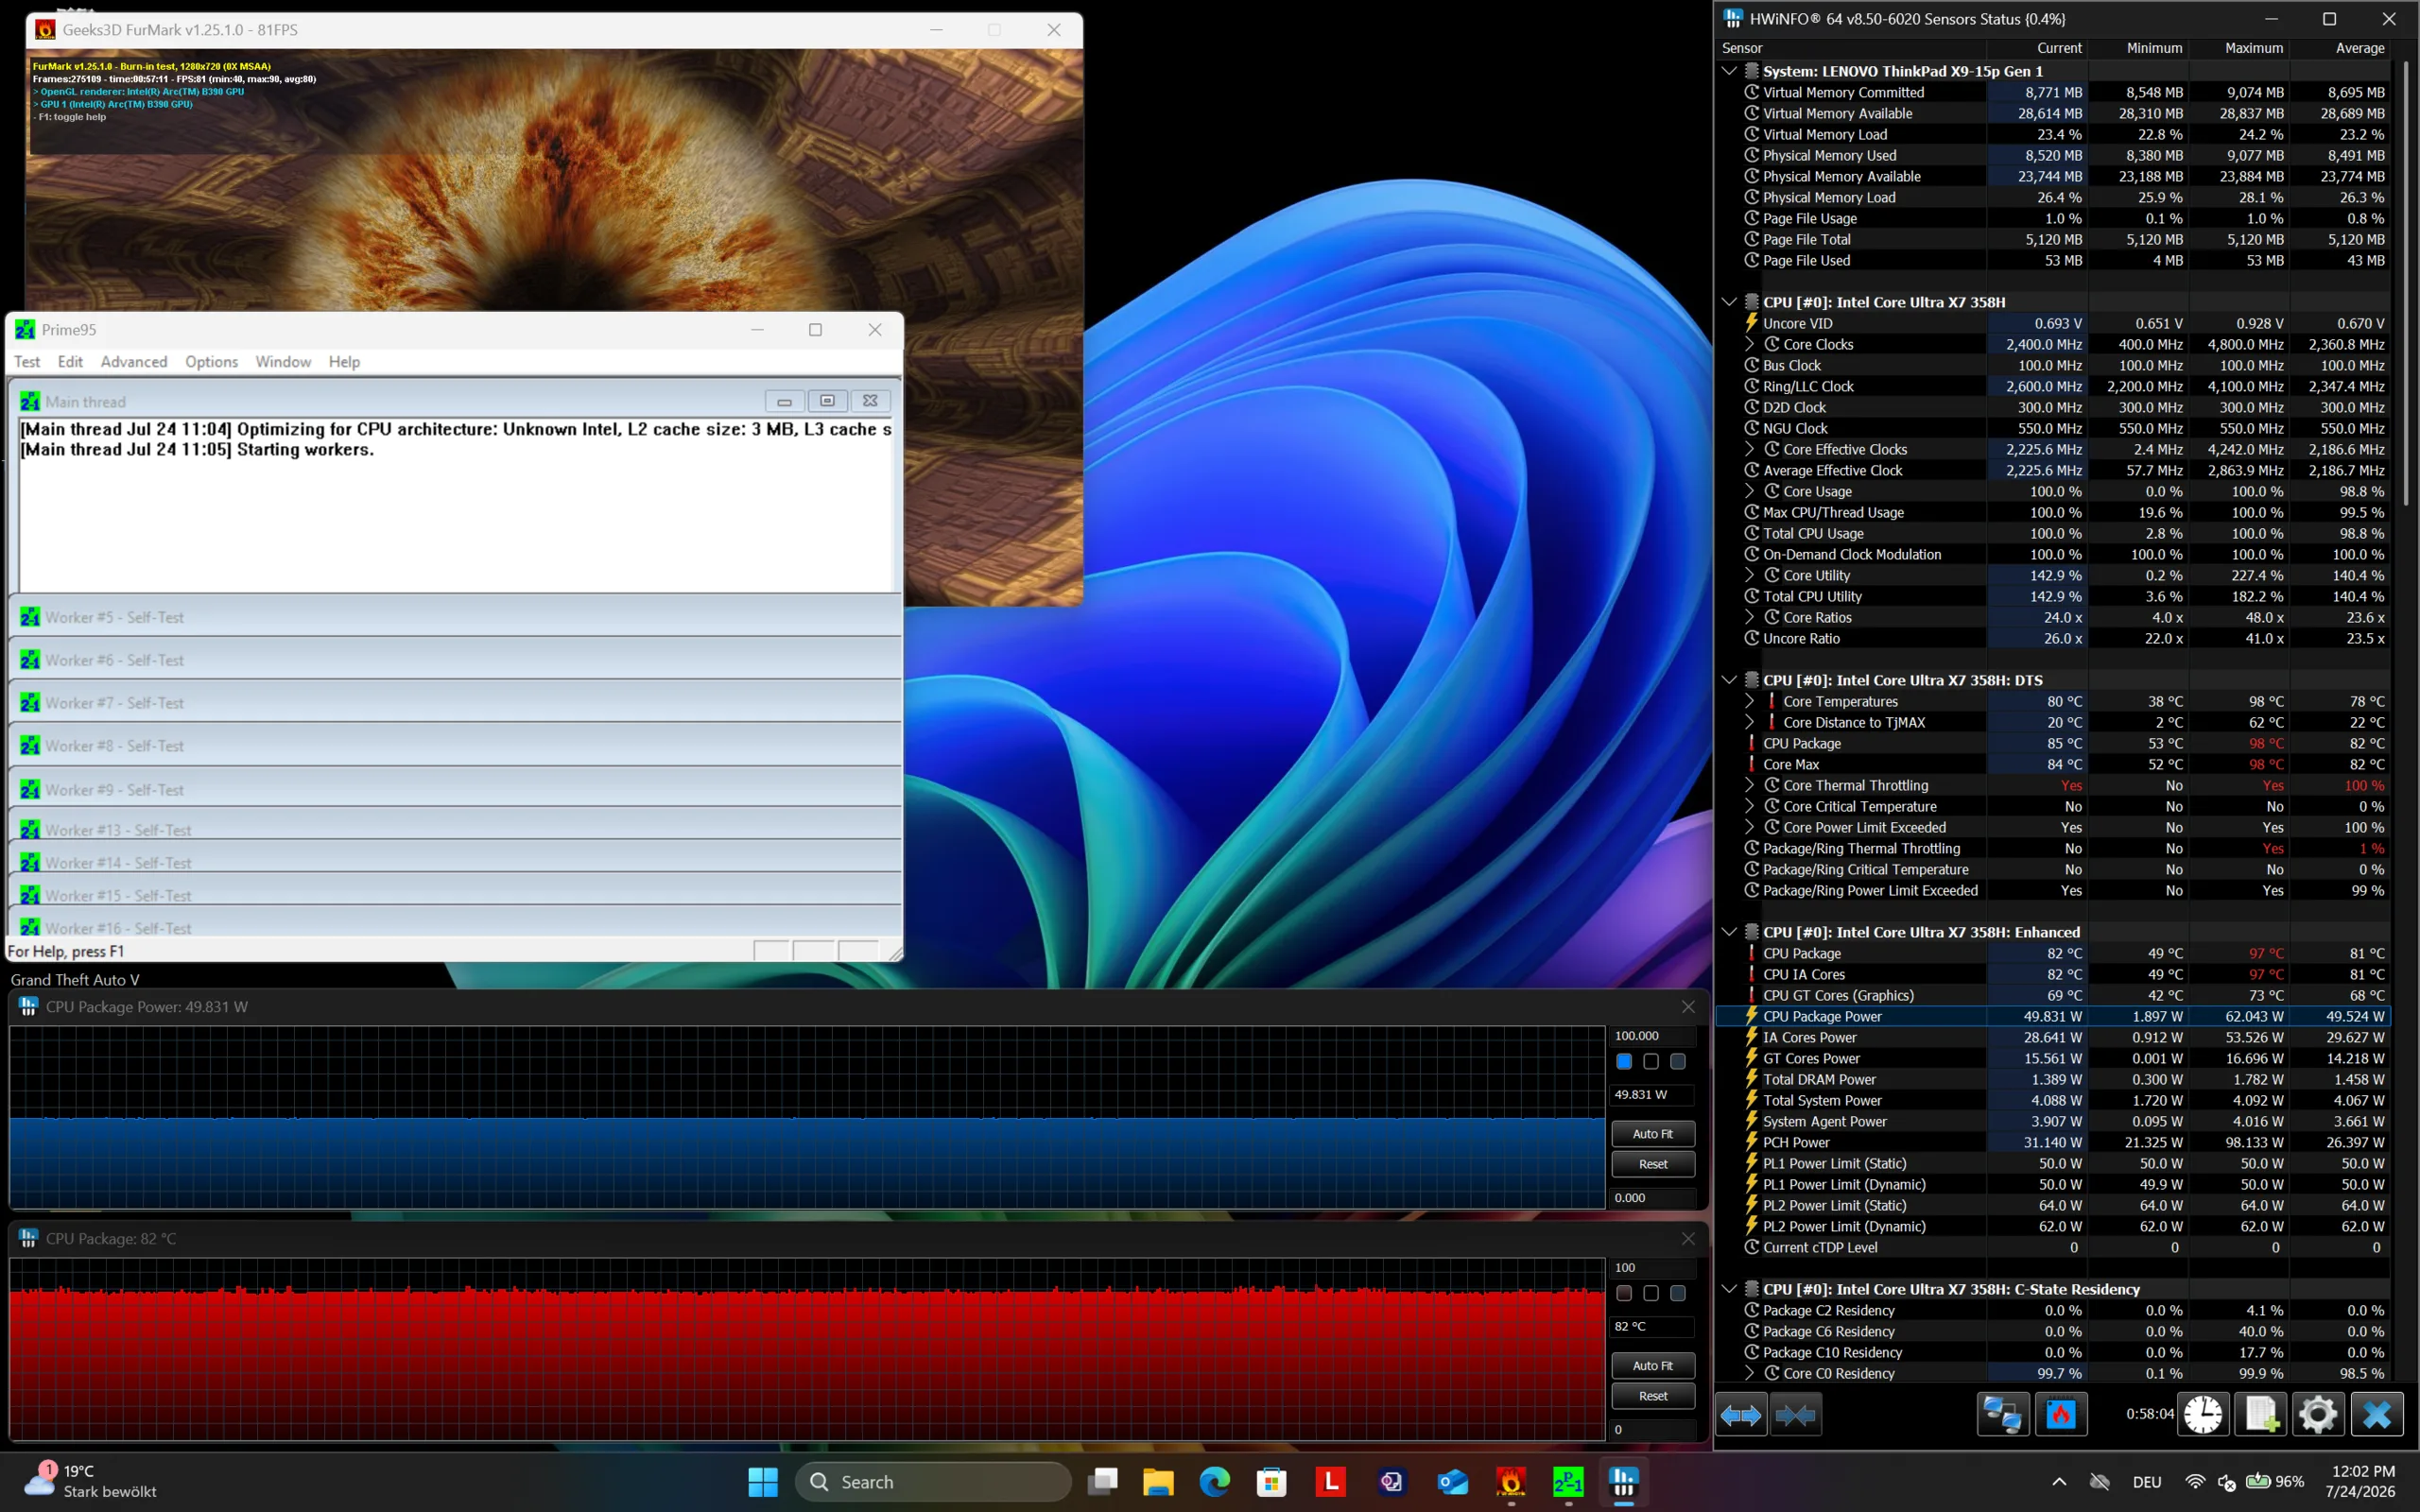
Chassis temperatures under load are barely higher than those of the older ThinkPad X9-15. The maximum temperature we measured reached 45 degrees Celsius, or 113 °F, at a single hotspot above the keyboard during the Cyberpunk load test.
The ThinkPad did not throttle during our hour-long stress test.
(±) The maximum temperature on the upper side is 43.3 °C / 110 F, compared to the average of 36.8 °C / 98 F, ranging from 21 to 71 °C for the class Multimedia.
(+) The bottom heats up to a maximum of 38.6 °C / 101 F, compared to the average of 39.1 °C / 102 F
(+) In idle usage, the average temperature for the upper side is 28.5 °C / 83 F, compared to the device average of 31.3 °C / 88 F.
(±) 3: The average temperature for the upper side is 34.3 °C / 94 F, compared to the average of 31.3 °C / 88 F for the class Multimedia.
(+) The palmrests and touchpad are cooler than skin temperature with a maximum of 29.9 °C / 85.8 F and are therefore cool to the touch.
(±) The average temperature of the palmrest area of similar devices was 28.7 °C / 83.7 F (-1.2 °C / -2.1 F).
| Lenovo ThinkPad X9-15p Gen 1 Ultra X7 358H, Arc B390 Panther Lake iGPU | Lenovo ThinkPad X9-15 Aura Edition Core Ultra 7 258V, Arc 140V | Apple MacBook Pro 14 2026 M5 Max M5 Max, M5 Max 40-Core GPU | Apple MacBook Air 15 M5 M5 10-Core, M5 10-Core GPU | Dell XPS 16 Core Ultra X7 358H Ultra X7 358H, Arc B390 Panther Lake iGPU | |
|---|---|---|---|---|---|
| Heat | 12% | 10% | 8% | 14% | |
| Maximum Upper Side * (°C) | 43.3 | 42.1 3% | 47 -9% | 44.1 -2% | 40.6 6% |
| Maximum Bottom * (°C) | 38.6 | 39.5 -2% | 40.5 -5% | 43.1 -12% | 39.8 -3% |
| Idle Upper Side * (°C) | 32.6 | 24.5 25% | 23.3 29% | 24 26% | 23.2 29% |
| Idle Bottom * (°C) | 30.4 | 24.4 20% | 23.4 23% | 23.9 21% | 23.8 22% |
* ... smaller is better
Speakers
With six speakers in total, the Lenovo ThinkPad X9-15p delivers great sound. The volume could be a bit higher, but the speakers produce strong bass. Overall, listening to music on this laptop is an enjoyable experience.
Lenovo ThinkPad X9-15p Gen 1 audio analysis
(±) | speaker loudness is average but good (80.3 dB)
Bass 100 - 315 Hz
(+) | good bass - only 4.2% away from median
(±) | linearity of bass is average (10.2% delta to prev. frequency)
Mids 400 - 2000 Hz
(+) | balanced mids - only 3.9% away from median
(+) | mids are linear (5.2% delta to prev. frequency)
Highs 2 - 16 kHz
(+) | balanced highs - only 4.3% away from median
(+) | highs are linear (2.6% delta to prev. frequency)
Overall 100 - 16.000 Hz
(+) | overall sound is linear (8.9% difference to median)
Compared to same class
» 11% of all tested devices in this class were better, 2% similar, 87% worse
» The best had a delta of 5%, average was 17%, worst was 45%
Compared to all devices tested
» 3% of all tested devices were better, 1% similar, 96% worse
» The best had a delta of 4%, average was 23%, worst was 136%
Dell XPS 16 Core Ultra X7 358H audio analysis
(+) | speakers can play relatively loud (85.1 dB)
Bass 100 - 315 Hz
(±) | reduced bass - on average 7.6% lower than median
(+) | bass is linear (6.1% delta to prev. frequency)
Mids 400 - 2000 Hz
(+) | balanced mids - only 2.1% away from median
(+) | mids are linear (3.4% delta to prev. frequency)
Highs 2 - 16 kHz
(+) | balanced highs - only 2.3% away from median
(+) | highs are linear (4.1% delta to prev. frequency)
Overall 100 - 16.000 Hz
(+) | overall sound is linear (6.2% difference to median)
Compared to same class
» 4% of all tested devices in this class were better, 0% similar, 96% worse
» The best had a delta of 5%, average was 17%, worst was 45%
Compared to all devices tested
» 0% of all tested devices were better, 0% similar, 99% worse
» The best had a delta of 4%, average was 23%, worst was 136%
Energy Management
Power Consumption
Unsurprisingly, the ThinkPad X9-15p sips a bit more energy than its lower-powered predecessor. This applies both under load and while idling.
The 100 W charger is appropriately sized for the maximum power consumption of 97.1 W.
| Off / Standby | 0.2 / 0.6 Watt |
| Idle | 3.5 / 4.7 / 6.2 Watt |
| Load |
59.7 / 97.1 Watt |
   
| |
Key:
min: ,
med: ,
max: Metrahit Energy | |
| Lenovo ThinkPad X9-15p Gen 1 Ultra X7 358H, Arc B390 Panther Lake iGPU, Samsung PM9E1 1 TB MZVLC1T0HFLU, OLED, 2880x1800, 15.3" | Lenovo ThinkPad X9-15 Aura Edition Core Ultra 7 258V, Arc 140V, WD PC SN740 SDDQMQD-1T00, OLED, 2880x1800, 15.3" | Apple MacBook Pro 14 2026 M5 Max M5 Max, M5 Max 40-Core GPU, Apple SSD AP8192Z, Mini-LED, 3024x1964, 14.2" | Apple MacBook Air 15 M5 M5 10-Core, M5 10-Core GPU, Apple SSD AP2048Z, IPS, 2880x1864, 15.3" | Dell XPS 16 Core Ultra X7 358H Ultra X7 358H, Arc B390 Panther Lake iGPU, , OLED, 3200x2000, 16" | Average Intel Arc B390 12 Xe3 Panther Lake iGPU | Average of class Multimedia | |
|---|---|---|---|---|---|---|---|
| Power Consumption | 32% | -42% | 6% | -1% | -4% | -63% | |
| Idle Minimum * (Watt) | 3.5 | 2.4 31% | 2.5 29% | 2.2 37% | 4 -14% | 3.59 ? -3% | 5.59 ? -60% |
| Idle Average * (Watt) | 4.7 | 3.9 17% | 11.6 -147% | 11.7 -149% | 4.4 6% | 5.93 ? -26% | 10.4 ? -121% |
| Idle Maximum * (Watt) | 6.2 | 5.1 18% | 11.8 -90% | 11.8 -90% | 10.2 -65% | 8.17 ? -32% | 12.6 ? -103% |
| Load Average * (Watt) | 59.7 | 42.5 29% | 95.6 -60% | 36.2 39% | 44.2 26% | 46.1 ? 23% | 67.1 ? -12% |
| Cyberpunk 2077 ultra * (Watt) | 76.6 | 43.5 43% | 89.4 -17% | 23.5 69% | 62.6 18% | ||
| Cyberpunk 2077 ultra external monitor * (Watt) | 78.4 | 40.2 49% | 86.4 -10% | 21.7 72% | 62.4 20% | ||
| Load Maximum * (Watt) | 97.1 | 64.4 34% | 98.8 -2% | 37.4 61% | 94.6 3% | 81.5 ? 16% | 113.7 ? -17% |
* ... smaller is better
Power Consumption: Cyberpunk / Stress Test
Power Consumption: External Monitor
Battery Life
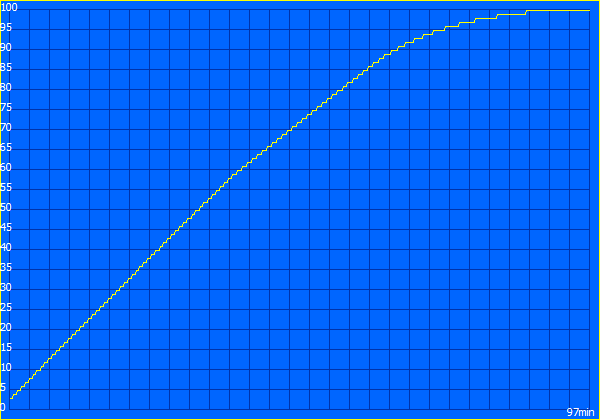
Compared with the earlier ThinkPad X9-15, Lenovo has increased the capacity of the internal battery from 80 to 88 Wh. The result is excellent battery life of over 18 hours in our Wi-Fi/web-surfing test (150 cd/m²). Note that we tested with the refresh rate set to 60 Hz, as this was the factory preset.
| Lenovo ThinkPad X9-15p Gen 1 Ultra X7 358H, Arc B390 Panther Lake iGPU, 88 Wh | Lenovo ThinkPad X9-15 Aura Edition Core Ultra 7 258V, Arc 140V, 80 Wh | Apple MacBook Pro 14 2026 M5 Max M5 Max, M5 Max 40-Core GPU, 72.4 Wh | Apple MacBook Air 15 M5 M5 10-Core, M5 10-Core GPU, 66.5 Wh | Dell XPS 16 Core Ultra X7 358H Ultra X7 358H, Arc B390 Panther Lake iGPU, 70 Wh | Average of class Multimedia | |
|---|---|---|---|---|---|---|
| Battery runtime | 9% | -31% | -6% | -44% | -20% | |
| WiFi v1.3 (h) | 18.3 | 17.5 -4% | 15.2 -17% | 17.2 -6% | 10.3 -44% | 12.7 ? -31% |
| Load (h) | 1.8 | 2.2 22% | 1 -44% | 1.647 ? -8% | ||
| H.264 (h) | 23 | 20.2 | 17.2 ? |
Notebookcheck Rating
With a minimum of 32 GB of memory and powerful Panther Lake Ultra X7 processors, the Lenovo ThinkPad X9-15p Gen 1 is a strong option for anyone seeking a 15.3-inch workhorse laptop.
Lenovo ThinkPad X9-15p Gen 1
- 08/04/2026 v8
Benjamin Herzig
 Total Sustainability Score:
 Potential Competitors in Comparison
Image | Model / Review | Price | Weight | Height | Display |
|---|---|---|---|---|---|
1. 89.9%  | Lenovo ThinkPad X9-15p Gen 1 Intel Core Ultra X7 358H ⎘ Intel Arc B390 12 Xe3 Panther Lake iGPU ⎘ 32 GB Memory, 1024 GB SSD | List Price: 2500 Euro | 1.5 kg | 18 mm | 15.30" 2880x1800 222 PPI OLED |
2. 90.1%  | Lenovo ThinkPad X9-15 Aura Edition Intel Core Ultra 7 258V ⎘ Intel Arc Graphics 140V ⎘ 32 GB Memory, 1024 GB SSD | Amazon: List Price: 1989€ | 1.4 kg | 17.7 mm | 15.30" 2880x1800 222 PPI OLED |
3. 90.2%  | Apple MacBook Pro 14 2026 M5 Max Apple M5 Max ⎘ Apple M5 Max 40-Core GPU ⎘ 128 GB Memory, 8192 GB SSD | List Price: 8589€ | 1.6 kg | 15.5 mm | 14.20" 3024x1964 254 PPI Mini-LED |
4. 91.6%  | Apple MacBook Air 15 M5 Apple M5 10-Core ⎘ Apple M5 10-Core GPU ⎘ 32 GB Memory, 2048 GB SSD | 1.5 kg | 11.5 mm | 15.30" 2880x1864 224 PPI IPS | |
5. 87.2%  | Dell XPS 16 Core Ultra X7 358H Intel Core Ultra X7 358H ⎘ Intel Arc B390 12 Xe3 Panther Lake iGPU ⎘ 32 GB Memory | Amazon: 1. $1,977.99 Dell Premium 16 (Previously ... 2. $2,599.00 Dell Premium 16 (XPS 16 2025... 3. $2,899.99 Dell Premium 16 (XPS 16 2025... List Price: 2350 USD | 1.7 kg | 14.62 mm | 16.00" 3200x2000 236 PPI OLED |
Transparency
The selection of devices to be reviewed is made by our editorial team. The test sample was provided to the author as a loan by the manufacturer or retailer for the purpose of this review. The lender had no influence on this review, nor did the manufacturer receive a copy of this review before publication. There was no obligation to publish this review. As an independent media company, Notebookcheck is not subjected to the authority of manufacturers, retailers or publishers.
This is how Notebookcheck is testing
Every year, Notebookcheck independently reviews hundreds of laptops and smartphones using standardized procedures to ensure that all results are comparable. We have continuously developed our test methods for around 20 years and set industry standards in the process. In our test labs, high-quality measuring equipment is utilized by experienced technicians and editors. These tests involve a multi-stage validation process. Our complex rating system is based on hundreds of well-founded measurements and benchmarks, which maintains objectivity. Further information on our test methods can be found here.
 Add as a preferred source on Google


