Samsung PM9A1a MZVL21T0HDLU vs Samsung PM9C1a MZAL81T0HDLB
Samsung PM9A1a MZVL21T0HDLU
► remove from comparison
The Samsung OEM Client SSD PM9A1a 1TB, M.2 (MZVL21T0HDLU-00B07, OEM variant of the 980 Pro) is a fast M.2 2280 SSD which supports PCIe 4.0 x4. It most likely uses the Samsung Elpis (S4LV003) Controller with 8 channels and 512 MB LPDDR4. The memory modules are from Samsung (3D-NAND TLC 136 layers). The 1TB version is specified at 7000 MB/s and 5100 MB/s write (SLC cached).
Samsung PM9C1a MZAL81T0HDLB
► remove from comparison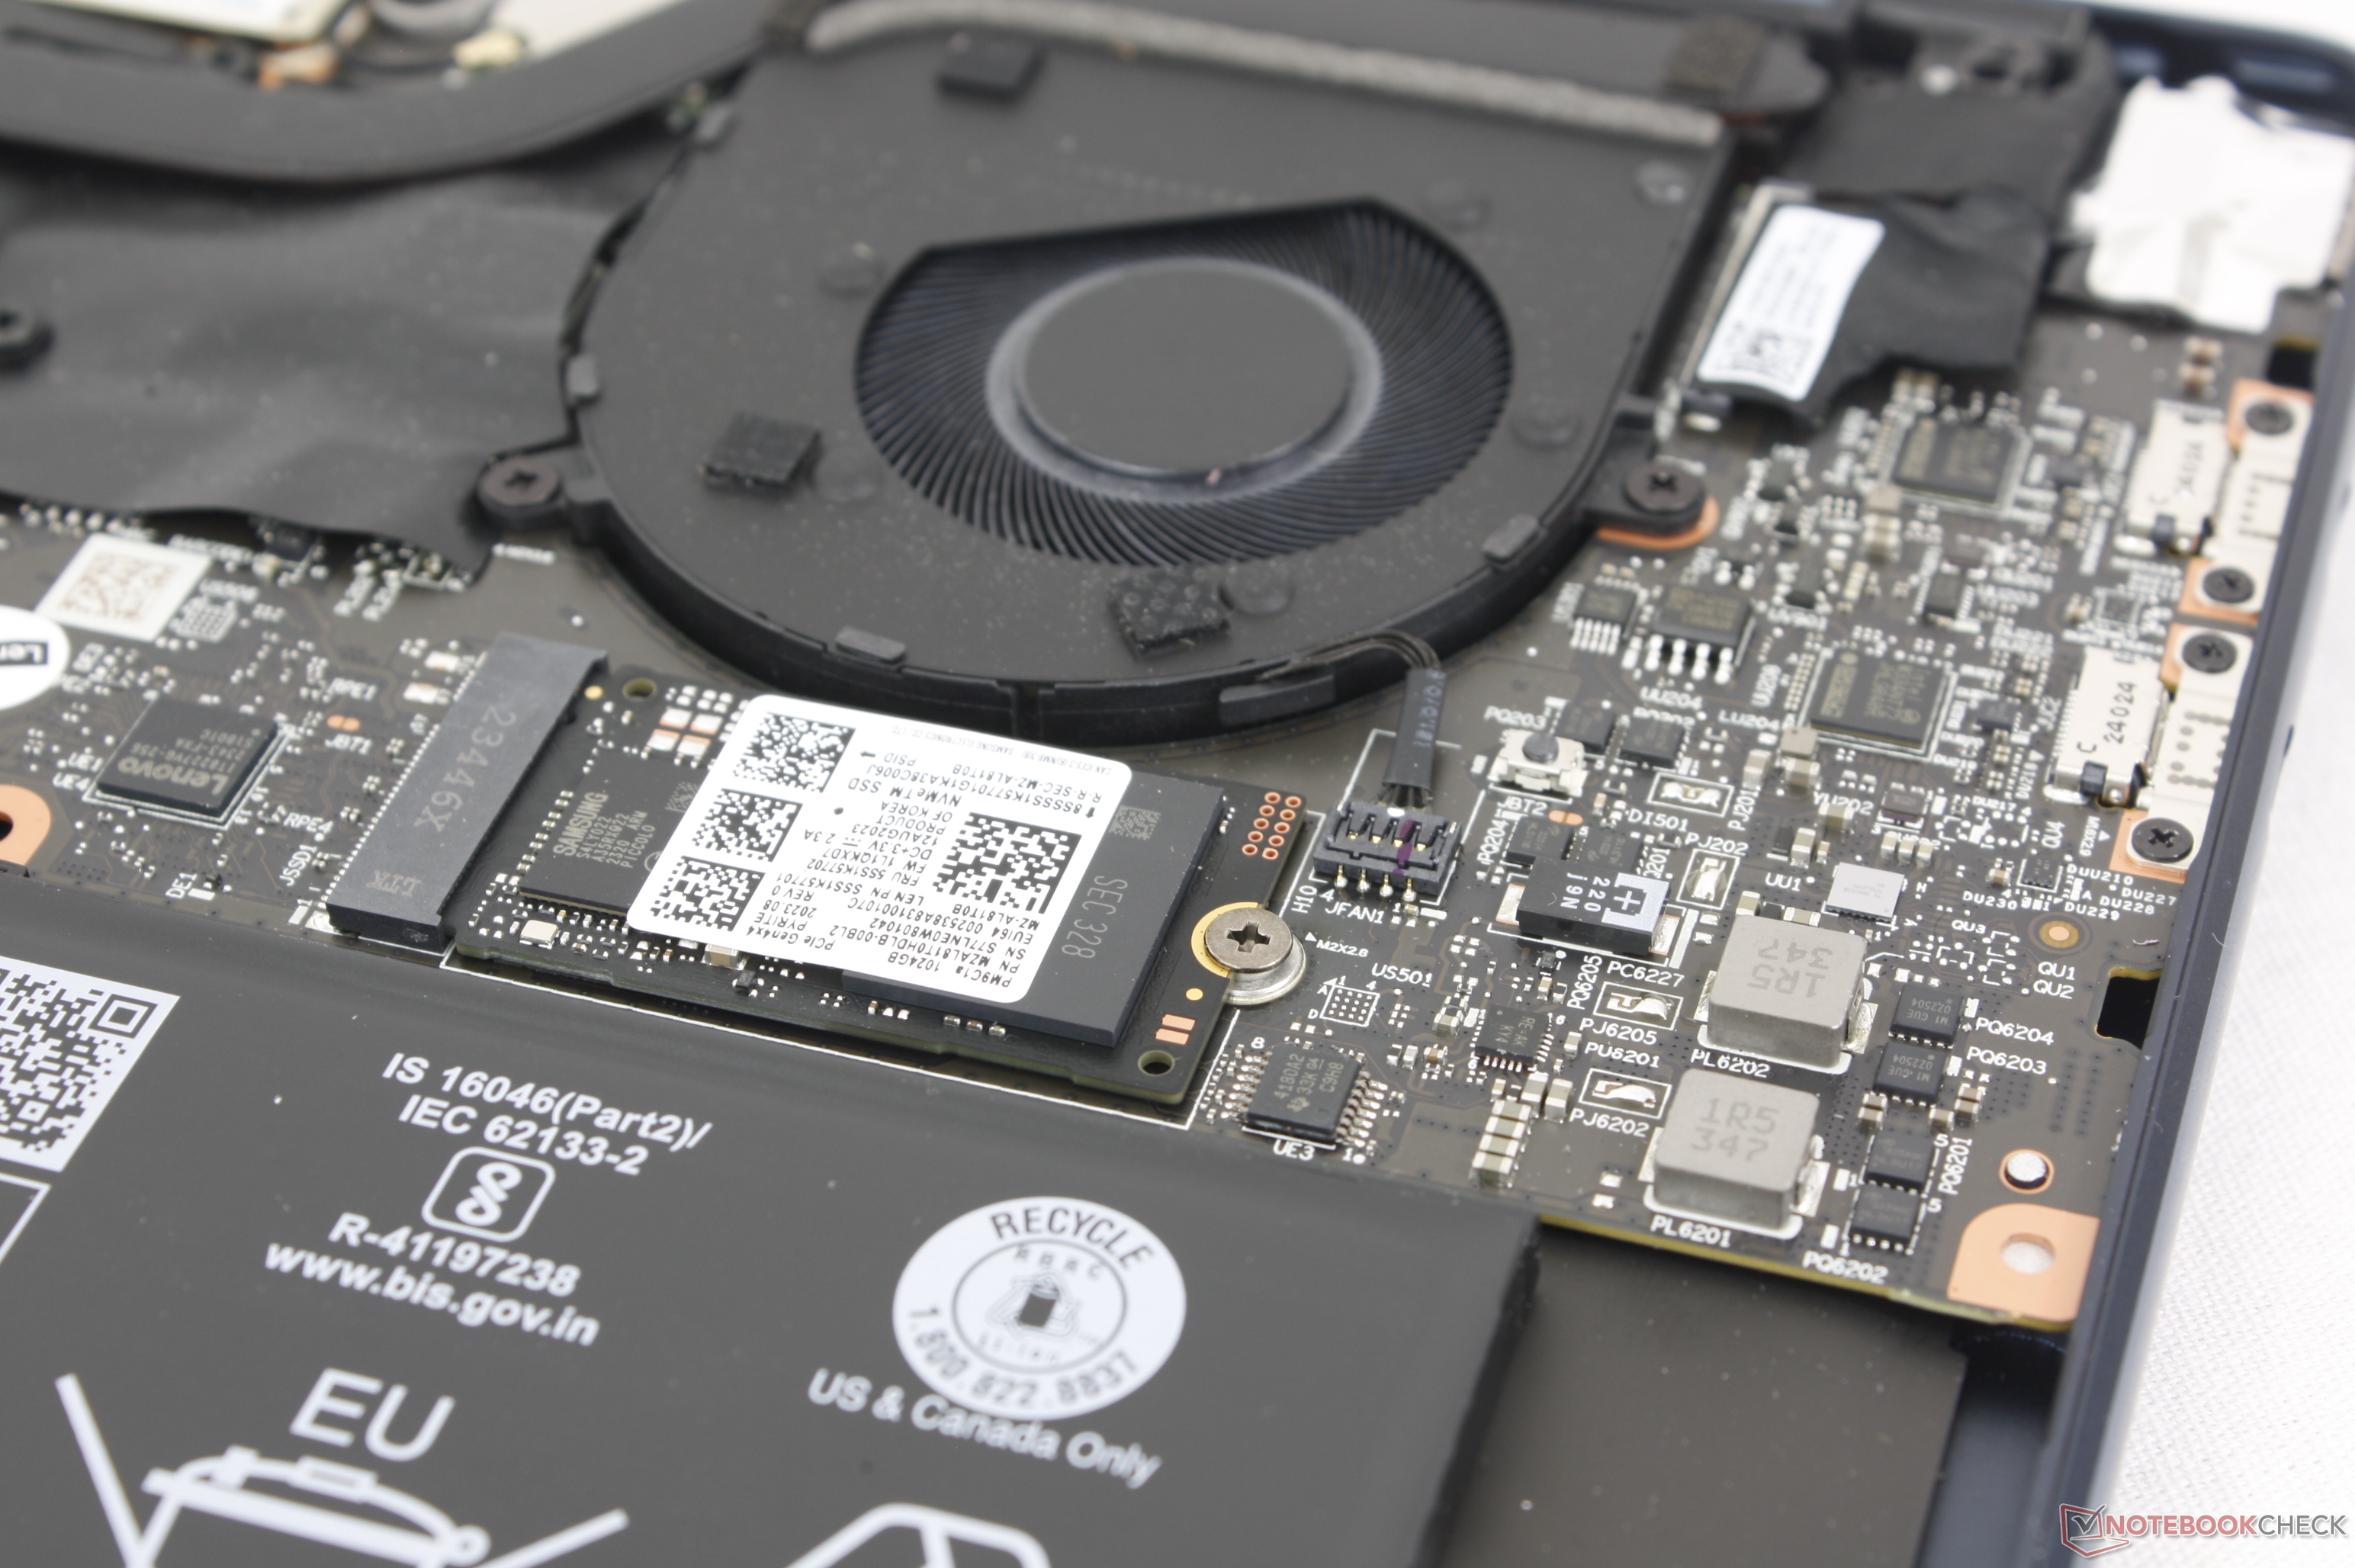
The Samsung PM9C1a MZAL81T0HDLB is a fast 1TB PCIe4 x4 SSD in the small M.2 2242 form factor. The PM9C1a is the successor to the PM9B1 OEM SSSD and advertised as a value drive with improved efficiency.
| Samsung PM9A1a MZVL21T0HDLU | Samsung PM9C1a MZAL81T0HDLB | |
| Type | SSD | SSD |
| Size | M.2 2280 | M.2 2242 |
| Capacity | 1024 GB | 1024 GB |
| Interface | NVMe | NVMe |
| Announced | 04.10.2023 | 09.04.2024 |
| Link | Samsung PM9A1a MZVL21T0HDLU | Samsung PM9C1a MZAL81T0HDLB |
Benchmarks
| Model | CPU | GPU | RAM | Value |
|---|---|---|---|---|
| Asus NUC 14 Pro+ | Ultra 9 185H 115 W / 115 W | Arc 8-Core 2350 MHz | 32 GB | 322.79 |
| Lenovo ThinkPad T14s G4-21F8002TGE | R7 7840U 30 W / 24 W | Radeon 780M 800 MHz | 32 GB | 450 |
| Lenovo ThinkPad T14 G4 21K4S02000 | R7 PRO 7840U 32.5 W / 27.5 W | Radeon 780M | 32 GB | 1045.76 |
| Lenovo ThinkPad T14s G4 21F6005GGE 2.0.6485.19676 | i7-1355U 50 W / 24 W | Iris Xe G7 96EUs | 32 GB | 2334.29 |
| Acer Predator Helios Neo 16 (2024) | i7-14700HX 157 W / 95 W | GeForce RTX 4070 Laptop GPU 140 W 1980 / 2000 MHz 8 GB | 32 GB | 2708.57 |
| Lenovo ThinkStation P3 Tiny-30H0006AGE | i9-14900 219 W / 65 W | T1000 1395 / 1250 MHz 8 GB | 64 GB | 3442.64 |
| Model | CPU | GPU | RAM | Value |
|---|---|---|---|---|
| Lenovo ThinkPad T14s G4-21F8002TGE | R7 7840U 30 W / 24 W | Radeon 780M 800 MHz | 32 GB | 222.39 |
| Asus NUC 14 Pro+ | Ultra 9 185H 115 W / 115 W | Arc 8-Core 2350 MHz | 32 GB | 258.35 |
| Lenovo ThinkPad T14 G4 21K4S02000 | R7 PRO 7840U 32.5 W / 27.5 W | Radeon 780M | 32 GB | 615.3 |
| Lenovo ThinkPad T14s G4 21F6005GGE 2.0.6485.19676 | i7-1355U 50 W / 24 W | Iris Xe G7 96EUs | 32 GB | 883.07 |
| Acer Predator Helios Neo 16 (2024) | i7-14700HX 157 W / 95 W | GeForce RTX 4070 Laptop GPU 140 W 1980 / 2000 MHz 8 GB | 32 GB | 1302.05 |
| Lenovo ThinkStation P3 Tiny-30H0006AGE | i9-14900 219 W / 65 W | T1000 1395 / 1250 MHz 8 GB | 64 GB | 1329.32 |
| Model | CPU | GPU | RAM | Value |
|---|---|---|---|---|
| Asus NUC 14 Pro+ | Ultra 9 185H 115 W / 115 W | Arc 8-Core 2350 MHz | 32 GB | 550.52 |
| Lenovo ThinkPad T14s G4-21F8002TGE | R7 7840U 30 W / 24 W | Radeon 780M 800 MHz | 32 GB | 648.32 |
| Lenovo ThinkPad T14 G4 21K4S02000 | R7 PRO 7840U 32.5 W / 27.5 W | Radeon 780M | 32 GB | 1460.85 |
| Lenovo ThinkPad T14s G4 21F6005GGE 2.0.6485.19676 | i7-1355U 50 W / 24 W | Iris Xe G7 96EUs | 32 GB | 3245.62 |
| Acer Predator Helios Neo 16 (2024) | i7-14700HX 157 W / 95 W | GeForce RTX 4070 Laptop GPU 140 W 1980 / 2000 MHz 8 GB | 32 GB | 3768.22 |
| Lenovo ThinkStation P3 Tiny-30H0006AGE | i9-14900 219 W / 65 W | T1000 1395 / 1250 MHz 8 GB | 64 GB | 4097.63 |
| Model | CPU | GPU | RAM | Value |
|---|---|---|---|---|
| Lenovo ThinkPad T14s G4 21F6005GGE 2.0.6485.19676 | i7-1355U 50 W / 24 W | Iris Xe G7 96EUs | 32 GB | 4533 |
| Lenovo ThinkPad T14s G4-21F8002TGE 2.0.7316.34247 | R7 7840U 30 W / 24 W | Radeon 780M 800 MHz | 32 GB | 4928 |
| Asus ROG NUC 14-90AS0051 2.0.7316.34247 | Ultra 9 185H 115 W / 90 W | GeForce RTX 4070 Laptop GPU 115 W 2175 / 2000 MHz 8 GB | 32 GB | 5387 |
| Asus NUC 14 Pro+ 2.0.7316.34247 | Ultra 9 185H 115 W / 115 W | Arc 8-Core 2350 MHz | 32 GB | 5414 |
| Lenovo ThinkPad T14 G4 21K4S02000 | R7 PRO 7840U 32.5 W / 27.5 W | Radeon 780M | 32 GB | 5803 |
| Lenovo ThinkStation P3 Tiny-30H0006AGE 2.0.7316.34247 | i9-14900 219 W / 65 W | T1000 1395 / 1250 MHz 8 GB | 64 GB | 8056 |
| Acer Predator Helios Neo 16 (2024) | i7-14700HX 157 W / 95 W | GeForce RTX 4070 Laptop GPU 140 W 1980 / 2000 MHz 8 GB | 32 GB | 9056 |
| Model | CPU | GPU | RAM | Value |
|---|---|---|---|---|
| Lenovo ThinkPad T14s G4 21F6005GGE 2.0.6485.19676 | i7-1355U 50 W / 24 W | Iris Xe G7 96EUs | 32 GB | 2703 |
| Lenovo ThinkPad T14s G4-21F8002TGE 2.0.7316.34247 | R7 7840U 30 W / 24 W | Radeon 780M 800 MHz | 32 GB | 2921 |
| Lenovo ThinkPad T14 G4 21K4S02000 | R7 PRO 7840U 32.5 W / 27.5 W | Radeon 780M | 32 GB | 3300 |
| Asus ROG NUC 14-90AS0051 2.0.7316.34247 | Ultra 9 185H 115 W / 90 W | GeForce RTX 4070 Laptop GPU 115 W 2175 / 2000 MHz 8 GB | 32 GB | 3324 |
| Lenovo ThinkStation P3 Tiny-30H0006AGE 2.0.7316.34247 | i9-14900 219 W / 65 W | T1000 1395 / 1250 MHz 8 GB | 64 GB | 3356 |
| Asus NUC 14 Pro+ 2.0.7316.34247 | Ultra 9 185H 115 W / 115 W | Arc 8-Core 2350 MHz | 32 GB | 3401 |
| Acer Predator Helios Neo 16 (2024) | i7-14700HX 157 W / 95 W | GeForce RTX 4070 Laptop GPU 140 W 1980 / 2000 MHz 8 GB | 32 GB | 4018 |
| Model | CPU | GPU | RAM | Value |
|---|---|---|---|---|
| Lenovo ThinkPad T14s G4 21F6005GGE 2.0.6485.19676 | i7-1355U 50 W / 24 W | Iris Xe G7 96EUs | 32 GB | 1283 |
| Lenovo ThinkPad T14s G4-21F8002TGE 2.0.7316.34247 | R7 7840U 30 W / 24 W | Radeon 780M 800 MHz | 32 GB | 1391 |
| Asus NUC 14 Pro+ 2.0.7316.34247 | Ultra 9 185H 115 W / 115 W | Arc 8-Core 2350 MHz | 32 GB | 1395 |
| Asus ROG NUC 14-90AS0051 2.0.7316.34247 | Ultra 9 185H 115 W / 90 W | GeForce RTX 4070 Laptop GPU 115 W 2175 / 2000 MHz 8 GB | 32 GB | 1437 |
| Lenovo ThinkPad T14 G4 21K4S02000 | R7 PRO 7840U 32.5 W / 27.5 W | Radeon 780M | 32 GB | 1712 |
| Lenovo ThinkStation P3 Tiny-30H0006AGE 2.0.7316.34247 | i9-14900 219 W / 65 W | T1000 1395 / 1250 MHz 8 GB | 64 GB | 3160 |
| Acer Predator Helios Neo 16 (2024) | i7-14700HX 157 W / 95 W | GeForce RTX 4070 Laptop GPU 140 W 1980 / 2000 MHz 8 GB | 32 GB | 3368 |
| Model | CPU | GPU | RAM | Value |
|---|---|---|---|---|
| Acer Predator Helios Neo 16 (2024) | i7-14700HX 157 W / 95 W | GeForce RTX 4070 Laptop GPU 140 W 1980 / 2000 MHz 8 GB | 32 GB | 0.019 |
| Lenovo ThinkStation P3 Tiny-30H0006AGE 2.0.7316.34247 | i9-14900 219 W / 65 W | T1000 1395 / 1250 MHz 8 GB | 64 GB | 0.02 |
| Lenovo ThinkPad T14s G4 21F6005GGE 2.0.6485.19676 | i7-1355U 50 W / 24 W | Iris Xe G7 96EUs | 32 GB | 0.023 |
| Asus ROG NUC 14-90AS0051 2.0.7316.34247 | Ultra 9 185H 115 W / 90 W | GeForce RTX 4070 Laptop GPU 115 W 2175 / 2000 MHz 8 GB | 32 GB | 0.023 |
| Lenovo ThinkPad T14s G4-21F8002TGE 2.0.7316.34247 | R7 7840U 30 W / 24 W | Radeon 780M 800 MHz | 32 GB | 0.026 |
| Lenovo ThinkPad T14 G4 21K4S02000 | R7 PRO 7840U 32.5 W / 27.5 W | Radeon 780M | 32 GB | 0.026 |
| Asus NUC 14 Pro+ 2.0.7316.34247 | Ultra 9 185H 115 W / 115 W | Arc 8-Core 2350 MHz | 32 GB | 0.027 |
| Model | CPU | GPU | RAM | Value |
|---|---|---|---|---|
| Lenovo ThinkPad T14s G4-21F8002TGE 2.0.7316.34247 | R7 7840U 30 W / 24 W | Radeon 780M 800 MHz | 32 GB | 0.025 |
| Lenovo ThinkPad T14s G4 21F6005GGE 2.0.6485.19676 | i7-1355U 50 W / 24 W | Iris Xe G7 96EUs | 32 GB | 0.028 |
| Lenovo ThinkStation P3 Tiny-30H0006AGE 2.0.7316.34247 | i9-14900 219 W / 65 W | T1000 1395 / 1250 MHz 8 GB | 64 GB | 0.031 |
| Acer Predator Helios Neo 16 (2024) | i7-14700HX 157 W / 95 W | GeForce RTX 4070 Laptop GPU 140 W 1980 / 2000 MHz 8 GB | 32 GB | 0.038 |
| Asus NUC 14 Pro+ 2.0.7316.34247 | Ultra 9 185H 115 W / 115 W | Arc 8-Core 2350 MHz | 32 GB | 0.044 |
| Lenovo ThinkPad T14 G4 21K4S02000 | R7 PRO 7840U 32.5 W / 27.5 W | Radeon 780M | 32 GB | 0.058 |
| Asus ROG NUC 14-90AS0051 2.0.7316.34247 | Ultra 9 185H 115 W / 90 W | GeForce RTX 4070 Laptop GPU 115 W 2175 / 2000 MHz 8 GB | 32 GB | 0.064 |
| Model | CPU | GPU | RAM | Value |
|---|---|---|---|---|
| Lenovo ThinkPad T14s G4 21F6005GGE 2.0.6485.19676 | i7-1355U 50 W / 24 W | Iris Xe G7 96EUs | 32 GB | 2278 |
| Lenovo ThinkPad T14s G4-21F8002TGE 2.0.7316.34247 | R7 7840U 30 W / 24 W | Radeon 780M 800 MHz | 32 GB | 2502 |
| Lenovo ThinkStation P3 Tiny-30H0006AGE 2.0.7316.34247 | i9-14900 219 W / 65 W | T1000 1395 / 1250 MHz 8 GB | 64 GB | 2754 |
| Asus ROG NUC 14-90AS0051 2.0.7316.34247 | Ultra 9 185H 115 W / 90 W | GeForce RTX 4070 Laptop GPU 115 W 2175 / 2000 MHz 8 GB | 32 GB | 2876 |
| Lenovo ThinkPad T14 G4 21K4S02000 | R7 PRO 7840U 32.5 W / 27.5 W | Radeon 780M | 32 GB | 2878.08 |
| Asus NUC 14 Pro+ 2.0.7316.34247 | Ultra 9 185H 115 W / 115 W | Arc 8-Core 2350 MHz | 32 GB | 2955 |
| Acer Predator Helios Neo 16 (2024) | i7-14700HX 157 W / 95 W | GeForce RTX 4070 Laptop GPU 140 W 1980 / 2000 MHz 8 GB | 32 GB | 3338.79 |
| Model | CPU | GPU | RAM | Value |
|---|---|---|---|---|
| Lenovo ThinkPad T14s G4 21F6005GGE 2.0.6485.19676 | i7-1355U 50 W / 24 W | Iris Xe G7 96EUs | 32 GB | 705 |
| Asus NUC 14 Pro+ 2.0.7316.34247 | Ultra 9 185H 115 W / 115 W | Arc 8-Core 2350 MHz | 32 GB | 801 |
| Asus ROG NUC 14-90AS0051 2.0.7316.34247 | Ultra 9 185H 115 W / 90 W | GeForce RTX 4070 Laptop GPU 115 W 2175 / 2000 MHz 8 GB | 32 GB | 842 |
| Lenovo ThinkPad T14s G4-21F8002TGE 2.0.7316.34247 | R7 7840U 30 W / 24 W | Radeon 780M 800 MHz | 32 GB | 844 |
| Lenovo ThinkPad T14 G4 21K4S02000 | R7 PRO 7840U 32.5 W / 27.5 W | Radeon 780M | 32 GB | 1188.59 |
| Lenovo ThinkStation P3 Tiny-30H0006AGE 2.0.7316.34247 | i9-14900 219 W / 65 W | T1000 1395 / 1250 MHz 8 GB | 64 GB | 2532 |
| Acer Predator Helios Neo 16 (2024) | i7-14700HX 157 W / 95 W | GeForce RTX 4070 Laptop GPU 140 W 1980 / 2000 MHz 8 GB | 32 GB | 2721.41 |
| Model | CPU | GPU | RAM | Value |
|---|---|---|---|---|
| Asus NUC 14 Pro+ 2.0.7316.34247 | Ultra 9 185H 115 W / 115 W | Arc 8-Core 2350 MHz | 32 GB | 146.2 |
| Lenovo ThinkPad T14s G4-21F8002TGE 2.0.7316.34247 | R7 7840U 30 W / 24 W | Radeon 780M 800 MHz | 32 GB | 157.8 |
| Lenovo ThinkPad T14 G4 21K4S02000 | R7 PRO 7840U 32.5 W / 27.5 W | Radeon 780M | 32 GB | 159.91 |
| Asus ROG NUC 14-90AS0051 2.0.7316.34247 | Ultra 9 185H 115 W / 90 W | GeForce RTX 4070 Laptop GPU 115 W 2175 / 2000 MHz 8 GB | 32 GB | 178.6 |
| Lenovo ThinkPad T14s G4 21F6005GGE 2.0.6485.19676 | i7-1355U 50 W / 24 W | Iris Xe G7 96EUs | 32 GB | 180.5 |
| Lenovo ThinkStation P3 Tiny-30H0006AGE 2.0.7316.34247 | i9-14900 219 W / 65 W | T1000 1395 / 1250 MHz 8 GB | 64 GB | 203 |
| Acer Predator Helios Neo 16 (2024) | i7-14700HX 157 W / 95 W | GeForce RTX 4070 Laptop GPU 140 W 1980 / 2000 MHz 8 GB | 32 GB | 231.38 |
| Model | CPU | GPU | RAM | Value |
|---|---|---|---|---|
| Lenovo ThinkPad T14s G4-21F8002TGE 2.0.7316.34247 | R7 7840U 30 W / 24 W | Radeon 780M 800 MHz | 32 GB | 63.9 |
| Lenovo ThinkPad T14 G4 21K4S02000 | R7 PRO 7840U 32.5 W / 27.5 W | Radeon 780M | 32 GB | 64.68 |
| Asus NUC 14 Pro+ 2.0.7316.34247 | Ultra 9 185H 115 W / 115 W | Arc 8-Core 2350 MHz | 32 GB | 66.9 |
| Asus ROG NUC 14-90AS0051 2.0.7316.34247 | Ultra 9 185H 115 W / 90 W | GeForce RTX 4070 Laptop GPU 115 W 2175 / 2000 MHz 8 GB | 32 GB | 70.6 |
| Lenovo ThinkPad T14s G4 21F6005GGE 2.0.6485.19676 | i7-1355U 50 W / 24 W | Iris Xe G7 96EUs | 32 GB | 72.5 |
| Lenovo ThinkStation P3 Tiny-30H0006AGE 2.0.7316.34247 | i9-14900 219 W / 65 W | T1000 1395 / 1250 MHz 8 GB | 64 GB | 75.1 |
| Acer Predator Helios Neo 16 (2024) | i7-14700HX 157 W / 95 W | GeForce RTX 4070 Laptop GPU 140 W 1980 / 2000 MHz 8 GB | 32 GB | 84.56 |
| Model | CPU | GPU | RAM | Value |
|---|---|---|---|---|
| Lenovo ThinkPad T14s G4 21F6005GGE 2.0.6485.19676 | i7-1355U 50 W / 24 W | Iris Xe G7 96EUs | 32 GB | 2443 |
| Lenovo ThinkPad T14s G4-21F8002TGE 2.0.7316.34247 | R7 7840U 30 W / 24 W | Radeon 780M 800 MHz | 32 GB | 2609 |
| Lenovo ThinkPad T14 G4 21K4S02000 | R7 PRO 7840U 32.5 W / 27.5 W | Radeon 780M | 32 GB | 2622.82 |
| Asus ROG NUC 14-90AS0051 2.0.7316.34247 | Ultra 9 185H 115 W / 90 W | GeForce RTX 4070 Laptop GPU 115 W 2175 / 2000 MHz 8 GB | 32 GB | 2696 |
| Asus NUC 14 Pro+ 2.0.7316.34247 | Ultra 9 185H 115 W / 115 W | Arc 8-Core 2350 MHz | 32 GB | 3006 |
| Lenovo ThinkStation P3 Tiny-30H0006AGE 2.0.7316.34247 | i9-14900 219 W / 65 W | T1000 1395 / 1250 MHz 8 GB | 64 GB | 3985 |
| Acer Predator Helios Neo 16 (2024) | i7-14700HX 157 W / 95 W | GeForce RTX 4070 Laptop GPU 140 W 1980 / 2000 MHz 8 GB | 32 GB | 4482.43 |
| Model | CPU | GPU | RAM | Value |
|---|---|---|---|---|
| Lenovo ThinkPad T14 G4 21K4S02000 | R7 PRO 7840U 32.5 W / 27.5 W | Radeon 780M | 32 GB | 4589.8 |
| Lenovo ThinkPad T14s G4-21F8002TGE 2.0.7316.34247 | R7 7840U 30 W / 24 W | Radeon 780M 800 MHz | 32 GB | 4825 |
| Lenovo ThinkPad T14s G4 21F6005GGE 2.0.6485.19676 | i7-1355U 50 W / 24 W | Iris Xe G7 96EUs | 32 GB | 5053 |
| Asus ROG NUC 14-90AS0051 2.0.7316.34247 | Ultra 9 185H 115 W / 90 W | GeForce RTX 4070 Laptop GPU 115 W 2175 / 2000 MHz 8 GB | 32 GB | 5245 |
| Asus NUC 14 Pro+ 2.0.7316.34247 | Ultra 9 185H 115 W / 115 W | Arc 8-Core 2350 MHz | 32 GB | 5266 |
| Lenovo ThinkStation P3 Tiny-30H0006AGE 2.0.7316.34247 | i9-14900 219 W / 65 W | T1000 1395 / 1250 MHz 8 GB | 64 GB | 5536 |
| Acer Predator Helios Neo 16 (2024) | i7-14700HX 157 W / 95 W | GeForce RTX 4070 Laptop GPU 140 W 1980 / 2000 MHz 8 GB | 32 GB | 5622.8 |
| Model | CPU | GPU | RAM | Value |
|---|---|---|---|---|
| Asus NUC 14 Pro+ | Ultra 9 185H 115 W / 115 W | Arc 8-Core 2350 MHz | 32 GB | 325.5 |
| Asus ROG NUC 14-90AS0051 | Ultra 9 185H 115 W / 90 W | GeForce RTX 4070 Laptop GPU 115 W 2175 / 2000 MHz 8 GB | 32 GB | 400.4 |
| Lenovo ThinkStation P3 Tiny-30H0006AGE | i9-14900 219 W / 65 W | T1000 1395 / 1250 MHz 8 GB | 64 GB | 687.8 |
| Model | CPU | GPU | RAM | Value |
|---|---|---|---|---|
| Asus NUC 14 Pro+ | Ultra 9 185H 115 W / 115 W | Arc 8-Core 2350 MHz | 32 GB | 379.9 |
| Asus ROG NUC 14-90AS0051 | Ultra 9 185H 115 W / 90 W | GeForce RTX 4070 Laptop GPU 115 W 2175 / 2000 MHz 8 GB | 32 GB | 431.7 |
| Lenovo ThinkStation P3 Tiny-30H0006AGE | i9-14900 219 W / 65 W | T1000 1395 / 1250 MHz 8 GB | 64 GB | 780.5 |
| Model | CPU | GPU | RAM | Value |
|---|---|---|---|---|
| Asus NUC 14 Pro+ | Ultra 9 185H 115 W / 115 W | Arc 8-Core 2350 MHz | 32 GB | 118.6 |
| Asus ROG NUC 14-90AS0051 | Ultra 9 185H 115 W / 90 W | GeForce RTX 4070 Laptop GPU 115 W 2175 / 2000 MHz 8 GB | 32 GB | 137.2 |
| Lenovo ThinkStation P3 Tiny-30H0006AGE | i9-14900 219 W / 65 W | T1000 1395 / 1250 MHz 8 GB | 64 GB | 238.9 |
| Model | CPU | GPU | RAM | Value |
|---|---|---|---|---|
| Asus ROG NUC 14-90AS0051 | Ultra 9 185H 115 W / 90 W | GeForce RTX 4070 Laptop GPU 115 W 2175 / 2000 MHz 8 GB | 32 GB | 53.31 |
| Asus NUC 14 Pro+ | Ultra 9 185H 115 W / 115 W | Arc 8-Core 2350 MHz | 32 GB | 66.49 |
| Lenovo ThinkStation P3 Tiny-30H0006AGE | i9-14900 219 W / 65 W | T1000 1395 / 1250 MHz 8 GB | 64 GB | 83.36 |
| Model | CPU | GPU | RAM | Value |
|---|---|---|---|---|
| Asus NUC 14 Pro+ | Ultra 9 185H 115 W / 115 W | Arc 8-Core 2350 MHz | 32 GB | 2158 |
| Asus ROG NUC 14-90AS0051 | Ultra 9 185H 115 W / 90 W | GeForce RTX 4070 Laptop GPU 115 W 2175 / 2000 MHz 8 GB | 32 GB | 2374 |
| Lenovo ThinkStation P3 Tiny-30H0006AGE | i9-14900 219 W / 65 W | T1000 1395 / 1250 MHz 8 GB | 64 GB | 3642 |
| Model | CPU | GPU | RAM | Value |
|---|---|---|---|---|
| Asus NUC 14 Pro+ | Ultra 9 185H 115 W / 115 W | Arc 8-Core 2350 MHz | 32 GB | 2292 |
| Asus ROG NUC 14-90AS0051 | Ultra 9 185H 115 W / 90 W | GeForce RTX 4070 Laptop GPU 115 W 2175 / 2000 MHz 8 GB | 32 GB | 2352 |
| Lenovo ThinkStation P3 Tiny-30H0006AGE | i9-14900 219 W / 65 W | T1000 1395 / 1250 MHz 8 GB | 64 GB | 2894 |
| Model | CPU | GPU | RAM | Value |
|---|---|---|---|---|
| Asus NUC 14 Pro+ | Ultra 9 185H 115 W / 115 W | Arc 8-Core 2350 MHz | 32 GB | 2949 |
| Asus ROG NUC 14-90AS0051 | Ultra 9 185H 115 W / 90 W | GeForce RTX 4070 Laptop GPU 115 W 2175 / 2000 MHz 8 GB | 32 GB | 3157 |
| Lenovo ThinkStation P3 Tiny-30H0006AGE | i9-14900 219 W / 65 W | T1000 1395 / 1250 MHz 8 GB | 64 GB | 4183 |
| Model | CPU | GPU | RAM | Value |
|---|---|---|---|---|
| Asus ROG NUC 14-90AS0051 | Ultra 9 185H 115 W / 90 W | GeForce RTX 4070 Laptop GPU 115 W 2175 / 2000 MHz 8 GB | 32 GB | 3428 |
| Asus NUC 14 Pro+ | Ultra 9 185H 115 W / 115 W | Arc 8-Core 2350 MHz | 32 GB | 3556 |
| Lenovo ThinkStation P3 Tiny-30H0006AGE | i9-14900 219 W / 65 W | T1000 1395 / 1250 MHz 8 GB | 64 GB | 3966 |
| Model | CPU | GPU | RAM | Value |
|---|---|---|---|---|
| Asus NUC 14 Pro+ | Ultra 9 185H 115 W / 115 W | Arc 8-Core 2350 MHz | 32 GB | 115.8 |
| Lenovo ThinkPad T14s G4-21F8002TGE 6.0.1 x64 1024 MiB [C: 6.9% (65.6/951.6 GiB)] (x5) [Interval=5 sec] | R7 7840U 30 W / 24 W | Radeon 780M 800 MHz | 32 GB | 133.9 |
| Lenovo ThinkStation P3 Tiny-30H0006AGE | i9-14900 219 W / 65 W | T1000 1395 / 1250 MHz 8 GB | 64 GB | 235.4 |
| Acer Predator Helios Neo 16 (2024) | i7-14700HX 157 W / 95 W | GeForce RTX 4070 Laptop GPU 140 W 1980 / 2000 MHz 8 GB | 32 GB | 264 |
| Asus ROG NUC 14-90AS0051 | Ultra 9 185H 115 W / 90 W | GeForce RTX 4070 Laptop GPU 115 W 2175 / 2000 MHz 8 GB | 32 GB | 384.4 |
| Model | CPU | GPU | RAM | Value |
|---|---|---|---|---|
| Asus NUC 14 Pro+ | Ultra 9 185H 115 W / 115 W | Arc 8-Core 2350 MHz | 32 GB | 67.06 |
| Lenovo ThinkPad T14s G4-21F8002TGE 6.0.1 x64 1024 MiB [C: 6.9% (65.6/951.6 GiB)] (x5) [Interval=5 sec] | R7 7840U 30 W / 24 W | Radeon 780M 800 MHz | 32 GB | 67.4 |
| Lenovo ThinkStation P3 Tiny-30H0006AGE | i9-14900 219 W / 65 W | T1000 1395 / 1250 MHz 8 GB | 64 GB | 83.06 |
| Acer Predator Helios Neo 16 (2024) | i7-14700HX 157 W / 95 W | GeForce RTX 4070 Laptop GPU 140 W 1980 / 2000 MHz 8 GB | 32 GB | 94.81 |
| Asus ROG NUC 14-90AS0051 | Ultra 9 185H 115 W / 90 W | GeForce RTX 4070 Laptop GPU 115 W 2175 / 2000 MHz 8 GB | 32 GB | 453.5 |
| Model | CPU | GPU | RAM | Value |
|---|---|---|---|---|
| Asus NUC 14 Pro+ | Ultra 9 185H 115 W / 115 W | Arc 8-Core 2350 MHz | 32 GB | 2679 |
| Lenovo ThinkStation P3 Tiny-30H0006AGE | i9-14900 219 W / 65 W | T1000 1395 / 1250 MHz 8 GB | 64 GB | 4165 |
| Acer Predator Helios Neo 16 (2024) | i7-14700HX 157 W / 95 W | GeForce RTX 4070 Laptop GPU 140 W 1980 / 2000 MHz 8 GB | 32 GB | 4519 |
| Asus ROG NUC 14-90AS0051 | Ultra 9 185H 115 W / 90 W | GeForce RTX 4070 Laptop GPU 115 W 2175 / 2000 MHz 8 GB | 32 GB | 5083 |
| Model | CPU | GPU | RAM | Value |
|---|---|---|---|---|
| Lenovo Yoga Slim 9 14ILL10 | Core Ultra 7 258V 40 W / 35 W | Arc 140V 1950 MHz | 32 GB | 946.7 |
| Lenovo ThinkBook Plus Gen6 Rollable | Core Ultra 7 258V 39 W / 28 W | Arc 140V 1900 MHz | 32 GB | 2389 |
| Lenovo Yoga 9 2-in-1 14IMH9 | Ultra 7 155H 67 W / 39 W | Arc 8-Core | 16 GB | 2833 |
| Lenovo ThinkBook Plus Gen5 Hybrid | Ultra 7 155H 65 W / 31 W | Arc 8-Core 2250 MHz | 32 GB | 2933 |
| Lenovo IdeaPad Pro 5 16IMH G9 RTX 4050 | Ultra 9 185H 85 W / 65 W | GeForce RTX 4050 Laptop GPU 90 W 2155 / 2050 MHz 6 GB | 32 GB | 3120 |
| Lenovo IdeaPad 5 2-in-1 14Q8X9 | SD X Plus X1P-42-100 | Adreno X1-45 1.7 TFLOPS ? / 1056 MHz | 16 GB | 3122 |
| Lenovo Yoga Book 9 14IAH10 | Ultra 7 255H 62 W / 32 W | Arc 140T 2150 MHz | 16 GB | 3337 |
| Lenovo IdeaPad Slim 3i 15IRU9 | Core 5 120U 50 W / 20 W | Iris Xe G7 80EUs 1100 / 2600 MHz | 16 GB | 3373 |
| Model | CPU | GPU | RAM | Value |
|---|---|---|---|---|
| Asus NUC 14 Pro+ | Ultra 9 185H 115 W / 115 W | Arc 8-Core 2350 MHz | 32 GB | 3386 |
| Lenovo ThinkStation P3 Tiny-30H0006AGE | i9-14900 219 W / 65 W | T1000 1395 / 1250 MHz 8 GB | 64 GB | 3990 |
| Acer Predator Helios Neo 16 (2024) | i7-14700HX 157 W / 95 W | GeForce RTX 4070 Laptop GPU 140 W 1980 / 2000 MHz 8 GB | 32 GB | 4328 |
| Asus ROG NUC 14-90AS0051 | Ultra 9 185H 115 W / 90 W | GeForce RTX 4070 Laptop GPU 115 W 2175 / 2000 MHz 8 GB | 32 GB | 6833 |
| Model | CPU | GPU | RAM | Value |
|---|---|---|---|---|
| Lenovo ThinkBook Plus Gen5 Hybrid | Ultra 7 155H 65 W / 31 W | Arc 8-Core 2250 MHz | 32 GB | 2498 |
| Lenovo IdeaPad Slim 3i 15IRU9 | Core 5 120U 50 W / 20 W | Iris Xe G7 80EUs 1100 / 2600 MHz | 16 GB | 2902 |
| Lenovo Yoga Slim 9 14ILL10 | Core Ultra 7 258V 40 W / 35 W | Arc 140V 1950 MHz | 32 GB | 3083 |
| Lenovo IdeaPad 5 2-in-1 14Q8X9 | SD X Plus X1P-42-100 | Adreno X1-45 1.7 TFLOPS ? / 1056 MHz | 16 GB | 3094 |
| Lenovo ThinkBook Plus Gen6 Rollable | Core Ultra 7 258V 39 W / 28 W | Arc 140V 1900 MHz | 32 GB | 3141 |
| Lenovo Yoga 9 2-in-1 14IMH9 | Ultra 7 155H 67 W / 39 W | Arc 8-Core | 16 GB | 3177 |
| Lenovo IdeaPad Pro 5 16IMH G9 RTX 4050 | Ultra 9 185H 85 W / 65 W | GeForce RTX 4050 Laptop GPU 90 W 2155 / 2050 MHz 6 GB | 32 GB | 3258 |
| Lenovo Yoga Book 9 14IAH10 | Ultra 7 255H 62 W / 32 W | Arc 140T 2150 MHz | 16 GB | 3341 |
| Model | CPU | GPU | RAM | Value |
|---|---|---|---|---|
| Asus NUC 14 Pro+ | Ultra 9 185H 115 W / 115 W | Arc 8-Core 2350 MHz | 32 GB | 323.6 |
| Asus ROG NUC 14-90AS0051 | Ultra 9 185H 115 W / 90 W | GeForce RTX 4070 Laptop GPU 115 W 2175 / 2000 MHz 8 GB | 32 GB | 396.6 |
| Lenovo ThinkPad T14s G4-21F8002TGE 6.0.1 x64 1024 MiB [C: 6.9% (65.6/951.6 GiB)] (x5) [Interval=5 sec] | R7 7840U 30 W / 24 W | Radeon 780M 800 MHz | 32 GB | 402 |
| Acer Predator Helios Neo 16 (2024) | i7-14700HX 157 W / 95 W | GeForce RTX 4070 Laptop GPU 140 W 1980 / 2000 MHz 8 GB | 32 GB | 539.7 |
| Lenovo ThinkStation P3 Tiny-30H0006AGE | i9-14900 219 W / 65 W | T1000 1395 / 1250 MHz 8 GB | 64 GB | 588 |
| Model | CPU | GPU | RAM | Value |
|---|---|---|---|---|
| Asus NUC 14 Pro+ | Ultra 9 185H 115 W / 115 W | Arc 8-Core 2350 MHz | 32 GB | 384.6 |
| Lenovo ThinkPad T14s G4-21F8002TGE 6.0.1 x64 1024 MiB [C: 6.9% (65.6/951.6 GiB)] (x5) [Interval=5 sec] | R7 7840U 30 W / 24 W | Radeon 780M 800 MHz | 32 GB | 430 |
| Asus ROG NUC 14-90AS0051 | Ultra 9 185H 115 W / 90 W | GeForce RTX 4070 Laptop GPU 115 W 2175 / 2000 MHz 8 GB | 32 GB | 439.5 |
| Acer Predator Helios Neo 16 (2024) | i7-14700HX 157 W / 95 W | GeForce RTX 4070 Laptop GPU 140 W 1980 / 2000 MHz 8 GB | 32 GB | 708 |
| Lenovo ThinkStation P3 Tiny-30H0006AGE | i9-14900 219 W / 65 W | T1000 1395 / 1250 MHz 8 GB | 64 GB | 766 |
| Model | CPU | GPU | RAM | Value |
|---|---|---|---|---|
| Asus NUC 14 Pro+ | Ultra 9 185H 115 W / 115 W | Arc 8-Core 2350 MHz | 32 GB | 4991.1 |
| Lenovo ThinkStation P3 Tiny-30H0006AGE | i9-14900 219 W / 65 W | T1000 1395 / 1250 MHz 8 GB | 64 GB | 5128.3 |
| Lenovo ThinkPad T14s G4-21F8002TGE 6.0.1 x64 1024 MiB [C: 6.9% (65.6/951.6 GiB)] (x5) [Interval=5 sec] | R7 7840U 30 W / 24 W | Radeon 780M 800 MHz | 32 GB | 5137 |
| Asus ROG NUC 14-90AS0051 | Ultra 9 185H 115 W / 90 W | GeForce RTX 4070 Laptop GPU 115 W 2175 / 2000 MHz 8 GB | 32 GB | 5143.4 |
| Acer Predator Helios Neo 16 (2024) | i7-14700HX 157 W / 95 W | GeForce RTX 4070 Laptop GPU 140 W 1980 / 2000 MHz 8 GB | 32 GB | 5225 |
| Model | CPU | GPU | RAM | Value |
|---|---|---|---|---|
| Asus ROG NUC 14-90AS0051 | Ultra 9 185H 115 W / 90 W | GeForce RTX 4070 Laptop GPU 115 W 2175 / 2000 MHz 8 GB | 32 GB | 7054.3 |
| Lenovo ThinkPad T14s G4-21F8002TGE 6.0.1 x64 1024 MiB [C: 6.9% (65.6/951.6 GiB)] (x5) [Interval=5 sec] | R7 7840U 30 W / 24 W | Radeon 780M 800 MHz | 32 GB | 7079 |
| Asus NUC 14 Pro+ | Ultra 9 185H 115 W / 115 W | Arc 8-Core 2350 MHz | 32 GB | 7084.6 |
| Acer Predator Helios Neo 16 (2024) | i7-14700HX 157 W / 95 W | GeForce RTX 4070 Laptop GPU 140 W 1980 / 2000 MHz 8 GB | 32 GB | 7089 |
| Lenovo ThinkStation P3 Tiny-30H0006AGE | i9-14900 219 W / 65 W | T1000 1395 / 1250 MHz 8 GB | 64 GB | 7093.5 |
| Model | CPU | GPU | RAM | Value |
|---|---|---|---|---|
| Asus NUC 14 Pro+ | Ultra 9 185H 115 W / 115 W | Arc 8-Core 2350 MHz | 32 GB | 315.5 |
| Asus ROG NUC 14-90AS0051 | Ultra 9 185H 115 W / 90 W | GeForce RTX 4070 Laptop GPU 115 W 2175 / 2000 MHz 8 GB | 32 GB | 373.5 |
| Lenovo ThinkPad T14s G4-21F8002TGE 6.0.1 x64 1024 MiB [C: 6.9% (65.6/951.6 GiB)] (x5) [Interval=5 sec] | R7 7840U 30 W / 24 W | Radeon 780M 800 MHz | 32 GB | 398 |
| Lenovo ThinkStation P3 Tiny-30H0006AGE | i9-14900 219 W / 65 W | T1000 1395 / 1250 MHz 8 GB | 64 GB | 2752.2 |
| Model | CPU | GPU | RAM | Value |
|---|---|---|---|---|
| Lenovo IdeaPad Pro 5 16IMH G9 6.0.1 x64 1024 MiB [C: 13.5% (128.2/951.6 GiB)] (x5) [Interval=5 sec] | Ultra 7 155H 70 W / 50 W | Arc 8-Core 2250 MHz | 32 GB | 199.8 |
| Lenovo ThinkBook 16 G7+ AMD 6.0.1 x64 1024 MiB [C: 7.4% (70.4/951.6 GiB)] (x5) [Interval=5 sec] | Ryzen AI 9 365 65 W / 50 W | Radeon 880M 2900 / 937 MHz | 32 GB | 383 |
| Lenovo Yoga Pro 7 14IMH9, RTX 4050 6.0.1 x64 1024 MiB [C: 13.9% (132.3/951.6 GiB)] (x5) [Interval=5 sec] | Ultra 7 155H 75 W / 70 W | GeForce RTX 4050 Laptop GPU 60 W 1965 / 2000 MHz 6 GB | 32 GB | 400 |
| Lenovo Yoga Slim 7X 14Q8X9 6.0.1 x64 1024 MiB [C: 7.6% (71.9/951.5 GiB)] (x5) [Interval=5 sec] | SD X Elite X1E-78-100 | Adreno X1-85 3.8 TFLOPS 1250 MHz | 32 GB | 603 |
| Model | CPU | GPU | RAM | Value |
|---|---|---|---|---|
| Asus NUC 14 Pro+ | Ultra 9 185H 115 W / 115 W | Arc 8-Core 2350 MHz | 32 GB | 1002.6 |
| Asus ROG NUC 14-90AS0051 | Ultra 9 185H 115 W / 90 W | GeForce RTX 4070 Laptop GPU 115 W 2175 / 2000 MHz 8 GB | 32 GB | 1025.6 |
| Lenovo ThinkPad T14s G4-21F8002TGE 6.0.1 x64 1024 MiB [C: 6.9% (65.6/951.6 GiB)] (x5) [Interval=5 sec] | R7 7840U 30 W / 24 W | Radeon 780M 800 MHz | 32 GB | 1077 |
| Lenovo ThinkStation P3 Tiny-30H0006AGE | i9-14900 219 W / 65 W | T1000 1395 / 1250 MHz 8 GB | 64 GB | 2902.5 |
| Model | CPU | GPU | RAM | Value |
|---|---|---|---|---|
| Lenovo IdeaPad Pro 5 16IMH G9 6.0.1 x64 1024 MiB [C: 13.5% (128.2/951.6 GiB)] (x5) [Interval=5 sec] | Ultra 7 155H 70 W / 50 W | Arc 8-Core 2250 MHz | 32 GB | 489 |
| Lenovo ThinkBook 16 G7+ AMD 6.0.1 x64 1024 MiB [C: 7.4% (70.4/951.6 GiB)] (x5) [Interval=5 sec] | Ryzen AI 9 365 65 W / 50 W | Radeon 880M 2900 / 937 MHz | 32 GB | 638 |
| Lenovo Yoga Pro 7 14IMH9, RTX 4050 6.0.1 x64 1024 MiB [C: 13.9% (132.3/951.6 GiB)] (x5) [Interval=5 sec] | Ultra 7 155H 75 W / 70 W | GeForce RTX 4050 Laptop GPU 60 W 1965 / 2000 MHz 6 GB | 32 GB | 986 |
| Lenovo Yoga Slim 7X 14Q8X9 6.0.1 x64 1024 MiB [C: 7.6% (71.9/951.5 GiB)] (x5) [Interval=5 sec] | SD X Elite X1E-78-100 | Adreno X1-85 3.8 TFLOPS 1250 MHz | 32 GB | 1143 |
| Model | CPU | GPU | RAM | Value |
|---|---|---|---|---|
| LG Gram Pro 16Z90TS-G.AU89G diskspd 2.0.17 f | Core Ultra 7 256V | Arc 140V | 16 GB | 106.2 |
| Asus NUC 14 Pro+ diskspd 2.0.17 f | Ultra 9 185H 115 W / 115 W | Arc 8-Core 2350 MHz | 32 GB | 119.6 |
LG Gram Pro 16 16Z90TR-E.AD8BG  diskspd 2.0.17 f diskspd 2.0.17 f | Ultra 7 255H | GeForce RTX 5050 Laptop 8 GB | 32 GB | 125.1 |
| Asus ROG NUC 14-90AS0051 diskspd 2.0.17 f | Ultra 9 185H 115 W / 90 W | GeForce RTX 4070 Laptop GPU 115 W 2175 / 2000 MHz 8 GB | 32 GB | 132.2 |
| Lenovo ThinkPad T14s G4-21F8002TGE | R7 7840U 30 W / 24 W | Radeon 780M 800 MHz | 32 GB | 136.3 |
| Lenovo ThinkPad T14s G4 21F6005GGE | i7-1355U 50 W / 24 W | Iris Xe G7 96EUs | 32 GB | 136.4 |
| Lenovo ThinkPad T14 G4 21K4S02000 diskspd 2.0.17 f | R7 PRO 7840U 32.5 W / 27.5 W | Radeon 780M | 32 GB | 151 |
| Lenovo ThinkStation P3 Tiny-30H0006AGE diskspd 2.0.17 f | i9-14900 219 W / 65 W | T1000 1395 / 1250 MHz 8 GB | 64 GB | 244 |
| Acer Predator Helios Neo 16 (2024) diskspd 2.0.17 f | i7-14700HX 157 W / 95 W | GeForce RTX 4070 Laptop GPU 140 W 1980 / 2000 MHz 8 GB | 32 GB | 270 |
| Model | CPU | GPU | RAM | Value |
|---|---|---|---|---|
| Asus ROG NUC 14-90AS0051 diskspd 2.0.17 f | Ultra 9 185H 115 W / 90 W | GeForce RTX 4070 Laptop GPU 115 W 2175 / 2000 MHz 8 GB | 32 GB | 57.3 |
| LG Gram Pro 16Z90TS-G.AU89G diskspd 2.0.17 f | Core Ultra 7 256V | Arc 140V | 16 GB | 57.7 |
| Asus NUC 14 Pro+ diskspd 2.0.17 f | Ultra 9 185H 115 W / 115 W | Arc 8-Core 2350 MHz | 32 GB | 65.8 |
| Lenovo ThinkStation P3 Tiny-30H0006AGE diskspd 2.0.17 f | i9-14900 219 W / 65 W | T1000 1395 / 1250 MHz 8 GB | 64 GB | 68.4 |
| LG Gram Pro 16 16Z90TR-E.AD8BG diskspd 2.0.17 f | Ultra 7 255H | GeForce RTX 5050 Laptop 8 GB | 32 GB | 68.9 |
| Lenovo ThinkPad T14s G4-21F8002TGE | R7 7840U 30 W / 24 W | Radeon 780M 800 MHz | 32 GB | 69 |
| Lenovo ThinkPad T14 G4 21K4S02000 diskspd 2.0.17 f | R7 PRO 7840U 32.5 W / 27.5 W | Radeon 780M | 32 GB | 70 |
| Lenovo ThinkPad T14s G4 21F6005GGE | i7-1355U 50 W / 24 W | Iris Xe G7 96EUs | 32 GB | 79.8 |
| Acer Predator Helios Neo 16 (2024) diskspd 2.0.17 f | i7-14700HX 157 W / 95 W | GeForce RTX 4070 Laptop GPU 140 W 1980 / 2000 MHz 8 GB | 32 GB | 95.2 |
| Model | CPU | GPU | RAM | Value |
|---|---|---|---|---|
| Asus NUC 14 Pro+ diskspd 2.0.17 f | Ultra 9 185H 115 W / 115 W | Arc 8-Core 2350 MHz | 32 GB | 349 |
| Lenovo ThinkPad T14s G4 21F6005GGE | i7-1355U 50 W / 24 W | Iris Xe G7 96EUs | 32 GB | 363 |
| LG Gram Pro 16Z90TS-G.AU89G diskspd 2.0.17 f | Core Ultra 7 256V | Arc 140V | 16 GB | 396 |
| Lenovo ThinkPad T14s G4-21F8002TGE | R7 7840U 30 W / 24 W | Radeon 780M 800 MHz | 32 GB | 407 |
| Asus ROG NUC 14-90AS0051 diskspd 2.0.17 f | Ultra 9 185H 115 W / 90 W | GeForce RTX 4070 Laptop GPU 115 W 2175 / 2000 MHz 8 GB | 32 GB | 423 |
| LG Gram Pro 16 16Z90TR-E.AD8BG diskspd 2.0.17 f | Ultra 7 255H | GeForce RTX 5050 Laptop 8 GB | 32 GB | 478 |
| Lenovo ThinkPad T14 G4 21K4S02000 diskspd 2.0.17 f | R7 PRO 7840U 32.5 W / 27.5 W | Radeon 780M | 32 GB | 502 |
| Lenovo ThinkStation P3 Tiny-30H0006AGE diskspd 2.0.17 f | i9-14900 219 W / 65 W | T1000 1395 / 1250 MHz 8 GB | 64 GB | 3686 |
| Acer Predator Helios Neo 16 (2024) diskspd 2.0.17 f | i7-14700HX 157 W / 95 W | GeForce RTX 4070 Laptop GPU 140 W 1980 / 2000 MHz 8 GB | 32 GB | 3717 |
| Model | CPU | GPU | RAM | Value |
|---|---|---|---|---|
| LG Gram Pro 16Z90TS-G.AU89G diskspd 2.0.17 f | Core Ultra 7 256V | Arc 140V | 16 GB | 635 |
| Lenovo ThinkPad T14s G4 21F6005GGE | i7-1355U 50 W / 24 W | Iris Xe G7 96EUs | 32 GB | 675 |
| Asus NUC 14 Pro+ diskspd 2.0.17 f | Ultra 9 185H 115 W / 115 W | Arc 8-Core 2350 MHz | 32 GB | 873 |
| Asus ROG NUC 14-90AS0051 diskspd 2.0.17 f | Ultra 9 185H 115 W / 90 W | GeForce RTX 4070 Laptop GPU 115 W 2175 / 2000 MHz 8 GB | 32 GB | 875 |
| LG Gram Pro 16 16Z90TR-E.AD8BG diskspd 2.0.17 f | Ultra 7 255H | GeForce RTX 5050 Laptop 8 GB | 32 GB | 910 |
| Lenovo ThinkPad T14s G4-21F8002TGE | R7 7840U 30 W / 24 W | Radeon 780M 800 MHz | 32 GB | 931 |
| Lenovo ThinkPad T14 G4 21K4S02000 diskspd 2.0.17 f | R7 PRO 7840U 32.5 W / 27.5 W | Radeon 780M | 32 GB | 1347 |
| Acer Predator Helios Neo 16 (2024) diskspd 2.0.17 f | i7-14700HX 157 W / 95 W | GeForce RTX 4070 Laptop GPU 140 W 1980 / 2000 MHz 8 GB | 32 GB | 3764 |
| Lenovo ThinkStation P3 Tiny-30H0006AGE diskspd 2.0.17 f | i9-14900 219 W / 65 W | T1000 1395 / 1250 MHz 8 GB | 64 GB | 3896 |
| Model | CPU | GPU | RAM | Value |
|---|---|---|---|---|
| LG Gram Pro 16Z90TS-G.AU89G diskspd 2.0.17 f | Core Ultra 7 256V | Arc 140V | 16 GB | 2298 |
| LG Gram Pro 16 16Z90TR-E.AD8BG diskspd 2.0.17 f | Ultra 7 255H | GeForce RTX 5050 Laptop 8 GB | 32 GB | 2899 |
| Asus NUC 14 Pro+ diskspd 2.0.17 f | Ultra 9 185H 115 W / 115 W | Arc 8-Core 2350 MHz | 32 GB | 2979 |
| Lenovo ThinkPad T14s G4-21F8002TGE | R7 7840U 30 W / 24 W | Radeon 780M 800 MHz | 32 GB | 3104 |
| Lenovo ThinkPad T14s G4 21F6005GGE | i7-1355U 50 W / 24 W | Iris Xe G7 96EUs | 32 GB | 3199 |
| Lenovo ThinkPad T14 G4 21K4S02000 diskspd 2.0.17 f | R7 PRO 7840U 32.5 W / 27.5 W | Radeon 780M | 32 GB | 3233 |
| Asus ROG NUC 14-90AS0051 diskspd 2.0.17 f | Ultra 9 185H 115 W / 90 W | GeForce RTX 4070 Laptop GPU 115 W 2175 / 2000 MHz 8 GB | 32 GB | 3433 |
| Lenovo ThinkStation P3 Tiny-30H0006AGE diskspd 2.0.17 f | i9-14900 219 W / 65 W | T1000 1395 / 1250 MHz 8 GB | 64 GB | 3651 |
| Acer Predator Helios Neo 16 (2024) diskspd 2.0.17 f | i7-14700HX 157 W / 95 W | GeForce RTX 4070 Laptop GPU 140 W 1980 / 2000 MHz 8 GB | 32 GB | 4533 |
| Model | CPU | GPU | RAM | Value |
|---|---|---|---|---|
| Asus ROG NUC 14-90AS0051 diskspd 2.0.17 f | Ultra 9 185H 115 W / 90 W | GeForce RTX 4070 Laptop GPU 115 W 2175 / 2000 MHz 8 GB | 32 GB | 3028 |
| LG Gram Pro 16Z90TS-G.AU89G diskspd 2.0.17 f | Core Ultra 7 256V | Arc 140V | 16 GB | 3202 |
| Lenovo ThinkPad T14s G4-21F8002TGE | R7 7840U 30 W / 24 W | Radeon 780M 800 MHz | 32 GB | 3340 |
| Lenovo ThinkPad T14 G4 21K4S02000 diskspd 2.0.17 f | R7 PRO 7840U 32.5 W / 27.5 W | Radeon 780M | 32 GB | 3417 |
| Asus NUC 14 Pro+ diskspd 2.0.17 f | Ultra 9 185H 115 W / 115 W | Arc 8-Core 2350 MHz | 32 GB | 3463 |
| LG Gram Pro 16 16Z90TR-E.AD8BG diskspd 2.0.17 f | Ultra 7 255H | GeForce RTX 5050 Laptop 8 GB | 32 GB | 3480 |
| Lenovo ThinkStation P3 Tiny-30H0006AGE diskspd 2.0.17 f | i9-14900 219 W / 65 W | T1000 1395 / 1250 MHz 8 GB | 64 GB | 3532 |
| Lenovo ThinkPad T14s G4 21F6005GGE | i7-1355U 50 W / 24 W | Iris Xe G7 96EUs | 32 GB | 3634 |
| Acer Predator Helios Neo 16 (2024) diskspd 2.0.17 f | i7-14700HX 157 W / 95 W | GeForce RTX 4070 Laptop GPU 140 W 1980 / 2000 MHz 8 GB | 32 GB | 4104 |
| Model | CPU | GPU | RAM | Value |
|---|---|---|---|---|
| Lenovo ThinkPad T14s G4 21F6005GGE | i7-1355U 50 W / 24 W | Iris Xe G7 96EUs | 32 GB | 4913 |
| Lenovo ThinkPad T14 G4 21K4S02000 diskspd 2.0.17 f | R7 PRO 7840U 32.5 W / 27.5 W | Radeon 780M | 32 GB | 4924 |
| LG Gram Pro 16 16Z90TR-E.AD8BG diskspd 2.0.17 f | Ultra 7 255H | GeForce RTX 5050 Laptop 8 GB | 32 GB | 4928 |
| LG Gram Pro 16Z90TS-G.AU89G diskspd 2.0.17 f | Core Ultra 7 256V | Arc 140V | 16 GB | 4954 |
| Lenovo ThinkPad T14s G4-21F8002TGE | R7 7840U 30 W / 24 W | Radeon 780M 800 MHz | 32 GB | 4957 |
| Lenovo ThinkStation P3 Tiny-30H0006AGE diskspd 2.0.17 f | i9-14900 219 W / 65 W | T1000 1395 / 1250 MHz 8 GB | 64 GB | 4960 |
| Asus NUC 14 Pro+ diskspd 2.0.17 f | Ultra 9 185H 115 W / 115 W | Arc 8-Core 2350 MHz | 32 GB | 4971 |
| Asus ROG NUC 14-90AS0051 diskspd 2.0.17 f | Ultra 9 185H 115 W / 90 W | GeForce RTX 4070 Laptop GPU 115 W 2175 / 2000 MHz 8 GB | 32 GB | 5047 |
| Acer Predator Helios Neo 16 (2024) diskspd 2.0.17 f | i7-14700HX 157 W / 95 W | GeForce RTX 4070 Laptop GPU 140 W 1980 / 2000 MHz 8 GB | 32 GB | 5265 |
| Model | CPU | GPU | RAM | Value |
|---|---|---|---|---|
| Asus ROG NUC 14-90AS0051 diskspd 2.0.17 f | Ultra 9 185H 115 W / 90 W | GeForce RTX 4070 Laptop GPU 115 W 2175 / 2000 MHz 8 GB | 32 GB | 6023 |
| LG Gram Pro 16Z90TS-G.AU89G diskspd 2.0.17 f | Core Ultra 7 256V | Arc 140V | 16 GB | 6837 |
| Asus NUC 14 Pro+ diskspd 2.0.17 f | Ultra 9 185H 115 W / 115 W | Arc 8-Core 2350 MHz | 32 GB | 6962 |
| LG Gram Pro 16 16Z90TR-E.AD8BG diskspd 2.0.17 f | Ultra 7 255H | GeForce RTX 5050 Laptop 8 GB | 32 GB | 6966 |
| Lenovo ThinkPad T14s G4-21F8002TGE | R7 7840U 30 W / 24 W | Radeon 780M 800 MHz | 32 GB | 6999 |
| Lenovo ThinkPad T14s G4 21F6005GGE | i7-1355U 50 W / 24 W | Iris Xe G7 96EUs | 32 GB | 7002 |
| Lenovo ThinkStation P3 Tiny-30H0006AGE diskspd 2.0.17 f | i9-14900 219 W / 65 W | T1000 1395 / 1250 MHz 8 GB | 64 GB | 7026 |
| Lenovo ThinkPad T14 G4 21K4S02000 diskspd 2.0.17 f | R7 PRO 7840U 32.5 W / 27.5 W | Radeon 780M | 32 GB | 7027 |
| Acer Predator Helios Neo 16 (2024) diskspd 2.0.17 f | i7-14700HX 157 W / 95 W | GeForce RTX 4070 Laptop GPU 140 W 1980 / 2000 MHz 8 GB | 32 GB | 7058 |
| Model | CPU | GPU | RAM | Value |
|---|---|---|---|---|
| LG Gram Pro 16 16Z90TR-E.AD8BG diskspd 2.0.17 f | Ultra 7 255H | GeForce RTX 5050 Laptop 8 GB | 32 GB | 5302 |
| Asus ROG NUC 14-90AS0051 diskspd 2.0.17 f | Ultra 9 185H 115 W / 90 W | GeForce RTX 4070 Laptop GPU 115 W 2175 / 2000 MHz 8 GB | 32 GB | 6673 |
| LG Gram Pro 16Z90TS-G.AU89G diskspd 2.0.17 f | Core Ultra 7 256V | Arc 140V | 16 GB | 6745 |
| Asus NUC 14 Pro+ diskspd 2.0.17 f | Ultra 9 185H 115 W / 115 W | Arc 8-Core 2350 MHz | 32 GB | 6962 |
| Lenovo ThinkPad T14s G4 21F6005GGE | i7-1355U 50 W / 24 W | Iris Xe G7 96EUs | 32 GB | 6980 |
| Lenovo ThinkPad T14s G4-21F8002TGE | R7 7840U 30 W / 24 W | Radeon 780M 800 MHz | 32 GB | 7003 |
| Lenovo ThinkPad T14 G4 21K4S02000 diskspd 2.0.17 f | R7 PRO 7840U 32.5 W / 27.5 W | Radeon 780M | 32 GB | 7003 |
| Acer Predator Helios Neo 16 (2024) diskspd 2.0.17 f | i7-14700HX 157 W / 95 W | GeForce RTX 4070 Laptop GPU 140 W 1980 / 2000 MHz 8 GB | 32 GB | 7013 |
| Lenovo ThinkStation P3 Tiny-30H0006AGE diskspd 2.0.17 f | i9-14900 219 W / 65 W | T1000 1395 / 1250 MHz 8 GB | 64 GB | 7023 |
* Smaller numbers mean a higher performance
Average Benchmarks
Samsung PM9A1a MZVL21T0HDLU → 100% n=33
Samsung PM9C1a MZAL81T0HDLB → 83% n=33
- $294.88Samsung PM9A1 MZ-VL21T100 1TB PCIe 4.0 NVMe 2280 Solid State Drive, 7000MB/s Read, 5200MB/s Write, 1000K IOPS Ran. Read, 850K IOPS Ran. Write - PM9A1
- $109.00Samsung SSD PM9A1 M.2 NVMe 512GB
- $320.00Samsung 870 EVO SATA III SSD 1TB 2.5” Internal Solid State Drive, Upgrade PC or Laptop Memory and Storage for IT Pros, Creators, Everyday Users, MZ-77E1T0B/AM
- $957.00Samsung PM9A3 960GB M.2 (PCIE 4.0 x4) Nvme SSD MZ1L2960HCJR-00A07
- $794.00Samsung PM9A3 960 GB Solid State Drive - 2.5 Internal - U.2 [PCI Express NVMe 4.0 x4]
#0 ran 0s before starting gpusingle class +0s ... 0s
#1 checking url part for id 4067 +0s ... 0s
#2 checking url part for id 4144 +0s ... 0s
#3 redirected to Ajax server, took 1780506025s time from redirect:0 +0s ... 0s
#4 did not recreate cache, as it is less than 5 days old! Created at Mon, 01 Jun 2026 22:56:29 +0200 +0s ... 0s
#5 composed specs +0.003s ... 0.003s
#6 did output specs +0s ... 0.003s
#7 getting avg benchmarks for device 4067 +0.005s ... 0.008s
#8 got single benchmarks 4067 +0.009s ... 0.017s
#9 getting avg benchmarks for device 4144 +0.003s ... 0.02s
#10 got single benchmarks 4144 +0.012s ... 0.033s
#11 got avg benchmarks for devices +0s ... 0.033s
#12 min, max, avg, median took s +0.083s ... 0.116s
#13 return log +0.566s ... 0.682s