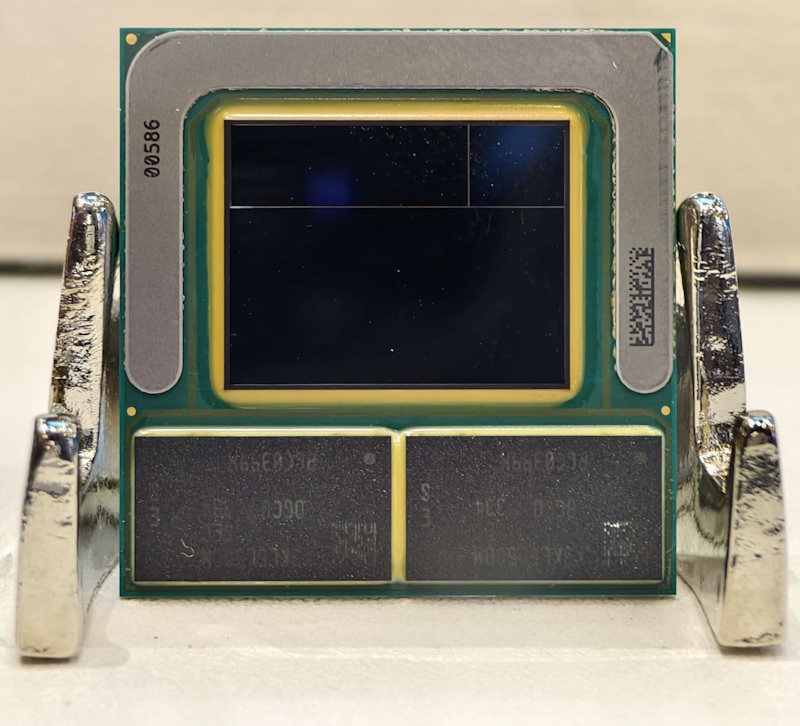
Intel Core Ultra 7 258V ► remove from comparison The Intel Core Ultra 5 258V is an upper mid-range Lunar Lake family processor. This is an SoC for use in tablets and laptops of the slimmer kind that was unveiled in Autumn 2024. It sports 4 new Skymont E-cores and 4 new Lion Cove P-cores running at up to 3.7 GHz and 4.8 GHz respectively, along with the new Arc 140V iGPU and 32 GB of on-package LPDDR5x-8533 RAM. A new 47 TOPS neural engine, Thunderbolt 4 and PCIe 5 SSD support are included as well.
The only difference between this chip and the Ultra 7 256V is the amount of on-package, non-replaceable RAM: 32 GB vs 16 GB respectively.
Architecture and Features
Lunar Lake is built using the Foveros technology (stacking several dies on top of each other and next to each other), just like Meteor Lake was. The new chips make use of the enormous BGA2833 socket interface. Of the 8 cores, not a single one is Hyper-Threading-enabled which is the opposite of what AMD currently does with its Zen 5/5c chips.
Intel claims Lion Cove cores bring a 14% IPC improvement over Redwood Cove. For Skymont and Crestmont, the difference is much higher at 68%. Several tweaks and improvements are present here, such as the Low Latency Fabric that is supposed to make small data transfers between cores/caches a lot faster. The 258V has a very healthy 12 MB of level 3 cache; elsewhere, it has 4 PCIe 5 and 4 PCIe 4 lanes for connecting various kinds of devices, including NVMe SSDs at up to 15.75 GB/s. Thunderbolt 4 support is onboard by default, as is support for CNVi WiFi 7 + BT 5.4 cards from Intel. The 47 TOPS "AI Boost" neural engine is present along with technologies such as Threat Detection to make AI-enabled applications such as the Windows Defender more powerful.
Intel is predicted to get short of on-package RAM in subsequent CPU generations.
Performance
Based on the time we've had with 2 systems powered by the 258V, the chip's multi-thread performance is as good as that of the Core Ultra 7 165U and the Core i7-1360P . Please note that one of the two systems had a higher long-term TDP power target than the Intel-recommended value: 32 W vs 17 W.
Generally speaking, the 288V, 268V, 266V, 258V, 256V are faster than the 238V, 236V, 228V and 226V due to the difference in their last-level cache size (8 MB vs 12 MB) as well as clock speeds. However, the difference in performance between the slowest Lunar Lake chip, the 226V, and the fastest chip, the 288V is fairly small at around 10% to 15%. It depends on the TDP figures of the laptops being pitted against each other more than on anything else.
Graphics
The Arc Graphics 140V is here to replace the Arc 8 iGPU. Its 8 Xe² architecture "cores" run at up to 1,950 MHz and it also has 8 ray tracing units at its disposal. The adapter is DirectX 12 Ultimate-enabled and able to HW-decode a long list of popular video codecs such as h.266 VVC, h.265 HEVC, h.264 AVC, AV1 and VP9. Three SUHD 4320p monitors can be used simultaneously with this iGPU.
All 2023 and 2024 games are playable at 1080p on low graphics settings or higher with this iGPU. We got well over 30 fps in Ghost of Tsushima Baldur's Gate 3 Radeon 780M gets left behind while the Radeon 890M reigns supreme.
Power consumption
This 2nd generation Core Ultra processor is supposed to consume 17 W when under long-term workloads. The Intel-recommended short-term power limit for the chip sits at 37 W.
AMD Ryzen AI 7 350 ► remove from comparison The AMD Ryzen AI 7 350 is a powerful mobile processor from the Krackan Point family that was announced at CES in early 2025. The APU integrates 8 CPU cores (4x Zen 5 with up to 5 GHz and 4x Zen 5c with less cache and a maximum of 3.5 GHz) and a big 16 MB L3-Cache.
Architecture and features
The Krackan Point family APUs are powered by Zen 5 and Zen 5c microarchitecture cores located in separate clusters, the latter being a slightly slower, smaller and more energy efficient version of the former. One of the differences between Zen 5 and Zen 5c is the size of the cache; the Zen 5 cores have larger caches available.
However, the mobile Zen 5 implementation is reportedly (ChipsAndCheese ) is closer to desktop Zen 4 than desktop Zen 5 due to the different cache sizes, large differences in AVX-512 throughput, and other factors.
Elsewhere, the Ryzen AI 7 chip supports DDR5-5600 and LPDDR5x-8000 RAM, giving system designers a choice between lower latency and higher throughput. The chip is natively compatible with USB 4 (and therefore Thunderbolt). It has PCIe 4.0 support for a throughput of 1.9 GB/s per lane, just like its 8000 series predecessors. The integrated XDNA 2 NPU, which is much more complex than the first generation XDNA, delivers up to 50 INT8 TOPS for accelerating various AI workloads.
As usual with laptop CPUs, the Ryzen 7 AI chip cannot be replaced by the user as it is soldered.
Performance
Thanks to the Zen 5 architecture and the high clock rates, the CPU performance should be very good.
Graphics
The Radeon 860M is the direct successor to the Radeon 760M and offers 8 cores (CUs = 512 shaders) and clocks at up to 3 GHz. It uses the new RDNA 3.5 architecture.
Power consumption
The AI 350 is said to have a base TDP of 28 W, although laptop manufacturers are free to set the TDP between 15 and 54 W.
The 4 nm TSMC process with which these CPUs are manufactured ensures above-average energy efficiency.
Model Intel Core Ultra 7 258V AMD Ryzen AI 7 350 Codename Lunar Lake Krackan Point (Zen 5) Series Intel Lunar Lake AMD Strix / Gorgon Point Series: Lunar Lake Lunar Lake Clock 2200 - 4800 MHz 2000 - 5000 MHz L1 Cache 1.4 MB L2 Cache 14 MB 8 MB L3 Cache 12 MB 16 MB Cores / Threads 8 / 8 8 / 16 TDP 17 Watt 28 Watt TDP Turbo PL2 37 Watt 54 Watt Technology 3 nm 4 nm max. Temp. 100 °C Socket BGA2833 FP8 Features LPDDR5x-8533 RAM, PCIe 5 + PCIe 4, USB 4, AI Boost NPU (47 TOPS), Thread Director, PSE, Threat Detection, MMX, SSE, SSE2, SSE3, SSSE3, SSE4.1, SSE4.2, AES, AVX, AVX2, AVX-VNNi, FMA3, SHA DDR5-5600/LPDDR5x-8000 RAM, PCIe 4, USB 4, XDNA 2 NPU (50 TOPS), Secure Processor, SMT, AES, AVX, AVX2, AVX512, FMA3, MMX (+), SHA, SSE, SSE2, SSE3, SSSE3, SSE4.1, SSE4.2, SSE4A iGPU Intel Arc Graphics 140V (300 - 1950 MHz)AMD Radeon 860M ( - 3000 MHz)NPU / AI 47 TOPS INT8 50 TOPS INT8 Chip AI 115 TOPS INT8 66 TOPS INT8 Architecture x86 x86 Announced Manufacturer ark.intel.com www.amd.com
Performance Rating - CB R15 + R20 + 7-Zip + X265 + Blender + 3DM11 CPU - Core Ultra 7 258V
Performance Rating - CB R15 + R20 + 7-Zip + X265 + Blender + 3DM11 CPU - Ryzen AI 7 350
Cinebench 2024 - Cinebench 2024 CPU Single Core
min: 107.8 avg: 118.7 median: 119.8 (60%) max: 123 Points
CPU TDP 17 W TDP 18 W TDP 20 W TDP 22 W TDP 25 W TDP 26 W TDP 27 W TDP 28 W TDP 29 W TDP 30 W TDP 35 W TDP 38 W 99% 99% 99% 99% 100% 100% 97% 99% 89% 98% 99% 100%
min: 113.5 avg: 115.8 median: 115.5 (58%) max: 119 Points
CPU TDP ? TDP 17 W TDP 18 W TDP 20 W TDP 22 W TDP 25 W TDP 26 W TDP 27 W TDP 28 W TDP 29 W TDP 30 W TDP 32 W TDP 35 W TDP 38 W TDP 40 W TDP 45 W TDP 65 W TDP 70 W 94% 99% 99% 99% 99% 100% 100% 97% 99% 89% 98% 96% 99% 100% 96% 96% 96% 97%
Cinebench 2024 - Cinebench 2024 CPU Multi Core
min: 406 avg: 555 median: 573 (11%) max: 660 Points
CPU TDP ? TDP 17 W TDP 18 W TDP 20 W TDP 22 W TDP 25 W TDP 26 W TDP 27 W TDP 28 W TDP 29 W TDP 30 W TDP 35 W TDP 38 W 79% 72% 80% 77% 84% 87% 87% 98% 90% 76% 91% 100% 94%
min: 720 avg: 892 median: 905 (17%) max: 1011 Points
CPU TDP ? TDP 17 W TDP 18 W TDP 20 W TDP 22 W TDP 25 W TDP 26 W TDP 27 W TDP 28 W TDP 29 W TDP 30 W TDP 32 W TDP 35 W TDP 38 W TDP 40 W TDP 45 W TDP 65 W TDP 70 W 67% 49% 55% 53% 57% 60% 59% 67% 62% 52% 62% 85% 68% 64% 89% 93% 100% 100%
Cinebench R23 - Cinebench R23 Multi Core
min: 7920 avg: 10184 median: 10416 (10%) max: 11097 Points
CPU TDP ? TDP 17 W TDP 18 W TDP 20 W TDP 22 W TDP 25 W TDP 26 W TDP 27 W TDP 28 W TDP 29 W TDP 30 W TDP 32 W TDP 35 W TDP 38 W 88% 77% 87% 93% 95% 85% 93% 100% 97% 94% 96% 100% 99% 95%
min: 12647 avg: 15721 median: 15971.5 (15%) max: 17899 Points
CPU TDP ? TDP 17 W TDP 18 W TDP 20 W TDP 22 W TDP 25 W TDP 26 W TDP 27 W TDP 28 W TDP 29 W TDP 30 W TDP 32 W TDP 35 W TDP 38 W TDP 40 W TDP 45 W TDP 65 W TDP 70 W 74% 48% 54% 58% 59% 53% 58% 62% 60% 58% 60% 71% 62% 59% 88% 92% 100% 96%
Cinebench R23 - Cinebench R23 Single Core
min: 1664 avg: 1860 median: 1872 (76%) max: 1957 Points
CPU TDP ? TDP 17 W TDP 18 W TDP 20 W TDP 22 W TDP 25 W TDP 26 W TDP 27 W TDP 28 W TDP 29 W TDP 30 W TDP 32 W TDP 35 W TDP 38 W 94% 94% 96% 96% 95% 97% 96% 94% 95% 85% 96% 91% 94% 100%
min: 1916 avg: 1960 median: 1954 (79%) max: 2006 Points
CPU TDP ? TDP 17 W TDP 18 W TDP 20 W TDP 22 W TDP 25 W TDP 26 W TDP 27 W TDP 28 W TDP 29 W TDP 30 W TDP 32 W TDP 35 W TDP 38 W TDP 40 W TDP 45 W TDP 65 W TDP 70 W 96% 92% 94% 95% 94% 95% 94% 93% 93% 84% 95% 95% 93% 98% 99% 100% 100% 98%
Cinebench R20 - Cinebench R20 CPU (Single Core)
min: 643 avg: 712 median: 717 (78%) max: 749 Points
CPU TDP ? TDP 17 W TDP 18 W TDP 20 W TDP 22 W TDP 25 W TDP 26 W TDP 27 W TDP 28 W TDP 29 W TDP 30 W TDP 32 W TDP 35 W TDP 38 W 95% 92% 97% 98% 97% 98% 97% 96% 96% 87% 98% 92% 96% 100%
min: 751 avg: 768 median: 769 (84%) max: 784 Points
CPU TDP ? TDP 17 W TDP 18 W TDP 20 W TDP 22 W TDP 25 W TDP 26 W TDP 27 W TDP 28 W TDP 29 W TDP 30 W TDP 32 W TDP 35 W TDP 38 W TDP 40 W TDP 45 W TDP 65 W TDP 70 W 95% 88% 93% 93% 92% 93% 93% 91% 92% 83% 94% 95% 92% 95% 99% 100% 100% 99%
Cinebench R20 - Cinebench R20 CPU (Multi Core)
min: 3130 avg: 3953 median: 4071 (10%) max: 4314 Points
CPU TDP ? TDP 17 W TDP 18 W TDP 20 W TDP 22 W TDP 25 W TDP 26 W TDP 27 W TDP 28 W TDP 29 W TDP 30 W TDP 32 W TDP 35 W TDP 38 W 86% 77% 87% 93% 94% 85% 92% 99% 98% 94% 96% 99% 100% 96%
min: 4897 avg: 6114 median: 6245.5 (15%) max: 6990 Points
CPU TDP ? TDP 17 W TDP 18 W TDP 20 W TDP 22 W TDP 25 W TDP 26 W TDP 27 W TDP 28 W TDP 29 W TDP 30 W TDP 32 W TDP 35 W TDP 38 W TDP 40 W TDP 45 W TDP 65 W TDP 70 W 69% 48% 54% 58% 58% 53% 57% 62% 61% 59% 60% 70% 62% 59% 87% 92% 100% 95%
Cinebench R15 - Cinebench R15 CPU Multi 64 Bit
min: 1280 avg: 1569 median: 1597 (10%) max: 1656 Points
CPU TDP ? TDP 17 W TDP 18 W TDP 20 W TDP 22 W TDP 25 W TDP 26 W TDP 27 W TDP 28 W TDP 29 W TDP 30 W TDP 32 W TDP 35 W TDP 38 W 92% 85% 98% 95% 97% 92% 97% 98% 96% 100% 97% 99% 97% 90%
min: 1932 avg: 2438 median: 2477 (16%) max: 2734 Points
CPU TDP ? TDP 17 W TDP 18 W TDP 20 W TDP 22 W TDP 25 W TDP 26 W TDP 27 W TDP 28 W TDP 29 W TDP 30 W TDP 32 W TDP 35 W TDP 38 W TDP 40 W TDP 45 W TDP 65 W TDP 70 W 77% 53% 61% 59% 61% 57% 61% 61% 60% 62% 61% 74% 61% 56% 95% 95% 100% 98%
Cinebench R15 - Cinebench R15 CPU Single 64 Bit
min: 258 avg: 284.2 median: 285 (79%) max: 298 Points
CPU TDP ? TDP 17 W TDP 18 W TDP 20 W TDP 22 W TDP 25 W TDP 26 W TDP 27 W TDP 28 W TDP 29 W TDP 30 W TDP 32 W TDP 35 W TDP 38 W 94% 91% 97% 98% 95% 96% 95% 95% 97% 88% 98% 95% 97% 100%
min: 204 avg: 280.1 median: 296 (82%) max: 305 Points
CPU TDP ? TDP 17 W TDP 18 W TDP 20 W TDP 22 W TDP 25 W TDP 26 W TDP 27 W TDP 28 W TDP 29 W TDP 30 W TDP 32 W TDP 35 W TDP 38 W TDP 40 W TDP 45 W TDP 65 W TDP 70 W 90% 88% 94% 95% 93% 94% 93% 92% 95% 86% 96% 86% 95% 98% 98% 99% 100% 88%
Cinebench R11.5 - Cinebench R11.5 CPU Multi 64 Bit
min: 28.96 avg: 29.9 median: 29.9 (39%) max: 30.75 Points
CPU TDP 17 W TDP 40 W 66% 100%
Cinebench R11.5 - Cinebench R11.5 CPU Single 64 Bit
min: 3.59 avg: 3.6 median: 3.6 (85%) max: 3.6 Points
CPU TDP 17 W TDP 40 W 93% 100%
Cinebench R10 - Cinebench R10 Rend. Single (32bit)
min: 8478 avg: 8482 median: 8482 (51%) max: 8486 Points
CPU TDP 17 W TDP 40 W 100% 85%
Cinebench R10 - Cinebench R10 Rend. Multi (32bit)
min: 48792 avg: 49866 median: 49865.5 (36%) max: 50939 Points
CPU TDP 17 W TDP 40 W 73% 100%
Cinebench R10 - Cinebench R10 Rend. Multi (64bit)
Cinebench R10 - Cinebench R10 Rend. Single (64bit)
wPrime 2.10 - wPrime 2.0 1024m *
min: 68.229 avg: 171 median: 171 (2%) max: 273.713 s
wPrime 2.10 - wPrime 2.0 32m *
min: 3.069 avg: 4.5 median: 4.5 (1%) max: 5.935 s
wPrime 1.55 - wPrime 1.55 1024m *
wPrime 1.55 - wPrime 1.55 32m *
min: 6.46 avg: 3177 median: 3176.7 (5%) max: 6347 Points
CPU TDP 17 W TDP 40 W 100% 37%
7-Zip 18.03 - 7-Zip 18.03 Multi Thread 4 runs
min: 28482 avg: 34795 median: 35705 (20%) max: 36724 MIPS
CPU TDP ? TDP 17 W TDP 18 W TDP 20 W TDP 22 W TDP 25 W TDP 26 W TDP 27 W TDP 28 W TDP 29 W TDP 30 W TDP 32 W TDP 35 W TDP 38 W 91% 83% 93% 98% 97% 90% 97% 98% 100% 98% 98% 99% 100% 94%
min: 48124 avg: 57016 median: 58647 (34%) max: 64653 MIPS
CPU TDP ? TDP 17 W TDP 18 W TDP 20 W TDP 22 W TDP 25 W TDP 26 W TDP 27 W TDP 28 W TDP 29 W TDP 30 W TDP 32 W TDP 35 W TDP 38 W TDP 40 W TDP 45 W TDP 65 W TDP 70 W 73% 48% 55% 58% 57% 53% 57% 57% 58% 58% 58% 75% 59% 55% 80% 96% 99% 100%
7-Zip 18.03 - 7-Zip 18.03 Single Thread 4 runs
min: 5265 avg: 5694 median: 5706 (67%) max: 5869 MIPS
CPU TDP ? TDP 17 W TDP 18 W TDP 20 W TDP 22 W TDP 25 W TDP 26 W TDP 27 W TDP 28 W TDP 29 W TDP 30 W TDP 32 W TDP 35 W TDP 38 W 94% 96% 100% 100% 96% 98% 97% 95% 96% 95% 99% 99% 98% 100%
min: 5544 avg: 6012 median: 6033.5 (71%) max: 6371 MIPS
CPU TDP ? TDP 17 W TDP 18 W TDP 20 W TDP 22 W TDP 25 W TDP 26 W TDP 27 W TDP 28 W TDP 29 W TDP 30 W TDP 32 W TDP 35 W TDP 38 W TDP 40 W TDP 45 W TDP 65 W TDP 70 W 93% 91% 94% 95% 91% 93% 92% 90% 91% 90% 94% 96% 93% 94% 95% 98% 98% 100%
X264 HD Benchmark 4.0 - x264 Pass 2
X264 HD Benchmark 4.0 - x264 Pass 1
HWBOT x265 Benchmark v2.2 - HWBOT x265 4k Preset
min: 9.65 avg: 12.4 median: 12.4 (22%) max: 14.2 fps
CPU TDP ? TDP 17 W TDP 18 W TDP 20 W TDP 22 W TDP 25 W TDP 26 W TDP 27 W TDP 28 W TDP 29 W TDP 30 W TDP 32 W TDP 35 W TDP 38 W 85% 71% 80% 86% 93% 79% 86% 100% 96% 87% 93% 92% 100% 94%
min: 14 avg: 19.9 median: 20.6 (36%) max: 22.9 fps
CPU TDP ? TDP 17 W TDP 18 W TDP 20 W TDP 22 W TDP 25 W TDP 26 W TDP 27 W TDP 28 W TDP 29 W TDP 30 W TDP 32 W TDP 35 W TDP 38 W TDP 40 W TDP 45 W TDP 65 W TDP 70 W 69% 45% 50% 54% 58% 49% 54% 63% 60% 54% 58% 64% 63% 59% 89% 88% 99% 100%
TrueCrypt - TrueCrypt Serpent
min: 1 avg: 1.1 median: 1.1 (31%) max: 1.1 GB/s
CPU TDP 17 W TDP 40 W 100% 88%
TrueCrypt - TrueCrypt Twofish
min: 1.8 avg: 1.9 median: 1.9 (32%) max: 1.9 GB/s
CPU TDP 17 W TDP 40 W 76% 100%
TrueCrypt - TrueCrypt AES
min: 9.1 avg: 9.8 median: 9.8 (26%) max: 10.5 GB/s
CPU TDP 17 W TDP 40 W 78% 100%
Blender - Blender 3.3 Classroom CPU *
min: 509 avg: 598 median: 582 (7%) max: 772 Seconds
CPU TDP ? TDP 17 W TDP 18 W TDP 20 W TDP 22 W TDP 25 W TDP 26 W TDP 27 W TDP 28 W TDP 29 W TDP 30 W TDP 32 W TDP 35 W 102% 100% 101% 102% 102% 101% 102% 103% 102% 103% 103% 102% 103%
min: 281 avg: 333.6 median: 322 (4%) max: 427 Seconds
CPU TDP ? TDP 17 W TDP 18 W TDP 20 W TDP 22 W TDP 25 W TDP 26 W TDP 27 W TDP 28 W TDP 29 W TDP 30 W TDP 32 W TDP 35 W TDP 40 W TDP 45 W TDP 65 W TDP 70 W 104% 100% 101% 102% 102% 101% 102% 103% 102% 103% 103% 104% 103% 106% 106% 106% 106%
Blender - Blender 2.79 BMW27 CPU *
min: 315 avg: 356.6 median: 351 (2%) max: 452 Seconds
CPU TDP ? TDP 17 W TDP 18 W TDP 20 W TDP 22 W TDP 25 W TDP 26 W TDP 27 W TDP 28 W TDP 29 W TDP 30 W TDP 32 W TDP 35 W TDP 38 W 101% 100% 100% 101% 101% 100% 101% 101% 101% 101% 101% 101% 101% 101%
min: 182 avg: 221.5 median: 200 (1%) max: 386 Seconds
CPU TDP ? TDP 17 W TDP 18 W TDP 20 W TDP 22 W TDP 25 W TDP 26 W TDP 27 W TDP 28 W TDP 29 W TDP 30 W TDP 32 W TDP 35 W TDP 38 W TDP 40 W TDP 45 W TDP 65 W TDP 70 W 101% 100% 100% 101% 101% 100% 101% 101% 101% 101% 101% 101% 101% 101% 102% 102% 102% 102%
R Benchmark 2.5 - R Benchmark 2.5 *
min: 0.443 avg: 0.5 median: 0.5 (10%) max: 0.4998 sec
CPU TDP ? TDP 17 W TDP 18 W TDP 20 W TDP 22 W TDP 25 W TDP 26 W TDP 27 W TDP 28 W TDP 29 W TDP 30 W TDP 32 W TDP 35 W TDP 38 W 100% 101% 101% 101% 101% 101% 101% 101% 101% 101% 101% 101% 101% 101%
min: 0.403 avg: 0.4 median: 0.4 (9%) max: 0.4934 sec
CPU TDP ? TDP 17 W TDP 18 W TDP 20 W TDP 22 W TDP 25 W TDP 26 W TDP 27 W TDP 28 W TDP 29 W TDP 30 W TDP 32 W TDP 35 W TDP 38 W TDP 40 W TDP 45 W TDP 65 W TDP 70 W 100% 100% 100% 100% 100% 100% 100% 100% 101% 100% 100% 100% 100% 100% 101% 101% 102% 101%
3DMark 06 - CPU - 3DMark 06 - CPU
min: 14510 avg: 15492 median: 15605 (33%) max: 16362 Points
CPU TDP ? TDP 17 W TDP 40 W 100% 65% 92%
Super Pi mod 1.5 XS 1M - Super Pi mod 1.5 XS 1M *
min: 8.541 avg: 8.7 median: 8.7 (2%) max: 8.947 s
CPU TDP 17 W TDP 40 W 100% 100%
Super Pi mod 1.5 XS 2M - Super Pi mod 1.5 XS 2M *
min: 18.179 avg: 31.9 median: 31.9 (1%) max: 45.607 s
CPU TDP 17 W TDP 40 W 101% 100%
Super Pi Mod 1.5 XS 32M - Super Pi mod 1.5 XS 32M *
CPU TDP 17 W TDP 40 W 100% 102%
3DMark Vantage - 3DM Vant. Perf. CPU no Physx
min: 72985 avg: 76362 median: 77404 (59%) max: 78696 Points
CPU TDP ? TDP 17 W TDP 40 W 100% 53% 98%
3DMark 11 - 3DM11 Performance Physics
min: 11274 avg: 14709 median: 15273 (38%) max: 15903 Points
CPU TDP ? TDP 17 W TDP 18 W TDP 20 W TDP 22 W TDP 25 W TDP 26 W TDP 27 W TDP 28 W TDP 29 W TDP 30 W TDP 32 W TDP 35 W TDP 38 W 94% 81% 87% 92% 87% 98% 95% 100% 99% 95% 98% 95% 96% 71%
min: 13154 avg: 19303 median: 19672 (48%) max: 21820 Points
CPU TDP ? TDP 17 W TDP 18 W TDP 20 W TDP 22 W TDP 25 W TDP 26 W TDP 27 W TDP 28 W TDP 29 W TDP 30 W TDP 32 W TDP 35 W TDP 38 W TDP 40 W TDP 45 W TDP 65 W TDP 70 W 81% 61% 65% 69% 66% 73% 71% 75% 74% 72% 74% 83% 72% 53% 77% 93% 97% 100%
3DMark - 3DMark Ice Storm Physics
min: 89997 avg: 92003 median: 92002.5 (75%) max: 94008 Points
CPU TDP ? TDP 30 W 96% 100%
min: 74698 avg: 77067 median: 77668.5 (63%) max: 78233 Points
CPU TDP ? TDP 30 W TDP 40 W 87% 100% 81%
3DMark - 3DMark Ice Storm Extreme Physics
min: 77917 avg: 78292 median: 78291.5 (64%) max: 78666 Points
CPU TDP ? TDP 40 W 99% 100%
3DMark - 3DMark Ice Storm Unlimited Physics
min: 72599 avg: 75260 median: 75259.5 (60%) max: 77920 Points
CPU TDP ? TDP 40 W 100% 93%
3DMark - 3DMark Cloud Gate Physics
min: 10515 avg: 13390 median: 13645 (35%) max: 14569 Points
CPU TDP ? TDP 17 W TDP 26 W TDP 27 W TDP 28 W TDP 29 W TDP 30 W TDP 35 W TDP 38 W 92% 79% 91% 98% 98% 94% 100% 97% 93%
min: 13958 avg: 17897 median: 18291 (46%) max: 20125 Points
CPU TDP ? TDP 17 W TDP 26 W TDP 27 W TDP 28 W TDP 29 W TDP 30 W TDP 32 W TDP 35 W TDP 38 W TDP 40 W TDP 65 W TDP 70 W 82% 57% 66% 71% 71% 68% 72% 78% 70% 67% 92% 92% 100%
3DMark - 3DMark Fire Strike Standard Physics
min: 15893 avg: 20487 median: 21012.5 (37%) max: 22333 Points
CPU TDP ? TDP 17 W TDP 18 W TDP 20 W TDP 22 W TDP 25 W TDP 26 W TDP 27 W TDP 28 W TDP 29 W TDP 30 W TDP 32 W TDP 35 W TDP 38 W 94% 78% 90% 94% 93% 97% 91% 100% 94% 96% 97% 96% 97% 78%
min: 20603 avg: 27063 median: 28243 (50%) max: 30008 Points
CPU TDP ? TDP 17 W TDP 18 W TDP 20 W TDP 22 W TDP 25 W TDP 26 W TDP 27 W TDP 28 W TDP 29 W TDP 30 W TDP 32 W TDP 35 W TDP 38 W TDP 40 W TDP 45 W TDP 65 W TDP 70 W 86% 58% 68% 71% 70% 73% 69% 75% 71% 72% 73% 74% 74% 58% 94% 97% 97% 100%
3DMark - 3DMark Time Spy CPU
min: 2097 avg: 6732 median: 7009 (30%) max: 8350 Points
CPU TDP ? TDP 17 W TDP 18 W TDP 20 W TDP 22 W TDP 25 W TDP 26 W TDP 27 W TDP 28 W TDP 29 W TDP 30 W TDP 32 W TDP 35 W TDP 38 W 86% 69% 83% 91% 93% 37% 92% 82% 88% 77% 100% 80% 100% 100%
min: 7361 avg: 9857 median: 10149 (43%) max: 11005 Points
CPU TDP ? TDP 17 W TDP 18 W TDP 20 W TDP 22 W TDP 25 W TDP 26 W TDP 27 W TDP 28 W TDP 29 W TDP 30 W TDP 32 W TDP 35 W TDP 38 W TDP 40 W TDP 45 W TDP 65 W TDP 70 W 87% 52% 63% 69% 71% 28% 70% 62% 67% 59% 76% 73% 75% 75% 91% 96% 97% 100%
Geekbench 6.5 - Geekbench 6.5 Single-Core
min: 2593 avg: 2739 median: 2754 (64%) max: 2795 Points
CPU TDP ? TDP 17 W TDP 18 W TDP 20 W TDP 22 W TDP 25 W TDP 26 W TDP 27 W TDP 28 W TDP 29 W TDP 30 W TDP 32 W TDP 35 W TDP 38 W 94% 97% 100% 99% 97% 100% 99% 98% 99% 96% 99% 99% 99% 99%
min: 1874 avg: 2737 median: 2854 (66%) max: 2942 Points
CPU TDP ? TDP 17 W TDP 18 W TDP 20 W TDP 22 W TDP 25 W TDP 26 W TDP 27 W TDP 28 W TDP 29 W TDP 30 W TDP 32 W TDP 35 W TDP 38 W TDP 40 W TDP 45 W TDP 65 W TDP 70 W 90% 94% 96% 95% 94% 97% 95% 94% 95% 93% 96% 98% 96% 95% 99% 100% 84% 100%
Geekbench 6.5 - Geekbench 6.5 Multi-Core
min: 8964 avg: 10796 median: 10967 (43%) max: 11334 Points
CPU TDP ? TDP 17 W TDP 18 W TDP 20 W TDP 22 W TDP 25 W TDP 26 W TDP 27 W TDP 28 W TDP 29 W TDP 30 W TDP 32 W TDP 35 W TDP 38 W 88% 92% 100% 98% 98% 97% 96% 97% 96% 97% 97% 97% 98% 79%
min: 10774 avg: 12985 median: 13083 (51%) max: 14194 Points
CPU TDP ? TDP 17 W TDP 18 W TDP 20 W TDP 22 W TDP 25 W TDP 26 W TDP 27 W TDP 28 W TDP 29 W TDP 30 W TDP 32 W TDP 35 W TDP 38 W TDP 40 W TDP 45 W TDP 65 W TDP 70 W 81% 74% 80% 79% 79% 78% 77% 78% 78% 78% 78% 88% 79% 64% 86% 95% 95% 100%
Geekbench 5.5 - Geekbench 5.1 - 5.5 64 Bit Single-Core
min: 1891 avg: 1997 median: 2006 (67%) max: 2046 Points
CPU TDP ? TDP 17 W TDP 18 W TDP 20 W TDP 22 W TDP 25 W TDP 26 W TDP 27 W TDP 28 W TDP 29 W TDP 30 W TDP 32 W TDP 35 W TDP 38 W 95% 97% 99% 100% 97% 99% 98% 97% 98% 98% 98% 98% 98% 99%
min: 805 avg: 1873 median: 2065.5 (69%) max: 2155 Points
CPU TDP ? TDP 17 W TDP 18 W TDP 20 W TDP 22 W TDP 25 W TDP 26 W TDP 27 W TDP 28 W TDP 29 W TDP 30 W TDP 32 W TDP 35 W TDP 38 W TDP 40 W TDP 45 W TDP 65 W TDP 70 W 77% 93% 95% 96% 93% 95% 94% 93% 94% 94% 93% 97% 94% 95% 94% 100% 83% 100%
Geekbench 5.5 - Geekbench 5.1 - 5.5 64 Bit Multi-Core
min: 7574 avg: 9431 median: 9651 (17%) max: 9918 Points
CPU TDP ? TDP 17 W TDP 18 W TDP 20 W TDP 22 W TDP 25 W TDP 26 W TDP 27 W TDP 28 W TDP 29 W TDP 30 W TDP 32 W TDP 35 W TDP 38 W 85% 93% 100% 98% 99% 98% 97% 98% 99% 99% 97% 99% 97% 77%
min: 6705 avg: 11162 median: 11344 (20%) max: 12968 Points
CPU TDP ? TDP 17 W TDP 18 W TDP 20 W TDP 22 W TDP 25 W TDP 26 W TDP 27 W TDP 28 W TDP 29 W TDP 30 W TDP 32 W TDP 35 W TDP 38 W TDP 40 W TDP 45 W TDP 65 W TDP 70 W 75% 73% 78% 77% 78% 77% 76% 77% 78% 77% 76% 85% 76% 60% 86% 93% 95% 100%
Geekbench 5.0 - Geekbench 5.0 64 Bit Single-Core
min: 1247 avg: 1736 median: 1970 (9%) max: 1992 Points
CPU TDP ? TDP 40 W 63% 100%
Geekbench 5.0 - Geekbench 5.0 64 Bit Multi-Core
min: 10194 avg: 11057 median: 11207 (35%) max: 11769 Points
CPU TDP ? TDP 40 W 100% 98%
Geekbench 4.4 - Geekbench 4.1 - 4.4 64 Bit Single-Core
min: 5708 avg: 7251 median: 7765 (78%) max: 8281 Points
CPU TDP ? TDP 40 W 71% 100%
Geekbench 4.4 - Geekbench 4.1 - 4.4 64 Bit Multi-Core
min: 41544 avg: 42707 median: 41591 (41%) max: 44985 Points
CPU TDP ? TDP 40 W 96% 100%
Mozilla Kraken 1.1 - Kraken 1.1 Total Score *
min: 468 avg: 484.4 median: 479 (1%) max: 559 ms
CPU TDP ? TDP 17 W TDP 18 W TDP 20 W TDP 22 W TDP 25 W TDP 26 W TDP 27 W TDP 28 W TDP 29 W TDP 30 W TDP 32 W TDP 35 W TDP 38 W 100% 100% 100% 100% 100% 100% 100% 100% 100% 100% 100% 100% 100% 100%
min: 431 avg: 499.6 median: 437 (1%) max: 702 ms
CPU TDP ? TDP 17 W TDP 18 W TDP 20 W TDP 22 W TDP 25 W TDP 26 W TDP 27 W TDP 28 W TDP 29 W TDP 30 W TDP 32 W TDP 35 W TDP 38 W TDP 40 W TDP 45 W TDP 65 W TDP 70 W 100% 100% 100% 100% 100% 100% 100% 100% 100% 100% 100% 100% 100% 100% 100% 100% 100% 100%
Octane V2 - Octane V2 Total Score
min: 94615 avg: 107955 median: 112290 (74%) max: 113526 Points
CPU TDP 17 W TDP 18 W TDP 25 W TDP 30 W 90% 100% 99% 91%
min: 105563 avg: 114061 median: 115427 (76%) max: 119825 Points
CPU TDP 17 W TDP 18 W TDP 25 W TDP 30 W TDP 45 W TDP 65 W TDP 70 W 87% 97% 96% 89% 90% 100% 100%
WebXPRT 4 - WebXPRT 4 Score
min: 199.5 avg: 270.4 median: 277 (72%) max: 291 Points
CPU TDP ? TDP 17 W TDP 18 W TDP 20 W TDP 22 W TDP 25 W TDP 26 W TDP 27 W TDP 28 W TDP 29 W TDP 30 W TDP 32 W TDP 35 W TDP 38 W 82% 92% 98% 100% 98% 98% 97% 100% 95% 91% 93% 92% 100% 96%
min: 193.1 avg: 250.6 median: 253.5 (66%) max: 277 Points
CPU TDP ? TDP 17 W TDP 18 W TDP 20 W TDP 22 W TDP 25 W TDP 26 W TDP 27 W TDP 28 W TDP 29 W TDP 30 W TDP 32 W TDP 35 W TDP 38 W TDP 40 W TDP 45 W TDP 65 W TDP 70 W 83% 92% 98% 100% 98% 98% 97% 100% 95% 91% 93% 88% 100% 96% 86% 95% 90% 86%
WebXPRT 3 - WebXPRT 3 Score
min: 219 avg: 285.9 median: 294 (53%) max: 317 Points
CPU TDP ? TDP 17 W TDP 18 W TDP 20 W TDP 22 W TDP 25 W TDP 26 W TDP 27 W TDP 28 W TDP 29 W TDP 30 W TDP 32 W TDP 35 W TDP 38 W 79% 89% 94% 97% 92% 86% 98% 96% 97% 87% 87% 88% 98% 100%
min: 256 avg: 297.6 median: 304 (55%) max: 336 Points
CPU TDP ? TDP 17 W TDP 18 W TDP 20 W TDP 22 W TDP 25 W TDP 26 W TDP 27 W TDP 28 W TDP 29 W TDP 30 W TDP 32 W TDP 35 W TDP 38 W TDP 40 W TDP 45 W TDP 65 W TDP 70 W 86% 87% 92% 95% 91% 84% 96% 94% 96% 86% 86% 82% 97% 98% 90% 100% 96% 95%
CrossMark - CrossMark Overall
min: 1551 avg: 1682 median: 1686 (63%) max: 1742 Points
CPU TDP ? TDP 17 W TDP 18 W TDP 20 W TDP 22 W TDP 25 W TDP 26 W TDP 27 W TDP 28 W TDP 29 W TDP 30 W TDP 32 W TDP 35 W TDP 38 W 94% 95% 100% 99% 97% 98% 99% 99% 94% 93% 99% 96% 99% 89%
min: 1406 avg: 1741 median: 1757 (66%) max: 2005 Points
CPU TDP ? TDP 17 W TDP 18 W TDP 20 W TDP 22 W TDP 25 W TDP 26 W TDP 27 W TDP 28 W TDP 29 W TDP 30 W TDP 32 W TDP 35 W TDP 38 W TDP 40 W TDP 45 W TDP 65 W TDP 70 W 83% 85% 90% 89% 87% 89% 89% 89% 85% 84% 89% 84% 89% 80% 90% 96% 100% 93%
Power Consumption - Prime95 Power Consumption - external Monitor *
min: 28 avg: 45.1 median: 45.6 (8%) max: 55.2 Watt
CPU TDP ? TDP 17 W TDP 18 W TDP 20 W TDP 22 W TDP 25 W TDP 26 W TDP 27 W TDP 28 W TDP 29 W TDP 30 W TDP 32 W TDP 35 W TDP 38 W 103% 105% 103% 103% 102% 103% 100% 101% 101% 101% 101% 102% 100% 101%
min: 32.9 avg: 75 median: 70.3 (12%) max: 112.4 Watt
CPU TDP ? TDP 17 W TDP 18 W TDP 20 W TDP 22 W TDP 25 W TDP 26 W TDP 27 W TDP 28 W TDP 29 W TDP 30 W TDP 32 W TDP 35 W TDP 38 W TDP 40 W TDP 45 W TDP 65 W TDP 70 W 111% 116% 114% 114% 113% 113% 111% 112% 112% 112% 111% 113% 111% 112% 108% 108% 100% 100%
Power Consumption - Cinebench R15 Multi Power Consumption - external Monitor *
min: 38.2 avg: 53.6 median: 54.1 (10%) max: 61.6 Watt
CPU TDP ? TDP 17 W TDP 18 W TDP 20 W TDP 22 W TDP 25 W TDP 26 W TDP 27 W TDP 28 W TDP 29 W TDP 30 W TDP 35 W TDP 38 W 103% 103% 101% 102% 101% 102% 100% 101% 101% 100% 102% 102% 102%
min: 30 avg: 74.3 median: 67.5 (12%) max: 115.7 Watt
CPU TDP ? TDP 17 W TDP 18 W TDP 20 W TDP 22 W TDP 25 W TDP 26 W TDP 27 W TDP 28 W TDP 29 W TDP 30 W TDP 32 W TDP 35 W TDP 38 W TDP 40 W TDP 45 W TDP 65 W TDP 70 W 114% 115% 112% 113% 112% 113% 111% 112% 112% 111% 113% 115% 113% 113% 109% 110% 102% 100%
Power Consumption - Idle Power Consumption - external Monitor *
min: 1.484 avg: 4.6 median: 4.7 (3%) max: 7.21 Watt
CPU TDP ? TDP 17 W TDP 18 W TDP 20 W TDP 22 W TDP 25 W TDP 26 W TDP 27 W TDP 28 W TDP 29 W TDP 30 W TDP 32 W TDP 35 W TDP 38 W 102% 103% 101% 103% 101% 102% 103% 102% 100% 103% 101% 101% 101% 101%
min: 3.7 avg: 10.5 median: 6 (4%) max: 56.4 Watt
CPU TDP ? TDP 17 W TDP 18 W TDP 20 W TDP 22 W TDP 25 W TDP 26 W TDP 27 W TDP 28 W TDP 29 W TDP 30 W TDP 32 W TDP 35 W TDP 38 W TDP 40 W TDP 45 W TDP 65 W TDP 70 W 100% 115% 112% 114% 112% 114% 114% 114% 111% 114% 112% 113% 112% 112% 113% 113% 112% 108%
Power Consumption - Idle Power Consumption 150cd 1min *
min: 2.25 avg: 5 median: 5.2 (4%) max: 9.04 Watt
CPU TDP ? TDP 17 W TDP 18 W TDP 20 W TDP 22 W TDP 25 W TDP 26 W TDP 27 W TDP 28 W TDP 29 W TDP 30 W TDP 32 W TDP 35 W 102% 102% 102% 102% 100% 102% 103% 102% 100% 103% 101% 101% 101%
min: 4.21 avg: 7.1 median: 6.9 (5%) max: 12.1 Watt
CPU TDP ? TDP 17 W TDP 18 W TDP 20 W TDP 22 W TDP 25 W TDP 26 W TDP 27 W TDP 28 W TDP 29 W TDP 30 W TDP 32 W TDP 35 W TDP 40 W TDP 45 W TDP 65 W TDP 70 W 103% 105% 104% 105% 103% 104% 105% 105% 103% 105% 104% 104% 104% 103% 103% 102% 100%
Power Consumption - Power Efficiency - Cinebench R15 Multi external Monitor
min: 26.1 avg: 29.5 median: 29.2 (22%) max: 33.5 Points per Watt
CPU TDP ? TDP 17 W TDP 18 W TDP 20 W TDP 22 W TDP 25 W TDP 26 W TDP 27 W TDP 28 W TDP 30 W TDP 38 W 98% 100% 93% 93% 93% 96% 83% 91% 92% 96% 88%
min: 21 avg: 36.4 median: 35.9 (27%) max: 67.9 Points per Watt
CPU TDP ? TDP 17 W TDP 18 W TDP 20 W TDP 22 W TDP 25 W TDP 26 W TDP 27 W TDP 28 W TDP 30 W TDP 32 W TDP 38 W TDP 40 W TDP 45 W TDP 65 W TDP 70 W 76% 60% 56% 56% 56% 58% 50% 55% 56% 58% 100% 53% 69% 71% 51% 45%
Average Benchmarks Intel Core Ultra 7 258V → 100% n=41 Average Benchmarks AMD Ryzen AI 7 350 → 235% n=41
- Range of benchmark values for this graphics card
- Average benchmark values for this graphics card
* Smaller numbers mean a higher performance
1 This benchmark is not used for the average calculation
log 30. 14:14:54
#0 ran 0s before starting gpusingle class +0s ... 0s
#1 checking url part for id 17995 +0s ... 0s
#2 checking url part for id 19172 +0s ... 0s
#3 redirected to Ajax server, took 1767100494s time from redirect:0 +0s ... 0s
#4 did not recreate cache, as it is less than 5 days old! Created at Mon, 29 Dec 2025 10:37:44 +0100 +0s ... 0s
#5 composed specs +0.007s ... 0.007s
#6 did output specs +0s ... 0.007s
#7 getting avg benchmarks for device 17995 +0.005s ... 0.012s
#8 got single benchmarks 17995 +0.029s ... 0.041s
#9 getting avg benchmarks for device 19172 +0.005s ... 0.046s
#10 got single benchmarks 19172 +0.019s ... 0.065s
#11 got avg benchmarks for devices +0s ... 0.065s
#12 min, max, avg, median took s +0.065s ... 0.13s
#13 return log +0.002s ... 0.132s